Transportation Network Speed Limit Review - City of St. Albert
336
-
Upload
khangminh22 -
Category
Documents
-
view
0 -
download
0
Transcript of Transportation Network Speed Limit Review - City of St. Albert


Table of Contents
1.0 Introduction .................................................................................................................. 1 1.1 Background 1 1.2 Approaches to Setting Speed Limits 1 1.3 Study Objectives 2
2.0 Best Practices Review ................................................................................................. 3 2.1 Introduction 3 2.2 Survey Methodology 3 2.3 Survey Results 4 2.4 Emerging Trends and Best Practices 13
3.0 Background Data Review ........................................................................................... 16 3.1 Background Data 16
4.0 Applying TAC Guidelines for Posted Speed Limits ..................................................... 24 4.1 Introduction 24 4.2 TAC Canadian Guidelines for Establishing Posted Speed Limits 24 4.3 Methodology 24 4.4 Application of the Guide 25 4.5 TAC CGEPSL Recommendations 33
5.0 Local Roadway Review .............................................................................................. 38 5.1 Introduction 38 5.2 Review Purpose 38 5.3 Local Road Assessments 39 5.4 Local Roadway Field Review 40
6.0 School Zones and Playground Zones ........................................................................ 44 6.1 Introduction 44 6.2 Review Purpose 44 6.3 Applying AT School Zone Input Worksheet 44 6.4 Applying the AT Playground Zone Worksheet 48 6.5 Zone or Area Signing and Marking 49 6.6 School and Playground Zone Proximity Review 52 6.7 Regional Best Practices 52 6.8 Schools as Playground Zones Evaluation 53 6.9 School Zone and Playground Zone Summary 60
7.0 Safe Systems Review ................................................................................................ 61 7.1 Background Information 61 7.2 Applying Safe Systems 62
8.0 Preliminary Speed Limit Recommendations ............................................................... 69 8.1 Boulevard Roadways 69 8.2 Crosstown Roadways 70 8.3 Connector Roadways 70 8.4 Neighbourhood Roadways 71 8.5 Local Roadways 72 8.6 Playground and School Zone/Area Recommendations 72 8.7 Short 30 km/h Sections 74


9.0 Stakeholder Consultation ........................................................................................... 75 9.1 Introduction 75 9.2 Stakeholder Workshop 75 9.3 Stakeholder Feedback 76
10.0 Final Speed Limit Recommendations ......................................................................... 81 10.1 Recommendations 81 10.2 Potential Impacts of the Recommendations 83
11.0 Next Steps ................................................................................................................ 89
12.0 Acronyms ................................................................................................................... 90
13.0 Glossary of Terms ...................................................................................................... 91
14.0 References ................................................................................................................ 93
APPENDICES
Appendix A Survey Question Results
Appendix B CGEPSL Inputs
Appendix C CGESPL Results
Appendix D AT Playground/School Zone/Area Inputs/Results
Appendix E Stakeholder Presentation
TABLES
Table 2.1: Municipalities Surveyed ................................................................................................................... 3
Table 2.2: St. Albert’s Current Practice – Methodology for Setting Speed Limits .............................................. 6
Table 2.3: Default Posted Speed Limit Response Count (by road type) ........................................................... 7
Table 2.4: St. Albert’s Current Practice – Default Speed Limits ........................................................................ 7
Table 2.5: Triggers for Conducting Speed Reviews .......................................................................................... 8
Table 2.6: St. Albert Current Practice – Triggers for Conducting Speed Limit Reviews .................................... 8
Table 2.7: Current State of Changing Neighbourhood Speed Limits ................................................................ 9
Table 2.8: Capture and Share Traffic Operations Data and Safety Data ........................................................ 10
Table 2.9: Acceptable Ranges for Speeding (Playground and School Zones)................................................ 10
Table 2.10: Examination of Prevailing Speeds, Comparing Roadway Characterises to Posted Speeds .......... 11
Table 2.11: Signage Install Guidelines .............................................................................................................. 12
Table 2.12: Public Communication Protocol ..................................................................................................... 12
Table 2.13: Experience or Study with Variable Speed Limits ............................................................................ 13
Table 3.1: Boudreau Road Collisions (2012 – 2018 inclusive) ........................................................................ 17


Table 3.2: St. Albert Trail (2012 – 2018 inclusive) .......................................................................................... 18
Table 3.3: Maximum Operating Speeds (Municipal Engineering Design Standards Table 3.1) ...................... 22
Table 4.1: TAC Recommend Posted Speed Limit Criteria (Arterials) .............................................................. 25
Table 4.2: TAC Recommend Posted Speed Limit Criteria (Collectors) ........................................................... 25
Table 4.3: Non-geometric Data Inputs ............................................................................................................ 26
Table 4.4: Geometric Data Inputs ................................................................................................................... 27
Table 4.5: Horizontal Curves ........................................................................................................................... 28
Table 4.6: Vertical Curves ............................................................................................................................... 28
Table 4.7: Lane Width ..................................................................................................................................... 29
Table 4.8: Roadside Hazards .......................................................................................................................... 30
Table 4.9: Pedestrian Exposure ...................................................................................................................... 31
Table 4.10: Cyclist Exposure ............................................................................................................................ 31
Table 4.11: Pavement Surface .......................................................................................................................... 32
Table 4.12: On Street Parking ........................................................................................................................... 32
Table 4.13: Supplemental Results, Collector Speed Limit Recommendations (total for 57 segments) ............. 37
Table 5.1: Local Roadways Selected .............................................................................................................. 39
Table 6.1: School Zone Results Matrix (AT Guidelines for School and Playground Zones & Areas) .............. 44
Table 6.2: School Type Point Breakdown ....................................................................................................... 45
Table 6.3: Fencing Point Breakdown .............................................................................................................. 45
Table 6.4: Road Classification Point Breakdown ............................................................................................ 46
Table 6.5: Property Line Separation Point Breakdown ................................................................................... 46
Table 6.6: School Entrance Point Breakdown ................................................................................................. 46
Table 6.7: Sidewalks Point Breakdown for School Zones ............................................................................... 47
Table 6.8: Playground Results Matrix (AT Guidelines for School and Playground Zones & Areas) ................ 48
Table 6.9: Playground Type Point Breakdown ................................................................................................ 48
Table 6.10: Sidewalks Point Breakdown for Playground Zones ........................................................................ 49
Table 6.11: School Playground Zone Evaluation Results (Applying AT Playground Zone) .............................. 54
Table 6.12: School Playground Zone Evaluation Results (Applying AT Playground Zone) .............................. 55
Table 9.1: Stakeholder Feedback Summary ................................................................................................... 79
Table 10.1: Field Signage Cost ......................................................................................................................... 83
Table 10.2: Time Comparison ........................................................................................................................... 84


FIGURES
Figure 3.1: Injury Colission Density – St. Albert Collisions Statistics (2017) .................................................... 16
Figure 3.2: Analogy - Impacts of Falling and Impacts (Collision between Vehicle and Pedestrian) ................. 20
Figure 4.1: Current Posted Speed Limit ........................................................................................................... 34
Figure 4.2: Recommended Speed Limits ......................................................................................................... 34
Figure 4.3: Posted Speed Subtract Recommended Speed .............................................................................. 35
Figure 4.4: Posted Speed Subtract Prevailing Speed ...................................................................................... 36
Figure 6.1: School and Playground Collisions by Time Interval ....................................................................... 56
Figure 6.2: Playground Activity - Thursday....................................................................................................... 57
Figure 6.3: Playground Activity - Friday ........................................................................................................... 57
Figure 6.4: Playground Activity - Saturday ....................................................................................................... 58
Figure 7.1: St. Albert Typology Street Map (St. Albert Complete Streets Guidelines, August 2018) ................ 63
Figure 10.1: Motor Vehicle Collisions in Speed Reduced Communities (April – November) .............................. 87
Figure 10.2: Injury Motor Vehicle Collisions in Speed Reduced Communities (April – November) .................... 88
EXHIBITS
Following Page
Exhibit 4.1: Arterials and Collectors Analyzed .................................................................................................. 26
Exhibit 4.2: TAC CGEPSL Recommended Speed Limit ................................................................................... 34
Exhibit 4.3: TAC CGEPSL Recommended Speed Limit vs Posted Speed ....................................................... 36
Exhibit 6.1: School Zone and Area Recommendations ..................................................................................... 48
Exhibit 6.2: Playground Zone and Area Recommendations.............................................................................. 50
Exhibit 10.1: Final Recommendations ................................................................................................................ 82


islengineering.com
November 2019
Transportation Network Speed Limit Review
City of St. Albert
FINAL REPORT
1
1.0 Introduction
1.1 Background
An important aspect of transportation safety is linked to roadway operations and directly associated
with speed. This aligns to, not only road user behaviour and the speed at which they travel, but also
the context of how the City’s roadways are designed and managed. A strategy (strategy VS-S1-C)
recommended within the City of St. Albert Transportation Safety Plan (2018) identified the opportunity
for the City to evaluate the existing road network using the Transportation Association of Canada
(TAC) Guidelines for posted speed limits and compare results of the evaluation with recorded driver
speeds on roadways (representing drivers’ perception of appropriate speeds). Further analysis of
safety information, such as motor vehicle collisions, would be incorporated into the review to
complete a holistic evaluation of the network based from existing roadway design criteria and risk
factors within the corridors, recorded roadway operational inputs and consideration of safe
management or roadways.
St. Albert’s road network to date has been designed and posted following the Transportation of
Canada (TAC) Guidelines; however, there is a lack of formal documentation and direct reporting on
the varying corridor’s characteristics and resulting posted speed limits. The performance of a network
speed review allows for both the re-evaluation of the road system, as well as creates an opportunity
for public information sharing and education on posted speeds through the results of the evaluation
and final reporting.
1.2 Approaches to Setting Speed Limits
The following report considers several approaches for setting speed limits and provides
recommendations based on each approach, with the goal of combining the recommendations into a
single recommendation that has been informed through all approaches. The approaches for setting
speed limits are as follows:
• Canadian Guidelines for Establishing Posted Speed Limits (CGEPSL): Applies to setting
speed limits for arterial and collector roadways (not including school zones and playground zones).
• Alberta Transportation Guidelines to Playground and School Area and Zones: Applies to
setting speed limits (zones and areas) for playground and schools.
• Local Roadway Review: Applies to setting speed limits on local roadways.
• Safety Systems Review: Applies to all roadways based on managing the network at operational
consideration to reduce collision severity.
1.2.1 The Canadian Guidelines for Establishing Posted Speed Limits
The Canadian Guidelines for Establishing Posted Speed Limits (CGEPSL), published by TAC is used
in this report for evaluating the speed limits on collector and arterial roadways. The guideline,
published in 2009, is the first single accepted uniform methodology for evaluating speed limits
available for Canadian use. The guide provides an evaluation tool to assess posted speed limits
based on roadway classifications, function and physical characteristics providing an objective
assessment considering engineering factors related to a roadway’s risk level.

2 Transportation Network Speed Limit Review
City of St. Albert
FINAL REPORT
Integrated Expertise.
Locally Delivered.
1.2.2 Alberta Transportation Guideline to Playground and School Area and Zones
The Alberta Transportation Guidelines for School and Playground Zones and Areas is used in this
report for evaluating speed limits on roadways adjacent to school and playgrounds. The guideline,
published in 2007, is a well-used guideline in the province of Alberta and is applied as a standard by
some municipalities. Speed limits for school and playgrounds are designated based on the type of
school, size of playground and other road features such as the presence of sidewalks and fencing.
The guidelines provide a systematic, objective, and quantitative procedure for assessing the need for
a school and playground zone or area.
1.2.3 Local Roadway Review
Local roadway review includes evaluation of a representative selection of the City’s local roadways
based on literature review and field observation.
1.2.4 Safe Systems Review
The St. Albert Transportation Safety Plan, which aligns with Safe Systems, focuses on the objective
of “Vision Zero” and seeks to reduce injuries and fatal collisions on St. Albert roadways. Vision Zero is
a long-term traffic safety goal that is focused on working towards the objective of no fatality or serious
injury occurrence as a result of a motor vehicle collision. The application of a Safe Systems Approach
to reviewing and establishing speed limits is different from the CGEPSL and AT’s school and
playground speed limit guide. A safe systems approach prioritizes the safety of vulnerable road users
(pedestrians and cyclists) over the many other factors considered by the two aforementioned guides
and considers the need to reduce speeds to reduce risk to all road users.
1.3 Study Objectives
The purpose of this study is to complete a road network assessment of speed limits within St. Albert.
The objective of this study is to provide the City with comprehensive recommendations for posted
speeds based on completing the following process steps:
• Section 2.0 Best Practices Review: Best practices review of comparable communities regarding
current speed limit setting practices.
• Section 3.0 Background Information Review: Comprehensive review of existing St. Albert
studies, reports and documents related to speed limits.
• Section 4.0 CGESL Assessment: An overview of the CGEPSL and recommended speeds based
on applying the CGEPSL guide.
• Section 5.0 Local Roadway Review: Separate review of local roadways and recommendations
made based on the review.
• Section 6.0 Playground and School Zone Review: A review of the current Playground Zones
and School Zones and recommendations based on the Alberta Transportation Guidelines for
Playground and School Zone Area and Zones.
• Section 7.0 Safe Systems Review: Application of safe systems and recommendations for setting
speed limits based on the safe system approach.
• Section 8.0 Speed Limit Recommendations: Recommendations for speed limits based on
interpreting combined results from the above subject areas.

islengineering.com
November 2019
Transportation Network Speed Limit Review
City of St. Albert
FINAL REPORT
3
2.0 Best Practices Review
2.1 Introduction
This section of the report describes results from the review of similar sized municipalities for setting
speed limits based on information collected from a survey. Described below are the survey
methodology, survey results and a summary of emerging trends and best practices based on the
feedback.
2.2 Survey Methodology
An online survey was completed from April 25 – May 10, 2019 to collect information from similar sized
municipalities related to their practices for posting and reviewing speed limits, including questions
related to future review, data collection and public communications. The survey was sent out to 14
municipalities, which were selected using the following criteria:
• Must be a Canadian municipality.
• Three to four from the Edmonton region.
• Similar in population to St. Albert.
• Similar road hierarchy and topography as St. Albert.
• Note: In interest as a comparator, the municipality was also asked to look into the existence of
any formalized Traffic Safety Program or Plan (similar to the one in Appendix A of the City’s
Transportation Safety Plan).
Survey Monkey, which is an online tool to administer and store responses from a survey, was used to
create the survey. Fourteen municipalities plus the City of St. Albert completed the survey, and
municipalities that responded to the survey are listed in the following table:
Table 2.1: Municipalities Surveyed
Number Municipality Traffic Safety Program/Plan Population Response Received
1 City of St. Albert Yes 66,082 Yes
2 City of Airdrie, AB Yes 68,091 Yes
3 Strathcona County, AB Yes 98,044 Yes
4 City of Calgary, AB Yes 1,239,000 Yes
5 City of Edmonton, AB Yes 932,500 Yes
6 City of Red Deer, AB Yes 100,400 Yes
7 City of Saskatoon, SK Yes 246,400 Yes
8 City of Hamilton, ON Yes 536,900 Yes
9 City of London, ON Yes 383,800 Yes
10 City of Leduc AB Unknown 30,498 Yes
11 City of Spruce Grove, AB Unknown 33,640 Yes
12 Town of Okotoks, AB Unknown 28,881 Yes
13 City of Lethbridge, AB Unknown 92,730 Yes
14 City of Medicine Hat, AB Unknown 63,260 Yes
15 City of Grande Prairie, AB Unknown 63,170 Yes

4 Transportation Network Speed Limit Review
City of St. Albert
FINAL REPORT
Integrated Expertise.
Locally Delivered.
Of the 14 municipalities surveyed, 16 survey forms were filled as two municipalities conducted the
survey twice (City of Airdrie and other not indicated). Therefore, the maximum number of responses
for each question is 16.
2.3 Survey Results
The following is a summary of the results for each question in the survey. The detailed responses for
each question are provided in Appendix A.
2.3.1 Overall Speed Philosophy
Survey Question: What is your municipality’s philosophy for setting speed limits?
Survey Responses
Overall, the responses varied greatly, and there was no apparent trend in the philosophy. The
following is a summary of the responses received regarding the philosophy for setting posted speed
limits.
• Three responses indicated using the TAC design guidelines for setting speed limits, which is the
closest of a trend in the answers.
• Other notable responses:
• 50 km/h unless otherwise posted.
• Use of the functional classifications.
• Use of local design and construction standards.
• Council approved policies that accounts for land use, number of access, lane width, vehicle
volumes.
• Vision zero, safe speeds, safe streets.
St. Albert’s Current Practice
• TAC Guideline application / provincial playground and school zone applications; however,
transitioning to a Safe System approach with greater emphasis on road function
General Observations Based on Survey Responses
The variation in the responses illustrates one of a few conclusions:
• There is no single philosophy adapted for setting speed limits.
• The respondent is unaware of the local philosophy for setting speeds limits.
• Speed limits change so infrequently that there is no standard philosophy for reviewing these or
identification that one is unnecessary.

islengineering.com
November 2019
Transportation Network Speed Limit Review
City of St. Albert
FINAL REPORT
5
2.3.2 Methodology for Setting Speeds
Survey Question: What methodology does your municipality uses to establish speed limits along the following types of roadways or zones?
• Arterial
• Collector
• Local
• School zone
• Playground zone
Survey Responses
Overall, the responses varied greatly, and there was no apparent trend in the methodology. The
following is a summary of the responses received regarding the methodology for setting posted speed
limits on arterials, collectors and local roads.
Arterials
• Six responses indicated using the TAC design guidelines for setting speed limits.
• Two conflicting methodologies, including use of the design speed for setting posted limits or using
the design speed minus 10 km/h (for example design at 70 km/h and post at 60 km/h).
• Other notable responses:
• Single response that it is based on consultant recommendations.
• 60, 70 or 80 km/h depending upon the built environment.
Collectors
• Five responses indicated using the TAC design guidelines for setting speed limits.
• Three responses indicated a default speed of 50 km/h.
• Other notable responses:
• Posted speed equals design speed.
• Posted speed equals design speed minus 10 km/h.
• All residential collectors are posted at 50 km/h.
Locals
• Two responses indicated using the TAC design guidelines for setting speed limits.
• Seven responses indicated a default speed of 50 km/h.
• Other notable responses:
• Default of 40 km/h.
• Default of 30 km/h.
• Posted speed equals design speed.
• Posted speed equals design speed minus 10 km/h.
• Vision zero.

6 Transportation Network Speed Limit Review
City of St. Albert
FINAL REPORT
Integrated Expertise.
Locally Delivered.
School Zones
• Five responses indicated using Alberta Transportation Guidelines.
• Four responses indicated using TAC.
• Other notable response:
• Vision Zero.
• Bill 65.
• All school zones designated as playground zones.
• Traffic Safety Act.
Playground Zone
• Four responses indicated using Alberta Transportation Guidelines.
• Four responses indicated using TAC.
• Other notable responses:
• Vision Zero.
• Bill 65.
St. Albert’s Current Practice
Table 2.2: St. Albert’s Current Practice – Methodology for Setting Speed Limits
Road Type Methodology
Arterial Roads TAC
Collector Roads TAC & Provincial default of 50 km/h
Local Roads TAC & Provincial default of 50 km/h
School Zone Provincial Guidelines for School Zones – 30 km/h
Playground Zone Provincial Guidelines for Playground Zones – 30 km/h
General Observations Based on Survey Responses
• TAC prevails for setting speeds on arterial roadways, but less prevalent on collector and minimal
use on local roadways.
• Local roadways generally set at a default speed limit of 50 km/h or less.
• Conflicting philosophy regarding use of design speed equals posted speed or posted speed is
10 km/h lower.

islengineering.com
November 2019
Transportation Network Speed Limit Review
City of St. Albert
FINAL REPORT
7
2.3.3 Default Posted Speed Limits
Survey Question: What are the default posted speed limits on the following street types in your municipality?
• Arterial
• Collector
• Local
• School zone
• Playground zone
Survey Responses
Table 2.3: Default Posted Speed Limit Response Count (by road type)
Roadway Classification/Area
Default Speed Limit Total
30 40 40-50 50 50-60 60 60-70 70 Varies
Arterial 4 3 4 1 4 16
Collector 1 1 12 2 15
Local 2 2 12 16
School Zone 11 1 1 13
Playground Zone 12 2 14
Notable responses regarding default speed limits:
• Arterials: Default speed limits generally range from 50 – 60 km/h.
• Collectors: Default speed limit is generally 50 km/h, except where 30 – 40 km/h is used, either in
residential areas on a trial basis or in some cases no reason indicated.
• Locals: Default speed limit is 50 km/h, except where it is 30 or 40 km/h with no reason indicated.
• School Zones: Default speed limit is generally 30 km/h, where higher speeds likely indicate no
use of school zones. Three occurrences of playground zones used, not school zones.
• Playground Zones: Default speed limit is 30 km/h, where higher speed limits likely indicate no use
of playground zones.
St. Albert’s Current Practice
Table 2.4: St. Albert’s Current Practice – Default Speed Limits
Road Type Default Posted Speed
Arterial Roads 50 – 60 km/h
Collector Roads 50 km/h unless school or playground zone
Local Roads 50 km/h unless school or playground zone
School Zones 30 km/h
Playground Zones 30 km/h
General Observations Based on Survey Responses
Arterials have the largest variability in posted speeds compared to collector and local roadways. This
is potentially because of arterial roadways generally having a larger range in attributes, including
number of lanes, lane widths, connectivity, roadside features, cross section features, adjacent land
use, traffic volumes and others. Collector and local roadways have a small variability in posted speed
limits, potentially a result of these roadways having a small range in attributes.

8 Transportation Network Speed Limit Review
City of St. Albert
FINAL REPORT
Integrated Expertise.
Locally Delivered.
Compared to arterial roadways, collector roadways typically have less than four lanes, limited
connectivity (compared to arterials) and lower traffic volumes. Local roadways typically are most
consistent.
Collector and local roadway speed limits are consistently posted at 50 km/h although the posted
speeds appear to be trending downward, with some respondents indicating the using or trialing lower
default speeds.
2.3.4 Triggers for Conducting Reviews
Survey Question: What are triggers at which point your municipality reviews posted speed limits along the following types of roadways or zones?
• Arterial
• Collector
• Local
• School zone
• Playground zone
Survey Responses
Table 2.5: Triggers for Conducting Speed Reviews
Responses Response Totals (by classification/area)
Total Arterial Collector Local SZ PG
Combination (significant geometric changes, public concern safety concerns, new developments)
8 4 1 1 2 16
Public or safety concerns 2 2 2 2 2 10
Pubic/council concerns 2 4 1 1 8
Public concern or speed based 1 1
Public concern or significant development 1 2 2 1 5
No review process 1 1 1 1 4
Design construction, only 1 1
Operating speed, only 1 1 2
Safety based, only 1 1 1 3
Development 1 1 1
New School/Playground 2 2 2 2 8
St. Albert’s Current Practice
Table 2.6: St. Albert Current Practice – Triggers for Conducting Speed Limit Reviews
Road Type Trigger for Posted Speed Review
Arterial Roads Development impacts
Collector Roads Resident requests
Local Roads Resident request – although typically no change
School Zones Resident/school request, Safe Journeys Review, new school
Playground Zones Resident request, new playground

islengineering.com
November 2019
Transportation Network Speed Limit Review
City of St. Albert
FINAL REPORT
9
General Observations Based on Survey Responses
• The majority of responses indicated a variety of reasons for reviewing speed limits, including major
roadway projects, safety concerns, new developments and/or resident concerns.
• Public concerns cited as a trigger in a majority of the responses for reviewing speed limits, as a
single trigger or as a combined trigger.
• Local roadways have the highest number of reviews triggered by only public/council concern as the
single reason.
2.3.5 Speed Limit Current State of Review
Survey Question: Is your municipality currently, or will be, in the process of reviewing and/or changing residential neighbourhood speed limits on local and collector roads?
Survey Responses
Table 2.7: Current State of Changing Neighbourhood Speed Limits
Response Total
Current reviewing/debating 7
Considering lower speed limits on local roads in the future 2
Considering lower speed limits in neighbourhoods in the future 1
Waiting on other municipalities to complete their review 1
Not being considered 4
St. Albert’s Current Practice
• Yes – currently performing a City network wide review of all classes of roadways; inclusive of
playground and school zones and have performed piloted reduction of neighbourhood speeds
aligned with Neighbourhood Traffic Calming work.
General Observations Based on Survey Responses
• The majority of respondents indicated they are currently in the process of reviewing neighbourhood
speed limits or awaiting the outcomes of results of such reviews from other agencies.

10 Transportation Network Speed Limit Review
City of St. Albert
FINAL REPORT
Integrated Expertise.
Locally Delivered.
2.3.6 Data Collection
Survey Question: Does your municipality capture and publicly share traffic operations data on roadways, including safety statistics?
Survey Responses
Table 2.8: Capture and Share Traffic Operations Data and Safety Data
Response Total
Yes 11
No 1
In the process 1
Yes, when requested 2
St. Albert’s Current Practice
• Yes – volume data and collision data; speed data is shared with communities involved in
neighbourhood traffic calming projects.
General Observations Based on Survey Responses
• The vast majority of respondents indicated they capture traffic and safety data.
• The majority of respondents indicated they publicly share traffic operations data.
2.3.7 Acceptable Ranges
Survey Question: If your municipality collects speed data along school zones or playground zones, what are acceptable ranges of speeds for a zone that is deemed working well?
Responses
Table 2.9: Acceptable Ranges for Speeding (Playground and School Zones)
Response Total
No thresholds 1
90th percentile <10 % above speed limit 1
85th percentile < 35 km/h 3
85th percentile <10% above speed limit 1
10 km/h above 1
+10% 1
30 – 35 km/h 1
Assessed at a network level (prioritized) 1
<5 km/h above limit 2

islengineering.com
November 2019
Transportation Network Speed Limit Review
City of St. Albert
FINAL REPORT
11
St. Albert Current Practice
• Currently <10 km/h variance from the posted speed; however, the tolerance level of “acceptable” is
reducing with particular attention in areas of playground/school zones which have a <5 km
variance. Note – this “tolerance” is aligned to engineering tolerance and is not reflective of any
enforcement tolerances.
General Observations Based on Survey Responses
• There is a high level of variability in the responses.
• The most common criteria from the respondents was the 85th percentile.
• The vast majority of respondents indicated they collect speed data from school zones.
2.3.8 Prevailing Speeds
Survey Question: Does your municipality examine prevailing speeds in comparison to the roadway characteristics and posted speed limits?
Survey Responses
Table 2.10: Examination of Prevailing Speeds, Comparing Roadway Characterises to Posted Speeds
Response Total
Yes, with public concerns 2
Yes, with public concerns/safety incidents 1
Yes 12
No 0
Yes, data collected, but not examined 1
St. Albert’s Current Practice
• Yes – however, more so aligned to prevailing speeds compared to posted speeds. Annual traffic
counts and speed data is recorded and reviewed. Specific review also occurs in response to public
concerns, where data is gathered to confirm relative degree of the speeding issue(s). Additionally,
recorded speed data is utilized in prioritization of programing such as Neighbourhood Traffic
Calming, pedestrian improvements. The use of the information typically aligns to a response to
specific concerns or delivery of a specific program.
General Observations Based on Survey Responses
• The vast majority of respondents indicated they collect speed data.
• The majority of respondents indicated they review their speed data regardless of public inquiry.

12 Transportation Network Speed Limit Review
City of St. Albert
FINAL REPORT
Integrated Expertise.
Locally Delivered.
2.3.9 Signage Installation
Survey Question: How does your municipality determine the type of signage and how/where it is placed?
Survey Responses
Table 2.11: Signage Install Guidelines
Response Total
TAC 3
Case by case 1
TAC and MUTCD 4
MUTCD 5
OTM 2
OTM and HTA 1
St. Albert’s Current Practice
• Signage is determined and placed according to MUTCD/TAC Guidelines, Alberta Solicitor General
enforcement requirements; for posted speeds anywhere there is a transition from one speed to the
next.
General Observations Based on Survey Responses
• The majority of respondents use TAC, or specifically the Manual of Uniform Traffic Control Devices
for Canada (MUTCD), to determine the type and placement of signage.
• Engineering judgement often supports the decisions.
2.3.10 Public Communication
Survey Question: How does your municipality inform the public when a speed limit is modified?
Survey Responses
Table 2.12: Public Communication Protocol
Response Total
Temporary “new” signs, website, radio, newspaper 1
Public notification and temporary “new” signs 1
Public service announcement and electronic message boards 2
Signage, social media, quarterly mail out 1
City website, social media, media release and interview 1
Public community meeting 1
Temporary “new” signs 4
Change speed limit signage, no other notification 2
Newspaper, electronic media, social media, electronic signs 1
City council 1

islengineering.com
November 2019
Transportation Network Speed Limit Review
City of St. Albert
FINAL REPORT
13
St. Albert Current Practice
• Updates or amendments to the Traffic Bylaw require Council approval and during presentations
and readings of the Bylaw a non-statutory public hearing process is followed to which written media
notification of the public hearing occurs. If Bylaw amendments are approved there is typically
media campaigns applied (social and print) prior to implementation and when changes are
implemented in the field, “NEW” signs accompany changed speed signs for a minimum period of
time. Playground/school zones are often simply implemented, and field signage accompanied with
“NEW” tabs are used.
General Observations Based on Survey Responses
• While the combinations vary, the main methods of notifying the public are temporary “new”
signs/electronic message, print media, and social/electronic media.
• Temporary “new” signs/electronic message boards are the most common ones.
• The majority of respondents alert the public to speed limit changes in some way.
2.3.11 Variable Speed Limits
Survey Question: Does your municipality have any experience with studying or applying variable speed limits?
Survey Responses
Table 2.13: Experience or Study with Variable Speed Limits
Response Total
No 14
Yes 2
School zones only 2
St. Albert’s Current Practice
• No, the City does not have any experience with studying or applying variable speed limits.
General Observations Based on Survey Responses
• The majority of respondents do not employ variable speed limits.
2.4 Emerging Trends and Best Practices
The survey responses for overall speed philosophy were varied, with no clear trend. Three responses
indicated using the TAC design guidelines for setting speed limits, which is the closest of a trend in
the answers. A default speed of 50 km/h appears to be common. There seems to be no single
philosophy for setting speed limits, or the respondents are not aware of any as speed limits change
so infrequently. Eleven of the 15 respondents capture and share traffic operations data with the
public, two when requested, one in the process, and one that indicated traffic operations data was
either not captured or shared. The 14 responses indicated they review prevailing speeds in
comparison to the roadway characteristics and posted speed limits.
Roadway specific best practices are discussed in the following sections.

14 Transportation Network Speed Limit Review
City of St. Albert
FINAL REPORT
Integrated Expertise.
Locally Delivered.
Arterial Roadway Best Practices
Based on the survey results, the TAC design guidelines are the most frequent method of setting
arterial roadway speeds with six of the responses indicating its use. Two conflicting philosophies
emerged for setting the posted speed, with some using the design speed and others using the design
speed minus 10 km/h. The default speed limit for arterial roadways generally ranges between 50
km/h and 60 km/h, with 11 the responses falling within this range. Triggers for conducting arterial
roadway speed limit reviews are generally a combination of significant geometric changes public
safety concerns, and new development.
Collector Roadway Best Practices
Based on the survey results, the TAC design guidelines are the most frequent method of setting
collector roadway speeds with five the responses indicating its use. Three responses indicated a
default collector speed on 50 km/h. Similar to arterial roadways, there is a discrepancy as to whether
the design speed or the design speed plus 10 km/h is used. Triggers for conducting arterial roadway
speed limit reviews are generally a combination of significant geometric changes public safety
concerns, and new development.
Local Roadway Best Practices
Based on the survey responses, the default speed limit on local roadways is 50 km/h, except in four
municipalities where 30 – 40 km/h is used either on a trial basis or with no reason indicated. Local
speed limit reviews are generally triggered due to public request, safety concerns, or the construction
of a new school or playground nearby. Seven municipalities indicated that a residential
neighbourhood speed limit is currently being reviewed or debated, with three more indicating that is it
a topic of future review.
School Zone Best Practices
Based on the survey responses, transportation guidelines are used frequently when setting school
zone best practices, with Alberta Transportation Guidelines being used by five of the responses, and
the TAC guidelines were used by four. Vision Zero, Bill 65, school zones as playground zones, and
the traffic safety act were other notable responses. The default speed limit for school zones is
30 km/h for of the surveyed municipalities. Triggers for a school zone speed limit review generally
include the construction of a new school or safety concerns. There is a high variability in the
acceptable range of speeds for a school zone to be deemed working well; however, the most
common response is the 85th percentile speed being below 5km/h over the zone speed (<35km/h).
Playground Zone Best Practices
Based on the survey responses, transportation guidelines are used frequently when setting
playground zone best practices, with Alberta Transportation Guidelines being used by four of the
responses, and four used the TAC guidelines. Bill 65 and Vision Zero were also noted. The default
playground zone speed limit is 30 km/h, with higher speed responses indicating no playground zone
use. Triggers for a playground zone speed limit review generally include the construction of a new
playground or safety concerns. There is a high variability in the acceptable range of speeds for a
playground zone to be deemed working well; however, the most common response is the 85th
percentile speed being below 5 km/h over the zone speed (<35km/h).

islengineering.com
November 2019
Transportation Network Speed Limit Review
City of St. Albert
FINAL REPORT
15
2.4.1 St. Albert’s Current Practice
St. Albert previously adhered to TAC guidelines for setting speed limits; however, aligned with this
network review and with the City’s transportation safety objectives, there is a desired safe systems
approach towards future transportation management. A default speed of 50 km/h has been applied
on neighbourhood roadways (locals and collectors) and is currently in use with the exception of
piloted areas of reduced speed that have had Neighbourhood Traffic Calming applied. Generally, St.
Albert’s practices conform to the most typical responses from the surveyed municipalities.
Documentation and evaluation for setting speed limits have been minimal, which is one of the factors
that influenced the City to perform this network study.
Roadway specific practices are discussed below.
Arterial Roadways
As previously stated, St. Albert uses the TAC guidelines to set arterial (boulevards and crosstown)
roadway speed limits. The speeds on arterials are generally posted at 60 km/h, with the exception of
Ray Gibbon Drive, which is posted at 70 km/h and a segment of north St. Albert Trail that is posted at
80 km/h as a transition to the highway north of the City.
Collector Roadways
A default posted speed of 50 km/h is applied to collector roadways. The neighbourhoods of Erin
ridge, Erin Ridge North, and Lacombe Park neighbourhood roadways (local and collectors) had their
posted speed limits reduced to 40 km/h in 2019 to align with the City’s Neighbourhood Traffic
Calming program, as well as a recommendation within the Transportation Safety Plan to pilot reduced
neighbourhood speeds.
Local Roadways
A default speed of 50 km/h is applied to local roadways. The neighbourhoods of Erin Ridge, Erin
Ridge North, and Lacombe Park neighbourhood roadways (local and collectors) had their posted
speed limits reduced to 40 km/h in 2019 to align with the City’s Neighbourhood Traffic Calming
program, as well as a recommendation within the Transportation Safety Plan to pilot reduced
neighbourhood speeds.
School Zones
Currently school zones are used within St. Albert and posted to 30 km/h from 8:00 AM to 4:00 PM on
schooldays only. The vast majority of school zones are adjacent to Elementary schools and located in
neighbourhoods on collector/local roadways; however, there are some school zones installed
adjacent to junior high schools and some zones adjacent to elementary schools that are located on
arterial roadways. School zones are created based on the Provincial Guidelines for School Zones
with a speed limit of 30km/h.
Playground Zones
Currently Playground Zones follow the provincial guideline of being in effect from 8:30 a.m. to one
hour after sunset daily (every day of the year). Playground zones are created based on the Provincial
Guidelines for School Zones with a speed limit of 30 km/h.

16 Transportation Network Speed Limit Review
City of St. Albert
FINAL REPORT
Integrated Expertise.
Locally Delivered.
3.0 Background Data Review
The following section describes the results of the background data review, including an inventory of
information, relevancy, gaps analysis and recommendations for inclusion into the speed review.
3.1 Background Data
The City provided data and reports related to this project, including:
• Traffic Data: Traffic collision statistics, traffic speed and traffic count data.
• Reports/Plans: Transportation Master Plan, Municipal Development Plan, Transportation Safety
Plan, Engineering Standards.
• Legislation: Traffic Bylaw, Transportation System Bylaw.
3.1.1 Traffic Collision Statistics
The traffic collision statistics were
reviewed to get a better understanding
of the safety conditions within the City.
In total, 6,288 collisions (unfiltered)
occurred in St. Albert from 2012 to 2018
(inclusive). After the initial collision data
screening, by filtering out collisions
involving parked cars, the total number
of collisions were 5,112, and the annual
collision frequency was 730 collisions
per year.
Speeding, as one of the contributing
factors to the collision occurrence, is
recognized to have a higher probability
of potential influence on collisions
related to “Rear End” and “Off Road
Right” Collisions. In addition, having
speed differential between vehicles may
cause drivers to pass one another, and
consequently could increase the risk of
“Passing” and “Side Swipe” Collisions.
Problematic corridors in the City include
St. Albert Trail and Boudreau Road
based on the concentration of injury
resulting collisions in the City, as
illustrated in Figure 3.1.
Figure 3.1: Injury Colission Density – St. Albert Collisions Statistics (2017)

islengineering.com
November 2019
Transportation Network Speed Limit Review
City of St. Albert
FINAL REPORT
17
A more detailed review of the collision data for Boudreau Road and St. Albert Trail was conducted to
aid in developing a methodology for determining the potential impact of the speed limit on safety and
collision frequency. The findings from the review are discussed below.
Boudreau Road: Key findings form the detailed review of collision statistics on Boudreau Road are
as follows:
• 556 collisions were found over 7 years (79 collisions per year), which account for approximately
11% of the total City-wide collisions.
• The severity of these collisions included one fatal, 148 injury, and 407 property damage only
collisions, the collision casualty (fatal and injury) rate was determined as 27%.
• As shown in the table, 50% of the total collisions involved “Rear End”, followed by “Left Turn –
Across Path” (17%), and “Right Angle” (10%).
• Although speeding is of the contributing factors considered in the collision data, it was identified
that only one collision was directly reported to have speeding as a factor, which does not seem to
be reliable.
The collision history by alone Boudreau Road from 2012 to 2018 (inclusive) is shown in Table 3.1.
Table 3.1: Boudreau Road Collisions (2012 – 2018 inclusive)
COLLISION TYPE Collision
Rear End 278 50.0%
Left Turn Across Path 97 17.4%
Right Angle 58 10.4%
Sideswipe 46 8.3%
Struck Object 30 5.4%
Ran Off Road 21 3.8%
Backing 7 1.3%
Pedestrian Involved 6 1.1%
Passing - Left Turn 5 0.9%
Other 3 0.5%
Hit and Run 2 0.4%
Passing Right Turn 2 0.4%
Head On 1 0.2%
Grand Total 556 100.0%
St. Albert Trail: Key findings form the detailed review of collision statistics on St. Albert Trail are as
follows:
• 1,428 collisions were found over 7 years (204 collisions per year), which account for approximately
28% of the total City-wide collisions.
• The severity of these collisions included one fatal, 383 injury, and 1,428 property damage only
collisions, the collision casualty (fatal and injury) was determined as 27%.
• As shown in Table 3.2, 56% of the total collisions were “Rear End”, followed by “Sideswipe” (14%),
and “Left Turn - Across Path” (12%). All these collisions may be related to high vehicle speed.
• Only three collisions were reported to have speeding as a direct contributing factor, which does not
seem to be reliable.

18 Transportation Network Speed Limit Review
City of St. Albert
FINAL REPORT
Integrated Expertise.
Locally Delivered.
The collision history by alone St. Albert Trail from 2012 to 2018 (inclusive) is provided in Table 3.2.
Table 3.2: St. Albert Trail (2012 – 2018 inclusive)
COLLISION TYPE Collision
Rear End 798 55.9%
Sideswipe 204 14.3%
Left Turn Across Path 167 11.7%
Right Angle 126 8.8%
Struck Object 60 4.2%
Ran Off Road 24 1.7%
Backing 13 0.9%
Passing Right Turn 11 0.8%
Pedestrian Involved 6 0.4%
Passing - Left Turn 6 0.4%
Head On 5 0.4%
Other 5 0.4%
Hit and Run 2 0.1%
Passing - Right Turn 1 0.1%
Implications of the Traffic Collision Data
Although one of the provided information in the collision data is for the contributing factors, we found
that only three collisions that had occurred on St. Albert Trail and one collision that had occurred on
Boudreau Road were directly reported to have speeding as a factor, which does not seem to be
reliable. Therefore, it is difficult to quantify and associate collision occurrence directly to speed issues
and the posted speed limit.
3.1.2 Traffic Speed and Count Data
The City provided over 750 data points, representing 2016, 2017 and 2018 average daily volumes
and 85th percentile speeds recorded in several neighbourhoods, major roadways, in playground and
school zones. The 85th percentile speeds and average daily traffic (ADT) volumes are recorded for
each segment with the speed warrant. For purposes of this project, the 2018 data was utilized (as the
most up to date information), unless unavailable and then 2017 or 2016 information was analyzed.
3.1.3 Other Reports/Plans
Reviewing existing plans and reports completed by the City establishes a baseline for understanding
the current state of transportation and directs focus areas for this study. The following sections outline
applicable information gathered from existing plans and reports that apply to this report. Relevant
excerpts are provided from these plans and reports as they apply; and discussion includes the
implication of the relevant report on this study.

islengineering.com
November 2019
Transportation Network Speed Limit Review
City of St. Albert
FINAL REPORT
19
Municipal Development Plan (2007)
A Municipal Development Plan (MDP) is a strategic planning document for articulating the
community’s vision, goals, objectives, and policies to guide the physical, social, and economic
development to a set future horizon. The City’s MDP was last updated in 2007 named “CityPlan
2007” and is in the process of being updated for finalization in the spring of 2020.
• Based on a review of the 2007 document, the MDP does not specify or guide a policy for setting
speed limits within the City.
Transportation Master Plan (2015)
The Transportation Master Plan (TMP) is a strategic planning document for maintaining, improving
and planning a future transportation system. There are four principals outlined in the 2015 TMP that
apply to the transportation network, which aspire to guide the improvements for the transportation
network. These are provided as follows.
• Principal 1: St. Albert is a livable community with safe access to amenities and employment, where
we prioritize accommodation for accessible and affordable transit and active transportation.
• Principal 2: St. Albert has a strategic approach to sustainable transportation to serve our diverse
population.
• Principal 3: St. Albert protects environmental health by creating opportunities for alternative
transportation to maintain the beauty of surrounding nature.
• Principal 4: St. Albert's transportation system supports economic prosperity.
An opportunity identified in the TMP aligns to the recommendation of integrating Intelligent
Transportation Systems (ITS) within the City to maximize existing road infrastructure, and suggests
the potential application of variable speed limits on the St. Albert Trail corridor. ITS uses technology
to improve the efficiency, safety and security of the road network and some examples are listed in the
TMP, although variable speed limits are not listed, they fall into the ITS category. Variable speed
limits are one of many ITS tools and known to improve safety and efficiency of roadway networks;
however, operational conditions of St. Albert Trail would have be investigated, as optimal integration
of variable speeds may more so align with corridors with limited intersections (more free flow tie-ins or
exits) and limited direct accesses from the roadways (commercial accesses) which cause disruption
to typical driving speeds.
Implications of the Transportation Master Plan on this report:
• Generally, the TMP focuses on many transportation areas, including roads, active transportation,
transit and goods movement and general safety; however, there is no direct focus on principal,
policy or process on speed limit reviews. Principal 1, to create a livable community, implicates this
report where liveable could be interpreted as roadways posted with consistent speed limits that
reflect their constructed features and through this study, recommendations of this nature are
anticipated. Other principals are more challenging to directly apply to speed limit review.
• Direct reference and strategy recommendations within the TMP suggest formalizing the roadway
network into appropriate classifications to better represent the roadway’s function and service
requirements. Within this context speed is relevant for safety and operational considerations in
servicing various road users and align to “comfort” for residents and users of adjacent land use.
• ITS tools, including the potential use of variable speed limits could be beneficial, but require
additional effort that is outside the scope of this report.

20 Transportation Network Speed Limit Review
City of St. Albert
FINAL REPORT
Integrated Expertise.
Locally Delivered.
Transportation Safety Plan (2018)
The Transportation Safety Plan, completed in 2018, pursues a set of strategies that will minimize the
risk of fatality and injury on roadways in the City and aspires to the objective of Vision Zero, where no
serious injury or fatalities occur as a result of motor vehicle collisions. The priority of the
Transportation Safety Plan is on injury and fatality collisions to prioritize the prevention of harm
associated with these more-serious collisions that have the greatest impacts on the community,
causing the most tragedy, costs and loss of productivity.
The Transportation Safety Plan and this report are connected by the recognition that higher speed
collisions are observed to have the greatest impacts, resulting in higher probability of fatality and
injury. A visual representation of the correlation between risk and speed is illustrated in the Figure
3.2, showing an analogy of speed related risk of injury in a collision between a vehicle and a
pedestrian at varying speeds and building heights.
Figure 3.2: Analogy - Impacts of Falling and Impacts (Collision between Vehicle and Pedestrian)
The Transportation Safety Plan provides some speed specific related messaging throughout the
report. Excerpts from the Transportation Safety Plan are provided as follows, where they relate to this
project:
Background Information:
• The review of municipal safety plans (from 11 Canadian municipalities found a strong emphasis on
speed management.
• Speed is both a primary and secondary cause of collisions and high-speed collisions result in much
higher severity.

islengineering.com
November 2019
Transportation Network Speed Limit Review
City of St. Albert
FINAL REPORT
21
• Drivers typically select speed based on the road design, adjacent land use and roadway features,
more often than posted speed limits.
• 2015 speed surveys indicated that speeding is regularly occurring on arterial roads, with recorded
“hot spots” on local roads.
Proposed Strategies and Projects – From the Traffic Safety Plan and their implications in this
report:
• Strategy #1 – Provide speed limits consistent with the road design.
• Implications: This project aspires to make recommendations for posted speed limits that are
consistent with the road design by objectively reviewing the entire arterial and collector roadway
network using the TAC Guidelines for Posted Speed Limits. This addresses strategy #1 as
shown above.
• Strategy #2 – Provide road designs to achieve a target speed.
• Implications: Outside of this project, the City has completed the development of the Complete
Streets Guidelines, which will be incorporated into an update of the Municipal Engineering
Standards (2020), as well as integration of Traffic Calming design into the update of Standards
for direction of retrofit considerations or new development. It is noted that the Complete Streets
Guidelines indicate a 30 – 50 km/h posted for neighbourhood roadways and this may need to be
updated, pending outcomes of this study.
• Strategy #3 – Encourage lower speeds in urbanized areas, where access locations are more
frequent and vulnerable road users are more prominent.
• Implications: This project includes a detailed evaluation of all Arterial and Collector roadways
from a TAC design and posted speed perspective, as well as a review of 10 representative local
roadways and explores the recommendations for speed limits in neighbourhoods. Results of this
review will inform on posted speeds for various roadway functions and adjacent land use.
• Strategy #4 – Safe speeds and speed limits strategy, including revising road classifications and
design standards, piloting low speeds on local roads.
• Implications: Similar to Strategy #2, a reclassification system has been identified through the
Complete Streets Guidelines that better aligns roadway function with adjacent land use. Outputs
of this report may provide a “typical” operational setting for various classes of roadways.
• The City has already integrated reduced neighbourhood speeds in communities having
Neighbourhood Traffic Calming applied (speeds reduced to 40 km/h in the neighbourhoods of
Erin Ridge, Erin Ridge North and Lacombe Park (East)).
• Strategy #5 – Review all posted speed limits, including comparison of 85th percentile speed to
posted speed limit and perform a TAC speed limit evaluation.
• Implications: This project directly delivers on Strategy #5, as it compares prevailing (85th
percentile speed) with the posted speed limit and the TAC warrant speed limit.
Municipal Engineering Standards (2013)
Engineering standards direct the design and construction activities for most components of roadway
infrastructure, including general requirements, design details, design materials, construction
requirements, quality control and post construction inspection and maintenance. The purpose of
engineering standards is to provide direction to designs and ensure consistency across infrastructure
projects.

22 Transportation Network Speed Limit Review
City of St. Albert
FINAL REPORT
Integrated Expertise.
Locally Delivered.
The correlation between engineering standards and this project are that roadway standards, including
lane widths, design speed, parking standards, boulevard design, pedestrian accommodation and
other cross section features have a significant impact on the perceived functionality of the roadway
and resulting operating speeds of drivers. For example, wide lanes on roadways with parking
prohibited (no on-street parking), very few landscaping or street-scape features and mild curves are
more comfortable for drivers and make it easier to travel at higher rates of speeds. In contrast, narrow
lanes, parked vehicles and densely build-up boulevard spaces are less comfortable for drivers that
influence reduced speeds.
The municipal engineering design standards offer the maximum operating speed by roadway
classification and this is provided in the following excerpt.
Table 3.3: Maximum Operating Speeds (Municipal Engineering Design Standards Table 3.1)
Road Classification Roadway Curb-to-Curb Width
(m)
Right-of-Way Width
(m)
Maximum Operating
Speed (km/h)
Residential Roads
Local 9.0 20.0 50
Cul-de-sac 9.0 20.0 50
Minor Collector 11.0 22.0 50
Major Collector 12.0 23.0 50
Commercial Roads
Minor Collector 11.0 22.0 50
Major Collector 12.0 23.0 50
Arterial Roads
Undivided 15.0 37.0 60
Divided 8.0 x 2 45.0 60/70
The maximum operating speed in St. Albert is 70 km/h, reserved only for divided arterials. The
maximum operating speed for undivided arterials is 60 km/h and the maximum operating speed for all
other roadways is 50 km/h.
Implications of the Municipal Engineering Standards in this report includes the following:
• Any recommendations to posted speed limits that are made as a result of this report need to be
reviewed against the municipal engineering standards for each roadway classification to ensure
roadway design features are consistent.
islengineering.com
November 2019
Transportation Network Speed Limit Review
City of St. Albert
FINAL REPORT
23
Traffic Bylaw
The traffic bylaw is a regulatory document governing operations of motor vehicles, bicycles, parking
of motor vehicles, pedestrian behaviours, trucks routes, dangerous goods routes, and rules for
parades, construction activities and several other regulatory aspects of transportation in St. Albert.
Items of the traffic bylaw that pertain to this study are as follows:
• Schedule 7: Speed Limits – Except as indicated in schedule (speed limit map) or otherwise in the
bylaw, the speed limit on all roadways is 50 km/h.
• Section 17 – School zone speed limit is 30 km/h, from 8:00 to 16:00 on each school day and is
indicated by a traffic control device.
• Section 17 – Playground zone speed limit is 30 km/h, from 8:30 to one hour after sunset and is
indicated by a traffic control device.
• Section 18 – The speed limit in an alley and on private land is 20 km/h.
• Section 41 – Bicycles may be operated on a sidewalk, if yielding to pedestrians and not recklessly.
Implications of the Traffic Bylaw on this report includes the following:
• The overall posted speed limit for roadways (speed limit posting on specific roadways as well as
general default speed limit) may be influenced and recommended for amendments based on the
outcomes of this report.
• The integration of school zones and playground zones and operational considerations such as
times of day for application of such zones may be influenced by the findings and recommendations
of this report.
Transportation System Bylaw
The Transportation System Bylaw identifies roadway classifications (arterial, collector and locals) but
has since been integrated with the Complete Streets roadway classifications – at the time of this
report, the bylaw has been approved by local council and is undergoing final approval by the
Provincial Ministry. Aligned to the Bylaw, this report follows the following nomenclature and typology
(from Complete Streets to Transportation Association of Canada):
• Boulevards = Arterials
• Connectors = Arterials
• Crosstown = Arterials
• Neighbourhood = Collector
• Local = Locals
Implications of the Transportation System Bylaw in this report includes the following:
• Roadway classification is an input to the TAC speed limit warrant.

24 Transportation Network Speed Limit Review
City of St. Albert
FINAL REPORT
Integrated Expertise.
Locally Delivered.
4.0 Applying TAC Guidelines for Posted Speed Limits
4.1 Introduction
This section of the report describes the results for reviewing the City’s collector and arterial roadways
using the Canadian Guidelines for Establishing Posted Speed Limits (CGEPSL), published by the
Transportation Association of Canada (TAC). The focus of this section is reviewing all non-
playground and non-school zone arterial and collector roadways, a total of approximately 60 linear km
of arterials and 50 linear km of collectors.
This section provides the following:
• Section 4.2: Overview of the Canadian Guidelines for Establishing Posted Speed Limits.
• Section 4.3: Detailed documentation of methodology applied for conducting the speed limit review
according to the CGEPSL guide, including any assumptions or interpretations needed.
• Section 4.4: Results of applying the guide, including a discussion of speed limits recommended by
the CGEPSL guide compared to existing posted speed limits.
The recommendations included in this section of the report are based solely on the CGEPSL guide
for posted speeds and do not necessarily represent the final recommendation.
4.2 TAC Canadian Guidelines for Establishing Posted Speed Limits
The CGEPSL guide is an evaluation tool to determine a recommended speed limit for a specific
segment of roadway based on its classification, function and physical characteristics. The CGEPSL
guide provides recommendations for posted speed limits from 40 km/h to 110 km/h.
4.3 Methodology
The methodology for using the CGEPSL guide is as follows:
• Segment Creation: Arterials and collectors are broken into segments based on homogeneity,
where each segment is geometrically similar. The detailed methodology for selecting segments is
provided in Section 4.4.1.
• Data Inputs: The CGEPSL guides provides an automatic spreadsheet for conducting the review
and calculating the associated risk score for each segment. Data inputs for the guide and
associated section in this report are as follows:
• Non-Geometric Inputs:
• Classification, Urban or rural, major or minor, design speed, posted speed, prevailing speed,
policy speed.
• Geometric Inputs
• Divided or undivided, number of lanes, segment length, horizontal alignment, vertical
alignment, average lane width, pedestrian exposure, cyclist exposure, pavement surface,
number of intersections, number of accesses, interchanges and on-street parking.
• Results (Risk Score and Recommended Speed Limit): The automatic spreadsheet calculates
a risk score based on the non-geometric and geometric inputs and correlates the risk score to a
recommended speed limit. The recommended speed limit and correlating risk score is outlined
in the following tables, 4.1 (arterials) and 4.2 (collectors).

islengineering.com
November 2019
Transportation Network Speed Limit Review
City of St. Albert
FINAL REPORT
25
Table 4.1: TAC Recommend Posted Speed Limit Criteria (Arterials)
Arterials Recommended Posted Speed Limit (by risk level)
Urban Divided Major (1 lane or 2+ lanes)
Recommended Speed
90 km/h 80 km/h 70 km/h 60 km/h 50 km/h
Associated Risk Score
<25 26 – 33 34 – 41 42 – 59 >60
Urban Undivided Major or Divided Minor
(1 lane or 2+ lanes)
Recommended Speed
80 km/h 70 km/h 60 km/h 50 km/h Associated Risk
Score <29 30 – 48 49 – 64 >65
Urban Undivided Minor (1 lane or 2+ lanes)
Recommended Speed
70 km/h 60 km/h 50 km/h
Associated Risk
Score <33 34 – 56 >57
Table 4.2: TAC Recommend Posted Speed Limit Criteria (Collectors)
Collectors Recommended Posted Speed Limit (by risk level)
Urban Divided Major (1 lane or 2+ lanes)
Recommended Speed
80 km/h 70 km/h 60 km/h 50 km/h
Associated Risk Score
<29 30 – 36 37 – 39 >40
Urban Undivided Major or Divided Minor
(1 lane or 2+ lanes)
Recommended Speed
70 km/h 60 km/h 50 km/h
Associated Risk
Score <33 34 – 37 >38
Urban Undivided Minor (1 lane or 2+ lanes)
Recommended Speed
60 km/h 50 km/h 40 km/h
Associated Risk Score
<33 34 – 50 >51
4.4 Application of the Guide
Application of the CGEPSL guide relies on consistency in the interpretation and application of the
required data inputs for using the guide. The following sections are provided to limit inconsistencies
for future application of the CGEPSL guide and allow reviewers to understand how the CGEPSL
guide was applied.
4.4.1 Segment Creation
The CGEPSL applies to roadway segments, which are defined as sections of a roadway corridor
between intersections or otherwise designated at a certain distance between intersections. Careful
selection of roadway segments that reflect homogenous sections of a corridor is required for the
speed limit guide to apply. Roadway cross section is the primary screening criteria to determine a
segment as this is the primary input to the TAC warrant. However, other aspects must be considered,
including the number of lanes, divided/undivided, lanes widths, horizontal curvature and
classifications, vertical curvature and land use.

26 Transportation Network Speed Limit Review
City of St. Albert
FINAL REPORT
Integrated Expertise.
Locally Delivered.
Notable application of the guide for creating segments includes the following:
• Posted speed limit is not a criterion for selecting roadway segments. If there are two speed limits
for a segment, the speed limit that is the larger portion within the segment will be used for
reference only.
• The CGEPSL guide indicates that no speed zones should be less than 500 m for roadways less
than 70 km/h speed, therefore no segments should be less than 500 m.
Notable interpretation of the guide:
• A significant change in land use will warrant a change in segment.
• Segments reflect 2019 construction projects (example is Boudreau Road, St. Albert Trail project).
Segment Selection Results
Dividing St. Albert’s roadway corridors into segments based on the CGEPSL guide resulted in the
creation of 53 arterial and 57 collector roadway segments. Collector and arterial roadway segments
are provided in Exhibit 4.1.
4.4.2 Non-Geometric Inputs
Non-geometric inputs include classification, designation as urban or rural, design speed, posted
speed, prevailing Speed and policy speed. Input options and data sources are detailed in the
following table.
Table 4.3: Non-geometric Data Inputs
Non-geometric Input
Input Options Data Source Interpretation of Source
Road Classifications
Arterial Collector Local
Complete Streets Guidelines
Boulevards, Connectors, Crosstown = Arterials Neighbourhood = Collector Local = Locals
Major or Minor Classification
Major, Minor See detailed discussion in this section below table.
Urban or Rural Designation
Urban or Rural All roadways considered urban, except Meadowview Drive (west of Ray Gibbon Drive)
Current Posted Speed
Speed (km/h) Traffic Bylaw
Prevailing Speed
Speed (km/h) City-provided speed data
85th Percentile Speed (see note below this table)
Policy Speed Speed (km/h) Not available (not required, for reference only)
Design Speed Speed (km/h) Not available (not required, for reference only)
Additional notes for each input are provided as needed.
Major/Minor Classification
The City of St. Albert does not differentiate between major or minor roadways in their roadway
classifications and the CGEPSL guide suggests assuming major classification where there is no
designation used.

HUDS
ONRO
AD
LAYDON DRIVE
RIVERSIDE DRIVE
GRANDVILLE AVENUEKINGSW
OOD
BOUL
EVAR
D
DENN
ISON
DRI
VE
SALISBURY
AVENUE
LAC O
MBE
DRI V
E
ERIN
RIDGE DRIVE
KINGSWO ODDRIVE
GRANDIN ROAD
GRO S
VENO
RBO
ULE V
ARD
PARKWOO
D
DRIVE
D ORCHESTER DRIVE
BISHOP STREET
GRESH
AM
BOULEVARD
DUNBAR STREET
HARWOO
DDR
IVE
STERLING STREET
GREN
FELL
AVENUE
CURIAL DRIVE
KEILLOR DRIVE
VILLEMAGNE ROAD
LOCKHARTDRIVE
STUR
GEON ROAD
EDISON DRIVEERNEST BOULEVARD
CUST AVENUE
LEXI
NGTO
N DR
IVE
MADONNA
DRIVEHERI TAG E
WAY
ERIN RIDGE ROAD
NEIL ROSS ROAD
CHISHOLM AVENUE
LARSON AVENUE
OAKMONT
DR
IVEJENS
ENLA
KEBOULEVARD
COAL MINE
ROAD
WESTW
OODDRIVE
LANGLEY AVENUE FAIRVIEWBOULEVARD
INGLEWOOD
D RIVE
GATE A VENUE
CHEV
IGNY
STR
EET
MALMO AVENUESTALBERT ROAD
CIRCLE DRIVE
MUIR DRIVE
STAN
NE
STREET
ELDORADO DRIVE
P INEVIE W
DRIV
E
BURN HAMAV
EN
UE
K I NGSW
AY DRIVE
VILLENUEVE ROAD
LECLAIR
W AY
CARN
EGIE
DRI
VE
OAKVISTA
DRIVE
OAKR
IDGE
DR
IVE NORTH
ALPINE
BOULEVARD
GERV
AISRO
AD
ATTW
OODDRIVE
SIRW
INSTO
N CHURCHILL AVENUE
WILLOUGHBYDRIVE
GAINSBOROUGH AVENUE
WOOD
LA NDS ROAD
CUNNINGHAM ROAD
LANGHOLMDRIVE
ST
V ITA
L AVENUE
EVERIT
T DRIV
E NORTH
LIBERTONDRIVE
DAWSON ROAD
A R L I NGTO
NDRIVE
HOGA NROAD
MISSIO N AVE NUE
RICHAR DS
ON D R IVE
SUNSET BOULEVARD
AKINSDR IVE
MCKENNEY AVENUE
FOREST DR
IVEMEADOWVIEW DRIVE
RIEL DRIVE
CAMP
BELL
ROA
D
DEER RIDGE DRIVE POUNDMAKER ROAD
VENE
SS R
OAD
HEBER
T ROAD
LEVASSEUR ROAD
VILLENEUVE ROAD
BELLE
ROSE DRIVE
GIROUX ROAD
BOUDREAU ROAD
RAY GIBBON DRIVE
HERITA GEDRIVE
CARLETON
DRIVE
LAROSEDRIVE
EXHIBIT 4.1:ARTERIALS AND
COLLECTORSANALYZED
Docu
ment:
G:\P
rojec
ts\15
000\1
5400
\1543
9_St
_Albe
rt_Sp
eed_
Limit_
Revie
w\02
_CAD
D\25
_GIS\
251_
Figure
s\154
39_E
xhibi
t_41_
Colle
ctors_
Arter
ials_
1911
28.m
xd
1:55,0000 1 20.5
km City of St. AlbertRoad Unclassified
Arterial*Collector*
¹
Credits:
CANA83-3TM114
*Colours provided to differentiate segments and have no other relevance to the study


islengineering.com
November 2019
Transportation Network Speed Limit Review
City of St. Albert
FINAL REPORT
27
To address this input into the evaluation, the following criteria was developed to determine major or
minor roadway classification to be applied for this study only.
• Residential Collector
• Minor = <3,000 AADT AND shorter less continuous segments.
• Major = >3,000 AADT AND longer more continuous segments.
• Industrial Collector
• Major for all, given levels of adjacent development
• Arterial
• Major for all is assumed
Prevailing Speed
The City of St. Albert provided recorded speed data for the prevailing speed along segments. The
2018 data was used for most of the segments and if multiple points of data were available, the data
furthest from an intersection/ driveway was selected. There were nine segments that did not have
speed data in 2018, so the 2017 speed and AADT data was used.
4.4.3 Geometric Inputs
Geometric inputs are used to determine the risk score, depending on whether the roadway is
classified as an arterial or collector. The following table outlines the geometric data inputs, data
source and interpretation of data source.
Table 4.4: Geometric Data Inputs
Geometric Input Input Options
Cross Section Divided or Undivided
Intersections and Access Total number
Number of through lanes per direction 1 or 2+
Horizontal Curvature Curves/km
Vertical Curvature % Grade
Lane Widths Narrow, Moderate, Wide
Roadside Hazards Total/km
Pedestrian Exposure
See detailed description Cyclist Exposure
Pavement Surface
On-street Parking
The geometric inputs were sourced from field review of each segment. The detailed description of the
data inputs, assumptions and associated risk score is provided in the following sections.
Cross Section (Divided or Undivided)
Where there is a mix of divided and undivided sections, the main characteristic can be considered as
the one observed for greater than 50 per cent of the segment being evaluated. There is no risk score
associated with this input as it is used to correlate risk score to recommend a speed limit.

28 Transportation Network Speed Limit Review
City of St. Albert
FINAL REPORT
Integrated Expertise.
Locally Delivered.
Intersections and Accesses (Total Number)
Some anomalies that were encountered were service streets and pedestrian actuated crossing
signals. Service roads were counted as stop-controlled side streets and pedestrian actuated crossing
signals were counted as signalized intersections. Any accesses that have not been completed
(barricaded with jersey barriers) were not counted as side roads or private accesses because the
public cannot use them. The risk score resulting from the number of intersections and accesses is not
published in the CGEPSL guide.
Number of Through Lanes
Number of through lanes was clear and did not require any interpretation. There is no risk score
associated with this input as it is used to correlate risk score to recommend a speed limit.
Horizontal Curves
Horizontal curves are those of any radius that require any level of driver involvement to maintain their
location within the lane.
Table 4.5: Horizontal Curves
Risk Level Description TAC Description Risk
Score Weight
Higher - > 4 Higher – More than 4 curves per kilometre 3
2 – arterial 1 – collector
Medium - Between 2 and 4 Medium – 2 to 4 curves per kilometre 2
Lower - < 2 Lower – Less than 2 curves per kilometre 1
Source: Preliminary source from Google Maps and verified in the field.
Roadways with substantial continuous curves are counted as more than one curve based on number
of different curve radii, and using engineering judgement.
Vertical Curves
Vertical curves are counted where the grade is over 4%, occurring on 50% or more of the segment
and described in the following table.
Table 4.6: Vertical Curves
Risk Level Description TAC Description Risk
Score Weight
Higher – 6% or more on 50% of the section or more
Higher – Frequent steep grades (6% or more on 50% of the section or more)
3
2 – arterial 1 – collector
Medium – 4% or more on 50% of the section or more
Medium – Some steep grades (4% or more on 50% of the section or more)
2
Lower – Moderate grates or flat
Lower – Generally moderate grades or flat 1
Source: Preliminary source from Google Maps using the bike directions tool and verified in the field using an
inclinometer.

islengineering.com
November 2019
Transportation Network Speed Limit Review
City of St. Albert
FINAL REPORT
29
Lane Width
Available lane width depends on the presence of a shoulder and potential of parked vehicles. The
lane width inputs are provided in the following table.
Table 4.7: Lane Width
Risk Level Description
TAC Description Risk
Score Weight
Higher – Narrow
Available width is narrow compared to typical roadways with the same road classification AND (if applicable) adjacent parking lane is available but always busy OR shoulder is narrow.
3
2 – arterial 2 – collector
Medium – Similar
Option 1: Available width is narrow to typical roadways AND on-street parking is available and rarely used OR shoulder is wide Option 2: Available width is similar to typical roadways with the same road classification AND parking is available and busy OR should is narrow.
2
Lower – Wide
Option 1: Available width is similar to typical roadways with the same road classification AND parking is available and never used OR shoulder is wide. Option 2: Available width is wide compared to typical roadways with the same road classification, regardless of parking and shoulder conditions.
1
Source: Refer to Appendix B for image descriptions of each risk level. The City of St. Albert Complete Street
Guidelines use a lane width of 3.5 m for all Boulevard, Crosstown, Connector, and neighbourhood type roads.
Google Street View and aerial photos will be used to judge the lane width.
Roadways where parking is allowed may have wider carriageways necessary to accommodate
parking. The addition of parking lanes slightly changes the judgement used for assigning a risk level.
Below is the logic followed along collector roads:
• Risk level = Higher, where parking is allowed along one or both sides of the road and the travel
lane is narrow compared to regular lanes.
• Risk level = Medium, where parking is allowed along one or both sides of the road and the travel
lane is similar size to a regular lane.
• Risk level = Lower, where parking is allowed along one or both sides of the road and the travel
lane is wide compared to regular lanes.
30 Transportation Network Speed Limit Review
City of St. Albert
FINAL REPORT
Integrated Expertise.
Locally Delivered.
Road Side Hazards
Road side hazards within the clear zone area are counted (totaled) for the segment into two
categories, “non-breakable” and “breakable”; described as follows:
• Clear zone is 1.5 m based on the complete streets cross-sections.
• Non-breakable: Non-breakable includes infrastructure traditionally considered “break-away” and
other larger items. For example, breakaway bases for utility, although considered break-away,
have a substantial impact if involved in a collision from a vehicle running off the road. Examples of
Non-breakable hazards:
• Utility poles
• Larger trees (based on judgement)
• Larger trees located on the median
• Larger utility pedestals
• Mail boxes
• Neighbourhood gateway sign
• Jersey barriers
• Concrete bus benches
• Wooden barrier combined with fence and
large tress (along Grandin 2)
• Train crossing poles
• Breakable: Breakable and non-recoverable hazards include the following:
• Fences
• Traffic control signage posts
• Smaller trees (based on judgement)
• Smaller poles (example knock down barricades at shared use paths)
Refer to Appendix B for image descriptions of different roadside hazards. Items like super mailboxes,
which have many mailboxes with minimal spacing between then were considered one roadside
hazard. Some segments have a minimum risk score for roadside hazards of medium because of the
continuous hazards along the segment; however, if over 10 hazards are present along the segment
the risk was deemed high. Additionally, when on-street parking is permitted, the roadside hazards
were evaluated as if no cars are parked along the segment. The roadside hazards risk score and
weight is provided in the table below.
Table 4.8: Roadside Hazards
Risk Level Description
TAC Description Risk
Score Weight
Higher – 10 hazards or more/km
10 or more hazards per kilometre, or continuous hazards on more than 50% of the segment length, on one or both sides.
3
1 – arterial 1 – collector
Medium – 5 to 9 hazards/km
5 to 9 hazards per kilometre, or continuous hazards on 25 to 50% of the segment length, on one or both sides.
2
Lower – <5 hazards/km
Less than 5 hazards per kilometre, any continuous hazards extend for less than 25% of the segment length, or curb and gutter.
1

islengineering.com
November 2019
Transportation Network Speed Limit Review
City of St. Albert
FINAL REPORT
31
Pedestrian Exposure
The risk associated with pedestrians is measured based on the likelihood of pedestrians using a
roadway and the facilities provided for pedestrian use. A roadway with known pedestrian activity but
limited pedestrian activity may justify a lower speed limit as the lack of facilities may increase the risk
of pedestrian collisions. The pedestrian exposure risk score and weighting are provided in the table
below.
Table 4.9: Pedestrian Exposure
Risk Level Description
TAC Description Risk
Score Weight
Higher – No pedestrian facility
Roadway is used by pedestrians and no pedestrian facilities are provided.
3
3 – arterial 3 – collector
Medium – Shoulder Trail
Roadway is used by pedestrians and a shoulder or trail adjacent to the roadway and at the same elevation as the roadway is provided.
2
Lower – Physically separated
Roadway is used by pedestrians and physically separated pedestrian facilities (sidewalks; trails away from the road) are available; or roadway has negligible pedestrian demand.
1
Source: Aerial maps and Google Street View will be used to determine the pedestrian exposure risk. The
determined risk level will be field verified.
If both monolithic and physically separated sidewalks are present along a segment, the type that
covers the majority of the segment will be chosen.
Cyclist Exposure
Similar to pedestrian exposure, cyclists are at a higher risk when there is known cyclist activity on a
roadway with no cycling facilities. The pedestrian cyclist risk score and weighting is provided in the
table below.
Table 4.10: Cyclist Exposure
Risk Level Description
TAC Description Risk
Score Weight
Higher – No road space
Roadway is used by cyclists and no road space is allocated to bikes.
3
3 – arterial 3 – collector
Medium – Wide curb or shoulder
Roadway is used by cyclists and wide curb lane or shoulder is provided.
2
Lower – Designated bike lane
Roadway is used by cyclists and a designated bike lane is provided; or roadway is used by cyclist and no road space is allocated to bikes, but roadway has very low traffic volumes; or roadway has negligible cyclist demand.
1
Source: Aerial maps and Google Street View will be used to determine the cyclist exposure risk. The determined
risk level will be field verified.
For the purposes of this project, all roadways are assumed to have some level of cyclist demand. St.
Albert has many multiuse trails, and these are considered designated bike lanes with a lower risk
associated for the purposes of this project.

32 Transportation Network Speed Limit Review
City of St. Albert
FINAL REPORT
Integrated Expertise.
Locally Delivered.
Where there are no multiuse trails available, and the lane widths are identified in table 3.6 as narrow
or similar, cyclist exposure is assumed as higher and where lane widths are identified in table 3.6 as
wide, cyclist exposure is assumed as medium.
Pavement Surface
A vehicle’s maneuverability can be significantly reduced by rough surface conditions or unpaved
road. Roadways with poor or unpaved/gravel pavement surfaces may necessitate lower speed limits.
The pavement surface risk score and weighting are provided in the table below.
Table 4.11: Pavement Surface
Risk Level Description TAC Description Risk Score Weight
Higher – Poor or Unpaved Poor or unpaved/gravel. 3
1 – arterial 1 – collector
Medium – Fair or Rough Fair or rough (significant sections with pot holes, rutting, large cracks, etc.).
2
Lower – Good or Smooth Good or smooth. 1
Source: Aerial maps and Google Street View will be used to determine the pavement surface. The determined
risk level will be field verified.
During the desktop review, if there were visible signs of multiple crack or pothole repairs the
pavement condition was considered fair/rough. Otherwise, pavement was considered good/smooth.
On Street Parking
Conflicts may occur along streets where parking is permitted. The risk for on-street parking is focused
on the duration that on street parking is permitted and assumes parking is utilized if it is provided.
Lower posted speed limits are justified along roadway segments with parking permitted all day. The
on-street parking risk score and weighting is provided in the table below.
Table 4.12: On Street Parking
Risk Level Description
TAC Description Risk Score Weight
Higher – Parking all day
Parking permitted all day on one or both sides of the roadway.
3
3 – arterial 3 – collector
Medium – Parking during part of the day
Parking permitted during part of the day on one or both sides of the roadway.
2
Lower – Hardly used/not allowed
No parking allowed; or parking is permitted but rarely if ever actually utilized.
1
Source: Aerial maps and Google Street View will be used to determine on-street parking risk level and will be
confirmed with a field verification. Additionally, the City’s Traffic Bylaw will be reviewed for roadways where
parking/stopping is prohibited. Judgement is used when “Parking Prohibited” signage cannot be found. It is
assumed drivers would not block a through lane of traffic to park on the street.
The TAC guide does not provide direction for identifying the risk level based on parking occupancy
and there is no indication in the Guide as to what qualifies as “rarely used” parking. In St. Albert’s
residential areas, parking is generally provided on both sides of the roadway; however, the actual
demand and use of on-street parking varies greatly throughout the day, typically higher during

islengineering.com
November 2019
Transportation Network Speed Limit Review
City of St. Albert
FINAL REPORT
33
evenings/nights and lower during the day. To improve accuracy for identify parking risk levels, the
following additions apply to the risk levels in Table 4.12.
• Risk level = Higher; where parking is permitted all day on one or both sides of the roadway AND
covers at least a 25% proportion of the segment and is at least 25% occupied during the day.
• Risk level = Medium; where parking is permitted during part of the day AND covers at least 25%
proportion of the segment and is at least 25% occupied during the day.
• Risk level = Lower; where no parking is permitted, or parking is permitted over less then 25%
proportion of the segment, or parking is permitted and covers greater than 25% proportion of the
segment but is less 25% occupied during the day.
The 25% thresholds for segment coverage and occupancy is based on engineering judgment towards
the impact of parked vehicles on vehicle flow during the field verification tasks of this project. The
experience from the field was that a minimal volume of parked vehicles will influence driver comfort
on the roadway by increasing driver workload to maneuver through the roadway. Further investigation
could be performed with additional data collection comparing varying levels of parking supply,
occupancy, and their impacts on driver speed to confirm the risk level thresholds suggested.
4.5 TAC CGEPSL Recommendations
The results indicate the recommended speed limit based on CGEPSL and serve as an important tool
for reviewing speed limits. It is important to note that the results do not constitute statutory
requirements, as the CGEPSL is a guideline and not a statutory document. Application of the results
require interpretation and judgement before implementation and the following provides a discussion
of the results for the purpose of making recommendations, including:
• Comparison of recommended speed limits from the CGEPSL to the existing posted speed limits.
• Comparison of recommended speed limits from the CGEPSL to prevailing speeds on St. Albert’s
roads.
• Discussion of the use of minor and major classifications for neighbourhood roadways in relations to
the recommended speed limits from the CGEPSL.
The results of the assessment are provided in Exhibit 4.2. Detailed results for each segment are
provided in Appendix C.

34 Transportation Network Speed Limit Review
City of St. Albert
FINAL REPORT
Integrated Expertise.
Locally Delivered.
Comparison of Results to Existing Posted Speed Limits
The posted speed limits are centralized around 50 km/h, with most segment speed limits set at
50 km/h, as shown in the following figure.
Figure 4.1: Current Posted Speed Limit
Figure 4.2: Recommended Speed Limits
The recommended speed limits are still centralized around 50 km/h; however, as can be seen in
Figure 4.2, the results recommend increased application of 70 km/h and 40 km/h zones.
The posted speeds are compared to the recommended speeds by subtracting the recommended
speed limit from the posted speed limit for each segment. The results are provided in the following
figure.
2 11
73
21 3 0
30 40 50 60 70 80
Nu
mb
er
of
Segm
en
ts
Posted Speed on the Segment (km/h)
Posted Speed (km/h)
28
39
25
171
40 50 60 70 80
Nu
mb
er
of
Segm
en
ts
Recommended Speed Limit (km/h)
Recommended Speed Limits (km/h)

HUDS
ONRO
AD
LAYDON DRIVE
RIVERSIDE DRIVE
GRANDVILLE AVENUEKINGSW
OOD
BOUL
EVAR
D
DENN
ISON
DRI
VE
SALISBURY
AVENUE
LAC O
MBE
DRI V
E
ERIN
RIDGE DRIVE
KINGSWO ODDRIVE
GRANDIN ROAD
GRO S
VENO
RBO
ULE V
ARD
PARKWOO
D
DRIVE
D ORCHESTER DRIVE
BISHOP STREET
GRESH
AM
BOULEVARD
DUNBAR STREET
HARWOO
DDR
IVE
STERLING STREET
GREN
FELL
AVENUE
CURIAL DRIVE
KEILLOR DRIVE
VILLEMAGNE ROAD
LOCKHARTDRIVE
STUR
GEON ROAD
EDISON DRIVEERNEST BOULEVARD
CUST AVENUE
LEXI
NGTO
N DR
IVE
MADONNA
DRIVEHERI TAG E
WAY
ERIN RIDGE ROAD
NEIL ROSS ROAD
CHISHOLM AVENUE
LARSON AVENUE
OAKMONT
DR
IVEJENS
ENLA
KEBOULEVARD
COAL MINE
ROAD
WESTW
OODDRIVE
LANGLEY AVENUE FAIRVIEWBOULEVARD
INGLEWOOD
D RIVE
GATE A VENUE
CHEV
IGNY
STR
EET
MALMO AVENUESTALBERT ROAD
CIRCLE DRIVE
MUIR DRIVE
STAN
NE
STREET
ELDORADO DRIVE
P INEVIE W
DRIV
E
BURN HAMAV
EN
UE
K I NGSW
AY DRIVE
VILLENUEVE ROAD
LECLAIR
W AY
CARN
EGIE
DRI
VE
OAKVISTA
DRIVE
OAKR
IDGE
DR
IVE NORTH
ALPINE
BOULEVARD
GERV
AISRO
AD
ATTW
OODDRIVE
SIRW
INSTO
N CHURCHILL AVENUE
WILLOUGHBYDRIVE
GAINSBOROUGH AVENUE
WOOD
LA NDS ROAD
CUNNINGHAM ROAD
LANGHOLMDRIVE
ST
V ITA
L AVENUE
EVERIT
T DRIV
E NORTH
LIBERTONDRIVE
DAWSON ROAD
A R L I NGTO
NDRIVE
HOGA NROAD
MISSIO N AVE NUE
RICHAR DS
ON D R IVE
SUNSET BOULEVARD
AKINSDR IVE
MCKENNEY AVENUE
FOREST DR
IVEMEADOWVIEW DRIVE
RIEL DRIVE
CAMP
BELL
ROA
D
DEER RIDGE DRIVE POUNDMAKER ROAD
VENE
SS R
OAD
HEBER
T ROAD
LEVASSEUR ROAD
VILLENEUVE ROAD
BELLE
ROSE DRIVE
GIROUX ROAD
BOUDREAU ROAD
RAY GIBBON DRIVE
HERITA GEDRIVE
CARLETON
DRIVE
LAROSEDRIVE
EXHIBIT 4.2:TAC CGEPSL
RECOMMENDED SPEED LIMIT
Docu
ment:
G:\P
rojec
ts\15
000\1
5400
\1543
9_St
_Albe
rt_Sp
eed_
Limit_
Revie
w\02
_CAD
D\25
_GIS\
251_
Figure
s\154
39_E
xhibi
t_42_
Warra
ntedS
peed
_191
128.m
xd
1:55,0000 1 20.5
km City of St. AlbertRoad Unclassified
Warranted Speed (km/h)4050607080
¹
Credits:
CANA83-3TM114
HUDS
ONRO
AD
LAYDON DRIVE
RIVERSIDE DRIVE
GRANDVILLE AVENUEKINGSW
OOD
BOUL
EVAR
D
DENN
ISON
DRI
VE
SALISBURY
AVENUE
LAC O
MBE
DRI V
E
ERIN
RIDGE DRIVE
KINGSWO ODDRIVE
GRANDIN ROAD
GRO S
VENO
RBO
ULE V
ARD
PARKWOO
D
DRIVE
D ORCHESTER DRIVE
BISHOP STREET
GRESH
AM
BOULEVARD
DUNBAR STREET
HARWOO
DDR
IVE
STERLING STREET
GREN
FELL
AVENUE
CURIAL DRIVE
KEILLOR DRIVE
VILLEMAGNE ROAD
LOCKHARTDRIVE
STUR
GEON ROAD
EDISON DRIVEERNEST BOULEVARD
CUST AVENUE
LEXI
NGTO
N DR
IVE
MADONNA
DRIVEHERI TAG E
WAY
ERIN RIDGE ROAD
NEIL ROSS ROAD
CHISHOLM AVENUE
LARSON AVENUE
OAKMONT
DR
IVEJENS
ENLA
KEBOULEVARD
COAL MINE
ROAD
WESTW
OODDRIVE
LANGLEY AVENUE FAIRVIEWBOULEVARD
INGLEWOOD
D RIVE
GATE A VENUE
CHEV
IGNY
STR
EET
MALMO AVENUESTALBERT ROAD
CIRCLE DRIVE
MUIR DRIVE
STAN
NE
STREET
ELDORADO DRIVE
P INEVIE W
DRIV
E
BURN HAMAV
EN
UE
K I NGSW
AY DRIVE
VILLENUEVE ROAD
LECLAIR
W AY
CARN
EGIE
DRI
VE
OAKVISTA
DRIVE
OAKR
IDGE
DR
IVE NORTH
ALPINE
BOULEVARD
GERV
AISRO
AD
ATTW
OODDRIVE
SIRW
INSTO
N CHURCHILL AVENUE
WILLOUGHBYDRIVE
GAINSBOROUGH AVENUE
WOOD
LA NDS ROAD
CUNNINGHAM ROAD
LANGHOLMDRIVE
ST
V ITA
L AVENUE
EVERIT
T DRIV
E NORTH
LIBERTONDRIVE
DAWSON ROAD
A R L I NGTO
NDRIVE
HOGA NROAD
MISSIO N AVE NUE
RICHAR DS
ON D R IVE
SUNSET BOULEVARD
AKINSDR IVE
MCKENNEY AVENUE
FOREST DR
IVE
MEADOWVIEW DRIVE
RIEL DRIVE
CAMP
BELL
ROA
D
DEER RIDGE DRIVE POUNDMAKER ROAD
VENE
SS R
OAD
HEBER
T ROAD
LEVASSEUR ROAD
VILLENEUVE ROAD
BELLE
ROSE DRIVE
GIROUX ROAD
BOUDREAU ROAD
RAY GIBBON DRIVE
HERITA GEDRIVE
CARLETON
DRIVE
LAROSEDRIVE
From the Complete Streets Guidelines


islengineering.com
November 2019
Transportation Network Speed Limit Review
City of St. Albert
FINAL REPORT
35
Figure 4.3: Posted Speed Subtract Recommended Speed
The following observations are made from the figure:
• Overall, the difference between the posted and recommended speed limit was relatively small, with
99 of 110 segments reflecting a posted speed limit within 10 km/h of the recommended speed limit.
• 43 of 100 segments have a matching posted and recommended speed limit.
• 56 segments have a posted speed limit within 10 km/h of the recommended speed limit.
• 39 segments have an increased recommended speed limit and 28 segments have a decreased
recommended speed limit.
• Eleven segments have a recommended speed limit that is 20 km/h greater than the posted speed
limit.
These above three observations indicate that overall the speed limits within St. Albert generally align
with the CGEPSL, which aligns with reported past practices. Key exceptions exist where the
recommended speed limit is for an increase of 20 km/h or more. The posted speed is compared to
the recommended speed in Exhibit 4.3.
Comparison of Results to Prevailing Speeds
Prevailing driver speeds is an important consideration when reviewing the speed limits within a City.
Although not a specific input to the CGEPSL guide, understanding speeds that drivers choose to
drive provides context for understanding local conditions and reviewing the results. For this, the City
provided traffic speed data based on the 85th percentile for 2018 and 2017 where available. The 85th
percentile speed represents the speed that 85 per cent of vehicles were observed to travel at or
below, or rather the speed that only 15 per cent of drivers were observed to exceed.
The recommended speed minus the prevailing speed is tabulated in the following figure, Note – the
total segments with speed data recorded equals 82.
0 11
28
43
28
0 0
-30 -20 -10 0 +10 +20 +30
Nu
mb
er
of
Segm
en
ts
Posted Speed Subtract Recommended Speed (km/h)
Posted Speed SubtractRecommended Speed

36 Transportation Network Speed Limit Review
City of St. Albert
FINAL REPORT
Integrated Expertise.
Locally Delivered.
Figure 4.4: Posted Speed Subtract Prevailing Speed
The following observations can be made from the above figure and Exhibit 4.3:
• Approximately 77% of segments (63 of 82 segment) show drivers travelling at speeds at or below
the posted speed limit.
Based on this speed data, the majority of drivers travel well within the posted speed limit. This is
important as the results indicate that there are more cases where an increase in the posted speed
limit is recommended rather than a decrease. When considering the prevailing driving speed is
generally at, or lower, than what is currently posted, an increase in the posted speed limit may not be
appropriate. While it may be recommended through the CGEPSL process, increasing the posted
speed limit on roadways in which the prevailing speed is aligned to or lower than the current posted
speed limit could result in a greater differential in travel speeds along the corridor which is both an
operational and safety concern.
Major/Minor Classification
As previously discussed, the City of St. Albert does not differentiate between major and minor
roadway classifications, which is a key factor in determining the recommended posted speed. With
this criterion not clearly identified, as part of this project, the team utilized operational considerations
and recorded information to assign a classification to the roadways. Information used to classify the
roadways as minor or major was based on traffic volumes and roadway segment continuity. The
results of applying these factors resulted in a recommendation to utilize the “minor” classification for
the roadways and under this criterion, approximately 70% of the neighbourhood roadways are
recommended as 40 km/h.
• For the purposes of testing the sensitivity of the CGEPSL guide, maintaining the classification of
neighbourhood roads as “minor” roads, and adjusting the risk score threshold from 51 to 47 (<10%)
resulted in a substantial increase to approximately 90% of roadways recommended to be posted at
40 km/h.
0 1
18
2
18
36
7
<-20 <-10 <0 <10 <20 <30
>-30 >-20 >-10 0 >0 >10 >20
Nu
mb
er
of
Segm
en
ts
Posted Speed Subtract Prevailing Speed (km/h)
Posted Speed SubtractPrevailing Speed

HUDS
ONRO
AD
LAYDON DRIVE
RIVERSIDE DRIVE
GRANDVILLE AVENUEKINGSW
OOD
BOUL
EVAR
D
DENN
ISON
DRI
VE
SALISBURY
AVENUE
LAC O
MBE
DRI V
E
ERIN
RIDGE DRIVE
KINGSWO ODDRIVE
GRANDIN ROAD
GRO S
VENO
RBO
ULE V
ARD
PARKWOO
D
DRIVE
D ORCHESTER DRIVE
BISHOP STREET
GRESH
AM
BOULEVARD
DUNBAR STREET
HARWOO
DDR
IVE
STERLING STREET
GREN
FELL
AVENUE
CURIAL DRIVE
KEILLOR DRIVE
VILLEMAGNE ROAD
LOCKHARTDRIVE
STUR
GEON ROAD
EDISON DRIVEERNEST BOULEVARD
CUST AVENUE
LEXI
NGTO
N DR
IVE
MADONNA
DRIVEHERI TAG E
WAY
ERIN RIDGE ROAD
NEIL ROSS ROAD
CHISHOLM AVENUE
LARSON AVENUE
OAKMONT
DR
IVEJENS
ENLA
KEBOULEVARD
COAL MINE
ROAD
WESTW
OODDRIVE
LANGLEY AVENUE FAIRVIEWBOULEVARD
INGLEWOOD
D RIVE
GATE A VENUE
CHEV
IGNY
STR
EET
MALMO AVENUESTALBERT ROAD
CIRCLE DRIVE
MUIR DRIVE
STAN
NE
STREET
ELDORADO DRIVE
P INEVIE W
DRIV
E
BURN HAMAV
EN
UE
K I NGSW
AY DRIVE
VILLENUEVE ROAD
LECLAIR
W AY
CARN
EGIE
DRI
VE
OAKVISTA
DRIVE
OAKR
IDGE
DR
IVE NORTH
ALPINE
BOULEVARD
GERV
AISRO
AD
ATTW
OODDRIVE
SIRW
INSTO
N CHURCHILL AVENUE
WILLOUGHBYDRIVE
GAINSBOROUGH AVENUE
WOOD
LA NDS ROAD
CUNNINGHAM ROAD
LANGHOLMDRIVE
ST
V ITA
L AVENUE
EVERIT
T DRIV
E NORTH
LIBERTONDRIVE
DAWSON ROAD
A R L I NGTO
NDRIVE
HOGA NROAD
MISSIO N AVE NUE
RICHAR DS
ON D R IVE
SUNSET BOULEVARD
AKINSDR IVE
MCKENNEY AVENUE
FOREST DR
IVEMEADOWVIEW DRIVE
RIEL DRIVE
CAMP
BELL
ROA
D
DEER RIDGE DRIVE POUNDMAKER ROAD
VENE
SS R
OAD
HEBER
T ROAD
LEVASSEUR ROAD
VILLENEUVE ROAD
BELLE
ROSE DRIVE
GIROUX ROAD
BOUDREAU ROAD
RAY GIBBON DRIVE
HERITA GEDRIVE
CARLETON
DRIVE
LAROSEDRIVE
EXHIBIT 4.3:TAC CGEPSL
RECOMMENDED SPEED LIMIT
VS POSTED SPEED
Docu
ment:
G:\P
rojec
ts\15
000\1
5400
\1543
9_St
_Albe
rt_Sp
eed_
Limit_
Revie
w\02
_CAD
D\25
_GIS\
251_
Figure
s\154
39_E
xhibi
t_43_
Poste
dvsW
arran
ted_1
9112
8.mxd
1:55,0000 1 20.5
km City of St. AlbertRoad Unclassified
Posted - Warranted Speed (km/h)-30-20
-100102030
¹
Credits:
CANA83-3TM114


islengineering.com
November 2019
Transportation Network Speed Limit Review
City of St. Albert
FINAL REPORT
37
• As a further comparison, the roadways were also evaluated under a “major” and “minor”
classification system, focused on a difference of the roadways based on traffic volumes. The
application of the two classifications resulted in an approximate split (50%) of collector roadways to
be recommended at 40 km/h. This evaluation of the collector/neighbourhood roads is illustrated in
the following table.
Table 4.13: Supplemental Results, Collector Speed Limit Recommendations (total for 57 segments)
Total (Threshold 51) Neighbourhood Classification
System All Minor (Threshold 51) Results If all Minor + 47 Risk
Threshold (instead of 51)
40 km/h 28 40 51
50 km/h 28 16 5
60 km/h 1 1 1
As shown in the table:
1. Classifying all neighbourhood roads as minor and using the threshold score of 51 results in a
recommended speed limit of 40 km/h for 40 of the 57 segments (70% of the collector roadways).
2. If the threshold is reduced by 4 points, from 51 to 47 (10%) than 51 of 57 segments are
recommended at 40 km/h (89% of the collector roadways).
a. There are five exceptions where the speed limit is still recommended at 50 km/h; however, the
risk score is relatively close to the threshold.
b. The only other exception is Kingswood Boulevard where the roadway is adjacent to a large
open and undeveloped space, but it is anticipated this area will become developed and thus
the criteria and score would change.
i. The risk score is very low for this segment (27) as a result, which is why 60 km/h is
recommended.

38 Transportation Network Speed Limit Review
City of St. Albert
FINAL REPORT
Integrated Expertise.
Locally Delivered.
5.0 Local Roadway Review
5.1 Introduction
Local roadways make up the largest portion of the City’s network (their total linear length of 170 km is
more than the combined length of arterials and collectors). The major function of local roadways is to
provide vehicle access to private and public developments and thus vehicle mobility and speed
expectations are very different from collector and arterial roadways (although in the context of St.
Albert with front facing residential access along collectors, there is stronger similarity of function from
local to collector in comparison to arterial). Local roadways also often share mobility with vulnerable
road uses and sometimes serve as recreational spaces for local activities such as street hockey
games.
Based on the results of the best practices survey, the majority of municipalities have a current default
speed of 50 km/h on local roadways and local roadway speed reviews are generally conducted due to
public request, safety concern, or the construction of a new playground or school. In addition, of the
municipalities surveyed, the majority of responses indicated that they are currently conducting or
discussing a local roadway speed limit review or intend to do so in the future.
The results of the best practices survey indicate a trend towards reviewing the default 50 km/h speed
limit on local roadways. This is likely due to a combination of safety concerns and public opinion.
5.2 Review Purpose
The purpose of this section is to share information following the evaluation of a representative
selection of the City’s local roadways based on literature review and field observation.
5.2.1 Literature Review
Safety is central around the local roadway speed limit debate, due to the high number of pedestrians
typically associated with these roadways. There is no debate surrounding the strong correlation
between pedestrian fatality risk and the impact speed of the vehicle.1 In fact, it was determined that
the pedestrian fatality risk at 50 km/h is twice as high as the risk at 40 km/h and more than five times
higher than the risk at 30 km/h.2 Note – this fatality risk only applies to pedestrians aged 15 years or
older.
• It was found that the risk of child pedestrian injury is seven times more likely with an increase in
impact speed from approximately 30 km/h to 50 km/h (actual values are 32 km/h to 48 km/h).3
In addition to safety, speed limits influence the level of comfort on the environment for cyclists. The
National Association of City Transportation Officials (NACTO) Design for All Ages, All Abilities facility
selection guidance is a tool to design safe and inviting bicycle infrastructure that any cyclist would feel
comfortable using, regardless of their age or abilities. In the guidebook, the suggested speed limit for
1 Rosén, E., and Sander, U. “Pedestrian Fatality Risk as a Function of Car Impact Speed.” Accident Analysis and
Prevention, 41 (2009): 536-542 2 Rosén, E., and Sander, U. “Pedestrian Fatality Risk as a Function of Car Impact Speed.” Accident Analysis and
Prevention, 41 (2009): 536-542 3 Jacobson, P. et al. “Child Pedestrian Injuries on Residential Streets: Implications for Traffic Engineering.”
Institute for transportation Engineers, February 2000
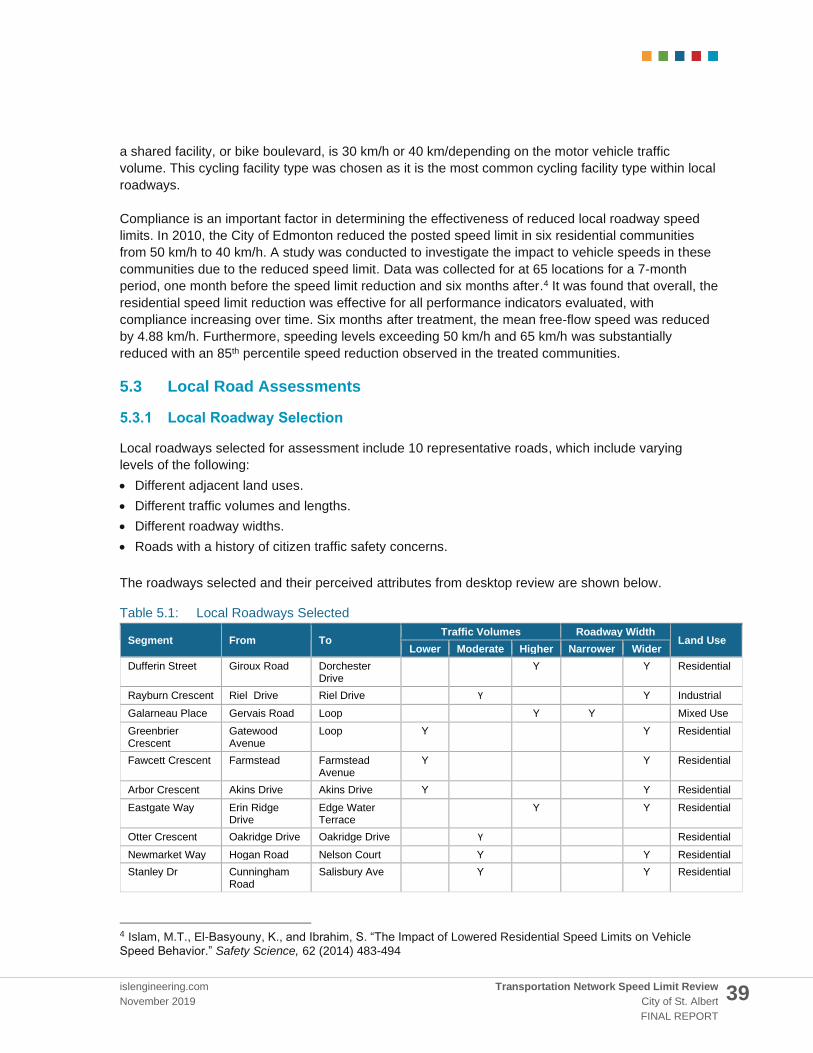
islengineering.com
November 2019
Transportation Network Speed Limit Review
City of St. Albert
FINAL REPORT
39
a shared facility, or bike boulevard, is 30 km/h or 40 km/depending on the motor vehicle traffic
volume. This cycling facility type was chosen as it is the most common cycling facility type within local
roadways.
Compliance is an important factor in determining the effectiveness of reduced local roadway speed
limits. In 2010, the City of Edmonton reduced the posted speed limit in six residential communities
from 50 km/h to 40 km/h. A study was conducted to investigate the impact to vehicle speeds in these
communities due to the reduced speed limit. Data was collected for at 65 locations for a 7-month
period, one month before the speed limit reduction and six months after.4 It was found that overall, the
residential speed limit reduction was effective for all performance indicators evaluated, with
compliance increasing over time. Six months after treatment, the mean free-flow speed was reduced
by 4.88 km/h. Furthermore, speeding levels exceeding 50 km/h and 65 km/h was substantially
reduced with an 85th percentile speed reduction observed in the treated communities.
5.3 Local Road Assessments
5.3.1 Local Roadway Selection
Local roadways selected for assessment include 10 representative roads, which include varying
levels of the following:
• Different adjacent land uses.
• Different traffic volumes and lengths.
• Different roadway widths.
• Roads with a history of citizen traffic safety concerns.
The roadways selected and their perceived attributes from desktop review are shown below.
Table 5.1: Local Roadways Selected
Segment From To Traffic Volumes Roadway Width
Land Use Lower Moderate Higher Narrower Wider
Dufferin Street Giroux Road Dorchester Drive
Y
Y Residential
Rayburn Crescent Riel Drive Riel Drive
Y
Y Industrial
Galarneau Place Gervais Road Loop
Y Y
Mixed Use
Greenbrier Crescent
Gatewood Avenue
Loop Y
Y Residential
Fawcett Crescent Farmstead Farmstead Avenue
Y
Y Residential
Arbor Crescent Akins Drive Akins Drive Y
Y Residential
Eastgate Way Erin Ridge Drive
Edge Water Terrace
Y
Y Residential
Otter Crescent Oakridge Drive Oakridge Drive
Y
Residential
Newmarket Way Hogan Road Nelson Court Y
Y Residential
Stanley Dr Cunningham Road
Salisbury Ave Y
Y Residential
4 Islam, M.T., El-Basyouny, K., and Ibrahim, S. “The Impact of Lowered Residential Speed Limits on Vehicle
Speed Behavior.” Safety Science, 62 (2014) 483-494

40 Transportation Network Speed Limit Review
City of St. Albert
FINAL REPORT
Integrated Expertise.
Locally Delivered.
5.4 Local Roadway Field Review
Each of the segments listed in Table 5.1 were investigated in the field. Results of the review are as
follows:
On-street Parking and Roadway Width
Overall, local roads have a relatively narrow cross-section, which is not typically wide enough to
support parked vehicles on both sides of the street and allow two vehicles to pass by each other in
opposing directions. The narrow width along with even a small number of parked vehicles creates a
substantial traffic calming effect based on experience travelling through the local roads.
Waiting to Pass
Lot Width, Driveway and Garages
In older areas of St. Albert, there appeared to be generally wider residential lots, and in some areas
more single car driveways and single car garages. This appears to be a trend amongst areas
constructed in the 1950 to 1980s. Newer areas, especially those build in the past 10 years, have
generally narrower lots and in most cases two car driveways and two car garages. This is important
as the roadways in older areas appeared narrower with more parked vehicles present, possibly due
to less vehicles parked in driveways and garages. In newer areas roadways appear to be wider,
potentially to accommodate street parking, but with less vehicles parked on the street, possibly due to
more vehicles parked on driveways and garages. Newer areas also have less space between
driveways where vehicles could park.

islengineering.com
November 2019
Transportation Network Speed Limit Review
City of St. Albert
FINAL REPORT
41
Older Area, Single Car Driveways and Street Parking
Newer Area, Double Car Driveways and Street Parking
Horizontal Curves
The St. Albert road network is curvilinear, from arterials to neighbourhood roads, and many of the
local roads reviewed have sharp corners that would not be constructed on roadways of a higher
classification. The sharp corners include 90-degree corners that require a substantial reduction in
speed to navigate and more consideration and attention if there are parked vehicles. Generally, there
is an engineering judgment that local roadways are not designed to accommodate moderate to high
traffic flow speed with the types of curves constructed and instead the design suggests lower speed
requirements.

42 Transportation Network Speed Limit Review
City of St. Albert
FINAL REPORT
Integrated Expertise.
Locally Delivered.
Example of Curves on Local Roads
Comfortable Speed
On many of the local road segments investigated, the comfortable driving speed was much less than
50 km/h, typically ranging between 30 – 40 km/h, depending on the number of parked vehicles,
roadway widths, curves and presence of pedestrians. On two segments, the comfortable speed was
perceived as slightly higher due to the segment having longer straight sections of road, with few
parked cars.
Adjacent Land Use
The majority of local roads reviewed are in residential areas and travelling through these areas at a
speed of 50 km/h may be deemed inappropriate, in the context of surroundings and expectations of
other road users. In these areas, there are a number of vulnerable users that share the road space,
including those using local road streetscape for activities such as ball hockey, skateboarding,
basketball (these conditions were both observed and are known).

islengineering.com
November 2019
Transportation Network Speed Limit Review
City of St. Albert
FINAL REPORT
43
Basketball Net on Local Road
Two local roadways outside of residential areas were also reviewed, including an industrial area and
a mixed use, commercial/residential area. In these areas there were a high number of parked
vehicles due to the higher activities in the area. These roadways are operationally and functionally
different in comparison to the roadways investigated adjacent to residential land use; they involve
less on-street or vicinity activities and could be considered for being maintained at 50 km/h or
potentially be reduced to 40 km/h to be consistent with other roadways.

44 Transportation Network Speed Limit Review
City of St. Albert
FINAL REPORT
Integrated Expertise.
Locally Delivered.
6.0 School Zones and Playground Zones
6.1 Introduction
The Alberta Transportation (AT) Guidelines for School and Playground Zones and Areas was created
to promote uniformity in establishment, signage, and marking of school and playground zones and
areas in Alberta. A maximum speed limit of 30 km/h is prescribed within school and playground zones
in Section 107 of the Alberta Traffic Safety Act. By bylaw, a municipality may prescribe a lower
maximum speed limit that shall be no lower than 20 km/h. The guidelines provide a systematic,
objective, and quantitative procedure for assessing the need for a school and playground zone or
area.
St. Albert’s past practice has been application of the AT Guidelines; however, the City has applied
only school zones and has not integrated school areas – meaning that in some cases, the
identification of a score for a school area resulted in the field application of a school zone. Whereas,
there has been the application of both playground zones and playground areas throughout the city.
6.2 Review Purpose
The purpose of this section of the study is to summarize the review process and findings on the City’s
existing playground and school zones using the AT Guide and interpreting the results to provide
recommendations to playground and school zones for the City’s consideration. The following were the
main focal points to be investigated in the review:
1. How do the City’s current zones or areas rank in regard to the AT Guidelines?
2. Do current school zones meet the Guidelines for application of playground zones?
3. From operational information (vehicle and pedestrian volumes), what time of day applications may
be considered for playground zones or school zones?
The recommendations included in this section of the report are based solely on the AT Guidelines for
School and Playground Zones for posted speeds and do not necessarily represent the final
recommendation.
6.3 Applying AT School Zone Input Worksheet
The AT School Zone Input Worksheet provides a quantitative assessment for the need of a school
zone or area. A total score of 100 points is possible based on six weighted categories for school type,
school fencing, adjacent roadway classification, property line separation, school entrance features
and presence of sidewalks. The school zone results matrix is provided in the table below.
Table 6.1: School Zone Results Matrix (AT Guidelines for School and Playground Zones & Areas)
Total Score Area or Zone?
0 – 40 Nothing
41 – 64 School Area
65 – 80 School Area or School Zone*
81 – 100 School Zone *Local conditions must be considered in detail to determine the appropriate treatment. Wherever possible, mitigation measures
should be explored that would reduce the score so that marginal school zones can be avoided. The reasons for the final
decision should always be documented.

islengineering.com
November 2019
Transportation Network Speed Limit Review
City of St. Albert
FINAL REPORT
45
The six installation criteria for a school zone or school area are discussed in the following sections.
School Type
The type of school has the greatest contribution to the total score with a maximum point value of 40
points. Children of elementary school age without a parent present are considered the most
vulnerable due to their tendency to accidentally enter the roadway and their limited ability to anticipate
and understand vehicular traffic movements. As such, elementary schools receive the highest
weighting factor while high schools receive the lowest. The point breakdown for school type is
provided in the following table.
Table 6.2: School Type Point Breakdown
Maximum Point Value
Description Weighting
Factor
40
Elementary 1.0
Middle/Junior High 0.4
High School 0.2
Post Secondary/College/University 0.0
Fencing
Fencing can act as physical barrier to prevent movements onto the roadway, thus reducing the need
for a school zone. The effectiveness of the fencing depends on how easily the fence can be
traversed. A school is classified as fully traversable if there is no fence along the side adjacent to the
roadway, or the fence is easily traversed. Partially traversable can describe low-height fencing or
fencing with several openings. Non-traversable describes high-mounted fencing with limited openings
at defined points such as a main entrance. The fencing point breakdown is provided in the table
below.
Table 6.3: Fencing Point Breakdown
Maximum Point Value
Description Weighting
Factor
20
Fully Traversable 1.0
Partially Traversable 0.5
Non-Traversable 0.1
Road Classification
The roadway classification is important when considering school zones as it may influence
compliance and create a false sense of security on potentially hazardous roadways. School zones
should be avoided on expressways/freeways and arterial roads for this reason. The more significant
speed reduction required going from higher class roadways to a school zone can appear to contradict
the roadway’s function and be unexpected or disrespected. As such, it is advisable that school zones
remain on local or collector roadways only. The point breakdown for road classifications is provided in
the table below.

46 Transportation Network Speed Limit Review
City of St. Albert
FINAL REPORT
Integrated Expertise.
Locally Delivered.
Table 6.4: Road Classification Point Breakdown
Maximum Point Value
Description Weighting
Factor
20
Local 1.0
Minor Collector Collector
0.75 0.5
Major Collector/Minor Arterial 0.25
Major Arterial/Expressway 0.0 *All provincial highways shall be treated as “Freeway” for the purpose of assignment of the weighting factor for the “Road
Classification” under “Rural Land Use”.
Property Line Separation
A school’s property line typically abuts at least one roadway and may be near an intersecting
roadway if the school is located near an intersection. When assessing the need for a school zone on
the intersecting roadway, the proximity between the school’s property line and the roadway should be
considered. A property line that is separated from the roadway by only a sidewalk or fence is
considered to abut the roadway. If the school property line is located within 50 metres of the
intersecting roadway, there is a greater likelihood that a child may enter the roadway than in the
property line separation exceeds 50 metres. The property line separation point breakdown is provided
in the table below.
Table 6.5: Property Line Separation Point Breakdown
Maximum Point Value
Description Weighting
Factor
10
Abuts Roadway 1.0
Within 50 metres 0.5
Further than 50 metres 0.0
School Entrance
School entrances is the focal point of congestion, both for pedestrians and vehicles, with the activity
typically concentrated at the main entrance. A secondary entrance, if it exists, typically has far less
activity than the main entrance and is thus less likely for pedestrian-vehicle conflicts to occur. A
school entrance can be a driveway to the school, the closest point along the road to the main door, or
a designated pick up and drop off area. The point breakdown for school entrances is provided in the
table below.
Table 6.6: School Entrance Point Breakdown
Maximum Point Value
Description Weighting
Factor
5
Main Entrance/Multiple Secondary Entrances
1.0
Secondary Entrance 0.6
No Entrance 0.0

islengineering.com
November 2019
Transportation Network Speed Limit Review
City of St. Albert
FINAL REPORT
47
Sidewalks
Sidewalks provide a safe route for children onto the school grounds or a defined crossing point on the
roadway. Children are less likely to walk on the roadway if sidewalks are present. The point
breakdown for sidewalks is provided in the table below.
Table 6.7: Sidewalks Point Breakdown for School Zones
Maximum Point Value
Description Weighting
Factor
5
None or non-school side 1.0
School Side 0.6
Both Sides 0.0
6.3.1 Results
School Zone Data Review
The City of St. Albert applied the Alberta Transportation School Zone Input Worksheet to roadways
adjacent to schools. Exhibit 6.1 shows the results of the School Zone and Area analysis conducted
with a few updates confirming the type of school, property line separation and application of the
segment. In order to reduce clutter, the schools are numbered rather than named. A legend with the
school names is provided on the reverse of the exhibit.
Where the results of the final score fall into the category of applying an area or zone (refer to Table
6.1), the considerations of school type and property line separation were focused on and if the school
was an elementary school and the roadway was adjacent to, or reasonably close to, the school it was
classified as a zone. The resulting scores of the school evaluation, as well as identification of the
existing school zones are shown on a map in Appendix D.
Based on pure application of the AT guidelines, the number of roadways that are currently signed as
school zones within St. Albert is higher than what is recommended through the guidelines; with 60
currently designated and 46 warranted. The main differentiator is the type of school, as the point
difference between an elementary school and a junior high school or high school is 26 and 32
respectively.
Based on the results, several roadways that are currently signed as school zones are suggested to
be signed as school areas based on the direct application of the Guidelines, with 23 school areas
suggested. This result aligns to the past applications exceeding the guidelines recommendations
when investigating school zones, where zones were applied over areas.
It is also noted that four roadways previously not signed as school zones or areas are now
suggested.

48 Transportation Network Speed Limit Review
City of St. Albert
FINAL REPORT
Integrated Expertise.
Locally Delivered.
6.4 Applying the AT Playground Zone Worksheet
The AT Playground Zone Input Worksheet provides a quantitative assessment for the need of a
playground zone or area. Similar to the school zone, a total score of 100 points is possible based on
six weighted categories including playground type, fencing, road classifications, property line
separation, playground entrance and presence of sidewalks. The playground zone results matrix is
provided in the table below.
Table 6.8: Playground Results Matrix (AT Guidelines for School and Playground Zones & Areas)
Total Score Area or Zone?
0 – 40 Nothing
41 – 80 Playground Area
81 – 100 Playground Zone
The criteria for a playground zone will be discussed in the following sections.
Playground Type
The type of playground type reflects the likely level of utilization of the facility and its exposure to the
roadway. Playgrounds with more equipment (capacity) are more likely to warrant a reduced speed
zone. The playground type point breakdown is provided in the table below.
Table 6.9: Playground Type Point Breakdown
Maximum Point Value
Description Weighting Factor
40
Frontage Playground Capacity (number of children)
N/A
≥ 50 m
16 or more 1.0
5 to 15 0.75
1 to 4 0.4
No play equipment: sports field or open field only
0.2
< 50 m Any facilities 0.2
Fencing
The fencing point breakdown for playground zones is the same as for school zones, provided in the
previous section, see Table 6.3. The evaluation methodology is similar, however if a play area is the
focal point of activity within a much larger field, the fencing around the play area itself should be
considered, particularly if fencing is not provided roadside.
Road Classification
Similar to school assessments, the roadway classification is important when considering playground
zones as it may influence compliance and create a false sense of security on potentially hazardous
roadways. The point breakdown for road classifications for playground zones is the same as for
school zones, see Table 6.4.

HUDS
ONRO
AD
WYCLIFFPLACE
LAYDONDRIVE
KINGSWOO
DBO
ULEV
ARD
SALISBURY AVENUE
LACO
MBE
DRIV
E
ERIN
RIDGE
DRIVE
RIVERSIDE DRIVE
KINGSWOOD
DRIVE
GRANDIN ROAD
GRESHAMBOULEVARD
GROS
VENO
RBO
ULEV
ARD
PA RKWOOD
D RIVE
DORCHESTER
DRIVE DEER
BOURNE
DRIVE
DUNBAR
STREET
DELBROCKBOULEVARD
HERITAGEBOULEVARDHAR
WOO D
DRIV E
STERLING STREET
CURIALDRIVE
BISHOP STREET
VERSAILLES AVENUE
KEILLOR DRIVE
VILLEMAGNEROAD
LOCKHART
DRIVE
JOYALWAY
STUR
GEON ROAD
EDISON DRIVE
WAVERLY
DRIVE
ERNESTBOULEVARD
CUSTAVENUE
LEXI
NGTO
NDR
IVE
DURHAMAVENUE
GRANITE AVENUE
PARKAVENUE
EVERITT DRIVE
FALSTAFFAVENUE
GRAH
AMAV
ENUE
EBONY WAYHERITAGE
WAY
OA K RI DGE DRIVE
SOUTH
PAGEDRIVE
CHAT
ELAI
N DR
IVE
ERINRIDGE ROAD
NEIL ROSSRO
AD
CHISHOLMAVENUE
OAKM
ONTD
RIVECOAL MI
NERO
AD
GRANGE DRIVE
WESTW
OODDR
IVE
LANGLEYAVENUE
ING LEWOOD
DRIV E
GLOUCESTER
DRIVE
GATE
AVENUE
CHEV
IGNY
STRE
ET
ELEMENT DRIVE NORTH
MALMOAVENUE
PERRON
STREET
ST ALBERT ROAD
CIRCLE DRIVE
GREEN
GROVE DRIVE
MUIRDRIVE
STANNE STREET
ELDORADODRIVE
NORTHRIDGE
DRIVE
LENNOX DRIVE
PINEVIEW
DRIVEBURNHAMAVENUE
KINGSWAYDRIVE
CORRIVEAUAVENUE
VILLENUEVE ROAD
LECLA IRWAY
CARN
EGIE
DRIV
E
OAKVISTA
DRIVE
OAKR
IDGED
RIVEN
ORTH
ALPIN
EBOULEVARD
GERV
AISRO
AD
ATTW
OODDRIVE
SIRW
INST
ONCH
URCHILL
AVENUE
GAINSBOROUGH
AVENUE
POIRIER AVENUE
WOODLANDS
ROADLANGHOLMDRIVE
ST VITAL
AVENUE
LIBERTONDRIVE
DAWSON ROAD
A RLING
TON
DRIVE
HOGA
NRO
AD
MISSION AVENUE
RICH
ARDS
ONDR
IVE
SUNSET
BOULEVARD
AKINS DRIVEMCKENNEY AVENUE
FOREST
DRIVE
MEADOWVIEW DRIVE
RIEL DRIVE
CAMP
BELL
ROA
D
DEER RIDGE DRIVE POUNDMAKER ROAD
VENE
SS R
OAD
HEBER
T ROAD
LEVASSEUR ROAD
VILLENEUVE ROAD
BELLE
ROSE DRIV E
GIROU
XROAD
BOUDREAU ROAD
RAY GIBBON DRIVE
HERITAGE
DRIVE
CARLETON
D RIVE
23
19
4
11
18
21
22
1
2
14
13
3
10
16
6
9
26
20
24
5
8
28
27
25
15
17
7
12
EXHIBIT 6.1:AT GUIDE
SCHOOL ZONE AND AREA
RECOMMENDATIONS
Docu
ment:
G:\P
rojec
ts\15
000\1
5400
\1543
9_St
_Albe
rt_Sp
eed_
Limit_
Revie
w\02
_CAD
D\25
_GIS\
251_
Figure
s\154
39_E
xhibi
t51_S
choo
l_Zon
e_Re
cs_1
9112
8.mxd
1:55,0000 1 20.5
km City of St. AlbertRoad Unclassified
Recommended AreaRecommended Zone
¹
Credits:
CANA83-3TM114

11
18
14
16
8
7
12
MAP B.6:RECOMMENDED SCHOOL ZONES
AND AREAS
Docu
ment:
G:\P
rojec
ts\15
000\1
5400
\1543
9_St
_Albe
rt_Sp
eed_
Limit_
Revie
w\02
_CAD
D\25
_GIS\
251_
Figure
s\154
39_M
ap_B
7_Sc
hool_
Zone
_Rec
s_19
1030
.mxd
0 0.
¹
arthstar Geographics, CNES/Airbus DS, USDA, USGS, AeroGRID, IGN, and the
CANA83-
RAFT &
ONFIDENTIAL
EXHIBIT 5.1:
SCHOOL ZONE AND AREARECOMMENDATIONS
1 Albert Lacombe Elementary School2 Bellerose High School3 Bertha Kennedy Elementary School4 Ecole Alexandre Tache Junior High School5 Ecole Father Jan Elementary School6 Ecole La Mission Elementary School7 Ecole Marie Poburan Elementary School8 Elmer Gish Elementary School9 J.J. Nearing Elementary School10 Joseph M Demko Elementary School11 Keenooshayo Elementary School12 Leo Nickerson Elementary School13 Lois E Hole Elementary School14 Lorne Akins Junior High School15 Muriel Martin Elementary School16 Neil Ross Elementary School17 Paul Kane High School18 Richard S Fowler Junior High School19 Robert Rundle Elementary School20 Ronald Harvey Elementary School21 Sir George Simpson Junior High School22 Sir MacKenzie Elementary School23 Sister Alphonse Academy Elementary School24 Sturgeon Heights Elementary School25 V.J Maloney Junior High School26 Vital Grandin Elementary School27 W.D. Cuts Junior High School28 Wild Rose Elementary School

islengineering.com
November 2019
Transportation Network Speed Limit Review
City of St. Albert
FINAL REPORT
49
Property Line Separation
A playground’s property line typically abuts at least one roadway, and may be near an intersecting
roadway if the playground is located near an intersection. The property line separation point
breakdown for a playground zone is the same as a school zone; however, unlike for schools, the
location of the play equipment should be considered when assessing the property line. See Table 6.5.
Playground Entrance
As with schools, playground entrances are the focal point of congestion, both of pedestrians and
vehicles, with the activity typically concentrated at the main entrance. The point breakdown for
playground entrances is the same as for school zones and is provided in a previous section, see
Table 6.6.
Sidewalks
Sidewalks provide a safe route for children onto the playground grounds or a defined crossing point
on the roadway. Children are less likely to walk on the roadway if sidewalks are present. The point
breakdown for sidewalks is slightly different for playgrounds, and is provided in the table below.
Table 6.10: Sidewalks Point Breakdown for Playground Zones
Maximum Point Value Description Weighting Factor
5
None (or non-playground side) 1.0
Playground Side 0.4
Both Sides 0.0
6.4.1 Results
The results of the playground evaluations are provided in Exhibit 6.2. The evaluation scores are
provided in Appendix D.
Based on this analysis, the number of playground zones recommended are 13, compared with 18
total existing playground zones. This decrease is generally triggered by the type of playground, where
the existing zones that are no longer warranted are typically fields rather than locations with play
areas / equipment. The most significant outcome from the evaluation is the number of warranted
playground areas:
• St. Albert currently has 12 signed playground areas, whereas the evaluation results suggests there
should be 53.
• It is noted that some of the suggested playground areas have very small frontages, such as the
various Tot-Lots. Some judgement is required to determine if signing the adjacent roadway
segment as a playground area is appropriate.
6.5 Zone or Area Signing and Marking
Section D3.3 in the Alberta Transportation Guidelines for School and Playground Zones and Areas is
dedicated to signing and marking. The following section will discuss the practices outlined in the
Guidelines and the current signing and marking practices within St. Albert.

50 Transportation Network Speed Limit Review
City of St. Albert
FINAL REPORT
Integrated Expertise.
Locally Delivered.
6.5.1 Alberta Transportation Guidelines
The guidelines state that a school or playground zone or area should be signed in a way that is
consistent with the desired objectives and the roadway context. The beginnings of all zones and
areas should be clearly identified. Sign type and placement should comply with the Manual of Traffic
Control Devices for Canada (MUTCDC). The signage guidelines are discussed below. Drawing
showing signage placement and type based on several scenarios from the Guide are provided in the
Appendix D.
Sign Type
All School areas are to be marked with the School Area sign (WC-1 of MUTCDC) and Playground
Areas with the Playground Area sign (WC-3 of MUTCDC). The signs should be posted at a distance
that allows adequate perception and reaction time for drivers. No specific signage is required at the
end of an area (as there is no regulatory change in speed).
School and playground zones should be marked with a reduced RB-1 speed limit sign directly below
the Area warning sign. A sign is required to denote the end of the zone. This can be achieved with an
RB-1 sign to reinstate the original speed limit, or an END SCHOOL/PLAYGROUND ZONE sign on
local roads only. The times the reduced speed is in effect must be shown is it is different from the Act,
otherwise the time may be shown but it is not compulsory.
Signage Placement
The distance away from the property line a zone sign should be placed is determined by the speed
limit on the roadway, as shown in the drawings in Appendix D.
Schools and playgrounds are sometimes located at or near an intersection. Where it is determined
that a zone is required on one roadway but not the cross street, motorists on the cross street and
other approaches may still need to be informed of the upcoming zone. The intent in all cases is to
avoid surprising drivers when turning into a zone as they may miss the start-of-zone signs. The Guide
outlines the treatment of opposing and intersecting streets based on intersection controls, as follows:
• Zone or Area on uncontrolled approach:
• On stop controlled approaches, the signage should be placed several metres in advance of the
intersection to provide adequate stopping sight distance.
• On uncontrolled approaches, the signage should be placed at least 50 m in advance of the
intersection to avoid breaking close to or in the intersection.
• All departure legs of the intersection and the end of the school or playground should provide a
RB-1 sign reinstate the original speed limit, or END ZONE sign on local roads.
• Zone or Area on stop controlled approach:
• Similar rules apply in general, however, the zone may have to start or end more than 50 m from
the intersection if the school property extends further.
• Zone or Area on signalized approach:
• The guide strongly discourages the continuation of a school or playground zone through a
signalized intersection, however if it must be provided, similar rules for the stop controlled
intersections apply.

HUDS
ONRO
AD
PARKWOOD
DRIVE
LAY DONDRIVE
NORTH RIDGEDRIVE
KINGSWOO
DBO
ULEV
ARD
DENN
ISON
DRI
VE
SALISBURYAVENUE
LAC O MBE
DRIVE
ERIN
RIDGE
DRIVE
RIVERSIDE DRIVE
KINGSW OODDRIVE
PRIMEA
ULA
NE
GRESHAM
BOULEVARD
GROSVENOR
BOULEVARD
DORCHESTE
R
DRIVEDUNBARSTREET
HERITAGEBOULEVARDHAR
WOO D
DRIV E
GREN
FELL
AVEN
UE
CURIALDRIVE
BISHOP
STREET
VERSAILLES AVENUE
KEILLORDRIVE
GRANDINROAD
VILLEMAGNEROAD
LOCKHART
DRIVE
JOYALWAY
STUR
GEONRO
AD
CUSTAVENUE
DURHAMAVENUE
GRANITEAVENUE
EVERITT
DRIVE
MADONNA
DRIVE
FALSTAFFAVENUE
GRAHAMAVENUE
EBONY WAY
FARM
STEA
DAV
ENUE
HE RI TAG EW
AY
LEDDY
AVENUE
MOUNT ROYAL
DRIVE
OA K RI DGE DRIVE
SOUTH
PAGEDRIVE
CHAT
ELAI
N DR
IVE
ERINRIDGE ROAD
NEIL ROSS
ROAD
CHISHOLMAVENUE
LARSON AVENUE
JENS
ENLA
KE
BOULEVARD
GATEWOODAVENUE
GRANGE DRIVE
WESTW
OODDR
IVE
LANGLEYAVENUE
E LEMENT DRIVE NORTH
FAIRV
IEW
BOUL
EVA R
D
ING LEWOOD
DRIV E
GLOUCESTERDRIVE
GATE
AVENUE
CHEV
IGNY
STRE
ET
MALMOAVENUE
ST ALBERT ROADCIRCLE DRIVE
GREEN GROVE
DRIVE
MUIRDRIVE
STAN
NE
STREET
ELDORADODRIVE
LENNOXDRIVE
PINEVIEW
DRIV
E
BURNHAMAVENUE
K I NGSW
AY DRIVE
CORRIVEAUAVENUE
VILLENUEVE ROAD
LECLA IRWAY
CARN
EGIE
DRIV
E
OAKVISTA
DRIVE
ALPIN
EBO
ULEVA
RD
GERV
AISRO
AD
ATTWOODDRIVE
SIR WINSTON CH
URCHILL AVENUE
WILLOUGHBYDRIVE
GAINSBOROUGH
AVENUE
POIRIER AVENUE
WOOD
LAND
SRO
AD
LANGHOLM
DRIVE
ST VITAL
AVENUE
EVER
ITT DRIVENORTH
DAWSON ROAD
A RLING
TON
DRIVE
HOGA
NRO
AD
MISSION AVENUE
RICH
ARDS
ONDR
IVE
SUNSET
BOULEVARD
AKIN S DRIVE
MCKENNEY AVENUE
FOREST
DRIVE
MEADOWVIEW DRIVE
RIEL DRIVE
CAMP
BELL
ROAD
DEER RIDGE DRIVE
VENE
SS R
OAD
HEBER
T ROAD
VILLENEUVE ROAD
BELLE
ROSE DRIV E
GIROUX ROAD
BOUDREAU ROAD
RAY GIBBON DRIVE
HE RITAGE
DRIVE
CARLETON
D RIVELAROSE DRIVE
25
27
244
12
26
53
39
36
8
9
4840
3633
10
20
18
41
13
1
2
29
22
1752
5
38
16
19
5557
47
49
31
43
14
37 46
63
58
50
54
44
66
11
30
60
28
56
67
EXHIBIT 6.2:AT GUIDE
PLAYGROUND ZONE AND AREA
RECOMMENDATIONS
Docu
ment:
G:\P
rojec
ts\15
000\1
5400
\1543
9_St
_Albe
rt_Sp
eed_
Limit_
Revie
w\02
_CAD
D\25
_GIS\
251_
Figure
s\154
39_E
xhibi
t_52_
Playg
round
_Zon
e_Re
cs_1
9112
8.mxd
1:55,0000 1 20.5
km City of St. AlbertRoad Unclassified
Recommended AreaRecommended Zone
¹
Credits:
CANA83-3TM114
MAP B.6:COMMENDED HOOL ZONES AND AREAS
¹
DA, USGS, AeroGRID, IGN, and the
NTIAL
:
ONE AND AREARECOMMENDATIONS
1 Alderwood_Park 35 Keenoshayo School
2 Alpine Park 36 Kensington Park
3 Amherst Park 37 Lacomb Lake Park
4 Arbor Park 38 Lafleur Park
5 Attwood Park 39 Langholm Park
6 Balmoral Park 40 Larkspur Park
7 Bellerose Park 41 Larose Park
8 Butterfield Park 42 Leo Nickerson School
9 Daulton Park 43 Liberton Park
10 Deer Ridge Park 44 Lions Park
11 Deerbourne Park 45 Lois E Hole School
12 Delage Park 46 Malamo Ave
13 Eldorado Park 47 Morgan Park
14 Ellesmere Park 48 Naples Park
15 Elmer S Gish School 49 Napoleon Park
16 Erin Ridge Diamond 50 Natalia Park
17 Erin Ridge Park 51 Neil Ross School
18 Erin Ridge Soccer 52 Oakmont Park
19 Fairview Field 53 Oakridge Park
20 Flagstone Park 54 Pineview Park
21 Forest Park 55 Poplar Park
22 Fountain Park 56 Princeton Park
23 Fowler Athletic Park 57 Red Willow Park
24 Glenmore Park 58 Reil Rec Park
25 Gloucester Park 59 Ronald Harvey
26 Gordon Tot Lot 60 Salisbury Park
27 Greer/Gillian Tot Lot 61 Sir Alexander MacKenzie School
28 Grosvenor Park 62 Sturgeon Heights School
29 Harwood Park 63 Ted Hole Park
30 Henderson Park 64 Vital Grandin School
31 Heritage Lakes 65 Wild Rose School
32 Hodgson Park 66 Willoughby Park
33 Ironwood Park 67 Woodlands Park
34 J.J. Nearing School

islengineering.com
November 2019
Transportation Network Speed Limit Review
City of St. Albert
FINAL REPORT
51
Schools and playgrounds are often located adjacent to one another. In these cases, one single zone
or area should be created in order to simplify the message for motorists. In general, if a school and
playground both require a zone, it is suggested that the whole segment become a playground zone to
provide coverage over a more extended period of time. The guide states that a school zone can be
considered to cover both the school and the playground if the playground utilization and access is
closely tied to the school operation. This can also be applied for schools that are near but not
adjacent to a playground. The same principal applies to near or adjacent schools as well as for areas.
If one facility requires a zone and the nearby facility requires an area, one zone should be provided
for both.
6.5.2 St. Albert Practices for Signing School and Playground Zones / Areas
The following observations were made on St. Albert’s current signage practices relating to school or
playground zones or areas:
• St. Albert currently uses the appropriate zone and area signage based on the MUTCDC.
• Additional signage and roadway treatments to demarcate a school zone appears to be based on
the adjacent roadway classification.
• For example, the school zone on Sir Winston Churchill Avenue has a flashing light that is active
during the times the speed reduction is in effect and a thick yellow SCHOOL pavement marking
whereas school zones on local roadways are typically demarcated by the required School Zone
sign.
• If there are two school zones nearby, the zone length is combined.
• The sign placement generally meets the minimum distance outlined in the Guide however; some
school zones come into effect well before the recommended distance from the property line or
much less, typically recognized to address school routes and pedestrian crossings. Examples of
type of sign placement include:
• Leo Nickerson Elementary School, 140 m east and over 200 m west of the school property line.
• Wild Rose Elementary School, 130 m south of the property line.
• Vital Grandin School, the school zone sign west of the school is less than 10 m from the start of
the property line.
• Some school zone signs within the City are placed at an intersection with no setbacks when a
setback is recommended in the guide. Examples of this include:
• Wild Rose Elementary School, the school zone signage on both sides is set back less than 10
meters from the intersection. As the zone is on an uncontrolled roadway, it is recommended that
the signage be placed 50 m away from the intersection to prevent breaking at the intersection.
• Bertha Kennedy Catholic Community School, similar to Wild Rose, the school zone sign is
placed with minimal setback from the uncontrolled leg of a T-intersection south out the school on
Larose Drive.
• JJ Nearing Catholic Elementary School, the school zone signage on Deer Ridge Drive is placed
less than 10 m from the far side of the intersection with Dubonnet Way.
• Elmer S. Gish School, the signage on Akins Drive north of the school is less than 10 m near side
from the intersection with Arbor Crescent.
• Vital Grandin Catholic School, signage on sunset boulevard, less than 10 m far side from the
intersection with Sheridan Drive.

52 Transportation Network Speed Limit Review
City of St. Albert
FINAL REPORT
Integrated Expertise.
Locally Delivered.
Note, the above lists of signage that does not comply with the AT Guide is not meant to contain
everything within St. Albert but is rather meant to illustrate that the signage practices do not always
align with the guide.
6.6 School and Playground Zone Proximity Review
As noted in Section 6.5.1, a school or playground’s proximity to another school or playground may
change the way the adjacent roadway is designated. The principals in this subject area
recommended by the AT guide were applied to the school and playground evaluation results as
follows:
• A roadway with a school zone adjacent to or near a playground zone is classified as a playground
zone.
• A roadway with a school area adjacent to or near a playground area is classified as a playground
zone.
• A school area adjacent to or near a school zone is classified as a school zone.
• A playground area adjacent to or near a school zone is classified as a school zone.
Applying the above criteria to the previous school and playground recommendations resulted in the
following:
• 7 roadway segments previously classified as school areas based on the AT Guide score become
school zones, including Paul Kane High School.
• 5 roadway segments become playground zones.
• 9 roadway segments previously classified as a school area based (on the AT Guide score) become
playground areas.
6.7 Regional Best Practices
City of Edmonton
The City of Edmonton has undertaken several reviews of their playground and school zone practices.
School zones were introduced near elementary schools in City of Edmonton in September 2014. The
zones were in effect from 8:00 a.m. to 4:30 p.m. on school days and required a speed reduction to 30
km/h within the zones. City council approved the expansion of the school zones to include junior high
grades in May 2017 and this came into effect in September 2017.
Up until 2017, the City of Edmonton did not have playground zones; however, studies were underway
to determine the need and potential implementation of playground zones. One key factor in the study
was the times in which a 30 km/h speed would be required. This is the result of the city’s commitment
to Vision Zero, which outlines the long-term goal of zero fatalities and serious injuries from motor
vehicle collisions. An important component of Vision Zero is the adoption of the Safe Systems
Approach, a holistic approach to improve traffic safety which pays particular attention to children’s
safety, as children are more vulnerable due to their inability to judge vehicular approach speeds as
well as adults.

islengineering.com
November 2019
Transportation Network Speed Limit Review
City of St. Albert
FINAL REPORT
53
A report was presented at the June 8, 2017 City of Edmonton Community and Public Services
Committee to report on playground speed limits within the City of Edmonton and prepare
recommendations. Included within the report is a summary of a survey asking members of the public
about speed limits around playgrounds. Eighty-five (85) percent of the responses indicated that they
would be in favour of extending the hours playground speed limits should be in place at playgrounds
adjacent to schools. Additionally, eighty-four (84) percent of respondents indicated they would be in
favour of a single speed-limit zone including both schools and playgrounds with the extended hours of
a playground zone. In summary, Edmonton residents showed significant support for the
implementation of playground zone speed limits for those attached to schools.
In September 2017, the City of Edmonton approved the conversion of all school zones into
playground zones effective from 7:30 a.m. to 9:00 p.m.
Since then, 150 standalone playground zones were installed, and 242 school zones were converted
into playground zones.
Edmonton reports presented to council relating to school and playground zones are provided in
Appendix D.
City of Calgary
The City of Calgary opted to convert their school zones to playground zones in August 2015. The
playground zones are in effect from 7:30 a.m. to 9:00 p.m. year round. The shift was motivated by a
desire to increase safety and make reduced speed limit areas easier to understand.
In 2017, the University of Calgary conducted a study to determine the effects of consolidating all
school zones into playground zones. The study found that the mean speed through playground zones
decreased from 36 km/h to 30 km/h. An increase in speed compliance was also noted, except in
school zones from 6:00 p.m. to 9:00 p.m. where it was determined that while the compliance
decreased by 5%, the average speeds decreased from 45 km/h to 32 km/h. This indicates that most
drivers were aware of the time changes and adhering to the new zone timing. The number of
collisions involving pedestrians within school and playground zones decreased by 70% between
5:30 p.m. and 9:00 p.m. with an overall decrease of 33%. The collision rate also decreased form
0.049 collisions per million vehicle kilometers to 0.011per year.
The study also completed a survey of citizens and found that the majority of residents were aware
and knew the exact start and end times for playground zones. More than 80% of respondents
indicated they find it easier to remember the zone times with a single type of zone that remains
consistent year-round.
6.8 Schools as Playground Zones Evaluation
Roadways adjacent to elementary and junior high schools were evaluated using the AT Playground
Zone worksheet as well as the AT School Zone worksheet. This was performed to determine if any
roadways adjacent to schools qualify for a playground zone based on AT’s evaluation framework. The
results of the school playground evaluations are summarized in the table below.

54 Transportation Network Speed Limit Review
City of St. Albert
FINAL REPORT
Integrated Expertise.
Locally Delivered.
Table 6.11: School Playground Zone Evaluation Results (Applying AT Playground Zone)
AT Playground Zone Worksheet Score
Elementary School Total Number
(Within score range)
Junior High School Total Number
(Within score range)
Playground Zone Warranted (min. 81 score)
>80 1 0 Yes
80 3 0 No
70-79 13 0 No
60-69 4 0 No
<59 1 8 No
Total 22 8 1 of 30
Based on the results above, only one roadway segment, Deer Ridge Drive in front of J.J. Nearing
Elementary School, qualifies as a playground zone using AT’s Playground Zone Guidelines.
Conversely, all of the roadways evaluated qualified as school zones using AT’s school zone
guidelines. This discrepancy is primarily due to the differences between the playground and school
zone results matrix.
A roadway is recommended as a school zone with a worksheet score between 81 and 100 inclusive
and may be designated as a school zone or area with a score between 65 and 80 inclusive based on
the evaluator’s discretion.
Playground zones are only recommended in the AT Guide with a score of 81 to 100 inclusive and are
therefore much less likely to be recommended than a school zone. It is noted that three of the
roadways evaluated received a score of 80, one point away from meriting a playground zone
classification according to the AT guide. These three roadways are the following:
• Gainsborough Avenue adjacent to Albert Lacombe Elementary School
• Mission Avenue adjacent to École Father Jan Elementary School
• Grenfell Avenue adjacent to Wild Rose Elementary School
Generally, the worksheet scores for individual inputs are the same when evaluating the potential for
school zones and playground zones; however, the point value assigned to the property line
separation and entrance often differ between the two. While the property line separation input for
School Zones is based on the distance from the school’s property line to the roadway being
evaluated, for playground evaluations it is based on the distance between the playground equipment
and the roadway. School playgrounds are typically over 50 metres from the roadway as they are often
located behind the school, resulting in a score of zero out of a possible ten for the property line
separation. The location of the playground has a similar effect on the potential five points for the
playground entrance, as it is stated in the guide that playgrounds situated behind a school that can
only be accessed from the school can be said to have no entrance from any of the surrounding
roadways.

islengineering.com
November 2019
Transportation Network Speed Limit Review
City of St. Albert
FINAL REPORT
55
6.8.1 Discussion of Playground Zone Guidelines for Schools
The potential for pedestrian-vehicle collisions is much higher at a school than a separate playground
as the play equipment typically has a significantly higher capacity. The AT Playground Zone
worksheet requires a score of 81 or higher for recommending a playground zone, but application of a
Playground Zone at a school should use the same threshold of 65 used for a school zone. In addition,
focusing only on playground equipment at schools ignores that the school building and grounds are
typically the primary access point for children destined to the play equipment.
The distance from the roadway and the school property line has been used to reflect the probability of
high numbers of vulnerable users accessing the playground from the school entrance.
Roadways adjacent to Elementary and Junior High Schools have been reevaluated using the AT
Playground Zone worksheet with the lower threshold of 65 and treating school buildings as the
playgrounds. The results are illustrated in the following table.
Table 6.12: School Playground Zone Evaluation Results (Applying AT Playground Zone)
AT Playground Zone Worksheet Score
Elementary School Total Number
(Within score range)
Junior High School Total Number
(Within score range)
Playground Zone Warranted
(min. 65 score)
>80 10 0 Yes
71-80 10 0 Yes
65-70 2 0 Yes
<65 0 8 No
Total 22 8 22 of 30
Modifying the playground zone evaluation criteria for school sites results in all elementary schools
warranting playground zones. None of the junior high schools met the lowered threshold for a
playground zone. These results indicate that while it may reasonable to classify all roadways adjacent
to elementary schools as playground zones, it is not advisable to extend this to junior high schools.
The lower total scores for junior high schools are primarily due to the lack of playground equipment,
resulting in a playground capacity score of eight out of a possible 40.
Based on the discussion above, it is reasonable to classify all elementary schools as playground
zones to protect vulnerable users for an extended period of time. Junior High schools are
recommended to remain school zones rather than playground zones.
6.8.2 Time of Day Consideration
Recent changes to the Alberta Traffic Safety Act allow municipalities to now set their own times
playground zone are in effect. Previously, the Act dictated that drivers in playground zones must slow
down to 30 kilometers per hour between 8:30 am and one hour after sunset. A common area of
debate surrounding the utilization of school and playground zones is the time in which the reduced
speed applies and the likelihood for children to be at risk outside of the zone times. Playground zones
apply every day of the week and all days of the year and their hours of effectiveness and the potential
of changing school zones to playground zones requires thoughtful consideration.

56 Transportation Network Speed Limit Review
City of St. Albert
FINAL REPORT
Integrated Expertise.
Locally Delivered.
The City of St. Albert has provided a table correlating collisions that occur in playground and school
zones with the time they occur, as seen below.
Figure 6.1: School and Playground Collisions by Time Interval
The following observations may be made based on the chart above:
1. Collisions occur most frequently in school zones within the typical periods of higher congestion –
times aligned to student pick up and drop off.
2. The third most frequent collision occurrence shown in the chart is within a school zone from 5:00
PM to 6:00 PM, outside of existing School Zone hours.
a. While this may be correlated to a general increase of collisions during this time due to home-
bound traffic, the data indicates that this time interval has a high probability of collisions. This
could indicate that students or children utilizing the schools or grounds for after school activities
or sporting events may face a similar risk to that of the pick-up and drop-off times.
• This supports extended school zone times or a transition from school zones to playground
zones, which have longer hours of effect.
3. A number of collisions occur within School Zones on the weekend, which is why a school zone
and school zone time bar occurs within the same time intervals. The collision frequency during
non-school days between 12:00 PM and 3:00 PM
• This also supports the transition from school zones to playground zones.
4. Collisions are far more frequent within School Zones than Playground Zones. This may be due to
the tendency to situate schools on roadways with higher roadway classifications while playgrounds
are often situated on local roadways.
Video surveillance data at playgrounds on school grounds and parks was collected from nine schools
and three parks. Each location was surveilled for three consecutive days in October 2019, on
Thursday, Friday, and Saturday. The number of children using the playground equipment was
recorded to inform on the times of day the facilities are utilized. As the number of schools and parks
observed is unequal, the average number of children using playground equipment per hour was used
and is summarized in the following graphs.
00:00-00:59
01:00-01:59
02:00-02:59
03:00-03:59
04:00-04:59
05:00-05:59
07:00-07:59
08:00-08:59
09:00-09:59
10:00-10:59
11:00-11:59
12:00-12:59
13:00-13:59
14:00-14:59
15:00-15:59
16:00-16:59
17:00-17:59
18:00-18:59
19:00-19:59
20:00-20:59
21:00-21:59
22:00-22:59
23:00-23:59
Playground Zone 0 0 0 0 0 0 1 1 0 0 1 1 1 1 0 2 1 2 0 1 1 0 2
School Zone 3 1 3 1 3 2 7 5 1 1 1 6 4 2 4 7 16 6 4 2 2 6 5
School Zone Times 0 0 0 0 0 0 0 17 7 2 1 9 5 9 17 0 0 0 0 0 0 0 0
02468
1012141618
Co
llisi
on
Fre
qu
ency
School and Playground Zone Collisions by Time Interval

islengineering.com
November 2019
Transportation Network Speed Limit Review
City of St. Albert
FINAL REPORT
57
Figure 6.2: Playground Activity - Thursday
Figure 6.3: Playground Activity - Friday
0102030405060708090
1005
:00
AM
- 6
:00
AM
6:0
0 A
M-
7:0
0 A
M
7:0
0 A
M-
8:0
0 A
M
8:0
0 A
M-
9:0
0 A
M
9:0
0 A
M-
10
:00
AM
10
:00
AM
- 1
1:0
0 A
M
11
:00
AM
- 1
2:0
0 P
M
12
:00
PM
- 1
:00
PM
1:0
0 P
M-
2:0
0 P
M
2:0
0 P
M-
3:0
0 P
M
3:0
0 P
M-
4:0
0 P
M
4:0
0 P
M-
5:0
0 P
M
5:0
0 P
M-
6:0
0 P
M
6:0
0 P
M-
7:0
0 P
M
7:0
0 P
M-
8:0
0 P
M
8:0
0 P
M-
9:0
0 P
M
9:0
0 P
M-
10
:00
PM
Nu
mb
er o
f C
hild
ren
Time Intervals
Average Playground Activity - Thursday
School
Parks
0
10
20
30
40
50
60
70
80
90
100
5:0
0 A
M-
6:0
0 A
M
6:0
0 A
M-
7:0
0 A
M
7:0
0 A
M-
8:0
0 A
M
8:0
0 A
M-
9:0
0 A
M
9:0
0 A
M-
10
:00
AM
10
:00
AM
- 1
1:0
0 A
M
11
:00
AM
- 1
2:0
0 P
M
12
:00
PM
- 1
:00
PM
1:0
0 P
M-
2:0
0 P
M
2:0
0 P
M-
3:0
0 P
M
3:0
0 P
M-
4:0
0 P
M
4:0
0 P
M-
5:0
0 P
M
5:0
0 P
M-
6:0
0 P
M
6:0
0 P
M-
7:0
0 P
M
7:0
0 P
M-
8:0
0 P
M
8:0
0 P
M-
9:0
0 P
M
9:0
0 P
M-
10
:00
PM
Nu
mb
er o
f C
hild
ren
Time Intervals
Average Playground Activity - Friday
School
Parks

58 Transportation Network Speed Limit Review
City of St. Albert
FINAL REPORT
Integrated Expertise.
Locally Delivered.
Figure 6.4: Playground Activity - Saturday
Based on the three graphs above, it appears that children are most active on playground equipment
on school grounds, even on Saturdays. During school days, children were observed using play
equipment from 7:00 AM to 8:00 PM. The playground equipment was most used between 8:00 AM
and 4:00 PM, the current school zone hours in effect in St. Albert; however, there is also notable
activity between 4:00 PM and 5:00 PM. On Saturdays, children were observed on play equipment
between 9:00 AM to 9:00 PM. Playground usage can be seen increasing from 9:00 AM to peak
between 3:00 PM and 5:00 PM on Saturdays. The playground activity data was collected in October,
a traditionally cooler month. Increased and later playground activity is expected in the spring or
summer. Activity was primarily observed on school grounds rather than parks on Saturday as well.
The higher playground usage on school grounds as opposed to parks may be due to the higher
capacity of the facilities. Generally, playgrounds intended for school use are larger as they must
accommodate large amounts of students during breaks (recess). This combined with the tendency to
have more modern and varied equipment on school grounds may make school playgrounds more
attractive to users. School playgrounds may also be a convenient meeting location for play sessions
outside of school hours as many children’s friends are made at school and are likely to all live nearby.
The data used for this discussion was collected in October 2019 when the weather is cooler, and
children may be less likely to play outside. While data collected in warmer months would likely
capture increased playground equipment, the fact that children were observed playing outside on the
equipment in October is sufficient to indicate that playground equipment on school grounds are used
outside of St. Albert’s 8:00 a.m. to 4:00 p.m. school zone times. In fact, this data may be considered
as a conservative estimate of playground usage in St. Albert. Additional playground surveillance
during warmer months may be conducted to confirm this assumption.
0102030405060708090
100
5:0
0 A
M-
6:0
0 A
M
6:0
0 A
M-
7:0
0 A
M
7:0
0 A
M-
8:0
0 A
M
8:0
0 A
M-
9:0
0 A
M
9:0
0 A
M-
10
:00
AM
10
:00
AM
- 1
1:0
0 A
M
11
:00
AM
- 1
2:0
0 P
M
12
:00
PM
- 1
:00
PM
1:0
0 P
M-
2:0
0 P
M
2:0
0 P
M-
3:0
0 P
M
3:0
0 P
M-
4:0
0 P
M
4:0
0 P
M-
5:0
0 P
M
5:0
0 P
M-
6:0
0 P
M
6:0
0 P
M-
7:0
0 P
M
7:0
0 P
M-
8:0
0 P
M
8:0
0 P
M-
9:0
0 P
M
9:0
0 P
M-
10
:00
PM
Nu
mb
er o
f C
hild
ren
Time Intervals
Average Playground Activity - Saturday
School
Parks

islengineering.com
November 2019
Transportation Network Speed Limit Review
City of St. Albert
FINAL REPORT
59
6.8.3 Playground Zone Application to Schools Summary
The following summarizes the findings for assessing school zones as playground zones.
• AT Playground Zone Worksheet Results: The results of direct application of the AT guide for
playground zones at school zones found that one of 30 schools are recommended as a playground
zone.
• This result reflects the higher score threshold for a playground zone, which is 81 compared to a
school zone which is 65.
• Separation of playground equipment from the roadway is higher at schools than at playgrounds
resulting in lower scores for the property line separation component of the AT guide.
• Considering the two main factors impacting the standard approach for evaluating playground
zones, changing the criteria and applying the same threshold for a school zone (65) and treating
school buildings as playground equipment results in 22 of the schools recommended a
playground zone.
• None of the eight junior high schools warranted a playground zone using the new criteria and
lowered threshold. Considering this, none of the junior high schools are recommended to be
converted into playground zones.
• Time of Day Considerations:
• The collision data indicated that a significant number of collisions occur at school zones outside
of the hours of effect.
• The playground usage data indicates that playgrounds on school grounds are much more
utilized than standalone playgrounds, even outside of school hours.
• Considering the collision data and observed usage of playground equipment, playground zone
hours of effectiveness are recommended between 8:00 AM and 8:00 PM.
• Additional data collection may be performed to confirm this assumption; however, this is
consistent with other municipalities.

60 Transportation Network Speed Limit Review
City of St. Albert
FINAL REPORT
Integrated Expertise.
Locally Delivered.
6.9 School Zone and Playground Zone Summary
This chapter compared the City’s current zones and areas with the recommendations based on the
evaluation process outlines in the AT Guidelines, explored whether the current school zones meet the
Guidelines for application of playground zones, and discussed the time of day application for
playground and school zones. This section’s conclusions are provided below
1. AT Guidelines for school zones and playground zones review
• It was determined that the City’s current practices for designating school zones is consistent with
what is recommended using the AT guidelines, while there was significant variation between
number of playground zones and areas recommended using the AT guidelines and those
currently signed.
• A review of the zone and area signing practices indicated that sign placement does not always
align with the AT guidelines.
2. School Zone consolidation to playground zone review
• Only the portion of Deer Ridge Drive adjacent to J.J. Nearing Elementary School is warranted as
a playground zone; however, it is noted that three other roadways were only one point away
from being warranted.
• Modifying the threshold for playground zones to 65 (consistent with School Zones) and the
property line separation criteria, all 22 of the elementary school zones warrant playground
zones.
• Playground zones are not recommended for junior high schools.
• A review of the City of Edmonton’s and the City of Calgary’s recent transition from School Zones
to playground Zones indicated potential safety and compliance benefits to consolidating zones.
3. School zone and playground zone time of day review
• A review of the collision data at school or playground zones indicated that collisions occur
relatively frequently outside of school zone hours, generally occurring most frequently between
7:00 AM and 6:00 PM
• A review of the playground usage data revealed that play equipment is used between 7:00 AM
and 9:00 PM even during the cooler months.
• Playground zone times between 8:00 AM and 8:00 PM are recommended based on the collision
and playground usage data.
• School zone times between 7:00 AM and 5:00 PM are recommended based on the collision
data.

islengineering.com
November 2019
Transportation Network Speed Limit Review
City of St. Albert
FINAL REPORT
61
7.0 Safe Systems Review
7.1 Background Information
According to the Methods and Practices for Setting Speed Limits: An Information Report, prepared by
FHWA (Federal Highway Administration, US Department of Transportation) and ITE (Institute of
Transportation Engineers) in 2012, there are four general approaches to setting speed limits:
• Engineering approach;
• Expert system approach;
• Optimization; and
• Safe system approach or injury minimization.
For the definition from the FHWA report, the Safe System Approach emphasizes that some degree of
roadway user error will occur, and that such errors should not result in a fatality or serious injury.
Speed limits are set according to the crash types that are likely to occur, the impact forces that result,
and the human body’s tolerance to withstand these forces. Therefore, the primary concept is the
safety of all road users, including pedestrians and cyclists that are more vulnerable to injury and
death when hit by a vehicle with relatively high speed. Consequently, the Safe System Approach
usually results in lower speed limits than those that would be determined by other approaches, such
as Engineering and Expert System Approaches.
Currently, some countries, such as Sweden, Netherlands, and New Zealand, have applied the Safe
System Approach or Vision Zero Approach to setting the speed limits. The Swedish Safe Systems
Approach states that “human life and health are paramount and take priority over mobility and other
objectives of the road traffic system.” Dutch Sustainable Safety Vision considered “necessary to
achieve sustainably safe road traffic, and the principles are based on scientific theories and research
methods arising from disciplines including psychology, biomechanics and traffic engineering”.
According to the New Zealand Safer Journeys, “the safe system approach aims for a more forgiving
road system that takes human fallibility and vulnerability into account. Under a Safe System, we
design the whole transport system to protect people from death and serious injury.”
Safe System Approach may include development of traffic calming measures (e.g. curb extensions),
physical separation of roadway users (e.g. multi-use pathway), and treatments that enhance visibility
of vulnerable users to give drivers greater reaction time (e.g. pavement markings and road signs). It is
expected that as Safe System Approach requires a holistic planning of the roads, and interconnected
factors provide optimal safety to strengthen protection of vulnerable users, the safe system is an ideal
approach for many urban roads.
Compared to other approaches, the data collection requirements for the Safe Systems Approach
requires very little data collection since it is based on very basic road design parameters (e.g. number
and frequency of accesses, presence of a raised median, etc.) and general traffic characteristics (e.g.
type and frequency of road users). The data collection effort is relatively minor. Under the Safe
Systems Approach to setting the speed limit, the critical factor is the type of collisions that can be
expected to occur given the physical features of the road, and the types of road users that are
expected to be encountered. The collision types and patterns for different road types and survivability
rates for different operating speeds are the major data requirements to develop the speed limits.

62 Transportation Network Speed Limit Review
City of St. Albert
FINAL REPORT
Integrated Expertise.
Locally Delivered.
7.2 Applying Safe Systems
The application of a Safe Systems Approach to reviewing and establishing speed limits in an urban
area, as previously noted, can be very different from traditional engineering methodologies. Many
traditional applications of heuristic methodologies look at the safety afforded to the driver and
passengers of a motorized vehicle and evaluated the safe speed for the vehicle based on the risks to
the occupants. Conversely, a Safe Systems Approach prioritizes the safety of vulnerable road users
(pedestrians and cyclists) much higher than the operational factors of a road network, or the travel
time for motorists. As such, the application of a Safe Systems Approach to setting speed limits can be
accommodated more from a policy perspective than an engineering perspective.
In considering the City of St. Albert, the existing road network, the existing speed limits and any
potential changes that may be appropriate from a Safe Systems perspective, it is possible to consider
and assess the implications of the following policy approaches:
• Assessing vulnerable user presence related to land use.
• Assessing vulnerable user presence and location related to road type.
• Setting speed limits related to land use and road type.
Within the City of St. Albert Complete Streets Guidelines, all the City’s land uses are classified as
either commercial, residential or employment and are allocated to the roadway typologies of
Boulevard, Crosstown, Connector, Neighbourhood, Local and Lanes. As the linkages between land
use, transportation, and safety are inextricably interconnected, it is difficult, if not impossible, to
address the setting of speed limits based on one of these factors independently. However, it is
possible to apply a Safe Systems Approach to the Complete Streets hierarchy and address
appropriate speed limits that could be applied given the associated land uses, roadway contexts and
probable presence of vulnerable road users.
The recommendations included in this section of the report are based solely on the Safe Systems
Approach and do not necessarily represent the final recommendation.
7.2.1 Setting Target Speeds Related to Land Use and Roadway Typology
This section of the report outlines how each of the Safe Systems Approaches could be applied to
each of the 13 different land use/roadway typologies as defined by the City of St. Albert Complete
Streets Guidelines (2018). These roadway typologies have been used in this section to assist in the
identification and classification of St. Albert’s roadways in an ordered manner to ensure that all City
roadways and road types have been reviewed and assessed within a Safe Systems Approach. For
reference, Figure 7.1 below shows the St. Albert Typology Street Network as presented within the
Complete Streets Guidelines. This map is included herein as a reference to assist with evaluation and
correlation of street type with recommended speeds.

islengineering.com
November 2019
Transportation Network Speed Limit Review
City of St. Albert
FINAL REPORT
63
Figure 7.1: St. Albert Typology Street Map (St. Albert Complete Streets Guidelines, August 2018)
Boulevards
Within the Complete Streets Guidelines, Boulevards are defined as regional roadways that support
the Edmonton Metropolitan Region, serving local and regional travel, often accommodating transit,
providing commercial and large load movement. These roadways are unique in both character and
function and have traditionally been defined as either highways, freeways or expressways.
The only two Boulevards in St. Albert are St. Albert Trail and Ray Gibbon Drive, both of which vary in
cross section, land use and access conditions as they traverse through the City in a north-south
manner. The Complete Streets Guidelines note that traffic volumes and access frequencies should
determine the speed limit. From a Safe Systems perspective, addressing the speed limits on these
roads must consider the land use, cross section, traffic volumes, and number of lanes and presence
of vulnerable users.
For St. Albert Trail, a Safe Systems Approach could consider revisiting the current speed limit of north
St. Albert Trail from 80 km/h to 70 km/h as a means for reducing the speed differential from vehicles
transitioning from highway speeds as they enter the urban area of St. Albert from the rural area to the
north. The current speed limit for the majority of the remainder of St. Albert Trail from the South City
limit to 500 m south of the North City Limit may already fit within the safe systems perspective. It is
already posted at 60 km/h, is divided, has limited direct accesses and has separated pedestrian
walkways.

64 Transportation Network Speed Limit Review
City of St. Albert
FINAL REPORT
Integrated Expertise.
Locally Delivered.
The exception is the segment of St. Albert Trail in the central commercial section of the City from
south of Sturgeon Road to McKenney Avenue/Bellerose Drive where the sidewalk is immediate
adjacent to the travel lanes on St. Albert Trail without boulevard separation. Consideration could be
given to a speed reduction to 50 km/h in this section of St. Albert Trail as there is a higher probability
of a collision with a pedestrian or cyclist due to the reduced offset to the designated facilities.
The current speed limit for Ray Gibbon Drive is 70 km/h from the south City limit to Villeneuve Road.
With most of the roadway being 2-lane undivided and rural in nature, a contextual review of this road
suggests that the current speed limit fits within the Safe Systems perspective.
Crosstowns
Within the Complete Streets Guidelines, crosstowns are defined as major streets that allow users to
travel across the city without changing corridors. These streets enable higher speed movements and
accommodate transit and larger heavy vehicles (designated as truck routes). The Complete Streets
Guidelines note that possible speed limits for these roadways could be within the 50km/h - 60km/h
range.
The design guidelines note that crosstowns would all be divided roadways and have separated cycle
facilities (bike lines) and separated pedestrian sidewalks. It is also noted that the Commercial
Crosstown can also be designed to accommodate on-street parking. However, in correlating the
guidelines to the existing developed 10 Crosstown roadways within St. Albert, it is noted that not all of
the roadways comply with the guidelines. In addition, all of the Crosstowns are also located within or
adjacent to residential areas, with limited exceptions of Campbell Road and Sir Winston Churchill
Avenue having residential on one side and employment on the other. In addition, all of the crosstowns
that connect to St. Albert Trail have a portion of their route through commercially developed areas.
• Gervais Road, predominantly residential, commercial near St. Albert Trail, some stop controlled
accesses and pedestrian crossings, posted at 50 km/h.
• Hebert Road, predominantly residential, commercial near St. Albert Trail, employment east of
Campbell road, some stop controlled accesses and pedestrian crossings, posted at 60km/h.
• Sir Winston Churchill Avenue, predominantly residential, commercial near St. Albert Trail, some
stop controlled accesses and pedestrian crossings, posted at 50 km/h.
• Campbell Road, residential to the west, employment to the east, some stop controlled accesses
and pedestrian crossings, posted at 60 km/h.
• Boudreau Road, predominantly residential, commercial near St. Albert Trail, predominantly signal
controlled accesses and pedestrian crossings, hospital, posted at 60 km/h.
• Bellerose Drive, predominantly residential, commercial near St. Albert Trail, some stop controlled
accesses and pedestrian crossings, posted at 50 km/h.
• McKenney Avenue, predominantly residential, commercial near St. Albert Trail, some stop
controlled accesses and pedestrian crossings, posted at 50 km/k from 200 m west of CN to St.
Albert Trail and 60 km/h from 200 m west of CN to the west City Limits.
• Giroux Road, predominantly residential, commercial near St. Albert Trail, some stop controlled
accesses and pedestrian crossings, posted at 60 km/h.
• Neil Ross Road, still developing, 6 lanes, near commercial land uses, posted at 60 km/h.
• Fowler Way, future crosstown, predominantly residential, speed limit to be determined.

islengineering.com
November 2019
Transportation Network Speed Limit Review
City of St. Albert
FINAL REPORT
65
In considering the existing nature of the network, the existing speed limits on all of the crosstown
corridors, layering a Safe Systems Approach to the crosstowns would be consistent with the
Complete Streets Guidelines by providing consistency across the City; a recommendation could be
considered to standardize the speed limits. As all of the crosstowns travel through or adjacent to
residential areas, have pedestrian and cycling facilities as part of the active transportation network,
Safe Systems would recommend a common speed of 50 km/h. Given that there are existing
residential land uses, stop controlled accesses and pedestrian crossing on the Crosstowns, a Safe
Systems Approach would provide for vulnerable users first and vehicle mobility second. Examples of
impact would be speed limit reductions on Hebert Road, Campbell Road, and Giroux Road, as these
corridors traverse though predominantly residential areas with a higher proportion of vulnerable
users.
Connectors
Within the Complete Streets Guidelines Connectors are defined as major streets that connect
crosstowns together. Many of the Connector streets are undivided, and most are adjacent to
Residential and Commercial areas with the exception of Corriveau Avenue and Venesse Road in the
Campbell Industrial area. Connectors enable the provision of transit and can accommodate have
vehicles. The Complete Streets Guidelines notes that speed limits for connectors could be 50km/h,
which would align with a safe system approach.
It is worth noting that there are a limited number of Connectors within St. Albert and that the posted
speed limits currently vary among them.
• Hogan Road, Dawson Road, Riel Drive, Gate Avenue, Sturgeon Road, Cunningham Road, and
Poirier Avenue are all posted at 50 km/h.
• Grandin Road, 40 km/h in Downtown and 50 km/h south of Glenview Crescent.
• St. Anne Street and Perron Street in downtown, are both posted at 40 km/h.
• Levasseur Road and Villeneuve Road are posted at 60 km/h.
• Corriveau Avenue and Venesse Road in Campbell Industrial are posted at 50 km/h and 60 km/h
respectively.
In applying a Safe Systems Approach to the review of Connectors, the presence of vulnerable users
along these corridors should be considered as well as the context of the corridors themselves. This
approach would recommend lower speed limits in areas when higher proportions of pedestrian would
be present. As all of the Connector roadways with the downtown already have a lower 40km/h speed
limit, a contextual review of this road suggests that the posted speed limit may not need to be altered
and that the current speed limit fits within the Safe Systems perspective.
For the remaining roadway, a Safe Systems Approach that places higher priority on vulnerable users
would suggest that the lower speed limit would be appropriate. Given that the connectors have limited
direct access to parcels as most land use is read facing or flanking the connectors, the level of
pedestrian interaction along these roadways would be expected to be lower than in the downtown
areas. As such, for the majority of the corridors with a posted 50km/h speed limit a contextual review
of this road suggests that the posted speed limit may not need to be altered and that the current
speed limit fits within the Safe Systems perspective.

66 Transportation Network Speed Limit Review
City of St. Albert
FINAL REPORT
Integrated Expertise.
Locally Delivered.
However, as noted, there are three exceptions within the Connector typology that deserve addressing
outside of the general corridors. As the context of these corridors Levasseur Road, Villeneuve Road
and Venesse Road with wide rights of way along straight alignments varies significantly from all other
Connectors, a uniform approach may not be feasible. Given the historic grid line nature of, these
three corridors, although a lower speed limit of 50 km/h may be considered desirable from in a Safe
Systems Approach, the application of this lower limit on these roadways may not be practical. Given
the existing nature of the corridors, a re-designation of the speed limit may not be effective without
enforcement and physical changes to the roadways that que drivers to the need to a lower operating
speed. As such, consideration could be given to leaving the speed limit on these three connector
corridors at 60 km/h.
Neighbourhoods
Within the Complete Streets Guidelines Neighbourhoods are defined as minor streets that provide
direct access to street-fronting commercial and mixed-use developments as well as residential
developments. Neighbourhood streets are capable of accommodating transit and were traditionally
known as collector streets. The guidelines note that the Neighbourhoods would also accommodate on
street parking as well as one street cycling. The Complete Streets Guidelines notes that possible
speed limits for these roadways could be within the 30km/h-50km/h range.
With respect to the neighbourhood residential roadways, based on review of the Complete Streets
road network, this classification of roadway would have the largest proportion of all of the
Neighbourhood roadways. As the name in and of itself suggests, these roadways are both found and
located within residential neighbourhoods. Many of the existing Neighbourhood roadways would
conversely fall under the general 50km/h unless otherwise posted designation for speed limit, with the
exceptions of Neighbourhoods in the communities of Erin Ridge, Erin Ridge North and Lacombe Park
where the Neighbourhoods are posted at 40km/h.
With respect to the Neighbourhood Commercial and Neighbourhood Employment Roadways, these
roadways are often found and located at the entrances/exits to communities and form a portion of the
length of the overall Neighbourhood roadway. As transitional segments of roadway, the integration of
these segments to the residential segments is managed through the consistent application of cross
section.
As all of the Neighbourhood Roadways are located within communities, provide direct access to
parcels, accommodate transit, accommodate on-street cycling as well as pedestrians, the probability
of vulnerable user interaction with vehicles along these roadways would be higher than on
Crosstowns or Connectors. As places and spaces where pedestrians are anticipated to be on a
frequent basis a Safe Systems Approach would favour the safety provisions to pedestrians and
cyclists over traditional operating speeds of these roadways. While the level of pedestrian and cyclist
activity on these roadways in anticipated to be higher, it is not anticipated to be as high as on Local
Streets when considering vulnerable user/vehicle proportionality. As such, a speed limit of 40 km/h for
neighbourhood roadways would be considered appropriate from a safe systems perspective given the
context of these roadways.

islengineering.com
November 2019
Transportation Network Speed Limit Review
City of St. Albert
FINAL REPORT
67
Locals
Within the Complete Streets Guidelines Locals are defined as minor streets that provide direct access
from the front of a residential or employment developments with probable speed limits of 20km/h-
30km/h. These streets do not accommodate separate cycling facilities, nor do they accommodate
transit. Based on the land uses, these streets have a higher proportion of vulnerable users of all ages.
This street type also makes up the largest proportion of roads within St. Albert (by both number roads
and overall linear length of roadways). Currently most of the local roads within St. Albert classified as
Locals would fall under the blanket speed limit designation of 50 km/h (unless otherwise posted).
Much of the global movement related to safe systems and Vision Zero has often been focused on
local streets, as the streets where people live and play and where the highest probability of a
vulnerable user collision can occur, due in part to a higher proportion of pedestrians and cyclists.
From a safe Systems perspective, a speed limit of 50 km/h on any roadway with a high proportion of
vulnerable users would be considered unacceptable due to the greater impacts to vulnerable users
involved in collisions with a vehicle travelling at 50 km/h. As noted in Section 3 of this report, the
impacts to a vulnerable user involved in a collision with a vehicle traveling at 50 km/h would be
analogous to the impacts from a fall form a 3rd story balcony whereas the impacts to a vulnerable user
involved in a collision with a vehicle traveling at 30 km/h would be analogous to the impacts from a
fall form a 1st story balcony.
To address these aspects and the material presented within the Complete Streets, it is understood
that a Safe Systems Approach to speed limits on Locals would be to recommend a 30 km/h speed
limit. It is noted that some jurisdictions have implemented or are considering implementing this level
speed limit change.
• Montreal, implemented city wide.
• Toronto, implemented by ward.
• Vancouver, pilot project underway.
• Winnipeg, being considered.
• Edmonton, being considered.
• Calgary, and being considered.
• Saskatoon being considered.
Lanes
Within the Complete Streets Guidelines Lanes are defined as streets that provided rear access to
commercial, employment and residential developments with probable speed limits of <20 km/h. While
serving differing land uses, the general function of Lanes can be considered uniformly with a high
probability of the presence of vulnerable users.
Given the narrow nature of lanes (6-7 m or right of way with 4-6 m of driving surface), the shared
nature of the environment and the lack of separate facilities for pedestrians a very low speed would
be appropriate for Lanes. In addition, direct pedestrian access from buildings and fenced yards can
create conflicts that would be mitigatable with lower speed operating environments. In recognition of
short block lengths and complex nature of Lanes, a Safe Systems Approach would suggest that a
reduction of current speed limit from 20 km/h to a speed limit <20 km/h would be appropriate. This
change would be consistent with the recommendations with the City’s Complete Streets Guideline
and would be consistent with other municipal jurisdictions.

68 Transportation Network Speed Limit Review
City of St. Albert
FINAL REPORT
Integrated Expertise.
Locally Delivered.
As such, a 15 km/h speed limit for lanes is recommended for Lanes. This change has a limited impact
on travel time (6s increase over a moderate 100 m long Lane), but a large increase due to the safety
33% speed reduction.

islengineering.com
November 2019
Transportation Network Speed Limit Review
City of St. Albert
FINAL REPORT
69
8.0 Preliminary Speed Limit Recommendations
The following recommendations are made for each of the road typologies from the Complete Streets
Guidelines, by combining recommendations from the four areas studied, including the application of
the CGEPSL, Local Roadway Reviews, application of the AT Guide for Playground and School Zones
and Areas and application of Safe Systems.
Note: The preliminary speed limits are provided for discussion only. Final speed limit
recommendations are illustrated in Section 10.0, based on discussions and feedback from
stakeholders.
8.1 Boulevard Roadways
Boulevards are defined as regional roadways that support the Edmonton Metropolitan Region,
serving local and regional travel, often accommodating transit, providing commercial and large load
movement. The only two Boulevards in St. Albert are St. Albert Trail and Ray Gibbon Drive, both of
which vary in cross section, land use and access conditions as they traverse through the City in a
north/south manner.
• Ray Gibbon Drive: Application of the CGEPSL resulted a higher speed limit for a large portion of
Ray Gibbon Drive, however this is not recommended given current levels of congestion, interaction
with wildlife, and future consideration of accommodation of active modes. Increasing the speed
limit may be investigated in the future when twinning improvements are completed; however,
considerations of development, and the aforementioned conditions will remain and would have to
be accounted for.
• Recommended to maintain the current 70 km/h posted speed limit.
• North St. Albert Trail (existing 80 km/h): For St. Albert Trail, a Safe Systems Approach
recommends reduction of the speed limit from 80 km/h to 70 km/h as a means for reducing the
speed differential from vehicles transitioning from highway speeds as they enter the urban area of
St. Albert from the rural area to the north. Reducing the speed limit from 80 km/h to 70 km/h is
discussed with the Safe Systems Approach but this results in a 30 km/h transition from Highway 2,
posted at 100 km/h. The CGESPL recommends maximum transitions of 20 km/h.
• Recommended to maintain the existing 80 km/h zone; however, as development and road
design or operations change to the north, consideration of extension of the 60 km/h zone should
be made.
• St. Albert Trail (South of Sturgeon Road to McKenney Avenue/Bellerose Drive): A Safe
Systems Approach recommends a reduction from 60 km/h to 50 km/h as the sidewalk is directly
adjacent to the travel lanes on St. Albert Trail without boulevard separation. This creates a higher
risk of collision with a pedestrian or cyclist due to the reduced offset, however in recognition of the
change of speed for this short section of the St. Albert Trail corridor and potential confusion or
issue with adherence, consideration that improvements to the active mode infrastructure (some
form of barrier or separation) is recommended to then support the 60 km/h posted speed. The
recommendation for this section of the St. Albert Trail corridor is as follows:
• Recommended to maintain the 60 km/h speed limit and investigate a form of pedestrian
improvement in terms of a barrier or separation of the sidewalk.

70 Transportation Network Speed Limit Review
City of St. Albert
FINAL REPORT
Integrated Expertise.
Locally Delivered.
• St. Albert Trail (remaining sections): For remaining sections of St. Albert Trail, the results of the
analysis, including application of the CGESPL and Safe Systems review, indicated the existing 60
km/h speed limit is appropriate.
8.2 Crosstown Roadways
Within the Complete Streets Guidelines Crosstowns are defined as major streets that allow users to
travel across the city without changing corridors. These streets enable high speed movements,
accommodate transit and larger heavy vehicles (designated truck routes). Many crosstown roads
have a significant amount of existing residential land uses, stop controlled accesses and pedestrian
crossings. The Complete Streets Guidelines notes that possible speed limits for these roadways
could be within the 50 km/h-60km/h range.
Results of the CGEPSL and from applying a Safe Systems Approach vary to certain degrees as
follows. Considering the different speed setting methodologies, the following is recommended for
crosstowns:
• A Safe Systems Approach prioritizes risk to vulnerable users by reducing speeds through sections
that have a significant amount of existing residential land uses, stop controlled accesses and
pedestrian crossings. In addition, the CGEPSL recommends reducing speed limits on crosstown
roads where they pass through dense commercial areas near St. Albert Trail due to the higher
levels of risk associated with the higher number of accesses and intersections in these areas.
• The CGEPSL recommends increasing the speed limits on certain crosstown roads by 10 km/h and
20 km/h, but applying these recommendations to increase speed limits is not consistent with the
Safety Systems Approach.
To respect both approaches and recognizing that higher speed limits are likely desirable by drivers
where the CGEPSL suggests an increase of 20 km/h, it is recommended to increase speed limits by
10 km/h where a 20 km/h increase is recommended and apply zero increase where the
recommendation is only 10 km/h.
Based on the above inputs, the following speed limit changes are recommended:
• Giroux Road (Nevade Place to Liberton Drive): Reduce from 60 – 50 km/h.
• Hebert Road (St. Albert Trail to Boudreau Road): Reduce from 60 – 50 km/h.
• Campbell Road (South City Limit to Centre Street): Reduce from 60 – 50 km/h.
• Boudreau Road (Liberton Drive to Inglewood Drive): Reduce from 60 – 50 km/h.
• Villeneuve Road (Commercial Area to St. Albert Trail): Reduce from 60 – 50 km/h.
• Sir Winston Churchill Avenue (Reil Drive to Levasseur Road): Increase from 50 – 60 km/h.
• Bellerose Drive (Evergreen Drive to City Limits): Increase from 50 – 60 km/h.
8.3 Connector Roadways
Within the Complete Streets Guidelines Connectors are defined as major streets that connect
crosstowns together. Many of the Connector streets are undivided and most are adjacent to
residential and commercial areas. The current posted speed limits vary on connector roadways from
40 km/h – 60 km/h, with lower speed limits in the downtown.

islengineering.com
November 2019
Transportation Network Speed Limit Review
City of St. Albert
FINAL REPORT
71
40 km/h Posted Connectors: In applying a Safe Systems Approach to the review of Connectors, the
presence of vulnerable users along these corridors should be considered as well as the context of the
corridors themselves. As all of the Connector roadways within the downtown already have a lower
40 km/h speed limit, a contextual review of this road suggests no changes are recommended and that
the current speed limit fits within the Safe Systems perspective. The CGEPSL recommended an
increase to 50 km/h speed limit in this area but this is not recommended given the precedent speed
limit and land use.
50 km/h Posted Connectors: For 50 km/h, a Safe Systems Approach that places higher priority on
vulnerable users would suggest that the lower speed limit would be appropriate. Given that the
Connectors outside of the Downtown have limited direct access to parcels as most land use is rear
facing or flanking the Connectors, the level of pedestrian interaction along these roadways would be
expected to be lower than in the downtown areas. As such, no alterations are recommended for the
majority of the corridors with a posted 50km/h speed limit. The only exceptions recommended are
where the CGEPSL recommends a 20 km/h increase to existing 50 km/h connectors. As a means of
balancing the two approaches and recognizing that higher speed limits are likely desirable by drivers
where the CGEPSL suggests an increase of 20 km/h a 10 km/h increase is recommended. This
applies to two roadways as follows:
• Sturgeon Road (Beacon Crescent (South) to Boudreau Road): Increase from 50 – 60 km/h.
• Dawson Road (Giroux Road to McKenney Avenue): Increase from 50 – 60 km/h.
60 km/h Posted Connectors: Levasseur Road, Villeneuve Road and Venesse Road have wide
rights of way along straight alignments with a posted speed limit of 60 km/h. Given the historic grid
line nature of these three corridors, although a lower speed limit of 50 km/h may be considered
desirable from in a Safe Systems Approach, the application of this lower limit on these roadways may
not be practical as a lowering the speed limit may not be effective without enforcement and physical
changes to the roadways. Results of the CGEPSL indicate that an increase to 70 km/h but this is not
recommended considering the Safe Systems Approach. As such, it is recommended to leave the
speed limit on these three Connector corridors at 60 km/h.
Prior to any adjustments of increasing the posted speed limits, it is suggested that the City investigate
and improve pedestrian crossings along these corridors; particularly at locations transitioning from
50 km/h to 60 km/h. Improvements may align to installation of warning flashers or signalized
pedestrian crossings to enhance visibility of the pedestrian crossings and provide improved
notification to drivers when a pedestrian is on site and seeking to cross or in the process of crossing
the roadway.
8.4 Neighbourhood Roadways
For Neighbourhood roadways that provide direct access to parcels, accommodate transit,
accommodate on-street cycling as well as pedestrians. The probability of vulnerable user interaction
with vehicles along these roadways is much higher than other higher classifications. A Safe Systems
Approach favours the safety provisions to pedestrians and cyclists over traditional operating speeds
of these roadways and as such, a speed limit of 40km/h for Neighbourhood Roadways would be
considered appropriate from a safe systems perspective given the context of these roadways.
Application of the CGEPSL with a split of “minor” and “major” classification system resulted in
approximately 50% of the roadways recommended to be posted at 40 km/h; however, applying
operational values of vehicle volumes and taking into account the intended function of these roads

72 Transportation Network Speed Limit Review
City of St. Albert
FINAL REPORT
Integrated Expertise.
Locally Delivered.
suggests a “minor” classification is more appropriate which then results in 70% of the roadways being
recommended for posting of 40km/h. The remaining Neighbourhood roads are very close to being
suggested to be posted at 40 km/h, so much so that a reduction of less than 10% of the risk level
scoring criteria (from 51 points to 47) results in approximately 89% of roadways being recommended
for posting to 40 km/h. Therefore, considering the recommendations from the Safety Systems
approach and the CGEPSL generally align, it is recommended that all neighbourhood roadways be
posted at 40 km/h.
8.5 Local Roadways
The built standard for Local roads reviewed, along with the adjacent land uses, narrowing due to
parked vehicles and sharpness of curves suggest that a 50 km/h speed limit is inappropriate, and a
lower speed limit is recommended. From the best practices review, there are some municipalities
exploring 30 km/h on residential local roadways, but expecting drivers to navigate and differentiate
between a Local roadway and a Neighbourhood (Collector) roadway is inappropriate. In addition,
should the speeds vary between a Neighbourhood roadway to the adjoining local roads, the required
infrastructure to sign and mark the speed change both off the Neighbourhood on to the Local and vice
versa is impractical.
With Neighbourhood roadways recommended for 40 km/h, lowering local residential roadways to 40
km/h is a logical conclusion.
8.6 Playground and School Zone/Area Recommendations
Review of school and playground zones and areas included evaluating these areas based on the
following:
• Application of Alberta Transportation Guidelines to School and Playground Zones and Areas.
• Review of regional best practices for setting school and playground speed limits.
• Assessing activities around these areas based on the time of day and comparing the application of
school zones and playground zones.
The objective of the review was to:
1. Confirm the current application of the AT Guidelines guidelines for existing school and playground
zones.
2. Investigate whether the City should consider applying playground zones at school sites and if site
conditions warrant a change by use of the AT Guidelines.
3. Investigate appropriate times of day for school and playground zones.
Summary of Results
The AT guidelines for school and playground zones and areas was created to promote uniformity in
establishment, signage, and making of school and playground zones and Areas in Alberta. To
develop the recommendations the guide was applied.
• For school zones to be recommended a minimum score of 65 points out of a 100 is needed
based on based on six weighted categories for school type, school fencing, adjacent roadway
classification, property line separation, school entrance features and presence of sidewalks.

islengineering.com
November 2019
Transportation Network Speed Limit Review
City of St. Albert
FINAL REPORT
73
• For playground zones to be recommended a minimum score of 80 points out of 100 is
needed based on six weighted categories for playground type, fencing, road classifications,
property line separation, playground entrance and presence of sidewalks.
Application of the guide confirmed the recommendation of school zones for all elementary schools in
the City, with a posted speed limit of 30 km/h. These schools scored at least 65 points out of 100. The
guide recommended school areas or nothing for junior high school and high schools. Application of
the guide confirmed the recommendation of 13 playground zones and recommended removal of 5
current playground zones. The recommendation of removal of current playground zones mostly apply
to open field with no playground equipment. Application of the guide also recommended the
designation of 53 playground areas compared with 12 existing playground areas.
School zones are only applicable during school hours and playground zones can be applicable for a
longer period of the day. The City of Edmonton and the City of Calgary have converted their school
zones to playground zones to extend the reduce speed limits beyond the school hours. The City of St.
Albert provided collision data around school sites that also confirms the need to extend the reduced
speed zone around school zones beyond school zone times. This is also consistent with the Safe
Systems Approach to setting speed limits since there is a higher likelihood of children in these areas
throughout the day and not only during school times.
The criteria in the AT guidelines for playground zones was modified to reflect high volume of
vulnerable users at school playgrounds. Elementary and Junior High School roadways were then
reevaluated using the updated criteria. The modified playground zone evaluation at schools resulted
in all elementary schools being warranted as playground zones, whereas only one Junior High School
met the modified playground zone threshold.
8.6.1 School Zone and Playground Zone Recommendations
• Apply playground zones instead of school zones for all elementary schools to create a reduced
speed limit that applies throughout a longer period of the day and for all days of the year.
• Apply school zones to all warranted road segments (following the AT Guidelines) adjacent to junior
high schools, as this is consistent with regional best practices.
• This is also consistent with St. Albert’s current practice for designating school zones, which has
been applied to all elementary and junior high schools and formalizing this practice is
reasonable.
• This results in no changes recommended for removing any of the existing reduced speed zones
to any junior high school.
• Junior high schools adjacent to elementary schools are recommended to be playground zones
as this will simplify signage and reduce confusion.
• High schools adjacent or in vicinity of elementary schools are also recommended to have a
reduced speed zone.
• The only exception is Bellerose High School which is not currently a school zone and is not
recommended to be a playground zone.
• Based upon collision information and records of counts taken from playgrounds, it is recommended
that Playground Zones be in effect from 8:00 a.m. to 8:00 p.m.

74 Transportation Network Speed Limit Review
City of St. Albert
FINAL REPORT
Integrated Expertise.
Locally Delivered.
• The recommendation for designating 53 playground areas is a significant increase to the 12
existing playground areas.
• Considering that neighbourhood roadways speed limit reduction 40 km/h is recommended,
application of playground areas on neighbourhood roadways may also align to a Safe System
approach to provide warning of conflict areas and gently remind drivers of the reduced
neighbourhood speed (40 km/h).
• Additional consideration of driver warning could be applied to Playground Areas (as
recommended by the AT Guide) adjacent to higher classified roadways, including boulevard,
crosstown and connector roadways. This may apply to two playground areas:
• Lions Park (Sir Winston Churchill Avenue): Install playground area signage.
• Lacombe Park/Morgan Crescent location (McKenney Avenue): Install playground area
signage.
• Maintain the 13 playground zones recommended by the AT guide, but remove playground zones
located on open fields where there is no playground equipment.
• The removal is recommended based on the type of playground, where they are open fields
rather than playgrounds.
• Removal is only recommended where they are located on neighbourhood roadways, since a
reduction to 40 km/h is also recommended.
• The recommended changes apply to the following playgrounds:
• Attwood Park (Atwood Drive playground zone): Remove.
• Forest Park (Forest Drive playground zone): Remove.
• Deerbourne Park (Deerbound Drive South playground zone): Remove.
8.7 Short 30 km/h Sections
Posted speed limits that are shorter than 500 m are not recommended, and this applies to a few
existing 30 km/h zones that are not associated with a playground or school zone. These should be
removed and incorporated with the adjacent speed limit.
Locations include:
• Sturgeon Road: Burns Street to Burnham Avenue.
• Mission Avenue: Between St Vital Avenue and Malmo Avenue.
• Grosvenor Boulevard: Gaylord Place to south of Grenfell Avenue.
• Grenfell Avenue: Gatewood Avenue to Greenwich Crescent.
• Meadowview Drive: Mission Avenue to 150 m west of Mission Avenue.
• Cunningham Road: South of Sycamore Avenue to Stanley Drive.

islengineering.com
November 2019
Transportation Network Speed Limit Review
City of St. Albert
FINAL REPORT
75
9.0 Stakeholder Consultation
9.1 Introduction
Key stakeholders were identified to discuss the preliminary recommended speed limit changes.
These groups were selected as their department’s operations and services to the City may be
impacted by the proposed changes. Stakeholders include:
• Public Works
• Transit
• Parks and Recreation
• Municipal Enforcement
• RCMP
• Engineering
• Strategic Services – Communication
9.2 Stakeholder Workshop
A workshop was held on December 3, 2019 to present the preliminary recommendations to the key
stakeholders. The stakeholder presentation is provided in the Appendix E.
Stakeholders were sent a follow up email summary of the preliminary recommendations, which
included the following information:
1. Collectors and Locals – these are roadways within communities or neighbourhoods (transit
services operate on locals, waste management exists on all classes).
a. Recommendation: Reduction in speeds to 40 km/h.
b. Currently the posted speed limit is 50 km/h.
2. Arterials – these are the main roadway corridors.
a. Reduction in speed limits where the following arterials cross/connect to St. Albert Trail: NOTE –
the segments are identified below and the restrictions do not reflect a recommended change to
the entire corridor (just the specific zones).
i. Boudreau Road – Liberton Drive to Inglewood: Reduce from 60 to 50 km/h
ii. Villeneuve Road – Commercial Area in vicinity to the Walmart to St. Albert Trail: Reduce
from 60 to 50 km/h.
iii. Hebert Road – St. Albert Trail to Arlington Drive: Reduce from 60 to 50 km/h.
b. Increase in speed limits for the following arterial roads, with “start” and “end” points shown:
i. Sir Winston Churchill Avenue - Riel Drive to Levassuer Road: Increase from 50 to 60 km/h.
ii. Bellerose Drive – Evergreen Drive to City limits: Increase from 50 to 60 km/h.
iii. Sir Winston Churchill Avenue – Poirier Avenue to City Limits: Increase from 50 to 60 km/h.
iv. Sturgeon Road – St. Albert Trail to Boudreau Road: Increase from 50 to 60 km/h.
v. Dawson Road – Giroux Road to McKenney Avenue): Increase from 50 to 60 km/h.
vi. Meadowview Drive – West of Ray Gibbon Drive: Increase from 60 to 70 km/h.
76 Transportation Network Speed Limit Review
City of St. Albert
FINAL REPORT
Integrated Expertise.
Locally Delivered.
3. School zones and playground zones.
a. Change from school zone to playground zones at elementary schools.
b. Apply a time of day for playground zones, 8 a.m.– 8 p.m., this would apply every day of the
year.
c. Removal of three playground zones, with no playground equipment (only park space).
d. Apply Playground Areas – warning signs with tab signs encouraging the proposed reduced
neighbourhood speed of 40 km/h (not a change in the actual speed limit – just reposted with
the warning sign).
4. Short 30 km/h segments.
a. Removing short 30 km/h zones.
i. Sturgeon Road: Burns Street to Burnham Avenue.
ii. Mission Avenue: Between St Vital Avenue and Malmo Avenue.
iii. Grosvenor Boulevard: Gaylord Place to south of Grenfell Avenue.
iv. Grenfell Avenue: Gatewood Avenue to Greenwich Crescent.
v. Meadowview Drive: Mission Avenue to 150 m west of Mission Avenue.
Stakeholder feedback was received for approximately 10 business days following the follow up email.
9.3 Stakeholder Feedback
Stakeholder groups were sent an email asking their consideration and feedback on the
recommendations presented at the workshop as a follow-up. A summary of each stakeholder group’s
responses is in the following sections.
9.3.1 Parks and Recreation
Parks and Recreation feedback primarily focused on the school and playground zone
recommendations as it was most directly identified to align to their service delivery. Extensive internal
discussions occurred surrounding school zones and the impact to the public and traffic flow with the
possibility of extending the school zones to playground zones until 8:00 p.m. It was questioned
whether this time extension is necessary when school playgrounds are perceived to be primarily
utilized during school hours, particularly along major roads.
The department indicated that they do not support the removal of the playground zones at the three
fields without utilization data from warmer months; however, recognize that consideration could be
made with acknowledgment of reducing neighbourhood speeds to 40 km/h. Additionally, the
department identified that high schools should be classified as school zones due to the high number
of busses and people merging at the same time.
It was also suggested that the new speed changes be implemented in stages to see what the impacts
may be.

islengineering.com
November 2019
Transportation Network Speed Limit Review
City of St. Albert
FINAL REPORT
77
9.3.2 Transit
The department acknowledges and appreciates all efforts of improving transportation safety, and for
the most part supports the recommended changes; however, Transit’s primary concern is how the
recommended speed reductions would impact their ability to maintain existing transit service levels –
specifically, meeting service levels with increased travel time from reduced neighbourhood speeds.
The recommendations were reviewed internally, and it was determined that two key routes (with bi-
directional servicing) of St. Albert’s current bus routes would be unable to adhere to the schedules
with the recommended speed limit reduction to 40 km/h. The routes with anticipated schedule
conflicts are A4, A5, A7, and A8, of which A4 and A5 operate in opposite directions of the same path,
as with A7 and A8.
Transit noted that if the current schedules cannot be adhered to and current service levels were
required to be maintained; an additional transit bus for each paring would be anticipated to be
required. These two additional busses would be required throughout all operating hours, including
weekdays and Sundays according to the transit department. An estimated operational impact (not
including funding to acquire additional fleet) was provided at approximately $960,000 annually to
operate the additional buses required to support the changes without acknowledgement or approval
of any change to service levels.
9.3.3 Public Works
Public Works indicated that they support all the recommendations and do not anticipate any service
level, operational, or funding impacts as a result. They noted that there could be a safety benefit to
the recommendations, as the reduced speed limits in areas where their staff are working provides a
safer work environment. It was also noted that the slight increases in speeds on some of their regular
routes are anticipated to offset the slowdowns in local roads.
9.3.4 Municipal Enforcement/RCMP
Municipal enforcement indicated that the recommended speed reductions and increases have no
expected direct impacts to service levels or funding. The potential for indirect impacts, however, were
noted as:
• Municipal enforcement operations may be indirectly influenced by an expectation from the
community to focus more time and effort in areas where new reduced speeds have been
established.
Additionally, concern was expressed as to the perception of speed enforcement as it relates to
budgetary motivation, as there is a perception that enforcement is a “cash cow” orchestrated as a
result of reduced fine revenues coming in over the years.
Reactions were mixed for the arterial recommendations, as follows:
• While the speed reductions on the three arterial corridors was supported by enforcement, concern
was raised due to the short length of the segment as the length may make enforcement
challenging and cause driver confusion to which adherence may be reduced.
• The arterial speed increase recommendations were all supported by enforcement except on Sir
Winston Churchill Avenue and Sturgeon Road.

78 Transportation Network Speed Limit Review
City of St. Albert
FINAL REPORT
Integrated Expertise.
Locally Delivered.
• Municipal enforcement expressed concerns for Sir Winston Churchill Avenue between Poirier
Avenue to the City Limits due to the hill and crosswalk at the bottom of the hill and the proximity
to the Kingswood Park intersection.
• The number of crosswalks on Sturgeon Road between St. Albert Trail and Boudreau Road was
also a cause for concern.
The Playground and School Zone recommendations were well received by Enforcement, however the
change from the end of the playground zone time of effect from one hour after sunset to 8:00 PM was
questioned.
Municipal enforcement supported the removal of all the short 30 km/h zones. It was noted that
consideration should be given to additional traffic calming measures to ensure speeds are adhered
to, for example 40 km/h on collector roadways.
RCMP do not anticipate impacts to service delivery or service levels; and overall support for the
recommendations was provided.
9.3.5 Engineering
Engineering’s reception of the speed limit recommendations was generally supportive. The reduction
of the Neighbourhood and Local roadway default speed limit within the City from 50 km/h to 40 km/h
and the school zone and playground zone recommendations were fully supported, while the arterial
recommendations received support with stipulations.
Engineering felt additional background collision data was required to support the recommended
reduced speed limits on sections of Boudreau road, Villeneuve Road, and Hebert Road.
• It was identified that there are programs in progress to which network improvements for efficiency
and safety are occurring; for example, the St. Albert Trail at Boudreau Road / Giroux Road
intersection.
• It was recommended that these segments, of recommended reduced speed limits, be monitored
during collision network screening and effort be made to report on the areas and evaluate to better
quantify the actual demand; or identify the impacts of the improvements to the areas once
completed.
Similarly, the recommended speed limit increases were supported, but it was noted that each
recommendation should be given with a stipulation.
• Prior to increasing the speed, the City should perform improvements of existing pedestrian
crossings, for example, design and install flashing warning systems to improve driver awareness
when a pedestrian is seeking to cross the roadway.
The removal of the short 30 km/h segments was supported by the Transportation Department. There
is agreement with enforcement’s comment that there may be an opportunity to specifically
recommend targeting improvements and/or traffic calming measures or warnings to drivers to ensure
the speeds are adhered to. It was also noted that some locations of the suggested removal of the
30 km/h zone fall within the proposed Neighbourhood speed reduction to 40 km/h.

islengineering.com
November 2019
Transportation Network Speed Limit Review
City of St. Albert
FINAL REPORT
79
It was also identified that the removal of some of the 30 km/h segments assists with delivery of
current traffic calming efforts, such as the Grandin area (in vicinity of the Grosvenor Boulevard and
Grenfell Avenue intersection).
9.3.6 Strategic Services – Communication
Strategic Services would anticipate a service level demand to support communications of proposed
speed limit changes. Impacts would be relevant to any proactive communication to promote the
proposed traffic bylaw changes and notify of a Public Hearing (inclusive of following standard
notifications of the forthcoming Public Hearing for proposed changes to the Traffic Bylaw), as well as
necessary public notification of any approved Bylaw amendments prior to the actual implementation
of changes in the field.
Actions would be inclusive of various public engagement and notification forums such as
development of focus groups, written notifications in the local paper, social media updates, field
signage and messaging and support to departments in any media requests and public inquiry or
concerns communication.
9.3.7 Stakeholder Feedback Summary
Overall response to the preliminary recommendations were positive. The areas that are of the
greatest concern to stakeholders are:
1. Reduced neighbourhood speed (40 km/h) impact to Transit services and their ability to maintain
current service levels.
2. A general concern of playground zone time extension, as some question the need for this
increased time at schools or more so application at specific sites. An example of a concerned site
are the current school zones on Sir Winston Churchill Avenue.
Table 9.1: Stakeholder Feedback Summary
Recommendation Descriptive Summary
Collectors and Locals - Default Speed Reduction (50 km/h to 40km/h)
The majority of feedback was supportive, with Parks and Recreation noting that the reduced speeds will likely create safer conditions for their workers. Transit did not support this recommendation due to the impacts of increased travel times on the existing transit schedule.
Boudreau Road – Liberton Drive to Inglewood: Reduce from 60 to 50 km/h
The majority of feedback was supportive, with Parks and Recreation noting that the reduced speeds will likely create safer conditions for their workers. Transit did not support this recommendation due to the impacts increased travel times on the existing transit schedule. Engineering felt additional background collision data was required to support the recommended reduced speed limits.
Villeneuve Road – Commercial Area in vicinity to the Walmart to St. Albert Trail: Reduce from 60 to 50 km/h
Same as previous.
Hebert Road – St. Albert Trail to Arlington Drive: Reduce from 60 to 50 km/h
Same as previous.
Sir Winston Churchill Avenue – Riel Drive to Levassuer Road: Increase from 50 to 60 km/h
Fully supported by all stakeholders. It is noted that the City should target the completion of improvements to existing pedestrian crossings before implementing the speed reduction.
Bellerose Drive – Evergreen Drive to City limits: Increase from 50 to 60 km/h
Same as previous.

80 Transportation Network Speed Limit Review
City of St. Albert
FINAL REPORT
Integrated Expertise.
Locally Delivered.
Recommendation Descriptive Summary
Sir Winston Churchill Avenue – Poirier Avenue to City Limits: Increase from 50 to 60 km/h
Supported by all but Municipal Enforcement due to the crosswalk at the bottom of the hill and proximity to the Kingswood intersection. It was noted by Engineering that the City should target the completion of improvements to existing pedestrian crossings before implementing the speed reduction.
Sturgeon Road – St. Albert Trail to Boudreau Road: Increase from 50 to 60 km/h
Supported by all but Municipal Enforcement due to the number of crosswalks in along the roadway segment. It was noted by Engineering that the City should target the completion of improvements to existing pedestrian crossings before implementing the speed reduction.
Dawson Road – Giroux Road to McKenney Avenue): Increase from 50 to 60 km/h
Fully supported by all stakeholders. It is noted that the City should target the completion of improvements to existing pedestrian crossings before implementing the speed reduction.
Meadowview Drive – West of Ray Gibbon Drive: Increase from 60 to 70 km/h
Fully supported by all stakeholders. It is noted that the City should target the completion of improvements to existing pedestrian crossings before implementing the speed reduction.
Change from school zone to playground zones at elementary schools
Many of the stakeholders support this, however questions were raised about the playground utilization and the need to maintain zones outside of school hours.
Apply a time of day for playground zones, 8 AM – 8 PM, this would apply every day of the year.
Same as previous.
Removal of three playground zones, with no playground equipment (only park space)
The majority of stakeholders support this recommendation, however Parks and Recreation was reluctant to provide support without utilization data for the fields, but willing to consider should reduce neighbourhood speeds be applied.
Apply Playground Areas – warning signs with tab signs encouraging the proposed reduced neighbourhood speed of 40 km/h
Fully supported.
Removing short 30 km/h zones at Sturgeon Road, Mission Avenue, Grosvenor Boulevard Grenfell Avenue, Meadowview Drive
Fully supported, with suggestions to explore traffic calming measures, warnings and notifications, in these areas to ensure speeds are followed.
9.3.8 Stakeholder Feedback Discussion
The prevailing concern from stakeholders involved the travel time impacts anticipated from speed
reductions and increased playground zone times and coverage. To address these concerns, the
following may be considered for further study:
• Playground and field usage during the warmer months, both while school is in session and during
summer vacation.
• The results of the data collection could strengthen the case for the playground zone classification
for elementary schools and extended zone times, or indicate that the usage is not as assumed
based on the available data at the writing of this report, and suggest the playground and school
zone recommendations should be revisited.
• A detailed review of the transit scheduling impacts, potential solutions, and potential associated
costs of maintaining the current transit service levels while implementing the recommendations.

islengineering.com
November 2019
Transportation Network Speed Limit Review
City of St. Albert
FINAL REPORT
81
10.0 Final Speed Limit Recommendations
The final speed recommendations are provided in the following section based on a combination of
speed limit setting methodologies and the stakeholder feedback. Potential impacts of these
recommendations are also explored.
10.1 Recommendations
The final speed limit recommendations are as follows and illustrated in Exhibit 10.1, where applicable.
Collectors and Locals
• Recommendation #1: Reduction in the default and posted speed of 50 km/h to 40 km/h.
Arterials
• Recommended Option #2a: Reduce speed limits as per study recommendations:
• Boudreau Road – Liberton Drive to Inglewood: Reduce from 60 to 50 km/h.
• Villeneuve Road – Commercial Area in vicinity to the Walmart to St. Albert Trail: Reduce from 60
to 50 km/h.
• Hebert Road – St. Albert Trail to Arlington Drive: Reduce from 60 to 50 km/h.
Or,
• Recommended Option #2b: Maintain existing speed limit of 60 km/h for recommended option 2a,
by implementing recommendations for reducing the risk score to maintain a 60 km/h posted speed
recommendation by the CGEPSL.
Or,
• Recommended Option #2c: Maintain existing speed limit of 60 km/h for recommended option 2a,
with future review of background collision data to confirm a speed related collision issue exists, if
no issue, maintain speed with monitoring.
This recommendation reflects opportunity to account for intersection improvements underway or
planned (St. Albert Trail and Boudreau Road and intersection improvements planned in the short
term for St. Albert Trail and Villeneuve Road) Monitoring only to confirm a speed related collision
issue is recommended for the Hebert Road segment as there are no improvement planned in the
near future.
Upon finalizing this report, it was identified that Option #2c for Arterials is the preferred
recommendation.
• Recommended Option #3: Increase from 50 km/h to 60 km/h at the following segments:
• Sir Winston Churchill Avenue – Reil Drive to Levassuer Road.
• Bellerose Drive – Evergreen Drive North to City limits.
• Sir Winston Churchill Avenue – North to City Limits.
• Sturgeon Road – Beacon Crescent (South) to Boudreau Road.

82 Transportation Network Speed Limit Review
City of St. Albert
FINAL REPORT
Integrated Expertise.
Locally Delivered.
• Maintaining the reduced speed warning sign along the curve of the road in the vicinity of Bishop
Street.
• Dawson Road – Giroux Road to McKenney Avenue: Increase from 50 to 60 km/h.
• Meadowview Drive – West of Ray Gibbon Drive: Increase from 60 to 70 km/h.
• Recommendation #4: Prior to any increase in speed limits in recommendation #3, it is
recommended that the City targets completion of improvements to existing pedestrian crossings
within these segments; designing and installing warning flasher systems that will improve driver
awareness and warning when pedestrians are on site and seeking to cross the roadway.
• Recommendation #5: The City, by use of the performed speed review outputs and identification of
factors influencing current lower speed limits on some arterial roadways, identify and complete
further speed limit reviews with completion of network improvements or roadway projects.
• An example of this would be the Connector road segment of Poirier Avenue and Corriveau
Road, which should sidewalk be constructed on Corriveau Road, could result in a suggested
increase in speed from the 50 km/h to 60 km/h.
Playground and School Zones
• Recommendation #6: Change from school zone to playground zones at Elementary Schools
• Recommendation #7: Apply a time of day for playground zones, 8 a.m.– 8 p.m., which would
apply every day of the year.
• Recommendation #8: Removal of three playground zones, with no playground equipment (only
park space); this is to be applied in conjunction with approval of reduced neighbourhood speeds as
these are located within neighbourhoods. Parks include: Attwood Park (Atwood Drive Playground
Zone), Forest Park (Forest Drive Playground Zone), Deerbourne Park (Deerbound Drive, South
Playground Zone).
• Recommendation #9: Apply playground areas – warning signs with tab signs encouraging the
proposed reduced neighbourhood speed of 40 km/h (not a change in the actual speed limit – just
reposted with the warning sign).
• Recommendation #10: It is recommended that the City reviews additional school and playground
sites further to capture spring and summer use throughout 2020 to gain a better understanding of
school and playground utilization, as needed.
Other
• Recommendation #11: Short 30 km/h segments.
• Removing short 30 km/h zones and installing warning only signs at the following:
• Sturgeon Road: Burns Street to Burnham Avenue.
• Mission Avenue: Between St Vital Avenue and Malmo Avenue.
• Grosvenor Boulevard: Gaylord Place to south of Grenfell Avenue.
• Grenfell Avenue: Gatewood Avenue to Greenwich Crescent.
• Meadowview Drive: Mission Avenue to 150 m west of Mission Avenue.
• A review of potential targeted improvements or traffic calming at the locations above is
recommended for consideration.

HUDS
ONRO
AD
LAYDON DRIVE
RIVERSIDE DRIVE
KINGSWOO
DBO
ULEV
ARD
DENN
ISON
DRI
VE
SALISBURY
AVENUE
LAC O
MBE
DRI V
E
ERIN
RIDGE DRIVE
KINGSWO ODDRIVE
GRANDIN ROAD
GROSVENO RBOULEVARD
PARKWOO
D
DRIVE
DORCHESTER DRIVE
BISHOP STREET
GRESH
AM
BOULEVARD
DUNBAR STREET
HARWOO
DDR
IVE
GREN
FELL
AVENUE
CURIAL DRIVE
KEILLOR DRIVE
VILLEMAGNE ROADLOCKHART DRIVE
STUR
GEON ROAD
EDISON DRIVEERNEST BOULEVARD
CUST AVENUE
LEXI
NGTO
N DR
IVE
HE RI TAGEW
AY
ERIN RIDGE ROAD
NEIL ROSS ROAD
CHISHOLM AVENUE
LARSONAVENUE
OAKMONT
DR
IVEJENS
ENLA
KEBOULEVARD
COAL MINE
ROAD
GRANGE DRIVE
WESTW
OOD DRIVE
LANGLEY AVENUE
FAIRVIEWBOULEVARD
INGLEWOOD
D RIVE
CHEV
IGNY
STR
EET
MALMO AVENUESTALBERT ROAD
CIRCLE DRIVE
GREEN GROVE DRIVE
MUIR DRIVE
STAN
NE
STREET
ELDORADO DRIVE
PINEVIE W DRIVE
BURN HAMAV
EN
UE
K I NGSW
AY DRIVE
VILLENUEVE ROAD
LECLAIR
W AY
CARN
EGIE
DRI
VE
OAKVISTA
DRIVE
OAKR
IDGE
DR
IVE NORTH
ALPINE
BOULEVARD
GERV
AISRO
AD
ATTW
OODDRIVE
SIRWINS
TON CHURCHILL AVENUE
WILLOUGHBYDRIVE
GAINSBOROUGH AVENUE
WOODLA NDS ROAD
CUNNINGHAM ROAD
LANGHOLMDRIV E
ST
VITAL AVENUE
EVERIT
T DRIV
E NORTH
LIBERTONDRIVE
DAWSON ROAD
A R L I NGTON
DRIVE
HOGA NROAD
M ISSION
AVENUE
RICHARD S
ON D R IVE
SUNSET BOULEVARD
AKINSDR IVE
MCKENNEY AVENUE
FOREST DR
IVEMEADOWVIEW DRIVE
RIEL DRIVE
CAMP
BELL
ROA
D
DEER RIDGE DRIVE POUNDMAKER ROAD
VENE
SS R
OAD
HEBER
T ROAD
LEVASSEUR ROAD
VILLENEUVE ROAD
BELLE
ROSE DRIVE
GIROUX ROAD
BOUDREAU ROAD
RAY GIBBON DRIVE
HERITA GEDRIVE
CARLETON
DRIVE
LAROSEDRIV E
EXHIBIT 10.1:FINAL
RECOMMENDATIONS
Docu
ment:
G:\P
rojec
ts\15
000\1
5400
\1543
9_St
_Albe
rt_Sp
eed_
Limit_
Revie
w\02
_CAD
D\25
_GIS\
251_
Figure
s\154
39_E
xhibi
t101_
Final_
Reco
mmen
datio
ns_2
0020
4.mxd
1:55,0000 1 20.5
km City of St. AlbertPlayground ZoneSchool Zone
Speed Limit (km/h)304050607080
¹
Credits:
CANA83-3TM114


islengineering.com
November 2019
Transportation Network Speed Limit Review
City of St. Albert
FINAL REPORT
83
• Recommendation #12: Clearance intervals (amber and all-red) at signalized intersections along
corridors need to be updated where there is a change in posted speed limit.
10.2 Potential Impacts of the Recommendations
As with any project, these recommendations have potential advantages and disadvantages. An in-
depth understanding of the potential impacts the recommendations may have on the City’s
operations, safety, and budget is needed to make an informed decision. The following section
discusses the potential direct and indirect impacts of the speed limit recommendations, as well as the
observed impacts from similar projects such as the shift from school zones to playground zones in the
City of Edmonton and the isolated areas of 40 km/h posted speed within St. Albert.
10.2.1 Direct Impacts
Direct impacts include costs associated with applying the recommended speed changes and travel
time increases, as discussed in the following subsections. All costs estimates in this section were
supplied by the City of St. Albert.
Field Signage Costs
Signage will need to be upgraded or installed to reflect the recommended speed limit and
school/playground zone/area changes. The following table summarized the estimated cost of field
signage.
Table 10.1: Field Signage Cost
Signage Description Estimated Amount
Estimated Cost
Speed Sign Changed from 50 km/h to 40 km/h 260 $36,000 (Supply and install)
Warning Signs of Reduced Speeds
Entering communities 75 $13,000 (Supply and install)
Playground Zone Changed from school zone to playground zone with new time of day tabs
140 $20,000
Total 475 $69,000
Pedestrian Crossing Improvements
Prior to implementing recommended arterial roadway segment speed increases, it is advisable to
ensure that pedestrian crossings are addressed and improved to promote safety and ensure they are
highly visible. Improvements suggested to the existing or potential crossings along these segments
would be inclusive of road markings and warning flashers.
Pedestrian crossings anticipated to be impacted and recommended for improvements include:
1. Sir Winston Churchill Avenue:
a. Crossing north of Gainsborough Avenue.
b. Crossings south of Gatewood Avenue x 2.
c. Crossing at Sturgeon Road.

84 Transportation Network Speed Limit Review
City of St. Albert
FINAL REPORT
Integrated Expertise.
Locally Delivered.
2. Bellerose Drive:
a. Crossing at Eldorado Drive.
b. Crossing at Empress Way.
3. Dawson Road:
a. Crossing at Lennox Drive.
b. Crossing at Langholm Crescent (South).
Improvements are estimated at $270,000 for completion of necessary design and supply and
installation of warning systems and road markings.
Travel Times
Travel times within neighbourhoods will increase; however, anticipated impacts of actual travel time
are negligible. No anticipated further delay or impact at existing traffic controls (stop signs or yield
signs); the change in travel time occurs only during actual travel. An example of potential travel time
implications is provided in the table below, assuming a total travel distance of 2 km within a
community.
Table 10.2: Time Comparison
Scenario Travel Time
Traveling 2 km at 50 km/h 2 minutes 24 seconds
Traveling 2 km at 40 km/h 3 minutes
Travel time variance (40 km/h subtract 50 km/h) 36 seconds
As a comparator of actual travel distances within communities, the following provides examples of
what may be deemed substantial travel routes and distances within communities from a local
roadway to an adjacent arterial roadway (acknowledging that alternative and shorter routes would
exist):
• Erin Ridge community; Eastcott Drive to Bellerose Drive at Erin Ridge Drive via the route of Erin
Ridge Drive = 2.63 km.
• Oakmont community; Otter Crescent to Bellerose Drive at Oak Vista Drive, via the route of
Oakridge Drive South = 1.6 km.
• Kingswood community; Kingsford Crescent to Poirier Avenue at Keillor Drive, via the route of
Kingswood Boulevard to Keillor Drive = 1.8 km.
• Lacombe Park community; Lamartine Crescent to Giroux Road at Larson Avenue, via a route of
Larose Drive (eastbound) to Larson Avenue to Giroux = 1.9 km.
Transit Services
Despite the travel time impact anticipated to be low, any influence on Transit services that impact
time can have implications on service delivery.
It was communicated that two key routes (with bi-directional servicing) of St. Albert’s current bus
routes would be unable to adhere to the schedules with the recommended speed limit reduction to
40 km/h. The routes with anticipated schedule conflicts are A4, A5, A7, and A8, of which A4 and A5
operate in opposite directions of the same path, as with A7 and A8.

islengineering.com
November 2019
Transportation Network Speed Limit Review
City of St. Albert
FINAL REPORT
85
Transit noted that if the current schedules cannot be adhered to and current service levels were
required to be maintained; an additional transit bus for each paring would be anticipated to be
required. These two additional busses would be required throughout all operating hours, including
weekdays and Sundays according to the transit department.
An estimated operational impact (not including funding to acquire additional fleet) was provided at
approximately $960,000 annually to operate the additional buses required to support the changes
without acknowledgement or approval of any change to service levels. The value of $960,000 is
derived from the following cost calculation provided by Transit Services:
• 2 buses X 14 hours per day X 6 days per week X 52 weeks per year X $110.00 per hour =
$960.960.00 per year.
On January 20, 2020, Council approved motion CB-20-011; “That Administration implement the
transit service level revisions, effective September 2020, as presented at the January 13, 2020
Community Growth & Infrastructure Standing Committee meeting.”
The results of this motion and approved service level change are anticipated to enable Transit to
accommodate the recommended Traffic Bylaw amendments, with no operational costs associated.
10.2.2 Public Perception of Speed and Enforcement
It is anticipated that there may be some public opinion on the rational of enforcement revenue being
the key influence towards reducing neighbourhood speeds. This opinion may be amplified based on
recent review of photo enforcement programs within Alberta.
The process followed, and the reporting performed (inclusive of this final report being a public facing
document), is anticipated to assist in public communications and education on how the speed limit
recommendations have been developed.
It is noted and important to clarify that the Transportation Network Speed Review and resulting
recommendations have been developed and are based upon engineering application of guidelines,
site inspections and current practice models. Recommendations of speed changes (reduction or
increase) were not generated based on enforcement activity or prior communication; however, once
the recommendations were developed they were shared with the enforcement branches (Municipal
and RCMP) as they are key service delivery stakeholders.
10.2.3 Reported Implications from St. Albert Reduced Speeds in St. Albert
In spring (March/April) 2019, the posted speed in the neighbourhoods of Erin Ridge, Erin Ridge
North, and Lacombe Park East were reduced from 50 km/h to 40 km/h. Since implementation, no
substantial operational issues or service related concerns have been reported to the Transportation
department from the neighbourhoods.
Speed Measurements
Eighty-fifth (85) percentile speeds, meaning that 85% of recorded vehicles are traveling at the
recorded speed or lower; or also considered as 15% of vehicles are recorded as traveling faster than
the recorded speed, indicate a strong compliance within the communities to the reduced
neighbourhood speeds.

86 Transportation Network Speed Limit Review
City of St. Albert
FINAL REPORT
Integrated Expertise.
Locally Delivered.
Data captured during 2019 traffic counts later in the year, included twenty-two (22) midblock locations
as comparators and examples of speeds being traveled. The twenty-two sites include the following:
five (5) in the Erin Ridge North community, 11 in the Erin Ridge community, four (4) in the Lacombe
Park East community and two in the downtown.
The results are as follows:
• One (1) site recorded an 85% speed limit above the posted 40 km/h; which was 44 km/h.
• This site was on Erin Ridge Drive at a location north of Boudreau Road.
• Twenty-one (21) sites recorded an 85% speed limit below the posted 40 km/h.
• The average variance of the 21 sites from the posted 40 km/h speed limit was 8 km/h below the
speed limit.
• The average 85% speed limit recorded of the 21 sites was 33 km/h.
Summary: The results reflect a high level of driver compliance of the 40 km/h speed limit.
Automated Enforcement
*Note: this summary of enforcement information has been compiled from Automated Enforcement
data only. Conventional enforcement (tickets issued by officer on roadside) data is not available to
this level of detail and therefore has not been included.
In the areas of reduced neighbourhood speed, there are ten approved photo enforcement sites that
have enforced speed in the communities (enforcement sites were approved prior to speed reductions
in the communities). Following the implementation of the reduced speeds in March and April of 2019,
there was a period of 6 weeks that warnings were provided to drivers in violation of the posted speed
limit (40 km/h) versus violation tickets.
From the end of the warning period to end of December 2019 there were:
• Speed Limit: Posted speed limit of 40 km/h
• 2.5 violations recorded per hour of enforcement
• The average speed violation recorded was 56.8 km/h (16.8 km/h above the posted speed limit)
• Note: This average is not reflective of the average recorded speed; it is reflective of the average
speed violation.
For comparison of the broader City-wide enforcement activity during the same time period as the
enforcement period at sites of reduced speeds, the following information may be considered:
• School Zones and Playground Zones: Total of 53 enforcement sites.
• Speed Limit: Posted speed limit of 30 km/h during times of day for school and playground zone
periods
• 4.8 violations recorded per hour of enforcement
• The average speed violation was 40.3 km/h (10.3 km/h over the posted speed limit)
• Note: This average is not reflective of the average recorded speed; it is reflective of the average
speed violation.

islengineering.com
November 2019
Transportation Network Speed Limit Review
City of St. Albert
FINAL REPORT
87
• Other Speed Zone Sites (approved enforcement sites beyond school and playground zones, with
the sites of locations of reduced neighbourhood speeds removed) – Total of 57 approved
enforcement sites.
• Speed Limit: Posted speed limit of 50 km/h, 60 km/h or 70 km/h pending the roadway and site
• 4.0 violations recorded per hour of enforcement
• The average speed violation was:
• For 50 km/h road segments – 67.2 km/h (17.2 km/h over the posted speed)
• For 60 km/h road segments – 77.6 km/h (17.6 km/h over the posted speed)
• For 70 km/h road segments – 87.3 km/h (17.3 km/h over the posted speed limit)
Results of comparing the enforcement activities and violation information from reduced
neighbourhood speed sites to typical city-wide areas:
• The violations recorded per hour at locations with a 40 km/h reduced speed limit are lower then
other approved enforcement sites, including at school zones, playground zones and locations with
50 km/h, 60 km/h and 70 km/h speed limits.
• The average speed violation in the reduced speed community is 56.6 km/h, 16.6 km/h above
speed limit. This is similar to the average violation above the posted speed limit in other approved
site locations.
• School and playground sites had the lowest average violation recorded (10.3 km/h over the posted
speed).
Collisions
The following figure provides an overview of motor vehicle collision frequency within the communities
to which reduced speeds have been applied.
It should be noted that as the reduced speed limits were implemented mid-year in 2019, the figures
below compare collision frequencies in the months from April to November only.
Figure 10.1: Motor Vehicle Collisions in Speed Reduced Communities (April – November)
From the graph above, the change in average total collisions per year at all location is as follows:
Erin Ridge Erin Ridge North Lacombe Park
2016 17 5 25
2017 15 5 21
2018 22 8 25
2019 14 9 16
0
5
10
15
20
25
30
Co
llisi
on
Fre
qu
en
cy

88 Transportation Network Speed Limit Review
City of St. Albert
FINAL REPORT
Integrated Expertise.
Locally Delivered.
• Before: 15.9 collisions per year (all locations)
• After: 13 collisions per year (all locations)
As a priority for the City is to influence and reduce severe motor vehicle collisions, a review of the
impact of reduced speeds on the resulting severity outcomes of any motor vehicle collision that
occurred is an important aspect of consideration of reduced neighbourhood speed limits. The
following figure highlights the frequency of injury related or worse motor vehicle collisions in
communities that had 40 km/h speed limits introduced in 2019.
Figure 10.2: Injury Motor Vehicle Collisions in Speed Reduced Communities (April – November)
From the above, it can be identified that injury collisions were reduced in two of the three
communities, with no injury related incidents reported following the speed reduction in the community
of Erin Ridge North. The average total injury collisions have changed as follows:
• Before: 3.3 injury collisions per year (all locations)
• After: 1.7 injury collisions per year (all locations)
Overall, the results suggest a correlation between the decrease in total collisions and the reduction in
speed limits. Future monitoring, additional months/years of data and additional analysis is suggested
to confirm the correlation is caused by the reduction in speed limit as most, but not all locations had a
reduction.
Erin Ridge Erin Ridge North Lacombe Park
2016 3 9
2017 2 2
2018 4 1 2
2019 2 3
0
1
2
3
4
5
6
7
8
9
10
Axi
s Ti
tle

islengineering.com
November 2019
Transportation Network Speed Limit Review
City of St. Albert
FINAL REPORT
89
11.0 Next Steps
The Transportation Network Speed Limit Review and resulting report, provides recommendations that
ultimately seek to advance the City’s Transportation Safety Plan. In recognition of the competing
interests and demands of the transportation network from varying needs of road users, it is important
the City acknowledges and continues to promote the primary objective of Vision Zero, and the goal of
reducing severe collision occurrences, while at the same time applying sustainable and efficient traffic
management practices.
The final recommendations provide opportunity to present amendments to the City’s Traffic Bylaw,
with rationale and background clearly documented. At the same time, the results of this study provide
opportunity to maintain and update the road segment evaluations for posted speed as roadway
improvements are considered or applied to the network and support the development of general
principles and policy surrounding posted speed limits.
Continued monitoring and network screening of safety, such as collision reporting or public reports of
concern and operations (recorded vehicle volumes and speed) should also be performed, with
particular review of noted segments that were identified in this report to be areas of potential
recommended changes – to either quantify and prioritize changes or to capture opportunity of
roadway improvements to further reduce conflict or support safety with minimal operational change.

90 Transportation Network Speed Limit Review
City of St. Albert
FINAL REPORT
Integrated Expertise.
Locally Delivered.
12.0 Acronyms
CGEPSL Canadian Guidelines for Establishing Posted Speed Limits
AADT Average Annual Daily Traffic
NACTO National Association of City Transportation
AT Alberta Transportation
MUTCDC Manual of Traffic Control Devices for Canada
FHWA Federal Highway Administration, US Department of Transportation
ITE Institute of Transportation Engineers
TAC Transportation Association of Canada
OTM Ontario Traffic Manual
HTA Highway Traffic Act

islengineering.com
November 2019
Transportation Network Speed Limit Review
City of St. Albert
FINAL REPORT
91
13.0 Glossary of Terms
Term Definition
Alberta Traffic Safety Act A provincial Act defining regulations regarding traffic safety, vehicles, and vehicle operators.
Alberta Transportation (AT) A provincial roadway authority that creates legislation and guidelines for Alberta's roadways as well as owns, operates, and maintains the provincial highway network.
Area (School Area or Playground Area)
A section of roadway adjacent to a school or playground that is denoted by School Area or Playground Area signage only.
Average Annual Daily Traffic (AADT)
A traffic volume measurement often used in transportation engineering.
Best Practices The prevailing or most common practices used by other roadway authorities or municipalities.
Canadian Guidelines for Establishing Posted Speed Limits (CGEPSL)
A set of guidelines published by the Transportation Association of Canada that outlines how to set speed limits for arterial and collector roadways.
Cross Section A vertical section of the roadway and surrounding ground including all elements of a roadway from the right-of-way line.
Exposure (Pedestrian or Cyclist)
Relates to the proximity of pedestrians or cyclists to roadway activities.
Federal Highway Administration, US Department of Transportation (FHWA)
A division in the United States Department that specialized in highway transportation.
Felid Review An on-site review of the roadway characteristics to confirm
Institute of Transportation Engineers (ITE)
An international educational and scientific association of transportation professionals.
Manual of Traffic Control Devices for Canada (MUTCDC)
A document published by the Transportation Association of Canada that offers guidance on traffic control device types, use, and placement for a variety of road authorities and jurisdictions.
National Association of City Transportation (NACTO)
A coalition of the Departments of Transportation in North American cities formed to cooperatively approach transportation issues.
Playground Playgrounds are recreational facilities utilized primarily by children. This includes outdoor playgrounds with play equipment, sports fields, ball diamonds, tot lots and indoor or enclosed facilities such as skating rinks and swimming pools.
Posted Speed The maximum speed limit posted on a section of roadway using a regulatory sign.
Prevailing Speed The speed at which 85 percent of motorists travel on a roadway.
Road Network A system of interconnecting roadways that support movement throughout the City.

92 Transportation Network Speed Limit Review
City of St. Albert
FINAL REPORT
Integrated Expertise.
Locally Delivered.
Term Definition
Roadway Segment A portion of a roadway, typically defined by its homogeneity or proximity to a playground or school.
Safe Systems A system that prioritizes the safety of vulnerable road users (pedestrians and cyclists) over the many other factors considered by the two aforementioned guides and considers the need to reduce speeds to reduce risk to all road users.
School Schools are educational institutions that are attended primarily by children. This includes elementary schools, middle schools, junior high schools and high schools. No distinction is made between public and private schools.
Transportation Association of Canada (TAC)
A national technical association that focuses on road and highway infrastructure and urban transportation.
Vision Zero A long-term traffic safety goal that is focused on working towards a world with zero traffic fatalities
Zone (School Zone or Playground Zone)
A section of roadway adjacent to a school or playground that is denoted by School Area or Playground Area signage and a 30 km/h speed limit sign.

islengineering.com
November 2019
Transportation Network Speed Limit Review
City of St. Albert
FINAL REPORT
93
14.0 References
Reference Organization or Author
Alberta Traffic Safety Act Alberta Transportation
Canadian Guidelines for Establishing Posted Speed Limits (CGEPSL)
Transportation Association of Canada
Child Pedestrian Injuries on Residential Streets: Implications for Traffic Engineering. Institute for transportation Engineers, February 2000
Jacobson, P. et al.
Guidelines to Playground and School Area and Zones Alberta Transportation
Municipal Development Plan (2007) City of St. Albert
Municipal Engineering Standards (2013) City of St. Albert
Pedestrian Fatality Risk as a Function of Car Impact Speed. Accident Analysis and Prevention, 41 (2009): 536-542
Rosén, E., and Sander, U.
Review of school and Playground Zone harmonization in Calgary
City of Calgary, University of Calgary, Mishra, S., Kattan, L.
The Impact of Lowered Residential Speed Limits on Vehicle Speed Behavior. Safety Science, 62 (2014) 483-494
Islam, M.T., El-Basyouny, K., and Ibrahim, S.
Traffic Bylaw City of St. Albert
Transportation Master Plan (2015) City of St. Albert
Transportation Safety Plan (2018) City of St. Albert
Transportation Safety Plan (2018) City of St. Albert
Transportation System Bylaw City of St. Albert
Variable Seasonal Times for Playground Zones City of Edmonton
Methods and Practices for Setting Speed Limits: An Information Report (2012)
FHWA (Federal Highway Administration, US Department of Transportation) and ITE (Institute of Transportation Engineers)


islengineering.com
February 2020
Transportation Network Speed Limit Review
City of St. Albert
FINAL REPORT
APPENDIX Survey Question Results A


Q1 What is your municipality’s philosophy for setting speed limits?Answered: 16 Skipped: 0
# RESPONSES DATE
1 . 5/10/2019 1:14 PM
2 50 unless posted. Reduce speeds only within playground and school areas/zones. One exceptionarea in our more walk able main street where it is 30 km/hr
5/10/2019 10:42 AM
3 The speed limit shall be appropriate to the functional classification of the roadway. The primarycriteria would be to provide safety for all road users whilst fulfilling the functions of mobility andaccessibility as appropriate to the functional class of the roadway.
5/8/2019 4:45 PM
4 TAC and Alberta Transportation guidelines 5/8/2019 4:07 PM
5 The City’s philosophy for setting posted speed limit is based on the TAC’s Canadian Guidelinesfor Establishing Posted Speed Limits. The posted speed limit is determined to alleviate safetyconcerns while meeting the driver’s expectation.
5/6/2019 4:20 PM
6 Follow TAC guidelines and internal speed limit guidelines also based upon TAC as well asroadway classification and design. Design speed related to posted speed is found in CompleteStreets Design and Construction Standards. See Section 3.2https://www.edmonton.ca/city_government/urban_planning_and_design/city-design-construction-standards.aspx?utm_source=virtualaddress&utm_campaign=designconstructionstandards
5/3/2019 4:31 PM
7 Most roads in Calgary default to 50 kph as per the Alberta Traffic Safety Act . Recently with theCalgary City Charter, we have been been granted the ability to set a different default speed limit.We are curently preparing a report to Council on the possible alternatives for either reducing thedefault limit to either 30 or 40 kph where the remainder of the roadways (collectors, arterials andexpressways) being signed at higher speeds. Current policy is that arterials are designed andposted between 50 - 60 kph, and expressways between 60 - 80 kph.
5/2/2019 2:18 PM
8 Provide a safe, effective and efficient conditions for road users 4/30/2019 8:15 AM
9 Red Deer follows TAC guidelines for setting speed limits on arterial roads. The posted speedconsiders conflicts and road conditions, is normally less than the design speed and less than orequal to the 85th percentile speed.
4/29/2019 8:57 AM
10 We use the TAC Guideline for Establishing Posted Speed Limits and will be converting all localneighbourhood roadways to 40km/h as per Bill 65.
4/29/2019 8:06 AM
11 Vision Zero, Safe speeds & Safe streets 4/29/2019 7:05 AM
12 The speeds are set using the Council approved policy which takes into account land use, numberof accesses, lane width, vehicle volume
4/29/2019 6:42 AM
13 Speed limit should be reasonable and acceptable by majority of road users. Changing speed limitswithout changing road environment do not work.
4/26/2019 4:24 PM
14 Establish a reasonable and safe speed limit that is appropriate for a particular roadway based onits design and classification
4/26/2019 3:56 PM
15 Posted speeds should be intuitive, with drivers receiving visual cues from their environment. 4/26/2019 2:09 PM
16 We use several factors such as design speed, adjacent land use, local Bylaws and existingdevelopment.
4/26/2019 12:37 PM
1 / 22
City of St. Albert Speed Limit Review

100.00% 16
100.00% 16
100.00% 16
100.00% 16
100.00% 16
Q2 What is the methodology your municipality uses to establish speedlimits?
Answered: 16 Skipped: 0
# ARTERIAL ROADS DATE
1 Based on consultant recomendations 5/10/2019 1:14 PM
2 Assumed 50 5/10/2019 10:42 AM
3 Based on our roadway standards for new roads. In the eixsting areas or retrofit situations, we useITE recommended practices consistisng one or more of engineering approach and safe systemapproach.
5/8/2019 4:45 PM
4 TAC 5/8/2019 4:07 PM
5 Canadian Guidelines for Establishing Posted Speed Limits, road geometry/characteristics,operational safety, prevailing 85th percentile speed
5/6/2019 4:20 PM
6 Design speed is 10 km/hr greater than posted, Complete Streets Section 3.21 5/3/2019 4:31 PM
7 Posted speed limit is less than or equal to design speed of the roadway. Engineering judgement isused to determine whether the roadway is either 50 or 60 kph. A multitude of factors are used todetermine the posted speed (crashes, driveway density, access frequency, access volumes,adjacent land use, pedestrian volumes, presence of active mode facilities, etc.)
5/2/2019 2:18 PM
8 Geometric Standard and design speed 4/30/2019 8:15 AM
9 TAC Guidelines, design speed and 85th percentile speed with some additional analysis asneeded.
4/29/2019 8:57 AM
10 TAC Guideline 4/29/2019 8:06 AM
11 TAC Guidelines 4/29/2019 7:05 AM
12 Our Policy 4/29/2019 6:42 AM
13 Engineering approach - Road risk method (TAC guidelines) 4/26/2019 4:24 PM
14 TAC 4/26/2019 3:56 PM
15 60, 70 or 80kph, depending upon level of built environment 4/26/2019 2:09 PM
16 Design speed, adjacent land use and development 4/26/2019 12:37 PM
# COLLECTOR ROADS DATE
1 Collector and Local - 40 5/10/2019 1:14 PM
2 Assumed 50 5/10/2019 10:42 AM
3 We sue our default speed of 50 km/h, excpet for traffic calmed streets 5/8/2019 4:45 PM
4 TAC 5/8/2019 4:07 PM
5 Canadian Guidelines for Establishing Posted Speed Limits, road geometry/characteristics,operational safety, prevailing 85th percentile speed
5/6/2019 4:20 PM
ANSWER CHOICES RESPONSES
Arterial Roads
Collector Roads
Local Roads
School Zone
Playground Zone
2 / 22
City of St. Albert Speed Limit Review

6 Design speed equals posted speed with exceptions, Complete Streets Section 3.21 5/3/2019 4:31 PM
7 Posted speed limit on most collectors is set at the default speed limit, which was also used as thedesign speed of these roadways
5/2/2019 2:18 PM
8 Bylaw and Geometric Standard and design speed 4/30/2019 8:15 AM
9 50 km/h posted speed with 60 km/h design speed. 4/29/2019 8:57 AM
10 TAC Guideline + Bill 65 4/29/2019 8:06 AM
11 Major Collector - TAC, Minor Collector - Vision Zero 4/29/2019 7:05 AM
12 All residential areas are posted at 50 km/hr 4/29/2019 6:42 AM
13 Using default speed of 50 km/h 4/26/2019 4:24 PM
14 TAC 4/26/2019 3:56 PM
15 50 kph 4/26/2019 2:09 PM
16 As per Arterial Roads unless adjacent land use is residential development. Then City Bylawrequires 30km/hr in residential.
4/26/2019 12:37 PM
# LOCAL ROADS DATE
1 Collector and Local - 40 5/10/2019 1:14 PM
2 Assumed 50 5/10/2019 10:42 AM
3 We sue our default speed of 50 km/h, except for traffic calmed streets 5/8/2019 4:45 PM
4 TAC 5/8/2019 4:07 PM
5 Currently speed limit on local roads is posted at 50 km/h and is generally not reviewed. 5/6/2019 4:20 PM
6 Statutory speed is 50 km/hr except in a few locations/neighbourhoods 5/3/2019 4:31 PM
7 Posted speed limit on most local roadways is set at the default speed limit, which was also used asthe design speed of these roadways
5/2/2019 2:18 PM
8 Bylaw and Geometric Standard 4/30/2019 8:15 AM
9 50 km/h posted speed with 60 km/h design speed. 4/29/2019 8:57 AM
10 Bill 65 4/29/2019 8:06 AM
11 Vision Zero 4/29/2019 7:05 AM
12 All locals are 50 km/hr 4/29/2019 6:42 AM
13 Using default speed of 50 km/h 4/26/2019 4:24 PM
14 TAC 4/26/2019 3:56 PM
15 50kph 4/26/2019 2:09 PM
16 As per City Bylaw - 30km/hr 4/26/2019 12:37 PM
# SCHOOL ZONE DATE
1 Alberta Transportation Guidelines 5/10/2019 1:14 PM
2 School zone evaluated then posted 30 during key hours (provincial standard hours) 5/10/2019 10:42 AM
3 30 km/h based on Alberta Guidelines 5/8/2019 4:45 PM
4 AT warrant analysis 5/8/2019 4:07 PM
5 All school zones are designated at playground zones 5/6/2019 4:20 PM
6 See playground zone 5/3/2019 4:31 PM
7 Roadway speed limits in school zones are the same as the remainder of the street which theschool zone has been established andis in effect outside of school zone hours/days. A few yearsago, Calgary d has removed all school zones and replaced all school zones with playground zonesthat have modified hours different that default Provincial hours (7:30 am to 9:00 pm) 24/7/365
5/2/2019 2:18 PM
8 MUTCD 4/30/2019 8:15 AM
3 / 22
City of St. Albert Speed Limit Review

9 TAC Guidelines with 08:00 to 16:30 custom time. 4/29/2019 8:57 AM
10 Bill 65 4/29/2019 8:06 AM
11 Vision Zero 4/29/2019 7:05 AM
12 All streets with connections to school property are zoned 40 km/hr 4/29/2019 6:42 AM
13 TAC guide for establishing speed limits through school zones 4/26/2019 4:24 PM
14 TAC 4/26/2019 3:56 PM
15 30kph (want to make times consistent with playground zones ie 7:30 to 1hr after sunset) 4/26/2019 2:09 PM
16 As per Alberta Traffic Safety Act - 30km/hr 4/26/2019 12:37 PM
# PLAYGROUND ZONE DATE
1 Alberta Transportation Guidelines 5/10/2019 1:14 PM
2 Playground zone evaluated then posted 30 5/10/2019 10:42 AM
3 30 km/h based on Alberta Guidelines 5/8/2019 4:45 PM
4 AT warrant analysis 5/8/2019 4:07 PM
5 As per Alberta TSA 5/6/2019 4:20 PM
6 30 km/hr time restricted 5/3/2019 4:31 PM
7 Roadway speed limits in playground zones are the same as the remainder of the street which theschool zone has been established and is in effect outside of school zone hours/days. A few yearsago, Calgary d has removed all school zones and replaced all school zones with playground zonesthat have modified hours different that default Provincial hours (7:30 am to 9:00 pm) 24/7/365
5/2/2019 2:18 PM
8 MUTCD 4/30/2019 8:15 AM
9 TAC Guidelines with 08:00 to 21:00 custom time. 4/29/2019 8:57 AM
10 No methodology specfically for Playground Zone 4/29/2019 8:06 AM
11 Vision Zero 4/29/2019 7:05 AM
12 50 km/hr 4/29/2019 6:42 AM
13 TAC guide for establishing speed limits through playground zones 4/26/2019 4:24 PM
14 NA 4/26/2019 3:56 PM
15 30kph 7:30 to 1hr after sunset 4/26/2019 2:09 PM
16 As per Traffic Safety Act - 30km/hr 4/26/2019 12:37 PM
4 / 22
City of St. Albert Speed Limit Review

100.00% 16
100.00% 16
100.00% 16
100.00% 16
100.00% 16
Q3 What is the default posted speed limits on the following street types inyour municipality?
Answered: 16 Skipped: 0
# ARTERIAL ROADS DATE
1 50 or 60 5/10/2019 1:14 PM
2 50 5/10/2019 10:42 AM
3 60 km/h 5/8/2019 4:45 PM
4 60 5/8/2019 4:07 PM
5 50 km/h 5/6/2019 4:20 PM
6 50 km/hr 5/3/2019 4:31 PM
7 Currently the Provincial default speed limit within urban municipalities is 50 kph. Speed limits otherthan 50 kph must be posted. current policy is that arterials speed limits are between 50 and 60kph.
5/2/2019 2:18 PM
8 60 4/30/2019 8:15 AM
9 50 km/h 4/29/2019 8:57 AM
10 50 4/29/2019 8:06 AM
11 varies 4/29/2019 7:05 AM
12 Can vary from 50 km/hr to 80 km/hr 4/29/2019 6:42 AM
13 70 km/h - two corridors, 60 km/h - other corridors, 50 km/h on one road 4/26/2019 4:24 PM
14 60-70 4/26/2019 3:56 PM
15 60, 70 or 80kph, depending upon level of built environment 4/26/2019 2:09 PM
16 60 km/hr 4/26/2019 12:37 PM
# COLLECTOR ROADS DATE
1 40 5/10/2019 1:14 PM
2 50 5/10/2019 10:42 AM
3 50 km/h 5/8/2019 4:45 PM
4 50 5/8/2019 4:07 PM
5 50 km/h 5/6/2019 4:20 PM
6 50 km/hr 5/3/2019 4:31 PM
7 Currently the Provincial default speed limit within urban municipalities is 50 kph. Speed limits otherthan 50 kph must be posted. current policy is that collector speed limits are 50 kph.
5/2/2019 2:18 PM
8 50 or 30 4/30/2019 8:15 AM
ANSWER CHOICES RESPONSES
Arterial Roads
Collector Roads
Local Roads
School Zone
Playground Zone
5 / 22
City of St. Albert Speed Limit Review

9 50 km/h 4/29/2019 8:57 AM
10 50 4/29/2019 8:06 AM
11 40-50k 4/29/2019 7:05 AM
12 Depends on land use, most are 50 km/hr 4/29/2019 6:42 AM
13 50 km/h, 40 km/h on two collectors on trial basis 4/26/2019 4:24 PM
14 50 4/26/2019 3:56 PM
15 50kph 4/26/2019 2:09 PM
16 30 km/hr - Residential, 50km/hr - Commercial 4/26/2019 12:37 PM
# LOCAL ROADS DATE
1 40 5/10/2019 1:14 PM
2 50 5/10/2019 10:42 AM
3 50 km/h 5/8/2019 4:45 PM
4 50 5/8/2019 4:07 PM
5 50 km/h 5/6/2019 4:20 PM
6 50 km/hr 5/3/2019 4:31 PM
7 Currently the Provincial default speed limit within urban municipalities is 50 kph. Speed limits otherthan 50 kph must be posted. Current policy is that local roads are 50 kph.
5/2/2019 2:18 PM
8 30 4/30/2019 8:15 AM
9 50 km/h 4/29/2019 8:57 AM
10 50 4/29/2019 8:06 AM
11 40k 4/29/2019 7:05 AM
12 50 km/hr 4/29/2019 6:42 AM
13 50 km/h 4/26/2019 4:24 PM
14 50 4/26/2019 3:56 PM
15 50kph 4/26/2019 2:09 PM
16 30 km/hr 4/26/2019 12:37 PM
# SCHOOL ZONE DATE
1 30 5/10/2019 1:14 PM
2 30 during specific hours (flashing lights to indicate) 5/10/2019 10:42 AM
3 30 km/h 5/8/2019 4:45 PM
4 30 5/8/2019 4:07 PM
5 All school zones are designated at playground zones 5/6/2019 4:20 PM
6 See Playground Zone 5/3/2019 4:31 PM
7 Calgary has no school zones. All schools have playground zones which are in effect 365 days peryear between 7:30 am and 9:00 pm. The posted speed limit of these zones outside of school zonehours is whatever the posted speed limit is of the roadway the playground zone is located, usually50 or 60 kph. The playground zone speed is the default 30 kph required by the TSA 107(1) .
5/2/2019 2:18 PM
8 30 4/30/2019 8:15 AM
9 30 km/h 4/29/2019 8:57 AM
10 50 4/29/2019 8:06 AM
11 30k 4/29/2019 7:05 AM
12 40 km/hr 4/29/2019 6:42 AM
6 / 22
City of St. Albert Speed Limit Review

13 30 km/h 4/26/2019 4:24 PM
14 30 4/26/2019 3:56 PM
15 30kph (want to make times consistent with playground zones ie 7:30 to 1hr after sunset) 4/26/2019 2:09 PM
16 30 km/hr 4/26/2019 12:37 PM
# PLAYGROUND ZONE DATE
1 30 5/10/2019 1:14 PM
2 30 5/10/2019 10:42 AM
3 30 km/h 5/8/2019 4:45 PM
4 30 5/8/2019 4:07 PM
5 30 km/h 5/6/2019 4:20 PM
6 30 km/hr 5/3/2019 4:31 PM
7 All playground zones are in effect 365 days per year between 7:30 am and 9:00 pm. The postedspeed limit of these zones outside of school zone hours is whatever the posted speed limit is of theroadway the playground zone is located, usually 50 or 60 kph. The playground zone speed is thedefault 30 kph required by the TSA 107(1) .
5/2/2019 2:18 PM
8 30 4/30/2019 8:15 AM
9 30 km/h 4/29/2019 8:57 AM
10 50 4/29/2019 8:06 AM
11 30k 4/29/2019 7:05 AM
12 50 km/hr 4/29/2019 6:42 AM
13 30 km/h 4/26/2019 4:24 PM
14 NA 4/26/2019 3:56 PM
15 30kph 7:30 to 1hr after sunset 4/26/2019 2:09 PM
16 30 km/hr 4/26/2019 12:37 PM
7 / 22
City of St. Albert Speed Limit Review

100.00% 16
87.50% 14
Q4 What time of day applies for the following zones?Answered: 16 Skipped: 0
# SCHOOL ZONE DATE
1 0730-1700h 5/10/2019 1:14 PM
2 8-9:30, 11:30-1, 2:30-4 on school days 5/10/2019 10:42 AM
3 7:30 AM to 4:30 PM school days 5/8/2019 4:45 PM
4 8-9:30, 11:30-1, 3-4:30 5/8/2019 4:07 PM
5 All school zones are designated at playground zones 5/6/2019 4:20 PM
6 See playground zone. All zones classified as playground zones. 5/3/2019 4:31 PM
7 N/A 5/2/2019 2:18 PM
8 Traffic Safety Act 4/30/2019 8:15 AM
9 08:00 to 16:30 4/29/2019 8:57 AM
10 school arrival, lunch and dismissal times 4/29/2019 8:06 AM
11 24 hrs / 40 k on major collector and arterials, school times only with Flashers 4/29/2019 7:05 AM
12 24 hours 4/29/2019 6:42 AM
13 7:30 am - 4:30 pm 4/26/2019 4:24 PM
14 8am-5pm, M-F, Sept. 1st-June 30th 4/26/2019 3:56 PM
15 currently 07:30 to 16:30, in the process of changing this to be consistent with playground zones ie.7:30 to 1hr after sunset.
4/26/2019 2:09 PM
16 7:30 to 17:00 4/26/2019 12:37 PM
# PLAYGROUND ZONE DATE
1 0730-One hour after sunset 5/10/2019 1:14 PM
2 7:30 - 9 every day 5/10/2019 10:42 AM
3 8:30 AM to 1 hour after sunset (all year round) 5/8/2019 4:45 PM
4 7:30 AM to 9:00 PM 5/6/2019 4:20 PM
5 7:30 - 21:00 5/3/2019 4:31 PM
6 7:30 am to 9:00 pm 5/2/2019 2:18 PM
7 Traffic Safety Act 4/30/2019 8:15 AM
8 08:00 to 21:00 4/29/2019 8:57 AM
9 N/A 4/29/2019 8:06 AM
10 24 hrs 4/29/2019 7:05 AM
11 8:30 am - one hour after sunset 4/26/2019 4:24 PM
12 NA 4/26/2019 3:56 PM
13 30kph 7:30 to 1hr after sunset 4/26/2019 2:09 PM
14 8:30 to one hour after sunset 4/26/2019 12:37 PM
ANSWER CHOICES RESPONSES
School Zone
Playground Zone
8 / 22
City of St. Albert Speed Limit Review

100.00% 16
93.75% 15
87.50% 14
81.25% 13
87.50% 14
Q5 What are triggers at which point your municipality reviews postedspeed limits along the following types of roadways?
Answered: 16 Skipped: 0
# ARTERIAL ROADS DATE
1 Significant change to accesses/intersections/etc. or resident inquiry 5/10/2019 1:14 PM
2 No current review process - assumed 50 5/10/2019 10:42 AM
3 Safety concerns, public complaints, reconstruction, inservice safety reviews 5/8/2019 4:45 PM
4 count data 85th percentile 5/8/2019 4:07 PM
5 Road upgrade, significant development, safety/operational concern and public complaints 5/6/2019 4:20 PM
6 Road Widening, Citizen/Councillor Inquiry 5/3/2019 4:31 PM
7 Reconstruction, operational safety review (high crash rate/frequency), request from the public orrequest from Council.
5/2/2019 2:18 PM
8 Design and Construction 4/30/2019 8:15 AM
9 Large geometric changes, new developments and engineering studies. 4/29/2019 8:57 AM
10 Public requests/safety reviews 4/29/2019 8:06 AM
11 complaints or collision analysis 4/29/2019 7:05 AM
12 Complaints or significant development 4/29/2019 6:42 AM
13 Over representation of severe injury collisions 4/26/2019 4:24 PM
14 Safety concerns, changes in adjacent land use, public concerns 4/26/2019 3:56 PM
15 increase of built environment, review of collision reports and inservice safety reviews 4/26/2019 2:09 PM
16 Adjacent Development 4/26/2019 12:37 PM
# COLLECTOR ROADS DATE
1 Resident inquiry 5/10/2019 1:14 PM
2 No current review process - assumed 50 5/10/2019 10:42 AM
3 Safety concerns, public complaints, inservice safety reviews 5/8/2019 4:45 PM
4 Road upgrade, significant development, safety/operational concern and public complaints 5/6/2019 4:20 PM
5 Citizen/Councillor Inquiry 5/3/2019 4:31 PM
6 Default 50 kph. Direction from Council 5/2/2019 2:18 PM
7 Bylaw 4/30/2019 8:15 AM
8 New school or playground opened. 4/29/2019 8:57 AM
9 Public requests/safety reviews 4/29/2019 8:06 AM
ANSWER CHOICES RESPONSES
Arterial Roads
Collector Roads
Local Roads
School Zone
Playground Zone
9 / 22
City of St. Albert Speed Limit Review

10 complaints or collision analysis 4/29/2019 7:05 AM
11 Complaints or significant development 4/29/2019 6:42 AM
12 Speeding complaints or operating speeds higher than 5 km/h posted speed limit 4/26/2019 4:24 PM
13 Safety concerns, changes in adjacent land use, public concerns 4/26/2019 3:56 PM
14 review of collision reports and inservice safety reviews 4/26/2019 2:09 PM
15 Adjacent Development 4/26/2019 12:37 PM
# LOCAL ROADS DATE
1 Resident inquiry 5/10/2019 1:14 PM
2 No current review process - assumed 50 5/10/2019 10:42 AM
3 Safety concerns, public complaints, inservice safety reviews 5/8/2019 4:45 PM
4 Currently speed limit on local roads is posted at 50 km/h and is generally not reviewed. However,the speed limits on local roads may be reviewed in the future
5/6/2019 4:20 PM
5 Citizen/Councillor Inquiry, not a lot of flexibility for change outside of current Council discussion 5/3/2019 4:31 PM
6 Default 50 kph. Direction from Council 5/2/2019 2:18 PM
7 Bylaw 4/30/2019 8:15 AM
8 New school or playground opened. 4/29/2019 8:57 AM
9 Public requests/safety reviews 4/29/2019 8:06 AM
10 City converting all local roadways to 40k, Bill 65 4/29/2019 7:05 AM
11 Speeding complaints validated through speed survey 4/26/2019 4:24 PM
12 Safety concerns, changes in adjacent land use, public concerns 4/26/2019 3:56 PM
13 review of collision reports and inservice safety reviews 4/26/2019 2:09 PM
14 Adjacent Development 4/26/2019 12:37 PM
# SCHOOL ZONE DATE
1 Construction of new school 5/10/2019 1:14 PM
2 When orignally installed and then when any large changes occur (road widening, play groundequipment installation/removal exc.)
5/10/2019 10:42 AM
3 school construction/type, resident concerns 5/8/2019 4:07 PM
4 See playground zone 5/3/2019 4:31 PM
5 New school, operational safety review (high crash rate/frequency), request from School board,request from community association, request from the public, request from Council
5/2/2019 2:18 PM
6 Traffic Safety Act 4/30/2019 8:15 AM
7 New school opened. 4/29/2019 8:57 AM
8 Public requests/safety reviews 4/29/2019 8:06 AM
9 City converting all schools on local roadways to 30k 4/29/2019 7:05 AM
10 School zones are always posted at 30 km/h 4/26/2019 4:24 PM
11 Safety concerns, changes in adjacent land use, public concerns 4/26/2019 3:56 PM
12 currently in process of reviewing school & playground zones to ensure consistency within City andwith other municipalities.
4/26/2019 2:09 PM
13 Alberta Transportation Guidelines 4/26/2019 12:37 PM
# PLAYGROUND ZONE DATE
1 Construction of, or changes to, a playground 5/10/2019 1:14 PM
2 When orignally installed and then when any large changes occur (road widening, play groundequipment installation/removal exc.)
5/10/2019 10:42 AM
10 / 22
City of St. Albert Speed Limit Review
3 playground installation, resident concerns 5/8/2019 4:07 PM
4 Not reviewed 5/6/2019 4:20 PM
5 Citizen/Councillor Inquiry but not a lot of flexibility for change 5/3/2019 4:31 PM
6 New/expanded playground equipment, operational safety review (high crash rate/frequency),request from School board, request from community association, request from the public, requestfrom Council
5/2/2019 2:18 PM
7 Traffic Safety Act 4/30/2019 8:15 AM
8 New playground opened. 4/29/2019 8:57 AM
9 Public requests/safety reviews 4/29/2019 8:06 AM
10 City converting all parks on local roadways to 30k 4/29/2019 7:05 AM
11 Playground zones are always posted at 30 km/h 4/26/2019 4:24 PM
12 Safety concerns, changes in adjacent land use, public concerns 4/26/2019 3:56 PM
13 currently in process of reviewing school & playground zones to ensure consistency within City andwith other municipalities.
4/26/2019 2:09 PM
14 Alberta Transportation Guidelines 4/26/2019 12:37 PM
11 / 22
City of St. Albert Speed Limit Review

Q6 Is your municipality currently, or will be, in the process of reviewingand/or changing neighbourhood speed limits?
Answered: 16 Skipped: 0
# RESPONSES DATE
1 We may consider reducing to 30 km/h for local roads in the future. 5/10/2019 1:14 PM
2 Yes our municipality is currently looking to include a survey in census to evaluate support fordecreasing neighborhood speed and/or increasing arterial road speeds
5/10/2019 10:42 AM
3 We are waiting for the ongoing review work at the City of Calgary. We may initiate our own reviewfollowing the results/recommendations from the City of Calgary.
5/8/2019 4:45 PM
4 no 5/8/2019 4:07 PM
5 Currently speed limit on local roads is posted at 50 km/h and is generally not reviewed. However,the speed limits on local roads may be reviewed in the future.
5/6/2019 4:20 PM
6 Yes, See Community and Public Services Committee from April 24, 2019 and City Council meetingminutes from May 14, 2019 on edmonton.ca
5/3/2019 4:31 PM
7 Currently in progress as a result of recent changes to the Calgary City charter that allows Calgaryto set its own default speed limit within the municipality
5/2/2019 2:18 PM
8 No 4/30/2019 8:15 AM
9 40 km/h was considered in the past but 50 km/h was kept instead. No current plans to reviewneighbourhood limits again.
4/29/2019 8:57 AM
10 Yes 4/29/2019 8:06 AM
11 In process, Council report forthcoming 4/29/2019 7:05 AM
12 This is currently under review 4/29/2019 6:42 AM
13 The County is currently in the process of dropping speed limit from 50 km/h to 40 km/h for oneneighbourhood after going through an extensive traffic calming
4/26/2019 4:24 PM
14 The City of Saskatoon is in the process of reviewing neighbourhood speed limits. 4/26/2019 3:56 PM
15 Currently in process of reviewing all speed limits to ensure consistency within City and with othermunicipalities.
4/26/2019 2:09 PM
16 No 4/26/2019 12:37 PM
12 / 22
City of St. Albert Speed Limit Review
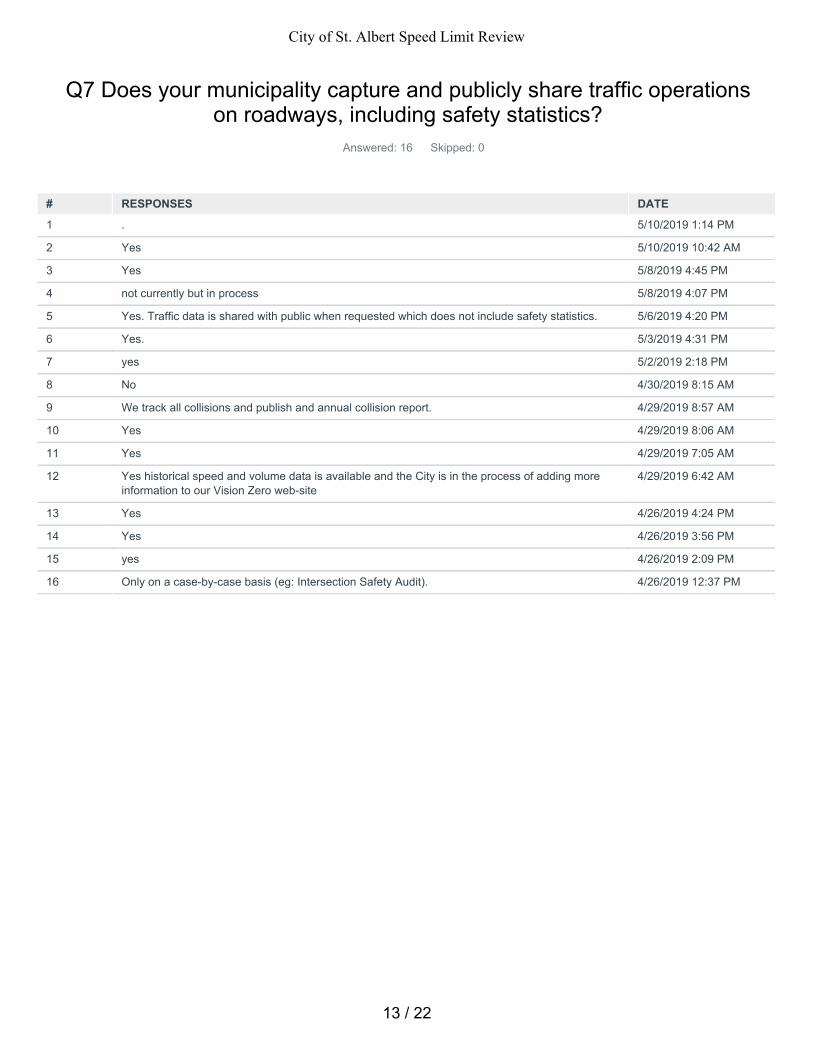
Q7 Does your municipality capture and publicly share traffic operationson roadways, including safety statistics?
Answered: 16 Skipped: 0
# RESPONSES DATE
1 . 5/10/2019 1:14 PM
2 Yes 5/10/2019 10:42 AM
3 Yes 5/8/2019 4:45 PM
4 not currently but in process 5/8/2019 4:07 PM
5 Yes. Traffic data is shared with public when requested which does not include safety statistics. 5/6/2019 4:20 PM
6 Yes. 5/3/2019 4:31 PM
7 yes 5/2/2019 2:18 PM
8 No 4/30/2019 8:15 AM
9 We track all collisions and publish and annual collision report. 4/29/2019 8:57 AM
10 Yes 4/29/2019 8:06 AM
11 Yes 4/29/2019 7:05 AM
12 Yes historical speed and volume data is available and the City is in the process of adding moreinformation to our Vision Zero web-site
4/29/2019 6:42 AM
13 Yes 4/26/2019 4:24 PM
14 Yes 4/26/2019 3:56 PM
15 yes 4/26/2019 2:09 PM
16 Only on a case-by-case basis (eg: Intersection Safety Audit). 4/26/2019 12:37 PM
13 / 22
City of St. Albert Speed Limit Review

Q8 If your municipality collects speed data along school zones orplayground zones, what are acceptable ranges of speed for a zone that is
deemed working well?Answered: 16 Skipped: 0
# RESPONSES DATE
1 We do not have defined thresholds. 5/10/2019 1:14 PM
2 90% of traffic traveling less then 10% above posted speeds, higher volumes of speeding then thismerits further evaluation for traffic calming
5/10/2019 10:42 AM
3 yes, we do not have a set number but anything 10 km above speed limit will be considered foradditional enforcement or other traffic calming measures.
5/8/2019 4:45 PM
4 +10% 5/8/2019 4:07 PM
5 Yes speed data is collected along playground zone and an average speed of 32km/h is measured. 5/6/2019 4:20 PM
6 Contact [email protected] for feedback on this. 5/3/2019 4:31 PM
7 From an engineering perspective, 'well' would be 85th percentile speeds being below 35 kph andaverage speeds equal to or below 30 kph.
5/2/2019 2:18 PM
8 -+10kmph 4/30/2019 8:15 AM
9 30 to 35 km/h 4/29/2019 8:57 AM
10 85th Percentile speed up to 15% higher than posted speed limit 4/29/2019 8:06 AM
11 85th percentile, 5km over posted speed limit 4/29/2019 7:05 AM
12 The City has a traffic calming policy. All speed and volume studies are accessed as per thescoring criteria in the policy. Last year out of 160 studies 4 qualified for traffic calming
4/29/2019 6:42 AM
13 Yes, speed data is collected along school and playground zones, and the operating speed within 5km/h of the posted speed is acceptable.
4/26/2019 4:24 PM
14 Currently, less than 5 kph over the posted speed limit 4/26/2019 3:56 PM
15 85th%ile speed should be within 10% of posted speed 4/26/2019 2:09 PM
16 We do not collect speed data in school or playground zones 4/26/2019 12:37 PM
14 / 22
City of St. Albert Speed Limit Review

Q9 Does your municipality examine prevailing speeds in comparison tothe roadway characteristics and posted speed limits?
Answered: 16 Skipped: 0
# RESPONSES DATE
1 Following resident inquiry. 5/10/2019 1:14 PM
2 In high incident areas and high complaint areas yes 5/10/2019 10:42 AM
3 Yes 5/8/2019 4:45 PM
4 yes 5/8/2019 4:07 PM
5 Yes the 85th percentile speed is measured and used while a posted speed limit is assessed for aroad section. The built environment and the road characteristics are generally self-regulate thedriver’s behaviour/operating speed.
5/6/2019 4:20 PM
6 Yes 5/3/2019 4:31 PM
7 yes, upon request.complaint 5/2/2019 2:18 PM
8 No 4/30/2019 8:15 AM
9 Yes. 4/29/2019 8:57 AM
10 Yes 4/29/2019 8:06 AM
11 yes 4/29/2019 7:05 AM
12 yes under our speed policy we try to promote uniformity across the City 4/29/2019 6:42 AM
13 Yes. 4/26/2019 4:24 PM
14 Yes 4/26/2019 3:56 PM
15 yes 4/26/2019 2:09 PM
16 We collect data on Arterial Roads for growth management. This data collection includes speeddata but we do not examine this data.
4/26/2019 12:37 PM
15 / 22
City of St. Albert Speed Limit Review
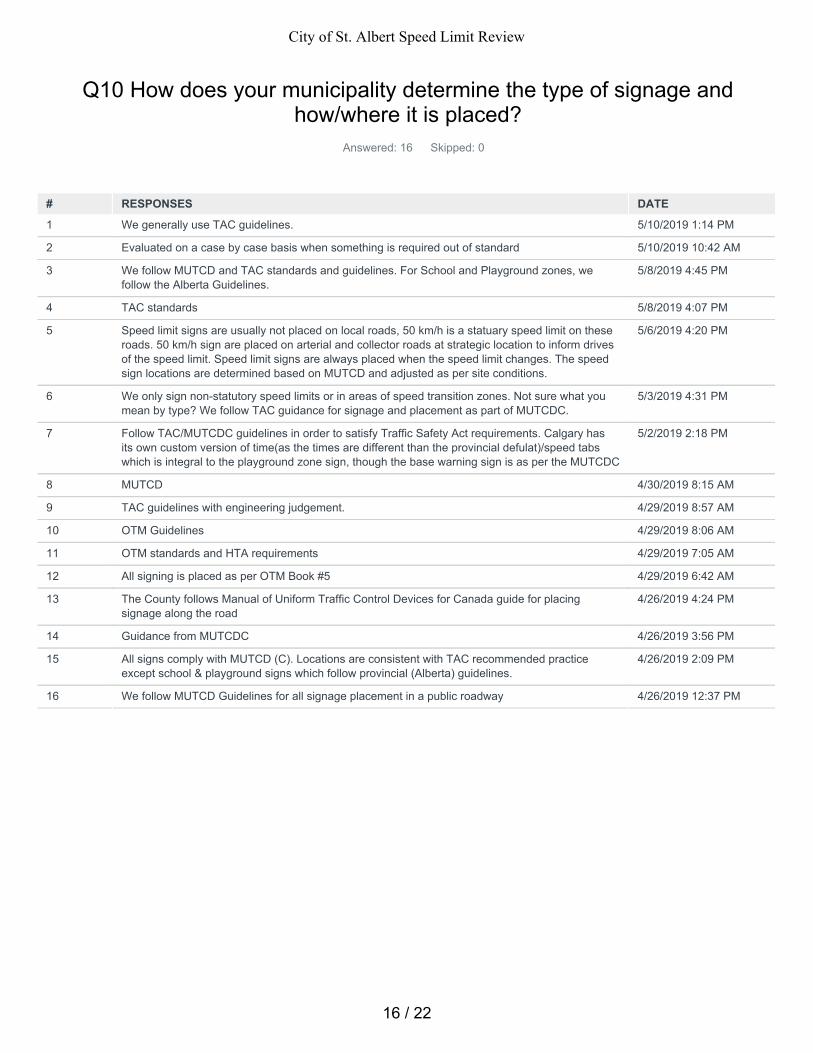
Q10 How does your municipality determine the type of signage andhow/where it is placed?
Answered: 16 Skipped: 0
# RESPONSES DATE
1 We generally use TAC guidelines. 5/10/2019 1:14 PM
2 Evaluated on a case by case basis when something is required out of standard 5/10/2019 10:42 AM
3 We follow MUTCD and TAC standards and guidelines. For School and Playground zones, wefollow the Alberta Guidelines.
5/8/2019 4:45 PM
4 TAC standards 5/8/2019 4:07 PM
5 Speed limit signs are usually not placed on local roads, 50 km/h is a statuary speed limit on theseroads. 50 km/h sign are placed on arterial and collector roads at strategic location to inform drivesof the speed limit. Speed limit signs are always placed when the speed limit changes. The speedsign locations are determined based on MUTCD and adjusted as per site conditions.
5/6/2019 4:20 PM
6 We only sign non-statutory speed limits or in areas of speed transition zones. Not sure what youmean by type? We follow TAC guidance for signage and placement as part of MUTCDC.
5/3/2019 4:31 PM
7 Follow TAC/MUTCDC guidelines in order to satisfy Traffic Safety Act requirements. Calgary hasits own custom version of time(as the times are different than the provincial defulat)/speed tabswhich is integral to the playground zone sign, though the base warning sign is as per the MUTCDC
5/2/2019 2:18 PM
8 MUTCD 4/30/2019 8:15 AM
9 TAC guidelines with engineering judgement. 4/29/2019 8:57 AM
10 OTM Guidelines 4/29/2019 8:06 AM
11 OTM standards and HTA requirements 4/29/2019 7:05 AM
12 All signing is placed as per OTM Book #5 4/29/2019 6:42 AM
13 The County follows Manual of Uniform Traffic Control Devices for Canada guide for placingsignage along the road
4/26/2019 4:24 PM
14 Guidance from MUTCDC 4/26/2019 3:56 PM
15 All signs comply with MUTCD (C). Locations are consistent with TAC recommended practiceexcept school & playground signs which follow provincial (Alberta) guidelines.
4/26/2019 2:09 PM
16 We follow MUTCD Guidelines for all signage placement in a public roadway 4/26/2019 12:37 PM
16 / 22
City of St. Albert Speed Limit Review
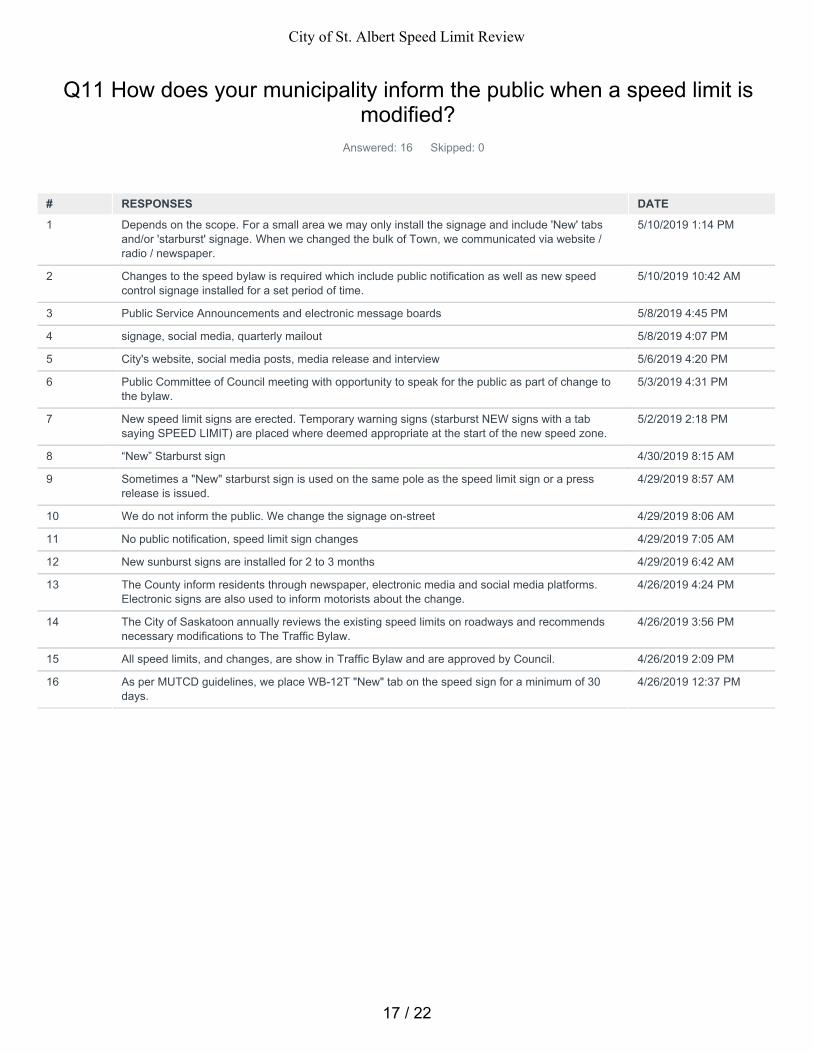
Q11 How does your municipality inform the public when a speed limit ismodified?
Answered: 16 Skipped: 0
# RESPONSES DATE
1 Depends on the scope. For a small area we may only install the signage and include 'New' tabsand/or 'starburst' signage. When we changed the bulk of Town, we communicated via website /radio / newspaper.
5/10/2019 1:14 PM
2 Changes to the speed bylaw is required which include public notification as well as new speedcontrol signage installed for a set period of time.
5/10/2019 10:42 AM
3 Public Service Announcements and electronic message boards 5/8/2019 4:45 PM
4 signage, social media, quarterly mailout 5/8/2019 4:07 PM
5 City's website, social media posts, media release and interview 5/6/2019 4:20 PM
6 Public Committee of Council meeting with opportunity to speak for the public as part of change tothe bylaw.
5/3/2019 4:31 PM
7 New speed limit signs are erected. Temporary warning signs (starburst NEW signs with a tabsaying SPEED LIMIT) are placed where deemed appropriate at the start of the new speed zone.
5/2/2019 2:18 PM
8 “New” Starburst sign 4/30/2019 8:15 AM
9 Sometimes a "New" starburst sign is used on the same pole as the speed limit sign or a pressrelease is issued.
4/29/2019 8:57 AM
10 We do not inform the public. We change the signage on-street 4/29/2019 8:06 AM
11 No public notification, speed limit sign changes 4/29/2019 7:05 AM
12 New sunburst signs are installed for 2 to 3 months 4/29/2019 6:42 AM
13 The County inform residents through newspaper, electronic media and social media platforms.Electronic signs are also used to inform motorists about the change.
4/26/2019 4:24 PM
14 The City of Saskatoon annually reviews the existing speed limits on roadways and recommendsnecessary modifications to The Traffic Bylaw.
4/26/2019 3:56 PM
15 All speed limits, and changes, are show in Traffic Bylaw and are approved by Council. 4/26/2019 2:09 PM
16 As per MUTCD guidelines, we place WB-12T "New" tab on the speed sign for a minimum of 30days.
4/26/2019 12:37 PM
17 / 22
City of St. Albert Speed Limit Review

Q12 Does your municipality have any experience with studying orapplying variable speed limits?
Answered: 16 Skipped: 0
# RESPONSES DATE
1 No. 5/10/2019 1:14 PM
2 No 5/10/2019 10:42 AM
3 Yes, we are the first municipality in Canada to have implemented variable speed limit. 5/8/2019 4:45 PM
4 only in school zones by time of day 5/8/2019 4:07 PM
5 No 5/6/2019 4:20 PM
6 Yes, some on Whitemud Drive. 5/3/2019 4:31 PM
7 TSA only allows for variable speed limits under certain conditions which have not been relevant inCalgary. Recent City Charter changes have given Calgary the authority to create a bylaw to enactvariable speed limits at our discretion. No work has been undertaken to take advantage of the newregulation, nor has the necessary bylaw been enacted to allow administration to implement such apractice.
5/2/2019 2:18 PM
8 No 4/30/2019 8:15 AM
9 No. 4/29/2019 8:57 AM
10 No, aside from school zones 4/29/2019 8:06 AM
11 no 4/29/2019 7:05 AM
12 no 4/29/2019 6:42 AM
13 NO, the County has not tried variable speed limits. 4/26/2019 4:24 PM
14 No 4/26/2019 3:56 PM
15 No 4/26/2019 2:09 PM
16 No 4/26/2019 12:37 PM
18 / 22
City of St. Albert Speed Limit Review

islengineering.com
February 2020
Transportation Network Speed Limit Review
City of St. Albert
FINAL REPORT
APPENDIX CGEPSL Inputs B

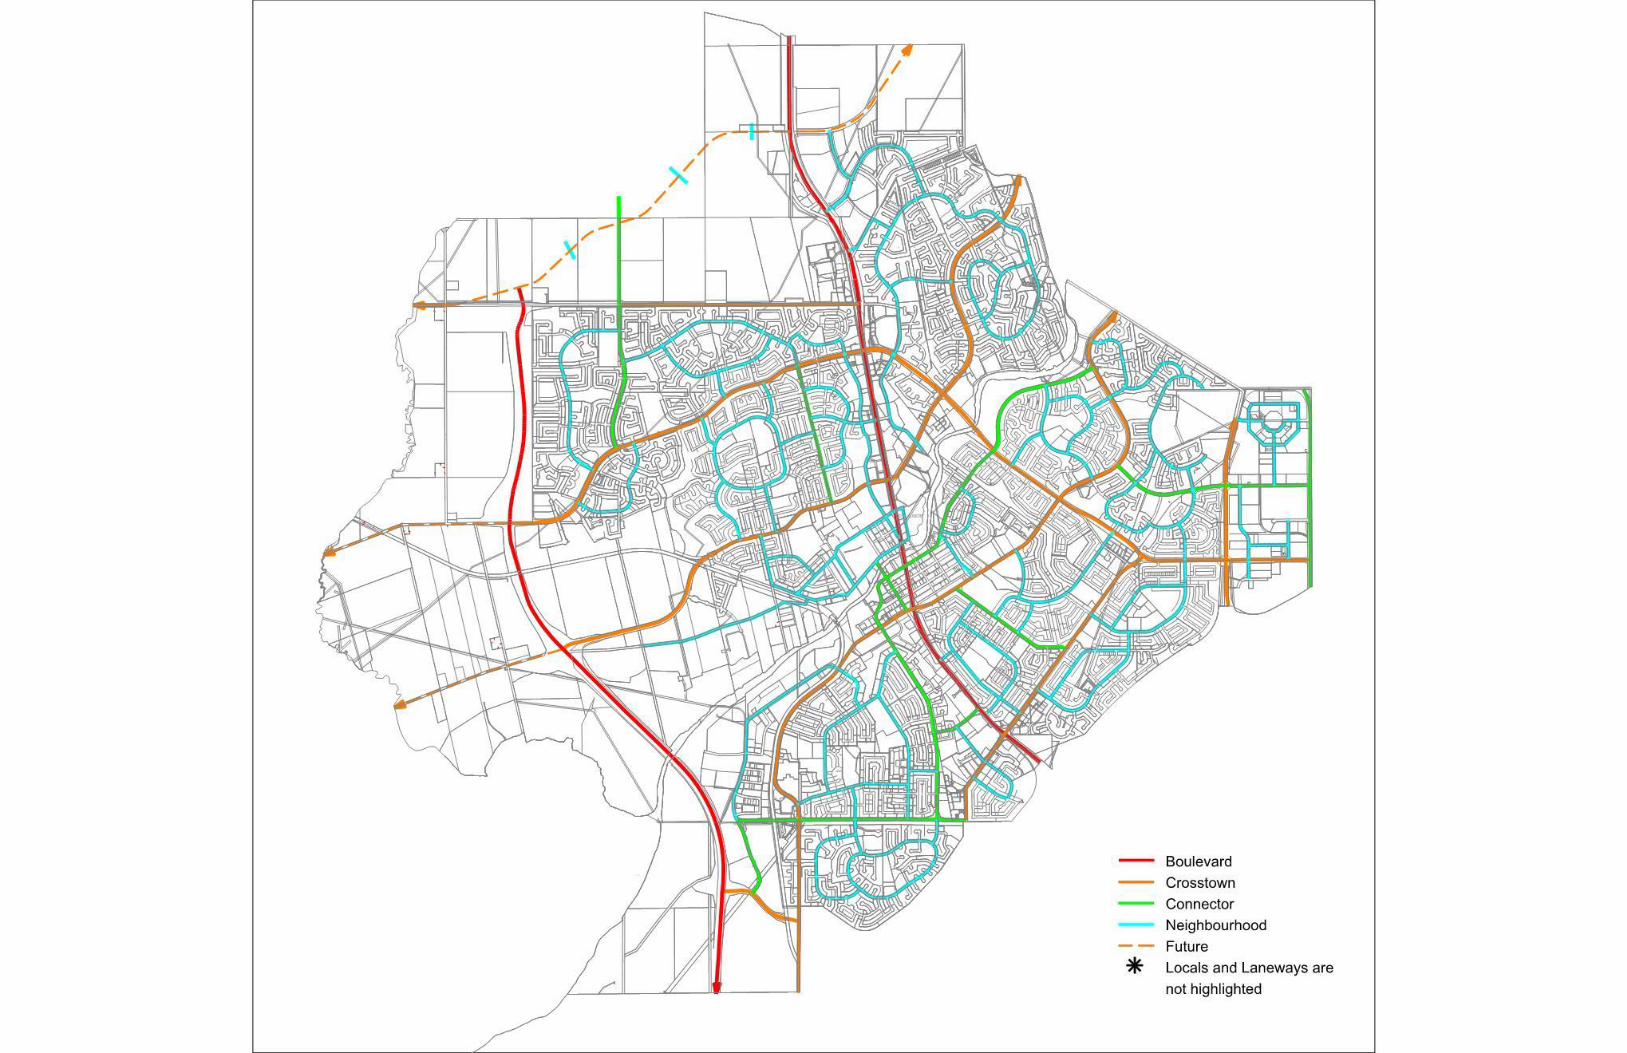


LAROSE DRIVE
DEER
RANKIN DRIVE
LACOMBE
RIDGEDRIVE
GIROUX ROAD
DENN
ISON
DR
LOCKHARTAVE
LAYDON DR
RIEL
BELLEROSE DR
OAKRIDGE
ROAD
GOODRIDGE
MISSION AVE
GATEWOOD
AVE
AVE
MALMO
LARSON
LAROSE
MISSION AVELANGLEY AVE
RIEL
DR
DEER RIDGE DR.
LAROSE DR
AVE
LEDDY AVE
SIR
WIN
STON
VILLENEUVE ROAD
DEERBOURNE
LANGHOLM
MILL DRIVE
GAINSBOROUGH
DELBROOK
DRIV
E
McKENNEY AVE
DRIVE
ST. VITA
L AVE
GREN
FELL
AVE
BLVD
LIBERTON
ST. VITAL AVE
GRESHAM
GRAHAM
HARWOOD
WAY
HARWOOD DRIVE
GRANDVILLE
ERIN
RIDGE D
RIVE
MUIR DR
INGLE WOOD
PERRON
GRANDIN ROAD
GROSVENOR
ROADERIN RIDGE
BOUDREAU
LIBERTON DRIVE
DR
MADONNA
MUIR
GRENFELL AVE
GROS
VENO
R
HERITAGE
ERIN
RID
GE D
R
INGLE
WOOD
BELL
EROSE
DR
IVE
ST. ANNE ST
HERITAGE DR
ROAD
BISHOP ST
SIR WINSTON
STERLING
LEVASSEUR ROAD
GRAN
DIN
ROAD
HUDSON RD
AVE
BELLEROSE
DRIVE
BURNHAM
CUNNINGHAM
BLVD
SALISBURY AVE
GRANGE DRIVE
GATE AVE
WAVERLY
SIR WINSTON
FORES
T
PARK
AKINS
BOUDREAU ROAD
SYCA
MORE
OAKM
ONT
OAKRIDGE
NORTH
FORES
T
ROAD
DRIVE
GLOUCESTER
WESTW
OODFA
IRVIEW
FARM
STEA
D
SUNSET BLVD
ST. ALBERT
HEBE
RT ROAD
FALSTAFF
WOOD
W ILLOUGHBY
DR
ATTW
OOD
ARLINGTON
ROADSTURGEON
ROAD
DRIVE HEBE
RT ROAD
KINGSWAY
POUNDMAKER ROAD
PARKWOODAVE
DRIVE
LANE
ATTWOOD DR
ARLINGTON DR
ALPIN
E BLVD
DR
KIRKWOOD
DR
PINE
VIEW
BLVD
PAGE DR
BOUDREAU ROAD
POIRIER AVE
DRIV
EKE
ILLOR
CARN
EGIE
DR
CAMP
BELL
ROA
D
CHEV
IGNY
ST
CHISHOLM
CORRIVEAU AVE
CURI
AL
CHAT
ELAI
N DR
VENE
SS
ROAD
ST. ALBERT TRAIL
SOUTH
ERIN RIDGEDRIVE
DORCHESTER DR
DAWSON ROAD
AKINS DRIVE
KINGSWOOD
DRIVE
RIEL DR
DRIVE
AVE
AVE
DR
HERITAGE
BLVD
HERITAGE
DR
BLVD
BOULEVARD
GRANITE
AVE
AVE
STREET
DRIVE
CHURCHILL AVE
AVE
AVEFOREST
DRIVE
BLVD
DRIVE
AVE
DRIVE
AVE
AVE
ROAD
DRIVE
DRIVE
DRIVELE
TON
DRIVE
DRIVE
DURHAM
BLVDLENNOX
DRIVE
DRIVE
ST
KINGS
WOOD
DR
PRIM
EAU
WOOD
DRIVE
ROAD
DRIVE
DRIVE
DRIVE
LANDS
LANDS
DRDRIVE
DRIVE
(MARK MESSIER TRAIL)
(170th
STR
EET)
GERVAIS
OAKLANDWAY
DUNBARSTREET
DRIV
E
CARLETON
DRIVE
CHUR
CHILL
AVE
RANGE ROAD 260
McKENNEY AVENUE
RAY GIBBON DRIVE
RANGE ROAD 260
VILLENEUVE ROAD
GIROUX ROAD LACOMBEDRIVE
RAY GIBBON DRIVE
ST. ALBERT TRAIL
CENTRE
CARLETON DRIVE
RIELDR
LECLAIRWAY
Range Road 253
VERSAILLES
AVENUENEVADAPLACE
EVERITT DRIVE NORTH
ELEMENT DRIVE NORTH
Sturgeon River
Sturge
on R
iver
Sturge
on R
iver
Big Lake
NEIL ROSS ROAD
BOULEVARDJENSEN LAKE
JOYAL WAY
JUBILATIONDRIVE
VILLEMAGNEROAD
VANDELOR
ROAD
STUR
GEON
TRAIL
CHURCHILL AVE
PINEVIEWDRIVE
CHUR
CHILL
SIR
WIN
STON
DR
SUNSET
STREETCENTRESTREET
NORTH RIDGE DR
HOGA
N RD
NORT
H RI
DGE
DRIV
E
ELDORADO DR
RAY GIBBON DRIVE
TACHE ST
MEADOWVIEW DRIVE
¯Speed Limits
LAYERPlayground ZoneSchool Zone Times
Speed limits20304050607080


islengineering.com
November 2019
Transportation Network Speed Limit Review
City of St. Albert
DRAFT REPORT
i
TAC Application Approach
Visual Definition of Risk Levels
Risk Criteria Level
Description Images
Lane Width
High – Narrow compared to similar roads
Appears narrow with minimal space for vehicle to move in lane.
Medium – Similar compared to similar roads
Appears to be an average size lane similar to other roadways of the same type.
Low – Wide compared to similar roads
Appears wide with a lot of space on either side of a vehicle in the lane.

ii Transportation Network Speed Limit Review
City of St. Albert
DRAFT REPORT
Integrated Expertise.
Locally Delivered.
Risk Criteria Level
Description Images
Roadside Hazards
Non – breakable
Utility poles
Large trees – based on judgement
Larger utility pedestals

islengineering.com
November 2019
Transportation Network Speed Limit Review
City of St. Albert
DRAFT REPORT
iii
Risk Criteria Level
Description Images
Mail boxes
Neighbourhood gateway signs
Jersey barriers
Wooden barrier

iv Transportation Network Speed Limit Review
City of St. Albert
DRAFT REPORT
Integrated Expertise.
Locally Delivered.
Risk Criteria Level
Description Images
Train crossing poles
Breakable Fences
Traffic control signage poles

islengineering.com
November 2019
Transportation Network Speed Limit Review
City of St. Albert
DRAFT REPORT
v
Risk Criteria Level
Description Images
Smaller trees – based on judgement
Smaller poles


islengineering.com
February 2020
Transportation Network Speed Limit Review
City of St. Albert
FINAL REPORT
APPENDIX CGEPSL Results C


FORM A
Automated Speed Limit Guidelines Version:FORM A - Automated Speed Limit Guidelines Spreadsheet 10-Apr-09
Name of Corridor: St. Anne Street 1
Segment Evaluated: St. Albert Trail to Glenview Cresent
Geographic Region: City of St. Albert
Road Agency: St. Ablert
Road Classification: Arterial Length of Corridor: 900 m
Urban / Rural: Urban Design Speed: (Required for Freeway,Expressway, Highway)
0 km/h
Divided / Undivided: Undivided Current Posted Speed:(For information only)
50 km/h
Major / Minor: Major Prevailing Speed:(85th Percentile - for information only)
29 km/h# Through LanesPer Direction: 2+ lanes Policy:
(Maximum Posted Speed)0 km/h
RISK Score
A1 GEOMETRY (Horizontal) Lower 2
A2 GEOMETRY (Vertical) Lower 2
A3 AVERAGE LANE WIDTH Medium 4 Total Risk Score:
B ROADSIDE HAZARDS Higher 3 87
C1 PEDESTRIAN EXPOSURE Medium 6
C2 CYCLIST EXPOSURE Higher 9
D PAVEMENT SURFACE Lower 1 Recommended PostedSpeed Limit (km/h):
E1
NUMBER OF INTERSECTIONSWITH PUBLIC ROADS
Number ofOccurrences
36
As determined by road characteristicsSTOP controlled intersection 0
50Signalized intersection 3
Roundabout or traffic circle 1 As determined by policyCrosswalk 3
0Active, at-grade railroad crossing 0
Sidestreet STOP-controlled or lane 1 The recommended posted speed limit may bechecked against the prevailing speeds of theroadway and the road's safety performance.
E2
NUMBER OF INTERSECTIONSWITH PRIVATE ACCESS DRIVEWAYS
Number ofOccurrences
15Left turn movements permitted 11 Comments:Right-in / Right-out only 4
E3NUMBER OF INTERCHANGES Number of
Occurrences 0Number of interchanges along corridor 0
F ON-STREET PARKING Higher 9

FORM A
Automated Speed Limit Guidelines Version:FORM A - Automated Speed Limit Guidelines Spreadsheet 10-Apr-09
Name of Corridor: Sturgeon Road 1
Segment Evaluated: St. Albert Trail to Burnham Ave
Geographic Region: City of St. Albert
Road Agency: St. Ablert
Road Classification: Arterial Length of Corridor: 500 m
Urban / Rural: Urban Design Speed: (Required for Freeway,Expressway, Highway)
0 km/h
Divided / Undivided: Undivided Current Posted Speed:(For information only)
30 km/h
Major / Minor: Major Prevailing Speed:(85th Percentile - for information only)
0 km/h# Through LanesPer Direction: 2+ lanes Policy:
(Maximum Posted Speed)0 km/h
RISK Score
A1 GEOMETRY (Horizontal) Lower 2
A2 GEOMETRY (Vertical) Lower 2
A3 AVERAGE LANE WIDTH Medium 4 Total Risk Score:
B ROADSIDE HAZARDS Higher 3 118
C1 PEDESTRIAN EXPOSURE Lower 3
C2 CYCLIST EXPOSURE Higher 9
D PAVEMENT SURFACE Lower 1 Recommended PostedSpeed Limit (km/h):
E1
NUMBER OF INTERSECTIONSWITH PUBLIC ROADS
Number ofOccurrences
76
As determined by road characteristicsSTOP controlled intersection 0
50Signalized intersection 1
Roundabout or traffic circle 0 As determined by policyCrosswalk 6
0Active, at-grade railroad crossing 0
Sidestreet STOP-controlled or lane 6 The recommended posted speed limit may bechecked against the prevailing speeds of theroadway and the road's safety performance.
E2
NUMBER OF INTERSECTIONSWITH PRIVATE ACCESS DRIVEWAYS
Number ofOccurrences
15Left turn movements permitted 7 Comments:Right-in / Right-out only 0
E3NUMBER OF INTERCHANGES Number of
Occurrences 0Number of interchanges along corridor 0
F ON-STREET PARKING Lower 3

FORM A
Automated Speed Limit Guidelines Version:FORM A - Automated Speed Limit Guidelines Spreadsheet 10-Apr-09
Name of Corridor: Sturgeon Road 2
Segment Evaluated: Burnham Ave to Boudreau Rd
Geographic Region: City of St. Albert
Road Agency: St. Ablert
Road Classification: Arterial Length of Corridor: 900 m
Urban / Rural: Urban Design Speed: (Required for Freeway,Expressway, Highway)
0 km/h
Divided / Undivided: Undivided Current Posted Speed:(For information only)
50 km/h
Major / Minor: Major Prevailing Speed:(85th Percentile - for information only)
55 km/h# Through LanesPer Direction: 2+ lanes Policy:
(Maximum Posted Speed)0 km/h
RISK Score
A1 GEOMETRY (Horizontal) Lower 2
A2 GEOMETRY (Vertical) Lower 2
A3 AVERAGE LANE WIDTH Medium 4 Total Risk Score:
B ROADSIDE HAZARDS Higher 3 47
C1 PEDESTRIAN EXPOSURE Lower 3
C2 CYCLIST EXPOSURE Higher 9
D PAVEMENT SURFACE Medium 2 Recommended PostedSpeed Limit (km/h):
E1
NUMBER OF INTERSECTIONSWITH PUBLIC ROADS
Number ofOccurrences
19
As determined by road characteristicsSTOP controlled intersection 0
70Signalized intersection 0
Roundabout or traffic circle 0 As determined by policyCrosswalk 3
0Active, at-grade railroad crossing 0
Sidestreet STOP-controlled or lane 4 The recommended posted speed limit may bechecked against the prevailing speeds of theroadway and the road's safety performance.
E2
NUMBER OF INTERSECTIONSWITH PRIVATE ACCESS DRIVEWAYS
Number ofOccurrences
0Left turn movements permitted 0 Comments:Right-in / Right-out only 0
E3NUMBER OF INTERCHANGES Number of
Occurrences 0Number of interchanges along corridor 0
F ON-STREET PARKING Lower 3

FORM A
Automated Speed Limit Guidelines Version:FORM A - Automated Speed Limit Guidelines Spreadsheet 10-Apr-09
Name of Corridor: Sturgeon Road 3
Segment Evaluated: Boudreau Rd to Sir Winston Churchill Ave
Geographic Region: City of St. Albert
Road Agency: St. Ablert
Road Classification: Arterial Length of Corridor: 1,380 m
Urban / Rural: Urban Design Speed: (Required for Freeway,Expressway, Highway)
0 km/h
Divided / Undivided: Undivided Current Posted Speed:(For information only)
50 km/h
Major / Minor: Major Prevailing Speed:(85th Percentile - for information only)
55 km/h# Through LanesPer Direction: 1 lane Policy:
(Maximum Posted Speed)0 km/h
RISK Score
A1 GEOMETRY (Horizontal) Lower 2
A2 GEOMETRY (Vertical) Lower 2
A3 AVERAGE LANE WIDTH Medium 4 Total Risk Score:
B ROADSIDE HAZARDS Higher 3 57
C1 PEDESTRIAN EXPOSURE Higher 9
C2 CYCLIST EXPOSURE Higher 9
D PAVEMENT SURFACE Lower 1 Recommended PostedSpeed Limit (km/h):
E1
NUMBER OF INTERSECTIONSWITH PUBLIC ROADS
Number ofOccurrences
11
As determined by road characteristicsSTOP controlled intersection 0
60Signalized intersection 0
Roundabout or traffic circle 0 As determined by policyCrosswalk 3
0Active, at-grade railroad crossing 0
Sidestreet STOP-controlled or lane 1 The recommended posted speed limit may bechecked against the prevailing speeds of theroadway and the road's safety performance.
E2
NUMBER OF INTERSECTIONSWITH PRIVATE ACCESS DRIVEWAYS
Number ofOccurrences
13Left turn movements permitted 9 Comments:Right-in / Right-out only 0
E3NUMBER OF INTERCHANGES Number of
Occurrences 0Number of interchanges along corridor 0
F ON-STREET PARKING Lower 3

FORM A
Automated Speed Limit Guidelines Version:FORM A - Automated Speed Limit Guidelines Spreadsheet 10-Apr-09
Name of Corridor: Boudreau Road 1
Segment Evaluated: 142 Street to Campbell Rd
Geographic Region: City of St. Albert
Road Agency: St. Ablert
Road Classification: Arterial Length of Corridor: 780 m
Urban / Rural: Urban Design Speed: (Required for Freeway,Expressway, Highway)
0 km/h
Divided / Undivided: Divided Current Posted Speed:(For information only)
60 km/h
Major / Minor: Major Prevailing Speed:(85th Percentile - for information only)
63 km/h# Through LanesPer Direction: 2+ lanes Policy:
(Maximum Posted Speed)0 km/h
RISK Score
A1 GEOMETRY (Horizontal) Lower 2
A2 GEOMETRY (Vertical) Lower 2
A3 AVERAGE LANE WIDTH Medium 4 Total Risk Score:
B ROADSIDE HAZARDS Higher 3 44
C1 PEDESTRIAN EXPOSURE Lower 3
C2 CYCLIST EXPOSURE Higher 9
D PAVEMENT SURFACE Lower 1 Recommended PostedSpeed Limit (km/h):
E1
NUMBER OF INTERSECTIONSWITH PUBLIC ROADS
Number ofOccurrences
7
As determined by road characteristicsSTOP controlled intersection 0
60Signalized intersection 1
Roundabout or traffic circle 0 As determined by policyCrosswalk 0
0Active, at-grade railroad crossing 0
Sidestreet STOP-controlled or lane 1 The recommended posted speed limit may bechecked against the prevailing speeds of theroadway and the road's safety performance.
E2
NUMBER OF INTERSECTIONSWITH PRIVATE ACCESS DRIVEWAYS
Number ofOccurrences
10Left turn movements permitted 3 Comments:Right-in / Right-out only 2
E3NUMBER OF INTERCHANGES Number of
Occurrences 0Number of interchanges along corridor 0
F ON-STREET PARKING Lower 3

FORM A
Automated Speed Limit Guidelines Version:FORM A - Automated Speed Limit Guidelines Spreadsheet 10-Apr-09
Name of Corridor: Boudreau Road 2
Segment Evaluated: Campbell Rd to Sir Winston Churchill Ave
Geographic Region: City of St. Albert
Road Agency: St. Ablert
Road Classification: Arterial Length of Corridor: 1,750 m
Urban / Rural: Urban Design Speed: (Required for Freeway,Expressway, Highway)
0 km/h
Divided / Undivided: Divided Current Posted Speed:(For information only)
60 km/h
Major / Minor: Major Prevailing Speed:(85th Percentile - for information only)
40 km/h# Through LanesPer Direction: 2+ lanes Policy:
(Maximum Posted Speed)0 km/h
RISK Score
A1 GEOMETRY (Horizontal) Lower 2
A2 GEOMETRY (Vertical) Lower 2
A3 AVERAGE LANE WIDTH Medium 4 Total Risk Score:
B ROADSIDE HAZARDS Medium 2 39
C1 PEDESTRIAN EXPOSURE Lower 3
C2 CYCLIST EXPOSURE Higher 9
D PAVEMENT SURFACE Lower 1 Recommended PostedSpeed Limit (km/h):
E1
NUMBER OF INTERSECTIONSWITH PUBLIC ROADS
Number ofOccurrences
11
As determined by road characteristicsSTOP controlled intersection 0
70Signalized intersection 4
Roundabout or traffic circle 0 As determined by policyCrosswalk 0
0Active, at-grade railroad crossing 0
Sidestreet STOP-controlled or lane 0 The recommended posted speed limit may bechecked against the prevailing speeds of theroadway and the road's safety performance.
E2
NUMBER OF INTERSECTIONSWITH PRIVATE ACCESS DRIVEWAYS
Number ofOccurrences
2Left turn movements permitted 0 Comments:Right-in / Right-out only 3
E3NUMBER OF INTERCHANGES Number of
Occurrences 0Number of interchanges along corridor 0
F ON-STREET PARKING Lower 3

FORM A
Automated Speed Limit Guidelines Version:FORM A - Automated Speed Limit Guidelines Spreadsheet 10-Apr-09
Name of Corridor: Boudreau Road 3
Segment Evaluated: Sir Winston Churchill Ave to Surgeon Rd
Geographic Region: City of St. Albert
Road Agency: St. Ablert
Road Classification: Arterial Length of Corridor: 770 m
Urban / Rural: Urban Design Speed: (Required for Freeway,Expressway, Highway)
0 km/h
Divided / Undivided: Divided Current Posted Speed:(For information only)
60 km/h
Major / Minor: Major Prevailing Speed:(85th Percentile - for information only)
40 km/h# Through LanesPer Direction: 2+ lanes Policy:
(Maximum Posted Speed)0 km/h
RISK Score
A1 GEOMETRY (Horizontal) Lower 2
A2 GEOMETRY (Vertical) Medium 4
A3 AVERAGE LANE WIDTH Medium 4 Total Risk Score:
B ROADSIDE HAZARDS Medium 2 42
C1 PEDESTRIAN EXPOSURE Lower 3
C2 CYCLIST EXPOSURE Higher 9
D PAVEMENT SURFACE Lower 1 Recommended PostedSpeed Limit (km/h):
E1
NUMBER OF INTERSECTIONSWITH PUBLIC ROADS
Number ofOccurrences
14
As determined by road characteristicsSTOP controlled intersection 0
60Signalized intersection 2
Roundabout or traffic circle 0 As determined by policyCrosswalk 0
0Active, at-grade railroad crossing 0
Sidestreet STOP-controlled or lane 1 The recommended posted speed limit may bechecked against the prevailing speeds of theroadway and the road's safety performance.
E2
NUMBER OF INTERSECTIONSWITH PRIVATE ACCESS DRIVEWAYS
Number ofOccurrences
0Left turn movements permitted 0 Comments:Right-in / Right-out only 0
E3NUMBER OF INTERCHANGES Number of
Occurrences 0Number of interchanges along corridor 0
F ON-STREET PARKING Lower 3

FORM A
Automated Speed Limit Guidelines Version:FORM A - Automated Speed Limit Guidelines Spreadsheet 10-Apr-09
Name of Corridor: Boudreau Road 4
Segment Evaluated: Surgeon Rd to Bellerose Dr
Geographic Region: City of St. Albert
Road Agency: St. Ablert
Road Classification: Arterial Length of Corridor: 690 m
Urban / Rural: Urban Design Speed: (Required for Freeway,Expressway, Highway)
0 km/h
Divided / Undivided: Divided Current Posted Speed:(For information only)
60 km/h
Major / Minor: Major Prevailing Speed:(85th Percentile - for information only)
65 km/h# Through LanesPer Direction: 2+ lanes Policy:
(Maximum Posted Speed)0 km/h
RISK Score
A1 GEOMETRY (Horizontal) Lower 2
A2 GEOMETRY (Vertical) Medium 4
A3 AVERAGE LANE WIDTH Medium 4 Total Risk Score:
B ROADSIDE HAZARDS Higher 3 44
C1 PEDESTRIAN EXPOSURE Lower 3
C2 CYCLIST EXPOSURE Lower 3
D PAVEMENT SURFACE Lower 1 Recommended PostedSpeed Limit (km/h):
E1
NUMBER OF INTERSECTIONSWITH PUBLIC ROADS
Number ofOccurrences
14
As determined by road characteristicsSTOP controlled intersection 0
60Signalized intersection 2
Roundabout or traffic circle 0 As determined by policyCrosswalk 0
0Active, at-grade railroad crossing 0
Sidestreet STOP-controlled or lane 0 The recommended posted speed limit may bechecked against the prevailing speeds of theroadway and the road's safety performance.
E2
NUMBER OF INTERSECTIONSWITH PRIVATE ACCESS DRIVEWAYS
Number ofOccurrences
7Left turn movements permitted 2 Comments:Right-in / Right-out only 1
E3NUMBER OF INTERCHANGES Number of
Occurrences 0Number of interchanges along corridor 0
F ON-STREET PARKING Lower 3

FORM A
Automated Speed Limit Guidelines Version:FORM A - Automated Speed Limit Guidelines Spreadsheet 10-Apr-09
Name of Corridor: Boudreau Road 5
Segment Evaluated: Bellerose Dr to Inglewood Dr
Geographic Region: City of St. Albert
Road Agency: St. Ablert
Road Classification: Arterial Length of Corridor: 600 m
Urban / Rural: Urban Design Speed: (Required for Freeway,Expressway, Highway)
0 km/h
Divided / Undivided: Divided Current Posted Speed:(For information only)
60 km/h
Major / Minor: Major Prevailing Speed:(85th Percentile - for information only)
60 km/h# Through LanesPer Direction: 2+ lanes Policy:
(Maximum Posted Speed)0 km/h
RISK Score
A1 GEOMETRY (Horizontal) Lower 2
A2 GEOMETRY (Vertical) Medium 4
A3 AVERAGE LANE WIDTH Medium 4 Total Risk Score:
B ROADSIDE HAZARDS Medium 2 46
C1 PEDESTRIAN EXPOSURE Lower 3
C2 CYCLIST EXPOSURE Higher 9
D PAVEMENT SURFACE Lower 1 Recommended PostedSpeed Limit (km/h):
E1
NUMBER OF INTERSECTIONSWITH PUBLIC ROADS
Number ofOccurrences
18
As determined by road characteristicsSTOP controlled intersection 0
60Signalized intersection 2
Roundabout or traffic circle 0 As determined by policyCrosswalk 0
0Active, at-grade railroad crossing 0
Sidestreet STOP-controlled or lane 1 The recommended posted speed limit may bechecked against the prevailing speeds of theroadway and the road's safety performance.
E2
NUMBER OF INTERSECTIONSWITH PRIVATE ACCESS DRIVEWAYS
Number ofOccurrences
0Left turn movements permitted 0 Comments:Right-in / Right-out only 0
E3NUMBER OF INTERCHANGES Number of
Occurrences 0Number of interchanges along corridor 0
F ON-STREET PARKING Lower 3

FORM A
Automated Speed Limit Guidelines Version:FORM A - Automated Speed Limit Guidelines Spreadsheet 10-Apr-09
Name of Corridor: Boudreau Road 6
Segment Evaluated: Inglewood Dr to Dunbar St
Geographic Region: City of St. Albert
Road Agency: St. Ablert
Road Classification: Arterial Length of Corridor: 500 m
Urban / Rural: Urban Design Speed: (Required for Freeway,Expressway, Highway)
0 km/h
Divided / Undivided: Divided Current Posted Speed:(For information only)
60 km/h
Major / Minor: Major Prevailing Speed:(85th Percentile - for information only)
0 km/h# Through LanesPer Direction: 2+ lanes Policy:
(Maximum Posted Speed)0 km/h
RISK Score
A1 GEOMETRY (Horizontal) Lower 2
A2 GEOMETRY (Vertical) Lower 2
A3 AVERAGE LANE WIDTH Medium 4 Total Risk Score:
B ROADSIDE HAZARDS Medium 2 70
C1 PEDESTRIAN EXPOSURE Lower 3
C2 CYCLIST EXPOSURE Higher 9
D PAVEMENT SURFACE Lower 1 Recommended PostedSpeed Limit (km/h):
E1
NUMBER OF INTERSECTIONSWITH PUBLIC ROADS
Number ofOccurrences
30
As determined by road characteristicsSTOP controlled intersection 0
50Signalized intersection 3
Roundabout or traffic circle 0 As determined by policyCrosswalk 0
0Active, at-grade railroad crossing 0
Sidestreet STOP-controlled or lane 0 The recommended posted speed limit may bechecked against the prevailing speeds of theroadway and the road's safety performance.
E2
NUMBER OF INTERSECTIONSWITH PRIVATE ACCESS DRIVEWAYS
Number ofOccurrences
14Left turn movements permitted 1 Comments:Right-in / Right-out only 5
E3NUMBER OF INTERCHANGES Number of
Occurrences 0Number of interchanges along corridor 0
F ON-STREET PARKING Lower 3

FORM A
Automated Speed Limit Guidelines Version:FORM A - Automated Speed Limit Guidelines Spreadsheet 10-Apr-09
Name of Corridor: Giroux Road 1
Segment Evaluated: Ray Gibbon Dr to Hogan Rd
Geographic Region: City of St. Albert
Road Agency: St. Ablert
Road Classification: Arterial Length of Corridor: 1,350 m
Urban / Rural: Urban Design Speed: (Required for Freeway,Expressway, Highway)
0 km/h
Divided / Undivided: Divided Current Posted Speed:(For information only)
60 km/h
Major / Minor: Major Prevailing Speed:(85th Percentile - for information only)
62 km/h# Through LanesPer Direction: 2+ lanes Policy:
(Maximum Posted Speed)0 km/h
RISK Score
A1 GEOMETRY (Horizontal) Lower 2
A2 GEOMETRY (Vertical) Lower 2
A3 AVERAGE LANE WIDTH Medium 4 Total Risk Score:
B ROADSIDE HAZARDS Medium 2 49
C1 PEDESTRIAN EXPOSURE Lower 3
C2 CYCLIST EXPOSURE Higher 9
D PAVEMENT SURFACE Lower 1 Recommended PostedSpeed Limit (km/h):
E1
NUMBER OF INTERSECTIONSWITH PUBLIC ROADS
Number ofOccurrences
19
As determined by road characteristicsSTOP controlled intersection 0
60Signalized intersection 4
Roundabout or traffic circle 0 As determined by policyCrosswalk 1
0Active, at-grade railroad crossing 0
Sidestreet STOP-controlled or lane 2 The recommended posted speed limit may bechecked against the prevailing speeds of theroadway and the road's safety performance.
E2
NUMBER OF INTERSECTIONSWITH PRIVATE ACCESS DRIVEWAYS
Number ofOccurrences
4Left turn movements permitted 2 Comments:Right-in / Right-out only 1
E3NUMBER OF INTERCHANGES Number of
Occurrences 0Number of interchanges along corridor 0
F ON-STREET PARKING Lower 3

FORM A
Automated Speed Limit Guidelines Version:FORM A - Automated Speed Limit Guidelines Spreadsheet 10-Apr-09
Name of Corridor: Giroux Road 2
Segment Evaluated: Hogan Rd to Dunbar St
Geographic Region: City of St. Albert
Road Agency: St. Ablert
Road Classification: Arterial Length of Corridor: 2,330 m
Urban / Rural: Urban Design Speed: (Required for Freeway,Expressway, Highway)
0 km/h
Divided / Undivided: Divided Current Posted Speed:(For information only)
60 km/h
Major / Minor: Major Prevailing Speed:(85th Percentile - for information only)
62 km/h# Through LanesPer Direction: 2+ lanes Policy:
(Maximum Posted Speed)0 km/h
RISK Score
A1 GEOMETRY (Horizontal) Higher 6
A2 GEOMETRY (Vertical) Lower 2
A3 AVERAGE LANE WIDTH Medium 4 Total Risk Score:
B ROADSIDE HAZARDS Medium 2 53
C1 PEDESTRIAN EXPOSURE Lower 3
C2 CYCLIST EXPOSURE Higher 9
D PAVEMENT SURFACE Lower 1 Recommended PostedSpeed Limit (km/h):
E1
NUMBER OF INTERSECTIONSWITH PUBLIC ROADS
Number ofOccurrences
20
As determined by road characteristicsSTOP controlled intersection 0
60Signalized intersection 6
Roundabout or traffic circle 0 As determined by policyCrosswalk 3
0Active, at-grade railroad crossing 0
Sidestreet STOP-controlled or lane 3 The recommended posted speed limit may bechecked against the prevailing speeds of theroadway and the road's safety performance.
E2
NUMBER OF INTERSECTIONSWITH PRIVATE ACCESS DRIVEWAYS
Number ofOccurrences
3Left turn movements permitted 2 Comments:Right-in / Right-out only 2
E3NUMBER OF INTERCHANGES Number of
Occurrences 0Number of interchanges along corridor 0
F ON-STREET PARKING Lower 3

FORM A
Automated Speed Limit Guidelines Version:FORM A - Automated Speed Limit Guidelines Spreadsheet 10-Apr-09
Name of Corridor: McKenney Avenue / Bellerose Drive 1
Segment Evaluated: Liberton Dr to Inglewood Dr
Geographic Region: City of St. Albert
Road Agency: St. Ablert
Road Classification: Arterial Length of Corridor: 640 m
Urban / Rural: Urban Design Speed: (Required for Freeway,Expressway, Highway)
0 km/h
Divided / Undivided: Divided Current Posted Speed:(For information only)
50 km/h
Major / Minor: Major Prevailing Speed:(85th Percentile - for information only)
0 km/h# Through LanesPer Direction: 2+ lanes Policy:
(Maximum Posted Speed)0 km/h
RISK Score
A1 GEOMETRY (Horizontal) Lower 2
A2 GEOMETRY (Vertical) Lower 2
A3 AVERAGE LANE WIDTH Medium 4 Total Risk Score:
B ROADSIDE HAZARDS Higher 3 64
C1 PEDESTRIAN EXPOSURE Lower 3
C2 CYCLIST EXPOSURE Higher 9
D PAVEMENT SURFACE Lower 1 Recommended PostedSpeed Limit (km/h):
E1
NUMBER OF INTERSECTIONSWITH PUBLIC ROADS
Number ofOccurrences
23
As determined by road characteristicsSTOP controlled intersection 0
50Signalized intersection 3
Roundabout or traffic circle 0 As determined by policyCrosswalk 0
0Active, at-grade railroad crossing 0
Sidestreet STOP-controlled or lane 0 The recommended posted speed limit may bechecked against the prevailing speeds of theroadway and the road's safety performance.
E2
NUMBER OF INTERSECTIONSWITH PRIVATE ACCESS DRIVEWAYS
Number ofOccurrences
14Left turn movements permitted 0 Comments:Right-in / Right-out only 9
E3NUMBER OF INTERCHANGES Number of
Occurrences 0Number of interchanges along corridor 0
F ON-STREET PARKING Lower 3

FORM A
Automated Speed Limit Guidelines Version:FORM A - Automated Speed Limit Guidelines Spreadsheet 10-Apr-09
Name of Corridor: Bellerose Drive 2
Segment Evaluated: Inglewood Dr to Evergreen Dr
Geographic Region: City of St. Albert
Road Agency: St. Ablert
Road Classification: Arterial Length of Corridor: 730 m
Urban / Rural: Urban Design Speed: (Required for Freeway,Expressway, Highway)
0 km/h
Divided / Undivided: Divided Current Posted Speed:(For information only)
50 km/h
Major / Minor: Major Prevailing Speed:(85th Percentile - for information only)
0 km/h# Through LanesPer Direction: 2+ lanes Policy:
(Maximum Posted Speed)0 km/h
RISK Score
A1 GEOMETRY (Horizontal) Lower 2
A2 GEOMETRY (Vertical) Lower 2
A3 AVERAGE LANE WIDTH Lower 2 Total Risk Score:
B ROADSIDE HAZARDS Higher 3 56
C1 PEDESTRIAN EXPOSURE Lower 3
C2 CYCLIST EXPOSURE Lower 3
D PAVEMENT SURFACE Lower 1 Recommended PostedSpeed Limit (km/h):
E1
NUMBER OF INTERSECTIONSWITH PUBLIC ROADS
Number ofOccurrences
22
As determined by road characteristicsSTOP controlled intersection 0
60Signalized intersection 2
Roundabout or traffic circle 0 As determined by policyCrosswalk 1
0Active, at-grade railroad crossing 0
Sidestreet STOP-controlled or lane 2 The recommended posted speed limit may bechecked against the prevailing speeds of theroadway and the road's safety performance.
E2
NUMBER OF INTERSECTIONSWITH PRIVATE ACCESS DRIVEWAYS
Number ofOccurrences
15Left turn movements permitted 6 Comments:Right-in / Right-out only 0
E3NUMBER OF INTERCHANGES Number of
Occurrences 0Number of interchanges along corridor 0
F ON-STREET PARKING Lower 3

FORM A
Automated Speed Limit Guidelines Version:FORM A - Automated Speed Limit Guidelines Spreadsheet 10-Apr-09
Name of Corridor: Bellerose Drive 3
Segment Evaluated: Evergreen Dr to 145m North of Edward Way
Geographic Region: City of St. Albert
Road Agency: St. Ablert
Road Classification: Arterial Length of Corridor: 660 m
Urban / Rural: Urban Design Speed: (Required for Freeway,Expressway, Highway)
0 km/h
Divided / Undivided: Divided Current Posted Speed:(For information only)
50 km/h
Major / Minor: Major Prevailing Speed:(85th Percentile - for information only)
60 km/h# Through LanesPer Direction: 2+ lanes Policy:
(Maximum Posted Speed)0 km/h
RISK Score
A1 GEOMETRY (Horizontal) Lower 2
A2 GEOMETRY (Vertical) Lower 2
A3 AVERAGE LANE WIDTH Medium 4 Total Risk Score:
B ROADSIDE HAZARDS Lower 1 34
C1 PEDESTRIAN EXPOSURE Lower 3
C2 CYCLIST EXPOSURE Lower 3
D PAVEMENT SURFACE Lower 1 Recommended PostedSpeed Limit (km/h):
E1
NUMBER OF INTERSECTIONSWITH PUBLIC ROADS
Number ofOccurrences
15
As determined by road characteristicsSTOP controlled intersection 0
70Signalized intersection 2
Roundabout or traffic circle 0 As determined by policyCrosswalk 0
0Active, at-grade railroad crossing 0
Sidestreet STOP-controlled or lane 0 The recommended posted speed limit may bechecked against the prevailing speeds of theroadway and the road's safety performance.
E2
NUMBER OF INTERSECTIONSWITH PRIVATE ACCESS DRIVEWAYS
Number ofOccurrences
0Left turn movements permitted 0 Comments:Right-in / Right-out only 0
E3NUMBER OF INTERCHANGES Number of
Occurrences 0Number of interchanges along corridor 0
F ON-STREET PARKING Lower 3

FORM A
Automated Speed Limit Guidelines Version:FORM A - Automated Speed Limit Guidelines Spreadsheet 10-Apr-09
Name of Corridor: Bellerose Drive 5
Segment Evaluated: Empress Way to Coal Mine Rd
Geographic Region: City of St. Albert
Road Agency: St. Ablert
Road Classification: Arterial Length of Corridor: 820 m
Urban / Rural: Urban Design Speed: (Required for Freeway,Expressway, Highway)
0 km/h
Divided / Undivided: Undivided Current Posted Speed:(For information only)
50 km/h
Major / Minor: Major Prevailing Speed:(85th Percentile - for information only)
55 km/h# Through LanesPer Direction: 1 lane Policy:
(Maximum Posted Speed)0 km/h
RISK Score
A1 GEOMETRY (Horizontal) Lower 2
A2 GEOMETRY (Vertical) Lower 2
A3 AVERAGE LANE WIDTH Medium 4 Total Risk Score:
B ROADSIDE HAZARDS Lower 1 32
C1 PEDESTRIAN EXPOSURE Lower 3
C2 CYCLIST EXPOSURE Lower 3
D PAVEMENT SURFACE Lower 1 Recommended PostedSpeed Limit (km/h):
E1
NUMBER OF INTERSECTIONSWITH PUBLIC ROADS
Number ofOccurrences
13
As determined by road characteristicsSTOP controlled intersection 0
70Signalized intersection 0
Roundabout or traffic circle 0 As determined by policyCrosswalk 2
0Active, at-grade railroad crossing 0
Sidestreet STOP-controlled or lane 2 The recommended posted speed limit may bechecked against the prevailing speeds of theroadway and the road's safety performance.
E2
NUMBER OF INTERSECTIONSWITH PRIVATE ACCESS DRIVEWAYS
Number ofOccurrences
0Left turn movements permitted 0 Comments:Right-in / Right-out only 0
E3NUMBER OF INTERCHANGES Number of
Occurrences 0Number of interchanges along corridor 0
F ON-STREET PARKING Lower 3

FORM A
Automated Speed Limit Guidelines Version:FORM A - Automated Speed Limit Guidelines Spreadsheet 10-Apr-09
Name of Corridor: Campbell Road
Segment Evaluated: Centre St to 400m South of Boudreay rd
Geographic Region: City of St. Albert
Road Agency: St. Ablert
Road Classification: Arterial Length of Corridor: 1,730 m
Urban / Rural: Urban Design Speed: (Required for Freeway,Expressway, Highway)
0 km/h
Divided / Undivided: Divided Current Posted Speed:(For information only)
60 km/h
Major / Minor: Major Prevailing Speed:(85th Percentile - for information only)
65 km/h# Through LanesPer Direction: 2+ lanes Policy:
(Maximum Posted Speed)0 km/h
RISK Score
A1 GEOMETRY (Horizontal) Lower 2
A2 GEOMETRY (Vertical) Lower 2
A3 AVERAGE LANE WIDTH Medium 4 Total Risk Score:
B ROADSIDE HAZARDS Higher 3 41
C1 PEDESTRIAN EXPOSURE Lower 3
C2 CYCLIST EXPOSURE Higher 9
D PAVEMENT SURFACE Lower 1 Recommended PostedSpeed Limit (km/h):
E1
NUMBER OF INTERSECTIONSWITH PUBLIC ROADS
Number ofOccurrences
9
As determined by road characteristicsSTOP controlled intersection 0
70Signalized intersection 3
Roundabout or traffic circle 0 As determined by policyCrosswalk 0
0Active, at-grade railroad crossing 0
Sidestreet STOP-controlled or lane 1 The recommended posted speed limit may bechecked against the prevailing speeds of theroadway and the road's safety performance.
E2
NUMBER OF INTERSECTIONSWITH PRIVATE ACCESS DRIVEWAYS
Number ofOccurrences
5Left turn movements permitted 3 Comments:Right-in / Right-out only 3
E3NUMBER OF INTERCHANGES Number of
Occurrences 0Number of interchanges along corridor 0
F ON-STREET PARKING Lower 3

FORM A
Automated Speed Limit Guidelines Version:FORM A - Automated Speed Limit Guidelines Spreadsheet 10-Apr-09
Name of Corridor: Corriveau Avenue
Segment Evaluated: Campbell Rd to 142 St
Geographic Region: City of St. Albert
Road Agency: St. Ablert
Road Classification: Arterial Length of Corridor: 790 m
Urban / Rural: Urban Design Speed: (Required for Freeway,Expressway, Highway)
0 km/h
Divided / Undivided: Undivided Current Posted Speed:(For information only)
50 km/h
Major / Minor: Major Prevailing Speed:(85th Percentile - for information only)
43 km/h# Through LanesPer Direction: 2+ lanes Policy:
(Maximum Posted Speed)0 km/h
RISK Score
A1 GEOMETRY (Horizontal) Lower 2
A2 GEOMETRY (Vertical) Lower 2
A3 AVERAGE LANE WIDTH Medium 4 Total Risk Score:
B ROADSIDE HAZARDS Lower 1 69
C1 PEDESTRIAN EXPOSURE Higher 9
C2 CYCLIST EXPOSURE Higher 9
D PAVEMENT SURFACE Lower 1 Recommended PostedSpeed Limit (km/h):
E1
NUMBER OF INTERSECTIONSWITH PUBLIC ROADS
Number ofOccurrences
26
As determined by road characteristicsSTOP controlled intersection 1
50Signalized intersection 1
Roundabout or traffic circle 0 As determined by policyCrosswalk 2
0Active, at-grade railroad crossing 1
Sidestreet STOP-controlled or lane 2 The recommended posted speed limit may bechecked against the prevailing speeds of theroadway and the road's safety performance.
E2
NUMBER OF INTERSECTIONSWITH PRIVATE ACCESS DRIVEWAYS
Number ofOccurrences
15Left turn movements permitted 17 Comments:Right-in / Right-out only 1
E3NUMBER OF INTERCHANGES Number of
Occurrences 0Number of interchanges along corridor 0
F ON-STREET PARKING N/A 0

FORM A
Automated Speed Limit Guidelines Version:FORM A - Automated Speed Limit Guidelines Spreadsheet 10-Apr-09
Name of Corridor: Dawson Road
Segment Evaluated: Giroux Rd to McKenney Ave
Geographic Region: City of St. Albert
Road Agency: St. Ablert
Road Classification: Arterial Length of Corridor: 1,330 m
Urban / Rural: Urban Design Speed: (Required for Freeway,Expressway, Highway)
0 km/h
Divided / Undivided: Undivided Current Posted Speed:(For information only)
50 km/h
Major / Minor: Major Prevailing Speed:(85th Percentile - for information only)
39 km/h# Through LanesPer Direction: 2+ lanes Policy:
(Maximum Posted Speed)0 km/h
RISK Score
A1 GEOMETRY (Horizontal) Lower 2
A2 GEOMETRY (Vertical) Lower 2
A3 AVERAGE LANE WIDTH Medium 4 Total Risk Score:
B ROADSIDE HAZARDS Higher 3 47
C1 PEDESTRIAN EXPOSURE Lower 3
C2 CYCLIST EXPOSURE Higher 9
D PAVEMENT SURFACE Medium 2 Recommended PostedSpeed Limit (km/h):
E1
NUMBER OF INTERSECTIONSWITH PUBLIC ROADS
Number ofOccurrences
17
As determined by road characteristicsSTOP controlled intersection 0
70Signalized intersection 2
Roundabout or traffic circle 0 As determined by policyCrosswalk 2
0Active, at-grade railroad crossing 0
Sidestreet STOP-controlled or lane 6 The recommended posted speed limit may bechecked against the prevailing speeds of theroadway and the road's safety performance.
E2
NUMBER OF INTERSECTIONSWITH PRIVATE ACCESS DRIVEWAYS
Number ofOccurrences
2Left turn movements permitted 1 Comments:Right-in / Right-out only 0
E3NUMBER OF INTERCHANGES Number of
Occurrences 0Number of interchanges along corridor 0
F ON-STREET PARKING Lower 3

FORM A
Automated Speed Limit Guidelines Version:FORM A - Automated Speed Limit Guidelines Spreadsheet 10-Apr-09
Name of Corridor: Gate Avenue
Segment Evaluated: Grandon Rd to St Albert Trail
Geographic Region: City of St. Albert
Road Agency: St. Ablert
Road Classification: Arterial Length of Corridor: 490 m
Urban / Rural: Urban Design Speed: (Required for Freeway,Expressway, Highway)
0 km/h
Divided / Undivided: Undivided Current Posted Speed:(For information only)
50 km/h
Major / Minor: Major Prevailing Speed:(85th Percentile - for information only)
36 km/h# Through LanesPer Direction: 2+ lanes Policy:
(Maximum Posted Speed)0 km/h
RISK Score
A1 GEOMETRY (Horizontal) Lower 2
A2 GEOMETRY (Vertical) Lower 2
A3 AVERAGE LANE WIDTH Medium 4 Total Risk Score:
B ROADSIDE HAZARDS Higher 3 82
C1 PEDESTRIAN EXPOSURE Lower 3
C2 CYCLIST EXPOSURE Higher 9
D PAVEMENT SURFACE Lower 1 Recommended PostedSpeed Limit (km/h):
E1
NUMBER OF INTERSECTIONSWITH PUBLIC ROADS
Number ofOccurrences
40
As determined by road characteristicsSTOP controlled intersection 1
50Signalized intersection 1
Roundabout or traffic circle 0 As determined by policyCrosswalk 2
0Active, at-grade railroad crossing 0
Sidestreet STOP-controlled or lane 1 The recommended posted speed limit may bechecked against the prevailing speeds of theroadway and the road's safety performance.
E2
NUMBER OF INTERSECTIONSWITH PRIVATE ACCESS DRIVEWAYS
Number ofOccurrences
15Left turn movements permitted 8 Comments:Right-in / Right-out only 0
E3NUMBER OF INTERCHANGES Number of
Occurrences 0Number of interchanges along corridor 0
F ON-STREET PARKING Lower 3

FORM A
Automated Speed Limit Guidelines Version:FORM A - Automated Speed Limit Guidelines Spreadsheet 10-Apr-09
Name of Corridor: Gervais Road 1
Segment Evaluated: Levasseur rd to Gloucester dr
Geographic Region: City of St. Albert
Road Agency: St. Ablert
Road Classification: Arterial Length of Corridor: 590 m
Urban / Rural: Urban Design Speed: (Required for Freeway,Expressway, Highway)
0 km/h
Divided / Undivided: Divided Current Posted Speed:(For information only)
50 km/h
Major / Minor: Major Prevailing Speed:(85th Percentile - for information only)
57 km/h# Through LanesPer Direction: 2+ lanes Policy:
(Maximum Posted Speed)0 km/h
RISK Score
A1 GEOMETRY (Horizontal) Lower 2
A2 GEOMETRY (Vertical) Lower 2
A3 AVERAGE LANE WIDTH Medium 4 Total Risk Score:
B ROADSIDE HAZARDS Medium 2 50
C1 PEDESTRIAN EXPOSURE Lower 3
C2 CYCLIST EXPOSURE Higher 9
D PAVEMENT SURFACE Medium 2 Recommended PostedSpeed Limit (km/h):
E1
NUMBER OF INTERSECTIONSWITH PUBLIC ROADS
Number ofOccurrences
18
As determined by road characteristicsSTOP controlled intersection 0
60Signalized intersection 1
Roundabout or traffic circle 0 As determined by policyCrosswalk 1
0Active, at-grade railroad crossing 0
Sidestreet STOP-controlled or lane 1 The recommended posted speed limit may bechecked against the prevailing speeds of theroadway and the road's safety performance.
E2
NUMBER OF INTERSECTIONSWITH PRIVATE ACCESS DRIVEWAYS
Number ofOccurrences
5Left turn movements permitted 1 Comments:Right-in / Right-out only 1
E3NUMBER OF INTERCHANGES Number of
Occurrences 0Number of interchanges along corridor 0
F ON-STREET PARKING Lower 3

FORM A
Automated Speed Limit Guidelines Version:FORM A - Automated Speed Limit Guidelines Spreadsheet 10-Apr-09
Name of Corridor: Grandin Road 1
Segment Evaluated: Levasseur rd to Gilchrist Pl
Geographic Region: City of St. Albert
Road Agency: St. Ablert
Road Classification: Arterial Length of Corridor: 1,100 m
Urban / Rural: Urban Design Speed: (Required for Freeway,Expressway, Highway)
0 km/h
Divided / Undivided: Undivided Current Posted Speed:(For information only)
50 km/h
Major / Minor: Major Prevailing Speed:(85th Percentile - for information only)
55 km/h# Through LanesPer Direction: 2+ lanes Policy:
(Maximum Posted Speed)0 km/h
RISK Score
A1 GEOMETRY (Horizontal) Lower 2
A2 GEOMETRY (Vertical) Lower 2
A3 AVERAGE LANE WIDTH Medium 4 Total Risk Score:
B ROADSIDE HAZARDS Medium 2 60
C1 PEDESTRIAN EXPOSURE Lower 3
C2 CYCLIST EXPOSURE Higher 9
D PAVEMENT SURFACE Lower 1 Recommended PostedSpeed Limit (km/h):
E1
NUMBER OF INTERSECTIONSWITH PUBLIC ROADS
Number ofOccurrences
27
As determined by road characteristicsSTOP controlled intersection 0
60Signalized intersection 2
Roundabout or traffic circle 0 As determined by policyCrosswalk 3
0Active, at-grade railroad crossing 0
Sidestreet STOP-controlled or lane 10 The recommended posted speed limit may bechecked against the prevailing speeds of theroadway and the road's safety performance.
E2
NUMBER OF INTERSECTIONSWITH PRIVATE ACCESS DRIVEWAYS
Number ofOccurrences
7Left turn movements permitted 4 Comments:Right-in / Right-out only 0
E3NUMBER OF INTERCHANGES Number of
Occurrences 0Number of interchanges along corridor 0
F ON-STREET PARKING Lower 3

FORM A
Automated Speed Limit Guidelines Version:FORM A - Automated Speed Limit Guidelines Spreadsheet 10-Apr-09
Name of Corridor: Grandin Road 2
Segment Evaluated: Glichrisht Pl to Glenview Cresent
Geographic Region: City of St. Albert
Road Agency: St. Ablert
Road Classification: Arterial Length of Corridor: 710 m
Urban / Rural: Urban Design Speed: (Required for Freeway,Expressway, Highway)
0 km/h
Divided / Undivided: Undivided Current Posted Speed:(For information only)
50 km/h
Major / Minor: Major Prevailing Speed:(85th Percentile - for information only)
41 km/h# Through LanesPer Direction: 2+ lanes Policy:
(Maximum Posted Speed)0 km/h
RISK Score
A1 GEOMETRY (Horizontal) Lower 2
A2 GEOMETRY (Vertical) Medium 4
A3 AVERAGE LANE WIDTH Medium 4 Total Risk Score:
B ROADSIDE HAZARDS Higher 3 64
C1 PEDESTRIAN EXPOSURE Lower 3
C2 CYCLIST EXPOSURE Higher 9
D PAVEMENT SURFACE Lower 1 Recommended PostedSpeed Limit (km/h):
E1
NUMBER OF INTERSECTIONSWITH PUBLIC ROADS
Number ofOccurrences
31
As determined by road characteristicsSTOP controlled intersection 0
60Signalized intersection 0
Roundabout or traffic circle 0 As determined by policyCrosswalk 4
0Active, at-grade railroad crossing 0
Sidestreet STOP-controlled or lane 4 The recommended posted speed limit may bechecked against the prevailing speeds of theroadway and the road's safety performance.
E2
NUMBER OF INTERSECTIONSWITH PRIVATE ACCESS DRIVEWAYS
Number ofOccurrences
4Left turn movements permitted 1 Comments:Right-in / Right-out only 1
E3NUMBER OF INTERCHANGES Number of
Occurrences 0Number of interchanges along corridor 0
F ON-STREET PARKING Lower 3

FORM A
Automated Speed Limit Guidelines Version:FORM A - Automated Speed Limit Guidelines Spreadsheet 10-Apr-09
Name of Corridor: Gervais Road / Herbert Road 1
Segment Evaluated: Gloucester Dr to Arlington Dr
Geographic Region: City of St. Albert
Road Agency: St. Ablert
Road Classification: Arterial Length of Corridor: 840 m
Urban / Rural: Urban Design Speed: (Required for Freeway,Expressway, Highway)
0 km/h
Divided / Undivided: Divided Current Posted Speed:(For information only)
60 km/h
Major / Minor: Major Prevailing Speed:(85th Percentile - for information only)
0 km/h# Through LanesPer Direction: 2+ lanes Policy:
(Maximum Posted Speed)0 km/h
RISK Score
A1 GEOMETRY (Horizontal) Lower 2
A2 GEOMETRY (Vertical) Lower 2
A3 AVERAGE LANE WIDTH Medium 4 Total Risk Score:
B ROADSIDE HAZARDS Higher 3 71
C1 PEDESTRIAN EXPOSURE Lower 3
C2 CYCLIST EXPOSURE Higher 9
D PAVEMENT SURFACE Medium 2 Recommended PostedSpeed Limit (km/h):
E1
NUMBER OF INTERSECTIONSWITH PUBLIC ROADS
Number ofOccurrences
30
As determined by road characteristicsSTOP controlled intersection 0
50Signalized intersection 5
Roundabout or traffic circle 0 As determined by policyCrosswalk 0
0Active, at-grade railroad crossing 0
Sidestreet STOP-controlled or lane 0 The recommended posted speed limit may bechecked against the prevailing speeds of theroadway and the road's safety performance.
E2
NUMBER OF INTERSECTIONSWITH PRIVATE ACCESS DRIVEWAYS
Number ofOccurrences
13Left turn movements permitted 3 Comments:Right-in / Right-out only 5
E3NUMBER OF INTERCHANGES Number of
Occurrences 0Number of interchanges along corridor 0
F ON-STREET PARKING Lower 3

FORM A
Automated Speed Limit Guidelines Version:FORM A - Automated Speed Limit Guidelines Spreadsheet 10-Apr-09
Name of Corridor: Hebert Road 2
Segment Evaluated: Arlington Dr to Boudreay Rd
Geographic Region: City of St. Albert
Road Agency: St. Ablert
Road Classification: Arterial Length of Corridor: 1,630 m
Urban / Rural: Urban Design Speed: (Required for Freeway,Expressway, Highway)
0 km/h
Divided / Undivided: Divided Current Posted Speed:(For information only)
60 km/h
Major / Minor: Major Prevailing Speed:(85th Percentile - for information only)
62 km/h# Through LanesPer Direction: 2+ lanes Policy:
(Maximum Posted Speed)0 km/h
RISK Score
A1 GEOMETRY (Horizontal) Lower 2
A2 GEOMETRY (Vertical) Lower 2
A3 AVERAGE LANE WIDTH Medium 4 Total Risk Score:
B ROADSIDE HAZARDS Higher 3 45
C1 PEDESTRIAN EXPOSURE Lower 3
C2 CYCLIST EXPOSURE Higher 9
D PAVEMENT SURFACE Lower 1 Recommended PostedSpeed Limit (km/h):
E1
NUMBER OF INTERSECTIONSWITH PUBLIC ROADS
Number ofOccurrences
16
As determined by road characteristicsSTOP controlled intersection 0
60Signalized intersection 3
Roundabout or traffic circle 0 As determined by policyCrosswalk 2
0Active, at-grade railroad crossing 0
Sidestreet STOP-controlled or lane 2 The recommended posted speed limit may bechecked against the prevailing speeds of theroadway and the road's safety performance.
E2
NUMBER OF INTERSECTIONSWITH PRIVATE ACCESS DRIVEWAYS
Number ofOccurrences
2Left turn movements permitted 1 Comments:Right-in / Right-out only 2
E3NUMBER OF INTERCHANGES Number of
Occurrences 0Number of interchanges along corridor 0
F ON-STREET PARKING Lower 3

FORM A
Automated Speed Limit Guidelines Version:FORM A - Automated Speed Limit Guidelines Spreadsheet 10-Apr-09
Name of Corridor: Hogan Road
Segment Evaluated: Giroux Rd to 85m North of Dunfield Cres
Geographic Region: City of St. Albert
Road Agency: St. Ablert
Road Classification: Arterial Length of Corridor: 520 m
Urban / Rural: Urban Design Speed: (Required for Freeway,Expressway, Highway)
0 km/h
Divided / Undivided: Undivided Current Posted Speed:(For information only)
50 km/h
Major / Minor: Major Prevailing Speed:(85th Percentile - for information only)
55 km/h# Through LanesPer Direction: 2+ lanes Policy:
(Maximum Posted Speed)0 km/h
RISK Score
A1 GEOMETRY (Horizontal) Lower 2
A2 GEOMETRY (Vertical) Lower 2
A3 AVERAGE LANE WIDTH Medium 4 Total Risk Score:
B ROADSIDE HAZARDS Lower 1 50
C1 PEDESTRIAN EXPOSURE Lower 3
C2 CYCLIST EXPOSURE Lower 3
D PAVEMENT SURFACE Lower 1 Recommended PostedSpeed Limit (km/h):
E1
NUMBER OF INTERSECTIONSWITH PUBLIC ROADS
Number ofOccurrences
31
As determined by road characteristicsSTOP controlled intersection 0
60Signalized intersection 1
Roundabout or traffic circle 0 As determined by policyCrosswalk 2
0Active, at-grade railroad crossing 0
Sidestreet STOP-controlled or lane 2 The recommended posted speed limit may bechecked against the prevailing speeds of theroadway and the road's safety performance.
E2
NUMBER OF INTERSECTIONSWITH PRIVATE ACCESS DRIVEWAYS
Number ofOccurrences
0Left turn movements permitted 0 Comments:Right-in / Right-out only 0
E3NUMBER OF INTERCHANGES Number of
Occurrences 0Number of interchanges along corridor 0
F ON-STREET PARKING Lower 3

FORM A
Automated Speed Limit Guidelines Version:FORM A - Automated Speed Limit Guidelines Spreadsheet 10-Apr-09
Name of Corridor: Lavasseur Road 1
Segment Evaluated: Gervais Rd / 170 st to Sir Winston Churchill Ave
Geographic Region: City of St. Albert
Road Agency: St. Ablert
Road Classification: Arterial Length of Corridor: 1,560 m
Urban / Rural: Urban Design Speed: (Required for Freeway,Expressway, Highway)
0 km/h
Divided / Undivided: Undivided Current Posted Speed:(For information only)
60 km/h
Major / Minor: Major Prevailing Speed:(85th Percentile - for information only)
65 km/h# Through LanesPer Direction: 2+ lanes Policy:
(Maximum Posted Speed)0 km/h
RISK Score
A1 GEOMETRY (Horizontal) Lower 2
A2 GEOMETRY (Vertical) Lower 2
A3 AVERAGE LANE WIDTH Medium 4 Total Risk Score:
B ROADSIDE HAZARDS Higher 3 40
C1 PEDESTRIAN EXPOSURE Lower 3
C2 CYCLIST EXPOSURE Lower 3
D PAVEMENT SURFACE Medium 2 Recommended PostedSpeed Limit (km/h):
E1
NUMBER OF INTERSECTIONSWITH PUBLIC ROADS
Number ofOccurrences
17
As determined by road characteristicsSTOP controlled intersection 0
70Signalized intersection 4
Roundabout or traffic circle 0 As determined by policyCrosswalk 1
0Active, at-grade railroad crossing 0
Sidestreet STOP-controlled or lane 2 The recommended posted speed limit may bechecked against the prevailing speeds of theroadway and the road's safety performance.
E2
NUMBER OF INTERSECTIONSWITH PRIVATE ACCESS DRIVEWAYS
Number ofOccurrences
1Left turn movements permitted 1 Comments:Right-in / Right-out only 0
E3NUMBER OF INTERCHANGES Number of
Occurrences 0Number of interchanges along corridor 0
F ON-STREET PARKING Lower 3

FORM A
Automated Speed Limit Guidelines Version:FORM A - Automated Speed Limit Guidelines Spreadsheet 10-Apr-09
Name of Corridor: Lavasseur Road 2
Segment Evaluated: Sir Winston Churchill Ave to Riel Dr
Geographic Region: City of St. Albert
Road Agency: St. Ablert
Road Classification: Arterial Length of Corridor: 570 m
Urban / Rural: Urban Design Speed: (Required for Freeway,Expressway, Highway)
0 km/h
Divided / Undivided: Undivided Current Posted Speed:(For information only)
50 km/h
Major / Minor: Major Prevailing Speed:(85th Percentile - for information only)
0 km/h# Through LanesPer Direction: 1 lane Policy:
(Maximum Posted Speed)0 km/h
RISK Score
A1 GEOMETRY (Horizontal) Lower 2
A2 GEOMETRY (Vertical) Medium 4
A3 AVERAGE LANE WIDTH Lower 2 Total Risk Score:
B ROADSIDE HAZARDS Medium 2 44
C1 PEDESTRIAN EXPOSURE Lower 3
C2 CYCLIST EXPOSURE Lower 3
D PAVEMENT SURFACE Medium 2 Recommended PostedSpeed Limit (km/h):
E1
NUMBER OF INTERSECTIONSWITH PUBLIC ROADS
Number ofOccurrences
19
As determined by road characteristicsSTOP controlled intersection 0
70Signalized intersection 2
Roundabout or traffic circle 0 As determined by policyCrosswalk 0
0Active, at-grade railroad crossing 1
Sidestreet STOP-controlled or lane 0 The recommended posted speed limit may bechecked against the prevailing speeds of theroadway and the road's safety performance.
E2
NUMBER OF INTERSECTIONSWITH PRIVATE ACCESS DRIVEWAYS
Number ofOccurrences
4Left turn movements permitted 1 Comments:Right-in / Right-out only 0
E3NUMBER OF INTERCHANGES Number of
Occurrences 0Number of interchanges along corridor 0
F ON-STREET PARKING Lower 3

FORM A
Automated Speed Limit Guidelines Version:FORM A - Automated Speed Limit Guidelines Spreadsheet 10-Apr-09
Name of Corridor: Leclair Way 1
Segment Evaluated: Ray Gibbon Dr to Sir Winston Churchill Ave
Geographic Region: City of St. Albert
Road Agency: St. Ablert
Road Classification: Arterial Length of Corridor: 810 m
Urban / Rural: Urban Design Speed: (Required for Freeway,Expressway, Highway)
0 km/h
Divided / Undivided: Divided Current Posted Speed:(For information only)
60 km/h
Major / Minor: Major Prevailing Speed:(85th Percentile - for information only)
48 km/h# Through LanesPer Direction: 2+ lanes Policy:
(Maximum Posted Speed)0 km/h
RISK Score
A1 GEOMETRY (Horizontal) Medium 4
A2 GEOMETRY (Vertical) Lower 2
A3 AVERAGE LANE WIDTH Medium 4 Total Risk Score:
B ROADSIDE HAZARDS Medium 2 49
C1 PEDESTRIAN EXPOSURE Lower 3
C2 CYCLIST EXPOSURE Lower 3
D PAVEMENT SURFACE Lower 1 Recommended PostedSpeed Limit (km/h):
E1
NUMBER OF INTERSECTIONSWITH PUBLIC ROADS
Number ofOccurrences
27
As determined by road characteristicsSTOP controlled intersection 0
60Signalized intersection 2
Roundabout or traffic circle 0 As determined by policyCrosswalk 2
0Active, at-grade railroad crossing 1
Sidestreet STOP-controlled or lane 2 The recommended posted speed limit may bechecked against the prevailing speeds of theroadway and the road's safety performance.
E2
NUMBER OF INTERSECTIONSWITH PRIVATE ACCESS DRIVEWAYS
Number ofOccurrences
0Left turn movements permitted 0 Comments:Right-in / Right-out only 0
E3NUMBER OF INTERCHANGES Number of
Occurrences 0Number of interchanges along corridor 0
F ON-STREET PARKING Lower 3
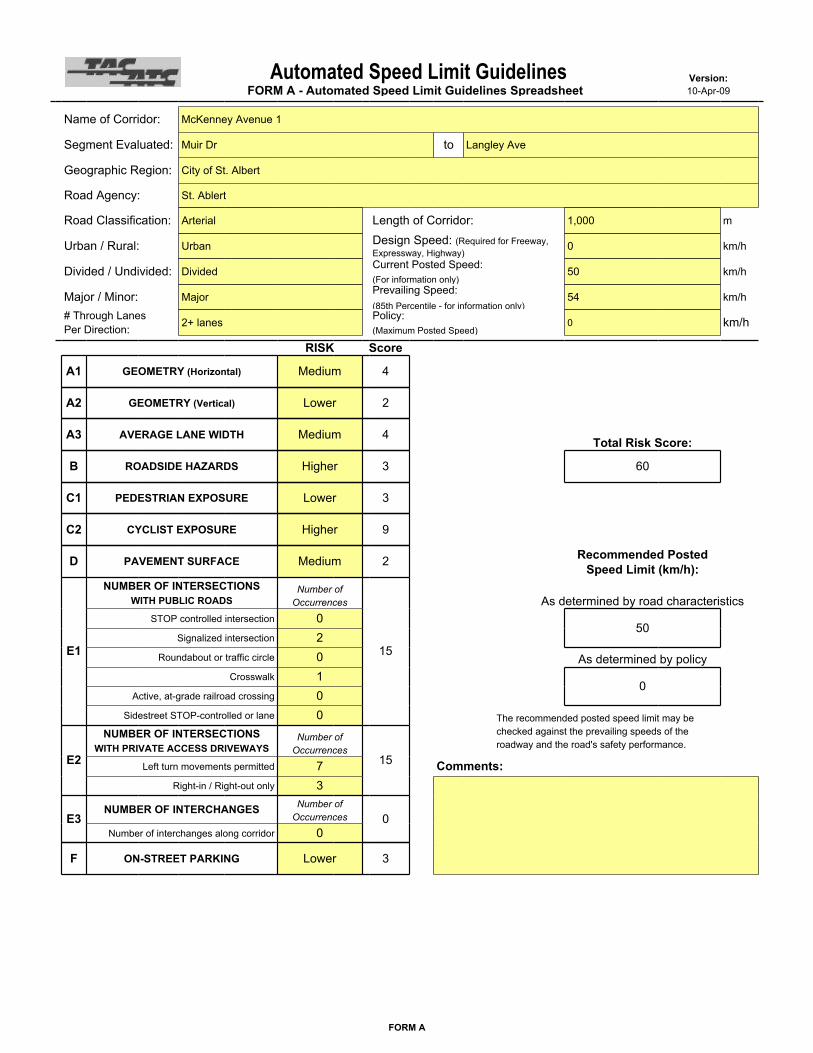
FORM A
Automated Speed Limit Guidelines Version:FORM A - Automated Speed Limit Guidelines Spreadsheet 10-Apr-09
Name of Corridor: McKenney Avenue 1
Segment Evaluated: Muir Dr to Langley Ave
Geographic Region: City of St. Albert
Road Agency: St. Ablert
Road Classification: Arterial Length of Corridor: 1,000 m
Urban / Rural: Urban Design Speed: (Required for Freeway,Expressway, Highway)
0 km/h
Divided / Undivided: Divided Current Posted Speed:(For information only)
50 km/h
Major / Minor: Major Prevailing Speed:(85th Percentile - for information only)
54 km/h# Through LanesPer Direction: 2+ lanes Policy:
(Maximum Posted Speed)0 km/h
RISK Score
A1 GEOMETRY (Horizontal) Medium 4
A2 GEOMETRY (Vertical) Lower 2
A3 AVERAGE LANE WIDTH Medium 4 Total Risk Score:
B ROADSIDE HAZARDS Higher 3 60
C1 PEDESTRIAN EXPOSURE Lower 3
C2 CYCLIST EXPOSURE Higher 9
D PAVEMENT SURFACE Medium 2 Recommended PostedSpeed Limit (km/h):
E1
NUMBER OF INTERSECTIONSWITH PUBLIC ROADS
Number ofOccurrences
15
As determined by road characteristicsSTOP controlled intersection 0
50Signalized intersection 2
Roundabout or traffic circle 0 As determined by policyCrosswalk 1
0Active, at-grade railroad crossing 0
Sidestreet STOP-controlled or lane 0 The recommended posted speed limit may bechecked against the prevailing speeds of theroadway and the road's safety performance.
E2
NUMBER OF INTERSECTIONSWITH PRIVATE ACCESS DRIVEWAYS
Number ofOccurrences
15Left turn movements permitted 7 Comments:Right-in / Right-out only 3
E3NUMBER OF INTERCHANGES Number of
Occurrences 0Number of interchanges along corridor 0
F ON-STREET PARKING Lower 3

FORM A
Automated Speed Limit Guidelines Version:FORM A - Automated Speed Limit Guidelines Spreadsheet 10-Apr-09
Name of Corridor: McKenney Avenue 2
Segment Evaluated: Langely Ave to 170m South of Rail Crossing
Geographic Region: City of St. Albert
Road Agency: St. Ablert
Road Classification: Arterial Length of Corridor: 970 m
Urban / Rural: Urban Design Speed: (Required for Freeway,Expressway, Highway)
0 km/h
Divided / Undivided: Divided Current Posted Speed:(For information only)
50 km/h
Major / Minor: Major Prevailing Speed:(85th Percentile - for information only)
42 km/h# Through LanesPer Direction: 2+ lanes Policy:
(Maximum Posted Speed)0 km/h
RISK Score
A1 GEOMETRY (Horizontal) Lower 2
A2 GEOMETRY (Vertical) Lower 2
A3 AVERAGE LANE WIDTH Medium 4 Total Risk Score:
B ROADSIDE HAZARDS Higher 3 48
C1 PEDESTRIAN EXPOSURE Lower 3
C2 CYCLIST EXPOSURE Higher 9
D PAVEMENT SURFACE Medium 2 Recommended PostedSpeed Limit (km/h):
E1
NUMBER OF INTERSECTIONSWITH PUBLIC ROADS
Number ofOccurrences
18
As determined by road characteristicsSTOP controlled intersection 0
60Signalized intersection 0
Roundabout or traffic circle 0 As determined by policyCrosswalk 3
0Active, at-grade railroad crossing 1
Sidestreet STOP-controlled or lane 3 The recommended posted speed limit may bechecked against the prevailing speeds of theroadway and the road's safety performance.
E2
NUMBER OF INTERSECTIONSWITH PRIVATE ACCESS DRIVEWAYS
Number ofOccurrences
2Left turn movements permitted 1 Comments:Right-in / Right-out only 0
E3NUMBER OF INTERCHANGES Number of
Occurrences 0Number of interchanges along corridor 0
F ON-STREET PARKING Lower 3

FORM A
Automated Speed Limit Guidelines Version:FORM A - Automated Speed Limit Guidelines Spreadsheet 10-Apr-09
Name of Corridor: McKenney Avenue 3
Segment Evaluated: 170m South of Rail Crossing to Ray Gibbon Dr
Geographic Region: City of St. Albert
Road Agency: St. Ablert
Road Classification: Arterial Length of Corridor: 1,450 m
Urban / Rural: Urban Design Speed: (Required for Freeway,Expressway, Highway)
0 km/h
Divided / Undivided: Undivided Current Posted Speed:(For information only)
60 km/h
Major / Minor: Major Prevailing Speed:(85th Percentile - for information only)
59 km/h# Through LanesPer Direction: 1 lane Policy:
(Maximum Posted Speed)0 km/h
RISK Score
A1 GEOMETRY (Horizontal) Lower 2
A2 GEOMETRY (Vertical) Lower 2
A3 AVERAGE LANE WIDTH Medium 4 Total Risk Score:
B ROADSIDE HAZARDS Lower 1 30
C1 PEDESTRIAN EXPOSURE Higher 9
C2 CYCLIST EXPOSURE Lower 3
D PAVEMENT SURFACE Lower 1 Recommended PostedSpeed Limit (km/h):
E1
NUMBER OF INTERSECTIONSWITH PUBLIC ROADS
Number ofOccurrences
4
As determined by road characteristicsSTOP controlled intersection 0
70Signalized intersection 1
Roundabout or traffic circle 0 As determined by policyCrosswalk 0
0Active, at-grade railroad crossing 0
Sidestreet STOP-controlled or lane 1 The recommended posted speed limit may bechecked against the prevailing speeds of theroadway and the road's safety performance.
E2
NUMBER OF INTERSECTIONSWITH PRIVATE ACCESS DRIVEWAYS
Number ofOccurrences
1Left turn movements permitted 1 Comments:Right-in / Right-out only 0
E3NUMBER OF INTERCHANGES Number of
Occurrences 0Number of interchanges along corridor 0
F ON-STREET PARKING Lower 3

FORM A
Automated Speed Limit Guidelines Version:FORM A - Automated Speed Limit Guidelines Spreadsheet 10-Apr-09
Name of Corridor: Perron Street
Segment Evaluated: Sir Winston Churchill Ave to Mission Ave
Geographic Region: City of St. Albert
Road Agency: St. Ablert
Road Classification: Arterial Length of Corridor: 540 m
Urban / Rural: Urban Design Speed: (Required for Freeway,Expressway, Highway)
0 km/h
Divided / Undivided: Undivided Current Posted Speed:(For information only)
40 km/h
Major / Minor: Major Prevailing Speed:(85th Percentile - for information only)
29 km/h# Through LanesPer Direction: 2+ lanes Policy:
(Maximum Posted Speed)0 km/h
RISK Score
A1 GEOMETRY (Horizontal) Lower 2
A2 GEOMETRY (Vertical) Lower 2
A3 AVERAGE LANE WIDTH Medium 4 Total Risk Score:
B ROADSIDE HAZARDS Higher 3 113
C1 PEDESTRIAN EXPOSURE Medium 6
C2 CYCLIST EXPOSURE Higher 9
D PAVEMENT SURFACE Medium 2 Recommended PostedSpeed Limit (km/h):
E1
NUMBER OF INTERSECTIONSWITH PUBLIC ROADS
Number ofOccurrences
65
As determined by road characteristicsSTOP controlled intersection 1
50Signalized intersection 2
Roundabout or traffic circle 0 As determined by policyCrosswalk 4
0Active, at-grade railroad crossing 0
Sidestreet STOP-controlled or lane 2 The recommended posted speed limit may bechecked against the prevailing speeds of theroadway and the road's safety performance.
E2
NUMBER OF INTERSECTIONSWITH PRIVATE ACCESS DRIVEWAYS
Number ofOccurrences
11Left turn movements permitted 3 Comments:Right-in / Right-out only 0
E3NUMBER OF INTERCHANGES Number of
Occurrences 0Number of interchanges along corridor 0
F ON-STREET PARKING Higher 9

FORM A
Automated Speed Limit Guidelines Version:FORM A - Automated Speed Limit Guidelines Spreadsheet 10-Apr-09
Name of Corridor: Poirier Avenue
Segment Evaluated: Sir Winston Churchill Ave to Campbell Rd
Geographic Region: City of St. Albert
Road Agency: St. Ablert
Road Classification: Arterial Length of Corridor: 1,130 m
Urban / Rural: Urban Design Speed: (Required for Freeway,Expressway, Highway)
0 km/h
Divided / Undivided: Undivided Current Posted Speed:(For information only)
50 km/h
Major / Minor: Major Prevailing Speed:(85th Percentile - for information only)
42 km/h# Through LanesPer Direction: 2+ lanes Policy:
(Maximum Posted Speed)0 km/h
RISK Score
A1 GEOMETRY (Horizontal) Lower 2
A2 GEOMETRY (Vertical) Lower 2
A3 AVERAGE LANE WIDTH Medium 4 Total Risk Score:
B ROADSIDE HAZARDS Higher 3 59
C1 PEDESTRIAN EXPOSURE Lower 3
C2 CYCLIST EXPOSURE Higher 9
D PAVEMENT SURFACE Lower 1 Recommended PostedSpeed Limit (km/h):
E1
NUMBER OF INTERSECTIONSWITH PUBLIC ROADS
Number ofOccurrences
23
As determined by road characteristicsSTOP controlled intersection 0
60Signalized intersection 2
Roundabout or traffic circle 0 As determined by policyCrosswalk 3
0Active, at-grade railroad crossing 0
Sidestreet STOP-controlled or lane 2 The recommended posted speed limit may bechecked against the prevailing speeds of theroadway and the road's safety performance.
E2
NUMBER OF INTERSECTIONSWITH PRIVATE ACCESS DRIVEWAYS
Number ofOccurrences
9Left turn movements permitted 5 Comments:Right-in / Right-out only 0
E3NUMBER OF INTERCHANGES Number of
Occurrences 0Number of interchanges along corridor 0
F ON-STREET PARKING Lower 3

FORM A
Automated Speed Limit Guidelines Version:FORM A - Automated Speed Limit Guidelines Spreadsheet 10-Apr-09
Name of Corridor: Ray Gibbon Drive 1
Segment Evaluated: 137 Ave NW to 615m North of McKenney Ave
Geographic Region: City of St. Albert
Road Agency: St. Ablert
Road Classification: Arterial Length of Corridor: 4,380 m
Urban / Rural: Urban Design Speed: (Required for Freeway,Expressway, Highway)
0 km/h
Divided / Undivided: Undivided Current Posted Speed:(For information only)
70 km/h
Major / Minor: Major Prevailing Speed:(85th Percentile - for information only)
75 km/h# Through LanesPer Direction: 1 lane Policy:
(Maximum Posted Speed)0 km/h
RISK Score
A1 GEOMETRY (Horizontal) Lower 2
A2 GEOMETRY (Vertical) Lower 2
A3 AVERAGE LANE WIDTH Lower 2 Total Risk Score:
B ROADSIDE HAZARDS Lower 1 27
C1 PEDESTRIAN EXPOSURE Higher 9
C2 CYCLIST EXPOSURE Medium 6
D PAVEMENT SURFACE Lower 1 Recommended PostedSpeed Limit (km/h):
E1
NUMBER OF INTERSECTIONSWITH PUBLIC ROADS
Number ofOccurrences
1
As determined by road characteristicsSTOP controlled intersection 0
80Signalized intersection 1
Roundabout or traffic circle 0 As determined by policyCrosswalk 0
0Active, at-grade railroad crossing 0
Sidestreet STOP-controlled or lane 0 The recommended posted speed limit may bechecked against the prevailing speeds of theroadway and the road's safety performance.
E2
NUMBER OF INTERSECTIONSWITH PRIVATE ACCESS DRIVEWAYS
Number ofOccurrences
0Left turn movements permitted 0 Comments:Right-in / Right-out only 0
E3NUMBER OF INTERCHANGES Number of
Occurrences 0Number of interchanges along corridor 0
F ON-STREET PARKING Lower 3

FORM A
Automated Speed Limit Guidelines Version:FORM A - Automated Speed Limit Guidelines Spreadsheet 10-Apr-09
Name of Corridor: Ray Gibbon Drive 2
Segment Evaluated: Giroux Rd to Vileneuve rd
Geographic Region: City of St. Albert
Road Agency: St. Ablert
Road Classification: Arterial Length of Corridor: 2,100 m
Urban / Rural: Urban Design Speed: (Required for Freeway,Expressway, Highway)
0 km/h
Divided / Undivided: Undivided Current Posted Speed:(For information only)
70 km/h
Major / Minor: Major Prevailing Speed:(85th Percentile - for information only)
83 km/h# Through LanesPer Direction: 1 lane Policy:
(Maximum Posted Speed)0 km/h
RISK Score
A1 GEOMETRY (Horizontal) Lower 2
A2 GEOMETRY (Vertical) Lower 2
A3 AVERAGE LANE WIDTH Lower 2 Total Risk Score:
B ROADSIDE HAZARDS Lower 1 31
C1 PEDESTRIAN EXPOSURE Higher 9
C2 CYCLIST EXPOSURE Medium 6
D PAVEMENT SURFACE Lower 1 Recommended PostedSpeed Limit (km/h):
E1
NUMBER OF INTERSECTIONSWITH PUBLIC ROADS
Number ofOccurrences
5
As determined by road characteristicsSTOP controlled intersection 0
70Signalized intersection 2
Roundabout or traffic circle 0 As determined by policyCrosswalk 0
0Active, at-grade railroad crossing 0
Sidestreet STOP-controlled or lane 0 The recommended posted speed limit may bechecked against the prevailing speeds of theroadway and the road's safety performance.
E2
NUMBER OF INTERSECTIONSWITH PRIVATE ACCESS DRIVEWAYS
Number ofOccurrences
0Left turn movements permitted 0 Comments:Right-in / Right-out only 0
E3NUMBER OF INTERCHANGES Number of
Occurrences 0Number of interchanges along corridor 0
F ON-STREET PARKING Lower 3

FORM A
Automated Speed Limit Guidelines Version:FORM A - Automated Speed Limit Guidelines Spreadsheet 10-Apr-09
Name of Corridor: Ray Gibbon Drive 3
Segment Evaluated: 615m North of McKenney Ave to Giroux Rd
Geographic Region: City of St. Albert
Road Agency: St. Ablert
Road Classification: Arterial Length of Corridor: 750 m
Urban / Rural: Urban Design Speed: (Required for Freeway,Expressway, Highway)
0 km/h
Divided / Undivided: Undivided Current Posted Speed:(For information only)
70 km/h
Major / Minor: Major Prevailing Speed:(85th Percentile - for information only)
71 km/h# Through LanesPer Direction: 1 lane Policy:
(Maximum Posted Speed)0 km/h
RISK Score
A1 GEOMETRY (Horizontal) Lower 2
A2 GEOMETRY (Vertical) Lower 2
A3 AVERAGE LANE WIDTH Lower 2 Total Risk Score:
B ROADSIDE HAZARDS Lower 1 35
C1 PEDESTRIAN EXPOSURE Higher 9
C2 CYCLIST EXPOSURE Medium 6
D PAVEMENT SURFACE Medium 2 Recommended PostedSpeed Limit (km/h):
E1
NUMBER OF INTERSECTIONSWITH PUBLIC ROADS
Number ofOccurrences
8
As determined by road characteristicsSTOP controlled intersection 0
70Signalized intersection 1
Roundabout or traffic circle 0 As determined by policyCrosswalk 0
0Active, at-grade railroad crossing 1
Sidestreet STOP-controlled or lane 0 The recommended posted speed limit may bechecked against the prevailing speeds of theroadway and the road's safety performance.
E2
NUMBER OF INTERSECTIONSWITH PRIVATE ACCESS DRIVEWAYS
Number ofOccurrences
0Left turn movements permitted 0 Comments:Right-in / Right-out only 0
E3NUMBER OF INTERCHANGES Number of
Occurrences 0Number of interchanges along corridor 0
F ON-STREET PARKING Lower 3

FORM A
Automated Speed Limit Guidelines Version:FORM A - Automated Speed Limit Guidelines Spreadsheet 10-Apr-09
Name of Corridor: Reil Drive 1
Segment Evaluated: Leclair Way to Levasseur Rd
Geographic Region: City of St. Albert
Road Agency: St. Ablert
Road Classification: Arterial Length of Corridor: 730 m
Urban / Rural: Urban Design Speed: (Required for Freeway,Expressway, Highway)
0 km/h
Divided / Undivided: Undivided Current Posted Speed:(For information only)
50 km/h
Major / Minor: Major Prevailing Speed:(85th Percentile - for information only)
41 km/h# Through LanesPer Direction: 1 lane Policy:
(Maximum Posted Speed)0 km/h
RISK Score
A1 GEOMETRY (Horizontal) Lower 2
A2 GEOMETRY (Vertical) Lower 2
A3 AVERAGE LANE WIDTH Lower 2 Total Risk Score:
B ROADSIDE HAZARDS Medium 2 42
C1 PEDESTRIAN EXPOSURE Lower 3
C2 CYCLIST EXPOSURE Medium 6
D PAVEMENT SURFACE Lower 1 Recommended PostedSpeed Limit (km/h):
E1
NUMBER OF INTERSECTIONSWITH PUBLIC ROADS
Number ofOccurrences
13
As determined by road characteristicsSTOP controlled intersection 1
70Signalized intersection 1
Roundabout or traffic circle 0 As determined by policyCrosswalk 0
0Active, at-grade railroad crossing 0
Sidestreet STOP-controlled or lane 1 The recommended posted speed limit may bechecked against the prevailing speeds of theroadway and the road's safety performance.
E2
NUMBER OF INTERSECTIONSWITH PRIVATE ACCESS DRIVEWAYS
Number ofOccurrences
8Left turn movements permitted 3 Comments:Right-in / Right-out only 0
E3NUMBER OF INTERCHANGES Number of
Occurrences 0Number of interchanges along corridor 0
F ON-STREET PARKING Lower 3

FORM A
Automated Speed Limit Guidelines Version:FORM A - Automated Speed Limit Guidelines Spreadsheet 10-Apr-09
Name of Corridor: Sir Winston Churchill Avenue 1
Segment Evaluated: 137 Ave NW to Levasseur Rd
Geographic Region: City of St. Albert
Road Agency: St. Ablert
Road Classification: Arterial Length of Corridor: 930 m
Urban / Rural: Urban Design Speed: (Required for Freeway,Expressway, Highway)
0 km/h
Divided / Undivided: Undivided Current Posted Speed:(For information only)
60 km/h
Major / Minor: Major Prevailing Speed:(85th Percentile - for information only)
45 km/h# Through LanesPer Direction: 2+ lanes Policy:
(Maximum Posted Speed)0 km/h
RISK Score
A1 GEOMETRY (Horizontal) Lower 2
A2 GEOMETRY (Vertical) Lower 2
A3 AVERAGE LANE WIDTH Medium 4 Total Risk Score:
B ROADSIDE HAZARDS Medium 2 43
C1 PEDESTRIAN EXPOSURE Lower 3
C2 CYCLIST EXPOSURE Higher 9
D PAVEMENT SURFACE Lower 1 Recommended PostedSpeed Limit (km/h):
E1
NUMBER OF INTERSECTIONSWITH PUBLIC ROADS
Number ofOccurrences
17
As determined by road characteristicsSTOP controlled intersection 0
70Signalized intersection 3
Roundabout or traffic circle 0 As determined by policyCrosswalk 0
0Active, at-grade railroad crossing 0
Sidestreet STOP-controlled or lane 2 The recommended posted speed limit may bechecked against the prevailing speeds of theroadway and the road's safety performance.
E2
NUMBER OF INTERSECTIONSWITH PRIVATE ACCESS DRIVEWAYS
Number ofOccurrences
0Left turn movements permitted 0 Comments:Right-in / Right-out only 0
E3NUMBER OF INTERCHANGES Number of
Occurrences 0Number of interchanges along corridor 0
F ON-STREET PARKING Lower 3

FORM A
Automated Speed Limit Guidelines Version:FORM A - Automated Speed Limit Guidelines Spreadsheet 10-Apr-09
Name of Corridor: Sir Winston Churchill Avenue 2
Segment Evaluated: Levasseur Rd to 310m North of Grandin Woods Estates
Geographic Region: City of St. Albert
Road Agency: St. Ablert
Road Classification: Arterial Length of Corridor: 600 m
Urban / Rural: Urban Design Speed: (Required for Freeway,Expressway, Highway)
0 km/h
Divided / Undivided: Divided Current Posted Speed:(For information only)
50 km/h
Major / Minor: Major Prevailing Speed:(85th Percentile - for information only)
0 km/h# Through LanesPer Direction: 2+ lanes Policy:
(Maximum Posted Speed)0 km/h
RISK Score
A1 GEOMETRY (Horizontal) Medium 4
A2 GEOMETRY (Vertical) Lower 2
A3 AVERAGE LANE WIDTH Medium 4 Total Risk Score:
B ROADSIDE HAZARDS Higher 3 59
C1 PEDESTRIAN EXPOSURE Lower 3
C2 CYCLIST EXPOSURE Higher 9
D PAVEMENT SURFACE Medium 2 Recommended PostedSpeed Limit (km/h):
E1
NUMBER OF INTERSECTIONSWITH PUBLIC ROADS
Number ofOccurrences
27
As determined by road characteristicsSTOP controlled intersection 0
60Signalized intersection 2
Roundabout or traffic circle 0 As determined by policyCrosswalk 1
0Active, at-grade railroad crossing 0
Sidestreet STOP-controlled or lane 2 The recommended posted speed limit may bechecked against the prevailing speeds of theroadway and the road's safety performance.
E2
NUMBER OF INTERSECTIONSWITH PRIVATE ACCESS DRIVEWAYS
Number ofOccurrences
2Left turn movements permitted 0 Comments:Right-in / Right-out only 1
E3NUMBER OF INTERCHANGES Number of
Occurrences 0Number of interchanges along corridor 0
F ON-STREET PARKING Lower 3

FORM A
Automated Speed Limit Guidelines Version:FORM A - Automated Speed Limit Guidelines Spreadsheet 10-Apr-09
Name of Corridor: Sir Winston Churchill Avenue 3
Segment Evaluated: 310m North of Grandin Woods Estates to Gresham Blvd
Geographic Region: City of St. Albert
Road Agency: St. Ablert
Road Classification: Arterial Length of Corridor: 1,150 m
Urban / Rural: Urban Design Speed: (Required for Freeway,Expressway, Highway)
0 km/h
Divided / Undivided: Divided Current Posted Speed:(For information only)
50 km/h
Major / Minor: Major Prevailing Speed:(85th Percentile - for information only)
60 km/h# Through LanesPer Direction: 2+ lanes Policy:
(Maximum Posted Speed)0 km/h
RISK Score
A1 GEOMETRY (Horizontal) Lower 2
A2 GEOMETRY (Vertical) Lower 2
A3 AVERAGE LANE WIDTH Medium 4 Total Risk Score:
B ROADSIDE HAZARDS Higher 3 37
C1 PEDESTRIAN EXPOSURE Lower 3
C2 CYCLIST EXPOSURE Higher 9
D PAVEMENT SURFACE Medium 2 Recommended PostedSpeed Limit (km/h):
E1
NUMBER OF INTERSECTIONSWITH PUBLIC ROADS
Number ofOccurrences
6
As determined by road characteristicsSTOP controlled intersection 0
70Signalized intersection 1
Roundabout or traffic circle 0 As determined by policyCrosswalk 0
0Active, at-grade railroad crossing 0
Sidestreet STOP-controlled or lane 3 The recommended posted speed limit may bechecked against the prevailing speeds of theroadway and the road's safety performance.
E2
NUMBER OF INTERSECTIONSWITH PRIVATE ACCESS DRIVEWAYS
Number ofOccurrences
3Left turn movements permitted 2 Comments:Right-in / Right-out only 0
E3NUMBER OF INTERCHANGES Number of
Occurrences 0Number of interchanges along corridor 0
F ON-STREET PARKING Lower 3

FORM A
Automated Speed Limit Guidelines Version:FORM A - Automated Speed Limit Guidelines Spreadsheet 10-Apr-09
Name of Corridor: Sir Winston Churchill Avenue 4
Segment Evaluated: Gresham Blvd to Green Grove Dr
Geographic Region: City of St. Albert
Road Agency: St. Ablert
Road Classification: Arterial Length of Corridor: 890 m
Urban / Rural: Urban Design Speed: (Required for Freeway,Expressway, Highway)
0 km/h
Divided / Undivided: Divided Current Posted Speed:(For information only)
50 km/h
Major / Minor: Major Prevailing Speed:(85th Percentile - for information only)
40 km/h# Through LanesPer Direction: 2+ lanes Policy:
(Maximum Posted Speed)0 km/h
RISK Score
A1 GEOMETRY (Horizontal) Medium 4
A2 GEOMETRY (Vertical) Lower 2
A3 AVERAGE LANE WIDTH Medium 4 Total Risk Score:
B ROADSIDE HAZARDS Higher 3 66
C1 PEDESTRIAN EXPOSURE Lower 3
C2 CYCLIST EXPOSURE Higher 9
D PAVEMENT SURFACE Lower 1 Recommended PostedSpeed Limit (km/h):
E1
NUMBER OF INTERSECTIONSWITH PUBLIC ROADS
Number ofOccurrences
22
As determined by road characteristicsSTOP controlled intersection 0
50Signalized intersection 4
Roundabout or traffic circle 0 As determined by policyCrosswalk 0
0Active, at-grade railroad crossing 0
Sidestreet STOP-controlled or lane 0 The recommended posted speed limit may bechecked against the prevailing speeds of theroadway and the road's safety performance.
E2
NUMBER OF INTERSECTIONSWITH PRIVATE ACCESS DRIVEWAYS
Number ofOccurrences
15Left turn movements permitted 1 Comments:Right-in / Right-out only 11
E3NUMBER OF INTERCHANGES Number of
Occurrences 0Number of interchanges along corridor 0
F ON-STREET PARKING Lower 3

FORM A
Automated Speed Limit Guidelines Version:FORM A - Automated Speed Limit Guidelines Spreadsheet 10-Apr-09
Name of Corridor: Sir Winston Churchill Avenue 5
Segment Evaluated: Green Grove Dr to Bishop St
Geographic Region: City of St. Albert
Road Agency: St. Ablert
Road Classification: Arterial Length of Corridor: 660 m
Urban / Rural: Urban Design Speed: (Required for Freeway,Expressway, Highway)
0 km/h
Divided / Undivided: Divided Current Posted Speed:(For information only)
50 km/h
Major / Minor: Major Prevailing Speed:(85th Percentile - for information only)
0 km/h# Through LanesPer Direction: 2+ lanes Policy:
(Maximum Posted Speed)0 km/h
RISK Score
A1 GEOMETRY (Horizontal) Lower 2
A2 GEOMETRY (Vertical) Lower 2
A3 AVERAGE LANE WIDTH Medium 4 Total Risk Score:
B ROADSIDE HAZARDS Medium 2 59
C1 PEDESTRIAN EXPOSURE Lower 3
C2 CYCLIST EXPOSURE Higher 9
D PAVEMENT SURFACE Lower 1 Recommended PostedSpeed Limit (km/h):
E1
NUMBER OF INTERSECTIONSWITH PUBLIC ROADS
Number ofOccurrences
31
As determined by road characteristicsSTOP controlled intersection 0
60Signalized intersection 2
Roundabout or traffic circle 0 As determined by policyCrosswalk 2
0Active, at-grade railroad crossing 0
Sidestreet STOP-controlled or lane 1 The recommended posted speed limit may bechecked against the prevailing speeds of theroadway and the road's safety performance.
E2
NUMBER OF INTERSECTIONSWITH PRIVATE ACCESS DRIVEWAYS
Number ofOccurrences
2Left turn movements permitted 0 Comments:Right-in / Right-out only 1
E3NUMBER OF INTERCHANGES Number of
Occurrences 0Number of interchanges along corridor 0
F ON-STREET PARKING Lower 3

FORM A
Automated Speed Limit Guidelines Version:FORM A - Automated Speed Limit Guidelines Spreadsheet 10-Apr-09
Name of Corridor: Sir Winston Churchill Avenue 6
Segment Evaluated: South Ridgewood Terrace to 200m North of Boudreau Rd
Geographic Region: City of St. Albert
Road Agency: St. Ablert
Road Classification: Arterial Length of Corridor: 560 m
Urban / Rural: Urban Design Speed: (Required for Freeway,Expressway, Highway)
0 km/h
Divided / Undivided: Divided Current Posted Speed:(For information only)
50 km/h
Major / Minor: Major Prevailing Speed:(85th Percentile - for information only)
0 km/h# Through LanesPer Direction: 2+ lanes Policy:
(Maximum Posted Speed)0 km/h
RISK Score
A1 GEOMETRY (Horizontal) Lower 2
A2 GEOMETRY (Vertical) Lower 2
A3 AVERAGE LANE WIDTH Medium 4 Total Risk Score:
B ROADSIDE HAZARDS Higher 3 50
C1 PEDESTRIAN EXPOSURE Lower 3
C2 CYCLIST EXPOSURE Higher 9
D PAVEMENT SURFACE Lower 1 Recommended PostedSpeed Limit (km/h):
E1
NUMBER OF INTERSECTIONSWITH PUBLIC ROADS
Number ofOccurrences
19
As determined by road characteristicsSTOP controlled intersection 0
60Signalized intersection 1
Roundabout or traffic circle 0 As determined by policyCrosswalk 1
0Active, at-grade railroad crossing 0
Sidestreet STOP-controlled or lane 1 The recommended posted speed limit may bechecked against the prevailing speeds of theroadway and the road's safety performance.
E2
NUMBER OF INTERSECTIONSWITH PRIVATE ACCESS DRIVEWAYS
Number ofOccurrences
4Left turn movements permitted 1 Comments:Right-in / Right-out only 0
E3NUMBER OF INTERCHANGES Number of
Occurrences 0Number of interchanges along corridor 0
F ON-STREET PARKING Lower 3

FORM A
Automated Speed Limit Guidelines Version:FORM A - Automated Speed Limit Guidelines Spreadsheet 10-Apr-09
Name of Corridor: Sir Winston Churchill Avenue 7
Segment Evaluated: 50m South of Poirier Ave to Poundmarker rd
Geographic Region: City of St. Albert
Road Agency: St. Ablert
Road Classification: Arterial Length of Corridor: 1,700 m
Urban / Rural: Urban Design Speed: (Required for Freeway,Expressway, Highway)
0 km/h
Divided / Undivided: Undivided Current Posted Speed:(For information only)
50 km/h
Major / Minor: Major Prevailing Speed:(85th Percentile - for information only)
43 km/h# Through LanesPer Direction: 1 lane Policy:
(Maximum Posted Speed)0 km/h
RISK Score
A1 GEOMETRY (Horizontal) Lower 2
A2 GEOMETRY (Vertical) Medium 4
A3 AVERAGE LANE WIDTH Lower 2 Total Risk Score:
B ROADSIDE HAZARDS Medium 2 41
C1 PEDESTRIAN EXPOSURE Lower 3
C2 CYCLIST EXPOSURE Medium 6
D PAVEMENT SURFACE Medium 2 Recommended PostedSpeed Limit (km/h):
E1
NUMBER OF INTERSECTIONSWITH PUBLIC ROADS
Number ofOccurrences
16
As determined by road characteristicsSTOP controlled intersection 0
70Signalized intersection 2
Roundabout or traffic circle 0 As determined by policyCrosswalk 3
0Active, at-grade railroad crossing 0
Sidestreet STOP-controlled or lane 3 The recommended posted speed limit may bechecked against the prevailing speeds of theroadway and the road's safety performance.
E2
NUMBER OF INTERSECTIONSWITH PRIVATE ACCESS DRIVEWAYS
Number ofOccurrences
1Left turn movements permitted 1 Comments:Right-in / Right-out only 0
E3NUMBER OF INTERCHANGES Number of
Occurrences 0Number of interchanges along corridor 0
F ON-STREET PARKING Lower 3

FORM A
Automated Speed Limit Guidelines Version:FORM A - Automated Speed Limit Guidelines Spreadsheet 10-Apr-09
Name of Corridor: St. Albert Trail 1
Segment Evaluated: 400m South of Herbert rd to Sir Winston Churchill Ave
Geographic Region: City of St. Albert
Road Agency: St. Ablert
Road Classification: Arterial Length of Corridor: 1,870 m
Urban / Rural: Urban Design Speed: (Required for Freeway,Expressway, Highway)
0 km/h
Divided / Undivided: Divided Current Posted Speed:(For information only)
60 km/h
Major / Minor: Major Prevailing Speed:(85th Percentile - for information only)
0 km/h# Through LanesPer Direction: 2+ lanes Policy:
(Maximum Posted Speed)0 km/h
RISK Score
A1 GEOMETRY (Horizontal) Lower 2
A2 GEOMETRY (Vertical) Lower 2
A3 AVERAGE LANE WIDTH Medium 4 Total Risk Score:
B ROADSIDE HAZARDS Medium 2 50
C1 PEDESTRIAN EXPOSURE Medium 6
C2 CYCLIST EXPOSURE Higher 9
D PAVEMENT SURFACE Lower 1 Recommended PostedSpeed Limit (km/h):
E1
NUMBER OF INTERSECTIONSWITH PUBLIC ROADS
Number ofOccurrences
11
As determined by road characteristicsSTOP controlled intersection 0
60Signalized intersection 4
Roundabout or traffic circle 0 As determined by policyCrosswalk 0
0Active, at-grade railroad crossing 0
Sidestreet STOP-controlled or lane 0 The recommended posted speed limit may bechecked against the prevailing speeds of theroadway and the road's safety performance.
E2
NUMBER OF INTERSECTIONSWITH PRIVATE ACCESS DRIVEWAYS
Number ofOccurrences
10Left turn movements permitted 1 Comments:Right-in / Right-out only 17
E3NUMBER OF INTERCHANGES Number of
Occurrences 0Number of interchanges along corridor 0
F ON-STREET PARKING Lower 3

FORM A
Automated Speed Limit Guidelines Version:FORM A - Automated Speed Limit Guidelines Spreadsheet 10-Apr-09
Name of Corridor: St. Albert Trail 2
Segment Evaluated: Sir Winston Churchill Ave to Mission Ave
Geographic Region: City of St. Albert
Road Agency: St. Ablert
Road Classification: Arterial Length of Corridor: 630 m
Urban / Rural: Urban Design Speed: (Required for Freeway,Expressway, Highway)
0 km/h
Divided / Undivided: Divided Current Posted Speed:(For information only)
60 km/h
Major / Minor: Major Prevailing Speed:(85th Percentile - for information only)
0 km/h# Through LanesPer Direction: 2+ lanes Policy:
(Maximum Posted Speed)0 km/h
RISK Score
A1 GEOMETRY (Horizontal) Lower 2
A2 GEOMETRY (Vertical) Medium 4
A3 AVERAGE LANE WIDTH Medium 4 Total Risk Score:
B ROADSIDE HAZARDS Medium 2 44
C1 PEDESTRIAN EXPOSURE Lower 3
C2 CYCLIST EXPOSURE Higher 9
D PAVEMENT SURFACE Lower 1 Recommended PostedSpeed Limit (km/h):
E1
NUMBER OF INTERSECTIONSWITH PUBLIC ROADS
Number ofOccurrences
8
As determined by road characteristicsSTOP controlled intersection 0
60Signalized intersection 1
Roundabout or traffic circle 0 As determined by policyCrosswalk 0
0Active, at-grade railroad crossing 0
Sidestreet STOP-controlled or lane 0 The recommended posted speed limit may bechecked against the prevailing speeds of theroadway and the road's safety performance.
E2
NUMBER OF INTERSECTIONSWITH PRIVATE ACCESS DRIVEWAYS
Number ofOccurrences
8Left turn movements permitted 0 Comments:Right-in / Right-out only 5
E3NUMBER OF INTERCHANGES Number of
Occurrences 0Number of interchanges along corridor 0
F ON-STREET PARKING Lower 3

FORM A
Automated Speed Limit Guidelines Version:FORM A - Automated Speed Limit Guidelines Spreadsheet 10-Apr-09
Name of Corridor: St. Albert Trail 3
Segment Evaluated: Mission Ave to 250m North of Boudreau rd/ Giroux rd
Geographic Region: City of St. Albert
Road Agency: St. Ablert
Road Classification: Arterial Length of Corridor: 2,100 m
Urban / Rural: Urban Design Speed: (Required for Freeway,Expressway, Highway)
0 km/h
Divided / Undivided: Divided Current Posted Speed:(For information only)
60 km/h
Major / Minor: Major Prevailing Speed:(85th Percentile - for information only)
0 km/h# Through LanesPer Direction: 2+ lanes Policy:
(Maximum Posted Speed)0 km/h
RISK Score
A1 GEOMETRY (Horizontal) Lower 2
A2 GEOMETRY (Vertical) Lower 2
A3 AVERAGE LANE WIDTH Medium 4 Total Risk Score:
B ROADSIDE HAZARDS Lower 1 49
C1 PEDESTRIAN EXPOSURE Lower 3
C2 CYCLIST EXPOSURE Higher 9
D PAVEMENT SURFACE Lower 1 Recommended PostedSpeed Limit (km/h):
E1
NUMBER OF INTERSECTIONSWITH PUBLIC ROADS
Number ofOccurrences
10
As determined by road characteristicsSTOP controlled intersection 0
60Signalized intersection 4
Roundabout or traffic circle 0 As determined by policyCrosswalk 0
0Active, at-grade railroad crossing 0
Sidestreet STOP-controlled or lane 1 The recommended posted speed limit may bechecked against the prevailing speeds of theroadway and the road's safety performance.
E2
NUMBER OF INTERSECTIONSWITH PRIVATE ACCESS DRIVEWAYS
Number ofOccurrences
14Left turn movements permitted 0 Comments:Right-in / Right-out only 29
E3NUMBER OF INTERCHANGES Number of
Occurrences 0Number of interchanges along corridor 0
F ON-STREET PARKING Lower 3

FORM A
Automated Speed Limit Guidelines Version:FORM A - Automated Speed Limit Guidelines Spreadsheet 10-Apr-09
Name of Corridor: St. Albert Trail 4
Segment Evaluated: 250m North of Boudreau rd/ Giroux rd to Northern City Limits
Geographic Region: City of St. Albert
Road Agency: St. Ablert
Road Classification: Arterial Length of Corridor: 2,360 m
Urban / Rural: Urban Design Speed: (Required for Freeway,Expressway, Highway)
0 km/h
Divided / Undivided: Divided Current Posted Speed:(For information only)
60 km/h
Major / Minor: Major Prevailing Speed:(85th Percentile - for information only)
0 km/h# Through LanesPer Direction: 2+ lanes Policy:
(Maximum Posted Speed)0 km/h
RISK Score
A1 GEOMETRY (Horizontal) Lower 2
A2 GEOMETRY (Vertical) Lower 2
A3 AVERAGE LANE WIDTH Medium 4 Total Risk Score:
B ROADSIDE HAZARDS Lower 1 42
C1 PEDESTRIAN EXPOSURE Higher 9
C2 CYCLIST EXPOSURE Medium 6
D PAVEMENT SURFACE Lower 1 Recommended PostedSpeed Limit (km/h):
E1
NUMBER OF INTERSECTIONSWITH PUBLIC ROADS
Number ofOccurrences
11
As determined by road characteristicsSTOP controlled intersection 0
60Signalized intersection 5
Roundabout or traffic circle 0 As determined by policyCrosswalk 0
0Active, at-grade railroad crossing 0
Sidestreet STOP-controlled or lane 0 The recommended posted speed limit may bechecked against the prevailing speeds of theroadway and the road's safety performance.
E2
NUMBER OF INTERSECTIONSWITH PRIVATE ACCESS DRIVEWAYS
Number ofOccurrences
3Left turn movements permitted 0 Comments:Right-in / Right-out only 6
E3NUMBER OF INTERCHANGES Number of
Occurrences 0Number of interchanges along corridor 0
F ON-STREET PARKING Lower 3

FORM A
Automated Speed Limit Guidelines Version:FORM A - Automated Speed Limit Guidelines Spreadsheet 10-Apr-09
Name of Corridor: Veness Road
Segment Evaluated: Poundmaker Rd to 160m South of Boudreau rd
Geographic Region: City of St. Albert
Road Agency: St. Ablert
Road Classification: Arterial Length of Corridor: 1,770 m
Urban / Rural: Urban Design Speed: (Required for Freeway,Expressway, Highway)
0 km/h
Divided / Undivided: Undivided Current Posted Speed:(For information only)
60 km/h
Major / Minor: Major Prevailing Speed:(85th Percentile - for information only)
51 km/h# Through LanesPer Direction: 1 lane Policy:
(Maximum Posted Speed)0 km/h
RISK Score
A1 GEOMETRY (Horizontal) Lower 2
A2 GEOMETRY (Vertical) Lower 2
A3 AVERAGE LANE WIDTH Medium 4 Total Risk Score:
B ROADSIDE HAZARDS Higher 3 32
C1 PEDESTRIAN EXPOSURE Lower 3
C2 CYCLIST EXPOSURE Medium 6
D PAVEMENT SURFACE Lower 1 Recommended PostedSpeed Limit (km/h):
E1
NUMBER OF INTERSECTIONSWITH PUBLIC ROADS
Number ofOccurrences
7
As determined by road characteristicsSTOP controlled intersection 1
70Signalized intersection 1
Roundabout or traffic circle 0 As determined by policyCrosswalk 0
0Active, at-grade railroad crossing 1
Sidestreet STOP-controlled or lane 6 The recommended posted speed limit may bechecked against the prevailing speeds of theroadway and the road's safety performance.
E2
NUMBER OF INTERSECTIONSWITH PRIVATE ACCESS DRIVEWAYS
Number ofOccurrences
1Left turn movements permitted 0 Comments:Right-in / Right-out only 2
E3NUMBER OF INTERCHANGES Number of
Occurrences 0Number of interchanges along corridor 0
F ON-STREET PARKING Lower 3

FORM A
Automated Speed Limit Guidelines Version:FORM A - Automated Speed Limit Guidelines Spreadsheet 10-Apr-09
Name of Corridor: Erin Ridge Road / Villeneuve Road 1
Segment Evaluated: Erin Ridge dr to 420m West of St. Albert Trail
Geographic Region: City of St. Albert
Road Agency: St. Ablert
Road Classification: Arterial Length of Corridor: 810 m
Urban / Rural: Urban Design Speed: (Required for Freeway,Expressway, Highway)
0 km/h
Divided / Undivided: Undivided Current Posted Speed:(For information only)
40 km/h
Major / Minor: Major Prevailing Speed:(85th Percentile - for information only)
39 km/h# Through LanesPer Direction: 1 lane Policy:
(Maximum Posted Speed)0 km/h
RISK Score
A1 GEOMETRY (Horizontal) Lower 2
A2 GEOMETRY (Vertical) Lower 2
A3 AVERAGE LANE WIDTH Medium 4 Total Risk Score:
B ROADSIDE HAZARDS Higher 3 71
C1 PEDESTRIAN EXPOSURE Lower 3
C2 CYCLIST EXPOSURE Higher 9
D PAVEMENT SURFACE Lower 1 Recommended PostedSpeed Limit (km/h):
E1
NUMBER OF INTERSECTIONSWITH PUBLIC ROADS
Number ofOccurrences
23
As determined by road characteristicsSTOP controlled intersection 1
50Signalized intersection 2
Roundabout or traffic circle 0 As determined by policyCrosswalk 1
0Active, at-grade railroad crossing 0
Sidestreet STOP-controlled or lane 0 The recommended posted speed limit may bechecked against the prevailing speeds of theroadway and the road's safety performance.
E2
NUMBER OF INTERSECTIONSWITH PRIVATE ACCESS DRIVEWAYS
Number ofOccurrences
15Left turn movements permitted 8 Comments:Right-in / Right-out only 0
E3NUMBER OF INTERCHANGES Number of
Occurrences 0Number of interchanges along corridor 0
F ON-STREET PARKING Higher 9

FORM A
Automated Speed Limit Guidelines Version:FORM A - Automated Speed Limit Guidelines Spreadsheet 10-Apr-09
Name of Corridor: Villeneuve Road 2
Segment Evaluated: 420m West of St. Albert Trail to Ray Gibbon Dr
Geographic Region: City of St. Albert
Road Agency: St. Ablert
Road Classification: Arterial Length of Corridor: 2,710 m
Urban / Rural: Urban Design Speed: (Required for Freeway,Expressway, Highway)
0 km/h
Divided / Undivided: Undivided Current Posted Speed:(For information only)
60 km/h
Major / Minor: Major Prevailing Speed:(85th Percentile - for information only)
47 km/h# Through LanesPer Direction: 1 lane Policy:
(Maximum Posted Speed)0 km/h
RISK Score
A1 GEOMETRY (Horizontal) Lower 2
A2 GEOMETRY (Vertical) Lower 2
A3 AVERAGE LANE WIDTH Lower 2 Total Risk Score:
B ROADSIDE HAZARDS Lower 1 32
C1 PEDESTRIAN EXPOSURE Higher 9
C2 CYCLIST EXPOSURE Medium 6
D PAVEMENT SURFACE Lower 1 Recommended PostedSpeed Limit (km/h):
E1
NUMBER OF INTERSECTIONSWITH PUBLIC ROADS
Number ofOccurrences
2
As determined by road characteristicsSTOP controlled intersection 0
70Signalized intersection 1
Roundabout or traffic circle 0 As determined by policyCrosswalk 0
0Active, at-grade railroad crossing 0
Sidestreet STOP-controlled or lane 2 The recommended posted speed limit may bechecked against the prevailing speeds of theroadway and the road's safety performance.
E2
NUMBER OF INTERSECTIONSWITH PRIVATE ACCESS DRIVEWAYS
Number ofOccurrences
4Left turn movements permitted 6 Comments:Right-in / Right-out only 0
E3NUMBER OF INTERCHANGES Number of
Occurrences 0Number of interchanges along corridor 0
F ON-STREET PARKING Lower 3

FORM A
Automated Speed Limit Guidelines Version:FORM A - Automated Speed Limit Guidelines Spreadsheet 10-Apr-09
Name of Corridor: N Ridge Drive 1
Segment Evaluated: Giroux Rd to Hogan Rd
Geographic Region: City of St. Albert
Road Agency: St. Ablert
Road Classification: Collector Length of Corridor: 1,190 m
Urban / Rural: Urban Design Speed: (Required for Freeway,Expressway, Highway)
0 km/h
Divided / Undivided: Undivided Current Posted Speed:(For information only)
50 km/h
Major / Minor: Major Prevailing Speed:(85th Percentile - for information only)
36 km/h# Through LanesPer Direction: 1 lane Policy:
(Maximum Posted Speed)0 km/h
RISK Score
A1 GEOMETRY (Horizontal) Medium 2
A2 GEOMETRY (Vertical) Lower 1
A3 AVERAGE LANE WIDTH Medium 4 Total Risk Score:
B ROADSIDE HAZARDS Higher 3 49
C1 PEDESTRIAN EXPOSURE Lower 3
C2 CYCLIST EXPOSURE Medium 6
D PAVEMENT SURFACE Lower 1 Recommended PostedSpeed Limit (km/h):
E1
NUMBER OF INTERSECTIONSWITH PUBLIC ROADS
Number ofOccurrences
11
As determined by road characteristicsSTOP controlled intersection 1
50Signalized intersection 0
Roundabout or traffic circle 0 As determined by policyCrosswalk 3
0Active, at-grade railroad crossing 0
Sidestreet STOP-controlled or lane 11 The recommended posted speed limit may bechecked against the prevailing speeds of theroadway and the road's safety performance.
E2
NUMBER OF INTERSECTIONSWITH PRIVATE ACCESS DRIVEWAYS
Number ofOccurrences
15Left turn movements permitted 99 Comments:Right-in / Right-out only 0
E3NUMBER OF INTERCHANGES Number of
Occurrences 0Number of interchanges along corridor 0
F ON-STREET PARKING Lower 3

FORM A
Automated Speed Limit Guidelines Version:FORM A - Automated Speed Limit Guidelines Spreadsheet 10-Apr-09
Name of Corridor: Erin Ridge Drive 1
Segment Evaluated: Boudreau Rd to Elliot Pl
Geographic Region: City of St. Albert
Road Agency: St. Ablert
Road Classification: Collector Length of Corridor: 460 m
Urban / Rural: Urban Design Speed: (Required for Freeway,Expressway, Highway)
0 km/h
Divided / Undivided: Undivided Current Posted Speed:(For information only)
40 km/h
Major / Minor: Major Prevailing Speed:(85th Percentile - for information only)
47 km/h# Through LanesPer Direction: 1 lane Policy:
(Maximum Posted Speed)0 km/h
RISK Score
A1 GEOMETRY (Horizontal) Medium 2
A2 GEOMETRY (Vertical) Lower 1
A3 AVERAGE LANE WIDTH Medium 4 Total Risk Score:
B ROADSIDE HAZARDS Higher 3 54
C1 PEDESTRIAN EXPOSURE Lower 3
C2 CYCLIST EXPOSURE Medium 6
D PAVEMENT SURFACE Lower 1 Recommended PostedSpeed Limit (km/h):
E1
NUMBER OF INTERSECTIONSWITH PUBLIC ROADS
Number ofOccurrences
24
As determined by road characteristicsSTOP controlled intersection 1
50Signalized intersection 1
Roundabout or traffic circle 0 As determined by policyCrosswalk 2
0Active, at-grade railroad crossing 0
Sidestreet STOP-controlled or lane 3 The recommended posted speed limit may bechecked against the prevailing speeds of theroadway and the road's safety performance.
E2
NUMBER OF INTERSECTIONSWITH PRIVATE ACCESS DRIVEWAYS
Number ofOccurrences
1Left turn movements permitted 1 Comments:Right-in / Right-out only 0
E3NUMBER OF INTERCHANGES Number of
Occurrences 0Number of interchanges along corridor 0
F ON-STREET PARKING Higher 9

FORM A
Automated Speed Limit Guidelines Version:FORM A - Automated Speed Limit Guidelines Spreadsheet 10-Apr-09
Name of Corridor: Erin Ridge Drive 2
Segment Evaluated: Elliot Pl to Everitt Dr
Geographic Region: City of St. Albert
Road Agency: St. Ablert
Road Classification: Collector Length of Corridor: 1,100 m
Urban / Rural: Urban Design Speed: (Required for Freeway,Expressway, Highway)
0 km/h
Divided / Undivided: Undivided Current Posted Speed:(For information only)
40 km/h
Major / Minor: Major Prevailing Speed:(85th Percentile - for information only)
35 km/h# Through LanesPer Direction: 1 lane Policy:
(Maximum Posted Speed)0 km/h
RISK Score
A1 GEOMETRY (Horizontal) Lower 1
A2 GEOMETRY (Vertical) Lower 1
A3 AVERAGE LANE WIDTH Medium 4 Total Risk Score:
B ROADSIDE HAZARDS Higher 3 44
C1 PEDESTRIAN EXPOSURE Lower 3
C2 CYCLIST EXPOSURE Medium 6
D PAVEMENT SURFACE Lower 1 Recommended PostedSpeed Limit (km/h):
E1
NUMBER OF INTERSECTIONSWITH PUBLIC ROADS
Number ofOccurrences
9
As determined by road characteristicsSTOP controlled intersection 0
50Signalized intersection 0
Roundabout or traffic circle 0 As determined by policyCrosswalk 4
0Active, at-grade railroad crossing 0
Sidestreet STOP-controlled or lane 12 The recommended posted speed limit may bechecked against the prevailing speeds of theroadway and the road's safety performance.
E2
NUMBER OF INTERSECTIONSWITH PRIVATE ACCESS DRIVEWAYS
Number ofOccurrences
7Left turn movements permitted 16 Comments:Right-in / Right-out only 0
E3NUMBER OF INTERCHANGES Number of
Occurrences 0Number of interchanges along corridor 0
F ON-STREET PARKING Higher 9

FORM A
Automated Speed Limit Guidelines Version:FORM A - Automated Speed Limit Guidelines Spreadsheet 10-Apr-09
Name of Corridor: Erin Ridge Drive 3
Segment Evaluated: Everitt Dr to Bellerose Dr
Geographic Region: City of St. Albert
Road Agency: St. Ablert
Road Classification: Collector Length of Corridor: 860 m
Urban / Rural: Urban Design Speed: (Required for Freeway,Expressway, Highway)
0 km/h
Divided / Undivided: Undivided Current Posted Speed:(For information only)
40 km/h
Major / Minor: Minor Prevailing Speed:(85th Percentile - for information only)
30 km/h# Through LanesPer Direction: 1 lane Policy:
(Maximum Posted Speed)0 km/h
RISK Score
A1 GEOMETRY (Horizontal) Medium 2
A2 GEOMETRY (Vertical) Lower 1
A3 AVERAGE LANE WIDTH Medium 4 Total Risk Score:
B ROADSIDE HAZARDS Higher 3 55
C1 PEDESTRIAN EXPOSURE Lower 3
C2 CYCLIST EXPOSURE Medium 6
D PAVEMENT SURFACE Lower 1 Recommended PostedSpeed Limit (km/h):
E1
NUMBER OF INTERSECTIONSWITH PUBLIC ROADS
Number ofOccurrences
11
As determined by road characteristicsSTOP controlled intersection 1
40Signalized intersection 0
Roundabout or traffic circle 0 As determined by policyCrosswalk 4
0Active, at-grade railroad crossing 0
Sidestreet STOP-controlled or lane 3 The recommended posted speed limit may bechecked against the prevailing speeds of theroadway and the road's safety performance.
E2
NUMBER OF INTERSECTIONSWITH PRIVATE ACCESS DRIVEWAYS
Number ofOccurrences
15Left turn movements permitted 62 Comments:Right-in / Right-out only 0
E3NUMBER OF INTERCHANGES Number of
Occurrences 0Number of interchanges along corridor 0
F ON-STREET PARKING Higher 9

FORM A
Automated Speed Limit Guidelines Version:FORM A - Automated Speed Limit Guidelines Spreadsheet 10-Apr-09
Name of Corridor: Oak Vista Drive
Segment Evaluated: Bellerose Dr to Otter Cresent
Geographic Region: City of St. Albert
Road Agency: St. Ablert
Road Classification: Collector Length of Corridor: 880 m
Urban / Rural: Urban Design Speed: (Required for Freeway,Expressway, Highway)
0 km/h
Divided / Undivided: Undivided Current Posted Speed:(For information only)
50 km/h
Major / Minor: Minor Prevailing Speed:(85th Percentile - for information only)
39 km/h# Through LanesPer Direction: 1 lane Policy:
(Maximum Posted Speed)0 km/h
RISK Score
A1 GEOMETRY (Horizontal) Medium 2
A2 GEOMETRY (Vertical) Lower 1
A3 AVERAGE LANE WIDTH Lower 2 Total Risk Score:
B ROADSIDE HAZARDS Higher 3 51
C1 PEDESTRIAN EXPOSURE Lower 3
C2 CYCLIST EXPOSURE Medium 6
D PAVEMENT SURFACE Lower 1 Recommended PostedSpeed Limit (km/h):
E1
NUMBER OF INTERSECTIONSWITH PUBLIC ROADS
Number ofOccurrences
9
As determined by road characteristicsSTOP controlled intersection 1
40Signalized intersection 0
Roundabout or traffic circle 0 As determined by policyCrosswalk 2
0Active, at-grade railroad crossing 0
Sidestreet STOP-controlled or lane 4 The recommended posted speed limit may bechecked against the prevailing speeds of theroadway and the road's safety performance.
E2
NUMBER OF INTERSECTIONSWITH PRIVATE ACCESS DRIVEWAYS
Number ofOccurrences
15Left turn movements permitted 78 Comments:Right-in / Right-out only 0
E3NUMBER OF INTERCHANGES Number of
Occurrences 0Number of interchanges along corridor 0
F ON-STREET PARKING Higher 9

FORM A
Automated Speed Limit Guidelines Version:FORM A - Automated Speed Limit Guidelines Spreadsheet 10-Apr-09
Name of Corridor: Oakland Drive S / Oakland Drive N
Segment Evaluated: Otter Cresent to Oakmont Dr
Geographic Region: City of St. Albert
Road Agency: St. Ablert
Road Classification: Collector Length of Corridor: 1,700 m
Urban / Rural: Urban Design Speed: (Required for Freeway,Expressway, Highway)
0 km/h
Divided / Undivided: Undivided Current Posted Speed:(For information only)
50 km/h
Major / Minor: Minor Prevailing Speed:(85th Percentile - for information only)
40 km/h# Through LanesPer Direction: 1 lane Policy:
(Maximum Posted Speed)0 km/h
RISK Score
A1 GEOMETRY (Horizontal) Medium 2
A2 GEOMETRY (Vertical) Lower 1
A3 AVERAGE LANE WIDTH Lower 2 Total Risk Score:
B ROADSIDE HAZARDS Higher 3 53
C1 PEDESTRIAN EXPOSURE Lower 3
C2 CYCLIST EXPOSURE Medium 6
D PAVEMENT SURFACE Medium 2 Recommended PostedSpeed Limit (km/h):
E1
NUMBER OF INTERSECTIONSWITH PUBLIC ROADS
Number ofOccurrences
10
As determined by road characteristicsSTOP controlled intersection 2
40Signalized intersection 0
Roundabout or traffic circle 0 As determined by policyCrosswalk 2
0Active, at-grade railroad crossing 0
Sidestreet STOP-controlled or lane 15 The recommended posted speed limit may bechecked against the prevailing speeds of theroadway and the road's safety performance.
E2
NUMBER OF INTERSECTIONSWITH PRIVATE ACCESS DRIVEWAYS
Number ofOccurrences
15Left turn movements permitted 104 Comments:Right-in / Right-out only 0
E3NUMBER OF INTERCHANGES Number of
Occurrences 0Number of interchanges along corridor 0
F ON-STREET PARKING Higher 9

FORM A
Automated Speed Limit Guidelines Version:FORM A - Automated Speed Limit Guidelines Spreadsheet 10-Apr-09
Name of Corridor: Oakmont Drive
Segment Evaluated: Oak Vista Dr to Bellerose Dr
Geographic Region: City of St. Albert
Road Agency: St. Ablert
Road Classification: Collector Length of Corridor: 940 m
Urban / Rural: Urban Design Speed: (Required for Freeway,Expressway, Highway)
0 km/h
Divided / Undivided: Undivided Current Posted Speed:(For information only)
50 km/h
Major / Minor: Minor Prevailing Speed:(85th Percentile - for information only)
38 km/h# Through LanesPer Direction: 1 lane Policy:
(Maximum Posted Speed)0 km/h
RISK Score
A1 GEOMETRY (Horizontal) Higher 3
A2 GEOMETRY (Vertical) Lower 1
A3 AVERAGE LANE WIDTH Medium 4 Total Risk Score:
B ROADSIDE HAZARDS Higher 3 62
C1 PEDESTRIAN EXPOSURE Lower 3
C2 CYCLIST EXPOSURE Medium 6
D PAVEMENT SURFACE Medium 2 Recommended PostedSpeed Limit (km/h):
E1
NUMBER OF INTERSECTIONSWITH PUBLIC ROADS
Number ofOccurrences
16
As determined by road characteristicsSTOP controlled intersection 1
40Signalized intersection 1
Roundabout or traffic circle 0 As determined by policyCrosswalk 4
0Active, at-grade railroad crossing 0
Sidestreet STOP-controlled or lane 7 The recommended posted speed limit may bechecked against the prevailing speeds of theroadway and the road's safety performance.
E2
NUMBER OF INTERSECTIONSWITH PRIVATE ACCESS DRIVEWAYS
Number ofOccurrences
15Left turn movements permitted 28 Comments:Right-in / Right-out only 0
E3NUMBER OF INTERCHANGES Number of
Occurrences 0Number of interchanges along corridor 0
F ON-STREET PARKING Higher 9

FORM A
Automated Speed Limit Guidelines Version:FORM A - Automated Speed Limit Guidelines Spreadsheet 10-Apr-09
Name of Corridor: Woodlands Road
Segment Evaluated: Sir Winston Churchill Ave to Woodcrest Ave
Geographic Region: City of St. Albert
Road Agency: St. Ablert
Road Classification: Collector Length of Corridor: 540 m
Urban / Rural: Urban Design Speed: (Required for Freeway,Expressway, Highway)
0 km/h
Divided / Undivided: Undivided Current Posted Speed:(For information only)
50 km/h
Major / Minor: Minor Prevailing Speed:(85th Percentile - for information only)
30 km/h# Through LanesPer Direction: 1 lane Policy:
(Maximum Posted Speed)0 km/h
RISK Score
A1 GEOMETRY (Horizontal) Medium 2
A2 GEOMETRY (Vertical) Medium 2
A3 AVERAGE LANE WIDTH Lower 2 Total Risk Score:
B ROADSIDE HAZARDS Medium 2 48
C1 PEDESTRIAN EXPOSURE Lower 3
C2 CYCLIST EXPOSURE Medium 6
D PAVEMENT SURFACE Lower 1 Recommended PostedSpeed Limit (km/h):
E1
NUMBER OF INTERSECTIONSWITH PUBLIC ROADS
Number ofOccurrences
6
As determined by road characteristicsSTOP controlled intersection 0
50Signalized intersection 0
Roundabout or traffic circle 0 As determined by policyCrosswalk 1
0Active, at-grade railroad crossing 0
Sidestreet STOP-controlled or lane 4 The recommended posted speed limit may bechecked against the prevailing speeds of theroadway and the road's safety performance.
E2
NUMBER OF INTERSECTIONSWITH PRIVATE ACCESS DRIVEWAYS
Number ofOccurrences
15Left turn movements permitted 25 Comments:Right-in / Right-out only 0
E3NUMBER OF INTERCHANGES Number of
Occurrences 0Number of interchanges along corridor 0
F ON-STREET PARKING Higher 9

FORM A
Automated Speed Limit Guidelines Version:FORM A - Automated Speed Limit Guidelines Spreadsheet 10-Apr-09
Name of Corridor: Willoughby Drive
Segment Evaluated: Woodlands Rd to Woodlands Rd
Geographic Region: City of St. Albert
Road Agency: St. Ablert
Road Classification: Collector Length of Corridor: 960 m
Urban / Rural: Urban Design Speed: (Required for Freeway,Expressway, Highway)
0 km/h
Divided / Undivided: Undivided Current Posted Speed:(For information only)
50 km/h
Major / Minor: Minor Prevailing Speed:(85th Percentile - for information only)
32 km/h# Through LanesPer Direction: 1 lane Policy:
(Maximum Posted Speed)0 km/h
RISK Score
A1 GEOMETRY (Horizontal) Medium 2
A2 GEOMETRY (Vertical) Lower 1
A3 AVERAGE LANE WIDTH Medium 4 Total Risk Score:
B ROADSIDE HAZARDS Higher 3 60
C1 PEDESTRIAN EXPOSURE Lower 3
C2 CYCLIST EXPOSURE Medium 6
D PAVEMENT SURFACE Lower 1 Recommended PostedSpeed Limit (km/h):
E1
NUMBER OF INTERSECTIONSWITH PUBLIC ROADS
Number ofOccurrences
16
As determined by road characteristicsSTOP controlled intersection 2
40Signalized intersection 0
Roundabout or traffic circle 0 As determined by policyCrosswalk 2
0Active, at-grade railroad crossing 0
Sidestreet STOP-controlled or lane 10 The recommended posted speed limit may bechecked against the prevailing speeds of theroadway and the road's safety performance.
E2
NUMBER OF INTERSECTIONSWITH PRIVATE ACCESS DRIVEWAYS
Number ofOccurrences
15Left turn movements permitted 36 Comments:Right-in / Right-out only 0
E3NUMBER OF INTERCHANGES Number of
Occurrences 0Number of interchanges along corridor 0
F ON-STREET PARKING Higher 9
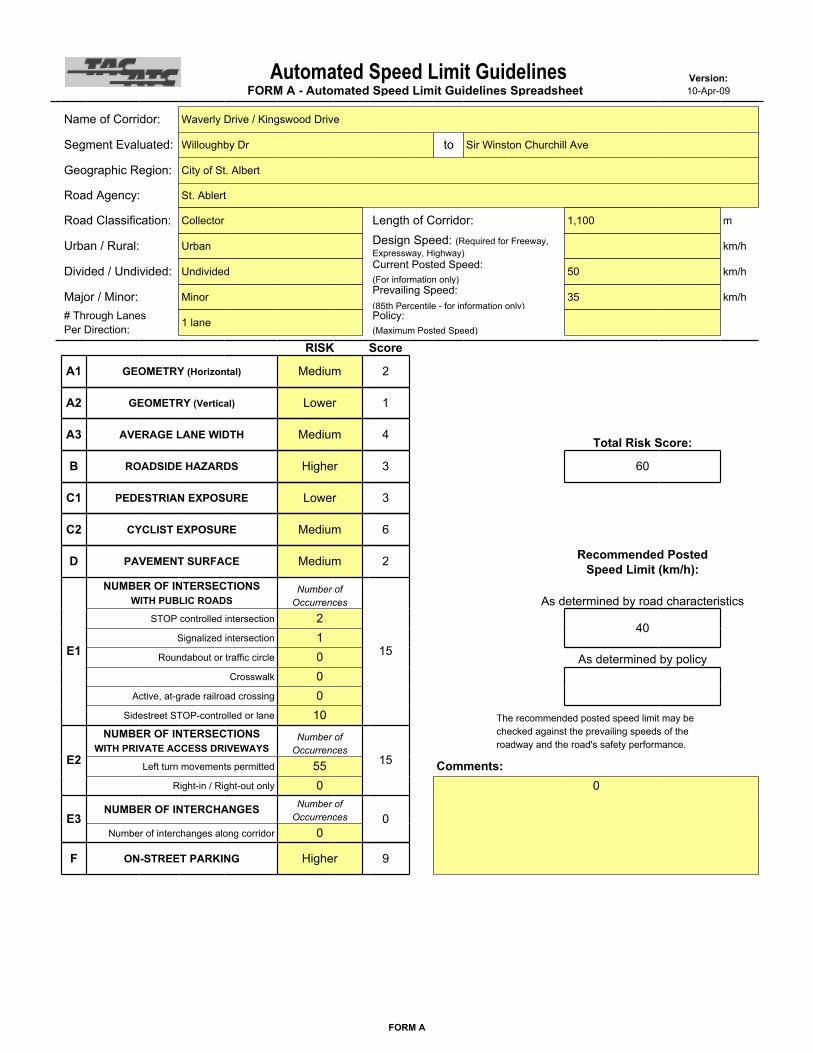
FORM A
Automated Speed Limit Guidelines Version:FORM A - Automated Speed Limit Guidelines Spreadsheet 10-Apr-09
Name of Corridor: Waverly Drive / Kingswood Drive
Segment Evaluated: Willoughby Dr to Sir Winston Churchill Ave
Geographic Region: City of St. Albert
Road Agency: St. Ablert
Road Classification: Collector Length of Corridor: 1,100 m
Urban / Rural: Urban Design Speed: (Required for Freeway,Expressway, Highway)
km/h
Divided / Undivided: Undivided Current Posted Speed:(For information only)
50 km/h
Major / Minor: Minor Prevailing Speed:(85th Percentile - for information only)
35 km/h# Through LanesPer Direction: 1 lane Policy:
(Maximum Posted Speed)
RISK Score
A1 GEOMETRY (Horizontal) Medium 2
A2 GEOMETRY (Vertical) Lower 1
A3 AVERAGE LANE WIDTH Medium 4 Total Risk Score:
B ROADSIDE HAZARDS Higher 3 60
C1 PEDESTRIAN EXPOSURE Lower 3
C2 CYCLIST EXPOSURE Medium 6
D PAVEMENT SURFACE Medium 2 Recommended PostedSpeed Limit (km/h):
E1
NUMBER OF INTERSECTIONSWITH PUBLIC ROADS
Number ofOccurrences
15
As determined by road characteristicsSTOP controlled intersection 2
40Signalized intersection 1
Roundabout or traffic circle 0 As determined by policyCrosswalk 0
Active, at-grade railroad crossing 0Sidestreet STOP-controlled or lane 10 The recommended posted speed limit may be
checked against the prevailing speeds of theroadway and the road's safety performance.
E2
NUMBER OF INTERSECTIONSWITH PRIVATE ACCESS DRIVEWAYS
Number ofOccurrences
15Left turn movements permitted 55 Comments:Right-in / Right-out only 0 0
E3NUMBER OF INTERCHANGES Number of
Occurrences 0Number of interchanges along corridor 0
F ON-STREET PARKING Higher 9

FORM A
Automated Speed Limit Guidelines Version:FORM A - Automated Speed Limit Guidelines Spreadsheet 10-Apr-09
Name of Corridor: Kingsway Drive
Segment Evaluated: Kingswood Dr to Kingswood Blvd
Geographic Region: City of St. Albert
Road Agency: St. Ablert
Road Classification: Collector Length of Corridor: 710 m
Urban / Rural: Urban Design Speed: (Required for Freeway,Expressway, Highway)
km/h
Divided / Undivided: Undivided Current Posted Speed:(For information only)
50 km/h
Major / Minor: Minor Prevailing Speed:(85th Percentile - for information only)
28 km/h# Through LanesPer Direction: 1 lane Policy:
(Maximum Posted Speed)
RISK Score
A1 GEOMETRY (Horizontal) Medium 2
A2 GEOMETRY (Vertical) Lower 1
A3 AVERAGE LANE WIDTH Medium 4 Total Risk Score:
B ROADSIDE HAZARDS Higher 3 59
C1 PEDESTRIAN EXPOSURE Lower 3
C2 CYCLIST EXPOSURE Medium 6
D PAVEMENT SURFACE Lower 1 Recommended PostedSpeed Limit (km/h):
E1
NUMBER OF INTERSECTIONSWITH PUBLIC ROADS
Number ofOccurrences
15
As determined by road characteristicsSTOP controlled intersection 2
40Signalized intersection 0
Roundabout or traffic circle 0 As determined by policyCrosswalk 0
Active, at-grade railroad crossing 0Sidestreet STOP-controlled or lane 6 The recommended posted speed limit may be
checked against the prevailing speeds of theroadway and the road's safety performance.
E2
NUMBER OF INTERSECTIONSWITH PRIVATE ACCESS DRIVEWAYS
Number ofOccurrences
15Left turn movements permitted 38 Comments:Right-in / Right-out only 0 0
E3NUMBER OF INTERCHANGES Number of
Occurrences 0Number of interchanges along corridor 0
F ON-STREET PARKING Higher 9

FORM A
Automated Speed Limit Guidelines Version:FORM A - Automated Speed Limit Guidelines Spreadsheet 10-Apr-09
Name of Corridor: Kingswood Boulevard 3
Segment Evaluated: 55m South of Kingsford Crescent to South Kingsmeade Crecent
Geographic Region: City of St. Albert
Road Agency: St. Ablert
Road Classification: Collector Length of Corridor: 600 m
Urban / Rural: Urban Design Speed: (Required for Freeway,Expressway, Highway)
km/h
Divided / Undivided: Undivided Current Posted Speed:(For information only)
50 km/h
Major / Minor: Minor Prevailing Speed:(85th Percentile - for information only)
0 km/h# Through LanesPer Direction: 1 lane Policy:
(Maximum Posted Speed)
RISK Score
A1 GEOMETRY (Horizontal) Lower 1
A2 GEOMETRY (Vertical) Lower 1
A3 AVERAGE LANE WIDTH Medium 4 Total Risk Score:
B ROADSIDE HAZARDS Higher 3 48
C1 PEDESTRIAN EXPOSURE Lower 3
C2 CYCLIST EXPOSURE Medium 6
D PAVEMENT SURFACE Lower 1 Recommended PostedSpeed Limit (km/h):
E1
NUMBER OF INTERSECTIONSWITH PUBLIC ROADS
Number ofOccurrences
6
As determined by road characteristicsSTOP controlled intersection 0
50Signalized intersection 0
Roundabout or traffic circle 0 As determined by policyCrosswalk 0
Active, at-grade railroad crossing 0Sidestreet STOP-controlled or lane 7 The recommended posted speed limit may be
checked against the prevailing speeds of theroadway and the road's safety performance.
E2
NUMBER OF INTERSECTIONSWITH PRIVATE ACCESS DRIVEWAYS
Number ofOccurrences
14Left turn movements permitted 17 Comments:Right-in / Right-out only 0
E3NUMBER OF INTERCHANGES Number of
Occurrences 0Number of interchanges along corridor 0
F ON-STREET PARKING Higher 9

FORM A
Automated Speed Limit Guidelines Version:FORM A - Automated Speed Limit Guidelines Spreadsheet 10-Apr-09
Name of Corridor: Kingswood Boulevard 2
Segment Evaluated: South Kingsmeade Crecent to Kingsmoor Close
Geographic Region: City of St. Albert
Road Agency: St. Ablert
Road Classification: Collector Length of Corridor: 590 m
Urban / Rural: Urban Design Speed: (Required for Freeway,Expressway, Highway)
km/h
Divided / Undivided: Undivided Current Posted Speed:(For information only)
50 km/h
Major / Minor: Minor Prevailing Speed:(85th Percentile - for information only)
41 km/h# Through LanesPer Direction: 1 lane Policy:
(Maximum Posted Speed)
RISK Score
A1 GEOMETRY (Horizontal) Lower 1
A2 GEOMETRY (Vertical) Medium 2
A3 AVERAGE LANE WIDTH Medium 4 Total Risk Score:
B ROADSIDE HAZARDS Higher 3 27
C1 PEDESTRIAN EXPOSURE Lower 3
C2 CYCLIST EXPOSURE Medium 6
D PAVEMENT SURFACE Lower 1 Recommended PostedSpeed Limit (km/h):
E1
NUMBER OF INTERSECTIONSWITH PUBLIC ROADS
Number ofOccurrences
4
As determined by road characteristicsSTOP controlled intersection 0
60Signalized intersection 0
Roundabout or traffic circle 0 As determined by policyCrosswalk 0
Active, at-grade railroad crossing 0Sidestreet STOP-controlled or lane 5 The recommended posted speed limit may be
checked against the prevailing speeds of theroadway and the road's safety performance.
E2
NUMBER OF INTERSECTIONSWITH PRIVATE ACCESS DRIVEWAYS
Number ofOccurrences
0Left turn movements permitted 0 Comments:Right-in / Right-out only 0
E3NUMBER OF INTERCHANGES Number of
Occurrences 0Number of interchanges along corridor 0
F ON-STREET PARKING Lower 3

FORM A
Automated Speed Limit Guidelines Version:FORM A - Automated Speed Limit Guidelines Spreadsheet 10-Apr-09
Name of Corridor: Kingswood Boulevard 1
Segment Evaluated: Kingsmoor Close to 60m East of Knightsbridge
Geographic Region: City of St. Albert
Road Agency: St. Ablert
Road Classification: Collector Length of Corridor: 500 m
Urban / Rural: Urban Design Speed: (Required for Freeway,Expressway, Highway)
km/h
Divided / Undivided: Undivided Current Posted Speed:(For information only)
50 km/h
Major / Minor: Minor Prevailing Speed:(85th Percentile - for information only)
0 km/h# Through LanesPer Direction: 1 lane Policy:
(Maximum Posted Speed)
RISK Score
A1 GEOMETRY (Horizontal) Medium 2
A2 GEOMETRY (Vertical) Lower 1
A3 AVERAGE LANE WIDTH Lower 2 Total Risk Score:
B ROADSIDE HAZARDS Higher 3 48
C1 PEDESTRIAN EXPOSURE Lower 3
C2 CYCLIST EXPOSURE Medium 6
D PAVEMENT SURFACE Lower 1 Recommended PostedSpeed Limit (km/h):
E1
NUMBER OF INTERSECTIONSWITH PUBLIC ROADS
Number ofOccurrences
6
As determined by road characteristicsSTOP controlled intersection 0
50Signalized intersection 0
Roundabout or traffic circle 0 As determined by policyCrosswalk 0
Active, at-grade railroad crossing 0Sidestreet STOP-controlled or lane 6 The recommended posted speed limit may be
checked against the prevailing speeds of theroadway and the road's safety performance.
E2
NUMBER OF INTERSECTIONSWITH PRIVATE ACCESS DRIVEWAYS
Number ofOccurrences
15Left turn movements permitted 23 Comments:Right-in / Right-out only 0
E3NUMBER OF INTERCHANGES Number of
Occurrences 0Number of interchanges along corridor 0
F ON-STREET PARKING Higher 9

FORM A
Automated Speed Limit Guidelines Version:FORM A - Automated Speed Limit Guidelines Spreadsheet 10-Apr-09
Name of Corridor: Arlington Drive
Segment Evaluated: Herbert Rd to Akins Dr
Geographic Region: City of St. Albert
Road Agency: St. Ablert
Road Classification: Collector Length of Corridor: 1,380 m
Urban / Rural: Urban Design Speed: (Required for Freeway,Expressway, Highway)
km/h
Divided / Undivided: Undivided Current Posted Speed:(For information only)
50 km/h
Major / Minor: Minor Prevailing Speed:(85th Percentile - for information only)
37 km/h# Through LanesPer Direction: 1 lane Policy:
(Maximum Posted Speed)
RISK Score
A1 GEOMETRY (Horizontal) Medium 2
A2 GEOMETRY (Vertical) Lower 1
A3 AVERAGE LANE WIDTH Medium 4 Total Risk Score:
B ROADSIDE HAZARDS Medium 2 55
C1 PEDESTRIAN EXPOSURE Lower 3
C2 CYCLIST EXPOSURE Medium 6
D PAVEMENT SURFACE Medium 2 Recommended PostedSpeed Limit (km/h):
E1
NUMBER OF INTERSECTIONSWITH PUBLIC ROADS
Number ofOccurrences
11
As determined by road characteristicsSTOP controlled intersection 1
40Signalized intersection 1
Roundabout or traffic circle 0 As determined by policyCrosswalk 3
Active, at-grade railroad crossing 0Sidestreet STOP-controlled or lane 10 The recommended posted speed limit may be
checked against the prevailing speeds of theroadway and the road's safety performance.
E2
NUMBER OF INTERSECTIONSWITH PRIVATE ACCESS DRIVEWAYS
Number ofOccurrences
15Left turn movements permitted 110 Comments:Right-in / Right-out only 0
E3NUMBER OF INTERCHANGES Number of
Occurrences 0Number of interchanges along corridor 0
F ON-STREET PARKING Higher 9

FORM A
Automated Speed Limit Guidelines Version:FORM A - Automated Speed Limit Guidelines Spreadsheet 10-Apr-09
Name of Corridor: Attwood Drive
Segment Evaluated: Annette Crescent to Arlington Dr
Geographic Region: City of St. Albert
Road Agency: St. Ablert
Road Classification: Collector Length of Corridor: 610 m
Urban / Rural: Urban Design Speed: (Required for Freeway,Expressway, Highway)
km/h
Divided / Undivided: Undivided Current Posted Speed:(For information only)
50 km/h
Major / Minor: Minor Prevailing Speed:(85th Percentile - for information only)
0 km/h# Through LanesPer Direction: 1 lane Policy:
(Maximum Posted Speed)
RISK Score
A1 GEOMETRY (Horizontal) Lower 1
A2 GEOMETRY (Vertical) Lower 1
A3 AVERAGE LANE WIDTH Medium 4 Total Risk Score:
B ROADSIDE HAZARDS Higher 3 55
C1 PEDESTRIAN EXPOSURE Lower 3
C2 CYCLIST EXPOSURE Medium 6
D PAVEMENT SURFACE Medium 2 Recommended PostedSpeed Limit (km/h):
E1
NUMBER OF INTERSECTIONSWITH PUBLIC ROADS
Number ofOccurrences
11
As determined by road characteristicsSTOP controlled intersection 1
40Signalized intersection 0
Roundabout or traffic circle 0 As determined by policyCrosswalk 1
Active, at-grade railroad crossing 0Sidestreet STOP-controlled or lane 3 The recommended posted speed limit may be
checked against the prevailing speeds of theroadway and the road's safety performance.
E2
NUMBER OF INTERSECTIONSWITH PRIVATE ACCESS DRIVEWAYS
Number ofOccurrences
15Left turn movements permitted 45 Comments:Right-in / Right-out only 0
E3NUMBER OF INTERCHANGES Number of
Occurrences 0Number of interchanges along corridor 0
F ON-STREET PARKING Higher 9

FORM A
Automated Speed Limit Guidelines Version:FORM A - Automated Speed Limit Guidelines Spreadsheet 10-Apr-09
Name of Corridor: Falstaff Avenue / Akins Drive 1
Segment Evaluated: Forrest Dr to Acorn Crescent
Geographic Region: City of St. Albert
Road Agency: St. Ablert
Road Classification: Collector Length of Corridor: 950 m
Urban / Rural: Urban Design Speed: (Required for Freeway,Expressway, Highway)
km/h
Divided / Undivided: Undivided Current Posted Speed:(For information only)
50 km/h
Major / Minor: Major Prevailing Speed:(85th Percentile - for information only)
38 km/h# Through LanesPer Direction: 1 lane Policy:
(Maximum Posted Speed)
RISK Score
A1 GEOMETRY (Horizontal) Medium 2
A2 GEOMETRY (Vertical) Lower 1
A3 AVERAGE LANE WIDTH Medium 4 Total Risk Score:
B ROADSIDE HAZARDS Higher 3 51
C1 PEDESTRIAN EXPOSURE Lower 3
C2 CYCLIST EXPOSURE Medium 6
D PAVEMENT SURFACE Lower 1 Recommended PostedSpeed Limit (km/h):
E1
NUMBER OF INTERSECTIONSWITH PUBLIC ROADS
Number ofOccurrences
13
As determined by road characteristicsSTOP controlled intersection 1
50Signalized intersection 1
Roundabout or traffic circle 0 As determined by policyCrosswalk 2
Active, at-grade railroad crossing 0Sidestreet STOP-controlled or lane 6 The recommended posted speed limit may be
checked against the prevailing speeds of theroadway and the road's safety performance.
E2
NUMBER OF INTERSECTIONSWITH PRIVATE ACCESS DRIVEWAYS
Number ofOccurrences
15Left turn movements permitted 58 Comments:Right-in / Right-out only 0
E3NUMBER OF INTERCHANGES Number of
Occurrences 0Number of interchanges along corridor 0
F ON-STREET PARKING Lower 3

FORM A
Automated Speed Limit Guidelines Version:FORM A - Automated Speed Limit Guidelines Spreadsheet 10-Apr-09
Name of Corridor: Alpine Boulevard
Segment Evaluated: Akins Dr to Akins Dr
Geographic Region: City of St. Albert
Road Agency: St. Ablert
Road Classification: Collector Length of Corridor: 890 m
Urban / Rural: Urban Design Speed: (Required for Freeway,Expressway, Highway)
km/h
Divided / Undivided: Undivided Current Posted Speed:(For information only)
50 km/h
Major / Minor: Minor Prevailing Speed:(85th Percentile - for information only)
36 km/h# Through LanesPer Direction: 1 lane Policy:
(Maximum Posted Speed)
RISK Score
A1 GEOMETRY (Horizontal) Medium 2
A2 GEOMETRY (Vertical) Lower 1
A3 AVERAGE LANE WIDTH Lower 2 Total Risk Score:
B ROADSIDE HAZARDS Higher 3 53
C1 PEDESTRIAN EXPOSURE Lower 3
C2 CYCLIST EXPOSURE Medium 6
D PAVEMENT SURFACE Medium 2 Recommended PostedSpeed Limit (km/h):
E1
NUMBER OF INTERSECTIONSWITH PUBLIC ROADS
Number ofOccurrences
10
As determined by road characteristicsSTOP controlled intersection 1
40Signalized intersection 0
Roundabout or traffic circle 0 As determined by policyCrosswalk 2
Active, at-grade railroad crossing 0Sidestreet STOP-controlled or lane 5 The recommended posted speed limit may be
checked against the prevailing speeds of theroadway and the road's safety performance.
E2
NUMBER OF INTERSECTIONSWITH PRIVATE ACCESS DRIVEWAYS
Number ofOccurrences
15Left turn movements permitted 69 Comments:Right-in / Right-out only 0
E3NUMBER OF INTERCHANGES Number of
Occurrences 0Number of interchanges along corridor 0
F ON-STREET PARKING Higher 9

FORM A
Automated Speed Limit Guidelines Version:FORM A - Automated Speed Limit Guidelines Spreadsheet 10-Apr-09
Name of Corridor: Akins Drive 2 / Page Drive
Segment Evaluated: Arbor Crescent to Pineview Drive
Geographic Region: City of St. Albert
Road Agency: St. Ablert
Road Classification: Collector Length of Corridor: 820 m
Urban / Rural: Urban Design Speed: (Required for Freeway,Expressway, Highway)
km/h
Divided / Undivided: Undivided Current Posted Speed:(For information only)
50 km/h
Major / Minor: Major Prevailing Speed:(85th Percentile - for information only)
32 km/h# Through LanesPer Direction: 1 lane Policy:
(Maximum Posted Speed)
RISK Score
A1 GEOMETRY (Horizontal) Medium 2
A2 GEOMETRY (Vertical) Lower 1
A3 AVERAGE LANE WIDTH Medium 4 Total Risk Score:
B ROADSIDE HAZARDS Higher 3 61
C1 PEDESTRIAN EXPOSURE Lower 3
C2 CYCLIST EXPOSURE Medium 6
D PAVEMENT SURFACE Lower 1 Recommended PostedSpeed Limit (km/h):
E1
NUMBER OF INTERSECTIONSWITH PUBLIC ROADS
Number ofOccurrences
17
As determined by road characteristicsSTOP controlled intersection 1
50Signalized intersection 1
Roundabout or traffic circle 0 As determined by policyCrosswalk 4
Active, at-grade railroad crossing 0Sidestreet STOP-controlled or lane 5 The recommended posted speed limit may be
checked against the prevailing speeds of theroadway and the road's safety performance.
E2
NUMBER OF INTERSECTIONSWITH PRIVATE ACCESS DRIVEWAYS
Number ofOccurrences
15Left turn movements permitted 41 Comments:Right-in / Right-out only 0
E3NUMBER OF INTERCHANGES Number of
Occurrences 0Number of interchanges along corridor 0
F ON-STREET PARKING Higher 9

FORM A
Automated Speed Limit Guidelines Version:FORM A - Automated Speed Limit Guidelines Spreadsheet 10-Apr-09
Name of Corridor: Forest Drive
Segment Evaluated: Cunningham Rd to Boudreau Rd
Geographic Region: City of St. Albert
Road Agency: St. Ablert
Road Classification: Collector Length of Corridor: 1,510 m
Urban / Rural: Urban Design Speed: (Required for Freeway,Expressway, Highway)
km/h
Divided / Undivided: Undivided Current Posted Speed:(For information only)
50 km/h
Major / Minor: Major Prevailing Speed:(85th Percentile - for information only)
38 km/h# Through LanesPer Direction: 1 lane Policy:
(Maximum Posted Speed)
RISK Score
A1 GEOMETRY (Horizontal) Medium 2
A2 GEOMETRY (Vertical) Lower 1
A3 AVERAGE LANE WIDTH Medium 4 Total Risk Score:
B ROADSIDE HAZARDS Higher 3 56
C1 PEDESTRIAN EXPOSURE Lower 3
C2 CYCLIST EXPOSURE Medium 6
D PAVEMENT SURFACE Lower 1 Recommended PostedSpeed Limit (km/h):
E1
NUMBER OF INTERSECTIONSWITH PUBLIC ROADS
Number ofOccurrences
12
As determined by road characteristicsSTOP controlled intersection 2
50Signalized intersection 1
Roundabout or traffic circle 0 As determined by policyCrosswalk 2
Active, at-grade railroad crossing 0Sidestreet STOP-controlled or lane 10 The recommended posted speed limit may be
checked against the prevailing speeds of theroadway and the road's safety performance.
E2
NUMBER OF INTERSECTIONSWITH PRIVATE ACCESS DRIVEWAYS
Number ofOccurrences
15Left turn movements permitted 117 Comments:Right-in / Right-out only 0
E3NUMBER OF INTERCHANGES Number of
Occurrences 0Number of interchanges along corridor 0
F ON-STREET PARKING Higher 9

FORM A
Automated Speed Limit Guidelines Version:FORM A - Automated Speed Limit Guidelines Spreadsheet 10-Apr-09
Name of Corridor: Parkwood Drive 1
Segment Evaluated: 50m South of Primrose Pl to Pineview Drive
Geographic Region: City of St. Albert
Road Agency: St. Ablert
Road Classification: Collector Length of Corridor: 510 m
Urban / Rural: Urban Design Speed: (Required for Freeway,Expressway, Highway)
km/h
Divided / Undivided: Undivided Current Posted Speed:(For information only)
50 km/h
Major / Minor: Minor Prevailing Speed:(85th Percentile - for information only)
34 km/h# Through LanesPer Direction: 1 lane Policy:
(Maximum Posted Speed)
RISK Score
A1 GEOMETRY (Horizontal) Medium 2
A2 GEOMETRY (Vertical) Lower 1
A3 AVERAGE LANE WIDTH Medium 4 Total Risk Score:
B ROADSIDE HAZARDS Medium 2 59
C1 PEDESTRIAN EXPOSURE Lower 3
C2 CYCLIST EXPOSURE Medium 6
D PAVEMENT SURFACE Medium 2 Recommended PostedSpeed Limit (km/h):
E1
NUMBER OF INTERSECTIONSWITH PUBLIC ROADS
Number ofOccurrences
15
As determined by road characteristicsSTOP controlled intersection 0
40Signalized intersection 0
Roundabout or traffic circle 0 As determined by policyCrosswalk 4
Active, at-grade railroad crossing 0Sidestreet STOP-controlled or lane 7 The recommended posted speed limit may be
checked against the prevailing speeds of theroadway and the road's safety performance.
E2
NUMBER OF INTERSECTIONSWITH PRIVATE ACCESS DRIVEWAYS
Number ofOccurrences
15Left turn movements permitted 21 Comments:Right-in / Right-out only 0
E3NUMBER OF INTERCHANGES Number of
Occurrences 0Number of interchanges along corridor 0
F ON-STREET PARKING Higher 9

FORM A
Automated Speed Limit Guidelines Version:FORM A - Automated Speed Limit Guidelines Spreadsheet 10-Apr-09
Name of Corridor: Pineview Drive / Keiffor Drive
Segment Evaluated: Kingswood Blvd to Parkwood Dr
Geographic Region: City of St. Albert
Road Agency: St. Ablert
Road Classification: Collector Length of Corridor: 870 m
Urban / Rural: Urban Design Speed: (Required for Freeway,Expressway, Highway)
km/h
Divided / Undivided: Undivided Current Posted Speed:(For information only)
50 km/h
Major / Minor: Minor Prevailing Speed:(85th Percentile - for information only)
35 km/h# Through LanesPer Direction: 1 lane Policy:
(Maximum Posted Speed)
RISK Score
A1 GEOMETRY (Horizontal) Medium 2
A2 GEOMETRY (Vertical) Lower 1
A3 AVERAGE LANE WIDTH Lower 2 Total Risk Score:
B ROADSIDE HAZARDS Medium 2 64
C1 PEDESTRIAN EXPOSURE Lower 3
C2 CYCLIST EXPOSURE Medium 6
D PAVEMENT SURFACE Lower 1 Recommended PostedSpeed Limit (km/h):
E1
NUMBER OF INTERSECTIONSWITH PUBLIC ROADS
Number ofOccurrences
23
As determined by road characteristicsSTOP controlled intersection 3
40Signalized intersection 0
Roundabout or traffic circle 0 As determined by policyCrosswalk 5
Active, at-grade railroad crossing 0Sidestreet STOP-controlled or lane 6 The recommended posted speed limit may be
checked against the prevailing speeds of theroadway and the road's safety performance.
E2
NUMBER OF INTERSECTIONSWITH PRIVATE ACCESS DRIVEWAYS
Number ofOccurrences
15Left turn movements permitted 40 Comments:Right-in / Right-out only 0
E3NUMBER OF INTERCHANGES Number of
Occurrences 0Number of interchanges along corridor 0
F ON-STREET PARKING Higher 9
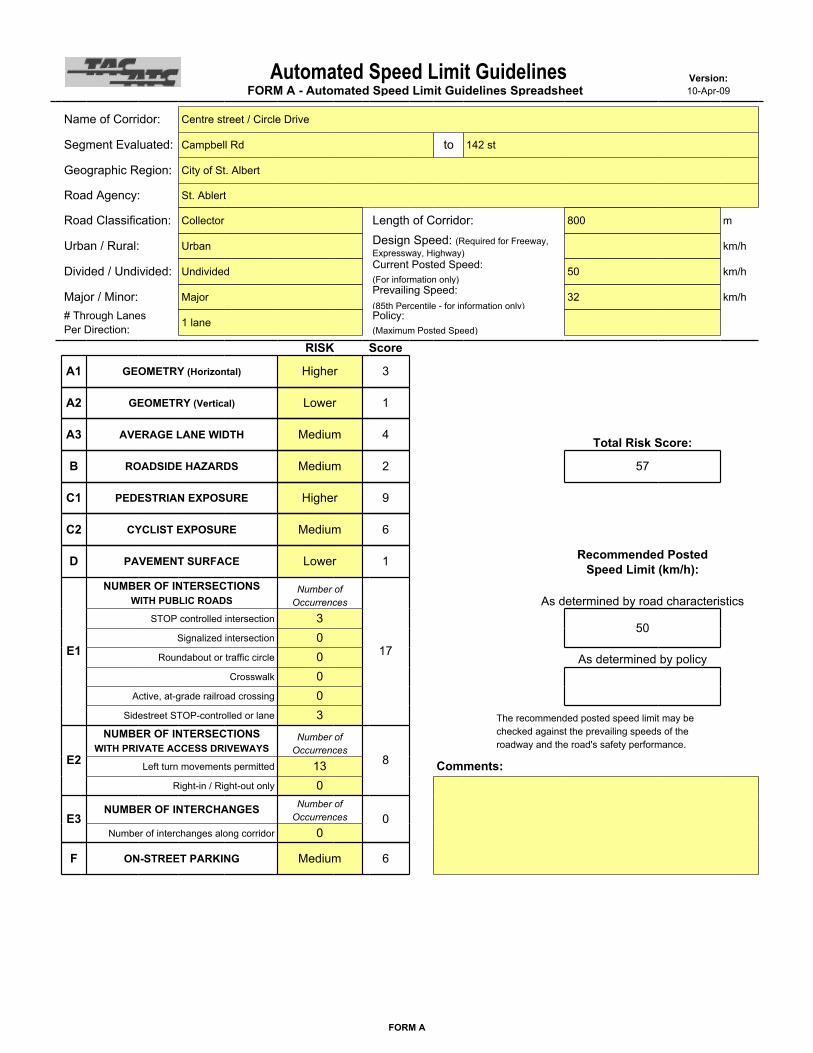
FORM A
Automated Speed Limit Guidelines Version:FORM A - Automated Speed Limit Guidelines Spreadsheet 10-Apr-09
Name of Corridor: Centre street / Circle Drive
Segment Evaluated: Campbell Rd to 142 st
Geographic Region: City of St. Albert
Road Agency: St. Ablert
Road Classification: Collector Length of Corridor: 800 m
Urban / Rural: Urban Design Speed: (Required for Freeway,Expressway, Highway)
km/h
Divided / Undivided: Undivided Current Posted Speed:(For information only)
50 km/h
Major / Minor: Major Prevailing Speed:(85th Percentile - for information only)
32 km/h# Through LanesPer Direction: 1 lane Policy:
(Maximum Posted Speed)
RISK Score
A1 GEOMETRY (Horizontal) Higher 3
A2 GEOMETRY (Vertical) Lower 1
A3 AVERAGE LANE WIDTH Medium 4 Total Risk Score:
B ROADSIDE HAZARDS Medium 2 57
C1 PEDESTRIAN EXPOSURE Higher 9
C2 CYCLIST EXPOSURE Medium 6
D PAVEMENT SURFACE Lower 1 Recommended PostedSpeed Limit (km/h):
E1
NUMBER OF INTERSECTIONSWITH PUBLIC ROADS
Number ofOccurrences
17
As determined by road characteristicsSTOP controlled intersection 3
50Signalized intersection 0
Roundabout or traffic circle 0 As determined by policyCrosswalk 0
Active, at-grade railroad crossing 0Sidestreet STOP-controlled or lane 3 The recommended posted speed limit may be
checked against the prevailing speeds of theroadway and the road's safety performance.
E2
NUMBER OF INTERSECTIONSWITH PRIVATE ACCESS DRIVEWAYS
Number ofOccurrences
8Left turn movements permitted 13 Comments:Right-in / Right-out only 0
E3NUMBER OF INTERCHANGES Number of
Occurrences 0Number of interchanges along corridor 0
F ON-STREET PARKING Medium 6

FORM A
Automated Speed Limit Guidelines Version:FORM A - Automated Speed Limit Guidelines Spreadsheet 10-Apr-09
Name of Corridor: Carleton Drive 1
Segment Evaluated: North of Centre Street to Cust Ave
Geographic Region: City of St. Albert
Road Agency: St. Ablert
Road Classification: Collector Length of Corridor: 740 m
Urban / Rural: Urban Design Speed: (Required for Freeway,Expressway, Highway)
km/h
Divided / Undivided: Undivided Current Posted Speed:(For information only)
50 km/h
Major / Minor: Minor Prevailing Speed:(85th Percentile - for information only)
0 km/h# Through LanesPer Direction: 1 lane Policy:
(Maximum Posted Speed)
RISK Score
A1 GEOMETRY (Horizontal) Higher 3
A2 GEOMETRY (Vertical) Lower 1
A3 AVERAGE LANE WIDTH Higher 6 Total Risk Score:
B ROADSIDE HAZARDS Lower 1 56
C1 PEDESTRIAN EXPOSURE Higher 9
C2 CYCLIST EXPOSURE Medium 6
D PAVEMENT SURFACE Lower 1 Recommended PostedSpeed Limit (km/h):
E1
NUMBER OF INTERSECTIONSWITH PUBLIC ROADS
Number ofOccurrences
11
As determined by road characteristicsSTOP controlled intersection 2
40Signalized intersection 0
Roundabout or traffic circle 0 As determined by policyCrosswalk 0
Active, at-grade railroad crossing 0Sidestreet STOP-controlled or lane 0 The recommended posted speed limit may be
checked against the prevailing speeds of theroadway and the road's safety performance.
E2
NUMBER OF INTERSECTIONSWITH PRIVATE ACCESS DRIVEWAYS
Number ofOccurrences
9Left turn movements permitted 13 Comments:Right-in / Right-out only 0
E3NUMBER OF INTERCHANGES Number of
Occurrences 0Number of interchanges along corridor 0
F ON-STREET PARKING Higher 9

FORM A
Automated Speed Limit Guidelines Version:FORM A - Automated Speed Limit Guidelines Spreadsheet 10-Apr-09
Name of Corridor: Carleton Drive 2
Segment Evaluated: South of Center Street to Cust Ave
Geographic Region: City of St. Albert
Road Agency: St. Ablert
Road Classification: Collector Length of Corridor: 760 m
Urban / Rural: Urban Design Speed: (Required for Freeway,Expressway, Highway)
km/h
Divided / Undivided: Undivided Current Posted Speed:(For information only)
50 km/h
Major / Minor: Minor Prevailing Speed:(85th Percentile - for information only)
0 km/h# Through LanesPer Direction: 1 lane Policy:
(Maximum Posted Speed)
RISK Score
A1 GEOMETRY (Horizontal) Higher 3
A2 GEOMETRY (Vertical) Lower 1
A3 AVERAGE LANE WIDTH Medium 4 Total Risk Score:
B ROADSIDE HAZARDS Lower 1 56
C1 PEDESTRIAN EXPOSURE Lower 3
C2 CYCLIST EXPOSURE Medium 6
D PAVEMENT SURFACE Lower 1 Recommended PostedSpeed Limit (km/h):
E1
NUMBER OF INTERSECTIONSWITH PUBLIC ROADS
Number ofOccurrences
16
As determined by road characteristicsSTOP controlled intersection 3
40Signalized intersection 0
Roundabout or traffic circle 0 As determined by policyCrosswalk 0
Active, at-grade railroad crossing 0Sidestreet STOP-controlled or lane 0 The recommended posted speed limit may be
checked against the prevailing speeds of theroadway and the road's safety performance.
E2
NUMBER OF INTERSECTIONSWITH PRIVATE ACCESS DRIVEWAYS
Number ofOccurrences
12Left turn movements permitted 18 Comments:Right-in / Right-out only 0
E3NUMBER OF INTERCHANGES Number of
Occurrences 0Number of interchanges along corridor 0
F ON-STREET PARKING Higher 9

FORM A
Automated Speed Limit Guidelines Version:FORM A - Automated Speed Limit Guidelines Spreadsheet 10-Apr-09
Name of Corridor: Chevigny Street
Segment Evaluated: Circle Drive to Corriveau Ave
Geographic Region: City of St. Albert
Road Agency: St. Ablert
Road Classification: Collector Length of Corridor: 510 m
Urban / Rural: Urban Design Speed: (Required for Freeway,Expressway, Highway)
km/h
Divided / Undivided: Undivided Current Posted Speed:(For information only)
50 km/h
Major / Minor: Major Prevailing Speed:(85th Percentile - for information only)
36 km/h# Through LanesPer Direction: 1 lane Policy:
(Maximum Posted Speed)
RISK Score
A1 GEOMETRY (Horizontal) Lower 1
A2 GEOMETRY (Vertical) Lower 1
A3 AVERAGE LANE WIDTH Lower 2 Total Risk Score:
B ROADSIDE HAZARDS Lower 1 56
C1 PEDESTRIAN EXPOSURE Higher 9
C2 CYCLIST EXPOSURE Medium 6
D PAVEMENT SURFACE Lower 1 Recommended PostedSpeed Limit (km/h):
E1
NUMBER OF INTERSECTIONSWITH PUBLIC ROADS
Number ofOccurrences
17
As determined by road characteristicsSTOP controlled intersection 2
50Signalized intersection 0
Roundabout or traffic circle 0 As determined by policyCrosswalk 0
Active, at-grade railroad crossing 0Sidestreet STOP-controlled or lane 1 The recommended posted speed limit may be
checked against the prevailing speeds of theroadway and the road's safety performance.
E2
NUMBER OF INTERSECTIONSWITH PRIVATE ACCESS DRIVEWAYS
Number ofOccurrences
15Left turn movements permitted 17 Comments:Right-in / Right-out only 0
E3NUMBER OF INTERCHANGES Number of
Occurrences 0Number of interchanges along corridor 0
F ON-STREET PARKING Lower 3

FORM A
Automated Speed Limit Guidelines Version:FORM A - Automated Speed Limit Guidelines Spreadsheet 10-Apr-09
Name of Corridor: Carnegie Drive / Curial Drive
Segment Evaluated: 100m North of Corriveau Ave to Carswell St
Geographic Region: City of St. Albert
Road Agency: St. Ablert
Road Classification: Collector Length of Corridor: 1,000 m
Urban / Rural: Urban Design Speed: (Required for Freeway,Expressway, Highway)
km/h
Divided / Undivided: Undivided Current Posted Speed:(For information only)
50 km/h
Major / Minor: Major Prevailing Speed:(85th Percentile - for information only)
38 km/h# Through LanesPer Direction: 1 lane Policy:
(Maximum Posted Speed)
RISK Score
A1 GEOMETRY (Horizontal) Medium 2
A2 GEOMETRY (Vertical) Lower 1
A3 AVERAGE LANE WIDTH Lower 2 Total Risk Score:
B ROADSIDE HAZARDS Higher 3 56
C1 PEDESTRIAN EXPOSURE Higher 9
C2 CYCLIST EXPOSURE Medium 6
D PAVEMENT SURFACE Lower 1 Recommended PostedSpeed Limit (km/h):
E1
NUMBER OF INTERSECTIONSWITH PUBLIC ROADS
Number ofOccurrences
12
As determined by road characteristicsSTOP controlled intersection 2
50Signalized intersection 1
Roundabout or traffic circle 0 As determined by policyCrosswalk 0
Active, at-grade railroad crossing 0Sidestreet STOP-controlled or lane 1 The recommended posted speed limit may be
checked against the prevailing speeds of theroadway and the road's safety performance.
E2
NUMBER OF INTERSECTIONSWITH PRIVATE ACCESS DRIVEWAYS
Number ofOccurrences
11Left turn movements permitted 21 Comments:Right-in / Right-out only 0
E3NUMBER OF INTERCHANGES Number of
Occurrences 0Number of interchanges along corridor 0
F ON-STREET PARKING Higher 9

FORM A
Automated Speed Limit Guidelines Version:FORM A - Automated Speed Limit Guidelines Spreadsheet 10-Apr-09
Name of Corridor: Sunset Boulevard
Segment Evaluated: Cunningham Rd to Sheridan Dr
Geographic Region: City of St. Albert
Road Agency: St. Ablert
Road Classification: Collector Length of Corridor: 630 m
Urban / Rural: Urban Design Speed: (Required for Freeway,Expressway, Highway)
km/h
Divided / Undivided: Undivided Current Posted Speed:(For information only)
50 km/h
Major / Minor: Minor Prevailing Speed:(85th Percentile - for information only)
34 km/h# Through LanesPer Direction: 1 lane Policy:
(Maximum Posted Speed)
RISK Score
A1 GEOMETRY (Horizontal) Medium 2
A2 GEOMETRY (Vertical) Lower 1
A3 AVERAGE LANE WIDTH Medium 4 Total Risk Score:
B ROADSIDE HAZARDS Higher 3 57
C1 PEDESTRIAN EXPOSURE Lower 3
C2 CYCLIST EXPOSURE Medium 6
D PAVEMENT SURFACE Lower 1 Recommended PostedSpeed Limit (km/h):
E1
NUMBER OF INTERSECTIONSWITH PUBLIC ROADS
Number ofOccurrences
13
As determined by road characteristicsSTOP controlled intersection 1
40Signalized intersection 0
Roundabout or traffic circle 0 As determined by policyCrosswalk 1
Active, at-grade railroad crossing 0Sidestreet STOP-controlled or lane 6 The recommended posted speed limit may be
checked against the prevailing speeds of theroadway and the road's safety performance.
E2
NUMBER OF INTERSECTIONSWITH PRIVATE ACCESS DRIVEWAYS
Number ofOccurrences
15Left turn movements permitted 42 Comments:Right-in / Right-out only 0
E3NUMBER OF INTERCHANGES Number of
Occurrences 0Number of interchanges along corridor 0
F ON-STREET PARKING Higher 9

FORM A
Automated Speed Limit Guidelines Version:FORM A - Automated Speed Limit Guidelines Spreadsheet 10-Apr-09
Name of Corridor: Salisbury Avenue
Segment Evaluated: Sunset Blvd to Sunset Blvd
Geographic Region: City of St. Albert
Road Agency: St. Ablert
Road Classification: Collector Length of Corridor: 1,000 m
Urban / Rural: Urban Design Speed: (Required for Freeway,Expressway, Highway)
km/h
Divided / Undivided: Undivided Current Posted Speed:(For information only)
50 km/h
Major / Minor: Minor Prevailing Speed:(85th Percentile - for information only)
33 km/h# Through LanesPer Direction: 1 lane Policy:
(Maximum Posted Speed)
RISK Score
A1 GEOMETRY (Horizontal) Medium 2
A2 GEOMETRY (Vertical) Lower 1
A3 AVERAGE LANE WIDTH Medium 4 Total Risk Score:
B ROADSIDE HAZARDS Higher 3 54
C1 PEDESTRIAN EXPOSURE Lower 3
C2 CYCLIST EXPOSURE Medium 6
D PAVEMENT SURFACE Lower 1 Recommended PostedSpeed Limit (km/h):
E1
NUMBER OF INTERSECTIONSWITH PUBLIC ROADS
Number ofOccurrences
10
As determined by road characteristicsSTOP controlled intersection 1
40Signalized intersection 0
Roundabout or traffic circle 0 As determined by policyCrosswalk 2
Active, at-grade railroad crossing 0Sidestreet STOP-controlled or lane 8 The recommended posted speed limit may be
checked against the prevailing speeds of theroadway and the road's safety performance.
E2
NUMBER OF INTERSECTIONSWITH PRIVATE ACCESS DRIVEWAYS
Number ofOccurrences
15Left turn movements permitted 56 Comments:Right-in / Right-out only 0
E3NUMBER OF INTERCHANGES Number of
Occurrences 0Number of interchanges along corridor 0
F ON-STREET PARKING Higher 9

FORM A
Automated Speed Limit Guidelines Version:FORM A - Automated Speed Limit Guidelines Spreadsheet 10-Apr-09
Name of Corridor: Bishop Street
Segment Evaluated: Sturgeon Rd to Sir Winston Churchill Ave
Geographic Region: City of St. Albert
Road Agency: St. Ablert
Road Classification: Collector Length of Corridor: 500 m
Urban / Rural: Urban Design Speed: (Required for Freeway,Expressway, Highway)
km/h
Divided / Undivided: Undivided Current Posted Speed:(For information only)
50 km/h
Major / Minor: Minor Prevailing Speed:(85th Percentile - for information only)
37 km/h# Through LanesPer Direction: 1 lane Policy:
(Maximum Posted Speed)
RISK Score
A1 GEOMETRY (Horizontal) Higher 3
A2 GEOMETRY (Vertical) Lower 1
A3 AVERAGE LANE WIDTH Medium 4 Total Risk Score:
B ROADSIDE HAZARDS Medium 2 60
C1 PEDESTRIAN EXPOSURE Lower 3
C2 CYCLIST EXPOSURE Medium 6
D PAVEMENT SURFACE Lower 1 Recommended PostedSpeed Limit (km/h):
E1
NUMBER OF INTERSECTIONSWITH PUBLIC ROADS
Number ofOccurrences
16
As determined by road characteristicsSTOP controlled intersection 1
40Signalized intersection 0
Roundabout or traffic circle 0 As determined by policyCrosswalk 2
Active, at-grade railroad crossing 0Sidestreet STOP-controlled or lane 4 The recommended posted speed limit may be
checked against the prevailing speeds of theroadway and the road's safety performance.
E2
NUMBER OF INTERSECTIONSWITH PRIVATE ACCESS DRIVEWAYS
Number ofOccurrences
15Left turn movements permitted 23 Comments:Right-in / Right-out only 0
E3NUMBER OF INTERCHANGES Number of
Occurrences 0Number of interchanges along corridor 0
F ON-STREET PARKING Higher 9

FORM A
Automated Speed Limit Guidelines Version:FORM A - Automated Speed Limit Guidelines Spreadsheet 10-Apr-09
Name of Corridor: Burnham Avenue
Segment Evaluated: Sturgeon Rd to Sturgeon Rd
Geographic Region: City of St. Albert
Road Agency: St. Ablert
Road Classification: Collector Length of Corridor: 700 m
Urban / Rural: Urban Design Speed: (Required for Freeway,Expressway, Highway)
km/h
Divided / Undivided: Undivided Current Posted Speed:(For information only)
50 km/h
Major / Minor: Minor Prevailing Speed:(85th Percentile - for information only)
32 km/h# Through LanesPer Direction: 1 lane Policy:
(Maximum Posted Speed)
RISK Score
A1 GEOMETRY (Horizontal) Higher 3
A2 GEOMETRY (Vertical) Lower 1
A3 AVERAGE LANE WIDTH Lower 2 Total Risk Score:
B ROADSIDE HAZARDS Higher 3 54
C1 PEDESTRIAN EXPOSURE Lower 3
C2 CYCLIST EXPOSURE Medium 6
D PAVEMENT SURFACE Lower 1 Recommended PostedSpeed Limit (km/h):
E1
NUMBER OF INTERSECTIONSWITH PUBLIC ROADS
Number ofOccurrences
11
As determined by road characteristicsSTOP controlled intersection 1
40Signalized intersection 0
Roundabout or traffic circle 0 As determined by policyCrosswalk 0
Active, at-grade railroad crossing 0Sidestreet STOP-controlled or lane 7 The recommended posted speed limit may be
checked against the prevailing speeds of theroadway and the road's safety performance.
E2
NUMBER OF INTERSECTIONSWITH PRIVATE ACCESS DRIVEWAYS
Number ofOccurrences
15Left turn movements permitted 42 Comments:Right-in / Right-out only 0
E3NUMBER OF INTERCHANGES Number of
Occurrences 0Number of interchanges along corridor 0
F ON-STREET PARKING Higher 9

FORM A
Automated Speed Limit Guidelines Version:FORM A - Automated Speed Limit Guidelines Spreadsheet 10-Apr-09
Name of Corridor: Inglewood Drive
Segment Evaluated: Bellerose Dr to Boudreau Rd
Geographic Region: City of St. Albert
Road Agency: St. Ablert
Road Classification: Collector Length of Corridor: 980 m
Urban / Rural: Urban Design Speed: (Required for Freeway,Expressway, Highway)
km/h
Divided / Undivided: Undivided Current Posted Speed:(For information only)
50 km/h
Major / Minor: Major Prevailing Speed:(85th Percentile - for information only)
36 km/h# Through LanesPer Direction: 1 lane Policy:
(Maximum Posted Speed)
RISK Score
A1 GEOMETRY (Horizontal) Higher 3
A2 GEOMETRY (Vertical) Medium 2
A3 AVERAGE LANE WIDTH Medium 4 Total Risk Score:
B ROADSIDE HAZARDS Medium 2 47
C1 PEDESTRIAN EXPOSURE Lower 3
C2 CYCLIST EXPOSURE Medium 6
D PAVEMENT SURFACE Lower 1 Recommended PostedSpeed Limit (km/h):
E1
NUMBER OF INTERSECTIONSWITH PUBLIC ROADS
Number ofOccurrences
8
As determined by road characteristicsSTOP controlled intersection 0
50Signalized intersection 2
Roundabout or traffic circle 0 As determined by policyCrosswalk 0
Active, at-grade railroad crossing 0Sidestreet STOP-controlled or lane 2 The recommended posted speed limit may be
checked against the prevailing speeds of theroadway and the road's safety performance.
E2
NUMBER OF INTERSECTIONSWITH PRIVATE ACCESS DRIVEWAYS
Number ofOccurrences
9Left turn movements permitted 18 Comments:Right-in / Right-out only 0
E3NUMBER OF INTERCHANGES Number of
Occurrences 0Number of interchanges along corridor 0
F ON-STREET PARKING Higher 9

FORM A
Automated Speed Limit Guidelines Version:FORM A - Automated Speed Limit Guidelines Spreadsheet 10-Apr-09
Name of Corridor: Everitt Drive North
Segment Evaluated: Element Dr N to Erin Ridge Dr
Geographic Region: City of St. Albert
Road Agency: St. Ablert
Road Classification: Collector Length of Corridor: 670 m
Urban / Rural: Urban Design Speed: (Required for Freeway,Expressway, Highway)
km/h
Divided / Undivided: Undivided Current Posted Speed:(For information only)
40 km/h
Major / Minor: Major Prevailing Speed:(85th Percentile - for information only)
33 km/h# Through LanesPer Direction: 1 lane Policy:
(Maximum Posted Speed)
RISK Score
A1 GEOMETRY (Horizontal) Medium 2
A2 GEOMETRY (Vertical) Lower 1
A3 AVERAGE LANE WIDTH Medium 4 Total Risk Score:
B ROADSIDE HAZARDS Higher 3 60
C1 PEDESTRIAN EXPOSURE Lower 3
C2 CYCLIST EXPOSURE Medium 6
D PAVEMENT SURFACE Lower 1 Recommended PostedSpeed Limit (km/h):
E1
NUMBER OF INTERSECTIONSWITH PUBLIC ROADS
Number ofOccurrences
16
As determined by road characteristicsSTOP controlled intersection 1
50Signalized intersection 0
Roundabout or traffic circle 0 As determined by policyCrosswalk 3
Active, at-grade railroad crossing 0Sidestreet STOP-controlled or lane 8 The recommended posted speed limit may be
checked against the prevailing speeds of theroadway and the road's safety performance.
E2
NUMBER OF INTERSECTIONSWITH PRIVATE ACCESS DRIVEWAYS
Number ofOccurrences
15Left turn movements permitted 56 Comments:Right-in / Right-out only 0
E3NUMBER OF INTERCHANGES Number of
Occurrences 0Number of interchanges along corridor 0
F ON-STREET PARKING Higher 9

FORM A
Automated Speed Limit Guidelines Version:FORM A - Automated Speed Limit Guidelines Spreadsheet 10-Apr-09
Name of Corridor: Element Drive North
Segment Evaluated: Everitt Dr N to Neil Ross Rd
Geographic Region: City of St. Albert
Road Agency: St. Ablert
Road Classification: Collector Length of Corridor: 510 m
Urban / Rural: Urban Design Speed: (Required for Freeway,Expressway, Highway)
km/h
Divided / Undivided: Undivided Current Posted Speed:(For information only)
40 km/h
Major / Minor: Major Prevailing Speed:(85th Percentile - for information only)
40 km/h# Through LanesPer Direction: 1 lane Policy:
(Maximum Posted Speed)
RISK Score
A1 GEOMETRY (Horizontal) Medium 2
A2 GEOMETRY (Vertical) Lower 1
A3 AVERAGE LANE WIDTH Medium 4 Total Risk Score:
B ROADSIDE HAZARDS Medium 2 49
C1 PEDESTRIAN EXPOSURE Lower 3
C2 CYCLIST EXPOSURE Medium 6
D PAVEMENT SURFACE Lower 1 Recommended PostedSpeed Limit (km/h):
E1
NUMBER OF INTERSECTIONSWITH PUBLIC ROADS
Number ofOccurrences
17
As determined by road characteristicsSTOP controlled intersection 2
50Signalized intersection 0
Roundabout or traffic circle 0 As determined by policyCrosswalk 0
Active, at-grade railroad crossing 0Sidestreet STOP-controlled or lane 1 The recommended posted speed limit may be
checked against the prevailing speeds of theroadway and the road's safety performance.
E2
NUMBER OF INTERSECTIONSWITH PRIVATE ACCESS DRIVEWAYS
Number ofOccurrences
4Left turn movements permitted 4 Comments:Right-in / Right-out only 0
E3NUMBER OF INTERCHANGES Number of
Occurrences 0Number of interchanges along corridor 0
F ON-STREET PARKING Higher 9

FORM A
Automated Speed Limit Guidelines Version:FORM A - Automated Speed Limit Guidelines Spreadsheet 10-Apr-09
Name of Corridor: Dunbar Street/ Liberton Drive 1
Segment Evaluated: Deerbourn Dr to Lennox Dr
Geographic Region: City of St. Albert
Road Agency: St. Ablert
Road Classification: Collector Length of Corridor: 820 m
Urban / Rural: Urban Design Speed: (Required for Freeway,Expressway, Highway)
km/h
Divided / Undivided: Undivided Current Posted Speed:(For information only)
40 km/h
Major / Minor: Major Prevailing Speed:(85th Percentile - for information only)
31 km/h# Through LanesPer Direction: 1 lane Policy:
(Maximum Posted Speed)
RISK Score
A1 GEOMETRY (Horizontal) Higher 3
A2 GEOMETRY (Vertical) Lower 1
A3 AVERAGE LANE WIDTH Lower 2 Total Risk Score:
B ROADSIDE HAZARDS Higher 3 57
C1 PEDESTRIAN EXPOSURE Lower 3
C2 CYCLIST EXPOSURE Medium 6
D PAVEMENT SURFACE Lower 1 Recommended PostedSpeed Limit (km/h):
E1
NUMBER OF INTERSECTIONSWITH PUBLIC ROADS
Number ofOccurrences
17
As determined by road characteristicsSTOP controlled intersection 2
50Signalized intersection 1
Roundabout or traffic circle 0 As determined by policyCrosswalk 2
Active, at-grade railroad crossing 0Sidestreet STOP-controlled or lane 1 The recommended posted speed limit may be
checked against the prevailing speeds of theroadway and the road's safety performance.
E2
NUMBER OF INTERSECTIONSWITH PRIVATE ACCESS DRIVEWAYS
Number ofOccurrences
12Left turn movements permitted 19 Comments:Right-in / Right-out only 0
E3NUMBER OF INTERCHANGES Number of
Occurrences 0Number of interchanges along corridor 0
F ON-STREET PARKING Higher 9

FORM A
Automated Speed Limit Guidelines Version:FORM A - Automated Speed Limit Guidelines Spreadsheet 10-Apr-09
Name of Corridor: Liberton Drive 2
Segment Evaluated: Lennox Dr to McKenney Ave
Geographic Region: City of St. Albert
Road Agency: St. Ablert
Road Classification: Collector Length of Corridor: 610 m
Urban / Rural: Urban Design Speed: (Required for Freeway,Expressway, Highway)
km/h
Divided / Undivided: Undivided Current Posted Speed:(For information only)
40 km/h
Major / Minor: Major Prevailing Speed:(85th Percentile - for information only)
37 km/h# Through LanesPer Direction: 1 lane Policy:
(Maximum Posted Speed)
RISK Score
A1 GEOMETRY (Horizontal) Higher 3
A2 GEOMETRY (Vertical) Lower 1
A3 AVERAGE LANE WIDTH Medium 4 Total Risk Score:
B ROADSIDE HAZARDS Higher 3 41
C1 PEDESTRIAN EXPOSURE Lower 3
C2 CYCLIST EXPOSURE Medium 6
D PAVEMENT SURFACE Lower 1 Recommended PostedSpeed Limit (km/h):
E1
NUMBER OF INTERSECTIONSWITH PUBLIC ROADS
Number ofOccurrences
12
As determined by road characteristicsSTOP controlled intersection 1
50Signalized intersection 1
Roundabout or traffic circle 0 As determined by policyCrosswalk 0
Active, at-grade railroad crossing 0Sidestreet STOP-controlled or lane 0 The recommended posted speed limit may be
checked against the prevailing speeds of theroadway and the road's safety performance.
E2
NUMBER OF INTERSECTIONSWITH PRIVATE ACCESS DRIVEWAYS
Number ofOccurrences
5Left turn movements permitted 6 Comments:Right-in / Right-out only 0
E3NUMBER OF INTERCHANGES Number of
Occurrences 0Number of interchanges along corridor 0
F ON-STREET PARKING Lower 3

FORM A
Automated Speed Limit Guidelines Version:FORM A - Automated Speed Limit Guidelines Spreadsheet 10-Apr-09
Name of Corridor: Lennox Drive / Inglewood Drive
Segment Evaluated: Inglewood Dr to Dawson Rd
Geographic Region: City of St. Albert
Road Agency: St. Ablert
Road Classification: Collector Length of Corridor: 750 m
Urban / Rural: Urban Design Speed: (Required for Freeway,Expressway, Highway)
km/h
Divided / Undivided: Undivided Current Posted Speed:(For information only)
40 km/h
Major / Minor: Major Prevailing Speed:(85th Percentile - for information only)
35 km/h# Through LanesPer Direction: 1 lane Policy:
(Maximum Posted Speed)
RISK Score
A1 GEOMETRY (Horizontal) Medium 2
A2 GEOMETRY (Vertical) Lower 1
A3 AVERAGE LANE WIDTH Lower 2 Total Risk Score:
B ROADSIDE HAZARDS Medium 2 58
C1 PEDESTRIAN EXPOSURE Lower 3
C2 CYCLIST EXPOSURE Medium 6
D PAVEMENT SURFACE Lower 1 Recommended PostedSpeed Limit (km/h):
E1
NUMBER OF INTERSECTIONSWITH PUBLIC ROADS
Number ofOccurrences
23
As determined by road characteristicsSTOP controlled intersection 2
50Signalized intersection 1
Roundabout or traffic circle 0 As determined by policyCrosswalk 4
Active, at-grade railroad crossing 0Sidestreet STOP-controlled or lane 4 The recommended posted speed limit may be
checked against the prevailing speeds of theroadway and the road's safety performance.
E2
NUMBER OF INTERSECTIONSWITH PRIVATE ACCESS DRIVEWAYS
Number ofOccurrences
15Left turn movements permitted 44 Comments:Right-in / Right-out only 0
E3NUMBER OF INTERCHANGES Number of
Occurrences 0Number of interchanges along corridor 0
F ON-STREET PARKING Lower 3

FORM A
Automated Speed Limit Guidelines Version:FORM A - Automated Speed Limit Guidelines Spreadsheet 10-Apr-09
Name of Corridor: Langholm Drive
Segment Evaluated: 60m South of Lorne Crescent to Dawson Rd
Geographic Region: City of St. Albert
Road Agency: St. Ablert
Road Classification: Collector Length of Corridor: 840 m
Urban / Rural: Urban Design Speed: (Required for Freeway,Expressway, Highway)
km/h
Divided / Undivided: Undivided Current Posted Speed:(For information only)
40 km/h
Major / Minor: Minor Prevailing Speed:(85th Percentile - for information only)
31 km/h# Through LanesPer Direction: 1 lane Policy:
(Maximum Posted Speed)
RISK Score
A1 GEOMETRY (Horizontal) Higher 3
A2 GEOMETRY (Vertical) Lower 1
A3 AVERAGE LANE WIDTH Medium 4 Total Risk Score:
B ROADSIDE HAZARDS Higher 3 59
C1 PEDESTRIAN EXPOSURE Lower 3
C2 CYCLIST EXPOSURE Medium 6
D PAVEMENT SURFACE Lower 1 Recommended PostedSpeed Limit (km/h):
E1
NUMBER OF INTERSECTIONSWITH PUBLIC ROADS
Number ofOccurrences
14
As determined by road characteristicsSTOP controlled intersection 2
40Signalized intersection 0
Roundabout or traffic circle 0 As determined by policyCrosswalk 1
Active, at-grade railroad crossing 0Sidestreet STOP-controlled or lane 6 The recommended posted speed limit may be
checked against the prevailing speeds of theroadway and the road's safety performance.
E2
NUMBER OF INTERSECTIONSWITH PRIVATE ACCESS DRIVEWAYS
Number ofOccurrences
15Left turn movements permitted 69 Comments:Right-in / Right-out only 0
E3NUMBER OF INTERCHANGES Number of
Occurrences 0Number of interchanges along corridor 0
F ON-STREET PARKING Higher 9

FORM A
Automated Speed Limit Guidelines Version:FORM A - Automated Speed Limit Guidelines Spreadsheet 10-Apr-09
Name of Corridor: Deer Ridge Drive 1
Segment Evaluated: Dorchester Point to Dennison Dr
Geographic Region: City of St. Albert
Road Agency: St. Ablert
Road Classification: Collector Length of Corridor: 540 m
Urban / Rural: Urban Design Speed: (Required for Freeway,Expressway, Highway)
km/h
Divided / Undivided: Undivided Current Posted Speed:(For information only)
50 km/h
Major / Minor: Minor Prevailing Speed:(85th Percentile - for information only)
0 km/h# Through LanesPer Direction: 1 lane Policy:
(Maximum Posted Speed)
RISK Score
A1 GEOMETRY (Horizontal) Medium 2
A2 GEOMETRY (Vertical) Lower 1
A3 AVERAGE LANE WIDTH Lower 2 Total Risk Score:
B ROADSIDE HAZARDS Higher 3 49
C1 PEDESTRIAN EXPOSURE Lower 3
C2 CYCLIST EXPOSURE Medium 6
D PAVEMENT SURFACE Lower 1 Recommended PostedSpeed Limit (km/h):
E1
NUMBER OF INTERSECTIONSWITH PUBLIC ROADS
Number ofOccurrences
7
As determined by road characteristicsSTOP controlled intersection 0
50Signalized intersection 0
Roundabout or traffic circle 0 As determined by policyCrosswalk 1
Active, at-grade railroad crossing 0Sidestreet STOP-controlled or lane 6 The recommended posted speed limit may be
checked against the prevailing speeds of theroadway and the road's safety performance.
E2
NUMBER OF INTERSECTIONSWITH PRIVATE ACCESS DRIVEWAYS
Number ofOccurrences
15Left turn movements permitted 56 Comments:Right-in / Right-out only 0
E3NUMBER OF INTERCHANGES Number of
Occurrences 0Number of interchanges along corridor 0
F ON-STREET PARKING Higher 9
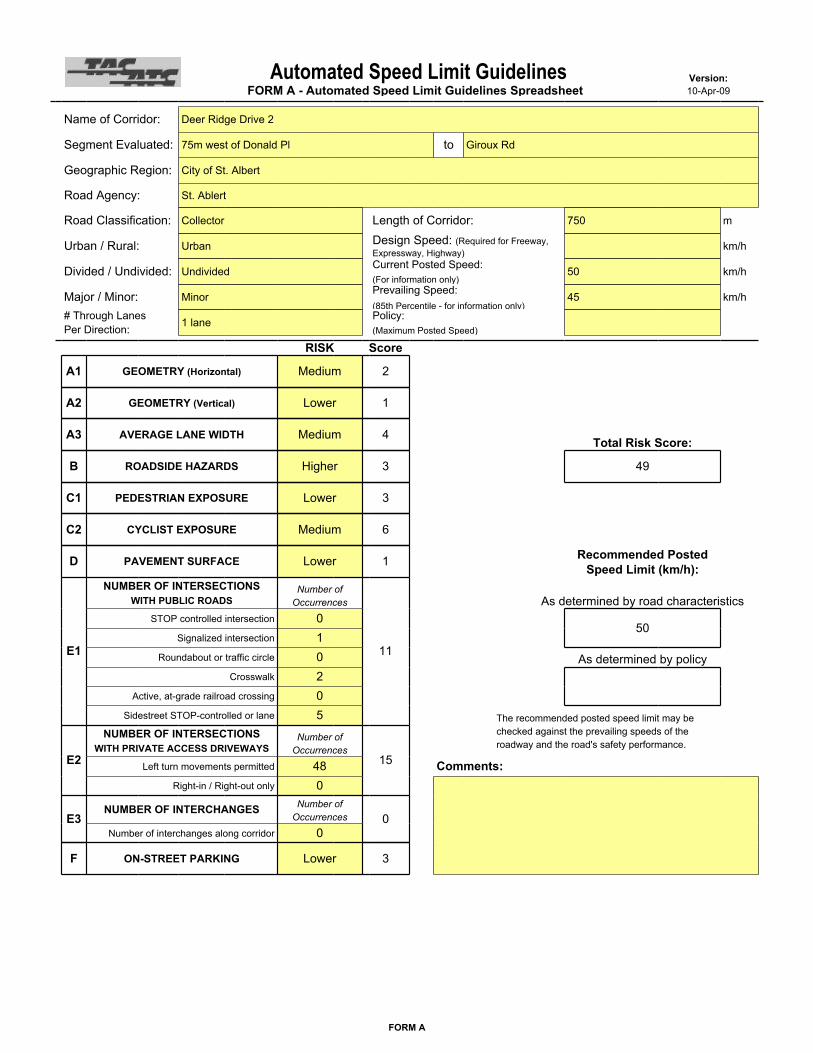
FORM A
Automated Speed Limit Guidelines Version:FORM A - Automated Speed Limit Guidelines Spreadsheet 10-Apr-09
Name of Corridor: Deer Ridge Drive 2
Segment Evaluated: 75m west of Donald Pl to Giroux Rd
Geographic Region: City of St. Albert
Road Agency: St. Ablert
Road Classification: Collector Length of Corridor: 750 m
Urban / Rural: Urban Design Speed: (Required for Freeway,Expressway, Highway)
km/h
Divided / Undivided: Undivided Current Posted Speed:(For information only)
50 km/h
Major / Minor: Minor Prevailing Speed:(85th Percentile - for information only)
45 km/h# Through LanesPer Direction: 1 lane Policy:
(Maximum Posted Speed)
RISK Score
A1 GEOMETRY (Horizontal) Medium 2
A2 GEOMETRY (Vertical) Lower 1
A3 AVERAGE LANE WIDTH Medium 4 Total Risk Score:
B ROADSIDE HAZARDS Higher 3 49
C1 PEDESTRIAN EXPOSURE Lower 3
C2 CYCLIST EXPOSURE Medium 6
D PAVEMENT SURFACE Lower 1 Recommended PostedSpeed Limit (km/h):
E1
NUMBER OF INTERSECTIONSWITH PUBLIC ROADS
Number ofOccurrences
11
As determined by road characteristicsSTOP controlled intersection 0
50Signalized intersection 1
Roundabout or traffic circle 0 As determined by policyCrosswalk 2
Active, at-grade railroad crossing 0Sidestreet STOP-controlled or lane 5 The recommended posted speed limit may be
checked against the prevailing speeds of theroadway and the road's safety performance.
E2
NUMBER OF INTERSECTIONSWITH PRIVATE ACCESS DRIVEWAYS
Number ofOccurrences
15Left turn movements permitted 48 Comments:Right-in / Right-out only 0
E3NUMBER OF INTERCHANGES Number of
Occurrences 0Number of interchanges along corridor 0
F ON-STREET PARKING Lower 3

FORM A
Automated Speed Limit Guidelines Version:FORM A - Automated Speed Limit Guidelines Spreadsheet 10-Apr-09
Name of Corridor: Dorchester Drive
Segment Evaluated: Deer Ridge Dr to Deer Ridge Dr
Geographic Region: City of St. Albert
Road Agency: St. Ablert
Road Classification: Collector Length of Corridor: 1,290 m
Urban / Rural: Urban Design Speed: (Required for Freeway,Expressway, Highway)
km/h
Divided / Undivided: Undivided Current Posted Speed:(For information only)
50 km/h
Major / Minor: Minor Prevailing Speed:(85th Percentile - for information only)
0 km/h# Through LanesPer Direction: 1 lane Policy:
(Maximum Posted Speed)
RISK Score
A1 GEOMETRY (Horizontal) Medium 2
A2 GEOMETRY (Vertical) Lower 1
A3 AVERAGE LANE WIDTH Lower 2 Total Risk Score:
B ROADSIDE HAZARDS Higher 3 56
C1 PEDESTRIAN EXPOSURE Lower 3
C2 CYCLIST EXPOSURE Medium 6
D PAVEMENT SURFACE Medium 2 Recommended PostedSpeed Limit (km/h):
E1
NUMBER OF INTERSECTIONSWITH PUBLIC ROADS
Number ofOccurrences
13
As determined by road characteristicsSTOP controlled intersection 2
40Signalized intersection 0
Roundabout or traffic circle 0 As determined by policyCrosswalk 4
Active, at-grade railroad crossing 0Sidestreet STOP-controlled or lane 10 The recommended posted speed limit may be
checked against the prevailing speeds of theroadway and the road's safety performance.
E2
NUMBER OF INTERSECTIONSWITH PRIVATE ACCESS DRIVEWAYS
Number ofOccurrences
15Left turn movements permitted 95 Comments:Right-in / Right-out only 0
E3NUMBER OF INTERCHANGES Number of
Occurrences 0Number of interchanges along corridor 0
F ON-STREET PARKING Higher 9

FORM A
Automated Speed Limit Guidelines Version:FORM A - Automated Speed Limit Guidelines Spreadsheet 10-Apr-09
Name of Corridor: Lacombe Drive
Segment Evaluated: Giroux Rd to Giroux Rd
Geographic Region: City of St. Albert
Road Agency: St. Ablert
Road Classification: Collector Length of Corridor: 740 m
Urban / Rural: Urban Design Speed: (Required for Freeway,Expressway, Highway)
km/h
Divided / Undivided: Undivided Current Posted Speed:(For information only)
50 km/h
Major / Minor: Minor Prevailing Speed:(85th Percentile - for information only)
29 km/h# Through LanesPer Direction: 1 lane Policy:
(Maximum Posted Speed)
RISK Score
A1 GEOMETRY (Horizontal) Higher 3
A2 GEOMETRY (Vertical) Lower 1
A3 AVERAGE LANE WIDTH Medium 4 Total Risk Score:
B ROADSIDE HAZARDS Higher 3 62
C1 PEDESTRIAN EXPOSURE Lower 3
C2 CYCLIST EXPOSURE Medium 6
D PAVEMENT SURFACE Medium 2 Recommended PostedSpeed Limit (km/h):
E1
NUMBER OF INTERSECTIONSWITH PUBLIC ROADS
Number ofOccurrences
16
As determined by road characteristicsSTOP controlled intersection 2
40Signalized intersection 0
Roundabout or traffic circle 0 As determined by policyCrosswalk 0
Active, at-grade railroad crossing 0Sidestreet STOP-controlled or lane 8 The recommended posted speed limit may be
checked against the prevailing speeds of theroadway and the road's safety performance.
E2
NUMBER OF INTERSECTIONSWITH PRIVATE ACCESS DRIVEWAYS
Number ofOccurrences
15Left turn movements permitted 65 Comments:Right-in / Right-out only 0
E3NUMBER OF INTERCHANGES Number of
Occurrences 0Number of interchanges along corridor 0
F ON-STREET PARKING Higher 9

FORM A
Automated Speed Limit Guidelines Version:FORM A - Automated Speed Limit Guidelines Spreadsheet 10-Apr-09
Name of Corridor: Larose Drive 1
Segment Evaluated: Lucerne Crescent to Lawrence Crescent
Geographic Region: City of St. Albert
Road Agency: St. Ablert
Road Classification: Collector Length of Corridor: 1,290 m
Urban / Rural: Urban Design Speed: (Required for Freeway,Expressway, Highway)
km/h
Divided / Undivided: Undivided Current Posted Speed:(For information only)
50 km/h
Major / Minor: Minor Prevailing Speed:(85th Percentile - for information only)
35 km/h# Through LanesPer Direction: 1 lane Policy:
(Maximum Posted Speed)
RISK Score
A1 GEOMETRY (Horizontal) Medium 2
A2 GEOMETRY (Vertical) Lower 1
A3 AVERAGE LANE WIDTH Medium 4 Total Risk Score:
B ROADSIDE HAZARDS Higher 3 44
C1 PEDESTRIAN EXPOSURE Lower 3
C2 CYCLIST EXPOSURE Medium 6
D PAVEMENT SURFACE Lower 1 Recommended PostedSpeed Limit (km/h):
E1
NUMBER OF INTERSECTIONSWITH PUBLIC ROADS
Number ofOccurrences
6
As determined by road characteristicsSTOP controlled intersection 0
50Signalized intersection 0
Roundabout or traffic circle 0 As determined by policyCrosswalk 3
Active, at-grade railroad crossing 0Sidestreet STOP-controlled or lane 10 The recommended posted speed limit may be
checked against the prevailing speeds of theroadway and the road's safety performance.
E2
NUMBER OF INTERSECTIONSWITH PRIVATE ACCESS DRIVEWAYS
Number ofOccurrences
15Left turn movements permitted 95 Comments:Right-in / Right-out only 0
E3NUMBER OF INTERCHANGES Number of
Occurrences 0Number of interchanges along corridor 0
F ON-STREET PARKING Lower 3

FORM A
Automated Speed Limit Guidelines Version:FORM A - Automated Speed Limit Guidelines Spreadsheet 10-Apr-09
Name of Corridor: Laydon Drive
Segment Evaluated: Larose Dr to McKenney Ave
Geographic Region: City of St. Albert
Road Agency: St. Ablert
Road Classification: Collector Length of Corridor: 660 m
Urban / Rural: Urban Design Speed: (Required for Freeway,Expressway, Highway)
km/h
Divided / Undivided: Undivided Current Posted Speed:(For information only)
50 km/h
Major / Minor: Major Prevailing Speed:(85th Percentile - for information only)
28 km/h# Through LanesPer Direction: 1 lane Policy:
(Maximum Posted Speed)
RISK Score
A1 GEOMETRY (Horizontal) Medium 2
A2 GEOMETRY (Vertical) Lower 1
A3 AVERAGE LANE WIDTH Medium 4 Total Risk Score:
B ROADSIDE HAZARDS Higher 3 66
C1 PEDESTRIAN EXPOSURE Lower 3
C2 CYCLIST EXPOSURE Medium 6
D PAVEMENT SURFACE Lower 1 Recommended PostedSpeed Limit (km/h):
E1
NUMBER OF INTERSECTIONSWITH PUBLIC ROADS
Number ofOccurrences
22
As determined by road characteristicsSTOP controlled intersection 2
50Signalized intersection 0
Roundabout or traffic circle 0 As determined by policyCrosswalk 3
Active, at-grade railroad crossing 0Sidestreet STOP-controlled or lane 7 The recommended posted speed limit may be
checked against the prevailing speeds of theroadway and the road's safety performance.
E2
NUMBER OF INTERSECTIONSWITH PRIVATE ACCESS DRIVEWAYS
Number ofOccurrences
15Left turn movements permitted 44 Comments:Right-in / Right-out only 0
E3NUMBER OF INTERCHANGES Number of
Occurrences 0Number of interchanges along corridor 0
F ON-STREET PARKING Higher 9

FORM A
Automated Speed Limit Guidelines Version:FORM A - Automated Speed Limit Guidelines Spreadsheet 10-Apr-09
Name of Corridor: Mission Avenue
Segment Evaluated: Mt Royal Dr to McKenney Ave
Geographic Region: City of St. Albert
Road Agency: St. Ablert
Road Classification: Collector Length of Corridor: 1,310 m
Urban / Rural: Urban Design Speed: (Required for Freeway,Expressway, Highway)
km/h
Divided / Undivided: Undivided Current Posted Speed:(For information only)
50 km/h
Major / Minor: Major Prevailing Speed:(85th Percentile - for information only)
35 km/h# Through LanesPer Direction: 1 lane Policy:
(Maximum Posted Speed)
RISK Score
A1 GEOMETRY (Horizontal) Medium 2
A2 GEOMETRY (Vertical) Lower 1
A3 AVERAGE LANE WIDTH Medium 4 Total Risk Score:
B ROADSIDE HAZARDS Higher 3 47
C1 PEDESTRIAN EXPOSURE Lower 3
C2 CYCLIST EXPOSURE Medium 6
D PAVEMENT SURFACE Lower 1 Recommended PostedSpeed Limit (km/h):
E1
NUMBER OF INTERSECTIONSWITH PUBLIC ROADS
Number ofOccurrences
9
As determined by road characteristicsSTOP controlled intersection 1
50Signalized intersection 0
Roundabout or traffic circle 0 As determined by policyCrosswalk 4
Active, at-grade railroad crossing 0Sidestreet STOP-controlled or lane 7 The recommended posted speed limit may be
checked against the prevailing speeds of theroadway and the road's safety performance.
E2
NUMBER OF INTERSECTIONSWITH PRIVATE ACCESS DRIVEWAYS
Number ofOccurrences
15Left turn movements permitted 61 Comments:Right-in / Right-out only 0
E3NUMBER OF INTERCHANGES Number of
Occurrences 0Number of interchanges along corridor 0
F ON-STREET PARKING Lower 3

FORM A
Automated Speed Limit Guidelines Version:FORM A - Automated Speed Limit Guidelines Spreadsheet 10-Apr-09
Name of Corridor: Malmo Avenue
Segment Evaluated: Mission Ave to St Vital Ave
Geographic Region: City of St. Albert
Road Agency: St. Ablert
Road Classification: Collector Length of Corridor: 540 m
Urban / Rural: Urban Design Speed: (Required for Freeway,Expressway, Highway)
km/h
Divided / Undivided: Undivided Current Posted Speed:(For information only)
50 km/h
Major / Minor: Minor Prevailing Speed:(85th Percentile - for information only)
32 km/h# Through LanesPer Direction: 1 lane Policy:
(Maximum Posted Speed)
RISK Score
A1 GEOMETRY (Horizontal) Medium 2
A2 GEOMETRY (Vertical) Lower 1
A3 AVERAGE LANE WIDTH Medium 4 Total Risk Score:
B ROADSIDE HAZARDS Higher 3 57
C1 PEDESTRIAN EXPOSURE Lower 3
C2 CYCLIST EXPOSURE Medium 6
D PAVEMENT SURFACE Lower 1 Recommended PostedSpeed Limit (km/h):
E1
NUMBER OF INTERSECTIONSWITH PUBLIC ROADS
Number ofOccurrences
19
As determined by road characteristicsSTOP controlled intersection 2
40Signalized intersection 0
Roundabout or traffic circle 0 As determined by policyCrosswalk 0
Active, at-grade railroad crossing 0Sidestreet STOP-controlled or lane 4 The recommended posted speed limit may be
checked against the prevailing speeds of theroadway and the road's safety performance.
E2
NUMBER OF INTERSECTIONSWITH PRIVATE ACCESS DRIVEWAYS
Number ofOccurrences
15Left turn movements permitted 29 Comments:Right-in / Right-out only 0
E3NUMBER OF INTERCHANGES Number of
Occurrences 0Number of interchanges along corridor 0
F ON-STREET PARKING Lower 3

FORM A
Automated Speed Limit Guidelines Version:FORM A - Automated Speed Limit Guidelines Spreadsheet 10-Apr-09
Name of Corridor: St Vital Avenue 1
Segment Evaluated: Mission Ave to Mt Royal Dr
Geographic Region: City of St. Albert
Road Agency: St. Ablert
Road Classification: Collector Length of Corridor: 510 m
Urban / Rural: Urban Design Speed: (Required for Freeway,Expressway, Highway)
km/h
Divided / Undivided: Undivided Current Posted Speed:(For information only)
50 km/h
Major / Minor: Minor Prevailing Speed:(85th Percentile - for information only)
26 km/h# Through LanesPer Direction: 1 lane Policy:
(Maximum Posted Speed)
RISK Score
A1 GEOMETRY (Horizontal) Medium 2
A2 GEOMETRY (Vertical) Lower 1
A3 AVERAGE LANE WIDTH Lower 2 Total Risk Score:
B ROADSIDE HAZARDS Medium 2 65
C1 PEDESTRIAN EXPOSURE Lower 3
C2 CYCLIST EXPOSURE Medium 6
D PAVEMENT SURFACE Lower 1 Recommended PostedSpeed Limit (km/h):
E1
NUMBER OF INTERSECTIONSWITH PUBLIC ROADS
Number ofOccurrences
24
As determined by road characteristicsSTOP controlled intersection 2
40Signalized intersection 0
Roundabout or traffic circle 0 As determined by policyCrosswalk 1
Active, at-grade railroad crossing 0Sidestreet STOP-controlled or lane 6 The recommended posted speed limit may be
checked against the prevailing speeds of theroadway and the road's safety performance.
E2
NUMBER OF INTERSECTIONSWITH PRIVATE ACCESS DRIVEWAYS
Number ofOccurrences
15Left turn movements permitted 20 Comments:Right-in / Right-out only 0
E3NUMBER OF INTERCHANGES Number of
Occurrences 0Number of interchanges along corridor 0
F ON-STREET PARKING Higher 9

FORM A
Automated Speed Limit Guidelines Version:FORM A - Automated Speed Limit Guidelines Spreadsheet 10-Apr-09
Name of Corridor: St Vital Avenue 2
Segment Evaluated: Mt Royal Dr to St Albert Trail
Geographic Region: City of St. Albert
Road Agency: St. Ablert
Road Classification: Collector Length of Corridor: 710 m
Urban / Rural: Urban Design Speed: (Required for Freeway,Expressway, Highway)
km/h
Divided / Undivided: Undivided Current Posted Speed:(For information only)
50 km/h
Major / Minor: Minor Prevailing Speed:(85th Percentile - for information only)
33 km/h# Through LanesPer Direction: 1 lane Policy:
(Maximum Posted Speed)
RISK Score
A1 GEOMETRY (Horizontal) Medium 2
A2 GEOMETRY (Vertical) Medium 2
A3 AVERAGE LANE WIDTH Medium 4 Total Risk Score:
B ROADSIDE HAZARDS Lower 1 52
C1 PEDESTRIAN EXPOSURE Medium 6
C2 CYCLIST EXPOSURE Medium 6
D PAVEMENT SURFACE Medium 2 Recommended PostedSpeed Limit (km/h):
E1
NUMBER OF INTERSECTIONSWITH PUBLIC ROADS
Number ofOccurrences
15
As determined by road characteristicsSTOP controlled intersection 1
40Signalized intersection 1
Roundabout or traffic circle 0 As determined by policyCrosswalk 2
Active, at-grade railroad crossing 0Sidestreet STOP-controlled or lane 2 The recommended posted speed limit may be
checked against the prevailing speeds of theroadway and the road's safety performance.
E2
NUMBER OF INTERSECTIONSWITH PRIVATE ACCESS DRIVEWAYS
Number ofOccurrences
5Left turn movements permitted 7 Comments:Right-in / Right-out only 0
E3NUMBER OF INTERCHANGES Number of
Occurrences 0Number of interchanges along corridor 0
F ON-STREET PARKING Higher 9

FORM A
Automated Speed Limit Guidelines Version:FORM A - Automated Speed Limit Guidelines Spreadsheet 10-Apr-09
Name of Corridor: Muir Drive
Segment Evaluated: McKenney Ave to St Albert Trail
Geographic Region: City of St. Albert
Road Agency: St. Ablert
Road Classification: Collector Length of Corridor: 580 m
Urban / Rural: Urban Design Speed: (Required for Freeway,Expressway, Highway)
km/h
Divided / Undivided: Undivided Current Posted Speed:(For information only)
50 km/h
Major / Minor: Major Prevailing Speed:(85th Percentile - for information only)
34 km/h# Through LanesPer Direction: 1 lane Policy:
(Maximum Posted Speed)
RISK Score
A1 GEOMETRY (Horizontal) Higher 3
A2 GEOMETRY (Vertical) Lower 1
A3 AVERAGE LANE WIDTH Medium 4 Total Risk Score:
B ROADSIDE HAZARDS Medium 2 59
C1 PEDESTRIAN EXPOSURE Lower 3
C2 CYCLIST EXPOSURE Medium 6
D PAVEMENT SURFACE Lower 1 Recommended PostedSpeed Limit (km/h):
E1
NUMBER OF INTERSECTIONSWITH PUBLIC ROADS
Number ofOccurrences
29
As determined by road characteristicsSTOP controlled intersection 3
50Signalized intersection 1
Roundabout or traffic circle 0 As determined by policyCrosswalk 1
Active, at-grade railroad crossing 0Sidestreet STOP-controlled or lane 1 The recommended posted speed limit may be
checked against the prevailing speeds of theroadway and the road's safety performance.
E2
NUMBER OF INTERSECTIONSWITH PRIVATE ACCESS DRIVEWAYS
Number ofOccurrences
7Left turn movements permitted 8 Comments:Right-in / Right-out only 0
E3NUMBER OF INTERCHANGES Number of
Occurrences 0Number of interchanges along corridor 0
F ON-STREET PARKING Lower 3

FORM A
Automated Speed Limit Guidelines Version:FORM A - Automated Speed Limit Guidelines Spreadsheet 10-Apr-09
Name of Corridor: Riel Drive
Segment Evaluated: Sir Winston Churchill Ave to Levasseur Rd
Geographic Region: City of St. Albert
Road Agency: St. Ablert
Road Classification: Collector Length of Corridor: 1,990 m
Urban / Rural: Urban Design Speed: (Required for Freeway,Expressway, Highway)
km/h
Divided / Undivided: Undivided Current Posted Speed:(For information only)
50 km/h
Major / Minor: Major Prevailing Speed:(85th Percentile - for information only)
37 km/h# Through LanesPer Direction: 1 lane Policy:
(Maximum Posted Speed)
RISK Score
A1 GEOMETRY (Horizontal) Medium 2
A2 GEOMETRY (Vertical) Lower 1
A3 AVERAGE LANE WIDTH Medium 4 Total Risk Score:
B ROADSIDE HAZARDS Lower 1 40
C1 PEDESTRIAN EXPOSURE Higher 9
C2 CYCLIST EXPOSURE Lower 3
D PAVEMENT SURFACE Medium 2 Recommended PostedSpeed Limit (km/h):
E1
NUMBER OF INTERSECTIONSWITH PUBLIC ROADS
Number ofOccurrences
4
As determined by road characteristicsSTOP controlled intersection 0
50Signalized intersection 1
Roundabout or traffic circle 0 As determined by policyCrosswalk 0
Active, at-grade railroad crossing 1Sidestreet STOP-controlled or lane 6 The recommended posted speed limit may be
checked against the prevailing speeds of theroadway and the road's safety performance.
E2
NUMBER OF INTERSECTIONSWITH PRIVATE ACCESS DRIVEWAYS
Number ofOccurrences
11Left turn movements permitted 43 Comments:Right-in / Right-out only 0
E3NUMBER OF INTERCHANGES Number of
Occurrences 0Number of interchanges along corridor 0
F ON-STREET PARKING Lower 3

FORM A
Automated Speed Limit Guidelines Version:FORM A - Automated Speed Limit Guidelines Spreadsheet 10-Apr-09
Name of Corridor: Grenfell Avenue
Segment Evaluated: Gatewood Ave to Grosvenor Blvd
Geographic Region: City of St. Albert
Road Agency: St. Ablert
Road Classification: Collector Length of Corridor: 650 m
Urban / Rural: Urban Design Speed: (Required for Freeway,Expressway, Highway)
km/h
Divided / Undivided: Undivided Current Posted Speed:(For information only)
30 km/h
Major / Minor: Minor Prevailing Speed:(85th Percentile - for information only)
23 km/h# Through LanesPer Direction: 1 lane Policy:
(Maximum Posted Speed)
RISK Score
A1 GEOMETRY (Horizontal) Lower 1
A2 GEOMETRY (Vertical) Lower 1
A3 AVERAGE LANE WIDTH Medium 4 Total Risk Score:
B ROADSIDE HAZARDS Higher 3 50
C1 PEDESTRIAN EXPOSURE Lower 3
C2 CYCLIST EXPOSURE Medium 6
D PAVEMENT SURFACE Medium 2 Recommended PostedSpeed Limit (km/h):
E1
NUMBER OF INTERSECTIONSWITH PUBLIC ROADS
Number ofOccurrences
12
As determined by road characteristicsSTOP controlled intersection 1
50Signalized intersection 0
Roundabout or traffic circle 0 As determined by policyCrosswalk 1
Active, at-grade railroad crossing 0Sidestreet STOP-controlled or lane 6 The recommended posted speed limit may be
checked against the prevailing speeds of theroadway and the road's safety performance.
E2
NUMBER OF INTERSECTIONSWITH PRIVATE ACCESS DRIVEWAYS
Number ofOccurrences
15Left turn movements permitted 36 Comments:Right-in / Right-out only 0
E3NUMBER OF INTERCHANGES Number of
Occurrences 0Number of interchanges along corridor 0
F ON-STREET PARKING Lower 3

FORM A
Automated Speed Limit Guidelines Version:FORM A - Automated Speed Limit Guidelines Spreadsheet 10-Apr-09
Name of Corridor: Grosvenor Boulevard 1
Segment Evaluated: Grandin Rd to 130m South of Grenfell Ave
Geographic Region: City of St. Albert
Road Agency: St. Ablert
Road Classification: Collector Length of Corridor: 600 m
Urban / Rural: Urban Design Speed: (Required for Freeway,Expressway, Highway)
km/h
Divided / Undivided: Undivided Current Posted Speed:(For information only)
50 km/h
Major / Minor: Minor Prevailing Speed:(85th Percentile - for information only)
22 km/h# Through LanesPer Direction: 1 lane Policy:
(Maximum Posted Speed)
RISK Score
A1 GEOMETRY (Horizontal) Medium 2
A2 GEOMETRY (Vertical) Lower 1
A3 AVERAGE LANE WIDTH Medium 4 Total Risk Score:
B ROADSIDE HAZARDS Medium 2 49
C1 PEDESTRIAN EXPOSURE Lower 3
C2 CYCLIST EXPOSURE Medium 6
D PAVEMENT SURFACE Lower 1 Recommended PostedSpeed Limit (km/h):
E1
NUMBER OF INTERSECTIONSWITH PUBLIC ROADS
Number ofOccurrences
12
As determined by road characteristicsSTOP controlled intersection 1
50Signalized intersection 0
Roundabout or traffic circle 0 As determined by policyCrosswalk 1
Active, at-grade railroad crossing 0Sidestreet STOP-controlled or lane 4 The recommended posted speed limit may be
checked against the prevailing speeds of theroadway and the road's safety performance.
E2
NUMBER OF INTERSECTIONSWITH PRIVATE ACCESS DRIVEWAYS
Number ofOccurrences
15Left turn movements permitted 29 Comments:Right-in / Right-out only 0
E3NUMBER OF INTERCHANGES Number of
Occurrences 0Number of interchanges along corridor 0
F ON-STREET PARKING Lower 3

FORM A
Automated Speed Limit Guidelines Version:FORM A - Automated Speed Limit Guidelines Spreadsheet 10-Apr-09
Name of Corridor: Grosvenor Boulevard 2
Segment Evaluated: 25m North of Grandora Crescent to Levasseur Rd
Geographic Region: City of St. Albert
Road Agency: St. Ablert
Road Classification: Collector Length of Corridor: 690 m
Urban / Rural: Urban Design Speed: (Required for Freeway,Expressway, Highway)
km/h
Divided / Undivided: Undivided Current Posted Speed:(For information only)
50 km/h
Major / Minor: Minor Prevailing Speed:(85th Percentile - for information only)
28 km/h# Through LanesPer Direction: 1 lane Policy:
(Maximum Posted Speed)
RISK Score
A1 GEOMETRY (Horizontal) Lower 1
A2 GEOMETRY (Vertical) Lower 1
A3 AVERAGE LANE WIDTH Medium 4 Total Risk Score:
B ROADSIDE HAZARDS Medium 2 53
C1 PEDESTRIAN EXPOSURE Lower 3
C2 CYCLIST EXPOSURE Medium 6
D PAVEMENT SURFACE Lower 1 Recommended PostedSpeed Limit (km/h):
E1
NUMBER OF INTERSECTIONSWITH PUBLIC ROADS
Number ofOccurrences
11
As determined by road characteristicsSTOP controlled intersection 1
40Signalized intersection 0
Roundabout or traffic circle 0 As determined by policyCrosswalk 0
Active, at-grade railroad crossing 0Sidestreet STOP-controlled or lane 7 The recommended posted speed limit may be
checked against the prevailing speeds of theroadway and the road's safety performance.
E2
NUMBER OF INTERSECTIONSWITH PRIVATE ACCESS DRIVEWAYS
Number ofOccurrences
15Left turn movements permitted 39 Comments:Right-in / Right-out only 0
E3NUMBER OF INTERCHANGES Number of
Occurrences 0Number of interchanges along corridor 0
F ON-STREET PARKING Higher 9

FORM A
Automated Speed Limit Guidelines Version:FORM A - Automated Speed Limit Guidelines Spreadsheet 10-Apr-09
Name of Corridor: Graham Avenue / Heritage Way
Segment Evaluated: 90m South of Gainsborough Ave to Heritage Dr
Geographic Region: City of St. Albert
Road Agency: St. Ablert
Road Classification: Collector Length of Corridor: 290 m
Urban / Rural: Urban Design Speed: (Required for Freeway,Expressway, Highway)
km/h
Divided / Undivided: Undivided Current Posted Speed:(For information only)
50 km/h
Major / Minor: Minor Prevailing Speed:(85th Percentile - for information only)
33 km/h# Through LanesPer Direction: 1 lane Policy:
(Maximum Posted Speed)
RISK Score
A1 GEOMETRY (Horizontal) Higher 3
A2 GEOMETRY (Vertical) Lower 1
A3 AVERAGE LANE WIDTH Medium 4 Total Risk Score:
B ROADSIDE HAZARDS Medium 2 58
C1 PEDESTRIAN EXPOSURE Lower 3
C2 CYCLIST EXPOSURE Medium 6
D PAVEMENT SURFACE Medium 2 Recommended PostedSpeed Limit (km/h):
E1
NUMBER OF INTERSECTIONSWITH PUBLIC ROADS
Number ofOccurrences
19
As determined by road characteristicsSTOP controlled intersection 1
40Signalized intersection 0
Roundabout or traffic circle 0 As determined by policyCrosswalk 0
Active, at-grade railroad crossing 0Sidestreet STOP-controlled or lane 3 The recommended posted speed limit may be
checked against the prevailing speeds of theroadway and the road's safety performance.
E2
NUMBER OF INTERSECTIONSWITH PRIVATE ACCESS DRIVEWAYS
Number ofOccurrences
15Left turn movements permitted 30 Comments:Right-in / Right-out only 0
E3NUMBER OF INTERCHANGES Number of
Occurrences 0Number of interchanges along corridor 0
F ON-STREET PARKING Lower 3

FORM A
Automated Speed Limit Guidelines Version:FORM A - Automated Speed Limit Guidelines Spreadsheet 10-Apr-09
Name of Corridor: Hardwood Drive
Segment Evaluated: Heritage Way to Heritage Dr
Geographic Region: City of St. Albert
Road Agency: St. Ablert
Road Classification: Collector Length of Corridor: 930 m
Urban / Rural: Urban Design Speed: (Required for Freeway,Expressway, Highway)
km/h
Divided / Undivided: Undivided Current Posted Speed:(For information only)
50 km/h
Major / Minor: Minor Prevailing Speed:(85th Percentile - for information only)
33 km/h# Through LanesPer Direction: 1 lane Policy:
(Maximum Posted Speed)
RISK Score
A1 GEOMETRY (Horizontal) Medium 2
A2 GEOMETRY (Vertical) Lower 1
A3 AVERAGE LANE WIDTH Medium 4 Total Risk Score:
B ROADSIDE HAZARDS Medium 2 53
C1 PEDESTRIAN EXPOSURE Lower 3
C2 CYCLIST EXPOSURE Medium 6
D PAVEMENT SURFACE Medium 2 Recommended PostedSpeed Limit (km/h):
E1
NUMBER OF INTERSECTIONSWITH PUBLIC ROADS
Number ofOccurrences
15
As determined by road characteristicsSTOP controlled intersection 2
40Signalized intersection 0
Roundabout or traffic circle 0 As determined by policyCrosswalk 0
Active, at-grade railroad crossing 0Sidestreet STOP-controlled or lane 11 The recommended posted speed limit may be
checked against the prevailing speeds of theroadway and the road's safety performance.
E2
NUMBER OF INTERSECTIONSWITH PRIVATE ACCESS DRIVEWAYS
Number ofOccurrences
15Left turn movements permitted 53 Comments:Right-in / Right-out only 0
E3NUMBER OF INTERCHANGES Number of
Occurrences 0Number of interchanges along corridor 0
F ON-STREET PARKING Lower 3

FORM A
Automated Speed Limit Guidelines Version:FORM A - Automated Speed Limit Guidelines Spreadsheet 10-Apr-09
Name of Corridor: Heritage Drive
Segment Evaluated: Hardcastle Pl to Harvest Ct
Geographic Region: City of St. Albert
Road Agency: St. Ablert
Road Classification: Collector Length of Corridor: 1,890 m
Urban / Rural: Urban Design Speed: (Required for Freeway,Expressway, Highway)
km/h
Divided / Undivided: Undivided Current Posted Speed:(For information only)
50 km/h
Major / Minor: Minor Prevailing Speed:(85th Percentile - for information only)
35 km/h# Through LanesPer Direction: 1 lane Policy:
(Maximum Posted Speed)
RISK Score
A1 GEOMETRY (Horizontal) Medium 2
A2 GEOMETRY (Vertical) Lower 1
A3 AVERAGE LANE WIDTH Medium 4 Total Risk Score:
B ROADSIDE HAZARDS Higher 3 46
C1 PEDESTRIAN EXPOSURE Lower 3
C2 CYCLIST EXPOSURE Medium 6
D PAVEMENT SURFACE Medium 2 Recommended PostedSpeed Limit (km/h):
E1
NUMBER OF INTERSECTIONSWITH PUBLIC ROADS
Number ofOccurrences
7
As determined by road characteristicsSTOP controlled intersection 0
50Signalized intersection 0
Roundabout or traffic circle 0 As determined by policyCrosswalk 1
Active, at-grade railroad crossing 0Sidestreet STOP-controlled or lane 26 The recommended posted speed limit may be
checked against the prevailing speeds of theroadway and the road's safety performance.
E2
NUMBER OF INTERSECTIONSWITH PRIVATE ACCESS DRIVEWAYS
Number ofOccurrences
15Left turn movements permitted 67 Comments:Right-in / Right-out only 0
E3NUMBER OF INTERCHANGES Number of
Occurrences 0Number of interchanges along corridor 0
F ON-STREET PARKING Lower 3

FORM A
Automated Speed Limit Guidelines Version:FORM A - Automated Speed Limit Guidelines Spreadsheet 10-Apr-09
Name of Corridor: Parkwood Drive 2 / Kirkwood Drive
Segment Evaluated: Park Ave to Kingswood Blvd
Geographic Region: City of St. Albert
Road Agency: St. Ablert
Road Classification: Collector Length of Corridor: 670 m
Urban / Rural: Urban Design Speed: (Required for Freeway,Expressway, Highway)
km/h
Divided / Undivided: Undivided Current Posted Speed:(For information only)
50 km/h
Major / Minor: Minor Prevailing Speed:(85th Percentile - for information only)
36 km/h# Through LanesPer Direction: 1 lane Policy:
(Maximum Posted Speed)
RISK Score
A1 GEOMETRY (Horizontal) Higher 3
A2 GEOMETRY (Vertical) Lower 1
A3 AVERAGE LANE WIDTH Medium 4 Total Risk Score:
B ROADSIDE HAZARDS Higher 3 60
C1 PEDESTRIAN EXPOSURE Lower 3
C2 CYCLIST EXPOSURE Medium 6
D PAVEMENT SURFACE Medium 2 Recommended PostedSpeed Limit (km/h):
E1
NUMBER OF INTERSECTIONSWITH PUBLIC ROADS
Number ofOccurrences
14
As determined by road characteristicsSTOP controlled intersection 2
40Signalized intersection 0
Roundabout or traffic circle 0 As determined by policyCrosswalk 0
Active, at-grade railroad crossing 0Sidestreet STOP-controlled or lane 3 The recommended posted speed limit may be
checked against the prevailing speeds of theroadway and the road's safety performance.
E2
NUMBER OF INTERSECTIONSWITH PRIVATE ACCESS DRIVEWAYS
Number ofOccurrences
15Left turn movements permitted 57 Comments:Right-in / Right-out only 0
E3NUMBER OF INTERCHANGES Number of
Occurrences 0Number of interchanges along corridor 0
F ON-STREET PARKING Higher 9

FORM A
Automated Speed Limit Guidelines Version:FORM A - Automated Speed Limit Guidelines Spreadsheet 10-Apr-09
Name of Corridor: Meadowview Drive Rural
Segment Evaluated: West City Limits to Ray Gibbon Drive
Geographic Region: City of St. Albert
Road Agency: St. Ablert
Road Classification: Arterial Length of Corridor: 1,680 m
Urban / Rural: Rural Design Speed: (Required for Freeway,Expressway, Highway)
km/h
Divided / Undivided: Undivided Current Posted Speed:(For information only)
60 km/h
Major / Minor: Major Prevailing Speed:(85th Percentile - for information only)
0 km/h# Through LanesPer Direction: 2+ lanes Policy:
(Maximum Posted Speed)
RISK Score
A1 GEOMETRY (Horizontal) Lower 3
A2 GEOMETRY (Vertical) Lower 3
A3 AVERAGE LANE WIDTH Higher 9 Total Risk Score:
B ROADSIDE HAZARDS Lower 3 49
C1 PEDESTRIAN EXPOSURE Higher 6
C2 CYCLIST EXPOSURE Higher 9
D PAVEMENT SURFACE Medium 6 Recommended PostedSpeed Limit (km/h):
E1
NUMBER OF INTERSECTIONSWITH PUBLIC ROADS
Number ofOccurrences
5
As determined by road characteristicsSTOP controlled intersection 0
70Signalized intersection 1
Roundabout or traffic circle 0 As determined by policyCrosswalk 0
Active, at-grade railroad crossing 0Sidestreet STOP-controlled or lane 1 The recommended posted speed limit may be
checked against the prevailing speeds of theroadway and the road's safety performance.
E2
NUMBER OF INTERSECTIONSWITH PRIVATE ACCESS DRIVEWAYS
Number ofOccurrences
4Left turn movements permitted 10 Comments:Right-in / Right-out only 0
E3NUMBER OF INTERCHANGES Number of
Occurrences 0Number of interchanges along corridor 0
F ON-STREET PARKING Lower 1

islengineering.com
February 2020
Transportation Network Speed Limit Review
City of St. Albert
FINAL REPORT
APPENDIX AT Playground /School Zone/Area Inputs/Results D


LAROSE DRIVE
DEER
RANKIN DRIVE
LACOMBE
RIDGEDRIVE
GIROUX ROAD
DENN
ISON
DR
LOCKHARTAVE
LAYDON DR
RIEL
BELLEROSE DR
OAKRIDGE
ROAD
GOODRIDGE
MISSION AVE
GATEWOOD
AVE
AVE
MALMO
LARSON
LAROSE
MISSION AVELANGLEY AVE
RIEL
DR
DEER RIDGE DR.
LAROSE DR
AVE
LEDDY AVE
SIR W
INST
ON
VILLENEUVE ROAD
DEERBOURNE
LANGHOLM
MILL DRIVE
GAINSBOROUGH
DELBROOK
DRIV
E
McKENNEY AVE
DRIVE
ST. VITAL A
VEGR
ENFE
LL AV
E
BLVD
LIBERTON
ST. VITAL AVE
GRESHAM
GRAHAM
HARWOOD
WAY
HARWOOD DRIVE
GRANDVILLE
ERIN
RIDGE
DRIVE
MUIR DR
INGLE WOOD
PERRON
GRANDIN ROAD
GROSVENOR
ROADERIN RIDGE
BOUDREAU
LIBERTON DRIVEDR
MADONNA
MUIR
GRENFELL AVE
GROS
VENO
R
HERITAGE
ERIN
RID
GE D
R
INGLE
WOOD
BELL
EROS
E D
RIVE
ST. ANNE ST
HERITAGE DR
ROAD
BISHOP ST
SIR WINSTON
STERLING
LEVASSEUR ROAD
GRAN
DIN
ROAD
HUDSON RD
AVE
BELLEROSE
DRIVE
BURNHAM
CUNNINGHAM
BLVD
SALISBURY AVE
GRANGE DRIVE
GATE AVE
WAVERLY
SIR WINSTON
FORES
T
PARK
AKINS
BOUDREAU ROADSY
CAMORE
OAKM
ONT
OAKRIDGE
NORTH
FORES
T
ROAD
DRIVE
GLOUCESTER
WESTW
OODFA
IRVIEW
FARMST
EAD
SUNSET BLVD
ST. ALBERT
HEBE
RT R
OAD
FALSTAFF
WOOD
WILLOUGHBY
DR
ATTW
OOD
ARLINGTON
ROADSTURGEON
ROAD
DRIVE HEBERT R
OAD
KINGSW
AY
POUNDMAKER ROAD
PARKWOODAVE
DRIVE
LANE
ATTWOOD DR
ARLINGTON DR
ALPIN
E BLV
D
DR
KIRKWOOD
DR
PINEV
IEW
BLVD
PAGE DR
BOUDREAU ROAD
POIRIER AVE
DRIV
EKE
ILLOR
CARN
EGIE
DR
CAMP
BELL
ROA
D CHISHOLM
CORRIVEAU AVE
CURI
AL
ST. ALBERT TRAIL
SOUTH
ERIN RIDGEDRIVE
DORCHESTER DR
DAWSON ROAD
AKINS DRIVE
KINGSWOOD
DRIVE
RIEL DR
DRIVE
AVE
AVE
DR
HERITAGE
BLVD
HERITAGE
DR
BLVD
BOULEVARD
GRANITE
AVE
AVE
STREET
DRIVE
CHURCHILL AVE
AVE
AVEFOREST
DRIVE
BLVD
DRIVE
AVE
DRIVE
AVE
AVE
ROAD
DRIVE
DRIVE
DRIVE
LEXI
NGTO
N
DRIVE
DRIVE
DURHAM
BLVDLENNOX
DRIVE
DRIVE
ST
KINGS
WOOD
DR
PRIM
EAU
WOOD
DRIVE
ROAD
DRIVE
DRIVE
DRIVE
LANDS
LANDS
DRDRIVE
DRIVE
(MARK MESSIER TRAIL)
(170th
STRE
ET)
GERVAIS
OAKLANDWAY
DUNBARSTREET
DRIV
E
CARLETON
DRIVE
CHUR
CHILL
AVE
RANGE ROAD 260
McKENNEY AVENUE
RAY GIBBON DRIVE
GIROUX ROAD LACOMBEDRIVE
RAY GIBBON DRIVE
ST. ALBERT TRAIL
CARLETON DRIVE
RIELDR
LECLAIRWAY
Range Road 253
VERSAILLES
AVENUENEVADAPLACE
EVERITT DRIVE NORTH
ELEMENT DRIVE NORTH
Sturgeon River
Sturge
on R
iver
Sturge
on R
iver
Big Lake
NEIL ROSS ROAD
BOULEVARDJENSEN LAKE
JOYAL WAY
JUBILATIONDRIVE
VILLEMAGNEROAD
VANDELOR
ROAD
STUR
GEON
TRAIL
CHURCHILL AVE
PINEVIEWDRIVE
CHUR
CHILL
SIR W
INST
ON
DR
SUNSE
T
CENTRESTREET
NORTH RIDGE DR
HOGA
N RD
NORT
H RI
DGE D
RIVE
ELDORADO DR
RAY GIBBON DRIVE
TACHE ST
´
LegendSchool Zone Times
Playground Zone
School & Playground Zones


23
19
4
11
18
21
22
1
2
14
13
3
10
16
6
9
26
20
24
58
28
27
25
15
17
7
12
MAP B.6:SCHOOL ZONE
EVALUATION RESULTS (ISL REVIEW)
Docu
ment:
G:\P
rojec
ts\15
000\1
5400
\1543
9_St
_Albe
rt_Sp
eed_
Limit_
Revie
w\02
_CAD
D\25
_GIS\
251_
Figure
s\154
39_M
ap_B
6_Sc
hool_
Zone
_Eva
luatio
n_19
1022
.mxd
1:55,0000 1 20.5
km City of St. Albert 41-50 (School Area)51-60 (School Area)61-70 (School Zone or Area)71-80 (School Zone or Area)81-90 (School Zone)91-100 (School Zone)
¹
Credits: Source: Esri, DigitalGlobe, GeoEye, Earthstar Geographics, CNES/Airbus DS, USDA, USGS, AeroGRID, IGN, and the
CANA83-3TM114
DRAFT &
CONFIDENTIAL


2527
244
12
26
53
39
36
8
9
4840
3633
10
20
18
41
13
1
2
29
22
17 52
5
38
16
19
5557
47
49
31
43
14
37 46
63
58
50
54
44
66
11
30
60
28
56
67
MAP C.7:PLAYGROUND ZONE
EVALUATION RESULTS
Docu
ment:
G:\P
rojec
ts\15
000\1
5400
\1543
9_St
_Albe
rt_Sp
eed_
Limit_
Revie
w\02
_CAD
D\25
_GIS\
251_
Figure
s\154
39_M
ap_C
7_Pla
ygrou
nd_Z
one_
Evalu
ation
_Res
ults_
1910
23.m
xd
1:55,0000 1 20.5
km City of St. Albert 41-50 (Playground Area)51-60 (Playground Area)61-70 (Playground Area)71-80 (Playground Area)81-90 (Playground Zone)91-100 (Playground Zone)
¹
Credits: Source: Esri, DigitalGlobe, GeoEye, Earthstar Geographics, CNES/Airbus DS, USDA, USGS, AeroGRID, IGN, and the
CANA83-3TM114
DRAFT &
CONFIDENTIAL


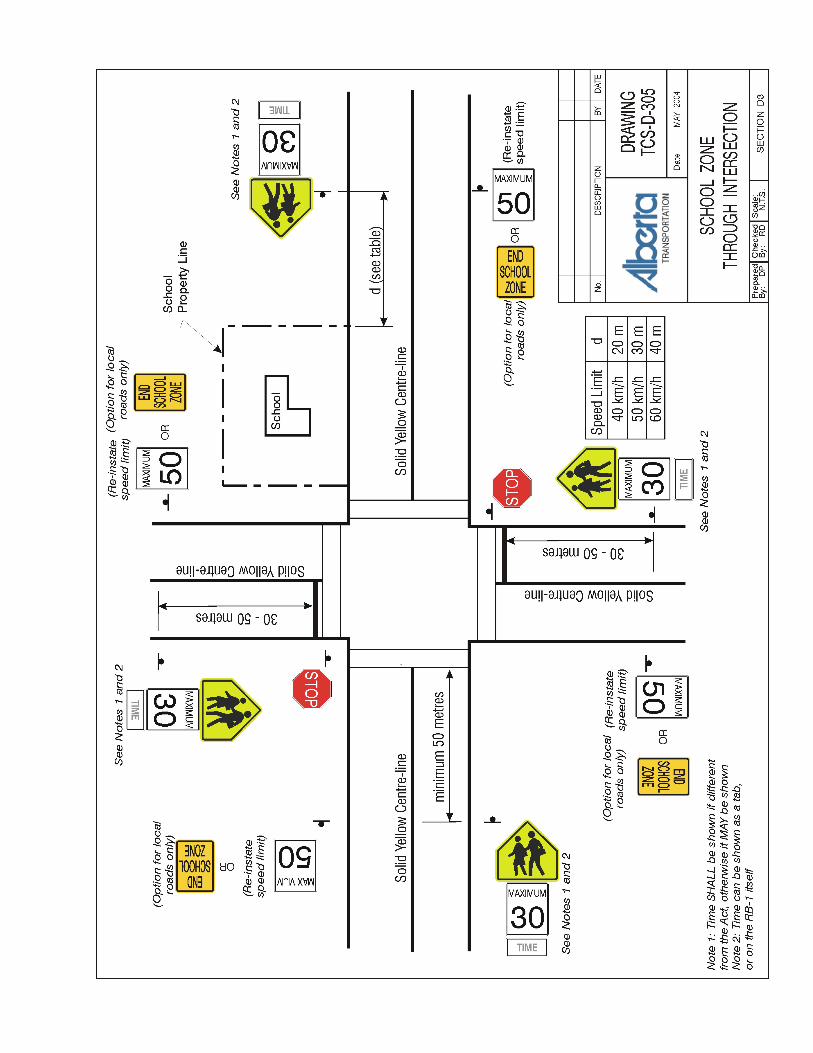


THIS
PA
GE
WA
S IN
TEN
TIO
NA
LLY
LEF
T B
LAN
K.

THIS
PA
GE
WA
S IN
TEN
TIO
NA
LLY
LEF
T B
LAN
K.


6. 2
Variable Seasonal Times for Playground Zones
Recommendation That the June 25, 2019, City Operations report CR_6043, be received for information.
Previous Council/Committee Action At the May 8, 2018, City Council meeting, the following motion was passed:
5. That Administration bring a report outlining options or recommendations forvariable seasonal times for playground zones based on operational data.
and provide a report back on Parts 1 to 4 with a due date of the August 14, 2018, Urban Planning Committee meeting and Part 5 with a due date of Second Quarter 2019.
Executive Summary Council approved the implementation of harmonized playground zones in September 2017. Since that time, 150 standalone playgrounds were installed and 242 school zones were converted to playground zones. Playground zones in Edmonton currently have a 30 km/h speed limit in effect between 0730-2100 hours year-round.
Residents have raised concerns about the effectiveness of playground zone speed limits in the evening, during the winter or when school is not in session. In response, Council requested Administration bring forward options for seasonal playground zones.
For this report, Administration looked at operational data and other jurisdictions to consider three options for variable times:
● Continue zones around schools at the existing hours (0730-2100), but changetime for standalone playgrounds
● Reconsider effective times for all playground zones● Continue with status quo
Playground zones have been in place for less than one year. While collision data is limited, early information points towards a decrease in the number and severity of collisions occurring in playground zones. Adding variable or seasonal times could put vulnerable road users (children, those with limited mobility, etc.) at greater risk due to increased vehicle speeds outside of existing playground effective hours.
ROUTING - Urban Planning Committee | DELEGATION - G. Cebryk/B. Simpson June 25, 2019 - City Operations CR_6043 Page 1 of 7
Variable Seasonal Times for Playground Zones
Based on local data and available information from other jurisdictions, as well as the pending decision on lower residential speed limits, Administration does not recommend variable effective time changes for playground zones.
Report Background
In September 2015, the City of Edmonton adopted Vision Zero, a traffic safety strategy designed to eliminate fatalities and serious injuries on roadways. Roadway speeds factor significantly in collision likelihood and the severity of injuries. When pedestrians are struck by a vehicle traveling at 30 km/h, they have a 90 percent chance of surviving the impact; at 50 km/h, the survival rate drops to 20 percent. Children are more vulnerable than adults and often experience life-threatening or permanent injuries if struck by a vehicle, especially at higher speeds. The introduction of 30km/h zones near elementary schools in September 2014 was found effective in reducing all types of collisions, including injury collisions. The zones were in effect 0800 -1630 on school days. City Council approved the expansion of school zones to include any schools with junior high grades (seven to nine) in May 2017, which were installed September 2017. Council approved playground zones in September 2017, creating 150 standalone playgrounds and expanding the operational hours of 242 school zones. Playground zone speed limits are 30 km/hr between 0730-2100 daily. The Traffic Safety Act sets the default hours for playground zones as “8:30 am until one hour after sunset,” but allows municipalities to vary those times by bylaw. Edmonton playground zones and times are consistent with those in Calgary, Red Deer and Medicine Hat. Some municipalities use different enforcement hours for playground zones; however, none in Alberta vary hours by season, such as summer and winter. Some use a daily variable time that changes based on daylight. Attachment 1 outlines various school and playground zones in Alberta. Playground Safety
Edmonton
In 2014, the City installed 30 km/h school zones at 233 schools with elementary grades. In October 2016, Administration presented Effects of 2014 Change in Elementary School Zones to 30 km/h (October 17, 2016, City Operations report CR_1504), which showed a marked decrease in collisions and injuries after the introduction of the reduced speed limit. The data showed that 30 km/h speed limits
Page 2 of 7 Report: CR_6043
Variable Seasonal Times for Playground Zones
around schools reduced total injury collisions from 17 to 10 in the year post speed limit reduction. Injury collisions involving pedestrians and cyclists were reduced from seven collisions to two in the year after implementation. Based on the roadway safety improvements following the implementation of school zones, City Council approved the extension of the zones to include junior high schools in May 2017. Administration completed installation by September 2017. City Council also approved the implementation of playground zones in September 2017, and all existing school zones were subsequently converted to playground zones by spring 2018. School zones sometimes caused confusion for drivers due in part to public, Catholic, and charter schools having different schedules and vacation days. Some schools also follow a year-round schedule. The consistent hours of playground zones help to reduce driver confusion and increase safety. Since the implementation of playground zones, Administration has received both positive and negative feedback from the public regarding their implementation. The common theme of concern is that playground zones are not necessary due to low temperature, darkness, or when school is not in session. Calgary
The City of Calgary opted to combine school zones and playground zones in August 2015. The City then implemented 30 km/h playground zones with consistent hours of operation citywide. In 2017, the University of Calgary, Department of Civil Engineering, conducted a study to determine the safety impacts. Comparing the periods before school and playground zones were combined, the study found:
● The mean speed decreased from 36 km/h to 30 km/h; and ● Pedestrian collisions within school and playground zones decreased by 33
percent (from 30 pedestrian collisions prior to combination to 20 collisions after), including a drop from 10 collisions to three between the hours of 1730-2100.
Based on a survey that was conducted after the zones were combined, more than 80 percent of the respondents found it easier to remember the zone times when the time was consistent throughout the week and the year. Edmonton Playground Zone Collision Data 2014 - 2018
The current best practice is to use a minimum of three years before-and-after data to evaluate the effectiveness of safety engineering measures. Since playground zones have been in place for approximately one year, Administration cautions against using
Page 3 of 7 Report: CR_6043

Variable Seasonal Times for Playground Zones
this data conclusively. The data provided in Attachment 2 shows collisions on roadway segments that are now defined as standalone or combined playground zones. Definitions are summarized in Attachment 3. Current data indicates that injury collisions occur in playground zones year-round and at all times of day. Between 2014 and 2018, there were 43 instances where a motor vehicle struck a pedestrian or cyclist aged 15 and younger in areas that are now playground zones. Of these collisions, 35 percent (15 of 43) occurred outside of the previous school zone hours of 0800-1630. Standalone Playground Zones Injury Collisions
Between 2014 and 2018, there were 118 injury collisions involving any roadway user in locations that are now standalone playground zones:
● 21 of the 118 collisions involved pedestrians and cyclists ○ five of the 21 occurred between the hours of 1900-2100 ○ 12 of the 21 occurred in winter months (November to February)
Combined Playground Zones Injury Collisions
Between 2014 and 2018, there were 330 injury collisions involving any roadway user in locations that are now combined playground zones:
● 77 of the 330 collisions involved pedestrians and cyclists ○ 30 of the 77 occurred between the hours of 1700-2100 ○ nine out of 77 occurred in summer months (July and August)
Variable Seasonal Times for Playground Zones
Administration considered three options for variable seasonal times for playgrounds:
1. Maintain the zones around schools at the existing hours (0730-2100) but change times of standalone playgrounds
2. Change the effective times for all playground zones 3. Maintain the status quo
Option 1 - Maintain the zones around schools at the existing hours (0730-2100) but change times of standalone playgrounds
This option would allow existing 30 km/h playground zones to remain at combined playground zones (playgrounds adjacent to schools) but change the effective times based on season for standalone playground zones.
Page 4 of 7 Report: CR_6043

Variable Seasonal Times for Playground Zones
Standalone playground zones have been in effect for approximately one year and drivers are still adjusting to the new hours. Changing the effective hours of these zones could lead to roadway user uncertainty and frustration. Data from both before and after playground zone installation indicates that injury collisions with vulnerable road users occur during evening hours and evenly during all seasons. Although data is limited, early indications are that these lower limits are having a positive impact on collision reduction and severity. The addition of seasonal playground zone effective times, such as sunrise to sunset, would require additional budget for communications for the changing hours as well as for new sign production and installation. Option 2 - Change the effective times for all playground zones
This option would allow varied effective times for all playground zones. The effective times could be based on seasonality (i.e. differing effective times for the summer versus winter months), or, alternatively, on the effective time period set out in the Use of the Highway and Rules of the Road Regulation (i.e. commencing at 8:30 a.m. and ending one hour after sunset seven days a week). There are no municipalities in Alberta that use a variable playground zone time based on season. Some municipalities use a daily variable time based on sunrise and sunset. Introducing multiple operational times and/or variable seasonal times would lead to increased driver confusion for operational hours given Edmonton’s current playground zones being in effect for static hours. Amendments to the existing Speed Zones Bylaw, public education campaigns and installation of new signs would be required to mitigate driver confusion with any changes. Generally, most drivers will not be aware of exact sunrise and sunset times, and effective months due to seasonality (e.g., November to March for winter) may not match perception due to weather. Enforcement for the edges of variable times due to the sun or season could also prove challenging. Edmonton’s school systems have differing daily and weekly hours of operation, scheduled holidays and some have year-round programs. Schools and playgrounds are used during evening hours, weekends and holidays by children and adults for various community gatherings or athletic activities. A variable playground zone could put these users at risk as inconsistency of playground zone active times would likely decrease driver compliance with lower speed limits.
Page 5 of 7 Report: CR_6043
Variable Seasonal Times for Playground Zones
Option 3 - Maintain the status quo
Playground zones have been in effect for less than one year and drivers are still adjusting to the playground locations and effective times. Although data from after playground zone installation is limited, early indications are that the lower limits are having a positive impact on collision reduction and severity. Keeping the status quo would allow for the collection of additional data and allow for a more comprehensive post installation collision review. Result of Analysis
Administration suggests that making changes to playground zone hours now would negatively impact driver and pedestrian safety as both road users are becoming accustomed to the current hours. Council will also be considering lowered residential speed limits in early 2020, which could change effective playground hours and sign requirements. That decision and additional collision data will help provide stronger evidence in favor of keeping or changing the playground zones. Administration does not currently recommend variable seasonal times or changes to daily effective times for any playground zones for a number of reasons. Schools have high activity levels at many times of day and during the year. Younger pedestrians and cyclists are more likely to sustain serious injuries when they are involved in collisions because of their physical size. School boards in Edmonton have expressed their support for the present playground zone hours. From a Vision Zero perspective, lower speed limits at schools during all times of the year is an important element in protecting not only children, but all vulnerable road users.
Corporate Outcomes and Performance Management
Corporate Outcome(s): Edmonton is a Safe City
Outcome(s) Measure(s) Result(s) Target(s)
The city’s road networks promote safety and security for all Edmontonians.
Monthly average of vulnerable road user injury collisions in combined and standalone playground zones
24 percent decrease after playground zone installation (preliminary 2018 results)
TBD - Will be set after three year review period (2021)
Attachments 1. School Zones and Playground Zones in other Alberta Municipalities 2. Edmonton Playground Zone Collision Data 2014 - 2018 3. Edmonton Playground Zone Definitions
Page 6 of 7 Report: CR_6043
Variable Seasonal Times for Playground Zones
Others Reviewing this Report ● R. Kits, Acting Deputy City Manager, Financial and Corporate Services ● C. Owen, Deputy City Manager, Communications and Engagement ● S. McCabe, Deputy City Manager, Urban Form and Corporate Strategic
Development ● B. Andriachuk, City Solicitor
Page 7 of 7 Report: CR_6043

Atta
chm
ent #
1 Sc
hool
Zon
es a
nd P
layg
roun
d Zo
nes
in o
ther
Alb
erta
Mun
icip
aliti
es
Mun
icip
ality
Sc
hool
Zon
es
Play
grou
nd Z
ones
Cal
gary
-
7:30
am -
9:00
pm
Edm
onto
n -
7:30
am -
9:00
pm
Red
Dee
r 8:
00am
- 4:
30pm
Sch
ool D
ays*
8:
00am
- 9:
00pm
St. A
lber
t 8:
00am
- 4:
00pm
Sch
ool D
ays
8:30
am -
one
hour
afte
r sun
set
Stra
thco
na C
ount
y 7:
30am
- 4:
30pm
Sch
ool D
ays
8:30
am -
one
hour
afte
r sun
set
Med
icin
e H
at
- 7:
30am
- 9:
00pm
Ledu
c 8:
00 -
9:30
am; 1
1:30
-1:3
0pm
; 3:
00 -
4:30
pm
8:30
am -
one
hour
afte
r sun
set
Spru
ce G
rove
8:
00 -
9:30
am; 1
1:30
-1:3
0pm
; 3:
00 -
4:30
pm
Hal
f hou
r bef
ore
sunr
ise
- hal
f hou
r afte
r sun
set
Leth
brid
ge
7:30
am -
4:30
pm S
choo
l Day
s 8:
30am
- on
e ho
ur a
fter s
unse
t
Gra
nde
Prai
rie
7:30
am -
4:30
pm S
choo
l Day
s 7:
30am
- on
e ho
ur a
fter s
unse
t
* Red
Dee
r has
onl
y on
e sc
hool
zon
e w
ith h
ours
8:0
0am
to 4
:30p
m. A
ll th
eir o
ther
sch
ools
are
har
mon
ized
and
hav
e pl
aygr
ound
zon
es in
pla
ce fr
om 8
:00a
m -
9:00
pm y
ear-r
ound
.
Pa
ge 1
of 1
Rep
ort:
CR
_604
3

Attachment #2
Edmonton Playground Zone Collision Data 2014 - 2018
Vulnerable Road User (VRU) Collisions in Playground Zones involving children aged 15 years old and younger 2014-2018
Page 1 of 5 Report: CR_6043
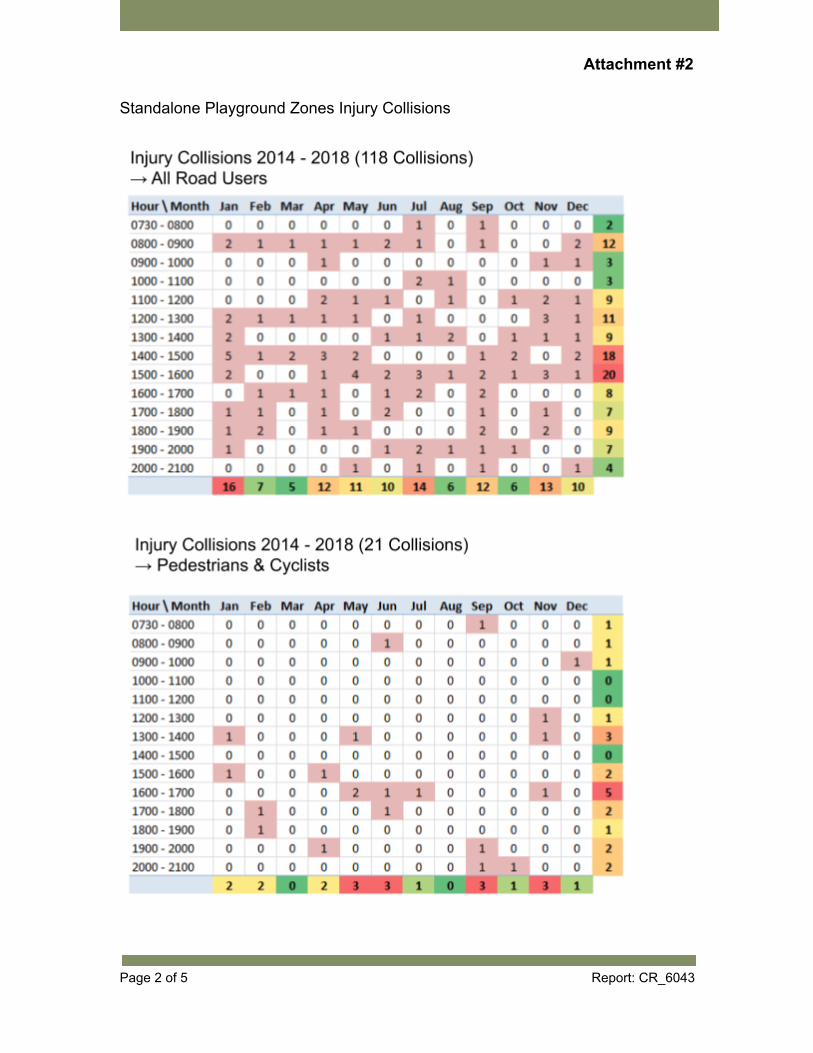
Attachment #2
Standalone Playground Zones Injury Collisions
Page 2 of 5 Report: CR_6043

Attachment #2
Combined Playground Zones Injury Collisions
Page 3 of 5 Report: CR_6043

Attachment #2
Average Injury Collisions per month Before & After Playground Zones
Page 4 of 5 Report: CR_6043

Attachment #2
Page 5 of 5 Report: CR_6043

Atta
chm
ent #
3 Ed
mon
ton
Play
grou
nd Z
one
Def
initi
ons
St
anda
lone
Pla
ygro
und:
A p
layg
roun
d th
at is
not
adj
acen
t to
a sc
hool
. Sta
ndal
one
play
grou
nds
repr
esen
t ap
prox
imat
ely
40 p
erce
nt o
f all
play
grou
nd z
ones
. C
ombi
ned
Play
grou
nd: A
pla
ygro
und
that
is a
djac
ent t
o a
scho
ol. T
hese
repl
aced
pre
viou
s sc
hool
zon
es (s
ame
spee
d lim
it bu
t with
ext
ende
d ho
urs
0730
- 21
00) o
r rep
lace
d pr
evio
us s
choo
l zon
es a
nd e
xten
ded
the
zone
to
cove
r adj
acen
t par
ks.
Scho
ol Z
one:
Sch
ool z
ones
wer
e in
trodu
ced
in S
epte
mbe
r 201
4 fo
r Ele
men
tary
Sch
ools
and
exp
ande
d to
incl
ude
Juni
or H
igh
Scho
ols
in S
epte
mbe
r 201
7. T
hese
zon
es h
ad a
pos
ted
spee
d lim
it of
30
km/h
080
0 - 1
630
on S
choo
l D
ays.
Pa
ge 1
of 1
Rep
ort:
CR
_604
3


islengineering.com
February 2020
Transportation Network Speed Limit Review
City of St. Albert
FINAL REPORT
APPENDIX Stakeholder Presentation E


Tra
nsport
ation N
etw
ork
Speed L
imit R
evie
w

Stu
dy
Purp
ose
Pro
ject
Sta
tem
en
t
Netw
ork
level assessm
ent
of
the s
peed lim
its w
ithin
St
Alb
ert
, in
clu
din
g a
rterials
, colle
cto
rs,
locals
, pla
ygro
und
zones/a
reas a
nd s
chool zones/a
reas b
ased o
n p
revio
us
stu
die
s,
em
erg
ing b
est
pra
ctices, curr
ent
guid
elin
es,
and s
afe
syste
ms.

•T
raffic
Safe
ty A
ct
•P
revio
us P
rovin
cia
l Law
•D
efa
ult o
f 5
0 k
m/h
•S
ch
oo
l zo
ne
tim
es s
et
•R
ecent T
ransfe
r to
Munic
ipalit
ies
•S
ett
ing
de
fau
lt s
pe
ed
s, re
du
ce
d s
pe
ed
zo
ne
s
•S
t. A
lbert
Sto
ry,
•D
ean/S
udip
–D
o y
ou h
ave a
ny s
pecific
“sto
ry p
oin
ts”
to a
dd,
•d
o y
ou
ha
ve
a v
isio
n z
ero
lo
go
?
•P
ast P
roje
cts
•V
isio
n Z
ero
•P
ub
lic C
on
ce
rns/C
ou
ncil
Initia
tive
s?
His
tory
of S
peed
Lim
its

Pre
sen
tatio
n O
utlin
e
1.
Pu
rpo
se
of P
rese
nta
tio
n
2.
Pro
ject O
ve
rvie
w
3.
Ba
ckg
rou
nd
In
form
atio
n R
evie
w
4.
Be
st P
ractice
s R
evie
w
5.
Ap
ply
ing
Tra
nsp
ort
atio
n A
sso
cia
tio
n o
f C
an
ad
a (
TA
C)
Ca
na
dia
n G
uid
elin
es to
Esta
blis
hin
g
Po
ste
d S
pe
ed
Lim
it (
CG
EP
SL
)
6.
Lo
ca
l R
oa
dw
ay R
evie
w
7.
Ap
ply
ing
Alb
ert
a T
ran
sp
ort
atio
n (
AT
) P
layg
rou
nd
an
d S
ch
oo
l Z
on
e a
nd
Are
a G
uid
elin
e
8.
Sa
fe S
yste
ms R
evie
w
9.
Re
co
mm
en
da
tio
ns

Pre
sen
tatio
n P
urp
ose
•P
rese
nt P
relim
ina
ry R
eco
mm
en
da
tio
ns
•O
bta
in F
ee
db
ack
•Im
pa
ct o
f re
co
mm
en
da
tio
ns b
y s
take
ho
lde
r g
rou
p
•In
co
rpo
rate
fe
ed
ba
ck in
to r
ep
ort
pre
se
nte
d to
exe
cu
tive
co
mm
itte
e o
n F
eb
rua
ry 1
2, 2
02
0

Pro
ject O
verv
iew
A M
erg
e o
f D
iffe
rent S
peed S
ett
ing P
hilo
sophie
s
CO
MB
INE
D
RE
CO
MM
EN
DA
TIO
NS
TA
C
CG
EP
SL
AT
GU
IDE
TO
P
LA
YG
RO
UN
D
AN
D S
CH
OO
L
ZO
NE
S A
ND
A
RE
A
SA
FE
S
YS
TE
MS
R
EV
IEW
Lo
ca
l R
oa
ds
Re
vie
w
Separa
te R
ecom
mendations F
rom
Each
Focus A
rea
1.
Tra
nsp
ort
atio
n A
sso
cia
tio
n o
f C
an
ad
a
Ca
na
dia
n G
eo
me
tric
Gu
ide
line
s to
E
sta
blis
hin
g P
oste
d S
pe
ed
Lim
its (
TA
C
CG
EP
SL
)
2.
Alb
ert
a T
ran
sp
ort
atio
n G
uid
e to
P
layg
rou
nd
an
d S
ch
oo
l Z
on
es a
nd
Are
as
3.
Lo
ca
l R
oa
ds R
evie
w
4.
Sa
fe S
yste
ms R
evie
w
Pre
limin
ary
Recom
mendations
•C
om
bin
ed
fro
m a
ll a
rea
s
Backg
rou
nd
Data
Revie
wR
evie
w a
nd im
plic
ations
Ba
ck
gro
un
d D
ata
•C
halle
nges a
ssocia
ting c
olli
sio
n d
ata
to s
peeds
•S
peed a
nd c
ount data
used in r
evie
w
Le
gis
lati
on
•T
raffic
Byla
w (
exis
ting s
peed lim
it m
ap)
-used
•T
ransport
ation S
yste
m B
yla
w –
used in r
evie
w

Backg
rou
nd
Data
Revie
wR
evie
w a
nd im
plic
ations
Re
po
rt/P
lan
s
•M
unic
ipal D
evelo
pm
ent
Pla
n (
curr
ently b
ein
g u
pdate
d)
•T
MP
Princip
al 1 –
Cre
ating a
liv
able
com
munity
•A
pplic
able
Tra
nsport
ation S
afe
ty P
lan S
trate
gie
s
•S
pee
d c
onsis
tent w
ith r
oad d
esig
n
•R
oad d
esig
ns to a
chie
ve targ
et
speed
•E
ncoura
gin
g L
ow
er
Spee
ds
•S
afe
speeds a
nd s
peed lim
it s
trate
gy im
plic
ations to c
lassific
ations a
nd d
esig
n s
tandard
s
•P
roje
ct =
TA
C A
ssessm
ent a
nd r
evie
w o
f pre
vaili
ng s
peeds
•P
ote
ntial im
plic
ations t
o E
ngin
eering s
tandard
s

Best P
ractices R
evie
w
Ou
tlin
e
•W
ho
•C
anadia
n
•S
imila
r siz
e
•C
ity o
f E
dm
onto
n a
nd C
ity o
f C
alg
ary
•Q
ue
stio
ns T
he
me
s:
•A
ppro
ach t
o s
ettin
g s
peed lim
its
•D
efa
ult s
peed lim
its
•R
evie
w t
riggers
•C
urr
ent
sta
te o
f re
vie
w
•A
ccepta
ble
thre
shold
s
•S
ignage
City o
f S
t. A
lbe
rt
City o
f A
ird
rie
, A
B
Str
ath
con
a C
ou
nty
, A
B
City o
f C
alg
ary
, A
B
City o
f E
dm
on
ton
, A
B
City o
f R
ed
De
er,
AB
City o
f S
aska
too
n, S
K
City o
f H
am
ilto
n, O
N
City o
f L
on
do
n, O
N
City o
f L
ed
uc A
B
City o
f S
pru
ce
Gro
ve
, A
B
To
wn
of O
ko
toks, A
B
City o
f L
eth
bridg
e, A
B
City o
f M
ed
icin
e H
at,
AB
City o
f G
ran
de
Pra
irie
, A
B

Best P
ractices R
evie
wE
merg
ing T
rends a
nd B
est
Pra
ctices -
Hig
hlig
hts
Art
eri
als
•V
ari
atio
n in
ap
pro
ach
to
se
ttin
g s
pe
ed
s
•U
tiliz
ation o
f TA
C G
uid
elin
es f
or
art
erials
and c
olle
cto
rs,
Desig
n s
peed,
Desig
n s
peed +
10 k
m/h
Co
lle
cto
rs
•S
imila
r a
s a
rte
ria
ls
Lo
ca
ls
•M
ost d
efa
ult 5
0 k
m/h
,
•C
on
sid
era
tio
n fo
r lo
we
rin
g s
pe
ed
s
Sc
ho
ol a
nd
Pla
yg
rou
nd
Zo
ne
s
•A
T G
uid
elin
es fo
r S
ch
oo
l/P
layg
rou
nd
Zo
ne
s in
Alb
ert
a
•C
ity o
f E
dm
on
ton
an
d C
alg
ary
, P
layg
rou
nd
Zo
ne
s fo
r S
ch
oo
ls

Best P
ractices R
evie
wC
ity A
lbert
’s C
urr
en
t P
racti
ce t
o S
ett
ing
Sp
eed
Lim
its
Art
eri
als
•TA
C C
GE
PS
L
Co
lle
cto
rs
•G
en
era
lly d
efa
ult 5
0 k
m/h
Lo
ca
ls
•S
imila
r to
co
llecto
rs, e
xce
pt re
ce
nt ch
an
ge
s in
Erin
Rid
ge
No
rth
Sc
ho
ol a
nd
Pla
yg
rou
nd
Zo
ne
s
•A
T G
uid
e,
•S
ch
oo
l Z
on
e: 8
–4
PM
•P
layg
rou
nd
Zo
ne
: 8
:30
AM
to
1 H
ou
r a
fte
r su
nse
t

Can
ad
ian
Gu
idelin
es fo
r E
sta
blis
hin
g P
oste
d S
peed
Lim
its
Overv
iew
•A
pp
licati
on
= C
oll
ecto
r, A
rteri
als
•R
eco
mm
en
dati
on
s =
40 k
m/h
an
d G
reate
r
•R
isk B
ased
Ap
pro
ach
•G
uid
elin
es (
no
t sta
nd
ard
s,
no
n-s
tatu
tory
)

Can
ad
ian
Gu
idelin
es fo
r E
sta
blis
hin
g P
oste
d S
peed
Lim
its
Meth
odolo
gy (
inputs
)
Seg
men
t C
reati
on
•M
inim
um
500 m
sections (
TA
C r
equirem
en
ts)
•H
om
ogen
ous s
ections
Data
In
pu
ts
•N
on
-geom
etr
ic
•C
lassific
atio
n, U
rba
n/R
ura
l, M
ajo
r/M
ino
r, D
esig
n S
pe
ed
, P
oste
d S
pe
ed
, P
reva
ilin
g S
pe
ed
•G
eom
etr
ic
•D
ivid
ed
or
Un
div
ide
d,
Nu
mb
er
of L
an
es, S
eg
me
nt L
en
gth
, H
orizo
nta
l A
lign
me
nt,
Ve
rtic
al A
lign
me
nt,
Ave
rag
e L
an
e W
idth
, P
ed
estr
ian
Exp
osu
re,
Cyclis
t E
xp
osu
re, P
ave
me
nt
Su
rfa
ce
, N
um
be
r o
f In
ters
ectio
ns, N
um
be
r o
f A
cce
sse
s, N
um
be
r o
f In
terc
han
ges a
nd
On
-str
ee
t P
ark
ing

Can
ad
ian
Gu
idelin
es fo
r E
sta
blis
hin
g P
oste
d S
peed
Lim
its
Outp
uts
Ro
ad
way T
yp
e
•C
lassific
ation
•N
um
ber
of Lanes
•M
ajo
r/M
inor
•D
ivid
ed/U
ndiv
ided
Ris
k S
co
re f
or
Ro
ad
way T
yp
e
Reco
mm
en
ded
Sp
eed

Can
ad
ian
Gu
idelin
es fo
r E
sta
blis
hin
g P
oste
d S
peed
Lim
its
Results
•R
eco
mm
en
ds s
peed
s –
TA
C C
GE
PS
L R
esu
lts
•N
ot
sta
tuto
ry
•O
vera
ll R
esu
lts:
99 o
f 110 s
egm
ents
within
10 k
m/h
of re
com
mended s
peed
•43 m
atc
h e
xactly
•56 w
ithin
10 k
m/h
•In
cre
ase i
n S
peed
: 39 s
egm
ents
•In
cre
ase o
f 20 k
m/h
: 11 s
egm
en
ts
•D
ecre
ase i
n S
peed
Lim
it:
28 s
egm
ents

Can
ad
ian
Gu
idelin
es fo
r E
sta
blis
hin
g P
oste
d S
peed
Lim
its
Dis
cussio
n -
Neig
hbourh
ood R
oadw
ays (
Colle
cto
rs)
•O
vera
ll R
esu
lts:
•28 o
f 57 s
egm
en
ts r
ecom
mende
d a
t 40 k
m/h
•U
pd
ate
d R
esu
lts
•R
ecla
ssify a
s m
inor
(as p
er
com
ple
te s
treets
polic
y)
•4
0 o
f 5
7 s
eg
me
nts
re
co
mm
en
de
d a
t 4
0 k
m/h
•11
of 5
7 s
eg
me
nts
with
in <
10
% o
f th
resh
old
fo
r re
co
mm
en
da
tio
n a
t 4
0 k
m/h
•5
of 5
7 s
eg
me
nts
with
in <
20
% o
f th
resh
old
fo
r re
co
mm
en
da
tio
n a
t 4
0 k
m/h

Can
ad
ian
Gu
idelin
es fo
r E
sta
blis
hin
g P
oste
d S
peed
Lim
its
Key O
utc
om
es
•TA
C r
ecom
mends m
ore
incre
ases in s
peed t
han d
ecre
ases
•S
evera
l segm
ents
recom
mended f
or
incre
ase o
f 20 k
m/h
•R
eflect hig
h s
tandard
of
roads
•P
revaili
ng s
peed s
how
s m
ore
drivers
belo
w s
peed lim
it
•N
eig
hbourh
ood r
oads r
ecom
mended @
40 k
m/h

Lo
cal R
oad
way R
evie
wO
verv
iew
•N
on
-CG
EP
SL
Ap
pli
cab
le
•F
ield
Ob
serv
ati
on
s
•10 s
egm
en
ts w
ith v
arious land u
se a
nd c
onfigura
tio
n
•P
ractical assessm
ent o
f drivin
g r
oads a
nd e
xperience
•L
itera
ture
revie
w

Lo
cal R
oad
way R
evie
wR
evie
w
Park
ing
an
d W
idth
•N
arr
ow
er
cro
ss s
ection
•P
ark
ed v
ehic
les lim
it s
pace
Lo
t W
idth
an
d D
rivew
ay
•O
lder
are
as:
•W
ider
lots
•S
ingle
Car
Drivew
ays a
nd S
treet
Park
ing
•N
ew
er
are
as:
•N
arr
ow
er
lots
•D
ouble
Car
Drivew
ays a
nd S
treet
Park
ing

Lo
cal R
oad
way R
evie
wR
evie
w
Ho
rizo
nta
l C
urv
es
•90 d
egre
e c
orn
ers
, re
quire s
ubsta
ntial speed
reduction
Ad
jacen
t L
an
d U
se
•M
ajo
rity
resid
ential
•S
hare
d p
lay s
pace
Lo
cal R
oad
way R
evie
wK
ey O
utc
om
es
50 k
m/h
no
t a p
racti
cal sp
eed
lim
it, d
ue t
o:
•P
ark
ed v
ehic
les
•N
arr
ow
er
roadw
ay w
idth
s
•A
dja
cent la
nd u
se
•H
orizonta
l C
urv
es
Co
nsid
era
tio
ns:
•Long s
traig
ht
sections, w
ith:
•N
arr
ow
lo
ts a
nd
do
ub
le c
ar
drive
wa
y
•L
imite
d o
n-s
tre
et p
ark
ing
op
po
rtu
nitie
s
•M
ay n
ee
d a
dd
itio
na
l fe
atu
res

Alb
ert
a T
ran
sp
ort
atio
n G
uid
elin
es fo
r S
ch
oo
l an
d P
layg
rou
nd
Z
on
es a
nd
Are
as
Ou
tlin
e
•A
pplic
ation =
Pla
ygro
unds a
nd S
chool Z
ones a
nd A
rea
•30 k
m/h
Zones
•S
imila
r R
isk B
ased A
ppro
ach
•R
ecom
mendation B
ased o
n P
oin
t S
yste
m
•G
uid
elin
es (
not
sta
ndard
s,
non
-sta
tuto
ry)

Alb
ert
a T
ran
sp
ort
atio
n G
uid
elin
es fo
r S
ch
oo
l an
d P
layg
rou
nd
Zo
nes a
nd
A
reas
School Z
one M
eth
odolo
gy
Inp
uts
•S
chool T
ype
•F
encin
g T
ype
•A
dja
cent
Road C
lassific
ation
•P
ropert
y L
ine S
et
Back
•S
chool E
ntr
ance
•S
idew
alk
s
Sco
re u
p t
o 1
00
•S
chool Z
one @
65 p
oin
ts o
r gre
ate
r

Alb
ert
a T
ran
sp
ort
atio
n G
uid
elin
es fo
r S
ch
oo
l an
d P
layg
rou
nd
Zo
nes a
nd
A
reas
Pla
ygro
und Z
one M
eth
odolo
gy
Inp
uts
•P
laygro
und T
ype (
Capacity)
•F
encin
g
•A
dja
cent
Road C
lassific
ation
•P
ropert
y L
ine S
etb
ack (
from
pla
y e
quip
tment)
•E
ntr
ance L
ocation
•S
idew
alk
s
Sco
re u
p t
o 1
00
•P
laygro
und Z
one @
81 p
oin
ts o
r gre
ate
r

Alb
ert
a T
ran
sp
ort
atio
n G
uid
elin
es fo
r S
ch
oo
l an
d P
layg
rou
nd
Zo
nes a
nd
A
reas
Results
•S
chool Z
ones
•46 S
chool Z
ones w
arr
ante
d
•6
0 c
urr
en
tly p
oste
d
•S
ch
oo
l ty
pe
typ
ica
lly d
icta
tes th
e r
esu
lts
•M
ost
ele
menta
ry s
chools
are
warr
ante
d,
and s
om
e junio
r hig
h
schools
•R
esults c
onsis
tent w
ith c
urr
ent
sig
ned p
laygro
und z
ones w
ithin
th
e C
ity
•P
laygro
und Z
ones
•13 p
laygro
und z
ones w
arr
ante
d
•1
8 c
urr
en
tly p
oste
d
•G
enera
lly, park
s w
ith f
ield
s a
re n
ot re
com
mended p
laygro
und z
ones
•53 p
laygro
und a
reas w
arr
ante
d
•1
2 c
urr
en
tly p
oste
d
•M
ost ro
ad
wa
y s
eg
me
nts
eva
lua
ted
wa
rra
nte
d a
n a
rea

Alb
ert
a T
ran
sp
ort
atio
n G
uid
elin
es fo
r S
ch
oo
l an
d P
layg
rou
nd
Zo
nes a
nd
A
reas
Dis
cussio
n
•S
chool Z
one a
s P
laygro
und Z
one
•S
chools
that
warr
ant
pla
ygro
und =
1 o
f 30
ele
menta
ry a
nd junio
r hig
h s
chools
•P
laygro
und z
ones h
ave longer
hours
of
effect
and a
re in e
ffect
every
day
•P
laygro
unds o
n s
chool pro
pert
y a
re larg
er
and
attra
ct
hig
her
num
be
rs o
f vuln
era
ble
users
•To
re
fle
ct th
is, th
e p
layg
rou
nd
zo
ne
eva
lua
tio
n w
as
mo
difie
d a
nd
th
e th
resh
old
wa
s lo
we
red
.
•A
ll e
lem
en
tary
sch
oo
ls w
arr
an
ted
pla
yg
rou
nd
zo
ne
s
with
th
e n
ew
crite
ria
•A
ll ju
nio
r h
igh s
ch
ools
re
co
mm
en
ded
sch
ool zo
nes

Alb
ert
a T
ran
sp
ort
atio
n G
uid
elin
es fo
r S
ch
oo
l an
d P
layg
rou
nd
Zo
nes a
nd
A
reas
Results
•T
ime o
f D
ay
•C
olli
sio
n d
ata
and p
laygro
und a
ctivity d
ata
•S
chool Z
one tim
es r
ecom
mende
d f
rom
7:0
0 A
M to 5
:00 P
M
•P
laygro
und Z
one t
imes r
ecom
mende
d f
rom
7:0
0 A
M to 9
:00 P
M
•T
he
se
tim
e w
ere
se
t a
ssu
min
g in
cre
ase
d a
ctivity in
th
e m
orn
ing
s a
nd
e
ve
nin
gs d
urin
g w
arm
er
mo
nth
s (
activity d
ata
fro
m O
cto
be
r)
0
20
40
60
80
5:00 AM- 6:00 AM
6:00 AM- 7:00 AM
7:00 AM- 8:00 AM
8:00 AM- 9:00 AM
9:00 AM- 10:00…
10:00 AM- 11:00…
11:00 AM- 12:00…
12:00 PM- 1:00…
1:00 PM- 2:00 PM
2:00 PM- 3:00 PM
3:00 PM- 4:00 PM
4:00 PM- 5:00 PM
5:00 PM- 6:00 PM
6:00 PM- 7:00 PM
7:00 PM- 8:00 PM
8:00 PM- 9:00 PM
9:00 PM- 10:00PM
Number of Children
Tim
e Inte
rvals
Ave
rag
e P
layg
rou
nd
Activity -
Th
urs
da
y
Scho
ol
Pa
rks
05
10
15
20
5:00 AM- 6:00 AM
6:00 AM- 7:00 AM
7:00 AM- 8:00 AM
8:00 AM- 9:00 AM
9:00 AM- 10:00 AM
10:00 AM- 11:00 AM
11:00 AM- 12:00 PM
12:00 PM- 1:00 PM
1:00 PM- 2:00 PM
2:00 PM- 3:00 PM
3:00 PM- 4:00 PM
4:00 PM- 5:00 PM
5:00 PM- 6:00 PM
6:00 PM- 7:00 PM
7:00 PM- 8:00 PM
8:00 PM- 9:00 PM
9:00 PM- 10:00PM
Number of Children
Tim
e Inte
rvals
Ave
rag
e P
layg
rou
nd
Activity -
Sa
turd
ay
Scho
ol
Pa
rks
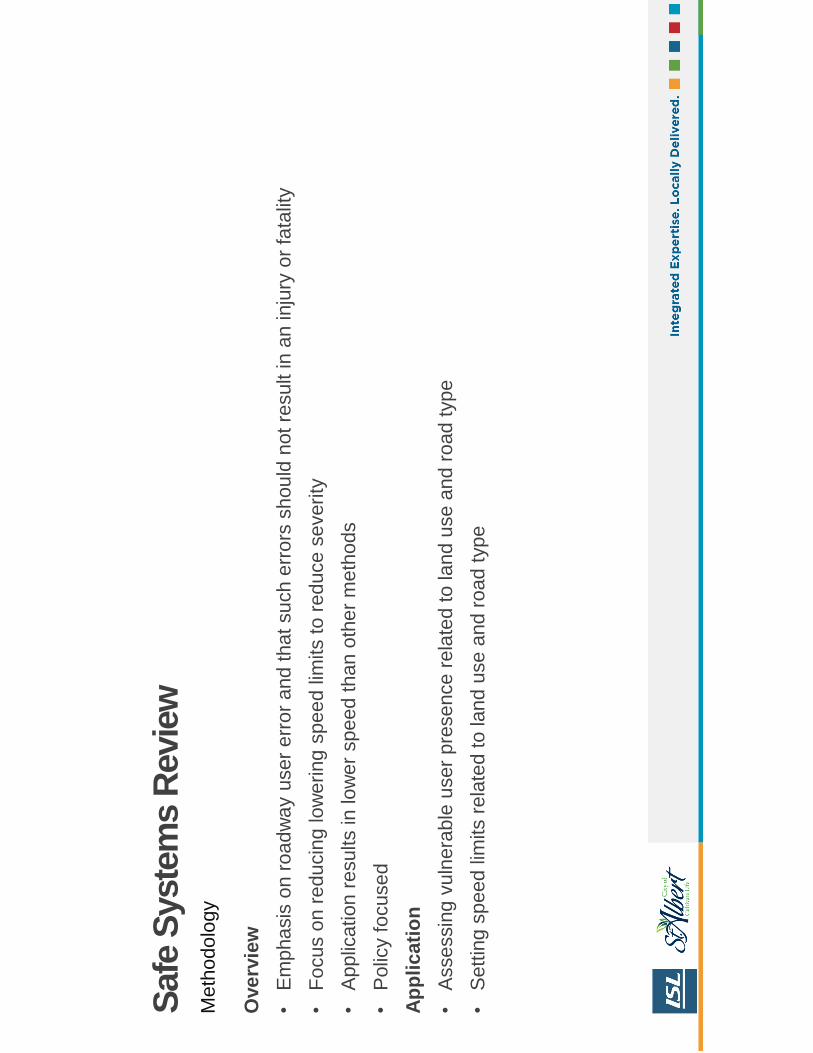
Safe
Syste
ms R
evie
w
Meth
odolo
gy
Overv
iew
•E
mphasis
on r
oadw
ay u
ser
err
or
and t
hat
such e
rrors
should
not
result in a
n inju
ry o
r fa
talit
y
•F
ocus o
n r
educin
g low
ering s
peed lim
its t
o r
educe s
everity
•A
pplic
ation r
esults in low
er
speed t
han o
ther
meth
ods
•P
olic
y f
ocused
Ap
pli
cati
on
•A
ssessin
g v
uln
era
ble
user
pre
sence r
ela
ted t
o land u
se a
nd r
oad type
•S
ett
ing s
peed lim
its r
ela
ted t
o land u
se a
nd r
oad t
ype

Safe
Syste
ms R
evie
w
Results
Bo
ule
vard
s
•M
ain
tain
exis
ting s
peeds,
except
•8
0 –
70 k
m/h
at
nort
h o
f S
t. A
lbert
Tra
il
•6
0 –
50 k
m/h
, th
rough w
ith n
o s
idew
alk
separa
tion
Cro
ssto
wn
s
•50 k
m/h
Recom
mended
•C
onsis
tency w
ith C
om
ple
te S
treets
Guid
elin
es
•C
om
mon s
peed a
ppro
ach
•H
ebert
Road,
Cam
pbell
Road,
Gir
oux R
oad

Safe
Syste
ms R
evie
w
Results
Co
nn
ecto
rs
•Lim
ited n
um
ber
of connecto
rs
•N
o c
hanges r
ecom
mended
Neig
hb
ou
rho
od
s
•40 k
m/h
Recom
mended
•W
ithin
com
munitie
s
•P
rovid
e d
irect access, tr
ansit,
on
-str
eet
cyclin
g
•H
igher
inte
ractions w
ith v
uln
era
ble
users
Lo
cals
•30 k
m/h
recom
mended
•S
imila
r to
neig
hbourh
oods,
•M
ore
access, vuln
era
ble
users
, ro
ad a
ctivites

Reco
mm
en
datio
ns
Boule
vard
s
•S
t. A
lbert
Tra
il a
nd
Ray G
ibb
on
Dri
ve
•R
eg
ion
al ro
ad
ways s
erv
ing
lo
cal
an
d r
eg
ion
al tr
aff
ic
•R
ay G
ibb
on
Dri
ve
•C
GE
PS
L r
ecom
mended h
igher
speed lim
it, but
not
recom
mended d
ue t
o c
urr
ent
congestion levels
. F
utu
re
consid
era
tio
n w
ith w
idenin
g
•S
t. A
lbert
Tra
il
•E
xte
nsio
n o
f 60 k
m/h
@ n
ort
h S
t. A
lbert
Tra
il
•M
ain
tain
60 k
m/h
and a
ddre
ss s
epara
tion r
equir
em
ent
for
sid
ew
alk
within
centr
al S
t. A
lbert
Tra
il

Reco
mm
en
datio
ns
Cro
ssto
wns
•D
escri
pti
on
•A
llow
drivers
to t
ravel acro
ss the C
ity w
ithout
changin
g c
orr
idors
•T
ransit a
nd h
eavy v
ehic
les (
most
as tru
ck r
oute
s)
•S
ignific
ant re
sid
ential la
nd u
ses
•Tw
o V
ary
ing
Resu
lts
•S
afe
Syste
ms:
Vuln
era
ble
users
fir
st
•C
GE
SP
L:
Recom
mended incre
ases o
f 20 k
m/h
not re
com
mended,
10 k
m/h
com
pro
mis
e.
•R
eco
mm
en
dati
on
s
1.
Gir
ou
x R
oad
(N
evad
eP
lac
e t
o L
ibert
on
Dri
ve):
Reduce fro
m 6
0 –
50 k
m/h
2.
Heb
ert
Ro
ad
(S
t. A
lbert
Tra
il t
o B
ou
dre
au
Ro
ad
): R
educe fro
m 6
0 –
50 k
m/h
3.
Cam
pb
ell R
oad
(S
ou
th C
ity L
imit
to
Cen
tre S
treet)
: R
educe fro
m 6
0 –
50 k
m/h
4.
Bo
ud
reau
Ro
ad
(L
ibert
on
Dri
ve t
o I
ng
lew
oo
d D
rive):
Reduce fro
m 6
0 –
50 k
m/h
5.
Ville
neu
ve R
oad
(C
om
merc
ial A
rea t
o S
t. A
lbert
Tra
il):
Reduce fro
m 6
0 –
50 k
m/h
6.
Sir
Win
sto
n C
hu
rch
ill A
ven
ue (
Reil
Dri
ve t
o L
evasseu
rR
oad
):In
cre
ase f
rom
50 –
60 k
m/h
7.
Bellero
se D
rive (
Everg
reen
Dri
ve t
o C
ity L
imit
s):
Incre
ase f
rom
50 –
60 k
m/h
.

1
2
4
7
Recom
mendations -
Cro
ssto
wns
56
3

Reco
mm
en
datio
ns
Connecto
rs
•D
escri
pti
on
•C
onnect
cro
ssto
wns
tog
eth
er
•M
ostly a
dja
cent to
resid
ential and c
om
merc
ial
•R
ecom
mendations
•40 k
m/h
Po
ste
d C
on
necto
rs
•D
ow
nto
wn
•M
ain
tain
ba
se
d o
n S
afe
Syste
ms
•C
GE
PS
L in
cre
ases n
ot re
co
mm
en
de
d
•5
0 k
m/h
Po
ste
d C
on
necto
rs
•In
cre
ase
by 1
0 k
m/h
wh
ere
CG
EP
SL r
eco
mm
en
ds 2
0 k
m/h
in
cre
ase
•C
om
pro
mis
e o
f b
uilt
ro
ad
wa
y s
tan
da
rd a
nd
Sa
fe S
yste
ms
1.
Stu
rge
on
Ro
ad
(S
t. A
lbe
rt T
ria
l to
Bo
ud
rea
u R
ao
d):
In
cre
ase
fro
m 5
0 –
60
km
/h
2.
Da
wso
n R
oa
d (
Gir
ou
x R
oa
d t
o M
cK
en
ne
y):
In
cre
ase
fro
m 5
0 –
60
km
/h
•60 k
m/h
Po
ste
d C
on
necto
rs
•M
ain
tain
•In
ve
stig
ate
an
d im
pro
ve
pe
de
str
ian c
rossin
gs

1
2
Recom
mendations -
Connecto
rs

Reco
mm
en
datio
ns
Neig
hbourh
oods a
nd L
ocal
•D
escri
pti
on
•W
ithin
com
munitie
s, w
ith s
imila
r la
nd u
se
•P
rovid
e h
igh levels
of
access, on
-str
eet
cyclin
g,
hig
h levels
of
vuln
era
ble
users
•R
eco
mm
en
d a
co
nsis
ten
t ap
pro
ach
fo
r b
oth
typ
es o
f ro
ad
ways
•N
ot
pra
ctical to
expect
drivers
to d
iffe
rentia
te b
etw
een local and n
eig
hbourh
ood
•40 k
m/h
defa
ult
po
ste
d s
peed
lim
it
•C
onsis
tent w
ith C
GE
PS
L, S
afe
Syste
ms A
ppro
ach
•P
ractical applic
ation b
ased o
n fie
ld o
bserv
ations o
f lo
cal ro
adw
ays

Reco
mm
en
datio
ns
Pla
ygro
und a
nd S
chool Z
ones
•P
laygro
und Z
one for
all
Ele
menta
ry S
chools
•C
hild
ren w
ere
observ
ed u
sin
g the p
laygro
und e
quip
ment
well
outs
ide o
f th
e c
urr
ent
School Z
one h
ours
and o
n
weekends
•S
chool Z
one for
all
Junio
r H
igh S
chools
•E
xcept
those a
dja
cent to
Ele
menta
ry S
chools
(com
bin
ed w
ith P
laygro
und Z
one)
•Z
one T
imes
•S
chool Z
one tim
es f
rom
7:0
0 A
M t
o 5
:00 P
M
•P
laygro
und Z
one t
imes fro
m 7
:00 A
M t
o 9
:00 P
M
•B
oth
ba
se
d o
n th
e c
olli
sio
n a
nd
pla
yg
rou
nd
utiliz
atio
n d
ata

Reco
mm
en
datio
ns
Short
30 k
m/h
Sections
•D
o n
ot
meet
min
imum
500 m
section r
ecom
mended b
y C
GE
PS
L
•R
em
ove a
nd incorp
ora
te w
ith a
dja
cent
speeds
•In
sta
ll advis
ory
speed s
igns (
where
necessary
for
curv
es)
•S
turg
eo
n R
oad
: B
urn
s S
treet
to B
urn
ham
Avenue
•M
issio
n A
ven
ue:
Betw
een S
t V
ital A
venue a
nd M
alm
o A
venue
•G
rosven
or
Bo
ule
vard
: G
aylo
rd P
lace to s
outh
of
Gre
nfe
ll A
venue
•G
ren
fell A
ven
ue
: G
ate
wood
Avenue to G
reenw
ich C
rescent
•M
ead
ow
vie
w D
rive:
Mis
sio
n A
venue to 1
50 m
west
of
Mis
sio
n A
venue
•C
un
nin
gh
am
Ro
ad
: S
outh
of
Sycam
ore
Avenue to S
tan
ley D
rive

Recom
mendations -
All

Reco
mm
en
datio
ns
Implic
ations o
f R
ecom
mendations
•Im
plic
ations o
n M
unic
ipal E
ngin
eering S
tandard
s f
or
neig
hbourh
oods a
nd locals
•C
urr
ent
desig
n s
peed is 5
0 k
m/h
.
•In
corp
ora
te d
esig
n p
rincip
als
to a
chie
ve t
arg
et speeds w
here
needed
.
•E
xam
ple
on long tangent
sections that
have m
inim
al in
here
nt
traffic
calm
ing c
om
pon
ent.
•O
pe
n fie
lds
•N
arr
ow
er
lots
, w
ide
drive
wa
ys a
nd
min
ima
l p
ark
ing
•U
pdating C
om
ple
te S
treets
Guid
elin
es
•4
0 k
m/h
on n
eig
hbourh
ood a
nd local ro
adw
ays is r
ecom
mende
d.
•U
pdating t
he T
raffic
Byla
w