Transport - Kerala State Planning Board
32
Transport CHAPTER
-
Upload
khangminh22 -
Category
Documents
-
view
4 -
download
0
Transcript of Transport - Kerala State Planning Board
Transport
CH
AP
TER

287
Transport sector plays a pivotal role in the overall development of the country which enables social and culture and trade development between countries. Transport infrastructure consists of fixed instal-lations necessary for transport, such as roads, railways, airways, waterways, canals ,pipelines, and terminals .Terminals may be used both for interchange of passengers and cargo and for maintenance. Kerala holds a good transport system. The major development indicators of Transport and Communi-cation Sector in the state since 2005 are given in Appendix 11.1.
Roads in Kerala11.2 The roads in Kerala are maintained by National Highways / Public Works Department (R&B), Local Bodies, Department of Irrigation, KSEB, Department of Forests, Railways etc. Other agencies dealing with transport sector are National Transportation Planning and Research Centre (NATPAC), Motor Vehicles Department, Kerala State Road Transport Corporation (KSRTC), Kerala Transport De-velopment Finance Corporation (KTDFC) and Roads & Bridges Development Corporation of Kerala (RBDCK).
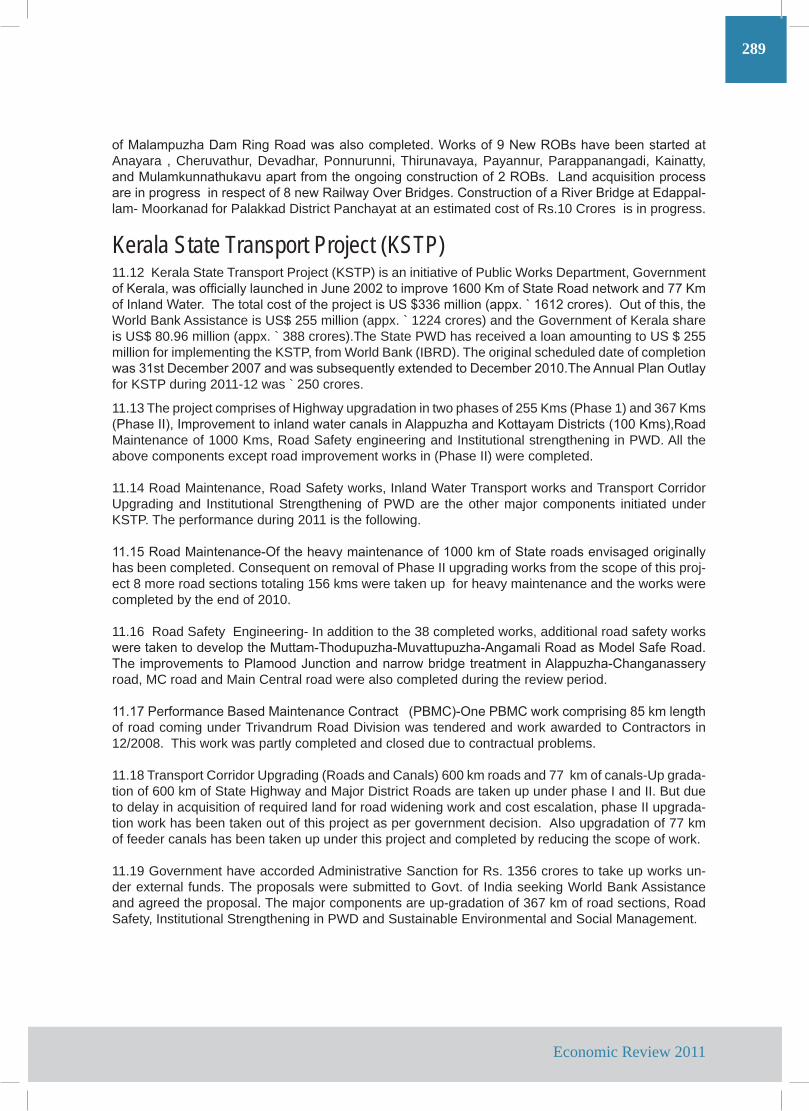
11.3 In the State of Kerala the Public Works Department have a total road length of 33106 Kms of State roads and 1542 Kms of National Highways.The State roads includes 4342 Kms. of State High-ways and 18900. 058 Kms of Major District Roads. Road improvements , repair and maintenance of existing roads , development and up gradation are the major activities taken up in the sector during the year . Budgetary support, private finance and institutional supports are used for the purpose
Figure 11.1Roads under PWD in Kerala (2010-11)
6%18%
76%
National Highways(6%)State High Ways (18%)
Major District Roads(76%)
Transport
Economic Review 2011
288
State Highways and Major District Roads11.4 All major arterial roads which provide mobility are with the PWD (R&B) consist of 4342 Km State Highways and 18900. 058 Km Major District Roads, which shows the length of SH &MDR during the year. Districtwise details of Road length is shown in Appendix 11.2.
11.5 Of the 14 districts in the State Kottayam has the major share of PWD roads with the length of 3016.765 Km and Wayanad has the lowest share with 766.352 Km. The district wise, surface wise and category wise length of road maintained by PWD (R&B) as on 31-3-2011 is given in Appendix 10.3. The surface wise and category wise length of PWD Roads during 2010-11 is given in Appendix 11.4.
11.6 Analyzing the PWD roads it reveals that only 6.655Km is cement concrete, 22174.503 Km is black topped and 447.238 Km water bound macadam. The black topped surface contributes 95.4 percentages. The district wise details are given in Appendix 11.5.
11.7 The number of bridges and culverts and number of unsafe bridges and culverts remained same. There are 2179 bridges (627 on SH and 1552 on MDR) and 51422 culverts (11512 on SH and 39910 on MDR) in PWD. Of them 148 bridges and 1519 culverts are unsafe and need reconstruction /reno-vation and details is shown in Appendix 11.6.
11.8 Grama Panchayats and Block Panchayats maintain lion share of State Roads which comes to 104257 Kms which constitutes 68.75% of the total road length in the State. Agency Wise Distribution of road length during 2009-10 is given in table 11.1.
Table 11.1Agency Wise Distribution of Road Length during 2010-11
Sl No Department State Road
Length(Kms)Percentage
1 2 3 4
1 Panchayats 104257 68.748
2 PWD(R&B) 23242 15.32
3 Municipilaties 8917 5.88
4 Corporations 6644 4.381
5 Forest 4075 2.689
6 Irrigation 2664 1.757
7 PWD (NH) 1542 1.006
8 Others (Railway,KSEB) 328 0.216
Total 151652 100 Source; Various agencies
Railway Over Bridge (ROB) Projects 11.9 Out of 65 ROB’s approved by Railways for Kerala on cost sharing basis 48 are to be con-structed by Roads and Bridges Development Corporation of Kerala Ltd. (RBDCK).
11.10 The corporation was entrusted with the work of construction of 48 Railway Over Bridges spread all over Kerala including one road namely Seaport Airport Road, and a river bridge at Pulam-anthole. Corporation completed the construction of the first phase of the road, a river bridge and 16 ROBs upto the year 2009-10.
11.11 During the year 2010-11 the Corporation completed 4 ROBs and opened for traffic. The work
Kerala State Planning Board
289
of Malampuzha Dam Ring Road was also completed. Works of 9 New ROBs have been started at Anayara , Cheruvathur, Devadhar, Ponnurunni, Thirunavaya, Payannur, Parappanangadi, Kainatty, and Mulamkunnathukavu apart from the ongoing construction of 2 ROBs. Land acquisition process are in progress in respect of 8 new Railway Over Bridges. Construction of a River Bridge at Edappal-lam- Moorkanad for Palakkad District Panchayat at an estimated cost of Rs.10 Crores is in progress.
Kerala State Transport Project (KSTP)11.12 Kerala State Transport Project (KSTP) is an initiative of Public Works Department, Government of Kerala, was officially launched in June 2002 to improve 1600 Km of State Road network and 77 Km of Inland Water. The total cost of the project is US $336 million (appx. ` 1612 crores). Out of this, the World Bank Assistance is US$ 255 million (appx. ` 1224 crores) and the Government of Kerala share is US$ 80.96 million (appx. ` 388 crores).The State PWD has received a loan amounting to US $ 255 million for implementing the KSTP, from World Bank (IBRD). The original scheduled date of completion was 31st December 2007 and was subsequently extended to December 2010.The Annual Plan Outlay for KSTP during 2011-12 was ` 250 crores.
11.13 The project comprises of Highway upgradation in two phases of 255 Kms (Phase 1) and 367 Kms (Phase II), Improvement to inland water canals in Alappuzha and Kottayam Districts (100 Kms),Road Maintenance of 1000 Kms, Road Safety engineering and Institutional strengthening in PWD. All the above components except road improvement works in (Phase II) were completed.
11.14 Road Maintenance, Road Safety works, Inland Water Transport works and Transport Corridor Upgrading and Institutional Strengthening of PWD are the other major components initiated under KSTP. The performance during 2011 is the following.
11.15 Road Maintenance-Of the heavy maintenance of 1000 km of State roads envisaged originally has been completed. Consequent on removal of Phase II upgrading works from the scope of this proj-ect 8 more road sections totaling 156 kms were taken up for heavy maintenance and the works were completed by the end of 2010.
11.16 Road Safety Engineering- In addition to the 38 completed works, additional road safety works were taken to develop the Muttam-Thodupuzha-Muvattupuzha-Angamali Road as Model Safe Road. The improvements to Plamood Junction and narrow bridge treatment in Alappuzha-Changanassery road, MC road and Main Central road were also completed during the review period.
11.17 Performance Based Maintenance Contract (PBMC)-One PBMC work comprising 85 km length of road coming under Trivandrum Road Division was tendered and work awarded to Contractors in 12/2008. This work was partly completed and closed due to contractual problems.
11.18 Transport Corridor Upgrading (Roads and Canals) 600 km roads and 77 km of canals-Up grada-tion of 600 km of State Highway and Major District Roads are taken up under phase I and II. But due to delay in acquisition of required land for road widening work and cost escalation, phase II upgrada-tion work has been taken out of this project as per government decision. Also upgradation of 77 km of feeder canals has been taken up under this project and completed by reducing the scope of work.
11.19 Government have accorded Administrative Sanction for Rs. 1356 crores to take up works un-der external funds. The proposals were submitted to Govt. of India seeking World Bank Assistance and agreed the proposal. The major components are up-gradation of 367 km of road sections, Road Safety, Institutional Strengthening in PWD and Sustainable Environmental and Social Management.
Economic Review 2011
290
Research and Development in Road Sector11.20 Research and Development activities play a crucial role in meeting the challenges of moderniz-ing road system, technology Upgradation, road safety, traffic control and finding cost effective solution to infrastructure problems in general. NATPAC, KHRI and DRIQ Board are the agencies engaged in Research and Development of the Road Sector.
National Transportation Planning and Research Centre (NATPAC)11.21 The broad area of activities of NATPAC includes Rural/Regional Transportation, Transportation Planning and Road Safety, Highway Engineering, Traffic Engineering and Management, Project Plan-ning, Training and Extension Programmes. The Centre undertakes R&D Programmes in these areas.
11.22 Major Achievements of NATPAC during the year 2010-2011 are : Integrated Development of Transport Infrastructure for an emerging town- NATPAC conducted a study to understand the amount of traffic generated at Kottarakkara, assessed various infrastructure facilities available, and identified deficiencies in the existing system. NATPAC identified the major traffic bottlenecks in the town and suggested improvement proposals for the major roads as well as the problematic junctions in the town. Data collection such as traffic volume at selected traffic corridors were carried out along with peak-hour volume counts at major intersections.
11.23 Short-term Development Plan for Kottayam Town: Detailed surveys were conducted to iden-tify the major traffic bottlenecks resulted in the slow movement of traffic, the problems faced by the pe-destrians, the problems faced by the vehicle users to park their vehicles, etc. Suitable traffic circulation plans were submitted which will, if implemented properly will ease the traffic movement through the town. NATPAC also identified unused roads, which if improved can be used by two wheelers and light vehicles so that major roads can get rid of the ever increasing two-wheeler traffic. Suitable parking locations and pedestrian crossings were identified and recommended for implementation. As a long term proposal, an outer ring road has recommended in which some missing links to be formed so that traffic can be diverted through this ring road thereby relieving the traffic through the town.
11.24 Inventory of Roads for Grama Panchayaths: The spatial data base for the 16 Grama Pan-chayaths in Kannur District was prepared. Detailed road network map for Rural Local Bodies using GIS format were prepared which will enable to prepare an Integrated District Development Plan. The maps generated were distributed to the respective grama panchayaths, which will help them to identify roads for getting external funds such as PMGSY scheme and NABARD RIDF scheme and also the panchayaths are getting a good scaled map with the features such as the latest ward boundaries, an updated road network and also the locations of infrastructure facilities available in their panchayaths. Mobility Plan for West Kallada Panchayath in Kollam District:
11.25 NATPAC prepared a mobility plan for the West Kallada Panchayath panchayath which is en-gulfed on all the three sides with water bodies and thus the road connectivity is limited to only one PWD road passing through the panchayath. The roads maintained by the panchayath are in very bad condition and improving all these roads will be cost effective. Hence an index has been developed to prioritize the roads and suggestions were submitted to the panchayath for improving the roads in a phased manner.
11.26 Traffic and Transportation studies for 23 towns in Kerala state: Department of Town and Country Planning has entrusted NATPAC to carry out Traffic and Transportation studies for selected 23 towns in the State.
11.27 Elevated Road Corridor between Aroor and Edappally in Cochi: NATPAC assessed the traf-fic demand and growth potentials of the study region and arrived at technical feasibility of developing an Elevated Corridor (EC) between Aroor and Edappally in Kochi region. This would help to improve the quality of service of the byepass and provide adequate buffer lanes to accommodate the future growth of traffic. This can be the longterm solution to the traffic problems of Kochi city, with optimum benefits to the traveling public and least-impact on the environment.
Kerala State Planning Board
291
11.28 Use of Waste Plastics in road construction:Disposal of waste plastics is a major environmen-tal problem in the State. Roads laid with plastic wastes have demonstrated the application of waste plastics in road construction.
11.29 Resource mapping of road construction materials: Resource Mapping of Road Construction Materials has enabled to estimate the quantity and quality of different types of construction materials based on the engineering properties. Database with the quantum of materials available in each quarry is prepared. 11.30 Accident Abatement Measures: Accident-prone locations on State Highways of Northern Ker-ala have been identified and analysed the trends in accidents.
11.31 Inland Water Transport: The study to identify constraints in developing West-Coast Canal in Kerala with respect to National Waterway III identifies the constraints for making NW-III fully opera-tional and suggest measures to improve the traffic and to maintain sustainability of the canal.
11.32 Road Safety Measures: The study on ‘characteristics of Para transit modes’ identified distin-guishing characteristics of para transit services like low speed and low fuel efficiency, more depend-able and easily available. A study on ‘Traffic Medicine’ has enabled to review the emergency medical care system in Kerala, with special reference to Thiruvananthapuram.
11.33 NATPAC prepared booklets and pamphlets for school children and driving manual for autorick-shaw and truck drivers and produced two short documentary films on Road Safety. Training pro-grammes on ‘Road Safety’ and ‘Defensive Driving’ were conducted for all target groups which include students, tipper lorry drivers, departmental drivers and general public
Kerala Highway Research Institute (KHRI)11.34 KHRI, Kariavattom, Thiruvananthapuram is the only Research Institute under Kerala PWD.The major objectives and functions of the Institutes are:
• to impart quality control in PWD by carrying out laboratory and field tests of all types of building materials;• undertake applied research works (R&D works)• to function as a regular training institute
Economic Review 2011
292
11.35 The Institute functions under four divisions as follows.• Soil Mechanics and Foundation Division conduct subsoil investigations, field studies, laboratory testing of soil samples etc. During 2010 – 11, this division conducted 374 tests.• Flexible Pavement Division conduct field studies for evaluation of flexible pavements, laboratory tests to ascertain the properties of aggregates and bitumen, carrying out bituminous mix design, pavement design etc. During 2010 – 11, this division conducted 86 tests• Concrete and structure division conduct mix design for concrete, testing concrete cubes, cement, sand, bricks, hollow bricks and other construction materials. During 2010 – 11, this division con-ducted 1771 tests.• Traffic Engineering Division carries out topographical surveys using total station, carries out in-vestigations connected with road safety, accident analysis etc. Also conducted traffic counts, feasi-bility studies and DPR preparation.
11.36 KHRI also conduct training programmes for technical and non-technical staff of PWD utilizing the plan fund and also under the State Training Policy of IMG with the support of regional centres at Ernakulam, Kozhikode, Kannur, Thrissur and Kottayam. During the review period an amount of 15,03,565/- was received as revenue by conducting 2231 tests.
Design, Research, Investigation and Quality Control Board (DRIQ Board)11.37 Designing and construction of Bridges, Research and Project Preparation, Quality Control and Computerisation are the major activities of DRIQ Board. The major achievements during 2010-11 are given below.
• The wing had complead 41 structural design amd 20 nos of partially completed work which cost about `. 210 crores znd is expected to complete structural design of 80 works for an maount of `. 400 crores.• Structural design of 50 bridges ( Total cost ` 300 crores)were completed during the review year and expected tom complete the design of 60 bridges( Total cost ` 450 crores)• DPR preparation of widening of 6/4 lane from Karamana to Kaliyikkavila of NH 47- Phase I from Karamana to Vazhimukku alignment plan submitted and approved• The preliminary report along with alignment plans of Vizhinjam International Container Terminal 2 KM road connectivity forwarded to VISI
High Speed Rail Corridor1.38 The Kerala Government has decided to develop and implement High - Speed rail corridor which required relatively less land and connecting Thiruvananthapuram to Kasaragod. The total lengh of the corridor was estimated as 570 kms. A company named KERALA HIGH SPEED RAIL CORPORA-TION LTD has been incorporated on 13.09.2011 and KSIDC has been nominated as the nodal agency and DMRC is assigned the task of conducting the pre feasibility study of the project and allotted an amount of Rs. 50 crores for the purpose during the Annual Plan 2010-11.
Motor Vehicle DepartmentMotor Vehicles Population11.39 Motor Vehicles Department is one of the major revenue earning departments of the Kerala State. Towards the administration and enforcement of Motor Vehicle Laws, collection of tax on Motor Vehicles under various categories, registration of vehicles, licensing of drivers and regulation of use of motor vehicles in the State in accordance with the powers conferred on the Department, and has achieved remarkable achievements. The revenue generated during the year 2009-10 was 1094.49 Crores. During 2010-11 it has been raised up to 1265.41 Crores which shows 15.61 % increase in the review year.
Kerala State Planning Board
293
11.40 The number of motor vehicles having valid registration as on 31-3-2011 is 6072019. The District wise and category wise details of motor vehicles having valid registration as on 31-3-2010 is given in Appendix 11.7. The number of newly registered vehicles for the year 2010- 11 is 674367. The details are given in Appendix 11.8.
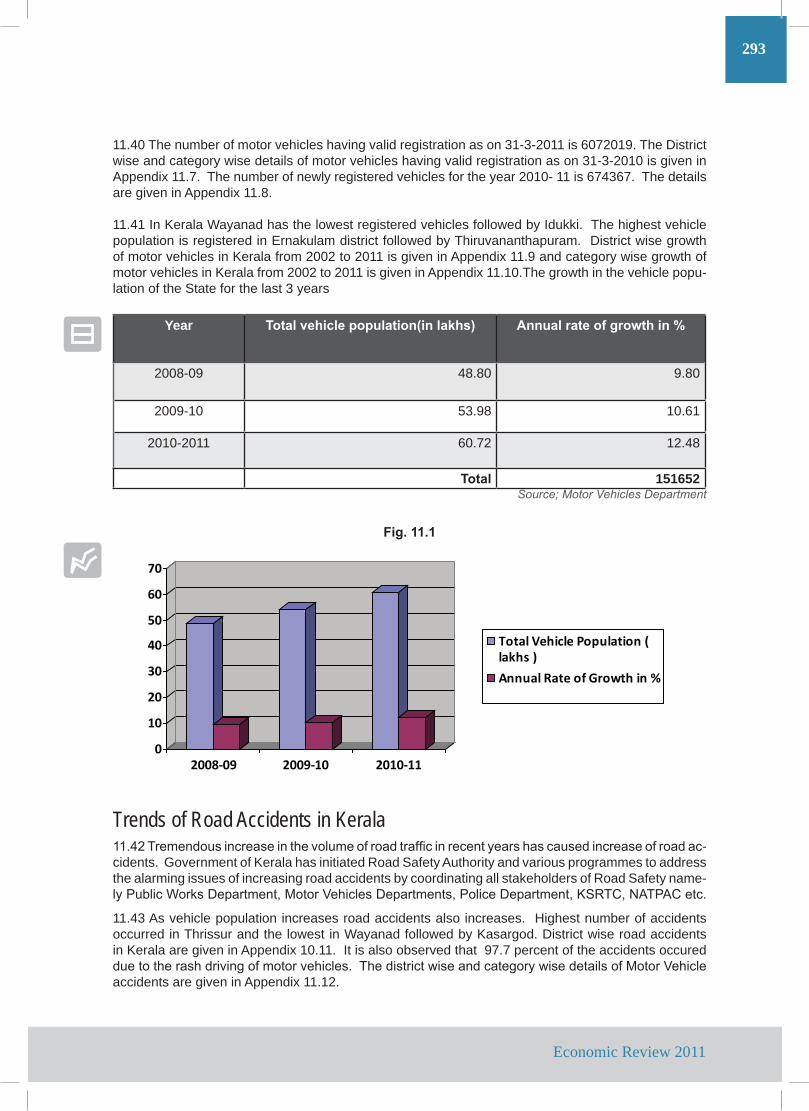
11.41 In Kerala Wayanad has the lowest registered vehicles followed by Idukki. The highest vehicle population is registered in Ernakulam district followed by Thiruvananthapuram. District wise growth of motor vehicles in Kerala from 2002 to 2011 is given in Appendix 11.9 and category wise growth of motor vehicles in Kerala from 2002 to 2011 is given in Appendix 11.10.The growth in the vehicle popu-lation of the State for the last 3 years
Year Total vehicle population(in lakhs) Annual rate of growth in %
2008-09 48.80 9.80
2009-10 53.98 10.61
2010-2011 60.72 12.48
Total 151652Source; Motor Vehicles Department
Fig. 11.1
0
10
20
30
40
50
60
70
2008-09 2009-10 2010-11
Total Vehicle Population (lakhs )Annual Rate of Growth in %
Trends of Road Accidents in Kerala 11.42 Tremendous increase in the volume of road traffic in recent years has caused increase of road ac-cidents. Government of Kerala has initiated Road Safety Authority and various programmes to address the alarming issues of increasing road accidents by coordinating all stakeholders of Road Safety name-ly Public Works Department, Motor Vehicles Departments, Police Department, KSRTC, NATPAC etc.
11.43 As vehicle population increases road accidents also increases. Highest number of accidents occurred in Thrissur and the lowest in Wayanad followed by Kasargod. District wise road accidents in Kerala are given in Appendix 10.11. It is also observed that 97.7 percent of the accidents occured due to the rash driving of motor vehicles. The district wise and category wise details of Motor Vehicle accidents are given in Appendix 11.12.
Economic Review 2011
294
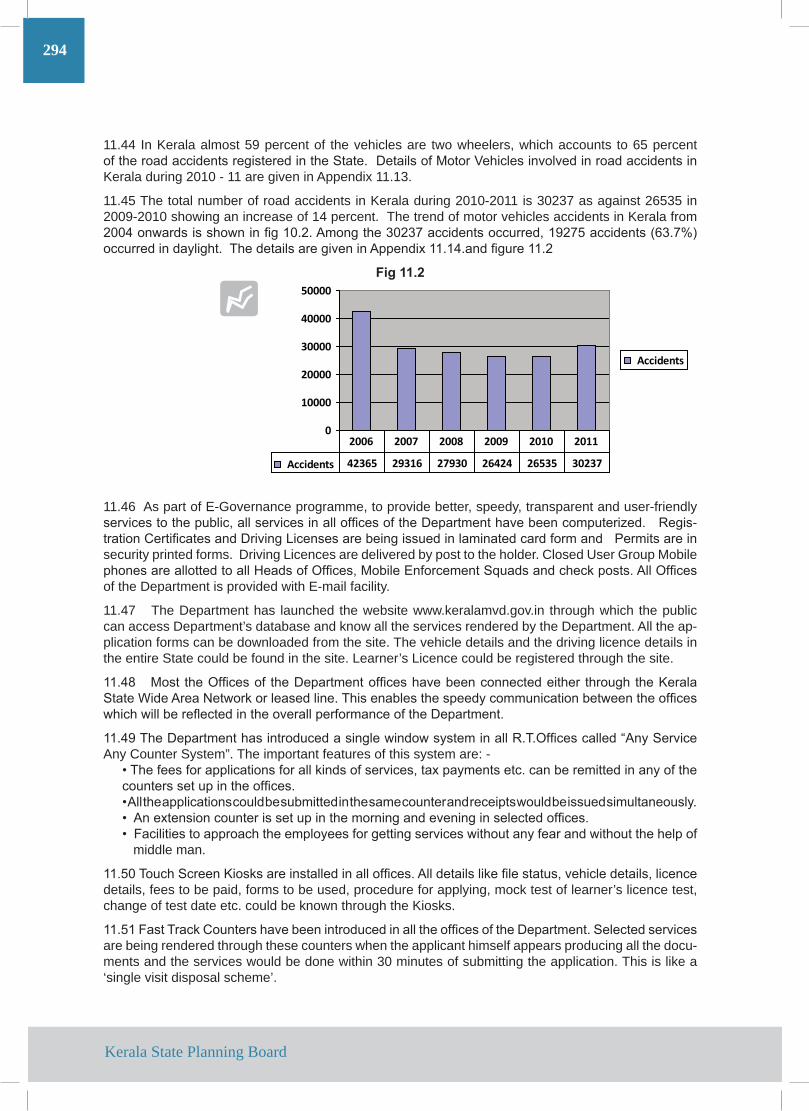
11.44 In Kerala almost 59 percent of the vehicles are two wheelers, which accounts to 65 percent of the road accidents registered in the State. Details of Motor Vehicles involved in road accidents in Kerala during 2010 - 11 are given in Appendix 11.13.
11.45 The total number of road accidents in Kerala during 2010-2011 is 30237 as against 26535 in 2009-2010 showing an increase of 14 percent. The trend of motor vehicles accidents in Kerala from 2004 onwards is shown in fig 10.2. Among the 30237 accidents occurred, 19275 accidents (63.7%) occurred in daylight. The details are given in Appendix 11.14.and figure 11.2
Fig 11.2
0
10000
20000
30000
40000
50000
Accidents
Accidents 42365 29316 27930 26424 26535 30237
2006 2007 2008 2009 2010 2011
11.46 As part of E-Governance programme, to provide better, speedy, transparent and user-friendly services to the public, all services in all offices of the Department have been computerized. Regis-tration Certificates and Driving Licenses are being issued in laminated card form and Permits are in security printed forms. Driving Licences are delivered by post to the holder. Closed User Group Mobile phones are allotted to all Heads of Offices, Mobile Enforcement Squads and check posts. All Offices of the Department is provided with E-mail facility.
11.47 The Department has launched the website www.keralamvd.gov.in through which the public can access Department’s database and know all the services rendered by the Department. All the ap-plication forms can be downloaded from the site. The vehicle details and the driving licence details in the entire State could be found in the site. Learner’s Licence could be registered through the site.
11.48 Most the Offices of the Department offices have been connected either through the Kerala State Wide Area Network or leased line. This enables the speedy communication between the offices which will be reflected in the overall performance of the Department.
11.49 The Department has introduced a single window system in all R.T.Offices called “Any Service Any Counter System”. The important features of this system are: -
• The fees for applications for all kinds of services, tax payments etc. can be remitted in any of the counters set up in the offices. • All the applications could be submitted in the same counter and receipts would be issued simultaneously. • An extension counter is set up in the morning and evening in selected offices.• Facilities to approach the employees for getting services without any fear and without the help of middle man.
11.50 Touch Screen Kiosks are installed in all offices. All details like file status, vehicle details, licence details, fees to be paid, forms to be used, procedure for applying, mock test of learner’s licence test, change of test date etc. could be known through the Kiosks.
11.51 Fast Track Counters have been introduced in all the offices of the Department. Selected services are being rendered through these counters when the applicant himself appears producing all the docu-ments and the services would be done within 30 minutes of submitting the application. This is like a ‘single visit disposal scheme’.
Kerala State Planning Board
295
11.52 A Road Safety Authority has been set up by the Department for implementing various road safety initiatives and to create awareness among the drivers and public regarding safe driving. 153 Nos. of Road Safety Clubs have been formed in various schools and colleges throughout the State to create awareness of road safety among students and to involve student community.
11.53 Most of the R.T. Offices is equipped with speed checking radars for trapping over speeding vehicles. All the 4 D.T.C offices have been equipped with the ‘Mobile Interceptors’ for the surveillance and enforcement activities of the Department. A new scheme namely Driver Testing Yard has been introduced during the last financial year and a pilot project is being implemented at Chevayur, Kozhik-kode. Another yard would be launched in Kannur during the current financial year.
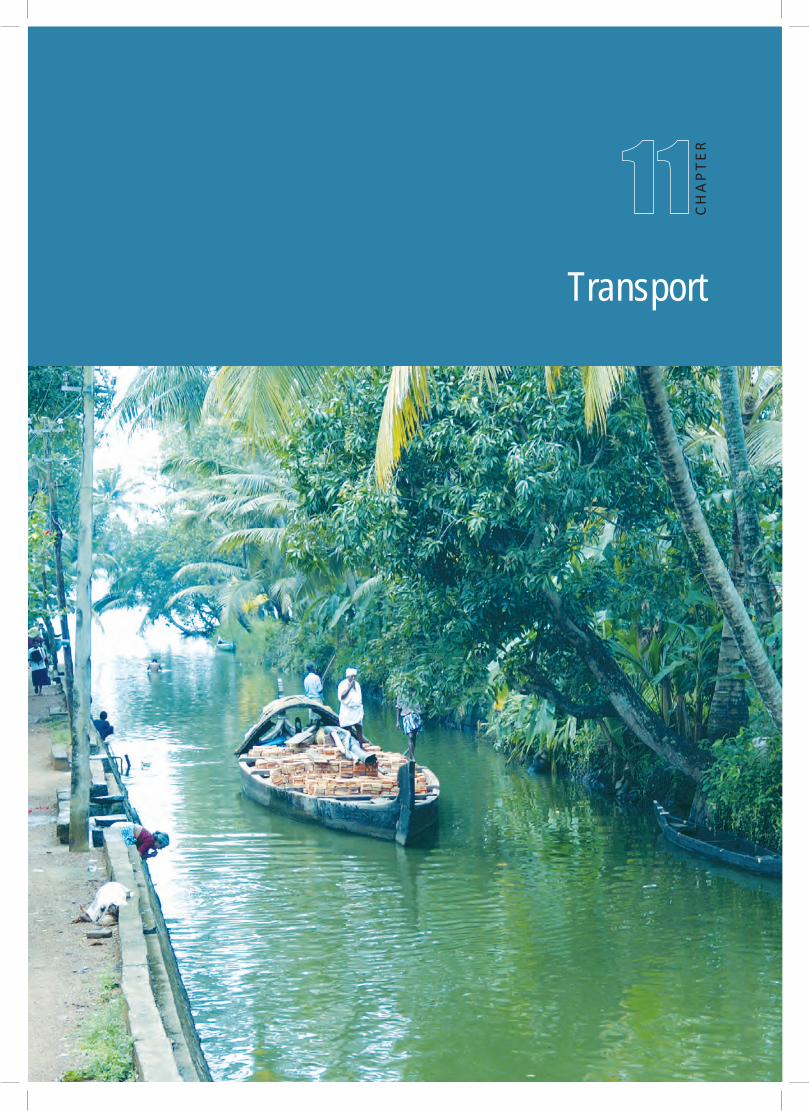
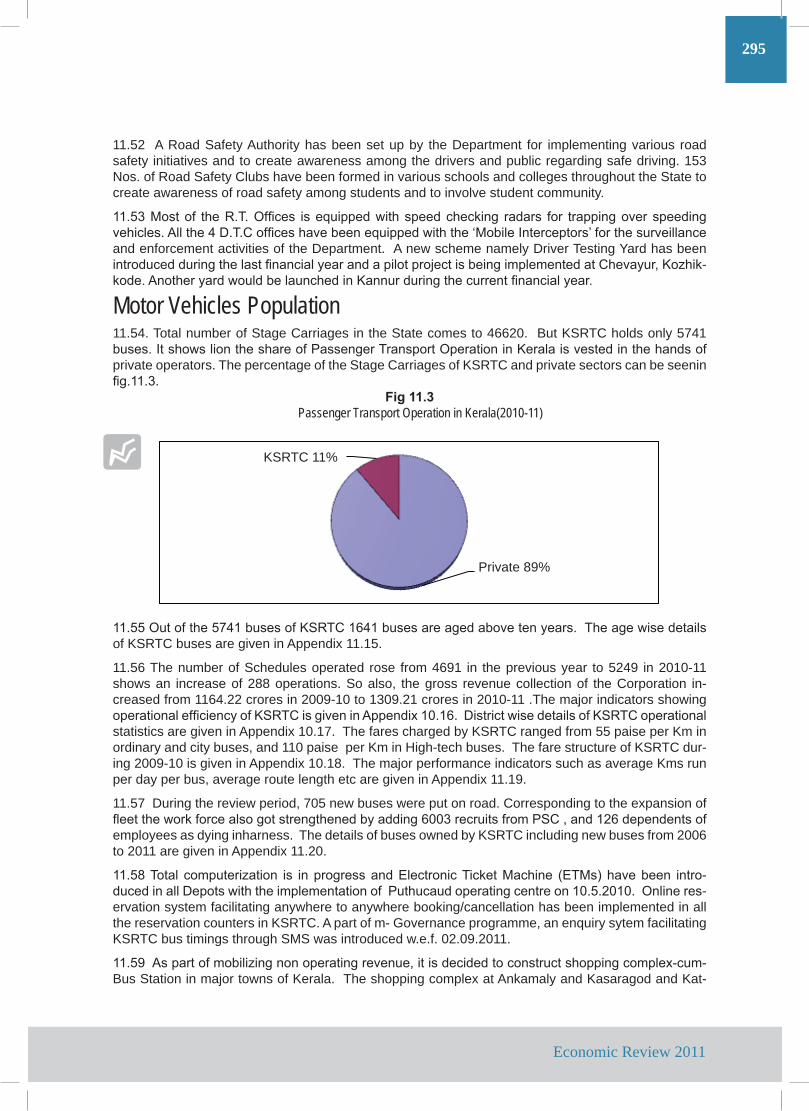
Motor Vehicles Population11.54. Total number of Stage Carriages in the State comes to 46620. But KSRTC holds only 5741 buses. It shows lion the share of Passenger Transport Operation in Kerala is vested in the hands of private operators. The percentage of the Stage Carriages of KSRTC and private sectors can be seenin fig.11.3.
Fig 11.3 Passenger Transport Operation in Kerala(2010-11)
Private Sector 89%
KSRTC11%
11.55 Out of the 5741 buses of KSRTC 1641 buses are aged above ten years. The age wise details of KSRTC buses are given in Appendix 11.15.
11.56 The number of Schedules operated rose from 4691 in the previous year to 5249 in 2010-11 shows an increase of 288 operations. So also, the gross revenue collection of the Corporation in-creased from 1164.22 crores in 2009-10 to 1309.21 crores in 2010-11 .The major indicators showing operational efficiency of KSRTC is given in Appendix 10.16. District wise details of KSRTC operational statistics are given in Appendix 10.17. The fares charged by KSRTC ranged from 55 paise per Km in ordinary and city buses, and 110 paise per Km in High-tech buses. The fare structure of KSRTC dur-ing 2009-10 is given in Appendix 10.18. The major performance indicators such as average Kms run per day per bus, average route length etc are given in Appendix 11.19.
11.57 During the review period, 705 new buses were put on road. Corresponding to the expansion of fleet the work force also got strengthened by adding 6003 recruits from PSC , and 126 dependents of employees as dying inharness. The details of buses owned by KSRTC including new buses from 2006 to 2011 are given in Appendix 11.20.
11.58 Total computerization is in progress and Electronic Ticket Machine (ETMs) have been intro-duced in all Depots with the implementation of Puthucaud operating centre on 10.5.2010. Online res-ervation system facilitating anywhere to anywhere booking/cancellation has been implemented in all the reservation counters in KSRTC. A part of m- Governance programme, an enquiry sytem facilitating KSRTC bus timings through SMS was introduced w.e.f. 02.09.2011.
11.59 As part of mobilizing non operating revenue, it is decided to construct shopping complex-cum- Bus Station in major towns of Kerala. The shopping complex at Ankamaly and Kasaragod and Kat-
KSRTC 11%
Private 89%
Economic Review 2011

296
takada has been inaugurated. The work at Kozhikode, Thiruvananthapuram Central (Thampanoor), Thiruvalla are in progress. In addition, several construction works
11.60 Training was given to 6263 employees at the staff Training Centre, KSRTC, which includes all the newly recruited drivers, conductors and other staff. 507 drivers were given corrective training to the drivers with special emphasis on avoiding accidents.
Transport Finance11.61 Kerala Transport Development Finance Corporation , formed with the aim of providing loans to Kerala State Road Transport Corporation and the company has expanded its business by granting loans to other Government / Quasi Government Organizations, individuals for purchase of new ve-hicles from 1998 onwards.
11.62 Till date the Corporation has granted `1741.57 Crores to Kerala State Road Transport Corpora-tion. The company is mobilizing the funds required for these business activities through the issue of Bonds, Fixed Deposits, Bank borrowings etc.The authorized capital of the company is ` 50 crores and the paid up share capital including share capital advance of ` 43.83 crores.
Water TransportPort SectorNational Scenario11.63 India has a long coastline extending over 7517 km with about 150 working ports including 12 major ports and 187 minor ports. Nearly 95 per cent of the countries transportation of goods is by sea, making development of ports critical for nation’s progress. The major ports in India are maintained by the Central government, while all the other ports come under the jurisdiction of respective state government. India’s 12 major ports handle one third of country’s external trade with cargo handling capacity of 575 MT.
11.64 Government of India targets to increasing the cargo handling capacity of major ports by two folds to reach 1.5 billion metric tonnes (MT) by the year 2012. This will be achieved at an investment of around USD 25 billion through public-private partnerships. A Crisil research on Indian ports and mari-time transport estimates that ports will grow by 160 per cent over the 2011-12 period. Cargo handling at the major ports is projected to grow at 7.7% per annum (CAGR) till 2011-12 and the cargo traffic is estimated to reach 877 million tonnes by 2011-12, whereas the containerized cargo is expected to grow at 15.5% (CAGR) over a period of 7 years. The New Foreign Trade Policy envisages doubling of India’s share in global exports in next five years to Rs.675000 crores (USD 150 billion). A large portion of the foreign trade to be through the maritime route: 95% by volume and 70% by value.
11.65 The experience of operating berths through PPPs at some of the major ports in India has been quite successful. It was, therefore, decided to expand the programme and allocate new berths to be constructed through PPPs. Governments have also decided to empower and enable the 12 major ports to attain world class standards. To this end, each port is preparing a Master Plan for 20 years and an Action Plan for seven years. Recognizing that the shipping industry is moving towards large vessels, a plan for capital dredging of channels in major ports has also been formulated.
11.66 Major ports in India handle nearly 75% of the total cargo traffic. 70% of the traffic at major ports by volume is dry and liquid bulk, remaining 30% is general cargo including containers.
11.67 Container traffic at Indian Ports is growing rapidly and has increased by 102% in the last five years to 5.4 million Twenty-Foot-Equivalent Unit *(TEU) in 2006-07. It is expected that the growth rate will continue to be dramatic and that by 2016-17, the country will handle 15.64 million TEU.
Kerala State Planning Board
297
Kerala Port Sector11.67. The Kerala state lies in the south west corner of the Indian peninsula. It has a coastal length of 585 km and the state has an average width of about 60 km with one major port at Cochin and 17 non major ports. The non major ports are under the administration of Government of Kerala. Government of Kerala intends to provide a boost to coastal shipping with the development of ports. Kerala state has got the Ghats in the east and the Arabian Sea on the west. The forest area in the east and coastal area in the west are environmentally very sensitive areas. The midland and coastal lowland are thickly populated. The physical and geographical features of Kerala and shortage of land causes man hard-ships for port development and industrialization in Kerala. The geographical location of Kerala is very close to international shipping route. There are seventeen minor ports in Kerala, out of which three are considered as intermediate ports based on berthing, cargo handling and storage facilities available in them. These have contributed much to the development of industry. trade, commerce and agriculture in the country.
11.69 Presently cargo operations take place only in three ports – i.e. in Vizhinjam, Beypore and Azhik-kal ports. Vizhinjam handles about 1000 tonnes. Beypore 50,000 tonnes and Azhikkal about 5000 tonnes annually. The remaining minor ports in Kerala are now defunct due to various reasons. As stated above the intermediate and minor ports are to be developed and modernized to meet the ex-pected increase in traffic and also to tap the potential available. These developmental activities have to be taken up and completed in the Eleventh Plan.
Advantage11.70 The main advantages of moving from Road/Rail Transport to Costal Shipping are that coastal shipping will ease the burden on the heavily congested highways in the State apart from savings in transportation cost. Government, besides acting as a catalyst for establishment of ship repair and ship building industries, would also encourage other port based industries contributing to the development of ports.
Private Sector Participation 11.71 Recognizing the need to develop the ports in a time bound manner, on account of the paucity of adequate resources, Government decided to encourage private sector participation in the sec-tor. Government is committed to seek private sector investments into the port sector and to create a framework for such participation; the Kerala Port Policy was announced in the year 2004.
Cochin Port11.72 Cochin Port is the only major port in Kerala. It spreads over 827 hectares. It has a water frontage of 7.5 Km. The port has connectivity to hinterland through NH 47, NH 17 and NH 49. Rail links to the Konkan and Southern Railway also give key rail access to its hinterland. An inland waterway connecting Kollam and Kottappuram on either side is being developed by the Inland Waterways Authority of India.
11.73 The total traffic handled by the Port during 2011 recorded an increase by 12.52%showing an increase of 174.29 lakhs tonnes against 154.94 lakhs tonnes in the preceding year. During the year foreign cargo traffic increased by 11.08 % to 118.81 lakhs tonnes from 106.96 lakhs tonnes in the preceding year. Coastal cargo traffic increased by 15.63% to 55.48 lakhs tonnes from 47.98 lakhs tonnes.
11.74 Total import traffic handled during the year recorded an increase by 8.21% to 138.33 lakhs tonnes from 127.84 lakhs tonnes in the preceding year. Total export traffic handled during the year showed increase of 32.69% to 35.96 lakhs tonnes from 27.10 lakhs tonnes in the preceding year.
11.75 During the year the tonnage of container cargo (excluding tare weight of containers) handled recorded an increase of 11.38% to 32.88 lakhs tonnes from 29.52 lakhs tonnes in the preceding year. Exports in containers showed an increase of 49.82% during the year to 16.48 lakhs tonnes from 11
Economic Review 2011

298
lakhs tonnes in the preceding year and import in containers showed a decrease by 11.45% during the year to 16.40 lakhs tonnes from 18.52 lakhs tonnes in the preceding year. Total number of containers handled also showed an increase to 289817 TEU’s during the year from 260784 TEU’s handled in the preceding year indicating an increase by 11.13%.
11.76 During the year 2010-11, 1256 ships called at the Port as against 1278 ships in the preceding year registering an decrease of 1.72% in shipping activity. The total NRT of ships called at the Port showed an increase of 2% during the year over that of the preceding year which is shown in Appendix 11.21.
11.77 During the year 2011 total number of passengers arrived at and sailed from Cochin Port during the year was 102371 and 110115 respectively as against 59899 and 62941 in the preceding year.
Vallarpadam International Container Transshipment Terminal11.78 The Prime Minister of India laid the foundation stone for Vallarpadam International Container Transshipment Terminal in 1995. Completion of this prestigious project would make the Cochin port a major hub port in the Indian Ocean region.
11.79 At present containers from the Indian sub continent are being transshipped to Colombo. With the development of Vallarpadam Mother Vessels will come to Kochi and consolidate and carry the containers from other ports of India to the outside world.
11.80 All statutory clearances required for the Terminal construction were received. The first stage work of Capital Dredging for providing 12.5 m depth at the existing Rajiv Gandhi Container Terminal was completed in 2006.
11.81 Regarding the construction of ICTT at Vallarpadam, Soil stabilization work with stone columns and band drains commenced and is in progress. Supporting infrastructure project namely stage-II capital dredging for providing 14.5 m draft at ICTT, National High Way connectivity at a route length of 17.2 kms and Rail connectivity with route length of 8.86 Km are at various stages of execution.
Kerala State Planning Board
299
Vizhinjam Deep Water International Container Transshipment Terminal11.82 Vizhinjam International Deep Water multipurpose Seaport is a flagship project of Government of Kerala being developed on a landlord port model. Vizhinjam Intermational Deep Water multipurpose Sea-port limited ( VISL ) is a special purpose government company ( fully owned by government of Kerala ) that would act as a implementing agency for the development of a Greenfield port 11.83 Vizhinjam is a natural port, which is located close to the international ship route. So it is expected that at least 50% of the (nearly 20,000) ships that pass through the Suez canal (per annum) will anchor at Vizhinjam Port. It is expected that with the functioning of Vizhinjam port in its full swing, the ports of Colombo, Singapore and Dubai might face serious competition from India. This will boost the trade and commercial activities not only in Kerala but also to entire India. It is estimated that India could save more than a 100 million U.S. dollars per year in terms of foreign exchange.
11.84 Studies conducted at Vizhinjam have shown that there is a natural depth of 23 metres. A port con-structed here could easily accommodate ships with displacements of up to 300,000 tons, with little or no dredging. Most of the current ports are not able to accommodate ships of even 200,000 tons even after massive dredging. Basically this means that the Vizhinjam port can handle supertankers and the biggest container mother ships with ease.
11.85 Government of Kerala decided to adopt Landlord model for the development of the port based on the recommendations of International Finance Corporation ( IFC ) , the transaction advisor to the project. This model is a combination of public and private partnership where the Government of Kerala would invest in the infrastructural facilities like the breakwater, dredging ,reclamation ,utility and connectivity . The port operatios and superstructure will be taken up by private operators.
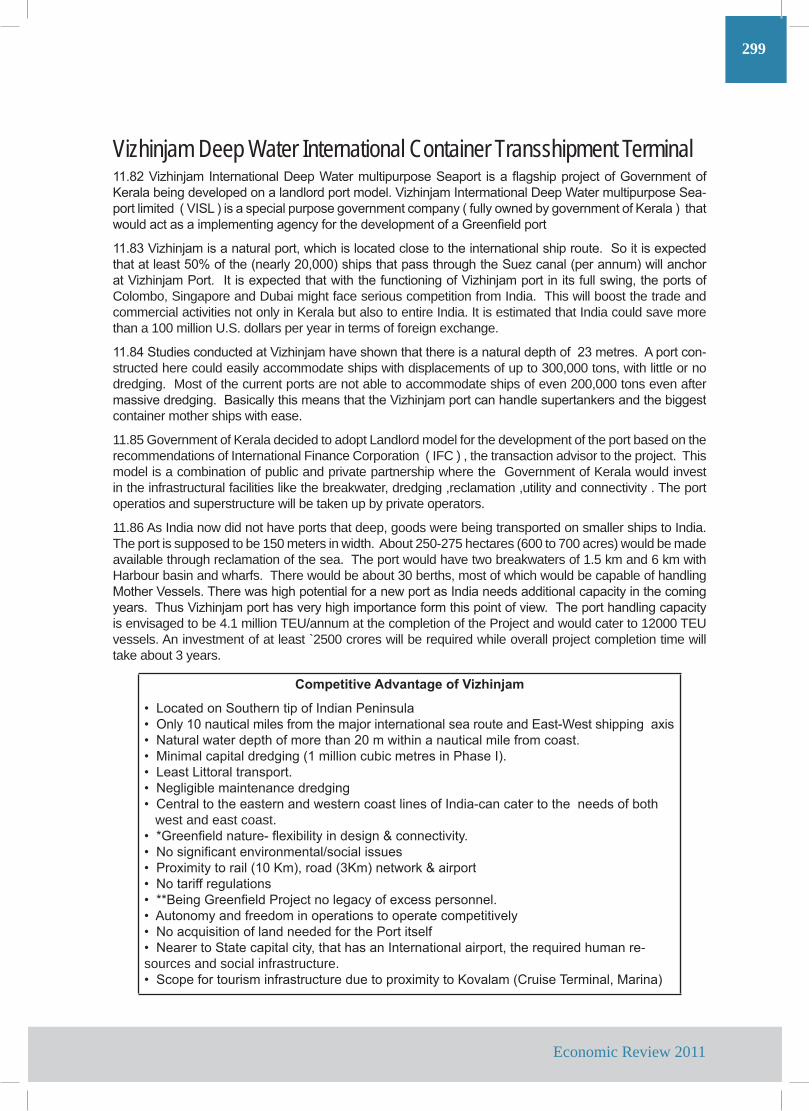
11.86 As India now did not have ports that deep, goods were being transported on smaller ships to India. The port is supposed to be 150 meters in width. About 250-275 hectares (600 to 700 acres) would be made available through reclamation of the sea. The port would have two breakwaters of 1.5 km and 6 km with Harbour basin and wharfs. There would be about 30 berths, most of which would be capable of handling Mother Vessels. There was high potential for a new port as India needs additional capacity in the coming years. Thus Vizhinjam port has very high importance form this point of view. The port handling capacity is envisaged to be 4.1 million TEU/annum at the completion of the Project and would cater to 12000 TEU vessels. An investment of at least `2500 crores will be required while overall project completion time will take about 3 years.
Competitive Advantage of Vizhinjam
• Located on Southern tip of Indian Peninsula• Only 10 nautical miles from the major international sea route and East-West shipping axis • Natural water depth of more than 20 m within a nautical mile from coast.• Minimal capital dredging (1 million cubic metres in Phase I).• Least Littoral transport.• Negligible maintenance dredging• Central to the eastern and western coast lines of India-can cater to the needs of both west and east coast.• *Greenfield nature- flexibility in design & connectivity.• No significant environmental/social issues• Proximity to rail (10 Km), road (3Km) network & airport• No tariff regulations• **Being Greenfield Project no legacy of excess personnel.• Autonomy and freedom in operations to operate competitively• No acquisition of land needed for the Port itself • Nearer to State capital city, that has an International airport, the required human re-sources and social infrastructure.• Scope for tourism infrastructure due to proximity to Kovalam (Cruise Terminal, Marina)
Economic Review 2011
300
Non Major Ports11.87 The Non Major ports are under the direct control of State Government. The Government agencies involved in the development of ports in the State are Port Department, Harbour Engineering Department, Hydrographic Survey Wing
11.88 Commodity – wise cargo handled in the non – major ports during the year 2010-11 are shown in appendix 10.22. Cargo handling during 2010-11 was confined mainly to Kozhikode, Kollam,Vizhinjam and Azhikkal ports. The number and tonnage of steamers and sailing vessels that called at intermediate and minor ports during 2011 are shown at appendix 10.23. During 2010-11, 549 steamers and sailing vessels with registered tonnage of 141609 are called at non- major ports against 592 steamers and sailing ves-sels with 156621.99 tonnage in the previous year. The number of crafts ( Cargo operations )owned by the private parties registered at the intermediate and minor ports are shown in appendix 11.24
11.89 Statement showing the revenue collection at the non-major ports during 2010-11 is shown in Ap-pendix 10.25. The revenue collected during the year 2010-11 is `791.37 lakhs as against the collection of `429.59 lakh during 2009-10
Development of Beypore Cargo Harbour11.90 The scheme was originally sanctioned for an amount of `325 lakhs during 3/1997. Construction of 100 M wharf, transit shed, parking and loading area, internal road , water supply arrangements, are completed. During 11/2002 Government sanctioned another wharf of 60 m length costing `123 lakhs in between the old and new wharves. A passenger terminal costing `34 lakhs was also sanctioned by the Government in 2005. During 2010-11construction of approach road, stack yards were completed.
Development of Azhikkal Cargo Harbour11.91 Government have already issued administrative sanction for ̀ 825 lakhs for the phase I development of Azhikkal port. The components of the scheme are 226.2 m long wharf , land acquisition , compound wall , transit shed, widening of port road , electrification ,navigational aids investigation etc. construction of wharf, widening of port road were completed .Dredging ,power supply arrangements and navigational aids are to be arranged
Cargo Berth at Kollam (Thangassery) 11.92 Thangassery harbour area is already a declared cargo port and there is ample scope for future development. The sheltered fishery harbor basin available is very ideal to develop a cargo port, which can accommodate cargo vessels as well as passenger liners. At the entrance the depth available is 8 m and in the basin varies from 6 to 8m.
Development of Vizhinjam Cargo Harbour 11.93 Vizhinjam port is situated near the international sea route,which is having adequate natu-ral depth and enough potential for economic development as a deep- water cargo harbor . The facili-ties presently available at the port are quite insufficient for the above purpose. Hence for the devel-opment of Vizhinjam cargo port for larger draft vessels the required facilities are to be provided. As a first stage , it was decided to construct a second cargo berth with ancillary inside the basin by the side of the seaward breakwater.
Kerala Maritime Institute 11.94 Port Department inaugurated on 3/05/2010 its first Maritime Institute at Neendakara in an 11 acre campus. The tender documents for campus development at Neendakara approved by Government Body held on 7/7/2011, chaired by Hon’able minister for ports. A sub centre of the institute started functioning on 3/09/2011 at Kodungalloor. A campus and buildings for Maritime Institutes in Neendakara And Kodun-galloor is under the consideration of the Government.
Kerala State Planning Board
301
Hydrographic Survey Wing11.95 The Hydrographic Survey Wing was constituted in 1968 as a component of the Kerala State Port Department with a view to cater to the requirements of Hydrographic Investigation for the development of the non major ports of Maritime State of Kerala. There is no similar establishment in India run by a State Government.
11.96 Since its formation, the Wing has been conducting pre-dredging and post-dredging, pre-monsoon and post-monsoon surveys to ascertain various aspects such as requirement of dredging, data required for the construction of Fishing Harbours, Fish Lading Centers, Small ports etc. In addition to the routine pre-monsoon and post-monsoon survey at 16 non-major ports they also undertakes survey work for oth-er departments like Irrigation, Inland Navigation, PWD and Research Institutions like Kerala Engineering Research Institute etc.
11.97 20 surveys were conducted during the year 2010-11 for Port Department . Dredging surveys of Thankasserry , Beypore, Azhikal, Akkulam were also conducted during 2010-11. Hydrographic Surveys of Neendakara, Muthlapozhy and Thenmala Dam were conducted by the Southern range of this Wing. Pre –Monsoon surveys of Beypore & Azhikal ports and post –Monsoon surveys of Beypore port were conducted.
Inland Water Transport11.98 Inland Water Transport, is a fuel efficient and environment friendly mode of transportation. India is richly endowed with navigable waterways, comprising rivers, canals, backwaters, creeks, etc. It is esti-mated that a total of 14500 km of the waterways could be used for passenger and cargo movement. About 44 million tones of cargo is being moved annually by inland water transport. But, this means of transport is important only in few States, namely, Assam, West Bengal, Bihar and Kerala. Also, it is operational only in restricted stretches of Ganga-Bhagirathi-Hooghly river; the Brahmaputra river; the Barak river; the rivers in Goa; the backwaters in Kerala; Inland waters in Mumbai and the deltaic region of the Godavari-Krishna rivers.
10.99 Besides, the capacity of this sector is under-utilized, because most navigable waterways suffer from hazards like shallow water and narrow width of channel during dry weather; silting of river beds and erosion of banks; absence of adequate infrastructural facilities like terminals for loading and berthing and surface road links.
11.100 As a part of the Government’s policy to optimally develop and harness the potential of Inland Waterways in the country, the ‘Inland Waterways Authority of India (IWAI)’ was set up under the Inland Waterways Authority of India Act, 1985’. The IWAI has been established for the development and regu-lation of Inland waterways for shipping and navigation and for matters connected therewith or incidental thereto. The Inland Waterways Authority of India Act, 1985, empowers the Government to declare water-ways with potential for development of shipping and navigation as National Waterways.
Currently, three waterways have been declared as National Waterways:-
1. National Waterway No.1:- The Ganga between Allahabad-Haldia (1629 km) in UP, Bihar, Jharkhand and West Bengal.
2. National Waterway No.2:- The Sadiya-Dhubri stretch of river Brahmaputra (891 km) in Assam; and
3. National Waterway No3:- The Kollam – Kottapuram stretch of West Coast Canal along with Champakara and Udyogmandal Canals (205 km) in Kerala. 11.101 Also, in order to provide an impetus to the development of Inland water transport modes, an Inland Water Transport Policy has been announced. It includes several fiscal concessions and guidelines for encouraging private sector participation in development of infrastructure and ownership and operation of Inland vessels. IWAI is also authorized for joint ventures and equity participation in BOT projects.
Economic Review 2011
302
Inland Water Transport in Kerala11.102 The State of Kerala, with numerous backwaters, is one of the State in India, where waterways are successfully used for commercial Inland Water Transport. The transportation is mainly done with country craft and passenger vessels. There are 41 navigable rivers in Kerala. The total length of the Inland Water-ways in the State is 1687 Kms.
11.103 The Government agencies engaged in the development of Inland Water Transport in the State are Coastal Shipping and Inland Navigation Department (CSIND), State Water Transport Department (SWTD) and Kerala Shipping and Inland Navigation Corporation Ltd. (KSINC).
State Water Transport Department11.104 State Water Transport Department formed during 1968 with the objectives to provide Transport facilities to the people residing in the water logged areas at cheaper rates and Cargo transportation. Con-struction of roads, bridges and speedy transportation-roadways shortened the operation of the Department to passenger transport only-in the backwaters and ferries. But in the world of speed and hurry the advan-tage of this pollution free, accident free and cheaper transport system beckons least preferences.
11.105 During 2010-11 the department took stringent action to replace most of the old wooden boats above 25 years old with new steel boats and timely repair were made to rest of the wooden boats by purchasing timber from the Forest Department . As such steel boats of 90 & 100 passenger capacity were purchased. The existing workshop at Alappuzha was equipped with technically advanced instruments.
11.106 Procedures were started to construct new station office building at Kollam and fuelling jetty at Er-nakulam .All boats were equipped with life saving equipments including life jackets prescribed in Inland Vessel Rule 2010. Supply order were made for the purchase of out board engine ,power steening assem-bly , Ashok Leyland engine Chemical toilet etc.
Kerala Shipping and Inland Navigation Corporation Ltd. 11.107 The Corporation was formed in 1989 by the statutory amalgamation of Kerala Inland Navigation Corporation Ltd. (KINCO) and Kerala Shipping Corporation Limited (KSC) are two Government of Kerala Companies. The main objective of the company is to develop passenger and cargo transportation through Inland Waterways of Kerala, docking and repair of marine vessels, construction of boats, conducting navi-gation training programmes, conducting tourist cruises, providing navigational aids and maintenance in National Waterway-III.
11.108 The Corporation at present has 9 barges 9 tourist boats and 2 Jhankars. During 2010-11 KSINC has commissioned one new 600 MT Dry bulk cargo barge . Construction and repair of boats, barges and other marine vessels of the Corporation and customers in the public and private sector are carried out by the corporation by leasing a slipway complex from Cochin Port Trust since 1991.
11.109 The Corporation had also started a Marine Training Institute for giving training for operating Inland Vessels and Crafts. Three batches have completed training. The volume of cargo carried by the Corpo-ration during 2010-11 is 288.35 (000 tonnes) as against 295.81(000 tonnes) during 2009-10 showing a decrease of 2.5 percent. The Corporation is employing 205 persons during the period.
Railways in Kerala 11.110 Railways are essentially the cause for Industrial upsurge in the nation and it still remained the larg-est employment provider for the huge population of the country. The total length of track used by Indian Railways is about 111599 Km and the total route length is 64215 kms. The State total Railway route has a length of 1257 Km and covers 13 Railway routes. The Railway Divisions at Thiruvananthapuram, Palak-kad and Madurai jointly carry out Railway Operations in Kerala. The following six new Train services were started from Kerala during 2010-11
Kerala State Planning Board
303
1. 15905/15906 Kanniyakumari-Thiruvananthapuram-Dibrugarh Vivek Exp.(weekly)2. 22852/22851 Manglore-Santragachi Superfast Vivek Exp.(weekly) 3. 16350/16349 Nilambur Road-Thiruvananthapuram Rajya Rani Exp.(daily)4. 19259/19260 Kochuveli-Bhavanagar Exp.(weekly)5. 22816/22815 Ernakulam –Bilaspur Exp.(weekly)6. 22609/22610 Mangalore-Palakkad Superfast Intercity Exp.(daily)
Rail Coach Factory, Palakkad11.111 Hon’ble Union Minister of Railways made an announcement in the Railway Budget for 2008-2009, that a Rail Coach Factory would be set up at Palakkad in the State of Kerala.RITES conducted a detailed study on this project.11.112 Govt. of Kerala after discussions with the Southern Railway, notified that 239 acres of land would be handed over to the Ministry of Railways at a cost of Rs.33.70 crores for setting up the proposed Rail Coach Factory at Kanjikode near Palakkad. The land acquisition process by the railway and the Kerala State is now in progress.The adequacy of the land for setting up of Rail Coach Factory has been reviewed and found that 239 acres of plain land is sufficient for setting up of the Rail Coach Factory with can produce upto 400 coaches a year.The project is estimated at a cost of Rs.550 crores and will be undertaken as a joint venture in which Railway shall contribute 26% of the equity.
11.113 The State government has allotted 426 acres of land at Kanjikode for the Rail Coach Factory. The work on the Coach factory in Palakkad is progressing. The project is being taken up as a Public Private Participation (PPP) project for which token provision has to be provided in the Railway budget. The Coach Factory will also bring more than 100 ancillary industrial units to the area .
11.114 The coach factory entailed an investment of `5000 crore in the first phase and the coaches were also meant to be exported. Once the process are over and the land is handed over by the State Govern-ment, funds could be earmarked in the Railway Budget for the factory.
Air Transport11.115 Kerala has three Air Ports at Thiruvananthapuram, Kochi and Kozhicode handling both Interna-tional and Domestic flights. Thiruvananthapuram and Kozhicode Air Ports are owned by Government of India and Kochi Air Port is owned by Kochin International Air Port Ltd (CIAL), a company set up by Gov-ernment of Kerala with Public Private Participation. The Details of the Flights operated during 2010-11 by various agencies at these three airports are given in Appendices Appendices 11.27 (A), (B) and (C).
11.116 The major achievements of Cochin International Airport Limited during the review year is as follows
• The passenger Traffic during March- 2011 is 43,45,179 against to 39,46,103 in the last last year registering growth of 10.11%• Air Asia and Sri Lankan Airlines have commenced their flights operations to/from Cochin International Airport.• Cochin International Airport Limited has declared dividend of 215% to their shareholders• The construction work of air-conditioned Trade fair Centre is nearing completion• The work of Air Port Museum is nearing completion• The work of Hanger Facility is almost completed and same will be operational shortly• The work of First Phase of Golf Course ( 9 Holes ) has been completed• Commenced the construction of Duty Free Godown
11.117 The following are the major achievements of Kozhicode International Air Port during 2010-11.• LS commissioned for Runway 10 (Now both the Runways is with ILS)• Procured new advanced Airfield Crash Fire Tenders at a cost of Rs.14 crores.• Augmentation of Power supply by providing 750 KVA DG sets.• Administrative approval issued for Rs.121 crores to construct new Arrival Block & Apron expansion.• Hajj operations were conducted smoothly.
Economic Review 2011
304
Kannur Air port11.118 The State’s prestigious greenfield airport project named ‘KANNUR INTERNATIONAL AIRPORT’ will be coming up close to Mattannur in Kannur district of Kerala State. It is only 20 kms away from Kan-nur city, and 2 kms from Mattannur on Kannur – Mattannur – Mysore road. The Airport will have a runway length of 3400 meters. The orientation of the runway is 07/25, which permits obstacle free approach. The airport is expected to have an annual traffic of more than 1 million international passengers and above 0.3 million domestic passengers as per 2009-2010 estimate.
Objectives• To provide an international gateway with state-of-the art facilities to support safe, efficient and cost effective travel for foreign tourists and ‘non-resident’ Indians from Kerala, as well as domestic passen-gers.• To act as air cargo hub for perishable cargo like cut-flowers, vegetables, fruits, seafood etc. • To provide a host of commercial, trade promotion and industrial activities that can generate employ-ment opportunities, provide avenues for the trade in traditional products to affluent markets in the Gulf and Europe and to open new vistas in the field of IT & ICT. • To promote beach, pilgrimage and health tourism.• To transform the North Malabar region into a highly developed growth centre for travel, tourism and industries.
11.119 The major achievements of Kannur International Airport during the review year is as follows• 192.18 acres of land acquired during the Phase I for the Airport project transferred to KIAL .• 1085 acres of land has been acquired during Phase II under the Fast Track Scheme and compen-sation paid to the land owners. Land required for rehabilitation has also been taken over and plots to be given to each of the 126 families have been selected through lottery in the presence of the families and representatives of Mattannur Municipality and Keezhallur Panchayat.• In the Third Phase, 783 acres more has been notified and is expected to be taken over in 6 months. • MOU signed for transferring 453 acres of land towards Kerala Govt. Equity. Balance land will be transferred on lease basis to KIAL.• Equity allotted to Kerala Tourism Development Corporation Ltd, M/s Kerala State Beverage (Manu-facturing & Marketing) Corporation Ltd, M/S Kerala State Industrial Enterprises Ltd and The Kerala Minerals & Metals Limited • Foundation stone laid on 17th December 2010 and preliminary works commencedConsultancy for Kannur Airport Project has been assigned to Cochin International Airport Ltd. (CIAL) and the work is in progress• Centre for Earth Science Studies (CESS) has been engaged for obtaining environmental clearance for the project. • Techno economic feasibility study completed by EMA Unihorn (P) Ltd and Techno-Economic Fea-sibility Report (TEFR) submitted in the year 2005. CIAL would be revising this TEFR and a Detailed Project Report (DPR) will be given by CIAL as part of their consultancy work.
Cargo Traffic11.120 Kerala State Industrial Enterprises Ltd, a PSU under the industries department is the management of the two Air Cargo Complexes at Thiruvananthapuram and Calicut Airport. The Company is the custodian of these tow Air Cargo Complexes as appointed by the respective commissioners of customs. KSIE pro-vides necessary infrastructural facilities for the promotion of exports through these Air Cargo Complexes. The company is also engaged in trading activities through the 3 business centres at Thiruvananthapurma, Ernaklulam and Kozhikode and also through its e-com site Keralarcade. Com. KSIE also continues to act as the virtual office in Kerala for agricultural and processed Food Products Export Development Authority (APEDA), Ministry of commerce, Govt, of India. Last year KSIE had commissioned the “ Kerala Soaps “ unit at Kozhikode by spending around Rs.Seven crores and had re-launched the branded soaps items
Kerala State Planning Board
305
like Kerala Sandal, Vep, Thrill, Washwell etc of the erstwhile Kerala Soaps and Oils Ltd. KSIE is currently concentrating on the commissioning of its Freight Station at Kalamassery at an estimated project cost of Rs. 3223 lakhs.
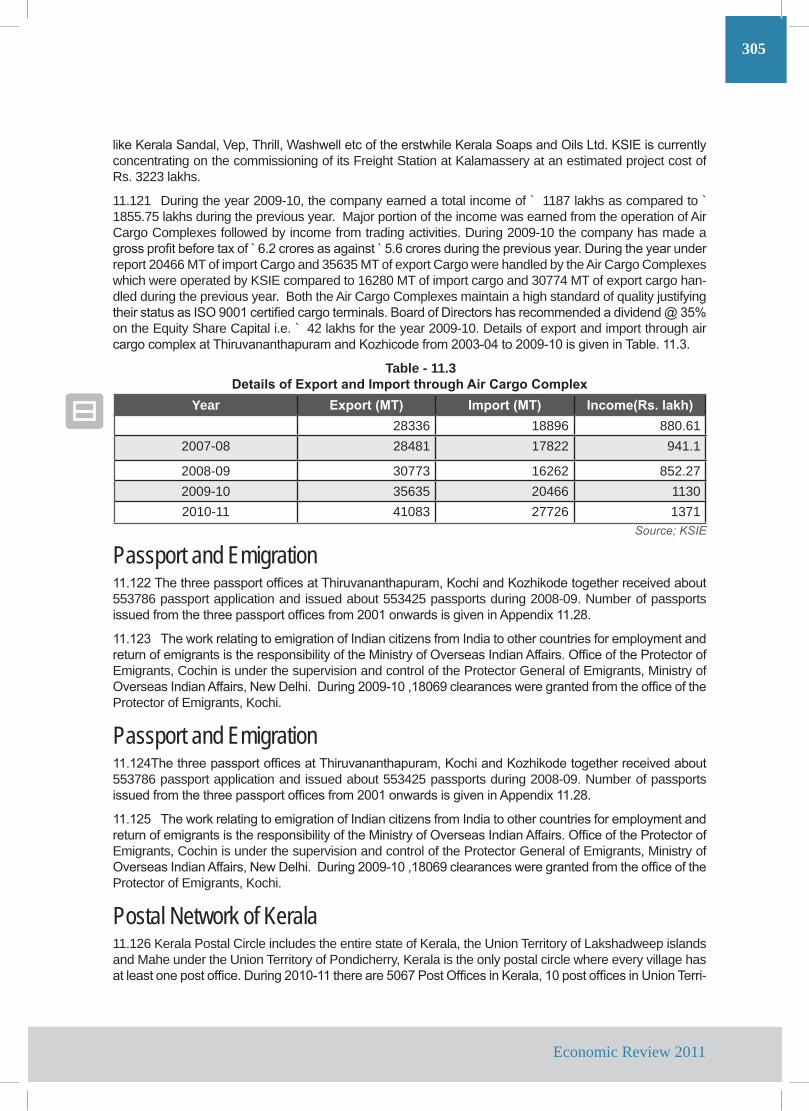
11.121 During the year 2009-10, the company earned a total income of ` 1187 lakhs as compared to ` 1855.75 lakhs during the previous year. Major portion of the income was earned from the operation of Air Cargo Complexes followed by income from trading activities. During 2009-10 the company has made a gross profit before tax of ̀ 6.2 crores as against ̀ 5.6 crores during the previous year. During the year under report 20466 MT of import Cargo and 35635 MT of export Cargo were handled by the Air Cargo Complexes which were operated by KSIE compared to 16280 MT of import cargo and 30774 MT of export cargo han-dled during the previous year. Both the Air Cargo Complexes maintain a high standard of quality justifying their status as ISO 9001 certified cargo terminals. Board of Directors has recommended a dividend @ 35% on the Equity Share Capital i.e. ` 42 lakhs for the year 2009-10. Details of export and import through air cargo complex at Thiruvananthapuram and Kozhicode from 2003-04 to 2009-10 is given in Table. 11.3.
Table - 11.3Details of Export and Import through Air Cargo Complex
Year Export (MT) Import (MT) Income(Rs. lakh)2006-07 28336 18896 880.612007-08 28481 17822 941.1
2008-09 30773 16262 852.272009-10 35635 20466 11302010-11 41083 27726 1371
Source; KSIE
Passport and Emigration11.122 The three passport offices at Thiruvananthapuram, Kochi and Kozhikode together received about 553786 passport application and issued about 553425 passports during 2008-09. Number of passports issued from the three passport offices from 2001 onwards is given in Appendix 11.28.
11.123 The work relating to emigration of Indian citizens from India to other countries for employment and return of emigrants is the responsibility of the Ministry of Overseas Indian Affairs. Office of the Protector of Emigrants, Cochin is under the supervision and control of the Protector General of Emigrants, Ministry of Overseas Indian Affairs, New Delhi. During 2009-10 ,18069 clearances were granted from the office of the Protector of Emigrants, Kochi.
Passport and Emigration11.124The three passport offices at Thiruvananthapuram, Kochi and Kozhikode together received about 553786 passport application and issued about 553425 passports during 2008-09. Number of passports issued from the three passport offices from 2001 onwards is given in Appendix 11.28.
11.125 The work relating to emigration of Indian citizens from India to other countries for employment and return of emigrants is the responsibility of the Ministry of Overseas Indian Affairs. Office of the Protector of Emigrants, Cochin is under the supervision and control of the Protector General of Emigrants, Ministry of Overseas Indian Affairs, New Delhi. During 2009-10 ,18069 clearances were granted from the office of the Protector of Emigrants, Kochi.
Postal Network of Kerala11.126 Kerala Postal Circle includes the entire state of Kerala, the Union Territory of Lakshadweep islands and Mahe under the Union Territory of Pondicherry, Kerala is the only postal circle where every village has at least one post office. During 2010-11 there are 5067 Post Offices in Kerala, 10 post offices in Union Terri-
Economic Review 2011
306
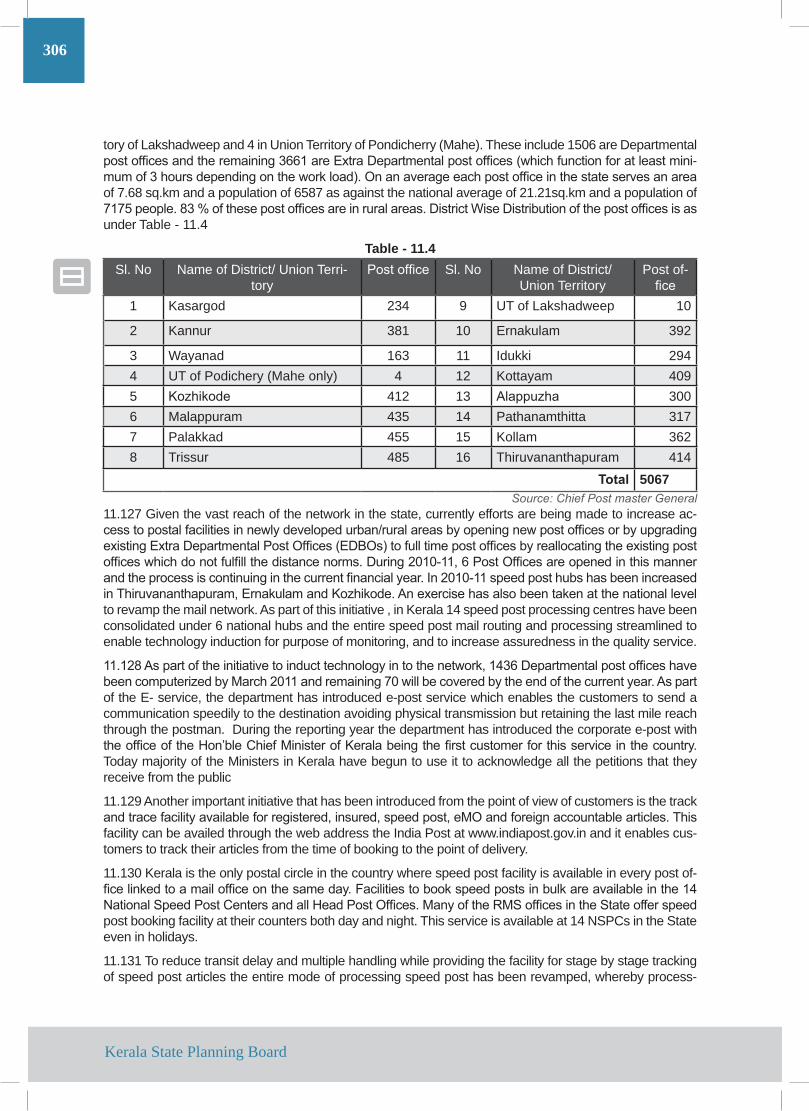
tory of Lakshadweep and 4 in Union Territory of Pondicherry (Mahe). These include 1506 are Departmental post offices and the remaining 3661 are Extra Departmental post offices (which function for at least mini-mum of 3 hours depending on the work load). On an average each post office in the state serves an area of 7.68 sq.km and a population of 6587 as against the national average of 21.21sq.km and a population of 7175 people. 83 % of these post offices are in rural areas. District Wise Distribution of the post offices is as under Table - 11.4
Table - 11.4 Sl. No Name of District/ Union Terri-
toryPost office Sl. No Name of District/
Union TerritoryPost of-
fice1 Kasargod 234 9 UT of Lakshadweep 10
2 Kannur 381 10 Ernakulam 392
3 Wayanad 163 11 Idukki 2944 UT of Podichery (Mahe only) 4 12 Kottayam 4095 Kozhikode 412 13 Alappuzha 3006 Malappuram 435 14 Pathanamthitta 3177 Palakkad 455 15 Kollam 3628 Trissur 485 16 Thiruvananthapuram 414
Total 5067 Source: Chief Post master General11.127 Given the vast reach of the network in the state, currently efforts are being made to increase ac-cess to postal facilities in newly developed urban/rural areas by opening new post offices or by upgrading existing Extra Departmental Post Offices (EDBOs) to full time post offices by reallocating the existing post offices which do not fulfill the distance norms. During 2010-11, 6 Post Offices are opened in this manner and the process is continuing in the current financial year. In 2010-11 speed post hubs has been increased in Thiruvananthapuram, Ernakulam and Kozhikode. An exercise has also been taken at the national level to revamp the mail network. As part of this initiative , in Kerala 14 speed post processing centres have been consolidated under 6 national hubs and the entire speed post mail routing and processing streamlined to enable technology induction for purpose of monitoring, and to increase assuredness in the quality service.
11.128 As part of the initiative to induct technology in to the network, 1436 Departmental post offices have been computerized by March 2011 and remaining 70 will be covered by the end of the current year. As part of the E- service, the department has introduced e-post service which enables the customers to send a communication speedily to the destination avoiding physical transmission but retaining the last mile reach through the postman. During the reporting year the department has introduced the corporate e-post with the office of the Hon’ble Chief Minister of Kerala being the first customer for this service in the country. Today majority of the Ministers in Kerala have begun to use it to acknowledge all the petitions that they receive from the public
11.129 Another important initiative that has been introduced from the point of view of customers is the track and trace facility available for registered, insured, speed post, eMO and foreign accountable articles. This facility can be availed through the web address the India Post at www.indiapost.gov.in and it enables cus-tomers to track their articles from the time of booking to the point of delivery.
11.130 Kerala is the only postal circle in the country where speed post facility is available in every post of-fice linked to a mail office on the same day. Facilities to book speed posts in bulk are available in the 14 National Speed Post Centers and all Head Post Offices. Many of the RMS offices in the State offer speed post booking facility at their counters both day and night. This service is available at 14 NSPCs in the State even in holidays.
11.131 To reduce transit delay and multiple handling while providing the facility for stage by stage tracking of speed post articles the entire mode of processing speed post has been revamped, whereby process-
Kerala State Planning Board
307
ing is concentrated in six National Hubs functioning at Thiruvananthapuram, Thiruvalla, Kochi, Thrissur, Kozhikode and Kannur. Track and trace facility is available from the point of booking till the point of delivery. Today tracking details are available for 95% of articles booked and 97% of articles delivered in the circle.
11.132 World Net Express Service [WNX] has also been introduced during the last 2 years to connect 220 countries. This service is now available from 18 Post Offices and 3 RMS offices at Thiruvanantha-puram GPO, Medical College, Manacaud, Thycaud, Kawdiar, Sasthamangalam, TVM Fort, Pattom Palace, Kochi Head Post Office, Thrissur, Aluva, Alappuzha, Kottayam, Thodupuzha, Kakkanadu, M.G.Road Ko-chi, Kozhikode and Kannur post offices and at Thiruvananthapuram RMS, Speed Post Centre Thiruvana-nthapuram, and at Speed Post Centre Kochi.
11.133 Through the Business Post service, total mailing solutions are made available to bulk customers. There are 27 Business Post centers in the State located independently in places like Thiruvananthapuram, Ernakulam and Kozhikode and in Head Post Offices in other places.
11.134 eMO ( Electronic Money Order) service was introduced in the year 2008 for remitting money to and from addressees within the country from any computerized post office. This service has been extended to 1074 Post Offices s in Kerala
11.135 International Money Transfer Service [IMTS] is the facility to remit funds to India from 185 coun-tries abroad and Kerala is the second largest market for this service within the postal system. 628 post offices in the state provide this service. In the year 2011 this facility has been extended to 13 more post of-fices. The introduction of an additional, alternate channel for remittance through post offices in collaboration with Money Gram will also be implemented in the year 2011.
11.136 Express Parcel Post, a variant of the registered parcel service with the value addition of track and trace facility and direct dispatch by train to destination with no handling enroute, is available from 43 centers for bulk customers. In 2010-11, Retail EPP service was extended to retail customers also through all HOs and 68 Pos and a domestic version of this service has also been introduced for the same weight slabs from 51 Head Post Offices in the State.
11.137 In Kerala Circle Savings Bank facility is available in all the 5067 Post Offices. Schemes under SB include the Monthly Income Scheme, the Senior Citizens’ Savings Scheme, Time Deposit, the Public Provident Fund, 5 Year Recurring Deposit Scheme and the 5 and 10 Year National Savings Certificates extended by the Ministry of Finance, Government of India. As on 31.03.2011, the Circle has nearly One Crore live accounts.
11.138 Banking facilities in 1136 Departmental Post Offices have been computerized and by the end of the financial year, this will be extended to all the Departmental Post Offices.As part of a national level initiative to promote ‘financial inclusion’, a special drive was organized from August 2011 to open exclusive Savings Bank accounts by persons identified in the Below Poverty Line [BPL] category. 1.57 lakh accounts were opened in the State by September 2011.
11.139 Collection of contributions towards the pension for Kerala Madrasa Teachers’ Welfare fund: This scheme provides for the convenient collection of contributions from Madrasa teachers through their Postal Savings Bank accounts towards the welfare pension scheme launched by the Government of Kerala in June/2010.
11.140 Distribution of financial assistance to the beneficiaries belonging to SC category for construction of house under e-housing scheme was launched on 28/1/2011. Under this scheme, the financial assistance for house construction is distributed through the post office savings bank account of the beneficiaries. 11.141 The New Pension System (NPS) initially introduced by Union Government for its new recruits, except Defence forces, from 1st January 2004 was subsequently extended to the general public w.e.f. 01.04.2009. Department of Posts is a point of presence for the scheme, and all Head Post Offices under-take the registration and collection of contributions for it under e-Payment. In Kerala all the 51 Head Post Offices provide the NPS facility for any customer w.e.f. 30.04.2010.
Economic Review 2011
308
11.143 India Post is one of the Registrars for the enrolment for the issue of UID- Aadhaar. Post Office Aad-haar’ enrolment was launched in Kerala on 04.07.2011 by Sri. Oommen Chandy, Hon’ble Chief Minister of Kerala who distributed the first five PO-Aadhaar enrolment receipts on that occasion. So far 56 such stations have been set up. It is proposed to extend this facility to more post offices assessing the public demand for this facility.
11.144 Category wise offices in postal and other postal services in Kerala is given in Appendix 11.30 Divi-sion wise and category wise post offices under Kerala circle is given in Appendix 11.31. Urban / Rural split of post offices as on 31.03.11 is given in Appendix 11.32. District wise details of area and population served by one post office during 2009-10 are given in Appendix 11.33.
Bharat Sanchar Nigam Limited (BSNL)11.145. Kerala Telecom circle serves the whole of Kerala State, the Union Territory of Lakshadweep and part of Union Territory of Pondicherry (Mahe). The Circle has 11 major SSAs and one minor SSA of Lakshadweep. Out of 11 major Secondary Switching Areas, 4 (at Trivandrum, Ernakulam, Kottayam and Trichur) are headed by Principal General Managers and 7 are headed by General Managers. Lakshad-weep minor SSA is headed by a Telecom District Manager.
11.146 Kerala has an impressive record of performance in Telecom Sector. It was in this State that all the telephone exchanges were made automatic for the first time in the whole country, way back in 1990. In 1992, we become the first state to provide Public Telephone facilities in all panchayat Head Quarters. Kerala is also the first State to provide public telephone in every village, by 1995. Again it has the unique status of providing STD facility to all telephone exchanges.
11.147 There are 573683 internet customers and 739606 Broadband customers available in the circle as on 30.09.2011. Public Grievance Cell is working at Circle level with ‘12727’ and District Level with ‘12728’ other than computerized 198 fault repair services. Call Centre with ‘1500’ is fully functioning for Kerala. Call Centre for Mobile service is 9447024365. Internet helpline is also working at 12678 for Kerala Circle.
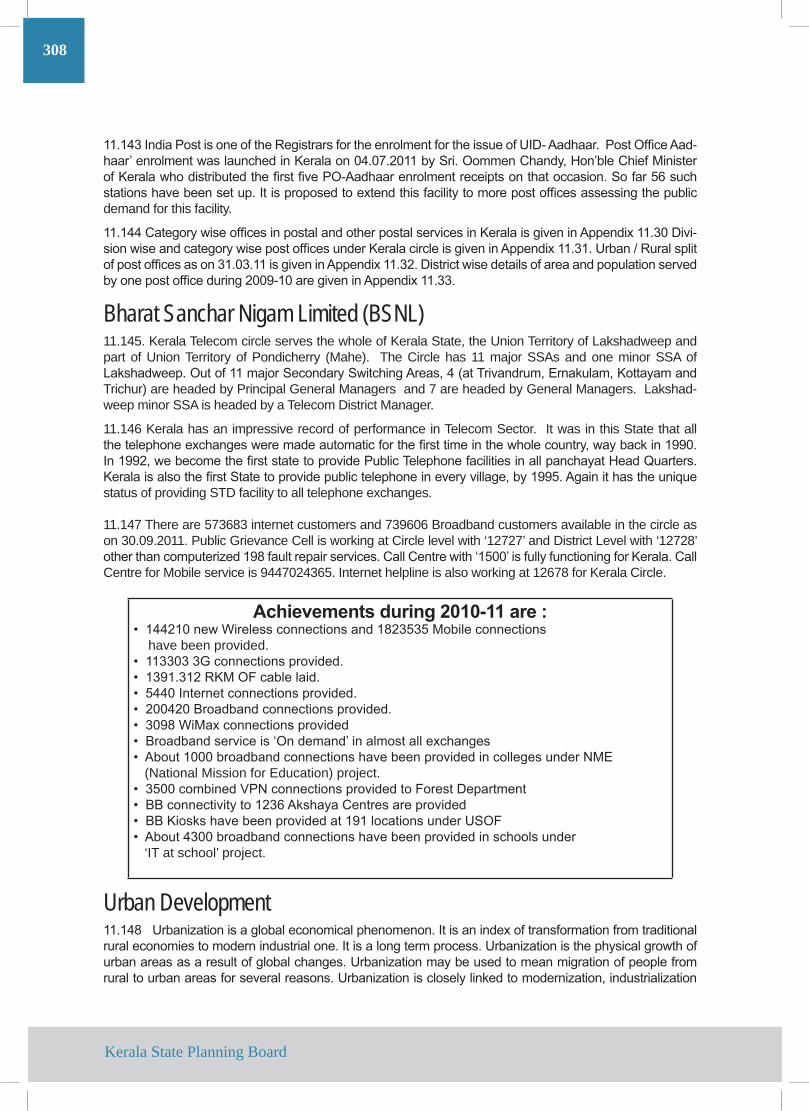
Achievements during 2010-11 are :• 144210 new Wireless connections and 1823535 Mobile connections have been provided. • 113303 3G connections provided. • 1391.312 RKM OF cable laid. • 5440 Internet connections provided. • 200420 Broadband connections provided. • 3098 WiMax connections provided• Broadband service is ‘On demand’ in almost all exchanges• About 1000 broadband connections have been provided in colleges under NME (National Mission for Education) project. • 3500 combined VPN connections provided to Forest Department• BB connectivity to 1236 Akshaya Centres are provided• BB Kiosks have been provided at 191 locations under USOF• About 4300 broadband connections have been provided in schools under ‘IT at school’ project.
Urban Development11.148 Urbanization is a global economical phenomenon. It is an index of transformation from traditional rural economies to modern industrial one. It is a long term process. Urbanization is the physical growth of urban areas as a result of global changes. Urbanization may be used to mean migration of people from rural to urban areas for several reasons. Urbanization is closely linked to modernization, industrialization
Kerala State Planning Board
309
and the sociological process of rationalization. In fact all the developed countries in the world are generally urbanized. Growth of population is more prevalent in urban areas and it provided better economic opportu-nities. Urbanization in India has occurred more slowly than in other developing countries and the proportion of population in urban areas has been only 28 per cent based on the 2001 census. The pace of urbaniza-tion is now set to accelerate as the country sets to a more rapid growth.
11.149 The trend of urbanization in the state of Kerala shows marked peculiarities. Generally, increase in the growth rate of urban population is the result of over concentration in the existing cities especially in metropolitan cities. But in Kerala, the main reason for the growth of urban population is the increase in the number of urban areas and also urbanization of the peripheral areas of the existing major urban centers. With high population densities and the composite primary and tertiary occupational structure in the rural area, the urban characteristics are present even in the rural areas.
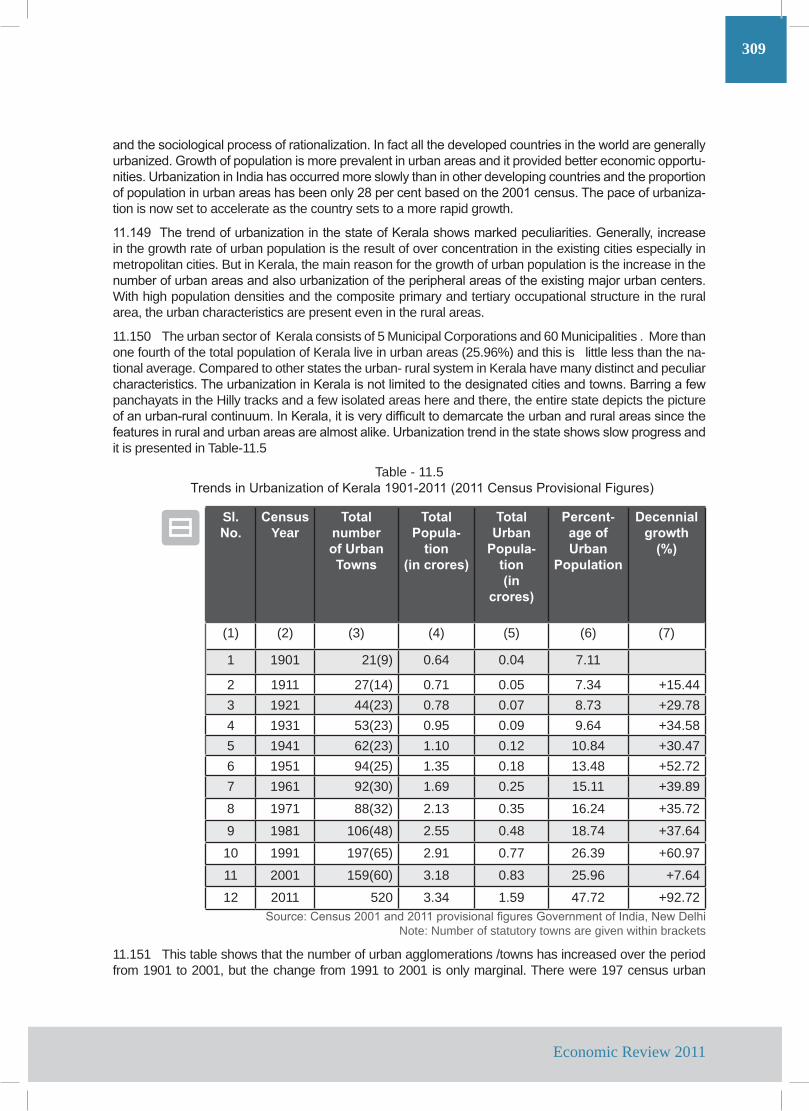
11.150 The urban sector of Kerala consists of 5 Municipal Corporations and 60 Municipalities . More than one fourth of the total population of Kerala live in urban areas (25.96%) and this is little less than the na-tional average. Compared to other states the urban- rural system in Kerala have many distinct and peculiar characteristics. The urbanization in Kerala is not limited to the designated cities and towns. Barring a few panchayats in the Hilly tracks and a few isolated areas here and there, the entire state depicts the picture of an urban-rural continuum. In Kerala, it is very difficult to demarcate the urban and rural areas since the features in rural and urban areas are almost alike. Urbanization trend in the state shows slow progress and it is presented in Table-11.5
Table - 11.5 Trends in Urbanization of Kerala 1901-2011 (2011 Census Provisional Figures)
Sl.No.
Census Year
Total number of Urban Towns
Total Popula-
tion(in crores)
Total Urban
Popula-tion(in
crores)
Percent-age of Urban
Population
Decennial growth
(%)
(1) (2) (3) (4) (5) (6) (7)
1 1901 21(9) 0.64 0.04 7.11
2 1911 27(14) 0.71 0.05 7.34 +15.443 1921 44(23) 0.78 0.07 8.73 +29.784 1931 53(23) 0.95 0.09 9.64 +34.585 1941 62(23) 1.10 0.12 10.84 +30.476 1951 94(25) 1.35 0.18 13.48 +52.727 1961 92(30) 1.69 0.25 15.11 +39.89
8 1971 88(32) 2.13 0.35 16.24 +35.72
9 1981 106(48) 2.55 0.48 18.74 +37.64
10 1991 197(65) 2.91 0.77 26.39 +60.97
11 2001 159(60) 3.18 0.83 25.96 +7.64
12 2011 520 3.34 1.59 47.72 +92.72 Source: Census 2001 and 2011 provisional figures Government of India, New Delhi
Note: Number of statutory towns are given within brackets
11.151 This table shows that the number of urban agglomerations /towns has increased over the period from 1901 to 2001, but the change from 1991 to 2001 is only marginal. There were 197 census urban
Economic Review 2011
310
towns (65 statutory towns and 132 census towns) in the state in 1991 which decreased to 159 (60 statu-tory towns and 99 census towns) in 2001. The urban content of the total population of the state has been 18.74% in 1981, 26.4% in 1991 (76.76 lakhs) and 26% in 2001. There are 19 Urban Agglomeration in the State of Kerala, as per 2011 census, which are continuous urban spreads constituting a town and its adjoin-ing urban out-growths, or two or more physically contiguous towns together and any adjoining urban out-growths of such towns. Ottappalam (UA), Chalakkudy (UA), Kothamangalam (UA), Changanassery (UA) and Kayamkulam (UA) are the five new Urban Agglomerations for 2011 census. The Urban Agglomeration of Vadakara (UA), 2001 census has been merged with Kozhikode (UA) for 2011 census. Similarly Kodun-gallur (UA) and Guruvayoor (UA) are merged with Thrissur (UA) for 2011 census.
11.152 The population of Kerala has increased from 64 lakh in 1901 to 318 lakh in 2001. This growth marks an increase of 10.93 per cent during 1901 to 1911 and 9.28 percent during 1991 to 2001. As per provisional census figures of 2011 the increase in population during the period from 2001 to 2011 is only 5.03% which shows that the rate of growth of population is decreasing. The density of population was 747 persons per sq km in 1991, which increased to 819 persons per sq km in 2001. The density of population varies from the coastal plains to the highland regions, the highest in the coastal land and the lowest in the highland. The share of urban population in Kerala recorded steady growth from 7.11% in 1901 to 26.39% in 1991, but then declined to 25.96% in 2001. But during the last decade the urban population recorded a sharp growth from 25.96% to 47.72% of the population according to provisional census figures of 2011.
11.153 In Kerala, urban content has been increasing from 7.11% in 1901 to 26.39% in 1991, but a slight decline seen in the decade 1991 to 2001. This is partially due to the declassification of Pandalam, Pira-vom, Koothattukulam and Mannarkad municipalities during 1991-2001. The declassification of Eloor and Earattupetta municipalities has not affected urbanization due to classification of the area contained in these municipalities as census towns in 2001 census.
11.154 Declassification of a few census towns in 2001 as rural has also contributed to the lower proportion of urban population in the state. Among the districts, the percentage of urbanization has varied from 3.8% in Wayanad to 50.4% in Kannur. Ernakulam district follows Kannur with 47.6% urban population. In six
Kerala State Planning Board
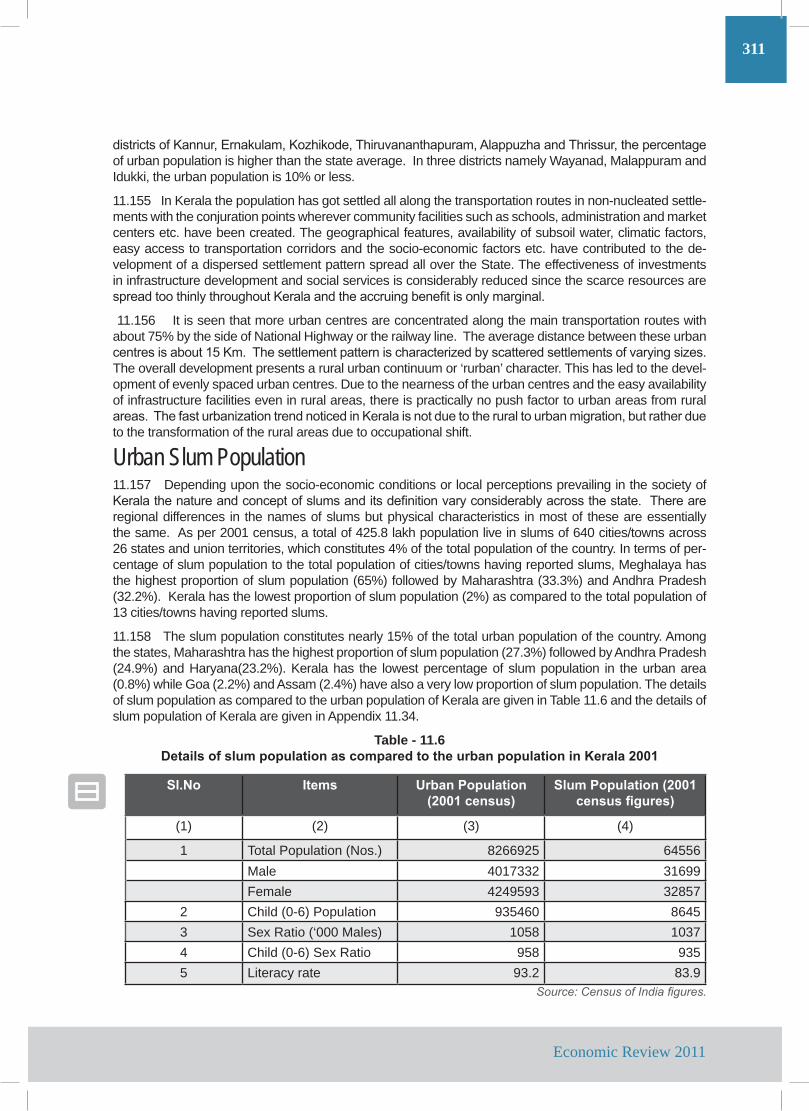
311
districts of Kannur, Ernakulam, Kozhikode, Thiruvananthapuram, Alappuzha and Thrissur, the percentage of urban population is higher than the state average. In three districts namely Wayanad, Malappuram and Idukki, the urban population is 10% or less.
11.155 In Kerala the population has got settled all along the transportation routes in non-nucleated settle-ments with the conjuration points wherever community facilities such as schools, administration and market centers etc. have been created. The geographical features, availability of subsoil water, climatic factors, easy access to transportation corridors and the socio-economic factors etc. have contributed to the de-velopment of a dispersed settlement pattern spread all over the State. The effectiveness of investments in infrastructure development and social services is considerably reduced since the scarce resources are spread too thinly throughout Kerala and the accruing benefit is only marginal.
11.156 It is seen that more urban centres are concentrated along the main transportation routes with about 75% by the side of National Highway or the railway line. The average distance between these urban centres is about 15 Km. The settlement pattern is characterized by scattered settlements of varying sizes. The overall development presents a rural urban continuum or ‘rurban’ character. This has led to the devel-opment of evenly spaced urban centres. Due to the nearness of the urban centres and the easy availability of infrastructure facilities even in rural areas, there is practically no push factor to urban areas from rural areas. The fast urbanization trend noticed in Kerala is not due to the rural to urban migration, but rather due to the transformation of the rural areas due to occupational shift.
Urban Slum Population11.157 Depending upon the socio-economic conditions or local perceptions prevailing in the society of Kerala the nature and concept of slums and its definition vary considerably across the state. There are regional differences in the names of slums but physical characteristics in most of these are essentially the same. As per 2001 census, a total of 425.8 lakh population live in slums of 640 cities/towns across 26 states and union territories, which constitutes 4% of the total population of the country. In terms of per-centage of slum population to the total population of cities/towns having reported slums, Meghalaya has the highest proportion of slum population (65%) followed by Maharashtra (33.3%) and Andhra Pradesh (32.2%). Kerala has the lowest proportion of slum population (2%) as compared to the total population of 13 cities/towns having reported slums.
11.158 The slum population constitutes nearly 15% of the total urban population of the country. Among the states, Maharashtra has the highest proportion of slum population (27.3%) followed by Andhra Pradesh (24.9%) and Haryana(23.2%). Kerala has the lowest percentage of slum population in the urban area (0.8%) while Goa (2.2%) and Assam (2.4%) have also a very low proportion of slum population. The details of slum population as compared to the urban population of Kerala are given in Table 11.6 and the details of slum population of Kerala are given in Appendix 11.34.
Table - 11.6Details of slum population as compared to the urban population in Kerala 2001 Sl.No Items Urban Population
(2001 census) Slum Population (2001
census figures)
(1) (2) (3) (4)
1 Total Population (Nos.) 8266925 64556Male 4017332 31699Female 4249593 32857
2 Child (0-6) Population 935460 86453 Sex Ratio (‘000 Males) 1058 10374 Child (0-6) Sex Ratio 958 9355 Literacy rate 93.2 83.9
Source: Census of India figures.
Economic Review 2011
312
Urbanization Policy for Kerala11.159 Urbanization is an important aspect in the process of economic and social development and is associated with many problems such as migration from villages to towns, relative cost of providing economic and social services in the towns of varying sizes, provision of housing for different sections of the people, provision of facilities like water supply, sanitation, transport and power, pattern of eco-nomic development, location and dispersal of industries, civic administration etc. The main objective of Urban Development Policy as envisaged by the National Commission on Urbanization included the following:
i) Saving the super-metros and national cities and also reviving their economiesii) Development of fast growing intermediary level urban centres by ensuring financial invest-ment for maintaining the existing infrastructure and augmenting it to a level wherein there will be more efficient urban entities andiii) Development of stagnating towns by providing gainful employment opportunities
11.160 In Kerala situation, the development of tertiary sector is the main cause of urbanization. It is not the outcome of accelerated industrialization and urbanization, as seen in Tamil Nadu, Maharashtra, Andhra Pradesh and Karnataka. Kannur district, with an urban population of 50.4% is ranked first in urban content, but 11th in per capita income. This is mainly due to the prevalence of low-income generating small-scale industries. Ernakulam District with an urban content of 47.6 % ranked second in urban content and first in per capita income. This is due to production specialization in industrial activities and port induced service sector development. Idukki district though ranks 13th in urban content, is second in per capita income. This is the outcome of production specialization in plantation crops.
Urban Development Strategy11.161 The National Commission on Urbanization suggested that urbanization strategy should be a part of the major strategy of generating economic growth. Urbanization and Economic Development have long been recognized as concomitant factors. The State Government also accept the special economics inter-related to urban development. The State Urban development Strategy prepared in 1996 states that the first priority in the strategy for urban development shall be given for Kochi Urban Agglomeration. Second priority is for Thiruvananthapuram Urban Agglomeration and the third for Kozhikode Urban Agglomeration. Major parameters considered in evolving the State Urban Development Strategy were:
• Density of population• Functional linkage with parent settlement• Functional dependency of the surrounding panchayats• Corridor development along major arterial roads• Transportation and land use• Functional category of town in the region
Urban Development Programmes11.162 The major Urban Development Programmes implemented at the state level are given below.
1. Urban Infrastructure Development Scheme for Small and Medium Towns (UIDSSMT)10.163 The Urban Infrastructure Development Scheme for Small and Medium Towns (UIDSSMT) is a centrally sponsored scheme launched by GOI during the year 2005-06 to improve the infrastructure in small and medium towns in the country in a planned manner. The scheme is for a period of seven years. In Kerala, 61 urban local bodies (excluding Thiruvananthapuram and Kochi Corporations, Thrippunithura and Kalamasseri Municipalities) are eligible for getting financial assistance under the scheme. The objectives of this Scheme are: • Improving infrastructural facilities and helping in the creation of durable public assets in small and medium towns having potential to emerge as regional centres of economic growth and employ-
Kerala State Planning Board
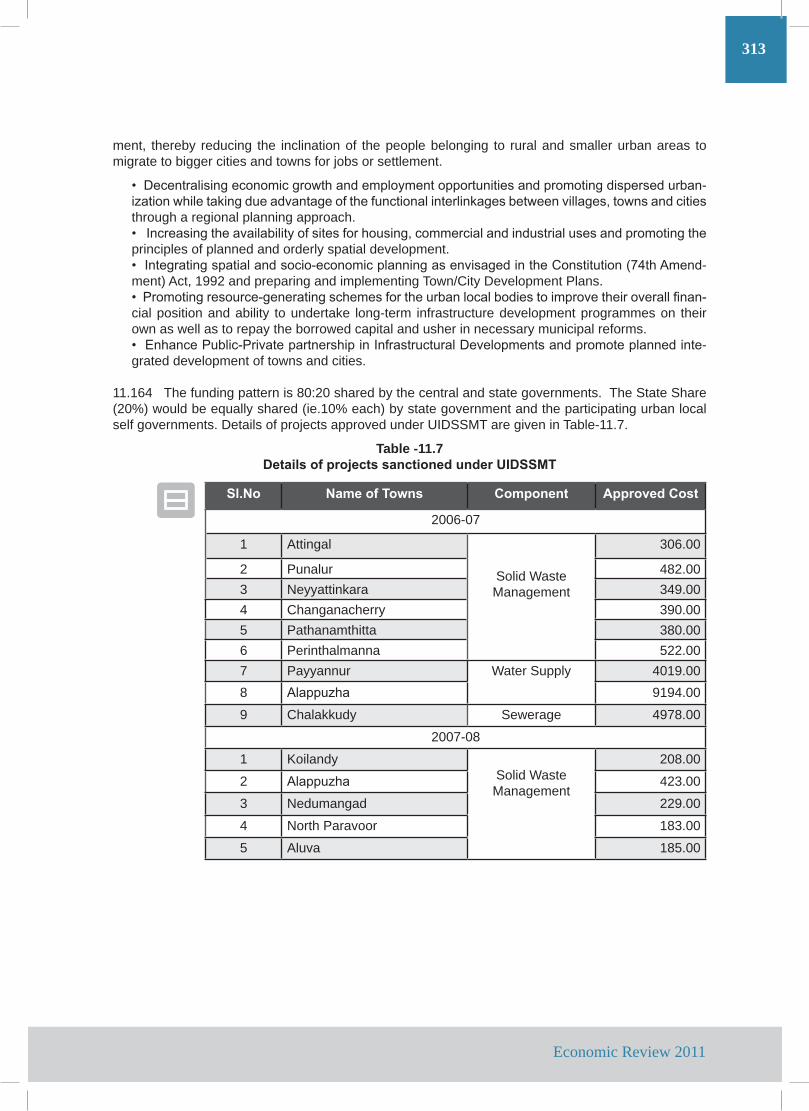
313
ment, thereby reducing the inclination of the people belonging to rural and smaller urban areas to migrate to bigger cities and towns for jobs or settlement.
• Decentralising economic growth and employment opportunities and promoting dispersed urban-ization while taking due advantage of the functional interlinkages between villages, towns and cities through a regional planning approach.• Increasing the availability of sites for housing, commercial and industrial uses and promoting the principles of planned and orderly spatial development.• Integrating spatial and socio-economic planning as envisaged in the Constitution (74th Amend-ment) Act, 1992 and preparing and implementing Town/City Development Plans.• Promoting resource-generating schemes for the urban local bodies to improve their overall finan-cial position and ability to undertake long-term infrastructure development programmes on their own as well as to repay the borrowed capital and usher in necessary municipal reforms.• Enhance Public-Private partnership in Infrastructural Developments and promote planned inte-grated development of towns and cities.
11.164 The funding pattern is 80:20 shared by the central and state governments. The State Share (20%) would be equally shared (ie.10% each) by state government and the participating urban local self governments. Details of projects approved under UIDSSMT are given in Table-11.7.
Table -11.7Details of projects sanctioned under UIDSSMT
Sl.No Name of Towns Component Approved Cost
2006-07
1 Attingal
Solid WasteManagement
306.00
2 Punalur 482.003 Neyyattinkara 349.004 Changanacherry 390.005 Pathanamthitta 380.006 Perinthalmanna 522.007 Payyannur Water Supply 4019.008 Alappuzha 9194.00
9 Chalakkudy Sewerage 4978.00
2007-08
1 KoilandySolid WasteManagement
208.00
2 Alappuzha 423.00
3 Nedumangad 229.00
4 North Paravoor 183.00
5 Aluva 185.00
Economic Review 2011
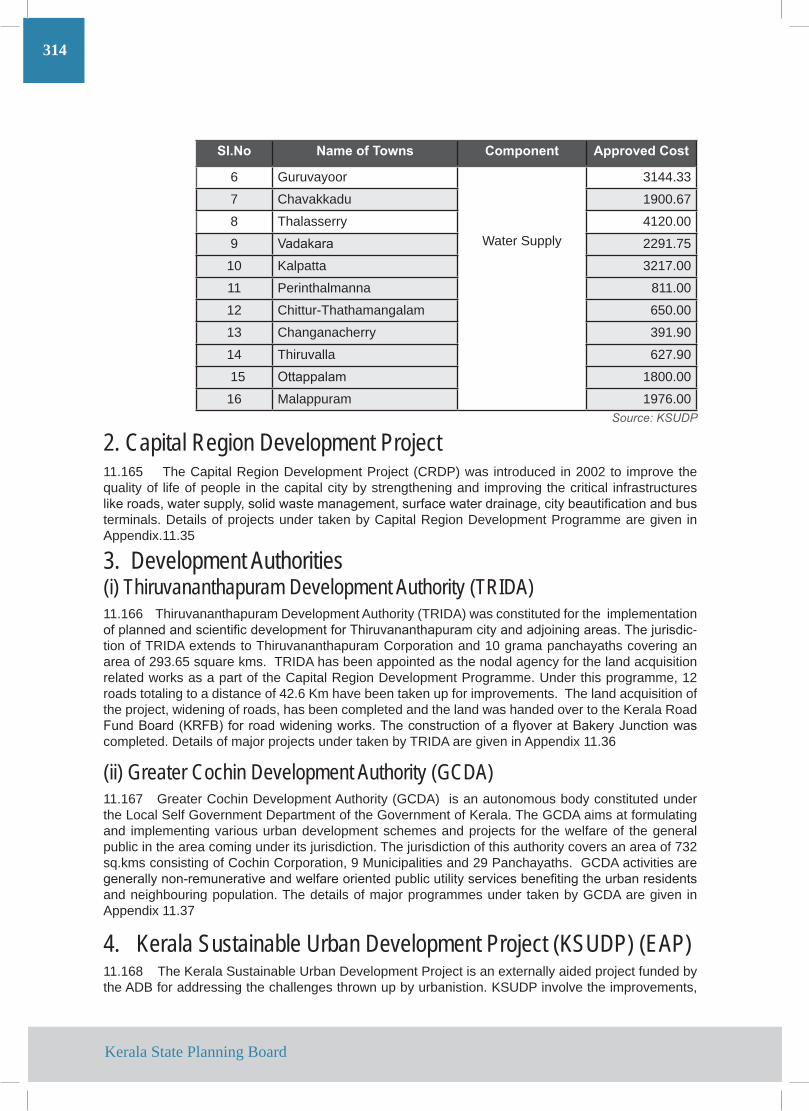
314
Sl.No Name of Towns Component Approved Cost
6 Guruvayoor
Water Supply
3144.33
7 Chavakkadu 1900.67
8 Thalasserry 4120.00
9 Vadakara 2291.75
10 Kalpatta 3217.00
11 Perinthalmanna 811.00
12 Chittur-Thathamangalam 650.00
13 Changanacherry 391.90
14 Thiruvalla 627.90
15 Ottappalam 1800.00
16 Malappuram 1976.00 Source: KSUDP
2. Capital Region Development Project11.165 The Capital Region Development Project (CRDP) was introduced in 2002 to improve the quality of life of people in the capital city by strengthening and improving the critical infrastructures like roads, water supply, solid waste management, surface water drainage, city beautification and bus terminals. Details of projects under taken by Capital Region Development Programme are given in Appendix.11.35
3. Development Authorities(i) Thiruvananthapuram Development Authority (TRIDA)11.166 Thiruvananthapuram Development Authority (TRIDA) was constituted for the implementation of planned and scientific development for Thiruvananthapuram city and adjoining areas. The jurisdic-tion of TRIDA extends to Thiruvananthapuram Corporation and 10 grama panchayaths covering an area of 293.65 square kms. TRIDA has been appointed as the nodal agency for the land acquisition related works as a part of the Capital Region Development Programme. Under this programme, 12 roads totaling to a distance of 42.6 Km have been taken up for improvements. The land acquisition of the project, widening of roads, has been completed and the land was handed over to the Kerala Road Fund Board (KRFB) for road widening works. The construction of a flyover at Bakery Junction was completed. Details of major projects under taken by TRIDA are given in Appendix 11.36
(ii) Greater Cochin Development Authority (GCDA)11.167 Greater Cochin Development Authority (GCDA) is an autonomous body constituted under the Local Self Government Department of the Government of Kerala. The GCDA aims at formulating and implementing various urban development schemes and projects for the welfare of the general public in the area coming under its jurisdiction. The jurisdiction of this authority covers an area of 732 sq.kms consisting of Cochin Corporation, 9 Municipalities and 29 Panchayaths. GCDA activities are generally non-remunerative and welfare oriented public utility services benefiting the urban residents and neighbouring population. The details of major programmes under taken by GCDA are given in Appendix 11.37
4. Kerala Sustainable Urban Development Project (KSUDP) (EAP)11.168 The Kerala Sustainable Urban Development Project is an externally aided project funded by the ADB for addressing the challenges thrown up by urbanistion. KSUDP involve the improvements,
Kerala State Planning Board
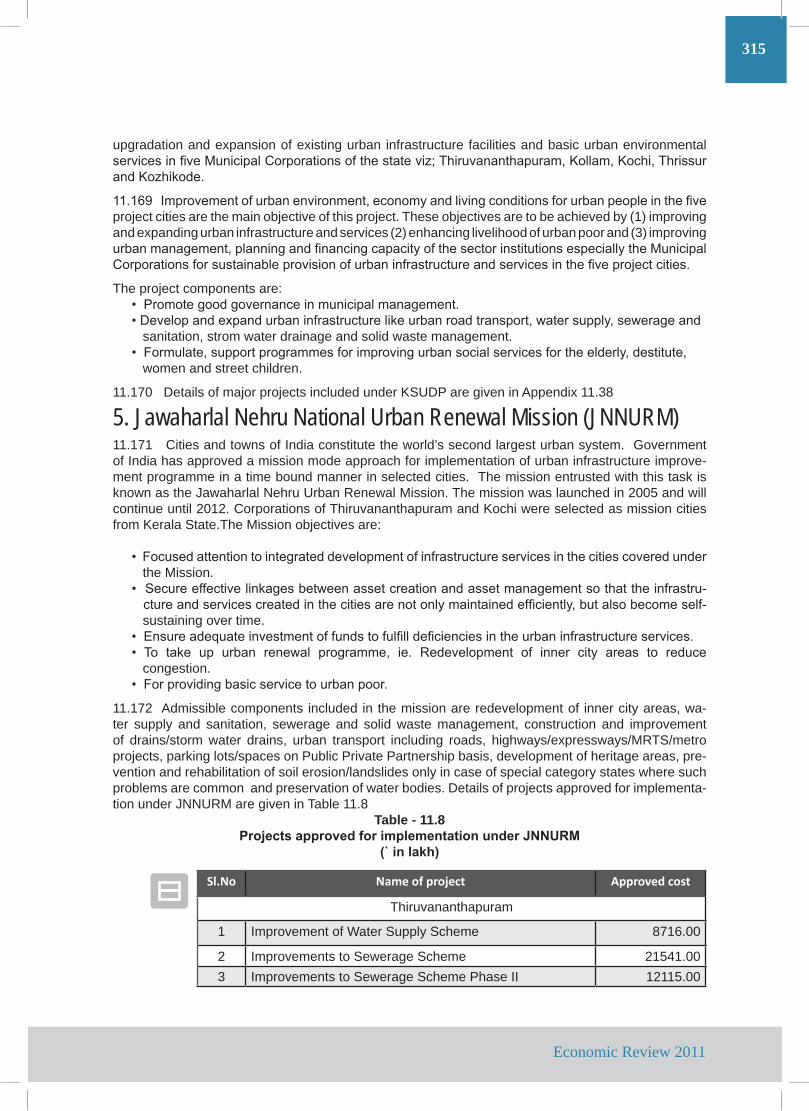
315
upgradation and expansion of existing urban infrastructure facilities and basic urban environmental services in five Municipal Corporations of the state viz; Thiruvananthapuram, Kollam, Kochi, Thrissur and Kozhikode.
11.169 Improvement of urban environment, economy and living conditions for urban people in the five project cities are the main objective of this project. These objectives are to be achieved by (1) improving and expanding urban infrastructure and services (2) enhancing livelihood of urban poor and (3) improving urban management, planning and financing capacity of the sector institutions especially the Municipal Corporations for sustainable provision of urban infrastructure and services in the five project cities.
The project components are:• Promote good governance in municipal management.• Develop and expand urban infrastructure like urban road transport, water supply, sewerage and sanitation, strom water drainage and solid waste management.• Formulate, support programmes for improving urban social services for the elderly, destitute, women and street children.
11.170 Details of major projects included under KSUDP are given in Appendix 11.38
5. Jawaharlal Nehru National Urban Renewal Mission (JNNURM)11.171 Cities and towns of India constitute the world’s second largest urban system. Government of India has approved a mission mode approach for implementation of urban infrastructure improve-ment programme in a time bound manner in selected cities. The mission entrusted with this task is known as the Jawaharlal Nehru Urban Renewal Mission. The mission was launched in 2005 and will continue until 2012. Corporations of Thiruvananthapuram and Kochi were selected as mission cities from Kerala State.The Mission objectives are:
• Focused attention to integrated development of infrastructure services in the cities covered under the Mission.• Secure effective linkages between asset creation and asset management so that the infrastru- cture and services created in the cities are not only maintained efficiently, but also become self- sustaining over time.• Ensure adequate investment of funds to fulfill deficiencies in the urban infrastructure services.• To take up urban renewal programme, ie. Redevelopment of inner city areas to reduce congestion.• For providing basic service to urban poor.
11.172 Admissible components included in the mission are redevelopment of inner city areas, wa-ter supply and sanitation, sewerage and solid waste management, construction and improvement of drains/storm water drains, urban transport including roads, highways/expressways/MRTS/metro projects, parking lots/spaces on Public Private Partnership basis, development of heritage areas, pre-vention and rehabilitation of soil erosion/landslides only in case of special category states where such problems are common and preservation of water bodies. Details of projects approved for implementa-tion under JNNURM are given in Table 11.8
Table - 11.8Projects approved for implementation under JNNURM
(` in lakh) Sl.No Name of project Approved cost
Thiruvananthapuram
1 Improvement of Water Supply Scheme 8716.00
2 Improvements to Sewerage Scheme 21541.003 Improvements to Sewerage Scheme Phase II 12115.00
Economic Review 2011
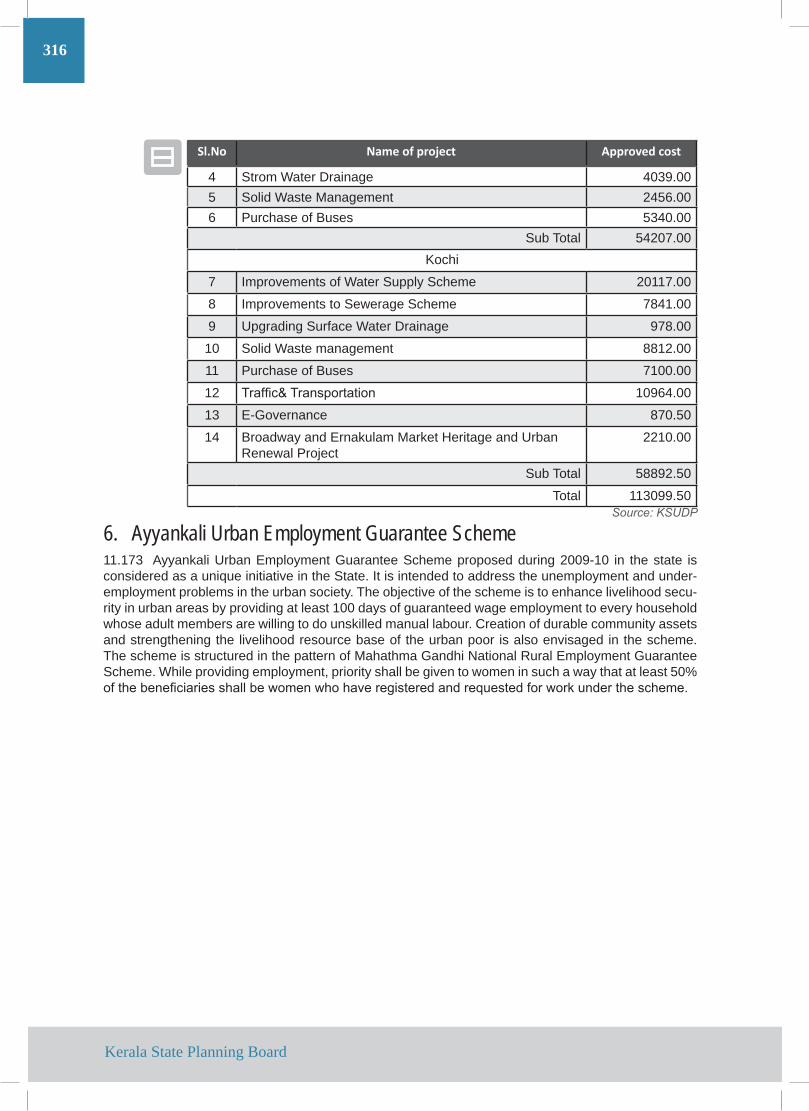
316
Sl.No Name of project Approved cost
4 Strom Water Drainage 4039.005 Solid Waste Management 2456.006 Purchase of Buses 5340.00
Sub Total 54207.00Kochi
7 Improvements of Water Supply Scheme 20117.00
8 Improvements to Sewerage Scheme 7841.00
9 Upgrading Surface Water Drainage 978.00
10 Solid Waste management 8812.00
11 Purchase of Buses 7100.00
12 Traffic& Transportation 10964.00
13 E-Governance 870.50
14 Broadway and Ernakulam Market Heritage and Urban Renewal Project
2210.00
Sub Total 58892.50
Total 113099.50Source: KSUDP
6. Ayyankali Urban Employment Guarantee Scheme11.173 Ayyankali Urban Employment Guarantee Scheme proposed during 2009-10 in the state is considered as a unique initiative in the State. It is intended to address the unemployment and under-employment problems in the urban society. The objective of the scheme is to enhance livelihood secu-rity in urban areas by providing at least 100 days of guaranteed wage employment to every household whose adult members are willing to do unskilled manual labour. Creation of durable community assets and strengthening the livelihood resource base of the urban poor is also envisaged in the scheme. The scheme is structured in the pattern of Mahathma Gandhi National Rural Employment Guarantee Scheme. While providing employment, priority shall be given to women in such a way that at least 50% of the beneficiaries shall be women who have registered and requested for work under the scheme.
Kerala State Planning Board