KOLLAM - Kerala State Land Use Board
275
NATURAL RESOURCES DATA BANK KOLLAM KERALA STATE LAND USE BOARD VIKAS BHAVAN THIRUVANANTHAPURAM-33 2014
-
Upload
khangminh22 -
Category
Documents
-
view
0 -
download
0
Transcript of KOLLAM - Kerala State Land Use Board

NATURAL RESOURCES DATA BANKKOLLAM
KERALA STATE LAND USE BOARDVIKAS BHAVAN THIRUVANANTHAPURAM-33
2014

P. MARYKUTTY I.A.S.Land Use Commissioner
P. MARYKUTTY IASCommissionerKerala State Land Use Board
KERALA STATE LAND USE BOARDVikas Bhavan, Thiruvananthapuram 695 033
email : [email protected] : +91 471 2307833 (P), 2302231, 2307830
Fax : +91 471 2307838
PREFACE
Land Use planning is a process of determining future action through systematic
evaluation of Land Resources. Through proper study of natural
resources like land, water, biomass etc., land use planning can be effectively
implemented for various purposes. For NRM basic information on natural
resources, both spatial and nonspatial is absolutely essential. Planning
reveals the scope of resources and how they can be meaningfully used in future. This
publication, “Natural Resources Data Bank” will help in understanding the natural
resources of the district especially in the context of decentralized planning. Though
many gaps might be there in this publication, I hope it would serve as an effective tool
for planning at microlevel.
Thiruvananthapuram 26-02-2014

CONTENTS PAGE NO.
1. GENERAL INFORMATION ........................................................................... 1
2. ADMINISTRATIVE BOUNDARY ................................................................... 15
3. LEGISLATIVE ASSEMBLY/PARLIAMENT CONSTITUENCIES .................. 19
4. DEMOGRAPHY ............................................................................................. 23
5. METEOROLOGY ........................................................................................... 33
6. GEOLOGY & GEOMORPHOLOGY .............................................................. 39
7. PHYSIOGRAPHY .......................................................................................... 65
8. SOIL. .............................................................................................................. .71
9. WATER RESOURCES .................................................................................. 79
10. MINERALS ..................................................................................................... 89
11. LAND USE ..................................................................................................... 97
12. BIODIVERSITY .............................................................................................. 145
13. FORESTS ...................................................................................................... 149
14. AGRICULTURE ............................................................................................. 155
15. PLANTATION ................................................................................................ 179
16. ANIMAL HUSBANDRY .................................................................................. 183
17. FISHERIES .................................................................................................... 187
18. WETLAND ...................................................................................................... 191
19. WASTE LAND ................................................................................................ 209
20. WATERSHED ................................................................................................ 221
21. IRRIGATION (MINOR & MAJOR) .................................................................. 241
22. POWER .......................................................................................................... 255
23. MISCELLANEOUS ................................................................................... . 261
N.B:- Related Maps are provided in each Chapter.

GENERAL INFORMATION
Kollam district the South West coast of Kerala State came into existence on
1st July 1949. District has an area of 248788 ha consisting 11 blocks, 3 municipalities
and 1 corporation. Being South West coast of India District lies between North
latitude 90 10’ and 80 45’ and East longitude 760 25’ and 770 15’. Based on
physiographical features district consist four micro regions viz Kollam coast, Adoor
Rolling plain, Kottarakkara undulating upland and Kulathupuzha forested hills. Forest
is classified into six different regions and covers an area of 81438 ha. Large forest
reserves favourably affect the climate and induce more rain in the district. With vast
stretches of evergreen forest Kollam is blessed with natural habitat for variety of
plants and animals. Mineral resources are immensely rich and endowed with large
deposits of beach sand containing Ilmenite, Monazite, Clay, Bauxite, Graphite and
Laterite. Sandy, Alluvial, Laterite and Forest soil are the four types of soil cover the
whole area. Main river systems are Achenkovil, Kallada, Ithikkara, Ayoor. Besides
the conventional sources of irrigation like tanks, wells and private canals, Kollam has
major and minor irrigation schemes. Kallada irrigation project which is the largest
irrigation project in Kerala State situated in this district. Watershed has become an
acceptable unit of planning for optimum use and conservation of soil and water
resources. Agriculture plays a vital role and total cropped area is 157343 ha during
2011-12 report. District stands 1st position in tapioca cultivation and plantation crops
are also grown here. Kollam is an important maritime district and coastal area
extends 37 km consisting 53 fishing villages. Major fishing port in south Kerala,
Neendakara is located on the banks of Ashtamudi lake. District has one of the largest
cattle stock population and there were 255773 live stock population and 766412
poultry population during 2010-11 Animal husbandry reports. Land use categories
observed in this district are builtup land, waterbodies, forest, agriculture land, wet
land and waste land. Major categories of wasteland are Land with dense scrub, Land
with open scrub and Miscellaneous polygon. Wetland has a vital role in maintaining
the fragile environmental balance. Sasthamkotta which is the largest fresh water lake
in Kerala State is situated in this district. With its rich history and cultural heritage
Kollam is known as ‘God’s Own Capital’. District provides famous industries including
traditional industries and mills. Kollam is rich with beautiful tourist spots, backwaters
and pilgrim centres.
-1-

HISTORY Quilon, an old seaport town on the Arabian coast, is flanked by the
Lakshadweep Sea on the West and the South and the Ashtamudi lake on the North.
The district is named after this headquarters town. The word ‘Quilon’ is an anglicized
form of the Malayalam word ‘Kollam’. After February 1990, the names of the district
and its headquarters town had been changed to Malayalam version ‘Kollam’. The
district is bounded on the North by Mavelikkara and Karthikappally taluks of
Alappuzha district and on the North-East by Adoor and Kozhencherry taluks of
Pathanamthitta district, on the East by Thirunelveli district of Tamil Nadu, on the
South by Nedumangad and Chirayinkeezhu taluks of Thiruvananthapuram district
and on the West by the Lakshadweep Sea.
This district was formerly a part of Travancore State. Travancore State was
bifurcated into Northern and Southern Revenue divisions in 1835 A.D., with
headquarters at Kottayam and Quilon respectively. Hence, Quilon was the
headquarters of the Southern division. But Travancore and Cochin States were
integrated on the 1st July, 1949. Then Quilon was one of the three Revenue divisions
in the State. These three Revenue divisions were later on converted into three
districts. There were 12 taluks in Quilon district, which were Quilon, Kottarakkara,
Pathanapuram, Chencottah, Kunnathur, Pathanamthitta, Karthikappally,
Karunagappally, Mavelikkara, Thiruvalla, Ambalappuzha and Chertallai. When the
States were re-organised on the 1st November, 1956, Chencottah taluk was
transferred to Tamil Nadu State. Thiruvalla taluk was difurcated and a new taluk
named Chengannur was created. A new district Alleppey was carved out on the 17th
August, 1957 with six taluks, viz., Chertallai, Ambalappuzha, Karthikappally,
Mavelikkara, Chengannur and Thiruvalla from the erstcwhile Quilon district. Thus,
Quilon district was left with six taluks, namely, Karunagappally, Kunnathur,
Pathanamthitta, Pathanapuram, Kottarakkara and Quilon. The district almost
remained undisturbed till 1981, except the transfer of Srayikkad and Azheekkal-
Thura Karas of Puthuppally village of Karthikappally taluk of Alleppey district to
Perinad village of Karunagappally taluk of Quilon district.
The rulers of Quilon (Desinganadu) and China exchanged embassies. There
was a flourishing Chinese settlement at Quilon. Merchant Sulaiman of Siraf in Persia
(9th Century), on his way from Canton to Persian Gulf, found Quilon to be the only
Port in India touched by the huge Chinese junks. Marco Polo, the Great Venecian
-2-

Traveller who was in the Chinese Service under Kublaikhan, in 1275 visited Quilon
and other towns on the West coast in his capacity as Chinese mandarin.
Quilon was a great centre of learning and culture as the capital of Venad. It
attracted distinguished scholars from all parts of South India. “Leelathilakam” and
“unnuneelisandesam”, two outstanding literary works of historical importance are
contributions of Quilon in the 14th Century. The dance form of Kathakali in its new
version of “Ramanattam” was the creation of Kottarakkara Thampuran, who also
improved “Krishnattam” by substituting Malayalam for Sanskrit. Quilon also gave
Kerala leaders like T.M.Varughese, C.Kesavan, Kumbalathu Sanku Pillai,
N.Sreekantan Nair and R.Shankar who played prominent roles in shaping the socio-
political destiny of the State.
-3-

KERALA AT A GLANCE
Location : North Latitude between 8018’ and 12048’
East Longitude between 740 52’ and 77022’ Area : 38863 sq.km. Forests : 11309.42 sq.km. Wetlands : 1941 sq.km. Percentage of area to the area of Indian Union : 1.18 Length of Coastal Line : 590 km. Highest Peak : Anamudi (2694 metres) Longest River : Periyar (244 km.) Rivers West flowing : 41 Nos. East flowing : 3 Nos. Administration Districts : 14 Nos. Taluks : 63 Nos. Revenue Villages : 1478 Nos. Village Panchayats : 978 Nos. Corporations : 5 Nos. Municipalities : 60 Nos. Cantonments : 1 No. Community Development Blocks : 152 Nos. Average Annual Rainfall : 2900 m.m. Cultivated Area : 2.292 m.ha. Per capita land : 0.13 ha. Per capita cultivated land : 0.10 ha. Per capita production food grain : 37 kg/annum Members in State Legislature Elected : 140 Nos. Nominated : 1 No. Members of Parliament from the State Lok Sabha : 20 Nos. Rajya Sabha : 9 Nos. -4-

Table: 1.1
Population 1991 Census
2001 Census
2011 Census
Total population (lakhs)
Male population (lakhs)
Female Population (lakhs)
Density per sq.km.
Sex ratio (Females per 1000 males)
Literacy (%)
Male Literacy
Female Literacy
Rural population (lakhs)
Urban population (lakhs)
Increase of population (%)
Life Expectancy (Years)
Infant Mortality (per 1000)
Birth Rate (per 1000)
290.99
142.89
148.10
749
1036
89.81
93.62
86.17
214.18
78.80
13.88
68
22
19.8
318.41
154.69
163.73
819
1058
90.86
94.24
87.72
235.75
82.67
9.43
16
18.3
333.88
160.21
173.66
859
1084
93.91
96.02
91.98
174.56
159.32
4.86
74
12
14.7
-5-

KOLLAM AT A GLANCE Table: 1.2
ADMINISTRATIVE SET UP
Sl. No.
Particulars Kollam State
1 No. of Revenue Divisions 1 212 No. of Taluks 5 633 No. of Revenue Villages 104 14784 No. of Corporations 1 55 No. of Municipalities 3 606 No. of Municipality Wards 102 22167 No. of Block Panchayat 11 1528 No. of Block Panchayat Wards 153 20959 No. of Grama Panchayat 70 97810 No. of Grama Panchayat Wards 1274 1668011 No. of Assembly Constituencies 11 140
12 No. of Parliament Constituencies 1 2013 No. of District Panchayat Wards 26 332
Table: 1.3
DEMOGRAPHY
Sl.No. Particulars Kollam State
1 Total Population 2629703 33387677
2 No. of Literates 2242757 28234227
3 No. of Migrant 126346 1625653
Table: 1.4
GEOGRAPHICAL PARTICULARS
Sl. No.
Area Categorization Kollam State
1 Total Area (Ha) 248788 3886287
2 Forest Area (Ha) 81438 1081509
3 Length of Coastal Line (Kms) 37 590
-6-

Table: 1.5
AGRICULTURE
Sl. No.
Land Utilization Pattern Kollam State
1 Total geographical area 248788 3886287
2 Forest area 81438 1081509
3 Land put to non agricultural use 26567 399924
4 Barren & uncultivable land 222 17552
5 Permanent pastures and other grazing land 2 85
6 Land under misc. tree crops 64 3366
7 Cultivable waste 1583 95437
8 Fallow other than current fallow 1804 57670
9 Current fallow 4457 77056
10 Net area sown 124779 2040132
11 Area sown more than once 32564 621625
12 Total cropped area 157343 2661757
Table: 1.6
ANIMAL HUSBANDRY
Sl. No.
Livestock Population Kollam State
1 Cattle 124390 1740117
2 Buffaloes 4475 58145
3 Goats 125905 1729127
4 Pigs 1976 109480
5 Sheep 0 965
6 Ducks 71019 865331
-7-

Table: 1.7
FISHERIES
Sl. No.
Particulars Kollam State
1 Length of Coastal line 37 590
2 No. of Fishing Villages
a) Marine 27 222
b) Inland 26 113
3 Fisher folk population
a) Marine 108584 957929
b) Inland 43372 282344 Table: 1.8
INDUSTRIES
Sl. No. Industrial Units Kollam State
1 Number of Factories 1825 18525
2 Number of SSI Units Registered 13705 205987
3 Number of Women SSI Units 5185 52294
4 Number of Industrial Co-operative Societies 161 1113
Table: 1.9
COMMUNICATION
Sl. No. Communication Divisions Kollam State
1 Total Number of Post offices 362 5054a) Number of Head office 3 51b) Number of Sub Office 91 1455c) Number of ED Branch office 151 3560d) Number of ED Sub office 0 22 Total Number of Telephone exchanges 86 1245
-8-

Table: 1.10
EDUCATION
Sl. No.
Institutions Kollam State
1 Government Lower Primary Schools 278 2607
2 Government Upper Primary Schools 65 924
3 Government High Schools 84 1089
4 Government Higher Secondary Schools 56 769
5 Government Vocational Higher Secondary Schools 20 261
6 Teachers Training Institute 29 222
7 Kendriya Vidyalaya 1 278 Jawahar Navodaya Vidyalaya 1 14
9 CBSE School 60 797
10 ICSE School 14 108
11 Government Engineering Colleges 3 9
12 Government Medical Colleges 0 5
13 Government Polytechnic Colleges 3 49
Table: 1.11
DRINKING WATER FACILITIES
Sl.No. Water Supply Connections Kollam State
1 Number of Public Canals 1220 85825
2 Number of Public Wells 12 603
3 Number of Public Tanks 18 1777
4 Number of Tube Wells 24 19716
5 Number of Dug Wells 25 423
-9-

Table: 1.12
HEALTH
Sl. No. Institutions Kollam State
1 General Hospital 0 11
2 Women & Children Hospital 1 8
3 District Hospital 1 15
4 Taluk Hospital 8 80
5 Primary Health Centre 48 660
6 Leprosy Control Unit/Hospitals 0 3
7 TB Centre/Clinic 2 17
8 Mental Health Centre 0 3
9 Number of Ayurvedic Hospitals 9 119
10 Number of Govt. Homeopathic Hospitals 3 30
Table: 1.13
POWER
Sl.No. Particulars State
1 No. of pump sets energised 524568
2 No. of streetlight energised 1202988
3 No. of transformers 58104 Table: 1.14
WATER RESOURCES
River
Achenkovil Pallickal Kallada Ithikkara
Ayoor
Brackish Water
Paravoor Ashtamudi
Kayamkulam Sasthamkotta
-10-

Table: 1.15
MAJOR TOURIST SPOTS
Sl.No. Tourist Centre Focus
1 Thenmala Eco tourism
2 Palaruvi Water fall
3 Kunnicode Hillock
4 Jetayupara Rock hill
5 Agastyarmalai Biosphere Reserve
6 Ashtamudi
Back Waters 7 Munroe Island
8 Alumkadavu
9 Paravoor
10 Sasthamkotta Freshwater
11 Shendurney Wild life sanctuary
-11-

-12-


-14-

-15-

-16-

-17-

-18-

-19-

-20-

-21-

-22-

DEMOGRAPHY
INDIA'S POPULATION – CENSUS 2011
Table: 4.1 Current Population of India in 2011 1,210,193,422 (1.21 billion)
Total Male Population in India 623,700,000 (623.7 million)
Total Female Population in India 586,500,000 (586.5 million)
Sex Ratio 940 females per 1,000 males
Age structure
0 to 25 years 50% of India's current population
Currently, there are about 51 births in India in a minute.
India's Population in 2001 1.02 billion
Population of India in 1947 350 million
KEY FINDINGS OF THE CENSUS
• Population grows to 1.21 billion • 181 million people added during 2001-11 • Growth declines to 17.64% from 21.15% during 1991-2001 • There are 623.7 million males and 586.5 million females • India accounts for 17.5% of the world’s population, China 19.4% • First decade (with exception of 1911-1921) which saw addition of lesser
people than the previous decade. • Child sex ratio — 914 females against 1,000 males — lowest since
independence • Overall sex ratio rises by seven points — 940 females per 1,000 males • Literacy rate goes up from 64.83% to 74.04% • 74% people aged seven and above are literate • 82.14% male literacy, 65.46% female literacy • In 2001, male literacy was 75.26%, female literacy was 53.67% • Delhi (11,297 people per square km) has the highest population density,
followed by Chandigarh (9,252) • Uttar Pradesh is the most populous state with 199 million people while
Lakshadweep is the least populated at 64,429 Source: Census Report 2011
-23-

Tabl
e:- 4
.2
Per
sons
Mal
esFe
mal
esP
erso
nsM
ales
Fem
ales
Per
sons
Mal
esFe
mal
es1
23
45
67
89
1011
IND
IA31
,66,
285
1,21
,01,
93,4
2262
,37,
24,2
4858
,64,
69,1
7415
,87,
89,2
878,
29,5
2,13
57,
58,3
7,15
277
,84,
54,1
2044
4,20
3,76
233
4,25
0,35
8K
ER
ALA
38,8
633,
33,8
7,67
71,
60,2
1,29
01,
73,6
6,38
733
,22,
247
16,9
5,93
516
,26,
312
2,82
,34,
227
1,37
,55,
888
1,44
,78,
339
Kas
arag
od1,
992
13,0
2,60
06,
26,6
176,
75,9
831,
49,2
8076
,149
73,1
3110
,36,
289
5,17
,031
5,19
,258
Kan
nur
2,96
625
,25,
637
11,8
4,01
213
,41,
625
2,65
,276
1,35
,189
1,30
,087
21,5
6,57
510
,22,
972
11,3
3,60
3W
ayan
ad2,
131
8,16
,558
4,01
,314
4,15
,244
89,7
2045
,776
43,9
446,
49,1
863,
30,0
933,
19,0
93K
ozhi
kode
2,34
430
,89,
543
14,7
3,02
816
,16,
515
3,23
,511
1,64
,800
1,58
,711
26,3
4,49
312
,76,
384
13,5
8,10
9M
alap
pura
m3,
550
41,1
0,95
619
,61,
014
21,4
9,94
25,
52,7
712,
81,9
582,
70,8
1333
,28,
658
16,0
8,22
917
,20,
429
Pal
akka
d4,
480
28,1
0,89
213
,60,
067
14,5
0,82
52,
88,3
661,
46,9
471,
41,4
1922
,32,
190
11,1
9,36
011
,12,
830
Thris
sur
3,03
231
,10,
327
14,7
4,66
516
,35,
562
2,89
,126
1,48
,428
1,40
,698
26,8
9,22
912
,86,
141
14,0
3,08
8E
rnak
ulam
3,06
832
,79,
860
16,1
7,60
216
,62,
258
2,89
,281
1,48
,047
1,41
,234
28,6
1,50
914
,27,
572
14,3
3,93
7Id
ukki
4,35
811
,07,
453
5,51
,944
5,55
,509
1,00
,107
51,1
3248
,975
9,28
,774
4,74
,988
4,53
,786
Kot
taya
m2,
208
19,7
9,38
49,
70,1
4010
,09,
244
1,68
,563
86,1
1382
,450
17,4
5,69
48,
59,0
388,
86,6
56
Ala
ppuz
ha1,
414
21,2
1,94
310
,10,
252
11,1
1,69
11,
86,0
2295
,565
90,4
6618
,63,
558
8,95
,476
9,68
,082
Pat
hana
mth
itta
2,63
711
,95,
537
5,61
,620
6,33
,917
91,5
0146
,582
44,9
1910
,70,
120
5,03
,171
5,66
,949
Kol
lam
2,49
126
,29,
703
12,4
4,81
513
,84,
888
2,38
,062
1,21
,484
1,16
,581
22,4
2,75
710
,76,
509
11,6
6,24
8Th
iruva
nan
thap
uram
2,19
233
,07,
284
15,8
4,20
017
,23,
084
2,90
,661
1,47
,777
1,42
,884
27,9
5,19
513
,58,
924
14,3
6,27
1
CEN
SUS
OF
IND
IA 2
011-
PRO
VISI
ON
AL
POPU
LATI
ON
TO
TALS
IND
IA, K
ERA
LA S
TATE
AN
D
DIS
TRIC
TS
Are
a in
sq
.km
.In
dia/
Sta
te/
Dis
trict
Tota
l Pop
ulat
ion
Pop
ulat
ion
in a
ge g
roup
0-6
Num
ber o
f Lite
rate
s
-24-

1IN
DIA
KE
RA
LAK
asar
agod
Kan
nur
Way
anad
Koz
hiko
deM
alap
pura
m
Pal
akka
dTh
rissu
rE
rnak
ulam
Iduk
kiK
otta
yam
Ala
ppuz
haP
atha
nam
thitt
aK
olla
mTh
iruva
nan
thap
uram
Indi
a/S
tate
/D
istri
ct
Per
cent
age
deca
dal g
row
th
rate
of p
opul
atio
nS
ex R
atio
(Num
ber o
f Fe
mal
es p
er 1
000
Mal
es)
Sex
Rat
io 0
-6 p
opul
atio
n
Per
sons
Mal
esFe
mal
es20
01-1
120
1120
1112
1314
1516
1774
.04
82.1
465
.46
17.6
494
091
493
.91
96.0
291
.98
4.86
1084
959
89.9
593
.93
86.1
38.
1810
7996
095
.41
97.5
493
.57
4.84
1133
962
89.3
292
.84
85.9
44.
610
3596
095
.24
97.5
793
.16
7.31
1097
963
93.5
595
.78
91.5
513
.39
1096
960
88.4
992
.27
84.9
97.
3910
6796
295
.32
96.9
893
854.
5811
0994
895
.68
97.1
494
.27
5.6
1028
954
92.2
94.8
489
.59
1.93
1006
958
96.4
97.1
495
.67
1.32
1040
957
96.2
697
.994
.80.
6111
0094
7
96.9
397
.796
.26
3.12
1129
964
93.7
795
.83
91.9
51.
7211
1396
0
92.6
694
.690
.89
2.25
1088
967
Sou
rce
: Cen
sus
Rep
ort 2
011
Lite
racy
rate
(in
Per
cent
age)
-25-

Tabl
e: 4
.3
Popu
latio
n - 2
011
Cen
sus
Sl. N
o.
C
ateg
ory
Kol
lam
K
eral
a
Tota
l M
ale
Fem
ale
Tota
l M
ale
Fem
ale
1 To
tal P
opul
atio
n
Tota
l 26
3537
512
4696
813
8840
733
4060
6116
0274
1217
3786
49
Rur
al
1448
217
6806
8776
7530
1747
1135
8408
054
9063
081
Urb
an
1187
158
5662
8162
0877
1593
4926
7619
358
8315
568
2 P
opul
atio
n in
the
age
grou
p 0-
6 Y
ears
To
tal
2542
6012
8899
1253
6134
7295
517
6824
417
0471
1
Rur
al
1375
5969
705
6785
418
2366
492
7888
8957
76
Urb
an
1167
0159
194
5750
716
4929
184
0356
8089
35
3 S
ched
uled
Cas
te P
opul
atio
n To
tal
3282
6315
7801
1704
6230
3957
314
7780
815
6176
5R
ural
20
8474
9976
110
8713
1818
281
8838
1993
4462
Urb
an
1197
8958
040
6174
912
2129
259
3989
6273
03
4 S
ched
uled
Trib
e P
opul
atio
n To
tal
1076
151
9555
6648
4839
2382
0324
6636
Rur
al
7886
3821
4065
4330
9221
3208
2198
84U
rban
28
7513
7415
0151
747
2499
526
752
5 Li
tera
tes
Tota
l 22
4027
310
7434
511
6592
828
1358
2413
7049
0314
4309
21
Rur
al
1233
362
5873
8764
5975
1454
9320
7132
430
7416
890
Urb
an
1006
911
4869
5851
9953
1358
6504
6572
473
7014
031
6 Ill
itera
tes
To
tal
3951
0217
2623
2224
7952
7023
723
2250
929
4772
8
Rur
al
2148
5593
300
1215
5529
2181
512
7562
416
4619
1U
rban
18
0247
7932
310
0924
2348
422
1046
885
1301
537
-26-

Tabl
e: 4
.3 C
ontin
ued…
….
7 To
tal W
orke
rs
Tota
l 91
2025
6443
6226
7663
1161
9063
8451
569
3167
494
Rur
al
5128
1735
4505
1583
1263
4195
745
0750
118
3445
6U
rban
39
9208
2898
5710
9351
5277
106
3944
068
1333
038
M
ain
Wor
kers
8 W
orke
rs
Tota
l 69
5299
5099
0918
5390
9329
747
7179
828
2149
919
Rur
al
3738
0026
9660
1041
4049
3019
137
4307
811
8711
3
Urb
an32
1499
2402
4981
250
4399
556
3436
750
9628
06
9 C
ultiv
ator
s To
tal
4146
737
441
4026
5449
3246
5546
7938
6
Rur
al
3686
733
350
3517
4816
5141
0532
7111
9U
rban
4600
4091
509
6328
155
014
8267
10
Agr
icul
tura
l Lab
oure
rs
Tota
l 56
640
4771
689
2491
9136
6290
9229
0044
Rur
al
4547
238
219
7253
7606
3251
0300
2503
32U
rban
1116
894
9716
7115
8504
1187
9239
712
11
Hou
se h
old
Indu
stry
Wor
kers
To
tal
1385
197
7840
7319
8281
1321
1166
170
Rur
al
7599
5490
2109
1046
4268
889
3575
3U
rban
6252
4288
1964
9363
963
222
3041
7
12
Oth
er W
orke
rs
Tota
l 58
3341
4149
7416
8367
7667
398
5953
079
1714
319
Rur
al
2838
6219
2601
9126
135
8326
627
5335
782
9909
Urb
an29
9479
2223
7377
106
4084
132
3199
722
8844
10
-27-

Tabl
e: 4
.3 C
ontin
ued…
…
M
argi
nal W
orke
rs
13
Wor
kers
To
tal
2167
2613
4453
8227
322
8931
612
7174
110
1757
5R
ural
13
9017
8484
554
172
1411
766
7644
2364
7343
Urb
an77
709
4960
828
101
8775
5050
7318
3702
32
14
Cul
tivat
ors
Tota
l 15
226
1203
531
9112
5321
8136
043
961
Rur
al
1304
610
348
2698
1053
7868
349
3702
9U
rban
2180
1687
493
1994
313
011
6932
15
Agr
icul
tura
l Lab
oure
rs
Tota
l 35
553
2708
584
6840
3714
2289
0317
4811
Rur
al
2841
821
491
6927
3223
7117
9994
1423
77
Urb
an71
3555
9415
4181
343
4890
932
434
16
Hou
seho
ld In
dust
ry W
orke
rs
Tota
l 76
6043
6432
9674
741
3250
442
237
Rur
al
4873
2809
2064
4628
520
508
2577
7
Urb
an27
8715
5512
3228
456
1199
616
460
17
Oth
er W
orke
rs
Tota
l 15
8287
9096
967
318
1685
540
9289
7475
6566
Rur
al
9268
050
197
4248
393
7732
4955
7244
2160
Urb
an65
607
4077
224
835
7478
0843
3402
3144
06
18
Non
Wor
kers
To
tal
1723
350
6026
0611
2074
421
7869
9875
7584
314
2111
55
Rur
al
9354
0032
6182
6092
1811
1291
7839
0055
372
2862
5
Urb
an78
7950
2764
2451
1526
1065
7820
3675
290
6982
530
Sou
rce:
Pan
chay
at S
tatis
tics,
201
1
-28-

-29-

-30-

-31-

-32-

METEOROLOGY
Meteorology is the interdisciplinary scientific study of the atmosphere.
Meteorology, climatology, atmospheric physics and atmospheric chemistry are
sub-disciplines of the atmospheric sciences. Meteorology and hydrology
compose the interdisciplinary field of hydrometeorology. Interactions between
Earth's atmosphere and the oceans are part of coupled ocean-atmosphere
studies. Weather information and forecasts are of vital importance to many
activities like agriculture, aviation, shipping, fisheries, tourism, defense, industrial
projects, water management and disaster mitigation. Kerala’s climatically
condition is divided into four seasons viz Winter, Summer, South-West monsoon
and North-East monsoon.
Kollam district has a tropical humid climate with an oppressive summer
and plentiful seasonal rainfall. Summer season is from March to end of May. The
temperature is almost steady through out the year and temperature in the coastal
regions are somewhat less that in the interior. Punalur taluk in Kollam district is
the hottest place in Kerala. The average temperature varies between 320 to 330 c
in the coastal region and 350 to 360c in the interior areas. The average annual
rainfall is 2272 mm. Second rainy season is North East monsoon (Thulavarsham)
starts from October to November. December, January, February is the coolest
months of the year.
-33-

Table: 5.1
RAINFALL DISTRIBUTION 2011-12
(Rainfall in m.m) 2011
District/State Jul Aug Sep Oct Nov Dec
Kollam 283.0 219.6 242.2 233.7 268.4 100.9Kerala 539.3 496.9 389.7 232.3 168.1 49.9
2012
District/State Jan Feb Mar Apr May June
Kollam 13.7 20.9 77.0 228.6 145.8 167.5
Kerala 7.3 9.1 29.5 197.5 83.5 444.9
2011-12
District/State Actual Normal Departure
Kollam 2001.3 2491.5 -19.7
Kerala 2639.4 2939.75 -10.2 Source: Agricultural Statistics, 2012 (DES) Table: 5.2
NORTH EAST & SOUTH WEST MONSOON RAINFALL
1 Oct - 31 Dec 2012 (N.E)
Kollam Actual Rainfall Normal Rainfall % Departure
368.7 638.9 -42
1 Jun – 30 Sep 2013 (S.W)
Kollam Actual Rainfall Normal Rainfall % Departure
1777.2 1332.1 33 Source: IMD
-34-

Tabl
e: 5
.3
Dis
tric
t wis
e A
ctua
l Rai
nfal
l, N
orm
al R
ainf
all a
nd P
erce
ntag
e of
Dep
artu
re fo
r the
yea
r 201
2
Sl.
No.
Dis
tric
ts/
Su
b di
visi
on
Pre-
Mon
soon
Rai
nfal
l (M
ar to
May
) So
uth
Wes
t Mon
soon
Rai
nfal
l (J
un to
Sep
) N
orth
Eas
t Mon
soon
Rai
nfal
l (O
ct to
Dec
)
Act
ual
Rai
nfal
l (m
m)
Nor
mal
R
ainf
all
(mm
)
Perc
enta
ge
depa
rtur
e (%
)
Act
ual
Rai
nfal
l (m
m)
Nor
mal
R
ainf
all
(mm
)
Perc
enta
ge
depa
rtur
e (%
)
Act
ual
Rai
nfal
l (m
m)
Nor
mal
R
ainf
all
(mm
)
Perc
enta
ge
depa
rtur
e (%
)
1 A
lapp
uzha
43
0.2
477.
3-1
010
89.7
1745
.9-3
826
1.7
571.
7-5
4.0
2 Ka
nnur
95
.930
0.4
-68
2317
.926
69.0
-13
247.
334
4.8
-28.
0 3
Erna
kula
m
544
443.
723
1554
.320
65.0
-25
485.
148
9.1
-1.0
4
Iduk
ki
432.
142
6.6
118
04.1
2276
.3-2
135
5.4
564.
5-3
7.0
5 Ka
sara
god
134.
627
2.5
-51
2739
.330
07.1
-917
2.5
337.
4-4
9.0
6 K
olla
m
452.
046
9.3
-480
0.5
1332
.1-4
036
8.7
638.
9-4
2.0
7 Ko
ttaya
m
429.
846
0.1
-713
97.7
1897
.9-2
642
3.7
535.
4-2
1.0
8 K
ozhi
kode
15
5.6
352.
9-5
623
59.5
2602
.8-8
374.
142
2.1
-11.
0 9
Mal
appu
ram
20
3.3
320.
6-3
715
58.8
2060
.7-2
422
1.8
448.
2-5
1.0
10
Pala
kkad
21
2.4
279.
5-2
412
23.1
1572
.0-2
226
2.6
427.
5-3
9.0
11
Path
anam
thitt
a 45
0.6
553.
3-1
910
40.1
1715
.0-3
930
5.0
623.
7-5
1.0
12
Thiru
vana
ntha
pura
m
279.
536
8.8
-24
492.
787
1.4
-43
332.
752
2.6
-36.
0 13
Th
rissu
r 31
5.0
385.
2-1
817
39.6
2197
.5-2
129
5.4
469.
5-3
7.0
14
Way
anad
22
5.0
275.
1-1
813
54.8
2631
.9-4
925
4.6
331.
5-2
3.0
15
Laks
hadw
eep
308.
523
2.4
-57
1147
.199
8.5
1516
7.3
333.
6-5
0.0
K
eral
a 30
8.5
379.
7-1
915
51.3
2039
.6-2
431
0.8
480.
7-3
5 So
urce
: Eco
nom
ic R
evie
w, 2
012
-35-

-36-

-37-

-38-

GEOLOGY & GEOMORPHOLOGY
Kollam district covers an area of 2491 km2 in the Southern most part of Kerala. It
is situated on the South West coast of India between North latitudes 90 10’ and 80 45’
and East longitudes 760 25’ and 770 15’. The district is bounded by the Lakshadweep
Sea on the West and Tamilnadu State in the East. Along the Northern boundary lie
Alappuzha and Pathanamthitta district, while to the South lies Thiruvananthapuram
district. It has a maximum length of 75 kms in the E-W direction and maximum width of
45 kms in the N-S direction. The district has three distinct physiographic zones: viz. the
coastal plain, the midland and the Western Ghats. The district is mainly drained by
Kallada and Ithikkara rivers which has perennial.
GEOLOGY The district can be broadly divided into three geological provinces the western
most Quaternary alluvial deposits followed by a narrow N-S zone of late Tertiary
sediments and the eastern most Precambrian metamorphics. The Precambrian
metamorphics are represented by Khondalite, Charnockite and Migmatite groups. They
are intruded by younger basic dykes and overlain by Tertiary and Quaternary sediments.
High grade metamorphic rocks of Khondalite Group include Calc-granulite, Quartzite and
Garnet-biotite-sillimanite gneiss with or without graphite. Thin lenticular bands of calc-
granulite occur within Charnockite and Migmatite. A few narrow bands of quartzite are
seen within migmatite. The Khondalite paragneiss tends to occur as linear bodies
towards the middle and western part of the district.
The Charnockite Group consists of Pyroxene granulite, Cordierite gneiss and
Hypersthene-hornblende granite-gneiss (Charnockite). It mostly occurs as concordant
bands and lenses of varied dimensions in Khondalite and Migmatite with a diffused
contact. It grades into gneiss. Generally it is garnet ferrous near the contact with the
gneiss. The rock shows granoblastic texture and is mostly intermediate to acidic.
Pyroxene granulite occurs as thin, discordant, lenticular patches, within migmatite and is
concordant with the para gneiss. Cordiertite gneiss is found as impersistent bands and
lenses within garnet-biotite gneiss and is confined to the contact with gneiss and
Charnockite. It displays xenoblastic gneissose texture and consists of varying
-39-

proportions of cordierite plagioclase, microperthite, quartz, biotite, hypersthene, garnet
and hornblende. Near Punalur, there is a small body of dunite.
The Migmatite Complex comprising garnet-biotite gneiss and quartzo-feldspathic
gneiss are the major rock units of the area and they are traversed by thin pegmatite and
aplite veins. The rocks of the Migmatite Complex are widely distributed and interlayered
with rocks of Charnockite Group. Garnet-biotite gneiss has a larger area distribution and
is characterized by the presence of biotite foliae and concentration of garnet in layers.
Bands and lenses of quartzo feldspathic gneiss occur within it. Granite gneiss of
Peninsular Gneissic Complex occurs as small isolated bands within migmatite. Granite
generally occurs as small lenses towards the east. All the older rocks are intruded by
basic intrusives of doleritic composition having a general NW-SE trend.
Towards west, the rocks of Archaen age are unconformably overlain by
sedimentary rocks of Mio-Pliocene age. Two distinct sequence of sediments are
noticeable. A lower marine sequence (Quilon Formation) represented by fossiliferous
limestone and marl and an upper nonmarine sequence of alternating beds of sandstone
and clay, with carbonaceous clay and lignite seams towards the bottom (Warkalli
Formation). These beds are horizontally disposed and are lateritised at the top. The
midland portion representing the tertiary sedimentary terrain and the Western part of the
Archaen terrain is extensively lateritised and the laterite is 5 to 10m thick. The coastal
plain is covered by Quaternary alluvium mainly of marine origin. Flood plain deposits, an
admixture of sand, silt and clay occur along the river banks and valleys. Near the coast
and in the vicinity of backwaters, tidal deposits are noticed. The Quarternary sediments
have been classified into different morphostratigraphic units based on their environment
of formation, lithocontent and morphological character. Guruvayur Formation represents
an old marine deposit, while Kadappuram (marine), Periyar (fluvial) and Viyyam
(fluviomarine) formations are contemporary.
GEOMORPHOLOGY AND GEOHYDROLOGY Geomorphologically, the district can be divided into three units from west to east
as the coastal plain, the midland and the high hill region. The coastal plain has a
maximum width of 90kms in the north and gradually narrows down to less than 0.5kms
towards south. It is nearly level to very gently sloping terrain depicting depositional
-40-

landforms like strandlines (Paleobeach ridges), flood plain and tidal flats. The coastal
plain has a number of backwaters known as kayals in Kerala, the prominent being
Ashtramudi Kayal, Paravur Kayal, Panmana Kayal and the Sasthamkotta Kayal. Among
these the last one is fresh water lagoon, while the others are brackish. The midland
towards east has a rolling topography with elevations ranging from 20m to around 300m.
The region is characterized by gently to moderately slopping spurs, moderately to
steeply sloping ridges, flat and domal hills with intervening narrow valleys and broad
valley floors. The hilly region to the east has a rugged topography. The hills have steep
slopes and narrow and small summits. Highest peaks along the eastern boundary are
1200 to 1500m high.
Geohydrologically, the area comprises zones with respect to groundwater
potential as low to poor, moderate to low and fairly good respectively. The district is
subdivided into Vamanapuram, Ayur, Ithikkara, Kallada, Pallikkal and Achenkovil basins.
The coastal areas in this district have been found suitable for sinking filter point and
medium capacity tube wells. The Kollam-Aleppey tract is a potential source for
groundwater and can be the ideal locate nucleus for heavy industries which may require
quantities of water. The ground water in the crystalline rocky terrain can be developed
through large diameter open wells.
-41-

Sl.
No.
Roc
k Ty
peA
laya
mon
Anc
hal
Ary
anka
vuEd
amul
acka
lEr
oor
Kar
aval
oor
Kul
atho
opp
uzha
Then
mal
a
1M
etam
orph
ic R
ocks
5583
.24
2704
.25
2147
5.73
3651
.05
4248
.88
2615
.59
3983
9.5
1281
0.09
2P
luto
nic
Roc
ks44
.64
47.3
53
Res
idua
l Cap
ping
s4
Sem
icon
solid
ated
Sed
imen
t5
Tank
/WB
/Riv
er6
Unc
onso
lidat
ed S
edim
ents
23.5
5Pa
ncha
yath
Tot
al55
83.2
427
04.2
521
520.
3736
51.0
542
48.8
826
15.5
939
839.
512
880.
99B
lock
Tot
al
Tabl
e:6.
2
Sl.
No.
Roc
k Ty
peC
hada
yam
anga
lam
Chi
thar
aEl
amad
uItt
iva
Kad
akka
lK
umm
ilN
ilam
elVe
linal
loor
1M
etam
orph
ic R
ocks
2529
.79
5936
.28
2958
.54
4233
.25
3125
.04
1777
.50
1897
.80
2523
.81
2P
luto
nic
Roc
ks3
Res
idua
l Cap
ping
s4
Sem
icon
solid
ated
Sed
imen
t5
Tank
/WB
/Riv
er6
Unc
onso
lidat
ed S
edim
ents
Panc
haya
th T
otal
2529
.79
5936
.28
2958
.54
4233
.25
3125
.04
1777
.50
1897
.80
2523
.81
Blo
ck T
otal
(Are
a in
Ha)
2498
2.01
Tabl
e:6.
1
(Are
a in
Ha)
GEO
LOG
Y D
ETA
ILS
AN
CH
AL
BLO
CK
9304
3.87
CH
AD
AYA
MA
NG
ALA
M B
LOC
K
-42-

Tabl
e:6.
3
Sl.N
o.R
ock
Type
Cha
vara
Nee
ndak
ara
Panm
ana
Thek
kum
bhag
amTh
eval
akka
ra
1M
etam
orph
ic R
ocks
2P
luto
nic
Roc
ks3
Res
idua
l Cap
ping
s4
Sem
icon
solid
ated
Sed
imen
t0.
255
8.07
5Ta
nk/W
B/R
iver
68.9
225
3.01
923.
9515
1.6
6U
ncon
solid
ated
Sed
imen
ts11
43.7
844
1.25
1676
.346
8.04
978.
24Pa
ncha
yath
Tot
al12
12.7
069
4.26
1676
.50
1391
.99
1687
.91
Blo
ck T
otal
Tabl
e:6.
4
Sl.N
o.R
ock
Type
Adi
chan
allo
orC
hath
anno
orC
hira
kkar
aK
allu
vath
ukka
lPo
otha
kula
m
1M
etam
orph
ic R
ocks
1207
.77
746.
5717
6.21
2885
.82
2P
luto
nic
Roc
ks3
Res
idua
l Cap
ping
s4
Sem
icon
solid
ated
Sed
imen
t11
02.9
558
7.34
1417
.53
920.
0514
16.4
45
Tank
/WB
/Riv
er53
.98
284.
896
Unc
onso
lidat
ed S
edim
ents
Panc
haya
th T
otal
2364
.70
1333
.91
1593
.74
3805
.87
1701
.33
Blo
ck T
otal
CH
AVA
RA
BLO
CK
ITH
IKK
AR
A B
LOC
K(A
rea
in H
a)
1079
9.55
(Are
a in
Ha)
6663
.36
-43-

Tabl
e:6.
5
(Are
a in
Ha)
Sl.N
o.R
ock
Type
Ezhu
kone
Kar
eepr
aK
otta
rakk
ara
Ned
uvat
hoor
Pooy
appa
llyVe
liyam
1M
etam
orph
ic R
ocks
1782
2272
.30
1750
.26
2237
.90
2349
.16
3069
.02
2P
luto
nic
Roc
ks3
Res
idua
l Cap
ping
s4
Sem
icon
solid
ated
Sed
imen
t5
Tank
/WB
/Riv
er6
Unc
onso
lidat
ed S
edim
ents
79.5
2Pa
ncha
yath
Tot
al17
82.0
022
72.3
018
29.7
822
37.9
023
49.1
630
69.0
2B
lock
Tot
al
Tabl
e:6.
6
Sl.N
o.R
ock
Type
Ala
ppad
Kla
pana
Kul
asek
hara
pura
mO
chira
Thaz
hava
Thod
iyoo
r
1M
etam
orph
ic R
ocks
2P
luto
nic
Roc
ks3
Res
idua
l Cap
ping
s4
Sem
icon
solid
ated
Sed
imen
t45
5.84
120.
675
Tank
/WB
/Riv
er94
.83
18.3
86
Unc
onso
lidat
ed S
edim
ents
793.
9810
39.3
816
97.1
313
26.5
219
23.6
419
50.8
1Pa
ncha
yath
Tot
al88
8.81
1039
.38
1715
.51
1326
.52
2379
.48
2071
.48
Blo
ck T
otal
KO
TTA
RA
KK
AR
A B
LOC
K
(Are
a in
Ha)
9421
.18
OC
HIR
A B
LOC
K
1354
0.16
-44-

Tabl
e:6.
7
Sl.N
o.R
ock
Type
East
K
alla
daK
unda
raM
antr
othu
ruth
uPa
naya
mPe
raya
mPe
rinad
uTh
rikka
davo
orTh
rikka
ruva
1M
etam
orph
ic R
ocks
18.4
771
0.97
2.81
2P
luto
nic
Roc
ks3
Res
idua
l Cap
ping
s4
Sem
icon
solid
ated
Sed
imen
t70
4.32
594.
2375
5.30
710.
0066
7.13
1157
.61
35.7
219
9.81
5Ta
nk/W
B/R
iver
73.3
69.
3055
9.89
233.
5878
7.35
422.
2756
7.67
1065
.10
6U
ncon
solid
ated
Sed
imen
ts50
7.04
3.12
866.
1553
6.36
Panc
haya
th T
otal
1303
.19
1314
.50
1315
.19
943.
5814
60.4
115
79.8
814
69.5
418
01.2
7B
lock
Tot
al
Tabl
e:6.
8
Sl.N
o.R
ock
Type
Kun
nath
oor
Myn
aga
pally
Poru
vazh
iSa
stha
mko
ttaSo
oran
adu
Sout
hSo
oran
adu
Nor
thW
est
Kal
lada
1M
etam
orph
ic R
ocks
1603
.12
1016
.94
72.3
047
.22
2P
luto
nic
Roc
ks3
Res
idua
l Cap
ping
s4
Sem
icon
solid
ated
Sed
imen
t51
1.43
1959
.27
846.
7615
63.3
911
27.1
418
70.1
887
0.06
5Ta
nk/W
B/R
iver
6U
ncon
solid
ated
Sed
imen
ts32
.94
87.0
027
.84
865.
6461
0.83
364.
7846
7.66
Panc
haya
th T
otal
2147
.49
2046
.27
1891
.54
2501
.33
1737
.97
2282
.18
1337
.72
Blo
ck T
otal
SAST
HA
MK
OTT
A B
LOC
K 1394
4.50
(Are
a in
Ha)
CH
ITTU
MA
LA B
LOC
K(A
rea
in H
a)
1118
7.56
-45-

Tabl
e:6.
9
Sl.N
o.R
ock
Type
Path
anap
uram
Patta
zhi
Patta
zhi
Vada
kkek
kara
Pira
vant
hoor
Thal
avoo
rVi
lakk
udy
1M
etam
orph
ic R
ocks
3244
.52
1493
.61
1654
.04
1297
7.24
2874
.48
1740
.52
2P
luto
nic
Roc
ks30
.35
147.
673
Res
idua
l Cap
ping
s81
6.21
248.
028.
170.
334
Sem
icon
solid
ated
Sed
imen
t5
Tank
/WB
/Riv
er6
Unc
onso
lidat
ed S
edim
ents
1.11
108.
6335
.91
21.2
555
3.88
273.
82Pa
ncha
yath
Tot
al40
92.1
918
50.2
616
98.1
213
146.
1634
28.6
920
14.3
4B
lock
Tot
al
Tabl
e:6.
10
Sl.N
o.R
ock
Type
Kul
akka
daM
elila
Myl
amPa
vith
resw
aram
Um
man
noor
Vetti
kkav
ala
1M
etam
orph
ic R
ocks
3112
.36
1475
.67
1642
.98
2278
.66
3494
.58
3456
.17
2P
luto
nic
Roc
ks3
Res
idua
l Cap
ping
s4
Sem
icon
solid
ated
Sed
imen
t13
3.25
5Ta
nk/W
B/R
iver
6U
ncon
solid
ated
Sed
imen
ts41
.742
5.52
645.
722
.61
21.5
7Pa
ncha
yath
Tot
al31
54.0
619
01.1
922
88.6
824
34.5
234
94.5
834
77.7
4B
lock
Tot
al
(Are
a in
Ha)
1675
0.77
PATH
AN
APU
RA
M B
LOC
K(A
rea
in H
a)
2622
9.76
VETT
IKA
VALA
BLO
CK
-46-

Sl.N
o.R
ock
Type
Elam
pallo
orK
otta
nkar
aM
ayya
nadu
Ned
umpa
naTh
rikov
ilvat
tom
1M
etam
orph
ic R
ocks
87.2
636
.21
2258
.24
18.4
72
Plu
toni
c R
ocks
3R
esid
ual C
appi
ngs
4S
emic
onso
lidat
ed S
edim
ent
1129
.81
1229
.37
1221
.14
247.
5818
33.3
15
Tank
/WB
/Riv
er20
5.07
6U
ncon
solid
ated
Sed
imen
ts56
1.4
33.5
9Pa
ncha
yath
Tot
al12
17.0
712
65.5
819
87.6
125
05.8
218
85.3
7B
lock
Tot
al
Tabl
e:6.
12
Sl.
No.
Roc
k Ty
peK
arun
agap
pally
(M)
Par
avoo
r (M
)Pu
nalu
r (M
)K
olla
m
(C)
1M
etam
orph
ic R
ocks
3620
.23
2P
luto
nic
Roc
ks3
Res
idua
l Cap
ping
s4
Sem
icon
solid
ated
Sed
imen
t15
29.4
912
71.3
05
Tank
/WB
/Riv
er7.
4938
9.15
307.
096
Unc
onso
lidat
ed S
edim
ents
1825
.96
4113
.68
Tot
al18
33.4
519
18.6
436
20.2
356
92.0
7
MU
NIC
IPA
LITY
/CO
RPO
RA
TIO
N
8861
.45
MU
KH
ATH
ALA
BLO
CK
(Are
a in
Ha)
Tabl
e:6.
11
(Are
a in
Ha)
-47-

-48-

-49-

-50-

Sl.
No.
Roc
k Ty
peA
laya
mon
Anc
hal
Ary
anka
vuEd
amul
acka
lEr
oor
Kar
aval
oor
Kul
atho
opu
zha
Then
mal
a
1B
each
(Coa
stal
Pla
in)
2C
oast
al P
lain
3D
enud
atio
nal H
ills
4D
enud
atio
nal S
truct
ural
Hill
s33
83.6
720
554.
3416
34.6
525
.07
3113
0.98
1050
1.92
5Li
near
Rid
ge (L
ower
Pla
teau
)15
.57
18.4
140
.99
6Li
near
Rid
ge (P
iedm
ont Z
one)
15.2
840
.35
7Lo
wer
Pla
teau
(Lat
eriti
c) -
Dis
sect
ed11
25.1
219
56.7
828
66.8
475
1.62
1670
.525
48.6
722
8.85
8M
ud F
lat (
Coa
stal
Pla
in)
9P
iedm
ont Z
one
837.
538.
3173
7.45
1425
.21
294.
4944
31.2
216
38.2
810
Poi
nt B
ar (F
lood
Pla
in)
11R
esid
ual H
ill21
.94
99.7
75.6
177
.74
12R
esid
ual M
ount
11
.39
100.
2727
8.31
97.0
610
3.65
71.3
715
.61
13R
esid
ual M
ount
(Ped
imen
t)47
.07
14R
ock
Exp
osur
e15
Stru
ctur
al V
alle
y18
0.51
207.
4716
Sw
ale
(Coa
stal
Pla
in)
17V
alle
y20
1.74
50.8
318
Val
ley
Fill
225.
5460
1.37
503.
7032
5.47
388.
483.
519
Wat
er B
ody
0.01
48.0
62.
2114
.88
1335
.42
72.8
6Pa
ncha
yath
Tot
al55
83.2
527
04.2
521
520.
3636
51.0
642
48.8
926
15.5
839
839.
5012
880.
98B
lock
Tot
al93
043.
87
Tabl
e:6.
13
(Are
a in
Ha)
GEO
MO
RPH
OLO
GY
DET
AIL
SA
NC
HA
L B
LOC
K
-51-

Sl.
No.
Roc
k Ty
peC
hada
yam
anga
lam
Chi
thar
aEl
amad
uItt
iva
Kad
akka
lK
umm
ilN
ilam
elVe
linal
loor
1B
each
(Coa
stal
Pla
in)
2C
oast
al P
lain
3D
enud
atio
nal H
ills
548.
084
Den
udat
iona
l Stru
ctur
al H
ills
1137
.77
38.9
20.
195
Line
ar R
idge
(Low
er P
late
au)
32.2
186
.80
107.
540.
4611
.61
28.0
46
Line
ar R
idge
(Pie
dmon
t Zon
e)24
91.9
47
Low
er P
late
au (L
ater
itic)
- D
isse
cted
2094
.41
3052
.21
3290
.82
2842
.47
1501
.416
39.3
821
93.3
18
Mud
Fla
t (C
oast
al P
lain
)9
Pie
dmon
t Zon
e 76
7.33
114.
1228
.91
10P
oint
Bar
(Flo
od P
lain
)11
Res
idua
l Hill
47.3
90.
6399
.58
53.4
612
Res
idua
l Mou
nt
65.2
377
.29
121.
1610
1.51
158.
5757
.46
132.
9350
.93
13R
esid
ual M
ount
(Ped
imen
t)14
Roc
k E
xpos
ure
15S
truct
ural
Val
ley
16S
wal
e (C
oast
al P
lain
)17
Val
ley
18V
alle
y Fi
ll24
3.83
352.
9725
6.67
453.
6294
.44
165.
1811
3.87
216.
319
Wat
er B
ody
46.7
21.
9727
.15
35.2
4Pa
ncha
yath
Tot
al25
29.7
959
36.2
829
58.5
442
33.2
631
25.0
417
77.5
018
97.7
925
23.8
2B
lock
Tot
al
Tabl
e:6.
14
CH
AD
AYA
MA
NG
ALA
M B
LOC
K(A
rea
in H
a)
2498
2.02
-52-

Sl.
No.
Roc
k Ty
peC
hava
raN
eend
akar
aPa
nman
aTh
ekku
mbh
agam
Thev
alak
kara
1B
each
(Coa
stal
Pla
in)
2C
oast
al P
lain
922.
2742
0.80
1218
.74
427.
5167
9.91
3D
enud
atio
nal H
ills
4D
enud
atio
nal S
truct
ural
Hill
s5
Line
ar R
idge
(Low
er P
late
au)
6Li
near
Rid
ge (P
iedm
ont Z
one)
7Lo
wer
Pla
teau
(Lat
eriti
c) -
Dis
sect
ed0.
0650
5.59
8M
ud F
lat (
Coa
stal
Pla
in)
89.2
94.
7326
2.50
49.8
818
5.37
9P
iedm
ont Z
one
10P
oint
Bar
(Flo
od P
lain
)11
Res
idua
l Hill
12R
esid
ual M
ount
13
Res
idua
l Mou
nt (P
edim
ent)
14R
ock
Exp
osur
e15
Stru
ctur
al V
alle
y16
Sw
ale
(Coa
stal
Pla
in)
181.
017.
3617
1.00
14.8
630
.65
17V
alle
y18
Val
ley
Fill
6.60
181.
6019
Wat
er B
ody
20.1
326
1.37
17.6
789
9.67
104.
79Pa
ncha
yath
Tot
al12
12.7
069
4.26
1676
.51
1391
.98
1687
.91
Blo
ck T
otal
6663
.36
Tabl
e:6.
15
(Are
a in
Ha)
CH
AVA
RA
BLO
CK
-53-

Sl.
No.
Roc
k Ty
peEa
st
Kal
lada
Kun
dara
Man
trot
huru
thu
Pana
yam
Pera
yam
Perin
adu
Thrik
kada
voor
Thrik
karu
va
1B
each
(Coa
stal
Pla
in)
2C
oast
al P
lain
0.11
245.
040.
040.
593
Den
udat
iona
l Hill
s4
Den
udat
iona
l Stru
ctur
al H
ills
5Li
near
Rid
ge (L
ower
Pla
teau
)6
Line
ar R
idge
(Pie
dmon
t Zon
e)7
Low
er P
late
au (L
ater
itic)
- D
isse
cted
882.
2511
67.9
461
.15
455.
5068
6.72
1046
.86
779.
2361
7.16
8M
ud F
lat (
Coa
stal
Pla
in)
315.
012.
392.
780.
933.
599
Pie
dmon
t Zon
e 10
Poi
nt B
ar (F
lood
Pla
in)
11R
esid
ual H
ill12
Res
idua
l Mou
nt
13R
esid
ual M
ount
(Ped
imen
t)14
Roc
k E
xpos
ure
15S
truct
ural
Val
ley
16S
wal
e (C
oast
al P
lain
)17
Val
ley
18V
alle
y Fi
ll35
0.78
144.
7676
.53
219.
760.
1711
6.81
78.9
79.8
619
Wat
er B
ody
70.0
51.
8161
7.47
265.
9377
0.69
416.
2160
9.90
1100
.66
Panc
haya
th T
otal
1303
.19
1314
.51
1315
.20
943.
5814
60.4
015
79.8
814
69.5
518
01.2
7B
lock
Tot
al
Tabl
e:6.
16
CH
ITTU
MA
LA B
LOC
K(A
rea
in H
a)
1118
8.27
-54-

Sl.
No.
Roc
k Ty
peA
dich
anal
loor
Cha
than
noor
Chi
rakk
ara
Kal
luva
thuk
kal
Poot
haku
lam
1B
each
(Coa
stal
Pla
in)
2C
oast
al P
lain
138.
791.
251.
663
Den
udat
iona
l Hill
s4
Den
udat
iona
l Stru
ctur
al H
ills
5Li
near
Rid
ge (L
ower
Pla
teau
)6
Line
ar R
idge
(Pie
dmon
t Zon
e)7
Low
er P
late
au (L
ater
itic)
- D
isse
cted
1651
.81
1164
.45
1179
.12
3544
.68
1324
.66
8M
ud F
lat (
Coa
stal
Pla
in)
116.
069
Pie
dmon
t Zon
e 10
Poi
nt B
ar (F
lood
Pla
in)
11R
esid
ual H
ill12
Res
idua
l Mou
nt
35.7
745
.44
13R
esid
ual M
ount
(Ped
imen
t)14
Roc
k E
xpos
ure
15S
truct
ural
Val
ley
16S
wal
e (C
oast
al P
lain
)17
Val
ley
18V
alle
y Fi
ll32
5.93
147.
4238
5.54
210.
5712
0.87
19W
ater
Bod
y96
.34
22.0
427
.83
5.18
254.
15Pa
ncha
yath
Tot
al23
64.7
013
33.9
115
93.7
438
05.8
717
01.3
4B
lock
Tot
al10
799.
56
Tabl
e:6.
17
ITH
IKK
AR
A B
LOC
K(A
rea
in H
a)
-55-

Sl.
No.
Roc
k Ty
peEz
huko
neK
aree
pra
Kot
tara
kkar
aN
eduv
atho
orPo
oyap
pally
Veliy
am
1B
each
(Coa
stal
Pla
in)
2C
oast
al P
lain
3D
enud
atio
nal H
ills
4D
enud
atio
nal S
truct
ural
Hill
s5
Line
ar R
idge
(Low
er P
late
au)
10.5
841
.37
6Li
near
Rid
ge (P
iedm
ont Z
one)
7Lo
wer
Pla
teau
(Lat
eriti
c) -
Dis
sect
ed15
40.4
418
78.8
515
87.0
520
02.6
121
81.1
927
13.5
28
Mud
Fla
t (C
oast
al P
lain
)9
Pie
dmon
t Zon
e 10
Poi
nt B
ar (F
lood
Pla
in)
11R
esid
ual H
ill12
Res
idua
l Mou
nt
39.7
621
.58
9.10
104.
0622
.46
62.9
013
Res
idua
l Mou
nt (P
edim
ent)
14R
ock
Exp
osur
e15
Stru
ctur
al V
alle
y16
Sw
ale
(Coa
stal
Pla
in)
17V
alle
y18
Val
ley
Fill
201.
7937
1.86
223.
0613
1.23
126.
7825
1.23
19W
ater
Bod
y18
.73
Panc
haya
th T
otal
1781
.99
2272
.29
1829
.79
2237
.90
2349
.16
3069
.02
Blo
ck T
otal
Tabl
e:6.
18
(Are
a in
Ha)
KO
TTA
RA
KK
AR
A B
LOC
K
1354
0.15
-56-

(Are
a in
Ha)
Sl.
No.
Roc
k Ty
peEl
ampa
lloor
Kot
tank
ara
May
yana
duN
edum
pana
Thrik
ovilv
atto
m
1B
each
(Coa
stal
Pla
in)
2C
oast
al P
lain
367.
993
Den
udat
iona
l Hill
s4
Den
udat
iona
l Stru
ctur
al H
ills
5Li
near
Rid
ge (L
ower
Pla
teau
)6
Line
ar R
idge
(Pie
dmon
t Zon
e)7
Low
er P
late
au (L
ater
itic)
- D
isse
cted
969.
6410
19.3
612
15.5
719
93.8
914
41.1
98
Mud
Fla
t (C
oast
al P
lain
)32
.17
3.55
9P
iedm
ont Z
one
10P
oint
Bar
(Flo
od P
lain
)11
Res
idua
l Hill
12R
esid
ual M
ount
4.
2313
Res
idua
l Mou
nt (P
edim
ent)
14R
ock
Exp
osur
e15
Stru
ctur
al V
alle
y16
Sw
ale
(Coa
stal
Pla
in)
17V
alle
y18
Val
ley
Fill
244.
6524
6.22
186.
5949
0.64
434.
6019
Wat
er B
ody
2.78
185.
2917
.06
6.02
Panc
haya
th T
otal
1217
.07
1265
.58
1987
.61
2505
.82
1885
.36
Blo
ck T
otal
8861
.44
Tabl
e:6.
19
MU
KH
ATH
ALA
BLO
CK
-57-

Sl.
No.
Roc
k Ty
peA
lapp
adK
lapa
naK
ulas
ekha
rapu
ram
Och
iraTh
azha
vaTh
odiy
oor
1B
each
(Coa
stal
Pla
in)
0.01
2C
oast
al P
lain
442.
6154
3.47
1208
.27
1027
.03
1114
.78
1326
.91
3D
enud
atio
nal H
ills
4D
enud
atio
nal S
truct
ural
Hill
s5
Line
ar R
idge
(Low
er P
late
au)
6Li
near
Rid
ge (P
iedm
ont Z
one)
7Lo
wer
Pla
teau
(Lat
eriti
c) -
Dis
sect
ed46
8.96
8M
ud F
lat (
Coa
stal
Pla
in)
132.
8832
2.62
286.
6596
.84
656.
2866
3.14
9P
iedm
ont Z
one
10P
oint
Bar
(Flo
od P
lain
)11
Res
idua
l Hill
12R
esid
ual M
ount
13
Res
idua
l Mou
nt (P
edim
ent)
14R
ock
Exp
osur
e15
Stru
ctur
al V
alle
y16
Sw
ale
(Coa
stal
Pla
in)
137.
2421
7.84
202.
6513
8.67
21.5
217
Val
ley
18V
alle
y Fi
ll1.
6519
Wat
er B
ody
313.
3136
.05
2.74
0.77
58.2
6Pa
ncha
yath
Tot
al88
8.81
1039
.38
1715
.50
1326
.52
2379
.46
2071
.48
Blo
ck T
otal
Tabl
e:6.
20
(Are
a in
Ha)
OC
HIR
A B
LOC
K
9421
.15
-58-

Sl.
No.
Roc
k Ty
pePa
than
apur
amPa
ttazh
iPa
ttazh
i Va
dakk
ekka
raPi
rava
ntho
orTh
alav
oor
Vila
kkud
y
1B
each
(Coa
stal
Pla
in)
2C
oast
al P
lain
3D
enud
atio
nal H
ills
1233
.24
83.2
64
Den
udat
iona
l Stru
ctur
al H
ills
164.
6885
93.1
45
Line
ar R
idge
(Low
er P
late
au)
27.8
944
.27
63.5
46
Line
ar R
idge
(Pie
dmon
t Zon
e)14
0.61
7Lo
wer
Pla
teau
(Lat
eriti
c) -
Dis
sect
ed14
85.8
614
97.6
113
62.3
926
40.4
028
56.3
416
25.4
38
Mud
Fla
t (C
oast
al P
lain
)9
Pie
dmon
t Zon
e 94
1.55
714.
8610
Poi
nt B
ar (F
lood
Pla
in)
4.87
6.88
24.4
93.
3011
Res
idua
l Hill
8.50
133.
9059
8.81
7.11
77.1
212
Res
idua
l Mou
nt
27.9
348
.47
26.9
013
6.31
134.
8089
.31
13R
esid
ual M
ount
(Ped
imen
t)14
Roc
k E
xpos
ure
15S
truct
ural
Val
ley
16S
wal
e (C
oast
al P
lain
)17
Val
ley
17.8
813
3.23
18V
alle
y Fi
ll18
6.86
144.
7124
7.79
36.9
334
4.73
152.
7219
Wat
er B
ody
20.8
318
.69
36.5
540
.71
38.1
66.
22Pa
ncha
yath
Tot
al40
92.2
018
50.2
616
98.1
213
146.
1534
28.7
120
14.3
4B
lock
Tot
al
Tabl
e:6.
21
PATH
AN
APU
RA
M B
LOC
K(A
rea
in H
a)
2622
9.78
-59-

Sl.
No.
Roc
k Ty
peK
unna
thoo
rM
ynag
apal
lyPo
ruva
zhi
Sast
ham
kotta
Soor
anad
u So
uth
Soor
anad
u N
orth
Wes
t K
alla
da
1B
each
(Coa
stal
Pla
in)
2C
oast
al P
lain
3.46
3.68
4.50
3D
enud
atio
nal H
ills
4D
enud
atio
nal S
truct
ural
Hill
s5
Line
ar R
idge
(Low
er P
late
au)
6Li
near
Rid
ge (P
iedm
ont Z
one)
7Lo
wer
Pla
teau
(Lat
eriti
c) -
Dis
sect
ed18
77.7
314
67.7
516
60.5
517
00.1
112
46.2
716
06.1
066
9.53
8M
ud F
lat (
Coa
stal
Pla
in)
31.0
51.
8811
0.08
477.
4851
3.69
9P
iedm
ont Z
one
10P
oint
Bar
(Flo
od P
lain
)7.
081.
361.
7711
Res
idua
l Hill
12R
esid
ual M
ount
13
Res
idua
l Mou
nt (P
edim
ent)
14R
ock
Exp
osur
e15
Stru
ctur
al V
alle
y16
Sw
ale
(Coa
stal
Pla
in)
17V
alle
y18
Val
ley
Fill
197.
7952
2.53
225.
1864
2.22
361.
9419
6.2
54.0
719
Wat
er B
ody
64.8
921
.48
5.80
155.
7616
.01
2.41
94.1
5Pa
ncha
yath
Tot
al21
47.4
920
46.2
718
91.5
325
01.3
317
37.9
822
82.1
913
37.7
1B
lock
Tot
al
Tabl
e:6.
22
(Are
a in
Ha)
SAST
HA
MK
OTT
A B
LOC
K
1394
4.50
-60-

Sl.
No.
Roc
k Ty
peK
ulak
kada
Mel
ilaM
ylam
Pavi
thre
swar
amU
mm
anno
orVe
ttikk
aval
a
1B
each
(Coa
stal
Pla
in)
2C
oast
al P
lain
3D
enud
atio
nal H
ills
4D
enud
atio
nal S
truct
ural
Hill
s5
Line
ar R
idge
(Low
er P
late
au)
29.5
817
3.29
74.7
56
Line
ar R
idge
(Pie
dmon
t Zon
e)7
Low
er P
late
au (L
ater
itic)
- D
isse
cted
2733
.00
1592
.59
1752
.40
2059
.93
2749
.24
2904
.87
8M
ud F
lat (
Coa
stal
Pla
in)
9P
iedm
ont Z
one
10P
oint
Bar
(Flo
od P
lain
)14
.99
6.15
0.76
11R
esid
ual H
ill5.
7373
.67
12R
esid
ual M
ount
10
1.03
53.0
777
.70
222.
9519
.67
13R
esid
ual M
ount
(Ped
imen
t)14
Roc
k E
xpos
ure
7.16
15S
truct
ural
Val
ley
16S
wal
e (C
oast
al P
lain
)17
Val
ley
18V
alle
y Fi
ll24
8.06
249.
8042
1.36
357.
3034
9.10
404.
7819
Wat
er B
ody
49.8
21.
4916
.53
Panc
haya
th T
otal
3154
.06
1901
.19
2288
.68
2434
.52
3494
.58
3477
.74
Blo
ck T
otal
Tabl
e:6.
23
(Are
a in
Ha)
VETT
IKA
VALA
BLO
CK
1675
0.77
-61-

(Are
a in
Ha)
Sl.
No.
Roc
k Ty
peK
arun
agap
ally
(M
)Pa
ravo
or(M
)Pu
nalu
r (M
)K
olla
m
(C)
1B
each
(Coa
stal
Pla
in)
2C
oast
al P
lain
934.
2461
.53
1826
.37
3D
enud
atio
nal H
ills
4D
enud
atio
nal S
truct
ural
Hill
s33
9.33
5Li
near
Rid
ge (L
ower
Pla
teau
)40
.32
6Li
near
Rid
ge (P
iedm
ont Z
one)
7Lo
wer
Pla
teau
(Lat
eriti
c) -
Dis
sect
ed13
10.4
517
89.5
424
13.4
48
Mud
Fla
t (C
oast
al P
lain
)58
1.90
491.
859
Pie
dmon
t Zon
e 99
9.84
10P
oint
Bar
(Flo
od P
lain
)11
Res
idua
l Hill
53.5
712
Res
idua
l Mou
nt
135.
3613
Res
idua
l Mou
nt (P
edim
ent)
96.9
514
Roc
k E
xpos
ure
15S
truct
ural
Val
ley
16S
wal
e (C
oast
al P
lain
)71
.40
98.2
717
Val
ley
59.8
918
Val
ley
Fill
153.
8625
.44
436.
5619
Wat
er B
ody
245.
9139
2.80
79.9
942
5.58
Tota
l18
33.4
519
18.6
436
20.2
356
92.0
7
Tabl
e:6.
24
MU
NIC
IPA
LITY
/CO
RPO
RA
TIO
N
-62-

-63-

-64-

PHYSIOGRAPHY
Based on the physiographic nature, Kerala is divided into three regions
namely highland, midland and lowland then again it is further sub divided into
four micro regions. Kollam district consist of four such micro regions viz i) Quilon
Coast ii) Adoor Rolling Plain iii) Kottarakkara Undulating Upland iv) Kulathupuzha
Forested Hills. The first region Quilon coast lies all along the coast of the district
and is bounded by the Alleppey coast in the North, Adoor Rolling Plain and
Kottarakkara Undulating Upland in the East, Trivandrum coast in the South and
the Lakshadweep Sea in the West. The Quilon coast comprises of the whole of
Karunagappally taluk and parts of Kunnathur and Quilon taluks. The height of
this region is varying between 5 m and 27 m. The highest point lies in West
Kallada village of Kunnathur taluk. Adoor Rolling Plain the second region is
bounded by Chengannur Rolling Plain in the North, Kottarakkara Undulating
Upland in the East, South and Quilon coast in the West. Parts of Kunnathur,
Pathanamthitta, Kottarakkara and Quilon taluks from the Adoor Rolling Plains
has a gentle slope towards the West. It has been maximum height (110 m) at
Erath village of Adoor taluk and the minimum height (66 m) at Puthur village of
Kottarakkara taluk. The third region Kottarakkara Undulating Upland terrain lies
in a narrow stretch from North to South over the central part of the district
comprising of parts of Kunnathur, Kozhencherry, Pathanapuram and
Kottarakkara taluks. This region is narrow in the North and wider towards the
South. The minimum height (106 m) lies in the Southern part of Kuzhinathikkad
of Kareepra village of Kottarakkara taluk. Kulathupuzha Forested Hills the fourth
region lies in the South Eastern portion of the district with boundaries as Pamba-
Kakki forested hills in the North, Tamilnadu in the East, Ponmudi Agasthiar
Forested Hills in the South and Kottarakkara Undulating Upland in the West. The
maximum height (1233 m) lies in the Eastern end in the reserve forest and the
minimum height (297 m) lies in the central portion in Chaliyakkara of Edamon
village of Pathanapuram taluk.
-65-

Table:7.1
Sl.No. Taluks/Villages Low land Mid land High land
1 Perunad 2575 - -2 Krishnapuram 745 - -3 Thazhava 2358 - -4 Kulasekharapuram 1877 - -5 Thodiyoor 2061 - -6 Karunagappally 2116 - -7 Panmana 1685 - -8 Chavara 1189 - -9 Thekkumbhagam 3045 - -10 Thevalakkara 1571 - -11 Mynagappally - 1970 -
Total 19222 1970 -
1 Sooranad North - 2267 -2 Kunnathur - 2144 -3 Poruvazhy - 1935 -4 Sooranad South - 1717 -5 Sasthamkotta - 2442 -6 West Kallada - 1336 -
Total - 11841 -
1 Pattazhi - 3972 -2 Pathanapuram - 2365 -3 Thalavoor - 2261 -4 Vilakkudi - 2143 -5 Arakkal - 1781 -6 Idamulakkal - 2092 -7 Piravanthoor - - 126138 Edamon - - 203609 Aryankavu - - 1573910 Kulathupuzha - - 4222311 Eroor - - 429912 Punalur (M) - - 346013 Pidavoor - - 147814 Karavalur (P) - - 236415 Anchal - - 244516 Alayamon - - 3774
Total - 14614 108755
NATURAL REGIONS OF KOLLAM – DETAILS OF TALUKS/VILLAGES WITH AREA BY REGIONS
Kunnathur Taluk
Pathanapuram Taluk
Karunagappally Taluk
(Area in ha)
-66-

Sl.No. Taluks/Villages Low land Mid land High land
1 Pavithreswaram - 2362 -2 Kulakkada - 2918 -3 Mailom - 2749 -4 Naduvathoor - 2270 -5 Ezhukone - 1724 -6 Kareepra - 2320 -7 Veliyam - 3028 -8 Melila - 1852 -9 Kottarakkara - 1740 -10 Vettikavala - 3623 -11 Ummannoor - 3443 -12 Elamadu - 3002 -13 Pooyappally - 2228 -14 Velinalloor - 2746 -15 Chadayamangalam - 4106 -16 Ittiva - 4389 -17 Kadakkal - 4890 -18 Chithara - 5770 -
Total - 55160 -
1 Kollam (P) 917 - -2 Thrikkaruva 1839 - -3 Munroe Island 1336 - -4 East Kallada 1220 - -5 Perinad 2492 - -6 Thrikkadavur 1485 - -7 Vadakkevila 855 - -8 Iravipuram 1006 - -9 Mayyanadu 1683 - -10 Paravoor 1638 - -11 Quilon (M) 1848 - -12 Mulavana - 2664 -13 Kottamkara - 2531 -14 Nedumpana - 2806 -15 Thrikovilvattom - 2222 -16 Adichanalloor - 1688 -17 Meenad - 3356 -18 Kalluvathukkal - 3657 -19 Poothakulam - 1657 -20 Kilikolloor 1121 - -
Total 17440 20581 -
Kollam Taluk
Kottarakkara Taluk
-67-

-68-

-69-

-70-

SOIL
Soil is an important natural resource, from it we obtain everything directly
or indirectly. Its thickness varies from a few centimeters to a few meters on
earth’s surface, but it takes millions of years for its formation. Formation of soil is
formed due to weathering by chemical, mechanical and biological forces.
Formation is a very slow process as 21/2 cm of soil is formed in one thousand
years. Soil is one of the major resources of land which determines the use of
potential. Factors upon which formation of soil depend are (i) the parent rock
(ii) topography or relief (soil cover is thin in hilly areas than on the plains)
(iii) climate (it is the most important soil forming factor; weathering, i.e., breaking
or disintegration of rocks depends upon the elements of climate, i.e., heat
(hot/cold), rain, wind, etc.) (iv) vegetation. Soil is a natural body consisting of
layers (soil horizons) that are primarily composed of minerals which differ from
their parent materials in their texture, structure, consistency, colour, chemical,
biological and other characteristics. The result soil is the end product of the
influence of the climate (temperature, precipitation), relief (slope), organisms
(flora and fauna), parent materials (original minerals), temperature and time.
Kerala State is endowed with wide range of soil types.
Kollam district covers mainly four types of soils viz sandy, alluvial, laterite
and forest. The sandy soil covers the entire Karunagappally taluk and a small
coastal belt of Kollam taluk. Alluvial soil is important for agricultural purposes.
Quilon coast and Adoor Rolling Plain cover sandy and alluvial soil. Laterite soil is
found in entire region of Kottarakkara and part of Kunnathur taluks, Eastern
region of Kollam taluk and Western sector of Pathanapuram taluk. Kottarakkara
Undulating Upland region has sandy, alluvial and laterite soil. The forest soil
covers the Eastern region of Pathanapuram taluk. Most of the area of
Kulathupuzha Forested Hill is having forest loam soil.
-71-

Tabl
e: 8
.1
SO
ILS
IN K
OLL
AM
DIS
TRIC
T (C
OM
PREH
ENSI
VE L
EGEN
D)
Soil
Map
ping
U
nit
Des
crip
tion
Maj
or S
oil
Cla
ssifi
catio
n
Maj
or S
oils
In
clus
ions
K01
Ver
y de
ep,
mod
erat
ely
wel
l dr
aine
d,
sand
y so
ils
with
m
oder
atel
y sh
allo
w w
ater
tab
le o
n ve
ry g
ently
slo
ping
sub
dued
san
d du
nes,
with
sl
ight
ero
sion
:
Ass
ocia
ted
with
ver
y de
ep, m
oder
atel
y w
ell d
rain
ed, s
andy
soi
ls.
Mix
ed, A
quic
U
stip
sam
men
ts
M
ixed
Typ
ic
Ust
ipsa
mm
ents
Fine
-loam
y, M
ixed
, Ty
pic
Dys
trope
pts
C
oars
e-lo
amy,
Mix
ed
Aqu
ic U
stor
then
ts
K02
Ver
y de
ep, s
omew
hat e
xces
sive
ly d
rain
ed s
andy
soi
ls w
ith m
oder
atel
y de
ep w
ater
tabl
e on
ver
y ge
ntly
slo
ping
bea
ches
, with
slig
ht e
rosi
on:
Ass
ocia
ted
with
ver
y de
ep,
mod
erat
ely
wel
l dra
ined
, sa
ndy
soils
with
m
oder
atel
y sh
allo
w w
ater
tabl
e.
Mix
ed,
Typi
c U
stip
sam
men
ts
M
ixed
, Aqu
ic
Ust
ipsa
mm
ents
Coa
rse-
loam
y, M
ixed
A
quic
Uto
rthen
ts
Fi
ne, M
ixed
Aer
ic
Trop
aque
pts
K05
V
ery
deep
, im
perfe
ctly
dra
ined
, cla
yey
soils
with
sha
llow
wat
er ta
ble
on
leve
l lan
ds w
ith v
alle
ys, w
ith s
light
ero
sion
.
Fine
, Mix
ed T
ypic
D
ystro
pept
s
Fine
, Mix
ed A
eric
Tr
opaq
uept
s
Fine
, Mix
ed T
ypic
Tr
opaq
uept
s
Fine
-loam
y, M
ixed
U
stic
Kan
hapl
ohum
ults
K07
Ver
y de
ep,
wel
l dr
aine
d, g
rave
lly c
lay
soils
on
gent
ly s
lopi
ng c
oast
al
late
rites
, with
mod
erat
e er
osio
n:
Ass
ocia
ted
with
ve
ry
deep
, w
ell
drai
ned,
gr
avel
ly
clay
so
ils
with
m
oder
ate
surfa
ce g
rave
lline
ss.
Cla
yey-
skel
etal
, K
aolin
itic,
Typ
ic
Kan
dius
tults
Cla
yey-
skel
etal
, K
aolin
itic,
Typ
ic
Kan
hapl
ustu
lts
Loam
y- s
kele
tal,
Mix
ed
Ust
oxic
Dys
trope
pts
C
laye
y, K
aolin
itic,
Ty
pic
Kan
dius
tults
-72-

Soil
Map
ping
U
nit
Des
crip
tion
Maj
or S
oil
Cla
ssifi
catio
n
Maj
or S
oils
M
ajor
Soi
ls
K08
Ver
y de
ep,
mod
erat
ely
wel
l dr
aine
d,
clay
ey s
oils
with
m
oder
atel
y sh
allo
w w
ater
tabl
e in
nea
rly le
vel n
arro
w v
alle
ys, w
ith s
light
ero
sion
: A
ssoc
iate
d w
ith
very
de
ep,
impe
rfect
ly
drai
ned
clay
ey
soils
w
ith
mod
erat
ely
shal
low
wat
er ta
ble
on n
early
leve
l lan
d.
Fine
Mix
ed T
ypic
D
ystro
pept
s
Fine
Mix
ed T
ypic
Tr
opaq
uept
s
Cla
yey,
Kao
liniti
c,
Typi
c K
anha
plus
tults
Fine
Mix
ed T
ypic
U
stro
pept
s
K09
Ver
y de
ep,
wel
l dr
aine
d, g
rave
lly c
lay
soils
with
mod
erat
e su
rface
gr
avel
lines
s on
m
oder
atel
y st
eepl
y sl
opin
g la
terit
e m
ound
s,
with
m
oder
ate
eros
ion:
A
ssoc
iate
d w
ith d
eep,
wel
l dra
ined
, gra
velly
cla
y so
ils o
n ge
ntly
slo
pes.
Cla
yey-
skel
etal
, K
aolin
itic,
Oxi
c H
umitr
opep
ts
C
lay-
skel
etal
, K
aolin
itic,
Ust
ic-
Hap
lohu
mul
ts
Cla
y-sk
elet
al,
Kao
liniti
c, U
stic
-K
andi
hum
ults
Fine
-loam
y, M
ixed
Ty
pic
Kan
dihu
mul
ts
K12
Ver
y de
ep,
wel
l dr
aine
d, g
rave
lly c
lay
soils
with
mod
erat
e su
rface
gr
avel
lines
s on
gen
tly s
lopi
ng m
idla
nd la
terit
e w
ith v
alle
ys o
n S
outh
ern
Ker
ala,
with
mod
erat
e er
osio
n:
Ass
ocia
ted
with
ver
y de
ep, w
ell d
rain
ed, c
laye
y so
ils.
Cla
y-sk
elet
al,
Kao
liniti
c, U
stic
-K
anha
ploh
umul
ts
C
laye
y, K
aolin
itic,
Ty
pic
Kan
dius
tults
Fine
-loam
y, M
ixed
A
quic
Ust
ifluv
ents
Cla
y-sk
elet
al,
Kao
liniti
c, T
ypic
K
anha
plus
tults
K31
Ver
y de
ep, w
ell d
rain
ed, g
rave
lly lo
am s
oils
on
stee
ply
slop
ing
med
ium
hi
lls w
ith th
ick
vege
tatio
n, w
ith m
oder
ate
eros
ion:
A
ssoc
iate
d w
ith v
ery
deep
, w
ell
drai
ned,
cla
yey
soils
on
mod
erat
e sl
opes
.
Fine
-loam
y,
Mix
ed, U
stic
H
umitr
opep
ts
C
laye
y, M
ixed
U
stic
Pal
ehum
ults
Roc
k la
nd
C
laye
y, M
ixed
Ust
ic
Hap
lohu
mul
ts
-73-

Soil
Map
ping
U
nit
Des
crip
tion
Maj
or S
oil
Cla
ssifi
catio
n
Maj
or S
oils
M
ajor
Soi
ls
K32
Dee
p, w
ell d
rain
ed lo
amy
soils
on
gent
ly s
lopi
ng lo
w h
ills w
ith is
olat
ed
hillo
cks,
with
mod
erat
e er
osio
n:
Ass
ocia
ted
with
dee
p, w
ell d
rain
ed, l
oam
y so
ils w
ith c
oher
ent m
ater
ial
at 1
00 to
150
cm
. on
mod
erat
e sl
opes
, sev
erel
y er
oded
.
Fine
-loam
y,
Mix
ed, U
stic
H
umitr
opep
ts
Fi
ne-lo
amy,
M
ixed
Ust
ic-
Hap
lohu
mul
ts
Fine
Mix
ed U
stic
H
umitr
opep
ts
C
laye
y-sk
elet
al, M
ixed
U
stic
Hum
itrop
epts
K34
Ver
y de
ep, i
mpe
rfect
ly d
rain
ed, l
oam
y so
ils w
ith m
oder
atel
y de
ep w
ater
ta
ble
in n
early
leve
l val
leys
, with
slig
ht e
rosi
on:
Ass
ocia
ted
with
ver
y de
ep,
wel
l dr
aine
d, c
laye
y so
ils o
n ve
ry g
ently
sl
opes
.
Fine
-loam
y,
Mix
ed T
ypic
U
stro
pept
s
Cla
yey-
mix
ed
Ust
ic P
aleh
umul
ts
Fine
Loa
my
Mix
ed
Trop
ic F
luva
quen
ts
Fi
ne-lo
amy,
Mix
ed
Typi
c U
stifl
uven
ts
K35
Dee
p, w
ell d
rain
ed g
rave
lly c
lay
soils
with
coh
eren
t mat
eria
l at 1
00 to
15
0 cm
. on
mod
erat
ely
slo
ping
isol
ated
hill
ocks
, with
sev
ere
eros
ion:
Ass
ocia
ted
with
mod
erat
ely
shal
low
, w
ell
drai
ned,
gra
vely
loa
m s
oils
w
ith
cohe
rent
m
ater
ial
at
50
to
75
cm.
on
very
ge
ntly
sl
opes
, m
oder
atel
y er
oded
.
Cla
yey-
skel
etal
, K
aolin
itic
Oxi
c H
umitr
opep
ts
Fi
ne-lo
amy
Mix
ed
Oxi
c H
umitr
opep
ts
Cla
yey-
skel
etal
, Mix
ed
Ust
ic H
umitr
opep
ts
C
laye
y, M
ixed
Ust
ic
Hap
lohu
mul
ts
K36
Ver
y de
ep,
wel
l dr
aine
d, c
laye
y so
ils o
n m
oder
atel
y st
eepl
y sl
opin
g hi
gh h
ills
with
thic
k ve
geta
tion,
with
mod
erat
e er
osio
n:
Ass
ocia
ted
with
dee
p, w
ell
drai
ned,
gra
velly
loa
m s
oils
on
gent
ly
slop
es.
Cla
yey,
Mix
ed,
Ust
ic
Hap
lohu
mul
ts
Fi
ne-lo
amy,
M
ixed
Oxi
c H
umitr
opep
ts
Fine
, Mix
ed, U
stic
H
umitr
opep
ts
R
ock
land
-74-

Soil
Map
ping
U
nit
Des
crip
tion
Maj
or S
oil
Cla
ssifi
catio
n
Maj
or S
oils
M
ajor
Soi
ls
K37
Ver
y de
ep,
wel
l dra
ined
, cl
ayey
soi
ls o
n m
oder
atel
y sl
opin
g fo
ot h
ills
with
mod
erat
e er
osio
n:
Ass
ocia
ted
with
ver
y de
ep,
wel
l dra
ined
, gr
avel
ly c
lay
soils
on
gent
le
slop
es.
Cla
yey,
Mix
ed,
Ust
ic P
aleh
umul
ts
Cla
yey,
Mix
ed
Ust
ic
Hap
lohu
mul
ts
K38
Ver
y de
ep,
wel
l dr
aine
d, c
laye
y so
ils o
n m
oder
atel
y st
eepl
y sl
opin
g hi
gh h
ills
with
thin
veg
etat
ion,
with
mod
erat
e er
osio
n:
Ass
ocia
ted
with
rock
out
crop
s.
Cla
yey,
Mix
ed,
Ust
ic P
aleh
umul
ts
Roc
k la
nd
Fine
, Mix
ed, U
stic
H
umitr
opep
ts
Fi
ne-lo
amy,
Mix
ed
Ust
ic H
umitr
opep
ts
Soils
of t
he L
owla
nd
- K
01, K
02, K
05, K
07
Soils
of t
he M
idla
nd
- K
08, K
09, K
12
Soils
of t
he S
outh
Sah
yadr
i
- K
31, K
32, K
37, K
38
Soils
of t
he N
ilgris
-
K34
, K35
, K36
-75-

Table:8.2
Sl.No. Map Symbol Depth Texture Slope Drainage
1 K01 vd s vg mw2 K02 vd s vg e3 K05 vd c vg l4 K07 vd gc g w5 K08 vd c vg mw6 K09 vd gc ms w7 K12 vd gc g w8 K31 vd gl s w9 K32 d l g w10 K34 vd l vg l11 K35 d gc m w12 K36 vd c ms w13 K37 vd c m w14 K38 vd c ms w
1 d2 vd
1 g2 vg3 m4 s5 ms
1 s2 gc3 c4 l5 gl
1 mw2 w3 e4 i imperfectly
Depth
loamgravelly loam
Drainagemoderately well drained
Texturesandy
clay
LEGEND FOR THE SOIL MAP OF KOLLAM DISTRICT
deepvery deep
Slopegentle
excessive
gravelly clay
very gentlemoderate
steepmoderately steep
well
-76-

-77-

-78-

WATER RESOURCES
In most developing countries, agriculture is the dominant user of water,
accounting for more than 85% of all water use. Use of water in agriculture raises
significant issues for water resources management like issues dealing with water
scarcity, competing demands from other sectors, irrigation service delivery and system
management, water use efficiencies are so forth. The primary objective in coming years
will be to balance water supply and demand among users to ensure adequate water for
agriculture and sustainable irrigation system management while satisfying other needs.
Investments in irrigation are changing globally in response to changes in environment
and experience with previous projects. In 1970’s and 1980’s investment typically
involved large irrigation and drainage projects with considerable infrastructure
development. In 1990’s investment often supported system rehabilitation and
management and more recently to small irrigation schemes. Increased water scarcity
has shifted the focus from exploitation of water resources and building infrastructure to
improvement of water use efficiency.
The basic premise of water resource management is that manages and develops
the river basins as an integrated approach. This is always legally and politically complex
due to the challenges of allocation between users and uses. In many cases the need of
river infrastructure such as weirs, dykes, regulators and other storage structures are
primary drivers for adopting institutional solutions. The investment in storage structures
is essential to optimize water use as well as to address the growing number of water
conflicts. The surface irrigation consists of major chunk of irrigation infrastructure in the
State. There are 18 dams in the state intended for irrigation. Out of this, 14 have
storages and remaining are barrages.
Live storage capacities of irrigation Reservoirs
The live storage position of the reservoirs during the beginning and end of the
monsoon period for 2008 to 2011 are given in the following table.
-79-

Table: 9.1 (Mm3)
Sl. No. Item 2008 2009 2010 2011
1 Storage at the beginning of the Monsoon 452 392 531 525
2 Storage at the end of the Monsoon 1156 1180 1213 12743 Increase due to Monsoon 704 788 682 7494 Average for 10 years (2002 – 2011)
(I) at the beginning of the monsoon 430.48 (ii) at the end of the monsoon 1133.16 (iii) increase in monsoon storage 702.68
The awareness among the public about the importance of the ground water has
increased during the recent years. The need for ground water being felt by all sectors
because of the shortage of surface water sources to mitigate the growing needs of the
society. Recently the problems of decline in water table, contamination of ground water,
sea water intrusion etc are being reported at many places. The shortage of rainfall in
recent years and the increased utilization of ground water caused concern among the
public that water may become scarce commodity in future. In order to assess the real
situation of ground water conditions, it is very essential to monitor the ground water level
and water quality over time and space. Central Ground Water Board monitoring water
level and quality through a network of Ground Water Monitoring Wells distributed
through out State. The monitoring started from the year 1969 for the nine monitoring
wells and the number of monitoring wells was increased during the subsequent years
and became 224 by the year 1979 and the number became 460 by the year 1988.
Presently the total number of Ground Water Monitoring Wells (GWMWs) through out the
Kerala State is 941. Water level is being monitored four times a year during January,
April, August and November months and water quality is being monitored from the water
samples collected from GWMWs during April.
The total number of GWMWs as on 31.3.2010 is 941. Out of these, 662 are dug
wells tapping phreatic aquifers and 279 are bore wells/tube wells tapping deeper
aquifers of confined/semi-confined nature. These GWMWs are spread over all the
-80-

physiographic divisions of the State. About 62% of the GWMWs fall in the midland
region, 18% in coastal plains, 15% in highlands and 5% in plateau region. Among the
GWMWs tapping phreatic acquire, 65% are tapping laterite, 17% tapping weathers and
fractured crystalline, 15% tapping coastal alluvium and 3% tapping reverie alluvium. The
data of these GWMWs were analyzed to understand the depth to water level scenario in
the State, annual fluctuation in the water levels due to the monsoon recharge, long term
trend in water levels and the nature of the quality of ground water and the salient
features are brought out in this report.
RIVERS
There are 41 west flowing and 3 east flowing rivers, most of them having their
source in the Western Ghats and draining into the Arabian Sea. Some of these rivers
have a portion of their catchments in the adjoining States of Karnataka and Tamil Nadu.
In addition, there are three rivers which also originate from the Western Ghats, but they
flow eastwards into the States of Karnataka and Tamil Nadu. The important rivers in the
district are Achenkovil, Pallikkal, Kallada, Ithikkara and Ayroor.
Achenkovil River
Several small streams originate from Pasukida Mettu, Ramakkal Teri and Rish
Malai at altitudes ranging between +700m and +160m above M.S.L join together to form
Achencovil River. The length of the river is 128km. The total drainage area of the river
1484 sq.km covering portions of Kunnathur, Mavelikkara, Chengannoor, Karthikappally,
Karunagappally and Pathanamthitta Taluks. The important towns in the basin are
Pandalam, Mavelikkara and Harippad.
Pallickal River
The river rises from the Southern slopes of Kalaritharakunnu at an elevation of
less than +60m M.S.L North of Adoor. It initially flows in a southerly direction and after
passing Adoor it takes a South – Westerly direction till Nellimugal. River has a length of
42km with a drainage area of 220 sq.km.
-81-

Kallada River
River is formed by three rivers Kulathupuzha, Chendumi and Kalthuruthy which
join together near Parappar by the side of Trivandrum-Shencottah road. The length of
the river is 121km with a drainage area of 1699 sq.km. The catchment lies entirely within
the State. The important towns situated in the basin are Punalur, Pathanapuram,
Kottarakkara, Adoor, Kundara and Quilon.
Ithikkara River
Ithikkara River originates from the low hills situated near Madathurikunnu at
about +240m above M.S.L. and from the hills located South West of Kulathupuzha.
Vattaparambu stream and Kundumon thodu are its important tributaries. The river
passes through the villages of Vayala, Pampira, Ayur, Thiruvambhagom, Atturkonam
and Adichanalloor. Kottayam, Chathannur and Chadayamangalam are some of the
important places in the basin. River has a length of 56 km. and a catchment area of
642sq.km. The complete catchment lies within the State.
Ayroor River
Ayroor River is rising from Navaikulam. The length of river is 17km. and it drains
an area of 66sq.km.
Source: ER, CGWD, PWD.
-82-

-83-

-84-
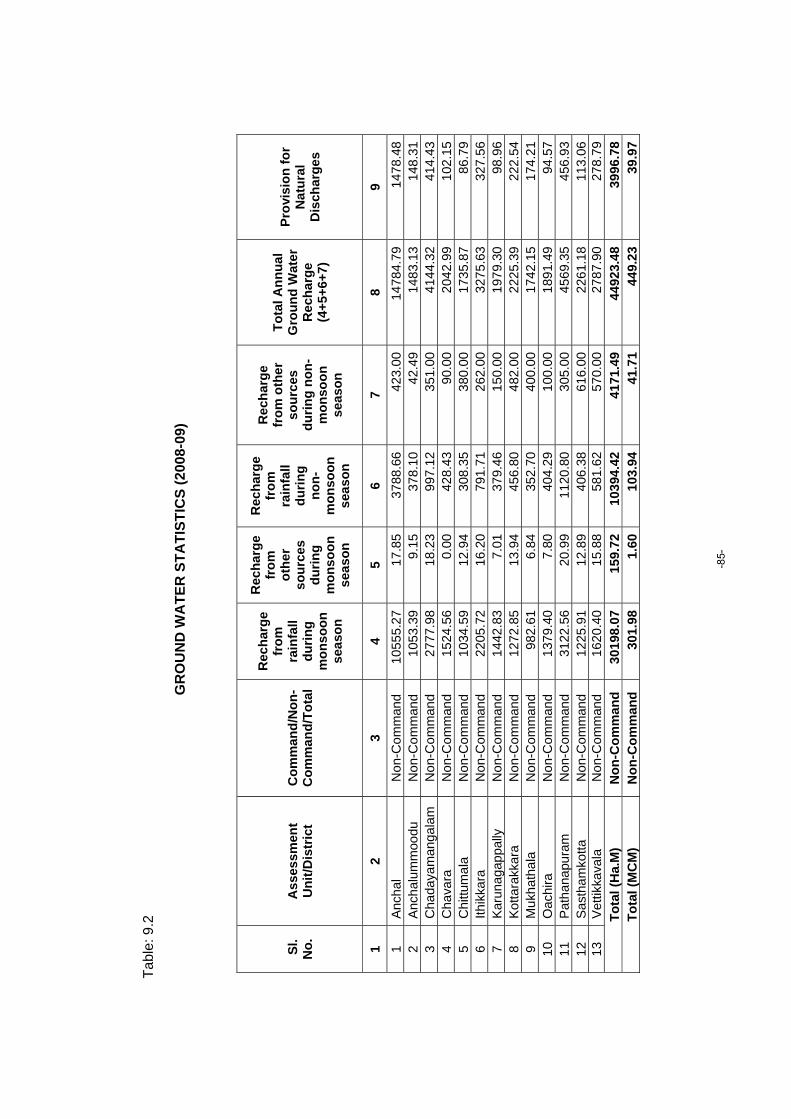
Tabl
e: 9
.2
GR
OU
ND
WA
TER
STA
TIST
ICS
(200
8-09
)
Sl.
No.
A
sses
smen
t U
nit/D
istr
ict
Com
man
d/N
on-
Com
man
d/To
tal
Rec
harg
e fr
om
rain
fall
durin
g m
onso
on
seas
on
Rec
harg
e fr
om
othe
r so
urce
s du
ring
mon
soon
se
ason
Rec
harg
e fr
om
rain
fall
durin
g no
n-m
onso
on
seas
on
Rec
harg
e fr
om o
ther
so
urce
s du
ring
non-
mon
soon
se
ason
Tota
l Ann
ual
Gro
und
Wat
er
Rec
harg
e (4
+5+6
+7)
Prov
isio
n fo
r N
atur
al
Dis
char
ges
1 2
3 4
5 6
7 8
9 1
Anch
al
Non
-Com
man
d 10
555.
2717
.85
3788
.66
423.
0014
784.
7914
78.4
82
Anch
alum
moo
du
Non
-Com
man
d 10
53.3
99.
1537
8.10
42.4
914
83.1
314
8.31
3 C
hada
yam
anga
lam
N
on-C
omm
and
2777
.98
18.2
399
7.12
351.
0041
44.3
241
4.43
4 C
hava
ra
Non
-Com
man
d 15
24.5
60.
0042
8.43
90.0
020
42.9
910
2.15
5 C
hittu
mal
a N
on-C
omm
and
1034
.59
12.9
430
8.35
380.
0017
35.8
786
.79
6 Ith
ikka
ra
Non
-Com
man
d 22
05.7
216
.20
791.
7126
2.00
3275
.63
327.
567
Karu
naga
ppal
ly
Non
-Com
man
d 14
42.8
37.
0137
9.46
150.
0019
79.3
098
.96
8 Ko
ttara
kkar
a N
on-C
omm
and
1272
.85
13.9
445
6.80
482.
0022
25.3
922
2.54
9 M
ukha
thal
a N
on-C
omm
and
982.
616.
8435
2.70
400.
0017
42.1
517
4.21
10
Oac
hira
N
on-C
omm
and
1379
.40
7.80
404.
2910
0.00
1891
.49
94.5
711
Pa
than
apur
am
Non
-Com
man
d 31
22.5
620
.99
1120
.80
305.
0045
69.3
545
6.93
12
Sast
ham
kotta
N
on-C
omm
and
1225
.91
12.8
940
6.38
616.
0022
61.1
811
3.06
13
Vetti
kkav
ala
Non
-Com
man
d 16
20.4
015
.88
581.
6257
0.00
2787
.90
278.
79To
tal (
Ha.
M)
Non
-Com
man
d 30
198.
0715
9.72
1039
4.42
4171
.49
4492
3.48
3996
.78
Tota
l (M
CM
) N
on-C
omm
and
301.
981.
6010
3.94
41.7
144
9.23
39.9
7
-85-

Tabl
e: 9
.2 C
ontin
ued…
……
.
Sl.
No.
A
sses
smen
t U
nit/D
istr
ict
Net
Ann
ual
Gro
und
Wat
er
Ava
ilabi
lity
Exis
ting
Gro
ss
Gro
und
Wat
er
Dra
ft fo
r irr
igat
ion
Exis
ting
Gro
ss
Wat
er
Dra
ft fo
r do
mes
tic
and
indu
stria
l w
ater
su
pply
Exis
ting
Gro
ss
Gro
und
Wat
er
Dra
ft fo
r al
l iss
ues
(11+
12)
Prov
isio
n fo
r do
mes
tic,
and
indu
stria
l re
quire
men
t su
pply
upt
o ne
xt 2
5 ye
ars
Net
Gro
und
Wat
er
Ava
ilabi
lity
for
futu
re
irrig
atio
n de
velo
pmen
t (1
0-11
-14)
Stag
e of
G
roun
d w
ater
D
evel
opm
ent
(13/
10)*
100
1 2
10
11
12
13
14
15
16
1 An
chal
13
306.
3143
1.58
1145
.12
1576
.70
1271
.39
1160
3.34
11.8
52
Anch
alum
moo
du
1334
.82
202.
7698
4.63
1187
.39
1092
.59
39.4
788
.96
3 C
hada
yam
anga
lam
37
29.8
943
9.03
1030
.63
1469
.66
1143
.02
2147
.84
39.4
04
Cha
vara
19
40.8
417
8.10
762.
9894
1.08
846.
2191
6.53
48.4
95
Chi
ttum
ala
1649
.08
299.
3358
2.72
882.
0564
6.92
702.
8353
.49
6 Ith
ikka
ra
2948
.06
389.
1011
45.4
215
34.5
212
71.8
212
87.1
452
.05
7 Ka
runa
gapp
ally
18
80.3
318
8.64
808.
5599
7.19
1130
.12
561.
5753
.03
8 Ko
ttara
kkar
a 20
02.8
533
4.36
871.
4312
05.7
996
6.07
702.
4260
.20
9 M
ukha
thal
a 15
67.9
318
9.22
900.
9610
90.1
888
8.46
490.
2569
.53
10
Oac
hira
17
96.9
219
7.97
681.
1487
9.11
756.
2184
2.73
48.9
211
Pa
than
apur
am
4112
.41
475.
4498
4.54
1459
.98
1092
.70
2544
.28
35.5
012
Sa
stha
mko
tta
2148
.12
308.
2680
6.93
1115
.19
895.
7294
4.14
51.9
113
Ve
ttikk
aval
a 25
09.1
138
1.17
991.
1413
72.3
111
00.3
210
27.6
354
.69
Tota
l (H
a.M
) 40
926.
6740
14.9
611
696.
1915
711.
1513
101.
5523
810.
1738
.39
Tota
l (M
CM
) 40
9.27
40.1
511
6.96
157.
1113
1.02
238.
0238
.39
Sour
ce: C
entra
l Gro
und
Wat
er D
epar
tmen
t
-86-

-87-

-88-

MINERALS
The availability of minerals determines the pace of economic development of a
State to a great extent. Minerals are basically natural resources. Kerala State is
endowed with a number of occurrences/deposits of minerals such as Heavy Mineral
Sands (llmenite, Rutile, Zircon, Monazite, Sillimanite), Gold, Iron Ore, Bauxite, Graphite,
China Clay, Fire Clay, Tile and Brick Clay, Silica Sand, Lignite, Limestone, Limeshell,
Dimension Stone (Granite), Gemstones, Magnezite and Steatite etc. However mining
activities on large scale are confined mainly to a few minerals - Heavy Mineral Sands,
China Clay and to a lesser extent Limestone/Limeshell, Silica Sand and Granite. In fact,
Heavy Mineral Sand and China Clay contribute more than 90% of the total value of
mineral production in the State.
The district is immensely rich in mineral sources and is endowed with large
deposits of beach sand containing Ilmenite, Monozite, Clays, Bauxite, Graphite and
Laterite. Ilmenite and Monozite are found at Chavara, Neendakara and Koilthottam. The
mineral deposit of the Kollam coast containing Monozite is one of the richest in the world
and reported to have the highest content of Thorium. Good quality bauxite occurs in
Sooranadu - Vadakkemuri, Adichanallur and Chittavattom areas. Aluminium oxide
content varies between 40 to 50%. China Clay both primary and secondary origin
suitable for ceramics, paper coating, textile and rubber industries occurs in Kundara,
Mulavana, Vellichikala, Perumbuzha, Kalluvathukkal and Chathanoor. Phologophite
mica occurs near Punalur. The khondalite suite has graphite, associated with it. China
Clay is concentrated at Chathannur, Kundara and Mulavana. Large deposits of residual
clays occur at Kundara. Fire clay deposits were discovered in Padappakara, Kundara,
Pallimon, Ambalathumbhagom and Vadakkumthala. Ball clay occurs in large quantities
at Polachira and Padappakkara. Limeshell deposits were seen in Ashtamudi Lake and
Vembanad Lake. Bauxite deposits are available in Adichanalloor and disseminated
Graphite in Punalur. Gemstones were discovered in Kulathupuzha and Mineral Sands in
Chavara and Kayamkulam.
-89-

Table: 10.1
INVENTORY OF THE MINERAL RESOURCES OF THE STATE
Sl. No.
Name of Minerals Occurrence
Reserves (Million Tonnes)
Uses
1 Gold Wayanad, Maruda, Nilambur, Malappuram 0.55 Manufacture of
ornaments
2 Iron
Kozhikode (Eleyettimala, Naduvallur Nanminda, Cheruppa, Alampara) Malappuram (Korattimala)
83.04
Iron is useful in building (Bridge, highway, rail road, etc.), transportation (car, train, boats, plane, etc.) tools (knife, machines, etc.)
3 China clay Thiruvananthapuram, Kollam, Kannur, Kasaragod 172
Ceramics, pottery, paper, textiles, rubber and paints
4 Ball clay
Thiruvananthapuram (Nadayara) Kollam (Kumbalam, Kanjirottussery, Mulavana) Kannur (Pattuvam, Karivalloor, Earipuram, Pazhayangadi)
1.67
Manufacture of Refractory products, Ceramic Granite tiles, Glazed tiles, table ware & High tension electric insulators etc.
5 Fire clay
Kollam (Kundamon, Pallikkal), Alappuzha (Thamarakulam), Ernakulam (Amballoor, Kanjiramattom, Keezhumadu), Thrissur (Poomangalam) Kannur (Pattuvam)
11.55
Manufacture of firebrick and of various accessory utensils, such as crucibles, saggers, retorts and glass pots, used in the metal working industries.
6 Silica Coastal area of Alappuzha 28.40
Used in ceramics and to make glass with. It can also be used to strength iron and steel.
7 Bauxite
Thiruvananthapuram (Mangalapuram, Chilambil, Sasthavattom), Kollam (Poruvazhy, Aadichanalloor) Kannur, Kasaragod
12.5
Manufacture of Aluminium. It is used in cement, chemicals, face makeup, soda cans, dishwashers, siding for houses.
-90-

Sl. No.
Name of Minerals Occurrence
Reserves (Million Tonnes)
Uses
8 Lime shell
Alappuzha, Ernakulam (Vembanad lake), Kottayam, Thrissur (Vadanapally) Kannur (Payyannur, Thrikkaripur)
4.05
Manufacture of a variety of products including white cements.
9 Limestone Palakkad (Walayar) 24
Manufacture of cement, calcium carbide, Iron & Steel Industry etc.
10 Graphite
Thiruvananthapuram (Veli, Kuttichal), Ernakulam (Vadakode), Kottayam (Chirakadavu)
2.81Crucible Foundry, Refractory, Paints & Lubricant Industries
11 Lignite Kannur (Madai), Kasaragod (Nileswaram, Palayi) 9.65
Used as fuel for steam electric power generation in some countries
12 Magnezite Palakkad (Attapadi) 0.037 Refractory bricks for furnaces
Table: 10.2
NUMBER OF QUARRYING PERMITS ISSUED DURING 2009-10 (Mineral wise)
Sl. No. District
Name of Mineral Granite Building
Stone Laterite
Brick Clay
OrdinarySand
Sea shell
Lime Shell Total
1 Thiruvananthapuram 158 4 5 4 1712 Kollam 112 11 7 25 1553 Pathanamthitta 162 9 8 1794 Alappuzha 51 4 555 Kottayam 274 14 239 5276 Idukki 172 118 2907 Ernakulam 294 11 14 2 1 3228 Thrissur 299 60 82 4419 Palakkad 142 7 283 43210 Malappuram 326 489 17 83211 Kozhikode 336 85 30 20 47112 Wayanad 151 3 12 4 17013 Kannur 218 226 37 1 48214 Kasaragod 172 336 148 656
Total 2816 1292 193 880 1 1 5183
-91-

Table: 10.3
NUMBER OF MINING LEASES IN THE STATE OF KERALA AS ON 31-03-2010 (Mineral wise)
Sl. No. District
Name of Mineral
Gra
phite
Chi
na c
lay
Late
rite
Iron
ore
Qua
rtz
Lim
e sh
ell
Min
eral
san
d
Lim
e st
one
Silic
a sa
nd
Qua
rtzi
te
1 Thiruvananthapuram 30
2 Kollam 1 3
3 Pathanamthitta
4 Alappuzha 1 4 22
5 Kottayam 2 1
6 Idukki
7 Ernakulam 1
8 Thrissur
9 Palakkad 1
10 Malappuram
11 Kozhikode 1
12 Wayanad
13 Kannur 2 5
14 Kasaragod 1 1
Total 1 34 7 1 1 6 3 1 22 1
-92-

Table: 10.4
DISTRICT WISE REVENUE COLLECTION FOR 2011-12
Sl. No. Districts Major
minerals Minor
minerals Total
1 Thiruvananthapuram 11661103 24533618 36294721
2 Kollam 47548382 14615433 62163815
3 Pathanamthitta 0 20203550 20203550
4 Alappuzha 8138592 2364614 10503206
5 Kottayam 1875258 20363947 22239205
6 Idukki 0 13817639 13817639
7 Ernakulam 18720 48886751 48905471
8 Thrissur 0 39086404 39086404
9 Palakkad 34417152 34307255 68724407
10 Malappuram 158850 33863331 34022181
11 Kozhikode 0 17572244 17572244
12 Wayanad 0 11442866 11442866
13 Kannur 1582350 27790851 29373201
14 Kasaragod 4040597 12668970 16709567
15 KMS(NR) 52700 1926000 1978700
16 KMS(SR) 0 915000 915000
17 KMS(CR) 0 4882000 4882000
18 DRT 2183979 1970672 4154651
Total 111677683 331311145 442988828Source: Infrastructure Statistics of Kerala, 2011
-93-

-94-

Mineral r
Mineral m
Source
reserves (20
map of Kerala (
e: www. Ker
000-01)
(After Dept.
renvis.nic.in
of Mining an
n
nd Geology, 2005)
-95-

-96-

LAND USE
The spatial information on land use/land cover and their pattern of change is
essential for planning, utilization and management of the country’s land resources. Land
use/land cover inventories are assuming increasing importance in various resource
sectors like agriculture planning, settlement and cadastral surveys, environmental
studies and operational planning based on agro-climatic zones. Information on land use/
land cover permits a better understanding of the land utilization aspects on cropping
pattern, fallow land, forest and grazing land, wasteland, surface water bodies etc., which
is very vital for developmental planning. Further the draft outline of the National land Use
Policy having strongly re-iterated the main thrust and strategy on “Optimum Land Use
Planning” for sustained efforts and economic returns, up to date information on the
nature, distribution and extent of land use/land cover will be of great relevance. Space
remote sensing with its wider scope, rapid and repetitive coverage capabilities, can
provide highly reliable and accurate estimate on the various resources.
Realising its importance, land use mapping on 1:250,000 scales was envisaged
for the entire country using satellite data by Department of Space in 1986 as a part of
Remote Sensing Application Mission Project. The study enabled to arrive at a
Nationwide Land use/Land cover classification system.
Subsequently, the Government of Kerala felt the need for having up to date
information for the whole State on agriculture and other land use categories and their
estimate for agro-climate zone planning in 1:50,000 scale. The work undertaken by the
Board, involves preparation of land use maps on 1:50,000 scale for 14 districts through
digital techniques.
The Kerala State Land Use Board was entrusted with the task of preparing the
Land use/land cover maps of State, by interpretation of satellite imagery. Standard False
Color Composite (FCC) generated on 1:12,500 scale of IRS (LISS-IV) was interpreted
for identification of different Land use/Land cover classes, based on the image
characteristics like tone, size, shape, pattern, texture, location, association etc. by
developing a detailed interpretation key for each district.
-97-

Multi-date imaginary was essentially interpreted to identify and map the details of
crop land in Viruppu and Mundakan seasons the area under double crop, fallow lands
and for better boundary delineation of boundaries of the other land use/land cover
classes. Ancillary data like topographical maps and other thematic maps of the district
was also used for the interpretation.
METHODOLOGY
The methodology is essentially digital interpretation of IRS-1C (LISS - IV) geo-
coded image (FCC) for identification of different categories of land use/land cover using
standard visual image interpretation techniques which is based on interpretation
elements such as tone, texture, shape, size, etc. supplemented by the local knowledge
of the interpreter. Other ancillary data like topographical maps and any other available
information will be used for identification and mapping of land use/ land cover. The
interpreted details are to be verified on the ground in order to rectify the doubtful areas,
and based on the ground verification, the wasteland boundaries (interpreted details) are
to be finalized.
The geographical area under different land use/land cover categories was then
computed and expressed as simple percentage to the total geographical area of each
district.
Land Use/Land Cover Categories and their Spatial Distribution- Kollam
Land use refers to man’s activities and the various use which are carried on land.
Land cover refers to, “natural vegetation, water bodies, rock/soil, artificial cover and
others resulting due to land transformations”.
A brief description of the major land use/land cover categories observed in the
Kollam district and their spatial distribution is given below:
i) Built up land
It is defined as an area of human habitation developed due to non-agricultural
use and that which has a cover of buildings, transport, and communication, utilities in
association with water, vegetation and vacant lands. An area 6926 ha accounting for
2.79 per cent of the TGA is estimated under this category.
-98-

ii) Agricultural land
It is defined as the land primarily used for farming and for production of food,
fibre and other commercial and horticultural crops. It includes land under crops (irrigated
and unirrigated), fallow land and plantation area under agricultural tree crops planted
adopting certain agricultural management techniques. This is the major category
occupying an area of 144928 ha accounting for 56.38 per cent of the TGA. Of these, the
paddy area covers an area of 10820 ha. Nearly 5320 ha of paddy area has been
converted to other land uses. The mixed crop which covers an area of 50744 ha is the
major land use identified under this category.
iii) Forest
It is an area bearing an association predominantly of trees and other vegetation
types capable of producing timber and other forest produce. It includes notified forests,
private forests and vested forests, of which only the notified forests possess territorial
boundaries. The other categories do not have any demarcation in the ground as well as
in the concerned toposheets. This category includes Evergreen/Semi-evergreen and
Deciduous forests, degraded forests where the vegetative (crown) density is less than
20% of the canopy cover, forest blanks described as openings amidst forests without
any tree cover and forest plantations of trees of forestry importance and raised on forest
lands. This category accounts for 84293 ha, which is 33.96 per cent of the total
geographical area.
iv) Waste lands
It is described as degraded land which can be brought under vegetative cover
with reasonable efforts and which is currently under utilized and land which is
deteriorating due to lack of appropriate water and soil management or on account of
natural causes. The three major classes in the category are; a) Land with or without
scrub which occupy higher topography like uplands or high grounds with or without
scrub, generally prone to degradation or erosion b) underutilized/degraded notified
forest - scrub dominated and c) barren rocky/stony waste/sheet rock area which are rock
exposures of varying lithology and devoid of soil cover and vegetation. They occur
amidst hill forests as opening or scattered as isolated exposures or loose fragments of
-99-

boulders or as sheet rocks on plateau and plains. The waste lands occupy an area of
5231 ha accounting for 2.11 percent of the total geographical area.
v) Water bodies
It is an area of impounded water, area in extent and often with a regulated flow of
water. It includes manmade reservoirs/lakes/tanks/canals, besides natural lakes,
rivers/streams and creeks. The water bodies mapped occupy an area of 11816 Ha
accounting for 4.76 percent of the total area.
The land use/land cover categories identified and mapped in the district is
furnished in the table below:
Table: 11.1
LAND USE / LAND COVER CATEGORIES- KOLLAM (Area in Sq.Km)
Sl.No. Category Area Percentage
1 Built up land (urban) - industrial 0.01 02 Built up land (urban) - commercial 46.78 1.883 Built up land (urban) - beaches 4.2 0.174 Built up land (rural) - residential 17.65 0.715 Built up land (rural) - mixed builtup 0.62 0.026 Paddy - viruppu 82.96 3.347 Paddy - viruppu + mundakan 25.24 1.028 Paddy reclaimed arecanut 2.79 0.119 Paddy reclaimed coconut 3.69 0.15
10 Paddy reclaimed rubber 2.1 0.0811 Paddy reclaimed mixed crop 6.53 0.2612 Paddy reclaimed banana 32.22 1.313 Paddy reclaimed banana + tapioca 4.19 0.1714 Paddy reclaimed residential area 1.68 0.0715 Paddy - fallow 8.57 0.3516 Tea 1.49 0.0617 Rubber 513.03 20.6718 Coconut 48.02 1.9319 Oil palm 4.11 0.1720 Tea + Eucalyptus 0.76 0.03
-100-

21 Teak 0.22 0.0122 Mixed crop 507.44 20.4523 Coconut dominant mixed crop 154.24 6.2124 Semi evergreen/Evergreen - Dense mixed forest 5.66 0.23
25 Semi evergreen/Evergreen - Dense mixed forest (Reserve Forest) 416.81 16.79
26 Semi evergreen/Evergreen - Dense mixed forest mainly bamboo 0.2 0.01
27 Semi evergreen/Evergreen - Dense mixed forest mainly bamboo (Reserve Forest) 0.17 0.01
28 Deciduous - Dense mixed forest mainly bamboo + teak (Reserve Forest) 64.01 2.58
29 Deciduous - Open mixed forest (Reserve Forest) 1.62 0.0730 Deciduous - Scrub forest 11.05 0.4531 Forest plantation - Teak (Reserve Forest) 231.35 9.3232 Forest plantation - Eucalyptus (Reserve Forest) 10.37 0.4233 Forest plantation - Rubber (Reserve Forest) 65.29 2.6334 Forest plantation - Cashew (Reserve Forest) 0.56 0.0235 Forest plantation - Oilpalm (Reserve Forest) 20.1 0.8136 Forest plantation - Tea (Reserve Forest) 6.59 0.2737 Forest plantation - Bamboo (Reserve Forest) 2.05 0.08
38 Forest plantation - Teak + Softwood (Reserve Forest) 7.1 0.29
39 Land with scrub 11.15 0.4540 Land without scrub 0.3 0.0141 Mining/Industrial wastelands 6.51 0.2642 Barren rocky/sheet rock area 0.59 0.0243 Degraded land under plantation crop (Tea) 1.78 0.0744 Degraded land under plantation crop (Teak) 0.04 045 Degraded land under plantation crop (Rubber) 24.57 0.9946 Degraded land under plantation crop (Cashew) 0.08 047 Degraded land under plantation crop (Oil palm) 2.82 0.1148 Coastal sand 0.08 049 Waterlogged area 4.17 0.1750 Sands/riverine 0.22 0.0151 Water bodies 118.16 4.76
Total 2481.94 100
-101-

Sl.
No.
Land
Use
Ala
yam
onA
ncha
lA
ryan
kavu
Edam
ula
ckal
Eroo
rK
arav
alo
orK
ulat
hoo
puzh
aTh
enm
ala
1A
gric
ultu
re p
lant
atio
n (A
reca
nut)
2A
gric
ultu
re p
lant
atio
n (B
anan
a)3
Agr
icul
ture
pla
ntat
ion
(Cas
hew
)4
Agr
icul
ture
pla
ntat
ion
(Coc
onut
)66
.13
11.1
785
.91
5A
gric
ultu
re p
lant
atio
n (M
ixed
)13
69.9
616
65.0
80.
6123
31.6
627
40.2
942.
7536
75.9
362
2.49
6A
gric
ultu
re p
lant
atio
n (R
ubbe
r)38
1.04
744.
0913
55.0
497
2.05
1041
.111
35.7
916
15.6
818
17.6
17
Agr
icul
ture
pla
ntat
ion
(Tea
)69
4.18
824.
4632
3.82
8B
arre
nroc
k/S
tony
was
te/S
heet
rock
20.7
338
6.72
305.
1061
9.51
9B
uilt-
up (C
ities
/Tow
n/V
illag
es)
16.4
071
.97
11.6
647
.25
27.7
942
.64
33.9
619
.33
10C
ropl
and
(Kha
rif)
11D
oubl
ecro
p (K
harif
+Rab
i)15
3.96
156.
9933
.62
166.
9826
9.02
408.
512
Fallo
w la
nd13
Fore
st d
ecid
uous
(Den
se)
1.85
14Fo
rest
dec
iduo
us (O
pen)
15Fo
rest
dec
iduo
us (s
crub
/deg
rade
)78
.93
488.
9516
Fore
st e
verg
reen
(Den
se)
5344
.25
2287
5.12
1248
.56
17Fo
rest
eve
rgre
en (O
pen)
30.0
765
88.5
418
Fore
st p
lant
atio
ns32
62.9
812
312.
1460
.69
5179
.77
19Fo
rest
man
grov
es (L
ittor
al S
wam
p)20
Land
with
scr
ub37
6.43
1158
.26
119.
7395
.19
1534
.64
1271
.39
21La
nd w
ithou
t scr
ub10
5.41
2022
.04
315.
6822
Mar
shy/
Sw
ampy
23M
inin
ig/In
dust
rial w
aste
1.73
2.72
24R
iver
/Wat
erbo
dies
0.01
37.7
12.
2114
.88
1251
.06
54.0
525
San
dy a
rea
26W
etla
nds
(Wat
erlo
gged
)Pa
ncha
yath
Tot
al55
83.2
327
04.2
721
520.
3836
51.0
542
48.8
826
15.5
939
839.
5012
880.
98B
lock
Tot
al
AN
CH
AL
BLO
CK
Tabl
e:11
.2
9304
3.88
(Are
a in
Ha)
-102
-

Sl.
No.
Land
Use
Cha
daya
man
gala
mC
hith
ara
Elam
adu
Ittiv
aK
adak
kal
Kum
mil
Nila
mel
Velin
allo
or
1A
gric
ultu
re p
lant
atio
n (A
reca
nut)
2A
gric
ultu
re p
lant
atio
n (B
anan
a)3
Agr
icul
ture
pla
ntat
ion
(Cas
hew
)72
.42
7.24
20.5
14
Agr
icul
ture
pla
ntat
ion
(Coc
onut
)11
.35
5A
gric
ultu
re p
lant
atio
n (M
ixed
)17
56.8
134
53.6
118
66.8
2901
.721
98.9
413
40.4
512
55.7
916
83.1
16
Agr
icul
ture
pla
ntat
ion
(Rub
ber)
470.
8785
9.96
768.
4257
5.43
592.
4518
1.07
458.
6455
9.06
7A
gric
ultu
re p
lant
atio
n (T
ea)
8B
arre
nroc
k/S
tony
was
te/S
heet
rock
31.1
45.
2113
.41
2.21
3.22
14.1
012
.97
9B
uilt-
up (C
ities
/Tow
n/V
illag
es)
36.4
912
.62
46.8
251
.36
6.64
85.2
142
.85
10C
ropl
and
(Kha
rif)
5.85
11D
oubl
ecro
p (K
harif
+Rab
i)21
2.89
292.
4519
0.61
387.
0718
2.41
210.
8132
.53
179.
1512
Fallo
w la
nd13
Fore
st d
ecid
uous
(Den
se)
14Fo
rest
dec
iduo
us (O
pen)
15Fo
rest
eve
rgre
en (D
ense
)16
Fore
st m
angr
oves
(Litt
oral
Sw
amp)
17Fo
rest
dec
iduo
us (s
crub
/deg
rade
)18
Fore
st e
verg
reen
(Ope
n)19
Fore
st p
lant
atio
ns10
36.2
043
.67
20La
nd w
ith s
crub
202.
1177
.48
68.5
83.
382.
4521
Land
with
out s
crub
37.0
269
.38
42.6
822
Mar
shy/
Sw
ampy
23M
inin
ig/In
dust
rial w
aste
13.2
321
.38
108.
2016
.65
24.4
311
.43
24R
iver
/Wat
erbo
dies
46.7
21.
9727
.15
35.2
425
San
dy a
rea
26W
etla
nds
(Wat
erlo
gged
)Pa
ncha
yath
Tot
al25
29.7
859
36.2
829
58.5
442
33.2
531
25.0
317
77.5
018
97.8
125
23.8
1B
lock
Tot
al
CH
AD
AYA
MA
NG
ALA
M B
LOC
K
2498
2.00
(Are
a in
Ha)
Tabl
e:11
.3
-103
-

Tabl
e:11
.4
(Are
a in
Ha)
Sl.
No.
Land
Use
Cha
vara
Nee
ndak
ara
Panm
ana
Thek
kum
bhag
amTh
eval
akka
ra
1A
gric
ultu
re p
lant
atio
n (A
reca
nut)
2A
gric
ultu
re p
lant
atio
n (B
anan
a)3
Agr
icul
ture
pla
ntat
ion
(Cas
hew
)4
Agr
icul
ture
pla
ntat
ion
(Coc
onut
)21
7.15
157.
5686
.92
5.50
1.02
5A
gric
ultu
re p
lant
atio
n (M
ixed
)79
8.47
210.
0313
29.0
846
4.23
1342
.09
6A
gric
ultu
re p
lant
atio
n (R
ubbe
r)7
Agr
icul
ture
pla
ntat
ion
(Tea
)8
Bar
renr
ock/
Sto
nyw
aste
/She
etro
ck9
Bui
lt-up
(Citi
es/T
own/
Vill
ages
)54
.43
3.97
159.
5023
.08
33.1
510
Cro
plan
d (K
harif
)11
Dou
blec
rop
(Kha
rif+R
abi)
49.2
862
.58
117.
7812
Fallo
w la
nd5.
4613
Fore
st d
ecid
uous
(Den
se)
14Fo
rest
dec
iduo
us(O
pen)
15Fo
rest
eve
rgre
en(D
ense
)16
Fore
st m
angr
oves
(Litt
oral
Sw
amp)
17Fo
rest
dec
iduo
us (S
crub
/deg
rade
)18
Fore
st e
verg
reen
(Ope
n)19
Fore
st p
lant
atio
ns20
Land
with
scr
ub21
Land
with
out s
crub
22M
arsh
y/S
wam
py23
Min
inig
/Indu
stria
l was
te24
Riv
er/W
ater
bodi
es20
.13
258.
1617
.67
899.
1718
8.42
25S
andy
are
a73
.24
64.5
420
.76
26W
etla
nds(
Wat
erlo
gged
)Pa
ncha
yath
Tot
al12
12.7
069
4.26
1676
.51
1391
.98
1687
.92
Blo
ck T
otal
CH
AVA
RA
BLO
CK
6663
.37
-104
-

Tabl
e:11
.5
Sl.
No.
Land
Use
East
ka
llada
Kun
dara
Man
tro
thur
uthu
Pana
yam
Pera
yam
Perin
adu
Thrik
kada
voor
Thrik
karu
va1
Agr
icul
ture
pla
ntat
ion
(Are
canu
t)2
Agr
icul
ture
pla
ntat
ion
(Ban
ana)
3A
gric
ultu
re p
lant
atio
n (C
ashe
w)
4A
gric
ultu
re p
lant
atio
n (C
ocon
ut)
880.
0881
4.52
618.
2057
4.81
646.
0110
17.2
578
0.12
631.
375
Agr
icul
ture
pla
ntat
ion
(Mix
ed)
44.3
227
2.15
2.48
5.18
1.48
6A
gric
ultu
re p
lant
atio
n (R
ubbe
r)4.
977
Agr
icul
ture
pla
ntat
ion
(Tea
)8
Bar
renr
ock/
Sto
nyw
aste
/She
etro
ck9
Bui
lt-up
(Citi
es/T
own/
Vill
ages
)98
.33
10.8
110
.84
36.8
161
.55
33.7
710
Cro
plan
d (K
harif
)11
Dou
blec
rop
(Kha
rif+R
abi)
223.
1497
.01
91.4
40.
1297
.05
17.2
935
.67
12Fa
llow
land
13Fo
rest
dec
iduo
us(D
ense
)14
Fore
st d
ecid
uous
(Ope
n)15
Fore
st e
verg
reen
(Den
se)
16Fo
rest
man
grov
es(L
ittor
al S
wam
p)17
Fore
st d
ecid
uous
(scr
ub/d
egra
de)
18Fo
rest
eve
rgre
en(O
pen)
19Fo
rest
pla
ntat
ions
20La
nd w
ith s
crub
21La
nd w
ithou
t scr
ub22
Mar
shy/
Sw
ampy
23M
inin
ig/In
dust
rial w
aste
16.8
97.
3824
Riv
er/W
ater
bodi
es35
.68
0.69
694.
5126
6.53
770.
7941
6.21
609.
111
00.4
625
San
dy a
rea
26W
etla
nds(
Wat
erlo
gged
)11
9.97
26.8
315
.75
Panc
haya
th T
otal
1303
.19
1314
.513
15.1
994
3.59
1460
.415
79.8
814
69.5
418
01.2
7B
lock
Tot
al
CH
ITTU
MA
LA B
LOC
K
1118
7.56
(Are
a in
Ha)
-105
-

(Are
a in
Ha)
Sl No
Land
Use
Adi
chan
allo
orC
hath
anno
orC
hira
kkar
aK
allu
vath
ukka
lPo
otha
kula
m
1A
gric
ultu
re p
lant
atio
n (A
reca
nut)
2A
gric
ultu
re p
lant
atio
n (B
anan
a)3
Agr
icul
ture
pla
ntat
ion
(Cas
hew
)68
.56
0.01
99.0
420
7.58
4A
gric
ultu
re p
lant
atio
n (C
ocon
ut)
814.
4165
3.56
463.
864.
5563
.68
5A
gric
ultu
re p
lant
atio
n (M
ixed
)69
2.37
369.
8210
00.4
628
49.2
390
8.37
6A
gric
ultu
re p
lant
atio
n (R
ubbe
r)21
0.86
38.5
737
7.72
7A
gric
ultu
re p
lant
atio
n (T
ea)
8B
arre
nroc
k/S
tony
was
te/S
heet
rock
9B
uilt-
up (C
ities
/Tow
n/V
illag
es)
235.
2081
.35
69.5
499
.22
33.4
110
Cro
plan
d (K
harif
)11
Dou
blec
rop
(Kha
rif+R
abi)
88.2
014
5.06
43.2
436
6.29
205.
8012
Fallo
w la
nd13
Fore
st d
ecid
uous
(Den
se)
14Fo
rest
dec
iduo
us(o
pen)
15Fo
rest
eve
rgre
en(D
ense
)16
Fore
st m
angr
oves
(Litt
oral
Sw
amp)
17Fo
rest
dec
iduo
us(s
crub
/deg
rade
)18
Fore
st e
verg
reen
(Ope
n)19
Fore
st p
lant
atio
ns20
Land
with
scr
ub23
.51
6.86
25.5
421
Land
with
out s
crub
22M
arsh
y/S
wam
py23
Min
inig
/Indu
stria
l was
te4.
6424
Riv
er/W
ater
bodi
es10
9.17
22.0
49.
785.
1825
2.58
25S
andy
are
a4.
3726
Wet
land
s(W
ater
logg
ed)
145.
93Pa
ncha
yath
Tot
al23
64.7
013
33.9
115
93.7
538
05.8
717
01.3
3B
lock
Tot
al
ITH
IKK
AR
A B
LOC
K
1079
9.56
Tabl
e:11
.6
-106
-

Sl.
No.
Land
Use
Ezhu
kone
Kar
eepr
aK
otta
rakk
ara
Ned
uvat
hoor
Pooy
appa
llyVe
liyam
1A
gric
ultu
re p
lant
atio
n (A
reca
nut)
2A
gric
ultu
re p
lant
atio
n (B
anan
a)3
Agr
icul
ture
pla
ntat
ion
(Cas
hew
)24
.84
13.8
971
.89
4A
gric
ultu
re p
lant
atio
n (C
ocon
ut)
86.3
923
2.32
5A
gric
ultu
re p
lant
atio
n (M
ixed
)13
88.7
615
87.6
711
91.6
914
01.4
012
38.8
620
88.8
56
Agr
icul
ture
pla
ntat
ion
(Rub
ber)
158.
9017
1.23
161.
5244
3.83
459.
6467
4.16
7A
gric
ultu
re p
lant
atio
n (T
ea)
8B
arre
nroc
k/S
tony
was
te/S
heet
rock
6.78
13.5
21.
559
Bui
lt-up
(Citi
es/T
own/
Vill
ages
)72
.09
15.1
131
4.81
73.3
829
6.93
77.3
110
Cro
plan
d (K
harif
)11
Dou
blec
rop
(Kha
rif+R
abi)
57.2
723
2.97
147.
8723
9.02
311.
9017
9.59
12Fa
llow
land
6.42
13Fo
rest
dec
iduo
us(D
ense
)14
Fore
st d
ecid
uous
(Ope
n)15
Fore
st e
verg
reen
(Den
se)
16Fo
rest
man
grov
es(L
ittor
al S
wam
p)17
Fore
st d
ecid
uous
(scr
ub/d
egra
de)
18Fo
rest
eve
rgre
en(O
pen)
19Fo
rest
pla
ntat
ions
20La
nd w
ith s
crub
11.2
84.
0411
.61
21La
nd w
ithou
t scr
ub22
Mar
shy/
Sw
ampy
23M
inin
ig/In
dust
rial w
aste
7.31
4.11
1.61
3.17
35.9
524
Riv
er/W
ater
bodi
es18
.73
25S
andy
are
a26
Wet
land
s(W
ater
logg
ed)
Panc
haya
th T
otal
1782
.00
2272
.29
1829
.78
2237
.91
2349
.17
3069
.02
Blo
ck T
otal
KO
TTA
RA
KK
AR
A B
LOC
K
1354
0.17
(Are
a in
Ha)
Tabl
e:11
.7
-107
-

Tabl
e:11
.8
(Are
a in
Ha )
Sl. N
o.La
nd U
seEl
ampa
lloor
Kot
tank
ara
May
yana
duN
edum
pana
Thrik
ovilv
atto
m
1A
gric
ultu
re p
lant
atio
n (A
reca
nut)
2A
gric
ultu
re p
lant
atio
n (B
anan
a)3
Agr
icul
ture
pla
ntat
ion
(Cas
hew
)11
3.23
4A
gric
ultu
re p
lant
atio
n (C
ocon
ut)
472.
0288
6.98
1207
.45
622.
3212
02.3
35
Agr
icul
ture
pla
ntat
ion
(Mix
ed)
568.
6015
1.62
118.
9813
22.7
618
1.46
6A
gric
ultu
re p
lant
atio
n (R
ubbe
r)11
9.96
7A
gric
ultu
re p
lant
atio
n (T
ea)
2.81
8B
arre
nroc
k/S
tony
was
te/S
heet
rock
9B
uilt-
up (C
ities
/Tow
n/V
illag
es)
52.5
834
.91
214.
4015
.32
131.
7810
Cro
plan
d (K
harif
)11
Dou
blec
rop
(Kha
rif+R
abi)
123.
8818
3.10
150.
0627
6.10
356.
6612
Fallo
w la
nd13
Fore
st d
ecid
uous
(Den
se)
14Fo
rest
dec
iduo
us(O
pen)
15Fo
rest
eve
rgre
en(D
ense
)16
Fore
st m
angr
oves
(Litt
oral
Sw
amp)
17Fo
rest
dec
iduo
us(s
crub
/deg
rade
)18
Fore
st e
verg
reen
(Ope
n)19
Fore
st p
lant
atio
ns20
Land
with
scr
ub8.
9721
Land
with
out s
crub
22M
arsh
y/S
wam
py23
Min
inig
/Indu
stria
l was
te24
Riv
er/W
ater
bodi
es18
3.49
35.0
06.
0225
San
dy a
rea
26W
etla
nds(
Wat
erlo
gged
)11
4.36
4.30
Panc
haya
th T
otal
1217
.08
1265
.58
1987
.61
2505
.82
1885
.36
Blo
ck T
otal
MU
KH
ATH
ALA
BLO
CK
8861
.45
-108
-

Tabl
e:11
.9
Sl. N
o.La
nd U
seA
lapp
adK
lapa
naK
ulas
ekha
rapu
ram
Och
iraTh
azha
vaTh
odiy
oor
1A
gric
ultu
re p
lant
atio
n (A
reca
nut)
2A
gric
ultu
re p
lant
atio
n (B
anan
a)3
Agr
icul
ture
pla
ntat
ion
(Cas
hew
)4
Agr
icul
ture
pla
ntat
ion
(Coc
onut
)52
8.22
892.
9114
19.5
698
0.90
1008
.92
1547
.30
5A
gric
ultu
re p
lant
atio
n (M
ixed
)9.
944.
816.
573.
5065
2.15
19.0
06
Agr
icul
ture
pla
ntat
ion
(Rub
ber)
7.53
7A
gric
ultu
re p
lant
atio
n (T
ea)
8B
arre
nroc
k/S
tony
was
te/S
heet
rock
9B
uilt-
up(C
ities
/Tow
n/V
illag
es)
7.98
63.0
763
.47
47.9
891
.54
10C
ropl
and(
Kha
rif)
12.5
90.
6811
Dou
blec
rop(
Kha
rif+R
abi)
22.3
885
.87
223.
5827
7.96
529.
3730
8.71
12Fa
llow
land
13Fo
rest
Dec
iduo
us(D
ense
)14
Fore
st D
ecid
uous
(Ope
n)15
Fore
st E
verg
reen
(Den
se)
16Fo
rest
man
grov
es(L
ittor
al S
wam
p)17
Fore
st D
ecid
uous
(scr
ub/d
egra
de)
18Fo
rest
Eve
rgre
en(O
pen)
19Fo
rest
pla
ntat
ions
20La
nd w
ith s
crub
21La
nd w
ithou
t scr
ub22
Mar
shy/
Sw
ampy
23M
inin
ig/In
dust
rial w
aste
24R
iver
/wat
erbo
dies
312.
8635
.21
2.74
76.7
296
.73
25S
andy
are
a15
.426
Wet
land
s(w
ater
logg
ed)
56.8
18.
20Pa
ncha
yath
Tot
al88
8.8
1039
.37
1715
.52
1326
.51
2379
.48
2071
.48
Blo
ck T
otal
OC
HIR
A B
LOC
K
9421
.16
(Are
a in
Ha)
-109
-

Tabl
e:11
.10
(Are
a in
Ha)
Sl.
No.
Land
Use
Path
anap
uram
Patta
zhi
Patta
zhi
Vada
kkek
ara
Pira
vant
hoor
Thal
avoo
rVi
lakk
udy
1A
gric
ultu
re p
lant
atio
n (A
reca
nut)
32.1
92
Agr
icul
ture
pla
ntat
ion
(Ban
ana)
7.72
3A
gric
ultu
re p
lant
atio
n (C
ashe
w)
43.8
94
Agr
icul
ture
pla
ntat
ion
(Coc
onut
)5
Agr
icul
ture
pla
ntat
ion
(Mix
ed)
656.
1195
4.85
861.
1278
1.83
2215
.97
1192
.04
6A
gric
ultu
re p
lant
atio
n (R
ubbe
r)18
86.9
264
6.87
533.
1525
60.1
776
5.53
368.
147
Agr
icul
ture
pla
ntat
ion
(Tea
)8
Bar
renr
ock/
Sto
nyw
aste
/She
etro
ck17
4.69
9B
uilt-
up(C
ities
/Tow
n/V
illag
es)
221.
7764
.36
33.7
528
.80
124.
7530
4.10
10C
ropl
and(
Kha
rif)
11D
oubl
ecro
p(K
harif
+Rab
i)15
1.52
95.1
717
7.84
158.
2324
5.32
117.
2612
Fallo
w la
nd13
Fore
st D
ecid
uous
(Den
se)
14Fo
rest
Dec
iduo
us(O
pen)
4.59
15Fo
rest
Eve
rgre
en(D
ense
)15
0.59
16Fo
rest
man
grov
es(L
ittor
al S
wam
p)17
Fore
st D
ecid
uous
(scr
ub/d
egra
de)
18Fo
rest
Eve
rgre
en(O
pen)
19Fo
rest
pla
ntat
ions
868.
3189
13.2
320
Land
with
scr
ub27
4.53
63.9
539
.11
202.
1927
.93
26.5
921
Land
with
out s
crub
3.51
54.2
322
Mar
shy/
Sw
ampy
23M
inin
ig/In
dust
rial w
aste
24R
iver
/wat
erbo
dies
20.8
318
.69
36.4
346
.12
38.0
86.
2225
San
dy a
rea
4.09
6.38
16.7
23.
3726
Wet
land
s(w
ater
logg
ed)
Panc
haya
th T
otal
4092
.18
1850
.27
1698
.12
1314
6.16
3428
.67
2014
.35
Blo
ck T
otal
PATH
AN
APU
RA
M B
LOC
K
2622
9.75
-110
-

Sl.
No.
Land
Use
Kun
nath
oor
Myn
agap
ally
Poru
vazh
iSa
stha
mko
ttaSo
oran
adu
Sout
hSo
oran
adu
Nor
thW
est
Kal
lada
1A
gric
ultu
re p
lant
atio
n (A
reca
nut)
2A
gric
ultu
re p
lant
atio
n (B
anan
a)21
.98
3A
gric
ultu
re p
lant
atio
n (C
ashe
w)
4A
gric
ultu
re p
lant
atio
n (C
ocon
ut)
139.
984.
376.
4581
.35
65.2
69.
445
Agr
icul
ture
pla
ntat
ion
(Mix
ed)
1474
.00
1582
.13
1481
.10
1548
.08
1281
.09
1651
.81
886.
216
Agr
icul
ture
pla
ntat
ion
(Rub
ber)
199.
8011
1.37
27.9
611
.93
102.
237
Agr
icul
ture
pla
ntat
ion
(Tea
)8
Bar
renr
ock/
Sto
nyw
aste
/She
etro
ck9
Bui
lt-up
(Citi
es/T
own/
Vill
ages
)39
.54
69.1
221
.97
212.
4240
.05
15.8
562
.89
10C
ropl
and(
Kha
rif)
11D
oubl
ecro
p(K
harif
+Rab
i)21
7.16
234.
0923
1.10
112.
1525
5.19
509.
8812
Fallo
w la
nd13
Fore
st D
ecid
uous
(Den
se)
14Fo
rest
Dec
iduo
us(O
pen)
15Fo
rest
Eve
rgre
en(D
ense
)16
Fore
stm
angr
oves
(Litt
oral
Sw
amp)
18.3
417
Fore
st D
ecid
uous
(scr
ub/d
egra
de)
11.8
418
Fore
st E
verg
reen
(Ope
n)11
.91
19Fo
rest
pla
ntat
ions
20La
nd w
ith s
crub
21La
nd w
ithou
t scr
ub22
Mar
shy/
Sw
ampy
1.47
11.9
123
Min
inig
/Indu
stria
l was
te7.
610.
513.
8924
Riv
er/w
ater
bodi
es68
.42
21.7
15.
8149
4.26
18.5
62.
4127
6.44
25S
andy
are
a7.
131.
3626
Wet
land
s(w
ater
logg
ed)
127.
2511
.77
35.1
398
.85
Panc
haya
th T
otal
2147
.50
2046
.28
1891
.55
2501
.33
1737
.97
2282
.18
1337
.72
Blo
ck T
otal
SAST
HA
MK
OTT
A B
LOC
K
1394
4.53
(Are
a in
Ha)
Tabl
e:11
.11
-111
-

Tabl
e:11
.12
(Are
a in
Ha)
Sl. N
o.La
nd U
seK
ulak
kada
Mel
ilaM
ylam
Pavi
thre
swar
amU
mm
anno
orVe
ttikk
aval
a
1A
gric
ultu
re p
lant
atio
n (A
reca
nut)
37.8
72
Agr
icul
ture
pla
ntat
ion
(Ban
ana)
8.47
2.11
3A
gric
ultu
re p
lant
atio
n (C
ashe
w)
4A
gric
ultu
re p
lant
atio
n (C
ocon
ut)
77.6
112
.86
5A
gric
ultu
re p
lant
atio
n (M
ixed
)19
47.9
613
05.4
316
63.2
918
51.7
025
38.8
221
26.8
56
Agr
icul
ture
pla
ntat
ion
(Rub
ber)
525.
0739
0.62
263.
6116
6.27
633.
0096
6.12
7A
gric
ultu
re p
lant
atio
n (T
ea)
8B
arre
nroc
k/S
tony
was
te/S
heet
rock
5.08
2.41
9B
uilt-
up(C
ities
/Tow
n/V
illag
es)
122.
6567
.85
132.
1557
.13
24.9
957
.92
10C
ropl
and(
Kha
rif)
12.6
411
Dou
blec
rop(
Kha
rif+R
abi)
413.
0612
0.02
219.
8823
4.94
276.
7080
.31
12Fa
llow
land
13Fo
rest
Dec
iduo
us(D
ense
)14
Fore
st D
ecid
uous
(Ope
n)15
Fore
st E
verg
reen
(Den
se)
16Fo
rest
man
grov
es(L
ittor
al S
wam
p)17
Fore
st D
ecid
uous
(scr
ub/d
egra
de)
18Fo
rest
Eve
rgre
en(O
pen)
19Fo
rest
pla
ntat
ions
20La
nd w
ith s
crub
8.73
14.0
010
.21
235.
6221
Land
with
out s
crub
22M
arsh
y/S
wam
py23
Min
inig
/Indu
stria
l was
te2.
895.
7824
Riv
er/w
ater
bodi
es49
.86
1.49
8.72
25S
andy
are
a14
.95
0.07
6.15
0.75
8.52
26W
etla
nds(
wat
erlo
gged
)37
.64
Panc
haya
th T
otal
3154
.05
1901
.19
2288
.68
2434
.52
3494
.58
3477
.75
Blo
ck T
otal
VETT
IKA
VALA
BLO
CK
1675
0.77
-112
-

Tabl
e:11
.13
(Are
a in
Ha)
Sl. N
o.La
nd U
seK
arun
agap
ally
(M)
Para
voor
(M)
Puna
lur
(M)
Kol
lam
(C)
1A
gric
ultu
re p
lant
atio
n (A
reca
nut)
2A
gric
ultu
re p
lant
atio
n (B
anan
a)8.
143
Agr
icul
ture
pla
ntat
ion
(Cas
hew
)13
.49
4A
gric
ultu
re p
lant
atio
n (C
ocon
ut)
1254
.31
436.
7725
47.0
55
Agr
icul
ture
pla
ntat
ion
(Mix
ed)
20.5
477
6.77
1353
.85
368.
646
Agr
icul
ture
pla
ntat
ion
(Rub
ber)
1229
.56
7A
gric
ultu
re p
lant
atio
n (T
ea)
8B
arre
nroc
k/S
tony
was
te/S
heet
rock
9B
uilt-
up(C
ities
/Tow
n/V
illag
es)
52.7
915
2.13
608.
5918
73.2
710
Cro
plan
d(K
harif
)11
Dou
blec
rop(
Kha
rif+R
abi)
259.
9377
.17
97.5
144
2.73
12Fa
llow
land
13Fo
rest
Dec
iduo
us(D
ense
)14
Fore
st D
ecid
uous
(Ope
n)15
Fore
st E
verg
reen
(Den
se)
16Fo
rest
man
grov
es(L
ittor
al S
wam
p)17
Fore
st D
ecid
uous
(scr
ub/d
egra
de)
1.27
18Fo
rest
Eve
rgre
en(O
pen)
19Fo
rest
pla
ntat
ions
26.5
920
Land
with
scr
ub9.
7121
6.00
21La
nd w
ithou
t scr
ub22
Mar
shy/
Sw
ampy
23M
inin
ig/In
dust
rial w
aste
24R
iver
/wat
erbo
dies
245.
8939
6.05
79.9
942
7.63
25S
andy
are
a18
.30
31.4
726
Wet
land
s(w
ater
logg
ed)
38.2
4 T
otal
1833
.46
1918
.63
3620
.23
5692
.06
MU
NIC
IPA
LITY
/CO
RPO
RA
TIO
N
-113
-

-114
-

-115
-

-116
-

-117
-

-118
-

-119
-

-120
-

-121
-

-122
-

-123
-

-124
-

-125
-

-126
-

-127
-

-128
-

-129
-

-130
-

-131
-

-132
-

-133
-

-134
-

-135
-

-136
-

-137
-

-138
-

-139
-

-140
-

-141
-

-142
-

-143
-

-144
-

BIODIVERSITY
Biodiversity refers to the variety and variability of life on earth. It is the variety
of all living organisms including all species. Biodiversity is expressed at three levels
on earth viz., genetic diversity, species diversity and ecosystem diversity. Its direct
and indirect services are crucial for the subsistence of life on earth. Biodiversity
ensures food, fuel, shelter, medicines and other resources vital for our survival. Most
of the crop pests are controlled by a variety of other organisms including insects,
birds and fungi. Genetic diversity is the variety of genetic information contained in all
individual plants, animals and micro organisms. Species diversity is the variety
species on earth. Species diversity is usually a measure of the number of species
and their relative abundances for a given area at a given point in time. Ecosystem
diversity is the variety of habitats, biotic communities and ecological processes.
Western Ghats, one of the Biodiversity hot spots is running along the length
of Kerala. Almost a fourth of India's 10,000 plant species are found in the State.
Among the 4,000 flowering plant species (1,272 of which are endemic to Kerala and
159 threatened) almost 900 species are of medicinal plants. Its 9,400 km² of forests
include tropical wet evergreen and semi-evergreen forests (lower and middle
elevations-3,470 km²), tropical moist and dry deciduous forests (mid-elevations-
4,100 km² and 100 km² respectively), montane subtropical and temperate (shola)
forests (highest elevations-100 km²). Altogether, 29% of Kerala is forested. Two of
the world’s Ramsar convention listed wetland lake SasthamKotta and the
Vembanad-Kol wetlands are in Kerala, as well as 1455.4 km² of the vast Nilgiri
Biosphere Reserve. Table: 12.1
PLANT DIVERSITY
Sl.No. Items Nos. 1 Flowering plants 4000 2 Grass species 350 3 Bamboo species 15 4 Reeds species 9 5 Orchid species 214 6 Gymnosperms 4 7 Ferns and fern allies 200 8 Liverworts 200 9 Algae 231 10 Fungi 1044 11 Lichens 800
-145-

Table: 12.2 ANIMAL DIVERSITY
Sl.No. Items Nos.
1 Large and medium sized mammals 48
2 Birds species 475
3 Water Birds 101
4 Reptiles Genera 60
5 Lizard (endemic) species 30
6 Snake (endemic) species 57
7 Amphibian (endemic) species 87
8 Fresh water fish (endemic) species 84
9 Butterflies 313 Source: Economic Review.
-146-

Table: 12.3
WESTERN GHAT TALUKS, BLOCKS, GRAMA PANCHAYATS OF KOLLAM DISTRICT
Taluk Block Panchayath
Kunnathoor Sasthamkotta
Kunnathoor Poruvazhy Sasthamkotta Sooranad North Sooranad South West Kallada
Pathanapuram
Pathanapuram
Pathanapuram Pattazhy North Pattazhy South Piravanthoor Thalavoor Vilakkudy
Anchal
Alayamon Anchal Aryancavu Edamulakkal Karavalloor Kulathupuzha Thenmala Eroor
Kottarakkara
Vettikkavala
Kulakkada Melila Mylam Pavithreswaram Ummannoor Vettikkavala
Kottarakkara
Ezhukone Kareepra Kottarakkara Neduvathoor Pooyappally Veliyam
Chadayamangalam
Chadayamangalam Chithara Elamadu Ittiva Kadakkal NIlamel Vellinalloor
Source: Western Ghat Development Programme
-147-

-148-

FOREST
Kerala has a total recorded forest cover of 11309.47 Sq.Km which is
29.09% of the total geographical area of the State (38863 Sq.Km).
11309.47sq.km of forest cover includes reserve forest (9107.20 sq.km),
proposed reserve (364.47 sq.km), vested forest (1837.79 sq.km) and EFL
(Ecological Fragile Land). Tropical climate favours forests with rich biodiversity
and endemism. Western Ghats cover major portion of forest in Kerala. Kollam
district covers 81438 ha of forest area which is 32% of the total geographical
area of the district (248788). Punalur Forest Division, Thenmala Forest Division
and Shendurney Wild Life Division fall wholly within the district. Konni,
Achenkovil and Thiruvananthapuram Forest Divisions lie partly with in the district.
The forest area in the district is confined to Pathanapuram and Kottarakkara
taluks. The important species of timber available in the district are Teak,
Rosewood, Jack, Manjakadambu, White cedar (akil), Vengai, Indian laurel
(thembavu), Maruthu, Venthekku, Mulluvengai, Irul, Iron wood (Kambakom), Wild
jack (anjili), Karanjily, Unnam, Mullilavu, Karincha, Red silk cotton tree (ilavu),
Tamarind, Poonspar (kallupunna), Black dammar (kunthirippayni), Black fish tree
(cheru), Marotty, Mavu, Kolamavu, Malakayala, Mathi, Cheeni etc.
Table: 13.1
CLASSIFICATION OF FOREST TYPES AS ON 31-03-2011
Sl.No. Type Area (km2) % of total
1 Tropical Wet Evergreen and Semi Evergreen 3877.44 34.28
2 Tropical Moist Deciduous 3615.98 31.97
3 Tropical Dry Deciduous 391.36 3.46
4 Montane Sub-tropical Temperate sholas 386.42 3.42
5 Plantations 1492.91 13.206 Grass Lands 501.08 4.43
7 Others 1044.26 9.24
Total 11309.47 100.00
-149-

Table: 13.2
CLASSIFICATION OF FOREST AREA ACCORDING TO UTILIZATION AS ON 31-03-2011
Sl.No. Mode of Utilisation Area (km2) % of total
1 Dense Forests/Degraded Forest 8982.97 79.43
2 Plantation 1492.91 13.20
3 Area under lease 423.22 3.74
4 Forest land diverted under FCA 410.35 3.63
Total 11309.47 100.00 Table: 13.3
DISTRICT WISE FOREST AREA (APPROX) BY LEGAL STATUS AS ON 31-03-2011 (KM2)
District Division Reserve Forest/ Proposed Reserve
Vested Forest + EFL Total (km2)
Kollam
Trivandrum 116.76 116.76Thenmala 123.43 7.73 131.16Punalur 280.05 0.16 280.22Konni 78.39 78.39Achenkovil 62.81 0.20 63.02Shendurney 166.42 4.58 171.00
Total 827.87 12.69 840.56 Table: 13.4
DIVISION WISE AREA OF FORESTS AS ON 31-03-2011 (Km2)
Sl. No.
Division Reserve Forests
Proposed Reserve
Vested Forest +
EFL Total Percentage
of total
Southern Circle, Kollam
1 Thiruvananthapuram 359.12 5.82 3.65 368.60 3.26
2 Thenmala 123.43 - 7.73 131.16 1.16
3 Achenkovil 284.32 - 0.20 284.53 2.52
4 Ranni 1050.33 7.16 1.56 1,059.06 9.36
5 Punalur 280.05 - 0.16 280.22 2.48
6 Konni 320.64 11.02 - 331.66 2.93
Total 2417.91 24.00 13.33 2455.25 21.71
-150-

Table: 13.5
DISTRICT WISE FOREST AREA (APPROX) AS ON 31-03-2011
Sl.No. Districts Area (Km2)
1 Thiruvananthapuram 463.83
2 Kollam 840.56 3 Pathanamthitta 1533.79
4 Kottayam 100.84
5 Ernakulam 823.83
6 Idukki 2713.72
7 Thrissur 1022.75
8 Palakkad 1527.35
9 Malappuram 723.91
10 Kozhikode 290.45
11 Wayanad 907.04
12 Kannur 241.45
13 Kasaragod 119.84
Total 11309.41
Table: 13.6
DISTRICT WISE ECOLOGICALLY FRAGILE LAND (EFL) AREA
Sl.No. Districts Area (ha)
1 Thiruvananthapuram 881.75 2 Kollam 273.72 3 Idukki 1255.55 4 Thrissur 70.79 5 Palakkad 5177.56 6 Malappuram 1265.12 7 Kozhikode 1531.90 8 Wayanad 2673.03 9 Kannur 777.13 10 Kasaragod 94.88 Total 14001.46
Source: Forest Statistics, Forest Department
-151-

-152-

-153-

-154-

AGRICULTURE
The agricultural sector is the important sub-sector of the primary sector in
Kerala. Agriculture has been a way of life and continues to be the single most
important livelihood of the masses. Stabilization and augmentation of productivity
assume critical importance, given the limited scope for increasing area under
cultivation of various crops. Agricultural crops in the State are broadly classified
as food crops and non-food crops. Food crops are cereals & condiments, fresh
fruits, vegetables etc. The major non-food crops are rubber, betel leaves, lemon
grass etc. Another classification of crops is seasonal crops, annual crops and
perennial crops which are based on their life time.
The district has a prominent place in the field of agriculture. The principal
crops in the district are paddy, tapioca, coconut, rubber, pepper, banana, mango
and cashew. During the period 2000-01 an area of 14939 ha was under paddy
and it has declined to 21172 ha during 2011-12 period. Tapioca is another crop
which is cultivated in an area of 16859 ha of land and stands 1st position in
Kerala during 2011-12 periods. This cultivation is most commonly seen in
Vettikkavala, Sasthamkotta, Chadayamangalam blocks. Area under coconut
cultivation is 55304 ha and production is 426 million numbers during the same
period. Cashew is a perennial crop which is cultivated in an area of 3352 ha and
production is 914 and is cultivated in Sasthamkotta, Chadayamangalam,
Chittumala, Ithikara blocks. Banana, mango, pineapple etc. are the some of the
main fruit crops intensively grown in the district. Total cropped area during
2010-11 is 159706 ha as against 157343 ha in 2011-12 period.
-155-

Table: 14.1
CLASSIFICATION OF AREA ON THE BASIS OF LAND UTILISATION
(Area in Ha)
Year Total
Geographical area
Forest Land put to non agricultural use
Barren & uncultivable
land
Permanent pastures &
other grazing land
1 2 3 4 5 6
2011-2012 248788 81438 26567 222 22010-2011 248788 81438 25199 231 0
2009-2010 248788 81438 24860 201 0
Year Land under misc. tree
crops
Cultivable waste
Fallow other than current
fallow
Current fallow Marshy land
1 7 8 9 10 11
2011-2012 64 1583 1804 4457 13
2010-2011 85 1520 1506 4505 15
2009-2010 79 1364 1164 4714 17
Year Still water
Water logged area
Social forestry
Net area sown
Area sown more than
once
Total cropped area
1 12 13 14 15 16 17
2011-2012 7160 618 81 124779 32564 157343
2010-2011 7570 628 92 125999 33707 159706
2009-2010 7860 635 84 126372 35126 161498
-156-

Tabl
e: 1
4.2
B
LOC
K W
ISE
AR
EA O
F C
RO
PS 2
011-
2012
(Are
a in
Ha)
Sl.
No.
Nam
e of
Blo
ck
Padd
y Ta
pioc
a
Dru
mst
ick
Amar
an
thus
B
rinja
l La
dies
fin
ger
Autu
mn
Win
ter
Sum
mer
Autu
mn
Win
ter
Sum
mer
1 2
3 4
5 6
7 8
9 10
11
12
1 C
hittu
mal
a 18
.35
72.2
3.
161.
3034
5.22
27
3.01
254.
899.
124.
563.
12
2 Ith
ikka
ra
28.3
724
3.04
4.47
269.
5942
2.12
47
8.92
209.
096.
946.
846.
59
3 M
ukha
thal
a 48
.03
109.
6625
7.05
392.
37
396.
6919
1.71
8.89
4.39
3.76
4 C
hava
ra
11.8
112
.64
55.3
928
3.44
25
7.80
86.2
77.
702.
611.
08
5 O
chira
45
.88
106.
572.
2317
.26
499.
12
456.
3275
.84
22.9
54.
003.
33
6 Sa
stha
mko
tta
61.2
932
6.11
8.24
203.
0999
9.85
10
86.5
215
8.36
14.1
67.
143.
88
7 C
hada
yam
anga
lam
11
2.69
154.
80.
9362
2.24
575.
66
1127
.13
242.
459.
007.
616.
11
8 Ko
ttara
kkar
a 41
.45
85.3
80.
1030
2.46
435.
23
538.
8399
.67
7.04
3.96
3.29
9 Ve
ttika
vala
77
.64
131.
4189
7.32
517.
56
1200
.80
123.
79.
574.
102.
88
10
Anch
al
113.
9712
4.21
7.86
361.
2864
8.90
76
6.78
108.
6217
.42
7.01
3.47
11
Path
anap
uram
46
.90
66.1
60.
0234
8.80
459.
02
753.
1455
.62
15.1
511
.93
7.35
B
lock
s To
tal
606.
3814
32.2
123
.85
3495
.78
5578
.49
7335
.94
1606
.22
127.
9464
.15
44.8
6
Mun
icip
aliti
es
13.5
119
.15
31.6
113
8.51
15
9.38
76.6
06.
601.
290.
86
Cor
pora
tion
1.70
27.9
347
.84
43.7
098
.84
2.65
1.64
1.32
D
istr
ict T
otal
61
9.89
1453
.06
23.8
535
55. 3
257
64.8
4 75
39.0
217
81.6
613
7.19
67.0
847
.04
-157
-

Tabl
e: 1
4.2
Con
tinue
d……
……
.
(Are
a in
Ha)
Sl.
No.
Nam
e of
Blo
ck
Bitte
r go
urd
Snak
e go
urd
Littl
e go
urd
Ash
gour
d Pa
yar
Pum
pkin
C
ucum
ber
Bot
tle
gour
d G
reen
ch
illi
Cab
bage
1 2
13
14
15
16
17
18
19
20
21
22
1 C
hittu
mal
a 2.
76
0.35
6.
60
1.04
8.
28
1.68
0.
22
0.11
15
.89
2 Ith
ikka
ra
7.07
3.
42
7.33
2.
22
10.2
5 3.
03
0.84
27.3
4
3 M
ukha
thal
a 2.
08
0.28
5.
18
1.76
4.
78
0.74
0.
11
13
.17
4 C
hava
ra
3.20
0.
26
9.47
1.
70
3.64
1.
75
0.42
8.93
5 O
chira
5.
94
3.95
7.
99
4.21
6.
79
3.37
1.
50
7.
40
0.02
6 Sa
stha
mko
tta
13.1
5 4.
84
13.8
8 7.
73
31.7
0 9.
74
3.50
21.6
2
7 C
hada
yam
anga
lam
8.
41
4.54
9.
07
5.28
13
.14
6.40
1.
36
0.64
27
.99
8 Ko
ttara
kkar
a 7.
27
3.46
5.
34
2.44
10
.37
1.49
1.
42
0.08
16
.42
9 Ve
ttika
vala
5.
58
1.94
6.
04
2.45
12
.00
2.68
1.
40
0.36
11
.62
10
Anch
al
18.5
7 5.
62
13.3
3 4.
29
54.0
2 6.
96
0.46
0.
35
11.4
9
11
Path
anap
uram
7.
37
2.83
8.
74
4.70
30
.64
6.09
1.
40
0.96
11
.97
Blo
cks
Tota
l 81
.40
31.4
9 92
.97
37.8
2 18
5.61
43
.93
12.6
3 2.
50
173.
84
0.02
Mun
icip
aliti
es
3.68
0.
43
5.33
1.
17
5.02
1.
54
0.20
2.81
C
orpo
ratio
n 1.
39
0.47
3.
26
0.43
5.
49
0.47
0.
06
4.
80
Dis
tric
t Tot
al
86.4
7 32
.39
101.
56
39.4
2 19
6.12
45
.94
12.8
9 2.
50
181.
45
0.02
-158
-

Tabl
e: 1
4.2
Con
tinue
d……
……
.
(Are
a in
Ha)
Sl.
No.
N
ame
of B
lock
To
mat
o C
auli
flow
er
Oth
er
vege
tabl
es
Elep
hant
fo
ot y
am
Col
ocas
ia
Yam
Ko
orka
S
wee
t po
tato
N
ana
kizh
angu
O
ther
tu
bers
1 2
23
24
25
26
27
28
29
30
31
32
1 C
hittu
mal
a 0.
160.
1636
.95
104.
8325
.67
0.03
3.19
7.87
2 Ith
ikka
ra
0.13
1.09
42.5
385
.28
18.7
30.
110.
4711
.60
10.4
5
3 M
ukha
thal
a 0.
110.
0334
.33
63.4
513
.95
0.03
2.74
15.4
7
4 C
hava
ra
0.22
42.0
014
8.00
61.9
70.
090.
108.
574.
54
5 O
chira
0.
070.
0239
.13
159.
5942
.44
0.33
15.5
44.
08
6 Sa
stha
mko
tta
0.19
345.
1549
1.85
214.
568.
480.
4612
.08
7.99
7 C
hada
yam
anga
lam
0.
130.
3013
0.54
146.
2545
.05
0.12
0.83
10.7
127
.07
8 Ko
ttara
kkar
a 0.
130.
020.
0710
8.18
123.
9134
.57
0.48
6.42
9.78
9 Ve
ttika
vala
0.
040.
9810
0.06
108.
7620
.77
0.02
0.37
3.06
13.1
1
10
Anch
al
188.
8715
5.83
28.4
70.
780.
311.
274.
25
11
Path
anap
uram
13
7.48
131.
6965
.76
0.88
0.06
3.93
2.1
B
lock
s To
tal
1.18
0.07
2.60
1205
.22
1719
.44
571.
9410
.51
3.44
79.1
110
6.71
M
unic
ipal
ities
0.
020.
0425
.32
37.4
512
.85
0.09
1.99
0.76
C
orpo
ratio
n 0.
110.
224.
8717
.63
3.81
0.02
0.89
1.77
D
istr
ict T
otal
1.
310.
072.
8612
35.4
117
74.5
258
8.60
10.5
13.
5581
.99
109.
24
-159
-

Tabl
e: 1
4.2
Con
tinue
d……
……
.
(Are
a in
Ha)
Sl.
No.
Nam
e of
Blo
ck
Puls
es
Gin
ger
Turm
eric
C
ocon
ut
Arec
anut
C
ashe
w
Pepp
er
Jack
M
ango
Ta
mar
ind
1 2
33
34
35
36
37
38
39
40
41
42
1 C
hittu
mal
a 14
.49
10.8
412
.22
5265
.44
121.
65
450.
6032
7.71
1267
.91
969.
0890
.23
2 Ith
ikka
ra
3.79
8.57
7.87
4663
.577
.14
443.
0528
1.88
690.
1860
4.56
79.3
1
3 M
ukha
thal
a 0.
8110
.50
13.8
739
62.9
089
.94
216.
7722
5.56
481.
4252
8.03
16.1
3
4 C
hava
ra
5.36
4.44
5540
.35
422.
05
140.
2512
6.88
376.
1756
1.18
31.8
6
5 O
chira
8.
2813
.69
6.12
6124
.65
196.
26
201.
0084
.46
183.
4928
1.19
25.5
0
6 Sa
stha
mko
tta
2.9
67.6
927
.57
4849
.73
282.
88
609.
0455
1.59
771.
8059
5.69
108.
75
7 C
hada
yam
anga
lam
66
.36
56.6
050
76.7
821
0.46
56
9.19
623.
1210
38.0
355
8.34
171.
41
8 Ko
ttara
kkar
a 1.
4730
.42
26.2
641
45.0
610
6.77
20
5.81
334.
0853
5.77
283.
9542
.90
9 Ve
ttika
vala
22
.54
36.6
633
.73
3668
.48
131.
62
199.
2431
3.09
597.
3134
1.81
29.7
3
10
Anch
al
5.13
95.8
929
.73
4726
.55
587.
78
118.
1363
3.94
764.
4842
4.09
34.4
7
11
Path
anap
uram
0.
2842
.45
16.5
719
14.3
410
4.27
75
.20
217.
8335
5.96
214.
6927
.82
B
lock
s To
tal
59.6
938
8.43
234.
9849
937.
7823
30.8
2 32
28.2
837
20.1
470
62.5
253
62.6
165
8.11
M
unic
ipal
ities
5.
067.
294.
7628
10.5
261
.05
50.2
085
.16
193.
6518
8.35
16.2
3
Cor
pora
tion
1.96
1.20
2555
.45
51.7
3 73
.97
79.7
326
3.60
269.
9710
.22
D
istr
ict T
otal
64
.75
397.
6824
0.94
5530
3.75
2443
.60
3352
.45
3885
.03
7519
.77
5820
.93
684.
56
-160
-

Tabl
e: 1
4.2
Con
tinue
d……
……
.
(Are
a in
Ha)
Sl.
No.
N
ame
of B
lock
C
love
N
utm
eg
Coc
oa
Papp
aya
Bana
na
Pin
e ap
ple
Plan
tain
O
rang
e Su
gar
cane
Se
sa
mum
1 2
43
44
45
46
47
48
49
50
51
52
1 C
hittu
mal
a 0.
979.
370.
4018
7.11
11.0
7 7.
7221
3.48
0.07
0.02
1.39
2 Ith
ikka
ra
1.74
5.48
0.74
140.
8919
.82
10.2
615
7.54
0.18
3 M
ukha
thal
a 0.
916.
3213
8.94
16.1
1 2.
1925
0.56
4 C
hava
ra
1.46
5.82
1.67
79.0
55.
40
2.74
370.
060.
033.
34
5 O
chira
2.
114.
630.
1183
.46
9.15
8.
0015
8.13
49.8
6
6 Sa
stha
mko
tta
3.09
7.59
1.59
109.
8144
4.61
9.
0042
9.92
0.06
7 C
hada
yam
anga
lam
2.
967.
661.
4516
3.72
308.
77
25.3
569
1.04
8 Ko
ttara
kkar
a 0.
743.
840.
0210
1.51
85.5
7 14
.00
423.
28
9 Ve
ttika
vala
1.
345.
540.
3711
4.72
305.
49
30.6
453
3.18
10
Anch
al
2.87
2.04
0.16
114.
3426
1.60
23
.63
525.
06
11
Path
anap
uram
0.
961.
980.
1048
.30
215.
61
44.3
427
1.92
B
lock
s To
tal
19.1
560
.27
6.61
1281
.85
1683
.20
177.
8740
24.1
70.
160.
2054
.59
M
unic
ipal
ities
0.
041.
980.
3872
.19
8.10
1.
7291
.42
0.04
C
orpo
ratio
n 0.
802.
940.
1682
.85
2.68
0.
5611
9.55
0.05
D
istr
ict T
otal
19
.99
65.1
97.
1514
36.8
916
93.9
8 18
0.15
4235
.14
0.16
0.29
54.5
9
-161
-

Tabl
e: 1
4.2
Con
tinue
d……
……
.
(Are
a in
Ha)
Sl.
No.
N
ame
of B
lock
Le
mon
gra
ss
Fodd
er g
rass
G
reen
Man
ure
Pla
nts
Van
ila
Teak
M
edic
inal
Pla
nts
1 2
53
54
55
56
57
58
1 C
hittu
mal
a 0.
1011
.81
158.
40
0.20
98.1
32.
51
2 Ith
ikka
ra
21.9
513
1.31
84
.00
5.60
3 M
ukha
thal
a 2.
5870
.46
85.3
22.
52
4 C
hava
ra
0.02
7.16
19.6
8 0.
0248
.32
2.46
5 O
chira
28
.76
14.6
0 31
.29
3.10
6 Sa
stha
mko
tta
46.2
811
3.37
0.
3415
0.24
7.06
7 C
hada
yam
anga
lam
0.
0620
.24
141.
03
0.99
145.
997.
21
8 Ko
ttara
kkar
a 0.
0614
.74
89.4
5 0.
0420
0.88
1.92
9 Ve
ttika
vala
0.
1817
.57
64.9
4 0.
1410
9.31
2.67
10
Anch
al
0.19
22.7
613
8.12
17
9.23
1.07
11
Path
anap
uram
0.
0312
.11
62.8
0 0.
0311
1.65
2.85
B
lock
s To
tal
0.64
205.
9610
04.1
6 1.
7612
44.3
638
.97
M
unic
ipal
ities
2.
2240
.62
0.04
59.2
51.
74
Cor
pora
tion
2.44
43.6
8 0.
0737
.70
1.96
D
istr
ict T
otal
0.
6421
0.62
1088
.46
1.87
1341
.31
42.6
7
-162
-

Tabl
e: 1
4.3
B
LOC
K W
ISE
AR
EA O
F C
RO
PS 2
010-
2011
(Are
a in
Ha)
Sl.
No.
N
ame
of B
lock
Pa
ddy
Pul
ses
Suga
r ca
ne
Palm
yrah
Pe
pper
G
inge
r
Turm
eric
Arec
anut
A
utum
nW
inte
r S
umm
er
1 2
3 4
5 6
7 8
9 10
11
12
1 Ith
ikka
ra
71.9
949
1.14
6.81
66.0
60.
06
2.42
731.
0113
.48
18.4
310
2.15
2 M
ukha
thal
a 32
.91
263.
874.
141.
320.
02
0.02
385.
185.
175.
5962
.56
3 An
chal
umm
ood
10.4
617
.79
1.51
0.06
0.
9515
5.16
2.75
2.35
78.9
3
4 C
hittu
mal
a 22
.24
90.1
310
.95
3.20
0.12
5.
4359
7.88
9.48
10.9
998
.81
5 C
hava
ra
18.4
419
.10
0.35
0.27
0.04
1.
1424
5.35
7.21
4.77
396.
23
6 Ka
runa
gapp
ally
62
.16
168.
0245
.91
18.9
1
0.54
172.
6011
.74
4.98
128.
37
7 O
chira
28
.12
27.1
10.
450.
04
0.01
89.8
85.
502.
5889
.81
8 Sa
stha
mko
tta
69.1
234
2.78
3.47
2.
3111
15.5
568
.90
28.5
327
1.58
9 C
hada
yam
anga
lam
17
1.34
280.
790.
233.
680.
08
2.64
1246
.20
63.4
954
.12
211.
74
10
Kotta
rakk
ara
122.
1712
7.03
3.
3070
1.18
31.2
529
.23
78.9
3
11
Vetti
kkav
ala
172.
2713
4.44
2.26
2.
4566
4.67
39.8
334
.95
122.
18
12
Anch
al
77.6
416
1.31
5.96
2.
0812
33.0
081
.23
29.2
121
2.07
13
Path
anap
uram
82
.66
138.
0112
.19
0.34
0.02
1.
3244
4.85
42.4
016
.02
108.
46
Mun
icip
aliti
es
18.8
439
.05
4.61
0.06
0.
2514
9.80
4.54
2.83
45.0
5
Dis
tric
t Tot
al
960.
3623
00.5
780
.58
112.
040.
50
24.8
679
32.3
138
6.97
244.
5820
06.8
7
-1
63-

Tabl
e: 1
4.3
Con
tinue
d……
……
…
Sl.
No.
Nam
e of
Blo
ck
Tam
arin
d Va
nila
C
love
N
utm
eg
Cin
na
mon
Ja
ck
Man
go
Bana
na
Plan
tain
Pi
neap
ple
1 2
13
14
15
16
17
18
19
20
21
22
1 Ith
ikka
ra
70.3
90.
103.
486.
190.
4775
5.13
670.
2230
.38
222.
7810
.89
2 M
ukha
thal
a 8.
160.
082.
9843
4.91
333.
4142
.50
279.
342.
08
3 An
chal
umm
ood
28.8
80.
084.
3110
.10
0.57
237.
6720
4.47
4.21
81.2
80.
51
4 C
hittu
mal
a 64
.97
0.62
2.00
8.23
707.
7555
4.45
10.4
016
7.85
4.64
5 C
hava
ra
26.9
50.
062.
206.
500.
5031
9.20
446.
108.
3915
7.86
2.71
6 Ka
runa
gapp
ally
16
.76
0.17
1.71
3.95
0.10
129.
5116
0.34
5.39
122.
974.
12
7 O
chira
14
.39
0.03
1.10
2.59
0.01
76.5
212
4.94
2.17
85.8
74.
27
8 Sa
stha
mko
tta
76.8
01.
282.
485.
810.
2261
5.56
487.
2641
8.30
433.
969.
67
9 C
hada
yam
anga
lam
12
3.54
0.84
4.03
7.53
0.77
833.
6445
5.33
246.
7770
6.09
29.3
7
10
Kotta
rakk
ara
39.2
10.
151.
143.
780.
0844
1.24
237.
1729
5.66
539.
8312
.23
11
Vetti
kkav
ala
30.1
70.
301.
586.
231.
0346
5.58
264.
8242
7.51
536.
4931
.51
12
Anch
al
23.7
90.
055.
514.
331.
1761
5.97
334.
3629
8.06
535.
7824
.03
13
Path
anap
uram
29
.39
0.24
1.01
2.78
0.51
303.
9820
1.54
253.
2731
4.23
33.4
5
Mun
icip
aliti
es
11.5
30.
060.
311.
250.
3720
6.64
191.
4810
.95
152.
241.
04
Dis
tric
t Tot
al
564.
933.
9830
.94
72.2
55.
8061
43.3
046
65.8
920
53.9
643
36.5
717
0.52
-1
64-

Tabl
e: 1
4.3
Con
tinue
d……
……
…
Sl.
No.
Nam
e of
Blo
ck
Papp
aya
Ora
nge
Lem
on
(big
) Le
mon
(s
mal
l) C
ashe
w
Tapi
oca
Elep
hant
fo
ot y
am
Col
ocas
ia
Yam
S
wee
t po
tato
1 2
23
24
25
26
27
28
29
30
31
32
1 Ith
ikka
ra
223.
550.
082.
452.
9746
0.95
14
91.2
057
.56
106.
0325
.14
0.83
2 M
ukha
thal
a 10
4.83
1.14
0.98
137.
39
682.
2719
.89
44.6
78.
030.
06
3 An
chal
umm
ood
95.3
50.
020.
971.
9510
2.97
14
7.72
6.73
19.8
03.
48
4 C
hittu
mal
a 16
2.28
0.02
2.95
5.20
323.
83
696.
0133
.42
91.1
725
.11
0.15
5 C
hava
ra
79.7
42.
254.
1010
5.80
64
2.34
40.3
117
5.91
64.8
60.
11
6 Ka
runa
gapp
ally
62
.32
0.16
0.93
121.
33
824.
4736
.68
110.
3732
.91
0.23
7 O
chira
27
.74
0.74
2.04
104.
15
352.
2115
.07
74.4
624
.98
0.31
8 Sa
stha
mko
tta
107.
130.
062.
397.
8944
2.39
22
84.7
833
9.49
471.
1622
2.55
0.29
9 C
hada
yam
anga
lam
16
2.48
0.04
17.1
212
.42
455.
38
2028
.58
153.
3115
1.39
50.4
71.
44
10
Kotta
rakk
ara
105.
449.
7110
.43
146.
65
1394
.51
108.
1213
2.63
37.1
70.
39
11
Vetti
kkav
ala
102.
767.
205.
6214
2.88
22
89.7
911
8.61
127.
8525
.74
0.55
12
Anch
al
101.
294.
202.
0310
5.19
17
06.1
117
8.03
141.
2024
.13
0.10
13
Path
anap
uram
56
.86
0.02
3.72
3.23
89.7
1 13
63.3
714
8.48
155.
9376
.42
0.17
M
unic
ipal
ities
78
.17
0.99
0.57
36.3
3 26
9.12
15.8
227
.94
6.82
0.06
D
istr
ict T
otal
14
69.9
40.
2455
.99
60.3
627
74.9
5 16
172.
4812
71.5
218
30.5
162
7.81
4.69
-1
65-

Tabl
e: 1
4.3
Con
tinue
d……
……
…
Sl.
No.
Nam
e of
Blo
ck
Koor
ka
Nan
a ki
zhan
gu
Oth
er
tube
rs
Dru
m
stic
k Am
aran
th
us
Bitte
r go
urd
Snak
e go
urd
Ladi
es
finge
r B
rinja
l G
reen
ch
illi
1 2
33
34
35
36
37
38
39
40
41
42
1 Ith
ikka
ra
13.4
623
.71
314.
878.
87
7.00
3.00
9.43
8.60
30.7
1
2 M
ukha
thal
a 0.
301.
226.
3112
6.70
9.87
2.
020.
402.
142.
7410
.28
3 An
chal
umm
ood
0.05
0.80
2.30
97.5
08.
62
2.04
0.15
1.14
2.31
8.43
4 C
hittu
mal
a 2.
785.
7219
6.61
8.38
2.
330.
642.
253.
6111
.81
5 C
hava
ra
0.24
9.29
5.58
99.3
87.
17
4.13
0.42
1.37
3.27
7.71
6 Ka
runa
gapp
ally
7.
403.
4365
.32
17.4
6 6.
032.
251.
472.
044.
89
7 O
chira
0.
0410
.35
0.76
61.6
711
.38
2.71
1.74
1.18
1.69
3.60
8 Sa
stha
mko
tta
12.9
413
.07
10.8
014
5.02
11.5
9 12
.58
6.13
4.68
6.95
23.3
4
9 C
hada
yam
anga
lam
0.
1211
.93
28.7
425
8.17
8.73
7.
761.
156.
358.
5527
.01
10
Kotta
rakk
ara
6.29
9.92
108.
217.
58
9.97
7.59
4.
18
5.26
18.0
0
11
Vetti
kkav
ala
0.84
4.23
14.7
412
6.88
7.79
5.
132.
672.
915.
0915
.80
12
Anch
al
1.05
2.49
3.75
95.9
315
.78
19.9
73.
843.
016.
5815
.31
13Pa
than
apur
am
0.55
3.48
7.75
64.8
716
.29
12.6
95.
366.
3015
.38
12.7
7
Mun
icip
aliti
es
0.09
0.77
1.99
114.
194.
20
1.86
0.24
0.85
1.52
3.85
D
istr
ict T
otal
16
.22
87.5
612
5.50
1875
.32
143.
71
96.2
235
.58
47.2
673
.59
193.
51
-166
-

Tabl
e: 1
4.3
Con
tinue
d……
……
…
Sl.
No.
Nam
e of
Blo
ck
Bot
tle
gour
d Li
ttle
gour
d As
h go
urd
Pum
pkin
C
ucum
ber
Paya
r C
abba
geTo
mat
o O
ther
Ve
geta
bles
Sesa
m
um
1 2
43
44
45
46
47
48
49
50
51
52
1 Ith
ikka
ra
0.22
7.94
2.67
4.15
1.35
10
.84
0.36
1.42
2 M
ukha
thal
a 4.
221.
691.
540.
31
4.80
0.03
0.17
1.50
3 An
chal
umm
ood
6.51
0.31
0.66
0.13
3.
620.
110.
032.
42
4 C
hittu
mal
a 0.
153.
680.
961.
590.
17
6.23
0.39
0.20
5 C
hava
ra
8.05
2.45
2.77
0.61
5.
470.
254.
30
6 Ka
runa
gapp
ally
8.
041.
711.
811.
76
7.02
0.12
0.14
159.
82
7 O
chira
3.
772.
522.
571.
26
3.09
0.19
23.3
4
8 Sa
stha
mko
tta
15.6
88.
1711
.10
7.66
34
.10
0.20
0.45
9 C
hada
yam
anga
lam
0.
719.
886.
215.
631.
81
17.2
50.
541.
160.
52
10
Kotta
rakk
ara
0.82
6.41
2.34
2.79
0.69
11
.37
0.19
0.18
0.44
11
Vetti
kkav
ala
0.04
6.43
2.42
3.42
1.76
11
.15
0.04
2.03
12
Anch
al
0.31
9.18
4.80
5.70
0.50
31
.07
13
Path
anap
uram
1.
079.
766.
016.
311.
93
23.1
7
Mun
icip
aliti
es
3.01
0.79
1.66
0.12
3.
780.
040.
05
Dis
tric
t Tot
al
3.32
102.
5643
.05
51.7
020
.06
172.
960.
222.
596.
9719
0.85
-167
-

Tabl
e: 1
4.3
Con
tinue
d……
……
…
Sl.
No.
N
ame
of B
lock
C
ocon
ut
Bete
l lea
ves
Lem
on
gras
s C
ocoa
Fo
dder
gra
ss
Gre
en M
anur
e P
lant
s Te
ak
1 2
53
54
55
56
57
58
59
1 Ith
ikka
ra
6107
.80
0.16
0.71
16
.81
124.
0711
2.38
2 M
ukha
thal
a 34
18.7
60.
310.
05
4.97
77.5
541
.45
3 An
chal
umm
ood
3090
.91
0.08
0.90
3.
9638
.64
73.8
9
4 C
hittu
mal
a 37
88.0
20.
210.
07
9.27
102.
4167
.45
5 C
hava
ra
5717
.24
0.82
1.47
7.
8821
.21
43.0
1
6 Ka
runa
gapp
ally
39
97.8
81.
310.
24
24.6
09.
5422
.41
7 O
chira
31
45.7
90.
730.
10
6.71
6.75
15.6
1
8 Sa
stha
mko
tta
4797
.51
5.16
1.25
46
.00
111.
5115
2.84
9 C
hada
yam
anga
lam
52
84.2
36.
201.
37
19.2
613
7.12
144.
76
10
Kotta
rakk
ara
4396
.50
1.39
0.10
11
.75
78.3
516
7.38
11
Vetti
kkav
ala
3698
.36
5.44
0.07
16
.22
71.1
410
3.35
12
Anch
al
4553
.13
3.75
0.49
0.62
19
.55
139.
1223
5.20
13
Path
anap
uram
19
59.4
69.
080.
160.
70
12.6
475
.94
104.
87
Mun
icip
aliti
es
2103
.91
0.78
0.11
1.
1153
.73
75.5
5
Dis
tric
t Tot
al
5605
9.50
35.4
20.
657.
76
200.
7310
47.0
813
60.1
5
-168
-

Tabl
e: 1
4.4
B
LOC
K W
ISE
PRO
DU
CTI
ON
OF
CR
OPS
201
1-12
(P
rodu
ctio
n in
Ton
nes)
Sl.
No.
N
ame
of B
lock
R
ice
Bla
ck
Pepp
er
Cur
ed
Gin
ger
Cur
ed
Turm
eric
Ar
ecan
ut
Tam
arin
d Ja
ck
(mill
ion
no.)
Bana
na
Autu
mn
Win
ter
Sum
mer
1 2
3 4
5 6
7 8
9 10
11
12
1 C
hittu
mal
a 53
.62
171.
0313
7.63
19.8
2 17
.69
58.1
479
.39
5.56
46.3
5
2 Ith
ikka
ra
59.2
350
1.73
6.89
124.
5914
.29
11.2
822
.84
32.7
11.
5993
.01
3 M
ukha
thal
a 95
.45
235.
3410
7.59
17.0
8 14
.34
49.4
719
.46
1.39
91.8
6
4 C
hava
ra
23.9
99.
7539
.96
7.86
3.
8212
4.87
33.0
2 0.
6827
.64
5 O
chira
81
.80
179.
556.
7525
.92
15.8
5 5.
2066
.64
49.0
60.
4132
.20
6 Sa
stha
mko
tta
161.
0583
1.57
5.45
140.
1012
0.55
34
.35
282.
1614
6.93
2.12
2861
.23
7 C
hada
yam
anga
lam
25
8.68
395.
302.
0726
7.94
120.
84
71.3
116
9.09
74.1
13.
7827
63.1
9
8 Ko
ttara
kkar
a 10
0.62
216.
560.
2016
4.36
60.6
5 36
.44
89.7
925
.22
1.95
428.
88
9 Ve
ttika
vala
17
8.89
312.
1794
.86
67.5
6 46
.78
98.2
638
.99
3.16
2121
.26
10
Anch
al
246.
3528
2.43
15.4
816
7.94
287.
47
58.3
987
9.39
15.6
04.
2418
27.3
5
11
Path
anap
uram
10
3.77
154.
500.
0362
.51
129.
81
36.6
212
0.93
11.7
02.
0019
73.1
4
B
lock
s To
tal
1363
.45
3289
.93
36.8
713
33.4
086
1.78
33
6.22
1961
.58
526.
1926
.88
1226
6.11
M
unic
ipal
ities
32
.78
41.7
125
.25
19.6
1 7.
8928
.98
14.6
90.
6445
.58
Cor
pora
tion
3.48
36.3
53.
54
1.75
15.1
95.
090.
5613
.82
Dis
tric
t To
tal
1396
.23
3335
.12
36.8
713
95.0
688
4.93
34
5.86
2005
.75
545.
9728
.08
1232
5.51
-169
-

Tabl
e: 1
4.4
Con
tinue
d……
……
.
(P
rodu
ctio
n in
Ton
nes)
Sl.
No.
Nam
e of
Blo
ck
Oth
er
Pla
ntai
n Pi
ne
appl
e Ta
pioc
a Pa
ppay
a Se
sa
mum
Coc
onut
(m
illio
n no
.) N
utm
eg
Cas
hew
C
ocoa
B
etel
le
aves
1 2
13
14
15
16
17
18
19
20
21
22
1 C
hittu
mal
a 71
4.73
70.0
927
283.
5511
72.9
90.
46
46.3
32.
5617
1.67
8.28
2 Ith
ikka
ra
694.
5910
0.79
3755
7.32
536.
65
49.4
10.
9110
0.57
1.50
3 M
ukha
thal
a 18
50.3
816
.95
2571
6.52
783.
20
26.7
33.
3663
.94
6.72
4 C
hava
ra
1922
.46
14.2
015
164.
5452
0.54
1.84
52
.52
1.37
26.9
20.
5311
.40
5 O
chira
75
3.17
33.2
020
061.
9335
4.20
29.9
2 41
.55
0.59
21.3
052
.53
6 Sa
stha
mko
tta
3895
.50
47.4
971
545.
6265
2.71
40
.05
1.50
133.
9814
8.83
7 C
hada
yam
anga
lam
64
59.1
522
0.46
5754
4.49
646.
53
33.0
63.
4514
4.57
46.9
8
8 Ko
ttara
kkar
a 31
57.2
489
.30
3382
7.78
686.
00
26.1
91.
0067
.09
72.0
8
9 Ve
ttika
vala
40
52.1
623
8.10
7062
3.36
383.
96
22.0
31.
7966
.54
110.
50
10
Anch
al
3493
.74
171.
2978
630.
4844
6.95
26
.46
0.53
40.0
410
0.80
11
Path
anap
uram
17
70.1
927
3.13
7648
7.04
194.
02
10.1
00.
7541
.43
296.
37
B
lock
s To
tal
2876
3.31
1275
.00
5144
42.6
063
77.7
532
.22
374.
4317
.81
878.
050.
5385
5.99
M
unic
ipal
ities
45
8.77
16.5
979
37.3
031
0.45
24
.41
0.48
14.8
110
.46
Cor
pora
tion
763.
205.
2231
06.2
230
1.49
27
.73
0.70
21.5
20.
80
Dis
tric
t To
tal
2998
5.28
1296
.81
5254
86.1
269
89.6
932
.22
426.
5718
.99
914.
380.
5386
7.25
-1
70-

Tabl
e: 1
4.5
B
LOC
K W
ISE
PRO
DU
CTI
ON
OF
CR
OPS
201
0-11
(P
rodu
ctio
n in
Ton
nes)
Sl.
No.
Nam
e of
Blo
ck
Ric
e B
lack
Pe
pper
C
ured
G
inge
r C
ured
Tu
rmer
ic
Arec
a nu
t Ta
mar
ind
Jack
(M
illio
n N
o.)
Bana
na
Autu
mn
Win
ter
Sum
mer
1 2
3 4
5 6
7 8
9 10
11
12
1 Ith
ikka
ra
172.
0211
49.1
35.
9710
7.22
25.0
5 29
.09
32.0
869
.68
2.35
138.
73
2 M
ukha
thal
a 84
.60
526.
311.
5910
4.27
11.3
2 7.
9144
.32
16.2
82.
1229
9.50
3 An
chal
umm
ood
21.4
833
.56
24.1
64.
95
2.93
31.9
131
.55
0.61
14.0
7
4 C
hittu
mal
a 60
.97
167.
6315
.28
122.
2016
.51
14.9
051
.82
69.1
92.
4556
.81
5 C
hava
ra
32.3
924
.86
39.6
69.
58
4.22
154.
9512
8.80
0.86
53.5
2
6 Ka
runa
gapp
ally
11
4.00
301.
2097
.57
28.3
717
.91
4.83
54.2
453
.25
0.41
29.3
7
7 O
chira
49
.47
53.2
412
.55
6.05
2.
0924
.48
63.6
10.
143.
40
8 Sa
stha
mko
tta
138.
5564
6.78
187.
0811
6.76
30
.11
149.
8514
7.07
2.11
2259
.58
9 C
hada
yam
anga
lam
39
8.37
691.
890.
5419
3.44
145.
96
75.5
5 13
3.94
281.
043.
9123
83.0
5
10
Kotta
rakk
ara
306.
6131
3.19
105.
6756
.89
40.9
310
5.24
51.8
92.
0921
35.6
6
11
Vetti
kava
la
403.
9231
0.61
145.
5584
.12
44.7
110
6.88
64.8
03.
9439
71.0
1
12
Anch
al
172.
8934
0.21
172.
5123
9.01
53
.38
162.
1633
.99
4.28
2159
.52
13
Path
anap
uram
15
3.90
282.
9915
.75
60.5
513
4.44
33
.15
99.7
131
.77
2.00
2307
.69
Mun
icip
aliti
es
48.2
817
.78
8.68
9.31
3.
1912
.82
2.41
0.61
90.1
2
Dis
tric
t To
tal
2157
.45
4859
.38
136.
7013
11.9
187
7.86
34
6.99
1164
.40
1045
.33
27.8
815
902.
03
-171
-

Tabl
e: 1
4.5
Con
tinue
d……
……
.
(P
rodu
ctio
n in
Ton
nes)
Sl.
No.
Nam
e of
Blo
ck
Oth
er
Pla
ntai
n Pi
ne
appl
e Ta
pioc
a Pa
ppay
a Se
sa
mum
Coc
onut
(M
illio
n N
o.)
Nut
m
eg
Coc
oa
Raw
C
ashe
w
nuts
Bet
el
leav
es
1 2
13
14
15
16
17
18
19
20
21
22
1 Ith
ikka
ra
116
3.13
90.4
434
988.
0211
00.7
6
58.8
21.
1415
4.93
4.16
2 M
ukha
thal
a 16
41.1
215
.58
1276
3.90
714.
83
26.3
31.
7342
.64
5.89
3 An
chal
umm
ood
294.
313.
2520
31.1
533
4.01
1.08
18
.39
3.09
28.1
71.
60
4 C
hittu
mal
a 11
63.7
039
.07
2009
7.28
937.
16
22.1
12.
0696
.89
4.20
5 C
hava
ra
979.
5223
.13
1284
6.80
408.
343.
39
43.7
41.
450.
3327
.95
13.9
4
6 Ka
runa
gapp
ally
47
8.35
17.8
518
206.
7726
7.10
107.
07
34.2
10.
4524
.49
20.9
6
7 O
chira
35
7.04
20.7
266
03.9
328
2.64
17.5
0 22
.54
0.47
16.2
513
.14
8 Sa
stha
mko
tta
3023
.39
44.8
458
550.
0510
13.9
70.
14
31.8
10.
8814
0.46
149.
64
9 C
hada
yam
anga
lam
29
10.5
017
8.74
5150
1.58
903.
87
32.7
25.
670.
8516
5.75
260.
40
10
Kotta
rakk
ara
1235
.67
57.3
336
675.
6162
1.34
26
.47
2.29
59.5
868
.11
11
Vetti
kava
la
2928
.16
180.
4860
594.
7147
6.70
20
.29
4.10
55.3
323
9.36
12
Anch
al
5115
.62
164.
8970
846.
2143
1.59
22
.65
0.57
65.1
814
6.25
13
Path
anap
uram
26
04.3
323
5.78
6356
7.12
254.
84
11.7
20.
490.
3041
.60
426.
76
M
unic
ipal
ities
56
5.61
4.57
5606
.43
171.
21
5.88
0.22
7.16
21.5
7
Dis
tric
t To
tal
2446
0.45
1076
.67
4548
79.5
679
18.3
612
9.18
37
7.68
24.6
11.
4892
6.38
1375
.98
-172
-

Tabl
e: 1
4.6
PR
OD
UC
TIO
N O
F IM
POR
TAN
T C
RO
PS
(Pro
duct
ion
in T
onne
s)
Year
R
ice
Blac
k pe
pper
G
reen
ch
illies
Pul
ses
incl
udin
g Tu
r
Cur
ed
Gin
ger
Cur
ed
Turm
eric
A
reca
nut
Tam
arin
d Au
tum
n W
inte
r Su
mm
er
1 2
3 4
5 6
7 8
9 10
11
2011
-12
1396
33
3537
1395
164
5288
534
620
0654
6
2010
-11
2159
48
5913
713
1217
682
878
347
1164
1045
2009
-10
2060
56
9319
415
0118
814
989
834
115
8712
28
Year
M
ango
Ja
ck (M
illio
n N
os)
Bana
na
Oth
er
plan
tain
Pi
neap
ple
Tapi
oca
Sw
eet
pota
to
Papp
aya
Dru
mst
ick
1 12
13
14
15
16
17
18
19
20
2011
-12
3772
7 28
1232
629
985
1297
52
5486
4469
9020
08
2010
-11
3024
1 28
1590
224
461
1077
45
4880
5579
1821
14
2009
-10
2972
4 22
1362
426
735
1187
50
3095
132
7572
1725
Year
Se
sam
um
Coc
onut
(M
illion
Nut
s)
Nut
meg
Te
a R
ubbe
r C
ocoa
R
aw c
ashe
w
nuts
Be
tel l
eave
s C
love
1 21
22
23
24
25
26
27
28
29
2011
-12
32
427
1913
055
600
191
486
71
2010
-11
129
378
2511
554
130
192
613
762
2009
-10
86
412
2295
5083
02
1271
1745
2S
ourc
e: A
gric
ultu
ral S
tatis
tics
-173
-

SEED RATE FOR IMPORTANT CROPS OF KERALA
1. Rice Transplanting - 60-85kg/ha
Broadcasting - 80-100kg/ha Dibbling - 80-90kg/ha
2. Maize - 20kg/ha 3. Ragi Direct sown - 5kg/ha
Transplanted crop - 4-5kg/ha 4. Sorghum - 12-15kg/ha 5. Black gram Pure crop - 20kg/ha
Mixed crop - 6kg/ha 6. Cowpea
1. For vegetable type a. Bush - 20-25kg/ha b. Trailing - 4-5kg/ha
2. For grain and dual purpose a. Broadcasting - 60-65kg\ha b. Dibbling - 50-60kg/ha
7. Green gram Pure crop - 20-25kg/ha Mixed crop - 6kg/ha
8. Green pea - 60kg/ha 9. Horse gram - 25-30kg/ha 10. Red gram
Pure crop - 15-20kg/ha Mixed crop - 6-7kg/ha
11. Amorphophallus - 9-12tonnes/ha 12. Colocasia - 800-1200kg/ha 13. Greater yam (Kachil) - 3000-3700kg/ha 14. Lesser yam (Nanakizhangu) - 1800-2700kg/ha 15. Sweet potato - 80kg tubers/ha 16. Tapioca - 2000 stems/ha 17. Rubber - 450-500plants/ha 18. Ground nut
Pure crop - 100kg kernels/ha Inter crop in coconut - 80kg kernel/ha Inter crop in Tapioca - 40-50kg kernel/ha
19. Sesamum - 4-5kg/ha 20. Mango ginger - 1500kg/ha 21. Ginger - 1500kg/ha 22. Turmeric - 2000-2500kg/ha 23. Betel vine - 20000to25000cuttings/ha 24. Okra - 7-8.5kg/ha 25. Bitter gourd - 5-6kg/ha 26. Coleus - 75-100kg/tubers/ha 27. Snake gourd - 3-4kg/ha
-174-

28. Cucumber - 0.5-0.75kg/ha 29. Watermelon - 1-1.5kg/ha 30. Bottle gourd - 3-4kg/ha 31. Pumpkin - 1-1.5kg/ha 32. Ash gourd - 0.75-1kg/ha 33. Brinjal - 370-500g/ha 34. Chilli - 1kg/ha 35. Tomato - 400g/ha 36. Cabbage - 500-750g/ha 37. Cauliflower - 600-750g/ha 38. Carrot - 5-6kg/ha 39. Beetroot - 7-8kg/ha 40. Radish - 7-8kg/ha 41. Potato - 1000-2000kg seed tuber/ha 42. Garlic - 500kg of cloves/ha 43. Winged bean - 15-20kg/ha 44. Cluster bean - 10-12kg/ha 45. Clove bean - 6-7kg/ha 46. Smooth gourd - 2.5-3kg/ha 47. Ridge gourd - 2.5-3kg/ha 48. Bell pepper - 400-600g/ha
CONVERSION RATES BETWEEN RAW MATERIALS AND PROCESSED PRODUCTS
Paddy Rice Cleaned 2/3 by weight of paddy Groundnut Kernels to nuts in shell 70 percent Oil to nuts in shell 28 percent Oil to Kernels crushed 40 percent Cake to Kernels crushed 60 percent Sesamum Oil to seeds crushed 40 percent Cake to seeds crushed 60 percent Coconut Copra to nuts 6,773 nuts gives one tone of copra (average), presently it is 7250-7500 nuts due to mite attack Cake to copra 38 percent Pepper Green to dry 21-39 percent by weight Sugarcane Gur from cane 10 percent Crystal sugar from gur 62.4 percent Crystal sugar from cane 9.9 percent Molasses from cane 3.5 percent Cashew Cashew Kernel 25 percent of nuts Arecanut Husked Champan to unhusked 35 percent by weight Supari (Processed tender nut to Unhusked champan) 12 percent Tapioca Starch 28-30 percent on the weight of fresh tubers
-175-

Turmeric Cured to raw (Dry 17-25% of the raw stuff) 16-20 percent of the weight Ginger Dry Ginger 21-30 percent by weight Cocoa Pod to wet beans 40 percent by weight Wet beans to dried beans 35-40 percent by weight Coffee Robusta-Berried to clean coffee 4.5 to 3.6:1 Wet beans to dried beans 5.0 to 3.3:1 Cardamom Green to dry 25-35 percent Oil Palm Palm Oil 20% by weight of Bunch Soyabean seed Oil to soyabean seed crushed 18 percent Meal to soyabean seed crushed 73 percent Hull from soyabean seed crushed 8 percent Neem seed Oil to kernel crushed 45-50 percent Cake to kernel crushed 50-55 percent
CONVERSION FACTORS FOR COCONUT
A. Number of Coconuts to a tonne of Copra: Kerala 6,250 to 6,850 (at present it is 7250- 7500 nuts due to mite attack) Andrapradesh 8,820 Tamilnadu 7,000 Laccadives 12,000
B. Copra yield from coconut in different months in Kerala at 6% moisture level/1000 nuts January 163kg February 181kg March 178kg April 176kg May 179kg June 165kg July 152kg August 139kg September 147kg October 148kg November 155kg December 158kg
C. Nuts to shell, Coconut water etc. 114kg shell 1000 nuts 100 litres of coconut water 1000 nuts 35kg of charcoal
D. Coconut Oil from Copra Chekkus 58-60% Rotories 62-63% Expellers 63-65%
E. Ball copra from coconut (per 1000 nuts) 1.5tonne (grade 1) 1.3tonne (average)
F. Desiccated coconut (per 1000 nuts) 1 tonne of DC
-176-

G. Cake yield as percentage of copra crushed
Chekkus 38% Rottories 36% Expellers 34%
H. Coconut to Fibre (per 1000 nuts) 81.8kg - Kerala 68.3kg - Andhrapradesh 90.0kg - Tamilnadu 81.9kg - Karnataka 56.9kg - Others
I. Composition of Coconut (Husked) Shell 27.9% (23.5 to32.8) Kernel 55.2% (48.2 to 62.0) Water 17.0% (8.2 to 25.1)
J. Composition of Standard Copra Moisture 6% Oil 68 to 71%
Free Fatty Acids 2% Composition Kernel (%) Copra% Cake% Moisture 46.3 5.8 10.7 Protein 4.1 8.9 19.1 Fat 37.3 67.0 11.1 Carbohydrates 7.9 12.4 40.9 Crude Fibre 3.4 4.1 14.1 Ash 1.0 1.8 4.1
K. Fatty Acid Composition of Coconut Oil Saturated Fatty Acids Un-Saturated Fatty Acids Lauric Acid Palmitoleic Acid Caprylic Acid Oleic Acid Myristic Acid Linoleic Acid Straric Acid Arachidonic Acid Arachidic Acid
L. Coir pith per 10000 husk 2 tonnes M. Charcoal yield from shell (per 3 tonnes of shell) 1 tonne N. Processed coconut cream/1000 coconut 200kg cream O. Coconut Vinegar (per 100 litres coconut water) 110 litre vinegar
Source:- Farm Guide.
-177-

-178-

PLANTATION CROPS
Plantation crops are perennial crops which are grown in larger areas and
commercially important. Plantation crops in general are either export oriented or
import substituting and therefore assume special significance from the national
point of view. Kerala has a substantial share in the four plantation crops of
rubber, tea, coffee and cocoa.
Rubber: - Natural Rubber occupies the prime position in Kerala among
plantation crops. In Kerala the coverage under the crop in 2011-12 was 5.39 lakh
ha. higher by 5335 ha over the previous year. The production of natural rubber in
Kerala during the period was 7.89 lakh tonnes indicating 2.4% increase over the
previous year. In 2011-12, the productivity increased slightly to 1462 kg/ha from
1442 kg/ha in 2010-11. 87.3% of total rubber production in the country was from
Kerala in the current year. The total area of rubber cultivation in the district during
2011-12 is 36840 ha. and production is 55600 tonnes.
Tea: - Tea is greater significant to Kerala because of high land productivity
relative to other crops, exports earnings and employment in rural and backward
areas. The share of Kerala in tea production is 6.9% in 2011-12. There is slight
increase in production of tea in Kerala and it ranged from .57 lakh MT in 2010-11
to .58 lakh MT in 2011-12. The total tea production in the district during 2010-11
is 115 tonnes increased to 130 tonnes during 2011-12. The district is having an
area of 1258 ha under tea plantation.
Coffee: - Area under coffee production in Kerala was 0.84 lakh ha and share of
production in the State is nearly 22% during 2011-12. The total area during
2011-12 is 37,028 ha and district is having no area under coffee plantation.
Cocoa: - The total area of cocoa production in the Kerala State is 12,764 ha. and
only 7 ha of land is under cocoa production in district during 2011-12 period.
-179-

Tabl
e: 1
5.1
(Met
ric T
onne
s)
Jan
uary
20
13 J
anua
ry
2012
Apr
il 20
12 to
Ja
nuar
y 20
13A
pril
2011
to
Janu
ary
2012
Apr
il 20
11 to
M
arch
201
2
Perc
enta
ge in
crea
se
(+)/
decr
ease
(-)
of (
3) &
(4)
12
34
56
Rib
bed
Sm
oked
She
et (R
SS
)74
690
7792
358
8920
5754
2465
8200
Sol
id B
lock
Rub
ber
1290
511
851
1012
5510
1085
1198
15La
tex
Con
cent
rate
s (d
rc)
7820
7506
6179
563
896
7649
0O
ther
s55
8552
2046
230
4399
549
195
Tota
l10
1000
1025
0079
8200
7844
0090
3700
1.8
Sty
rene
But
adie
ne (S
BR
)17
7421
3715
705
1601
518
791
Pol
y B
utad
iene
(BR
)64
2067
8064
798
6603
078
745
Oth
ers
809
1497
1003
910
850
1306
3To
tal
9003
1041
490
542
9289
511
0599
-2.5
Tota
l NR
& S
R11
0003
1129
1488
8742
8772
9510
1429
91.
3
Rib
bed
Sm
oked
She
et (R
SS
)44
090
5108
048
3215
5128
3561
6215
Sol
id B
lock
Rub
ber
2298
023
625
2489
4020
4910
2482
85
Late
x C
once
ntra
tes
(drc
)69
2058
5064
070
6115
573
190
Oth
ers
1820
1980
2206
522
850
2672
5
Tota
l75
810
8253
581
8290
8017
5096
4415
2.1
Out
of w
hich
Aut
o Ty
re
Man
ufac
ture
s47
419
5429
353
4372
5257
0263
1410
1.6
RU
BB
ER S
TATI
STIC
S
PRO
DU
CTI
ON
Synt
hetic
Rub
ber (
SR)
CO
NSU
MPT
ION
Nat
ural
Rub
ber (
NR
)
Type
- wis
e Pr
oduc
tion
&
Con
sum
ptio
n of
NR
& S
R
Nat
ural
Rub
ber (
NR
)
-180
-

Jan
uary
20
13 J
anua
ry
2012
Apr
il 20
12 to
Ja
nuar
y 20
13A
pril
2011
to
Janu
ary
2012
Apr
il 20
11 to
M
arch
201
2
Perc
enta
ge in
crea
se
(+)/
decr
ease
(-)
of (
3) &
(4)
Type
- wis
e Pr
oduc
tion
&
Con
sum
ptio
n of
NR
& S
R
Sty
rene
But
adie
ne (S
BR
)16
390
1560
516
3530
1529
8518
5265
Pol
y B
utad
iene
(BR
)11
865
1162
012
2100
1108
2513
4630
Oth
ers
8870
7160
8543
088
585
1034
55To
tal
3712
534
385
3710
6035
2395
4233
505.
3O
ut o
f whi
ch A
uto
Tyre
M
anuf
actu
res
2633
724
914
2702
3125
6287
3073
655.
4
Tota
l NR
& S
R11
2935
1169
2011
8935
011
5414
513
8776
53.
1O
ut o
f whi
ch A
uto
Tyre
M
anuf
actu
res
7375
679
207
8046
0378
1989
9387
752.
9
Jan
uary
20
13 J
anua
ry
2012
Apr
il 20
12 to
Ja
nuar
y 20
13A
pril
2011
to
Janu
ary
2012
Apr
il 20
11 to
M
arch
201
2
12
34
5
9225
8915
9669
584
990
1035
65
9055
8785
9592
584
410
1024
35
3545
3650
3892
935
679
4317
8
6850
5530
Sou
rce:
- Rub
ber B
oard
Synt
hetic
Rub
ber (
SR)
Out
of w
hich
Aut
o Ty
re M
anuf
actu
res
Sto
ck w
ith M
anuf
actu
res
(end
of m
onth
/yea
r)
Prod
uctio
n C
onsu
mpt
ion
and
sto
ck o
f RR
Rec
laim
ed R
ubbe
r (R
R)
(Met
ric T
onne
s)
Pro
duct
ion
Con
sum
ptio
n
-181
-

-182
-

ANIMAL HUSBANDRY
Animal husbandry plays an important role in generating employment and income
to the weaker sections of the population. The preservation and the development of cattle
wealth and poultry are also significant to the production of major livestock products of
nutritional standard and the district is covered by the Integrated Dairy Development
Project. District has one of the largest cattle stock populations and there were 255773
live stock population and 766412 poultry population during 2010-11 Animal husbandry
reports.
Table: 16.1
NUMBER OF CASES TREATED UNDER IMPORTANT CATEGORIES OF DISEASES IN VARIOUS DEPARTMENT INSTITUTIONS DURING 2010-11
Digestive disorders
Cattle 63436 Buffaloe 1755
Goat 32544 Others 19681
Respiratory Diseases
Cattle 13444 Buffaloe 204
Goat 9074 Others 29122
Metabolic Diseases
Cattle 8501 Buffaloe 24
Goat 667 Others 76
Deficiency Diseases
Cattle 4868 Buffaloe 47
Goat 2018 Others 3137
Coccidiosis
Cattle 4523 Buffaloe 130
Goat 1068 Others 12145
Babesiosis
Cattle 718 Buffaloe 0
Goat 136 Others 5
Other endoparasites
Cattle 2570 Buffaloe 64
Goat 1216 Others 5722
-183-

Table: 16.1 Continued…..
Ectoparasitic conditions
Cattle 7127 Buffaloe 319
Goat 3950 Others 11270
Abortion
Cattle 746 Buffaloe 4
Goat 475 Others 887
Dystocia
Cattle 1682 Buffaloe 7
Goat 674 Others 0
Other reproductive disorder
Cattle 745 Buffaloe 0
Goat 125 Others 0
Poisoning
Cattle 676 Buffaloe 0
Goat 241 Others 0
Mastitis
Cattle 8535 Buffaloe 23
Goat 1984 Others 3
Table: 16.2
ANTI RABIES VACCINATION DONE IN 2010-11
Prophylactic in dogs
Post Exposure Vaccinations Number of deaths due to rabies
Cat
tle
Buf
falo
Goa
t
Can
ine
Oth
er
Ani
mal
s
Cat
tle
Buf
falo
Goa
t
Can
ine
Oth
er
Ani
mal
s
9,602 79 2 422 0 0 0 0 0 0 0 Table: 16.3
DAIRY CO-OPERATIVE SOCIETIES AS ON 31-03-2011
Primary Societies 334 Regional Unions Total 334 Anand Mode (APCOS) 270 Traditional 64 Total 334
-184-

Table: 16.4
OUTBREAKS, ATTACKS, DEATHS ETC.DUE TO CONTAGIOUS DISEASES AND NUMBER OF ANIMALS PROTECTED/VACCINATED DURING THE YEAR 2010-11
Foot and Mouth Anthrax Black Quarter
Out
Bre
ak
Atta
ck
Dea
th
Prot
ecte
d/
Vacc
inat
ed
Out
Bre
ak
Atta
ck
Dea
th
Prot
ecte
d/
Vacc
inat
ed
Out
Bre
ak
Atta
ck
Dea
th
Prot
ecte
d/
Vacc
inat
ed
0 0 0 109752 3 3 3 0 0 0 0 300Hemorrhagic Septicemia Canine Distember Parvo Virus
Out
Bre
ak
Atta
ck
Dea
th
Prot
ecte
d/
Vacc
inat
ed
Out
Bre
ak
Atta
ck
Dea
th
Prot
ecte
d/
Vacc
inat
ed
Out
Bre
ak
Atta
ck
Dea
th
Prot
ecte
d/
Vacc
inat
ed
3 5 5 889 0 0 0 691 0 0 0 691Ranikhet Fowl Pox Infectious Bursal Disease
Out
Bre
ak
Atta
ck
Dea
th
Prot
ecte
d/
Vacc
inat
ed
Out
Bre
ak
Atta
ck
Dea
th
Prot
ecte
d/
Vacc
inat
ed
Out
Bre
ak
Atta
ck
Dea
th
Prot
ecte
d/
Vacc
inat
ed
4 229 128 573741 5 259 212 26400 0 0 0 0Duck Plague Others Total
Out
Bre
ak
Atta
ck
Dea
th
Prot
ecte
d/
Vacc
inat
ed
Out
Bre
ak
Atta
ck
Dea
th
Prot
ecte
d/
Vacc
inat
ed
Out
Bre
ak
Atta
ck
Dea
th
Prot
ecte
d/
Vacc
inat
ed
0 0 0 65741 0 0 0 12122 15 496 348 790327 Source: Bulletin 2011, AHD.
-185-

Tabl
e: 1
6.5
AC
TIVI
TIES
IN T
HE
AN
IMA
L H
USB
AN
DR
Y SE
CTO
R IN
KER
ALA
(200
3-04
to 2
010-
12)
Sl
. N
o.
Act
iviti
es
Uni
t (‘0
00)
2003
-04
2004
-05
2005
-06
2006
-07
2007
-08
2008
-09
2009
-10
2010
-11
2011
-12
1 C
ases
trea
ted
Nos
. 46
2948
7950
2952
60
5015
4873
4663
4 28
748
30
2 O
pera
tions
Per
form
ed
Nos
.13
613
512
512
0 12
111
612
286
78
3 C
astra
tion
done
N
os.
66
55
4.8
5.6
4.7
4.37
3.94
4 Va
ccin
atio
n do
ne
1.
Liv
esto
ck
Nos
.44
1413
3434
4027
23
2517
2282
3653
1636
1681
2.
Pou
ltry
Nos
.45
5461
7096
0387
52
7251
7008
8829
8903
1022
2
5 A
nti R
abie
s V
acci
natio
ns
done
in D
ogs
Nos
.13
211
310
119
7 17
320
717
614
1.04
167.
8
6 Ar
tific
ial I
nsem
inat
ion
done
N
os.
1231
1176
1180
1204
10
7511
96.9
612
98.5
513
87.4
614
85.1
7
7 C
alvi
ngs
reco
rded
N
os.
354
358
355
383
358
346.
9032
6.70
368.
9241
3
8 C
hick
s ha
tche
d ou
t in
Dep
artm
ent P
oultr
y Fa
rms
N
os.
977
747
515
859
369
603
792
1054
.77
1388
9 Va
ccin
es p
rodu
ced
in V
eter
inar
y Bi
olog
ical
s
1.
Pou
ltry
Dos
es
1796
713
488
1094
820
892
1110
319
285
138.
4923
661.
118
908
2.
Liv
esto
ck
Dos
es
534
329
184
440
678
494
227
326
456
Sou
rce:
Eco
nom
ic R
evie
w 2
012
-186
-

FISHERIES
In Kerala fishing industry occupies an important position in its economy.
With a coastal line of about 590 Km long, Kerala offers immense possibilities for
fishing both marine and inland. The activities covered in this sector are (i) fishing
in ocean, coastal, offshore and inland waters for commercial purposes
(ii) Subsistence fishing in inland waters (iii) Gathering of sea weeds, seashells
and other ocean and coastal water products (iv) Fish curing. The important factor
that has a decisive note in the fishery potential of the State is the existence of
mud-banks, locally known as ‘Chakara’, closed to the coast. Kollam is an
important maritime district of the State with a coastal line of 37Km. Neendakara
on the South-West coast, situated closed to the Ashtamudi Lake and
Sakthikulangara are the two villages which thrive in fishing. The lighterage port at
Neendakara through not envisaged as a fishing harbour is at present the most
important fishing centre of the State using mechanised boats. There are 27
marine and 26 inland fishing villages. Based on 2011-12 report, annual fish
production was 112085MT from marine and 15577MT from inland sector. The
fisher folk population was 123100 with a breakup of 89466 from marine and
33634 from inland sector during the same year. There are 45 Fishermen
Development Welfare Cooperative Societies functioning at this district extends all
basic support and assistance in the development of inland fish farming.
-187-

Table: 17.1
FRESH WATER RESOURCES IN KOLLAM DISTRICT
Year
Panchayat ponds
Holy ponds and streams
Village ponds and other water
holds Irrigation tanks
No Area (Ha) No Area (Ha) No Area
(Ha) No Area (Ha)
2009 589 62.93 188 24.96 16 35.55 17 150.26
2010 589 62.93 188 24.96 16 35.55 17 150.26 Table: 17.2
DETAILS OF DISTRICT WISE PADASEKHARAMS IN KERALA
Sl. No. Name of District No. of
PanchayatsNo. of
PadasekharamsArea in
Acre Cent
1 Kollam 17 104 6837 31.5
2 Alappuzha 52 557 68173 67
3 Kottayam 18 206 15810 40
4 Ernakulam 40 257 10432 20
5 Thrissur 10 92 6002 30
6 Palakkad 11 44 1638 16
7 Malappuram 15 85 580 34
8 Kozhikode 3 8 173
9 Kannur 41 117 3381 69
10 Kasaragod 11 80 2479 78
Total 218 1550 115505 85.5
-188-

Total: 17.3
DISTRICT WISE SPECIES WISE INLAND FISH LANDINGS IN KOLLAM (QTY in MT)
2009-2010
Sl. No. Name of Fish Quantity
1 Prawn 722
2 Etroplus 564
3 Murrels 521
4 Mullets 743
5 Cat fish 782
6 Jew fish 366
7 Tilapia 1349
8 Labeo fimbriatus 0
9 Barbus 76
10 Mrigal 846
11 Crabs 121
12 Common crabs 1229
13 Catla 1584
14 Gourami 0
15 Chamos 73
16 Eels 8
17 Labeo Rohitha 1854
18 Shrimp 87
19 Mussel 635
20 Edible Oyster 192
21 Miscellaneous 294
Total 12046
2008-2009
Sl. No. Name of Fish Quantity
1 Prawn 708
2 Etroplus 565
3 Murrels 517
4 Mullets 746
5 Cat fish 778
6 Jew fish 370
7 Tilapia 1366
8 Labeo fimbriatus 0
9 Barbus 76
10 Mrigal 674
11 Crabs 98
12 Common crabs 1027
13 Catla 1189
14 Gourami 0
15 Chamos 73
16 Eels 8
17 Labeo Rohitha 1598
18 Shrimp 0
19 Mussel 476
20 Edible Oyster 307
21 Miscellaneous 316
Total 10892
-189-

Total: 17.4
DISTRICT WISE SPECIES WISE VALUES OF INLAND FISHES IN KOLLAM (Rs in 000’s)
2009-2010
Sl. No. Name of Fish Value
1 Prawn 158840
2 Etroplus 73320
3 Murrels 26050
4 Mullets 70585
5 Cat fish 36754
6 Jew fish 13176
7 Tilapia 47215
8 Labeo fimbriatus 0
9 Barbus 2128
10 Mrigal 35532
11 Crabs 36905
12 Common crabs 55305
13 Catla 71280
14 Gourami 0
15 Chamos 4380
16 Eels 288
17 Labeo Rohitha 83430
18 Shrimp 16095
19 Mussel 11430
20 Edible Oyster 2688
21 Miscellaneous 14112 Total 759513
Source: Inland Fisheries Statistics, Dept of Fisheries
2008-2009
Sl. No. Name of Fish Value
1 Prawn 155760
2 Etroplus 42375
3 Murrels 25850
4 Mullets 70870
5 Cat fish 36566
6 Jew fish 13320
7 Tilapia 47810
8 Labeo fimbriatus 0
9 Barbus 2128
10 Mrigal 28308
11 Crabs 29890
12 Common crabs 46215
13 Catla 53505
14 Gourami 0
15 Chamos 4380
16 Eels 288
17 Labeo Rohitha 71910
18 Shrimp 0
19 Mussel 8568
20 Edible Oyster 4298
21 Miscellaneous 15168
Total 657209
-190-

WETLAND
Wetlands play a vital role in maintaining the fragile environmental balance.
Wetlands serve as sinks, sources and transformers of innumerable chemical,
biological and genetic materials. They offer a unique habitat for a wide variety of flora
and fauna as well. Wetlands are lands transitional between terrestrial and aquatic
ecosystem where the water table is usually at or near the surface or the land is
covered by shallow water. This definition, given by Cowardin et al (1979), is widely
accepted by wetland scientists of the United States and is also used in India (Mitsch
and Gosselink, 1989). Wetlands include the swamps, bogs, marshes, mires, fens
and other wet ecosystems found throughout the world under different names.
Wetland is an area of ground that is saturated with water either permanently or
seasonally. Wetlands are categorized by their characteristic vegetation, which is
adapted to these unique soil conditions.
Wetlands are found on every continent except Antartica. The main functions
of wetlands are as water purification systems flood control, shoreline stability and as
reservoirs of biodiversity. Wetlands may be converted to agriculture or development
or constructed as a water management tool as in the recent developing field of water
sensitive urban design.
Wetlands have been categorized both biomes and ecosystem. A patch of
land that develops pools of water after a rain storm would not be considered as a
‘wetland’ though the land is wet. Wetlands have unique characteristics. They are
generally distinguished from other water bodies or landforms based on their water
level and on the types of plants that thrive within their specifically wetlands are
characterized as having a water table that stands at or near the land surface either
permanently or seasonally for a large enough period each year to support aquatic
plants.
Wetlands vary widely due to local and regional differences in topography,
hydrology, vegetation and other factors including human interference. Wetlands can
be divided into two main classes, tidal and non-tidal areas.
Wetland hydrology is associated with the spartial and dispersion, flow, and
physio chemical attributes of surface and ground water in its reservoirs. Based on
hydrology wetlands can be categorized as reveries (associated with streams)
lacustrine (associated with lakes and reservoirs) and palustrine (isolated). Salinity
-191-

has a very strong influence on wetland water chemistry. In non-reverine wetlands
natural salinity is regulated by interaction between ground and surface water, which
may be influenced by human activity.
Carbon is the major nutrient cycled within wetlands. Most nutrients such as
carbon, sulfur, phosphorus and nitrogen are found within the soil of wetlands. The
biota of a wetland system includes its vegetation zones and structure as well as
animal population and distribution which are highly dependent of water chemistry.
The chemistry of water flowing into wetlands depends on the source of water and the
geological material in which it flows through as well as the nutrients discharged from
organic matter in the soils and plants at higher elevation as the slope wetlands.
There are four main groups of hydrophytes that found in wetland systems.
Submerged water plants - found completely underwater, floating water plants usually
small although it may take up a large surface area in wetland systems, emergent
water plants seen above the surface of water but whose roots are completely
submerged.
Fish are more dependent on wetland ecosystems than any other type of
habitant. Frogs are the most crucial amphibian species in wetland systems.
Temperatures vary greatly depending on the location of the wetland. Rainfall
also varies according its location.
Wetland reservoirs are very rich in our country which exhibit significant ecological diversity because of variability in climate conditions and topography.
Though small in size Kerala is land of affluent in water sources. 44 rivers
drain the land of, which are west flowing and 3 flows east. Apart from these 44 rivers
their tributaries and a countless number of streams and rivulets crisscross the land
making it green and fertile and also serve as inland waterways.
Besides these rivers Kerala is bestowed with a number of lakes and
backwater lagoon which add to the beauty of the land. The important wetlands of
Kerala are Ashtamudi Lake, Vembanadu Lake and Sasthamkotta Lake. In the State
of Kerala 1762 wetlands have been delineated. Total wetlands area estimated to
160590ha. The major wetland types are River/stream (65162ha) Lagoons (38442 ha)
Reservoirs (26167 ha) and Waterlogged (20305 ha). Analysis of wetland status in
terms of open water and aquatic vegetation showed that around 88 and 83% of
wetland area is under open water category during post monsoon and pre monsoon
-192-

respectively. Aquatic vegetation (floating/emergent) occupies around 8 and 6% of
wetland area during post and pre monsoon respectively.
The wetlands can be broadly classified into inland fresh and saline as well as
coastal fresh and saline areas. The coastal wetland ecosystems are often classified
as tidal salt marshes, tidal freshwater marshes and mangrove wetlands; the inland
wetland ecosystems, as inland fresh water marshes, peatlands, deepwater swamps
and riparian wetlands. Examples of artificial wetlands are those of wild-life
sanctuaries of Bharathpur and Kaziranga in India and the extensive man-managed
rice fields in different parts of Asia.
The wetlands are among the most important ecosystems of the Earth. On a
short-time scale, wetlands are useful as sources, sinks and transformers of a
multitude of chemical, biological and genetic materials. They have been found to
cleanse polluted waters, prevent floods, protect shorelines and recharge groundwater
aquifers; further more wetlands provide unique habitats for a wide variety of flora and
fauna. In a long-time scale, the swampy environment of the carboniferous Period
produced and preserved many of the fossil fuels on which we depend now. Some
scientists have rightly called the wetlands as ‘nature’s kidneys’ because of the natural
functions they perform.
Wetlands are the most productive life-supports system in the world and are of
immense socio-economic and ecological importance to mankind. The management
of these wetlands has become the most important concern of mankind today. The
paddy wetlands are a potential source for the food security of the State. The area of
these wetlands is shrinking at an alarming rate due to the shift from rice to cash
crops and non-agricultural use. Scientific Management coupled with socioeconomic
considerations will provide an effective tool to the planner for recognizing wetlands as
one of the prime life-sustaining ecosystems. To save this unique inter-tidal
ecosystem from being endangered its conservation and management as well as in
river basin management policies/programmes.
- 1 9 3 -

Tabl
e:18
.1
Are
a (H
a)Sl
.N
o.C
ateg
ory
Ala
yam
onA
ncha
lA
ryan
kavu
Edam
ulac
kal
Eroo
rK
arav
aloo
rK
ulat
hoo
puzh
aTh
enm
ala
1P
addy
Con
verte
d to
Are
canu
t9.
273.
783.
812
Pad
dy C
onve
rted
to B
anan
a1.
9750
.03
614.
5340
.10
3P
addy
Con
verte
d to
Bui
lt up
+ M
ixed
Cro
ps11
.13
4P
addy
Con
verte
d to
Bui
lt up
Lan
d78
.56
147.
1387
.85
14.6
52.1
35
Pad
dy C
onve
rted
to C
lay
Min
ing
6P
addy
Con
verte
d to
Coc
onut
29.7
198
.74
48.7
252
.76
48.6
7P
addy
Con
verte
d to
Coc
onut
+ B
uilt
up L
and
8P
addy
Con
verte
d to
Coc
onut
+ A
reca
nut
9P
addy
Con
verte
d to
Coc
onut
+ M
ixed
Tre
es10
Pad
dy C
onve
rted
to C
ultiv
able
Was
te L
and
1.44
1.24
0.81
3.78
11P
addy
Con
verte
d to
Mix
ed c
rop
24.6
735
.17
43.7
710
.53
23.6
412
Pad
dy C
onve
rted
to M
ixed
Tre
es12
.88
2.28
9.36
149.
3445
.61
26.4
713
Pad
dy C
onve
rted
to R
ubbe
r58
.81
19.4
728
.47
30.5
42.
7114
Viri
ppu
71.9
618
1.98
196.
8086
.99
121.
3715
Viri
ppu
+ P
unch
a16
Wat
er B
odie
s32
.13
13.5
511
40.9
671
.26
17M
unda
kan
18O
ther
Lan
d U
ses
5303
.25
2158
.95
2151
3.95
3170
.538
86.0
522
73.8
438
687.
4212
783.
26Pa
ncha
yath
Tot
al55
83.2
527
04.2
621
546.
0836
51.0
642
48.8
926
15.5
939
839.
5112
880.
99B
lock
Tot
al
AN
CH
AL
BLO
CK
9306
9.63
-194
-

Tabl
e:18
.2
Are
a (H
a)Sl
.N
o.C
ateg
ory
Cha
daya
man
gala
mC
hith
ara
Elam
adu
Ittiv
aK
adak
kal
Nila
mel
Velin
allo
or
1P
addy
Con
verte
d to
Are
canu
t2
Pad
dy C
onve
rted
to B
anan
a4.
811.
964.
892.
459.
073
Pad
dy C
onve
rted
to B
uilt
up +
Mix
ed C
rops
33.2
14
Pad
dy C
onve
rted
to B
uilt
up L
and
17.0
125
.23
20.6
215
.32
48.6
819
.28
41.1
05
Pad
dy C
onve
rted
to C
lay
Min
ing
6P
addy
Con
verte
d to
Coc
onut
25.9
830
.40
18.4
612
.18
2.94
48.2
57
Pad
dy C
onve
rted
to C
ocon
ut +
Bui
lt up
Lan
d5.
4625
.97
8P
addy
Con
verte
d to
Coc
onut
+ A
reca
nut
9P
addy
Con
verte
d to
Coc
onut
+ M
ixed
Tre
es10
Pad
dy C
onve
rted
to C
ultiv
able
Was
te L
and
22.7
2.95
4.66
4.79
1.86
3.29
11P
addy
Con
verte
d to
Mix
ed c
rop
10.6
113
.23
7.52
21.0
559
.52
73.3
112
Pad
dy C
onve
rted
to M
ixed
Tre
es15
5.43
61.7
130
1.31
68.9
51.
4113
.75
13P
addy
Con
verte
d to
Rub
ber
117.
1012
6.86
187.
579.
0010
9.44
64.0
814
3.94
14V
iripp
u17
7.11
44.4
516
0.64
105.
0599
.00
23.7
610
8.5
15V
iripp
u +
Pun
cha
16W
ater
Bod
ies
44.4
61.
8328
.51.
2410
.11
17M
unda
kan
18O
ther
Lan
d U
ses
2109
.99
5551
.11
2472
.16
3743
.43
4532
.31
1722
.49
2046
.52
Panc
haya
th T
otal
2529
.77
5936
.29
2958
.53
4233
.25
4902
.53
1897
.79
2523
.81
Blo
ck T
otal
CH
AD
AYA
MA
NG
ALA
M B
LOC
K
2498
1.97
-195
-

Tabl
e:18
.3
Are
a (H
a)
Sl.N
o.C
ateg
ory
Cha
vara
Nee
ndak
ara
Panm
ana
Thek
kum
bhag
omTh
eval
akka
ra
1P
addy
Con
verte
d to
Are
canu
t1.
51
2P
addy
Con
verte
d to
Ban
ana
4.13
2.45
1.15
3P
addy
Con
verte
d to
Bui
lt up
+ M
ixed
Cro
ps
4P
addy
Con
verte
d to
Bui
lt up
Lan
d14
.09
48.3
82.
314.
16
5P
addy
Con
verte
d to
Cla
y M
inin
g0.
35
6P
addy
Con
verte
d to
Coc
onut
24.4
24.
4714
5.70
4.02
61.5
7
7P
addy
Con
verte
d to
Coc
onut
+ B
uilt
up L
and
163.
5517
9.91
2.49
108.
45
8P
addy
Con
verte
d to
Coc
onut
+ A
reca
nut
8.74
15.2
435
.53
9P
addy
Con
verte
d to
Coc
onut
+ M
ixed
Tre
es
10P
addy
Con
verte
d to
Cul
tivab
le W
aste
Lan
d47
.75
7.38
27.4
612
.37
72.2
8
11P
addy
Con
verte
d to
Mix
ed c
rop
54.8
18.
0682
.22
46.7
753
.08
12P
addy
Con
verte
d to
Mix
ed T
rees
10.9
116
.48
6.51
13P
addy
Con
verte
d to
Rub
ber
14V
iripp
u4.
0614
.24
10.6
9
15V
iripp
u +
Pun
cha
8.63
16W
ater
Bod
ies
18.5
526
9.47
13.8
790
8.57
189.
77
17M
unda
kan
18O
ther
Lan
d U
ses
857.
7740
0.83
1129
.54
415.
4511
36.8
9
Panc
haya
th T
otal
1208
.78
692.
6616
75.7
013
91.9
816
87.9
1
Blo
ck T
otal
CH
AVA
RA
BLO
CK
6657
.03
-196
-

Tabl
e:18
.4
Are
a (H
a)Sl
.N
o.C
ateg
ory
East
K
alla
daK
unda
raM
antr
oth
urut
huPa
naya
mPe
raya
mPe
rinad
uTh
rikka
davo
orTh
rikka
ruva
1P
addy
Con
verte
d to
Are
canu
t3.
162
Pad
dy C
onve
rted
to B
anan
a11
.16
1.36
3P
addy
Con
verte
d to
Bui
lt up
+ M
ixed
Cro
ps91
.64
26.8
54
Pad
dy C
onve
rted
to B
uilt
up L
and
9.14
9.93
24.4
41.
0734
.75
9.49
5P
addy
Con
verte
d to
Cla
y M
inin
g6
Pad
dy C
onve
rted
to C
ocon
ut11
.48
65.9
615
9.04
43.2
963
.57
53.0
57
Pad
dy C
onve
rted
to C
ocon
ut +
Bui
lt up
Lan
d10
.33
12.1
728
.46
8P
addy
Con
verte
d to
Coc
onut
+ A
reca
nut
9P
addy
Con
verte
d to
Coc
onut
+ M
ixed
Tre
es10
Pad
dy C
onve
rted
to C
ultiv
able
Was
te L
and
131.
8118
.50
2.26
10.9
68.
4211
Pad
dy C
onve
rted
to M
ixed
cro
p13
.32
26.2
54.
8926
.95
3.23
3.31
12P
addy
Con
verte
d to
Mix
ed T
rees
3.52
1.11
13P
addy
Con
verte
d to
Rub
ber
5.58
14V
iripp
u13
0.50
20.2
515
Viri
ppu
+ P
unch
a12
.91
71.8
322
.26
40.2
113
.32
62.8
915
.20
16W
ater
Bod
ies
69.6
71.
1769
9.49
266.
7877
7.96
415.
4361
0.24
1098
.11
17M
unda
kan
18O
ther
Lan
d U
ses
822.
3911
28.5
752
7.49
446.
8866
5.78
1031
.32
722.
3658
4.13
Panc
haya
th T
otal
1303
.19
1314
.51
1315
.20
943.
6014
60.3
915
79.8
814
69.5
418
01.2
8B
lock
Tot
al11
187.
59
CH
ITTU
MA
LA B
LOC
K
-197
-

Tabl
e:18
.5
Are
a (H
a)
Sl.N
o.C
ateg
ory
Adi
chan
allo
orC
hath
anno
orK
allu
vath
ukka
lPo
otha
kula
m
1P
addy
Con
verte
d to
Are
canu
t0.
584.
14
2P
addy
Con
verte
d to
Ban
ana
3.07
12.8
39.
313.
66
3P
addy
Con
verte
d to
Bui
lt up
+ M
ixed
Cro
ps23
.79
7.87
55.3
4P
addy
Con
verte
d to
Bui
lt up
Lan
d16
.28
20.3
62.
15
5P
addy
Con
verte
d to
Cla
y M
inin
g
6P
addy
Con
verte
d to
Coc
onut
164.
6920
3.36
78.9
718
.03
7P
addy
Con
verte
d to
Coc
onut
+ B
uilt
up L
and
100.
7943
.29
12.0
459
.7
8P
addy
Con
verte
d to
Coc
onut
+ A
reca
nut
37.9
455
.14
19.3
617
.57
9P
addy
Con
verte
d to
Coc
onut
+ M
ixed
Tre
es
10P
addy
Con
verte
d to
Cul
tivab
le W
aste
Lan
d12
6.03
27.9
432
.77
96.9
4
11P
addy
Con
verte
d to
Mix
ed c
rop
26.7
489
.27
71.3
572
.62
12P
addy
Con
verte
d to
Mix
ed T
rees
36.5
820
.27
89.3
4
13P
addy
Con
verte
d to
Rub
ber
16.0
6
14V
iripp
u74
.97
195.
3922
3.56
46.8
8
15V
iripp
u +
Pun
cha
95.4
2
16W
ater
Bod
ies
105.
3849
.97
5.49
264.
52
17M
unda
kan
18O
ther
Lan
d U
ses
1536
.96
2201
.37
3204
.24
1119
.25
Panc
haya
th T
otal
2364
.70
2927
.64
3805
.87
1701
.32
Blo
ck T
otal
ITH
IKK
AR
A B
LOC
K
1079
9.53
-198
-

Tabl
e:18
.6
Are
a (H
a)Sl
.No.
Cat
egor
yEz
huko
neK
aree
pra
Kot
tara
kkar
aN
eduv
atho
orPo
oyap
pally
Veliy
am
1P
addy
Con
verte
d to
Are
canu
t0.
5722
.12
0.78
4.57
12.7
11.
33
2P
addy
Con
verte
d to
Ban
ana
6.85
9.81
19.8
824
.10
3.35
6.52
3P
addy
Con
verte
d to
Bui
lt up
+ M
ixed
Cro
ps3.
0725
.93
62.1
626
.39
9.46
4P
addy
Con
verte
d to
Bui
lt up
Lan
d33
.07
19.0
877
.10
67.3
535
.84
47.5
0
5P
addy
Con
verte
d to
Cla
y M
inin
g
6P
addy
Con
verte
d to
Coc
onut
55.5
848
.01
47.4
025
.36
31.6
148
.87
7P
addy
Con
verte
d to
Coc
onut
+ B
uilt
up L
and
5.95
8P
addy
Con
verte
d to
Coc
onut
+ A
reca
nut
4.79
7.54
13.3
011
.31
81.2
6
9P
addy
Con
verte
d to
Coc
onut
+ M
ixed
Tre
es
10P
addy
Con
verte
d to
Cul
tivab
le W
aste
Lan
d2.
976.
9218
.68
70.2
111
.72
43.2
3
11P
addy
Con
verte
d to
Mix
ed c
rop
117.
4584
.23
40.2
610
1.47
31.0
682
.65
12P
addy
Con
verte
d to
Mix
ed T
rees
26.8
178
.86
50.7
448
.35
52.4
310
9.33
13P
addy
Con
verte
d to
Rub
ber
0.82
32.6
56.
2654
.98
14V
iripp
u33
.65
237.
2080
.99
4.62
275.
5214
3.15
15V
iripp
u +
Pun
cha
16W
ater
Bod
ies
20.9
9
17M
unda
kan
18O
ther
Lan
d U
ses
1496
.36
1732
.60
1385
.86
1859
.21
1807
.63
2489
.77
Panc
haya
th T
otal
1781
.99
2272
.30
1829
.80
2237
.89
2349
.15
3069
.02
Blo
ck T
otal
KO
TTA
RA
KK
AR
A B
LOC
K
1354
0.15
-199
-

Tabl
e:18
.7
Are
a (H
a)Sl
.No.
Cat
egor
yEl
ampa
lloor
Kot
tank
ara
May
yana
duN
edum
pana
Thrik
kovi
lvat
tom
1P
addy
Con
verte
d to
Are
canu
t13
.75
2P
addy
Con
verte
d to
Ban
ana
7.99
15.9
427
.65
3P
addy
Con
verte
d to
Bui
lt up
+ M
ixed
Cro
ps
4P
addy
Con
verte
d to
Bui
lt up
Lan
d4.
653.
037.
8831
.17
19.1
5
5P
addy
Con
verte
d to
Cla
y M
inin
g0.
502.
05
6P
addy
Con
verte
d to
Coc
onut
27.0
852
.21
70.5
267
.08
86.4
2
7P
addy
Con
verte
d to
Coc
onut
+ B
uilt
up L
and
37.2
724
.66
62.3
524
.18.
35
8P
addy
Con
verte
d to
Coc
onut
+ A
reca
nut
5.19
19.7
115
6.92
9P
addy
Con
verte
d to
Coc
onut
+ M
ixed
Tre
es
10P
addy
Con
verte
d to
Cul
tivab
le W
aste
Lan
d4.
5634
.36
11P
addy
Con
verte
d to
Mix
ed c
rop
84.4
758
.07
52.8
433
.81
31.0
4
12P
addy
Con
verte
d to
Mix
ed T
rees
3.79
6.07
93.9
8
13P
addy
Con
verte
d to
Rub
ber
14V
iripp
u10
4.63
111.
8416
.42
63.1
689
.05
15V
iripp
u +
Pun
cha
55.3
814
3.09
110.
93
16W
ater
Bod
ies
188
35.7
17M
unda
kan
18O
ther
Lan
d U
ses
945.
7999
6.04
1516
.86
1917
.76
1381
.46
Panc
haya
th T
otal
1217
.07
1265
.58
1980
.88
2505
.82
1885
.37
Blo
ck T
otal
MU
KH
ATH
ALA
BLO
CK
8854
.72
-200
-

Tabl
e:18
.8
Are
a (H
a)
Sl.N
o.C
ateg
ory
Ala
ppad
Kla
pana
Kul
asek
hara
pura
mO
chira
Thaz
hava
Thod
iyoo
r
1P
addy
Con
verte
d to
Are
canu
t2
Pad
dy C
onve
rted
to B
anan
a2.
501.
483.
5619
.17
3P
addy
Con
verte
d to
Bui
lt up
+ M
ixed
Cro
ps17
.63
4P
addy
Con
verte
d to
Bui
lt up
Lan
d9.
7166
.58
94.3
083
.61
121.
165
.01
5P
addy
Con
verte
d to
Cla
y M
inin
g0.
360.
616
Pad
dy C
onve
rted
to C
ocon
ut17
.26
163.
7113
7.33
117
193.
7911
5.14
7P
addy
Con
verte
d to
Coc
onut
+ B
uilt
up L
and
41.6
66.6
932
9.55
226.
0230
9.48
234.
278
Pad
dy C
onve
rted
to C
ocon
ut +
Are
canu
t1.
149
Pad
dy C
onve
rted
to C
ocon
ut +
Mix
ed T
rees
8.95
10P
addy
Con
verte
d to
Cul
tivab
le W
aste
Lan
d3.
9514
.64
17.9
621
.84
160.
932.
1011
Pad
dy C
onve
rted
to M
ixed
cro
p15
.83
8.59
79.9
343
.53
21.7
219
.41
12P
addy
Con
verte
d to
Mix
ed T
rees
2.08
13P
addy
Con
verte
d to
Rub
ber
14V
iripp
u49
.73
37.1
58.
9324
.19
22
7.60
15V
iripp
u +
Pun
cha
85.7
316
Wat
er B
odie
s31
6.50
36.3
10.
3578
.06
87.2
717
Mun
daka
n18
Oth
er L
and
Use
s42
6.20
559.
9610
47.1
580
8.50
1390
.26
1271
.72
Panc
haya
th T
otal
883.
2810
39.3
617
15.5
013
26.5
322
79.5
120
71.4
9B
lock
Tot
al
OC
HIR
A B
LOC
K
9315
.67
-201
-

Tabl
e:18
.9
Are
a (H
a)
Sl.N
o.C
ateg
ory
Path
anap
uram
Pa
ttazh
iPa
ttazh
i Va
dakk
ekka
raPi
rava
ntho
orTh
alav
oor
Vila
kkud
y
1P
addy
Con
verte
d to
Are
canu
t0.
630.
339.
358.
252
Pad
dy C
onve
rted
to B
anan
a33
.44
14.2
1.49
23.3
433
.66
23.7
63
Pad
dy C
onve
rted
to B
uilt
up +
Mix
ed C
rops
4P
addy
Con
verte
d to
Bui
lt up
Lan
d27
.47
14.1
618
.54
37.3
118
5.36
151.
165
Pad
dy C
onve
rted
to C
lay
Min
ing
1.55
0.53
0.47
6P
addy
Con
verte
d to
Coc
onut
12.5
69.
9110
.35
9.22
189.
1010
3.32
7P
addy
Con
verte
d to
Coc
onut
+ B
uilt
up L
and
8P
addy
Con
verte
d to
Coc
onut
+ A
reca
nut
9P
addy
Con
verte
d to
Coc
onut
+ M
ixed
Tre
es10
Pad
dy C
onve
rted
to C
ultiv
able
Was
te L
and
4.23
2.39
3.15
5.46
8.34
0.68
11P
addy
Con
verte
d to
Mix
ed c
rop
13.7
14.
687.
1432
.38
29.1
311
.89
12P
addy
Con
verte
d to
Mix
ed T
rees
100.
826.
418.
4754
.05
54.6
268
.80
13P
addy
Con
verte
d to
Rub
ber
18.8
30.
9830
.96
139.
9871
.37
14V
iripp
u38
.34
108.
2811
8.33
125.
6989
.36
73.7
815
Viri
ppu
+ P
unch
a44
.42
29.2
416
Wat
er B
odie
s26
.00
26.0
159
.44
26.6
743
.72
6.93
17M
unda
kan
18O
ther
Lan
d U
ses
3816
.79
1662
.02
1470
.21
1280
0.74
2601
.12
1464
.69
Panc
haya
th T
otal
4092
.19
1850
.24
1698
.10
1314
6.15
3428
.69
2014
.34
Blo
ck T
otal
2622
9.71
PATH
AN
APU
RA
M B
LOC
K
-202
-

Tabl
e:18
.10
Are
a (H
a)Sl
.N
o.C
ateg
ory
Kun
nath
oor
Myn
aga
ppal
lyPo
ruva
zhi
Sast
ham
kotta
Soor
anad
u So
uth
Soor
anad
u N
orth
Wes
t K
alla
da
1P
addy
Con
verte
d to
Are
canu
t
2P
addy
Con
verte
d to
Ban
ana
1.15
18.6
326
.17
9.75
63.0
4
3P
addy
Con
verte
d to
Bui
lt up
+ M
ixed
Cro
ps10
2.98
3.23
3.29
153.
5576
.36
24.6
2
4P
addy
Con
verte
d to
Bui
lt up
Lan
d25
.72
29.0
13.
9823
.91
19.0
14.
900.
27
5P
addy
Con
verte
d to
Cla
y M
inin
g
6P
addy
Con
verte
d to
Coc
onut
128.
8818
.05
89.5
399
.96
130.
9472
.58
192.
46
7P
addy
Con
verte
d to
Coc
onut
+ B
uilt
up L
and
88.1
41.
70
8P
addy
Con
verte
d to
Coc
onut
+ A
reca
nut
21.5
868
.81
32.2
424
.27
43.4
2
9P
addy
Con
verte
d to
Coc
onut
+ M
ixed
Tre
es
10P
addy
Con
verte
d to
Cul
tivab
le W
aste
Lan
d29
.62
6.27
14.9
451
.85
149.
1534
.54
11P
addy
Con
verte
d to
Mix
ed c
rop
118.
3216
.00
55.8
265
.93
54.3
817
7.62
108.
79
12P
addy
Con
verte
d to
Mix
ed T
rees
121.
362.
6941
.01
27.8
044
.65
186.
5895
.44
13P
addy
Con
verte
d to
Rub
ber
14V
iripp
u16
.67
499.
0846
.95
25.1
025
.68
48.6
1
15V
iripp
u +
Pun
cha
28.3
718
7.29
7.45
75.2
216
0.29
153.
72
16W
ater
Bod
ies
70.3
321
.30
5.63
517.
412.
2814
0.63
17M
unda
kan
18O
ther
Lan
d U
ses
1483
.67
1372
.00
1450
.67
1626
.39
1124
.28
1369
.79
480.
80
Panc
haya
th T
otal
2147
.50
2046
.27
1891
.53
2501
.32
1737
.97
2282
.18
1337
.73
Blo
ck T
otal
SAST
HA
MK
OTT
A B
LOC
K
1394
4.50
-203
-

Tabl
e:18
.11
Are
a (H
a)
Sl.N
o.C
ateg
ory
Kul
akka
daM
elila
Myl
amPa
vith
resw
aram
Um
man
noor
Vetti
kava
la
1P
addy
Con
verte
d to
Are
canu
t10
.52
37.9
80.
1321
.35
23.5
330
.90
2P
addy
Con
verte
d to
Ban
ana
9.76
2.38
7.31
11.9
721
.72
3P
addy
Con
verte
d to
Bui
lt up
+ M
ixed
Cro
ps
4P
addy
Con
verte
d to
Bui
lt up
Lan
d69
.99
103.
5415
3.7
116.
2289
.22
150.
72
5P
addy
Con
verte
d to
Cla
y M
inin
g0.
521.
181.
73
6P
addy
Con
verte
d to
Coc
onut
194.
3332
1.06
270.
6157
.18
117.
0838
8.44
7P
addy
Con
verte
d to
Coc
onut
+ B
uilt
up L
and
8.05
8P
addy
Con
verte
d to
Coc
onut
+ A
reca
nut
9P
addy
Con
verte
d to
Coc
onut
+ M
ixed
Tre
es
10P
addy
Con
verte
d to
Cul
tivab
le W
aste
Lan
d41
.89
20.0
111
9.14
32.5
79.
30
11P
addy
Con
verte
d to
Mix
ed c
rop
168.
2127
7.14
105.
0816
7.60
129.
4225
6.87
12P
addy
Con
verte
d to
Mix
ed T
rees
51.1
266
.86
33.8
0
13P
addy
Con
verte
d to
Rub
ber
35.1
841
.57
14V
iripp
u18
4.32
5.88
4.46
112.
8674
.91
23.7
8
15V
iripp
u +
Pun
cha
28.1
55.
43
16W
ater
Bod
ies
68.1
76.
4815
.21
17M
unda
kan
4.16
18O
ther
Lan
d U
ses
2406
.34
1153
.21
1675
.92
1779
.71
2904
.24
2520
.64
Panc
haya
th T
otal
3154
.05
1901
.19
2288
.69
2434
.51
3494
.57
3477
.74
Blo
ck T
otal
VETT
IKA
VALA
BLO
CK
1675
0.75
-204
-

Tabl
e:18
.12
Are
a (H
a)
Sl.N
o.C
ateg
ory
Kar
unag
appa
lly
(M)
Par
avoo
r (M
)Pu
nalu
r (M
)K
olla
m
(C)
1P
addy
Con
verte
d to
Are
canu
t2.
13
2P
addy
Con
verte
d to
Ban
ana
16.5
11.
7919
.46
0.46
3P
addy
Con
verte
d to
Bui
lt up
+ M
ixed
Cro
ps39
.46
618.
43
4P
addy
Con
verte
d to
Bui
lt up
Lan
d69
.52
10.2
687
.77
29.4
6
5P
addy
Con
verte
d to
Cla
y M
inin
g
6P
addy
Con
verte
d to
Coc
onut
185
31.4
92.
6517
7.79
7P
addy
Con
verte
d to
Coc
onut
+ B
uilt
up L
and
227.
29
8P
addy
Con
verte
d to
Coc
onut
+ A
reca
nut
7.88
9P
addy
Con
verte
d to
Coc
onut
+ M
ixed
Tre
es
10P
addy
Con
verte
d to
Cul
tivab
le W
aste
Lan
d1.
0812
3.01
4.39
2.89
11P
addy
Con
verte
d to
Mix
ed c
rop
36.7
14.5
711
.76
72.8
2
12P
addy
Con
verte
d to
Mix
ed T
rees
1.05
19.7
923
.16
13P
addy
Con
verte
d to
Rub
ber
25.3
195
.58
14V
iripp
u11
1.58
34.2
964
.35
15V
iripp
u +
Pun
cha
8.98
93.0
4
16W
ater
Bod
ies
250.
5842
1.15
81.9
143
6.76
17M
unda
kan
18O
ther
Lan
d U
ses
934.
1412
19.0
332
57.1
141
84.8
7
Tota
l18
33.4
519
14.8
436
20.2
156
88.7
5
MU
NIC
IPA
LITY
/CO
RPO
RA
TIO
N
-205
-

-206
-

-207
-

-208
-

WASTELAND
Land is a critical natural resource Land is one of the most important critical resources which determine the
success of development planning of any region. Promoting optimum land use is an
essential purpose in achieving the planned goals of economic efficiency and
ecological activity. Identification of prime and unique lands for agriculture and
prevention of its misuse, assume utmost importance for food, security and self-
reliance. It is therefore imperative that for sustainable development, effort should be
made to ensure that the available land in the state is put to wise and optimum use.
Wasteland in Kerala
It is a not an exaggeration to say that wasteland exist in Kerala, where the per
capita availability of land is only 0.13 hectare and the average size of holding is 0.33
hectare. The studies by National Remote Sensing Agency (1985) using satellite
imageries has revealed that cultivable and uncultivable wasteland exists in Kerala,
and it amounts to 5.2 percent of the total geographical area. The State Land Use
Board made an attempt to estimate the extent of wasteland in the State utilizing the
primary data available from the Department of Economics and Statistics; the only
source on land utilization statistics in the State (Extent of Wasteland in Kerala State
Land Use Board, 1986). This study has shown that 8.15 percent of the geographical
area or 11.09 percent of the non-forest area of the State is categorized as wasteland.
Though the two figures are from two different methodologies and classifications, the
area involved is much significant in the small State like ours, where the density of
population and pressure on land are so high.
The National Wasteland Development Board has undertaken the mapping of
wasteland in India on 1:50,000 scale during 1987-88. They have identified six
districts having maximum area of wastelands, viz, Kasargod, Kannur, Wayanad,
Malappuram, Palakkad and Idukki under Wasteland mapping Project Phase II at
national level. Kerala State Land use Board undertook the task of identifying and
mapping and completed the project, Later the remaining eight districts, viz. Alapuzha,
Ernakulam, Kollam, Kottayam, Kozhikode, Pathanamthitta, Thiruvananthapuram and
Thrissur were taken up under the project, Wasteland Mapping Phase V. The study
revealed that there is a total area of 1457 sq.km (3.73 percent) under wasteland in
the State.
-209-

Presently under this project, the updation of the wastelands was done using
the LISS III satellite imagery of 2003. The data gathered by this task is presented for
the use of various departments/agencies in the State engaged in the programme of
reclamation of wastelands in the State.
Wasteland defined
Wasteland is defined as "degraded land which can be brought under
vegetative cover with reasonable effort and which is currently under utilized and land
which is deteriorating for lack of appropriate water and soil management or on
account of natural causes." Wastelands can result from inherent/imposed disabilities
such as by location, environment, chemical and physical properties of the soil or
financial or management constraints. These lands could fall under Government
occupation, private occupation or forest lands. 13 categories of wasteland have
been standardized and State and Central Government departments are using the
same.
Wasteland classification
The wasteland categories standardized by National Remote Sensing Centre,
Hyderabad for Kerala for this project is as follows:
1. Land with scrub
2. Land without scrub
3. Waterlogged –permanent
4. Waterlogged – seasonal
5. Under utilized/degraded notified forest land - scrub dominated
6. Degraded pastures/grazing land
7. Degraded land under plantation crop
8. Sands (riverine/coastal/desertic) - flood plain
9. Coastal sand
10. Mining/Industrial - Mining
11. Mining/Industrial – Industrial
12. Barren Rocky/Stony waste/Sheet rock
13. Steep slopping area
-210-

Brief description on spatial distribution and physical condition of wastelands in Kollam district
Area and percentage to total of major categories of wasteland in the district
are given below:-
Table: 19.1
Sl. No. Wasteland categories Area in Ha.
Percentage to total Geographical area
(Total area 248788 ha) 1 Barren rocky area 47.11 0.012 Land with dense scrub 824.51 0.333 Land with open scrub 2353.06 0.944 Scrub dominated forest 3645.00 1.465 Miscellaneous polygon 241617.9 97.11
1. Barren rocky area: - It covers an area of 47.11 ha. which comes to 0.01% of the
total geographical area of the district. It is mainly distributed in Elamadu
(18.24 ha.), Melila (9.4 ha.), Vettikavala (8.12 ha.) Panchayats.
2. Land with dense scrub: - Land with dense scrub identified and mapped
824.51 ha. area which covers 0.03% of the total geographical area of the district.
This is mainly distributed in Kulathoopuzha (303.39 ha.), Punalur (263.20 ha.),
Chadayamangalam (224.12 ha.) Panchayats.
3. Land with open scrub: - This is the third major category wasteland identified in
the district. It covers in an area of 2353.06 ha. which comes to 0.94% of the total
geographical area of the district. It is mainly identified in Kudakkal (224.12 ha.),
Chathannoor (198.55 ha.) and Eroor (99.42 ha.) Panchayats.
4. Scrub dominated forest: - This category of wasteland mapped an area of
3645 ha. area which covers 1.46% of the total geographical area. It is distributed
mainly in Pooyappally (2310.81 ha.), Kulathupuzha (492.16 ha.), Piravanthur
(324.08 ha.) Panchayats.
5. Miscellaneous Polygon: - This is the major category of wasteland mapped an
area of 241617.9 ha. covering 97.11% of the total geographical area. These are
seen in Kulathoopuzha (38979.53 ha.), Pathanapuram (12639.31ha.), Chithara
(5772.51ha.) Panchayats.
-211-

Tabl
e: 1
9.2
Are
a (H
a)Sl
.No.
Cat
egor
yA
laya
mon
Anc
hal
Ary
anka
vuEd
amul
acka
lEr
oor
Kar
aval
oor
Kul
atho
opuz
haTh
enm
ala
1B
arre
n ro
cky
area
6.
112
Coa
stal
san
ds3
Land
with
den
se s
crub
36.0
324
.12
122.
4155
.55
209.
0349
.15
303.
3925
7.01
4La
nd w
ith o
pen
scru
b4.
2929
.23
99.4
264
.43
48.8
45
Mis
cella
neou
s po
lygo
n55
39.4
626
75.8
421
050.
6435
95.5
039
40.4
225
66.4
538
979.
5312
487.
886
Scr
ub d
omin
ated
fore
st7.
7531
8.08
0.01
492.
1681
.14
Panc
haya
th T
otal
5583
.24
2704
.25
2152
0.36
3651
.05
4248
.88
2615
.60
3983
9.51
1288
0.98
Blo
ck T
otal
Tabl
e:19
.3
Are
a (H
a)
Sl.N
o.C
ateg
ory
East
Kal
lada
Kun
dara
Man
tro
thur
uthu
Pana
yam
Pera
yam
Perin
adu
Thrik
kada
voor
Thrik
karu
va
1B
arre
n ro
cky
area
2
Coa
stal
san
ds3
Land
with
den
se s
crub
4La
nd w
ith o
pen
scru
b5
Mis
cella
neou
s po
lygo
n13
03.1
913
14.5
113
15.2
094
3.59
1460
.40
1579
.88
1469
.54
1801
.27
6S
crub
dom
inat
ed fo
rest
Panc
haya
th T
otal
1303
.19
1314
.51
1315
.20
943.
5914
60.4
015
79.8
814
69.5
418
01.2
7B
lock
Tot
al
AN
CH
AL
BLO
CK
9304
3.87
CH
ITTU
MA
LA B
LOC
K
1118
7.58
-212
-
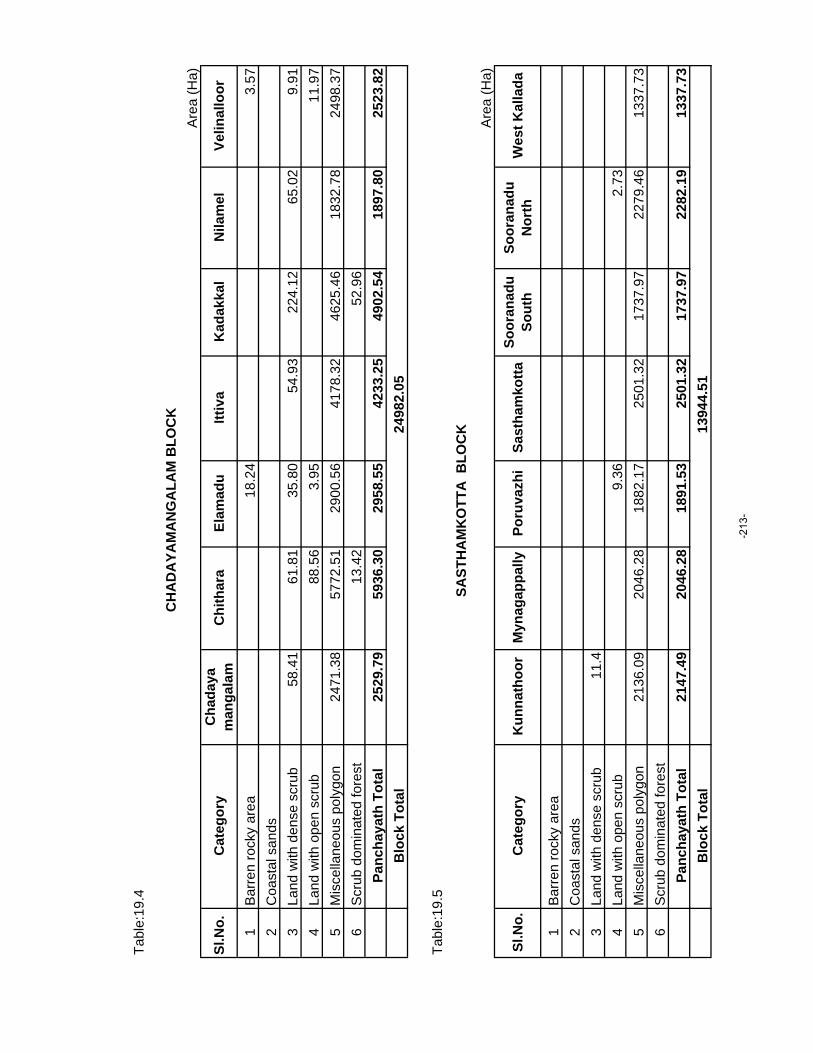
Tabl
e:19
.4
Are
a (H
a)
Sl.N
o.C
ateg
ory
Cha
daya
man
gala
mC
hith
ara
Elam
adu
Ittiv
aK
adak
kal
Nila
mel
Velin
allo
or
1B
arre
n ro
cky
area
18
.24
3.57
2C
oast
al s
ands
3La
nd w
ith d
ense
scr
ub58
.41
61.8
135
.80
54.9
322
4.12
65.0
29.
914
Land
with
ope
n sc
rub
88.5
63.
9511
.97
5M
isce
llane
ous
poly
gon
2471
.38
5772
.51
2900
.56
4178
.32
4625
.46
1832
.78
2498
.37
6S
crub
dom
inat
ed fo
rest
13.4
252
.96
Panc
haya
th T
otal
2529
.79
5936
.30
2958
.55
4233
.25
4902
.54
1897
.80
2523
.82
Blo
ck T
otal
Tabl
e:19
.5
Are
a (H
a)
Sl.N
o.C
ateg
ory
Kun
nath
oor
Myn
agap
pally
Poru
vazh
iSa
stha
mko
ttaSo
oran
adu
Sout
hSo
oran
adu
Nor
thW
est K
alla
da
1B
arre
n ro
cky
area
2
Coa
stal
san
ds3
Land
with
den
se s
crub
11.4
4La
nd w
ith o
pen
scru
b9.
362.
735
Mis
cella
neou
s po
lygo
n21
36.0
920
46.2
818
82.1
725
01.3
217
37.9
722
79.4
613
37.7
36
Scr
ub d
omin
ated
fore
stPa
ncha
yath
Tot
al21
47.4
920
46.2
818
91.5
325
01.3
217
37.9
722
82.1
913
37.7
3B
lock
Tot
al13
944.
51
CH
AD
AYA
MA
NG
ALA
M B
LOC
K
2498
2.05
SAST
HA
MK
OTT
A B
LOC
K
-213
-

Tabl
e:19
.6
Are
a (H
a)
Sl.N
o.C
ateg
ory
Ezhu
kone
Kar
eepr
aK
otta
rakk
ara
Ned
uvat
hoor
Pooy
appa
llyVe
liyam
1B
arre
n ro
cky
area
2
Coa
stal
san
ds3
Land
with
den
se s
crub
1.07
23.6
318
.68
4La
nd w
ith o
pen
scru
b14
.71
5M
isce
llane
ous
poly
gon
1782
.00
2272
.30
1828
.71
2237
.90
2310
.81
3050
.34
6S
crub
dom
inat
ed fo
rest
Panc
haya
th T
otal
1782
.00
2272
.30
1829
.78
2237
.90
2349
.15
3069
.02
Blo
ck T
otal
Tabl
e:19
.7
Are
a (H
a)
Sl.N
o.C
ateg
ory
Ala
ppad
Kla
pana
Kul
asek
hara
pura
mO
chira
Thaz
hava
Thod
iyoo
r
1B
arre
n ro
cky
area
2
Coa
stal
san
ds3
Land
with
den
se s
crub
4La
nd w
ith o
pen
scru
b5
Mis
cella
neou
s po
lygo
n88
8.81
1039
.38
1715
.50
1326
.52
2379
.47
2071
.48
6S
crub
dom
inat
ed fo
rest
Panc
haya
th T
otal
888.
8110
39.3
817
15.5
013
26.5
223
79.4
720
71.4
8B
lock
Tot
al94
21.1
6
KO
TTA
RA
KK
AR
A B
LOC
K
1354
0.15
OC
HIR
A B
LOC
K
-214
-

Tabl
e:19
.8
Are
a (H
a)
Sl.N
o.C
ateg
ory
Path
anap
uram
Pa
ttazh
iPa
ttazh
i Va
dakk
ekka
raPi
rava
ntho
orTh
alav
oor
Vila
kkud
y
1B
arre
n ro
cky
area
1.
672
Coa
stal
san
ds3
Land
with
den
se s
crub
39.3
111
.83
41.1
315
2.49
8.79
7.07
4La
nd w
ith o
pen
scru
b7.
8430
.27
5M
isce
llane
ous
poly
gon
4007
.62
1838
.43
1656
.99
1263
9.31
3419
.920
05.6
06
Scr
ub d
omin
ated
fore
st37
.43
324.
08Pa
ncha
yath
Tot
al40
92.2
018
50.2
616
98.1
213
146.
1534
28.6
920
14.3
4B
lock
Tot
al
Tabl
e:19
.9
Are
a (H
a)Sl
.No.
Cat
egor
yK
ulak
kada
Mel
ilaM
ylam
Pavi
thre
swar
amU
mm
anno
orVe
ttika
vala
1B
arre
n ro
cky
area
9.
408.
122
Coa
stal
san
ds3
Land
with
den
se s
crub
10.5
56.
4749
.63
77.0
54
Land
with
ope
n sc
rub
5M
isce
llane
ous
poly
gon
3154
.06
1881
.24
2282
.20
2434
.52
3444
.95
3392
.58
6S
crub
dom
inat
ed fo
rest
Panc
haya
th T
otal
3154
.06
1901
.19
2288
.67
2434
.52
3494
.58
3477
.75
Blo
ck T
otal
2622
9.76
1675
0.77
PATH
AN
APU
RA
M B
LOC
K
VETT
IKA
VALA
B
LOC
K
-215
-

Tabl
e: 1
9.10
Are
a (H
a)
Sl.N
o.C
ateg
ory
Cha
vara
Nee
ndak
ara
Panm
ana
Thek
kum
bhag
omTh
eval
akka
ra
1B
arre
n ro
cky
area
2
Coa
stal
san
ds3
Land
with
den
se s
crub
4La
nd w
ith o
pen
scru
b5
Mis
cella
neou
s po
lygo
n12
12.7
069
4.26
1676
.50
1391
.99
1687
.91
6S
crub
dom
inat
ed fo
rest
Panc
haya
th T
otal
1212
.70
694.
2616
76.5
013
91.9
916
87.9
1B
lock
Tot
al
Tabl
e:19
.11
Are
a (H
a)
Sl.N
o.C
ateg
ory
Elam
pallo
orK
otta
nkar
aM
ayya
nadu
Ned
umpa
naTh
rikko
vilv
atto
m
1B
arre
n ro
cky
area
2
Coa
stal
san
ds3
Land
with
den
se s
crub
4La
nd w
ith o
pen
scru
b24
.58
5M
isce
llane
ous
poly
gon
1217
.07
1265
.58
1987
.61
2481
.24
1885
.37
6S
crub
dom
inat
ed fo
rest
Panc
haya
th T
otal
1217
.07
1265
.58
1987
.61
2505
.82
1885
.37
Blo
ck T
otal
8861
.45
6663
.36
CH
AVA
RA
BLO
CK
MU
KH
ATH
ALA
BLO
CK
-216
-

Tabl
e:19
.12
Are
a (H
a)Sl
.No.
Cat
egor
yA
dich
anal
loor
Cha
than
noor
Kal
luva
thuk
kal
Poot
haku
lam
1B
arre
n ro
cky
area
2
Coa
stal
san
ds3
Land
with
den
se s
crub
3.68
5.83
54.5
64
Land
with
ope
n sc
rub
2.47
198.
5517
3.98
1.36
5M
isce
llane
ous
poly
gon
2358
.55
2723
.27
3577
.33
1699
.97
6S
crub
dom
inat
ed fo
rest
Panc
haya
th T
otal
2364
.70
2927
.65
3805
.87
1701
.33
Blo
ck T
otal
Tabl
e:19
.13
Are
a (H
a)
Sl.N
o.C
ateg
ory
Kar
unag
appa
lly
( M)
Para
voor
( M
)Pu
nalu
r ( M
)K
olla
m
( C)
1B
arre
n ro
cky
area
2
Coa
stal
san
ds0.
453
Land
with
den
se s
crub
263.
204
Land
with
ope
n sc
rub
7.97
5M
isce
llane
ous
poly
gon
1833
.46
1918
.64
3341
.17
5691
.61
6S
crub
dom
inat
ed fo
rest
7.89
Tot
al18
33.4
619
18.6
436
20.2
356
92.0
6
ITH
IKK
AR
A B
LOC
K
1079
9.55
MU
NIC
IPA
LITY
/CO
RPO
RA
TIO
N
-217
-

-218
-

-219
-

-220
-

WATERSHED
Watershed development and management is an integration of technology
within the natural boundary of a drainage area for optimum development of land,
water and plant resources to meet the basic minimum needs of the people in a
sustained manner. The poor in the rural areas who are struggling for survival cannot
be expected to pay heed to the conservation strategy unless their daily needs of
food, fiber and fuel are met with. A still more urgent need is for assured and full
employment for all. Integrated watershed development and management is not only
the most effective solutions to many of the problems mentioned above, but also
effective solution to many other common problems like drought, floods etc. It includes
the integration of many scattered programs of soil conservation, afforest ration, minor
irrigation, crop production, tree plantation, fodder development and other
development activities into a well prepared micro watershed project based on study
of climate, land, water &plant resources on the one hand and man, animal resources
on the other, offers hope for bringing about sustained natural resources
development.
It also provides solution to many environmental problems like soil erosion,
siltation, improper land use, lowering ground water table etc. Once these are solved
the overall productivity, income of the family and employment opportunity in the
villages could be increased and thereby the living conditions of the rural population
can be enhanced.
The rain water after absorbed by the soil, flows as runoff in small gullies,
rivulets and joins the stream and form river system. This represents a natural
drainage system. The river basin at macro level and watershed /sub watershed at
microlevel represent the Natural Drainage System.
A watershed is an area from which runoff, resulting from precipitation flows
past a single point into a large stream, river, lake or an ocean. In other words a
watershed is that area in which all the precipitation converges and drains past a
particular point. The term watershed, catchment area of drainage basin can be used
interchangeably. A watershed may be only a few hectares as in the case of small
ponds, or hundreds of square kilometers as in the case of rivers or big reservoirs.
For convenience watershed are classified in terms of size into: Basins, Catchments,
-221-

Sub catchments, Watershed, Sub watershed, Mini & Micro watersheds. Each
watershed is an independent hydrological unit; any modification of the land use in the
watershed will be reflected on the water as well as in the sediment yield of the
watershed.
The watershed can be demarcated from the topo sheet. But for a small
(micro) watershed a detailed topographical survey has to be made and a contour
map may have to be prepared. The ridge points are marked and the area below the
ridge line is known as the watershed area. This contour map can be imposed with
the village map. In case of small watershed, it could be demarcated by walking over
the ridge point.
Watershed has become an acceptable unit of planning for optimum use and
conservation of soil and water resources. A watershed is hydrological units which
produce water as an end product by interaction of rainfall and watershed factor.
-222-

Table:20.1
Block Panchayath WS code Area (Ha)Anchal Alayamon 6I10a 162.86
6I10b 510.306I10c 145.986I11a 1449.316I12a 511.636I12b 1122.276I12c 233.666I12d 511.316I12e 282.156I12f 211.016I14b 23.46
6I8c 5.496I9a 283.42
7K33c 6.977K35a 88.377K40c 35.05
5583.24Anchal 6I13a 0.38
6I7a 76.216I8a 896.086I8b 892.106I8c 223.456I9a 91.64
7K40b 14.627K40d 302.057K40e 207.73
2704.25Aryankavu 7K14e 1161.88
7K17a 672.347K17b 1156.557K17c 2616.827K17d 2978.357K17e 692.397K17f 118.167K18a 765.967K18b 37.579A24c 1.459A25a 0.969A25c 0.929A26h 0.44
WATERSHED DETAILS
-223-

Block Panchayath WS code Area (Ha)9A27a 24.809A28a 27.619A28b 1205.539A28c 2760.879A29a 1650.079A29b 1540.149A29c 828.939A30a 705.459A30b 1421.389A30c 830.709A31a 321.08
21520.36Edamulackal 6I15a 7.55
6I17a 0.086I6a 15.256I6b 1611.716I6c 522.416I7a 1106.706I8a 31.50
7K40e 163.767K43b 192.08
3651.05Eroor 6I10a 167.38
6I10b 879.866I10c 156.526I11a 17.196I8b 375.606I9a 16.14
7K16a 5.627K38b 17.027K38c 59.607K39a 751.737K40a 451.687K40b 155.457K40c 956.247K40d 238.85
4248.88Karavaloor 6I8a 12.32
6I8b 14.827K40a 301.617K40b 184.117K40d 212.877K40e 1125.96
-224-

Block Panchayath WS code Area (Ha)7K40f 440.647K41a 214.227K43b 109.06
2615.59Kulathooppuzha 6I12b 22.31
6I12c 922.887K16a 9.357K17a 1.217K17d 15.667K17f 135.297K18a 1342.887K18b 1279.407K18c 1686.057K18d 1707.807K18e 3053.887K18f 1974.447K18g 1194.667K18h 464.107K18i 871.17
7K19a 867.757K20a 505.627K20b 1567.327K20c 1485.637K21a 1753.437K22a 838.677K23a 1436.147K24a 420.227K24b 1678.427K24c 400.037K25a 576.057K26a 571.367K27a 1368.697K27b 1508.017K28a 543.177K29a 314.877K29b 24.097K29c 0.537K30a 6.817K32a 84.487K33a 45.277K33c 131.777K34a 545.717K35a 1443.20
-225-

Block Panchayath WS code Area (Ha)7K36a 795.877K36b 805.207K37a 623.857K37b 1037.377K38a 712.227K38b 2561.527K38c 292.417K39a 73.547K40c 139.21
39839.50Thenmala 7K14d 20.68
7K14e 1042.337K14f 955.057K14g 304.487K14h 3828.677K14i 1317.357K14j 1.12
7K15a 48.087K16a 3203.887K17a 1982.607K17f 11.157K37a 3.067K37b 12.717K38a 0.687K38c 0.327K39a 1.009A29b 147.82
12880.9993043.88
Chadayamangalam Chadayamangalam 6I15a 711.236I16a 500.736I17a 470.016I18a 361.286I18c 263.086I19a 5.166I5a 205.626I6a 0.066I7a 12.62
2529.79Chithara 4V11c 57.55
4V12b 1607.084V7d 1898.786I12c 2.05
-226-

Block Panchayath WS code Area (Ha)6I12d 3.086I12e 1560.426I12f 41.546I14b 565.66
7K33c 200.125936.28
Elamadu 6I17a 3.256I2i 1115.836I2j 15.89
6I5a 706.406I6a 1114.336I6c 2.806I7a 0.04
2958.54Ittiva 6I10a 1.24
6I10c 2.726I11a 57.396I12a 17.296I12b 20.556I12f 179.316I13a 850.276I14a 883.966I14b 533.816I14c 906.176I15a 730.176I16a 1.286I7a 20.376I8a 0.476I8c 1.516I9a 26.73
4233.25Kadakkal 4V7c 180.49
4V7d 209.766I14b 1282.966I14c 24.226I15a 205.426I16a 827.086I18b 395.11
3125.04Kummil 4V7c 366.19
4V7d 1322.116I14b 88.246I18b 0.96
-227-

Block Panchayath WS code Area (Ha)1777.50
Nilamel 4V6a 19.264V7c 23.826I16a 272.506I18a 315.996I18b 900.146I18c 365.396I19a 0.69
1897.80Velinalloor 6I19a 5.76
6I20a 32.436I21a 2.616I22a 0.44
6I2i 317.286I2j 19.48
6I3a 405.496I4a 1226.046I5a 437.346I6a 76.94
2523.8124982.02
Chavara Chavara 7K1a 1202.118P14a 1.308P1a 9.28
1212.70Neendakara 7K1a 171.09
7K2a 21.077K51a 502.10
694.26Panmana 7K1a 240.66
8P14a 1308.198P1a 98.308P4a 1.82
999 27.531676.50
Thekkumbhagam 7K1a 363.347K2a 861.00
7K49a 136.287K51a 31.36
1391.99Thevalakkara 7K1a 886.26
7K3b 3.217K49a 0.79
-228-

Block Panchayath WS code Area (Ha)8P14a 797.65
1687.916663.36
Chittumala East Kallada 7K48a 903.487K49a 399.687K4a 0.03
1303.19Kundara 7K48a 716.70
7K49a 597.127K49b 0.68
1314.51Mantrothuruthu 7K1a 101.43
7K3b 98.747K49a 1115.03
1315.20Panayam 7K49a 709.41
7K49b 234.18943.59
Perayam 7K49a 1460.401460.40
Perinadu 7K49a 1029.987K49b 549.897K50b 0.01
1579.88Thrikkadavoor 7K49a 497.86
7K49b 684.287K50a 53.397K50c 164.137K51a 69.89
1469.54Thrikkaruva 7K49a 1782.58
7K49b 18.691801.27
11187.57Ithikkara Adichanalloor 6I1b 704.98
6I22a 26.946I24a 154.896I2a 292.316I2j 5.25
6I2k 500.596I3a 669.88
7K50b 9.862364.70
Chathannoor 6I22a 882.33
-229-

Block Panchayath WS code Area (Ha)6I23a 441.346I23b 8.596I3a 1.65
1333.91Chirakkara 5A1a 0.01
5A2a 41.036I1b 0.02
6I22a 24.296I23a 255.406I23b 876.166I23c 315.606I24a 81.24
1593.74Kalluvathukkal 5A2a 29.41
5A3b 540.145a3c 366.735a4b 129.66
6I20a 169.636I21a 1667.686I22a 558.326I23b 344.246I3a 0.06
3805.87Poothakulam 5A1a 582.05
5A2a 1014.695A3b 2.565A5a 18.365A6a 39.326I23b 0.886I23c 43.47
1701.3310799.55
Karunagapally Municipality 8P14a 27.808P1a 1.808P2a 889.558P3a 480.138P4a 242.85
999 191.321833.461833.46
Kollam Corporation 6I1a 1146.687K49a 57.107K49b 287.94
-230-

Block Panchayath WS code Area (Ha)7K50a 834.497K50c 1404.147K51a 1961.72
5692.075692.07
Kottarakkara Ezhukone 6I2b 3.966I2d 259.526I2e 356.286I2h 16.97
7K47b 102.427K48a 1042.84
1782.00Kareepra 6I2b 80.95
6I2c 18.136I2d 1029.876I2e 484.806I2f 651.526I2g 3.076I2j 3.95
2272.30Kottarakkara 6I2e 63.01
6I2g 48.406I2h 1054.30
7K45a 77.327K45b 586.75
1829.78Neduvathoor 6I2e 110.67
6I2h 476.167K45b 185.067K46a 10.237K47a 138.467K47b 1253.397K47c 63.93
2237.90Pooyappally 6I22a 21.08
6I2c 2.296I2f 2.066I2j 641.90
6I2k 150.026I3a 1531.726I4a 0.10
2349.16Veliyam 6I2e 211.57
-231-

Block Panchayath WS code Area (Ha)6I2f 268.106I2g 502.626I2h 0.066I2i 1049.226I2j 1037.45
3069.0213540.15
Mukhathala Elampalloor 6I2b 607.267K48a 3.697K49a 26.067K49b 7.187K50b 572.88
1217.07Kottankara 6I2b 245.22
7K49b 11.247K50a 328.147K50b 680.97
1265.58Mayyanadu 6I1a 1500.91
6I1b 92.116I24a 78.37
7K50b 43.937K50c 272.29
1987.61Nedumpana 6I2a 621.01
6I2b 646.546I2c 916.786I2d 75.396I2k 236.10
7K50b 10.022505.82
Thrikovilvattom 6I1b 36.946I2a 52.476I2b 0.07
7K50a 169.887K50b 1320.107K50c 305.91
1885.378861.45
Paravoor Municipality 5A1a 530.696I1a 10.09
6I23a 0.136I23c 129.176I24a 1098.71
-232-

Block Panchayath WS code Area (Ha)6I25a 149.84
1918.641918.64
Ochira Alappad 8P1a 229.028P2a 42.14
999 215.859A1a 269.42
9A47a 132.38888.81
Klapana 8P2a 144.248P3a 7.93
999 6.759A47a 880.47
1039.38Kulasekharapuram 8P2a 871.50
8P3a 558.348P4a 271.79
999 13.871715.50
Ochira 8P3a 454.188P4a 153.83
9A46b 368.469A46c 136.009A47a 214.05
1326.52Thazhava 8P12a 1.73
8P4a 454.988P5a 548.228P6a 667.148P6c 324.478P7a 381.088P7c 0.40
9A46b 1.462379.47
Thodiyoor 8P12a 21.168P13a 3.028P14a 37.308P4a 717.028P5a 1174.168P6a 117.848P7a 0.98
2071.489421.17
-233-

Block Panchayath WS code Area (Ha)Pathanapuram Pathanapuram 7K10a 89.50
7K10c 124.117K10e 1.147K10f 668.057K10g 957.407K11a 443.867k12a 1022.817K12b 378.317K12c 99.917k13a 0.277K42a 10.677K43a 4.677K43c 3.807K44a 3.979A34b 283.74
4092.19Pattazhi 7K11a 0.00
7K43a 0.737K43c 57.607K44a 1695.037K45a 92.50
7k8a 0.897K9a 3.52
1850.26Pattazhi Vadakkekkara 7K10a 97.26
7K10g 41.167K44a 19.47
7k8a 8.867K9a 1531.37
1698.12Piravanthoor 7K11a 0.16
7k12a 39.787K12b 1154.957K12c 874.987k13a 1442.007K14a 1068.237K14b 1615.047K14c 493.947K14d 1234.167K14e 614.997K14f 74.697K14g 0.647K14i 39.63
-234-

Block Panchayath WS code Area (Ha)7K14j 171.68
7K15a 0.177K41a 12.627K42a 8.999A23a 3.809A24a 0.549A24c 0.889A30c 20.169A31a 976.069A32a 2229.449A33a 455.459A34a 441.329A34b 171.469A34c 0.39
13146.16Thalavoor 7K11a 3.07
7k13a 18.597K42a 408.487K43a 530.427K43c 1850.737K44a 149.337K45a 287.947K45b 180.14
3428.69Vilakkudy 7k13a 7.45
7K41a 299.647K42a 231.007K43a 1102.227K43b 109.037K43c 264.437K45b 0.58
2014.3426229.77
Punalur Municipality 7k13a 0.107K14a 7.247K14i 11.797K14j 284.88
7K15a 1438.397K16a 52.197K39a 433.277K40a 413.947K40f 6.477K41a 845.687K42a 23.24
-235-

Block Panchayath WS code Area (Ha)7K43a 103.03
3620.233620.23
Sasthamkotta Kunnathoor 7K46a 42.257K47a 8.797K4a 367.517K5a 1697.937K6a 30.28
8P11a 0.732147.49
Mynagapally 7K1a 46.448P13a 135.268P14a 1854.538P5a 10.04
2046.28Poruvazhi 7K4a 214.48
8P11a 1321.128P12a 86.648P13a 268.63
8P8c 0.008P9a 0.67
1891.54Sasthamkotta 7K1a 114.46
7K3a 418.277K3b 288.94
7K47a 3.467K47c 2.147K48a 26.447K4a 757.307K5a 56.43
8P13a 718.268P14a 115.61
2501.32Sooranadu South 8P12a 415.11
8P13a 1292.528P14a 17.188P5a 13.038P6a 0.008P7a 0.12
1737.97Sooranadu North 8P11a 4.23
8P12a 1636.038P13a 12.98
-236-

Block Panchayath WS code Area (Ha)8P7a 30.778P7b 31.558P7c 522.798P8a 43.838P8c 0.00
2282.18West Kallada 7K1a 506.09
7K3b 757.367K48a 40.117K49a 30.437K4a 1.76
8P14a 1.981337.73
13944.50Vettikavala Kulakkada 7K45a 17.06
7K45b 211.667K45c 833.597K46a 2036.247K47a 20.437K47b 2.677K5a 16.507K6c 0.737K7a 5.007k8a 10.18
3154.06Melila 6I2h 0.01
7K43a 180.807K43b 447.577K43c 67.537K45a 149.497K45b 1055.78
1901.18Mylam 7K43c 0.83
7K44a 39.287K45a 1449.727K45b 549.747K45c 240.20
7k8a 8.902288.68
Pavithreswaram 0.007K46a 337.857K47a 393.097K47b 316.80
-237-

Block Panchayath WS code Area (Ha)7K47c 754.957K48a 631.83
2434.52Ummannoor 6I2g 51.47
6I2h 745.326I2i 1405.41
6I6a 700.146I6b 572.516I6c 3.99
7K43b 15.743494.58
Vettikkavala 6I2h 836.516I2i 0.66
6I6b 53.997K40e 13.077K41a 3.717K43a 32.627K43b 1949.957K45b 587.23
3477.7416750.76
248488.55
-238-

-239
-

-240
-
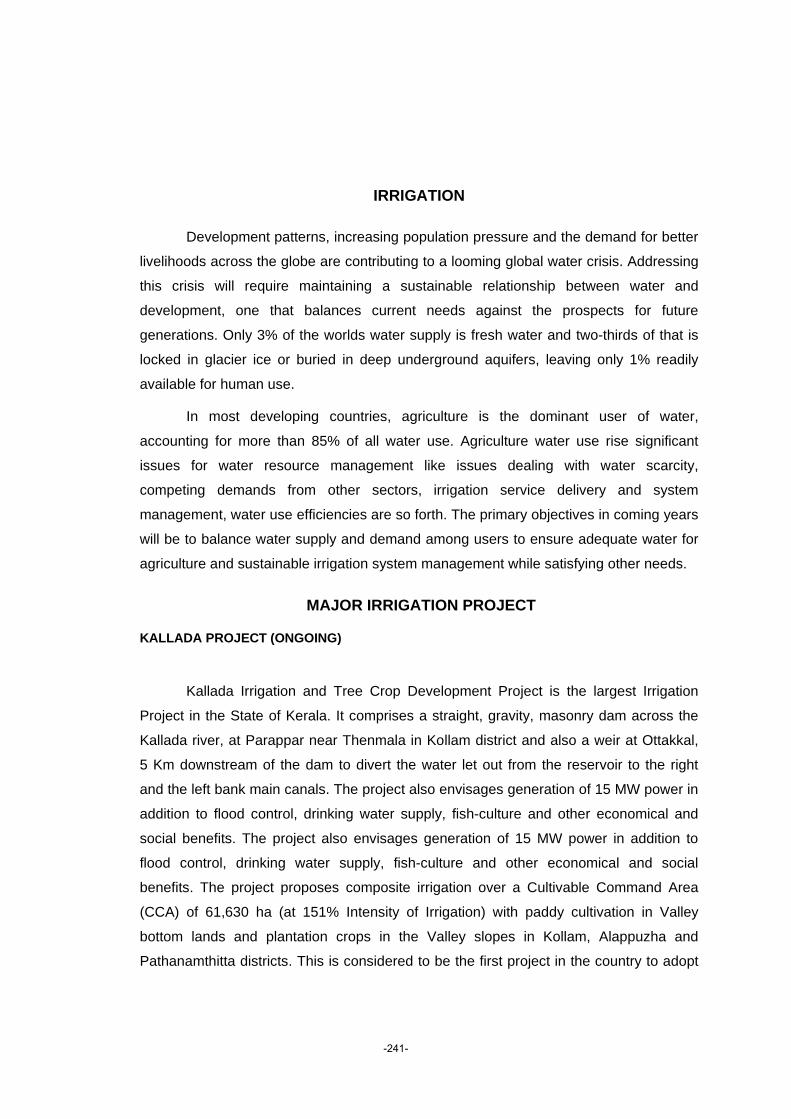
IRRIGATION
Development patterns, increasing population pressure and the demand for better
livelihoods across the globe are contributing to a looming global water crisis. Addressing
this crisis will require maintaining a sustainable relationship between water and
development, one that balances current needs against the prospects for future
generations. Only 3% of the worlds water supply is fresh water and two-thirds of that is
locked in glacier ice or buried in deep underground aquifers, leaving only 1% readily
available for human use.
In most developing countries, agriculture is the dominant user of water,
accounting for more than 85% of all water use. Agriculture water use rise significant
issues for water resource management like issues dealing with water scarcity,
competing demands from other sectors, irrigation service delivery and system
management, water use efficiencies are so forth. The primary objectives in coming years
will be to balance water supply and demand among users to ensure adequate water for
agriculture and sustainable irrigation system management while satisfying other needs.
MAJOR IRRIGATION PROJECT
KALLADA PROJECT (ONGOING)
Kallada Irrigation and Tree Crop Development Project is the largest Irrigation
Project in the State of Kerala. It comprises a straight, gravity, masonry dam across the
Kallada river, at Parappar near Thenmala in Kollam district and also a weir at Ottakkal,
5 Km downstream of the dam to divert the water let out from the reservoir to the right
and the left bank main canals. The project also envisages generation of 15 MW power in
addition to flood control, drinking water supply, fish-culture and other economical and
social benefits. The project also envisages generation of 15 MW power in addition to
flood control, drinking water supply, fish-culture and other economical and social
benefits. The project proposes composite irrigation over a Cultivable Command Area
(CCA) of 61,630 ha (at 151% Intensity of Irrigation) with paddy cultivation in Valley
bottom lands and plantation crops in the Valley slopes in Kollam, Alappuzha and
Pathanamthitta districts. This is considered to be the first project in the country to adopt
-241-

micro-distribution system at the block level through PVC pipes to increase water
management efficiency.
PHYSICAL PROGRESS The construction of the main dam at Parappar has been completed. The
construction of weir at Ottakkal and construction of saddle dam at Pallamvetty are
completed. The construction of an ungated labyrinth type auxiliary spillway is nearly
completed. The work of most of the branches, distributaries and minors are nearing
completion. The details of works that remain to be completed and are ongoing/ being
taken up are given in the section on ‘Physical Progress’. The irrigation potential created
by the project up to 3/2000 is 35602 ha. net, gross is 53602 ha.
MINOR CONVEYANCE SYSTEM
In irrigation projects, water is usually conveyed upto the boundary of farmer’s plot
through field channels/field bothies. Kallada Irrigation Project is the first project in India,
to adopt Minor Conveyance System of irrigation in the ayacut. The main principle of this
system is to irrigate maximum area with minimum water loss. In this system, the
distribution of water is effected through a network of buried PVC pipes from a spout in
the main or branch canal upto the hydrant in the farmer’s plot and then through hoses.
The main advantages are:
i) Loss of precious irrigation water through field channels/bothies by percolation or
seepage is prevented completely.
ii) As water distribution is effected through underground pipe system, valuable
agriculture land is not wasted thereby increasing the effective area of cultivation.
iii) Construction of very expensive field channels and field bothies is avoided.
iv) Irrigation water is given to each and every tree crop thereby ensuring correct and
optimum use of water.
DETAILS OF MINOR CONVEYANCE SYSTEM WORK
Minor Conveyance (MCS) of Irrigation works under gravity. A minimum slope of
3% is necessary for effecting working of the system. The system consists of the
following parts:-
-242-

a) Spout: A spout is constructed in the bank of the main canal/branch canal/distributory
from where water is let in the system. It consists of an inlet chamber control valve
leading channel, measuring device and an outlet channel. These are covered at top with
covering slab and locking arrangements. The water from the canal is let in the inlet
chamber through pipe of required diameter with a control valve. The inlet end of the pipe
is protected with G.I mesh to prevent entry of floating materials. The water thus entered
in the inlet chamber flows to the outlet chamber through a leading channel. This is fixed
with a ‘V-Notch’ to measure discharge into the outlet chamber. The supply of water to
the ayacut will be through pipes of lesser diameter as per the design. The inlet ends of
the pipes are covered with welded mesh to prevent entry of debris.
b) Pipeline System:
The pipelines are so aligned to form a network of pipes so as to command the
entire ayacut by gravity flow. The pipes and specials used under this system are of PVC
type varying in dia from 200 mm to 90 mm depending on the water requirement at each
delivery points. For releasing pressure created in the pipeline, necessary pressure
release arrangements (rises) should be provided at suitable points.
c) Delivery Points:
There are two types of delivery points in the system. These are described below:
Hydrants: This is a pipe connection taken from the end of the buried pipe above
ground level using G.I pipe of 100 mm with two 50 mm wheel valve outlets. These are
encased in a concrete shell called hydrant having a dia of 60 cm and height of 1.2m with
cover and locking arrangement to regulate the opening of valves. Two 50 mm dia G.I
pipe outlets from the 50 mm wheel valves protrude outside the shell above ground level,
so as to connect delivery hoses having a length of 45 m long. The hydrants are located
at about 90 m apart. The discharge of water from each outlet is 2.5 litres/sec making the
total discharge from one hydrant as 5 litres/sec. These hydrants are located at places in
the ayacut where there is sufficient pressure head of water to command the area with
two hoses 45 m long each. For the efficient functioning of the system, the pressure head
should not be less than 1.2 m.
-243-

BASIC INFORMATION
District : Kollam Ayacut Area in ha (Potential) : 61630 (Net) 92800 (Gross) (Achievement) : 35602 (Net) 53608 (Gross) Classification Major Benefited District : Kollam, Pathanamthitta, Alleppey Year of Starting : 1961 Year of Commission (Partial) Ist stage : 1986 2nd stage : 1992 SALIENT FEATURES
Location State : Kerala District : Kollam River : Kallada Latitude : 80 57’ N Longitude : 770 4’ 20”E Route : 65 kms from Kollam (By NH 208) 72 kms from Thiruvananthapuram (By SH 2) Hydrology Annual rainfall : 305 cms Catchment area of the reservoir : 549 sq. km Name of the dam : Kallada (Parappar) Construction started : 1972 Partially commissioned : 24.05.1986 Type of dam : Masonry straight gravity with spillway Length of dam : 335 m Length of overflow section : 42 m Length of non-overflow section : 293 m Maximum height above Deepest Foundation: 7.62 m Top Width of Dam : 85.35 m Top of Dam (Roadway) : +118.87
-244-

Top Level of Parapet : +119.87 Full Reservoir Level : +115.82m Maximum Water Level : +116.77 m Low Water Level : +70.25 m Tail Water Level : +69.65 m Gross Storage at FRL : 524 Mm3 Gross Storage at MWL : 536 Mm3 Live Storage at FRL : 507 Mm3 Dead Storage Capacity : 17.0 Mm3 Water Spread at Full Reservoir Level : 23.sq.km SPILLWAY Type : Gated Ogee Type Type of Crest Gates and Size : Radial 12.19mX9.14 m Number of Crest Gates : 3 nos. Crest Level : +106.68 m Head over Crest : 9.14 m Design Discharge : 2830 Cumecs Capacity of Low Level Outlets : 3.75 m diameter conduit with sill Level +70.25 m discharge capacity 60 Cumecs AUXILIARY SPILLWAY WITHOUT CONTROL GATE Location : On right flank of masonry dam Length : 56 m Crest Level : +116.73 cm Design Discharge : 698 m3/sec Type : Labyrinth weir Gates : No gates- free flow SADDLE DAM Length : 225.70m Maximum height : 12.51 Pick-up weir
River sluice : 1 no (2.44 m x1.83 m size) Length of weir : 120.69 m
Crest Level : +63.09 m Deepest bed level : +57.50 m
-245-

Width of roadway over weir : 4.27 m No: of span : 7 Maximum upstream flood level : +68.45 m Maximum downstream flood level : +65.84 m CANAL SYSTEM Right Bank Main Canal Length : 69 km Width at starting : 4.65 m Capacity : 39.08 m3/sec Cultivable command area : 39530 ha.
Left Bank Main Canal Length : 56 km Width at starting : 4.00 m Capacity : 22.00 m3/sec Cultivable command area : 22100 ha
-246-

Tabl
e:21
.1
Dug
wel
lS
hallo
w
Tube
wel
lD
eep
Tube
wel
lTo
tal
(4+5
+6)
S. F
low
S
chem
eS
. Lift
S
chem
eTo
tal (
8+9)
12
34
56
78
910
1112
1A
ncha
l8
780
10
781
755
8086
18
2A
ncha
lam
oodu
219
22
019
40
00
194
23
Cha
daya
man
gala
m8
910
00
910
720
7298
28
4C
hava
ra5
235
00
235
00
023
55
5C
hittu
mal
a6
676
20
678
221
2370
16
6Ith
ikka
ra6
645
40
649
282
3067
96
7K
arun
agap
pally
430
31
030
436
036
340
48
Kol
lam
Cor
pora
tion
115
50
015
50
00
155
19
Kot
tara
kkar
a6
643
00
643
760
7671
96
10M
ukha
thal
a4
324
40
328
290
2935
74
11O
chira
430
96
031
53
03
318
412
Par
avoo
r1
119
00
119
100
1012
91
13P
atha
napu
ram
696
00
096
085
186
1046
614
Pun
alur
110
50
010
522
123
128
115
Sas
tham
kotta
664
21
064
326
834
677
616
Vet
tikka
vala
661
16
061
781
081
698
6D
istr
ict T
otal
7476
0927
076
3656
518
583
8219
74
MIN
OR
IRR
IGA
TIO
N C
ENSU
S (2
006-
07)
Gro
und
Wat
erN
o. o
f V
illag
e S
ched
ules
Gra
nd T
otal
(7
+10)
Surf
ace
Wat
er
Tota
l Num
ber o
f Sch
emes
No.
of
Vill
ages
Sl.N
o.N
ame
of B
lock
/Mun
./Cor
.
MIN
OR
IRR
IGA
TIO
N S
CH
EMES
AT
A G
LAN
CE
-247
-

Tabl
e:21
.2
12
34
56
78
910
1112
1314
1A
ncha
l78
016
416
41
00
00
078
116
416
42
Anc
hala
moo
du19
273
732
11
00
019
474
743
Cha
daya
man
gala
m91
028
828
70
00
00
091
028
828
74
Cha
vara
235
6767
00
00
00
235
6767
5C
hittu
mal
a67
612
012
02
2525
00
067
814
514
56
Ithik
kara
645
8080
41
10
00
649
8181
7K
arun
agap
pally
303
9090
10
00
00
304
9191
8K
olla
m C
orpo
ratio
n15
512
1912
180
00
00
015
512
1912
189
Kot
tara
kkar
a64
315
215
10
00
00
064
315
215
110
Muk
hath
ala
324
8484
410
010
00
00
328
184
184
11O
chira
309
100
966
22
00
031
510
298
12P
arav
oor
119
2727
00
00
00
119
2727
13P
atha
napu
ram
960
299
299
00
00
00
960
299
299
14P
unal
ur10
524
240
00
00
010
524
2415
Sas
tham
kotta
642
100
991
00
00
064
310
099
16V
ettik
kava
la61
113
313
26
11
00
061
713
513
3D
istr
ict T
otal
7609
3020
3011
2713
013
00
00
7636
3152
3142
NU
MB
ER O
F G
RO
UN
D W
ATE
R S
CH
EMES
AN
D IR
RIG
ATI
ON
PO
TEN
TIA
L C
REA
TED
AN
D P
OTE
NTI
AL
UTI
LISE
D
Dug
wel
lSh
allo
w T
ubew
ell
Dee
p Tu
bew
ell
Tota
l Gro
und
Wat
er
Nam
e of
B
lock
/Mun
./Cor
.S
l.No.
No.
Pot
entia
l C
reat
edP
oten
tial
Util
ised
Pot
entia
l U
tilis
edP
oten
tial
Cre
ated
Pot
entia
l U
tilis
edN
o.P
oten
tial
Cre
ated
No.
Pot
entia
l C
reat
edP
oten
tial
Util
ised
No.
-248
-

Tabl
e:21
.3
12
34
56
78
910
111
Anc
hal
7563
138
65
4949
8068
043
62
Anc
hala
moo
du0
00
00
00
00
3C
hada
yam
anga
lam
7233
430
10
00
7233
430
14
Cha
vara
00
00
00
00
05
Chi
ttum
ala
2224
124
11
135
135
2337
637
66
Ithik
kara
2822
922
92
8787
3031
631
67
Kar
unag
appa
lly36
300
610
00
3630
061
8K
olla
m C
orpo
ratio
n0
00
00
00
00
9K
otta
rakk
ara
7611
4783
70
00
7611
4783
710
Muk
hath
ala
2919
919
80
00
2919
919
811
Och
ira3
2020
00
03
2020
12P
arav
oor
1066
660
00
1066
6613
Pat
hana
pura
m85
1885
1793
115
915
986
2044
1952
14P
unal
ur22
364
161
131
3123
395
192
15S
asth
amko
tta26
508
432
833
333
334
841
765
16V
ettik
kava
la81
999
849
00
081
999
849
Dis
tric
t Tot
al56
569
2355
7418
794
794
583
7717
6369
Pot
entia
l C
reat
edP
oten
tial
Util
ised
Sl.N
o.N
ame
of
Blo
ck/M
un./C
or.
Surf
ace
Flow
Sch
emes
Surf
ace
Lift
Sche
mes
Tota
l Sur
face
Wat
er
No.
Pot
entia
l C
reat
edP
oten
tial
Util
ised
NU
MB
ER O
F SU
RFA
CE
WA
TER
SC
HEM
ES A
ND
IRR
IGA
TIO
N P
OTE
NTI
AL
CR
EATE
D A
ND
PO
TEN
TIA
L U
TILI
SED
No.
Pot
entia
l C
reat
edP
oten
tial
Util
ised
No.
-249
-

Tabl
e:21
.4
12
34
56
78
910
1112
1314
1516
1A
ncha
l50
86
10
265
178
15
00
00
05
2A
ncha
lam
oodu
166
00
028
019
43
Cha
daya
man
gala
m60
82
10
299
091
04
Cha
vara
231
40
00
023
55
Chi
ttum
ala
422
30
025
21
678
10
00
00
16
Ithik
kara
454
00
019
50
649
10
00
01
27
Kar
unag
appa
lly24
80
00
560
304
8K
olla
m C
orpo
ratio
n47
91
00
163
064
39
Kot
tara
kkar
a23
61
00
910
328
10M
ukha
thal
a28
53
00
270
315
11O
chira
686
390
023
50
960
10
00
00
112
Par
avoo
r42
90
00
212
264
38
00
00
08
13P
atha
napu
ram
574
20
041
061
714
Pun
alur
147
00
07
115
515
Sas
tham
kotta
992
00
180
119
16V
ettik
kava
la83
00
022
010
51
00
00
01
Dis
tric
t Tot
al56
5563
20
1911
576
3617
00
00
018
Ele
ctric
P
ump
Die
sel
Pum
pW
ind
Mill
sS
olar
P
umps
Sol
ar
Pum
psM
anua
l/A
nnua
lM
anua
l/A
nnua
lO
ther
sTo
tal
(3-8
)E
lect
ric
Pum
pO
ther
sTo
tal
(10-
15)
MIN
OR
IRR
IGA
TIO
N S
CH
EMES
AC
CO
RD
ING
TO
SO
UR
CE
OF
ENER
GY
Sl.
No.
Nam
e of
Blo
ck/M
un./C
or.
Gro
und
Wat
er S
chem
esSu
rfac
e W
ater
Sch
emes
(Sur
face
Lift
Sch
eme
Onl
y)
Die
sel
Pum
pW
ind
Mill
s
-250
-

Tabl
e:21
.5
12
34
56
78
910
11
1A
ncha
l78
116
416
480
680
436
861
844
599
2A
ncha
lam
oodu
194
7474
00
019
474
743
Cha
daya
man
gala
m91
028
828
772
334
301
982
622
589
4C
hava
ra23
567
670
00
235
6767
5C
hittu
mal
a67
814
514
523
376
376
701
521
521
6Ith
ikka
ra64
981
8130
316
316
679
397
397
7K
arun
agap
pally
304
9191
3630
061
340
391
152
8K
olla
m C
orpo
ratio
n15
512
1912
180
00
155
1219
1218
9K
otta
rakk
ara
643
152
151
7611
4783
771
912
9998
810
Muk
hath
ala
328
184
184
2919
919
835
738
338
211
Och
ira31
510
298
320
2031
812
311
812
Par
avoo
r11
927
2710
6666
129
9393
13P
atha
napu
ram
960
299
299
8620
4419
5210
4623
4322
5114
Pun
alur
105
2424
2339
519
212
841
921
615
Sas
tham
kotta
643
100
9934
841
765
677
941
864
16V
ettik
kava
la61
713
513
381
999
849
698
1134
982
Dis
tric
t Tot
al76
3631
5231
4258
377
1763
6982
1910
870
9511
Tota
l
No.
Pot
entia
l C
reat
edP
oten
tial
Util
ised
No.
Pot
entia
l U
tilis
edP
oten
tial
Cre
ated
Pot
entia
l U
tilis
edN
o.P
oten
tial
Cre
ated
NU
MB
ER O
F M
INO
R IR
RIG
ATI
ON
SC
HEM
ES A
ND
IRR
IGA
TIO
N P
OTE
NTI
AL
CR
EATE
D A
ND
PO
TEN
TIA
L U
TILI
SED
Sl.N
o.N
ame
of
Blo
ck/M
un./C
or.
Gro
und
Wat
er S
chem
esSu
rfac
e W
ater
Sch
emes
-251
-

Tabl
e:21
.6
12
34
56
78
910
1112
1314
1516
1718
1920
1A
ncha
l0
780
780
01
10
00
075
750
55
086
186
1
2A
ncha
lam
oodu
019
219
20
22
00
00
00
00
00
194
194
3C
hada
yam
anga
lam
091
091
00
00
00
00
7272
00
00
982
982
4C
hava
ra6
229
235
00
00
00
00
00
00
622
923
5
5C
hittu
mal
a0
676
676
02
20
00
022
220
11
070
170
1
6Ith
ikka
ra0
645
645
04
40
00
028
280
22
067
967
9
7K
arun
agap
pally
030
330
30
11
00
00
3636
00
00
340
340
8K
otta
rakk
ara
064
364
30
00
00
00
7676
00
00
719
719
9M
ukha
thal
a20
304
324
04
40
00
029
290
00
2033
735
7
10O
chira
030
930
90
66
00
00
33
00
00
318
318
11P
atha
napu
ram
096
096
00
00
00
00
8585
01
10
1046
1046
12S
asth
amko
tta0
642
642
01
10
00
026
260
88
067
767
7
13V
ettik
kava
la0
611
611
06
60
00
081
810
00
069
869
8
14K
olla
m C
orpo
ratio
n0
155
155
00
00
00
00
00
00
015
515
5
15P
arav
oor
011
911
90
00
00
00
1010
00
00
129
129
16P
unal
ur0
105
105
00
00
00
022
220
11
012
812
8
Dis
tric
t Tot
al26
7583
7609
027
270
00
056
556
50
1818
2681
9382
19
Sl.
No.
Non
Tr
ibal
Trib
alTr
ibal
Non
Tr
ibal
Tota
lTr
ibal
Non
Tr
ibal
Tota
lTr
ibal
MIN
OR
IRR
IGA
TIO
N S
CH
EMES
IN T
RIB
AL
& N
ON
TR
IBA
L VI
LLA
GES
Dug
wel
lSh
allo
w
Tube
wel
lD
eep
Tube
wel
lSu
rfac
e Fl
ow
Sche
mes
Surf
ace
Lift
Sche
mes
Tota
l Min
or Ir
rigat
ion
Sche
mes
Nam
e of
Blo
ck/
Mun
./Cor
.Tr
ibal
Non
Tr
ibal
Tota
lTo
tal
Non
Tr
ibal
Tota
lN
on
Trib
alTo
tal
Trib
al
-252
-

Tabl
e:21
.7
Kharif
Rabi
Perennial
Others
Total (3 to 7)
Kharif
Rabi
Perennial
Others
Total (8 to 11)
Kharif
Rabi
Perennial
Others
Total (13 to 16)
12
34
56
78
910
1112
1314
1516
17
1A
ncha
l35
4756
2616
488
119
128
101
436
123
166
184
126
599
2A
ncha
lam
oodu
1616
2516
730
00
00
1616
2516
733
Cha
daya
man
gala
m40
3514
864
287
111
104
581
301
151
139
153
146
589
4C
hava
ra12
738
1067
00
00
012
738
1067
5C
hittu
mal
a26
4062
1714
523
280
2539
376
258
120
8756
521
6Ith
ikka
ra20
2722
1281
140
131
936
316
160
159
3148
398
7K
arun
agap
pally
1233
388
9120
1910
1261
3252
4820
152
8K
otta
rakk
ara
49
106
3315
228
528
317
496
838
289
291
279
129
988
9M
ukha
thal
a33
3875
3918
585
740
3919
811
811
275
7838
310
Och
ira8
1743
3098
55
55
2013
2249
3511
911
Pat
hana
pura
m37
3716
561
300
964
964
023
1951
1001
1001
165
8422
5112
Sas
tham
kotta
3029
2614
9922
337
713
629
765
253
406
162
4386
413
Vet
tikka
vala
68
6652
132
255
258
159
178
850
261
266
225
230
982
14K
olla
m C
orpo
ratio
n29
930
431
630
012
190
00
00
299
304
316
300
1219
15P
arav
oor
49
104
2729
250
1266
3334
1016
9316
Pun
alur
22
137
2493
930
719
395
9513
1421
7D
istr
ict T
otal
584
658
1209
693
3144
2530
2532
651
658
6371
3114
3190
1860
1351
9515
Sou
rce:
Irrig
atio
n D
epar
tmen
t
Nam
e of
Blo
ck/
Mun
./Cor
.
SEA
SON
WIS
E A
REA
IRR
IGA
TED
BY
MIN
OR
IRR
IGA
TIO
N S
CH
EMES
Are
a irr
igat
ed b
y G
roun
d w
ater
sc
hem
esA
rea
irrig
ated
by
Surf
ace
wat
er
sche
mes
Are
a irr
igat
ed b
y To
tal m
inor
irr
igat
ion
sche
mes
Sl.
No.
-253
-

Tabl
e: 2
1.8
D
ISTR
IBU
TIO
N O
F D
ISTR
ICT
WIS
E H
OLD
ING
S R
ECEI
VIN
G IR
RIG
ATI
ON
BY
DIF
FER
ENT
SOU
RC
ES 2
005-
06
D
istr
ict
Can
al
Tank
W
ell
Tube
wel
ls
Oth
er s
ourc
es
Tota
l
Kol
lam
N
o %
N
o %
N
o %
N
o %
N
o %
N
o %
1203
0.
7321
511.
8217
5693
9.23
814
0.37
4355
86.
0822
3419
7.16
Tabl
e: 2
1.9
4th
MIN
OR
IRR
IGA
TIO
N C
ENSU
S 20
06-0
7
Dis
tric
t G
roun
d W
ater
Su
rfac
e W
ater
To
tal
Sche
mes
Cul
tivab
le
Are
a (In
Ha)
N
et A
rea
Sow
n (In
Ha)
Net
Are
a Irr
igat
ed (I
n H
a)
Kol
lam
D
ug w
ell
Shal
low
wel
l D
eep
tube
wel
lSu
rfac
e flo
w
Surf
ace
lift
7609
27
056
518
8219
1441
6110
5471
3830
1 Ta
ble:
21.
10
R
EPO
RT
OF
MIN
OR
IRR
IGA
TIO
N S
CH
EMES
201
0-11
Sl.
No.
Nam
e of
Dep
artm
ent/
Org
anis
atio
n
No
of s
chem
es
com
plet
ed
Expe
nditu
re
incu
rred
in 0
00’s
Po
tent
ial c
reat
ed (I
n H
a)
Pote
ntia
l util
ized
(In
Ha)
GW
SW
G
W
SW
GW
SW
G
W
SW
1 Irr
igat
ion
718
375
1237
2398
20
345
1920
341
15.8
92
Dis
trict
Pan
chay
ath
LSG
D
11
500
844
1521
1521
3 G
roun
d W
ater
Dep
artm
ent
567
0
613
061
30
4 Ag
ricul
ture
Dep
artm
ent
820
969
7282
4028
40
437
234
937
25
Inst
itutio
nal F
inan
ce
3490
732
0812
5049
317
2039
22
882.
6434
373.
8121
591.
532
494.
31
Tota
l 36
302
4361
1265
787
5493
09
2411
7.64
3928
622
771.
537
003.
2So
urce
: Inf
rast
ruct
ure
Stat
istic
s of
Ker
ala
2011
-254
-

POWER
Power Sector in Kerala plays a vital role in all developmental activities in Kerala.
Obviously power crisis is the prime obstacle to start new initiatives in the industrial field.
The need for power is increasing and the production of power should also be increased
accordingly. Monsoon is essential tom sustain the hydropower base in the State and the
shortage in rainfall usually creates power crisis. Kerala received abundant monsoon
during the current year and increased the inflow in to KSEB reservoirs; the KSEB could
manage the power supply situation with higher quantum of cheaper hydel power. Kerala
is one among the very few states in the country where there was no load shedding and
power out during 2010-11. KSEB has been responsible for the generation, transmission
and supply of electricity in the State, with particular emphasis to provide electricity at
affordable cost to the domestic as well as for agricultural purposes. The Board has been
passing through a transitional phase of reforms in the electricity sector. The Electricity
Act 2003 envisages separate organizations for Transmission and Distribution. Hydel and
Thermal Projects, which form the backbone of the power sector of Kerala State, cater to
needs of the various industries, which are augmented by the supply from National grids.
High rainfall and terrain conditions have endowed the State with a vast potential of
hydro-electricity, which is about 6% of India’s total hydroelectric potential. The Small
Hydro Power (SHP) units have spurted the momentum of development of wind, solar
and biomass energy systems, paving the way for integrated renewable energy systems
in all potential development blocks/taluks.
Kerala’s power sector projections
In the past, the energy demand was presumed to be basis with load factor being
used to convert the projected energy demand to peak MW demand. The projected
energy demand was worked out by a combination of end use and time series analysis.
This was the methodology used in the Electric Power Surveys (EPS) conducted by CEA
in conjunction with the State Electricity Boards.
One of the problems with the above approach has been consistent over
projection of peak demand. The annual growth of peak power demand has been
assumed to be the order of 7-8% and this has resulted in projections well beyond actual
demand realized.
-255-

Some of these anomalies have been corrected in the current Electric Power
Surveys conducted and the projections for Kerala as continued in the 17th Survey. The
figures for Kerala in terms of demand projection in the Draft 17th EPS are given below.
Table: 22.1
17th EPS ESTIMATES FOR 11th PLAN PERIOD
Year Energy Consumption Peak Demanded Annual Load Factor (%)
2006-07 11147 2699 60.752007-08 12037 2823 61.542008-09 12973 2947 62.342009-10 13977 3078 63.142010-11 15112 3227 63.942011-12 16345 3391 64.74
It is evident from the 17th EPS Draft Report that a number of assumptions made
for projections which may result in the actual demand being more than what is projected
in the EPS or less. KSEB’s own projections taking into account a higher growth rate and
a slightly lower load factor projects the following demands for the 11th plan period.
Table: 22.2
Year Energy Consumption Peak Demand Annual Load Factor (%)
2007-08 15217 2856 60.822008-09 16096 3004 61.172009-10 17025 3159 61.522010-11 18077 3335 61.87
2011-12 19230 3528 62.22 Source: EPA Draft Report
-256-

Table: 22.3
PLAN-WISE ACHIEVEMENTS
Sl. No. Particulars
11th Plan
1st Year 2nd Year 3rd Year 4th Year
2007-08 2008-09 2009-10 2010-11
1 Installed Capacity (MW) 13.68 68.1 7 116.6
2 220 KV line (km) 1.01 0 18.26 0
3 110 KV line (km) 56.38 17.5 48.30 34.22
4 66 KV line (km) 11.13 0 0 0
5 33 KV line (km) 105.44 169.57 199.22 63.6
6 11 KV line (km) 1816.45 3048.00 3398.27 36659
7 LT Lines (km) 8158.18 7563.00 7837.95 6761
8 Step up transformer capacity (MVA) 0 39.8 1.6 235.11
9 No. of EHT substations including upgradation 6 2 11 6
10 No. of 33 KV substations 13 16 18 7
11 Step down transformer capacity (MVA) 469 385 1095 934
12 Distribution transformer a. Nos. 2553 4109 5790 5804
b. Capacity (MVA) 265.17 514.67 770.99 611.22
13 Consumer Nos. 482766 442895 380015 384470
14 Connected Load (MW) 912 2889.44 599.11 815.3
15 Street light installed (No) 49448 37641 61532 54768
16 Pump set connected (No) 15553 11231 10715 12467
-257-

Table: 22.4
ANNUAL GENERATION FROM RENEWABLE ENERGY SOURCES (Small hydel up to 25 mw, wind, etc)
Sl. No. Stations
Installed capacity
(mw)
GENERATION (MU)
2006-07 2007-08 2008-09 2009-10 2010-11
HYDEL (KSEB)
1 Kallada 15 76.16 73.03 46.34 60.42 72.092 Peppara 3 7.48 8.18 5.52 6.05 9.753 Mattupetty 2 5.68 6.91 5.74 1.91 2.284 Peringalkuthu LBE 16 107.81 59.94 109.62 108.82 120.675 Malampuzha 2.5 2.06 0 0 0 06 Lower Meenmutty 3.5 5.62 4.92 4.11 3.43 7.197 Urumi 6.15 14.52 13.77 11.79 11.58 15.948 Chembukkadavu 6.45 12.17 9.28 10.03 8.46 13.549 Malankara 10.5 32.22 43.7 33.49 32.46 36.93
10 Neriamangalam Extention 25 - - 47.41 92.6 95.48
11 Kuttiyadi Tailrace 3.75 - - 5.76 4.62 4.34 HYDEL(CPP) 1 Maniyar 12 43.02 38.52 25.3 33.79 41.242 Kuthungal 21 37.52 62.88 38.42 34.25 47.05 HYDEL(IPP) 1 Ullungal 7 - - 3.12 19.82 24.292 Iruttukkanam 3 - - - - 5.96 WIND (KSEB) 1 Kanjikode 2.02 2.14 1.96 1.68 1.84 1.51 WIND (IPP) 1 Ramakkalmedu 14.25 - - 21.72 32.54 29.382 Agali 13.8 - - 10.28 35.07 33.66 Cogeneration (IPP)
1 MPS Steel Casting 10 - 10.26 49.02 34.07
Total 346.4 323.09 390.59 536.68 595.37
-258-

Table: 22.5
ALL INDIA GENERATING INSTALLED ELECTRICITY GENERATION CAPACITY AS ON 31-03-11
Name of State/U.Ts Hydro Coal Diesel Gas
1 2 3 4 5
Northern Region 13822.75 24232.5 12.99 4134.76
Western Region 7447.5 30995.5 17.48 7903.81
Southern Region 11299.03 19882.5 939.32 4690.78
Eastern Region 3882.12 18747.88 17.2 190
North Eastern Region 1116 60 142.74 787
Islands 0 0 70.02 0
Total (All India) 37567.4 93918.38 1199.75 17706.35
Name of State/U.Ts Nuclear RES Total
1 6 7 8
Northern Region 1620 3165.55 46988.55
Western Region 1840 5357.96 53562.25
Southern Region 1320 9341.67 47473.3
Eastern Region 0 359.64 23196.84
North Eastern Region 0 223.6 2329.34
Islands 0 6.1 76.12
Total (All India) 4780 18454.52 173626.4Source: Kerala State Electricity Board
-259-

-260-

MISCELLANEOUS
WATER TRANSPORT
Kerala is a land with abundant water bodies. Backwater is a wonderful gift
of nature to the God’s Own Country. Ashtamudy and Vembanadu lake which
completes the network of waterways not only provides natural beauty but inland
navigation facilities also. State Water Transport Department is the main agency
who provides inland water transport facilities to the people residing in the water
logged areas and to enjoy the everlasting memory of backwaters. This inland
Water Transport system consists of 1895 kms of waterways. This includes
navigable river, backwaters and manmade cross canals. Most of these are in
Travancore-Cochin region. Of the 44 rivers in Kerala, the 41 west flowing rivers
together with back waters and manmade canals form the integral part of inland
navigation system.
State Water Transport Department formed during 1968 with the objectives
to provide Transport facilities to the people residing in the water logged areas at
cheaper rates and Cargo transportation. Construction of roads, bridges and
speedy transportation-roadways shortened the operation of the department to
passenger transport only-in the backwaters and ferries. But in the world of speed
and hurry the advantage of this pollution free, accident free and cheaper
transport system beckons least preference.
-261-

Backwaters
(1) Vembanattu lake - 52 sq.kms.
(2) Ashtamudy lake - 200 sq.kms.
(3) Ernakulam - Vypeen ferry (Cochin port & Harbour)
(4) Muhamma - Kumarakom
(5) Vaikom - Thavanakkadavu
(6) Payyannur - Parassinikkadavu
Total distance operated - 79,00 km per day
No. of passengers carried - 80,000 per day
No. of operating centers - 14 stations
Station Offices
Kottayam District - Kottayam, Changanassery & Vaikom
Capacity of boats - 50 passenger to 150 passengers (wooden boats) Boats are constructed in the traditional way with well seasoned teak wood.
Speed of boat - 10 to 15km per hour
Size of boats length - 20 mtr to 35 mtrs width - 3 to 4.5 meters depth - 2mtrs weight - 5 to 15 tonns.
No. of crew for a boat - 5 persons at a time
Source: Water Transport Department
-262-

IND
UST
RIE
S
Tabl
e: 2
3.1
BLO
CK
WIS
E IN
DU
STR
IAL
DEV
ELO
PMEN
T PL
OTS
& M
INI I
ND
UST
RIA
L ES
TATE
S
Sl
. N
o.
Nam
e of
Blo
cks/
M
unic
ipal
ities
No.
of
Indu
strie
s fu
nctio
ning
Dev
elop
men
t plo
ts
Min
i ind
ustr
ial e
stat
es
Tota
l No.
of
Plot
s Ex
tend
of
land
(A
cres
)
No.
of
plot
s al
lotte
d
No.
of
indu
stry
fu
nctio
ning
Exte
nd o
f la
nd
(Acr
es)
No.
of
plot
s al
lotte
d
No.
of
indu
stry
fu
nctio
ning
1 2
3 4
5 6
7 8
9 10
1 K
olla
m
Cor
pora
tion
5020
.667
5350
-
--
53
2 C
hava
ra
8
1.05
108
10
3 Th
eval
akka
ra
9
1.20
109
10
4 Sa
stha
mko
tta
9
1.06
109
10
5 Pe
rinad
u 9
1
109
10
6 Ka
reep
ra
9
110
910
To
tal
9420
.667
5350
5.
3150
4410
3
-263
-

Tabl
e: 2
3.2
B
LOC
K W
ISE
KH
AD
I & H
AN
DLO
OM
UN
IT
Sl.
No.
Nam
e of
Blo
ck/
Mun
icip
aliti
es/
Cor
pora
tions
Kha
di
Han
dloo
m
Empl
oym
ent
Khad
i Ind
ustry
W
orki
ng
Khad
i So
ciet
ies
Co-
oper
ativ
e Se
ctor
(No.
of
Uni
ts)
Co-
oper
ativ
e Se
ctor
(No.
of
Wor
kers
) Te
xtile
Indu
stry
1 2
3 4
5 6
7 8
1 O
achi
ra
7Sc
rew
pin
e 3
37
22
Cha
vara
93
Mas
ala,
Kha
di
2 2
933
Vetti
kkav
ala
6
Khad
i, M
atch
2
26
34
Cha
daya
man
gala
m
1El
ectro
nics
1
11
45
Sast
ham
kotta
1
Gar
men
ts
1 1
11
6 Pa
than
apur
am
2C
ane
& Ba
mbo
o 1
12
17
Chi
ttum
ala
0
Khad
i 1
10
18
Anch
al
19
Muk
hath
ala
3
10
Ithik
kara
8
11
Chi
ttum
ala
12
Ko
ttara
kkar
a
713
Pa
ravu
r Mun
.
1
14
Karu
naga
ppal
ly M
un.
2El
ectro
nics
1
12
15
Kol
lam
Cor
. 25
Mat
ch,
Cas
hew
,Gar
men
ts
6 6
252
Bloc
k To
tal (
Rur
al)
110
11
1111
031
Mun
i/Cor
p. T
otal
27
7 7
271/
2
Dis
tric
t Tot
al
137
18
1813
734
So
urce
: Pan
chay
at S
tatis
tics
(Kol
lam
)
-264
-

Table: 23.3 NEWLY REGISTERED VEHICLES FOR THE YEAR 2010-11
Sl.No. Classification of Vehicles Number
1 Multiaxied Articulated Vehicles 22 Trucks and Lorries 3003 Four Wheelers 18784 Three Wheelers 607 Total 2787
5 Stage Carriage 936 Contract Carriage 2237 Private Service Vehicles 718 Other Buses 174 Total 561
9 Motor Cabs 69610 Maxi Cabs/Taxi 011 Other Taxis 116 Total 812
12 LMV 3 Seater 327013 LMV 4 to 6 Seater 014 Motor Cycle Hire 0 Total 3270 Other TVs 99 Total Transport 7529
15 Scooters 016 Mopads 017 Motor Cycles including above & below 95cc 41188 Total 41188
18 Cars 1761219 Jeeps 020 Omni Buses 121 Tractors 3322 Trailors 123 Others 789 Total 18436 Total Non Transport 59624 Grand Total 67153
Source: Economic Review 2011
-265-

Table: 23.4
CATEGORY-WISE LENGTH OF ROADS MAINTAINED BY PWD (R&B) AS ON 31-03-2011
(In Kms)
District & State State High ways
Major district Roads
Other district Roads
Village Roads Total
Kollam 180.36 1471.94 0 0 1652.30
Kerala 4341.65 18900.05 0 0 23241.70
Table: 23.5
NUMBER OF MOTOR VEHICLE HAVING VALID REGISTRATION AS ON 2011
Goods and Vehicles Four Wheelers and above 19610
Three Wheelers including tempos 7500
Buses Stage carriages 1310
Contract Carriages/Omni Buses 7507
Four Wheelers Cars 89810
Taxis 8745
Jeeps 4879
Three Wheelers Autorickshaws 38304
Motorized Cycle Rickshaws 12
Two Wheelers Motorized Cycles 1004
Scooter/Motor Cycles 275715
Tractors/Trailors
Tractors/Trailors 511
Tillers 234
Trailors 335
Others 2484
Grand Total 457960
Source: Infrastructure Statistics of Kerala
-266-

Sl. No. Institutions Location No. of
Beds Health Block
1 CHC Nedumpana 75 CHC Kalakkodu2 CHC Nedumancavu 16 CHC Nedumancavu3 CHC Pathanapuram 12 CHC Pathanapuram4 CHC Kalakode 24 CHC Kalakode5 CHC Kulathupuzha 12 CHC Kulathupuzha6 CHC Thekkumbhagom 18 CHC Thekkumbhagom7 CHC Anchal 30 CHC Anchal8 CHC Thrikkadavur 16 CHC Thrikkadavur9 CHC Sooranadu 16 CHC Sooranadu10 CHC Mynagappally 24 CHC Mynagappally11 CHC Kulakkada 24 CHC Kulakkada12 CHC Ochira 12 CHC Ochira13 CHC Chavara 46 CHC Chavara14 CHC Nilamel 12 CHC Nilamel15 CHC Velinalloor 24 CHC Velinalloor16 CHC Palathara 12 CHC Palathara17 CHC Mayyanadu 70 CHC Mayyanadu18 24X7 PHC Parippally 24 CHC Kalakkodu19 24X7 PHC Thazhava 24 CHC Mynagappally20 24X7 PHC Perumon 24 CHC Kundara21 24X7 PHC Munroe Island 0 CHC Kundara22 24X7 PHC Madathara 18 CHC Nilamel23 24X7 PHC Chadayamangalam 24 CHC Velinalloor24 PHC Veliyam 0 CHC Nedumancavu25 PHC Pooyappally 0 CHC Nedumancavu26 PHC Neduvathur 0 CHC Nedumancavu27 PHC Ezhukone 0 CHC Nedumancavu28 PHC Ezhukone Pavithreswaram 0 CHC Nedumancavu29 PHC Piravanthur 0 CHC Pathanapuram30 PHC Vilakudy 0 CHC Pathanapuram31 PHC Thalavur 0 CHC Pathanapuram32 PHC Pattazhy Vadakkekara 0 CHC Pathanapuram33 PHC Pattazhy 0 CHC Pathanapuram34 PHC Mancode Pathanapuram 0 CHC Pathanapuram35 PHC Chathanoor 0 CHC Kalakkodu36 PHC Adichanalloor 0 CHC Kalakkodu37 PHC Paravoor Pozhikkara 0 CHC Kalakkodu38 PHC Achenkovil 0 CHC Kulathupuzha39 PHC Aryancavu 0 CHC Kulathupuzha40 PHC Thenmala 0 CHC Kulathupuzha
STANDARDISED LIST OF INSTITUTIONS IN KOLLAM DISTRICT
Table:23.6
HEALTH
-267-

Sl. No. Institutions Location No. of
Beds Health Block
41 PHC Thevalakkara 0 CHC Thekkumbhagom42 PHC Alayamon 0 CHC Anchal43 PHC Edamulakkal 0 CHC Anchal44 PHC Karavaloor 0 CHC Anchal45 PHC Eroor 0 CHC Anchal46 PHC Thrikaruva 0 CHC Thrikkadavur47 PHC Kilikalloor 0 CHC Thrikkadavur48 PHC Sakthikulangara 0 CHC Thrikkadavur49 PHC Poruvazhy 0 CHC Sooranadu50 PHC Kunnathoor 0 CHC Sooranadu51 PHC Sooranadu South 0 CHC Sooranadu52 PHC West Kallada 0 CHC Sooranadu53 PHC Alappadu 0 CHC Mynagappally54 PHC Azheekal 0 CHC Mynagappally55 PHC Thodiyoor 0 CHC Mynagappally56 PHC East Kallada 0 CHC Kundara57 PHC Perayam 0 CHC Kundara58 PHC Melila 0 CHC Kulakkada59 PHC Mylam 0 CHC Kulakkada60 PHC Thalachira 0 CHC Kulakkada61 PHC S.N.Puram 0 CHC Kulakkada62 PHC Ummannoor 0 CHC Kulakkada63 PHC K.S.Puram 0 CHC Ochira64 PHC Vallikavu 0 CHC Ochira65 PHC Chavara 0 CHC Chavara66 PHC Mancode Chithara 0 CHC Nilamel67 PHC Elamadu 0 CHC Velinalloor68 PHC Ittiva 0 CHC Velinalloor69 PHC Eravipuram 0 CHC Palathara70 PHC Kottamkara 0 CHC Palathara71 PHC Thrikkovilvattom 0 CHC Palathara
Source: DHS
-268-

-269-

-270-

-271
-

-272
-