Exercise No. 1 Preparation of Saturated Paste and saturation ...
Upload
independentCategory
view
1download
0
Tog
AHa
b
c
a
ARRA
KVBGTH
I
tztc52pplg
h1
International Journal of Hygiene and Environmental Health 217 (2014) 861–870
Contents lists available at ScienceDirect
International Journal of Hygiene andEnvironmental Health
jo u r n al homepage: www.elsev ier .com/ locate / i jheh
ransport and removal of viruses in saturated sand columns underxic and anoxic conditions – Potential implications forroundwater protection
nne Frohnerta, Susann Apeltb, Sondra Klitzkeb, Ingrid Chorusc, Regine Szewzyka,ans-Christoph Selinkaa,∗
Federal Environment Agency, Section Microbiological Risks, Corrensplatz 1, 14195 Berlin, GermanyFederal Environment Agency, Section Drinking Water Resources and Treatment, Schichauweg 58, 12307 Berlin, GermanyFederal Environment Agency, Department of Drinking Water and Swimming Pool Hygiene, Schichauweg 58, 12307 Berlin, Germany
r t i c l e i n f o
rticle history:eceived 24 February 2014eceived in revised form 13 June 2014ccepted 14 June 2014
eywords:irusesacteriophagesroundwaterransportealth risk
a b s t r a c t
To protect groundwater as a drinking water resource from microbiological contamination, protectionzones are installed. While travelling through these zones, concentrations of potential pathogens shoulddecline to levels that pose no risks to human health. Removal of viruses during subsurface passage isinfluenced by physicochemical conditions, such as oxygen concentration, which also affects virus survival.The aim of our study was to evaluate the effect of redox conditions on the removal of viruses during sandfiltration. Experiments in glass columns filled with medium-grained sand were conducted to investigatevirus removal in the presence and absence of dissolved oxygen. Bacteriophages MS2 and PhiX174, assurrogates for human enteric viruses were spiked in pulsed or in continuous mode and pumped throughthe columns at a filter velocity of about 1 m/d. Virus breakthrough curves were analyzed by calculatingtotal viral elimination and fitted using one-dimensional transport models (CXTFIT and HYDRUS-1D).While short-term experiments with pulsed virus application showed only small differences with regard
to virus removal under oxic and anoxic conditions, a long-term experiment with continuous dosingrevealed a clearly lower elimination of viruses under anoxic conditions. These findings suggest that lessinactivation and less adsorption of viruses in anoxic environments affect their removal. Therefore, in riskassessment studies aimed to secure drinking water resources from viral contamination and optimizationof protection zones, the oxic and anoxic conditions in the subsurface should also be considered.© 2014 Elsevier GmbH. All rights reserved.
ntroduction
Groundwater is a major resource for drinking water. To pro-ect it against contamination with microbial pathogens protectionones for groundwater wells are installed. In Germany, accordingo generally accepted rules of technology, these protection zonesomprise an area with a minimum groundwater travel time of0 days to protect water utilities from pathogens (DVGW W 101,006). Besides bacteria and protozoa, pathogenic viruses can beresent in water resources and may cause diseases, even when
resent at very low concentrations. Furthermore, viruses may beess efficiently eliminated during soil passage than other microor-anisms, due to their small sizes and long survival. Hence, travel
∗ Corresponding author. Tel.: +49 30 8903 1303.E-mail address: [email protected] (H.-C. Selinka).
ttp://dx.doi.org/10.1016/j.ijheh.2014.06.004438-4639/© 2014 Elsevier GmbH. All rights reserved.
times of 50 days, originally based on data for the removal of bacte-ria, may not be sufficient for virus removal.
To gain information about the behaviour of human virusesin the environment or technical processes like disinfection, bac-teriophages are commonly applied as surrogate nonpathogenicviruses. In studies examining the transport of virus particles inwater and soil passages, the RNA bacteriophage MS2 and the DNAbacteriophage PhiX174 are often used because their sizes and struc-tures resemble that of human enteric viruses, the major source ofviral contamination in fecally polluted water. Using these modelviruses, field studies revealed that virus removal was reduced inanoxic aquifers or zones of aquifers compared to oxic parts/aquifers(Schijven et al., 2000; van der Wielen et al., 2008). In addition, it
was shown that virus removal was non-linear with distance andmuch higher in the first parts of the subsurface passages (Schijvenet al., 2000). These observations were attributed to the presenceof minerals such as ferric oxyhydroxides which have the capacity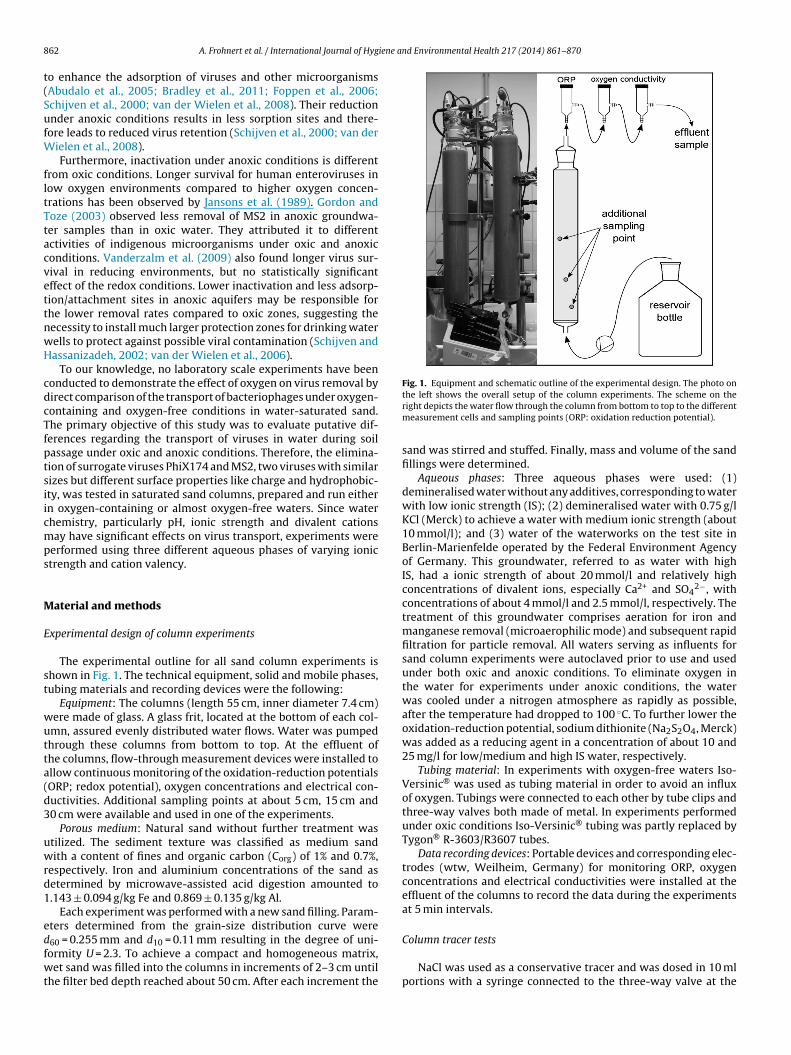
8 iene and Environmental Health 217 (2014) 861–870
t(SufW
fltTtacvettnwH
cdcTfptsiicmps
M
E
st
wutta(d3
uwrd1
edfwt
Fig. 1. Equipment and schematic outline of the experimental design. The photo on
62 A. Frohnert et al. / International Journal of Hyg
o enhance the adsorption of viruses and other microorganismsAbudalo et al., 2005; Bradley et al., 2011; Foppen et al., 2006;chijven et al., 2000; van der Wielen et al., 2008). Their reductionnder anoxic conditions results in less sorption sites and there-ore leads to reduced virus retention (Schijven et al., 2000; van der
ielen et al., 2008).Furthermore, inactivation under anoxic conditions is different
rom oxic conditions. Longer survival for human enteroviruses inow oxygen environments compared to higher oxygen concen-rations has been observed by Jansons et al. (1989). Gordon andoze (2003) observed less removal of MS2 in anoxic groundwa-er samples than in oxic water. They attributed it to differentctivities of indigenous microorganisms under oxic and anoxiconditions. Vanderzalm et al. (2009) also found longer virus sur-ival in reducing environments, but no statistically significantffect of the redox conditions. Lower inactivation and less adsorp-ion/attachment sites in anoxic aquifers may be responsible forhe lower removal rates compared to oxic zones, suggesting theecessity to install much larger protection zones for drinking waterells to protect against possible viral contamination (Schijven andassanizadeh, 2002; van der Wielen et al., 2006).
To our knowledge, no laboratory scale experiments have beenonducted to demonstrate the effect of oxygen on virus removal byirect comparison of the transport of bacteriophages under oxygen-ontaining and oxygen-free conditions in water-saturated sand.he primary objective of this study was to evaluate putative dif-erences regarding the transport of viruses in water during soilassage under oxic and anoxic conditions. Therefore, the elimina-ion of surrogate viruses PhiX174 and MS2, two viruses with similarizes but different surface properties like charge and hydrophobic-ty, was tested in saturated sand columns, prepared and run eithern oxygen-containing or almost oxygen-free waters. Since waterhemistry, particularly pH, ionic strength and divalent cationsay have significant effects on virus transport, experiments were
erformed using three different aqueous phases of varying ionictrength and cation valency.
aterial and methods
xperimental design of column experiments
The experimental outline for all sand column experiments ishown in Fig. 1. The technical equipment, solid and mobile phases,ubing materials and recording devices were the following:
Equipment: The columns (length 55 cm, inner diameter 7.4 cm)ere made of glass. A glass frit, located at the bottom of each col-mn, assured evenly distributed water flows. Water was pumpedhrough these columns from bottom to top. At the effluent ofhe columns, flow-through measurement devices were installed tollow continuous monitoring of the oxidation-reduction potentialsORP; redox potential), oxygen concentrations and electrical con-uctivities. Additional sampling points at about 5 cm, 15 cm and0 cm were available and used in one of the experiments.
Porous medium: Natural sand without further treatment wastilized. The sediment texture was classified as medium sandith a content of fines and organic carbon (Corg) of 1% and 0.7%,
espectively. Iron and aluminium concentrations of the sand asetermined by microwave-assisted acid digestion amounted to.143 ± 0.094 g/kg Fe and 0.869 ± 0.135 g/kg Al.
Each experiment was performed with a new sand filling. Param-ters determined from the grain-size distribution curve were
60 = 0.255 mm and d10 = 0.11 mm resulting in the degree of uni-ormity U = 2.3. To achieve a compact and homogeneous matrix,et sand was filled into the columns in increments of 2–3 cm untilhe filter bed depth reached about 50 cm. After each increment the
the left shows the overall setup of the column experiments. The scheme on theright depicts the water flow through the column from bottom to top to the differentmeasurement cells and sampling points (ORP: oxidation reduction potential).
sand was stirred and stuffed. Finally, mass and volume of the sandfillings were determined.
Aqueous phases: Three aqueous phases were used: (1)demineralised water without any additives, corresponding to waterwith low ionic strength (IS); (2) demineralised water with 0.75 g/lKCl (Merck) to achieve a water with medium ionic strength (about10 mmol/l); and (3) water of the waterworks on the test site inBerlin-Marienfelde operated by the Federal Environment Agencyof Germany. This groundwater, referred to as water with highIS, had a ionic strength of about 20 mmol/l and relatively highconcentrations of divalent ions, especially Ca2+ and SO4
2−, withconcentrations of about 4 mmol/l and 2.5 mmol/l, respectively. Thetreatment of this groundwater comprises aeration for iron andmanganese removal (microaerophilic mode) and subsequent rapidfiltration for particle removal. All waters serving as influents forsand column experiments were autoclaved prior to use and usedunder both oxic and anoxic conditions. To eliminate oxygen inthe water for experiments under anoxic conditions, the waterwas cooled under a nitrogen atmosphere as rapidly as possible,after the temperature had dropped to 100 ◦C. To further lower theoxidation-reduction potential, sodium dithionite (Na2S2O4, Merck)was added as a reducing agent in a concentration of about 10 and25 mg/l for low/medium and high IS water, respectively.
Tubing material: In experiments with oxygen-free waters Iso-Versinic® was used as tubing material in order to avoid an influxof oxygen. Tubings were connected to each other by tube clips andthree-way valves both made of metal. In experiments performedunder oxic conditions Iso-Versinic® tubing was partly replaced byTygon® R-3603/R3607 tubes.
Data recording devices: Portable devices and corresponding elec-trodes (wtw, Weilheim, Germany) for monitoring ORP, oxygenconcentrations and electrical conductivities were installed at theeffluent of the columns to record the data during the experimentsat 5 min intervals.
Column tracer tests
NaCl was used as a conservative tracer and was dosed in 10 mlportions with a syringe connected to the three-way valve at the
A. Frohnert et al. / International Journal of Hygiene and Environmental Health 217 (2014) 861–870 863
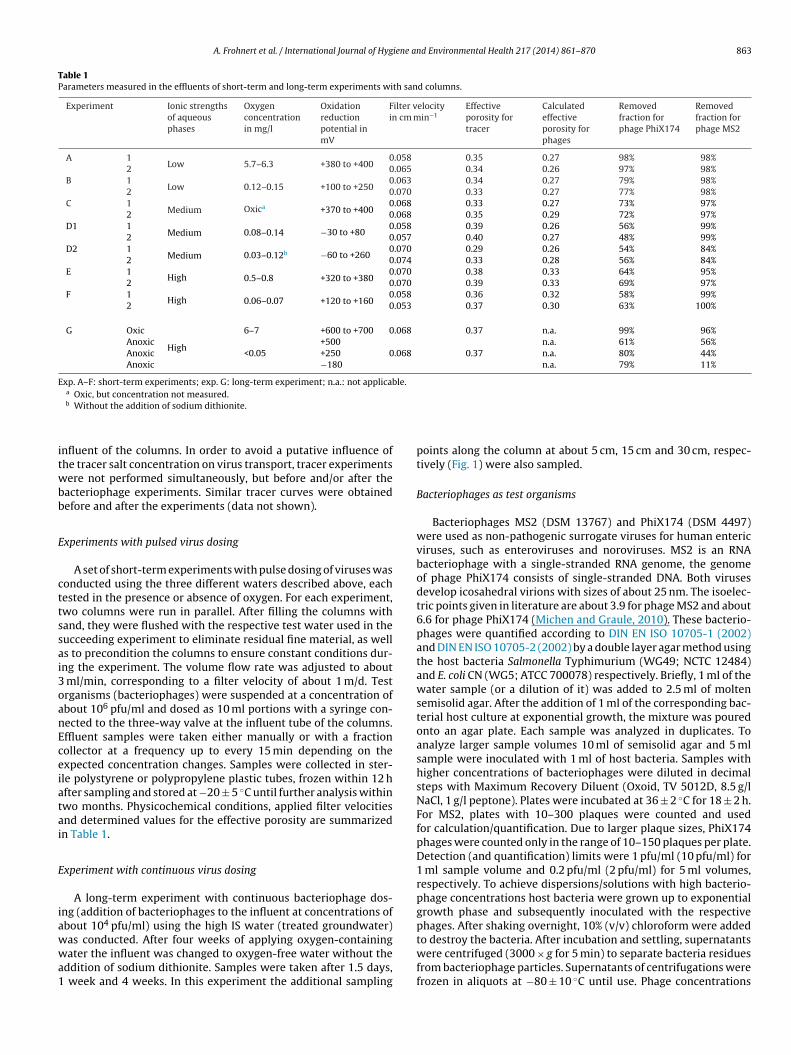
Table 1Parameters measured in the effluents of short-term and long-term experiments with sand columns.
Experiment Ionic strengthsof aqueousphases
Oxygenconcentrationin mg/l
Oxidationreductionpotential inmV
Filter velocityin cm min−1
Effectiveporosity fortracer
Calculatedeffectiveporosity forphages
Removedfraction forphage PhiX174
Removedfraction forphage MS2
A 1Low 5.7–6.3 +380 to +400
0.058 0.35 0.27 98% 98%2 0.065 0.34 0.26 97% 98%
B 1Low 0.12–0.15 +100 to +250
0.063 0.34 0.27 79% 98%2 0.070 0.33 0.27 77% 98%
C 1Medium Oxica +370 to +400
0.068 0.33 0.27 73% 97%2 0.068 0.35 0.29 72% 97%
D1 1Medium 0.08–0.14 −30 to +80
0.058 0.39 0.26 56% 99%2 0.057 0.40 0.27 48% 99%
D2 1Medium 0.03–0.12b −60 to +260
0.070 0.29 0.26 54% 84%2 0.074 0.33 0.28 56% 84%
E 1High 0.5–0.8 +320 to +380
0.070 0.38 0.33 64% 95%2 0.070 0.39 0.33 69% 97%
F 1High 0.06–0.07 +120 to +160
0.058 0.36 0.32 58% 99%2 0.053 0.37 0.30 63% 100%
G Oxic
High
6–7 +600 to +700 0.068 0.37 n.a. 99% 96%Anoxic +500 n.a. 61% 56%Anoxic <0.05 +250 0.068 0.37 n.a. 80% 44%Anoxic −180 n.a. 79% 11%
Exp. A–F: short-term experiments; exp. G: long-term experiment; n.a.: not applicable.a
itwbb
E
cttssai3oanEceiatai
E
iawwa1
Oxic, but concentration not measured.b Without the addition of sodium dithionite.
nfluent of the columns. In order to avoid a putative influence ofhe tracer salt concentration on virus transport, tracer experimentsere not performed simultaneously, but before and/or after the
acteriophage experiments. Similar tracer curves were obtainedefore and after the experiments (data not shown).
xperiments with pulsed virus dosing
A set of short-term experiments with pulse dosing of viruses wasonducted using the three different waters described above, eachested in the presence or absence of oxygen. For each experiment,wo columns were run in parallel. After filling the columns withand, they were flushed with the respective test water used in theucceeding experiment to eliminate residual fine material, as wells to precondition the columns to ensure constant conditions dur-ng the experiment. The volume flow rate was adjusted to about
ml/min, corresponding to a filter velocity of about 1 m/d. Testrganisms (bacteriophages) were suspended at a concentration ofbout 106 pfu/ml and dosed as 10 ml portions with a syringe con-ected to the three-way valve at the influent tube of the columns.ffluent samples were taken either manually or with a fractionollector at a frequency up to every 15 min depending on thexpected concentration changes. Samples were collected in ster-le polystyrene or polypropylene plastic tubes, frozen within 12 hfter sampling and stored at −20 ± 5 ◦C until further analysis withinwo months. Physicochemical conditions, applied filter velocitiesnd determined values for the effective porosity are summarizedn Table 1.
xperiment with continuous virus dosing
A long-term experiment with continuous bacteriophage dos-ng (addition of bacteriophages to the influent at concentrations ofbout 104 pfu/ml) using the high IS water (treated groundwater)
as conducted. After four weeks of applying oxygen-containingater the influent was changed to oxygen-free water without theddition of sodium dithionite. Samples were taken after 1.5 days, week and 4 weeks. In this experiment the additional sampling
points along the column at about 5 cm, 15 cm and 30 cm, respec-tively (Fig. 1) were also sampled.
Bacteriophages as test organisms
Bacteriophages MS2 (DSM 13767) and PhiX174 (DSM 4497)were used as non-pathogenic surrogate viruses for human entericviruses, such as enteroviruses and noroviruses. MS2 is an RNAbacteriophage with a single-stranded RNA genome, the genomeof phage PhiX174 consists of single-stranded DNA. Both virusesdevelop icosahedral virions with sizes of about 25 nm. The isoelec-tric points given in literature are about 3.9 for phage MS2 and about6.6 for phage PhiX174 (Michen and Graule, 2010). These bacterio-phages were quantified according to DIN EN ISO 10705-1 (2002)and DIN EN ISO 10705-2 (2002) by a double layer agar method usingthe host bacteria Salmonella Typhimurium (WG49; NCTC 12484)and E. coli CN (WG5; ATCC 700078) respectively. Briefly, 1 ml of thewater sample (or a dilution of it) was added to 2.5 ml of moltensemisolid agar. After the addition of 1 ml of the corresponding bac-terial host culture at exponential growth, the mixture was pouredonto an agar plate. Each sample was analyzed in duplicates. Toanalyze larger sample volumes 10 ml of semisolid agar and 5 mlsample were inoculated with 1 ml of host bacteria. Samples withhigher concentrations of bacteriophages were diluted in decimalsteps with Maximum Recovery Diluent (Oxoid, TV 5012D, 8.5 g/lNaCl, 1 g/l peptone). Plates were incubated at 36 ± 2 ◦C for 18 ± 2 h.For MS2, plates with 10–300 plaques were counted and usedfor calculation/quantification. Due to larger plaque sizes, PhiX174phages were counted only in the range of 10–150 plaques per plate.Detection (and quantification) limits were 1 pfu/ml (10 pfu/ml) for1 ml sample volume and 0.2 pfu/ml (2 pfu/ml) for 5 ml volumes,respectively. To achieve dispersions/solutions with high bacterio-phage concentrations host bacteria were grown up to exponentialgrowth phase and subsequently inoculated with the respectivephages. After shaking overnight, 10% (v/v) chloroform were added
to destroy the bacteria. After incubation and settling, supernatantswere centrifuged (3000 × g for 5 min) to separate bacteria residuesfrom bacteriophage particles. Supernatants of centrifugations werefrozen in aliquots at −80 ± 10 ◦C until use. Phage concentrations
8 iene a
oo
V
tscIpafc
D
v
v
aamira
dcbvc
Bvt
pa(ihauo
i
R
ttw(ls
64 A. Frohnert et al. / International Journal of Hyg
f 1012 pfu/ml for MS2 and about 1010 pfu/ml for PhiX174 werebtained.
irus inactivation test
In order to determine the inactivation of viruses in liquid phases,riplicate batches of each water (with or without oxygen), werepiked with both bacteriophages simultaneously. Sampling wasarried out over a time period of two days (temperature: 20 ± 2 ◦C).n flasks carried under oxygen-free conditions, the removed sam-le volume was replaced by glass beads to prevent formation ofn oxic gas phase. No sodium dithionite was added. Samples wererozen at −20 ± 5 ◦C until further analysis. The corresponding rateoefficients were calculated as described in the next section.
ata analysis and modelling
To calculate changes in the bacteriophage concentrations due toirus inactivation a first order kinetic was assumed:
c
c0= e−k·t (1)
alues for k, converted into log10/d, were calculated.Breakthrough curves of the column experiments were analyzed
s follows: concentrations were plotted against time and totalmounts of detected bacteriophages in the effluent were deter-ined by assessing the areas under the breakthrough curves (linear
nterpolation between data points) and multiplication with flowates. In relation to the dosed virus input, the fractions of recoverednd eliminated bacteriophages were calculated.
Data were further analyzed by using programs for one-imensional modelling (inverse solution). Tracer breakthroughurves were analyzed using CXTFIT (Toride et al., 1995), using theasic advection dispersion equation to determine the pore waterelocity vp,tracer (in cm min−1) and the dispersion coefficient D (inm2 min−1):
∂c
∂t= D
∂2c
∂x2− vp
∂c
∂x= ˛Lvp
∂2c
∂x2− vp
∂c
∂x(2)
y dividing the filter velocity vf by the resulting median pore-waterelocity vp,tracer, the effective porosity ne,tracer for the conservativeracer was calculated.
Because of the more complex transport behaviour of bacterio-hages as compared to the conservative tracer, phage data werenalyzed with two different models: on the one hand CXTFITToride et al., 1995) with an advection dispersion equation includ-ng equilibrium sorption and first-order removal and on the otherand Hydrus-1D (Simunek and van Genuchten, 2008), a modelllowing calculation of advection, dispersion, inactivation in liq-id and on solid phases as well as kinetic adsorption/desorption tone type of adsorption site.
Equilibrium sorption (using CXTFIT) is described by the follow-ng formula:
∂c
∂t= D
∂2c
∂x2− vp
∂c
∂x− �Rc with R = 1 + �BKd
ne(3)
Thereby, c (in ml−1) denotes the concentration of the respec-ive phage in water, R the retardation factor (dimensionless), Dhe dispersion coefficient (in cm2 min−1), vp (in cm min−1) the pore
ater velocity, � (in min−1) the inactivation rate coefficient, �Bin g cm−3) the dry bulk density, Kd the distribution coefficient forinear adsorption (in cm3 g−1) and ne the effective porosity (dimen-ionless).
nd Environmental Health 217 (2014) 861–870
Kinetic sorption (using HYDRUS-1D) is described by two formu-las:
∂c
∂t= ˛Lvp
∂2c
∂x2− vp
∂c
∂x− kattc − �lc + kdet
�B
neS (4)
∂S
∂t= ne
�Bkattc − �sS − kdetS (5)
with the following parameters: concentration in water c (in ml−1),amount of attached viruses per sand mass S (in g−1), dry bulk den-sity �B (in g cm−3), longitudinal dispersivity ˛L (in cm), pore watervelocity vp (in cm min−1), porosity ne (dimensionless), the inactiva-tion rate coefficients in water �l and attached to the solid surface �s
(in min−1) and the rate coefficients for attachment katt and detach-ment kdet (in min−1).
Tailing is caused by kinetically limited phage attachment toand detachment from the solid phase. The heights (starting point)and slopes of the tails are determined by the detachment ratecoefficients and the inactivation rate coefficients of attachedphages, respectively (Schijven and Hassanizadeh, 2000).
Results and discussion
Short-term experiments with pulsed virus input under oxic andanoxic conditions
To test the transport of bacteriophages MS2 and PhiX174 underoxic and anoxic conditions, sand-filled columns were spiked with asmall volume of both model viruses and water was flushed throughthe columns from bottom to top with a filter velocity of about 1 m/d.A series of experiments using three waters of different ionic com-positions was performed. The breakthrough curves of both the DNAbacteriophage PhiX174 and the RNA bacteriophage MS2 displayedtailing (Figs. 2 and 3). In experiments using water with high ionicstrength (Fig. 2E and F) the tailing of PhiX174 reached high levels.The small slopes observed for both phages in these experimentssuggest, that inactivation on solid surface was lowest in water withhigh ionic strength.
Notably, the bacteriophage breakthrough curves were not con-gruent to that of the tracer (see Figs. 2 and 3). Peak values of bothbacteriophages appeared about 50 min before the correspondingtracer peaks, suggesting that the phages travelled faster than thetracer. This phenomenon may be explained by pore size exclusiondue to size differences of bacteriophages and sodium/chloride ions.In relation to the phages, with diameters of 25–30 nm, the Na+ andCl− ions are retarded by entering smaller pores. This effect corre-lates with observations from other studies (Keller et al., 2004, vander Wielen et al., 2008) and may be attributed to the amount of finematerials in the sand. In the average of all experiments, the effectiveporosity accounted to 0.35 (±0.03) for the tracers and 0.28 (±0.02)for PhiX174 (Table 1). Based on these calculations, there is 20% lesspore space for the transport of bacteriophages compared to that ofsalt ions.
Comparing the breakthrough curves of both bacteriophages, itis obvious that MS2 (Fig. 3) was reduced to a higher extent duringtransport through the sand columns than PhiX174 (Fig. 2). PhageMS2 always displayed lower peaks (about one log10 unit), regard-less of the aqueous phase or the oxygen content of the test water.Comparison of the MS2 breakthrough curves under oxic (Fig. 3A,C and E) and anoxic (Fig. 3B, D1 and F) conditions did not revealany evident differences. Effluent concentrations readily reachedlow values (often near or below the quantification limit), impeding
to draw reliable conclusions.In anoxic waters with low or medium ionic strengths (Fig. 2B and D1), peak concentrations of PhiX174 were higher than incorresponding oxic waters (Fig. 2A and C). Due to less marked

A. Frohnert et al. / International Journal of Hygiene and Environmental Health 217 (2014) 861–870 865
Fig. 2. Breakthrough curves of the DNA bacteriophage PhiX174 and the NaCl tracer from short-term column experiments run under oxic and anoxic conditions. Squaresrepresent data of relative concentrations (c/c0 values) of phage PhiX174 and crosses represent c/c0 values for the tracers. Experiments A, C, and E were conducted in thep ases
e
pss(temwmptn
FcD
resence of oxygen, experiments B, D1 and F in the absence of oxygen. Mobile phxperiments were run in duplicates.
eaks, clear statements could not be drawn from high ionictrength water experiments. Therefore, to draw further conclu-ions, the total amount of bacteriophage removal was calculatedTable 1). In these short-time runs (Exp. A–F) performed withhe RNA phage MS2, there were no marked differences withinxperiments. Removal was always high, ranging from 95% toore than 99%. In contrast, total removal values for PhiX174ere in the range of 48–98%. In anoxic water with low or
edium ionic strengths, PhiX174 removal was reduced com-ared to the corresponding oxic experiments. This indicateshat reduced oxygen concentrations lead to lower virus elimi-ation. The removal of PhiX174 in anoxic high ionic strength
ig. 3. Breakthrough curves of the RNA bacteriophage MS2 and the NaCl tracer from
oncentrations (c/c0 values) of phage MS2 (circles) and of the tracer (crosses) are shown.
1 and F in the absence of oxygen. Mobile phases contained water of low (A, B), medium
contained water of low (A, B), medium (C, D1) and high (E, F) ionic strengths. All
water was calculated conservatively. Interpolating the concen-trations between the higher data points (Fig. 2F) would resultin a higher recovery and hence a lower removal. Despite theseless pronounced differences, the lower removal under oxygen-free compared to oxygen-containing conditions was observed inall three test waters.
With regard to ionic strength, no trend in the eliminationof phage MS2 was observed, since numbers of infective phages
leaving the columns were low in all cases (Table 1). Removalof PhiX174 from water with medium (only monovalent ions)and high ionic strengths (containing monovalent and divalentions) was lower than in water with low ionic strength (Table 1),short-term column experiments run under oxic and anoxic conditions. RelativeExperiments A, C, and E were conducted in the presence of oxygen, experiments B,
(C, D1) and high (E, F) ionic strengths. All experiments were run in duplicates.
866 A. Frohnert et al. / International Journal of Hygiene and Environmental Health 217 (2014) 861–870
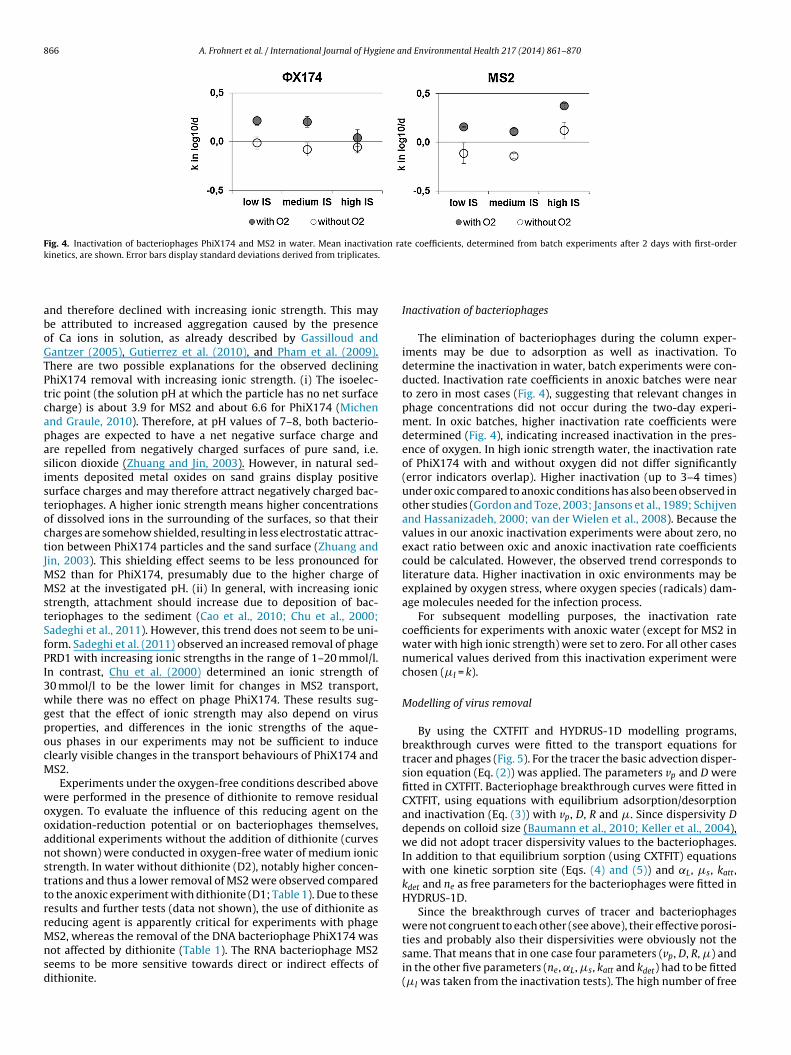
Fig. 4. Inactivation of bacteriophages PhiX174 and MS2 in water. Mean inactivation rate coefficients, determined from batch experiments after 2 days with first-orderk .
aboGTPtcapasistoctJMMstSfPI3wgpocM
wooansttrrMnsd
inetics, are shown. Error bars display standard deviations derived from triplicates
nd therefore declined with increasing ionic strength. This maye attributed to increased aggregation caused by the presencef Ca ions in solution, as already described by Gassilloud andantzer (2005), Gutierrez et al. (2010), and Pham et al. (2009).here are two possible explanations for the observed declininghiX174 removal with increasing ionic strength. (i) The isoelec-ric point (the solution pH at which the particle has no net surfaceharge) is about 3.9 for MS2 and about 6.6 for PhiX174 (Michennd Graule, 2010). Therefore, at pH values of 7–8, both bacterio-hages are expected to have a net negative surface charge andre repelled from negatively charged surfaces of pure sand, i.e.ilicon dioxide (Zhuang and Jin, 2003). However, in natural sed-ments deposited metal oxides on sand grains display positiveurface charges and may therefore attract negatively charged bac-eriophages. A higher ionic strength means higher concentrationsf dissolved ions in the surrounding of the surfaces, so that theirharges are somehow shielded, resulting in less electrostatic attrac-ion between PhiX174 particles and the sand surface (Zhuang andin, 2003). This shielding effect seems to be less pronounced for
S2 than for PhiX174, presumably due to the higher charge ofS2 at the investigated pH. (ii) In general, with increasing ionic
trength, attachment should increase due to deposition of bac-eriophages to the sediment (Cao et al., 2010; Chu et al., 2000;adeghi et al., 2011). However, this trend does not seem to be uni-orm. Sadeghi et al. (2011) observed an increased removal of phageRD1 with increasing ionic strengths in the range of 1–20 mmol/l.n contrast, Chu et al. (2000) determined an ionic strength of0 mmol/l to be the lower limit for changes in MS2 transport,hile there was no effect on phage PhiX174. These results sug-
est that the effect of ionic strength may also depend on virusroperties, and differences in the ionic strengths of the aque-us phases in our experiments may not be sufficient to inducelearly visible changes in the transport behaviours of PhiX174 andS2.Experiments under the oxygen-free conditions described above
ere performed in the presence of dithionite to remove residualxygen. To evaluate the influence of this reducing agent on thexidation-reduction potential or on bacteriophages themselves,dditional experiments without the addition of dithionite (curvesot shown) were conducted in oxygen-free water of medium ionictrength. In water without dithionite (D2), notably higher concen-rations and thus a lower removal of MS2 were observed comparedo the anoxic experiment with dithionite (D1; Table 1). Due to theseesults and further tests (data not shown), the use of dithionite aseducing agent is apparently critical for experiments with phage
S2, whereas the removal of the DNA bacteriophage PhiX174 wasot affected by dithionite (Table 1). The RNA bacteriophage MS2eems to be more sensitive towards direct or indirect effects ofithionite.
Inactivation of bacteriophages
The elimination of bacteriophages during the column exper-iments may be due to adsorption as well as inactivation. Todetermine the inactivation in water, batch experiments were con-ducted. Inactivation rate coefficients in anoxic batches were nearto zero in most cases (Fig. 4), suggesting that relevant changes inphage concentrations did not occur during the two-day experi-ment. In oxic batches, higher inactivation rate coefficients weredetermined (Fig. 4), indicating increased inactivation in the pres-ence of oxygen. In high ionic strength water, the inactivation rateof PhiX174 with and without oxygen did not differ significantly(error indicators overlap). Higher inactivation (up to 3–4 times)under oxic compared to anoxic conditions has also been observed inother studies (Gordon and Toze, 2003; Jansons et al., 1989; Schijvenand Hassanizadeh, 2000; van der Wielen et al., 2008). Because thevalues in our anoxic inactivation experiments were about zero, noexact ratio between oxic and anoxic inactivation rate coefficientscould be calculated. However, the observed trend corresponds toliterature data. Higher inactivation in oxic environments may beexplained by oxygen stress, where oxygen species (radicals) dam-age molecules needed for the infection process.
For subsequent modelling purposes, the inactivation ratecoefficients for experiments with anoxic water (except for MS2 inwater with high ionic strength) were set to zero. For all other casesnumerical values derived from this inactivation experiment werechosen (�l = k).
Modelling of virus removal
By using the CXTFIT and HYDRUS-1D modelling programs,breakthrough curves were fitted to the transport equations fortracer and phages (Fig. 5). For the tracer the basic advection disper-sion equation (Eq. (2)) was applied. The parameters vp and D werefitted in CXTFIT. Bacteriophage breakthrough curves were fitted inCXTFIT, using equations with equilibrium adsorption/desorptionand inactivation (Eq. (3)) with vp, D, R and �. Since dispersivity Ddepends on colloid size (Baumann et al., 2010; Keller et al., 2004),we did not adopt tracer dispersivity values to the bacteriophages.In addition to that equilibrium sorption (using CXTFIT) equationswith one kinetic sorption site (Eqs. (4) and (5)) and ˛L, �s, katt,kdet and ne as free parameters for the bacteriophages were fitted inHYDRUS-1D.
Since the breakthrough curves of tracer and bacteriophageswere not congruent to each other (see above), their effective porosi-
ties and probably also their dispersivities were obviously not thesame. That means that in one case four parameters (vp, D, R, �) andin the other five parameters (ne, ˛L, �s, katt and kdet) had to be fitted(�l was taken from the inactivation tests). The high number of free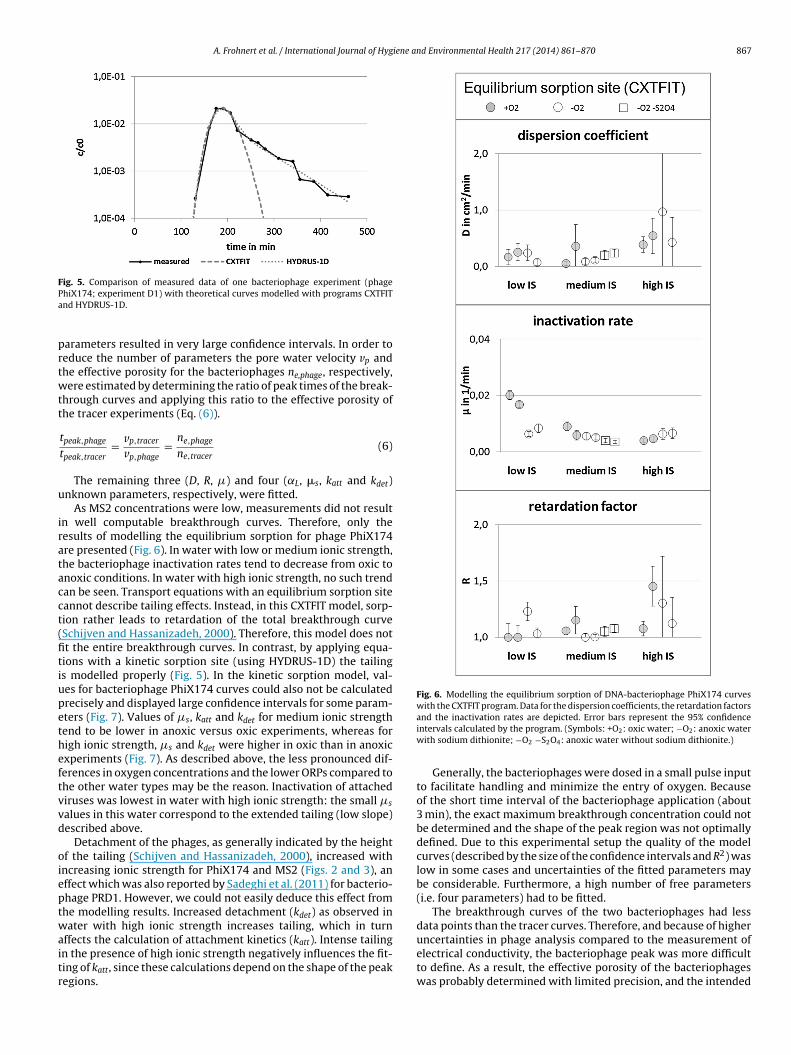
A. Frohnert et al. / International Journal of Hygiene and Environmental Health 217 (2014) 861–870 867
Fig. 5. Comparison of measured data of one bacteriophage experiment (phagePa
prtwtt
u
iratacct(fitiupetheftvvd
oieptwaitr
Fig. 6. Modelling the equilibrium sorption of DNA-bacteriophage PhiX174 curveswith the CXTFIT program. Data for the dispersion coefficients, the retardation factors
uncertainties in phage analysis compared to the measurement of
hiX174; experiment D1) with theoretical curves modelled with programs CXTFITnd HYDRUS-1D.
arameters resulted in very large confidence intervals. In order toeduce the number of parameters the pore water velocity vp andhe effective porosity for the bacteriophages ne,phage, respectively,ere estimated by determining the ratio of peak times of the break-
hrough curves and applying this ratio to the effective porosity ofhe tracer experiments (Eq. (6)).
tpeak,phage
tpeak,tracer= vp,tracer
vp,phage= ne,phage
ne,tracer(6)
The remaining three (D, R, �) and four (˛L, �s, katt and kdet)nknown parameters, respectively, were fitted.
As MS2 concentrations were low, measurements did not resultn well computable breakthrough curves. Therefore, only theesults of modelling the equilibrium sorption for phage PhiX174re presented (Fig. 6). In water with low or medium ionic strength,he bacteriophage inactivation rates tend to decrease from oxic tonoxic conditions. In water with high ionic strength, no such trendan be seen. Transport equations with an equilibrium sorption siteannot describe tailing effects. Instead, in this CXTFIT model, sorp-ion rather leads to retardation of the total breakthrough curveSchijven and Hassanizadeh, 2000). Therefore, this model does nott the entire breakthrough curves. In contrast, by applying equa-ions with a kinetic sorption site (using HYDRUS-1D) the tailings modelled properly (Fig. 5). In the kinetic sorption model, val-es for bacteriophage PhiX174 curves could also not be calculatedrecisely and displayed large confidence intervals for some param-ters (Fig. 7). Values of �s, katt and kdet for medium ionic strengthend to be lower in anoxic versus oxic experiments, whereas forigh ionic strength, �s and kdet were higher in oxic than in anoxicxperiments (Fig. 7). As described above, the less pronounced dif-erences in oxygen concentrations and the lower ORPs compared tohe other water types may be the reason. Inactivation of attachediruses was lowest in water with high ionic strength: the small �s
alues in this water correspond to the extended tailing (low slope)escribed above.
Detachment of the phages, as generally indicated by the heightf the tailing (Schijven and Hassanizadeh, 2000), increased withncreasing ionic strength for PhiX174 and MS2 (Figs. 2 and 3), anffect which was also reported by Sadeghi et al. (2011) for bacterio-hage PRD1. However, we could not easily deduce this effect fromhe modelling results. Increased detachment (kdet) as observed inater with high ionic strength increases tailing, which in turn
ffects the calculation of attachment kinetics (katt). Intense tailing
n the presence of high ionic strength negatively influences the fit-ing of katt, since these calculations depend on the shape of the peakegions.and the inactivation rates are depicted. Error bars represent the 95% confidenceintervals calculated by the program. (Symbols: +O2: oxic water; −O2: anoxic waterwith sodium dithionite; −O2 −S2O4: anoxic water without sodium dithionite.)
Generally, the bacteriophages were dosed in a small pulse inputto facilitate handling and minimize the entry of oxygen. Becauseof the short time interval of the bacteriophage application (about3 min), the exact maximum breakthrough concentration could notbe determined and the shape of the peak region was not optimallydefined. Due to this experimental setup the quality of the modelcurves (described by the size of the confidence intervals and R2) waslow in some cases and uncertainties of the fitted parameters maybe considerable. Furthermore, a high number of free parameters(i.e. four parameters) had to be fitted.
The breakthrough curves of the two bacteriophages had lessdata points than the tracer curves. Therefore, and because of higher
electrical conductivity, the bacteriophage peak was more difficultto define. As a result, the effective porosity of the bacteriophageswas probably determined with limited precision, and the intended

868 A. Frohnert et al. / International Journal of Hygiene and Environmental Health 217 (2014) 861–870
F the Hs rror b
eu
kepavnlo
La
cmdo
Fda
ig. 7. Modelling the kinetic sorption of DNA-bacteriophage PhiX174 curves witholid surfaces, attachment rates and detachment rates are depicted. (Symbols and e
ffect to use effective porosity values in order to reduce the overallncertainty of the modelling was not achieved (Figs. 6 and 7).
Modelling the MS2 breakthrough curves provided higher �s andatt values than for phage PhiX174, though accompanied by largerrror bars (data not shown). Due to these limitations it was notossible to determine to which extent the different mechanismsccount for bacteriophage removal. As for the total removal ofiruses (Table 1), modelling of these short-time experiments didot provide general conclusions but rather showed a tendency for
ower inactivation and lower attachment of viruses in anoxic versusxic waters.
ong-term experiment with continuous dosing under both oxicnd anoxic conditions
Since differences in the removal of phages under oxic and anoxic
onditions were not well pronounced in the short-term experi-ents, another experiment was conducted with continuous phageosing in water with high ionic strength, supplemented by the usef additional sampling points along the saturated sand columns
ig. 8. Profiles for the removal of DNA-bacteriophage PhiX174 and RNA-bacteriophage
epicted by open symbols and dashed lines were taken during the oxic trial period; samnoxic trial period. (For sample oxic a only values for influent and effluent are available.)
YDRUS-1D program. Data for the longitudinal dispersivities, inactivation rates onars as described in Fig. 6).
(see Fig. 1) to get further information for different travel dis-tances. The profiles for removal of DNA-bacteriophage PhiX174and RNA-bacteriophage MS2 in this long-term experiment underoxic (dashed lines) versus anoxic (solid lines) water conditionsare shown in Fig. 8. After changing the influent to oxygen-freewater, oxygen concentrations in the effluent dropped from levelsof 6–7 mg/l during the oxic period down to the detection limit ofthe device (about 0.05 mg/l O2). The ORP values decreased slowlyover the course of time.
During the oxic period the concentrations of bacteriophagesPhiX174 and MS2 were reduced after a filtration distance of about55 cm by 99% and 96%, respectively (see Fig. 8, sample oxic a–c).Phage removal was nearly constant over a time period of aboutfour weeks. After changing to oxygen-free water the bacteriophageremoval was reduced substantially. For example, PhiX174 and MS2were only reduced by 61% and 56% in the first sampling after 1.5
days. PhiX174 effluent concentrations subsequently declined, butremained above the oxic level (equivalent to lower removal). MS2concentrations further increased with sampling after 1 week and 4weeks, respectively (Fig. 8 and Table 1).MS2 along the sand column used in the long-term experiment. Samples oxic a–cples anoxic a–c depicted by filled symbols and solid lines were taken during the

iene an
outeimosr2ceebawsrsr
dadtotttdt
u1(dfTt
dSltsiu(trdwmd
C
-
-
-
A. Frohnert et al. / International Journal of Hyg
Less adsorption, less inactivation and more detachment of previ-usly sorbed phages may explain these high effluent concentrationsnder anoxic conditions. Whereas in the short-term experimentshe processes lead to different curve shapes, in the long-termxperiments these processes are most likely superposed. A lowernactivation might not be relevant on this time scale since water
ovement through the column only took less than 8 h. Possiblyccurring patches of aluminium and iron oxides/hydroxides in theolid phase show a positive charge and may be important for virusemoval by adsorbing negatively charged virions (Bradley et al.,011; Foppen et al., 2006). Changes in iron oxide/hydroxide con-entrations were not evaluated in our experiments, but at thend of the anoxic period we still observed iron precipitates in theffluent, indicating that iron oxides dissolved slowly, accompaniedy declining ORP values. Since the effect of lower removal undernoxic conditions was already pronounced after 1.5 days (a timehen iron oxides were still present with ORPs at +500 mV), dis-
olving iron oxides may not be the only reason for lower virusemoval. Working in laboratory scale it might be advisable to con-ider both short-term and long-term experiments to study virusemoval, especially when redox processes are involved.
The results of the long-term experiment with continuous phageosing under controlled conditions are in good accordance withnalyses of field data by Schijven and Hassanizadeh (2002) and vaner Wielen et al. (2008), in which PhiX174 was better removedhan MS2. This is most likely due to the lower isoelectric pointf phage MS2, resulting in stronger electrostatic repulsion andherefore less attachment of the phage to the sand grains. The facthat bacteriophage MS2 survived the low oxygen concentrations inhis long-term experiment supports the hypothesis that the use ofithionite to achieve anoxic conditions may have affected MS2 inhe short-term experiments.
If mean values are used for comparison of phage reductionsnder oxic and anoxic conditions, PhiX174 removal declined from.9 log10 (99%) to 0.6 log10 (73%) and MS2 removal from 1.4 log1096%) to 0.2 log10 (37%), respectively. Therefore, under anoxic con-itions, the removal of bacteriophage PhiX174 was reduced by aactor of about 3 and that of phage MS2 by a factor of more than 6.he RNA-phage MS2 seems to react more explicitly to the changeo anoxic conditions than the DNA-phage PhiX174.
It is important to note that in field studies phage removaleclined along the travel distance (reviewed in Pang, 2009;chijven et al., 2000). Therefore, one has to be careful to extrapolateaboratory data to field conditions. However, in our experimentshis effect was also observed. By considering only the last columnection (from about 30 to 55 cm) the average filtration coefficientsn oxic water would change from 0.35 log10/10 cm (entire col-mn) to 0.10 log10/10 cm for PhiX174 and from 0.26 log10/10 cmentire column) to 0.13 log10/10 cm for MS2. Under anoxic condi-ions differences along the distance were less pronounced. PhiX174emoval in the last section was comparable to that under oxic con-itions. The filtration coefficients for MS2 were small in all sectionsith an average of 0.02 log10/10 cm in the last section. These valuesight be even much lower under field conditions with extended
istances in anoxic aquifers.
onclusions
In oxic experiments the majority of viruses was removed afterpassing the 0.5 m sand columns, whereas in anoxic experiments,a clearly lower percentage of viruses was removed.
The inactivation of both viruses was lower under anoxic com-pared to oxic conditions.
The differences in virus removal between oxic and anoxic condi-tions were more pronounced in the long-term experiments.
d Environmental Health 217 (2014) 861–870 869
- Although short transport distances may overestimate theremoval capacity of the subsurface passage, virus elimination waslow under anoxic conditions.
- Since redox conditions during bank filtration often change fromoxic to anoxic and groundwater is also often anoxic, our resultsmay have practical implications. The size of oxic and anoxic zonesduring subsurface passages should be more emphasized in riskassessment studies aimed to secure drinking water resourcesfrom contaminations with human enteric viruses.
Acknowledgements
This study was conducted within the BMBF-funded project‘Efficiency of virus elimination by filtration processes in drinkingwater treatment’ (grant 02WT0944) and partially cofunded by theDeutsche Forschungsgemeinschaft (PAK 436, Pathogenic viruses inwater; grant SE 508/2-1). We also thank our colleagues, H. Dizer, A.Reuchsel and K. Hanley for discussions and support.
References
Abudalo, R., Bogatsu, Y., Ryan, J., Harvey, R., Metge, D., Elimelech, M., 2005. Effectof ferric oxyhydroxide grain coatings on the transport of bacteriophage PRD1and Cryptosporidium parvum oocysts in saturated porous media. Environ. Sci.Technol. 39 (17), 6412–6419.
Baumann, T., Toops, L., Niessner, R., 2010. Colloid dispersion on the pore scale. WaterRes. 44 (4), 1246–1254.
Bradley, I., Straub, A., Maraccini, P., Markazi, S., Nguyen, T., 2011. Iron oxide amendedbiosand filters for virus removal. Water Res. 45 (15), 4501–4510.
Cao, H., Tsai, F., Rusch, K., 2010. Salinity and soluble organic matter on virus sorptionin sand and soil columns. Ground Water 48 (1), 42–52.
Chu, Y., Jin, Y., Yates, M., 2000. Virus transport through saturated sand columns asaffected by different buffer solutions. J. Environ. Qual. 29 (4), 1003–1110.
DIN EN ISO 10705-1, 2002. Water Quality – Detection and Enumeration of Bacterio-phages – Part 1: Enumeration of F-specific RNA Bacteriophages (in German).
DIN EN ISO 10705-2, 2002. Water Quality – Detection and Enumeration of Bacterio-phages – Part 2: Enumeration of Somatic Coliphages (in German).
DVGW W 101, 2006. Guidelines on Drinking Water Protection Areas – Part 1:Groundwater protection areas (in German).
Foppen, J., Okletey, S., Schijven, J., 2006. Effect of goethite coating and humic acid onthe transport of bacteriophage PRD1 in columns of saturated sand. J. Contam.Hydrol. 85 (3-4), 287–301.
Gassilloud, B., Gantzer, C., 2005. Adhesion-aggregation and inactivation of poliovirus1 in groundwater stored in a hydrophobic container. Appl. Environ. Microbiol.71 (2), 912–920.
Gordon, C., Toze, S., 2003. Influence of groundwater characteristics on the survivalof enteric viruses. J. Appl. Microbiol. 95 (3), 536–544.
Gutierrez, L., Mylon, S., Nash, B., Nguyen, T., 2010. Deposition and aggregationkinetics of rotavirus in divalent cation solutions. Environ. Sci. Technol. 44 (12),4552–4557.
Jansons, J., Edmonds, L., Speight, B., Bucens, M., 1989. Survival of viruses in ground-water. Water Res. 23 (3), 301–306.
Keller, A., Sirivithayapakorn, S., Chrysikopoulos, C., 2004. Early breakthrough of col-loids and bacteriophage MS2 in a water-saturated sand column. Water Resour.Res. 40, W08304.
Michen, B., Graule, T., 2010. Isoelectric points of viruses. J. Appl. Microbiol. 109 (2),388–397.
Pang, L., 2009. Microbial removal rates in subsurface media estimated from pub-lished studies of field experiments and large intact soil cores. J. Environ. Qual.38 (4), 1531–1559.
Pham, M., Mintz, E., Nguyen, T., 2009. Deposition kinetics of bacteriophage MS2 tonatural organic matter: role of divalent cations. J. Colloid Interface Sci. 338 (1),1–9.
Sadeghi, G., Schijven, J., Behrends, T., Hassanizadeh, S., Gerritse, J., Kleingeld, P., 2011.Systematic study of effects of pH and ionic strength on attachment of phagePRD1. Ground Water 49 (1), 12–19.
Schijven, J., Hassanizadeh, S., 2000. Removal of Viruses by soil passage: overviewof modeling, processes, and parameters. Crit. Rev. Environ. Sci. Technol. 30 (1),49–127.
Schijven, J., Medema, G., Vogelaar, A., Hassanizadeh, S., 2000. Removal of microor-ganisms by deep well injection. J. Contam. Hydrol. 44 (3-4), 301–327.
Schijven, J., Hassanizadeh, S., 2002. Virus removal by soil passage at field scaleand groundwater protection of sandy aquifers. Water Sci. Technol. 46 (3),123–129.
Simunek, J., van Genuchten, M., 2008. Modeling nonequilibrium flow and transportprocesses using HYDRUS. Vadose Zone J. 7 (2), 782–797.
Toride, N., Leij, F., van Genuchten, M., 1995. The CXTFIT Code for Estimating TransportParameters from Laboratory or Field Tracer Experiments. Version 2.0, ResearchReport No. 137. U.S. Salinity Laboratory, USDA, ARS, Riverside, CA.

8 iene a
V
v
and PhiX174 during transport in a sandy anoxic aquifer. Environ. Sci. Technol.
70 A. Frohnert et al. / International Journal of Hyg
anderzalm, J., Sidhu, J., Bekele, E., Ying, G.-G., Pavelic, P., Toze, S., Dillon, P., Kookana,R., Hanna, J., Barry, K., Yu, X., Nicholson, B., Morran, J., Tanner, S., Short, S., 2009.
Water Quality Changes During Aquifer Storage and Recovery. Water ResearchFoundation.an der Wielen, P., Blokker, M., Medema, G., 2006. Modelling the length of micro-biological protection zones around phreatic sandy aquifers in The Netherlands.Water Sci. Technol. 54 (3), 63–69.
nd Environmental Health 217 (2014) 861–870
van der Wielen, P., Senden, W., Medema, G., 2008. Removal of bacteriophages MS2
42 (12), 4589–4594.Zhuang, J., Jin, Y., 2003. Virus retention and transport through Al-oxide coated
sand columns: effects of ionic strength and composition. J. Contam. Hydrol. 60,193–209.
Copyright © 2022 FDOKUMEN