Transmission and Distribution – SEEA1402 UNIT 1
155
SCHOOL OF ELECTRICAL AND ELECTRONICS DEPARTMENT OF ELECTRICAL AND ELECTRONICS ENGINEERING Transmission and Distribution – SEEA1402 UNIT 1- STRUCTURE OF ELECTRIC POWER SYSTEM
-
Upload
khangminh22 -
Category
Documents
-
view
3 -
download
0
Transcript of Transmission and Distribution – SEEA1402 UNIT 1

SCHOOL OF ELECTRICAL AND ELECTRONICS
DEPARTMENT OF ELECTRICAL AND ELECTRONICS ENGINEERING
Transmission and Distribution – SEEA1402
UNIT 1- STRUCTURE OF ELECTRIC POWER SYSTEM

I. STRUCTURE OF ELECTRIC POWER SYSTEM
Single Line Diagram - Distributors with Concentrated and Uniform Loading - DC Two Wire and Three
Wire Systems - AC Distributors - Radial and Ring Distributors - Interconnectors - Electrical Layout &
Bus Bar Arrangement in Generating Sub Stations and Bulk Power Substation - Kelvin’s Law for the
Design of Feeders and its Limitations.
1.1 Single Line Diagram
The large network of conductors between the power station and the consumers can be broadly divided
into two parts viz., transmission system and distribution system. Each part can be further sub-divided
into two—primary transmission and secondary transmission and primary distribution and secondary
distribution. Fig. 1.1 shows the layout of a typical a.c. power supply scheme by a single line diagram. It
may be noted that it is not necessary that all power schemes include all the stages shown in the figure.
For example, in a certain power scheme, there may be no secondary transmission and in another case,
the scheme may be so small that there is only distribution and no transmission.
Fig. 1.1 Structure of Electric Power System
(i) Generating station : In Figure G.S. represents the generating station where electric power
is produced by 3-phase alternators operating in parallel. The usual generation voltage is †11
kV. For economy in the transmission of electric power, the generation voltage (i.e., 11 kV)

is stepped upto 132 kV (or **more) at the generating station with the help of 3-phase
transformers. The transmission of electric power at high voltages has several advantages
including the saving of conductor material and high transmission efficiency. It may appear
advisable to use the highest possible voltage for transmission of electric power to save
conductor material and have other advantages. But there is a limit to which this voltage can
be increased. It is because increase in transmission voltage introduces insulation problems
well as the cost of switchgear and transformer equipment is increased. Therefore, the choice
of proper transmission voltage is essentially a question of economics. Generally the primary
transmission is carried at 66 kV, 132 kV, 220 kV or 400 kV.
(ii) Primary transmission. The electric power at 132 kV is transmitted by 3-phase, 3-wire
overhead system to the outskirts of the city. This forms the primary transmission.
(iii) Secondary transmission. The primary transmission line terminates at the receiving station
(RS) which usually lies at the outskirts of the city. At the receiving station, the voltage is
reduced to 33kV by step-down transformers. From this station, electric power is transmitted
at 33kV by 3-phase, 3-wire overhead system to various sub-stations (SS) located at the
strategic points in the city. This forms the secondary transmission
(iv) Primary distribution. The secondary transmission line terminates at the sub-station (SS)
where voltage is reduced from 33 kV to 11kV, 3-phase, 3-wire. The 11 kV lines run along
the important road sides of the city. This forms the primary distribution. It may be noted that
big consumers (having demand more than 50 kW) are generally supplied power at 11 kV for
further handling with their own sub-stations
(v) Secondary distribution. The electric power from primary distribution line (11 kV) is
delivered to distribution sub-stations (DS). These sub-stations are located near the
consumers’ localities and step down the voltage to 400 V, 3-phase, 4-wire for secondary
distribution. The voltage between any two phases is 400 V and between any phase and
neutral is 230 V. The single-phase residential lighting load is connected between any one
phase and neutral, whereas 3-phase, 400 V motor load is connected across 3-phase lines
directly.
It may be worthwhile to mention here that secondary distribution system consists of feeders,
distributors and service mains. Fig. shows the elements of low voltage distribution system. Feeders
(SC or SA) radiating from the distribution sub-station (DS) supply power to the distributors (AB,
BC, CD and AD). No consumer is given direct connection from the feeders. Instead, the consumers
are connected to the distributors through their service mains.
1.2 Comparison of D.C. and A.C. Transmission
The electric power can be transmitted either by means of d.c. or a.c. Each system has its own merits
and demerits. It is, therefore, desirable to discuss the technical advantages and disadvantages of the
two systems for transmission of electric power.
1.2.1 D.C. transmission. For some years past, the transmission of electric power by d.c. has been
receiving the active consideration of engineers due to its numerous advantages.
Advantages.
The high voltage d.c. transmission has the following advantages over high voltage a.c. transmission :
(i) It requires only two conductors as compared to three for a.c. transmission.
(ii) There is no inductance, capacitance, phase displacement and surge problems in d.c.

transmission.
(iii) Due to the absence of inductance, the voltage drop in a d.c. transmission line is less than the
a.c. line for the same load and sending end voltage. For this reason, a d.c. transmission line
has better voltage regulation.
(iv) There is no skin effect in a d.c. system. Therefore, entire cross-section of the line conductor
is utilised.
(v) For the same working voltage, the potential stress on the insulation is less in case of d.c.
system than that in a.c. system. Therefore, a d.c. line requires less insulation.
(vi) A d.c. line has less corona loss and reduced interference with communication circuits.
(vii) The high voltage d.c. transmission is free from the dielectric losses, particularly in the case
of cables.
(viii) In d.c. transmission, there are no stability problems and synchronising difficulties.
Disadvantages
(i) Electric power cannot be generated at high d.c. voltage due to commutation problems.
(ii) The d.c. voltage cannot be stepped up for transmission of power at high voltages.
(iii) The d.c. switches and circuit breakers have their own limitations
1.2.2 A.C. transmission.
Now-a-days, electrical energy is almost exclusively generated, transmitted and distributed in the form
of a.c.
Advantages
(i) The power can be generated at high voltages.
(ii) The maintenance of a.c. sub-stations is easy and cheaper.
(iii) The a.c. voltage can be stepped up or stepped down by transformers with ease and
efficiency. This permits to transmit power at high voltages and distribute it at safe potentials.
Disadvantages
(i) An a.c. line requires more copper than a d.c. line.
(ii) The construction of a.c. transmission line is more complicated than a d.c. transmission line.
(iii) Due to skin effect in the a.c. system, the effective resistance of the line is increased.
(iv) An a.c. line has capacitance. Therefore, there is a continuous loss of power due to charging
current even when the line is open.
1.3 Advantages of High Transmission Voltage
The transmission of electric power is carried at high voltages due to the following reasons :
(i) Reduces volume of conductor material. Consider the transmission of electric power by a three-
phase line. Let P = power transmitted in watts V = line voltage in volts cos φ = power factor of the
load l = length of the line in metres R = resistance per conductor in ohms ρ = resistivity of conductor
material a = area of X-section of conductor

It is clear from exp. (i) that for given values of P, l, ρ and W, the volume of conductor material
required is inversely proportional to the square of transmission voltage and power factor. In other
words, the greater the transmission voltage, the lesser is the conductor material required.
(ii) Increases transmission efficiency
(iii) Decreases percentage line drop

Limitations of high transmission voltage.
From the above discussion, it might appear advisable to use the highest possible voltage for
transmission of power in a bid to save conductor material. However, it must be realised that high
transmission voltage results in (i) the increased cost of insulating the conductors (ii) the increased cost
of transformers, switchgear and other terminal apparatus. Therefore, there is a limit to the higher
transmission voltage which can be economically employed in a particular case. This limit is reached
when the saving in cost of conductor material due to higher voltage is offset by the increased cost of
insulation, transformer, switchgear etc. Hence, the choice of proper transmission voltage is essentially
a question of economics
1.4 Various Systems of Power Transmission
It has already been pointed out that for transmission of electric power, 3-phase, 3-wire a.c. system is
universally adopted. However, other systems can also be used for transmission under special
circumstances. The different possible systems of transmission are
1. D.C. system
(i) D.C. two-wire.
(ii) D.C. two-wire with mid-point earthed.
(iii) D.C. three-wire.
2. Single-phase A.C. system
(i) Single-phase two-wire.
(ii) Single-phase two-wire with mid-point earthed.
(iii) Single-phase three-wire.
3. Two-phase A.C. system
(i) Two-phase four-wire.
(ii) Two-phase three wire.
4. Three-phase A.C. system
(i) Three-phase three-wire.
(ii) Three-phase four-wire.
1.5 CLASSIFICATION OF DISTRIBUTION SYSTEMS
A distribution system may be classified according to ;
i) Nature of current According to nature of current, distribution system may be classified as
(a) d.c. Distribution system
(b) a.c. Distribution system

Now-a-days, a.c. system is universally adopted for distribution of electric power as it is
simpler and more economical than direct current method
ii) Type of construction
According to type of construction distribution system may be classified as (a) Overhead system
(b) Underground system.
The overhead system is generally employed for distribution as it is 5 to 10 times cheaper than
the equivalent underground system. In general, the underground system is used at places where
overhead con struction is impracticable or prohibited by the local laws
(iii) Scheme of connection
According to scheme of connection, the distribution system may be classified as (a) Radial system
(b) Ring main system
(c) Inter-connected system
Fig.1.2 Distribution Systems
1.6 AC DISTRIBUTION
Now-a-days electrical energy is generated, transmitted and distributed in the form of
alternating cur-rent. One important reason for the widespread use of alternating current in
preference to direct current is the fact that alternating voltage can be conveniently changed in
magnitude by means of a transformer. Transformer has made it possible to transmit a.c. power
at high voltage and utilise it at a safe potential. High transmission and distribution voltages
have greatly reduced the current in the conductors and the resulting line losses.
There is no definite line between transmission and distribution according to voltage or bulk
capacity. However, in general, the a.c. distribution system is the electrical system between
the

step- down substation fed by the transmission system and the consumers’ meters. The a.c.
distribution system is classified into
primary distribution system and
Secondary distribution system.
i) Primary distribution system.
It is that part of a.c. distribution system which operates at voltages somewhat higher than
general utilization and handles large blocks of electrical energy than the average low- voltage
consumer uses. The voltage used for primary distribution depends upon the amount of power to be
conveyed and the distance of the substation required to be fed. The most commonly used primary
distribution voltages are 11 kV, 6·6 kV and 3·3 kV.
Due to economic considerations, primary distribution is carried out by 3- phase, 3-wire
system Fig. shows a typical primary distribution system Electric power from the generating station
is transmitted at high voltage to the substation located in or near the city.
Fig. 1.3 Primary Distribution Systems
ii) Secondary distribution system
It is that part of a.c. distribution system.Thesecondarydistributionemploys400/230V,3-
phase,4wire system. Fig shows a typical secondary distribution system. The primary distribution
circuit delivers power to various substations, called distribution sub-stations. The substations are
situated near the consumers’ localities and contain step-down transformers. At each distribution
substation, the voltage is stepped down to 400Vandpowerisdeliveredby 3-phase,4- wire a.c.
system. The voltage between any two phasesis400Vandbetween any phase and neutralize
230V.Thesinglephasedomesticloadsareconnectedbetween anyonephaseandtheneutral,whereas3-
phase400Vmotor loadsareconnectedacross3- phase lines directly.

Fig. 1.4 Secondary Distribution Systems
1.7 D.C. DISTRIBUTION
It is a common knowledge that electric power is almost exclusively generated, transmitted
and distributed as a.c. However, for certain applications, d.c. supply is absolutely necessary. For
instance, d.c. supply is required for the operation of variable speed machinery (d.c. motors), for
electro-chemical work and for congested areas where storage battery reserves are necessary. For
this purpose, a.c. power is converted into d.c. power at the substation by using converting
machinery e.g., mercury arc rectifiers, rotary converters and motor-generator sets.
The d.c. supply from the substation may be obtained in the form of
( i) 2-wire
( ii) 3-wire for distribution.
( i) 2-wire d.c. system.
As the name implies, this system of distribution consists of two wires. One is the outgoing
or positive wire and the other is the return or negative wire. The loads such as lamps, motors etc.
are connected in parallel between the two wires as shown in Fig. This system is never used for
transmission purposes due to low efficiency but may be employed for distribution of d.c. power.

*
Fig.1.5 a) DC 2 wire system b) DC three wire system
( ii) 3-wire d.c. system.
It consists of two outers and a middle or neutral wire which is earthed at the substation.
The voltage between the outers is twice the voltage between either outer and neutral wire as shown
in Fig.. The principal advantage of this system is that it makes available two voltages at the
consumer terminals viz., V between any outer and the neutral and 2V between the outers. Loads
requiring high voltage ( e.g., motors) are connected across the outers, whereas lamps and heating
circuits requiring less voltage are connected between either outer and the neutral. The methods of
obtaining 3-wire system are discussed in the following article.
1.8 OVERHEAD VERSUS UNDERGROUND SYSTEM
The distribution system can be overhead or underground. Overhead lines are generally
mounted on wooden, concrete or steel poles which are arranged to carry distribution transformers
in addition to the conductors. The underground system uses conduits, cables and manholes under
the surface of streets and sidewalks. The choice between overhead and underground system
depends upon a number of widely differing factors. Therefore, it is desirable to make a comparison
between the two.
( i) Public safety.
The underground system is more safe than overhead system because all distribution wiring is
placed underground and there are little chances of any hazard.
( ii) Initial cost.
The underground system is more expensive due to the high cost of trenching, conduits, cables,
manholes and other special equipment. The initial cost of an underground system may be five to
ten times than that of an overhead system.
( iii) Flexibility.
The overhead system is much more flexible than the underground system. In the latter case,
manholes, duct lines etc., are permanently placed once installed and the load expansion can only
be met by laying new lines. However, on an overhead system, poles, wires, transformers etc., can
be easily shifted to meet the changes in load conditions.
( iv) Faults.
The chances of faults in underground system are very rare as the cables are laid underground and
are generally provided with better insulation.
( v) Appearance.
The general appearance of an underground system is better as all the distribution lines are
invisible. This factor is exerting considerable public pressure on electric supply companies to
switch over to underground system.

( vi) Fault location and repairs.
In general, there are little chances of faults in an underground system. However, if a fault does
occur, it is difficult to locate and repair on this system. On an overhead system, the conductors are
visible and easily accessible so that fault locations and repairs can be easily made.
( vii) Current carrying capacity and voltage drop.
An overhead distribution conductor has a considerably higher current carrying capacity than an
underground cable conductor of the same material and cross-section. On the other hand,
underground cable conductor has much lower inductive reactance than that of an overhead
conductor because of closer spacing of conductors. ( viii) Useful life.
The useful life of underground system is much longer than that of an overhead system. An
overhead system may have a useful life of 25 years, whereas an underground system may have a
useful life of more than 50 years.
( ix) Maintenance cost.
The maintenance cost of underground system is very low as compared with that of overhead
system because of less chances of faults and service interruptions from wind, ice, lightning as
well as from traffic hazards.
( x) Interference with communication circuits.
An overhead system causes electromagnetic interference with the telephone lines. The power line
currents are superimposed on speech currents, resulting in the potential of the communication
channel being raised to an undesirable level. However, there is no such interference with the
underground system.
It is clear from the above comparison that each system has its own advantages and disadvan
tages. However, comparative economics ( i.e., annual cost of operation) is the most powerful factor
influencing the choice between underground and overhead system. The greater capital cost of
underground system prohibits its use for distribution. But sometimes non- economic factors ( e.g.,
general appearance, public safety etc.) exert considerable influence on choosing underground
system. In general, overhead system is adopted for distribution and the use of underground system
is made only where overhead construction is impracticable or prohibited by local laws.
1.9 CONNECTION SCHEMES OF DISTRIBUTION SYSTEM
All distribution of electrical energy is done by constant voltage system. In practice, the
following distribution circuits are generally used :
( i) Radial System.
In this system, separate feeders radiate from a single substation and feed the distributors
at one end only. Fig. shows a single line diagram of a radial system for d.c. distribution where a
feeder OC supplies a distributor A B at point A . Obviously, the distributor is fed at one end only
i.e., point A is this case. Fig ( ii) shows a single line diagram of radial system for a.c. distribution.
The radial system is employed only when power is generated at low voltage and the substation is
located at the centre of the load.

Fig.1.6 Radial Distribution system
This is the simplest distribution circuit and has the lowest initial cost. However, it suffers
from the following drawbacks :
( a) The end of the distributor nearest to the feeding point will be heavily loaded.
( b) The consumers are dependent on a single feeder and single distributor. Therefore,
any fault on the feeder or distributor cuts off supply to the consumers who are on the side of the
fault away from the substation.
( c) The consumers at the distant end of the distributor would be subjected to serious
voltage fluctuations when the load on the distributor changes.
Due to these limitations, this system is used for short distances only.
( ii) Ring main system.
In this system, the primaries of distribution transformers form a loop. The loop circuit starts
from the substation bus-bars, makes a loop through the area to be served, and returns to the
substation. Fig. shows the single line diagram of ring main system for a.c. distribution where
substation supplies to the closed feeder LMNOPQRS.

Fig. 1.7 Ring main distribution system
The distributors are tapped from different points M, O and Q of the feeder through
distribution transformers. The ring main system has the following advantages :
( a) There are less voltage fluctuations at consumer’s terminals.
( b) The system is very reliable as each distributor is fed via *two feeders. In the event of
fault on any section of the feeder, the continuity of supply is maintained. For example, suppose
that fault occurs at any point F of section SLM of the feeder. Then section SLM of the feeder can
be isolated for repairs and at the same time continuity of supply is maintained to all the
consumers via the feeder SRQPONM.
( iii) Interconnected system.
When the feeder ring is energised by two or more than two generating stations or
substations, it is called inter-connected system. Fig. shows the single line diagram of
interconnected system where the closed feeder ring ABCD is supplied by two substations S and
S at points D and C respectively.

Fig.1.8 Interconnected System
Distributors are connected to points O, P, Q and R of the feeder ring through distribution
transformers. The interconnected system has the following advantages :
( a) It increases the service reliability.
( b) Any area fed from one generating station during peak load hours can be fed from the
other generating station. This reduces reserve power capacity and increases efficiency of the
system.
1.10 REQUIREMENTS OF A DISTRIBUTION SYSTEM
A considerable amount of effort is necessary to maintain an electric power supply within
the requirements of various types of consumers. Some of the requirements of a good distribution
system are : proper voltage, availability of power on demand and reliability.

( i) Proper voltage.
One important requirement of a distribution system is that voltage variations at consumer’s
terminals should be as low as possible. The changes in voltage are generally caused due to the
variation of load on the system. Low voltage causes loss of revenue, inefficient lighting and
possible burning out of motors. High voltage causes lamps to burn out permanently and may cause
failure of other appliances. Therefore, a good distribution system should ensure that the voltage
variations at consumers terminals are within permissible limits. The statutory limit of voltage
variations is ± 6% of the rated value at the consumer’s terminals. Thus, if the declared voltage is
230 V, then the highest voltage of the consumer should not exceed 244 V while the lowest voltage
of the consumer should not be less than 216 V.
( ii) Availability of power on demand.
Power must be available to the consumers in any amount that they may require from time to
time. For example, motors may be started or shut down, lights may be turned on or off, without
advance warning to the electric supply company. As electrical energy cannot be stored, therefore,
the distribution system must be capable of supplying load demands of the consumers. This
necessitates that operating staff must con-tinuously study load patterns to predict in advance those
major load changes that follow the known schedules.
( iii) Reliability.
Modern industry is almost dependent on electric power for its operation. Homes and office
buildings are lighted, heated, cooled and ventilated by electric power. This calls for reliable
service. Unfortunately, electric power, like everything else that is man-made, can never be
absolutely reliable. However, the reliability can be improved to a considerable extent by ( a)
interconnected system ( b) reliable automatic control system ( c) providing additional reserve
facilities.
1.10.1 DESIGN CONSIDERATIONS IN DISTRIBUTION SYSTEM
Good voltage regulation of a distribution network is probably the most important factor
responsible for delivering good service to the consumers. For this purpose, design of feeders and
distributors requires careful consideration.
( i) Feeders.
A feeder is designed from the point of view of its current carrying capacity while the voltage
drop consideration is relatively unimportant. It is because voltage drop in a feeder can be
compensated by means of voltage regulating equipment at the substation.
( ii) Distributors.
A distributor is designed from the point of view of the voltage drop in it. It is because a distributor
supplies power to the consumers and there is a statutory limit of voltage variations at the
consumer’s terminals (± 6% of rated value). The size and length of the distributor should be such
that voltage at the consumer’s terminals is within the permissible limits.
1.11 A.C. DISTRIBUTION -INTRODUCTION
In the beginning of electrical age, electricity was generated, transmitted and distributed as
direct current. The principal disadvantage of d.c. system was that voltage level could not readily

be changed, except by the use of rotating machinery, which in most cases was too expensive. With
the development of transformer by George Westinghouse, a.c. system has become so predominant
as to make d.c. system practically extinct in most parts of the world. The present day large power
system has been possible only due to the adoption of a.c. system Now-a-days, electrical energy is
generated, transmitted and distributed in the form of alter- nating current as an economical
proposition. The electrical energy produced at the power station is transmitted at very high voltages
by 3-phase, 3-wire system to step-down sub-stations for distribution. The distribution system
consists of two parts viz. primary distribution and secondary distribution. The primary distribution
circuit is 3-phase, 3-wire and operates at voltages (3·3 or 6·6 or 11kV) somewhat higher than
general utilization levels. It delivers power to the secondary distribution circuit through
distribution transformers situated near consumers’ localities. Each distribution transformer steps
down the voltage to 400 V and power is distributed to ultimate consumers’ by 400/230 V, 3-phase,
4-wire system. In this chapter, we shall focus our attention on the various aspects of a.c.
distribution.
1.11.1 A.C. DISTRIBUTION CALCULATIONS
A.C. distribution calculations differ from those of d.c. distribution in the following
respects :
( i) In case of d.c. system, the voltage drop is due to resistance alone. However, in a.c. system,
the voltage drops are due to the combined effects of resistance, inductance and capacitance.
( ii) In a d.c. system, additions and subtractions of currents or voltages are done arithmetically
but in case of a.c. system, these operations are done vectorially.
( iii) In an a.c. system, power factor (p.f.) has to be taken into account. Loads tapped off
form the distributor are generally at different power factors. There are two ways of referring
power factor viz
( a) It may be referred to supply or receiving end voltage which is regarded as the
reference vector.
( b) It may be referred to the voltage at the load point itself.
There are several ways of solving a.c. distribution problems. However, symbolic notation method
has been found to be most convenient for this purpose. In this method, voltages, currents and
impedances are expressed in complex notation and the calculations are made exactly as in
d.c. distribution.
1.11.2 METHODS OF SOLVING A.C. DISTRIBUTION PROBLEMS
In a.c. distribution calculations, power factors of various load currents have to be
considered since currents in different sections of the distributor will be the vector sum of load
currents and not the arithmetic sum. The power factors of load currents may be given ( i) w.r.t.
receiving or sending end voltage or ( ii) w.r.t. to load voltage itself. Each case shall be discussed
separately.
( i) Power factors referred to receiving end voltage.
Consider an a.c. distributor A B with concentrated loads of I1 and I2 tapped off at points
C and B as shown in Fig. Taking the receiving end voltage VB as the reference vector, let

lagging power factors at C and B be cos φ1 and cos φ 2 w.r.t. VB . Let R1 , X1 and R2 , X2 be the
resistance and reactance of sections A C and CB of the distributor.

The vector diagram of the a.c. distributor under these conditions is shown in Fig. Here, the
receiving end voltage VB is taken as the reference vector. As power factors of loads are given
w.r.t. VB , therefore, I1 and I2 lag behind VB by φ1 and φ2 respectively.
( ii) Power factors referred to respective load voltages.
Suppose the power factors of loads in the previous Fig. are referred to their respective load
voltages. Then φ1 is the phase angle between Vc and I1 and φ2 is the phase angle between VB and
I2 . The vector diagram under these conditions is shown in Fig

1.12 TYPES OF D.C. DISTRIBUTORS
The most general method of classifying d.c. distributors is the way they are fed by the
feeders. On this basis, d.c. distributors are classified as:
( i) Distributor fed at one end
( ii) Distributor fed at both ends
( iii) Distributor fed at the centre
( iv) Ring distributor.
( i) Distributor fed at one end.
In this type of feeding, the distributor is connected to the supply at one end and loads are taken at
different point along the length of the distributor.
Fig. shows the single line diagram of a d.c. distributor A B fed at the end A (also known as singly
fed distributor) and loads I1 , I2 and I3 tapped off at points C, D and E respectively.
The following points are worth noting in a singly fed distributor:
( a) The current in the various sections of the distributor away from feeding point goes on
decreasing. Thus current in section AC is more than the current in section CD and current in section
CD is more than the current in section DE.
( b) The voltage across the loads away from the feeding point goes on decreasing. Thus in
Fig. the minimum voltage occurs at the load point E.

( c) In case a fault occurs on any section of the distributor, the whole distributor will have
to be disconnected from the supply mains. Therefore, continuity of supply is interrupted.
( ii) Distributor fed at both ends.
In this type of feeding, the distributor is connected to the supply mains at both ends and loads are
tapped off at different points along the length of the distributor. The voltage at the feeding points
may or may not be equal. Fig. shows a distributor A B fed at the ends A and B and loads of I1 ,
I2 and I3 tapped off at points C, D and E respectively.
Here, the load voltage goes on decreasing as we move away from one feeding point say A , reaches
minimum value and then again starts rising and reaches maximum value when we reach the other
feeding point B. The minimum voltage occurs at some load point and is never fixed. It is shifted
with the variation of load on different sections of the distributor.
Advantages
( a) If a fault occurs on any feeding point of the distributor, the continuity of supply is
maintained from the other feeding point.
( b) In case of fault on any section of the distributor, the continuity of supply is
maintained from the other feeding point.
( c) The area of X-section required for a doubly fed distributor is much less than that of a
singly fed distributor.
( iii) Distributor fed at the centre.
In this type of feeding, the centre of the distributor is connected to the supply mains as shown in
Fig. It is equivalent to two singly fed distributors, each distributor having a common feeding point
and length equal to half of the total length.

( iv)Ring mains.
In this type, the distributor is in the form of a closed ring as shown in Fig.It is equivalent to a
straight distributor fed at both ends with equal voltages, the two ends being brought together to
form a closed ring. The distributor ring may be fed at one or more than one point.
1.12.1 D.C. DISTRIBUTOR FED AT ONE END — CONCENTRATED LOADING
Fig. shows the single line diagram of a 2-wire d.c. distributor A B fed at one end A and
having concentrated loads I1 , I2 , I3 and I4 tapped off at points C, D, E and F respectively.
Let r1 , r2 , r3 and r4 be the resistances of both wires (go and return) of the
sections A C, CD, DE and EF of the distributor respectively

It is easy to see that the minimum potential will occur at point F which is farthest from the feeding
point A .
1.12.2 UNIFORMLY LOADED DISTRIBUTOR FED AT ONE END
Fig shows the single line diagram of a 2-wire d.c. distributor A B fed at one end A and
loaded uniformly with i amperes per metre length. It means that at every 1 m length of the
distributor, the load tapped is i amperes. Let l metres be the length of the distributor and r ohm
be the resistance per metre run.
Consider a point C on the distributor at a distance x metres from the feeding point A as shown in
Fig. Then current at point C is
= i l − i x amperes = i ( l − x) amperes
Now, consider a small length dx near point C. Its resistance is r dx and the voltage drop over length
dx is d v = i ( l − x) r dx = i r ( l − x) dx Total voltage drop in the distributor upto point C is
The voltage drop upto point B ( i.e. over the whole distributor) can be obtained by putting x = l
in the above expression.
∴ Voltage drop over the distributor AB

where
i l = I, the total current entering at point A
r l = R, the total resistance of the distributor
Thus, in a uniformly loaded distributor fed at one end, the total voltage drop is equal to that
produced by the whole of the load assumed to be concentrated at the middle point.
1.12.3 DISTRIBUTOR FED AT BOTH ENDS — CONCENTRATED LOADING
Whenever possible, it is desirable that a long distributor should be fed at both ends
instead of at one end only, since total voltage drop can be considerably reduced without increasing
the cross-section of the conductor. The two ends of the distributor may be supplied with ( i) equal
voltages ( ii) unequal voltages.
( i) Two ends fed with equal voltages. Consider a distributor A B fed at both ends with equal
voltages V volts and having concentrated loads I1 , I2 , I3 , I4 and I5 at points C, D, E, F and G
respectively as shown in Fig. As we move away from one of the feeding points, say A , p.d.
goes on decreasing till it reaches the minimum value at some load point, say E, and then again
starts rising and becomes V volts as we reach the other feeding point B.
All the currents tapped off between points A and E (minimum p.d. point) will be supplied
from the feeding point A while those tapped off between B and E will be supplied from the feeding
point B.
The current tapped off at point E itself will be partly supplied from A and partly from B.
If these currents are x and y respectively, then,
I 3= x + y
Therefore, we arrive at a very important conclusion that at the point of minimum potential,
current comes from both ends of the distributor.
Point of minimum potential.
It is generally desired to locate the point of minimum potential. There is a simple method
for it. Consider a distributor A B having three concentrated loads I1 , I2 and I3 at points C, D and
E respectively. Suppose that current supplied by feeding end A is Ia . Then current distribution in
the various sections of the distributor can be worked out as shown in Fig.

Voltage drop between A and B = Voltage drop over A B
From this equation, the unknown IA can be calculated as the values of other quantities are generally
given. Suppose actual directions of currents in the various sections of the distributor are indicated
as shown in Fig. The load point where the currents are coming from both sides of the distributor
is the point of minimum potential i.e. point E in this case
( ii) Two ends fed with unequal voltages.
Fig. shows the distributor A B fed with unequal voltages end A being fed at V1 volts and
end B at V2 volts. The point of minimum potential can be found by following the same procedure
as discussed above. Thus in this case, Voltage drop between A and B = Voltage drop over A B
V1 − V2 = Voltage drop over A B
1.12.4 UNIFORMLY LOADED DISTRIBUTOR FED AT BOTH ENDS
We shall now determine the voltage drop in a uniformly loaded distributor fed at both
ends. There can be two cases viz. the distributor fed at both ends with ( i) equal voltages ( ii)
unequal voltages. The two cases shall be discussed separately.
( i) Distributor fed at both ends with equal voltages.
Consider a distributor A B of length l metres, having resistance r ohms per metre run and

with uniform loading of i amperes per metre run as shown in Fig. Let the distributor be fed at
the feeding points A and B at equal voltages, say V volts. The total current supplied to the
distributor is i l. As the two end voltages are equal, therefore, current supplied from each feeding
point is i l/2 i.e.
Current supplied from each feeding point
Consider a point C at a distance x metres from the feeding point A. Then current at point C is i l
Now, consider a small length dx near point C. Its resistance is r dx and the voltage drop over length dx is
Obviously, the point of minimum potential will be the mid-point. Therefore, maximum voltage drop will occur at
mid-point i.e. where x = l/2.

26
( ii) Distributor fed at both ends with unequal voltages.
Consider a distributor AB of length l metres having resistance r ohms per
metre run and with a uniform loading of i amperes per metre run as shown in Fig.
Let the distributor be fed from feeding points A and B at voltages VA and VB
respectively. Suppose that the point of minimum potential C is situated at a
distance x metres from the feeding point A. Then current supplied by the feeding
point A will be * i x.
As the distance of C from feeding point B is ( l − x), therefore, current fed from B is i ( l − x).
As all the quantities on the right hand side of the equation are known, therefore, the
point on the distributor where minimum potential occurs can be calculated.
1.13 COMPONENTS OF POWER SYSTEM
Components of the system are represented by standard symbols & the transmission lines
are represented by straight lines. “Hence a single line diagram is diagrammatic of power
system in which the components are represented by their symbols and the interconnection
between them is shown by straight lines”.

27
1.13.1 ELEMENTS OF POWER SYSTEM
Power transformers:
Power transformers are used generation and transmission network for stepping-up the
voltage at generating station and stepping-down the voltage for distribution. Auxiliary
transformers supply power to auxiliary equipments at the substations.
Current transformers (CT):
The lines in substations carry currents in the order of thousands of amperes. The measuring
instruments are designed for low value of currents. Current transformers are connected in
lines to supply measuring instruments and protective relays.
Potential transformers (PT):
The lines in substations operate at high voltages. The measuring instruments are designed
for low value of voltages. Potential transformers are connected in lines to supply measuring
instruments and protective relays. These transformers make the low voltage instruments
suitable for measurement of high voltages. For example a 11kV/110V PT is connected to
a power line and the line voltage is 11kV then the secondary voltage will be 110V.
Circuit breaker (CB):
Circuit breakers are used for opening or closing a circuit under normal as well as abnormal
(faulty) conditions. Different types of CBs which are generally used are oil circuit breaker,
air-blast circuit breaker, and vacuum circuit breaker and SF6 circuit breaker.
Isolators or Isolating switches:
Isolators are employed in substations to isolate a part of the system for general
maintenance. Isolator switches are operated only under no load condition. They are
provided on each side of every circuit breaker Bus-bar: When number of lines operating at

28
the same voltage levels needs to be connected electrically, bus-bars are used. Bus-bars are
conductors made of copper or aluminum, with very low impedance and high current
carrying capacity. Different types of bus-bar arrangements are single bus bar arrangements,
single bus-bar with sectionalisation, double bus-bar arrangements, sectionalized double
bus-bar arrangement, double main and auxiliary bus-bar arrangement, breaker and a half
scheme/1.5 Breaker scheme, and ring bus-bar scheme.
1.13 Bus-Bar Arrangements in Sub-Stations
Bus-bars are the important components in a sub-station. There are several bus-bar
arrangements that can be used in a sub-station. The choice of a particular arrangement
depends upon various factors such as system voltage, position of sub-station, degree of
reliability, cost etc. The following are the important bus-bar arrangements used in sub-
stations :
(i) Single bus-bar system. As the name suggests, it consists of a single bus-bar and
all the incoming and outgoing lines are connected to it. The chief advantages of
this type of arrangement are low initial cost, less maintenance and simple
operation. However, the principal disadvantage of single bus-bar system is that if
repair is to be done on the bus-bar or a fault occurs on the bus, there is a complete
interruption of the supply. This arrangement is not used for voltages exceeding
33kV. The indoor 11kV sub-stations often use single bus-bar arrangement. Fig.
shows single bus-bar arrangement in a sub-station. There are two 11 kV incoming
lines connected to the bus-bar through circuit breakers and isolators. The two
400V outgoing lines are connected to the bus bars through transformers
(11kV/400 V) and circuit breakers

29
(ii) Single bus-bar system with sectionalisation.
In this arrangement, the single bus-bar is divided into sections and load is equally
distributed on all the sections. Any two sections of the busbar are connected by a
circuit breaker and isolators. Two principal advantages are claimed for this
arrangement. Firstly, if a fault occurs on any section of the bus, that section can
be isolated without affecting the supply from other sections. Secondly, repairs and
maintenance of any section of the busbar can be carried out by de-energising that
section only, eliminating the possibility of complete shut down. This arrangement
is used for voltages upto 33 kV. Fig.shows bus-bar with sectionalisation where
the bus has been divided into two sections. There are two 33 kV incoming lines
connected to sections I and II as shown through circuit breaker and isolators. Each
11 kV outgoing line is connected to one section through transformer (33/11 kV)
and circuit breaker. It is easy to see that each bus-section behaves as a separate
bus-bar.
(iii) Duplicate bus-bar system.
This system consists of two bus-bars, a “main” bus-bar and a “spare” bus-bar.
Each bus-bar has the capacity to take up the entire sub-station load. The incoming
and outgoing lines can be connected to either bus-bar with the help of a bus-bar
coupler which consists of a circuit breaker and isolators. Ordinarily, the incoming

30
and outgoing lines remain connected to the main bus-bar. However, in case of
repair of main bus-bar or fault occuring on it, the continuity of supply to the circuit
can be maintained by transferring it to the spare bus-bar. For voltages exceeding
33kV, duplicate bus-bar system is frequently used.
Fig. shows the arrrangement of duplicate bus-bar system in a typical sub-station.
The two 66kV incoming lines can be connected to either bus-bar by a bus-bar
coupler. The two 11 kV outgoing lines are connected to the bus-bars through
transformers (66/11 kV) and circuit breakers.
1.14 Economics of Power Transmission
While designing any scheme of power transmission, the engineer must have before him the
commercial aspect of the work entrusted to him. He must design the various parts of
transmission scheme in a way that maximum economy is achieved. The economic design
and layout of a complete power transmission scheme is outside the scope of this book.
However, the following two fundamental economic principles which closely influence the
electrical design of a transmission line will be discussed :
(i) Economic choice of conductor size
(ii) Economic choice of transmission voltage

31
(i) Annual charge on capital outlay. This is on account of interest and
depreciation on the capital cost of complete installation of transmission line.
In case of overhead system, it will be the annual interest and depreciation on
the capital cost of conductors, supports and insulators and the cost of their
erection. Now, for an overhead line, insulator cost is constant, the conductor
cost is proportional to the area of X-section and the cost of supports and their
erection is partly constant and partly proportional to area of X-section of the
conductor. Therefore, annual charge on an overhead† transmission line can
be expressed as :
Annual charge = P1 + P2 a
where P1 and P2 are constants and a is the area of X-section of the conductor.
(ii) Annual cost of energy wasted. This is on account of energy lost mainly‡
in the conductor due to I 2 R losses. Assuming a constant current in the
conductor throughout the year, the energy lost in the conductor is
proportional to resistance. As resistance is inversely proportional to the area
of X section of the conductor, therefore, the energy lost in the conductor is
inversely proportional to area of X-section. Thus, the annual cost of energy
wasted in an overhead transmission line can be expressed as :
Therefore Kelvin’s Law can also be stated in an another way i.e. the most
economical area of conductor is that for which the variable part* of annual
charge is equal to the cost of energy losses per year
Graphical illustration of Kelvin’s law. Kelvin’s law can also be illustrated
graphically by plotting annual cost against X-sectional area ‘a’ of the
conductor . In the diagram, the straight line (1) shows the relation between
the annual charge (i.e., P1 + P2a) and the area of X-section a of the conductor.
Similarly, the rectangular hyperbola (2) gives the relation between annual

32
cost of energy wasted and X-sectional areaa. By adding the ordinates of
curves (1) and (2), the curve (3) is obtained. This latter curve shows the
relation between total annual cost (P1 + P2a + P3/a) of transmission line and
area of X-section a. The lowest point on the curve (i.e., point P) represents
the most economical area of X-section.
Limitations of Kelvin’s law. Although theoretically Kelvin’s law holds
good, there is often considerable difficulty in applying it to a proposed
scheme of power transmission. In practice, the limitations of this law are :
(i) It is not easy to estimate the energy loss in the line without actual load
curves, which are not available at the time of estimation.
(ii) The assumption that annual cost on account of interest and depreciation
on the capital outlay is in the form P1 + P2a is strictly speaking not true. For
instance, in cables neither the cost of cable dielectric and sheath nor the cost
of laying vary in this manner
(iii) This law does not take into account several physical factors like safe
current density, mechanical strength, corona loss etc.
(iv)The conductor size determined by this law may not always be practicable
one because it may be too small for the safe carrying of necessary current. (v)
Interest and depreciation on the capital outlay cannot be determined
accurately.

33
QUESTIONS:
Q.No Question
1 Draw a model one line diagram of a power system showing generation,
transmission and distribution.
2 Compare feeder and distributor.
3 List the components of a power system?
4 State Kelvin’s law.
5 State the limitations of kelvins law.
6 Discuss the need for DC power.
7 Why the transmission voltages are in terms of kV?
8 Explain ring main system
9 What are the transmission level voltages available in India?
10 Distinguish between 3 phase 3 wire and 3 phase 4 wire distribution systems?
11 List two main requirements of a good distribution system.
Q.No Question
1 A dc 2-wire distributor AB is 500m long and is fed at both ends at 240V. The loads
of 100 A and 60 A are tapped from C and D which are at a distance of 100m and
250m from point A respectively. The last 200m. (Near end B) is loaded uniformly
at the rate of 1 A/m. The resistance of (both go and return) the distributor is 0.001
ohm per metre. Estimate i) the point of minimum potential and its value.
2 The cost of a 3 phase overhead transmission line is Rs. (25000 a + 2500) per km
where ‘a’ is the area of cross-section of each conductor in cm2. The line is supplying
a load of 5 MW at 33 kV and 0.8 p.f. lagging assumed to be constant throughout
the year. Energy costs 4P per kWh and interest and depreciation total 10% per
annum. Estimate the most economical size of the conductor. Given that the specific
resistance of conductor material is 10-6 ohm-cm.
3 A single phase distributor one km. long has resistance and reactance per conductor
of 0.1ohm and 0.15 ohm respectively. At the far end, the voltage is 200V and the

34
current is 100 A at a p.f. of 0.8 lagging. At the mid-point M of the distributor, a
current of 100 A is tapped at a p.f of 0.6 lagging with reference to the voltage at the
mid point. Determine :
a. voltage at the midpoint
b. sending end voltage
c. phase angle between sending and receiving end voltages
4 An electric train runs between two two substations 6 km. apart maintained at
voltages 600 V and 590 V respectively and draws a constant current of 300 A while
ion motion. The track resistance of go and return path is 0.04 ohm/km. Determine
a) the point of minimum potential along the track
b) currents supplied by the two substations when the train is at the point of
minimum potential
5 A d.c ring main ABCDA is fed from point A at 250 V supply and the resistances of
various sections are as follows :- AB = 0.02 Ω, BC = 0.018 Ω, CD = 0.025 Ω, DA
= 0.02 Ω. The main supplies loads of 150 A at B, 300 A at C, 250 A at D. Determine
the voltage at each point. If the points A & C are linked through an interconnector
of resistance 0.02 Ω, determine the new voltage at each load point.
6 Explain Kelvin’s law for economic selection of conductors and State its limitations
7 a. Draw the layout of a substation and explain the components in a
substation.
b. Discuss the points and factors to be considered while planning a
distribution system.
References :
1. C.L. Wadhwa, “Electrical Power Systems”, 6th Edition, New Age International (P)
Limited, New Delhi, 2010.
2. V.K. Metha & Rohit Metha,”Principles of Power System”, S. Chand, 3rd Edition,
2006.
SCHOOL OF ELECTRICAL AND ELECTRONICS
DEPARTMENT OF ELECTRICAL AND ELECTRONICS ENGINEERING
TRANSMISSION AND DISTRIBUTION – SEEA1402
UNIT II- TRANSMISSION LINE PARAMETERS

II. TRANSMISSION LINE PARAMETERS
Resistance, Inductance and Capacitance of Single Phase and Three Phase (Including Double Circuits)
Transmission Lines - Stranded and Bundled Conductors - Symmetrical and Unsymmetrical Spacing -
Transposition - Application of Self and Mutual GMD - Skin and Proximity Effect - Inductive Interference
with Neighboring Circuits - Corona - Factors Affecting Corona - Advantages and Disadvantages of Corona
- Methods of Reducing Corona Effect.
2.1 PARAMETERS OF SINGLE AND THREE PHASE TRANSMISSION LINES WITH
SINGLE AND DOUBLE CIRCUITS
2.1.1 CONSTANTS OF A TRANSMISSION LINE
A transmission line has resistance, inductance and capacitance uniformly distributed along
the whole length of the line. Before we pass on to the methods of finding these constants for a
transmission line, it is profitable to understand them thoroughly.
( i) Resistance. It is the opposition of line conductors to current flow. The resistance is
distributed uniformly along the whole length of the line as shown in Fig. However, the
performance of a transmission line can be analysed conveniently if distributed resistance is
considered as lumped as shown in Fig.
( ii) Inductance. When an alternating current flows through a conductor, a changing flux
is set up which links the conductor. Due to these flux linkages, the conductor possesses inductance.
Mathematically, inductance is defined as the flux linkages per ampere i.e.,
The inductance is also uniformly distributed along the length of the * line as show in Fig. Again
for the convenience of analysis, it can be taken to be lumped as shown in Fig
( iii) Capacitance. We know that any two conductors separated by an insulating material consti-
tute a capacitor. As any two conductors of an overhead transmission line are separated by air which
acts as an insulation, therefore, capacitance exists between any two overhead line conductors. The
capacitance between the conductors is the charge per unit potential difference i.e.,

where
q = charge on the line in coulomb
v = p.d. between the conductors in volts
The capacitance is uniformly distributed along the whole length of the line and may be
regarded as a uniform series of capacitors connected between the conductors as shown in Fig.
9.2( i). When an alternating voltage is impressed on a transmission line, the charge on the
conductors at any point increases and decreases with the increase and decrease of the
instantaneous value of the voltage between conductors at that point. The result is that a current
(known as charging current) flows between the conductors [See Fig. 9.2( ii)]. This charging
current flows in the line even when it is open-circuited i.e., supplying no load. It affects the
voltage drop along the line as well as the efficiency and power factor of the line.
Resistance of a Transmission Line The resistance of transmission line conductors is the most important cause of power loss in a transmission
line. The resistance R of a line conductor having resistivity ρ, length l and area of cross-section a is given by ;
R = ρ l/a
The variation of resistance of metallic conductors with temperature is practically linear over the normal range
of operation. Suppose R1 and R2 are the resistances of a conductor at t1 ºC and t2 ºC
( t2 > t1 ) respectively. If α 1is the temperature coefficient at t1 °C, then,
2.2 INDUCTANCE OF A SINGLE PHASE TWO-WIRE LINE
A single phase line consists of two parallel conductors which form a rectangular loop of
one turn.
When an alternating current flows through such a loop, a changing magnetic flux is set up.
The changing flux links the loop and hence the loop (or single phase line) possesses inductance. It
may appear that inductance of a single phase line is negligible because it consists of a loop of
one turn and the flux path is through air of high reluctance. But as the X -sectional

area of the loop is very **large, even for a small flux density, the total flux linking the loop is quite
large and hence the line has appreciable inductance.
Consider a single phase overhead line consisting of two parallel conductors A and B spaced d
metres apart as shown in Fig. 9.7. Conductors A and B carry the same amount of current ( i.e. IA
= IB ), but in the opposite direction because one forms the return circuit of the other.
IA+IB = 0
In order to find the inductance of conductor A (or conductor B), we shall have to consider the flux
linkages with it. There will be flux linkages with conductor A due to its own current IA and also A
due to the mutual inductance effect of current IB in the conductor B Flux linkages with conductor
A due to its own current
Flux linkages with conductor A due to current IB
Total flux linkages with conductor A is

Note that eq. ( ii) is the inductance of the two-wire line and is sometimes called loop inductance.
However, inductance given by eq. ( i) is the inductance per conductor and is equal to half the loop
inductance.
2.2.1 INDUCTANCE OF A 3-PHASE OVERHEAD LINE
Fig. shows the three conductors A, B and C of a 3-phase line carrying currents IA , IB and
IC respectively. Let d1 , d2 and d3 be the spacings between the conductors as shown. Let us further
assume that the loads are balanced i.e. IA + IB + IC = 0. Consider the flux linkages with conductor
There will be flux linkages with conductor A due to its own current and also due to the mutual
inductance effects of IB and IC

Flux linkages with conductor A due to its own current
Flux linkages with conductor A due to current IB
Flux linkages with conductor A due to current IC
Total flux linkages with conductor A is
2.2.2 SYMMETRICAL SPACING
If the three conductors A, B and C are placed symmetrically at the corners of an equilateral
triangle of side d, then, d1 = d2 = d3 = d. Under such conditions, the flux Derived in a similar
way, the expressions for inductance are the same for conductors B and C.

2.2.3 UNSYMMETRICAL SPACING
When 3-phase line conductors are not equidistant from each other, the conductor spacing
is said to be unsymmetrical. Under such conditions, the flux linkages and inductance of each
phase are not the same. A different inductance in each phase results in unequal voltage drops in
the three phases even if the currents in the conductors are balanced. Therefore, the voltage at the
receiving end will not be the same for all phases. In order that voltage drops are equal in all
conductors, we generally interchange the positions of the conductors at regular intervals along
the line so that each conductor occupies the original position of every other conductor over an
equal distance. Such an exchange of positions is known as transposition. Fig.shows the
transposed line. The phase conductors are designated as A, B and C and the positions occupied
are numbered 1, 2 and 3. The effect of transposition is that each conductor has the same average
inductance.
Fig. shows a 3-phase transposed line having unsymmetrical spacing. Let us assume that
each of the three sections is 1 m in length. Let us further assume balanced conditions i.e.,
IA + IB +IC = 0
Let the line currents be :

As proved above, the total flux linkages per metre length of conductor A is
Similarly inductance of conductors B and C will be :

Inductance of each line conductor
If we compare the formula of inductance of an un symmetrically spaced transposed line with that
of symmetrically spaced line, we find that inductance of each line conductor in the two cases will
be equal if The distance d is known as equivalent equilateral spacing for un
symmetrically transposed line
2.3 SPIRALING AND BUNDLE CONDUCTOR EFFECT
There are two types of transmission line conductors: overhead and underground. Overhead
conductors, made of naked metal and suspended on insulators, are preferred over underground
conductors because of the lower cost and easy maintenance. Also, overhead transmission lines use
aluminum conductors, because of the lower cost and lighter weight compared to copper conductors,
although more cross-section area is needed to conduct the same amount of current. There are
different types of commercially available aluminum conductors: aluminum-conductor-steel-
reinforced (ACSR), aluminum-conductor-alloy-reinforced (ACAR), all-aluminum-conductor
(AAC), and all-aluminumalloy- conductor (AAAC).
ACSR is one of the most used conductors in transmission lines. It consists of alternate
layers of stranded conductors, spiraled in opposite directions to hold the strands together,

surrounding a core of steel strands. Figure 13.4 shows an example of aluminum and steel strands
combination. The purpose of introducing a steel core inside the stranded aluminum conductors is
to obtain a high strength-to-weight ratio. A stranded conductor offers more flexibility and easier
to manufacture than a solid large conductor. However, the total resistance is increased because the
outside strands are larger than the inside strands on account of the spiraling. The resistance of each
wound conductor at any layer, per unit length, is based on its total length as follows:
2.4 CONCEPT OF SELF-GMD AND MUTUAL-GMD
The use of self geometrical mean distance (abbreviated as self-GMD) and mutual
geometrical mean distance (mutual-GMD) simplifies the inductance calculations, particularly
relating to multi conductor arrangements. The symbols used for these are respectively Ds and Dm.
We shall briefly discuss these terms.
( i) Self-GMD (Ds)
In order to have concept of self-GMD (also sometimes called Geometrical mean radius;
GMR), consider the expression for inductance per conductor per metre already derived in Art.
Inductance/conductor/m
In this expression, the term 2 × 10-7 × (1/4) is the inductance due to flux within the solid conductor.
For many purposes, it is desirable to eliminate this term by the introduction of a concept called
self-GMD or GMR. If we replace the original solid conductor by an equivalent hollow cylinder
with extremely thin walls, the current is confined to the conductor surface and internal conductor
flux linkage would be almost zero. Consequently, inductance due to internal flux would be zero
and the term 2 × 10-7 × (1/4) shall be eliminated. The radius of this equivalent hollow
cylinder must be sufficiently smaller than the physical radius of the conductor to allow room for
enough additional flux to compensate for the absence of internal flux linkage. It can be proved
mathematically that for a solid round conductor of radius r, the self-GMD or GMR = 0·7788 r.
Using self-GMD, the eq. ( i) becomes :
Inductance/conductor/m = 2 × 10⁻⁷loge d/ Ds *
Where
Ds = GMR or self-GMD = 0·7788 r
It may be noted that self-GMD of a conductor depends upon the size and shape of the conductor
and is independent of the spacing between the conductors.
(ii) Mutual-GMD
The mutual-GMD is the geometrical mean of the distances form one conductor to the other
and, therefore, must be between the largest and smallest such distance. In fact, mutual- GMD
simply represents the equivalent geometrical spacing.

(a) The mutual-GMD between two conductors (assuming that spacing between
conductors is large compared to the diameter of each conductor) is equal to the distance between
their centres i.e. Dm = spacing between conductors = d
(b) For a single circuit 3-φ line, the mutual-GMD is equal to the equivalent equilateral
spacing i.e., ( d1 d2 d3 )1/3.
(c) The principle of geometrical mean distances can be most profitably employed to 3-φ
double circuit lines. Consider the conductor arrangement of the double circuit shown in Fig.
Suppose the radius of each conductor is r.
Self-GMD of conductor = 0·7788 r
Self-GMD of combination aa’ is
Self-GMD of combination bb’ is
Self-GMD of combination cc’ is
Equivalent self-GMD of one phase
The value of Ds is the same for all the phases as each conductor has the same radius. Mutual-GMD between phases A and B is
Mutual-GMD between phases B and C is
Mutual-GMD between phases C and A is
It is worthwhile to note that mutual GMD depends only upon the spacing and is substantially
independent of the exact size, shape and orientation of the conductor.
Inductance Formulas in Terms of GMD
The inductance formulas developed in the previous articles can be conveniently
expressed in terms of geometrical mean distances.

2.5 SKIN EFFECT
The phenomena arising due to unequal distribution of electric current over the entire cross
section of the conductor being used for long distance power transmission is referred as the skin
effect in transmission lines. Such a phenomena does not have much role to play in case of a very
short line, but with increase in the effective length of the conductors, skin effect increases
considerably. So the modifications in line calculation needs to be done accordingly. The
distribution of electric current over the entire cross section of the conductor is quite uniform in
case of a DC system. But what we are using in the present era of power system engineering is
predominantly an alternating electric current system, where the electric current tends to flow with
higher density through the surface of the conductors (i.e skin of the conductor), leaving the core
deprived of necessary number of electrons.
In fact there even arises a condition when absolutely no electric current flows through the core,
and concentrating the entire amount on the surface region, thus resulting in an increase in the
effective electrical resistance of the conductor. This particular trend of an AC transmission system
to take the surface path for the flow of electric current depriving the core is referred to as the skin
effect in transmission lines.
2.6 PROXIMITY EFFECT
Proximity means nearness in space or time, so as the name suggests, proximity effect in
transmission lines indicates the effect in one conductor for other neighboring conductors. When
the alternating current is flowing through a conductor, alternating magnetic flux is generated

surrounding the conductor. This magnetic flux associates with the neighboring wires and generates
a circulating current (it can be termed as ‘eddy current’ also). This circulating current increases
the resistance of the conductor and push away the flowing current through the conductor, which
causes the crowding effect.
2.7 CAPACITANCE OF A SINGLE PHASE TWO-WIRE LINE
Consider a single phase overhead transmission line consisting of two parallel conductors
A and B spaced d metres apart in air. Suppose that radius of each conductor is r metres. Let their
respective charge be + Q and − Q coulombs per metre length. The total p.d. between conductor
A and neutral “infinite” plane is
Similarly, p.d. between conductor B and neutral “infinite” plane is
Both these potentials are w.r.t. the same neutral plane. Since the unlike charges attract each other,
the potential difference between the conductors is
Capacitance to neutral Equation ( i) gives the capacitance between the conductors of a two-wire line Often it is
desired to know the capacitance between one of the conductors and a neutral point between
them. Since potential of the mid-point between the conductors is zero, the potential difference

between each conductor and the ground or neutral is half the potential difference between the
conductors. Thus the capacitance to ground or capacitance to neutral for the two-wire line is twice
the line-to-line capacitance
The reader may compare eq. ( ii) to the one for inductance. One difference between the equations
for capacitance and inductance should be noted carefully. The radius in the equation for
capacitance is the actual outside radius of the conductor and not the GMR of the conductor as in
the inductance formula. Note that eq. ( ii) applies only to a solid round conductor.
2.7.1 CAPACITANCE OF A 3-PHASE OVERHEAD LINE
In a 3-phase transmission line, the capacitance of each conductor is considered instead of
capacitance from conductor to conductor. Here, again two cases arise viz., symmetrical spacing
and unsymmetrical spacing.
( i) Symmetrical Spacing
Fig shows the three conductors A, B and C of the 3-phase overhead transmission line
having charges QA , QB and QC per meter length respectively. Let the conductors be equidistant
(d meters) from each other. We shall find the capacitance from line conductor to neutral in this
symmetrically spaced line. Referring to Fig,
Overall potential difference between conductor A and infinite neutral plane is given by

∴ Capacitance of conductor A w.r.t neutral,
Note that this equation is identical to capacitance to neutral for two-wire line. Derived in a
similar manner, the expressions for capacitance are the same for conductors B and C.
(ii) Unsymmetrical spacing.
Fig. shows a 3-phase transposed line having unsymmetrical spacing. Let us assume
balanced conditions i.e. QA + QB + QC = 0.
Considering all the three sections of the transposed line for phase A,

Average voltage on condutor A is
Capacitance from conductor to neutral is
2.8 INDUCTIVE INTERFERENCE WITH NEIGHBOURING COMMUNICATION
CIRCUITS
It is usual practice to run telephone lines along the same route as the power lines. The
transmission lines transmit bulk power at relatively high voltages and, therefore, these lines give
rise to electro-magnetic and electrostatic fields of sufficient magnitude which induce are
superposed on the true speech currents in the neighboring telephone wires and set up distortion
while the voltage so induced raise the potential of the communication circuit as a whole. In extreme
cases the effect of these may make it impossible to transmit any message faithfully and may raise
the potential of the telephone receiver above the ground to such an extent to render the handling
of the telephone receiver extremely dangerous and in such cases elaborate precautions are required
to be observed to avoid this danger.
In practice it is observed that the power lines and the communication lines run along the same
path. Sometimes it can also be seen that both these lines run on same supports along the same
route. The transmission lines transmit bulk power with relatively high voltage. Electromagnetic
and electrostatic fields are produced by these lines having sufficient magnitude. Because of these
fields, voltages and currents are induced in the neighbouring communication lines. Thus it gives
rise to interference of power line with communication circuit.

Due to electromagnetic effect, currents are induced which is superimposed on speech current
of the neighbouring communication line which results into distortion. The potential of the
communication circuit as a whole is raised because of electrostatic effect and the communication
apparatus and the equipments may get damaged due to extraneous voltages. In the worst situation,
the faithful transmission of message becomes impossible due to effect of these fields. Also the
potential of the apparatus is raised above the ground to such an extent that the handling of
telephone receiver becomes extremely dangerous.
The electromagnetic and the electrostatic effects mainly depend on what is the distance
between power and communication circuits and the length of the route over which they are parallel.
Thus it can be noted that if the distortion effect and potential rise effect are within permissible
limits then the communication will be proper. The unacceptable disturbance which is produced in
the telephone communication because of power lines is called Telephone Interference.
There are various factors influencing the telephone interference. These factors are as follows
1) Because of harmonics in power circuit, their frequency range and magnitudes.
2) Electromagnetic coupling between power and telephone conductor.
The electric coupling is in the form of capacitive coupling between power and telephone
conductor whereas the magnetic coupling is through space and is generally expressed in terms of
mutual inductance at harmonic frequencies.
3) Due to unbalance in power circuits and in telephone circuits.
4) Type of return telephone circuit i.e. either metallic or ground return.
5) Screening effects.
Steps for Reducing Telephone Interference
There are various ways that can reduce the telephone interference. Some of them are as
listed below
i) The harmonics at the source can be reduced with the use of A.C. harmonic filters, D.C. harmonic
filters and smoothing rectors.
ii) Use greater spacing between power and telephone lines.
iii) The parallel run between telephone line and power line is avoided.
iv) Instead of using overhead telephone wires, underground telephone cables may be used.
v) If the telephone circuit is ground return then replace it with metallic return.
vi) Use microwave or carrier communication instead of telephone communication.
vii) The balance of AC power line is improved by using transposition. Transposition of lines
reduces the induced voltages to a considerable extent. The capacitance of the lines is balanced by
transposition leading to balance in electrostatically induced voltages. Using transposition the
fluxes due to positive and negative phase sequence currents cancel out so the electromagnetically
induced e.m.f.s are diminished. For zero sequence currents the telephone lines are also transposed
which is shown in the Fig.

2.9 CONDUCTORS
Commonly used conductor materials:
The most commonly used conductor materials for over head lines are copper, aluminium, steel
cored aluminium, galvanised steel and cadmium copper. The choice of a particular material will
depend upon the cost, the required electrical and mechanical properties and the local conditions.
All conductors used for overhead lines are preferably stranded in order to increase the flexibility.
In stranded conductors, there is generally one central wire and round this, successive layers of
wires containing 6, 12, 18, 24 ...... wires. Thus, if there are n layers, the total number of individual
wires is 3n(n + 1) + 1. In the manufacture of stranded conductors, the consecutive layers of wires
are twisted or spiralled in opposite directions so that layers are bound together.
2.9.1 TYPES OF CONDUCTOR
1.Copper
Copper is an ideal material for overhead lines owing to its high electrical conductivity and
greater tensile strength. It is always used in the hard drawn form as stranded conductor. Although
hard drawing decreases the electrical conductivity slightly yet it increases the tensile strength
considerably. Copper has high current density i.e., the current carrying capacity of copper per unit
of Xsectional area is quite large. This leads to two advantages. Firstly, smaller X- sectional area of
conductor is required and secondly, the area offered by the conductor to wind loads is reduced.
Moreover, this metal is quite homogeneous, durable and has high scrap value. There is hardly any
doubt that copper is an ideal material for transmission and distribution of electric power. However,
due to its higher cost and non-availability, it is rarely used for these purposes. Now a days the trend
is to use aluminium in place of copper.
2. Aluminium
Aluminium is cheap and light as compared to copper but it has much smaller conductivity
and tensile strength. The relative comparison of the two materials is briefed below:
(i) The conductivity of aluminium is 60% that of copper. The smaller conductivity of aluminium

means that for any particular transmission efficiency, the X-sectional area of conductor must be
larger in aluminium than in copper. For the same resistance, the diameter of aluminium conductor
is about 1·26 times the diameter of copper conductor. The increased X-section of aluminium
exposes a greater surface to wind pressure and, therefore, supporting towers must be designed for
greater transverse strength. This often requires the use of higher towers with consequence of greater
sag.
(ii) The specific gravity of aluminium (2·71 gm/cc) is lower than that of copper (8·9
gm/cc).Therefore, an aluminium conductor has almost one-half the weight of equivalent copper
conductor. For this reason, the supporting structures for aluminium need not be made so strong
as that of copper conductor.
(iii) Aluminium conductor being light, is liable to greater swings and hence larger cross-arms are
required.
(iv) Due to lower tensile strength and higher co-efficient of linear expansion of aluminium, the sag
is greater in aluminium conductors. Considering the combined properties of cost, conductivity,
tensile strength, weight etc., aluminium has an edge over copper. Therefore, it is being widely used
as a conductor material. It is particularly profitable to use aluminium for heavy-current
transmission where the conductor size is large and its cost forms a major proportion of the total
cost of complete installation.
3. Steel cored aluminium
Due to low tensile strength, aluminium conductors produce greater sag. This prohibits their
use for larger spans and makes them unsuitable for long distance transmission.In order to increase
the tensile strength, the aluminium conductor is reinforced with a core of galvanised steel wires.
The composite conductorthus obtained is known as steel cored aluminium and is abbreviated as
A.C.S.R. (aluminium conductor steel reinforced).
Steel-cored aluminium conductor consists of central core of galvanized steel wires surrounded by
a number of aluminium strands. Usually, diameter of both steel and aluminium wires is the same.
The X-section of the two metals are generally in the ratio of 1 : 6 but can be modified to 1 : 4 in
order to get more tensile strength for the conductor. Fig. shows steel cored aluminium conductor
having one steel wire surrounded by six wires of aluminium. The result of this composite
conductor is that steel core takes greater percentage of mechanical strength while aluminium
strands carry the bulk of current. The steel cored aluminium conductors have the following
Advantages:
(i) The reinforcement with steel increases the tensile strength but at the same time keeps the
composite conductor light. Therefore, steel cored aluminium conductors will produce smaller sag
and hence longer spans can be used.

(ii) Due to smaller sag with steel cored aluminium conductors, towers of smaller heights can be
used.
4. Galvanised steel
Steel has very high tensile strength. Therefore, galvanised steel conductors can be used
for extremely long spans or for short line sections exposed to abnormally high stresses due to
climatic conditions. They have been found very suitable in rural areas where cheapness is the main
consideration. Due to poor conductivity and high resistance of steel, such conductors are not
suitable for transmitting large power over a long distance. However, they can be used to advantage
for transmitting a small power over a small distance where the size of the copper conductor
desirable from economic considerations would be too small and thus unsuitable for use because
of poor mechanical strength.
5. Cadmium copper
The conductor material now being employed in certain cases is copper alloyed with
cadmium. An addition of 1% or 2% cadmium to copper increases the tensile strength by about
50% and the conductivity is only reduced by 15% below that of pure copper. Therefore, cadmium
copper conductor can be useful for exceptionally long spans. However, due to high cost of
cadmium, such conductors will be economical only for lines of small X-section i.e., where the
cost of conductor material is comparatively small compared with the cost of supports.
2.10 CORONA
When an alternating potential difference is applied across two conductors whose spacing
is large as compared to their diameters, there is no apparent change in the condition of atmospheric
air surrounding the wires if the applied voltage is low. However, when the applied voltage exceeds
a certain value, called critical disruptive voltage, the conductors are surrounded by a faint violet
glow called corona.
The phenomenon of corona is accompanied by a hissing sound, production of ozone, power
loss and radio interference. The higher the voltage is raised, the larger and higher the luminous
envelope becomes, and greater are the sound, the power loss and the radio noise. If the applied
voltage is increased to breakdown value, a flash-over will occur between the conductors due to the
breakdown of air insulation If the conductors are polished and smooth, the corona glow will be
uniform throughout the length of the conductor, otherwise the rough points will appear brighter.
With d.c. voltage, there is difference in the appearance of the two wires. The positive wire has
uniform glow about it, while the negative conductor has spotty glow.
Theory of corona formation
Some ionisation is always present in air due to cosmic rays, ultraviolet radiations and
radioactivity. Therefore, under normal conditions, the air around the conductors contains some
ionised particles and neutral molecules. When p.d. is applied between the conductors, potential
gradient is set up in the air which will have maximum value at the conductor surfaces. Under the
influence of potential gradient, the existing free electrons acquire greater velocities. The greater
the applied voltage, the greater the potential gradient and more is the velocity of free electrons.
When the potential gradient at the conductor surface reaches about 30 kV per cm (max. value), the
velocity acquired by the free electrons is sufficient to strike a neutral molecule with enough

force to dislodge one or more electrons from it. This produces another ion and one or more free
electrons, which is turn are accelerated until they collide with other neutral molecules, thus
producing other ions. Thus, the process of ionisation is cummulative. The result of this ionisation
is that either corona is formed or spark takes place between the conductors.
Factors Affecting Corona
The phenomenon of corona is affected by the physical state of the atmosphere as well as
by the conditions of the line. The following are the factors upon which corona depends:
(i)Atmosphere
As corona is formed due to ionsiation of air surrounding the conductors, therefore, it is
affected by the physical state of atmosphere. In the stormy weather, the number of ions is more
than normal and as such corona occurs at much less voltage as compared with fair weather.
(ii) Conductor size.
The corona effect depends upon the shape and conditions of the conductors. The rough and
irregular surface will give rise to more corona because unevenness of the surface decreases the
value of breakdown voltage. Thus a stranded conductor has irregular surface and hence gives rise
to more corona that a solid conductor.
(iii) Spacing between conductors.
If the spacing between the conductors is made very large as compared to their diameters,
there may not be any corona effect. It is because larger distance between conductors reduces the
electro-static stresses at the conductor surface, thus avoiding corona formation.
(iv) Line voltage.
The line voltage greatly affects corona. If it is low, there is no change in the condition of
air surrounding the conductors and hence no corona is formed. However, if the line voltage has
such a value that electrostatic stresses developed at the conductor surface make the air around the
conductor conducting, then corona is formed.
Important Terms
The phenomenon of corona plays an important role in the design of an overhead
transmission line. Therefore, it is profitable to consider the following terms much used in the
analysis of corona effects:
(i) Critical Disruptive Voltage
It is the minimum phase-neutral voltage at which corona occurs. Consider two conductors
of radii r cm and spaced d cm apart. If V is the phase-neutral potential, then potential gradient at
the conductor surface is given by:
In order that corona is formed, the value of g must be made equal to the breakdown strength of
air. The breakdown strength of air at 76 cm pressure and temperature of 25ºC is 30 kV/cm (max)
or 21·2 kV/cm (r.m.s.) and is denoted by go. If Vc is the phase-neutral potential required under
these conditions, then,

The above expression for disruptive voltage is under standard conditions i.e., at 76 cm of Hg and
25ºC. However, if these conditions vary, the air density also changes, thus altering the value of go.
The value of go is directly proportional to air density. Thus the breakdown strength of air at a
barometric pressure of b cm of mercury and temperature of tºC becomes δ go where
Correction must also be made for the surface condition of the conductor. This is accounted for by
multiplying the above expression by irregularity factor mo.
(ii) Visual critical voltage
It is the minimum phase-neutral voltage at which corona glow appears all along the line
conductors. It has been seen that in case of parallel conductors, the corona glow does not begin at
the disruptive voltage Vc but at a higher voltage Vv, called visual critical voltage. The phase-
neutral effective value of visual critical voltage is given by the following empirical formula : where
mV is another irregularity factor having a value of 1·0 for polished conductors and 0·72 to 0·82 for
rough conductors.
(iii) Power loss due to corona Formation of corona is always accompanied by energy loss which is dissipated in the form
of light, heat, sound and chemical action. When disruptive voltage is exceeded, the power loss due
to corona is given by:
Advantages and Disadvantages of Corona
Corona has many advantages and disadvantages. In the correct design of a high voltage overhead
line, a balance should be struck between the advantages and disadvantages.

23
Advantages
(i) Due to corona formation, the air surrounding the conductor becomes
conducting and hence virtual diameter of the conductor is increased. The increased
diameter reduces the electrostatic stresses between the conductors.
(ii) Corona reduces the effects of transients produced by surges.
Disadvantages
(i) Corona is accompanied by a loss of energy. This affects the transmission
efficiency of the line.
(ii) Ozone is produced by corona and may cause corrosion of the conductor
due to chemical action.
(iii) The current drawn by the line due to corona is non-sinusoidal and hence
no sinusoidal voltage drop occurs in the line. This may cause inductive interference
with neighboring communication lines.
Methods of Reducing Corona Effect
It has been seen that intense corona effects are observed at a working voltage
of 33 kV or above. Therefore, careful design should be made to avoid corona on the
sub-stations or bus-bars rated for 33 kV and higher voltages otherwise highly ionized
air may cause flash-over in the insulators or between the phases, causing
considerable damage to the equipment. The corona effects can be reduced by the
following methods
(i) By increasing conductor size.
By increasing conductor size, the voltage at which corona occurs is raised
and hence corona effects are considerably reduced. This is one of the reasons that
ACSR conductors which have a larger cross-sectional area are used in transmission
lines.
(ii) By increasing conductor spacing
By increasing the spacing between conductors, the voltage at which corona
occurs is raised and hence corona effects can be eliminated. However, spacing
cannot be increased too much otherwise the cost of supporting structure (e.g., bigger
cross arms and supports) may increase to a considerable extent.

24
QUESTIONS :
Q.No Question
1 Define Skin effect.
2 Explain the term ‘proximity effect’ when referred to overhead lines.
3 Why transmission lines are transposed?
4 Deduce an expression for the capacitance of each conductor of single phase
overhead line if there is effect of the earth.
5 What are the advantages of using bundled conductors?
6 What is critical disruptive voltage?
7 What do you understand by inductive interference?
8 What are the disadvantages of corona?
9 Determine the loop inductance per km of a single phase circuit comprising of two
parallel conductors 1 m. apart and 1 cm. in diameter.
10 Distinguish between GMD and GMR
Q.No Question
1 Deduce an expression for inductance of 3-phase transposed unsymmetrically
spaced transmission line
2 Derive the formula for capacitance of 1-phase transmission line.
3 a. Derive an expression for critical disruptive voltage?
b. A 3-phase line has conductors 2 cm. in diameter spaced equilaterally 1m.
apart. If the dielectric strength of air is 30 kV (max) per cm., Evaluate the disruptive
critical voltage for the line. Take air density factor δ = 0/952 and irregularity factor
m0 = 0.9
4 Determine the inductance per phase per km. of double circuit 3-phase line shown
in fig. The conductors are transposed and are of radius 0.75 cm. each. The phase
sequence is ABC. The distance between a and c’ is 4 m.

25
5 A 3 phase, 50 Hz,, 132 kV overhead line has regularly transposed conductors
equilaterally spaced 3 m. apart. Conductor diameter is 2 cm. If the line length is
100 km., calculate the charging current per phase. Determine the capacitance of the
same line taking into account the effect of ground.
6 a. Deduce an equation for the inductance of a single phase line by deriving the
expression for calculating the internal and external flux linkages of a conductor
carrying the current.
b. A 132 KV line with 1.96cm diameter conductors is built so that corona takes
place if the line voltage exceeds 210 KV (r.m.s). if the value of potential gradient
at which ionization occurs can be taken as 30 KV per cm, find the spacing between
the conductors.
7 Elaborate the following
i. skin effect
ii. ACSR conductors
iii. Corona discharge

26
References :
1. C.L. Wadhwa, “Electrical Power Systems”, 6th Edition, New Age International (P)
Limited, New Delhi, 2010.
2. V.K. Metha & Rohit Metha,”Principles of Power System”, S. Chand, 3rd Edition, 2006.
3. S.L. Uppal, Electrical Power, Khanna Publishers, New Delhi, 2006.
4. Chakrabarti A., Soni M.I., Gupta P.V., “Textbook on power system engineering”,
Dhanpat Rai & Co., 2008.
5. S.N.Singh, “Electric Power Generation, Transmission & Distribution”, Prentice Hall of
India, New Edn, New Delhi, 2008.
6. Soni, Bhatnagar and Gupta, ”Electrical Power”, Dhanpat Rai & Sons, New Delhi, 2006.
7. Colin R.Bayliss, Brian Hardy, 4th Edition, ”Transmission and Distribution Electrical
Engineering”, Newnes, 2012.

SCHOOL OF ELECTRICAL AND ELECTRONICS
DEPARTMENT OF ELECTRICAL AND ELECTRONICS ENGINEERING
TRANSMISSION AND DISTRIBUTION – SEEA1402
UNIT III- PERFORMANCE OF TRANSMISSION LINES

III. PERFORMANCE OF TRANSMISSION LINES
Equivalent Circuits for Short, Medium (p and T circuits) and Long Lines - Efficiency and
Regulation - Attenuation Constant, Phase Constant, Surge Impedance and Surge Impedance
Loading - Real and Reactive Power Flows in Lines - Power Circle Diagrams for Receiving and
Sending Ends - Ferranti Effect.
3.1 CLASSIFICATION OF LINES - INTRODUCTION
The important considerations in the design and operation of a transmission line are the
determination of voltage drop, line losses and efficiency of transmission. These values are greatly
influenced by the line constants R, L and C of the transmission line. For instance the voltage drop
in the line depends upon the values of above three line constants. Similarly, the resistance of
transmission line conductors is the most important cause of power loss in the line and determines
the transmission efficiency. In this chapter, we shall develop formulas by which we can calculate
voltage regulation, line losses and efficiency of transmission lines. These formulas are important
for two principal reasons. Firstly, they provide an opportunity to understand the effects of the
parameters of the line on bus voltages and the flow of power. Secondly, they help in developing
an overall understanding of what is occuring on electric power system.
3.1.1 CLASSIFICATION OF OVERHEAD TRANSMISSION LINES
A transmission line has *three constants R, L and C distributed uniformly along the whole
length of the line. The resistance and inductance form the series impedance. The capacitance
existing between conductors for 1-phase line or from a conductor to neutral for a 3- phase line
forms a shunt path throughout the length of the line. Therefore, capacitance effects introduce
complications in transmission line calculations. Depending upon the manner in which capacitance
is taken into account, the overhead transmission lines are classified as :
( i) Short transmission lines. When the length of an overhead transmission line is upto
about 50 km and the line voltage is comparatively low (< 20 kV), it is usually considered as a short
transmission line. Due to smaller length and lower voltage, the capacitance effects are small and
hence can be neglected. Therefore, while studying the performance of a short transmission line,
only resistance and inductance of the line are taken into account.
( ii) Medium transmission lines. When the length of an overhead transmission line is
about 50-150 km and the line voltage is moderatly high (>20 kV < 100 kV), it is considered as a
medium transmission line. Due to sufficient length and voltage of the line, the capacitance effects
are taken into account. For purposes of calculations, the distributed capacitance of the line is
divided and lumped in the form of condensers shunted across the line at one or more points.
( iii) Long transmission lines. When the length of an overhead transmission line is more
than 150 km and line voltage is very high (> 100 kV), it is considered as a long transmission line.
For the treatment of such a line, the line constants are considered uniformly distributed over the
whole length of the line and rigorous methods are employed for solution.
It may be emphasised here that exact solution of any tranmission line must consider the
fact that the constants of the line are not lumped but are distributed unfiormly throughout the length
of the line.

However, reasonable accuracy can be obtained by considering these constants as lumped
for short and medium transmission lines.
Important Terms
While studying the performance of a transmission line, it is desirable to determine its
voltage regulation and transmission efficiency. We shall explain these two terms in turn.
( i) Voltage regulation. When a transmission line is carrying current, there is a voltage drop in
the line due to resistance and inductance of the line. The result is that receiving end voltage ( VR)
of the line is generally less than the sending end voltage ( VS ). This voltage drop ( Vs −V R) in
the line is expressed as a percentage of receiving end voltage V and is called voltage regulation.
The difference in voltage at the receiving end of a transmission line **between
conditions of no load and full load is called voltage regulation and is expressed as a percentage
of the receiving end voltage.
( ii) Transmission efficiency. The power obtained at the receiving end of a transmission line is
generally less than the sending end power due to losses in the line resistance.
The ratio of receiving end power to the sending end power of a transmission line is
known as the transmission efficiency of the line
3.2 PERFORMANCE OF SINGLE PHASE SHORT TRANSMISSION LINES
As stated earlier, the effects of line capacitance are neglected for a short transmission line.
Therefore, while studying the performance of such a line, only resistance and inductance of the
line are taken into account. The equivalent circuit of a single phase short transmission line is shown
in Fig.
Here, the total line resistance and inductance are shown as concentrated or lumped
instead of being distributed. The circuit is a simple a.c. series circuit.
Let
I = load current
R = loop resistance i.e., resistance of both conductors
XL= loop reactance
VR = receiving end voltage
cos φR = receiving end power factor (lagging)
VS= sending end voltage
cos φS= sending end power factor

The *phasor diagram of the line for lagging load power factor is shown in Fig. From the right
angled traingle ODC, we get,
An approximate expression for the sending end voltage Vs can be obtained as follows. Draw S
perpendicular from B and C on OA produced as shown in Fig. Then OC is nearly equal to OF
OC = OF = OA + AF = OA + AG + GF
= OA + AG + BH
Vs= VR + IR cos φR + I XL sin φR
3.2.1 THREE-PHASE SHORT TRANSMISSION LINES
For reasons associated with economy, transmission of electric power is done by 3-phase
system. This system may be regarded as consisting of three single phase units, each wire
transmitting one-third of the total power. As a matter of convenience, we generally analyse 3-
phase system by considering one phase only. Therefore, expression for regulation, efficiency etc.
derived for a single phase line can also be applied to a 3-phase system. Since only one phase is
considered, phase values of 3-phase system should be taken. Thus, Vs and VR are the phase
voltages, whereas R and XL are the resistance S and inductive reactance per phase respectively.

Fig (i) shows a Y-connected generator supplying a balanced Y-connected load through a
transmission line. Each conductor has a resistance of R Ω and inductive reactance of X Ω. Fig. (
ii) shows one phase separately. The calculations can now be made in the same way as for a
single phase line.
3.2.2 Effect of Load p.f. On Regulation and Efficiency
The regulation and efficiency of a transmission line depend to a considerable extent upon
the power factor of the load.
1. Effect on regulation.
The expression for voltage regulation of a short transmission line is given by :
The following conclusions can be drawn from the above expressions :
( i) When the load p.f. is lagging or unity or such leading that I R cos φR > I XL sin φR , then voltage
regulation is positive i.e. , receiving end voltage VR will be less than the sending end voltage VS .
( ii) For a given VR and I, the voltage regulation of the line increases with the decrease in p.f. for
lagging loads.
( iii) When the load p.f. is leading to this extent that I XL sin φR > I cos φ R , then voltage
regulation is negative i.e. the receiving end voltage VR is more than the sending end voltage VS .
( iv) For a given VR and I, the voltage regulation of the line decreases with the decrease in p.f.
for leading loads.
2. Effect on transmission efficiency.
The power delivered to the load depends upon the power factor.

It is clear that in each case, for a given amount of power to be transmitted ( P) and receiving end
voltage Power Factor Meter ( V R), the load current I is inversely proportional to the load p.f. cos
φ R. Consequently, with the decrease in load p.f., the load current and hence the line losses are
increased. This leads to the conclusion that transmission efficiency of a line decreases with the
decrease in load Power Factor Regulator p.f. and vice-versa,
3.3 SHORT TRANSMISSION LINES
As stated earlier, the effects of line capacitance are neglected for a short transmission line.
Therefore, while studying the performance of such a line, only resistance and inductance of the
line are taken into account. The equivalent circuit of a single phase short transmission line is shown
in Fig. Here, the total line resistance and inductance are shown as concentrated or lumped instead
of being distributed. The circuit is a simple a.c. series circuit. Let
I = load current
R = loop resistance i.e., resistance of both conductors
XL = loop reactance VR = receiving end voltage
cos φR = receiving end power factor (lagging)
VS = sending end voltage cos φS = sending end power factor

3.4 MEDIUM TRANSMISSION LINES
In short transmission line calculations, the effects of the line capacitance are neglected
because such lines have smaller lengths and transmit power at relatively low voltages (< 20 kV).
However, as the length and voltage of the line increase, the capacitance gradually becomes of
greater importance.
Since medium transmission lines have sufficient length (50-150 km) and usually operate
at voltages greater than 20 kV, the effects of capacitance cannot be neglected. Therefore, in order
to obtain reasonable accuracy in medium transmission line calculations, the line capacitance must
be taken into consideration.
The capacitance is uniformly distributed over the entire length of the line. However, in
order to make the calculations simple, the line capacitance is assumed to be lumped or concentrated
in the form of capacitors shunted across the line at one or more points. Such a treatment of
localising the line capacitance gives reasonably accurate results. The most commonly used
methods (known as localised capacitance methods) for the solution of medium transmissions lines
are :
( i) End condenser method
( ii) Nominal T method
( iii) Nominal π method.
Although the above methods are used for obtaining the performance calculations of
medium lines, they can also be used for short lines if their line capacitance is given in a particular
problem.
i) End Condenser Method
In this method, the capacitance of the line is lumped or concentrated at the receiving or
load end as shown in Fig.This method of localising the line capacitance at the load end
overestimates the effects of capacitance. In Fig, one phase of the 3-phase transmission line is
shown as it is more convenient to work in phase instead of line-to-line values.

Let
I R= load current per phase
R = resistance per phase
XL= inductive reactance per phase
C = capacitance per phase
cos φR= receiving end power factor ( lagging)
VS= sending end voltage per phase
The *phasor diagram for the circuit is shown in Fig Taking the receiving end voltage VR as the
reference phasor,
The sending end current Is is the phasor sum of load current IR and capacitive current IC i.e. ,
Thus, the magnitude of sending end voltage VS can be calculated.

Limitations
lthough end condenser method for the solution of medium lines is simple to work out
calculations, yet it has the following drawbacks :
( i) There is a considerable error (about 10%) in calculations because the distributed
capacitance has been assumed to be lumped or concentrated.
( ii) This method overestimates the effects of line capacitance.
ii) Nominal T Method
In this method, the whole line capacitance is assumed to be concentrated at the middle
point of the line and half the line resistance and reactance are lumped on its either side as shown
in Fig.Therefore, in this arrangement, full charging current flows over half the line. In Fig. one
phase of 3-phase transmission line is shown as it is advantageous to work in phase instead of line-
to-line values.
Let IR = load current per phase ;
R = resistance per phase
XL = inductive reactance per phase ;
C = capacitance per phase
cos φR = receiving end power factor ( lagging) ;
VS= sending end voltage/phase
V1 = voltage across capacitor C
The *phasor diagram for the circuit is shown in Fig. Taking the receiving end voltage VR as the
reference phasor, we have,

iii) Nominal π Method
In this method, capacitance of each conductor ( i.e., line to neutral) is divided into two
halves; one half being lumped at the sending end and the other half at the receiving end as shown
in Fig. It is obvious that capacitance at the sending end has no effect on the line drop. However,
its charging current must be added to line current in order to obtain the total sending end current.

Let IR = load current per phase
R = resistance per phase
XL = inductive reactance per phase
C = capacitance per phase
cos φR = receiving end power factor ( lagging)
VS= sending end voltage per phase
The *phasor diagram for the circuit is shown in Fig. Taking the receiving end voltage as the
reference phasor, we have,
3.5 LONG TRANSMISSION LINES
It is well known that line constants of the transmission line are uniformly distributed over
the entire length of the line. However, reasonable accuracy can be obtained in line calculations for
short and medium lines by considering these constants as lumped. If such an assumption of lumped
constants is applied to long transmission lines (having length excess of about 150 km), it is found
that serious errors are introduced in the performance calculations. Therefore, in order to obtain fair
degree of accuracy in the performance calculations of long lines, the line constants are considered
as uniformly distributed throughout the length of the line. Rigorous mathematical

treatment is required for the solution of such lines. Fig shows the equivalent circuit of a 3-phase
long transmission line on a phase-neutral basis. The whole line length is divided into n sections,
each section having line constants 1 /n th of those for the whole line. The following points may by
noted :
( i) The line constants are uniformly distributed over the entire length of line as is actually
the case.
( ii) The resistance and inductive reactance are the series elements.
( iii) The leakage susceptance ( B) and leakage conductance ( G) are shunt elements. The
leakage susceptance is due to the fact that capacitance exists between line and neutral. The leakage
conductance takes into account the energy losses occurring through leakage over the
insulators or due to corona effect between conductors. Admittance
( iv) The leakage current through shunt admittance is maximum at the sending end of the
line and decreases continuously as the receiving end of the circuit is approached at which point
its value is zero.
3.5.1 ANALYSIS OF LONG TRANSMISSION LINE (RIGOROUS METHOD)
Fig. shows one phase and neutral connection of a 3-phase line with impedance and shunt
admittance of the line uniformly distributed.
Consider a small element in the line of length dx situated at a distance x from the receiving
end.
Let
z = series impedance of the line per unit length
y = shunt admittance of the line per unit length
V = voltage at the end of element towards receiving end
V + dV = voltage at the end of element towards sending end
I + dI = current entering the element dx
I = current leaving the element dx
Then for the small element dx,
z dx = series impedance
y dx = shunt admittance
Obviously, dV = I z dx
Now, the current entering the element is I + dI whereas the current leaving the element is I. The
difference in the currents flows through shunt admittance of the element i.e.,
dI = Current through shunt admittance of element = Vy dx

Equations ( iv) and ( v) give the expressions for V and I in the form of unknown constants k1
and K2 . The values of k1 and k2 can be found by applying end conditions as under

3.6 CIRCLE DIAGRAMS
Transmission line problems often involve manipulations with complex numbers,
making the time and effort required for a solution several times greater than that needed for a
similar sequence of operations on real numbers. One means of reducing the labor without
seriously affecting the accuracy is by using transmission-line charts. Probably the most widely
used one is the Smith chart. Basically, this diagram shows curves of constant resistance and
constant reactance; these may represent either an input impedance or a load impedance. The
latter, of course, is the input impedance of a zero-length line. An indication of location along
the line is also provided, usually in terms of the fraction of a wavelength from a voltage
maximum or minimum. Although they are not specifically shown on the chart, the standing-
wave ratio and the magnitude and angle of the reflection coefficient are very quickly
determined. As a matter of fact, the diagram is constructed within a circle of unit radius, using
polar coor- dinates, The basic relationshipupon which the chart is constructed is
The impedances which we plot on the chart will be normalized with respect to the
characteristic impedance. Let us identify the normalized load impedance as zL

3.7 SURGE IMPEDANCE LOADING
Surge impedance of a line, Zo
A transmission line loaded to its surge impedance loading:
(i) has no net reactive power flow into or out of the line, and
(ii) will have approximately a flat voltage profile along its length.
For (i) to hold:
This means that there will be no net reactive power flow at surge-impedance
loading.
For (ii) to hold:

This means that the line will have a flat voltage profile, i.e., no voltage drop.
3.8 FERRANTI EFFECT
A long transmission line draws a substantial quantity of charging current. If such a line is open
circuited or very lightly loaded at the receiving end, the voltage at receiving end may become
greater than voltage at sending end. This is known as Ferranti Effect and is due to the voltage
drop across the line inductance (due to charging current) being in phase with the sending end
voltages. Therefore both capacitance and inductance is responsible to produce this phenomenon
The capacitance (and charging current) is negligible in short line but significant in medium line
and appreciable in long line. Therefore this phenomenon occurs in medium and long lines.
Represent line by equivalent π model.
Line capacitance is assumed to be concentrated at the receiving end.
OM = receiving end voltage Vr
OC = Current drawn by capacitance = Ic
MN = Resistance drop
NP = Inductive reactance drop
Therefore;
OP = Sending end voltage at no load and is less than receiving end voltage (Vr)
Since, resistance is small compared to reactance; resistance can be neglected in calculating
Ferranti effect.
From π model,

For open circuit line; Ir = 0
Neglecting resistance;
Substituting the value in above equation;
Now, from above expression;
i.e. receiving end voltage is greater than sending end voltage and this effect is called Ferranti
Effect. It is valid for open circuit condition of long line.

QUESTIONS :
Q.No Question
1 Define regulation of a transmission line
2 What is surge impedance?
3 Outline about tuned power lines
4 What is the use of power circle diagram?
5 Model the T-equivalent circuit of a medium transmission line
6 How the capacitance effects infer in a long transmission line?
7 What are voltage regulating equipments used in transmission system?
8 What are the units of ABCD constants and give the relation between those constants?
9 Classify the transmission line based on length
10 Identify suitable methods to control the voltage
Q.No Question
1 A 3 phase, 50 Hz, 150 km line has a resistance, inductive reactance and capacitive
shunt admittance of 0.1 ohm, 0.5 ohm and 3 * 10-6 S per km per phase. If the line
delivers 50 MW at 110 kV and 0.8 p.f. lagging, determine the sending end voltage and
current. Assume Nominal π method.
2 A 3-phase, 50 Hz overhead transmission line 100km. long has the following
constants:
Resistance/km/phase = 0.1 ohm
Inductive reactance/km/phase = 0.2 ohm
Capacitive susceptance/km/ phase = 0.04 * 10-4 siemen
Determine i) sending end current ii) sending end voltage iii) sending end power factor
and iv) transmission efficiency when supplying a balanced load of 10000 kW at 66
kV, p.f. 0.8 lagging. Use Nominal T method
3 Explain the power circle diagram for sending end.
4 Explain briefly the voltage control of transmission line by
i) Tap-changing transformers ii) Synchronous condenser iii) Induction regulators
5 A balanced 3-phase load of 30 MW is supplied at 132 kV, 50 Hz and 0.85 p.f. lagging
by means of a transmission line. The series impedance of a single conductor is (20 +
j52) ohms and the total phase-neutral admittance is 315 * 10-6 siemen. Using Nominal
T method, determine i) A,B,C and D constants of the line ii) sending end voltage iii)
regulation of the line
6 A 3-phase transmission line 200 km long has the following constants:
Resistance/phase/km = 0.16 ohm
Reactance/phase/km = 0.25 ohm
Shunt admittance/phase/km = 1.5 * 10-6 S
Solve by rigorous method, the sending end voltage and current when the line is
delivering a load of 20 MW at 0.8 p.f. lagging. The receiving end voltage is kept
constant at 110 kV.
References :
1. C.L. Wadhwa, “Electrical Power Systems”, 6th Edition, New Age International (P) Limited, New
Delhi, 2010.
2. V.K. Metha & Rohit Metha,”Principles of Power System”, S. Chand, 3rd Edition, 2006.
3. S.L. Uppal, Electrical Power, Khanna Publishers, New Delhi, 2006.
4. Chakrabarti A., Soni M.I., Gupta P.V., “Textbook on power system engineering”, Dhanpat Rai & Co.,
2008.
5. S.N.Singh, “Electric Power Generation, Transmission & Distribution”, Prentice Hall of India, New
Edn, New Delhi, 2008.
6. Soni, Bhatnagar and Gupta, ”Electrical Power”, Dhanpat Rai & Sons, New Delhi, 2006.
7. Colin R.Bayliss, Brian Hardy, 4th Edition, ”Transmission and Distribution Electrical Engineering”,
Newnes, 2012.

SCHOOL OF ELECTRICAL AND ELECTRONICS
DEPARTMENT OF ELECTRICAL AND ELECTRONICS ENGINEERING
TRANSMISSION AND DISTRIBUTION – SEEA1402
UNIT IV- INSULATORS, CABLES AND MECHANICAL DESIGN
OF OH LINES

IV. INSULATORS, CABLES AND MECHANICAL DESIGN OF OH LINES
Insulators - Types and Construction - Voltage Distribution in String Insulator - string Efficiency -
Methods of Improving String Efficiency - Cables - types - Capacitance of Cables - Insulation Resistance
- Dielectric Stress and Grading - Dielectric Loss - Thermal Characteristics - capacitance of Three Core
Cables - Stress and Sag Calculations - Effect of Wind and Ice - Supports at Different Levels - stinging
Chart.
4.1 INSULATOR - INTRODUCTION
Electrical Insulator must be used in electrical system to prevent unwanted flow of
current to the earth from its supporting points. The insulator plays a vital role in electrical system.
Electrical Insulator is a very high resistive path through which practically no current
can flow. In transmission and distribution system, the overhead conductors are generally supported
by supporting towers or poles. The towers and poles both are properly grounded. So there must be
insulator between tower or pole body and current carrying conductors to prevent the flow of
current from conductor to earth through the grounded supporting towers or poles.
4.1.1 INSULATING MATERIAL
The main cause of failure of overhead line insulator, is flash over, occurs in between line
and earth during abnormal over voltage in the system. During this flash over, the huge heat produced
by arcing, causes puncher in insulator body. Viewing this phenomenon the materials used for
electrical insulator, has to posses some specific properties.
Properties of insulating material
The materials generally used for insulating purpose is called insulating material. For
successful utilization, this material should have some specific properties as listed below- 1.It
must be mechanically strong enough to carry tension and weight of conductors.
2. It must have very high dielectric strength to withstand the voltage stresses in High Voltage
system.
3. It must possess high Insulation Resistance to prevent leakage current to the earth.
4. There physical as well as electrical properties must be less affected by changing temperature
Porcelain
Porcelain in most commonly used material for over head insulator in present days. The
porcelain is aluminium silicate. The aluminium silicate is mixed with plastic kaolin, feldspar and
quartz to obtain final hard and glazed porcelain insulator material. The surface of the insulator
should be glazed enough so that water should not be traced on it. Porcelain also should be free from
porosity since porosity is the main cause of deterioration of its dielectric property. It must also be
free from any impurity and air bubble inside the material which may affect the insulator properties.

Glass Insulator
Now days glass insulator has become popular in transmission and distribution system.
Annealed tough glass is used for insulating purpose. Glass insulator has numbers of advantages
over conventional porcelain insulator
Advantage
1. It has very high dielectric strength compared to porcelain. 2. Its resistivity is also very high.
3. It has low coefficient of thermal expansion.
4. It has higher tensile strength compared to porcelain insulator.
5. As it is transparent in nature is not heated up in sunlight as porcelain.
6. The impurities and air bubble can be easily detected inside the glass insulator body
because of its transparency.
7. Glass has very long service life as because mechanical and electrical properties of
glass do not be affected by ageing.
8. After all, glass is cheaper than porcelain.
Disadvantage

1. Moisture can easily condensed on glass surface and hence air dust will be deposited on
the wed glass surface which will provide path to the leakage current of the system.
2. For higher voltage glass cannot be cast in irregular shapes since due to irregular
cooling internal cooling internal strains are caused.
Polymer Insulator
In a polymer insulator has two parts, one is glass fiber reinforced epoxy resin rod shaped
core and other is silicone rubber or EPDM (Ethylene Propylene Diene Monomer) made weather
sheds. Rod shaped core is covered by weather sheds. Weather sheds protect the insulator core from
outside environment. As it is made of two parts, core and weather sheds,polymer insulator is also
called composite insulator. The rod shaped core is fixed with Hop dip galvanized cast steel made
end fittings in both sides.
Advantage
1. It is very light weight compared to porcelain and glass insulator. 2. As the composite insulator is flexible the chance of breakage becomes minimum.
3. Because of lighter in weight and smaller in size, this insulator has lower installation
cost.
4. It has higher tensile strength compared to porcelain insulator.
5. Its performance is better particularly in polluted areas.
6. Due to lighter weight polymer insulator imposes less load to the supporting structure.
7. Less cleaning is required du e to hydrophobic nature of the insulator.
Disadvantage
1. Moisture may enter in the core if there is any unwanted gap between core and weather
sheds. This may cause electrical failure of the insulator.
2. Over crimping in end fittings may result to cracks in the core which leads to
mechanical failure of polymer insulator.

In addition to these, some other disadvantages might be experienced. Let us give a practical
example where many difficulties are faced in maintaining a distribution network in Victoria
Australia due to polymeric insulator.
There are many Cockatoos, Galahs & Parrots in that area of Australia, which love to chew
on polymeric strain insulators. Here, the 22KV network has many of polymeric strain insulators
installed and now after a few years of installing polymeric strain insulators, the authority is now
replacing many of them back with Glass disc insulators.
Another disadvantage is that they have had post type polymeric insulators melt and bend in
bushfire areas. They have a concrete pole and a steel cross arm that survives a bushfire, however
the polymers in some cases fail. This would not be the case with glass or porcelain insulators.
They have also had polymeric insulators fail in areas close to the ocean coastline where there are
high salt levels in the air.
1. Subject to bird attack by Parrots, Cockatoos & Galahs.
2. Not resilient to bushfire temperatures.
3. Not recommended for location near surf beaches due to salt spray.
4.2 TYPES OF INSULATOR
There are mainly three types of insulator likewise
1. Pin Insulator
2. Suspension Insulator
3. Stray Insulator
In addition to that there are other two types of electrical insulator available mainly for
low voltage application, e.i. stay insulator and shackle insulator.
1. Pin Type Insulators

As the name suggests, the pin type insulator is secured to the cross-arm on the pole.
There is a groove on the upper end of the insulator for housing the conductor. The conductor passes
through this groove and is bound by the annealed wire of the same material as the conductor. Pin
type insulators are used for transmission and distribution of electric power at voltages up to 33 kV.
Beyond operating voltage of 33 kV, the pin type insulators become too bulky and hence
uneconomical.
Causes of Insulator Failures:
Insulators are required to withstand both mechanical and electrical stresses. The latter
type is primarily due to line voltage and may cause the breakdown of the insulator. The electrical
breakdown of the insulator can occur either by flash-over or puncture. In flashover, an arc occurs
between the line conductor and insulator pin (i.e., earth) and the discharge jumps across the air
gaps, following shortest distance. Figure shows thearcing distance (i.e. a + b + c) for the insulator.
In case of flash-over, the insulator will continue to act in its proper capacity unless extreme heat
produced by the arc destroys the insulator. In case of puncture, the discharge occurs from conductor
to pin through the body of the insulator. When such breakdown is involved, the insulator is
permanently destroyed due to excessive heat. In practice, sufficient thickness of porcelain is
provided in the insulator to avoid puncture by the line voltage. The ratio of puncture strength to
flashover voltage is known as safety factor.
2. Suspension Type
For high voltages (>33 kV), it is a usual practice to use suspension type insulators shown
in Figure. Consist of a number of porcelain discs connected in series by metal links in the form

of a string. The conductor is suspended at the bottom end of this string while the other end of the
string is secured to the cross-arm of the tower. Each unit or disc is designed for low voltage, say
11 kV. The number of discs in series would obviously depend upon the working voltage. For
instance, if the working voltage is 66 kV, then six discs in series will be provided on the string.
Advantages of suspension type:
Suspension type insulators are cheaper than pin type insulators for voltages beyond 33 kV.
Each unit or disc of suspension type insulator is designed for low voltage, usually 11 kV. Depending upon the working voltage, the desired number of discs can be connected in
series.
If anyone disc is damaged, the whole string does not become useless because the damaged disc can be replaced.
The suspension arrangement provides greater flexibility to the line. The connection at the cross arm is such that insulator string is free to swing in any direction and can take up the
position where mechanical stresses are minimum.
In case of increased demand on the transmission line, it is found more satisfactory to supply the greater demand by raising the line voltage than to provide another set of conductors.
The additional insulation required for the raised voltage can be easily obtained in the suspension arrangement by adding the desired number of discs.
The suspension type insulators are generally used with steel towers. As the conductors run below the earthed cross-arm of the tower, therefore, this arrangement provides partial protection from lightning.
3. Strain Insulators
When there is a dead end of the line or there is corner or sharp curve, the line is subjected
to greater tension. In order to relieve the line of excessive tension, strain insulators are used. For
low voltage lines (< 11 kV), shackle insulators are used as strain insulators. However, for high
voltage transmission lines, strain insulator consists of an assembly of suspension insulators as

shown in Figure. The discs of strain insulators are used in the vertical plane. When the tension in
lines is exceedingly high, at long river spans, two or more strings are used in parallel.
4. Shackle Insulators
In early days, the shackle insulators were used as strain insulators. But now a day, they
are frequently used for low voltage distribution lines. Such insulators can be used either in a
horizontal position or in a vertical position. They can be directly fixed to the pole with a bolt or
to the cross arm.
5. Stay Insulator
For low voltage lines, the stays are to be insulated from ground at a height. The insulator
used in the stay wire is called as the stay insulator and is usually of porcelain and is so designed
that in case of breakage of the insulator the guy-wire will not fall to the ground. There are several
methods of increasing the string efficiency or improving voltage distribution across different units
of a string.

4.3 POTENTIAL DISTRIBUTION OVER SUSPENSION INSULATOR STRING
A string of suspension insulators consists of a number of porcelain discs connected
in series through metallic links. Fig. shows 3-disc string of suspension insulators. The porcelain
portion of each disc is in between two metal links. Therefore, each disc forms a capacitor C as
shown in Fig. This is known as mutual capacitance or self-capacitance. If there were mutual
capacitance alone, then charging current would have been the same through all the discs and
consequently voltage across each unit would have been the same i.e., V/3 as shown However, in
actual practice, capacitance also exists between metal fitting of each disc and tower or earth. This
is known as shunt capacitance C1. Due to shunt capacitance, charging current is not the same
through all the discs of the string Therefore, voltage across each disc will be different. Obviously,
the disc nearest to the line conductor will have the maximum* voltage. Thus referring to
Fig V3 will be much more than V2 or V1. The following points may be noted regarding the
potential distribution over a string of suspension insulators:
The voltage impressed on a string of suspension insulators does not distribute itself uniformly across the individual discs due to the presence of shunt capacitance.
The disc nearest to the conductor has maximum voltage across it. As we move towards the cross-arm, the voltage across each disc goes on decreasing.
The unit nearest to the conductor is under maximum electrical stress and is likely to be punctured. Therefore, means must be provided to equalize the potential across each
unit.
If the voltage impressed across the string were d.c., then voltage across each unit would be the same. It is because insulator capacitances are ineffective for d.c.

4.4 STRING EFFICIENCY
As stated above, the voltage applied across the string of suspension insulators is not
uniformly distributed across various units or discs. The disc nearest to the conductor has much
higher potential than the other discs. This unequal potential distribution is undesirable and is
usually expressed in terms of string efficiency.
The ratio of voltage across the whole string to the product of number of discs and the
voltage across the disc nearest to the conductor is known as string efficiency i.e.,
String efficiency is an important consideration since it decides the potential distribution
along the string. The greater the string efficiency, the more uniform is the voltage distribution.
Thus 100% string efficiency is an ideal case for which the voltage across each disc will be exactly
the same. Although it is impossible to achieve 100% string efficiency, yet efforts should be
made to improve it as close to this value as possible.
Mathematical Expression. Fig. Shows the equivalent circuit for a 3-disc string. Let us suppose
that self capacitance of each disc is C. Let us further assume that shunt capacitance C1 is some
fraction K of self capacitance i.e., C1 =KC. Starting from the cross-arm or tower, the voltage across
each unit is V1,V2 and V3 respectively as shown.

The Following Points May Be Noted From The Above Mathematical Analysis
(i) If K = 0·2 (Say), then from exp. (iv), we get, V2 = 1·2 V1 and V3 = 1·64 V1. This
clearly shows that disc nearest to the conductor has maximum voltage across it; the voltage across
other discs decreasing progressively as the cross-arm in approached.
(ii) The greater the value of K (= C1/C), the more non-uniform is the potential across the
discs and lesser is the string efficiency.
(iii) The inequality in voltage distribution increases with the increase of number of discs
in the string. Therefore, shorter string has more efficiency than the larger one
4.5 METHODS OF IMPROVING STRING EFFICIENCY
It has been seen above that potential distribution in a string of suspension insulators is not
uniform. The maximum voltage appears across the insulator nearest to the line conductor and
decreases progressively as the cross arm is approached. If the insulation of the highest stressed
insulator breaks down or flash over takes place, the breakdown of other units will take place in
succession. This necessitates equalizing the potential across the various units of the string i.e. to
improve the string efficiency. The various methods for this purpose are:
(I) By Using Longer Cross-Arms
The value of string efficiency depends upon the value of K i.e., ratio of shunt capacitance
to mutual capacitance. The lesser the value of K, the greater is the string efficiency

and more uniform is the voltage distribution. The value of K can be decreased by reducing the
shunt capacitance. In order to reduce shunt capacitance, the distance of conductor from tower must
be increased i.e., longer cross-arms should be used. However, limitations of cost and strength of
tower do not allow the use of very long cross-arms. In practice, K = 0·1 is the limit that can be
achieved by this method.
(II) By Grading The Insulators
In this method, insulators of different dimensions are so chosen that each has a different
capacitance. The insulators are capacitance graded i.e. they are assembled in the string in such a
way that the top unit has the minimum capacitance, increasing progressively as the bottom unit
(i.e., nearest to conductor) is reached. Since voltage is inversely proportional to capacitance, this
method tends to equalize the potential distribution across the units in the string. This method has
the disadvantage that a large number of different-sized insulators are required. However, good
results can be obtained by using standard insulators for most of the string and larger units for that
near to the line conductor.
(III) By Using A Guard Ring
The potential across each unit in a string can be equalised by using a guard ring which is
a metal ring electrically connected to the conductor and surrounding the bottom insulator as shown
in the Fig The guard ring introduces capacitance between metal fittings and the line conductor.
The guard ring is contoured in such a way that shunt capacitance currents i1, i2 etc. are equal to
metal fitting line capacitance currents i′1, i′2 etc. The result is that same charging current I flows
through each unit of string. Consequently, there will be uniform potential distribution across the
units.

4.6 TESTING OF INSULATOR
To ensure the desired performance of an electrical insulator, that is for avoiding unwanted
insulator failure, each insulator has to undergo numbers of insulator test. Before going
through testing of insulator we will try to understand different causes of insulator failure.
Because insulator testing ensures the quality of electrical insulator and chances for failure
of insulation depend upon the quality of insulator.
Causes
There are different causes due to which failure of insulation in electrical power system may occur. Let's have a look on them one by one-
Cracking Of Insulator
The porcelain insulator mainly consists of three different materials. The main porcelain
body, steel fitting arrangement and cement to fix the steel part with porcelain. Due to changing
climate conditions, these different materials in the insulator expand and contract in different rate.
These unequal expansion and contraction of porcelain, steel and cement are the chief cause of
cracking of insulator.
Defective Insulation Material
If the insulation material used for insulator is defective anywhere, the insulator may have
a high chance of being puncher from that place.
Porosity In The Insulation Materials
If the porcelain insulator is manufactured at low temperatures, it will make it porous, and
due to this reason it will absorb moisture from air thus its insulation will decrease and leakage
current will start to flow through the insulator which will lead to insulator failure.
Improper Glazing on Insulator Surface
If the surface of porcelain insulator is not properly glazed, moisture can stick over it. This
moisture along with deposited dust on the insulator surface, produces a conducting path. As a

result the flash over distance of the insulator is reduced. As the flash over distance is reduced, the
chance of failure of insulator due to flash over becomes more.
Flash Over Across Insulator
If flash over occurs, the insulator may be over heated which may ultimately results into
shuttering of it.
Mechanical Stresses on Insulator
If an insulator has any weak portion due to manufacturing defect, it may break from that
weak portion when mechanical stress is applied on it by its conductor. These are the main causes
of insulator failure. Now we will discuss the different insulator test procedures to ensure
minimum chance of failure of insulation.
4.7 INSULATOR TESTING TYPES
According to the British Standard, the electrical insulator must undergo the following tests
1. Flashover tests of insulator
2. Performance tests
3. Routine tests
Let's have a discussion one by one
1. FLASHOVER TEST
There are mainly three types of flashover test performed on an insulator and these are-
Power Frequency Dry Flashover Test of Insulator
First the insulator to be tested is mounted in the manner in which it would be used practically.
Then terminals of variable power frequency voltage source are connected to the both electrodes of the insulator.
Now the power frequency voltage is applied and gradually increased up to the specified value. This specified value is below the minimum flashover voltage.
This voltage is maintained for one minute and observe that there should not be any flash- over or puncher occurred.
The insulator must be capable of sustaining the specified minimum voltage for one minute
without flash over.
Power Frequency Wet Flashover Test or Rain Test of Insulator
In this test also the insulator to be tested is mounted in the manner in which it would be
used practically.
Then terminals of variable power frequency voltage source are connected to the both
electrodes of the insulator.
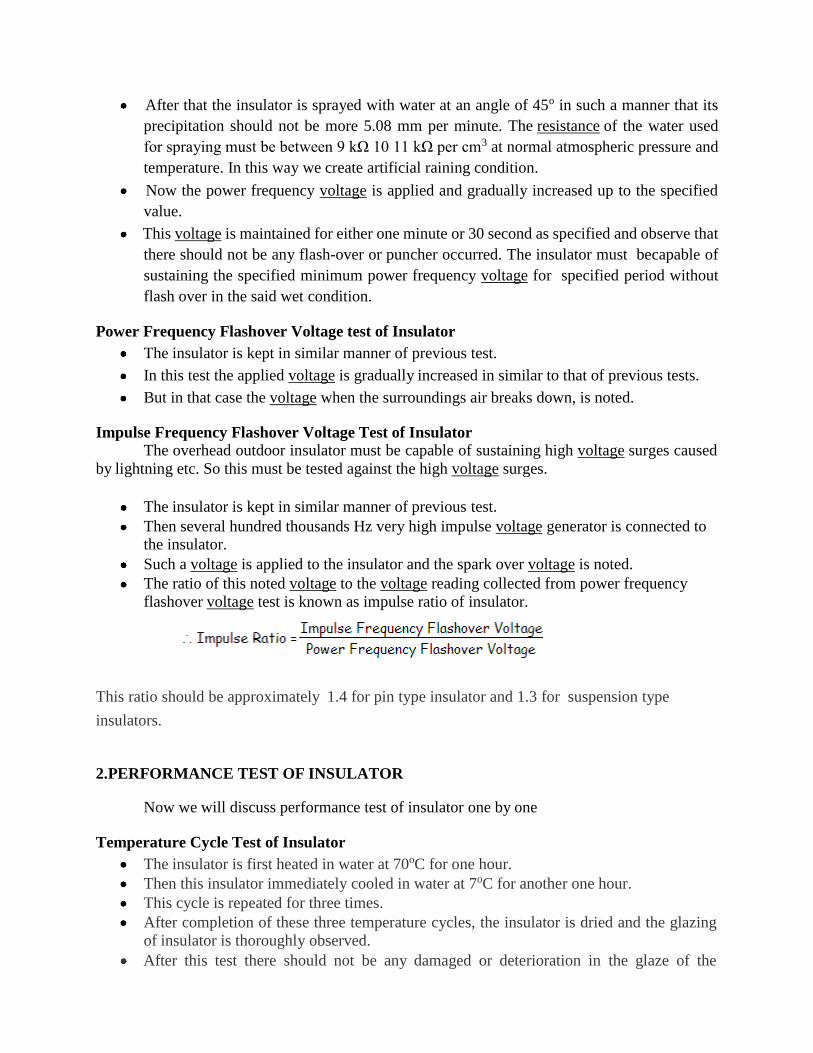
After that the insulator is sprayed with water at an angle of 45o in such a manner that its
precipitation should not be more 5.08 mm per minute. The resistance of the water used
for spraying must be between 9 kΩ 10 11 kΩ per cm3 at normal atmospheric pressure and
temperature. In this way we create artificial raining condition.
Now the power frequency voltage is applied and gradually increased up to the specified
value.
This voltage is maintained for either one minute or 30 second as specified and observe that
there should not be any flash-over or puncher occurred. The insulator must be capable of
sustaining the specified minimum power frequency voltage for specified period without
flash over in the said wet condition.
Power Frequency Flashover Voltage test of Insulator
The insulator is kept in similar manner of previous test.
In this test the applied voltage is gradually increased in similar to that of previous tests.
But in that case the voltage when the surroundings air breaks down, is noted.
Impulse Frequency Flashover Voltage Test of Insulator
The overhead outdoor insulator must be capable of sustaining high voltage surges caused
by lightning etc. So this must be tested against the high voltage surges.
The insulator is kept in similar manner of previous test.
Then several hundred thousands Hz very high impulse voltage generator is connected to the insulator.
Such a voltage is applied to the insulator and the spark over voltage is noted.
The ratio of this noted voltage to the voltage reading collected from power frequency
flashover voltage test is known as impulse ratio of insulator.
This ratio should be approximately 1.4 for pin type insulator and 1.3 for suspension type
insulators.
2. PERFORMANCE TEST OF INSULATOR
Now we will discuss performance test of insulator one by one
Temperature Cycle Test of Insulator
The insulator is first heated in water at 70oC for one hour.
Then this insulator immediately cooled in water at 7oC for another one hour.
This cycle is repeated for three times.
After completion of these three temperature cycles, the insulator is dried and the glazing
of insulator is thoroughly observed.
After this test there should not be any damaged or deterioration in the glaze of the

insulator surface
Puncture Voltage Test of Insulator
The insulator is first suspended in an insulating oil.
Then voltage of 1.3 times of flash over voltage, is applied to the insulator.
A good insulator should not puncture under this condition
Porosity Test of Insulator
The insulator is first broken into pieces.
Then These broken pieces of insulator are immersed in a 0.5 % alcohol solution of fuchsine dye under pressure of about 140.7 kg ⁄ cm2 for 24 hours.
After that the sample are removed and examine.
The presence of a slight porosity in the material is indicated by a deep penetration of the
dye into it.
Mechanical Strength Test of Insulator
The insulator is applied by 2½ times the maximum working strength for about one minute.
The insulator must be capable of sustaining this much mechanical stress for one minute
without any damage in it.
3. ROUTINE TEST OF INSULATOR
Each of the insulator must undergo the following routine test before they are recommended for using at site.
Proof Load Test of Insulator
In proof load test of insulator, a load of 20% in excess of specified maximum working load is applied for about one minute to each of the insulator.
Corrosion Test of Insulator
The insulator with its galvanized or steel fittings is suspended into a copper sulfate
solution for one minute.
Then the insulator is removed from the solution and wiped, cleaned.
Again it is suspended into the copper sulfate solution for one minute.
The process is repeated for four times.
Then it should be examined and there should not be any disposition of metal on it.
4.8 INSULATED CABLE - INTRODUCTION
Electric power can be transmitted or distributed either by overhead system or by
underground cables. The underground cables have several advantages such as less liable to damage
through storms or lightning, low maintenance cost, less chance of faults, smaller voltage drop and
better general appearance. However, their major drawback is that they have greater installation
cost and introduce insulation problems at high voltages compared with the equivalent overhead
system. For this reason, underground cables are employed where it is impracticable to use overhead
lines. Such locations may be thickly populated areas where municipal authorities prohibit overhead
lines for reasons of safety, or around plants and substations or where maintenance conditions do
not permit the use of overhead construction. The chief use of underground cables for many years

has been for distribution of electric power in congested urban areas at comparatively low or
moderate voltages. However, recent improvements in the design and manufacture have led to the
development of cables suitable for use at high voltages. This has made it possible to employ
underground cables for transmission of electric power for short or moderate distances. In this
chapter, we shall focus our attention on the various aspects of underground cables and their
increasing use in power system.
4.8.1 UNDERGROUND CABLES
An underground cable essentially consists of one or more conductors covered with suitable
insulation and surrounded by a protecting cover. Although several types of cables are available,
the type of cable to be used will depend upon the working voltage and service requirements. In
general, a cable must fulfill the following necessary requirements:
(i) The conductor used in cables should be tinned stranded copper or aluminum of high
conductivity. Stranding is done so that conductor may become flexible and carry more current.
(ii) The conductor size should be such that the cable carries the desired load current
without overheating and causes voltage drop within permissible limits.
(iii) The cable must have proper thickness of insulation in order to give high degree of
safety and reliability at the voltage for which it is designed.
(iv) The cable must be provided with suitable mechanical protection so that it may
withstand the rough use in laying it.
(v) The materials used in the manufacture of cables should be such that there is complete
chemical and physical stability throughout.
4.9 CONSTRUCTION OF CABLES
Fig shows the general construction of a 3-conductor cable.
The various parts are

a) Cores or Conductors
A cable may have one or more than one core (conductor) depending upon the type
of service for which it is intended. For instance, the 3- conductor cable shown in Fig. is
used for 3- phase service. The conductors are made of tinned copper or aluminum and
are usually stranded in order to provide flexibility to the cable.
b) Insulation
Each core or conductor is provided with a suitable thickness of insulation, the
thickness of layer depending upon the voltage to be withstood by the cable. The commonly
used materials for insulation are impregnated paper, varnished cambric or rubber mineral
compound.
c) Metallic sheath.
In order to protect the cable from moisture, gases or other damaging liquids (acids
or alkalies) in the soil and atmosphere, a metallic sheath of lead or aluminum is provided
over the insulation as shown in Fig.
d) Bedding.
Over the metallic sheath is applied a layer of bedding which consists of a fibrous
material like jute or hessian tape. The purpose of bedding is to protect the metallic
sheath against corrosion and from mechanical injury due to armouring.
e) Armouring.
Over the bedding, armouring is provided which consists of one or two layers of
galvanized steel wire or steel tape. Its purpose is to protect the cable from mechanical
injury while laying it and during the course of handling. Armouring may not be done in
the case of some cables.
f) Serving.
In order to protect armouring from atmospheric conditions, a layer of fibrous
material (like jute) similar to bedding is provided over the armouring. This is known as
serving.
It may not be out of place to mention here that bedding, armouring and serving are only
applied to the cables for the protection of conductor insulation and to protect the
metallic sheath from Mechanical injury.
4.9.1 INSULATING MATERIALS FOR CABLES
The satisfactory operation of a cable depends to a great extent upon the
characteristics of insulation used. Therefore, the proper choice of insulating material for
cables is of considerable importance. In general, the insulating materials used in cables
should have the following Properties
(i) High insulation resistance to avoid leakage current.
(ii) High dielectric strength to avoid electrical breakdown of the cable.
(iii) High mechanical strength to withstand the mechanical handling of cables.
(iv) Non-hygroscopici.e., it should not absorb moisture from air or soil. The
moisture tends to decrease the insulation resistance and hastens the breakdown of the cable.
In case the insulating material is hygroscopic, it must be enclosed in a waterproof covering
like lead sheath.
(v) Non-inflammable.
(vi) Low cost so as to make the underground system a viable proposition.
(vii) Unaffected by acids and alkalies to avoid any chemical action. No one
insulating material possesses all the above mentioned properties. Therefore, the type of

insulating material to be used depends upon the purpose for which the cable is required
and the quality of insulation to be aimed at. The principal insulating materials used in
cables are rubber, vulcanized India rubber, impregnated paper, varnished cambric and
polyvinyl chloride.
Rubber
Rubber may be obtained from milky sap of tropical trees or it may be produced
from oil products. It has relative permittivity varying between 2 and 3, dielectric strength
is about 30 kV/mm and resistivity of insulation is 1017 cm. Although pure rubber has
reasonably high insulating properties, it suffers form some major drawbacks viz., readily
absorbs moisture, maximum safe temperature is low (about 38ºC), soft and liable to damage
due to rough handling and ages when exposed to light. Therefore, pure rubber cannot be
used as an insulating material.
Vulcanised India Rubber (V.I.R.)
It is prepared by mixing pure rubber with mineral matter such as zinc oxide, red
lead etc., and 3 to 5% of sulphur. The compound so formed is rolled into thin sheets and
cut into strips. The rubber compound is then applied to the conductor and is heated to a
temperature of about 150ºC. The whole process is called vulcanisation and the product
obtained is known as vulcanised India rubber. Vulcanised India rubber has greater
mechanical strength, durability and wear resistant property than pure rubber. Its main
drawback is that sulphur reacts very quickly with copper and for this reason, cables using
VIR insulation have tinned copper conductor. The VIR insulation is generally used for low
and moderate voltage cables.
Impregnated paper
It consists of chemically pulped paper made from wood chippings and impregnated
with some compound such as paraffinic or naphthenic material. This type of insulation has
almost superseded the rubber insulation. It is because it has the advantages of low cost,
low capacitance, high dielectric strength and high insulation resistance. The only
disadvantage is that paper is hygroscopic and even if it is impregnated with suitable
compound, it absorbs moisture and thus lowers the insulation resistance of the cable. For
this reason, paper insulated cables are always provided with some protective covering and
are never left unsealed. If it is required to be left unused on the site during laying, its ends
are temporarily covered with wax or tar. Since the paper insulated cables have the
tendency to absorb moisture, they are used where the cable route has a few joints. For
instance, they can be profitably used for distribution at low voltages in congested areas
where the joints are generally provided only at the terminal apparatus. However, for
smaller installations, where the lengths are small and joints are required at a number of
places, VIR cables will be cheaper and durable than paper insulated cables.
Varnished cambric
It is a cotton cloth impregnated and coated with varnish. This type of insulation is
also known as empire tape. The cambric is lapped on to the conductor in the form of a tape
and its surfaces are coated with petroleum jelly compound to allow for the sliding of one
turn over another as the cable is bent. As the varnished cambric is hygroscopic, therefore,
such cables are always provided with metallic sheath. Its dielectric strength is about 4

kV/mm and permittivity is 2.5 to 3.8.
Polyvinyl chloride (PVC)
This insulating material is a synthetic compound. It is obtained from the
polymerization of acetylene and is in the form of white powder. For obtaining this material
as a cable insulation, it is compounded with certain materials known as plasticizers which
are liquids with high boiling point. The plasticizer forms a gell and renders the material
plastic over the desired range of temperature. Polyvinyl chloride has high insulation
resistance, good dielectric strength and mechanical toughness over a wide range of
temperatures. It is inert to oxygen and almost inert to many alkalies and acids. Therefore,
this type of insulation is preferred over VIR in extreme environmental conditions such as
in cement factory or chemical factory. As the mechanical properties (i.e., elasticity etc.) of
PVC are not so good as those of rubber, therefore, PVC insulated cables are generally used
for low and medium domestic lights and power installations.
4.10 CLASSIFICATION OF CABLES
Cables for underground service may be classified in two ways according to (i) the type of insulating material used in their manufacture
(ii) (ii) the voltage for
which they are manufactured. However, the latter method of classification is generally
preferred, according to which cables can be divided into the following groups:
Low-tension (L.T.) cables — upto
1000 V High-tension (H.T.) cables
— upto 11,000 V
Super-tension (S.T.) cables — from 22 kV to 33 kV
Extra high-tension (E.H.T.) cables — from 33 kV
to 66 kV Extra super voltage cables — beyond 132
kV
A cable may have one or more than one core depending upon the type of service for
which it is intended. It may be
(i) single-core

(ii) (ii) two-core
(iii) (iii) three-core
(iv) (iv) four-core etc.
For a 3-phase service, either 3-single-core cables or three-core cable can be used
depending upon the operating voltage and load demand. Fig. shows the constructional
details of a single- core low tension cable. The cable has ordinary construction because the
stresses developed in the cable for low voltages (up to 6600 V) are generally small. It
consists of one circular core of tinned stranded copper (or aluminium) insulated by layers
of impregnated paper. The insulation is surrounded by a lead sheath which prevents the
entry of moisture into the inner parts. In order to protect the lead sheath from corrosion,
an overall serving of compounded fibrous material (jute etc.) is provided. Single-core
cables are not usually armoured in order to avoid excessive sheath losses. The principal
advantages of single-core cables are simple construction and availability of larger copper
section.
Cable For 3-Phase
In practice, underground cables are generally required to deliver 3-phase power.
For the purpose, either three-core cable or three single core cables may be used. For
voltages upto 66 kV, 3-core cable (i.e., multi-core construction) is preferred due to
economic reasons. However, for voltages beyond 66 kV, 3-core-cables become too large
and unwieldy and, therefore, single- core cables areused. The following types of cables are
generally used for 3-phase service :
1. Belted cables — upto 11 kV
2. Screened cables — from 22 kV to 66 kV
3. Pressure cables — beyond 66 kV.
1. Belted Cables
These cables are used for voltages upto 11kV but in extraordinary cases, their use
may be extended upto 22kV. Fig.3 shows the constructional details of a 3-core belted cable.
The cores are insulated from each other by layers of impregnated paper.

Another layer of impregnated paper tape, called paper belt is wound round the
grouped insulated cores. The gap between the insulated cores is filled with fibrous
insulating material (jute etc.) so as to give circular cross-section to the cable. The cores are
generally stranded and may be of non circular shape to make better use of available space.
The belt is covered with lead sheath to protect the cable against ingress of moisture and
mechanical injury. The lead sheath is covered with one or more layers of armouring with
an outer serving (not shown in the figure).The belted type construction is suitable only for
low and medium voltages as the electro static stresses developed in the cables for these
voltages are more or less radial i.e., across the insulation. However, for high voltages
(beyond 22 kV), the tangential stresses also become important. These stresses act along
the layers of paper insulation. As the insulation resistance of paper is quite small along the
layers, therefore, tangential stresses set up leakage current along the layers of paper
insulation. The leakage current causes local heating, resulting in the risk of breakdown of
insulation at any moment. In order to overcome this difficulty, screened cables are used
where leakage currents are conducted to earth through metallic screens.
2. Screened Cables
These cables are meant for use up to 33 kV, but in particular cases their use may
be extended to operating voltages up to 66 kV. Two principal types of screened cables are
H-type cables and S.L. type cables.
(i)H-type Cables
This type of cable was first designed by H. Hochstetler and hence the name. Fig.
shows the constructional details of a typical 3-core, H-type cable. Each core is insulated
by layers of impregnated paper. The insulation on each core is covered with a metallic
screen which usually consists of a perforated aluminum foil. The cores are laid in such a
way that metallic screens
Make contact with one another. An additional conducting belt (copper woven
fabric tape) is Wrapped round the three cores. The cable has no insulating belt but lead
sheath, bedding, armouring and serving follow as usual. It is easy to see that each core
screen is in electrical contact with the conducting belt and the lead sheath. As all the four
screens (3 core screens and one conducting belt) and the lead sheath are at earth potential,
therefore, the electrical stresses are purely radial and consequently dielectric losses are

reduced. Two principal advantages are claimed for H-type cables. Firstly, the perforations
in the metallic screens assist in the complete impregnation of the cable with the compound
and thus the possibility of air pockets or voids (vacuous spaces) in the dielectric is
eliminated. The voids if present tend to reduce the breakdown strength of the cable and
may cause considerable damage to the paper insulation. Secondly, the metallic screens
increase the heat dissipating power of the cable.
(Ii) s.l. Type cables
Fig. shows the constructional details of a 3-core S.L. (separate lead) type cable. It
is basically H-type cable but the screen round each core insulation is covered by its own
lead sheath. There is no overall lead sheath but only armouring and serving are provided.
The S.L. type cables have two main advantages over H-type cables. Firstly, the separate
sheaths minimize the possibility of core-to-core breakdown. Secondly, bending of cables
becomes easy due to the elimination of overall lead sheath. However, the disadvantage
is that the three lead sheaths of
S.L. cable are much thinner than the single sheath of H-cable and, therefore, call for greater
care in manufacture
3. Pressure cables
For voltages beyond 66 kV, solid type cables are unreliable because there is a
danger of breakdown of insulation due to the presence of voids. When the operating
voltages are greater than 66 kV, pressure cables are used. In such cables, voids are
eliminated by increasing the pressure of compound and for this reason they are called
pressure cables. Two types of pressure cables viz oil-filled cables and gas pressure cables
are commonly used.
(i) Oil-filled cables.
In such types of cables, channels or ducts are provided in the cable for oil
circulation. The oil under pressure (it is the same oil used for impregnation) is kept
constantly supplied to the channel by means of external reservoirs placed at suitable
distances (say 500 m) along the route of the cable. Oil under pressure compresses the layers
of paper insulation and is forced in to any voids that may have formed between the layers.
Due to the elimination of voids, oil-filled cables can be used for higher voltages, the range
being from 66 kV up to 230 kV. Oilfilled cables are of three types viz., single-core
conductor channel, single-core sheath channel and three-core filler- space channels.

Fig. shows the constructional details of a single-core conductor channel, oil filled cable.
The oil channel is formed at the center by stranding the conductor wire around a hollow cylindrical
steel spiral tape. The oil under pressure is supplied to the channel by means of external reservoir.
As the channel is made of spiral steel tape, it allows the oil to percolate between copper strands
to the wrapped insulation. The oil pressure compresses the layers of paper insulation and
prevents the possibility of void formation. The system is so designed that when the oil gets
expanded due to increase in cable temperature, the extra oil collects in the reservoir. However,
when the cable temperature falls during light load conditions, the oil from the reservoir flows to
the channel. The disadvantage of this type of cable is that the channel is at the middle of the cable
and is at full voltage w.r.t. earth, so that a very complicated system of joints is necessary. Fig.
shows the constructional details of a single core sheath channel oil-filled cable. In this type of
cable, the conductor is solid similar to that of solid cable and is paper insulated. However, oil ducts
are provided in them etallic sheath as shown. In the 3-core oil-filler cable shown in Fig. the oil
ducts are located in the filler spaces. These channels are composed of perforated metalribbon
tubing and are at earth potential.
(ii) Gas Pressure Cable
The voltage required to set up ionization inside a void increases as the pressure is
increased. Therefore, if ordinary cable is subjected to a sufficiently high pressure, the ionization
can be altogether eliminated. At the same time, the increased pressure produces radial compression
which tends to close any voids. This is the underlying principle of gas pressure cables.

Fig Shows the section of external pressure cable designed by Hochstetler, Vogal and Bowden. The
construction of the cable is similar to that of an ordinary solid type except that it is of triangular
shape and thickness of lead sheath is 75% that of solid cable. The triangular section reduces the
weight and gives low thermal resistance but the main reason for triangular shape is that the lead
sheath acts as a pressure membrane. The sheath is protected by a thin metal tape. The cable is laid
in a gas-tight steel pipe. The pipe is filled with dry nitrogen gas at 12 to 15 atmospheres. The gas
pressure produces radial compression and closes the voids that may have formed between the
layers of paper insulation. Such cables can carry more load current and operate at higher voltages
than a normal cable. Moreover, maintenance cost is small and the nitrogen gas helps in quenching
any flame. However, it has the disadvantage that the overall cost is very high.
Dielectric Stress In Cable
Under operating conditions, the insulation of a cable is subjected to electrostatic forces. This is
known as dielectric stress. The dielectric stress at any point in a cable is in fact the potential
gradient (or electric intensity) at that point. Consider a single core cable with core diameter d and

internal sheath diameter D. As proved in Art 8, the electric intensity at a point x metres from the
centre of the cable is
By definition, electric intensity is equal to potential gradient. Therefore, potential gradient g at a
point x meters from the Centre of cable is
As proved, potential difference V between conductor and sheath is
Substituting the value of Q from exp. (ii) in exp. (i), we get,
It is clear from exp. (iii) that potential gradient varies inversely as the distance x. Therefore,
potential gradient will be maximum when x is minimum i.e., when x = d/2 or at the surface of the
conductor. On the other hand, potential gradient will be minimum at x = D/2 or at sheath surface.
Maximum potential gradient is

The variation of stress in the dielectric is shown in Fig.14. It is clear that dielectric stress is
maximum at the conductor surface and its value goes on decreasing as we move away from the
conductor. It may be noted that maximum stress is an important consideration in the design of a
cable. For instance, if a cable is to be operated at such a voltage that maximum stress is 5
kV/mm, then the insulation used must have a dielectric strength of at least 5 kV/mm, otherwise
breakdown of the cable will become inevitable.
Most Economical Size of Conductor
It has already been shown that maximum stress in a cable occurs at the surface of the
conductor. For safe working of the cable, dielectric strength of the insulation should be more
than the maximums tress. Rewriting the expression for maximum stress, we get,
The values of working voltage V and internal sheath diameter D have to be kept fixed at certain
values due to design considerations. This leaves conductor diameter d to be the only variable in
exp.(i). For given values of V and D, the most economical conductor diameter will be one for
which gmax has a minimum value. The value of gmax will be minimum when d loge D/d is
maximum i.e.
Most economical conductor diameter is
and the value of gmax under this condition is
4.11 GRADING OF CABLES
The process of achieving uniform electrostatic stress in the dielectric of cables is known as
grading of cables.
It has already been shown that electrostatic stress in a single core cable has a maximum
value (gmax) at the conductor surface and goes on decreasing as we move towards the sheath.

The maximum voltage that can be safely applied to a cable depends upon gmax i.e., electrostatic
stress at the conductor surface. For safe working of a cable having homogeneous dielectric, the
strength of dielectric must be more than gmax .If a dielectric of high strength is used for a cable,
it is useful only near the conductor where stress is maximum. But as we move away from the
conductor, the electrostatic stress decreases, so the dielectric will be unnecessarily over strong.
The unequal stress distribution in a cable is undesirable for two reasons. Firstly, insulation of
greater thickness is required which increases the cable size.
Secondly, it may lead to the break down of insulation. In order to overcome above
disadvantages, it is necessary to have a uniform stress distribution in cables. This can be achieved
by distributing the stress in such a way that its value is increased in the outer layers of dielectric.
This is known as grading of cables. The following are the two main methods of grading of cables:
(i) Capacitance grading
(ii) Intersheath grading
(i) Capacitance Grading
The process of achieving uniformity in the dielectric stress by using layers of different
dielectrics is known as capacitance grading.

In capacitance grading, the homogeneous dielectric is replaced by a composite dielectric.
The composite dielectric consists of various layers of different dielectrics in such a manner that
relative permittivity r of any layer is inversely proportional to its distance from the center. Under
such conditions, the value of potential gradient any point in the dielectric is constant and is
independent of its distance from the center. In other words, the dielectric stress in the cable is same
everywhere and the grading is ideal one. However, ideal grading requires the use of an infinite
number of dielectrics which is an impossible task. In practice, two or three dielectrics are used in
the decreasing order of permittivity, the dielectric of highest permittivity being used near the core.
The capacitance grading can be explained beautifully by referring to Fig. There are three
dielectrics of outer diameter d1, d2 and D and of relative permittivity 1, 2 and 3 respectively. If
the permittivity are such that 1 > 2 > 3 and the three dielectrics are worked at
the same maximum stress, then,
Potential difference across the inner layer is
Similarly, potential across second layer (V2) and third layer (V3) is given by
Total p.d. between core and earthed sheath is

If the cable had homogeneous dielectric, then, for the same values of d, D and gmax, the
permissible potential difference between core and earthed sheath would have been
(ii) Intersheath Grading
In this method of cable grading, a homogeneous dielectric is used, but it is divided into
various layers by placing metallic inters heaths between the core and lead sheath. The inter sheaths
are held at suitable potentials which are in between the core potential and earth potential. This
arrangement improves voltage distribution in the dielectric of the cable and consequently more
uniform potential gradient is obtained.
Consider a cable of core diameter d and outer lead sheath of diameter D. Suppose that two inters
heaths of diameters d1 and d2 are inserted into the homogeneous dielectric and maintained at some
fixed potentials. Let V1,V2 and V3 respectively be the voltage between core and intersheath 1,
between inter sheath 1 and 2 and between inter sheath 2 and outer lead sheath. As there is a definite
potential difference between the inner and outer layers of each inter sheath,

therefore, each sheath can be treated like a homogeneous single core cable Maximum stress
between core and inter sheath 1 is
Since the dielectric is homogeneous, the maximum stress in each layer is the same i.e.,
As the cable behaves like three capacitors in series, therefore, all the potentials are in phase i.e.
Voltage between conductor and earthed lead sheath is
Inter sheath grading has three principal disadvantages. Firstly, there are complications in fixing
the sheath potentials. Secondly, the inter sheaths are likely to be damaged during transportation
and installation which might result in local concentrations of potential gradient. Thirdly, there
are considerable losses in the inter sheaths due to charging currents. For these reasons, inter sheath
grading is rarely used.
Capacitance of 3-core Cable
The capacitance of a cable system is much more important than that of overhead line
because in cables
(i) conductors are nearer to each other and to the earthed sheath
(ii) they are separated bya dielectric of permittivity much greater than that of air.
Fig. shows a system of capacitances in a 3-core belted cable used for 3-phase system. Since
potential difference exists between pairs of conductors and between each conductor and the sheath,
electrostatic fields are set up in the cable as shown in Fig (i). These electrostatic fields give rise to
core-core capacitances Cc and conductor-earth capacitances Ceas shown in Fig.(ii). The three Cc
are delta connected whereas the three Ceare star connected, the sheath forming the star point

They lay of a belted cable makes it reasonable to assume equality of each Cc and each Ce. The
three delta connected capacitances Cc (i)can be converted into equivalent star connected
capacitances as shown in Fig. It can be easily *shown that equivalent star capacitance Ceqis
equal to three times the delta capacitance Cc i.e. Ceq= 3Cc. The system of capacitances shown in
Fig.(iii) reduces to the equivalent circuit shown in Fig. Therefore, the whole cable is equivalent
to three star-connected capacitors each of capacitance See Fig.
If Vphis the phase voltage, then charging current IC is given by ;

4.12 MECHANICAL DESIGN OF TRANSMISSION LINE
4.12.1 SAG IN OVERHEAD LINES
While erecting an overhead line, it is very important that conductors are under safe tension.
If the conductors are too much stretched between supports in a bid to save conductor material, the
stress in the conductor may reach unsafe value and in certain cases the conductor may break due
to excessive tension. In order to permit safe tension in the conductors, they are not fully stretched
but are allowed to have a dip or sag. The difference in level between points of supports and the
lowest point on the conductor is called sag. Following Fig. shows a conductor suspended between
two equal level supports A and B. The conductor is not fully stretched but is allowed to have a dip.
The lowest point on the conductor is O and the sag is S. The following points may be noted
(i) When the conductor is suspended between two supports at the same level, it takes the shap e of
catenary. However, if the sag is very small compared with the span, then sag-span curve is like a
parabola.
(ii) The tension at any point on the conductor acts tangentially. Thus tension TO at the lowest
Point O acts horizontally as shown in Fig. (ii).
(iii) The horizontal component of tension is constant throughout the length of the wire.
(iv) The tension at supports is approximately equal to the horizontal tension acting at any point
on the wire. Thus if T is the tension at the support B, then T = TO
Conductor Sag And Tension
This is an important consideration in the mechanical design of overhead lines. The
conductor sag should be kept to a minimum in order to reduce the conductor material required and
to avoid extra pole height for sufficient clearance above ground level. It is also desirable that
tension in the conductor should be low to avoid the mechanical failure of conductor and to permit
the use of less strong supports. However, low conductor tension and minimum sag are not
possible. It is because low sag means a tight wire and high tension, whereas a low tension means
a loose wire and increased sag. Therefore, in actual practice, a compromise in made between the
two.

4.12.2 CALCULATION OF SAG
In an overhead line, the sag should be so adjusted that tension in the conductors is within
safe limits. The tension is governed by conductor weight, effects of wind, ice loading and
temperature variations. It is a standard practice to keep conductor tension less than 50% of its
ultimate tensile strength i.e., minimum factor of safety in respect of conductor tension should be
2. We shall now calculate sag and tension of a conductor when ( i ) supports are at equal levels
and ( ii ) supports are at unequal levels.
When supports are at equal levels .Consider a conductor between two equilevel supports A and
B with O as the lowest point as shown in Fig.8.2. It can be proved that lowest point will be at a
conductor between two equilevel supports A and B with O as the lowest point as shown in Fig.
It can be proved that lowest point will be at the mid-span.
a conductor between two equilevel supports A and B with O as the lowest point as shown in Fig.
It can be proved that lowest point will be at the mid-span.
Let
l = Length of span
w = Weight per unit length of conductor
T = Tension in the conductor.
Consider a point P on the conductor. Taking the lowest point O as the origin, let the co-ordinates
of point P be x and y. Assuming that the curvature is so small that curved length is equal to its
horizontal projection ( i.e., OP = x ), the two forces acting on the portion OP of the conductor are
:
(a) The weight wx of conductor acting at a distance x/2 from O.
(b) The tension T acting at O .
Equating the moments of above two forces about point O, we get,
( ii ) When supports are at unequal levels. In hilly areas, we generally come across conductors
suspended between supports at unequal levels. Fig.3 shows a conductor suspended between two
supports A and B which are at different levels. The lowest point on the conductor is O .
Let

l = Span length
h = Difference in levels between two supports
x 1 = Distance of support at lower level ( i.e., A ) from O
x 2 = Distance of support at higher level ( i.e. B ) from O
T = Tension in the conductor
4.12.3 EFFECT OF WIND AND ICE LOADING
The above formulae for sag are true only in still air and at normal temperature when the
conductor is acted by its weight only. However, in actual practice, a conductor may have ice
coating and simultaneously subjected to wind pressure. The weight of ice acts vertically
downwards i.e. , in the same direction as the weight of conductor. The force due to the wind is
assumed to act horizontally i.e ., at right angle to the projected surface of the conductor. Hence,
the total force on the conductor is the vector sum of horizontal and vertical forces as shown in

Total weight of conductor per unit length is
Where w = weight of conductor per unit length
= conductor material density ⋅ volume per unit length
Wi = weight of ice per unit length
= density of ice * volume of ice per unit length
ww = wind force per unit length
= wind pressure per unit area projected area per unit length
When the conductor has wind and ice loading also, the following points may be noted :
i)The conductor sets itself in a plane at an angle to the vertical where
ii) The sag in the conductor is given by
Hence S represents the slant sag in a direction making an angle to the vertical. If no specific
mention is made in the problem, then slant slag is calculated by using the above formula.
iii) The vertical sag =

4.12.4 VIBRATION DAMPER
Aeolian vibrations mostly occur at steady wind velocities from 1 to 7 m/s. With increasing
wind turbulences the wind power input to the conductor will decrease. The intensity to induce
vibrations depends on several parameters such as type of conductors and clamps, tension, span
length, topography in the surrounding, height and direction of the line as well as the frequency
of occurrence of the vibration induced wind streams. In the wake of wind power plants (up to 3 x
diameter of the rotor behind the plant) the wind velocity will be reduced up to 0,5 of the velocity
of the free wind stream, so that lower wind velocities could be expected more frequently here.
That’s why the probability of a higher stresses for the conductors caused by wind-induced
vibrations will be greater than without wind power plants. On the other hand the intensity of
turbulences will increase which will hinder the arising of vibrations. The both important
parameters for inducing vibrations, wind velocity and turbulence intensity, depends on the
distance to the rotor and the height of it.
The investigations showed an increasing of damage probability on OHTL due to the wake
of wind power plants of the factor 2,5 to 3,5 between one and three rotor diameters behind the plant
which will cause an equivalent decreasing of lifetime of conductors and earth wires.
Vibration Damping
The knowledge of the mechanical self- damping of conductors is an important parameter
for the energy balance calculation. The impedance and the efficiency of the vibration damper have
been measured in relationship to frequency and used as input data for the energy balance.
The velocity of the damper clamp shall be remain under the limit of 10 cm/s. The vibration dampers
are tested at this vibrating velocity in an endurance test. They must stand at least 100 million
vibrations without damages. If the velocity of the damper clamp remains beneath the value of 10
cm/s the bending stresses remain in the endurance range so that damages could not be expected.

4.12.5 STRINGING CHART
For use in the field work of stringing the conductors, temperature-sag and temperature tension
charts are plotted for the given conductor and loading conditions. Such curves are called stringing
charts (see Fig). These charts are very helpful while stringing overhead lines.
4.12.6 SAG TEMPLATE
A Sag Template is a very important tool with the help of which the position of towers on
the Profile is decided so that they conform to the limitations of vertical and wind loads on any
particular tower, and minimum clearances, as per I.E. Rules, required to be maintained between
the line conductor to ground, telephone lines, buildings, streets, navigable canals, power lines, or
any other object coming under or near the line.
A Sag Template is specific for the particular line voltage, the conductor used and the applicable
design conditions. Therefore, the correct applicable Sag Template should be used. A Sag Template
consists of a set of parabolic curves drawn on a transparent celluloid or a crylic clear sheet duly
cut in over the maximum conductor sag curve to allow the conductor curve to be drawn and the
lowest points of the conductor sag to be marked on the profile when the profile is

placed underneath it.
The set of curves in the sag template consists of:
(i) Cold or Uplift Curve’ showing sag of conductor at minimum temperature
(minus 2.5ºC) and still wind.
(ii) Hot or Maximum Sag Curve’ showing maximum sag of conductor at
maximum temperature and still wind including sag tolerances allowed (normally 4%),
if any, and under maximum ice condition wherever applicable.
(iii) Ground Clearance Curve’ which is drawn parallel to the ‘Hot or
Maximum Sag Curve’ and at a distance equal to the specified minimum ground
clearance for the relevant voltage.
(iv) ‘Tower Footing Curve’ which is drawn parallel to the ‘Ground
Clearance Curve’ and separated by a minimum distance equal to the maximum sag at
the basic design span.
QUESTIONS :
Q.No Question
1 What is inter-sheath grading?
2 Identify the insulating materials used in cables?
3 Define insulation resistance?
4 List advantages of underground cables in distribution systems?
5 List out the methods of improving string efficiency
6 What are the requirements of insulators?
7 List the advantages of suspension type insulators over pin type insulators?
8 What is grading of cables?
9 Define string efficiency
10 Illustrate the types of cable based on voltage level
11 What is sag
12 What are the two types of supports used and when they are used?
Q.No Question
1 Draw a neat sketch and explain the following
i. 3-core belted cable
ii. H-type cable
iii. S.L. type cable
2 A single core 66 kV cable working on 3-phase system has a conductor diameter of 2 cm.
and a sheath of inside diameter 5.3 cm. If two intersheaths are introduced in such a way
that the stress varies between the same maximum and minimum in the three layers, Solve
for:
i. positions of intersheaths

ii. voltage on the intersheaths
iii. maximum and minimum stress
3 Each line of a 3-phase system is suspended by a string of 3 identical insulators of self-
capacitance C farad. The shunt capacitance of connecting metal work of each insulator is
0.2 C to earth and 0.1 C to line. Determine the string efficiency of the system if a guard
ring increases the capacitance to the line of metal work of the lowest insulator to 0.3 C
4 Discuss any two methods to increase the value of string efficiency, with suitable sketches.
5 Explain any two methods of grading of cables with necessary diagrams
6 With a neat sketch, explain the following:
a. pin type insulators
b. Suspension type insulators
c. Also list out the advantages of suspension type over pin
type.
7 Deduce an approximate expression for sag in overhead lines when supports are at equal
levels
8 A transmission line has a span of 275 m. between level supports. The conductor has an
effective diameter of 1.96 cm. and weighs 0.865 kg/m. Its ultimate strength is 8060 kg.
If the conductor has ice coating of radial thickness 1.27 cm. and is subjected to a wind
pressure of 3.9 gm/cm2 of projected area, Estimate the sag for a safety factor of 2. Weight
of 1 c.c. of ice is 0.91 gm.
Reference s :
1. C.L. Wadhwa, “Electrical Power Systems”, 6th Edition, New Age International (P) Limited, New
Delhi, 2010.
2. V.K. Metha & Rohit Metha,”Principles of Power System”, S. Chand, 3rd Edition, 2006.
3. S.L. Uppal, Electrical Power, Khanna Publishers, New Delhi, 2006.
4. Chakrabarti A., Soni M.I., Gupta P.V., “Textbook on power system engineering”, Dhanpat Rai &
Co., 2008.
5. S.N.Singh, “Electric Power Generation, Transmission & Distribution”, Prentice Hall of India, New
Edn, New Delhi, 2008.
6. Soni, Bhatnagar and Gupta, ”Electrical Power”, Dhanpat Rai & Sons, New Delhi, 2006.
7. Colin R.Bayliss, Brian Hardy, 4th Edition, ”Transmission and Distribution Electrical Engineering”,
Newnes, 2012.

1
SCHOOL OF ELECTRICAL AND ELECTRONICS
DEPARTMENT OF ELECTRICAL AND ELECTRONICS ENGINEERING
TRANSMISSION AND DISTRIBUTION – SEEA1402
UNIT V- RECENT TRENDS IN TRANSMISSION

2
V. RECENT TRENDS IN TRANSMISSION
Extra High Voltage AC (EHVAC) Transmission - Need, Advantages, Limitations -High Voltage
Direct current Transmission (HVDC) - Terminal Equipment for HVDC Systems - Classifications,
Advantages, Limitations - Economic Distance for HVDC - Comparison of EHVAC and HVDC
Transmission -Interconnection of HVDC & AC Systems - Voltage Control of Lines -Introduction to
FACTS Technology -SVC,TCSC,STATCOM, UPFC.
5.1 EXTRA HIGH VOLTAGE ALTERNATING CURRENT(EHVAC)
The first 735 kV system was commissioned in Canada in 1965. Since then, voltage levels up to
765 kV have been introduced in Russia with neighboring countries, U.S.A, South Africa, Brazil,
Venezuela and South Korea. The general trend of 800 kV investments is indicated in the
diagram, which shows the total capacity of power transformers and generator step-up
transformers for 800 kV delivered by ABB. Since the 90’s, However, plans are under way for
future introduction of 800 kV in India and China.
5.1.1 Extra High Voltage (EHV)Transmission system
As per present terminology, voltages less than 300 kV are termed as High Voltages.The voltages
in the range of 300 kV to 765 kV are known as Extra High Voltages (EHV). The voltages which
are 765 kV are termed as Ultra High Voltage (UHV). In India, transmission voltage ranges from
66 kV to 400 kV (RMS value of line to line voltage in three phase system). There are several
advantages of extra high voltage transmission. In EHV AC lines additional parallel three-phase
line is always provided to ensure continuity of power supply and stability of line. A long EHV
AC line is always double circuit line with intermediate substations at an interval of 250 km to
400 km for compensating reactive power. Electrical energy is generated at a voltage of about 11
kV. Then it is stepped up to 132,220 or 400kV for transmission.
Electrical power transmission is preferred at high voltages because it has many advantages.
The advantages of extra high voltage transmission will be
obvious from the following discussion.
Power transmitted is given by
P = √3 V I cos φ
Where, V = transmission voltage, I = load current, cos φ = load power factor.
Or Load current, I = P/( √3 V cos φ)
From above expression, it is clear that for a constant power and power factor, the load
current is inversely proportional to the transmission voltage. In simple words, as we
increase the transmission voltage, the load current decreases.

3
Reassons for adoption of Extra High Voltage
(EHV)Transmission system . This decrease in load current results in following
advantages:
As current gets reduced, size and volume of conductor required also reduces for
transmitting the same amount of power.
Voltage drop in line (3IR) reduces and hence voltage regulation of the line is improved.
Line losses (3I2R) gets reduced which results in the increase in transmission line
efficiency.
Power handling capacity of the line increases as we increase the transmission voltage.
It is proportional to the square of operating voltage.
The cost related to tower, insulators and different types of equipment are proportional
to voltage rather than the square of voltage.
Thus the net capital cost of transmission line decreases as voltage increases. Therefore,
a large power can be transmitted with high voltage transmission lines economically.
The total line cost of per MW per km decreases considerably.
The operation of EHV AC system is simple, reliable and can be adopted easily.
The lines can be easily tapped and extended.
5.1.2 Problems involved in Extra High Voltage (EHV)Transmission
system
The major problems in this system are as under.
Corona loss is a big problem at higher voltages. This may further increase in bad weather
conditions.
It increases radio interference.
The height of towers and insulation increases with increase in transmission voltage.
The cost of different types of equipment and switchgear required for transmission
increases with increase in transmission voltage.
The high voltage lines produce electrostatic effects which are injurious to human beings
and animals.
There are certain limitations in the transmission of power by EHV ac system.These
limitations and design aspects are discussed below:
1. Stability Considerations:
Power transferred is expressed as:

4
if resistance and shunt leakance of the transmission line are
neglected.
For equal terminal voltages (i.e. VS = VR = V)
Maximum steady state transfer of power takes place theoretically for δ
= 90° but in actual practice δ is kept within limits of 20° to 30° at full load. Taking X = 0.3475
Ω/km and δ = 30°, we have,
If the line operates at natural load given by the expression:
Thus we see that the theoretical length of a transmission line in km that can be operated
on its natural load and load angle of 30° without loss of stability only is 1.43 times surge
impedance (which comes out to be about 500 km).
The transmission distance in EHV ac systems is, therefore, limited. This limitation is
overcome by use of special equipment such as series capacitors or shunt reactors.
2. Current Carrying Capacity:
The loading of overhead line conductors does not depend on the thermal considerations.
However, for overhead transmission lines operating at voltage up to 220 kV, the
conductor size is determined on the basis of its continuous and short-term current
carrying capacity
In case of underground cables, however, both thermal current limit and charging current
are very important and that is why the underground cable is never operated beyond its
natural load.

5
Also the cost of cable is very high in comparison to that of an overhead line; therefore
use of underground cables is limited in high voltage systems.
3. Ferranti Effect:
We know that with the capacitive load on the line the receiving-end voltage is higher than
sending-end voltage.
This increase is of the order of 1.5 per cent for 160 km, 13 per cent for 500 km and 100
per cent for 960 km.
Also there is a rise in sending- end voltage whenever the load on the generator is thrown
off suddenly. Care is also to be taken from these aspects in case of ac transmission system.
Voltage rise, due to Ferranti effect, is controlled by using shunt reactors at the load end.
4. Surge Impedance Loading:
Surge impedance loading (SIL) of a transmission line is defined as the load at the
receiving end which is equivalent to √L/C.
The surge impedance loading for a transmission line is given as V2/Z0 watts per phase.
SIL is also called the natural load.
then the line carries natural load, the voltage along the entire length of line is the same.
Other problems include Aeolian vibrations and galloping.
The problem of galloping can, however, is controlled by applying weights at different
locations of the line span.
6. Environment and Biological Aspects:
EHV/UHV lines are designed such that maximum electrostatic field gradient does not
exceed 9 kV/m at mid span under the line near the ground level.
It has been found that very low frequency magnetic fields even of weak intensities can
affect certain cellular processes.
Induced current densities below 10 mA/m2 have no significant biological effect. Currents
10-100 mA/m2 cause minor biological effects. Current densities exceeding 100 mA/m2
cause health hazards.
Safe line to ground clearance of 20 m at mid span is recommended for 400 kV lines and
24 m for 1,100 kV lines. This permits movement of vehicles safely.
7. Route Clearance:
EHV/UHV transmission lines are generally constructed over different terrain including
dense forests, hilly areas and agricultural land, and clearance of minimum ROW is very
important.

6
Generally the trees are not taller than 10 m. Only dry trees need to be cleared from the
ROW of transmission lines because a live tree is found to be well grounded through its
sap, has small power loss and little chance of burning.
It has also been found that the dry tree burning can occur if an induced voltage exceeding
100 kV occurs and potential of 100 kV can exist within a radius of 6 m from 765 kV line.
So a minimum clearance of 6 m from 765 kV line conductors is essential.
8. Conductor Material:
ACSR conductors are universally employed for overhead transmission lines.
Necessary data about ACSR bundle conductors used for ac transmission lines is given
below in tabular form:
9. Span, Number of Circuits, Conductor Configuration:
For a high voltage line the economical value of span is 200-300 m, whereas for 400 kV line
it is 350-400 m
If two three-phase lines are on the same tower and are identical in construction and
electrically in parallel then they have the same reactance X. The inductive reactance of the
single equivalent circuit becomes X/2 and hence the power transfer capability is doubled.
Double-circuit lines are in common use. They have additional advantage that continuity of
supply is maintained over one line, though with reduced capability, while the other line is
out of service for maintenance or repair.
Each circuit of a double circuit line is usually designed for 75% of the line capacity. In India,
both single and double circuit lines exist in the high voltage and extra high voltage class (66,
132, 220 and 400 kV). The number of circuits is determined from the SIL.
Vertical configuration has been found the most economical for double circuit lines. For
single circuit lines, horizontal or L type configurations are most suitable.
10. Insulation Coordination:
Transmission lines and substations are subjected to overvoltages due to switching,
lightning, faults, resonance and other causes.
The surge arrestors are provided at strategic locations to protect the line insulation and
substation equipment from transient and temporary overvoltages.

7
In general there are three types of overvoltages viz. switching overvoltages, temporary
overvoltages and overvoltages due to lightning. Switching overvoltages are caused due
to energization of lines, reclosing, fault interruption, load throw, out of phase switching
and sudden switch-off of a line.
The temporary overvoltages at power frequency are due to sudden loss of load,
disconnection of inductive loads, connections of capacitive loads, etc.
For EHV and UHV transmission lines the switching overvoltages become the limiting
factor in the design of insulation levels and arrester characteristics.
Once the line is designed adequately against switching overvoltages, it is capable of
encountering temporary overvoltages.
It has also been found that overvoltages due to lightning are not very important for
EHV/UHV transmission lines.
.11. Series Compensation:
Series compensation is an important method of improving the performance of EHV transmission lines.
It consists of capacitors connected in series with the line at suitable locations and thus
opposes directly the effect of series inductive reactance of the line.
It increases the power handling capacity and reduces the voltage regulation of a
transmission line .
12. Shunt Compensation:
In EHV transmission systems, shunt compensation is invariably essential.
Shunt compensation with capacitive VARs is used to inject reactive power and control
the receiving-end voltage whereas shunt reactor compensation is used to neutralize the
Ferranti effect.
For shunt compensation, static compensation employing capacitors and reactors or
synchronous compensation using synchronous phase modifier may be employed.
5.2 HIGH VOLTAGE DIRECT CURRENT (HVDC)
The first HVDC system for ± 500 kV and above was the Cabora Bassa project,
commissioned in 1979.
The major HVDC investments at these voltage levels were made in the late 80’s and
early 90’s.
However, an increasing interest in high-capacity HVDC links have been noted in recent
years, as seen from the diagram, which shows all HVDC projects for ±500 kV and above.
The need for higher voltage levels can be anticipated for HVDC projects in the near
future, especially when the transmission line is more than 1000 km long.
From a technical point of view, there are no special obstacles against higher DC voltages.

8
Present solutions are extendable to e.g. ±800 kV when the need arises.
The need for higher voltage levels can be anticipated for HVDC projects in the near
future, especially when the transmission line is more than 1000 km long.
From a technical point of view, there are no special obstacles against higher DC voltages.
Present solutions are extendable to e.g. ±800 kV when the need arises.
5.2.1Advantages of HVDC Transmission
The HVDC system needs only one or two conductors, therefore, cost of conductor
reduces considerably. Hence it is very economical for bulk transmission of power over long
distances. The cost of towers and insulators is also reduced.
Due to corona loss considerations, when the AC system voltage exceeds 200 kV ‘bundle
conductors’ are required. With HVDC transmission this limit is 400 kV.
The radio interference is less and corona loss is low with HVDC system.
The transmission losses are less with the DC system.
In the HVDC system rectifier unit can be converted into inverter unit very easily and vice
versa. Thus in this system, power flow can be reversed very easily.
The charging current considerations at 400 kV for AC cables limits the ‘critical length’
to 40 km. HVDC cables do not need such charging current and there is no such limit for DC
cables. Cables in the DC system do not suffer from the high dielectric loss. The skin effect
is also low in the DC system.
DC power can be transmitted between two systems operating at different frequencies.
This is not possible with AC transmission.
Greater power transmission per conductor is possible with HVDC system.
There are no serious problems of voltage regulation as there is no reactance drop in this
system.
AC cables require shunt inductors for compensation. DC can be compensated by
capacitors which are cheaper and with little-associated losses. Further, these capacitors
can be used as ‘harmonic filter’ also.
In the development stage, a DC system can be worked with a single conductor and earth
as the return. This is also an advantage under the emergency conditions.
During fault with HVDC system, the grid control of the converter reduces the fault
current significantly.
Intermediate substations are not required in this system.
Due to unidirectional stress, DC cable insulation has longer life.
In case of insulation degradation, DC converter can be operated at a reduced voltage.

9
Lightning has never struck two poles of a DC line together.
However, in the case of AC, it is known to have struck two sections
simultaneously. This increases the reliability of DC link and in
many cases, shield wire can be dispensed with.
5.2.2 Disadvantages of HVDC Transmission
This system is uneconomical if the length of the transmission
line is less than 500 km as converters, inverters, and filters are
required additionally in this system.
DC circuit breaking is difficult and expensive.
Filtration is very necessary for this system due to excessive
generation of harmonics.
Overload capacity of this system is low.
As HVDC does not transmit reactive power, it has to supply
locally if required.
The maintenance of insulators in this system is more.
There are additional losses in valves and converter
transformers. These losses are continuous. Hence, a very
efficient cooling system has to be provided.
5.3 ECONOMICAL COMPARISION
EHVAC and
HVDC
The trend of power electronic components, for use in the main
circuit of an HVDC transmission, being developed means that the
relative cost of HVDC transmissions is reduced as the components
become cheaper as a result of continuing innovative technological
developments. Thus a large converter station with a cost of 50 USD/kW
is today cheaper in current dollars compared with the situation 20 years
ago. The dc line is less costly compared with an 800 kV ac line. On the
other hand, the converter station cost offsets the gain in reduced cost
of the transmission line. Thus a short line is cheaper with ac
transmission, while a longer line is cheaper with dc.
In a general comparison of HVDC vs. EHVAC power
transmission, the design of the transmission lines and the related

10
investment costs are of great importance. The aim of this paper has been
to focus on the differences in the design of line insulation and conductor
configuration, and its influence on the mechanical loads. For the line
insulation, air clearance requirements are more critical with EHVAC due
to the nonlinear behavior of the switching overvoltage withstand. The
corona effects are more pronounced at AC voltage, therefore, larger
conductor bundles are needed at higher system voltages. The altitude
effects are more important to HVDC lines, since the lightning
overvoltage withstand is the most sensitive insulation parameter with
regard to air density. The mechanical load on the tower is considerably
lower with HVDC due to less number of sub conductors required to
fulfill the corona noise limits. The high transmission capacity of the
HVDC lines, combined with lower requirements on conductor bundles
and air clearances at the higher voltage levels, makes the HVDC lines
very cost efficient compared to EHVAC lines. The cost advantage is even
more pronounced at the highest voltage levels.
5.4 HVDC CLASSIFICATIONS
Tthe HVDC transmission, which is economical for long distance power transmission, and
for the interconnection of two or more networks that has different frequencies or voltages.
For connecting two networks or system, various types of HVDC links are used. HVDC
links are classified into three types. These links are explained below;

11
1. Monopolar link – It has a single conductor of negative polarity and uses earth or sea for
the return path of current. Sometimes the metallic return is also used. In the Monopolar link,
two converters are placed at the end of each pole. Earthing of poles is done by earth electrodes
placed about 15 to 55 km away from the respective terminal stations. But this link has several
disadvantages because it uses earth as a return path. The monopolar link is not much in use
nowadays.
2. Bipolar Link– The Bipolar link has two conductors one is positive, and the other one is
negative to the earth. The link has converter station at each end. The midpoints of the
converter stations are earthed through electrodes. The voltage of the earthed electrodes is
just half the Bipolar linkvoltage of the conductor used for transmission the HVDC.

12
3.Homopolar link– It has two conductors of the same polarity usually negative polarity,
and always operates with earth or metallic return. In the homopolar link, poles are operated
in parallel, which reduces the insulation cost.
5.5 COMPARISON OF HVDC AND EHVAC TRANSMISSION
S.No HVDC Transmission Lines HVAC Transmission Lines
1
For lines designed for same insulation It
can carry as much power with level, it can carry more power with two conductors of the same size. conductors
(positive and negative).
It can carry as much power with three number of conductors
2 For a given power level, it requires less right of way, cheaper towers, reduced
conductor costs.
For given Power level, the cost of the towers and conductors
are high
3 Cable insulation required is less
Cable Insulation strength is required more. Hence it
consume high cost on the insulation factor.
4 The net power losses are reduced as the decreased the number of comductor
usage
The power losses is very high as it has three number of
conductors.

13
5 HVDC does not have skin effect hence the
net operation cost get reduced.
Due to the skin effect, power losses increases, therefore the
operation cost very increases as compared with HVDC
transmission lines.
6 Dielectric losses is less Dielectric losses is high
7
Corona loss and radio interference is less
compared to that of A.C. This leads to the choice of economic size of conductors for
D.C
Corona loss and radio interference is high and which causes high Operational cost
8 DC does not require shunt compensation. So In DC we do not want to install shunt
compensation devices.
It is requires shunt compensation devices.
9 Terminal equipment such as converters
inverters, filters cost is high
Terminal equipment cost is
low
10
HVDC requires High maintenance cost. I.e failure of IGBTs leads to high cost. A 400
Volts FF300 model IGBTs are cost about $2000, So think what about 500kV igbt
cost.
In AC No maintenance cost.
Even We do not want to touch our system for a year.
11
DC Tranmission systems are more economical, if the transmitting distance is more than breake even point. The
breaken even point will be 500 to 600 KM depending on the PU Units
For transferring power to Short distance, AC
Tranmission power has more advantages.
S.No HVDC HVAC
1
Full Control on Power Transmitted: DC does not affect by the distance of the
transmission line. In DC we can send constant power over long distance.
But In AC transmission, the
tranmitting power is depending on the voltage ange. Hence power carrying
capatity of the transmission line decreases after some

14
distance. The power transfer is limited by the consideration of
transient and steady state stability.
2
Voltage control: DC Converter station requires reactive power related to the line
loading, the line itself does not require reactive power control
Voltage control is very compicated in AC transmission
system due to line charging and inductive voltage drops.
Voltage profile is flat due to surge impedance loading. AC
transmission line needs reactive power control to
maintain the same voltage at receiving end. The reactive
power componsation is directly propotional to the
length of the transmission line, hence the long distance
transmission lines needs high reactive power.
3 Fault current: DC line allows the fault
current upto maimum rating of the line.
The fault current increases as the number of interconnection
of AC system increases.
4
DC Does not require any line compensation devices because of the
Inductor and capacitor charecteristics on DC. Inductor act as short circuit and
capacitor acts as open circuit on DC
AC System Needs reactive power compensation
componts (shunt reactor )in long transmission lines to
overcome line charging and stability limitations.
5
Interconnection problem: In DC Two systems are interconnected with different
frequencies. Synchronization of DC tie lines, no need of co-ordinated control for
inter connection.
Two system can not be
interconnected with different frequencies.
6 Ground Impedance: DC does not have any ground impedance, hence the ground
can be taken as current return path.
But In AC system, the ground
offers high magnitude of impedance, hence the ground

15
current can not permitted for steady state operation.
7
Fast control to limit the fault current in DC: DC breakers in Two terminal DC links
are avoided. At the same time the cost of DC circuit breakers are very high as
compared with AC circuit breaker.
Circuit Breaker is compulsary.
8 Transformer can not be used to reduce
the voltage level
Transformer is the heart of the AC power system. Which can
be used to reduce the voltage level.
5.6 VOLTAGE CONTROL - INTRODUCTION
In a modern power system, electrical energy from the generating station
is delivered to the ultimate consumers through a network of transmission and
distribution. For satisfactory operation of motors, lamps and other loads, it is
desirable that consumers are supplied with substantially constant voltage. Too
wide variations of voltage may cause erratic operation or even malfunctioning of
consumers’ appliances. To safe- guard the interest of the consumers, the
government has enacted a law in this regard. The statutory limit of voltage
variation is ± 6% of declared voltage at consumers’ terminals. The principal cause
of voltage variation at consumer’s premises is the change in load on the supply
system. When the load on the system increases, the voltage at the consumer’s
terminals falls due to the increased voltage drop in
( i) alternator synchronous impedance
( ii) transmission line
( iii) transformer impedance
( iv) feeders and Condenser
(v) Distributors.
The reverse would happen should the load on the system decrease. These
voltage variations are undesirable and must be kept within the prescribed limits (
i.e. ± 6% of the declared voltage). This is achieved by installing voltage
regulating equipment at suitable places in the Voltage Control power system. The
purpose of this chapter is to deal with important voltage control equipment and its
increasing utility in this fast developing power system.
5.6.1 IMPORTANCE OF VOLTAGE CONTROL
When the load on the supply system changes, the voltage at the

16
consumer’s terminals also changes.
The variations of voltage at the consumer’s terminals are undesirable
and must be kept within prescribed limits for the following reasons :
( i) In case of lighting load, the lamp characteristics are very
sensitive to changes of voltage.
For instance, if the supply voltage to an incandescent lamp decreases
by 6% of rated value, then illuminating power may decrease by 20%. On the
other hand, if the supply voltage is
6% above the rated value, the life of the lamp may be reduced by 50% due to rapid
deterio-ration of the filament.
( ii) In case of power load consisting of induction motors, the voltage
variations may cause erratic operation. If the supply voltage is above the normal,
the motor may operate with a saturated magnetic circuit, with consequent large
magnetising current, heating and low power factor. On the other hand, if the
voltage is too low, it will reduce the starting torque of the motor considerably.
( iii) Too wide variations of voltage cause excessive heating of distribution
transformers.
This may reduce their ratings to a considerable extent.
It is clear from the above discussion that voltage variations in a power
system must be kept to minimum level in order to deliver good service to the
consumers. With the trend towards larger and larger interconnected system, it has
become necessary to employ appropriate methods of voltage control.
5.6.2 LOCATION OF VOLTAGE CONTROL EQUIPMENT
In a modern power system, there are several elements between the
generating station and the consumers. The voltage control equipment is used at
more than one point in the system for two reasons.
Firstly, the power network is very extensive and there is a considerable
voltage drop in transmission and distribution systems. Secondly, the various
circuits of the power system have dissimilar load characteristics. For these reasons
, it is necessary to provide individual means of voltage control for each circuit or
group of circuits. In practice, voltage control equipment is used at : ( i) generating
stations
( ii) transformer stations
(iii) the feeders if the drop exceeds the permissible limits 15.3 Methods of
Voltage
Control There are several methods of voltage control. In each method, the system
voltage is changed in accordance with the load to obtain a fairly constant voltage
at the consumer’s end of the system. The following are the methods of voltage
control in an *a.c. power system:
( i) By excitation control
( ii) By using tap changing transformers
( iii) Auto-transformer tap changing
( iv) Booster transformers

17
( v) Induction regulators
( vi) By synchronous condenser
Method ( i) is used at the generating station only whereas methods ( ii) to ( v) can
be used
For transmission as well as primary distribution systems. However, methods ( vi) is
reserved for the voltage control of a transmission line. We shall discuss each method
separately in the next sections.
1. Excitation Control When the load on the supply system changes, the terminal voltage of the
alternator also varies due to the changed voltage drop in the synchronous reactance
of the armature. The voltage of the alternator can be kept constant by changing the
*field current of the alternator in accordance with the load. This is known as
excitation control method. The excitation of alternator can be controlled by the
use of automatic or hand operated regulator acting in the field circuit of the
alternator. The first method is preferred in modern practice. There are two main
types of automatic voltage regulators viz.
( i) Tirril Regulator
( ii) Brown-Boveri Regulator
These regulators are based on the “overshooting the mark †principle” to
enable them to respond quickly to the rapid fluctuations of load. When the load
on the alternator increases, the regulator produces an increase in excitation more
than is ultimately necessary. Before the voltage has the time to increase to the value
corresponding to the increased excitation, the regulator reduces the excitation to
the proper value.
i) Tirril Regulator
In this type of regulator, a fixed resistance is cut in and cut out of the
exciter field circuit of the alternator. This is achieved by rapidly opening and
closing a shunt circuit across the exciter rheostat.
For this reason, it is also known as vibrating type voltage regulator.
Construction
Fig. shows the essential parts of a Tirril voltage regulator. A rheostat R is provided
in the exciter circuit and its value is set to give the required excitation. This
rheostat is put in and out of the exciter circuit by the regulator, thus varying the
exciter voltage to maintain the desired voltage of the alternator.

18
( i) Main contact.
There are two levers at the top which carry the main contacts at the facing
ends. The left- hand lever is controlled by the exciter magnet whereas the right
hand lever is controlled by an
a.c. magnet known as main control magnet.
( ii) Exciter magnet.
This magnet is of the ordinary solenoid type and is connected across the
exciter mains. Its exciting current is, therefore, proportional to the exciter voltage.
The counter balancing force for the exciter magnet is provided by four coil
springs.
( iii) A. C. magnet.
It is also of solenoid type and is energised from a.c. bus-bars. It carries
series as well as shunt excitation. This magnet is so adjusted that with normal load
and voltage at the alternator, the pulls of the two coils are equal and opposite, thus
keeping the right-hand lever in the horizontal position.
( iv) Differential relay.
It essentially consists of a U-shaped relay magnet which operates the relay
contacts. The relay magnet has two identical windings wound differentially on
both the limbs. These windings are connected across the exciter mains–the left
hand one permanently while the right hand one has its circuit completed only when
the main contacts are closed. The relay contacts are arranged to shunt the exciter-
field rheostat R. A capacitor is provided across the relay contacts to reduce the
sparking at the time the relay contacts are opened.
Operation
The two control magnets ( i.e. exciter magnet and a.c. magnet) are so
adjusted that with normal load and voltage at the alternator, their pulls are equal,
thus keeping the main contacts open. In this position of main contacts, the relay
magnet remains energised and pulls down the armature carrying one relay contact.

19
Consequently, relay contacts remain open and the exciter field rheostat is in the
field circuit.
When the load on the alternator increases, its terminal voltage tends to fall.
This causes the series excitation to predominate and the a.c. magnet pulls down
the right-hand lever to close the main contacts. Consequently, the relay magnet is
*de-energised and releases the armature carrying the relay contact. The relay
contacts are closed and the rheostat R in the field circuit is short circuited.
This increases the exciter-voltage and hence the excitation of the
alternator. The increased excitation causes the alternator voltage to rise quickly.
At the same time, the excitation of the exciter magnet is increased due to the
increase in exciter voltage. Therefore, the left-hand lever is pulled down, opening
the main contacts, energising the relay magnet and putting the rheostat R again in
the field circuit before the alternator voltage has time to increase too far. The
reverse would happen should the load on the alternator decrease.
It is worthwhile to mention here that exciter voltage is controlled by the
rapid opening and closing of the relay contacts. As the regulator is worked on the
overshooting the mark principle, therefore, the terminal voltage does not remain
absolutely constant but oscillates between the maximum and minimum values. In
fact, the regulator is so quick acting that voltage variations never exceed ± 1%.
ii) Brown-Boveri Regulator In this type of regulator, exciter field rheostat is varied continuously or in
small steps instead of being first completely cut in and then completely cut out as
in Tirril regulator. For this purpose, a regulating resistance is connected in
series with the field circuit of the exciter. Fluctuations in the alternator voltage
are detected by a control device which actuates a motor. The motor drives the
regulating rheostat and cuts out or cuts in some resistance from the rheostat, thus
changing the exciter and hence the alternator voltage.
Construction
Fig. shows the schematic diagram of a Brown-Boveri voltage regulator.
It also works on the “overshooting the mark principle” and has the following four
important parts :
( i) Control system
The control system is built on the principle of induction motor. It consists

20
of two windings A and B on an annular core of laminated sheet steel. The winding
A is excited from two of the generator terminals through resistances U and U′
while a resistance R is inserted in the circuit of winding B. The ratio of resistance
to reactance of the two windings are suitably adjusted so as to create a phase
difference of currents in the two windings. Due to the phase difference of currents
in the two windings, rotating magnetic field is set up. This produces
electromagnetic torque on the thin aluminium drum C carried by steel spindle ;
the latter being supported at both ends by jewel bearings. The torque on drum C
varies with the terminal voltage of the alternator. The variable resistance U’ can
also vary the torque on the drum.
If the resistance is increased, the torque is decreased and vice-versa. Therefore,
the variable resistance U′ provides a means by which the regulator may be set to
operate at the desired voltage.
( ii) Mechanical control torque
The electric torque produced by the current in the split phase winding is
opposed by a combination of two springs (main spring and auxiliary spring) which
produce a constant mechanical torque irrespective of the position of the drum.
Under steady deflected state, mechanical torque is equal and opposite to the
electric torque.

21
( iii) Operating system
It consists of a field rheostat with contact device. The rheostat consists of
a pair of resistance elements connected to the stationary contact blocks CB . These
two resistance sectors R are connected in series with each other and then in series
with the field circuit of the exciter. On the inside surface of the contact blocks roll
the contact sectors Cs .
When the terminal voltage of the alternator changes, the electric torque acts on the
drum. This causes the contact sectors to roll over the contact blocks, cutting in or
cutting out rheostat resistance in the exciter field circuit.
( iv) Damping torque
The regulator is made stable by damping mechanism which consists of
an aluminium disc O rotating between two permanent magnets m. The disc is
geared to the rack of an aluminium sector P and is fastened to the aluminium drum
C by means of a flexible spring S acting as the recall spring. If there is a change
in the alternator voltage, the eddy currents induced in the disc O produce the
necessary damping torque to resist quick response of the moving system.
Operation
Suppose that resistances U and U′ are so adjusted that terminal voltage of
the alternator is normal at position 1. In this position, the electrical torque is
counterbalanced by the mechanical torque and the moving system is in
equilibrium. It is assumed that electrical torque rotates the shaft in a clockwise
direction.
Now imagine that the terminal voltage of the alternator rises due to
decrease in load on the supply system. The increase in the alternator voltage
will cause an increase in electrical torque which becomes greater than the
mechanical torque. This causes the drum to rotate in clockwise direction, say to
position 3. As a result, more resistance is inserted in the exciter circuit, thereby
decreasing the field current and hence the terminal voltage of the alternator.
Meanwhile, the recall spring S is tightened and provides a counter torque forcing
the contact roller back to position 2 which is the equilibrium position. The
damping system prevents the oscillations of the system about the equilibrium
position.
2. Tap-Changing Transformers
The excitation control method is satisfactory only for relatively short lines.
However, it is *not suitable for long lines as the voltage at the alternator terminals will have to
be varied too much in order that the voltage at the far end of the line may be
constant. Under such situations, the problem of voltage control can be solved by
employing other methods. One important method is to use tap-changing
transformer and is commonly employed where main transformer is necessary. In
this method, a number of tappings are provided on the secondary of the
transformer. The voltage drop in the line is supplied by changing the secondary
e.m.f. of the transformer through the adjustment of its number of turns.

22
( i) Off load tap-changing transformer.
Fig. shows the arrangement where a number of tappings have been
provided on the sec- ondary. As the position of the tap is varied, the effective
number of secondary turns is varied and hence the output voltage of the secondary
can be changed. Thus referring to Fig.
when the movable arm makes contact with stud 1, the secondary voltage
is minimum and when with stud 5, it is maximum. During the period of light load,
the voltage across the primary is not much below the alternator voltage and the
movable arm is placed on stud 1. When the load increases, the voltage across the
primary drops, but the secondary voltage can be kept at the previous value by
placing the movable arm on to a higher stud. Whenever a tapping is to be changed
in this type of transformer, the load is kept off and hence the name off load tap-
changing transformer. The principal disadvantage of the circuit arrangement
shown in Fig. is that it cannot be used for tap-changing on load. Suppose for a
moment that tapping is changed from position 1 to position 2 when the transformer
is supplying load. If contact with stud 1 is broken before contact with stud 2 is
made, there is break in the circuit and arcing results. On the other hand, if contact
with stud 2 is made before contact with stud 1 is broken, the coils connected
between these two tappings are short-circuited and carry damaging heavy
currents. For this reason, the above circuit arrangement cannot be used for tap-
changing on load.

23
( ii) On-load tap-changing transformer
In supply system, tap-changing has normally to be performed on load so
that there is no interruption to supply. Fig shows diagrammatically one type of on-
load tap-changing transformer. The secondary consists of two equal parallel
windings which have similar tappings 1 a ...... 5 a and 1 b ......... 5 b. In the normal
working conditions, switches a, b and tappings with the same number remain
closed and each secondary winding carries one-half of the total current. Referring
to Fig.
the secondary voltage will be maximum when switches a, b and 5 a, 5 b are
closed. However, the secondary voltage will be minimum when switches a, b and
1 a, 1 b are closed. Suppose that the transformer is working with tapping position
at 4 a, 4 b and it is desired to alter its position to 5 a, 5 b. For this purpose, one of
the switches a and b, say a, is opened. This takes the secondary winding controlled
by switch a out of the circuit. Now, the secondary winding controlled by switch b
carries the total current which is twice its rated capacity. Then the tapping on the
disconnected winding is changed to 5 a and switch a is closed. After this, switch
b is opened to disconnect its winding, tapping position on this winding is changed
to 5 b and then switch b is closed. In this way, tapping position is changed without
interrupting the supply.
This method has the following disadvantages:
( i) During switching, the impedance of transformer is increased and
there will be a voltage surge.
( ii) There are twice as many tappings as the voltage steps.
3. Auto-Transformer Tap-changing
Fig. shows diagrammatically auto-transformer tap changing. Here, a mid-
tapped auto- transformer or reactor is used. One of the lines is connected to its
mid-tapping. One end, say a of this transformer is connected to a series of

24
switches across the odd tappings and the other end b is connected to switches
across even tappings. A short-circuiting switch S is connected across the auto-
transformer and remains in the closed position under normal operation. In the
normal operation, there is *no inductive voltage drop across the auto-transformer.
Referring to Fig, it isclear that with switch 5 closed, minimum secondary turns
are in the circuit and hence the output voltage will be the lowest. On the other
hand, the output voltage will be maximum when switch 1 is closed.
Suppose now it is desired to alter the tapping point from position 5 to
position 4 in order to raise the output voltage. For this purpose, short-circuiting
switch S is opened, switch 4 is closed, then switch 5 is opened and finally short-
circuiting switch is closed. In this way, tapping can be changed without
interrupting the supply.
It is worthwhile to describe the electrical phenomenon occurring during
the tap changing. When the short-circuiting switch is opened, the load current
flows through one-half of the reactor coil so that there is a voltage drop across the
reactor. When switch 4 is closed, the turns between points 4 and 5 are connected
through the whole reactor winding. A circulating current flows through this local
circuit but it is limited to a low value due to high reactance of the reactor.
4. Booster Transformer
Sometimes it is desired to control the voltage of a transmission line at a
point far away from the main transformer. This can be conveniently achieved by
the use of a booster transformer as shown in Fig.
The secondary of the booster transformer is connected in series with the
line whose voltage is to be controlled. The primary of this transformer is supplied
from a regulating transformer *fitted with on-load tap-changing gear. The booster
transformer is connected in such a way that its secondary injects a voltage in phase
with the line voltage.

25
he voltage at AA is maintained constant by tap-changing gear in the main
transformer. However, there may be considerable voltage drop between AA and
BB due to fairly long feeder and tapping of loads. The voltage at BB is controlled
by the use of regulating transformer and booster transformer. By changing the
tapping on the regulating transformer, the magnitude of the voltage injected into
the line can be varied. This permits to keep the voltage at BB to the de- sired
value. This method of voltage control has three disadvantages. Firstly, it is more
expensive than the on-load tap-changing transformer. Secondly, it is less efficient
owing to losses in the booster and thirdly more floor space is required. Fig. shows
a three-phase booster transformer.
5. Induction Regulators An induction regulator is essentially a constant voltage transformer, one
winding of which can be moved w.r.t. the other, thereby obtaining a variable
secondary voltage. The primary winding is connected across the supply while the
secondary winding is connected in series with the line whose voltage is to be
controlled. When the position of one winding is changed w.r.t. the other, the
secondary voltage injected into the line also changes. There are two types of
induction regulators viz. single phase and 3-phase.
( i) Single-phase induction regulator.
A single phase induction regulator is illustrated in Fig. In construction, it
is similar to a single phase induction motor except that the rotor is not allowed
to rotate continuously but can be adjusted in any position either manually or by a
small motor. The primary winding A B is wound on the *stator and is connected
across the supply line. The secondary winding CD is wound on the rotor and is
connected in series with the line whose voltage is to be controlled.
The primary exciting current produces an alternating flux that induces an

26
alternating voltage in the secondary winding CD. The magnitude of voltage
induced in the secondary depends upon its position w.r.t. the primary winding. By
adjusting the rotor to a suitable position, the secondary voltage can be varied from
a maximum positive to a maximum negative value. In this way, the regulator can
add or subtract from the circuit voltage according to the relative positions of the
two windings.
Owing to their greater flexibility, single phase regulators are frequently
used for voltage control of distribution primary feeders.
( ii) Three-phase induction regulator
In construction, a 3-phase induction regulator is similar to a 3-phase
induction motor with wound rotor except that the rotor is not allowed to rotate
continuously but can be held in any position by means of a worm gear. The
primary windings either in star or delta are wound on the stator and are connected
across the supply. The secondary windings are wound on the rotor and
the six terminals are brought out since these windings are to be connected in series
with the line whose voltage is to be controlled.
When poly phase currents flow through the primary windings, a rotating field is
set up which induces an e.m.f. in each has of rotor winding. As the rotor is turned,
the magnitude of the rotating flux is not changed; hence the rotor e.m.f. per phase
remains constant. However, the variation of the position of the rotor will affect the
phase of the rotor e.m.f. w.r.t. the applied voltage as shown in Fig.
The input primary voltage per phase is Vp and the boost introduced by the

27
regulator is Vr . The output voltage V is the vector sum of Vp and Vr . Three
phase p induction regulators are used to regulate the voltage of feeders and in
connection with high voltage oil testing transformers.
6. Voltage Control by Synchronous Condenser The voltage at the receiving end of a transmission line can be controlled
by installing specially designed synchronous motors called *synchronous
condensers at the receiving end of the line. The synchronous condenser supplies
watt less leading kVA to the line depending upon the excitation of the motor. This
watt less leading kVA partly or fully cancels the watt less lagging kVA of the line,
thus controlling the voltage drop in the line. In this way, voltage at the receiving
end of a transmission line can be kept constant as the load on the system changes.
For simplicity, consider a short transmission line where the effects of
capacitance are neglected. Therefore, the line has only resistance and
inductance. Let V1 and V2 be the per
phase sending end and receiving end voltages respectively. Let I2 be the load
current at a lagging power factor of cos φ2 .
( i) Without synchronous condenser.
Fig. ( i) shows the transmission line with resistance R and inductive
reactance X per phase. The load current I can be resolved into two 2 rectangular
components viz I in phase with V and I at right angles to V Each component will
produce resistive and reactive drops ; the resistive drops being in phase with and
the reactive drops in quadrature leading with the corresponding currents. The
vector addition of these voltage drops to V gives the sending end voltage V
( ii) With synchronous condenser

28
Now suppose that a synchronous condenser taking a leading current * *I
is connected at the receiving end of the line. The vector diagram of the circuit
becomes as shown in Fig. Note that since I and I are in direct opposition and that
I must be greater than I , the four drops due to these two currents simplify to :
From this equation, the value of Im can be calculated to obtain any desired ratio of
V1 / V2 for a m
5.7 Introduction to FACTS Technology
Flexible alternating current transmission systems (FACTS) controllers represent one of the most
important technological advances in recent years, both enhancing controllability and increasing
power transfer capacity of electric power transmission networks
5.7.1 Static VAR Compensator (SVC)
A static VAR compensator is a parallel combination of controlled reactor and fixed shunt
capacitor shown in the figure below. The thyristor switch assembly in the SVC controls the
reactor. The firing angle of the thyristor controls the voltage across the inductor and thus the
current flowing through the inductor. In this way, the reactive power draw by the inductor can be
controlled.

29
Static-var-compensator-compressor(1)The SVC is capable of step less adjustment of reactive
power over an unlimited range without any time delay. It improves the system stability and
system power factor. Most commonly used SVC scheme are as follows.
Thyristor controlled reactor (TCR)
Thyristor-switched capacitor (TSC)
Self Reactor (SR)
Thyristor controlled reactor – Fixed capacitor (TCR-FC)
Thyristor-switched capacitor – Thyristor controlled reactor (TSC-TCR)
Advantage of Static VAR Compensator
It increased the power transmission capability of the transmission lines.
It improved the transient stability of the system.
It controlled the steady state and temporary overvoltages.
It improved the load power factor, and therefore, reduced line losses and improved system
capability.
Static VAR compensator has no rotating parts and is employed for surge impedance
compensation and compensation by sectionalizing a long transmission line.
5.7.2 TCSC
The basic Thyristor Controlled Series Capacitor scheme was proposed in 1986 by Vithayathil
with others as a method of "rapid adjustment of network impedance". A TCSC can be defined as
a capacitive reactance compensator which consists of a series capacitor bank shunted by a
thyristor-controlled reactor in order to provide a smoothly variable series capacitive reactance.
In a practical TCSC implementation, several such basic compensators may be connected in series
to obtain the desired voltage rating and operating characteristics. However, the basic idea behind

30
the TCSC scheme is to provide a continuously variable capacitor by means of partially canceling
the effective compensating capacitance by the TCR. The basic conceptual TCSC module
comprises a series capacitor, C, in parallel with a thyristor controlled reactor.
A TCSC is a series-controlled capacitive reactance that can provide continuous control of power
on the ac line over a wide range. From the system viewpoint, the principle of variable-series
compensation is simply to increase the fundamental-frequency voltage across a Fixed Capacitor
(FC) in a series compensated line through appropriate variation of the firing angle, α. This
enhanced voltage changes the effective value of the series capacitive reactance. A simple
understanding of TCSC functioning can be obtained by analyzing the behavior of a variable
inductor connected in parallel with an FC. The maximum voltage and current limits are design
values for which the thyristor valve, the reactor and capacitor banks are rated to meet specific
application requirements.
5.7.3 STATCOM
A STATCOM is a controlled reactive-power source. It provides the desired reactive-power
generation and absorption entirely by means of electronic processing of the voltage and current
waveforms in a voltage-source converter (VSC).
A single-line STATCOM power circuit is shown in Fig.(a),where a VSC is connected to a utility
bus through magnetic coupling.
In Fig. (b), a STATCOM is seen as an adjustable voltage source behind a reactance meaning that
capacitor banks and shunt reactors are not needed for reactive-power generation and absorption,
thereby giving a STATCOM a compact design, or small footprint, as well as low noise and low
magnetic impact.
The exchange of reactive power between the converter and the ac system can be controlled by
varying the amplitude of the 3-phase output voltage, Es, of the converter, as illustrated in Fig.
(c).
If the amplitude of the output voltage is increased above that of the utility bus voltage, Et, then a

31
current flows through the reactance from the converter to the ac system and the converter
generates capacitive-reactive power for the ac system.
If the amplitude of the output voltage is decreased below the utility bus voltage, then the current
flows from the ac system to the converter and the converter absorbs inductive-reactive power
from the ac system.
The STATCOM principle diagram: (a) a power circuit;(b) an equivalent circuit;(c) a power
exchange
Ø If the output voltage equals the ac system voltage, the reactive-power exchange becomes
zero, in which case the STATCOM is said to be in a floating state.
Ø Adjusting the phase shift between the converter-output voltage and the acsystem voltage can
similarly control real-power exchange between the converter and the ac system. In other words,
the converter can supply real power to the ac system from its dc energy storage if the converter-
output voltage is made to lead the ac-system voltage.
Ø On the other hand, it can absorb real power from the ac system for the dc system if its voltage
lags behind the ac-system voltage.
Ø A STATCOM provides the desired reactive power by exchanging the instantaneous reactive
power among the phases of the ac system.

32
Ø The mechanism by which the converter internally generates and/ or absorbs the reactive power
can be understood by considering the relationship between the output and input powers of the
converter. The converter switches connect the dc-input circuit directly to the ac-output circuit.
Thus the net instantaneous power at the acoutput terminals must always be equal to the net
instantaneous power at the dc-input terminals (neglecting losses).
Ø Assume that the converter is operated to supply reactive-output power. In this case, the real
power provided by the dc source as input to the converter must be zero.
Ø Furthermore, because the reactive power at zero frequency (dc) is by definition zero, the dc
source supplies no reactive ower as input to the converter and thus clearly plays no part in the
generation of reactive-output power by the converter.
Ø In other words, the converter simply interconnects the three output terminals so that the
reactive-output currents can flow freely among them. If the terminals of the ac system are
regarded in this context, the converter establishes a circulating reactive-power exchange among
the phases. However, the real power that the converter exchanges at its ac terminals with the ac
system must, of course, be supplied to or absorbed from its dc terminals by the dc capacitor.
Ø Although reactive power is generated internally by the action of converter switches, a dc
capacitor must still be connected across the input terminals of the converter.
Ø The primary need for the capacitor is to provide a circulating-current path as well as a voltage
source.
Ø The magnitude of the capacitor is chosen so that the dc voltage across its terminals remains
fairly constant to prevent it from contributing to the ripples in the dc current. The VSC-output
voltage is in the form of a staircase wave into which smooth sinusoidal current from the ac system
is drawn, resulting in slight fluctuations in the output power of the converter.
Ø However, to not violate the instantaneous power-equality constraint at its input and output
terminals, the converter must draw a fluctuating current from its dc source.
Ø Depending on the converter configuration employed, it is possible to calculate the minimum
capacitance required to meet the system requirements, such as ripple limits on the dc voltage and
the rated-reactivepower support needed by the ac system.
Ø The VSC has the same rated-current capability when it operates with the capacitive- or
inductive-reactive current.
Ø Therefore, a VSC having a certain MVA rating gives the STATCOM twice the dynamic range
in MVAR (this also contributes to a compact design). A dc capacitor bank is used to support
(stabilize) the controlled dc voltage needed for the operation of the VSC.
Ø The reactive power of a STATCOM is produced by means of power-electronic equipment of
the voltage-source-converter type.
Ø The VSC may be a 2- level or 3-level type, depending on the required output power and
voltage . A number of VSCs are combined in a multi-pulse connection to form the STATCOM.
In the steady state, the VSCs operate with fundamental-frequency switching to minimize
converter losses. However, during transient conditions caused by line faults, a pulse width–

33
modulated (PWM) mode is used to prevent the fault current from entering the VSCs . In this way,
the STATCOM is able to withstand transients on the ac side without blocking.
Advantages of STATCOM
1. It occupies a small footprint, for it replaces passive banks of circuit elements by compact
electronic converters;
2. It offers modular, factory-built equipment, thereby reducing site work and commissioning
time; and
3. It uses encapsulated electronic converters, thereby minimizing its environmental impact.
5.7.4 Unified Power Flow Controller (UPFC)
The UPFC is the most versatile FACTS controller developed so far, with all encompassing
capabilities of voltage regulation, series compensation, and phase shifting.
Ø It can independently and very rapidly control both real- and reactive power flows in a
transmission.
Ø It is configured as shown in Fig. and comprises two VSCs coupled through a common dc
terminal.

34
The implementation of the UPFC using two “back – to –back” VSCs with a common DC-
terminal capacitor
Ø One VSC converter 1 is connected in shunt with the line through a coupling transformer; the
other VSC converter 2 is inserted in series with the transmission line through an interface
transformer.
Ø The dc voltage for both converters is provided by a common capacitor bank.
Ø The series converter is controlled to inject a voltage phasor, Vpq, in series with the line, which
can be varied from 0 to Vpq max. Moreover, the phase angle of Vpq can be independently varied
from 00 to 3600.
Ø In this process, the series converter exchanges both real and reactive power with the
transmission line.
Ø Although the reactive power is internally generated/ absorbed by the series converter, the
real-power generation/ absorption is made feasible by the dc-energy–storage device that is, the
capacitor.
Ø The shunt-connected converter 1 is used mainly to supply the real-power demand of converter
2, which it derives from the transmission line itself. The shunt converter maintains constant
voltage of the dc bus.
Ø Thus the net real power drawn from the ac system is equal to the losses of the two converters
and their coupling transformers.
Ø In addition, the shunt converter functions like a STATCOM and independently regulates the
terminal voltage of the interconnected bus by generating/ absorbing a requisite amount of reactive
power.

35
QUESTIONS :
Q.No Question
1 Define EHV AC & HVDC Transmission
2 Show the need for compensation with a vector diagram
3 Discuss the limitations in EHVAC transmission
4 Distinguish between Monopolar & Bipolar link in HVDC transmission
5 What is the major role of FACTS devices in Power System
6 Define STATCOM
7 What are the advantages of HVDC transmission
8 List out the different modes of operation in TCSC.
Q.No Question
1 Explain HVDC transmission system and its terminal equipments
2 List the applications of HVDC systems. Also Explain the technical reasons for
adopting EHV AC transmission
3 Discuss in detail about the classification of HVDC transmission
4 Explain about the interconnection of HVDC & AC systems
5 Explain in detail about TCSC and its different modes of operation
6 What is meant by UPFC. Also discuss the operation benefit of UPFC in power
system.
7 Explain about STATCOM and list out the advantages.

36
References :
1. C.L. Wadhwa, “Electrical Power Systems”, 6th Edition, New Age International (P)
Limited, New Delhi, 2010.
2. V.K. Metha & Rohit Metha,”Principles of Power System”, S. Chand, 3rd Edition,
2006.
3. S.L. Uppal, Electrical Power, Khanna Publishers, New Delhi, 2006.
4. Chakrabarti A., Soni M.I., Gupta P.V., “Textbook on power system engineering”,
Dhanpat Rai & Co., 2008.
5. S.N.Singh, “Electric Power Generation, Transmission & Distribution”, Prentice Hall
of India, New Edn, New Delhi, 2008.
6. Soni, Bhatnagar and Gupta, ”Electrical Power”, Dhanpat Rai & Sons, New Delhi,
2006.
7. Colin R.Bayliss, Brian Hardy, 4th Edition, ”Transmission and Distribution Electrical
Engineering”, Newnes, 2012.


![Transmission Distribution and Utilization [15EE52T]](https://static.fdokumen.com/doc/165x107/6328d58109048e4b7c061729/transmission-distribution-and-utilization-15ee52t.jpg)


