Translational PK/PD modeling for cardiovascular safety assessment of drug candidates: Methods and...
13
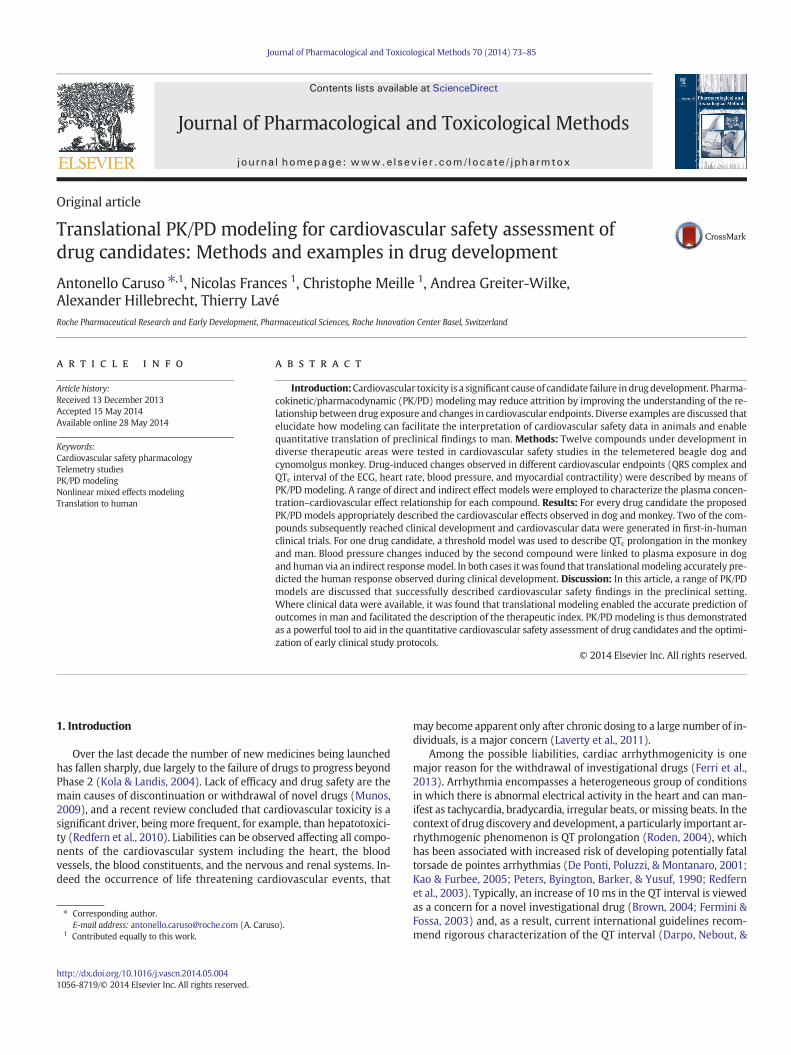
Original article Translational PK/PD modeling for cardiovascular safety assessment of drug candidates: Methods and examples in drug development Antonello Caruso ⁎ ,1 , Nicolas Frances 1 , Christophe Meille 1 , Andrea Greiter-Wilke, Alexander Hillebrecht, Thierry Lavé Roche Pharmaceutical Research and Early Development, Pharmaceutical Sciences, Roche Innovation Center Basel, Switzerland abstract article info Article history: Received 13 December 2013 Accepted 15 May 2014 Available online 28 May 2014 Keywords: Cardiovascular safety pharmacology Telemetry studies PK/PD modeling Nonlinear mixed effects modeling Translation to human Introduction: Cardiovascular toxicity is a significant cause of candidate failure in drug development. Pharma- cokinetic/pharmacodynamic (PK/PD) modeling may reduce attrition by improving the understanding of the re- lationship between drug exposure and changes in cardiovascular endpoints. Diverse examples are discussed that elucidate how modeling can facilitate the interpretation of cardiovascular safety data in animals and enable quantitative translation of preclinical findings to man. Methods: Twelve compounds under development in diverse therapeutic areas were tested in cardiovascular safety studies in the telemetered beagle dog and cynomolgus monkey. Drug-induced changes observed in different cardiovascular endpoints (QRS complex and QT c interval of the ECG, heart rate, blood pressure, and myocardial contractility) were described by means of PK/PD modeling. A range of direct and indirect effect models were employed to characterize the plasma concen- tration–cardiovascular effect relationship for each compound. Results: For every drug candidate the proposed PK/PD models appropriately described the cardiovascular effects observed in dog and monkey. Two of the com- pounds subsequently reached clinical development and cardiovascular data were generated in first-in-human clinical trials. For one drug candidate, a threshold model was used to describe QT c prolongation in the monkey and man. Blood pressure changes induced by the second compound were linked to plasma exposure in dog and human via an indirect response model. In both cases it was found that translational modeling accurately pre- dicted the human response observed during clinical development. Discussion: In this article, a range of PK/PD models are discussed that successfully described cardiovascular safety findings in the preclinical setting. Where clinical data were available, it was found that translational modeling enabled the accurate prediction of outcomes in man and facilitated the description of the therapeutic index. PK/PD modeling is thus demonstrated as a powerful tool to aid in the quantitative cardiovascular safety assessment of drug candidates and the optimi- zation of early clinical study protocols. © 2014 Elsevier Inc. All rights reserved. 1. Introduction Over the last decade the number of new medicines being launched has fallen sharply, due largely to the failure of drugs to progress beyond Phase 2 (Kola & Landis, 2004). Lack of efficacy and drug safety are the main causes of discontinuation or withdrawal of novel drugs (Munos, 2009), and a recent review concluded that cardiovascular toxicity is a significant driver, being more frequent, for example, than hepatotoxici- ty (Redfern et al., 2010). Liabilities can be observed affecting all compo- nents of the cardiovascular system including the heart, the blood vessels, the blood constituents, and the nervous and renal systems. In- deed the occurrence of life threatening cardiovascular events, that may become apparent only after chronic dosing to a large number of in- dividuals, is a major concern (Laverty et al., 2011). Among the possible liabilities, cardiac arrhythmogenicity is one major reason for the withdrawal of investigational drugs (Ferri et al., 2013). Arrhythmia encompasses a heterogeneous group of conditions in which there is abnormal electrical activity in the heart and can man- ifest as tachycardia, bradycardia, irregular beats, or missing beats. In the context of drug discovery and development, a particularly important ar- rhythmogenic phenomenon is QT prolongation (Roden, 2004), which has been associated with increased risk of developing potentially fatal torsade de pointes arrhythmias (De Ponti, Poluzzi, & Montanaro, 2001; Kao & Furbee, 2005; Peters, Byington, Barker, & Yusuf, 1990; Redfern et al., 2003). Typically, an increase of 10 ms in the QT interval is viewed as a concern for a novel investigational drug (Brown, 2004; Fermini & Fossa, 2003) and, as a result, current international guidelines recom- mend rigorous characterization of the QT interval (Darpo, Nebout, & Journal of Pharmacological and Toxicological Methods 70 (2014) 73–85 ⁎ Corresponding author. E-mail address: [email protected] (A. Caruso). 1 Contributed equally to this work. http://dx.doi.org/10.1016/j.vascn.2014.05.004 1056-8719/© 2014 Elsevier Inc. All rights reserved. Contents lists available at ScienceDirect Journal of Pharmacological and Toxicological Methods journal homepage: www.elsevier.com/locate/jpharmtox
-
Upload
independent -
Category
Documents
-
view
2 -
download
0
Transcript of Translational PK/PD modeling for cardiovascular safety assessment of drug candidates: Methods and...
Journal of Pharmacological and Toxicological Methods 70 (2014) 73–85
Contents lists available at ScienceDirect
Journal of Pharmacological and Toxicological Methods
j ourna l homepage: www.e lsev ie r .com/ locate / jpharmtox
Original article
Translational PK/PD modeling for cardiovascular safety assessment ofdrug candidates: Methods and examples in drug development
Antonello Caruso ⁎,1, Nicolas Frances 1, Christophe Meille 1, Andrea Greiter-Wilke,Alexander Hillebrecht, Thierry LavéRoche Pharmaceutical Research and Early Development, Pharmaceutical Sciences, Roche Innovation Center Basel, Switzerland
⁎ Corresponding author.E-mail address: [email protected] (A. Carus
1 Contributed equally to this work.
http://dx.doi.org/10.1016/j.vascn.2014.05.0041056-8719/© 2014 Elsevier Inc. All rights reserved.
a b s t r a c t
a r t i c l e i n f oArticle history:
Received 13 December 2013Accepted 15 May 2014Available online 28 May 2014Keywords:Cardiovascular safety pharmacologyTelemetry studiesPK/PD modelingNonlinear mixed effects modelingTranslation to human
Introduction:Cardiovascular toxicity is a significant cause of candidate failure in drug development. Pharma-cokinetic/pharmacodynamic (PK/PD) modeling may reduce attrition by improving the understanding of the re-lationship between drug exposure and changes in cardiovascular endpoints. Diverse examples are discussed thatelucidate how modeling can facilitate the interpretation of cardiovascular safety data in animals and enablequantitative translation of preclinical findings to man. Methods: Twelve compounds under development indiverse therapeutic areas were tested in cardiovascular safety studies in the telemetered beagle dog andcynomolgus monkey. Drug-induced changes observed in different cardiovascular endpoints (QRS complex andQTc interval of the ECG, heart rate, blood pressure, and myocardial contractility) were described by means ofPK/PDmodeling. A range of direct and indirect effect models were employed to characterize the plasma concen-tration–cardiovascular effect relationship for each compound. Results: For every drug candidate the proposed
PK/PD models appropriately described the cardiovascular effects observed in dog and monkey. Two of the com-pounds subsequently reached clinical development and cardiovascular data were generated in first-in-humanclinical trials. For one drug candidate, a threshold model was used to describe QTc prolongation in the monkeyand man. Blood pressure changes induced by the second compound were linked to plasma exposure in dogand human via an indirect responsemodel. In both cases itwas found that translational modeling accurately pre-dicted the human response observed during clinical development. Discussion: In this article, a range of PK/PDmodels are discussed that successfully described cardiovascular safety findings in the preclinical setting.Where clinical data were available, it was found that translational modeling enabled the accurate prediction ofoutcomes in man and facilitated the description of the therapeutic index. PK/PD modeling is thus demonstratedas a powerful tool to aid in the quantitative cardiovascular safety assessment of drug candidates and the optimi-zation of early clinical study protocols.© 2014 Elsevier Inc. All rights reserved.
1. Introduction
Over the last decade the number of new medicines being launchedhas fallen sharply, due largely to the failure of drugs to progress beyondPhase 2 (Kola & Landis, 2004). Lack of efficacy and drug safety are themain causes of discontinuation or withdrawal of novel drugs (Munos,2009), and a recent review concluded that cardiovascular toxicity is asignificant driver, beingmore frequent, for example, than hepatotoxici-ty (Redfern et al., 2010). Liabilities can be observed affecting all compo-nents of the cardiovascular system including the heart, the bloodvessels, the blood constituents, and the nervous and renal systems. In-deed the occurrence of life threatening cardiovascular events, that
o).
may become apparent only after chronic dosing to a large number of in-dividuals, is a major concern (Laverty et al., 2011).
Among the possible liabilities, cardiac arrhythmogenicity is onemajor reason for the withdrawal of investigational drugs (Ferri et al.,2013). Arrhythmia encompasses a heterogeneous group of conditionsin which there is abnormal electrical activity in the heart and can man-ifest as tachycardia, bradycardia, irregular beats, or missing beats. In thecontext of drug discovery and development, a particularly important ar-rhythmogenic phenomenon is QT prolongation (Roden, 2004), whichhas been associated with increased risk of developing potentially fataltorsade de pointes arrhythmias (De Ponti, Poluzzi, & Montanaro, 2001;Kao & Furbee, 2005; Peters, Byington, Barker, & Yusuf, 1990; Redfernet al., 2003). Typically, an increase of 10 ms in the QT interval is viewedas a concern for a novel investigational drug (Brown, 2004; Fermini &Fossa, 2003) and, as a result, current international guidelines recom-mend rigorous characterization of the QT interval (Darpo, Nebout, &
74 A. Caruso et al. / Journal of Pharmacological and Toxicological Methods 70 (2014) 73–85
Sager, 2006). Because of these guidelines, as well as the ethical impera-tive to avoid exposing human healthy volunteers or patients to unnec-essary risk and the expense of clinical trials, a significant effort is beingmade in drug development to predict the QT prolongation potentialfor new chemical entities using preclinical measures (Giorgi, Bolanos,Gonzalez, & Di Girolamo, 2010). These typically include in vivoexperiments in non-rodent species (monkey, dog, and other species(Authier, Pugsley, Troncy, & Curtis, 2010; Chaves et al., 2006;Holzgrefe, Cavero, Buchanan, Gill, & Durham, 2007; Nolan et al., 2006;Ollerstam et al., 2007)).
Significant cardiovascular safety risks exist via a spectrum of possi-ble mechanisms and hence other measures of cardiovascular functionhave predictive value besides QT prolongation. For example, modestchronic drug-induced changes in systolic blood pressure (5 mmHg) orheart rate (5 beats/min) increase by up to 25% the risk of sufferingheart failure, cardiac ischemia, or cerebral stroke events (Barter et al.,2007; Paul et al., 2010). Drugs can also impact the inotropic state of car-diac tissue, a quantity that can bemonitored preclinically using invasivemeasures of left ventricular function such as the contractility index(maximal rate of change of left ventricular pressure over time, positivedP/dt, described in the context of this paper as ΔP/Δt) (Pugsley,Authier, & Curtis, 2008). In addition, drugs affecting cardiac ion channelkinetics may alter other components of the ECG beyond the QT interval,causing changes in morphology, amplitude, and duration of the PR in-terval or QRS complex. For example, a great variety of pharmacologicalagents (e.g., class IA and IC antiarrhythmics, antihistamines, antidepres-sants, antipsychotics) exert an influence on the QRS complex (Madias,2008). QRS prolongation is thought to be associated with higher ratesof heart failure (Lund et al., 2013) and pro-arrhythmic risks, especiallyin patients with underlying cardiac disease (Kashani & Barold, 2005).Thus, preclinical determination of QRS modification may also providevaluable information for predicting toxicity in man.
Projecting cardiovascular safety risks from preclinical studies to theclinical situation demands experiment designs powered to detectchanges in cardiovascular function (Guth et al., 2009) and adequate un-derstanding of the relationship between exposure and effect (Langdonet al., 2010a). The changes in cardiovascular safety endpoints inducedby investigational drugs are commonly assessed with the time-matched mean differences between drug and vehicle treatment(Holzgrefe et al., 2014; Watson et al., 2011). This statistical approachdoes not allow for the establishment of a continuous concentration–response relationship. Moreover, a number of complexities such aslow signal-to-noise ratios, multiple sources of variability (e.g., inter-individual differences in drug absorption, distribution, and elimination,or in sensitivity to the compound), and time dependent phenomena(such as the in vivo response lagging behind drug concentration),limit considerably the value of the standard approach for quantitativesafety assessment. In contrast, population pharmacokinetic/pharmaco-dynamic (PK/PD) modeling can provide a description of the concentra-tion–effect relationship and an estimate of the pharmacological potency(e.g., the concentration associated with half-maximal response (C50)).This methodology allows one to describe time dependencies, identifyoutliers, discriminate inter-subject variability from noise, and performrisk assessments at an individual level (Fleury et al., 2011; Piotrovsky,2005; Sheiner, Rosenberg, & Melmon, 1972; Watson et al., 2011).
Literature reports are available presenting PK/PDmodels that can re-produce the drug-induced changes observed in animals (Fleury et al.,2011; Hao et al., 2007; Ollerstam et al., 2006; Watson et al., 2011) orhumans (Jonker et al., 2005; Persky, Berry, Pollack, & Brouwer, 2004)for several cardiovascular endpoints. Understanding of the concentra-tion–response relationship with a mechanistic or semi-mechanisticmodel further enables cross-species translation and prediction of thehuman therapeutic index (defined as the separation between efficacyand safety) (Danhof, de Lange, Della Pasqua, Ploeger, & Voskuyl,2008). Limited information is, however, reported in the literature onthe model-based translation of cardiovascular effects in animals and
humans (Langdon et al., 2010b; Parkinson et al., 2013; Piotrovsky,2005).
This paper describes PK/PD analyses of diverse cardiovascular end-points (QT,QRS, heart rate,ΔP/Δt, and blood pressure) evaluated in bea-gle dog and cynomolgus monkey, as well as two examples of thetranslation of preclinical safety findings to human. The goal is to eluci-date how modeling can facilitate the interpretation of cardiovascularsafety data in animals and enable the quantitative translation to man.The candidate compounds discussed herein have been developedfor a broad range of indications including metabolic, viral, and centralnervous system disease, demonstrating the general utility of the meth-odology. Given the richness and complexity of the data generated in car-diovascular safety studies, the need is present to efficiently processthese in a way that permits informed decision making during drug dis-covery and development. Thus, the application of PK/PD modeling isdiscussed as an effective and accurate methodology to quantify cardio-vascular effects, enable translation to human, and influence decisionmaking.
2. Methods
2.1. Animal experiments and data acquisition
All animal procedures and care conformed to regulations on use ofexperimental animals applicable in Europe (Directive 86/609/EEC)and the USA. All studies were performed in accordance with the ICHGuidelines S7A and S7B on Technical Requirements for Registration ofPharmaceuticals for Human Use (Anonymous, 2001; Anonymous,2005).
2.1.1. Surgical proceduresCaptive bred male and female cynomolgus monkeys (Macaca
fascicularis) and beagle dogs were used (Table 1). In monkeys, the elec-trodes were placed on the pericardium in lead II configuration. Theblood pressure (BP) sensor was introduced into the femoral artery. Indogs, the BP transducer was inserted into the aorta via thoracotomyand also served as ECG lead. The secondECG leadwas placed subcutane-ously near the apex of the heart. The left ventricular BP sensor wasinserted through the cardiac apex. After the surgery, at least 2 weeksof recovery were observed before the start of treatment.
2.1.2. CompoundsTwelve drug candidates (presented here as compounds 1–12) were
investigated for cardiovascular adverse effects after oral administrationby gavage. All compounds were synthesized at F. Hoffmann La RocheLtd. sites in Basel (Switzerland), Palo Alto (California, USA), and Nutley(New Jersey, USA). The drugs have been developed for a broad range oftherapeutic uses in the neuroscience, metabolic, cardiovascular, andviral disease areas.
In vitro profiling results (hERG IC50; human Nav1.5 IC50; hitsagainst a panel of receptors, transporters, enzymes, and ion channels)for the twelve drug candidates are provided in Section A1 of the supple-mentary materials. The relevance of those in vitro results for potentialcardiovascular effects is indicated in Table A1.
Protein binding in dog, monkey, and human plasma was considereddrug concentration independent for all compounds.
2.1.3. Drug administration and pharmacokinetic samplingDetails on study dosing regimens and sampling schedules are pro-
vided in Table 1. Blood samples were taken and transferred into tubescontaining EDTA as anticoagulant. After collection, the samples weremixed and centrifuged at 1500–3000 g at 4 °C. The plasma was thentransferred to polypropylene vials containing EDTA and stored at −20to −80 °C. Drug concentrations in plasma were subsequently deter-mined using validated bioanalytical LC/MS/MS methods.

Table 1Dosing regimen and pharmacokinetic sampling for telemetry studies.
Compound Species (no ofmales, females)
Supplier Study designa Dosesb
(mg/kg p.o.c)Feeding status Treatment
duration perdose level(days)
Washout periodbetween treatmentswith test item (days)
Blood samplingschedule ontelemetry daysor TK days (hourspost-dose)
Compound 1 Cynomolgusmonkey (3 M, 3 F)
Noveprim(Port-Louis, Mauritius)and Le Tamarinier(Tamarin, Mauritius)
Ascending dosedesign, 3 dayswith telemetryrecordings
Vehicle (qd) Non-fasted(food availablead libitum)
3 ≥5 Telemetry: 0(pre-dose), 2, 24TK: 0 (pre-dose),2, 4, 8, 24
5 (qd) 730 (qd) 8100 (qd) 8
Compound 2 Beagle dog(4 M, 4 F)
Marshall BioResources(North Rose, NY, USA)
Latin squarecrossover
Vehicle (bid),20 (bid), 100(bid), 400 (bid)
Fed 1 ≥6 Telemetry: 0(pre-dose), 9, 24TK: 0 (pre-dose), 2,4, 6, 10, 24, 32, 48
Compound 3 Beagle dog (4 M) RCC (Füllinsdorf,Switzerland)
SAD Vehicle, 10, 30, 60 Fed 1 ≥3 Telemetry: 0(pre-dose), 2, 24
Compound 4 Beagle dog (4 M) RCC (Füllinsdorf,Switzerland)
SAD Vehicle, 22, 110 Fed 1 5 Telemetry: 0(pre-dose), 2, 24
Compound 5 Beagle dog (4 M) RCC (Füllinsdorf,Switzerland)
SAD Vehicle, 4.5, 15, 45 Fed 1 ≥3 Telemetry: 0(pre-dose), 2, 24
Compound 6 Beagle dog (4 M) RCC (Füllinsdorf,Switzerland)
SAD Vehicle, 1.6, 5.2, 16 Fed 1 ≥3 Telemetry: 0(pre-dose), 2, 24
Compound 7 Beagle dog (4 M) RCC (Füllinsdorf,Switzerland)
SAD Vehicle, 5.5, 18.5, 55 Fasted 1 ≥3 Telemetry: 0(pre-dose), 2, 6
Compound 8 Cynomolgusmonkey (4 M, 4 F)
CRP (Denver, PA, USA) Latin squarecrossover
Vehicle, 30, 100, 200 Non-fasted 1 ≥6 Telemetry:−2(pre-dose), 2.5TK: 0 (pre-dose),1, 2, 4, 8, 24
Compound 9 Cynomolgusmonkey (3 M, 3 F)
Noveprim(Port-Louis, Mauritius)and Le Tamarinier(Tamarin, Mauritius)
Crossover Vehicle, 1, 10, 50 Non-fasted 1 ≥3 Telemetry: 0(pre-dose), 4, 24TK: 0 (pre-dose),0.5, 1, 2, 4, 14
Compound 10 Beagle dog(4 M, 4 F)
Marshall BioResources(North Rose, NY, USA)
Latin squarecrossover
Vehicle, 0.4, 5, 50 Fed 1 ≥2 Telemetry: 0(pre-dose), 1, 24TK: 0 (pre-dose),1, 3, 7, 24
Compound 11 Beagle dog(3 M, 3 F)
RCC (Füllinsdorf,Switzerland) andMarshall BioResources(North Rose, NY, USAand Montichiari, Italy)
Crossover Vehicle, 2, 10, 50 Fasted 1 ≥3 Telemetry: 0(pre-dose), 3, 24TK: 1, 3, 5, 7, 9, 24
Compound 12 Beagle dog(3 M, 3 F)
Harlan (Füllinsdorf,Switzerland) andMarshall BioResources(Montichiari, Italy)
Crossover Vehicle, 5, 10, 20 Fasted 1 ≥3 Telemetry: 0(pre-dose), 1.5, 24
a SAD: single ascending dose; MAD: multiple ascending dose.b qd: once daily; bid: twice daily; else single dose.c p.o.: per os administration by gavage.
75A. Caruso et al. / Journal of Pharmacological and Toxicological Methods 70 (2014) 73–85
2.1.4. Telemetered acquisition and data processingDetails on protocols for telemetered ECG and hemodynamic record-
ing are presented in Table 2. Where appropriate, signal low-pass filter-ing and down-sampling were performed prior to modeling in order toremove artifacts and reduce dataset size. Single delta (Δ) correction ofthe cardiovascular parameters on active treatment was calculated as in-dividual time-matched change from vehicle/placebo. Double delta (ΔΔ)correction was achieved by baseline and vehicle/placebo subtraction.Data processing was carried out in the software MATLAB (MATLAB,2009b).
The QT interval is dependent on the heart rate (HR), with fasterheart rates being associated with shorter QT intervals. Hence the QT in-terval needs to be corrected using the RR interval of the ECG to accountfor changes in HR, yielding the parameter QTc. Various methods havebeen proposed to correct the QT data (Bazett, 1920; Fridericia, 1920;Holzgrefe et al., 2007; Sagie, Larson, Goldberg, Bengtson, & Levy,1992). RawQTmeasures were corrected by using the individual correc-tion formula described by Holzgrefe et al. (2007):
QTc ¼ 10 log QTð Þ−β log RRð Þ− log RRrefð Þð Þ½ � ð1Þ
with a reference cycle length (RRref) of 500ms in cynomolgus monkeys(corresponding to 120 bpm HR) and a RRref of 750 ms in beagle dogs(80 bpm) (Holzgrefe et al., 2007). The individual QT/RR slope (β) wasdetermined via linear regression analysis from log–log transformed ve-hicle data which enabled the individual correction of the raw QT inter-val for HR changes (Champeroux et al., 2009; Holzgrefe, Cavero,Gleason, et al., 2007).
2.2. Modeling analyses
Study data were analyzed by using models that describe reversibledirect or indirect concentration–effect relationships, as discussed inthe literature (Mager, Wyska, & Jusko, 2003). Modeling was performedwith a nonlinearmixed effects approach as implemented in theMonolixsoftware (Chan, Jacqmin, Lavielle, McFadyen, & Weatherley, 2011) (seeSection A3 of the supplementary materials). Model selection and pa-rameterization were accomplished according to the following criteria:(i) precision of fixed and random parameter estimates, (ii) diagnosticplots (observed versus predicted plot, residual distribution plot, and vi-sual predictive check), (iii) extent of residuals and of inter-individual

Table 2Telemetered ECG and hemodynamic acquisition.
Compound Software for telemetered ECG acquisition and analysis Modeled endpoint Data processing
Compound 1 Ponemah P3 Plus v. 4.2 (DSI, New Brighton, MN, USA) QTc 10 min mean values per hour reported over 24 hCompound 2 Ponemah P3 Plus v. 4.2 (DSI, New Brighton, MN, USA) QTc Data averaged into hourly intervals for the first 24 h, thereafter binned
into bihourly time intervals until 48 hCompounds 3–7 ITS CA Recorder and VR2 software (ITS, Delaware) QRS Mean values of consecutive 5 min post-dose intervals reported over 20 hCompound 8 Ponemah P3 Plus v. 4.2 (DSI, New Brighton, MN, USA) QTc Post-dose data reported as 0.5-h segment averages (1st light cycle) or
1-h segment averages (dark and 2nd light cycle) over 48 hCompound 9 Ponemah P3 Plus v. 4.2 (DSI, New Brighton, MN, USA) QTc 10 min mean values per hour reported over 24 hCompound 10 Ponemah P3 Plus v. 4.2 (DSI, New Brighton, MN, USA) HR Post-dose segment averaged into hourly time intervals over 24 hCompound 11 ITS CA Recorder and VR2 software (ITS, Delaware) Δp/Δt Mean values of consecutive 5 min post-dose intervals reported over 20 hCompound 12 ITS CA Recorder and VR2 software (ITS, Delaware) MAP Mean values of consecutive 5 min post-dose intervals reported over 20 h
76 A. Caruso et al. / Journal of Pharmacological and Toxicological Methods 70 (2014) 73–85
variability and (iv) model-fitting criteria (log-likelihood, Akaike infor-mation criterion). Covariates were included in the final model if the as-sociated p-value was b0.05. Where feasible, a simultaneous estimationof the PK/PD parameters was performed; otherwise, a sequential fittingstrategy was employed.
In the case of effects on multiple cardiovascular endpoints in thesame study, the parameters for the safety assessment were selected ac-cording to their relevance for further clinical development or primaryeffect. For example, primary heart rate or blood pressure changes willhave secondary effects on ΔP/Δt (Markert et al., 2007), in such casesonly heart rate or blood pressure changes would be subjected tomodeling.
The spectrum of possible PK/PD behaviors necessitated utilization ofa range of model structures presented in the following sub-sections.
2.2.1. Preclinical PK analysesCompartmental PK modeling was employed to describe the plasma
drug concentrations observed in the preclinical species. The relevantequations are presented in Section A4 of the supplementary materials.Where exposure data from the telemetry study did not enable a satisfac-tory estimation of PK parameters according to the criteria of Section 2.2(compounds 3–7, 11, and 12), data fromprevious PK studies in the samespecieswere added to the dataset (see Section A2 of the supplementarymaterials).
2.2.2. Human PK simulationsFor compounds 1 and 12, plasma concentration time courses in man
were simulated with a physiologically based PK (PBPK) model imple-mented in GastroPlus (Anonymous). The model was developed accord-ing to a PBPK modeling strategy described elsewhere (Jones, Parrott,Jorga, & Lave, 2006) and updated when exposure data from a first-in-human single ascending dose (SAD) study became available.
2.2.3. Graphical exploration of study resultsCardiovascular data were inspected for signs of a time lag between
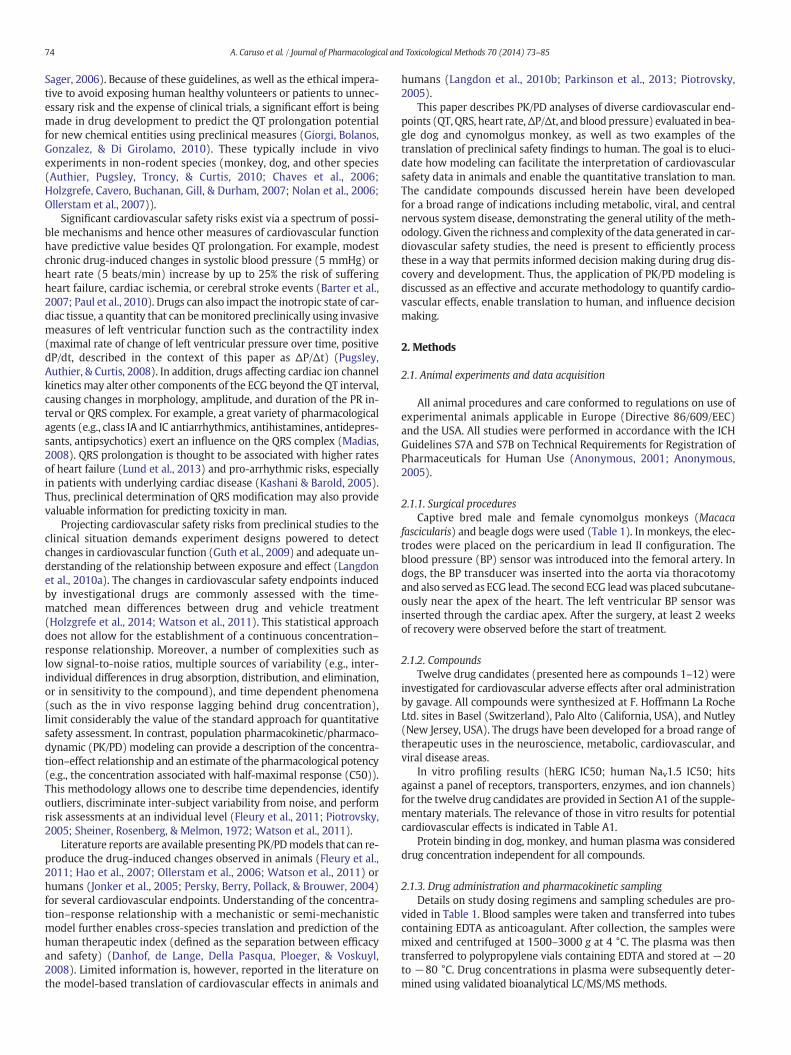
PK and PD. This was, for instance, achieved by plotting time-matchedobserved effect versus observed or simulated (if available) concentra-tion data and diagnosing the presence of hysteresis (Fig. 1). Because ofsparse PK sampling and inter-individual variability, the nature of thePK/PD relationship was not always apparent. The selection of a modelwith delayed response over a direct one (with or without effect com-partment) was then based on improvements in the objective functionand statistical criteria as described in Section 2.2. The cardiovascularpharmacology of compounds 1–7 was finally classified as exhibiting di-rect effects and compounds 8–12 as indirect. The correspondingmodelsare described more in detail below.
2.2.4. Preclinical direct effects models
2.2.4.1. Threshold model for QTc prolongation (compounds 1 and 2). Forcompounds 1 and 2, potential effects on QTc could not be discerned at
low concentrations from the intrinsic dispersion of the data. Drug-induced prolongation of QTc was apparent at higher concentrations,and no saturation of effectwas observed across the tested concentrationrange. Drug concentration and QTc time-matched data were thus fittedassuming a threshold concentration–response relationship (Franceset al., 2012; Lutz & Lutz, 2009; Lynch et al., 2003; Purchase & Auton,1995; Yanagimoto & Yamamoto, 1979). The effect was thereby definedby a zero-slope segment at exposures below a positive threshold level(Ct), and a linear, concentration dependent increase above Ct:
E ¼ b for C≤Ct ð2Þ
E ¼ s � C−Ctð Þ þ b for CNCt ð3aÞ
where E is the change in QTc interval duration (ΔQTc and ΔΔQTc forcompound 1 and 2, respectively), b the baseline level, s the slope, andC the plasma concentration (Cp) for compound 1 or the peak plasmaconcentration (Cmax) for compound 2. In an alternative parameteriza-tion, Eq. (3a) can be rewritten as follows:
E ¼ s � C−Ctð Þ þ b ¼ 10 � C−Ct
C10−Ctþ b for CNCt ð3bÞ
where C10 is the plasma exposure associatedwith an effect size equal to10 (i.e. 10 ms QTc prolongation).
2.2.4.2. Sigmoidal Emax model for QRS widening (compounds 3–7). Forcompounds 3–7 QRS effects were modeled according to Eq. (4):
ΔQRS ¼ Emax �Cγp
Cγp þ Cγ
50
ð4Þ
where ΔQRS is the increase in QRS duration expressed as individualtime-matchedpercent change fromvehicle, Emax is themaximumeffect,C50 the concentration associated with half-maximal response, and γ aslope parameter (Hill coefficient).
2.2.5. Preclinical indirect effect models
2.2.5.1. Thresholdmodel for QTc prolongation (compounds 8 and 9) and HRincrease (compound 10). For compounds 8, 9, and 10 a delay between PKand PD was observed. In the interest of speed of analysis, a parsimoni-ous and pragmatic approach was applied by relating the maximum ex-posure and effect, with no attempt to further describe the nature of thetemporal displacement. Study resultswerefitted to the thresholdmodelof Eqs. (2) and (3), with C being the peak plasma concentration and Ethe maximum change in QTc or HR (ΔQTc, ΔΔQTc, and ΔΔHR for com-pound 8 to 10, respectively).
2.2.5.2. Indirect response model for ΔP/Δt (compound 11) and BP (com-pound 12). A type II indirect response pharmacodynamic model
0 1 2 3 4 5 6 7 8 9 10 11 12210
215
220
225
230
235
240
245
250
255
260
Predicted total plasma concentration (μg/ml)
30 mg/kg 100 mg/kg 200 mg/kg
Ob
serv
ed Q
Tc
(ms)
Fig. 1.QTc versus time-matched total plasma exposuremeasured in one exemplary animal(cynomolgus monkey) after administration of compound 8. The plot exhibits counter-clockwise hysteresis indicating that the pharmacological response lags behind the drugconcentration.
77A. Caruso et al. / Journal of Pharmacological and Toxicological Methods 70 (2014) 73–85
(Dayneka, Garg, & Jusko, 1993) was used to analyze the positive ΔP/Δtchanges in beagle dogs and account for the observed delayed responseto compound 11:
ddt
ΔP=Δtð Þ ¼ kin � 1þ Emax �Cγp
Cγ50 þ Cγ
p
!−kout � ΔP=Δtð Þ ð5Þ
and
kin ¼ kout � ΔP=Δt0 ð6Þ
whereΔP/Δt0 is the baselineΔP/Δt, kin and kout the zero order input andfirst order output rate constants, respectively, and Imax the maximuminhibition.
BP effects of compound 12 in the beagle dog were analyzed with atype III indirect responsemodel (Dayneka et al., 1993). A linear pharma-codynamic model was used according to Eqs. (7) and (8):
ddt
MAP ¼ kin � 1þ Cp
CMAP
� �−kout �MAP ð7Þ
and
kin ¼ kout �MAP0 ð8Þ
where MAP is the mean arterial blood pressure, MAP0 the baselinevalue, and CMAP the drug potency parameter.
2.2.6. Translation and simulation of cardiovascular effects in manCompounds 1 and 12were investigated in first-in-human studies in-
cluding ECG and hemodynamic acquisition to assess their cardiovascu-lar effects. The study protocols are summarized in Table A3 of thesupplementary materials.
Human QTc data recorded in 35 healthy male volunteers aged 18 to45 years taking part in a first-in-human SAD study with compound 1were analyzed similarly to the corresponding observations in cynomol-gus monkey (Section 2.2.4). The inter-species difference in plasma un-bound fraction (cynomolgus monkey fup: 4%, human fup: 3%) wastaken into account for the simulations with the assumption that onlythe free drug concentration is associated with pharmacological activity.
BP effects by compound 12 measured in a first-in-human SAD trial(72 healthy male volunteers aged 18 to 45 years) were simulated by
using the indirect response PK/PD model developed in the beagle dog(Eqs. (7)–(8)). Since predictions of the systolic blood pressure (SBP)were considered more meaningful in the clinical setting, the MAP out-put of the model was converted with the following equation (Gauer,1960; Wezler & Böger, 1939) assuming no pharmacological effects onthe diastolic blood pressure (DBP):
SBP ¼ 3 �MAP−2 � DBP ð9Þ
To perform the translation of the model to man, the system-specificparameters (baseline SBP and DBP, kout) were adjusted, whereas thepharmacological potency (CMAP) was assumed comparable betweenspecies (Mager & Jusko, 2008). In order to achieve this, the human base-line SBP and DBP values were obtained from the literature (Hall, 2010).The human kout value was derived from data of SBP changes associatedwith physical activity (rate of recovery after treadmill running in a com-parable population of subjects (Lentner, 1990)) under the assumptionthat exercise-induced blood pressure changes are relevant for modelextrapolation. The species difference in plasma protein binding wasconsidered negligible (beagle dog fup: 9.2%, human fup: 9.8%). The po-tency parameter CMAP was assumed equal to the estimate in the dog.The parameter values of the human model are summarized in Table 6.
3. Results
3.1. Preclinical PK analyses
The preclinical PK data were appropriately described by using one-and two-compartment models according to the criteria stated inSection 2.2. The estimated PK model parameters are tabulated in thesupplementary materials (Table A4).
3.2. Preclinical direct effects models
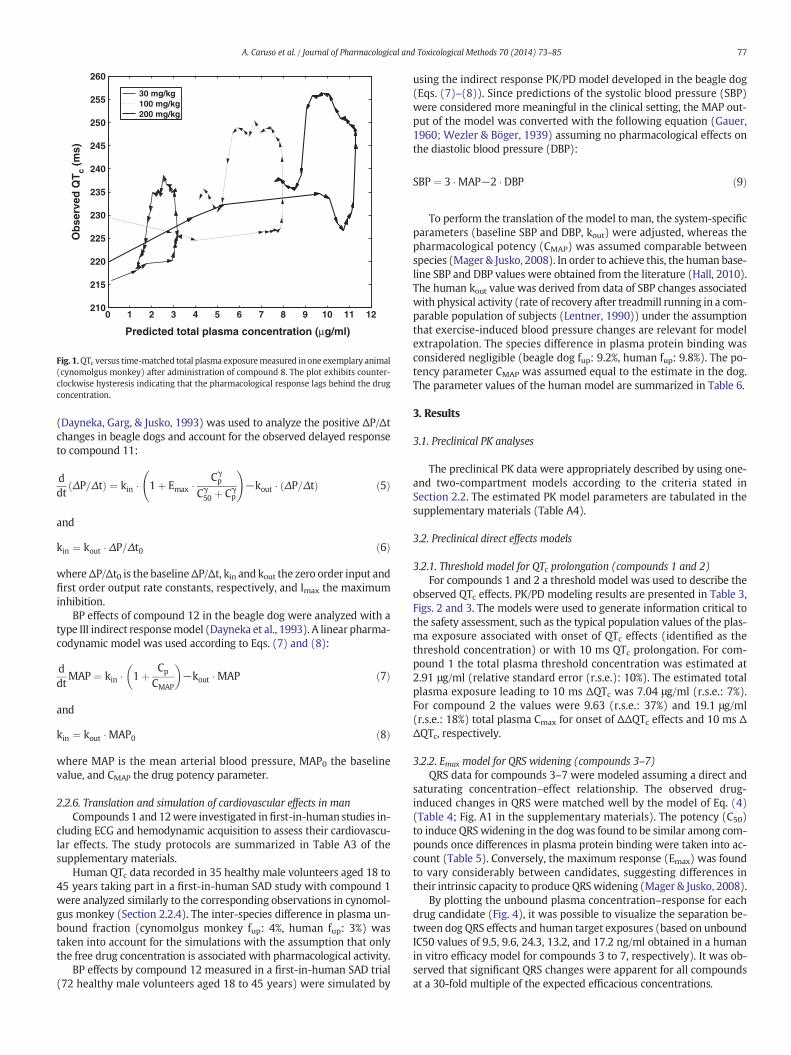
3.2.1. Threshold model for QTc prolongation (compounds 1 and 2)For compounds 1 and 2 a threshold model was used to describe the
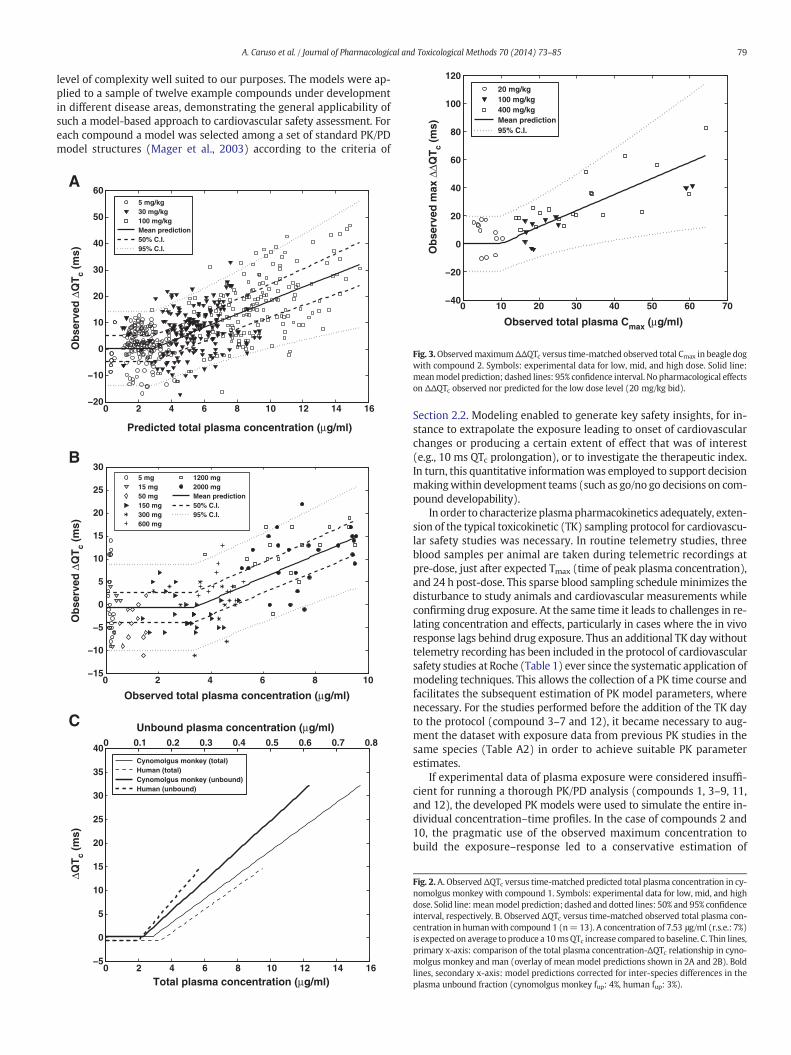
observed QTc effects. PK/PD modeling results are presented in Table 3,Figs. 2 and 3. The models were used to generate information critical tothe safety assessment, such as the typical population values of the plas-ma exposure associated with onset of QTc effects (identified as thethreshold concentration) or with 10 ms QTc prolongation. For com-pound 1 the total plasma threshold concentration was estimated at2.91 μg/ml (relative standard error (r.s.e.): 10%). The estimated totalplasma exposure leading to 10 ms ΔQTc was 7.04 μg/ml (r.s.e.: 7%).For compound 2 the values were 9.63 (r.s.e.: 37%) and 19.1 μg/ml(r.s.e.: 18%) total plasma Cmax for onset of ΔΔQTc effects and 10 ms ΔΔQTc, respectively.
3.2.2. Emax model for QRS widening (compounds 3–7)QRS data for compounds 3–7 were modeled assuming a direct and
saturating concentration–effect relationship. The observed drug-induced changes in QRS were matched well by the model of Eq. (4)(Table 4; Fig. A1 in the supplementary materials). The potency (C50)to induce QRSwidening in the dogwas found to be similar among com-pounds once differences in plasma protein binding were taken into ac-count (Table 5). Conversely, the maximum response (Emax) was foundto vary considerably between candidates, suggesting differences intheir intrinsic capacity to produce QRSwidening (Mager & Jusko, 2008).
By plotting the unbound plasma concentration–response for eachdrug candidate (Fig. 4), it was possible to visualize the separation be-tween dog QRS effects and human target exposures (based on unboundIC50 values of 9.5, 9.6, 24.3, 13.2, and 17.2 ng/ml obtained in a humanin vitro efficacy model for compounds 3 to 7, respectively). It was ob-served that significant QRS changes were apparent for all compoundsat a 30-fold multiple of the expected efficacious concentrations.

Table 3Parameter estimates of the threshold models for compounds 1–2 and 8–10.
Drug Parameter FEa r.s.e.a (%) IIVa (−) r.s.e.a (%)
Compound 1 (cynomolgus monkey) Threshold (μg/ml) 2.91 10 x xC10 (μg/ml) 7.04 7 0.171 32Slope (ms·ml/μg) 2.42b na na naBaseline ΔQTc (ms) 0.010 x 0.050 xa (ms) 7.38 3 na na
Compound 1 (man) Threshold (μg/ml) 3.38 15 x xC10 (μg/ml) 7.53 7 0.1 xSlope (ms·ml/μg) 2.41b na na naBaseline ΔQTc (ms) −0.400 5 0.100 xa (ms) 4.61 7 na na
Compound 2 Threshold (μg/ml) 9.63 37 0.050 xC10 (μg/ml) 19.1 18 0.151 35Slope (ms·ml/μg) 1.06b na na naBaseline ΔΔQTc (ms) 0 14 0.300 xa (ms) 10 14 na na
Compound 8 Threshold (μg/ml) 3.76 56 0.010 xC10 (μg/ml) 10.3 17 0.160 xSlope (ms·ml/μg) 1.53b na na naBaseline ΔQTc (ms) 2.30 10 0.200 xa (ms) 2.65 47 na na
Compound 9 Threshold (μg/ml) 9.12 30 0.100 xC10 (μg/ml) 13.9 12 0.050 xSlope (ms·ml/μg) 2.09b na na naBaseline ΔΔQTc (ms) 0.500 14 0.300 xa (ms) 3.76 22 na na
Compound 10 Threshold (ng/ml) 256 67 0.300 xSlope (ml/ng/min) 0.053 37 0.350 xBaseline ΔΔHR (min−1) 0 14 0.400 xa (min−1) 4.54 51 na na
a FE: fixed effect; IIV: inter-individual variability; r.s.e: relative standard error; na: not applicable; x: parameter not estimated.b Calculated value (Eq. (3b)).
78 A. Caruso et al. / Journal of Pharmacological and Toxicological Methods 70 (2014) 73–85
3.3. Preclinical indirect effects models
3.3.1. Threshold model for QTc prolongation (compounds 8 and 9) and HRincrease (compound 10)
For compounds 8–10, a thresholdmodelwas used to describe the re-lationship between themaximumQTc andHR effects and themaximumobserved concentration. Modeling results are presented in Table 3 andFigs. 5–6. For compounds 8, 9, and 10 the threshold for QTc and HReffects was estimated at 3.76 (r.s.e.: 56%), 9.12 (r.s.e.: 30%), and0.256 μg/ml (r.s.e.: 67%), respectively. For compounds 8 and 9, the plas-ma concentration determining a 10 ms QTc change was estimated at10.3 (r.s.e.: 17%) and 13.9 μg/ml (r.s.e.: 12%), respectively.
3.3.2. Indirect response model for ΔP/Δt (compound 11) and BP(compound 12)
Myocardial contractility appeared to be delayed relative to plasmaconcentrations of compound 11. ΔP/Δt pharmacodynamics was welldescribed with the indirect response model of Eqs. (5)–(6) (Table 6,Fig. 7). Estimating inter-individual variability of the baselinemyocardialcontractility was noted to be of critical importance to achieve satisfacto-ry parameter precision.
BP increases induced by compound 12 were evaluated in beagledogs with the aim of quantifying the effects and enabling the extrapola-tion to man. The drug dependent changes in MAP in the beagledog were best described by an indirect response PK/PD model(Eqs. (7)–(8)). Model simulations were in agreement with experimen-tal data (Fig. 8), and parameter relative standard errors b25% (Table 6).
3.4. Translation to human
3.4.1. Extrapolation of QTc prolongation effects from cynomolgusmonkey tohuman (compound 1)
In the case of compound 1, human plasma drug concentration andQTc data were generated in a first-in-man SAD trial. A thresholdmodel was applied to the human observations as done for the
cynomolgus monkey (Table 3, Fig. 2B). The total plasma concentrationsleading to onset of QTc effects and to 10 ms QTc prolongation in humanwere estimated at 3.38 (r.s.e.: 15%) and 7.53 μg/ml (r.s.e.: 7%), respec-tively. Interestingly, the concentration–response relationships of thetwo species were in good agreement (Fig. 2C) suggesting similar sensi-tivity to the compound.
3.4.2. Extrapolation of BP effects from beagle dog to human (compound 12)The human PK of compound 12 was extrapolated by using a PBPK
modeling strategy. Through translation of the BP PK/PD model devel-oped in the beagle dog (Table 6), it was possible to project the anticipat-ed human response. Fig. 9 shows that the simulations were concordantwith data collected in a first-in-man SAD study exhibiting a dose depen-dent ΔΔSBP increase (observations largely within the 90% C.I.envelope). The human data and simulations clearly indicated thatdrug-induced SBP changes are to be expected at the efficacious dose of40 mg qd (Fig. 9, Fig. A3 in the supplementary materials). During thecourse of Phase 1, the validated model was also used to explore the po-tential advantages of controlled release formulations (Fig. A3).
4. Discussion
This manuscript describes the modeling approach that was used toprovide guidance on the interpretation of preclinical cardiovascularsafety data and support further development of drug candidates. Theprimary goal of modeling was to facilitate the understanding of the re-lationship between drug exposure and the observed changes in cardio-vascular endpoints. A further objective was to enable the quantitativetranslation of preclinical findings to man. Model-based predictionsand available human data were compared to assess model translatabil-ity and translational accuracy.
A series of PK/PD models are discussed that successfully describeddrug effects on different cardiovascular safety endpoints (QRS, QTc,HR, BP, and ΔP/Δt) in the preclinical and clinical setting. The series in-cludes linear and nonlinear, direct and indirect effect models with a
80
100
120 20 mg/kg 100 mg/kg 400 mg/kg Mean prediction 95% C.I.
Tc
(ms)
79A. Caruso et al. / Journal of Pharmacological and Toxicological Methods 70 (2014) 73–85
level of complexity well suited to our purposes. The models were ap-plied to a sample of twelve example compounds under developmentin different disease areas, demonstrating the general applicability ofsuch a model-based approach to cardiovascular safety assessment. Foreach compound a model was selected among a set of standard PK/PDmodel structures (Mager et al., 2003) according to the criteria of
0 10 20 30 40 50 60 70−40
−20
0
20
40
60
Observed total plasma Cmax (μg/ml)
Ob
serv
ed m
ax Δ
ΔQ
Fig. 3.ObservedmaximumΔΔQTc versus time-matched observed total Cmax in beagle dogwith compound 2. Symbols: experimental data for low, mid, and high dose. Solid line:meanmodel prediction; dashed lines: 95% confidence interval. No pharmacological effectson ΔΔQTc observed nor predicted for the low dose level (20 mg/kg bid).
0 2 4 6 8 10 12 14 16−20
−10
0
10
20
30
40
50
60
Predicted total plasma concentration (μg/ml)
5 mg/kg 30 mg/kg 100 mg/kg Mean prediction 50% C.I. 95% C.I.
0 2 4 6 8 10−15
−10
−5
0
5
10
15
20
25
30
Observed total plasma concentration (μg/ml)
5 mg 15 mg 50 mg 150 mg 300 mg 600 mg
1200 mg 2000 mg Mean prediction 50% C.I. 95% C.I.
Ob
serv
ed Δ
QT
c (m
s)O
bse
rved
ΔQ
Tc
(ms)
A
B
C
0 2 4 6 8 10 12 14 16−5
0
5
10
15
20
25
30
35
40
Total plasma concentration (μg/ml)
0 0.1 0.2 0.3 0.4 0.5 0.6 0.7 0.8
Unbound plasma concentration (μg/ml)
Cynomolgus monkey (total) Human (total) Cynomolgus monkey (unbound) Human (unbound)
ΔQT
c (m
s)
Section 2.2. Modeling enabled to generate key safety insights, for in-stance to extrapolate the exposure leading to onset of cardiovascularchanges or producing a certain extent of effect that was of interest(e.g., 10 ms QTc prolongation), or to investigate the therapeutic index.In turn, this quantitative informationwas employed to support decisionmakingwithin development teams (such as go/no go decisions on com-pound developability).
In order to characterize plasmapharmacokinetics adequately, exten-sion of the typical toxicokinetic (TK) sampling protocol for cardiovascu-lar safety studies was necessary. In routine telemetry studies, threeblood samples per animal are taken during telemetric recordings atpre-dose, just after expected Tmax (time of peak plasma concentration),and 24 h post-dose. This sparse blood sampling schedule minimizes thedisturbance to study animals and cardiovascular measurements whileconfirming drug exposure. At the same time it leads to challenges in re-lating concentration and effects, particularly in cases where the in vivoresponse lags behind drug exposure. Thus an additional TK day withouttelemetry recording has been included in the protocol of cardiovascularsafety studies at Roche (Table 1) ever since the systematic application ofmodeling techniques. This allows the collection of a PK time course andfacilitates the subsequent estimation of PK model parameters, wherenecessary. For the studies performed before the addition of the TK dayto the protocol (compound 3–7 and 12), it became necessary to aug-ment the dataset with exposure data from previous PK studies in thesame species (Table A2) in order to achieve suitable PK parameterestimates.
If experimental data of plasma exposure were considered insuffi-cient for running a thorough PK/PD analysis (compounds 1, 3–9, 11,and 12), the developed PK models were used to simulate the entire in-dividual concentration–time profiles. In the case of compounds 2 and10, the pragmatic use of the observed maximum concentration tobuild the exposure–response led to a conservative estimation of
Fig. 2. A. Observed ΔQTc versus time-matched predicted total plasma concentration in cy-nomolgus monkey with compound 1. Symbols: experimental data for low, mid, and highdose. Solid line:meanmodel prediction; dashed and dotted lines: 50% and 95% confidenceinterval, respectively. B. Observed ΔQTc versus time-matched observed total plasma con-centration in humanwith compound 1 (n=13). A concentration of 7.53 μg/ml (r.s.e.: 7%)is expected on average to produce a 10msQTc increase compared to baseline. C. Thin lines,primary x-axis: comparison of the total plasma concentration-ΔQTc relationship in cyno-molgus monkey and man (overlay of mean model predictions shown in 2A and 2B). Boldlines, secondary x-axis: model predictions corrected for inter-species differences in theplasma unbound fraction (cynomolgus monkey fup: 4%, human fup: 3%).

Table 5Summary of direct Emax ΔQRS analyses.
Drug Emax (%) Total C50(μg/ml)
γ (−) fup (%) Unbound C50(μg/ml)
Compound 3 56.5 3.34 1.55 33 1.10Compound 4 49.3 9.70 1.52 16 1.46Compound 5 22.9 2.51 2.07 24 0.602Compound 6 7.91 1.49 2.45 40 0.596Compound 7 25.8 3.17 1.17 37 1.17
0 2 4 6 8 10 12−10
−5
0
5
10
15
20
25
30
Predicted total plasma Cmax (μg/ml)
Predicted total plasma Cmax (μg/ml)
30 mg/kg 100 mg/kg 200 mg/kg Mean prediction 95% C.I.
0 2 4 6 8 10 12 14 16 18 20 22−20
−10
0
10
20
30
40
50 1 mg/kg 10 mg/kg 50 mg/kg Mean prediction 95% C.I.
Ob
serv
ed m
ax Δ
QT
c (ms)
Ob
serv
ed m
ax Δ
ΔQT
c (ms)
A
B
Fig. 5. Observed maximum QTc prolongation versus predicted total plasma Cmax in cyno-
Table 4Parameter estimates of the direct Emax models for compounds 3–7.
Drug Parameter FEa r.s.e.a (%) IIVa (−) r.s.e.a (%)
Compound 3 Emax (%) 56.5 57 x xC50 (μg/ml) 3.34 59 x xγ (−) 1.55 13 0.141 51a (%) 1.60 7 na nab (−) 0.124 27 na na
Compound 4 Emax (%) 49.3 14 x xC50 (μg/ml) 9.70 21 x xγ (−) 1.52 13 0.222 39a (%) 2.17 7 na nab (−) −0.016 63 na na
Compound 5 Emax (%) 22.9 16 0.152 42C50 (μg/ml) 2.51 15 x xγ (−) 2.07 16 0.267 39a (%) 1.56 6 na nab (−) −0.065 19 na na
Compound 6 Emax (%) 7.91 48 x xC50 (μg/ml) 1.49 68 0.749 43γ (−) 2.45 52 x xa (%) 1.55 5 na na
Compound 7 Emax (%) 25.8 21 0.226 45C50 (μg/ml) 3.17 33 x xγ (−) 1.17 12 0.136 50a (%) 1.43 7 na nab (−) 0.043 59 na na
a FE: fixed effect; IIV: inter-individual variability; r.s.e: relative standard error; na: notapplicable; x: parameter not estimated.
80 A. Caruso et al. / Journal of Pharmacological and Toxicological Methods 70 (2014) 73–85
pharmacological potency given that the true individual plasma Cmax
might have been higher.As a first step in the PK/PD analysis, the concentration–effect rela-
tionship was explored by plotting time-matched response versus
Fig. 4. Simulated QRS widening effects (ΔQRS) of compounds 3–7 in the beagle dogexpressed as percent change from vehicle. Lines: unbound plasma concentration-ΔQRSresponse relationships for the 5 candidates. Shaded areas: expected human efficaciousconcentration range (minimum–maximum efficacious IC50: 9.5–24.3 ng/ml) and its 30-fold multiple.
molgus monkey after treatment with compound 8 (ΔQTc, 5A) and 9 (ΔΔQTc, 5B). Sym-bols: experimental data for low, mid, and high dose. Solid line: mean model prediction;dashed lines: 95% confidence interval.
exposure data as a means to identify potential delays between PK andPD. Fig. 1 presents an example diagnostic plot with hysteresis for com-pound 8. The drug candidates 1–7 were diagnosed as exhibiting directeffects and compounds 8–12 indirect effects. Potential reasons for thetemporal disconnect could be for instance the formation of an activemetabolite in sufficient quantity to be biologically relevant, or the in-volvement of a second messenger mediating the response. Howeverdue to time constraints no further investigations were performed.
For compounds 1, 2, and 8–10 the threshold model of Eqs. (2) and(3) was found to adequately describe the available QTc and HR data(Figs. 2, 3, 5, and 6). This type of mathematical relationship has beenused previously to fit data from toxicological studies (Lutz & Lutz,2009; Lynch et al., 2003; Purchase & Auton, 1995) and in the contextof environmental chemical safety (Yanagimoto & Yamamoto, 1979).The threshold model can be understood as a piecewise linear approxi-mation of the initial portion of a sigmoidal concentration–responsecurve. Arguably it provides a closer approximation than a linearmodel, used by others to model concentration-QTc and HR effect rela-tionships (Langdon et al., 2010b; Watson et al., 2011). This approachis particularly useful in application to safety and toxicology studies,

0 200 400 600 800 1000 1200−20
−10
0
10
20
30
40
50
60
70
80
Observed total plasma Cmax (ng/ml)
0.4 mg/kg 5 mg/kg 50 mg/kg Mean prediction 95% C.I.
Ob
serv
ed m
ax Δ
ΔHR
(m
in−1
)
Fig. 6.Observed maximum ΔΔHR versus observed total Cmax in the beagle dog with com-pound 10. Symbols: experimental data for low,mid, andhigh dose. Solid line:meanmodelprediction; dashed lines: 95% confidence interval.
81A. Caruso et al. / Journal of Pharmacological and Toxicological Methods 70 (2014) 73–85
where the ability to increase concentrations and achieve response satu-rationmay be limited by, for example, unfavorable PK properties, lack oftechnical feasibility, or adverse effects. Under these circumstances theonset of effects may be observed, but the datamay be insufficient to de-termine the pharmacological potency and maximal response (e.g., pa-rameters Emax and C50 in the case of a sigmoidal concentration effectrelationship) (Dutta, Matsumoto, & Ebling, 1996; Mager & Jusko,2008; Mager et al., 2003).
The threshold model assumes the existence of a non-zero thresholdconcentration. The validity of this assumption has been the subject ofdebate and is considered difficult to demonstrate (Purchase & Auton,1995; Yanagimoto & Yamamoto, 1979). A possible mechanistic inter-pretation is the existence of factors that limit or modulate a drug'spro-arrhythmic potency. This is plausible in the context of the tightlyregulated cardiovascular system, in which multiple feedback mecha-nisms contribute to homeostasis. A physiologically relevant change incardiovascular function may only be observed at dose levels that over-come these compensatory processes. Pragmatically, the threshold maybe regarded as the concentration below which any effect is indistin-guishable from the response seen in control subjects (Lovell, 2000;Lutz & Lutz, 2009). This may be reminiscent of the commonly usedno observed adverse effect level (NOAEL), defined as the highest
Table 6Parameter values of the indirect response models for compounds 11 and 12.
Drug Parameter FE
Compound 11 kout (h−1)Baseline ΔP/Δt (mmHg/s) 32Emax (%)C50 (μg/ml)γ (−)b (−)
Compound 12 (beagle dog) kout (h−1)Baseline MAP (mmHg) 1CMAP (male) (μg/ml)β_CMAP (female) (−)a (mmHg)
Compound 12 (human)b kout (h−1)Baseline SBP (mmHg) 1Baseline DBP (mmHg)CMAP (μg/ml)
a FE: fixed effect; IIV: inter-individual variability; r.s.e: relative standard error; na: not applib Compound 12 (human): parameters used for simulation.
experimental dose/exposure that does not produce a statistically signif-icant adverse alteration in the endpoint of interest (Dorato &Engelhardt, 2005). Nevertheless, use of a threshold identified viamodeling may be advantageous since it eludes well-known limitationsof theNOAEL approach, such as its sensitivity to dose selection and sam-ple size and lack of consideration for an inherent concentration–response relationship (Crump, 1984; Leisenring & Ryan, 1992).
Published examples of translation of QTc PK/PD between species arelimited. Notably though, the translational relationship between QTcchanges in beagle dogs and humans via retrospective PK/PD modelingwas recently reported for 2 proprietary compounds and 2 referencedrugs (moxifloxacin and dofetilide) (Parkinson et al., 2013). After cor-rection for differences in plasma protein binding, a consistent relation-ship was found at low ΔQTc intervals indicating that a QTc change of2.5–8 ms in the beagle dog would correspond to a 10 ms change inman. In contrast, Fig. 2C shows that human and cynomolgus monkeyunbound concentration-QTc response curves of compound 1 are charac-terized by similar threshold concentrations and slopes, implying com-parable sensitivity to this compound. Hence, one conclusion may bethat species-specific translational scale factors are required for QTc. Con-sistentwith this, cynomolgusmonkeys have been found to bemore sen-sitive than beagle dogs to QTc prolongation caused by moxifloxacin(Dubois et al., 2011) whereas the concentration response between cy-nomolgus monkey and man was in good agreement (Watson et al.,2011). This was confirmed by Holzgrefe et al. who compared the QTc re-sponse normalized to moxifloxacin exposure in five preclinical speciesand humans (Holzgrefe et al., 2014). They showed that the QTc increaseindividually corrected for heart rate was fairly comparable to man inboth beagle dogs and cynomolgusmonkeys, with themonkeys showinga slightly stronger response. However, further data will be needed be-fore conclusions can be drawn on the general significance of theseobservations.
The modeled human QTc and efficacy dose–response curves ofcompound 1 were combined in a simple graphical format for the pur-pose of facilitating the design of subsequent clinical studies (Fig. A2,Section A7.1 in the supplementary materials). It became apparent thatthe dose producing the targeted 50% efficacy biomarker inhibition didnot significantly prolong the QTc interval duration. Hence the model-based approach was conducive to the integration of available safetyand efficacy data and the understanding of the therapeutic index.
Compounds 3–7 were developed for the same indication and QRSwidening was apparent in all chemical series under investigation.Although current ICH guidelines do not address pharmacological QRSprolongation as an independent predictor for the development of ven-tricular arrhythmias, it has been recognized that increasedQRS durationmay be associated with pro-arrhythmic risk (Desai et al., 2006; Erdemli
a r.s.e.a (%) IIVa (−) r.s.e.a (%)
0.603 22 0.100 x40 3 0.058 3150.2 27 x x5.60 57 x x0.865 25 0.200 x0.057 6 x x0.379 16 x x
03 2 0.050 231.55 24 0.100 x1.47 20 na na4.33 4 na na2.00 na na na
20 na na na80 na na na1.55 24 na na
cable; x: parameter not estimated.

Time (h)
0 6 12 18 242500
3000
3500
4000
4500
5000
0 6 12 18 242500
3000
3500
4000
4500
5000
0 6 12 18 24
2500
3000
3500
4000
4500
50000 6 12 18 24
2500
3000
3500
4000
4500
5000
0 mg/kg Mean prediction 50% C.I. 95% C.I.
2 mg/kg
10 mg/kg 50 mg/kg
ΔP/Δ
t (m
mH
g/s
)
Fig. 7.ΔP/Δt changes as a function of time observed in the beagle dog after treatmentwith compound 11. Symbols: experimental data for vehicle and 2, 10, and 50 mg/kg dose. Solid lines:mean model prediction; dashed and dotted lines: 50 and 95% confidence interval, respectively.
80 90 100 110 120 130 140 15080
90
100
110
120
130
140
150
80 90 100 110 120 130 140 15080
90
100
110
120
130
140
150
Ob
serv
ed M
AP
(m
mH
g)
Predicted MAP (mmHg)
A B
Fig. 8.Goodness-of-fit plot: observed versus predictedMAP changes in the beagle dogwith compound 12. Predictions obtained using the population (8A) and individual parameters (8B).Symbols: study data; solid line: identity line.
82 A. Caruso et al. / Journal of Pharmacological and Toxicological Methods 70 (2014) 73–85

0 12 24 36 48−5
0
5
10
15
20
25
Time (h)
30 mg Mean prediction 90% C.I.
0 12 24 36 48−5
0
5
10
15
20
25
Time (h)
60 mg Mean prediction 90% C.I.
0 12 24 36 48−5
0
5
10
15
20
25
Time (h)
90 mg Mean prediction 90% C.I.
ΔΔS
BP
(m
mH
g)
ΔΔS
BP
(m
mH
g)
ΔΔS
BP
(m
mH
g)
A
B
C
Fig. 9. Drug-induced SBP changes in human after 30, 60, and 90 mg single dose adminis-tration of compound 12 (9A, 9B, and 9C, respectively). Symbols: baseline- and placebo-subtracted SBP data (ΔΔSBP) collected in a first-in-man SAD study (n = 6 per dosegroup, mean and standard deviation). Solid lines: mean PBPK/PD model prediction;dashed lines: 90% confidence interval.
83A. Caruso et al. / Journal of Pharmacological and Toxicological Methods 70 (2014) 73–85
et al., 2012; Gintant, Gallacher, & Pugsley, 2011). The objective of themodel-based evaluation was to facilitate ranking of the compoundssuch that an optimal chemotype could be selected for progression. It
was found that the QRS data could be fitted by using Emax models ac-cording to Eq. (4) (Tables 4 and 5; Fig. A1 in the supplementary mate-rials). Under the assumption that the unbound plasma concentration-QRS response is similar in the beagle dog and man (Mager & Jusko,2008), this PK/PD modeling approach enabled the prediction of QRSwidening at selected concentrations that were of interest, namely 30-fold the expected human therapeutic exposures. Such simulations(Fig. 4) showed that the therapeutic index of each compound was lessthan the 30-fold multiple considered necessary for progression. It wasconcluded that none of the drug candidates were amenable to furtherdevelopment. Investigating and validating the translatability of QRS ef-fects across species would be an important topic of future research.
For compounds 8–10 a pragmatic and parsimonious approach wasemployed to describe the exposure–effect relationship. The peak plas-ma concentration was related to themaximum observed effect withoutexplicit incorporation of the temporal disconnect between PK and PDinto themodel. This approach is usefulwhen a PKmodel is not available,as in the case of compound 10, or the PK/PD model is not intended fortranslational purposes. It enables to rapidly provide quantitative in-sights around e.g. the exposure associated with onset of cardiovasculareffects or to support the design of studies in the same species for whichcardiovascular effects may be of relevance (provided that the protocolsare comparable, for instance in the factors that may affect PK, like for-mulation and route of administration).
In the case of compound 11, ΔP/Δt data recorded in the beagle dogwere analyzed with a pharmacodynamic indirect response model(Eqs. (5)–(6)). Inclusion of inter-individual variability on the baselineΔP/Δt was found to be important in order to adequately describe theΔP/Δt observations (Table 6, Fig. 7). The PK/PD analysis of left ventricu-lar contractility supported the decision to further develop the com-pound. In fact, the estimated C50 for ΔP/Δt effects in the dog largelyexceeded the anticipated efficacious human plasma concentration(N500-fold safety multiple). Limited reports on ΔP/Δt PK/PD are avail-able in the literature (for instance, (Chelly et al., 1987; Cools et al.,2013)), pointing to the novelty of the work presented here.
Graphical analysis of themean arterial pressure recorded in the bea-gle dog for compound 12 clearly revealed a hysteresis in the concentra-tion–response relationship. An indirect response pharmacodynamicmodel (Eqs. (7)–(8))was found to adequately describe the observed ef-fects on MAP (Fig. 8). In tandem with a PBPK prediction, the PD modeldeveloped in the beagle dog was used to simulate BP effects in man.The human system parameters (SBP and DBP baseline and kout values)were derived from the literature while the pharmacological potency(CMAP) was assumed to be similar among species. These PBPK/PD simu-lations were subsequently comparedwith SBP data generated in a first-in-human study. Close concordance was observed across a range ofdoses (Fig. 9) except possibly an underprediction of the time to maxi-mum effect. The use of an indirect response model was in fact reportedto successfully describe BP changes in man caused by an investigativeVEGF inhibitor (Keizer et al., 2010). A similar lumped PD model of BPhomeostasis was proposed by Stroh et al. to reproduce the BP elevationobserved in a first-in-man trial with a novel compound (Stroh et al.,2009). Also, a more mechanistic PK/PD model describing the interrela-tionship between BP, cardiac output, and total peripheral resistancewas reported to successfully translate between preclinical and clinicalresponse for a range of marketed drugs (Snelder et al., 2013). The pre-dictive performance of the PBPK/PD model developed for compound12 shows that, despite its simplicity, it captures sufficient mechanisticdetail to enable interspecies extrapolation.
Compound 12 is amonoamine transporter inhibitor intended for thetreatment of depression that inhibits reuptake of three neurotransmit-ters. It is well known that compounds targeting monoamine trans-porters can exhibit cardiovascular side effects, including increases inBP (Kintscher, 2012). Given the therapeutic advantages of these drugs,insights that improve their benefit–risk profile can have a significantimpact. Hence the human PBPK/PD model was used to simulate the

84 A. Caruso et al. / Journal of Pharmacological and Toxicological Methods 70 (2014) 73–85
influence of different release formulations on the therapeutic index ofcompound 12. An analogous approach aiming to minimize drug-induced SBP changes was successfully explored by Stroh et al. (Strohet al., 2009) for a different investigative compound. Assuming that a40 mg dose of compound 12 is required for efficacy based on humanPET and in vitro bindingdata (not shown), itwas found that a controlledrelease formulation characterized by 90% release after 10 h would leadto a peak SBP change that is 5mmHg smaller than for the immediate re-lease formulation (Fig. A3, Section A7.2 in the supplementary mate-rials). Such clinical trial simulations can be of considerable importancetoward the development of safer medicines.
Herein PK/PD models were described that enabled the quantitativeevaluation of cardiovascular effects across a range of species and drugmechanisms. Hence, supporting evidence was provided for the generalutility of model-based approaches to facilitate cardiovascular safety as-sessments. For the subset of compounds for which human data weregenerated, we observed good agreement between the preclinical pre-dictions and clinical data. This adds to the limited but growing body ofevidence that PK/PD can effectively be translated among species. Inthe context of designing first-in-human studies, this model-based ap-proach enables to extrapolate and integrate human PK, safety, and effi-cacy information and it aids the assessment of the therapeutic index.Systematic application of translational PK/PD modeling may thereforecontribute to reducing attrition rates associated with cardiovascularsafety liabilities.
Conflict of interest statement
All authors are Roche employees and declare no conflict of interest.
Acknowledgments
Our sincere thanks for the expert advice go to Eric Worth, CheikhDiack, Christophe Boetsch, Carsten Hofmann, and Candice Jamois(Clinical Pharmacology), Christian Freichel, Pascale David-Pierson,Monique Schmitt, Hans Peter Grimm, Anthony Harrison, JenniferFretland, Lisa Benincosa,Martin Sanders, and Caitlin Bever (Pharmaceu-tical Sciences). We would also like to thank Roland Jenni and DavidWaiz from the Safety Pharmacology Laboratory and the colleaguesfrom the bioanalytical labs for data generation. Our gratitude is extend-ed to Xenologiq Ltd. for the assistance with writing the manuscript.
Appendix A. Supplementary data
Supplementary data to this article can be found online at http://dx.doi.org/10.1016/j.vascn.2014.05.004.
References
The non-clinical evaluation of the potential for delayed ventricular repolarization (QT in-terval prolongation) by human pharmaceuticals. International Conference onHarmonisation (ICH) Harmonised Tripartite Guidelines ICH-S7B. (2005). CDER.
GastroPlusTM 6.1 User Manual (2009). Lancaster (CA): Simulations Plus Inc.Authier, S., Pugsley, M. K., Troncy, E., & Curtis, M. J. (2010, Sep–Oct). Arrhythmogenic lia-
bility screening in cardiovascular safety pharmacology: commonality between non-clinical safety pharmacology and clinical thorough QT (TQT) studies. Journal ofPharmacological and Toxicological Methods, 62(2), 83–88.
Barter, P. J., Caulfield, M., Eriksson, M., Grundy, S. M., Kastelein, J. J., Komajda, M., et al.(2007, Nov 22). Effects of torcetrapib in patients at high risk for coronary events.The New England Journal of Medicine, 357(21), 2109–2122.
Bazett, H. C. (1920). An analysis of the time-relations of electrocardiograms. Heart, 7,353–370.
Brown, A.M. (2004, Jun). Drugs, hERG and sudden death. Cell Calcium, 35(6), 543–547.Champeroux, P., Martel, E., Fowler, J. S., Maurin, A., Sola, M. L., Jude, S., et al. (2009, Mar–
Apr). Calculation of QT shift in non clinical safety pharmacology studies. Journal ofPharmacological and Toxicological Methods, 59(2), 73–85.
Chan, P. L., Jacqmin, P., Lavielle, M., McFadyen, L., & Weatherley, B. (2011, Feb). The use ofthe SAEM algorithm in MONOLIX software for estimation of population pharmacoki-netic–pharmacodynamic–viral dynamics parameters of maraviroc in asymptomaticHIV subjects. Journal of Pharmacokinetics and Pharmacodynamics, 38(1), 41–61.
Chaves, A. A., Keller, W. J., O'Sullivan, S., Williams, M.A., Fitzgerald, L. E., McPherson, H. E.,et al. (2006, Sep–Oct). Cardiovascular monkey telemetry: sensitivity to detect QT in-terval prolongation. Journal of Pharmacological and Toxicological Methods, 54(2),150–158.
Chelly, J. E., Hill, D. C., Abernethy, D. R., Dlewati, A., Doursout, M. F., & Merin, R. G. (1987,Oct). Pharmacodynamic and pharmacokinetic interactions between lidocaine and ve-rapamil. Journal of Pharmacology and Experimental Therapeutics, 243(1), 211–216.
Cools, F., Dhuyvetter, D., Vanlommel, A., Janssens, S., Borghys, H., Geys, H., et al. (2013, Oct16). A translational assessment of preclinical versus clinical tools for the measure-ment of cardiac contractility: comparison of LV dP/dt with echocardiography intelemetry implanted beagle dogs. Journal of Pharmacological and ToxicologicalMethods, 69(1), 17–23.
Crump, K. S. (1984, Oct). A new method for determining allowable daily intakes.Fundamental and Applied Toxicology, 4(5), 854–871.
Danhof, M., de Lange, E. C., Della Pasqua, O. E., Ploeger, B.A., & Voskuyl, R. A. (2008, Apr).Mechanism-based pharmacokinetic–pharmacodynamic (PK–PD) modeling in trans-lational drug research. Trends in Pharmacological Sciences, 29(4), 186–191.
Darpo, B., Nebout, T., & Sager, P. T. (2006, May). Clinical evaluation of QT/QTc prolonga-tion and proarrhythmic potential for nonantiarrhythmic drugs: the InternationalConference on Harmonization of Technical Requirements for Registration of Pharma-ceuticals for Human Use E14 guideline. Journal of Clinical Pharmacology, 46(5),498–507.
Dayneka, N. L., Garg, V., & Jusko, W. J. (1993, Aug). Comparison of four basicmodels of indirect pharmacodynamic responses. Journal of Pharmacokinetics andBiopharmaceutics, 21(4), 457–478.
De Ponti, F., Poluzzi, E., & Montanaro, N. (2001, Jun). Organising evidence on QT prolon-gation and occurrence of Torsades de Pointes with non-antiarrhythmic drugs: a callfor consensus. European Journal of Clinical Pharmacology, 57(3), 185–209.
Desai, A.D., Yaw, T. S., Yamazaki, T., Kaykha, A., Chun, S., & Froelicher, V. F. (2006, Jul).Prognostic significance of quantitative QRS duration. The American Journal ofMedicine, 119(7), 600–606.
Dorato, M.A., & Engelhardt, J. A. (2005, Aug). The no-observed-adverse-effect-level indrug safety evaluations: use, issues, and definition(s). Regulatory Toxicology andPharmacology: RTP, 42(3), 265–274.
Dubois, V. F. S., Chain, A., van der Graaf, P., Leishman, D., Gallacher, D., McMahon, N., et al.(2011). Population Approach Group in Europe (PAGE) meeting. (Abstr 2226).
Dutta, S., Matsumoto, Y., & Ebling, W. F. (1996, Feb). Is it possible to estimate the param-eters of the sigmoid Emax model with truncated data typical of clinical studies?Journal of Pharmaceutical Sciences, 85(2), 232–239.
Erdemli, G., Kim, A.M., Ju, H., Springer, C., Penland, R. C., & Hoffmann, P. K. (2012). Cardiacsafety implications of hNav1.5 blockade and a framework for pre-clinical evaluation.Frontiers in Pharmacology, 3, 6.
Fermini, B., & Fossa, A. A. (2003, Jun). The impact of drug-induced QT interval prolonga-tion on drug discovery and development. Nature Reviews Drug Discovery, 2(6),439–447.
Ferri, N., Siegl, P., Corsini, A., Herrmann, J., Lerman, A., & Benghozi, R. (2013, Jun). Drug at-trition during pre-clinical and clinical development: understanding and managingdrug-induced cardiotoxicity. Pharmacology & Therapeutics, 138(3), 470–484.
Fleury, A., Lave, T., Jonsson, F., Schmitt, M., Hirkaler, G., Polonchuk, L., et al. (2011 Jan–Feb).A pharmacokinetic–pharmacodynamic model for cardiovascular safety assessment ofR1551. Journal of Pharmacological and Toxicological Methods, 63(1), 123–133.
Frances, N., Meille, C., Caruso, A., Fretland, J., Harrison, A.C., Greiter-Wilke, A., Sanders, M.,et al. (2012). A translational threshold model to assess exposure-driven QTc changes.(PAGE, Abstract 2577).
Fridericia, L. S. (1920). The duration of systole in the electrocardiogram of normal subjectsand of patients with heart disease. Acta Medica Scandinavica, 53, 469–486.
Gauer, O. H. (1960). Kreislauf des blutes. In L. Landois, & H. -U. Rosemann (Eds.), Lehrbuchder Physiologie des Menschen (pp. 95–135). München and Berlin: Urban andSchwarzenberg.
Gintant, G. A., Gallacher, D. J., & Pugsley, M. K. (2011, Sep). The ‘overly-sensitive’ heart:sodium channel block and QRS interval prolongation. British Journal of Pharmacology,164(2), 254–259.
Giorgi, M.A., Bolanos, R., Gonzalez, C. D., & Di Girolamo, G. (2010, Jan). QT intervalprolongation: preclinical and clinical testing arrhythmogenesis in drugs and regulato-ry implications. Current Drug Safety, 5(1), 54–57.
Guth, B.D., Bass, A. S., Briscoe, R., Chivers, S., Markert, M., Siegl, P. K., et al. (2009, Sep–Oct).Comparison of electrocardiographic analysis for risk of QT interval prolongation usingsafety pharmacology and toxicological studies. Journal of Pharmacological andToxicological Methods, 60(2), 107–116.
Hall, J. E. (2010). Guyton and Hall textbook of medical physiology (12th ed.). Philadelphia:Saunders.
Hao, K., Chen, Y. C., Cao, Y. G., Yu, D., Liu, X. Q., & Wang, G. J. (2007, May). Pharmacokinet-ic–pharmacodynamic modeling of telmisartan using an indirect response model inspontaneously hypertensive rats. Acta Pharmacologica Sinica, 28(5), 738–743.
Holzgrefe, H. H., Cavero, I., Buchanan, L. V., Gill, M. W., & Durham, S. K. (2007, May–Jun).Application of a probabilistic method for the determination of drug-induced QT pro-longation in telemetered cynomolgus monkeys: effects of moxifloxacin. Journal ofPharmacological and Toxicological Methods, 55(3), 227–237.
Holzgrefe, H. H., Cavero, I., Gleason, C. R., Warner, W. A., Buchanan, L. V., Gill, M. W., et al.(2007, Mar–Apr). Novel probabilistic method for precisely correcting the QT intervalfor heart rate in telemetered dogs and cynomolgus monkeys. Journal ofPharmacological and Toxicological Methods, 55(2), 159–175.
Holzgrefe, H., Ferber, G., Champeroux, P., Gill, M., Honda, M., Greiter-Wilke, A., et al.(2014, Jan–Feb). Preclinical QT safety assessment: cross-species comparisons andhuman translation from an industry consortium. Journal of Pharmacological andToxicological Methods, 69(1), 61–101.
85A. Caruso et al. / Journal of Pharmacological and Toxicological Methods 70 (2014) 73–85
Jones, H. M., Parrott, N., Jorga, K., & Lave, T. (2006). A novel strategy for physiologicallybased predictions of human pharmacokinetics. Clinical Pharmacokinetics, 45(5),511–542.
Jonker, D.M., Kenna, L. A., Leishman, D., Wallis, R., Milligan, P. A., & Jonsson, E. N. (2005,Jun). A pharmacokinetic–pharmacodynamic model for the quantitative predictionof dofetilide clinical QT prolongation from human ether-a-go-go-related gene currentinhibition data. Clinical Pharmacology and Therapeutics, 77(6), 572–582.
Kao, L. W., & Furbee, R. B. (2005, Nov). Drug-induced Q-T prolongation. The Medical Clinicsof North America, 89(6), 1125–1144.
Kashani, A., & Barold, S. S. (2005Dec 20). Significance of QRS complex duration in patientswith heart failure. Journal of the American College of Cardiology, 46(12), 2183–2192.
Keizer, R. J., Gupta, A., Mac Gillavry, M. R., Jansen, M., Wanders, J., Beijnen, J. H., et al.(2010, Aug). A model of hypertension and proteinuria in cancer patientstreated with the anti-angiogenic drug E7080. Journal of Pharmacokinetics andPharmacodynamics, 37(4), 347–363.
Kintscher, U. (2012). Reuptake inhibitors of dopamine, noradrenaline, and serotonin.Handbook of Experimental Pharmacology, 209, 339–347.
Kola, I., & Landis, J. (2004, Aug). Can the pharmaceutical industry reduce attrition rates?Nature Reviews Drug Discovery, 3(8), 711–715.
Langdon, G., Davis, J.D., McFadyen, L. M., Dewhurst, M., Brunton, N. S., Rawal, J. K., et al.(2010, Apra). Translational pharmacokinetic–pharmacodynamic modelling; applica-tion to cardiovascular safety data for PF-00821385, a novel HIV agent. BritishJournal of Clinical Pharmacology, 69(4), 336–345.
Langdon, G., Davis, J.D., McFadyen, L. M., Dewhurst, M., Brunton, N. S., Rawal, J. K., et al.(2010, Aprb). Translational pharmacokinetic–pharmacodynamic modelling; applica-tion to cardiovascular safety data for PF-00821385, a novel HIV agent. British Journalof Clinical Pharmacology, 69(4), 336–345.
Laverty, H., Benson, C., Cartwright, E., Cross, M., Garland, C., Hammond, T., et al. (2011,Jun). How can we improve our understanding of cardiovascular safety liabilities todevelop safer medicines? British Journal of Pharmacology, 163(4), 675–693.
Leisenring, W., & Ryan, L. (1992, Apr). Statistical properties of the NOAEL. RegulatoryToxicology and Pharmacology: RTP, 15(2 Pt 1), 161–171.
Lentner, C. (1990). Geigy scientific tables: Heart and circulation. In C. Lentner (Ed.), (8th ed.).Ciba-Geigy Limited.
Lovell, D. P. (2000, Jan 3). Dose–response and threshold-mediated mechanisms in muta-genesis: Statistical models and study design. Mutation Research, 464(1), 87–95.
Lund, L. H., Jurga, J., Edner, M., Benson, L., Dahlstrom, U., Linde, C., et al. (2013 Feb). Prev-alence, correlates, and prognostic significance of QRS prolongation in heart failurewith reduced and preserved ejection fraction. European Heart Journal, 34(7), 529–539.
Lutz, W. K., & Lutz, R. W. (2009, Aug). Statistical model to estimate a threshold dose andits confidence limits for the analysis of sublinear dose–response relationships, exem-plified for mutagenicity data. Mutation Research, 678(2), 118–122.
Lynch, A., Harvey, J., Aylott, M., Nicholas, E., Burman, M., Siddiqui, A., et al. (2003, Jul). In-vestigations into the concept of a threshold for topoisomerase inhibitor-inducedclastogenicity. Mutagenesis, 18(4), 345–353.
Madias, J. E. (2008). Drug-induced QRS, morphology and duration changes. CardiologyJournal, 15(6), 505–509.
Mager, D. E., & Jusko, W. J. (2008, Jun). Development of translational pharmacokinetic–pharmacodynamic models. Clinical Pharmacology and Therapeutics, 83(6), 909–912.
Mager, D. E., Wyska, E., & Jusko, W. J. (2003, May). Diversity of mechanism-basedpharmacodynamic models. Drug metabolism and disposition: The biological fate ofchemicals, 31(5), 510–518.
Markert, M., Klumpp, A., Trautmann, T., Mayer, K., Stubhan, M., & Guth, B. (2007, Sep–Oct). The value added by measuring myocardial contractility ‘in vivo’ in safety phar-macological profiling of drug candidates. Journal of Pharmacological and ToxicologicalMethods, 56(2), 203–211.
MATLAB (2009b). High-performance numeric computation and visualization software, R.Natick MA: The Math Works.
Munos, B. (2009, Dec). Lessons from 60 years of pharmaceutical innovation. NatureReviews Drug Discovery, 8(12), 959–968.
Nolan, E. R., Feng, M. R., Koup, J. R., Liu, J., Turluck, D., Zhang, Y., et al. (2006, Jan–Feb). Anovel predictive pharmacokinetic/pharmacodynamicmodel of repolarization prolon-gation derived from the effects of terfenadine, cisapride and E-4031 in the conscious
chronic av node–ablated, His bundle-paced dog. Journal of Pharmacological andToxicological Methods, 53(1), 1–10.
Ollerstam, A., Visser, S. A., Duker, G., Forsberg, T., Persson, A. H., Nilsson, L. B., et al. (2007,Sep–Oct). Comparison of the QT interval response during sinus and paced rhythm inconscious and anesthetized beagle dogs. Journal of Pharmacological and ToxicologicalMethods, 56(2), 131–144.
Ollerstam, A., Visser, S. A., Persson, A. H., Eklund, G., Nilsson, L. B., Forsberg, T., et al. (2006,Mar–Apr). Pharmacokinetic–pharmacodynamic modeling of drug-induced effect onthe QT interval in conscious telemetered dogs. Journal of Pharmacological andToxicological Methods, 53(2), 174–183.
Parkinson, J., Visser, S. A., Jarvis, P., Pollard, C., Valentin, J. P., Yates, J. W., et al. (2013, Apr6). Translational pharmacokinetic–pharmacodynamic modeling of QTc effects in dogand human. Journal of Pharmacological and Toxicological Methods.
Paul, L., Hastie, C. E., Li, W. S., Harrow, C., Muir, S., Connell, J. M., et al. (2010, Feb). Restingheart rate pattern during follow-up and mortality in hypertensive patients.Hypertension, 55(2), 567–574.
Persky, A.M., Berry, N. S., Pollack, G. M., & Brouwer, K. L. (2004, May). Modelling the car-diovascular effects of ephedrine. British Journal of Clinical Pharmacology, 57(5),552–562.
Peters, R. W., Byington, R. P., Barker, A., & Yusuf, S. (1990). Prognostic value of prolongedventricular repolarization following myocardial infarction: the BHAT experience. TheBHAT Study Group. Journal of Clinical Epidemiology, 43(2), 167–172.
Piotrovsky, V. (2005). Pharmacokinetic–pharmacodynamic modeling in the data analysisand interpretation of drug-induced QT/QTc prolongation. The AAPS Journal, 7(3),E609–E624.
Pugsley, M. K., Authier, S., & Curtis, M. J. (2008, Aug). Principles of safety pharmacology.British Journal of Pharmacology, 154(7), 1382–1399.
Purchase, I. F., & Auton, T. R. (1995, Dec). Thresholds in chemical carcinogenesis.Regulatory Toxicology and Pharmacology: RTP, 22(3), 199–205.
Redfern, W. S., Carlsson, L., Davis, A. S., Lynch, W. G., MacKenzie, I., Palethorpe, S., et al.(2003, Apr 1). Relationships between preclinical cardiac electrophysiology, clinicalQT interval prolongation and torsade de pointes for a broad range of drugs: Evidencefor a provisional safety margin in drug development. Cardiovascular Research, 58(1),32–45.
Redfern, W. S., Ewart, L., Hammond, T. G., Bialecki, R., Kinter, L., Lindgren, S., et al. (2010).Impact and frequency of different toxicities throughout the pharmaceutical life cycle.The Toxicologist, 114, 1081.
Roden, D.M. (2004, Mar 4). Drug-induced prolongation of the QT interval. The NewEngland Journal of Medicine, 350(10), 1013–1022.
Safety pharmacology studies for human pharmaceuticals. International Conference onHarmonisation (ICH) Harmonised Tripartite Guidelines ICH-S7A. (2001). CDER.
Sagie, A., Larson, M. G., Goldberg, R. J., Bengtson, J. R., & Levy, D. (1992, Sep 15). An im-proved method for adjusting the QT interval for heart rate (the Framingham HeartStudy). The American Journal of Cardiology, 70(7), 797–801.
Sheiner, L. B., Rosenberg, B., & Melmon, K. L. (1972, Oct). Modelling of individual pharma-cokinetics for computer-aided drug dosage. Computers and Biomedical Research, anInternational Journal, 5(5), 411–459.
Snelder, N., Ploeger, B.A., Luttringer, O., Rigel, D. F., Webb, R. L., Feldman, D., et al. (2013,Aug). PKPDmodelling of the interrelationship betweenmean arterial BP, cardiac out-put and total peripheral resistance in conscious rats. British Journal of Pharmacology,169(7), 1510–1524.
Stroh, M., Addy, C., Wu, Y., Stoch, S. A., Pourkavoos, N., Groff, M., et al. (2009, Mar). Model-based decision making in early clinical development: Minimizing the impact of ablood pressure adverse event. The AAPS Journal, 11(1), 99–108.
Watson, K. J., Gorczyca, W. P., Umland, J., Zhang, Y., Chen, X., Sun, S. Z., et al. (2011, May–Jun). Pharmacokinetic–pharmacodynamic modelling of the effect of moxifloxacin onQTc prolongation in telemetered cynomolgus monkeys. Journal of Pharmacologicaland Toxicological Methods, 63(3), 304–313.
Wezler, K., & Böger, A. (1939). Die Dynamik des arteriellen systems. In L. Asher, & K.Sapiro (Eds.), Ergebnisse der Physiologie München (pp. 292–606). Verlag von JFBergmann.
Yanagimoto, T., & Yamamoto, E. (1979, Oct). Estimation of safe doses: Critical review ofthe hockey stick regression method. Environmental Health Perspectives, 32, 193–199.