Innovation and inertia: the emerging dislocation of imperatives ...

Transformation-Induced, Geometrically Necessary,Dislocation-Based Flow Curve Modeling of Dual-PhaseSteels: Effect of Grain Size
ALI RAMAZANI, KRISHNENDU MUKHERJEE, ULRICH PRAHL,and WOLFGANG BLECK
The flow behavior of dual-phase (DP) steels is modeled on the finite-element method (FEM)framework on the microscale, considering the effect of the microstructure through the repre-sentative volume element (RVE) approach. Two-dimensional RVEs were created from micro-structures of experimentally obtained DP steels with various ferrite grain sizes. The flowbehavior of single phases was modeled through the dislocation-based work-hardeningapproach. The volume change during austenite-to-martensite transformation was modeled, andthe resultant prestrained areas in the ferrite were considered to be the storage place of trans-formation-induced, geometrically necessary dislocations (GNDs). The flow curves of DP steelswith varying ferrite grain sizes, but constant martensite fractions, were obtained from theliterature. The flow curves of simulations that take into account the GND are in betteragreement with those of experimental flow curves compared with those of predictions withoutconsideration of the GND. The experimental results obeyed the Hall-Petch relationship betweenyield stress and flow stress and the simulations predicted this as well.
DOI: 10.1007/s11661-012-1196-3� The Minerals, Metals & Materials Society and ASM International 2012
I. I. INTRODUCTION
IN recent studies, dual-phase (DP) steels have beenprojected to be the most applicable steel for future-generation cars.[1] This is because DP steels show anattractive combination of high strength, ductility, andinitial work-hardening rate. These unique properties ofDP steels are the result of their characteristic microstruc-ture, which consists of hardmartensite islands distributedin a soft ferrite matrix, as reported by DeCooman andSpeer.[2] For optimized properties of DP steels, thevolume fractions of martensite and ferrite phases are tobe approximately 0.2 and 0.8, respectively. Ferrite grainsize also influences the flow behavior of DP steels.[3–5]
However, as reported by Liedl et al.,[6] the behavior ofDP steels is not fully explained through composite flowproperties. According to Fischmeister and Karlsson,[7]
the yield stress of the soft matrix controls the start of theplastic flow of composite material consisting of hardinclusions embedded in a continuous soft matrix. Asferrite and martensite have comparable elastic moduli,the yield stress of ferrite should be independent of themartensite content.[6] However, in their study, Liedl
et al.[6] found the yield stress of DP steels does dependon the martensite content. To explain this, they initiateda micromechanical study of the flow behavior of DPsteels, taking into consideration the expansion of vol-ume in the second phase during the austenite-to-martensite phase transformation during the productionof DP steels.The effect of grain size has been found to influence the
yield stress of single-phase materials through the well-known Hall-Petch equation[8,9]
ry ¼ r0 þ kd�1=2 ½1�
where r0 and k are the material constants and d is theaverage diameter of grain.Conflicting observations are reported in the literature
about the effect of ferrite grain sizes on the flowbehavior of DP steels. Some studies have indicated thatDP steels do not show grain size strengthening as per theHall-Petch equation.[10,11] According to these research-ers, DP steels have mobile dislocations in ferrite grainsin regions adjacent to the martensite islands, which areformed by volume expansion during austenite-to-martensite transformation during the production ofDP steels. These mobile dislocations render DP steelsfree of Hall-Petch behavior. After all, the Hall-Petchrelation arises from a lack of mobile dislocations causingdelay of the initiation of plastic flow. Among industrialsteel products, this behavior is similar only to intersti-tial-free steels. However, Jiang et al.[12] proposed a Hall-Petch relation between the ferrite grain size and yieldstress of DP steels for constant martensite fractions.They reported that the Hall-Petch parameters are
KRISHNENDU MUKHERJEE, Postdoc Researcher, formerlywith the RWTH-Aachen University, D-52072, Aachen, Germany, isnow with the Colorado School of Mines, Golden, CO 80401. ULRICHPRAHL, Head of Material Simulation Group, WOLFGANGBLECK, Professor, and ALI RAMAZANI, Doctoral Candidate andProject Engineer, are with the Department of Ferrous Metallurgy,RWTH Aachen University. Contact e-mail: [email protected]
Manuscript submitted August 5, 2011.Article published online May 17, 2012
3850—VOLUME 43A, OCTOBER 2012 METALLURGICAL AND MATERIALS TRANSACTIONS A

functions of strain, martensite fraction fm, and martens-ite particle size dm. Lanzilotto and Pickering[13] reporteda Hall-Petch relationship between flow stress and size ofmartensite-austenite particles.
Transformation-induced, geometrically necessarydislocations (GND), which are created through austen-ite-to-martensite transformation, show a significantinfluence on the initial work-hardening behavior of DPsteels. Volume expansion during the austenite-to-martensite phase transformation during cooling fromintercritical annealing temperature forms these GND, asreported by Lawson et al.[3] and Song et al.[14] Rigsbeeand Van der Arend[15] and Marder[16] proved the realityof GND in ferrite regions adjacent to the martensiticislands through transmission electron microscopy(TEM). According to Davies,[17] for DP steels incommercial usage (with 15 pct to 25 pct martensite),the yielding is fixed by the GND. The decisive work byAshby[18,19] established a methodology to include theinfluence of GND into the calculation of the flow curvesof composite materials. Jiang et al.[20] used this meth-odology to compute the influence of microstructuralvariables on the deformation behavior of DP steels.
The objective of this study is to set up a modelingapproach for predicting the flow curve for DP steels bymicromechanical modeling and to show that it cancapture the effect of grain size. A dislocation-basedwork-hardening approach was used to model the flowcurves of the ferrite and martensite phases.[21–24] Thesecurves were introduced to the two-dimensional (2-D)representative volume element (RVE) calculationdomains to model the flow behavior of the DP steels.The experimental microstructures were input to this
framework. The effect of GND was incorporated intothe finite-element method (FEM) framework by includ-ing the volume change of the remaining austenite tomartensite during cooling. Finally, the effect of grainsize on the yield stress of DP steels was studied. For thispurpose, the flow curves of DP steels with similarmartensite content, but varying ferrite grain sizes wereobtained from the literature and are described inSection II.[25]
II. DATA FROM THE LITERATURE
Calcagnotto et al.[25] produced DP steels with varyingferrite grain sizes but a constant martensite fraction.They used a 0.17C-1.49Mn-0.22Si (composition inwt pct) steel for this purpose. A large-scale 2.5 MNhot deformation simulator was used for thermomechan-ical processing to produce fine-grained and ultrafine-grained ferrite.[14,26,27] To obtain fine-grained ferrite, astrain of 1.6 was applied at 973 K (700 �C), whereas toproduce ultrafine-grained ferrite, a strain of 1.6 wasapplied at 823 K (550 �C). No thermomechanical pro-cessing was needed to make the coarse-grained DP steel.After the thermomechanical processing, all samples wereannealed to produce the dual-phase microstructure. Theannealing was done at 1003 K (730 �C) for 3 minuteswith subsequent water quenching. This produced similarmartensite fractions for all the steels (~30 pct). Figure 1shows the schematic representation for obtaining theseDP steels with various ferrite grain sizes.The ferrite grain sizes and martensite fractions of DP
steels studied are summarized in Table I, along with
Table I. Quantification of DP Steels Studied[25]
Microstructure TTMCP [K (�C)] Ferrite Grain Size, df (lm) Martensite Island Size, dm (lm) Vm (pct)
Coarse grain Not applied 12.4 3.05 31.3Fine grain 973 (700) 2.4 1.31 30.1Ultrafine grain 823 (550) 1.2 0.97 29.8
Fig. 1—Thermomechanical processing routes employed to produce different ferrite grain sizes in DP steels. All treatments are followed by inter-critical annealing. (Ar3: nonequilibrium transformation start temperature, Pf: pearlite transformation finish temperature, and e: logarithmicstrain.).[25]
METALLURGICAL AND MATERIALS TRANSACTIONS A VOLUME 43A, OCTOBER 2012—3851

the corresponding thermomechanical processingtemperature (TTMCP). The SEM microstructures areshown in Section III–A (Figure 2). Electron backscat-tered diffraction (EBSD) maps are shown in Section IV–C(Figures 12 and 13). The martensite island sizes weredetermined by the current authors. For this purpose, thearea of each martensite island of the DP steels’ micro-graphs were determined using the commercial imageanalysis software ImagePro. The equivalent area diameter(EQAD) of each martensite island was calculated next.The average EQADs of the DP steels are summarized asmartensite island size in Table I.
The results of the tensile tests performed as per DIN50125-B standard are reported in Table II. Later, inSection IV–B (Figure 5), the true stress vs true straingraphs are shown. These data were used to evaluate thecapability of the proposed modeling approach.
III. MICROMECHANICAL FLOW CURVEMODELING TECHNIQUE
To study the flow behavior of DP steels, microme-chanical modeling is a suitable procedure. This methodprovides a good description of the deformation of thematerial at the micro level. Numerical calculation withinthe framework of continuum mechanics was performedthrough FEM. The DP microstructure is embodied inFEM through a RVE. Plane strain conditions were usedfor the numerical tensile tests. The flow curves from thenumerical tensile test result were computed through ahomogenization strategy, as shown by Kouznetsova.[28]
In the following subsections, the premises and simula-tion methods that have been used for modeling will bediscussed.
Fig. 2—Selection of RVE for micromechanical modeling of DP steel with a grain size of (a) 12.4, (b) 2.4, and (c) 1.2 lm.
3852—VOLUME 43A, OCTOBER 2012 METALLURGICAL AND MATERIALS TRANSACTIONS A

A. Description of RVEs
A volume of the microstructure of a material that canreplicate the flow behavior of the material throughnumerical tensile testing is termed a representativevolume element. In this study, the satisfactory dimen-sion of the RVE was considered to be 21 lm. The RVEshould contain a minimum of 12 martensite particles, asreported by Ramazani et al.[29] An in-house software,Gitter, was utilized to transform the experimentalmicrographs to a finite-element mesh.[29] Quadraticelements with parabolic form functions were used inthis study. The generated RVEs, based on the realmicrostructures of developed DP steels, are depicted inFigure 2. RVEs were cautiously selected from the initialmicrostructure (shown on the left) so that they contain30 pct martensite. Periodic boundary conditions wereimplemented for this purpose, and a FORTRANprogram was used to develop the equation for theboundary.
B. Quantification of Carbon in Different Phases of DPSteel at Martensite Start (Ms) and Martensite Finish(Mf) Temperatures
Before describing the procedure to calculate the flowcurves of different phases numerically at differenttemperatures, the carbon content in different phasesand the Ms and Mf temperatures are quantified in thisarticle. The carbon content of ferrite (ca) was estimatedto be the equilibrium carbon content at the peakannealing temperature. This was determined viaThermo-Calc (Thermo-Calc Software, Stockholm,Sweden) using the TCFe6 database. The elements beingtaken into account for Thermo-Calc calculations wereMn, C, and Si. The carbon content of the martensite(cm) phase was then calculated by considering thebalance carbon (as shown in Eq. [2]).
CDP ¼ Vmcm þ Vaca ½2�
where CDP is the carbon composition of the DP steel.The carbon composition in ferrite at an annealingtemperature of 1003 K (730 �C) was determined fromThermo-Calc to be 0.01 wt pct. This gives a carboncontent of 0.54 wt pct in the remaining austenite, whichtransforms to martensite. These values are the same asthose reported by Calcagnotto et al.[25]
The Ms and Mf temperatures were determined to be528 K (255 �C) and 393 K (120 �C), respectively, fromJmatPro software (Sente Software Ltd., Surrey, U.K.)for the composition of the investigated steel.
C. Microstructural-Based Flow Curve Predictionat Room Temperature
The flow curve of individual phases for ferrite andmartensite at room temperature is quantified based onthe dislocation-based strain-hardening model.[21] Thismodel emerges from the classic dislocation theoryapproach of Bergstrom[30] and Estrin and Mecking.[31]
The model constants are quantified by References 21and 24 and are reported in Eqs. [3] and [4].
rðin MPa)¼ r0þDrþ a�M�l�ffiffiffi
bp�
ffiffiffiffiffiffiffiffiffiffiffiffiffiffiffiffiffiffiffiffiffiffiffiffiffiffiffiffiffiffiffiffiffi
1� expð�MkreÞkr �L
s
½3�
The first term mentioned in Eq. [3] signifies thecontribution of the lattice friction and takes intoaccount the elements in solid solution. This contributioncan be calculated by application of Eq. [4].
r0 in MPað Þ ¼ 77þ 750 pct Pð Þ þ 60 pct Sið Þ þ 80 pct Cuð Þþ 45 pct Nið Þ þ 60 pct Crð Þ þ 80 pct Mnð Þþ 11 pct Moð Þ þ 5000 pctNssð Þ ½4�
The second term in Eq. [3] (Dr) indicates strengthen-ing by precipitation and carbon in solution. For ferrite itis 5000 9 (pct Css
f ), and for martensite it is 3065 9 (pctCssm) –161, where Css
f is carbon in solution in ferrite andCssm is the martensite carbon content, as reported by
Thomser et al.[24]
The last term in Eq. [3] is the strain-dependent part. Itis deduced from the literature,[23,32] where M is theTaylor factor (M = 3); l is the shear modulus (l = 80,000 MPa); b is the Burger’s vector (b = 2.5 9 10–10m);a is a constant (a = 0.33); and L is the dislocation meanfree path (for ferrite it is the average grain diameter (da),which was determined experimentally, and for martens-ite it is 3.8 9 10–8 m); kr is the recovery rate (for ferriteit is 10–5/da and for martensite it is 41); and r0 ishe Peierls stress and the effects of elements in solidsolution.
D. Flow Curves at Higher Temperatures
An interstitial free (IF) steel with a carbon content offerrite similar to the investigated DP steel was tensiletested at a Mf temperature of 393 K (120 �C), a Ms
temperature of 528 K (255 �C), and at room tempera-ture (RT) to determine the ferritic flow curve and to findthe ratio of the flow curves. This ratio was used toevaluate the ferritic flow curve in the range of the high-temperature (HT)–RT flow curve of the ferrite. The flowcurve of ferrite at room temperature was obtained froma dislocation-based model, as mentioned at the begin-ning of this section.To calculate the flow curve of austenite at HT, first of
all, the flow curve of austenite at RT should becalculated based on a Ludwik’s type equation, as wasdone in Resiner’s thesis.[33]
r in MPað Þ ¼ 650þ 1200 � e0:4� �
½5�
The relationship between the flow curves of austeniticstainless steels (AISI 304, AISI 316, and AISI 321) at673 K (400 �C) and at RT were then found from areview of the literature.[34,35] According to the obtainedresults, the flow curve of these steels at 523 K (250 �C) isequal to 70 to 80 pct of their flow curve at RT.Therefore, it was concluded that the flow curve of
METALLURGICAL AND MATERIALS TRANSACTIONS A VOLUME 43A, OCTOBER 2012—3853

austenite at high temperature will be 75 pct of the flowcurve of austenite at RT.
Because the high temperature flow curve of martensitewas unavailable for a carbon content of 0.54 wt pct,which is the carbon content of martensite in this study, itwas hypothesized that the ratio of the flow curve ofmartensite at room temperature and at an elevatedtemperature is independent of carbon content. Hence,an available steel chemistry with 0.17 wt pct carbon wasselected to determine the ratio of the flow curve ofmartensite at room temperature and at Mf temperature.This ratio will be used to obtain the flow curve ofmartensite with a carbon content of 0.54 wt pct atMf. The room-temperature flow curve of martensitewith 0.54 wt pct carbon will be determined from thedislocation-based models, as discussed in Section III–C.
To calculate the martensite flow curve at Mf temper-ature, a steel with a carbon content of 0.17 wt pct washeat treated in a Trebel hot deformation simulator. Thegeometry of the samples used for heat treatment andmechanical testing is shown in Figure 3. The heatingrate was 1 and the annealing temperature used was1133 K (860 �C), which was applied to obtain fullyaustenitic steel. After annealing, the samples wereimmediately gas quenched at a rate of 80 K/s to formmartensite from austenite. These parameters wereadjusted to develop martensitic steel. After heat treat-ment, tensile testing was carried out on the generatedmartensitic steel at room temperature and at Mf (393 K(120 �C)) and with a strain rate of 0.01 mm/s in theTrebel hot deformation simulator. The flow curve ofmartensitic steel was found to be 96 pct of that at RT.Based on this approach, rmart (at Mf) is 0.96 9 rmart (atRT), where the flow of martensite at RT is determinedfrom the dislocation-based work-hardening model, asdescribed in Section III–B.
E. Simulation of Formation of GND
As the transformation (c to a¢) involves volumechange and depends on the temperature of transforma-tion, in this study temperature-dependent materials lawsare implemented. For this transformation, plastificationstarts significantly above room temperature. It wasfurther assumed that both phases were homogeneousand were modeled through isotropic material models.To implement this idea, the flow curves of the
transforming austenite-to-martensite region were inter-polated between the flow curve of austenite at 528 K(255 �C) (Ms temperature) and the flow curve ofmartensite at 393 K (120 �C) (Mf) temperature. Also,for intermediate temperatures, the flow curves of fer-rite are interpolated between the flow curve offerrite at 528 K (255 �C) (Ms temperature) and roomtemperature.During cooling from the annealing temperature, it
was assumed that the austenite-to-martensite transfor-mation imposes volumetric expansion force on thesurrounding ferritic regions. This replicated the forma-tion of the GND. This happened between the Ms and Mf
temperatures. As the different variants of martensitecancel each other’s shear deformation,[35] the shear partof the austenite-to-martensite transformation is ignored.The transformation strain etr of the austenite-to-martensite transformation can be simplified to a simpleshearing c0 and volume increment d.[36]
etr� ¼d=3 0 00 d=3 00 0 d=3
0
@
1
A
The phase transformation in the finite-element calcu-lation is introduced by different thermal expansioncoefficients of ferrite and the second phase. The thermalexpansion coefficients of ferrite aT,f and second phaseaT,m are described in Eqs. [6] and [7], respectively[6]
aT;f ¼ 1:2� 10�5K�1 ½6�
The thermal expansion coefficient of the martensitephase is
aT;m ¼ 1:2� 10�5K�1 � d=3ð Þ=DT ¼ �5:47� 10�5K�11
½7�
with d = 0.026.
Fig. 3—Specimen design for heat treatment and tensile testing (alldimensions in mm).
Fig. 4—Assumed kinetics of austenite-to-martensite phasetransformation.
3854—VOLUME 43A, OCTOBER 2012 METALLURGICAL AND MATERIALS TRANSACTIONS A
The kinetics of the austenite-to-martensite transfor-mation were considered to be linear between Ms and Mf
temperatures and are shown in Figure 4, where thecontent of martensite is plotted against the undercoolingfrom the martensite start temperature. This is accordingto the Koistinen-Marburger equation, which predictsthe linear transformation kinetics of austenite-to-mar-tensite phase transformation. In this study, it is assumedthat the flow property of the second phase changescontinuously from the Ms temperature to the Mf
temperature. At the Ms temperature, the flow propertyof the second phase is that of austenite at thattemperature. Below the Ms temperature, the secondphase starts to transform to martensite from austenite.Furthermore, the flow behavior of martensite at the Mf
temperature is calculated from the dislocation-basedwork-hardening model for martensite at RT and thenadjusted for the Mf temperature, as discussed inSection III–D.
Below the Mf temperature, there are only ferrite andmartensite phases in the microstructure. As these twophases have the same coefficient of thermal expansion,below the Mf temperature there is no further incompe-tent volume expansion of the different phases present inthe microstructure. Hence, the formation of GND isstopped at the Mf temperature. Below the Mf temper-ature, there is no change in the fraction of phases.Figure 4 shows that from Mf to RT there is no change inthe fraction of martensite.
In this study, it is postulated that the GND formsduring the austenite-to-martensite phase transformationas a result of volume expansion. The development ofGND during cooling from Ms (528 K [255 �C]) to Mf
(393 K [120 �C]) will be shown as a rectangular cellcontaining 30 pct austenite. Below Mf, the thermalexpansion coefficient of martensite and ferrite isassumed to be the same, and there is no furtherformation of GND. Figure 5(a) shows the initial geom-etry of the simulation area. The cell is cubic in shape,with a length of 10 lm. The initial austenitic area iscircular, with a diameter of 6.18 lm. Outside theaustenite, the remaining portion of the cell is ferrite.Figure 5(b) shows the finite-element meshing of thesimplified regular geometry. Quadratic plane strainelements were used to mesh the simulation area. Thesize of the elements used was 0.25 lm.
IV. RESULTS AND DISCUSSION
A. Results of Experimental Tensile Tests
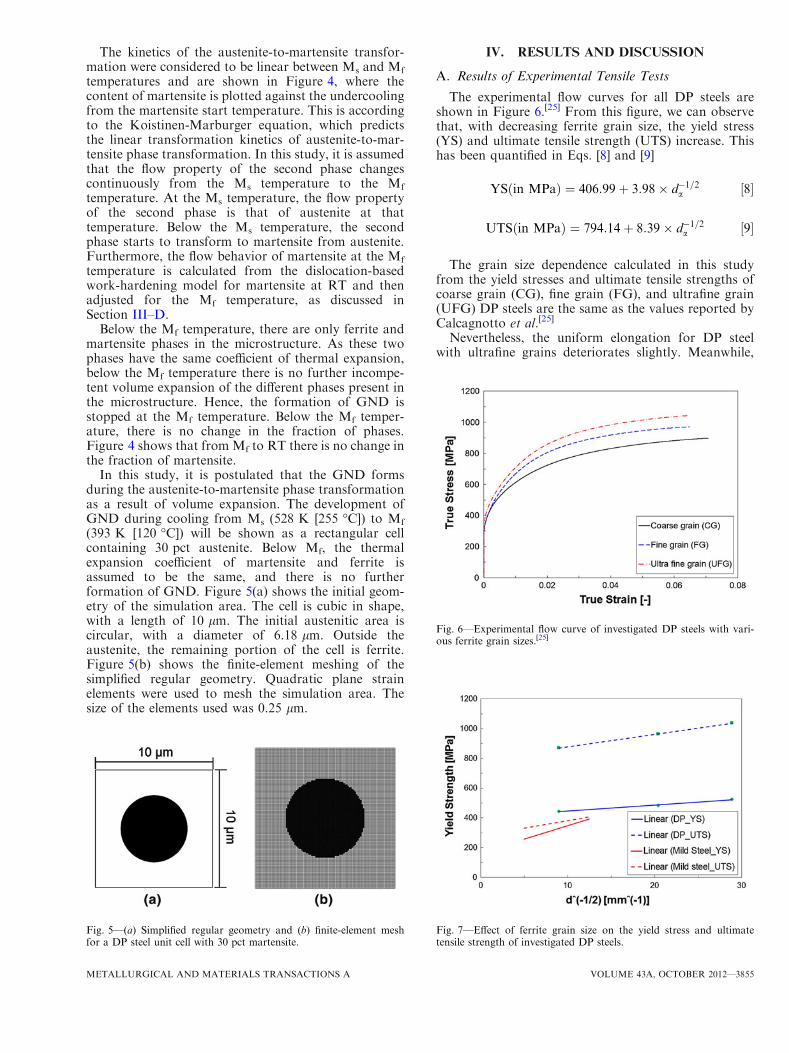
The experimental flow curves for all DP steels areshown in Figure 6.[25] From this figure, we can observethat, with decreasing ferrite grain size, the yield stress(YS) and ultimate tensile strength (UTS) increase. Thishas been quantified in Eqs. [8] and [9]
YS in MPað Þ ¼ 406:99þ 3:98� d�1=2a ½8�
UTS in MPað Þ ¼ 794:14þ 8:39� d�1=2a ½9�
The grain size dependence calculated in this studyfrom the yield stresses and ultimate tensile strengths ofcoarse grain (CG), fine grain (FG), and ultrafine grain(UFG) DP steels are the same as the values reported byCalcagnotto et al.[25]
Nevertheless, the uniform elongation for DP steelwith ultrafine grains deteriorates slightly. Meanwhile,
Fig. 5—(a) Simplified regular geometry and (b) finite-element meshfor a DP steel unit cell with 30 pct martensite.
Fig. 6—Experimental flow curve of investigated DP steels with vari-ous ferrite grain sizes.[25]
Fig. 7—Effect of ferrite grain size on the yield stress and ultimatetensile strength of investigated DP steels.
METALLURGICAL AND MATERIALS TRANSACTIONS A VOLUME 43A, OCTOBER 2012—3855

the initial work-hardening behavior is improved bydecreasing the grain size. This makes ultrafine-grainedDP steels attractive to automakers, as they have bothhigh strength and sufficient ductility.
The YS and UTS for mild steel, having a similarcarbon content to the steel studied in this work, wereexpressed as a function of ferrite grain size in Eqs. [10]and [11], respectively.[37–39] According to these equa-tions, the developed Hall-Petch equations for DP andmild steels with a similar carbon content are comparedin Figure 7. It can be observed that the Hall-Petch slopeis higher for YS in mild steels compared with that in theDP steels; nevertheless, this slope decreases from 18 to10 for the UTS in mild steels. However, for DP steels,the Hall-Petch slope increases from 3.98 for YS to 8.39for UTS. Furthermore, the grain size of mild steelsranges from 6.5 to 30 lm, whereas it can even bereduced to 1.2 lm in DP steels. Comparing Eqs. [10]
and [11] with [8] and [9], it is observed that the Hall-Petch slope is higher for YS for carbon steel, whereas forthe DP steel, the expression for UTS has a higher Hall-Petch slope. This finding confirms the fact that thework-hardening rate of DP steel is superior to that ofmild steels with the same composition.
YS in MPað Þ ¼ 168:5þ 18� d�1=2a ½10�
UTS in MPað Þ ¼ 281þ 10� d�1=2a ½11�
B. Flow Curves of Different Phases at Ms, Mf, and RT
As discussed in the previous section, the flow curvesfor ferrite at RT were determined using Rodriguez’sapproach and are shown in Figure 8(a). Higher yield
Fig. 8—Calculated stress–strain responses of (a) ferrite and (b) martensite for DP steel with different sizes of ferrite grain.
Fig. 9—Stress–strain curves of IF steel and ferrite phase of DP steel with different ferrite grain sizes at RT, 393 K (120 �C), and 528 K (255 �C).
3856—VOLUME 43A, OCTOBER 2012 METALLURGICAL AND MATERIALS TRANSACTIONS A

stress is observed for ferritic microstructure with smallergrain size. The martensitic flow curve is plotted inFigure 8(b).
After showing the results at RT, now the HT flowcurves of ferrite are shown in Figure 9. The flow curvesof ferrite at Ms and Mf temperatures were estimatedfrom tensile testing of IF steel at Ms, Mf, and RT. IFsteel with 0.01 pct C was tensile tested at 528 K (255 �C)(Ms), 393 K (120 �C) (Mf), and at RT. According to theresults, it was found that the flow curves of IF steel atMs and Mf are equal to the 70 pct and 85 pct of that atRT, respectively. This can be observed from Figure 9 bycomparing the curves IF_528 K (255 �C) (for Ms
temperature), IF_393 K (120 �C) (for Mf temperature),and IF_RT. Therefore, the flow curves of ferrite at Ms
and Mf were concluded to be 70 pct and 85 pct of theflow curve of ferrite at RT (shown as ferrite (CG/FG/UFG)_528 K (255 �C) (for Ms temperature), ferrite
(CG/FG/UFG)_393 K (120 �C) (for Mf temperature),and ferrite (CG/FG/UFG)_RT in Figure 9.The RT flow curve of austenite was determined
according to Ludwik’s approach, as mentioned inSection III�D. The Ms temperature flow curve ofaustenite was set as 0.75 9 RT flow curve, as mentionedin Section III�D (Figure 10).The flow curve of martensitic steel at RT and 393 K
(120 �C) is depicted in Figure 11(a). As shown in thisfigure, the flow curve of martensitic steel at 393 K(120 �C) can be estimated as 96 pct of that at RT. Basedon this approach, the flow curve of martensite in DPsteel was considered to be 96 pct of that at RT, as shownin Figure 11(b).
C. Evolution of GND During Cooling
Figure 11(a) shows the contour plot of the plasticequivalent strain at the end of the cooling simulation forCG and UFG DP steels. For these two calculations, theinputs of the ferritic flow curves were significantlydifferent (ferrite (CG)_RT vs Ferrite (UFG)_RT). It isobserved that, around the martensite particles in theferrite, regions with higher plastic equivalent strain haveformed for both UFG and CG DP steels. These regionswere developed to contain the volume increase causedby the austenite-to-martensite transformation. FromFigure 12, it can be concluded that ferrite grain size hasan insignificant effect on the thickness of the GND layer.In both the cases of CG and FG DP unit cellcalculations, the GND layer had a thickness of 25 pctof the second-phase particle size. In addition, from thisfigure, it can be observed that the distribution of theGND layer around the second-phase particles is alsosimilar. Furthermore, from the simulation, we foundthat the areas of higher plastic equivalent strains offerrite were also work hardened. Figure 11(b) shows theequivalent plastic strain in the work-hardened region ofthe ferrite neighboring the martensite island.
Fig. 10—Stress–strain curves of austenite in DP steel at RT and Ms
(528 K [255 �C]).
Fig. 11—Stress–strain curves of (a) martensitic steel and (b) martensite in DP steel at RT and at Mf (393 K [120 �C]).
METALLURGICAL AND MATERIALS TRANSACTIONS A VOLUME 43A, OCTOBER 2012—3857

To describe this work-hardened region, we will firstdiscuss the EBSD studies available in the literatureabout the ferritic region in proximity with martensite inDP steels. It is reported that enhanced dislocationdensity around the martensite islands can be observedby analyzing the local orientation gradients in the EBSDmaps.[5] Figure 13(a) shows an image quality map of aDP steel with 21 pct martensite. The regions with higherlattice distortion have low image quality and, hence,appear darker in this figure. This feature was used by theauthor to distinguish the darker areas as martensite andthe lighter areas as ferrite in the figure. The other map
shows the kernel average misorientation (KAM) of thesame area (Figure 13(b)). All neighbors at a distance of300 lm were included by the author to calculate theKAM of an EBSD point. As the minimum misorienta-tion angle of a low-angle grain boundary was assumedto be 2 deg, the KAM values above this were notincluded in the calculations. The largest orientationgradients were found within the martensite islands. TheKAM map shows significant orientation spreading fromthe ferrite–martensite phase boundaries to the ferritegrain interior. We observe that every martensite island issurrounded by a minimum of one distinct orientation
Table II. Tensile Properties of DP Steels with Various Ferrite Grain Sizes[25]
Microstructure Yield Stress (MPa) UTS (MPa) Uniform El. (pct)
Coarse grain 445 ± 17 870 ± 25 7.2 ± 0.7Fine grain 483 ± 7 964 ± 4 7.4 ± 0.4Ultrafine grain 525 ± 8 1037 ± 15 7.1 ± 0.5
UTS, ultimate tensile strength.
Fig. 12—(a) Plastic equivalent strain after cooling the unit cell. (b) Equivalent plastic strain in the work-hardened region of the ferrite neighbor-ing the martensite island.
Fig. 13—Orientation gradients near ferrite–ferrite and ferrite–martensite grain boundaries in a DP steel containing 21 pct martensite: (a) imagequality map and (b) KAM maps.[5]
3858—VOLUME 43A, OCTOBER 2012 METALLURGICAL AND MATERIALS TRANSACTIONS A

gradient in one of its neighboring ferrite grains. Fur-thermore, we observe that as more ferrite grain issurrounded by martensite, higher intragranular orienta-tion gradients result.
Figure 14(a) shows the misorientation profiles, start-ing from a ferrite–ferrite interface and from a ferrite–martensite interface, and ending in the center of thecorresponding ferrite grains. The position of the profilevectors is shown in the KAM map in Figure 14(b). Thelattice imperfections in the immediate vicinity ofthe ferrite–ferrite grain boundaries can be attributed tothe fact that the ferrite–ferrite curve shows an initial step
to 0.5 deg. After this initial step, the misorientationvalues remain in the normal scatter range, which comesfrom the spatial resolution of the EBSD system. How-ever, for the case that starts from the ferrite–martensiteinterface, the misorientation profile increases more grad-ually compared with the ferrite–ferrite case, and it reachesa much higher value of 1.4 deg at a distance ofapproximately 2 lm from the ferrite–martensite inter-face. From the KAM values, the GND density in theferrite was quantified in Figure 14(c). This value rangesfrom 2.5 9 1014 m–2 in proximity to the martensiteislands to 2.5 9 1013 m–2 in the ferrite grain interior.
Fig. 14—(a) Misorientation and image quality evolution from grain boundary to grain center obtained from 2-D profile vectors starting from theferrite–martensite (FM) interface and ferrite–ferrite (FF) interface shown in (b). Error bars indicate the statistical result obtained from a range ofmisorientation profiles. (b) KAM map and grain boundary. (c) GND calculated from KAM angles. (d) Image quality map showing the gradualdecrease of the dislocation density from the FM boundary to the center.[5]
METALLURGICAL AND MATERIALS TRANSACTIONS A VOLUME 43A, OCTOBER 2012—3859

In a recent study, Kadkhodapour et al.[40] carried outnanohardness testing on commercial DP steel, for whichthe EBSD result is described in Section IV–B. Thesummary of their results is shown in Figure 15. The
authors concluded that the thickness of the interfaceregion in which the hardness varies, starting from theferrite–martensite interface into the ferrite grain interior,can be assumed typically as 1.5 lm. However, theauthors did not report the criterion used to obtain thisthickness.We propose a criterion to quantify the thickness of
the GND layer. From the work of Kadkhodapouret al.,[40] we characterize the thickness of the hardenedlayer that, according to the study by Calcagnottoet al.,[5] can be considered to be the zone containingGND. We propose that the thickness of the layer withGND be considered the region, where ry is greater than1.3 9 ry
center, where ry is proportional to the hardness ofthe ferrite grain, and ry
center is proportional to thehardness of the same ferrite grain in the grain center.The line in Figure 15 shows this criterion. FromFigure 15, it can be concluded that, according to thiscriterion, the thickness of the GND layer is 1.5 lm. Forour numerical studies, the same criterion can be used todescribe the thickness of the GND. Considering that theGND deform the ferrite within the elastic limit, ry canbe expressed as proportional to the equivalent plasticstrain in ferrite eeq
p , Young’s modulus E being theproportionality limit; ry = E 9 eeq
p . This gives theFig. 15—Summary of nanohardness tests done on DP steel.[40]
Fig. 16—Plastic equivalent strain after cooling a DP steel with (a) coarse, (b) fine, and (c) ultrafine grains containing 30 pct martensite afterintercritical annealing.
3860—VOLUME 43A, OCTOBER 2012 METALLURGICAL AND MATERIALS TRANSACTIONS A

GND layer thickness as the region where eeqp >
1.3 9 eeqpcenter and where eeq
p center is the equivalent plasticstrain in the center of the ferrite grain. The line inFigure 12(b) shows this criterion. From Figure 12(b),we can conclude that, according to this criterion, thethickness of the GND layer is 1.5 lm as well. FromFigures 12(b) and 15, we can conclude that the criteriadeveloped in this study can be successfully correlatedwith the GND quantification from experimental and
numerical simulation. The thickness of the GND layer is25 pct of the second-phase particle size; therefore, thethickness of the GND layer is estimated as 0.76, 0.56,and 0.24 lm for DP steel with coarse grain, fine grain,and ultrafine grain, and with a martensite island size of3.05, 1.31, and 0.97 lm, respectively.Figure 16 shows the evolution of prestrained regions in
the investigated DP steels after cooling. The prestrainedregions are in proximity to the ferrite–martensite
Fig. 17—Predicted von Mises’ stress in the RVE of DP steel with a ferrite grain size of 12.4 lm without (left) and with (right) GND after (a)2 pct, (b) 5 pct, and (c) 10 pct plastic deformation.
METALLURGICAL AND MATERIALS TRANSACTIONS A VOLUME 43A, OCTOBER 2012—3861

boundary. The center of the ferrite grain is mostly strainfree. The prestrained areas at the ferrite–martensiteboundaries are regionswhereGNDare produced.As perthe findings of Calcagnotto et al.et al., these prestrainedregions are proposed to be the regions where GND areformed.[5] These are the regions of high dislocationdensity, which gives rise to the prestraining. ComparingFigures 12(b) and 15, we can conclude that the profile ofthe prestrained region matches the profile of the hard-ness values in the ferrite grain, from the martensiteboundary to grain interior. Having established this, now
we will show that the RVE-FEM modeling of DP steelswith prestrained ferrite grains (in the boundary to themartensite islands) is suitable to simulate the flow curveof these steels.
D. Results of Numerical Tensile Tests
Numerical tensile tests were carried out on the DPmicrographs, as discussed in Section III. The evolutionof stress and strain in the microstructure can beobtained from these numerical tensile tests. These tests
Fig. 18—Predicted equivalent strain in the RVE of DP steel with a ferrite grain size of 12.4 lm without (left) and with (right) GND after (a)2 pct, (b) 5 pct, and (c) 10 pct plastic deformation.
3862—VOLUME 43A, OCTOBER 2012 METALLURGICAL AND MATERIALS TRANSACTIONS A

are shown in the next paragraphs to describe the effectof ferrite grain size on stress–strain evolution. Later, thestress–strain curve obtained from the numerical tensiletests is also shown and is compared in detail with theexperimental curves.
Figures 17 through 22 illustrate the contour plot ofvon Mises stress and equivalent plastic strain onmicroscale after a macroscopic uniaxial deformation of
2 pct, 5 pct, and 10 pct for the investigated DP steel(left-hand side figures without consideration of GNDand right-hand side figures with consideration of GND).A significant difference on the von Mises stress distri-bution between the simulations without and with GNDcan be observed after 2 pct and 5 pct deformation, asshown in Figures 17(a) and 18(a), i.e., taking intoaccount that the GND affect the initial work-hardening
Fig. 19—Predicted von Mises’ stress in the RVE of DP steel with a ferrite grain size of 2.4 lm without (left) and with (right) GND after (a)2 pct, (b) 5 pct, and (c) 10 pct plastic deformation.
METALLURGICAL AND MATERIALS TRANSACTIONS A VOLUME 43A, OCTOBER 2012—3863

behavior of DP steel. This explains the higher work-hardening rates for the situation with GND. The causecan be established by observing Figures 17(b) through22(b). From these figures, we can observe that, even ifthe quantities of macroscopic deformation are identical,ferrite has elevated strains, considering the GNDsituation. However, raising the deformation to 10 pctresults in softening of the GND-incorporated micro-structure because of the large amount of shear band
formation under the plane strain condition. The direc-tion of the localized plastic deformation is, on average,45 deg to the tensile direction. High stresses up to2700 MPa are noticed in the martensitic areas. Further-more, from Figure 18 we can conclude that taking GNDinto account makes deformation for small strains lessinhomogeneous and helps to avoid stress and strainpeaks. However, this effect vanishes at evaluated strainshigher than 5 pct.
Fig. 20—Predicted equivalent strain in the RVE of DP steel with a ferrite grain size of 2.4 lm without (left) and with (right) GND after(a) 2 pct, (b) 5 pct, and (c) 10 pct plastic deformation.
3864—VOLUME 43A, OCTOBER 2012 METALLURGICAL AND MATERIALS TRANSACTIONS A

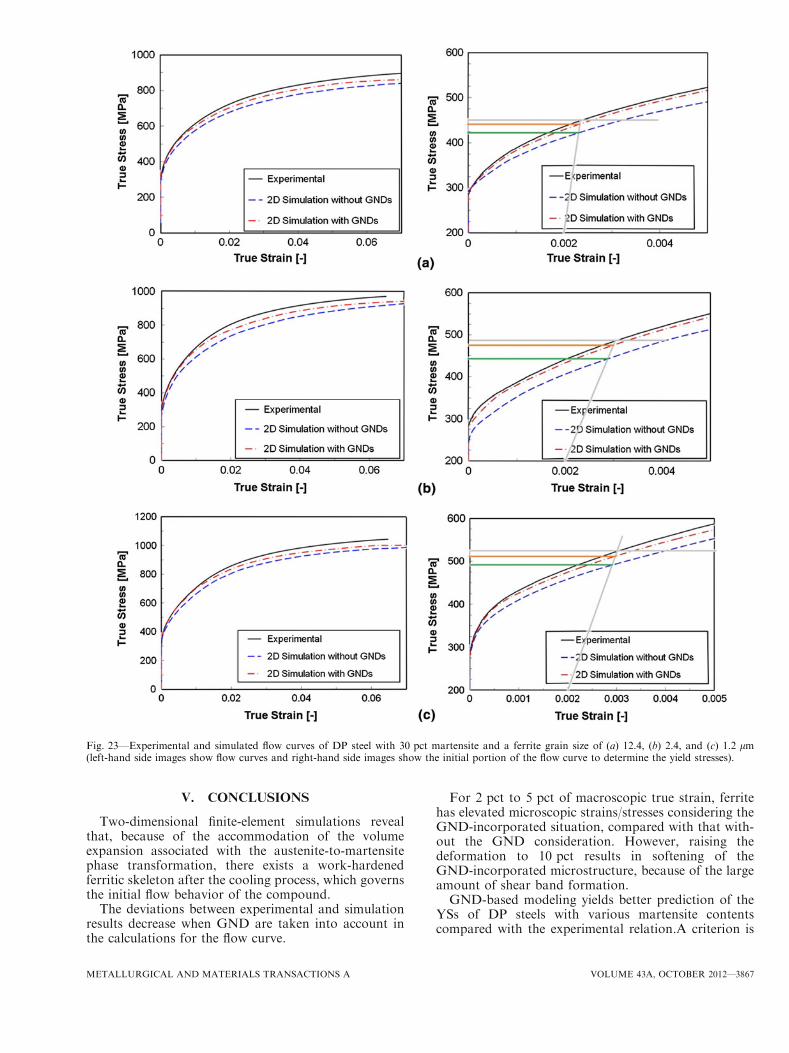
The left-hand side images in Figures 23 show the flowcurves of DP steels with different martensite contents,both from the experiment and the simulation. From thesefigures, we can observe that calculations including GNDcan predict the high initial work-hardening rate of DPsteels much better compared with the calculations with-out theGND. Therefore, the initial flow behavior of aDPsteel strongly depends on whether GND are taken intoaccount. All simulations that included GND resulted inslightly lower values of stiffness at the beginning of the
deformation. This may be because microplastic behaviortakes place in some areas of the GND where the residualstress is as high as the flow stress of ferrite.The right-hand side images in Figures 23 show initial
parts of the flow curve. The determination of yield stressfrom experimental flow curves, simulated both withGND and without GND, is shown for all steels studied.For this, a line with a slope of 210 GPa is drawn,passing through the true strain of 0.002. The meetingpoint of these lines with the flow curves gives the yield
Fig. 21—Predicted von Mises’ stress in the RVE of DP steel with a ferrite grain size of 1.2 lm without (left) and with (right) GND after(a) 2 pct, (b) 5 pct, and (c) 10 pct plastic deformation.
METALLURGICAL AND MATERIALS TRANSACTIONS A VOLUME 43A, OCTOBER 2012—3865

stress of each respective flow curve. The yield stressesdetermined in this way are shown in Figure 24.
The effect of grain size on yield stress is shown inFigure 24. There is a significant difference in themagnitude of the dependence of yield stress on thegrain size between the experimental and computedresults without consideration of the GND. This devia-tion decreases when the GND are also involved in thesimulations. The constants of the developed Hall-Petchequation for experimental and simulation approachesare calculated and presented in Table III. As shown
in this table, the difference between the constantsis insignificant when GND are included in thesimulations.Table IV summarizes the experimental and predicted
yield stresses for the three different kinds of DP steelinvestigated in this study. In this table, the YS fromexperiments and two relations from numerical tensiletests are compared. It can be observed that GND-basedmodeling gives a better prediction of YS for theinvestigated DP steels with various martensite contentswhen the martensite fraction increases.
Fig. 22—Predicted equivalent strain in the RVE of DP steel with a ferrite grain size of 1.2 lm without (left) and with (right) GND after(a) 2 pct, (b) 5 pct, and (c) 10 pct plastic deformation.
3866—VOLUME 43A, OCTOBER 2012 METALLURGICAL AND MATERIALS TRANSACTIONS A
V. CONCLUSIONS
Two-dimensional finite-element simulations revealthat, because of the accommodation of the volumeexpansion associated with the austenite-to-martensitephase transformation, there exists a work-hardenedferritic skeleton after the cooling process, which governsthe initial flow behavior of the compound.
The deviations between experimental and simulationresults decrease when GND are taken into account inthe calculations for the flow curve.
For 2 pct to 5 pct of macroscopic true strain, ferritehas elevated microscopic strains/stresses considering theGND-incorporated situation, compared with that with-out the GND consideration. However, raising thedeformation to 10 pct results in softening of theGND-incorporated microstructure, because of the largeamount of shear band formation.GND-based modeling yields better prediction of the
YSs of DP steels with various martensite contentscompared with the experimental relation.A criterion is
Fig. 23—Experimental and simulated flow curves of DP steel with 30 pct martensite and a ferrite grain size of (a) 12.4, (b) 2.4, and (c) 1.2 lm(left-hand side images show flow curves and right-hand side images show the initial portion of the flow curve to determine the yield stresses).
METALLURGICAL AND MATERIALS TRANSACTIONS A VOLUME 43A, OCTOBER 2012—3867

developed to quantify the thickness of the GND layerbased on the nanohardness variation in the ferrite grain.
Ferrite grain size has an insignificant effect on thethickness of the GND layer. In all cases of CG, FG, andUFG DP unit cell calculations, the distribution of theGND layer around the second phase particle is similar.The thickness of the GND layer is estimated as 1.5 lmunder all conditions.
The thickness of the GND layer depends on the sizeof the second phase, and it is estimated as 25 pct of thesecond phase particle size; therefore, the thickness of theGND layer is identified as 0.76, 0.56, and 0.24 lm forDP steel with coarse grain, fine grain, and ultrafinegrain, and with a martensite island size of 3.05, 1.31, and0.97 lm, respectively.
ACKNOWLEDGMENTS
This research was carried out under project numberMC2.07293 in the framework of the Research
Program of the Materials Innovation Institute M2i(www.m2i.nl). The authors also wish to thankDr. Marion Calcagnotto from Salzgitter MannesmannForschung GmbH for her tensile test data files anddiscussions.
REFERENCES1. J. Shaw, B. Engl, C. Espina, E.C. Oren, and Y. Kawamoto: New
Steel Sheet and Steel Bar Products and Processing, D.W.Anderson, ed., SAE-SP 1685, Society of Automotive Engineers(SAE), Warrendale, PA, 2002, pp. 63–71.
2. B.C. De Cooman and J.G. Speer: Fundamentals of Steel ProductPhysical Metallurgy, ASM International, Materials Park, OH,2011, p. 392.
3. R.D. Lawson, D.K. Matlock, and G. Krauss: Fundamentals ofDual Phase Steels Symposium, TMS-AIME, Warrendale, PA,1981, pp. 347–81.
4. Y.I. Son, Y.K. Lee, K.-T. Park, C.S. Lee, and D. Hyuk Shin: ActaMater, 2005, vol. 53, pp. 3125–34.
5. M. Calcagnotto, D. Ponge, E. Demir, and D. Raabe: Mater. Sci.Eng. A, 2010, vol. 527, pp. 2738–46.
6. U. Liedl, S. Traint, and E.A. Werner: Computat. Mater. Sci., 2002,vol. 25, pp. 122–28.
7. H. Fischmeister and B. Karlsson: Z. Fur Metallkunde, 1977,vol. 68, pp. 311–27.
8. M. Dollar and S. Gorczyca: Metal Sci., 1983, vol. 17, pp. 671–79.9. M.Y. Liu, B. Shi, C. Wang, S.K. Ji, X. Cai, and H.W. Song:
Mater. Lett., 2002, vol. 57, pp. 2798–2802.10. O. Maid: PhD Thesis, RWTH, Aachen University, Aachen,
Germany, 1986.11. W. Bleck and W. Mueschenborn: Thyssen Technische Berichte,
1984, no.1, pp. 24–32.12. Z. Jiang, G. Zhenzhong, and J. Lian: Mater. Sci., 1995, vol. 190,
pp. 55–64.13. C.A.N. Lanzilotto and F.B. Pickering: Metal Sci., 1982, vol. 16,
p. 371.14. R. Song, D. Ponge, D. Raabe, and R. Kaspar: Acta Mater., 2005,
vol. 53, pp. 845–58.15. J.M. Rigsbee and P.J. Van der Arend: Dual-Phase HSLA Steels,
Formable HSLA and Dual-Phase Steels, A.T. Davenport, ed.,TMS-AIME, Warrendale, PA, 1979, pp. 56–86.
16. A.R. Marder: Metall. Trans. A, 1982, vol. 13A, pp. 85–92.17. R. Davies: Metall. Trans. A, 1978, vol. 9A, pp. 671–79.18. M.F. Ashby: Phil. Mag., 1970, vol. 21, pp. 399–424.19. M.F. Ashby: Phil. Mag., 1966, vol. 14, pp. 1157–78.20. Z. Jiang, J. Liu, and J. Lian: Acta Metall. Mater., 1992, vol. 40,
pp. 1587–97.21. R.M. Rodriguez and I. Gutierrez: Mater. Sci. Forum, 2003,
vols. 426–432, pp. 4525–30.22. V. Uthaisangsuk: PhD Thesis, RWTH, Aachen University,
Aachen, Germany, 2009.23. V. Uthaisangsuk, S. Muenstermann, U. Prahl, W. Bleck, H.-P.
Schmitz, and T. Pretorius: Computat. Mater. Sci., 2011, vol. 50,pp. 1225–32.
24. C. Thomser, V. Uthaisangsuk, and W. Bleck: Steel Res. Int., 2009,vol. 80, pp. 582–87.
25. M. Calcagnotto, Y. Adachi, D. Ponge, and D. Raabe: ActaMater., 2011, vol. 59, pp. 658–70.
26. R. Kaspar and O. Pawelski: Materialprufung, 1989, vol. 31, p. 14.27. O. Pawelski and R. Kaspar:Materialprufung, 1988, vol. 30, p. 357.28. V.G. Kouznetsova: PhD Thesis, Technical University Eindhoven,
Eindhoven, the Netherlands, 2002.29. A. Ramazani, K. Mukherjee, U. Prahl, and W. Bleck: Comput.
Mater. Sci., 2011, vol. 52, pp. 46–54.30. Y. Bergstrom: Mater. Sci. Eng., 1970, vol. 5, pp. 193–200.31. Y. Estrin and H. Mecking: Acta Metall., 1984, vol. 32, pp. 57–70.32. O. Bouaziz and P. Buessler: La Revue De Metallurgie–CIT 99,
2002, pp. 71–77.33. G. Reisner: VDI Fortschritt-Berichte, Reihe 18: Mechanik/
Bruchmechanik, no. 214.34. G. Piatti and P. Schiller: J. Nucl. Mater., 1986, vols. 141–143,
pp. 417–26.
Fig. 24—Evaluation of the Hall-Petch behavior in DP steel.
Table III. The Constants of Hall-Petch Equations Developedfor the Experimental and Numerical Approaches
ry ¼ r0 þ kd�1=2 r0 k
Experimental 406.99 3.98Simulation without GND 384.33 3.48Simulation with GND 407.33 3.54
Table IV. Summary of Processing Conditions and the Effectof Microstructural Characteristics on the Yield Stress
of Different DP Steel Microstructures
YS in MPa Experimental2-D Simulationwithout GND
2-D Simulationwith GND
Coarse grain 450 421 441Fine grain 483 443 475Ultrafine grain 525 492 512
3868—VOLUME 43A, OCTOBER 2012 METALLURGICAL AND MATERIALS TRANSACTIONS A

35. B.A. Bilby and J.W. Christian: J. Iron Steel Inst., 1961, vol. 197,pp. 122–31.
36. M.S. Wechsler, D.S. Lieberman, and T.A. Read: AIME Trans.JIM, 1953, vol. 197, pp. 1503–15.
37. T. Gladman and F.B. Pickering: Yield, Flow and Fracture ofPolycrystals, T.N. Baker, ed., Applied Science Publishers Ltd.,London, U.K., 1983, pp. 141–98.
38. W. Bleck: Material Characterisation, 1st ed., Verlag Mainz,Aachen, Germany, 2009.
39. F.B. Pickering: Constitution and Properties of Steels, R.W. Chanand F.B. Pickering, eds., VCH Verlasgesellschaft GmbH, Wein-heim, Germany, 1992, pp. 41–94.
40. J. Kadkhodapour, S. Schmauder, D. Raabe, S. Ziaei-Rad, U.Weber, and M. Calcagnotto: Acta Mater., 2011, vol. 59, pp. 4387–94.
METALLURGICAL AND MATERIALS TRANSACTIONS A VOLUME 43A, OCTOBER 2012—3869
Copyright © 2022 FDOKUMEN