
Transfer Entropy and Information Flow Patterns in Functional Brain Networks during Cognitive...
10
C.K. Loo et al. (Eds.): ICONIP 2014, Part I, LNCS 8834, pp. 1–10, 2014. © Springer International Publishing Switzerland 2014 Transfer Entropy and Information Flow Patterns in Functional Brain Networks during Cognitive Activity Md. Hedayetul Islam Shovon 1 , D (Nanda) Nandagopal 1 , Ramasamy Vijayalakshmi 2 , Jia Tina Du 1 , and Bernadine Cocks 1 1 Cognitive Neuroengineering Laboratory, Division of IT, Engineering and the Environments, University of South Australia, Adelaide, Australia 2 Department of Applied Mathematics and Computational Science, PSG College of Technology, Coimbatore, Tamil Nadu, India [email protected] Abstract. Most previous studies of functional brain networks have been con- ducted on undirected networks despite the direction of information flow able to provide additional information on how one brain region influences another. The current study explores the application of normalized transfer entropy to EEG data to detect and identify the patterns of information flow in the functional brain networks during cognitive activity. Using a mix of signal processing, information and graph-theoretic techniques, this study has identified and cha- racterized the changing connectivity patterns of the directed functional brain networks during different cognitive tasks. The results demonstrate not only the value of transfer entropy in evaluating the directed functional brain networks but more importantly in determining the information flow patterns and thus providing more insights into the dynamics of the neuronal clusters underpinning cognitive function. Keywords: Transfer entropy, directed functional brain network, EEG, cognitive load, graph theory. 1 Introduction The human brain is a complex and dense network of billions of interconnected neu- rons. To quantify the topological features of this network, graph theoretical analysis has been successfully employed by researchers in the recent past [1-3]. Most of this graph theoretical analysis has, however, been applied to undirected networks. Such analysis can, however, be applied to directed networks [2]. This is perhaps, surprising given that directed networks exhibit more prominent features by providing directional interactions between pairwise elements thereby enabling more detailed analysis. Al- though Granger causality is often used to identify causal relationship in electroence- phalogram (EEG) data, it is limited to the linear model of interaction [4]. As a result, it fails to accurately identify causal relationships in highly nonlinear systems such as the human brain. By comparison, the information theoretical measure of transfer en- tropy (TE) determines the direction and quantifies the information transfer between two processes [5]. TE estimates the amount of activity of a system which is not
Transcript of Transfer Entropy and Information Flow Patterns in Functional Brain Networks during Cognitive...

C.K. Loo et al. (Eds.): ICONIP 2014, Part I, LNCS 8834, pp. 1–10, 2014. © Springer International Publishing Switzerland 2014
Transfer Entropy and Information Flow Patterns in Functional Brain Networks during Cognitive Activity
Md. Hedayetul Islam Shovon1, D (Nanda) Nandagopal1, Ramasamy Vijayalakshmi2, Jia Tina Du1, and Bernadine Cocks1
1 Cognitive Neuroengineering Laboratory, Division of IT, Engineering and the Environments, University of South Australia, Adelaide, Australia
2 Department of Applied Mathematics and Computational Science, PSG College of Technology, Coimbatore, Tamil Nadu, India
Abstract. Most previous studies of functional brain networks have been con-ducted on undirected networks despite the direction of information flow able to provide additional information on how one brain region influences another. The current study explores the application of normalized transfer entropy to EEG data to detect and identify the patterns of information flow in the functional brain networks during cognitive activity. Using a mix of signal processing, information and graph-theoretic techniques, this study has identified and cha-racterized the changing connectivity patterns of the directed functional brain networks during different cognitive tasks. The results demonstrate not only the value of transfer entropy in evaluating the directed functional brain networks but more importantly in determining the information flow patterns and thus providing more insights into the dynamics of the neuronal clusters underpinning cognitive function.
Keywords: Transfer entropy, directed functional brain network, EEG, cognitive load, graph theory.
1 Introduction
The human brain is a complex and dense network of billions of interconnected neu-rons. To quantify the topological features of this network, graph theoretical analysis has been successfully employed by researchers in the recent past [1-3]. Most of this graph theoretical analysis has, however, been applied to undirected networks. Such analysis can, however, be applied to directed networks [2]. This is perhaps, surprising given that directed networks exhibit more prominent features by providing directional interactions between pairwise elements thereby enabling more detailed analysis. Al-though Granger causality is often used to identify causal relationship in electroence-phalogram (EEG) data, it is limited to the linear model of interaction [4]. As a result, it fails to accurately identify causal relationships in highly nonlinear systems such as the human brain. By comparison, the information theoretical measure of transfer en-tropy (TE) determines the direction and quantifies the information transfer between two processes [5]. TE estimates the amount of activity of a system which is not

2 M.H.I. Shovon et al.
dependent on its own past activity but on the past activity of another system. It does not require a model of the interaction and inherently non-linear [4]. As a consequence, TE has been used in various applications such as identifying information transfer between auditory cortical neurons using spike train data, investigating the influence of heart rate on breath rate and vice versa, and for the localization of the epileptic focus of epileptic patients on EEG data [5-8]. TE has however not been applied in the con-struction and analysis of directed functional brain networks (FBN) during different cognitive states. The current study reported in this paper aims to investigate the appli-cation of normalized TE to construct a directed FBN. It further explores graph theo-retic and statistical analysis to characterize this directed FBN and its patterns of in-formation flow during cognitive tasks. Complex network metrics have also been used to delineate the cognitive tasks and the comparative results are presented. The re-search literature on TE and graph theoretical analysis are reviewed and described in the following sections.
2 Transfer Entropy
Given two processes and , the TE from to is shown in Equation 1 [9]: , , log , , ., . , , , 1
Here, denotes the status (value) of signal/system at time , denotes the status of signal at time and denotes the status of signal at time 1. The value of is calculated by summing over all possible combination of , , and . TE is in the range 0 ∞. Here, . There is another similar equation for . In practice, for the calculation of TE, two additional steps were included to improve the calculation accuracy [7, 10]. Due to the finite size and non-stationarity of data, TE matrices usually contain much noise. In the existing literature, noise/bias has been removed from the estimate of TE by subtracting the average trans-fer entropy from to using shuffled version of denoted by ,
over several shuffles [10]. contains the same symbol as in but those sym-bols are rearranged in a randomly shuffled order. Then, normalized transfer entropy is calculated from to with respect to the total information in sequence itself. This will represent the relative amount of information transferred by . The normalized transfer entropy (NTE) is shown in Equation 2 as follows [7]: | 2
In equation 2, | represents the conditional entropy of process at time 1 given its value at time as shown in equation 3. | , log ,, 3

Transfer Entropy and Information Flow Patterns in Functional Brain Networks 3
NTE is in the range 0 1 . NTE is 0 when transfers no information to , and is 1 when transfers maximal information to .
3 Functional Brain Networks and Graph Theoretical Analysis
To capture the dynamic interactions between the neuronal elements of human brain, FBNs can be derived from time series observations of EEG signals [2]. As EEG is cheap non-invasive method with high temporal resolution, it has been used extensively in research, medical diagnosis and brain computer interaction [3, 11]. In the present study, the FBNs are constructed by computing the NTE between EEG channels. Ac-cording to the graph theory, graph is a mathematical model that consists of vertices (nodes) where the connection between each pairs of vertices is called an edge (link) [1, 2]. In the case of FBNs, scalp electrodes are considered as vertices and the connec-tions/links between electrodes are measured using correlation. The following graph (or complex network) metrics are also used in this study: connectivity density representing the actual number of edges as a proportion to the total number of possible edges [1]; reciprocity representing the ratio of the number of pairs with a reciprocated edges rela-tive to the total number of edges [12]; clustering coefficient quantifying the fraction of triangles around a node [13]; average of shortest path length between all node pairs known as the characteristic path length [14]; small world representing both high cluster-ing and short characteristics path length [14]; node eccentricity representing the maxim-al shortest path length between any two nodes [12]; and node strength representing the total of all incoming and outgoing link weights [15].
4 Methods
4.1 Participants and EEG Data Acquisition
Six healthy, right handed adults (4 males, 2 females) volunteered for EEG data collec-tion (age range 19-59) at the Cognitive Neuroengineering Laboratory of University of South Australia. The participants were recruited from staff and students cohort of University of South Australia. All reported normal hearing, normal or corrected-to-normal vision, with none reporting any psychological, neurological or psychiatric disorder. EEG data were acquired at a sampling rate of 1000 Hz through a 40 channel Neuroscan Nuamps amplifier using Curry 7 software. The 30 electrode sites used in the current study were based on the international 10-20 convention: FP1, FP2, F7, F3, Fz, F4, F8, FT7, FC3, FCz, FC4, FT8, T3, C3, Cz, C4, T4, TP7, CP3, CPz, CP4, TP8, T5, P3, Pz, P4, T6, O1, Oz and O2. Continuous EEG data were collected as each par-ticipant undertook three tasks in a Simuride Driving Simulator. In Task 1 (baseline), data were collected for 2 minutes (each) in both eyes open and eyes closed conditions. In Task 2, participants were asked to drive normally on a virtual winding road for approximately 4 minutes. In Task 3, participants were asked to drive, as per Task 2, while also responding to auditory stimuli. All stimulus onsets and participant res-ponses were time-marked on the EEG record using STIM 2 software.
4 M.H.I. Shovon et al.
4.2 EEG Signal Pre-processing
A band pass filter of 1-70 Hz and a notch filter of 50 Hz were applied to the EEG data. Eye blinks were removed using principal component analysis (PCA), with any residual. Bad blocks were removed manually. For Tasks 1 and 2, two seconds epoched averaged data were extracted by applying back-to-back epoching process of Curry software using epoch length of 2 seconds, and then averaging those epochs. For tasks 3, two seconds epochs were extracted by identifying all two seconds epochs from stimulus onsets, where reaction times were between 1.5 and 3 seconds, and then averaging those epochs.
4.3 Proposed Methodology for the Analysis of Directed Functional Brain Network
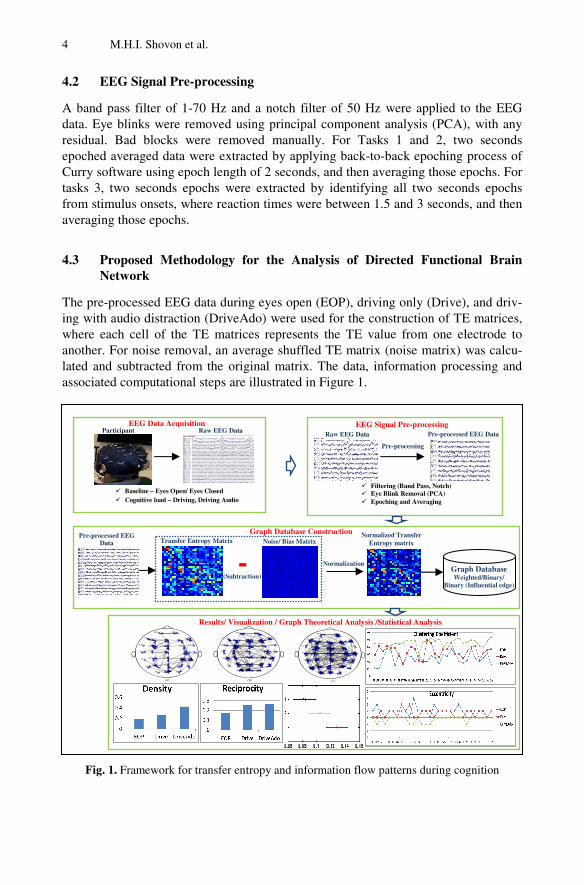
The pre-processed EEG data during eyes open (EOP), driving only (Drive), and driv-ing with audio distraction (DriveAdo) were used for the construction of TE matrices, where each cell of the TE matrices represents the TE value from one electrode to another. For noise removal, an average shuffled TE matrix (noise matrix) was calcu-lated and subtracted from the original matrix. The data, information processing and associated computational steps are illustrated in Figure 1.
Fig. 1. Framework for transfer entropy and information flow patterns during cognition
Raw EEG Data
Baseline – Eyes Open/ Eyes Closed Cognitive load – Driving, Driving Audio
EEG Data Acquisition Participant
Pre-processing
Filtering (Band Pass, Notch) Eye Blink Removal (PCA) Epoching and Averaging
EEG Signal Pre-processing Raw EEG Data
Pre-processed EEG Data
-
Transfer Entropy Matrix Noise/ Bias Matrix Normalized Transfer
Entropy matrix
Pre-processed EEG Data
Normalization
Graph Database Construction
(Subtraction)
Results/ Visualization / Graph Theoretical Analysis /Statistical Analysis FP1 FP2
F7F3 Fz F4
F8
FT7FC3 FCz FC4
FT8
T3 C3 Cz C4 T4
TP7CP3 CPz CP4
TP8
T5P3 Pz P4
T6
O1 Oz O2
FP1 FP2
F7F3 Fz F4
F8
FT7FC3 FCz FC4
FT8
T3 C3 Cz C4 T4
TP7CP3 CPz CP4
TP8
T5P3 Pz P4
T6
O1 Oz O2
FP1 FP2
F7F3 Fz F4
F8
FT7FC3 FCz FC4
FT8
T3 C3 Cz C4 T4
TP7CP3 CPz CP4
TP8
T5P3 Pz P4
T6
O1 Oz O2
(a) (b) (c)
Graph Database Weighted/Binary/
Binary (Influential edge)

Transfer Entropy and Information Flow Patterns in Functional Brain Networks 5
The Normalized TE (NTE) matrices were used for the construction of both binary and weighed directed FBNs. The objectives of the proposed methodology are twofold:
1. To quantify the topological features of binary and weighted directed FBNs during different cognitive states; and
2. To determine information flow patterns during different cognitive states.
To investigate the topological features and information flow patterns from con-structed FBNs, the following complex network metrics were used. Connectivity den-sity is calculated by counting the actual number of edges in a graph and then diving by all possible number of edges in that graph. For a directed graph with nodes where there is no self-connections/loop, the total number of possible connections are 1 . Reciprocity of a graph is calculated by finding the ratio of the total num-ber of bidirectional edges relative to the total number of any directional edges be-tween the node pairs. Clustering coefficient has been calculated using the technique of directed variant of clustering coefficient developed by Fagiolo [13]. In a directed graph, 3 nodes can generate up to 8 triangles. The clustering coefficient for node represents the ratio between all directed triangles actually formed by and the number of all possible triangles that could form. The experimental results and analysis are presented in the following section.
5 Results and Discussion
The NTE matrices (each are 30 by 30 in size) during EOP, Drive and DriveAdo states are presented in Figure 2. The increased information flow during cognitive load con-dition is demonstrated by the appearance of more cluttered brighter pixels (see Figure 2b and 2c). From this experiment, it can be inferred that, during cognitive load, in-formation flow generally increases between the electrodes than in baseline condition (EOP).
Fig. 2. Normalized transfer entropy matrix during a) EOP, b) Drive and c) DriveAdo
5.1 Analysis of Binary Directed Functional Brain Network
The binary directed FBNs constructed using NTE matrices with threshold=0.002 was utilized in this study and as shown in Figure 3 demonstrating increased connectivity between the electrodes during the cognitive load. Due to space limitations the result of graph metrics analysis is shown only for one participant. As indicated in Figure 4a connectivity density is higher in the cognitive load than the baseline condition, infer-ring more connections are established to facilitate more active information flow.
0.0 (b) (c)
0.1
(a)

6 M.H.I. Shovon et al.
Figure 4b shows that reciprocity is higher in the cognitive load condition, which further suggests that most electrode pairs are trying to establish mutual connections to facilitate effective information transmission within the network.
Fig. 3. Binary directed functional brain network during a) EOP, b) Drive and c) DriveAdo
Fig. 4. Comparison of a) Connectivity density, and b) Reciprocity of the brain network during EOP, Drive and DriveAdo
Clustering coefficient value increases in almost all of the electrodes during cogni-tive load (Figure 5). This indicates that each node’s nearest neighbors directly communicate and form clusters. This type of segregated neural processing of brain network during cognitive load would increases the local efficiency of the information transfer. The electrodes F3, F8, FT7, FT8 and TP8 are not showing that trend which need to explore in further research.
Fig. 5. Clustering coefficient across electrodes during EOP, Drive and DriveAdo
(a) (b)
00.20.40.6
EOP Drive DriveAdo
Density
0
0.2
0.4
EOP Drive DriveAdo
Reciprocity
Electrodes
Clu
ster
ing
Coe
ffici
ent
FP1 FP2
F7F3 Fz F4
F8
FT7FC3 FCz FC4
FT8
T3 C3 Cz C4 T4
TP7CP3 CPz CP4
TP8
T5P3 Pz P4
T6
O1 Oz O2
FP1 FP2
F7F3 Fz F4
F8
FT7FC3 FCz FC4
FT8
T3 C3 Cz C4 T4
TP7CP3 CPz CP4
TP8
T5P3 Pz P4
T6
O1 Oz O2
FP1 FP2
F7F3 Fz F4
F8
FT7FC3 FCz FC4
FT8
T3 C3 Cz C4 T4
TP7CP3 CPz CP4
TP8
T5P3 Pz P4
T6
O1 Oz O2
(a) (b) (c)

Transfer Entropy and Information Flow Patterns in Functional Brain Networks 7
Between the regular lattice and completely random networks there is a class of networks which has the properties of high clustering and short path length. That means, most of the nodes are not neighbors but most of the nodes can traverse each other’s by small number of edges. This class of network is called as “small world network” [14]. Small world network can be also characterized as a set of network with both high local and global efficiency [16]. Efficiency estimates how well the information propagates over the network. The small world properties of the directed FBNs during different cognitive tasks are illustrated in Table 1.
Table 1. Small-worldness of directed FBNs during EOP, Drive and DriveAdo
Cognitive Tasks
/
/ /
EOP 0.4735 0.4708 1.5345 1.5264 1.0056 1.0053 1.0003 Drive 0.5736 0.4882 1.4356 1.5126 1.1749 0.9491 1.2680
DriveAdo 0.7930 0.4905 1.2425 1.5011 1.6167 0.8277 1.9532
Here, and are the clustering coefficient of a tested and random network re-spectively; and are the characteristic path length of a tested and random net-work respectively. The results reveal that characteristics path length decreases during cognitive load which would suggest a high global efficiency of information transfer in the FBN. The directed FBNs during EOP, Drive and DriveAdo all exhibit small-worldness ( 1 , however, the FBN constructed during cognitive load exhibits more small world properties than that of the baseline condition suggesting that the FBN facilitates both high local and global efficiency of information transfer.
5.2 Analysis of Binary Directed Functional Brain Network (Influential Edges Only)
Binary FBNs were constructed by keeping only the influential edges between each electrode pair during different cognitive states; namely, two electrodes and , may have two possible edges: and . In the current study, the maximum weight value’s edge or was chosen.
Fig. 6. Comparison of node eccentricity across electrodes during EOP, Drive and DriveAdo
Electrodes
Ecce
ntric
ity

8 M.H.I. Shovon et al.
Eccentricity was then calculated for different cognitive states (See Figure 6). The maximum number of edges traversed to reach one node from another during EOP, Drive and DriveAdo are 6, 5 and 4 edges, respectively. It may be concluded that, during cognitive load, information may travel pretty quickly in FBN than in baseline condition.
5.3 Analysis of Weighted Directed Functional Brain Network
NTE matrices without applying any threshold were also used to construct weighted FBN. Figure 7 represents the comparison of the node strengths during different cogni-tive states computed using the weighted network. As shown, almost all the electrodes have higher strength values during cognitive load, which indicates that each electrode sends and receives more information during cognitive load.
Fig. 7. Comparison of strength across electrodes during EOP, Drive and DriveAdo
5.4 Statistical Analysis
The following experiments were conducted to demonstrate the statistical significance of information flow during various cognitive states. For the three cognitive states, the total information flow of each electrode to all other electrodes was calculated. One-way analysis of variance (ANOVA) was applied to compare the mean information flow of each group and the multi-comparison results are shown in Figure 8.
Fig. 8. Multi-comparison of mean total information flow of each electrode to all other elec-trodes during different cognitive states for 3 participants (a) DP1, (b) DP2 and (c) DP3 (Y-Axis: Cognitive States 1 for EOP, 2 for Drive, and 3 for DriveAdo)
Electrodes
Stre
ngth
Mean of Total Information Flow
(b)
Mean of Total Information Flow
(c)
0.02 0.04 0.06 0.08 0.1 0.12
3
2
1
Cog
nitiv
e St
ates
0.06 0.08 0.1 0.12 0.14 0.16
3
2
1
0.02 0.03 0.04 0.05 0.06 0.07 0.08
3
2
1
12 00
3
2
1
Cog
nitiv
e St
ates
00.16.16 000
3
2
1
Cog
nitiv
e St
ates
0.02 0.04 0.06 0.08 0.1 0.1.11212 00Mean of Total Information Flow (a)

Transfer Entropy and Information Flow Patterns in Functional Brain Networks 9
The statistical significance of the differences between means is calculated using t-test at 0.05 (two-tailed) and the results are shown in Table 2. The results dem-onstrate that mean of total information flow is significantly different in EOP and Dri-veAdo experiments for all participants.
Table 2. Statistical validation of mean information flow difference in different cognitive states
States DP 1 DP 2 DP 3 Mean Diff 95% CI Mean Diff 95% CI Mean Diff 95% CI
Drive EOP 0.0244 [0.0244,0.0651] 0.0218 [-0.0033,0.0469] 0.0155* [ 0.0053, 0.0258] DriveAdo Drive -0.0108 [-0.0329,0.0113] 0.0239 [-0.0071,0.0550] 0.0235* [ 0.0110, 0.0360] DriveAdo EOP 0.0339* [0.0191,0.0487] 0.0457* [0.0200,0.0715] 0.039* [0.0285, 0.0495]
*Mean difference is significant at p< .05 level.
6 Conclusion
In this study the information theoretical NTE measure has been applied to construct EEG based directed FBNs in baseline and cognitive load conditions. Using the tech-niques of signal processing, information and graph theoretic measures, and inferential statistics, information flow patterns during cognition have been detected and identi-fied. The overall results demonstrate that the directed FBNs constructed using NTE are sensitive to cognitive load. This sensitivity of NTE based FBN has the potential to assist the development of quantitative metrics to measure cognition. The NTE ap-proach may have likely application in the clinical diagnosis of cognitive impairments in future. Future research should address the application of various graph mining al-gorithms on the constructed directed functional brain networks to detect and track possible patterns as well as quantum of information flow during cognitive activity. This may lead to deeper understanding of cognitive function. Acknowledgement. The authors wish to acknowledge partial support provided by the Defence Science and Technology Organisation (DSTO), Australia. The assistance and technical support provided by fellow researchers Mr Nabaraj Dahal and Mr Naga Dasari are greatly appreciated.
References
1. Rubinov, M., Sporns, O.: Complex network measures of brain connectivity: Uses and in-terpretations. Neuroimage 52, 1059–1069 (2010)
2. Bullmore, E., Sporns, O.: Complex brain networks: Graph theoretical analysis of structural and functional systems. Nature Reviews Neuroscience 10, 186–198 (2009)
3. Nandagopal, N.D., Vijayalakshmi, R., Cocks, B., Dahal, N., Dasari, N., Thilaga, M., Dharwez, S.: Computational Techniques for Characterizing Cognition Using EEG Data – New Approaches. Procedia Computer Science 22, 699–708 (2013)
4. Vicente, R., Wibral, M., Lindner, M., Pipa, G.: Transfer entropy—a model-free measure of effective connectivity for the neurosciences. Journal of Computational Neuroscience 30, 45–67 (2011)
5. Schreiber, T.: Measuring information transfer. Physical Review Letters 85, 461 (2000)

10 M.H.I. Shovon et al.
6. Chávez, M., Martinerie, J., Le Van Quyen, M.: Statistical assessment of nonlinear causali-ty: Application to epileptic EEG signals. Journal of Neuroscience Methods 124, 113–128 (2003)
7. Gourévitch, B., Eggermont, J.J.: Evaluating information transfer between auditory cortical neurons. Journal of Neurophysiology 97, 2533–2543 (2007)
8. Sabesan, S., Narayanan, K., Prasad, A., Iasemidis, L., Spanias, A., Tsakalis, K.: Informa-tion flow in coupled nonlinear systems: Application to the epileptic human brain. In: Data Mining in Biomedicine, pp. 483–503. Springer (2007)
9. Kaiser, A., Schreiber, T.: Information transfer in continuous processes. Physica D: Nonli-near Phenomena 166, 43–62 (2002)
10. Neymotin, S.A., Jacobs, K.M., Fenton, A.A., Lytton, W.W.: Synaptic information transfer in computer models of neocortical columns. Journal of Computational Neuroscience 30, 69–84 (2011)
11. Kim, S.P.: A review on the computational methods for emotional state estimation from the human EEG. Computational and Mathematical Methods in Medicine 2013 (2013)
12. Hanneman, R.A., Riddle, M.: Introduction to social network methods. University of Cali-fornia Riverside (2005), published in digital form at http://faculty.ucr.edu/ ~hanneman/
13. Fagiolo, G.: Clustering in complex directed networks. Physical Review E 76, 026107 (2007)
14. Watts, D.J., Strogatz, S.H.: Collective dynamics of ‘small-world’ networks. Nature 393, 440–442 (1998)
15. Brain Connectivity Toolbox, https://sites.google.com/site/bctnet/ measures/list
16. Latora, V., Marchiori, M.: Economic small-world behavior in weighted networks. The Eu-ropean Physical Journal B-Condensed Matter and Complex Systems 32, 249–263 (2003)