Transcriptome Sequencing and Annotation for the Jamaican Fruit Bat (Artibeus jamaicensis
12
Transcriptome Sequencing and Annotation for the Jamaican Fruit Bat (Artibeus jamaicensis) Timothy I. Shaw 1 , Anuj Srivastava 2 , Wen-Chi Chou 1 , Liang Liu 3 , Ann Hawkinson 4 , Travis C. Glenn 5 , Rick Adams 4 , Tony Schountz 4 * 1 Institute of Bioinformatics, University of Georgia, Athens, Georgia, United States of America, 2 The Jackson Laboratory, Bar Harbor, Maine, United States of America, 3 Department of Statistics, University of Georgia, Athens, Georgia, United States of America, 4 School of Biological Sciences, University of Northern Colorado, Greeley, Colorado, United States of America, 5 Department of Environmental Health Science, University of Georgia, Athens, Georgia, United States of America Abstract The Jamaican fruit bat (Artibeus jamaicensis) is one of the most common bats in the tropical Americas. It is thought to be a potential reservoir host of Tacaribe virus, an arenavirus closely related to the South American hemorrhagic fever viruses. We performed transcriptome sequencing and annotation from lung, kidney and spleen tissues using 454 and Illumina platforms to develop this species as an animal model. More than 100,000 contigs were assembled, with 25,000 genes that were functionally annotated. Of the remaining unannotated contigs, 80% were found within bat genomes or transcriptomes. Annotated genes are involved in a broad range of activities ranging from cellular metabolism to genome regulation through ncRNAs. Reciprocal BLAST best hits yielded 8,785 sequences that are orthologous to mouse, rat, cattle, horse and human. Species tree analysis of sequences from 2,378 loci was used to achieve 95% bootstrap support for the placement of bat as sister to the clade containing horse, dog, and cattle. Through substitution rate estimation between bat and human, 32 genes were identified with evidence for positive selection. We also identified 466 immune-related genes, which may be useful for studying Tacaribe virus infection of this species. The Jamaican fruit bat transcriptome dataset is a resource that should provide additional candidate markers for studying bat evolution and ecology, and tools for analysis of the host response and pathology of disease. Citation: Shaw TI, Srivastava A, Chou W-C, Liu L, Hawkinson A, et al. (2012) Transcriptome Sequencing and Annotation for the Jamaican Fruit Bat (Artibeus jamaicensis). PLoS ONE 7(11): e48472. doi:10.1371/journal.pone.0048472 Editor: Michelle L. Baker, CSIRO, Australia Received July 16, 2012; Accepted September 26, 2012; Published November 15, 2012 Copyright: ß 2012 Shaw et al. This is an open-access article distributed under the terms of the Creative Commons Attribution License, which permits unrestricted use, distribution, and reproduction in any medium, provided the original author and source are credited. Funding: This work was supported by National Institutes of Health grant AI089419 (TS), NIH Emerging Virus Diseases Unit contract AI25489 (TS, AH), and the University of Northern Colorado Provost Fund (AH, RA, and TS). The funders had no role in study design, data collection and analysis, decision to publish, or preparation of the manuscript. Competing Interests: The authors have declared that no competing interests exist. * E-mail: [email protected] Introduction Bats are an ancient and diverse group [1] and are the second largest taxonomic group of mammals with more than 1,200 identified species among the 5,499 known mammals [2,3]. Bats are the only mammals to have evolved powered flight, which has allowed dispersal across all continents other than Antarctica. Bats are critical components of ecosystems, serving as major predators of insects, pollinating flowers and dispersing seeds of keystone plant species worldwide. The body sizes of bats range from less than 2 gm with 8 cm wingspans to more than 1 kg with 2 m wingspans. Most contemporary species of bats are insect-, nectar-, or fruit-eaters, but about 1% are carnivores, including fish-eating and blood-drinking species. The evolutionary origin of bats remains controversial [4,5]. In early work, bats were thought to be closely related to rodents and primates [6]. Bats are now established within Laurasiatheria; however, the placement of bats within Laurasiatheria has been difficult to resolve because the major groups diverged from one another within a relatively short period of time [7]. Different placements recently hypothesized for bats include: (A) sister to Perissodactyla (horse) [8]; (B) sister to Cetartiodacyla (cattle+dol- phin) [5], (C) sister to Perissodactyla+Cetartiodacyla (horse, cattle, dolphin) [9], (D) sister to Ferungulata (cattle+dolphin, dog+horse) [4,10] and (E) the Pegasoferae hypothesis which places bat with Perissodactyla and Carnivora (horse+dog) [11] (see [5] for a review). Two bat genomes have been sequenced to date [12], the little brown bat (Myotis lucifugus,7 6 coverage) and the large flying fox (Pteropus vampyrus, 2.6 6 coverage), but neither has been extensively annotated. These species represent the two major clades within bats: the microbats and megabats. Transcriptome sequencing for another megabat species, the Australian flying fox (Pteropus alecto), has recently been published [13]. Thus, a transcriptome for a microbat species is needed. Many highly pathogenic viruses are hosted, or suspected to be hosted, by bat reservoirs, including ebolaviruses, Marburg virus, Hendra virus, Nipah virus, rabies virus and coronaviruses [2]. In total, more than 100 viruses have been isolated from, or detected in, bats of dozens of species, yet many of the viruses that cause disease in humans cause little or no disease in the bats. Significantly, the great majority of bat species have not been examined for infectious agents and are, thus, likely underappre- ciated as reservoir hosts. The continued encroachment of humans upon bat habitat and bat migrations caused by climate change may lead to novel infectious diseases among humans and livestock. Moreover, some infectious diseases cause significant morbidity and PLOS ONE | www.plosone.org 1 November 2012 | Volume 7 | Issue 11 | e48472
Transcript of Transcriptome Sequencing and Annotation for the Jamaican Fruit Bat (Artibeus jamaicensis

Transcriptome Sequencing and Annotation for theJamaican Fruit Bat (Artibeus jamaicensis)Timothy I. Shaw1, Anuj Srivastava2, Wen-Chi Chou1, Liang Liu3, Ann Hawkinson4, Travis C. Glenn5,
Rick Adams4, Tony Schountz4*
1 Institute of Bioinformatics, University of Georgia, Athens, Georgia, United States of America, 2 The Jackson Laboratory, Bar Harbor, Maine, United States of America,
3 Department of Statistics, University of Georgia, Athens, Georgia, United States of America, 4 School of Biological Sciences, University of Northern Colorado, Greeley,
Colorado, United States of America, 5 Department of Environmental Health Science, University of Georgia, Athens, Georgia, United States of America
Abstract
The Jamaican fruit bat (Artibeus jamaicensis) is one of the most common bats in the tropical Americas. It is thought to be apotential reservoir host of Tacaribe virus, an arenavirus closely related to the South American hemorrhagic fever viruses. Weperformed transcriptome sequencing and annotation from lung, kidney and spleen tissues using 454 and Illumina platformsto develop this species as an animal model. More than 100,000 contigs were assembled, with 25,000 genes that werefunctionally annotated. Of the remaining unannotated contigs, 80% were found within bat genomes or transcriptomes.Annotated genes are involved in a broad range of activities ranging from cellular metabolism to genome regulationthrough ncRNAs. Reciprocal BLAST best hits yielded 8,785 sequences that are orthologous to mouse, rat, cattle, horse andhuman. Species tree analysis of sequences from 2,378 loci was used to achieve 95% bootstrap support for the placement ofbat as sister to the clade containing horse, dog, and cattle. Through substitution rate estimation between bat and human,32 genes were identified with evidence for positive selection. We also identified 466 immune-related genes, which may beuseful for studying Tacaribe virus infection of this species. The Jamaican fruit bat transcriptome dataset is a resource thatshould provide additional candidate markers for studying bat evolution and ecology, and tools for analysis of the hostresponse and pathology of disease.
Citation: Shaw TI, Srivastava A, Chou W-C, Liu L, Hawkinson A, et al. (2012) Transcriptome Sequencing and Annotation for the Jamaican Fruit Bat (Artibeusjamaicensis). PLoS ONE 7(11): e48472. doi:10.1371/journal.pone.0048472
Editor: Michelle L. Baker, CSIRO, Australia
Received July 16, 2012; Accepted September 26, 2012; Published November 15, 2012
Copyright: � 2012 Shaw et al. This is an open-access article distributed under the terms of the Creative Commons Attribution License, which permitsunrestricted use, distribution, and reproduction in any medium, provided the original author and source are credited.
Funding: This work was supported by National Institutes of Health grant AI089419 (TS), NIH Emerging Virus Diseases Unit contract AI25489 (TS, AH), and theUniversity of Northern Colorado Provost Fund (AH, RA, and TS). The funders had no role in study design, data collection and analysis, decision to publish, orpreparation of the manuscript.
Competing Interests: The authors have declared that no competing interests exist.
* E-mail: [email protected]
Introduction
Bats are an ancient and diverse group [1] and are the second
largest taxonomic group of mammals with more than 1,200
identified species among the 5,499 known mammals [2,3]. Bats are
the only mammals to have evolved powered flight, which has
allowed dispersal across all continents other than Antarctica. Bats
are critical components of ecosystems, serving as major predators
of insects, pollinating flowers and dispersing seeds of keystone
plant species worldwide. The body sizes of bats range from less
than 2 gm with 8 cm wingspans to more than 1 kg with 2 m
wingspans. Most contemporary species of bats are insect-, nectar-,
or fruit-eaters, but about 1% are carnivores, including fish-eating
and blood-drinking species.
The evolutionary origin of bats remains controversial [4,5]. In
early work, bats were thought to be closely related to rodents and
primates [6]. Bats are now established within Laurasiatheria;
however, the placement of bats within Laurasiatheria has been
difficult to resolve because the major groups diverged from one
another within a relatively short period of time [7]. Different
placements recently hypothesized for bats include: (A) sister to
Perissodactyla (horse) [8]; (B) sister to Cetartiodacyla (cattle+dol-
phin) [5], (C) sister to Perissodactyla+Cetartiodacyla (horse, cattle,
dolphin) [9], (D) sister to Ferungulata (cattle+dolphin, dog+horse)
[4,10] and (E) the Pegasoferae hypothesis which places bat with
Perissodactyla and Carnivora (horse+dog) [11] (see [5] for a
review).
Two bat genomes have been sequenced to date [12], the little
brown bat (Myotis lucifugus, 76 coverage) and the large flying fox
(Pteropus vampyrus, 2.66coverage), but neither has been extensively
annotated. These species represent the two major clades within
bats: the microbats and megabats. Transcriptome sequencing for
another megabat species, the Australian flying fox (Pteropus alecto),
has recently been published [13]. Thus, a transcriptome for a
microbat species is needed.
Many highly pathogenic viruses are hosted, or suspected to be
hosted, by bat reservoirs, including ebolaviruses, Marburg virus,
Hendra virus, Nipah virus, rabies virus and coronaviruses [2]. In
total, more than 100 viruses have been isolated from, or detected
in, bats of dozens of species, yet many of the viruses that cause
disease in humans cause little or no disease in the bats.
Significantly, the great majority of bat species have not been
examined for infectious agents and are, thus, likely underappre-
ciated as reservoir hosts. The continued encroachment of humans
upon bat habitat and bat migrations caused by climate change
may lead to novel infectious diseases among humans and livestock.
Moreover, some infectious diseases cause significant morbidity and
PLOS ONE | www.plosone.org 1 November 2012 | Volume 7 | Issue 11 | e48472

mortality in bats that could have dramatic impacts on population
numbers and cascading ecological effects [14]. Thus, the study of
bats and their infectious agents is an important but neglected
aspect of zoonotic and wildlife disease research.
Jamaican fruit bats (Artibeus jamaicensis) are one of the most
common bats in the tropical Americas, ranging from the
Caribbean Islands, tropical South and Central America, Mexico
and the Florida Keys [15]. The Jamaican fruit bat is a microbat in
the family Phyllostomidae, which contains 56 genera and 192
species. They are a frugivorous generalist and fig specialist of
medium size; about 80 mm in length with a wingspan of 130 mm
and mass of about 50 grams. They can readily fly 20 km per night,
although they typically maintain a smaller home range as long as
food is available, and can live 9 years or more in the wild. Females
typically produce two offspring per year and provide maternal care
for about 50 days, with pups reaching adult body weight by about
80 days. Several microbes of interest have been isolated from or
detected in Jamaican fruit bats, including Histoplasma capsulatum,
Trypanosoma cruzi, eastern equine encephalitis virus, Mucambo
virus, Jurona virus, Catu virus, Itaporanga virus and Tacaiuma
virus, suggesting the species may be an important reservoir and
vector of infectious diseases [15–18]. It is unknown what diseases
these pathogens may cause in bats.
Tacaribe virus (TCRV) was isolated from 11 artibeus bats (6 A.
lituratus, 5 A. jamaicensis) in the late 1950s in and near Port of Spain,
Trinidad [19]. TCRV was the first arenavirus isolated in the
Americas and during the next decades other arenaviruses with
substantial similarity to TCRV were identified that cause the
South American hemorrhagic fevers (SAHF) [20,21]. The known
reservoir hosts for all other arenaviruses are rodents, making
TCRV exceptional for its repeated isolation from artibeus bats.
Because exhaustive searches for evidence of other potential
reservoir hosts of TCRV failed to suggest another reservoir
species [19,22], it has been suspected that artibeus bats are
reservoirs of the virus. However, recent work by us demonstrated
that TRLV-11573, the only remaining isolate of TCRV, causes a
fatal infection resembling the SAHF in Jamaican fruit bats, one of
the species from which TCRV was isolated, or is cleared without
disease, suggesting this species is not a suitable reservoir host for
TCRV and the virus may be a significant pathogen for bats [23].
Because of the equivocal role of artibeus bats as a reservoir host
species for TCRV, and because of the similarities with human
SAHF, the Jamaican fruit bat may be a novel model for studying
the pathology of the disease. However, as an unusual, non-model
organism, very little is known about its physiology, immunology or
host response to TCRV. No antibodies are available with known
specificity to Jamaican fruit bat proteins, which dramatically limits
its usefulness. To address some of these deficiencies, we have
performed transcriptome sequencing and analysis of spleen, lung,
kidney and poly-IC-stimulated primary kidney cells to identify
genes of interest for assessing the host response to TCRV infection.
Results
Sequence Assembly and SNP detectionMore than 240,000 454 reads and 142 million Illumina reads
were obtained (Table 1). The reads were submitted to Short Read
Archive (SRA) under SRR539297 and SRR538731. Reads from
lung, kidney, and poly-IC-stimulated primary kidney cell libraries
were pooled for a combined de novo assembly using the 454 gs
Assembler program, yielding 6,450 contigs. For the Illumina
spleen sequences, we first corrected reads using the SOAPdenovo
correction tool and further assembled them using SOAPdenovo,
yielding 214,707 contigs. A total of 367,317 SNPs and 44,679
indels were detected through GigaBayes. At least 16 reads
covering a site were required to ensure the SNP was of high
quality. Using TGICL, a combined assembly of the 454 and
Illumina contigs was constructed that contained 102,237 contigs
with N10, N50, and N90 of 3,882 bp, 1,004 bp, and 289 bp,
respectively.
Localization of ContigsHuman and mouse genomes were used as references to estimate
the distribution of bat contigs within known gene transcripts.
Human and mouse genomes were chosen for completeness of their
annotations. Genomic features were divided into 5 groups: 1 Kb
upstream of 59 UTR, 59 UTR, CDS (coding sequence), 39 UTR,
1 Kb downstream of 39 UTR. We found 58.03% and 23.18%
mapped CDS region for human and mouse genome respectively
(Figure 1A). Because we performed transcriptome sequencing, we
expected a majority of the sequences to map to CDS and UTR
regions of the genome. Many RNA genes were also mapped,
including long noncoding RNAs and a substantial number of
microRNAs (Figure 1B). Annotation was concentrated on
identifying microRNAs because they could be cross validated
through their RNA secondary structure features. To further obtain
a confident set of microRNA sequences, a microRNA prediction
pipeline was used to cross validate the BLAST mapping of
prediction. In the process, 42 confident microRNA candidates
were found that have been deposited within MirBase [24,25]. We
present the list of predicted microRNAs as Table S1. Mapping the
predicted SNPs on the genomic features indicates that the vast
majority of SNPs are in the CDS region (Figure 1C–1D). Although
humans and mice are both outside Laurasiatheria the relatively
fast rate of molecular evolution of mice is expected to result in
more differences between bats and mice than bats and humans
[26–29]. The presence of sequences mapped 1 Kb upstream or
downstream of the known transcript indicated possible alternative
splicing from human and mouse transcripts.
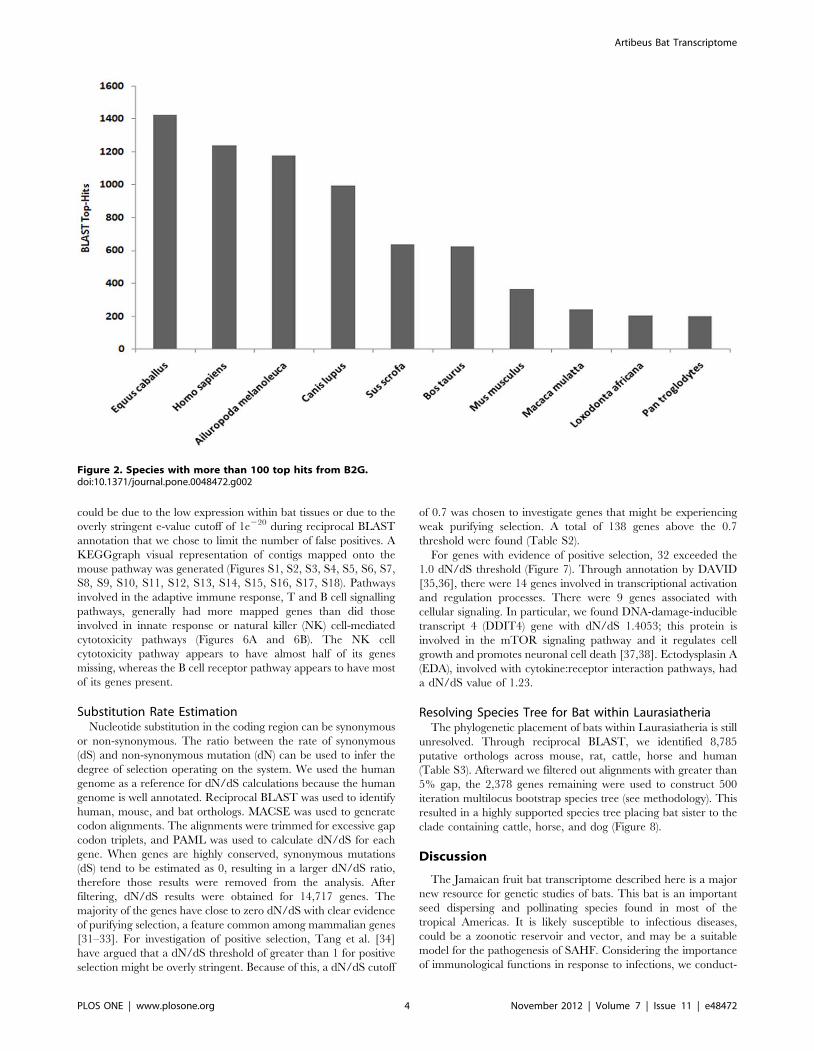
GO Localization of all ContigsBLAST2GO was used to functionally annotate contigs. A total
of 20,020 contigs (19.58% overall) had significant matches to
known proteins in the NCBI non-redundant protein (nr) database.
Horse and human were identified as the top two species with best
BLAST hits for bat contigs (Figure 2). The BLASTX annotation
process is biased by the completeness of the annotation for each
respective genome; therefore, despite the lack of a completely
annotated horse genome, a high similarity between bat and horse
genomes was apparent. The human genome is well annotated,
which explains the high number of BLAST hits between bat and
human. The GO annotation divides the functional annotation into
three main components: biological process, cellular process, and
molecular [30]. A majority of the annotated genes encoding
proteins that function within a cell or organelle are involved in
metabolic and cellular processes. The primary molecular functions
of these genes are catalytic and binding activities (Figures 3A–C).
A total of 466 immune-related genes were annotated by
BLAST2GO. These immune genes include toll-like receptors,
cytokines, transcription factors, kinases and several chemokine
receptors. In addition, CateGOrizer was used to categorize the
immune class using the GOslim database, resulting in 30
categories representing a broad range of immune activities
(Figure 4). The immune response and lymphocyte activation
genes represented the largest proportion of theses transcripts.
Artibeus Bat Transcriptome
PLOS ONE | www.plosone.org 2 November 2012 | Volume 7 | Issue 11 | e48472

Unannotated ContigsThere were 82,218 unannotated contigs. A total of 16,869
sequences had open reading frames longer than 300 nt; 5,417
were identified through BLASTP to the nr database with E-
value,1e23. For the remaining contigs, 54,892 mapped to the
assembled Myotis lucifugus genome, and 48,809 mapped to the
assembled Pteropus vampyrus genome. There were 20,145 contigs
that mapped to Pteropus alecto, Australian flying fruit bat, and
18,359 that overlapped between genomic and transcriptome
sequences for all three datasets (Figure 5). Through this process,
we were able to account for 65,828 (80%) unannotated contigs.
Mapping Bat Contigs in Immunological PathwaysThe completeness of genes mapped to immunological pathways
was examined using human and mouse as reference species. Based
on the ortholog data obtained, all contigs were mapped onto
immune system related KEGG pathways (Table 2) and deter-
mined that many genes were missing from these pathways. This
Table 1. Assembly statistics.
454 Lung and KidneyIllumina SpleenPaired End Combined Assembly
Raw reads # 241327 142351486 –
Corrected Reads – 119262966 –
Contigs/Scaffold 6450 108065 102237
Total number of BP in Contigs/Scaffold
6668393 82606450 71067811
N50 2899 641 1004
doi:10.1371/journal.pone.0048472.t001
Figure 1. Distribution of mapped contigs. Histograms displaying the proportion of contigs mapped to particular features of protein codinggenes of human and mouse (UTR is the untranslated region, and CDS is the coding sequence). The upper panel (A) displays the raw count and thelower panel (B) normalized values (the proportion discovered relative to how many could be discovered within each category). The raw count of SNPs(C) and Indels (D) mapped to particular features of protein coding genes of human and mouse.doi:10.1371/journal.pone.0048472.g001
Artibeus Bat Transcriptome
PLOS ONE | www.plosone.org 3 November 2012 | Volume 7 | Issue 11 | e48472
could be due to the low expression within bat tissues or due to the
overly stringent e-value cutoff of 1e220 during reciprocal BLAST
annotation that we chose to limit the number of false positives. A
KEGGgraph visual representation of contigs mapped onto the
mouse pathway was generated (Figures S1, S2, S3, S4, S5, S6, S7,
S8, S9, S10, S11, S12, S13, S14, S15, S16, S17, S18). Pathways
involved in the adaptive immune response, T and B cell signalling
pathways, generally had more mapped genes than did those
involved in innate response or natural killer (NK) cell-mediated
cytotoxicity pathways (Figures 6A and 6B). The NK cell
cytotoxicity pathway appears to have almost half of its genes
missing, whereas the B cell receptor pathway appears to have most
of its genes present.
Substitution Rate EstimationNucleotide substitution in the coding region can be synonymous
or non-synonymous. The ratio between the rate of synonymous
(dS) and non-synonymous mutation (dN) can be used to infer the
degree of selection operating on the system. We used the human
genome as a reference for dN/dS calculations because the human
genome is well annotated. Reciprocal BLAST was used to identify
human, mouse, and bat orthologs. MACSE was used to generate
codon alignments. The alignments were trimmed for excessive gap
codon triplets, and PAML was used to calculate dN/dS for each
gene. When genes are highly conserved, synonymous mutations
(dS) tend to be estimated as 0, resulting in a larger dN/dS ratio,
therefore those results were removed from the analysis. After
filtering, dN/dS results were obtained for 14,717 genes. The
majority of the genes have close to zero dN/dS with clear evidence
of purifying selection, a feature common among mammalian genes
[31–33]. For investigation of positive selection, Tang et al. [34]
have argued that a dN/dS threshold of greater than 1 for positive
selection might be overly stringent. Because of this, a dN/dS cutoff
of 0.7 was chosen to investigate genes that might be experiencing
weak purifying selection. A total of 138 genes above the 0.7
threshold were found (Table S2).
For genes with evidence of positive selection, 32 exceeded the
1.0 dN/dS threshold (Figure 7). Through annotation by DAVID
[35,36], there were 14 genes involved in transcriptional activation
and regulation processes. There were 9 genes associated with
cellular signaling. In particular, we found DNA-damage-inducible
transcript 4 (DDIT4) gene with dN/dS 1.4053; this protein is
involved in the mTOR signaling pathway and it regulates cell
growth and promotes neuronal cell death [37,38]. Ectodysplasin A
(EDA), involved with cytokine:receptor interaction pathways, had
a dN/dS value of 1.23.
Resolving Species Tree for Bat within LaurasiatheriaThe phylogenetic placement of bats within Laurasiatheria is still
unresolved. Through reciprocal BLAST, we identified 8,785
putative orthologs across mouse, rat, cattle, horse and human
(Table S3). Afterward we filtered out alignments with greater than
5% gap, the 2,378 genes remaining were used to construct 500
iteration multilocus bootstrap species tree (see methodology). This
resulted in a highly supported species tree placing bat sister to the
clade containing cattle, horse, and dog (Figure 8).
Discussion
The Jamaican fruit bat transcriptome described here is a major
new resource for genetic studies of bats. This bat is an important
seed dispersing and pollinating species found in most of the
tropical Americas. It is likely susceptible to infectious diseases,
could be a zoonotic reservoir and vector, and may be a suitable
model for the pathogenesis of SAHF. Considering the importance
of immunological functions in response to infections, we conduct-
Figure 2. Species with more than 100 top hits from B2G.doi:10.1371/journal.pone.0048472.g002
Artibeus Bat Transcriptome
PLOS ONE | www.plosone.org 4 November 2012 | Volume 7 | Issue 11 | e48472

Artibeus Bat Transcriptome
PLOS ONE | www.plosone.org 5 November 2012 | Volume 7 | Issue 11 | e48472

ed a transcriptome assessment of genes from spleen, kidney and
lungs so that genetic tools and methods can be used to study this
species as well as other microbats.
Genes were identified that mapped to immune response
pathways; based on CateGOrize classification of immune classes,
we found 40 different immune classes. Recently, the transcriptome
sequencing for the Australian black flying fox was performed [13].
Our data contain a greater proportion of lymphocyte related
immune classes than does the flying fox’s transcriptome dataset.
However, our dataset also contained a lesser proportion of
cytokine related immune classes than the flying fox’s transcriptome
dataset. Genes involved in adaptive immune response generally
had more mapped genes compared to genes involved in innate
responses. From Figures 6A and 6B, more genes were mapped to
the B cell receptor signalling pathway than to the NK cell-
mediated cytotoxicity pathway. This bias is likely due to the large
number of B cells found in the spleen. Due to our stringent
BLAST criteria, it is also possible that lowering the e-value
threshold could obtain additional genes mapped but at the risk of
more false positives. We deposited 42 microRNA genes for A.
jamaicensis into MiRBase, and according to MiRBase this gene set
is the first deposited bat microRNA genes.
Estimates of substitutions within the orthologous contigs found
32 genes with a dN/dS ratio.1. This ratio provides a guide for
indicating potential genes that are under positive selection. Many
genes were involved in transcriptional activation/regulation
processes, suggesting potential differences in the transcriptional
regulating architectures of bats and humans. The DDIT4 and
EDA have a dN/dS ratio.1, suggesting these genes are under
positive evolutionary selection. DDIT4 is involved in regulation of
cell death and its positive selection suggests a potential difference
in cell death regulation between human and bats; further analysis
will need to be performed to verify the functional differences.
Another potential positively selected gene, EDA is associated with
ectodermal dysplasia type 1 [39], a disorder associated with
abnormal development of physical structures, including skin, hair,
nails, teeth, and sweat glands. We suspect the bat’s EDA gene
could be used as a potential reference for future studies of the
disorder.
For transcripts that failed to be identified by reciprocal BLAST
searches, we predicted the ORF for the unannotated contigs and
used BLASTP against the nr database to identify 5,349
unannotated contigs. For the remaining unannotated contigs, we
used genomic data from Myotis lucifugus and Pteropus vampyrus, as
well as transcriptome data from Pteropus alecto to identify additional
unannotated contigs. Existing Artibeus contigs that were not present
within the nr database, but overlapped among Myotis and Pteropus
genomic and transcriptomic sequences indicated the possibility for
bat specific transcripts. We also found contigs that mapped only to
the Myotis lucifugus genome indicating the possibility for microbat
specific contigs. In total, we were able to account for 80% of the
unannotated trancripts, and the remaining unannotated tran-
scripts likely include misassembled contigs, contigs not sequenced
sufficiently in the other bats to be included in their genome
assemblies, as well as a few transcripts specific to Artibeus jamaicensis.
Many additional analyses are warranted to further refine the
transcriptome information from Artibeus and other bats.
Figure 3. B2G annotation for Molecular Function, Biological Process, and Cellular Component Level 2.doi:10.1371/journal.pone.0048472.g003
Figure 4. Distribution of immune genes at the GO slim level based on CateGOrizer.doi:10.1371/journal.pone.0048472.g004
Artibeus Bat Transcriptome
PLOS ONE | www.plosone.org 6 November 2012 | Volume 7 | Issue 11 | e48472

Phylogenomics is an important tool for resolving the Tree of
Life, and this transcriptome data set provides an opportunity to
study the evolutionary history of bats. Bats were once thought to
be closely related to primates [6]; however, further work using
molecular information placed them within Laurasiatheria [40].
Our finding of bat as sister to the clade containing horse, dog, and
cattle is consistent with the recent study by McCormack et al. [4]
and Zhou et al [10]. Here, we used 2,378 loci from a microbat and
species tree analyses to obtain 95% bootstrap support, whereas
McCormack et al. use 683 loci to obtain 64%bootstrap support. A
recent study by Nery et al. [5] obtained a concatenated data from
3,733 loci from megabat with 100% bootstrap support and 1.0
posterior probability placing bat as sister to cattle. Our phyloge-
netic tree is less resolved than Nery et al., probably because we did
not include the more limited transcriptome data available from
dolphin and hedgehog. Maximum likelihood analyses are power-
ful, yet can lead to incorrect conclusions in certain situations,
whereas species tree analyses are less powerful but more robust to
well-known violations of the models used for maximum likelihood
phylogenetic analysis, such as incomplete lineage sorting (see [5]
and references therein). Additional work is clearly warranted,
especially by using additional taxa, testing for convergence and
specific violations of gene-tree models, and other sources of
conflict among protein-coding genes and other portions of the
genome.
A principal difficulty for identifying mechanisms of pathogenesis
of the SAHF, in which the immune response may play a
contributory role, is a lack of animal model resources that
faithfully recapitulate human disease [41]. Although laboratory
mice (Mus musculus) and rats (Rattus norvegicus), which have
substantial experimental methodologies and reagents, can be
infected with Junı́n virus (JUNV), the etiologic agent of Argentine
hemorrhagic fever, the pathogenesis is markedly different than
human disease. The guinea pig (Cavia porcellus) typically exhibits
signs of disease that closely resembles human disease; however,
there are few immunological or genetic tools for assessing the host
response to infection. JUNV is also a BSL-4 and select agent, thus
use of virulent strains is confined to only a few laboratories with
highly specialized containment facilities. The pathogenesis of
TCRV, a BSL-2 agent, in Jamaican fruit bats exhibits many
similarities to the SAHF in humans, thus the use of transcriptome
data could be useful for studying pathogenesis using a variety of
Figure 5. Venn Diagram comparison of unannotated transcriptmapped to Myotis lucifugus genome, Pteropus vampyrus ge-nome, and Pteropus alecto transcriptome.doi:10.1371/journal.pone.0048472.g005
Table 2. Comprehensively mapped genes on the KEGG pathway.
PathwaysContigs Mapped toHuman Pathway
Proportion of MappedHuman Pathway
Contigs Mapped toMouse Pathway
Proportion of MappedMouse Pathway
Toll-like receptor signaling pathway 73 0.715686275 66 0.653465347
RIG-I-like receptor signaling pathway 49 0.690140845 43 0.623188406
Cytokine-cytokine receptor interaction 133 0.501886792 93 0.379591837
Cell adhesion molecules_CAMs 87 0.654135338 73 0.489932886
Complement and coagulation cascades 36 0.52173913 28 0.368421053
Intestinal immune network for IgAproduction Apoptosis
78 0.735849057 72 0.620689655
Fc gamma R-mediated phagocytosis 80 0.85106383 78 0.866666667
Chemokine signaling pathway 131 0.693121693 121 0.654054054
Leukocyte transendothelial migration 84 0.724137931 79 0.658333333
Jak-STAT signaling pathway 93 0.6 76 0.496732026
mTOR signaling pathway 51 0.980769231 50 0.943396226
MAPK signaling pathway 211 0.787313433 199 0.742537313
T cell receptor signaling pathway 94 0.87037037 88 0.8
ErbB signaling pathway 73 0.83908046 68 0.781609195
B cell receptor signaling pathway 68 0.906666667 62 0.815789474
Natural killer cell mediated cytotoxicity 66 0.485294118 58 0.464
VEGF signaling pathway 64 0.842105263 55 0.723684211
TGF-beta signaling pathway 59 0.702380952 59 0.694117647
doi:10.1371/journal.pone.0048472.t002
Artibeus Bat Transcriptome
PLOS ONE | www.plosone.org 7 November 2012 | Volume 7 | Issue 11 | e48472

new technologies, such as PCR arrays for pathway discovery, and
for the development of antibodies to specific artibeus proteins that
are important in the pathogenesis of disease.
The transcriptome resource provided will facilitate research into
artibeus host responses to infectious agents, including mechanisms
of pathogenesis of arenavirus disease and will also provide further
resource for additional understanding for the bat species evolution
and physiological development.
Materials and Methods
Ethics StatementAll procedures were approved by the UNC Institutional Animal
Care and Use Committee (IACUC) and were in compliance with
Figure 6. KEGG Mapped Genes. A graphical representation for two KEGG pathways: (A) B cell receptor signaling pathway and (B) natural killer cell-mediated cytotoxicity. Because the original KEGG graph is much larger, we only present the center genes and genes neighboring these central nodes. Ifmapped, genes representing nodes were either highlighted with light green or light blue colors. Genes highlighted with light blue contain SNPs.doi:10.1371/journal.pone.0048472.g006
Figure 7. Substitution estimation scatter plot. We calculated thenonsynonymous mutation rate (dN) and synonymous mutation rate(dS) using orthologous genes between bat and human. Two lines weredrawn representing the two dN/dS cutoffs of 0.7 (green) and 1.0 (blue).doi:10.1371/journal.pone.0048472.g007
Figure 8. Unrooted species tree from the orthologous datasetacross six Boreoeutheria mammals. The species tree was generatedfrom 2378 gene loci. There was 95% bootstrap support for placing bats(Chiroptera) sister to Perissodactyla, Cetartiodactyla, and Carnivora.doi:10.1371/journal.pone.0048472.g008
Artibeus Bat Transcriptome
PLOS ONE | www.plosone.org 8 November 2012 | Volume 7 | Issue 11 | e48472

the USA Animal Welfare Act. UNC animal care and use
committee approval number, 1207C-RA-B-15.
Bats, Cells and RNA ExtractionsFive bats from the University of Northern Colorado Jamaican
fruit bat colony were used for this work. Male and female A.
jamaicensis bats were euthanized by respiratory hyperanesthesia
followed immediately by thoracotomy. Tissues were aseptically
removed and flash frozen in liquid nitrogen for subsequent RNA
extraction. Tissues were homogenized in Buffer RLT (RNEasy kit,
Qiagen, Valencia, CA) containing 2ME using a Bead Beater and
silicone beads. The homogenate was passed over a Qiashredder
column prior to total RNA extraction according to manufacturer’s
instructions.
For cell culture, one kidney from one bat was collected in
serum-free HBSS and minced under aseptic conditions, then
trypsinized (trypsin-versene) at room temperature in a sterile 50 ml
trypsin flask. Cells were washed 36 in 10% FBS-EMEM, then
seeded into a vented T-25 flask. The next day, unattached cells
were removed and fresh 10% FBS-EMEM added. When cells
approached confluence they were passaged with trypsin at a split
ratio of 1:4. Poly-IC was added to 50 mg/ml in two T-75 flasks
containing 20 ml each of 10% FBS-EMEM and incubated for 6
hours, after which RNA was extracted according to manufactur-
er’s instructions (Qiagen).
SequencingTotal RNA was extracted using the RNeasy MinElute Cleanup
Kit (Qiagen) and then shipped on dry ice to SeqWright (Houston,
TX) for cDNA library construction and sequencing. RNA
concentrations and quality were assessed by A260/A280 and
A260/A230 absorbance values and agarose gel electrophoresis.
A260/A280 values were all above 2.0 and A260/A230 were all
above 1.9. Electrophoresis of the RNA samples demonstrated that
28S and 18S rRNA were not degraded. Libraries for the 454 were
prepared from three tissues (kidney, lung, poly-IC-stimulated
kidney cells). For 454 library construction, full-length cDNA was
synthesized with two set of primers for driver and tester cDNA
[42,43]. Single-stranded cDNA was used for hybridization instead
of double-stranded cDNA. Excess amounts of sense-stranded
cDNA hybridized with antisense-stranded cDNA. After hybrid-
ization, duplex was removed by hydroxyapatite chromatography.
Normalized tester cDNA was re-amplified with tester specific
primer L4N. Driver cDNA was unable to amplify using L4N. An
Illumina TruSeq RNA library was made from spleens according to
manufacturer’s instructions. The libraries were then sequenced
according to manufacturer’s recommendations: 454 using Titani-
um chemistry and Illumina using 26100 nucleotide paired-end
sequencing on a Hi-Seq 2000.
Sequence Assembly and Polymorphism DetectionThe 454 and Illumina libraries were assembled individually and
also by combining both libraries. Bases from the 454 reads were
called from the 454 generated sff file using Pyrobayes [44] and
454 gs assembler (version 2.5) was used to perform the assembly.
SOAP denovo [45] (version 1.04) was used to assemble reads
obtained from spleen (Illumina library). Only contigs greater than
200 bases were used in the final analysis. Prior to performing the
combined assembly, duplicates from pre-assembled contigs of
lung, kidney and spleen tissues were removed with CD-Hit [46]
(cd-hit-2009-0427) at default criterion and then combined into
longer fragments with TGICL [47]. GigaBayes [48] - a short-read
SNP/indel discovery program was used to detect polymorphisms.
SNP/Indel detection was performed for both libraries separately.
To make SNP/indel predictions more reliable, we used the
criterion that minor allele and major allele (alleles with fewer reads
are minor alleles, and alleles with more reads are major alleles)
occur at least twice and 8 times for 454 and Illumina libraries,
respectively.
Localization of ContigsTo identify the approximate relative position of conserved
mammalian genes, we mapped the bat contigs on to the genome of
Mouse mm9 and Human GRCh37 (downloaded from the UCSC
genome browser) using BLAT v.34 [49] with a minimum score of
80 used as a filter. Coordinates of the protein coding genes were
obtained from Ensemble (http://uswest.ensembl.org/index.html)
Xenoref and gtf files. We also normalized the number of BLAT
hits based on the total annotated transcript regions (1000 nt
upstream of 59 UTR, 59 UTR, CDS, 39UTR, and 1000 nt
downstream of 39UTR) that were present in the mouse and
human.
Precursor Micro RNA PredictionsTo predict precursor-microRNA genes within assembled
sequences, we downloaded precursor microRNAs for mouse, rat
and human from miRBase [24,25]. We performed a BLAST
search focused on high quality candidates, hits with $95%
sequence identity [50]. Based upon RNAfold [51] secondary
structure prediction, we further filtered out sequences that did not
possess any hairpin loop structure. Previously, it had been
demonstrated that microRNAs tend to have deterministic folding
[52] and, therefore, we used Unpaired Structural Entropy (USE)
to evaluate the RNA secondary structure base pairing distribution
(cutoff 0.83 USE score). MiR-abela, a support vector machine
learning program [53], was used to cross validate the prediction.
The final remaining unfiltered sequences are considered as highly
confident microRNA candidates.
Orthology IdentificationOrthologous contigs (against human, mouse, dog, cattle and
horse) were identified using the reciprocal BLAST (BLASTN)
approach [54] as it has been found to be superior to sophisticated
orthology detection algorithms [55]. A stringent cutoff of 1e220
was used to separate paralogs from orthologs. cDNA sequences
from human (Homo_sapiens.GRCh37.64.cdna.all.fa), mouse
(Mus_musculus.NCBIM37. 64.cdna.all.fa), dog (Canis_familiaris.-
BROADD2.64.cdna.all.fa), cattle (Bos_taurus. UMD3.1.64.cd-
na.all.fa) and horse (Equus_caballus.EquCab2.64.cdna.all.fa) were
obtained from the Biomart database (www.biomart.org).
dN/dS CalculationThe substitution rate is inferred from orthologous genes
between bat and mouse. Sequences were aligned using MACSE
[56] and an in-house java script was used to trim/remove codon
gap triplets from the alignment. Substitution rate was estimated
using a maximum likelihood method implemented in the
CODEML program of PAML 4.5 [57,58]. The pairwise
maximum likelihood analyses were performed in runmode-2.
Estimated rates of non-synonymous to synonymous substitutions
(dN/dS) were plotted as a scatter plot.
Functional Annotation Through BLAST2GO and KEGGBlast2GO [59] was used to functionally annotate contigs. A
combined graph was generated for each GO category. To prevent
overloading graphs, the sequence filter value was changed to 500
in all 3 categories (biological process, molecular function and
Artibeus Bat Transcriptome
PLOS ONE | www.plosone.org 9 November 2012 | Volume 7 | Issue 11 | e48472

cellular component). Functional annotation was performed
separately for all assembled contigs present in the combined
assembly. Based on CateGOrizer [60], we further classified the
genes using the GO slim database immune classes.
The completeness of mapping the bat genes using Euarchon-
toglires as a reference was further examined through KEGG. To
do this, we first downloaded the xml file of annotated KEGG
pathways [61,62]for human and mouse. To identify genes that are
functionally important within KEGG pathways, KEGGgraph was
used to represent a graph form of the KEGG pathway. We further
used KEGGgraph to compute the relative betweenness centrality,
which is the algorithmic representation of the involvement of a
node within a network. We chose to set a cutoff of grabbing the
top 4 nodes within each network, or selecting the top 4
functionally important genes within each pathway [63].
ORF IdentificationOpen reading frame was predicted from the assembled contigs
through the OrfPredictor web server (http://proteomics.ysu.edu/
tools/OrfPredictor.html) [64]. A customized java program was
used to parse through the prediction to identify sequences longer
than 300 nt. To perform additional annotation of the predicted
open reading frame we used BLASTP with an e-value of 1e23
against the most recent nr database that is available from NCBI
during our analysis (August 26th, 2012).
Bat Genome ComparisonUsing contigs that were functionally unannotated, we compared
the Jaimacan fruit bat contigs against three other available bat
sequence dataset. Myotis lucifugus and Pteropus vampyrus
genomes were downloaded from the ncbi traceDB FTP server
(ftp://ftp.ncbi.nih.gov/pub/TraceDB/). The Pteropus alecto
transcriptome was obtained from Dr. A. Papenfuss [13]. An e-
value threshold of 1e25 was used to indicate BLAST hit. We then
used an R package VennDiagram [65] for displaying the mapped
unannotated contigs that overlapped between different bat
genome and transcriptomes.
Species Tree AnalysisTo resolve the evolutionary relationship for the artibeus bat
species, we filtered the putative bat orthologs between human,
mouse, dog, cattle, and horse. Insectivores such as hedgehog and
dolphin were not used in our analysis due to limited gene
annotation in these taxa. To obtain the best multiple sequence
alignment for each putative orthologs, we used AQUA’s pipeline
for performing multiple sequence alignment; the pipeline consists
of multiple sequence alignment through MUSCLE and MAFFT
which is refined by RASCAL and assessed by NORMD [66–69].
A customized java program was used to filter alignments (obtained
through AQUA) with greater than 5% gap per sequence.
Additionally, we filtered for sequences that are at least.1,000 bp
long. PHYML 3 was used to generate a maximum likelihood gene
tree [70,71]. MrAIC, a perl script wrapper for PHYML, was used
to infer the best substitution model for each gene tree based on
AIC, AICc, BIC, and Akaike weights [72]. AIC was used as the
objective function since not much variation was observed across
different objective function. NJst was used to calculate the
unrooted species tree based on our gene trees [73]. A customized
Rprogram is used for Performing a nonparametric bootstrap
species tree through resampling nucleotides within loci as well as
resampling the loci within the data set as described by Seo [74].
Supporting Information
Figure S1 B cell receptor signalling pathway.
(TIF)
Figure S2 Cell adhesion molecules.
(TIF)
Figure S3 Chemokine signalling pathway.
(TIF)
Figure S4 Complement and coagulation cascades.
(TIF)
Figure S5 Cytokine-cytokine receptor interaction.
(TIF)
Figure S6 ErbB signalling pathway
(TIF)
Figure S7 Fc gamma receptor-mediated phagocytosis.
(TIF)
Figure S8 Intestinal immune network for IgA produc-tion.
(TIF)
Figure S9 Jak-STAT signalling pathway.
(TIF)
Figure S10 Leukocyte transendothelial migration.
(TIF)
Figure S11 MAPK signalling pathway.
(TIF)
Figure S12 mTOR signalling pathway.
(TIF)
Figure S13 Natural killer cell-mediated cytotoxicity.
(TIF)
Figure S14 RIG-I-like receptor signalling pathway.
(TIF)
Figure S15 T cell receptor signalling pathway.
(TIF)
Figure S16 TGF beta signalling pathway.
(TIF)
Figure S17 Toll-like receptor signalling pathway.
(TIF)
Figure S18 VEGF signalling pathway.
(TIF)
Table S1 List of annotated microRNAs.
(XLSX)
Table S2 List of genes with greater than 0.7 dN/dSratio.
(XLSX)
Table S3 List of orthologous genes across each species.
(XLSX)
Acknowledgments
We thank Jason Shaw for assistance with bat handling and Stephanie
James for laboratory assistance, and UGA’s Georgia Advanced Computing
Resource Center and Institute of Bioinformatics for computational
resources and support. We thank Anthony Papenfuss for providing the
assembled transcriptome for P. alecto.
Artibeus Bat Transcriptome
PLOS ONE | www.plosone.org 10 November 2012 | Volume 7 | Issue 11 | e48472

Author Contributions
Conceived and designed the experiments: TS TG. Performed the
experiments: TS AH RA. Analyzed the data: TIS AS WC LL TG.
Contributed reagents/materials/analysis tools: TS TG LL. Wrote the
paper: TIS TG TS.
References
1. Gunnell GF, Simmons NB (2005) Fossil Evidence and the Origin of Bats.
Journal of Mammalian Evolution 12: 209–246.
2. Calisher CH, Childs JE, Field HE, Holmes KV, Schountz T (2006) Bats:
important reservoir hosts of emerging viruses. Clin Microbiol Rev 19: 531–545.
3. IUCN (2012) IUCN Red List version 2011.2: Tabel 3a - Status category
summary by major taxonomic group (animals).
4. McCormack JE, Faircloth BC, Crawford NG, Gowaty PA, Brumfield RT, et al.
(2012) Ultraconserved elements are novel phylogenomic markers that resolve
placental mammal phylogeny when combined with species-tree analysis.
Genome Res 22: 746–754.
5. Nery MF, Gonzalez DJ, Hoffmann FG, Opazo JC (2012) Resolution of the
laurasiatherian phylogeny: evidence from genomic data. Mol Phylogenet Evol
64: 685–689.
6. Novacek MJ (1992) Mammalian phylogeny: shaking the tree. Nature 356: 121–
125.
7. Murphy WJ, Pevzner PA, O’Brien SJ (2004) Mammalian phylogenomics comes
of age. Trends Genet 20: 631–639.
8. Murphy WJ, Pringle TH, Crider TA, Springer MS, Miller W (2007) Using
genomic data to unravel the root of the placental mammal phylogeny. Genome
Res 17: 413–421.
9. Prasad AB, Allard MW, Program NCS, Green ED (2008) Confirming the
phylogeny of mammals by use of large comparative sequence data sets. Mol Biol
Evol 25: 1795–1808.
10. Zhou X, Xu S, Xu J, Chen B, Zhou K, et al. (2012) Phylogenomic analysis
resolves the interordinal relationships and rapid diversification of the
laurasiatherian mammals. Syst Biol 61: 150–164.
11. Nishihara H, Hasegawa M, Okada N (2006) Pegasoferae, an unexpected
mammalian clade revealed by tracking ancient retroposon insertions. Proc Natl
Acad Sci U S A 103: 9929–9934.
12. Lindblad-Toh K, Garber M, Zuk O, Lin MF, Parker BJ, et al. (2011) A high-
resolution map of human evolutionary constraint using 29 mammals. Nature
478: 476–482.
13. Papenfuss AT, Baker ML, Feng ZP, Tachedjian M, Crameri G, et al. (2012) The
immune gene repertoire of an important viral reservoir, the Australian black
flying fox. BMC Genomics 13: 261.
14. Wibbelt G, Moore MS, Schountz T, Voigt CC (2010) Emerging diseases in
Chiroptera: why bats? Biol Lett 6: 438–440.
15. Ortega J (2001) Artibeus jamaicensis. Mammalian Species 662: 1–9.
16. Calisher CH, Kinney RM, de Souza Lopes O, Trent DW, Monath TP, et al.
(1982) Identification of a new Venezuelan equine encephalitis virus from Brazil.
Am J Trop Med Hyg 31: 1260–1272.
17. McMurray DN, Thomas ME, Greer DL, Tolentino NL (1978) Humoral and
cell-mediated immunity to Histoplasma capsulatum during experimental
infection in neotropical bats (Artibeus lituratus). Am J Trop Med Hyg 27:
815–821.
18. Reid JE, Jackson AC (2001) Experimental rabies virus infection in Artibeus
jamaicensis bats with CVS-24 variants. J Neurovirol 7: 511–517.
19. Downs WG, Anderson CR, Spence L, Aitken THG, Greenhall AH (1963)
Tacaribe Virus, a New Agent Isolated from Artibeus Bats and Mosquitoes in
Trinidad, West Indies. Am J Trop Med Hyg 12: 640–646.
20. Bowen MD, Peters CJ, Nichol ST (1996) The phylogeny of New World
(Tacaribe complex) arenaviruses. Virology 219: 285–290.
21. Bowen MD, Peters CJ, Nichol ST (1997) Phylogenetic analysis of the
Arenaviridae: patterns of virus evolution and evidence for cospeciation between
arenaviruses and their rodent hosts. Mol Phylogenet Evol 8: 301–316.
22. Price JL (1978) Serological evidence of infection of Tacaribe virus and
arboviruses in Trinidadian bats. Am J Trop Med Hyg 27: 162–167.
23. Cogswell-Hawkinson A, Bowen R, James S, Gardiner D, Calisher CH, et al.
(2012) Tacaribe virus causes fatal infection of an ostensible reservoir host, the
Jamaican fruit bat. J Virol 86: 5791–5799.
24. Griffiths-Jones S (2006) miRBase: the microRNA sequence database. Methods
Mol Biol 342: 129–138.
25. Kozomara A, Griffiths-Jones S (2011) miRBase: integrating microRNA
annotation and deep-sequencing data. Nucleic Acids Res 39: D152–157.
26. Bininda-Emonds OR (2007) Fast genes and slow clades: comparative rates of
molecular evolution in mammals. Evol Bioinform Online 3: 59–85.
27. Bromham L, Rambaut A, Harvey PH (1996) Determinants of rate variation in
mammalian DNA sequence evolution. J Mol Evol 43: 610–621.
28. Nabholz B, Mauffrey JF, Bazin E, Galtier N, Glemin S (2008) Determination of
mitochondrial genetic diversity in mammals. Genetics 178: 351–361.
29. Welch JJ, Bininda-Emonds OR, Bromham L (2008) Correlates of substitution
rate variation in mammalian protein-coding sequences. BMC Evol Biol 8: 53.
30. Joslyn CA, Mniszewski SM, Fulmer A, Heaton G (2004) The gene ontology
categorizer. Bioinformatics 20 Suppl 1: i169–177.
31. Bustamante CD, Fledel-Alon A, Williamson S, Nielsen R, Hubisz MT, et al.
(2005) Natural selection on protein-coding genes in the human genome. Nature
437: 1153–1157.
32. Nielsen R, Bustamante C, Clark AG, Glanowski S, Sackton TB, et al. (2005) A
scan for positively selected genes in the genomes of humans and chimpanzees.
PLoS Biol 3: e170.
33. Vallender EJ, Lahn BT (2004) Positive selection on the human genome. Hum
Mol Genet 13 Spec No2: R245–254.
34. Tang H, Wu CI (2006) A new method for estimating nonsynonymous
substitutions and its applications to detecting positive selection. Mol Biol Evol
23: 372–379.
35. Huang da W, Sherman BT, Lempicki RA (2009) Systematic and integrative
analysis of large gene lists using DAVID bioinformatics resources. Nat Protoc 4:
44–57.
36. Huang da W, Sherman BT, Lempicki RA (2009) Bioinformatics enrichment
tools: paths toward the comprehensive functional analysis of large gene lists.
Nucleic Acids Res 37: 1–13.
37. Malagelada C, Ryu EJ, Biswas SC, Jackson-Lewis V, Greene LA (2006) RTP801
is elevated in Parkinson brain substantia nigral neurons and mediates death in
cellular models of Parkinson’s disease by a mechanism involving mammalian
target of rapamycin inactivation. J Neurosci 26: 9996–10005.
38. Gery S, Park DJ, Vuong PT, Virk RK, Muller CI, et al. (2007) RTP801 is a
novel retinoic acid-responsive gene associated with myeloid differentiation. Exp
Hematol 35: 572–578.
39. Chen Y, Molloy SS, Thomas L, Gambee J, Bachinger HP, et al. (2001)
Mutations within a furin consensus sequence block proteolytic release of
ectodysplasin-A and cause X-linked hypohidrotic ectodermal dysplasia. Proc
Natl Acad Sci U S A 98: 7218–7223.
40. Madsen O, Scally M, Douady CJ, Kao DJ, DeBry RW, et al. (2001) Parallel
adaptive radiations in two major clades of placental mammals. Nature 409: 610–
614.
41. Gomez RM, Jaquenod de Giusti C, Sanchez Vallduvi MM, Frik J, Ferrer MF, et
al. (2011) Junin virus. A XXI century update. Microbes Infect 13: 303–311.
42. Patanjali SR, Parimoo S, Weissman SM (1991) Construction of a uniform-
abundance (normalized) cDNA library. Proc Natl Acad Sci U S A 88: 1943–
1947.
43. Soares MB, Bonaldo MF, Jelene P, Su L, Lawton L, et al. (1994) Construction
and characterization of a normalized cDNA library. Proc Natl Acad Sci U S A
91: 9228–9232.
44. Quinlan AR, Stewart DA, Stromberg MP, Marth GT (2008) Pyrobayes: an
improved base caller for SNP discovery in pyrosequences. Nat Methods 5: 179–
181.
45. Li R, Zhu H, Ruan J, Qian W, Fang X, et al. (2010) De novo assembly of
human genomes with massively parallel short read sequencing. Genome Res 20:
265–272.
46. Li W, Godzik A (2006) Cd-hit: a fast program for clustering and comparing large
sets of protein or nucleotide sequences. Bioinformatics 22: 1658–1659.
47. Pertea G, Huang X, Liang F, Antonescu V, Sultana R, et al. (2003) TIGR Gene
Indices clustering tools (TGICL): a software system for fast clustering of large
EST datasets. Bioinformatics 19: 651–652.
48. Marth GT, Korf I, Yandell MD, Yeh RT, Gu Z, et al. (1999) A general
approach to single-nucleotide polymorphism discovery. Nat Genet 23: 452–456.
49. Kent WJ (2002) BLAT–the BLAST-like alignment tool. Genome Res 12: 656–
664.
50. Ambros V, Bartel B, Bartel DP, Burge CB, Carrington JC, et al. (2003) A
uniform system for microRNA annotation. RNA 9: 277–279.
51. Hofacker I, Fontana W, Stadler PF, Bonhoeffer S, Tacker M, et al. (1994) Fast
Folding and Comparison of RNA Secondary Structures. Monatshefte f Chemie
125: 167–188.
52. Shaw TI, Manzour A, Wang Y, Malmberg RL, Cai L (2011) Analyzing modular
RNA structure reveals low global structural entropy in microRNA sequence.
J Bioinform Comput Biol 9: 283–298.
53. Sewer A, Paul N, Landgraf P, Aravin A, Pfeffer S, et al. (2005) Identification of
clustered microRNAs using an ab initio prediction method. BMC Bioinformatics
6: 267.
54. Altschul SF, Madden TL, Schaffer AA, Zhang J, Zhang Z, et al. (1997) Gapped
BLAST and PSI-BLAST: a new generation of protein database search
programs. Nucleic Acids Res 25: 3389–3402.
55. Altenhoff AM, Dessimoz C (2009) Phylogenetic and functional assessment of
orthologs inference projects and methods. PLoS Comput Biol 5: e1000262.
56. Ranwez V, Harispe S, Delsuc F, Douzery EJ (2011) MACSE: Multiple
Alignment of Coding SEquences accounting for frameshifts and stop codons.
PLoS One 6: e22594.
57. Yang Z (2007) PAML 4: phylogenetic analysis by maximum likelihood. Mol Biol
Evol 24: 1586–1591.
Artibeus Bat Transcriptome
PLOS ONE | www.plosone.org 11 November 2012 | Volume 7 | Issue 11 | e48472

58. Yang Z (1997) PAML: a program package for phylogenetic analysis by
maximum likelihood. Comput Appl Biosci 13: 555–556.59. Conesa A, Gotz S, Garcia-Gomez JM, Terol J, Talon M, et al. (2005) Blast2GO:
a universal tool for annotation, visualization and analysis in functional genomics
research. Bioinformatics 21: 3674–3676.60. Hu Z-LB, Reecy J (2008) CateGOrizer: A Web-Based Program to Batch
Analyze Gene Ontology Classification Categories. Online J Bioinformatics 9:108–112.
61. Kanehisa M, Goto S, Sato Y, Furumichi M, Tanabe M (2012) KEGG for
integration and interpretation of large-scale molecular data sets. Nucleic AcidsRes 40: D109–114.
62. Kanehisa M, Goto S (2000) KEGG: kyoto encyclopedia of genes and genomes.Nucleic Acids Res 28: 27–30.
63. Zhang JD, Wiemann S (2009) KEGGgraph: a graph approach to KEGGPATHWAY in R and bioconductor. Bioinformatics 25: 1470–1471.
64. Min XJ, Butler G, Storms R, Tsang A (2005) OrfPredictor: predicting protein-
coding regions in EST-derived sequences. Nucleic Acids Res 33: W677–680.65. Chen H, Boutros PC (2011) VennDiagram: a package for the generation of
highly-customizable Venn and Euler diagrams in R. BMC Bioinformatics 12:35.
66. Edgar RC (2004) MUSCLE: multiple sequence alignment with high accuracy
and high throughput. Nucleic Acids Res 32: 1792–1797.67. Katoh K, Misawa K, Kuma K, Miyata T (2002) MAFFT: a novel method for
rapid multiple sequence alignment based on fast Fourier transform. Nucleic
Acids Res 30: 3059–3066.68. Muller J, Creevey CJ, Thompson JD, Arendt D, Bork P (2010) AQUA:
automated quality improvement for multiple sequence alignments. Bioinfor-matics 26: 263–265.
69. Thompson JD, Thierry JC, Poch O (2003) RASCAL: rapid scanning and
correction of multiple sequence alignments. Bioinformatics 19: 1155–1161.70. Criscuolo A (2011) morePhyML: improving the phylogenetic tree space
exploration with PhyML 3. Mol Phylogenet Evol 61: 944–948.71. Guindon S, Delsuc F, Dufayard JF, Gascuel O (2009) Estimating maximum
likelihood phylogenies with PhyML. Methods Mol Biol 537: 113–137.72. Burnham K, Anderson D (2002) Model Selection and Multi-Model Inference.
New York: Springer.
73. Liu L, Yu L (2011) Estimating species trees from unrooted gene trees. Syst Biol60: 661–667.
74. Seo TK (2008) Calculating bootstrap probabilities of phylogeny using multilocussequence data. Mol Biol Evol 25: 960–971.
Artibeus Bat Transcriptome
PLOS ONE | www.plosone.org 12 November 2012 | Volume 7 | Issue 11 | e48472