Transcriptome sequences resolve deep relationships of the grape family.
9
Transcriptome Sequences Resolve Deep Relationships of the Grape Family Jun Wen 1* , Zhiqiang Xiong 2 , Ze-Long Nie 3 , Likai Mao 2 , Yabing Zhu 2 , Xian-Zhao Kan 4 , Stefanie M. Ickert- Bond 5 , Jean Gerrath 6 , Elizabeth A. Zimmer 1 , Xiao-Dong Fang 2* 1 Department of Botany, National Museum of Natural History, MRC166, Smithsonian Institution, Washington, D.C., United States of America, 2 BGI-Shenzhen, Shenzhen, China, 3 Key Laboratory of Biodiversity and Biogeography, Kunming Institute of Botany, Chinese Academy of Sciences, Kunming, Yunnan, China, 4 College of Life Sciences, Anhui Normal University, Wuhu, Anhui, China, 5 UA Museum of the North Herbarium and Department of Biology and Wildlife, University of Alaska Fairbanks, Fairbanks, Alaska, United States of America, 6 Department of Biology, University of Northern Iowa, Cedar Falls, Iowa, United States of America Abstract Previous phylogenetic studies of the grape family (Vitaceae) yielded poorly resolved deep relationships, thus impeding our understanding of the evolution of the family. Next-generation sequencing now offers access to protein coding sequences very easily, quickly and cost-effectively. To improve upon earlier work, we extracted 417 orthologous single-copy nuclear genes from the transcriptomes of 15 species of the Vitaceae, covering its phylogenetic diversity. The resulting transcriptome phylogeny provides robust support for the deep relationships, showing the phylogenetic utility of transcriptome data for plants over a time scale at least since the mid-Cretaceous. The pros and cons of transcriptome data for phylogenetic inference in plants are also evaluated. Citation: Wen J, Xiong Z, Nie Z-L, Mao L, Zhu Y, et al. (2013) Transcriptome Sequences Resolve Deep Relationships of the Grape Family. PLoS ONE 8(9): e74394. doi:10.1371/journal.pone.0074394 Editor: Hector Candela, Universidad Miguel Hernández de Elche, Spain Received February 2, 2013; Accepted August 1, 2013; Published September 17, 2013 This is an open-access article, free of all copyright, and may be freely reproduced, distributed, transmitted, modified, built upon, or otherwise used by anyone for any lawful purpose. The work is made available under the Creative Commons CC0 public domain dedication. Funding: This study was funded by grants from the Office of the Smithsonian Undersecretary of Science, the US National Science Foundation (grant DEB 0743474 to S.R. Manchester and J. Wen, and grant DEB 0743499 to J. Gerrath), the Small Grants Program of the National Museum of Natural History of the Smithsonian Institution to JW, and trust funds generated by EAZ. The funders had no role in study design, data collection and analysis, decision to publish, or preparation of the manuscript. Competing interests: The authors have declared that no competing interests exist. * E-mail: [email protected] (JW); [email protected] (XDF) Introduction The grape family (Vitaceae) has been widely recognized for its economic importance as the source of table grapes, wine, and raisins. The family consists of 14 genera and ~ 900 species [1]. Many species of the family are dominant lianas in lowland tropical forests, while species in Parthenocissus Planchon, Ampelopsis Michx. and Vitis L. are primarily from the temperate zone. Previous phylogenetic analyses support five major clades within Vitaceae: (i) the Vitis – Ampelocissus– clade (180 spp.), (ii) the Ampelopsis – Rhoicissus clade (43 spp.), (iii) the Parthenocissus -Yua clade (15 spp.), (iv) the core Cissus clade (300 spp.), and (v) the Cayratia – Tetrastigma – Cyphostemma – clade (350 spp.) [2,3]. Parthenocissus and Yua are supported as closely related to Vitis (3, 4). However, in spite of several recent efforts [2,3,5,6,7,8] that effectively resolved the relationships within each of the main clades, the deep relationships of the family remained poorly resolved. Recently, it has been demonstrated for a number of plant and animal lineages that uncertainty of deep relationships among taxonomic groups hinders progress in understanding their evolution including their temporal and spatial origins as well as their morphological changes over time [9,10]. In particular, biogeographic reconstructions, especially at the family level, are a major challenge for plant biologists [2,3,11–16], even though methods have been developed to account for phylogenetic uncertainty in biogeographic inferences [17–19]. Transcriptome sequences, generated using high throughput techniques, have been shown to provide a rich set of characters to produce phylogenies in eukaryotes and are more efficient and cost-effective than traditional PCR-based and EST-based methods (20). Recent studies have demonstrated the utility of transcriptome data for resolving the relationships of mosquitoes [20], mollusks [9,21], and the large tetrapod group consisting of turtles, birds and crocodiles [22]. For example, even though mollusks have an excellent fossil record, deep relationships of the phyllum have been uncertain when molecular phylogenies used a few genes. With a transcriptome approach, the major clades were resolved with highly significant statistical support. Given its potential, we decided to take a phylogenomics approach to resolve the deep relationships of the Vitaceae. This represents the first study in PLOS ONE | www.plosone.org 1 September 2013 | Volume 8 | Issue 9 | e74394
Transcript of Transcriptome sequences resolve deep relationships of the grape family.

Transcriptome Sequences Resolve Deep Relationships ofthe Grape FamilyJun Wen1*, Zhiqiang Xiong2, Ze-Long Nie3, Likai Mao2, Yabing Zhu2, Xian-Zhao Kan4, Stefanie M. Ickert-Bond5, Jean Gerrath6, Elizabeth A. Zimmer1, Xiao-Dong Fang2*
1 Department of Botany, National Museum of Natural History, MRC166, Smithsonian Institution, Washington, D.C., United States of America, 2 BGI-Shenzhen,Shenzhen, China, 3 Key Laboratory of Biodiversity and Biogeography, Kunming Institute of Botany, Chinese Academy of Sciences, Kunming, Yunnan, China,4 College of Life Sciences, Anhui Normal University, Wuhu, Anhui, China, 5 UA Museum of the North Herbarium and Department of Biology and Wildlife,University of Alaska Fairbanks, Fairbanks, Alaska, United States of America, 6 Department of Biology, University of Northern Iowa, Cedar Falls, Iowa, UnitedStates of America
Abstract
Previous phylogenetic studies of the grape family (Vitaceae) yielded poorly resolved deep relationships, thusimpeding our understanding of the evolution of the family. Next-generation sequencing now offers access to proteincoding sequences very easily, quickly and cost-effectively. To improve upon earlier work, we extracted 417orthologous single-copy nuclear genes from the transcriptomes of 15 species of the Vitaceae, covering itsphylogenetic diversity. The resulting transcriptome phylogeny provides robust support for the deep relationships,showing the phylogenetic utility of transcriptome data for plants over a time scale at least since the mid-Cretaceous.The pros and cons of transcriptome data for phylogenetic inference in plants are also evaluated.
Citation: Wen J, Xiong Z, Nie Z-L, Mao L, Zhu Y, et al. (2013) Transcriptome Sequences Resolve Deep Relationships of the Grape Family. PLoS ONE8(9): e74394. doi:10.1371/journal.pone.0074394
Editor: Hector Candela, Universidad Miguel Hernández de Elche, Spain
Received February 2, 2013; Accepted August 1, 2013; Published September 17, 2013
This is an open-access article, free of all copyright, and may be freely reproduced, distributed, transmitted, modified, built upon, or otherwise used byanyone for any lawful purpose. The work is made available under the Creative Commons CC0 public domain dedication.
Funding: This study was funded by grants from the Office of the Smithsonian Undersecretary of Science, the US National Science Foundation (grant DEB0743474 to S.R. Manchester and J. Wen, and grant DEB 0743499 to J. Gerrath), the Small Grants Program of the National Museum of Natural History ofthe Smithsonian Institution to JW, and trust funds generated by EAZ. The funders had no role in study design, data collection and analysis, decision topublish, or preparation of the manuscript.
Competing interests: The authors have declared that no competing interests exist.
* E-mail: [email protected] (JW); [email protected] (XDF)
Introduction
The grape family (Vitaceae) has been widely recognized forits economic importance as the source of table grapes, wine,and raisins. The family consists of 14 genera and ~ 900species [1]. Many species of the family are dominant lianas inlowland tropical forests, while species in ParthenocissusPlanchon, Ampelopsis Michx. and Vitis L. are primarily from thetemperate zone. Previous phylogenetic analyses support fivemajor clades within Vitaceae: (i) the Vitis – Ampelocissus–clade (180 spp.), (ii) the Ampelopsis – Rhoicissus clade (43spp.), (iii) the Parthenocissus -Yua clade (15 spp.), (iv) the coreCissus clade (300 spp.), and (v) the Cayratia – Tetrastigma –Cyphostemma – clade (350 spp.) [2,3]. Parthenocissus andYua are supported as closely related to Vitis (3, 4). However, inspite of several recent efforts [2,3,5,6,7,8] that effectivelyresolved the relationships within each of the main clades, thedeep relationships of the family remained poorly resolved.Recently, it has been demonstrated for a number of plant andanimal lineages that uncertainty of deep relationships amongtaxonomic groups hinders progress in understanding their
evolution including their temporal and spatial origins as well astheir morphological changes over time [9,10]. In particular,biogeographic reconstructions, especially at the family level,are a major challenge for plant biologists [2,3,11–16], eventhough methods have been developed to account forphylogenetic uncertainty in biogeographic inferences [17–19].
Transcriptome sequences, generated using high throughputtechniques, have been shown to provide a rich set ofcharacters to produce phylogenies in eukaryotes and are moreefficient and cost-effective than traditional PCR-based andEST-based methods (20). Recent studies have demonstratedthe utility of transcriptome data for resolving the relationships ofmosquitoes [20], mollusks [9,21], and the large tetrapod groupconsisting of turtles, birds and crocodiles [22]. For example,even though mollusks have an excellent fossil record, deeprelationships of the phyllum have been uncertain whenmolecular phylogenies used a few genes. With a transcriptomeapproach, the major clades were resolved with highlysignificant statistical support. Given its potential, we decided totake a phylogenomics approach to resolve the deeprelationships of the Vitaceae. This represents the first study in
PLOS ONE | www.plosone.org 1 September 2013 | Volume 8 | Issue 9 | e74394

plants to use RNA-Seq data to reconstruct phylogenies inflowering plants. Several previous studies employed RNA-Seqdata to explore the evolution of paleopolyploidy (e.g. [23-25];also see 26). The 1KP collaborative project has also generatedlarge-scale gene sequence information for many differentspecies of plants (http://www.onekp.com/).
Results and Discussion
Backbone relationships of the grape familyTranscriptome (RNA-Seq) data were obtained from 14
species of the grape family and one species of its sister familyLeeaceae (Table S1, Figure S1), and augmented with publiclyavailable whole genome data of the domesticated grape Vitisvinifera [27]. Each of the five major lineages of the grape family[3] was represented in the data. We obtained about twentymillion 90 bp paired-end DNA sequence reads from non-normalized cDNA libraries for each of the 15 species using anIllumina HiSeq 2000, assembled the sequence reads de novoand retained all contigs ≥ 150 bp for further analysis (TableS2). This strategy identified 417 orthologous genes suitable forconcatenation and phylogenetic inference (Table S3, also seeFigure S2), totaling 770,922 nucleotide and 256,974 aminoacid positions. After filtering out any gene where each taxoncontained no more than 50% of the data as missing, a 229gene data set resulted, totaling 334,317 nucleotide and111,439 amino acid positions.
Initial maximum likelihood analysis of the nucleotidesequences of the 417 gene matrix using PhyML [28] producedrobust support for relationships of the grape family (Figure 1; allnodes with 100% bootstrap support values). However, tominimize the impact of missing data, we subsequentlyemployed the 229 gene data set to explore variousphylogenetic inference methods. Maximum likelihood estimates(ML [28,29]) and Bayesian inference (BI) with a phylogeneticmixture model [30] of the 229 gene data set also supported thetopology shown in Figure 1. The maximum parsimony (MP)analyses [31], however, placed the Cissus clade at the base,even though the unrooted relationships within Vitaceae wereidentical with all three different analytical strategies (Figure 2).When we examined the data set closely, we noted that Cissusis the most divergent taxon within Vitaceae. The parsimonymethod has been known to be problematic under conditions ofgreatly unequal branch lengths, referred to as the long-branchattraction phenomenon [32]. Our analyses using maximumlikelihood with both PhyML (28) and RAxML [29], and Bayesianinference [30] all yielded an identical topology of Vitaceae(Figure 1) that showed all nodes with 100% bootstrap supportand posterior probabilities of 1.00, suggesting that all taxa ofVitaceae were represented by sufficient data to be reliablyplaced.
Thus, using the model-based analytical methods, weproduced a transcriptome phylogeny (Figure 1) that supportsthe Ampelopsis – Rhoicissus clade as the basally divergedclade in Vitaceae. Vitis, Ampelocissus, Pterisanthes, andNothocissus form a clade, which is sister to Parthenocissus.The taxa Cissus, Cayratia, Cyphostemma and Tetrastigmaform a separate clade, with the latter three genera forming a
subclade sister to core Cissus. These four genera possess twomorphological synapomorphies: 4-merous flowers and verywell-developed thick floral discs. This backbone relationship ofVitaceae is similar to the results of Ren et al. [3] using threechloroplast markers, but support values were relatively low forseveral major clades in that earlier study. It is of interest tomention that the deep clades, such as the Parthenocissus-Vitis-Ampelocissus-Nothocissus-Pterisanthus (PVANP) clade,as well as the clade of PVANP and Cayratia, Tetrastigma,Cyphostemma and Cissus, lack detectable morphologicalsynapomorphies. Morphological convergence is the most likelyreason for such a pattern at the deep level. All relationships atthe shallower level are consistent with the results of theprevious analyses of various clades of Vitaceae [4,6-8].
The biogeographic origin of the grape family has never beenexplored with analytical methods. With the phylogeny ofVitaceae unavailable at that time, in their seminal paper, Ravenand Axelrod [33] considered Vitaceae as a relatively ancientfamily and proposed that it might have originated in theLaurasian region and subsequently reached the SouthernHemisphere subsequently. The first diverged clade, i.e., theAmpelopsis-Rhoicissus clade, consists of ca. 43 speciesdisjunctly distributed over six continents (Asia, Europe, NorthAmerica, South America, Africa, and Australia), and representsa rare example in angiosperms with such a widely disjunctdistribution in both the Northern and the Southern Hemisphere.The Ampelopsis - Rhoicissus clade is composed of two distinctLaurasian lineages, each disjunct between the Old and theNew World, and one Southern Hemisphere group with aGondwana-like intercontinental disjunction: (Africa (Australia,and South America)). The biogeographic analyses of the 28species sampled by Nie et al. [34] suggested that theAmpelopsis – Rhoicissus clade had an early diversification inthe Northern Hemisphere and subsequently migrated into theSouthern Hemisphere and diversified there. Our results alsosupport the hypothesis that the primarily North Temperategrape genus Vitis forms a clade with the pantropicalAmpelocissus, and the tropical Asian Pterisanthes andNothocissus (Figure 1). This large clade of four generaconsisting of the close relatives of grapes is sister toParthenocissus, a North Temperate genus disjunct in easternAsia and eastern North America. Even though a biogeographicanalysis of the family is beyond the scope of the current paper,the establishment of the backbone phylogeny (Figure 1) willultimately facilitate our inference of the family at the globalscale and help elucidate the diversification processes involvingboth the temperate and tropical floristic elements. In particular,the placement of the Ampelopsis-Rhoicissus clade as the firstdiverged clade, the Northern Hemisphere taxa forming a grade,and the Southern Hemisphere taxa (e.g., Rhoicissus) nestedwithin the Northern Hemisphere grade (also see [34]) areconsistent with the Northern Hemisphere origin of the family. Adetailed biogeographic analysis with a broad taxon samplingscheme will be attempted in the near future.
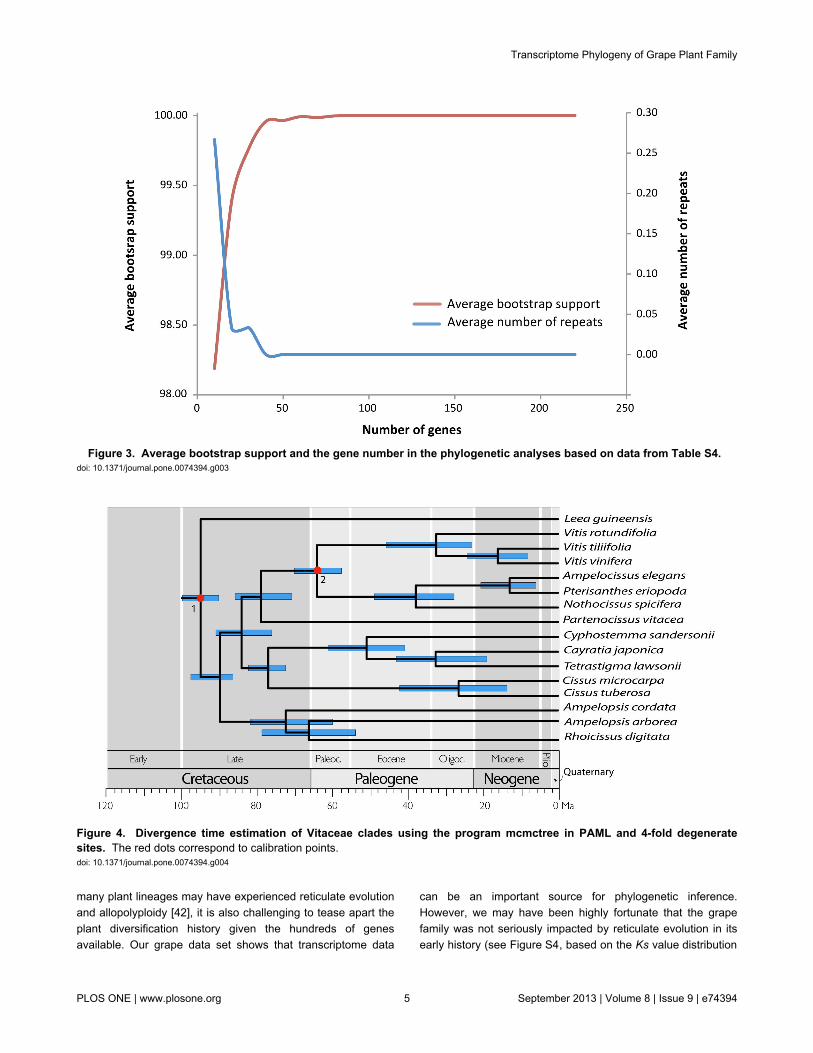
Given the strong support for the Vitaceae backbonephylogeny, we further tested its topological stability byproducing new data sets via randomly reducing the genenumber in multiples of 10, starting from the 229 gene tree. To
Transcriptome Phylogeny of Grape Plant Family
PLOS ONE | www.plosone.org 2 September 2013 | Volume 8 | Issue 9 | e74394

automatically obtain bootstrap support scores on the nodes oflarge numbers of trees, we used the following strategy. Foreach specified gene number N, we obtained a random set of Ngenes from the 229 orthologous genes. Then we built an MLtree based on this set and compared the topology of the treewith that of the standard tree (Figure 2). If the topologies werethe same, the set and tree were kept, or else they werediscarded, and new sets and trees would be created andfollowed by comparison of the new topology to the 229 genedata set. The process was repeated until a tree with standardtopology was obtained. For each N, the program built 30 treesbased on 30 random sets of N genes. N was set to 10, 20, 30..220. The average numbers of repeats for each N weretabulated and plotted (Figure 3). With just 30 genes, all nodeshad bootstrap support (BS) of more than 95% using thelikelihood approach in PhyML; with 40 genes, all nodes had BS
of at least 99% (Figure 2; Table S4). We also examined theaverage bootstrap support and the resampled nucleotidepositions in the phylogenetic analyses to show the topologicalstability (Figure S3). Our results thus indicate that RNA-Seq[35], even with non-normalized transcriptomes, offers access toprotein coding sequences very easily and quickly andrepresents a data-rich, accurate, and cost-effective source oforthologous sequences for phylogenetic inference.
Our data sets also showed that only 48 of the 229 gene treeshad exactly the topology found in Figure 1, and in fact, thegene trees were quite diverse in topology. Nevertheless, theconcatenated gene tree had all clades strongly supported. Thisresult is reminiscent of the study of Rokas et al. [36], whodemonstrated that concatenation of a sufficient number ofrandomly selected genes overwhelms conflicting signalspresent in different genes.
Figure 1. Maximum likelihood tree of Vitaceae using nucleotide sequences of 229 genes from the 15 transcriptomes ofVitaceae. The same topology was recovered from the 417 gene data set. Bootstrap support for all nodes was 100%, and posteriorprobabilities in the Bayesian inference for all nodes were 1.00.doi: 10.1371/journal.pone.0074394.g001
Transcriptome Phylogeny of Grape Plant Family
PLOS ONE | www.plosone.org 3 September 2013 | Volume 8 | Issue 9 | e74394

Utility of transcriptome data for phylogenetic inferenceA practical disadvantage of using the transcriptome
approach is that it requires high quality RNA from freshmaterial, while silica gel dried plant tissue samples andherbarium specimens will rarely yield good RNA. In fact,Hittinger et al. [20] have shown that large phylogenetic datamatrices can be assembled accurately from even short (50 bpaverage) transcript sequences, so even non-optimal plantmaterial, for example, that was preserved in “RNAlater” mayeventually be used for transcriptome data generation. Our datademonstrate that the transcriptomes can yield resolution forpreviously difficult to resolve radiations, especially at the familylevel in plants, in the time frame since the mid-Cretaceous(Figure 4). This may be true, even though these are codingsequences, since their third positions and the 5’ and 3’untranslated regions do evolve relatively rapidly [37].Transcriptome data can effectively lead to identification of truly
single copy transcripts and offer the conserved sequencesnecessary to generate primer pairs that can be used to amplifyand sequence rapidly evolving intron regions for studies at andbelow the species level, generally without cloning steps [38].The amplifications may then be standard ones followed bySanger sequencing, or may be ones employed in the next-generation sequencing approaches generally referred to astargeted sequence capture [39,40]. Nevertheless, as the RNA-Seq approach is still relatively costly, extensive taxon samplingis not presently feasible. Our sampling in the grape familyemphasized the backbone relationships and represents anexample of what we can accomplish using transcriptomes anda first step toward resolving the deep phylogeneticrelationships of Vitaceae.
Transcriptomic phylogenetic analyses do face somechallenges due to the complications associated withpseudogenes and paralogous comparisons [38,41]. Because
Figure 2. Unrooted tree of 15 species of Vitaceae based on nucleotide sequences of 229 genes. The node numberscorrespond to those in Table S4.doi: 10.1371/journal.pone.0074394.g002
Transcriptome Phylogeny of Grape Plant Family
PLOS ONE | www.plosone.org 4 September 2013 | Volume 8 | Issue 9 | e74394
many plant lineages may have experienced reticulate evolutionand allopolyploidy [42], it is also challenging to tease apart theplant diversification history given the hundreds of genesavailable. Our grape data set shows that transcriptome data
can be an important source for phylogenetic inference.However, we may have been highly fortunate that the grapefamily was not seriously impacted by reticulate evolution in itsearly history (see Figure S4, based on the Ks value distribution
Figure 3. Average bootstrap support and the gene number in the phylogenetic analyses based on data from Table S4. doi: 10.1371/journal.pone.0074394.g003
Figure 4. Divergence time estimation of Vitaceae clades using the program mcmctree in PAML and 4-fold degeneratesites. The red dots correspond to calibration points.doi: 10.1371/journal.pone.0074394.g004
Transcriptome Phylogeny of Grape Plant Family
PLOS ONE | www.plosone.org 5 September 2013 | Volume 8 | Issue 9 | e74394

of paralogs of species across the grape family), which allowedus to recover the highly robust topology (Figure 1).
With respect to data analyses, species tree approaches [43]may need to be explored more thoroughly and otherpartitioning strategies may be applied [44]. Testing andselecting genes with strong phylogenetic signals will be animportant next step with our data set (see [45]). New analyticalstrategies will be needed to handle these large data sets, andto deal with realistic assumptions about the complications ofmolecular evolution as well as differences in nucleotidesubstitution rates. A number of common computer programssuch as MrBayes [46], BEAST [47] and even PhyloBayes [44]cannot accommodate large data sets like ours with over300,000 aligned nucleotide positions at present. Clearly, thesystematic biology community needs to invest in thebioinformatics front more aggressively, as large data sets noware being generated at a rapid rate. Our study alsodemonstrates that the non-parametric parsimony method [31]may be misleading when handling genomic datasets withhundreds of thousands of characters when the sequenceevolution is highly unequal across taxa in the study group.Furthermore, our case study on the grape family is within thetime frame of 100 million years of evolution (Figure 4). If wemove deeper into the time scale of the tree of life, we expectadditional complications concerning homology of genesequences. Nevertheless, plant biologists have experiencedenormous difficulties in resolving deep relationships amongtaxa in the time frame of the last 100 million years, and ourdata demonstrate the power of transcriptome data over thisevolutionary time scale.
Materials and Methods
Ethics StatementNo specific permits were required for the collection of
samples as they were all grown in the greenhouse, whichcomplied with all relevant regulations. None of the samplesrepresents endangered or protected species.
RNA extraction and transcriptome sequencingTotal RNA was isolated from finely ground mixed tissue
samples of stems, leaves, tendrils and sometimes flowers ofplants growing in the Botany Department greenhouse of theSmithsonian Institution. Voucher information for the speciesused is given in Table S1. We used the Sigma Spectrum™Plant Total RNA Kit for the extractions. The transcriptomelibrary construction and sequencing were performed at BGI andfollowed the protocols in Peng et al. [48].
De novo assembly and transcript annotationAfter we obtained raw sequencing data, we first filtered out
reads of low quality, including cases of weak signal, largenumber of N’ s and PCR duplication. The reads with more than40 bases of low quality, i.e., 71 or lower Illumina scores or withmore than 20% of N (unknown) bases were all filtered out.Three software packages, Trinity [49], Velvet-Oases [50] andSOAPdenovo-Trans (http://soap.genomics.org.cn/
SOAPdenovo-Trans.html) were evaluated for the initialassembly. The genes from the grape whole genome annotationwere used as calibration to check the performance of theprograms. We also used a gene set of conservative proteins ineukaryotes to evaluate the assemblies. After comparing theassemblies to check for completeness, redundancy, and thecoverage of some essential or housekeeping genes in thegrape genome, we selected the software SOAPdenovo-Transas our assembler for its overall best performance.
After the de novo assembly of each sample withSOAPdenovo-Trans, we filtered out highly similar transcriptsthat may represent alternatively spliced transcripts. We thenaligned the remaining transcripts to the reference grapegenome in the Swiss-Prot database using BLAST [51] with theparameters “-e 1e-5 -F F -a 5”. The transcripts that could bealigned to reference sequences were selected and scanned todefine coding regions (CDS). Length distribution of the codingregions extracted from the 14 transcriptomes and onereference genome (Vitis vinifera) of Vitaceae is shown in FigureS1.
Gene orthologsSelf-to-self BLASTP [51] was conducted for all protein
sequences with an E-value of 1E-5. We assigned a connection(edge) between two nodes (genes) if the aligned length waslonger than 1/3 for both genes. An H-score that ranged from 0to 100 was used to weight the edges. For genes G1 and G2, H-score is defined as Score (G1, G2) *100 / max(Score(G1, G1),Score(G2, G2)), where Score(A, B) is BLAST raw score ofgenes A and B.
To define gene families, we used average distance for ahierarchical clustering algorithm implemented in Hcluster_sg(part of TreeFam) [52]. It required the minimum edge weight(H-score) to be larger than 5 and the minimum edge density(total number of edges / theoretical number of edges) to belarger than 1/3. One-to-one single-copy orthologous genefamilies were then selected. The length distribution of 417ortholog gene sequences (data including 6672 sequences, thetotal of 417 genes x 16 samples) is shown in Figure S2. Thegrape transcriptome sequence data have been deposited inGenBank (submission ID: Grape Transcriptome; submissioncontent: Transcriptome analysis of 16 grapes; Submission:Grape Transcriptome; Created SUBMISSION: ACC =SRA081731 subid = 14992).
Phylogenetic reconstructionMUSCLE [53] was used to obtain multi-sequence alignments
for each orthologous gene family. All alignments wereconcatenated for phylogenetic analyses using the optimalitycriteria of maximum parsimony (MP), maximum likelihood (ML),and Bayesian inference (BI), as implemented in PAUP 4.0b10[31], PhyML 7.2.6 [28] and RAxML [29] and BayesPhylogenies[30], respectively. For the MP analyses, we used heuristicsearches with tree-bisection-reconnection (TBR) branchswapping, MULTREES option on, and 1000 random additions.All characters were unordered and equally weighted, and gapswere treated as missing data in the analyses. For the MLanalysis, the ML tree was calculated assuming a GTR + CAT
Transcriptome Phylogeny of Grape Plant Family
PLOS ONE | www.plosone.org 6 September 2013 | Volume 8 | Issue 9 | e74394

model of sequence evolution. Robustness of inference wasassessed by running 1000 fast bootstrap replicates. For theBayesian analysis, we employed a joint model thataccommodates both rate-heterotachy and pattern-heterogeneity as implemented in the programBayesPhylogenies [30]. We performed two runs of 2 milliongenerations, sampling every 1000 generations, using 4 chainswith the default heating scheme. After discarding the first200,000 trees in the chain as a ‘‘burn-in’’ period, we sampled1000 trees to ensure that successive trees in our sample wereindependent.
Divergence time estimationWe used the program mcmctree in PAML [54] and 4-fold
degenerate sites to estimate divergence time. The fossil recordof Vitaceae is rich, and seed fossils can be differentiated at thegeneric level [55,56]. The oldest confirmed vitaceous seedfossil is unambiguously assigned to Ampelocissus s.l. (A.parvisemina) and dates back to the late Paleocene in NorthDakota of North America [56]. Furthermore, Ampelocissus hasbeen shown not to be monophyletic, but clearly forms a cladewith Vitis, Pterisanthes, and Nothocissus [2,3]. The stem of theVitis-Ampelocissus-Pterisanthes-Nothocissus clade was thusfixed at 58.5 ± 5.0 million yeas ago (Ma). For the root age ofthe family Vitaceae, Nie et al. [4,34] and Zecca et al. [57] fixedthe split between Vitaceae and its sister lineage, Leea, as 85 ±4.0 Ma based on the estimated age of 78-92 Ma by Wikströmet al. [58]. However, Magallón and Castillo [59] reported a pre-Tertiary origin at 90.65 to 90.82 Ma for Vitaceae. The estimatedages from Magallón and Castillo [48] and Wikström et al. [58]are close, but the latter was criticized for using nonparametricrate smoothing and for calibrating the tree using only a singlecalibration point [50]. We herein use the estimate fromMagallón and Castillo [59] and set the normal prior distributionof 90.7±1.0 Ma for the stem age of the family.
Supporting Information
Figure S1. Length distribution of the coding regions extractedfrom the 14 transcriptomes and one reference genome (Vitisvinifera) of Vitaceae. Sample numbers are shown in Table S1.(TIF)
Figure S2. Length distribution of 417 ortholog genesequences (data include 6672 sequences, the total of 417genes x 16 samples).
(TIF)
Figure S3. Average bootstrap support and the resamplednucleotide positions in the phylogenetic analyses to show thetopological stability.(TIF)
Figure S4. Ks value distributions for paralogs of Vitaceaespecies and the outgroup.(TIF)
Table S1. Vitaceae species sampled for the grapetranscriptome analyses. Voucher specimens are deposited atthe US National Herbarium (US).(DOCX)
Table S2. Statistical information of the transcriptomes of 15species of Vitaceae and Leeaceae.(DOCX)
Table S3. The 1:1:1 orthlog genes selected for phylogeneticanalysis of the grape family.(DOCX)
Table S4. Topological stability as estimated by bootstrapsupport of nodes with the maximum likelihood method byrandomly reducing the gene number by 10, starting from the229 gene data set.(DOCX)
Acknowledgements
We thank Mike Barker and Sarah Mathews for advice anddiscussions and Tim Utteridge for the photo of Pterisanthes.
Author Contributions
Conceived and designed the experiments: JW EAZ XDF.Performed the experiments: JW ZQX ZLN LKM XZK YBZ.Analyzed the data: ZQX ZLN LKM JW. Wrote the manuscript:JW ZQX ZLN LKM JG XDF SMI EAZ.
References
1. Wen J (2007) Vitaceae in K Kubitzki, The families and genera ofvascular plants, vol. 9. Berlin: Springer-Verlag. pp 466–478.
2. Wen J, Nie Z-L, Soejima A, Meng Y (2007) Phylogeny of Vitaceaebased on the nuclear GAI1 gene sequences. Can J Bot 85: 731–745.doi:10.1139/B07-071.
3. Ren H, Lu L-M, Soejima A, Luke Q, Zhang D-X et al. (2011)Phylogenetic analysis of the grape family (Vitaceae) based on thenoncoding plastid trnC-petN, trnH-psbA, and trnL-F sequences. Taxon60: 629–637.
4. Nie ZL, Sun H, Chen ZD, Meng Y, Manchester SR et al. (2010)Molecular phylogeny and biogeographic diversification ofParthenocissus (Vitaceae) disjunct between Asia and North America.
Am J Bot 97: 1342–1353. doi:10.3732/ajb.1000085. PubMed:21616887.
5. Soejima A, Wen J (2006) Phylogenetic analysis of the grape family(Vitaceae) based on three chloroplast markers. Am J Bot 93: 278–287.doi:10.3732/ajb.93.2.278. PubMed: 21646189.
6. Lu L, Wen J, Chen Z (2012) A combined morphological and molecularphylogenetic analysis of Parthenocissus (Vitaceae) and taxonomicimplications. Bot J Linn Soc, 168: 43–63. doi:10.1111/j.1095-8339.2011.01186.x.
7. Lu L, Wang W, Chen Z, Wen J (2013) Phylogeny of the non-monophyletic Cayratia Juss. (Vitaceae) and implications for character
Transcriptome Phylogeny of Grape Plant Family
PLOS ONE | www.plosone.org 7 September 2013 | Volume 8 | Issue 9 | e74394

evolution and biogeography. Mol Phylogenet Evol 68: 502–515. doi:10.1016/j.ympev.2013.04.023. PubMed: 23669013.
8. Liu XQ, Ickert-Bond SM, Chen LQ, Wen J (2013) Molecular phylogenyof Cissus L. of Vitaceae (the grape family) and evolution of itspantropical intercontinental disjunctions. Mol Phylogenet Evol 66(1):43–53. doi:10.1016/j.ympev.2012.09.003. PubMed: 23000818.
9. Kocot KM, Cannon JT, Todt C, Citarella MR, Kohn AB et al. (2011)Phylogenomics reveals deep molluscan relationships. Nature 477:452–456. doi:10.1038/nature10382. PubMed: 21892190.
10. Bell CD, Kutschker A, Arroyo MTK (2012) Phylogeny and diversificationof Valerianaceae (Dipsacales) in the southern Andes. Mol PhylogenetEvol 63: 724–737. doi:10.1016/j.ympev.2012.02.015. PubMed:22421085.
11. Wen J, Plunkett GM, Mitchell A, Wagstaff S (2001) Evolution ofAraliaceae: a phylogenetic analysis based on the ITS sequences ofnrDNA. Syst Bot 26: 144–167.
12. Plunkett GM, Wen J, Lowry PP (2004) Infrafamilial relationships inAraliaceae: Insights from nuclear (ITS) and plastid (trnL-trnF) sequencedata. Plant Syst Evol 245: 1–39.
13. Gernandt DS, Magallón S, Lopez GG, Flores OZ, Willyard A et al.(2008) Use of simultaneous analyses to guide fossil-based calibrationsof Pinaceae phylogeny. Int J Plant Sci 169: 1086–1099. doi:10.1086/590472.
14. Bremer B, Eriksson T (2009) Time tree of Rubiaceae: Phylogeny anddating the family, subfamilies and tribes. Int J Plant Sci 170: 766–793.doi:10.1086/599077.
15. Franzke A, German D, Al-Shehbaz IA, Mummenhoff K (2009)Arabidopsis family ties: molecular phylogeny and age estimates inBrassicaceae. Taxon 58: 425–437.
16. Olmstead RG, Zjhra ML, Lohmann LG, Grose SO, Eckert AJ (2009) Amolecular phylogeny and classification of Bignoniaceae. Am J Bot 96:1731–1743. doi:10.3732/ajb.0900004. PubMed: 21622359.
17. Nylander JAA, Olsson U, Alström P, Sanmartín I (2008) Accounting forphylogenetic uncertainty in biogeography: A Bayesian approach todispersal-vicariance analysis of the thrushes (Aves: Turdus). Syst Biol57: 257–268. doi:10.1080/10635150802044003. PubMed: 18425716.
18. Ree RH, Smith SA (2008) Maximum likelihood inference of geographicrange evolution by dispersal, local extinction, and cladogenesis. SystBiol 57: 4–14. doi:10.1080/10635150701883881. PubMed: 18253896.
19. Yu Y, Harris AJ, He X (2010) S-DIVA (Statistical Dispersal-VicarianceAnalysis): A tool for inferring biogeographic histories. Mol PhylogenetEvol 56: 848–850. doi:10.1016/j.ympev.2010.04.011. PubMed:20399277.
20. Hittinger CT, Johnston M, Tossberg JT, Rokas A (2010) Leveragingskewed transcript abundance by RNA-Seq to increase the genomicdepth of the tree of life. Proc Natl Acad Sci U S A 107: 1476–1481. doi:10.1073/pnas.0910449107. PubMed: 20080632.
21. Smith SA, Wilson NG, Goetz FE, Feehery C, Andrade SCS et al.(2011) Resolving the evolutionary relationships of molluscs withphylogenomic tools. Nature 480: 364–367. doi:10.1038/nature10526.PubMed: 22031330.
22. Chiari Y, Cahais V, Galtier N, Delsuc F (2012) Phylogenomic analysessupport the position of turtles as the sister group of birds and crocodiles(Archosauria). BMC Biol 10: 65. doi:10.1186/1741-7007-10-65.PubMed: 22839781.
23. Barker MS, Kane NC, Matvienko M, Kozik A, Michelmore RW et al.(2008) Multiple paleopolyploidizations during the evolution of theCompositae reveal parallel patterns of duplicate gene retention aftermillions of years. Mol Biol Evol 25: 2445–2455. doi:10.1093/molbev/msn187. PubMed: 18728074.
24. Barker MS, Vogel H, Schranz ME (2009) Paleopolyploidy in theBrassicales: Analyses of the Cleome transcriptome elucidate thehistory of genome duplications in Arabidopsis and other Brassicales.Genome Biol Evolution 1(1): 391–399. PubMed: 20333207.
25. McKain MR, Wickett N, Zhang Y, Ayyampalayam S, McCombie WR etal. (2012) Phylogenomic analysis of transcriptome data elucidates co-occurrence of a paleopolyploid event and the origin of bimodalkaryotypes in Agavoideae (Asparagaceae). Am J Bot 99: 397–406. doi:10.3732/ajb.1100537. PubMed: 22301890.
26. Cronn R, Knaus BJ, Liston A, Maughan PJ, Parks M et al. (2012)Targeted enrichment strategies for next-generation plant biology. Am JBot 99: 291–311. doi:10.3732/ajb.1100356. PubMed: 22312117.
27. Jaillon O, Aury JM, Noel B, Policriti A, Clepet C et al. (2007) Thegrapevine genome sequence suggests ancestral hexaploidization inmajor angiosperm phyla. Nature 449: 463–467. doi:10.1038/nature06148. PubMed: 17721507.
28. Guindon S, Dufayard J-F, Lefort V, Anisimova M, Hordijk W et al.(2010) New algorithms and methods to estimate maximum-likelihood
phylogenies: assessing the performance of PhyML. Syst Biol 3.0 59:307–321.
29. Stamatakis A (2006) RAxML-VI-HPC: Maximum likelihood-basedphylogenetic analyses with thousands of taxa and mixed models.Bioinformatics 22: 2688–2690. doi:10.1093/bioinformatics/btl446.PubMed: 16928733.
30. Pagel M, Meade A (2004) A phylogenetic mixture model for detectingpattern-heterogeneity in gene sequence or character-state data. SystBiol 53: 571–581. doi:10.1080/10635150490468675. PubMed:15371247.
31. Swofford DL (2003) PAUP*. Phylogenetic Analysis Using Parsimony (*and Other Methods), version 4. Sunderland, MA: Sinauer Associates.
32. Felsenstein J (1978) Cases in which parsimony or compatibilitymethods will be positively misleading. Syst Zool 27: 401-410. doi:10.2307/2412923.
33. Raven PH, Axelrod DI (1974) Angiosperm biogeography and pastcontinental movements. Ann Mo Bot Gard 61: 539–673. doi:10.2307/2395021.
34. Nie ZL, Sun H, Manchester SR, Meng Y, Luke Q et al. (2012) Evolutionof the intercontinental disjunctions in six continents in the Ampelopsisclade of the grape family (Vitaceae). BMC Evol Biol 12: 17. doi:10.1186/1471-2148-12-17.
35. Wang Z, Gerstein M, Snyder M (2009) RNA-Seq: A revolutionary toolfor transcriptomics. Nat Rev Genet 10: 57–63. doi:10.1038/nrg2484.PubMed: 19015660.
36. Rokas A, Williams BL, King N, Carroll SB (2003) Genome-scaleapproaches to resolving incongruence in molecular phylogenies.Nature 425: 798–804. doi:10.1038/nature02053. PubMed: 14574403.
37. Whittall JB, Medina-Marino A, Zimmer EA, Hodges SA (2006)Generating single-copy nuclear gene data in a recent adaptiveradiation. Mol Phylogenet Evol 39: 124–134. doi:10.1016/j.ympev.2005.10.010. PubMed: 16314114.
38. Zimmer EA, Wen J (2012) Using nuclear gene data for plantphylogenetics: progress and prospects. Mol Phylogenet Evol 65:774-785. doi:10.1016/j.ympev.2012.07.015. PubMed: 22842093.
39. Faircloth BC, McCormack JE, Crawford NG, Harvey MG, Brumfield RTet al. (2012) Ultraconserved elements anchor thousands of geneticmarkers for target enrichment spanning multiple evolutionarytimescales. Syst Biol 61: 717-726. doi:10.1093/sysbio/sys004. PubMed:22232343.
40. Grover CE, Salmon A, Wendel JF (2012) Targeted sequence captureas a powerful tool for evolutionary analysis. Am J Bot 99: 312–319. doi:10.3732/ajb.1100323. PubMed: 22268225.
41. Franssen SU, Shrestha RP, Bräutigam A, Bornberg-Bauer E, WeberAPM (2011) Comprehensive transcriptome analysis of the highlycomplex Pisum sativum genome using next generation sequencing.BMC Genomics 12: 227. doi:10.1186/1471-2164-12-227. PubMed:21569327.
42. Soltis DE, Albert VA, Leebens-Mack J, Bell CD, Paterson AH et al.(2009) Polyploidy and angiosperm diversification. Am J Bot 96: 336–348. doi:10.3732/ajb.0800079. PubMed: 21628192.
43. Liu L, Yu L, Edwards SV (2010) A maximum pseudo-likelihoodapproach for estimating species trees under the coalescent model.BMC Evol Biol 10: 302. doi:10.1186/1471-2148-10-302. PubMed:20937096.
44. Lartillot N, Blanquart S, Lepage T (2012) PhyloBayes. p. 3.3, aBayesian software for phylogenetic reconstruction and molecular datingusing mixture models. Available: www.phylobayes.org. Accessed 2013January 15.
45. Salichos L, Rokas A (2013) Inferring ancient divergences requiresgenes with strong phylogenetic signals. Nature 497: 327-333. doi:10.1038/nature12130. PubMed: 23657258.
46. Huelsenbeck JP, Ronquist R (2001) MRBAYES: Bayesian inference ofphylogenetic trees. Bioinformatics 17: 754-755. doi:10.1093/bioinformatics/17.8.754. PubMed: 11524383.
47. Drummond AJ, Rambaut A (2007) BEAST: Bayesian evolutionaryanalysis by sampling trees. BMC Evol Biol 7: 214. doi:10.1186/1471-2148-7-214. PubMed: 17996036.
48. Peng Z, Cheng Y, Tan BC, Kang L, Tian Z et al. (2012) Comprehensiveanalysis of RNA-seq data reveals extensive RNA editing in a humantranscriptome. Nat Biotechnol 30: 253–260. doi:10.1038/nbt.2122.PubMed: 22327324.
49. Grabherr MG, Haas BJ, Yassour M, Levin JZ, Thompson DA et al.(2011) Full-length transcriptome assembly from RNA-seq data withouta reference genome. Nat Biotechnol 29: 644–652. doi:10.1038/nbt.1883. PubMed: 21572440.
50. Schulz MH, Zerbino DR, Vingron M, Birney E (2012) Oases: Robust denovo RNA-seq assembly across the dynamic range of expression
Transcriptome Phylogeny of Grape Plant Family
PLOS ONE | www.plosone.org 8 September 2013 | Volume 8 | Issue 9 | e74394

levels. Bioinformatics 28: 1086–1092. doi:10.1093/bioinformatics/bts094. PubMed: 22368243.
51. Altschul SF, Madden TL, Schäffer AA, Zhang J, Zhang Z et al. (1997)Gapped BLAST and PSI-BLAST: A new generation of protein databasesearch programs. Nucleic Acids Res 25: 3389–3402. doi:10.1093/nar/25.17.3389. PubMed: 9254694.
52. Li H, Coghlan A, Ruan J, Coin LJ, Hériché JK et al. (2006) TreeFam: Acurated database of phylogenetic trees of animal gene families. NucleicAcids Res 34: D572–D580. doi:10.1093/nar/gkj118. PubMed:16381935.
53. Edgar RC (2004) MUSCLE: multiple sequence alignment with highaccuracy and high throughput. Nucleic Acids Res 32: 1792–1797. doi:10.1093/nar/gkh340. PubMed: 15034147.
54. Yang Z (2007) PAML 4: Phylogenetic analysis by maximum likelihood.Mol Biol Evol 24: 1586–1591. doi:10.1093/molbev/msm088. PubMed:17483113.
55. Chen I, Manchester SR (2007) Seed morphology of modern and fossilAmpelocissus (Vitaceae) and implications for phytogeography. Am JBot 94: 1534–1553. doi:10.3732/ajb.94.9.1534. PubMed: 21636520.
56. Chen I, Manchester SR (2011) Seed morphology of Vitaceae. Int JPlant Sci 172: 1–35. doi:10.1086/657283.
57. Zecca G, Abbott JR, Sun WB, Spada A, Sala F et al. (2012) The timingand the mode of evolution of wild grapes (Vitis). Mol Phylogenet Evol62: 736–747. doi:10.1016/j.ympev.2011.11.015. PubMed: 22138159.
58. Wikström N, Savolainen V, Chase MW (2001) Evolution of theangiosperms: Calibrating the family tree. Proc R Soc Lond B 268:2211–2220. doi:10.1098/rspb.2001.1782. PubMed: 11674868.
59. Magallón SA, Castillo A (2009) Angiosperm diversification through time.Am J Bot 96: 349–365. doi:10.3732/ajb.0800060. PubMed: 21628193.
Transcriptome Phylogeny of Grape Plant Family
PLOS ONE | www.plosone.org 9 September 2013 | Volume 8 | Issue 9 | e74394