
Transcriptional profiling of host gene expression in chicken embryo lung cells infected with...
15
RESEARCH ARTICLE Open Access Transcriptional profiling of host gene expression in chicken embryo lung cells infected with laryngotracheitis virus Jeong Yoon Lee 1,2 , Joon Jin Song 2,3 , Ann Wooming 1 , Xianyao Li 4 , Huaijun Zhou 4 , Walter G Bottje 1,2 , Byung-Whi Kong 1,2* Abstract Background: Infection by infectious laryngotracheitis virus (ILTV; gallid herpesvirus 1) causes acute respiratory diseases in chickens often with high mortality. To better understand host-ILTV interactions at the host transcriptional level, a microarray analysis was performed using 4 × 44 K Agilent chicken custom oligo microarrays. Results: Microarrays were hybridized using the two color hybridization method with total RNA extracted from ILTV infected chicken embryo lung cells at 0, 1, 3, 5, and 7 days post infection (dpi). Results showed that 789 genes were differentially expressed in response to ILTV infection that include genes involved in the immune system (cytokines, chemokines, MHC, and NF-B), cell cycle regulation (cyclin B2, CDK1, and CKI3), matrix metalloproteinases (MMPs) and cellular metabolism. Differential expression for 20 out of 789 genes were confirmed by quantitative reverse transcription-PCR (qRT-PCR). A bioinformatics tool (Ingenuity Pathway Analysis) used to analyze biological functions and pathways on the group of 789 differentially expressed genes revealed that 21 possible gene networks with intermolecular connections among 275 functionally identified genes. These 275 genes were classified into a number of functional groups that included cancer, genetic disorder, cellular growth and proliferation, and cell death. Conclusion: The results of this study provide comprehensive knowledge on global gene expression, and biological functionalities of differentially expressed genes in chicken embryo lung cells in response to ILTV infections. Background Infectious laryngotracheitis virus (ILTV; gallid herpes- virus 1) is the only member of the Iltovirus genus of the Alphaherpesvirinae subfamily of the Herpesviridae family. ILTV includes ~150 kb of linear dsDNA genome consist- ing of two unique regions (unique long; UL and unique short; US), inverted repeats (IR) and terminal repeats (TR) flanking the US region [1]. About 76 open reading frames (ORFs) have been shown to express viral proteins in ILTV [2]. The genome structure and gene contents of the ILTV genome clearly prove its classification as an alphaherpesvirus [3]. Infection of ILTV causes an upper respiratory disease in chickens during lytic infection, and ILTV can establish latency in the central nervous system. Respiratory symptoms of ILTV infection include dramati- cally increased mucus formation in the trachea and tra- cheal hemorrhage that can cause up to 70% mortality. Currently, live attenuated vaccines developed from chicken embryo or cultured cells are commercially avail- able to control ILTV disease [4]. However, vaccinal lar- yngtracheitis (VLT), resulting from reversion of vaccine virus to virulent form and spreading from vaccinated- to unvaccinated birds, is often associated with the use of live attenuated ILTV vaccines [5,6]. Microarray methodology was developed as an epochal method to simultaneously analyze enormous data sets for gene expression patterns in various biological condi- tions [7]. Microarrays have been used to investigate host responses to the infection of various viruses such as Epstein-Barr virus (EBV) [8-10], varicella-zoster virus (VZV) [11], human cytomegalovirus (HCMV) [12], Mar- ek’s disease virus (MDV) [13-17], herpesvirus of turkey * Correspondence: [email protected] 1 Department of Poultry Science, University of Arkansas, Fayetteville, AR 72701, USA Lee et al. BMC Genomics 2010, 11:445 http://www.biomedcentral.com/1471-2164/11/445 © 2010 Lee et al; licensee BioMed Central Ltd. This is an Open Access article distributed under the terms of the Creative Commons Attribution License (http://creativecommons.org/licenses/by/2.0), which permits unrestricted use, distribution, and reproduction in any medium, provided the original work is properly cited.
-
Upload
independent -
Category
Documents
-
view
4 -
download
0
Transcript of Transcriptional profiling of host gene expression in chicken embryo lung cells infected with...
RESEARCH ARTICLE Open Access
Transcriptional profiling of host gene expressionin chicken embryo lung cells infected withlaryngotracheitis virusJeong Yoon Lee1,2, Joon Jin Song2,3, Ann Wooming1, Xianyao Li4, Huaijun Zhou4, Walter G Bottje1,2,Byung-Whi Kong1,2*
Abstract
Background: Infection by infectious laryngotracheitis virus (ILTV; gallid herpesvirus 1) causes acute respiratorydiseases in chickens often with high mortality. To better understand host-ILTV interactions at the hosttranscriptional level, a microarray analysis was performed using 4 × 44 K Agilent chicken custom oligo microarrays.
Results: Microarrays were hybridized using the two color hybridization method with total RNA extracted from ILTVinfected chicken embryo lung cells at 0, 1, 3, 5, and 7 days post infection (dpi). Results showed that 789 geneswere differentially expressed in response to ILTV infection that include genes involved in the immune system(cytokines, chemokines, MHC, and NF-�B), cell cycle regulation (cyclin B2, CDK1, and CKI3), matrixmetalloproteinases (MMPs) and cellular metabolism. Differential expression for 20 out of 789 genes were confirmedby quantitative reverse transcription-PCR (qRT-PCR). A bioinformatics tool (Ingenuity Pathway Analysis) used toanalyze biological functions and pathways on the group of 789 differentially expressed genes revealed that 21possible gene networks with intermolecular connections among 275 functionally identified genes. These 275 geneswere classified into a number of functional groups that included cancer, genetic disorder, cellular growth andproliferation, and cell death.
Conclusion: The results of this study provide comprehensive knowledge on global gene expression, and biologicalfunctionalities of differentially expressed genes in chicken embryo lung cells in response to ILTV infections.
BackgroundInfectious laryngotracheitis virus (ILTV; gallid herpes-virus 1) is the only member of the Iltovirus genus of theAlphaherpesvirinae subfamily of the Herpesviridae family.ILTV includes ~150 kb of linear dsDNA genome consist-ing of two unique regions (unique long; UL and uniqueshort; US), inverted repeats (IR) and terminal repeats(TR) flanking the US region [1]. About 76 open readingframes (ORFs) have been shown to express viral proteinsin ILTV [2]. The genome structure and gene contents ofthe ILTV genome clearly prove its classification as analphaherpesvirus [3]. Infection of ILTV causes an upperrespiratory disease in chickens during lytic infection, andILTV can establish latency in the central nervous system.
Respiratory symptoms of ILTV infection include dramati-cally increased mucus formation in the trachea and tra-cheal hemorrhage that can cause up to 70% mortality.Currently, live attenuated vaccines developed fromchicken embryo or cultured cells are commercially avail-able to control ILTV disease [4]. However, vaccinal lar-yngtracheitis (VLT), resulting from reversion of vaccinevirus to virulent form and spreading from vaccinated- tounvaccinated birds, is often associated with the use oflive attenuated ILTV vaccines [5,6].Microarray methodology was developed as an epochal
method to simultaneously analyze enormous data setsfor gene expression patterns in various biological condi-tions [7]. Microarrays have been used to investigate hostresponses to the infection of various viruses such asEpstein-Barr virus (EBV) [8-10], varicella-zoster virus(VZV) [11], human cytomegalovirus (HCMV) [12], Mar-ek’s disease virus (MDV) [13-17], herpesvirus of turkey
* Correspondence: [email protected] of Poultry Science, University of Arkansas, Fayetteville, AR72701, USA
Lee et al. BMC Genomics 2010, 11:445http://www.biomedcentral.com/1471-2164/11/445
© 2010 Lee et al; licensee BioMed Central Ltd. This is an Open Access article distributed under the terms of the Creative CommonsAttribution License (http://creativecommons.org/licenses/by/2.0), which permits unrestricted use, distribution, and reproduction inany medium, provided the original work is properly cited.
[18], herpes simplex virus-1 (HSV-1) [19,20], hepatitisvirus [21], human immunodeficiency virus (HIV) [22-25]and coxsackieviruses [26].Microarray data sets can be interpreted further by
clustering analysis. Many of the heuristic clusteringmethods have several shortcomings; these include thedetermination of the number of clusters which generallyis unknown when there is no prior knowledge of thenumber or there no other information about the struc-ture of the data to be clustered. A model-based cluster-ing method can overcome these critical drawbacks bytreating a clustering problem as a model selection pro-blem over a variety of candidate models specified by dif-ferent numbers of clusters and distribution, and byestimating the number of clusters in the clustering ana-lysis. The best model is selected on the basis of a modelselection criterion, simultaneously providing the optimalnumber of clusters and assigning cluster membership toobservations.To our knowledge, the effects of ILTV infection on
changes in global gene expression in host cells have notbeen previously reported. ILTV is a special type of her-pesvirus that causes acute respiratory disease in poultry.Thus, the objective of this study was to understand hostresponses to ILTV infection in cultured chicken embryolung cells using microarray analysis. The microarrayused in the current study contains 44 K chicken genesincluding functionally identified genes, predicted ORFs,ESTs, genomic contigs, chicken microRNAs and variouscontrol spots [27]. Importantly, functional analysis ofdifferentially expressed genes should follow gene discov-ery research. To this end, a software program (IngenuityPathway Analysis), specifically developed to analyzelarge data sets such as microarray data for biologicalfunctionalities, gene networks, and physiological path-ways [28], was used to assign biological functionalitiesand molecular interactions in chicken embryo lung cellsafter 1 to 7 days in response to ILTV infection.
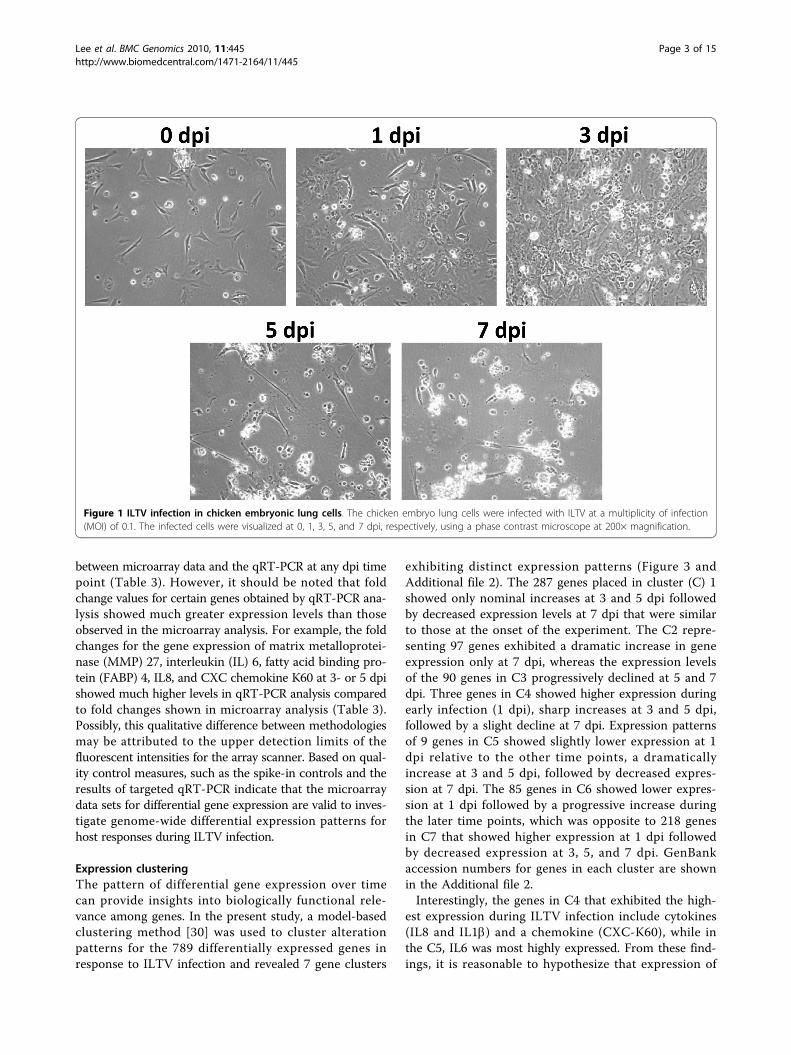
Results and DiscussionGene expression profile of lung cells infected by ILTVPrimary chicken embryo lung cells at passage 1 wereinfected by the USDA reference strain of ILTV and cellswere collected at 1, 3, 5, and 7 dpi. Cytopathic effects(CPE) were observed by 3 dpi, which became moresevere by 5 dpi. Massive cell disruption was observed at7 dpi (Figure 1). Total RNA was isolated from both con-trols and infected lung cells at each dpi time point andsubjected to microarray analysis.To control for dye bias effects, spike-in control mix-
tures were utilized by mixing with RNA samples accord-ing to the manufacturer’s recommendations (SeeMethods). The spike-in RNA controls consisted of twosets of synthetic RNA mixtures derived from the
Adenovirus E1A genes with different concentrations ineach set [29]. The Agilent chicken 4 × 44 K oligo geneexpression array contains 320 spike-in indicator spots tobe hybridized with spike-in controls of both A mix,which was hybridized with Cy 3, and the B mix hybri-dized with Cy 5 on each array. These spike-in sets weremixed with either uninfected control or infected samplesand co-hybridized to arrays. The ratio of signal intensi-ties for all spike-in spots were calculated, evaluated, andrevealed no significant dye effects on all array slides(data not shown) as reported previously [29]. All rawand normalized data were deposited in the Gene Expres-sion Omnibus (GEO; accession number: GSE20630).Normalized signal intensities were subjected to statis-
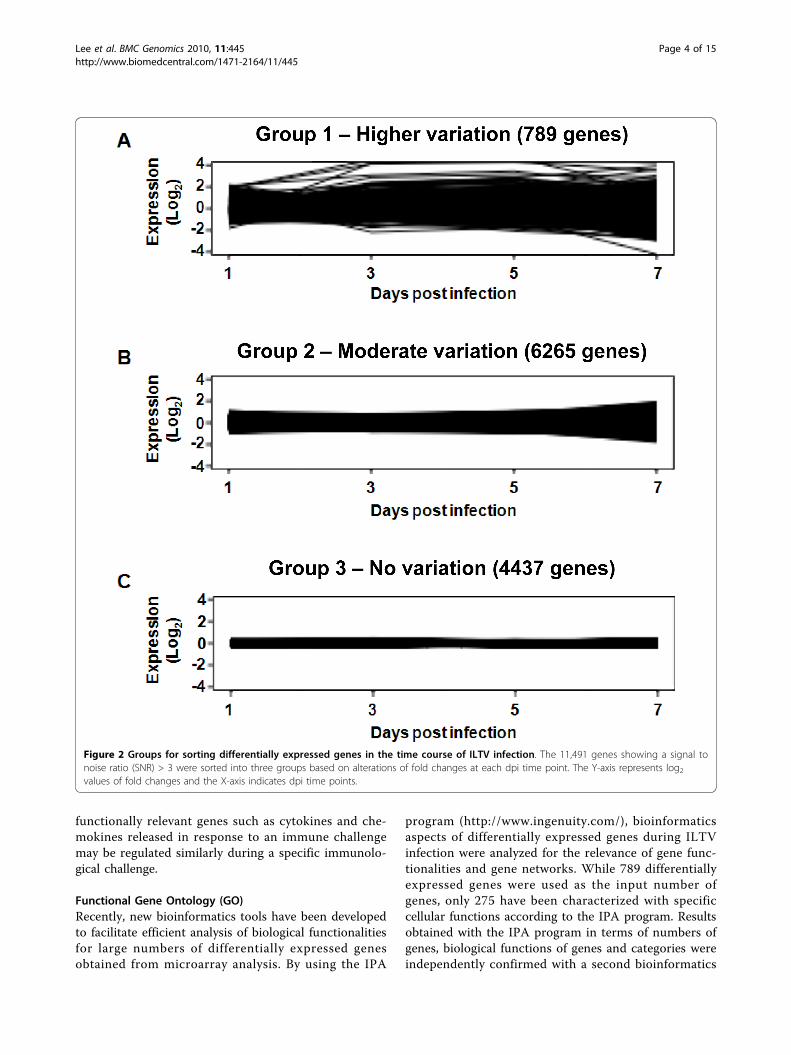
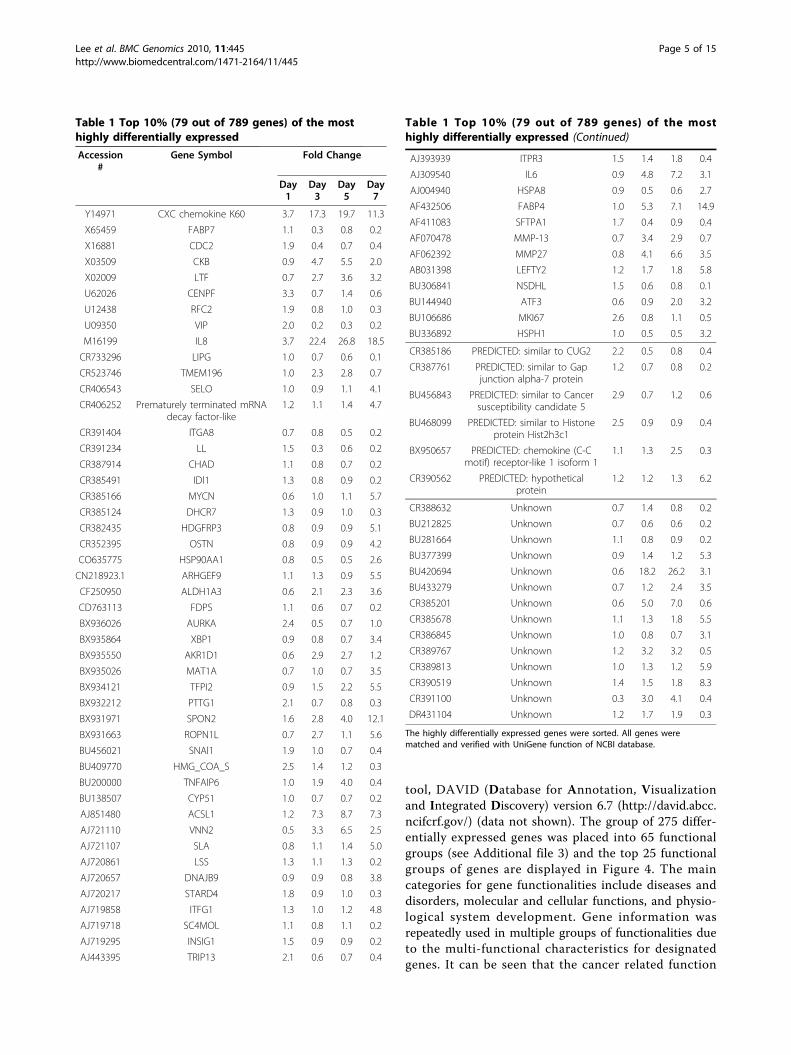
tical analysis to find differentially expressed genes dur-ing ILTV infection in cultured embryonic lung cells.The 44 K array revealed 11,491 genes with significantsignal intensities that were sorted by signal to noiseratio (SNR) >3, meaning that real (forward) signals ofthe samples were three times greater than backgroundsignals. In order to discover time course change in geneexpression patterns, a model-based method [30] wasused for clustering the gene expression profiles. A keydrawback in heuristic clustering techniques is that it isdifficult to determine the number of clusters a priori.The method enables the number of clusters to be deter-mined by estimating the number of components in amultivariate normal mixture model from which the dataare generated. The clustering analysis resulted in threegene groups (Figure 2). Group 1 included a total of 789genes that showed significant differential expression inresponse to ILTV, Group 2 included 6,265 genes thatdisplayed moderate alterations, and Group 3 included4,437 genes that revealed no alterations during ILTVinfection at four time points in chicken lung cells. Ofthe 789 genes in Group 1 exhibiting differential expres-sion in response to ILTV (see Additional file 1), the top10% (79 genes) were sorted by statistical analysis basedon the highest value of standard deviations using themean values of four different time points (Table 1). Thisapproach highlights genes with more significant altera-tions in response to ILTV overtime. Out of the 789genes, 390, 370, 320, and 422 genes were down-regu-lated, while 399, 419, 469, and 367 genes were up-regu-lated relative to uninfected cells at 1, 3, 5, and 7 dpi,respectively.
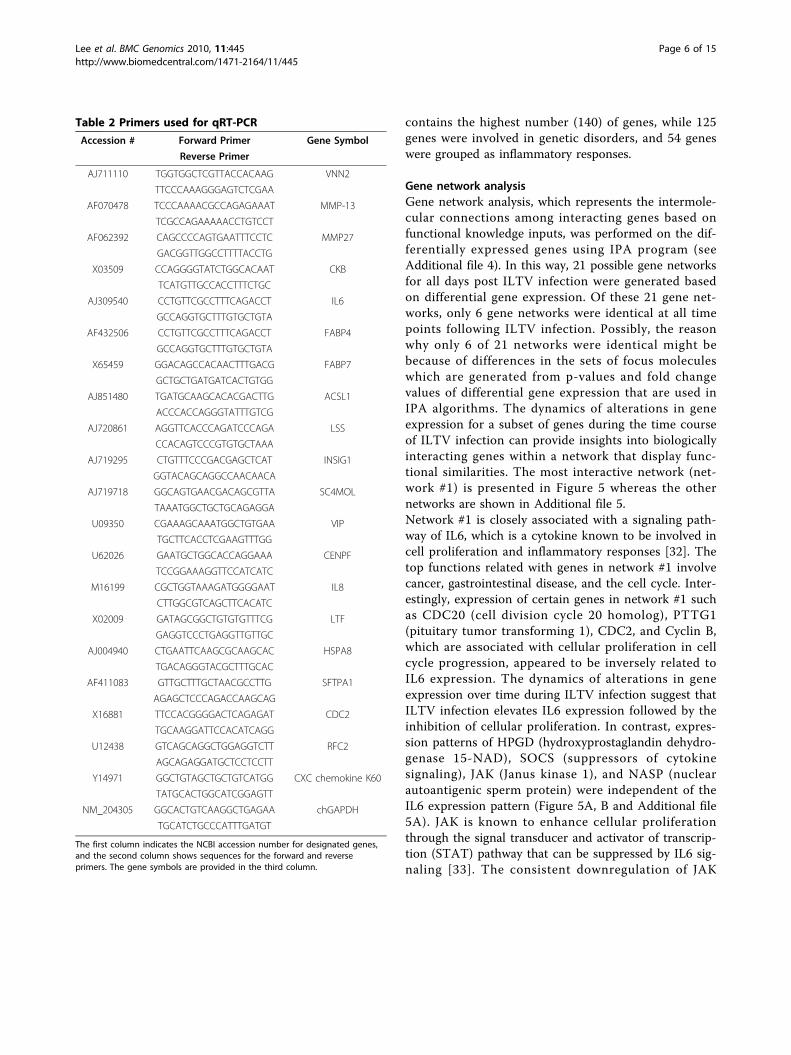
Quantitative reverse transcription-PCR (qRT-PCR)To validate the microarray data, 20 genes were subjected toqRT-PCR using gene specific primer pairs and the sameRNA samples as in the microarray analysis (Table 2).Results were analyzed by 2-ΔΔCt method to determine rela-tive levels of gene expression at each dpi time point com-pared to uninfected control [31]. There were no differences
Lee et al. BMC Genomics 2010, 11:445http://www.biomedcentral.com/1471-2164/11/445
Page 2 of 15
between microarray data and the qRT-PCR at any dpi timepoint (Table 3). However, it should be noted that foldchange values for certain genes obtained by qRT-PCR ana-lysis showed much greater expression levels than thoseobserved in the microarray analysis. For example, the foldchanges for the gene expression of matrix metalloprotei-nase (MMP) 27, interleukin (IL) 6, fatty acid binding pro-tein (FABP) 4, IL8, and CXC chemokine K60 at 3- or 5 dpishowed much higher levels in qRT-PCR analysis comparedto fold changes shown in microarray analysis (Table 3).Possibly, this qualitative difference between methodologiesmay be attributed to the upper detection limits of thefluorescent intensities for the array scanner. Based on qual-ity control measures, such as the spike-in controls and theresults of targeted qRT-PCR indicate that the microarraydata sets for differential gene expression are valid to inves-tigate genome-wide differential expression patterns forhost responses during ILTV infection.
Expression clusteringThe pattern of differential gene expression over timecan provide insights into biologically functional rele-vance among genes. In the present study, a model-basedclustering method [30] was used to cluster alterationpatterns for the 789 differentially expressed genes inresponse to ILTV infection and revealed 7 gene clusters
exhibiting distinct expression patterns (Figure 3 andAdditional file 2). The 287 genes placed in cluster (C) 1showed only nominal increases at 3 and 5 dpi followedby decreased expression levels at 7 dpi that were similarto those at the onset of the experiment. The C2 repre-senting 97 genes exhibited a dramatic increase in geneexpression only at 7 dpi, whereas the expression levelsof the 90 genes in C3 progressively declined at 5 and 7dpi. Three genes in C4 showed higher expression duringearly infection (1 dpi), sharp increases at 3 and 5 dpi,followed by a slight decline at 7 dpi. Expression patternsof 9 genes in C5 showed slightly lower expression at 1dpi relative to the other time points, a dramaticallyincrease at 3 and 5 dpi, followed by decreased expres-sion at 7 dpi. The 85 genes in C6 showed lower expres-sion at 1 dpi followed by a progressive increase duringthe later time points, which was opposite to 218 genesin C7 that showed higher expression at 1 dpi followedby decreased expression at 3, 5, and 7 dpi. GenBankaccession numbers for genes in each cluster are shownin the Additional file 2.Interestingly, the genes in C4 that exhibited the high-
est expression during ILTV infection include cytokines(IL8 and IL1b) and a chemokine (CXC-K60), while inthe C5, IL6 was most highly expressed. From these find-ings, it is reasonable to hypothesize that expression of
Figure 1 ILTV infection in chicken embryonic lung cells. The chicken embryo lung cells were infected with ILTV at a multiplicity of infection(MOI) of 0.1. The infected cells were visualized at 0, 1, 3, 5, and 7 dpi, respectively, using a phase contrast microscope at 200× magnification.
Lee et al. BMC Genomics 2010, 11:445http://www.biomedcentral.com/1471-2164/11/445
Page 3 of 15
functionally relevant genes such as cytokines and che-mokines released in response to an immune challengemay be regulated similarly during a specific immunolo-gical challenge.
Functional Gene Ontology (GO)Recently, new bioinformatics tools have been developedto facilitate efficient analysis of biological functionalitiesfor large numbers of differentially expressed genesobtained from microarray analysis. By using the IPA
program (http://www.ingenuity.com/), bioinformaticsaspects of differentially expressed genes during ILTVinfection were analyzed for the relevance of gene func-tionalities and gene networks. While 789 differentiallyexpressed genes were used as the input number ofgenes, only 275 have been characterized with specificcellular functions according to the IPA program. Resultsobtained with the IPA program in terms of numbers ofgenes, biological functions of genes and categories wereindependently confirmed with a second bioinformatics
Figure 2 Groups for sorting differentially expressed genes in the time course of ILTV infection. The 11,491 genes showing a signal tonoise ratio (SNR) > 3 were sorted into three groups based on alterations of fold changes at each dpi time point. The Y-axis represents log2values of fold changes and the X-axis indicates dpi time points.
Lee et al. BMC Genomics 2010, 11:445http://www.biomedcentral.com/1471-2164/11/445
Page 4 of 15
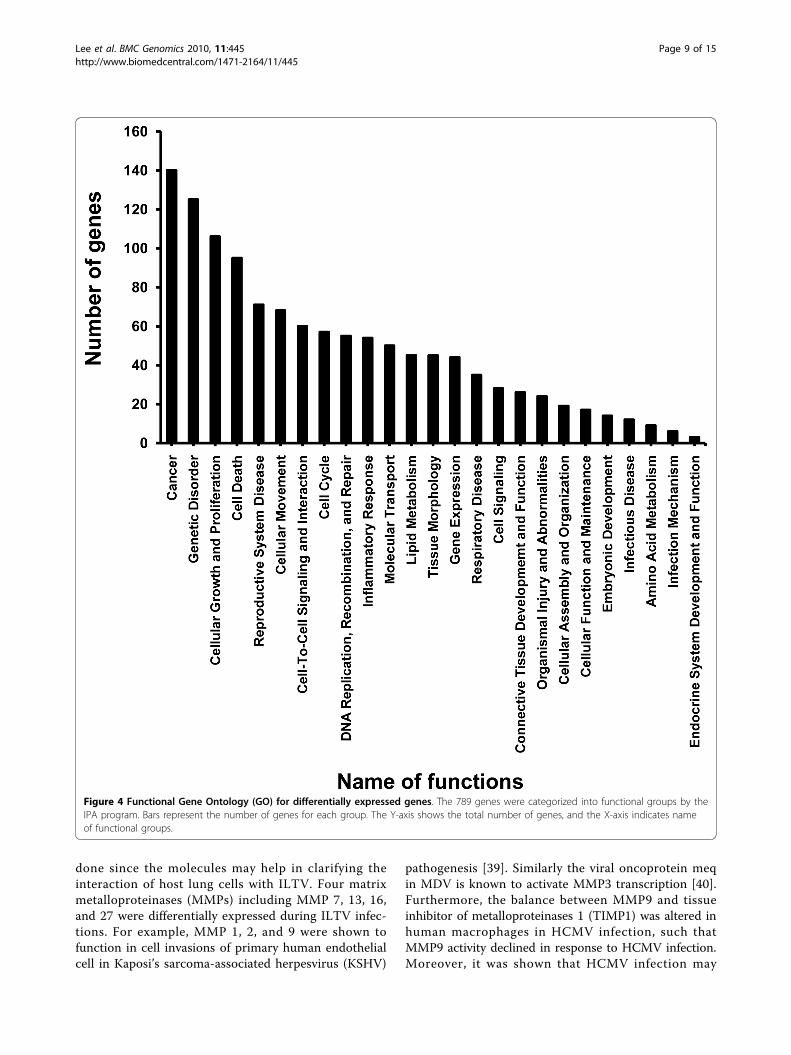
tool, DAVID (Database for Annotation, Visualizationand Integrated Discovery) version 6.7 (http://david.abcc.ncifcrf.gov/) (data not shown). The group of 275 differ-entially expressed genes was placed into 65 functionalgroups (see Additional file 3) and the top 25 functionalgroups of genes are displayed in Figure 4. The maincategories for gene functionalities include diseases anddisorders, molecular and cellular functions, and physio-logical system development. Gene information wasrepeatedly used in multiple groups of functionalities dueto the multi-functional characteristics for designatedgenes. It can be seen that the cancer related function
Table 1 Top 10% (79 out of 789 genes) of the mosthighly differentially expressed
Accession#
Gene Symbol Fold Change
Day1
Day3
Day5
Day7
Y14971 CXC chemokine K60 3.7 17.3 19.7 11.3
X65459 FABP7 1.1 0.3 0.8 0.2
X16881 CDC2 1.9 0.4 0.7 0.4
X03509 CKB 0.9 4.7 5.5 2.0
X02009 LTF 0.7 2.7 3.6 3.2
U62026 CENPF 3.3 0.7 1.4 0.6
U12438 RFC2 1.9 0.8 1.0 0.3
U09350 VIP 2.0 0.2 0.3 0.2
M16199 IL8 3.7 22.4 26.8 18.5
CR733296 LIPG 1.0 0.7 0.6 0.1
CR523746 TMEM196 1.0 2.3 2.8 0.7
CR406543 SELO 1.0 0.9 1.1 4.1
CR406252 Prematurely terminated mRNAdecay factor-like
1.2 1.1 1.4 4.7
CR391404 ITGA8 0.7 0.8 0.5 0.2
CR391234 LL 1.5 0.3 0.6 0.2
CR387914 CHAD 1.1 0.8 0.7 0.2
CR385491 IDl1 1.3 0.8 0.9 0.2
CR385166 MYCN 0.6 1.0 1.1 5.7
CR385124 DHCR7 1.3 0.9 1.0 0.3
CR382435 HDGFRP3 0.8 0.9 0.9 5.1
CR352395 OSTN 0.8 0.9 0.9 4.2
CO635775 HSP90AA1 0.8 0.5 0.5 2.6
CN218923.1 ARHGEF9 1.1 1.3 0.9 5.5
CF250950 ALDH1A3 0.6 2.1 2.3 3.6
CD763113 FDPS 1.1 0.6 0.7 0.2
BX936026 AURKA 2.4 0.5 0.7 1.0
BX935864 XBP1 0.9 0.8 0.7 3.4
BX935550 AKR1D1 0.6 2.9 2.7 1.2
BX935026 MAT1A 0.7 1.0 0.7 3.5
BX934121 TFPI2 0.9 1.5 2.2 5.5
BX932212 PTTG1 2.1 0.7 0.8 0.3
BX931971 SPON2 1.6 2.8 4.0 12.1
BX931663 ROPN1L 0.7 2.7 1.1 5.6
BU456021 SNAl1 1.9 1.0 0.7 0.4
BU409770 HMG_COA_S 2.5 1.4 1.2 0.3
BU200000 TNFAIP6 1.0 1.9 4.0 0.4
BU138507 CYP51 1.0 0.7 0.7 0.2
AJ851480 ACSL1 1.2 7.3 8.7 7.3
AJ721110 VNN2 0.5 3.3 6.5 2.5
AJ721107 SLA 0.8 1.1 1.4 5.0
AJ720861 LSS 1.3 1.1 1.3 0.2
AJ720657 DNAJB9 0.9 0.9 0.8 3.8
AJ720217 STARD4 1.8 0.9 1.0 0.3
AJ719858 ITFG1 1.3 1.0 1.2 4.8
AJ719718 SC4MOL 1.1 0.8 1.1 0.2
AJ719295 INSIG1 1.5 0.9 0.9 0.2
AJ443395 TRIP13 2.1 0.6 0.7 0.4
Table 1 Top 10% (79 out of 789 genes) of the mosthighly differentially expressed (Continued)
AJ393939 ITPR3 1.5 1.4 1.8 0.4
AJ309540 IL6 0.9 4.8 7.2 3.1
AJ004940 HSPA8 0.9 0.5 0.6 2.7
AF432506 FABP4 1.0 5.3 7.1 14.9
AF411083 SFTPA1 1.7 0.4 0.9 0.4
AF070478 MMP-13 0.7 3.4 2.9 0.7
AF062392 MMP27 0.8 4.1 6.6 3.5
AB031398 LEFTY2 1.2 1.7 1.8 5.8
BU306841 NSDHL 1.5 0.6 0.8 0.1
BU144940 ATF3 0.6 0.9 2.0 3.2
BU106686 MKI67 2.6 0.8 1.1 0.5
BU336892 HSPH1 1.0 0.5 0.5 3.2
CR385186 PREDICTED: similar to CUG2 2.2 0.5 0.8 0.4
CR387761 PREDICTED: similar to Gapjunction alpha-7 protein
1.2 0.7 0.8 0.2
BU456843 PREDICTED: similar to Cancersusceptibility candidate 5
2.9 0.7 1.2 0.6
BU468099 PREDICTED: similar to Histoneprotein Hist2h3c1
2.5 0.9 0.9 0.4
BX950657 PREDICTED: chemokine (C-Cmotif) receptor-like 1 isoform 1
1.1 1.3 2.5 0.3
CR390562 PREDICTED: hypotheticalprotein
1.2 1.2 1.3 6.2
CR388632 Unknown 0.7 1.4 0.8 0.2
BU212825 Unknown 0.7 0.6 0.6 0.2
BU281664 Unknown 1.1 0.8 0.9 0.2
BU377399 Unknown 0.9 1.4 1.2 5.3
BU420694 Unknown 0.6 18.2 26.2 3.1
BU433279 Unknown 0.7 1.2 2.4 3.5
CR385201 Unknown 0.6 5.0 7.0 0.6
CR385678 Unknown 1.1 1.3 1.8 5.5
CR386845 Unknown 1.0 0.8 0.7 3.1
CR389767 Unknown 1.2 3.2 3.2 0.5
CR389813 Unknown 1.0 1.3 1.2 5.9
CR390519 Unknown 1.4 1.5 1.8 8.3
CR391100 Unknown 0.3 3.0 4.1 0.4
DR431104 Unknown 1.2 1.7 1.9 0.3
The highly differentially expressed genes were sorted. All genes werematched and verified with UniGene function of NCBI database.
Lee et al. BMC Genomics 2010, 11:445http://www.biomedcentral.com/1471-2164/11/445
Page 5 of 15
contains the highest number (140) of genes, while 125genes were involved in genetic disorders, and 54 geneswere grouped as inflammatory responses.
Gene network analysisGene network analysis, which represents the intermole-cular connections among interacting genes based onfunctional knowledge inputs, was performed on the dif-ferentially expressed genes using IPA program (seeAdditional file 4). In this way, 21 possible gene networksfor all days post ILTV infection were generated basedon differential gene expression. Of these 21 gene net-works, only 6 gene networks were identical at all timepoints following ILTV infection. Possibly, the reasonwhy only 6 of 21 networks were identical might bebecause of differences in the sets of focus moleculeswhich are generated from p-values and fold changevalues of differential gene expression that are used inIPA algorithms. The dynamics of alterations in geneexpression for a subset of genes during the time courseof ILTV infection can provide insights into biologicallyinteracting genes within a network that display func-tional similarities. The most interactive network (net-work #1) is presented in Figure 5 whereas the othernetworks are shown in Additional file 5.Network #1 is closely associated with a signaling path-way of IL6, which is a cytokine known to be involved incell proliferation and inflammatory responses [32]. Thetop functions related with genes in network #1 involvecancer, gastrointestinal disease, and the cell cycle. Inter-estingly, expression of certain genes in network #1 suchas CDC20 (cell division cycle 20 homolog), PTTG1(pituitary tumor transforming 1), CDC2, and Cyclin B,which are associated with cellular proliferation in cellcycle progression, appeared to be inversely related toIL6 expression. The dynamics of alterations in geneexpression over time during ILTV infection suggest thatILTV infection elevates IL6 expression followed by theinhibition of cellular proliferation. In contrast, expres-sion patterns of HPGD (hydroxyprostaglandin dehydro-genase 15-NAD), SOCS (suppressors of cytokinesignaling), JAK (Janus kinase 1), and NASP (nuclearautoantigenic sperm protein) were independent of theIL6 expression pattern (Figure 5A, B and Additional file5A). JAK is known to enhance cellular proliferationthrough the signal transducer and activator of transcrip-tion (STAT) pathway that can be suppressed by IL6 sig-naling [33]. The consistent downregulation of JAK
Table 2 Primers used for qRT-PCR
Accession # Forward Primer Gene Symbol
Reverse Primer
AJ711110 TGGTGGCTCGTTACCACAAG VNN2
TTCCCAAAGGGAGTCTCGAA
AF070478 TCCCAAAACGCCAGAGAAAT MMP-13
TCGCCAGAAAAACCTGTCCT
AF062392 CAGCCCCAGTGAATTTCCTC MMP27
GACGGTTGGCCTTTTACCTG
X03509 CCAGGGGTATCTGGCACAAT CKB
TCATGTTGCCACCTTTCTGC
AJ309540 CCTGTTCGCCTTTCAGACCT IL6
GCCAGGTGCTTTGTGCTGTA
AF432506 CCTGTTCGCCTTTCAGACCT FABP4
GCCAGGTGCTTTGTGCTGTA
X65459 GGACAGCCACAACTTTGACG FABP7
GCTGCTGATGATCACTGTGG
AJ851480 TGATGCAAGCACACGACTTG ACSL1
ACCCACCAGGGTATTTGTCG
AJ720861 AGGTTCACCCAGATCCCAGA LSS
CCACAGTCCCGTGTGCTAAA
AJ719295 CTGTTTCCCGACGAGCTCAT INSIG1
GGTACAGCAGGCCAACAACA
AJ719718 GGCAGTGAACGACAGCGTTA SC4MOL
TAAATGGCTGCTGCAGAGGA
U09350 CGAAAGCAAATGGCTGTGAA VIP
TGCTTCACCTCGAAGTTTGG
U62026 GAATGCTGGCACCAGGAAA CENPF
TCCGGAAAGGTTCCATCATC
M16199 CGCTGGTAAAGATGGGGAAT IL8
CTTGGCGTCAGCTTCACATC
X02009 GATAGCGGCTGTGTGTTTCG LTF
GAGGTCCCTGAGGTTGTTGC
AJ004940 CTGAATTCAAGCGCAAGCAC HSPA8
TGACAGGGTACGCTTTGCAC
AF411083 GTTGCTTTGCTAACGCCTTG SFTPA1
AGAGCTCCCAGACCAAGCAG
X16881 TTCCACGGGGACTCAGAGAT CDC2
TGCAAGGATTCCACATCAGG
U12438 GTCAGCAGGCTGGAGGTCTT RFC2
AGCAGAGGATGCTCCTCCTT
Y14971 GGCTGTAGCTGCTGTCATGG CXC chemokine K60
TATGCACTGGCATCGGAGTT
NM_204305 GGCACTGTCAAGGCTGAGAA chGAPDH
TGCATCTGCCCATTTGATGT
The first column indicates the NCBI accession number for designated genes,and the second column shows sequences for the forward and reverseprimers. The gene symbols are provided in the third column.
Lee et al. BMC Genomics 2010, 11:445http://www.biomedcentral.com/1471-2164/11/445
Page 6 of 15

supports a role of JAK in the repression of cellular pro-liferation by ILTV infection. The top functions of genesin network #2 are involved with cellular compromise,connective tissue disorders, and post-translational modi-fications. Several heat shock proteins (HSP) were alsofocused in this network (see Additional file 5B). Heatshock proteins, especially the HSP70 family that serve asmolecular chaperones, are known to interact with viralearly immediate genes in HSV-1 genomic DNA replica-tion [34]. Interestingly, since the expression of severalHSPs in network #2 were downregulated, it is reason-able to hypothesize that the lower HSP through 5 dpimay lead to production of erroneous virion structures ofILTV that in turn results in low ILTV titers in tissueculture, which has been reported to barely exceed oneinfectious unit per cell [1,35].Network #3 contains genes for growth factors and
matrix metalloproteinases (MMPs), and genes have topfunctions associated with endocrine system function anddevelopment, carbohydrate metabolism, and digestivesystem function and development (see Additional file5C). Expression for growth factors and MMPs increasedon 3 dpi and remain elevated through 7 dpi. This obser-vation is in agreement with other reports that infectionwith herpesviruses, such as HSV and HCMV, lead toan increase in growth factor expression and MMPsfor extracellular remodeling, tissue invasion and
angiogenesis [36-38]. Networks #4 and #5 contain cyto-kine genes (IFNb and IL1b), chemokine genes (CCL20and CCL4), and genes of the NF-kB families (NF-kBand NFIB) with top functions that are involved inorganism injury and abnormalities, antigen presentation,cell mediated immune responses, lipid metabolism,small molecule biochemistry, and molecular transport(see Additional file 5D and 5E). Finally, genes in net-work #6 contain IL1, NF-kB, and ID1 that function incardiac inflammation, cardiovascular disease and in theinflammatory response (see Additional file 5F). Interact-ing molecules found in networks #4, 5, and 6 are mostlyfocused on the host immune responses against patho-genic infections.The network analysis suggests that a large number of
biological pathways, regulated by various sets of genes,closely interact with each other in host responsivenessduring ILTV infection. More detailed interactionsamong genes showing altered expression levels in eachnetwork are currently under investigation to identifyhost-response mechanisms that may occur in conjunc-tion with general immunological reactions during ILTVinfections.The fold changes in gene expression of key molecules
associated with cellular immune response, cell signaling,MMP molecules, cytokines, chemokines, and cell prolif-eration were plotted individually (Figure 6). This was
Table 3 Comparison of fold changes between microarray and qRT-PCR
Gene Accession # Gene Symbol 1 Day 3 Day 5 Day 7 Day
Micro-array RT-PCR Micro-array RT-PCR Micro-array RT-PCR Micro-array RT-PCR
AJ721110 VNN2 0.5 0.3 3.3 3.5 6.5 8.7 2.5 2.6
AF070478 MMP13 0.7 0.8 3.4 3.7 2.9 3.8 0.7 0.5
AF062392 MMP27 0.8 0.8 4.1 7.8 6.6 23.7 3.5 7.9
X03509 CKB 0.9 1.4 4.7 6.8 5.5 11.0 2.0 3.3
AJ309540 IL6 0.9 1.1 4.8 7.7 7.2 37.1 3.1 5.7
AF432506 FABP4 1.0 1.2 5.3 7.8 7.1 33.4 15.0 10.0
X65459 FABP7 1.1 1.5 0.3 0.8 0.8 1.1 0.2 0.3
AJ851480 ACSL1 1.2 0.9 7.3 6.0 8.7 8.0 7.3 7.6
AJ720861 LSS 1.3 1.1 1.1 0.7 1.3 1.1 0.2 0.1
AJ719295 Insulin induced gene 1 1.5 1.3 1.0 0.7 0.9 0.9 0.2 0.1
AJ719718 SC4MOL 1.1 1.7 0.8 0.9 1.1 1.3 0.2 0.2
U09350 VIP 2.0 2.4 0.2 0.1 0.3 0.2 0.2 0.2
U62026 CENPF 3.3 9.9 0.7 0.7 1.4 2.2 0.6 0.6
M16199 IL8 3.7 3.0 22.4 43.4 26.8 172.7 18.5 39.0
X02009 LTF 0.7 0.5 2.7 2.3 3.6 5.2 3.2 4.1
AJ004940 HSPA8 0.9 1.1 0.5 0.4 0.6 0.5 2.7 3.2
AF411083 SFTPA1 1.7 2.5 0.4 0.7 0.9 0.9 0.4 0.3
X16881 CDC2 1.9 2.2 0.4 0.3 0.7 0.6 0.4 0.4
U12438 RFC2 1.9 2.0 0.8 0.6 1.0 0.9 0.3 0.2
Y14971 CXC chemokine K60 3.7 7.9 17.3 60.3 19.7 206.4 11.3 38.2
The gene expression levels of 20 genes at four different time points in microarray analysis were confirmed by qRT-PCR. The expression levels were presented byfold changes values in microarray analysis, while, for qRT-PCR, the values were calculated by 2-ΔΔCT method [31], which would be comparable to fold changes inthe microarray. All values are mean values determined by the calculation from three replicating assays.
Lee et al. BMC Genomics 2010, 11:445http://www.biomedcentral.com/1471-2164/11/445
Page 7 of 15
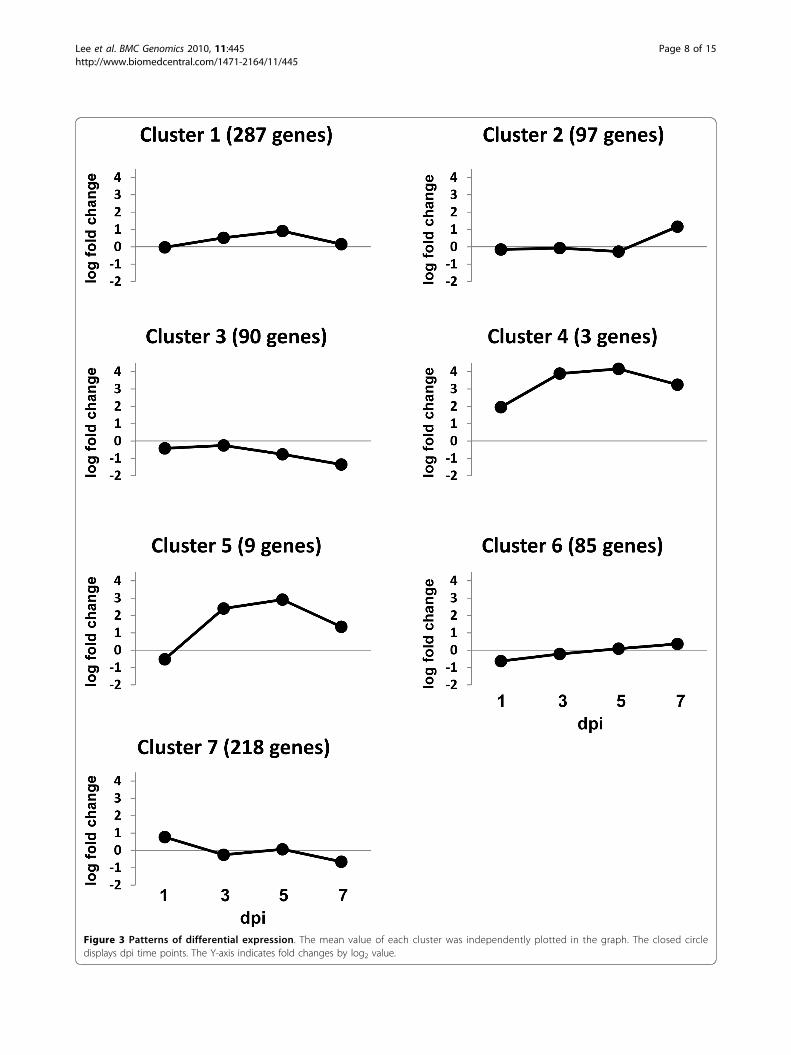
Figure 3 Patterns of differential expression. The mean value of each cluster was independently plotted in the graph. The closed circledisplays dpi time points. The Y-axis indicates fold changes by log2 value.
Lee et al. BMC Genomics 2010, 11:445http://www.biomedcentral.com/1471-2164/11/445
Page 8 of 15
done since the molecules may help in clarifying theinteraction of host lung cells with ILTV. Four matrixmetalloproteinases (MMPs) including MMP 7, 13, 16,and 27 were differentially expressed during ILTV infec-tions. For example, MMP 1, 2, and 9 were shown tofunction in cell invasions of primary human endothelialcell in Kaposi’s sarcoma-associated herpesvirus (KSHV)
pathogenesis [39]. Similarly the viral oncoprotein meqin MDV is known to activate MMP3 transcription [40].Furthermore, the balance between MMP9 and tissueinhibitor of metalloproteinases 1 (TIMP1) was altered inhuman macrophages in HCMV infection, such thatMMP9 activity declined in response to HCMV infection.Moreover, it was shown that HCMV infection may
Figure 4 Functional Gene Ontology (GO) for differentially expressed genes. The 789 genes were categorized into functional groups by theIPA program. Bars represent the number of genes for each group. The Y-axis shows the total number of genes, and the X-axis indicates nameof functional groups.
Lee et al. BMC Genomics 2010, 11:445http://www.biomedcentral.com/1471-2164/11/445
Page 9 of 15
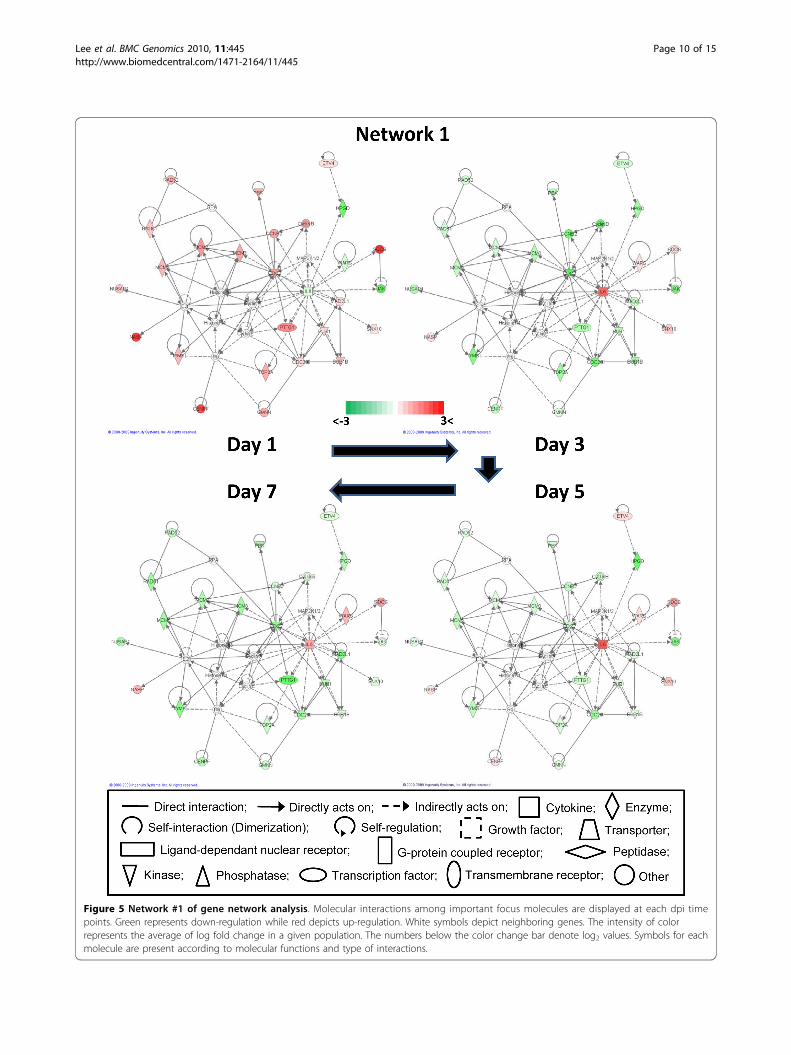
Figure 5 Network #1 of gene network analysis. Molecular interactions among important focus molecules are displayed at each dpi timepoints. Green represents down-regulation while red depicts up-regulation. White symbols depict neighboring genes. The intensity of colorrepresents the average of log fold change in a given population. The numbers below the color change bar denote log2 values. Symbols for eachmolecule are present according to molecular functions and type of interactions.
Lee et al. BMC Genomics 2010, 11:445http://www.biomedcentral.com/1471-2164/11/445
Page 10 of 15
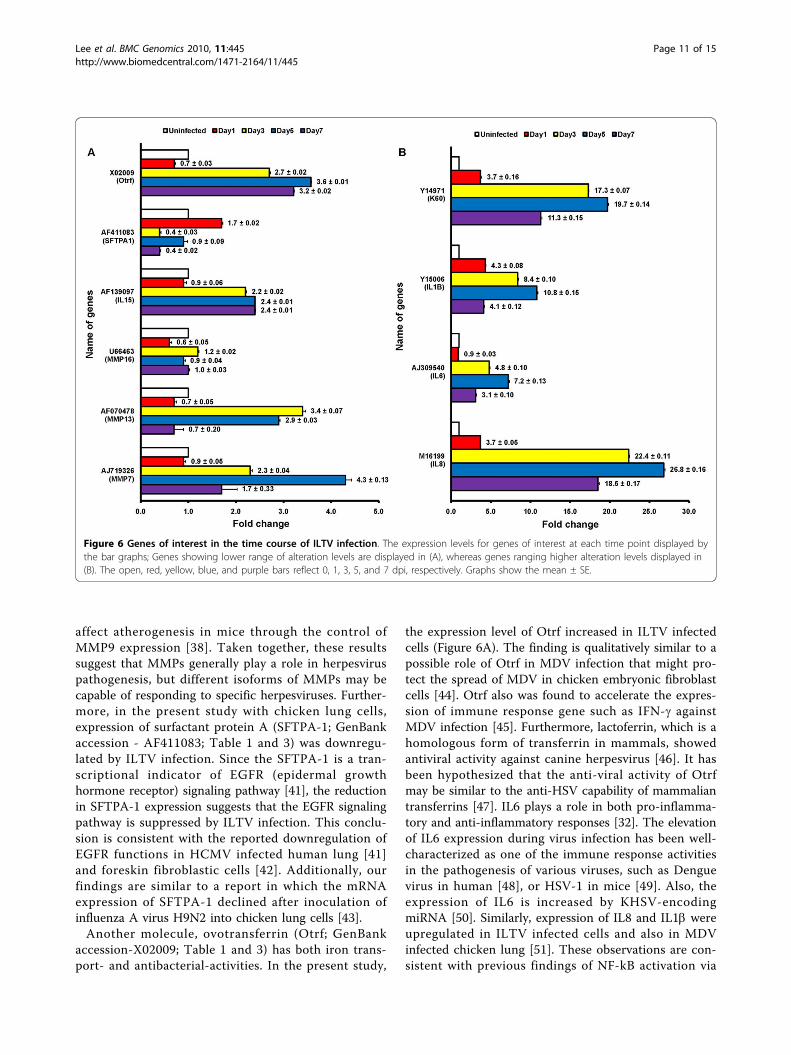
affect atherogenesis in mice through the control ofMMP9 expression [38]. Taken together, these resultssuggest that MMPs generally play a role in herpesviruspathogenesis, but different isoforms of MMPs may becapable of responding to specific herpesviruses. Further-more, in the present study with chicken lung cells,expression of surfactant protein A (SFTPA-1; GenBankaccession - AF411083; Table 1 and 3) was downregu-lated by ILTV infection. Since the SFTPA-1 is a tran-scriptional indicator of EGFR (epidermal growthhormone receptor) signaling pathway [41], the reductionin SFTPA-1 expression suggests that the EGFR signalingpathway is suppressed by ILTV infection. This conclu-sion is consistent with the reported downregulation ofEGFR functions in HCMV infected human lung [41]and foreskin fibroblastic cells [42]. Additionally, ourfindings are similar to a report in which the mRNAexpression of SFTPA-1 declined after inoculation ofinfluenza A virus H9N2 into chicken lung cells [43].Another molecule, ovotransferrin (Otrf; GenBank
accession-X02009; Table 1 and 3) has both iron trans-port- and antibacterial-activities. In the present study,
the expression level of Otrf increased in ILTV infectedcells (Figure 6A). The finding is qualitatively similar to apossible role of Otrf in MDV infection that might pro-tect the spread of MDV in chicken embryonic fibroblastcells [44]. Otrf also was found to accelerate the expres-sion of immune response gene such as IFN-g againstMDV infection [45]. Furthermore, lactoferrin, which is ahomologous form of transferrin in mammals, showedantiviral activity against canine herpesvirus [46]. It hasbeen hypothesized that the anti-viral activity of Otrfmay be similar to the anti-HSV capability of mammaliantransferrins [47]. IL6 plays a role in both pro-inflamma-tory and anti-inflammatory responses [32]. The elevationof IL6 expression during virus infection has been well-characterized as one of the immune response activitiesin the pathogenesis of various viruses, such as Denguevirus in human [48], or HSV-1 in mice [49]. Also, theexpression of IL6 is increased by KHSV-encodingmiRNA [50]. Similarly, expression of IL8 and IL1b wereupregulated in ILTV infected cells and also in MDVinfected chicken lung [51]. These observations are con-sistent with previous findings of NF-kB activation via
Figure 6 Genes of interest in the time course of ILTV infection. The expression levels for genes of interest at each time point displayed bythe bar graphs; Genes showing lower range of alteration levels are displayed in (A), whereas genes ranging higher alteration levels displayed in(B). The open, red, yellow, blue, and purple bars reflect 0, 1, 3, 5, and 7 dpi, respectively. Graphs show the mean ± SE.
Lee et al. BMC Genomics 2010, 11:445http://www.biomedcentral.com/1471-2164/11/445
Page 11 of 15

IL8 signaling pathway by human herpesvirus (HHV)-8infection [52] and HHV-6 infection in peripheral bloodmononuclear cell cultures [53], respectively.In addition to the well-characterized host-virus inter-
actions, a variety of unique responses detected with themicroarray analysis of ILTV infection in the presentstudy. For instance, the expression level of vasoactiveintestinal peptide (VIP; GenBank accession number-U09350: Table 1 and 3) decreased dramatically in ILTVinfection, but the functional consequences were notdetermined. Likewise, genes related to various metabolicenzyme functions such as acyl-CoA synthetase longchain-1 (ACSL1; GenBank Accession number-AJ851480;Table 1 and 3) were differentially expressed in ILTVinfected cells, but the precise mechanisms in the hostresponse have not been verified. Therefore, furtherinvestigations are being performed to identify uniqueand more deeply involved interactions between hostlung cells and ILTV.
ConclusionsIn this study, we have demonstrated changes in globalgene expression in response to ILTV infection in chickenembryo lung cells using microarray analysis. A total of 789differentially expressed genes were involved in a variety ofmolecular and cellular defense mechanisms of immuneresponse, cell cycle regulation, cellular metabolism, andmatrix metalloprotenases. Moreover, the bioinformaticsstudies, such as gene ontology and gene network analysis,using knowledge based bioinformatics tools (IngenuityPathway Analysis and DAVID) revealed biological func-tionalities and intermolecular connections among interact-ing genes associated with differentially expressed genes.Our study provides epigenetic insights into the pathogen-esis of ILTV infection in chicken lung cells.
MethodsCell culture and ILTV infectionCell culture reagents were purchased from InvitrogenLife Technologies (Carlsbad, CA, USA). Chicken embryolungs were isolated from 19 day old specific-pathogenfree (SPF) chicken embryos (Charles River Laboratories,North Franklin, CT, USA). Lung tissues were homoge-nized and incubated in a 0.125% trypsin solution for 30min at room temperature (25°C). Cells dissociated fromlung tissues were suspended in a 1:1 ratio of mammaryepithelial growth media (MEGM; Lonza, Rockland, ME,USA) and Dulbecco’s Modified Eagle’s Medium (DMEM,0.45% glucose) plus 2% fetal bovine serum (FBS), 100units/ml penicillin, 100 μg/ml streptomycin, and 2 mML-glutamine in 10 cm tissue culture dishes (Sarstedt Inc.,Newton, NC, USA) pretreated with 0.5% gelatin in PBSto improve cell adhesion. Cultured cells were grown at39°C containing 5% CO2 until cells reached confluent
monolayers (2 to 4 days). The USDA reference strain ofILTV (National Veterinary Services Laboratories, Ames,IA, USA) was used to infect the chicken embryonic lungcells at a multiplicity of infection (m.o.i.) of 0.1. Infectedcells were incubated at 37°C for 1 hr with rocking gentlyevery 15 min. After the incubation, 10 ml of media, 1:1MEGM/DMEM, were added to each culture dish, andthe cells were incubated at 37°C in 5% CO2 for up to 7days. This research was performed under the permittedprotocol approved by both the Institutional BiosafetyCommittee (IBC; permit number: 10007) of University ofArkansas and the Animal and Plant Health InspectionService (APHIS; permit number: 102743) of United StatesDepartment of Agriculture (USDA).
Total RNA extractionTotal RNA was extracted from uninfected- or ILTVinfected chicken embryonic lung cells at 1, 3, 5, and 7dpi using TRIzol reagent (Invitrogen Life Technologies,Carlsbad, CA, USA) following the manufacturer’sinstructions. Total RNA was treated with DNase I (NewEngland BioLabs Inc., Ipswich, MA, USA), and RNAwas re-purified by the TRIzol reagent. The quality ofRNA was checked by fractionation on an agarose gel(data not shown).
Probe labeling and microarray hybridizationA two color labeling microarray system was used to com-pare uninfected- and ILTV infected embryonic lung cellsat 1, 3, 5, and 7 dpi. Fluorescently labeled complementaryRNA (cRNA) probes were generated by using the TwoColor Microarray Quick Labeling kit (Agilent Technolo-gies, Palo Alto, CA, USA) and following the manufac-turer’s instructions. RNA spike-in controls were used toadjust possible dye effects following manufacturer’sinstructions. The Spike-in controls represent two sets often synthesized RNA mixtures derived from the Adeno-virus E1A transcriptome with different concentrations ineach set [29]. These spike-in sets were mixed with eitheruninfected control or infected samples and co-hybridizedto arrays. Briefly, 2 μg of total RNA were mixed withSpike-ins and converted to cDNA using reverse transcrip-tase and oligo dT primers in which T7 promotersequences were added. T7 RNA polymerase was used forthe synthesis and labeling of cRNA with either Cy3 dye forthe uninfected control or Cy5 dye for the ILTV infectedsamples. The fluorescently labeled cRNA probes were pur-ified using the Qiagen RNeasy Mini Kit (Qiagen Inc.,Valencia, CA, USA), and the concentration, fluorescentintensities, and quality of labeled cRNA probes were deter-mined using a Nano-drop spectrophotometer (ThermoScientific, Wilmington, DE, USA). An equal amount (825ng) of Cy3 and Cy5 labeled cRNA probes were hybridizedon a 4 × 44 K Agilent custom chicken oligo microarray
Lee et al. BMC Genomics 2010, 11:445http://www.biomedcentral.com/1471-2164/11/445
Page 12 of 15
(array ID: 017698). The hybridized slides were washedusing a commercial kit package (Agilent Technologies,Palo Alto, CA, USA) and then scanned using a Genepix4000B scanner (Molecular Devices Corporation, Sunny-vale, CA, USA) with the tolerance of saturation setting of0.005%. Three biological replicates were conducted.
Microarray data collection and analysisBackground-corrected red and green intensities for eachspot were used in the subsequent analysis. Global nor-malization based on local polynomial regression (loess)was applied to the intensities to remove effects that weredue to undesirable systematic variations in microarrayexperiments rather than biological differences. The aver-age values of the resulting normalized expression valuesin replicate hybridization sets were considered in the sub-sequent analysis. In order to identify a given set of genesthat exhibited major alterations over time, a model-basedclustering method [30] was employed, and the genes inthe cluster were considered as differentially expressedover the time period. All analytic techniques were imple-mented in R (http://www.R-project.org).
Quantitative reverse transcription-polymerase chainreaction (qRT-PCR)Reverse transcription was performed with 3 μg of totalRNA using Superscript II reverse transcriptase (Invitro-gen Life Technologies, Carlsbad, CA, USA) with oligodT12-18 primers (Invitrogen Life Technologies, Carlsbad,CA, USA) following the manufacturer’s instructions.The reverse-transcribed cDNA were diluted by 1:10ratio and a portion (1 μl) of each product was subjectedto qPCR under the following conditions: 40 cycles of95°C for 30 s, gene-specific annealing temperature for62°C for 1 min, extension for 30 s at 72°C, and a finalextension at 72°C for 10 min. A non-template controland endogenous control (chicken GAPDH) were usedfor the relative quantification. The differential expres-sion levels for the ILTV infected group were comparedby the 2-ΔΔCT method against the uninfected controls[31]. Primers for qRT-PCR were designed using Primer3software (http://frodo.wi.mit.edu/cgi-bin/primer3/pri-mer3.cgi) with these parameters: amplicon length, 95-100 bp; primer length, 18-27 nucleotides; primer melt-ing temperature, 60-64°C; primer and amplicon GC con-tent, 20-80%; difference in melting temperature betweenforward and reverse primers, 1-2°C. Primers weresynthesized by Integrated DNA Technologies (Coralville,IA, USA). Primer information is listed in Table 2.
BioinformaticsFunctional interpretation of differentially expressed geneswas analyzed in the context of gene ontology and molecu-lar networks using the Ingenuity Pathways Analysis (IPA)
6.5 software (Ingenuity Systems®; http://www.ingenuity.com). The differentially expressed genes were categorized,compared to genetic categories in the IPA database, andranked according to p-values [54]. The IPA analysis deter-mined the subcategories within each category which issupplied with an appropriate p-value and the number ofgenes identified. Since the size of the created networkcould potentially be enormous, the IPA software limitedthe number of molecules in the network to 35, leavingonly the most important ones based on the number ofconnections for each focus gene (focus genes = a subset ofuploaded significant genes having direct interactions withother genes in the database) to other significant genes [55].
Additional material
Additional file 1: List of 789 highly variable genes expresseddifferentially. The values at each time point indicate fold changes. Theblack letters indicate characterized genes, the orange letters arepredicted genes, and the green letters denote uncharacterized genes.The accession numbers and descriptions were derived from Agilent genelist and GenBank database.
Additional file 2: GenBank accession numbers of 7 clusters forexpression patterns.
Additional file 3: Gene Ontology generated by IPA. The 789differentially expressed genes were divided into 65 groups based ontheir functions.
Additional file 4: Gene lists of each network. Gene symbols andGenBank accession numbers were displayed for the illustrations ofnetwork analysis. Only focus molecules, which were elected asdifferentially expressed genes from microarray analysis, are marked asbold and GenBank accession numbers are provided. Accession numbersfor reference molecules were not included in the table.
Additional file 5: Six gene networks. (A) network #1 (B) network #2 (C)network #3 (D) network #4 (E) network #5 and (F) network #6 aredisplayed. Enlarged images are followed by small alphabetical orders (a -d) to indicate dpi time points. Colored shapes indicate focus molecules,which were identified as differentially expressed genes by microarrayanalysis, while clear shapes indicate reference molecules. The greenrepresents down-regulation and the red represents up-regulation. Degreeof color intensities indicates levels of fold changes.
AcknowledgementsWe thank Drs. Gisela Erf (University of Arkansas) and Douglas Foster(University of Minnesota) for helpful comments and reviewing thismanuscript. This work was supported, in part, by Arkansas AgriculturalExperimental Station and US Poultry and Egg Association (project #640).
Author details1Department of Poultry Science, University of Arkansas, Fayetteville, AR72701, USA. 2Cell and Molecular Biology Graduate Program, University ofArkansas, Fayetteville, AR 72701, USA. 3Department of Mathematical Sciences,University of Arkansas, Fayetteville, AR 72701, USA. 4Department of PoultryScience, Texas A&M University, College Station, TX 77845, USA.
Authors’ contributionsJYL and BWK designed the experiments, performed the experiments,analyzed the data, and wrote the manuscript. JJS contributed in statisticalanalysis of microarray data, and AW participated in virus preparation andhelped analysis of the qRT-PCR data. XL and HZ contributed the analysis ofmicroarray data. WB contributed the bioinformatics analysis and manuscriptediting. All authors read and approved the final manuscript.
Lee et al. BMC Genomics 2010, 11:445http://www.biomedcentral.com/1471-2164/11/445
Page 13 of 15
Received: 13 February 2010 Accepted: 21 July 2010Published: 21 July 2010
References1. Fuchs W, Veits J, Helferich D, Granzow H, Teifke JP, Mettenleiter TC:
Molecular biology of avian infectious laryngotracheitis virus. Vet Res2007, 38(2):261-279.
2. Thureen DR, Keeler CL Jr: Psittacid herpesvirus 1 and infectiouslaryngotracheitis virus: Comparative genome sequence analysis of twoavian alphaherpesviruses. J Virol 2006, 80(16):7863-7872.
3. Roizmann B, Desrosiers RC, Fleckenstein B, Lopez C, Minson AC,Studdert MJ: The family Herpesviridae: an update. The Herpesvirus StudyGroup of the International Committee on Taxonomy of Viruses. Arch Virol1992, 123(3-4):425-449.
4. Bagust TJ, Johnson MA: Avian infectious laryngotracheitis: virus-hostinteractions in relation to prospects for eradication. Avian Pathol 1995,24(3):373-391.
5. Clarke JK, Robertson GM, Purcell DA: Spray vaccination of chickens usinginfectious laryngotracheitis virus. Aust Vet J 1980, 56(9):424-428.
6. Guy JS, Barnes HJ, Smith L: Increased virulence of modified-live infectiouslaryngotracheitis vaccine virus following bird-to-bird passage. Avian Dis1991, 35(2):348-355.
7. Kulesh DA, Clive DR, Zarlenga DS, Greene JJ: Identification of interferon-modulated proliferation-related cDNA sequences. Proc Natl Acad Sci USA1987, 84(23):8453-8457.
8. Carter KL, Cahir-McFarland E, Kieff E: Epstein-barr virus-induced changes inB-lymphocyte gene expression. J Virol 2002, 76(20):10427-10436.
9. Malizia AP, Keating DT, Smith SM, Walls D, Doran PP, Egan JJ: Alveolarepithelial cell injury with Epstein-Barr virus upregulates TGFbeta1expression. Am J Physiol Lung Cell Mol Physiol 2008, 295(3):451-460.
10. Chen X, Liang S, Zheng W, Liao Z, Shang T, Ma W: Meta-analysis ofnasopharyngeal carcinoma microarray data explores mechanism of EBV-regulated neoplastic transformation. BMC Genomics 2008, 9:322-332.
11. Jones JO, Arvin AM: Microarray analysis of host cell gene transcription inresponse to varicella-zoster virus infection of human T cells andfibroblasts in vitro and SCIDhu skin xenografts in vivo. J Virol 2003,77(2):1268-1280.
12. Chan G, Bivins-Smith ER, Smith MS, Smith PM, Yurochko AD: Transcriptomeanalysis reveals human cytomegalovirus reprograms monocytedifferentiation toward an M1 macrophage. J Immunol 2008,181(1):698-711.
13. Liu HC, Cheng HH, Tirunagaru V, Sofer L, Burnside J: A strategy to identifypositional candidate genes conferring Marek’s disease resistance byintegrating DNA microarrays and genetic mapping. Anim Genet 2001,32(6):351-359.
14. Morgan RW, Sofer L, Anderson AS, Bernberg EL, Cui J, Burnside J: Inductionof host gene expression following infection of chicken embryofibroblasts with oncogenic Marek’s disease virus. J Virol 2001,75(1):533-539.
15. Sarson AJ, Abdul-Careem MF, Zhou H, Sharif S: Transcriptional analysis ofhost responses to Marek’s disease viral infection. Viral Immunol 2006,19(4):747-758.
16. Sarson AJ, Parvizi P, Lepp D, Quinton M, Sharif S: Transcriptional analysisof host responses to Marek’s disease virus infection in geneticallyresistant and susceptible chickens. Anim Genet 2008, 39(3):232-240.
17. Heidari M, Huebner M, Kireev D, Silva RF: Transcriptional profiling ofMarek’s disease virus genes during cytolytic and latent infection. VirusGenes 2008, 36(2):383-392.
18. Karaca G, Anobile J, Downs D, Burnside J, Schmidt CJ: Herpesvirus ofturkeys: microarray analysis of host gene responses to infection. Virology2004, 318(1):102-111.
19. Mossman KL, Macgregor PF, Rozmus JJ, Goryachev AB, Edwards AM,Smiley JR: Herpes simplex virus triggers and then disarms a host antiviralresponse. J Virol 2001, 75(2):750-758.
20. Clement C, Popp MP, Bloom DC, Schultz G, Liu L, Neumann DM,Bhattacharjee PS, Hill JM: Microarray analysis of host gene expression forcomparison between naive and HSV-1 latent rabbit trigeminal ganglia.Mol Vis 2008, 14:1209-1221.
21. Otsuka M, Aizaki H, Kato N, Suzuki T, Miyamura T, Omata M, Seki N:Differential cellular gene expression induced by hepatitis B and Cviruses. Biochem Biophys Res Commun 2003, 300(2):443-447.
22. de la Fuente C, Santiago F, Deng L, Eadie C, Zilberman I, Kehn K,Maddukuri A, Baylor S, Wu K, Lee CG, Pumfery A, Kashanchi F: Geneexpression profile of HIV-1 Tat expressing cells: a close interplaybetween proliferative and differentiation signals. BMC Biochem 2002,3:14-35.
23. Geiss GK, Bumgarner RE, An MC, Agy MB, van’t Wout AB, Hammersmark E,Carter VS, Upchurch D, Mullins JI, Katze MG: Large-scale monitoring ofhost cell gene expression during HIV-1 infection using cDNAmicroarrays. Virology 2000, 266(1):8-16.
24. Sun Y, Huang PL, Li JJ, Huang YQ, Zhang L, Huang PL, Lee-Huang S: Anti-HIV agent MAP30 modulates the expression profile of viral and cellulargenes for proliferation and apoptosis in AIDS-related lymphoma cellsinfected with Kaposi’s sarcoma-associated virus. Biochem Biophys ResCommun 2001, 287(4):983-994.
25. van’t Wout AB, Lehrman GK, Mikheeva SA, O’Keeffe GC, Katze MG,Bumgarner RE, Geiss GK, Mullins JI: Cellular gene expression upon humanimmunodeficiency virus type 1 infection of CD4(+)-T-cell lines. J Virol2003, 77(2):1392-1402.
26. Taylor LA, Carthy CM, Yang D, Saad K, Wong D, Schreiner G, Stanton LW,McManus BM: Host gene regulation during coxsackievirus B3 infection inmice: assessment by microarrays. Circ Res 2000, 87(4):328-334.
27. Li X, Chiang HI, Zhu J, Dowd SE, Zhou H: Characterization of a newlydeveloped chicken 44 K Agilent microarray. BMC Genomics 2008, 9:60-73.
28. Mazzatti DJ, White A, Forsey RJ, Powell JR, Pawelec G: Gene expressionchanges in long-term culture of T-cell clones: genomic effects of chronicantigenic stress in aging and immunosenescence. Aging Cell 2007,6(2):155-163.
29. Zahurak M, Parmigiani G, Yu W, Scharpf RB, Berman D, Schaeffer E,Shabbeer S, Cope L: Pre-processing Agilent microarray data. BMCBioinformatics 2007, 8:142-154.
30. Fraley C, Raftery E: Model-Based Clustering, Discriminant Analysis, andDensity Estimation. Journal of the American Statistical Association 2002,97(458):611-631.
31. Livak KJ, Schmittgen TD: Analysis of relative gene expression data usingreal-time quantitative PCR and the 2(-Delta Delta C(T)) Method. Methods2001, 25(4):402-408.
32. Kishimoto T: Interleukin-6: from basic science to medicine–40 years inimmunology. Annu Rev Immunol 2005, 23:1-21.
33. Heinrich PC, Behrmann I, Muller-Newen G, Schaper F, Graeve L: Interleukin-6-type cytokine signaling through the gp130/Jak/STAT pathway. BiochemJ 1998, 334(Pt 2):297-314.
34. Li L, Johnson LA, Dai-Ju JQ, Sandri-Goldin RM: Hsc70 focus formation atthe periphery of HSV-1 transcription sites requires ICP27. PLoS One 2008,3(1):e1491.
35. Granzow H, Klupp BG, Fuchs W, Veits J, Osterrieder N, Mettenleiter TC:Egress of alphaherpesviruses: comparative ultrastructural study. J Virol2001, 75(8):3675-3684.
36. Hayashi K, Hooper LC, Detrick B, Hooks JJ: HSV immune complex (HSV-IgG: IC) and HSV-DNA elicit the production of angiogenic factor VEGFand MMP-9. Arch Virol 2009, 154(2):219-226.
37. Mahller YY, Vaikunth SS, Ripberger MC, Baird WH, Saeki Y, Cancelas JA,Crombleholme TM, Cripe TP: Tissue inhibitor of metalloproteinase-3 viaoncolytic herpesvirus inhibits tumor growth and vascular progenitors.Cancer Res 2008, 68(4):1170-1179.
38. Straat K, de Klark R, Gredmark-Russ S, Eriksson P, Soderberg-Naucler C:Infection with human cytomegalovirus alters the MMP-9/TIMP-1 balancein human macrophages. J Virol 2009, 83(2):830-835.
39. Qian LW, Xie J, Ye F, Gao SJ: Kaposi’s sarcoma-associated herpesvirusinfection promotes invasion of primary human umbilical veinendothelial cells by inducing matrix metalloproteinases. J Virol 2007,81(13):7001-7010.
40. Ajithdoss DK, Reddy SM, Suchodolski PF, Lee LF, Kung HJ, Lupiani B: Invitro characterization of the Meq proteins of Marek’s disease virusvaccine strain CVI988. Virus Res 2009, 142(1-2):57-67.
41. Fairley JA, Baillie J, Bain M, Sinclair JH: Human cytomegalovirus infectioninhibits epidermal growth factor (EGF) signalling by targeting EGFreceptors. J Gen Virol 2002, 83(11):2803-2810.
42. Jafferji I, Bain M, King C, Sinclair JH: Inhibition of epidermal growth factorreceptor (EGFR) expression by human cytomegalovirus correlates withan increase in the expression and binding of Wilms’ Tumour 1 proteinto the EGFR promoter. J Gen Virol 2009, 90(7):1569-1574.
Lee et al. BMC Genomics 2010, 11:445http://www.biomedcentral.com/1471-2164/11/445
Page 14 of 15
43. Reemers SS, Veldhuizen EJ, Fleming C, van Haarlem DA, Haagsman H,Vervelde L: Transcriptional expression levels of chicken collectins areaffected by avian influenza A virus inoculation. Vet Microbiol 2010, 141(3-4):379-384.
44. Giansanti F, Giardi MF, Massucci MT, Botti D, Antonini G: Ovotransferrinexpression and release by chicken cell lines infected with Marek’sdisease virus. Biochem Cell Biol 2007, 85(1):150-155.
45. Federica Giardi M, La Torre C, Giansanti F, Botti D: Effects of transferrinsand cytokines on nitric oxide production by an avian lymphoblastoidcell line infected with Marek’s disease virus. Antiviral Res 2009,81(3):248-252.
46. Tanaka T, Nakatani S, Xuan X, Kumura H, Igarashi I, Shimazaki K: Antiviralactivity of lactoferrin against canine herpesvirus. Antiviral Res 2003,60(3):193-199.
47. Jenssen H: Anti herpes simplex virus activity of lactoferrin/lactoferricin –an example of antiviral activity of antimicrobial protein/peptide. Cell MolLife Sci 2005, 62(24):3002-3013.
48. Lee YR, Su CY, Chow NH, Lai WW, Lei HY, Chang CL, Chang TY, Chen SH,Lin YS, Yeh TM, Liu HS: Dengue viruses can infect human primary lungepithelia as well as lung carcinoma cells, and can also induce thesecretion of IL-6 and RANTES. Virus Res 2007, 126(1-2):216-225.
49. LeBlanc RA, Pesnicak L, Cabral ES, Godleski M, Straus SE: Lack ofinterleukin-6 (IL-6) enhances susceptibility to infection but does notalter latency or reactivation of herpes simplex virus type 1 in IL-6knockout mice. J Virol 1999, 73(10):8145-8151.
50. Qin Z, Kearney P, Plaisance K, Parsons CH: Pivotal advance: Kaposi’ssarcoma-associated herpesvirus (KSHV)-encoded microRNA specificallyinduce IL-6 and IL-10 secretion by macrophages and monocytes. JLeukoc Biol 2010, 87(1):25-34.
51. Abdul-Careem MF, Haq K, Shanmuganathan S, Read LR, Schat KA,Heidari M, Sharif S: Induction of innate host responses in the lungs ofchickens following infection with a very virulent strain of Marek’sdisease virus. Virology 2009, 393(2):250-257.
52. Sun Q, Matta H, Lu G, Chaudhary PM: Induction of IL-8 expression byhuman herpesvirus 8 encoded vFLIP K13 via NF-kappaB activation.Oncogene 2006, 25(19):2717-2726.
53. Flamand L, Gosselin J, D’Addario M, Hiscott J, Ablashi DV, Gallo RC,Menezes J: Human herpesvirus 6 induces interleukin-1 beta and tumornecrosis factor alpha, but not interleukin-6, in peripheral bloodmononuclear cell cultures. J Virol 1991, 65(9):5105-5110.
54. Mori R, Xiong S, Wang Q, Tarabolous C, Shimada H, Panteris E,Danenberg KD, Danenberg PV, Pinski JK: Gene profiling and pathwayanalysis of neuroendocrine transdifferentiated prostate cancer cells.Prostate 2009, 69(1):12-23.
55. Calvano SE, Xiao W, Richards DR, Felciano RM, Baker HV, Cho RJ, Chen RO,Brownstein BH, Cobb JP, Tschoeke SK, Miller-Graziano C, Moldawer LL,Mindrinos MN, Davis RW, Tompkins RG, Lowry SF: A network-basedanalysis of systemic inflammation in humans. Nature 2005,437(7061):1032-1037.
doi:10.1186/1471-2164-11-445Cite this article as: Lee et al.: Transcriptional profiling of host geneexpression in chicken embryo lung cells infected with laryngotracheitisvirus. BMC Genomics 2010 11:445.
Submit your next manuscript to BioMed Centraland take full advantage of:
• Convenient online submission
• Thorough peer review
• No space constraints or color figure charges
• Immediate publication on acceptance
• Inclusion in PubMed, CAS, Scopus and Google Scholar
• Research which is freely available for redistribution
Submit your manuscript at www.biomedcentral.com/submit
Lee et al. BMC Genomics 2010, 11:445http://www.biomedcentral.com/1471-2164/11/445
Page 15 of 15