Transcriptional Profiles of Roots of Different Soybean Genotypes Subjected to Drought Stress
16
Transcriptional Profiles of Roots of Different Soybean Genotypes Subjected to Drought Stress Renata Stolf-Moreira & Eliana G. M. Lemos & Lúcia Carareto-Alves & Jackson Marcondes & Selma S. Pereira & Amanda A. P. Rolla & Rodrigo M. Pereira & Norman Neumaier & Eliseu Binneck & Ricardo V. Abdelnoor & Maria C. N. de Oliveira & Francismar C. Marcelino & José R. B. Farias & Alexandre L. Nepomuceno Published online: 16 April 2010 # Springer-Verlag 2010 Abstract To identify differentially expressed genes in soy- bean grown under different drought conditions, cDNA libraries from roots of different genotypes were constructed. Genes of contrasting genotypes of soybean were found to be differentially expressed in plants exposed to drought con- ditions. A total of 753 no redundant clones were identified by PCR, and these were printed on microarray glass slides. Probes of total RNA were prepared from bulked roots subjected to 25 and 50 min (Bulk 1) or 75 and 100 min (Bulk 2) of drought stress. Differential expression of 145 genes, involved in metabolic pathways responsive to biotic and abiotic stresses, was observed. These genes were classified into nine functional categories, including energy, transcription factors, metabolism, stress response, protein synthesis, cell communication, cell cycle, cell transport, and unknown function. The functionality of some of these genes was confirmed by quantitative real-time PCR (qRT-PCR). Keywords Glycine max . Microarray . Quantitative PCR . Water stress Introduction Drought is one of the main environmental factors limiting crop production and plant distribution throughout the world. Previous studies have shown that drought modifies plant physiological and biochemical responses, including stomatal closure, photosynthesis, and respiration, which adversely affect growth and development (Gorantla et al. 2007). Plants also respond and adapt to stress situations at the cell and molecular levels, especially by accumulating the osmolytes and proteins involved in stress tolerance (Umezawa et al. 2006). However, plant responses to drought are complex, involving the expression of genes that coordinate and integrate multiple biochemical path- ways related to adaptation to dryness. Genes differentially expressed during drought include those encoding key enzymes for the biosynthesis of abscisic acid, proteins involved in osmotic adjustment and cell protection, numer- ous cell-signaling proteins such as kinases and phospha- tases, and transcription factors (Kim et al. 2007). Understanding molecular mechanisms involved in drought tolerance is essential for developing strategies to control drought stress and subsequently for genetic engi- neering, breeding, and selecting plants adapted to drought (Shinozaki and Yamaguchi-Shinozaki 2007). The applica- tion of transcript analysis techniques to study drought tolerance has brought important insights within the bio- chemical and molecular mechanisms. The drought tolerance mechanisms involve alterations in the cell-signaling cas- cade that can be mediated by transcriptional and posttran- scriptional changes. The greatest challenge is selecting R. Stolf-Moreira (*) : E. G. M. Lemos : L. Carareto-Alves : J. Marcondes : R. M. Pereira Paulist State University Via de Acesso Prof. Paulo Donato Castellane s/n, Posted code 14884-900 Jaboticabal, SP, Brazil e-mail: [email protected] S. S. Pereira : A. A. P. Rolla Department of General Biology, Londrina State University, Rodovia Celso Garcia Cid, PR 445, Km 380, Campus Universitário, Cx. Postal 6001, Posted code 86051-990 Londrina, PR, Brazil N. Neumaier : E. Binneck : R. V. Abdelnoor : M. C. N. de Oliveira : F. C. Marcelino : J. R. B. Farias : A. L. Nepomuceno Embrapa Soybean, Rodovia Carlos João Strass, Distrito de Warta, Cx. Postal 231, Posted code 86001-970 Londrina, PR, Brazil Plant Mol Biol Rep (2011) 29:19–34 DOI 10.1007/s11105-010-0203-3
Transcript of Transcriptional Profiles of Roots of Different Soybean Genotypes Subjected to Drought Stress

Transcriptional Profiles of Roots of Different SoybeanGenotypes Subjected to Drought Stress
Renata Stolf-Moreira & Eliana G. M. Lemos & Lúcia Carareto-Alves &
Jackson Marcondes & Selma S. Pereira & Amanda A. P. Rolla & Rodrigo M. Pereira &
Norman Neumaier & Eliseu Binneck & Ricardo V. Abdelnoor & Maria C. N. de Oliveira &
Francismar C. Marcelino & José R. B. Farias & Alexandre L. Nepomuceno
Published online: 16 April 2010# Springer-Verlag 2010
Abstract To identify differentially expressed genes in soy-bean grown under different drought conditions, cDNAlibraries from roots of different genotypes were constructed.Genes of contrasting genotypes of soybean were found to bedifferentially expressed in plants exposed to drought con-ditions. A total of 753 no redundant clones were identified byPCR, and these were printed on microarray glass slides.Probes of total RNA were prepared from bulked rootssubjected to 25 and 50 min (Bulk 1) or 75 and 100 min (Bulk2) of drought stress. Differential expression of 145 genes,involved in metabolic pathways responsive to biotic andabiotic stresses, was observed. These genes were classifiedinto nine functional categories, including energy, transcriptionfactors, metabolism, stress response, protein synthesis, cellcommunication, cell cycle, cell transport, and unknownfunction. The functionality of some of these genes wasconfirmed by quantitative real-time PCR (qRT-PCR).
Keywords Glycine max . Microarray . Quantitative PCR .
Water stress
Introduction
Drought is one of the main environmental factors limitingcrop production and plant distribution throughout theworld. Previous studies have shown that drought modifiesplant physiological and biochemical responses, includingstomatal closure, photosynthesis, and respiration, whichadversely affect growth and development (Gorantla et al.2007). Plants also respond and adapt to stress situations atthe cell and molecular levels, especially by accumulatingthe osmolytes and proteins involved in stress tolerance(Umezawa et al. 2006). However, plant responses todrought are complex, involving the expression of genesthat coordinate and integrate multiple biochemical path-ways related to adaptation to dryness. Genes differentiallyexpressed during drought include those encoding keyenzymes for the biosynthesis of abscisic acid, proteinsinvolved in osmotic adjustment and cell protection, numer-ous cell-signaling proteins such as kinases and phospha-tases, and transcription factors (Kim et al. 2007).
Understanding molecular mechanisms involved indrought tolerance is essential for developing strategies tocontrol drought stress and subsequently for genetic engi-neering, breeding, and selecting plants adapted to drought(Shinozaki and Yamaguchi-Shinozaki 2007). The applica-tion of transcript analysis techniques to study droughttolerance has brought important insights within the bio-chemical and molecular mechanisms. The drought tolerancemechanisms involve alterations in the cell-signaling cas-cade that can be mediated by transcriptional and posttran-scriptional changes. The greatest challenge is selecting
R. Stolf-Moreira (*) : E. G. M. Lemos : L. Carareto-Alves :J. Marcondes :R. M. PereiraPaulist State University Via de Acesso Prof. Paulo DonatoCastellane s/n,Posted code 14884-900 Jaboticabal, SP, Brazile-mail: [email protected]
S. S. Pereira :A. A. P. RollaDepartment of General Biology, Londrina State University,Rodovia Celso Garcia Cid, PR 445, Km 380,Campus Universitário, Cx. Postal 6001,Posted code 86051-990 Londrina, PR, Brazil
N. Neumaier : E. Binneck :R. V. Abdelnoor :M. C. N. de Oliveira : F. C. Marcelino : J. R. B. Farias :A. L. NepomucenoEmbrapa Soybean, Rodovia Carlos João Strass,Distrito de Warta, Cx. Postal 231,Posted code 86001-970 Londrina, PR, Brazil
Plant Mol Biol Rep (2011) 29:19–34DOI 10.1007/s11105-010-0203-3

candidate genes for detailed study from the thousands ofgenes present in the genome (Matsumura et al. 2005).TheDNA-microarray technique helps elucidate gene expressionprofiles. One of its advantages is the simultaneous analysisof a large number of genes and samples. Also, it provides away to explore metabolic and gene expression patterns atthe genomic scale, and the possibility of analyzing theexpression of unknown genes compared to sequences indata banks (Oono et al. 2003). Other advantages include theability to analyze expression standards in a parallel manner,immediate interpretation of the hybridization results, andthe possibility of analyzing the expression of unknowngenes with sequences contained in data banks (Yamada etal. 2003). qRT-PCR has been used to complement andconfirm results generated by microarray analyses, it isverified to be precise in quantifying expression levels of aparticular gene (Ginzinger 2002).
Lately, much information has been reported in droughttolerance mechanisms in soybean. However, much researchis still needed if the molecular mechanisms involved indefense and regulation responses against cell dehydrationare to be understood. Previous physiological and agronom-ical characterizations by our research group have rankedsoybean genotypes regarding drought tolerance, in whichMG/BR46 (Conquista) genotype—a water-deficit tolerantone—presents a more aggressive root system and produc-tivity aspects that make it more tolerant to drought. BR16—a water-deficit sensitive one—presents high productivity,but it is very sensitive to drought conditions (Oya et al.2004).
As a starting point to understand the key molecularmechanisms involved in drought tolerance, a microarrayexperiment was carried out focused on the effects ofdrought stress on a tolerant and a sensitive soybeangenotype. The arrays were constructed from cDNAlibraries from roots submitted to varied water shortageintensities. Our objective was to identify differentiallyexpressed genes in response to drought, to categorize thegenes according to biological function, and to locatetheir respective products in likely metabolic pathways.Finally, possible differences in the expression patterns ofthose genes were assessed in the two drought tolerancecontrasting genotypes.
Materials and Methods
Plant Material and Experimental Design for cDNAMicroarray Analysis
Seeds of two genotypes, MG/BR46 (Conquista) and BR16,tolerant and sensitive to drought, respectively, weregerminated in a controlled environment chamber and the
4-day-old seedlings were transferred to a hydroponicsystem containing nutrient solution. Each treatment con-sisted of 30 plants, totaling 450 plants per genotype,considering three biological repetitions, in a randomizedcomplete block design experiment. Water stress was appliedat the V3 stage. The plants were subjected to drought for 0,25, 50, 75, or 100 min, removing the roots from the nutrientsolution, and keeping them in the dark. Roots werecollected after each period of exposure for molecularanalyses. Temperatures in the greenhouse were controlledat 30±2°C during the day and 25±2°C at night, withrelative humidity near 50%.
The physiological effects of the treatments weremonitored in terms of photosynthetic rate (A), stomatalconductance (gs), intercellular carbon dioxide concentra-tion (Ci), and leaf temperature (°C). Data were collectedfrom the middle leaflet of the third completely expandedleaf from the apex of all plants in each treatment, using aportable Photosynthesis System (LI-COR, model LI-6400) set at a light intensity of 1,000 µmol m−2s−1.ANOVA was performed on the physiological data usingthe SAS program, comparing effects of treatments withineach genotype. Means were compared using Tukey’s test(p≤0.05).
cDNA Microarray: Array Construction, Hybridizationand Analysis
Selected clones from a cDNA library, previously constructedat the Biotechnology Laboratory at Embrapa Soybean, wereindependently amplified by PCR to produce the microarray. APCR reaction was carried out for each clone of 50 µLcontaining approximately 25 ng DNA, 0.1 mM dNTPs,0.2 µM each primer (Forward: 5′-CCGAGATCTGGACGAGCTT-3′ and Reverse: 5′-GCTTAACCGGTTCACTCG-3′), 2.4 mM MgCl2 , 0.25% DMSO (Dimethylsulfoxide),reaction buffer (1×), and 0.04 U/µL Taq DNA polymerase(Invitrogen). The amplification conditions corresponded toone step at 10 min at 94°C, 30 cycles at 94°C for 30 s, 73°Cfor 30 s, and 68°C for 1 min and a final step of 10min at 72°C.One aliquot of the PCR product was run in 1% agarose gel toverify the presence of a single band.
The amplification product of each clone, correspondingto approximately a 3-µg DNA, was placed in a 96-wellpolystyrene plate and mixed with DMSO (1:1v:v). TheDNA samples obtained were printed on CMT-GAPS2 glassslides (Corning, New York, USA) treated with aminolysine,which permitted covalent linkage of the NH4+ extremitywith the PO4
− extremity of the DNA, in duplicate, using theGMS-417 Arrayer equipment (Affymetrix).
In each period of time and genotype, total RNA wasextracted using Trizol reagent (Invitrogen) according to themanufacturer’s instructions. The direct cDNA marking
20 Plant Mol Biol Rep (2011) 29:19–34

technique was used during the reverse transcription, usingthe Cy3 (green) and Cy5 (red) fluorophorous. For marking,20 µg of total RNA from each sample was mixed with40 U/µl RNAsin (Promega), 15 µg pd(N)6 random primer(Amersham Bioscience). A mixture was incubated at 70°Cfor 10 min and quickly chilled at 4°C. The RNA samplewas mixed with reaction buffer (1×) (Invitrogen), DTT10 mM, dNTP mix (0.25 mM dATP, dGTP, dCTP; 0.1 mMdTTP), Cy3-dUTP or Cy5-dUTP 1.25 mM (AmershanBioscience), and 20 U of the RT-Superscript II reversetranscriptase (Invitrogen). The cDNA was synthesized at37°C for 3 h in the dark, and the RNA was laterhydrolyzed by incubating with NaOH 1 M at 37°C for40 min. The reaction was neutralized by adding Tris–HCl8 M, pH 7.5. The sample containing marked cDNA wasthen purified in a Microcon YM-100 column (Millipore)(Souza 2006).
The hybridization schemes using different treatments toboth genotypes were paired as follows: 1) T0-Cy5 (controlplants) plus T1-Cy3 (bulked roots of plants submitted to 25and 50 min of treatment), and 2) T0-Cy5 (control plants)plus T2 (bulked roots of plants submitted to 75 and 100 minof treatment). The pairs of cDNA markers were mixed inhybridization solution containing the RPN3601 liquidblocker (Amershan Bioscience), SSC (20×) and SDS 2%,and pre-denatured at 95°C for 2 min. Hybridizationoccurred in the GeneTac Hybridization station (GeneticMicrosystems), to which the glass slides of the microarraywere attached. Each cDNA mixture was distributed on theslide and hybridized at 42°C for 12 h. After hybridization,the slide was automatically and sequentially washed in0.5% SSC (2×)/SDS, SSC (0.5×) and SSC (0.05×), at 25°C.Each washing lasted for a period of 15 min, with 10-s flowand 20-s incubation for 10 cycles. The slide was dried for15 min. Three slides were used for each experiment, that is,RNA extractions; cDNA synthesis and hybridizations werecarried out with three biological repetitions for eachexperiment performed, and in each slide, the PCR productwas spotted in duplicate.
The fluorescent signs were obtained using a GMS-418Arrayer scanner (Affymetrix). The images obtained wereoverlaid and analyzed, and the density in pixels (intensity)was determined for each spot on the microarray, using theImaGene program 5.5 version (Biodiscovery). A grid ofindependent cells, corresponding to each DNA spot on thearrays, was drawn on the image to designate each spot to bequantified. The quantification was calculated by the meanof the intensity of all the pixels concerning the hybrid signof each spot. The pixels classified as background wereautomatically subtracted by the program.
The location and identification of each gene in the arraywere defined in a text file created by the CloneTracker 2program (Biodiscovery), and the quantified data were
exported and transformed by the Gene Sight Programversion 5.5 (Biodiscovery). Normalization was carried outfollowing the correction parameters (locally weighted linearregression/robust locally weighted regression/local polyno-mial regression) (Cleveland 1979), with a local normaliza-tion method (the algorithm was applied in physical subsetsof the data, that is, on a subgrid).
After normalization, the microarray replication data,independent for the same experiment, were processed bythe SAM statistical tool (Significance Analysis of Micro-array, Chu et al. 2001). This analysis was based on a seriesof specific t tests for each gene, adapted for large-scaledetection of differentially expressed genes (Tusher et al.2001). Resulting differentially expressed genes were cate-gorized by the Gene Ontology site (GO) searching throughthe following databases: Kyoto Encyclopedia of Genes andGenomes (Kegg), the Arabidopsis Information Resource(Tair), and the Munich Information Center for ProteinSequence (MIPs) in the Functional Category (FunCat)scheme to determine the functional group each genebelongs to. The soybean genes were distributed in ninecategories according to cell function. After processing, thesequences identified as different were placed in theGenbank, in the ESTs bank (NCBI, www.ncbi.nlm.nih.gov), and the experimental data were placed on theEmbrapa Soybean site (http://bioinfo.cnpso.embrapa.br/seca) following the MIAME standards (minimal informa-tion on the microarray data) (Brazma et al. 2001).
qRT-PCR Analysis
For each period of time, total RNA was extracted usingTrizol reagent (Invitrogen) according to the manufac-turer’s instructions and synthesis of the complementaryDNA (cDNA) was achieved using Moloney murineleukemia virus (MMLV) (Invitrogen) reverse transcrip-tase, according to the method described by (Schenk et al.2003). Primer Express program v.3.0 (Applied Biosys-tems) was used to design the primers for RT-PCR, beingdetermined on the 3′ regions of the genes with putativeamplicons of 75 to 150 base pairs (bp). In order to validatemicroarray data, based on those results seven genes werechosen, verifying the probable location of these genes onabiotic-response metabolic pathways. The number ofaccessions was obtained from the NCBI similarity searchincluding the genes Gmerd1, Gmsiringolide A Gmsiringo-lide B, Gmp450, Gmcpn10, and Gmlea14. Gmβ-actin wasused as the reference for normalization (Stolf 2007)(Table 1).
qRT-PCR analyses were performed using a 7300 RealTime System (Applied Biosystems) thermocycler and thePlatinum®SYBR®Green qPCR SuperMix UDG (Invitro-gen). The reaction conditions were 50°C for 2 min, 95°C
Plant Mol Biol Rep (2011) 29:19–34 21

for 10 min, 45 cycles at 95°C for 2 min, 62°C for 30 s, and72°C for 30 s; the data were collected in the last phase(extension phase). The formula E=[10−1/slope]−1 was usedto calculate the reaction efficiency. The results werecaptured by the Sequence Detection program (PerkinElmer) and analyzed by Relative Expression Software Toll(REST) version 2.0.7 (Pfaffl et al. 2002).
Results and Discussion
Physiological Response of Soybean to Drought Stress
The aim of this study was to identify mechanisms with ageneral relevance for drought tolerance in soybean bycomparing genotypes differing in drought stress tolerance.Water shortage monitoring in plants submitted to waterdeficit showed that A and gs values gradually decreased untilthe end of the experiment (100 min of stress), but the valuesfor the MG/BR46 (Conquista) and BR 16 genotypes differedonly for the T0 treatment (no stress) (Fig. 1a and b). Ci andleaf temperature increased proportionally with the severity ofthe stress; Ci values were greater in BR16 (Fig. 1c), whereasleaf temperatures were the same in both genotypes (Fig. 1d).The experiment for the construction of cDNA library wasperformed in pots containing sand. The profile of physio-logical responses was similar to that of plants in the
hydroponic system. A values were reduced 24% for MG/BR46 (Conquista) genotype and 40% for BR16 genotypeand gs values were reduced by 65 and 50% for the MG/BR46 (Conquista) and BR16 genotypes, respectively, in15 days after the onset of stress (T1). No differences betweenthe genotypes were detected for A in the second treatmentperiod (T2), probably because the plants were alreadysenescing. However, the values of gs were reduced by 79%in MG/BR46 (Conquista) (Stolf 2007).
The results with BR16 in both treatments suggest a partialclosing of the stomata, with sufficient CO2 input to themaintenance of photosynthesis and Ci. Water stress signifi-cantly reduced A in all conditions evaluated. In addition tostomata closure-limiting CO2 entry and causing photosyn-thesis reduction, plants under water deficit may presentlimited ribulose-1, 5-bisphosphate synthesis (Lawlor andCornic 2002). The limitation of RuBP synthesis is probablylinked to the reduction in the synthesis of ATP (Lawlor2002). Plants under water stress often show a moderateincrease in water use efficiency, since a reduction of stomataopening limits transpiration more than the influx of CO2
(Kron et al. 2008). This is due to a greater increase inresistance to CO2 diffusion in the mesophyll, thus decreasingthe efficiency of carboxylation (Lawlor and Cornic 2002).These results indicate that the treatments effectively inducedsevere stress, and were a reliable basis for molecularanalyses.
Table 1 Gene description, primer sequences and efficiencies of the selected primer pairs used in qRT-PCR
Gene identification/accession number Primer sequence/amplicon size Amplification efficiency
Gmerd1 (NP568750.1) 5′ CCCTGAGAAGTCCTCCCAGCTT 3′ 0.725′ CACCGTACTCCGGCAAGAGC 3′
71 bp
Gmsiringolide A (AB083025) 5′ GAGGACATAGTGAGGCA 3′ 0.965′ AGCCTGTGGAATGCAGAT 3′
95 bp
Gmsiringolide B (BAB86890) 5′ TGTCACCATTGGCTTAGG 3′ 0.995′ CTGCAGCAGAACCAGAG 3′
82 bp
Gmp450 (AF135485) 5′ ACTCAAGTGCAAGCCTGTTCC 3′ 0.895′ CACAGTCTTCAGGCAGCGAA 3′
71 bp
Gmcpn10 (NM180714) 0.95 5′ CTTCAAACGACGCCGTAGAGAT 3′ 0.865′ CGGTTTCGTTACGTTCTGCTTC 3′
75 bp
Gmlea14 (CA784216) 5′ AGTCACCAACATGCCAAGC 3′ 0.965′ TGCTATCTCCTGCCAGCA 3′
96 bp
Gm-actin (GMU60500) 5′ GAGCTATGAATTGCCTGATGG 3′ 0.955′ CGTTTCATGAATTCCAGTAGC 3′
85 bp
22 Plant Mol Biol Rep (2011) 29:19–34

Drought Effects on Gene Expression
A total of 753 non-redundant sequences were used froma cDNA library to construct the DNA-microarray slides.Each one of the amplified clones presented a band
indicating the presence of only one fragment, between0.4 and 1.6 kilobases (kb) in length, corresponding tothe plasmid DNA insert (data not shown). For cDNAmicroarray analysis, the q value and data reliabilityvalues, which are significant indicators of gene expres-
Fig. 1 Physiological parametersanalyzed in the two soybeangenotypes to monitor thedrought treatments (0, 25, 50,75, and 100 min) in a hydro-ponic system. a Photosyntheticrate, b stomatal conductance, cIntercellular CO2 concentration,and d leaf temperature. ■ MG/BR46 (Conquista) and □ BR16.The vertical lines between thebars correspond to the standarderror of the means
Table 2 Parameters applied by SAM tool during analysis of cDNA microarray data and number of differentially expressed genes for two soybeangenotypes, MG/BR46 (Conquista) and BR16, in two stress periods (T1: 25 and 50-min stress and T2: 75 and 100-min stress) in a hydroponicsystem. Time zero (T0, without stress) was used as control in cDNA microarrays analyses
Treatments Parameters Analyzed data
Foldchange
Delta-value
FSN (false significantnumber)
FDR (false discoveryrate)
q value(%)
Datareliability
Expressedgenes
MG/BR46(Conquista) T1
a2 0.87 0.83 2.13 2.13 97.87 39
MG/BR46(Conquista) T2
b2 0.66 0.84 2.27 2.27 97.73 37
BR16 T1a 2 0.19 0.83 13.88 9.25 90.75 6
BR16 T2b 1.5 0.54 1.00 1.58 1.58 98.42 63
a Hybridization was performed using the cDNA from time zero (T0, without stress) marked with “Cy5” and cDNA from the first treatment period—T1 (25and 50-min stress) marked with “Cy3”.b Hybridization was performed using the cDNA from time zero (T0, without stress) marked with “Cy5” and cDNA from the second treatment period—T2
(75 and 100-min stress) marked with “Cy3”.
Table 2 Parameters applied by SAM tool during analysis of cDNAmicroarray data and number of differentially expressed genes for twosoybean genotypes, MG/BR46 (Conquista) and BR16, in two stress
periods (T1: 25 and 50-min stress and T2: 75 and 100-min stress) in ahydroponic system. Time zero (T0, without stress) was used as controlin cDNA microarrays analyses
Plant Mol Biol Rep (2011) 29:19–34 23

Table 3 Differentially expressed genes in MG/BR46 (Conquista) genotype in the first stress period—T1 (25 and 50-min stress) in a hydroponicsystem. Time zero (T0, without stress) was used as control in cDNA microarray analyses
MG/BR46 (Conquista) T1
GenBankaccessiona
Similarityb Description Expressionlevel
Energy categoryc
GT185150 Alpha/beta hydrolase Electrons transport 16.2
GT185151 Ubyquinol-cytochrome c reductase 7.8 kDacomplex
Oxidative phosphorylation 9.31
GT185152 Metallothionein 1A (MT-1A) (MT-Q) (MT-2) Pentoses phosphate path, high light and copper 2.94
GT185153 Bul1p Ubiquitin-binding complex 1.55
Trancriptional factor categoryc
GT185154 Ethylene responsive element binding (EREB) Cytocyanin responsive 3.32
GT185155 RCBF2/OsDREB1F Transcription cell cycle phase G1/S 2.34
GT185156 bZIP Transcription factor 1.81
GT185157 Swi6p Transcription cell cycle phase G1/S 1.5
GT185158 MYBJ7 Phytohormones responsive 1.59
GT185159 Ras (ARA-5) protein, GTP binding Mediated endoplasmatic reticule to Golgicomplex
1.95
GT185160 Actin 5 (ADF5) depolymerization factor Actin binding 2.87
Metabolism categoryc
GT185161 Cystein synthase/O-acetylserin sulfydrilase (OAS1) Cystein from serin biosynthesis 2
GT185162 p450 cytochrome UV responsive, flavonoids biosynthesisflavonoids
1.67
GT185163 Lactoylglutathione lyase Carbohydrates metabolism 1.58
GT185164 Acetyl-CoA C-acetyltransferase 1 Fatty acid oxidation 1.5
GT185165 Amine oxidase family Carotenoids biosynthesis 1.53
GT185166 Desidrogenase zinc-binding protein,oxidoreductase
Oxidoreductase activity 2.25
Stress-responsive categoryc
GT185167 ATP-binding protein Protelyse ATP dependent 5.97
GT185168 Chaperonin subunit 10 kDa Protein folding 4.01
GT185236 Late embryogenesis abundant (LEA14) protein High light responsive and wounding 3.68
GT185169 Regulated giberelin protein Giberilin responsive 1.55
Protein synthesis categoryc
GT185170 Ribossomic 40S (RPS25A) protein Structural ribossomic constituent 2.7
Cell communication categoryc
GT185254 Ras (RAB7) protein Intracell transport 2.13
GT185171 Guanine-binding extra large G (XLG) Signal transduction 1.51
Cell cycle categoryc
GT185172 Topoisomerase III DNA unfolding 1.68
Unknown categoryc
GT185173 7.47
GT185174 4.68
GT185175 3.9
GT185176 3.46
GT185177 3.07
GT185178 2.6
GT185179 No hits found 2.46
GT185180 1.93
GT185181 No hits found 1.58
GT185182 1.57
24 Plant Mol Biol Rep (2011) 29:19–34

sion, are shown in Table 2. The expression patterns of theidentified soybean transcripts are shown in Tables 3, 4, 5,6. Genes were found for nine functional categories,namely energy, transcription factors, metabolism, stressresponse, photosynthesis, cell communication, cell cycle,cell transport, and unknown proteins. Various percentagesof differentially expressed genes were obtained withineach category (Fig. 2) and the interrelationship of thedifferentially expressed genes in both genotypes andapplied treatments (Fig. 3).
We focused on genes differing in their response todrought stress, from tolerant and sensitive genotypes. Instatistical terms, this means that we searched for genesshowing a significant interaction effect between conditionand tolerance group. To validate our method, we comparedgenes that had previously been described as droughtinduced in soybean or monocots with those showing adrought significant effect on gene expression. In responseto drought, plants activate and express genes related toother abiotic stresses, such as cold and salinity, includinggenes that are at the top of the signaling cascade, such asthose identified in this study, for example, the nac2, ereb,siringolide a and b, c2h2, myb, dreb1, and bzip transcrip-tion factors. Genes which are activated by these transcrip-tion factors and by hormone/metabolic mechanisms areinvolved in cascade reactions acting directly in response toabiotic stresses—such as the erd1, erd6, lea14, and cpn10genes and stress-signaling response genes—including ki-nase proteins that are involved in the protection of macro-molecules, such as enzymes and lipids, and in theprotection of cell components, such as membrane proteins.Data reported by Vanderauwera et al. (2007) also showeddifferentially expressed genes related directly to abiotic-stress responses in Arabidopsis thaliana, including erd1,lea14, and others such as rd29a, kin1, and cor15a. Thesedata indicate an overlap and sharing of metabolic pathwaysin Arabidopsis and soybean. Metallothioneins and late
embryogenesis abundant proteins had previously beenfound to be induced in young rice plants under long-termdrought stress (Hazen et al. 2005; Markandeya et al. 2007)and in barley and A. thaliana (Ozturk et al. 2002; Talamè etal. 2007) under drought stress. Also, cytochrome P450family proteins and serine/threonine protein kinases wereprominent among genes in EST libraries from drought-stressed rice plants (Degenkolbe et al. 2009).
In our study, the unknown genes added up to twenty-nine, which corresponds to 20% of the differentiallyexpressed transcripts. This is an indication that thesetranscripts have not been reported in other organisms;therefore, the number of functionally unknown transcriptsis probably greater because many were distributed bycategory based on the domain similarity with other deducedprotein sequences, but their true functions were notreported. In addition to these, genes encoding transcriptionfactors and genes involved in metabolism had the greatestrepresentation in both soybean genotypes. These transcrip-tion factors include those participating in biosynthetic andregulatory pathways, such as mybj7, siringolide a and b,nac2, bzip, c2h2, and ereb.
Differential Response of Drought Stress Tolerantand Sensitive Genotypes
Some genes were identified in T1 in MG/BR46 (Conquista)and in T2 in BR16, which may explain the difference indrought tolerance and sensitivity of these genotypes. MG/BR46 (Conquista) perceived moisture deficiency quickerand in T1 set off immediate response mechanisms, whereas,in BR16, the response mechanisms were triggered later. Infact, if we considered only the physiological aspects,especially photosynthesis and stomata conductance, wewould deduce that both genotypes sense drought similarly.However, our molecular data, especially gene expressionvalues, suggest that the same molecular mechanisms
Table 3 (continued)
MG/BR46 (Conquista) T1
GenBankaccessiona
Similarityb Description Expressionlevel
GT185183 1.51
GT185183 No hits found 1.51
GT185185 1.58
GT185186 1.99
a GenBank Accession—NCBIb Similarity—tBlastx (NCBI)c Category—Functional category by MIPs (Monique Information for Protein Sequence)
Plant Mol Biol Rep (2011) 29:19–34 25
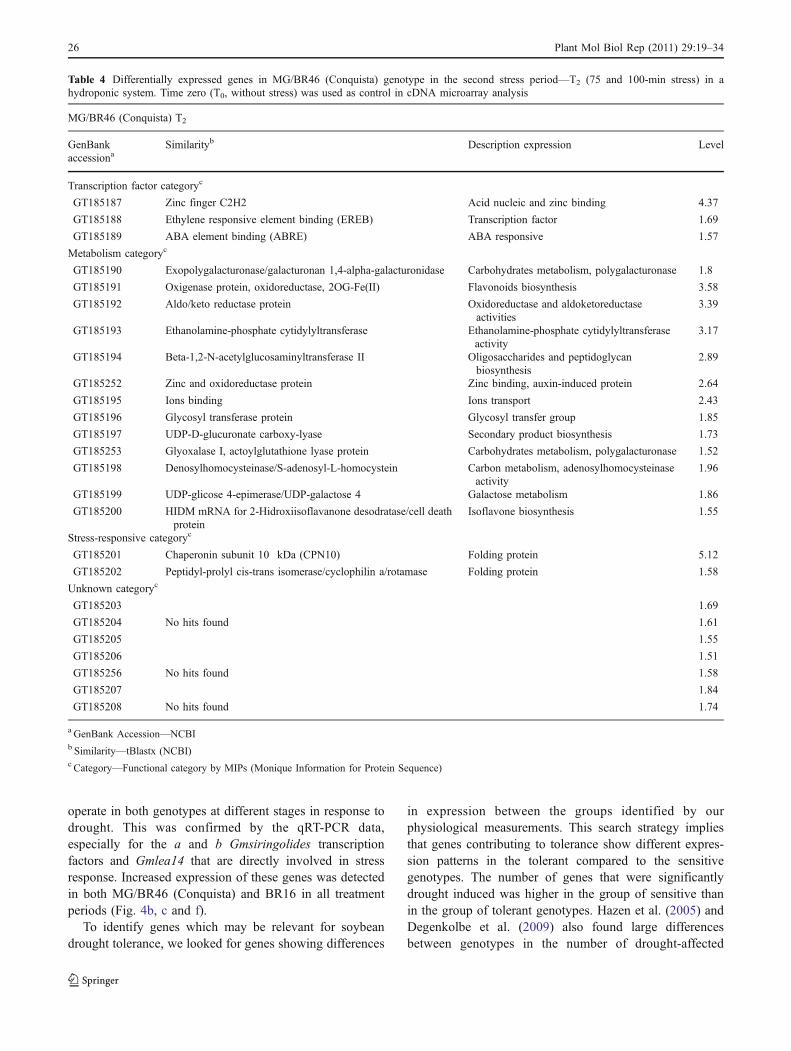
operate in both genotypes at different stages in response todrought. This was confirmed by the qRT-PCR data,especially for the a and b Gmsiringolides transcriptionfactors and Gmlea14 that are directly involved in stressresponse. Increased expression of these genes was detectedin both MG/BR46 (Conquista) and BR16 in all treatmentperiods (Fig. 4b, c and f).
To identify genes which may be relevant for soybeandrought tolerance, we looked for genes showing differences
in expression between the groups identified by ourphysiological measurements. This search strategy impliesthat genes contributing to tolerance show different expres-sion patterns in the tolerant compared to the sensitivegenotypes. The number of genes that were significantlydrought induced was higher in the group of sensitive thanin the group of tolerant genotypes. Hazen et al. (2005) andDegenkolbe et al. (2009) also found large differencesbetween genotypes in the number of drought-affected
Table 4 Differentially expressed genes in MG/BR46 (Conquista) genotype in the second stress period—T2 (75 and 100-min stress) in ahydroponic system. Time zero (T0, without stress) was used as control in cDNA microarray analysis
MG/BR46 (Conquista) T2
GenBankaccessiona
Similarityb Description expression Level
Transcription factor categoryc
GT185187 Zinc finger C2H2 Acid nucleic and zinc binding 4.37
GT185188 Ethylene responsive element binding (EREB) Transcription factor 1.69
GT185189 ABA element binding (ABRE) ABA responsive 1.57
Metabolism categoryc
GT185190 Exopolygalacturonase/galacturonan 1,4-alpha-galacturonidase Carbohydrates metabolism, polygalacturonase 1.8
GT185191 Oxigenase protein, oxidoreductase, 2OG-Fe(II) Flavonoids biosynthesis 3.58
GT185192 Aldo/keto reductase protein Oxidoreductase and aldoketoreductaseactivities
3.39
GT185193 Ethanolamine-phosphate cytidylyltransferase Ethanolamine-phosphate cytidylyltransferaseactivity
3.17
GT185194 Beta-1,2-N-acetylglucosaminyltransferase II Oligosaccharides and peptidoglycanbiosynthesis
2.89
GT185252 Zinc and oxidoreductase protein Zinc binding, auxin-induced protein 2.64
GT185195 Ions binding Ions transport 2.43
GT185196 Glycosyl transferase protein Glycosyl transfer group 1.85
GT185197 UDP-D-glucuronate carboxy-lyase Secondary product biosynthesis 1.73
GT185253 Glyoxalase I, actoylglutathione lyase protein Carbohydrates metabolism, polygalacturonase 1.52
GT185198 Denosylhomocysteinase/S-adenosyl-L-homocystein Carbon metabolism, adenosylhomocysteinaseactivity
1.96
GT185199 UDP-glicose 4-epimerase/UDP-galactose 4 Galactose metabolism 1.86
GT185200 HIDM mRNA for 2-Hidroxiisoflavanone desodratase/cell deathprotein
Isoflavone biosynthesis 1.55
Stress-responsive categoryc
GT185201 Chaperonin subunit 10 kDa (CPN10) Folding protein 5.12
GT185202 Peptidyl-prolyl cis-trans isomerase/cyclophilin a/rotamase Folding protein 1.58
Unknown categoryc
GT185203 1.69
GT185204 No hits found 1.61
GT185205 1.55
GT185206 1.51
GT185256 No hits found 1.58
GT185207 1.84
GT185208 No hits found 1.74
a GenBank Accession—NCBIb Similarity—tBlastx (NCBI)c Category—Functional category by MIPs (Monique Information for Protein Sequence)
26 Plant Mol Biol Rep (2011) 29:19–34

genes. In fact, this pattern has recently been observed inArabidopsis accessions differing in freezing tolerance(Hannah et al. 2006). However, the sensitive genotypecould show gene expression alterations if the imposeddegree of stress evoked additional, damage-relatedresponses that were not yet induced in the tolerantgenotype. Alternatively, genes contributing to droughttolerance could be constitutively highly expressed in thetolerant genotype. If these genes are not (or very lowly)expressed in the sensitive genotype, they will not bereliably identified with our search strategy. If thesetolerance genes are drought induced in the sensitivegenotype, a negative interaction factor will result.
The cytochrome Gmp450, which showed increasedexpression in microarray analysis in both genotypes in T2,has a key role in the biosynthesis of several lipophiliccompounds such as fatty acids, sterols, phenylpropanols,phytoalexins, and gibberellins. Furthermore, an experi-ment with A. thaliana showed that, in the promoter regionof this gene, the cis elements acting in response to abioticstresses, such as for the myb, myc, abre, and nac genes,have an independent ABA pathway (Narusaka et al.2003). In confirmation, qRT-PCR showed high expressionof this gene in MG/BR46 (Conquista) and BR16 in T2
(Fig. 4d). It was, therefore, inferred that Gmp450 isprobably involved in activating Gmnac2. In Arabidopsis,CYP86A2 of the cytrochrome family catalyze the oxida-tion of fatty acids and are involved in the biosynthesis ofextracellular lipids and cuticle development (Xiao et al.2004). CYP86A2 transcripts are increased under variousstress conditions including drought (Duan and Schuler2005) and co-expressed among others with genes encod-ing enzymes involved in the TCA cycle, fatty acid
elongation, wax and cutin metabolism (Ehlting et al2008).
In rice, epicuticular wax content is low, but geneticvariation of the amount exists (O’Toole and Cruz 1983).Induction of cuticle biosynthesis under drought could thusreduce non-stomata water loss in the tolerant genotypes andthereby contribute to the observed increased water useefficiency. In Arabidopsis, cyp86A2 is furthermore co-expressed with genes coding for chlorophyll biosynthesisand photosystems, which suggests a link to the secondprocess that has been identified as relevant for rice droughttolerance (Degenkolbe et al. 2009). Cytochrome P45076C2, which is more highly induced in the sensitive thanin the tolerant genotypes, is known to be induced duringhypersensitive and developmental cell death, senescence,and also under drought stress (Narusaka et al. 2004),stressing the significance of both differences in P450protein regulation and senescence-associated processes forrice drought tolerance .
The NAC family is one of the largest groups oftranscription factors in plants. A NAC sequence wasidentified (Gmnac2) in BR16 in T2. Genes from this familyparticipate in various biological processes includingresponses to biotic and abiotic stresses. A study using A.thaliana showed that the Atnac2 gene is involved in thesalinity response and lateral-root development; this genealso induced the stress-response expression of erdl (He etal. 2005). The expression profile of Gmerd1 differed fromthat of Gmnac2, as shown by the microarray for MG/BR46 (Conquista) (Fig. 4a). However, expression of erd1was not affected in transgenic drought-affected A. thalianathat over-expressed the nac gene. By an independentABA-regulated system, of which erd1 is part, promoter
Table 5 Differentially expressed genes in BR16 genotype in the first stress period—T1 (25 and 50-min stress) in a hydroponic system. Time zero(T0, without stress) was used as control in cDNA microarray analysis
BR16 T1
GenBank accessiona Similarityb Description Expression level
Metabolism categoryc
GT185249 UDP-glycose 4-epimerase/UDP-galactose 4- Galactose metabolism 2.28
GT185209 Permease, gamma-aminobutyrate (GABA) GABA utilization like N source 2.19
GT185250 Aldo/keto reductase protein Oxydoreductases and aldocetoredutases activity 1.87
GT185251 p450 cytochrome UV responsive and flavonoids biosynthesis 1.61
Unknown categoryc
GT185210 1.5
GT185211 1.5
a GenBank Accession—NCBIb Similarity—tBlastx (NCBI)c Category—Functional category by MIPs (Monique Information for Protein Sequence)
Plant Mol Biol Rep (2011) 29:19–34 27

Table 6 Differentially expressed genes in BR16 genotype in the second stress period—T2 (75 and 100-min stress) in a hydroponic system. Timezero (T0, without stress) was used as control in cDNA microarrays analysis
BR16 T2
GenBankaccessiona
Similarityb Description Expressionlevel
Energy categoryc
GT185243 Ubiquinol-cytochrome C reductase 7.8-kDa proteiccomplex
Electrons mitochondria transport 1.5
GT185212 Syringolide-induced protein 19-1-5 Transcription factor 3.51
GT185213 Syringolide-induced protein 13-1–1 Transcription factor 2.81
GT185214 Acid nucleic-binding protein Transcription factor 1.76
GT185244 Ethylene responsive element binding (EREB) Citocinin and ethylene responsive 1.69
GT185255 NAC2 protein Development 1.52
GT185216 Calmodulin-binding protein Auxin responsive 1.52
GT185217 Homeobox leucine zipper 4 (HAT4) Citocinin responsive 1.9
Stress-responsive categoryc
GT185234 Primary fungal elicitor protein Other organisms responsive 2.61
GT185235 Multidrug resistance-associated protein Nematoid, water stress responsive and stomatalmovement
1.56
GT185236 Late embryogenesis abundant (LEA 14) protein High light responsive 1.95
GT185237 Germination protein (GLP4 and GLP5) Cold and nutrients responsive 1.54
GT185248 Giberelin-regulated protein Giberelin responsive 1.7
Protein syntesis categoryc
GT185238 Ribosome 40S protein (RPS21B) Structural constituent of ribosome, biogenesisribosome
2.32
GT185239 Ribosome 60S protein (RPL37A) Structural constituent of ribosome, biogenesisribosome
1.59
Cell communication categoryc
GT185240 Kinase serine/threonine protein (RKF2) Serine/threonine activity flag
GT185241 Leucine-rich protein Translation signal
GT185242 Kinase serine/threonine protein (RKF2) Serine/threonine activity flag
Cell cyclec
GT185225 Single-strand DNA-binding protein Single-strand DNA binding 1.71
GT185247 DNA topoisomerase I Topoisomerase activity 1.64
Cell transportc
GT185226 Sugar 1 transport Sugar transport and nematoid responsive 2.3
GT185227 Nuclear pore 24 kDa Embryonary development 1.9
GT185228 Phosphate/phosphoenolpyruvate translocatorprecursor
Phosphoenolpyruvate and pyruvate transportthrough plastid
1.53
GT185229 Plant ripening-regulated protein Antiporter activity 1.97
GT185230 Electrons intermediate transport by thiol-disulphidechanges
Electrons transport, homeostase redox 1.84
GT185231 Translocase protein Translocase activity, secret ion protein 1.51
Downregulated
GT185232 Acetyl-CoA carboxylase Cell energy product ion −3.13GT185233 No hits found −2.84
a GenBank Accession—NCBIb Similarity—tBlastx (NCBI)c Category—Functional category by MIPs (Monique Information for Protein Sequence)
28 Plant Mol Biol Rep (2011) 29:19–34

analysis has shown that erd1 is differentially expressed inresponse to drought and salinity, and senescence isinduced by the absence of light (Tran et al. 2007).However, Simpson et al. (2003) demonstrated that theexpression of erd1 during dehydration is controlled by thecoordinated activity of two cis-acting elements, the recogni-tion site of the myc (CATGTG) and the sequence of the rps1site of the 14 bp nac (CACTAAATTGTCAC). The myc genewas not identified by cDNA microarray analysis, probablybecause the redundancy of the cDNA library (48%, data notshown) was not high enough or because the stress wasapplied at 30 days after plant emergence, possibly too latefor detection of this transcription factor.
In the study by Tran et al (2009) 31 unigenes wereidentified containing the complete open reading framesencoding Gmnac proteins from soybean. Analysis of C-terminal regulatory domain using yeast one-hybrid systemindicated that among 31 GmNAC proteins, 28 had transcrip-tional activation activity. Expression analysis of these Gmnacgenes showed that they are differentially expressed indifferent organs, suggesting that they have diverse functionsduring plant growth and development. To search for thedrought-inducible Gmnac genes, it was prescreened and re-confirmed by quantitative real-time PCR analysis that nineGmnac genes are induced by dehydration stress withdifferential induction levels in both shoot and root. Phylo-genetic analysis of the GmNAC proteins with previously
reported drought-inducible NAC proteins of Arabidopsis andrice revealed that the nine drought-inducible GmNACproteins belong to the stress-inducible NAC group. Theresults of this systematic analysis of the GmNAC family willprovide novel tools and resources for the development ofimproved drought-tolerant transgenic soybean genotypes.
The introduction of the gus reporter directed by theerd1 promoter region showed that there is a recognitionsequence (NACRS) in the erd1 promoter region. TheNAC protein activates the expression of erd1 in the stressresponse. The expression of NAC did not induced thetranscription of erd1 in the present study, as the nac maybe linked to this NACRS and other transcription factorsare needed to link to the rps1 site; together they maycontrol transcription of erdl induced by dehydration. For abetter understanding of the signaling paths leading to erd1activation, Tran et al. (2007) isolated zinc-finger tran-scription factors (zfhd1) containing the domain that maybe linked to the rpsl site. The over-expression of bothnac2 and zfhdl-activated erd1 under normal growthconditions (without stress) in genetically engineered A.thaliana plants. The transcription factor containing zinc-finger domain was also differentially expressed in BR16in T2 as nac2 (Table 6), indicating that the transcriptionfactors functioning in the expression of the stress-inducederd1 may be transcriptional activators. However, theparticipation of a single transcription factor, for example
Fig. 2 Rates of genetic expres-sion per functional category intwo soybean genotypes, MG/BR46 (Conquista) and BR16,under different drought condi-tions in a hydroponic system(T1, 25 and 50-min stress; T2, 75and 100-min stress). Time zero(T0, without stress) was used ascontrol in cDNA microarrayanalysis
Plant Mol Biol Rep (2011) 29:19–34 29

zfhd1, was not sufficient to produce any increase in erd1levels. These observations suggest that the attachment ofadditional transcription factors is necessary. Two studieshave shown the involvement of transcriptional activatorsof stress-induced genes, one of them rd22, which, duringdehydration, is controlled by the coordinated actions ofthe Atmyc2 and Atmyb2 factors in the expression of theABA response of the rd29a gene that required theinteraction of the DREB and AREB transcriptionalactivators (Abe et al. 2003).
The differential expression of ereb occurred in bothsoybean genotypes analyzed (Fig. 3), indicating that it wasactivated by the ethylene signal pathway, although itoccurred at different times after the onset of stress. Studiesof the function of ethylene response genes (ereb) haveshown that signaling and the function of the ethylenereceptors are important in regulating growth and theresponse to saline stress, for example as observed ingenetically engineered tobacco plants that over-expressed
the ethylene receptor (NTHK1). This was confirmed bythe application of the ethylene precursor, aminocyclopro-pane carboxylic acid (ACC), partially or completelysuppressing epinasty, suggesting that ethylene may berequired for tolerance of abiotic stresses in plants, such assalinity and drought (Cao et al. 2007). A mutant sensitiveto ethylene, ein2-1, showed tolerance to salt indicatingthat this mutant permits tolerance of the plant tosalinity. This receptor (NTHK1) was essential for salt-induced expression of the Atnac2 gene, which promotesnatural root formation (He et al. 2005). The genesencoding the siringolide transcription factor, althoughrelated more directly to biotic stress, presented the greatestexpression for both genotypes with the treatments thatwere applied (Tables 3, 4, 5, 6). Siringolide is an elicitorthat functions in pathogen recognition by linking to acytoplasmic protein that is present both in resistant and insusceptible soybean cultivars (Rpg4/rpg4). Several bio-chemical processes are activated in the recognition
Fig. 3 The interrelationship ofthe differentially expressedgenes in the analyzed soybeangenotypes, MG/BR46 (Con-quista) and BR16, under differ-ent drought conditions in ahydroponic system (T1, 25 and50-min stress; T2, 75 and100-min stress). Time zero (T0,without stress) was used ascontrol in cDNA microarrayanalysis
30 Plant Mol Biol Rep (2011) 29:19–34

process, such as the activation of other defense genes,biosynthesis of phytoalexin and generation of reactiveoxygen species (ROS) (Slaymaker and Keen 2003). Theparticipation of a and b siringolide genes in the droughttolerance process in the soybean plants studied was alsorelated to this induction of gene expression, such as stress-responsive MAP-kinase proteins, ROS, and other stillunknown processes that are common to biotic and abioticstresses.
Genes encoding components of protein synthesis werealso quickly induced in T1 in MG/BR46 (Conquista);however, the expression of these genes did not persist until
T2. These results suggest a time control at the cellular levelensuring synthesis of chaperonin 10 (CPN10) (Fig. 4),observed by the quantification of its mRNA by qRT-PCR,in order to assure the stabilization of the synthesizedproteins and, thus, the short-term expression of componentsinvolved in protein syntheses, such as the structuralcomponents of the ribosomes.
Gmlea14 presented differential expression in thesegenotypes analyzed by microarrays (Fig. 3), and, aftervalidation by qRT-PCR, higher expression was observed inMG/BR46 in all the treatments assessed, although BR16also presented high Gmlea14 expression (Fig. 4). This gene
Fig. 4 Expression levels for the differentially expressed genes,Gmerd1, GmsyrA, GmsyrB, Gmp450, Gmcpn10, and Gmlea14 intwo soybean genotypes, MG/BR46 (Conquista) (blue) and BR16(red), submitted to stress treatments (25, 50, 75, and 100 min) in ahydroponic system. Time zero (0 min) was used as calibrator and the
Gm β-actin gene was used as a reference gene to normalize data. qRT-PCR for each gene was performed in triplicate for each of the threeindependent biological replicates. Significance was determined withREST software version 2.0.7 (p value<0.05)
Plant Mol Biol Rep (2011) 29:19–34 31

was identified in A. thaliana plants containing the dreb1agene when submitted to cold (Maruyama et al. 2004); itmay also be activated under drought conditions, since itwas detected in the present study. Research by Seki et al.(2002) on 7,000 A. thaliana genes, permitted the identifi-cation of 277 genes induced by drought, 53 genes inducedby cold, and 194 genes induced by salinity. Expression oflea14 gene was increased more than four times in all thesestresses, indicating its importance in tolerance to abioticstresses (Fig. 4). Most genes encoding LEA proteins hadabscisic acid response (ABRE) and/or low temperatureresponse (LTRE) elements in their promoters, and manygenes containing the respective promoter elements wereinduced by abscisic acid, cold, or drought (Hundertmarkand Hincha 2008).
For a better overview of the characteristic features of thedifferent LEA groups in Arabidopsis, its group-specificcharacteristics were compiled: LEA4 group is the mostdominant containing 18 members. This group is veryheterogeneous, and the gene products differ greatly in sizeand GRAVY (Grand Average of Hydropathy) index.Although the LEA proteins in G. hirsutum show thisconserved motif, it seems to be quite variable in LEA4group genes from other species (Dure 1993). The secondbiggest group is the dehydrin group with ten genes, such asgenes directly involved in drought tolerance. This is similarto the number found in rice (8) and in barley (13) (Choi etal. 1999), but much more than in poplar and grapevine(Alsheikh et al. 2005).
It is well established that osmotic stresses such asdrought cause rapid and excessive accumulation of ROSin plant cells, leading to oxidative stress and earlysenescence (Navabpour et al. 2003). Crucial biologicalprocesses in plants such as hormone response, stressresponse, photomorphogenesis, and senescence are regulat-ed by proteolysis, such as the results obtained in this study.Analysis of the cDNA array hybridization patterns showedby Clement et al. (2008) allowed validating 56 up-regulatedgenes under a drought condition. Approximately 50% ofthe validated genes (22/56) encode proteins involved ingeneral metabolism and in maintenance of essentialfunctions, indicating that water-stressed nodules were stillin an active metabolic state. The other up-regulated genesencode proteins implicated in cell type differentiation,protein fate, signal transduction mechanisms, cell rescue,defense, and virulence suggesting that stressed nodulesunderwent a strong change in gene regulation.
Conclusion
Our study presents a number of new markers potentiallyinvolved in drought tolerance of leguminous plants. It is
well known that small changes in gene expression mightdrastically change the protein levels. Thus, proteomicanalysis will be required to correlate the transcript levelsto the protein contents in drought-stressed plants to relatewith gene expression. In two soybean genotypes withcontrasting drought tolerance, 145 genes were differentiallyexpressed. It was verified that the two genotypes presenteddifferent transcriptional profiles and activated genes differ-ently in response to drought. Some of these genes arecandidates for more detailed study at the cellular andfunctional levels, such as Gmsiringolide, which presentedincreased expression. In addition, Gmnac2 and Gmerd1require more detailed analyses especially in their promoterregions, enabling the construction of over-expressioncassettes or genetic silencing to confirm their involvementin the drought tolerance mechanism. Furthermore, 20% ofthe genes identified have not been reported in otherorganisms, indicating the potential for finding new genesrelated to drought tolerance in soybean.
Acknowledgments The authors thank the financial support fromCAPES, JIRCAS, and Embrapa Soybean.
References
Abe H, Urao T, Ito T, Seki M, Shinozaki K, Yamaguchi-Shinozaki K(2003) Arabidopsis AtMYC2 (bHLH) and AtMYB2 (MYB)function as transcriptional activators in abscisic acid signaling.Plant Cell 15:63–78
Alsheikh MK, Svensson JT, Randall SK (2005) Phosphorylationregulated ion-binding is a property shared by the acidic subclassdehydrins. Plant Cell Environ 28:1114–1122
Brazma A, Hingamp P, Quackenbush J, Sherlock G, Spellman P,Stoeckert C, Aach J, Ansorge W, Ball CA, Causton HC (2001)Minimum information about a microarray experiment (MIAME)—toward standards for microarray data. Nature Genet 29:365–371
Cao WH, Liu J, He X-J, Mu R-L, Zhou H-L, Chen S-Y, Zhang J-S(2007) Modulation of ethylene responses affects plant salt-stressresponses. Plant Physiol 143:707–719
Choi D-W, Zhu B, Close TJ (1999) The barley (Hordeum vulgare L.)dehydrin multigene family: sequences, allele types, chromosomeassignments, and expression characteristics of 11 Dhn genes ofcv Dicktoo. Theor Appl Genet 98:1234–1247
Chu G, Narasimhan B, Tibshirani R, Tusher V (2001) SAM“significance analysis of microarrays”. Users guide and technicaldocument
Clement M, Lambert A, Herouart D, Boncompagni E (2008)Identification of new up-regulated genes under drought stress insoybean nodules. Gene 426:15–22
Cleveland WS (1979) Robust locally weighted regression andsmoothing scatterplots. Jour Americ Statistic Assoc 74:829–836
Degenkolbe T, Do PD, Zuther E, Repsilber D, Walther D, Hincha DK,Kohl KI (2009) Expression profiling of rice cultivars differing intheir tolerance to long-term drought stress. Plant Mol Biol69:133–153
Duan H, Schuler MA (2005) Differential expression and evolution ofthe Arabidopsis CYP86A subfamily. Plant Physiol 137:1067–1081
32 Plant Mol Biol Rep (2011) 29:19–34

Dure L III (1993) A repeating 11-mer amino acid motif and plantdesiccation. Plant J 3:363–369
Ehlting J, Sauveplane V, Olry A (2008) An extensive (co-) expressionanalysis tool for the cytochrome P450 superfamily in Arabidopsisthaliana. BMC Plant Biol 8:47
Ginzinger DG (2002) Gene quantification using real-time quantitativePCR: an emerging technology hits the mainstream. ExperimHematol 30:503–512
Gorantla M, Babu PR, Lachagari VBR, Reddy AMM, Wusirika R,Bennetzen JL, Reddy AR (2007) Identification of stress-responsive genes in an indica rice (Oryza sativa L.) using ESTsgenerated from drought-stressed seedlings. J Exp Bot 58:253–265
Hannah MA, Wiese D, Freund S et al (2006) Natural genetic variationof freezing tolerance in Arabidopsis. Plant Physiol 142:98–112
Hazen SP, Pathan MS, Sanchez A et al (2005) Expression profiling ofrice segregating for drought tolerance QTLs using a rice genomearray. Funct Integr Genomics 5:104–116
He XJ, RL MU, Cao WH, Zhang ZG, Zhang JS, Chen SY (2005)AtNAC2, a transcription factor downstream of ethylene andauxin signaling pathways, is involved in salt stress response andlateral root development. Plant J 44:903–916
Hundertmark M, Hincha DK (2008) LEA (Late EmbryogenesisAbundant) proteins and their encoding genes in Arabidopsisthaliana. BMC Genomics 9:118
Kim J-Y, Park SJ, Jang B, Jung C-H, Ahn SJ, Goh C-H, Cho K, HanO, Kang H (2007) Functional characterization of a glycine-richRNA-binding protein 2 in Arabidopsis thaliana under abioticstress conditions. Plant J 50:439–451
Kron AP, Souza GM, Ribeiro RV (2008) Water deficiency at differentdevelopmental stages of Glycine max can improve droughttolerance. Bragantia 67:43–49
Lawlor DW (2002) Carbon and nitrogen assimilation in relation toyield: mechanisms are the key to understanding productionsystems. J Exp Bot 53:773–787
Lawlor DW, Cornic G (2002) Photosynthetic carbon assimilation andassociated metabolism in relation to water deficits in higherplants. Plant, Cell and Environ 25:275–294
Markandeya G, Babu PR, Reddy Lachagari VB et al (2007)Identification of stress-responsive genes in an indica rice (Oryzasativa L.) using ESTs generated from drought-stressed seedlings.J Exp Bot 58:253–265
Maruyama K, Sakuma Y, Kasuga M, Ito Y, Seki M, Goda H, ShimadaY, Yoshida S, Shinozaki K, Yamaguchi-Shinozaki K (2004)Identification of cold-inducible downstream genes of the Arabi-dopsis DREB/CBF3 transcriptional factor using two microarraysystems. Plant J 38:982–993
Matsumura H, ITO A, Saitoh H, Winter P, Kahl G, Reuter M, KrugerDH, Terauchi R (2005) SuperSAGE. Cell Microbiol 7:11–18
Narusaka Y, Nakashima K, Zk S, Sakuma Y, Furihata T, Abe H,Narusaka M, Shinozaki K, Yamaguchi-Shinozaki K (2003)Interaction between two cis-acting elements, ABRE and DRE,in ABA-dependent expression of Arabidopsis rd29A gene inresponse to dehydration and high-salinity stresses. Plant J34:137–148
Narusaka Y, Narusaka M, Seki M (2004) Crosstalk in the responses toabiotic and biotic stresses in Arabidopsis: analysis of geneexpression in cytochrome P450 gene superfamily by cDNAmicroarray. Plant Mol Biol 44:327–342
Navabpour S, Morris K, Allen R, Harrison E, Mackerness SA-H,Buchanan-Wollaston V (2003) Expression of senescence-enhanced genes in response to oxidative stress. J Exp Bot54:2285–2292
Oono Y, Seki M, Nanjo T, Narusaka M, Fugita M, Satoh R, SatouM, Sakurai T, Ishida J, Akiyama K, Iida K, Maruyama K,Satoh S (2003) Monitoring expression profiles of Arabidopsis
gene expression during rehydration process after dehydrationusing ca. 7000 full-length cDNA microarray. Plant J 34:868–887
O’Toole J, Cruz RT (1983) Genotypic variation in epicuticular wax ofrice. Crop Sci 23:392–394
Ozturk ZN, Talame V, Deyholos M et al (2002) Monitoring large-scalechanges in transcript abundance in drought-and salt-stressedbarley. Plant Mol Biol 48:551–573
Oya T, Nepomuceno AL, Neumaier N, Farias JRB, Tobita S, Ito O(2004) Drought tolerance characteristics of Brazilian soybeancultivars—evaluation and characterization of drought tolerance ofvarious Brazilian soybean cultivars in the field. Plant Produc Sci7:129–137
Pfaffl MW, Horgan GW, Dempfle L (2002) Relative ExpressionSoftware Tool (REST) for group-wise comparison and statisticalanalysis of relative expression results in Real-Time PCR. NucleicAcid Res 30:36
Schenk PM, Kazan K, Manners JM, Anderson JP, Simpson B, WilsonI, Somerville SC, Maclean DJ (2003) Systemic gene expressionin Arabidopsis during an incompatible interaction with Alter-naria brassicicola. Plant Physiol 132:999–1010
Seki M, Narusaka M, Ishida J, Nanjo T, Fujita M, Oono Y, Kamiya A,Nakajima M, Enju A, Sakurai T, Satou M, Akiyama K, TAJI T,Yamaguchi-Shinozaki K, Carninci P, Kawai J, Hayashizaki Y,Shinozaki K (2002) Monitoring the expression of 7000 Arabi-dopsis genes under drought, cold and high-salinity stresses usinga full-length cDNA microarray. Plant J 31:279–292
Shinozaki K, Yamaguchi-Shinozaki K (2007) Gene networksinvolved in drought stress response and tolerance. J Exp Bot58:221–227
Simpson SD, Nakashima K, Narusaka Y, Seki M, Shinozaki K,Yamaguchi-Shinozaki K (2003) Two different novel cis-actingelements of erd1, aclpA homologous Arabidopsis gene, functionin induction by dehydration stress and dark-induced senescence.Plant J 33:259–270
Slaymaker D, Keen NT (2003) Syringolide elicitor-induced oxidativeburst and protein phosphorylation in soybean cells, and tentativeidentification of two affected phosphoproteins. Plant Sci166:387–396
Souza JAM (2006) Perfil transcricional de Bradyrhizobium elkaniisemia 587 “in vitro” e em simbiose com soja (Glycine max L.Merrill) através de microarranjo de DNA. Tese (Doutorado).2006. p 152
Stolf R (2007) Identificação e análise da expressão de genesrelacionados com tolerância à seca em soja através de micro-arranjos de DNA e PCR em tempo real. Universidade EstadualPaulista Júlio de Mesquita Filho, Jaboticabal-SP (Tese dedoutorado)
Talamè V, Ozturk NZ, Bohnert HJ (2007) Barley transcript profilesunder dehydration shock and drought stress treatments: acomparative analysis. J Exp Bot 58:229–240
Tran L-SP, Nakashima K, Sakuma Y, Osakabe Y, Qin F, SimpsonSD, Maruyama K, Fujita Y, Shinozaki K, Yamaguchi-Shinozaki K (2007) Co-expression of the stress-inducible zincfinger homeodomain ZFHD1 and NAC transcription factorsenhances expression of the ERD1 gene in Arabidopsis. Plant J49:46–63
Tran L-SP, Quach TN, Guttikonda SK, Aldrich DL, Kumar R,Neelakandan A, Valliyodan B, Nguyen HT (2009) Molecularcharacterization of stress-inducible GmNAC genes in soybean.Mol Gen Genomics 281:647–664
Tusher V, Tibshirani R, Chu G (2001) Significance analysis ofmicroarrays applied to transcriptional responses to ionizingradiation. Proceed Nat Acad Sci 98:5116–5121
Umezawa T, Fujita M, Fujita Y, Yamaguchi-Shinozaki K, Shinozaki K(2006) Engineering drought tolerance in plants: discovering and
Plant Mol Biol Rep (2011) 29:19–34 33

tailoring genes unlock the future. Curr Opin Biotechnol 17:113–122
Vanderauwera S, De Block M, De Steenne NV, Van De Cotte B,Metzlaff M, Breusegem FV (2007) Silencing of poly (ADP-ribose) polymerase in plants alters abiotic stress signaltransduction. www.pnas.org/cgi/doi/10.1073/pnas.0706668104,104:15150-15155
Xiao F, Goodwin SM, Xiao Y et al (2004) Arabidopsis CYP86A2represses Pseudomonas syringae type III genes and is requiredfor cuticle development. EMBO J 2004:2903–2913
Yamada K, Lim J, Dale JM, Chen H, Shinn P, Palm CJ, SouthwickAM, Wu HC, Kim C, Nguyen M (2003) Empirical analysis oftranscriptional activity in the Arabidopsis genome. Sci 302:842–846
34 Plant Mol Biol Rep (2011) 29:19–34