Transcriptional profile of Pseudomonas syringae pv. phaseolicola NPS3121 in response to tissue...
16
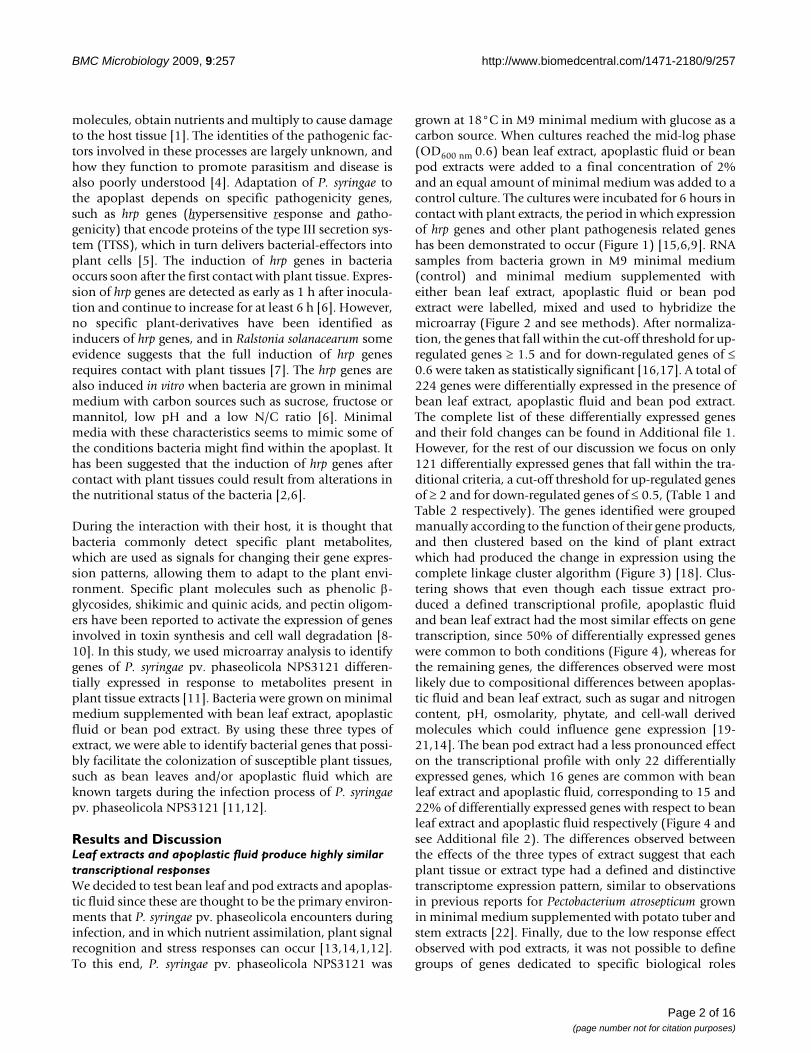
BioMed Central Page 1 of 16 (page number not for citation purposes) BMC Microbiology Open Access Research article Transcriptional profile of Pseudomonas syringae pv. phaseolicola NPS3121 in response to tissue extracts from a susceptible Phaseolus vulgaris L. cultivar Alejandro Hernández-Morales 1 , Susana De la Torre-Zavala 1 , Enrique Ibarra-Laclette 2 , José Luis Hernández-Flores 1 , Alba Estela Jofre-Garfias 1 , Agustino Martínez-Antonio 1 and Ariel Álvarez-Morales* 1 Address: 1 Departamento de Ingeniería Genética, Cinvestav-IPN Unidad Irapuato, Apdo Postal 629, CP 36821, Irapuato, Gto, México and 2 Laboratorio Nacional de Genómica para la Biodiversidad, Cinvestav-IPN Unidad Irapuato, Apdo Postal 629, CP 36821, Irapuato, Gto, México Email: Alejandro Hernández-Morales - [email protected]; Susana De la Torre-Zavala - [email protected]; Enrique Ibarra- Laclette - [email protected]; José Luis Hernández-Flores - [email protected]; Alba Estela Jofre-Garfias - [email protected]; Agustino Martínez-Antonio - [email protected]; Ariel Álvarez-Morales* - [email protected] * Corresponding author Abstract Background: Pseudomonas syringae pv. phaseolicola is a Gram-negative plant-pathogenic bacterium that causes "halo blight" disease of beans (Phaseolus vulgaris L.). This disease affects both foliage and pods, and is a major problem in temperate areas of the world. Although several bacterial genes have been determined as participants in pathogenesis, the overall process still remains poorly understood, mainly because the identity and function of many of the genes are largely unknown. In this work, a genomic library of P. syringae pv. phaseolicola NPS3121 was constructed and PCR amplification of individual fragments was carried out in order to print a DNA microarray. This microarray was used to identify genes that are differentially expressed when bean leaf extracts, pod extracts or apoplastic fluid were added to the growth medium. Results: Transcription profiles show that 224 genes were differentially expressed, the majority under the effect of bean leaf extract and apoplastic fluid. Some of the induced genes were previously known to be involved in the first stages of the bacterial-plant interaction and virulence. These include genes encoding type III secretion system proteins and genes involved in cell-wall degradation, phaseolotoxin synthesis and aerobic metabolism. On the other hand, most repressed genes were found to be involved in the uptake and metabolism of iron. Conclusion: This study furthers the understanding of the mechanisms involved, responses and the metabolic adaptation that occurs during the interaction of P. syringae pv. phaseolicola with a susceptible host plant. Background Pseudomonas syringae is an important Gram-negative bac- terium that infects a wide variety of plant species and causes disease symptoms ranging from leaf spots to stem cankers in agriculturally important crops. Bacteria such as P. syringae often live as epiphytes on the leaf surface with- out causing any obvious disease symptoms. However, under permissible conditions of temperature and humid- ity, P. syringae can enter the plant through natural open- ings such a stomata and hydathodes or via mechanical wounds [1-3]. Once bacteria enter the intercellular spaces (the apoplast), they can withstand preformed defense Published: 14 December 2009 BMC Microbiology 2009, 9:257 doi:10.1186/1471-2180-9-257 Received: 9 July 2009 Accepted: 14 December 2009 This article is available from: http://www.biomedcentral.com/1471-2180/9/257 © 2009 Hernández-Morales et al; licensee BioMed Central Ltd. This is an Open Access article distributed under the terms of the Creative Commons Attribution License (http://creativecommons.org/licenses/by/2.0 ), which permits unrestricted use, distribution, and reproduction in any medium, provided the original work is properly cited.
-
Upload
independent -
Category
Documents
-
view
3 -
download
0
Transcript of Transcriptional profile of Pseudomonas syringae pv. phaseolicola NPS3121 in response to tissue...
BioMed CentralBMC Microbiology
ss
Open AcceResearch articleTranscriptional profile of Pseudomonas syringae pv. phaseolicola NPS3121 in response to tissue extracts from a susceptible Phaseolus vulgaris L. cultivarAlejandro Hernández-Morales1, Susana De la Torre-Zavala1, EnriqueIbarra-Laclette2, José Luis Hernández-Flores1, Alba Estela Jofre-Garfias1, Agustino Martínez-Antonio1 and Ariel Álvarez-Morales*1Address: 1Departamento de Ingeniería Genética, Cinvestav-IPN Unidad Irapuato, Apdo Postal 629, CP 36821, Irapuato, Gto, México and 2Laboratorio Nacional de Genómica para la Biodiversidad, Cinvestav-IPN Unidad Irapuato, Apdo Postal 629, CP 36821, Irapuato, Gto, México
Email: Alejandro Hernández-Morales - [email protected]; Susana De la Torre-Zavala - [email protected]; Enrique Ibarra-Laclette - [email protected]; José Luis Hernández-Flores - [email protected]; Alba Estela Jofre-Garfias - [email protected]; Agustino Martínez-Antonio - [email protected]; Ariel Álvarez-Morales* - [email protected]
* Corresponding author
AbstractBackground: Pseudomonas syringae pv. phaseolicola is a Gram-negative plant-pathogenicbacterium that causes "halo blight" disease of beans (Phaseolus vulgaris L.). This disease affects bothfoliage and pods, and is a major problem in temperate areas of the world. Although several bacterialgenes have been determined as participants in pathogenesis, the overall process still remains poorlyunderstood, mainly because the identity and function of many of the genes are largely unknown. Inthis work, a genomic library of P. syringae pv. phaseolicola NPS3121 was constructed and PCRamplification of individual fragments was carried out in order to print a DNA microarray. Thismicroarray was used to identify genes that are differentially expressed when bean leaf extracts, podextracts or apoplastic fluid were added to the growth medium.
Results: Transcription profiles show that 224 genes were differentially expressed, the majorityunder the effect of bean leaf extract and apoplastic fluid. Some of the induced genes werepreviously known to be involved in the first stages of the bacterial-plant interaction and virulence.These include genes encoding type III secretion system proteins and genes involved in cell-walldegradation, phaseolotoxin synthesis and aerobic metabolism. On the other hand, most repressedgenes were found to be involved in the uptake and metabolism of iron.
Conclusion: This study furthers the understanding of the mechanisms involved, responses and themetabolic adaptation that occurs during the interaction of P. syringae pv. phaseolicola with asusceptible host plant.
BackgroundPseudomonas syringae is an important Gram-negative bac-terium that infects a wide variety of plant species andcauses disease symptoms ranging from leaf spots to stemcankers in agriculturally important crops. Bacteria such asP. syringae often live as epiphytes on the leaf surface with-
out causing any obvious disease symptoms. However,under permissible conditions of temperature and humid-ity, P. syringae can enter the plant through natural open-ings such a stomata and hydathodes or via mechanicalwounds [1-3]. Once bacteria enter the intercellular spaces(the apoplast), they can withstand preformed defense
Published: 14 December 2009
BMC Microbiology 2009, 9:257 doi:10.1186/1471-2180-9-257
Received: 9 July 2009Accepted: 14 December 2009
This article is available from: http://www.biomedcentral.com/1471-2180/9/257
© 2009 Hernández-Morales et al; licensee BioMed Central Ltd. This is an Open Access article distributed under the terms of the Creative Commons Attribution License (http://creativecommons.org/licenses/by/2.0), which permits unrestricted use, distribution, and reproduction in any medium, provided the original work is properly cited.
Page 1 of 16(page number not for citation purposes)
BMC Microbiology 2009, 9:257 http://www.biomedcentral.com/1471-2180/9/257
molecules, obtain nutrients and multiply to cause damageto the host tissue [1]. The identities of the pathogenic fac-tors involved in these processes are largely unknown, andhow they function to promote parasitism and disease isalso poorly understood [4]. Adaptation of P. syringae tothe apoplast depends on specific pathogenicity genes,such as hrp genes (hypersensitive response and patho-genicity) that encode proteins of the type III secretion sys-tem (TTSS), which in turn delivers bacterial-effectors intoplant cells [5]. The induction of hrp genes in bacteriaoccurs soon after the first contact with plant tissue. Expres-sion of hrp genes are detected as early as 1 h after inocula-tion and continue to increase for at least 6 h [6]. However,no specific plant-derivatives have been identified asinducers of hrp genes, and in Ralstonia solanacearum someevidence suggests that the full induction of hrp genesrequires contact with plant tissues [7]. The hrp genes arealso induced in vitro when bacteria are grown in minimalmedium with carbon sources such as sucrose, fructose ormannitol, low pH and a low N/C ratio [6]. Minimalmedia with these characteristics seems to mimic some ofthe conditions bacteria might find within the apoplast. Ithas been suggested that the induction of hrp genes aftercontact with plant tissues could result from alterations inthe nutritional status of the bacteria [2,6].
During the interaction with their host, it is thought thatbacteria commonly detect specific plant metabolites,which are used as signals for changing their gene expres-sion patterns, allowing them to adapt to the plant envi-ronment. Specific plant molecules such as phenolic β-glycosides, shikimic and quinic acids, and pectin oligom-ers have been reported to activate the expression of genesinvolved in toxin synthesis and cell wall degradation [8-10]. In this study, we used microarray analysis to identifygenes of P. syringae pv. phaseolicola NPS3121 differen-tially expressed in response to metabolites present inplant tissue extracts [11]. Bacteria were grown on minimalmedium supplemented with bean leaf extract, apoplasticfluid or bean pod extract. By using these three types ofextract, we were able to identify bacterial genes that possi-bly facilitate the colonization of susceptible plant tissues,such as bean leaves and/or apoplastic fluid which areknown targets during the infection process of P. syringaepv. phaseolicola NPS3121 [11,12].
Results and DiscussionLeaf extracts and apoplastic fluid produce highly similar transcriptional responsesWe decided to test bean leaf and pod extracts and apoplas-tic fluid since these are thought to be the primary environ-ments that P. syringae pv. phaseolicola encounters duringinfection, and in which nutrient assimilation, plant signalrecognition and stress responses can occur [13,14,1,12].To this end, P. syringae pv. phaseolicola NPS3121 was
grown at 18°C in M9 minimal medium with glucose as acarbon source. When cultures reached the mid-log phase(OD600 nm 0.6) bean leaf extract, apoplastic fluid or beanpod extracts were added to a final concentration of 2%and an equal amount of minimal medium was added to acontrol culture. The cultures were incubated for 6 hours incontact with plant extracts, the period in which expressionof hrp genes and other plant pathogenesis related geneshas been demonstrated to occur (Figure 1) [15,6,9]. RNAsamples from bacteria grown in M9 minimal medium(control) and minimal medium supplemented witheither bean leaf extract, apoplastic fluid or bean podextract were labelled, mixed and used to hybridize themicroarray (Figure 2 and see methods). After normaliza-tion, the genes that fall within the cut-off threshold for up-regulated genes ≥ 1.5 and for down-regulated genes of ≤0.6 were taken as statistically significant [16,17]. A total of224 genes were differentially expressed in the presence ofbean leaf extract, apoplastic fluid and bean pod extract.The complete list of these differentially expressed genesand their fold changes can be found in Additional file 1.However, for the rest of our discussion we focus on only121 differentially expressed genes that fall within the tra-ditional criteria, a cut-off threshold for up-regulated genesof ≥ 2 and for down-regulated genes of ≤ 0.5, (Table 1 andTable 2 respectively). The genes identified were groupedmanually according to the function of their gene products,and then clustered based on the kind of plant extractwhich had produced the change in expression using thecomplete linkage cluster algorithm (Figure 3) [18]. Clus-tering shows that even though each tissue extract pro-duced a defined transcriptional profile, apoplastic fluidand bean leaf extract had the most similar effects on genetranscription, since 50% of differentially expressed geneswere common to both conditions (Figure 4), whereas forthe remaining genes, the differences observed were mostlikely due to compositional differences between apoplas-tic fluid and bean leaf extract, such as sugar and nitrogencontent, pH, osmolarity, phytate, and cell-wall derivedmolecules which could influence gene expression [19-21,14]. The bean pod extract had a less pronounced effecton the transcriptional profile with only 22 differentiallyexpressed genes, which 16 genes are common with beanleaf extract and apoplastic fluid, corresponding to 15 and22% of differentially expressed genes with respect to beanleaf extract and apoplastic fluid respectively (Figure 4 andsee Additional file 2). The differences observed betweenthe effects of the three types of extract suggest that eachplant tissue or extract type had a defined and distinctivetranscriptome expression pattern, similar to observationsin previous reports for Pectobacterium atrosepticum grownin minimal medium supplemented with potato tuber andstem extracts [22]. Finally, due to the low response effectobserved with pod extracts, it was not possible to definegroups of genes dedicated to specific biological roles
Page 2 of 16(page number not for citation purposes)

BMC Microbiology 2009, 9:257 http://www.biomedcentral.com/1471-2180/9/257
Table 1: Induced genes with ≥ 2.0 fold change in expression level FDR (p-value ≤ 0.05)
Fold change extract/control
Gene/ORF Gene product L A P
Cluster I Plant-bacteria interaction
pnlA pectin lyase 3.0PSPPH_A0072 Polygalacturonase 2.0 1.8 1.9hopAK1 type III effector HopAK1 2.9hopAT1 type III effector HopAT1 2.5 1.6PSPPH_3107 type II and III secretion system family protein 3.7 2.6 1.8PSPPH_2990 phytase domain protein 3.2
Cluster II Phaseolotoxin synthesis (Cluster Pht)
phtM hypothetical protein 2.3 2.3phtM-phtN hypothetical protein (control) 2.1 2.1phtO hypothetical protein 2.1 2.1amtA L-arginine:lysine amidinotransferase, putative 2.9 2.5phtQ conserved hypothetical protein 2.7 2.1phtS adenylylsulfate kinase 2.7 3.2phtT membrane protein, putative 3.3 2.8phtU hypothetical protein 3.5 2.9phtL pyruvate phosphate dikinase, PEP/pyruvate binding domain protein 2.1 2.0phtL pyruvate phosphate dikinase, PEP/pyruvate binding domain protein(control) 2.6 2.3
Cluster III Bacterial metabolism
Ppc phosphoenolpyruvate carboxylase 2.2acsA acetate-CoA ligase 3.0PSPPH_1186 aldose 1-epimerase family protein 2.8PSPPH_1256 transketolase, N-terminal subunit, putative 6.0PSPPH_2070 nitrate reductase 2.2PSPPH_3291 oxidoreductase, molybdopterin-binding 2.0hutH2 histidine ammonia-lyase 2.0 1.5nuoE NADH-quinone oxidoreductase, E subunit 5.0nuoF NADH-quinone oxidoreductase, F subunit 2.4nuoG NADH-quinone oxidoreductase, G subunit 6.6 2.4nuoH NADH-quinone oxidoreductase, H subunit 4.3 1.7PSPPH_2973 monooxygenase, NtaA/SnaA/SoxA family 2.3PSPPH_2357 xylose operon regulatory protein 2.1 1.8PSPPH_0756 glycosyl hydrolase, family 3 2.1
Cluster IV Adaptation responses
clpB2 clpB protein 2.2 1.5groEL chaperonin, 60 kDa 4.3dnaK dnaK protein 2.8hslU heat shock protein HslVU, ATPase subunit HslU 2.1bfr2 Bacterioferritin 3.1 1.8
Cluster V Unknown function
PSPPH_3261 conserved hypothetical protein 4.4PSPPH_3262 conserved hypothetical protein 4.4PSPPH_1192 conserved hypothetical protein 2.8PSPPH_2708 conserved hypothetical protein 2.5PSPPH_1613 conserved hypothetical protein 2.3PSPPH_1422 conserved hypothetical protein 2.2PSPPH_4323 conserved hypothetical protein 2.0
Page 3 of 16(page number not for citation purposes)

BMC Microbiology 2009, 9:257 http://www.biomedcentral.com/1471-2180/9/257
affected in this condition. Hence, in the following discus-sion we will refer exclusively to results obtained in theexperiments using leaf extract and apoplastic fluid.
Bean leaf extract and apoplastic fluid induce bacterial genes involved in the first stages of plant infectionPhytopathogenic bacteria possess a large number of genesthat allow them to multiply and cause disease on plants.Many of these genes are induced only in planta or in thepresence of host components, suggesting that gene expres-sion is regulated by signals that bacteria receive from theplant tissue. In this study, we identified a cluster of sixgenes that includes genes already known to be inducedduring the interaction of the bacteria with its host plantand which could be used as positive controls in this study(Figure 3 and see below). Four genes of this group; pectinlyase, polygalacturonase and the type III effector proteinsHopAK1 and HopAT1 were previously classified as viru-lence factors in the annotated genome of P. syringae pv.phaseolicola 1448A [23]. As shown in Figure 5 the expres-sion levels of the type III effector proteins HopAK1 andHopAT1 increase significantly under the effect of bean leafextract, suggesting the presence of an inducing signal inthis extract. It seems that M9 minimal medium mimicsome of the conditions to what the pathogen encountersin the apoplast, moreover it was recently shown by Ricoand Preston that apoplast extracts support higher growthwhile promoting TTSS expression than synthetic minimalmedia [6,14]. This supports the idea that apoplast extractsprovide more nutrients than minimal media with glucose
as carbon source (Figure 1). [14]. As we are using thismedium, we did not expect to find changes in the levels ofexpression of genes needed for TTSS assembly, for exam-ple hrpJ gene as shown in figure 5. However, changes wereobserved in the effector proteins HopAK1 and HopAT1that could be attributed to the presence of specific signalmolecules in both the leaf extract and the apoplast fluid.It has been demonstrated that type III effector proteins aretranslocated through the TTSS directly into the cytosol ofthe host cell, where they interfere with or modulate hostcell processes to facilitate bacterial multiplication, inva-sion and disease [24-26]. Genes encoding pectin lyase andpolygalacturonase were also up-regulated (Figure 5). Pre-vious studies demonstrated that pectin lyase and polyga-lacturonase are both induced in plant tissues or in vitrocultures that contain plant extracts [27,28,4,22]. Both,pectin lyase and polygalacturonase are involved in pectindegradation, and possibly facilitate the assembly of func-tional type III secretion complexes [29-31]. In P. syringaestrains, pectin lyase, polygalacturonase and type III effec-tor proteins with a pectate lyase domain, such as HopAK1,are found in some pathovars, however little is knownabout their role and contribution to pathogenicity [32-35]. The four genes discussed above show a hrp box motifin their regulatory region; this element is recognized orbound by HrpL, an alternative RNA polymerase sigma fac-tor that regulates the expression of many genes involvedin pathogenesis and virulence [36,4]. Thus, if this group ofgenes is transcribed by a common sigma factor, it makessense that it is found to be up-regulated under these con-
PSPPH_3212 conserved hypothetical protein 4.9 2.3PSPPH_3852 conserved hypothetical protein 2.5 1.6PSPPH_3020 conserved hypothetical protein 2.1PSPPH_1470 conserved hypothetical protein 2.2 1.9
Cluster VI None particular group
PSPPH_0804 methyl-accepting chemotaxis protein 3.2PSPPH_2971 methyl-accepting chemotaxis transducer/sensory box protein 2.2PSPPH_2994 transcriptional regulator, AraC family 2.3PSPPH_1595 transcriptional regulator, GntR family 2.1pbpC penicillin-binding protein 1C 2.3PSPPH_2053 membrane protein, putative 2.2PSPPH_3868 ompA family protein 2.6 2.1PSPPH_3993 acetyltransferase, GNAT family 3.0PSPPH_0740 Ribosomal large subunit pseudouridine synthase D(Pseudouridine synthase) (Uracil hydrolyase) 2.6 1.6PSPPH_2812 PAP2 superfamily protein 2.3 2.1PSPPH_0920 S-type pyocin family protein 2.3fadB fatty oxidation complex, alpha subunit FadB 2.3iucD siderophore biosynthesis protein 2.0PSPPH_2652 ABC transporter, ATP-binding protein 8.7PSPPH_2653 lipopolysaccharide core biosynthesis domain protein 10.5PSPPH_2654 lipoprotein, putative 6.4
The table comprises all the genes that shown ≥ 2.0 fold change in expression level. L Bean leaf extract, A apoplastic fluid and P Bean pod extract. ORF nomenclature corresponding to 1448A reference sequenced strain. For a complete list of all statistically induced genes please consult Additional File 1.
Table 1: Induced genes with ≥ 2.0 fold change in expression level FDR (p-value ≤ 0.05) (Continued)
Page 4 of 16(page number not for citation purposes)

BMC Microbiology 2009, 9:257 http://www.biomedcentral.com/1471-2180/9/257
Table 2: Repressed genes with ≤ 0.5 fold change in expression level FDR (p-value ≤ 0.05)
Fold change extract/control
Gene Gene product L A P
Cluster VII Iron uptake and metabolism
pvdS RNA polymerase sigma-70 factor, ECF subfamily 0.01 0.09fpvA outer membrane ferripyoverdine receptor 0.47PSPPH_4765 RNA polymerase sigma-70 family protein 0.26 0.55PSPPH_1911 pyoverdine chromophore precursor synthetase 0.04 0.14PSPPH_1912 diaminobutyrate--2-oxoglutarate transaminase 0.26 0.53PSPPH_1923 pyoverdine sidechain peptide synthetase I, epsilon-Lys module 0.03 0.25PSPPH_1924 pyoverdine sidechain peptide synthetase II, D-Asp-L-Thr component 0.03 0.09PSPPH_1925 pyoverdine sidechain peptide synthetase III, L-Thr-L-Ser component 0.02 0.10PSPPH_1926 pyoverdine sidechain peptide synthetase IV, D-Asp-L-Ser component 0.08 0.27PSPPH_1929 pyoverdine ABC transporter, ATP-binding/permease protein 0.26 0.40PSPPH_1930 conserved hypothetical protein 0.11PSPPH_1933 Tat (twin-arginine translocation) pathway signal sequence domain protein 0.05 0.28PSPPH_1934 outer membrane efflux lipoprotein, NodT family 0.14PSPPH_2751 achromobactin biosynthetic protein AcsD 0.26pchA isochorismate synthase 0.18 0.25PSPPH_2895 ABC transporter, ATP-binding/permease protein 0.07PSPPH_2896 ABC transporter, ATP-binding/permease protein 0.14 0.18PSPPH_2897 yersiniabactin non-ribosomal peptide synthetase 0.15 0.13exbD1 TonB system transport protein ExbD1 0.16 0.30PSPPH_3266 TonB-dependent siderophore receptor, putative 0.48PSPPH_2117 FecR protein superfamily 0.15 0.41 0.61PSPPH_5185 iron compound ABC transporter, iron compound-binding protein 0.13 0.19PSPPH_2957 Mn2+/Fe2+ transporter, NRAMP family 0.20 0.08 0.07PSPPH_3288 Predicted periplasmic lipoprotein involved in iron transport 0.17
Cluster VIII Unknown function
PSPPH_4882 conserved hypothetical protein 0.11 0.06 0.05PSPPH_2116 conserved hypothetical protein 0.12 0.32 0.65PSPPH_1082 conserved hypothetical protein 0.14 0.28 0.63PSPPH_5155 conserved hypothetical protein 0.37 0.20 0.31PSPPH_1173 conserved hypothetical protein 0.46 0.66PSPPH_1243 conserved hypothetical protein 0.18PSPPH_2103 conserved hypothetical protein 0.20PSPPH_5180 conserved hypothetical protein 0.50
Cluster IX None particular cluster
PSPPH_2486 acetyltransferase, GNAT family 0.37 0.45 0.58PSPPH_2918 membrane protein, putative 0.37 0.13 0.12PSPPH_2919 carbonic anhydrase, putative 0.27 0.18 0.19osmC hydroperoxide resistance protein OsmC 0.22 0.45 0.63PSPPH_4984 prophage PSPPH06, site-specific recombinase, phage integrase family 0.11 0.25 0.62PSPPH_2219 transcriptional regulator, AsnC family 0.09 0.15 0.59PSPPH_3916 membrane protein, putative 0.07 0.01 0.02PSPPH_2216 zinc carboxypeptidase domain protein 0.04 0.20 0.54PSPPH_2747 transcriptional regulator, Cro/CI family 0.49 0.59PSPPH_B0005 transcriptional regulator, Cro/CI family 0.46 0.45PSPPH_3928 ABC transporter, binding protein 0.34 0.63PSPPH_0189 ATP-dependent DNA helicase RecG 0.34 0.42PSPPH_4962 prophage PSPPH06, C4-type zinc finger protein, DksA/TraR family 0.24 0.16PSPPH_0194 ActC family protein 0.24 0.56PSPPH_2746 dipeptide ABC transporter, ATP binding protein 0.14 0.33PSPPH_0970 O-methyltransferase I 0.12 0.24
Page 5 of 16(page number not for citation purposes)

BMC Microbiology 2009, 9:257 http://www.biomedcentral.com/1471-2180/9/257
ditions. However RT-PCR analysis showed that hrpL isalso expressed in M9 without plant extracts thereforesome possibilities are that an additional regulator is nec-essary to activate these genes or some anti-sigma could beinactivated in this precise condition. Definitively morestudies are necessary to find the mechanism of transcrip-tion of this group of genes by HrpL (Figure 5). In addition,cluster I contains a gene that encodes a protein with asecretin N-domain that is closely related to bacterial typeII and III secretion system proteins, which export proteinsfrom within the bacterial cell to the extracellular matrixand/or into target host cells [25]. Leaf extract also inducesa gene encoding a protein with a phytase domain, mostlikely involved in the hydrolysis of the phytate present inthe bean leaf extract [37-39].
Bean leaf extract was obtained by maceration, where beanleaves were pulverized and homogenized in water. Duringthis process it is probable that plant compounds such aphytate and cell wall derived pectin oligomers are solubi-lized within the extract. If these compounds are present inthe extract, it makes sense that genes involved in phytateand pectin degradation are up-regulated on exposure tobean leaf extract, contrary to the effect observed with apo-plast extract. Apoplastic fluid was isolated by infiltration-centrifugation procedures, a method widely used toobtain apoplastic fluid with minimal cytoplasmic con-tamination, which ensures that cell-wall fragments, plantdebris, or any others factors are excluded [40,9,14,20,21].Thus, apoplastic fluid does not contain cell wall deriva-tives, phytate or a signal(s) capable of inducing genesinvolved in phytate and pectin degradation correlatingwell with the results obtained (Table 1, Figure 3).
Bean leaf extract induces the expression of genes involved in the synthesis of phaseolotoxinCluster II contains genes involved in phaseolotoxin syn-thesis, the production of which is temperature dependent,with an optimum at 18°C (Figure 3). The phaseolotoxincluster (pht cluster) is composed of 23 genes organized in
five transcriptional units, two monocistronic and threepolycistronic [41]. Since our study was performed at18°C, the optimal temperature for toxin production, itwas expected that the genes of the pht cluster would beexpressed in control and test cultures. However, sevengenes of the phtM operon, phtM, phtO, amtA, phtQ, phtS,phtT, phtU; and phtL showed increased levels of transcrip-tion in the presence of bean leaf extract and apoplasticfluid compared to M9 medium alone (Table 1). Neverthe-less, this was not the case for bean pod extract. This resultindicates that in addition to the requirement of low tem-perature, for the optimum expression of phaseolotoxin,specific plant components present in leaf and apoplast areprobably also required. Analysis of reverse transcriptionof phtL, intergenic region of phtMN, and amtA, confirmedthat expression of these genes is enhanced by componentspresent in leaf extract (Figure 5). Additionally, two genes,phtB and desI, which belong to the phtA and phtD operonsrespectively, showed a 1.5 fold increase in expression, val-ues that are statistically significant on the basis of themicroarray analysis (see Additional file 1 for phtB and desIgenes).
Previous studies demonstrated that secreted plant signalssuch as phenolic β-glycosides induce genes involved insyringomycin synthesis in P. syringae pv. syringae[42,43,8]. Likewise, in P. syringae pv. tomato DC3000, thecoronatine biosynthetic genes were strongly induced bycrude extracts and apoplastic fluid from tomato leaf. Theactive compounds responsible for this induction wereidentified as shikimic, quinic, malic and citric acids, but itis unclear how specifically these environmental signalsinfluence the transcription of coronatine biosyntheticgenes [9]. In P. syringae pv. phaseolicola, no plant signalthat induces phaseolotoxin synthesis has been identifiedso far. Our results suggest that some of these signals mightbe present in bean leaf extract and apoplastic fluid. In con-trast, no changes were observed in the expression patternof these genes when bacteria were exposed to bean podextract with the exception of the argK gene whose expres-
PSPPH_0592 high-affinity branched-chain amino acid ABC transporter, permease protein BraE 0.08 0.30eda2 2-dehydro-3-deoxyphosphogluconate aldolase/4-hydroxy-2-oxoglutarate aldolase 0.43PSPPH_4761 glutathione S-transferase family protein 0.43PSPPH_1737 transcriptional regulator, LysR family 0.42PSPPH_4723 molybdate transport regulator ModE, putative 0.41PSPPH_3100 isocitrate dehydrogenase, NADP-dependent 0.40PSPPH_3284 beta-lactamase 0.34PSPPH_1244 transcriptional regulator, AsnC family 0.30PSPPH_3265 acetyltransferase, GNAT family 0.27pilo type IV pilus biogenesis protein PilO 0.16PSPPH_5152 pyridoxal kinase 0.43
The table includes genes that shown ≤ 0.5 fold change in expression level. L Bean leaf extract, A apoplastic fluid and P Bean pod extract. ORF nomenclature corresponding to 1448A reference sequenced strain. For a complete list of all statistically repressed genes please consult Additional File 1.
Table 2: Repressed genes with ≤ 0.5 fold change in expression level FDR (p-value ≤ 0.05) (Continued)
Page 6 of 16(page number not for citation purposes)

BMC Microbiology 2009, 9:257 http://www.biomedcentral.com/1471-2180/9/257
sion decreased (see Additional file 1). The argK geneencodes an ornithin-carbamoyl-transferase (OCTase)involved in bacterial immunity against its own toxin andis expressed at 18°C in coordination with phaseolotoxinsynthesis [44]. The reason why expression of this genedecreased in the presence of pod extract is unclear at thismoment; however, it has been shown that expression ofthis gene is only partially dependent on temperature, as asmall signal molecule resembling carbamoyl phosphateas inducer is also required [45]. On the other hand, beanpods infected with P. syringae pv. phaseolicola do notshow the characteristic chlorotic halo caused by the actionof phaseolotoxin [12]. It is unclear whether this phenom-enon might be due to an unknown bean pod signal thatinhibits phaseolotoxin synthesis.
P. syringae pv. phaseolicola NPS3121 adapts its metabolism to take advantage of nutrients provided by its host plantP. syringae pv. phaseolicola NPS3121 was grown in M9minimal medium supplemented with either bean leafextract, apoplastic fluid or bean pod extract. The growth ofthe cultures was monitored by optical density measure-ments during the induction period until the beginning ofthe late-log phase. The bean extracts increased bacterialgrowth rate on supplemented media in comparison tonon-supplemented media, suggesting that plant extracts
contained nutrients that enhanced the growth of the bac-teria (Figure 1). Apoplastic fluid induces genes involved incarbon and nitrogen metabolism suggesting that the bac-teria may use carbon and nitrogen sources present in apo-plast fluid. In cluster III we classified genes involved inbacterial metabolism. Four genes ppC, acsA, PSPPH_1186,PSPPH_1256 involved in either, carbon fixation, glycoly-sis, pyruvate metabolism and/or the pentose phosphatepathway were induced, and are probably related to assim-ilation of sucrose, mannose, glucose or fructose, which arethe most common sugars in the plant apoplast (Figure 3)[46,21]. With respect to nitrogen metabolism, our resultsshowed that apoplastic fluid induces two genes oneencoding a nitrate reductase and the other an oxidore-ductase-molybdopterin-binding protein. These proteinsare involved in converting nitrate to nitrite, which can befurther reduced to ammonia (Figure 3 and see Additionalfile 1 for oxidoreductase-molybdoptering-binding pro-tein). The induced gene hutH2 encodes a histidine ammo-nia-lyase, which catalyzes the first step in the degradationof histidine to produces urocanic acid. Both ammoniaand urocanic acid are incorporated in glutamate metabo-lism, suggesting that this pathway is active when bacteriawere exposed to apoplastic fluid. In addition, the genegabP encoding a permease for γ-aminobutyric acid(GABA) was induced with apoplastic fluid (see Additionalfile 1). GABA is the most abundant amino acid in theplant apoplast and is used as a nitrogen source by P. syrin-gae pv. phaseolicola 1448A and other related pathovars[14,20,46].
On the other hand, the genes involved in carbon andnitrogen metabolism are not highly expressed under theeffect of bean leaf extract. We speculate that the leaf extractis capable of providing most of the carbon and nitrogenmetabolic intermediates required to sustain bacterialgrowth, without the need to express genes involved in thesynthesis of such compounds.
Despite the fact that bean pod extract has a positive effecton bacterial growth; a minimal effect on genes involved inmetabolism was obtained in comparison with the otherextracts. It is possible that differences in nutrient content,pH, catabolite repression, or tissue specificity promotedifferential expression between whole leaf tissue (includ-ing apoplast) and pod tissue [47].
Cluster III also includes the nuoE, nuoF, nuoG and nuoHgenes, all of which are members of the nuo operon. Thisoperon encodes the first enzyme of the respiratory chain,NADH-dehydrogenase [48,49,23]. The nuo operon of P.syringae pv. phaseolicola 1448A contains 13 genes, how-ever in our microarray only the four genes mentionedabove are present. The induction of these four genes sug-gests that all the other genes of the nuo operon were
Effects of plant extracts on cultures grown in M9 minimal mediaFigure 1Effects of plant extracts on cultures grown in M9 minimal media. Growth of P. syringae pv. phaseolicola NPS3121 in M9 minimal medium supplemented with bean leaf extract, apoplastic fluid and bean pod extract. At mid log phase (OD600 nm 0.6) the cultures were supplemented with 2% of plant extracts. Culture density was measured by spec-trophotometry after induction during 6 hours. The bean extracts increased bacterial growth rate on supplemented media in comparison to non supplemented media.
Page 7 of 16(page number not for citation purposes)

BMC Microbiology 2009, 9:257 http://www.biomedcentral.com/1471-2180/9/257
induced to maintain levels of metabolic activity in thebacteria according to energy demand.
Bean leaf extract and apoplastic fluid induce genes related to adaptation responsesCluster IV includes a group of four genes, three of which:clpB2, groEL, and dnaK encode chaperones, and hsIUwhich encodes a heat shock protein (Figure 3). Chaper-ones are involved in numerous bacterial processes such as,folding newly synthesized proteins, protein secretion, pre-vention of aggregation of proteins on heat shock, and rep-aration of proteins that have been damaged or misfoldedby stresses. Induction of genes encoding chaperones isperhaps an indication of high protein re-flux as a product
of an active or adaptive metabolism [50]. Another possi-bility is that these chaperones are required for assemblingthe secretion systems mentioned above which exportproducts induced in response to bean leaf extract [51].
Analysis of reverse transcription showed that leaf extractinduced two genes involved in protection from oxidativestress, katA and katB which encode catalases A and Brespectively and are associated with the detoxification ofreactive oxygen species produced as a consequence of aer-obic metabolism, or the presence of iron and/or toxicmolecules in the plant extracts (Figure 5) [52,53]. Mostbacterial catalases require haem groups for catalytic activ-ity; the final step of haem synthesis is catalyzed by ferro-
Overview of the microarray strategyFigure 2Overview of the microarray strategy. A library of chromosomal DNA fragments of P. syringae pv. phaseolicola NPS3121 (Psp NPS3121) was constructed in the pUC19 vector and introduced into the E. coli Top10 strain. 30% (2880 clones) of the genomic library was sequenced, aligned and annotated against the complete genome of P. syringae pv. phaseolicola 1448A. This strategy allowed selection of 1911 clones that provided approximately 1× coverage of the genome. The fragments of 1911 clones were amplified by PCR reaction, and the products were printed on a microarray slide. This microarray was used to identify genes that are differentially expressed when bean leaf or pod extracts and apoplastic fluid were added to the growth medium.
Page 8 of 16(page number not for citation purposes)

BMC Microbiology 2009, 9:257 http://www.biomedcentral.com/1471-2180/9/257
Page 9 of 16(page number not for citation purposes)
Clustering of genes with distinct patterns of differential expressionFigure 3Clustering of genes with distinct patterns of differential expression. Differentially expressed genes with ≥ 2 or ≤ 0.5 fold change were grouped manually according to the function of their gene products, and then clustered using the complete linkage cluster algorithm. This analysis grouped genes with similar putative or known function. Red and green squares repre-sent induced and repressed genes respectively. Intensity of color is related to magnitude of differential expression. Roman numerals represent clusters of genes mentioned in discussion of results. The complete list of the differentially expressed genes and their fold changes can be found in Additional file 1.

BMC Microbiology 2009, 9:257 http://www.biomedcentral.com/1471-2180/9/257
chelatase, which condenses Fe2+ into protoporphyrin IX.In P. aeruginosa, the cellular source of iron required forhaem assembly is the protein bacterioferritin A, encodedby the bfrA gene, that is required as an iron supplier for thehaem group of KatA and thus for protection against H2O2[54]. Our results show that gene bfr2 encoding an ironstorage bacterioferritin was induced under the effect ofbean leaf extract and apoplastic fluid, which may supplyiron for catalase activity (Figure 3, Table 1).
In summary, the increased growth in media supple-mented with plant extracts can be associated with nutrientassimilation and active metabolism. In these conditionswe identified genes involved in carbon and nitrogen utili-zation, chaperones, heat shock proteins and thoseinvolved in protection against oxidative stress (Table 1).Some of the identified genes such as heat shock proteins,bacterioferritin, and genes involved in defense against oxi-dative stress are positively regulated by the Ferric uptakeregulator protein (Fur) [55]. These findings suggest thataerobic metabolism is active during contact with plant tis-sues, as will be discussed below in the section describingrepressed genes (Figure 5).
Additionally 16 genes were grouped into two clusters.Cluster V includes 11 poorly characterized genes; seven ofthese are preferentially induced by leaf extract and mayhave functions related to responses to signal molecules
present in the extracts. Some other induced genes thatcould not be classified as being involved in a particularbiological process, were included in Cluster VI, two genesinvolved in chemotaxis, two transcriptional regulators ofthe AraC and GntR families and four genes which may berelated to membrane biogenesis (Figure 3 and Table 1).
Bean leaf extract and apoplastic fluid down-regulate genes involved in iron uptake and metabolismCluster VII was the largest cluster and contained 24 genesrepressed in response to bean leaf extract and apoplasticfluid (Figure 3). Thirteen of these genes are known orhypothesized to be associated with pyoverdine produc-tion. This group includes pvdS, an extracytoplasmic sigmafactor (ECF) needed for the transcription of genes for pyo-verdine synthesis, a ferripyoverdine receptor (FpvA)involved in binding of iron-siderophore complexes in P.aeruginosa and a gene encoding a sigma-70 family proteinwith 34% identity (aa) to sigma factor FpvI, which isneeded for fpvA transcription [56,57]. In this cluster thereare also five genes associated with biosynthesis of achro-mobactin and yersiniabactin, the secondary siderophoresin P. syringae pv. syringae B728a and P. syringae pv. tomatoDC3000 respectively (Table 2) [58,59]. Two of thesegenes whose products belong to an ABC transporter sys-tem are located close to genes for yersiniabactin synthesison the chromosome and are probably involved in trans-porting this siderophore [23]. Two genes of the TonBtransport system required for active transport of iron-siderophore complexes, and another gene encoding theregulatory protein (FecR) and proteins involved in ironuptake/transport are also included in this group (Table 2)[60]. Many genes in this cluster have been shown to beregulated by Fur in P. aeruginosa. In this bacterium Fur hasbeen revealed as a master regulator of iron homeostasis.Fur acts as a general repressor of iron uptake genes whenthe amount of their iron co-repressor (Fe2+) reaches athreshold level (Fur-Fe2+). In contrast, under iron-limitingconditions, Fur repression is relieved and transcriptioncan occur. In P. aeruginosa Fur represses the transcriptionof the pvdS and fpvI genes, both encoding extracytoplas-mic sigma factors (ECFó). PvdS and FpvI are needed fortranscription of all pyoverdine related genes and the pyo-verdine receptor (FpvA) respectively (Figure 5) [61,55].The PvdS sigmulon is conserved among the fluorescentpseudomonads, including plant pathogens of the P. syrin-gae group [57]. In P. syringae pv. phaseolicola 1448A, thecluster associated with pyoverdine synthesis contains 29genes, of which 13 genes were printed in our microarray,including orthologs of fpvA and pvdS [23,57]. All of thesegenes were repressed under the tested conditions (Table2). Although the gene encoding the Fur repressor was notprinted in our microarray, its functional status can beinferred as active on the basis that genes regulated by thisprotein are repressed. Moreover analysis of reverse tran-scription of the fur gene confirmed that it is up-regulated
Comparative analyses of the tested conditionsFigure 4Comparative analyses of the tested conditions. Com-parison of differentially expressed genes in P. syringae pv. pha-seolicola NPS3121 under the effect of bean leaf or pod extract and apoplast fluid. The genes with ± 2.0 fold change were distributed as shown in Venn diagram (Tables 1 and 2). This analysis showed that bean leaf extract and apoplastic fluid had similar effects on gene transcription, 61 differentially expressed genes are being shared between both conditions.
Page 10 of 16(page number not for citation purposes)

BMC Microbiology 2009, 9:257 http://www.biomedcentral.com/1471-2180/9/257
under our conditions (Figure 5). These results suggest thatplant extracts contain the co-repressor (Fe2+) at non-limit-ing concentrations and this causes a strong repression ofiron responsive genes possibly through a regulatory cas-cade similar to that found in Fur-mediated repression inP. aeruginosa (Figure 5) [55].
It is also known that under conditions of iron-sufficiencythe Fur protein represses two small RNAs in P. aeruginosa(PrrF1 and PrrF2), which in turn control negatively, atpost-transcriptional level, the expression of genes for thepathways that are associated with the availability of largeamounts of iron [62]. Thus, the positive regulation of Furis mediated through its negative regulation of the negative
regulatory RNAs (repressing the repressors). PrrF-regu-lated genes are derepressed under iron-sufficient condi-tions and are involved in a wide range of metabolicactivities such as iron storage (bfr2), defense against oxi-dative stress (katA, katB), induction of heat shock proteins(hsIU), carbon metabolism and electron transport (nuoE,nuoF, nuoG, nuoH) in aerobic conditions [55]. All theseobservations are congruent with the metabolic status ofthe bacteria, produced in our study conditions, as men-tioned above in the induced genes section (Figure 3, Fig-ure 5). Two putative homologous prrF sequences werefound in P. putida, P. fluorescens, and P. syringae, suggest-ing that the small RNAs (PrrF1 and PrrF2) are conservedamong the pseudomonads [62]. A search in the P. syringae
Functional analysis of the results of microarray profilesFigure 5Functional analysis of the results of microarray profiles. Red and green letters represent induced and repressed genes respectively. Gray words represent genes constitutively expressed under our study conditions (name of genes or their identifi-ers are in parenthesis). We propose that induction of some genes is related to the presence of host components in the medium (leaf and apoplast). Similarly, repression of genes involved in iron acquisition, suggests that host extracts are a non-lim-iting source of this element. The figure also shows results of RT-PCR validation; control culture without extract (A, at the left) and test culture with bean leaf extract (B, to the right). Nine up-regulated genes were selected for RT-PCR analysis. The inde-pendent determination of transcript levels using RT-PCR analysis was congruent with the microarray data. Additionally we included genes involved in protection against oxidative stress such as catalase A (katA), and genes involved in TTSS (hrpJ, HopAB1, avrB2), which in the case of the latter are also included as controls in the microarrays and the fur gene.
Page 11 of 16(page number not for citation purposes)

BMC Microbiology 2009, 9:257 http://www.biomedcentral.com/1471-2180/9/257
pv. phaseolicola 1448A genome revealed an intergenicregion with approximately the same length and 84% and83% nucleotide identity with PrrF1 and PrrF2 respec-tively. In our study many genes regulated by PrrF in otherpseudomonads were also up-regulated, suggesting thatthis positive effect might also be mediated by the Fur pro-tein and the PrrF sRNA which regulate genes involved incarbon metabolism, bacterioferritin, catalase productionand electron transport (Figure 5) [55,62].
ConclusionsThe apoplast is the first point of contact of P. syringae pv.phaseolicola during the infection of the plant. However,apoplastic fluid will not completely mimic the conditionspresent in planta, which include the interaction with intactplant cell walls and plant metabolites that are only pro-duced as a reaction to the presence of the bacteria. Herewe investigate the physiological adaptation of P. syringaepv. phaseolicola NPS3121 when grown in the presence ofleaf and pod extracts and apoplastic fluid. The greatestnumber of genes showing significant changes in expres-sion levels was obtained under the effect of bean leafextract and apoplastic fluid, in contrast with bean podextract, which affected only a few genes. These resultsdemonstrate that each tissue or extract type produces adefining and distinctive transcriptional pattern in the bac-teria and that the shared expression profiles were corre-lated with the biological relationship of the extract type(leaf and apoplastic fluid).
Up-regulated genes include those encoding cell walldegrading enzymes, secretion system proteins (TTSS),proteins involved in phaseolotoxin synthesis, carbon andnitrogen metabolism, aerobic respiration (nuo operon),adaptation responses and protection against oxidativestress. On the other hand, some down-regulated genes areclearly involved in iron uptake and transport, suggestingthat host extracts provide enough iron for bacterialgrowth.
We speculate that under the experimental conditions ofthis study bacteria produce reactive oxygen species as aconsequence of aerobic metabolism. High iron concentra-tion (of the plant extract) during aerobic respiration canlead to interactions that generate the highly reactive oxy-gen species that can damage a variety of cellular compo-nents. Therefore, iron metabolism must be carefullybalanced in terms of acquisition and storage. The resultsshowed that bacteria repress genes involved in iron acqui-sition, induce iron dependant enzymes and iron storageproteins (bacterioferritin) that provide the cofactor Fe2+
for catalase, which is involved in protection against oxida-tive stress. These responses allow P. syringae pv. phaseoli-cola NPS3121 to adapt to media supplemented with plantextracts.
In addition, the results demonstrate that for many genes,a significant increase in expression is probably due toplant signal molecule(s) found in bean extracts. The roleof some of these gene products such a pectin lyase, polyg-alacturonase and TTSS proteins during the first stages ofthe plant-bacterial interaction and the role of phaseolo-toxin in virulence has previously been reported. Further-more, this study suggests that to obtain information ofgenes required for the late stages in the infective process,other approaches such as gene expression analysis ininfected tissue may be required. This type of analysiscould provide information about processes occurring dur-ing metabolic adaptation to host tissue, disease develop-ment ranging from first stages to the development ofsymptoms and bacterial physiology influenced by respon-sive factors such as antimicrobials and other defensivemetabolites inside the plant cell.
MethodsAssembly of a DNA microarray of P. syringae pv. phaseolicola NPS3121 (see Figure 2)Genomic DNA from P. syringae pv. phaseolicola NPS3121was isolated as described previously [63], partiallydigested with Sau3AI and run on a continuous sucrosegradient to recover fragments with an average size of 3kbp. The genomic fragments were ligated into the plasmidvector pUC19 (Invitrogen, California, USA) previouslydigested with BamHI, and the ligation mixture was usedto transform Escherichia coli TOP10 cells (Invitrogen, Cal-ifornia, USA). Transformants were transferred to 96-wellmicroplates, grown overnight and plasmids were recov-ered. A total of 9792 recombinant clones were obtainedwith an average insert size of 2.6 kbp giving an estimated4× coverage of the P. syringae pv. phaseolicola NPS3121genome whose size is reported to be 5640 Mpb [64].Around 30% of the genomic clones were randomlyselected and partially sequenced in a single directionusing the forward M13-primer (5'-CCCAGTCAC-GACGTTGTAAAACGAC) by the Sanger method. 2880sequences with an average size of 531 pb were obtained.Using the MUMmer system each sequence was alignedand annotated against the complete genome sequence ofP. syringae pv. phaseolicola 1448A [23]. This strategyallowed us to select those clones that provided approxi-mately 1× coverage of the genome, eliminating redun-dancy and providing information regarding the identity ofthe 5' end of each clone. From these, 1911 clones wereamplified by PCR in a 100 μl PCR reaction containing 10μM M13 forward and reverse primers (as above and 5'-AGCGGATAACAATTTCACACAGGAA), 10 μl of 10× PCRbuffer, 50 mM MgCl2, 10 mM dNTP mix and 1 unit of TaqDNA polymerase. Thirty cycles of: denaturation at 94°Cfor 30 s, annealing at 60°C for 30 s, and extension at 68°Cfor 3 min were performed, followed by 5 min of finalextension at 68°C. Amplified products were visualized on
Page 12 of 16(page number not for citation purposes)

BMC Microbiology 2009, 9:257 http://www.biomedcentral.com/1471-2180/9/257
ethidium bromide-stained agarose gels. These PCR prod-ucts were purified, dissolved in water, and quantifiedusing a ND-1000 Spectrophotometer (NanoDrop Tech-nologies, Wilmington, DE, USA). The DNA concentrationfor each sample (average size 2.4 kbp) was adjusted to 240ng/μl in 1× spotting solutions (Micro Spotting Plus,ArrayltTM, Sunnyvale, CA), and then spotted ontoGamma Amino Propyl Silane coated slides (Corning Inc.,NY, U.S.A.) using the Virtek Chiprender ProfessionalArrayer at 20°C and 60% humidity. As controls, PCRproducts for genes involved in the synthesis of the type IIIsecretion system (hrpRS, hrpTU, hrpOP, hrpJ, virPphA,avrPphC, avrPphD, avrPphE), phaseolotoxin synthesis(argK, phtA, phtD, desI, phtL, phtMN, amtA), quorum sens-ing (ahlI, ahlR, algD), global regulators (rpoD, gacA, rpoN,gacS, rsmA), and lucidea universal ScoreCard controls(GE) were printed on the microarray to validate, filter andnormalize data. All samples were printed in triplicate in acontiguous arrangement of 12 grids of 24 rows × 24 col-umns. The microarray was printed twice on the same slidefor a total 6 replicates for each fragment. To further checkthe quality of the printed microarrays, a quality controlassay was performed. To this end, P. syringae pv. phaseoli-cola NPS3121 was grown at 18°C in minimal M9medium until it reach the late-log phase (OD600 nm 0.95-1.0), RNA was isolated, and cDNA was synthesized andlabelled with either dUTP-Cy5 or dUTP-Cy3. The cDNAswere used as probes to hybridize the microarray. The Cy3and Cy5 signals were quantified, and the correspondinganalyses were performed as described below in the micro-array analysissection. Most spots printed on the DNAmicroarray showed uniform intensities of fluorescencewhen hybridized with RNA of strain NPS3121 grown in asingle condition. Accordingly, when the means of signalintensity of the Cy5 probe were plotted against those ofthe Cy3 probe, a curve with slope 1 was obtained. Mostsignals were found near the diagonal, indicating that mostof the genes were constitutively expressed (data notshown). After the quality control had shown that the DNAmicroarray results were reliable, we aimed to characterizethe changes in the transcriptional profile of P. syringae pv.phaseolicola NPS3121 under the effects of bean leafextract, apoplastic fluid, and bean pod extract.
Preparation of bean leaf and pod extracts, and apoplastic fluidBean plants (Phaseolus vulgaris L. cv. Canadian Wonder)were grown in a controlled environmental chamber for 3to 4 weeks (16 h light/8 h dark [25°C]). Leaf and podextracts were obtained according to the methodologydescribed by Li and collaborators [9], using 1 g of tissuemixed with 2 ml of water. Apoplastic fluid was obtainedfrom 3 to 4 week-old bean plants by a method describedpreviously [40,9].
Bacterial growth conditions and RNA extractionP. syringae pv. phaseolicola NPS3121 was inoculated in 20ml of M9 minimal media with glucose (0.8%) as carbonsource and cultured overnight at 28°C. The cells werewashed with minimal medium and inoculated into 200ml of M9 minimal medium at OD600 nm 0.1. The bacteriawere grown at 18°C until the mid-log phase (OD 600nm0.6). The culture was then split into two equal parts. Oneof which was induced with 2% of bean leaf or pod extractor apoplastic fluid and to the other an equal amount ofminimal medium was added as control. Each culture wasincubated for 6 h at 18°C, until the beginning of late-logphase and the cells were then recovered by centrifugation.Total RNA was isolated from these cultures using Trizolreagent as recommended by the manufacturer (Invitro-gen, California, USA). A second step of purification wasperformed using RNeasy MinElute spin columns (Qiagen,Valencia, CA) to remove any contaminating DNA. RNAswere eluted in 50 μl of diethylpyrocarbonate (DEPC)-treated water and their concentration was determinedusing the NanoDrop spectrophotometer. RNA integritywas checked by analytical agarose gel electrophoresis.
Synthesis of fluorescently labelled cDNA from P. syringae pv. phaseolicola NPS3121 total RNAFirst-strand cDNA was synthesized using the CyScribeFirst-Strand cDNA Labelling kit (Amersham Biosciences).Thirty μg of total RNA was mixed with 3 μl of randomnonamers, 0.5 μl anchored oligo (dT), 1 μl score cardSpike mix control or test, and 1 μl score card utility mix(in a final volume of 11 μl). The RNA sample was heatedat 70°C for 5 min. Reactions were held at room tempera-ture for 10 min to allow the primers and the RNA tem-plate to anneal. To each reaction, the following wereadded: 4 μl of 5× first strand buffer, 1 μl of 1 mM Cy5-dUTP or Cy3-dUTP, 2 μl of dithiothreitol 100 mM, 1 μl ofdUTP nucleotide mix and 100 U of Superscript II reversetranscriptase. cDNA synthesis was performed at 42°C for2 h in the dark and then the RNA template was hydrolyzedby incubation with 2 μl of 2.5 N NaOH at 37°C for 15min. The reaction was neutralized by adding 10 μl of 2 MHEPES. The labelled cDNA was purified using theCyScribe GFX purification Kit as recommended by themanufacturer (Amersham Biosciences). The incorpora-tion of Cy3 or Cy5 nucleotides into first-strand cDNA wasquantified with the NanoDrop equipment and sampleswere finally stored at -20°C before use.
Microarray hybridizationsPrinted microarray slides were hydrated with distilledwater steam and fixed with a UV cross linker at 1200 J,then denatured in boiling water for 2 min, immersed in95% ethanol and dried. The slides were prehybridized at45°C for 1 h in 5× SSC, 0.1% SDS, 1% BSA. They were
Page 13 of 16(page number not for citation purposes)

BMC Microbiology 2009, 9:257 http://www.biomedcentral.com/1471-2180/9/257
then washed twice for 5 min in 0.1× SSC and 30 s in 0.01×SSC, dried and used directly for hybridization. Thelabelled probes (10 μl) were added to 10 μl hybridizationbuffer (containing 3× SSC, 0.1% SDS, 1% BSA) and 10 μlof formamide. Probes were denatured at 95°C for 5 minand applied onto the genomic array slide, covered with acover slip (Hybri-slips, Sigma-Aldrich Co. St Louis U.S.A.)and hybridized at 45°C for 16 h. After hybridization theslides were washed sequentially for 5 min each in 2× SSC-0.1% SDS, 0.1× SSC-0.1% SDS, 0.1× SSC, and 0.01× SSC.The slides were dried and fluorescent signals were scannedusing an Axon Genepix 4000B scanner at a resolution of10 μm adjusting the laser and gain parameters to obtainsimilar levels of fluorescence intensity in both channels.Each microarray experiment was repeated six times (twotechnical replicates with the same RNA samples and threebiological replicates using RNA isolated from a differentculture).
Analysis of DNA microarray dataSpot intensities were quantified using Axon GenePix Pro6.0 image analysis software. First, an automatic spot find-ing and quantification option of the software was used.Subsequently, all spots were inspected individually and insome cases, the spot diameters were corrected or the spotswere removed from the analysis. The mean of the signalsand the median of backgrounds were used for furtheranalysis. Raw data were imported into the R 2.2.1 software[65]. Background signals were subtracted using the RobustMultichip Analysis "RMA" [66] whereas normalization ofthe signal intensities within slides was carried out usingthe "printtiploess" method and the LIMMA package[67,68]. Normalized data were log2 transformed and thenfitted into mixed model ANOVAs using the Mixed proce-dure [17,18]. The p-values of the bean extract effects wereadjusted for by the False Discovery Rate method "FDR"[69]. Changes in signal intensity of ± 1.5-fold or higher/lower between treatments and controls were highly signif-icant (FDR, p-value ≤ 0.05), however we focus only in dif-ferential expressed genes that fall in the more traditionalcriteria, which is the cut-off threshold for up-regulated (≥2) and down-regulated genes (≤ 0.5). The genes were sub-ject to cluster analysis with Gene Cluster 3.0, using theuncentered Pearson correlation and complete linkageclustering. Results were visualized with Treeview asdescribed by Eisen and collaborators [18].
Microarray validation by Reverse transcription-PCR analysisRT-PCR analysis was carried out to validate the arrayhybridization data. RT-PCR analysis was performed fornine up-regulated genes under the effect of bean leafextract. These RT-PCR experiments involved independentbiological experiments from those used for microarray
analysis. DNA-free RNA was obtained and checked forintegrity in an agarose gel, 200 ng of total RNA were usedfor reverse transcription (RT) and PCR using the Super-Script one-step kit (Invitrogen, California, USA). A list ofthe primers used in this analysis is available on request.Controls used for each set of primers were (i) PCR withoutthe reverse transcription step to verify the absence ofDNA, (ii) RT-PCRs performed without RNA templates todetect any contaminating DNA/RNA, (iii) PCRs per-formed using chromosomal DNA as a template to ensureprimer fidelity, and (iv) amplification of a portion of the16S rRNA operon using suitable primers as an internalcontrol of the reaction. The RT reaction was performed at50°C for 30 min, followed by PCR amplification at 94°Cfor 2 min for 1 cycle; 94°C for 35 s, 55-58°C for 30 s, and72°C for1.0 min for 28 cycles; and 72°C for 10 min for 1cycle.
Microarray data accessionThe microarray data from this study is available on theGEO database at http://www.ncbi.nlm.nih.gov/geo underseries GSE14625, GSE14983, and GSE14998.
Authors' contributionsAH-M contributed to experimental design; microarrayfabrication, performed experiments, analyzed the dataand drafted the manuscript. ST-Z participated in thedesign of the study and microarray fabrication. EI-L con-tributed to experimental design, microarray fabrication,analyzed microarray data and performed statistical analy-sis. JLH-F participated in the design of the study. AEJ-Gparticipated in the design of the study. AM-A contributedto interpretation of data and revision of the manuscript.AA-M conceived the study, contributed to experimentaldesign and edited the manuscript.
Additional material
Additional file 1Table of differential expressed genes. This Excel file contains all differ-entially expressed genes under effect of bean leaf, pod extract, and apoplas-tic fluid. The table contains 224 genes that showed ± 1.5 fold change in expression level. Comparative analysis was performed and the genes were grouped in accordance with similar responses. The group A comprises dif-ferential expressed genes in response to three plant extracts. Group B include genes in response to bean leaf extract and apoplastic fluid. Group C include genes in response to apoplastic fluid and bean pod extract. The group D, E and F comprises genes in particular responses to bean leaf extract, apoplastic fluid and bean pod extract respectively. The file includes a Venn diagram that shows the relations between the responses to three plant extracts.Click here for file[http://www.biomedcentral.com/content/supplementary/1471-2180-9-257-S1.XLS]
Page 14 of 16(page number not for citation purposes)
BMC Microbiology 2009, 9:257 http://www.biomedcentral.com/1471-2180/9/257
AcknowledgementsWe are grateful to June Simpson Williamson for suggestions and critical reading of the manuscript, and Jackeline L. Arvizu-Gómez for helpful com-ments and assistance in data organization. The work reported was funded by grants from CONACYT to AÁ-M (Research grant) and AH-M (graduate student scholarship).
References1. Hirano SS, Upper CD: Bacteria in the leaf ecosystem with
emphasis on Pseudomonas syringae : A pathogen, ice nucleus,and epiphyte. Microbiol Mol Biol Rev 2000, 64:624-653.
2. Jin Q, Thilmony R, Zwiesler-Vollick J, Sheng-Yang H: Type III pro-tein secretion in Pseudomonas syringae. Microb Infect 2003,5:301-310.
3. Bretz JR, Hutcheson SW: Role of type III effector secretion dur-ing bacterial pathogenesis in another kingdom. Infect Immun2004, 72:3697-3705.
4. Boch J, Joardar V, Gao L, Tara LR, Lim M, Kunkel BN: Identificationof Pseudomonas syringae pv. tomato genes induced duringinfection of Arabidopsis thaliana. Mol Microbiol 2002, 44:73-88.
5. Alfano JR, Collmer A: Bacterial pathogens in plants: life upagainst the wall. Plant Cell 1996, 8:1683-1698.
6. Rahme LG, Mindrinos MN, Panopoulos NJ: Plant and environmen-tal sensory signals control the expression of hrp genes inPseudomonas syringae pv. phaseolicola. J Bacteriol 1992,174:3499-3507.
7. Aldon D, Brito B, Boucher C, Genin S: A bacterial sensor of plantcell contact controls the transcriptional induction of Ralsto-nia solanacearum pathogenicity genes. EMBO Journal 2000,19:2304-2314.
8. Mo YY, Gross DC: Plant signal molecules activate the syrBgene, which is required for syringomicin production by Pseu-domonas syringae pv. syringae. J Bacteriol 1991, 173:5784-5792.
9. Li XZ, Starratt AN, Cuppels DA: Identification of tomato leaffactors that activate toxin gene expression in Pseudomonassyringae pv. tomato DC3000. Phytopathol 1998, 88:1094-1100.
10. Kelemu S, Collmer A: Erwinia chrysantemi EC16 produces a sec-ond set of plant-inducible pectate lyase isoenzymes. Appl Envi-ron Microbiol 1993, 59:1756-1761.
11. Lindgren PZ, Peet RC, Panopoulus NJ: Gene cluster of Pseu-domonas syringae pv "phaseolicola" controls pathogenicity ofbean plants and hypersensitivity on nonhost plants. J Bacteriol1986, 168:512-522.
12. Schwartz HF: Bacterial diseases of beans. Crop series diseases no2.913 2001 [http://www.ext.colostate.edu/crops/02913.pdf].
13. Brencic A, Winans SC: Detection of and response to signalsinvolved in host-microbe interactions by plant-associatedbacteria. Microbiol Mol Biol Rev 2005, 69:155-194.
14. Rico A, Preston GM: Pseudomonas syringae pv. tomato DC3000uses constitutive and apoplast-induced nutrient assimilationpathways to catabolize nutrients that are abundant in thetomato apoplast. Mol Plant-Microbe Interact 2008, 21:269-282.
15. Lan L, Deng X, Zhou J, Tang X: Genome-wide gene expressionanalysis of Pseudomonas syringae pv. tomato DC3000 revealsoverlapping and distinct pathways regulated by hrpL andhrpRS. Mol Plant-Microbe Interact 2006, 19:976-987.
16. Gibson G, Wolfinger R: Gene expression profiling using mixedmodels. In Genetics Analysis of Complex Traits Using SAS Edited by:Myron SA, Balzarini MG, Cappio-Borlino A. Cary, NC, USA: SASPress; 2004:251-278.
17. Wolfinger RD, Gibson G, Wolfinger ED, Bennett L, Hamadeh H,Bushel P, Afshari C, Paules RS: Assessing gene significance fromcDNA microarray expression data via mixed models. J Com-put Biol 2001, 8(6):625-637.
18. Eisen MB, Spellman PT, Brown PO, Botstein D: Cluster analysisand display of genome-wide expression patterns. Proc NatlAcad Sci 1998, 95(25):14863-14868.
19. Schjoerring JK, Pearson N, Husted S, Nielsen KH, Mattsson M: Theleaf apoplast: a central compartment in plant nitrogen utili-zation. Plant Nutrition-Food security and sustainability of agro-ecosystemsthrough basic and applied research. Netherlands 2001, 92:224-245.
20. Solomon PS, Oliver RP: The nitrogen content of the tomato leafapoplast increases during infection by Cladosporium fulvum.Planta 2001, 213:241-249.
21. Joosten MHAJ, Hendrickx LJM, De Wit PJGM: Carbohydrate com-position of apoplastic fluids isolated from tomato leavesinoculated with virulent or avirulent races of Cladosporiumfulvum (syn. Fulvia fulva). Neth J Pl Path 1990, 96:103-112.
22. Mattinen L, Somervuo P, Nykyri J, Nissinen R, Kuovonen P, CorthalsG, Auvinen P, Aittamaa M, Valkonen JP, Pirhonen M: Microarrayprofiling of host-extract-induced genes and characterizationof the type VI secretion cluster in the potato pathogen Pecto-bacterium atrosepticum. Microbiology 2008, 154:2387-2396.
23. Joardar V, Lindeberg M, Jackson RW, Selengut J, Dodson R, BrinkacLM, Daugherty SC, DeBoy R, Durkin AS, Giglio MG, Madupu R, Nel-son WC, Rasovitz MJ, Sullivan S, Crabtree J, Creasy T, Davidsen T,Haft DH, Zafar N, Zhou L, Halpin R, Holley T, Khouri H, FeldblyumT, White O, Fraser CM, Chatterjee AK, Cartinhour S, Schneider DJ,Mansfield J, Collmer A, Buell R: Whole genome sequence analy-sis of Pseudomonas syringae pv phaseolicola 1448A revealsdivergence among pathovars in genes involved in virulenceand transposition. J Bacteriol 2005, 187:6488-6498.
24. Hueck CJ: Type III protein secretion systems in bacterialpathogens of animals and plants. Microbiol Mol Biol Rev 1998,62:379-433.
25. Collmer A, Badel JL, Charkowski AO, Deng WL, Fouts DE, RamosAR, Rehm AH, Anderson DM, Schneewind O, van Dijk K, Alfano JR:Pseudomonas syringae Hrp type III secretion system andeffector proteins. Proc Natl Acad Sci 2000, 97:8770-8777.
26. Kunkel BN, Chen Z: Virulence strategies of plant pathogenicbacteria. Prokaryotes 2006, 2:421-440.
27. Okinaka YYC, Perna NT, Keen NT: Microarray profiling ofErwinia chrysanthemi 3937 genes that are regulated duringplant infection. Mol Plant-Microbe Interact 2002, 15(7):619-629.
28. Mattinen L, Nissinen R, Riipi T, Kalkkinen N, Pirhonen M: Host-extract induced changes in the secretome of the plant path-ogenic bacterium Pectobacterium atrosepticum. Proteomics2007, 7:3527-3537.
29. Collmer A, Keen NT: The role of pectic enzymes in plantpathogenesis. Annu Rev Phytopathol 1986, 24:383-409.
30. Perombelon MCM: Potato diseases caused by soft rot Erwinias:an overview of pathogenesis. Plant Pathol 2002, 51:1-12.
31. Salmond GPC: Secretion of extracellular virulence factors byplant-pathogenic bacteria. Annu Rev Phytopathol 1994,32:181-200.
32. Longland AC, Slusarenko AJ, Friend J: Pectolytic enzymes frominteractions between Pseudomonas syringae pv. phaseolicolaand French bean (Phaseolus vulgaris). J Phytopathol 1992,134:75-86.
33. Magro P, Varvaro L, Chilosi G, Avanzo C, Balestra GM: Pectolyticenzymes produced by Pseudomonas syringae pv. glycinea.FEMS Microbiol Lett 1994, 117:1-6.
34. Charkowski AO, Alfano JR, Preston G, Yuan J, He SY, Collmer A:The Pseudomonas syringae pv. tomato HrpW protein hasdomains similar to harpins and pectate lyases and can elicitthe plant hypersensitive response and bind to pectate. J Bac-teriol 1998, 180:5211-5217.
35. Kvitko BH, Ramos AR, Morello JE, Oh HS, Collmer A: Identificationof harpins in Pseudomonas syringae pv. tomato DC3000,which are functionally similar to HrpK1 in promoting trans-location of type III secretion system effectors. J Bacteriol 2007,189:8059-8072.
Additional file 2Table of differential expressed genes with the more stringent cut-off. The table contains 121 genes with ± 2.0 fold change in expression level. These genes were grouped according to the function, and then clustered based on the kind of plant extract using the complete linkage cluster algo-rithm. The cluster of induced and repressed genes that are discussed in manuscript and a comparative Venn diagram are also shown.Click here for file[http://www.biomedcentral.com/content/supplementary/1471-2180-9-257-S2.XLS]
Page 15 of 16(page number not for citation purposes)
http://www.ncbi.nlm.nih.gov/entrez/query.fcgi?cmd=Retrieve&db=PubMed&dopt=Abstract&list_uids=1592805
http://www.ncbi.nlm.nih.gov/entrez/query.fcgi?cmd=Retrieve&db=PubMed&dopt=Abstract&list_uids=1885550
http://www.ncbi.nlm.nih.gov/entrez/query.fcgi?cmd=Retrieve&db=PubMed&dopt=Abstract&list_uids=3023280
http://www.ncbi.nlm.nih.gov/entrez/query.fcgi?cmd=Retrieve&db=PubMed&dopt=Abstract&list_uids=3023280
http://www.ncbi.nlm.nih.gov/entrez/query.fcgi?cmd=Retrieve&db=PubMed&dopt=Abstract&list_uids=9843981
http://www.ncbi.nlm.nih.gov/entrez/query.fcgi?cmd=Retrieve&db=PubMed&dopt=Abstract&list_uids=9843981
http://www.ncbi.nlm.nih.gov/entrez/query.fcgi?cmd=Retrieve&db=PubMed&dopt=Abstract&list_uids=9618447
http://www.ncbi.nlm.nih.gov/entrez/query.fcgi?cmd=Retrieve&db=PubMed&dopt=Abstract&list_uids=9618447
http://www.ncbi.nlm.nih.gov/entrez/query.fcgi?cmd=Retrieve&db=PubMed&dopt=Abstract&list_uids=9748456
http://www.ncbi.nlm.nih.gov/entrez/query.fcgi?cmd=Retrieve&db=PubMed&dopt=Abstract&list_uids=9748456

BMC Microbiology 2009, 9:257 http://www.biomedcentral.com/1471-2180/9/257
Publish with BioMed Central and every scientist can read your work free of charge
"BioMed Central will be the most significant development for disseminating the results of biomedical research in our lifetime."
Sir Paul Nurse, Cancer Research UK
Your research papers will be:
available free of charge to the entire biomedical community
peer reviewed and published immediately upon acceptance
cited in PubMed and archived on PubMed Central
yours — you keep the copyright
Submit your manuscript here:http://www.biomedcentral.com/info/publishing_adv.asp
BioMedcentral
36. Vencato M, Tian F, Alfano JR, Buell CR, Cartinhour S, DeClerck GA,Guttman DS, Stavrinides J, Joardar V, Lindeberg M, Bronstein PA,Mansfield JW, Myers CR, Collmer A, Schneider DJ: Bioinformatics-enabled identification of the HrpL regulon and type III secre-tion system effector proteins of Pseudomonas syringae pv.phaseolicola 1448A. Mol Plant-Microbe Interact 2006,19:1193-1206.
37. Idriss EE, Makarewicz O, Farouk A, Rosner K, Greiner R, Bochow H,Richter T, Borriss R: Extracellular phytase activity of Bacillusamyloliquefaciens FZB45 contributes to its plant-growth-pro-moting effect. Microbiol 2002, 148:2097-2109.
38. Vohra A, Satyanarayana T: Phytases: microbial sources, produc-tion, purification, and potential biotechnological applica-tions. Critical Reviews in Biotechnology 2003, 23:29-60.
39. Dave OB, Blanchard C, Balasubramanian P: Phytic acid, phytase,minerals, and antioxidant activity in Canadian dry bean (Pha-seolus vulgaris L.) cultivars. J Agric Food Chem 2008,56:11312-11319.
40. Rathmell WG, Sequeira L: Soluble peroxidase in fluid from theintercellular spaces of tobacco leaves. Plant Phyisol 1974,53:317-318.
41. Aguilera S, López-López K, Nieto Y, Garcidueñas-Piña R, Hernández-Guzmán G, Hernández-Flores JL, Murillo J, Álvarez-Morales A: Func-tional characterization of the gene cluster from Pseu-domonas syringae pv. phaseolicola NPS3121 involved insynthesis of phaseolotoxin. J Bacteriol 2007, 189:2834-2843.
42. Quigley NB, Gross DC: Syringomicin production among strainsof Pseudomonas syringae pv. syringae: conservation of thesyrB and syrD genes and activation of phytotoxin productionby plant signal molecules. Mol Plant-Microbe Interact 1994,7:78-90.
43. Mo YY, Geibel M, Bonsall RF, Gross DC: Analysis of sweet cherry(Prunus avium L.) leaves for plant signal molecules that acti-vate the syrB gene requires for synthesis of the phytotoxin,syringomycin, by Pseudomonas syringae pv. syringae. PlantPhysiol 1995, 107:603-612.
44. Mosqueda G, Den Broeck GV, Saucedo O, Bailey AM, Alvarez-Morales A, Herrera-Estrella L: Isolation and characterization ofthe gene from Pseudomonas syringae pv. phaseolicola encod-ing the phaseolotoxin-insensitive ornithine carbamoyltrans-ferase. Mol Genet 1990, 222:461-466.
45. López-López K, Hernández-Flores JL, Cruz-Aguilar M, Alvarez-Morales A: In Pseudomonas syringae pv. phaseolicola the pha-seolotoxin-resistant ornithine carbamoyltransferaseencoded by argK is indirectly regulated by temperature anddirectly by a precursor molecule resembling carbamoyl-phospate. J Bacteriol 2004, 186:146-153.
46. Rico A, Jones R, Preston GM: Adaptation to the plant apoplastby plant pathogenic bacteria. In Plant Pathogenic Bacteria: Genom-ics and Molecular Biology Edited by: Jackson RW. School of BiologicalSciences, University of Reading, Whiteknights, Reading, UK;2009:63-89.
47. Herrera-Flores TS, Cárdenas-Soriano E, Ortíz-Cereceres J, Acosta-Gallegos JA, Mendoza-Castillo MC: Anatomy of the pod of threespecies of the genus Phaseolus. Agrociencia 2005, 39:595-602.
48. Brandt U: Energy converting NADH:Quinone Oxidoreduct-ase (Complex 1). Annu Rev Biochem 2006, 75:69-92.
49. Okuda S, Katayama T, Kawashima S, Goto S, Kanehisa M: ODB: adatabase of operons accumulating known operons acrossmultiple genomes. Nucleic Acids Res 2006:D358-D362.
50. Lund PA: Microbial molecular chaperones. Adv Microb Phyisiol2001, 44:93-140.
51. Zwiesler-Vollick J, Plovanich-Jones A, Nomura K, Bandyopadhyay S,Joardar V, Kunkel BN, He SY: Identification of novel hrp-regu-lated genes through functional genomic analysis of the Pseu-domonas syringae pv tomato DC3000 genome. Mol Microbiol2002, 45:1207-1218.
52. Klotz MG, Hutcheson SW: Multiple periplasmic catalases inphytopathogenic strains of Pseudomonas syringae. Appl EnvironMicrobiol 1992, 58:2468-2473.
53. Andrews SC, Robinson AK, Rodríguez-Quiñones F: Bacterial ironhomeostasis. FEMS Microbiol Rev 2003, 27:215-237.
54. Ma JF, Ochsner UR, Klotz MG, Nanayakkara VK, Howell ML, JohnsonZ, Posey JE, Vasil ML, Monaco JJ, Hassett DJ: Bacterioferritin Amodulates catalase A (KatA) activity and resistance to
hydrogen peroxide in Pseudomonas aeruginosa. J Bacteriol 1999,181:3730-3742.
55. Vasil ML: How we learnt about iron acquisition in Pseu-domonas aeruginosa : a series of very fortunate events. Biomet-als 2007, 20:587-601.
56. Llamas MA, Mooij MJ, Sparrius M, Vandenbroucke-Grauls CM,Ratledge C, Bitter W: Characterization of five novel Pseu-domonas aeruginosa cell-surface signalling systems. Mol Micro-biol 2008, 62(7):458-472.
57. Swingle B, Thete D, Moll M, Myers CR, Schneider DJ, Cartinhour S:Characterization of the PvdS-regulated promoter motif inPseudomonas syringae pv. tomato DC3000 reveals regulonmembers and insights regarding PvdS function in otherpseudomonads. Mol Microbiol 2008, 68(4):871-889.
58. Feil H, Feil WS, Chain P, Larimer F, DiBartolo G, Copeland A, LykidisA, Trong S, Nolan M, Goltsman E, Thiel J, Malfatti S, Loper JE, LapidusA, Detter JC, Land M, Richardson PM, Kyrpides NC, Ivanova N, Lin-dow SE: Comparison of the complete genome sequences ofPseudomonas syringae pv. syringae B728a and pv. tomatoDC3000. Proc Natl Acad Sci 2005, 102:11064-11069.
59. Jones AM, Lindow SE, Wildermuth MC: Salicylic acid, yersiniabac-tin, and pyoverdine production by the model phytopathogenPseudomonas syringae pv. tomato DC Synthesis, regulation,and impact on tomato and Arabidopsis host plants. J Bacteriol3000, 189(19):6773-6786.
60. Braun V, Braun M: Iron transport and signaling in Escherichiacoli. FEBS Letters 2002, 529:78-85.
61. Leoni L, Orsi N, de Lorenzo V, Visca P: Functional analysis ofPvdS, an iron starvation sigma factor of Pseudomonas aerugi-nosa. J Bacteriol 2000, 182(6):1481-1491.
62. Wilderman PJ, Sowa NA, FitzGerald DJ, FitzGerald PC, Gottesman S,Ochsner UA, Vasil ML: Identification of tandem duplicate regu-latory small RNAs in Pseudomonas aeruginosa involved in ironhomeostasis. Proc Natl Acad Sci 2004, 101(26):9792-9797.
63. Chen WP, Kuo TT: A simple and rapid method for the prepa-ration of gram negative bacterial genomic DNA. Nucleic AcidsRes 1993, 21:2260.
64. De Ita ME, Marsch-Moreno R, Guzmán P, Álvarez-Morales A: Physi-cal map of chromosome of the phytophatogenic bacteriumPseudomonas syringae pv. phaseolicola. Microbiology 1998,144:493-501.
65. The R project for statistical computing [http://www.r-project.org]
66. Irizarry RA, Bolstad BM, Collin F, Cope LM, Hobbs B, Speed TP:Summaries of Affymetrix, GeneChip probe level data.Nucleic Acid Res 2003, 31(4):e15.
67. Yang YH, Dudoit S, Luu P, Lin DM, Peng V, Ngai J, Speed TP: Nor-malization for cDNA microarray data: a robust compositemethod addressing single and multiple slide systematic vari-ation. Nucleic Acid Res 2002, 30(4):e15.
68. Limma: linear models for microarray data user's guide[http://www.bioconductor.org]
69. Benjamini Y, Hochberg Y: Controlling the False Discovery Rate:A practical and powerful approach to multiple testing. J R Sta-tist Soc B 1995, 57:289-300.
Page 16 of 16(page number not for citation purposes)
http://www.ncbi.nlm.nih.gov/entrez/query.fcgi?cmd=Retrieve&db=PubMed&dopt=Abstract&list_uids=7909458
http://www.ncbi.nlm.nih.gov/entrez/query.fcgi?cmd=Retrieve&db=PubMed&dopt=Abstract&list_uids=7909458
http://www.ncbi.nlm.nih.gov/entrez/query.fcgi?cmd=Retrieve&db=PubMed&dopt=Abstract&list_uids=1514792
http://www.ncbi.nlm.nih.gov/entrez/query.fcgi?cmd=Retrieve&db=PubMed&dopt=Abstract&list_uids=8502576