Effect of cultivar resistance and rotation crops on clubroot ...
177
Effect of cultivar resistance and rotation crops on clubroot (Plasmodiophora brassicae) in canola and brassica vegetables by Sarah C. Drury A Thesis presented to The University of Guelph In partial fulfilment of requirements for the degree of Master of Science in Plant Agriculture Guelph, Ontario, Canada © Sarah C. Drury, May, 2021
-
Upload
khangminh22 -
Category
Documents
-
view
1 -
download
0
Transcript of Effect of cultivar resistance and rotation crops on clubroot ...
Effect of cultivar resistance and rotation crops on clubroot (Plasmodiophora
brassicae) in canola and brassica vegetables
by
Sarah C. Drury
A Thesis
presented to
The University of Guelph
In partial fulfilment of requirements
for the degree of
Master of Science
in
Plant Agriculture
Guelph, Ontario, Canada
© Sarah C. Drury, May, 2021

ABSTRACT
EFFECT OF CULTIVAR RESISTANCE AND ROTATION CROPS ON CLUBROOT
(PLASMODIOPHORA BRASSICAE) IN CANOLA AND BRASSICA VEGETABLES
Sarah C. Drury
University of Guelph, 2021
Advisors:
Dr. Mary Ruth McDonald
Dr. Bruce D. Gossen
Clubroot, caused by Plasmodiophora brassicae Woronin, can dramatically reduce yields of
brassica crops. Once present in a field, eradication is difficult, but resistant cultivars can provide
effective management. The reactions of selected canola and brassica vegetable cultivars to
pathotypes 2 and 6, the prevalent pathotypes in Ontario, were assessed. The canola cultivars
marketed as resistant were resistant to both pathotypes. The vegetable cultivars marketed as
resistant were resistant to both pathotypes except for putative resistant cultivars of cabbage and
broccoli which were resistant to pathotype 6 but susceptible to pathotype 2. The effect of
selected field and cover crops on spore concentrations in soil and the combined effect of planting
a cereal crop and liming and were also assessed. Wheat reduced spores compared to a no-plant
control. Spore concentrations decreased as the lime rate increased and there was no interaction
between wheat and lime. Therefore, growers can use both strategies.

iii
ACKNOWLEDGEMENTS
My M.Sc has at times been a challenging process, but it has been rewarding and
enjoyable as well. I would like to thank my academic advisors, Dr. Mary Ruth McDonald and
Dr. Bruce Gossen for this opportunity, and for helping me to think critically about research
questions. They helped me to grow as a graduate student and I am thankful for their
encouragement to present my research at conferences and to write a manuscript. I am very
grateful for their guidance throughout every step of my project.
I would like to thank Dr. Peter Pauls who was on my advisory committee for his valuable
ideas. Thank you to Drs. Fadi Al-Daoud and Afsaneh Sedaghatkish for sharing their mentorship
and for helping me to troubleshoot any qPCR issue I was having. Thank you to all my lab mates
for their support and encouragement. I would also like to thank Travis Cranmer and Dennis Van
Dyk for sharing their knowledge and expertise when I did an internship with them for a summer.
Thank you to Chris Grainger for his advice and technical support while facing challenges with
qPCR. I would also like to express my gratitude to Kevin Vander Kooi and Laura Riches at the
Muck Crops Research Station for all their assistance with my field trials.
I would like to thank my family and friends for their constant support throughout my
M.Sc. In particular, I am very grateful to my parents for their advice and help whenever I needed
it. They always encouraged me to pursue my goals and have been constant inspirations to me.
iv
TABLE OF CONTENTS
Abstract ................................................................................................................................. ii
Acknowledgements .............................................................................................................. iii
Table of contents .................................................................................................................. iv
List of abbreviations ........................................................................................................... viii
List of figures ....................................................................................................................... ix
List of tables .......................................................................................................................... x
1 Literature review .......................................................................................................... 1
1.1 Brassica crops ........................................................................................................... 1
1.2 Canola (B. napus L., B. rapa L. and B. juncea L.) ................................................... 2
1.2.1 Canola production system ................................................................................. 3
1.2.2 Uses and benefits of canola ............................................................................... 5
1.3 Brassica vegetables ................................................................................................... 5
1.3.1 Brassica vegetable production in Canada .......................................................... 6
1.3.2 Diseases of brassica crops ................................................................................. 7
1.4 Clubroot .................................................................................................................... 8
1.4.1 Disease cycle ..................................................................................................... 9
1.4.2 Pathotyping systems ........................................................................................ 12
1.4.3 Clubroot in Canada .......................................................................................... 14
v
1.4.4 Host-pathogen interaction ................................................................................ 16
1.5 Factors affecting clubroot development .................................................................. 20
1.5.1 Soil pH ............................................................................................................. 20
1.5.2 Temperature ..................................................................................................... 22
1.5.3 Soil moisture .................................................................................................... 23
1.5.4 Soil types ......................................................................................................... 23
1.5.5 Pathogen distribution in soil ............................................................................ 24
1.6 Clubroot management strategies ............................................................................. 24
1.6.1 Preventing pathogen dissemination ................................................................. 24
1.6.2 Resistant cultivars ............................................................................................ 25
1.6.3 Crop rotation .................................................................................................... 28
1.6.4 Bait crops ......................................................................................................... 29
1.6.5 Seeding date ..................................................................................................... 32
1.6.6 Liming ............................................................................................................. 32
1.6.7 Patch management ........................................................................................... 35
1.6.8 Fungicides ........................................................................................................ 35
1.6.9 Biological control ............................................................................................ 37
1.7 Techniques .............................................................................................................. 39
1.7.1 Detecting clubroot in soil ................................................................................ 39
vi
1.7.2 Assessing infection in plants ........................................................................... 39
1.7.3 Quantifying resting spore concentrations ........................................................ 40
1.8 Research objectives ................................................................................................. 41
2 Clubroot resistance in canola and brassica vegetable cultivars .................................. 43
2.1 Introduction ............................................................................................................. 43
2.2 Materials and methods ............................................................................................ 46
2.2.1 Field site .......................................................................................................... 46
2.2.2 Field trials – canola.......................................................................................... 46
2.2.3 Field trials - vegetables .................................................................................... 49
2.2.4 Clubroot inoculum for growth room studies ................................................... 51
2.2.5 Growth room - canola ...................................................................................... 52
2.2.6 Growth room - vegetable cultivars .................................................................. 53
2.2.7 Pathotyping P. brassicae from the field .......................................................... 53
2.2.8 Statistical analysis............................................................................................ 53
2.3 Results ..................................................................................................................... 54
2.3.1 Canola .............................................................................................................. 54
2.3.2 Brassica vegetables .......................................................................................... 57
2.3.3 The pathotype of a field collection .................................................................. 61
2.4 Discussion ............................................................................................................... 62
vii
3 Using field crops and liming to reduce resting spores in soil ..................................... 67
3.1 Introduction ............................................................................................................. 67
3.2 Materials and methods ............................................................................................ 71
3.2.1 Field crop growth room study ......................................................................... 71
3.2.2 Cereal crops × lime study ................................................................................ 75
3.2.3 Propidium monoazide (PMA)-qPCR analysis ................................................. 78
3.2.4 Evans blue stain ............................................................................................... 81
3.2.5 Statistical analysis............................................................................................ 82
3.3 Results ..................................................................................................................... 84
3.3.1 Field crop study - Run 1 .................................................................................. 84
3.3.2 Field crop study - Runs 2 and 3 ....................................................................... 85
3.3.3 Cereal crops × lime study ................................................................................ 87
3.3.4 Evans blue stain ............................................................................................... 92
3.4 Discussion ............................................................................................................... 92
4 General discussion .................................................................................................... 103
References ......................................................................................................................... 109
Appendices ........................................................................................................................ 125
Appendix 1: Supplemental tables and figures, Chapter Two ............................................ 125
Appendix 2: Supplemental tables and figures, Chapter Three .......................................... 146
viii
LIST OF ABBREVIATIONS
Canadian Clubroot Differential – CCD
Clubroot incidence – CI
Clubroot-resistant – CR
Competitive internal positive control – CIPC
Days post inoculation – DPI
Disease severity index – DSI
European Clubroot Differential – ECD
Forward primer – DC1F
Green fluorescent protein – GFP
Jasmonic acid – JA
Organic matter – OM
Propidium monoazide – PMA
Quantification cycle – Cq
Quantitative polymerase chain reaction – qPCR
Quantitative trait loci – QTL
Reverse primer – DC1mR
Salicylic acid – SA
Species – Spp.

ix
LIST OF FIGURES
Figure 1.1 Triangle of U theory of the evolution of Brassica species (Source: U, 1935; Dixon,
2007). .............................................................................................................................................. 2
Figure 2.1 Clubroot disease severity rating scale. (a) 0 = no clubbing on root, (b) 1 = small clubs
on <1/3 of roots, (c) 2 = small to medium clubs on 1/3–2/3 of roots, and (d) 3 = large clubs on
>2/3 of roots. ................................................................................................................................. 49
Figure 3.1 Seedlings of perennial ryegrass, wheat, barley, field pea, soybean, Shanghai pak choi
(susceptible control) and the no-plant control inoculated with Plasmodiophora brassicae under
controlled conditions. .................................................................................................................... 73
Figure 3.2 Root systems of a) perennial ryegrass, b) wheat, c) barley, d) field pea and e) soybean
after 8 weeks of growth and f) Shanghai pak choi after 6 weeks of growth in soil inoculated with
Plasmodiophora brassicae............................................................................................................ 75
Figure 3.3 Seedlings of barley, Shanghai pak choi (susceptible control) and no-plant (negative
control) at three rates of lime incorporated in soil inoculated with Plasmodiophora brassicae. . 76
Figure 3.4 The effect of three rates of lime (calcium hydroxide, Ca(OH)2) on the concentration
of Plasmodiophora brassicae resting spores in soil after growing wheat and a no-plant control
for 8 weeks. The soil was inoculated to attain an initial concentration of 5 × 10⁵ resting spores
g-1. The linear regression line is based on lognormal distribution and presented using natural
logs. ............................................................................................................................................... 89
Figure 3.5 Proportion of viable Plasmodiophora brassicae resting spores, as determined using
Evans blue stain, as a function of the proportion of dead spores killed by heating. Capped lines
represent ± standard error. ............................................................................................................ 92

x
LIST OF TABLES
Table 1.1 Harvested areas (hectares) and farm gate values of brassica vegetables in Canada and
Ontario in 2019 (Statistics Canada, 2020). ..................................................................................... 7
Table 2.1 Expected reaction to pathotypes 2 and 6 (based on seed label), year evaluated in a field
trial, and type of trial used for evaluation (field trial or growth room study) of the canola
cultivars that were screened for resistance. ................................................................................... 48
Table 2.2 Expected reaction to clubroot pathotypes 2 and 6 (based on seed label) of the brassica
vegetable cultivars that were screened for resistance in 2018 and 2019 field trials and in growth
room studies. ................................................................................................................................. 51
Table 2.3 Clubroot incidence (CI, %), disease severity index (DSI), and fresh weight and dry
weight of clubroot susceptible and resistant canola cultivars grown at the Muck Crops Research
Station, ON, in 2018 and 2019...................................................................................................... 56
Table 2.4 Clubroot incidence (CI, %) and disease severity index (DSI) of canola cultivars
inoculated with pathotypes 2 and 6 of Plasmodiophora brassicae in a growth room study (n = 8).
....................................................................................................................................................... 57
Table 2.5 Clubroot incidence (CI, %), disease severity index (DSI), and fresh and dry weight of
clubroot susceptible (S) and resistant (R) brassica vegetable cultivars at the Muck Crops
Research Station, ON in 2018 and 2019. ...................................................................................... 60
Table 2.6 Clubroot incidence (CI, %) and severity (disease severity index, DSI) of clubroot
susceptible (S) and resistant (R) brassica vegetables inoculated with pathotypes 2 (n = 4) and 6 (n
= 8) of Plasmodiophora brassicae in a growth room study. ........................................................ 61
Table 2.7 Clubroot incidence (%) and disease severity index (DSI) of cultivars from Williams’
differential set (1966) inoculated with a field collection of Plasmodiophora brassicae from the
Muck Crops Research Station, 2019. ............................................................................................ 62
Table 3.1 qPCR reaction reagents, concentrations and volumes used to quantify Plasmodiophora
brassicae DNA in inoculated soil. ................................................................................................ 81
Table 3.2 Effect of field and cover crop species on the concentration of resting spores of
Plasmodiophora brassicae in soil and root dry weight in Run 1 after 8 weeks of growth. Resting
spore concentration was based on standard qPCR analysis (n = 6). ............................................. 85
Table 3.3 Effect of field and cover crops on the concentration of resting spores of
Plasmodiophora brassicae in soil and root dry weight after 8 weeks of growth in two runs of the
study (n = 6). ................................................................................................................................. 87
xi
Table 3.4 Correlation between root dry weight of the field/cover crops and resting spore
concentration in soil inoculated with Plasmodiophora brassicae after 8 weeks of growth in two
runs of the experiment (n = 6). ..................................................................................................... 87
Table 3.5 Soil pH in response to application of three rates of lime (calcium hydroxide, Ca(OH)2)
to a soil mix and planted with barley, wheat, Shanghai pak choi or a no-plant control after 6 or 8
weeks of growth (n = 6). ............................................................................................................... 90
Table 3.6 Effect of three rates of lime (calcium hydroxide, Ca(OH)2) on concentration of resting
spores of Plasmodiophora brassicae in soil, clubroot incidence (CI) and severity (disease
severity index, DSI) in Shanghai pak choi at 6 weeks of growth (n = 6). .................................... 91
1
CHAPTER ONE
1 Literature review
1.1 Brassica crops
Many important food crops belong to the family Brassicacea (formerly Cruciferae). There
are six species within the genus Brassica: B. napus (rapeseed), B. juncea (mustard greens),
B. carinata (Ethiopian mustard), Brassica nigra (black mustard), B. rapa (field mustard) and
B. oleracea. Brassica rapa has three subspecies: chinensis (pak choi), pekinensis (Chinese
cabbage), and rapifera (turnip). Also, Brassica oleracea has several subspecies: acephala (kale),
botrytis (cauliflower), capitata (cabbage), gemmifera (Brussels sprouts), gongylodes (Kohlrabi),
italica (broccoli) and sabellica (collards) (Fahey, 2003). Crossing and hybridization of Brassica
spp. has resulted in the diversity of species (Attia and Röbbelen, 1986). The triangle of U
represents a hypothesis the evolution of species in the genus (U, 1935) (Figure 1.1). The
hypothesis is that three diploid species (B. rapa, B. nigra and B. oleracea) were the progenitors
of the three amphidiploid species (B. carinata, B. juncea and B. napus). Genomic analysis
suggests that B. rapa and B. oleracea evolved from a common ancestor while B. nigra evolved
through a separate pathway (Song et al., 1993). It is believed that B. napus is the first of the
amphidiploid species to evolve (Olsson, 1960).

2
Figure 1.1 Triangle of U theory of the evolution of Brassica species (Source: U, 1935; Dixon,
2007).
1.2 Canola (B. napus L., B. rapa L. and B. juncea L.)
Canola is an oilseed quality standard developed in Canada and achieve using traditional
breeding techniques. Three brassica crop species, B. napus L., B. rapa L. and B. juncea L. have
been used to produce cultivars of canola, but by far the dominant species is B. napus. Canola oil
must contain less than 2% erucic acid and have glucosinolate levels below 30 µmol g-1 to qualify
(Canola Council of Canada, 2017c). Breeding to produce rapeseed with low glucosinolate levels
began in the 1960s (Daun, 1986). Dr. Baldur Stephenson from the University of Manitoba
released the first canola cultivar (B. napus) in 1974 and Dr. Keith Downey from the University
of Saskatchewan released the first B. rapa (syn. campestris) cultivar in 1977 (Bell, 1982). The
name ‘Canola’ is abbreviated from ‘Canadian oil’ and was trademarked in 1980 by the Rapeseed
Association of Canada which later became the Canola Council of Canada (Daun, 1986).
Canola production has increased dramatically since it first became available on the market
3
(Canadian Canola Growers Association, n.d.). By 1983, canola accounted for 90% of rapeseed
production in Western Canada (Daun, 1986). In 1986, 3.7 million metric tonnes of canola were
produced and by 2016 this number increased to 18.4 million metric tonnes (Canadian Canola
Growers Association, n.d.). In 2019, 8.5 million hectares of canola were planted in Canada
(Statistics Canada, 2019a), averaging 2.7 tonnes ha-1 (Statistics Canada, 2019b). Around 99% of
canola was planted in the Prairie provinces. Most of the production occurs in Saskatchewan; 4.7
million hectares were planted in 2019 (Statistics Canada, 2019a). The canola industry aims to
produce 3.5 tonnes ha-1 by 2025 (Canadian Canola Growers Association, n.d.).
The canola industry contributes $12.5 billion to worker wages, supports over 250,000 jobs,
and contributes $26.7 billion annually to the Canadian economy (Canadian Canola Growers
Association, n.d.; LMC International, 2016). Canola has produced the highest farm revenue of
any crop in Canada for over 10 years. Currently around 43,000 farms in Canada grow canola
(Canadian Canola Growers Association, n.d.). In 2016, farm cash receipts from canola were
estimated at $9.2 billion (Statistics Canada, 2017) with the Prairie provinces accounting for 91%
of the economic benefits. Ontario is responsible for approximately 4% of the economic impact of
canola in Canada (LMC International, 2016). Canada is the top canola exporter in the world;
90% of canola produced in Canada is exported. Canada exports canola seed that has not been
crushed or processed as well as canola oil and meal. In 2015, canola seed, oil and meal generated
$9 billion in exports (Canadian Canola Growers Association, n.d.).
1.2.1 Canola production system
Canola is seeded in the spring or fall in Canada (Gusta et al., 2004). Most of the canola in
Canada is spring canola. Many factors can influence the success of canola production, including
planting rate. A planting rate of 150 seeds m-2 is recommended as this resulted in higher
4
emergence, stubble density and yield compared to a rate of 75 seeds m-2 (Harker et al., 2012;
Harker et al., 2015b). The average canola seeding rate in Ontario is 5.0–6.2 kg ha-1 and the
optimal plant stand is 75–130 plants m-2 (OMAFRA, 2020). In addition, successful growth of
canola seedlings is dependent on the elimination of weeds, often with herbicides. The first
herbicide-tolerant canola cultivar was released in 1995 (Canadian Canola Growers Association,
n.d.).
Canola can be grown on many types of soil but is most successfully grown on well-drained
clay-loam soils. Canola growth is reduced in waterlogged soils or in drought conditions
(Berglund et al., 2007). The optimal soil temperature for canola seed germination is 22°C
(Nykiforuk and Johnson-Flanagan, 1994). High temperatures during the flowering and pod
development periods can substantially reduce yields (Harker et al., 2012). Low pH levels in soil
can also inhibit canola growth. Soil pH should be above 5.5, although suitable pH levels can vary
with the soil type (Baquy et al., 2017; Penney et al., 1977).
Canola requires a high concentration of many nutrients to produce optimum yields (Grant
and Bailey, 1993). Testing soil for nutrient content is recommended to determine fertilizer
requirements. Applications of nitrogen, phosphorus, and sulphur are often needed as deficiencies
in these nutrients can cause substantial yield losses (Canola Council of Canada, 2020c).
Potassium is also an essential nutrient but is rarely limiting to canola (Grant and Bailey, 1993).
Applications of calcium, magnesium, boron and copper may be needed but these nutrients are
less commonly associated with yield losses (Canola Council of Canada, 2020c).
Generally, canola growers in Ontario choose cultivars that can be straight cut, rather than
swathed prior to combining (M. Moran, OMAFRA Stratford, personal communication). Pod-
shatter-tolerant canola cultivars can be used for straight cutting or delayed swathing (BASF,
5
2019; Canola Council of Canada, 2019). In contrast, swathing is the most common harvest
method in Western Canada as it can accelerate drying and minimize seed losses due to pod
shattering (Canola Council of Canada, 2019; Vera et al., 2007). Growers in Western Canada are,
however, increasingly direct harvesting canola to reduce operational costs (Haile et al., 2014).
1.2.2 Uses and benefits of canola
Oil and meal (livestock feed) are obtained from crushing canola seed. The oil content of
canola seeds is 44%, significantly higher than other oilseed crops (Canadian Canola Growers
Association, n.d.). Canola oil is composed of over 93% monounsaturated and polyunsaturated
fats, making it the healthiest vegetable oil. Health benefits of canola include decreased blood
cholesterol and a lower risk of heart attack and stroke. Canola oil is also high in vitamin E
(Canola Council of Canada, 2017b).
Canola seeds are also used to produce animal meal after the oil has been removed (Canola
Council of Canada, 2017c). Canola meal is high in protein and is therefore the most used protein
source in livestock feed globally (Canola Council of Canada, 2017a). Canola meal is also used
for feed in the aquaculture industry (Casséus, 2009).
Canola oil is also used as an environmentally friendly biodiesel, producing 90% lower
greenhouse gas emissions than fossil fuels. Canola biodiesel is efficient under cold temperature
conditions (Canadian Canola Growers Association, n.d.). Canola has also recently been used as a
component of plastics, adhesives, sealants, and other industrial products (Canola Council of
Canada, 2017c).
1.3 Brassica vegetables
Brassica vegetables are a diverse group of crops obtained through human selection. They
6
are leaf, flower, stem and root vegetables.
Brassica vegetables have many uses including for human consumption, fodder, industrial
lubricants, medicines and biofumigants (Al-Shehbaz et al., 2006; Dixon, 2007; Prakash et al.,
2012). These vegetables contain folic acid, fibre, and antioxidants which provide health benefits
that decrease the risk of cancer, heart disease, and stroke (Agriculture and Agri-Food Canada,
2018a; Dixon, 2014). They are high in vitamins A, C, and K and minerals such as potassium and
manganese (Agriculture and Agri-Food Canada, 2018a).
1.3.1 Brassica vegetable production in Canada
Commercial production of many brassica vegetables occurs across Canada, with a
significant amount of production occurring in Ontario (Table 1.1). While brassica vegetables are
biennial crops, they are predominately grown as annuals in Canada (Agriculture and Agri-Food
Canada, 2018a). Cabbage, broccoli and cauliflower are cold tolerant crops (Atlantic Provinces
Agriculture, n.d.). For instance, cabbage seeds can germinate at 5°C and survive early in the
growing season at a temperature of -10°C (University of Florida, 1994). Cabbage is more
tolerant to high and low temperatures than broccoli and cauliflower (Atlantic Province
Agriculture, n.d.). Depending on the cultivar, well-drained sandy loam, loamy and clay loam
soils with a pH of 6.0–6.8 are optimal for growth (Agriculture and Agri-Food Canada, 2018a).
Cabbage, broccoli and cauliflower are often grown from transplants that are started in a
greenhouse and that can be transplanted into the field when seedlings are 4–6 weeks old
(Agricultural and Agri-Food Canada, 2018a; Atlantic Provinces Agriculture, n.d.). Early-season
crops should be grown as transplants for 5–6 weeks and mid- to late-season crops should be
grown for 4–5 weeks prior to planting. Seedlings are typically grown in greenhouses and should
be hardened off prior to transplanting (OMAFRA, 2016). Harvest occurs 12–13 weeks after

7
seeding. These crops are harvested early, midway, and late in the season (Agriculture and Agri-
Food Canada, 2018a).
The majority of commercially grown rutabaga in Canada is of the cultivar Laurentian.
Rutabaga can be planted in the spring, either by direct seeding or, more rarely, from transplants.
Cool and humid conditions are optimal for rutabaga growth (Agriculture and Agri-Food Canada,
2018b).
Table 1.1 Harvested areas (hectares) and farm gate values of brassica vegetables in Canada and
Ontario in 2019 (Statistics Canada, 2020).
Crop Harvested area (ha) Farm gate value (CAN$) (× 1,000)
Canada Ontario Canada Ontario
Cabbage1 5,285 2,135 88,225 33,058
Broccoli 4,108 1,502 78,124 32,327
Cauliflower 1,756 413 36,670 6,834
Rutabaga and
turnip 1,422 613 30,897 13,443
1The cabbage values include regular cabbage, Chinese cabbage and kale.
1.3.2 Diseases of brassica crops
The most devastating disease of oilseed rape is blackleg, caused by the fungal pathogen,
Leptosphaeria maculans (Desm.) Ces. & de Not. Blackleg is characterized by the formation of
black cankers on stems, causing early senescence, lodging, and plant death (Howlett et al., 2001;
West et al., 2001). Black rot is another serious disease of brassica crops and is caused by a
bacterium, Xanthomonas campestris pv. campestris (Pammel) Dowson (Williams, 1980).
Symptoms of black rot include V-shaped chlorotic lesions, darkened veins, necrotic leaves,
premature defoliation, orange coloration in roots and stunted growth (Meenu et al., 2013;
8
Vicente and Holub, 2013). Sclerotinia sclerotiorum (Lib.) de Bary causes stem rot, another
common disease of brassica crops worldwide (Bardin and Huang, 2001; Sharma et al., 2015).
Sclerotinia rot develops on leaves, stems and pods and can reduce seed yields by up to 80%
(Sharma et al., 2015). Worldwide, brassica crops are affected by dark leaf spot caused by
Alternaria brassicicola (Schw.) Wilts. and Alternaria brassicae (Berk.) Sacc. These fungi infect
the leaves, pods, seeds and stems of plants at various growth stages (Doullah et al., 2006; Köhl et
al., 2010). Rhizoctonia rot, caused by the fungi Rhizoctonia solani Kühn, is characterized by root
rot, damping-off and wirestem in brassica crops (Agriculture and Agri-Food Canada, 2018b).
Swede midge (Contarinia nasturtii Kieffer) (Diptera: Cecidomyiidae) is an insect pest that
forms galls on brassica hosts. This pest is found in Europe and has recently become an invasive
species in North America (Chen and Shelton, 2007). In 2000, Swede midge was first identified in
Ontario and has since spread to Quebec (Chen et al, 2011). Swede midge caused substantial
canola yield losses in many regions in Ontario, including western and northern Ontario where
most canola production in the province occurs. As a result, many Ontario growers have stopped
growing canola (Hallet, 2017). A related species has recently been identified on canola in the
Prairie provinces. Swede midge females lay eggs on tips of plants and the larvae feed on stems,
leaves and flowers (Chen and Shelton, 2007). Symptoms include twisted and misshapen shoots
and leaf stalks, crumpled leaves, swollen growing tips and galls on leaves and flowers (Chen et
al., 2011).
1.4 Clubroot
Clubroot is a soil-borne disease of plants in the Brassicaceae family that results in
excessive growth on plant roots and hypocotyls. The causative agent of clubroot is the obligate
protist Plasmodiophora brassicae (Ingram, 1969; Karling, 1942). The first report identifying the
9
pathogen was in 1878 by M. S. Woronin (Woronin, 1878). Plasmodiophora brassicae is in the
domain Eukarya, kingdom Chromista, infrakingdom Rhizaria, phylum Cercozoa, subphylum
Endomyxa, class Phytomyxea, order Plasmodiophorida, family Plasmodiophoraceae, genus
Plasmodiophora and species brassicae (Bulman et al., 2011; Cavalier-Smith and Chao, 2003;
Cavalier-Smith et al., 2018).
One of the first records of clubroot is thought to be by a Roman named Pallitus in Italy in
the 4th Century A.D. Pallitus recorded descriptions of spongy roots on oilseed rape, turnips and
radishes. An increase in cultivation of brassica crops in the 16th century led to the spread of
clubroot within Europe and from Europe to other continents (Watson and Baker, 1969). The
disease is speculated to have been transported to North America on infected turnip roots
(Sedaghatkish et al., 2019; Watson and Baker, 1969). Clubroot is now found in all parts of the
world where plants in the family Brassicaceae are grown (Dixon, 2009). Potential hosts include
brassica crops, weeds, wild crucifers, and Arabidopsis thaliana (Pedras et al., 2008).
The formation of clubs on roots and disruption of the vascular system by P. brassicae
restricts water and nutrient uptake (Macfarlane and Last, 1959). Above-ground symptoms
include stunted growth, foliar wilting, leaf chlorosis, delayed flowering and premature ripening
(Karling, 1942; Mithen and Magrath, 1992). Some symptoms, such as interveinal mottling, may
be the result of nutrient deficiencies. The number, size and thickness of new leaves can also be
reduced in infected plants (Macfarlane and Last, 1959). Severe cases of clubroot have been
reported to reduce canola yields by 30–100% (Hwang et al., 2012c). Clubroot reduces canola
seed quality and size as well as oil content (Pageau et al., 2006).
1.4.1 Disease cycle
The clubroot disease cycle occurs once every growing season, so P. brassicae is

10
characterized as a monocyclic pathogen. The disease cycle begins with the asynchronous
germination of haploid resting spores in the soil to produce primary zoospores (Ingram and
Tommerup, 1972). As soil temperature rises in the spring, germination is initiated in response to
root exudates (Macfarlane, 1970; Wellman, 1930). Resting spores can germinate at 6–27°, but
germination is lower below 18°C and above 25°C (Wellman, 1930). The serine protease Pro1 in
P. brassicae produces proteolytic compounds that trigger germination. Resting spores can
germinate in the absence of Pro1, but germination rates are lower (Feng et al., 2010).
Primary zoospores are uninucleate, 2.8–5.9 µm in length and oval or pyriform in shape
(Ayers, 1944; Ingram and Tommerup, 1972). Two whiplash flagella, one long and one short,
allow them to move in the soil solution (Ayers, 1944). Zoospores outside the host in the soil
solution are highly vulnerable to soil conditions, such as moisture, antimicrobial organisms and
temperature (Suzuki et al., 1992; Takahashi, 1994a), but the length of time that they survive in
soil is not known. Zoospores encyst on root hairs or epidermal cell walls of host or nonhost
species (Ayers, 1944; Williams, 1971), form adhesoria and penetrate the cell walls. Ovate spore
protoplasts 3.0–5.0 µm in diameter are released from a pore that is 1.4 µm in diameter (Ingram
and Tommerup, 1972).
Uninucleate primary plasmodia develop inside the cytoplasm of root hairs and undergo
synchronous nuclear divisions (Williams et al., 1971). Multinucleate zoosporangia are produced,
containing up to 6 nuclei. The zoosporangia mature and produce 4–16 uninucleate zoospores
(Ingram and Tommercup, 1972). Secondary zoospores are liberated into the soil through breaks
in the cell walls (Ayers, 1944). Root hair infection can occur 2 days after inoculation in canola in
optimal conditions (Sharma et al., 2011b). A pH of 5.0–6.5, temperature of 20–25°C and
sufficient moisture are conducive to root hair infection (Ayers, 1944; Gossen et al., 2013). Root
11
hair infection increases in susceptible cultivars for 6–8 days after inoculation (Hwang et al.,
2011b).
Secondary zoospores are morphologically similar to primary zoospores but invade the root
epidermis and infect the root cortex of the main roots (Ayers, 1944). Some authors report that the
secondary zoospores fuse and form binucleate plasmodia before infecting the root cortex (Ingram
and Tommercup, 1972), but this has never been demonstrated conclusively (Dobson and
Gabrielson, 1983). The plasmodia increase in size and undergo synchronous mitotic divisions to
become multinucleate (Ingram and Tommerup, 1972). Secondary zoospores can also infect root
hairs which facilitates rapid increase of inoculum for root infection (Feng et al., 2012). The
cortical infection stage is optimal at 25°C (Sharma et al., 2011a) and has been observed starting
at 4 days after inoculation (Ingram and Tommerup, 1972).
While P. brassicae nuclei are haploid for the majority of the lifecycle, multinucleate
secondary plasmodia nuclei are thought to fuse to become diploid in the cortical infection stage.
Meiosis of diploid nuclei follows, and the plasmodia cleave into millions of new haploid resting
spores (Ingram and Tommerup, 1972). The continual production of new secondary zoospores
from infection of fresh root hairs can lead to repeated cortical infection. Plasmodia and resting
spores can therefore be found in the same root system (Sharma et al., 2011a). After colonizing
the root cortex, P. brassicae invades the stele, stimulating division of parenchyma cells and de-
differentiation of the xylem (Deora et al., 2013). Hyperplasia and hypertrophy in roots results in
the formation of characteristic clubs (Ingram and Tommerup, 1972). Clubs typically form on
roots 4–6 weeks after the initial infection (Korbas et al., 2009). The resulting disruption of the
xylem inhibits water and nutrient uptake (Karling, 1942).
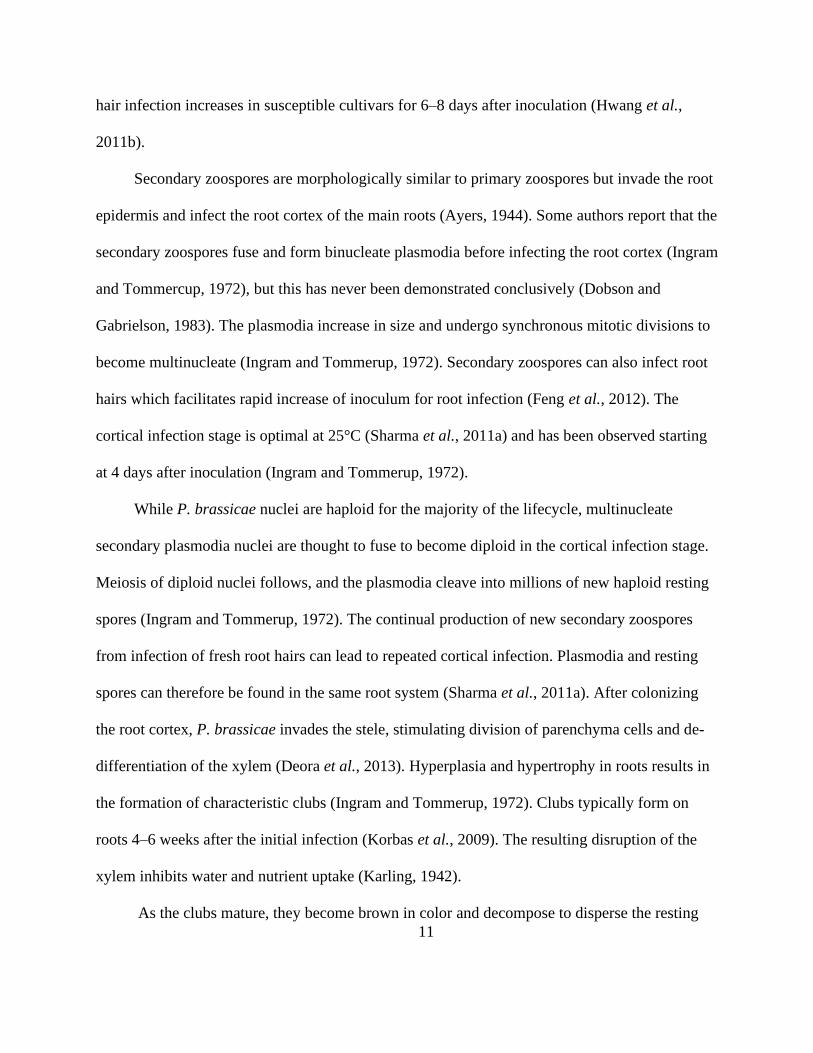
As the clubs mature, they become brown in color and decompose to disperse the resting
12
spores into the soil (Ayers, 1944). Resting spores start to reach maturity at 5–9 weeks after
infection, and sometimes earlier (Al-Daoud et al., 2020). Resting spores are spherical in shape,
3.0–5.0 µm in size, with spiny ornamentations on the exterior wall, and contain a nucleus 1.5 µm
in diameter (Ingram and Tommerup, 1972). They can be long-lived and remain dormant in the
soil for many years, with a half life estimated as 3–6 years (Wallenhammar, 1996). However,
recent studies have demonstrated that half life is not the best approach to describing the viability
of resting spores. The survival of resting spores follows a Type III survival curve. Many die
within the first two years of production, but the small percentage that survive are very persistent
(Gossen et al., 2019). The cell walls contain 25.1% chitin and 24.4% carbohydrates, which
protect against enzyme degradation in soil (Moxham and Buczacki, 1983). The concentration of
resting spores in the soil is a major determinant of the severity of infection (Korbas et al., 2009).
Generally, consistent clubroot symptoms develop at a minimum concentration of 103 resting
spores g-1 dry soil (Naiki et al., 1978). Infection of cortical cells and overall clubroot severity
increased with increasing concentrations of resting spores in soil with maximum severity
occurring at 106 resting spores g-1 and above (Hwang et al., 2011a; Murakami et al., 2002a; Peng
et al., 2019).
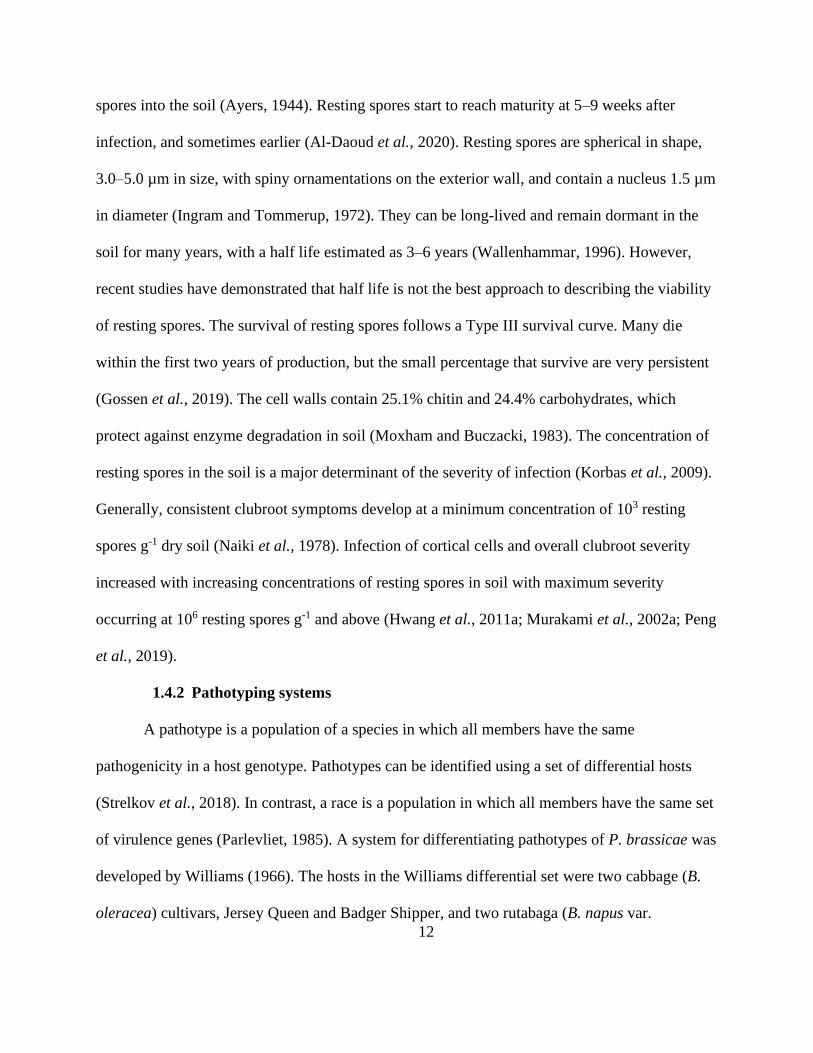
1.4.2 Pathotyping systems
A pathotype is a population of a species in which all members have the same
pathogenicity in a host genotype. Pathotypes can be identified using a set of differential hosts
(Strelkov et al., 2018). In contrast, a race is a population in which all members have the same set
of virulence genes (Parlevliet, 1985). A system for differentiating pathotypes of P. brassicae was
developed by Williams (1966). The hosts in the Williams differential set were two cabbage (B.
oleracea) cultivars, Jersey Queen and Badger Shipper, and two rutabaga (B. napus var.
13
napobrassica) cultivars, Laurentian and Wilhelmsburger. Nine P. brassicae pathotypes were
found with this system from testing 124 isolates from 16 countries.
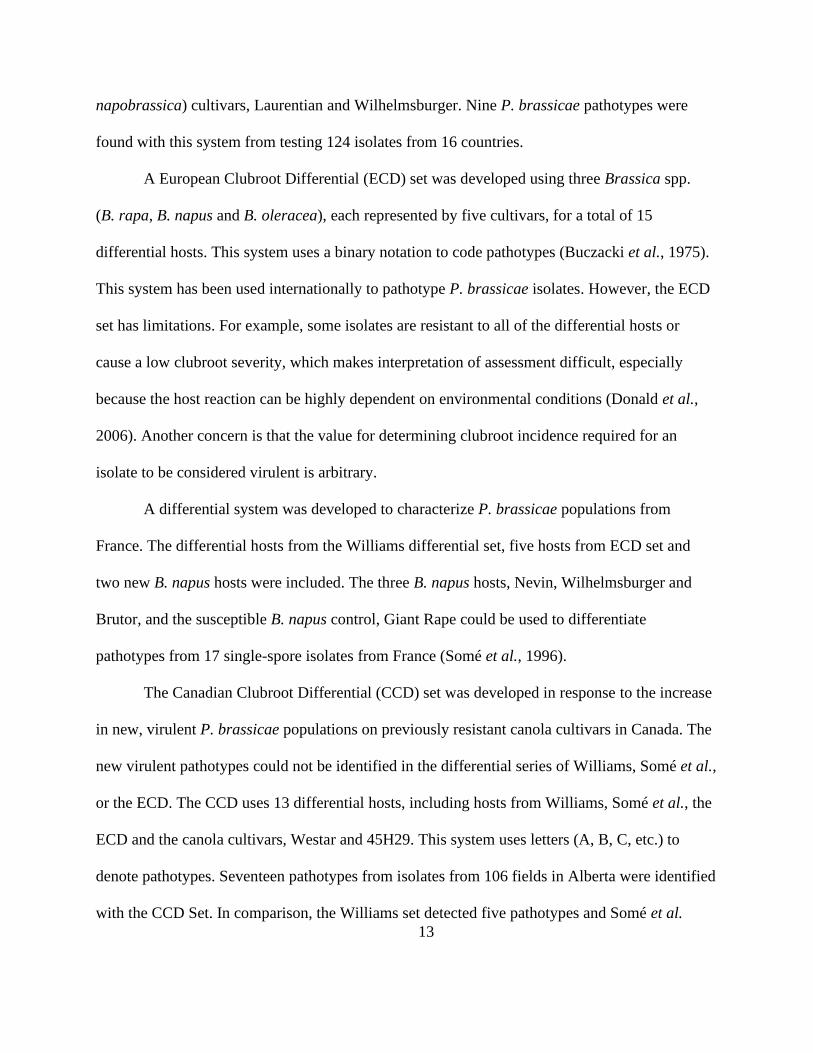
A European Clubroot Differential (ECD) set was developed using three Brassica spp.
(B. rapa, B. napus and B. oleracea), each represented by five cultivars, for a total of 15
differential hosts. This system uses a binary notation to code pathotypes (Buczacki et al., 1975).
This system has been used internationally to pathotype P. brassicae isolates. However, the ECD
set has limitations. For example, some isolates are resistant to all of the differential hosts or
cause a low clubroot severity, which makes interpretation of assessment difficult, especially
because the host reaction can be highly dependent on environmental conditions (Donald et al.,
2006). Another concern is that the value for determining clubroot incidence required for an
isolate to be considered virulent is arbitrary.
A differential system was developed to characterize P. brassicae populations from
France. The differential hosts from the Williams differential set, five hosts from ECD set and
two new B. napus hosts were included. The three B. napus hosts, Nevin, Wilhelmsburger and
Brutor, and the susceptible B. napus control, Giant Rape could be used to differentiate
pathotypes from 17 single-spore isolates from France (Somé et al., 1996).
The Canadian Clubroot Differential (CCD) set was developed in response to the increase
in new, virulent P. brassicae populations on previously resistant canola cultivars in Canada. The
new virulent pathotypes could not be identified in the differential series of Williams, Somé et al.,
or the ECD. The CCD uses 13 differential hosts, including hosts from Williams, Somé et al., the
ECD and the canola cultivars, Westar and 45H29. This system uses letters (A, B, C, etc.) to
denote pathotypes. Seventeen pathotypes from isolates from 106 fields in Alberta were identified
with the CCD Set. In comparison, the Williams set detected five pathotypes and Somé et al.

14
detected two pathotypes from these isolates (Strelkov et al., 2018). Since the development of this
system, the nomenclature has been modified to include the Williams pathotype number and a
letter to designate differences from the Williams system (Askarian et al., 2020).
A differential set for use with B. oleracea cultivars, including cauliflower, cabbage,
Brussels sprouts and Savoy cabbage, has also been developed (Smilde et al., 2012). This system
uses three B. oleracea cultivars: Lodero (red cabbage), 051632 (white cabbage), and one of
Kilaton (white cabbage), Monclano (broccoli), Clapton (cauliflower) or Crispus (Brussels
sprouts) (International Seed Federation, 2016; Smilde et al., 2012). Kilaton, Monclano, Clapton
and Crispus had the same clubroot reactions against the tested pathotypes (International Seed
Federation, 2016). This system identifies four pathotypes, designated Pb:0, Pb:1, Pb:2 and Pb:3
(International Seed Federation, 2016; Smilde et al., 2012).
A limitation of all of these differential sets is that they include host genotypes that are
open-pollinated, so the seed is not genetically homogenous (Strelkov et al., 2018). Thus, there
can be inconsistent reactions to a specific pathotype. There can also be more than one pathotype
in one club (Sedaghatkish et al., 2019; Strelkov et al., 2018; Xue et al., 2008).
1.4.3 Clubroot in Canada
In Canada, one of the first reports of clubroot on brassica vegetables was in the 1920s
(British Columbia Department of Agriculture, 1920). In 1966, pathotype 6 was reported in
British Colombia and pathotypes 2 and 4 were reported in Quebec (Williams, 1966). In 1972,
pathotypes 1, 2, 3 and 4 were reported in Maritime provinces, pathotype 2 was reported in
Quebec and pathotype 6 was reported in British Colombia and Ontario (Ayers, 1972). Pathotype
2 was found on rutabaga in Ontario in 1974 (Reyes et al., 1974) These early identifications,
together with more recent studies, have recently been summarized (McDonald et al., 2020a).

15
Clubroot was first detected on canola in Alberta in 2003 and was determined to be
pathotype 3. The pathogen spread among fields, primarily in soil carried on farm machinery (Cao
et al., 2009). The importance of this method of spread was shown by the finding that the highest
clubroot incidence was near the entrances of fields and severity decreased further into the fields
(Cao et al., 2009; Strelkov et al., 2007). Inoculum can also move between fields in manure from
livestock fed with fodder infected with the pathogen, on infested seeds, and by wind and water
(Karling, 1942; Rennie et al., 2011). Plasmodiophora brassicae was classified as a controlled
pest under Alberta’s Agriculture Pests Act in 2007, and under Saskatchewan’s Pest Act in 2009
(Cao et al., 2009; Rempel et al., 2014). These acts implemented methods of containing clubroot
spread, such as equipment sanitation and limiting how frequently canola could be planted in
infested fields (Cao et al., 2009).
Clubroot pathotype 2 (Williams’ system) and more recently 2X have recently caused
outbreaks in canola in Ontario (Al-Daoud et al., 2018; McDonald et al., 2020a). The ‘X’
indicates that the pathotype is virulent on the first generation of clubroot resistant canola
cultivars and can not be identified on Williams’ differential set. In 2019, pathotype 3X was also
found in one canola field in Ontario (McDonald et al., 2020a). Pathotype 6, the common
pathotype on vegetables in Ontario, is not very damaging to canola (Al-Daoud et al., 2018).
Pathotype 3 is the most common pathotype found in Alberta and has been found to cause more
severe symptoms on canola than pathotype 6 and other pathotypes (Deora et al., 2013; Gossen et
al., 2016). Between 2014 and 2016, a number of new, virulent pathotypes were identified from
central Alberta (Strelkov et al., 2018). Aggressiveness often varies among pathotypes; however,
this is likely due to pathotype-cultivar specificity rather than characteristics of the pathotypes
themselves (Sharma et al., 2013b).

16
1.4.4 Host-pathogen interaction
All stages of clubroot infection only occur in compatible interactions, where P. brassicae
is virulent and the host is susceptible. In compatible interactions, P. brassicae tends to suppress
any defense reaction initiated by the host (McDonald et al., 2014). For example, P. brassicae
inhibits lignin biosynthesis and production of reactive oxygen species (ROS) that could restrict
plasmodia formation (Deora et al., 2013; Pedras et al., 2008). In addition, P. brassicae alters host
metabolism and the availability of essential molecules and nutrients. Low amyloplast
concentrations have been found in infected plants which may be the result of P. brassicae using
starch as a carbon source (Deora et al., 2013). Clubs are also a major metabolic sink for
photosynthate (Ludwig-Müller and Schuller, 2008).
In compatible interactions, pathogen colonization causes cellular damage and increased
production of growth hormones. This results in rapid cell divisions in cortical tissues and
weakening of the walls of cells neighbouring infected cells (Deora et al., 2013). Cell wall
breakages can occur, and vesicles and inclusion bodies can develop in cell walls (Deora et al.,
2013; Donald et al., 2008). In addition, genes that increase levels of growth hormones, including
auxins, cytokinins and brassinosteroids, are activated (Hwang et al., 2012c; Ludwig-Müller,
2016). High levels of growth hormones cause hyperplasia and hypertrophy in cortical cells.
Auxin concentrates in epidermal cells and is gradually displaced into clubs in later disease
stages, accumulating primarily in the edges of clubs (Ludwig-Müller, 2016). Cytokinins are
produced by both the pathogen and the host and are transported to the secondary plasmodia
(Ludwig-Müller et al., 2009). Brassinosteroids may also cause cellular elongation in host roots
(Ludwig-Müller, 2016). Further, xyloglucan endo-transglucosylase/hydrolase becomes localized
in the epidermal layer of infected roots. Accumulation of indole-3-acetic acid and xyloglucan

17
endo-transglucosylase/hydrolase action is associated with loosening of cell walls and expansion
of epidermal cells and can cause plant growth promotion during the primary infection stage
(Devos et al., 2005). Auxin concentrates in epidermal cells and is gradually displaced into clubs
in later disease stages, accumulating primarily in the edges of clubs (Ludwig-Müller, 2016).
In incompatible interactions, resistant hosts can activate defense responses to restrict
clubroot development. Root hair infection, including the production of secondary zoospores,
occurs in compatible (susceptible host and virulent pathotype), incompatible and intermediate
interactions (Deora et al., 2012). However, the incidence of root hair infection is slightly higher,
and total P. brassicae DNA concentration and rate of disease progression is substantially higher
in susceptible cultivars compared to resistant cultivars (Deora et al., 2013; Hwang et al., 2011b;
Hwang et al., 2012a). It has been suggested that defense genes are generally not expressed
during the root hair infection stage (Hatakeyama et al., 2013), but the work of McDonald et al.
(2014) indicated that host response is initiated during root hair infection/colonization. Resistance
is also initiated during the root hair infection stage of certain nonhost plants, such as perennial
ryegrass (Lolium perenne L.) (Feng et al., 2012). The initiation of resistance in root hairs is
supported by the finding of Mei et al. (2019) that receptor kinases and guanine nucleotide-
binding regulatory proteins (G proteins) were activated in response to P. brassicae during the
root hair infection stage in the resistant B. napus genotype ‘ZHE-226’. G proteins are cell
membrane receptors that transduce extracellular signals to activate effector enzymes. These
effector enzymes in turn activate secondary messengers involved in defense responses (Neer,
1995). Resistance was, however, also initiated in the root cortex during the secondary disease
stage (McDonald et al., 2014).
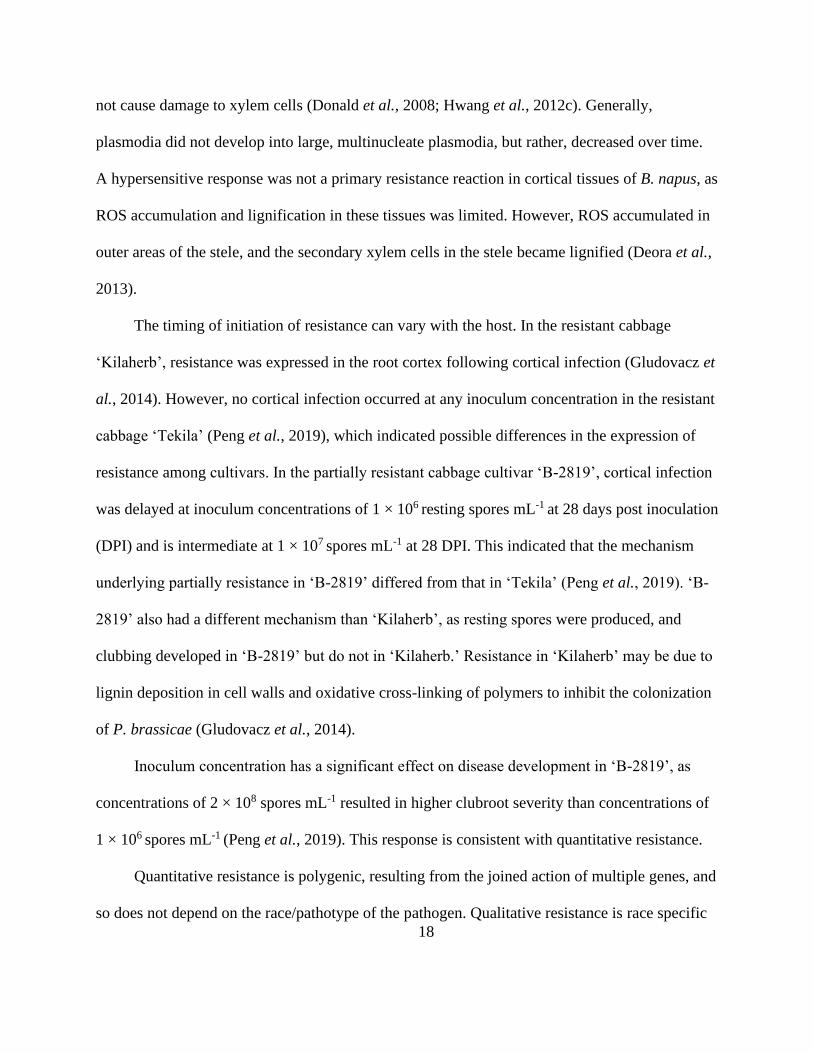
In incompatible interactions, plasmodia development in the root cortex was limited and did
18
not cause damage to xylem cells (Donald et al., 2008; Hwang et al., 2012c). Generally,
plasmodia did not develop into large, multinucleate plasmodia, but rather, decreased over time.
A hypersensitive response was not a primary resistance reaction in cortical tissues of B. napus, as
ROS accumulation and lignification in these tissues was limited. However, ROS accumulated in
outer areas of the stele, and the secondary xylem cells in the stele became lignified (Deora et al.,
2013).
The timing of initiation of resistance can vary with the host. In the resistant cabbage
‘Kilaherb’, resistance was expressed in the root cortex following cortical infection (Gludovacz et
al., 2014). However, no cortical infection occurred at any inoculum concentration in the resistant
cabbage ‘Tekila’ (Peng et al., 2019), which indicated possible differences in the expression of
resistance among cultivars. In the partially resistant cabbage cultivar ‘B-2819’, cortical infection
was delayed at inoculum concentrations of 1 × 10⁶ resting spores mL-1 at 28 days post inoculation
(DPI) and is intermediate at 1 × 10⁷ spores mL-1 at 28 DPI. This indicated that the mechanism
underlying partially resistance in ‘B-2819’ differed from that in ‘Tekila’ (Peng et al., 2019). ‘B-
2819’ also had a different mechanism than ‘Kilaherb’, as resting spores were produced, and
clubbing developed in ‘B-2819’ but do not in ‘Kilaherb.’ Resistance in ‘Kilaherb’ may be due to
lignin deposition in cell walls and oxidative cross-linking of polymers to inhibit the colonization
of P. brassicae (Gludovacz et al., 2014).
Inoculum concentration has a significant effect on disease development in ‘B-2819’, as
concentrations of 2 × 10⁸ spores mL-1 resulted in higher clubroot severity than concentrations of
1 × 10⁶ spores mL-1 (Peng et al., 2019). This response is consistent with quantitative resistance.
Quantitative resistance is polygenic, resulting from the joined action of multiple genes, and
so does not depend on the race/pathotype of the pathogen. Qualitative resistance is race specific
19
as the mechanisms differ depending on the race/pathotype and the host cultivar. This resistance
is monogenic as it is controlled by major resistance genes in the host (Van der Plank, 1969). The
source of resistance in many brassica hosts is qualitative (Diederichsen et al., 2009). In canola,
resistance in the initial generation of resistant cultivar was due to a minimum of three resistance
genes and a few quantitative trait loci (Hwang et al. 2012c). Resistance to pathotype 2 of P.
brassicae in B. rapa was conferred by the CR loci, Crr1 and Crr2, polygenically. The two loci
did not confer significant resistance alone. The Crr1 and Crr2 loci were located on different
regions of chromosomes or on separate chromosomes (Suwabe et al., 2003). Crr1aG004 allele was
expressed during the cortical infection stage in the stele and cortex of hypocotyls and roots of
susceptible B. rapa and Arabidopsis plants. The Crr1aG004 loci, encoded a Toll-Interleukin-1
receptor/nucleotide-binding site/leucine-rich repeat class of R protein. Expression of Crr1aG004
may be involved in inhibiting the formation of plasmodia in cortical cells (Hatakeyama et al.,
2013). A third CR locus, Crr3, was identified in B. rapa (Hirai et al., 2004). Identifying and
characterizing CR genes is useful in the breeding of CR cultivars (Hirai et al., 2004).
Salicylic acid (SA) is a phytohormone involved in growth and development as well as in
the defense responses in plants. Applied to roots of broccoli, SA was systemically carried to
leaves and up-regulated the pathogenesis related genes PR-1 and PR-2 in leaf tissues (Lovelock
et al., 2013). Clubbing symptoms were lower in plants treated with SA, suggesting that SA could
be used to manage clubroot. Jasmonic acid (JA) also functions in defense responses and when
applied together, SA and JA can increase host resistance. However, SA had toxic effects at
concentrations above 5 mM SA, inhibiting plant growth and photosynthetic reactions and
causing leaf chlorosis and necrosis (Lovelock et al., 2013). Biosynthesis of antimicrobial
compounds, such as phytoalexins and phytoanticipins also occurs in infected roots as a defense
20
response (Pedras et al., 2008).
Resistant hosts can display symptoms, including stunting and delayed flowering (Deora et
al., 2012; Donald et al., 2008) associated with the metabolic costs of resistance, even though
they do not develop clubs. Delayed maturity and reduced growth were most severe in resistant
cultivars grown in heavily infested soil; plants were not as affected at low infestation levels
(Gossen et al., 2017b).
1.5 Factors affecting clubroot development
1.5.1 Soil pH
Soil pH is a measure of the concentration of hydrogen ions in soil and is the negative log
of this concentration. The scale for pH ranges from 0 to 14 where 7 is neutral, 14 is very basic,
and 0 is very acidic. Soil pH is mainly affected by the geological materials of the soil, but is also
affected by other factors, including precipitation, decay of organic material, and fertilizers. In
many soils in Ontario, pH is low or neutral at the soil surface and increases deeper into the soil
profile. The capacity of the soil to withstand changes in pH can be measured by buffer pH.
Buffer pH is affected by the cation exchange capacity of the soil. A greater cation exchange
capacity provides a reserve of absorbed hydrogen ions that can go into solution if pH rises,
allowing soil to resist changes in pH (OMAFRA, 2018).
Many studies have demonstrated the effects of pH on the development of clubroot. For
example, root hair infection and club development were inhibited in broccoli when the soil pH
was increased to over 7.2 (Myers and Campbell, 1985). At these high pH levels, the
zoosporangia aborted, preventing the release of secondary zoospores. Also, acidic soils had
higher concentrations of phenolic compounds, including p-hydroxybenzoic acid, p-
hydroxyphenulpyruvic acid, trans-p-coumaric acid and humic acid, and were conducive to
21
clubroot infections (Young et al., 1991). Generally, pH levels of 5.0–6.5 were more conducive to
clubroot development compared to more alkaline pH levels. The pathogen did not progress
beyond primary plasmodia at a pH of 7.5–8.0 (Gossen et al., 2013). Resting spore germination
also decreased at pH values above 7.0 compared to pH values of 5.0–7.0 (Rashid et al., 2013).
The highest rate of resting spore germination was at pH 6.5. However, there are other factors that
affect the development of clubroot symptoms. While clubroot severity was higher in acidic fields
of canola in Alberta, clubbing still occurred in fields with a soil pH of 4.8–7.6 (Strelkov et al.,
2007).
The effect of pH on clubroot development is influenced by calcium. For example, cabbage
grown in clubroot infested calcium-rich organic waste (farmyard manure or food factory sludge
compost) suppressed clubroot development due to the increase in both soil pH and calcium
concentration (Niwa et al., 2007). A neutral pH, achieved with the application of calcium to soil,
suppressed infection by inhibiting the germination of resting spores in the rhizosphere (Niwa et
al., 2008). In addition, calcium reduced the motility of primary zoospores and restricted the
formation of plasmodia and zoosporangia during the primary infection stage (Dixon and Page,
1998; Myers and Campbell, 1985). Root hair infection in canola was lower at pH values above
7.0 when grown in the presence of a nutrient solution containing calcium. Root hair infection and
disease severity in canola were higher at high pH values (pH 6.5–9.0) when calcium-salt was not
added to the growth medium (Rashid et al., 2013). Calcium suppressed the dehiscence of
zoosporangia under high disease pressure and the formation of zoosporangia at lower pressure
(Webster and Dixon, 1991b). Certain forms of calcium also promote beneficial microorganisms
that are suppressive to P. brassicae by increasing soil pH (Dixon, 2016).
Boron can also reduce clubroot development. Boron inhibited club formation by slowing
22
the rate of infection of root hairs and the cortex. Boron more effectively suppressed clubroot at
pH 7.2 than pH 6.2 (Webster and Dixon,1991a). Boron increased seed yield and shoot weight in
canola even at high levels of clubroot severity. In one study, boron effectively reduced clubroot
infection in organic soils but was less suppressive in mineral soils (Deora et al., 2014). This may
be due to the high capacity of organic soils to retain boron. However, a potential issue with the
application of boron is that residual boron in soil might have a phytotoxic effect on subsequent
crops (Deora et al., 2014).
In addition to boron and calcium, clubroot is also suppressed by potassium hydroxide and
magnesium (Myers and Campbell, 1985; Niwa et al., 2007; Young et al, 1991). Likewise, certain
soil components such as nitrogen, sodium and manganese reduce resting spore germination
(Friberg et al., 2005). Nitrate-nitrogen also suppressed the development of primary plasmodia
into zoospores (Dixon and Page, 1998).
1.5.2 Temperature
Temperature during each phase of the disease cycle influences clubroot infection. Root
hair infection developed at a minimum temperature of 12–14°C in swede turnip (Ayers, 1944).
Similarly, severity of root hair infection in Shanghai pak choi was highest at 25°C and
significantly lower below 15°C (Sharma et al., 2011b). Further, the minimum threshold for
clubroot development in canola in field conditions was 14°C (Gossen et al., 2017a). Cortical
infection occurred in Shanghai pak choi at temperatures of 15–30°C and clubs only formed on a
susceptible cultivar at 20–30°C. Temperatures also delayed disease progression; infection of
cortical cells and development of young plasmodia was observed at 10 days after inoculation at
20–30°C and 22 days after inoculation at 15°C. Mature plasmodia were detected in cortical cells
10 days after inoculation at 25°C and 14 days after inoculation at 20°C and 30°C. The production
23
of resting spores occurred 12 days after the formation of mature plasmodia and was not
influenced by temperature (Sharma et al., 2011a). The degree and severity of clubroot infection
and the number of resting spores produced were greatest at 25°C, lower at 20°C and 30°C, and
lowest at 15°C (Sharma et al., 2011b). Soil or air temperature can be used as an indicator for
clubroot development (McDonald and Westerveld, 2008).
The effect of temperature on clubroot infection also varies with pH. Root hair infection
was the most severe at 25°C at a pH of 6.0–6.5 and at 20°C at a pH of 5.5–6.0. The temperature-
pH interaction with the highest disease incidence was a temperature of 25°C and a pH of 6.0.
The infection progressed more slowly at 10°C and 15°C when the pH was between 6.0–8.0 than
at higher temperatures (Gossen et al., 2013). Similarly, the highest activity levels of Pro1
occurred at 25°C and a pH of 6.0–6.4 (Feng et al., 2010).
1.5.3 Soil moisture
High moisture levels in soil are conducive to clubroot development, likely because free
water is required for resting spores to germinate and zoospores to swim and infect root hairs
(Ayers, 1944). Generally, higher clubroot incidence occurs in fields with poorly drained soils.
Low spots in fields often have poor drainage and higher levels of disease (Gossen et al., 2016;
Wellman, 1930). However, waterlogged soils inhibited zoospore respiration and movement in
the soil, which can delay infection (Berglund et al., 2007).
1.5.4 Soil types
Soils low in organic matter or high in clay content have occasionally been identified as
being conducive to clubroot development (Pageau et al., 2006). However, if sufficient moisture
is present, clubroot can develop in many soil types, including sand, mineral soil and soil high in
organic matter (Gossen et al., 2016). For example, susceptible crops can develop 100% clubroot
24
DSI in the high organic matter (50–75% OM) soils of the Holland Marsh. Some authors report
that soil types conducive to infection can also be pathotype dependent; for example, pathotype 2
was typically identified from sandy soils while pathotype 6 was typically from loam and muck
soils (Reyes et al., 1974). However, these differences may be associated to the crops grown on
these soils rather than the soil type itself.
1.5.5 Pathogen distribution in soil
The highest concentration of resting spores of P. brassicae is usually in the top 20 cm of
soil, with the concentration generally decreasing deeper in the soil profile. However, resting
spores move deeper into the soil over time (Cranmer et al., 2017). Therefore, in fields with
recent clubroot outbreaks, resting spores were mostly concentrated on the top layer of soil (10
cm) while in fields infested with P. brassicae for many years, resting spores were also found
deeper in the soil profile. The no-till production of canola in Western Canada would also leave
resting spores in the top layer of the soil. Resting spores at depth in the soil profile will likely
only come in contact with roots late in a growing season and therefore have a low chance of
reducing yield or seed quantity and quality. In addition, resting spores may not germinate at that
low soil depth due to the cooler soil temperature (Cranmer et al., 2017).
1.6 Clubroot management strategies
1.6.1 Preventing pathogen dissemination
The transportation of infested soil on farm equipment is major source of clubroot
dissemination between fields (Karling, 1942). To minimize pathogen dispersal on equipment,
soil and crop residues should be cleaned from equipment with a pressure washer, compressed air,
or scrubbing. A disinfectant should be subsequently applied to the equipment. Footwear,
vehicles, and any other tools should also be cleaned (Howard et al., 2010). However, adoption of
25
disinfection practices has been limited among farmers due to the time required to adequately
sanitize machinery (Rempel et al., 2014).
In addition, farmers should ensure that ponds or creeks used for irrigation have not been
contaminated with runoff from infested fields (Howard et al., 2010). The use of manure of
livestock fed with infected crops should also be avoided (Karling, 1942). Seed can also carry and
disseminate the disease, so cleaning and treating commercial seeds will reduce the risk of seed-
borne infection (Rennie et al., 2011).
Management of cruciferous weeds is important to manage clubroot. Cruciferous weeds,
such as Brassica kaber (wild mustard), Capsella bursa-pastoris (shepherd’s purse), and
Descurainia sophia (flixweed) are hosts of P. brassicae and can significantly increase resting
spore concentrations in soil (Reye et al., 1974). Removing weeds within three weeks of their
emergence is recommended to avoid the release of new resting spores into the soil (Canola
Council of Canada, 2020b). Clubs have fully mature resting spores in canola 5–9 weeks after
sowing in an infested field or inoculation. Resting spores can also continue to mature after hosts
cells have been killed by herbicide or shoots have been removed (Al-Daoud et al., 2020).
1.6.2 Resistant cultivars
The Canola Council of Canada recommends using commercial clubroot-resistant (CR)
cultivars to manage clubroot and to slow its spread in a field. A crop is designated as CR if that
crop does not develop symptoms of clubroot, although this designation has been modified by
seed companies. A crop is tolerant if clubs develop on roots but there is no yield reduction (Crute
et al., 1980). Canola cultivars are classified into categories by seed companies based on their
resistance to clubroot compared to a susceptible check. Cultivars are classified as resistant
(<30% infection compared to the check), moderately susceptible (30–50% infection compared to
26
the check) or susceptible (>50% infection compared to the check) (Canola Council of Canada,
2020b). The use of resistant cultivars is a cost-effective and environmentally friendly method of
managing clubroot (Cao et al., 2009). Resistant cultivars had greater emergence rates, plant
height and overall yields than susceptible cultivars grown in clubroot-infested soil (Hwang et al.,
2011b). However, the effect of CR on canola yield was highest under high disease pressure and
was not observed under low disease pressure (Sharma et al., 2013b).
The introduction of dominant CR genes into cultivars was first conducted in B. napus and
B. rapa (Crute et al., 1980). The development and release of CR cultivars of every brassica
species followed (Piao et al., 2009). Brassica rapa ssp. rapifera (European fodder turnip)
confers resistance to multiple pathotypes and is therefore frequently used as the source of CR
genes (Hirai, 2006).
Multiple CR loci have been identified in B. rapa, including Crr1, Crr2, Crr3, Crr4, CRa,
CRb, CRk, CRc and CRd (Hirai et al., 2004; Matsumoto et al., 1998; Pang et al., 2018; Piao et
al., 2002; Piao et al., 2004; Sakamoto et al., 2008; Suwabe et al., 2003; Suwabe et al., 2006).
Major dominant genes, such as, Pb-Bn1, and quantitative trait loci (QTLs) have been found in B.
napus (Li et al., 2016; Manzanares-Dauleux et al., 2000; Werner et al., 2008). In addition, many
QTLs have been found in B. oleracea, such as CR2a, CR2b, pb-3, pb-4, Pb-Bo1, CRQTL-GN_1
and CRQTL-GN_2 (Figdore et al., 1993; Grandclément and Thomas, 1996; Landry et al., 1992;
Lee et al., 2016; Moriguchi et al., 1999; Rocherieux et al., 2004; Vorrips et al., 1997). There is a
current international initiative to establish consistent nomenclature for CR loci, including
identifying genes that have been given different names by different research groups
(Diederichsen et al., 2019).
Studies of CR resistance have shown that resistance in the hybrid winter B. napus cultivar
27
Mendel was controlled by a major dominant gene from B. rapa ssp. rapifera and two recessive
genes (Diederichsen et al., 2006). Resistance genes from B. rapa have been transferred into
Chinese cabbage, oilseed rape and B. oleracea to create resistant cultivars (Diederichsen et al.,
2009). Also, interspecific hybridization has been used to transfer clubroot resistance from one
brassica species to another (Hirani et al., 2016; Niemann et al., 2018; Zhan et al., 2017).
The first resistant cultivar of canola in Canada, ‘45H29’ (Pioneer), was introduced in 2009.
Initially, most Canadian canola cultivars were resistant to pathotype 6 but are susceptible to
pathotype 3 (Deora et al., 2013). Many resistant canola cultivars have since been released with
over 20 CR canola cultivars registered in 2018 (Strelkov et al., 2018). The source of resistance in
cultivars is not in the public domain (Strelkov et al., 2018), but is known to be based on
resistance genes that are pathotype specific (Diederichsen et al., 2009).
One major drawback of reliance on host resistance has been that resistance based on single
genes is not durable. As a result, rapid selection for virulent pathotypes that were present in the
population in (presumably) low numbers that can overcome resistance can occur (Hollman et al.,
2020; Peng et al., 2014a; Peng et al., 2015; Sedaghatkish et al., 2019; Strelkov et al., 2018).
Around 3–4 years after CR canola cultivars were first released, a few P. brassicae populations
were identified that were able to cause clubroot on the CR cultivars. The number of new virulent
pathotypes continues to increase. The pathotypes that have emerged and overcome clubroot
resistance in Canada were likely already present in P. brassicae populations. Balancing selection
allowed these pathotypes to be retained in the population at low frequencies (Sedaghatkish et al.,
2019).
Similarly, susceptible cultivars of brassica crops, primarily vegetables, were grown at the
University of Guelph Muck Crops Research Station, Holland Marsh, Ontario prior to 2009, while

28
moderately resistant or resistant cultivars of canola and some brassica vegetables were grown
after 2009. The dominant pathotype had been pathotype 6 (Williams’ system) for many years,
but shifted to pathotype 2 between 2011 and 2014 (Al-Daoud et al., 2017a).
Resistance is also less effective if resistant cultivars are grown with susceptible plants such
as weeds and volunteers, that release resting spores back into the soil (Hwang et al., 2012a).
Further, a small percentage of each CR cultivar can become infected, even if they are resistant to
the pathotypes in a field because of off-types in each seed lot (Hwang et al., 2019). Therefore,
cultivating resistant cultivars in infested soil can increase inoculum levels. For example, an
initial concentration of 1.0 × 10⁵ resting spores g-1 of soil was found to increase to 2.6 × 10⁵
spores g-1 soil one year after growing CR canola (Ernst et al., 2019).
Other clubroot management strategies, such as crop rotation and weed management,
should therefore be used in addition to resistant cultivars to delay the breakdown of resistance
and to reduce inoculum in soil (Hwang et al., 2012b).
1.6.3 Crop rotation
Rotation with a nonhost crop or a fallow period decreases soil inoculum, increases yield,
and reduces clubroot severity compared to continuously growing susceptible canola (Hwang et
al., 2019). There is an average yield benefit of 19% in canola when grown in 3-year and 2-year
rotations over 6 years compared to continuously growing canola in the absence of clubroot (Gill,
2018). Many crops are commonly grown in rotation with canola, including wheat (Triticum
aestivum L.), pea (Pisum sativum L.), barley (Hordeum vulgare L.), pulses, and to a lesser extent
flax (Linum usitatissimum L.), buckwheat (Fagopyrum Mill.), oat (Avena sativa L.), rye (Secale
cereal L.), corn (Zea mays L.), and forage legumes (Canola Council of Canada, 2020a; Gill,
2018). The risk of clubroot and other diseases in canola is lower the more species that are

29
included in rotation sequences (Gill, 2018). In Western Canada, cereals and pulses are generally
grown in rotation with canola (Canola Council of Canada, 2020a; Gill, 2018). Wheat, soybean,
and corn are grown in rotation with canola in Ontario (OMAFRA, 2020; Ontario Grain Farmer
Magazine, 2021).
The most important reduction in resting spore concentrations in soil occurs in the first 1–2-
year break from a host, as P. brassicae spores follow a Type III survivorship curve (Gossen et
al., 2019). A 2-year break can reduce resting spore concentrations by 90% in heavily infested
field plots (Peng et al., 2014b). This finding was supported by a study by Peng et al. (2015) that
reported that a 4-year break was not significantly different than a 2-year break in reducing
resting spore concentrations. Therefore, the Canola Council of Canada (2020a) recommends a
minimum 2-year break from growing canola in clubroot-infested fields.
Fully eradicating P. brassicae from a field, however, is difficult as many of the spores that
survive the initial few years break from a host can survive for many years. After a 19-year break
from growing host crops, inoculum was still present in fields (Rastas et al., 2013). Therefore, in
heavily infested soils, high clubroot severity can still occur on susceptible and moderately
susceptible canola cultivars grown after a minimum 2-year break (Gill, 2018).
1.6.4 Bait crops
Bait crops are hosts or nonhosts that produce root exudates that stimulate the germination
of resting spores (Ahmed et al., 2011). Primary zoospores may be unable to infect a host and die,
leading to a reduction in soil inoculum (Friberg et al., 2006; Macfarlane, 1952; Takahashi,
1994a). Leafy daikon (also known as tillage radish, Raphanus sativus L. var. longipinnatus),
perennial ryegrass (Lolium perenne L.), creeping bentgrass (Agrostis stolonifera L.), and
strawberry (Fragaria spp. L.) can be used as bait crops for clubroot (Feng et al., 2012;

30
Murakami et al., 2000). Bait crops are likely to be the most effective in fields with low or
moderate clubroot infestations (Ahmed et al., 2011).
Leafy daikon grown as a cover crop has been effective in clubroot management (Murakami
et al., 2000). Leafy daikon breaks down soil layers to allow for increased water and nutrient
availability and root growth (Sharma et al., 2013b). In addition, leafy daikon decreases clubroot
inoculum in the soil by stimulating resting spore germination without leading to the production
of new resting spores. Disease indices in Chinese cabbage, broccoli, Brussels sprouts and
Shanghai pak choi, when grown after leafy daikon, were found to be significantly lower than
when these crops were grown without leafy daikon as a cover crop (Murakami et al., 2000). Low
levels of clubbing developed on tillage radish in controlled conditions but not under field
conditions (Sharma et al., 2013b).
Potato onion (Allium cepa var. aggregatum Don.) grown in rotation with Chinese cabbage
reduced clubroot incidence in Chinese cabbage (Chen et al., 2018). Root exudates of potato
onion suppressed the expression of Pro1, a gene involved in stimulating resting spore
germination (Chen et al., 2018; Hwang et al., 2012c). Chinese cabbage grown in rotation with
potato onion had a smaller number of secondary plasmodia in cortical cells and had overall lower
clubroot incidence (Chen et al., 2018).
Residues of meadowfoam (Limnanthes alba Hartweg ex. Benth), an oilseed crop, can
reduce clubroot incidence in cauliflower and mustard. Meadowfoam produces allelochemicals,
including glucosinolates and phytoecdysteroids, which can suppress P. brassicae. Glucosinolates
cause fungistasis in resting spores. However, application of high rates of meadowfoam residue
can have phytotoxic effects on cauliflower and mustard seedlings (Deuel and Svenson, 2000).
The proportion of resting spore germination can vary with the plant species. Root exudates

31
from ryegrass triggered the germination of more resting spores than both a host (Brassica rapa
var. perkinensis) and nonhosts, such as leek (Allium porrum L.), rye (Secale cereale L.) and red
clover (Trifolium pretense L.) (Friberg et al, 2005). In addition, root exudates from perennial
ryegrass stimulated resting spore germination at a higher rate than root exudates from canola and
Chinese cabbage (Rashid et al., 2013). In contrast, cruciferous hosts such as canola and Chinese
cabbage were more effective as bait crops compared to cereals and non-cruciferous hosts, such
as bentgrass (Agrotis palustris Huds.), orchardgrass (Dactylis glomerata L.), ryegrass or red
clover (Ahmed et al., 2011).
Smooth bromegrass (Bromus inermis L.), meadow bromegrass (Bromus riparius Rehm.)
and perennial ryegrass reduced resting spore levels in soil under controlled conditions
(Sedaghatkish, 2020). Bioassays to evaluate the effect of bait crops on resting spores and
clubroot severity can, however, be difficult to replicate in field conditions (Friberg et al., 2006).
For example, leek, winter rye, perennial ryegrass and red clover, which stimulated resting spore
germination under controlled conditions, were not effective in reducing P. brassicae in soil in
field studies. Environmental conditions and soil texture, chemistry and composition, and the
initial concentration of resting spores are possible factors that could have influenced this finding
(Friberg et al., 2006).
The root hair infection stage is very similar between a host plant and ryegrass. However,
while the secondary zoospores produced on ryegrass were infectious to both canola and ryegrass,
they caused smaller clubs to form on canola compared to the secondary zoospores produced on
canola. Resistance to the cortical infection stage in ryegrass is likely triggered during the root
hair infection stage (Feng et al., 2012). While clubroot infection is limited to the root hair
infection stage in nonhosts, secondary infection can occur in ryegrass if inoculated with

32
secondary zoospores (Feng et al., 2012; Friberg et al., 2005). However, no vegetative plasmodia
or resting spores developed. Secondary infection can occur in ryegrass inoculated with secondary
zoospores because typical nonhost mechanisms that are initiated during the root hair infection
stage are bypassed (Feng et al., 2012).
1.6.5 Seeding date
Clubroot infection is lower when temperatures are lower early in the season (Hwang et al.,
2012b; Sharma et al., 2011a). Clubroot severity was lower in canola seeded early in spring
compared to canola seeded later in the spring (Hwang et al., 2012b). Similarly, seeding
susceptible Asian brassica vegetables early in the spring or in late in the summer (August or
September) resulted in reduced clubroot severity (McDonald and Westerveld, 2008). Host crops
can become better established when temperatures are low. The optimal temperature for canola
germination and early seedling growth is 22°C and germination is low below 10°C. However,
canola seed can germinate and grow at temperatures as low as 2°C (Nykiforuk and Johnson-
Flanagan, 1994). The pathogen does not develop until temperatures are 14–18°C (Gossen et al.,
2017a). Older plants are less vulnerable to clubroot infection than younger plants in the high
temperatures conditions that are more conducive to infection later in the growing season (Hwang
et al., 2012b). Thus, the highest disease severity and even plant death occurs when plants are
infected at the seedling stage and temperatures are optimum for disease development.
1.6.6 Liming
Farmers have limed fields since the early 19th century to manage clubroot infestations
(Bélec et al., 2004). Early studies have found calcium oxide, stone limes and hydrated limes to
be effective in controlling clubroot (Wellman, 1930). Limes should be applied to attain a soil pH
of 7.2 for optimal for disease suppression (Myers and Campbell, 1985). Calcium cyanamide,
33
dolomite and calcium carbonate are common types of lime to reduce clubroot incidence in
Chinese cabbage and reduce resting spore concentration in soils (Murakami et al., 2002b).
Agricultural limes (calcitic lime) and dolomitic limes (calcium magnesium carbonate) are slow
acting and should be applied in high concentrations in the fall for spring seeding as these limes
take several months to alter soil pH. Other forms of lime include quicklimes (calcium oxide) and
hydrated limes (calcium hydroxide), which is produced by mixing water with calcium oxide,
generating heat. Hydrated limes should be applied in the spring; although they are fast acting,
they have shorter term effects (Hwang et al., 2014b). Organic matter with high calcium content
can also be applied to neutralize soil pH (Niwa et al., 2008). However, large quantities of organic
matter can lead to nitrogen leaching (Niwa et al., 2007).
Calcium cyanamide (trade name Perlka) is a slow-release-nitrogen-source granular
fertilizer that suppressed clubroot in Asian brassica vegetables (Bélec et al., 2004; McDonald et
al., 2004). Calcium cyanamide breaks down into calcium oxide (which neutralizes soil pH) and
urea and should be applied 1–2 weeks prior to seeding to allow for conversion into urea (Bélec et
al., 2004), and reduce the risk of phytotoxicity. Calcium cyanamide has been reported to inhibit
resting spore germination (Ludwig-Müller, 2016).
The effectiveness of a liming product can be dependent on the size of the liming particles.
Smaller particles can react faster in soil as they have a high surface area to volume ratio (Dobson
et al., 1983; Donald et al., 2004). For example, clubroot suppression was greater in powdery
forms of calcium carbonate and dolomite than in granular, fine or coarse forms of these limes
(Dobson et al., 1983; Murakami et al. 2002b). Similarly, a powder formulation of calcium
cyanamide was more effective at reducing clubbing in cabbage and broccoli in field trials than a
standard formulation which was composed of small and large particles, or a formulation that was

34
composed of larger particles (Donald et al., 2004). However, the reduction in clubroot severity in
Chinese cabbage was greater in granular calcium cyanamide than in powdery calcium cyanamide
in a greenhouse study. It was suggested that this finding may be the result of other factors or
modes of actions of cyanamide (Murakami et al., 2002b). Thorough mixing of lime products into
soil was associated with greater clubroot suppression as the lime was uniformly distributed
which prevents microsites with low pH levels (Dobson et al., 1983). Uniform incorporation of
particles in soil can improve calcium cation uptake in plants and was found to control clubroot
even when plants were sown one day after calcium carbonate was applied (Campbell et al.,
1985). Reducing spore levels in soil is also dependent on high concentrations of extractable
calcium cations (Campbell et al., 1985; Murakami et al., 2002b). For example, the pH of soils
with high buffering capacities may be unable to increase sufficiently to provide reduce clubroot
development, even at high rates of lime application (Welch et al., 1976).
Post-harvest application of calcitic lime in the year preceding cauliflower did not
effectively control clubroot (Tremblay et al., 2005). This low efficacy may be due to the large
particle size of the lime. Limestone with finer particles, which could be more uniformly
distributed in soil, suppressed clubroot more effectively than larger, coarser particles. Soil
properties, including texture and water content, that affect the homogenization of the limes in
soil can also influence the levels of control (Dobson et al., 1983). In addition, sufficient moisture
levels may be required to activate certain limes, such as calcium cyanamide (Bélec et al., 2004).
In many cases, more than one application of lime is required to suppress clubroot.
Similarly, a combination of two limes can be effective at managing clubroot, such as an
application of calcitic lime followed by an application of calcium cyanamide (Bélec et al., 2004).

35
While liming can reduce clubroot incidence and inoculum levels, other management
practices would likely also be needed if infestation levels are high and if environmental
conditions other than soil pH are optimal (Gossen et al., 2013).
1.6.7 Patch management
Distribution of clubroot in a field can be patchy (Wallenhammar et al., 2012). Clubroot
patches can occur at field entrances as resting spores can be spread in clumps of soil on farm
machinery and much of the soil will fall off as the equipment enters the field (Gossen et al.,
2018; Karling, 1942). Low spots in a field can also be conducive to clubroot development due to
poor drainage (Gossen et al., 2016; Wellman, 1930). In addition, selection for virulent
pathotypes initially present at low frequencies in the soil can occur in patches (Sedaghatkish et
al., 2019; Strelkov et al., 2018).
Planting grasses in a clubroot infested field as cover crops can be useful for patch
management of clubroot. The extensive root systems of grasses, such as ryegrasses, hold the soil
in place prevent the dissemination of resting spores in a field. Soil solarization can also be used
in highly clubroot-infested spots to reduce resting spore levels (Gossen et al., 2018; McDonald et
al. 2018b).
1.6.8 Fungicides
There are no fungicides currently registered to manage clubroot on canola in Canada.
Fungicides for clubroot management are registered in other countries, but they would not be
economical for Canadian canola production (Canola Council of Canada, 2020b). Hymexazol and
procymidone were found to reduce symptoms of clubroot but did not lead to increased yield. In
contrast, thiophanate-methyl improved yield but did not reduce clubroot development (Peng et
al., 2014b). Fluazinam is registered for clubroot on brassica vegetables but is not recommended.
36
Fluazinam has been reported to kill resting spores (Lahlali et al., 2011). Field trials in southern
Ontario found that fluazinam slightly reduced clubroot severity in susceptible cabbage at one of
three sites (Saude et al., 2012). Similarly, both fluazinam and cyazofamid suppressed clubroot
development on Shanghai pak choi under controlled conditions, but not under field conditions
(Adhikari, 2010). Banded soil incorporation was the most effective method of applying
fluazinam on broccoli and cauliflower (Donald et al., 2001). In contrast, application to plug
seedling trays followed by broadcast soil application with fluazinam reduced clubroot in Chinese
cabbage in heavily infested fields. This study also found that cyazofamid strongly inhibited
clubroot development. Cyazofamid inhibited resting spore germination by 80%, thus restricting
root hair infection and clubbing symptoms in Chinese cabbage. In fields with low clubroot
severity, plug seedling tray application of cyazofamid prior to transplanting is recommended
(Mitani et al., 2003). The fungicides Allegro and Ranman suppressed clubroot development in
Shanghai pak choi under controlled conditions but were not effective under field conditions
(Adhikari, 2010).
Commercial seed cleaning or fungicidal seed treatments also reduced the concentration of
seed-borne resting spores (Rennie et al., 2011). The fungicides azoxystrobin (trade name
Dynasty 100 FS), thiamethoxam + difenoconazole + metataxyl + fludioxonil (trade name Helix
Xtra), flusulfamide (trade name Nebijin 5SC), clothianidin + carbathiin + trifloxystrobin +
metataxyl (trade name Prosper FX) and carbathiin + thiram (Vitavax RS) reduced clubroot
infections on artificially infested canola seeds in greenhouse conditions. Dynasty 100 FS and
Nebijin 5SC were the most effective in reducing clubroot severity (Hwang et al., 2012b).
However, the dissemination of resting spores on seed poses a much lower risk than the transport
of spores on farm equipment as a greater quantity of resting spores can be carried in infested soil
37
on equipment (Rennie et al., 2011).
The fumigant Vapam (dithiocarbamate; sodium N-methyldithiocarbamate; metam sodium)
reduced root hair and cortical infection and severity of clubbing symptoms in canola (Ludwig-
Müller, 2016). Emergence, biomass, height and yield were higher in canola when Vapam was
applied to clubroot-infested fields (Hwang et al., 2014a). Vapam produces methyl
isothiocyanate, a volatile gas with fungicidal and nematicidal properties, when applied to soil
(Smelt and Leistra 1974). Rates of metam sodium over 75 kg a.i. ha-1 and rates of chloropicrin
over 124 kg ha-1 reduced severity of clubroot. In addition, soil solarization, where field plots
were covered with an impermeable plastic film also reduced clubroot severity (McDonald et al.,
2020b).
1.6.9 Biological control
Biological controls could represent an environmentally safer alternative to fumigants for
managing clubroot. The biofungicide Serenade (Bacillus subtilis) effectively suppressed clubroot
development (Lahlali et al., 2011). The lipopeptides in Serenade produced antibiotics, including
surfactins, iturins, and fengycins, in the rhizosphere that suppress infection by zoospores
(Kinsella et al., 2009; Lahlali et al., 2011; Ongena and Jacques, 2007). Bacillus subtilis also
formed a biofilm on root surfaces with the help of surfactin, and consumed exudates produced at
the root surface that might otherwise stimulate resting spore germination (Kinsella et al., 2009).
Serenade reduced resting spore viability by only 20%. Lipopeptides may also reduce competition
with other microbes, allowing B. subtilis to more effectively establish in the rhizosphere (Lahlali
et al., 2011). For instance, the antibiosis activities of iturins and fengycins suppressed other
microbes. Fengycins and surfactins also induced defense mechanisms in plants (Ongena and
Jacques, 2007). Bacillus subtilis alone suppressed clubroot less effectively than Serenade, which

38
may be due to secondary metabolites that contribute to B. subtilis colonization in the rhizosphere
(Lahlali et al., 2011). However, there were no reductions in clubroot severity in canola treated
with a B. subtilis seed dressing in a field trial (Peng et al., 2013).
Prestop (Clonostachys rosea) can also reduce clubroot infection (Gossen et al., 2016).
Clubroot incidence and severity on canola treated with Prestop was reduced by over 90%
(Lahlali and Peng, 2014b). As in the case of Serenade and B. subtilis, Prestop was more effective
at suppressing clubroot than C. rosea alone. Clonostachys rosea establishes an endophytic
relationship in roots and induces expression of defense genes in the host. In addition, C. rosea
produces antibiotics and lytic enzymes that suppress competing soil microbes, aid in the
establishment of C. rosea in the rhizosphere, and inhibit root hair and cortical infection.
However, as in the case of Serenade, Prestop was not effective in inhibiting resting spore
germination. Clonostachys rosea and B. subtilis may be activating phenylpropanoid, jasmonic
acid and ethylene pathways in host roots in induced systemic resistance responses against P.
brassicae (Lahlali and Peng, 2014). While Serenade was more effective at reducing clubroot on
sand, Prestop was more effective on mineral soil. This may be due to the lower competition with
other microbes for B. subtilis in sand (Gossen et al., 2016). The biofungicides, Mycostop
(Streptomyces griseoviridis) and Actinovate (Streptomyces lydicus), suppressed clubroot on
Shanghai pak choi under controlled conditions (Adhikari, 2010). Biofungicides have not yet,
however, been found to be effective in suppressing clubroot in field trials (Adhikari, 2010;
Gossen et al., 2016; Lahali et al., 2011). Biocontrols are expected to be most effective against
clubroot when disease pressure is low (Adhikari, 2010).
39
1.7 Techniques
1.7.1 Detecting clubroot in soil
To detect clubroot infection in plants or resting spores in soil, fields should be sampled in a
standardized pattern (Faggian and Strelkov, 2009). Many samples should be taken because P.
brassicae distribution can be patchy (Strelkov et al., 2007). Global positioning systems to
identify low spots in fields and entrances to fields where infections often start can be used to
reduce the number of samples taken (Faggian and Strelkov, 2009). Plasmodiophora brassicae
cannot be cultured as it is an obligate parasite (Karling, 1942), so bioassays are often used for
diagnosis. Susceptible plants can be infected with clubroot and clubroot severity can be visually
assessed 5–6 weeks after inoculation (Colhoun, 1957; Toxopeus and Janssen, 1975).
Techniques for more rapid diagnosis of P. brassicae have been developed. Polymerase
chain reaction assays can be used for routine detection of P. brassicae DNA in plant and soil
samples (Cao et al., 2007). Antibody, fatty acid analysis and serology-based tests can also be
used detect and quantify P. brassicae (Faggian and Strelkov, 2009; Hwang et al., 2012c). Highly
specific monoclonal antibodies have been developed for P. brassicae diagnostic tests (Faggian
and Strelkov, 2009). In addition, UV- and G- excitation can detect P. brassicae nuclei under a
fluorescent microscope. Nuclei identification can allow resting spores to be differentiated from
germinated resting spores (Niwa et al., 2008). This method, though effective, requires training in
microscopy and is not ideal for routine P. brassicae diagnosis (Faggian and Strelkov, 2009).
1.7.2 Assessing infection in plants
Clubroot can be visually identified in early stages of infection by assessing root hairs
microscopically (Donald and Porter, 2004). Root hairs in the top 2–3 cm of the tap root below
the hypocotyl should be evaluated as this region has the highest level of infection (Naiki et al.,
40
1978). Plasmodia in root hairs of seedlings can be identified starting at 2 days post-inoculation.
Staining roots with aniline-blue solution can allow plasmodia and zoosporangia structures to be
more easily identified (Sharma et al., 2011b). The percent of root hairs infection can be a strong
indication of the development and severity of clubroot on a plant (Gossen et al., 2013).
A rating system can be used to assess clubroot severity (Crête et al., 1963). Symptoms of
clubroot are routinely assessed on roots using a 0–3 scale. Each root is assigned to a class, where
class 0 = no clubs, 1 = small clubs on less than 1/3 of roots, class 2 = small or intermediate sized
clubs on 1/3 to 2/3 of roots, and class 3 = intermediate sized or large clubs on over 2/3 of roots.
A disease severity index calculates a number between 0 and 100 with the following formula
(Crête et al., 1963):
DSI = Σ[(class no. )(no. plants in each class)]
(total no. plants per sample)(no. classes − 1)× 100
1.7.3 Quantifying resting spore concentrations
Resting spore concentrations can be quantified using a quantitative polymerase chain
reaction (qPCR). However, qPCR quantifies both viable and nonviable resting spores. Spores
can be treated with the chemical, propidium monoazide (PMA) so that only viable spores are
amplified (Al-Daoud et al., 2017b). Propidium monoazide penetrates the cell membrane of
nonviable cells and photoactivation causes it to bind to DNA. Therefore, the DNA of nonviable
cells is not amplified during qPCR (Nocker et al., 2006).
Stains that can differentiate viable from nonviable resting spores when the spores are
viewed with a microscope have also been studied. Evaluation of the Evans blue stain indicated
that this stain did not effectively differentiate mature resting spores from immature resting spores
(Al-Daoud et al., 2017b). However, a subsequent study showed that a longer staining time was

41
required to accurately differentiate viable from nonviable spores (Harding et al., 2019). The
cytoplasm of nonviable cells can take up the stain, resulting in a dark blue colour when assessed
with bright field microscopy. The Evans blue method did not differ from the PMA qPCR method
when the viability of resting spores was assessed in response to 70°C and 90°C heat treatments.
However, the two methods were statistically different in response to the 80°C heat treatment as
the Evans blue stain was found to have a greater accuracy than PMA qPCR (Harding et al.,
2019).
1.8 Research objectives
Clubroot resistance in commercial brassica cultivars is based on major resistance genes
and is pathotype-specific. However, the specific pathotypes against which a cultivar is resistant
are not provided by seed companies. Testing is needed to assess the clubroot reaction of canola
and brassica vegetable cultivars grown in Ontario to pathotypes 2 and 6 of P. brassicae to
provide this information to growers.
Crop rotation is also an important clubroot management method to reduce resting spore
levels in soil. Some crops that are commonly grown in rotation with canola may be more
effective than others at reducing resting spores. For instance, the roots of some crops can
stimulate the germination of resting spores, and the zoospores quickly die if there are no root
hairs that can be infected. Another possibility is that root hairs will be infected, and secondary
zoospores released, but these will not be able to infect the root cortex of the non-host crop. In
either situation, the number of viable resting spores remaining in the soil will be reduced.
Assessing crops commonly grown in rotation with brassica crops in Canada for the ability to
reduce resting spores will provide important information for clubroot management.
Crop rotation and liming to increase calcium content and soil pH are effective for

42
clubroot management but their combined effect on resting spore levels in soil has not been
studied. Certain field crops commonly grown in rotation with canola may induce resting spore
germination, while application of lime can inhibit resting spore germination. The effects of these
two management practices may not be additive due to these different modes of action.
Combining these two strategies may be antagonistic. Studies of the interaction between planting
a field crop and liming soil would provide useful recommendations for growers.
The objectives of the research were:
1. To evaluate the resistance of canola and brassica vegetable (cabbage, cauliflower,
broccoli, napa cabbage and rutabaga) cultivars commonly grown in Ontario to P.
brassicae pathotypes 2 and 6
2. To evaluate rotation and cover crops (spring wheat, barley, soybean, field pea and
perennial ryegrass) to identify those that most effectively reduce resting spores in soil
3. Evaluate the combined effects of planting a cereal crop and liming with calcium
hydroxide on resting spore levels in soil
The following hypotheses were tested:
1. Certain clubroot resistant canola and brassica vegetable cultivars are not resistant to both
P. brassicae pathotypes 2 and 6 as resistance is usually pathotype-specific
2. Growing spring wheat, barley and perennial ryegrass can reduce P. brassicae inoculum
more than legumes (soybeans and field peas) because of their more extensive root
systems
3. Growing a cereal crop in soil treated with lime does not reduce resting spore levels more
than either method alone, due to their different modes of actions

43
CHAPTER TWO
2 Clubroot resistance in canola and brassica vegetable cultivars
Published in a modified format: Drury, S. C., Gossen, B. D., and McDonald, M. R. 2021.
Clubroot resistance in canola and brassica vegetable cultivars in Ontario, Canada. Canadian
Journal of Plant Science doi: 10.1139/CJPS-2020-0273
2.1 Introduction
Cultivars of canola (Brassica napus L.) resistant to clubroot are a cost-effective and
environmentally friendly strategy for clubroot management (Cao et al., 2009; Strelkov et al.,
2011), so genetic resistance is the main strategy for managing clubroot on the Canadian Prairies
(Canola Council of Canada, 2020b). Seedling emergence, above-ground biomass and yield are
greater in resistant cultivars of canola and brassica vegetables compared to susceptible cultivars
when grown in clubroot-infested soil, particularly when disease pressure is high (Hwang et al.,
2011b; Sharma et al., 2013b). Resistant canola and cabbage cultivars suppress or eliminate
cortical infection to prevent symptom development (Deora et al., 2013; Peng et al., 2019). They
can also be effective in slowing the build-up of resting spores of P. brassicae in fields (Hwang et
al., 2019).
Genetic resistance to clubroot is available in all of the major brassica crops, except
B. juncea and B. carinata (Diederichsen et al., 2009; Piao et al., 2009). Both qualitative
resistance, which is pathotype-specific and is often controlled by a single gene, and quantitative
resistance, which is not pathotype-specific and is generally polygenic (Van der Plank, 1969),
have been reported in Brassica species (Crute et al., 1980; Piao et al., 2009). The first clubroot-
resistant (CR) canola cultivar in Canada was released in 2009. More than 20 CR canola cultivars
44
had been registered by 2018, and that number continues to increase (Strelkov et al., 2018).
Single dominant, pathotype-specific resistance genes have generally been used to develop CR
cultivars of canola (Diederichsen et al., 2009). Gene pyramiding, where two or more CR genes
are added to cultivars, is being assessed to determine if this approach might provide a broader
spectrum of clubroot resistance. Pyramided CR genes can have interactive effects, which might
result in higher levels of resistance than using individual CR genes (Matsumoto et al., 2012). For
example, pyramids of CR genes have been developed for B. napus (Shah et al., 2019).
Resistance based on single dominant genes has not provided durable clubroot resistance
(Diederichsen et al., 2009; Piao et al., 2009). Only four years after the first CR canola cultivars
were released in Canada, virulent populations of P. brassicae that could overcome the resistance
in these cultivars were identified, and these virulent populations have increased rapidly (Strelkov
et al., 2018). A recent study of whole-genome sequences of P. brassicae indicated that these
virulent pathotypes were likely present at low frequencies in the initial population in fields and
have became dominant as a result of selection pressure (Sedaghatkish et al., 2019).
Several systems have been developed to characterize the pathotypes of P. brassicae. The
differential set developed by Williams (1966) has been widely adopted in Canada. However, the
emergence of new pathotypes in Canada that could not be identified on Williams’ system led to
the development of a new system, the Canadian Clubroot Differential (CCD) set (Strelkov et al.,
2018). Similarly, differential systems could not accurately describe lines of B. oleracea with
novel sources of resistance, so a differential set was developed to characterize the pathotypes on
B. oleracea (Smilde et al., 2012). This system uses red cabbage (B. oleracea var. capitata) cv.
Lodero, white cabbage cvs. Bejo 51632, and Kilaton, broccoli (B. oleracea var. italica) cv.
Monclano, and cauliflower (B. oleracea var. botrytis) cv. Clapton or Brussels sprouts (B.
45
oleracea var. gemmifera) cv. Crispus (International Seed Federation, 2016). Four pathotypes,
designated Pb:0, Pb:1, Pb:2 and Pb:3, can be identified using this system (Smilde et al., 2012).
The system has not been applied to the brassica vegetables grown in Ontario, and it is not known
which pathotype, based on this newer system, is present in fields in Ontario.
Many brassica vegetables are susceptible to pathotype 6 from Williams’ system (Al-Daoud
et al., 2018), but most canola cultivars are resistant (Deora et al., 2013). Most brassica
vegetables and many canola cultivars are susceptible to pathotype 2 (Al-Daoud et al., 2018).
Pathotype 6 has been predominant on vegetables in Ontario for many years (Al-Daoud et al.,
2017a), but pathotype 2 was recently identified on canola in Ontario (Al-Daoud et al., 2018).
Pathotypes 2 and 6 are currently the predominant pathotypes in Ontario (McDonald et al.,
2020a). Studies on the reaction of canola and brassica vegetable cultivars to pathotypes 2 and 6
have been limited as these pathotypes are not widespread in the Canadian Prairies (Strelkov et
al., 2018) where most of the canola in Canada is grown.
The green cabbage cvs. Kilaherb, Kilaton, Kilaxy and Tekila, and napa cabbage (B. rapa
L. ssp. pekinensis) cvs. Bilko, Yuki, Deneko, Emiko and China Gold are resistant to pathotype 6
(Saude et al., 2012; Sharma et al., 2013b). Some cultivars have resistance to multiple pathotypes.
For instance, cabbage cvs. Kilaherb and Tekila were resistant to pathotypes 2, 3, 5, 6 and 8,
which at the time were the only pathotypes prevalent in Canada (Peng et al., 2014a). In addition,
bok choy cv. Bejo 2834 and napa cabbage cv. Bilko were resistant to pathotypes 2, 3, 4 and 6.
Other cultivars had a differential reaction to the pathotypes. For example, Brussels sprouts cv.
Crispus was resistant to pathotypes 2 and 6 but susceptible to pathotypes 3 and 5 (Sharma et al.,
2013b). Rutabaga (B. napus var. napobrassica Mil.) cv. Laurentian, which is widely grown in
Ontario, is one of the differentials in Williams’ system. It is susceptible to pathotypes 1, 2, 3 and

46
4 and resistant to pathotypes 5 and 6 (Williams, 1966).
Screening germplasm for resistance to specific pathotypes is important for developing
resistant cultivars (Hasan et al., 2012), but information about the source of resistance in
individual cultivars is often not in the public domain (Strelkov et al., 2018).
The objective of this study was to evaluate selected canola and brassica vegetable cultivars
commonly grown in Ontario for resistance to pathotypes 2 and 6, which are the predominant
pathotypes of P. brassicae in the region. The results will help growers to select canola and
brassica vegetable cultivars that are resistant to clubroot for use in fields where clubroot occurs.
2.2 Materials and methods
2.2.1 Field site
Field trials were conducted at the Muck Crops Research Station of the University of
Guelph, Holland Marsh, Ontario in 2018 and 2019 on a muck soil (hemic histosol, pH ≈ 6.5,
organic matter ≈ 66%). Each study was arranged in a randomized complete block design with six
replicates. Each plot consisted of one (canola) or two (vegetables) 5-m-long rows with 40 cm
spacing between rows.
The site has been naturally infested with P. brassicae since 1954 (Anonymous, 1956).
The predominant pathotype at this site was pathotype 6 (Williams’ system) for many years but
has recently shifted to pathotype 2 (Al-Daoud et al., 2017a). The population of clubroot resting
spores in the field plots was 1–6 × 10⁷ spores g-1 of soil in 2019, based on standard qPCR
analyses.
2.2.2 Field trials – canola
InVigor hybrid CR canola cvs. L255PC, L241C and L135C were assessed. Each of the
cultivars is marketed as being resistant to the predominant pathotypes in Canada, and each
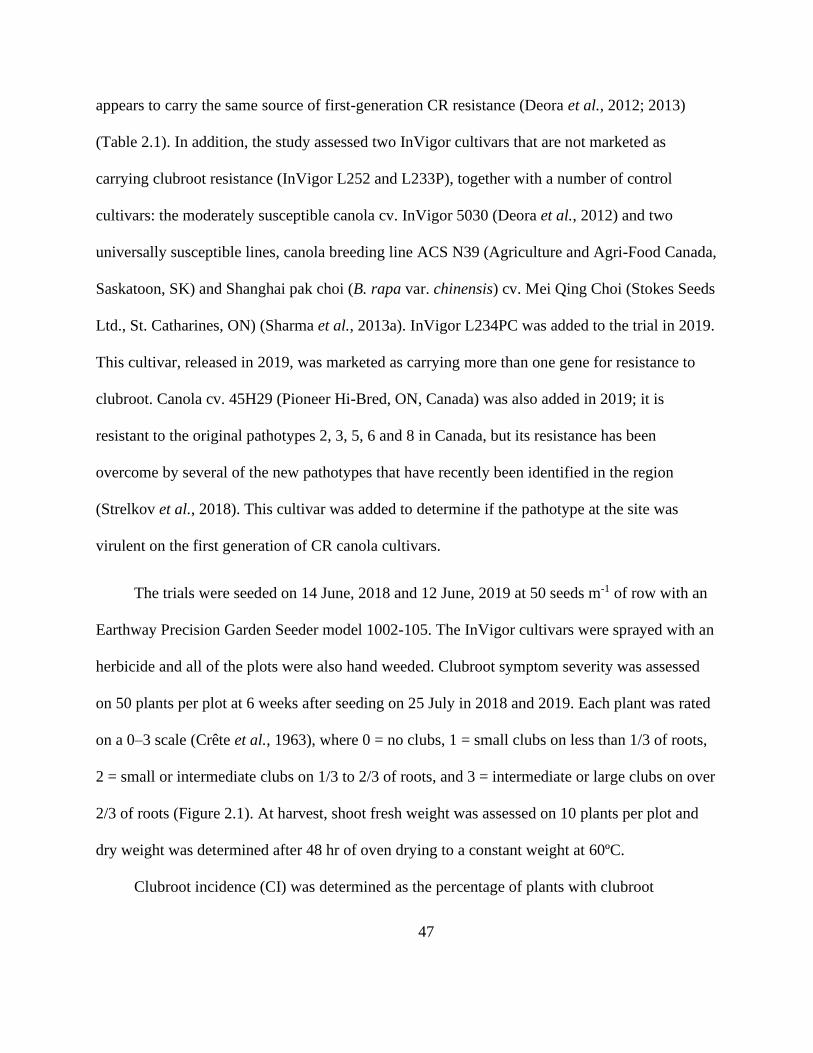
47
appears to carry the same source of first-generation CR resistance (Deora et al., 2012; 2013)
(Table 2.1). In addition, the study assessed two InVigor cultivars that are not marketed as
carrying clubroot resistance (InVigor L252 and L233P), together with a number of control
cultivars: the moderately susceptible canola cv. InVigor 5030 (Deora et al., 2012) and two
universally susceptible lines, canola breeding line ACS N39 (Agriculture and Agri-Food Canada,
Saskatoon, SK) and Shanghai pak choi (B. rapa var. chinensis) cv. Mei Qing Choi (Stokes Seeds
Ltd., St. Catharines, ON) (Sharma et al., 2013a). InVigor L234PC was added to the trial in 2019.
This cultivar, released in 2019, was marketed as carrying more than one gene for resistance to
clubroot. Canola cv. 45H29 (Pioneer Hi-Bred, ON, Canada) was also added in 2019; it is
resistant to the original pathotypes 2, 3, 5, 6 and 8 in Canada, but its resistance has been
overcome by several of the new pathotypes that have recently been identified in the region
(Strelkov et al., 2018). This cultivar was added to determine if the pathotype at the site was
virulent on the first generation of CR canola cultivars.
The trials were seeded on 14 June, 2018 and 12 June, 2019 at 50 seeds m-1 of row with an
Earthway Precision Garden Seeder model 1002-105. The InVigor cultivars were sprayed with an
herbicide and all of the plots were also hand weeded. Clubroot symptom severity was assessed
on 50 plants per plot at 6 weeks after seeding on 25 July in 2018 and 2019. Each plant was rated
on a 0–3 scale (Crête et al., 1963), where 0 = no clubs, 1 = small clubs on less than 1/3 of roots,
2 = small or intermediate clubs on 1/3 to 2/3 of roots, and 3 = intermediate or large clubs on over
2/3 of roots (Figure 2.1). At harvest, shoot fresh weight was assessed on 10 plants per plot and
dry weight was determined after 48 hr of oven drying to a constant weight at 60ºC.
Clubroot incidence (CI) was determined as the percentage of plants with clubroot

48
symptoms. A disease severity index (DSI) was calculated using the following formula (Crête et
al., 1963):
DSI = Σ[(class no. )(no. plants in each class)]
(total no. plants per sample)(no. classes − 1)× 100
Table 2.1 Expected reaction to pathotypes 2 and 6 (based on seed label), year evaluated in a field
trial, and type of trial used for evaluation (field trial or growth room study) of the canola
cultivars that were screened for resistance.
Cultivars Seed source Expected
reaction1
Year in field
trial
Type of study
InVigor L255PC BASF Resistant 2018, 2019 Field, growth room
InVigor L135C BASF Resistant 2018, 2019 Field, growth room
InVigor L241C BASF Resistant 2018, 2019 Field, growth room
InVigor L234PC BASF Resistant 2019 Field
45H29 Pioneer Resistant 2019 Field
InVigor 5030 BASF Moderately
susceptible
2018, 2019 Field, growth room
InVigor L252 BASF Susceptible 2018, 2019 Field, growth room
InVigor L233P BASF Susceptible 2018, 2019 Field, growth room
ACS N39 AAFC, SK Susceptible 2018, 2019 Field, growth room
Mei Qing Choi Stokes Seeds Susceptible 2018, 2019 Field, growth room 1The expected clubroot reaction of cultivars was based on breeder descriptions: DSI <30%
compared to a check is resistant, 30–50% is moderately susceptible and >50% is susceptible.
49
Figure 2.1 Clubroot disease severity rating scale. (a) 0 = no clubbing on root, (b) 1 = small clubs
on <1/3 of roots, (c) 2 = small to medium clubs on 1/3–2/3 of roots, and (d) 3 = large clubs on
>2/3 of roots.
2.2.3 Field trials - vegetables
Cabbage, broccoli, cauliflower, napa cabbage and rutabaga cultivars marketed as clubroot
resistant or tolerant were evaluated (Table 2.2). The susceptible control treatments were white
cabbage cv. Bronco (Bejo Seeds Inc., Geneva NY), broccoli cv. Asteroid, cauliflower cv.
Fremont, napa cabbage cv. Blue (Stokes Seeds Ltd., ON), rutabaga cv. Laurentian (sourced from
two suppliers, Stokes Seeds Ltd. and the University of Wisconsin-Madison) and Shanghai pak
choi cv. Mei Qing Choi. The clubroot reactions of the two sources of Laurentian rutabaga, a host
in Williams’ differential set and the CCD Set, were compared to determine if less expensive seed
from Stokes Seeds was equivalent to the University of Wisconsin seed.
Cabbage, cauliflower and broccoli were grown from transplants. These crops were seeded
in Original Grower Potting Soil Mix (ASB Greenworld) in 128-cell plug trays on 08 June, 2018
and 07 June, 2019. They were grown in a greenhouse at the Muck Crops Research Station, where
50
day length was not modified. The crops were transplanted by hand in the field on 11 July in 2018
and 2019. Rutabaga was grown from transplants in 2019 because emergence and growth were
poor when direct seeded in 2018. In 2019, rutabaga was seeded in 288-cell plug trays on 27 June
and transplanted on 18 July. There were 30 cm between each transplant and a mean of 16 plants
per row. Napa cabbage and Shanghai pak choi were direct seeded on 11 July in 2018 and 2019 at
50 seeds m-1. Rutabaga was direct seeded on 11 July, 2018.
Clubroot was assessed on the 0–3 scale as described previously on 30 plants per plot at 6
weeks after seeding/transplanting on 23 August, 2018, and on 22 and 23 August, 2019. Rutabaga
was assessed on 29 August in 2018 and 2019. As with canola, the shoot fresh weight of 10 plants
per plot was assessed at harvest and the shoot dry weight of five plants per plot was determined
after oven drying to constant moisture at 60ºC. Clubroot incidence and DSI were calculated as
described previously.
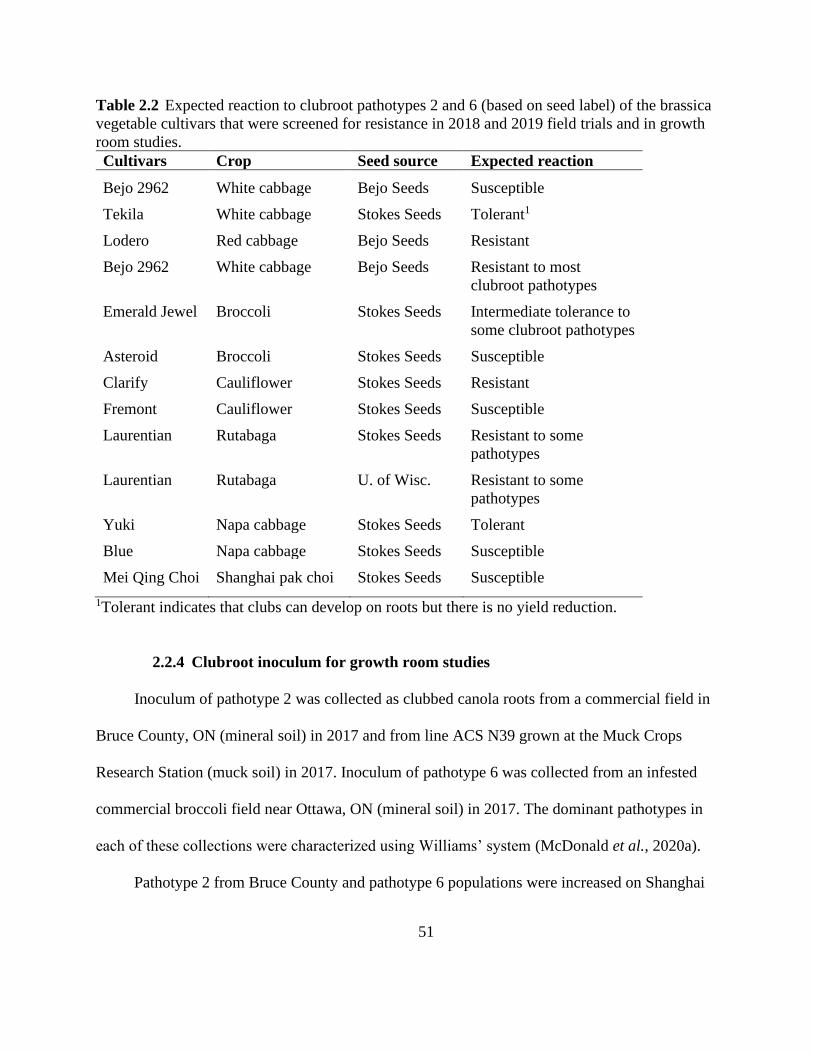
51
Table 2.2 Expected reaction to clubroot pathotypes 2 and 6 (based on seed label) of the brassica
vegetable cultivars that were screened for resistance in 2018 and 2019 field trials and in growth
room studies.
Cultivars Crop Seed source Expected reaction
Bejo 2962 White cabbage Bejo Seeds Susceptible
Tekila White cabbage Stokes Seeds Tolerant1
Lodero Red cabbage Bejo Seeds Resistant
Bejo 2962 White cabbage Bejo Seeds Resistant to most
clubroot pathotypes
Emerald Jewel Broccoli Stokes Seeds Intermediate tolerance to
some clubroot pathotypes
Asteroid Broccoli Stokes Seeds Susceptible
Clarify Cauliflower Stokes Seeds Resistant
Fremont Cauliflower Stokes Seeds Susceptible
Laurentian Rutabaga Stokes Seeds Resistant to some
pathotypes
Laurentian Rutabaga U. of Wisc. Resistant to some
pathotypes
Yuki Napa cabbage Stokes Seeds Tolerant
Blue Napa cabbage Stokes Seeds Susceptible
Mei Qing Choi Shanghai pak choi Stokes Seeds Susceptible
1Tolerant indicates that clubs can develop on roots but there is no yield reduction.
2.2.4 Clubroot inoculum for growth room studies
Inoculum of pathotype 2 was collected as clubbed canola roots from a commercial field in
Bruce County, ON (mineral soil) in 2017 and from line ACS N39 grown at the Muck Crops
Research Station (muck soil) in 2017. Inoculum of pathotype 6 was collected from an infested
commercial broccoli field near Ottawa, ON (mineral soil) in 2017. The dominant pathotypes in
each of these collections were characterized using Williams’ system (McDonald et al., 2020a).
Pathotype 2 from Bruce County and pathotype 6 populations were increased on Shanghai

52
pak choi cv. Mei Qing Choi grown under controlled conditions in tall narrow 164 mL plastic
pots (conetainers, Steuwe and Sons Inc. Corvallis, OR) filled with L4A Sunshine Mix (Sun Gro
Horticulture, MA) plus a fertilizer solution consisting of a 0.1% solution of nitrogen, phosphate,
potassium (20-20-20, Plant Products Classic, Brampton, ON), and magnesium sulfate. The clubs
were frozen after collection at -20ºC until use.
The inoculum was prepared following the methods of Sharma et al. (2011a). Frozen clubs
were thawed, ground in water with a mortar and pestle, then homogenized for 2 min with water
in a commercial blender on high speed. The resulting spore suspension was passed through eight
layers of cheesecloth and the spore concentration was estimated using a haemocytometer under a
compound microscope.
The growth room was set to 24/19°C day/night with a 17-hr photoperiod. Two seeds were
planted in each pot and thinned to one plant per pot prior to inoculation. At 6 days after seeding,
5 mL of 2 × 10⁷ resting spores mL-1 of P. brassicae was applied to the stem base of each
seedling. The plants were watered with tap water adjusted to pH 6.0 with 5% acetic acid
(commercial white vinegar) to maintain the slightly acidic conditions conducive for infection
(Gossen et al., 2013). The plants were fertilized weekly with a 0.1% solution of nitrogen,
phosphate, potassium (20-20-20), and magnesium sulfate. Clubs were harvested 6.5 weeks after
inoculation and stored at -20ºC.
2.2.5 Growth room - canola
The canola cultivars evaluated in the field trial, plus a non-inoculated susceptible control,
ACS N39 or Mei Qing Choi, were tested for clubroot reaction under controlled conditions. Each
study was laid out in a randomized compete block design with four replicates and 12 plants per
experimental unit. The growth room conditions and inoculation methods were as described

53
previously. Pathotypes 2 and 6 were assessed in separate studies, and both studies were repeated.
The collection of pathotype 2 from the Muck Crops Research Station was used as the inoculum
source in the initial run and the collection from Bruce County was used in the repetition. The
inoculum concentration used was 5 mL of 1 × 10⁷ resting spores mL-1. Clubroot symptoms were
assessed on all plants at 6 weeks after inoculation on the 0–3 scale, and clubroot incidence and
DSI were determined as described previously.
2.2.6 Growth room - vegetable cultivars
The clubroot reaction of the vegetable cultivars assessed in the field trials, plus a
susceptible control (Shanghai pak choi, inoculated and non-inoculated), to pathotypes 2 and 6
was assessed in separate growth room studies. The same sources of inoculum and methods were
used as in the canola growth room studies described above. The study was conducted once with
pathotype 2 (inoculum from Bruce County) and twice with pathotype 6.
2.2.7 Pathotyping P. brassicae from the field
The pathotype of clubs from the 2019 field trials was determined based on Williams’
system (1966) in a growth room trial. The cabbage cvs., Jersey Queen and Badger Shipper, and
the rutabaga cvs., Laurentian and Wilhelmsburger (source: S.E. Strelkov, University of Alberta)
from Williams’ differential set were evaluated. The CR canola cv. 45H29 was also included to
determine if a virulent pathotype had emerged that could not be identified with Williams’
system. The same experimental design and methods as the canola growth room cultivar
screening studies were used.
2.2.8 Statistical analysis
All statistical analyses were conducted in SAS 9.4 (SAS Institute, Cary, IN). Clubroot
incidence, DSI, shoot fresh weight and shoot dry weight were analyzed in PROC GLIMMIX
54
using Tukey’s test for means separation. A Type 1 error of P = 0.05 was set for all statistical
tests. The Shapiro-Wilk test and scatter plots of the residuals were used to assess the normality of
the data. The clubroot incidence and severity (DSI) data were analyzed based on a binomial
distribution, and shoot fresh and dry weight were analyzed based on a normal distribution.
In the field trials in 2019, canola cv. 45H29 was stunted by herbicide drift, so its shoot
weight was excluded from the analyses. Analyses of fresh and dry shoot weight were conducted
separately for each crop variety or subspecies in the brassica vegetable field trials. Mei Qing
Choi was not included in the shoot analyses of any field trial as there was no resistant cultivar for
comparison.
The data from the two years of fields trials could not be pooled because of significant
treatment × year interactions. There were no interactions among repetitions of growth room
studies of canola cultivars for resistance to pathotype 2 from MCRS and Bruce County, or
among repetitions of the growth room studies of canola or brassica vegetables inoculated with
pathotype 6, so those data were pooled for analysis and presentation.
2.3 Results
2.3.1 Canola
Clubroot severity in the field trials was slightly lower in 2019 than in 2018 (Table 2.3). In
the susceptible cultivars used as controls (including InVigor 5030), clubroot incidence and severity
was high in 2018 (CI = 92–100%, DSI = 83–99) and moderate in 2019 (CI = 67–99%, DSI = 49–
86). The resistant cultivars had low incidence and severity in both 2018 (CI = 2–5%, DSI = 1–2)
and 2019 (CI = 0–21%, DSI = 0–7).
Severe clubroot symptoms in susceptible canola cultivars were consistently associated with
reduced shoot weight (Table 2.3). The mean fresh shoot weight of susceptible canola cultivars
55
was 57% lower compared to the resistant cultivars in 2018. Dry shoot weight showed a similar
trend, but the differences were not always significant. In 2019, fresh and dry shoot weights were
higher in the CR cvs. L234PC and L255PC than the susceptible canola controls, but cvs. L241C
and L135C did not differ from the canola controls.
The clubroot reactions of canola cultivars in the growth room studies inoculated with
pathotype 2 were similar to their reactions in the field trials (Table 2.4). Both incidence and
severity were very low (CI and DSI = 0) in the resistant cultivars, but high in the other canola
cultivars and Mei Qing Choi (CI = 98–100%, DSI = 90–96). Clubroot incidence and severity in
the CR cvs. L255PC, L135C and L241C was very low, which confirmed that they were resistant
to pathotype 2, while cvs. L252, L233P, ACS N39, 5030 and the Shanghai pak choi cv. Mei
Qing Choi were susceptible to pathotype 2.
In the growth room studies, all of the InVigor cultivars and 45H29 were resistant to
pathotype 6 (CI = 0–8%, DSI = 0–4). Even the highly susceptible line ACS N39 had a relatively
low severity (DSI = 29), but Mei Qing Choi was highly susceptible (DSI = 100).

56
Table 2.3 Clubroot incidence (CI, %), disease severity index (DSI), and fresh weight and dry weight of clubroot susceptible and
resistant canola cultivars grown at the Muck Crops Research Station, ON, in 2018 and 2019.
Cultivar1
2018 2019
CI
(%)
DSI
(0–100 )
Fresh wt.
(g plant-1)
Dry wt.
(g plant-1)
CI
(%)
DSI
(0–100)
Fresh wt.
(g plant-1)
Dry wt.
(g plant-1)
Resistant
InVigor L234PC - - - - 0f 0e 109a 12.1a
InVigor L255PC 2c2 1d 130a 8.9a 21e 7d 123a 11.7a
InVigor L135C 2c 1d 108a 7.5abc 1f 0e 96ab 9.2ab
InVigor L241C 5c 2d 109a 8.3ab 1f 0e 83abc 7.7abc
45H29 - - - - 2ef 2de nd3 nd
Mod. susceptible
InVigor 5030 99a 95b 45b 4.8c 79bc 66b 42c 4.2c
Susceptible
Mei Qing Choi 92b 83c 254 1.2 67d 49c 504 1.5
InVigor L252 100a 99a 60b 5.8abc 71cd 66b 59bc 6.4bc
ACS N39 100a 98a 49b 5.6abc 81b 68b 46c 5.5bc
InVigor L233P 100a 98a 47b 5.2bc 99a 86a 52bc 6.0bc
1The expected clubroot reaction of cultivars was based on breeder descriptions: DSI <30% compared to a check is resistant, 30–50% is
moderately susceptible and >50% is susceptible. 2Means followed by the same letter in a column do not differ based on Tukey’s test at P = 0.05. 345H29 was stunted by herbicide, so the shoot weight could not be included. 4Mei Qing Choi was not included in the statistical analysis in both years because there was no resistant cultivar for comparison.
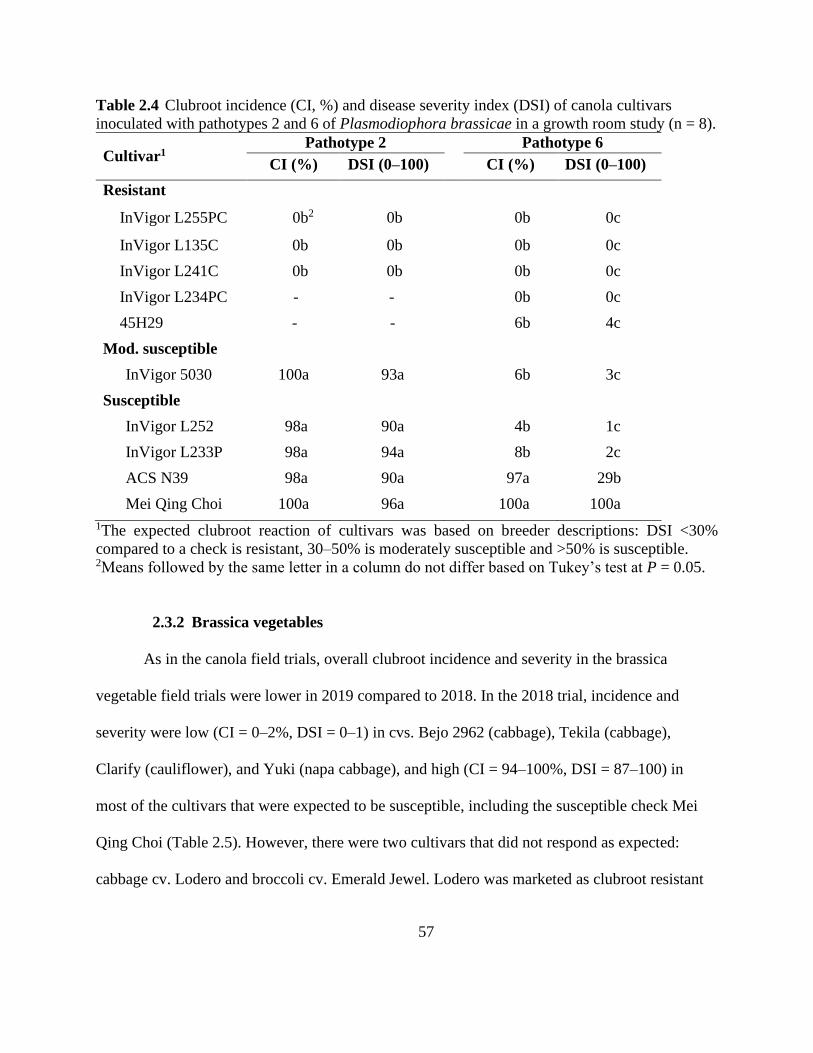
57
Table 2.4 Clubroot incidence (CI, %) and disease severity index (DSI) of canola cultivars
inoculated with pathotypes 2 and 6 of Plasmodiophora brassicae in a growth room study (n = 8).
Cultivar1 Pathotype 2 Pathotype 6
CI (%) DSI (0–100) CI (%) DSI (0–100)
Resistant
InVigor L255PC 0b2 0b 0b 0c
InVigor L135C 0b 0b 0b 0c
InVigor L241C 0b 0b 0b 0c
InVigor L234PC - - 0b 0c
45H29 - - 6b 4c
Mod. susceptible
InVigor 5030 100a 93a 6b 3c
Susceptible
InVigor L252 98a 90a 4b 1c
InVigor L233P 98a 94a 8b 2c
ACS N39 98a 90a 97a 29b
Mei Qing Choi 100a 96a 100a 100a
1The expected clubroot reaction of cultivars was based on breeder descriptions: DSI <30%
compared to a check is resistant, 30–50% is moderately susceptible and >50% is susceptible. 2Means followed by the same letter in a column do not differ based on Tukey’s test at P = 0.05.
2.3.2 Brassica vegetables
As in the canola field trials, overall clubroot incidence and severity in the brassica
vegetable field trials were lower in 2019 compared to 2018. In the 2018 trial, incidence and
severity were low (CI = 0–2%, DSI = 0–1) in cvs. Bejo 2962 (cabbage), Tekila (cabbage),
Clarify (cauliflower), and Yuki (napa cabbage), and high (CI = 94–100%, DSI = 87–100) in
most of the cultivars that were expected to be susceptible, including the susceptible check Mei
Qing Choi (Table 2.5). However, there were two cultivars that did not respond as expected:
cabbage cv. Lodero and broccoli cv. Emerald Jewel. Lodero was marketed as clubroot resistant

58
but developed severe symptoms (CI = 94%, DSI = 87), similar to the susceptible cabbage cv.
Bronco. Similarly, Emerald Jewel was marketed as clubroot resistant but developed severe
symptoms (CI = 97%, DSI = 87), similar to the susceptible broccoli cv. Asteroid. Clubroot
symptoms in rutabaga cv. Laurentian from both Stokes Seeds Ltd. and the University of
Wisconsin were intermediate, but considered susceptible because DSI was over 50% (CI = 64–
70%, DSI = 53–64). Severe clubroot symptoms were associated with reduced fresh shoot weight
(42–65%) in susceptible cultivars relative to resistant cultivars. Dry shoot weight showed a
similar trend, but was lower in broccoli cv. Asteroid than in Emerald Jewel. Also, dry shoot
weight did not differ between napa cabbage cvs. Yuki and Blue.
In 2019, incidence and severity were again low (CI = 0–21%, DSI = 0–9) in all of the
cultivars that were marketed as resistant. The susceptible cultivars had a range of reactions (CI =
12–77%, DSI = 3–55). Incidence and severity on the susceptible check Mei Qing Choi was also
quite low in 2019. Incidence and severity were lower in the cultivars marketed as resistant
compared to the susceptible cultivars. In contrast to 2018, incidence in cabbage cv. Lodero was
lower (CI = 12%) than in Bronco (48%). Clubroot severity in Lodero (DSI = 5) was midway
between the resistant cabbage cultivars (DSI = 0) and Bronco (DSI = 27). Incidence and severity
in broccoli cv. Emerald Jewel were also lower (CI = 21, DSI = 9) than in Asteroid (48%, 31).
Fresh and dry shoot weights were higher in the resistant cabbage cv. Bejo 2962 compared
to Bronco, but fresh and dry shoot weights of the other resistant cultivars were not greater than
the susceptible cultivars of the same crop.
In the growth room studies, the cultivars that were resistant when inoculated with
pathotype 2 were the same cultivars that were resistant in the 2018 field trial (Table 2.5 and
Table 2.6). Incidence and severity were low (CI = 0–4%, DSI = 0–4) in most of the resistant
59
cultivars and high (CI = 100%, DSI = 99–100) in the susceptible cultivars, including Mei Qing
Choi. Cabbage cv. Lodero and broccoli cv. Emerald Jewel were susceptible to pathotype 2,
which was consistent with the 2018 field trial.
There were more differences among the vegetable cultivars in the growth room study
inoculated with pathotype 6. Incidence and severity were low (CI = 0–7%, DSI = 0–5) in all of
the cultivars that were marketed as resistant (Table 2.6). Cabbage cv. Lodero, broccoli cv.
Emerald Jewel and rutabaga cv. Laurentian also had very low clubroot incidence and severity,
but the control cv. Mei Qing Choi was susceptible to both pathotypes.
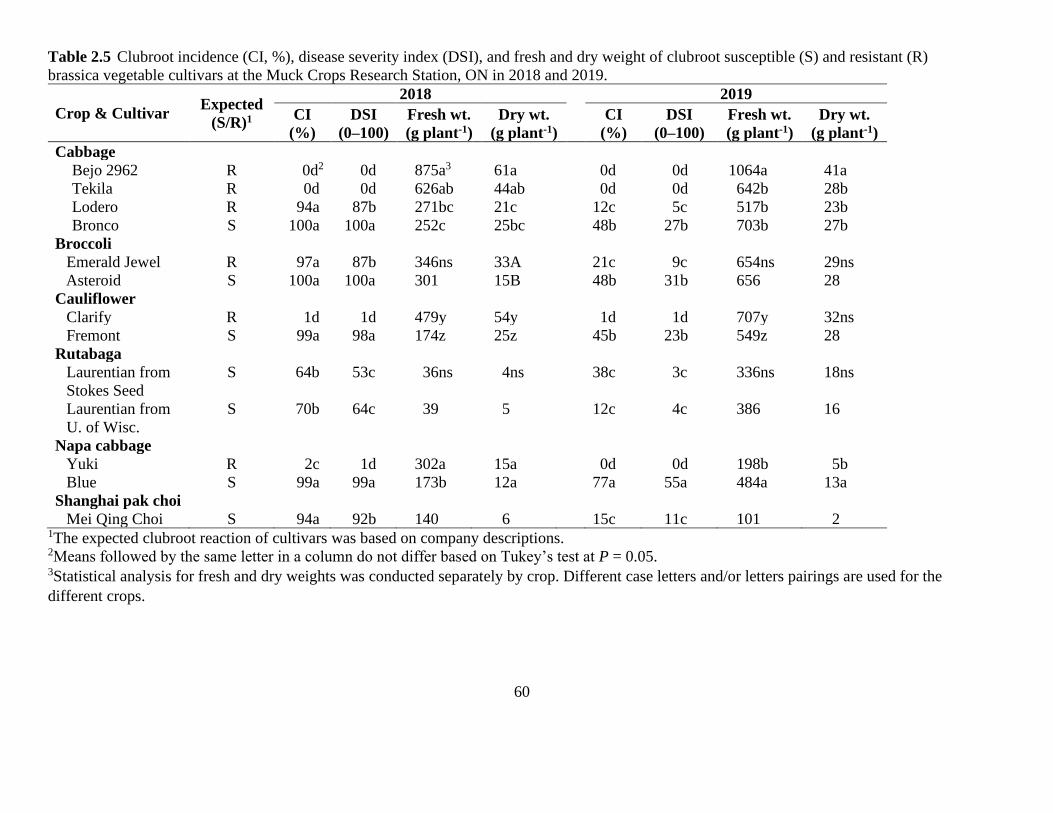
60
Table 2.5 Clubroot incidence (CI, %), disease severity index (DSI), and fresh and dry weight of clubroot susceptible (S) and resistant (R)
brassica vegetable cultivars at the Muck Crops Research Station, ON in 2018 and 2019.
Crop & Cultivar Expected
(S/R)1
2018 2019
CI
(%)
DSI
(0–100)
Fresh wt.
(g plant-1)
Dry wt.
(g plant-1)
CI
(%)
DSI
(0–100)
Fresh wt.
(g plant-1)
Dry wt.
(g plant-1)
Cabbage
Bejo 2962 R 0d2 0d 875a3 61a 0d 0d 1064a 41a
Tekila R 0d. 0d 626ab 44ab 0d 0d 642b 28b
Lodero R 94a. 87b 271bc 21c 12c 5c 517b 23b
Bronco S 100a. 100a 252c 25bc 48b 27b 703b 27b
Broccoli
Emerald Jewel R 97a. 87b 346ns 33A 21c 9c 654ns 29ns
Asteroid S 100a. 100a 301 15B 48b 31b 656 28
Cauliflower
Clarify R 1d. 1d 479y 54y 1d 1d 707y 32ns
Fremont S 99a. 98a 174z 25z 45b 23b 549z 28
Rutabaga
Laurentian from
Stokes Seed
S 64b. 53c 36ns 4ns 38c 3c 336ns 18ns
Laurentian from
U. of Wisc.
S 70b. 64c 39 5 12c 4c 386 16
Napa cabbage
Yuki R 2c. 1d 302a 15a 0d 0d 198b 5b
Blue S 99a. 99a 173b 12a 77a 55a 484a 13a
Shanghai pak choi
Mei Qing Choi S 94a. 92b 140 6 15c 11c 101 2 1The expected clubroot reaction of cultivars was based on company descriptions. 2Means followed by the same letter in a column do not differ based on Tukey’s test at P = 0.05. 3Statistical analysis for fresh and dry weights was conducted separately by crop. Different case letters and/or letters pairings are used for the
different crops.
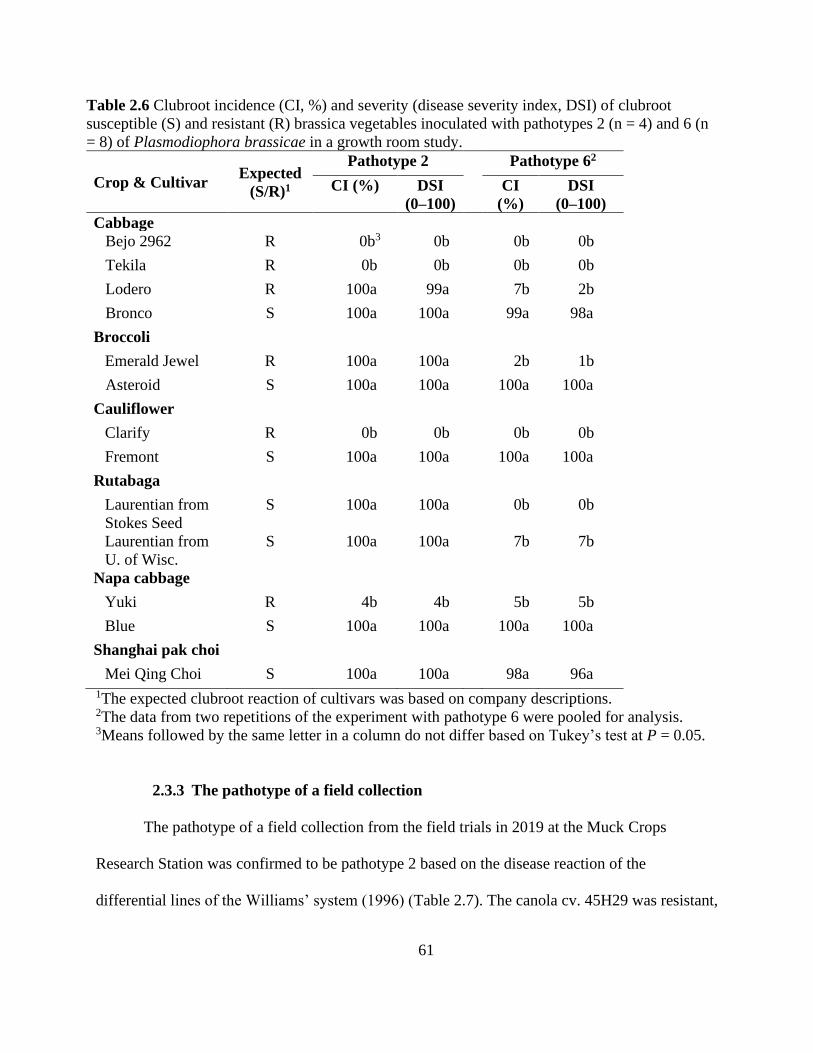
61
Table 2.6 Clubroot incidence (CI, %) and severity (disease severity index, DSI) of clubroot
susceptible (S) and resistant (R) brassica vegetables inoculated with pathotypes 2 (n = 4) and 6 (n
= 8) of Plasmodiophora brassicae in a growth room study.
Crop & Cultivar Expected
(S/R)1
Pathotype 2 Pathotype 62
CI (%) DSI
(0–100)
CI
(%)
DSI
(0–100)
Cabbage
Bejo 2962 R 0b3 0b 0b 0b
Tekila R 0b 0b 0b 0b
Lodero R 100a 99a 7b 2b
Bronco S 100a 100a 99a 98a
Broccoli
Emerald Jewel R 100a 100a 2b 1b
Asteroid S 100a 100a 100a 100a
Cauliflower
Clarify R 0b 0b 0b 0b
Fremont S 100a 100a 100a 100a
Rutabaga
Laurentian from
Stokes Seed
S 100a 100a 0b 0b
Laurentian from
U. of Wisc.
S 100a 100a 7b 7b
Napa cabbage
Yuki R 4b 4b 5b 5b
Blue S 100a 100a 100a 100a
Shanghai pak choi
Mei Qing Choi S 100a 100a 98a 96a
1The expected clubroot reaction of cultivars was based on company descriptions. 2The data from two repetitions of the experiment with pathotype 6 were pooled for analysis. 3Means followed by the same letter in a column do not differ based on Tukey’s test at P = 0.05.
2.3.3 The pathotype of a field collection
The pathotype of a field collection from the field trials in 2019 at the Muck Crops
Research Station was confirmed to be pathotype 2 based on the disease reaction of the
differential lines of the Williams’ system (1996) (Table 2.7). The canola cv. 45H29 was resistant,
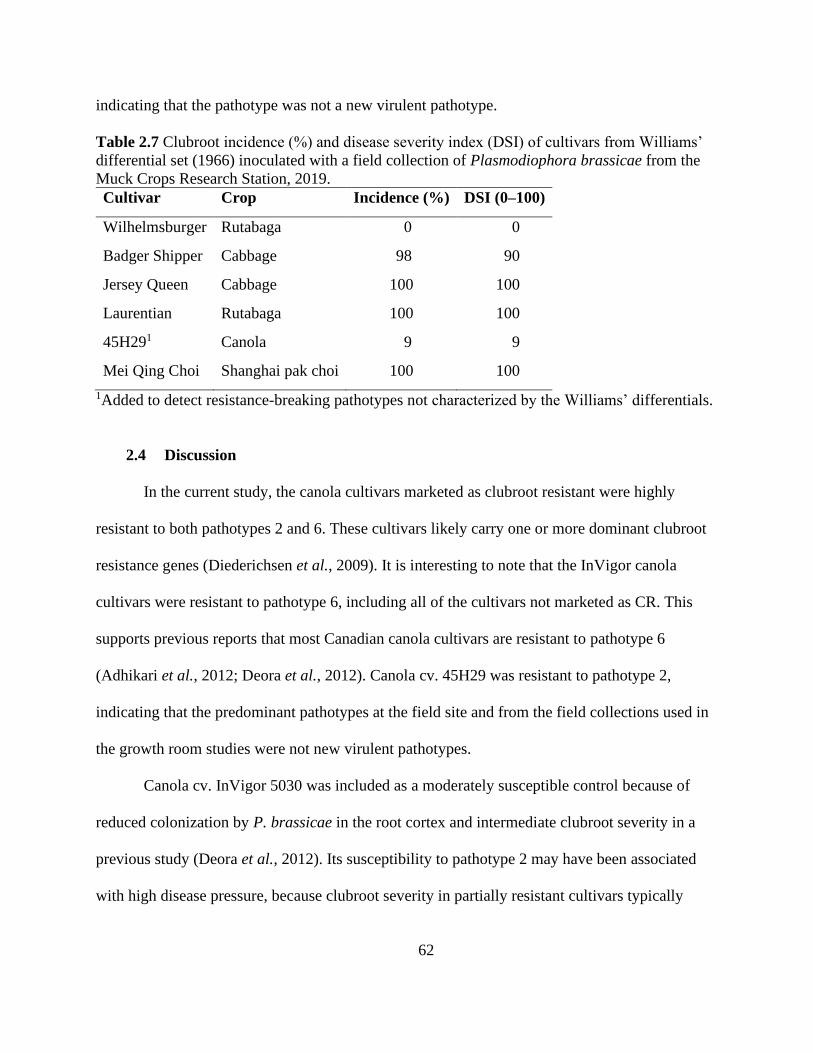
62
indicating that the pathotype was not a new virulent pathotype.
Table 2.7 Clubroot incidence (%) and disease severity index (DSI) of cultivars from Williams’
differential set (1966) inoculated with a field collection of Plasmodiophora brassicae from the
Muck Crops Research Station, 2019.
Cultivar Crop Incidence (%) DSI (0–100)
Wilhelmsburger Rutabaga 0 0
Badger Shipper Cabbage 98 90
Jersey Queen Cabbage 100 100
Laurentian Rutabaga 100 100
45H291 Canola 9 9
Mei Qing Choi Shanghai pak choi 100 100
1Added to detect resistance-breaking pathotypes not characterized by the Williams’ differentials.
2.4 Discussion
In the current study, the canola cultivars marketed as clubroot resistant were highly
resistant to both pathotypes 2 and 6. These cultivars likely carry one or more dominant clubroot
resistance genes (Diederichsen et al., 2009). It is interesting to note that the InVigor canola
cultivars were resistant to pathotype 6, including all of the cultivars not marketed as CR. This
supports previous reports that most Canadian canola cultivars are resistant to pathotype 6
(Adhikari et al., 2012; Deora et al., 2012). Canola cv. 45H29 was resistant to pathotype 2,
indicating that the predominant pathotypes at the field site and from the field collections used in
the growth room studies were not new virulent pathotypes.
Canola cv. InVigor 5030 was included as a moderately susceptible control because of
reduced colonization by P. brassicae in the root cortex and intermediate clubroot severity in a
previous study (Deora et al., 2012). Its susceptibility to pathotype 2 may have been associated
with high disease pressure, because clubroot severity in partially resistant cultivars typically
63
increases with increasing concentrations of inoculum (Hwang et al., 2017; Peng et al., 2019).
As with the CR canola cultivars, cabbage cvs. Bejo 2962 and Tekila, cauliflower cv.
Clarify and napa cabbage cv. Yuki, which had been marketed as clubroot resistant or tolerant,
were resistant to both pathotypes 2 and 6. In contrast, cabbage cv. Lodero and broccoli cv.
Emerald Jewel, which are also marketed as clubroot resistant or tolerant, were resistant to
pathotype 6 but susceptible to pathotype 2. However, it is important to note that the identification
of pathotype 2 in Ontario is a relatively new development (Al-Daoud et al., 2018), and pathotype
2 has been found almost exclusively on canola (McDonald et al., 2020a). The pathotype-specific
resistance found in the current study corresponds with a previous report that several brassica
vegetable cultivars, such as Brussels sprouts cv. Crispus, had pathotype-specific resistance while
other cultivars, such as bok choy cv. Bejo 2834 and napa cabbage cv. Bilko, were resistant to all
pathotypes assessed (pathotypes 2, 3, 5 and 6) (Sharma et al., 2013b). A study on the resistance
in the cv. Tekila showed that cortical infection was inhibited (Peng et al., 2019) and the clubroot
resistance gene, Rcr7 confers resistance to pathotype 3 in this cultivar (Dakouri et al., 2018).
Additional research to characterize the resistance in cvs. Bejo 2962, Clarify and Yuki might be
warranted.
Rutabaga cv. Laurentian is part of the Williams’ differential set, where it has been
characterized as susceptible to pathotype 2 and resistant to pathotype 6 (Williams, 1966). The
source of seed of Laurentian, from Stokes Seeds Ltd. or the University of Wisconsin, did not
affect the clubroot reactions to pathotypes 2 and 6. In the growth room trials, both seed sources
were susceptible to pathotype 2 and resistant to pathotype 6. In the field trials, both seed sources
had an intermediate reaction in 2018 but were resistant in 2019. The intermediate reaction was
likely due to the delayed emergence in 2018, but may also indicate that pathotype 6 is still an
64
important component of the pathogen population in some areas on the Muck Crops Research
Station. We conclude that seed of the Laurentian from commercial sources or from the
University of Wisconsin can be used interchangeably in Williams’ differential set and the CCD
differential set.
Two of the three differential cultivars for the B. oleracea differential system, Lodero and
Kilaton have been assessed at the Muck Crops Research Station. Seed of the third differential,
Bejo 51632, was not available. Lodero was highly to moderately susceptible in the field trials,
and highly susceptible to pathotype 2 in the growth room. Kilaton was highly resistant in other
field trials (Dr. M. R. McDonald, University of Guelph, personal communication). If the overall
reaction of Lodero is considered susceptible, this indicated that the predominant pathotype at the
MCRS could be pathotype Pb:3 in the B. oleracea system (Smilde et al., 2012). A study to
characterize the MCRS site and other vegetable fields in Canada based on the B. oleracea system
is clearly warranted.
Severe clubroot symptoms disrupt the vascular systems of roots, which restricts water
and nutrient uptake (Macfarlane and Last, 1959), and reduces plant height and yield (Hwang et
al., 2011b). In the current study, development of clubroot symptoms was associated with wilting
and reduced shoot weight in susceptible cultivars in the field trials. This difference was most
apparent and consistent in the 2018 field trials, when disease pressure was highest. In 2019,
shoot weights were generally higher in the resistant canola, cabbage and cauliflower cultivars
compared to susceptible cultivars, but the differences were not always statistically significant.
The smaller differences in biomass between resistant and susceptible cultivars in 2019 was likely
associated with lower clubroot severity. Similarly, a previous study on muck soil reported that
yield benefits of CR canola were smaller under low disease pressure relative to high disease

65
pressure (Sharma et al., 2013b).
Clubs developed on a small percentage of the plants of CR canola and brassica vegetable
cultivars in the field trials and growth room studies. Low clubroot incidence in resistant canola
cultivars has been reported previously (Hwang et al., 2019). This may be the result of off-types
in the seed lot (Canola Council of Canada, 2020b), or infection by virulent pathotypes present at
low concentrations in the pathogen population (Sedaghatkish et al., 2019). In the growth room
studies, the plants were inoculated with a high concentration of resting spores from field
collections, rather than single-spore isolates, which are not yet readily available for this
biotrophic pathogen. Virulent pathotypes may have been present at a low concentration in the
collection used for inoculum, and the high rate of inoculum used would have increased the
probability that some plants were exposed to virulent pathotypes other than the predominant
pathotype (Sedaghatkish et al., 2019).
The current study confirmed the clubroot resistance in Ontario of canola cultivars that are
marketed as CR on the Canadian Prairies, and also confirmed the resistance to pathotype 2 of
several vegetable cultivars marketed as clubroot resistant in Canada. Growers can use this
information to select cultivars based on the pathotype in a particular field, but need to be aware
that pathotypes can change over time. First-generation CR canola cultivars (e.g. 45H29)
currently provide effective clubroot reduction against the predominant pathotypes in Ontario,
pathotypes 2 and 6. However, growers should be aware that pathotypes that can overcome the
first-generation resistance have been identified in canola fields in Ontario (McDonald et al.,
2020a). Cultivars with more than one major CR gene may provide a more durable and broad-
spectrum resistance to clubroot (Kuginuki et al., 1999; Matsumoto et al., 2012). In addition,
alternating the source of resistance used in a field over time might delay or even prevent the
66
emergence of virulent pathotypes (Chu et al., 2013; Hwang et al., 2019), but this option is
currently not available because information about the source of resistance in most commercial
cultivars is not available to producers.
Monitoring for breakdown of resistance in CR cultivars is an important component of
clubroot management (Howard et al., 2010; Strelkov et al., 2018). Growers should also maintain
at least two years between clubroot susceptible crops in infested fields to reduce spore loads in
soil (Hwang et al., 2012a, 2019; Peng et al., 2014b, 2015; Sharma et al., 2013b) and to reduce
the risk of resistance erosion caused by selection for virulent pathotypes (Sedaghatkish et al.,
2019; Strelkov et al., 2018).
In summary, the canola cultivars marketed as resistant to clubroot (InVigor L234PC,
L255PC, L241C and L135C) were all resistant to pathotype 2 of P. brassicae from Ontario in
both the field and growth room trials. Also, all of the canola cultivars were resistant to pathotype
6 in the growth room studies. Cabbage cvs. Bejo 2962 and Tekila, cauliflower cv. Clarify and
napa cabbage cv. Yuki, which were marketed as resistant or tolerant to clubroot, were resistant to
pathotypes 2 and 6. Cabbage cv. Lodero and broccoli cv. Emerald Jewel, also marketed as
resistant or tolerant to clubroot, were resistant to pathotype 6 but susceptible to pathotype 2.
Pathotype 6 is still the predominant pathotype found in fields of brassica vegetables in Ontario,
so susceptibility to pathotype 2 is not an immediate concern. However, vegetable growers should
be aware of the potential of selecting for a more virulent pathotype that will overcome resistance.

67
CHAPTER THREE
3 Using field crops and liming to reduce resting spores in soil
3.1 Introduction
In canola cropping systems, a minimum of a one-year break between canola crops is
recommended, although a 2–3-year break provides additional benefits for pest management and
overall production (Canola Council of Canada, 2020a). Cereal and pulse crops are commonly
grown in rotation with canola in western Canada (Canola Council of Canada, 2020a; Gill, 2018).
In Ontario, canola is often grown in rotation with wheat, soybean, and corn (OMAFRA, 2020;
Ontario Grain Farmer Magazine, 2021).
More diversity in the cropping system is associated with higher canola yields (Gill, 2018;
Harker et al., 2015a). For example, the mean yield of canola was 11% higher following spring
wheat or field pea compared to continuous canola on the Canadian Prairies (Harker et al., 2018).
Including other crops in rotation with canola also reduces injury caused by pathogens and insects
(Harker et al., 2015a). For example, growing spring wheat before canola reduced blackleg
incidence compared to continuous canola (Harker et al., 2018). Populations of soil-borne
pathogens such as Fusarium, Pythium and Rhizoctonia also decreased with a greater diversity of
cropping rotation (Hwang et al., 2009).
Crop rotation is also effective in reducing populations of P. brassicae. The survival curve
of populations of resting spores in soil is typically a type III curve, where most resting spores die
in the first few years (Gossen et al., 2019), but the spores that survive can persist for many years
(Moxham and Buczacki, 1983). A minimum 2-year break from canola can reduce the
concentration of spores in the soil and increase canola yield (Gossen et al., 2017b; Hwang et al.,

68
2019; Peng et al., 2014b).
Inoculum levels of many pathogens can also be suppressed with the use of bait crops,
which stimulate the germination of soil-borne inoculum but do not allow the pathogen to
complete its life cycle. For example, host plants can be used as bait crops for P. brassicae if
removed from a field before P. brassicae can complete its life cycle. Removing a host after 4–5
weeks of growth was reported to reduce clubroot incidence and increase yield in a subsequent
host crop (Harling and Kennedy, 1991). However, mature resting spores were reported to be
present in clubs starting at 5 weeks following sowing in an infested site or inoculation. Also,
maturation of resting spores can continue after a host plant has been killed, so removal of
infected material from a field is important (Al-Daoud et al., 2020). If clubs form on even a small
number of bait plants, inoculum levels will increase because each club can contain millions or
billions of spores (Al-Daoud et al., 2020; Ingram and Tommerup, 1972; Hwang et al., 2015).
Bait crops for P. brassicae can also be nonhost crops that stimulate the germination of
resting spores (Ahmed et al., 2011; Friberg et al., 2005; Heath, 2000). Infection of nonhost crops
is generally restricted to the root hair infection stage, where primary plasmodia and zoosporangia
develop within root hairs, and secondary zoospores are released starting just 2 days after
infection (Liu et al., 2020; Murakami et al., 2000; Sharma et al., 2011b). These crops display
nonhost resistance, which can include both constitutive and induced defence responses (Heath,
2000; Niks and Marcel, 2009; Thordal-Christensen, 2003). Nonhost bait crops, such as perennial
ryegrass, leafy daikon, potato onion and creeping bentgrass, produce root exudates that stimulate
resting spore germination (Chen et al., 2018; Feng et al., 2012; Murakami et al., 2000). Root
exudates of perennial ryegrass stimulated the germination of a higher percentage of resting
spores than Chinese cabbage, which is a susceptible host (Friberg et al., 2005). Secondary

69
zoospores produced in root hairs cannot persist in soil for long periods because they do not have
cell walls that protect them against degradation (Moxham and Buczacki, 1983). They are
considered to be highly vulnerable to microbial organisms, temperature, pH, low moisture levels
and other soil factors and quickly disappear without a host to infect (Ayers, 1944; Suzuki et al.,
1992; Takahashi, 1994a), although the length of time that they survive is not known.
Grass cover crop species, including smooth bromegrass, meadow bromegrass and
perennial ryegrass, reduce the concentration of resting spores in soil under controlled conditions,
likely by stimulating resting spore germination (Sedaghatkish, 2020). The extensive root systems
of grass cover crops can also be useful in holding soil in place to prevent dispersal of resting
spores in a field. Therefore, grass species, especially perennial cover crops, are recommended for
patch management of clubroot and may have the added benefit of reducing resting spore
concentrations (Gossen et al., 2018).
Field studies assessing the effects of bait crops have faced limitations, including high
initial inoculum levels. It is difficult to detect small reductions in resting spore concentrations in
heavily infested fields (Ahmed et al., 2011; Friberg et al., 2006). In addition, the duration of
current studies may not be long enough for substantial reductions in spore levels (Ahmed et al.,
2011). Environmental conditions in the field can also interfere with the effect of bait crops, so
can make the extrapolation of controlled environment studies difficult (Friberg et al., 2006).
Applying large volumes of lime to raise soil pH is also an effective clubroot management
strategy. Soil pH levels between 5.0–6.5 are conducive to clubroot development (Gossen et al.,
2013). In early studies, calcium oxide, limestone and calcium hydroxide (Ca(OH)2) were shown
to suppress clubroot (Wellman, 1930). Calcium carbonate (CaCO3), dolomite (composed of

70
CaCO3 and MgCO3) and calcium cyanamide (CaCN2) also reduced resting spore levels in soil
(Murakami et al. 2002b; Naiki and Dixon, 1987). Commonly used forms of calcium carbonate,
which is a slow acting lime, include ground limestone, calcitic lime and dolomitic lime
(Campbell et al., 1985; McDonald et al., 2004; Wellman, 1930). Quicklime (calcium oxide,
CaO) is a highly unstable chemical that produces calcium hydroxide if sufficient moisture is
present in soil (Wellman, 1930). Calcium cyanamide, a granular fertilizer, is converted to
calcium oxide and urea in soil. It has also been reported to be effective in reducing clubroot
(Bélec et al., 2004; McDonald et al., 2004). Hydrated limes are composed of calcium hydroxide,
and are fast acting and highly effective against P. brassicae (Wellman, 1930). However,
hydrated limes are caustic, explosive and costly, which limits their use by growers (Anderson et
al., 2013). Applying calcium-rich organic waste to soil to increase soil pH also suppressed
clubroot development (Niwa et al., 2007).
Soil pH levels above 7.2 are generally suppressive to clubroot (Myers and Campbell,
1985; Gossen et al., 2013). Liming can inhibit the germination of resting spores in the
rhizosphere and reduce the concentration of resting spores (Murakami et al., 2002b; Niwa et al.,
2008). Calcium has some effects on clubroot that are separate from changes in soil pH (Hamilton
and Crête, 1978), such as inducing host resistance, which suppresses clubroot development
(Webster and Dixon, 1991b). High levels of calcium also reduce the motility of zoospores, the
development of plasmodia, and the formation and dehiscence of zoosporangia (Myers and
Campbell, 1985; Webster and Dixon, 1991b). The interaction of bait crops and liming on the
concentration of resting spores of P. brassicae is currently unknown. The interaction may be
antagonistic, because many nonhosts stimulate the germination of resting spores, but calcium in
the form of lime applied to raise soil pH inhibits resting spore germination (Friberg et al., 2005;
71
Rashid et al., 2013).
The main objective of this study was to determine if selected field crops reduce the
quantity of resting spores of P. brassicae in short-duration studies under controlled conditions. A
second objective was to assess the combined effect of a cereal crop and lime on resting spores in
soil to determine if the combination was more effective than each treatment alone.
3.2 Materials and methods
3.2.1 Field crop growth room study
Controlled environment studies were conducted at the University of Guelph to evaluate
the potential of selected field and cover crops to reduce resting spores of P. brassicae in soil. The
crops examined were: perennial ryegrass (Lolium perenne L.) cv. Norlea (provided by the Forage
breeding program at the University of Saskatchewan, Saskatoon, SK), spring wheat (Triticum
aestivum L.) cv. AAC Connery (Canterra Seeds, Balcarres, SK), barley (Hordeum vulgare L.)
cv. Trochu (SeCan, Ottawa, ON), soybean (Glycine max L.) cv. PRO 26X662N (ProSeeds-Sevita
International, Inkerman, Ontario), field pea (Pisum sativum L.) cv. CDC Meadow (Saskatchewan
Pulse Growers, Saskatoon, SK), and the clubroot-susceptible Shanghai pak choi (B. rapa var.
chinensis) cv. Mei Qing Choi (Stokes Seeds Ltd., St. Catharines, ON), which was included as a
positive control. A no-plant (bare soil) control was also included in the study. These crops are
common rotation crops in Ontario (soybean and barley) or the Prairie provinces (spring wheat,
field pea) (Canola Council of Canada, 2020a; Ontario Grain Farmer Magazine, 2021).
The growth medium was 2:1:1 by volume of mineral field soil (pH 6.4) from Elora,
Ontario, noncalcareous coarse sand (Hutcheson Sand & Mixes, Huntsville, ON) and soil-less
mix (L4A Sunshine Mix, Sun Gro Horticulture, MA). Sand and soil-less mix were added to
maintain soil texture. The soil for each replicate was prepared separately, with 1.4 kg of field
72
soil, 1.4 kg of sand and 0.2 kg of soil-less mix by weight for a total of 3.0 kg per replicate. This
growing medium (pH 6.4) was inoculated with resting spores of P. brassicae pathotype 2
obtained from clubbed roots of canola cv. ACS N39 grown for 9 weeks at the University of
Guelph Muck Crops Research Station, Holland Marsh, Ontario in 2017. The clubs were
maintained at -20°C after collection until use.
The inoculum was prepared following the methods of Sharma et al. (2011a). Briefly,
clubs were homogenized for 2 min with water in a commercial blender. The resulting spore
suspension was passed through eight layers of cheesecloth and the concentration of spores was
determined using a haemocytometer under a compound microscope. Each replicate was
inoculated separately, with a target of 5 × 10⁵ spores g-1 of soil which was chosen as it represents
moderate clubroot infestation (Wallenhammar et al., 2012). To inoculate, 7.5 mL of 2.0 × 10⁸
spores mL-1 was diluted with deionized water for a final spore suspension volume of 100 mL.
The inoculum was divided into two 50 mL falcon tubes and an EZ plant spray bottle was used to
apply the inoculum to the soil. The soil was spread out in a 74 cm × 46 cm × 15 cm bin to a
thickness of about 4 cm. The spray was applied at a 10 cm distance from the soil to moisten the
soil surface evenly. Then soil was mixed by hand for 30 sec. This process (inoculum sprayed,
soil mixed) was repeated 10 times, until all of the inoculum had been applied and incorporated,
to ensure that the inoculum was evenly distributed within the soil sample. The inoculated soil
was divided into sterilize 16 oz. plastic cups, where drainage holes had been punched into the
bottom of each cup. The study was arranged as a randomized complete block design, with six
replicates and one pot per experimental unit.
In the first run of the experiment, the cups were filled with 410 g of soil, and 15 seeds
were planted in each cup and thinned to 10 seedlings per cup at 6 days after planting (Figure

73
3.1). All crops were seeded at a 2.5 cm depth, except for perennial ryegrass, which was seeded
just below the soil surface. The soybean seed used in Run 1 did not germinate, so soybean was
not included in that initial assessment. Not all crops produced 10 plants in each replicate of Run
1, so 20 seeds were planted in each cup in Runs 2 and 3. The cups were filled with 385 g of soil
in Run 2 and 410 g in Run 3.
Figure 3.1 Seedlings of perennial ryegrass, wheat, barley, field pea, soybean, Shanghai
pak choi (susceptible control) and the no-plant control inoculated with Plasmodiophora
brassicae under controlled conditions.
The cups were each placed in a 20 cm × 16 cm × 10 cm plastic container and plants were
watered from the bottom with tap water adjusted to pH 6.0 with commercial white vinegar. In
Runs 2 and 3, the plants were watered based on field capacity, which was determined based on
soil bulk density and soil porosity (Reynolds et al., 2002). Soil bulk density was determined with
the following equation:
Bulk density (g cm−3) = Dry soil mass (g)
Soil volume (cm−3)
Porosity was determined with the following equation, with the assumption that particle
density was 2.65 g cm-3:

74
Porosity (%) = 1 − Bulk density (g cm−3)
2.65 g cm−3
Field capacity was considered as 50% of the porosity of the soil. The permanent wilting
point was considered as 50% of field capacity. Available water content was calculated as follows
(Reynolds et al., 2002):
Available water content (mL) = Field capacity (mL) − Permanent wilting point (mL)
The pots were initially weighed and watered to bring the soil to field capacity. Each pot
was weighed daily; when water content dropped below 50% of available water capacity, the pot
was watered to bring the soil back to field capacity. Adjustments were made to account for plants
weights after ~3 weeks of growth.
In each run, a fertilizer solution consisting of a 0.1% solution of nitrogen, phosphate,
potassium (20-20-20, Plant Products Classic, Brampton, ON), and magnesium sulfate was
applied weekly (from the bottom). The growth room was set at 24/19°C day/night, with 17-hr
photoperiod.
Pak choi was harvested at 6 weeks after seeding to avoid decay of clubs and loss of resting
spores back into the soil. The roots were assessed for clubroot severity on a 0–3 scale (Crête et
al., 1963), DSI was calculated as described previously. At 8 weeks after seeding, plants of the
other treatments were removed from their pots (Figure 3.2). Roots were extracted from the soil,
washed to remove excess soil, oven dried at 80ºC for 24 hr and root dry weight per pot was
measured. In addition, 20 g of soil from each replicate was air dried and then oven dried to
determine soil moisture content. The soil had a moisture content of 1% based on the difference
between air-dried and oven-dried soil.
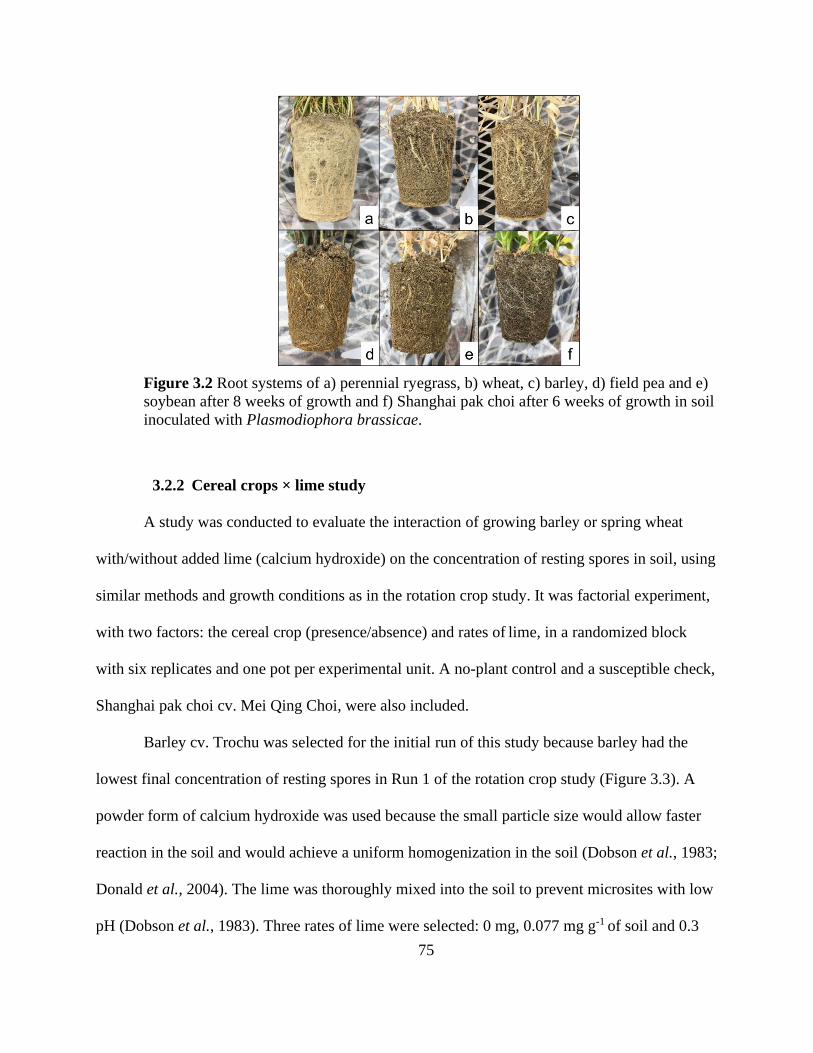
75
Figure 3.2 Root systems of a) perennial ryegrass, b) wheat, c) barley, d) field pea and e)
soybean after 8 weeks of growth and f) Shanghai pak choi after 6 weeks of growth in soil
inoculated with Plasmodiophora brassicae.
3.2.2 Cereal crops × lime study
A study was conducted to evaluate the interaction of growing barley or spring wheat
with/without added lime (calcium hydroxide) on the concentration of resting spores in soil, using
similar methods and growth conditions as in the rotation crop study. It was factorial experiment,
with two factors: the cereal crop (presence/absence) and rates of lime, in a randomized block
with six replicates and one pot per experimental unit. A no-plant control and a susceptible check,
Shanghai pak choi cv. Mei Qing Choi, were also included.
Barley cv. Trochu was selected for the initial run of this study because barley had the
lowest final concentration of resting spores in Run 1 of the rotation crop study (Figure 3.3). A
powder form of calcium hydroxide was used because the small particle size would allow faster
reaction in the soil and would achieve a uniform homogenization in the soil (Dobson et al., 1983;
Donald et al., 2004). The lime was thoroughly mixed into the soil to prevent microsites with low
pH (Dobson et al., 1983). Three rates of lime were selected: 0 mg, 0.077 mg g-1 of soil and 0.3
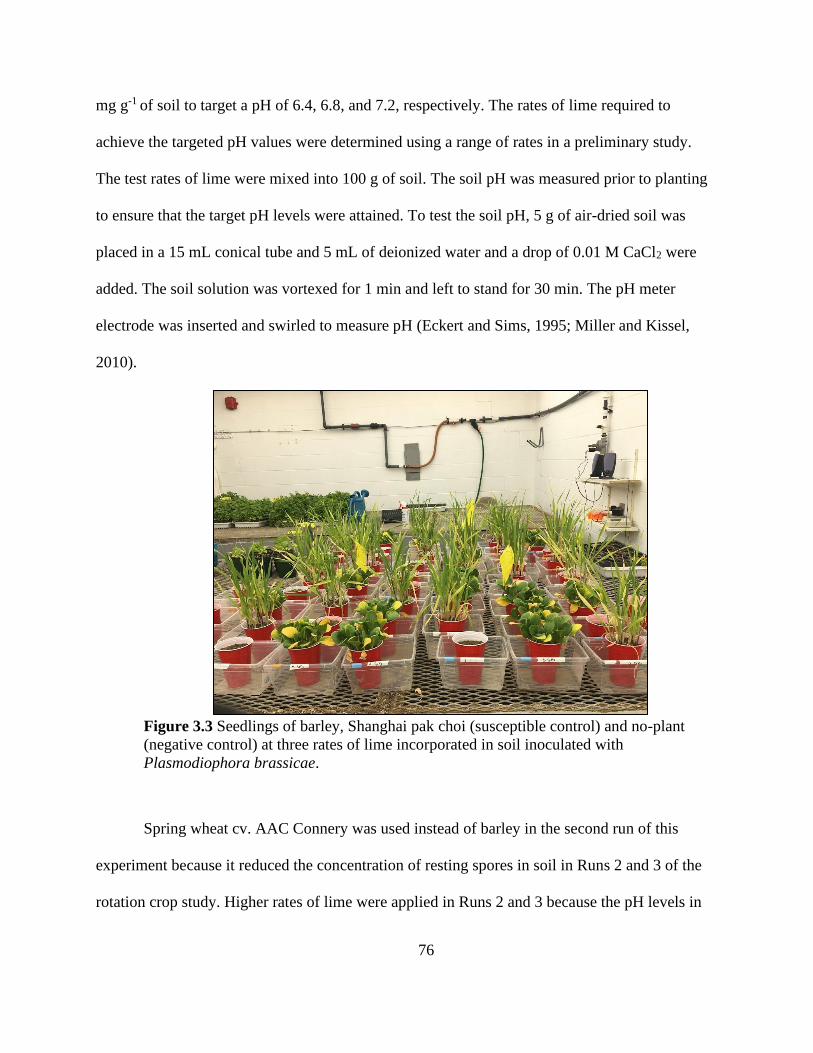
76
mg g-1 of soil to target a pH of 6.4, 6.8, and 7.2, respectively. The rates of lime required to
achieve the targeted pH values were determined using a range of rates in a preliminary study.
The test rates of lime were mixed into 100 g of soil. The soil pH was measured prior to planting
to ensure that the target pH levels were attained. To test the soil pH, 5 g of air-dried soil was
placed in a 15 mL conical tube and 5 mL of deionized water and a drop of 0.01 M CaCl2 were
added. The soil solution was vortexed for 1 min and left to stand for 30 min. The pH meter
electrode was inserted and swirled to measure pH (Eckert and Sims, 1995; Miller and Kissel,
2010).
Figure 3.3 Seedlings of barley, Shanghai pak choi (susceptible control) and no-plant
(negative control) at three rates of lime incorporated in soil inoculated with
Plasmodiophora brassicae.
Spring wheat cv. AAC Connery was used instead of barley in the second run of this
experiment because it reduced the concentration of resting spores in soil in Runs 2 and 3 of the
rotation crop study. Higher rates of lime were applied in Runs 2 and 3 because the pH levels in
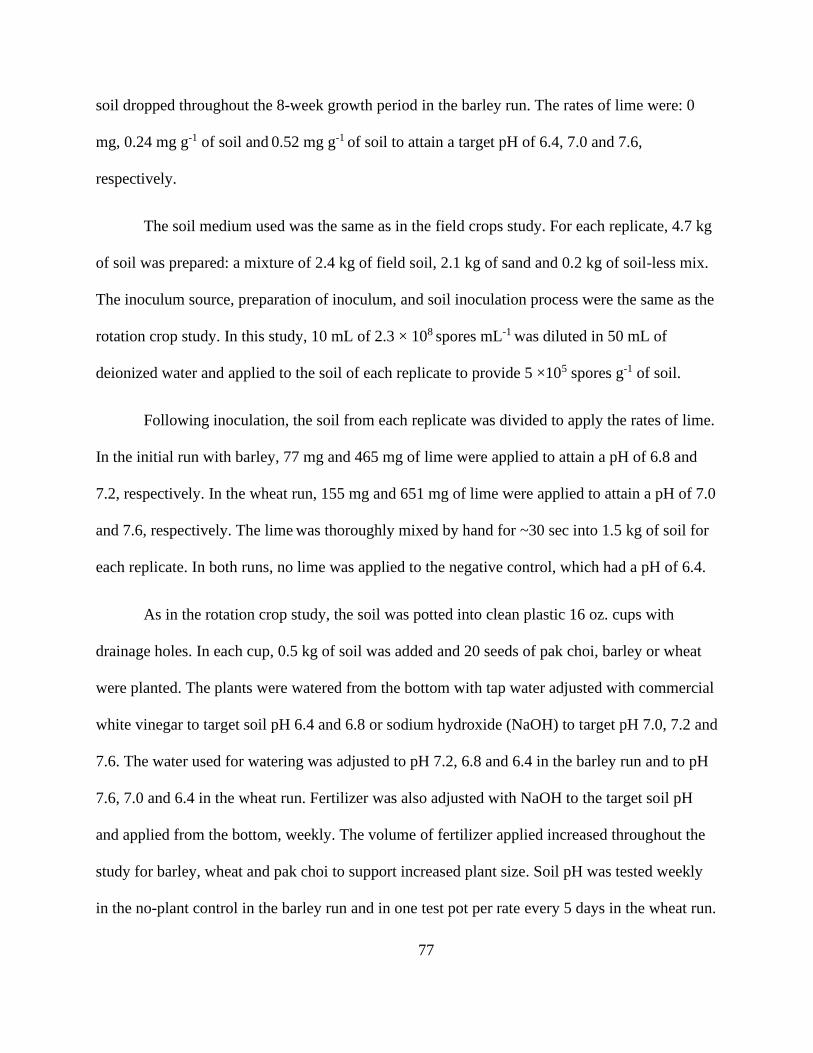
77
soil dropped throughout the 8-week growth period in the barley run. The rates of lime were: 0
mg, 0.24 mg g-1 of soil and 0.52 mg g-1 of soil to attain a target pH of 6.4, 7.0 and 7.6,
respectively.
The soil medium used was the same as in the field crops study. For each replicate, 4.7 kg
of soil was prepared: a mixture of 2.4 kg of field soil, 2.1 kg of sand and 0.2 kg of soil-less mix.
The inoculum source, preparation of inoculum, and soil inoculation process were the same as the
rotation crop study. In this study, 10 mL of 2.3 × 10⁸ spores mL-1 was diluted in 50 mL of
deionized water and applied to the soil of each replicate to provide 5 ×10⁵ spores g-1 of soil.
Following inoculation, the soil from each replicate was divided to apply the rates of lime.
In the initial run with barley, 77 mg and 465 mg of lime were applied to attain a pH of 6.8 and
7.2, respectively. In the wheat run, 155 mg and 651 mg of lime were applied to attain a pH of 7.0
and 7.6, respectively. The lime was thoroughly mixed by hand for ~30 sec into 1.5 kg of soil for
each replicate. In both runs, no lime was applied to the negative control, which had a pH of 6.4.
As in the rotation crop study, the soil was potted into clean plastic 16 oz. cups with
drainage holes. In each cup, 0.5 kg of soil was added and 20 seeds of pak choi, barley or wheat
were planted. The plants were watered from the bottom with tap water adjusted with commercial
white vinegar to target soil pH 6.4 and 6.8 or sodium hydroxide (NaOH) to target pH 7.0, 7.2 and
7.6. The water used for watering was adjusted to pH 7.2, 6.8 and 6.4 in the barley run and to pH
7.6, 7.0 and 6.4 in the wheat run. Fertilizer was also adjusted with NaOH to the target soil pH
and applied from the bottom, weekly. The volume of fertilizer applied increased throughout the
study for barley, wheat and pak choi to support increased plant size. Soil pH was tested weekly
in the no-plant control in the barley run and in one test pot per rate every 5 days in the wheat run.

78
Clubroot disease severity on pak choi was evaluated at 6 weeks after seeding using the
standard 0–3 scale described above. The soil from the barley/wheat and no-plant control
treatments was removed from the cups after 8 weeks. Barley or wheat roots were extracted, and
root dry weight per pot was measured after oven drying at 60ºC for 4 days.
3.2.3 Propidium monoazide (PMA)-qPCR analysis
The quantity of P. brassicae DNA in soil was determined in Runs 1 and 2 of the rotation
crop study and in the barley run of the cereal crop × lime study using standard quantitative
Polymerase Chain Reaction (qPCR) methods, and the quantity of total spores and viable spores
was determined using PMA-qPCR (Al-Daoud et al., 2017b). Pre-plant soil samples were taken
from each replicate to quantify the initial concentration of spores and post-plant samples were
taken from each experimental unit to quantify the final concentration of spores. Air-dried soil
samples of 1 g were ground to a fine powder with a mortar and pestle. The samples were
vortexed with 5 mL of deionized water in 50 mL falcon tubes for 2 min. The samples were left to
stand overnight.
The next day, propidium monoazide (PMA) was applied following the methods of Al-
Daoud et al. (2017b) to allow only the viable resting spores to be amplified with qPCR. The
spore suspensions were vortexed for 2 min and for each sample, 94 µL was dispensed into four
1.5 mL microcentrifuge tubes. In each tube, 6 µL of PMA- (equivalent to 120 uM PMA) or
DEPC-treated water (Invitrogen) were added. The water control was included to allow both
viable and nonviable resting spores to be amplified during qPCR. For each sample, two
subsamples were taken for each treatment (PMA and water). During this procedure, lights were
dimmed, and the PMA stock solution and the samples treated with PMA were covered with
aluminium foil to prevent PMA from reacting prematurely.

79
The samples were vortexed, spun in a mini-centrifuge and placed in a shaker at 300 rmp
for 30 min. The samples were placed on ice and exposed to 500-W halogen light (Globe Electric
Company) at a 20 cm distance from the samples for 15 min. The samples were flash frozen with
liquid nitrogen and stored at -80°C until DNA extraction was performed.
PMA was not utilized in Run 3 of the rotation crop study or in the wheat run of the crop
× lime study because there were no differences between the concentration of spores in the PMA-
and water-treated samples in Runs 1 and 2 of the rotation crop study or the barley run of the crop
× lime study. Instead, three subsamples were assessed for each experimental unit.
A DNeasy® PowerSoil® Kit (Qiagen) was used for extraction of P. brassicae DNA from
samples following the manufacturer’s instructions. A DNeasy® PowerSoil® Pro Kit (Qiagen)
was used for the post-plant samples in the wheat run of the crop × lime study because production
of the DNeasy® PowerSoil® Kit had been discontinued. For Runs 2 (post-plant) and 3 (pre-plant
and post-plant) of the rotation crop study and for the crop × lime study (pre-plant and post-plant),
a few small improvements were made based on methods by Wen et al. (2020). Specifically, the
soil samples and PowerBead Solution were homogenized three times for 1 min each with a
MiniG automated tissue homogenizer and cell lyser (SPEX SamplePrep) to maximize cell lysis.
In addition, the samples were eluted in 200 µL instead of 100 µL of elution buffer. All samples
were stored at -20°C until used for qPCR analysis.
The samples were quantified with qPCR using a TaqMan multiplex system. A forward
primer (DC1F) and a reverse primer (DC1mR) for P. brassicae were used (Table 3.1). The
P. brassicae probe had a FAM reporter dye at the 5’ end and an NFQ-MGB quencher at the 3’
end. A competitive internal positive control (CIPC) from a plasmid with a variant of the gene

80
coding for GFP (Deora et al., 2015) was used to assess amplification inhibition in each run. A
GFP probe with a VIC reporter dye at the 5’ end and an NFQ-MGB quencher at the 3’ end was
used to quantify the CIPC amplification. Serial dilutions of P. brassicae resting spore
suspensions from 103 to 107 spores were used to create a standard curve. Technical triplicates for
each subsample were analyzed.
The qPCR assays were conducted in a 96-well plate StepOnePlus real-time PCR system
(Applied Biosystems) using StepOne v2.1 software. The qPCR assays were run on a machine in
the Crop Sciences building at the University of Guelph, except for the wheat run of the crop ×
lime study, which was run at the Advanced Analysis Centre at the University of Guelph. The run
conditions were 50°C for 2 min, 95°C for 10 min, 40 cycles of 95°C for 15 sec and 62°C for 1
min. Results were analyzed if the assay efficiency was 90–110% and the R2 ≥ 0.93, based on the
standard curve. Due to technical challenges with the thermal cycler during the barley run of the
crop × lime study, assays were analyzed when R2 ≥ 0.87. The concentration of spores was
calculated as spores per gram of oven-dried soil based on the 1% moisture content of the air-
dried soil. The quantification cycle (Cq) of the CIPC in the no-template control was 28 to 35.
Samples were adjusted for inhibition based on the Cq in the no-template control. If inhibition
was high (∆Cq ≥ 3), the samples were repeated or diluted. In Run 1 of the rotation crop study, a
maximum Cq variation of 2 was set between technical replicates as there was more variability in
the estimates due to inexperience with qPCR. In Runs 2 and 3 of the rotation crop study and in
the wheat run of the crop × lime study, a smaller maximum Cq variation of 1.3 was used. Due to
challenges with the qPCR machine in Crop Science that reduced the efficiency of the assays, a
wider maximum Cq variation of 1.5 was set between technical replicates for the barley run of the
crop × lime study. Technical replicates were removed from the calculation for the mean for the

81
subsample if the maximum Cq variation threshold was exceeded. If two of the technical
replicates for an experimental unit exceeded the maximum Cq variation threshold, all three
technical replicates were repeated.
Table 3.1 qPCR reaction reagents, concentrations and volumes used to quantify
Plasmodiophora brassicae DNA in inoculated soil.
Reagents Concentration Quantity per reaction (µL)
Water 1.4
Taqman Universal PCR Master Mix 10.0
Forward primer (DC1F) 10 µmol 1.8
Reverse primer (DC1mR) 10 µmol 1.8
Plasmodiophora brassicae probe 10 µmol 0.5
GFP probe 10 µmol 0.5
Internal control 10-7 ng µL-1 2.0
Sample DNA 2.0
Total volume 20.0
3.2.4 Evans blue stain
Evans blue staining and light microscopy were evaluated to assess the concentration of
viable and nonviable resting spores as an alternative to PMA-qPCR. For this procedure, 50 µL of
resting spore suspension in 1.5 mL microcentrifuge tubes were treated with 50 µL of 20 mg mL-1
Evans blue stain solution. The Evans blue stain was prepared using deionized water. The spore
suspensions were incubated at room temperature for over 8 hrs (Harding et al., 2019). Resting
spores with dark blue-stained cytoplasm were considered to be nonviable. One hundred resting
spores were counted for each experimental unit using bright field microscopy and the percentage
of viable spores was determined.
To verify the efficacy of the Evans blue stain procedure, Evans blue-treated spore
suspensions were heat treated at 80°C for 72 hr to kill the spores. Spores stained with Evans blue

82
prior to the heat treatment were compared to spores stained with Evans blue after the heat
treatment using ×125 magnification on a bright field compound microscope. There was no
difference between the two approaches. The heat-treated spore suspensions were mixed with
non-heat-treated spore suspensions (also treated with Evans blue) at six ratios of non-heated to
heat-treated spores: 1:0, 4:1, 3:2, 3:2, 1:4, and 0:1. Six replicates were prepared, with one 100 µL
spore suspension mixture for each treatment ratio as the experimental unit. For each mixture, 10
µL of each spore suspension was dispensed onto a slide and the viability of 100 spores was
assessed using ×125 magnification on a bright field compound microscope.
3.2.5 Statistical analysis
All statistical analyses were conducted in SAS 9.4 (SAS Institute, Cary, IN).
Concentrations of resting spores in soil and dry root weight per pot were analyzed in PROC
GLIMMIX, and Tukey’s test was used for means separation. A type 1 error rate of P = 0.05 was
set for all statistical tests. The Shapiro-Wilk test and scatter plots of the residuals were used to
evaluate the normality of the data. Spore concentration was analyzed based on a lognormal
distribution. The spore concentration of the pak choi control was excluded from statistical
analyses of crop treatments because it was expected to increase over time rather than decrease. A
factorial analysis was used to evaluate Runs 1 and 2 of the rotation crop study. The two factors
were the evaluation method (PMA- or water-treated) and crop. There was no difference in spore
numbers between the PMA- and water-treated spores and no interaction between these factors in
either run. Therefore, the PMA- and water-treated samples were treated as subsamples. Variance
analyses of the rotation crop study showed that the three runs could not be pooled, so each run
was assessed separately. Dry root weight per pot among crop species was analyzed based on a
normal distribution. Pearson correlations were used to examine the relationship between the

83
concentration of resting spores and root weight among all crops and within each crop species
using PROC CORR.
The crop × lime study was also analyzed as a factorial design with two factors: crop
(cereal and no-plant control) and the lime rate. PMA application (PMA- or water-treated) was
initially included as a factor in the barley run, but was dropped from the subsequent analyses
because PMA did not affect spore concentration, based on data from the rotation crop studies.
Therefore, the PMA- and water-treated samples were treated as subsamples.
A mixed model analysis of variance (ANOVA) was conducted using PROC GLIMMIX
for the crop treatment (cereal and no-plant control) and pak choi, where the fixed effects were
the crop treatment and lime rate, and the random effects were block and subsample within block.
Orthogonal contrasts were used to determine if rate of lime had a linear or quadratic effect on
spore concentration. If significant linear or quadratic relationships were present, regression
analysis, estimation of regression coefficients and comparison of regression responses were
conducted. Efron’s pseudo R2 values were used to describe the fit of the regression equations
using PROC CORR.
Spore concentration from the pak choi treatment was analyzed among lime rates based on
a lognormal distribution and are presented in tables and text as back transformed least square
means. The effect of lime rate on CI and DSI in pak choi was analyzed based on a binomial
distribution in PROC GLIMMIX. Dry root weight per pot in barley and wheat among lime rates
were analyzed based on a normal distribution. The effect of the crop treatment (barley/wheat, no-
plant control and pak choi) on soil pH at the end of the experiment at each individual lime rate
was analyzed based on a normal distribution using PROC GLIMMIX.

84
Studentized residuals were evaluated to identify outliers in the data. One outlier was
removed from Run 2 of the rotation crop study (a water-treated subsample from the field pea
treatment in replicate 1). Three outliers were removed from the wheat study (all subsamples from
the no-plant control at pH 7.6 in replicate 6). One outlier was removed from the pak choi
samples in the wheat study (a subsample at pH 7.6 in replicate 6).
3.3 Results
3.3.1 Field crop study - Run 1
In Run 1 of the field crop study, clubroot development was severe in Shanghai pak choi
cv. Mei Qing Choi (CI = 100%, DSI = 100) after 6 weeks of growth. Some decay was observed
in the clubs. Perennial ryegrass, barley and field pea did not have 10 plants in each pot, and the
soybean treatment had to be dropped entirely because of low seedling emergence. Growth was
stunted and leaf yellowing occurred in all the crops except for perennial ryegrass, and was
particular severe in field pea. There were 46 of 122 samples that were not analyzed because they
did not amplify, or they exceeded the maximum Cq variation of 2. These samples were not
specific to any treatment or replicate. No clubs developed in any of the field crops or perennial
ryegrass.
There were no differences between the PMA- and water-treated samples in pre- or post-
plant concentration of spores. This indicated that most or all of the spores were viable or that
compounds in the soil interfered with the activity of the PMA, so these samples were treated as
subsamples. The soil was inoculated with resting spores to target 5 × 10⁵ spores g-1 and the mean
pre-plant concentration of resting spores tested with qPCR was 2.3 × 10⁵ spores g-1. The
concentration of spores increased to 2.5 × 10⁷ spores g-1 in the pak choi susceptible control and
decreased to 5.2 × 10⁴ spores g-1 in the no-plant control. There were no differences in the post-
85
plant concentration of spores among the crop treatments (Table 3.2). Resting spore counts ranged
from 3.8 × 10⁴ to 8.7 × 10⁵ spores g-1. There was a significant effect of block in the analysis of
spore concentrations (P = 0.02).
Dry root weight per pot was higher in perennial ryegrass than barley or field pea. Also,
the dry weight of roots of field pea was lower than wheat roots. There was no correlation
between root weight and concentration of spores when analyzed across crops or within
individual crop species (Table 3.2).
Table 3.2 Effect of field and cover crop species on the concentration of resting spores of
Plasmodiophora brassicae in soil and root dry weight in Run 1 after 8 weeks of growth. Resting
spore concentration was based on standard qPCR analysis (n = 6).
Crop Cultivar Resting spore concentration1
(spores g-1)
Root dry weight
(g pot-1)
Pre-plant mean 2.3 × 10⁵ nd
Perennial ryegrass Norlea 8.7 × 10⁵ ns2 5.3 a3
Field pea Meadow 7.6 × 10⁴ 0.6 c
Wheat AAC Connery 5.5 × 10⁴ 3.5 ab
No-plant (control) 5.2 × 10⁴ nd
Barley Trochu 3.8 × 10⁴ 2.6 bc 1Resting spore concentration data were analyzed based on a lognormal distribution and presented
as back transformed least square means. nd = not done. 2ns = not significant. 3Means followed by the same letter in a column do not differ based on Tukey’s test at P = 0.05.
3.3.2 Field crop study - Runs 2 and 3
In Runs 2 and 3 of the field crop study, plant growth was improved, and yellowing was
reduced compared to Run 1, likely in response to the change to watering based on field capacity.
Each crop treatment had 10 plants per pot. No clubs developed in any crop, except Shanghai pak
choi, where clubroot was severe (CI = 100%, DSI = 100). The clubs in pak choi had started to
decay when harvested at 6 weeks after planting.
As in Run 1, there were no differences between the PMA- and water-treated samples for
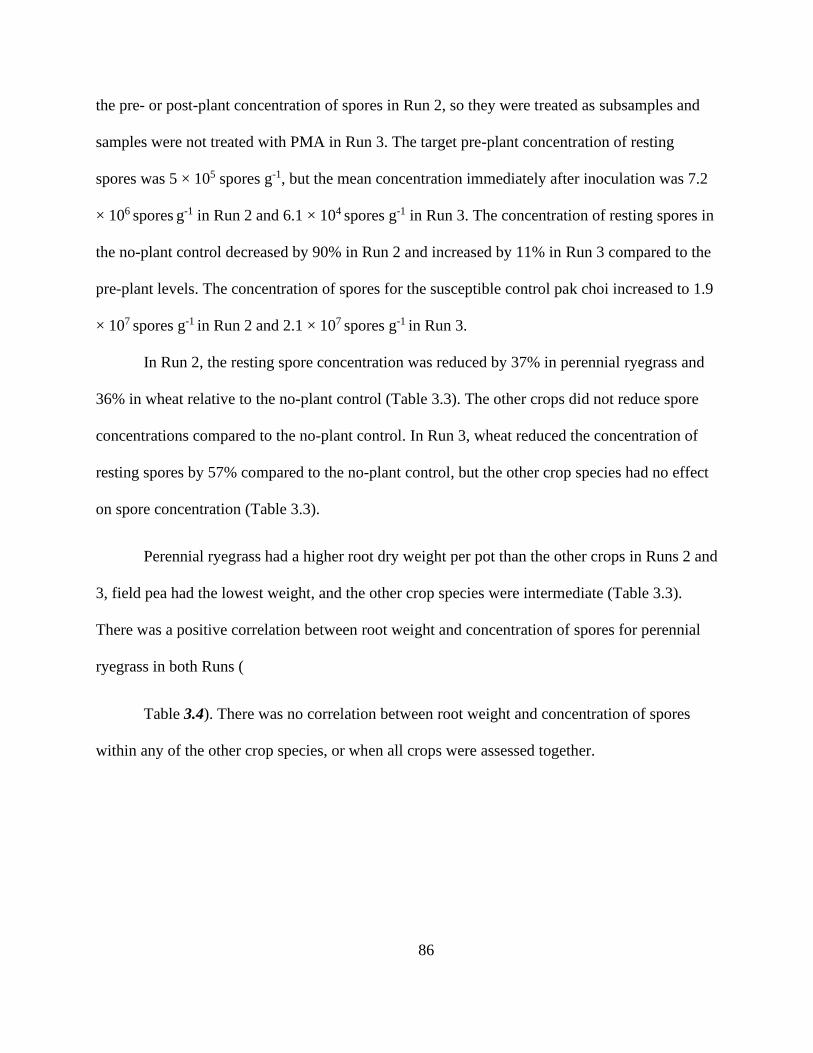
86
the pre- or post-plant concentration of spores in Run 2, so they were treated as subsamples and
samples were not treated with PMA in Run 3. The target pre-plant concentration of resting
spores was 5 × 10⁵ spores g-1, but the mean concentration immediately after inoculation was 7.2
× 106 spores g-1 in Run 2 and 6.1 × 10⁴ spores g-1 in Run 3. The concentration of resting spores in
the no-plant control decreased by 90% in Run 2 and increased by 11% in Run 3 compared to the
pre-plant levels. The concentration of spores for the susceptible control pak choi increased to 1.9
× 107 spores g-1 in Run 2 and 2.1 × 10⁷ spores g-1 in Run 3.
In Run 2, the resting spore concentration was reduced by 37% in perennial ryegrass and
36% in wheat relative to the no-plant control (Table 3.3). The other crops did not reduce spore
concentrations compared to the no-plant control. In Run 3, wheat reduced the concentration of
resting spores by 57% compared to the no-plant control, but the other crop species had no effect
on spore concentration (Table 3.3).
Perennial ryegrass had a higher root dry weight per pot than the other crops in Runs 2 and
3, field pea had the lowest weight, and the other crop species were intermediate (Table 3.3).
There was a positive correlation between root weight and concentration of spores for perennial
ryegrass in both Runs (
Table 3.4). There was no correlation between root weight and concentration of spores
within any of the other crop species, or when all crops were assessed together.
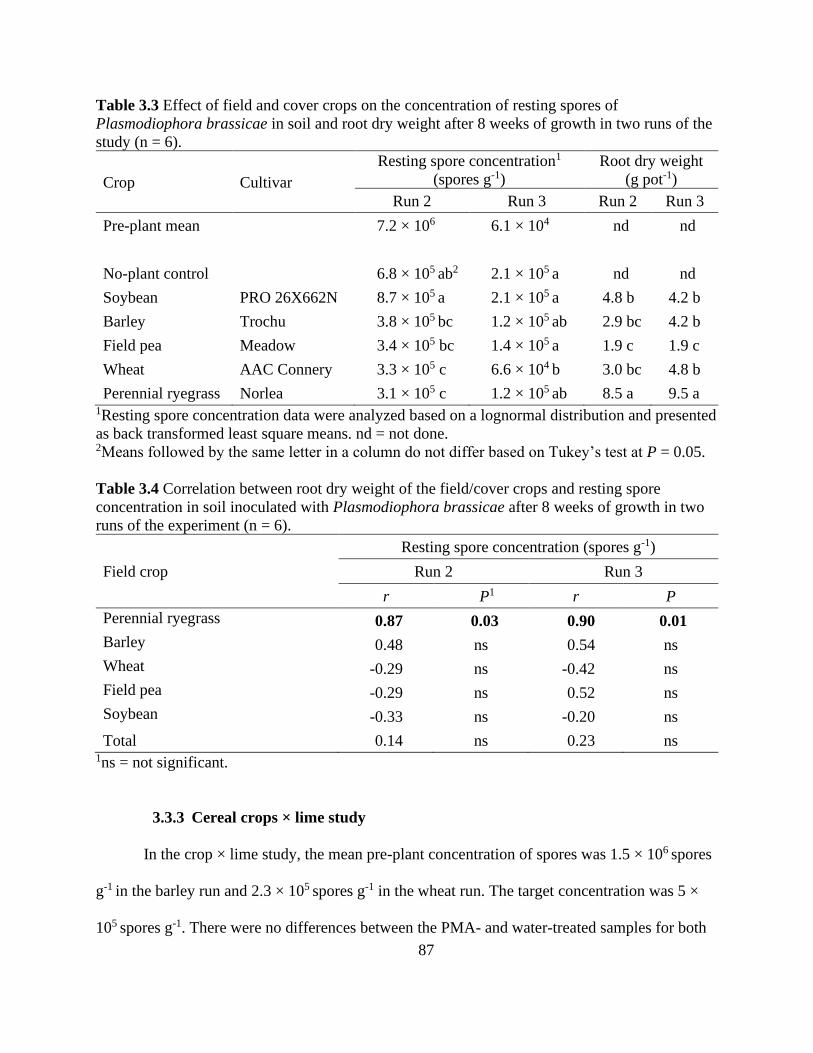
87
Table 3.3 Effect of field and cover crops on the concentration of resting spores of
Plasmodiophora brassicae in soil and root dry weight after 8 weeks of growth in two runs of the
study (n = 6).
Crop Cultivar
Resting spore concentration1
(spores g-1)
Root dry weight
(g pot-1)
Run 2 Run 3 Run 2 Run 3
Pre-plant mean 7.2 × 10⁶ 6.1 × 10⁴ nd nd
No-plant control 6.8 × 10⁵ ab2 2.1 × 10⁵ a nd nd
Soybean PRO 26X662N 8.7 × 10⁵ a 2.1 × 10⁵ a 4.8 b 4.2 b
Barley Trochu 3.8 × 10⁵ bc 1.2 × 10⁵ ab 2.9 bc 4.2 b
Field pea Meadow 3.4 × 10⁵ bc 1.4 × 10⁵ a 1.9 c 1.9 c
Wheat AAC Connery 3.3 × 10⁵ c 6.6 × 10⁴ b 3.0 bc 4.8 b
Perennial ryegrass Norlea 3.1 × 10⁵ c 1.2 × 10⁵ ab 8.5 a 9.5 a 1Resting spore concentration data were analyzed based on a lognormal distribution and presented
as back transformed least square means. nd = not done. 2Means followed by the same letter in a column do not differ based on Tukey’s test at P = 0.05.
Table 3.4 Correlation between root dry weight of the field/cover crops and resting spore
concentration in soil inoculated with Plasmodiophora brassicae after 8 weeks of growth in two
runs of the experiment (n = 6).
Field crop
Resting spore concentration (spores g-1)
Run 2 Run 3
r P1 r P
Perennial ryegrass 0.87 0.03 0.90 0.01
Barley 0.48 ns 0.54 ns
Wheat -0.29 ns -0.42 ns
Field pea -0.29 ns 0.52 ns
Soybean -0.33 ns -0.20 ns
Total 0.14 ns 0.23 ns 1ns = not significant.
3.3.3 Cereal crops × lime study
In the crop × lime study, the mean pre-plant concentration of spores was 1.5 × 10⁶ spores
g-1 in the barley run and 2.3 × 10⁵ spores g-1 in the wheat run. The target concentration was 5 ×
105 spores g-1. There were no differences between the PMA- and water-treated samples for both
88
the pre- or post-plant concentration of spores in the barley run, so these were treated as
subsamples, and PMA was not assessed in the wheat run. Compared to the pre-plant levels, the
concentration of spores increased in the no-plant control by 41% in the barley run and by 20% in
the wheat run.
In the barley run, there was a main effect of crop; the concentration of resting spores was
higher (P = 0.02) after barley (2.6 × 10⁶ spores g-1) compared to the no-plant control (1.4 × 10⁶
spores g-1). There was no main effect of lime and no crop × lime interaction. The range of resting
spore concentrations was 1.2–3.0 × 10⁶ spores g-1. As expected, given that there was no effect of
lime, single df contrasts for the effect of rate of lime on the concentration of resting spores were
not significant.
In the wheat run, there was a main effect for crop (P = 0.004), and a main effect of lime
(P= 0.001), but no interaction. Following wheat, spore concentration was reduced by 27%
relative to the no-plant control (2.7 × 10⁶ spores g-1 vs. 3.7 × 10⁶ spores g-1). There were 4.0 ×
106 spores g-1 in the soil limed to pH 7.6 and 2.4 × 10⁶ spores g-1 in the soil limed to pH 6.4.
The linear relationship for the effect of soil pH on the natural log of concentration of
resting spores was significant for the crop treatments in the wheat run (P = 0.0002) (Figure 3.4).
The least square regression equation for the concentration of spores in soil was ln(spores) =
18.01 – 0.44(pH), Pseudo R2 = 0.26. The range of resting spore concentrations was 2.1–4.7 × 10⁶
spores g-1. There was a significant (P < 0.0001) effect of block in the wheat run. There was no
effect of the lime rate on the dry root weight per pot of barley (mean = 5.1 g) or wheat (4.2 g).

89
Figure 3.4 The effect of three rates of lime (calcium hydroxide, Ca(OH)2) on the
concentration of Plasmodiophora brassicae resting spores in soil after growing wheat and
a no-plant control for 8 weeks. The soil was inoculated to attain an initial concentration of
5 × 10⁵ resting spores g-1. The linear regression line is based on lognormal distribution and
presented using natural logs.
The pH of the non-limed soil in the no-plant control increased after ~3 weeks to pH 6.8
(barley run) and pH 6.6 (wheat run), and stayed at those pH levels until the end of the study. Soil
limed to target pH 6.8, 7.0 and 7.2 stayed at around those pH levels over the course of the study
in the no-plant control. Soil limed to target pH 7.6 dropped to ~pH 7.3 in the first 2 weeks of the
study and was ~pH 7.1 by the end of the study (Table 3.5).
a a b0
1000000
2000000
3000000
4000000
5000000
6000000
6.4 7.0 7.6
Res
ting s
pore
s g
-1so
il
Target soil pH
ln(spores) = 18.01 – 0.44(pH), Pseudo R2 = 0.26
90
Table 3.5 Soil pH in response to application of three rates of lime (calcium hydroxide, Ca(OH)2)
to a soil mix and planted with barley, wheat, Shanghai pak choi or a no-plant control after 6 or 8
weeks of growth (n = 6).
Rate of Ca(OH)2 (mg g-1)1 Crop2 Initial pH Final pH
Barley run
0 mg No-plant 6.4 6.8 a3
Barley 6.4 6.9 a
Pak choi 6.4 6.8 a
0.077 mg No-plant 6.8 6.8 b
Barley 6.8 7.0 a
Pak choi 6.8 7.0 ab
0.30 mg No-plant 7.2 7.0 b
Barley 7.2 7.1 a
Pak choi 7.2 7.0 b
Wheat run
0 mg No-plant 6.4 6.6 z
Wheat 6.4 7.0 x
Pak choi 6.4 6.9 y
0.24 mg No-plant 7.0 6.7 z
Wheat 7.0 7.1 y
Pak choi 7.0 7.0 y
0.52 mg No-plant 7.6 6.9 z
Wheat 7.6 7.2 y
Pak choi 7.6 7.1 yz 1Statistical analysis was conducted for each lime rate separately. 2The soil pH of the no-plant control and barley/wheat treatments were measured at 8 weeks after
seeding and for Shanghai pak choi after 6 weeks. 3Means followed by the same letter in a column do not differ based on Tukey’s test at P = 0.05.
Different letter pairings are used for the different runs.
Clubroot developed in Shanghai pak choi cv. Mei Qing Choi at all three rates of lime in
both runs (barley and wheat), with incidence and severity over 90% in the non-limed soil.
Application of lime reduced severity, especially at pH > 7.0 (Table 3.6). Clubroot severity was
lower in the treatments that received the highest rate of lime in both studies, which targeted a pH
of 7.2 and 7.6 and the DSI was 50 and 57, respectively.
The concentration of spores after growing pak choi increased at all three rates of lime, but
spore numbers were lower at the high rate lime relative to no added lime in both studies. The
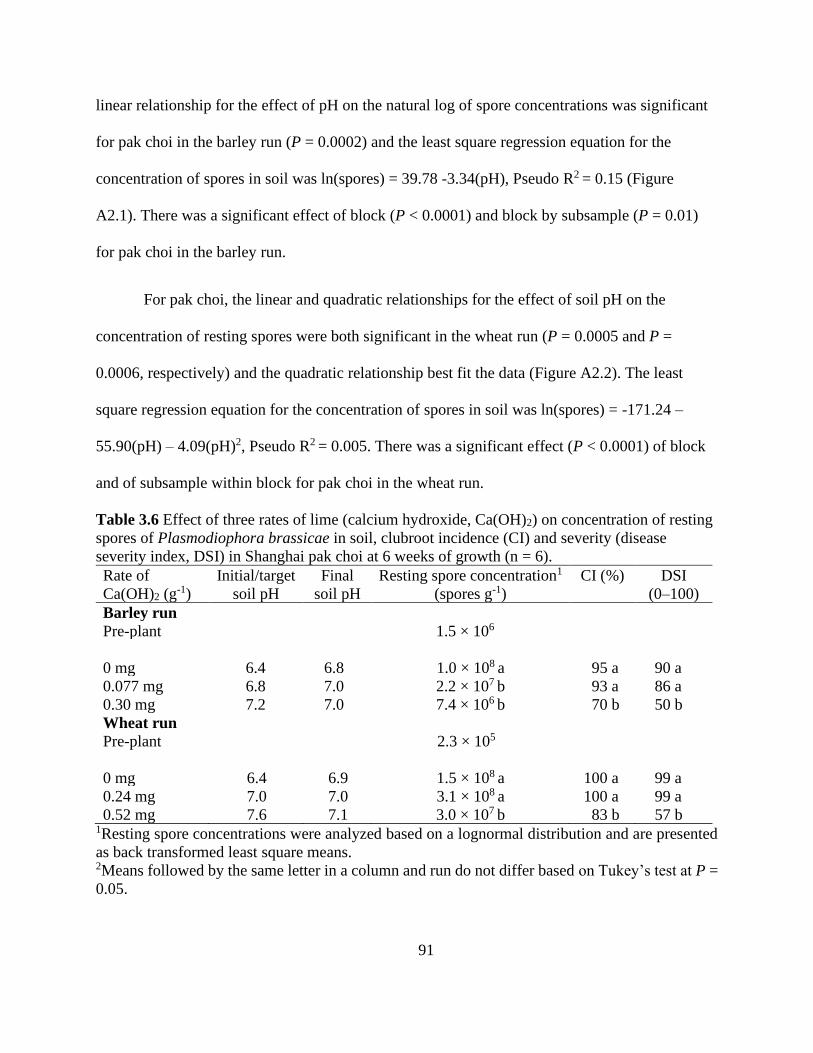
91
linear relationship for the effect of pH on the natural log of spore concentrations was significant
for pak choi in the barley run (P = 0.0002) and the least square regression equation for the
concentration of spores in soil was ln(spores) = 39.78 -3.34(pH), Pseudo R2 = 0.15 (Figure
A2.1). There was a significant effect of block (P < 0.0001) and block by subsample (P = 0.01)
for pak choi in the barley run.
For pak choi, the linear and quadratic relationships for the effect of soil pH on the
concentration of resting spores were both significant in the wheat run (P = 0.0005 and P =
0.0006, respectively) and the quadratic relationship best fit the data (Figure A2.2). The least
square regression equation for the concentration of spores in soil was ln(spores) = -171.24 –
55.90(pH) – 4.09(pH)2, Pseudo R2 = 0.005. There was a significant effect (P < 0.0001) of block
and of subsample within block for pak choi in the wheat run.
Table 3.6 Effect of three rates of lime (calcium hydroxide, Ca(OH)2) on concentration of resting
spores of Plasmodiophora brassicae in soil, clubroot incidence (CI) and severity (disease
severity index, DSI) in Shanghai pak choi at 6 weeks of growth (n = 6).
Rate of
Ca(OH)2 (g-1)
Initial/target
soil pH
Final
soil pH
Resting spore concentration1
(spores g-1)
CI (%) DSI
(0–100)
Barley run
Pre-plant 1.5 × 10⁶
0 mg 6.4 6.8 1.0 × 10⁸ a 95 a 90 a
0.077 mg 6.8 7.0 2.2 × 10⁷ b 93 a 86 a
0.30 mg 7.2 7.0 7.4 × 10⁶ b 70 b 50 b
Wheat run
Pre-plant 2.3 × 10⁵
0 mg 6.4 6.9 1.5 × 10⁸ a 100 a 99 a
0.24 mg 7.0 7.0 3.1 × 10⁸ a 100 a 99 a
0.52 mg 7.6 7.1 3.0 × 10⁷ b 83 b 57 b 1Resting spore concentrations were analyzed based on a lognormal distribution and are presented
as back transformed least square means. 2Means followed by the same letter in a column and run do not differ based on Tukey’s test at P =
0.05.

92
3.3.4 Evans blue stain
To evaluate the Evans blue staining method for differentiating viable from nonviable
spores, selected ratios of heat-treated to non-heat-treated spores were evaluated and the
effectiveness of Evans blue stain in determining resting spore viability was confirmed (Figure
3.5). There was not, however, enough spores that could be extracted from the post-plant soil
samples in any of the studies to count 100 spores per experimental unit so this method could not
be used.
Figure 3.5 Proportion of viable Plasmodiophora brassicae resting spores, as determined
using Evans blue stain, as a function of the proportion of dead spores killed by heating.
Capped lines represent ± standard error.
3.4 Discussion
Only a few studies have examined the effects of crops suitable for rotation with canola and
how they affect the concentration of P. brassicae spores in soil. This is the first study to examine
the effects of wheat, barley, field pea and soybean on spore levels. This is also the first study to
examine the interaction of crop × lime on spore levels. This study demonstrated that a wheat
0
10
20
30
40
50
60
70
80
90
100
0 10 20 30 40 50 60 70 80 90 100
Via
ble
re
sti
ng
sp
ore
s (
%)
Proportion of heated spores (%)
93
crop reduced spore concentrations of P. brassicae in soil, and provided some support for a
previous study (Sedaghatkish, 2020) that reported that perennial ryegrass reduced spore numbers
relative to the no-plant control. In the study to investigate the interaction of crop × lime, applying
lime and growing wheat reduced spore numbers and there was no negative interaction between
these strategies, demonstrating that both can be used for clubroot management. The absence of
an interaction demonstrated that the two approaches do not counteract each other.
In the field crop study, Run 1 was used as a preliminary study and portions of the sample
analysis were never completed. There were issues with low seed emergence in perennial
ryegrass, barley and field pea, and soybean. In addition, wheat, barley and field pea plants were
stunted, possibly from overwatering and from nutrient deficiency resulting from dense planting
in small pots. In Runs 2 and 3, plant density was uniform, and growth was improved by watering
based on field capacity.
Wheat reduced resting spore concentrations in soil relative to the no-plant control in Runs
2 and 3, and perennial ryegrass reduced spore concentrations in one of the two runs. Barley, field
pea and soybean did not have an effect on resting spore levels in either run. Wheat may produce
root exudates similar to other bait crops that can stimulate the germination of resting spores of
P. brassicae, but the pathogen is unable to complete its life cycle because wheat is not a
susceptible host (Friberg et al., 2005). Primary plasmodia developed at a low frequency in root
hairs and epidermal cells of wheat and barley, but infection did not progress beyond the primary
infection phase, so no zoosporangia or secondary zoospores were produced (Liu et al., 2020).
Therefore, P. brassicae may have died in the root hairs of wheat, leading to a reduction in spore
concentrations. In contrast, a previous study based on resting spore counts reported that wheat
94
and barley did not consistently reduce resting spore loads when used as bait crops at field sites
where initial inoculum levels were high (Ahmed et al., 2011).
Root exudates of nonhosts crops are known to trigger the germination of resting spores
(Friberg et al., 2006; Murakami et al., 2000). A concurrent assessment of root hair infection
showed that a moderate level of root hair infection occurred in perennial ryegrass cv. Norlea, low
levels of root hair infection occurred in wheat and barley, but there was no root hair infection in
field pea and soybean (Dr. J. Feng, Alberta Agriculture and Food, personal communication).
Previous studies have also reported that perennial ryegrass stimulated resting spore germination
(Ahmed et al., 2011; Feng et al., 2012; Friberg et al., 2005; Friberg et al., 2006; Rashid et al.,
2013). In the current study, perennial ryegrass cv. Norlea reduced spore levels compared to the
no-plant control in one of two runs of the field crop study.
In a recent controlled environment study, not all grasses evaluated reduced spore levels in
soil (Sedaghatkish, 2020). Perennial ryegrass was also not effective in suppressing clubroot
infection in a susceptible host in a field trial in Stockholm, Sweden (Friberg et al., 2006). Grass
species are likely to reduce inoculum levels only by small amounts and the effect can be difficult
to quantify due to variability in the assessment methods. Populations of resting spores in soil are
often high since a club can contain millions of resting spores (Ingram and Tommerup, 1972), and
grasses will likely stimulate the germination of only a portion of these spores. These small
reductions may not reduce clubroot severity in subsequently grown susceptible hosts.
A hypothesis for this study was that bait crops with more extensive root systems would
produce greater quantities of root exudates and consequently induce higher levels of spore
germination and concomitantly greater reduction in spore numbers. This hypothesis was not
95
supported in this study. There was no correlation between root weight and final concentration of
spores when crops were analyzed together, or within most crop species. The only exception was
perennial ryegrass, which had the largest roots of all the crops assessed; there was a positive
correlation between root weight of perennial ryegrass and spore con in both runs of the study.
This correlation may indicate that the DNA of zoospores in the root hairs of this grass was
amplified because perennial ryegrass has a much higher rate of root hair infection than the field
crops (Dr. J. Feng, Alberta Agriculture and Food, personal communication). The correlation may
also be spurious because cereal crops that likely also stimulated resting spore germination did not
show the same response. The lack of correlation between root weight and concentration of spores
indicated that the extent of soil colonization by the roots was either not related to resting spore
germination, or the effect was too small to measure in the limited time frame of the study.
However, grass crops with extensive root systems can still be useful for managing clubroot
because they hold soil in place and so prevent the dispersal of resting spores in the field (Gossen
et al., 2019b). Multi-year field trials that are currently in progress in the Prairie provinces may
provide this information (Dr. B.D. Gossen, AAFC Saskatoon, personal communication).
Differences among crops in stimulation of resting spore germination may be due to
differences in the composition of root exudates, including the presence and quantity of the
proteolytic products of a serine protease (Pro1) that can stimulate germination (Feng et al., 2010;
Sukuzi et al., 1992), rather than due solely to the quantity of root exudates. Also, the highest
concentration of resting spores is typically in the top 20 cm of soil, but spores appear to be
carried deeper into the soil over time (Cranmer et al., 2017). Growth of the bait crop over time
would let the roots explore more widely and deeper into the soil, which might stimulate
germination of spores throughout the soil profile (Sedaghatkish, 2020).

96
The conditions in the studies were designed to be conducive for resting spore
germination. The soil in the field crop study was kept moist at pH ~6.4, and temperature was
near optimal for clubroot development (Sharma et al., 2011b). Resting spores can germinate
starting at one day after exposure to root exudates (Rashid et al., 2013). Previous studies have
shown that resting spore germination rates were higher when spores were mature, moisture
content was high (Ayers, 1944; Macfarlane, 1970; Takahashi, 1994b), and pH was 6.5, which is
also optimal (25°C, pH 6.0–6.4) for Pro1 activity (Feng et al., 2010; Macfarlane, 1970; Rashid et
al., 2013).
Emerged zoospores only survive for a short period of time because they are highly
vulnerable to adverse soil conditions and to other microbes (Suzuki et al., 1992; Takahashi,
1994a). Primary zoospores can infect the root hairs of many nonhost species (Feng et al., 2012;
Friberg et al., 2005; Liu et al., 2020) and root hair infection generally increases in the first 6–8
days after infection (Hwang et al., 2011b). Infection of wheat, barley and many other nonhosts
does not progress beyond primary plasmodia, but for others, such as perennial ryegrass,
development and release of secondary zoospores can occur (Feng et al., 2012; Friberg et al.,
2005; Liu et al., 2020). A dramatic increase in secondary zoospores can occur during the root
hair infection stage, as each zoosporangium contains 4–16 zoospores (Ingram and Tommercup,
1972). However, secondary zoospores rarely, if ever, infect the root cortex of a nonhost (Feng et
al., 2012; Friberg et al., 2005).
Quantitative PCR is a commonly used method to quantify P. brassicae spores (e.g. Al-
Daoud et al., 2017; Deora et al., 2015; Ernst et al., 2019; Wallenhammer et al., 2012) and was
used in this study to assess spore concentration in soil. A high number of nonviable resting
97
spores detected using the PMA treatment (PMA-qPCR) would have indicated that DNA from
primary or secondary zoospores remained in the soil to confound spore estimates after their death
in the absence of a susceptible host. However, the PMA treatment did not show any consistent
differences between the concentration estimates of total resting spores and viable resting spores
from qPCR in the current study or in a similar study evaluating selected grass species under
controlled conditions (Sedaghatkish, 2020). Therefore, low levels of root hair infection in wheat
that did not result in secondary zoospore production, as noted in a recent report (Liu et al., 2020),
may have resulted in an overall reduction in spores. An alternative interpretation is that PMA
was not effective because compounds in the soil solution interfered with PMA activity or the rate
of PMA or incubation time may not have also not been sufficient for the high amount of DNA in
the samples (Harding et al., 2019).
In the study to investigate the interaction of crop × lime, both factors reduced resting
spore levels in soil. The wheat crop reduced resting spores in comparison to the no-plant control
and resting spore concentrations declined as the rate of lime increased. The results from the field
crop study indicate that root exudates from wheat can stimulate the germination of resting spores
while application of calcium to increase soil pH inhibited spore germination (Niwa et al., 2008).
The current study demonstrated that the effects of these two modes of action on resting spores
did not cancel each other out.
The regression response of lime rate on the log concentration of spores for wheat and the
no-plant control was linear. If liming only inhibited resting spore germination, the spore levels
would not be expected to decrease compared to the control. The reduction in spore levels with
increasing pH levels for wheat may have been possible because liming did not inhibit the
germination of all resting spores. Some primary infection can still occur, and the zoosporangia
98
that develop are misshapen and abort (Myers and Campbell, 1985). Therefore, the reduction in
spore levels may be because P. brassicae died in root hairs. Resting spore concentrations
decreased with increasing lime even in the no-plant control. This finding has been previously
reported with calcium cyanamide, dolomite and calcium carbonate under controlled conditions,
based on assessments with microscopy (Murakami et al., 2002b). This report and the finding of
the current study indicate that in addition to inhibiting resting spore germination, calcium limes
may kill resting spores, so that spores in alkaline soil are removed from soil at a faster rate than
would be expected in an acidic soil. The current study should be repeated to confirm that liming
reduces spores in bare soil.
There was no effect of barley on resting spore levels in soil, and no effect of applied lime
in the barley run of the crop × lime study. Barley was selected as the crop species for the first run
of this study based on results of Run 1 of the field crop study, which indicated that barley
reduced the concentration of spores. Primary infection has also been reported in barley, which
indicated that it might stimulate resting spore germination (Liu et al., 2020). However, barley did
not reduce the concentration of spores in soil relative to the no-plant control in Runs 2 and 3 of
the field crop study.
The absence of response to application of lime in the barley run may have been due to the
gradual decrease in pH over the course of the experiment. Optimal clubroot suppression occurs
at pH levels over 7.2 (Gossen et al., 2013; Myers and Campbell, 1985) and the soil pH in the
highest lime treatment dropped to pH 7.0–7.1. In addition, technical issues with the Step-one
real-time PCR thermal cycler at the Crop Science facility used for this study introduced more
variability in qPCR estimates, so may have also been a confounding factor.

99
Pak choi was included as a susceptible check in the crop × lime study. Liming reduced
clubroot severity in pak choi, which led to fewer spores being released from clubs into the soil.
The regression response of lime rate on the log concentration of spores for pak choi was linear in
the barley run but quadratic in the wheat run, which demonstrated that the rate of lime applied
had a strong impact on clubroot development on pak choi. This is consistent with other reports
that raising soil pH with calcium-rich compost or calcium carbonate inhibited resting spore
germination (Niwa et al., 2008). While clubroot incidence and severity were lower at pH 7.2
than at pH 6.4 and 6.8 in the barley run and at pH 7.6 than at pH 6.4 and 7.0 in the wheat run,
moderate clubbing occurred even at these higher pH levels (pH 7.2 and 7.6). Club development
was also reported in field conditions at pH levels up to 7.6 (Strelkov et al., 2007). Similarly,
moderately severe clubs developed in canola at pH 8.0 under optimal temperature and moisture
conditions (Gossen et al., 2013). The drop in pH over the course of the 8-week studies may have
also contributed to the moderate clubroot infection, especially at the intermediate levels of target
pH. However, root hair infection occurs rapidly after inoculation (Hwang et al., 2011b; Sharma
et al., 2011b), so some suppression likely occurred before the soil pH dropped. The pak choi
plants were harvested after 6 weeks of growth to reduce the decay of clubs in all the studies.
There was, however, some decay of clubs by the time of harvest, which likely contributed to the
release of resting spores that resulted in an increased concentration of spores in soil.
Soil pH in the liming treatments was not maintained throughout the barley and wheat
runs of the crop × lime study. A high concentration of extractable calcium cations in soil is
required for effective clubroot suppression (Campbell et al., 1985; Murakami et al., 2002b).
Some soils are more effective in maintaining pH than others (Welch et al., 1976), so the
buffering capacity of the soil from Elora used in these studies may have affected the pH levels
100
over time. Also, calcium hydroxide has a short-term effect on soil pH, particularly compared to
agricultural and dolomitic limes, which can take several months to increase the pH (Hwang et
al., 2014b). Therefore, to maintain soil pH, several applications of calcium hydroxide may be
required, or an agricultural or dolomitic lime could be used instead.
The effects of increased pH may be separate from the direct effects of calcium (Hamilton
and Crête, 1978; Webster and Dixon, 1991b), although liming affects both. Calcium has been
reported to increase activation of host resistance mechanisms to limit infection by primary and
secondary zoospores, development of plasmodia in the root cortex, mitotic divisions of
plasmodia and cellular hypertrophy (Webster and Dixon, 1991b). Calcium may also reduce
zoospore motility, independent of changes in soil pH (Sleigh and Barlow, 1981), which could
account for the reduction in clubroot severity in pak choi at increasing rates of lime despite the
pH not being maintained throughout the study.
There were differences in soil pH among the crop treatments, as the soil pH after
growing wheat, barley and pak choi was generally higher (more alkaline) than the no-plant
control. These differences may be associated with slightly different water and fertilizer
applications among the treatments. Barley and wheat had the highest water requirement,
followed by pak choi. The water requirement for the no-plant control was substantially lower. A
similar volume of fertilizer was applied to barley, wheat and pak choi, but a lower volume was
applied to the no-plant control. Further, the pH and chemical composition of root exudates
differs among crops. For example, the pH of root exudates was 6.3 in Chinese cabbage and 7.1 in
perennial ryegrass (Rashid et al., 2013). Also, some plant roots, such as oilseed rape plants,
released H+ due to an imbalance in the uptake of ions, which increases soil acidity (Hedley et al.,

101
1982). The root exudates of barley and wheat are composed of amino acids, organic acids,
sugars, and phenolic compounds (Vančura, 1964), which can affect soil pH. Therefore, the root
exudates produced by the crops may have affected soil pH, which in turn could have affected the
impact of the lime rate treatments.
All of the studies were inoculated with spore suspensions targeted to produce 5 × 10⁵
spores g-1 of soil, but there was an unexpectedly high variation in the pre-plant concentration of
spores tested with qPCR. In particular, the pre-plant spore levels for Run 2 of the field crop study
and for the barley run were over 106 spores g-1. Previous studies have shown that the
quantification of resting spores with qPCR is subject to high variability on account of the low
quantities of soil that are assessed (Bilodeau, 2011, Deora et al., 2015; Wen et al., 2020). Resting
spores may aggregate and lack a uniform distribution in soil, even with careful mixing, which
may have contributed to the high levels of spore estimates with qPCR. Variability within the
qPCR assays may have also contributed to differences in the spore levels tested. The pre-plant
concentration of spores was lower than the post-plant levels in the wheat run, which likely
indicates that the pre-plant estimate was substantially lower than the actual value. The DNeasy®
PowerSoil® Pro Kit used for the post-plant samples is more effective at extracting DNA than the
DNeasy® PowerSoil® Kit used for the pre-plant samples, and this improved efficiency may
have contributed to the difference in spore levels.
Also, there was a significant block and/or subsample by block effect in several of the
studies. Each block was inoculated separately, which could have contributed to some variation
between initial concentrations of spores. Variability in the qPCR estimates may have been a
factor in the variability among blocks and subsamples. Not all blocks and subsamples were run

102
in the same assay because of repeating subsamples that failed to amplify or that had high
inhibition, and this may have contributed to the significant subsample by block effect.
Further studies are needed to determine the mechanism by which wheat reduces resting
spore levels in soil and the combined effect of bait crops and lime and/or calcium on resting
spores are needed. Determining the mechanism will help to confirm that there is no negative
interaction between bait crops and liming and could provide useful information about how these
strategies can be used together. In addition, studies should be conducted to evaluate the effect of
bait crops and the interaction with lime under field conditions. Evaluating the effects of bait
crops in soil with different initial resting spore loads could provide valuable insights, as other
studies have concluded that the use of bait crops in a clubroot management program will not
likely reduce resting concentrations of spores in soil to a useful level if infestation levels are high
(Ahmed et al., 2011; Friberg et al., 2006). Even a moderate reduction in resting spore levels in
heavily infested field would likely result in clubroot infection, as clubs can develop at
concentrations of resting spores as low as 103 spores g-1 of soil (Naiki et al., 1987). Many
commercial field sites with clubroot infestations have concentrations of resting spores above 105
spores g-1 of soil (Ahmed et al., 2011; Ernst et al., 2019). Bait crops would likely be most
effective in fields with low clubroot infestations (Ahmed et al., 2011).
In summary, planting spring wheat as a rotation crop in clubroot infested soil may reduce
the number of P. brassicae spores in soil, but the changes are likely to be too small to have an
effect on grower operations or clubroot management. No negative interaction on spore reduction
was identified between applying lime and growing spring wheat, so growers can use both
clubroot management practices without concern about negative synergies.
103
CHAPTER FOUR
4 General discussion
Two important components of clubroot management were examined in the current study:
pathotype-specific genetic resistance and the reduction of the concentration of resting spores in
soil resulting from non-host crops. Growth room studies and field trials were conducted to
evaluate clubroot resistance in canola and brassica vegetables against clubroot pathotypes 2 and
6 (Williams’ system), which are prevalent in Ontario. In addition, growth room studies were
conducted to evaluate the effect of field and cover crops on the concentration of resting spores of
P. brassicae in soil, including studies to evaluate the interaction of lime application and growth
of a cereal crop.
Genetic resistance has been the primary method used to manage clubroot in canola crops
in Canada, and is becoming more common for clubroot management in brassica vegetables.
Therefore, screening cultivars for resistance to the pathotypes present in a region is an important
component of clubroot management. However, only limited information is available on the
reaction of many cultivars to specific pathotypes, especially in brassica vegetables. Most studies
on cultivar resistance have focused on the Prairie region, where 99% of canola is planted in
Canada. Initially, pathotypes 3 and 5 were prevalent on canola in Alberta (Hollman et al., 2020;
Statistics Canada, 2019a; Strelkov et al., 2018). Almost all of the canola cultivars in Canada are
partially resistant to pathotype 6 (Deora et al., 2013), but most were initially susceptible to
pathotype 3. The predominant pathotype on canola in Ontario is pathotype 2, and pathotype 6 is
predominant on vegetables (McDonald et al., 2020a).
The clubroot reaction of a sample of CR canola cultivars, InVigor L234PC, L255PC,
104
L241C and L135C, were resistant to both pathotypes 2 and 6 in a controlled environment study
and to pathotype 2 in the field. The sample of InVigor canola cultivars that were not marketed as
CR were resistant to pathotype 6 but not pathotype 2, which is consistent previous reports
(Adhikari et al., 2012; Deora et al., 2012). In the field trials, shoot weight was higher in resistant
cultivars relative to susceptible ones, as expected.
Pathotype 6 has been the predominant pathotype on brassica vegetables in Ontario for
decades (Al-Daoud et al., 2017), and pathotype 2 was recently identified in Ontario canola fields
(Al-Daoud et al., 2018). Some vegetable cultivars carry resistance to multiple pathotypes, while
the resistance in others is known to be effective against only one pathotype (Peng et al., 2014a;
Sharma et al., 2013b). Most of the resistant cultivars were resistant to pathotypes 2 and 6, except
for cabbage cv. Lodero and broccoli cv. Emerald Jewel, which were marketed as
resistant/tolerant and were resistant to pathotype 6 but susceptible to pathotype 2. As in the
canola trials, severe clubroot developed and reduced shoot weight in the susceptible cultivars, as
expected. In addition, Laurentian rutabaga seed from Stokes Seed had the same reaction to
pathotypes 2 and 6 as seed from the University of Wisconsin. Therefore, the Laurentian rutabaga
host in the Williams’ system and the CCD set can be sourced from Stokes Seed, which is a less
expensive source.
In the current study, the predominant pathotype at the MCRS was characterized to
determine if the pathotype had changed over time. The pathotype was confirmed to be pathotype
2. It might also be useful to characterize pathotypes affecting vegetables in Canada using the
clubroot differential set that was recently developed specifically for B. oleracea. Two of the
three differentials for the B. oleracea system have been assessed at the MCRS, cabbage cvs.
Lodero and Kilaton. Lodero was susceptible and Kilaton was resistant, which indicated that the
105
predominant pathotype at the MCRS could be classified as Pb:3 (Smilde et al., 2012).
The second objective of the current study was to determine if selected field crops and
perennial ryegrass reduced resting spore concentrations in soil in short duration studies under
controlled conditions. This is the first study to evaluate the effect of spring wheat, field pea and
soybean on resting spore concentrations in soil and the first to investigate the interaction of a
cereal crop and lime on spore concentrations. Resting spore quantities were estimated using
qPCR. Root hair infection has been previously reported in a wide range of nonhosts, including
perennial ryegrass, wheat, and barley (Liu et al., 2020; Macfarlane, 1952). Root exudates from
these crops may stimulate the germination of resting spores, but the pathogen is unable to
complete its lifecycle in a nonhost crop. In the current study, spring wheat slightly reduced the
spore concentration in soil compared to a no-plant control. Growers can therefore select spring
wheat as a rotation crop to reduce levels of clubroot inoculum, even though the effect was small.
Perennial ryegrass also reduced spore levels compared to the no-plant control, but only in one of
two repetitions of the study. Several previous studies have found that perennial ryegrass
stimulated resting spore germination (Ahmed et al., 2011; Feng et al., 2012; Friberg et al., 2005;
Friberg et al., 2006; Rashid et al., 2013), but the effect of perennial ryegrass on spore
concentration could not be detected under field conditions (Friberg et al., 2006). It is difficult to
evaluate bait crops in field conditions as their effect on reducing spore levels is likely small
(Ahmed et al., 2011).
The initial hypothesis was that crops with greater root biomasses would produce greater
quantities of root exudates, which would in turn result in more spore germination and greater
reductions in spore levels. However, there was no relationship between root weight and
reduction of resting spores. This may indicate that plants with a more extensive root system are
106
not more effective at stimulating spore germination. Some crops may produce more root
exudates, or more effective root exudates, regardless of the extent of the root system. However, a
longer-term study may be needed to quantify the effects of root systems on spore reduction.
Liming to raise soil pH above 7.2 has been used for many years to suppress clubroot
symptom development (Myers and Campbell, 1985), and many types of lime are effective
(Murakami et al., 2002b; Naiki and Dixon, 1987; Wellman, 1930). In addition, calcium inhibits
resting spore germination, zoospore motility, and the development of plasmodia and
zoosporangia (Murakami et al., 2002b; Myers and Campbell, 1985; Niwa et al., 2008; Webster
and Dixon, 1991b). Therefore, it seems likely that bait crops, which stimulate the germination of
resting spores, could have a negative effect when combined with liming to inhibit spore
germination. A study was conducted to investigate if the effects of liming with calcium
hydroxide interacted with those of a spring wheat for reduction of spores in soil. Spore
concentration was reduced with increasing rate of lime and there was no statistical interaction
with the effect of the wheat crop. Therefore, growers can employ both management strategies
and expect a reduction in resting spores.
There was considerable variability in the spore concentrations estimates from qPCR, even
though a competitive internal control was used to account for the effects of inhibition (Deora et
al, 2015). In several of the studies, estimates of pre-plant concentrations of resting spores were
much higher than the targeted levels, but one study was much lower than the target. Extracting
DNA from soil samples may have contributed to the variability, because only a very small
amount of soil is actually assessed for each extraction. Even with careful mixing of soil, resting
spores of P. brassicae may be clumped and unevenly distributed. A recent study found that
droplet digital PCR (ddPCR) had a higher accuracy and was more effective in diverse soil types

107
at quantifying P. brassicae spores compared to qPCR (Wen et al., 2020). Further, estimates on
ddPCR was less severely affected relative to qPCR when there were inhibitors in the soil.
Droplet digital PCR is recommended to be used at spore concentrations from 102 to 107 spores g-1
(Wen et al., 2020). Future studies should therefore consider using ddPCR because of its potential
for more accurate P. brassicae quantification.
Additional research is needed to investigate the effect of field crops and the interaction
between crop and liming on concentrations of clubroot resting spores under field conditions.
Longer duration field trials could investigate the effect of root growth on reduction of resting
spores in soil. The crops would be able to develop extensive root systems which produce root
exudates to stimulate the germination of resting spores. In addition, a bioassay to grow a
susceptible host after growing field crops or growing a field crop and liming could determine the
ability of these management strategies to suppress resting spores to sufficiently low levels to
reduce the development of clubroot symptoms. Evaluating different initial spore concentrations
to determine a threshold at which these strategies would be effective in reducing clubroot
severity would also be useful. Studies to investigate the mechanism by which wheat reduces
resting spore levels are also warranted. In addition, studies to evaluate the development of
primary plasmodia in root hairs of bait crops grown in limed soil would help to gain insight into
the effect of both management strategies on root hair infection. Determining the mode of action
of these strategies on the root hair infection stage would confirm the absence of a negative
interaction and would provide useful information on optimal timing of using these strategies.
This research has contributed information that is directly relevant to growers in Ontario.
Several CR canola cultivars were resistant to the prevalent clubroot pathotypes in Ontario,
108
pathotypes 2 and 6. This resistance can be used against the predominant pathotypes in Ontario.
Most brassica vegetable cultivars marketed as resistant were resistant to pathotypes 2 and 6, with
the exception of cabbage cv. Lodero and broccoli cv. Emerald Jewel, which were resistant to
pathotype 6 but susceptible to pathotype 2. Also, spring wheat reduced concentrations of resting
spores in soil compared to fallow (no-plant) soil with no negative interaction with liming to
increase the pH. This result indicated that these two strategies can be used together to manage
clubroot, but field studies to validate the result are still required.
109
REFERENCES
Adhikari, K. K. C. 2010. Effect of temperature, biofungicides and fungicides on clubroot of
selected brassica crops. MSc thesis, University of Guelph, Guelph, Ontario.
Adhikari, K. C., McDonald, M. R., and Gossen, B. D. 2012. Reaction to Plasmodiophora
brassicae pathotype 6 in lines of brassica vegetables, Wisconsin Fast Plants, and canola.
HortScience 47:374–377.
Agriculture and Agri-Food Canada. 2018a. Crop profile for Brassica vegetables in Canada,
2015. Available from http://publications.gc.ca/collections/collection_2018/aac-
aafc/A118-10-33-2015-eng.pdf [cited 20 June 2018].
Agriculture and Agri-Food Canada. 2018b. Crop profile for rutabaga in Canada, 2015.
Available from http://publications.gc.ca/collections/collection_2018/aac-aafc/A118-10-
23–2015-eng.pdf [cited 15 August 2018].
Ahmed, H. U., Hwang, S. F., Strelkov, S. E., Gossen, B. D., Peng, G., Howard, R. J., and
Turnbull, G. D. 2011. Assessment of bait crops to reduce inoculum of clubroot
(Plasmodiophora brassicae). Canadian Journal of Plant Science 91:545–551.
Al-Daoud, F., Gossen, B. D., and McDonald, M. R. 2017a. A shift in pathotype of
Plasmodiophora brassicae at a site in Ontario. Canadian Journal of Plant Pathology
39:540–541.
Al-Daoud, F., Gossen, B. D., Robson, J., and McDonald, M. R. 2017b. Propidium monoazide
improves quantification of resting spores of Plasmodiophora brassicae with qPCR. Plant
Disease 101:442–447.
Al-Daoud, F., Gossen, B. D., and McDonald, M. R. 2020. Maturation of resting spores of
Plasmodiophora brassicae continues after host cell death. Plant Pathology 69:310–319.
Al-Daoud, F., Moran, M., Gossen, B. D, and McDonald, M. R. 2018. First report of clubroot
(Plasmodiophora brassicae) on canola in Ontario. Canadian Journal of Plant Pathology
40:96–99.
Al-Shehbaz, I. A., Beilstein, M. A., and Kellogg, E. A. 2006. Systematics and phylogeny of the
Brassicaceae (Cruciferae): an overview. Plant Systematics and Evolution 259:89–120.
Anderson, N. P., Hart, J. M., Christensen, N. W., Horneck, D. A., and Pirelli, G. J. 2013.
Applying lime to raise soil pH for crop production (Western Oregon). Oregon State
University Extension Service. Available from
https://catalog.extension.oregonstate.edu/em9057 [cited 5 May 2020].
Anonymous. 1956. Diseases of vegetables and field crops. Canadian Plant Diseases Survey
36:48–97.
Askarian, H., Akhavan, A., Manolii, V. P., Cao, T., Hwang, S. F., and Strelkov, S. E. 2020.
Virulence spectrum of single-spore and field isolates of Plasmodiophora brassicae able
to overcome resistance in canola (Brassica napus). Plant Disease 105:43–52.
Atlantic Provinces Agriculture. n.d. Cole Crops Vegetable Production Guide. Available from:
https://www.gov.nl.ca/ffa/files/agrifoods-plants-pdf-cole-crops.pdf [cited 15 April 2020].
Attia, T., and Röbbelen, G. 1986. Cytogenetic relationship within cultivated Brassica analyzed
in amphihaploids from the three diploid ancestors. Canada Journal of Genetic Cytology
28:323–329.
Ayers, G. W. 1944. Studies on the life history of the club root organism, Plasmodiophora
brassicae. Canadian Journal of Research 22:143–149.

110
Ayers, G. W. 1972. Races of Plasmodiophora brassicae infecting crucifer crops in Canada.
Plant Disease Survey 52:77–81.
Baquy, M. A. -A. 2017. Determination of critical pH and Al concentration of acidic Ultisols for
wheat and canola crops. Solid Earth 8:149–159.
Barden, S. D., and Huang, H. C. 2001. Research on biology and control of Sclerotinia diseases
in Canada. Canadian Journal of Plant Pathology 23:88–98.
BASF. 2019. InVigor canola. Available from https://agriculture.basf.us/crop-
protection/products/invigor.html [cited 15 July 2020].
Bélec, C., Tremblay, N., and Coulombe, J. 2004. Liming and calcium cyanamide for clubroot
control in cauliflower. Acta Horticulturae 635:41–46.
Bell, J. M. 1982. From rapeseed to canola: a brief history of research for superior meal and
edible oil. Poultry Science 61:613–622.
Berglund, D.R., McKay, K., and Knodel, J. 2007. Canola production. NSDU Extension
Service. Available from
https://library.ndsu.edu/ir/bitstream/handle/10365/5281/a686.pdf?sequence=1
Bilodeau, G. J. 2011. Quantitative polymerase chain reaction for the detection of organisms in
soil. CAB Review: Perspectives in Agriculture, Veterinary Science, Nutrition and Natural
Resources 6:1–14.
British Columbia Department of Agriculture. 1920. Province of British Columbia 14th Annual
Report of the Department of Agriculture for the Year 1919.
Buczacki, S. T., Toxopeus, H., Mattusch P., Johnston, T. D., Dixon, G. R., and Hobolth, L.
A. 1975. Study of physiologic specialization in Plasmodiophora brassicae: proposals for
attempted rationalization through an international approach. Transactions of the British
Mycological Society 65:295–303.
Bulman, S., Candy, J. M., Fiers, M., Lister, R., Conner, A. J., and Eady, C. C. 2011.
Genomics of biotrophic, plant-infecting Plasmodiophorids using in vitro dual cultures.
Protist 162:449–461.
Campbell, R. N., Greathead, A. S., Myers, D. F., de Boer, G. J. 1985. Factors related to
control of clubroot of crucifers in the Salinas Valley of California. Phytopathology
75:665–670.
Canadian Canola Growers Association. n.d. Canola: A Canadian crop with big impact.
Canadian Canola Growers Association. Available from
http://www.ccga.ca/policy/Documents/Canola%20Information%20Booklet%20-
%20Web.pdf [cited 15 May 2018].
Canola Council of Canada. 2017a. Canola meal. Available from
https://www.canolacouncil.org/oil-and-meal/canola-meal/ [cited 15 May 2018].
Canola Council of Canada. 2017b. Canola oil. Available from
https://www.canolacouncil.org/oil-and-meal/canola-oil/ [cited 15 May 2018].
Canola Council of Canada. 2017c. What is canola? Available from
http://www.canolacouncil.org/markets-stats/industry-overview/ [cited 15 May 2018].
Canola Council of Canada. 2019. Harvest management. Available from
https://www.canolacouncil.org/canola-encyclopedia/managing-harvest/harvest-
management/ [cited 14 July 2020].
Canola Council of Canada. 2020a. Crop rotation. Available from
https://www.canolacouncil.org/canola-encyclopedia/field-characteristics/crop-rotation/
111
[cited 11 Jan 2021].
Canola Council of Canada. 2020b. Control clubroot. Available from
https://www.canolacouncil.org/canola-encyclopedia/diseases/clubroot/control-
clubroot/#croprotation [cited 21 April 2020].
Canola Council of Canada. 2020c. Fertilizer management. Available from
https://www.canolacouncil.org/canola-encyclopedia/fertilizer-management/ [cited 24
April 2020].
Cao, T., Manolii, V. P., Hwang, S. F., Howard, R. J., and Strelkov, S. E. 2009. Virulence and
spread of Plasmodiophora brassicae [clubroot] in Alberta, Canada. Canadian Journal of
Plant Pathology 31:321–329.
Cao, T., Tewari, J., and Strelkov, S. E. 2007. Molecular detection of Plasmodiophora
brassicae, causal agent of clubroot of crucifers, in plant and soil. Plant Disease 91:80–87.
Casséus, L. 2009. Canola: a Canadian success story. Component of Statistics Canada Catalogue
no. 96-325-X. Version updated April 2009. Available from
https://www150.statcan.gc.ca/n1/pub/96-325-x/2007000/article/10778-eng.htm [cited 15
August 2018].
Cavalier-Smith, T., and Chao E. E. 2003. Phylogeny and classification of phylum Cercozoan
(Protozoa). Protist 154:341–358.
Cavalier-Smith, T., Chao, E. E., and Lewis, R. 2018. Multigene phylogeny and cell evolution
chromist infrakingdom Rhizaria: Contrasting cell organisation of sister phyla Cercozoa
and Retaria. Protoplasma 255:1517–1574.
Chen, M., and Shelton, A. M. 2007. Impact of soil type, moisture, and depth on swede midge
(Diptera Cecidomyiidae) pupation and emergence. Population Ecology 36: 1349–1355.
Chen, M., Shelton, A. M., Hallet, R. H., Hoepting, C. A., Kikkert, J. R., and Wang, P. 2011.
Swede midge (Diptera: Cecidomyiidae), ten years of invasion of crucifer crops in North
America. Journal of Economic Entomology 104:709–716.
Chen, S., Zhou, X., Yu, H., and Wu, F. 2018. Root exudates of potato onion are involved in the
suppression of clubroot in a Chinese cabbage-potato onion-Chinese cabbage crop
rotation. European Journal of Plant Pathology 150:765–777.
Chiang, M. S., and Crête, R. 1970. Inheritance of clubroot resistance in cabbage (Brassica
oleracea L. var. Capitata L. Canadian Journal of Genetic Cytology 12:253–256.
Chu, M., Yu, F, Falk., K.C., Liu, X., Zhang, A., Chang, A and Peng, G. 2013. Identification
of the clubroot resistance gene Rpb1 and introgression of the resistance gene into canola
breeding lines using a marker-assisted selection approach. Acta Horticulturae 1005:599–
605.
Colhoun, J. 1957. A technique for examining soil for the presence of Plasmodiophora brassicae
Woron. Annals of Applied Biology 45:559–565.
Cranmer, T. J., Al-Daoud, F., Gossen, B. D., Deora, A., Hwang, S. F., and McDonald, M. R.
2017. Vertical distribution of resting spores of Plasmodiophora brassicae in soil.
European Journal of Plant Pathology 149:435–442.
Crête, R., Laliberté, J., Jasmin, J. J. 1963. Lutte chimique control la hernie, Plasmodiophora
brassicae Wor., des crucifères en sols minéral and organique. Canadian Journal of Plant
Science 43:349–354.
Crute, I. R., Gray, A. R., Crisp, P., and Buczacki, S. T. 1980. Variation in Plasmodiophora
brassicae and resistance to clubroot disease in Brassicas and allied crops – a critical
review. Plant breeding abstracts 50:92–104.

112
Dakouri, A., Zhang, X., Peng, G., Falk, K. C., Gossen, B. D., Strelkov, S. E., and Yu, F.
2018. Analysis of genome-wide variants through bulked segregant RNA sequencing
reveals a major gene for resistance to Plasmodiophora brassicae in Brassica oleracea.
Scientific Reports 8:17657.
Daun, J. K. 1986. Glucosinolate levels in western Canadian rapeseed and canola. Journal of
American Oil Chemists’ Society 63:639–643.
Deora, A., Gossen, B. D., Amirsadeghi, S., and McDonald, M. R. 2015. A multiplex qPCR
assay for detection and quantification of Plasmodiophora brassicae in soil. Plant Disease
99:1002–1009.
Deora, A., Gossen, B. D., and McDonald, M. R. 2012. Infection and development of
Plasmodiophora brassicae in resistant and susceptible canola cultivars. Canadian Journal
of Plant Pathology 34:239–247.
Deora, A., Gossen, B. D., and McDonald, M. R. 2013. Cytology of infection, development and
expression of resistance to Plasmodiophora brassicae in canola. Annals of Applied
Biology 163:56-71.
Deora, A., Gossen, B. D., Hwang, S. F., Pageau, D., Howard, R. J., Walley, F., and
McDonald, M. R. 2014. Effect of boron on clubroot of canola in organic and mineral
soils and on residual toxicity to rotational crops. Canadian Journal of Plant Science
94:109–118.
Deuel, W., and Svenson, S. 2000. Field evaluations of meadowfoam seedmeal to control
clubroot disease (Plasmodiophora brassicae) in cruciferous crops. HortScience
35:392A– 392.
Devos, S., Vissenberg, K., Verbelen, J. -P., and Prinsen, E. 2005. Infection of Chinese
cabbage by Plasmodiophora brassicae leads to a stimulation of plant growth: impacts on
cell wall metabolism and hormone balance. New Phytologist 166:241–250.
Diederichsen, E., Beckmann, J., Schondelmeier, J., and Dreyer, F. 2006. Genetics of clubroot
resistance in Brassica napus ‘Mendel’. Acta Horticulturae 706:307–311.
Diederichsen, E., Frauen, M., Linders, E. G. A., Hatakeyama, K., and Hirai, M. 2009.
Status and perspectives of clubroot resistance breeding in crucifer crops. Journal of Plant
Growth Regulation 28:265–281.
Diederichsen, E., Fredua-Agyeman, R., Hatakeyama, K., Hayashida, N., Lim, Y. P.,
Okazaki, K., Rahman, Z., Piao, Y., Yu, F., and Peng, G. 2019. 15th International
Rapeseed Congress. Berlin, Germany, 16–19 June 2019. Speaker presentation.
(https://www.irc2019-berlin.com/program/17062019/mon_clubroot).
Dixon, G. R. 2016. Managing clubroot disease (caused by Plasmodiophora brassicae Wor.) by
exploiting the interactions between calcium cyanamide fertilizer and soil
microorganisms. The Journal of Agricultural Science 155:527–543.
Dixon, G. R. 2007. Origins and diversity of Brassica and its relatives. in: Vegetable brassicas
and related crucifers, Atherton, J., ed. CABI, London, UK.
Dixon, G. R. 2009. The occurrence and economic impact of Plasmodiophora brassicae and
clubroot disease. Journal of Plant Growth Regulation 28:194–202.
Dixon, G. R. 2014. Clubroot (Plasmodiophora brassicae Woronin) – an agricultural and
biological challenge worldwide. Canadian Journal of Plant Pathology 36:5–18.
Dixon G. R., and Page, L. V. 1998. Calcium and nitrogen eliciting alterations to growth and
reproduction of Plasmodiophora brassicae (clubroot). Acta Horticulturae 459:343–350.
Dobson, R. L., and Gabrielson, R. L. 1983. Role of primary and secondary zoospores of
113
Plasmodiophora brassicae in the development of clubroot in Chinese cabbage.
Phytopathology 73:559–561.
Dobson, R. L., Gabrielson, R. L., Baker, A. S., and Bennett, L. 1983. Effects of lime particle
size and distribution and fertilizer formulation on clubroot disease caused by
Plasmodiophora brassicae. Plant Disease 67:50–52.
Donald, E. C., Cross, S. J., Lawrence, J. M., and Porter, I. J. 2006. Pathotypes of
Plasmodiophora brassicae, the cause of clubroot, in Australia. Annals of Applied
Biology 148:239–244.
Donald, E. C., Jaudzems, G., and Porter, I. J. 2008. Pathology of cortical invasion by
Plasmodiophora brassicae in clubroot resistant and susceptible Brassica oleracea hosts.
Plant Pathology 57:201–209.
Donald, E. C., Lawrence, J. M., and Porter, I. J. 2004. Influence of particle size and
application method on the efficacy of calcium cyanamide for control of clubroot of
vegetable brassicas. Crop Protection 23:297–303.
Donald, E. C., and Porter, I. J. 2004. A sand‐solution culture technique used to observe the
effect of calcium and pH on root hair and cortical stages of infection by Plasmodiophora
brassicae. Australasian Plant Pathology 33:585–9.
Donald, E. C., Porter, I. J., and Lancaster, R. A. 2001. Band incorporation of fluzinam
(Shirlan) into soil to control clubroot of vegetable brassica crops. Australian Journal of
Experimental Agriculture 41:1223–1226.
Doullah, M. A. U., Meah, M. B., and Okazaki, K. 2006. Development of an effective
screening method for partial resistance to Alternaria brassicicola (dark leaf spot) in
Brassica rapa. European Journal of Plant Pathology 116:33–43.
Eckert, D., and Sims, J. T. 1995. Recommended soil pH and lime requirement test. In: Sims.
J.T., and Wolf, A., editors. Recommended soil testing procedures for the Northeastern
United States. Northeastern Regional Publication; p. 16–21.
Ernst, T. W., Kher, S., Stanton, D., Rennie, D. C., Hwang, S. F., and Strelkov, S. E. 2019.
Plasmodiophora brassicae resting spore dynamics in clubroot resistant canola (Brassica
napus) cropping systems. Plant Pathology 68:399–408.
Faggian, R., and Strelkov, S. E. 2009. Detection and measurement of Plasmodiophora
brassicae. Journal of Plant Growth Regulation 28:282–288.
Fahey, J. W. 2003. Brassicas. in: Encyclopedia of food sciences and nutrition (Second Edition),
Cabellero, B., ed. Academic Press.
Feng, J., Hwang, R., Hwang, S. F., Strelkov, S. E., Gossen, B. D., Zhou, Q. X., and Peng, G.
2010. Molecular characterization of a serine protease Pro1 from Plasmodiophora
brassicae that stimulates resting spore germination. Molecular Plant Pathology 11:503–
512.
Feng, J., Xiao, Q., Hwang, S. F., Strelkov, S. E., and Gossen, B. D. 2012. Infection of canola
by secondary zoospores of Plasmodiophora brassicae produced on a nonhost. European
Journal of Plant Pathology 132:309–315.
Figdore, S. S., Ferreira, M. E., Slocum, M. K., and Williams, P. H. 1993. Association of
RFLP markers with trait loci affecting clubroot resistance and morphological characters
in Brassica oleracea L. Euphytica 69:33–44.
Friberg, H., Lagerlöf, J., and Rämert, B. 2005. Germination of Plasmodiophora
brassicae resting spores stimulated by a non-host plant. European Journal of Plant
Pathology 113:275–281.
114
Friberg, H., Lagerlöf, J., and Rämert, B. 2006. Usefulness of nonhost plants in managing
Plasmodiophora brassicae. Plant Pathology 55:690–695.
Gill, K. S. 2018. Crop rotations compared with continuous canola and wheat for crop production
and fertilizer use over 6 yr. Canadian Journal of Plant Science 98:1139–1149.
Gludovacz, T. V., Deora, A., McDonald, M. R., and Gossen, B. D. 2014. Cortical colonization
by Plasmodiophora brassicae in susceptible and resistant cabbage cultivars. European
Journal of Plant Pathology 140:859–862.
Gossen, B. D., Al-Daoud, F., Dumonceaux, T., Dalton, J. A., Peng, G., Pageau, D., and
McDonald, M. R. 2019. Comparison of techniques for estimation of resting spores of
Plasmodiophora brassicae in soil. Plant Pathology 68:954–961.
Gossen, B. D., Cranmer, T. J., Gludovacz, T. V., and McDonald, M. R. 2017a. Weather
thresholds for clubroot development on canola and brassica vegetables. Canadian Journal
of Plant Pathology 39:475–485.
Gossen, B. D., Dalton, J. A., Al-Daoud, F., and McDonald, M. R. 2017b. Metabolic cost of
resistance in clubroot-resistant canola and napa cabbage. Canadian Journal of Plant
Pathology 39:25–36.
Gossen, B. D., Kasinathan, H., Cao, T., Manolii, V. P., Strelkov, S. E., Hwang, S. F., and
McDonald, M. R. 2013. Interaction of pH and temperature affect infection and symptom
development of Plasmodiophora brassicae in canola. Canadian Journal of Plant
Pathology 35:294–303.
Gossen, B. D., Kasinathan, H., Deora, A., Peng, G., and McDonald, M. R. 2016. Effect of
soil type, organic matter content, bulk density and saturation on clubroot severity and
biofungicide efficacy. Plant Pathology 65:1238–1245.
Gossen, B. D., Sedaghatkish, A., Hwang, S. F., and McDonald, M. R. 2018. A recipe for
managing small patches of infestation of clubroot in canola. In: 2018 International
Clubroot Workshop, Edmonton, Alberta, Canada. Canadian Journal of Plant Pathology
41:475-494.
Grandclément, C., and Thomas, G. 1996. Detection and analysis of QTLs based on RAPD
markers for polygenic resistance to Plasmodiophora brassicae Woron in Brassica
oleracea L. Theoretical Applied Genetics 93:86–90.
Grant, C. A, and Bailey, L. D. 1993. Fertility management in canola production. Canadian
Journal of Plant Science 73:651–670.
Gusta, L. V., Johnson, E. N., Nesbitt, N. T., and Kirkland, K. J. 2004. Effect of seeding date
on canola seed quality and seed vigour. Canadian Journal of Plant Science 84:463–471.
Haile, T. A., Gulden, R. H., and Shirtliffe, S. J. 2014. On-farm seed loss does not differ
between windrowed and direct-harvested canola. Canadian Journal of Plant Science
94:785–789.
Hallett, R. H. 2017. The challenge of swede midge management in canola. in: Integrated
management of insect pests on canola and other brassica oilseed crops, Reddy, G. V. P.,
ed. CABI, Wallingford, UK.
Hamilton, H. A., and Crête, R. 1978. Influence of soil moisture, soil pH, and liming sources on
the incidence of clubroot, the germination and growth of cabbage produced in mineral
and organic soils under controlled conditions. Canadian Journal of Plant Science 58:45–
53.
Harding, M. W., Bill, T. B., Yang, Y., Daniels, G. C., Hwang, S. F., Strelkov, S. E., Howard,
R. J., and Feng, J. 2019. An improved Evans blue staining method for consistent,
115
accurate assessment of Plasmodiophora brassicae resting spore viability. Plant Disease
103:2330–2336.
Harker, K. N., Hartman, M. D., Tidemann, B. D., O’Donovan, J. T., Turkington, T. K.,
Lupwayi, N. Z., Smith, E. G., and Mohr, R. M. 2018. Attempts to rescue yield loss in
continuous canola with agronomic inputs. Canadian Journal of Plant Science 98:703–716.
Harker, K. N., O’Donovan, J. T., Smith, E. G., Johnson, E. N., Peng, G., Willenborg, C. J.,
Gulden, R. H., Mohr, R., Gill, K. S., and Grenkow, L. A. 2015b. Seed size and
seeding rate effects on canola emergence, development, yield and seed weight. Canadian
Journal of Plant Science 95:1–8.
Harker, K. N., O’Donovan, J. T., Turkington, T. K., Blackshaw, R. E., Lupwayi, N. Z.,
Smith, E. G., Johnson, E. N., Gan, Y., Kutcher, H. R., Dosdall, L. M., and Peng, G.
2015a. Canola rotation frequency impacts canola yield and associated pest species.
Canadian Journal of Plant Science 95:9–20.
Harker, K. N., O'Donovan, J. T., Turkington, T. K., Blackshaw, R. E., Lupwayi, N. Z.,
Smith, E. G., Klein-Gebbinck, H., Dosdall, L. M., Hall, L. M., Willenborg, C. J.,
Kutcher, H. R., Malhi, S. S., Vera, C. L., Gan, Y., Lafond, G. P., May, W. E., Grant,
C. A., and McLaren, D. L. 2012. High-yield no-till canola production on the Canadian
prairies. Canadian Journal of Plant Science 92:221–233.
Harling, R., and Kennedy, S. H. 1991. Biological control of Plasmodiophora brassicae using a
bait crop. Mededelingen van de Faculteit Landbouwwetenschappen, Rijksuniversiteit
Gent 56:159–170.
Hasan, M. J., Strelkov, S. E., Howard, R. J., and Rahman, H. 2012. Screening of Brassica
germplasm for resistance to Plasmodiophora brassicae pathotypes prevalent in Canada
for broadening diversity in clubroot resistance. Canadian Journal of Plant Science
92:501–515.
Hatakeyama, K., Suwabe, K., Tomita, R. N., Kato, T., Nunome, T., Fukuoka, H., and
Matsumoto, S. 2013. Identification and characterization of Crr1, a gene for resistance to
clubroot disease (Plasmodiophora brassicae Woronin) in Brassica rapa L. PLoS One 8:
e54745.
Heath, M. C. 2000. Nonhost resistance and nonspecific plant defenses. Current Opinion in
Biology 3:315–319.
Hedley, M. J., Nye, P. H., and White, R. E. 1982. Plant-induced changes in the rhizosphere of
rape (Brassica napus var. Emerald) seedlings. New Phytologist 91:31–44.
Hirai, M. 2006. Genetic analysis of clubroot resistance in Brassica crops. Breeding Science
56:223-229.
Hirai, M., Harada, T., Kubo, N., Tsukada, M., Suwabe, K., and Matsumoto, S. 2004. A
novel locus for clubroot resistance in Brassica rapa and its linkage markers. Theoretical
and Applied Genetics 108:639–643.
Hirani, A. H., Gao, F., Liu, J., Guohua, F., Wu, C., Yuan, Y., Li, W., Hou, J., Duncan, R.,
and Li, G. 2016. Transferring clubroot resistance from Chinese cabbage (Brassica rapa)
to canola (B. napus). Canadian Journal of Plant Pathology 38:82–90.
Hollman, K. B., Hwang, S. F., Manolii, V. P., and Strelkov, S. E. 2020. Pathotypes of
Plasmodiophora brassicae collected from clubroot resistant canola (Brassica napus L.)
cultivars in western Canada in 2017–2018. Canadian Journal of Plant Pathology.
Howard, R. J., Strelkov, S. E., and Harding, M. W. 2010. Clubroot of cruciferous crops – new
perspectives on an old disease. Canadian Journal of Plant Pathology 32:43–57.

116
Howlett, B. J., Idnurm, A., and Pedras, M. S. C. 2001. Leptosphaeria maculans, the causal
agent of blackleg disease of Brassicas. Fungal Genetics and Biology 33:1–14.
Hwang, S. F., Ahmed, H. U., Gossen, B. D., Kutcher, H. R., Brandt, Strelkov, S. E., Chang,
K. F., and Turnbull, G. D. 2009. Effect of crop rotation on the soil pathogen population
dynamics and canola seedling establishment. Plant Pathology Journal 8:106–112.
Hwang, S. F., Ahmed, H. U., Strelkov, S. E., Gossen, B. D., Turnbull, G. D., Peng, G., and
Howard, R. J. 2011a. Seedling age and inoculum density affect clubroot severity and
seed yield in canola. Canadian Journal of Plant Science 91:183–190.
Hwang, S. F., Ahmed, H. U., Zhou, Q., Fu, H., Turnbull, G. D., Fredua-Agyeman, R.,
Strelkov, S. E., Gossen, B. D., and Peng, G. 2019. Influence of resistant cultivars and
crop intervals on clubroot of canola. Canadian Journal of Plant Science 99:862–872.
Hwang, S. F., Ahmed, H. U., Zhou, Q., Strelkov, S. E., Gossen, B. D., Peng, G., and
Turnbull, G. D. 2011b. Influence of cultivar resistance and inoculum density on root
hair infection of canola (Brassica napus) by Plasmodiophora brassicae. Plant Pathology
60:820–829.
Hwang, S. F., Ahmed, H. U., Zhou, Q., Strelkov, S. E., Gossen, B. D., Peng, G., and
Turnbull, G. D. 2012a. Assessment of the impact of resistant and susceptible canola on
Plasmodiophora brassicae inoculum potential. Plant Pathology 61:945–952.
Hwang, S. F., Ahmed, H. U., Zhou, Q., Strelkov, S. E., Gossen, B. D., Peng, G., and
Turnbull, G. D. 2014a. Efficacy of Vapam fumigant against clubroot (Plasmodiophora
brassicae) of canola. Plant Pathology 63:1374–1383.
Hwang, S. F., Ahmed, H. U., Zhou, Q., Turnbull, G. D., Strelkov, S. E., Gossen, B. D., and
Peng, G. 2015. Effect of host and non-host crops on Plasmodiophora brassicae resting
spore concentrations and clubroot of canola. Plant Pathology 64:1198–1206.
Hwang, S. F., Cao, T., Xiao, Q., Ahmed, H. U., Manolii, V. P., Turnbull, G. D., Gossen, B.
D., Peng, G., and Strelkov, S. E. 2012b. Effects of fungicide, seeding date and seedling
age on clubroot severity, seedling emergence and yield of canola. Journal of Plant
Science 92:1175–1186.
Hwang, S. F., Howard, R. J., Strelkov, S. E., Gossen, B. D., and Peng, G. 2014b.
Management of clubroot (Plasmodiophora brassicae) on canola (Brassica napus) in
western Canada. Canadian Journal of Plant Pathology 36:49–65.
Hwang, S. F., Strelkov, S. E., Ahmed, H. U., Manolii, V. P., Zhou, Q., Fu, H., Turnbull, G.,
Fredua-Agyeman, R., and Feindel, D. 2017. Virulence and inoculum density-dependent
interactions between clubroot resistant canola (Brassica napus) and Plasmodiophora
brassicae. Plant Pathology 66:1318–1328.
Hwang, S. F., Strelkov, S. E., Feng, J., Gossen, B. D., and Howard, R. J. 2012c.
Plasmodiophora brassicae: a review of an emerging pathogen of the Canadian canola
(Brassica napus) crop. Molecular Journal of Plant Pathology 13:105–113.
Ingram, D. S. 1969. Growth of Plasmodiophora brassicae in host callus. Journal of General
Microbiology 55:9–18l
Ingram, D. S., and Tommerup, I. C. 1972. The life history of Plasmodiophora brassicae.
Proceedings of the Royal Society of London series B. Biological Sciences 180:103–112.
International Seed Federation. 2016. Differential sets. Available from
https://www.worldseed.org/wp-content/uploads/2016/11/Brassica_Oleracea-
clubroot_november2016.pdf [cited 2 March 2020].
Karling, J. 1942. The Plasmodiophorales; including a complete host index, bibliography, and a

117
description of diseases caused by species of this order (First Edition). Published by the
author.
Kinsella, K., Schulthess, C. P., Morris, T. F., and Stuart, J. D. 2009. Rapid quantification of
Bacillus subtilis antibiotics in the rhizosphere. Soil Biology and Biochemistry 41:374–
379.
Köhl, J., van Tongeren, C. A. M., Groenenboom-de Haas, B. H., van Hoof, R. A., Driessen,
R., and van der Heijden, L. 2010. Epidemiology of dark leaf spot caused by Alternaria
brassicicola and A. brassicae in organic seed production of cauliflower. Plant Pathology
59:358–367.
Korbas, K., Jajor, E., and Budka, A. 2009. Clubroot (Plasmodiophora brassicae) – a threat for
oilseed rape. Journal of Plant Protection Research 49:446–451.
Kuginuki, Y., Yoshikawa, H., and Hirai, M. 1999. Variation in virulence of Plasmodiophora
brassicae in Japan tested with clubroot-resistant cultivars of Chinese cabbage (Brassica
rapa L. ssp. pekinensis). European Journal of Plant Pathology 105:327–332.
Lahlali, R., and Peng, G. 2014. Suppression of clubroot by Clonostachys rosea via antibiosis
and induced host resistance. Plant Pathology 63:447–455.
Lahlali, R., Peng, G., McGregor, L., Gossen, B. D., Hwang, S. F., and McDonald, M. 2011.
Mechanisms of the biofungicide Serenade (Bacillus subtilis QST713) in suppressing
clubroot. Biocontrol Science and Technology 21:1351–1362.
Landry, B. S., Hubert, N., Crête R., Chang, M. S., Lincoln, S. E., and Etoh, T. 1992. A
genetic map for Brassica oleracea based on RFLP markers detected with expressed DNA
sequences and mapping of resistance genes to race 2 of Plasmodiophora brassicae
(Woronin). Genome 35:409–420.
Lee, J., Izzah, N. K., Choi, B. -S., Choi, B. -S., Joh, H. J., Lee, S. -C., Perumal, S., Seo, J.,
Ahn, K., Jo, E. J., Choi, G. J., Nou, I. -S., Yu, Y., and Yang, T. -J. 2016. Genotyping-
by-sequencing map permits identification of clubroot resistance QTLs and revision of the
reference genome assembly in cabbage (Brassica oleracea L.). DNA Research 23:29–41.
Li, L., Luo, Y., Chen, B., Xu, K., Zhang, F., Li, H., Huang, Q., Xiao, X., Zhang, T., Hu, J.,
Li, F., and Wu, X. 2016. A genome-wide association study reveals new loci for
resistance to clubroot disease in Brassica napus. Frontiers in Plant Science 7:1483.
Liu, L., Qin, L., Cheng, X., Zhang, Y., Xu, L., Liu, F., Tong, C., Huang, J., Liu, S., and Wei,
Y. 2020. Comparing the infection biology of Plasmodiophora brassicae in clubroot
susceptible and resistant hosts and non-hosts. Frontiers in Microbiology 11:507036.
LMC International. 2016. The economic impact of canola on the Canadian economy. Available
from https://www.canolacouncil.org/media/584356/lmc_canola_10-year_impact_study_-
_canada_final_dec_2016.pdf [cited 12 January 2018].
Lovelock, D. A., Donald, C. E., Conlan, X. A., and Cahill, D. M. 2013. Salicylic acid
suppression of clubroot in broccoli (Brassicae oleracea var. italica) caused by the
obligate biotroph Plasmodiophora brassicae. Australasian Plant Pathology 42:141–153.
Ludwig-Müller, J. 2016. Belowground defense strategies against clubroot (Plasmodiophora
brassicae). in: Belowground defense strategies in plants. Signaling and communication in
plants, Vos C. M. F., and Karzan, K., eds. Springer, Cham.
Ludwig-Müller, J., Prinsen, E., Rolfe, S. A., and Scholes, J. D. 2009. Metabolism and plant
hormone action during clubroot disease. Journal of Plant Growth Regulation 28:229–244.
Ludwig-Müller, J., and Schuller, A. 2008. What can we learn from clubroot: alterations in host
roots and hormone homeostasis caused by Plasmodiophora brassicae. European Journal

118
of Plant Pathology121:291–302.
Macfarlane, I. 1952. Factors affecting the survival of Plasmodio-phora brassicae Wor. in the
soil and its assessment by a host test. 1952. Annals of Applied Biology, 39(2):239–256.
Macfarlane, I. 1970. Germination of resting spores of Plasmodiophora brassicae. Transactions
of the British Mycological Society 55:97–112.
Macfarlane, I., and Last, F. T. 1959. Some effects of Plasmodiophora brassicae Woron. On
the growth of the young cabbage plant. Annals of Botany 23:547–558.
Matsumoto, E., Ueno, H., Aruga, D., Sakamoto, K., and Hayashida, N. 2012. Accumulation
of three clubroot resistance genes through marker-assisted selection in Chinese cabbage
(Brassica rapa spp. pekinensis. Journal of the Japanese Society for Horticultural Science
81:184-190.
Matsumoto, E., Yasui, C., Ohi, M., and Tsukada, M. 1998. Linkage analysis of RFLP
markers for clubroot resistance and pigmentation in Chinese cabbage (Brassica rapa ssp.
pekinensis). Euphytica 104:79–86.
Manzanares-Dauleux, M. J., Delourme, R., Baron, F., and Thomas, G. 2000. Mapping of
one major gene and of QTLs involved in resistance to clubroot in Brassica napus.
Theoretical and Applied Genetics 101:885–891.
McDonald, M. R., Al-Daoud, F., Sedaghatkish, A., Moran, M., Cranmer, T. J., and Gossen,
B. D. 2020a. Changes in the range and virulence of Plasmodiophora brassicae across
Canada. Canadian Journal of Plant Pathology 42: xxx–xxx. In press.
McDonald, M. R., Gossen, B. D., Robson, J., and Al-Daoud, F. 2020b. Interaction of
solarization, fumigation, and totally impermeable film for the management of clubroot
(Plasmodiophora brassicae) on brassica crops. Acta Horticulturae 1270:153–160.
McDonald, M. R., Kornatowska, B., and McKeown, A. W. 2004. Management of clubroot of
Asian brassica crops grown on organic soils. Acta Horticulturae 635:25–30.
McDonald, M. R., Sharma, K., Gossen, B. D., Deora, A., Feng, J., and Hwang, S. F. 2014.
The role of primary and secondary infection in host response to Plasmodiophora
brassicae. Phytopathology 104:1078–1087.
McDonald, M. R., and Westerveld, S. M. 2008. Temperature prior to harvest influences the
incidence and severity of clubroot on two Asian Brassica vegetables. HortScience
43:1509–1513.
Meenu, G., Vikram, A., and Bharat, N. 2013. Black rot: a continuing threat to world crucifers.
American Phytopathological Society 64:736–742.
Mei, J., Guo, Z., Wang, J., Feng, Y., Ma, G., Zhang, C., Qian, W., Chen, and Chen, G.
2019. Understanding the resistance mechanism in Brassica napus to clubroot caused by
Plasmodiophora brassicae. Phytopathology 109:810–818.
Miller, R.O., and Kissel, D.E. 2010. Comparison of soil pH methods on soils of North America.
Soil Science Society of America Journal 74:310–316.
Mitani, S., Sugimoto, K., Hayashi, H., Takii, Y., Ohshima, T., and Matsuo, N. 2003. Effects
of cyazofamid against Plasmodiophora brassicae Woronin on Chinese cabbage. Pest
Management Science 59:287–293.
Mithen, R., and Macgrath, R. 1992. A contribution to the life history of Plasmodiophora
brassicae: secondary plasmodia development in root galls of Arabidopsis thaliana.
Mycological research 96:877–885.
Moriguchi, K., Kimizuka-Takagi, C., Ishii, K., and Nomura, K. 1999. A genetic map based
on RAPD, RFLP, isozyme, morphological markers and QTL analysis for clubroot
119
resistance in Brassica oleracea. Breeding Science 49:257–265.
Moxham, S., and Buczacki, T. S. 1983. Chemical composition of the resting spore wall of
Plasmodiophora brassicae. Transaction of the British Mycological Society 80:291–304.
Murakami, H., Tsushima, S., Akimoto, T., Murakami, K., Goto, I., and Shishido, Y. 2000.
Effects of growing leafy daikon (Raphanus sativus) on populations of Plasmodiophora
brassicae (clubroot). Plant Pathology 49:584–589.
Murakami, H., Tsushima, S., and Shishido, Y. 2002a. Factors affecting the pattern of the dose
response curve of clubroot disease caused by Plasmodiophora brassicae. Soil Science
and Plant Nutrition 48:421–427.
Murakami, H., Tsushima, S., Kuroyanagi, Y., and Shishido, Y. 2002b. Reduction of resting
spore density of Plasmodiophora brassicae and clubroot disease severity by liming. Soil
Science and Plant Nutrition 48:685–691.
Myers, D. F., and Campbell, R. N. 1985. Lime of the control of clubroot of crucifers: Effects of
pH, calcium, magnesium, and their interactions. Phytopathology 75:670–673.
Naiki, T., and Dixon, G. R. 1987. The effects of chemicals on developmental stages of
Plasmodiophora brassicae (clubroot). Plant Pathology 36:316–327.
Naiki, T., Kageyama, K., and Ikegami, H. 1978. The relation of spore density of
Plasmodiophora brassicae Wor. to the root hair infection and club formation in Chinese
cabbage (studies on the clubroot of cruciferous plant II). Annals of the Phytopathological
Society of Japan 44:432–439.
Neer, R. 1995. Heterodimeric G proteins: organizers of transmembrane signals. Cell 80:249–
257.
Niemann, J., Kaczmarek, J., and Jedryczka, M. 2018. Introduction of clubroot resistance to
rapeseed through interspecific hybridization. European Journal of Plant Pathology
147:181–198.
Niks, R. E., and Marcel, T. C. 2009. Nonhost and basal resistance: how to explain specificity?
New Phytologist 182:817–828.
Niwa, R., Kumei, T., Yoshinobu, N., Yoshida, S., Osaki, M., and Ezawa, T. 2007. Increase in
soil pH due to Ca-rich organic matter application causes suppression of the clubroot
disease of crucifers. Soil Biology & Biochemistry 39:778–785.
Niwa, R., Nomura, Y., Osaki, M., and Ezawa, T. 2008. f. Plant Pathology 57:445–452.
Nocker, A., Cheung, C.- J., and Camper, A. K. 2006. Comparison of propidium monoazide
with ethidium monoazide for differentiation of live vs. dead bacteria by selective removal
of DNA from dead cells. Journal of microbiological methods 67:310–320.
Nykiforuk, C. L., and Johnson-Flanagan, A. M. 1994. Germination and early seedling
development under low temperature in canola. Crop Science 34: 1047–1054.
Olsson, G. 1960. Species crosses within the genus Brassica II. Artificial Brassica napus L.
Hereditas 46:351–386.
OMAFRA. 2016. Growing vegetable transplants in plug trays. Available from
http://www.omafra.gov.on.ca/english/crops/facts/transplants-plugtrays.htm [updated 17
March 2020; cited 7 April 2020].
OMAFRA. 2018. Soil Fertility Handbook Publication 611 (Third Edition). Munro, J., ed.
OMAFRA. 2020. 6. Spring and winter canola. Available from
http://www.omafra.gov.on.ca/english/crops/pub811/pub811ch6.pdf [cited 12 Jan 2021].
Ongena, M., and Jacques, P. 2007. Bacillus lipopeptides: versatile weapons for plant disease
biocontrol. Trends in Microbiology 16:115–125.

120
Ontario Grain Farmer Magazine. 2021. A new rotation? Available
https://ontariograinfarmer.ca/2018/08/01/a-new-rotation/ [cited 12 Jan 2021].
Pageau, D., Lajeunesse, J., and Lafond, J. 2006. Impact de l’hernie des crucifères
[Plasmodiophora brassicae] sur la productivité et la qualité du canola. Canadian Journal
of Plant Pathology 28:137–143.
Pang, W., Fu, P., Li, X., Zhan, Z., Yu, S., and Piao, Z. 2018. Identification and mapping of the
clubroot resistance gene CRd in Chinese cabbage (Brassica rapa ssp. pekinensis).
Frontiers in Plant Science. 9:653.
Parlevliet, J. E. 1985. Race and pathotype concepts in parasitic fungi. Bulletin OEPP 15:145–
150.
Pedras, M. S. C., Zheng, Q. -A., and Strelkov, S. 2008. Metabolic changes in roots of the
oilseed canola infected with the biotroph Plasmodiophora brassicae: Phytoalexins and
phytoanticipins. Journal of Agricultural and Food Chemistry 56:9949–9961.
Peng, G., Falk, K. C., Gugel, R. K., Franke, C., Yu, F., James, B., Strelkov, S. E., Hwang, S.
-H., and McGregor, L. 2014a. Sources of resistance to Plasmodiophora brassicae
(clubroot) pathotypes virulent on canola. Canadian Journal of Plant Pathology 36:89-99.
Peng, G., Lahlali, R., Hwang, S. F., Pageau, D., Hynes, R. K., McDonald, M. R., Gossen, B.
D., and Strelkov, S. E. 2014b. Crop rotation, cultivar resistance, and
fungicides/biofungicides for managing clubroot (Plasmodiophora brassicae) on canola.
Canadian Journal of Plant Pathology 36:99–112.
Peng, G., Lahlali, R., Hynes, R. H., Gossen, B. D., Falk, K. C., Yu, F., Boyetchko, S. M.,
McGregor, L., Hupka, D., and Geissler, J. 2013. Assessment of crop rotation, cultivar
resistance and Bacillus subtilis biofungicide for control of clubroot on canola. Acta
Horticulturae 1005:591–598.
Peng, G., Pageau, D., Strelkov, S. E., Gossen, B. D., Hwang, S. F., and Lahlali, R. 2015. A
>2-year crop rotation reduces resting spores of Plasmodiophora brassicae in soil and the
impact of clubroot on canola. European Journal of Agronomy 70:78–84.
Peng, Y., Gossen, B. D., Huang, Y., Al-Daoud, F., and McDonald, M. R. 2019. Development
of Plasmodiophora brassicae in the root cortex of cabbage over time. European Journal
of Plant Pathology 154:727–737.
Penney, D. C., Nyborg, M., Hoyt, P. B., Rice, W. A., Siemens, B., and Laverty, D. H. 1977.
An assessment of the soil acidity problem in Alberta and Northeastern British Columbia.
Canadian Journal of Soil Science 57:157–164.
Piao, Z. Y., Deng, Y. Q., Choi, S. R., Park, Y. J., and Lim, Y. P. 2004. SCAR and CAPS
mapping of CRb, a gene conferring resistance to Plasmodiophora brassicae in Chinese
cabbage (Brassica rapa ssp. pekinensis). Theoretical and Applied Genetics 108:1458–
1465.
Piao, Z. Y., Park, Y. J., Choi, S. R., Hong, C. P., Park, J. Y., Choi, Y. S., and Lim, Y. P.
2002. Conversion of an AFLP marker linked to clubroot resistance gene in Chinese
cabbage into a SCAR marker. Korean Journal of Horticultural Science and Technology
43:653–659.
Piao, Z. Y., Ramchiary, N., and Lim, Y. P. 2009. Genetics of clubroot resistance in Brassica
species. Journal of Plant Growth Regulation 28:252–264.
Prakash, S., Wu, X. -M., and Bhat, S. R. 2012. History, evolution, and domestication of
Brassica crops. in: Plant breeding reviews volume 35, Janick, J., ed. Wiley-Blackwell,
New Jersey.

121
Rashid, A., Ahmed, H. U., Xiao, Q., Hwang, S. F., and Strelkov, S. E. 2013. Effects of root
exudates and pH on Plasmodiophora brassicae resting spore germination and infection of
canola (Brassica napus L.) root hairs. Crop Protection 48:16–23.
Rastas, M., Latvala, S., and Hannukkala, A. 2013. Occurrence and survival of
Plasmodiophora brassicae in Finnish turnip rape and oilseed rape fields. Acta
Horticulturae 1005:627–632.
Rempel, C. B., Hutton, S. N., and Clinton, J. J. 2014. Clubroot and the importance of canola
in Canada. Canadian Journal of Plant Pathology 36:19–26.
Rennie, D. C., Manolii, V. P., Cao, T., Hwang, S. F., Howard, R. J., and Strelkov, S. E.
2011. Direct evidence of surface infestation of seeds and tubers by Plasmodiophora
brassicae and quantification of spore loads. Plant Pathology 60:811–819.
Reyes, A. A., Davidson, T. R., and Marks, F. 1974. Races, pathogenicity and chemical control
of Plasmodiophora brassicae in Ontario. Phytopathology 64:173–177.
Reynolds, W. D., Bowman, B. T., Drury, C. F., Tan, C. S., and Lu, X. 2002. Indicators of
good soil physical quality: density and storage parameters. Geoderma 110:131–146.
Rocherieux, J., Glory, P., Giboulot, A., Boury, S., Barbeyron, Thomas, G., and
Manzanares-Dauleux, M. J. 2004. Isolate-specific and broad-spectrum QTLs are
involved in the control of clubroot in Brassica oleracea. Theoretical and Applied
Genetics 108:1555–1563.
Sakamoto, K., Saito, A., Hayashida, N., Taguchi, G., and Matsumoto, E. 2008. Mapping of
isolate-specific QTLs for clubroot resistance in Chinese cabbage (Brassica rapa L. ssp.
pekinensis). Theoretical and Applied Genetics 117:759–767.
Saude, C., McKeown, A., Gossen, B. D., and McDonald, M. R. 2012. Effect of host resistance
and fungicide application on clubroot pathotype 6 in green cabbage and napa cabbage.
HortTechnology 22:311–319.
Sedaghatkish, A. 2020. The genomic structure and management of Plasmodiophora brassicae.
PhD thesis, University of Guelph, Guelph, Ontario.
Sedaghatkish, A., Gossen, B. D., Yu, F., Torkamaneh, D., and McDonald, M. R. 2019.
Whole-genome DNA similarity and population structure of Plasmodiophora brassicae
strains from Canada. BMC Genomics 20:744.
Shah, N., Sun, J., Yu, S., Yang, Z., Wang, Z., Huang, F., Dun, B., Gong, J., Liu, Y., Li, Y.,
Li, Q., Yuan, L., Baloch, A., Li, G., Li, S., and Zhang, C. 2019. Genetic variation
analysis of field isolates of clubroot and their responses to Brassica napus lines
containing resistant genes CRb and PbBa8.1 and their combination in homozygous and
heterozygous state. Molecular Breeding 39:153.
Sharma, K., Gossen, B. D., Greenshields, D., Selvaraj, G., Strelkov, S. E., and McDonald,
M. R. 2013a. Reaction of lines of the rapid cycling Brassica collection and Arabidopsis
thaliana to four pathotypes of Plasmodiophora brassicae. Plant Disease 97:740–727.
Sharma, K., Gossen, B. D., Howard, R. J., Gludovacz, T., and McDonald, M. R. 2013b.
Reaction of selected Brassica vegetable crops to Canadian pathotypes of Plasmodiophora
brassicae. Canadian Journal of Plant Pathology 35:371–383.
Sharma, K., Gossen, B. D., and McDonald, M. R. 2011a. Effect of temperature on cortical
infection by Plasmodiophora brassicae and clubroot severity. Phytopathology 101:1424–
1432.
Sharma, K., Gossen, B. D., and McDonald, M. R. 2011b. Effect of temperature on primary
infection by Plasmodiophora brassicae and initiation of clubroot symptoms. Plant

122
Pathology 60:830–838.
Sharma, P., Meena, P. D., Verma, P. D., Saharan, G. S., Mehta, N., Singh, D., and Kumar,
A. 2015. Sclerotinia sclerotium (Lib.) de Bary causing Sclerotinia rot in oilseed
Brassicas: A review. Journal of Oilseed Brassica 6:1–44.
Sleigh, M. A., and Barlow, D. I. 1981. How are different ciliary beat patterns produced?
Symposia of the Society for Experimental Biology 35:139–157.
Smelt, J. H., and Leistra, M. 1974. Conversion of metham-sodium to methyl isothiocyanate
and basic data on the behaviour of methyl isothiocyanate in soil. Pesticide Science 5:401–
407.
Smilde, W. D., Linders, E. G. A., and Veenstra, R. M. 2012. Characterization of clubroot
resistant in Brassica oleracea. 10th Conference of the European Foundation of Plant
Pathology. Wageningen, the Netherlands, 1–5 October 2012. Poster abstract P46.
(http://www.efpp.net/ipm2/Program_and_abstract_book/posters.html).
Somé, A., Manzanares, M. J., Laurens, F., Baron, F., Thomas, G., and Rouxel, F. 1996.
Variation for virulence on Brassica napus L. amongst Plasmodiophora brassicae
collections from France and derived single-spore isolates. Plant Pathology 45:432–439.
Song, K. M., Tang, K., and Osborn, T. C. 1993. Development of synthetic Brassica
amphidiploids by reciprocal hybridization and comparison to natural amphidiploids.
Theoretical and Applied Genetics 86:811–821.
Statistics Canada. 2017. Farm cash receipts ($ thousands). Statistics Canada, CANSIM.
Available from http://www.statcan.gc.ca/tables-tableaux/sum-som/l01/cst01/agri03a-
eng.htm [cited 18 May 2018].
Statistics Canada. 2019a. Principal field crop areas, June 2019. Statistics Canada, The Daily.
Available from https://www150.statcan.gc.ca/n1/daily-quotidien/190626/dq190626b-
eng.htm [cited 10 July 2020].
Statistics Canada. 2019b. Production of principal field crops, November 2019. Statistics
Canada, The Daily. Available from https://www150.statcan.gc.ca/n1/daily-
quotidien/191206/dq191206b-eng.htm [cited 10 July 2020].
Statistics Canada. 2020. Table 32-10-0365-01 Area production and farm gate value of marketed
vegetables. Available from
https://www150.statcan.gc.ca/t1/tbl1/en/tv.action?pid=3210036501 [cited 8 April 2020].
Strelkov, S. E., Hwang, S. F., Howard, R. J., Hartman, M., and Turkington, T. K. 2011.
Progress towards the sustainable management of clubroot [Plasmodiophora brassicae] of
canola on the Canadian Prairies. Prairie Soils and Crops 4:114–121.
Strelkov, S. E., Hwang, S. F., Manolii, V. P., Cao, T., Fredua-Agyeman, R., Harding, M.
W., Peng, G., Gossen, B. D., McDonald, M. R., and Feindel, D. 2018. Virulence and
pathotype classification of Plasmodiophora brassicae populations collected from
clubroot resistant canola (Brassica napus) in Canada. Canadian Journal of Plant
Pathology 40:284–298.
Strelkov, S. E., Manolii, V. P., Cao, T., Xue, S., and Hwang, S. F. 2007. Pathotype
classification of Plasmodiophora brassicae and its occurrence in Brassica napus in
Alberta, Canada. Phytopathology 155:706–712.
Sukuzi, K., Matsumiya, E., Ueno, Y., and Mizutani, J. 1992. Some properties of germination-
stimulating factor from plants for resting spores of Plasmodiophora brassicae. Annals of
the Phytopathological Society of Japan 58:699–705.
Suwabe, K., Tsukazaki, H., Iketani, H., Hatakeyama, K., Fujimura, M., Nunome, T.,

123
Fukuoka, H., Matsumoto, S., and Hirai, M. 2003. Identification of two loci for
resistance to clubroot (Plasmodiophora brassicae Woronin) in Brassica rapa L.
Theoretical and Applied Genetics 107:997–1002.
Suwabe, K., Tsukazaki, H., Iketani, H., Hatakeyama, K., Kondo, M., Fuigimura, M.,
Nunome, T., Fukuoka, H., Hirai, M., and Matsumoto, S. 2006. Simple sequence
repeat-based comparative genomics between Brassica rapa and Arabidopsis thaliana:
The genetic origin of clubroot resistance. Genetics 173:309–319.
Takahashi, K. 1994a. Biological agents affecting the viability of resting spores of
Plasmodiophora brassicae Wor. in soil without host roots. Annals of the
Phytopathological Society of Japan 60:667–674.
Takahashi, K. 1994b. Influences of some environmental factors on the viability of resting
spores of Plasmodiophora brassicae Wor. incubated in sterile soil. Annals of the
Phytopathological Society of Japan 60:658–666.
Thordal-Christensen, H. 2003. Fresh insights into processes of nonhost resistance. Current
Opinion in Plant Biology 6:351–357.
Toxopeus, H., and Janssen, M. P. 1975. Clubroot resistance in turnip II. The ‘slurry’ screening
method and clubroot races in the Netherlands. Euphytica 24:751–755.
Tremblay, N., Bélec, C., Coulombe, J., and Godin, C. 2005. Evaluation of calcium cyanamide
and liming for control of clubroot disease in cauliflower. Crop Protection 24:798–803.
University of Florida. 1994. Cabbage: Uses and production. Available from:
http://www.oocities.org/habbage/cab.pdf [cited 5 Jan 2020].
U, N. 1935. Genome analysis in Brassica with special reference to the experimental formation of
B. napus and peculiar mode of fertilization. Japanese Journal of Botany 7:389–452.
Vančura, V. 1964. Root exudates of plants I. Analysis of root exudates of barley and wheat in
their initial phases of growth. Plant and Soil 21:231–248.
Van der Plank, J. E. 1969. Pathogenic races, host resistance, and an analysis of pathogenicity.
Netherland Journal of Plant Pathology 75:45–52.
Vera, C. L., Downey, R. K., Woods, S. M., Raney, J. P., McGregor, D. I., Elliott, R. H., and
Johnson, E. N. 2007. Yield and quality of canola seed as affected by stage of maturity at
swathing. Canadian Journal of Plant Science 87:13–26.
Vicente, J. G., and Holub, E. B. 2013. Xanthomonas campestris pv. campestris (cause of black
rot of crucifers) in the genomic era is still a worldwide threat to brassica crops. Molecular
Plant Pathology 14:2–18.
Wallenhammar, A. -C. 1996. Prevalence of Plasmodiophora brassicae in a spring oilseed rape
growing area in central Sweden and factors influencing soil infestation levels.
Wallenhammar, A. -C., Almquist, C., Söderström, and Jonsson, A. 2012. In-field
distribution of Plasmodiophora brassicae measured using quantitative real-time PCR.
Plant Pathology 61:16–28.
Watson, A. G., and Baker, K. F. 1969. Possible gene centers for resistance in the genus
Brassica to Plasmodiophora brassicae. Economic Botany 23:245–252.
Webster, M. A., and Dixon, G. R. 1991a. Boron, pH and inoculum concentration influencing
colonization by Plasmodiophora brassicae. Mycological research 95:74–79.
Webster, M. A., and Dixon, G. R. 1991b. Calcium, pH and inoculum concentration influencing
colonization by Plasmodiophora brassicae. Mycological Research 95:64–73.
Welch, N., Greathead, A. S., Inman, J., and Quick, J. 1976. Club root control in brussels
sprouts using lime for pH adjustment. California Agriculture 30:10–11.
124
Wellman, F. L. 1930. Clubroot of crucifers. Technical Bulletin United States Department of
Agriculture 181.
Wen, R., Lee, J., Chu, M., Tonu, N., Dumonceaux, T., Gossen, B. D., Yu, F., and Peng, G.
2020. Quantification of Plasmodiophora brassicae resting spores in soil using droplet
digital PCR (ddPCR). Plant Disease 104:1188-1194.
Werner, S., Diederichsen, E., Frauen, M., Schondelmaier, J., and Jung, C. 2008. Genetic
mapping of clubroot resistance genes in oilseed rape. Theoretical and Applied Genetics
116:363–372.
West, J. S., Kharbanda, P. D., Barbetti, M. J., and Fitt, B. D. L. 2001. Epidemiology and
management of Leptosphaeria maculans (phoma stem canker) on oilseed rape in
Australia, Canada and Europe. Plant Pathology 50:10–27.
Williams, P. H. 1966. A system for the determination of races of Plasmodiophora brassicae that
infect cabbage and rutabaga. Phytopathology 56:624–626.
Williams, P. H. 1980. Black rot: a continuing threat to world crucifers. American
Phytopathological Society 64: 736–742.
Williams, P. H., Sheila, J. A., and Aist, J. R. 1971. Response of cabbage root hairs to infection
by Plasmodiophora brassicae. Canadian Journal of Botany 48:41–47.
Woronin, M. S. 1878. Plasmodiophora brassicae, Urheber der Kohlpflanzen-Hernie. 11:548–
574.
Young, C. C., Cheng, K. T., and Waller, G. R. 1991. Phenolic compounds in conducive and
suppressive soils on clubroot disease of crucifers. Soil Biology and Biochemistry
23:1183–1189.
Zhan, Z., Nwafor, C. C., Hou, Z., Gong, J., Zhu, B., Jiang, Y., Zhou, Y., Wu, J., Piao, Z.,
Tong, Y., Liu, C., and Zhang, C. 2017. Cytological and morphological analysis of
hybrids between Brassicoraphanus, and Brassica napus for introgression of clubroot
resistant trait into Brassica napus L. PLoS ONE 12: e0177470.

125
APPENDICES
Appendix 1: Supplemental tables and figures, Chapter Two
Table A1.1 Clubroot incidence (CI, %), disease severity index (DSI), and fresh dry weight of
clubroot susceptible and resistant canola cultivars grown at the Muck Crops Research Station,
ON, in 2018 (n = 6).
Cultivar Block Incidence
(%)
DSI (0–100) Fresh weight
(g)
Dry weight
(g)
L241C 1 0 0 106.4 14.52
L241C 2 6 2 112.4 15.37
L241C 3 0 0 90.4 13.22
L241C 4 22 7.333333 93.4 15.43
L241C 5 0 0 110.4 13.73
L241C 6 0 0 138.4 17.32
L255PC 1 0 0 133.4 15.77
L255PC 2 0 0 118.4 16.13
L255PC 3 2 0.666667 96.4 14.5
L255PC 4 8 2.666667 168.4 16.84
L255PC 5 0 0 114.4 14.12
L255PC 6 2 0.666667 149.4 15.38
L135C 1 0 0 118.4 13.69
L135C 2 0 0 127.4 15.43
L135C 3 0 0 82.4 12.72
L135C 4 12 4 107.4 12.93
L135C 5 0 0 171.4 19.23
L135C 6 0 0 40.4 10.6
L233P 1 100 100 50.4 12.74
L233P 2 100 100 54.4 11.44
L233P 3 100 99.33333 53.4 13.53
L233P 4 98 92.66667 48.4 11.75
L233P 5 100 99.33333 42.4 10.94
L233P 6 100 97.33333 30.4 10.36
L252 1 100 98.66667 73.4 14.27
L252 2 100 100 72.4 12.8
L252 3 100 100 70.4 15.44
L252 4 97.87234 97.16312 68.4 12.33
L252 5 100 100 43.4 10.33
L252 6 100 97.16312 34.4 8.99
ACS N39 1 100 98.66667 41.4 12.24
ACS N39 2 100 99.33333 48.4 12.21
ACS N39 3 100 100 58.4 12.49
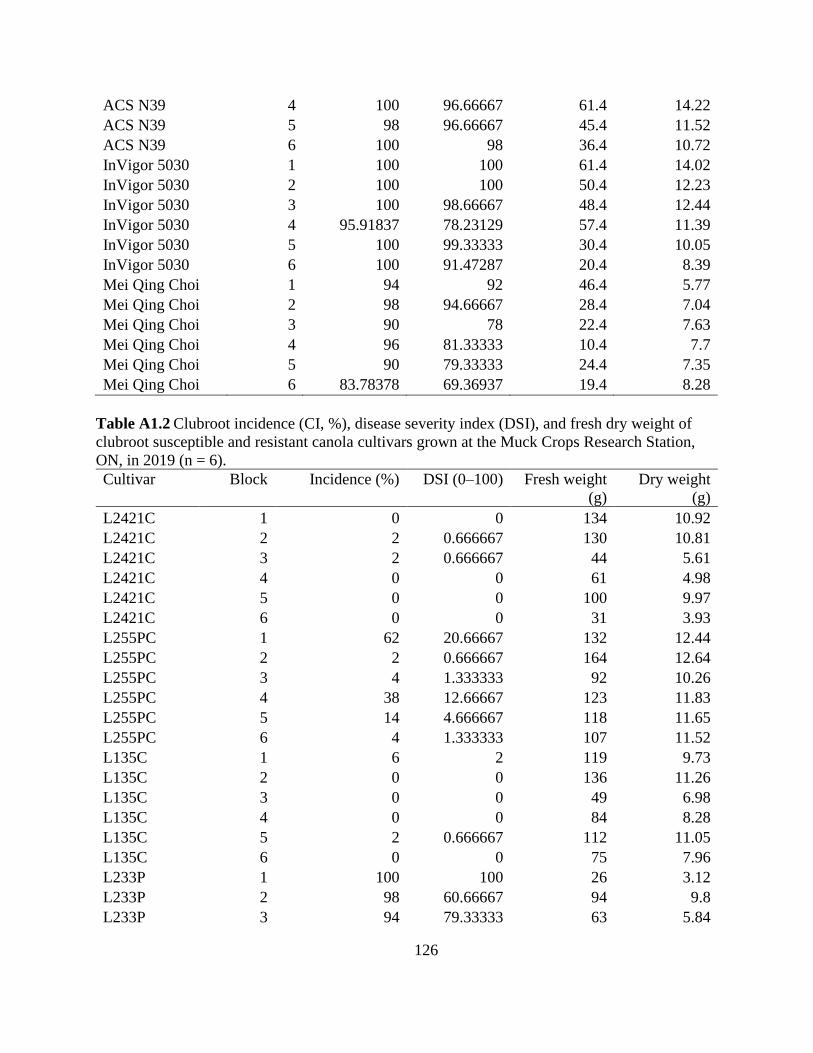
126
ACS N39 4 100 96.66667 61.4 14.22
ACS N39 5 98 96.66667 45.4 11.52
ACS N39 6 100 98 36.4 10.72
InVigor 5030 1 100 100 61.4 14.02
InVigor 5030 2 100 100 50.4 12.23
InVigor 5030 3 100 98.66667 48.4 12.44
InVigor 5030 4 95.91837 78.23129 57.4 11.39
InVigor 5030 5 100 99.33333 30.4 10.05
InVigor 5030 6 100 91.47287 20.4 8.39
Mei Qing Choi 1 94 92 46.4 5.77
Mei Qing Choi 2 98 94.66667 28.4 7.04
Mei Qing Choi 3 90 78 22.4 7.63
Mei Qing Choi 4 96 81.33333 10.4 7.7
Mei Qing Choi 5 90 79.33333 24.4 7.35
Mei Qing Choi 6 83.78378 69.36937 19.4 8.28
Table A1.2 Clubroot incidence (CI, %), disease severity index (DSI), and fresh dry weight of
clubroot susceptible and resistant canola cultivars grown at the Muck Crops Research Station,
ON, in 2019 (n = 6).
Cultivar Block Incidence (%) DSI (0–100) Fresh weight
(g)
Dry weight
(g)
L2421C 1 0 0 134 10.92
L2421C 2 2 0.666667 130 10.81
L2421C 3 2 0.666667 44 5.61
L2421C 4 0 0 61 4.98
L2421C 5 0 0 100 9.97
L2421C 6 0 0 31 3.93
L255PC 1 62 20.66667 132 12.44
L255PC 2 2 0.666667 164 12.64
L255PC 3 4 1.333333 92 10.26
L255PC 4 38 12.66667 123 11.83
L255PC 5 14 4.666667 118 11.65
L255PC 6 4 1.333333 107 11.52
L135C 1 6 2 119 9.73
L135C 2 0 0 136 11.26
L135C 3 0 0 49 6.98
L135C 4 0 0 84 8.28
L135C 5 2 0.666667 112 11.05
L135C 6 0 0 75 7.96
L233P 1 100 100 26 3.12
L233P 2 98 60.66667 94 9.8
L233P 3 94 79.33333 63 5.84
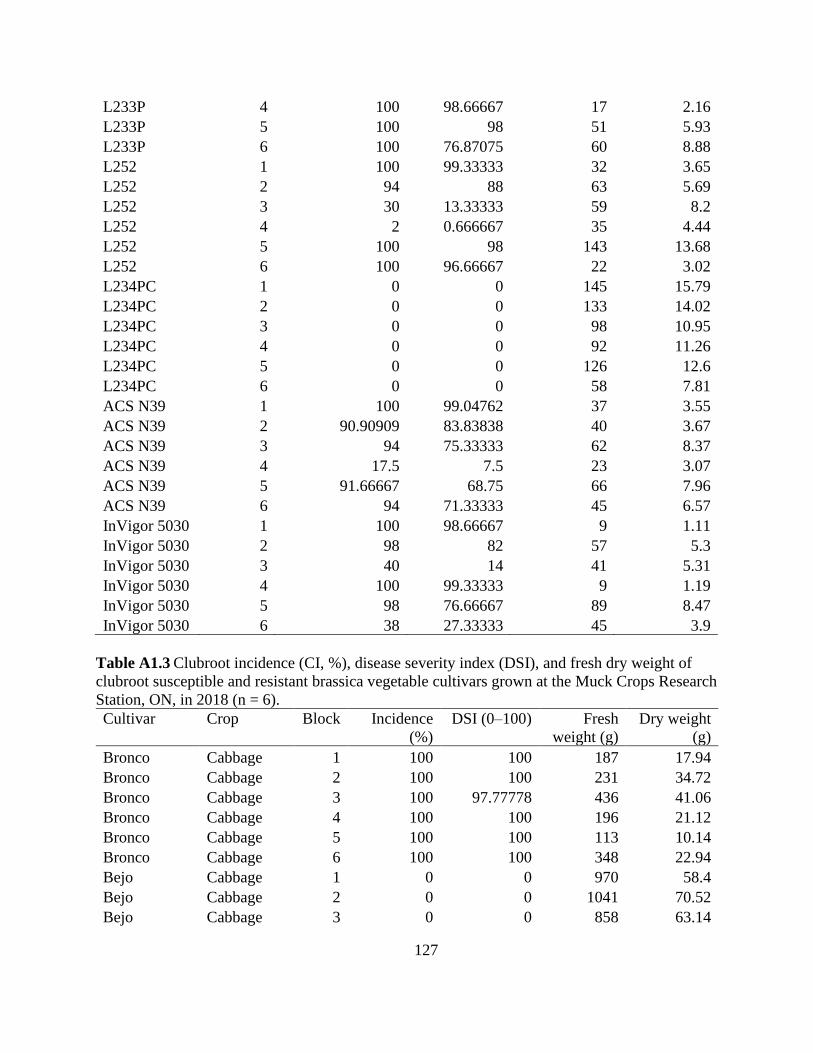
127
L233P 4 100 98.66667 17 2.16
L233P 5 100 98 51 5.93
L233P 6 100 76.87075 60 8.88
L252 1 100 99.33333 32 3.65
L252 2 94 88 63 5.69
L252 3 30 13.33333 59 8.2
L252 4 2 0.666667 35 4.44
L252 5 100 98 143 13.68
L252 6 100 96.66667 22 3.02
L234PC 1 0 0 145 15.79
L234PC 2 0 0 133 14.02
L234PC 3 0 0 98 10.95
L234PC 4 0 0 92 11.26
L234PC 5 0 0 126 12.6
L234PC 6 0 0 58 7.81
ACS N39 1 100 99.04762 37 3.55
ACS N39 2 90.90909 83.83838 40 3.67
ACS N39 3 94 75.33333 62 8.37
ACS N39 4 17.5 7.5 23 3.07
ACS N39 5 91.66667 68.75 66 7.96
ACS N39 6 94 71.33333 45 6.57
InVigor 5030 1 100 98.66667 9 1.11
InVigor 5030 2 98 82 57 5.3
InVigor 5030 3 40 14 41 5.31
InVigor 5030 4 100 99.33333 9 1.19
InVigor 5030 5 98 76.66667 89 8.47
InVigor 5030 6 38 27.33333 45 3.9
Table A1.3 Clubroot incidence (CI, %), disease severity index (DSI), and fresh dry weight of
clubroot susceptible and resistant brassica vegetable cultivars grown at the Muck Crops Research
Station, ON, in 2018 (n = 6).
Cultivar Crop Block Incidence
(%)
DSI (0–100) Fresh
weight (g)
Dry weight
(g)
Bronco Cabbage 1 100 100 187 17.94
Bronco Cabbage 2 100 100 231 34.72
Bronco Cabbage 3 100 97.77778 436 41.06
Bronco Cabbage 4 100 100 196 21.12
Bronco Cabbage 5 100 100 113 10.14
Bronco Cabbage 6 100 100 348 22.94
Bejo Cabbage 1 0 0 970 58.4
Bejo Cabbage 2 0 0 1041 70.52
Bejo Cabbage 3 0 0 858 63.14
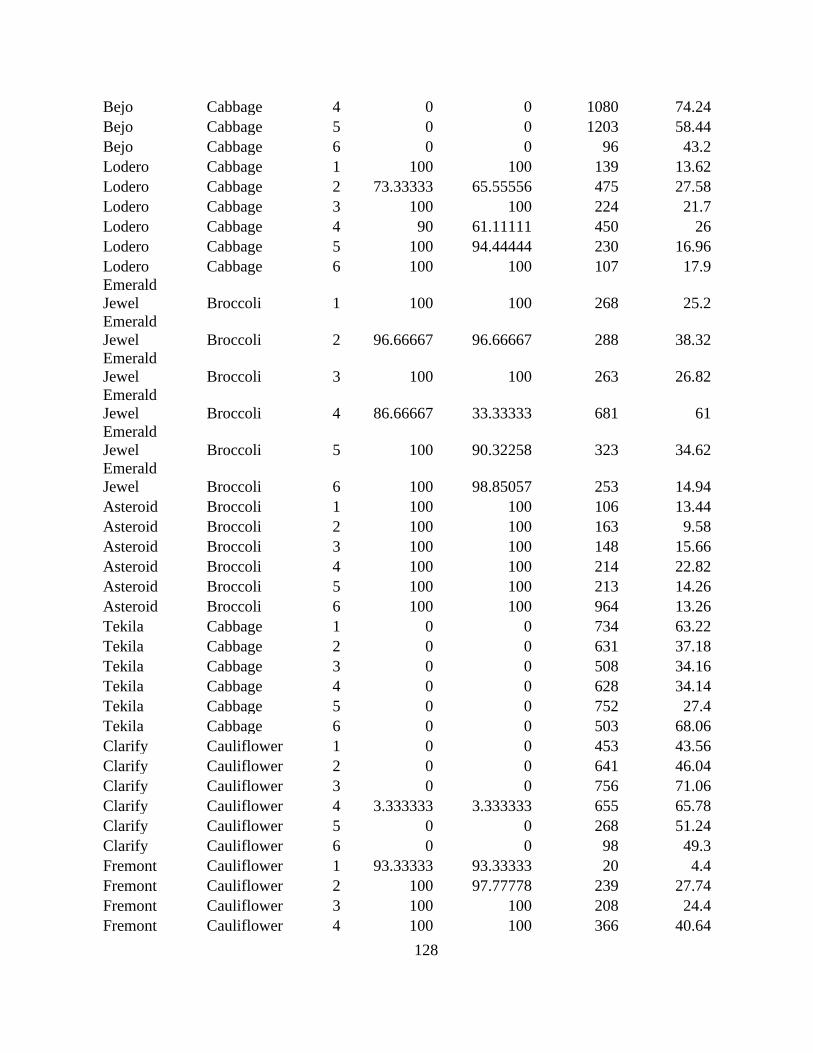
128
Bejo Cabbage 4 0 0 1080 74.24
Bejo Cabbage 5 0 0 1203 58.44
Bejo Cabbage 6 0 0 96 43.2
Lodero Cabbage 1 100 100 139 13.62
Lodero Cabbage 2 73.33333 65.55556 475 27.58
Lodero Cabbage 3 100 100 224 21.7
Lodero Cabbage 4 90 61.11111 450 26
Lodero Cabbage 5 100 94.44444 230 16.96
Lodero Cabbage 6 100 100 107 17.9
Emerald
Jewel Broccoli 1 100 100 268 25.2
Emerald
Jewel Broccoli 2 96.66667 96.66667 288 38.32
Emerald
Jewel Broccoli 3 100 100 263 26.82
Emerald
Jewel Broccoli 4 86.66667 33.33333 681 61
Emerald
Jewel Broccoli 5 100 90.32258 323 34.62
Emerald
Jewel Broccoli 6 100 98.85057 253 14.94
Asteroid Broccoli 1 100 100 106 13.44
Asteroid Broccoli 2 100 100 163 9.58
Asteroid Broccoli 3 100 100 148 15.66
Asteroid Broccoli 4 100 100 214 22.82
Asteroid Broccoli 5 100 100 213 14.26
Asteroid Broccoli 6 100 100 964 13.26
Tekila Cabbage 1 0 0 734 63.22
Tekila Cabbage 2 0 0 631 37.18
Tekila Cabbage 3 0 0 508 34.16
Tekila Cabbage 4 0 0 628 34.14
Tekila Cabbage 5 0 0 752 27.4
Tekila Cabbage 6 0 0 503 68.06
Clarify Cauliflower 1 0 0 453 43.56
Clarify Cauliflower 2 0 0 641 46.04
Clarify Cauliflower 3 0 0 756 71.06
Clarify Cauliflower 4 3.333333 3.333333 655 65.78
Clarify Cauliflower 5 0 0 268 51.24
Clarify Cauliflower 6 0 0 98 49.3
Fremont Cauliflower 1 93.33333 93.33333 20 4.4
Fremont Cauliflower 2 100 97.77778 239 27.74
Fremont Cauliflower 3 100 100 208 24.4
Fremont Cauliflower 4 100 100 366 40.64

129
Fremont Cauliflower 5 100 100 52 12.04
Fremont Cauliflower 6 100 97.33333 158 39.52
Stokes Rutabaga 1 90 84.44444 12 1.78
Stokes Rutabaga 2 93.33333 84.44444 60 5.58
Stokes Rutabaga 3 66.66667 42.22222 30 4.88
Stokes Rutabaga 4 0 0 55 5.06
Stokes Rutabaga 5 56.66667 43.33333 42 3.98
Stokes Rutabaga 6 78.26087 63.76812 16 2.06
Wisconsin Rutabaga 1 100 88 36 5.24
Wisconsin Rutabaga 2
Wisconsin Rutabaga 3 100 100 38 6.16
Wisconsin Rutabaga 4 0 0 78 8.3
Wisconsin Rutabaga 5 50 33.33333 15 2.32
Wisconsin Rutabaga 6 100 100 26.66667 3.433333
Yuki
Napa
cabbage 1 0 0 372 14.56
Yuki
Napa
cabbage 2 0 0 291 22.725
Yuki
Napa
cabbage 3 3.333333 3.333333 252 12.46
Yuki
Napa
cabbage 4 3.333333 1.111111 335 13.44
Yuki
Napa
cabbage 5 6.666667 2.222222 344 19
Yuki
Napa
cabbage 6 0 0 215 9.92
Blue
Napa
cabbage 1 96.66667 96.66667 54 7.08
Blue
Napa
cabbage 2 100 100 139 9.18
Blue
Napa
cabbage 3 100 100 144 11.16
Blue
Napa
cabbage 4 100 98.76543 191 16.12
Blue
Napa
cabbage 5 100 100 258 8.88
Blue
Napa
cabbage 6 96.66667 95.55556 253 20.7
Mei Qing
Choi
Shanghai
pak choi 1 96.66667 96.66667 63 3.96
Mei Qing
Choi
Shanghai
pak choi 2 100 95.55556 130 4.8
Mei Qing
Choi
Shanghai
pak choi 3 96.2963 93.82716 128 9.7
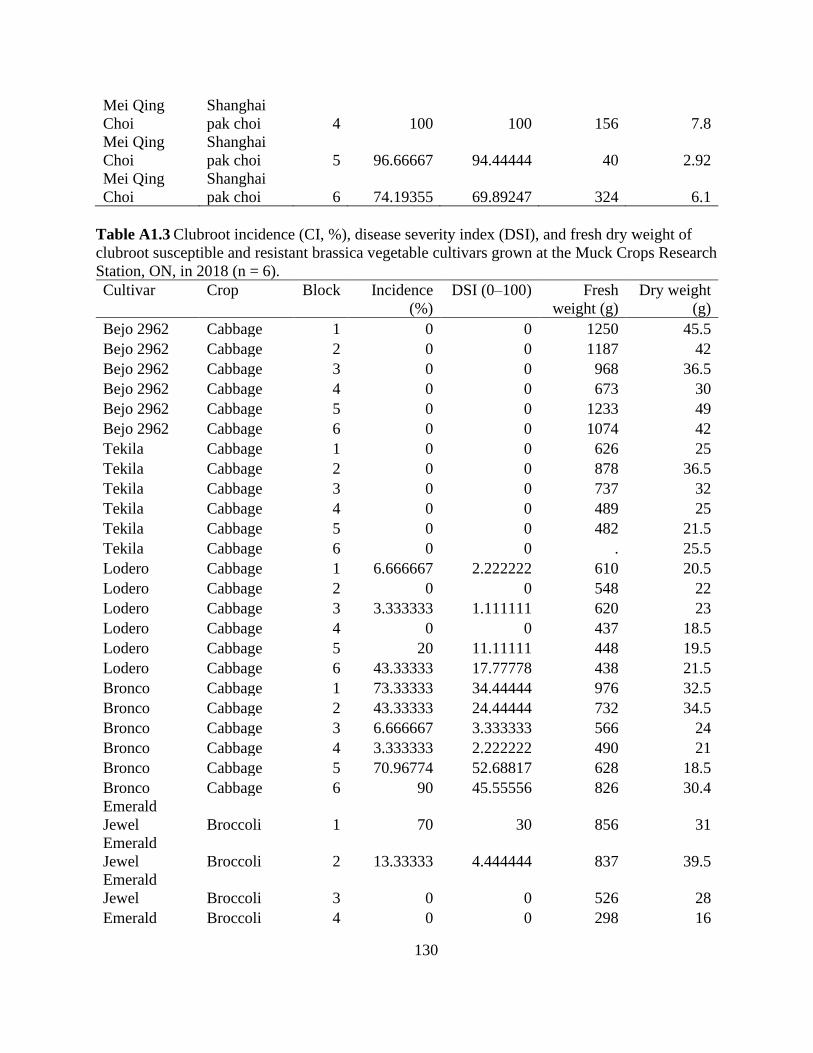
130
Mei Qing
Choi
Shanghai
pak choi 4 100 100 156 7.8
Mei Qing
Choi
Shanghai
pak choi 5 96.66667 94.44444 40 2.92
Mei Qing
Choi
Shanghai
pak choi 6 74.19355 69.89247 324 6.1
Table A1.3 Clubroot incidence (CI, %), disease severity index (DSI), and fresh dry weight of
clubroot susceptible and resistant brassica vegetable cultivars grown at the Muck Crops Research
Station, ON, in 2018 (n = 6).
Cultivar Crop Block Incidence
(%)
DSI (0–100) Fresh
weight (g)
Dry weight
(g)
Bejo 2962 Cabbage 1 0 0 1250 45.5
Bejo 2962 Cabbage 2 0 0 1187 42
Bejo 2962 Cabbage 3 0 0 968 36.5
Bejo 2962 Cabbage 4 0 0 673 30
Bejo 2962 Cabbage 5 0 0 1233 49
Bejo 2962 Cabbage 6 0 0 1074 42
Tekila Cabbage 1 0 0 626 25
Tekila Cabbage 2 0 0 878 36.5
Tekila Cabbage 3 0 0 737 32
Tekila Cabbage 4 0 0 489 25
Tekila Cabbage 5 0 0 482 21.5
Tekila Cabbage 6 0 0 . 25.5
Lodero Cabbage 1 6.666667 2.222222 610 20.5
Lodero Cabbage 2 0 0 548 22
Lodero Cabbage 3 3.333333 1.111111 620 23
Lodero Cabbage 4 0 0 437 18.5
Lodero Cabbage 5 20 11.11111 448 19.5
Lodero Cabbage 6 43.33333 17.77778 438 21.5
Bronco Cabbage 1 73.33333 34.44444 976 32.5
Bronco Cabbage 2 43.33333 24.44444 732 34.5
Bronco Cabbage 3 6.666667 3.333333 566 24
Bronco Cabbage 4 3.333333 2.222222 490 21
Bronco Cabbage 5 70.96774 52.68817 628 18.5
Bronco Cabbage 6 90 45.55556 826 30.4
Emerald
Jewel Broccoli 1 70 30 856 31
Emerald
Jewel Broccoli 2 13.33333 4.444444 837 39.5
Emerald
Jewel Broccoli 3 0 0 526 28
Emerald Broccoli 4 0 0 298 16
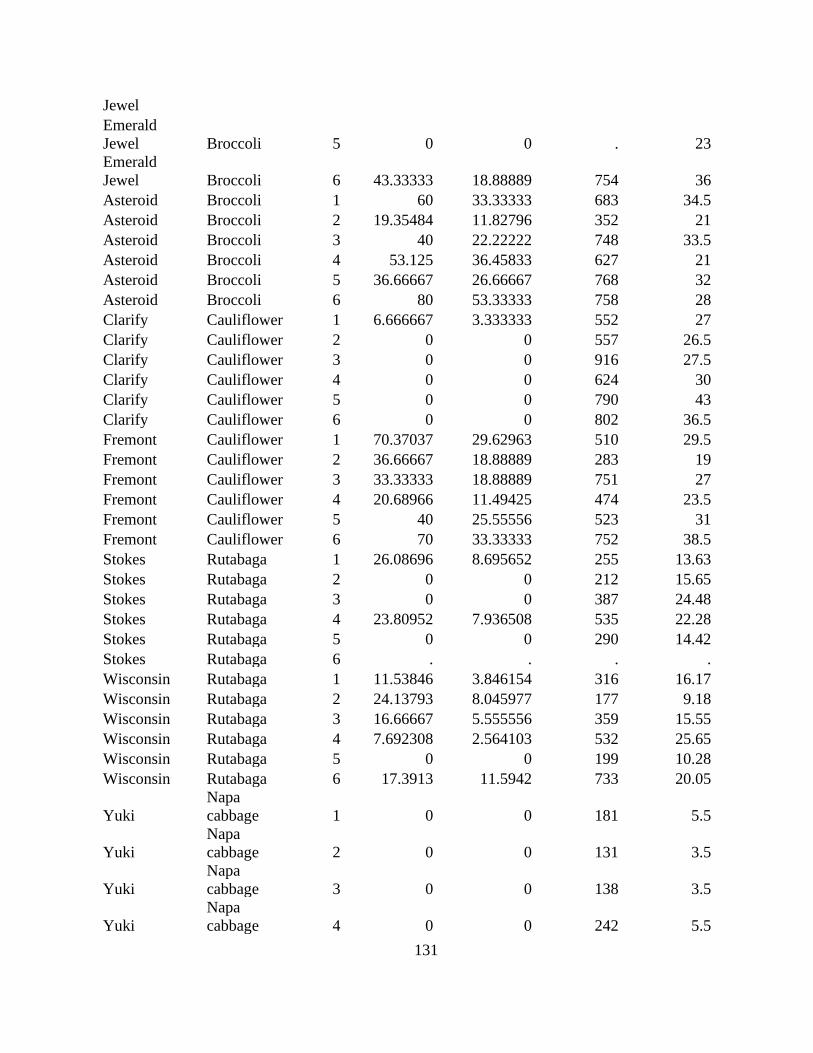
131
Jewel
Emerald
Jewel Broccoli 5 0 0 . 23
Emerald
Jewel Broccoli 6 43.33333 18.88889 754 36
Asteroid Broccoli 1 60 33.33333 683 34.5
Asteroid Broccoli 2 19.35484 11.82796 352 21
Asteroid Broccoli 3 40 22.22222 748 33.5
Asteroid Broccoli 4 53.125 36.45833 627 21
Asteroid Broccoli 5 36.66667 26.66667 768 32
Asteroid Broccoli 6 80 53.33333 758 28
Clarify Cauliflower 1 6.666667 3.333333 552 27
Clarify Cauliflower 2 0 0 557 26.5
Clarify Cauliflower 3 0 0 916 27.5
Clarify Cauliflower 4 0 0 624 30
Clarify Cauliflower 5 0 0 790 43
Clarify Cauliflower 6 0 0 802 36.5
Fremont Cauliflower 1 70.37037 29.62963 510 29.5
Fremont Cauliflower 2 36.66667 18.88889 283 19
Fremont Cauliflower 3 33.33333 18.88889 751 27
Fremont Cauliflower 4 20.68966 11.49425 474 23.5
Fremont Cauliflower 5 40 25.55556 523 31
Fremont Cauliflower 6 70 33.33333 752 38.5
Stokes Rutabaga 1 26.08696 8.695652 255 13.63
Stokes Rutabaga 2 0 0 212 15.65
Stokes Rutabaga 3 0 0 387 24.48
Stokes Rutabaga 4 23.80952 7.936508 535 22.28
Stokes Rutabaga 5 0 0 290 14.42
Stokes Rutabaga 6 . . . .
Wisconsin Rutabaga 1 11.53846 3.846154 316 16.17
Wisconsin Rutabaga 2 24.13793 8.045977 177 9.18
Wisconsin Rutabaga 3 16.66667 5.555556 359 15.55
Wisconsin Rutabaga 4 7.692308 2.564103 532 25.65
Wisconsin Rutabaga 5 0 0 199 10.28
Wisconsin Rutabaga 6 17.3913 11.5942 733 20.05
Yuki
Napa
cabbage 1 0 0 181 5.5
Yuki
Napa
cabbage 2 0 0 131 3.5
Yuki
Napa
cabbage 3 0 0 138 3.5
Yuki
Napa
cabbage 4 0 0 242 5.5

132
Yuki
Napa
cabbage 5 0 0 269 6.5
Yuki
Napa
cabbage 6 0 0 226 5
Blue
Napa
cabbage 1 96.42857 47.61905 295 12
Blue
Napa
cabbage 2 85.71429 60.31746 901 23
Blue
Napa
cabbage 3 88.88889 72.83951 736 11.5
Blue
Napa
cabbage 4 36.84211 15.78947 311 8.5
Blue
Napa
cabbage 5 57.14286 41.66667 184 7
Blue
Napa
cabbage 6 96.15385 91.02564 477 17
Mei Qing
Choi
Shanghai
pak choi 1 10 6.666667 54 2
Mei Qing
Choi
Shanghai
pak choi 2 6.666667 2.222222 136 3
Mei Qing
Choi
Shanghai
pak choi 3 0 0 74 2
Mei Qing
Choi
Shanghai
pak choi 4 23.33333 16.66667 128 3.5
Mei Qing
Choi
Shanghai
pak choi 5 0 0 69 1
Mei Qing
Choi
Shanghai
pak choi 6 51.6129 37.63441 145 2.5
Table A1.4 Clubroot incidence (CI, %), disease severity index (DSI), and fresh dry weight of
clubroot susceptible and resistant brassica vegetable cultivars grown at the Muck Crops Research
Station, ON, in 2019 (n = 6).
Cultivar Crop Block Incidence
(%)
DSI (0–100) Fresh
weight (g)
Dry weight
(g)
Bejo 2962 Cabbage 1 0 0 1250 45.5
Bejo 2962 Cabbage 2 0 0 1187 42
Bejo 2962 Cabbage 3 0 0 968 36.5
Bejo 2962 Cabbage 4 0 0 673 30
Bejo 2962 Cabbage 5 0 0 1233 49
Bejo 2962 Cabbage 6 0 0 1074 42
Tekila Cabbage 1 0 0 626 25
Tekila Cabbage 2 0 0 878 36.5
Tekila Cabbage 3 0 0 737 32
Tekila Cabbage 4 0 0 489 25
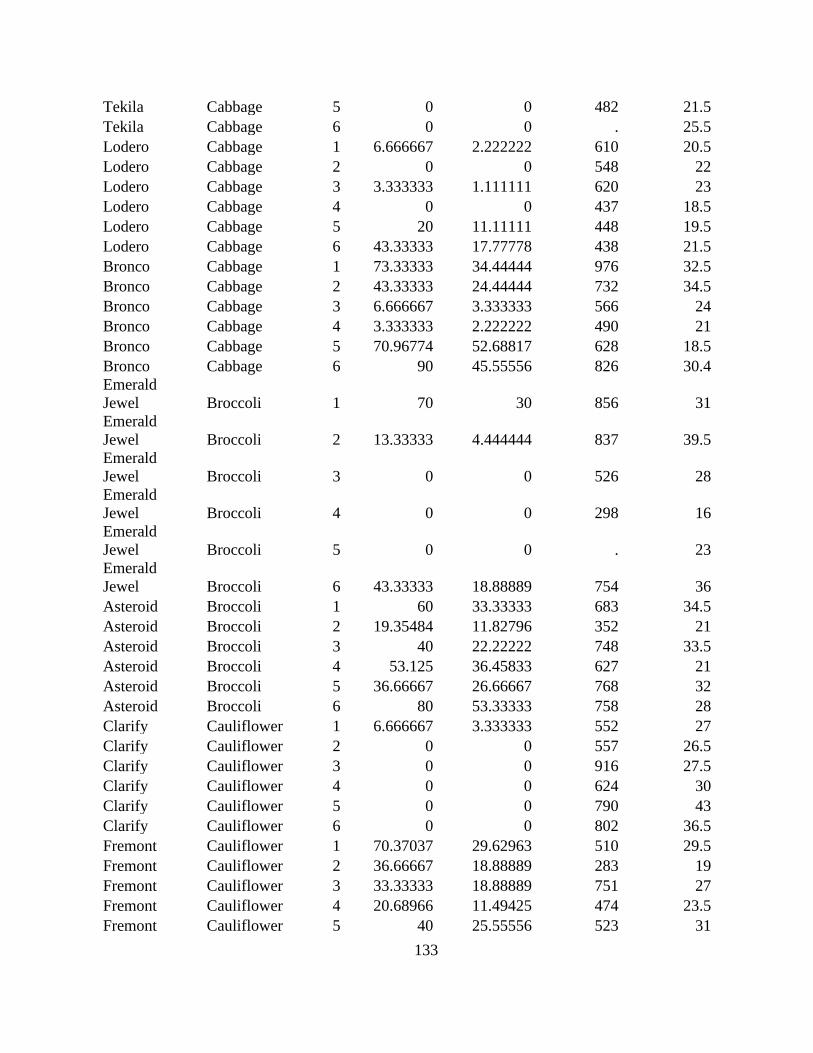
133
Tekila Cabbage 5 0 0 482 21.5
Tekila Cabbage 6 0 0 . 25.5
Lodero Cabbage 1 6.666667 2.222222 610 20.5
Lodero Cabbage 2 0 0 548 22
Lodero Cabbage 3 3.333333 1.111111 620 23
Lodero Cabbage 4 0 0 437 18.5
Lodero Cabbage 5 20 11.11111 448 19.5
Lodero Cabbage 6 43.33333 17.77778 438 21.5
Bronco Cabbage 1 73.33333 34.44444 976 32.5
Bronco Cabbage 2 43.33333 24.44444 732 34.5
Bronco Cabbage 3 6.666667 3.333333 566 24
Bronco Cabbage 4 3.333333 2.222222 490 21
Bronco Cabbage 5 70.96774 52.68817 628 18.5
Bronco Cabbage 6 90 45.55556 826 30.4
Emerald
Jewel Broccoli 1 70 30 856 31
Emerald
Jewel Broccoli 2 13.33333 4.444444 837 39.5
Emerald
Jewel Broccoli 3 0 0 526 28
Emerald
Jewel Broccoli 4 0 0 298 16
Emerald
Jewel Broccoli 5 0 0 . 23
Emerald
Jewel Broccoli 6 43.33333 18.88889 754 36
Asteroid Broccoli 1 60 33.33333 683 34.5
Asteroid Broccoli 2 19.35484 11.82796 352 21
Asteroid Broccoli 3 40 22.22222 748 33.5
Asteroid Broccoli 4 53.125 36.45833 627 21
Asteroid Broccoli 5 36.66667 26.66667 768 32
Asteroid Broccoli 6 80 53.33333 758 28
Clarify Cauliflower 1 6.666667 3.333333 552 27
Clarify Cauliflower 2 0 0 557 26.5
Clarify Cauliflower 3 0 0 916 27.5
Clarify Cauliflower 4 0 0 624 30
Clarify Cauliflower 5 0 0 790 43
Clarify Cauliflower 6 0 0 802 36.5
Fremont Cauliflower 1 70.37037 29.62963 510 29.5
Fremont Cauliflower 2 36.66667 18.88889 283 19
Fremont Cauliflower 3 33.33333 18.88889 751 27
Fremont Cauliflower 4 20.68966 11.49425 474 23.5
Fremont Cauliflower 5 40 25.55556 523 31
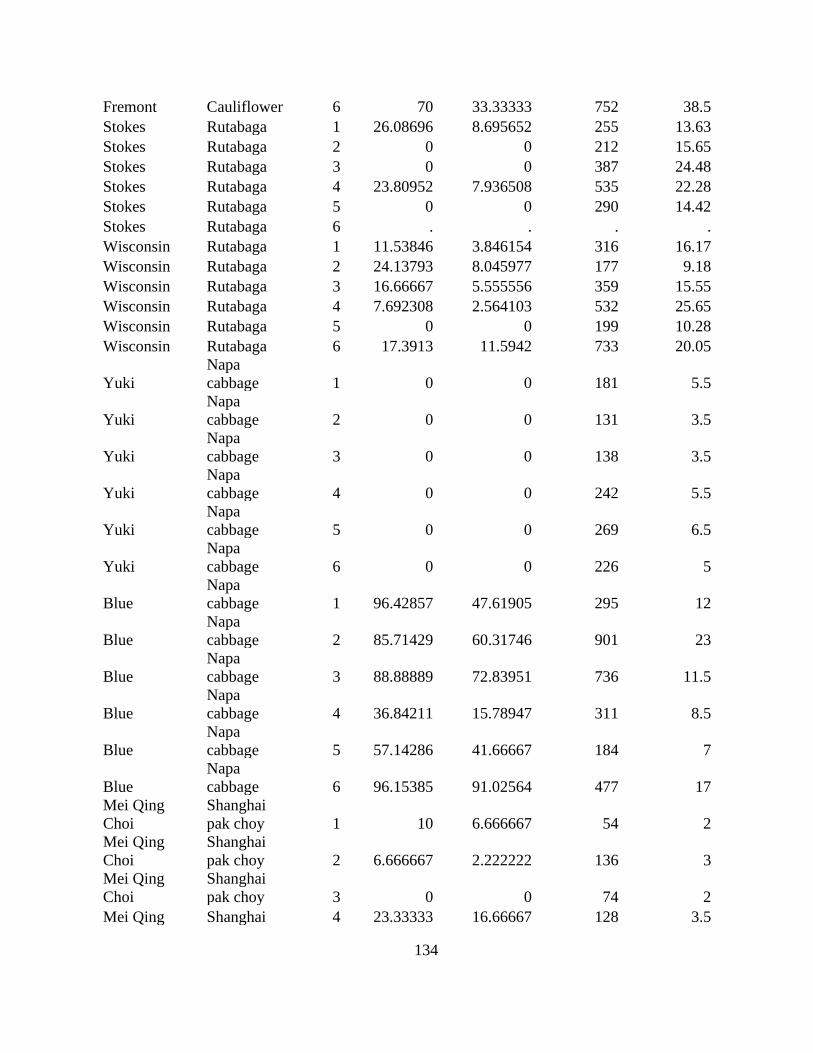
134
Fremont Cauliflower 6 70 33.33333 752 38.5
Stokes Rutabaga 1 26.08696 8.695652 255 13.63
Stokes Rutabaga 2 0 0 212 15.65
Stokes Rutabaga 3 0 0 387 24.48
Stokes Rutabaga 4 23.80952 7.936508 535 22.28
Stokes Rutabaga 5 0 0 290 14.42
Stokes Rutabaga 6 . . . .
Wisconsin Rutabaga 1 11.53846 3.846154 316 16.17
Wisconsin Rutabaga 2 24.13793 8.045977 177 9.18
Wisconsin Rutabaga 3 16.66667 5.555556 359 15.55
Wisconsin Rutabaga 4 7.692308 2.564103 532 25.65
Wisconsin Rutabaga 5 0 0 199 10.28
Wisconsin Rutabaga 6 17.3913 11.5942 733 20.05
Yuki
Napa
cabbage 1 0 0 181 5.5
Yuki
Napa
cabbage 2 0 0 131 3.5
Yuki
Napa
cabbage 3 0 0 138 3.5
Yuki
Napa
cabbage 4 0 0 242 5.5
Yuki
Napa
cabbage 5 0 0 269 6.5
Yuki
Napa
cabbage 6 0 0 226 5
Blue
Napa
cabbage 1 96.42857 47.61905 295 12
Blue
Napa
cabbage 2 85.71429 60.31746 901 23
Blue
Napa
cabbage 3 88.88889 72.83951 736 11.5
Blue
Napa
cabbage 4 36.84211 15.78947 311 8.5
Blue
Napa
cabbage 5 57.14286 41.66667 184 7
Blue
Napa
cabbage 6 96.15385 91.02564 477 17
Mei Qing
Choi
Shanghai
pak choy 1 10 6.666667 54 2
Mei Qing
Choi
Shanghai
pak choy 2 6.666667 2.222222 136 3
Mei Qing
Choi
Shanghai
pak choy 3 0 0 74 2
Mei Qing Shanghai 4 23.33333 16.66667 128 3.5
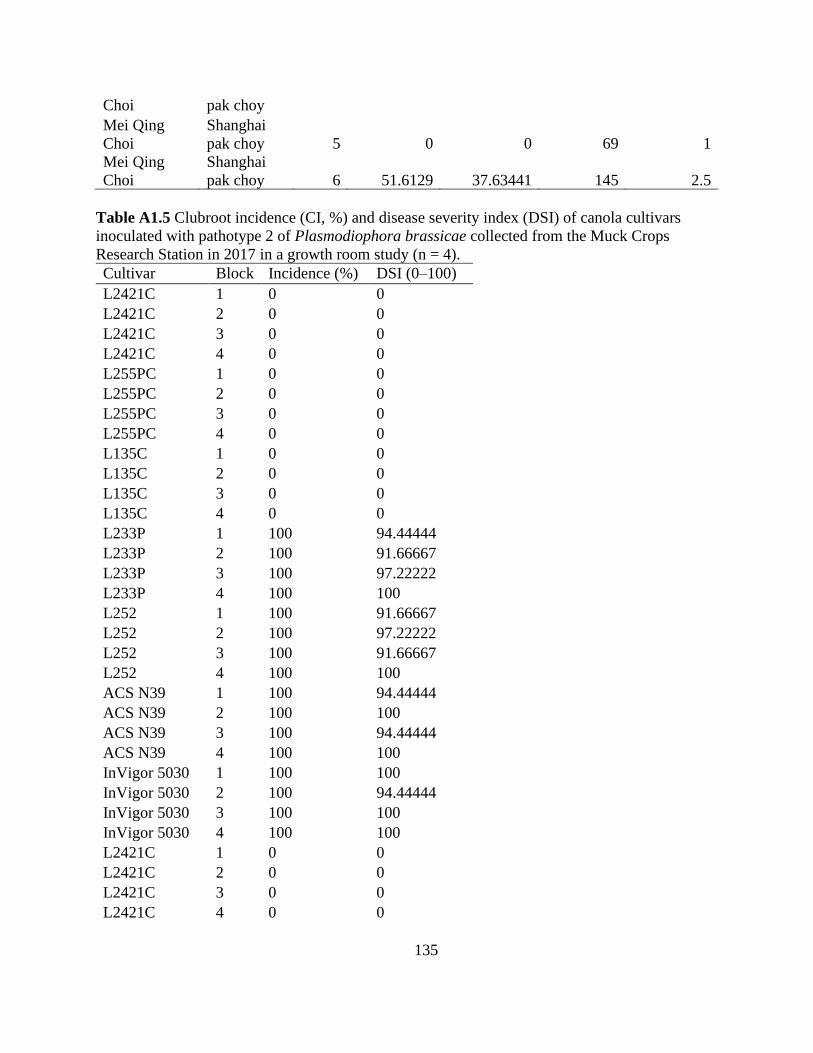
135
Choi pak choy
Mei Qing
Choi
Shanghai
pak choy 5 0 0 69 1
Mei Qing
Choi
Shanghai
pak choy 6 51.6129 37.63441 145 2.5
Table A1.5 Clubroot incidence (CI, %) and disease severity index (DSI) of canola cultivars
inoculated with pathotype 2 of Plasmodiophora brassicae collected from the Muck Crops
Research Station in 2017 in a growth room study (n = 4).
Cultivar Block Incidence (%) DSI (0–100)
L2421C 1 0 0
L2421C 2 0 0
L2421C 3 0 0
L2421C 4 0 0
L255PC 1 0 0
L255PC 2 0 0
L255PC 3 0 0
L255PC 4 0 0
L135C 1 0 0
L135C 2 0 0
L135C 3 0 0
L135C 4 0 0
L233P 1 100 94.44444
L233P 2 100 91.66667
L233P 3 100 97.22222
L233P 4 100 100
L252 1 100 91.66667
L252 2 100 97.22222
L252 3 100 91.66667
L252 4 100 100
ACS N39 1 100 94.44444
ACS N39 2 100 100
ACS N39 3 100 94.44444
ACS N39 4 100 100
InVigor 5030 1 100 100
InVigor 5030 2 100 94.44444
InVigor 5030 3 100 100
InVigor 5030 4 100 100
L2421C 1 0 0
L2421C 2 0 0
L2421C 3 0 0
L2421C 4 0 0

136
L255PC 1 0 0
L255PC 2 0 0
L255PC 3 0 0
L255PC 4 0 0
L135C 1 0 0
L135C 2 0 0
L135C 3 0 0
L135C 4 0 0
L233P 1 100 88.88889
L233P 2 100 100
L233P 3 100 91.66667
L233P 4 91.66667 86.11111
L252 1 100 83.33333
L252 2 100 91.66667
L252 3 100 97.22222
L252 4 83.33333 69.44444
ACS N39 1 100 77.77778
ACS N39 2 100 88.88889
ACS N39 3 100 86.11111
ACS N39 4 83.33333 80.55556
InVigor 5030 1 100 86.11111
InVigor 5030 2 100 86.11111
InVigor 5030 3 100 86.11111
InVigor 5030 4 100 91.66667
Mei Qing Choi 1 100 100
Mei Qing Choi 2 100 94.44444
Mei Qing Choi 3 100 94.44444
Mei Qing Choi 4 100 94.44444
Table A1.6 Clubroot incidence (CI, %) and disease severity index (DSI) of canola cultivars
inoculated with pathotype 2 of Plasmodiophora brassicae collected from a commercial field in
Bruce County, ON (mineral soil) in a growth room study (n = 4).
Cultivar Block Incidence (%) DSI (0 – 100)
L2421C 1 0 0
L2421C 2 0 0
L2421C 3 0 0
L2421C 4 0 0
L255PC 1 0 0
L255PC 2 0 0
L255PC 3 0 0
L255PC 4 0 0
L135C 1 0 0

137
L135C 2 0 0
L135C 3 0 0
L135C 4 0 0
L233P 1 100 94.44444
L233P 2 91.66667 91.66667
L233P 3 100 97.22222
L233P 4 100 100
L252 1 100 91.66667
L252 2 100 97.22222
L252 3 100 91.66667
L252 4 100 100
ACS N39 1 100 94.44444
ACS N39 2 100 100
ACS N39 3 100 94.44444
ACS N39 4 100 100
InVigor 5030 1 100 100
InVigor 5030 2 100 94.44444
InVigor 5030 3 100 100
InVigor 5030 4 100 100
ACS N39 non-
inoculated
1 0 0
ACS N39 non-
inoculated
2 0 0
ACS N39 non-
inoculated
3 0 0
ACS N39 non-
inoculated
4 0 0
Table A1.7 Clubroot incidence (CI, %) and disease severity index (DSI) of canola cultivars
inoculated with pathotype 6 of Plasmodiophora brassicae in the 1st repetition of a growth room
study (n = 4).
Cultivar Block Incidence (%) DSI (0–100)
L2421C 1 0 0
L2421C 2 0 0
L2421C 3 0 0
L2421C 4 0 0
L255PC 1 0 0
L255PC 2 0 0
L255PC 3 0 0
L255PC 4 0 0
L135C 1 0 0
L135C 2 0 0
L135C 3 0 0
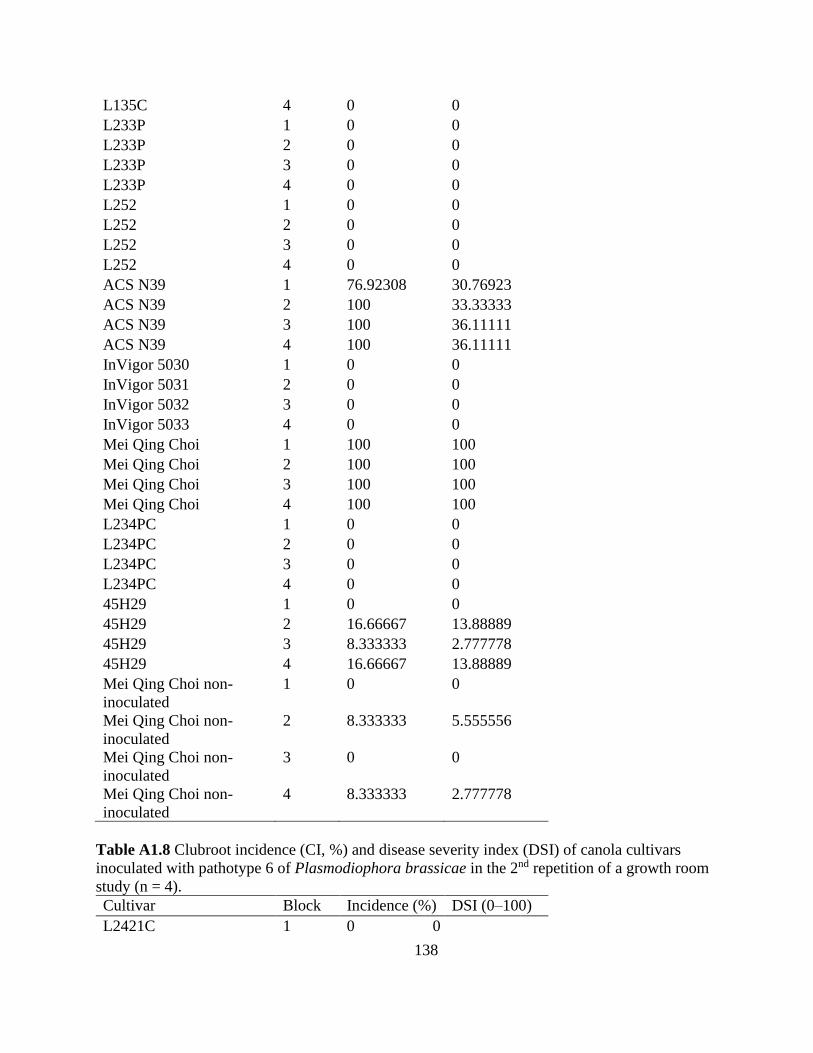
138
L135C 4 0 0
L233P 1 0 0
L233P 2 0 0
L233P 3 0 0
L233P 4 0 0
L252 1 0 0
L252 2 0 0
L252 3 0 0
L252 4 0 0
ACS N39 1 76.92308 30.76923
ACS N39 2 100 33.33333
ACS N39 3 100 36.11111
ACS N39 4 100 36.11111
InVigor 5030 1 0 0
InVigor 5031 2 0 0
InVigor 5032 3 0 0
InVigor 5033 4 0 0
Mei Qing Choi 1 100 100
Mei Qing Choi 2 100 100
Mei Qing Choi 3 100 100
Mei Qing Choi 4 100 100
L234PC 1 0 0
L234PC 2 0 0
L234PC 3 0 0
L234PC 4 0 0
45H29 1 0 0
45H29 2 16.66667 13.88889
45H29 3 8.333333 2.777778
45H29 4 16.66667 13.88889
Mei Qing Choi non-
inoculated
1 0 0
Mei Qing Choi non-
inoculated
2 8.333333 5.555556
Mei Qing Choi non-
inoculated
3 0 0
Mei Qing Choi non-
inoculated
4 8.333333 2.777778
Table A1.8 Clubroot incidence (CI, %) and disease severity index (DSI) of canola cultivars
inoculated with pathotype 6 of Plasmodiophora brassicae in the 2nd repetition of a growth room
study (n = 4).
Cultivar Block Incidence (%) DSI (0–100)
L2421C 1 0 0
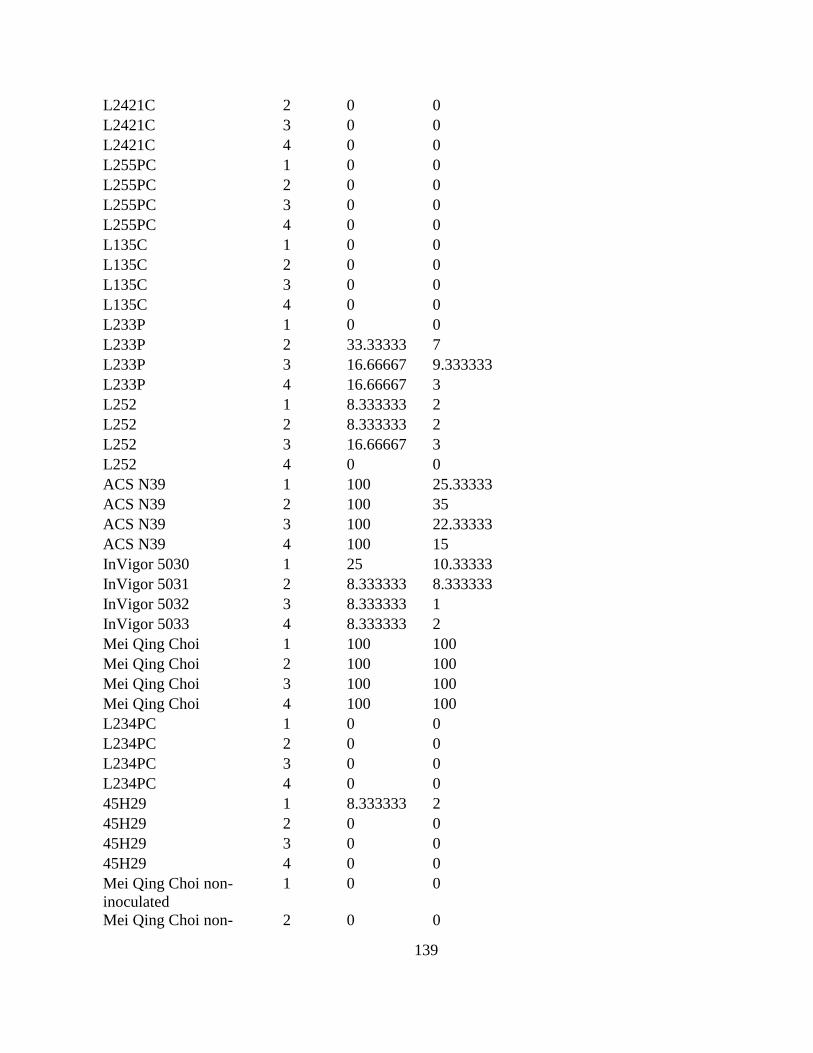
139
L2421C 2 0 0
L2421C 3 0 0
L2421C 4 0 0
L255PC 1 0 0
L255PC 2 0 0
L255PC 3 0 0
L255PC 4 0 0
L135C 1 0 0
L135C 2 0 0
L135C 3 0 0
L135C 4 0 0
L233P 1 0 0
L233P 2 33.33333 7
L233P 3 16.66667 9.333333
L233P 4 16.66667 3
L252 1 8.333333 2
L252 2 8.333333 2
L252 3 16.66667 3
L252 4 0 0
ACS N39 1 100 25.33333
ACS N39 2 100 35
ACS N39 3 100 22.33333
ACS N39 4 100 15
InVigor 5030 1 25 10.33333
InVigor 5031 2 8.333333 8.333333
InVigor 5032 3 8.333333 1
InVigor 5033 4 8.333333 2
Mei Qing Choi 1 100 100
Mei Qing Choi 2 100 100
Mei Qing Choi 3 100 100
Mei Qing Choi 4 100 100
L234PC 1 0 0
L234PC 2 0 0
L234PC 3 0 0
L234PC 4 0 0
45H29 1 8.333333 2
45H29 2 0 0
45H29 3 0 0
45H29 4 0 0
Mei Qing Choi non-
inoculated
1 0 0
Mei Qing Choi non- 2 0 0

140
inoculated
Mei Qing Choi non-
inoculated
3 0 0
Mei Qing Choi non-
inoculated
4 0 0
Table A1.9 Clubroot incidence (CI, %) and disease severity index (DSI) of brassica vegetables
cultivars inoculated with pathotype 2 of Plasmodiophora brassicae in a growth room study (n =
4).
Cultivar Crop Block Incidence (%) DSI (0–100)
Bejo 2962 Cabbage 1 0 0
Bejo 2962 Cabbage 2 0 0
Bejo 2962 Cabbage 3 0 0
Bejo 2962 Cabbage 4 0 0
Tekila Cabbage 1 0 0
Tekila Cabbage 2 0 0
Tekila Cabbage 3 0 0
Tekila Cabbage 4 0 0
Lodero Cabbage 1 100 96.9697
Lodero Cabbage 2 100 100
Lodero Cabbage 3 100 100
Lodero Cabbage 4 100 100
Bronco Cabbage 1 100 100
Bronco Cabbage 2 100 100
Bronco Cabbage 3 100 100
Bronco Cabbage 4 100 100
Emerald Jewel Broccoli 1 100 100
Emerald Jewel Broccoli 2 100 100
Emerald Jewel Broccoli 3 100 100
Emerald Jewel Broccoli 4 100 100
Asteroid Broccoli 1 100 100
Asteroid Broccoli 2 100 100
Asteroid Broccoli 3 100 100
Asteroid Broccoli 4 100 100
Clarify Cauliflower 1 0 0
Clarify Cauliflower 2 0 0
Clarify Cauliflower 3 0 0
Clarify Cauliflower 4 0 0
Fremont Cauliflower 1 100 100
Fremont Cauliflower 2 100 100
Fremont Cauliflower 3 100 100
Fremont Cauliflower 4 100 100
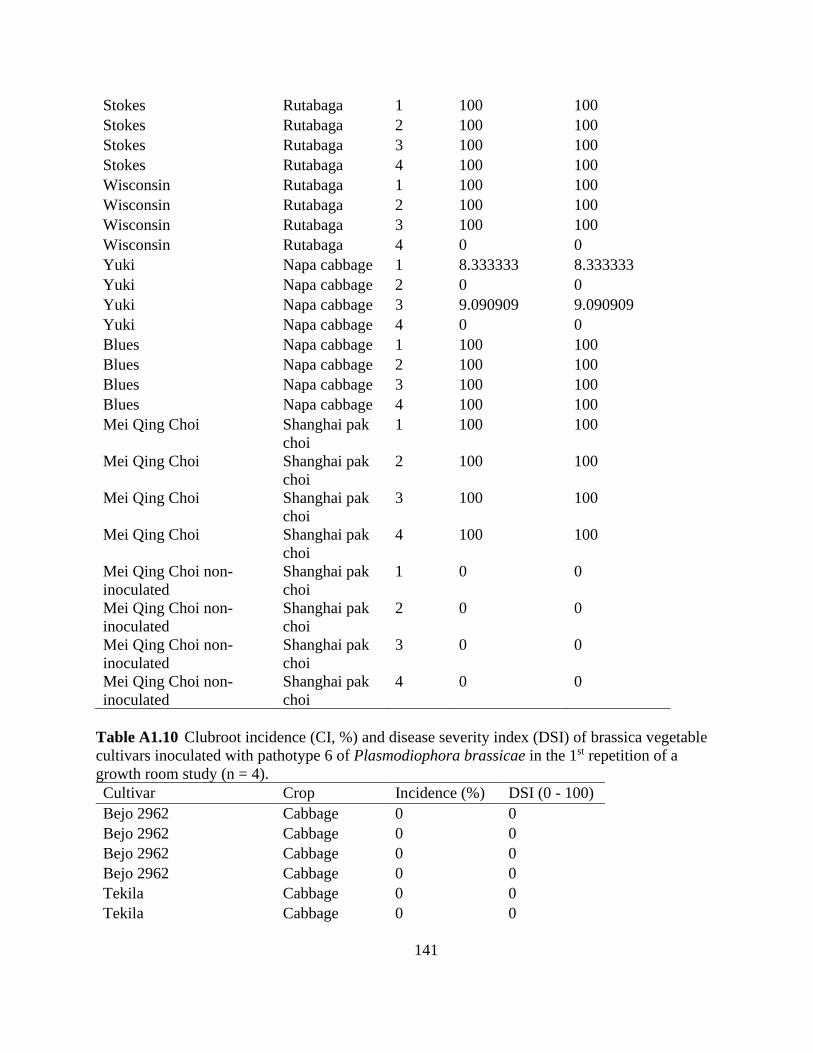
141
Stokes Rutabaga 1 100 100
Stokes Rutabaga 2 100 100
Stokes Rutabaga 3 100 100
Stokes Rutabaga 4 100 100
Wisconsin Rutabaga 1 100 100
Wisconsin Rutabaga 2 100 100
Wisconsin Rutabaga 3 100 100
Wisconsin Rutabaga 4 0 0
Yuki Napa cabbage 1 8.333333 8.333333
Yuki Napa cabbage 2 0 0
Yuki Napa cabbage 3 9.090909 9.090909
Yuki Napa cabbage 4 0 0
Blues Napa cabbage 1 100 100
Blues Napa cabbage 2 100 100
Blues Napa cabbage 3 100 100
Blues Napa cabbage 4 100 100
Mei Qing Choi Shanghai pak
choi
1 100 100
Mei Qing Choi Shanghai pak
choi
2 100 100
Mei Qing Choi Shanghai pak
choi
3 100 100
Mei Qing Choi Shanghai pak
choi
4 100 100
Mei Qing Choi non-
inoculated
Shanghai pak
choi
1 0 0
Mei Qing Choi non-
inoculated
Shanghai pak
choi
2 0 0
Mei Qing Choi non-
inoculated
Shanghai pak
choi
3 0 0
Mei Qing Choi non-
inoculated
Shanghai pak
choi
4 0 0
Table A1.10 Clubroot incidence (CI, %) and disease severity index (DSI) of brassica vegetable
cultivars inoculated with pathotype 6 of Plasmodiophora brassicae in the 1st repetition of a
growth room study (n = 4).
Cultivar Crop Incidence (%) DSI (0 - 100)
Bejo 2962 Cabbage 0 0
Bejo 2962 Cabbage 0 0
Bejo 2962 Cabbage 0 0
Bejo 2962 Cabbage 0 0
Tekila Cabbage 0 0
Tekila Cabbage 0 0

142
Tekila Cabbage 0 0
Tekila Cabbage 0 0
Lodero Cabbage 0 0
Lodero Cabbage 0 0
Lodero Cabbage 25 8.333333
Lodero Cabbage 33.33333 11.11111
Bronco Cabbage 100 100
Bronco Cabbage 100 100
Bronco Cabbage 100 100
Bronco Cabbage 100 100
Emerald Jewel Broccoli 8.333333 5.555556
Emerald Jewel Broccoli 0 0
Emerald Jewel Broccoli 8.333333 2.777778
Emerald Jewel Broccoli 0 0
Asteroid Broccoli 100 100
Asteroid Broccoli 100 100
Asteroid Broccoli 100 100
Asteroid Broccoli 100 100
Clarify Cauliflower 0 0
Clarify Cauliflower 0 0
Clarify Cauliflower 0 0
Clarify Cauliflower 0 0
Fremont Cauliflower 100 100
Fremont Cauliflower 100 100
Fremont Cauliflower 100 100
Fremont Cauliflower 100 100
Stokes Rutabaga 0 0
Stokes Rutabaga 0 0
Stokes Rutabaga 0 0
Stokes Rutabaga 0 0
Wisconsin Rutabaga 0 0
Wisconsin Rutabaga 0 0
Wisconsin Rutabaga 16.66667 16.66667
Wisconsin Rutabaga 0 0
Yuki Napa cabbage 8.333333 8.333333
Yuki Napa cabbage 0 0
Yuki Napa cabbage 8.333333 8.333333
Yuki Napa cabbage 8.333333 8.333333
Blue Napa cabbage 100 100
Blue Napa cabbage 100 100
Blue Napa cabbage 100 100
Blue Napa cabbage 100 100
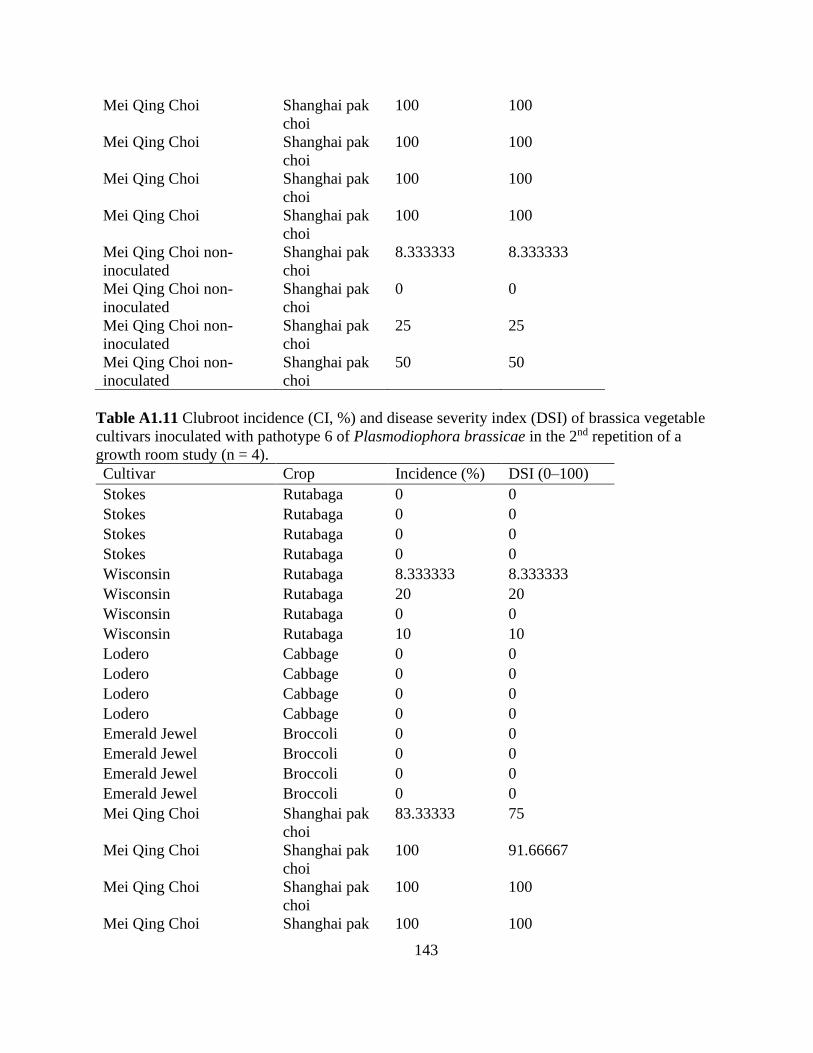
143
Mei Qing Choi Shanghai pak
choi
100 100
Mei Qing Choi Shanghai pak
choi
100 100
Mei Qing Choi Shanghai pak
choi
100 100
Mei Qing Choi Shanghai pak
choi
100 100
Mei Qing Choi non-
inoculated
Shanghai pak
choi
8.333333 8.333333
Mei Qing Choi non-
inoculated
Shanghai pak
choi
0 0
Mei Qing Choi non-
inoculated
Shanghai pak
choi
25 25
Mei Qing Choi non-
inoculated
Shanghai pak
choi
50 50
Table A1.11 Clubroot incidence (CI, %) and disease severity index (DSI) of brassica vegetable
cultivars inoculated with pathotype 6 of Plasmodiophora brassicae in the 2nd repetition of a
growth room study (n = 4).
Cultivar Crop Incidence (%) DSI (0–100)
Stokes Rutabaga 0 0
Stokes Rutabaga 0 0
Stokes Rutabaga 0 0
Stokes Rutabaga 0 0
Wisconsin Rutabaga 8.333333 8.333333
Wisconsin Rutabaga 20 20
Wisconsin Rutabaga 0 0
Wisconsin Rutabaga 10 10
Lodero Cabbage 0 0
Lodero Cabbage 0 0
Lodero Cabbage 0 0
Lodero Cabbage 0 0
Emerald Jewel Broccoli 0 0
Emerald Jewel Broccoli 0 0
Emerald Jewel Broccoli 0 0
Emerald Jewel Broccoli 0 0
Mei Qing Choi Shanghai pak
choi
83.33333 75
Mei Qing Choi Shanghai pak
choi
100 91.66667
Mei Qing Choi Shanghai pak
choi
100 100
Mei Qing Choi Shanghai pak 100 100

144
choi
Mei Qing Choi non-
inoculated
Shanghai pak
choi
0 0
Mei Qing Choi non-
inoculated
Shanghai pak
choi
0 0
Mei Qing Choi non-
inoculated
Shanghai pak
choi
0 0
Mei Qing Choi non-
inoculated
Shanghai pak
choi
0 0
Bejo 2962 Cabbage 0 0
Bejo 2962 Cabbage 0 0
Bejo 2962 Cabbage 0 0
Bejo 2962 Cabbage 0 0
Tekila Cabbage 0 0
Tekila Cabbage 0 0
Tekila Cabbage 0 0
Tekila Cabbage 0 0
Bronco Cabbage 91.66667 91.66667
Bronco Cabbage 100 94.44444
Bronco Cabbage 100 100
Bronco Cabbage 100 100
Asteroid Broccoli 100 100
Asteroid Broccoli 100 100
Asteroid Broccoli 100 100
Asteroid Broccoli 100 100
Clarify Cauliflower 0 0
Clarify Cauliflower 0 0
Clarify Cauliflower 0 0
Clarify Cauliflower 0 0
Fremont Cauliflower 100 100
Fremont Cauliflower 100 100
Fremont Cauliflower 100 100
Fremont Cauliflower 100 100
Yuki Napa cabbage 8.333333 8.333333
Yuki Napa cabbage 0 0
Yuki Napa cabbage 0 0
Yuki Napa cabbage 8.333333 8.333333
Blue Napa cabbage 100 100
Blue Napa cabbage 100 100
Blue Napa cabbage 100 100
Blue Napa cabbage 100 100

145

146
Appendix 2: Supplemental tables and figures, Chapter Three
Table A2.1 Correlation between field/cover crop root dry weight and Plasmodiophora brassicae
resting spore concentrations in soil after 8 weeks of growth (r) in Run 1 (n=6).
Crop Resting spore concentration (spores g-1)
Correlation coefficient (r)
Barley -0.84 ns1
Perennial ryegrass -0.76 ns
Field pea -0.40 ns
Wheat 0.37 ns
Total -0.06 ns 1ns = significant.
Figure A2.1 The effect of three rates of lime (calcium hydroxide, Ca(OH)2) on the
concentration of Plasmodiophora brassicae resting spores in soil after growing pak choi
for 6 weeks (barley study). Resting spore concentrations were analyzed based on a
lognormal distribution and are presented as back transformed least square means. Capped
lines represent ± standard error. The line is linear regression based on lognormal
distribution.
0
20000000
40000000
60000000
80000000
100000000
120000000
140000000
160000000
180000000
200000000
6.4 6.8 7.2
Res
ting s
pore
s g
-1so
il
Target soil pH
ln(spores) = 39.78 – 0.34(pH), Pseudo R2 = 0.15

147
Figure A2.2 The effect of three rates of lime (calcium hydroxide, Ca(OH)2) on the
concentration of Plasmodiophora brassicae resting spores in soil after growing pak choi
for 6 weeks (wheat study). Resting spore concentrations were analyzed based on a
lognormal distribution and are presented as back transformed least square means. Capped
lines represent ± standard error. The line is linear regression based on lognormal
distribution.
Table A2.2 Concentration of resting spores of Plasmodiophora brassicae in soil under
controlled conditions in Run 1 of the field crop study (n = 6).
Crop Block Treatment Subsample Resting spore
concentration1
(spores g-1)
Barley 1 Control 1 43247.46
Barley 1 Control 2 6155.846
Barley 1 PMA 3 49320.44
Barley 1 PMA 4 178867.4
Barley 2 Control 1 .
Barley 2 Control 2 .
Barley 2 PMA 3 .
Barley 2 PMA 4 .
Barley 3 Control 1 24623.45
Barley 3 Control 2 21326.09
Barley 3 PMA 3 .
Barley 3 PMA 4 .
Barley 4 Control 1 .
0
50000000
100000000
150000000
200000000
250000000
300000000
350000000
400000000
6.4 7.0 7.6
Res
ting s
pore
s g
-1so
il
Target soil pH
ln(spores) = -171.24 – 55.90(pH) – 4.09(pH)2, Pseudo R2 = 0.005

148
Barley 4 Control 2 .
Barley 4 PMA 3 .
Barley 4 PMA 4 .
Barley 5 Control 1 .
Barley 5 Control 2 20023.2
Barley 5 PMA 3 24478.11
Barley 5 PMA 4 22642.5
Barley 6 Control 1 168649.9
Barley 6 Control 2 .
Barley 6 PMA 3 174645.8
Barley 6 PMA 4 185950.7
No-plant 1 Control 1 20992.01
No-plant 1 Control 2 25684.63
No-plant 1 PMA 3 148173.3
No-plant 1 PMA 4 109166.9
No-plant 2 Control 1 .
No-plant 2 Control 2 .
No-plant 2 PMA 3 12236.36
No-plant 2 PMA 4 12637.82
No-plant 3 Control 1 35723
No-plant 3 Control 2 154672.9
No-plant 3 PMA 3 .
No-plant 3 PMA 4 28906.22
No-plant 4 Control 1 .
No-plant 4 Control 2 63343.13
No-plant 4 PMA 3 .
No-plant 4 PMA 4 .
No-plant 5 Control 1 47567.18
No-plant 5 Control 2 22728.86
No-plant 5 PMA 3 380886.4
No-plant 5 PMA 4 31520.69
No-plant 6 Control 1 86064.82
No-plant 6 Control 2 245461.5
No-plant 6 PMA 3 75778.54
No-plant 6 PMA 4 59964.04
Pea 1 Control 1 .
Pea 1 Control 2 11688.23
Pea 1 PMA 3 148173.3
Pea 1 PMA 4 .
Pea 2 Control 1 171000.2
Pea 2 Control 2 11440.01
Pea 2 PMA 3 126046.7
Pea 2 PMA 4 82406.05
Pea 3 Control 1 96918.16
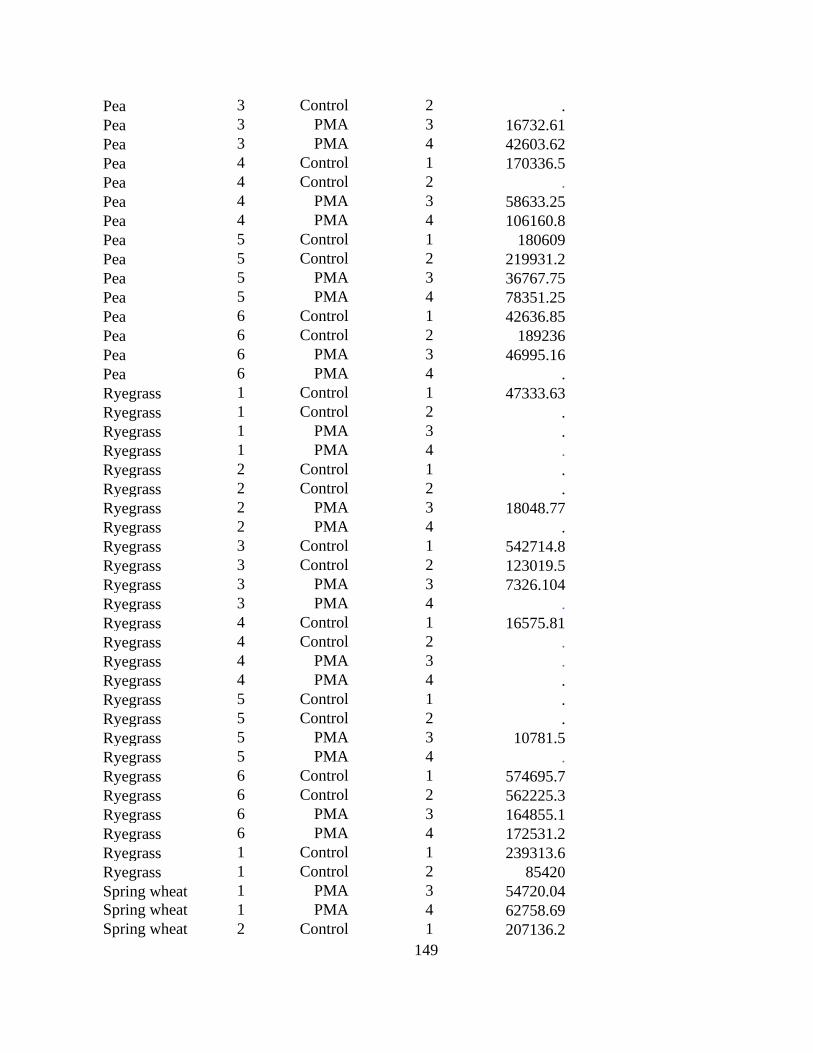
149
Pea 3 Control 2 .
Pea 3 PMA 3 16732.61
Pea 3 PMA 4 42603.62
Pea 4 Control 1 170336.5
Pea 4 Control 2 .
Pea 4 PMA 3 58633.25
Pea 4 PMA 4 106160.8
Pea 5 Control 1 180609
Pea 5 Control 2 219931.2
Pea 5 PMA 3 36767.75
Pea 5 PMA 4 78351.25
Pea 6 Control 1 42636.85
Pea 6 Control 2 189236
Pea 6 PMA 3 46995.16
Pea 6 PMA 4 .
Ryegrass 1 Control 1 47333.63
Ryegrass 1 Control 2 .
Ryegrass 1 PMA 3 .
Ryegrass 1 PMA 4 .
Ryegrass 2 Control 1 .
Ryegrass 2 Control 2 .
Ryegrass 2 PMA 3 18048.77
Ryegrass 2 PMA 4 .
Ryegrass 3 Control 1 542714.8
Ryegrass 3 Control 2 123019.5
Ryegrass 3 PMA 3 7326.104
Ryegrass 3 PMA 4 .
Ryegrass 4 Control 1 16575.81
Ryegrass 4 Control 2 .
Ryegrass 4 PMA 3 .
Ryegrass 4 PMA 4 .
Ryegrass 5 Control 1 .
Ryegrass 5 Control 2 .
Ryegrass 5 PMA 3 10781.5
Ryegrass 5 PMA 4 .
Ryegrass 6 Control 1 574695.7
Ryegrass 6 Control 2 562225.3
Ryegrass 6 PMA 3 164855.1
Ryegrass 6 PMA 4 172531.2
Ryegrass 1 Control 1 239313.6
Ryegrass 1 Control 2 85420
Spring wheat 1 PMA 3 54720.04
Spring wheat 1 PMA 4 62758.69
Spring wheat 2 Control 1 207136.2
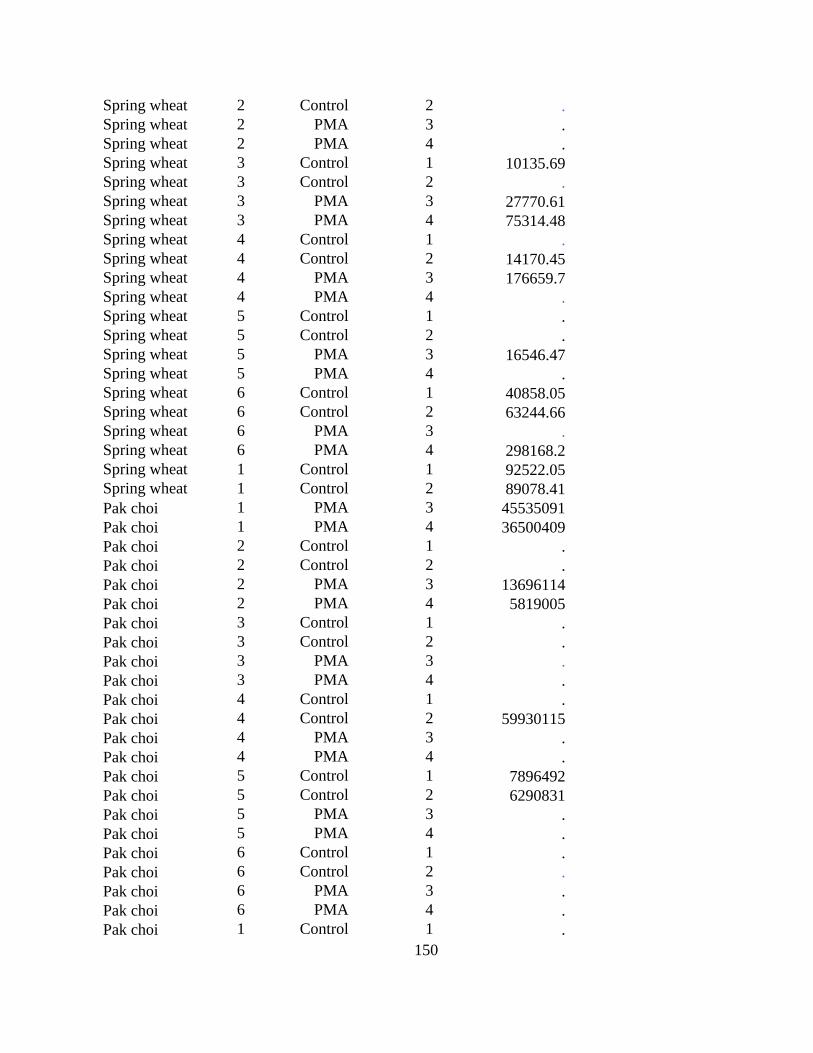
150
Spring wheat 2 Control 2 .
Spring wheat 2 PMA 3 .
Spring wheat 2 PMA 4 .
Spring wheat 3 Control 1 10135.69
Spring wheat 3 Control 2 .
Spring wheat 3 PMA 3 27770.61
Spring wheat 3 PMA 4 75314.48
Spring wheat 4 Control 1 .
Spring wheat 4 Control 2 14170.45
Spring wheat 4 PMA 3 176659.7
Spring wheat 4 PMA 4 .
Spring wheat 5 Control 1 .
Spring wheat 5 Control 2 .
Spring wheat 5 PMA 3 16546.47
Spring wheat 5 PMA 4 .
Spring wheat 6 Control 1 40858.05
Spring wheat 6 Control 2 63244.66
Spring wheat 6 PMA 3 .
Spring wheat 6 PMA 4 298168.2
Spring wheat 1 Control 1 92522.05
Spring wheat 1 Control 2 89078.41
Pak choi 1 PMA 3 45535091
Pak choi 1 PMA 4 36500409
Pak choi 2 Control 1 .
Pak choi 2 Control 2 .
Pak choi 2 PMA 3 13696114
Pak choi 2 PMA 4 5819005
Pak choi 3 Control 1 .
Pak choi 3 Control 2 .
Pak choi 3 PMA 3 .
Pak choi 3 PMA 4 .
Pak choi 4 Control 1 .
Pak choi 4 Control 2 59930115
Pak choi 4 PMA 3 .
Pak choi 4 PMA 4 .
Pak choi 5 Control 1 7896492
Pak choi 5 Control 2 6290831
Pak choi 5 PMA 3 .
Pak choi 5 PMA 4 .
Pak choi 6 Control 1 .
Pak choi 6 Control 2 .
Pak choi 6 PMA 3 .
Pak choi 6 PMA 4 .
Pak choi 1 Control 1 .
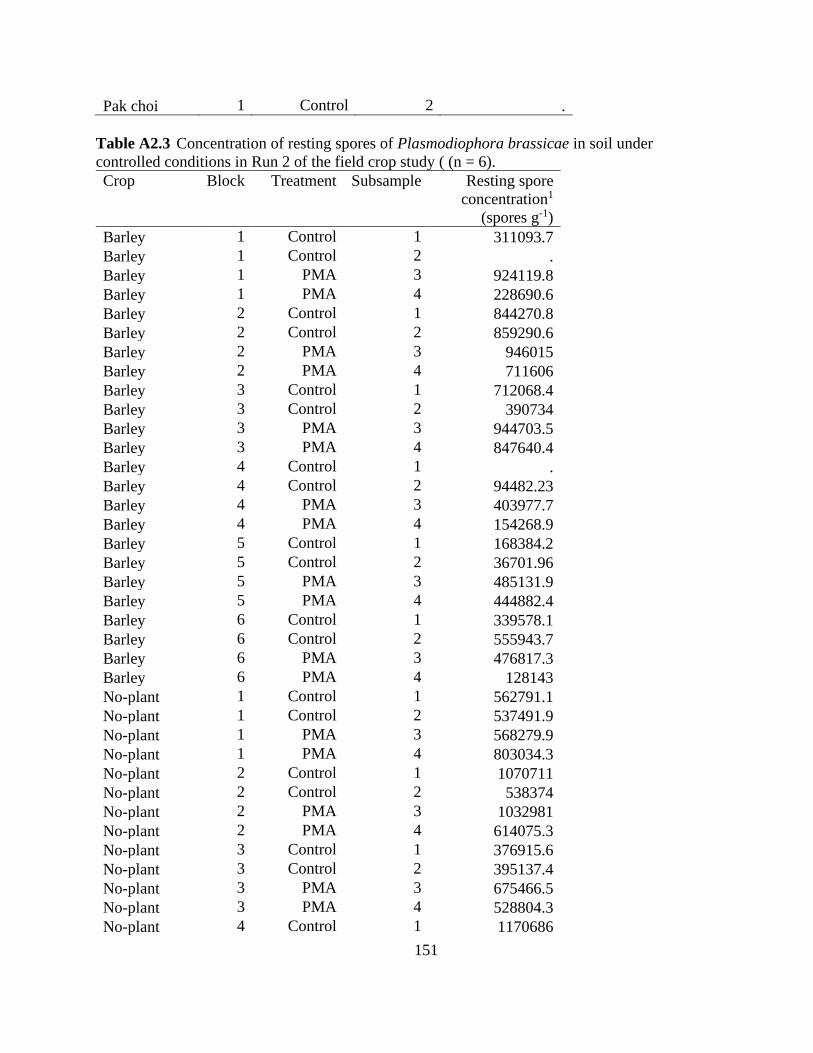
151
Pak choi 1 Control 2 .
Table A2.3 Concentration of resting spores of Plasmodiophora brassicae in soil under
controlled conditions in Run 2 of the field crop study ( (n = 6).
Crop Block Treatment Subsample Resting spore
concentration1
(spores g-1)
Barley 1 Control 1 311093.7
Barley 1 Control 2 .
Barley 1 PMA 3 924119.8
Barley 1 PMA 4 228690.6
Barley 2 Control 1 844270.8
Barley 2 Control 2 859290.6
Barley 2 PMA 3 946015
Barley 2 PMA 4 711606
Barley 3 Control 1 712068.4
Barley 3 Control 2 390734
Barley 3 PMA 3 944703.5
Barley 3 PMA 4 847640.4
Barley 4 Control 1 .
Barley 4 Control 2 94482.23
Barley 4 PMA 3 403977.7
Barley 4 PMA 4 154268.9
Barley 5 Control 1 168384.2
Barley 5 Control 2 36701.96
Barley 5 PMA 3 485131.9
Barley 5 PMA 4 444882.4
Barley 6 Control 1 339578.1
Barley 6 Control 2 555943.7
Barley 6 PMA 3 476817.3
Barley 6 PMA 4 128143
No-plant 1 Control 1 562791.1
No-plant 1 Control 2 537491.9
No-plant 1 PMA 3 568279.9
No-plant 1 PMA 4 803034.3
No-plant 2 Control 1 1070711
No-plant 2 Control 2 538374
No-plant 2 PMA 3 1032981
No-plant 2 PMA 4 614075.3
No-plant 3 Control 1 376915.6
No-plant 3 Control 2 395137.4
No-plant 3 PMA 3 675466.5
No-plant 3 PMA 4 528804.3
No-plant 4 Control 1 1170686

152
No-plant 4 Control 2 2035810
No-plant 4 PMA 3 715674.3
No-plant 4 PMA 4 937199.7
No-plant 5 Control 1 790886.2
No-plant 5 Control 2 535350.2
No-plant 5 PMA 3 806913.7
No-plant 5 PMA 4 275661
No-plant 6 Control 1 861869.3
No-plant 6 Control 2 777825.8
No-plant 6 PMA 3 688718.3
No-plant 6 PMA 4 587981.8
Pea 1 Control 1 15576.8
Pea 1 Control 2 25283.27
Pea 1 PMA 3 647125.1
Pea 1 PMA 4 35620.05
Pea 2 Control 1 662547.5
Pea 2 Control 2 862277.5
Pea 2 PMA 3 671638
Pea 2 PMA 4 759895.7
Pea 3 Control 1 352539.4
Pea 3 Control 2 120191
Pea 3 PMA 3 436379.4
Pea 3 PMA 4 405038.4
Pea 4 Control 1 809809.2
Pea 4 Control 2 .
Pea 4 PMA 3 501623.4
Pea 4 PMA 4 309086.6
Pea 5 Control 1 749446.4
Pea 5 Control 2 746944.6
Pea 5 PMA 3 322456.7
Pea 5 PMA 4 563650.4
Pea 6 Control 1 859186.7
Pea 6 Control 2 356266
Pea 6 PMA 3 242316.1
Pea 6 PMA 4 985769.9
Ryegrass 1 Control 1 284879.5
Ryegrass 1 Control 2 720545.6
Ryegrass 1 PMA 3 857094.5
Ryegrass 1 PMA 4 396229.8
Ryegrass 2 Control 1 1055357
Ryegrass 2 Control 2 753156.4
Ryegrass 2 PMA 3 373369.3
Ryegrass 2 PMA 4 1615775
Ryegrass 3 Control 1 629376.7
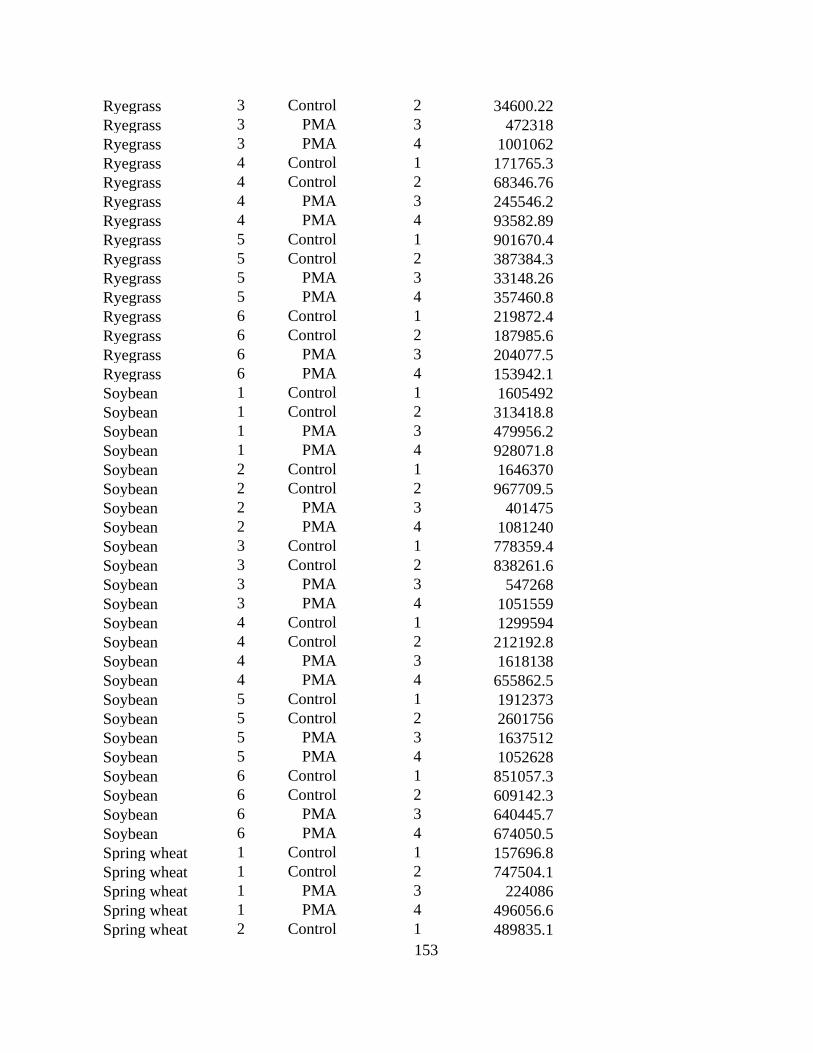
153
Ryegrass 3 Control 2 34600.22
Ryegrass 3 PMA 3 472318
Ryegrass 3 PMA 4 1001062
Ryegrass 4 Control 1 171765.3
Ryegrass 4 Control 2 68346.76
Ryegrass 4 PMA 3 245546.2
Ryegrass 4 PMA 4 93582.89
Ryegrass 5 Control 1 901670.4
Ryegrass 5 Control 2 387384.3
Ryegrass 5 PMA 3 33148.26
Ryegrass 5 PMA 4 357460.8
Ryegrass 6 Control 1 219872.4
Ryegrass 6 Control 2 187985.6
Ryegrass 6 PMA 3 204077.5
Ryegrass 6 PMA 4 153942.1
Soybean 1 Control 1 1605492
Soybean 1 Control 2 313418.8
Soybean 1 PMA 3 479956.2
Soybean 1 PMA 4 928071.8
Soybean 2 Control 1 1646370
Soybean 2 Control 2 967709.5
Soybean 2 PMA 3 401475
Soybean 2 PMA 4 1081240
Soybean 3 Control 1 778359.4
Soybean 3 Control 2 838261.6
Soybean 3 PMA 3 547268
Soybean 3 PMA 4 1051559
Soybean 4 Control 1 1299594
Soybean 4 Control 2 212192.8
Soybean 4 PMA 3 1618138
Soybean 4 PMA 4 655862.5
Soybean 5 Control 1 1912373
Soybean 5 Control 2 2601756
Soybean 5 PMA 3 1637512
Soybean 5 PMA 4 1052628
Soybean 6 Control 1 851057.3
Soybean 6 Control 2 609142.3
Soybean 6 PMA 3 640445.7
Soybean 6 PMA 4 674050.5
Spring wheat 1 Control 1 157696.8
Spring wheat 1 Control 2 747504.1
Spring wheat 1 PMA 3 224086
Spring wheat 1 PMA 4 496056.6
Spring wheat 2 Control 1 489835.1

154
Spring wheat 2 Control 2 223606.5
Spring wheat 2 PMA 3 1036704
Spring wheat 2 PMA 4 206232.2
Spring wheat 3 Control 1 26464.5
Spring wheat 3 Control 2 686948.3
Spring wheat 3 PMA 3 107550.3
Spring wheat 3 PMA 4 518342.2
Spring wheat 4 Control 1 219809.1
Spring wheat 4 Control 2 .
Spring wheat 4 PMA 3 .
Spring wheat 4 PMA 4 161722.6
Spring wheat 5 Control 1 926544.4
Spring wheat 5 Control 2 575282.9
Spring wheat 5 PMA 3 516632.5
Spring wheat 5 PMA 4 419837.9
Spring wheat 6 Control 1 406110.3
Spring wheat 6 Control 2 113186.9
Spring wheat 6 PMA 3 2023895
Spring wheat 6 PMA 4 205110.5
Pak choi 1 Control 1 31257410
Pak choi 1 Control 2 21970703
Pak choi 1 PMA 3 8269908
Pak choi 1 PMA 4 16781173
Pak choi 2 Control 1 44437354
Pak choi 2 Control 2 20472128
Pak choi 2 PMA 3 51437765
Pak choi 2 PMA 4 11522043
Pak choi 3 Control 1 .
Pak choi 3 Control 2 .
Pak choi 3 PMA 3 .
Pak choi 3 PMA 4 .
Pak choi 4 Control 1 9205735
Pak choi 4 Control 2 8223986
Pak choi 4 PMA 3 1483354
Pak choi 4 PMA 4 1783818
Pak choi 5 Control 1 17104571
Pak choi 5 Control 2 9139697
Pak choi 5 PMA 3 6490878
Pak choi 5 PMA 4 12858286
Pak choi 6 Control 1 30071465
Pak choi 6 Control 2 21594999
Pak choi 6 PMA 3 32370451
Pak choi 6 PMA 4 27416497

155
Table A2.4 Concentration of resting spores of Plasmodiophora brassicae in soil under
controlled conditions in Run 3 of the field crop study (n = 6).
Crop Block Subsample Resting spore
concentration1
(spores g-1)
Barley 1 1 201774.7
Barley 1 2 367566.4
Barley 1 3 243910
Barley 2 1 172872.9
Barley 2 2 218350.1
Barley 2 3 247112.1
Barley 3 1 124055
Barley 3 2 65339.38
Barley 3 3 33140.26
Barley 4 1 40970.85
Barley 4 2 122019.6
Barley 4 3 99824.69
Barley 5 1 51389.38
Barley 5 2 67411.57
Barley 5 3 141290.8
Barley 6 1 142294.5
Barley 6 2 152109.2
Barley 6 3 173462.2
Pea 1 1 224512
Pea 1 2 127145.8
Pea 1 3 207107.6
Pea 2 1 152959.5
Pea 2 2 357395.8
Pea 2 3 190743.2
Pea 3 1 125695.5
Pea 3 2 101464.2
Pea 3 3 85871.22
Pea 4 1 103904.3
Pea 4 2 114853.3
Pea 4 3 209712.4
Pea 5 1 110284.9
Pea 5 2 31415.75
Pea 5 3 297820.7
Pea 6 1 78303.39
Pea 6 2 236833.6
Pea 6 3 120711.2
No-plant 1 1 181496.5
No-plant 1 2 309035.5
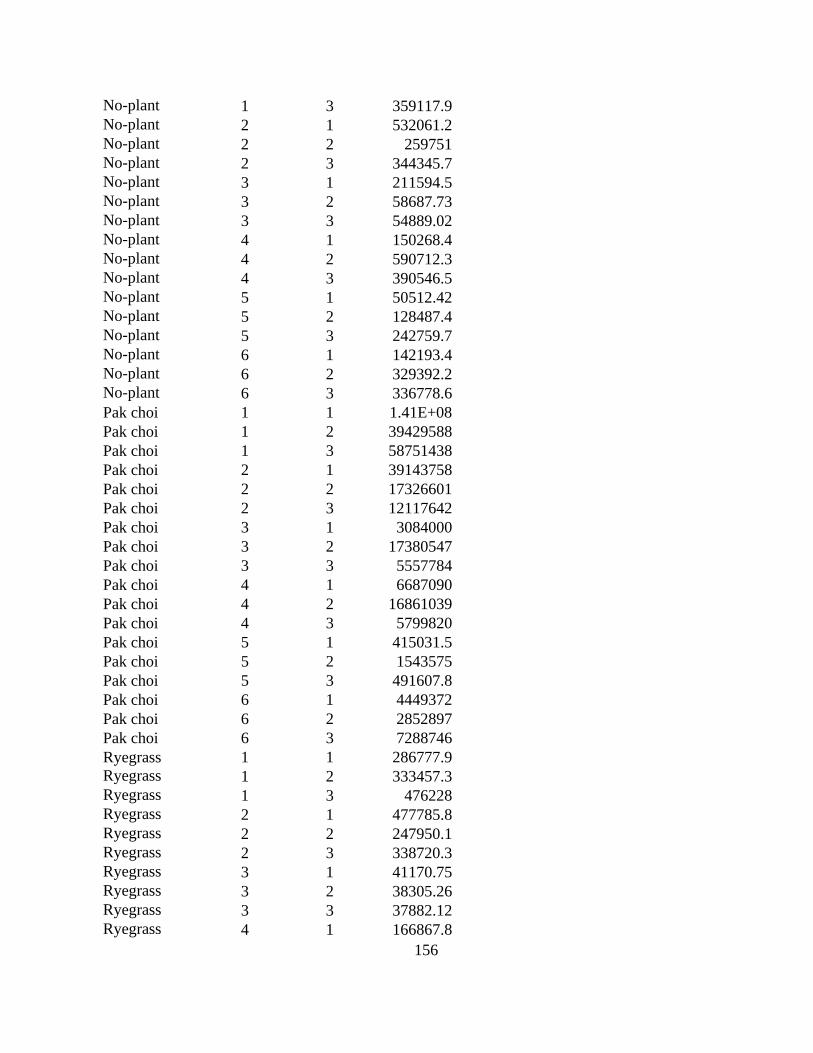
156
No-plant 1 3 359117.9
No-plant 2 1 532061.2
No-plant 2 2 259751
No-plant 2 3 344345.7
No-plant 3 1 211594.5
No-plant 3 2 58687.73
No-plant 3 3 54889.02
No-plant 4 1 150268.4
No-plant 4 2 590712.3
No-plant 4 3 390546.5
No-plant 5 1 50512.42
No-plant 5 2 128487.4
No-plant 5 3 242759.7
No-plant 6 1 142193.4
No-plant 6 2 329392.2
No-plant 6 3 336778.6
Pak choi 1 1 1.41E+08
Pak choi 1 2 39429588
Pak choi 1 3 58751438
Pak choi 2 1 39143758
Pak choi 2 2 17326601
Pak choi 2 3 12117642
Pak choi 3 1 3084000
Pak choi 3 2 17380547
Pak choi 3 3 5557784
Pak choi 4 1 6687090
Pak choi 4 2 16861039
Pak choi 4 3 5799820
Pak choi 5 1 415031.5
Pak choi 5 2 1543575
Pak choi 5 3 491607.8
Pak choi 6 1 4449372
Pak choi 6 2 2852897
Pak choi 6 3 7288746
Ryegrass 1 1 286777.9
Ryegrass 1 2 333457.3
Ryegrass 1 3 476228
Ryegrass 2 1 477785.8
Ryegrass 2 2 247950.1
Ryegrass 2 3 338720.3
Ryegrass 3 1 41170.75
Ryegrass 3 2 38305.26
Ryegrass 3 3 37882.12
Ryegrass 4 1 166867.8

157
Ryegrass 4 2 92581.42
Ryegrass 4 3 54995.53
Ryegrass 5 1 166017.9
Ryegrass 5 2 210290.7
Ryegrass 5 3 35280.07
Ryegrass 6 1 37322.06
Ryegrass 6 2 150000.4
Ryegrass 6 3 27208.33
Soybean 1 1 268538.8
Soybean 1 2 112140.1
Soybean 1 3 238515.1
Soybean 2 1 316114.2
Soybean 2 2 293596.4
Soybean 2 3 268495
Soybean 3 1 165368.8
Soybean 3 2 351556.4
Soybean 3 3 104331.3
Soybean 4 1 325563.4
Soybean 4 2 307983.5
Soybean 4 3 405095.5
Soybean 5 1 110046.7
Soybean 5 2 64070.91
Soybean 5 3 248191.7
Soybean 6 1 82499.56
Soybean 6 2 703668.2
Soybean 6 3 95308.13
Spring wheat 1 1 360890.4
Spring wheat 1 2 75624.6
Spring wheat 1 3 347713.7
Spring wheat 2 1 15679.54
Spring wheat 2 2 125427.7
Spring wheat 2 3 200557.3
Spring wheat 3 1 10755.35
Spring wheat 3 2 164415.3
Spring wheat 3 3 129914.6
Spring wheat 4 1 118245.6
Spring wheat 4 2 24527.61
Spring wheat 4 3 22155.66
Spring wheat 5 1 24759.79
Spring wheat 5 2 132970.6
Spring wheat 5 3 37511.97
Spring wheat 6 1 178940.4
Spring wheat 6 2 9995.591
Spring wheat 6 3 51920.91
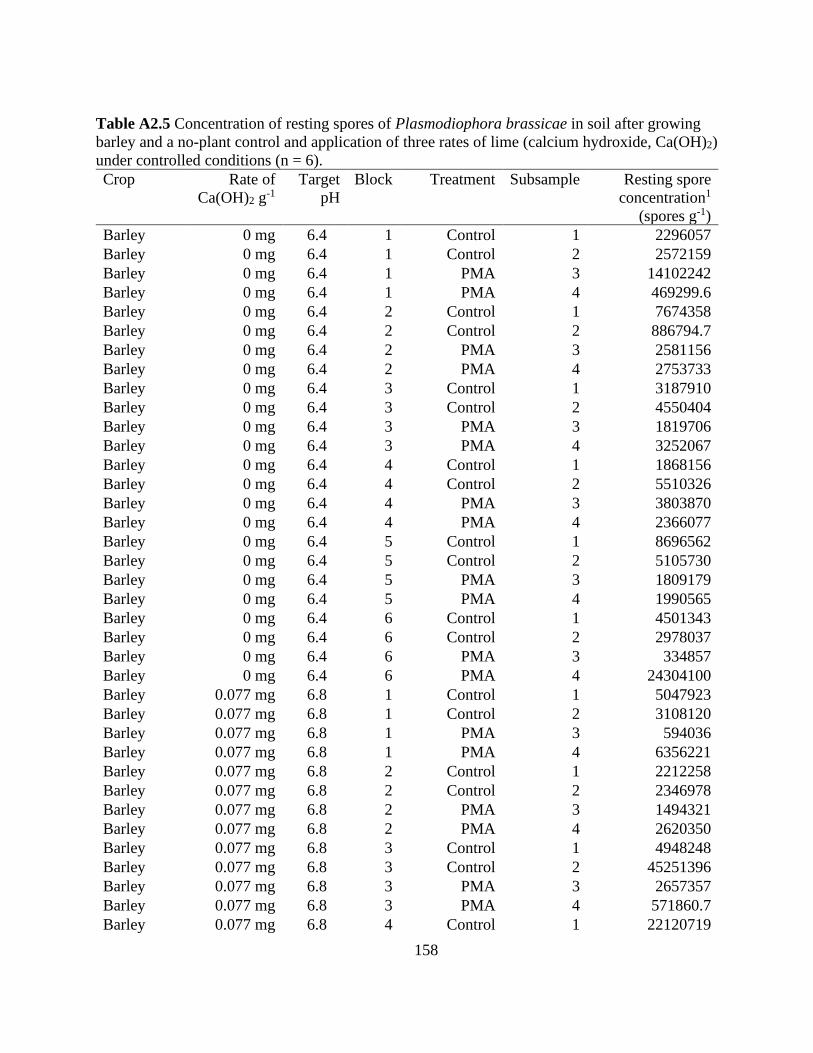
158
Table A2.5 Concentration of resting spores of Plasmodiophora brassicae in soil after growing
barley and a no-plant control and application of three rates of lime (calcium hydroxide, Ca(OH)2)
under controlled conditions (n = 6).
Crop Rate of
Ca(OH)2 g-1
Target
pH
Block Treatment Subsample Resting spore
concentration1
(spores g-1)
Barley 0 mg 6.4 1 Control 1 2296057
Barley 0 mg 6.4 1 Control 2 2572159
Barley 0 mg 6.4 1 PMA 3 14102242
Barley 0 mg 6.4 1 PMA 4 469299.6
Barley 0 mg 6.4 2 Control 1 7674358
Barley 0 mg 6.4 2 Control 2 886794.7
Barley 0 mg 6.4 2 PMA 3 2581156
Barley 0 mg 6.4 2 PMA 4 2753733
Barley 0 mg 6.4 3 Control 1 3187910
Barley 0 mg 6.4 3 Control 2 4550404
Barley 0 mg 6.4 3 PMA 3 1819706
Barley 0 mg 6.4 3 PMA 4 3252067
Barley 0 mg 6.4 4 Control 1 1868156
Barley 0 mg 6.4 4 Control 2 5510326
Barley 0 mg 6.4 4 PMA 3 3803870
Barley 0 mg 6.4 4 PMA 4 2366077
Barley 0 mg 6.4 5 Control 1 8696562
Barley 0 mg 6.4 5 Control 2 5105730
Barley 0 mg 6.4 5 PMA 3 1809179
Barley 0 mg 6.4 5 PMA 4 1990565
Barley 0 mg 6.4 6 Control 1 4501343
Barley 0 mg 6.4 6 Control 2 2978037
Barley 0 mg 6.4 6 PMA 3 334857
Barley 0 mg 6.4 6 PMA 4 24304100
Barley 0.077 mg 6.8 1 Control 1 5047923
Barley 0.077 mg 6.8 1 Control 2 3108120
Barley 0.077 mg 6.8 1 PMA 3 594036
Barley 0.077 mg 6.8 1 PMA 4 6356221
Barley 0.077 mg 6.8 2 Control 1 2212258
Barley 0.077 mg 6.8 2 Control 2 2346978
Barley 0.077 mg 6.8 2 PMA 3 1494321
Barley 0.077 mg 6.8 2 PMA 4 2620350
Barley 0.077 mg 6.8 3 Control 1 4948248
Barley 0.077 mg 6.8 3 Control 2 45251396
Barley 0.077 mg 6.8 3 PMA 3 2657357
Barley 0.077 mg 6.8 3 PMA 4 571860.7
Barley 0.077 mg 6.8 4 Control 1 22120719
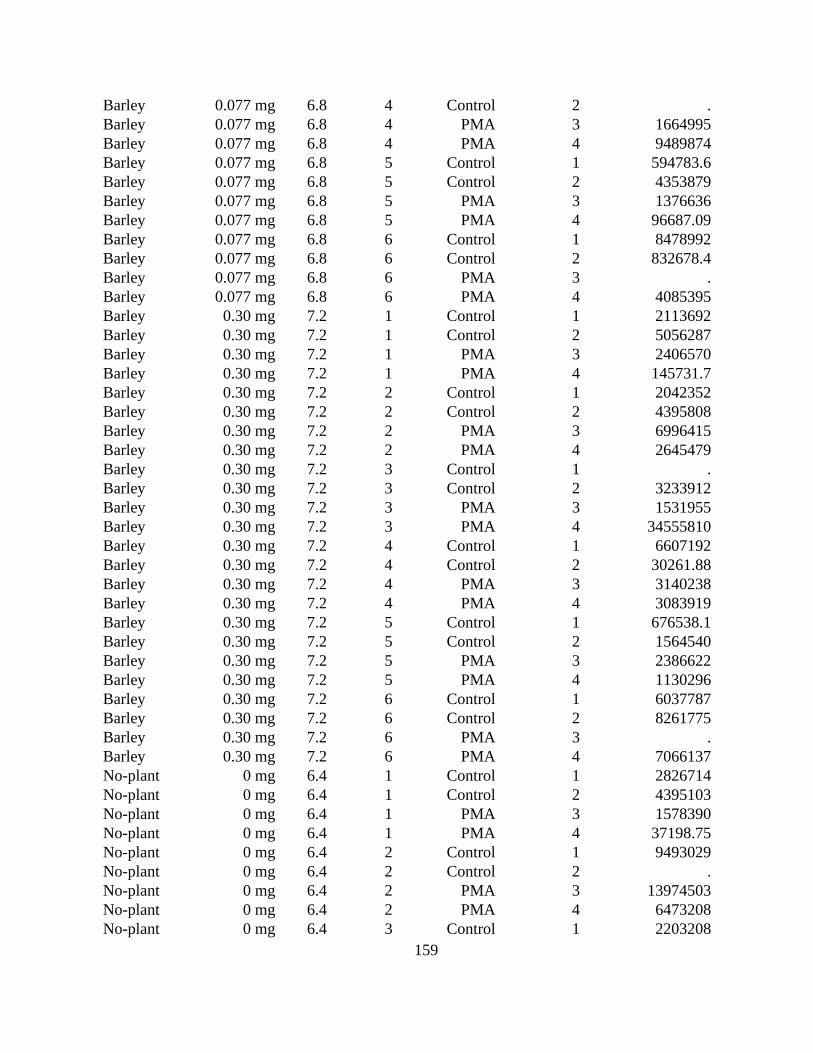
159
Barley 0.077 mg 6.8 4 Control 2 .
Barley 0.077 mg 6.8 4 PMA 3 1664995
Barley 0.077 mg 6.8 4 PMA 4 9489874
Barley 0.077 mg 6.8 5 Control 1 594783.6
Barley 0.077 mg 6.8 5 Control 2 4353879
Barley 0.077 mg 6.8 5 PMA 3 1376636
Barley 0.077 mg 6.8 5 PMA 4 96687.09
Barley 0.077 mg 6.8 6 Control 1 8478992
Barley 0.077 mg 6.8 6 Control 2 832678.4
Barley 0.077 mg 6.8 6 PMA 3 .
Barley 0.077 mg 6.8 6 PMA 4 4085395
Barley 0.30 mg 7.2 1 Control 1 2113692
Barley 0.30 mg 7.2 1 Control 2 5056287
Barley 0.30 mg 7.2 1 PMA 3 2406570
Barley 0.30 mg 7.2 1 PMA 4 145731.7
Barley 0.30 mg 7.2 2 Control 1 2042352
Barley 0.30 mg 7.2 2 Control 2 4395808
Barley 0.30 mg 7.2 2 PMA 3 6996415
Barley 0.30 mg 7.2 2 PMA 4 2645479
Barley 0.30 mg 7.2 3 Control 1 .
Barley 0.30 mg 7.2 3 Control 2 3233912
Barley 0.30 mg 7.2 3 PMA 3 1531955
Barley 0.30 mg 7.2 3 PMA 4 34555810
Barley 0.30 mg 7.2 4 Control 1 6607192
Barley 0.30 mg 7.2 4 Control 2 30261.88
Barley 0.30 mg 7.2 4 PMA 3 3140238
Barley 0.30 mg 7.2 4 PMA 4 3083919
Barley 0.30 mg 7.2 5 Control 1 676538.1
Barley 0.30 mg 7.2 5 Control 2 1564540
Barley 0.30 mg 7.2 5 PMA 3 2386622
Barley 0.30 mg 7.2 5 PMA 4 1130296
Barley 0.30 mg 7.2 6 Control 1 6037787
Barley 0.30 mg 7.2 6 Control 2 8261775
Barley 0.30 mg 7.2 6 PMA 3 .
Barley 0.30 mg 7.2 6 PMA 4 7066137
No-plant 0 mg 6.4 1 Control 1 2826714
No-plant 0 mg 6.4 1 Control 2 4395103
No-plant 0 mg 6.4 1 PMA 3 1578390
No-plant 0 mg 6.4 1 PMA 4 37198.75
No-plant 0 mg 6.4 2 Control 1 9493029
No-plant 0 mg 6.4 2 Control 2 .
No-plant 0 mg 6.4 2 PMA 3 13974503
No-plant 0 mg 6.4 2 PMA 4 6473208
No-plant 0 mg 6.4 3 Control 1 2203208
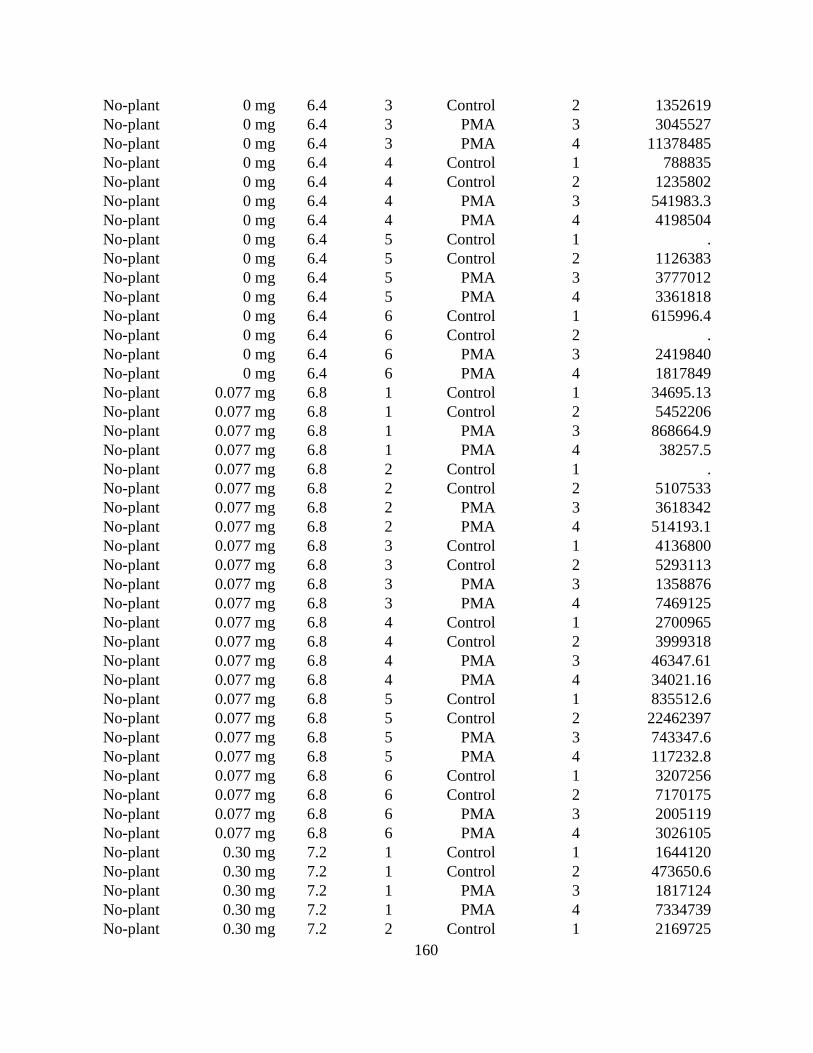
160
No-plant 0 mg 6.4 3 Control 2 1352619
No-plant 0 mg 6.4 3 PMA 3 3045527
No-plant 0 mg 6.4 3 PMA 4 11378485
No-plant 0 mg 6.4 4 Control 1 788835
No-plant 0 mg 6.4 4 Control 2 1235802
No-plant 0 mg 6.4 4 PMA 3 541983.3
No-plant 0 mg 6.4 4 PMA 4 4198504
No-plant 0 mg 6.4 5 Control 1 .
No-plant 0 mg 6.4 5 Control 2 1126383
No-plant 0 mg 6.4 5 PMA 3 3777012
No-plant 0 mg 6.4 5 PMA 4 3361818
No-plant 0 mg 6.4 6 Control 1 615996.4
No-plant 0 mg 6.4 6 Control 2 .
No-plant 0 mg 6.4 6 PMA 3 2419840
No-plant 0 mg 6.4 6 PMA 4 1817849
No-plant 0.077 mg 6.8 1 Control 1 34695.13
No-plant 0.077 mg 6.8 1 Control 2 5452206
No-plant 0.077 mg 6.8 1 PMA 3 868664.9
No-plant 0.077 mg 6.8 1 PMA 4 38257.5
No-plant 0.077 mg 6.8 2 Control 1 .
No-plant 0.077 mg 6.8 2 Control 2 5107533
No-plant 0.077 mg 6.8 2 PMA 3 3618342
No-plant 0.077 mg 6.8 2 PMA 4 514193.1
No-plant 0.077 mg 6.8 3 Control 1 4136800
No-plant 0.077 mg 6.8 3 Control 2 5293113
No-plant 0.077 mg 6.8 3 PMA 3 1358876
No-plant 0.077 mg 6.8 3 PMA 4 7469125
No-plant 0.077 mg 6.8 4 Control 1 2700965
No-plant 0.077 mg 6.8 4 Control 2 3999318
No-plant 0.077 mg 6.8 4 PMA 3 46347.61
No-plant 0.077 mg 6.8 4 PMA 4 34021.16
No-plant 0.077 mg 6.8 5 Control 1 835512.6
No-plant 0.077 mg 6.8 5 Control 2 22462397
No-plant 0.077 mg 6.8 5 PMA 3 743347.6
No-plant 0.077 mg 6.8 5 PMA 4 117232.8
No-plant 0.077 mg 6.8 6 Control 1 3207256
No-plant 0.077 mg 6.8 6 Control 2 7170175
No-plant 0.077 mg 6.8 6 PMA 3 2005119
No-plant 0.077 mg 6.8 6 PMA 4 3026105
No-plant 0.30 mg 7.2 1 Control 1 1644120
No-plant 0.30 mg 7.2 1 Control 2 473650.6
No-plant 0.30 mg 7.2 1 PMA 3 1817124
No-plant 0.30 mg 7.2 1 PMA 4 7334739
No-plant 0.30 mg 7.2 2 Control 1 2169725
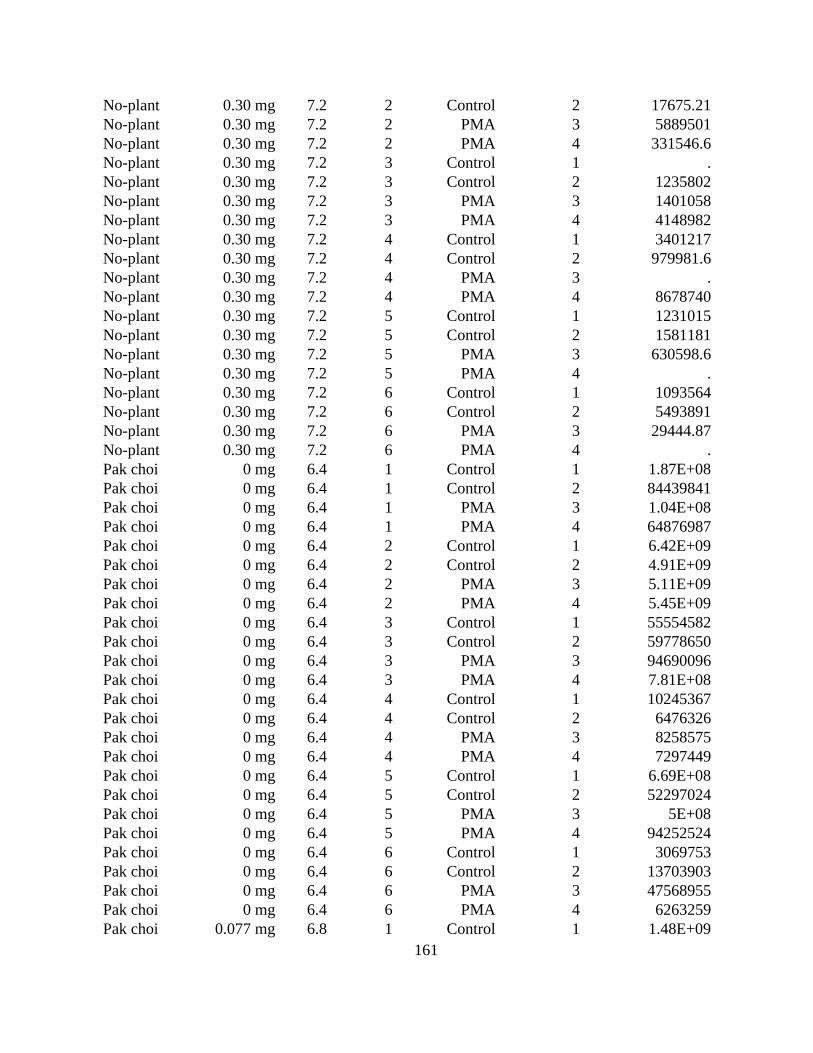
161
No-plant 0.30 mg 7.2 2 Control 2 17675.21
No-plant 0.30 mg 7.2 2 PMA 3 5889501
No-plant 0.30 mg 7.2 2 PMA 4 331546.6
No-plant 0.30 mg 7.2 3 Control 1 .
No-plant 0.30 mg 7.2 3 Control 2 1235802
No-plant 0.30 mg 7.2 3 PMA 3 1401058
No-plant 0.30 mg 7.2 3 PMA 4 4148982
No-plant 0.30 mg 7.2 4 Control 1 3401217
No-plant 0.30 mg 7.2 4 Control 2 979981.6
No-plant 0.30 mg 7.2 4 PMA 3 .
No-plant 0.30 mg 7.2 4 PMA 4 8678740
No-plant 0.30 mg 7.2 5 Control 1 1231015
No-plant 0.30 mg 7.2 5 Control 2 1581181
No-plant 0.30 mg 7.2 5 PMA 3 630598.6
No-plant 0.30 mg 7.2 5 PMA 4 .
No-plant 0.30 mg 7.2 6 Control 1 1093564
No-plant 0.30 mg 7.2 6 Control 2 5493891
No-plant 0.30 mg 7.2 6 PMA 3 29444.87
No-plant 0.30 mg 7.2 6 PMA 4 .
Pak choi 0 mg 6.4 1 Control 1 1.87E+08
Pak choi 0 mg 6.4 1 Control 2 84439841
Pak choi 0 mg 6.4 1 PMA 3 1.04E+08
Pak choi 0 mg 6.4 1 PMA 4 64876987
Pak choi 0 mg 6.4 2 Control 1 6.42E+09
Pak choi 0 mg 6.4 2 Control 2 4.91E+09
Pak choi 0 mg 6.4 2 PMA 3 5.11E+09
Pak choi 0 mg 6.4 2 PMA 4 5.45E+09
Pak choi 0 mg 6.4 3 Control 1 55554582
Pak choi 0 mg 6.4 3 Control 2 59778650
Pak choi 0 mg 6.4 3 PMA 3 94690096
Pak choi 0 mg 6.4 3 PMA 4 7.81E+08
Pak choi 0 mg 6.4 4 Control 1 10245367
Pak choi 0 mg 6.4 4 Control 2 6476326
Pak choi 0 mg 6.4 4 PMA 3 8258575
Pak choi 0 mg 6.4 4 PMA 4 7297449
Pak choi 0 mg 6.4 5 Control 1 6.69E+08
Pak choi 0 mg 6.4 5 Control 2 52297024
Pak choi 0 mg 6.4 5 PMA 3 5E+08
Pak choi 0 mg 6.4 5 PMA 4 94252524
Pak choi 0 mg 6.4 6 Control 1 3069753
Pak choi 0 mg 6.4 6 Control 2 13703903
Pak choi 0 mg 6.4 6 PMA 3 47568955
Pak choi 0 mg 6.4 6 PMA 4 6263259
Pak choi 0.077 mg 6.8 1 Control 1 1.48E+09
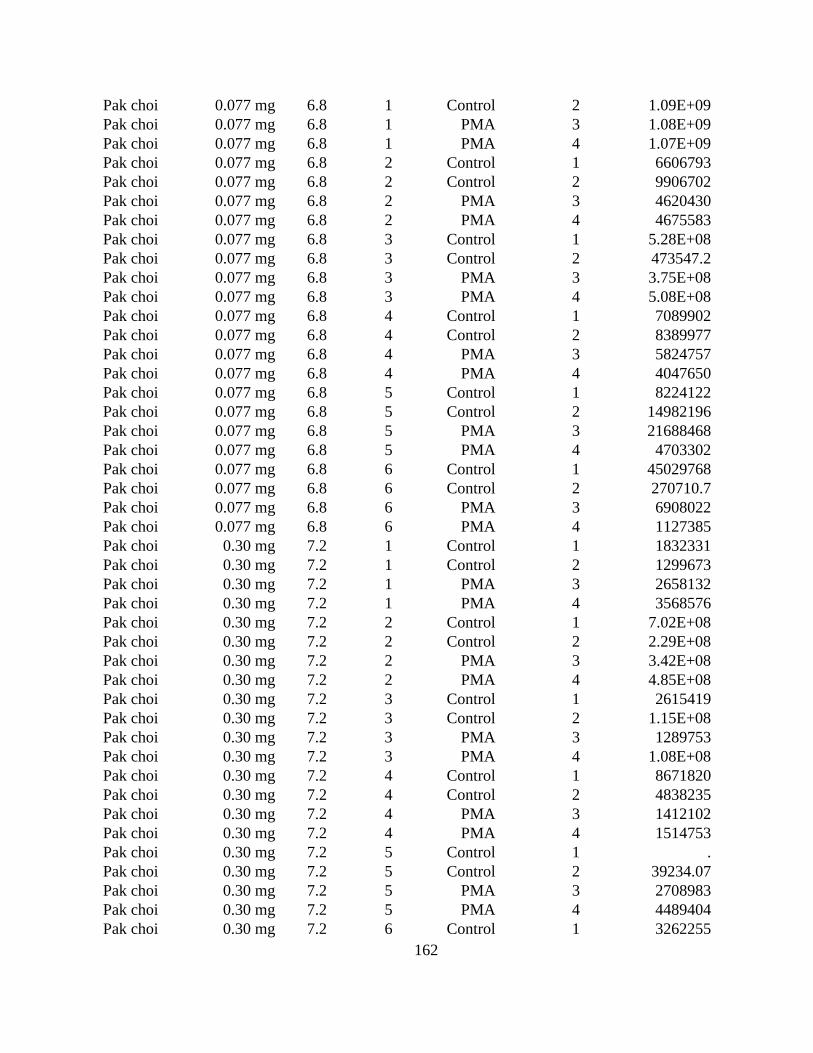
162
Pak choi 0.077 mg 6.8 1 Control 2 1.09E+09
Pak choi 0.077 mg 6.8 1 PMA 3 1.08E+09
Pak choi 0.077 mg 6.8 1 PMA 4 1.07E+09
Pak choi 0.077 mg 6.8 2 Control 1 6606793
Pak choi 0.077 mg 6.8 2 Control 2 9906702
Pak choi 0.077 mg 6.8 2 PMA 3 4620430
Pak choi 0.077 mg 6.8 2 PMA 4 4675583
Pak choi 0.077 mg 6.8 3 Control 1 5.28E+08
Pak choi 0.077 mg 6.8 3 Control 2 473547.2
Pak choi 0.077 mg 6.8 3 PMA 3 3.75E+08
Pak choi 0.077 mg 6.8 3 PMA 4 5.08E+08
Pak choi 0.077 mg 6.8 4 Control 1 7089902
Pak choi 0.077 mg 6.8 4 Control 2 8389977
Pak choi 0.077 mg 6.8 4 PMA 3 5824757
Pak choi 0.077 mg 6.8 4 PMA 4 4047650
Pak choi 0.077 mg 6.8 5 Control 1 8224122
Pak choi 0.077 mg 6.8 5 Control 2 14982196
Pak choi 0.077 mg 6.8 5 PMA 3 21688468
Pak choi 0.077 mg 6.8 5 PMA 4 4703302
Pak choi 0.077 mg 6.8 6 Control 1 45029768
Pak choi 0.077 mg 6.8 6 Control 2 270710.7
Pak choi 0.077 mg 6.8 6 PMA 3 6908022
Pak choi 0.077 mg 6.8 6 PMA 4 1127385
Pak choi 0.30 mg 7.2 1 Control 1 1832331
Pak choi 0.30 mg 7.2 1 Control 2 1299673
Pak choi 0.30 mg 7.2 1 PMA 3 2658132
Pak choi 0.30 mg 7.2 1 PMA 4 3568576
Pak choi 0.30 mg 7.2 2 Control 1 7.02E+08
Pak choi 0.30 mg 7.2 2 Control 2 2.29E+08
Pak choi 0.30 mg 7.2 2 PMA 3 3.42E+08
Pak choi 0.30 mg 7.2 2 PMA 4 4.85E+08
Pak choi 0.30 mg 7.2 3 Control 1 2615419
Pak choi 0.30 mg 7.2 3 Control 2 1.15E+08
Pak choi 0.30 mg 7.2 3 PMA 3 1289753
Pak choi 0.30 mg 7.2 3 PMA 4 1.08E+08
Pak choi 0.30 mg 7.2 4 Control 1 8671820
Pak choi 0.30 mg 7.2 4 Control 2 4838235
Pak choi 0.30 mg 7.2 4 PMA 3 1412102
Pak choi 0.30 mg 7.2 4 PMA 4 1514753
Pak choi 0.30 mg 7.2 5 Control 1 .
Pak choi 0.30 mg 7.2 5 Control 2 39234.07
Pak choi 0.30 mg 7.2 5 PMA 3 2708983
Pak choi 0.30 mg 7.2 5 PMA 4 4489404
Pak choi 0.30 mg 7.2 6 Control 1 3262255
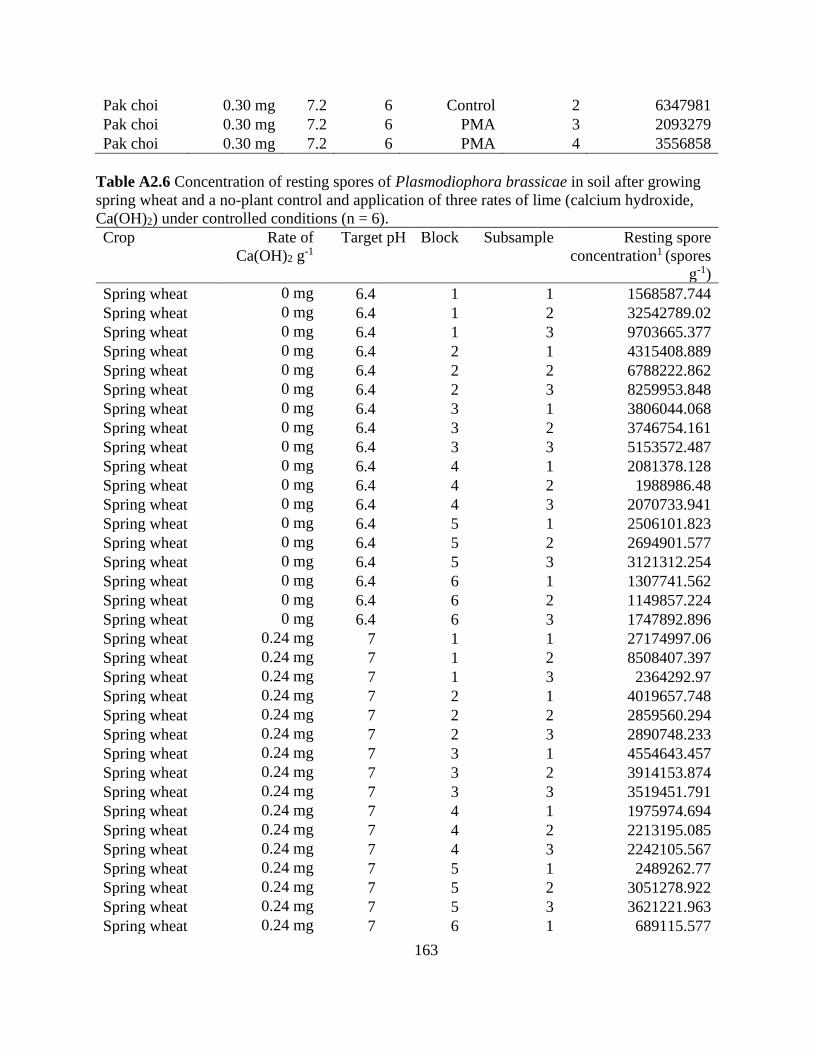
163
Pak choi 0.30 mg 7.2 6 Control 2 6347981
Pak choi 0.30 mg 7.2 6 PMA 3 2093279
Pak choi 0.30 mg 7.2 6 PMA 4 3556858
Table A2.6 Concentration of resting spores of Plasmodiophora brassicae in soil after growing
spring wheat and a no-plant control and application of three rates of lime (calcium hydroxide,
Ca(OH)2) under controlled conditions (n = 6).
Crop Rate of
Ca(OH)2 g-1
Target pH Block Subsample Resting spore
concentration1 (spores
g-1)
Spring wheat 0 mg 6.4 1 1 1568587.744
Spring wheat 0 mg 6.4 1 2 32542789.02
Spring wheat 0 mg 6.4 1 3 9703665.377
Spring wheat 0 mg 6.4 2 1 4315408.889
Spring wheat 0 mg 6.4 2 2 6788222.862
Spring wheat 0 mg 6.4 2 3 8259953.848
Spring wheat 0 mg 6.4 3 1 3806044.068
Spring wheat 0 mg 6.4 3 2 3746754.161
Spring wheat 0 mg 6.4 3 3 5153572.487
Spring wheat 0 mg 6.4 4 1 2081378.128
Spring wheat 0 mg 6.4 4 2 1988986.48
Spring wheat 0 mg 6.4 4 3 2070733.941
Spring wheat 0 mg 6.4 5 1 2506101.823
Spring wheat 0 mg 6.4 5 2 2694901.577
Spring wheat 0 mg 6.4 5 3 3121312.254
Spring wheat 0 mg 6.4 6 1 1307741.562
Spring wheat 0 mg 6.4 6 2 1149857.224
Spring wheat 0 mg 6.4 6 3 1747892.896
Spring wheat 0.24 mg 7 1 1 27174997.06
Spring wheat 0.24 mg 7 1 2 8508407.397
Spring wheat 0.24 mg 7 1 3 2364292.97
Spring wheat 0.24 mg 7 2 1 4019657.748
Spring wheat 0.24 mg 7 2 2 2859560.294
Spring wheat 0.24 mg 7 2 3 2890748.233
Spring wheat 0.24 mg 7 3 1 4554643.457
Spring wheat 0.24 mg 7 3 2 3914153.874
Spring wheat 0.24 mg 7 3 3 3519451.791
Spring wheat 0.24 mg 7 4 1 1975974.694
Spring wheat 0.24 mg 7 4 2 2213195.085
Spring wheat 0.24 mg 7 4 3 2242105.567
Spring wheat 0.24 mg 7 5 1 2489262.77
Spring wheat 0.24 mg 7 5 2 3051278.922
Spring wheat 0.24 mg 7 5 3 3621221.963
Spring wheat 0.24 mg 7 6 1 689115.577
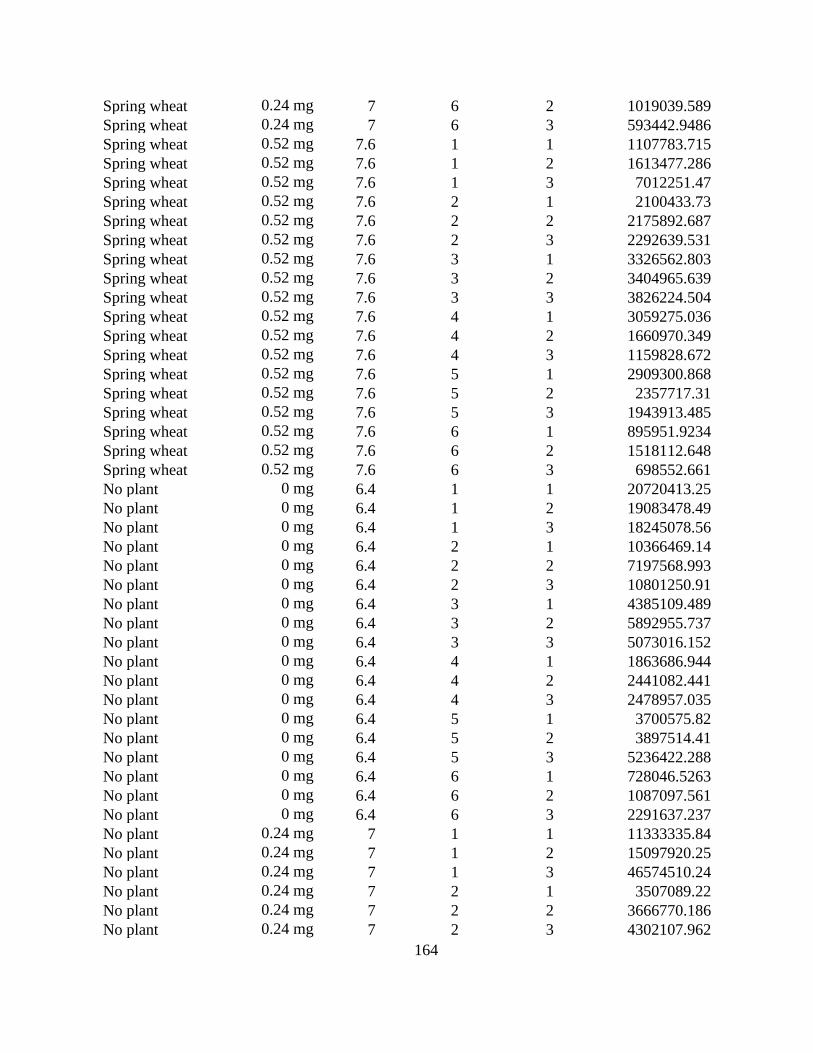
164
Spring wheat 0.24 mg 7 6 2 1019039.589
Spring wheat 0.24 mg 7 6 3 593442.9486
Spring wheat 0.52 mg 7.6 1 1 1107783.715
Spring wheat 0.52 mg 7.6 1 2 1613477.286
Spring wheat 0.52 mg 7.6 1 3 7012251.47
Spring wheat 0.52 mg 7.6 2 1 2100433.73
Spring wheat 0.52 mg 7.6 2 2 2175892.687
Spring wheat 0.52 mg 7.6 2 3 2292639.531
Spring wheat 0.52 mg 7.6 3 1 3326562.803
Spring wheat 0.52 mg 7.6 3 2 3404965.639
Spring wheat 0.52 mg 7.6 3 3 3826224.504
Spring wheat 0.52 mg 7.6 4 1 3059275.036
Spring wheat 0.52 mg 7.6 4 2 1660970.349
Spring wheat 0.52 mg 7.6 4 3 1159828.672
Spring wheat 0.52 mg 7.6 5 1 2909300.868
Spring wheat 0.52 mg 7.6 5 2 2357717.31
Spring wheat 0.52 mg 7.6 5 3 1943913.485
Spring wheat 0.52 mg 7.6 6 1 895951.9234
Spring wheat 0.52 mg 7.6 6 2 1518112.648
Spring wheat 0.52 mg 7.6 6 3 698552.661
No plant 0 mg 6.4 1 1 20720413.25
No plant 0 mg 6.4 1 2 19083478.49
No plant 0 mg 6.4 1 3 18245078.56
No plant 0 mg 6.4 2 1 10366469.14
No plant 0 mg 6.4 2 2 7197568.993
No plant 0 mg 6.4 2 3 10801250.91
No plant 0 mg 6.4 3 1 4385109.489
No plant 0 mg 6.4 3 2 5892955.737
No plant 0 mg 6.4 3 3 5073016.152
No plant 0 mg 6.4 4 1 1863686.944
No plant 0 mg 6.4 4 2 2441082.441
No plant 0 mg 6.4 4 3 2478957.035
No plant 0 mg 6.4 5 1 3700575.82
No plant 0 mg 6.4 5 2 3897514.41
No plant 0 mg 6.4 5 3 5236422.288
No plant 0 mg 6.4 6 1 728046.5263
No plant 0 mg 6.4 6 2 1087097.561
No plant 0 mg 6.4 6 3 2291637.237
No plant 0.24 mg 7 1 1 11333335.84
No plant 0.24 mg 7 1 2 15097920.25
No plant 0.24 mg 7 1 3 46574510.24
No plant 0.24 mg 7 2 1 3507089.22
No plant 0.24 mg 7 2 2 3666770.186
No plant 0.24 mg 7 2 3 4302107.962
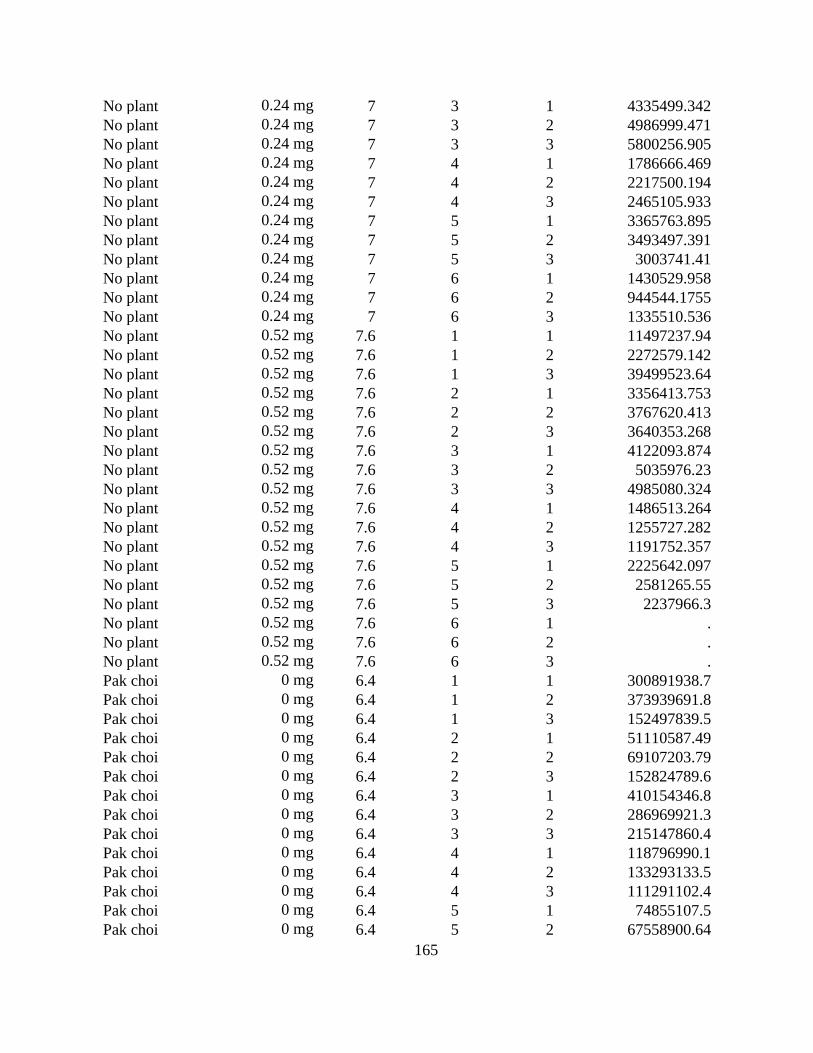
165
No plant 0.24 mg 7 3 1 4335499.342
No plant 0.24 mg 7 3 2 4986999.471
No plant 0.24 mg 7 3 3 5800256.905
No plant 0.24 mg 7 4 1 1786666.469
No plant 0.24 mg 7 4 2 2217500.194
No plant 0.24 mg 7 4 3 2465105.933
No plant 0.24 mg 7 5 1 3365763.895
No plant 0.24 mg 7 5 2 3493497.391
No plant 0.24 mg 7 5 3 3003741.41
No plant 0.24 mg 7 6 1 1430529.958
No plant 0.24 mg 7 6 2 944544.1755
No plant 0.24 mg 7 6 3 1335510.536
No plant 0.52 mg 7.6 1 1 11497237.94
No plant 0.52 mg 7.6 1 2 2272579.142
No plant 0.52 mg 7.6 1 3 39499523.64
No plant 0.52 mg 7.6 2 1 3356413.753
No plant 0.52 mg 7.6 2 2 3767620.413
No plant 0.52 mg 7.6 2 3 3640353.268
No plant 0.52 mg 7.6 3 1 4122093.874
No plant 0.52 mg 7.6 3 2 5035976.23
No plant 0.52 mg 7.6 3 3 4985080.324
No plant 0.52 mg 7.6 4 1 1486513.264
No plant 0.52 mg 7.6 4 2 1255727.282
No plant 0.52 mg 7.6 4 3 1191752.357
No plant 0.52 mg 7.6 5 1 2225642.097
No plant 0.52 mg 7.6 5 2 2581265.55
No plant 0.52 mg 7.6 5 3 2237966.3
No plant 0.52 mg 7.6 6 1 .
No plant 0.52 mg 7.6 6 2 .
No plant 0.52 mg 7.6 6 3 .
Pak choi 0 mg 6.4 1 1 300891938.7
Pak choi 0 mg 6.4 1 2 373939691.8
Pak choi 0 mg 6.4 1 3 152497839.5
Pak choi 0 mg 6.4 2 1 51110587.49
Pak choi 0 mg 6.4 2 2 69107203.79
Pak choi 0 mg 6.4 2 3 152824789.6
Pak choi 0 mg 6.4 3 1 410154346.8
Pak choi 0 mg 6.4 3 2 286969921.3
Pak choi 0 mg 6.4 3 3 215147860.4
Pak choi 0 mg 6.4 4 1 118796990.1
Pak choi 0 mg 6.4 4 2 133293133.5
Pak choi 0 mg 6.4 4 3 111291102.4
Pak choi 0 mg 6.4 5 1 74855107.5
Pak choi 0 mg 6.4 5 2 67558900.64

166
Pak choi 0 mg 6.4 5 3 83334848.93
Pak choi 0 mg 6.4 6 1 398201256
Pak choi 0 mg 6.4 6 2 187448972.9
Pak choi 0 mg 6.4 6 3 168613792.3
Pak choi 0.24 mg 7 1 1 120559854.7
Pak choi 0.24 mg 7 1 2 109999810.7
Pak choi 0.24 mg 7 1 3 104174625.2
Pak choi 0.24 mg 7 2 1 241098481.5
Pak choi 0.24 mg 7 2 2 303659073.9
Pak choi 0.24 mg 7 2 3 283940538.8
Pak choi 0.24 mg 7 3 1 295982290
Pak choi 0.24 mg 7 3 2 96113027.26
Pak choi 0.24 mg 7 3 3 175740811.2
Pak choi 0.24 mg 7 4 1 3587800735
Pak choi 0.24 mg 7 4 2 5176381998
Pak choi 0.24 mg 7 4 3 2920371308
Pak choi 0.24 mg 7 5 1 455902603.3
Pak choi 0.24 mg 7 5 2 124167667.7
Pak choi 0.24 mg 7 5 3 198970940.4
Pak choi 0.24 mg 7 6 1 145740811.2
Pak choi 0.24 mg 7 6 2 189473688.3
Pak choi 0.24 mg 7 6 3 .
Pak choi 0.52 mg 7.6 1 1 97296493.22
Pak choi 0.52 mg 7.6 1 2 78247481.59
Pak choi 0.52 mg 7.6 1 3 59806413.35
Pak choi 0.52 mg 7.6 2 1 43912616.04
Pak choi 0.52 mg 7.6 2 2 31354787.36
Pak choi 0.52 mg 7.6 2 3 24209456.27
Pak choi 0.52 mg 7.6 3 1 9469850.488
Pak choi 0.52 mg 7.6 3 2 12042907.53
Pak choi 0.52 mg 7.6 3 3 17069898.03
Pak choi 0.52 mg 7.6 4 1 22518088.58
Pak choi 0.52 mg 7.6 4 2 31203499.22
Pak choi 0.52 mg 7.6 4 3 26424431.02
Pak choi 0.52 mg 7.6 5 1 286108788.3
Pak choi 0.52 mg 7.6 5 2 260728756.7
Pak choi 0.52 mg 7.6 5 3 198576691.6
Pak choi 0.52 mg 7.6 6 1 1493050.512
Pak choi 0.52 mg 7.6 6 2 1539252.141
Pak choi 0.52 mg 7.6 6 3 .