TransCAD Training 2 - Caltrans Training For Travel Demand ...
86
Cambridge Systematics, Inc. presented to presented by TransCAD and the BCAG Model Caltrans District 3 Xuan Liu September 18 th of 2017
-
Upload
khangminh22 -
Category
Documents
-
view
2 -
download
0
Transcript of TransCAD Training 2 - Caltrans Training For Travel Demand ...

1
Cambridge Systematics, Inc.presented to presented by
TransCAD and the BCAG Model
Caltrans District 3
Xuan Liu
September 18th of 2017

2
AgendaTransCAD Overview and Navigation
Formatting and Viewing Data
Data Tables and Joining Data
Printing Maps using Layouts
Looking at BCAG Highway Assignment
Roadway Network Editing
Advanced Topics?

3
TransCAD Software OverviewTransportation data management and analysisGIS based transportation planning analysisTransCAD:» Let you store, retrieve, analyze, and visualize geographic
data in new and useful ways» Has tools to apply sophisticated transportation, operations
research, and statistical models. » GISDK (development computer programming language)Version & build» Version I have open: Version 7.0 Build 12215 64-bit» 64-bit vs. 32-bit

4
TransCAD User Interface

5
Tools
Zoom outZoom inPan
Prev. scaleMagnifier
Initial scaleInfo
Measure Measure size
Intersection Diagram
Most used
Multi-layer info
Selection toolbox
pointer Custom Labels
These can be docked at the top of the window!

6
Tools
Drawing toolbox*
* For objects on the map – not for geographic editingGISDK toolbox
Usually docked at the bottom of the window

7
TransCAD Software OverviewBuilt-In Forecasting Tools» 4-Step Travel Model» Model Calibration/Estimation Utilities» GIS-Based Roadway and Transit Data» Intermediate Results Analysis» Matrix Editor» Spatial Analysis Tools

8
Built In InterfaceProvides an interactive method of running a Travel Model
Very flexible, but can be a bit tedious to use
Is enhanced through use of customized “Add-Ins”
9
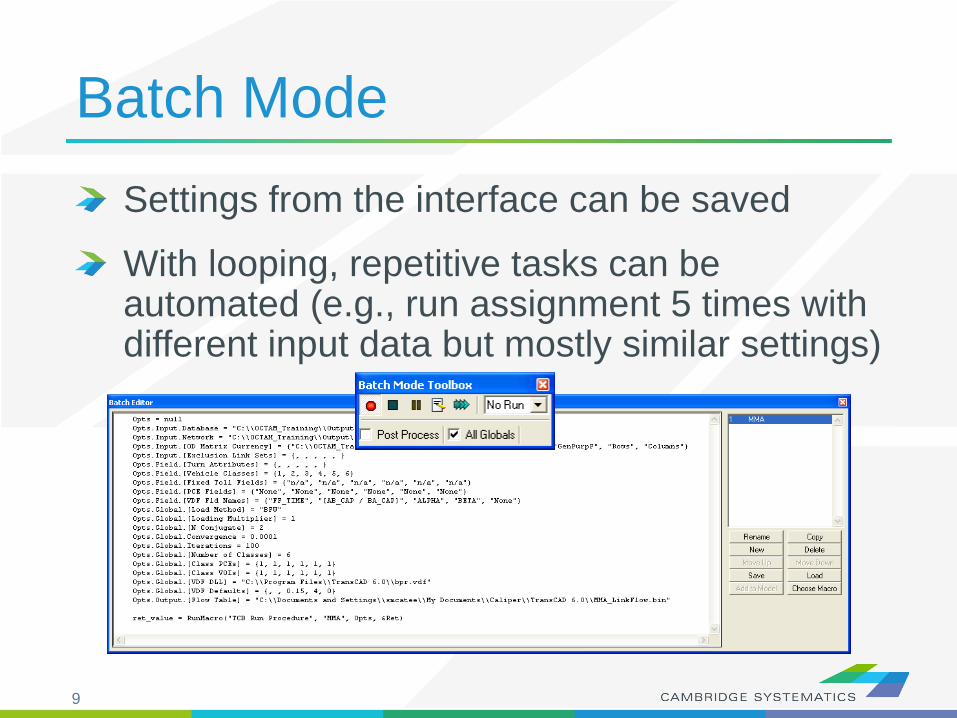
Settings from the interface can be saved
With looping, repetitive tasks can be automated (e.g., run assignment 5 times with different input data but mostly similar settings)
Batch Mode

10
Customized InterfacesCreated with the GISDK scripting languageUtilize Batch Mode to automate tasksUtilize customized code to streamline and customize model processesMakes running and analyzing scenarios easy and efficient

11
Open ArchitectureAllows for inclusion of any amount or type of data
Requires deliberate and careful definition of input data requirements
Almost any aggregate travel model algorithm that can be thought up can be implemented in TransCAD

12
Compatible File FormatsTransCAD can read and write data to/from many universally accepted file formats.» GIS (Shapefile, Geodatabase)» Spreadsheet» Database» Text» HTML (with add-in)» Traffic Software (with add-in)» Others

13
GIS ApplicationsUse TransCAD model results in ArcGIS to create high quality maps.
Link TransCAD networks to GIS-based analysis tools.

14
TransCAD Tips

15
File and Data TypesData Files actually contain information:» Tables (.bin, .DBF)» Geographic Files or Layers (.dbd, .shp)» Matrices (.mtx)

16
File and Data TypesSome files do not contain information:» Dataviews (.dvw)» Maps (.map) and workspaces (.wrk)» Matrix Views (.mvw)
These files refer to other file types that contain data» Same concept as a project file (.mxd) in ArcMAP
Never use File Save As “Dataview (.dvw)” or “Map (.map)”to save a copy for modification!

17
File and Data TypesGeographic Files (.dbd) are GIS layers and can be edited and viewed.» We use line layers as “roadway networks”
Route Systems (.rts) contain transit information» Route systems are linked to line layers
Routable Network Files (.net, .tnw) are routable networks used internally by TransCAD. » Routable network files must be created before running certain
tasks.» Separate networks for roadway and transit

18
Useful Features Saved Workspaces
Undo and Redo
Copy and Paste directly between TransCAD and other programs (e.g., Excel)
The Display Manager» Show it from
Map Display Manager
Multiple selection sets
Many more…

19
New in TransCAD 6.0, 7.0Read and write directly to ESRI GeodatabasesImproved Mapping Features» Label customization» Transparency
Under the Hood» 64-bit architecture» More multithreading» New procedures
(e.g., drive egress to transit)
TransCAD 7» Even More
multithreading» Improved transit
management» Improved elevation
data» Pivot tables and
charts

20
Map Basics: Visualizing

21
Working with LayersStart by opening a map or a geographic (dbd) layer file» Opening a layer will create a new map and add the layer» Opening a map will load all saved layers, settings, etc.
Access layers with the layers dialog box ( )

22
Working with Layers
Hide/show a layer
Add/Drop layers
Re-order layers
Change a layer style
Add/edit labels Automatically show/hide layers as certain scales
The Layers Dialog ( )

23
Working with Layers
Bottom layer (drawn last)
Layers are drawn from TOP to BOTTOM
Top layer (drawn first)

24
Display ManagerActivate from Map Display Manager
Quick access to layers, settings, etc.» Right-click for more settings, including make
working layerHide/show a
layer
Add/edit labels
Change a layer style
Bold text: links layer is active
Node layer is NOT active

25
Color Theme

26
Creating MapsCreate a new map by opening a Geographic File (*.dbd)
Add more layers if desired» then
Choose the active layer» Use the dropdown selector » Or use the display manager
Change the “default” styles for the layers» then , or , or use the display manager
Hide or show layers» or the display manager

27
Color and Pattern ThemesSet feature colors and styles based on attributes» Color Themes ( ) are often used to display
facility type on a roadway network» Pattern Themes (Map Pattern Theme…) is
sometimes used to display number of lanes on a roadway network

28
Color and Pattern Themes1. Choose a field to
represent
2. Choose a method to create categories and number of classes
* Use the Load and Save buttons to store and recall settings
» This is a huge time-saver!
The Settings Tab
12
3

29
Color and Pattern Themes1. Choose a style for
each class
2. Select a legend text for each class
3. Choose from pre-defined color settings if desired
The Styles Tab
1
2
3

30
Functional ClassFunc_Class
ArterialCentroidCollectorExpresswayExpressway 4 lanesFreewayLocalRamp
* Based on BCAG model link layer attribute table

31
Practice 1: Create a color theme for line layer based on function class
1. Open the BCAG Network File (BCAG_Network_2014.dbd) FileOpen, then in the file type dropdown next to ‘File name:’ select Geographic File(*.cdf,.*dbd)
option
Browse to the location/folder where the geographic file is located and select the ‘BCAG_Network_2014.dbd’ and click ‘Open’ button
2. On the top ribbon, click it is called ‘color theme map wizard’
3. It opens up a dialog box with two tabs. In the first tab ‘Settings’ tab: Select the Func_class from the ‘Field’ drop down options
Select the ‘List of Values’ from the ‘Method’ drop down options
Max. Classes: Use the default value (512)
4. Go to the ‘Styles’ tab Observe the default styles
Optional: Set a preferred style for each facility type (we will use a shortcut)
5. Go back to the Settings tab, click the Load button. Choose From Settings File
Browse to and select SCAG Training\Settings.stg
Click OK again to complete the color theme dialog box
6. Save the settings (optional, method 1) Tools Geographic Utilties Geographic file
Click Save Settings
7. Save the settings (optional, method 2) File –Save As Save a Map file that you can open later with the settings applied

32
Labels

33
Automatic LabelsLabels ( ) can be used to show things including:» Traffic Volumes» Number of Lanes» Centroid Numbers» SED/Land Use Data
Labels can be set differently for different selection sets

34
Automatic Labels1. Select the field to use
for labels
2. Set label placement options» Note the “Allow
Duplicates” checkbox
3. Set the label style options
The Labels Tab
1
2
3

35
Automatic Labels
Overlapping labels can be allowed if desired
Different layers can have different priorities
Autoscale can turn labels on and off automatically
The Overlaps Tab

36
Automatic Labels
Shadows, halos, frames, or shields can be added to labels to create better looking and more informative maps
The Background Tab

37
Automatic LabelsSet the default callout style to use when labels are manually re-positioned
The Callouts Tab

38
Practice 2: Add number of lanes labels
1. Start with the results from Practice 1 Open the saved map if needed
2. Use the and zoom-in tool ( ) to zoom in to the area of interest3. On the top ribbon, click the labels icon ( )
Select the [AB_LANES/BA_LANES] field Change the size and color to match your preference Change the format to have numbers by comma separated Click ‘OK’ button
In training, save the map for future use

39
Create Scaled Symbol Theme(also known as bandwidth map)

40
Scaled Symbol ThemesScaled Symbol Themes ( ) are often used to:» Display traffic volumes» Display results of a select link or node analysis

41
Scaled Symbol ThemesShow directional fields only, or all fields
Select a field to use
Specify a scale, or let TransCAD specify one automatically
The Settings Tab
1
2
3

42
Create Selection Sets

43
Selection SetsAdd additional formatting capabilityUseful for analysis and data processingUse the Selection Set Toolbox» Select items with a query » Select items by pointing» View the Selection Settings
One map can contain many selection sets» Show or hide selected items» Format selected items with different colors, styles,
and labels
44
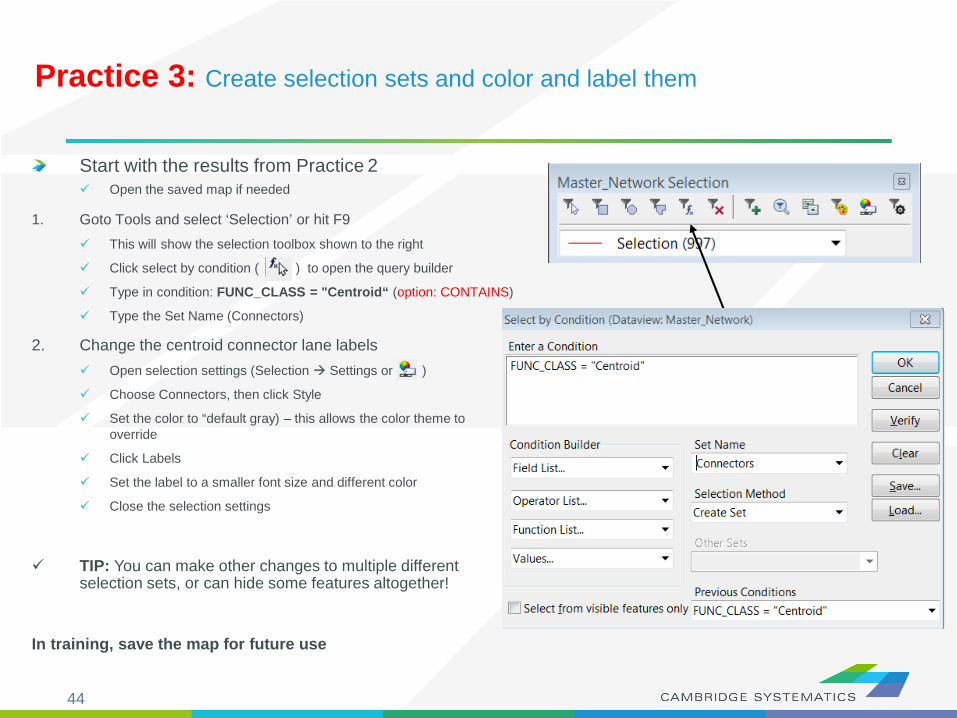
Practice 3: Create selection sets and color and label them
Start with the results from Practice 2 Open the saved map if needed
1. Goto Tools and select ‘Selection’ or hit F9 This will show the selection toolbox shown to the right
Click select by condition ( ) to open the query builder
Type in condition: FUNC_CLASS = "Centroid“ (option: CONTAINS)
Type the Set Name (Connectors)
2. Change the centroid connector lane labels Open selection settings (Selection Settings or )
Choose Connectors, then click Style
Set the color to “default gray) – this allows the color theme to override
Click Labels
Set the label to a smaller font size and different color
Close the selection settings
TIP: You can make other changes to multiple different selection sets, or can hide some features altogether!
In training, save the map for future use

45
Data Tables (“Dataviews”)

46
Working with dataviewsOpen a dataview for any existing layer ( )
Open a standalone table with File Open
Add/Remove fields with Dataview Modify Table » (or )» Be careful: Changes are permanent once you click “OK”
Data can be edited directly in the dataview» Be careful: Changes are saved as you go
Create formula fields with “Formula Field”
Right-Click on a column header for more options» Including a formula Fill

47
Working with DataviewsFormula Field vs. Add Field & Formula Fill» Formula Fill adds new data and saves values in the table» Formula Fields are updated when other values change, but are not
stored in the data table Formula fields are stored in a map, dataview (*.dvw), or workspace (*wrk)
1. Enter a formula
2. Use the Field List to find field names
3. Name the formula field
Tip: nz([Field]) converts nullvalues to zero values
1
2 3

48
Practice 4: Add total number of lanes in a NEW FIELD
Start with the results from Practice 3 Open the saved map if needed
1. On the top ribbon, click it will open the links layer daataview table
2. Use Dataview Modify Table or click Click ‘Add Field’
Name the field “TOT_LANES”
You can move the field position using Move Up and Move Down buttons to the right
Click ‘OK’
3. Go to ‘Dataview’ window Right click the top part of the ‘TOT_LANES’ field
Select ‘Fill’
Select the ‘Formula’ in the fill method options
Type: nz(AB_LANES) + nz(BA_LANES)
Alternatively you can use the formula builder
Click ‘OK’ button.
This fills in two-way number of lanes
Bonus: Try this example using a formula field instead!

49
Joining Data

50
Joining DataLayers have an associated data table ( )
Data can be joined ( ) to other tables» Roadway Network + Traffic Assignment results» TAZ layer + Land Use Data» Roadway Network + Lookup Table» More…
This is how traffic assignment results are viewed in TransCAD

51
Joining Data1. Select the Primary join table
» Be careful: Check the Field
2. Select the secondary join table
» Be careful: Check the Field
3. Create a name for the view, or use the default (do this last)
1
2
3
Tip: You can open a file from the join dialog box

52
Practice 5: Join the assignment data to the network layer (Tier 1)
1. Open the BCAG Network File (BCAG_Network_2014.dbd) FileOpen, then in the file type dropdown next to ‘File name:’
select Geographic File(*.cdf,.*dbd) option
Browse to the location/folder where the geographic file is located and select the ‘BCAG_Network_2014.dbd’ and click ‘Open’ button
2. Open the Assignment Data Table File Open
File Type Fixed-format Binary (*.bin)
Browse to \2014\Outputs\Volumes\Volumes_AM3.bin
3. Create a join from Dataview join or Set the left side of the join to Master_Network, field ‘ID’
Set the right side of the join to Volumes_AM3
Set the right side join field to Master_Network, field ‘ID1’
Click ‘OK’, then use “info” to review the data
Warning: Do NOT close the joined view!
Bonus: Create a scaled symbol theme map based tot_flow

53
Printing Maps (Layouts)

54
LayoutsAllow users to create a page to be printed» Set paper size» Set a specific printer PDF writers work best!
Created from File New
Print maps, drawing items, tables, and insets
Add titles, legends, etc.

55
Practice 6: Create a Layout with your map
1. Start with the results from Practice 5 Open the saved map if needed
2. Create a new layout using File New or Check the page settings with File Properties or Select a printer and page size Set to landsape Important: Un-check Change size of items when page size changes
3. Add your map to the layout using Draw a box to place the map
Select Map, check ‘Use actual point sizes’
Optionally un-check ‘Keep map’s aspect ratio’
Click ‘OK’
4. Position and edit the legend Use the pointer tool ( )
Drag the legend to a good location
Double-click to edit legend text and contents
5. Add a legend title Use the ‘Freehand Text’ tool ( ), usually at the bottom of the
window
Drag a box, then type a title
Use the pointer to reposition, double-clicking to edit

56
More on Networks and Zones

57
User VariablesCreating your own variables» Additional fields can be added to links & nodes
layers» Field names can contain spaces and numbers, and
do not have a practical limit to the number of characters
» HOWEVER…
58
User VariablesCreating your own variables» It is preferable to:
Limit field names to 10 characters Avoid using spaces Avoid starting a field name with a number
» If these guidelines are followed, compatibility with other GIS programs will be improved Field names that do not follow these guidelines will have
truncated or confusing names when exported to a shapefile

59
CentroidsCentroids are special nodes that are linked to socioeconomic data» TAZ numbers match the TAZ
layer, data tables, and matrices

60
Recap

61
Learned by ExampleCreating maps
Adding layers
Setting layer styles, labels, and themes
Working with data tables
Joining Views
Creating layouts for printing

62
Highway Assignment

63
Assignment ResultsBasic Volumes» Located on the Loaded Network» Outputs\Networks\Roads_Loaded_2014dbd
Volume and Travel Time for: » Each Period
(AM, MD, PM, OP)» Total daily

64
Assignment ResultsDetailed Results in a separate table» Join to the network using ID & ID1» By time period or daily» In the \Outputs\Volumes folder

65
Assignment ResultsDetailed Results include:» Basics:
Total Flow Flow by class (e.g., drive alone, shared ride, truck) Travel time and speed (congested time by period)
» Extras / Statistics: VMT (called V_Dist_T) VHT Volume to Capacity Ratio (“VOC”) PCE Values
» Select Link / Zone Results Only present if mode was run with \Inputs\BCAG_Links.qry

66
Practice 7: Review Assignment Results
1. Repeat practice 5 result
2. Label the links with the % share of vehicles that are “Drive Alone”(Hint: create a formula field)
3. Try creating a bandwidth (scaled symbol) theme showing directional volume
(hint: Use )

67
Roadway Network Editing

68
Network EditingWarning: Make a backup copy first!» There is an “Undo” function in TransCAD» Edits are made directly
to the network file: You can’t close without saving to discard changes
» Network files sometimes become corrupt
The Undo function in TransCAD 5+ makes
network editing less risky

69
Network EditingBacking up the Roadway Network Method 1 (recommended):» Open the network in TransCAD» Use Tools Geographic Utilities
Geographic File » Click Archive to save in a zip file
Method 2 (advanced):» Close all files in TransCAD» Create a zip file with the line layer
and route system files» Make sure to get all related files

70
Network EditingOnce you have made a backup, you can:» Edit attributes of existing links» Change data for a specific year or for multiple
years and alternatives» Add new links, delete existing links, or realign
existing links» Add data for a year not yet included in the network
71
Network EditingEdit attributes of existing links» Display settings can assist with editing
Additional labels and/or themes can be useful» Label # of lanes or other
values» Show Topology ( )
to see AB vs. BA

72
Network TopologyShow topology to identify AB and BA directions
To identify one-way roads, use the DIR field:» 0: Two-way travel» 1: A B travel» -1: B A travel

73
Network EditingEdit attributes of existing links – Method 1» To make most edits, use the information tool ( )
and edit text in the form that appears» Changes can be undone
Each edit action creates an undo point
» You can select and fill multiple links with the information tool Multiple values can be filled by
right-clicking on row names

74
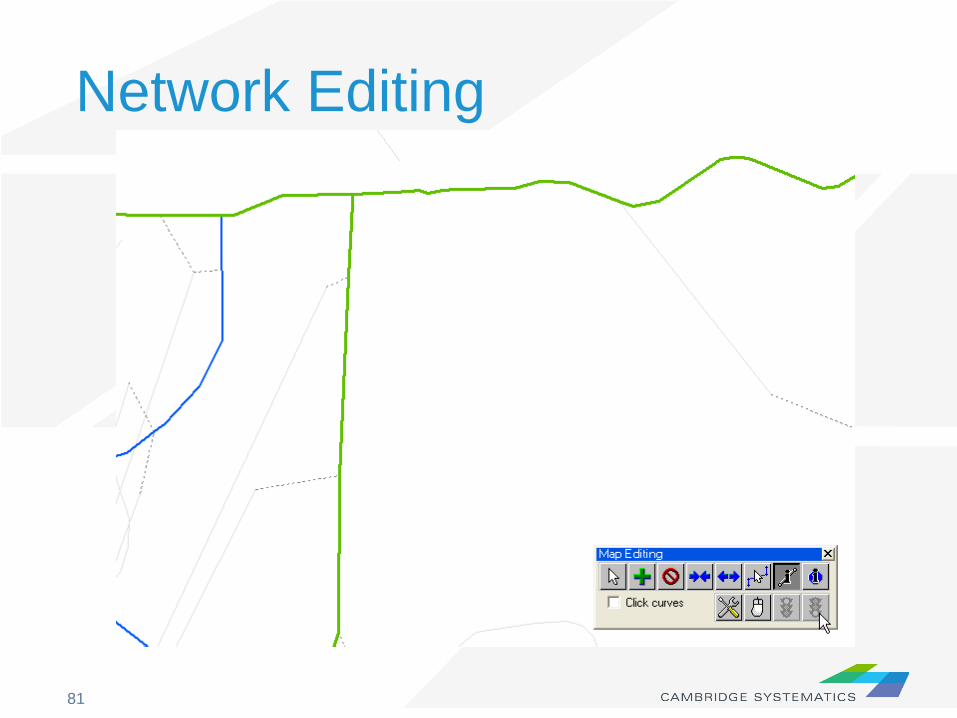
Network Editing Alternate Method
Edit attributes of existing linksAlternate Method» Use the map editing toolbox ( )» Use the Edit Line Attributes ( ) button
Operation of this tool is similar to using the information button
» Edits are saved when the green light ( ) is clicked
» Use the red ( ) light to cancel all unsaved edits
» The Undo function will undo all edits that are saved at once with the green light

75
Network EditingWhat Fields do I Edit???» Facility Type
Facility type identifier» Lanes
Directional number of lanes, by time period Aux. lanes (freeway links only)
» Direction» Area Type
Use nearby links as a guide» MODE
2 for most links (other values are for transit)» Other fields as necessary

76
Practice: Network EditingOpen the input network file
Make a backup copy of this network in a folder called “Backup”» Use Tools Geographic Utilities Geographic
File and archive the network» Add the date to the backup filename» Edit the original network file
Try using the different editing approaches to:» Change the facility type» Widen a Road

77
Practice: Network EditingShow Topology on the network
Change a roadway to represent a different number of lanes in each direction
Change a different roadway to a one-way road» 0 = Two-Way» 1 = A to B» -1 = to A

78
Network EditingAdding new links» Use the map editing toolbox ( )» Add links using Add Line ( )
To work properly, links must be connected at nodes Existing links may need to be split Avoid splitting links if possible
» Make sure that links are connected by: Saving edits Moving a node around – do all of the attached links move
with it? Canceling the edit

79
Network EditingAdding New Links» New links need new data!» Copy data from an existing link with similar
characteristics Use the Edit Link Attributes ( ) button Click/shift-click on the new link(s) Shift-click on the similar old link Right-click on the data for the “old” link and choose “Copy
Values”» Splitting/Joining Links
Check the split/join settings Use the split/join tools ( ) New/moved links may be connected at new nodes Check data on split/joined links
80
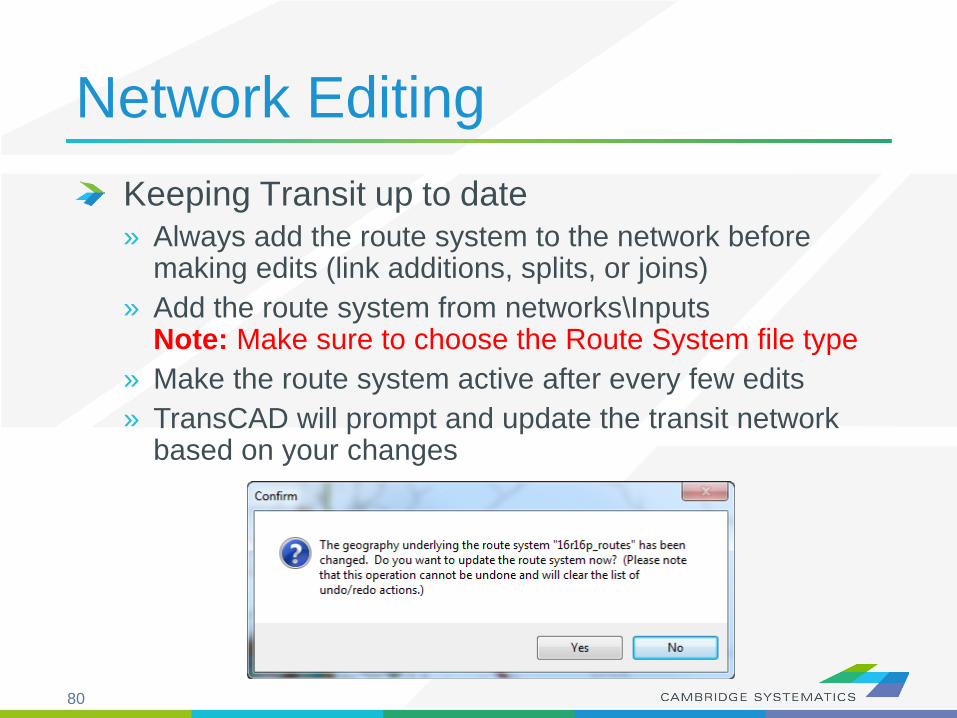
Network EditingKeeping Transit up to date» Always add the route system to the network before
making edits (link additions, splits, or joins)» Add the route system from networks\Inputs
Note: Make sure to choose the Route System file type» Make the route system active after every few edits» TransCAD will prompt and update the transit network
based on your changes
81
Network Editing

82
Practice: Network EditingContinue editing the input network
Add, delete, and realign some links» Show topology: Note that the way a new
link is created defines its AB direction
Copy link values from an old road to newly created links
Split and join links » look at the data that appears on each half» Look at the network editor settings ( )

83
Network EditingThings to keep in mind:» When splitting links, make sure the data on both
pieces still makes sense» When adding new roadways, adjust centroid
connectors if necessary» Adding detail or making corrections?
You may need to make edits to base and forecast networks

84
Advanced Topics

85
Advanced Topics
Matrix Files and OD Tables» Matching matrix files to zones/centroids» Visualizing trip table data
Desire Lines
Setting up Select Link and Zone Anlaysis» Creating a query file» Running assignment only with select analysis activated
Routable Networks» Creating and updating a “.net” Network» Interactive pathbuilding
Basic Scripting» Batch Recorder» Simple Macro Creation

86
Thank You!