TRANSACTIONS - MGMI India
87
ISSN 0371-9538 Vol. 116, April ’19 - March 2020 A Technical Publication of The Mining, Geological and Metallurgical Institute of India TRANSACTIONS The Mining, Geological and Metallurgical Institute of India
-
Upload
khangminh22 -
Category
Documents
-
view
3 -
download
0
Transcript of TRANSACTIONS - MGMI India

ISSN 0371-9538
Vol. 116, April ’19- March 2020
A Technical Publication ofThe Mining, Geological and
Metallurgical Institute of India
TRANSACTIONS
The Mining, Geological andMetallurgical Institute of India


TRANSACTIONS
MGMIEstablished 1906
ISSN 0371-9538 Vol. 116, April '19 - March 2020
A Technical Publication of
The Mining, Geological and Metallurgical
Institute of India

TRANSACTIONS ofTHE MININING, GEOLOGICAL AND METALLURGICAL INSTITUTE OF INDIAInaugurated 1906 – incorporated 1909 – as the Mining and Geological Institute of India,the word Metallurgical was included in the title in 1937.
Honoray Editor
Prof (Dr) Khanindra Pathak
Associate Editor
Dr Ajay Kumar Singh
Price
Free to Members (Rs. 100/- for each additionl copy)
Non-Members Rs. 200/- per copy
Foreign US$ 25.00 per copy
Published by
Rajiw LochanHonorary SecretaryThe Mining, Geological and Metallurgical Institute of IndiaGN-38/4, Sector - V, Salt Lake City, Kolkata - 700091
Printed by
Graphique InternationalKolkata

ContentsPresidential AddressShri Anil Kumar Jha
From Editor's DeskDr Khanindra Pathak
Technical PapersA Solution to Awkward Posture by OCRA-UnderErgonomic PerspectiveMukhopadhyay P, Dey N CInstrumentation and Study of Ground Vibrations Induced by Blasting in Opencast Coal and Metal Mines-Case StudiesSingam Jayanthu, Singam Jayadarshana, Singam Sai Sreeja
Effect of Temperature and Carbon Content on the Performance Parameters of Iron Ore-Coal Composite PelletSrinibash Mishra, Shailesh Priyadarshi, Gour Gopal Roy
Extraction of Deep-Seated Coal Deposits Using Emerging Underground Mining MethodsRanjan Kumar, Prabhat K. Mandal, Awanindra P. Singh, Lalan Kumar, Satyendra K. Singh
Bottom Ash Mixed with Plastic Waste as Stowing Material in Underground Coal Mines : A Feasibility StudyMunipala Manohar, Suresh Kumar, N.C. Karmakar
Optimization of Process Parameters to Achieve Better Mechanical Properties and Higher Productivity in Sinter PlantArghya Majumder, Chanchal Biswas, Saugata Dhar, G.C. Das
Impact of Covid-19 on Mining Operations & Mining Industry- Some ThoughtsG S Khuntia
Effect of Particle Size Distribution on Cohesion and Angle of Internal Friction on Sandstone and Shale Mix MaterialSubodh Kumar, K. Pathak, K. Dey
iiv
1
10
21
30
41
48
60
65

Snapshot of the Contents Page of MGMI Transactions Vol.- I, 1907.

MGMI Transactions Vol. 116, April '19 - March 2020
My friends of MGMI and Ladies and Gentlemen,I extend a warm welcome to all present here at the 113th Annual General Meeting of MGMI. I am very much thankful to everyone for re-electing me as President of this prestigious and more than century old institute for the coming year also. We, in fact, are very much fortunate that India could get a man of high foresight like Sir Thomas Holland who started this institute more than a century ago and was the first President of this institute. He felt right at the dawn of the Institute that Geologists and Mining Engineers are like brothers and they must unite for the growth of Mineral Industry of the country. Later the Institute was expanded to include Metallurgists too. Following the first President, many eminent geologists and mining engineers glorified this position to bring the institute to the present stature.I will feel glad if you accompany me in looking into the past stories of the industry, with what difficulty the miners of earlier days did mining around century ago in the Bengal (Ranigunj) and other old coalfields of our country. Life of a colliery Manager in those days was not a bed of roses. In those days none of the conveniences that we have today in transport and appliances were existing. Collieries were distant from the rail head. Bullock carts were the only means of carriage for despatching coal from the mine head as well
as inter colliery transporting of machineries. It is awesome reading the column “100 years ago” used to publish from archives in the MGMI News Journal that heavy machineries were shifted from colliery to colliery with the help of elephants. In present days, we have sidings right upto the pit heads and National Highways are passing by the mines. It is even difficult to imagine these days what labour it used to take to transport a heavy boiler of the Lancashire type or large flywheels and other parts of
mining machinery for miles over the country without roads and having canals and rivers to reach the interior mine sites. If we see the old publications of MGMI lying in the MGMI library, the British India was far flung those days. The members of the institute used to be from Burma (now Myanmar) in east to Baluchistan (now Pakistan) in west and from Mysore in south to northern India with nerve centre in Calcutta and Bengal coalfields. Handicapped by great distance with far less means of transportation and communication, various mining centres and communities used to have meetings for reading papers sharing their experiences and for discussions. Now the MGMI has 18 Chapters across the country with around 3000 members with ample scope of transportation and communication. But I feel bad when I see that except few branches many branches are dormant and exist only for the name’s sake. I
Shri Anil Kumar Jha*
Presidential Address delivered on 8th November 2019 at the 113th Annual General Meeting, at the hotel, The Westing Kolkata Rajarhat.* President, MGMI & Chairman, Coal India Ltd
Presidential Address
For 113th Annual General Meeting at the hotel, The Westin Kolkata Rajarhat8th November 2019
i

MGMI Transactions Vol. 116, April '19 - March 2020
will be happy if some effective steps are taken by MGMI Members for bringing up the not so active branches to an active state.The strength of MGMI is its available technical knowledge bank which needs to be more contributing factor for sustainability of the energy sector of the country as there is no substitute of fossil fuel in our country at least for the next few decades. Now, main consumer of coal is power sector in India. But earlier bulk user of Coal in India, in Bengal including Giridih, Orissa and Assam was the railways. In those days, expansion of railway lines was found to be utmost important for development and to keep the rails moving, use of coal was necessary. Although first rail link was established in 1853 from Boribunder to Thane (33.6 Km), feeling the need for fast movement of cotton for the British textile mills in the interest of Lancashire mills, but in the eastern sector, the importance of Ranigunj coalfields was acknowledged by East India Company as early as 1830 and they were eager to open railways. The Howrah - Ranigunj railway line was opened in 1854. The tea factory at Dom Dooma in 1880 used to import 3000 Maunds of coal from Ranigunj by steamer upto Dibrugarh (1100miles). However, search for coal was intensified and the pioneers of GSI located several coalfields in the North Eastern Region.The above facts are relevant to highlight that though ‘mining’ and ‘minerals’ did not have an official recognition in ‘trade’ and ‘industry’ during later part of 19th Century, it provided enough impetus for setting up railway lines between the ‘mineral provinces’ and ‘industrial hubs’. Thus consequently demand of coal enhanced with the expansion of railways. However, railways, by and by, shifted to diesel power and electrification for more efficient utilisation of the fuel.Now the seat of major consumption of coal has been occupied by power sector for non-coking coal. The prime position of coal as a major raw material for electricity generation will continue for decades since it is having comparatively comfortable proven reserve position and cheapest fuel available in the country. It being the most secure source of energy, Coal India is having a big plan to attain a target of more than one billion tonne of coal production within next few years with substantial investment in the sector.
The private players for production of coal are also encouraged by the Government by making the coal Block allotment policy more practicable and lucrative. The change in the auction policy will ensure fair deal for investors. The value of the mineral will be the basis of down payment to the Government for acquiring the lease. Conservation and fast rate of extraction will be taken care of by the miners for their own interest.It is however a big challenge for Coal India and the private entrepreneurs to achieve the target within a relatively short span of time. Apart from inadequate infrastructure, there are various constraints due to rules and regulations which I am constrained to say – are not very conducive to such rapid enhancement of production as projected. The concerned authorities should make sincere efforts in making the rules more congenial for rapid expansion in old mines and prompt commencement of operation in new mines. Without a fundamental change of attitude and approach, I apprehend, we may not achieve our target within such a short time.In spite of having more than sufficient power coal in our kitty, if we have to import it to maintain the rate of growth of our development, then we can blame none other than ourselves. To avoid such paradoxical situations, all the Indian scientists and technologists including the field experts should unite and collectively apply their knowledge and expertise whole heartedly towards the sustainable all round development of our country. Towards the development of the mineral & mining industry – I sincerely believe that MGMI has a big role to play. But we must honestly resolve to give our best, and mobilise our all-round expertise towards the goal of achieving the optimum utilisation of our mineral reserves to our best advantage. The good name and the glorious image of MGMI built through a century (and more) must remain as bright as ever through the pro-active participation of every member who are professional and expert in their respective field.
Wishing you all a very eventful year ahead for the betterment of our great nation India. Thank you,
ii

MGMI Transactions Vol. 116, April '19 - March 2020
2020 will be remembered by our new generations as a year of turning point. The whole world has undergone a rapid change. There were unprecedented sufferings and tragedies with sickness and death across the globe. A tiny virus took the completely scientific and medical community aback, the mass of the entire virus available in the world may not be few grams but these have created a havoc in every field of business, education, society and welfare. A new order is now emerging. Let us hope the toils of large number of scientists and businesspersons bring fruits and the vaccines that are brought to market serve the humankind and the happy world returns.In this turmoil we missed miserably the time lines of our publication of Transactions of 19-20, that was supposed be finalized after a paper meet in March2020. We started concentrating on our online functions with our MGMI news journal and we were able to keep it publishing on time. We had number of paper meets and finalized the papers for this transaction. Ergonomics in industrial world is now a developed area, various mining operations that used to give occupational health problems due to absence of ergonomic design. Our readers will be finding it interesting to know some pertinent issues related to ergonomics in one of the articles in this issue of our transactions. Strata control by backfilling of underground void is an important area of research to serve safety of underground coal mining and to avoid subsidence. We have accommodated an article on sand stowing in coalmines in this issue of our transaction. Bulk materials handling is a major field in mining and mineral industry. Properties of bulk materials whether it is the mixed material to be handled at the overburden dumps or rejected iron ore fines to make pallets, characterization studies are very important and there is a need of national mineral
and waste rock characteristics library just like a core library of all geological exploration. Many Indian scientists and engineering are studying on material properties; however, we do not have a compiled repository that MGMI may consider as a National project to be undertaken. We looked forward to publishing such research, however could not find enough response from quality research. India will require detailed technology
development to use her deep-seated coal deposits. Underground mining technology for future is going to adopt advanced techniques. We have included a paper on these issues in this volume of our transactions. Ground vibrations due to blasting has remained an area of environmental concerns in surface mining for a long time. New sensors and instrumentation are empowering environment monitoring to keep control of the sources. Contemporary metallurgical engineers are constantly contributing in finding ways of using low-grade ores and optimizing the metallurgical plant processes. MGMI is always encouraging studies on optimization of processes. An article in this direction is also included in this volume.I immensely thank the members of the editorial board and the reviewers for their active involvement in keeping this transaction published. We look forward to a happy and prosperous 2021 for all our readers. We are looking forward to receiving good research papers by our academic and researchers for our next issue. Geological and geophysical research for resource finding and mining and metallurgical research for resource conversion and value addition are back bone of national prosperity. We at MGMI are dedicated to serve the Nation by remaining as an important synergic factor in the mineral resource development and in contributing to National policy issues for such matters.
Dr Khanindra Pathak*
* Prof IIT, Kharagpur, Editor-in-Chief, MGMI
From Editor's Desk
iii

MGMI Transactions Vol. 116, April '19 - March 2020v
A Page from MGMI History………

TECHNICALARTICLES


MGMI Transactions Vol. 116, April '19 - March 2020 1
Introduction Cost drop by diminishing the time of operation and maximizing the fabrication is a collective occurrence in the industrial sector. This movement is so much accepted by the industrialist in the emerging country like us. Not only unorganized sector most of all Government sector and PSU are running through this problem. Among various job-associated syndromes, work related musculoskeletal disorder (WMSD) is most common among manufacturing or overhauling workers. The occupation likes manual material handling, electric arc welding, oxy-cutting, hand grinding, repetitive actions with awkward posture is too common to develop WMSD’s.
The ergonomics is of prime importance in this area of designing work place, and production sequence including healthy working environment. Management occasionally shows their interest in work station designing and the ignorance about rules and regulations along with early finish craze among the workers introduce them with the occupational diseases. By recognizing and enumerating the postural strains through different ergonomic tools the scientists are trying to find out the root causes and possible remedies of this problem. These outcomes may be categorized in two outlines i.e. instruments based and observations based. Observational based system is very much operative as it does not interpose the
Mukhopadhyay P1*, Dey N C2
1. Scholar, Dept. of Mining Engineering, IIEST Shibpur, Howrah-3, West Bengal, India.2. Professor, Dept. of Mining Engineering, IIEST Shibpur, Howrah-3, West Bengal, India.* [email protected], 09433034156
A Solution to Awkward Posture by OCRA- Under Ergonomic Perspective
AbstractErgonomics not only covenants between man, devices and settings but maintain the sustainability among these important pillars of industry. This paper emphasis to find the solution to awkward posture in a mechanical based Periodic Over Hauling (POH) industry by Occupational Repetitive Action (OCRA) under ergonomic perspective. It is awfully significant from ergonomic angle along with improvement of the employee’s comfort zone. The method is based on the data for a set of joint motion including hand, arm, neck, back and the corresponding holding time in static and dynamic posture considering repetitive actions which has suggested as a preferred method to measure the risk of bio-mechanical overload of the upper limb in ISO and CEN bio-mechanical standard which provides criteria and assessment tools for risk evaluation at different levels in details. Forty male workers who are directly involved to the Periodic Over Hauling (POH) in a mechanical industry are considered and evaluated over the ergonomic tool OCRA. Based on statistical elucidation 50% are in the medium risk and the remaining are in the high risk. This outcome recommends an investigative hazard assessment technique which is useful to design or redesigning the work station and approach planning to increase the output sustaining worker’s somatic and psychological circumstance.
Key words: Low back pain, bio-mechanical overload, OCRA, safety-health and environment, occupational health disorder, posture, work load.

2 MGMI Transactions Vol. 116, April '19 - March 2020
work and it is also less expensive than another one. OCRA tool can be used for assessing exposer to bio-mechanical overload of the upper limb and drawing up work diagram based on desired specificity, changeability and ideas.Different renowned academics revealed their thought and experience in their research papers both in national and international level in the field of WMSD. L Sell 1 et al stated (2014) musculoskeletal disorders (MSDs) as a multifactorial function which depends on both environmental and individual condition of workers. They basically tried to find out some way out, which would help workers to develop their working skills in a hostile working ambience. They followed Tailored ergonomic learning program and came to a conclusion to implement low stress working condition when complete involvement of workers and management is available. Vyas2 worked on (2014) musculoskeletal disorders of among agricultural workers. Usually awkward postures, repetitive motion, application of force during work are the root causes of MSDs among farmers. Rothmore3 et al stated (2014) their view on the musculoskeletal disorders among the workers engaged in health care, call center and transportation department. Most of the workers in those fields are suffering from upper limb and neck pain problem. The authors concluded, though there is moderate action taken to solve this but more effective steps should be taken to save the workers as well as to save the economic growth of the relevant industry too. Liu4 presented (2013) his conception about the influencing factors of musculoskeletal disorders and tried to find out the interaction between them. Basically MSDs are the cumulative effect of long lasting continuous load. To find out the relationship of internal and external factors of MSDs, he proposed a quantitive mode which marked bio-mechanical load, vibration and psychosocial factors as influencing characters for developing MSDs. Ker5 recommended (2012) the code of practice in connection with workstation designing having applied concept of ergonomics.
His design enriched the quality of employer’s and user’s working life minimizing occurrence of workstation related musculoskeletal disorder, by increasing productivity simultaneously. Kiirkhon et al6 stated (2010) about workplace risk and musculoskeletal disorders for the workers assigned in agricultural production sector. They experimented on the degree of MSDs where musculoskeletal problems have been treated as pain indicator which ultimately makes the basis of chronic disease. They also gave an overview on the best accepted work practice having good impact on productivity and comfort in agricultural field where high risk oriented tasks with allied factors force to incur appreciable compensation costs under the accepted regulatory framework. Muller7 et al experimented (2010) on a very significant issue of the present time. It is known to all that the application of computer as well as its mouse as an input device is gradually increasing and most of the professionals related to this device are suffering through work related musculoskeletal disorders (WMSDs) in finger, palm etc. which affected the worker’s health as well as company’s economy too. In this way all the scientists and researchers put importance on the MSD’s to control through professional implementation of ergo study.The aim and objectives of this present research are,
1. To find out the risk by recognizing exposure to repetitive movements of the upper limb of industrial workers which causes WMSD.
2. To find out the remedies by adopting engineering or management control to reduce WMSD.
Methodology Subject:Forty males directly involved to periodic over hauling job (POH) in Govt. sector in different mechanical operations i.e. fitting, manual material handling etc., having minimum one year of experience in this field with no history of medical illness as per report of in house health unit and

MGMI Transactions Vol. 116, April '19 - March 2020 3
who volunteer for this research are taken as subjects of this study. They are acclimatized with this job and during study no external influence is proposed in their daily work schedule. The subjects are re-segregating as age group of less than forty years (n=20) and greater than forty years (n=20).
TaskThe subjects are directly related to the P.O.H. job in mechanical sector where they are engaged in fabricating operations like fitting along with manual material handling etc.The fitter’s[12] role from inspection to final dispatch during P.O.H. is very important. On the other hand they have to stay with their co-worker for orienting and guiding.
Parameters Organizational data: It is the brief
description of individual items related to organization i.e.
1. Duration of shift, 2. Other break, 3. Lunch breaks, 4. Non-repetitive works eg. Cleaning, stocking
etc. With the above data net duration of repetitive work is calculated by subtracting item number 2, 3, and 4 from 1.Once the net duration of the repetitive work is calculated the following formula can be used to estimate the net total cycle time or rate in seconds.Net total cycle time [8] = (Net duration of repetitive work x 60)/ No. of pieces (or No. of cycles)
Then total time of observed cycle is calculated and finally percentage in difference between observed cycle time and official cycle time is calculated. A difference of less than 5% or equal to 20 minutes in the workday is considered acceptable. The duration of exposure factor:The duration of exposure factor or duration multiplier is used to calculate the final OCRA checklist [8] score based on the net duration of the repetitive work. Recovery time factor: Recovery time is considered as the period between which the upper limb is primarily physically inactive. The following can be considered as recovery time [9]1. Breaks :It includes the lunch break, provided
it is included as a part of the paid workday.2. Sufficiently long periods of working activity
in which the muscle groups are at rest.3. Periods within the cycle during which the
muscle groups are completely at rest.
Result and discussionThe POH activity associate upper limbs mostly while on work and the types of such job is repetitive in nature leading to cause of MSD’s related trouble. The OCRA tool is programmed to see through the muscle related development of disfunctioning when job nature is repetitive in any mode of posture and where time plays important variant with respect to force applied for this purpose.1. Postural assessment of the subjects based on
OCRA [10] method using software.
Table 1: Frequency score of different worker
Sl No. Category of worker *#Frequency scoreDynamic
Technical actionStatic Technical
actionTotal
1 Fitter of age ≤40 years. 3 2.5 3
2 Fitter of age > 40 years 2 2.5 2.5
* Mean. # [10]

4 MGMI Transactions Vol. 116, April '19 - March 2020
Table 1 clearly states the scores achieved during different dynamic and static technical action of the worker. The fitters of age group greater than
forty years score 3 in total [9] and their coubter part score 2.5.
2. Force:Table 2: OCRA Checklist [10]
FORCE OF 3-4(Medium)
FORCE OF 5-6-7(Heavy)
FORCE OF 8-9-10(Extremely heavy)
Time as % Score Time as % Score Time as % Score5 .50 0.33 4.00 0.33 6.00
110 .50 1.00 8.00 1.00 12.0018 1.00 1.50 9.00 1.33 13.0026 1.50 2.00 11.00 1.67 14.0033 2.00 2.50 11.00 2.00 15.0037 2.50 3.00 12.00 2.33 16.0042 3.00 3.50 13.00 2.67 17.0046 3.50 4.00 14.00 3.00 18.0050 4.00 4.50 15.00 3.33 19.0054 4.50 5.00 16.00 3.67 20.0058 5.00 5.63 17.00 4.00 21.0063 5.50 6.25 18.00 4.33 22.0067 6.00 6.88 19.00 4.67 23.0075 6.50 7.50 20.00 5.00 24.0083 7.00 8.13 21.00 5.63 25.0092 7.50 8.75 22.00 6.25 26.00100 8.00 9.38 23.00 6.88 27.00
10.00 24.00 7.50 28.008.13 29.008.75 30.009.38 31.0010.00 32.00
Table 2 describes about the different scores based on duration of working and types of forces applied.[10]
Table 3. Force score[10]
Sl No. Category of worker
Medium Heavy Extremely heavy *Force scoreTime as % Score Time as % Score Time as % Score
1 Fitter of age ≤40 years.
92 7.5 0.33 4.0 - - 11.5
2 Fitter of age > 40 years
92 7.5 0.33 4.0 - - 11.5
* Mean

MGMI Transactions Vol. 116, April '19 - March 2020 5
3. Posture:
Table 4. Standard posture score as per recommended by OCRA [10]
Sl. No.
Body part Time in awkward posture Score
1 Shoulder.The arms are kept at about shoulder height, without support or in the extreme posture
Below 10% of the total time 110% -24% of the time 225%-50% of the time 651%- 80% of the time 12
More than 80% of the time 242 Elbow
The elbow executes sudden movements ( wide flexion extension or prono- supination, jerking
movements, striking movements)
25%-50% of the time 251%- 80% of the time 4
More than 80% of the time 8
3 WristThe wrist must bent in an extreme position or
must keep awkard posture ( such as wide flexion, extension, wide lateral deviation etc.)
25%-50% of the time 251%- 80% of the time 4
More than 80% of the time 8
4 HandThe hand take objects or tools in pinch, hook grip,
other different types of grasp
25%-50% of the time 251%- 80% of the time 4
More than 80% of the time 8
Table 4 vividly explains about posture score for different awkward positions in respect of different body parts like shoulder, elbow, wrist and hand corosponding to holding time.
Table 5. Posture score [10]
Sl No. Category of worker *Posture scoreShoulder Elbow Wrist Hand Total score
1 Fitter of age ≤40 years.
1 - 1 1 3
2 Fitter of age > 40 years
1.5 - 1 2 4.5
* Mean
Table 5 describes the postural score [10] of the workers which is based on altered position, activities etc. of different body parts eg. shoulder, elbow, wrist and hand.
Table 3 explains clearly about the meantime taken by the workers while doing their job during different types of application of forces. It is clearly understood that no workers apply
extremely heavy force during work. Force score confirms that about 92 % working period they apply medium force while 0.33% of working hours they apply heavy force.

6 MGMI Transactions Vol. 116, April '19 - March 2020
4. Additional:
Table 6. Standard score of additional risk factor as recommended by OCRA. [10]
( only select one question from each group)
Group Sl. No. Situation ScoreA 1 Gloves inadequate or interfere with the handling ability
required by the task are used for over half the time2
2 The working gesture requires imply a counter shock with frequency of two times per minute or more.
2
3 The working gesture requires imply a counter shock with frequency of ten times per hour or more.
2
4 Exposures to cold or refrigeration (< 0°C) for over half the time
2
5 Vibrating tools are used for 1/3 of the time or more 26 The tools employed causes compression of the skin 27 Precession tasks are carried out for over half the time 28 More than one additional factor is present at the same
time and overall they occupy over half the time2
9 More than one additional factor is present at the same time and overall they occupy over whole of the time
3
B 1 Working pace set by the machine but there is breathing spaces in which the working rhythm can
either be slowed down or accelerated.
1
2 Working pace completely determined by the machine 2
As per guidelines of OCRA checklist [10] table 6 explains clearly about scores for different situations for finding additional risk factors.
Table 7. Additional score [10]
Sl No. Category of worker Additional score
1 Fitter of age ≤40 years. 32 Fitter of age > 40 years 3
As per recommendation of OCRA check list [10] Table 7 shows the additional score of different categories of worker. As more than one additional factor is present at the same time and occupies the whole of time all the worker score 3.
5. Recovery:
Table 8.Recovery multiplier [10]
No. of hours without adequate recovery
time
Recovery multiplier
0 1.5 1.0251 1.05
1.5 1.0862 1.12
2.5 1.163 1.2
3.5 1.2654 1.33
4.5 1.4

MGMI Transactions Vol. 116, April '19 - March 2020 7
5 1.485.5 1.586 1.7
6.5 1.837 2
7.5 2.258 or more 2.5
Table 8 reflects the recovery multiplier value for corresponding work having without adequate recovery time as prescribed by OCRA check list.[10]
Table 9. Recovery score [10]
Sl No. Category of worker Recovery score
1 Fitter of age ≤40 years. 1.22 Fitter of age > 40 years 1.33
Table 9 shows the recovery scores [10] for each group of worker. The junior fitters score 1.2 .The maximum score achieved by senior fitters are 1.33.
6. Duration:
Table 10. Standard duration multiplier [9] value
MULTIPLIER OF THE NET DURATION OF THE REPETITIVE WORK PERFORMED DURING THE SHIFT
Net duration of repetitive work (minutes) Duration multiplier60-120 0.5121-180 0.65181-240 0.75241-300 0.85301-360 0.925361-420 0.95421-480 1
Over 480 1.5
As per recommendation of OCRA [9] Table 10 reflects the value of duration multiplier for corresponding value of net duration of repetitive work in minutes.
Table 11. Duration multiplier score
Duration multiplier [9] used to calculate the final OCRA Checklist score based on the net duration
Sl No.
Category of worker Duration multiplier score
1 Fitter of age ≤40 years. 0.752 Fitter of age > 40 years 0.855
It is clearly seen from the table 11 the duration multiplier values of different types of worker. Fitters of the age group of above forty years score the highest value of 0.855 and their counterpart scores 0.75.
Table 12. Classification criteria [11] (According to exposure level) of the final OCRA Index
and OCRA checklist scores
OCRA checklist
OCRA Index
Level Risk
< 7.5 > 2.2 Green Acceptable risk7.6-11.0 2.3-3.5 Yellow Very low risk11.1-14.0 3.6-4.5 Light red Medium-low risk14.1-22.5 4.6-9.0 Dark red Medium risk
≥ 22.5 ≥ 9.1 Purple High risk
Table 12 shows the classification criteria (according to exposure level) of the final OCRA index and OCRA checklist scores.

8 MGMI Transactions Vol. 116, April '19 - March 2020
Findings through OCRA test:The risk zone of indicated worker are shown in table 13.The final check list score has been evaluated by using the revised OCRA checklist method. As in previous six steps the total segregation of score of individuals (mean value) are shown and after accumulation of those values, the OCRA checklist is prepared.Compairing these values with OCRA index, level of risk can be stated easily.In this case the junior fitters are in medium risk zone and the senior fitters are in high risk zone so special care should be taken for this group.But in both the cases the tool recommend to look over the problem, explore and take remidial extent proximately. Thus OCRA index indicates that precautionery measures should be taken to protect employee from possible occurrence of upper limb –work related muscuolo skeletal disorder(UL-WMSD)
Recommendations and conclusions:The ergonomic involvement in the work environment of the specified workers ascertains that unawareness among the workers conquers for early finish with huge variation in work force application. This ergonomic study based on OCRA tool helps finding substantial figure of workers suffering from WMSD especially the workers who are working in awkward postures viz. kneeling, half bent etc. Many of the workers are not feeling the pain in the body and continuing the work in same posture though there is a clear indication to feel the pain in near future. Assessments by OCRA accomplishes that not only immediate
applications of ergonomic interception is required in this industry but consciousness among the employees and administrators also be desirable. The management must go for plan, do, check and acts (PDCA) to reshape the terminal and other engineering controls ergonomically to humanize the work and work environment.
AcknowledgementAuthors are appreciative to the Chief of parallel industries along with safety officers, production supervisors and the workers for their kind co-operation and affable support.
References1. L Sell, A Haltermann, A Hauke, and K Segaard,
.A Tailored learning program for prevention of musculoskeletal disorders, J Ergonomics 2014.
2. R Vyas, Ergonomic assessment of prevalence of musculoskeletal disorders among Indian agricultural workers, J Ergonomics 2014.
3. P Rothmore, P Aylward and J Karnon, Ergonomics and musculoskeletal injury prevention in healthcare: Are they worth it? HFESA, Ergonomics Australia, 2014.
4. D R Liu, External load and the reaction of the musculoskeletal system- A conceptual model of the interaction, International Journal of Industrial Ergonomics 43(2013) 356-362.
5. Patrick Ker, Musculoskeletal disorders and office ergonomics-Part II., Occupational Therapy Dept. Singapore general hospital.
6. Kirkhorn S R, Earle Richardson G, Banks R J, Ergonomic risks and musculoskeletal disorders
7. Evaluation for final checklist scores for task:
Table 13. Final checklist [8]
Sl No.
Category of worker
Age group +OCRA check list
OCRA Index
Level Risk
1 Fitter ≤40 years. 18.45 4.6-9.0 Dark red Medium risk
> 40 years 24.305 ≥ 9.1 Purple High risk
+OCRA checklist= (Frequency+ Force+ Posture+ Additional factors) X Recovery multiplier X Duration multiplier [8]

MGMI Transactions Vol. 116, April '19 - March 2020 9
in production agriculture; recommendations for effective research to practice, J Agromedicine, 2010 Jul, 15(3); 281-299.
7. C Muller, L Tomatis, and T Laubli, Muscular load and performance compared between a pen and a computer mouse as input device, International Journal of Industrial Ergonomics 40 (2010) 607-617.
8. Colombini D et al, 2013, The Revised OCRA Checklist method, Editorials Factors Humans, Bercilona,Spain.
9. Colombini D & Occhipinti E, 2006. Preventing up[per limb work related musculoskeletal disorders (UL-WMSDs); new approaches in job (re) design and current trends in standardization, Applied Ergonomics, 37(4), 441-450.
10. http://www.epmresearch.org. [accessed 16th October 2017]
11. Colombini D et al, 2007, Repetitive movements in upper limbs in agriculture; set up of annual exposure level assessment models starting from OCRA checklist via simple and practical tools, in Khalid H.M. (Ed.) Proceedings of the Agriculture Ergonomics Development Conference 2007, Kualalampur, Malaysia; IEA Press.
12. Mukhopadhyay, P., & Dey, N. C. (2019), Ergonomic intervention through ‘OCRA’, an ergonomic tool, for work posture assessment of periodic over hauling activities in mechanical industries. Journal of Mines, Metals & Fuels; Vol.67, No.7.

10 MGMI Transactions Vol. 116, April '19 - March 2020
IntroductionWhen an explosive charge detonates, intense dynamic waves are set around the blast hole, due to sudden acceleration of the rock mass. The energy liberated by the explosive is transmitted to the rock mass as strain energy. The transmission of the energy takes place in the form of the waves (1). The energy carried by these waves crushes the rock, which is the immediate vicinity of the hole, to a fine powder. Blast induced ground vibrations, which are propagated in rock, can be divided into Compression waves,, Shear waves
and Rayleigh waves. The motion of the ground particle takes in three perpendicular directions viz. vertical, longitudinal and transverse directions. For the compression wave, the particle moves along the direction of propagation (longitudinal), while the shear wave moves across this direction (transverse). The Rayleigh waves have elliptical particle movements in the vertical plane (vertical). The particles rotate backward in this plane.The propagation velocity for the different wave types is dependent of the elasticity and density of the medium. Typical velocities for
Singam Jayanthu1 , Singam Jayadarshana2 and Singam Sai Sreeja3
1. Professor, Mining Engg Dept., NIT Rourkela,Odisha, India.2. BTech(ECE),MTech(EIE)-Center ofExcellence inArtificial Intelligence-Bhubaneswar, India3. BTech Student-CSE-SUIIT-Burla, India.
Instrumentation and Study of Ground Vibrations Induced by Blasting in Opencast Coal and Metal Mines- Case Studies
AbstractBlasting near sensitive areas has always been a cause of concern and utmost care has tobe taken to keep the charge per delay below the stipulated level. Part of the scientificstudies conducted on ground vibrations induced by blasting, and to estimate safemaximumchargeperdelay toprotect thenearby structures arepresented.Thispaper alsopresents instrumentationwith accelerometers, and scientific studies conducted on groundvibrations due to blastingwith various types of explosive and accessories (Cartridge, SiteMixed Emulsions, electronic detonators etc) at Dunguri limestone mine, Jindal PowerOpencastCoalMine- Tamnar, andBaphlimali BauxiteMines underM/SUtkalAluminaInternationalLimited, JayanthipuramLimestoneMine, TheRamcocementsLtdtodesignsafe blasting practices to contain the ground vibration levels below the damage criteria toprotect the structures surrounding the blasting site. A number of field visits were madeto collect thegeotechnicaldata, andmonitoringgroundvibrations inducedbyblasting forabove excavations. A number of blasts weremonitored to study various blast parametersrelatedtoblastingOverburdenandpitbenchesandtounderstandtheeffectofblastonthesurrounding structures, and rock mass conditions at the above four excavations. Furtherstudieswith application of trans-disciplinary research includingWireless SensorNetwork(WSN)andInternetofThings(IoT)isalsorecommendedforcollectionofmorerelevantdata,analysis andcommunicationofdata forbetter implementationof the results atmine sites.
Keywords: Miningexcavations,groundvibrations,PPV,frequency,Safeblastingdesign,opencastmines,Sensors,Limestone,Coal.

MGMI Transactions Vol. 116, April '19 - March 2020 11
shear waves in rock vary from 2000-4000 m/s correspondingly for compression waves 3000-6000 m/s. For inhomogeneous and stratified rocks the propagation of wave energy is complicated. During unfavorable conditions resonance and focusing effects may be created by the interference of incoming and reflecting waves. Under such conditions the vibrations may increase and not decrease when the distance from the blast source get larger. The three important wave characteristics, which are significant for blast damage, are amplitude, frequency and duration. The amplitude, which is given as acceleration, particle velocity or displacement, depends on detonating charge, length of the charge, confinement, damping conditions in the ground, the building response and the distance between the object and blasting. Concerning ground conditions and building response nothing can be done. Earlier peak particle velocity was the sole criterion for the ground vibration standards. However, after the role of frequency in the damage to the structures became known, it is now common to prescribe maximum permissible peak particle velocity along with corresponding frequency. Detailed scientific investigations on drilling and blasting including design of safe blasts vis-à-vis ground vibrations in various mines were conducted by the first author and details illustrated elsewhere [2-7].
Damage CriteriaThe damage criteria was proposed by many organizations including USBM, DGMS, Indian Standards etc based on the Permissible PPV in mm/s and Frequency of the ground vibrations for various types of structures (16-19). The criteria based on the Permissible PPV in mm/s and Frequency of the ground vibrations for various types of structures as per DGMS (1997) as presented below in Table 1 and 2 are generally followed to estimate safe charge per delay to limit the ground vibrations within safe limit in Indian geomining conditions.
Table I: Damage Criteria Vis-À-Vis Buildings / Structures Not Belonging To The Owner
Type of Structure Dominant Excitation Frequency
<8 Hz 8 to 25 Hz
> 25 Hz
a) Domestic Houses 5 10 15b) Industrial
Building10 20 25
c) Sensitive Structure
2 5 10
Table 2: Damage Criteria Vis-À-Vis Buildings / Structures Belonging To The Owner
Type of Structure
Dominant Excitation Frequency<8 Hz 8 to 25
Hz> 25 Hz
a) Domestic Houses
10 15 25
b) Industrial Building
15 25 50
The parameters, which exhibit control on the amplitude, frequency and duration of the ground vibration, are divided in to Non-controllable Parameters , and Controllable Parameters.The non-controllable parameters are those, over which the Blasting Engineer does not have any control. The local geology, rock characteristics and distances of the structures from blast site are non-controllable parameters. However, the control on the ground vibrations can be established with the help of controllable parameters such as Charge Weight , Delay Interval, Type of Explosive, Direction of blast progression, Burden, spacing and specific charge, Coupling, Confinement, Spatial distribution of charges etc.
Instrumentation Used For The StudiesMinimate Blaster is used for blast monitoring at various sites in and around the mine (Fig 1). Table 3 shows details of the instrument used for the study. The Minimate Blaster is a reliable blast monitoring in a simple and economical package

12 MGMI Transactions Vol. 116, April '19 - March 2020
with advantages such as Small, rugged package for portability and easy setup, Simple menu driven operation, Easy one button, download and reporting with concerned software, Continuous monitoring etc. Further studies with application of trans-disciplinary research including Wireless Sensor Network (WSN) and Internet of Things (IoT) is also being tried under the guidance of first author for collection of more relevant data, analysis and communication of data for better implementation of the results at mine sites. Following are some more advantages of the above instrumentation:
Integral monitoring log records time and duration of monitoring jobs.
Auto Record™ mode allows for continuous recording as long as activity cycles about the trigger level.
Fully compliant with the International Society of Explosives Engineers (ISEE) - Performance Specifications for Blasting Seismographs -requirements with the ISEE Linear Microphone and an ISEE Geophone (2250Hz).
Fully compliant to the DIN 456691 Standard with optional DIN Geophone (1315Hz).
Table 3: Specifications Of The Instrument Used For The Study
Key Features Easy to use Auto Record record stop modeBuilt for blasters
Channels Microphone and Triaxial Geophone
Available Memory
30 events
Record mode Manual and ContinuousAvailable sample rate
1024 to 4096 S/s per channel
Unit Dimensions
81 X 91 X160 mm
Unit weight 1.4 kgUser Interface 8 domed tactile keysProduct rank Low cost
Geomining DetailsScientific study was conducted on ground vibrations due to blasting at Dunguri limestone mine, Jayanthipuram Limestone Mine, The Ramco cements Ltd , ACC ltd, JPL –Tamnar Coal Mine, and UAIL Bauxite mine for estimation of explosive charge per delay for keeping the ground vibrations within the safe limits of Peak particle velocity and frequency. Details of the studies were presented in various reports of concerned mines (2-8)
Fig1: Instrumentation formonitoring of groundvibrationsdue to blasting
Analysis of Observations
Case Study-1The vibro-graph was installed at a predetermined distance in the range of 150 to 750 m from blast site to the monitoring station to monitor the ground vibrations generated from blast at Dunguri Lime stone mine (Fig 2). The Fly rock, fragmentation and muck pile tightness was assessed qualitatively using visual inspection. The Peak particle velocity (PPV) was measured for experimental blasts with respect to the distance from the blast site to the monitoring station with varying Charge per delay for various experimental blasts. Dominant Frequency , and Sound Pressure levels (SPL) were in the range of 2-34.3 Hz, and 100-140+, respectively (Table 4).

MGMI Transactions Vol. 116, April '19 - March 2020 13
Table 4: Details Of Monitoring Distance, Ppv, And Frequency Of Ground Vibrations In
Dunguri Mine, Acc
Dis-tance (m)
No of holes
PPV(mm/s)
Fre-quency
(Hz)
SPL (dBL)
500 64 L-1.33, T-0.953, V-1.59, PPV-1.62
21.5 114
150 67 L-1.65,T-2.98,V-3.24, PPV-4.16
19.8 125
300 99 L-2.54,T-2.22,V-1.91, PPV-3.52
2 100
200 15 L-2.29,T-1.14,V-1.59,PPV-2.52
2.25 100
400 80 L-1.27,T-1.46,V-1.71,PPV-2.05
11.3 134
500 40 L-0.69,T-1.33,V-0.06,PPV-1.33
24 126
600 96 L-0.76,T-0.69,V-0.63,PPV-0.873
25.3 116
750 55 L-0.127,T-.127,V-0.063,PPV-0.191
18.3 110
150 130 L-4.95,T-6.60,V-8.13,PPV-8.60
2.25 140+
500 58 L-0.572,T-2.98,V-1.08,PPV-3.10
34.3 130
150 63 L-4.45,T-5.46,V-0.953,PPV-6.10
17.8 140+
Ground vibration monitoring stations with various experimental blasts in the above mine were located during the investigations at a distance of 150 to 750 m from the blast site. Experimental blasts
were conducted with explosive charge per delay in the range of 30 to 55 kg, and total number of holes per blast was in the range of 15 to 130. At 750 m distance from the blast site, maximum PPV observed was about 0.191 mm/s, while maximum PPV recorded for a distance of 150 m was 8.6 mm/sec. Maximum PPV observed at a distance of 200 m to 500 m was within the range of 2.52 to 1.33 mm/sec. Observations shows that explosive charge of 50 kg per delay would induce PPV less than 5 mm/sec beyond 200 m distance from the blast site with the present blasting practice in the mine.To predict the safe charge per delay for reducing the damage potential for various distances from the blast site, regression analysis was done. Fig 3 shows the event report of typical balst and result of regression analysis for estimation of safe charge per delay to contain the ground vibrations within safe limits. In majority of the observations, the maximum air over pressure recorded was within 140 dBA, which is within the safe limits. The dominant frequency of ground vibration in the range of 2 to 34.3 Hz for distances from 150 m to 750 m in the experimental trials. Since the structures with normal civil construction may have a natural frequency of about 20 Hz, it is suggested to meticulously design the blasts with explosive charges considering both PPV and frequency content.
Fig2:Aviewof blasting in trial blast atDungurimine,ACC (Case study-1)
Predictor equation in terms of the scaled distance (x) and PPV (Peak particle velocity) developed to represent the data for utilization in estimation

14 MGMI Transactions Vol. 116, April '19 - March 2020
of safe explosive charge per delay to keep the vibration level within the safe limits is as in Eq.1.
PPV = 489.21(Scaled distance) -1.4 ( Eq.1)
Since the PPV levels were within safe limits of damage level criteria (< 5 mm/sec) for any type of structures other than sensitive structures, the blasting pattern may be followed with the respective explosive charge per delay as shown in Table 5 for containing the PPV of ground vibration within damage limit for various distances from the blast site.
Fig3:EventReport of a typical Blast atDungurimine,ACC
Table 5: Estimation Of Charge Per Delay (Kg) For Containing Ppv Within 5mm/Sec
Distance Charge per delay (Kg) for containing PPV within 5mm/sec
100 14150 32200 57250 90300 129350 176400 229450 290500 358
Case Study-2Many blasts were monitored for estimation of suitable charge per delay for keeping the ground vibrations within the safe limits of Peak particle velocity and frequency. Blasts were monitored by the team of Blasting Experts and assisted by Blasting In charge of Jindal Power Open cast Coal Mine along with the present investigators. The vibrograph was installed at a predetermined distances in the range of 100 to 350 m from blast site to the monitoring station to monitor the ground vibrations generated from blast. The Flyrock, fragmentation and muckpile tightness was assessed qualitatively using visual inspection. The Peak particle velocity (PPV) was measured for various blasts with respect to the distance from the blast site to the monitoring station including the Charge per delay for various blasts.Details of observations including the wave pattern in a typical blast is presented in Figure 4 with the damage criteria of OSMRE/USBM indicating that the ground vibrations vis-à-vis frequency content of vibration is within the safe limit for the structures corresponding to the distance of about 150 m from the blast site. Blast Vibration study report of Jindal Power Open cast Coal Mines for a typical blast is presented in Table-6. The ground vibration data for various blasts including Peak particle velocity (PPV), the distance from the blast site to the monitoring station; the Charge per delay for various blasts was analyzed for understanding the effect of ground vibrations induced by blasting at Jindal Power Open Cast Coal Mine. The following predictor equation (Eq.2) in terms of the scaled distance (x) and PPV (Peak Particle Velocity) is found to represent the data, and proposed for utilization in estimation of safe explosive charge per delay to keep the vibration level within the safe limits.
PPV = 290.12 (Scaled distance) -1.296 ( Eq.2)
Accordingly, the safe charge per delay recommended to keep the vibration level below 5 mm /sec is presented in Table 7 for the above

MGMI Transactions Vol. 116, April '19 - March 2020 15
geomining conditions of Jindal Power Opencast Coal Mine- Tamnar.
Table -6: Blast Vibration study report –Case study-2
1 Date of Blast 07/07/082 Location VIII Seam
OB3 Strata Medium
hard Sand Stone
4 No of Holes 475 Depth of Holes (Mtr) 4.5 to 6.06 Burden x Spacing (Mtr) 4.0 x 6.0 7 Diameter of Holes (Mtr) 159 mm
Explosives Used 8 Powergel B- 1 (SME) in Kgs 15009 Primex (100gm pellets) in
Kgs4.70
10 Total Explosives in Kgs 1504.7011 Accessories Used Exel
(250/25MS, 42MS,65MS)
12 Electric Detonator
13 Maximum charge/ Delay
(Kgs)70
14 Volume Blasted (Cu. Mtr) 6158.015 Powder Factor (Cu.Mtr/Kgs) 4.10
Post Blast Observations 16 Blast fragmentation Good17 Fly Rocks Within
20Mtr.18 Throw Normal19 Muck File Good
Distance (Mtr.) 200 300PPV (mm/Sec) 3.75 2.35Frequency (Hz) 23 18
Table 7: The safe charge per delay to keep the vibration level below
5 mm/sec at various distances from the blast site
Distance of blast site from the Kosumpali
village (m)
Safe Charge/Delay(kg)
100 18.9200 75.9300 170.8400 303.7500 474.5
Case Study-3Details of monitoring distance, PPV, and frequency of ground vibrations etc for a typical experimental blast are shown in Table 8. Emulsion matrix is observed to be a non explosive material having density of 1.40 g/cm3. NONEL system was used for initiation with accessories TWINDET-17/125 ms, TLD – 25 ms etc. Maximum charge/delay was in the range of 35 – 50 kg in the trial blasts. EMULBOOST manufactured by M/s IDL of 125 g cartridge weight was used as booster charge. The density of SME emulsion matrix is reduced by chemical gassing and below 1.30 g/cm3 detonation was observed. The density change on rate of gassing of matrix was also measured in the field conditions. Detailed measurement of density of the emulsion mixture supplied by M/s Keltech Energies Ltd at the study site without gassing was 1.4 g/cc which are found to be non-explosive. The density was 1.3 g/cc with gassing reduced to a minimum of 1.04 g/cc even after 4 hours of gassing.The blast result was also assessed in terms of ground vibrations, its frequency, air over Pressure produced and Fly rock. The vibrograph was installed at a predetermined distances in the range of 110 to 175 m from blast site to the monitoring station to monitor the ground vibrations generated from blast. The Fly rock, fragmentation and muck pile tightness was assessed qualitatively using visual inspection. The Peak particle velocity

16 MGMI Transactions Vol. 116, April '19 - March 2020
(PPV) was measured for experimental blasts with respect to the distance from the blast site to the monitoring station with varying Charge per delay for various experimental blasts. The maximum air over pressure recorded was within 80 dB (L), which is within the safe limits. The
blasting operation produced PPV less than 15 mm/sec, which is within safe limit for the industrial structures belonging to the owner in the frequency range of <8 Hz and 8-25 Hz for distances up to 110 m to 175 m.
Fig4:Wavepattern in a typical blast vibrationdata-Case study-2

MGMI Transactions Vol. 116, April '19 - March 2020 17
The ground vibration data including Peak particle velocity (PPV), the distance from the blast site to the monitoring station; the explosive Charge per delay for various blasts was analyzed for understanding the effect of ground vibrations induced by blasting at Baphlimali Open Cast bauxite Mine. The following predictor equation (Eq.3) in terms of the scaled distance (x) and PPV (Peak particle velocity) is found to represent the data, and proposed for utilization in estimation of safe explosive charge per delay to keep the vibration level within the safe limits.
PPV = 19.681 (Scaled distance) -0.427 ( Eq.3)
Case Study-4Nineteen Trial blasts were conducted during August to December 2019 at Jayanthipuram Mines of The Ramco cements Ltd (8). Salient observations of monitoring of ground vibrations during recent experimental blasts in December 2019 are shown in Table 9. Fig 5, and 6 shows monitoring of blasting operations with Minimate instrument, and the status of structures surrounding the Jayanthipuram village near Jayanthipuram mine site, respectively. Fig 7 represents a typical report related to ground vibrations generated by experimental Blasts at the mine site. The blast result was also assessed in terms of ground vibrations, its frequency, air over Pressure produced and Fly rock. The vibro-graph was
Table 8: Details Of Trial Blasts – Case Study-3
Sl no Particulars FACE 1 FACE 21 Location of Blast 2nd Bench/RL 1025 1st Bench/RL 10302 Type of Strata HARD HARD3 ORE/OB BAUXITE OVER BURDEN4 Hole Dia in mm 160 1605 Drill hole Pattern STAGGERED STAGGERED6 Depth of the hole in m 8 6
a Burden in m 4 3.5b Spacing in m 5 4.5c Total no of holes blasted 57 152
7 No of rows 4 48 Max Charge per hole in Kg 80 559 Max Charge per Delay in Kg 80 11010 Fly Rock distance in m 15 1611 Misfire if any NO NO12 smoke if any NO NO13 PPV mm/sec 5.55 12.514 Frequency in Hz 6.1 13.515 Distance from Observation Station to Blasting
site in m150 125
16 Total quantity of SME used in Kg 4500 781017 Total quantity of Emul Boost used in kg 14.250 35.75018 Total quantity of Explosive used in kg 4514.250 7845.75019 Percentage of Booster used 0.4 0.420 Type of detonators used Nonel Initiation 21 Stemming Material used DRILL CUT DRILL CUT22 Fragmentation Good Good23 Throw As desired As desired

18 MGMI Transactions Vol. 116, April '19 - March 2020
installed at a predetermined distance in the range of 100 to 350 m from blast site to the monitoring station to monitor the ground vibrations generated from blast. The Fly rock, fragmentation and muck pile tightness was assessed qualitatively using visual inspection. The Peak particle velocity (PPV) was measured for experimental blasts with respect to the distance from the blast site to the monitoring station with varying Charge per delay for various experimental blasts. Air Overpressures measured in the above trial blasts was in the range of 114 to 131 dB, which is within the damage limits of any structures. Fly rock observed was in the range of about 7 to 9 m and in almost all blasts it was within 50 m from the blast site, without causing any concern for the safety of the structures. Powder factor obtained for various experimental blasts with above parameters was in the range of 5.4 to 6. 8 tons per kg of explosive. Total explosive charge during the above experimental blasts was in the range of 1300 to 2800 kg. Table 8 shows Details of monitoring distance, PPV, and frequency of ground vibrations in Jayanthipuram Limestone Mine, The Ramco cements Ltd considered for analysis.
Fig5:Monitoring of blasting operationswithMinimateinstrument at Jayanthipurammine
Table 7: Ground vibration parameters related to experimental blasting at Jayanthipuram
Limestone Mine during December 2019
Sl No Date
PPV (mm/sec)
Instrument Distance
Maximum Charge/ Delay (Kgs)
15 3/12/2019 2.19 250 12016 5/12/2019 1.33 320 15017 20/12/2019 4.87 320 23618 21/12/2019 3.89 310 17519 24/12/2019 2.64 320 87.50
In majority of the observations, the maximum air over pressure recorded was about 131 dBA, which is within the safe limits. The dominant frequency of ground vibration in the range of 7.9 to 37 Hz for distances from 100 m to 300 m in the experimental trials. Since the structures with normal civil construction may have a natural frequency of about 20 Hz, it is suggested to meticulously design the blasts with explosive charges considering both PPV and frequency content. Predictor equation in terms of the scaled distance (x) and PPV (Peak particle velocity) developed to represent the data for utilization in estimation of safe explosive charge per delay to keep the vibration level within the safe limits for Jayanthipuram Mines of Ramco Cement Ltd is as in Eq.4.
PPV = 368.1 (Scaled distance) -1.51 (Eq.4)
In majority of the blasts, the dominant frequency is above 8 Hz, and hence Damage criteria vis-à-vis Buildings / Structures not belonging to the owner was considered for design of safe blast in the above geomining condition to contain the vibration levels within PPV of 10 mm/secs. Fig 11 shows Typical Structures at the Jayanthipuram village located at about 200 to 600 m from Jayanthipuram Lime mine. Since the PPV levels were within safe limits of damage level criteria

MGMI Transactions Vol. 116, April '19 - March 2020 19
(< 10 mm/sec) for any type of structures other than sensitive structures, the blasting pattern may be followed with the respective explosive charge per delay as shown in Table 9 for containing the PPV of ground vibration within damage limit for various distances from the blast site.
Fig 6: Typical Structures at the Jayanthipuram village located near Jayanthipuram Limestone
mine-Ramco cements Ltd
Fig 7 : Event Report of Blast on 24.12.19 at Jayanthipuram Limestone Mines
ConclusionsOn the basis of the scientific experimental study conducted with various instrumentation for understanding of behaviour of ground vibrations induced by blasting with various types of explosive and accessories (Cartridge, Site Mixed Emulsions, electronic detonators etc) of benches in four mines, following are the conclusions
and recommendations for protection of surface structures and safe design of blasting in respective opencast mines:
1. In Dunguri open cast limestone mine, ACC, it is recommended to use less than 358 kg as explosive charge per delay to contain the ground vibration level below 5 mm/sec beyond the distance of 500 m. Blasting operation with blasting parameters; 4.0 – 5.0 m spacing, and 2.5 – 3.5 m burden for bench heights of 10 m was observed to be safe with Aquadyne explosive of 50 kg of charge per delay beyond 200 m distance from the blast site. The dominant frequency of ground vibration in the range of 2 to 34.3 Hz for distances from 150 m to 750 m in the experimental trials.
2. The safe charge per delay for the distance of 100 m, 200 m, 300 m, 400 m, and 500 m is 18.9 Kg, 75.9 Kg, 170.8 Kg, 303.7 Kg, and 474.5 Kg, respectively was recommended to keep the vibration level below 5 mm/sec for the above geomining conditions of Jindal Power Opencast Coal Mine- Tamnar.
3. At UAIL Mines, blasting operation with bench heights of 5.5 – 8.0 m was observed to be safe and productive with powder factor of 2.41 to 4.22 ton/kg of explosive with 520 kg of SME charge per delay, and 80 kg of SME charge per hole with 3.5- 4.5 m spacing, and 2.5 – 3.5 m burden. Emulsion matrix is a non explosive material having density of 1.40 g/cm3. The density of emulsion matrix is reduced by chemical gassing and for density below 1.30 g/cm3 detonation was observed. The density was 1.3 g/cc with gassing, and reduced to a minimum of 1.04 g/cc even after 4 hours of gassing. Ground vibration levels and air overpressures were within the safe limits for a distance beyond 110 m from the blast site with good fragmentation, muck profile, and acceptable fly rock.
4. D u r i n g s t u d i e s f r o m A u g u s t t o

20 MGMI Transactions Vol. 116, April '19 - March 2020
December, 2019 for blasting of benches in Jayanthipuram Limestone Mine, The Ramco cements Ltd , Blasting operation with blasting parameters; 4.0 – 5.0 m spacing, and 3.0 – 3.5 m burden for bench heights of 9 m was observed to be safe with ANFO explosive of about 9.3 to 236 kg of charge per delay beyond 100 m distance from the blast site. The dominant frequency of ground vibration in the range of 7.9 to 37 Hz for distances from 100 m to 350 m in the experimental trials. Air overpressures were observed to be within damage limits for the above blasting practices.
On the whole, it is recommended to use respective explosive charge per delay to contain the vibration levels as per the damage criteria for various distances from the blast site in the above four mines. To improve the economics of blasting operations, air deck blasting may be followed with detailed studies on costs of drilling, explosives, blasting, mucking, transportation, crushing etc. for the opencast mine. Further studies with application of trans-disciplinary research including Wireless Sensor Network (WSN) and Internet of Things (IoT) is also recommended for collection of more relevant data, analysis and communication of data for better implementation of the results at mine sites.
AcknowledgmentsThanks are due to the Officers of M/s Dunguri mine and EE labs, the Jindal Power Opencast coal mine, M/s UAIL Opencast Bauxite mine, M/s Jayanthipuram Mines, Ramco Cements Ltd, and concerned DGMS officials of the region for their keen interest and informative discussions related to these studies.
References1. Mehdi H., Mehdi S. B., (2013) Analysing the
Ground Vibration Due to Blasting at Alvand Qoly Limestone Mine, International Journal of Mining Engineering and Mineral Processing, p-ISSN: 2166-997X e-ISSN: 2166-9988; 2(2): 17-23
2. Singam Jayanthu, 1989, Study of Frequency Content of Ground Vibrations due to Blasting, MTech Thesis, 1989, IIT BHU (Unpublished)
3. Singam Jayanthu, 1989, Study of Influence of Operational Parameters on Performance of Large Diameter Blast Hole Drills at Block II and Kusunda OCP, BCCL, 1989,45p, (Unpublished Report)
4. Singam Jayanthu, 2011, Evaluation of Blasting Operations and Suggestions on Safe Blasting to limit Ground Vibrations at Jindal Power Open Cast Coal Mines, Tamnar, Raigarh, 2011, 40 p, (Unpublished Report)
5. Singam Jayanthu, 2013, Experimental Trial of Site Mixed Emulsion Explosive in Deep Hole Blasting at Baphlimali Bauxite Mine, M/s UAIL, 2013, 34 p, (Unpublished Report)
6. Singam Jayanthu, 2016, Scientific Study related to Influence of Blasting on Surrounding Structures for Metal Cladding at IDL Explosives Limited, 2016, 54p, (Unpublished Report)
7. Singam Jayanthu, 2016, Scientific Study on ground vibrations due to blasting at Dunguri Limestone Mine, ACC ltd., 2016, 27 p, (Unpublished Report).
8. Singam Jayanthu, 2019, Scientific Study On Effect Of Blasting Operations At Jayanthipuram Lime Stone Mine, The Ramco Cements Limited,., 2016, 25 p, (Unpublished Report).

MGMI Transactions Vol. 116, April '19 - March 2020 21
1. IntroductionReduction of iron ore and coal fines in the form of composite pellet in rotary hearth furnace (RHF) has drawn significant attention of the researchers for last few decades. The intimacy between the iron oxide and carbon particles in iron ore-coal composite pellets not only diminishes the reduction time, but also improves the carbon utilisation. The carbon content and temperature are the two most important parameters which affect the reduction kinetics as well as carbon efficiency of the system. For single pellet reduction, many researchers have shown that increasing the amount of carbon relative to that of iron oxide in the pellet increases the reduction rate monotonically at around 1000°C [1-7]. The increase
in carbon content increases the carbon gasification reaction and subsequently the rate of reduction [2,7]. However, several other authors have also reported that increasing the carbon content beyond a certain limit does not have significant effect on the rate of reduction above 1200°C [8-10]. The rate of reduction is found to increase significantly with the increase in temperature[1-6,8,9].It is also reported that at comparatively lower temperature, carbon gasification is the rate controlling step during the initial stages of reduction that shifts towards wustite reduction during the later stage of reduction[3]. Freshly produced iron at the later stages of reduction is expected to catalyse the carbon gasification and increase the rate of carbon oxidation by several orders[11]. At
Srinibash Mishra1*, Shailesh Priyadarshi2*, and Gour Gopal Roy3*
1. 2. Research Scholar 3. Professor Department of Metallurgical and Materials EngineeringIndian Institute of Technology Kharagpur, 721302, India3* Corresponding author email : [email protected]
Effect of Temperature and Carbon Content on the Performance Parameters of Iron Ore-Coal Composite Pellet
AbstractEffect of temperature and carbon content on carbon utilisation in iron ore-coal composite pellet has been studied in a tube furnace under inert (Ar) atmosphere in the temperature range of 1100-1300°C. The C/Fe2O3 molar ratio has been varied between 1.66 and the stoichiometric level for direct reduction of hematite, i.e. 3. Extent of reduction is found to increase initially with increase in carbon in the pellet but the trend flattens at higher carbon level. CO utilization and carbon efficiency of low carbon containing pellets have been found to exceed those of high carbon containing pellets at higher temperature, which is attributed to lower coal ash, higher effective thermal conductivity and micro-porosity. The non-isothermal kinetic study showed comparatively lower activation energy (<50 kJ/mole) for all pellets indicating heat and mass transfer controlled process. Significant amount of cracks are observed on the surface of the high carbon containing pellets, especially at higher temperature. The shrinkage and compressive strength of the reduced pellet are found to be maximum for carbon containing pellets at C/Fe2O3 ratio of 2.33. Key words: Iron ore-coal composite pellet, C/Fe2O3molar ratio,carbon efficiency, non-isothermal kinetics.

22 MGMI Transactions Vol. 116, April '19 - March 2020
higher temperature, the kinetic becomes mixed controlled both by carbon gasification as well as wustite reduction[12].The volatiles of coal play an important role in the reduction of ore-coal composites. The volatiles are found to be more effective under slow heating rates[13]and their effect diminishes during fast heating[14].T Sharma reported that the expulsion of volatiles caused cracks on the surface of the pellets during fast heating in the case of iron ore-coal composite pellets[15]. Mishra et al. studied the reduction behaviour of iron ore-coal composite pellets in a laboratory scale multi-layer bed RHF and reported comparatively much higher carbon efficiency for low carbon containing pellets compared to high carbon containing pellets,when such pellets were reduced at 1250°C for 20 minutes [16]. Han et al. studied the mechanism and factors influencing iron nugget formation in iron ore-graphite composite briquettes in a high temperature electric resistance furnace [17]. They reported better slag metal separation with maximum iron recovery at optimum carbon content in the iron ore-carbon composites. They found that C/O ratio of 0.7 resulted in maximum iron recovery rate of 90% with large sized iron nuggets (>3.15 mm),when such pellets were reduced at 1300°C for 20 minutes. Further increase in carbon content reduced the metal recovery and size of the nugget. They also concluded that the presence of excess carbon inhibited the coalescence of iron phase and reduced the size distribution of iron nuggets. Similarly, Borra et al. reported that about 80% of the theoretical carbon requirement for direct reduction of hematite resulted in better slag-metal separation in iron ore-coal composite pellets, when they were reduced at 1400°C for 15 minutes[18].Based on the above literature it is observed that significant research has been carried out on the effect of temperature and carbon content on the extent of reduction in iron oxide-carbon composite pellets. The temperature plays an important
role in the carbon utilisation and can affect the optimum carbon to achieve maximum reduction efficiency. However, a comprehensive analysis of the combined effect of temperature and carbon content on the carbon utilisation is conspicuously absent in the literature. Two extreme reactions for reduction of hematite by carbon may be represented as: Fe2O3 + 3C = 2Fe + 3CO (5) Fe2O3 + 1.5C = 2Fe + 1.5CO2 (6)
In case I, it requires 3 moles of carbon per mole of hematite and the product gas is completely CO, which indicates zero utilisation of CO. In case II, it requires only 1.5 moles of carbon and the product gas is CO2. In case II, the CO generated from the direct reduction of iron oxide is completely utilised in removing the balance oxygen of the iron oxide. The case II is most carbon efficient, but very difficult to achieve kinetically. Therefore, the carbon required for the direct reduction of hematite theoretically may vary between 1.5 to 3 moles of carbon per mole of hematite. It will be demonstrated that the effect of carbon content on the performance parameters varies significantly at different temperature regime.
2. Materials and methodsThe raw materials used in the present study are iron ore and coal fines obtained from RDCIS Ranchi, India. The chemical composition of the raw materials used is provided in Table 1, 2 and 3.
Table 1 Chemical composition of iron ore (mass %)
Fe2O3 SiO2 CaO P2O5 MnO Al2O3 LOI
94.71 2.77 0.05 0.05 0.02 0.62 1.9

MGMI Transactions Vol. 116, April '19 - March 2020 23
Iron ore and coal fines (both -150 µm) with a small amount of bentonite (-74 µm, 3 wt %) are thoroughly mixed in a rotating glass bottle for 8-10 hours. Distilled water is added and pellets (16 mm diameter) of different compositions are prepared by hand rolling. The green pellets are air dried for 48 hours and subsequently dried at 200°C for 2 hours to remove the physical moisture from the pellets and get the strength after curing.The dried pellets are reduced under inert (Ar) atmosphere in a horizontally mounted tube furnace. The detailed experimental set up is shown in Fig. 1. The furnace is provided with SiC heating elements and is capable of attaining
high temperature of 1500°C. The alumina tube is of C799 (99.7% alumina) quality with internal diameter of 80 mm, 5 mm thick, and anisothermal zone of 80 mm with a variation of ±2°C. The pellet is placed in an alumina tray at the centre of the tube (isothermal zone) from the beginning of the experiment. Ar is flown at a rate of 40 litres /hour during reduction and of 80 litres /hour during cooling. The furnace is heated at a rate of 5°C/ minute and held at the reduction temperature for 20 minutes. The sample is cooled inside the furnace under argon atmosphere. The reduced pellet is subsequently characterised by different techniques.
Table 2 Coal composition (mass %)
Proximity Analysis of coal Ash composition
FC VM Ash Moisture SiO2 Al2O3 CaO Na2O Fe2O3 TiO2 K2O
68.2 24.3 6.8 0.7 48.1 30.6 1.94 1.38 8.86 2.12 1
Table 3 Chemical composition of bentonite (mass %)SiO2 Al2O3 CaO MgO Na2O Fe2O3 TiO2 K2O
58.3 17.47 0.93 2.05 5.89 9.55 1.81 1.07
Fig. 1 Schematic representation of the experimental set up

24 MGMI Transactions Vol. 116, April '19 - March 2020
Total weight loss is measured by noting the difference in weight of the pellet before and after reduction. The carbon loss is estimated by deducting the amount of residual carbon in reduced pellet from the initial carbon in the unreduced pellet. The initial carbon is estimated from the fixed carbon in the coal. The residual carbon in the reduced pellet is measured using G4-ICARUS carbon-sulphur analyser. Total removable oxygen is calculated as the total oxygen associated only with hematite in the unreduced pellet.The volumetric shrinkage of the reduced pellets is measured from the change in volume before and after reduction. Since the pellets are hand rolled, they are not completely spherical in nature. Thus, the diameter of the pellets is measured at six different locations and the average diameter is considered for the calculation.
Vo–VfShrinkage (%) = –––––––– × 100 (3) Vo
Where Vo is the volume of the pellet before reduction and Vf is the volume after reduction.Porosity of the pellets has been measured following Archimedes’ principles using Eq. (4):
W - DPorosity (%) = –––––––– × 100 (4) W - S
Where D is the weight of the dry pellet, S is the weight of the pellet soaked and suspended in isopropyl alcohol, W is the wet weight of the soaked pellet, after wiping the excess alcohol from the surface of the pellet.
3. Results and discussionIn the present experiments, the C/Fe2O3 molar
ratio varied between 1.66 and the stoichiometric level of carbon required for the direct reduction of hematite, i.e. 3. The temperature is varied between 1100°C to 1300°C. The effect of both temperature and carbon content on the reduction behaviour of iron ore-coal composite pellets, are discussed in the following sections:
3.1. Degree of reductionThe effect of temperature and carbon content on the extent of reduction is shown in Fig.2.
Fig. 2 Effect of temperature and carbon content on degree of reduction
It is observed that the DOR is increased with the increase in temperature irrespective of the carbon content in the pellet. The temperature effect is significant up to 1250°C, and thereafter the temperature effect on the extent of reduction is reduced significantly. Above 1200oC, liquid phases are likely to form that might hinder the mass transfer and reaction. It is also observed that at comparatively lower C/Fe2O3 molar ratio, the effect of temperature on DOR is significant; while such effect diminished significantly at higher
The extent of removal of oxygen from the composite pellets is characterized by the degree of reduction (%), which is defined as :
weight of oxygen removedDegree of reduction (%) = –––––––––––––––––––––––––––––––––––––––––––– ×100 weight of removable oxygen in iron oxide

MGMI Transactions Vol. 116, April '19 - March 2020 25
level of carbon in the pellet. If we see the ranges of DOR with the temperature at a particular C/Fe2O3 molar ratio, it may be observed that the range decreased with the increase in C/Fe2O3 molar ratio. For example, while the DOR range is 40 to 68% for a change of temperature from 1100OC to 1300OC for low carbon containing pellets at the C/Fe2O3 ratio of 1.66, the corresponding DOR range is 78 to 93% for the high carbon
containing pellets at C/Fe2O3 molar ratio of 3. Such phenomena definitely indicates that the reaction for high carbon containing pellet is less temperature sensitive and possibly due to higher heat transfer resistance in the pellet in presence of higher coal and coal ash. 3.2. Carbon efficiencyCarbon efficiency is defined as:
Stoichiometric carbon required for direct reduction of hematiteCarbon efficiency (%) = ––––––––––––––––––––––––––––––––––––––––––––––––––––– ×100 actual carbon utilised
(2)
Therefore, theoretically the maximum carbon efficiency may be 200% when carbon is totally oxidized to CO2 and it is 100% when CO utilization is zero, or the gaseous product is only CO. Variation of residual carbon present in the reduced pellets with different carbon contents and at different temperatures is shown in Fig. 3.
Fig. 3 Variation of residual carbon content in the reduced pellets at different carbon contents at different
temperaturesIt is observed that significant amount of residual carbon is present in the reduced pellet in high carbon containing pellets even after 1300°C, indicating poorer utilization of carbon, which is further discussed in the following section. Carbon efficiency (CE) calculated using Eq. (2) at different temperatures and carbon content is depicted in Fig. 4.
Fig. 4 Variation of Carbon Efficiency with temperature and carbon content
From Fig.4, two opposite trends of variation in CE with increasing carbon content in the pellets at lower and higher temperatures are evident. At comparatively lower temperature (up to 1200°C), CE initially increased with the increase in C/Fe2O3 molar ratio and then flattens or slightly decreased; optimum being at C/Fe2O3 ratio of 2.66. While at higher temperature, 1250°C and above, CE is maximum at lowest C/Fe2O3 ratio of 1.66 and then decreased with the increase in this ratio. It may further be noted that the range of variation of CE with temperature is much higher (75 to 124%) for low carbon containing pellets (C/Fe2O3=1.66), whereas, for high carbon containing pellets, the corresponding range is only 98 to 106% at C/Fe2O3 ratio of 3. Thus, it is noted

26 MGMI Transactions Vol. 116, April '19 - March 2020
that at comparatively low temperature, the CE is higher for high carbon containing pellets, which may be attributed to higher intimacy of carbon to iron oxide. While at higher temperature, the carbon efficiency and CO utilization far exceeds that of high carbon containing pellets, which may be attributed to better heat and mass transfer. Presence of enhanced micro-porosity in absence of open surface cracks (that allows easy escape of reducing gas without much participating into reaction) facilitates mass transfer (see Fig. 7 & 8). Besides, better heat conductance through pellets due to lesser amount of coal and coal ash, also aids heat transfer.
3.3 Estimation of non-isothermal activation energyFigure 5 shows the non-isothermal reduction data according to the equation proposed by Coats and Redfern[21].
Fig. 5 Coats-Redfern plot of non-isothermal reduction data for different carbon containing pellets
It is observed that the order of magnitude of activation energy is less than equal to 50 kJ/mole for all pellets. Activation energy for the non-isothermal reduction of iron ore-coal composites is widely reported in literature (12-80kJ/mol[22], 100-120 kJ/mol [23], 26.7-176 kJ/mol[24]) and our data fall within some of the reported ranges. Lower activation energy in high carbon containing pellets possibly indicates the dominance of heat
and mass transfer in the reduction process.
3.4. Surface morphology of reduced pelletsThe photograph of the pellets reduced at 1150°C with different C/Fe2O3 molar ratios is shown in Fig. 6, whereas Fig. 7 shows the same for C/Fe2O3 ratio of 3 at different temperature.
Fig. 6 Surface morphology of the reduced pellets at 1150°C for different C/Fe2O3 molar ratios (a) 1.66, (b) 2,
(c) 2.33, (d) 2.66, and (e) 3
Fig. 7 Surface morphology of the reduced pellets for C/Fe2O3 molar ratio of 3 at different temperature(a) 1100,
(b) 1150, (c) 1200, (d) 1250, and (e) 1300°C
From Fig. 6, it is observed that in the case of high carbon containing pellets significant amount of cracks are formed on the surface. The amount of cracks increased with the increase in carbon content of the pellets. The cracks are mainly formed due to the expulsion of volatile matter during the early stage of heating; the fact that is also reported in the literature[15]. For C/Fe2O3 ratio of 3, the amount of cracks increased with the increase in temperature as shown in Fig. 7. These cracks allow the gaseous products for easy escape without participating in reduction reaction, which results in lower carbon efficiency in high carbon containing pellets. Also, these cracks can affect the compressive strength of the reduced pellet significantly.
3.5. Volumetric shrinkageThe volumetric shrinkage of the reduced pellets as a function of temperature and carbon content is presented in Table 4.

MGMI Transactions Vol. 116, April '19 - March 2020 27
It is observed that the amount of shrinkage is increased with the increase in temperature irrespective of the carbon content in the pellet. Shrinkage is also found to pass through an optimum C/Fe2O3 molar ratio of 2, which may be attributed to better heat flow, reduction and consolidation.
3.6 PorosityThe porosity values of the reduced pellet as a function of temperature and C/Fe2O3 are shown in Fig. 8.
Fig. 8 Effect of temperature and carbon content on porosity of the reduced pellets
It is observed that the porosity of the reduced pellets increases significantly with increase in temperature, especially for low carbon containing pellets. Interestingly, it was also observed that low carbon containing pellets does not show tendency to develop surface cracks. Therefore. higher porosity without surface cracks, indeed develops
micro-porosity in low carbon containing pellets that assists mass transfer. High carbon containing pellets although shows higher porosity, they also contain surface cracks, which reduces their mass transfer potential for effective reduction. Surface cracks allow easy escape of gas without participating much in the reduction process. The increased porosity can affect the reducibility, internal heat transfer[26], and compressive strength significantly.
3.7 Compressive strengthThe compressive strength of the reduced pellets has been measured using an Instron universal testing machine with a cross-head movement of 0.25 mm/min. The variation of the compressive strength as a function of temperature with the variation in C/Fe2O3 molar ratio is depicted in Fig. 9.
Fig. 9 Compressive strength of the reduced pellets as a function of temperature and carbon content
Table 4 Volumetric shrin kage (%) of pellets at different temperature
C/Fe2O3 ratio 1100°C 1150°C 1200°C 1250°C 1300°C1.66 9.3 45.4 51.7 61.7 63
2 28.3 61.4 64.9 69.3 69.82.33 30.6 55 65.2 67 68.72.66 33.5 53.2 61.5 65.4 66.2
3 17.6 40 59.3 60.6 61.2

28 MGMI Transactions Vol. 116, April '19 - March 2020
It is observed that the carbon content inside the pellet influences the compressive strength of the reduced pellets only at higher temperature. There is a significant increase in compressive strength at C/Fe2O3 ratio of 2.33 at 1250°C and above. The decrease in strength beyond 2.33 ratios may be due to the presence of cracks on the surface. Pellets of comparatively high strength (above 2500N, for the ratio of 2.33 at 1250°C and 1300°C) can be utilised as an alternate feed in the blast furnace or any other smelting reactor [27].
4. Conclusions1. Effect of carbon and temperature has been
evaluated for carbon containing composite pellets in the C/Fe
2O
3 molar ratio range of
1.5 to 3 to understand the carbon efficiency. 2. Extent of reduction increased with increase
in temperature and carbon content in pellets. But it stabilized beyond a certain amount of carbon in the pellet.
3. Low carbon containing pellets produces better CO utilization and carbon efficiency at high temperature due to lower content of coal and its ash that yields higher effective thermal conductivity and porosity in the pellets, enhancing heat and mass flow.
4. High carbon containing pellets produces better results at lower temperature due to large intimacy between carbon and ore particles. But higher content of coal and its ash reduces effective thermal conductivity of pellets and as a result, its kinetics does not respond much with increase in temperature.
5. Comparatively lower values of estimated activation energy (<50 kJ/mole) indicates that the process is heat and mass transfer controlled.
6. The pellets develops lots of open cracks at higher temperature especially for high carbon containing pellets, that is likely to reduce gas efficiency and extent of reduction.
7. Compressive strength of the reduced pellet at higher temperature (1300°C) for C/Fe
2O
3
molar ratio of 2.33 was found to be maximum
(>2500N), which can be potentially utilised as an alternate feed in blast furnace or any other smelting reactor.
References1. RaoY K,Metall. Trans. 2(1971) 1439.2. FreuhanR J,Metall. Trans. B, 8(1977) 279.3. SrinivasanN Sand A.K.Lahiri,Metall. Trans. B8(1977)
175.4. Otsuka K and Kunii D,J. Chem. Eng. of Japan(1967)
46.5. Ajersch F,Canadian Metall. Quarterly26(1987) 137.6. Narcin N, Aydin S, and Dikec F,Int. J. of Mineral
Processing43(1995) 49.7. Jung S M,ISIJ Int. 54(2014) 2933.8. Sharma T,Ironmaking and Steelmaking20(1993) 362.9. B r y k C a n d L u W K , I ro n m a k i n g a n d
Steelmaking13(1986) 70.10. Kasai E, Kitajima T, and Kawaguchi T,ISIJ
Int.40(2000) 842.11. Turkdogan E T and Vinters J V,Carbon10(1972) 97.12. Fortini O M and Freuhan R J,Metall. Mat. Trans.
B36(2005) 865.13. Takyu Y, Murakami T, Sonp S H, and Kasai E,ISIJ
Int.55(2015) 1188.14. Wang Q, Yang Z, Tian J, Li W, and Sun J,Ironmaking
and Steelmaking25(1998) 443.15. Sharma T,Int. J. of Mineral Processing 39(1993) 299.16. Mishra S and Roy G G,Metall. Mat. Trans. B,
47(2016) 2347.17. Han H, Duan D, Chen S, and Yuan P, Metall. Mat.
Trans. B46(2015) 2208.18. Bora C R, Dwarapudi S, Kapure G, Tathavadkar
V, and Denys M B, Ironmaking and Steelmaking, 40(2013) 443.
19. C. E. Seaton, J. S. Foster, and J. V. Velasco: “Reduction kinetics of hematite and magnetite pellets containing coal char”, Trans. ISIJ, 1983, vol. 23, pp. 490-496.
20. S. Halder and R. J. Fruehan:“Reduction of iron-oxide-carbon composites: Part I. Estimation of the rate constants”, Metall. and Mat. Trans., 2008 vol. 39B, pp. 784-795.
21. Coats A W and Redfern J P,Nature, 201(1964) 68.22. Prakash S,Ironmaking and Steelmaking, 21(1994) 237.

MGMI Transactions Vol. 116, April '19 - March 2020 29
23. Mookherjee S, Ray H S, and Mukherjee A,Thermocimica Acta,95(1985)247.
24. Yang X M, Xie Y S, Wang D G,Huang D B, Yang T J, and Kong L T, Acta Metallurgica Sinica(English Letters), 13(2000) 1059.
25. Kent J A (ed.), Kent and Riegel’s handbook of industrial chemistry and biotechnology, 11th edn, New York, Springer, I(2007) 275.
26. Halder S and Freuhan R J,Metall. Mater. Trans. B 39(2008)809.
27. Takegoshi E, Hirasawa Y, Imura S, and Shimazaki T, Int. J. of Thermophysics, 5(1984)219.
28. Biswas A K, Principles of Blast Furnace Ironmaking, SBA Publications, Calcutta, India, 1981.

30 MGMI Transactions Vol. 116, April '19 - March 2020
1.0. IntroductionThe increasing trend of coal production using opencast mining method shifted the working depths at deeper horizon and therefore, the coal deposits at shallow depths are fast exhausting. This practice cannot continue for long time due to shortage of land area, regulatory restrictions, and growing social awareness about the negative externalities of opencast mining. Obviously, the policy makers should focus on development, adoption, and implementation of deep mining methods to unlock the deep-seated coal deposits in India. The mass production technologies in underground coal mines can match with the safety
and productivity records of opencast mining. Moreover, underground coal mines not only polluting the air less by treating the ventilation air methane but also disturbs the surface minimum by controlling the subsidence on surface.During the year, 2017-18, India produced 632.770 MT (93.7%) of coal from opencast mines and the rest 42.630 MT (6.3%) from underground mines (Coal Controller, 2017-18). This trend will not go on long time. To meet the growing demand of coal in cement, steel, and power sector, the miners will have to go deeper and opencast method may not go beyond 300m due to social and environmental issues. On the otherhand, as on 1st April, around
Ranjan Kumar*1, Prabhat K. Mandal1, Awanindra P. Singh1, Lalan Kumar1, Satyendra K. Singh1
1. Address: Mining Methods and Mine Design Simulation Section CSIR-Central Institute of Mining and Fuel Research, Barwa Road, Dhanbad- 826015* Email: [email protected]/[email protected] (communicating author)
Extraction of Deep-Seated Coal Deposits Using Emerging Underground Mining Methods
AbstractThe average depth of the underground coal workings has increased considerably due to the exhaustion of coal deposits near surface. Nevertheless, the coal extraction at depth is overwhelmed with geomining issues due to high in-situ stresses, dynamic behaviour of rockmass, large dilation in mine openings, etc. Therefore, to extract coal from deep mine safely, this paper assesses the geomechanical issues and the mining challenges of deep mining and emerging methods to manage these issues effectively for Indian mining conditions. The geo-mechanical issues have been assessed based on the basic rock mechanics of deep mines. The mining challenges are analyzed focusing on stable working face, roadways, transportation, etc. The comprehensive survey and critical studies of the emerging underground mining methods are done to find out the prospective methods of underground mining which can negotiate the complexities of deep-seated coal deposits in India. The selection of mining methods suitable to the characteristics of coal deposits has been discussed and suggested for mining at greater depth. The works presented in this paper are highly pertinent to Indian mining industry and would provide an insight to select greener, economical and safe mining method to extract deep-seated coal deposits.
Keywords: Mining methods, deep mining, underground coal mining, longwall method, geo-mechanics, longwall abutment, coal burst, gateroad stability.

MGMI Transactions Vol. 116, April '19 - March 2020 31
42% of coal reserves in India are within the range of 300 to 1200m depth of cover range as shown in Fig.1 and Fig.2 (CMPDI, 2018).
Fig.1. Depth-wise coal resources, 2018
Fig.2. Category-wise coal resources, 2018
Now, the question arises that how much depth from surface is termed as deep mining. Initially, deep cover mines have been considered 200m deep from the surface based on earlier experiences of coal mining in India (Deshmukh, 1987). During field studies in Indian coalfields, it was observed that spalling occurs around the pillars if the depth of cover of workings exceeds 200m (Singh et al., 2006). In USA, if the thickness of overlying strata exceeds 228.6m, the reserve is termed as deep-seated deposits (Chase et al., 2002). The geo-technical analysis of several panels of USA mines indicated that pillar squeezing were the probable failure mode where the depth was less than 381m, but bumps predominated in the deeper
cover cases. On the basis of this experience, it was observed that it is not feasible to extract coal by conventional mining methods under fragile roof in a deep cover of high-stress regime. Currently, most of the underground methods of mining widely applied in Indian mining industry to exploit deep-seated coal deposits are not as economical and safe as opencast methods due to challenging geomining conditions and operational problems. The geomechanical conditions of deep mines are high stresses, large deformations, changes in rock mass properties, bumps, rock bursts, excessive roof falls, spalling/crushing of natural supports, floor heaving, etc. (Mark et al., 2002). The mine operations become unviable due to long gestation period, difficult strata conditions, high breakdown of machinery, costly haulage of coal and frequent safety issues encountered during mining process at deeper horizon. Though several research studies worldwide have been focused on challenges of deep mining (Fairhust, 2017; Brown, 2012; Ranjith, 2017; Wagner, 2019), very few literature have been found on the issues and case studies in Indian context (Singh et al., 2011; 2017). Most of these prior works were focused on issues than the potential solutions to manage these issues at greater depth.Building upon the experience gained over more than five decades by CSIR-Central Institute of Mining and Fuel Research with large number of underground coal workings, this paper presents the limitations and observations of the present scientific methods in tackling the issues of deep mine in India. Additionally, the suitable emerging methods have been presented to extract coal from deeper deposits with high percentage of extractions in view of the deposit characteristics of Indian coal deposits at greater depth.
2.0. Key geomechanical challenges in deep minesThe coal deposits occur mainly in the bedded sedimentary rock mass and found in tabular form with varying degree of inclinations and thicknesses. The mechanical behaviour of bedded

32 MGMI Transactions Vol. 116, April '19 - March 2020
rock in the floor and the roof of coal workings are greatly influenced by the depth from surface. When any mine openings are made in underground rock mass, the pre-excavation stresses are redistributed due to gravitational loading, tectonics loads, pressure fluctuations, stress slackening, thermal effects around the openings, etc. The redistribution of stresses at higher depths causes several geo-mechanical issues because of varying geomechanical behaviours of coal-bearing rockmass in underground coal mines. Therefore, mine operators must understand and manage the following basic geomechanical issues for successful extraction of coal deposits at greater depth.
2.1. Rock mass classificationThe rock mass classification seeks to quantify the properties of rock mass that may influence its behaviour, and to join these numerical values into an index for the rock mass. This index is termed as rock mass rating and can be used in excavation stability considerations. Though, several rock mass classification systems (Terzagi, 1946; Bieniawski, 1989) have been proposed worldwide, CMRI classification for rock mass rating (RMR) has been specifically developed to determine the quality of coal mine roofs in Indian coalfields (Venkateswarlu, 1989). The RMR considered layer thickness, uniaxial compressive strength, rock weatherability, groundwater seepage, structural features for rating. However, there is no rating for the stresses due to depth of cover. Rather, they have adjustment for in-situ stresses, as given in Table 1.
Table 1: Adjustment to CMRI RMR system for deep workings
In-s i tu stresses
Depth Adjustment in RMR (%)
Final RMR value
Vertical stress
<250m 0 RMR250m-400m 10 0.9xRMR400m-600m 20 0.8xRMR
>600m 30 0.7xRMRLateral stress
Low 0 RMRHigh 15 0.85xRMR
From the above table, it is evident that if a working is at 650m depth with RMR value 62 subjected to higher vertical and lateral stresses, the RMR values will be (0.7)x(0.85)xRMR= 0.595x62=36.89. In other words, the good roof became poor roof due to adjustment suggested in RMR system which clearly looks that the adjustment for in-situ stresses is somewhat arbitrary. The RMR must be upgraded by including the depth of cover in its rating system because it is widely used in predicting the stand-up times of exposed spans, support design, cavability, fragmentation, etc.
2.2. In-situ stressesAt greater depths, in-situ stresses are an important parameter to design stable excavation. These in-situ stresses depend on Poisson ratio, lateral rock displacement, curvature of earth crust, tectonics, rock properties, topography and geological features. There are two predominant normal stresses acting on the sub-surface point are given by the following two equations (Hoek and Brown, 1980; Aydan and Kawamoto, 1997);
σ_v = 0.027H (in MPa) (1)k = (σ_H+σ_h)/2σ_v (2)
Where, σ_V, σ_H, σ_h, k and H are cover stress, major lateral stress, minor lateral stress, ratio of the lateral to cover stresses, and depth from surface. Fig.3 shows the variations of and with depth of mine workings.Practically, the measurement of in-situ stress in coal measure formation is a complex exercise, especially in Indian coalfields. A theoretical model of CSIR-CIMFR received good acceptance for this purpose and the equation for the mean horizontal stress (σh) provided by the model (Sheorey, 1994) is:
v βEGσh = ––––– yH – –––––– (H+1000)MPa (3) 1–v 1–v
where, ν is Poisson’s ratio, γ generic unit weight, β is co-efficient of linear thermal expansion, E is

MGMI Transactions Vol. 116, April '19 - March 2020 33
elastic modulus and G is geothermal gradient.
Fig.3. Depth vs. and k worldwide (Hoek and Brown, 1980)
But, this equation does not provide the direction of in-situ horizontal stress which is highly required to predict the ground stability. High value of in-situ stresses at deeper cover destabilizes the roof and pillars in and around an underground openings. Spalling of pillars and failure of roof/floor strata are two commonly observed phenomena under high-stress conditions of the underground. The effects of in-situ stresses including horizontal stress are essential to design and control the underground excavations.
2.3. Rockmass behaviour at higher depth2.3.1. Rock mass strengthThe determination of the compressive strength, tensile strength, elastic modulus etc. of rock mass is a complex problem in designing underground mine. These properties are required to determine the ground convergence around mine excavations, assessment of pillar strength, and the degree of sporadic subsidence. Lab strength of coal or rock expressed by uniaxial compressive strength (UCS) may not be applied directly to the mine structures such as pillars because the corner stresses are uniaxial, the side’s biaxial and triaxial at the centre of the pillar. The in-situ strengths are usually less than the UCS due to the presence of geological discontinuity.
Fig.4. Variations of in-situ and lab strengths of the conducted tests with depth (Sheorey, 1994)

34 MGMI Transactions Vol. 116, April '19 - March 2020
This has been confirmed by CIMFR tests, which has been conducted extensive in-situ strength tests on 30cm coal cubes using Schmidt hammers and their corresponding laboratory strength of 2.5cm cubes (Sheorey, 1994). The Fig.4 illustrates that the in-situ and lab strengths of coal vary with depth. This variation observed because the zone of failed coal in a pillar increases with depth, while lab sample is unaffected by this effect due to smaller size.
2.3.2. Failure criteria under high stressThe two most widely applied strength criteria are Mohr-Coulomb and Hoek-Brown criteria (Brady and Brown, 2013) which are given as follows:
σ_1=σ_c+σ_3 (√1+μ2+μ)2 (4)
σ3σ_1=σ_3+σ_c (m––– +s)1/2 (5) σc
Where, σ1, σ3,σc, μ, m and are major principal stress, minor principal stress, compressive stress, co-efficient of internal friction, a constant which depend on the rock type and an another constant which depends on the extent to which the rock is fractured before , and are applied, respectively. It quite clear from Eq. (4) & Eq. (5) that they do not take into account the effect of ,on peak strength (Wagner, 2019). Also, Hoek-Brown criterion with constant can overestimate the strength of rock mass strength at low restraining stresses under tensile failure and underestimate at high restraining stresses under shear failures.
2.3.3. Rock mass failures Depth of cover is one of the major contributing aspects to the rock mass failure in the form of coal burst (Peng, 2008). Such outbursts of coal happen when the high-stress concentration surpasses the coal strength around the excavation. A study in USA has been seen that almost all bumps happened at depths more than 300m (Chase at al.,2002). It has been reported that the following five factors are important to cause bump/bursts
which are (i) Considerable large thickness of overburden, generally, more than 300m, (ii) Structurally strong coal, (iii) Massive, strong and stiff roof strata, (iv) Competent floor not easily subjected to heaving and (v) The mining method causing development of high value of stresses (Couch and Fairhust, 1975). A CSIR-CIMFR study found that the coal bump/rock burst is a major hazard during underground coal mining at greater depth and the Dishergarh coal seam of Chinakuri Mine in Raniganj Coalfield is one of the most bump/burst susceptible seams in the country (CMRI report, 1994).
2.4. Control of rock failuresIn deep mines, rock failures around excavation are inevitable due to high stresses. Therefore, the key geomechanical challenge is to control such rock failures during the excavations. This is realized by several types of external supports and rock reinforcement using rock bolting. As discussed in previous section, deep excavation constantly prone to dynamic failures of the exposed rock mass. Therefore, support systems must be able to clamp the broken rock integrated, activate frictional resistance in the fractured region, restrict deformation after failure, and yield under high stress and seismic loading environments (Wagner, 2019). Integrated support system consisting of bolts/cables, wire-mesh, and steel-rope lacing meets the functional support requirements and can be applied at greater depth. The cone-bolts/D-bolts are yielding bolts and perform well under high stress and rock-burst conditions (Li et al., 2014).
3.0. Mining method challenges at higher depthIn conventional methods of development and subsequent depillaring, the percentage of extraction is low, and becomes even lesser as the depth of cover increases, due to regulatory restrictions. Moreover, as described above, the risks of coal burst, spalling, collapse, and squeezing during extraction are high due to induced stresses. Therefore, to restrict the risk

MGMI Transactions Vol. 116, April '19 - March 2020 35 35 MGMI Transactions Vol. 116, April '19 - March 2020
of violent coal burst in depillaring, an extensive research done in USA which recommended that pillar extraction may be done with well-designed barrier-pillars at depth more than 300m and it should not be done beyond 600m depth (NIOSH, 2010). In other words, longwall is the potential candidate of mining method to extract coal at depth greater than 300m. However, the high depth cover poses several challenges to manage the stability of the face and gateroads. 3.1. Prediction of roof weighting during longwall retreatUnderstanding the roof weighting behaviour is crucial for adequate support capacity, successful strata control, and safe operation at a longwall face. One of the important parameters of weighting behaviour is the span of roof weightings and it depends mainly on the cavability of roof rock layers exposed due to face progress. Estimation of roof weighting span depends mainly on the lithology of the overlying strata which varies significantly within a mine property. Though there are several models have been proposed in literature worldwide, no explicit mathematical relationships exist between lithology and geomechanical properties of the overlying roof rocks and spans of the weightings. The prediction of roof weighting is crucial for the safety of the face. However, the prediction by established model often does matches with the field measurement as given in Table 2.
Table 2: Prediction of roof weightings in Jhanjra RVI seam
Method Main fall Periodic fallObert, 1967 57 m 15 mSarkar, 1998 61.7 m Not available
Field measurement, CIMFR, 2018
Panel-2, 71m
Panel-2, 18m
3.2. Gateroads stability issues in a deep longwall mine At greater depth, tailgates of the longwall extraction panel are subject high stresses due to
abutment of mined out zone. Because tailgate roads are essential for ventilation network, the efforts are made to make it stable and open for return airflow. As shown in Fig.5, the stress on the chain pillar side can be grouped into zones-I, II, III, and IV for de-stressed yield, over-stressed plastic, over-stressed elastic, and pre-mining vertical stress respectively (Suchowerska, 2013).
Fig.5. Side stress profile in longwall panel (Suchowerska, 2013).
The parameters, k, H and γ are stress concentration factor, depth, and unit weight of overburden strata respectively. Most of the gateroads in conventional longwall mines are situated either in zone-II or zone-III by leaving chain pillars on goaf side and in between them. In other words, stability of gateroads is challenging due to over-stressed zone. In a case study, as shown in Fig.6, the monitoring of gateroads of Adriyala Longwall Project (ALP) have been done in Panel-1 and Panel-2. The depth of Panel-1 ranges from 362m to 457m and that of Panel-2 from 420m to 506m.
Fig.6. The extraction panels of Adriyala Longwall Project (Reddy, 2017)

36 MGMI Transactions Vol. 116, April '19 - March 2020MGMI Transactions Vol. 116, April '19 - March 2020 36
The lengths of Panel-1 and Panel-2 are 2320m and 2232m, respectively. The face width and extraction height are 250m and 3.5m. The panel has been developed in No.1 seam with average thickness of 6.5m.
Fig.7. Maximum cumulative convergence in tailgate (TG1) of Adriyala Longwall Panel-1
Fig.8. Maximum cumulative convergence in tailgate (TG2) of Adriyala Longwall Panel-2
Fig.7 and Fig.8 illustrate the measured convergence records of the roof in tailgates of Panel-1 and Panel-2 which clearly indicates the abutment in tailgate of Panel-1 is lower than that of Panel-2. This validates that the extraction of Panel-1 leads to the superimposition of the abutment of Panel-1 and Panel-2 which destabilized the roof in tailgates. This trend is going to be observed certainly in the tailgates of the Panel-3 and so on at deeper level. This trend challenges to design innovative longwall panels to avoid the failures of gateroads due to high depth of cover and extract coal safely in deep mine.
4.0. Emerging methods of deep coal miningThe methods of coal extraction must be
economically viable and safely executable at deeper horizons. Worldwide, several efforts were made to tackle the issues of geomechanics and mining methods encountered in deep coal mines. The Table 3 presents the summary of emerging methods of mining reported in literatures.
Table 3: Emerging methods of coal mining at higher depth (>300m)
Met
hods Technolo-
giesDeposits
characteris-tics
Remarks
Mec
hani
zed
depi
llari
ng
Enhanced pillar
extraction (Sleeman, 1993; Ran-dall et al.,
2013)
Flat and inclined Thickness (2m-6m) Depth (300-600m)
Low invest-ment Moderate % of extraction Complex ground control Competent roof and floor
Innovative longwall system
(Wang et al, 2017; Naz-imko, 1994; Tao et al.,
2018)
Flat and inclined Thickness (0.8m-20m) Depth (300-1000m)
High invest-ment High % of extraction Easier ground control Good/poor roof to good floor
TBM
bas
ed fl
uidi
zed
min
ing In-situ
energy conversion (Xie et al.,
2017)
Flat, incline, and steep Moder-ately thick Depth (>600m)
High invest-ment High % of extraction Easy ground control Any roof and ground floor Eco-friendly
In this paper, some of the emerging longwall methods are presented for potential application in extracting deeper deposits of coal in Indian coalfields by localizing the elements of these

MGMI Transactions Vol. 116, April '19 - March 2020 37
methods. These innovative methods have been proposed to eliminate the stability issues of gateroads taking into account of the stress distribution around the extraction panel, as shown in Fig.6 (Suchowerska et al., 2013). The emerging methods of longwall are being developed either by placing gateroads in the de-stressed zone (Wang et al., 2017) or by eliminating the stressed zone using pillarless barriers (Nazimko, 2017; Tao et al., 2018). These innovative methods are outlined below with potential applicability in Indian geomining conditions.
4.1. Novel layout of gateroads in modified longwall methodThe innovative layout of Longwall Mining with Split-level Gate roads (LMSG) has been proposed for controlling the ground problems in gateroads at deeper horizon (Wang et al., 2017). Though this method has been primarily developed for Longwall Top Coal Caving (LTCC), it can be applied for the medium-thick seam also after customization. Fig.9 illustrates the layouts of conventional and LMSG method.
Fig.9. Typical LMSG top coal caving (Wang et al., 2017)
As shown in bottom of Fig.9, 1 & 2 indicate the tailgate & headgate of the current panel whereas 3, 4, and 5 indicate tailgate of the next adjacent panel, headgate of the previous panel, triangular coal pillar lost. In this method, the gate roads are placed on the side of the panel (Wang et al., 2017). The advantage of LMSG method is that it
significantly improves ground control issues in development galleries during extraction of deep coal deposits under high stress. This method reduces the chances of coal burst in the entries due to absence of chain pillars. The LMSG concept may be further refined for Indian geomining conditions to mine out coal from deep-seated deposits to minimize the ground problems.
4.2. Gateroads development by directional pre-splitting roof cutting and supportsTo eliminate the stability issues of gateroads in conventional longwall mining, Roof cut short-arm beam theory (RSBT), has been suggested to eliminate the need of chain pillars (Tao et al., 2018). In this method, first, the overburden pressure is harnessed to drive down the exposed overlying strata, B, instead of resistance by overlying main roof, A, above chain coal pillars; second, the caved strata forms a sidewall of the tail-gate roadway; and third, the bulking properties of caved roof rock is utilized to reduce the surface subsidence.
Fig.10. Schematic of RSBT method (Tao et al., 2018)
This method will decrease gateway development up to 50% in comparison to that of conventional longwall panel and recovers 100% coal pillars, which significantly reduces mining costs and risks in gate-roadways. This approach can be very useful in longwall extraction under massive strata at greater depths. The weighting will also reduce drastically, as the roof rocks in goaf will be brought down regularly by cutting off the main roof regularly.
5.0. DiscussionCoal extraction from deep-seated coal extraction
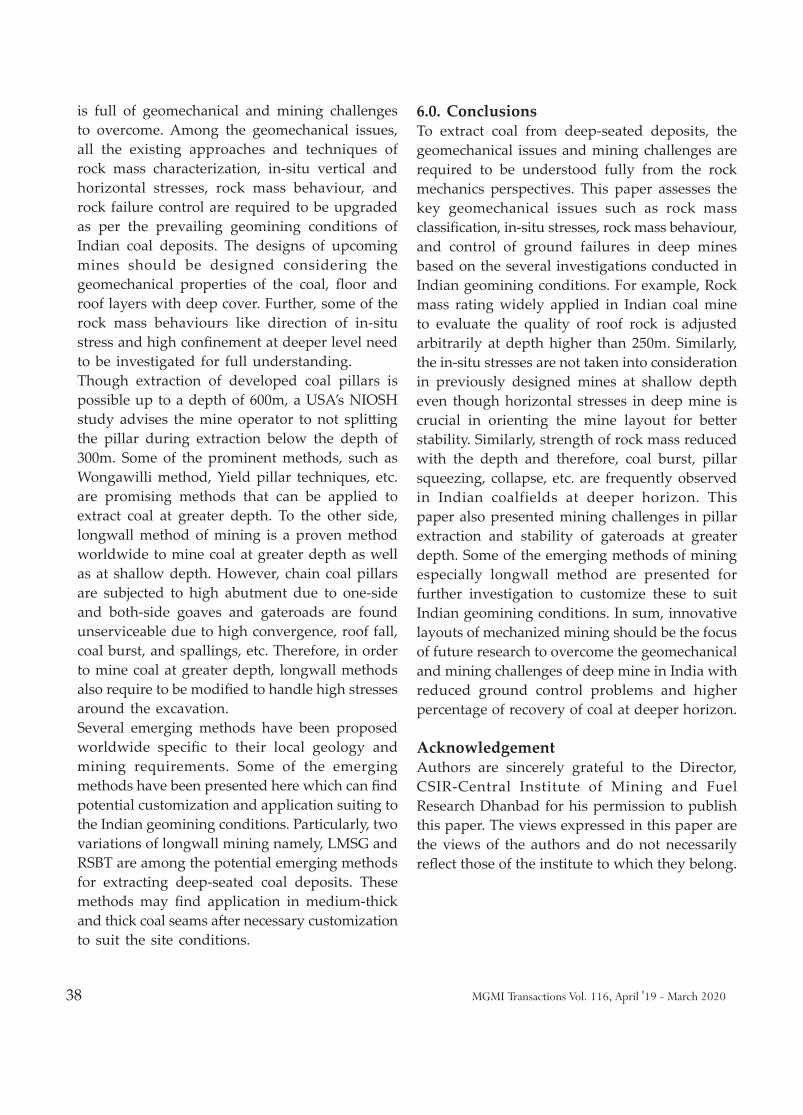
38 MGMI Transactions Vol. 116, April '19 - March 2020
is full of geomechanical and mining challenges to overcome. Among the geomechanical issues, all the existing approaches and techniques of rock mass characterization, in-situ vertical and horizontal stresses, rock mass behaviour, and rock failure control are required to be upgraded as per the prevailing geomining conditions of Indian coal deposits. The designs of upcoming mines should be designed considering the geomechanical properties of the coal, floor and roof layers with deep cover. Further, some of the rock mass behaviours like direction of in-situ stress and high confinement at deeper level need to be investigated for full understanding.Though extraction of developed coal pillars is possible up to a depth of 600m, a USA’s NIOSH study advises the mine operator to not splitting the pillar during extraction below the depth of 300m. Some of the prominent methods, such as Wongawilli method, Yield pillar techniques, etc. are promising methods that can be applied to extract coal at greater depth. To the other side, longwall method of mining is a proven method worldwide to mine coal at greater depth as well as at shallow depth. However, chain coal pillars are subjected to high abutment due to one-side and both-side goaves and gateroads are found unserviceable due to high convergence, roof fall, coal burst, and spallings, etc. Therefore, in order to mine coal at greater depth, longwall methods also require to be modified to handle high stresses around the excavation.Several emerging methods have been proposed worldwide specific to their local geology and mining requirements. Some of the emerging methods have been presented here which can find potential customization and application suiting to the Indian geomining conditions. Particularly, two variations of longwall mining namely, LMSG and RSBT are among the potential emerging methods for extracting deep-seated coal deposits. These methods may find application in medium-thick and thick coal seams after necessary customization to suit the site conditions.
6.0. ConclusionsTo extract coal from deep-seated deposits, the geomechanical issues and mining challenges are required to be understood fully from the rock mechanics perspectives. This paper assesses the key geomechanical issues such as rock mass classification, in-situ stresses, rock mass behaviour, and control of ground failures in deep mines based on the several investigations conducted in Indian geomining conditions. For example, Rock mass rating widely applied in Indian coal mine to evaluate the quality of roof rock is adjusted arbitrarily at depth higher than 250m. Similarly, the in-situ stresses are not taken into consideration in previously designed mines at shallow depth even though horizontal stresses in deep mine is crucial in orienting the mine layout for better stability. Similarly, strength of rock mass reduced with the depth and therefore, coal burst, pillar squeezing, collapse, etc. are frequently observed in Indian coalfields at deeper horizon. This paper also presented mining challenges in pillar extraction and stability of gateroads at greater depth. Some of the emerging methods of mining especially longwall method are presented for further investigation to customize these to suit Indian geomining conditions. In sum, innovative layouts of mechanized mining should be the focus of future research to overcome the geomechanical and mining challenges of deep mine in India with reduced ground control problems and higher percentage of recovery of coal at deeper horizon.
AcknowledgementAuthors are sincerely grateful to the Director, CSIR-Central Institute of Mining and Fuel Research Dhanbad for his permission to publish this paper. The views expressed in this paper are the views of the authors and do not necessarily reflect those of the institute to which they belong.

MGMI Transactions Vol. 116, April '19 - March 2020 39
References1. Coal Controller Organization. (2017-18). Provisional
coal statistics. CCO, India. 2. Central Mine Planning and Design Institute. (2018).
Inventory of Indian coal inventory, CMPDI, India.3. Deshmukh, D. J. (1987). Elements of mining
technology (vol. 1). 5th edition, Vidya Sewa Prakashan, Nagpur, India.
4. Singh R., Singh A. K., Mandal P. K., and Kumar R. (2006). Measurement and analysis of mining induced stress for strata control during underground coal mining. In: Proc. First Asian Mining Congress, January 16-18 January, Organised by MGMI of India, Kolkata, 105-112.
5. Chase, F. C., Mark, C., & Heasley, K. A. (2002). Deep cover pillar extraction in the USA In: Proceedings of the 21 st international conference ground control in mining. Morgantown WV USA, 28-29.
6. Mark C., Karabin G., Zelanko J. C., Hoch M. T. and Chase F. (2002). Evaluation of pillar recovery in southern West Virginia. International Conference on Ground Control in Mining, Morgantown, WV, USA.
7. Fairhurst, C. (2017). Some challenges of deep mining. Engineering, 3(4), 527-537.
8. Brown, E. T. (2012). Progress and challenges in some areas of deep mining. Mining Technology, 121(4), 177-191.
9. Ranjith, P. G., Zhao, J., Ju, M., De Silva, R. V., Rathnaweera, T. D., & Bandara, A. K. (2017). Opportunities and challenges in deep mining: a brief review. Engineering, 3(4), 546-551.
10. Wagner, H. (2019). Deep Mining: A Rock Engineering Challenge. Rock Mechanics and Rock Engineering, 52(5), 1417-1446.
11. Singh, R., Mandal, P. K., Singh, A. K., Kumar, R., & Sinha, A. (2011). Coal pillar extraction at deep cover: with special reference to Indian coalfields. International Journal of Coal Geology, 86(2-3), 276-288.
12. Singh, R., Kumar, A., Kumar, R., Singh, A. K., & Singh, A. K. (2017). Underground mining of deep seated thick coal seams: An analysis from rock mechanics prospective. NexGen Technologies for
Mining and Fuel Industries (Volume I and II), 433.13. Terzaghi, K. (1946). Rock Defects and Load on
Tunnel Supports. Rock Tunneling with Steel Supports, RV Proctor and TL White.
14. Bieniawski, Z. T. (1989). Engineering rock mass classifications: a complete manual for engineers and geologists in mining, civil, and petroleum engineering. John Wiley & Sons.
15. Venkateswarlu, V., Ghose, A. K., & Raju, N. M. (1989). Rock-mass classification for design of roof supports—a statistical evaluation of parameters. Mining Science and Technology, 8(2), 97-107.
16. Hoek, E., & Brown, E. T. (1980). Underground excavations in rock. CRC Press.
17. Aydan, Ö. and T. Kawamoto (1997). The general characteristics of the stress state in the various parts of the earth’s crust. Int. Symp. Rock Stress, Kumamoto, 369-373.
18. Sheorey, P. R. (1994, February). A theory for in situ stresses in isotropic and transverseley isotropic rock. In International journal of rock mechanics and mining sciences & geomechanics abstracts (Vol. 31, No. 1, pp. 23-34). Pergamon.
19. Brady, B. H., & Brown, E. T. (2013). Rock mechanics: for underground mining. Springer science & business media.
20. Peng, S. S. (2008). Coal mine ground control. 21. Crouch, S. L., & Fairhurst, C. (1975). Mechanics of
coal mine bumps: 12F, 15R. TRANS. SOC. MIN. ENGR. AIME, V256, 4, DEC. 1974, P317–P323
22. CMRI Report. (1994). A study of bump proneness of Indian coal seams and measures to alleviate the bump hazard. Coal S&T Grand-in-Aid Project Report, Central Mining Research Institute, Dhanbad, 124 pages.
23. Li, C. C., Stjern, G., & Myrvang, A. (2014). A review on the performance of conventional and energy-absorbing rockbolts. Journal of Rock Mechanics and Geotechnical Engineering, 6(4), 315-327.56–3327
24. NIOSH. (2010). Research report on the coal pillar recovery under deep cover (pp.82).
25. Obert, L., & Duvall, W. I. (1967). Rock mechanics and the design of structures in rock (No. BOOK). J. Wiley.

40 MGMI Transactions Vol. 116, April '19 - March 2020
26. Sarkar, S. K. (1998). Mechanised longwall mining: the Indian experiences. Oxford & IBH Publ..
27. CIMFR report. (2018). Strata and Support Behaviour Investigation of Longwall Panel 2 in R VI seam of Jhanjra Project.
28. Suchowerska, A. M., Merifield, R. S., & Carter, J. P. (2013). Vertical stress changes in multi-seam mining under supercritical longwall panels. International Journal of Rock Mechanics and Mining Sciences, 61, 306-320.
29. Reddy, B. V., Rao, K. N., Sridhar, K., Srikanth, K.. (2017). Strata control issues during development and retreat of high capacity longwall face at Adriyala Longwall Project, SCCL. DGMS workshop on strata monitoring in longwall workings, Dhanbad.
30. Sleeman, J. (1993). Bord and pillar methods. In A. J. Hargraves & C. H. Martin (Eds.), Australasian coal mining practice (Vol. 21, pp. 329–358). Melbourne: AusIMM.
31. Randall, P; Syrel, B; Stadie, U; Lubosik, Z; Swanson, J-G; Bigby, D; Prusek, S; Kent, L;
Moore, D; Scior, C; te Kook, J; Schunck, B. (2013). Improved extraction ratios for deep coal mines (IMPREX). Directorate-General for Research and Innovation (European Commission).
32. Wang, P., Zhao, J., Chugh, Y., & Wang, Z. (2017). A novel longwall mining layout approach for extraction of deep coal deposits. Minerals, 7(4), 60.
33. Nazimko, V. V. (1994, August). Pillarless longwall mining for multiple seams. In Proceedings of the 13th International Conference on Ground Control in Mining, Morgantown, WV, USA (pp. 2-4).
34. Tao, Z., Song, Z., He, M., Meng, Z., & Pang, S. (2018). Principles of the roof cut short-arm beam mining method (110 method) and its mining-induced stress distribution. International Journal of Mining Science and Technology, 28(3), 391-396.
35. Xie, H., Ju, Y., Gao, F., Gao, M., & Zhang, R. (2017). Groundbreaking theoretical and technical conceptualization of fluidized mining of deep underground solid mineral resources. Tunnelling and Underground Space Technology, 67, 68-70.

MGMI Transactions Vol. 116, April '19 - March 2020 41
1. IntroductionIndia is the country which mainly depends on coal for the generation of electricity and steel. Standing committee on coal observed that due to the absence of vision document, department of coal was not in a position to plan for future demand of coal. Therefore, the committee expressed concern to have a vision document for coal for next 20-25 year.The outcome was “Coal Vision 2025” which indicates that the growth of coal demand until 2025 is expected to be 5.04% with 7% GDP growth scenario, and 5.62% with 8% GDP growth scenario (Source: Report of the Working Group on Occupational Safety and Health for the 12th Five Year Plan). According to this vision document,
the coal demand would increase to 1147 MT with 7% GDP growth and to 1267 MT with 8% GDP growth. Coal production is thus projected to rise to 1086 MT – with opencast mining contribution of 902 MT (83%) and remaining 184 MT (17%) from underground workings.Extraction of coal from underground workings creates voids, which are to be filled with stowing material like sand to avoid subsidence and also for efficient extraction of coal. The stowed sand in the voids gets consolidated and prevents the collapse of the roof of the workings and protects the surface structures from being affected due to subsidence.According to the Coal Mines Regulations, stowing of voids is mandatory, where surface structures
Munipala Manohar1, Suresh Kumar2, N.C. Karmakar3*
1. M. Tech. Scholar, Department of Mining Engineering2. Assistant Professor, Department of Civil Engineering3. Professor, Department of Mining Engineering, IIT(BHU), Varanasi – 221005* Corresponding Author ([email protected]; [email protected])
Bottom Ash Mixed with Plastic Waste as Stowing Material in Underground Coal Mines : A Feasibility Study
AbstractMostly sand is used as a stowing material in underground coal mines. As sand is becoming a scarce commodity, research is going on to find its alternative. The present work aims to use a mixture of bottom ash and plastic waste chips as the stowing material in underground mines to conserve the sand and also to find a solution to dispose of the bottom ash and plastic waste. Four types of samples have been prepared and tested for their properties. First one is bottom ash alone. Second, third, and fourth samples have been prepared out of bottom ash by mixing 10%, 20% and 30% plastic by weight respectively.For all the prepared samples, properties related to stowing material such as specific gravity, permeability, uniaxial compressive strength, cohesion, and angle of internal friction have been determined. The obtained results of plastic mixed bottom ash samples have been compared against only bottom ash sample to decide whether the addition of plastic with bottom ash has adequate properties for use as a stowing material.It is found that 10% plastic chips mixed with bottom ash substantially improves the compressive strength and cohesion of the mixture which is favorable for stowing material. Though permeability for this composition decreases to some extent, it still remains very close to the desirable limit.

42 MGMI Transactions Vol. 116, April '19 - March 2020
are required to be protected. Again, as per the Coal Conservation and Development Act (1974), mines which are backfilling the voids are provided with financial assistance by the Ministry of Coal. Table 1 gives some details of sand requirement and amount of money spent for stowing during three years 2012-13, 2013-14 and 2014-15 (Source: Ministry of Coal Annual Report 2014-15). But the total availability of sand for stowing from the existing as well as approved sand quarrying projects is inadequate to meet the present demand. Condition will be even worse in future due to the increased gap between demand and supply of sand.
Table 1: Details of sand requirement and amount fund spent
Parameters 2012-13 2013-142014-15 ( u p t o Dec’14)
Amount disbursed for stowing & protective work (in Rs. Crore)
119.00 184.96 185.00
No. of stowing mines 96 90 78
Volume of sand stowed (in Lakh m3)
61.22 61.80 66.55
Hence, it is the only way to open new sand quarries to meet the demand. But excessive sand mining may have the following impacts (i) hazardous impact on the ecological equilibrium, (ii) effect to in-stream biota and (iii) disturbance to the channel configuration and flow paths.About 60% of Indian electricity comes from thermal-based projects, which uses coal for the generation of heat. The by-product of thermal power plants is coal combustion residue, generally called as ash, which is classified into two types – fly ash (FA) and bottom ash (BA). As per the Report on ‘Fly Ash Generation at Coal/Lignite Based Thermal Power Stations and its Utilization in the Country for the Year 2014-15 the Central
Electricity Authority (CEA)’, from 145 installed thermal power plants in India consumed 549.72 MT of coal to produce 1,38,915 MW of electricity with 184.14 MT of fly ash generation, out of which 102.54 MT (55.69%) of fly ash was utilized for various purposes and the remaining dumped into ash ponds. The process of pumping ash into ponds requires a huge quantity of water, huge storage space, and also creates environmental problems.The other recent most threatening problem is disposal of plastics. As per the ‘Document on Solid and Liquid Resource Management, plastic waste management, draft implementation framework’, over 15,000 tonnes of plastic is produced daily in India of which more than 40% of plastic is disposed of unsafely Chlorinated plastic releases harmful chemicals to the surrounding soils and water, and this causes serious problems to the species which drink the contaminated water.Therefore, the objective of the paper is to determine the physical and mechanical properties of samples of the bottom ash (BA) mixed with various proportions of plastic and compare the results against the BA sample alone to check the suitability of plastic and BA mixture as stowing material.
2. Literature Review Anup Kumar Gupta and Biswajit Paul (2017) conducted a comparative analysis among the different materials like sand, pond ash, fly ash and overburden (OB) with parameters such as grain size distribution, permeability, and specific gravity to check their suitability as a stowing material in underground mine voids. R Shanmuga Priya and G Kalyan Kumar (2015) conducted experiments on OB material of Srirampur opencast mine for its suitability as stowing material. They conducted experiments on certain properties such as specific gravity, particle size distribution and permeability. Maha Hatem Nsaif (2013) conducted experiments on behavior of soils strengthened by plastic waste materials. They concluded that effect of plastic on

MGMI Transactions Vol. 116, April '19 - March 2020 43
soil is influenced by soil type and plastic waste content; addition of plastic does not increase the cohesion of soil but increase the angle of internal friction, and plastic decrease the maximum dry density and optimum moisture content. S. Gangadhara, et. al. (2016) conducted experiments on effect of addition of plastic waste on engineering properties of soil. They concluded that, due to the pseudo-cohesion, as the plastic content increases cohesion increases up to certain point and beyond that decreases, whereas angle of internal friction decreases to a certain point and beyond that it again increases. The load-bearing capacity of the sand bed had increased up to a certain level of addition of plastic and beyond that it again decreased.Herget and Korompay (1978) found that particle shape affects the size of the voids, permeability, cohesion, and angle of internal friction. Well graded soils show increase of strength by filling the voids between coarse particles with fine particles and increasing the inter-particle contact.
3. MaterialsThe materials used for the project are bottom ash (BA) and plastic chips. BA was collected from Singareni Collieries Company Limited (SCCL) captive thermal power plant at Jaipur village of Mancherial District of Telangana State. Plastic chips were collected from village scraps of Godavarikhani village. Fig.1 shows the collected samples of BA and plastic chips.
Fig 1: Bottom ash and plastic chips
4. Experimental WorkThe experimental work consists of preparing four types of samples of different proportions of BA and plastic chips. The first sample is BA alone (named as 100BA). The second sample is of 90% BA with 10% plastic (90BA+10P), the third sample is of 80%BA with 20% plastic (80BA+20P), and the fourth one 70% BA and 30% plastic (70BA+30P) all by weight. The samples have been tested for the stowing material properties as per Indian standards, such as Specific Gravity (IS-2720 part-3/sec-1)-1980, Permeability (IS-2720 part-17)-1986, Uniaxial Compressive Strength (UCS) (IS-2720 part-10)-1991, Cohesion, and Angle of Internal Friction (IS-2720 part-2)-1993. The results obtained for BA and plastic mixture have been compared against the BA alone.
5. Results All the tests have been performed on 3 samples and the mean values have been reported here.
5.1 Particle Size AnalysisThe experiment was conducted as per IS-2720 part-4 (1985).For size analysis of BA, 250 g of oven dried BA sample was taken. Sieving was done through a set of sieves using a mechanical shaker for 10 min. Material retained on each sieve was weighed. Table- 2 gives the size analysis of BA.
Table 2: Particle size analysis of BA
Particle size
Retained wt (g)
%Retained
wt
% Cum retained
wt%
finer
5.6mm 2.2 0.884 0.884 99.1164.0mm 1.8 0.723 1.607 98.3932.0mm 4.7 1.888 3.495 96.5051.0mm 10.5 4.219 7.714 92.286425 µ 17.3 6.951 14.664 85.336250 µ 33.4 13.419 28.083 71.917125 µ 102.8 41.302 69.385 30.61575 µ 32.6 13.098 82.482 17.518
F i n e s (<75µ) 43.6 17.517 99.960 0.040

44 MGMI Transactions Vol. 116, April '19 - March 2020
Using this table particle distribution curve was plotted. From this curve it is found that D60 = 0.2 mm (which means 60% of particles are finer than 0.2 mm and 40% particles are coarser than 0.2 mm). Likewise, D30 = 0.125 mm and D10 = 0.015 mm.Now, uniformity coefficient
D60 0.2Cu = ––––– = –––––– = 13.33 D10 0.015 and coefficient of curvature
(D30)2 (0.125) 2Cc= –––––––– = –––––––– = 5.21. D60×D10 0.2×0.015
Larger the Cu value more is the range of particles. Sand with Cu greater than 6 is considered as well graded. Cc for well-graded soil lies between 1 and 3 ( K. R. Arora, 2004). From the particle size analysis it can be calculated that BA sample has 3.5% gravel, 84% sand, 10% silt, and 2.5% clay. Therefore as per the textural classification, BA sample falls in the sand category.
5.2 Specific GravityTo study how the addition of plastic affects on the specific gravity of BA, the experimental work was carried on all the four samples. Specific gravity values of BA and BA plastic mixture of different proportions are shown in Table-3.
Table 3: Specific gravity of BA and plastic mixtures for different percentages of plastic
Plastic % Specific gravity
0 1.655
10 1.564
20 1.489
30 1.369
It is seen that addition of plastic has decreased the value of specific gravity for the mixture from 1.65 to 1.564, 1.489, and 1.369 with 0%, 10%, 20% and 30% proportions of the plastic respectively. The same results have been plotted in Fig.2 also for visual appreciation.
Fig 2: Specific gravity of BA and plastic mixtures for different percentages of plastic
5.3 Permeability To study how the addition of plastic affects on the permeability of BA, the experimental work has been carried on four samples and the results obtained are shown in Table-4.
Table 4: Permeability of the mixture for different percentages of plastic
Plastic % Coefficient of permeability (k) 10-3 cm/s
0 5.00910 2.37420 1.66230 2.284
Addition of plastic has reduced the permeability of the mixture up to 20%, and there is an increase in the permeability at 30% of plastic. The same results have been plotted in Fig.3 for visual appreciation.

MGMI Transactions Vol. 116, April '19 - March 2020 45
Fig 3: Permeability of mixture for different % of plastic
5.4 Uniaxial Compressive Strength (UCS) To study how the addition of plastic affects on the UCS of BA, the experimental work has been carried on the four samples and the results obtained are shown in Table-5.
Table 5: UCS of mixture for different percentages of plastic
Plastic % UCS (kPa)
0 21.58
10 32.37
20 22.56
30 24.53
Addition of plastic to the BA has increased the UCS value from 21.58 kPa to 32.5 kPa for 10% of plastic content, and then for 20 % plastic, the value has reduced to 22.56kPa, and then slight increase to 24.53 kPa for 30% plastic. Even though the UCS value has decreased for plastic content of more than 10%, the strength is higher than BA alone. The variation of UCS values has been shown in Fig.4.
Fig 4: Uniaxial compressive strength for different % of plastic
5.5 CohesionTo study how the addition of plastic affects on the cohesion of BA, the experimental work has been carried on four samples and the results obtained are given in Table-6.
Table 6: Cohesion of mixture for different percentages of plastic
Plastic % Cohesion (kPa)
0 58.85
10 102.99
20 49.04
30 9.81
Addition of plastic has increased the value of cohesion from 58.85 kPa to 102.99 kPa at 10% Plastic, and then the cohesion has decreased to 49.04 kPa at 20% plastic and farther to 9.81 kPa at 30% plastic. The trend of variation of cohesion with plastic content has been graphically depicted in Fig.5.

46 MGMI Transactions Vol. 116, April '19 - March 2020
Fig 5: Cohesion for different % of plastic
5.6 Angle of Internal Friction (ø)To study how the addition of plastic affects on the angle of internal friction of BA, the experimental work has been carried on four samples and the results obtained are shown in Table-7.
Table 7: Angle of Internal Friction for different percentages of plastic
Plastic % Angle of internal friction (ø)
0 33º
10 20º
20 30º
30 38º
Addition of plastic decreases the angle of internal friction from 33º at 0% plastic to 20º at 10% plastic. Thereafter it again increased to 30º at 20% plastic and to 38º at 30% plastic. Variation of angle of internal friction of the mixture with different plastic content is depicted in Fig.6.
Fig 6: Angle of Internal Friction for different % of plastic
6. Conclusions All the results of the experimental parameters have been comprehensively presented in Table-8.
Table 8: Showing all the results of the parameters for various plastic proportions
Propor-tion of
plastic ( %)
Spe-cific
grav-ity
Perme-ability (10-3 cm/s)
U.C.S(kPa)
Cohe-sion(kPa)
Angle of in-ternal
friction
0 1.655 5.01 21.58 58.85 33ο
10 1.564 2.375 32.37 103.0 20ο
20 1.489 1.66 22.56 49.04 30ο
30 1.369 2.284 24.53 9.81 38ο
The following are the conclusions of the experimental work done to assess the BA and plastic mixture as the stowing material.
Fraction of BA which has more or less similar size distribution as that of sand is currently being used as stowing material. So an attempt was made to assess the properties of BA for stowing when Plastic is mixed with. The result shows that at 10% plastic

MGMI Transactions Vol. 116, April '19 - March 2020 47
and 90% BA most of the strength properties are better than that of BA alone.
To improve upon the properties of BA for stowing purpose, shredded plastic has been mixed with it.
At 10% plastic mix, uniaxial compressive strength has increased from 21.58 kPa to 32.38 kPa, and the cohesion has increased from 58.86 kPa to 103.00 kPa. This is encouraging result for exploring BA and plastic mix for using as stowing material.
However, at 10% plastic mix, there is decrease in permeability from 5.01×10⁻⁵ m/s to 2.38×10⁻⁵ m/s. As per the literature, desirable permeability of OB/coal refuse should be of the order of 2.78×10⁻⁵ m/s to be used as stowing material. The permeability of 10% mix is almost close to the desired value.
References1. Anup Kumar Gupta and Biswajit Paul, Comparative
analysis of different materials to be used for backfilling in underground mine voids with a particular reference to hydraulic stowing, Int. J. Oil, Gas and Coal Technology, vol. 15, no. 4, 2017.
2. Fly Ash Generation at Coal/Lignite Based Thermal Power Stations and its Utilization in the Country for the Year 2014-15, Central Electricity Authority (CEA), New Delhi (2018).
3. Herget, G. and Korompay, V., In-situ drainage properties of hydraulic backfills, Proc. Mining and Backfill, Research and Innovations, CIM, v.19 (1978), pp. 117-123.
4. Indian Standard methods of test for soils part 4 Grain Size Analysis IS-2720 (Part 4) – 1985.
5. Indian standard methods of test for soils part iii determination of Specific Gravity Section 1 Fine Grained Soils IS 2720 (Part III/SEC-1) – 1980
6. Indian standard methods of test for soils laboratory Determination of Permeability, IS 2720 (part 17)-1986.
7. Indian Standard method of test for soils part 10 determination of Unconfined Compressive Strength IS-2720 (Part 10): 1991.
8. Indian Standard methods of test for soils part 11 determination of the shear strength parameters of a specimen tested in Unconsolidated Undrained Triaxial Compression IS-2720 (Part II) : 1993.
9. K. R. Arora, Soil mechanics and foundation engineering, published by Standard Publishers and Distributers (2004), pp. 58-59.
10. Maha Hatem Nsaif, Behavior of Soils Strengthened By Plastic Waste Materials, Journal of Engineering and Development, vol. 17, no.4, ISSN 1813-7822 (October 2013).
11. Ministry of Coal Annual Report 2014-15, chapter-11, Conservation and Development of Transport Infrastructure (https://coal.nic.in/content/ annual-report-2014-15; accessed on 30 Aug. 2019)
12. R. Shanmuga Priya and G. Kalyan Kumar, Geotechnical Aspects of Overburden Materials for Stowing in Underground Coal Mines, Int. J. of Engineering Research & Technology (IJERT) ISSN: 2278-0181 Published by, www.ijert.org , RACEE - 2015 Conference Proceedings.
13. Report of the Working Group on Occupational Safety and Health for the 12th Five Year Plan (2012 to 2017), Chapter 3.1.5: Growth in Coal sector, Government of India, Ministry of Labour and Employment (2011), p.17.
14. S. Gangadhara, Vivek. S, Ranganath, Effect of addition of plastic waste on engineering properties of soil, International Research Journal of Engineering and Technology (IRJET) E-ISSN: 2395-0056, vol. 03, Issue: 11 (Nov. 2016).
15. Solid and Liquid Resource Management, Plastic waste Management a Document (http://ifca.net.in /pdf/Resource_book_Plastic_Waste_Management.pdf; accessed on 30 Aug. 2019.

48 MGMI Transactions Vol. 116, April '19 - March 2020
1.0 Introduction An integrated steel plant operates from the beneficiation process of run-of-mines to finished steel products of various grades for varied application through numerous steps. [1] The different units amongst them includes sintering unit, blast furnace unit, steel making unit like LD, manufacturing units like continuous caster, rolling, forging etc. [2-3] There is significant potential for growth given the low per capita steel consumption of 61 kg in India as compared to world average of 208 kg. [4] BF-BOF (Blast Furnace-Basic Oxygen Furnace) route is the main production process route of steel with a combined capacity around 50mt. the main feed for Blast Furnace is sinter which is being produced from
sinter plant. [5] If we can increase the productivity of sinter plant, the total steel production will increase. The productivity of one particular unit is affected by different parameters which in turn affect the productivity of succeeding shops and thus the overall productivity of integrated steel plant. [6] However, little research has been done to understand and ascertain the complex interlinkage amongst the different parameters with productivity of operational units. In this research paper, the operation unit chosen is the sinter plant. Sintering is a process of agglomerating iron ore fines into a porous mass by incipient fusion caused by combustion within the mass of the ore fine particles [7]. Depending on the chemical composition of the raw materials a wide
Arghya Majumder1*, Chanchal Biswas1, Saugata Dhar2, G.C. Das2
1. School of Mines and Metallurgy, Kazi Nazrul University, Asansol-713340, India2. Department Metallurgical and Material Engineering, Jadavpur University, Kolkata-700032, India* Corresponding author’s e-mail: [email protected] Corresponding author’s telephone number: +917893024057
Optimization of Process Parameters to Achieve Better Mechanical Properties and Higher Productivity in Sinter Plant
AbstractNow a day’s an effective process management system is essential for the sustainability of integrated steel plant. Their effective process enhances quality of product and increases the cost efficiency. The sinter mineralogy mainly depends on the nature of the raw material, its mix proportion, size, chemical composition and process parameter. The main objective of this study is to optimize the sinter plant process parameters to get the best productivity of Sinter Plant. The influence of those parameters on the phase transformations which are visualized through microstructures will be examined and further correlated with the sinter plant productivity. The characterization of sinter will be carried out to achieve optimum mechanical properties. An attempt has been made to correlate the sinter plant process parameters with required mechanical properties and microstructure to get a higher productivity with the help of ANN and Genetic Algorithm. Finally, an effort has been made to correlate the microstructure with the mechanical properties of sinters. Keyword: Sinter Plant Productivity, mechanical properties of sinter, Microstructure, Genetic Algorithm

MGMI Transactions Vol. 116, April '19 - March 2020 49
variety of minerals can be observed in the final sinter. These sinters are considered as multiphase materials, with heterogeneous microstructure. The main mineral phases are hematite, magnetite, SFCA and silicates. Quality of sinter indicates by mechanical properties such as shatter, abrasion, tumbler index and metallurgical properties like reduction degradation index, reducibility index, porosity etc. The metallurgical properties of an ore depend on the mineralogy, textural characteristics and also the pore size. The iron ores contain many impurities. They are chemically bonded or finely inter grown which makes their separation by physical beneficiation very difficult. The nature of gangue, specifically their quantity and distribution of alumina bearing minerals is also vital [8-9]. The same authors reported that the increase in open porosity improves the reducibility of the sinter and demonstrated that SFCA stabilizes fine porosity. Therefore, a sinter with good reducibility may be one with a large amount of acicular SFCA and amount of columnar and blocky SFCA. This structure has no cracks and no large pores, which improves the cold strength. But, the decrease in reduction degradation is related to the concentration of skeletal hematite [10-13]. In turn, high basicity, SiO2content, Al2O3/SiO2 ratio as well as temperature, oxygen potential and the composition of the raw materials influence the SFCA phase [10, 13]. The quality of sinter is therefore determined by the properties of the individual phases and the interaction between them [14, 15]. The sintering bed can be modelled as an unsteady one-dimensional process of the solid materials with multiple solid phases. Numerical simulations of the various conditions in iron ore sintering bed can be carried out for various parameters: coke contents and air suction rates, along with some other parameters of the model. A transient 1-dimensional model, which considers multiple solid phases, can be used for the iron ore sintering process based on the assumption of porous media. Complicated modes of heat transfer in the bed can also be considered in detail.
The sinter beds structural changes can also be estimated based on the assumption that decrease in the bed height occurs due to the decrease of the particle sizes, which results from the surface reactions [16-17]. Several different approaches have been used to develop mathematical models simulating the iron ore sintering process. Usually such models describe the heat and mass transfer, drying and condensation of water, gas flow, coke combustion, and charge melting and solidification phenomena that occur during the process. Such modelling enables calculation of different parameters inside the bed like composition, solid and gas temperature, and porosity. These models are very good for understanding the underlying mechanisms of the process and in prediction of the bed behaviour [18].The basic purpose of this work is to correlate the productivity of sinter with the parameters affecting the productivity, based on the huge set of industrial data collected over 12 years at VSP. Utilization of these data in a meaningful way through is applied by Artificial Neural Networking (ANN). Design of an artificial neural networking (ANN) involving 66 parameters followed by training and testing of neural network. The goodness of the prediction is to be tested by RMSD (Root Means Square Deviation). Obviously in this exercise, human bias and error may creep in. Logically one should choose mathematical process to get rid of this biasness. With this objective genetic algorithm (GA) has been made use of to reduce the number of variables from 34 if possible and arrange the variables in order of importance. The mechanical properties of the sinter are important as a feed to the Blast Furnace. The mechanical properties both high temperature and low temperature must satisfy certain minimum values. The mechanical properties of the sinter produced by using the number of parameters optimized by ANN-GA combination used under objective (c), will be calculated to see the values are within the accepted limits or not. From metallurgical point of view, structure property correlation is more basic.

50 MGMI Transactions Vol. 116, April '19 - March 2020
Finally an attempt would be made to correlate the microstructure with the mechanical properties of sinters.
2.0 MethodologyA detailed study has been done on the functioning of the sinter plant and the parameters which control the productivity of the sinter plant are identified, exhaustively. The number of parameters is 66. The data containing the controlling parameters for the sinter plant productivity are collected for about 12 years. The guiding parameters are tabulated against productivity for every sintering run. The tabulated data are feed to a MATLAB program to implement the Artificial Neural Networking (ANN) which mimics the human brain using the generalized regression model. The ANN works through the optimized weight values. The method by which the optimized weight values are attained is called learning. The training is carried out by sequentially feeding the input data. The learning is complete when there is no significant change in the weighted factors i.e. the best possible synaptic connection among the patters is reached. The algorithm is used in the generalized regression model. The input variables are organized in a single excel sheet naming “InputFileParametesValue.xlsx” in a columnar fashion one after another forming a table of which columns being parameters of one pattern and rows are number of observations taken for each parameter. Thus, a matrix of (n x m) is formed where ‘n’ being the no of parameters and ‘m’ is being the no of observations. After that, the trained neural network, with the updated optimal weights, is able to produce the output within desired accuracy corresponding to an input pattern. This trained ANN is used to predict the output and compared with the observed value, for a set of input data and the goodness of prediction is judged by calculating the RMSD values. By using metallurgical knowledge and working experience in the sintering plane, the number of variables has been reduced to 34 from 66 variables. Importance and effect of these parameters on
the productivity of sinter have analyzed using ANN. Thereafter, the revised network formed can predict the outcome beforehand with some legitimate error duly considered. An unbiased genetic algorithm (GA) has been used to find still reduced number of variables and to arrange them in order of importance. Now once the list of optimized parameters is decoded from its binary combination, the system process parameter set is now optimized. To have their sensitivity analysis, the error occurrence is noted once only one parameter is taken to form the ANN and rest is kept unchanged to realize if it were a one-on-one relation process. The lowest the error gives by its inclusion in the architecture of ANN, is essentially the most sensitive parameters towards this particular system in operation. To evaluate its percentage contribution towards the sensitivity, error percentage analysis is done for all the optimized no of parameters. Lower the error percentage higher is its percentage contribution. Now, the sinter produced with the optimised parameters is also subjected to high temperature like RDI, RI and room temperature like TI and AI test. The sinter chosen corresponds to the highest yield obtained industrially. The microstructure of that particular sinter is taken. The phases present in that sinter are viewed because properties of iron ore sinter are controlled by the composition and the distribution of the mineral phases present in it. The top three (3) parameters predicted by GA have been sequentially changed one at a time with ± 10 %. For each changed set of sinters RDI, RI, TI and AI tests are performed. The microstructures of each such sinter are viewed. A comparison study of the all the results is done. The percentages of all phases present in all the sinters are measured and a comparison study is made. From those results correlation of the mechanical properties, microstructure with the sinter plant productivity is established.
3.0 Results and Discursions3.1 Characterization of Raw Materials3.1.1 XRF Analysis of Iron Ore

MGMI Transactions Vol. 116, April '19 - March 2020 51
Wave length dispersive x-ray fluorescence (WDXRF; PAN Analytical) has been performed for the characterization of hematite ore and
is depicted in Table 1. The composition of the collected ore has been found to be 64.39 wt% of Fe (Total), 4.02 wt% of SiO2 and 2.26 wt% of Al2O3.
Element/Compound Fe(T) SiO2 Al2O3 TiO2 MnO MgO CaO Na2O P2O5 S K2O
Concentration (%) 64.39 4.02 2.26 0.18 0.06 0.25 0.39 0.02 0.09 0.1 <0.01
Table 1: WDXRF Analysis of hematite ore
3.1.2 Analysis of Coke DustCoke dust collected from the coke oven by product plant (COBP) of the Rashtriya Ispat Nigam Ltd. (RINL), India has been used as reductant for the
present experiments. Standard proximate as well as ultimate analyses (Leco TruSpec) are carried out for the determination of composition of coke dust and are tabulated in Table 2.
Proximate Analysis Ultimate AnalysisFixed
carbon (%)Volatile
matter (%)Moisture
(%) Ash (%) Carbon (%)
Hydrogen (%)
Nitrogen (%)
Coke dust 79.46 4.01 0.53 16 87.5 0.065 1.351
Table 2: Proximate and Ultimate analysis of coke dust
3.1.3 Analysis of Lime A lime flux consisting of quicklime or a blend of quicklime and dolomite lime is added. The total flux amount varies from 110 to 264Kg per ton of steel, and up to 50% of that may be dolomite lime. The composition of the lime, which is used as a flux in smelting of the reduced samples are given Table 3. Lime is obtained from Rashtriya Ispat Nigam Ltd. (RINL), India.
Typical constituents ContentsAcid Insoluble Matter 2.00%SiO2 1.00%Alumina 0.10%Fe 0.25%CaO 74.00% (Available lime
as Calcium Oxide – 70%MgO 0.60%Carbon Dioxide 0.80%Mn 0.01%Moisture 0.30%Calcium Carbonate (CaCO3)
1.8%
Calcium Hydroxide [Ca(OH)2]
95.00%
Sieve Analysis:Minus 300 to Plus 212 0.00%Minus 212 to Plus 150 0.80%Minus 150 to Plus 75 1.90%Minus 75 to Plus 45 2.00%Minus 45 95.30%
Table 3: Chemical composition of lime
3.1.4 XRF Analysis of Product SinterHematite ore (below 6 mm size) is used for sinter making. Sinter has been collected from Sinter Plant, Rashtriya Ispat Nigam Ltd. (RINL), India. The composition of sinter is analyzed by using x-ray Flouroscence (WDXRF, PanAlytical) and shown in Table 4.

52 MGMI Transactions Vol. 116, April '19 - March 2020
Details of Parameters
Iron
Ore
Fin
es (
%) Total Fe
Proc
ess
Va
riab
le
Green Mix Moisture (%)
% o
f Li
me
CaOSiO2 Sinter Return used (%) MgOAl2O3 Machine Speed (m/min) SiO2
LOI Vacuum (mm WC) Al2O3
Moisture
Raw
Mat
eria
l C
onsu
mpt
ion
(%) Iron Ore Fines FeO/ Fe2O3
(+) 10 mm Dolomite LOI(-) 150 micron Coke Breeze
Met
allu
rgic
al W
aste
(%
) Total Fe Lime
Cok
e Br
eeze
(%
)
SiO2
CaO LD Slag Al2O3
MgO Metallurgical Waste Fe2O3
SiO2
Cru
shin
g In
dex Coke Breeze CaO
Al2O3 Limestone MgOMnO Dolomite TiO2
LOI P2O5
Moisture Ash Content
Lim
esto
ne (
%) CaO
Sand
(%
) SiO2
MgO Al2O3
SiO2 MoistureAl2O3
LOI
LD S
lag
(%)
CaOMoisture MgO
Dol
omite
(%
) CaO SiO2
MgO Al2O3
SiO2 FeO/ Fe2O3
Al2O3 MnOLOI P2O5
Moisture Basicity
Table 5: Details parameter in sinter plant
Element/Compound Fe(T) FeO CaO SiO2 Al2O3 MnO MgO P2O5 TiO2 CaO/SiO2
Concentration 57.69 7.87 9.12 5.73 1.31 0.11 1.63 0.05 0.10 1.59
Table 4: WDXRF analysis of Iron Ore Sinter
3.2 Details analysis of Sinter Plant ParameterA working database is tabulated from the VSP raw data covering an extensive 12 years starting from the available months of 2003-2005 till October 2016. The data are collected for every day and
thus data available are huge enough for the use of Artificial Neural Networking (ANN). Following is the list of 66 parameters that would affect the productivity of sinter plants. Details parameter is given in Table 5.

MGMI Transactions Vol. 116, April '19 - March 2020 53
3.3 Analysis of ANN“An Artificial Neural Network (ANN) is an information processing paradigm that is inspired by the way biological nervous systems, such as the brain, process information. The key element of this paradigm is the novel structure of the information processing system. It is composed of a large number of highly interconnected processing elements (neurons) working in unison to solve specific problems. ANNs, like people, learn by example. An ANN is configured for a specific application, such as pattern recognition or data classification, through a learning process. Learning in biological systems involves adjustments to the synaptic connections that exist between the neurons. This is true of ANNs as well.” [19,20] After a detailed study on the functioning of the sinter plant at Vizag Steel Plant, the aforesaid parameters are the exhaustive number of variables
that control the sinter plant productivity. An ANN architecture is formed and total 106 sets of data, each consisting of 66 number of parameters are sequentially used to train the ANN. A few set of controlling parameters with corresponding sinter plant productivity have been given in Appendix 3(A). The training is carried out in MATLAB R2016a (9.0.0.341360) version with 64-bit (win64) and License Number: 123456. Once training is over, the network is then tested with 35 no. of data set. Fig. 1 shows the plot of predicted and observed productivity of sinters as a function of no. of data set used for testing. Table 6 summarizes the test data i.e. the predicted productivity of sinters along with industrially observed productivity of sinters. These data have been utilized to compute the RMSD (Root Means Square Deviation). The computed value is found to be 4.06 which is quite satisfactory and acceptable.
No. of Test
Observed Value
Predicted Value Error Mod
Error % error E Error Sq.
Error Sum
Error Sum /No. of Obs. (E)
Sqrt. Of E
1 370 380 10 10 2.631579 6.925208 577.63 16.50 4.062 355 380 25 21 5.526316 30.540173 371 380 9 9 2.368421 5.6094184 388 380 -8 8 2.105263 4.4321335 374 380 6 6 1.578947 2.4930756 376 380 4 4 1.052632 1.1080337 369 380 11 11 2.894737 8.3795018 374 380 6 6 1.578947 2.4930759 386 380 -6 6 1.578947 2.49307510 368 380 12 12 3.157895 9.97229911 395 380 -15 15 3.947368 15.5817212 386 380 -6 6 1.578947 2.49307513 383 380 -3 3 0.789474 0.62326914 385 380 -5 5 1.315789 1.73130215 386 380 -6 6 1.578947 2.49307516 393 380 -13 13 3.421053 11.703617 399 380 -19 19 5 2518 423 380 -43 33 8.684211 75.4155119 413 380 -33 22 5.789474 33.51801

54 MGMI Transactions Vol. 116, April '19 - March 2020
Fig. 1: Plot of predicted and the corresponding observed productivity of sinter as a function of no. of data sets for
testing
Working with such huge number of variables is going to pose problems to the operators as it takes a lot of time to properly record these variables. Secondly, most importantly it requires a high speed computational device to work with such huge data set and it requires longer computing time. To get rid of the above problem, it would be worthwhile if we could reduce number of variables using the experience and metallurgical knowledge along with the feedbacks
from operators having experience of running the machine for more than 20 years. Keeping above criteria in view, the parameters have been scaled down to workable 34 parameters from 66 parameters and the following table contains the list of 34 parameters. Subsequently the data sets with reduced no. of variables have been used for training and testing of ANN.
3.4 Analysis of GAA genetic Algorithm is an iterative procedure maintaining a population of structures that are candidate solutions to specific domain challenges. During each temporal increment (called a generation), the structures in the current population are rated for their effectiveness as domain solutions, and on the basis of these evaluations, a new population of candidate solutions is formed using specific genetic operators such as reproduction, crossover, and mutation.[21] Flowchart of a basic genetic algorithm is given in Fig. 2
20 419 380 -39 30 7.894737 62.3268721 406 380 -26 26 6.842105 46.814422 400 362 -38 20 5.524862 30.524123 397 362 -35 17 4.696133 22.0536624 386 362 -24 6 1.657459 2.74716925 403 362 -41 23 6.353591 40.3681226 394 380 -14 14 3.684211 13.5734127 409 380 -29 20 5.263158 27.7008328 398 362 -36 18 4.972376 24.7245229 384 362 -22 4 1.104972 1.22096430 383 362 -21 3 0.828729 0.68679231 371 362 -9 9 2.486188 6.1811332 370 362 -8 10 2.762431 7.63102533 371 362 -9 9 2.486188 6.1811334 398 362 -36 18 4.972376 24.7245235 395 362 -33 15 4.143646 17.16981
Table 6: Observed and predicted value of production and computation of RMSD

MGMI Transactions Vol. 116, April '19 - March 2020 55
Sl. No. Components RMSD Contribution Fractional Contribution %
Contribution1 IOF Al2O3 5.599938199 0.1785733993 0.09003837086 9.0032 -150 mic 10.89660068 0.09177173959 0.04627216571 4.623 SiO2 MW 6.558698429 0.1524692759 0.07687642873 7.684 SiO2 LS 10.38292398 0.09631198321 0.04856139882 4.855 CaO-Dolo 10.90608955 0.09169189336 0.0462319065 4.626 LOI dolo 10.90614148 0.09169145677 0.04623168636 4.627 SiO2 coke ash 10.90614148 0.09169145677 0.04623168636 4.628 ash content 10.84937832 0.09217117981 0.04647356719 4.649 CaO Lime 10.90614148 0.09169145677 0.04623168636 4.6410 Green Mix moisture 7.960604706 0.1256185977 0.06333806676 6.3311 Vacuum 5.570256809 0.1795249365 0.09051814479 9.0512 IOF % consumption 10.90614148 0.09169145677 0.04623168636 4.6213 LS % consumption 9.685837116 0.1032435285 0.05205634849 5.214 LD slag consumption 5.585679429 0.1790292502 0.09026821513 9.0215 MW % consumption 7.005313362 0.1427487891 0.07197526881 7.1916 CI-LS 10.90614148 0.09169145677 0.04623168636 4.6217 CI-Dolo 10.90614148 0.09169145677 0.04623168636 4.62
1.983303314 99.943
Table 7: Percentage contribution of each parameter
Making use of RMSD values of the variables, the percentage of contribution of each variable has
been computed and tabulated in the following Table 7.
Fig.2: Flowchart of a genetic algorithm

56 MGMI Transactions Vol. 116, April '19 - March 2020
To study the microstructure the sinter with highest productivity is chosen for simulation. The highest value of productivity is 433 Tons/hr. The sinter is simulated in sinter plant with fixing the data of 17 numbers of variables as found out by Genetic Algorithm technique. That means, the data of those 17 number of parameters (which have higher contribution on sinter plant productivity), are taken nearly equal to the plant data for which the highest productivity (433 t/hr) has been achieved. As the main focus is on 17 number of parameters, the other 49 parameters are kept as per normal running condition. After the sinter production is over, the sinter plant productivity along with the mechanical properties, microstructures are studied. The sinter plant productivity is found to be 430 t/hr as the parameters selected by the genetic algorithm. That means by only controlling those parameters, which have been selected by GA technique one can produce the sinter with similar productivity.The value of the optimized parameters which has given maximum productivity of the sinter plant to the tune of 433t /hr are hereby listed in Table 8.
Parameters Serial Number
Values of the parameters
Vacuum 1 936.885LD slag
consumption 2 0.77622
IOF AL2O3 3 1.45951
SiO2 MW 4 3.63261
MW % consumption 5 9.71367
Green Mix moisture 6 4.94962
LS % consumption 7 10.4572
SiO2 LS 8 12.9954
ash content 9 13.6001-150 mic 10 13.2257
CaO-Dolo 11 32.7678LOI dolo 12 39.2342
SiO2 coke ash 13 45.8989Cao Lime 14 83.0564
IOF % consumption 15 71.9245
CI-LS 16 63.1764CI-Dolo 17 73.2517
Table 8: Value of optimized parameters by GA analysis
So, as theoretically, this combination of the parameters have produced the maximum productivity in the VSP sinter plant, the same set of parameters were used to produce similar sinter and the same was subjected to chemical analysis, High temperature like RDI (Reduction degradation Index), RI (Reducibility Index) or room temperature properties like TI (Tumbler Index), AI (Abrasion Index) which are given in Table 9 and 10.
Sinter Tumbler Index Abrasion IndexSample 1 72.3 4.6Sample 2 72.5 4.8Average 72.4 4.7
Table 9: Room temperature properties of optimize sinter
Sinter RDI RISample 1 24.2 65Sample 2 24.6 65.4Average 24.4 65.2
Table 10: High temperature properties of optimize sinter
The microstructure of the same sinter was also seen it is given in Fig. 3. The main mineral phases present in Sinter are hematite, magnetite, SFCA and silicates. The following are the microstructure of the sinter.

MGMI Transactions Vol. 116, April '19 - March 2020 57
Fig. 3: Microstructure of optimize sinter
The phases present in the microstructure and their % concentration in the sinter is depicted in the Table 11 and Fig. 4.
Sinter % concentrationHematite 26.984Magnetite 31.139
SFCA 9.330Pores 26.696
Silicates 5.851
Table 11: Phases of optimize Samples
Fig. 4: Graphical analysis of different phases of optimize sample
Hence, to summarize a comparison is depicted in Table 12.
Parameters High Temperature Properties Room Temperature Properties
Variation RDI RI TI AI
3-year average 36.23 68.63 71.56 5.10
+10 % in Vacuum 23.0 63.0 74.0 4.6
-10 % in Vacuum NA NA NA NA
+10 % in LD slag 26.0 63.6 71.0 5.4
-10 % in LD slag 24.0 61.0 72.5 5.2
+10 % in Al2O
3 in IOF 26.4 62.0 70.5 6.1
-10 % in Al2O
3 in IOF 23.8 60.4 73.0 5.2
Table 12: Comparison of mechanical properties with that of last 3 years at VSP

58 MGMI Transactions Vol. 116, April '19 - March 2020
From the table it is clear that even though there has been a decrease in RI value, the value of RDI has shown a tremendous improvement in all the samples. Also, it may be noted that the room temperature properties are at per with the previous values though in some of the cases, TI and AI has shown some improvements. This means that if we are able to control the parameters as predicted by Genetic Algorithm, we will be able to produce better sinter as because it will behave in a better way inside the blast furnace by reducing the upper differential pressure. With better RDI value, furnace will have better permeability which certainly will lead to a better productivity of the furnace. Conclusion1. Summarizes the predicted and observed
production of sinters and these have been used to find the RMSD value. The observed RMSD value is 5.92 which is marginally higher than RMSD value of 4.06. However, for the latter case, the number of variables considered 66 which is significantly much higher than that of 34 variables. Secondly the observed productivity of sinter is about 2 order of magnitude higher than the RMSD of 5.92. Thus, prediction by ANN is quite satisfactory and acceptable even with the reduced number of variables. This is by itself a significant achievement, as one could predict the sinter productivity with a lesser number of 34 parameters and most importantly no attention has to be paid to the rest huge number of variables.
2. Using GA, we could further reduce the number of variables from 34 to 17 with marginal improvement in prediction of production of sinters. This is an important achievement from the industrial point of view, as we have to take care of less number of variables for the production of sinter. Based on the RMSD values, the contribution of each parameter for the production of sinters has been computed. A list of parameters in order
of importance has been constructed. Using the 17 number of parameters as predicted by GA, the production of sinter is 430 t/hr which is very close to the industrial highest production of 433 t/hr.
3. Moreover, the combination of mechanical properties which are being found are also in line with the contribution of parameters (Vacuum, LD Slag, Alumina). A higher “Tumbler Index” and lower “Abrasion Index” offers a better mechanical property of a sinter sample. If one goes through the combination of “Tumbler Index” and “Abrasion Index” values, it is revealed that all the data belongs to a certain band. But here also the effect of “Vacuum” is somewhat pronounced than “LD Slag” and then “Alumina” on overall mechanical properties.
4. The value of RDI has shown a tremendous improvement in all the samples. Also, it may be noted that the room temperature properties are at per with the previous values. This means that if we are able to control the parameters as predicted by Genetic Algorithm, we will be able to produce better sinter as because it will behave in a better way inside the blast furnace by reducing the upper differential pressure. With better RDI value, furnace will have better permeability which certainly will lead to a better productivity of the furnace.
5. Overall from the sinter plant productivity and mechanical properties study one can conclude that contribution of parameters which have been compiled by GA are in line with the practical industrial experiments.
Reference1. D.L Doushanov, Journal of Environmental
Protection and Ecology, 3, 2, (2002) pp 92-100 2. M.S Greenfield, Environmental problems in iron
and steel industry, Handbook of air pollution technology, Vol. 2 (ed. Calvert S. and England H. M.) (1984), p 24-91
3. C.R Copeland and S.K. Kawatra, Journal of Minerals & Metallurgical Processing 22,4 (2005)

MGMI Transactions Vol. 116, April '19 - March 2020 59
4. Report of the working group on steel industry for the twelfth five year plan (2012 –2017), Ministry of Steel, pp. 15 (November 2011)
5. B. Das, S. Prakash, S.K. Das and P.S.R. Reddy, Effective Beneficiation of Low Grade Iron Ore Through Jigging Operation, Journal of Minerals & Materials Characterization & Engineering, Vol. 7, No.1, pp 27-37, 2007
6. Umadevi T., Brahmacharyulu A., Roy, A.K., Mahapatra, P.C., Prabhu, M. & Ranjan, M. 2011. Influence of fines feed size on microstructure, productivity and quality of iron ore sinter, ISIJ International, vol. 51, no. 6, p. 922-929.
7. A.K.Biswas: Principles of blast furnace iron making’:Theory and Practice (1981), Cootha Publ.House, Australia, Ch VI.
8. Loo, C.E. (2005) A Perspective of Geothitic Ore Sintering Fundamentals. ISIJ, 45, 436-448
9. Hida Y, Sasaki M, Shimomura Y, Haruna S, Soma H. Basic Factors for Ensuring High Quality of Sintered Ore. BHP Central Research Laboratories, Australia, 1983; 60-74
10. Ishikawa, Y.; Shimomura, Y.; Sasaki, M.; Hida, Y.; and Hideo, T.: “Improvement of Sinter quality based on the mineralogical properties of Ores”, Ironmaking Proceedings, vol.42, pp.17-29, Atlanta, Ga., U.S.A, 17-20, April 1983.
11. Wang, S.; Gao, W.; and Kong, L.: “Formation Mechanism of Silicoferrite of Calcium and Aluminium in Sintering Process”, Ironmaking and steelmaking, 1998, vol.25, No.4, pp.296-301.
12. Panigraphy, S.C.; Jallouli, M.; and Rigaud, M.: “Porosity ofSinters and Pellets and its Relationship With Some of Their Properties”, Ironmaking Proceedings, Vol. 43, AIME, Chicago, Illinois, USA; 1-4 April 1984, pp. 233- 240. 1984.
13. HSIEH, L.H.; and Whiteman, J.A.: “Effect of Oxygen Potential on Mineral Formation in Lime-fluxed Iron Ore sinter”, ISIJ International, Vol.29, No.8, 1989, pp.625- 634.
14. HSIEH, L.H.; and Whiteman, J.A.: “Sintering conditions for simulating the Formation of Mineral Phases in Industrial Iron Ore Sinter”, ISIJ International, Vol. 29, No. 1, 1989, pp.24-32.
15. Chaigneau, R. and Heerema, R.H.: “Calcium Ferrites and the Diversity in their Reduction Behavior”, Ironmaking conference Proceedings, 1992, pp.111-120
16. P. Hou, S. Choi, E. Choi and H. Kang, Improved distribution of fuel particles in iron ore sintering process, Ironmaking and Steelmaking, 2011, vol. 38, pp. 379-385.
17. Kenichi HIGUCHI, Takuya KAWAGUCHI, Masanori KOBAYASHI, Yoshiki TODA, Yohei TSUBONE, Yohei ITO, Shingo FURUSHO, High-productivity Operation of Commercial Sintering Machine by Stand-support Sintering, NIPPON STEEL TECHNICAL REPORT No. 94 July 2006.
18. Cumming, M.J. and Thurlby, J.A. Developments in Modeling and Simulation of Iron-Ore Sintering. Ironmaking & Steelmaking 1990 17(4), 245-254.
19. A Multi-layer Artificial Neural Network Architecture Design for Load Forecasting in Power Systems by Axay J Mehta, Hema A Mehta, T.C.Manjunath , C.Ardil, World Academy of Science, Engineering and Technology International Journal of Electrical and Computer Engineering Vol:5, No:2, 2011
20. Robert Louis Stevenson, “Power System Analysis”, Mc. Graw Hill, Singapore
21. Genetic Algorithms in Optimization, Search and Machine Learning, David Goldberg, Addison Wesley, 1989.

60 MGMI Transactions Vol. 116, April '19 - March 2020
Introduction Corona virus has devastating effects on Mankind, it started in “Wuhan city in China in NOV-19, may be a few months before, affected People in China in a big way. More than 3000 people died in China in less than 2 months, thousands infected. It has become a pandemic, having spread to 225 Countries today & more than 4.27 Lakh people died by 13th June 2020. All the countries are scared now, as it spreads through contact. Countries globally are puzzled today by its devastating effect on mankind & society. Economic activity globally has been affected severely. Industries are severely impacted in almost all sectors.Many experts believe that Corona Virus started from a Laboratory in Wuhan, China in November 19. It is a Virus of size 75-100 micron (I micron=1 Millionth of a meter)Professionals in the field of mining are well conversant of- Occupational diseases like Silicosis, Pneumoconiosis, Asbestosis, Anthrcosis, Bartytes, Mn Poisoning due to Coal Dust, Iron ore dust, other types of DUST ,poor Ventilation, Poor lights standards, heat & humidity ,& other Environmental Maladies. Coal dust/Iron ore dust generated during Mining Operation in size range of 0.5 µ -10 µ size are very dangerous to humans when exposed to long hours. Directorate General of Mines Safety (DGMS) & other regulatory government bodies in India have prescribed very elaborate steps like Dust prevention, dust suppression , wet methods of mineral Beneficiation ,better machines lubrication/maintenance /repairs to reduce dust, Sounds, improve lighting standards is work places.
Miners are examined regularly like-Executive health check/Medical Examination /Audiometry /Spirometer /Immunisation/Health education /First aid , Chest X ray , ECG, Blood sugar , Cholesterol , urine examination etc once in 3 years,though Law provides once in FIVE YEARS. Corona Virus spreads through
person to person contact and the pace of this spread through population unprecedented, having impacted 225 countries in just a few months.Therefore preventive steps like-Social distancing of 2m, wearing face masks, staying in houseto breakthis chain of spread have become the new norm in society globally. State Police and administration are engaged by government to controlvehicle movements,those infected are kept in Quarantinecentre for 14 days , elaborate tests arrangements made. A large number ofdoctors and paramedic staff arealso engaged.The mining industry is deeply impacted by the covid-19 pandemic, and the situation continues to evolve as the virus spreads throughout the globe. Fitch Ratings has further reduced its
short-term price assumptions for copper, aluminium, nickel, zinc and thermal coal as the rapid spread of the coronavirus weakens the short-term global economic outlook and commodity demand.
Analysts maintain their iron ore price forecast for 2020 at $85/tonne, ,that has resulted in the decline of other metal prices.After averaging $90.4/tonne in 2019, iron ore prices have averaged $83.5/tonne in the year to date and are currently hovering downwards
By G S Khuntia, Former Executive Director (Optn.), SAIL / Director, NMDC / Currently Director, OMC Ltd / VP-SGAT& Chairman, MGMI-Bhubaneswar
Impact of COVID-19 On Mining Operations & Mining Industry- Some Thoughts

MGMI Transactions Vol. 116, April '19 - March 2020 61
Fitch expects prices to further recover from spot levels in H220 (220 countries) as steel production in China gears up.
Corona Virus spreads through person to person contact and the pace of this spread through population unprecedented, having impacted 225 countries in just a few months. Therefore preventive steps like-Social distancing of 2m, wearing face masks, staying in house to break this chain of spread have become the new norm in society globally. State Police and administration are engaged by government to control vehicle movements, those infected are kept in Quarantine centre for 14 days , elaborate tests arrangements made. A large number of doctors and paramedic staff are also engaged.The mining industry is deeply impacted by the covid-19 pandemic, and the situation continues to evolve as the virus spreads throughout the globe. Fitch Ratings has further reduced its
short-term price assumptions for copper, aluminium, nickel, zinc and thermal coal as the rapid spread of the coronavirus weakens the short-term global economic outlook and commodity demand.
Analysts maintain their iron ore price forecast for 2020 at $85/tonne, ,that has resulted in the decline of other metal prices. After averaging $90.4/tonne in 2019, iron ore prices have averaged $83.5/tonne in the year to date and are currently hovering downwards
Fitch expects prices to further recover from spot levels in H220 (220 countries) as steel production in China gears up.
Supply has been disrupted in H120 so far by forced mine shuts in Canada, South Africa, Peru and India, and seasonal weather also impacted Brazil and Australia.
Chinese domestic iron ore has been impacted by logistical issues, which has temporarily increased China’s demand for seaborne iron ore in Q120.
On the demand side, analysts expect stronger steel production by H220 to sustain iron ore
demand and support prices.Steel production in China averaged 3.6% y-o-y, compared with 7.7% in 2019, and we expect growth to pick up pace by average 5.0% y-o-y in 2020 while in Europe steel demand will be weak and could drag iron ore demand lower.
COVID-19 Mining Impacts - Many Mines Extending ClosuresAs the novel coronavirus pandemic continues to spread worldwide, quarantines and lockdowns are preventing employees from going to work, with mining operations experiencing adverse effects since early March-2020 ,national and provincial quarantines are the new normal now,while all commodities are potentially at risk, production of gold, copper and platinum group metals has been particularly affected.Since the outbreak in China was elevated to a public health emergency in January, S&P Global Market Intelligence has been monitoring and documenting worldwide mine closures. Chinese mines were significantly impacted beginning in January, limited reporting has been available on individual mines.Due to corona virus- disruptions have happened in 247 mine sites in 33 countries.New mine closures have slowed down significantly, many mines that closed in March and early April 20 have announced extensions of their shutdowns. Peru extended its national State of Emergency to April 26, and mining has not been listed as an essential service. South Africa’s quarantine has been extended to April 30, but mining was declared essential and operations were able to resume starting April 14. Many mines in Canada were able to begin ramping up operations starting April 15, with the Quebec provincial government declaring mining essential.It is too early in the pandemic’s spread to fully quantify impacts on the supply of commodities. Miners are making additional announcements daily, companies continue to withdraw 2020 guidance in light of the uncertainties, extensions

62 MGMI Transactions Vol. 116, April '19 - March 2020
to many suspensions are likely and limited disruptions at certain mines may not even impact full-year production.
Impact on Coal MiningCoal india though has not been affected by lock down in the months of march and april but coming months will show decline in production as economic growth comes to near standstill
Government of India, Ministry of Coal has declared coal production as Essential service even during the lockdown period. Measures have been put in place to monitor the coal production and dispatches to power plants so that energy and other critical sectors remain unaffected amid the current Coronavirus lockdown situation, Country should be assured in these testing time that Coal workers are working 24x7 in 3 shifts with dedication and enthusiasm, so that electricity reaches each and every household and hospitals of the nation uninterruptedly.Coal India the world’s largest coal Company has not been effected by lockdown on the production front in the last 8 days of March and even in the month of April. Indeed the inertia of enhanced production continued till the end of the fiscal year. Indeed production of Coal India was highest ever in March 2020 nearly 85 Mt. The total production of Coal India exceeded 600 Million tonnes(actual 602.14Mt) in the last fiscal year in spite of heavy monsoon and drowning of some large mines in SECL and law & order situation in MCL
Difficulties faced by cil for non lifting of coal from coal projectsCIL’s subsidiary Central Coalfields is the worst hit as almost all its power consumers are refusing to accept supplies and make payments.Stockyards of a number of power plants are full they cannot accommodate additional supplies. Others want to reduce inventory costs as their finances are strained due to non-payments from state utilities. Power demand has fallen 30 per cent since the
lockdown began, forcing nearly 65 GW of coal-fired plants to back down. Capacity utilisation has fallen to less than half, reducing fuel requirement, For 2019-20, the plants procured 66 million tonnes less than the 530 million tonnes of coal they had asked for. Some have not procured 70 per cent of their quota and may be penalised, As coal stock at Pithead has gone up CIL has no alternative than to waive of penalites.Coal India has no alternative but to supply coal even to the defaulting power plants. It had to agree to accept deferred payment terms. Power companies importing coal are also being encouraged to substitute their imported requirement with domestic coal through regular monthly allotments.Under normal circumstances, non-payment leads to restricted supplies while failure to lift ordered quantity within a stipulated time attracted forfeiture of earnest money deposited under auction schemes. CIL may have to revise its policy in view of the sluggish demand till such time the economy takes a upward curve.
Import of coal:India normally imports nearly 200 Mt of thermal coal and 45 Mt of Coking coal. With huge stock available with Coal India especially thermal coal, there will be sharp drop in coal Import.The coal ministry thinking on high growth of coal industry in the coming three to four years is likely to be very challenging.Union Minister Sri Prahlad Joshi while inaugurating WCL Mines in Maharashtra recently has indicated Rs. 1 lakh Crore investments in the coal sector in coming 3 to 4 years. He has also repeated what Mr Piyush Goel had said about 1 Billion tonne coal by 2020, only the goal post shifted to 2023-24. He further added that commercial mining will be allowed to supplement coal production. On coal gasification he indicated tender will be floated soon and 20% rebate in Coal Royalty will be given to private players who will experiment with coal gasification.Target of 1 Billion Tonne Coal Production-With

MGMI Transactions Vol. 116, April '19 - March 2020 63
present annual production level of 600 Mt ,to jack up another 400Mt by 2023-24 will be a herculean task , as GDP in the negative Zone ,much more investment than 1Lakh crore will be needed coupled with many structural reforms & dynamic employment generation and R & R policyEven though the production of coal India did not come down in the lockdown period but the economic slowdown followed by lockdown is expected to slow down performance of Coal India The target of 710 Mt by year end may be ambitiousOMC Experiences- OMC has shown consistency in the production of ore,Chrome ore and Chrome ore concentrate over the last 5 years. The production of iron ore has increased substantially from 34 lakh tonnes in 2005-06 to about 13 million tonnes in 2018-19. Production of chrome ore and chrome concentrate has been 1.3 MT a year & Bauxite about 2.5 MTPAAt the present rate, OMC is producing
about 10 % of total iron ore production of the State and about 30 % of the total chrome ore production of the State
Presently Daitari, Gandhamardan and Kurmitar (Khandadhar) are the major Iron ore Mines of OMC which are on major Expansion by MDO Route to by about > 20 MTPA capacity by MDO route by 2022-23, whereas South Kaliapani is the main Chrome ore Mine of OMC. Bangur Chrome ore Mine is the first and only underground mine of OMC. Are also being expanded
Current Covid situation—Production is marginally affected say 10% ,but Sales/despatches are almost 50% due to processing metal Industries -steel is affected , due to poor sales by lock down condition. Stock position of Iron ore & Chromite in Mines have increased considerably
OMC turn over crossed Rs 4000 CR in 2019-20 ,profit after tax was >800 Crores (down from 1500 Cr earlier), Royalty/DMF/NMET/Dividends/sales Tax during last 5
years was about 3740 Crs to STATESMarketing-OMC is also planning credit
policy to enhance from 90 days to 120 days, interest rate from 10% to lower side, subgrade Iron ore/Chromite ore sales through LTL Buyers, reduction of processing charges from 1% to lower side.
Iron ore & Coal production (Odisha Scenerio) in 2019-20 & Status in 2020-21As per IBM YEAR BOOK-2019-20, Odisha, which accounts for over half of India’s iron ore production, produced 120 million tonnes during the 2019-20, up slightly from 118 million tonnes the previous year.Odisha expect to produce around 120 million tonnes in 2020-21 as well, adding that producers will make up volumes once production resumes.However, analysts expect exports from India, the world’s fourth largest iron ore producer, to drop significantly as a result of lower demand due to the coronavirus outbreak, and production in 2020-21 to be lower than in 2019-20.Some analyst expect Odisha’s production to fall over 20% in FY 20-21 as the transfer of (mine) ownership following recently concluded auctions will take up to two months, expected India’s overall output to fall by more than 10%.India has auctioned many iron ore mines as mining leases expired, with the process concluding in February. Some of the winning bidders paid more than twice the floor price set by the government amid aggressive bidding.The majority of the new leases were won by steelmakers such as JSW Steel Ltd, marking a significant change in ownership as pure play miners who have historically owned most mines in the state were outbid.Some formal paper work has to be done that the start of mining by new owners would be delayed by 15 days.

64 MGMI Transactions Vol. 116, April '19 - March 2020
ConclusionMining operations &sales were adversely affected during COVID-19 Lockdown ,employment position of Labours were bad, Odisha state collected Rs. 1,700 Cr tax during May 2020, against target of Rs. 3,700 Cr .The situation not good unless some permanent solution for combating COVID-19 is established by effective treatment& many restriction imposed by government on markets/Movements /Business are withdrawn, it is unlikely that GDP will improve, with the possibility of recession is likely to continue for some years
(GS Khuntia)Acknowledgement 1. Thanks are due to Sri JP Panda, Former CGM,
MCL & currently Vice Chairman, MGMI-BBSR for COAL DETAILS of CIL
2. Thanks to OMC ltd for certain information from OMC Website

MGMI Transactions Vol. 116, April '19 - March 2020 65
1. IntroductionThe presence of varying size of rock fragments in dump materials influences the shear strength behaviour of the overburden dump materials (Fakhimi et. al., 2008). Many researchers have studied the effect of particle size, particle size distribution and particle shape on the shear strength behaviour. Holtz and Gibbs had conducted numerous triaxial tests to study the effect of maximum particle size, density, amount of gravel and particle shape on gravel, river sand and quarry material (Holtz and Gibbs, 1956). Hennes studied the effect of particle shape, particle size and gradation on angle of internal friction of dry crushed rock and gravels of rounded shape. He observed that as the max. particle size increases,
the angle of internal friction decreases (Hennes et. al., 1952). Rathee conducted direct shear test on granular soils in 30 cm × 30 cm shear box and observed that the angle of internal friction of sand-gravel mix increases as the maximum particle size increases, while for uniform gravel size, angle of internal friction was nearly constant for increasing maximum particle size (Rathee et. al., 1981). For finer material (like fine soil), the scale of the test have no effect on the measured values of dilation angle (ratio of maximum vertical stress to shear displacement) and angle of internal friction obtained from the direct shear test (Palmeira and Milligan, 1989). For material mix obtained from overburden dump, the scale of the test affects
Subodh Kumar1, K. Pathak2, K. Dey3
1. Research Scholar, Department of Mining Engineering, Indian Institute of Technology Kharagpur, Kharagpur-721302, [email protected]
2. Professor, Department of Mining Engineering, Indian Institute of Technology Kharagpur,Kharagpur-7213023. Assistant Professor, Department of Mining Engineering, Indian Institute of Technology Karagpur,Kharagpur-721302
Effect of Particle Size Distribution on Cohesion and Angle of Internal Friction on Sandstone and Shale Mix Material
Abstract Materials encountered in an overburden dump is a complex mixture of soils, rock fragments and rock fines in different proportions which made it to behave differently unlike soils. Shear strength behaviour of loose and unconsolidated material depends on moisture content, presence of amount of fines, maximum particle size and particle size distribution. This study had shown that the particle size greatly influences the cohesion and angle of internal friction of the material mix of coal mine overburden dump. For the material size less than 300 μm, the cohesion increases from 47.08 kPa (for 106 μm) to 107.91 kPa (for 300 μm). The trend is decreasing for angle of internal friction between the size ranges from 106 μm (friction angle of 16.69 degree) to 300 μm (friction angle of 10.64 degree). For the particle size greater than 1 mm (cohesion of 84.36 kPa), the cohesion decreases upto 4 mm (cohesion of 41.16 kPa) particle size and then increases upto 13.9 mm (cohesion of 108.9 kPa) particle size. In case of angle of internal friction, the friction angle increases from 1 mm (friction angle of 19.38 degree) particle size to 8 mm (friction angle of 35.81 degree) particle size and then started decreasing upto 13.9 mm (friction angle of 20.8 degree) particle size.
Key words: Cohesion, Angle of internal Friction, Direct Shear Test, Particle size

66 MGMI Transactions Vol. 116, April '19 - March 2020
the measured values of friction angle, cohesion and dilation angle as well. While shearing the material in the direct shear box, rate of shear loading is very important. Palmer (1999) pointed out the importance of rate of shearing in his study, and observed that when the shearing rate is too fast, even silt and sand can also exhibits dilation causing generation of significant suctions which ultimately results into increased effective stress and shear resistance. Many researchers have suggested different rate of shearing depending upon the purpose of shearing. For studying the cohesion and angle of internal friction for overburden dump slope study or embankment, rate of shear loading should be 1mm/ min (Bauer
and Zhao, 1993). Frederick (1961) studied the effect of particle size on the macroscopic response of the sand and he observed that, particle size is responsible for the change in shear strength, angle of internal friction increases with increasing particle size.
2. Literature ReviewCohesion of loose material like soil can be defined as the binding force that connects its constituent fine particles. Cohesion can be due to chemical bonding, cementation, electrostatic attraction or other similar processes between the constituent particles.. A short review of the same is presented in Table 1.
Table 1. Review of effect of particle size on cohesion and friction angle
[1] Author Year FindingsJ. Kolbuszewski and M. R. Frederick
1961 The angle of internal friction of the material (here, sand) increases with the increasing particle size
W. M. KirkPatric 1965 The shear strength of the material (for sand of uniform size) decreases with increasing particle size
N. D. Marschi,C. K. Chan & H. B. Seed
1972 Angle of internal friction of uniform (almost) sand decreases with the increasing particle size of the material
C. M. Nieble, Silveria and N. F. Midea
1974 He observed that for uniformly crushed basalt, as the maximum particle size increases, the angle of internal friction decreases. He also suggested that to avoid size effect in measuring angle of internal friction, maximum particle size should be less than 5% of the width of shear box.
G. E. Bauer and Y. Zhao 1993 Rate of loading should not be greater than 1mm/ min or else increase in suction pressure increases effective shear strength
G. T. Sitharam and S. M. Nimbkar
2000 He noticed that particle size and particle size distribution in the material influences the stress- strain behaviour greatly
A. Fakhimi and H. Hosseinpour
2008 He observed that due to presence of oversize material in the sample, friction angle and dilation angle, both increases
A. K. Gupta 2009
For Ranjit Sagar Rockfill material angle of internal friction increases with increasing particle size and the behaviour is opposite for Purulia Rockfill materials, i.e., the angle of internal friction decreases with increasing particle size
Terezie Vondrakova 2016 Cohesion get reduced with increasing plasticity of soils. Effective cohesion get decreased as the grain size increases.
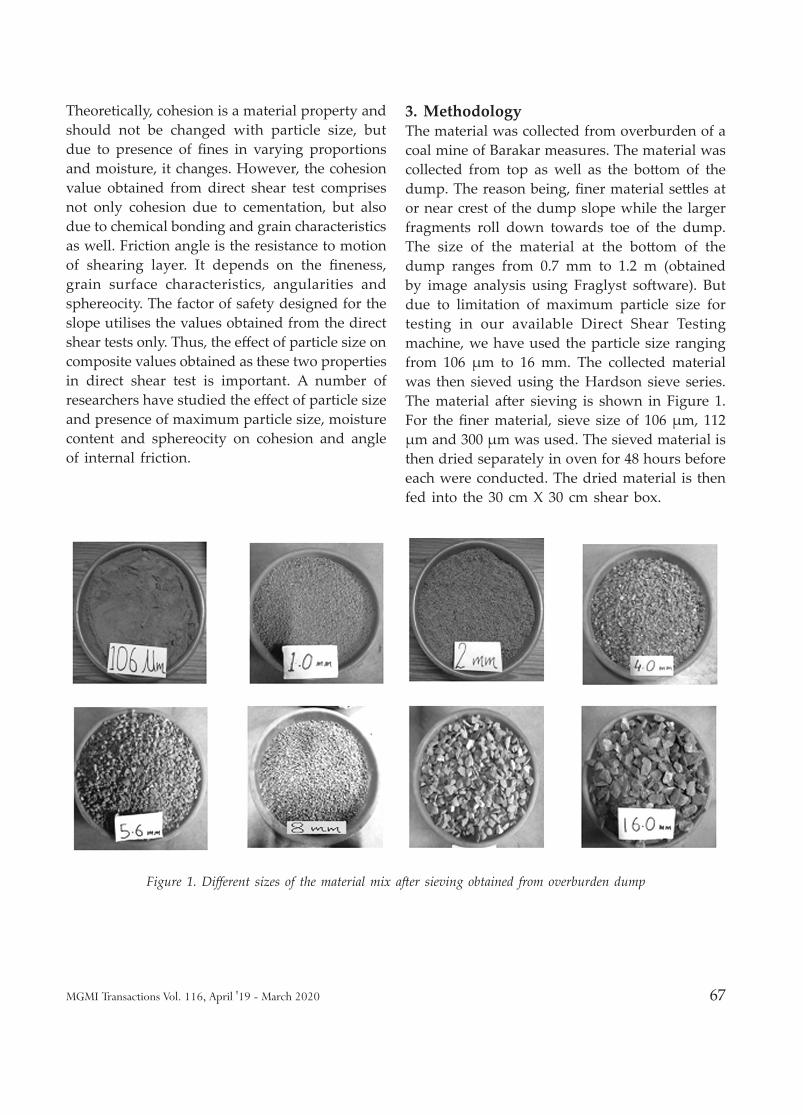
MGMI Transactions Vol. 116, April '19 - March 2020 67
Theoretically, cohesion is a material property and should not be changed with particle size, but due to presence of fines in varying proportions and moisture, it changes. However, the cohesion value obtained from direct shear test comprises not only cohesion due to cementation, but also due to chemical bonding and grain characteristics as well. Friction angle is the resistance to motion of shearing layer. It depends on the fineness, grain surface characteristics, angularities and sphereocity. The factor of safety designed for the slope utilises the values obtained from the direct shear tests only. Thus, the effect of particle size on composite values obtained as these two properties in direct shear test is important. A number of researchers have studied the effect of particle size and presence of maximum particle size, moisture content and sphereocity on cohesion and angle of internal friction.
3. MethodologyThe material was collected from overburden of a coal mine of Barakar measures. The material was collected from top as well as the bottom of the dump. The reason being, finer material settles at or near crest of the dump slope while the larger fragments roll down towards toe of the dump. The size of the material at the bottom of the dump ranges from 0.7 mm to 1.2 m (obtained by image analysis using Fraglyst software). But due to limitation of maximum particle size for testing in our available Direct Shear Testing machine, we have used the particle size ranging from 106 μm to 16 mm. The collected material was then sieved using the Hardson sieve series. The material after sieving is shown in Figure 1. For the finer material, sieve size of 106 μm, 112 μm and 300 μm was used. The sieved material is then dried separately in oven for 48 hours before each were conducted. The dried material is then fed into the 30 cm X 30 cm shear box.
Figure 1. Different sizes of the material mix after sieving obtained from overburden dump

68 MGMI Transactions Vol. 116, April '19 - March 2020
The material is weighed each time before putting in the shear box. This will help us to know the degree of compaction by measuring the settlement after the application of normal load. Three tests were conducted for each set of material. In each test, three different values of normal load were given. The normal load applied were 1 Kg, 2Kg and 4 Kg which yields a corresponding normal pressure of 100 kPa, 200 kPa and 400 kPa.
The setup for conducting direct shear test is shown in Figure 2. The shear testing machine used in this study is software controlled, so the chances of encountering error in loading (normal or shear) is minimized to a great extent. The rate of normal loading was fixed to 1mm/ min. The rate of shear loading was also kept to 1 mm/ min. For all the eight set of materials, shear testing to obtain cohesion and friction angle were performed.
Figure 2. Setup of direct shear testing machine of 30 cm × 30 cm shear box size
The make and model of the shear testing machine is Heico-M Servo Controlled (30x30). The shear box used was of size 30 cm by 30 cm to maintain the uniformity of setup during the entire test procedure.
4. Results And DiscussionThe sieving of the material is done as per Hardson sieve series. For very fine particles, sieve size of 106 μm, 112 μm and 300 μm were used. The size range varies from 106 μm to 13.2 mm size used
Figure 3. The above figure is showing th esize duistribution of the sieved material
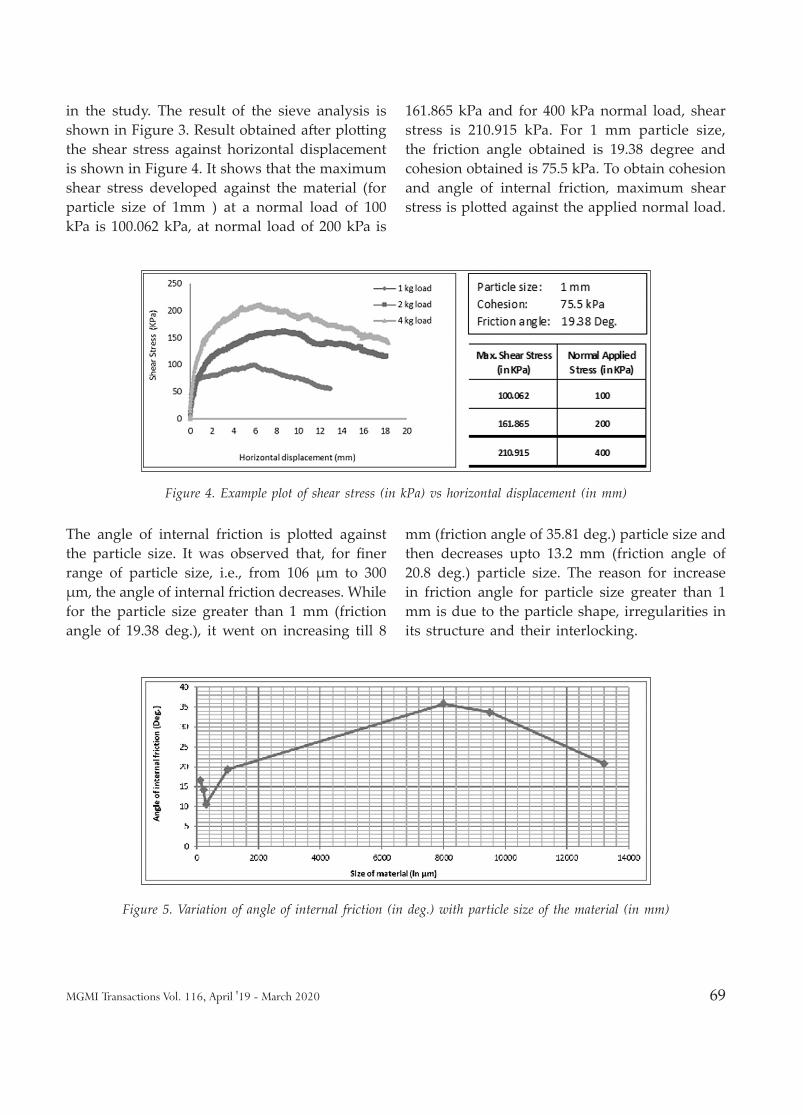
MGMI Transactions Vol. 116, April '19 - March 2020 69
in the study. The result of the sieve analysis is shown in Figure 3. Result obtained after plotting the shear stress against horizontal displacement is shown in Figure 4. It shows that the maximum shear stress developed against the material (for particle size of 1mm ) at a normal load of 100 kPa is 100.062 kPa, at normal load of 200 kPa is
161.865 kPa and for 400 kPa normal load, shear stress is 210.915 kPa. For 1 mm particle size, the friction angle obtained is 19.38 degree and cohesion obtained is 75.5 kPa. To obtain cohesion and angle of internal friction, maximum shear stress is plotted against the applied normal load.
Figure 4. Example plot of shear stress (in kPa) vs horizontal displacement (in mm)
The angle of internal friction is plotted against the particle size. It was observed that, for finer range of particle size, i.e., from 106 μm to 300 μm, the angle of internal friction decreases. While for the particle size greater than 1 mm (friction angle of 19.38 deg.), it went on increasing till 8
mm (friction angle of 35.81 deg.) particle size and then decreases upto 13.2 mm (friction angle of 20.8 deg.) particle size. The reason for increase in friction angle for particle size greater than 1 mm is due to the particle shape, irregularities in its structure and their interlocking.
Figure 5. Variation of angle of internal friction (in deg.) with particle size of the material (in mm)

70 MGMI Transactions Vol. 116, April '19 - March 2020
For uniform and homogenous material, due to the presence of substantial amount of fines, maximum particle size, moisture, the cohesion changes as these parameters changes. In this study, the particle size varies from 106 μm to 13.2 mm, so the cohesion obtained from direct shear test also changes. For finer particle size of 106 μm, the cohesion was 47.08 kPa. The cohesion increases from 47.08 for 106 μm particle size to 107.91 for 300 μm particle size. As the particle size increases from 300 μm to 4 mm, cohesion decreases and then again increases as the particle size increases upto 13.2 mm.
5. ConclusionThe particle size is very important parameter to be considered for understanding the behaviour of material mix of sandstone and shale and other loose material of the dump as well. The increasing size decreases the friction angle of the material due to decreasing contact area of the material. But the non-linearity is coming due to the complex shape, structure of exposed surface and their arrangement at the shearing plane. At the shearing plane, the orientation of the material mix particles changes gradually with gradually increasing shear load (rate of shearing is fixed at 1mm/min). Cohesion is also affected by the amount of fines and its proportion with coarser
material. For the very fine material, the cohesion increases with increasing particle size. When the particle size increases further then the cohesion first decreases upto 4mm size and then shown increasing trend.
Reference1. Fakhimi, A. and Hosseinpour, H., The role of
oversize particles o n the shear strength and deformational behaviour of rock pile material, 2008. 42nd US Rock Mechanics Symposium, San Francisco
2. Holtz, W.G. and H.J. Gibbs. 1956. Triaxial shear tests on pervious gravelly soils. Journal of the Soil Mechanics and Foundation Division; In Proceedings of the American Society of Civil Engineers. Vol. 82, pp. 1- 22.
3. Hennes, R.G. 1952. The strength of gravel in direct shear. ASTM special technical publication. Vol. STP 131, pp. 51-62
4. Rathee R.K. 1981. Shear strength of granular soils and its prediction by modelling techniques. Journal of the Institution of Engineers (India). Part C1, Civil Engineering Division, Vol. 62, Special Issue on Hydrology and Hydraulic Engineering, pp. 64-70.
5. Palmeira, E. M., and Milligan, G. W., 1989, “Scale Effects in Direct Shear Tests on Sand,” Proceedings of 12th International Conference on Soil Mechanics
Figure 6. Variation of cohesion (in kPa) with particle size of the material (in mm)

MGMI Transactions Vol. 116, April '19 - March 2020 71
and Foundation Engineering, pp. 739– 742.6. Palmer, A. C., 1999, “Speed Effects in Cutting and
Ploughing,” Geotechnique, Vol. 49, pp. 285–2947. Bauer, G. E., and Zhao, Y., 1993, “Shear Strength
Tests for Coarse Granular Backfill and Reinforced Soils,” Geotech. Test. J., Vol. 16, pp. 115–121
8. Frederick, M.R. (1961), Notes on the Shape of Particles & Its Influence on the Properties of Sand. Proceedings of the Midland Soil Mechanics and Foundation Engineering Society, Birmingham, vol. 4, pp. 157-162.
9. Kolbuszewski, J. and Frederick, M.R.(1963), “The significance of particle shape and size on the mechanical behaviour of granular materials”, European Conference on Soil Mechanics and Foundation Engineering (Wiesbaden) Sec.4 Paper9, pp-253-263.
10. KirkPatric, W. M. (1965), Effects of Grain size and Grading on the Shearing Behaviour of Granular Materials. Proceeding in 6th Int. Conf. Soil. Mech. and Foundation Engineering, Canada 1965, Vol. I, pp.273-277.
11. Marschi N.D, Chan C.K. and Seed H.B. (1972), Evaluation of Properties of Rockfill Materials, Journal of the Soil Mechanics and Foundations Division, vol. 98(1), pp. 95-114.
12. Gupta, A.K. (2009), Effect of Particle Size and Confining Pressure on Breakage and Strength Parameters of Rockfill Materials, Electronic Journal of Geotechnical Engineering. vol. 14 (H), pp.1-12
13. Nieble, C.M., Silveira, and N.F. Midea. 1974. Some experiences on the determination of the shear strength of rock fill materials. In Proceedings of the Second International Congress of the International Association of Engineering Geology. Sao Paulo, Brazil, pp. IV34.1, IV-34.12
14. Vondrackova Terezie, Kmec Jan, Cejka Jiri, Bartuska Ladislav and Stopka Ondrej, 2016. IOP Conference Series: Earth and Environmental Science, Volume 44, 022019
15. Sitharam, G.T. and Nimbkar, S. M, (2000), Micromechanical Modelling of Granular Materials: Effect of Particle Size and Gradation, Geotechnical and Geological Engineering, vol.18, pp. 91-117.

72 MGMI Transactions Vol. 116, April '19 - March 2020
MGMI Council for 2020-21
President
Polavarapu Mallikharjuna Prasad, Chairman-cum-Managing Director, Central Coalfields Limited
Immediate Past Presidents
Anil Kumar Jha, Former Chairman, Coal India Limited
Dr Narendra Kumar Nanda, Former Director (Technical), NMDC
Vice-Presidents
Binay Dayal, Director (Technical), Coal India Limited
Prabhat Kumar Sinha, CMD, Northern Coalfields Limited
Pravat Ranjan Mandal, Former Advisor (Projects), Ministry of Coal
Jagdish Prasad Goenka, Managing Partner, Nanda Millar Company
Honorary SecretaryRajiw Lochan, Advisor (CED/CBM), CMPDI
Members
Virendra Kumar Arora, Chief Mentor (Coal), KCT & Bros Dr Netai Chandra Dey, Professor, IIEST, Shibpur
Dr Jai Prakash Barnwal, Former Chief Scientist, RRL Prof (Dr) Ganga Prasad Karmakar, IIT, Kharagpur
Prof (Dr) Ashis Bhattacharjee, Professor, IIT, Kharagpur Tapas Kumar Nag, Former CMD, NCL
Anup Biswas, Former Deputy Director General, Mines Safety Dr Abani Kanta Samantaray, General Manager (CV), CIL
Lab Kumar Bose, Former Executive Director, CIL Prof Bhabesh Chandra Sarkar, Professor, IIT-ISM, Dhanbad
Smarajit Chakrabarti, Former CMD, ECL Dr Kalyan Sen, Former Director, CIMFR
Akhilesh Choudhury, Former Deputy Director General, GSI Anil Kumar Singh, Area General Manager (Lakhanpur ), MCL
Prof (Dr) Sajal Dasgupta, VC, University of Engg & Mgmt Dr Amalendu Sinha, Former Director, CSIR-CIMFR
Editorial Board
Hony Editor: Prof (Dr) Khanindra Pathak, IIT, Kharagpur
Associate Editor: Dr Ajay Kumar Singh, Former Scientist, CSIR-CIMFR
Immediate Past Secretary Hony Jt Secretary Hony TreasurerPrasanta Roy
Sr Manager (Geol/CV), CIL
Ranajit Talapatra
Chief Manager (WS), CIL
Anil Kumar Karmakar
Former General Manager (Admin), CIL
IN PRESS

MGMI Transactions Vol. 116, April '19 - March 2020 73
Editorial Board
Editor: Prof (Dr) Khanindra Pathak, Professor, IIT Kharagpur
Associate Editor: Dr Ajay Kr Singh, Former Scientist, CSIR-CIMFR
Members of Editorial Board
Smarajit Chakrabarti, Former CMD, ECL Dr Netai Ch Dey, Professor, IIEST Shibpur
Ranjit Datta, Former Director, GSI Dr Anupendu Gupta, Former Deputy Director General, GSI
Prof Rajib Dey, Professor, Jadavpur University


25
,