agri. export zone: prospects of wayanad district - International ...
Upload
khangminh22Category
view
2download
0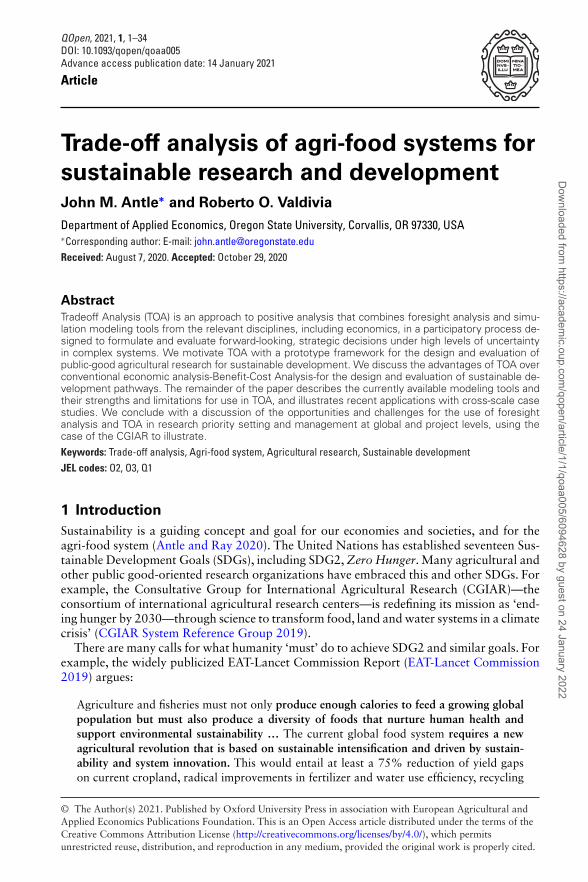
QOpen, 2021, 1, 1–34DOI: 10.1093/qopen/qoaa005Advance access publication date: 14 January 2021
Article
Trade-off analysis of agri-food systems for
sustainable research and developmentJohn M. Antle∗ and Roberto O. Valdivia
Department of Applied Economics, Oregon State University, Corvallis, OR 97330, USA∗Corresponding author: E-mail: [email protected]: August 7, 2020. Accepted: October 29, 2020
Abstract
Tradeoff Analysis (TOA) is an approach to positive analysis that combines foresight analysis and simu-lation modeling tools from the relevant disciplines, including economics, in a participatory process de-signed to formulate and evaluate forward-looking, strategic decisions under high levels of uncertaintyin complex systems. We motivate TOA with a prototype framework for the design and evaluation ofpublic-good agricultural research for sustainable development. We discuss the advantages of TOA overconventional economic analysis-Benefit-Cost Analysis-for the design and evaluation of sustainable de-velopment pathways. The remainder of the paper describes the currently available modeling tools andtheir strengths and limitations for use in TOA, and illustrates recent applications with cross-scale casestudies. We conclude with a discussion of the opportunities and challenges for the use of foresightanalysis and TOA in research priority setting and management at global and project levels, using thecase of the CGIAR to illustrate.Keywords: Trade-off analysis, Agri-food system, Agricultural research, Sustainable developmentJEL codes: O2, O3, Q1
1 Introduction
Sustainability is a guiding concept and goal for our economies and societies, and for theagri-food system (Antle and Ray 2020). The United Nations has established seventeen Sus-tainable Development Goals (SDGs), including SDG2,Zero Hunger.Many agricultural andother public good-oriented research organizations have embraced this and other SDGs. Forexample, the Consultative Group for International Agricultural Research (CGIAR)—theconsortium of international agricultural research centers—is redefining its mission as ‘end-ing hunger by 2030—through science to transform food, land and water systems in a climatecrisis’ (CGIAR System Reference Group 2019).
There are many calls for what humanity ‘must’ do to achieve SDG2 and similar goals. Forexample, the widely publicized EAT-Lancet Commission Report (EAT-Lancet Commission2019) argues:
Agriculture and fisheries must not only produce enough calories to feed a growing globalpopulation but must also produce a diversity of foods that nurture human health andsupport environmental sustainability … The current global food system requires a newagricultural revolution that is based on sustainable intensification and driven by sustain-ability and system innovation. This would entail at least a 75% reduction of yield gapson current cropland, radical improvements in fertilizer and water use efficiency, recycling
© The Author(s) 2021. Published by Oxford University Press in association with European Agricultural andApplied Economics Publications Foundation. This is an Open Access article distributed under the terms of theCreative Commons Attribution License (http://creativecommons.org/licenses/by/4.0/), which permitsunrestricted reuse, distribution, and reproduction in any medium, provided the original work is properly cited.
Dow
nloaded from https://academ
ic.oup.com/qopen/article/1/1/qoaa005/6094628 by guest on 24 January 2022
2 John M. Antle and Roberto O. Valdivia
of phosphorus, redistribution of global use of nitrogen and phosphorus, implementing cli-mate mitigation options including changes in crop and feed management, and enhancingbiodiversity within agricultural systems. In addition, to achieve negative emissions globallyas per the Paris Agreement, the global food system must become a net carbon sink from2040 and onward. (pp. 22–3; original emphasis)
Like other studies before it, the EAT-Lancet Commission Report calls for changes in agri-food systems and sets ‘science-based’ targets for meeting these normative goals. What thesekinds of reports do not do, and cannot do, is to say how the diverse agricultural systemsunderpinning the equally diverse local to global food systems can change to meet SDG2and related goals. This is the challenge for national and international research organizationsincluding the CGIAR—to contribute to the global process of creating the science to meetcritical agricultural and food system challenges in ways consistent with diverse private andpublic interests.
Sachs (2015) defines sustainable development as a positive analytical method and a set ofnormative goals such as the SDGs. As societies strive to achieve SDGs and other goals, thescale, scope, and complexity of agri-food systems and their linkages to natural and humansystems will lead to inevitable trade-offs among and between the economic, environmental,and social impacts of these systems. Trade-off analysis (TOA) is an approach to positiveanalysis that combines simulation modeling tools from the relevant disciplines, includingeconomics, with other analytical tools such as foresight analysis (FA) and monitoring andevaluation (ME) in a participatory process designed to inform a wide array of stakeholders.Thus, compared to the research paradigm of mainstream applied economics that involvesusing observational (historical) data to test hypotheses about causal effects of one or asmall number of factors, TOA is designed to help decision-makers formulate and evaluateforward-looking, strategic decisions under high levels of uncertainty in complex systems.The goal is to help research organizations such as the CGIAR establish evidence-based pri-orities, assess progress toward goals, and adapt priorities as new information becomes avail-able and uncertainties are resolved. In this paper, we describe TOA for analysis of agri-foodsystems, but the same logic supports the use of these tools more generally for sustainabilityresearch and development.
To motivate the use of TOA, in the second section of this paper we present a prototypeframework for the design and evaluation of public good agricultural research for sustainabledevelopment. The third section uses an example to describe what we mean by TOA andits advantages over conventional economic analysis—benefit–cost analysis (BCA)—for thedesign and evaluation of sustainable development pathways. The remainder of the paperdescribes the currently available modeling tools and their strengths and limitations for usein TOA, and illustrates recent applications with cross-scale case studies.We conclude with adiscussion of the opportunities and challenges for the use of TOA in research priority settingand management at global and project levels, using the case of the CGIAR to illustrate.
2 Designing and evaluating agricultural research for sustainabledevelopment
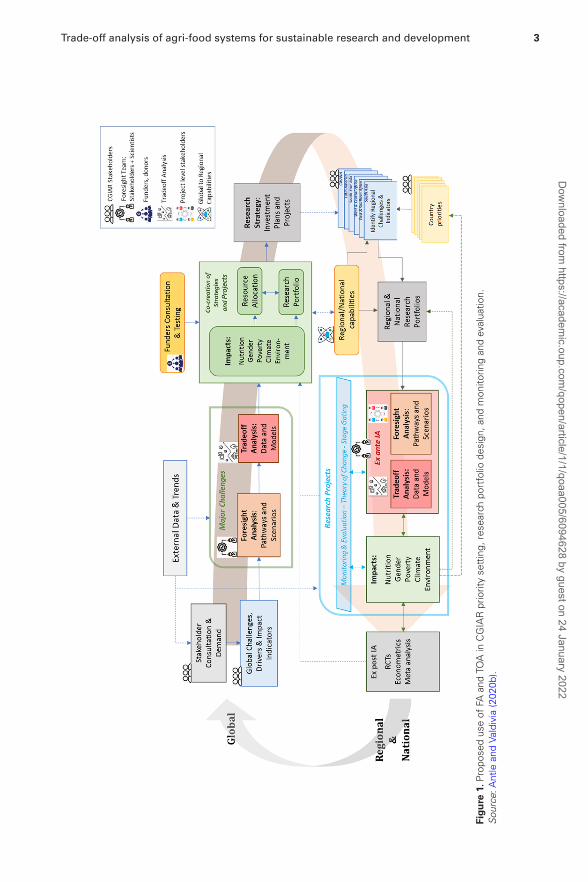
Agricultural research organizations around the world are now confronting the challenge ofadapting their investment decisions to achieve sustainable development. We use the currentefforts by the CGIAR’s reform toward ‘One CGIAR’ to illustrate the processes that are likelyto be involved (Barret et al. 2020). The CGIAR leadership and its donors have identifiedfive principal sustainable development impact areas associated with its overarching goalof ending hunger by 2030: nutrition and food security; poverty reduction, livelihoods, andjobs; gender equality, youth, and social inclusion; climate adaptation and greenhouse gas(GHG) reduction; and environmental health and biodiversity. As illustrated in Fig. 1, this
Dow
nloaded from https://academ
ic.oup.com/qopen/article/1/1/qoaa005/6094628 by guest on 24 January 2022
Trade-off analysis of agri-food systems for sustainable research and development 3
Figure
1.Prop
osed
useof
FAan
dTO
Ain
CGIARpriorityse
tting,
rese
arch
portfolio
design
,and
mon
itorin
gan
dev
alua
tion.
Source
:Antle
andVa
ldivia(202
0b).
Dow
nloaded from https://academ
ic.oup.com/qopen/article/1/1/qoaa005/6094628 by guest on 24 January 2022
4 John M. Antle and Roberto O. Valdivia
goal will be pursued through a small set of global and regional programs that address majorchallenges (CGIAR System Reference Group 2019).
Figure 1 illustrates how FA and TOA could fit into the CGIAR global and regional prioritysetting processes. These processes should be based on data and evidence created through theincorporation of FA and TOA and alignedwith the theory of change andME processes at thespatial and temporal scales appropriate to selected impact indicators. The global researchstrategy is built around stakeholder consultations that identify major global challenges andcorresponding impact indicators in the five priority impact areas, including goals for theseindicators. For each major challenge area:
• FA with stakeholders and scientists identifies a set of plausible future developmentpathways and agri-food system innovation scenarios implied by each challenge area.
• The pathways and innovation scenarios are used to implement TOA to evaluate the setsor ranges of impacts that are feasible, using the selected impact indicators. These sce-narios should include sufficient detail to enable project design in the following stagesof the process.
• Based on the FA and TOA results, consultations with funders and stakeholders lead tothe co-creation of a research strategy, including prospective research projects consistentwith goals in the five impact areas, and allocation of resources among projects.
• The research strategy is communicated to the regional programs for consultation withpartner countries and organizations, leading to regional and national research portfo-lios of projects consistent with capabilities in the regions.
• Research project implementation proceeds with activities to support project-level FA,TOA, and ME. FA and TOA are implemented at the beginning of a project to informthe design of the initial technology ‘funnel’ consistent with impact goals. Accumulationof data over time and improvement of models allow updating of TOA analysis. Thisinformation is passed to projectME and also synthesized with data from other projectsand the challenge areas and communicated to the global priority setting process.
• At the project level, a set of protocols is followed to ensure cost-effective implementa-tion of FA, TOA, and ME.◦ Allocate resources to FA, TOA, and ME to ensure they are part of every project and
scaled to the project’s budget.◦ Identify quantifiable indicators in each impact area; if indicators are not quantifiable,
then qualitative indicators should be identified.◦ Identify disciplinary data and models needed to carry out quantitative TOA. Data
should meet standards for minimum data to support initial and ongoing TOA andmeet standards to be findable, accessible, interpretable, ethical, and reproducible.
• Information is fed back from the project level to focus the technology developmentfunnels and periodically review and update institute-wide priorities.
3 TOA of agri-food systems
We define agri-food system TOA as a participatory process using qualitative and quantita-tive data and modeling tools to evaluate how technological and institutional innovationscan improve system performance using foresight methods and relevant metrics describedas impact indicators. This section discusses the motivations and rationale for TOA and il-lustrates the TOA method with the first application of TOA in CGIAR research, and thendiscusses the conceptual foundations and key elements of TOA.
3.1 Motivations for TOA
TOA addresses decision problems that arise in the management and improvement of com-plex, dynamic,multiscale systems with high levels of uncertainty. A key property of complex
Dow
nloaded from https://academ
ic.oup.com/qopen/article/1/1/qoaa005/6094628 by guest on 24 January 2022
Trade-off analysis of agri-food systems for sustainable research and development 5
systems, such as agri-food systems, is that the outputs and outcomes and eventual impactsof these systems are multidimensional and incommensurate. For example, in the case wepresent in the next section, pesticide use potentially impacts farm households’ incomes andthe health of farm family members, as well as the health of other members of the commu-nity, food consumers, and the environment. The conventional economic decision framework(BCA) would be applied to a problem like this by attempting to quantify and value the eco-nomic impacts (say, on farm household incomes), as well as the impacts on human health, inmonetary units. Economists argue that people must make choices that imply trade-offs be-tween monetary and non-market outcomes such as health, and thus imply implicit monetaryvalues to non-market outcomes (Loomis 2005). Yet, even if one accepts monetary valuationof non-market outcomes as valid, researchers rarely if ever have the resources available toaccount for the differing values within a diverse society, such as the multiple stakeholdersthat are represented in the research priority setting process described in Fig. 1. Thus, bytreating outcomes such as health or environmental risk as a monetary value, and aggregat-ing all such values into ‘net benefits’, researchers are obscuring rather than elucidating thetrade-offs that exist among outcomes, as well as the distribution of those outcomes amongmembers of society (Capalbo, Antle, and Seavert 2017).
Another motivation for TOA is the ubiquity and magnitude of multidimensional impactsand the diversity of stakeholder interests, values, and social and political decision-makingprocesses. These considerations belie the use of BCA or the maximization of a ‘social welfarefunction’ to choose technology or policy options. It is implausible in most cases to valueall impacts in monetary terms for BCA; thus, even when some non-market impacts canbe monetized, other dimensions that are rarely if ever monetized, such as gender-relatedimpacts, are often ignored (Lentz 2020). Consequently, attempting to ‘optimize’ in a subsetof the relevant dimensions will generally result in a ‘sub-optimal’ solution, if a well-definedand valid objective function exists. However, in fact there is no one objective function orsocial welfare functions to be maximized when there are diverse stakeholders with differentvalues. Thus, in actual decision-making contexts such as illustrated in Fig. 1, stakeholdersneed information about impacts and their inter-relationships (trade-offs and synergies) tohelp them choose among alternative development pathways, based on their values and onthe decision-making processes that are operating in their social and political settings.
Another key feature of forward-looking analysis is uncertainty. Forward-looking analy-sis deals with uncertainty by using scenario analysis methods. The goal is not to ‘predict’the future but rather to identify plausible ranges of outcomes, based on plausible ranges ofassumptions about the future.An example is the development of ‘Representative Concentra-tion Pathways’ and ‘Shared Socioeconomic Pathways’ by climate scientists to project futureclimate impacts using global integrated assessment models. Similarly, potential future agri-food system pathways are being evaluated using scenario methods (Lentz 2020; Valdiviaet al. 2015, 2020; Zurek, Hebinck, and Selomane 2020). The two case studies presented inSection 4.3illustrate the use of scenario methods for TOA.
Thus, TOA is motivated by the goal of elucidating potential impacts associated withactual or potential changes in an agri-food system, so that stakeholders can make in-formed choices among options using their own valuation among multiple, incommensurateoutcomes—i.e. outcomes that can be defined in different units. A critical component of TOAimplementation is therefore the selection of the relevant metrics of system performance thatare described as impact indicators. In large, complex systems, there are many potential im-pacts, and thus many possible impact indicators. Given that time and other resources arealways limited, a key part of TOA implementation is to select a minimally sufficient setof impact indicators to evaluate system performance consistent with stakeholder priorities.This aspect of TOA implementation is a judgment that must be made given the problemat hand, the research objectives, and the resources available. These elements of TOA areillustrated in the following section.
Dow
nloaded from https://academ
ic.oup.com/qopen/article/1/1/qoaa005/6094628 by guest on 24 January 2022

6 John M. Antle and Roberto O. Valdivia
3.2 TOA example: the Rockefeller pesticide studies
Two of the first uses of TOA in international agricultural research were studies supportedby the Rockefeller Foundation in the 1990s, one at the International Rice Research Instituteand one at the International Potato Center (CIP). Besides being the first studies of their kind,they laid out the foundations and conceptual framework of TOA and served to illustratethe ‘mechanics’ of TOA. These studies also provided important lessons about the poten-tial unintended consequences of agricultural technology development, and the potential forforward-looking analysis to evaluate options to improve the performance of the productionsystems in economic, environmental, and health dimensions.Background: Two studies in the 1990s funded by the Rockefeller Foundation carried out
analysis of the economic, environmental, and health impacts of pesticide use in rice pro-duction in the Philippines and potato production in Ecuador (Pingali and Roger 1995;Crissman, Antle, and Capalbo 1998). These studies were motivated by the recognitionamong farm communities, environmental interests, scientists, and the wider society of envi-ronmental risks associated with the use of highly toxic pesticides. In additional to environ-mental contamination, both studies found strong evidence of substantial acute health risksto farm workers and household members, most notably neurological impairment from ex-posure to highly toxic insecticides and fungicides. Both studies also showed there were trade-offs between farm income and human health with reductions in the use of these pesticides.However, better safety procedures for handling and use, and the use of better managementpractices such as integrated pest management (IPM) were found to produce ‘win–win’ out-comes, thus effectively improving the terms of the economic–health trade-offs. Developmentof IPM and farmer education, more effective labeling of pesticides for risk, and restrictinguse of the most harmful insecticides were among policy recommendations. In both cases,a clear implication for crop breeding was to focus attention on resistance to major diseaseand insect pests. Notably, in the case of potatoes, development of late blight-resistant pota-toes was a priority that also could potentially create win–win economic, environmental, andhealth outcomes, and was a focus of subsequent research led by CIP.TOA process: Both studies used a participatory process that brought together scientists
and stakeholders (researchers, farmers, local farm organizations, local to national policy andpolitical leaders) to identify key impact indicators—in these studies, the indicators were eco-nomic (crop production, farm income), environmental (water contamination from pesticideleaching to ground and runoff to surface water; harm to aquatic life and other species), andhuman health (acute health effects on farmworkers and family members, including impairedneurological function). The indicators in turn were used to identify the economic, environ-mental, and health data needed, and the disciplinary models needed to model and simulatethe systems. Stakeholders (scientists, interest groups, farmers, policymakers) also helped toidentify the technology and impact pathways (scenarios) for analysis, including the use ofimproved self-protection, the adoption of IPM practices, and feasible policy interventionssuch as pesticide regulation.Data: A key element of both studies was to identify the data needed to quantify the
selected indicators. Detailed farm production data were needed that could be combinedwith data on the practices and health of farm workers. As a result, a novel feature of bothstudies was collaboration with medical teams to collect data on pesticide use as well asthe health of farm workers making the applications. These workers typically applied highlytoxic ‘cocktails’ of multiple pesticides using backpack sprayers with little protection fromexposure during mixing and application.TOA modeling: These studies used simulation models to evaluate the economic and
health outcomes associated with changes in pesticide use. Economic outcomes were quanti-fied using econometric models that were simulated over alternative prices and managementpractices. Equations representing health outcomes were estimated using data collected from
Dow
nloaded from https://academ
ic.oup.com/qopen/article/1/1/qoaa005/6094628 by guest on 24 January 2022
Trade-off analysis of agri-food systems for sustainable research and development 7
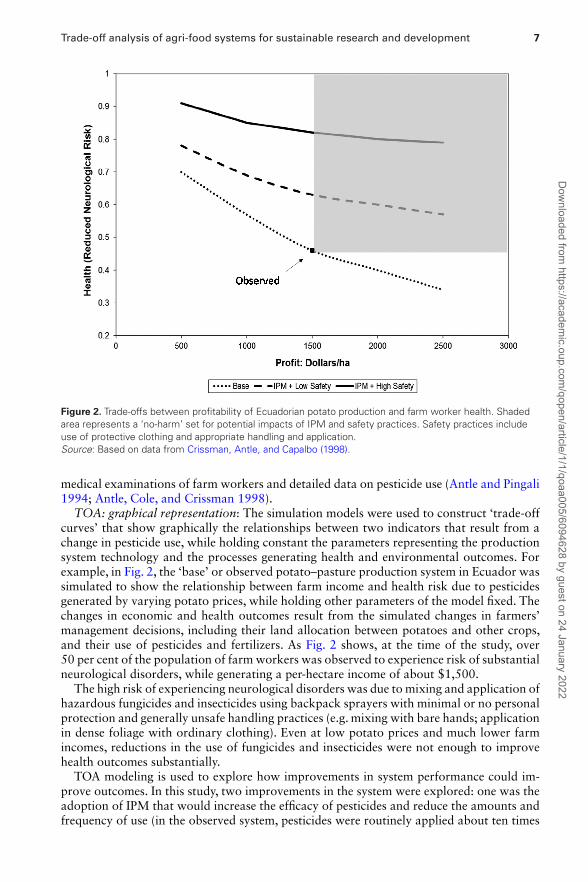
Figure 2. Trade-offs between profitability of Ecuadorian potato production and farm worker health. Shadedarea represents a ‘no-harm’ set for potential impacts of IPM and safety practices. Safety practices includeuse of protective clothing and appropriate handling and application.Source: Based on data from Crissman, Antle, and Capalbo (1998).
medical examinations of farm workers and detailed data on pesticide use (Antle and Pingali1994; Antle, Cole, and Crissman 1998).TOA: graphical representation: The simulation models were used to construct ‘trade-off
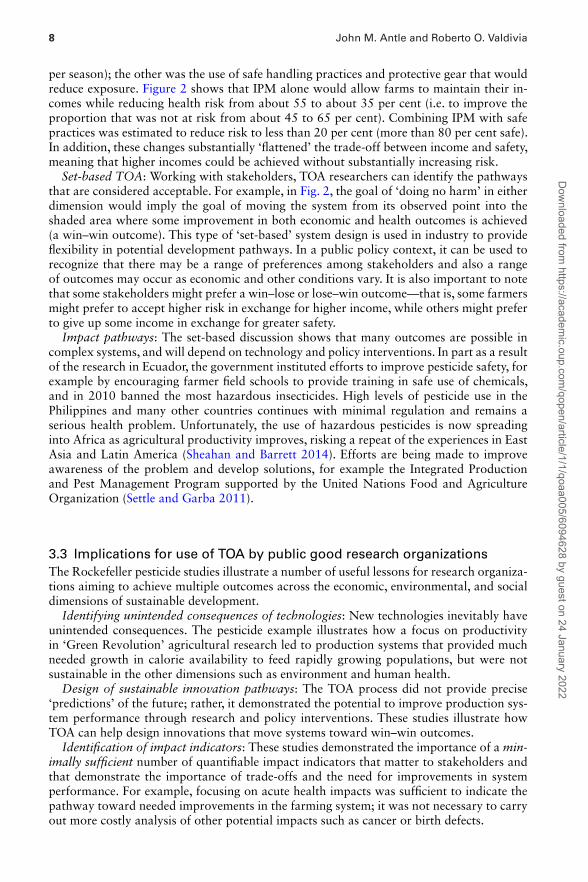
curves’ that show graphically the relationships between two indicators that result from achange in pesticide use, while holding constant the parameters representing the productionsystem technology and the processes generating health and environmental outcomes. Forexample, in Fig. 2, the ‘base’ or observed potato–pasture production system in Ecuador wassimulated to show the relationship between farm income and health risk due to pesticidesgenerated by varying potato prices, while holding other parameters of the model fixed. Thechanges in economic and health outcomes result from the simulated changes in farmers’management decisions, including their land allocation between potatoes and other crops,and their use of pesticides and fertilizers. As Fig. 2 shows, at the time of the study, over50 per cent of the population of farmworkers was observed to experience risk of substantialneurological disorders, while generating a per-hectare income of about $1,500.
The high risk of experiencing neurological disorders was due to mixing and application ofhazardous fungicides and insecticides using backpack sprayers with minimal or no personalprotection and generally unsafe handling practices (e.g.mixing with bare hands; applicationin dense foliage with ordinary clothing). Even at low potato prices and much lower farmincomes, reductions in the use of fungicides and insecticides were not enough to improvehealth outcomes substantially.
TOA modeling is used to explore how improvements in system performance could im-prove outcomes. In this study, two improvements in the system were explored: one was theadoption of IPM that would increase the efficacy of pesticides and reduce the amounts andfrequency of use (in the observed system, pesticides were routinely applied about ten times
Dow
nloaded from https://academ
ic.oup.com/qopen/article/1/1/qoaa005/6094628 by guest on 24 January 2022
8 John M. Antle and Roberto O. Valdivia
per season); the other was the use of safe handling practices and protective gear that wouldreduce exposure. Figure 2 shows that IPM alone would allow farms to maintain their in-comes while reducing health risk from about 55 to about 35 per cent (i.e. to improve theproportion that was not at risk from about 45 to 65 per cent). Combining IPM with safepractices was estimated to reduce risk to less than 20 per cent (more than 80 per cent safe).In addition, these changes substantially ‘flattened’ the trade-off between income and safety,meaning that higher incomes could be achieved without substantially increasing risk.Set-based TOA: Working with stakeholders, TOA researchers can identify the pathways
that are considered acceptable. For example, in Fig. 2, the goal of ‘doing no harm’ in eitherdimension would imply the goal of moving the system from its observed point into theshaded area where some improvement in both economic and health outcomes is achieved(a win–win outcome). This type of ‘set-based’ system design is used in industry to provideflexibility in potential development pathways. In a public policy context, it can be used torecognize that there may be a range of preferences among stakeholders and also a rangeof outcomes may occur as economic and other conditions vary. It is also important to notethat some stakeholders might prefer a win–lose or lose–win outcome—that is, some farmersmight prefer to accept higher risk in exchange for higher income, while others might preferto give up some income in exchange for greater safety.Impact pathways: The set-based discussion shows that many outcomes are possible in
complex systems, and will depend on technology and policy interventions. In part as a resultof the research in Ecuador, the government instituted efforts to improve pesticide safety, forexample by encouraging farmer field schools to provide training in safe use of chemicals,and in 2010 banned the most hazardous insecticides. High levels of pesticide use in thePhilippines and many other countries continues with minimal regulation and remains aserious health problem. Unfortunately, the use of hazardous pesticides is now spreadinginto Africa as agricultural productivity improves, risking a repeat of the experiences in EastAsia and Latin America (Sheahan and Barrett 2014). Efforts are being made to improveawareness of the problem and develop solutions, for example the Integrated Productionand Pest Management Program supported by the United Nations Food and AgricultureOrganization (Settle and Garba 2011).
3.3 Implications for use of TOA by public good research organizations
The Rockefeller pesticide studies illustrate a number of useful lessons for research organiza-tions aiming to achieve multiple outcomes across the economic, environmental, and socialdimensions of sustainable development.Identifying unintended consequences of technologies: New technologies inevitably have
unintended consequences. The pesticide example illustrates how a focus on productivityin ‘Green Revolution’ agricultural research led to production systems that provided muchneeded growth in calorie availability to feed rapidly growing populations, but were notsustainable in the other dimensions such as environment and human health.Design of sustainable innovation pathways: The TOA process did not provide precise
‘predictions’ of the future; rather, it demonstrated the potential to improve production sys-tem performance through research and policy interventions. These studies illustrate howTOA can help design innovations that move systems toward win–win outcomes.Identification of impact indicators: These studies demonstrated the importance of a min-
imally sufficient number of quantifiable impact indicators that matter to stakeholders andthat demonstrate the importance of trade-offs and the need for improvements in systemperformance. For example, focusing on acute health impacts was sufficient to indicate thepathway toward needed improvements in the farming system; it was not necessary to carryout more costly analysis of other potential impacts such as cancer or birth defects.
Dow
nloaded from https://academ
ic.oup.com/qopen/article/1/1/qoaa005/6094628 by guest on 24 January 2022
Trade-off analysis of agri-food systems for sustainable research and development 9
Importance of new and better data: These studies identified critical new data needed—data on farm workers’ health that could be linked to their pesticide use and exposure—toprovide the evidence needed on impacts. Today, this remains true in several impact areassuch as nutrition and gender.Importance of appropriate disciplinary models and analytical methods: A multidisci-
plinary, model-based approach made it possible to simulate outcomes that could not beobserved in the field, and could not be obtained from classical experimental approaches.Models could predict out of sample to show potential pathways to improve system perfor-mance. Whereas disciplinary models for some environmental impacts were available (i.e.for pesticide transport in the environment), models for health impacts were not availableto the research teams, so statistical models needed to be devised. This lack of disciplinarymodels remains a challenge for several of the impact areas of concern, notably in nutritionand gender, as discussed in Section 4.4.Methods to communicate impacts: The pesticide project research teams realized that even
two-dimensional graphs such as Fig. 2 were not likely to be effective to communicate re-sults of TOA, so other types of data displays and pictures were used. Since then, manyinnovations in data analytics and visualization, such as the ones illustrated in Section 4,are available and should be used. Particularly useful for presenting TOA results would berecently developed dashboard tools designed to compare and contrast results from multiplescenarios. These include the AgMIP (Agricultural Model Intercomparison and Improve-ment Project) Impact Explorer (http://agmip-ie.wenr.wur.nl/) and the Food Security Portaland the Global Foresight for Food and Agriculture Tool (http://tools.foodsecurityportal.org/impacts-alternative-agricultural-investments-version-9).
3.4 Participatory modeling framework for TOA
The early pesticide studies discussed above developed a participatory approach that in-volved scientists and stakeholders to identify the key impact indicators, and the correspond-ing disciplinary data and models that were needed to quantify those indicators in an agricul-tural system simulation (Crissman, Antle, and Capalbo 1998). Since the 1990s, there havebeen many innovations in methods for participatory modeling, as well as many advances indata and models discussed in the following section of this paper.
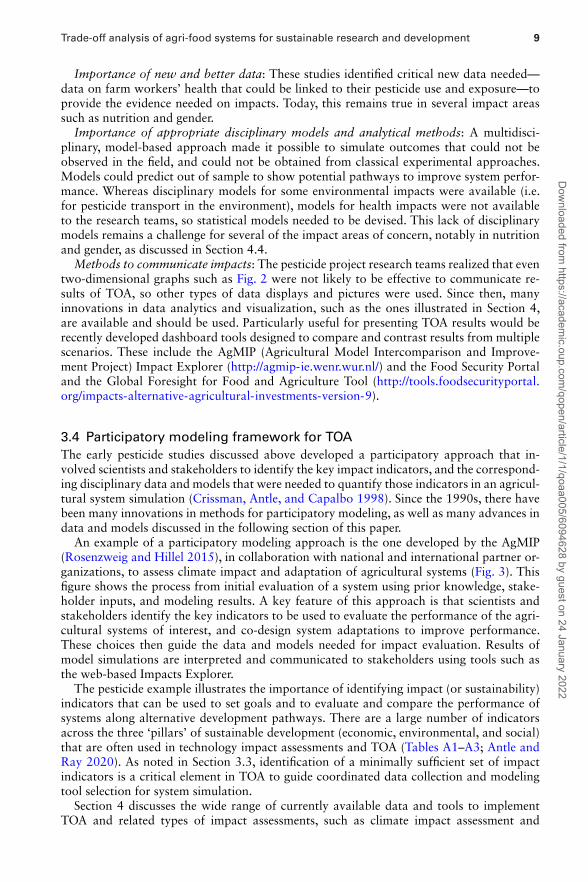
An example of a participatory modeling approach is the one developed by the AgMIP(Rosenzweig and Hillel 2015), in collaboration with national and international partner or-ganizations, to assess climate impact and adaptation of agricultural systems (Fig. 3). Thisfigure shows the process from initial evaluation of a system using prior knowledge, stake-holder inputs, and modeling results. A key feature of this approach is that scientists andstakeholders identify the key indicators to be used to evaluate the performance of the agri-cultural systems of interest, and co-design system adaptations to improve performance.These choices then guide the data and models needed for impact evaluation. Results ofmodel simulations are interpreted and communicated to stakeholders using tools such asthe web-based Impacts Explorer.
The pesticide example illustrates the importance of identifying impact (or sustainability)indicators that can be used to set goals and to evaluate and compare the performance ofsystems along alternative development pathways. There are a large number of indicatorsacross the three ‘pillars’ of sustainable development (economic, environmental, and social)that are often used in technology impact assessments and TOA (Tables A1–A3; Antle andRay 2020). As noted in Section 3.3, identification of a minimally sufficient set of impactindicators is a critical element in TOA to guide coordinated data collection and modelingtool selection for system simulation.
Section 4 discusses the wide range of currently available data and tools to implementTOA and related types of impact assessments, such as climate impact assessment and
Dow
nloaded from https://academ
ic.oup.com/qopen/article/1/1/qoaa005/6094628 by guest on 24 January 2022
10 John M. Antle and Roberto O. Valdivia
Figure
3.AgM
IPregion
alintegrated
asse
ssmen
tproc
ess.
Source
:Valdiviaetal.(20
19).
Dow
nloaded from https://academ
ic.oup.com/qopen/article/1/1/qoaa005/6094628 by guest on 24 January 2022
Trade-off analysis of agri-food systems for sustainable research and development 11
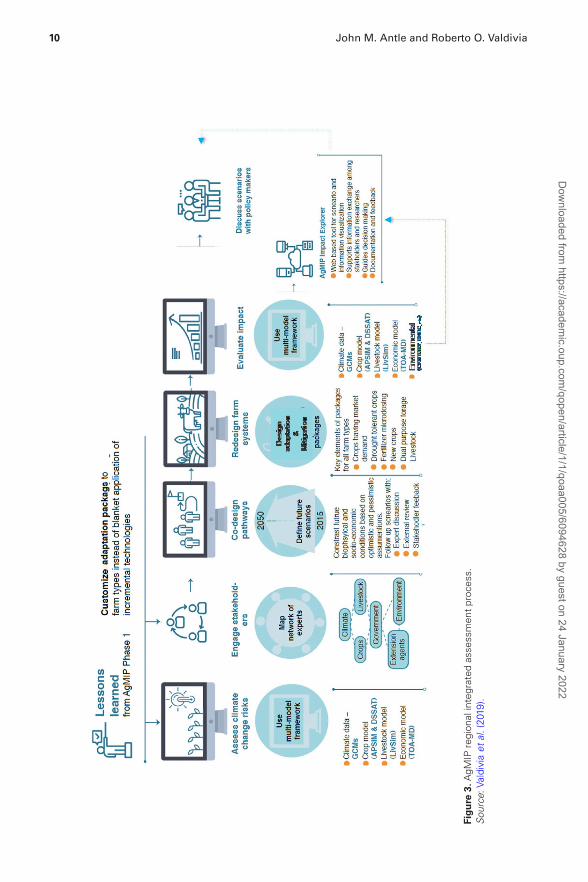
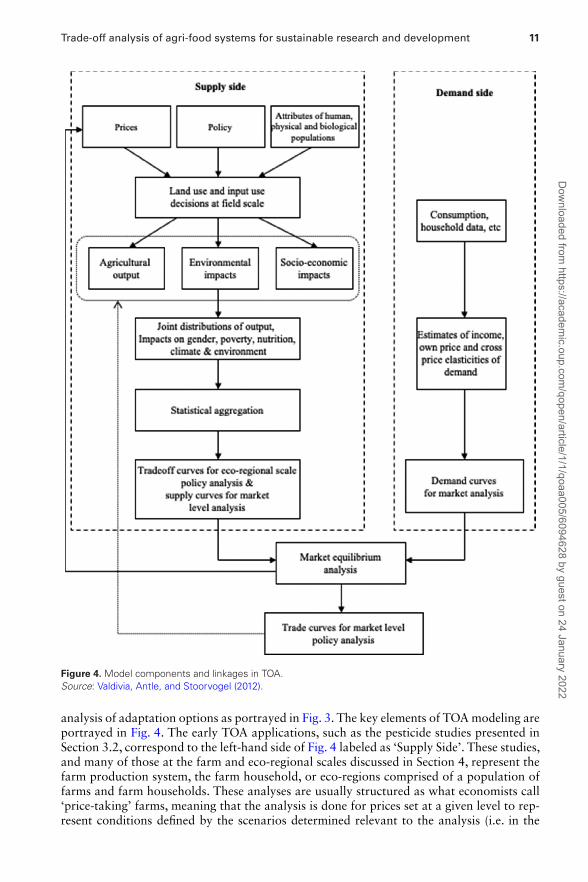
Figure 4. Model components and linkages in TOA.Source: Valdivia, Antle, and Stoorvogel (2012).
analysis of adaptation options as portrayed in Fig. 3. The key elements of TOAmodeling areportrayed in Fig. 4. The early TOA applications, such as the pesticide studies presented inSection 3.2, correspond to the left-hand side of Fig. 4 labeled as ‘Supply Side’. These studies,and many of those at the farm and eco-regional scales discussed in Section 4, represent thefarm production system, the farm household, or eco-regions comprised of a population offarms and farm households. These analyses are usually structured as what economists call‘price-taking’ farms, meaning that the analysis is done for prices set at a given level to rep-resent conditions defined by the scenarios determined relevant to the analysis (i.e. in the
Dow
nloaded from https://academ
ic.oup.com/qopen/article/1/1/qoaa005/6094628 by guest on 24 January 2022
12 John M. Antle and Roberto O. Valdivia
participatory development pathway design processes of Fig. 3). However, more recentstudies have begun to link these ‘Supply Side’ analyses to the demand side of marketsat subnational, national, or global levels, represented by the ‘Demand Side’ in Fig. 4.Currently, this sort of cross-scale linkage is at the frontier of TOA modeling. It providesa way to expand the scope of indicators in an analysis to the demand side, and to incor-porate feedbacks from market processes and price changes to the impacts at the farm oreco-regional scale.
An important insight from research on modeling human systems and their environmen-tal impacts is the importance of the similarities and differences in spatial and temporalscales within and across the various processes involved. These systems (physical, biologi-cal, human) are each complex and operate at various scales. Understanding these systems,modeling them, and devising ways to link them through their inputs and outputs, or inte-grate them into larger, ever more complex systems, is a daunting scientific challenge. Mostresearch to date has linked disciplinary models through input and output protocols. Theneed to combine models gives rise to the need for coordination across disciplines to identifyand obtain the data needed. For example, agronomists doing on-farm trials of new cropvarieties need to know what data are needed for economic analysis of the adoption andimpact of the technology. These insights are the basis for the recommendations in this pa-per that data standards should be established for ongoing efficient data collection efforts byprojects and programs, linked to the impact indicators that are identified in collaborationwith stakeholders.
4 Data and models for TOA
This section reviews the application of modeling tools at multiple scales and their featuresto conduct TOA of agricultural systems.
4.1 Major modeling approaches
A range of tools and approaches have been developed to evaluate impacts of agriculturaltechnologies and their potential trade-offs, and have been used by national and internationalresearch organizations since the early years of the Green Revolution. In this section, webriefly discuss the major modeling approaches. The following section reviews a number ofmodeling studies that have used these approaches.
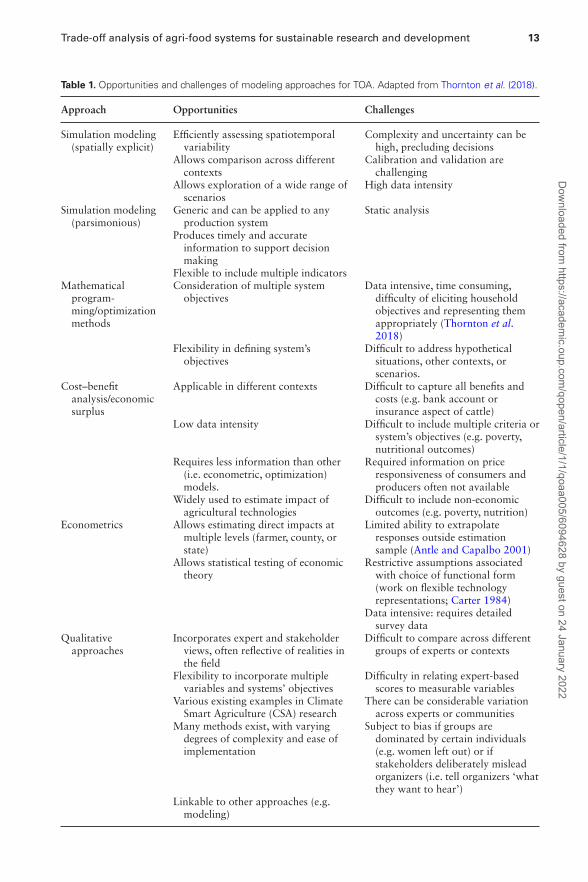
Cost–benefit analysis was applied in the 1970s to evaluate financial margins of new agri-cultural technologies (Herdt 1991; Alston et al. 1995).As sustainability began to be acceptedas a valid concept to guide economic development, interest in agricultural sustainability ledto new analytical approaches that coupled biophysical and economic data and models to as-sess the sustainability of agricultural systems. As discussed in Section 3, early TOA coupledeconomic, environmental, and health models to evaluate agricultural sustainability (Antleand Pingali 1994; Crissman, Antle, and Capalbo 1998; Pingali and Rosegrant 1994). An-alytical methods used for quantitative impact assessment and TOA are described below;opportunities and challenges for their use in TOA are described in Table 1.Simulation modeling: This approach is used to explore options that are not observed
or can be difficult to test in reality. These models have been applied to assess agri-cultural production at various levels of research, including crop, livestock, and farmingsystem‘(Klapwijk et al. 2014; Thornton et al. 2018). Simulation models are typically com-plex and are data intensive (e.g. spatially explicit models). Reduced-form or parsimonioussimulation models have been developed as alternative to provide timely information and atlow cost.Mathematical programming and optimization methods: These models are based on linear
or quadratic programming to achieve an objective such as input minimization or output
Dow
nloaded from https://academ
ic.oup.com/qopen/article/1/1/qoaa005/6094628 by guest on 24 January 2022
Trade-off analysis of agri-food systems for sustainable research and development 13
Table 1. Opportunities and challenges of modeling approaches for TOA. Adapted from Thornton et al. (2018).
Approach Opportunities Challenges
Simulation modeling(spatially explicit)
Efficiently assessing spatiotemporalvariability
Complexity and uncertainty can behigh, precluding decisions
Allows comparison across differentcontexts
Calibration and validation arechallenging
Allows exploration of a wide range ofscenarios
High data intensity
Simulation modeling(parsimonious)
Generic and can be applied to anyproduction system
Static analysis
Produces timely and accurateinformation to support decisionmaking
Flexible to include multiple indicatorsMathematicalprogram-ming/optimizationmethods
Consideration of multiple systemobjectives
Data intensive, time consuming,difficulty of eliciting householdobjectives and representing themappropriately (Thornton et al.2018)
Flexibility in defining system’sobjectives
Difficult to address hypotheticalsituations, other contexts, orscenarios.
Cost–benefitanalysis/economicsurplus
Applicable in different contexts Difficult to capture all benefits andcosts (e.g. bank account orinsurance aspect of cattle)
Low data intensity Difficult to include multiple criteria orsystem’s objectives (e.g. poverty,nutritional outcomes)
Requires less information than other(i.e. econometric, optimization)models.
Required information on priceresponsiveness of consumers andproducers often not available
Widely used to estimate impact ofagricultural technologies
Difficult to include non-economicoutcomes (e.g. poverty, nutrition)
Econometrics Allows estimating direct impacts atmultiple levels (farmer, county, orstate)
Limited ability to extrapolateresponses outside estimationsample (Antle and Capalbo 2001)
Allows statistical testing of economictheory
Restrictive assumptions associatedwith choice of functional form(work on flexible technologyrepresentations; Carter 1984)
Data intensive: requires detailedsurvey data
Qualitativeapproaches
Incorporates expert and stakeholderviews, often reflective of realities inthe field
Difficult to compare across differentgroups of experts or contexts
Flexibility to incorporate multiplevariables and systems’ objectives
Difficulty in relating expert-basedscores to measurable variables
Various existing examples in ClimateSmart Agriculture (CSA) research
There can be considerable variationacross experts or communities
Many methods exist, with varyingdegrees of complexity and ease ofimplementation
Subject to bias if groups aredominated by certain individuals(e.g. women left out) or ifstakeholders deliberately misleadorganizers (i.e. tell organizers ‘whatthey want to hear’)
Linkable to other approaches (e.g.modeling)
Dow
nloaded from https://academ
ic.oup.com/qopen/article/1/1/qoaa005/6094628 by guest on 24 January 2022
14 John M. Antle and Roberto O. Valdivia
Table 1. (Continued).
Approach Opportunities Challenges
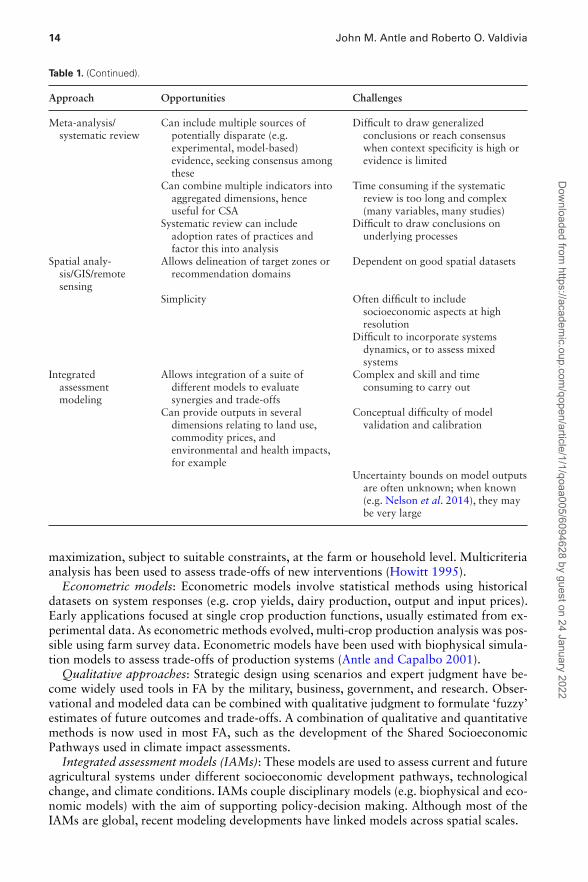
Meta-analysis/systematic review
Can include multiple sources ofpotentially disparate (e.g.experimental, model-based)evidence, seeking consensus amongthese
Difficult to draw generalizedconclusions or reach consensuswhen context specificity is high orevidence is limited
Can combine multiple indicators intoaggregated dimensions, henceuseful for CSA
Time consuming if the systematicreview is too long and complex(many variables, many studies)
Systematic review can includeadoption rates of practices andfactor this into analysis
Difficult to draw conclusions onunderlying processes
Spatial analy-sis/GIS/remotesensing
Allows delineation of target zones orrecommendation domains
Dependent on good spatial datasets
Simplicity Often difficult to includesocioeconomic aspects at highresolution
Difficult to incorporate systemsdynamics, or to assess mixedsystems
Integratedassessmentmodeling
Allows integration of a suite ofdifferent models to evaluatesynergies and trade-offs
Complex and skill and timeconsuming to carry out
Can provide outputs in severaldimensions relating to land use,commodity prices, andenvironmental and health impacts,for example
Conceptual difficulty of modelvalidation and calibration
Uncertainty bounds on model outputsare often unknown; when known(e.g. Nelson et al. 2014), they maybe very large
maximization, subject to suitable constraints, at the farm or household level. Multicriteriaanalysis has been used to assess trade-offs of new interventions (Howitt 1995).Econometric models: Econometric models involve statistical methods using historical
datasets on system responses (e.g. crop yields, dairy production, output and input prices).Early applications focused at single crop production functions, usually estimated from ex-perimental data. As econometric methods evolved, multi-crop production analysis was pos-sible using farm survey data. Econometric models have been used with biophysical simula-tion models to assess trade-offs of production systems (Antle and Capalbo 2001).Qualitative approaches: Strategic design using scenarios and expert judgment have be-
come widely used tools in FA by the military, business, government, and research. Obser-vational and modeled data can be combined with qualitative judgment to formulate ‘fuzzy’estimates of future outcomes and trade-offs. A combination of qualitative and quantitativemethods is now used in most FA, such as the development of the Shared SocioeconomicPathways used in climate impact assessments.Integrated assessment models (IAMs): These models are used to assess current and future
agricultural systems under different socioeconomic development pathways, technologicalchange, and climate conditions. IAMs couple disciplinary models (e.g. biophysical and eco-nomic models) with the aim of supporting policy-decision making. Although most of theIAMs are global, recent modeling developments have linked models across spatial scales.
Dow
nloaded from https://academ
ic.oup.com/qopen/article/1/1/qoaa005/6094628 by guest on 24 January 2022

Trade-off analysis of agri-food systems for sustainable research and development 15
Meta-analysis and systematic reviews: Meta-analysis involves a systematic review of pub-lished studies, and can include statistical analysis of results to obtain general conclusions.Some recent meta-analyses include Challinor et al. (2014), using 1,700 studies to assessthe impacts of climate change on maize, wheat, and rice yields. Corbeels et al. (2014) andRusinamhodzi et al. (2011) have conducted meta-analysis of conservation agriculture stud-ies.
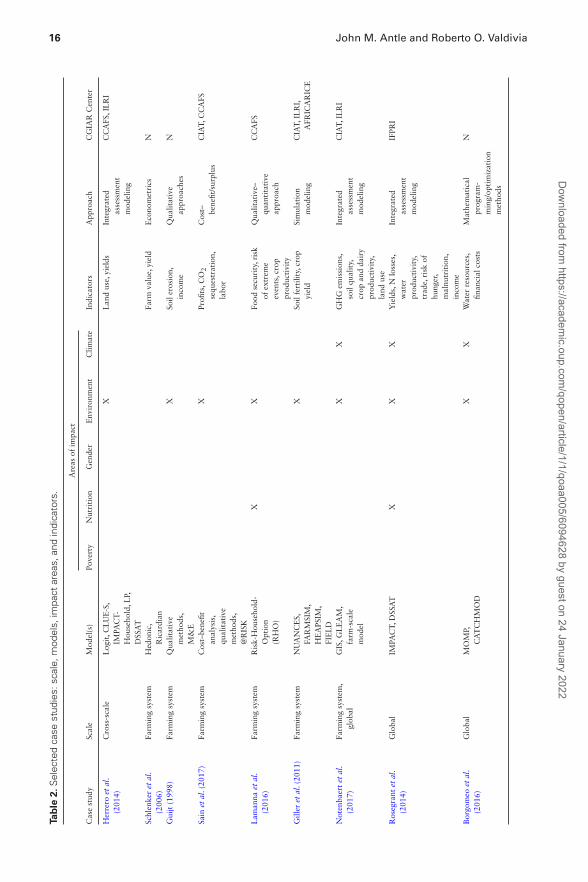
4.2 Modeling studies: scales, impact areas, and indicators
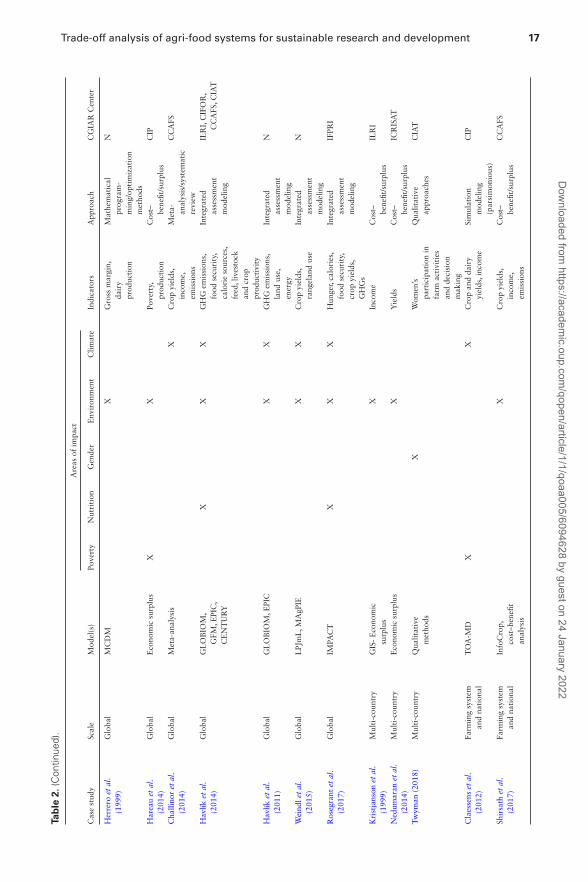
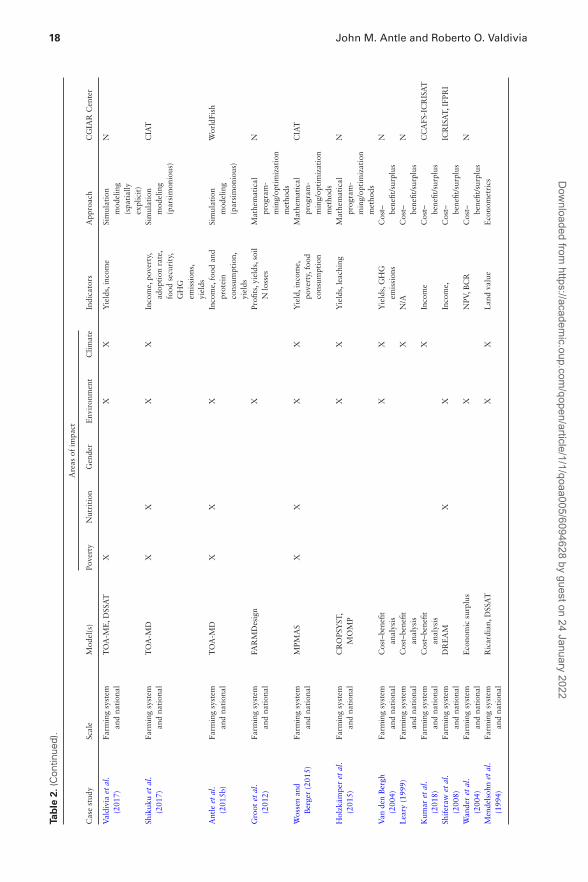
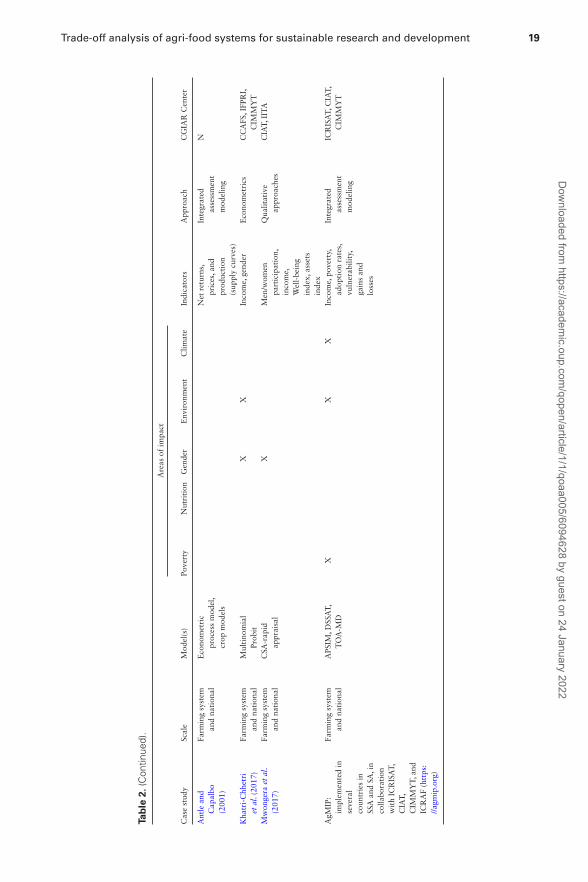
Table 2 presents examples of case studies using the approaches and models discussed inthe previous sections and identifies the impact areas and types of indicators used. The casestudies presented illustrate how they can inform priority setting at each scale. This is nota comprehensive review; rather, the goal is to illustrate studies across the types of methodsdescribed in the previous section and the scale they have been implemented. To focus thediscussion, we consider how they map into the five impact areas identified by the CGIAR.Field level: Biophysical process-based models that simulate crop or livestock yields are
widely used. Among the most important ones are the multiple crop simulation models em-bedded in the Decision Support System for Agrotechnology Transfer (DSSAT; Hoogenboomet al. 2019), the Agricultural Production Systems sIMulator (APSIM; Keating et al. 2003),Cropping Systems Simulation Model (CROPSYST; Stöckle, Donatelli, and Nelson 2003),Environmental Policy Integrated Climate (EPIC; Williams and Singh 1995), RUMINANT(Herrero et al. 2013), LIVESIM (Rufino et al. 2009), and LIFE-SIM (León Velarde et al.2006).Farm level: Economic models are used to estimate farmers’ livelihoods as well as farm
profitability. Often these models are linked to biophysical models to transfer field-level data(e.g. crop yields) and to environmental models (e.g. pesticide leaching). vanWijk et al. (2014)reviewed household- and farm-level models and evaluated and compared their attributesand approaches. At the landscape scale, biophysical models can simulate processes overlarge areas (e.g. watershed). The Soil Water Assessment Tool (Arnold et al. 1998), for ex-ample, simulates impacts of land use on water quantity and quality and sedimentation. TheIntegrated Valuation of Ecosystem Services and Trade-offs Tool (Tallis and Polasky 2009)estimates carbon sequestration and other ecosystem services in mixed-use landscapes usinga suite of different models.
Some economic models at this scale can be used to simulate potential adoption of agri-cultural technology or policy interventions. The Trade-off Analysis for Multi-dimensionalImpact Assessment Model (TOA-MD; Antle and Valdivia 2020a; Antle, Stoorvogel, andValdivia 2014) can simulate adoption rates of alternative technologies in heterogeneouspopulations of farms and the associated social, economic, and environmental impacts.National scale: Partial equilibrium economic models of the agricultural sector, and com-
putable general equilibrium (CGE) models of the entire economy, are being used at the na-tional level. For example, the IMPACT model (Rosegrant et al. 2008) has been adapted fornational-level analysis of policy interventions for Senegal and South Africa, and the GlobalBiosphere Management (GLOBIOM) model developed by the International Institute of Ap-plied Systems Analysis (IIASA; Havlík et al. 2011) has been adapted for national analysis forBrazil and Ethiopia. Another national-level model that has been applied to multiple coun-tries in the context of climate change and adaptation assessments is the FAO ModellingSystem for Agricultural Impacts of Climate Change to Support Decision-Making in Adap-tation (Kuik et al. 2011). The FABLE consortium has developed a generic national modelthat is being used by national modeling teams to assess sustainable development pathwayswith climate change (https://www.foodandlandusecoalition.org/fable/).Global level: More than ten major economic modeling systems have been used for global
analysis of prices, trade, and policy, and are also used for climate impact assessment (Nelson
Dow
nloaded from https://academ
ic.oup.com/qopen/article/1/1/qoaa005/6094628 by guest on 24 January 2022
16 John M. Antle and Roberto O. Valdivia
Table
2.Selec
tedcase
stud
ies:
scale,
mod
els,
impa
ctarea
s,an
dindicators.
Areas
ofim
pact
Casestud
yScale
Mod
el(s)
Poverty
Nutrition
Gender
Env
iron
ment
Clim
ate
Indicators
App
roach
CGIA
RCenter
Herrero
etal.
(201
4)Cross-scale
Log
it,C
LUE-S,
IMPA
CT-
Hou
seho
ld,L
P,DSSAT
XLan
duse,yields
Integrated
assessment
mod
eling
CCAFS
,ILRI
Schlenkeretal.
(200
6)Fa
rmingsystem
Hedon
ic,
Ricardian
Farm
value,yield
Eco
nometrics
N
Guijt(199
8)Fa
rmingsystem
Qua
litative
metho
ds,
M&E
XSo
ilerosion,
inco
me
Qua
litative
approa
ches
N
Sainetal.(20
17)
Farm
ingsystem
Cost–benefit
analysis,
qualitative
metho
ds,
@RISK
XProfi
ts,C
O2
sequ
estration,
labo
r
Cost– benefit/surplus
CIAT,
CCAFS
Lam
anna
etal.
(201
6)Fa
rmingsystem
Risk-Hou
seho
ld-
Option
(RHO)
XX
Food
security,risk
ofextrem
eevents,crop
prod
uctivity
Qua
litative–
quan
titative
approa
ch
CCAFS
Gilleretal.(20
11)
Farm
ingsystem
NUANCES,
FARM
SIM
,HEAPS
IM,
FIELD
XSo
ilfertility,crop
yield
Simulation
mod
eling
CIAT,
ILRI,
AFR
ICARIC
E
Notenba
ertetal.
(201
7)Fa
rmingsystem
,glob
alGIS,G
LEAM
,farm
-scale
mod
el
XX
GHG
emission
s,soilqu
ality,
crop
andda
iry
prod
uctivity,
land
use
Integrated
assessment
mod
eling
CIAT,
ILRI
Rosegrantetal.
(201
4)Globa
lIM
PACT,
DSSAT
XX
XYields,N
losses,
water
prod
uctivity,
trad
e,risk
ofhu
nger,
malnu
trition,
inco
me
Integrated
assessment
mod
eling
IFPR
I
Borgo
meo
etal.
(201
6)Globa
lMOMP,
CATCHMOD
XX
Water
resources,
finan
cial
costs
Mathe
matical
prog
ram-
ming/op
timization
metho
ds
N
Dow
nloaded from https://academ
ic.oup.com/qopen/article/1/1/qoaa005/6094628 by guest on 24 January 2022
Trade-off analysis of agri-food systems for sustainable research and development 17
Table
2.(Con
tinue
d).
Areas
ofim
pact
Casestud
yScale
Mod
el(s)
Poverty
Nutrition
Gender
Env
iron
ment
Clim
ate
Indicators
App
roach
CGIA
RCenter
Herrero
etal.
(199
9)Globa
lMCDM
XGross
margin,
dairy
prod
uction
Mathe
matical
prog
ram-
ming/op
timization
metho
ds
N
Hareauetal.
(201
4)Globa
lEcono
mic
surplus
XX
Poverty,
prod
uction
Cost– benefit/surplus
CIP
Cha
llino
retal.
(201
4)Globa
lMeta-an
alysis
XCropyields,
inco
me,
emission
s
Meta- analysis/systematic
review
CCAFS
Hav
líketal.
(201
4)Globa
lGLOBIO
M,
GFM
,EPIC,
CENTURY
XX
XGHG
emission
s,food
security,
caloriesources,
feed,livestock
andcrop
prod
uctivity
Integrated
assessment
mod
eling
ILRI,CIFOR,
CCAFS
,CIAT
Hav
líketal.
(201
1)Globa
lGLOBIO
M,E
PIC
XX
GHG
emission
s,land
use,
energy
Integrated
assessment
mod
eling
N
Weind
letal.
(201
5)Globa
lLPJmL,M
AgP
IEX
XCropyields,
rang
elan
duse
Integrated
assessment
mod
eling
N
Rosegrantetal.
(201
7)Globa
lIM
PACT
XX
XHun
ger,calories,
food
security,
crop
yields,
GHGs
Integrated
assessment
mod
eling
IFPR
I
Kristjanson
etal.
(199
9)Multi-cou
ntry
GIS-Econo
mic
surplus
XIncome
Cost– benefit/surplus
ILRI
Nedum
aran
etal.
(201
4)Multi-cou
ntry
Econo
mic
surplus
XYields
Cost– benefit/surplus
ICRISAT
Twym
an(201
8)Multi-cou
ntry
Qua
litative
metho
dsX
Wom
en’s
participationin
farm
activities
anddecision
mak
ing
Qua
litative
approa
ches
CIAT
Claessens
etal.
(201
2)Fa
rmingsystem
andna
tion
alTOA-M
DX
XCropan
dda
iry
yields,inc
ome
Simulation
mod
eling
(parsimon
ious)
CIP
Shirsathetal.
(201
7)Fa
rmingsystem
andna
tion
alInfoCrop,
cost–b
enefit
analysis
XCropyields,
inco
me,
emission
s
Cost– benefit/surplus
CCAFS
Dow
nloaded from https://academ
ic.oup.com/qopen/article/1/1/qoaa005/6094628 by guest on 24 January 2022
18 John M. Antle and Roberto O. Valdivia
Table
2.(Con
tinue
d).
Areas
ofim
pact
Casestud
yScale
Mod
el(s)
Poverty
Nutrition
Gender
Env
iron
ment
Clim
ate
Indicators
App
roach
CGIA
RCenter
Valdiviaetal.
(201
7)Fa
rmingsystem
andna
tion
alTOA-M
E,D
SSAT
XX
XYields,inco
me
Simulation
mod
eling
(spa
tially
explicit)
N
Shikuk
uetal.
(201
7)Fa
rmingsystem
andna
tion
alTOA-M
DX
XX
XIncome,po
verty,
adop
tion
rate,
food
security,
GHG
emission
s,yields
Simulation
mod
eling
(parsimon
ious)
CIAT
Antleetal.
(201
5b)
Farm
ingsystem
andna
tion
alTOA-M
DX
XX
Income,food
and
protein
consum
ption,
yields
Simulation
mod
eling
(parsimon
ious)
WorldFish
Grootetal.
(201
2)Fa
rmingsystem
andna
tion
alFA
RMDesign
XProfi
ts,y
ields,soil
Nlosses
Mathe
matical
prog
ram-
ming/op
timization
metho
ds
N
Wossenan
dBerger(201
5)Fa
rmingsystem
andna
tion
alM
PMAS
XX
XX
Yield,inc
ome,
poverty,food
consum
ption
Mathe
matical
prog
ram-
ming/op
timization
metho
ds
CIAT
Holzk
ämpe
retal.
(201
5)Fa
rmingsystem
andna
tion
alCROPS
YST
,MOMP
XX
Yields,leaching
Mathematical
prog
ram-
ming/op
timization
metho
ds
N
Van
denBergh
(200
4)Fa
rmingsystem
andna
tion
alCost–benefit
analysis
XX
Yields,GHG
emission
sCost– benefit/surplus
N
Leary
(199
9)Fa
rmingsystem
andna
tion
alCost–benefit
analysis
XN/A
Cost– benefit/surplus
N
Kum
aretal.
(201
8)Fa
rmingsystem
andna
tion
alCost–benefit
analysis
XIncome
Cost– benefit/surplus
CCAFS
-ICRISAT
Shiferaw
etal.
(200
8)Fa
rmingsystem
andna
tion
alDREAM
XX
Inco
me,
Cost– benefit/surplus
ICRISAT,
IFPR
I
Wan
deretal.
(200
4)Fa
rmingsystem
andna
tion
alEcono
mic
surplus
XNPV
,BCR
Cost– benefit/surplus
N
Mendelsoh
netal.
(199
4)Fa
rmingsystem
andna
tion
alRicardian
,DSSAT
XX
Lan
dvalue
Econo
metrics D
ownloaded from
https://academic.oup.com
/qopen/article/1/1/qoaa005/6094628 by guest on 24 January 2022
Trade-off analysis of agri-food systems for sustainable research and development 19
Table
2.(Con
tinue
d).
Areas
ofim
pact
Casestud
yScale
Mod
el(s)
Poverty
Nutrition
Gender
Env
iron
ment
Clim
ate
Indicators
App
roach
CGIA
RCenter
Antlean
dCap
albo
(200
1)
Farm
ingsystem
andna
tion
alEcono
metric
processmod
el,
crop
mod
els
Net
returns,
prices,a
ndprod
uction
(sup
plycurves)
Integrated
assessment
mod
eling
N
Kha
tri-Chh
etri
etal.(20
17)
Farm
ingsystem
andna
tion
alM
ultino
mial
Prob
itX
XInco
me,gend
erEco
nometrics
CCAFS
,IFP
RI,
CIM
MYT
Mwon
geraetal.
(201
7)Fa
rmingsystem
andna
tion
alCSA
-rap
idap
praisal
XMen
/wom
enpa
rticipation,
inco
me,
Well-be
ing
index,
assets
index
Qua
litative
approa
ches
CIAT,
IITA
AgM
IP:
implem
entedin
several
coun
triesin
SSAan
dSA
,in
colla
boration
withIC
RISAT,
CIAT,
CIM
MYT,
and
ICRAF(https:
//agm
ip.org)
Farm
ingsystem
andna
tion
alAPS
IM,D
SSAT,
TOA-M
DX
XX
Income,po
verty,
adop
tion
rates,
vulnerab
ility,
gainsan
dlosses
Integrated
assessment
mod
eling
ICRISAT,
CIAT,
CIM
MYT
Dow
nloaded from https://academ
ic.oup.com/qopen/article/1/1/qoaa005/6094628 by guest on 24 January 2022
20 John M. Antle and Roberto O. Valdivia
et al. 2014). CGE models that capture interactions between agriculture and other sectorsthat affect supply, demand, and crop price formation as well as partial equilibrium modelsthat calculate direct and indirect effects of agricultural productivity change under differ-ent economic, climatic, and demographic scenarios have been widely used by CGIAR re-searchers. The IMPACT model (Rosegrant et al. 2008) developed by IFPRI has been used toassess agricultural policy impacts and to conduct long-term assessments of climate changeon food, agriculture, and natural resources at global and regional scales. Similarly, theGLOBIOM model (Havlík et al. 2011) developed by the IIASA is frequently used to simu-late competition for land use between agriculture, forestry, and bioenergy at the global level.Other global economic models include the CGEmodel developed by the Global Trade Anal-ysis Project (Hertel, McDougall, and Itakura 2001), the Model of Agricultural Productionand Its Impact on Environment (MAgPIE; Dietrich et al. 2019), and the Environmental Im-pact and Sustainability Applied General Equilibrium model (van der Mensbrugghe 2008).
Although there has been much progress developing and linking existing disciplinary mod-els to assess impacts on various biological, physical, and economic outcomes (e.g. DSSATand the soil carbon model CENTURY have been linked to integrate soil carbon and nitro-gen processes to simulate crop yields and soil carbon dynamics), large gaps remain betweenmodels at various scales, e.g. farm system and landscape scales, and national scale for eco-nomic analysis of commodity and related markets, that prevent truly integrated assessmentsacross scales. For example, most farm system models assume farms are price takers with noformal linkage to a market equilibrium model. A few exceptions include Laborte, Van It-tersum, and Van den Berg (2007), van Ruijven, O’Neill, and Chateau (2015), and Valdivia,Antle, and Stoorvogel (2012); however, further research is needed to address key aggrega-tion and disaggregation issues (Antle, Stoorvogel, and Valdivia 2014).
4.3 Case studies from farm to global scales
This section presents two case studies that illustrate the types of analyses that are currentlybeing done at various scales. These studies reflect the fact that stakeholder objectives varyaccording to the spatial and temporal scales, from local to national to global, and fromgrowing season to the decadal progression of climate change and other global drivers. Thesescales in turn determine relevant indicators and the trade-offs that need to be evaluated.These case studies illustrate how FA and TOA can be used to guide project-level researchdesign and data collection to support ongoing ME and periodic re-evaluation of researchpriorities (e.g. updating theory of change).Economic, environmental, and social impact assessment of the East Africa Dairy Devel-
opment Project in Kenya (Antle and Valdivia 2011): The goal of this study was to conductan impact assessment of the practices promoted by the East Africa Dairy Development(EADD) Project, using baseline data collected by the International Livestock Research In-stitute (ILRI). This analysis was designed as a proof of concept for evaluation of researchinvestments by the Bill and Melinda Gates Foundation, using an environmental account-ing matrix with the TOA-MD. The analysis highlighted some of the complex economic,environmental, and social trade-offs and synergies that are likely to be associated with dis-semination of the EADD practices at farm, subregional, and regional scales.
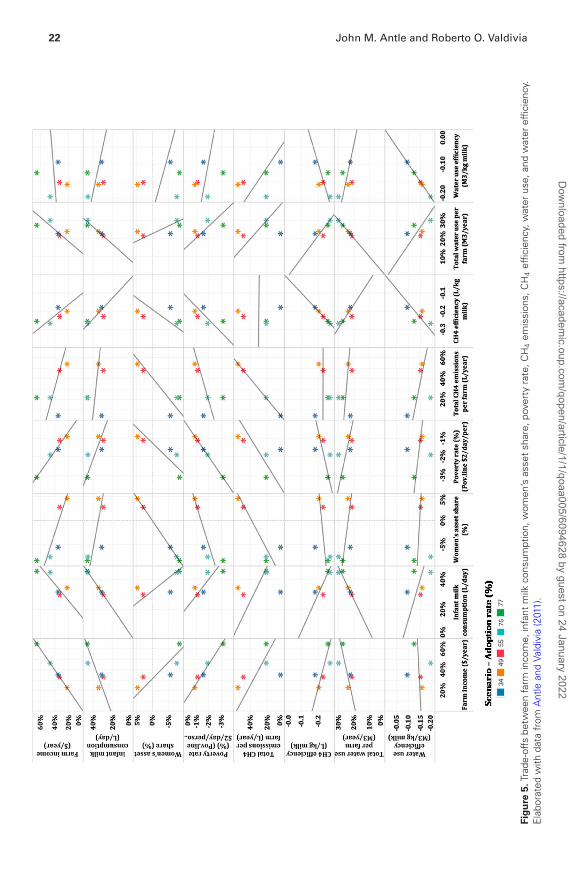
At the farm level, the EADD study shows that while farm income increases and povertydecreases, and total assets owned by both male and women increase, the share of assetscontrolled by women declines, and water use and GHG emissions increase. These resultsindicate that there are likely to be trade-offs between the economic benefits of livestockintensification and key social and environmental impacts that could be addressed in theresearch design for improvements in livestock management to reduce water use and GHGemissions. Inclusive technology dissemination could be designed tomitigate possible adversegender effects of the new technology.
Dow
nloaded from https://academ
ic.oup.com/qopen/article/1/1/qoaa005/6094628 by guest on 24 January 2022
Trade-off analysis of agri-food systems for sustainable research and development 21
The analysis shows that different EADD implementation scenarios result in different po-tential adoption rates and important trade-offs and synergies across the outcome indicators.Increasing income reduces poverty and increases infant milk consumption as well as effi-ciency in the use of water and methane emissions. Total water use and methane emissionsalso increase. The EADD study shows that while farm income increases, the poverty ratedecreases and total assets owned by both male and women increase, but the share of assetscontrolled by women is predicted to decline. This kind of information can support researchpriority setting and resource allocation decisions. For example, these results indicate thatdevelopment and investment strategies to mitigate possible adverse gender effects of the newtechnology are needed (see Fig. 5).The AgMIP: the Crop–Livestock Intensification Project—ICRISAT (Homann-Kee Tui
et al. 2020): This study applied a new protocol-based approach to climate impact and adap-tation analysis to generate actionable information for policy decision making, developed bythe AgMIP and collaborators (AgMIP 2017).Using themultiscale,multi-modeling approachdescribed in Fig. 3, a climate change and adaptation impact assessment for smallholderfarming systems in Zimbabwe drylands was carried out under current and future climateand socioeconomic conditions. The study produced indicators of vulnerability, defined asthe proportion of farm households that may lose income due to climate change; economicgains or losses as well as the net economic impact; changes in mean farm returns; changes inthe poverty rate among farm households; changes in crop and livestock yields; and potentialadoption rates of proposed innovations and adaptation packages co-developed with localstakeholders. The foresight component of this study developed plausible future socioeco-nomic conditions, called Representative Agricultural Pathways (RAPs; Valdivia et al. 2015,2020).
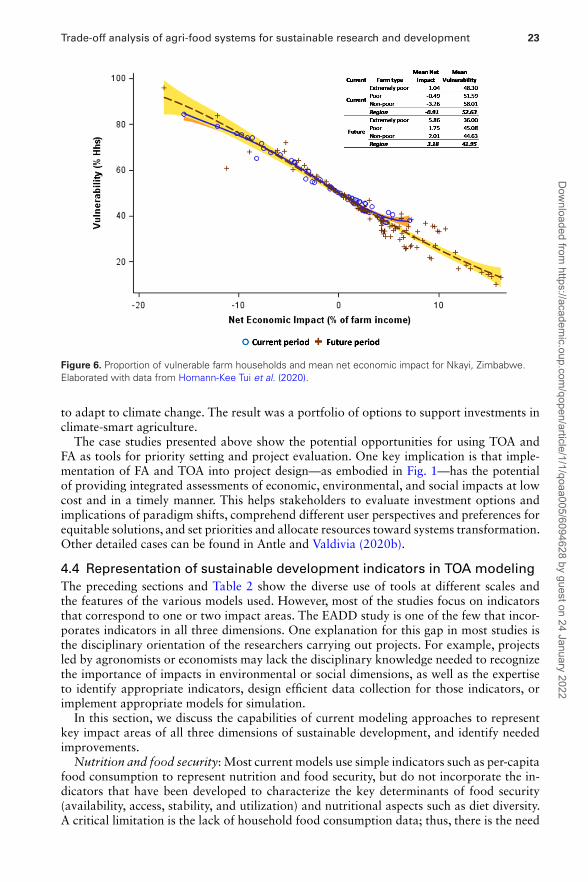
Crop simulations highlighted the importance of soils in quantifying the impacts of climatechange on crop yields. The results show that soils with higher organic carbon and water-holding capacity will buffer the impacts better under climate change than soils with lowproductivity. Groundnuts and fodder legumes were identified as important commoditiesto offset climate change impacts for the extremely poor households. Livestock simulationsshowed that farms with large herds were the most impacted by climate change. Improvingthe feed base through feed production and marketing, and the use of stock feed, is critical.One key implication of this analysis is that even in vulnerable regions like the drylands inZimbabwe, there are farm households that may lose and others that may gain from climatechange, and that socioeconomic conditions play an important role in the assessment ofvulnerability. Figure 6 shows that there are gainers and losers from climate change. Themean net economic impact under future conditions improves (3.18 per cent) compared tocurrent conditions where, on average, losses are greater than gains. However, even with apositive net economic impact in the aggregate, the proportion of farm households vulnerableto economic losses is still large (e.g. 53 and 42 per cent under current and future conditions,respectively, in the region). Thus, reporting only net economic impacts (as in BCA) obscuresthe distribution of impacts and vulnerabilities.
The AgMIP case study in Zimbabwe (Homann-Kee Tui et al. 2020) shows how TOA andFA can be used to inform multilevel stakeholders (from farming system to national level)about the likely consequences of following different development pathways. It also demon-strates that the process of co-designing pathways and adaptation strategies with stakehold-ers increased the demand for science-based information to support decision making. TheTOA also showed that diversification of food, cash, and feed crops, like legumes and smallgrains, can improve income and nutrition and empower youth and women in the fragiledrylands. The CGIAR Research Program on Grain Legumes and Dryland Cereals Agri-food Systems, managed by ICRISAT, can play a key role in the transformation of the crop–livestock system of this region. The AgMIP multi-model approach helped stakeholders toexplore the potential for new technologies and farming strategies to enable farm households
Dow
nloaded from https://academ
ic.oup.com/qopen/article/1/1/qoaa005/6094628 by guest on 24 January 2022
22 John M. Antle and Roberto O. Valdivia
Figure
5.Trad
e-offs
betw
eenfarm
inco
me,
infant
milk
cons
umption,
wom
en’sasse
tsh
are,
pove
rtyrate,C
H4em
ission
s,CH
4effic
ienc
y,water
use,
andwater
effic
ienc
y.Elabo
ratedwith
data
from
Antle
andVa
ldivia(2011).
Dow
nloaded from https://academ
ic.oup.com/qopen/article/1/1/qoaa005/6094628 by guest on 24 January 2022
Trade-off analysis of agri-food systems for sustainable research and development 23
Figure 6. Proportion of vulnerable farm households and mean net economic impact for Nkayi, Zimbabwe.Elaborated with data from Homann-Kee Tui et al. (2020).
to adapt to climate change. The result was a portfolio of options to support investments inclimate-smart agriculture.
The case studies presented above show the potential opportunities for using TOA andFA as tools for priority setting and project evaluation. One key implication is that imple-mentation of FA and TOA into project design—as embodied in Fig. 1—has the potentialof providing integrated assessments of economic, environmental, and social impacts at lowcost and in a timely manner. This helps stakeholders to evaluate investment options andimplications of paradigm shifts, comprehend different user perspectives and preferences forequitable solutions, and set priorities and allocate resources toward systems transformation.Other detailed cases can be found in Antle and Valdivia (2020b).
4.4 Representation of sustainable development indicators in TOA modeling
The preceding sections and Table 2 show the diverse use of tools at different scales andthe features of the various models used. However, most of the studies focus on indicatorsthat correspond to one or two impact areas. The EADD study is one of the few that incor-porates indicators in all three dimensions. One explanation for this gap in most studies isthe disciplinary orientation of the researchers carrying out projects. For example, projectsled by agronomists or economists may lack the disciplinary knowledge needed to recognizethe importance of impacts in environmental or social dimensions, as well as the expertiseto identify appropriate indicators, design efficient data collection for those indicators, orimplement appropriate models for simulation.
In this section, we discuss the capabilities of current modeling approaches to representkey impact areas of all three dimensions of sustainable development, and identify neededimprovements.Nutrition and food security: Most current models use simple indicators such as per-capita
food consumption to represent nutrition and food security, but do not incorporate the in-dicators that have been developed to characterize the key determinants of food security(availability, access, stability, and utilization) and nutritional aspects such as diet diversity.A critical limitation is the lack of household food consumption data; thus, there is the need
Dow
nloaded from https://academ
ic.oup.com/qopen/article/1/1/qoaa005/6094628 by guest on 24 January 2022
24 John M. Antle and Roberto O. Valdivia
to develop methods to collect these data with new approaches that can capture the dy-namics of household consumption (e.g. mobile apps). Most research now utilizes multipleindicators to measure nutritional diversity, which is becoming important to assess sustain-able diets beyond assessments based on kilocalories (Müller, Elliott, and Levermann 2014).Recent emerging research on sustainable healthy eating behavior seeks to integrate eatingor consumption attitudes and behavior toward changes in diets (Fanzo et al. 2012; Geiger,Fischer, and Schrader 2018). Additional research is needed to bring these dimensions intoquantitative models.Poverty and income distribution: Within agricultural populations, estimates of some com-
ponents of farm household income are usually included inmost economic household or farmmodels.However, a complete characterization of farm income sources (e.g. off-farm income)is needed to accurately assess poverty and income distribution in a population of farms. Inaddition, the distribution of income among household is required to estimate indicatorssuch as poverty rates. The headcount poverty rate (i.e. the proportion of households belowthe poverty line) is the most frequent indicator used in TOA. Other indicators such as thepoverty gap (i.e. the degree to which individuals are below the poverty line) and food-basedpoverty indicators (Smith and Urey 2002; Antle, Adhikari, and Price 2015) can be used torepresent other dimensions of poverty. Going beyond farm households to other rural andurban populations involves broader data and models that are typically highly aggregatedand thus not capable of representing income distributions or predicting changes in povertyrates. Linking disaggregate data and models with more aggregate models is the solution tothis challenge that is currently at the frontier of research.Gender and age: Despite the growing research on gender impacts and related outcomes,
there is little representation of gender in most models, at least quantitatively. Similarly, anal-ysis of children’s labor and their nutrition and health has also been limited, due to lackof data. Distributional impacts of new technologies or policy interventions on gender andintra-household equity, including asset ownership, health, education, and nutrition, couldbe incorporated in quantitative or qualitative impact assessment models with better age-and sex-disaggregated data that are context specific.Climate: Climate (and weather) has been included in many biophysical and economic
models to assess the impacts of climate change on crop yields. However, many of theseanalyses are crop based. In order to have a better assessment of the vulnerability of farmsto climate change, farm and household system-based analyses are needed, as illustrated byCase Study 2 in Section 4.3.Environment: Field- or point-level agricultural models (e.g. crop simulation models) can
capture the water, soil carbon, nitrogen, and nutrients, and environment fluxes. At this level,these models can be linked to economic models to assess the trade-offs between socioeco-nomic and environmental outcomes. For example, Valdivia, Antle, and Stoorvogel (2012)link the TOA–ME economic model to the DSSAT crop simulation model and the nutrientmonitoring model (De Jager, Nandwa, and Okoth 1998) to assess the trade-offs betweenmaize production, poverty, and soil nutrient depletion. At the landscape scale, upscalingthe field-level processes increases the complexity of the system. Process-based models canbe used to simulate hydrology, sediment and contaminant transport and cycling (pesticides,bacteria, and nutrients) in soils and streams, and crop or vegetative uptake, growth, andyields.
4.5 Improving models and enabling their use
In addition to better representation of all impact areas, there are many issues that arise inthe use of models for technology impact assessments and TOA. Here, we summarize somerecent research that has identified areas for data and model improvements (Antle, Jones,and Rosenzweig 2017; Jones et al. 2017).
Dow
nloaded from https://academ
ic.oup.com/qopen/article/1/1/qoaa005/6094628 by guest on 24 January 2022
Trade-off analysis of agri-food systems for sustainable research and development 25
Linking models across disciplines (e.g. crop–livestock–economic–environmental models):In order to link different models at farm system level, protocols and tools need to be createdfor standardized inputs and outputs (i.e. data and model harmonization).Linking models across scales: Methods are required to link household or farm system-
level economic models to market equilibrium models (e.g. partial or general equilibriummodels). There is need to address aggregation and disaggregation issues.Behavioral assumptions: Most of the economic models are based on profit-maximization
assumptions (in some cases, adjusted for risk). However, recent literature on behavioraleconomics and risk modeling could be incorporated in the TOA.Economic model intercomparison and improvement: The wide array of household- and
farm-level economic models use different approaches and assumptions; however, they canbe used for the same objective (e.g. assessing impacts of climate change on a specific farm-ing system). Responses to each model are likely to be different. Thus, there is the need tounderstand the differences and explore options to improve models and be able to use modelensembles to capture the inherent uncertainty of the models. Intercomparison and improve-ment of crop simulation models have been conducted by the AgMIP. Also, a comparisonactivity that involved ten global economic models was carried out under AgMIP (Nelsonet al. 2014).Representation of pests and diseases: Crop and livestock process models are limited in
the way they represent pest and diseases. However, there are advances on methods to incor-porate pest and diseases in modeling approaches (statistical and process-based approaches).Documentation and availability: Models and tools should be publicly available and well
documented. This is crucial for capacity building and knowledge transfer. Likewise, modelor method improved should also be documented.FA and TOA: A stronger integration of science and stakeholder-based knowledge is
needed to enable priority setting and to support decision-making processes effectively, asillustrated in Fig. 1 (Valdivia et al. 2020). At global level, a range of socioeconomic trendshave been established by scientists and stakeholders (Shared Socioeconomic Pathways) andare now being widely used to represent the range of plausible future trajectories of popu-lation growth, GDP, and other global drivers. The CGIAR Research Program on ClimateChange, Agriculture and Food Security (CCAFS) has developed similar multi-country futurescenarios for West and East Africa (Palazzo et al. 2017; Vervoort, Antle, and Stoorvogel2014). There is a need to develop more detailed national pathways specific to individualcountries’ circumstances. Similarly, for analysis at the farming system level, more detailedpathways are needed to provide input parameters to crop, livestock, and economic models.For climate impact and adaptation analysis, AgMIP has established participatory methodsto develop RAPs (Valdivia et al. 2015, 2020). Similar methods can be used for any type offorward-looking technology impact assessment, and can also be used to develop national-level pathways.Data: A critical data limitation is that most available data are collected for disciplinary
research and are often not readily accessible, or not suitable for use in impact assessmentdue to differences in spatial and temporal scales or lack of adequate documentation (Antle,Jones, and Rosenzweig 2017). For example, multiple detailed datasets exist on crop pro-duction or yields, but since the goal is to assess changes in crop yields or capture other bio-physical processes, key economic data (e.g. production costs) are frequently not recorded.A relatively new initiative within the CGIAR is the Rural Household Multi-Indicator Sur-vey (RHoMIS; van Wijk et al. 2020). RHoMIS is a tool that aims at reducing the cost andtime required to carry out and analyze surveys. It provides a structure and standard for-mat to collect data that describe farm productivity and practices, nutrition, food security,gender equity, climate, and poverty. However, one limitation is that it does not include eco-nomic data such as production costs that are critical for economic analysis and TOA. Thereis the need to advance data standards with the aid of digital technologies for collection.
Dow
nloaded from https://academ
ic.oup.com/qopen/article/1/1/qoaa005/6094628 by guest on 24 January 2022
26 John M. Antle and Roberto O. Valdivia
The Platform for Big Data in Agriculture of the CGIAR has defined a common core ofcross-sectional household survey as a first building block for a standardization of surveydata (van Wijk et al. 2019). The CGIAR’s Big Data initiative is working toward the goalfor agricultural data to meet desirable standards (findable, accessible, interoperable, ethical,and reproducible) through several actions: (1) identification of key concepts, indicators, andquestions commonly addressed in socioeconomic surveys; (2) developing a socioeconomicontology, building on existing ontologies and focusing on the key concepts, indicators, andquestions from the socioeconomic team; (3) developing a standard for documenting andarchiving metadata; and (4) identifying best practices in electronic data capture and devel-opment of data capture tools.Capacity building: A strategy for capacity building is needed to enable the priority set-
ting process that incorporates FA and TOA in agricultural research organizations (Fig. 1).The objective of the capacity building should include a research organization’s managementand its agricultural research scientists and stakeholders. There is a need to build capacitywithin research organizations for in-house modeling tools as well as for modeling toolsdeveloped by partner institutions. Examples are established modeling groups like DSSAT(DSSAT Foundation); TOA-MD Impact Assessment Courses offered by Oregon State Uni-versity; IFPRI’s IMPACT modeling group; and the Global Trade Analysis Project operatedby Purdue University.Private and public partnerships: Rapidly advancing genetic and digital technologies de-
veloped in the private sector mean that public sector agricultural research organizationsincreasingly need to establish strategic partnerships with the private sector. These partner-ships could improve access and knowledge to products that are not public but that can con-tribute to the process of priority setting and development of innovations as public goods.For example, digital innovation in the private sector can support the creation, use, combi-nation, analysis, and sharing of agricultural and other data in digital format to improve thesustainability and productivity of agriculture and food systems (OECD 2019).
5 FA and TOA: opportunities and challenges
We conclude that the currently available FA (Lentz 2020; Zurek, Hebinck, and Selomane2020) and the TOAmethods and tools discussed in this paper present an unprecedented op-portunity for national and international public good research organizations aiming to setpriorities among potential innovations to balance inevitable trade-offs and exploit synergiesalong sustainable development pathways. FA and TOA can help accomplish efficient man-agement through coordination of research design and evaluation at the project level withidentified global, regional, and national priorities. Achieving these results also will requiresubstantial improvements in data and methods.
Based on recent experience with FA and TOA, a number of significant challenges will needto be addressed as they are integrated into a research organization’s priority setting and re-search evaluation (Fig. 1). A key element in TOA is collaboration between scientists andstakeholders to identify sets of minimally sufficient impact indicators at global (or national)and project scales. Reaching a consensus on a relatively small number will be a major butcritical challenge. A key finding of the Lentz (2020) and Zurek, Hebinck, and Selomane(2020) studies is that global-scale foresight studies do not adequately represent impacts inseveral dimensions of sustainable development—nutrition and food security; poverty re-duction, livelihoods, and jobs; and gender dimensions, youth, and social inclusion. This isalso true for many important environmental impacts, and is a feature (or limitation) of theglobal and national impact assessment models discussed in this paper. This condition is duein part due to the lack of consensus on impact areas and indicators, but mainly due to a lackof analysis at disaggregate scales (farm, eco-regional) that can be meaningfully aggregated
Dow
nloaded from https://academ
ic.oup.com/qopen/article/1/1/qoaa005/6094628 by guest on 24 January 2022
Trade-off analysis of agri-food systems for sustainable research and development 27
to national, regional, and global scales. Project-level implementation of FA and TOA willhelp fill this gap in available data at higher levels of aggregation.
A major challenge in the implementation of FA and TOA of complex, multiscale sys-tems is to produce information that is low cost and timely. Based on experience applyingFA and TOA, analysts need to embrace the principle of parsimony: information to supportdecisions under uncertainty needs to be minimally sufficient to identify options that arelikely to meet goals and balance trade-offs across multiple impact dimensions. Accordingly,the need for timely information to support decisions argues for parsimonious quantitativemodeling and analysis. Priority setting processes should be designed to be cost-effective andfit-to-purpose, namely, to provide an objective evidence base to guide and justify prioritysetting decisions. As illustrated by the Rockefeller pesticide studies, the careful selection ofimpact indicators is a key element to addressing complexity through sufficiency and parsi-mony: if acute health impacts of toxic pesticides on farmer health show that farmers areexposed to unacceptably high neurological risks, evidence of chronic health impacts suchas cancer risks is not necessary to justify research that can help farmers to reduce the use oftoxic pesticides while achieving other goals such as poverty reduction and food security.
Acknowledgments
This article was adapted from a commissioned report that was funded by the CGIAR Inde-pendent Science for Development Council (ISDC). The authors wish to thank the membersof the ISDC for their comments and suggestions during the development of that report.
References
AgMIP. (2017) Protocols for AgMIP Regional Integrated Assessments, Version 7. https://agmip.org/wp-content/uploads/2018/08/AgMIP-Protocols-for-Regional-Integrated-Assessment-v7-0-20180218-1-ilovepdf-compressed.pdf. Accessed August 1, 2020.
Alston J. M., Norton G. W. and Pardey P. G. (1995) Science Under Scarcity: Principles and Practice forAgricultural Research Evaluation and Priority Setting. Ithaca, NY: Cornell University Press.
Antle J., Adhikari R. and Price S. (2015) ‘An income-based food security indicator for agricultural tech-nology impact assessment’, Food Security in an Uncertain World (Frontiers of Economics and Glob-alization, Vol. 15), Emerald Group Publishing Limited, 81–96.
Antle J. et al. (2015b) ‘Simulation based ex ante assessment of sustainable agricultural technologies: anapplication to integrated aquaculture–agriculture in Bangladesh’. A report submitted to the StandingPanel on Impact Assessment (SPIA), CGIAR Independent Science and Partnership Council (ISPC), 57pp.
Antle J. M. and Capalbo S. M. (2001) ‘Econometric-process models for integrated assessment of agricul-tural production systems’, American Journal of Agricultural Economics, 83: 389–401.
Antle J.M., Cole D. C. and Crissman C. C. (1998) ‘Further evidence on pesticides, productivity and farmerhealth: potato production in Ecuador’, Agricultural Economics, 18: 199–207.
Antle J.M., Jones J.W. and Rosenzweig C. (2017) ‘Next generation agricultural systemmodels and knowl-edge products: synthesis and strategy’, Agricultural Systems, 155: 179–85.
Antle J. M. and Pingali P. L. (1994) ‘Pesticides, productivity, and farmer health: a Philippine case study’,American Journal of Agricultural Economics, 76: 418–30.
Antle J. M. and Ray S. (2020) Sustainable Agricultural Development: An Economic Perspective. London:Palgrave Macmillan.
Antle J. M., Stoorvogel J. J. and Valdivia R. O. (2014) ‘New parsimonious simulation methods and toolsto assess future food and environmental security of farm populations’, Philosophical Transactions ofthe Royal Society B, 369: 20120280.
Antle J. M. and Valdivia R. (2011) ‘Preliminary economic, environmental and social impact assessmentof the EADD Project in Kenya using the tradeoff analysis model’. Report to the Trade-off Analysisfor the Heifer Project Using a Minimum Data Approach, Bill & Melinda Gates Foundation, Nairobi,Kenya. https://agsci.oregonstate.edu/sites/agscid7/files/toa/data-library/eadd_ia_report_final.pdf.Accessed August 1, 2020.
Dow
nloaded from https://academ
ic.oup.com/qopen/article/1/1/qoaa005/6094628 by guest on 24 January 2022
28 John M. Antle and Roberto O. Valdivia
Antle J.M. and Valdivia R.O. (2020a)TOA-MD: Trade-off Analysis Model forMulti-Dimensional ImpactAssessment of Agricultural Systems. https://agsci.oregonstate.edu/tradeoff-analysis-project/webform/toa-md-software. Accessed August 1, 2020.
———. (2020b) Tradeoff Analysis of Agri-Food Systems for One CGIAR. Rome: CGIARIndependent Science for Development Council (ISDC). https://cas.cgiar.org/isdc/publications/tradeoff-analysis-agri-food-systems-one-cgiar. Accessed August 1, 2020.
Arnold J. G. et al. (1998) ‘Large area hydrologic modeling and assessment. Part I: model development’,Journal of the American Water Resources Association, 34: 73–89.
Barret C. et al. (2020) ‘Foresight and tradeoff analyses: tools for science strategy development in agricul-ture and food systems research’,Q Open.
Borgomeo E. et al. (2016) ‘Trading-off tolerable risk with climate change adaptation costs in water supplysystems’,Water Resources Research, 52: 622–43.
Capalbo S. M., Antle J. M. and Seavert C. (2017) ‘Next generation data systems and knowledge productsto support agricultural producers and science-based policy decision making’, Agricultural Systems,155: 191–9.
Carter M. R. (1984) ‘Identification of the inverse relationship between farm size and productivity: anempirical analysis of peasant agricultural production’,Oxford Economic Papers, 36: 131–45.
CGIAR System Reference Group (2019) ‘One CGIAR: a bold set of recommendations tothe System Council’. In: Proceedings of the 9th Meeting of the CGIAR System Council,Chengdu, China, 13–14 November 2019. https://storage.googleapis.com/cgiarorg/2019/11/SC9-02_SRG-Recommendations-OneCGIAR.pdf. Accessed July 1, 2020.
Challinor A. J. et al. (2014) ‘A meta-analysis of crop yield under climate change and adaptation’,NatureClimate Change, 4: 287–91.
Claessens L. et al. (2012) ‘A method for evaluating climate change adaptation strategies for small-scalefarmers using survey, experimental and modeled data’, Agricultural Systems, 111: 85–95.
Corbeels M. et al. (2014) ‘Understanding the impact and adoption of conservation agriculture in Africa:a multi-scale analysis’, Agriculture, Ecosystems and Environment, 187: 155–70.
Crissman C. C., Antle J. M. and Capalbo S. M., eds (1998) Economic, Environmental, and Health Trade-offs in Agriculture: Pesticides and the Sustainability of Andean Potato Production. Economic, Envi-ronmental, and Health Tradeoffs in Agriculture: Pesticides and the Sustainability of Andean PotatoProduction. Dordrecht: Springer Netherlands.
De Jager A., Nandwa S.M. and Okoth P. F. (1998) ‘Monitoring nutrient flows and economic performancein African farming systems (NUTMON). I. Concepts and methodologies’,Agriculture, Ecosystems andEnvironment, 71: 37–48.
Dietrich J. P. et al. (2019) ‘MAgPIE 4—a modular open-source framework for modeling global land sys-tems’,Geoscientific Model Development, 12: 1299–317.
EAT-Lancet Commission (2019) ‘Summary report of the EAT-Lancet Commission’. In: Healthy Dietsfrom Sustainable Food Systems. Stockholm, Sweden: EAT-Lancet Commission. https://eatforum.org/content/uploads/2019/01/EAT-Lancet_Commission_Summary_Report. pdf. Accessed June 1, 2020.
Fanzo J. et al. (2012) ‘Metrics of sustainable diets and food systems’. Technical Brief, Bioversity Interna-tional.
Geiger S. M., Fischer D. and Schrader U. (2018) ‘Measuring what matters in sustainable consumption: anintegrative framework for the selection of relevant behaviors’, Sustainable Development, 26: 18–33.
Giller K. E. et al. (2011) ‘Communicating complexity: integrated assessment of trade-offs concerningsoil fertility management within African farming systems to support innovation and development’,Agricultural Systems, 104: 191–203.
Groot J. C. et al. (2012) ‘Multi-objective optimization and design of farming systems’, Agricultural Sys-tems, 110: 63–77.
Guijt I. (1998) ‘Participatory monitoring and impact assessment of sustainable agriculture initiatives: anintroduction to the key elements’. No. 1. IIED.
Hareau G. et al. (2014) ‘Strategic assessment of research priorities for potato’. RTB Working Paper No.8.
Havlík P. et al. (2014) ‘Climate change mitigation through livestock system transitions’, Proceedings ofthe National Academy of Sciences of the United States of America, 111: 3709–14.
Havlík P., Schneider U. A., Schmid E. et al. (2011) ‘Global land-use implications of first and second gen-eration biofuel targets’, Energy Policy, 39: 5690–702.
Herdt R. W. (1991) ‘Perspectives on agricultural biotechnology research for small countries’, Journal ofAgricultural Economics, 42: 298–308.
Dow
nloaded from https://academ
ic.oup.com/qopen/article/1/1/qoaa005/6094628 by guest on 24 January 2022
Trade-off analysis of agri-food systems for sustainable research and development 29
Herrero M. et al. (1999) ‘Bio-economic evaluation of dairy farm management scenarios using integratedsimulation and multiple-criteria models’, Agricultural Systems, 62: 169–88.
Herrero M. et al. (2014) ‘Exploring future changes in smallholder farming systems by linking socio-economic scenarios with regional and household models’,Global Environmental Change, 24: 165–82.
Herrero M. et al. (2013) ‘Biomass use, production, feed efficiencies, and greenhouse gas emissions fromglobal livestock systems’, Proceedings of the National Academy of Sciences of the United States ofAmerica, 110: 20888–20893.
Hertel T., McDougall R. and Itakura K. (2001) ‘GTAP model version 6.0’. Global Trade Analysis Project.Hoogenboom G. et al. (2019) ‘The DSSAT crop modeling ecosystem’, Advances in crop modelling for a
sustainable agriculture, 173–216. Burleigh Dodds Science Publishing Cambridge, UK.Holzkämper A. et al. (2015) ‘Assessing the propagation of uncertainties in multi-objective optimiza-
tion for agro-ecosystem adaptation to climate change’, Environmental Modelling & Software, 66:27–35.
Homann-Kee Tui S. et al. (2020) ‘Transforming farming systems in the face of changing climate and socio-economic conditions: a case from semi-arid Zimbabwe’, Climate Change, 21: 52–64.
Howitt R. E. (1995) ‘Positive mathematical programming’, American Journal of Agricultural Economics,77: 329–42.
Jones J. W. et al. (2017) ‘Toward a new generation of agricultural system data, models, and knowledgeproducts: state of agricultural systems science’, Agricultural Systems, 155: 255–68.
Keating B. A. et al. (2003) ‘An overview of APSIM, a model designed for farming systems simulation’,European Journal of Agronomy, 18: 267–88.
Khatri-Chhetri A. et al. (2017) ‘Farmers’ prioritization of climate-smart agriculture (CSA) technologies’,Agricultural Systems, 151: 184–91.
Klapwijk C. J. et al. (2014) ‘Analysis of trade-offs in agricultural systems: current status and way forward’,Current Opinion in Environmental Sustainability, 6: 110–5.
Kristjanson P. M. et al. (1999) ‘Measuring the costs of African animal trypanosomosis, the potential ben-efits of control and returns to research’, Agricultural Systems, 59: 79–98.
Kuik O. et al. (2011) ‘FAO-MOSAICC: the FAO Modelling System for Agricultural Impacts of ClimateChange to support decision-making in adaptation’. Food and Agriculture Organization of the UnitedNations.
Kumar S. et al. (2018) ‘Towards climate-smart agricultural policies and investments in Telangana’. CGIARResearch Program on Climate Change, Agriculture and Food Security.
Laborte A. G., Van Ittersum M. K. and Van den Berg M. M. (2007) ‘Multi-scale analysis of agricul-tural development: a modelling approach for Ilocos Norte, Philippines’, Agricultural Systems, 94:862–73.
Lamanna C. et al. (2016) ‘Evidence-based opportunities for out-scaling climate-smart agriculture in EastAfrica’. CCAFS Working Paper No. 172.
Leary N. A. (1999) ‘A framework for benefit–cost analysis of adaptation to climate change and climatevariability’,Mitigation and Adaptation Strategies for Global Change, 4: 307–18.
Lentz E. (2020) ‘Food and agriculture systems foresight study: implications for gender, poverty and nutri-tion’,Q Open.
León Velarde C. et al. (2006) ‘LIFE-SIM: livestock feeding strategies; simulation models’. Working Paper2006-1, NRM–International Potato Center, Lima, Peru.
Loomis J. B. (2005) ‘Economic values without prices: the importance of nonmarket values and valuationfor informing public policy debates’, Choices, 20/3: 179–82.
Mendelsohn R. et al. (1994) ‘The impact of global warming on agriculture: a Ricardian analysis’, TheAmerican Economic Review, 84: 753–71.
Müller C., Elliott J. and Levermann A. (2014) ‘Fertilizing hidden hunger’, Nature Climate Change, 4:540–1.
Mwongera C. et al. (2017) ‘Climate smart agriculture rapid appraisal (CSA-RA): a tool forprioritizing context-specific climate smart agriculture technologies’, Agricultural Systems, 151:192–203.
Nedumaran S. et al. (2014) ‘Potential welfare benefit of millets improvement research at ICRISAT: multi-country economic surplus model approach’. Socioeconomics Discussion Paper Series No. 15.
Nelson G. C. et al. (2014) ‘Agriculture and climate change in global scenarios: why don’t the modelsagree’, Agricultural Economics (United Kingdom), 45: 85–101.
Dow
nloaded from https://academ
ic.oup.com/qopen/article/1/1/qoaa005/6094628 by guest on 24 January 2022
30 John M. Antle and Roberto O. Valdivia
Notenbaert A. et al. (2017) ‘Targeting, out-scaling and prioritising climate-smart interventions in agri-cultural systems: lessons from applying a generic framework to the livestock sector in sub-SaharanAfrica’, Agricultural Systems, 151: 153–62.
OECD (2019) Digital Opportunities for Better Agricultural Policies. Digital Opportunities for BetterAgricultural Policies. Paris: OECD.
Palazzo A. et al. (2017) ‘Linking regional stakeholder scenarios and shared socioeconomic pathways:quantified West African food and climate futures in a global context’,Global Environmental Change,45: 227–42.
Pingali P. L. and Roger P. A. (1995) Impact of Pesticides on Farmer Health and the Rice Environment.Berlin: Springer.
Pingali P. L. and Rosegrant M. W. (1994) ‘Confronting the environmental consequences of the GreenRevolution in Asia’, Educating New Environmental Leadership for Asia, 2: 61–74.
Rosegrant M. W. et al. (2014) Food Security in a World of Natural Resource Scarcity: The Role of Agri-cultural Technologies. Washington, DC: International Food Policy Research Institute.
Rosegrant M.W. et al. (2017)Quantitative Foresight Modeling to Inform the CGIAR Research Portfolio.Washington, DC: International Food Policy Research Institute.
Rosegrant M. W. et al. (2008) ‘International model for policy analysis of agricultural commodities andtrade (IMPACT): model description’. Discussion Paper, International Food Policy Research Institute.
Rosenzweig C. and Hillel D. (2015) Handbook of Climate Change and Agroecosystems: The Agricul-tural Model Intercomparison and Improvement Project (AgMIP) Integrated Crop and EconomicAssessments—Joint Publication with American Society of Agronomy, Crop Science Society of America,and Soil Science Society of America, vol. 3. Singapore: World Scientific.
Rufino M. C. et al. (2009) ‘Lifetime productivity of dairy cows in smallholder farming systems of thecentral highlands of Kenya’, Animal, 3: 1044–56.
Rusinamhodzi L. et al. (2011) ‘A meta-analysis of long-term effects of conservation agriculture on maizegrain yield under rain-fed conditions’. Agronomy for Sustainable Development, 31: 657–73.
Sachs J. D. (2015) The Age of Sustainable Development. New York: Columbia University Press.Sain G. et al. (2017) ‘Costs and benefits of climate-smart agriculture: the case of the Dry Corridor in
Guatemala’, Agricultural Systems, 151: 163–73.Schlenker W. et al. (2006) ‘The impact of global warming on US agriculture: an econometric analysis of
optimal growing conditions’, Review of Economics and Statistics, 88: 113–25.Settle W. and Garba M. H. (2011) ‘Sustainable crop production intensification in the Senegal and Niger
River basins of francophone West Africa’, International Journal of Agricultural Sustainability, 9: 171–85.
Sheahan M. and Barrett C. B. (2014) ‘Understanding the agricultural input landscape in sub-SaharanAfrica: recent plot, household, and community-level evidence’. World Bank Policy Research WorkingPaper No. 7014.
Shiferaw B. A. et al. (2008) ‘Technology adoption under seed access constraints and the economic impactsof improved pigeonpea varieties in Tanzania’, Agricultural Economics, 39: 309–23.
Shikuku K. et al. (2017) ‘Prioritizing climate-smart livestock technologies in rural Tanzania: a minimumdata approach’, Agricultural Systems, 151: 204–16.
Shirsath P. B. et al. (2017) ‘Prioritizing climate-smart agricultural land use options at a regional scale’,Agricultural Systems, 151: 174–83.
Smith L. E. D. and Urey I. (2002) ‘Agricultural growth and poverty reduction: a review of lessons fromthe post-independence and Green Revolution experience in India’. Research project on Institutionsand Economic Policies for Pro-Poor Agricultural Growth, funded by the Department for InternationalDevelopment (DfID) of the United Kingdom. Department of Agricultural Sciences, Imperial College atWye.
Stöckle C. O., Donatelli M. and Nelson R. (2003) ‘CropSyst, a cropping systems simulation model’.European Journal of Agronomy, 18: 289–307.
Tallis H. and Polasky S. (2009) ‘Mapping and valuing ecosystem services as an approach for conservationand natural-resource management’. Annals of the New York Academy of Sciences, 1162: 265–83.
Thornton P. K. et al. (2018) ‘A framework for priority-setting in climate smart agriculture research’,Agri-cultural Systems 167: 161–75.
Twyman J. (2018) ‘RICE gender research in Latin America at CIAT’. International Center for TropicalAgriculture.
Valdivia R. O. et al. (2017) ‘Designing and evaluating sustainable development pathways for semi-subsistence crop–livestock systems: lessons from Kenya’, Agricultural Economics, 48(S1): 11–26.
Dow
nloaded from https://academ
ic.oup.com/qopen/article/1/1/qoaa005/6094628 by guest on 24 January 2022
Trade-off analysis of agri-food systems for sustainable research and development 31
Valdivia R. O. et al. (2019) ‘Enhancing agricultural production and food security amid a changing cli-mate: a new approach to inform decision-making’. The Inter-American Institute for Cooperation onAgriculture—Climate Change, Natural Resources and Management of Production Risks and the Agri-cultural Model Intercomparison and Improvement Project, San Jose, Costa Rica.
Valdivia R. O. et al. (2015) ‘Representative agricultural pathways and scenarios for regional integratedassessment of climate change impacts, vulnerability, and adaptation’. In: Rosenzweig, C., Hillel, D.(eds), Handbook of Climate Change and Agroecosystems: The Agricultural Model Intercomparisonand Improvement Project (AgMIP) Integrated Crop and Economic Assessments—Joint Publicationwith American Society of Agronomy, Crop Science Society of America, and Soil Science Society ofAmerica, vol. 3. Singapore: World Scientific.
Valdivia R. O., Antle J. M. and Stoorvogel J. J. (2012) ‘Coupling the tradeoff analysis model with a mar-ket equilibrium model to analyze economic and environmental outcomes of agricultural productionsystems’, Agricultural Systems, 110: 17–29.
Valdivia R. O. et al. (2020) ‘Representative agricultural pathways: a multi-scale co-designing process tosupport farming systems transformation and resilience’. In: Rosenzweig, C., Hillel, D. (eds),Handbookof Climate Change and Agroecosystems: The Agricultural Model Intercomparison and ImprovementProject (AgMIP) Integrated Crop and Economic Assessments—Joint Publication with American So-ciety of Agronomy, Crop Science Society of America, and Soil Science Society of America, vol. 3.Singapore: World Scientific.
Van den Bergh J.C. (2004) ‘Optimal climate policy is a utopia: from quantitative to qualitative cost–benefitanalysis’, Ecological Economics, 48: 385–93.
van Mensbrugghe D. (2008) ‘The environmental impact and sustainability applied general equilibrium(ENVISAGE) model’, The World Bank, January, 334934–1193838209522.
van Ruijven B. J., O’Neill B. C. and Chateau J. (2015) ‘Methods for including income distribution in globalCGE models for long-term climate change research’, Energy Economics, 51: 530–43.
van Wijk M. et al. (2019) ‘Towards a core approach for cross-sectional farm household survey data col-lection: a tiered setup for quantifying key farm and livelihood indicators’. CGIAR Platform for BigData in Agriculture.
van Wijk M. et al. (2020) ‘The Rural Household Multiple Indicator Survey, data from 13,310 farm house-holds in 21 countries’, Scientific Data, 7: 46.
van Wijk M. T. et al. (2014) ‘Farm household models to analyse food security in a changing climate: areview’,Global Food Security, 3: 77–84.
Vervoort J. M. et al. (2014) ‘Challenges to scenario-guided adaptive action on food security under climatechange’,Global Environmental Change 28: 383–94.
Wander A. E. et al. (2004) Using the economic surplus method to assess economic impacts of new tech-nologies: case studies of Embrapa’. In: Embrapa Caprinos e Ovinos-Artigo em anais de congresso(ALICE). Berlin: International Research on Food Security, Natural Resource Management and RuralDevelopment, 10 f.
Weindl I. et al. (2015) ‘Livestock in a changing climate: production system transitions as an adaptationstrategy for agriculture’, Environmental Research Letters, 10: 094021.
Williams J. R. and Singh V. (1995) ‘The EPIC model’. In: Computer Models of Watershed Hydrology.Highlands Ranch, CO: Water Resources Publications, pp. 909–1000.
Wossen T. and Berger T. (2015) ‘Climate variability, food security and poverty: agent-based assessment ofpolicy options for farm households in Northern Ghana’,Environmental Science & Policy, 47: 95–107.
ZurekM.,Hebinck A. and Selomane O. (2020) ‘Food and agriculture systems foresight study: implicationsfor climate change and the environment’,Q Open.
Dow
nloaded from https://academ
ic.oup.com/qopen/article/1/1/qoaa005/6094628 by guest on 24 January 2022
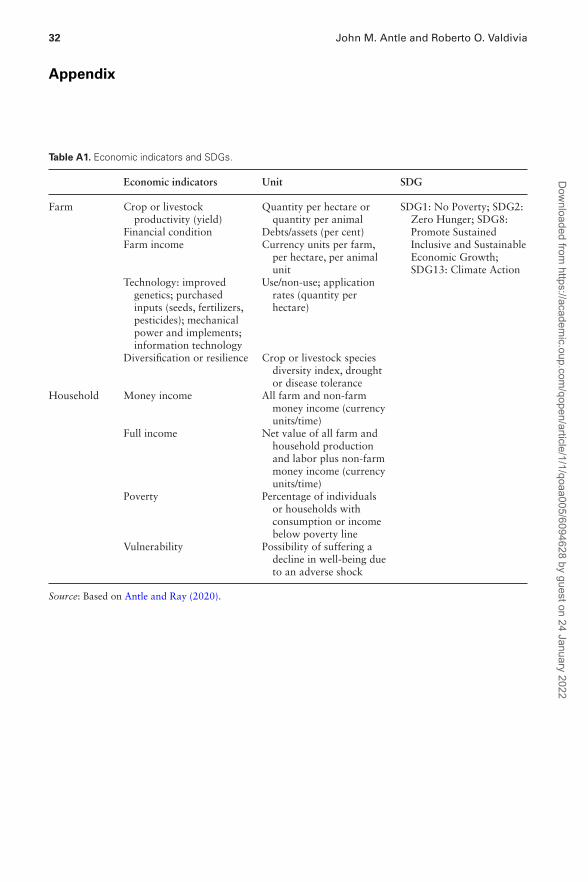
32 John M. Antle and Roberto O. Valdivia
Appendix
Table A1. Economic indicators and SDGs.
Economic indicators Unit SDG
Farm Crop or livestockproductivity (yield)
Quantity per hectare orquantity per animal
SDG1: No Poverty; SDG2:Zero Hunger; SDG8:Promote SustainedInclusive and SustainableEconomic Growth;SDG13: Climate Action
Financial condition Debts/assets (per cent)Farm income Currency units per farm,
per hectare, per animalunit
Technology: improvedgenetics; purchasedinputs (seeds, fertilizers,pesticides); mechanicalpower and implements;information technology
Use/non-use; applicationrates (quantity perhectare)
Diversification or resilience Crop or livestock speciesdiversity index, droughtor disease tolerance
Household Money income All farm and non-farmmoney income (currencyunits/time)
Full income Net value of all farm andhousehold productionand labor plus non-farmmoney income (currencyunits/time)
Poverty Percentage of individualsor households withconsumption or incomebelow poverty line
Vulnerability Possibility of suffering adecline in well-being dueto an adverse shock
Source: Based on Antle and Ray (2020).
Dow
nloaded from https://academ
ic.oup.com/qopen/article/1/1/qoaa005/6094628 by guest on 24 January 2022
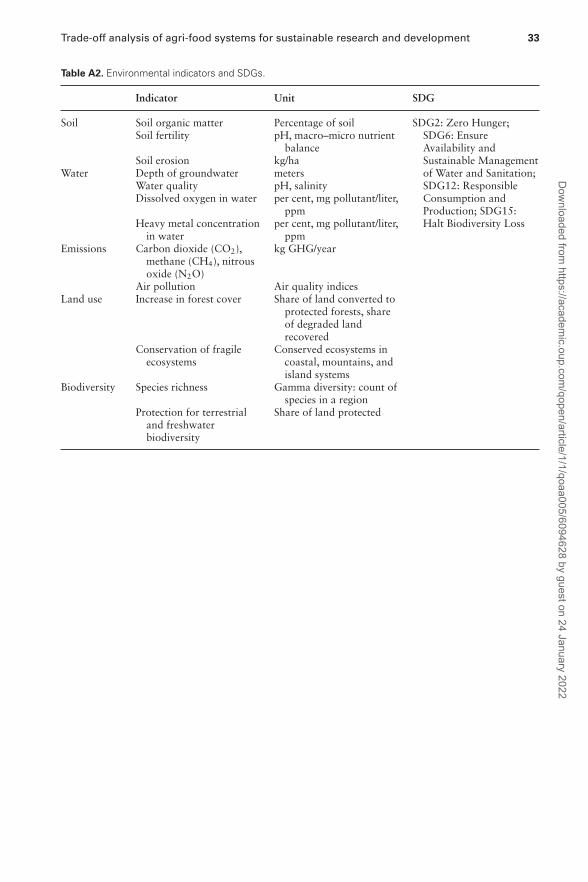
Trade-off analysis of agri-food systems for sustainable research and development 33
Table A2. Environmental indicators and SDGs.
Indicator Unit SDG
Soil Soil organic matter Percentage of soil SDG2: Zero Hunger;SDG6: EnsureAvailability andSustainable Managementof Water and Sanitation;SDG12: ResponsibleConsumption andProduction; SDG15:Halt Biodiversity Loss
Soil fertility pH, macro–micro nutrientbalance
Soil erosion kg/haWater Depth of groundwater meters
Water quality pH, salinityDissolved oxygen in water per cent, mg pollutant/liter,
ppmHeavy metal concentrationin water
per cent, mg pollutant/liter,ppm
Emissions Carbon dioxide (CO2),methane (CH4), nitrousoxide (N2O)
kg GHG/year
Air pollution Air quality indicesLand use Increase in forest cover Share of land converted to
protected forests, shareof degraded landrecovered
Conservation of fragileecosystems
Conserved ecosystems incoastal, mountains, andisland systems
Biodiversity Species richness Gamma diversity: count ofspecies in a region
Protection for terrestrialand freshwaterbiodiversity
Share of land protected
Dow
nloaded from https://academ
ic.oup.com/qopen/article/1/1/qoaa005/6094628 by guest on 24 January 2022
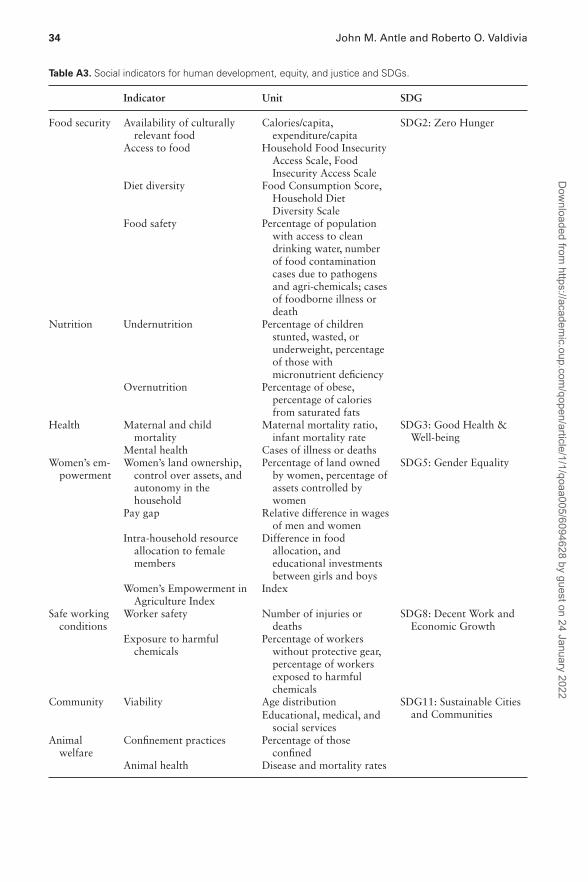
34 John M. Antle and Roberto O. Valdivia
Table A3. Social indicators for human development, equity, and justice and SDGs.
Indicator Unit SDG
Food security Availability of culturallyrelevant food
Calories/capita,expenditure/capita
SDG2: Zero Hunger
Access to food Household Food InsecurityAccess Scale, FoodInsecurity Access Scale
Diet diversity Food Consumption Score,Household DietDiversity Scale
Food safety Percentage of populationwith access to cleandrinking water, numberof food contaminationcases due to pathogensand agri-chemicals; casesof foodborne illness ordeath
Nutrition Undernutrition Percentage of childrenstunted, wasted, orunderweight, percentageof those withmicronutrient deficiency
Overnutrition Percentage of obese,percentage of caloriesfrom saturated fats
Health Maternal and childmortality
Maternal mortality ratio,infant mortality rate
SDG3: Good Health &Well-being
Mental health Cases of illness or deathsWomen’s em-powerment
Women’s land ownership,control over assets, andautonomy in thehousehold
Percentage of land ownedby women, percentage ofassets controlled bywomen
SDG5: Gender Equality
Pay gap Relative difference in wagesof men and women
Intra-household resourceallocation to femalemembers
Difference in foodallocation, andeducational investmentsbetween girls and boys
Women’s Empowerment inAgriculture Index
Index
Safe workingconditions
Worker safety Number of injuries ordeaths
SDG8: Decent Work andEconomic Growth
Exposure to harmfulchemicals
Percentage of workerswithout protective gear,percentage of workersexposed to harmfulchemicals
Community Viability Age distribution SDG11: Sustainable Citiesand CommunitiesEducational, medical, and
social servicesAnimalwelfare
Confinement practices Percentage of thoseconfined
Animal health Disease and mortality rates
Dow
nloaded from https://academ
ic.oup.com/qopen/article/1/1/qoaa005/6094628 by guest on 24 January 2022
Copyright © 2022 FDOKUMEN