Traceable Calibration, Performance Metrics, and Uncertainty Estimates of Minirhizotron Digital...
16
Traceable Calibration, Performance Metrics, and Uncertainty Estimates of Minirhizotron Digital Imagery for Fine-Root Measurements Joshua A. Roberti 1 *, Michael D. SanClements 1,2 , Henry W. Loescher 1,2 , Edward Ayres 1,2 1 National Ecological Observatory Network (NEON), Boulder, Colorado, United States of America, 2 Institute of Arctic and Alpine Research (INSTAAR), University of Colorado, Boulder, Colorado, United States of America Abstract Even though fine-root turnover is a highly studied topic, it is often poorly understood as a result of uncertainties inherent in its sampling, e.g., quantifying spatial and temporal variability. While many methods exist to quantify fine-root turnover, use of minirhizotrons has increased over the last two decades, making sensor errors another source of uncertainty. Currently, no standardized methodology exists to test and compare minirhizotron camera capability, imagery, and performance. This paper presents a reproducible, laboratory-based method by which minirhizotron cameras can be tested and validated in a traceable manner. The performance of camera characteristics was identified and test criteria were developed: we quantified the precision of camera location for successive images, estimated the trueness and precision of each camera’s ability to quantify root diameter and root color, and also assessed the influence of heat dissipation introduced by the minirhizotron cameras and electrical components. We report detailed and defensible metrology analyses that examine the performance of two commercially available minirhizotron cameras. These cameras performed differently with regard to the various test criteria and uncertainty analyses. We recommend a defensible metrology approach to quantify the performance of minirhizotron camera characteristics and determine sensor-related measurement uncertainties prior to field use. This approach is also extensible to other digital imagery technologies. In turn, these approaches facilitate a greater understanding of measurement uncertainties (signal-to-noise ratio) inherent in the camera performance and allow such uncertainties to be quantified and mitigated so that estimates of fine-root turnover can be more confidently quantified. Citation: Roberti JA, SanClements MD, Loescher HW, Ayres E (2014) Traceable Calibration, Performance Metrics, and Uncertainty Estimates of Minirhizotron Digital Imagery for Fine-Root Measurements. PLoS ONE 9(11): e112362. doi:10.1371/journal.pone.0112362 Editor: Ben Bond-Lamberty, DOE Pacific Northwest National Laboratory, United States of America Received July 31, 2014; Accepted October 10, 2014; Published November 12, 2014 Copyright: ß 2014 Roberti et al. This is an open-access article distributed under the terms of the Creative Commons Attribution License, which permits unrestricted use, distribution, and reproduction in any medium, provided the original author and source are credited. Data Availability: The authors confirm that all data underlying the findings are fully available without restriction. All relevant data are within the paper and its Supporting Information files. Funding: Funding provided by National Science Foundation (http://www.nsf.gov/); Grant #: DBI-0752017. The funders had no role in study design, data collection and analysis, decision to publish, or preparation of the manuscript. Competing Interests: The authors have declared that no competing interests exist. * Email: [email protected] Introduction The growth, senescence, and mortality of fine-roots, collectively referred to as fine-root turnover is key to estimate belowground nutrient and carbon cycling and ecosystem productivity [1,2]. Production of fine-roots accounts for a third of the Earth’s annual net primary production [3], supporting the notion that fine-root mortality returns more carbon and nitrogen to the soil than litterfall [1,4]. Unlike aboveground primary production, fine-root production has only been measured at a limited number of sites and over relatively short timescales, in part, because of short- comings associated with sampling methods [5–7]. Currently, there is no standardized method or ‘best community practice’ for evaluating fine-root turnover [8], even though a number of approaches have been used in the past. For example, radiocarbon 14 C measurements of fine-roots, although fundamentally sound in theory, provide estimates of mean carbon age based on modeled results that are often under question [9]. Methods such as sequential soil coring and ingrowth cores are reliable for quantifying the stocks of root biomass but embody large spatial and temporal uncertainties when assessing fine-root turnover as a result of sampling at different locations at each sampling event [8,10,11]. Moreover, root production and mortality of the same root size, and in some cases, species, cannot be observed successively as these methods are based on destructive sampling [12–14]. Today, the minirhizotron is the only nondestructive, in- situ sampling method for quantification of fine-root turnover at fine temporal scales. The first rhizotron was a large, underground room constructed with glass walls allowing for observations of root growth and decay [15]. Cost and area of disturbance in the installation of these large rhizotrons was prohibitive, resulting in a modified approach: the minirhizotron, i.e., buried cameras installed within transparent tubes that emerged in the 1980s [16]. Minirhizotrons are more cost effective, cause less disturbance, and allow for the analyses of successive root images to assess fine-root turnover through time [16,17], from many species across multiple ecosystems [2,8,18]. Like all sampling methods, uncertainties in the minirhizotron approach have been identified. For example, Hendrick and Pregitzer [19] indicated fine-root production and mortality can be underestimated due to the time between sampling (i.e., imaging PLOS ONE | www.plosone.org 1 November 2014 | Volume 9 | Issue 11 | e112362
-
Upload
independent -
Category
Documents
-
view
3 -
download
0
Transcript of Traceable Calibration, Performance Metrics, and Uncertainty Estimates of Minirhizotron Digital...

Traceable Calibration, Performance Metrics, andUncertainty Estimates of Minirhizotron Digital Imageryfor Fine-Root MeasurementsJoshua A. Roberti1*, Michael D. SanClements1,2, Henry W. Loescher1,2, Edward Ayres1,2
1 National Ecological Observatory Network (NEON), Boulder, Colorado, United States of America, 2 Institute of Arctic and Alpine Research (INSTAAR), University of
Colorado, Boulder, Colorado, United States of America
Abstract
Even though fine-root turnover is a highly studied topic, it is often poorly understood as a result of uncertainties inherent inits sampling, e.g., quantifying spatial and temporal variability. While many methods exist to quantify fine-root turnover, useof minirhizotrons has increased over the last two decades, making sensor errors another source of uncertainty. Currently, nostandardized methodology exists to test and compare minirhizotron camera capability, imagery, and performance. Thispaper presents a reproducible, laboratory-based method by which minirhizotron cameras can be tested and validated in atraceable manner. The performance of camera characteristics was identified and test criteria were developed: we quantifiedthe precision of camera location for successive images, estimated the trueness and precision of each camera’s ability toquantify root diameter and root color, and also assessed the influence of heat dissipation introduced by the minirhizotroncameras and electrical components. We report detailed and defensible metrology analyses that examine the performance oftwo commercially available minirhizotron cameras. These cameras performed differently with regard to the various testcriteria and uncertainty analyses. We recommend a defensible metrology approach to quantify the performance ofminirhizotron camera characteristics and determine sensor-related measurement uncertainties prior to field use. Thisapproach is also extensible to other digital imagery technologies. In turn, these approaches facilitate a greaterunderstanding of measurement uncertainties (signal-to-noise ratio) inherent in the camera performance and allow suchuncertainties to be quantified and mitigated so that estimates of fine-root turnover can be more confidently quantified.
Citation: Roberti JA, SanClements MD, Loescher HW, Ayres E (2014) Traceable Calibration, Performance Metrics, and Uncertainty Estimates of MinirhizotronDigital Imagery for Fine-Root Measurements. PLoS ONE 9(11): e112362. doi:10.1371/journal.pone.0112362
Editor: Ben Bond-Lamberty, DOE Pacific Northwest National Laboratory, United States of America
Received July 31, 2014; Accepted October 10, 2014; Published November 12, 2014
Copyright: � 2014 Roberti et al. This is an open-access article distributed under the terms of the Creative Commons Attribution License, which permitsunrestricted use, distribution, and reproduction in any medium, provided the original author and source are credited.
Data Availability: The authors confirm that all data underlying the findings are fully available without restriction. All relevant data are within the paper and itsSupporting Information files.
Funding: Funding provided by National Science Foundation (http://www.nsf.gov/); Grant #: DBI-0752017. The funders had no role in study design, datacollection and analysis, decision to publish, or preparation of the manuscript.
Competing Interests: The authors have declared that no competing interests exist.
* Email: [email protected]
Introduction
The growth, senescence, and mortality of fine-roots, collectively
referred to as fine-root turnover is key to estimate belowground
nutrient and carbon cycling and ecosystem productivity [1,2].
Production of fine-roots accounts for a third of the Earth’s annual
net primary production [3], supporting the notion that fine-root
mortality returns more carbon and nitrogen to the soil than
litterfall [1,4]. Unlike aboveground primary production, fine-root
production has only been measured at a limited number of sites
and over relatively short timescales, in part, because of short-
comings associated with sampling methods [5–7]. Currently, there
is no standardized method or ‘best community practice’ for
evaluating fine-root turnover [8], even though a number of
approaches have been used in the past. For example, radiocarbon14C measurements of fine-roots, although fundamentally sound in
theory, provide estimates of mean carbon age based on modeled
results that are often under question [9]. Methods such as
sequential soil coring and ingrowth cores are reliable for
quantifying the stocks of root biomass but embody large spatial
and temporal uncertainties when assessing fine-root turnover as a
result of sampling at different locations at each sampling event
[8,10,11]. Moreover, root production and mortality of the same
root size, and in some cases, species, cannot be observed
successively as these methods are based on destructive sampling
[12–14]. Today, the minirhizotron is the only nondestructive, in-situ sampling method for quantification of fine-root turnover at
fine temporal scales.
The first rhizotron was a large, underground room constructed
with glass walls allowing for observations of root growth and decay
[15]. Cost and area of disturbance in the installation of these large
rhizotrons was prohibitive, resulting in a modified approach: the
minirhizotron, i.e., buried cameras installed within transparent
tubes that emerged in the 1980s [16]. Minirhizotrons are more
cost effective, cause less disturbance, and allow for the analyses of
successive root images to assess fine-root turnover through time
[16,17], from many species across multiple ecosystems [2,8,18].
Like all sampling methods, uncertainties in the minirhizotron
approach have been identified. For example, Hendrick and
Pregitzer [19] indicated fine-root production and mortality can
be underestimated due to the time between sampling (i.e., imaging
PLOS ONE | www.plosone.org 1 November 2014 | Volume 9 | Issue 11 | e112362

of fine-roots) intervals. Villordon et al. [20] noted that a scanner-
based minirhizotron grossly underestimated adventitious root
quantity when compared to root quantity as measured by other
methods. The limitations of minirhizotron cameras may also
hinder accurate and precise estimates of fine-root stocks, turnover
and biomass [21]. And even though measurement limitations such
as these and others exist (e.g., uncertainties in automated image
analysis), minirhizotrons represent a robust and practical approach
for quantification of fine-root turnover [22]. Here, we argue that
the performance of minirhizotron cameras must be quantified in a
reproducible and traceable manner to best quantify fine-root
standing stock and turnover, and the processes they inform.
Some minirhizotron camera performances have been previously
assessed [22,23], yet a direct comparison of performance between
different commercially available minirhizotrons has not been
made. Standardized calibration methods and ‘best community
practices’ for quantifying measurement uncertainties of many
environmental sensors (e.g., resistance thermometers, pyran-
ometers, etc.) exist, but such is not the case for minirhizotron
cameras and their digital imagery. The absence of establishing
such criteria from both the scientific community as well as
standards-holding bodies hinder advances in design, deployment
and data collection of minirhizotrons. The objectives of this paper
are to present a reproducible, statistically traceable and defensible,
steady-state approach for quantifying uncertainty and comparing
key characteristics of minirhizotron camera performance (i.e.,digital imagery). We present measurement uncertainties for an
array of performance metrics for two minirhizotron cameras. We
also test for sources of human error and the potential for biases
due to heating of the soil environment.
Table 1. Metrology terms and definitions.
Variable Definition (is the-)
Accuracy closeness of agreement between a measured quantity value and a
true quantity value of a measurand; the concept ‘measurement
Accuracy’ is not a quantity and is not given a numerical quantity
Value
Precision closeness of agreement between indications or measured quantity
values obtained by replicate measurements on the same or similar
objects under specified conditions; the ‘specified conditions’ can
be, for example, repeatability conditions of measurement etc.
Relative uncertainty standard measurement uncertainty divided by the absolute value of
the measured quantity value
Repeatability condition condition of measurement, out of a set of conditions that includes
the same measurement procedure, same operators, same
measuring system, same operating conditions and same location,
and replicate measurements on the same or similar objects over a
short period of time
Reproducibility condition condition of measurement, out of a set of conditions that includes
different locations, operators, measurement systems, and
replicate measurements on the same or similar objects
Resolution smallest change in a quantity being measured that causes a
perceptible change in the corresponding indication
Resolvable limit minimum distance at which neighboring objects of the same
intensity are resolved as two objects [28,29]
Sensitivity quotient of the change in an indication of a measuring system and
the corresponding change in a value of a quantity being measured
Standard uncertainty measurement uncertainty expressed as a standard deviation
Trueness closeness of agreement between the average of an infinite number
of replicate measured quantity values and a reference quantity
Value
Type A evaluation evaluation of a component of measurement uncertainty by a
statistical analysis of measured quantity values obtained under
defined measurement conditions, e.g., repeatability condition
Type B evaluation evaluation of a component of measurement uncertainty determined
by means other than a Type A evaluation
All definitions are provided by JGCM [27] standards-holding body unless otherwise specified.doi:10.1371/journal.pone.0112362.t001
Minirhizotron Digital Imagery: Calibration, Metrics, and Uncertainties
PLOS ONE | www.plosone.org 2 November 2014 | Volume 9 | Issue 11 | e112362

Materials and Methods
Selected MinirhizotronsTo our knowledge only three companies commercially pro-
duced minirhizotrons at the time of our study; i) Bartz Technology
Corporation, Carpinteria, CA, USA, ii) CID-BioScience Inc.,
Camas, WA, USA, and iii) RhizoSystems LLC, Idyllwild, CA,
USA. Minirhizotrons from two of the companies: the CI-600 In-
Situ Root Imager (CID-BioScience), and the Automated Mini-
rhizotron version A (AMR-A; RhizoSystems LLC) were used in
developing a steady-state, laboratory approach to compare key
functions of minirhizotron cameras and to quantify associated
uncertainties. The AMR-A and CI-600 employ fundamentally
different but common technologies for root imaging. The AMR-A
is a fully automated, programmable instrument that uses a digital
microscopic camera, and operates in a closed, sealed system [24].
The CI-600 is a manually controlled minirhizotron that relies
upon scanner-based digital technology, and operates as an open
system [25]. Choosing to analyze the performance of two different
minirhizotrons also reflects the current range (albeit two) of
technologies used.
Quantification of Measurement UncertaintyWe assessed four key functions of minirhizotron cameras and
propose methods to quantify and reduce associated uncertainties.
We follow a traceable and statistically defensible approach
(presented below) to quantify measurement uncertainty as
proposed by the Joint Committee for Guides in Metrology [26].
Definitions of metrological terms used here are also consistent with
the Standards-holding body (Table 1). The first step in calculating
a measurement’s uncertainty is to identify all input quantities, Xi,
on which Y (the measurand) depends:
Y~f X1,X2,:::,Xnð Þ: ð1Þ
Because the measurement uncertainty of a measurand is a
function of the uncertainty of its input quantities, the function f
should contain every known, not necessarily quantifiable, source of
measurement uncertainty, including all corrections and correction
factors, unit conversions, etc. The standard uncertainty of each
input quantity is quantified by two different uncertainty evaluation
‘‘Types’’. Type A evaluation of uncertainty is based on first-hand
statistical analyses and quantifies the distribution of n independent
observations taken under controlled, often steady-state, conditions.
Type B evaluation assumes a priori distribution for data and is not
based on first-hand statistical analyses. In many cases, Type B
uncertainties are taken directly from calibration specifications,
typically provided by a manufacturer, or are arrived at using best
scientific judgment. Here, we give a mathematical overview of a
typical Type A evaluation. First, the mean of n independent
observations is calculated:
x~x~1
n
Xn
i{1
xi: ð2Þ
Second, the experimental standard deviation is calculated:
s xið Þ~1
n{1
Xn
i{1
xi{xð Þ2 !1
2
: ð3Þ
The standard uncertainty of the input quantity xi can either be
the experimental standard deviation of the sample if quantifying
the expected variance of an individual observation or the standard
deviation of the mean (standard error) if quantifying the expected
variance of a mean, such that,
u xið Þ~s xið Þ
n12
: ð4Þ
Each individual source of uncertainty (represented here by the
standard deviation of the mean) then propagates to a final,
combined uncertainty,
uc yð Þ~XN
i{1
Lf
Lxi
� �2
u2 xið Þz
2XN{1
i~1
XN
j~1z1
Lf
Lxi
� �Lf
Lxj
� �r xi,xj
� �u xið Þu xj
� �!12
ð5Þ
where,Lf
Lxi
is the partial derivative of the function, f , with respect
to the input quantity, xi; r xi,xj
� �is the correlation coefficient
computed by dividing the covariance, u xi,xj
� �, of the respective
input terms by the product of their individual uncertainties,
r xi,xj
� �~
u xi,xj
� �u xið Þu xj
� � : ð6Þ
When input quantities are uncorrelated, the second term of Eq.
(5) can be dismissed. However, for the case where the input
quantities share a correlation of +1, Eq. (5) decreases to the linear
sum of terms,
uc yð Þ~XN
i~1
Lf
Lxi
� �u xið Þ: ð7Þ
It is common practice to expand the combined uncertainty to a
larger confidence level, usually 95%. To do so, the function (Eq.
(5)) is estimated by a normal distribution with an effective degrees
of freedom, veff yð Þ, attained by the Welch-Satterthwaite formula,
veff yð Þ~ u4c yð ÞXN
i~1
u4i yð Þvi
, ð8Þ
where, ui yð Þ~ Lf
Lxi
� �u xið Þ represents the individual, partial
uncertainties of the combined uncertainty, and vi~n{1, repre-
sents the degrees of freedom of each input variable. The expanded
Minirhizotron Digital Imagery: Calibration, Metrics, and Uncertainties
PLOS ONE | www.plosone.org 3 November 2014 | Volume 9 | Issue 11 | e112362

uncertainty at 95% confidence, U95 yð Þ, is then obtained by,
U95 yð Þ~k95uc yð Þ, ð9Þ
where, k95 is the coverage factor (found in Table G.2 of [26]). It
should be noted that deriving an expanded uncertainty using the
Welch-Satterthwaite formula assumes input quantities are uncor-
related and independent. While this assumption typically holds
true when measuring in-situ phenomena, it is widely applied for
steady-state calibrations using repeated measures which further
assumes the conditions of instrument uncertainty under in-situ and
steady-state conditions remain the same. Currently, there is no
metrological or statistical alternative to using the Welch-
Satterthwaite formula that is accepted by the standards-holding
body, and addressing this issue is an active area of research
[30,31]. The reader should also note that unless otherwise
specified, all uncertainties presented in this manuscript are given
in expanded form at 95% confidence. Data and uncertainty
analyses for all procedures described in this manuscript are
provided in Data S1.
Assessing the Spatial Uncertainty of Camera PositioningRepeated images of the same area provide a measure of how
well the same root (stocks) and their turnover (a time delta) can be
estimated [32]. In all minirhizotrons, the camera moves within an
access tube to image the belowground environment. Hence, the
ability to assess the spatial variability or precision of a moving
camera to repeatedly image the same area is potentially a large
source of uncertainty. In some cases, researchers have engraved
marks onto minirhizotron tubes or utilized automatic indexing
post-manufacture to quantify and possibly account for spatial
uncertainties of camera location between sequential sampling
times [22]. The minirhizotron tubes of the AMR-A and CI-600,
however, did not include reference marks. The AMR-A camera
has the ability to ‘auto-index’ image locations [24], and once the
AMR-A completes a full pre-programmed scan of the tube the
camera returns to a ‘home’ position located at the top of the
minirhizotron tube. One method to assess the spatial variance
would be to examine the AMR-A camera’s auto indexed position
for subsequent scans, however, at the time of this study,
RhizoSystems LLC’s Root View software did not record or
archive such information. Because it is a manual minirhizotron,
auto indexing was not available in the CI-600.
Here, we quantify the spatial uncertainty among a set of
sequential images from each instrument. A stationary target
(Kodak TL-5003 imaging test chart, Eastman Kodak Co.,
Rochester, NY, USA) was secured to an arbitrary location on
the outside of each minirhizotron tube. The target was scanned
thirty times (n~30, noted throughout the remainder of the text as
‘‘test’’) at manufacturer-specified default settings (Table 2). In
total, five tests were completed independently, three with the
AMR-A (tests A1, A2, and A3), and two with the CI-600 (tests C1
and C2; Table 3).
To quantify the reproducibility of the AMR-A camera, two tests
were conducted under conditions where the camera was
programmed to return to its ‘home’ position, i.e., the manufactur-
er’s reference location, between subsequent scans of the target. For
best results the manufacturer recommends the camera returns to
within 620 mm of its ‘home’ position among subsequent scans,
thereby managing the reproducibility. The first test (A1) comprised
scans where the radial (around the tube) and vertical (along the
tube) distances between the camera’s actual position and its ‘home’
position exceeded 620 mm among subsequent scans. The second
test (A2) comprised scans where the radial and vertical distances
between the camera’s actual position and its ‘home’ position were
#620 mm among subsequent scans.
To quantify the repeatability of the AMR-A’s camera position,
the A3 test was conducted such that the camera was prepro-
grammed to image a 1 cm2 area starting at predetermined x
(radial) and y (vertical) coordinates within the tube. Between
subsequent scans, the camera was not programmed to return to its
‘home’ position. This test was designed to assess the variability of
the camera’s location independent of sending the camera to its
‘home’ position among subsequent scans.
Under field conditions, the CI-600 is manually installed into its
tube. Hence, the C1 test simulated field conditions where
measurements would be prone to human error through the
removal and replacement of the camera by the operator (i.e.,
reproducibility). This test consisted of i) aligning the CI-600’s
reference dots with a fixed location at the tube’s inlet, as
recommended by the manufacturer [25], ii) placing the CI-600
camera inside the minirhizotron tube, iii) pushing it to a
predetermined depth of the tube (target location) where the
camera ‘‘locked’’ into place via its attached placement rod (the
camera was pushed to the same depth for all scans), iv) allowing
the camera to complete a full, ,360u radial scan, and then rotate
back to ,0u from its starting position (an automated process
among subsequent scans [25]), and v) removing the CI-600
camera from the tube; this method was repeated thirty times. The
C2 test followed the same method as C1 with the exception that
thirty successive images were taken under identical and stable
conditions without removing the CI-600 from the tube (i.e.,repeatability). Test C2 was intended to quantify the spatial
uncertainty of the camera free of external factors such as the
influence of human error introduced in estimating reproducibility
via test C1.
Because the image size of each minirhizotron camera is different
(Table 2), two different sized targets of the Kodak TL-5003 test
chart, a crosshair and a line-segment, were imaged by the CI-600
and AMR-A cameras, respectively. This ensured that the entire
target was captured within an individual image rather than a
mosaic of images, thus eliminating another potential source of
uncertainty.
The Interactive Data Language (IDL) v8.1 (Exelis Visual
Information Solutions, Inc., Boulder, CO, USA) was used to
assess each image in grayscale format, and using the thresholdingand contouring functions [33], discern pixels that comprise the
target of interest from background pixels. To do so, the pixel
intensity (0 (black) to 255 (white)) threshold was initially set to 253
and the pixels that comprised intensities less than this threshold
test were then outlined with the contour function. Contouring was
used here to ensure that only one outline for the entire black
colored target was identified, i.e., pixels not part of the target were
excluded, and that only the coordinates of the pixels that included
the target were identified. We then tallied the number of contours
that were returned. If more than one contour was identified, the
threshold value was lowered by one and the process was repeated
until only one contour was identified in each image, i.e., dynamic
thresholding. Once the final threshold was determined (in this
case, it was lowered by a total of 3, thus determining the final
threshold of 250), the x and y coordinates of each pixel comprising
the target from all images (i.e., those with intensities less than the
final threshold value) were outputted to separate data files and
labeled by the test and image number.
We then quantified the central position of the respective object’s
location in each image by calculating the mean x and y
coordinates of those pixels passing the threshold test. This was
completed using Perl (v5.10, www.perl.org). By computing the
Minirhizotron Digital Imagery: Calibration, Metrics, and Uncertainties
PLOS ONE | www.plosone.org 4 November 2014 | Volume 9 | Issue 11 | e112362

object’s central location in sequential images (at time one, time
two, time n), we were then able to determine the difference in this
central location among images and hence, determine the ability of
the sensor to repetitively sample the same point(s) in space. We
present the spatial uncertainty of the camera via one standard
deviation (SD), because in this case, we think it is more informative
to do so in the context of the sample variance, rather than the
variance of the sample mean, i.e., standard error. The standard
deviation can then be used in part to compute the expected spatial
uncertainty of the camera (for an individual scan) relative to the
camera’s ‘‘true’’ location.
Digital Imaging PerformanceEvaluating Camera Sensitivity. Accurately quantifying the
size of fine-roots may be limited by camera sensitivity and
pixelation inherent in digital imagery. The pixelation process
averages the signals across a given area, which subsequently
decreases the overall sensitivity of a given technology, and can
cause large uncertainties when fine-roots are imaged with cameras
comprising low resolution, i.e., large pixels [34]. To assess the
cameras’ abilities to quantify root diameter, we determined the
sensitivity of each minirhizotron camera, quantified measurement
trueness over a range of known diameters, and computed the
precision of such measurements.
Individual, black line segment widths of a truncated fan pattern
(Kodak TL-5003 imaging test chart) were measured at the thirteen
designated points (Table 4) by a Model 1602 Filar Micrometer
(Los Angeles Scientific Instrument Company, Los Angeles, CA,
USA), traceable to National Institute of Standards and Technol-
ogy’s (NIST) standards (NIST Test# 821/253660-94) at Applied
Image Inc. (Rochester, NY, USA). These measurements were used
to calibrate the minirhizotron measurements.
Each minirhizotron camera imaged the truncated fan pattern
under steady-state conditions (i.e., no camera removal) and
operated with the highest manufacturer recommended resolution.
For the AMR-A this was ,212 pixels (p) mm21 with pixel sizes of
Table 2. Specifications and manufacturer recommended default settings of each minirhizotron
Specification/Settings CI-600 AMR-A
Tube length (cm) 182.0 (Others available) 156.8 (including handle and fin)
Tube diameter (cm) 6.4 10.8
Tube circumference (cm) 20.1 33.9
Operating range (uC) Dependent on laptop 212 to 45
Power requirements Powered by laptop 5A @ 120 VAC
Removable camera Yes No
Operations On site; field technician Remotely; automated
Image dimensions (cm) 21.6619.6 0.22660.301
aresolution (ım) 42.3642.3 (,24 pixels (p) mm21) 4.764.7 (,212 p mm21)
Pixels/image 2.3566107 3.076105
Images/full-tube scan 8 (with 182.0 cm tube) 3.29286104
Software CI-600 Root Scanner v.3.1.22 Root View v3.0.0.7
bDefault camera settings Brightness = 0; (50%) Camera Exposure = 8; (60%)
Contrast = 0; (50%) LED camera lights = 192; (100%)
Threshold = 0; (50%) Dwell time = 100 ms
amanufacturer recommended resolutions (B Meyer, CID-BioScience Inc., pers. comm.; M Taggart RhizoSystems, LLC, pers. comm.)bsettings provided with percentage relative to the maximum range of the particular setting [24,25]doi:10.1371/journal.pone.0112362.t002
Table 3. Description of camera position tests.
Test Condition of measurement Description
A1 Reproducibility AMR-A: Camera homed between subsequent scans;
deviation from home location was greater than the
manufacturer recommended 20 mm
A2 Reproducibility AMR-A: Camera homed between subsequent scans;
deviation from home location was equal to or less than
the manufacturer recommended 20 mm
A3 Repeatability AMR-A: Camera not homed between subsequent scans
C1 Reproducibility CI-600: Removal and replacement of camera
C2 Repeatability CI-600: No removal and replacement of camera
Each test had n = 30.doi:10.1371/journal.pone.0112362.t003
Minirhizotron Digital Imagery: Calibration, Metrics, and Uncertainties
PLOS ONE | www.plosone.org 5 November 2014 | Volume 9 | Issue 11 | e112362

4.764.7 mm [24], and for the CI-600, this was ,24 p mm21 with
pixel sizes of 42.3642.3 mm [25]. Each minirhizotron camera
operated inside a larger opaque tube to mimic underground
conditions and eliminate exposure to extraneous sources of light.
The resultant images were saved in bitmap (*.bmp) format to
avoid data compression.
We assessed the minirhizotron images using IDL. The
intensities and coordinates of each pixel residing within the
thirteen rows perpendicular to the truncated fan pattern (i.e., those
points measured by the NIST traceable micrometer) were
outputted to a *.csv file. Data were then normalized with respect
to the neighboring maxima. We followed the Rayleigh Criterion to
quantify the resolvable limit (sensitivity) of each minirhizotron
(Figure 1). This criterion can be thought of as defining the
minimum distance between two objects that can be individually
resolved by a camera [28,29]. More specifically, we also define this
minimum distance when a contrast of 26.4% exists between two
neighboring maxima with identical magnitudes [35]. In the case of
pixelated images, magnitudes relates to pixel intensities (signals).
Pixel intensity graphs (Figure 1) were generated via Microsoft
Excel 2010 (Microsoft Inc., Redmond, VA, USA) to assess
sensitivity and quantify the Rayleigh Criterion.
Quantifying Root Diameter. Measurement trueness was
quantified through a number of steps. First, pixel intensity data
(outputted by IDL) of the six widest lines measured by the
micrometer (Table 4) were ingested into a Perl script. These six
points were chosen because they did not reside near the resolvable
limit of either minirhizotron camera. Thus, we standardized the
approach to make robust comparisons between both minirhizo-
tron cameras. Second, we used two separate test methods to
estimate trueness of line thickness; we tallied the number of
successive pixels with intensities less than i) the threshold of 250 (as
determined by the camera positioning tests), and ii) half of the
maximum intensity of an individual group of successive, black
pixels. The latter follows the Full Width at Half Maximum
(FWHM) approach, a common method used in optics [28]. The
maximum intensity value for FWHM was independently calcu-
lated for each group of successive, black pixels. Successive, black
pixels from each test were tallied separately, thus quantifying the
width of a black line-segment in two different manners. Third, the
mean line segment widths of all the black line segments at each of
the six points were calculated in units of microns following Eq. (2).
Fourth, the standard errors of these six mean line thicknesses were
calculated following Eq. (3) and (4). Mean data from each of the
minirhizotrons were then fit to a calibration curve against those
values quantified by the micrometer.
Uncertainty estimates for uncorrected and corrected (i.e., those
data not fit and fit to the calibration curve, respectively) data were
estimated and compared. In both cases, input data were
considered uncorrelated and independent. Combined uncertain-
ties were derived following Eq. (5). Sources of quantifiable
uncertainties of each minirhizotron dataset included: i) uncertainty
of the micrometer measurements (Type B uncertainties taken from
calibration specifications), ii) measurement trueness (uncorrected
or corrected), and iii) the precision of the minirhizotron
measurements. The average of the computed standard errors
over the entire measurement range was used to calculate the
precision of each camera’s ability to quantify root diameter.
Individual uncertainties were summed in quadrature following Eq.
(5), and resulting combined uncertainties were then expanded
following Eq. (8) and (9).
Assumptions. It should be noted that two assumptions were
made when determining the resolvable limit of each camera and
their ability to quantify root diameter. First, we assumed each
camera operated using a constant focal length, such that the focal
point was always positioned at the outer edge of the respective
minirhizotron tube, i.e., where the truncated fan pattern was
secured, and not at some distance d (mm) away from the outer
edge of the tube. Second, it was assumed that the measured widths
of the line segments (two-dimensional objects) were representative
of root diameters (three dimensional objects; see [23]). We cannot
discount the possibility that these assumptions may lead to
additional uncertainties. Regardless, the presented approach is
reproducible, statistically traceable, and serves as a guideline for
future researchers to build upon.
Table 4. Line widths and expanded uncertainties asmeasured by the NIST traceable micrometer.
Line Width (mm) ±U95 (mm)
409.63 2.22
348.21 1.64
303.53 1.64
268.48 1.64
242.62 1.64
194.06 1.64
161.95 1.38
120.27 1.38
100.15 1.38
73.81 1.38
57.99 1.38
43.66 1.38
39.29 1.38
doi:10.1371/journal.pone.0112362.t004
Figure 1. Conceptual diagram depicting the resolution of twoobjects (smooth contours) with equal intensities at varyingdistances. The dashed lines denote two conceptual objects of equalintensity, and the shaded, gray area represents what the cameraresolves; (a) fully resolvable, (b) just resolvable (Rayleigh Criterion), and(c) unresolvable, i.e., both objects are resolved as a single object.doi:10.1371/journal.pone.0112362.g001
Minirhizotron Digital Imagery: Calibration, Metrics, and Uncertainties
PLOS ONE | www.plosone.org 6 November 2014 | Volume 9 | Issue 11 | e112362
Quantifying Root Color. Overestimation of fine-root life-
span and subsequent underestimation of fine-root turnover are
possible if fine-roots are only classified as dead once they disappear
from the view of the minirhizotron camera [10]. To address this
problem, some researchers quantify the age and/or health of fine-
roots as a function of color. However, the color nomenclature used
by researchers to define root health is unstandardized and
ambiguous. For example, the terms white [10,36–38] and/or
cream [32] are used to designate living and/or new roots, brown[32,36–38], or woody [32] to describe dying/aging roots, dark to
describe older roots [10], and dark brown, very dark brown [39] or
black to describe dead roots [32,37,39]. Interestingly, the term
brown is used to describe the colors orange and/or dark yellowimaged at low luminance [40]. In a recent paper, Dannoura et al.[36] quantified root-color changes via digital imagery to discern
between living and dying/dead roots, but did not provide an
estimate of the imager’s ability to quantify color with a known
trueness and precision. The color space vectors outputted by
digital cameras, e.g., RGB, are device-dependent, do not usually
adhere to the fundamentals of Colorimetry [41], and the spectral
response to color among a population of cameras can vary greatly
[42]. In other words, the same root stock may appear brown when
imaged by camera A, cream colored when imaged by camera B,
and dark brown when imaged by camera C. ‘‘True’’ root colors
cannot be known and comparisons cannot be made using device-
dependent imagery (and qualitative color terms). To our
knowledge no researchers have identified device-independent
color space, e.g., CIE XYZ, CIE L*a*b*, etc., thresholds for
digital imagery to discern among new/living, dying/aging, or dead
roots, nor have they provided color space uncertainty estimates.
JCGM [26] notes that any measurement is not complete
without a supplementary uncertainty estimate; this is especially
true for color measurements, as many factors, such as the lighting
and the geometry of measurement, can influence the uncertainty
of its measurement [43]. Here, we present an uncertainty analysis
of color quantification of the two minirhizotron cameras and also
stress the importance of monitoring root age and/or health in a
quantitative manner via a device-independent color space.
In many cases, spectral reflectance of a sample is quantified by
concurrently measuring signals of a sample and a standard under
identical measurement conditions [44]. For this study, however,
spectral reflectance of the samples and the standards were
quantified independently, as this is becoming a more common
approach (Gary Reif, Applied Image Inc., Personal Comm. 2014).
A Color Test Chart (QA-69-P-RM, Applied Image Inc.)
containing eight color patches was measured by a NIST traceable
X-Rite eXact densitometer (X-Rite Inc., Grand Rapids, MI, USA)
at Applied Image Inc. This densitometer directly measured
reflectance of the sample over a spectrum of 400 to 700 nm l at
10 nm increments while operating with International Commission
on Illumination (CIE) [45] Illuminant D50, 0/45u geometry of
measurement, and the CIE 1931 2u standard observer. This was
completed five separate times for each of the color patches to
inform uncertainty of the reflectance measurements. In total, five
datasets of n = 31 (reflectance data from 400–700 nm l at 10 nm
increments) for each of the eight colors were generated. The five
datasets of reflectance data for each color patch were then
averaged together at each wavelength. Although the CIE [45]
recommend that data should be captured at or interpolated to 5 or
1 nm increments to avoid uncertainties due to gaps, research
shows that the increase of uncertainty in reflectance data when
capturing data at 10 nm increments is likely trivial compared to
data captured at 5 or 1 nm [46]. Moreover, interpolating to these
increments can actually lead to larger uncertainties (than the
10 nm data) depending on the interpolation scheme (e.g., linear,
Lagrange). Therefore, we chose not to interpolate the reflectance
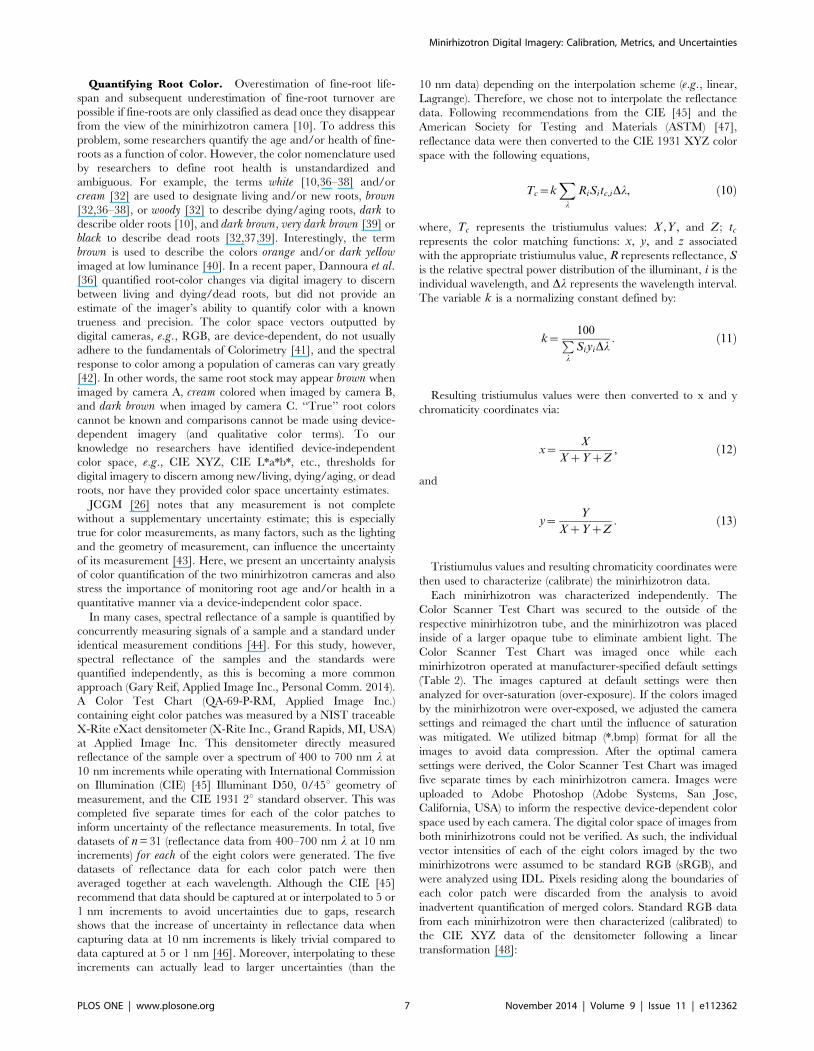
data. Following recommendations from the CIE [45] and the
American Society for Testing and Materials (ASTM) [47],
reflectance data were then converted to the CIE 1931 XYZ color
space with the following equations,
Tc~kX
l
RiSitc,iDl, ð10Þ
where, Tc represents the tristiumulus values: X ,Y , and Z; tc
represents the color matching functions: x, y, and z associated
with the appropriate tristiumulus value, R represents reflectance, S
is the relative spectral power distribution of the illuminant, i is the
individual wavelength, and Dl represents the wavelength interval.
The variable k is a normalizing constant defined by:
k~100P
l
SiyiDl: ð11Þ
Resulting tristiumulus values were then converted to x and y
chromaticity coordinates via:
x~X
XzYzZ, ð12Þ
and
y~Y
XzYzZ: ð13Þ
Tristiumulus values and resulting chromaticity coordinates were
then used to characterize (calibrate) the minirhizotron data.
Each minirhizotron was characterized independently. The
Color Scanner Test Chart was secured to the outside of the
respective minirhizotron tube, and the minirhizotron was placed
inside of a larger opaque tube to eliminate ambient light. The
Color Scanner Test Chart was imaged once while each
minirhizotron operated at manufacturer-specified default settings
(Table 2). The images captured at default settings were then
analyzed for over-saturation (over-exposure). If the colors imaged
by the minirhizotron were over-exposed, we adjusted the camera
settings and reimaged the chart until the influence of saturation
was mitigated. We utilized bitmap (*.bmp) format for all the
images to avoid data compression. After the optimal camera
settings were derived, the Color Scanner Test Chart was imaged
five separate times by each minirhizotron camera. Images were
uploaded to Adobe Photoshop (Adobe Systems, San Jose,
California, USA) to inform the respective device-dependent color
space used by each camera. The digital color space of images from
both minirhizotrons could not be verified. As such, the individual
vector intensities of each of the eight colors imaged by the two
minirhizotrons were assumed to be standard RGB (sRGB), and
were analyzed using IDL. Pixels residing along the boundaries of
each color patch were discarded from the analysis to avoid
inadvertent quantification of merged colors. Standard RGB data
from each minirhizotron were then characterized (calibrated) to
the CIE XYZ data of the densitometer following a linear
transformation [48]:
Minirhizotron Digital Imagery: Calibration, Metrics, and Uncertainties
PLOS ONE | www.plosone.org 7 November 2014 | Volume 9 | Issue 11 | e112362

X1~a11R1za12G1za13B1,
X2~a11R2za12G2za13B2,
X3~a11R3za12G3za13B3,
ð14Þ
where, Xi is a tristiumulus value of an individual color patch
(converted from spectral reflectance data measured by the
densitometer), Ri, Gi, and Bi are the values outputted by the
minirhizotron camera for the same color patch, and a11, a12, and
a13 are empirical coefficients. The same calculations were carried
out for Y and Z, for a total of nine equations. Three colors: white,
amber (a mixture of orange and yellow), and yellow, were used for
the linear transformation (Table 5). These colors were chosen as
they best represent the region of expected root colors relative to
the other five colors of the test chart. The resultant tristiumulus
values were then converted to chromatic coordinates following Eq.
(12) and (13).
Color space characterization, especially for applications relying
on digital imagery (RGB), is an active area of research. Various
techniques to characterize RGB to a CIE color space have been
investigated [48–50]. As cautioned by these studies, the use of a
linear calibration using only three colors will cause large
uncertainties when attempting to characterize other colors via
the derived coefficients a11, a12, and a13. Here, we acknowledge
this issue; however, one goal of this study was to develop a method
of traceable, standard, and defensible means to estimate the
uncertainties in minirhizotron imagery. The extent of our
characterization was limited by the number of colors on our test
chart, and thus a characterization that includes the many possible
combinations of tristiumulus values and higher order polynomial
modeling was beyond the scope of this investigation.
An uncertainty analysis for color is estimated following the
JCGM [26], Early and Nadal [44], the CIE [45], and Sandor et al.[46]. Uncertainty estimates of the spectral reflectance data (as
measured by the densitometer) were provided as relative values by
Applied Image Inc. and are considered Type B uncertainties.
Because the spectral reflectance data are the rawest form of data
obtained from the densitometer, we assumed that the correspond-
ing uncertainty values provided by Applied Image Inc. encom-
passed any correlations among the signals of the standard and the
sample, and are corrected for any systematic uncertainties
inherent in reflectance data (as mentioned in [44]). Correlations
among wavelengths and among tristiumulus values were quanti-
fied following Eq. (5), and the equations in [44]. Combined
uncertainties of each tristiumulus value, Tc, and each chromaticity
coordinate, vc, respectively, were derived via,
uc Tcð Þ~XN
i{1
LTc
LRi
� �2
u2 Rið Þz
2XN{1
i~1
XN
j~1z1
LTc
LRi
� �LTc
LRj
� �r Ri,Rj
� �u Rið Þu Rj
� �!12
,
ð15Þ
and,
uc vcð Þ~
Lvc
LX
� �2
u2 Xð Þz Lvc
LY
� �2
u2 Yð Þz Lvc
LZ
� �2
u2 Zð Þ
z2Lvc
LX
� �Lvc
LY
� �r X ,Yð Þu Xð Þu Yð Þ
z2Lvc
LX
� �Lvc
LZ
� �r X ,Zð Þu Xð Þu Zð Þ
z2Lvc
LY
� �Lvc
LZ
� �r Y ,Zð Þu Yð Þu Zð Þ
0BBBBBBBBBBBB@
1CCCCCCCCCCCCA
12
,ð16Þ
We present uncertainty estimates of uncharacterized (i.e., sRGB
vectors), and characterized (i.e., x and y chromaticity coordinates)
in expanded form. The act of characterizing from sRGB to the
chromatic coordinates is a calibration procedure, and thus, we
cannot display uncharacterized minirhizotron data in the form of
x and y chromatic coordinates.
Estimating Heat DissipationIt is well known that temperature controls many enzymatically-
driven metabolic processes in the soils [51–53]. Artificial changes
in soil temperature could, in turn, change plant and microbial
responses. For example, a meta-analysis by Rustad et al. [54]
concluded that nearly all soil warming experiments increased soil
respiration, N mineralization, and plant productivity. The AMR-
A operates as a closed system and uses the ground as a heat sink
[24], which may impact fine-root turnover. To assess the potential
impact of heat additions to the soil environment, we measured the
soil temperatures surrounding the installation of the AMR-A. We
did not measure the soil temperatures around the CI-600 as it is
not a closed system and we assumed its scanner-based imager
dissipated a negligible amount of heat to the surrounding
environment during the time it takes the CI-600 to complete a
full-tube scan (i.e., roughly thirty-minutes).
The AMR-A was placed into a 118 cm (L) x 30 cm (ID) QUIK-
TUBE (part number 6922, QUIKRETE, Atlanta, GA, USA) and
the area between the exterior of AMR-A’s tube and interior of the
QUIK-TUBE was filled with dry, QUIKRETE, All-Purpose sand
(part number 1152). Dry sand was chosen because of its uniformity
Table 5. Mean chromaticity coordinates (and expanded uncertainties) converted from reflectance data measured by thedensitometer.
Color x ±U95(x) y ±U95(y)
Yellow 0.463 0.001 0.494 0.001
Amber 0.424 0.001 0.397 0.001
White 0.349 0.001 0.363 0.002
doi:10.1371/journal.pone.0112362.t005
Minirhizotron Digital Imagery: Calibration, Metrics, and Uncertainties
PLOS ONE | www.plosone.org 8 November 2014 | Volume 9 | Issue 11 | e112362

and low specific heat capacity, thus ensuring that our approach
quantified a ‘‘worst case’’ scenario with regard to temperature
increase due to heat dissipation from the AMR-A. A pair of holes
was drilled at three different levels, and on opposing sides of the
QUIK-TUBE. The location of these holes coincided with the
AMR-A camera’s home position (top), mid-level of the AMR-A’s
tube (middle) and the lowest possible camera scanning level
achieved by the AMR-A (bottom; Figure 2). One four-Wire
Platinum Resistance Thermometer (100 V PRT; Thermometrics
Inc., Northridge, CA, USA) was inserted into each hole, thus
allowing each PRT to reside perpendicular to the AMR-A’s tube.
At each level, the tip of one PRT was positioned 0.5 cm away
from the edge of the AMR-A tube. This suite of 6 PRTs remained
fixed for this entire heat dissipation test (A through F in Figure 2).
We then positioned another suite of 6 PRTs at the same locations
and in the same manner, but inserted them at constant distances of
7.0, 3.0, and 2.0 cm from the AMR-A’s tube during three
sequential tests, respectively. We then mounted two PRTs 0.5 cm
from the AMR-A’s tube at heights of 10 and 30 cm above the
surface of the sand to measure temperature changes of ambient air
near the AMR-A’s electrical components and motor. Prior to
testing, all PRTs were calibrated against NIST’s standards (i.e., the
triple point of mercury and water, and melting point of gallium)
and uncertainty analyses were generated following JCGM [26].
Data from these fourteen, calibrated, PRTs were acquired with a
datalogger (CR3000, Campbell Scientific Inc., Logan, UT, USA)
at 0.1 Hz. Before testing began the QUIK-TUBE and AMR-A
were collectively tilted at an angle of 60# from horizontal (plane)
to mimic the angle minirhizotrons are usually installed in the field
[22]. This allowed our setup to mimic the dynamics of heat flow
similar to those encountered in the field.
Three, individual, full-tube scans were conducted over a ten-day
period. During testing, the AMR-A operated with manufacturer-
specified, default camera settings (Table 2). Upon completion of
each full-tube scan, the camera of the AMR-A was programmed to
return to its home position and was powered down. We allowed
for the thermal mass of the sand/tube assembly to equilibrate with
ambient conditions for a minimum of 48 hours between each test
scans. Mean, ambient lab temperature was 23.2160.21uC (mean
6 1 SD).
Temperature data were split into three different groups, one for
each test. Temperature change at each location was quantified
relative to the temperature of the respective PRT at the start time
of each full-tube scan.
Results and Discussion
A CaveatBecause we did not test a population of minirhizotron cameras,
we cannot rule out that our findings are a function of camera-
specific characteristics. We did, however, receive assurances from
the manufacturers that the tested cameras were representative of a
larger population. Two separate CI-600 In-Situ Root Imagers
were used during testing. Both experienced mechanical failures
that required replacement or manufacturer repair.
Spatial Uncertainties of Camera PositioningBoth the repeatability and reproducibility of the AMR-A
camera’s position were significantly better than that of the CI-
600 (Table 6). Regarding reproducibility, the radial and vertical
uncertainties of the CI-600 camera (test C1) were two to threeorders of magnitude larger than the radial and vertical uncertain-
ties of the AMR-A’s camera (i.e., A1, and A2). The larger spatial
uncertainty of the CI-600’s camera position for test C1 is most
likely a result of the extraction and replacement of the camera
between subsequent scans, a task that mimics how the CI-600 is
actually used in the field. The discrepancies of spatial uncertainties
for tests A1 and A2 are most likely due to the camera’s ability to
consistently return to the home position between subsequent scans.
In regards to repeatability, the differences between the spatial
camera uncertainty of tests A3 and C2 were not as large as those of
the reproducibility tests. However, the uncertainties quantified
during test C2 were still larger in the radial and vertical
dimensions when compared to test A3 (see Table 6). The
differences in spatial uncertainties between these two cameras
were most likely a result of the operational characteristics of the
minirhizotrons, i.e., automated vs. manual camera positioning.
That said, we also interpret the large difference between the spatial
uncertainties of camera location during tests C1 and C2, is due to
the CI-600’s removal and replacement from the tube. In other
words, the influence of human sources of error is evident in test
C1, and the potential magnitude of this error can be quite large.
When human interaction was completely removed from testing
(i.e., C2) results improved (Table 6).
Human operation and interaction with the technology is an
essential aspect of the CI-600 performance. The CI-600 camera
needs to be physically moved among field-deployed tubes and
moved to different depths of a tube during sampling. Although
such an approach can be beneficial in terms of cost, it leads to
additional uncertainties. In working with the C1-600, precautions
were taken to minimize misalignments of the camera with respect
to a reference point at the tube’s inlet, as recommended by CID-
BioSience Inc. [25]. We assume that our carefully controlled
laboratory conditions would result in performance superior to
those obtained under field conditions.
An underlying goal was to provide a traceable method to assure
the same area of roots is imaged across successive sampling
intervals. One solution is creating reference points along the tube
via indexed marks or etchings [32,55]. Given the large spatial
uncertainties in the CI-600 camera found in this study (Table 6),
the CI-600 is currently incapable of imaging the same area of root
stocks at sequential sampling intervals without the use of etchings
or reference points along the tube. Providing such indexed
etchings to all minirhizotron tubes, including the AMR-A,
provides the ability to assess the instrument’s spatial uncertainty
a posteri, as well as manage any changes that occur over time, e.g.,mechanical wear. Etchings on the tube would also aid in the
alignment of neighboring images when producing a larger
ensemble of images, however, estimating the uncertainties of
combining neighboring images into a larger mosaic were outside
the scope of this study.
Digital Imaging PerformanceCamera Sensitivity. The AMR-A was capable of resolving
smaller objects than the CI-600. The CI-600 was able to resolve
line widths at 100.1561.38 mm, but was unable to resolve line
widths at 73.8161.38 mm. Since the minirhizotron cameras were
calibrated at points, we cannot state (empirically) the exact
location where the CI-600 reached its resolvable limit, however,
we empirically bound its resolvable limit between 72.43 and
101.53 mm. Vamerali et al. [56] found that at least two pixels are
needed to resolve the diameter of an object. Thus, it is reasonable
to conclude that the resolvable limit of the CI-600’s camera is
84.6 mm, i.e., the width of two of its pixels. The ARM-A camera’s
resolvable limit was unable to be empirically quantified because
the camera was able to resolve the narrowest line widths,
39.2961.38 mm, of the truncated fan pattern. Provided the same
Minirhizotron Digital Imagery: Calibration, Metrics, and Uncertainties
PLOS ONE | www.plosone.org 9 November 2014 | Volume 9 | Issue 11 | e112362

reasoning as above, we conclude that the resolvable limit of the
AMR-A is 9.4 mm.
Although fine-root diameters can be resolved with two pixels,
this does not guarantee that fine-roots of 84.6 mm (CI-600), and
9.4 mm (AMR-A) will be resolvable in the field with varying
environmental conditions, root orientations, and potential camera
photocell degradation. This is also true if the object is not aligned
with the pixels themselves. Zobel [23] states that, ideally, pixel size
should be 25% of the diameter of the smallest root being imaged.
When we follow Zobel’s [23] research and incorporate our
findings, the conservative resolvable limits of the CI-600 and
AMR-A for operational use in the field would be 169.2 mm and
18.8 mm, respectively (with the given instrument settings used in
this study, Table 2). As noted previously, Villordon et al. [20],
underestimated root quantity using a scanner based minirhizotron
(i.e., the CI-600). Given the CI-600 settings that the researchers
utilized (i.e., 78 dots (d) cm21 or ,8 p mm21, with pixel sizes of
1276127 mm), the resolvable limit using the Rayleigh Criterion
would be 254 mm. Applying Zobel’s [23] findings (above) to the
research of Villordon et al. [20] would result in fine-roots with
diameters ,508 mm to go virtually undetected; this may provide
insight as to why root quantity was underestimated, and stresses
the importance of knowing the limits of digital imagery prior to
field use.
Neighboring Objects of Different Sizes. Mean, fine-root
diameters have been estimated globally as 220, 440, and 580 mm
for grasses, shrubs, and trees, respectively [57], while the range of
fine-root diameters are often defined as 0–3000 mm [8,34,58,59],
Figure 2. Experimental design to determine heat dissipation. A cross-section schematic of the experimental design used to assess heatdissipation (not to scale) for the AMR-A. The three depths: Top, Middle, and Bottom, correspond to depths of 5, 48, and 86 cm below the sand surface,respectively. The locations of the PRTs residing 0.5 cm from the minirhizotron are denoted by letters A through F, and correspond to the resultsshown in Figure 5. The LED lights reside on the body of the camera. The 60u angle refers to the overall installation relative to the horizontal (plane).doi:10.1371/journal.pone.0112362.g002
Minirhizotron Digital Imagery: Calibration, Metrics, and Uncertainties
PLOS ONE | www.plosone.org 10 November 2014 | Volume 9 | Issue 11 | e112362

and fungal hyphae diameters range from ,2–80 mm [60]. Given
that fine-root diameters can be quite small, argues that the
resolvable limit should be reported for such studies. This is the first
study to report a defensible and traceable means to determine the
resolvable limit of current, commercially available, minirhizotron
cameras.
Interestingly, we found a change in the cameras’ responses to
contrast. The signals of the black line segments became
progressively more saturated as the test lines became narrowed.
In other words, the signals of the black line segments became
larger, i.e., moving away from the lower end of the 0–255 intensity
range, and the contrast between the black and white line segments
decreased. At a line width of 409.6362.22 mm the mean pixel
intensities were 133.0262.39 and 121.5161.02, as imaged by the
CI-600 and AMR-A, respectively. At a line width of
194.0661.64 mm the mean pixel intensities were 146.2063.53
and 139.2561.41, as imaged by the CI-600 and AMR-A. We
interpret the change in the cameras’ abilities to consistently detect
contrast to i) the backscattering of light caused by the increased
area of white background surrounding the truncated fan pattern as
it narrowed, and the ii) signal averaging inherent in the pixelation
process. It may also be a result of the analysis software’s ability (in
this case, IDL) to convert color images to grayscale. Our finding
poses a challenge, as it suggests that the two cameras have
difficultly resolving neighboring objects of different sizes, i.e., they
may have difficulty resolving and quantifying neighboring fine-
roots with different colors or brightness, or when there is a range of
root diameters.
Root Diameter Measurements. Prior to calibration both
minirhizotrons exhibited measurement bias when quantifying root
diameter. Using the 250 threshold method, the AMR-A overes-
timated (i.e., a positive bias) root diameter by an average of
32.0363.06 mm (Figure 3a), while the CI-600 overestimated by an
average of 117.16613.97 mm (Figure 3c). Using the FWHM
method, the AMR-A underestimated (i.e., a negative bias) root
diameter by an average of 15.51612.50 mm (Figure 3b), while the
CI-600 underestimated, on average, by 12.4767.68 mm (Fig-
ure 3d). At first glance it may seem that using the FWHM method
yielded better results because the absolute bias is smaller than that
of the 250 method. Interestingly, however, using the FWHM
method, the AMR-A camera grossly underestimated approxi-
mately 6% (i.e., 6 of 101) of the samples and skewed the dataset;
the result of which was reflected not only in the average systematic
bias of -15.51 mm, but also in the large standard error of
612.50 mm. However, these same 6 samples (line widths) were not
significantly different than the other 95 samples when using the
signal threshold of 250. The results of the FWHM test suggest a
skewed distribution and a potential systematic bias if the products
are used for turnover and below ground productivity estimates. If
the degree of systematic bias is constant, then the delta calculation
of root growth and/or senescence between sequential images in
time will be small. If the bias is not constant, the contributing
uncertainties will be difficult to quantify over time.
The ability of each minirhizotron camera to quantify root
diameter was greatly improved after calibration. The systematic
biases of both cameras were corrected and resultant expanded
uncertainties for both minirhizotron cameras using either analysis
method reduced to within 617.00 mm of the estimated ‘‘truth’’.
The largest fraction of the expanded uncertainty for the calibrated
data resulted from the reproducibility of the cameras’ abilities to
quantify root diameter. Calibration can correct bias, but it cannot
mitigate the estimate of uncertainty in the form of repeatability
and/or reproducibility (see inset plots of Figure 3).
Root Color Measurements. When compared to one
another, both minirhizotrons exhibited significant differences in
quantifying the sRGB vector intensities of each of the eight colors
(Table 7, Table 8). At first, we operated using the manufacturer-
specified default settings, and three of the color patches: magenta,
yellow, and amber, imaged by the AMR-A were over-exposed and
all sRGB vectors were 255, i.e., the highest possible pixel intensity.
To mitigate over-saturation, the exposure of the camera was
adjusted. We empirically determined that the AMR-A was capable
of quantifying all eight colors (within reason) when operating at a
lower camera exposure of 12, (i.e., not the recommended, default
exposure; Table 7). Moreover, many of the AMR-A images were
also prone to areas of overexposure in the top left corner of each
image, regardless of which exposure was used. The CI-600 also
exhibited signs of over-saturation while operating at default
settings. Specifically, the R vectors of magenta, yellow, and amber,
all registered 255 (Table 8). Although we were aware of this over-
saturation, all color characterization tests of the CI-600 were
completed using default settings because the CI-600 encountered
systematic communication problems with its software during
testing, and we were unable to alter the settings.
Both minirhizotron cameras had the ability to repeatedly image
the same color with a high degree of precision. The largest
estimate of AMR-A imprecision was at 0.127, which was at the B
vector of the yellow color patch. In terms of relative uncertainty,
this result equates to ,0.7%, i.e., the signal-to-noise ratio is
99.3:0.7% (standard error at 95% confidence level). The largest
estimate of imprecision in the CI-600, was 0.06% of the signal,
which was found at the R vector of the blue color patch. Thus, the
signal-to-noise ratio when imaging the eight colors of the specified
target was better with the CI-600. But because we did not test over
a range of exposures, different lighting etc., we cannot be
conclusive if this result is consistent across all colors, or if this is
indicative of a population of sensors, but if it is important to the
end-user, it should be examined further.
A noted difference among the device-dependent color vectors
imaged by the AMR-A and CI-600 was expected. Characterizing
the device-dependent sRGB color spaces to the device-indepen-
dent chromaticity coordinates provided a means by which root
colors can be quantified and compared among a group of
minirhizotrons with a known accuracy (Table 9; Figure 4). Given
the results found here and elsewhere [42,48–50], we recommend
that minirhizotron cameras be characterized prior to field
deployment with a traceable color test target using the approach
presented here and by others [26,44,45]. We note that the linear
characterization used here may result in different response
functions when tested with different cameras (photocells) over a
broader color spectrum. The use of colorimetric cameras, and/or
Table 6. Precision of minirhizotron camera location for eachsampling method; values are provided as one standarddeviation.
Precision
Test Radial (degrees) Vertical (mm)
A1 0.12 24.87
A2 0.01 4.32
A3 0.01 38.37
C1 13.72 1942.23
C2 0.22 84.06
doi:10.1371/journal.pone.0112362.t006
Minirhizotron Digital Imagery: Calibration, Metrics, and Uncertainties
PLOS ONE | www.plosone.org 11 November 2014 | Volume 9 | Issue 11 | e112362

a higher order, non-linear characterization, as well as character-
izing with a test card comprised of hundreds of colors should be
explored further [48–50]. The resultant coefficients from charac-
terizations should be applied to minirhizotron cameras prior to
any type of color analysis. This will allow for traceable
quantification of color and will also facilitate estimation of root
age and health. We recommend that minirhizotron cameras’ are
also periodically validated while in the field, as this will aid in
quantifying color drift of the camera and photocell degradation
over time. Such a task can be completed by installing a color test
chart within the minirhizotron tube, preferably at the bottom as to
avoid direct interaction with sunlight, and imaging the chart on a
periodic basis. Lastly, and possibly most importantly, the natural
variation in species-specific relationships between root color and
health are likely large, and quite possibly the same magnitude or
larger than the variation in color exhibited by these technologies.
Only once species and site specific tests are conducted relating root
health to chromaticity, do we advise that the classification of root
age and or health be defined by chromaticity coordinates. In all
cases, however, we highly discourage classifying root age and or
health by qualitative, loose nomenclature, such as white, brown,
cream, or black. This method should also be extended to other
camera-based phenological measures and the like.
Heat Dissipation EstimatesWhen operational, the AMR-A increased temperatures in the
environment immediately adjacent to its tube, and away from the
tube to a distance of 7.0 cm at all measured depths. These
temperature increases, however, were not uniform in time or
space. The maximum and mean ambient air temperature
increases near the AMR-A’s motor (located 10 cm above the
sand surface) were 6.74 uC and 3.2960.05 uC, respectively.
Similarly, the maximum and mean ambient air temperature
increases near the AMR-A’s electrical components (located 30 cm
above the sand surface) were 9.36 uC and 7.560.05 uC,
respectively. The largest temperature increases in the sand were
found at shallower depths (i.e., closest to the surface; top level),
above (Figure 2), and at a distance of 0.5 cm from the AMR-A’s
tube (Figure 5). Specifically, the maximum and mean sand
temperature increases at this location (point A), were 3.25 uCand 1.8160.02 uC, respectively. The smallest temperature change
occurred at the bottom level, below the AMR-A, and at a distance
of 7.0 cm (not shown in Figure 5). The maximum temperature
increase at this location was 0.22 uC. However, the mean
temperature change at this location was negligible.
The increases in temperatures were not transient, and occurred
well before the camera passed a monitored area. Sand temper-
atures began increasing prior to the camera’s passing at PRT
locations, and continued to increase for a short period of time after
the camera passed. Once reaching their maxima, temperatures
persisted above pre-scan values for extended periods of time. For
instance, sand temperatures at distances of 0.5 cm away from the
AMR-A’s tube remained above ambient levels for approximately
28, 23, and 15 hours once maximum temperature change
occurred at the top, middle and bottom levels, respectively
(Figure 5).
Figure 3. Line widths as measured by both minirhizotrons. Estimated line widths as determined by both minirhizotrons cameras againstthose of the NIST traceable micrometer. Results of the AMR-A are shown in (a) using the 250 pixel intensity threshold (n~101), and (b) using theFWHM threshold (n~101). Results of the CI-600 are shown in (c) using the 250 pixel intensity threshold (n~114), and (d) using the FWHM threshold(n~120). A 1:1 line is shown on each graph. Inset plots are provided at the 194.0661.64 mm calibration point to emphasize the magnitude of randomuncertainty and show that calibration can correct for bias, but not random uncertainty. Error bars are given as 62 SE for uncalibrated data and6U95(y) for calibrated data.doi:10.1371/journal.pone.0112362.g003
Minirhizotron Digital Imagery: Calibration, Metrics, and Uncertainties
PLOS ONE | www.plosone.org 12 November 2014 | Volume 9 | Issue 11 | e112362

The motor, camera’s LED lights, and electrical components of
the AMR-A were the major sources of heat. The camera’s LED
lights, which were attached to the roving camera, were a
continuous heat source within the tube. The motor and
electronics, which were stationary, were a source of constant heat
at the top of the tube. We assumed internal chimney effects within
the minirhizotron tube also caused heat to convect to the highest
section of tube. Hence, we infer that even if the camera was
programmed to image a small and specific region (i.e., not a full
tube scan), temperatures generated by the camera’s LED lights
would rise within the tube, conduct through the AMR-A’s tube
and warm the surrounding soil.
Clearly, dry sand has a more similar heat capacity to soil than to
air, and stores heat similar to that found in soil warming
experiments [54], which are designed to alter the soil microclimate
in the surrounding rhizosphere. In moist soils, the AMR-A would
likely increase the soil vapor pressure and enhance the evaporation
of the soil water content around the tube. Given the long
operational time it takes the AMR-A to image an entire tube
(duration of 25.0860.43 hours observed during testing; mean 61
SD), and output of heat from the instrument to the soil, it will
likely alter the soil properties, respiration, and likely the
measurement of representative root mass (and fine-root turnover)
if measurements are conducted frequently, i.e., daily, weekly,
monthly or longer pending the ecosystem type.
Conclusions
Currently, minirhizotrons represent the best non-destructive
method for measuring in-situ fine-root production, mortality, and
turnover. The spatial heterogeneity of fine-root turnover however
is typically large [61–63], difficult to quantify [64–66], and
becomes a sample size problem [32,67–69]. Determining seasonal
and interannual variability, and long term trends, is a product of
matching one’s ability to detect a phenomenon with the spatial
and temporal signal-to-noise of the phenomenon, in this case fine-
root turnover. This is a particularly difficult task because we expect
the behavior of fine-roots to change non-linearly in time and space
with changes in climate, species composition, nutrient and water
availabillty, etc. As we have shown here, if uncalibrated
minirhizotrons are used to estimate standing stocks, the risk of
improper quantification of fine-root turnover, combined with the
amount of undectable roots using scanner-based technologies,
have large implications to understand allocation patterns. Know-
ing the uncertainties of measurements a priori is becoming
increasingly important as more and more Bayesian and data
assimilation approaches are being used in modeling these
processes.
Without a traceable and reproducible approach to quantify the
measurement uncertainty of minirhizotron camera performance,
the signal-to-noise ratio cannot be properly quantified. Once this
ratio is quantified, root measurements made by minirhizotrons will
be better understood and have increased scientific utilty. Being
Table 7. Mean sRGB values (and expanded uncertainties) as measured by the AMR-A.
Color R ±2SE (R) G ±2SE (G) B ±2SE (B)
Cyan 0 N/A 107.529 0.059 244.23 0.026
Magenta 206.423 0.035 123.219 0.048 200.561 0.041
Yellow 232.684 0.022 251.412 0.019 17.079 0.127
Amber 231.734 0.024 234.742 0.011 202.499 0.033
Red 130.17 0.048 0 N/A 0 N/A
Green 0 N/A 89.485 0.061 23.089 0.089
Blue 0 N/A 0 N/A 193.347 0.054
White 245.703 0.025 255 N/A 255 N/A
Expanded uncertainties represent the repeatability of the camera for the specific color patch. Uncertainties for values at the limits of the sRGB spectrum are notprovided. n~40,805 per color patch.doi:10.1371/journal.pone.0112362.t007
Table 8. Mean sRGB values (and expanded uncertainties) as measured by the CI-600.
Color R ±2SE (R) G ±2SE (G) B ±2SE (B)
Cyan 90.406 0.026 179.614 0.013 217.403 0.013
Magenta 255 N/A 167.971 0.012 200.864 0.011
Yellow 255 N/A 249.617 0.013 177.415 0.019
Amber 255 N/A 232.644 0.025 214.657 0.033
Red 231.103 0.015 95.250 0.027 95.827 0.029
Green 87.799 0.024 171.210 0.011 119.531 0.015
Blue 78.508 0.047 128.516 0.024 188.291 0.014
White 255 N/A 255 N/A 255 N/A
Expanded uncertainties represent the repeatability of the camera for the specific color patch. Uncertainties for values at the limits of the sRGB spectrum are notprovided. n~33,836 per color patch.doi:10.1371/journal.pone.0112362.t008
Minirhizotron Digital Imagery: Calibration, Metrics, and Uncertainties
PLOS ONE | www.plosone.org 13 November 2014 | Volume 9 | Issue 11 | e112362

able to understand and reduce measurement uncertainties in
minirhizotrons is key to monitoring root turnover over time and
space with minirhizotrons.
Prior to this study no uniform and reproducible method for
quantifying and comparing minirhizotron performance existed in
the literature. To address this issue, we identified essential,
objective, test parameters to assess the minirhizotron cameras’
signal-to-noise ratio. We were able to quantify and compare the
capabilities of manual and fully automated minirhizotrons to
repeatedly image a test target in space, quantify root size and
color, and dissipate heat. Because we estimated the signal-to-noise
ratio these data can be used as a benchmark to generate sample
size requirements given the expected signal-to-noise of fine-root
turnover or other ecological processes.
Each minirhizotron camera tested has tradeoffs inherent in their
hardware and operating procedures. This included the unavoid-
able presence of human error in the removal and replacement of
the manual minirhizotron camera (CI-600), or the unintended
heating of the soil environment (AMR-A). The potential heating
effects associated with the AMR-A should, however, be weighed
against the much greater sensitivity and repeatability afforded by a
fully automated microscopic camera. Additionally, the benefit-to-
cost ratio of using a portable camera that can be moved among
multiple minirhizotron tubes, such as the CI-600, should be
weighed against utilizing a non-portable camera, such as the
AMR-A. Regardless, our results suggest that effects of the known,
random and systematic uncertainties need to be taken into account
when interpreting minirhizotron images and represent an oppor-
tunity for new technological advances to increase our knowledge of
belowground processes.
In final recommendations; i) one should consider adopting
standardized calibration methods (i.e., JCGM [26], CIE [45]) of
minirhizotron cameras prior to field deployment, and ii) we
suggest that known, traceable targets be used in the calibration
process and buried with the minirhizotron tubes. Imaging these
targets before and after a full-tube scan would help inform the
current state of camera health, as the size and color of the targets
Figure 4. Characterized CIE chromaticity coordinates. CIEchromaticity coordinates of the (a) three characterization points relativeto the entire chromaticity coordinate space (as denoted by thehorseshoe shaped outline), (b) a zoomed version of the same data in(a) that also depicts the expanded uncertainties of the threecharacterization points. Error bars are given as 6U95(y): This figure ispresented in addition to Table 9 to demonstrate the spatial (color-space) limitations of the linear characterization performed in thisanalysis. The overlaid color gamut is for illustrative purposes only.doi:10.1371/journal.pone.0112362.g004
Ta
ble
9.
Me
an,
char
acte
rize
dch
rom
atic
coo
rdin
ate
s(a
nd
exp
and
ed
un
cert
ain
tie
s)o
fe
ach
min
irh
izo
tro
nca
me
ra.
AM
R-A
CI-
60
0
Co
lor
x±
U9
5(x
)y
±U
95
(y)
x±
U9
5(x
)y
±U
95
(x)
Yel
low
0.4
55
0.0
04
0.4
88
0.0
04
0.4
64
0.0
03
0.4
93
0.0
02
Am
ber
0.4
25
0.0
04
0.3
96
0.0
04
0.4
24
0.0
03
0.3
97
0.0
02
Wh
ite
0.3
49
0.0
04
0.3
62
0.0
04
0.3
49
0.0
02
0.3
63
0.0
02
do
i:10
.13
71
/jo
urn
al.p
on
e.0
11
23
62
.t0
09
Minirhizotron Digital Imagery: Calibration, Metrics, and Uncertainties
PLOS ONE | www.plosone.org 14 November 2014 | Volume 9 | Issue 11 | e112362

can be quantified over time and help post correct fine-root data for
any optical drift inherent in the camera.
Lastly, the approaches used here are not just germane to
minirhizotrons, but to all digital imaging devices used in the
scientific process. Approaches and findings presented here have
large relevance to other applications, for example, digital
microscopy, phenological cameras, digital biodiversity archives,
forensics, and others that also intentionally employ device-
dependent color imaging.
Supporting Information
Data S1 Data and uncertainty analyses for the proce-dures described in this manuscript.(ZIP)
Acknowledgments
The Authors thank the two previous reviewers who helped the clarity of
this manuscript. We extend thanks to M LeBlanc and M Pursley for
calibrating the PRT sensors, and also to K Sacca and J Taylor for
providing helpful insight regarding optical systems. Special thanks to J
Csavina and S Streett for providing expertise in uncertainty analyses, L
Goldman for graphic support, and also to K Sand for editorial assistance.
We are grateful and appreciative of the assistance from M Taggart
(RhizoSystems LLC), B Meyer (CID-BioScience Inc.), and G Reif (Applied
Image Inc.). This paper would not have taken shape if it were not the
guidance, lifetime work, and for many a conversation with leaders in the
soils community, and to Albert Einstein who stated ‘‘… as far as the laws of
mathematics refer to reality, they are not certain; and as far as they are
certain, they do not refer to reality’’. Geometry and Experience, Lecture
before the Prussian Academy of Sciences, January 27, 1921.
Author Contributions
Conceived and designed the experiments: JAR MDS HWL EA. Performed
the experiments: JAR MDS. Analyzed the data: JAR MDS HWL EA.
Contributed reagents/materials/analysis tools: JAR MDS HWL EA.
Wrote the paper: JAR MDS HWL EA.
References
1. Cox TL, Hams WF, Asmus BS, Edwards NT (1978) The role of roots in
biogeochemical cycles in an eastern deciduous forest. Pedobiologia 18: 264–271.
2. Pregitzer KS, Zak DR, Curtis PS, Kubiske ME, Teeri JA, et al. (1995)
Atmospheric CO2, soil nitrogen and turnover of fine roots. New Phytol 129:
579–585.
3. Gill RA, Jackson RB (2000) Global patterns of root turnover for terrestrial
ecosystems. New Phytol 147: 13–31.
4. Joslin JD, Henderson GS (1987) Organic matter and nutrients associated with
fine-root production in a white oak stand. For Sci 33: 330–346.
5. Majdi H, Andersson P (2005) Fine root production and turnover in a Norway
spruce stand in northern Sweeden: effects of nitrogen and water manipulation.
Ecosyst 8: 191–199.
6. Ostertag R, (2001) Effects of nitrogen and phosphorus availability on fine-root
dynamics in Hawaiian montane forests. Ecol 82: 485–499.
7. Ruess RW, Van Cleve K, Yarie J, Viereck LA (1996) Contributions of fine root
production and turnover to the carbon and nitrogen cycling in taiga forests of
the Alaskan Interior. Can J For Res 26: 1326–1336.
8. Majdi H, Pregitzer K, Moren AS, Nylund JE, Agren GI (2005) Measuring fine
root turnover in forest ecosystems. Plant Soil 276: 1–8.
9. Gaudinski JB, Trumbone SE, Davidson A, Cook AC, Markewitz D, et al. (2001)
The age of fine-root carbon in three forests of the eastern United States
measured by radiocarbon. Oecologia 129: 420–429.
10. Lukac M (2012) Fine root turnover, In: Mancuso S, editor. Measuring Roots:
Springer, Berlin. pp. 363–373.
11. Majdi H (1996) Root sampling methods: applications and limitations of the
minirhizotron technique. Plant Soil 185: 255–258.
12. Joslin JD, Henderson GS (1982) A test of the budget method: a refined approach
to measurement of the root turnover, In: Muller RN, editor. Central Hardwood
Forest Conference. pp. 220–228.
13. Kurz WA, Kimmins JP (1987) Analysis of error in methods used to determine
fine root production in forest ecosystems: a simulation approach. Can J For Res
17: 909–912.
Figure 5. Time series of temperature change at six profile locations. Temperature measurements were made at the three depths (5 [top], 48[middle], and 86 [bottom] cm) below the surface of the sand and at 0.5 cm away from the AMR-A’s tube, the locations of the PRTs A through F areshown in Figure 2. Temperature change at each location was quantified relative to the temperature of the respective PRT at the start time of eachfull-tube scan.doi:10.1371/journal.pone.0112362.g005
Minirhizotron Digital Imagery: Calibration, Metrics, and Uncertainties
PLOS ONE | www.plosone.org 15 November 2014 | Volume 9 | Issue 11 | e112362

14. Sanantonio D, Grace JC (1987) Estimating fine-root production and turnover
from biomass and decomposition data: a compartment flow model. Can J ForRes 17: 900–908.
15. Bates GH (1937) A device for the observation of root growth in the soil. Nature
139: 966–967.16. McMichael BL, Taylor HM (1987) Applications and limitations of rhizotrons
and minirhizotrons, In: American Association of Agronomy, editors. Mini-rhizotron observation tubes: methods and applications for measuring rhizo-
sphere dynamics, ASA Special Publication 50: 1–13.
17. Cheng W, Coleman DC, Box Jr JE (1991) Measuring root turnover with theminirhizotron technique. Agr Ecosyst Environ 34: 261–267.
18. Cheng W, Coleman DC, Box Jr JE (1990) Root dynamics, production anddistribution in agroecosystems on the Georgia Piedmont using minirhizotrons.
J Appl Ecol 27: 592–604.19. Hendrick RL, Pregitzer KS (1996) Temporal and depth-related patterns of fine
root dynamics in northern hardwood forests. J Ecol 84: 167–176.
20. Villordon A, LaBonte D, Solis J (2011) Using a scanner based minirhizotronsystem to characterize sweet potato adventitious root development during initial
storage root bulking stage. Hortic Sci 46: 513–517.21. Pierret A, Moran CJ, Doussan C (2005) Conventional detection methodology is
limiting our ability to understand the roles and functions of fine roots. New
Phytol 166: 967–980.22. Johnson MG, Tingey DT, Phillips DL, Storm MJ (2001) Review: Advancing fine
root research with minirhizotrons. Env Exp Bot 45: 263–289.23. Zobel RW (2003) Sensitivity analysis of computer-based diameter measurement
from digital images. Crop Sci 43: 583–591.24. RhizoSystems LLC (2012) Specifications for the automated mini-rhizotron.
Available: http://www.rhizosystems.com/Specifications.html. Accessed 10 April
2012.25. CID Bio-Science Inc. (2012) In-Situ Root Imager CI-600 Instruction Manual.
Available: http://www.cid-inc.com/docs/CI-600_Manual.pdf. Accessed 10April 2012.
26. Joint Committee for Guides in Metrology (JCGM) (2008) Evaluation of
measurement data – Guide to the expression of uncertainty in measurement.120 p.
27. Joint Committee for Guides in Metrology (JCGM) (2012) Internationalvocabulary of metrology – Basic and general concepts and associated terms
(VIM). 3rd Edition. 92 p.28. Hecht E (2002) Optics. Boston: Addison-Wesley Longman. 680 p.
29. Wilson JD (1990) College Physics. Englewood Cliffs: Prentice-Hall. 875 p.
30. Willink R (2007) A generalization of the Welch-Satterwaithe formula for usewith correlated uncertainty components. Metrologia 44: 340–349.
31. Ballico M (2000) Limitations of the Welch-Satterthwaite approximation formeasurement uncertainty calculations. Metrologia 37: 61–70.
32. Hendrick RL, Pregitzer KS (1992) The demography of fine roots in a northern
hardwood forest. Ecol 73: 1094–1104.33. Research Systems Inc. (RSI) (2004) Image Processing in IDL. Available: http://
vis.lbl.gov/NERSC/Software/idl/help6.1/image.pdf. Accessed 1 June 201234. Bauhus J, Messier C (1999) Evaluation of fine root length and diameter
measurements obtained using RHIZO image analysis. J Agron 91: 142–147.35. Jonkman JEN, Swoger J, Kress H, Rohrbach A, Stelzer EHK (2003) Resolution
in optical microscopy, In: Marriot G, Parker I, editors, Methods in Enzymology:
Biophotonics Part A. Elsevier Science. pp. 416–446.36. Dannoura M, Kominami Y, Oguma H, Kanazawa Y (2008) The development
of an optical scanner method for observation of plant root dynamics. Plantroot 2:14–18.
37. Comas LH, Eissenstat DM, Lasko AN (2000) Assessing root death and root
system dynamics in a study of grape canopy pruning. New Phytol 147: 171–178.38. Wells CE, Eissenstat DM (2001) Marked differences in survivorship among apple
roots of different diameters. Ecol 82: 882–89239. Wang Z, Burch WH, Mou P, Jones RH, Mitchell RJ (1995) Accuracy of visible
and ultraviolet light for estimating live root proportions with minirhizotrons.
Ecol 76: 2230–2334.40. Strutt J W (1871) Some experiments on colour. Nature 3: 234–236.
41. Hong G, Luo MR, Rhodes PA (2001) A study of digital camera colorimetriccharacterization based on polynomial modeling. Color Res Appl 26: 76–84.
42. Ilie A, Welch G (2005) Ensuring color consistency across multiple cameras. Proc.Conf. of the tenth IEEE international conference on computer vision 2: 1268–
1275.
43. Gardner JL (2000) Uncertainty estimation in colour measurement. Col Res Appl25: 349–355.
44. Early EA, Nadal ME (2004) Uncertainty analysis for reflectance colorimetry. Col
Res Appl 29: 205–216.
45. International Commission on Illumination (CIE) (2004) Technical report:
colorimetry. 3rd Ed. 75 p.
46. Sandor N, Ondro T, Schanda J (2005) Spectral interpolation errors. Col Res
Appl 30: 348–353.
47. American Society for Testing and Materials (ASTM) (1999) Standard practice
for computing the colors of objects by using the CIE system, E 308. 32 p.
48. Johnson T (1996) Methods for characterizing colour scanners and digital
cameras. Displays 14: 183–191.
49. Hung PC (1993) Colorimetric calibration in electronic imaging devices using a
look up table model and interpolations. J Electron Imaging 2: 53–61.
50. Hong G, Luo MR, Rhodes PA (2001) A study of digital camera colorimetric
characterization based on polynomial modeling. Col Res Appl 26: 76–84.
51. Lloyd J, Taylor JA (1994) On the temperature dependence of soil respiration.
Funct Ecol 8: 315–323.
52. Ryan MG (1991) The effects of climate change on plant respiration. Ecol Appl 1:
157–167.
53. Starr G, Staudhammer CL, Loescher HW, Mitchell R, Whelan A, et al. (2014)
Fire’s role in Longleaf pine forest carbon dynamics: Evidence of resiliency in
physiological estimates following prescribed fire. New Forests (in press).
54. Rustad LE, Campbell JL, Marion GM, Norby RJ, Mitchell MJ, et al. (2001) A
Meta-analysis of the response of soil respiration, net nitrogen mineralization, and
aboveground plant growth to experimental ecosystem warming. Oceologia 126:
543–562.
55. Weber EP, Day FP (1996) The effect of nitrogen fertilization on the phenology of
roots in a barrier island sand dune community. Plant Soil 182: 139–148.
56. Vamerali T, Bandiera M, Mosca G (2012) Minirhizotrons in modern root
studies, In: Mancuso S, editor. Measuring Roots: Springer, Berlin. pp. 341–362.
57. Jackson RB, Mooney HA, Schulze E-D (1997) A global budget for fine root
biomass, surface area, and nutrient contents. Proc. Natl. Acad. Sci. 94: 7362–
7366.
58. McClaugherty CA, Aber JD, Melillo JM (1982) The role of fine roots in the
organic matter and nitrogen budgets of two forested systems. Ecol. 63: 1481–
1490.
59. Kucbel S, Jalovair P, Spissak J (2011) Quantity, vertical distribution and
morphology of fine roots in Norway spruce stands with different stem density.
Plant Root. 5: 46–55.
60. Swift MJ, Heal OW, Anderson JM (1979) Decomposition in Terrestrial
Ecosystems. University of California Press, Berkeley.
61. Comas LH, Bauerle TL, Eissenstat DM (2010) Biological and environmental
factors controlling root dynamics and function: Effects of root ageing and soil
moisture. Aust J Grape Wine R 16: 131–137.
62. Comas LH, Anderson LJ, Dunst RM, Lakso AN, Eissenstat DM (2005) Canopy
and environmental control of root dynamics in a longterm study of ‘Concord’
grape. New Phytol 167: 829–840.
63. Norby RJ, Ledford J, Reilly CD, Miller NE, O’Neill EG (2004) Fine-root
production dominates response of a deciduous forest to atmospheric CO2
enrichment. Proc National Academy of Sciences, USA, 101: 9689–9693.
64. Fahey TJ, Bledsoe CS, Day FP, Ruess RW, Smucker AJM (1999) Fine root
production and demography, In: Robertson GP, Coleman DC, Bledsoe CS,
Sollins P, editors. Standard Soil Methods for Long-Term Ecological Research,
Oxford University Press, Oxford, pp. 437–455.
65. Jackson RB, Canadell J, Ehleringer, JR, Mooney HA, Sala OE, et al. (1996) A
global analysis of root distributions for terrestrial biomes. Oecologia. 108: 389–
411.
66. Vargas R, Allen MF (2008) Dynamics of fine root, fungal rhizomorphs, and soil
respiration in a mixed temperate forest: Integrating sensors and observations.
Vadose Zone J 7: 1055–1064.
67. Fitter AH, Graves JD, Self GK, Brown TK, Bogie DS, et al. (1998) Root
production, turnover and respiration under two grassland types along an
altitudinal gradient: influence of temperature and solar radiation. Oecologia.
114: 20–30.
68. Loescher HW, Law BE, Mahrt L, Hollinger DY, Campbell JL, et al. (2006)
Uncertainties in, and interpretation of carbon flux estimates using the eddy
covariance technique. J. Geophys. Res.-Atmos 111: D21S90, 1–19.
69. Vargas R, Allen MF (2008) Environmental controls and the influence of
vegetation type, fine roots and rhizomorphs on diel and seasonal variation in soil
respiration. New Phytol 179: 460–471.
Minirhizotron Digital Imagery: Calibration, Metrics, and Uncertainties
PLOS ONE | www.plosone.org 16 November 2014 | Volume 9 | Issue 11 | e112362