Trace element variations in clinopyroxene and amphibole from alkaline to peralkaline syenites and...
31
Trace element variations in clinopyroxene and amphibole from alkaline to peralkaline syenites and granites: implications for mineral–melt trace-element partitioning B Michael Marks, Ralf Halama, Thomas Wenzel, Gregor Markl * Institut fu ¨r Geowissenschaften, AB Mineralogie und Geodynamik, Eberhard-Karls-Universita ¨t Tu ¨bingen, Wilhelmstrag e 56, Tu ¨bingen D-72074, Germany Received 26 November 2003; accepted 6 June 2004 Abstract Trace element compositions of clinopyroxene and amphibole from three rift-related alkaline to peralkaline igneous complexes (syenites and granites) in South Greenland reflect evolving magma composition as well as crystal-chemical control on partitioning. Clinopyroxenes and amphiboles evolve from Ca–Mg-dominated members via intermediate to Na–Fe 3+ - dominated members. Most trace elements are highly enriched compared to primitive mantle values, consistent with the highly fractionated character of the host rocks. High field strength element (HFSE; Ti, Zr, Hf, Sn, Nb, Ta) abundances appear to be mainly controlled by the major element composition of the host crystal, which in turn determines the crystal site parameters. A crystal-chemical control is also indicated for the REE, since clinopyroxenes and amphiboles show continuous change from LREE-enriched patterns in the calcic minerals via wave-shaped pattern in the Ca–Na minerals towards a more pronounced HREE enrichment in the most Na-rich minerals. The low absolute abundances of large ion lithophile elements (Ba, Sr, Pb, Eu 2+ ) are interpreted to reflect both a crystal-chemical aversion to incorporate these elements and the effects of prolonged feldspar fractionation on the melt composition. Eu and Pb abundances are also affected by oxygen fugacity and crustal assimilation, respectively. The partitioning of most trace elements between clinopyroxene and co-genetic amphibole is independent of melt composition or major element composition of the crystals. Most incompatible trace elements (particularly Nb, Ta, U, Th, Rb, Ba and Li) show a slight preference for amphibole. Exceptions to this general trend occur in rocks affected by late-stage fluid circulation resulting in the redistribution of some mobile elements. Calculation of trace-element compositions of coexisting melts using published partition coefficients for alkaline systems shows that melt compositions similar to whole-rock compositions are obtained for clinopyroxenes with broadly augitic to diopsidic compositions. There is a considerable mismatch between calculated melt and whole-rock data for various elements, i.e., Zr, Hf and the HREE, when melt compositions are calculated from NaFe 3+ -rich aegirine–augites and aegirines. Melt 0009-2541/$ - see front matter D 2004 Elsevier B.V. All rights reserved. doi:10.1016/j.chemgeo.2004.06.032 B This is contribution to the mineralogy of Ilı ´maussaq No. 122. * Corresponding author. Tel.: +49 7071/29 72 930; fax: +49 7071/29 30 60. E-mail address: [email protected] (G. Markl). Chemical Geology 211 (2004) 185 – 215 www.elsevier.com/locate/chemgeo
Transcript of Trace element variations in clinopyroxene and amphibole from alkaline to peralkaline syenites and...

www.elsevier.com/locate/chemgeo
Chemical Geology 211
Trace element variations in clinopyroxene and amphibole from
alkaline to peralkaline syenites and granites: implications for
mineral–melt trace-element partitioningB
Michael Marks, Ralf Halama, Thomas Wenzel, Gregor Markl*
Institut fur Geowissenschaften, AB Mineralogie und Geodynamik, Eberhard-Karls-Universitat Tubingen,
Wilhelmstrage 56, Tubingen D-72074, Germany
Received 26 November 2003; accepted 6 June 2004
Abstract
Trace element compositions of clinopyroxene and amphibole from three rift-related alkaline to peralkaline igneous
complexes (syenites and granites) in South Greenland reflect evolving magma composition as well as crystal-chemical control
on partitioning. Clinopyroxenes and amphiboles evolve from Ca–Mg-dominated members via intermediate to Na–Fe3+-
dominated members. Most trace elements are highly enriched compared to primitive mantle values, consistent with the highly
fractionated character of the host rocks. High field strength element (HFSE; Ti, Zr, Hf, Sn, Nb, Ta) abundances appear to be
mainly controlled by the major element composition of the host crystal, which in turn determines the crystal site parameters. A
crystal-chemical control is also indicated for the REE, since clinopyroxenes and amphiboles show continuous change from
LREE-enriched patterns in the calcic minerals via wave-shaped pattern in the Ca–Na minerals towards a more pronounced
HREE enrichment in the most Na-rich minerals. The low absolute abundances of large ion lithophile elements (Ba, Sr, Pb, Eu2+)
are interpreted to reflect both a crystal-chemical aversion to incorporate these elements and the effects of prolonged feldspar
fractionation on the melt composition. Eu and Pb abundances are also affected by oxygen fugacity and crustal assimilation,
respectively.
The partitioning of most trace elements between clinopyroxene and co-genetic amphibole is independent of melt
composition or major element composition of the crystals. Most incompatible trace elements (particularly Nb, Ta, U, Th, Rb, Ba
and Li) show a slight preference for amphibole. Exceptions to this general trend occur in rocks affected by late-stage fluid
circulation resulting in the redistribution of some mobile elements.
Calculation of trace-element compositions of coexisting melts using published partition coefficients for alkaline systems
shows that melt compositions similar to whole-rock compositions are obtained for clinopyroxenes with broadly augitic to
diopsidic compositions. There is a considerable mismatch between calculated melt and whole-rock data for various elements,
i.e., Zr, Hf and the HREE, when melt compositions are calculated from NaFe3+-rich aegirine–augites and aegirines. Melt
0009-2541/$ - s
doi:10.1016/j.ch
B This is co
* Correspon
E-mail addr
(2004) 185–215
ee front matter D 2004 Elsevier B.V. All rights reserved.
emgeo.2004.06.032
ntribution to the mineralogy of Ilımaussaq No. 122.
ding author. Tel.: +49 7071/29 72 930; fax: +49 7071/29 30 60.
ess: [email protected] (G. Markl).
M. Marks et al. / Chemical Geology 211 (2004) 185–215186
compositions from amphiboles also show only limited overlap with whole-rock data. The reasons for these differences may
include the following: (1) The crystallization history of the rocks is very complex so that trace element partitioning cannot be
expressed with a single partition coefficient. (2) Published mineral–melt partition coefficients cannot generally be applied due to
compositional differences between the alkaline to peralkaline systems of this study and the previous studies. (3) Whole-rocks do
not reflect melt compositions.
Using a theoretical model of clinopyroxene–melt trace element partitioning based on the crystal chemistry alone, we show
that absolute values of DREE decrease but the relative preference for HREE increases as the crystal becomes more aegirine-rich,
which is in qualitative accordance with the observed REE patterns. Melts calculated from the theoretically determined partition
coefficients show a good overlap with whole-rock data for relatively Fe3+-poor clinopyroxene compositions. Melts calculated
from aegirines do not agree with whole-rock compositions, suggesting that the theoretical model needs refinements for the
previously not considered incorporation of the NaFe3+Si2O6 component.
D 2004 Elsevier B.V. All rights reserved.
Keywords: Trace element variation; Clinopyroxene; Amphibole; Mineral–melt trace element partitioning
1. Introduction
Trace element data can be used to model and
interpret magmatic processes (e.g., Schiano et al.,
1993; Walter et al., 1995; Costa et al., 2003). In situ
determination of trace elements in minerals has
become increasingly popular and many studies have
been published on basaltic systems (e.g., Jeffries et al.,
1995; Benoit et al., 1996; Coogan et al., 2000;
Thompson and Malpas, 2000; Tiepolo et al., 2002),
on ultramafic mantle rocks and on phases relevant to
mantle melting (e.g., Nimis and Vannucci, 1995;
Blundy and Dalton, 2000, Gregoire et al., 2000;
Tiepolo et al., 2000a). Studies of trace element
partitioning and trace element contents in more
evolved silicic systems are less frequent (Lemarchand
et al., 1987; Wood and Trigila, 2001), and especially
the trace element concentrations of mineral phases in
alkaline silicate plutonic rocks have only been studied
in a few cases (Larsen, 1979; Worner et al., 1983;
Shearer and Larsen, 1994). Unfortunately, experimen-
tal trace element partitioning studies between mafic
minerals and alkaline silicate melts are rare. Recent
studies based on theoretical models have shown that
the crystal chemistry exerts a major control on trace
element partitioning (Blundy and Wood, 1991, 1994,
2003; Wood and Blundy, 1997, 2001). However, a
number of studies also indicate that melt composition
influences trace element partitioning (e.g., Adam and
Green, 2003; Bennett et al., 2003).
In this study, we compare the trace element
contents of mafic minerals from three related, but
petrologically different alkaline to peralkaline igneous
complexes in order to investigate the partitioning
behavior of trace elements in natural alkaline silicate
melts. Our study is focused on clinopyroxene and
amphibole because these two minerals can incorporate
large amounts of geochemically relevant trace ele-
ments (Wood and Blundy, 1997; Bottazzi et al., 1999).
The three complexes studied show an almost con-
tinuous spectrum in mafic mineral compositions from
Ca–Mg-rich and Na-poor to Ca-poor and Na–Fe3+-
rich. This enables us to relate relative trace element
abundances in the minerals to their crystal chemistry.
Furthermore, we determine distribution coefficients
between clinopyroxene and amphibole for a wide
range of elements in alkaline igneous rocks and
compare them with literature data for other rock
types. Finally, we use a range of partition coefficients
from the literature determined for natural alkaline
rocks (Larsen, 1979; Worner et al., 1983; Lemarchand
et al., 1987) to evaluate if they are applicable for the
rocks studied here.
2. Regional geology
The Gardar Igneous Province (Fig. 1) in South
Greenland represents a failed rift structure of Mid-
Proterozoic (1.35–1.14 Ga) age (Upton and Emeleus,
1987; Upton et al., 2003). It comprises a sequence of
interlayered basalts and sandstones, a large number of
dike rocks of variable chemical composition and 12
major alkaline to peralkaline igneous complexes. The

Fig. 1. Sketch map of the alkaline igneous Gardar Province, South Greenland, with the three igneous complexes Puklen, Ilımaussaq and
Grbnnedal-Ika (modified after Escher and Watt, 1976).
M. Marks et al. / Chemical Geology 211 (2004) 185–215 187
basement rocks mainly consist of I-type calc-alkaline
plutonic rocks (Julianeh3b batholith) (Van Breemen et
al., 1974; Allaart, 1976; Kalsbeek and Taylor, 1985)
of Ketilidian (1.85–1.80 Ga) age (Garde et al., 2002).
Archaean country rocks occur in the northwestern part
of the province. The igneous complexes are mostly
composite and show a range from relatively primitive
gabbroic to highly evolved syenitic rocks. Fluid
inclusion data (Konnerup-Madsen and Rose-Hansen,
1984) and the preserved contacts between supracrustal
rocks and the Ilımaussaq intrusion (Poulsen, 1964)
show that the magmas intruded into shallow crustal
levels (b5 km).
For this study, we selected three igneous complexes:
(1) The Puklen complex evolved from silica-saturated
syenites to peralkaline granites and represents a silica-
oversaturated fractionation trend (Pulvertaft, 1961;
Parsons, 1972; Marks et al., 2003). (2) The Ilımaussaq
complex, evolving from alkaline, SiO2-saturated syen-
ites towards agpaitic nepheline syenites, represents the
silica-undersaturated trend (Larsen and Sbrensen,1987; Markl et al., 2001b). (3) The Grbnnedal-Ikacomplex represents an association of SiO2-undersatu-
rated syenite with carbonatite (Emeleus, 1964; Pearce
et al., 1997a,b; Halama et al., in press). In the
following, we briefly review the petrogenesis of these
three complexes.
2.1. The Puklen complex
The field geology of the Puklen complex (Fig. 1)
was described in detail by Pulvertaft (1961) and
Parsons (1972), and the petrology and geochemistry
were investigated by Marks et al. (2003). The first
magma pulse formed a suite of silica-saturated to
oversaturated syenites, which are cut by a fine-grained
and leucocratic granophyre. A second pulse of magma
produced a peralkaline granite, which grades into, or
may be locally intruded by, fine-grained and leuco-
cratic microgranite. The primary mafic silicates in
syenites are augite, olivine and calcic to sodic–calcic
amphibole I. Secondary calcic amphibole II formed by
late-stage autometasomatic reactions. In the granites,
the primary mafic silicate is sodic amphibole, which is
overgrown by late-stage aegirine. Detailed isotopic
work (Marks et al., 2003) showed that the Puklen
melts were primarily derived from a mantle source
with variable amounts of crustal contamination.
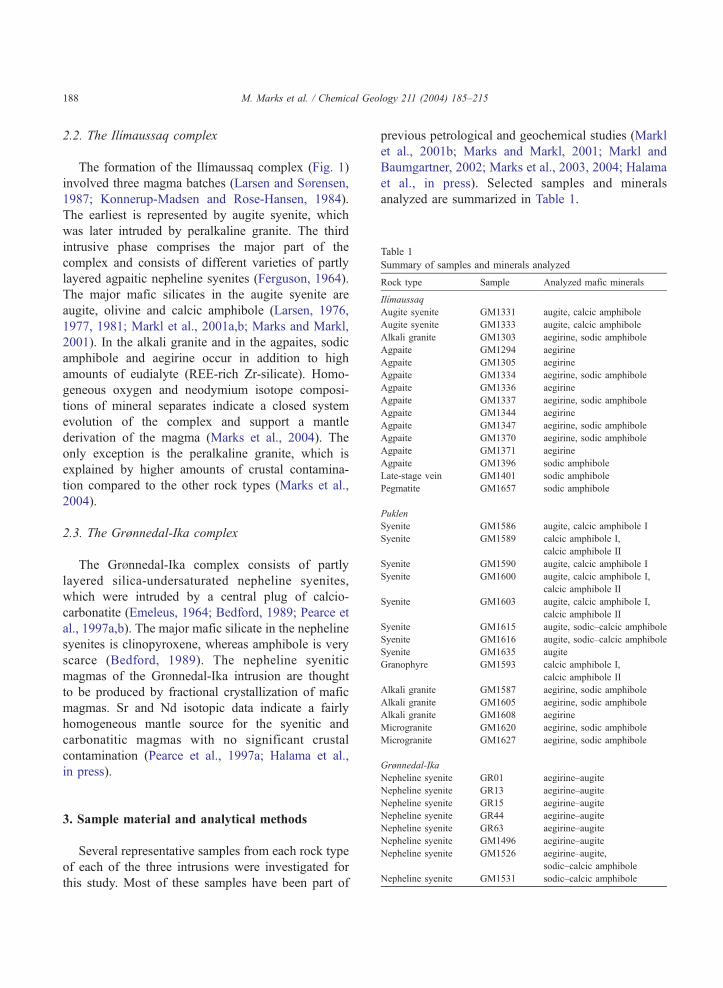
Table 1
Summary of samples and minerals analyzed
Rock type Sample Analyzed mafic minerals
Ilımaussaq
Augite syenite GM1331 augite, calcic amphibole
Augite syenite GM1333 augite, calcic amphibole
Alkali granite GM1303 aegirine, sodic amphibole
Agpaite GM1294 aegirine
Agpaite GM1305 aegirine
Agpaite GM1334 aegirine, sodic amphibole
Agpaite GM1336 aegirine
Agpaite GM1337 aegirine, sodic amphibole
Agpaite GM1344 aegirine
Agpaite GM1347 aegirine, sodic amphibole
Agpaite GM1370 aegirine, sodic amphibole
Agpaite GM1371 aegirine
Agpaite GM1396 sodic amphibole
Late-stage vein GM1401 sodic amphibole
Pegmatite GM1657 sodic amphibole
Puklen
Syenite GM1586 augite, calcic amphibole I
Syenite GM1589 calcic amphibole I,
calcic amphibole II
Syenite GM1590 augite, calcic amphibole I
Syenite GM1600 augite, calcic amphibole I,
calcic amphibole II
Syenite GM1603 augite, calcic amphibole I,
calcic amphibole II
Syenite GM1615 augite, sodic–calcic amphibole
Syenite GM1616 augite, sodic–calcic amphibole
Syenite GM1635 augite
Granophyre GM1593 calcic amphibole I,
calcic amphibole II
Alkali granite GM1587 aegirine, sodic amphibole
Alkali granite GM1605 aegirine, sodic amphibole
Alkali granite GM1608 aegirine
Microgranite GM1620 aegirine, sodic amphibole
Microgranite GM1627 aegirine, sodic amphibole
Grønnedal-Ika
Nepheline syenite GR01 aegirine–augite
M. Marks et al. / Chemical Geology 211 (2004) 185–215188
2.2. The Ilımaussaq complex
The formation of the Ilımaussaq complex (Fig. 1)
involved three magma batches (Larsen and Sbrensen,1987; Konnerup-Madsen and Rose-Hansen, 1984).
The earliest is represented by augite syenite, which
was later intruded by peralkaline granite. The third
intrusive phase comprises the major part of the
complex and consists of different varieties of partly
layered agpaitic nepheline syenites (Ferguson, 1964).
The major mafic silicates in the augite syenite are
augite, olivine and calcic amphibole (Larsen, 1976,
1977, 1981; Markl et al., 2001a,b; Marks and Markl,
2001). In the alkali granite and in the agpaites, sodic
amphibole and aegirine occur in addition to high
amounts of eudialyte (REE-rich Zr-silicate). Homo-
geneous oxygen and neodymium isotope composi-
tions of mineral separates indicate a closed system
evolution of the complex and support a mantle
derivation of the magma (Marks et al., 2004). The
only exception is the peralkaline granite, which is
explained by higher amounts of crustal contamina-
tion compared to the other rock types (Marks et al.,
2004).
2.3. The Grønnedal-Ika complex
The Grbnnedal-Ika complex consists of partly
layered silica-undersaturated nepheline syenites,
which were intruded by a central plug of calcio-
carbonatite (Emeleus, 1964; Bedford, 1989; Pearce et
al., 1997a,b). The major mafic silicate in the nepheline
syenites is clinopyroxene, whereas amphibole is very
scarce (Bedford, 1989). The nepheline syenitic
magmas of the Grbnnedal-Ika intrusion are thought
to be produced by fractional crystallization of mafic
magmas. Sr and Nd isotopic data indicate a fairly
homogeneous mantle source for the syenitic and
carbonatitic magmas with no significant crustal
contamination (Pearce et al., 1997a; Halama et al.,
in press).
Nepheline syenite GR13 aegirine–augite
Nepheline syenite GR15 aegirine–augite
Nepheline syenite GR44 aegirine–augite
Nepheline syenite GR63 aegirine–augite
Nepheline syenite GM1496 aegirine–augite
Nepheline syenite GM1526 aegirine–augite,
sodic–calcic amphibole
Nepheline syenite GM1531 sodic–calcic amphibole
3. Sample material and analytical methods
Several representative samples from each rock type
of each of the three intrusions were investigated for
this study. Most of these samples have been part of
previous petrological and geochemical studies (Markl
et al., 2001b; Marks and Markl, 2001; Markl and
Baumgartner, 2002; Marks et al., 2003, 2004; Halama
et al., in press). Selected samples and minerals
analyzed are summarized in Table 1.
M. Marks et al. / Chemical Geology 211 (2004) 185–215 189
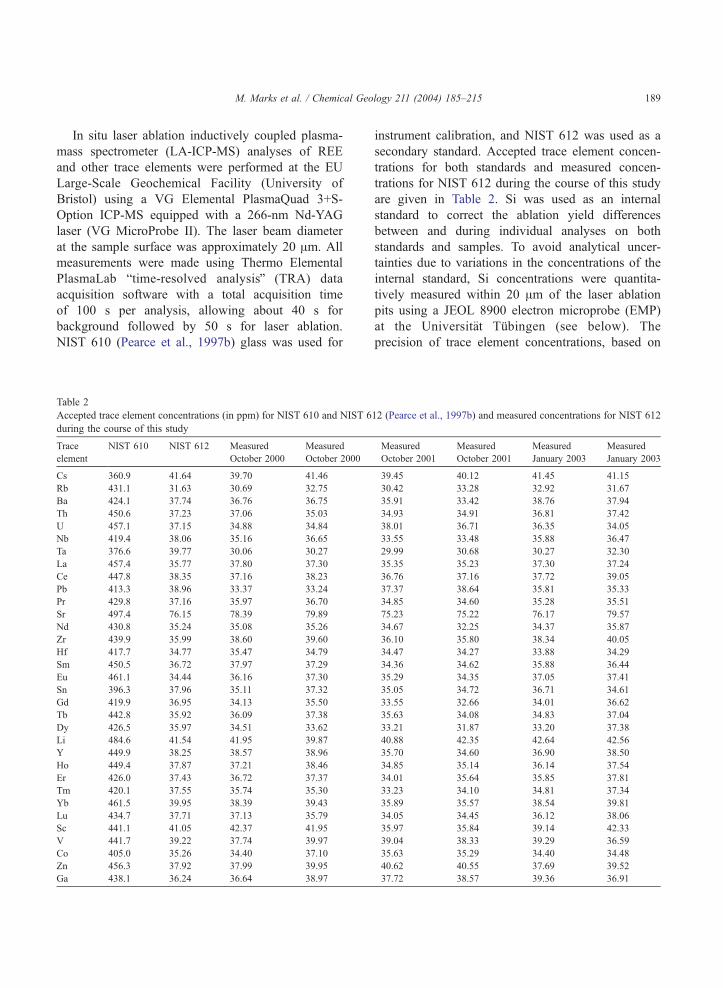
In situ laser ablation inductively coupled plasma-
mass spectrometer (LA-ICP-MS) analyses of REE
and other trace elements were performed at the EU
Large-Scale Geochemical Facility (University of
Bristol) using a VG Elemental PlasmaQuad 3+S-
Option ICP-MS equipped with a 266-nm Nd-YAG
laser (VG MicroProbe II). The laser beam diameter
at the sample surface was approximately 20 Am. All
measurements were made using Thermo Elemental
PlasmaLab btime-resolved analysisQ (TRA) data
acquisition software with a total acquisition time
of 100 s per analysis, allowing about 40 s for
background followed by 50 s for laser ablation.
NIST 610 (Pearce et al., 1997b) glass was used for
Table 2
Accepted trace element concentrations (in ppm) for NIST 610 and NIST 6
during the course of this study
Trace
element
NIST 610 NIST 612 Measured
October 2000
Measured
October 2000
Cs 360.9 41.64 39.70 41.46
Rb 431.1 31.63 30.69 32.75
Ba 424.1 37.74 36.76 36.75
Th 450.6 37.23 37.06 35.03
U 457.1 37.15 34.88 34.84
Nb 419.4 38.06 35.16 36.65
Ta 376.6 39.77 30.06 30.27
La 457.4 35.77 37.80 37.30
Ce 447.8 38.35 37.16 38.23
Pb 413.3 38.96 33.37 33.24
Pr 429.8 37.16 35.97 36.70
Sr 497.4 76.15 78.39 79.89
Nd 430.8 35.24 35.08 35.26
Zr 439.9 35.99 38.60 39.60
Hf 417.7 34.77 35.47 34.79
Sm 450.5 36.72 37.97 37.29
Eu 461.1 34.44 36.16 37.30
Sn 396.3 37.96 35.11 37.32
Gd 419.9 36.95 34.13 35.50
Tb 442.8 35.92 36.09 37.38
Dy 426.5 35.97 34.51 33.62
Li 484.6 41.54 41.95 39.87
Y 449.9 38.25 38.57 38.96
Ho 449.4 37.87 37.21 38.46
Er 426.0 37.43 36.72 37.37
Tm 420.1 37.55 35.74 35.30
Yb 461.5 39.95 38.39 39.43
Lu 434.7 37.71 37.13 35.79
Sc 441.1 41.05 42.37 41.95
V 441.7 39.22 37.74 39.97
Co 405.0 35.26 34.40 37.10
Zn 456.3 37.92 37.99 39.95
Ga 438.1 36.24 36.64 38.97
instrument calibration, and NIST 612 was used as a
secondary standard. Accepted trace element concen-
trations for both standards and measured concen-
trations for NIST 612 during the course of this study
are given in Table 2. Si was used as an internal
standard to correct the ablation yield differences
between and during individual analyses on both
standards and samples. To avoid analytical uncer-
tainties due to variations in the concentrations of the
internal standard, Si concentrations were quantita-
tively measured within 20 Am of the laser ablation
pits using a JEOL 8900 electron microprobe (EMP)
at the Universit7t Tqbingen (see below). The
precision of trace element concentrations, based on
12 (Pearce et al., 1997b) and measured concentrations for NIST 612
Measured
October 2001
Measured
October 2001
Measured
January 2003
Measured
January 2003
39.45 40.12 41.45 41.15
30.42 33.28 32.92 31.67
35.91 33.42 38.76 37.94
34.93 34.91 36.81 37.42
38.01 36.71 36.35 34.05
33.55 33.48 35.88 36.47
29.99 30.68 30.27 32.30
35.35 35.23 37.30 37.24
36.76 37.16 37.72 39.05
37.37 38.64 35.81 35.33
34.85 34.60 35.28 35.51
75.23 75.22 76.17 79.57
34.67 32.25 34.37 35.87
36.10 35.80 38.34 40.05
34.47 34.27 33.88 34.29
34.36 34.62 35.88 36.44
35.29 34.35 37.05 37.41
35.05 34.72 36.71 34.61
33.55 32.66 34.01 36.62
35.63 34.08 34.83 37.04
33.21 31.87 33.20 37.38
40.88 42.35 42.64 42.56
35.70 34.60 36.90 38.50
34.85 35.14 36.14 37.54
34.01 35.64 35.85 37.81
33.23 34.10 34.81 37.34
35.89 35.57 38.54 39.81
34.05 34.45 36.12 38.06
35.97 35.84 39.14 42.33
39.04 38.33 39.29 36.59
35.63 35.29 34.40 34.48
40.62 40.55 37.69 39.52
37.72 38.57 39.36 36.91

M. Marks et al. / Chemical Geology 211 (2004) 185–215190
repeated analyses of standards, is approximately
F5% for element concentrations N10 ppm and
F10% for concentrations b10 ppm. Data processing
was carried out offline using the same PlasmaLab
software used for data collection and various
custom-designed Excel spreadsheets. The limits of
detection are defined as 3.28 standard deviations
above background level, which equates to a 95%
confidence that the measured signal is significantly
above background. Typical detection limits are 1–20
ppm for Sc, V, Co, Cu, Zn, Ga, Rb and Ba, 0.2–1
ppm for Sr, Y, Zr, Nb, Sn, Cs, Hf and Pb and 0.05–
0.6 ppm for the REE, U, Th and Ta. Detection
limits for Li are highly variable between 2 and 80
ppm depending on the specific setting during
measurements.
The major and minor element composition of
minerals was determined using a JEOL 8900
electron microprobe at the Institut fqr Geowissen-
schaften at the Universit7t Tqbingen, Germany. Both
natural and synthetic standards were used for
calibration. The beam current was 15 nA and the
acceleration voltage was 15 kV. The counting time
on the peak was 16 s for major elements and 30–60
s for minor elements (Mn, Ti, Zr, F, Cl). Back-
ground counting times were half peak counting
times. The peak overlap between the Fe Lh and F
Ka lines was corrected for. Data reduction was
performed using the internal fUZ procedures of
JEOL (Armstrong, 1991).
4. Major element compositional trends of
clinopyroxene and amphibole from the
three investigated complexes
4.1. Clinopyroxene
The pyroxene trends observed in the three inves-
tigated intrusive complexes are shown in Fig. 2a. In
all three complexes, the most primitive pyroxenes (in
terms of XFe) are diopsidic with low Na contents
(b0.1 apfu). During fractionation, pyroxene composi-
tion gets more Fe- and Na-rich, reaching almost end-
member aegirine composition in Puklen and Ilımaus-
saq (Larsen, 1976; Marks and Markl, 2001; Markl et
al., 2001b; Marks et al., 2003). Differences in the
degree and timing of Na- and Fe3+-enrichment can be
attributed to oxygen fugacity during crystallization:
the strongly reducing conditions (below the FMQ
buffer) in the Ilımaussaq complex and in most of the
Puklen samples allow a strong Fe-enrichment, but still
low Na contents during fractionation (e.g., Larsen,
1976). In contrast, more oxidized conditions in the
Grbnnedal-Ika complex (Pearce et al., 1997a,b;
Halama et al., in press) result in relatively high Na-
and Fe3+-contents at intermediate Fe/Mg ratios. A
similar compositional trend found in the Puklen
complex is the result of more oxidized (DFMQ=+1)
conditions during late-magmatic autometasomatism
(Marks et al., 2003).
4.2. Amphibole
Fig. 2b shows the amphibole trends observed in the
three investigated intrusive complexes in the CaB vs.
Si diagram after Mitchell (1990). The Puklen and
Ilımaussaq trends are typical for alkaline to peralka-
line igneous rocks. Primary amphibole ranges in
composition from almost pure Ca-amphibole (ferro-
edenite, ferro-pargasite, hastingsite) with relatively
high Al-contents in the early rock types and evolves
via Na–Ca amphibole (katophorite, ferro-richterite) to
Na-amphibole (nybfite, arfvedsonite, leakeite) in the
most evolved rocks. Secondary amphibole in the
Puklen rocks evolves from ferro-edenite towards
ferro-actinolite, which is known only from silica-
oversaturated alkaline complexes (Mitchell, 1990).
Amphiboles in the Grbnnedal-Ika syenites are mainly
sodic–calcic katophorites; sodic and calcic amphib-
oles are very scarce (Bedford, 1989).
5. Trace element compositions
Overall, more than 230 trace element analyses of
clinopyroxene and 150 analyses of amphibole were
performed. In order to present a good overview of the
whole data set, we present the averages of analyses
from the respective minerals of each sample studied.
In cases of significant chemical zoning with respect to
major and trace element composition within individ-
ual grains, representative zoning profiles are shown.
Typical analyses of clinopyroxene and amphibole
from the three investigated igneous complexes are
summarized in Tables 3 and 4. All rare earth element

Fig. 2. (a) Major element compositional trends for clinopyroxenes of the three complexes studied, after data from Larsen (1976), Marks and
Markl (2001), Markl et al. (2001b), Marks et al. (2003) and Halama et al. (in press). (b) Major element compositional trends for amphiboles of
the three complexes studied, after data from Larsen (1976), Marks et al. (2004), Marks et al. (2003) and Halama et al. (in press).
M. Marks et al. / Chemical Geology 211 (2004) 185–215 191
(REE) and trace element (TE) patterns are normalized
to the primitive mantle values of McDonough and Sun
(1995). The order of presentation for both clinopyr-
oxenes and amphiboles follows the above-described
major element trends starting with the Ca-rich end
members.
5.1. Clinopyroxene
5.1.1. Augites of Puklen and Ilımaussaq
Fig. 3a and b shows average REE and TE patterns
from augites of Puklen and Ilımaussaq, which are
characterized by low Na/Ca ratios b0.15. Normalized
REE concentrations for all augites are 10 to 200 times
enriched relative to primitive mantle values. The
patterns are sinusoidal and show strongly developed
negative Eu anomalies (Eu/Eu*=0.12–0.38 for Puklen
and 0.31 and 0.42 for Ilımaussaq). LaN/YbN values
vary between 1.5 and 3.7 (Puklen) and between 2.1
and 2.3 (Ilımaussaq).
Most other incompatible elements are enriched by
a factor of about 10 to 100 compared to primitive
mantle values. For all augites, relative depletions for
the HFSE (Ti, Zr, Hf, Nb) can be detected. For the
large ion lithophile elements (LILE), strong negative
peaks are observed for Ba and Sr and also for Pb
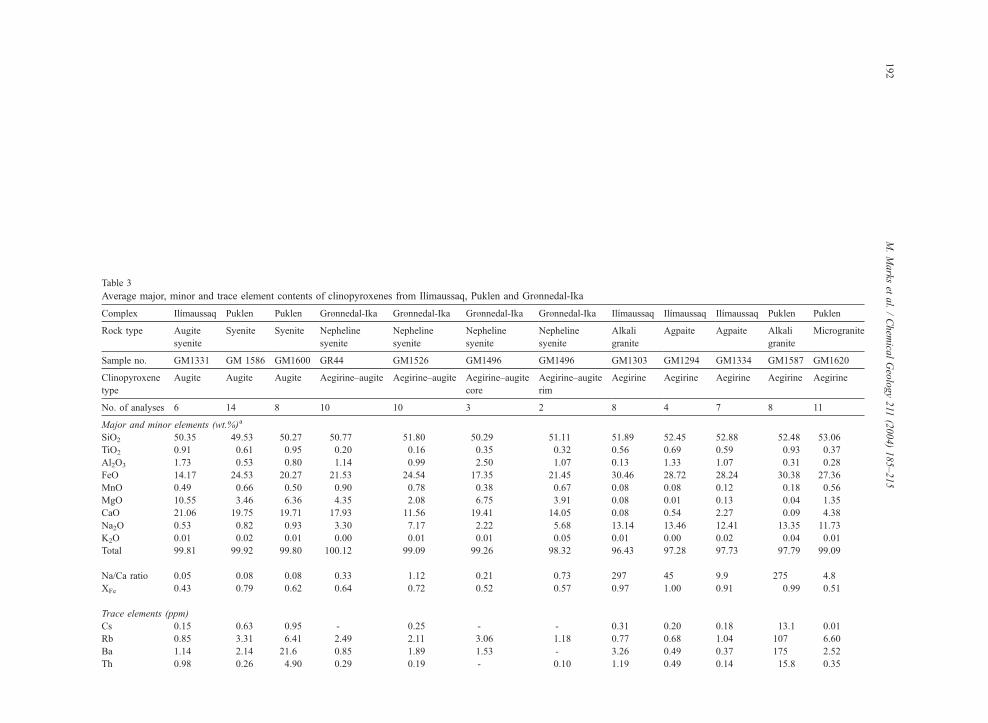
Table 3
Average major, minor and trace element contents of clinopyroxenes from Ilımaussaq, Puklen and Grbnnedal-Ika
Complex Ilımaussaq Puklen Puklen Grbnnedal-Ika Grbnnedal-Ika Grbnnedal-Ika Grbnnedal-Ika Ilımaussaq Ilımaussaq Ilımaussaq Puklen Puklen
Rock type Augite
syenite
Syenite Syenite Nepheline
syenite
Nepheline
syenite
Nepheline
syenite
Nepheline
syenite
Alkali
granite
Agpaite Agpaite Alkali
granite
Microgranite
Sample no. GM1331 GM 1586 GM1600 GR44 GM1526 GM1496 GM1496 GM1303 GM1294 GM1334 GM1587 GM1620
Clinopyroxene
type
Augite Augite Augite Aegirine–augite Aegirine–augite Aegirine–augite
core
Aegirine–augite
rim
Aegirine Aegirine Aegirine Aegirine Aegirine
No. of analyses 6 14 8 10 10 3 2 8 4 7 8 11
Major and minor elements (wt.%)a
SiO2 50.35 49.53 50.27 50.77 51.80 50.29 51.11 51.89 52.45 52.88 52.48 53.06
TiO2 0.91 0.61 0.95 0.20 0.16 0.35 0.32 0.56 0.69 0.59 0.93 0.37
Al2O3 1.73 0.53 0.80 1.14 0.99 2.50 1.07 0.13 1.33 1.07 0.31 0.28
FeO 14.17 24.53 20.27 21.53 24.54 17.35 21.45 30.46 28.72 28.24 30.38 27.36
MnO 0.49 0.66 0.50 0.90 0.78 0.38 0.67 0.08 0.08 0.12 0.18 0.56
MgO 10.55 3.46 6.36 4.35 2.08 6.75 3.91 0.08 0.01 0.13 0.04 1.35
CaO 21.06 19.75 19.71 17.93 11.56 19.41 14.05 0.08 0.54 2.27 0.09 4.38
Na2O 0.53 0.82 0.93 3.30 7.17 2.22 5.68 13.14 13.46 12.41 13.35 11.73
K2O 0.01 0.02 0.01 0.00 0.01 0.01 0.05 0.01 0.00 0.02 0.04 0.01
Total 99.81 99.92 99.80 100.12 99.09 99.26 98.32 96.43 97.28 97.73 97.79 99.09
Na/Ca ratio 0.05 0.08 0.08 0.33 1.12 0.21 0.73 297 45 9.9 275 4.8
XFe 0.43 0.79 0.62 0.64 0.72 0.52 0.57 0.97 1.00 0.91 0.99 0.51
Trace elements (ppm)
Cs 0.15 0.63 0.95 - 0.25 - - 0.31 0.20 0.18 13.1 0.01
Rb 0.85 3.31 6.41 2.49 2.11 3.06 1.18 0.77 0.68 1.04 107 6.60
Ba 1.14 2.14 21.6 0.85 1.89 1.53 - 3.26 0.49 0.37 175 2.52
Th 0.98 0.26 4.90 0.29 0.19 - 0.10 1.19 0.49 0.14 15.8 0.35
M.Marks
etal./Chem
icalGeology211
(2004)185–215
192

U 0.44 0.36 1.62 0.08 0.08 0.04 - 0.46 0.14 0.05 14.5 0.23
Nb 1.01 0.79 8.23 2.96 9.02 2.40 3.69 27.0 74.9 4.67 371 48.0
Ta n.a. 0.14 1.68 0.48 0.91 0.23 0.87 1.43 n.a. n.a. 22.7 1.69
La 28.91 32.44 13.4 43.4 11.2 8.17 9.73 2.41 4.06 5.01 370 39.5
Ce 104.4 98.11 313 140 42.8 32.5 38.9 7.17 11.4 13.8 622 115
Pb 0.74 1.71 35.6 0.49 0.46 0.21 0.27 25.0 28.8 0.82 1172 2.20
Pr 16.45 17.54 45.6 22.9 8.19 5.90 7.60 1.17 1.82 1.97 76.6 18.2
Sr 27.65 5.80 43.2 205 56.9 589 352 2.01 2.44 4.62 38.0 6.50
Nd 75.81 92.74 219 106 41.2 33.5 41.6 5.72 7.89 8.38 368 86.5
Zr 243.1 199.1 90.3 1127 5721 127 6218 1338 982 1406 2303 234
Hf 7.26 6.74 3.98 29.4 145 3.01 116.1 54.2 18.7 29.0 51.1 7.52
Sm 19.42 23.32 53.0 23.1 10.4 9.13 12.5 3.43 1.83 1.48 76.1 19.5
Eu 2.35 1.72 1.93 4.80 2.03 3.48 3.28 0.20 0.20 0.15 3.99 0.99
Sn 1.43 1.95 4.64 8.11 54.7 1.32 45.3 97.3 265 169 125 2.06
Gd 14.97 19.69 44.8 15.6 6.81 7.09 7.29 4.08 1.59 0.99 77.0 15.0
Tb 2.62 3.15 7.63 2.12 1.26 0.94 1.14 1.14 0.30 0.15 11.7 2.48
Dy 15.16 17.67 45.9 11.5 6.91 4.65 7.19 9.11 1.61 0.92 60.3 15.2
Li 32.0 195.0 278 8.47 5.31 8.76 2.49 71.0 25.0 29.0 148 176
Y 68.90 84.57 228 42.9 23.4 13.8 24.3 35.5 7.62 4.38 429 78.0
Ho 3.03 3.70 9.11 1.97 1.37 0.61 1.44 2.47 0.27 0.21 13.4 3.18
Er 7.87 9.52 23.9 5.62 4.76 1.32 4.49 10.4 0.79 0.77 39.0 10.8
Tm 1.17 1.64 3.40 1.03 1.15 0.16 0.84 2.02 0.20 0.24 6.03 1.88
Yb 8.87 14.84 23.4 9.16 13.5 0.80 8.96 11.5 2.13 3.08 45.4 18.0
Lu 1.40 2.83 3.69 1.88 2.78 0.15 2.06 1.77 0.51 0.79 6.53 3.45
Sc 210.3 121.2 118 12.8 13.2 8.50 2.45 2.44 3.44 10.6 7.38 53.0
V 3.99 1.38 196 12.1 4.21 148 8.99 0.76 0.20 5.73 8.41 3.50
Co n.a. 10.60 111 12.3 6.59 22.8 7.85 n.a. n.a. n.a. 7.90 5.31
Zn 199.9 276.4 487 247 306 89.2 322 376 61.6 130 1033 385
Ga 10.63 6.40 7.56 10.5 12.8 12.1 19.3 5.66 72.2 40.6 13.7 4.60
n.a.=not analyzed.
�=not detected.a Analyzed by electron microprobe.
M.Marks
etal./Chem
icalGeology211
(2004)185–215
193

Table 4
Average major, minor and trace element contents of amphiboles from Ilımaussaq, Puklen and Grbnnedal-Ika
Complex Ilımaussaq Puklen Puklen Puklen Puklen Grbnnedal-Ika Ilımaussaq Ilımaussaq Puklen Puklen
Rock type Augite syenite Granophyre Syenite Granophyre Syenite Nepheline syenite Alkali granite Agpaite Alkali granite Microgranite
Sample no. GM1331 GM1593 GM1600 GM1593 GM1615 GM1526 GM1303 GM1334 GM1587 GM1620
Amphibole
type
Calcic
ferro-pargasite
Calcic I
ferro-edenite
Calcic I
ferro-edenite
Calcic II
ferro-actinolite
Sodic–calcic
ferro-richterite
Sodic–calcic
katophorite
Sodic
arfvedsonite
Sodic
arfvedsonite
Sodic
arfvedsonite
Sodic
arfvedsonite
No. of analyses 6 8 9 4 7 1 14 7 7 5
Major and minor elements (wt.%)a
SiO2 41.07 44.08 44.98 50.42 48.67 44.55 43.66 47.39 51.07 49.59
TiO2 3.13 0.83 1.25 0.06 1.10 1.12 1.10 0.73 1.92 0.69
Al2O3 9.04 5.00 5.00 0.74 0.82 5.65 5.53 2.96 0.53 2.38
FeO 19.42 29.51 28.04 33.42 31.53 27.59 27.04 33.17 29.90 29.36
MnO 0.38 0.34 0.53 0.41 0.74 1.10 1.08 0.66 0.84 0.78
MgO 8.90 4.03 5.09 2.45 0.62 4.18 4.10 0.84 1.14 3.84
CaO 10.55 9.62 9.54 10.54 5.60 6.47 6.34 2.38 0.24 5.21
Na2O 2.71 2.86 2.61 0.85 6.08 5.37 5.26 7.71 8.61 5.44
K2O 1.49 0.99 0.91 0.26 1.27 1.72 1.68 1.74 1.58 0.56
Cl 0.13 0.30 0.26 0.01 0.04 0.03 0.03 0.00 0.02 0.14
F 0.72 1.57 2.33 0.00 0.74 1.13 1.11 0.07 2.57 0.13
Total 97.55 99.13 100.55 99.16 97.23 98.91 96.94 97.66 98.42 98.13
Na/Ca ratio 0.46 0.54 0.50 0.15 1.95 1.50 44.65 5.88 65.56 1.87
XFe 0.55 0.80 0.76 0.88 0.96 0.75 1.00 0.94 0.92 0.81
Trace elements (ppm)
Cs 0.02 1.43 1.01 – 0.39 – – 0.20 14.8 0.69
Rb 19.4 105 12.3 – 28.9 18.7 53.4 41.3 192 13.2
Ba 303 161 13.5 2.90 2.85 3.37 1.20 3.18 79.5 2.17
Th 23.3 4.31 2.40 3.05 0.35 – 1.48 0.20 154 1.65
U 6.61 1.00 0.24 0.32 0.14 – 1.33 0.13 9.84 0.93
M.Marks
etal./Chem
icalGeology211
(2004)185–215
194

Nb 365 303 86.5 10.4 137 517 94.6 132.8 355 36.4
Ta n.a. 7.57 1.93 0.88 2.11 20.4 1.22 n.a. 11.0 1.06
La 253 72.4 109 32.5 42.0 53.9 12.4 17.9 3986 104
Ce 557 264 407 57.9 103 145 44.2 44.1 7791 300
Pb 5.89 28.5 20.0 9.39 7.41 0.95 15.0 2.55 1260 24.0
Pr 168 37.1 57.8 7.47 15.0 20.1 4.74 5.67 1169 41.1
Sr 96.6 30.4 25.1 10.7 15.3 93.7 5.99 18.9 726 37.4
Nd 692 155 245 28.7 66.7 84.1 17.3 21.3 4993 186
Zr 1640 50.9 976 52.6 1087 1766 853 1472 1697 576
Hf 49.9 2.92 8.18 4.91 25.4 50.4 27.2 34.2 39.3 15.5
Sm 134 39.6 61.6 6.11 12.6 15.4 2.98 3.00 771 62.2
Eu 9.65 0.70 1.68 0.37 0.88 2.56 0.23 1.00 36.0 3.00
Sn 4.50 96.2 14.6 41.8 9.56 19.1 38.1 39.1 58.9 20.8
Gd 95.4 30.7 46.3 5.67 9.03 7.79 1.83 1.50 612 43.5
Tb 14.0 6.45 8.38 1.11 1.72 1.16 0.41 0.51 86.6 6.50
Dy 76.1 42.8 50.3 7.21 14.2 5.47 3.72 1.90 505 41.6
Li 29.0 722 167 240 1466 31.3 756 390 2895 288
Y 345 250 269 48.5 130 18.4 21.6 12.1 2494 177
Ho 14.7 9.28 10.0 1.64 4.87 0.92 1.49 0.73 122 9.51
Er 36.7 25.7 26.2 5.95 24.6 2.70 8.77 2.49 298 23.6
Tm 4.89 4.12 3.83 1.63 6.67 0.53 2.78 0.78 33.7 4.11
Yb 32.4 31.1 29.9 22.7 65.3 5.17 35.3 8.04 191 38.6
Lu 4.38 4.36 4.39 5.81 13.1 1.04 7.88 1.58 26.1 7.77
Sc 156 83.6 54.6 40.4 48.4 6.44 8.43 11.7 20.8 42.0
V 1.64 29.0 147 5.77 4.75 1.41 0.89 7.32 32.6 4.20
Co n.a. 43.6 29.8 n.a. 17.6 19.8 3.23 n.a. 13.0 8.80
Zn 381 1381 1109 1927 1476 592 3287 956 4667 931
Ga 56.0 45.5 23.5 5.32 13.2 32.3 6.16 36.0 16.2 6.40
n.a.=not analyzed.
�=not detected.a Analyzed by electron microprobe.
M.Marks
etal./Chem
icalGeology211
(2004)185–215
195

Fig. 3. Averaged primitive mantle-normalized REE and TE patterns for augites of (a) Puklen and (b) Ilımaussaq. Normalizing values are after
McDonough and Sun (1995).
M. Marks et al. / Chemical Geology 211 (2004) 185–215196
except for three Puklen samples. The transitional
metals Sc, V, Co and Zn are generally less enriched
(Sc and Zn) or even depleted (V and Co). Principally,
the REE and TE patterns for augites from Puklen and
Ilımaussaq are very similar. However, the negative
peaks for Pb and Sr are stronger developed in the
Ilımaussaq augites whereas those of Zr, Hf and Ti
appear to be weaker than in Puklen augites. In augites
from Puklen, a slightly positive anomaly of Li can be
detected, which is less pronounced in the Ilımaussaq
augites.
Fig. 4 shows representative zoning profiles (Na
p.f.u., XFe and selected trace element contents)
across an augite from Puklen (Fig. 4a) and Ilımaus-
saq (Fig. 4b), respectively. Both profiles show
similar characteristics. With increasing fractionation
(increase of XFe and Na content from core to rim),
Sc decreases, and Zn, Zr and the REE increase.
Whereas the amount of enrichment of Zn is more or
less equal in both augites, the enrichment of Zr and
REEtot is much more extensive in the Ilımaussaq
than in the Puklen augite.
5.1.2. Aegirine–augites of Grønnedal-Ika
REE and TE patterns for aegirine–augites of
Grbnnedal-Ika are shown in Fig. 5. Their Na/Ca
ratios vary between 0.2 and 2. The enrichment
levels for REE and most other TE are in a similar
range compared to augites. Besides the lack of a
significant Eu anomaly (Eu/Eu*=0.69–1.16) and
stronger enrichment in Tm–Lu, the shape of the
REE patterns is rather similar to that of augites (Fig.
5a). LaN/YbN ratios are quite variable with a range
from 0.6 to 6.5.
As for augites, negative peaks are detected for
some LILE (Ba, Pb, Sr), Ti and the transitional

Fig. 4. Zoning profiles for selected elements and XFe from core to rim of augite from (a) Puklen and (b) Ilımaussaq.
M. Marks et al. / Chemical Geology 211 (2004) 185–215 197
elements (Sc, V, Co). In contrast to augites, positive
peaks for Zr, Hf and Sn, and a negative Li anomaly
are developed.
In most samples, aegirine–augites are fairly homo-
geneous. However, in one sample (GM1496), aegir-
ine–augite with a relatively low Na/Ca ratio of about
0.2 shows a thin rim of distinctly more Na-rich
compositions (Na/Ca ratio ~0.7). Mantle-normalized
REE patterns and TE patterns of core and rim
compositions for a typical crystal of this sample are
shown in Fig. 5b. The core pattern is parallel to that of
the rim from La to Gd but shows a strong decrease
towards Lu. Furthermore, rim compositions are
enriched in Zr, Hf, Sn and Zn but depleted in Li,

Fig. 5. (a) Averaged mantle-normalized REE and TE patterns for aegirine–augites of Grbnnedal. (b) Mantle-normalized REE patterns and TE
patterns of core and rim compositions for an individual aegirine–augite of sample GM1496.
M. Marks et al. / Chemical Geology 211 (2004) 185–215198
Sc, V and Co compared to the core and are generally
similar to the patterns of the other aegirine–augites
(Fig. 5a).
5.1.3. Aegirines of Puklen and Ilımaussaq
Average mantle-normalized REE patterns for
aegirines (Fig. 6) are variable in their level of
enrichment, their extent of negative Eu anomalies
(Eu/Eu*=0.16–0.63) and their shape, especially for
the Puklen aegirines. With the exception of one
sample, all Puklen aegirines show a more or less
pronounced enrichment of HREE, whereas all Ilı-
maussaq aegirines are enriched in both LREE and
HREE. This results in a V-shaped pattern, which
seems to be typical of aegirines (Larsen, 1976;
Shearer and Larsen, 1994; Piilonen et al., 1998).
LaN/YbN ratios are typically lower than in augites and
aegirine–augites and vary from 0.1 to 2.9.
As for augites and aegirine–augites, multi-element
diagrams for aegirines show more or less pronounced
negative peaks for Ba, Sr, V and Co (Fig. 6). In
contrast, normalized Pb concentrations are variable
with some aegirines having a clear positive and some
a slightly negative Pb peak. As in aegirine–augites,
positive peaks for Zr, Hf and Sn are present, whereas
the negative Ti peak has disappeared in the aegirines.
A positive Li anomaly can be found in most aegirines
similar to most augites, but unlike the aegirine–
augites.
5.2. Amphibole
5.2.1. Ca and Na–Ca-amphiboles of Puklen,
Ilımaussaq and Grønnedal-Ika
Average REE patterns of Ca- and Ca–Na-amphib-
oles are shown in Figs. 7 and 8. The Puklen

Fig. 6. Averaged mantle-normalized REE and TE patterns for aegirines of (a) Puklen and (b) Ilımaussaq.
M. Marks et al. / Chemical Geology 211 (2004) 185–215 199
amphiboles have strongly developed negative Eu
anomalies (Eu/Eu*=0.06–0.29), but two different
patterns can be distinguished: Ferro-richterites show
pronounced HREE-enrichment with LaN/YbN ratios
between 0.47 and 0.45. In contrast, variably devel-
oped LREE-enrichment and a flat HREE section
resulting in LaN/YbN ratios between 1.5 and 2.5
characterize ferro-edenites. Secondary ferro-actino-
lites from Puklen syenites are heterogeneous in terms
of enrichment level and shape with LaN/YbN ratios
between 0.7 and 1.1. REE patterns of Ilımaussaq
ferro-pargasites from the augite syenite are charac-
terized by significant negative Eu-anomalies (Eu/
Eu*=0.26 and 0.30), a LREE enrichment and a
smooth decrease from Gd to Lu. LaN/YbN ratios vary
from 5.3 to 8.6. The Grbnnedal-Ika katophorites lack
a significant Eu anomaly (Eu/Eu*=0.70–0.71). They
show slight enrichments in LREE and the heaviest
REE (LaN/YbN=4.4 and 7.1).
Most trace elements in Ca- and Ca–Na amphiboles
are 5–300 times enriched compared to primitive
mantle values. Characteristic features of most samples
are negative anomalies for Ba, Sr, V and Co and
positive ones for Sn and Li. Strong negative Pb
anomalies are only present in amphiboles from
Ilımaussaq and Grbnnedal-Ika. Positive Zr-Hf peaks
do not occur in the Ca-amphiboles, but in the Ca–Na
amphiboles of Grbnnedal-Ika.Fig. 9 shows a representative zoning profile from
core to rim of a Ca–Na amphibole crystal from a Puklen
syenite (GM1615). The contents of Zr, Zn and REE
increase from core to rim.With increasing fractionation
(increase in XFe and Na/Ca ratio), LREE (La as
example) slightly decrease and HREE (Yb as example)
strongly increase resulting in a decrease of the LaN/YbNratio from about 1.2–1.3 in the core regions to about
0.13 at the rim of crystals. However, the Eu/Eu* value
remains relatively constant at about 0.25.

Fig. 7. Averaged mantle-normalized REE and TE patterns for (a) ferro-edenites and ferro-richterites and (b) ferro-actinolites of Puklen.
M. Marks et al. / Chemical Geology 211 (2004) 185–215200
5.2.2. Na-amphiboles of Puklen and Ilımaussaq
REE and TE spectra of arfvedsonites are shown in
Fig. 10. Eu anomalies are strongly negative in the
Puklen arfvedsonites (Eu/Eu*=0.04 and 0.19), but
more variable in Ilımaussaq arfvedsonites (Eu/
Eu*=0.26–0.92). The enrichment of LREE and HREE
is highly variable developed with LaN/YbN ratios b1
to 4. TE patterns of arfvedsonites are highly hetero-
geneous within and among the Puklen and Ilımaussaq
rocks. Highly variable concentrations can be observed
for Th, U, Pb, Zr and Hf. Most Ilımaussaq Na-
amphiboles have positive anomalies of Zr, Hf, Nb, Sn
and Li, which are much less prominent in Puklen.
Principally, zoning profiles of arfvedsonite from
Puklen and Ilımaussaq (Fig. 11) show similar charac-
teristics as the profiles of Ca-amphiboles (Fig. 9) and
augites (Fig. 4), except for the REE. Zn and Zr
increase from core to rim and Sc decreases. However,
the total content of REE decreases with fractionation,
which is in contrast to the behavior of augites and Ca-
amphiboles. The behavior of LREE and HREE in the
two amphibole types is different: in Na-amphiboles,
LREE and HREE have similar concentrations in the
core regions. During fractionation, HREE contents
remain fairly constant, whereas LREE concentrations
strongly decrease. This is in contrast to Ca-amphib-
oles, where LREE contents slightly decrease and
HREE strongly increase during fractionation. Both
processes result in a decrease of the LaN/YbN ratio
with increasing fractionation.
6. Discussion
In principle, relative trace element abundances in
minerals can reflect the influence of two factors: First,
the composition and structure of the melts or fluid
phases they crystallized from (e.g., Adam and Green,

Fig. 8. Averaged mantle-normalized REE and TE patterns for (a) ferro-pargasites of Ilımaussaq and (b) katophorites of Grbnnedal.
M. Marks et al. / Chemical Geology 211 (2004) 185–215 201
2003; Bennett et al., 2003), and, second, the control
by crystal-chemical effects (e.g., Blundy and Wood,
1994). The latter implies that the major element
composition of the crystals dominates the incorpo-
ration of the trace elements (e.g., Blundy and Wood,
1991; Wood and Blundy, 1997). Additional parame-
ters that influence trace element partitioning to a lesser
extent are P, T and fO2.
Absolute trace-element abundances in melts may
depend on the fractionation of minerals that preferen-
tially incorporate certain trace elements and on
assimilation of crustal material. In the Gardar Prov-
ince, early plagioclase fractionation is indicated by the
abundant occurrence of anorthosite xenoliths (Bridg-
water, 1967; Bridgwater and Harry, 1968; Halama et
al., 2002) and negative Eu anomalies in whole-rock
samples of the Ilımaussaq complex (Bailey et al.,
2001). Furthermore, fractionation of alkali feldspar is
seen in the investigated complexes. Since negative Eu
anomalies are mostly controlled by feldspar fractio-
nation (Drake and Weill, 1975), and Ba, Sr, Eu2+ and,
to a lesser extent, Pb are compatible in alkali feldspar
in silicic magmas (Nash and Crecraft, 1985; White,
2003), the absolute concentrations of these are likely
to be generally diminished in the residual Gardar
magmas from which the complexes crystallized. The
lack of significant negative Eu anomalies in the
Grbnnedal-Ika samples is probably related to the
more oxidized conditions (Bedford, 1989; Pearce et
al., 1997a) leading to the stabilization of Eu3+, which
is incompatible in feldspar. Low concentrations of Co
and V in the investigated mafic minerals might be
attributed to early precipitation of olivine and spinel
because both are compatible in olivine and/or spinel
(Arth, 1976; Canil and Fedortchouk, 2001), and the
presence of mafic cumulates underneath the exposed
alkaline complexes is required by the low whole-rock
Ni contents and confirmed by large positive gravity

Fig. 9. Zoning profile for selected elements, XFe and Na/Ca ratio
from core to rim of ferro-richterite from Puklen.
M. Marks et al. / Chemical Geology 211 (2004) 185–215202
and magnetic anomalies centered on the Ilımaussaq
area (Blundell, 1978; Forsberg and Rasmussen, 1978).
The systematic decrease of Sc concentrations from
calcic to sodic clinopyroxenes and amphiboles and
within a growing augite (Fig. 4) indicates that
fractionation of clinopyroxene was important, as Sc
is compatible in clinopyroxene and amphibole within
a large range of magma compositions (e.g., Arth,
1976; Mahood and Hildreth, 1983). In Ilımaussaq,
amphiboles and clinopyroxenes show an evolution
from a pronounced LREE enrichment in the most Ca-
rich minerals towards roughly an order of magnitude
lower values in the Na-rich compositions, contrary to
the trend expected for incompatible trace elements.
The same trend can be seen in single minerals, as
exemplified in a representative zoning profile of a Na-
amphibole from Ilımaussaq (Fig. 11). This feature is
best explained by the fractionation of eudialyte, which
is a REE-bearing mineral with highly enriched LREE
contents compared to HREE (Bailey et al., 2001) and
which is ubiquitous in the agpaitic Ilımaussaq rocks.
6.1. Crystal chemical controls on trace element
partitioning
Both clinopyroxenes and amphiboles show a
continuous development from LREE-enriched pat-
terns in the calcic members via wave-shaped pattern
in the sodic–calcic members towards a more pro-
nounced HREE enrichment in the most sodic mem-
bers (Fig. 10). These principal changes point towards
a crystal chemical control on trace element partition-
ing because of the following arguments:
! The enrichment of HREE in Ca–Na- and espe-
cially Na-rich mafic silicates might partly reflect a
general preference for trivalent REE as the
incorporation of Na+ requires charge balance with
a trivalent ion, following the coupled substitution
Na+ REEf2 Ca on the M2 site as proposed for
REE partitioning in clinopyroxene (Wood and
Blundy, 1997). However, this process should also
affect the LREE, which do not show significant
enrichment in the Na-rich minerals. Therefore, it
seems more likely that there is a particular site
preference of the HREE with smaller ionic radii
into the optimal sites available in the more Na-rich
minerals. HREE were also shown to be compatible
in Na-bearing clinopyroxene on the spinel-lherzo-
lite solidus (Blundy et al., 1998).
! For amphiboles, there are multiple crystal-chemical
mechanisms for REE3+ incorporation and REE are
distributed over more than one structural site
(Bottazzi et al., 1999) Additionally, it is known that
the REE site-preference is mainly a function of

Fig. 10. Averaged mantle-normalized REE and TE patterns for arfvedsonites of (a) Puklen and (b) Ilımaussaq.
M. Marks et al. / Chemical Geology 211 (2004) 185–215 203
major-element composition of the B-group sites in
amphiboles (Tiepolo et al., 2000b). This is in
agreement with our data, where we observe distinct
changes in REE patterns from calcic amphiboles
(two Ca2+ on B-site) via sodic–calcic amphiboles
(B-site occupied by one Ca2+ and one Na+) towards
sodic amphiboles (two Na+ on B-site).
Similarly to the REE, Ti, Zr, Hf and Sn show a
systematic behavior in terms of their normalized
concentrations in the various pyroxene types. Their
normalized concentrations relative to the neighboring
elements increase with increasing Na-content in the
host mineral. This increase is most pronounced for Zr,
Hf and Sn and weaker for Ti. In amphiboles, similar
systematics for Zr, Hf and Sn can be observed,
whereas Ti remains fairly constant and relatively less
depleted throughout the whole amphibole series. The
similar geochemical behavior of these elements is
probably related to their similar ionic radii and
charges (Shannon, 1976). The general increase of
Zr, Hf and Sn during fractionation within one single
pluton can partly be attributed to enrichment of
incompatible elements during closed system fractional
crystallization. However, several arguments indicate a
major element crystal-chemical control on the con-
tents of these trace elements as well:
! In two of the investigated complexes, significant
amounts of Ti-rich magnetite and/or ilmenite
crystallized early in their evolution (Larsen,
1976; Marks and Markl, 2001; Marks et al.,
2003), probably causing a strong depletion of Ti
in the evolving melt. However, in the Ilımaussaq
clinopyroxenes, the resulting effect on Ti content
in clinopyroxene is surprisingly small: early
augites contain only slightly more Ti (up to 5200
ppm) than later aegirines (up to 4200 ppm), and in

Fig. 11. Zoning profile for selected elements from core to rim of
arfvedsonite from Ilımaussaq.
M. Marks et al. / Chemical Geology 211 (2004) 185–215204
the Puklen rocks early augites are even poorer in
Ti (maximum of 5200 ppm) than late-stage
aegirines (up to 10,500 ppm).
! Ti-rich aegirines have been described from a
number of peralkaline igneous rocks of the Gardar
province (Larsen, 1976; Jones and Peckett, 1980;
Shearer and Larsen, 1994; Ranlov and Dymek,
1991) and elsewhere (Nielsen, 1979; Piilonen et
al., 1998; Njonfang and Nono, 2003). In contrast,
Ti-rich augites in more primitive alkali basaltic
lavas of the Gardar Province have not been
reported so far despite relatively high whole-rock
TiO2 contents of 1.7–3.0 wt.% (Halama et al.,
2003) compared to the typically low TiO2 contents
(b0.7 wt.%) in the highly fractionated agpaitic
rocks of Ilımaussaq (Bailey et al., 2001).
! For an optimal site of about 0.70 2 in pyroxenes
and amphiboles (Jensen, 1973; Bailey et al., 2001),
Zr4+ (0.72 2), Hf4+ (0.71 2) and Sn4+ (0.69 2) fitfairly well, whereas Ti4+ (0.61 2) is considerablysmaller (Shannon, 1976). This relatively large
mismatch of Ti might contribute to the rather
weak increase in Ti contents during fractionation
compared to Zr, Hf and Sn.
! Positive Zr–Hf anomalies are only present in Ca–
Na- and Na-dominated clinopyroxenes and
amphiboles, but not in the calcic varieties, again
suggesting a crystal-chemical control. An enrich-
ment of Zr and Hf due to prolonged fractional
crystallization alone is not a viable explanation
since the neighboring elements do not show such
an extreme enrichment.
! In the Ilımaussaq intrusion, late-stage hydrother-
mal mineralizations containing rare Sn silicates
like Sbrensenite (Na4SnBe2(OH)4Si6O16) are well
known (Semenov et al., 1965). Thus, one can
argue that the high Sn contents in late aegirines
compared to earlier augites are an effect of
fractionation and enrichment of Sn. However, the
relatively high Sn contents and strikingly positive
Sn anomalies in the Grbnnedal-Ika aegirine–
augites argue against this, since these pyroxenes
are invariably early magmatic phases.
Among the transition metals, Zn2+ has an ionic
radius of 0.74 2 in sixfold coordination, which is very
similar to the ionic radius of Sc3+ (0.745 2) (Shannon,1976). Since the compatibility of Sc in clinopyroxene
and amphibole is well known, it is likely that the Zn2+
ion with a similar ionic radius may have a similar
degree of compatibility, which can explain the enrich-
ment in normalized Zn contents in both clinopyroxene
and amphibole compared to primitive mantle.
6.2. Lithium: influence of the melt composition
In the clinopyroxenes, Li behaves quite variable
with flat patterns or small positive peaks in the
mantle-normalized augite patterns, negative peaks in
the aegirine–augites and positive peaks in the aegir-
ines. The enrichment level is also quite different,
depending on the complex: clinopyroxenes from
Ilımaussaq have medium values of ~20–40�, from
Puklen ~100� and from Grbnnedal-Ika b7� primitive
mantle values, apparently independent of the mineral
composition. This indicates that Li contents in the
clinopyroxenes are mainly dependent on the melt
composition. The Puklen melts were relatively most
enriched in Li, whereas the Grbnnedal-Ika melts had

Fig. 12. eNd vs. Pb/Pb* diagram for mineral separates of the Puklen
rocks. eNd data from Marks et al. (2003). See text for definition o
Pb/Pb*.
M. Marks et al. / Chemical Geology 211 (2004) 185–215 205
relatively low Li contents. The generally positive Li
peaks in amphiboles, however, particularly in the
sodic members, are clearly an effect of preferential
partitioning of Li into amphibole, and it was shown by
Hawthorne et al. (1993, 1994) that Li could be a major
component in Na-amphiboles from peralkaline igne-
ous rocks.
6.3. Crustal contamination
Based on Nd isotopic data, crustal contamination
plays a major role in the Puklen rocks (Marks et al.,
2003). In the following, we will use these data as
indicators for crustal contamination and discuss the
influence on the incorporation of some elements into
clinopyroxene and amphibole.
Syenites show a range of eNd values between �3.8
and �7.2, and alkali granites vary between �5.9 and
�9.6. Within the syenites, samples GM1593
(eNd=�7.2) and GM1600 (eNd=�6.4) are the most
contaminated ones. Augites of these two samples have
the highest contents in U, Pb, Vand Zn, but the lowest
concentrations of Ti, Zr and Hf. This is consistent
with assimilation of crustal rocks, which have high
contents of U, Pb, V and Zn, and low contents of Ti,
Zr and Hf compared to the primitive mantle (Rudnick
and Fountain, 1995; McDonough and Sun, 1995).
These two samples are also those with positive Pb
anomalies (Fig. 3). We defined a Pb/Pb* value, which
was calculated similar to Eu/Eu*, as the geometric
mean Pb/Pb*=PbNffiffiffiffiffiffiffiffiffiffiffiffiffiffiffiffiffiffiffiffiffiffiCeNd PrNð Þ
p. This should be a
useful parameter, since Ce and Pr normally have
similar normalized values. The significant correlation
between Pb/Pb* and eNd values in Fig. 12 confirms
the influence of crustal contamination on this param-
eter and provides evidence of a relation between trace
element composition in minerals and assimilation
processes during the magmatic evolution of an
alkaline complex. The same argument may also hold
for the differences in primary Li melt contents
discussed above.
6.4. Partitioning of trace elements between coexisting
clinopyroxene and amphibole
To establish meaningful intermineral partition
coefficients, chemical equilibrium is required, which
is, however, often difficult to evaluate (e.g., Chazot et
f
al., 1996). We calculated clinopyroxene–amphibole
trace element abundance ratios for selected samples
where textural and isotopic criteria (Markl et al.,
2001b; Marks et al., 2003) indicate equilibrium
conditions (Fig. 13a–d; Table 5). These values might
not strictly be interpreted as partition coefficients but
can act as useful guides for trace element partitioning
in alkaline magmatic rocks in general and will be used
here as an approximation for equilibrium partition
coefficients.
Calculated clinopyroxene–amphibole partition
coefficients (Dcpx–amph) for the majority of trace
elements vary for the Ilımaussaq augite syenites (Fig.
13a) between 0.1 and 0.6. In the Puklen syenites (Fig.
13b), they are slightly higher (between 0.6 and 1.7). In
the Na–Ca system of Grbnnedal-Ika (Fig. 13c), a largerrange between 0.3 and 2.7 is observed. Finally, in the
Na-dominated system of Ilımaussaq (Fig. 13d) they
vary between 0.07 and 0.9. For a specific element, the
determined Dcpx–amph values for the whole sample
suite vary within about 1 order of magnitude. How-
ever, samples with similar major element chemical
composition show similar patterns, despite certain
differences in the absolute D values. This points to the
reasonable assumption of chemical equilibrium
between the respective mineral pairs. Thus, clinopyr-
oxene–amphibole partition coefficients seem to be
relatively independent of major element mineral
compositions, and no systematic variation of D values
with increasing Na-content of clinopyroxene and
amphibole can be observed. This provides an interest-
ing tool to assess the equilibration of clinopyroxene,
amphibole and melt in magmatic systems.

Fig. 13. Clinopyroxene/amphibole partition coefficients for (a) Ilımaussaq augite syenites, (b) Puklen syenites, (c) Grbnnedal nepheline syeniteand (d) Ilımaussaq agpaites.
M. Marks et al. / Chemical Geology 211 (2004) 185–215206
Overall, our calculated Dcpx–amph values span a
comparable range as literature data for ultramafic
(Vannucci et al., 1991; Chazot et al., 1996; Gregoire et
al., 2000), basanitic (Irving and Frey, 1984; Adam and
Green, 1994) and more evolved compositions (Vil-
lemant et al., 1981; Worner et al., 1983; Lemarchand
et al., 1987) do (Dcpx–amph ~0.1 to ~10). There are no
systematic changes in absolute Dcpx–amph values with
SiO2 content or alkalinity, which indicates that trace
element partitioning between clinopyroxene and
amphibole is not significantly influenced by the melt
composition. This is interpreted to be due to the
principally similar crystal structures and cation sites of
these two minerals. Some elements exhibit note-
worthy features:
! Nb and Ta always have a strong preference for
amphibole, which is in accordance with previous
studies on mantle minerals (e.g., Witt-Eickschen
and Harte, 1994; Chazot et al., 1996) and andesitic
melts (Brenan et al., 1995). U and Th are also
preferentially incorporated into amphibole except
for the Puklen samples.
! Rb and Ba are apparently less compatible in
clinopyroxene than in amphibole, which is con-
sistent with previous studies (e.g., Brenan et al.,
1995; Chazot et al., 1996). This is caused by a
strong preference of these two elements for the A-
site in amphibole (e.g., Dalpe and Baker, 2000),
which has no equivalent position in pyroxene. As
for U and Th, Rb and Ba in the Puklen syenites
have significantly higher Dcpx–amph values. This
might be caused by secondary fluid circulation,
which was shown to disturb the Rb/Sr isotopic
system in the Puklen minerals (Marks et al.,
2003).

Table 5
Clinopyroxene–amphibole distribution coefficients for alkaline igneous rocks
Complex Ilımaussaq Ilımaussaq Ilımaussaq Ilımaussaq Puklen Puklen Gronnedal-Ika
Rock
type
Augite
syenite
Augite
syenite
Agpaite Agpaite Quartz
syenite
Quartz
syenite
Nepheline
syenite
Mineral pair Augite–
ferro-pargasite
Augite–
ferro-pargasite
Aegirine–
arfvedsonite
Aegirine–
arfvedsonite
Augite–
ferro-edenite
Augite–
ferro-edenite
Aegirine–
augite-katophorite
Sample GM 1331 GM 1333 GM 1334 GM 1337 GM 1600 GM 1603 GM 1526
Cs 7.50 1.57 0.90 0.25 0.94
Rb 0.04 0.05 0.03 0.03 0.52 1.08 0.11
Ba 0.004 0.004 0.12 0.04 1.60 3.92 0.56
Th 0.04 0.36 0.70 0.01 2.04 22.10
U 0.07 0.58 0.38 0.07 6.84 16.92
Nb 0.003 0.003 0.04 0.01 0.10 0.03 0.02
Ta 0.87 0.04 0.04
La 0.11 0.11 0.28 0.07 1.23 1.55 0.21
Ce 0.19 0.15 0.31 0.12 0.77 1.52 0.29
Pb 0.13 0.30 0.32 0.22 1.78 2.28 0.48
Pr 0.10 0.20 0.35 0.15 0.79 1.59 0.41
Sr 0.29 0.60 0.24 0.11 1.72 0.34 0.61
Nd 0.11 0.26 0.39 0.15 0.90 1.76 0.49
Zr 0.15 0.17 0.96 0.52 0.93 0.76 3.24
Hf 0.15 0.19 0.85 0.80 0.49 0.57 2.88
Sm 0.15 0.33 0.49 0.18 0.86 1.52 0.67
Eu 0.24 0.35 0.15 0.11 1.15 1.48 0.79
Ti 0.28 0.45 0.68 0.66 0.16 0.28 0.14
Sn 0.32 0.05 4.32 1.92 0.32 0.23 2.87
Gd 0.16 0.37 0.66 0.18 0.97 1.52 0.87
Tb 0.19 0.34 0.29 0.15 0.91 1.36 1.09
Dy 0.20 0.35 0.48 0.19 0.91 1.39 1.26
Li 1.10 0.25 0.07 0.06 1.66 0.82 0.17
Y 0.20 0.33 0.36 0.18 0.85 1.46 1.28
Ho 0.21 0.35 0.29 0.12 0.91 1.59 1.49
Er 0.21 0.37 0.31 0.17 0.91 1.52 1.76
Tm 0.24 0.41 0.31 0.20 0.89 1.52 2.19
Yb 0.27 0.46 0.38 0.26 0.78 1.52 2.62
Lu 0.32 0.61 0.50 0.33 0.84 1.66 2.69
Sc 1.35 14.13 0.90 0.50 2.17 2.53 2.05
V 2.43 6.17 0.78 0.48 1.33 0.20 2.99
Co 3.72 1.67 0.33
Zn 0.53 0.50 0.14 0.06 0.44 0.59 0.52
M. Marks et al. / Chemical Geology 211 (2004) 185–215 207
! Dcpx–amph values for Sr are characterized by small
positive peaks in the Ca-rich system, but slight
depressions in the Na-rich system. The two Puklen
samples behave variable, which may be an effect
of secondary metasomatism, as mentioned above
(Marks et al., 2003).
! Zr, Hf and Sn develop a preference for clinopyr-
oxene as the system evolves towards Ca–Na and
Na-rich compositions, but absolute DZr and DHf
values N1 only occur in the Ca–Na system
(Grbnnedal-Ika). For Zr and Hf, literature data
are contradictory, indicating similar compatibilities
in andesitic rocks (Brenan et al., 1995), variable
behavior (Vannucci et al., 1991) or a preference for
amphibole (Chazot et al., 1996) in ultramafic
rocks.
! The Dcpx–amph values of the REE are continuously
increasing from the LREE towards the HREE in
the Ilımaussaq and Grbnnedal-Ika rocks. However,whereas in Ilımaussaq, all DREE are b1, DREE
values in Grbnnedal-Ika increase from DLa=0.2
towards DLu=2.7, i.e., the LREE partition prefer-
entially into amphibole, but the HREE do not. In
contrast, DREE values for Puklen syenites are
M. Marks et al. / Chemical Geology 211 (2004) 185–215208
fairly constant. For the REE, Klein et al. (1997)
assumed that as a consequence of nearly identical
values of Young’s moduli and lattice site geo-
metries of M4- and M2-sites in amphibole and
clinopyroxene, respectively, Dcpx–amph should be
identical for all REE, and, consequently, REE
patterns of clinopyroxenes and amphiboles should
be subparallel. Measured REE partition coeffi-
cients between clinopyroxene and amphibole in
mantle rocks (Witt-Eickschen and Harte, 1994;
Chazot et al., 1996) partly confirm this assumption
as our data for the Puklen syenites do (Figs. 3a, 7a
and 13b). However, Witt-Eickschen and Harte
(1994) also found a slight tendency of increase of
Dcpx–amph for the REE with increasing Na-content,
which is not confirmed by our data. The tendency
of increase of Dcpx–amph values from La to Lu
found by Witt-Eickschen and Harte (1994) in
mantle rocks and by Irving and Frey (1984) for
basanitic rocks is in accordance with our results
for the Ilımaussaq and Grbnnedal-Ika rocks, but
not for the Puklen syenites.
Table 6
Maximum and minimum partition coefficients for alkaline rocks used to
Element Dclinopyroxene–melt Damphibole–melt
Dmax Dmin Dmax
Cs 0.05 0.03
Rb 0.04 0.02 0.14
Ba 0.02 0.01 5.58
Th 0.15 0.01 0.07
U 0.09 0.02 0.45
Nb 0.03 0.03
Ta 0.50 0.21 1.25
La 0.66 0.06 0.99
Ce 0.96 0.21 2.06
Pb 0.13 0.10
Sr 0.25 0.25 9.77
Nd 2.27 0.49 3.56
Zr 1.02 0.24 1.77
Hf 1.54 0.40 1.19
Sm 6.18 0.48 7.29
Eu 13.87 0.60 9.39
Tb 8.63 0.60 9.74
Tm 0.79 0.35 2.00
Yb 2.63 0.40 2.10
Lu 2.06 0.41 2.83
Sc 334 4.05 120.7
Partition coefficients from Larsen (1979), Worner et al. (1983) and Lema
sample from an alkali olivine basalt of the OGDC (Upton et al., 1985) and a
with the Ilımaussaq complex (Larsen and Steenfelt, 1974; Larsen, 1979).
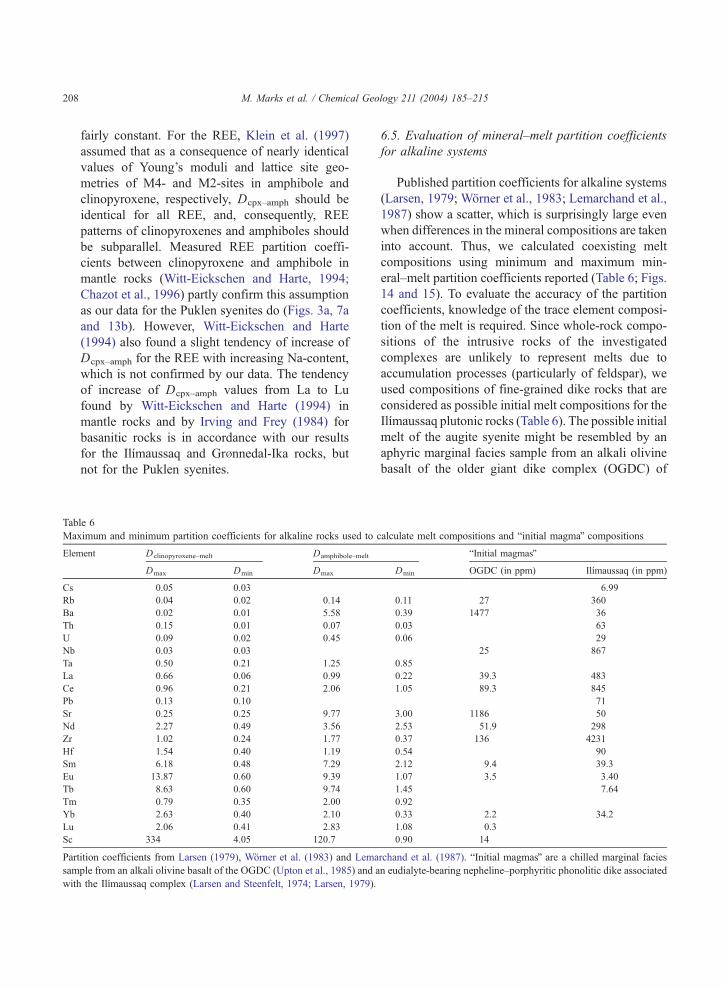
6.5. Evaluation of mineral–melt partition coefficients
for alkaline systems
Published partition coefficients for alkaline systems
(Larsen, 1979; Worner et al., 1983; Lemarchand et al.,
1987) show a scatter, which is surprisingly large even
when differences in the mineral compositions are taken
into account. Thus, we calculated coexisting melt
compositions using minimum and maximum min-
eral–melt partition coefficients reported (Table 6; Figs.
14 and 15). To evaluate the accuracy of the partition
coefficients, knowledge of the trace element composi-
tion of the melt is required. Since whole-rock compo-
sitions of the intrusive rocks of the investigated
complexes are unlikely to represent melts due to
accumulation processes (particularly of feldspar), we
used compositions of fine-grained dike rocks that are
considered as possible initial melt compositions for the
Ilımaussaq plutonic rocks (Table 6). The possible initial
melt of the augite syenite might be resembled by an
aphyric marginal facies sample from an alkali olivine
basalt of the older giant dike complex (OGDC) of
calculate melt compositions and binitial magmaQ compositions
bInitial magmasQ
Dmin OGDC (in ppm) Ilımaussaq (in ppm)
6.99
0.11 27 360
0.39 1477 36
0.03 63
0.06 29
25 867
0.85
0.22 39.3 483
1.05 89.3 845
71
3.00 1186 50
2.53 51.9 298
0.37 136 4231
0.54 90
2.12 9.4 39.3
1.07 3.5 3.40
1.45 7.64
0.92
0.33 2.2 34.2
1.08 0.3
0.90 14
rchand et al. (1987). bInitial magmasQ are a chilled marginal facies
n eudialyte-bearing nepheline–porphyritic phonolitic dike associated

Fig. 14. Comparison of calculated melts, using the partition coefficient listed in Table 6, with the assumed initial melt, which is an aphyric
marginal facies sample from an alkali olivine basalt of the older giant dike complex (OGDC) of Tugtutuq (Upton et al., 1985).
M. Marks et al. / Chemical Geology 211 (2004) 185–215 209
Tugtutoq (Upton et al., 1985). This dike rock is similar
in age and close to the Ilımaussaq complex. It is a fine-
grained, well-chilled rock, with high Sr contents (Table
6) and no Eu-anomaly, indicating that this rock had
undergone no significant plagioclase fractionation at
the time of emplacement. A very fine grained peralka-
line dike rock described by Larsen and Steenfelt (1974)
and by Larsen (1979) is used as approximation for the
initial peralkaline Ilımaussaq magma. Detailed min-
eral, chemical, petrological and isotopic investigations
of Marks and Markl (2003) on this dike rock confirm
the early assumption of Larsen and Steenfelt (1974)
that this dike rock is closely related to the initial
peralkaline Ilımaussaq magma. For example, the
different mineral assemblages found in this dike rock
can be correlated to the various types of plutonic rocks
of the Ilımaussaq complex. The intrusive complexes of
Puklen and Grbnnedal-Ika are not investigated further
here since for these complexes no such dike rocks
which could represent melt compositions exist.
By comparing the assumed initial melt composi-
tion with the calculated melts from augites, we note
that Ba, Sr and Eu in the Ilımaussaq calculated melts
tend to show marked negative spikes and lower
concentrations than the assumed initial melt, which
is most probably the effect of accumulation of
feldspar. However, for other elements (except U and
Zr) melt compositions calculated from augites show a
good agreement with the assumed initial melt for the
augite syenite (Fig. 14). If melt compositions are
calculated from Ca-amphiboles, positive deviations in
the melt compared to the whole-rock values occur for
Th, U, La, Ce, Nd, Zr, Hf, Yb and Lu (Fig. 14). This is
possibly related to their late-magmatic formation
under more hydrous conditions.
A crystal-chemical control on REE partitioning
between clinopyroxene and melt is suggested when
the clinopyroxene compositions with low Na contents
used in the previous studies (Larsen, 1979; Worner et
al., 1983; Lemarchand et al., 1987) and the theoretical
model of Wood and Blundy (1997) (WB97 model)
are considered in comparison to the Na-rich aegirine
(Fig. 15). To evaluate this more quantitatively, we
calculated partition coefficients for the REE (DREE)
from known clinopyroxene compositions after the
model of Wood and Blundy (1997) (WB97 model).
Examples of the calculated DREE values are listed in
Table 7 and the results are shown graphically in Fig.
15a. These calculations show that the apex of the
parabolic curve trends towards smaller ionic radii as
the clinopyroxene becomes more Na–Fe3+-rich. This
means that the HREE become more compatible
relative to the LREE, which is in qualitative agree-
ment with the observed increase in HREE concen-
trations in aegirine–augites and aegirines (Figs. 5 and
6). Calculated DREE for augite and Mg-rich aegirine–

M. Marks et al. / Chemical Geology 211 (2004) 185–215210
augite cores where Fe2+ dominates over Fe3+ (Table 7)
agree fairly well with data from natural samples
(Table 6), but for aegirine–augite rims and aegirines
they tend to be lower.
In Fig. 15b and c, melt compositions calculated
using the DREE determined from the Wood and
Blundy (1997) model and using the DREE derived
from natural samples are compared to whole-rock data
and possible melt compositions from Ilımaussaq. For
the augite syenite (Fig. 15b), the melts calculated after
the WB97 model show a good overlap with the
assumed initial melt, as well as with whole-rock data
for the Ilımaussaq augite syenite (Bailey et al., 2001),
except for Eu. This confirms the applicability of the
theoretical model to augitic clinopyroxenes in alkaline
systems. In contrast, melts calculated from a typical
aegirine using either DREE derived from natural
samples or after the WB97 model (Fig. 15c) have
lower REE contents than the assumed initial peralka-
line melt (Larsen and Steenfelt, 1974; Larsen, 1979;
see above) and agpaitic whole-rocks (Bailey et al.,
2001), and the most significant deviations occur when
the lowest aegirine formation temperatures are
assumed. However, there is a reasonable overlap
between the WB97 model melts and melts calculated
with the DREE from natural samples, but the WB97
model melts tend to higher LREE and lower HREE
concentrations. Despite the consideration of crystal-
chemical effects, the partition coefficients calculated
after the WB97 model appear not to be suitable to
calculate melt compositions from aegirines. This
theoretical model was based on clinopyroxenes with
high Mg numbers, which does not apply to the
formation of Mg-poor aegirine. Furthermore, Wood
and Blundy (1997) also note that compositions
containing substantial amounts of the NaFe3+Si2O6
component deviate from the simple activity–compo-
sition relationship used in their model.
In summary, partition coefficients derived from
natural samples and derived from the theoretical
model of Wood and Blundy (1997) can be used for
calculating melt compositions from clinopyroxenes
Fig. 15. (a) Clinopyroxene–melt REE partition coefficients calcu-
lated form mineral chemical data at P=1 kbar for differen
representative clinopyroxene compositions at 800 8C after Wood
and Blundy (1997). Dark grey vertical bars mark the position of r0(see Table 7 for data and explanations). (b) Primitive mantle-
normalized REE plots of calculated melts and comparative whole-
rock data for the Ilımaussaq augite syenite (c) for the Ilımaussaq
agpaitic rocks. L79, W83 and L87 denote melts calculated with a
range of partition coefficients from Larsen (1979), Wfrner et al
(1983) and Lemarchand et al. (1987) listed in Table 6. WB denotes
melts calculated with the partition coefficients derived from the
theoretical model of Wood and Blundy (1997) listed in Table 7
Whole-rock data are from Bailey et al. (2001) (B01), Upton et al
(1985) (U85) and Larsen (1979) (L79).
t
.
.
.
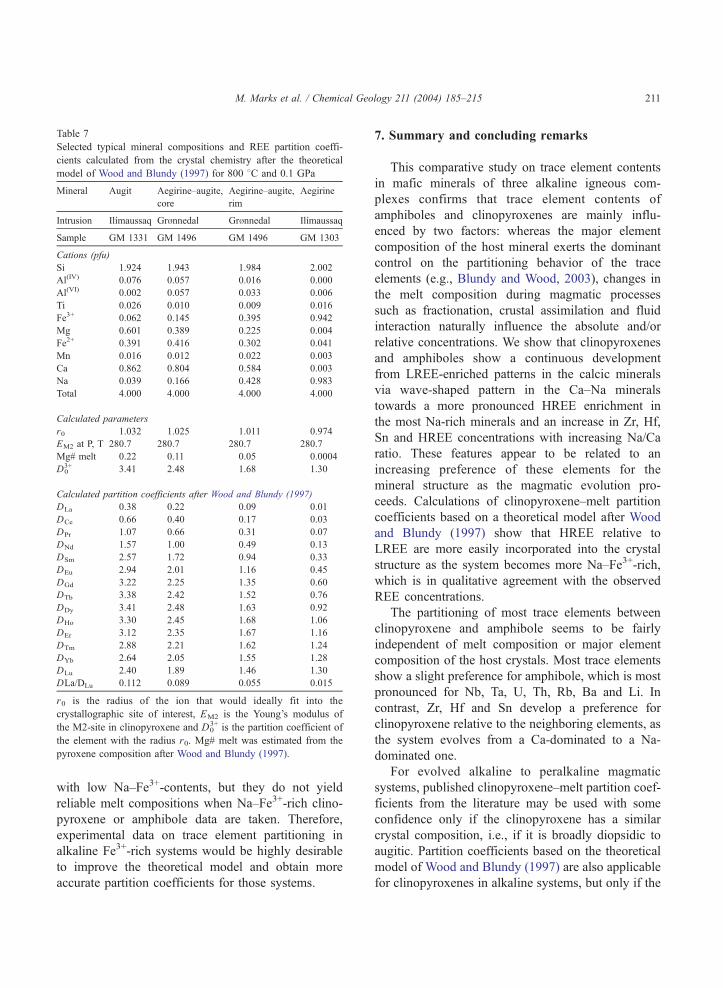
Table 7
Selected typical mineral compositions and REE partition coeffi-
cients calculated from the crystal chemistry after the theoretical
model of Wood and Blundy (1997) for 800 8C and 0.1 GPa
Mineral Augit Aegirine–augite,
core
Aegirine–augite,
rim
Aegirine
Intrusion Ilımaussaq Grbnnedal Grbnnedal Ilımaussaq
Sample GM 1331 GM 1496 GM 1496 GM 1303
Cations (pfu)
Si 1.924 1.943 1.984 2.002
Al(IV) 0.076 0.057 0.016 0.000
Al(VI) 0.002 0.057 0.033 0.006
Ti 0.026 0.010 0.009 0.016
Fe3+ 0.062 0.145 0.395 0.942
Mg 0.601 0.389 0.225 0.004
Fe2+ 0.391 0.416 0.302 0.041
Mn 0.016 0.012 0.022 0.003
Ca 0.862 0.804 0.584 0.003
Na 0.039 0.166 0.428 0.983
Total 4.000 4.000 4.000 4.000
Calculated parameters
r0 1.032 1.025 1.011 0.974
EM2 at P, T 280.7 280.7 280.7 280.7
Mg# melt 0.22 0.11 0.05 0.0004
D03+ 3.41 2.48 1.68 1.30
Calculated partition coefficients after Wood and Blundy (1997)
DLa 0.38 0.22 0.09 0.01
DCe 0.66 0.40 0.17 0.03
DPr 1.07 0.66 0.31 0.07
DNd 1.57 1.00 0.49 0.13
DSm 2.57 1.72 0.94 0.33
DEu 2.94 2.01 1.16 0.45
DGd 3.22 2.25 1.35 0.60
DTb 3.38 2.42 1.52 0.76
DDy 3.41 2.48 1.63 0.92
DHo 3.30 2.45 1.68 1.06
DEr 3.12 2.35 1.67 1.16
DTm 2.88 2.21 1.62 1.24
DYb 2.64 2.05 1.55 1.28
DLu 2.40 1.89 1.46 1.30
DLa/DLu 0.112 0.089 0.055 0.015
r0 is the radius of the ion that would ideally fit into the
crystallographic site of interest, EM2 is the Young’s modulus of
the M2-site in clinopyroxene and D03+ is the partition coefficient of
the element with the radius r0. Mg# melt was estimated from the
pyroxene composition after Wood and Blundy (1997).
M. Marks et al. / Chemical Geology 211 (2004) 185–215 211
with low Na–Fe3+-contents, but they do not yield
reliable melt compositions when Na–Fe3+-rich clino-
pyroxene or amphibole data are taken. Therefore,
experimental data on trace element partitioning in
alkaline Fe3+-rich systems would be highly desirable
to improve the theoretical model and obtain more
accurate partition coefficients for those systems.
7. Summary and concluding remarks
This comparative study on trace element contents
in mafic minerals of three alkaline igneous com-
plexes confirms that trace element contents of
amphiboles and clinopyroxenes are mainly influ-
enced by two factors: whereas the major element
composition of the host mineral exerts the dominant
control on the partitioning behavior of the trace
elements (e.g., Blundy and Wood, 2003), changes in
the melt composition during magmatic processes
such as fractionation, crustal assimilation and fluid
interaction naturally influence the absolute and/or
relative concentrations. We show that clinopyroxenes
and amphiboles show a continuous development
from LREE-enriched patterns in the calcic minerals
via wave-shaped pattern in the Ca–Na minerals
towards a more pronounced HREE enrichment in
the most Na-rich minerals and an increase in Zr, Hf,
Sn and HREE concentrations with increasing Na/Ca
ratio. These features appear to be related to an
increasing preference of these elements for the
mineral structure as the magmatic evolution pro-
ceeds. Calculations of clinopyroxene–melt partition
coefficients based on a theoretical model after Wood
and Blundy (1997) show that HREE relative to
LREE are more easily incorporated into the crystal
structure as the system becomes more Na–Fe3+-rich,
which is in qualitative agreement with the observed
REE concentrations.
The partitioning of most trace elements between
clinopyroxene and amphibole seems to be fairly
independent of melt composition or major element
composition of the host crystals. Most trace elements
show a slight preference for amphibole, which is most
pronounced for Nb, Ta, U, Th, Rb, Ba and Li. In
contrast, Zr, Hf and Sn develop a preference for
clinopyroxene relative to the neighboring elements, as
the system evolves from a Ca-dominated to a Na-
dominated one.
For evolved alkaline to peralkaline magmatic
systems, published clinopyroxene–melt partition coef-
ficients from the literature may be used with some
confidence only if the clinopyroxene has a similar
crystal composition, i.e., if it is broadly diopsidic to
augitic. Partition coefficients based on the theoretical
model of Wood and Blundy (1997) are also applicable
for clinopyroxenes in alkaline systems, but only if the

M. Marks et al. / Chemical Geology 211 (2004) 185–215212
mineral is relatively poor in Fe3+. For clinopyroxenes
containing considerable amounts of NaFe3+Si2O6,
neither the published partition coefficients nor the
partition calculated on the basis of the crystal
chemistry (Wood and Blundy, 1997) appears to be
adequate.
Acknowledgements
Laser ICP-MS measurements were carried out at
the Large Scale Geochemical Facility supported by
the European Community—Access to Research
Infrastructure action of the Improving Human Poten-
tial Programme, contract number HPRI-CT-1999-
00008 awarded to Prof. B. J. Wood (University of
Bristol) which is gratefully acknowledged. Bruce
Paterson provided invaluable help during these
measurements. Financial support for this work was
granted by the Deutsche Forschungsgemeinschaft
(grant Ma-2135/1-2). Constructive reviews of James
Brenan and John Adam and the editorial work of
Roberta Rudnick and Tim Horscroft are greatly
appreciated. [RR]
References
Adam, J., Green, T.H., 1994. The effects of pressure and
temperature on the partitioning of Ti, Sr and REE between
amphibole, clinopyroxene and basanitic melts. Chem. Geol.
117, 219–233.
Adam, J., Green, T., 2003. The influence of pressure, mineral
composition and water on trace element partitioning between
clinopyroxene, amphibole and basanitic melts. Eur. J. Mineral.
15, 831–841.
Allaart, J.H., 1976. Ketilidian mobile belt in South Greenland. In:
Escher, A., Watt, W.S. (Eds.), Geology of Greenland. GrbnlandsGeologiske Undersbgelse, pp. 121–151.
Armstrong, J.T., 1991. Quantitative elemental analysis of individual
microparticles with electron beam instruments. In: Heinrich,
K.F.J., Newbury, D.E. (Eds.), Electron Probe Quantitation.
Plenum, New York, pp. 261–315.
Arth, J.G., 1976. Behaviour of trace elements during magmatic
processes-a summary of theoretical models and their applica-
tions. J. Res. U.S. Geol. Surv. 4, 41–47.
Bailey, J.C., Gwozdz, R., Rose-Hansen, J., Sbrensen, H., 2001.Geochemical overview of the Ilimaussaq alkaline complex,
South Greenland. Geol. Greenl. Surv. Bull. 190, 35–53.
Bedford, C.M., 1989. The mineralogy, geochemistry and petro-
genesis of the Grbnnedal-Ika complex, southwest Greenland.
Unpublished PhD thesis, University of Durham.
Bennett, S.L., Blundy, J., Elliott, T., 2003. The effect of sodium and
titanium on crystal-melt partitioning of trace elements. Geo-
chim. Cosmochim. Acta 68, 2335–2347.
Benoit, M., Polve, M., Ceuleneer, G., 1996. Trace element and
isotopic characterization of mafic cumulates in a fossil mantle
diapir (Oman ophiolite). Chem. Geol. 134, 199–214.
Blundell, D.J., 1978. A gravity survey across the Gardar Igneous
Province, SW Greenland. J. Geol. Soc. (Lond.) 135, 545–554.
Blundy, J., Dalton, J., 2000. Experimental comparison of trace
element partitioning between clinopyroxene and melt in
carbonate and silicate systems, and implications for mantle
metasomatism. Contrib. Mineral. Petrol. 139, 356–371.
Blundy, J.D., Wood, B.J., 1991. Crystal-chemical controls on the
partitioning of Sr and Ba between plagioclase feldspar, silicate
melts, and hydrothermal solutions. Geochim. Cosmochim. Acta
55, 193–209.
Blundy, J., Wood, B., 1994. Prediction of crystal-melt partition
coefficients from elastic moduli. Nature 372, 452–454.
Blundy, J., Wood, B., 2003. Partitioning of trace elements between
crystals and melts. Earth Planet. Sci. Lett. 210, 383–397.
Blundy, J.D., Robinson, J.A.C., Wood, B.J., 1998. Heavy REE are
compatible in clinopyroxene on the spinel lherzolite solidus.
Earth Planet. Sci. Lett. 160, 493–504.
Bottazzi, P., Tiepolo, M., Vannucci, R., Zanetti, A., Brum, R., Foley,
S.F., Oberti, R., 1999. Distinct site preferences for heavy and
light REE in amphibole and the prediction of Amph/LDREE.
Contrib. Mineral. Petrol. 137, 36–45.
Brenan, J.M., Shaw, H.F., Ryerson, F.J., Phinney, D.L., 1995.
Experimental determination of trace-element partitioning
between pargasite and a synthetic hydrous andesitic melt. Earth
Planet. Sci. Lett. 135, 1–11.
Bridgwater, D., 1967. Feldspathic inclusions in the Gardar igneous
rocks of South Greenland and their relevance to the formation of
major anorthosites in the Canadian Shield. Can. J. Earth Sci. 4,
995–1014.
Bridgwater, D., Harry, W.T., 1968. Anorthosite xenoliths and
plagioclase megacrysts in Precambrian intrusions of South
Greenland. Medd. Grbnl. 185 (243 pp.).
Canil, D., Fedortchouk, Y., 2001. Olivine-liquid partitioning of
vanadium and other trace elements, with applications to modern
and ancient picrites. Can. Mineral. 39, 319–330.
Chazot, G., Menzies, M., Harte, B., 1996. Determination of
partition coefficients between apatite, clinopyroxene, amphib-
ole, and melt in natural spinel lherzolites from Yemen:
implications for wet melting of the lithospheric mantle. Geo-
chim. Cosmochim. Acta 60, 423–437.
Coogan, L.A., Kempton, P.D., Saunders, A.D., Norry, M.J., 2000.
Melt aggregation within the crust beneath the Mid-Atlantic
Ridge: evidence from plagioclase and clinopyroxene major
and trace element compositions. Earth Planet. Sci. Lett. 176,
245–257.
Costa, F., Chakraborty, S., Dohmen, R., 2003. Diffusion coupling
between trace and major elements and a model for calculation of
magma residence times using plagioclase. Geochim. Cosmo-
chim. Acta 67, 2189–2200.
Dalpe, C., Baker, D.R., 2000. Experimental investigation of large-
ion-lithophile-element-, high-field-strength-element- and rare-

M. Marks et al. / Chemical Geology 211 (2004) 185–215 213
earth-element-partitioning between calcic amphibole and basal-
tic melt: the effects of pressure and oxygen fugacity. Contrib.
Mineral. Petrol. 140, 223–250.
Drake, M.J., Weill, D.F., 1975. Partitioning of Sr, Ba, Ca, Y, Eu2+,
Eu3+ and other REE between plagioclase feldspar and magmatic
liquid: an experimental study. Geochim. Cosmochim. Acta 39,
689–712.
Emeleus, C.H., 1964. The Grbnnedal-Ika alkaline complex, South
Greenland. The structure and geological history of the complex.
Medd. Grbnl. 172 (75 pp.).
Escher, A., Watt, W.S., 1976. Geology of Greenland. Geological
Survey of Greenland, Copenhagen. 603 pp.
Ferguson, J., 1964. Geology of the Ilimaussaq alkaline
intrusion, South Greenland. Bull.-Grbnl. Geol. Unders. 39
(82 pp.).
Forsberg, R., Rasmussen, K.L., 1978. Gravity and rock densities in
the Ilimaussaq area, South Greenland. Rapp.-Grbnl. Geol.
Unders. 90, 81–84.
Garde, A.A., Hamilton, M.A., Chadwick, B., Grocott, J., McCaf-
frey, K.J.W., 2002. The Ketilidian orogen of South Greenland:
geochronology, tectonics, magmatism, and fore-arc accretion
during Palaeoproterozoic oblique convergence. Can. J. Earth
Sci. 39, 765–793.
Gregoire, M., Moine, B.N., O’Reilly, S.Y., Cottin, J.Y., Giret, A.,
2000. Trace element residence and partitioning in mantle
xenoliths metasomatized by highly alkaline, silicate- and
carbonate-rich melts (Kerguelen Islands, Indian Ocean). J.
Petrol. 41, 477–509.
Halama, R., Waight, T., Markl, G., 2002. Geochemical and isotopic
zoning patterns of plagioclase megacrysts in gabbroic dykes
from the Gardar Province, South Greenland: implications for
crystallisation processes in anorthositic magmas. Contrib.
Mineral. Petrol. 144, 109–127.
Halama, R., Wenzel, T., Upton, B.G.J., Siebel, W., Markl, G., 2003.
A geochemical and Sr–Nd–O isotopic study of the Proterozoic
Eriksfjord Basalts, Gardar Province, South Greenland: recon-
struction of an OIB-signature in crustally contaminated rift-
related basalts. Min. Mag. 67, 831–854.
Halama, R., Vennemann, T., Siebel, W., Markl, G., in press. The
Grbnnedal-Ika carbonatite–syenite complex, South Greenland:
an origin involving liquid immiscibility. J. Petrol.
Hawthorne, F.C., Ungaretti, L., Oberti, R., Bottazzi, P., 1993. Li: an
important component in igneous alkali amphiboles. Am.
Mineral. 78, 733–745.
Hawthorne, F.C., Ungaretti, L., Oberti, R., Cannillo, E., 1994. The
mechanisms of [6]Li incorporation in amphiboles. Am. Mineral.
79, 443–451.
Irving, A.J., Frey, F.A., 1984. Trace element abundances in
megacrysts and their host basalts: constraints on partition
coefficients and megacryst genesis. Geochim. Cosmochim. Acta
48, 1201–1221.
Jeffries, T.E., Perkins, W.T., Pearce, N.J.G., 1995. Measurements of
trace elements in basalts and their phenocrysts by laser probe
microanalysis inductively coupled plasma mass spectrometry
(LPMA-ICP-MS). Chem. Geol. 121, 131–144.
Jensen, B.B., 1973. Patterns of trace element partitioning. Geochim.
Cosmochim. Acta 37, 2227–2242.
Jones, A.P., Peckett, A., 1980. Zirconium-bearing aegirines
from Motzfeldt, South Greenland. Contrib. Mineral. Petrol.
75, 251–255.
Kalsbeek, F., Taylor, P.N., 1985. Isotopic and chemical variation in
granites across a Proterozoic continental margin—the Ketilidian
mobile belt of South Greenland. Earth Planet. Sci. Lett. 73,
65–80.
Klein, M., Stosch, H.-G., Seck, H.A., 1997. Partitioning of high
field-strength and rare-earth elements between amphibole and
quartz-dioritic to tonalitic melts: an experimental study. Chem.
Geol. 138, 257–271.
Konnerup-Madsen, J., Rose-Hansen, J., 1984. Composition and
significance of fluid inclusions in the Ilimaussaq peralkaline
granite, South Greenland. Bull. Mineral. 107, 317–326.
Larsen, L.M., 1976. Clinopyroxenes and coexisting mafic minerals
from the alkaline Ilimaussaq intrusion, South Greenland. J.
Petrol. 17, 258–290.
Larsen, L.M., 1977. Aenigmatites from the Ilimaussaq intrusion,
South Greenland: chemistry and petrological implications.
Lithos 10, 257–270.
Larsen, L.M., 1979. Distribution of REE and other trace elements
between phenocrysts and peralkaline undersaturated magmas,
exemplified by rocks from the Gardar igneous province, South
Greenland. Lithos 12, 303–315.
Larsen, L.M., 1981. Chemistry of feldspars in the Ilimaussaq augite
syenite with additional data on some other minerals. Rapp.-
Grbnl. Geol. Unders. 103, 31–37.Larsen, L.M., Sbrensen, H., 1987. The Ilimaussaq intrusion—
progressive crystallization and formation of layering in an
agpaitic magma. In: Fitton, J.G., Upton, B.G.J. (Eds.), Alkaline
Igneous Rocks, Spec. Publ.-Geol. Soc., vol. 30, pp. 473–488.
Larsen, L.M., Steenfelt, A., 1974. Alkali loss and retention in an
iron-rich peralkaline phonolite dyke from the Gardar province,
South Greenland. Lithos 7, 81–90.
Lemarchand, F., Villemant, B., Calas, G., 1987. Trace element
distribution coefficients in alkaline series. Geochim. Cosmo-
chim. Acta 51, 1071–1081.
Mahood, G., Hildreth, W., 1983. Large partition coefficients for
trace elements in high-silica rhyolithes. Geochim. Cosmochim.
Acta 47, 11–30.
Markl, G., Baumgartner, L., 2002. pH changes in peralkaline late-
magmatic fluids. Contrib. Mineral. Petrol. 144, 31–346.
Markl, G., Marks, M., Wirth, R., 2001a. The influence of T, aSiO2,
fO2 on exsolution textures in Fe–Mg olivine: an example from
augite syenite of the Ilimaussaq Intrusion, South Greenland.
Am. Mineral. 86, 36–46.
Markl, G., Marks, M., Schwinn, G., Sommer, H., 2001b. Phase
equilibrium constraints on intensive crystallization parameters
of the Ilimaussaq complex, South Greenland. J. Petrol. 42,
2231–2258.
Marks, M., Markl, G., 2001. Fractionation and assimilation
processes in the alkaline augite syenite unit of the Ilimaussaq
intrusion, South Greenland, as deduced from phase equilibria. J.
Petrol. 42, 1947–1969.
Marks, M., Markl, G., 2003. Ilimaussaq ben miniatureQ: closed-
system fractionation in an agpaitic dyke rock from the Gardar
province, South Greenland. Min. Mag. 67, 893–919.

M. Marks et al. / Chemical Geology 211 (2004) 185–215214
Marks, M., Vennemann, T.W., Siebel, W., Markl, G., 2003.
Quantification of magmatic and hydrothermal processes in a
peralkaline syenite–alkali granite complex based on textures,
phase equilibria, and stable and radiogenic isotopes. J. Petrol.
44, 1247–1280.
Marks, M., Vennemann, T.W., Siebel, W., Markl, G., 2004. NCl–,
O–, and H-isotopic evidence for complex, closed-system
evolution of the peralkaline Ilımaussaq Intrusion, South Green-
land. Geochim. Cosmochim. Acta 68, 3379–3395.
McDonough, W.F., Sun, S.S., 1995. The composition of the Earth.
Chem. Geol. 120, 223–253.
Mitchell, R.H., 1990. A review of the compositional variation of
amphiboles in alkaline plutonic complexes. Lithos 26, 135–156.
Nash, W.P., Crecraft, H.R., 1985. Partition coefficients for trace
elements in silicic magmas. Geochim. Cosmochim. Acta 49,
2309–2322.
Nielsen, T.F.D., 1979. The occurrence and formation of Ti-aegirines
in peralkaline syenites; an example from the Tertiary ultramafic
alkaline Gardiner complex, East Greenland. Contrib. Mineral.
Petrol. 69, 235–244.
Nimis, P., Vannucci, R., 1995. An ion microprobe study of
clinopyroxenes in websteritic and megacrystic xenoliths from
Hyblean Plateau (SE Sicily, Italy): constraints on HFSE/
REE/Sr fractionation at mantle depth. Chem. Geol. 124,
185–197.
Njonfang, E., Nono, A., 2003. Clinopyroxene from some felsic
alkaline rocks of the Cameroon Line, central Africa: petrological
implications. Eur. J. Mineral. 15, 527–542.
Parsons, I., 1972. Petrology of the Puklen syenite–alkali granite
complex, Nunarssuit, South Greenland. Medd. Grbnl. 195
(73 pp.).
Pearce, N.J.G., Leng, M.J., Emeleus, C.H., Bedford, C.M., 1997a.
The origins of carbonatites and related rocks from the
Grbnnedal-Ika nepheline syenite complex, South Greenland:
C–O–Sr isotope evidence. Min. Mag. 61, 515–529.
Pearce, N.J.G., Perkins, W.T., Westgate, J.A., Gorton, M.P.,
Jackson, E.E., Neal, C.R., Chenery, S.P., 1997b. A compilation
of new and published major and trace element data for NIST
SRM 610 and NIST SRM 612 glass reference materials.
Geostand. Newsl. 21, 115–144.
Piilonen, P.C., McDonald, A.M., Lalonde, A.E., 1998. The crystal
chemistry of aegirine from Mont Saint-Hilaire, Quebec. Can.
Mineral. 36, 779–791.
Poulsen, V., 1964. The sandstones of the Precambrian Eriksfjord
Formation in South Greenland. Rapp.-Grbnl. Geol. Unders. 2(16 pp.).
Pulvertaft, T.C.R., 1961. The Puklen intrusion, Nunarssuit, SW
Greenland. Medd. Grbnl. 123, 35–49.Ranlbv, J., Dymek, R.F., 1991. Compositional zoning in hydro-
thermal aegirine from fenites in the Proterozoic Gardar
Province, South Greenland. Eur. J. Mineral. 3, 837–853.
Rudnick, R., Fountain, D.M., 1995. Nature and composition of the
Continental Crust: a lower crustal perspective. Rev. Geophys.
33, 267–309.
Schiano, P., Allegre, C.-J., Dupre, B., Lewin, E., Joron, J.-L., 1993.
Variability of trace elements in basaltic suites. Earth Planet. Sci.
Lett. 119, 37–51.
Semenov, E.I., Gerassimivsky, V.I., Maksimova, N.V., Andersen, S.,
Peteresen, O.V., 1965. Sbrensenite, a new sodium–beryllium–
tin–silicate from the Ilimaussaq intrusion, South Greenland.
Bull.-Grbnl. Geol. Unders. 61 (19 pp.).
Shannon, R.D., 1976. Revised effective ionic radii and systematic
studies of interatomic distances in halides and chalcogenides.
Acta Crystallogr., A 32, 751–767.
Shearer, C.K., Larsen, L.M., 1994. Sector-zoned aegirine from
the Ilimaussaq alkaline intrusion, South Greenland: implica-
tions for trace-element behavior in pyroxene. Am. Mineral. 79,
340–352.
Thompson, G.M., Malpas, J., 2000. Mineral/melt partition coef-
ficients of oceanic alkali basalts determined on natural samples
using laser ablation-inductively coupled plasma-mass spectrom-
etry (LAM-ICP-MS). Min. Mag. 64, 85–94.
Tiepolo, M., Vannucci, R., Oberti, R., Foley, S., Bottazzi, P.,
Zanetti, A., 2000a. Nb and Ta incorporation and fractionation in
titanian pargasite and kaersurtite: crystal-chemical constraints
and implications for natural systems. Earth Planet. Sci. Lett.
176, 185–201.
Tiepolo, M., Vannucci, R., Bottazzi, P., Oberti, R., Zanetti, A.,
2000b. Partitioning of REE, Y, Th, U and Pb between pargasite,
kaersutite and basanite to trachyte melts: implications for
percolated and veined mantle. Geochem. Geophys. Geosyst. 1,
67–82.
Tiepolo, M., Tribuzio, R., Vannucci, R., 2002. The compositions of
mantle-derived melts developed during the Alpine continental
collision. Contrib. Mineral. Petrol. 144, 1–15.
Upton, B.G.J., Emeleus, C.H., 1987. Mid-Proterozoic alkaline
magmatism in southern Greenland: the Gardar province. In:
Fitton, J.G., Upton, B.G.J. (Eds.), Alkaline Igneous Rocks,
Spec. Publ.-Geol. Soc. vol. 30. , pp. 449–471.
Upton, B.G.J., Emeleus, C.H., Heaman, L.M., Goodenough, K.M.,
Finch, A., 2003. Magmatism of the mid-Proterozoic Gardar
Province, South Greenland: chronology, petrogenesis and geo-
logical setting. Lithos 68, 43–65.
Upton, B.G.J., Stephenson, D., Martin, A.R., 1985. The Tugtutuq
older giant dyke complex: mineralogy and geochemistry of an
alkali gabbro–augite–syenite–foyaite association in the Gardar
Province of South Greenland. Min. Mag. 49, 624–642.
van Breemen, O., Aftalion, M., Allart, J.H., 1974. Isotopic and
Geochronologic Studies on Granites from the Ketilidian
Mobile Belt of South Greenland. Bull. Geol. Soc. Am. 85,
403–412.
Vannucci, R., Tribuzio, R., Piccardo, G.B., Ottolini, L., Bottazzi, P.,
1991. SIMS analysis of REE in pyroxenes and amphiboles from
the Proterozoic Ikasaulak intrusive complex (SE Greenland):
implications for LREE enrichment processes during post-
orogenic plutonism. Chem. Geol. 92, 115–133.
Villemant, B., Jaffrezic, H., Joron, J.-L., Treuil, M., 1981. Distribu-
tion coefficients of major and trace elements; fractional crystal-
lization in the alkali basalt series of Chaine des Puys (Massif
Central, France). Geochim. Cosmochim. Acta 45, 1997–2016.
Walter, A.V., Flicoteaux, R., Parron, C., Loubet, M., Nahon, D.,
1995. Rare-earth elements and isotopes (Sr, Nd, O, C) in
minerals from the Juquia carbonatite (Brazil); tracers of a
multistage evolution. Chem. Geol. 120, 27–44.

M. Marks et al. / Chemical Geology 211 (2004) 185–215 215
White, J.C., 2003. Trace-element partitioning between alkali
feldspar and peralkalic quartz trachyte to rhyolite magma: Part
II. Empirical equations for calculating trace-element partition
coefficients of large-ion lithophile, high field-strength, and rare-
earth elements. Am. Mineral. 88, 330–337.
Witt-Eickschen, G., Harte, B., 1994. Distribution of trace elements
between amphibole and clinopyroxene from mantle peridotites
of the Eifel (western Germany): an ion-microprobe study. Chem.
Geol. 117, 235–250.
Wood, B.J., Blundy, J.D., 1997. A predictive model for rare earth
element partitioning between clinopyroxene and anhydrous
silicate melt. Contrib. Mineral. Petrol. 129, 166–181.
Wood, B.J., Blundy, J.D., 2001. The effect of cation charge on
crystal-melt partitioning of trace elements. Earth Planet. Sci.
Lett. 188, 59–71.
Wood, B.J., Trigila, R., 2001. Experimental determination of
aluminous clinopyroxene–melt partition coefficients for potassic
liquids, with application to the evolution of the Roman province
potassic magmas. Chem. Geol. 172, 213–223.
Wfrner, G., Beusen, J.-M., Duchateau, N., Gijbels, R.,
Schmincke, H.-U., 1983. Trace element abundances and
mineral/melt distribution coefficients in phonolites from the
Laacher See Volcano (Germany). Contrib. Mineral. Petrol. 84,
152–173.