Assessment and investigation of trace element in soils with reference to Geo-accumulation Index:...
12
INTERNATIONAL JOURNAL OF ENVIRONMENTAL SCIENCES Volume 4, No 1, 2013 © Copyright by the authors - Licensee IPA- Under Creative Commons license 3.0 Research article ISSN 0976 4402 Received on July 2013 Published on July 2013 54 Assessment and investigation of trace element in soils with reference to Geo-accumulation Index: Jalgaon District, Northern Maharashtra (India) Golekar R B 1 , Baride M V 2 , Patil S N 1 ,Yeole D R 1 1- Department of Applied Geology, School of Environmental and Earth Sciences, North Maharashtra University, Jalgaon 425001, India 2- Department of Geology, Z. B. Patil College, Dhule 424002, India [email protected] doi: 10.6088/ijes.2013040100006 ABSTRACT Assessment and investigation of trace elements Cd, Cu, Fe, Mn, Ni, Pb and Zn in soil and compares its quality. Nineteen sampling points were select the representing agricultural fields, industrial discharges, river-tributary confluence points and settlement located along river banks. Sampling was carried out in post monsoon 2010 and pre monsoon season 2011. Trace elements were analysed by using flame furnace atomic absorption spectrophotometer. The mean concentration of Fe (38.25 ppm) followed by Mn (3.39 ppm), Pb (1.028 ppm), Cd (0.095 ppm), Cu (0.56 ppm), Ni (0.536 ppm) and Zn (0.532 ppm) was found. The evaluation of anthropogenic influence and contamination with trace elements in soil of study area was carried out using geo accumulation index. Soil geo-accumulation index (Igeo) shows maximum values Cd (0.014) and least value of Ni (-4.011). The geo-accumulation class (Igeo class) sequence was observed to be Cd > Pb > Zn > Cu > Ni > Mn > Fe. Negative total geo-accumulation indices (Itot) discovered shows concentration of trace elements in soil is lower than those of basalt values. The data suggests that negligible geo-accumulation with trace element except Cd and Pb (slightly contamination) and proves the degree of obtainable trace element concentration in soil from Northern part of Maharashtra, does not exceed than toxic limits. Keywords: Trace elements, Soil pollution, Geo-accumulation Index, Jalgaon District, India 1. Introduction Trace elements earlier reported from urban soils (Pichtel J. and et al 1998) and (Kim K. and Kim S., 1998), industries (Ullrich S. M. et al 1999) and waste disposal sites (Yarlagadda P. S., et al 1995). Distribution of trace elements in soil depends upon number of factors like background parent rocks, weathering process, human activities (Martinez A., et al 2003), geology and anthropogenic sources (Bak, et al 1997). Trace elements dose a threat on health as they are toxic, when exceeding their limits (Macfarlane G. R. and Burchett M. D., 2000). The trace elements is primary content of the source of rocks, released due to weathering processes and their moderately contamination levels are usually safe to organism. But increasing concentration of trace elements in environment can be significantly destructive to human life. The aim of present study was assessment and investigation of trace elements in soils from Jalgaon district. Study area geographically situated in Jalgaon district, Northern Maharashtra,
Transcript of Assessment and investigation of trace element in soils with reference to Geo-accumulation Index:...

INTERNATIONAL JOURNAL OF ENVIRONMENTAL SCIENCES Volume 4, No 1, 2013
© Copyright by the authors - Licensee IPA- Under Creative Commons license 3.0
Research article ISSN 0976 4402
Received on July 2013 Published on July 2013 54
Assessment and investigation of trace element in soils with reference to Geo-accumulation Index: Jalgaon District, Northern Maharashtra (India)
Golekar R B1, Baride M V2, Patil S N1 ,Yeole D R1
1- Department of Applied Geology, School of Environmental and Earth Sciences, North Maharashtra University, Jalgaon 425001, India
2- Department of Geology, Z. B. Patil College, Dhule 424002, India [email protected]
doi: 10.6088/ijes.2013040100006
ABSTRACT
Assessment and investigation of trace elements Cd, Cu, Fe, Mn, Ni, Pb and Zn in soil and compares its quality. Nineteen sampling points were select the representing agricultural fields, industrial discharges, river-tributary confluence points and settlement located along river banks. Sampling was carried out in post monsoon 2010 and pre monsoon season 2011. Trace elements were analysed by using flame furnace atomic absorption spectrophotometer. The mean concentration of Fe (38.25 ppm) followed by Mn (3.39 ppm), Pb (1.028 ppm), Cd (0.095 ppm), Cu (0.56 ppm), Ni (0.536 ppm) and Zn (0.532 ppm) was found.
The evaluation of anthropogenic influence and contamination with trace elements in soil of study area was carried out using geo accumulation index. Soil geo-accumulation index (Igeo) shows maximum values Cd (0.014) and least value of Ni (-4.011). The geo-accumulation class (Igeo class) sequence was observed to be Cd > Pb > Zn > Cu > Ni > Mn > Fe. Negative total geo-accumulation indices (Itot) discovered shows concentration of trace elements in soil is lower than those of basalt values. The data suggests that negligible geo-accumulation with trace element except Cd and Pb (slightly contamination) and proves the degree of obtainable trace element concentration in soil from Northern part of Maharashtra, does not exceed than toxic limits.
Keywords: Trace elements, Soil pollution, Geo-accumulation Index, Jalgaon District, India
1. Introduction
Trace elements earlier reported from urban soils (Pichtel J. and et al 1998) and (Kim K. and Kim S., 1998), industries (Ullrich S. M. et al 1999) and waste disposal sites (Yarlagadda P. S., et al 1995). Distribution of trace elements in soil depends upon number of factors like background parent rocks, weathering process, human activities (Martinez A., et al 2003), geology and anthropogenic sources (Bak, et al 1997).
Trace elements dose a threat on health as they are toxic, when exceeding their limits (Macfarlane G. R. and Burchett M. D., 2000). The trace elements is primary content of the source of rocks, released due to weathering processes and their moderately contamination levels are usually safe to organism. But increasing concentration of trace elements in environment can be significantly destructive to human life.
The aim of present study was assessment and investigation of trace elements in soils from Jalgaon district. Study area geographically situated in Jalgaon district, Northern Maharashtra,

Assessment and investigation of trace element in soils with reference to Geo-accumulation Index: Jalgaon District, Northern Maharashtra (India)
Golekar R B, Baride M V, Patil S N ,Yeole D R
International Journal of Environmental Sciences Volume 4 No.1 2013 55
India (Fig.1). Study area lies between latitude 20.15 N to 21.25 N and longitude 74.55 E to 76.28 E. Present study area c l i m a t o l o g i c a l l y falls in semi arid climatic zone. The mean maximum temperature ranges from 29.50C to 480C in the month of May and mean minimum temperature ranges from 120C to 240C in the month of December to January. The high relative humidity value occurs during rainy season, viz. June to September. The average annual rainfall i s about 650 mm.
Geologically study area covered by two geological formations. 1) Deccan trap (Upper Cretaceous to Lower Eocene age) and 2) Alluvial formation (Quaternary age). Southern part of the study area covered by Deccan Basalts and northern parts of the study area covered by thick alluvium. The basaltic flow represents Deccan trap rocks which are fine grained basalt, vesicular, amygdaloidal, fractured, jointed, porphyritic and massive Basalts. The area is bounded to the north by Tapi alluvial and south by the Ajanta ranges. The soils of the study area can be classified in to three categories namely weathered basalt soil (murum is local name), black cotton soil (regur is local name) and alluvium soil (along Tapi river tracks).
MAHARASHTRA STATE Jalgaon District
Study area
Figure 1: Location map of soil sampilng stations
Assessment and investigation of trace element in soils with reference to Geo-accumulation Index: Jalgaon District, Northern Maharashtra (India)
Golekar R B, Baride M V, Patil S N ,Yeole D R
International Journal of Environmental Sciences Volume 4 No.1 2013 56
2. Material and methods
Soil sampling and analysis
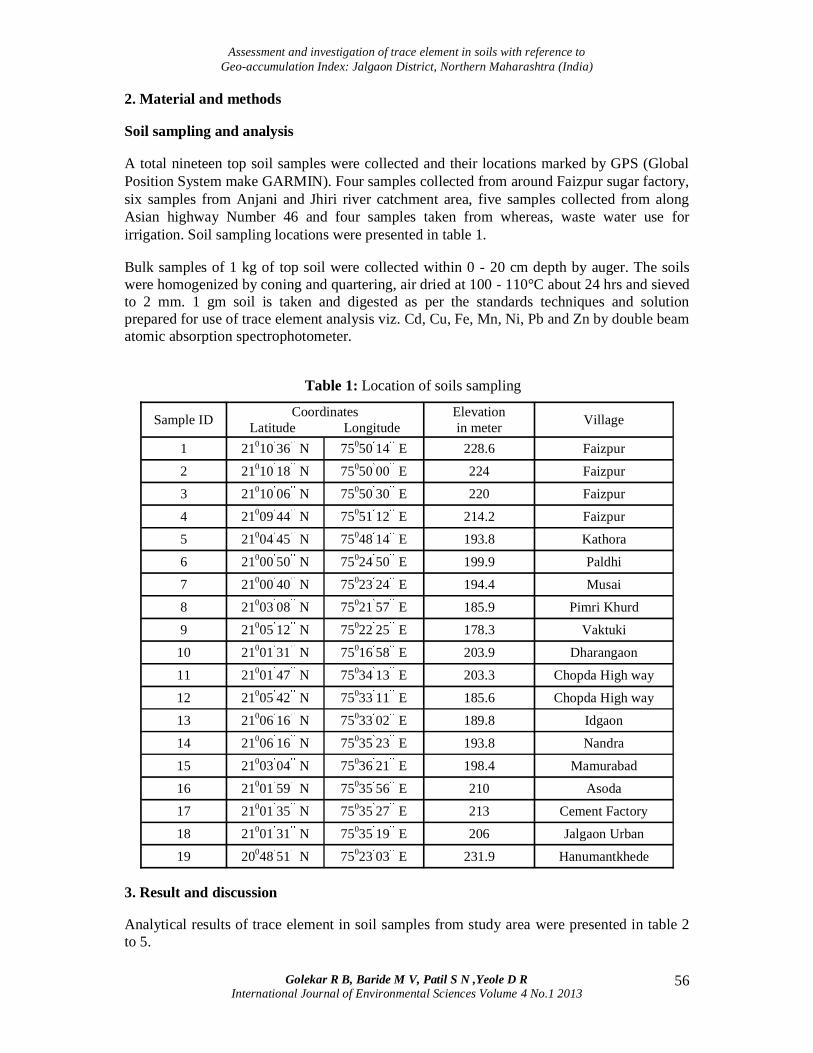
A total nineteen top soil samples were collected and their locations marked by GPS (Global Position System make GARMIN). Four samples collected from around Faizpur sugar factory, six samples from Anjani and Jhiri river catchment area, five samples collected from along Asian highway Number 46 and four samples taken from whereas, waste water use for irrigation. Soil sampling locations were presented in table 1.
Bulk samples of 1 kg of top soil were collected within 0 - 20 cm depth by auger. The soils were homogenized by coning and quartering, air dried at 100 - 110°C about 24 hrs and sieved to 2 mm. 1 gm soil is taken and digested as per the standards techniques and solution prepared for use of trace element analysis viz. Cd, Cu, Fe, Mn, Ni, Pb and Zn by double beam atomic absorption spectrophotometer.
Table 1: Location of soils sampling
Sample ID Coordinates Latitude Longitude
Elevation in meter Village
1 21010 36 N 75050 14 E 228.6 Faizpur
2 21010 18 N 75050 00 E 224 Faizpur
3 21010 06 N 75050 30 E 220 Faizpur
4 21009 44 N 75051 12 E 214.2 Faizpur
5 21004 45 N 75048 14 E 193.8 Kathora
6 21000 50 N 75024 50 E 199.9 Paldhi
7 21000 40 N 75023 24 E 194.4 Musai
8 21003 08 N 75021 57 E 185.9 Pimri Khurd
9 21005 12 N 75022 25 E 178.3 Vaktuki
10 21001 31 N 75016 58 E 203.9 Dharangaon
11 21001 47 N 75034 13 E 203.3 Chopda High way
12 21005 42 N 75033 11 E 185.6 Chopda High way
13 21006 16 N 75033 02 E 189.8 Idgaon
14 21006 16 N 75035 23 E 193.8 Nandra
15 21003 04 N 75036 21 E 198.4 Mamurabad
16 21001 59 N 75035 56 E 210 Asoda
17 21001 35 N 75035 27 E 213 Cement Factory
18 21001 31 N 75035 19 E 206 Jalgaon Urban
19 20048 51 N 75023 03 E 231.9 Hanumantkhede
3. Result and discussion
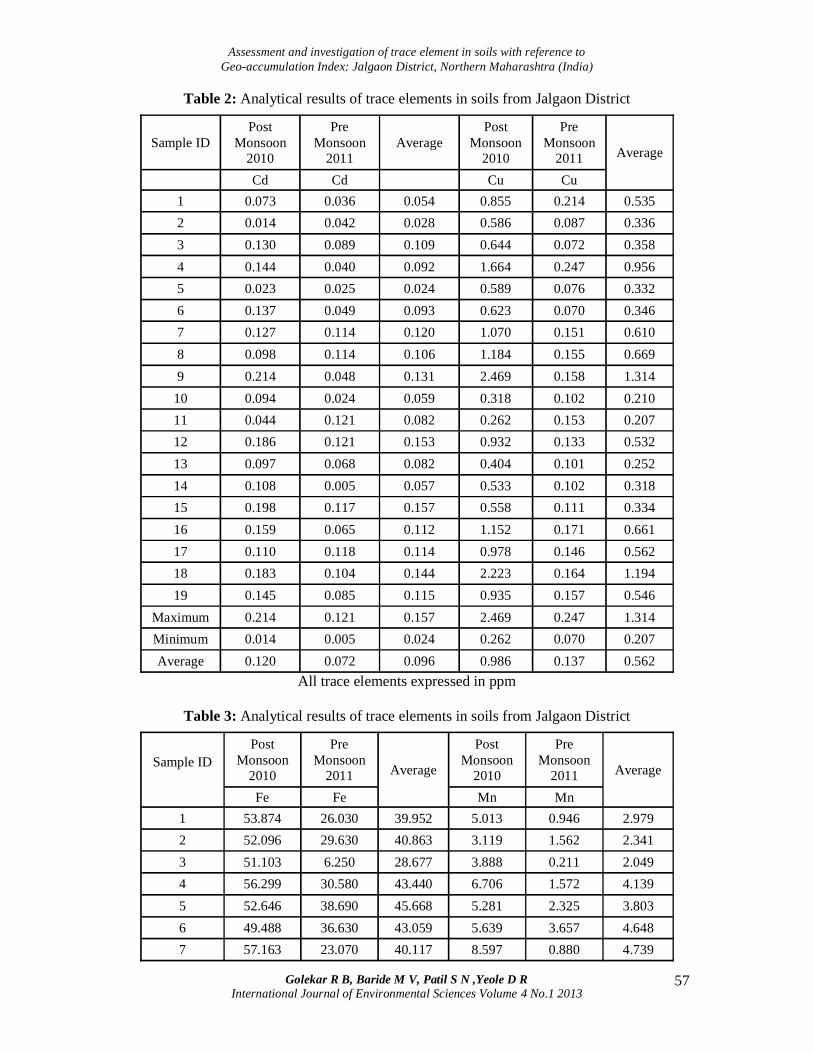
Analytical results of trace element in soil samples from study area were presented in table 2 to 5.
Assessment and investigation of trace element in soils with reference to Geo-accumulation Index: Jalgaon District, Northern Maharashtra (India)
Golekar R B, Baride M V, Patil S N ,Yeole D R
International Journal of Environmental Sciences Volume 4 No.1 2013 57
Table 2: Analytical results of trace elements in soils from Jalgaon District
Sample ID Post
Monsoon 2010
Pre Monsoon
2011 Average
Post Monsoon
2010
Pre Monsoon
2011 Average
Cd Cd Cu Cu 1 0.073 0.036 0.054 0.855 0.214 0.535 2 0.014 0.042 0.028 0.586 0.087 0.336 3 0.130 0.089 0.109 0.644 0.072 0.358 4 0.144 0.040 0.092 1.664 0.247 0.956 5 0.023 0.025 0.024 0.589 0.076 0.332 6 0.137 0.049 0.093 0.623 0.070 0.346 7 0.127 0.114 0.120 1.070 0.151 0.610 8 0.098 0.114 0.106 1.184 0.155 0.669 9 0.214 0.048 0.131 2.469 0.158 1.314
10 0.094 0.024 0.059 0.318 0.102 0.210 11 0.044 0.121 0.082 0.262 0.153 0.207 12 0.186 0.121 0.153 0.932 0.133 0.532 13 0.097 0.068 0.082 0.404 0.101 0.252 14 0.108 0.005 0.057 0.533 0.102 0.318 15 0.198 0.117 0.157 0.558 0.111 0.334 16 0.159 0.065 0.112 1.152 0.171 0.661 17 0.110 0.118 0.114 0.978 0.146 0.562 18 0.183 0.104 0.144 2.223 0.164 1.194 19 0.145 0.085 0.115 0.935 0.157 0.546
Maximum 0.214 0.121 0.157 2.469 0.247 1.314 Minimum 0.014 0.005 0.024 0.262 0.070 0.207 Average 0.120 0.072 0.096 0.986 0.137 0.562
All trace elements expressed in ppm
Table 3: Analytical results of trace elements in soils from Jalgaon District
Sample ID
Post Monsoon
2010
Pre Monsoon
2011 Average
Post Monsoon
2010
Pre Monsoon
2011 Average
Fe Fe Mn Mn 1 53.874 26.030 39.952 5.013 0.946 2.979 2 52.096 29.630 40.863 3.119 1.562 2.341 3 51.103 6.250 28.677 3.888 0.211 2.049 4 56.299 30.580 43.440 6.706 1.572 4.139 5 52.646 38.690 45.668 5.281 2.325 3.803 6 49.488 36.630 43.059 5.639 3.657 4.648 7 57.163 23.070 40.117 8.597 0.880 4.739

Assessment and investigation of trace element in soils with reference to Geo-accumulation Index: Jalgaon District, Northern Maharashtra (India)
Golekar R B, Baride M V, Patil S N ,Yeole D R
International Journal of Environmental Sciences Volume 4 No.1 2013 58
8 55.263 21.810 38.536 9.822 0.821 5.322 9 59.358 22.550 40.954 7.270 0.857 4.064
10 48.487 26.630 37.559 3.111 1.237 2.174 11 46.183 23.490 34.837 2.097 0.913 1.505 12 55.266 18.610 36.938 4.532 0.648 2.590 13 49.029 15.400 32.214 3.638 0.659 2.148 14 52.309 17.170 34.740 4.425 0.590 2.508 15 52.750 14.470 33.610 3.683 0.540 2.112 16 55.745 23.950 39.848 7.755 0.945 4.350 17 56.993 22.660 39.826 8.927 0.885 4.906 18 55.435 22.560 38.997 6.164 0.930 3.547 19 55.359 23.010 39.185 8.184 1.034 4.609
Maximum 59.358 38.690 45.668 9.822 3.657 5.322 Minimum 46.183 6.250 28.677 2.097 0.211 1.505 Average 53.352 23.244 38.255 5.703 1.194 3.398
All trace elements expressed in ppm
Table 4: Analytical results of trace element in soils from Jalgaon District
Sample ID
Post Monsoon
2010
Pre Monsoon
2011 Average
Post Monsoon
2010
Pre Monsoon
2011 Average
Ni Ni Pb Pb 1 0.357 0.213 0.285 0.727 0.669 0.698 2 0.035 0.179 0.107 1.015 0.865 0.940 3 0.372 0.257 0.315 1.230 0.471 0.851 4 0.699 0.205 0.452 1.222 0.862 1.042 5 0.106 0.215 0.160 0.843 0.769 0.806 6 0.240 0.180 0.210 1.217 1.103 1.160 7 1.060 0.310 0.685 0.966 0.769 0.867 8 0.764 0.303 0.534 1.595 1.005 1.300 9 0.824 0.206 0.515 1.987 0.893 1.440
10 0.186 0.017 0.101 0.612 0.457 0.534 11 0.005 0.006 0.006 1.270 0.214 0.742 12 0.653 0.259 0.456 1.496 1.237 1.366 13 0.158 0.215 0.187 0.512 0.991 0.752 14 0.375 0.017 0.196 1.887 0.358 1.122 15 0.591 0.296 0.444 1.613 1.264 1.438 16 0.755 0.207 0.481 1.148 1.046 1.097 17 0.563 0.196 0.380 1.812 0.496 1.154 18 0.593 0.304 0.448 1.429 1.490 1.459
Assessment and investigation of trace element in soils with reference to Geo-accumulation Index: Jalgaon District, Northern Maharashtra (India)
Golekar R B, Baride M V, Patil S N ,Yeole D R
International Journal of Environmental Sciences Volume 4 No.1 2013 59
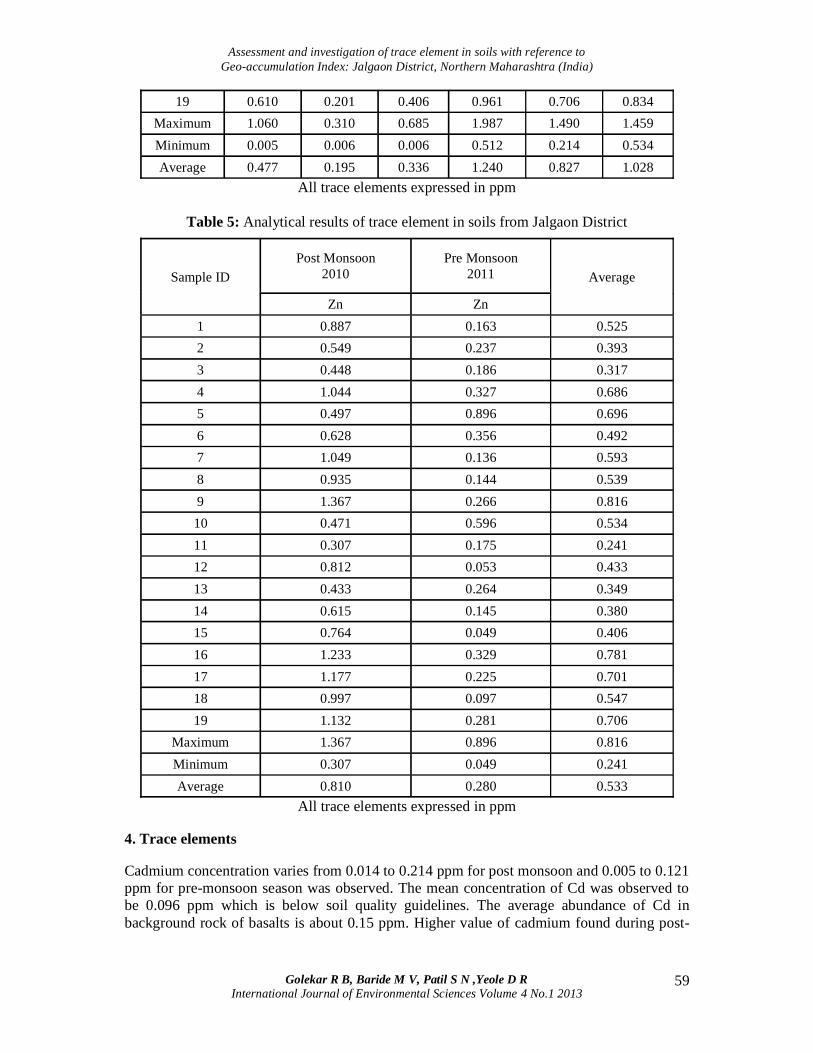
19 0.610 0.201 0.406 0.961 0.706 0.834 Maximum 1.060 0.310 0.685 1.987 1.490 1.459 Minimum 0.005 0.006 0.006 0.512 0.214 0.534 Average 0.477 0.195 0.336 1.240 0.827 1.028
All trace elements expressed in ppm
Table 5: Analytical results of trace element in soils from Jalgaon District
Sample ID Post Monsoon
2010 Pre Monsoon
2011 Average
Zn Zn 1 0.887 0.163 0.525 2 0.549 0.237 0.393 3 0.448 0.186 0.317 4 1.044 0.327 0.686 5 0.497 0.896 0.696 6 0.628 0.356 0.492 7 1.049 0.136 0.593 8 0.935 0.144 0.539 9 1.367 0.266 0.816 10 0.471 0.596 0.534 11 0.307 0.175 0.241 12 0.812 0.053 0.433 13 0.433 0.264 0.349 14 0.615 0.145 0.380 15 0.764 0.049 0.406 16 1.233 0.329 0.781 17 1.177 0.225 0.701 18 0.997 0.097 0.547 19 1.132 0.281 0.706
Maximum 1.367 0.896 0.816 Minimum 0.307 0.049 0.241 Average 0.810 0.280 0.533
All trace elements expressed in ppm
4. Trace elements
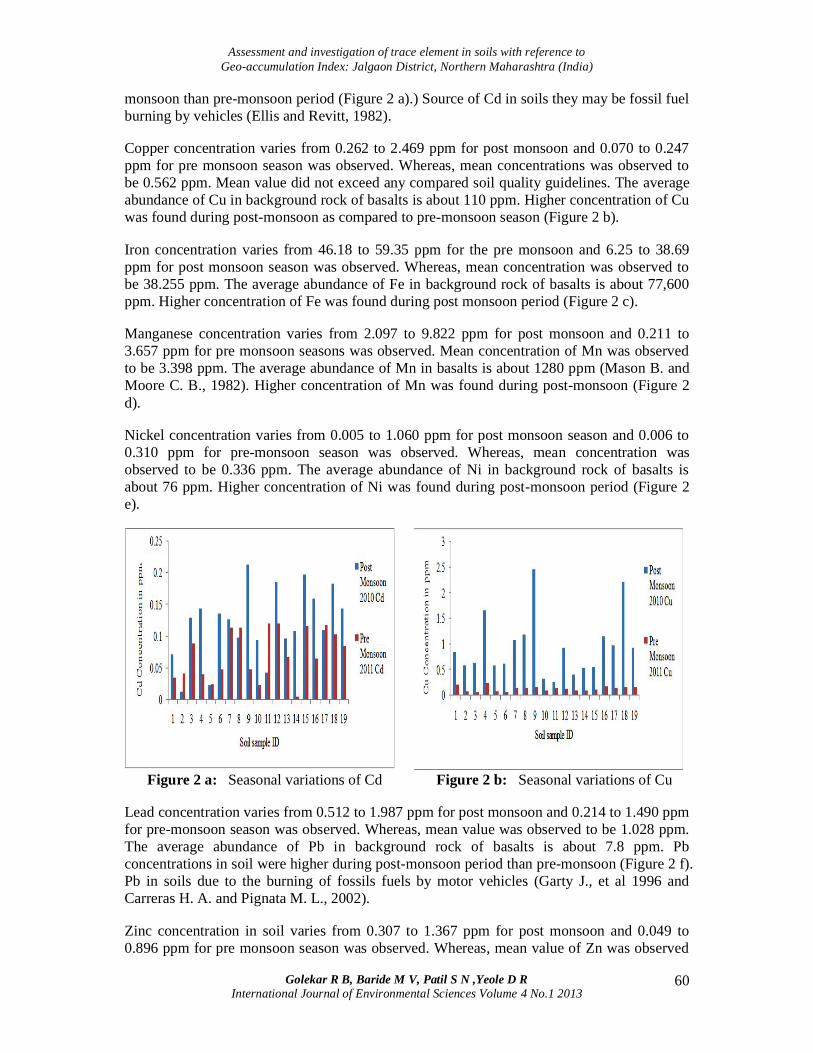
Cadmium concentration varies from 0.014 to 0.214 ppm for post monsoon and 0.005 to 0.121 ppm for pre-monsoon season was observed. The mean concentration of Cd was observed to be 0.096 ppm which is below soil quality guidelines. The average abundance of Cd in background rock of basalts is about 0.15 ppm. Higher value of cadmium found during post-
Assessment and investigation of trace element in soils with reference to Geo-accumulation Index: Jalgaon District, Northern Maharashtra (India)
Golekar R B, Baride M V, Patil S N ,Yeole D R
International Journal of Environmental Sciences Volume 4 No.1 2013 60
monsoon than pre-monsoon period (Figure 2 a).) Source of Cd in soils they may be fossil fuel burning by vehicles (Ellis and Revitt, 1982).
Copper concentration varies from 0.262 to 2.469 ppm for post monsoon and 0.070 to 0.247 ppm for pre monsoon season was observed. Whereas, mean concentrations was observed to be 0.562 ppm. Mean value did not exceed any compared soil quality guidelines. The average abundance of Cu in background rock of basalts is about 110 ppm. Higher concentration of Cu was found during post-monsoon as compared to pre-monsoon season (Figure 2 b).
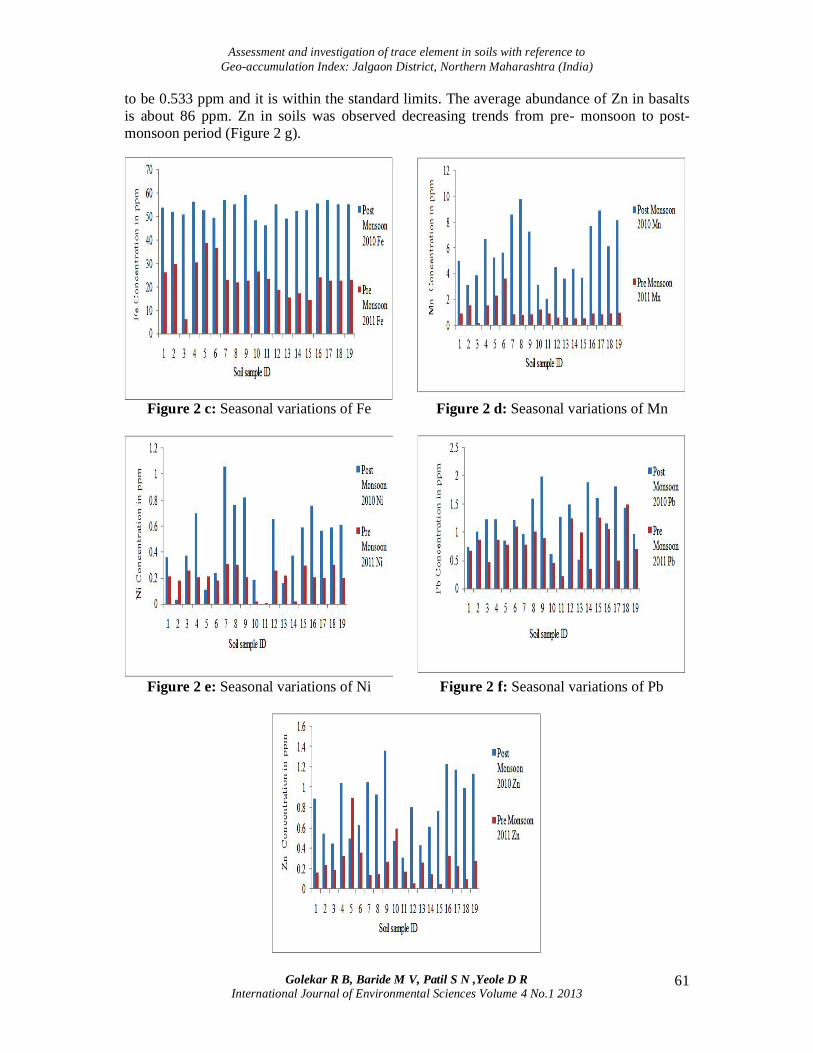
Iron concentration varies from 46.18 to 59.35 ppm for the pre monsoon and 6.25 to 38.69 ppm for post monsoon season was observed. Whereas, mean concentration was observed to be 38.255 ppm. The average abundance of Fe in background rock of basalts is about 77,600 ppm. Higher concentration of Fe was found during post monsoon period (Figure 2 c).
Manganese concentration varies from 2.097 to 9.822 ppm for post monsoon and 0.211 to 3.657 ppm for pre monsoon seasons was observed. Mean concentration of Mn was observed to be 3.398 ppm. The average abundance of Mn in basalts is about 1280 ppm (Mason B. and Moore C. B., 1982). Higher concentration of Mn was found during post-monsoon (Figure 2 d).
Nickel concentration varies from 0.005 to 1.060 ppm for post monsoon season and 0.006 to 0.310 ppm for pre-monsoon season was observed. Whereas, mean concentration was observed to be 0.336 ppm. The average abundance of Ni in background rock of basalts is about 76 ppm. Higher concentration of Ni was found during post-monsoon period (Figure 2 e).
Figure 2 a: Seasonal variations of Cd Figure 2 b: Seasonal variations of Cu
Lead concentration varies from 0.512 to 1.987 ppm for post monsoon and 0.214 to 1.490 ppm for pre-monsoon season was observed. Whereas, mean value was observed to be 1.028 ppm. The average abundance of Pb in background rock of basalts is about 7.8 ppm. Pb concentrations in soil were higher during post-monsoon period than pre-monsoon (Figure 2 f). Pb in soils due to the burning of fossils fuels by motor vehicles (Garty J., et al 1996 and Carreras H. A. and Pignata M. L., 2002).
Zinc concentration in soil varies from 0.307 to 1.367 ppm for post monsoon and 0.049 to 0.896 ppm for pre monsoon season was observed. Whereas, mean value of Zn was observed
Assessment and investigation of trace element in soils with reference to Geo-accumulation Index: Jalgaon District, Northern Maharashtra (India)
Golekar R B, Baride M V, Patil S N ,Yeole D R
International Journal of Environmental Sciences Volume 4 No.1 2013 61
to be 0.533 ppm and it is within the standard limits. The average abundance of Zn in basalts is about 86 ppm. Zn in soils was observed decreasing trends from pre- monsoon to post-monsoon period (Figure 2 g).
Figure 2 c: Seasonal variations of Fe Figure 2 d: Seasonal variations of Mn
Figure 2 e: Seasonal variations of Ni Figure 2 f: Seasonal variations of Pb
Assessment and investigation of trace element in soils with reference to Geo-accumulation Index: Jalgaon District, Northern Maharashtra (India)
Golekar R B, Baride M V, Patil S N ,Yeole D R
International Journal of Environmental Sciences Volume 4 No.1 2013 62
Figure 2 g: Seasonal variations of Zn
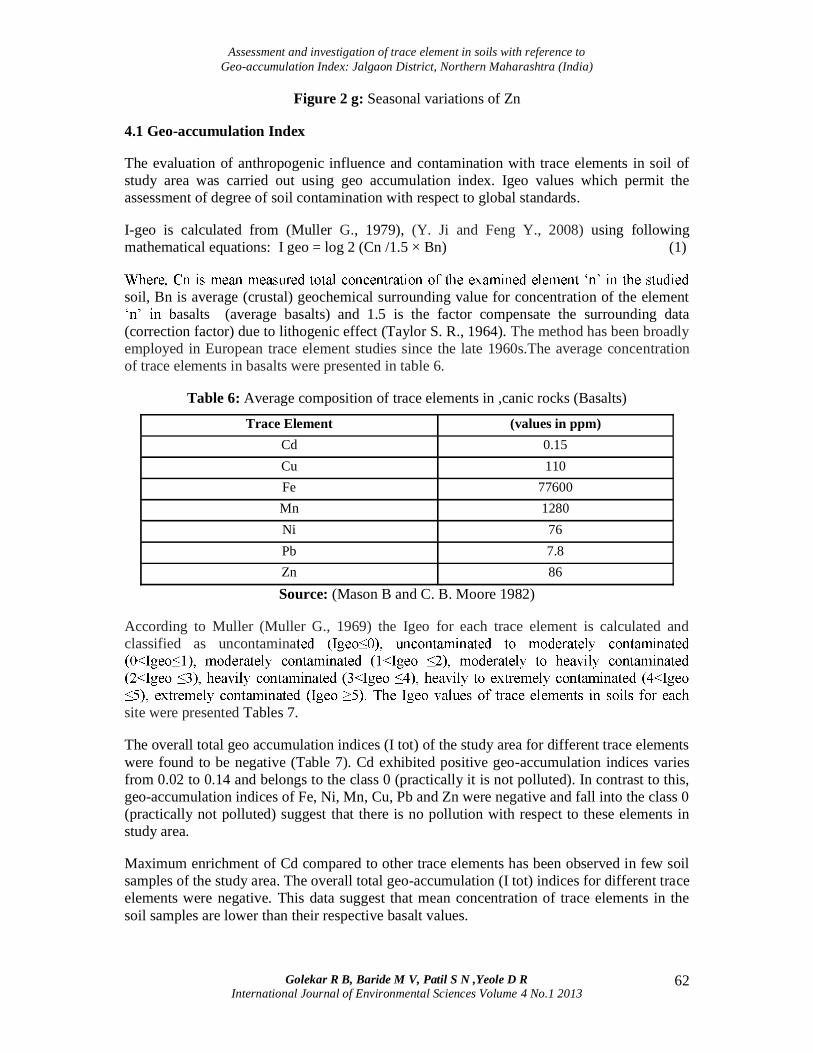
4.1 Geo-accumulation Index
The evaluation of anthropogenic influence and contamination with trace elements in soil of study area was carried out using geo accumulation index. Igeo values which permit the assessment of degree of soil contamination with respect to global standards.
I-geo is calculated from (Muller G., 1979), (Y. Ji and Feng Y., 2008) using following mathematical equations: I geo = log 2 (Cn /1.5 × Bn) (1)
soil, Bn is average (crustal) geochemical surrounding value for concentration of the element asalts (average basalts) and 1.5 is the factor compensate the surrounding data
(correction factor) due to lithogenic effect (Taylor S. R., 1964). The method has been broadly employed in European trace element studies since the late 1960s.The average concentration of trace elements in basalts were presented in table 6.
Table 6: Average composition of trace elements in ,canic rocks (Basalts)
Trace Element (values in ppm) Cd 0.15 Cu 110 Fe 77600 Mn 1280 Ni 76 Pb 7.8 Zn 86 Source: (Mason B and C. B. Moore 1982)
According to Muller (Muller G., 1969) the Igeo for each trace element is calculated and classified as uncontamina
site were presented Tables 7.
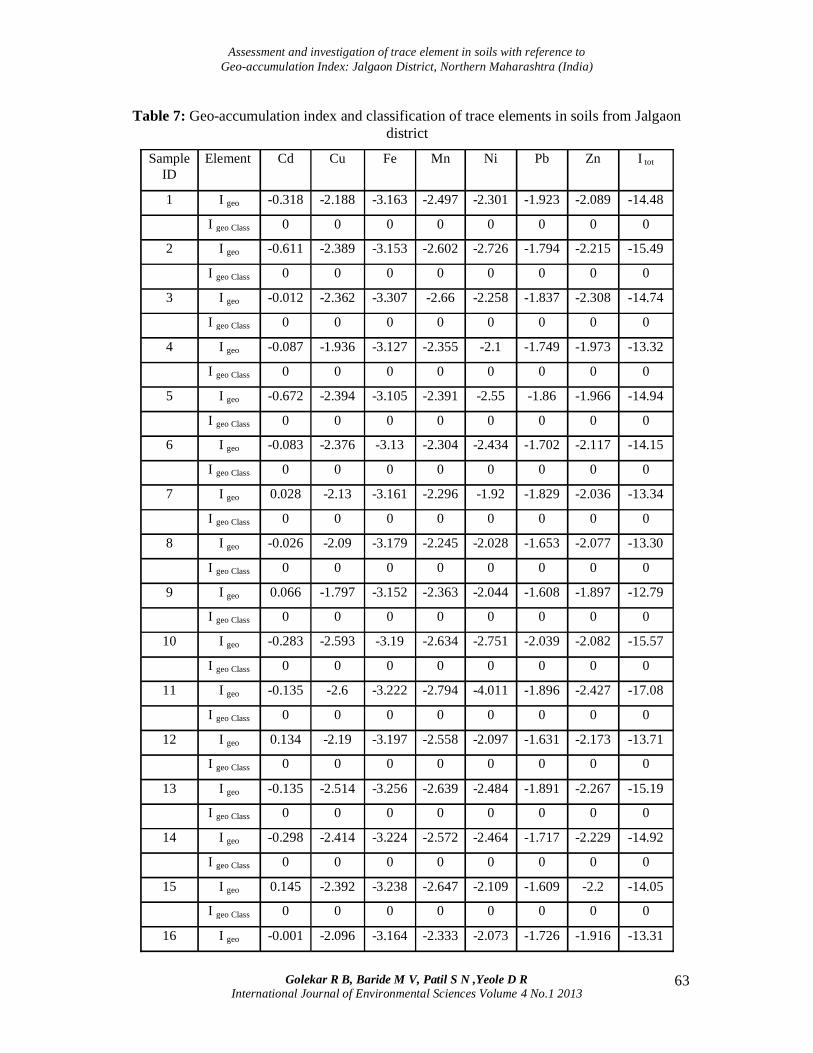
The overall total geo accumulation indices (I tot) of the study area for different trace elements were found to be negative (Table 7). Cd exhibited positive geo-accumulation indices varies from 0.02 to 0.14 and belongs to the class 0 (practically it is not polluted). In contrast to this, geo-accumulation indices of Fe, Ni, Mn, Cu, Pb and Zn were negative and fall into the class 0 (practically not polluted) suggest that there is no pollution with respect to these elements in study area.
Maximum enrichment of Cd compared to other trace elements has been observed in few soil samples of the study area. The overall total geo-accumulation (I tot) indices for different trace elements were negative. This data suggest that mean concentration of trace elements in the soil samples are lower than their respective basalt values.
Assessment and investigation of trace element in soils with reference to Geo-accumulation Index: Jalgaon District, Northern Maharashtra (India)
Golekar R B, Baride M V, Patil S N ,Yeole D R
International Journal of Environmental Sciences Volume 4 No.1 2013 63
Table 7: Geo-accumulation index and classification of trace elements in soils from Jalgaon
district
Sample ID
Element Cd Cu Fe Mn Ni Pb Zn I tot
1 I geo -0.318 -2.188 -3.163 -2.497 -2.301 -1.923 -2.089 -14.48
I geo Class 0 0 0 0 0 0 0 0
2 I geo -0.611 -2.389 -3.153 -2.602 -2.726 -1.794 -2.215 -15.49
I geo Class 0 0 0 0 0 0 0 0
3 I geo -0.012 -2.362 -3.307 -2.66 -2.258 -1.837 -2.308 -14.74
I geo Class 0 0 0 0 0 0 0 0
4 I geo -0.087 -1.936 -3.127 -2.355 -2.1 -1.749 -1.973 -13.32
I geo Class 0 0 0 0 0 0 0 0
5 I geo -0.672 -2.394 -3.105 -2.391 -2.55 -1.86 -1.966 -14.94
I geo Class 0 0 0 0 0 0 0 0
6 I geo -0.083 -2.376 -3.13 -2.304 -2.434 -1.702 -2.117 -14.15
I geo Class 0 0 0 0 0 0 0 0
7 I geo 0.028 -2.13 -3.161 -2.296 -1.92 -1.829 -2.036 -13.34
I geo Class 0 0 0 0 0 0 0 0
8 I geo -0.026 -2.09 -3.179 -2.245 -2.028 -1.653 -2.077 -13.30
I geo Class 0 0 0 0 0 0 0 0
9 I geo 0.066 -1.797 -3.152 -2.363 -2.044 -1.608 -1.897 -12.79
I geo Class 0 0 0 0 0 0 0 0
10 I geo -0.283 -2.593 -3.19 -2.634 -2.751 -2.039 -2.082 -15.57
I geo Class 0 0 0 0 0 0 0 0
11 I geo -0.135 -2.6 -3.222 -2.794 -4.011 -1.896 -2.427 -17.08
I geo Class 0 0 0 0 0 0 0 0
12 I geo 0.134 -2.19 -3.197 -2.558 -2.097 -1.631 -2.173 -13.71
I geo Class 0 0 0 0 0 0 0 0
13 I geo -0.135 -2.514 -3.256 -2.639 -2.484 -1.891 -2.267 -15.19
I geo Class 0 0 0 0 0 0 0 0
14 I geo -0.298 -2.414 -3.224 -2.572 -2.464 -1.717 -2.229 -14.92
I geo Class 0 0 0 0 0 0 0 0
15 I geo 0.145 -2.392 -3.238 -2.647 -2.109 -1.609 -2.2 -14.05
I geo Class 0 0 0 0 0 0 0 0
16 I geo -0.001 -2.096 -3.164 -2.333 -2.073 -1.726 -1.916 -13.31

Assessment and investigation of trace element in soils with reference to Geo-accumulation Index: Jalgaon District, Northern Maharashtra (India)
Golekar R B, Baride M V, Patil S N ,Yeole D R
International Journal of Environmental Sciences Volume 4 No.1 2013 64
I geo Class 0 0 0 0 0 0 0 0
17 I geo 0.005 -2.166 -3.164 -2.281 -2.176 -1.705 -1.963 -13.45
I geo Class 0 0 0 0 0 0 0 0
18 I geo 0.105 -1.839 -3.173 -2.422 -2.104 -1.603 -2.071 -13.10
I geo Class 0 0 0 0 0 0 0 0
19 I geo 0.008 -2.179 -3.171 -2.308 -2.147 -1.846 -1.96 -13.60
I geo Class 0 0 0 0 0 0 0 0
5. Conclusions
The concentration of Cd and Pb in all sites shows moderately contamination. However, other trace element like Fe, Zn, Mn, Cu and Ni in soils from all sites was observed lower concentration. The Igeo values suggest that the contamination of Cd and Pb is higher in all soils samples from study area. Agricultural soils are also significantly influenced by trace element derived from anthropogenic activities. The contamination of Cd and Pb are found to be higher than that of the other trace element. The sources of trace elements in urban soils and urban road dusts are mainly derived from traffic sources and industrial sources. However, the sources of trace element in agricultural soils are mainly influenced by parent materials, application of agrochemical fertilizer and pesticides.
Acknowledgements
The authors would like special gratitude to the Department of Science and Technology, New Delhi Govt. of India for providing financial Funds in the form of Major Research Project (Grant No.SR/S4/ES-328/2008). The authors also official acknowledge to North Maharashtra University Jalgaon.
6. References
1. Bak J, Jensen J, Larsen MM, Pritzl G, Scott Fordsmand J., (1997), A heavy metal monitoring programme in Denmark. Sci. Total Environ , 207, pp 179 186.
2. Carreras H. A. and Pignata M. L., (2002), Biomonitoring of heavy metals and air quality in Cordoba City, Argentina, Using transplanted lichens environmental pollution, 17 pp 77-87.
3. Ellis J. B. and Revitt D. M., (1982), Incidence of heavy metals in street surface sediments: Solubility and grain size studies water, Air and soil pollution, 17, pp 87-100
4. J. Garty, M. Kauppi and A. Kauppi., (1996), Accumulation of airborne elements from vehicles in transplanted lichens in urban sites journal of environmental quality , 25, pp 265-272 doi:10.2134/jeq1996.00472425002500020009x
5. Y. Ji, Y. Feng, J. Wu, T. Zhu, Z. Bai, C. Duan., (2008), Using geo-accumulation index to study source profiles of soil dust in China, Journal of environmental sciences, 20, pp 571 578.

Assessment and investigation of trace element in soils with reference to Geo-accumulation Index: Jalgaon District, Northern Maharashtra (India)
Golekar R B, Baride M V, Patil S N ,Yeole D R
International Journal of Environmental Sciences Volume 4 No.1 2013 65
6. Kim K. and Kim S., (1998), Heavy metal pollution of agricultural soils in central regions of Korea water air and soil pollution, 82, pp 109-122.
7. Macfarlane G. R. and Burchett M. D. (2000) Cellular distribution of Cu, Pb and Zn in the grey mangrove Avicenniamarina (Frorsk) Vierh Aquatic Botany , 68, pp 45-59.
8. Martinez A. et al., (2003), Distribution of some selected major and trace elements in four Italian soils developed from the deposits of the Gauro and Vico, - derma , 117 (3 4) pp 215-224 doi:10.1016/S0016-7061(03)00124-1
9. Mason B and C. B. Moore., (1982), Principle of Geochemistry 4th edition Wliely, New York
10. Muller G., (1969), Index of geo-accumulation in sediments of the Rhine river, Geo Journal, 2 pp 108 118
11. J. Pichtel, J, H. T. Sawyerr and Czarnowska, K., (1998), Spatial and Temporal Distribution of Metals in Soils in Warsaw, Poland Environmental Pollution, 98 (2), pp 169-174. doi:10.1016/S0269-7491(97)00131-0
12. Taylor S. R., (1964), Abundance of chemical elements in the continental crust: A new table. Geochemical Cosmochimica Acta, 28, pp 1273 1285.
13. Ullrich S. M., Ramsey M. H. and Helios-Rybicka E., (1999), Total and exchangeable concentrations of heavy metals in soils near Bytom, an Area of Pb/Zn mining and smelting in upper Silesia, Poland applied geochemistry, 14 pp 87-196.
14. Yarlagadda P. S., Matsumoto M. R., VanBenschoten J. E., Kathuria A., (1995), Characteristics of heavy metals in contaminated soils, Journal of Environmental Engineering, 121(4), pp 276-286.