TR-GL-94-9 "Earth resources stewardship at Department of ...
181
TA lri3 no.Gl 9 9 .2 orps ". Waterways Experiment Station Legacy Resource Management Program Earth Resources Stewardship Technical Report GL-94-9 March 1994 at Department of Defense Installations by David M. Patrick, Maureen K. Corcoran University of Southern Mississippi Paul E. Albertson, Lawson M. Smith Approved For Publ ic Release; Distribution Is Un limited Prepared for Office of the Deputy Assistant Secretary of Defense for the Environment - - - --- --- - -- - . ---- ---- ---- ----- - - - - -- -- --
-
Upload
khangminh22 -
Category
Documents
-
view
6 -
download
0
Transcript of TR-GL-94-9 "Earth resources stewardship at Department of ...
TA lri3 no.Gl 9 9
.2 orps
". a.··~···,....~rs Waterways Experiment Station
Legacy Resource Management Program
Earth Resources Stewardship
Technical Report GL-94-9 March 1994
at Department of Defense Installations
by David M. Patrick, Maureen K. Corcoran University of Southern Mississippi
Paul E. Albertson, Lawson M. Smith
Approved For Public Release; Distribution Is Unlimited
Prepared for Office of the Deputy Assistant Secretary of Defense for the Environment
- - -~;::::::= -------- -- - . ----.§=-~~ ----------------- -- - -------

Legacy Resource Management Program
--: -,... ' 1. ' ., •,. . . •
• , .r.c1 '"
Earth Resources Stewardship
Technical Report GL-94-9 March 1994
/A'7 W34-
no, G-L-9 4-9
at Department of Defense Installations c.d,.
by David M. Patrick, Maureen K. Corcoran
Department of Geology University of Southern Mississippi Hattiesburg, MS 39406-5044
Paul E. Albertson, Lawson M. Smith
U.S. Army Corps of Engineers Waterways Experiment Station 3909 Halls Ferry Road Vicksburg, MS 39180-6199
Final report
Approved for public release; distribution is unlimited
Prepared for U.S. Department of Defense Office of the Deputy Assistant Secretary
of Defense for the Environment Washington, DC 22202

US Army Corps of Engineers Waterways Experiment Station
/- ... -.-../"' I
r-' t
FOR ~110M o;:JHTN:r
PUBLIC AFFAIRS Of'FICE
U. S. ARIIY ENGINEER
N
WAnRWAYS EXPE-EHT STATION :IIC8 HAUS FERRY ROAD VICKS8URO, IIISSISSIPPI 381-1" PHONE : (101 )134-U02
~ SID I 100•
~~~~c=====~
Waterways Experiment Station Cataloging-In-Publication Data
Earth resources stewardship at Department of Defense installations I by David M. Patrick ... [et al) ; prepared for Office of the Deputy Assistant Secretary of Defense for the Environment.
189 p.: ill.; 28 em. - (Technical report ; GL-94-9) Includes bibliographic references. 1. Natural resources - United States. 2. Earth sciences - United
States. 3. Nature conservation - United States. 4. Ecosystem management. I. Patrick, David M. II. United States. Army. Corps of Engineers. Ill. U.S. Army Engineer Waterways Experiment Station. IV. United States. Office of the Deputy Assistant Secretary of Defense (Environment). V. Title. VI. Legacy Resource Management Program. VII. Series: Technical report (U.S. Army Engineer Waterways Experiment Station) ; GL-94-9. TA7 W34 no.GL-94-9
Contents
Preface . . . . . . . . . . . . . . . . . . . . . . . . . . . . .
Conversion Factors, Non-SI to SI Units of Measurement
Summary .....
}-Introduction .
Legacy Mission . Legacy Organization .. Earth Resource Task Area Objectives Background . . . . . . . . . . . . . . . Legislative Basis for Earth Resource Management DoD Regulations . . . . . . . . . . . . . . ..... . Computer-aided En vi ron mental Legislative
Data System(CELDS) .......... . Earth Resources and CELDS . . . . . . . Holistic Integrated Resource Management
2-0verview of Earth Resources .
General ... Lithosphere . Hydrosphere .
Atmosphere . . Near-Surface Energy, Processes and Materials
3-Significance of Earth Resources
Introduction . . . . . . .. Lithospheric Resources . Hydrospheric Resources . Atmospheric Resources .
4-Methods of Acquiring and Inventorying Earth Resource Data
General ..... . Lithospheric Data Hydrospheric Data
X
. XI
. . xu
I
1 1 2 3 4 6
7 7 9
10
10 10 10 12 13
14
14 14 32 41
48
48 49 73
iii

Atmospheric Data . . . . . . 86
5-Earth Resource Stewardship 93
General . . . . . . . . . . . . 93 Geologic Framework . . . . 93 Scientifically Important Rocks and Fossils 94 Scientifically Important Landforms . 94 Economic Minerals 95 Fossil Fuels . . . 95 Geologic Hazards 95 Water Resources . 96 Surface Water 96 Groundwater . . . 105 Wetlands . . . . . 105 GIS Data Layers . 105
6-Earth Resource Information in Cultural Resource Stewardship 110
General . . . . . . . . II 0 Geologic Framework II 0 Geomorphic Surfaces I I I Geomorphic Processes I 11 Soil Development . . 112 Geologic Ages/Dates . 112 Climatic Changes . . . 112 Effects of Human Activities I 13 Cultural Resource Interface Layer 113
7-Earth Resource Information in Biological Resource Stewardship . 114
General . . . . . . . . . 114 Geomorphic Processes 114 Geomorphic Surfaces . 115 Climatic Change . . . . 115 Acid Rain . . . . . . . . 115 Effects of Human Activities 1 15 Biological Resource Interface Layer 1 17
8-Integrated Stewardship . . . . . . . 118
General . . . . . . . . . . . . . . . . 118 Integrated Resource Management . 118 Resource Management Operations 119 Construction . . . . . . . . . . . . . 119 Environmental Assessments . . . . 120 Integrated Training Area Management 120 Installation Restoration . . . . . . . . . 120 Recreation, Education, and Public Awareness . 120
iv
9-Installation Planning . . 122
General . . . . . . . . . 122 Installation Expansion 122 Siting of Critical Structures 123 Installation Consolidation and Closure 123
1 0-Examples of Integrated Resource Management . 124
General . . . . . . . . . . . . . . . . . . . . . . 124 Crane Naval Surface Warfare Center Fossils . 124 Red River Waterway Gunboat . . . . . . . . . 126 The Bayou Darter in the Lower Mississippi Valley 129 Paleobotanical Studies at the Air Force Academy . 130 Integrated Studies at White Sands Missile Range . 133
11-Conclusions and Recommendations 136
Conclusions . . . . 136 Recommendations 137
12-Annotated References 139
General References . . 139 Lithospheric Resources 140 Hydrospheric Resources . 141 Atmospheric Resources . 142
Appendix A: Earth Resource Subjects and Key Words in CELDS AI
Appendix B: Glossary of Selected Earth Resource Terms B 1
Appendix C: Sources of Earth Resource Information Cl
List of Figures
Figure 1. The organization of the Legacy Resource Management Program, a tiered program concept . . . . . . . . . . . . . 2
Figure 2. The increased speed and lethality of modem
Figure 3.
weapons systems, along with better communications and the ability to see deep in the enemy's rear echelon has resulted in the need for increased training space and, consequently, increased emphasis on resource management . . . . . . . . . . . . . . . . . . . .
Resource management will be conducted most effectively with the integration of earth, biological, and cultural resource data .....
4
5
v

VI
Figure 4. The rock cycle, a unifying concept of earth science in which the three rock types are related by the processes of weathering, erosion, sedimentation, lithification, metamorphism, crustal deformation, volcanism and magmatic activity, and seismicity .
Figure 5. The hydrologic cycle describing the circulation of water through the atmosphere and hydrosphere. The principal processes are: precipitation, evapor-
II
ation, runoff, infiltration, storage, and transpiration 12
Figure 6. Atmospheric systems consisting of condensation, precipitation, humidity, evaporation, solar radiation, and circulation of air masses . . . . . . . . . . . . . . 13
Figure 7. An example of the geologic setting and lithospheric resources at Pine Bluff Arsenal, Arkansas . . . 15
Figure 8. An example of the endangered pitcher plant in its steep head habitat near upland surfaces at Eglin Air Force Base, Florida . . . . . . . . . 16
Figure 9. The relations between botanical habitats and stream terraces at Longhorn Army Ammunition Plant, Texas 16
Figure 10. An illustration of a typical soil horizon with all horizons. In some profiles the C horizon may be missing. The A and B horizons comprise the solum 19
Figure II. Soil depicted as a function of time, climate, relief, organisms, and parent material . . . . . . ...
Figure 12. The relations between gravitational, capillary, and molecular water occurring in soils . . . . .
21
23
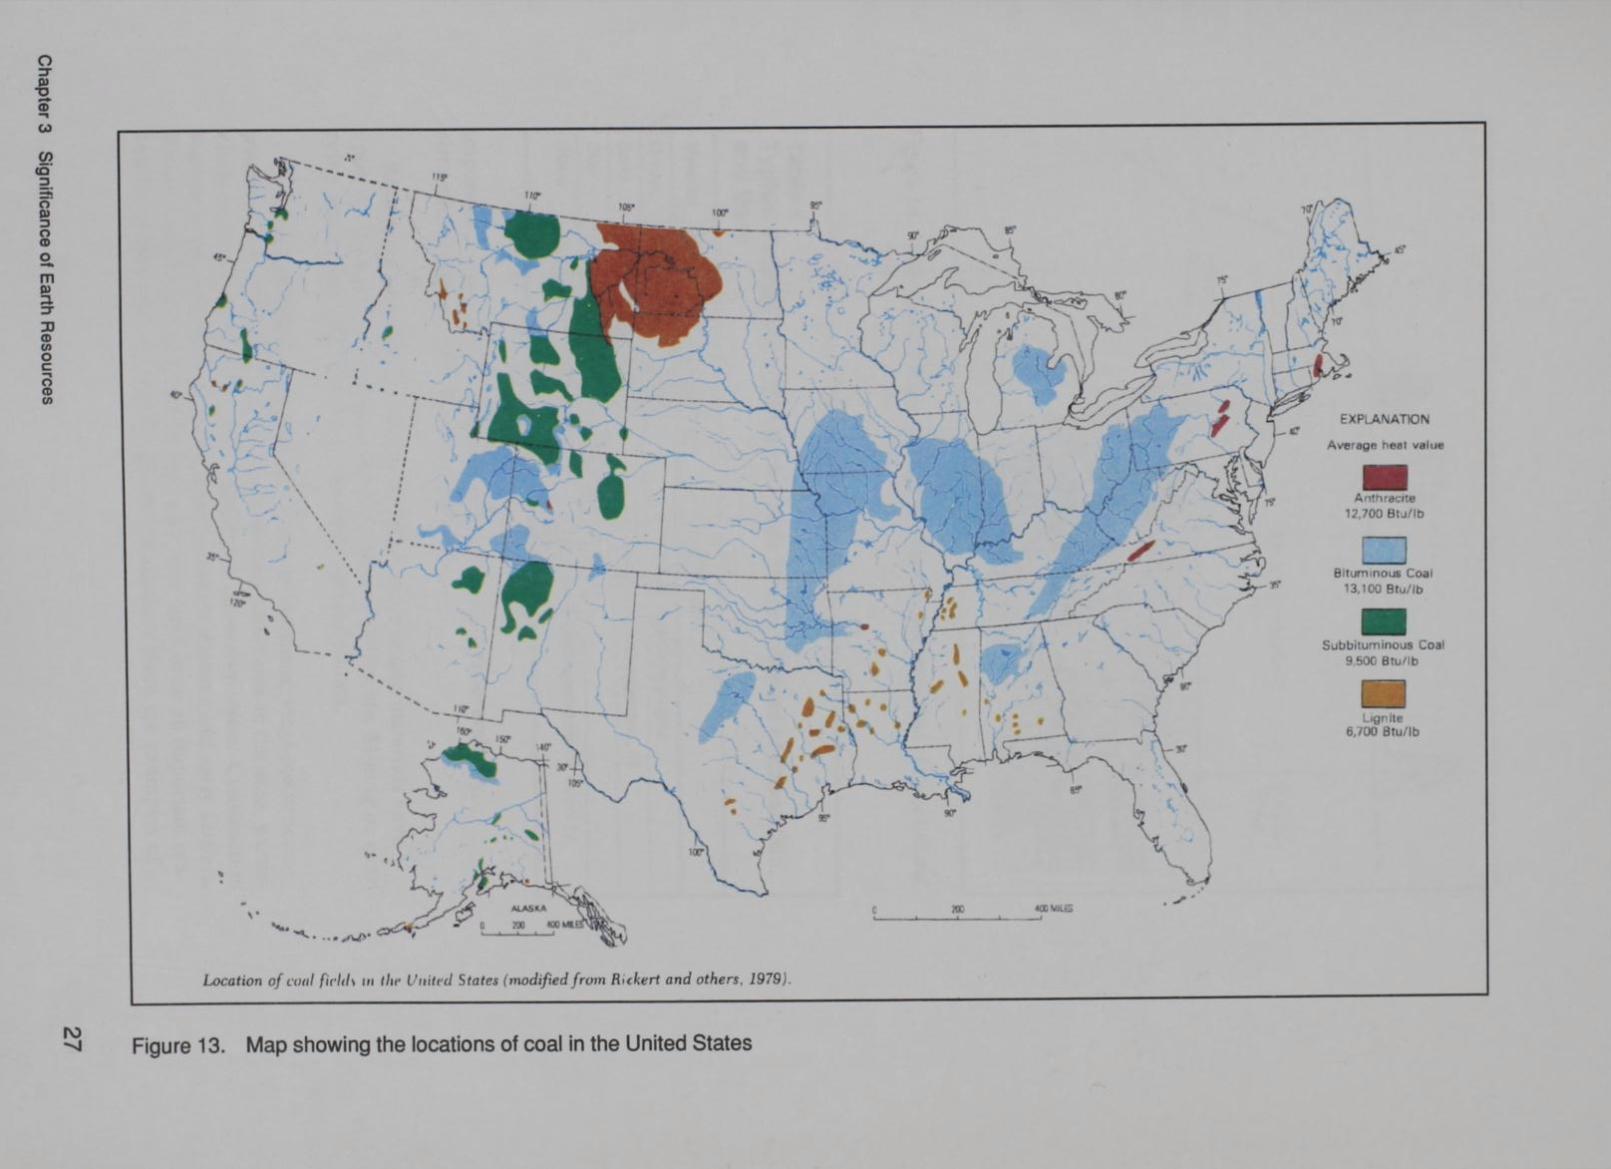
Figure 13. Map showing the locations of coal in the United States 27
Figure 14. Idealized geologic settings favoring the accumulation of oil or natural gas . . . . . . . . . . . . . . . . . . . . 29
Figure 15. An example of the distribution of archeological sites based on geomorphic landforms in the vicinity of Longhorn Army Ammunition Plant, Texas . . . . 31
Figure 16. Generalized block diagram of The Big Cypress Bayou showing the major landforms in the vicinity of Longhorn Army Ammunition Plant, Texas . . . . 32
Figure 17. An illustration of wetlands depicting two typical types-upland hillside seep and riparian "backswamp" 34
Figure 18. The typical geologic setting of aquifers . . . . 37
Figure 19. The physiography and underlying geology in the vicinity of Crane NWSC. Note the karst terrain of the Mite hell Plain . . . . . . . . . . . . . . . . . 40

Figure 20. The relationship between air temperature and relative humidity ................ . 42
Figure 21. The influence of atmospheric processes on soil and organic processes . . . . . . . . . . . . . 46
Figure 22. A map of Hurricane Hugo storm track . 47
Figure 23. Geologic map of Mississippi . . . . . . 51
Figure 24. Generalized geologic cross section at Fort Polk, Louisiana showing underlying aquifers .....
Figure 25. Geophysical well logs with graphic geologic log taken in a boring in the vicinity of Barksdale AFB
Figure 26. Magnetic survey conducted at the U.S. Army Engineer Waterway Experiment Station Test Site.
54
. . . . 65
Note the anomalies indicating buried metallic objects . 67
Figure 27. An example of a hydrocarbon scout card and oil well production record from a well in Louisiana .
Figure 28. Map showing the principal flood-prone regions of the U.S. . ....................... .
Figure 29. Spring location map of a portion of Crane NWSC.
Figure 30.
Springs are denoted as "Spr" ........... .
A 3-dimensional diagram depicting the variables involved in determining hydraulic conductivity and transmissivity . . . . . . . . . . . . . . . . . .
70
77
80
82
Figure 31. Potentiometric surface map in the vicinity of Fort Polk, Lomsaana . . . . . . . . . . . . . . . . . . . . . . . . 85
Figure 32. Map showing regions susceptible to mass wasting in the United States . . . . . . . . . . . . . . . . . . 97
Figure 33. Map showing the occurrence of expansive materials in the United States . . . . . . . . . . . . . . . . . . . 99
Figure 34. Map showing the location of volcanic activity in the United States . . . . . . . . . . . . . . . 101
Figure 35. Map showing areas of subsidence in the United States 103
Figure 36. A photograph showing fossils tracks discovered at the Crane (Indiana) Naval Weapons Support Center which is conducting DERP studies . . . . . . . . . . . . . . . 125
Figure 37. An artist's conceptual reconstruction of the Pennsylvanian Age environment at Crane NWSC . . . . 127
Figure 38. The geologic and geomorphic setting of the buried USS Eastport in the Red River Valley, Louisiana . . . . . 129
vii
VIII
Figure 39. The relationship between the habitat of the Bayou Darter and headward erosion along Bayou Pierre, Mississippi ..................... · ·
Figure 40. Fossil plant exacavation site along Monument Creek, Air Force Academy, Colorado . . . . . . . . . . . . . .
Figure 41. Illustration showing preservation of cuticle and dicot
130
131
leaves at Monument Creek site . . . . . . . . . . . 132
Figure 42. Examples of fossil palm leaves with attached leaf
Figure 43.
stalks . . . . . . . . . . . . . . . . . . . . . . . .
An integrated earth, biologic, and cultural GIS overlay for a part of the White Sands Missile Range, New Mexico . . . . . . . . . . . . . . ..
List of Tables
Table 1. Earth Resource Key Words Taken from the CELDS Glossary, and the Numbers of Accessions in the
133
135
Database for That Keyword . . . . . . . . . . . . . . 8
Table 2. A List of Earth Resource Subjects Which Must Be Considered for Establishing Performance Standards in Subpart X, Chapter I, 40 CFR . . . . . . . . . 9
Table 3. The 7th Approximation, the U.S. Department of Agriculture Soil Classification System . . . . . . 17
Table 4. The Unified Soil Classification System (USCS) . 21
Table 5. Economic Minerals . . . . . . . . . . . . . . . . . 24
Table 6. Typical Construction Materials, Their Origin, Method of Extraction, and Uses . . . . . . . . . . . . . . . . . . 29
Table 7. Earth Resource Data Elements and Their Relationship to Applicable Resources . . . . . . . . . . . . . . . . 50
Table 8. A Listing of Commercial and Government Imaging Systems, Both U.S. and Foreign, in Operation Now Or in the Near Future, of Interest to the USACE for Earth Resource Applications . . . . . . . . . . . . 57
Table 9. A Conceptual Earth Resource Geographic Information System Showing Individual Layers and Recommended Data Elements. For Small Installations, Layers May Be Combined . . . . . . . . . . . . . . . . . . . . . . 107
Table 10. A Conceptual Earth Resource Geographic Information System Interface Layers Showing Individual Overlays and Recommended Data Elements. For Small Installations, Layers May Be Combined . . . . . . . . . . . 109
Table 11. Recommended On-Going Procedures for the Identification, Classification, and Management of Cultural Sites Using Earth Resource Data ..
Table 12. Recommended Procedures for the Determination
. 1 1 1
of Relations Between Earth And Biological Resources . 115
Table 13. Components of an Integrated Natural Resource Management GIS Layer . . . . . . . . . . . . . . . . . . . . 119
IX
X
Preface
This study was performed during the period March 1991 through December 1992 at the U.S. Army Engineer Waterways Experiment Station (WES), Vicksburg, Mississippi. The work was conducted under the authority of the Legacy Resource Management Program under the Office of the Deputy Assistant Secretary of Defense for the Environment, U.S. Department of Defense (ODASD-E).
The study and report preparation were performed by Dr. David M. Patrick and Ms. Maureen K. Corcoran. University of Southern Mississippi (USM), and by Mr. Paul E. Albertson and Dr. Lawson M. Smith, Engineering Geology Branch (EGB), Earthquake Engineering and Geosciences Division (EEGD), Geotechnical Laboratory (GL). Dr. Smith supervised the work and is the Earth Resources Task Area Manager in the Legacy Program. General supervision was provided by Mr. Joseph Gatz, Chief, EGB; Dr. A.G. Franklin, Chief, EEGD; and Dr. William F. Marcuson III, Director, GL.
Mr. Thomas E. Baca was Deputy Assistant Secretary of Defense (Environment). Mr. L. Peter Boice was the Legacy Project Officer at ODASD(E). Dr. J. Douglas Ripley was the coordinator for Natural Resources Management at the U.S. Army Engineer Housing and Support Center (USAEHSC), Fort Belvoir, Virginia, through whom the Earth Resources Task Area was coordinated. Dr. Ripley also contributed to Chapter 10 of the report.
The authors acknowledge the thorough technical reviews conducted by Dr. Ripley, Ms. Pamela M. Klinger (Office, Chief of Engineers), Ms. Joanne Culbertson (CEHP, Inc.), Mr. William L. Murphy, GL, Dr. Jean O'Neal and Mr. Mike Waring, Environmental Laboratory (EL), WES and the assistance of Drs. Paul Nickens and Fred Briuer, EL, and Messrs . Gary Hennington, and Chris Gellasch, GL, and Messrs. Clint Roberts, Kevin Morrison, and Carlos Latorre, USM. Mr. J.D. Lashlee (GL) contributed to the sections on remote sensing imagery, mobility, and geographic information systems.
The Director of WES during the investigation and report preparation was Dr. Robert W. Whalin, and the Commander was COL Bruce K. Howard, EN.

Conversion Factors, Non-SI To Sl Units of Measurement
Non-SI units of measurement used in this report can be converted to SI units as follows:
Multiply By To Obtain
acres 4,046.873 square meters
feet 0.3048 meters
inches 2.54 centimeters
miles (U.S. statute) 1.609347 kilometers
pounds (force) per square foot 47.88026 pascals
pounds (mass) 0.453924 kilograms
bars 100,000. pascals
cubic feeVsecond 0.02831685 cubic meters/sec
xi
xii
Summary
This report describes the findings and recommendations of the Earth Resource Task Area of the DoD authorized Legacy Resources Management Program. The report is intended to serve as an earth resource primer and guide for planners and managers at DoD installations and facilities. Earth resources include the lithosphere, the hydrosphere, and the atmosphere, and, therefore, encompass soils, minerals, rocks, groundwater, surface water and wetlands, near-surface geological processes. and most aspects of climate. The management of these resources is important in its own right; however, NEPA, CERCLA, SARA, and other Federal and state environmental laws require resource management and imply that this management be integrated. Thus, the central theme of the report is the need for integrated natural (biological and earth) and cultural resource management at DoD installations/facilities. Integrated management is necessary because it is most efficient and comprehensive, and because earth resources may impose significant controls on the location and distribution of both biological and cultural resources. Twenty earth resources which are significant in and of themselves, and those earth resources which are important factors in biological or cultural resource management are described in terms of the processes and materials involved in their occurrence and their impact on biological and cultural resources. Forty-five earth resource data elements are also described. These descriptions are given in terms of definition of the data element, the purpose or use of the data, data sources, limitations of the data, the applicability of the data e lement, its units, data needs, acquisitions fllethods, and inventory procedures.
The report describes the stewardship of earth resources in terms of understanding the geologic framework of an installation--managing scientifically important rocks, fossils, and landforms; economic minerals, fossil fuels, geologic hazards, and water resources. A conceptual system of seven geographic information system (GIS) map layers is presented which is intended to enhance this stewardship. The GIS consists of two geologic layers, two water resource layers, a geomorphic layer, an atmospheric resource layer, and a natural hazard layer. The application of earth resource data to the management of biological and cultural or historic resources is presented in terms of GIS map overlays. For cultural resources, the GIS layer consists of geomorphic processes, relative energy of these processes, soil development, geologic age, known cultural/historic sites, and a classification of relative likelihood of discovering cultural sites. The biological

GIS consists of geomorphic processes, their relative energy. soil development, distribution of threatened and endangered species. and the occurrence of human activities affecting these species.
The integration of earth resources into installation operations is described in terms of construction, environmental assessments, integrated training area management (ITAM), recreation. education, and public awareness: and planning functions such as installation expansion, siting of critical structures, and base consolidation and closure. Examples of studies in which earth resource data have been applied are given for Crane Naval Weapons Support Center (Indiana), the Red River Waterway (Louisiana), Bayou Pierre Basin (Mississippi), Air Force Academy (Colorado), and White Sands Missile Range (New Mexico).
Installation/facility planners and resource managers should determine critical shortfalls in earth resource data and develop procedures for the collection and integration of these data, and they should select multiple user GIS systems in which these data may be maintained and used. Commanders should review the management of earth, biological, and cultural resources to ensure that these operations are (a) integrated-a team approach is used, (b) supervisory channels and organizational units support the flow of resource information among various users, and that (c) earth resource data are incorporated into base operations and planning.
XIII
1 Introduction
Legacy Mission
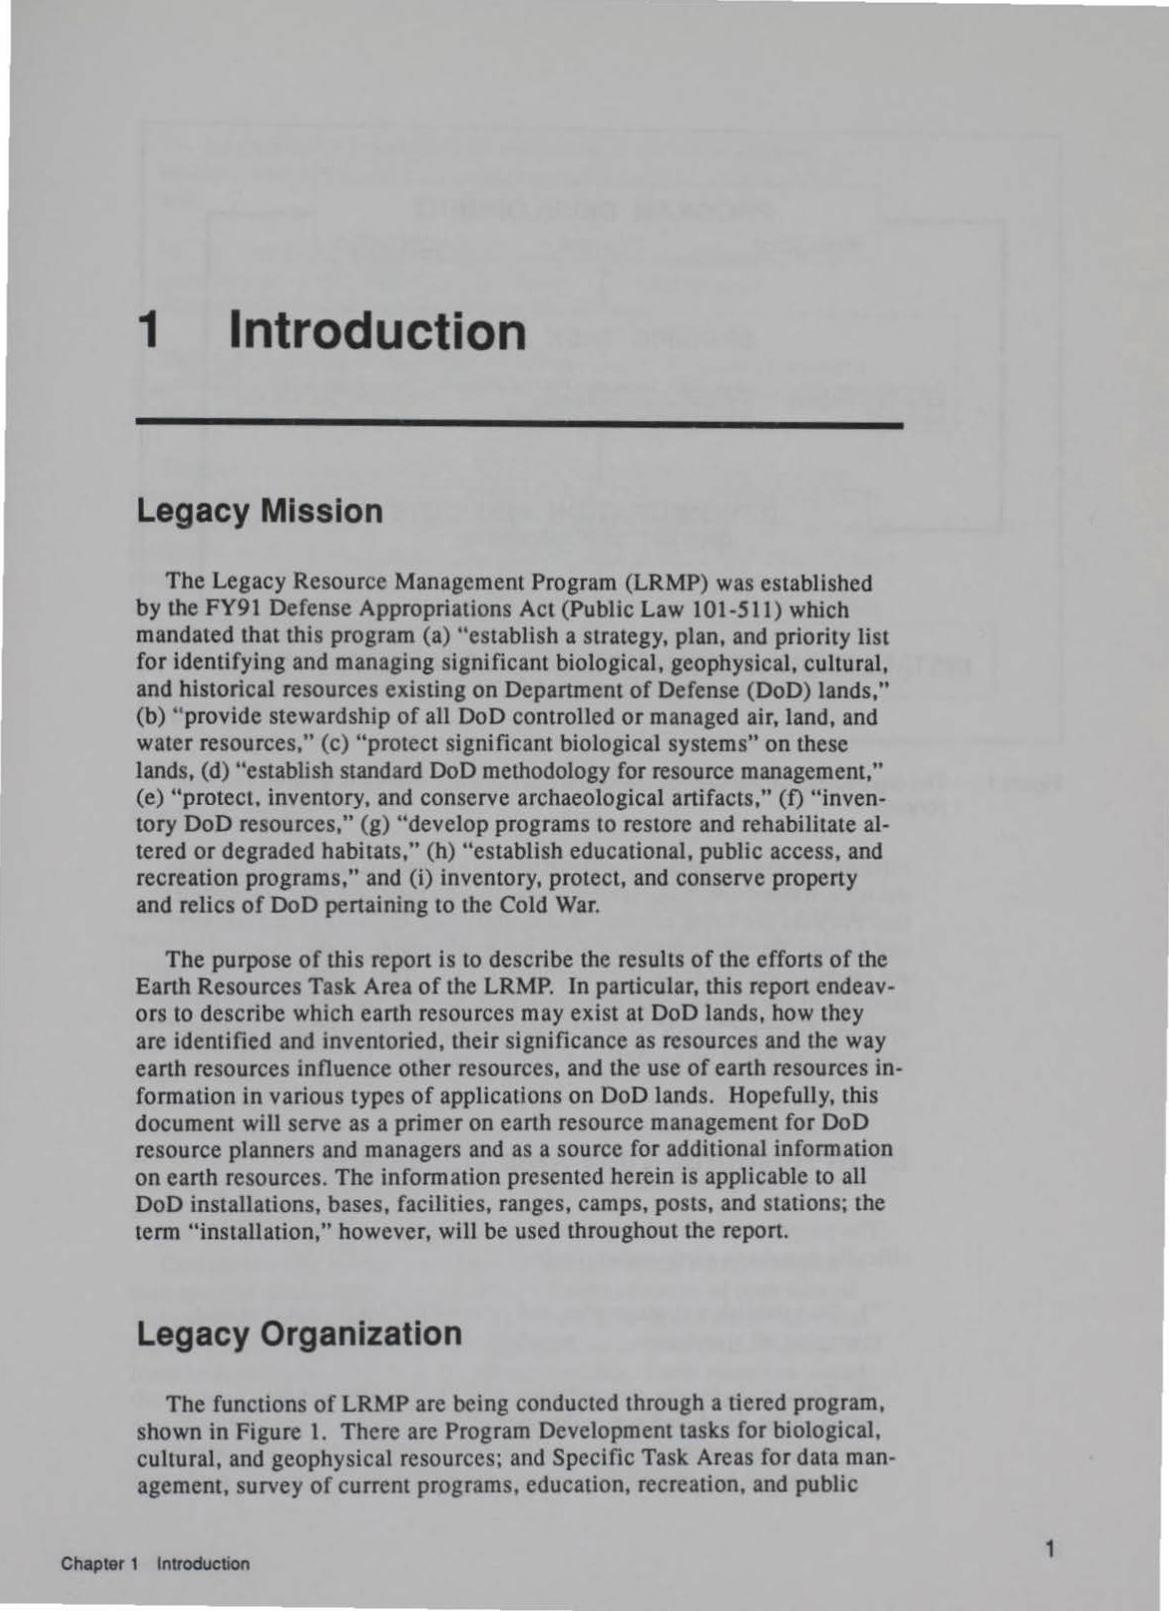
The Legacy Resource Management Program (LRMP) was established by the FY91 Defense Appropriations Act (Public Law 101-511) which mandated that this program (a) "establish a strategy, plan, and priority list for identifying and managing significant biological, geophysical, cultural, and historical resources existing on Department of Defense (DoD) lands," (b) ''provide stewardship of all DoD controlled or managed air, land, and water resources," (c) "protect significant biological systems" on these lands, (d) "establish standard DoD methodology for resource management," (e) "protect, inventory, and conserve archaeological artifacts," (f) "inventory DoD resources," (g) "develop programs to restore and rehabilitate altered or degraded habitats," (h) "establish educational, public access, and recreation programs," and (i) inventory, protect, and conserve property and relics of DoD pertaining to the Cold War.
The purpose of this report is to describe the results of the efforts of the Earth Resources Task Area of the LRMP. In particular, this report endeavors to describe which earth resources may exist at DoD lands, how they are identified and inventoried, their significance as resources and the way earth resources influence other resources, and the use of earth resources information in various types of applications on DoD lands. Hopefully, this document will serve as a primer on earth resource management for DoD resource planners and managers and as a source for additional information on earth resources. The information presented herein is applicable to all DoD installations, bases, facilities, ranges, camps, posts, and stations; the term "installation," however, will be used throughout the report.
Legacy Organization
The functions of LRMP are being conducted through a tiered program, shown in Figure 1. There are Program Development tasks for biological, cultural, and geophysical resources; and Specific Task Areas for data management, survey of current programs, education, recreation, and public
Chapter t Introduction 1

PROGRAM DEVELOPMENT -Biological Cultural Geophysical
SPECIFIC TASK AREAS
Data~ment Educational. R&Cfeatlon. Public Awareness Decision Framewor1c ~ SUrvey CulT. ogroms Native Amerlcons and Settle!'$ Cold War Sites. Artifacts Biodiversity Project Management Procedures
DEMONSTRATION PROJECTS • at more than 90 Installations
INSTALLATION SPECIALISTS and LEGACY PARTNERS
Figure 1. The organization of the Legacy Resource Management Program, a tiered program concept
2
relations, Native Americans and settlers, project management procedures, decision framework, biodiversity, training, and the Cold War. Demonstration Projects are being conducted at installations throughout the country; and Legacy Partners outside of DoD are participating in the program as are resource specialists at the installation level. This report addresses the findings of the Geophysical Resource Task Area, a part of Program Development. Because "earth" is a more meaningful term than "geophysical," earth resource will be used throughout this report.
Earth Resource Task Area Objectives
The purposes of the Legacy Resource Management Program which specifically pertain to earth resources are:
" 1. To establish a strategy plan and priority list for identifying and managing all significant ....... geophysical (earth ) .. resources."
"2. To provide for the stewardship of all DoD controlled or managed air, land, and water resources."
Chapter 1 Introduction

"4. To establish a standard DoD methodology for the collection, storage, and retrival of all ..... geophysical (earth) ..... information," and,
"6. To establish inventories of all scientifically significant geophysical (earth) assets on DoD lands .... as well as their interrelationship to the surrounding environment."
This report addresses legislative purposes 1 and 4. Legislative purposes 2 and 6 are being addressed at demonstration projects. Legislative purposes 3 and 5 are beyond the scope of earth resources.
The general mission of the Geophysical Task Area was to "Develop through coordination with other agencies, private organizations, and DoD professionals, the specifications and methods for exemplary management programs in the areas of geophysical (earth) resources." This mission supports the purpose of the Legacy Resource Management Program cited in the Defense Appropriations Act of 1991. The specific mission of this task area was to demonstrate and document the relationships between earth resource management and the management of both biological and cultural resources. For specific definition and descriptions of cultural resources, see LRMP (1993).
Background
The DoD is custodian of nearly 25 million acres of land; as such, enhanced resource management as provided by the LRMP is useful and necessary in its own right. It is particularly appropriate in these times of heightened environmental awareness and sensitivity, hazardous waste cleanup, increased training and operational costs, shrinking defense budgets, base closures and consolidations, increased speed and maneuverability of modem fighting vehicles and ships, and the resulting requirements for larger training areas (Figure 2). These conditions and requirements demand that resource management be conducted more efficiently and more comprehensively, that resource management operations be consolidated and integrated, and that computerized management information systems such as geographic information systems (GIS) be utilized to the maximum extent practical.
Comprehensive cultural and natural (biological and earth) resource management requires an understanding of a broad range of both natural and cultural features of the landscape. The LRMP specifically identifies the need for the inventory and the management of biological, cultural and historical, and earth resources at DoD installations. Earth resources include those characteristics and processes of the air, land, and water that may be beneficially used by humans, animals, and plants and which are not biologic in nature. Furthermore, a number of natural earth processes may be hazardous to life and property; earthquakes, volcanism, and flooding are
Chapter 1 Introduction 3

examples of such processes. These natural hazards may be viewed as "negative resources."
CIVIl WAR 216ACRES
WORlO WAR I 1 631 ACRES
WORlO WAR II J 874 ACRES
TOOAV - 82.531 ACRES
350M 250M I 200M SSOM I 6SOM 9SOM fROtiT fRONl FRONT
1865 1918 1945 1976
Figure 2. The increased speed and lethality of modern weapons systems, along with better communications and the ability to see deep in the enemy's rear echelon has resulted in
4
the need for increased training space and, consequently, increased emphasis on resource management
Earth resource phenomena are also important in affecting both the distribution and character of biological and cultural (including historic and pre-historic) resources at DoD installations. Therefore, it is important to understand both the distribution and character of earth resources as well as the influence of earth resources on the distribution of biological and cultural/historical resources. In effect, the identification and analysis of earth resources provides a foundation for the subsequent analysis of both biological and cultural resources that should provide the basis for an integrated resource management program at DoD installations (Figl!re 3).
Legislative Basis for Earth Resource Management
A major theme of the LRMP has been that good stewardship results in statutory compliance; that is, environmental efforts should not be
Chapter 1 Introduction

Biological Resources
Cultural Resources
Figure 3. Resource management will be conducted most effectively with the integration of earth, biological, and cultural resource data
compliance driven. Even so, the following discussion of compliance rules and guidelines as they penain to canh resources highlights the importance of eanh resources in environmental activities. Prior to the LRMP, there were a number of earlier legislative or statutory requirements which promulgate or involve the management or canh resources. These requirements arc diverse, and they include Federal environmental legislation, regulation:> developed by the military services. and laws or guidelines enacted by the various states and territories. The most notable Federal environmental regulations include: the National Environmental Policy Act of 1969 (NEPA) (42 USC 4321): the Clean Air Act (CAA): the Clean Water Act of 1972 (CWA) (33 USC 466): the Comprehensive Environmental Response, Compensation and Liability Act of 1980 (CERCLA); the Federal Insecticide, Fungicide and Rodenticide Act (FIFRA); the Resource Con ervation and Recovery Act (RCRA): the Safe Drinking Water Act (SDWA): the Superlund Amendments and Reauthorization Act (SARA); and the Toxic Sub-lance~ Control Act (TSCA).
The e laws, de cribed in 40 CFR, are "em ironmental" in nature in that they addre .. the pre\ ention and remediation of pollution affecting the air,
Chapter 1 IntroductiOn 5

6
waters, and the soils and rocks of the earth, whereas there are other Federal and state legislation which pertain to the exploration and extraction of earth resources such as minerals and fossil fuels. Also, there are numerous state laws addressing water rights, usage, and ownership issures. Other applicable Federal legislation include: the Coastal Zone Management Act (CZMA) (16 USC 1451), the Coastal Barrier Resource Act of 1982 (CBRA) (16 USC 3501), the Wilderness Act of 1964 (WA) (16 USC 1131-1132), the Farmland Protection Policy Act of 1981 (FPA) (7 USC 4201 et seq), the Wild and Scenic River Act, and the National Trails System Act. Although most of these laws and guidelines specifically address earth resources management, some do not; however, in most of them the need for earth resource data is implied.
Earth resource applications may also be important in addressing biological and cultural resource issues. Federal legislation pertaining to biological concerns is given in the Endangered Species Act of 1973 as ammended (ESA) (16 USC 1531). A number of legislative actions pertain to cultural resources including but not limited to: Historic Sites Act of 1935 (HSA) (16 USC 461 et seq), National Historic Preservation Act of 1966 (NHPA) as ammended (16 USC 470), Archaeological and Historic Preservation Act of 1974 (AHPA) (16 USC 469 et seq), Regulations for the Protection of Historic and Cultural Properties (ACHP) (36 CPR 800), Archaeological Resources Protection Act of 1979 (ARPA) (16 USC 470), and Department of the Interior - Criteria for Inclusion in the National Register of Historic Places (36 CFR 60.4). The Environmental Protection Agency (EPA) (1988) provides general guidelines and procedures for addressing the requirements of these legislative actions.
DoD Regulations
Regulations developed by the uniformed services also exhibit the twofold categorization in that they are considered either as "environmental" in which they promulgate the Federal environmental legislation, or they are categorized as "natural resources." For example, Air Force Regulations (AFR) 19-1 through 19-6 address environmental planning, whereas APR (or manuals) 126-1 through 126-8 are entitled "natural resources" which include land, forest, and wildlife management, outdoor recreation and cultural values, and historic preservation.
Earth, as well as biological and cultural, resources are addressed in a number of Army Regulations (AR's) as follows: Army Regulation series 115, Climatic, Hydrological, and Topographical Services; AR 200, Environmental Quality; AR 210, Installations, specifically, AR 210-9, Use of Off-Road Vehicles on Army Lands; AR 405, Real Estate, specifically AR 405-30, Mineral Exploration and Extraction; AR 420, Facilities Engineering, specifically AR 420-40, Historic Preservation; AR 420-47, Solid and Hazard Waste Management; and AR 420-74, Natural Resources, Land, Forests and Wildlife Management. For the Navy, OPNAVINST 5090.1A,
Chapter 1 Introduction
Environmental and Natural Resources Program Manual, is the primary document stating the requirements, responsibilities, and policies for the management of natural and cultural resources and the environment.
Computer-aided Environmental Legislative Data System (CELDS)
Resource managers seeking guidance on legislative or statutory requirements on many aspects of earth resources may consult the Environmental Technical Information System (ETIS) and its Computer-aided Environmental Legislative Data System (CELDS) developed by the U.S. Army Construction Engineering Research Laboratory (CERL). This on-line system, operated by the University of Illinois, Urbana-Champaign, provides abstracts on most state and Federal environmental legislation. The system consists of a subject glossary and key words for each environmental subject. The database may be queried on the basis of key word or other parameter, and the database will provide an abstract of the legislation, its date, title, proponent, and other information.
Earth Resources and CELDS
The earth resource subjects contained in the CELDS glossary and key word list are listed in Appendix A and the principal earth resource key words are shown in Table 1. The table also shows the number of state and Federal legislative accessions in CELDS for each key word. The number of legislative accessions is impressive, particularly for certain key words such as groundwater, surface water and monitoring; however, there are repetitions because some legislation may involve all three key words.
Paragraph 264.600 of 40 CFR, Chapter 1, Subpart X, Miscellaneous Units, is an example of Federal environmental legislation that addresses hazardous waste and earth resource subjects described in this report. These subjects must be generally known and understood by resource managers. The performance standards given in Paragraph 264.601 for hazardous waste are based upon consideration of earth resource data which are condensed and shown in Table 2. The earth resource subjects given in Table 2 include hydrology, geology, groundwater (quality, quantity, use and flow direction), topography, surface water and its quality and use, meteorology, atmospherics, precipitation patterns, and air quality.
Chapter 1 Introduction 7

Table 1 Earth Resource Key Words Taken from the CELDS Glossary, and the Numbers of Accessions in the Database for That Keyword
Number of Accessions
KeyWords State Federal Total
Air sampling 296 37 333
Aquifers 127 12 139
Bays, speclf 40 11 51
Coal 85 6 91
Coastal Zones 218 26 244
Dredged materials 71 21 92
Estuaries 62 13 75
Aoodplains 184 10 194
Fossil Fuel 82 9 91
Gas wells 193 1 94
Groundwater 651 60 711
Lakes. specific 59 3 62
Land classification 76 0 76
land preservation 246 15 261
Mineral mines 107 15 122
Monitoring (air, water, soil) 1,942 269 2,211
Natural gas 91 6 97
Navigable waters 46 26 72
Oil wells 197 6 203
Ore mines 3 12 15
Petroleum 231 19 250
Rivers. specific 135 20 155
Runoff 245 37 282
Sediments 32 4 136
Shale oil 4 0 4
Surface water 756 31 787
Underground injection wells 201 41 242
Uran1um mines 20 5 25
Wetlands 163 10 173
Zone or aeration 22 3 25
Note: Subjects and key words are given in Appendix A.
8 Chapter 1 Introduction

Table 2 A List of Earth Resource Subjects Which Must Be Considered for Establishing Performance Standards In Subpart X, Chapter 1, 40 CFR. Earth Resource Subjects and Data Elements Are Underlined
Paragraph 264.601 (a) (2) The hydrologic and geologic characteristics of the (waste) unit and the surrounding area; (3) The existing quality of ground water. including other sources of contamination and ...... . (4) The patterns of land use in the region:
1-----Paragraph 264.601 (b)
(3) The hydrologic characteristics ot the unit and the surrounding area, including the topography of the land around the unit;
(4) The patterns of precipitation in the region, (5) The quantity, quality and direction of ground-water flow; (6) The proximity of the unit to surface waters; (7) The current and potential uses of nearby surface waters and any water quality standards
established tor those surface waters; (8) The existing quality of surface waters and surface soils. including other sources of
contamination ..... ;
Paragraph 264.601 (c) (4) The atmospheric, meteorologic, and topographic characteristics of the unit and
the surrounding area; (5) The existing quality of the ~ including other sources of contamination and ... ..... ; L...---
Holistic Integrated Resource Management
The EPA guidelines and review proceedures for ensuring that CERCLA/ SARA remediation activities comply with NEPA and other environmental laws imply the need for an integrated and holistic approach to the management of earth, biological, and cultural resources. CERCLA/SARA remediation studies must specifically address (as applicable): wetlands, water bodies, floodplains, endangered and threatened species, critical habitats, coastal zones, coastal barriers, cultural resources, wild and scenic rivers, wilderness areas, and significant agricultural lands (U.S. Environmental Protection Agency, 1988). It stands to reason that these guidelines, developed for sites and activities at which environmental damage has occurred or at which such damage may occur, should also be considered at DoD installations in order to monitor existing conditions, to enhance them where appropriate, and to prevent future environmental harm.
Chapter 1 Introduction 9
10
2 Overview of Earth Resources
General
The broad definition of the term earth resources refers to the earth as a planet which includes the solid earth (lithosphere), the hydrosphere, and the atmosphere. These three spheres are described in general terms below.
Lithosphere
The global interaction within the lithosphere, hydrosphere, and atmosphere is described and defined by the rock cycle, illustrated in Figure 4. The rock cycle includes those geological and geophysical processes which describe the origin of the earth's features . These processes are weathering, erosion, sedimentation, lithification, metamorphism, crustal deformation, volcanism ami magmatic activity, and seismicity. These processes are cyclic and the energy driving these processes include thermal energy from within the earth and from the sun, potential and kinetic energy relative to gravity and elevation on the earth's surface or within the crust, and mechanical energy derived from the motion of crustal plates at the earth's surface.
Hydrosphere
Surface, subsurface, and atmospheric waters on, under, and above the surface of the earth are described by the hydrologic cycle shown in Figure 5. There are several basic elements of this cycle, namely, there is negligible addition or loss of water, the oceans are the main reservoir of water fo r the atmosphere and the continents, the waters and the lithosphere mutually interact, the waters are transitory in nature and are in nearly continual motion, and their movement is controlled by thermal energy from the sun
Chapter 2 Overview of Earth Resources
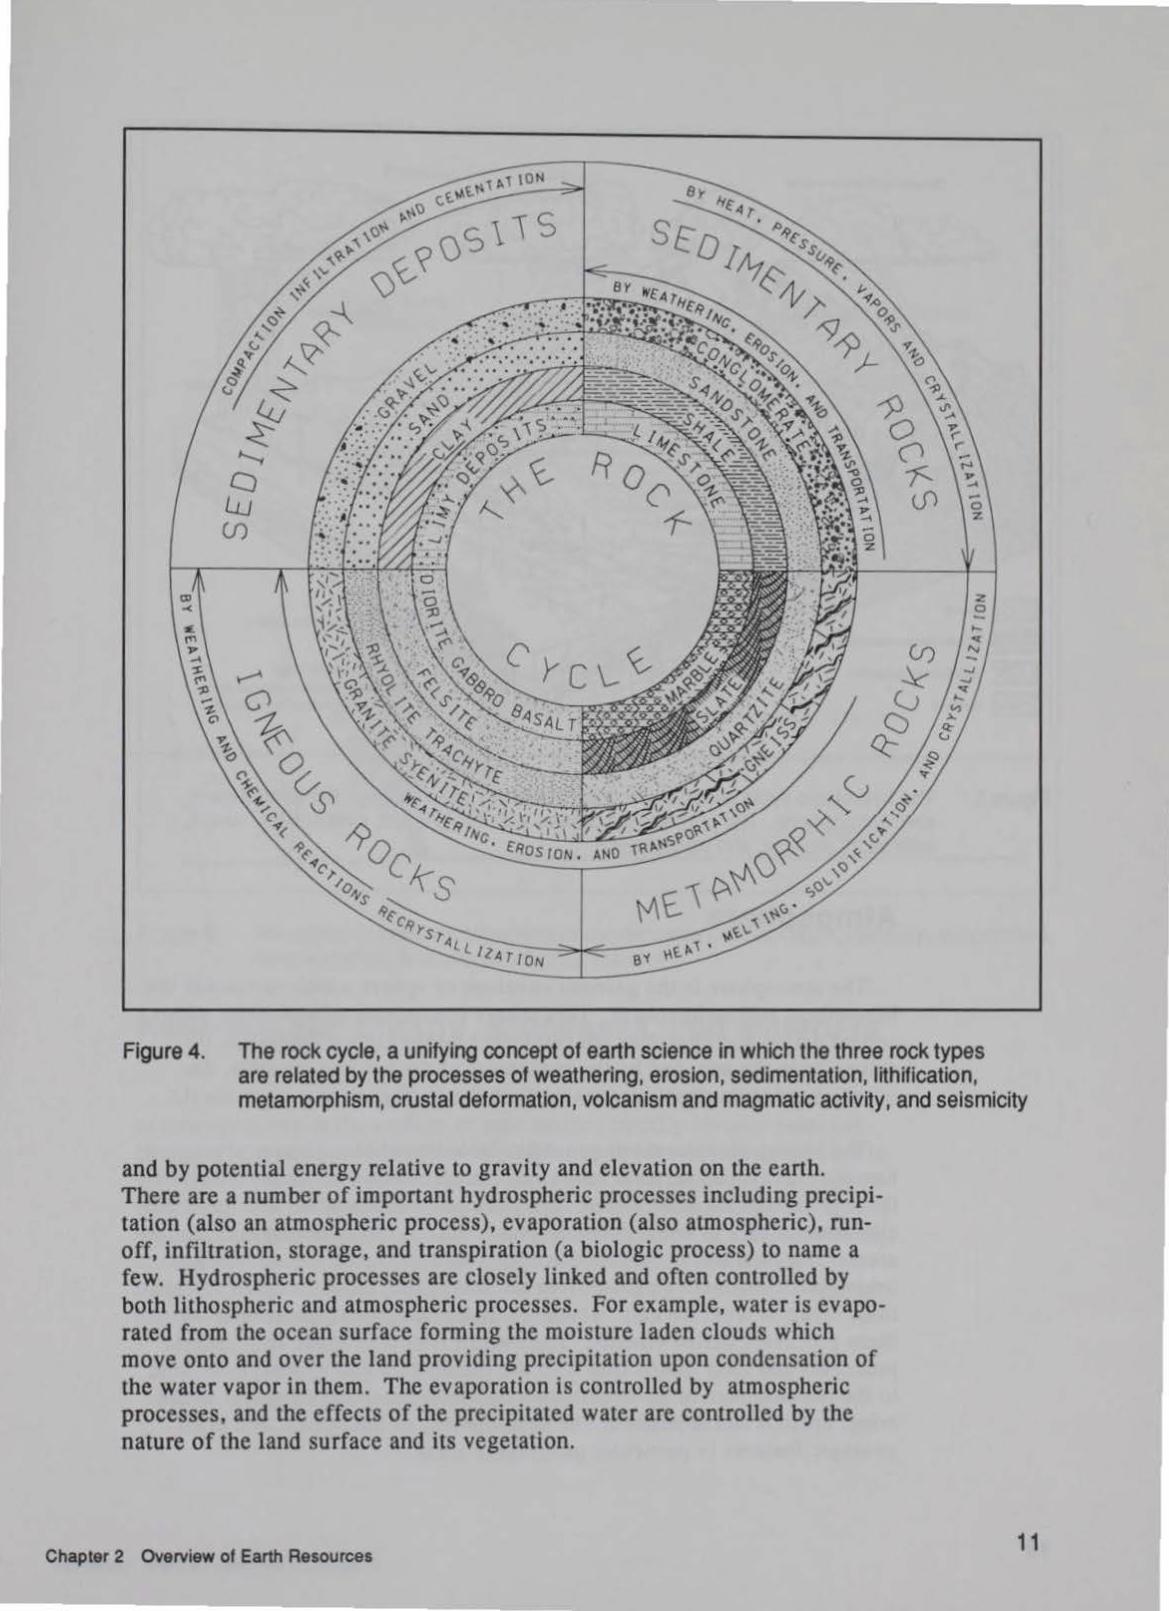
Figure 4. The rock cycle, a unifying concept of earth science in which the three rock types are related by the processes of weathering, erosion, sedimentation, lithification, metamorphism, crustal deformation, volcanism and magmatic activity, and seismicity
and by potential energy relative to gravity and elevation on the earth. There are a number of important hydrospheric processes including precipitation (also an atmospheric process), evaporation (also atmospheric), runoff, infiltration, storage, and transpiration (a biologic process) to name a few. Hydrospheric processes are closely linked and often controlled by both lithospheric and atmospheric processes. For example, water is evaporated from the ocean surface forming the moisture laden clouds which move onto and over the land providing precipitation upon condensation of the water vapor in them. The evaporation is controlled by atmospheric processes, and the effects of the precipitated water are controlled by the nature of the land surface and its vegetation.
Chapter 2 Overview of Earth Resources 11

[g Sond
~ Shole (impermeoble)
Fz~: Sondstone (oquifar)
~ Gronite Frelhwoter/seowoter
interfoco
--- Wotertoble
-- Direction of woter or moisture movement
Figure 5. The hydrologic cycle describing the circulation of water through the atmosphere and hydrosphere. The principal processes are precipitation, evaporation, runoff, infiltration, storage, and transpiration
12
Atmosphere
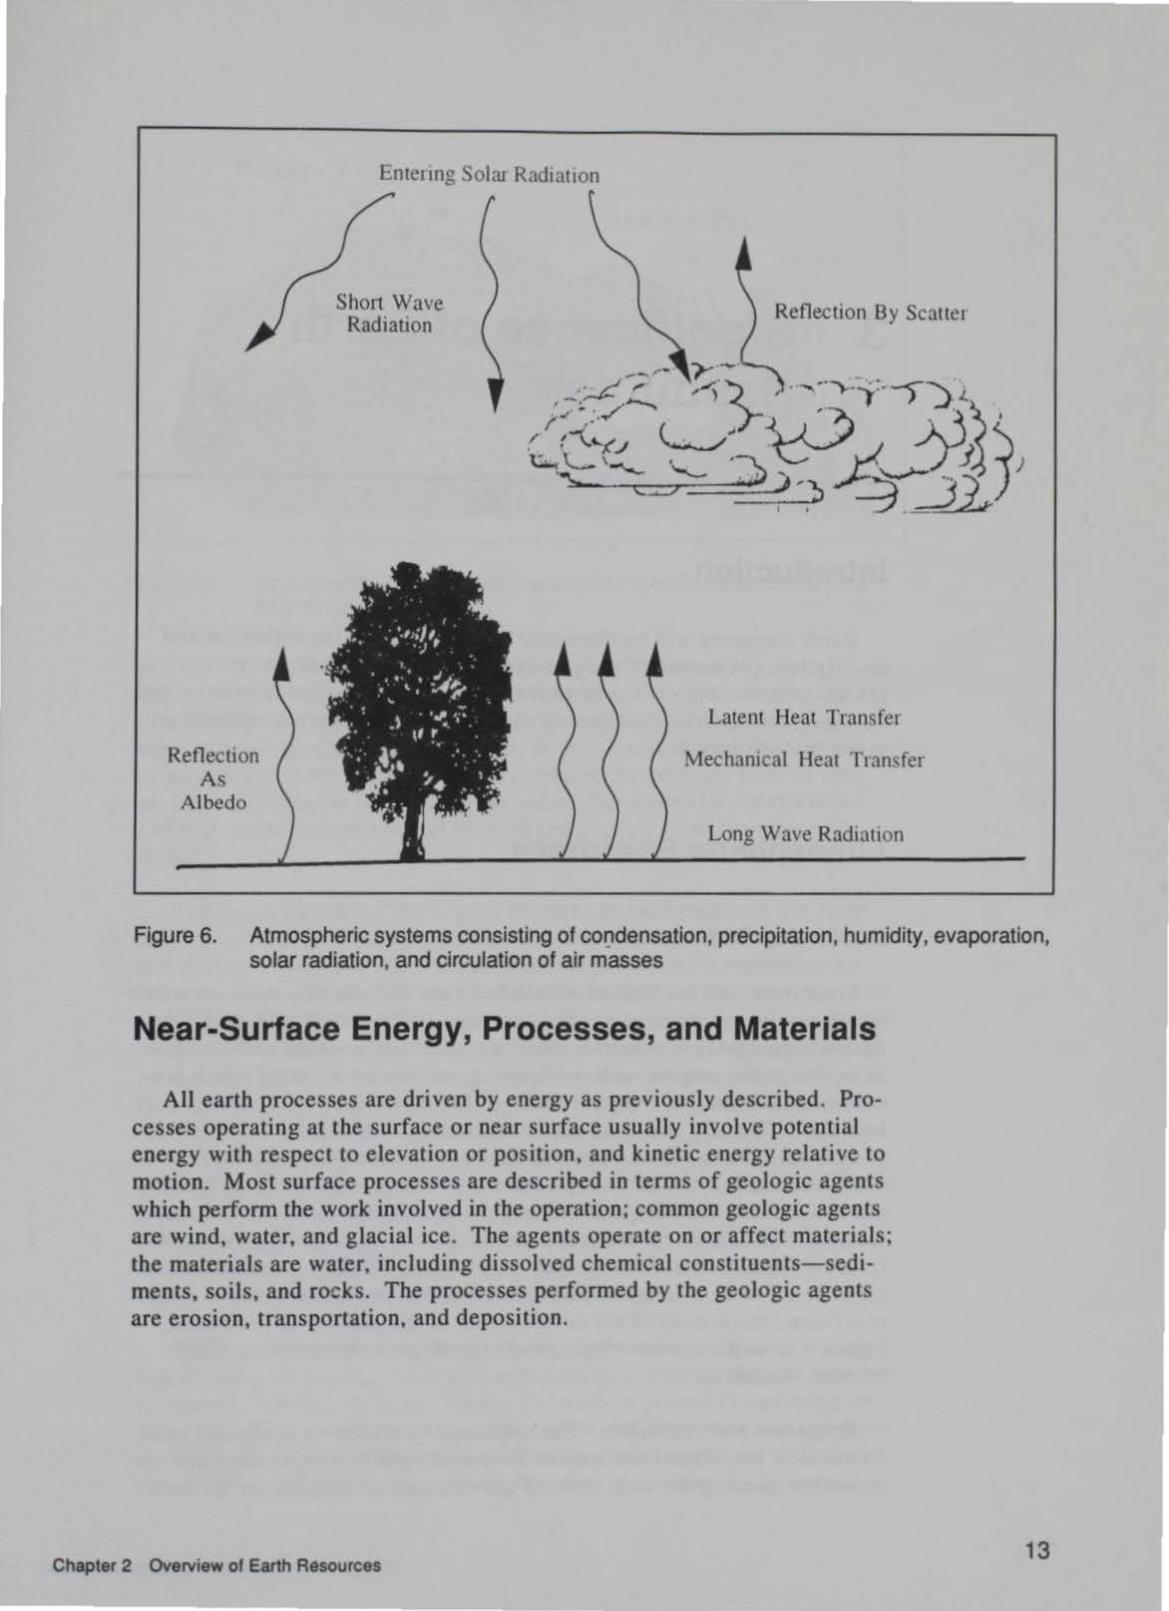
The atmosphere is the gaseous envelope or sphere which surrounds the lithosphere and hydrosphere. This sphere consists of air and water vapor, and its nature and character are controlled by the thermal radiation received from the sun, and by the movement of the earth in its orbit. An overview of atmospheric processes is shown in Figure 6.
The important atmospheric processes include: condensation, precipitation, humidity, evaporation, solar radiation, and circulation of winds. Most of these processes are interrelated. For example, condensation results in precipitation of rain or snow under certain conditions of humidity and temperature. Temperature, in turn, is controlled by solar radiation, season and orbital position, and circulation. In the short term, these complex interactions result in what we call "weather." In the long term, the results of these processes define climate. The overall results of these atmospheric processes and their interaction with the lithosphere and hydrosphere lead to the development of particular soils by mechanical and chemical weathering, erosion and deposition, the development of landforms, and other geologic features in particular geographic areas.
Chapter 2 Overview of Earth Resources
Reflecuon As
Albedo
Eme11ng Sola~ Radiation
Short Wave Radiation
')
.. •'
. · •. ,J:J ,, .. ') (
... ~., -
t. ,/ . . . • . • ::.11:, ·, \. .,. • ...
'JI , ...
J ,, ( .
. ~·. ·· .. .. .
·.
:, .. . .... · .. . ~ . I
\
Reflection By Sca11e1
Latent Heat Transfe1
Mechanical Heat Transfer
Long Wave RadJallon
Figure 6. Atmospheric systems consisting of cor:tdensation, precipitation, humidity, evaporation, solar radiation, and circulation of air masses
Near-Surface Energy, Processes, and Materials
All earth processes are driven by energy as previously described . Processes operating at the surface or near surface usually involve potential energy with respect to elevation or position, and kinetic energy relative to motion. Most surface processes are described in terms of geologic agents which perform the work involved in the operation; common geologic agents are wind, water, and glacial ice. The agents operate on or affect materials; the materials are water, including dissolved chemical constituents-sediments, soils, and rocks. The processes performed by the geologic agents are erosion, transportation, and deposition .
Chapter 2 Overview of Earth Resources 13

14
3 Significance of Earth Resources
Introduction
Earth resources will be discussed in terms of their (a) definition and description, (b) materials and processes associated with the resource, (c) interrelationships of the earth resources with biological resources, and (d) cultural resources. A glossary of selected earth resource terms is given in Appendix B.
Lithospheric Resources
Rocks and Sediments
Overview. All land-based installations are underlain by earth materials which may be categorized as either rocks or sediments. Rocks are hard, indurated aggregates of minerals which are of either igneous, sedimentary, or metamorphic origins; sediments are aggregates of minerals which are not indurated, and have not yet reached the sedimentary rock state of the rock cycle. Usually, the rocks and sediments will exhibit weathering zones at their surfaces in which soils will develop. On many installations the rocks and sediments will be exposed at the surface m outcrops in which one can identify the composition, origins, processes, and history of the materials. Generally, the rocks and sediments may be considered resources from two standpoints; namely, they may contain valuable economic minerals or fossil fuels as described elsewhere, and, more universally, in them is reflected the history of the development of that portion of the planet. Figure 7 is an illustration of the general geologic setting at Pine Bluff Arsenal, Arkansas.
Processes and materials. The processes by which the rocks and sediments have formed and are now in the present position or location are those described by the rock cycle (Figure 4) such as volcanic or tectonic
Chapter 3 Significance of Earth Resources

Water Well
~
Clay Lake
Figure 7. An example of geologic setting and lithospheric resources at Pine Bluff Arsenal, Arkansas
activity. Thus, examination of the rocks and sediments will lead to the understanding of the geologic history of the installation and, thereby, an understanding of the processes affecting the installation. Depending upon the nature of the rocks and sediments, the processes responsible for the origins of the materials may have occurred in the geologic past, or they may be occurring on the installation today. The materials are the rocks and sediments themselves and mineral and organic matter contained in them.
Biological impacts. The impact of rocks and sediments on the biota may be indirect or direct and strongly influenced by tectonic events, climate, and surface processes. The character and distribution of vegetation are often usually controlled by rock and sediment type, particularly in arid or semi-arid areas. In such areas, particular types of plants may be restricted to specific rock outcrops, and bands or belts containing these plants may be seen extending across the landscape. In extreme cases, one particular type of rock may be the only one capable of supporting vegetation. Often, rock or sediment controls occur because of the ability of a particular kind of rock or sediment to contain and retain moisture. Figure 8 shows the general geologic setting of the endangered pitcher plant at Eglin Air Force Base, Florida. The habitat of this plant is restricted to slope wetlands and steep head areas near upland surfaces. Another example is given in Figure 9 which illustrates the relations between vegetation and geomorphic landforms at Longhorn Army Ammunition Plant, Texas.
Cultural and historic impacts. Human habitation. cultivation, economic conditions, and other activities are controlled by intricate relations between rock and sediment type, and climatic and surface processes operating on these rocks and sediments. For example, the rich farmlands and extensive agricultural industry of the Midwest, the Mississippi Alluvial Valley, and Great Valley of California are possible because of the interactions between
Chapter 3 Significance of Earth Resources 15

.......
50
40
30
20
10
0
lnf i ltrotion
. . . . . . . . . . . . . . . . . . . . . . . . . . . . . . . . . . . . . . S on d. . . . . . . . . . . . . . . . . . . . . . . . . . . . . . . . . . . . . . . . . . . . . . . . . . .
Figure 8. An example of the endangered pitcher plant in its steep head habitat near upland surfaces at Eglin Air Force Base, Florida
Wiled Hwclooood. Pine Ridges
u ..... Slope
Figure 9. The relations between botanical habitats and stream terraces at Longhorn Army Ammunition Plant, Texas
16
the nature of the earth materials in these areas, the geologic processes which have led to their formation, and the climate. Rocks may also represent traditional places of Native Americans, or archeological s ites containing paintings or other evidences of past human activity.
Soils
The importance of soils as resources may be viewed in terms of their agricultural, engineering, and economic mineral applications. The definition of the term "soil" is a function of discipline; in agriculture, soil is a non- indurated aggregate of mineral grains exhibiting horizons each having specific attributes and which supports vegetation; in engineering, soil is a non- indurated, loose aggregate of mineral grains which may be either residual or transported in origin. Also, an engineering soil may be distinguished
Chapter 3 Significance of Earth Resources
from rock on the basis of strength. The geologic definition is similar to the engineering one except that it includes only residual soils or regolith. In regard to the latter, transported soils wou ld be considered sediment. Soil would be economically important if it contained specific, economically important mineral species, or if it could be used commercially for construction or other purposes. Aside from transported soi ls or sed iments, soils are produced by chemical and mechanical weathering of near-surface rocks or sediments. The horizons of a typical soil profile are shown in Figure 10.
Agronomic Soils
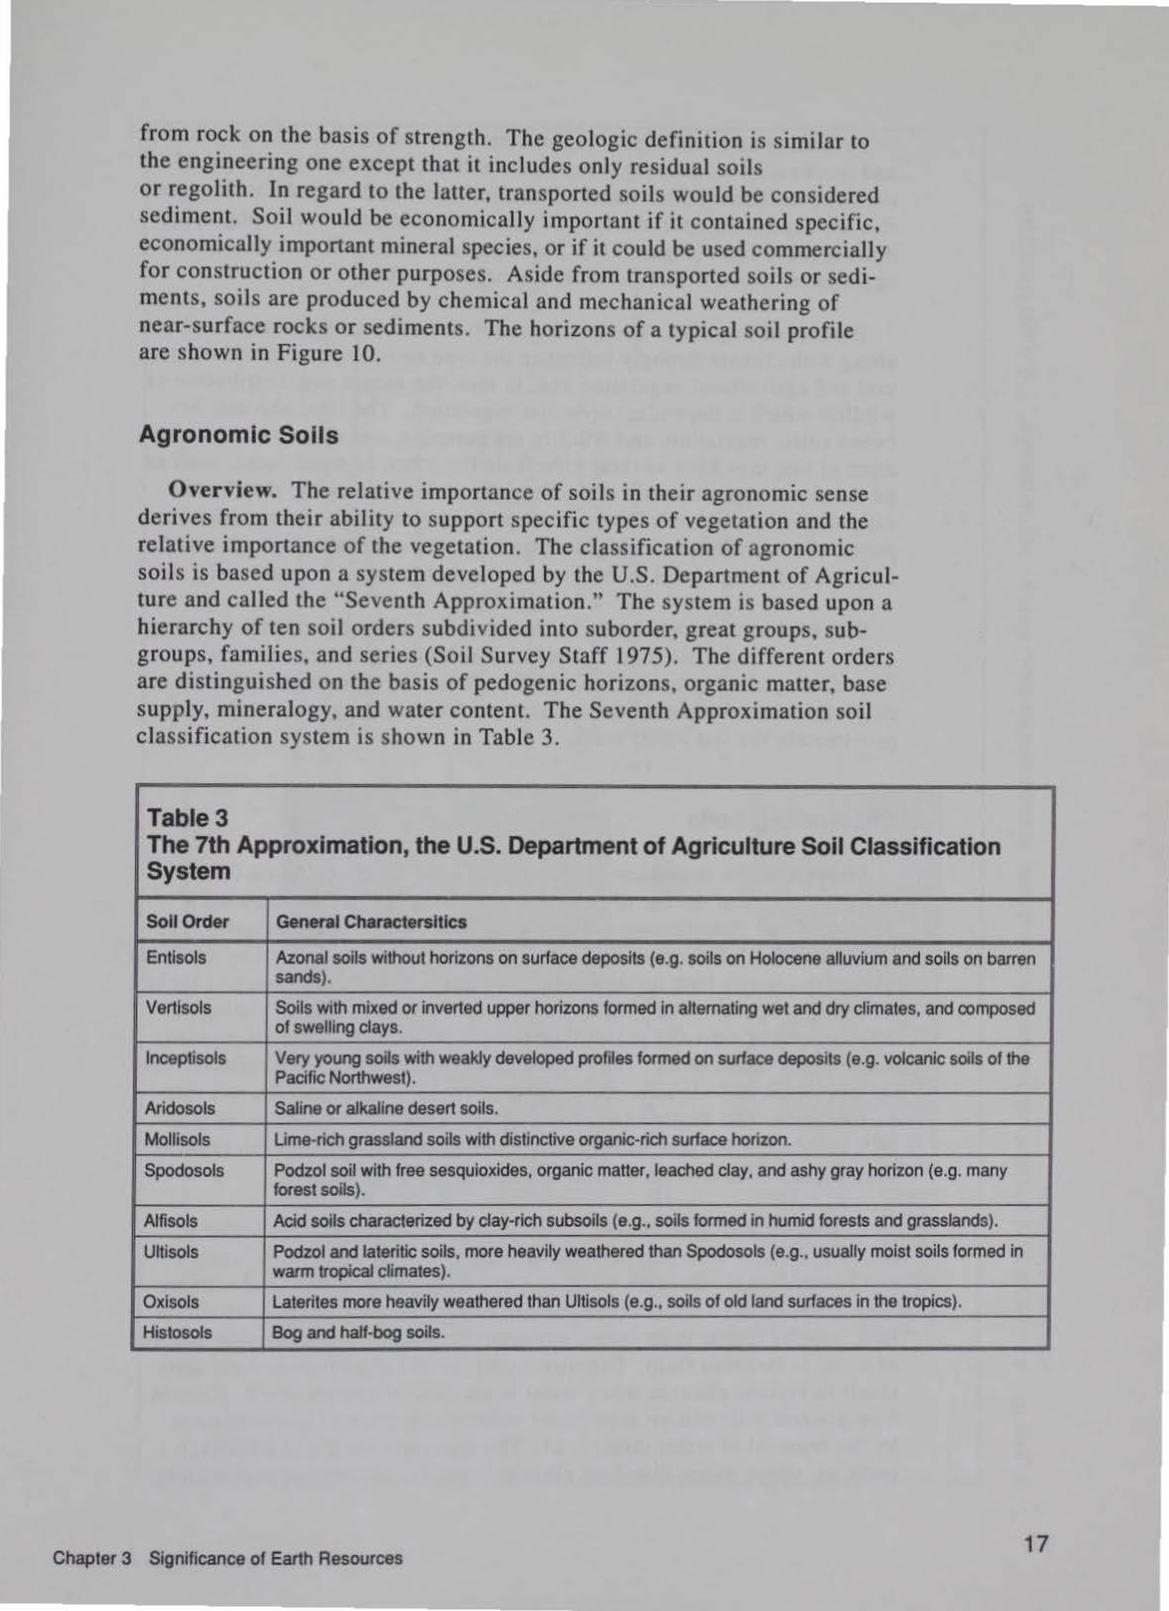
Overview. The relative importance of soils in their agronomic sense derives from their ability to support specific types of vegetation and the relative importance of the vegetation. The classification of agronomic soi ls is based upon a system developed by the U.S. Department of Agriculture and called the "Seventh Approximation." The system is based upon a hierarchy of ten soil orders subdivided into suborder, great groups, subgroups, families, and series (Soil Survey Staff 1975). The d ifferent orders are distinguished on the basis of pedogenic horizons, organic matter, base supply, mineralogy, and water content. The Seventh Approximation soil classification system is shown in Table 3.
Table 3 The 7th Approximation, the U.S. Department of Agriculture Soil Classification System
Soli Order General Charactersltlcs
Entisols Azonal soils without horizons on surface deposits (e.g. soils on Holocene alluvium and soils on barren sands).
Vertisols Soils w1th mixed or inverted upper horizons formed in alternating wet and dry climates, and composed of swelling clays.
lnceptisols Very young soils with weakly developed profiles formed on surface deposits (e.g. volcanic soils of the Pacific Northwest).
Aridosols Saline or alkaline desert soils.
Mollisols Lime-rich grassland soils with distinctive organic-rich surface horizon.
Spodosols Podzol soil with free sesquioxides, organic matter, leached clay, and ashy gray horizon (e.g. many forest soils).
Alfisols Acid soils characterized by clay-rich subsoils (e.g., soils formed in humid forests and grasslands).
Ultisols Podzol and lateritic soils, more heavily weathered than Spodosols (e.g., usually moist soils formed in warm tropical climates).
Oxisols Laterites more heavily weathered than Ultisols (e.g., soils of old land surfaces in the tropics).
Histosols Bog and half-bog soils.
Chapter 3 Significance of Earth Resources 17

18
Processes and materials. Agronomic soils are produced by physical and mechanical weathering processes which result in the breakdown of rock and sediment parent material; the soil order and subordinate categories are dependent upon the type of parent material, c limate, topography, drainage, and time (Figure II). The materials in the soil include mineral aggregates, water, dissolved ions, and organic matter.
Biological impacts. The quality and distribution of agronomic soils along with climate strongly influence the type and distribution of both natural and agricultural vegetation and, in turn, the nature and distribution of wildlife which is dependent upon the vegetation. The interrelations between soils, vegetation, and wildlife are complex, and disturbance or alteration of one may have adverse effects on the other. In some cases, such as on the thin serpentine soils at the Presidio of San Francisco, the chemically distinctive nature of the soil supports unique plant communities composed of very rare species highly adapted to the unusually high levels of iron, magnesium, nickel, chromium, and cobalt present in some soils.
Cultural and historic impacts. Humans live close to and depend on agronomic soil to sustain their agricultural or hunter-gatherer civilization. Therefore, globally, the quality and di stribution of agronomic soil have controlled the distribution the cultural and historic development for approximately the last 2,000 years.
Engineering Soils
Overview. The engineering properties of soil s are important earth resources because of the use of these materials in construction. There are a number of soil classification systems used by government and industry. The Unified Soils Classification System (USCS), for example, is used by civil engineers to classify both residual soils and transported soils (sediments) for engineering purposes. The system is based upon composition and sorting of soil particles of sand and gravel s ize, and the plasticity of the finer-grained, silt and clay constituents. The purpose of the system is to place soils into categories which provide information on their engineering properties and their performance. The engineering classification of soils is not a resource in itself; however, it is a tool which can be used to identify resources to estimate their impacts. An overview of the USCS is given in Table 4.
Processes and materials. By processes, we refer to the behavior of soils in terms of strength , permeability, density, compaction, expansion and consolidation. Strength refers to soil's ability to sustain a load without failing. Soils are usually compacted to increase their densities, which, in turn, usually results in increased strength. Permeability describes the ability of a soil to transmit fluid. Expansion and shrinkage of fine-grained soils result in volume changes when water is either added or removed. Certain fine-grained soils exhibit significant vo lume reduction or consolidation by the removal of water under load. The materials are the soil mineral particles, water, gases, dissolved chemical species, and organic constituents.
Chapter 3 Significance of Earth Resources


Figure 11. Soil depicted as a function of time, climate, relief, organisms, and parent material
Table 4 Unified Soil Classification System (Abbreviated) 1
Selected Properties
Group Symbols Description Drainage Compaction Expansion
GW Well-graded gravel Excellent Excellent None
GP Poorly graded gravel Excellent Good Slight
GM Silty gravel Low Good None
GC Clayey gravel Very low Good Slight
sw Well-graded sand Excellent Excellent None
SP Poorly graded sand Excellent Good None
SM Silty sand Low Good Some
sc Clayey sand Very low Good Slight
ML Silt, low plasticity Fair-Poor Poor iF air SlighVmedium
MH Silt, high plasticity Fair-Poor Poor/Fair Medium
OL Organic silt Very low Poor/Fair Medium/high
CL Clay,low plasticity Impervious Fair/Good Medium
CH Clay. high plasticity Impervious Poor/Fair High
OH Organic clay Impervious Poor High 1 Soil groups are determined from grain-size distributions and Atterberg limit tests of the fine-grained size fractions. The classification system permits the identification of important soil properties such as permeability (or drainability), compactability, and shrink/swell potential which are shown here.
Biological Impacts. The engineering properties of soils define conditions which have a direct bearing on the character and distribution of flora and fauna; thus, knowing the uses class ification of a particular soil and its geologic environment, we can gain further understanding of the habitat
Chapter 3 Significance of Earth Resources 21
22
and, in turn, estimate the character and distribution of flora or fauna. For example, soils described as CH (highly plastic clay) would exhibit low strength when moist, low permeability, and high expansion; such soils, being fine-grained, would occur in low energy environments and have poor drainage. The flora and fauna would consist of those species tolerant of such conditions.
Cultural and historic impacts. The impact of the engineering properties of soil on human cultural and historic activities is considerable and, in conjunction with geologic environment, permits the identification of potential camp sites and settlements. The knowledge of engineering properties also provides explanation for the abandonment of camps and settlements because of adverse conditions. Those engineering properties of soils most suitable for human habitation and exploitation and of greatest interest to engineers and planners would posses high strength, high density, high permeability (well-drained), and minimum expansion (compressibility).
Soli Moisture
Overview. In addition to a soil's agronomic and engineering properties, the water held by the soil is an important resource which can be determined from either its agronomic or engineering classification. Water occurs in the pore spaces of soils as it percolates downward toward the water table.
Processes and materials. Soils above the water table hold water in three different ways: (a) by gravity, in which case the water is flowing downward through the soil, (b) by capillarity through surface tension in fine-grained soils, and (c) by molecular attraction and the sorption of water molecules on the surfaces and within fine-grained soils. These relations are shown diagrammatically in Figure 12. Fine-grained soils such as silts and clay occurring above the water table may also hold water in their pore spaces by the action of surface tension. Very fine-grained soils consisting of clays also hold water on the surfaces of the clays by molecular attraction (either absorbed or adsorbed water). Generally, absorbed or adsorbed water is unavailable to plants.
Biological impacts. The amount of soil moisture available to support higher plants affects the distribution of vegetation. The quality and distribution of the vegetation often then partiaJly determine the associated animal distribution. The availability of soil moisture to plants is a function of physical and chemical properties of the soil and characteristics of the plant. Water held by gravity and capillarity (about 1-15 and 15-30 millibars pressure, respectively) is available to most plants. Sandy soils drain rapidly by gravity if free drainage occurs, making them poor soil moisture resources. Medium textured (loamy) soil, a mixture of sand, silt, and clay, usually holds most of its moisture by capillarity and provides the most potential soil moisture to plants under natural drainage conditions. Finegrained or "heavy textured" soils rich in clay hold most of their moisture
Chapter 3 Significance of Earth Resources


24
hygroscopically at greater than 30 millibars pressure, beyond the wilting point of most plants.
Cultural and historic impacts. The availabi lity and amount of soil moisture may often be the difference between agricultural, or military, success or failure. During "dust bowl" times, the so il moisture reached "permanent wilting point" resulting in the death of most plants. When the soi lmoisture is too high, soil strength may be so reduced that farm equipment cannot be operated in the fields, and these conditions may also severely restrict the movement of heavily armored military vehicles. The Condensed Army Mobility Model System (CAMMS) may be used to determine the effects of soil moisture on the mobility of military vehicles.
Metallic and Non-Metallic Minerals
Overview. Deposits which contain metallic or non-metallic minerals in sufficient quantity and quality, and which are economically recoverable may be or may have been important earth resources in some locations. These deposits include ores of important metals such as gold , silver, iron, aluminum, and lead, and non-metallic minerals such as potash, sulfur, silica, lime, and gypsum. The soil minerals, kaolinite and bentonite, are also included as non-metallic minerals. Table 5 is a short list of common economic minerals.
Table 5 Economic Minerals 1
Use Mineral
Iron and steel Iron ore Alloys Manganese, chromium, nickel, tungsten, molybdenum, vanadium, cobalt Other metals Copper, zinc, lead, tin, aluminum, mercury Precious metals Silver, gold, platinum
Metallurgy Auorite, bauxite, graphite Chemical industry Salt. sulfur, borax, coal Fertilizer Phosphates, potash, nitrates, calcite Ceramics Clay, feldspar. quartz Abrasives Diamond. garnet, quartz, corundum 1 An abbreviated list of oommon economic minerals. The upper portion of the table lists metallic mineral, and the lower portions gives the non-metallic.
Processes and materials. Mineral deposits originated as a part of the rock cycle by either sedimentary, igneous, or metamorphic processes, and they may have been further concentrated by weathering processes. The economic minerals, thus, occur in either sedimentary, igneous, or metamorphic rocks, or in soils. Minerals are naturally occurring, inorganic (usually), chemical substances having more-or-less regular internal structure, and are classified on the basis of their chemistry, e.g., native minerals, si licates, carbonates, sulfides, and their structure .
Chapter 3 Significance of Earth Resources

Biological impacts. Generally speaking, the effects of metallic or nonmetallic minerals on the biota are indirect, and these effects are derived from interactions between the biota and the soils produced by the weathering of the deposit, and between the biota and waters draining the deposit or by waters draining old mine workings or tailings. Usually, the soils derived from the deposit contain chemical elements or trace elements which are different from those of the surrounding non-mineralized rock. In some cases, where these chemical differences are pronounced and where the element or trace element is present in relatively high concentrations, the vegetation will consist of those plants which are tolerant of the element or trace element. For example, the presence of princes plume (Stanley pinnata) at the Air Force Academy, Colorado, is a specific indicator of high levels of selenium in the soil. Selenium is a vital element to grazing animals in which it facilitates vitamin E production necessary to prevent white muscle disease. However, when selenium is present in levels high enough to support princes plume, the vegetation cattle consume often contains toxic selenium levels, resulting in loss of hair, sloughing of hoves, liver injury, and death by starvation. Similar examples could be given for fauna; however, these faunal impacts may not be as important as impacts of vegetation. The mming and extraction of mineral deposits may have a significantly greater and potentially adverse effect on both the flora and fauna through disruption of habitats, and from other side-effects of the mining operations. Past mining operations may have resulted in hazardous wastes or safety problems such as ground subsidence and dangerous underground openings.
Cultural and historic impacts. In parts of the Old World, many metallic and non-metallic mineral deposits have been worked or mined for hundreds or thousands of years, and, in Europe and elsewhere, there are examples of deposits which have been worked almost continuously since Roman times. Such deposits have become a part of the heritage of the country in which they are located. Similar examples may be given for this country for shorter periods of time. Even so, there are many parts of this country which were settled primarily because of the occurrence of economic mineral deposits; also, some deposits had been worked earlier by Native Americans. Some deposits have been worked out and the deposits depleted resulting in economic declines; however, there are many which still contain minerals but cannot be worked because of economics, another factor contributing to community abandonment.
Energy Resources
Overview. This category includes petroleum, natural gas, and coal (referred to collectively as fossil fuels), and geothermal and hydro-electric energy. The successful exploration and development of these resources have been important ingredients in the economic and societal growth of this country. Figure 13 shows the locations of coal resources in the United States.
Chapter 3 Significance of Earth Resources 25
26
Processes and materials. Fossil fuels are associated almost exclusively with sedimentary and geothermal processes operating on and under the earth's surface. Petroleum and natural gas occur in the pore space of sediment and sedimentary rocks and are concentrated in traps formed by sedimentary and tectonic processes. Typical geologic settings for oil and natural gas are shown in Figure 14. Prospects for geothermal energy occur in areas exhibiting steep geothermal gradients, that is, great differences between temperatures at the surface and those at depth, which have developed because of igneous, metamorphic, or tectonic processes. The materials involved with geothermal energy include high temperature rocks, and hot water or steam. Hydroelectric energy is available in those locations exhibiting geologic and hydrologic conditions requisite for the construction of hydro-electric dams. These energy resources are, perhaps, some of the more important ones under consideration.
Biological impacts. The impact of in situ, undisturbed fossil fuels on the biota is minor; however, there are examples of interactions between the biota and hydrocarbons at seeps where the hydrocarbons were exposed at or seeped to the surface and in which animals were trapped. Probably the most significant impact on the biota has been habitat loss from the extraction and development of fossil fuels.
Cultural and historic impacts. The impacts of fossil fuel on local culture and history are similar to those of metallic and non-metallic mineral deposits except that the development of fossil fuel is relatively recent. Even so, the settlement and/or growth of communities and regions have occurred because of the prosperity derived from these resources; conversely, the depletion of these resources have, in certain circumstances, resulted in decline of communities. Locally, energy exploration and extraction may pose a threat to cultural sites.
Construction Materials
Overview. In this category are included those resources which are used for construction or other engineering use. Building (dimension) stone, sand and gravel aggregate for concrete, portland cement materials, and sources of light-weight aggregate are typical examples of these resources. Also, the in situ soil, sediment, or rock foundation materials upon which structures are built are also resources. Foundation materials may be satisfactory, or they may be deleterious in that they are unsuitable for structural foundations. Deleterious foundation materials may even be considered natural hazards in some cases (see Chapters 4 and 5). The locations of construction materials are usually shown in Terrain Folios prepared for some Army installations. Some common construction materials are shown in Table 6.
Processes and materials. The processes pertaining to these materials depend upon their origins (sedimentary, igneous, or metamorphic). The
Chapter 3 Significance of Earth Resources

Salt Dome
Dome Flank
Stratigraphic Trap
Fault Trap
Figure 14. Idealized geologic settings favoring the accumulation of oil or natural gas
Table 6 Typical Construction Materials, Their Origin, Method of Extraction, and Uses
Material Origin Extraction Typical Uses
Gravel River alluvium Open pit Concrete, asphalt aggregate
Sand River alluvium Open pit Concrete, asphalt aggregate, fill
Clay River alluvium Open pit bedrock Fill, filters
Stone Bedrock Quarry Concrete, asphalt aggregate, fill, masonry, rip-rap
important and necessary attributes of materials are recoverability, strength, durability, and aesthetic qualities.
Biological impacts. The impacts which these in situ materials have upon the biota are similar to those of rocks and sediments. Mining or quarrying operations may, however, adversely affect habitats.
Cultural and historic impacts ... At many locations, local construction materials are evident in habitations and other structures in the area, particularly in areas underlain by rocks suitable for dimension stone. Construction materials may also have been used by Native Americans and early settlers. Readily available construction materials may have been an important reason for settlement. At many military installations there are examples of
Chapter 3 Significance of Earth Resources 29

30
the early use of dimension stone in the construction of facilities and housing units. Surface mining and quarrying operations may also destroy cultural sites.
Geomorphic Landforms
Overview. Any recognizable physical feature on the surface of the earth having a definitive shape and produced by specific geomorphic processes is termed a landform. The landscape (see next section) comprises an association of different landforms. Geomorphic landforms may be important features intrinsically because of their natural beauty or their oddity, or because they consist of surfaces which support flora and fauna and human beings (past or present).
Processes and materials. The processes acting on the earth's surface are usually erosional or depositional; thus, landforms are usually either cut surfaces or surfaces which are being filled in. The materials are the sediments being eroded or deposited, and the materials underlying the sediments. The size of the sediment reflects the energy of the process.
Biological impacts. Geomorphic features affect and control the biota mainly by the type and level of energy acting on the surface, the nature of the materials, and moisture held by soils. The size of the materials involved in the process is particularly important for aquatic species and those which burrow.
Cultural and historic impacts. The level and kind of energy operating on the surface will determine whether sites have been occupied and, possibly, how long they were occupied; and the extent to which a possible site has been disturbed or buried. An example of the distribution of archeological sites based on landforms in the vicinity of Longhorn Army Ammunition Plant is given in Figure 15. In some instances, specific geomorphic landforms may be a part of "traditional places" which are important in the culture of Native Americans.
Landscapes
Overview. The landscape is a distinct association of landforms produced by a number of geomorphic processes which are interacting with tectonics, weathering, and climate at the earth's surface. The landscape is also a view of a region in which particular types of geomorphic processes are operating. For example, landscapes may be glacial, riverine, or eolian (dunes) in origin. Generally, a landscape represents an area larger than that of a landform.
Processes and materials. Since the landscape consists of a number of different landforms, the processes and materials are the same as those for landforms. The character of the landscape, the mountainous, rolling, or
Chapter 3 Significance of Earth Resources

0
50 w
w ..... u <l <l -a: ..... a: z w w ..... a:
40 w u.
C/) u. w -a. 0 0 z
w _, a: ::> 0 Vl <l <l 30 ID a. ~ ..... >- ::E :::::> z w ..... <l -w _, z 3: > u _, Vl ::> 0::: <l 0 ::..:: w ....J w > a. u Vl ....J a.
20 <l 0::: <l Cl) :::::>
0 >-w u 0::: z <l
0 z 0: w 0::: ..... z w
10 ..... C/) 0 ..... w :::::> <( - u 0 :::::> ::..:: ::E <l z 0 <l ::E ....J
<( -' :::J ID Vl <(
0
LANDFORMS
Figure 15. An example of the distribution of archeological sites based on geomorphic landforms in the vicinity of Longhorn Army Ammunition Plant. Texas
flat terrain, the shape of valleys and the configuration of hills are, thus, functions of a number of different geomorphic processes.
Biological impacts. Landscapes represent regions supporting biotic populations which have become adjusted to the physical conditions of that region. Biological communities may require a combination of landforms which, collectively, form a landscape. Also, some animals may require certain landforms for grazing and different landforms for breeding, for example.
Cultural and historic impacts. Topography, soils, climate, rocks and sediments, and economic aspects of rocks and sediments in the landscape region determine the suitability of human habitation, siting for landfills, areas for military training and recreation, and other human activities. A natural landscape may be a "traditional place" of importance to Native Americans, and it may contain archaeological sites yielding information on these peoples. "Cultural landscapes" are associated with hi storic events and persons, and "ethnographic landscapes" represent regions associated with specific ethnic groups. More detailed definitions of these terms are given in Legacy Resource Management Program ( 1993 ).
:::hapter 3 Significance of Earth Resources 31
Hydrospheric Resources
Streams
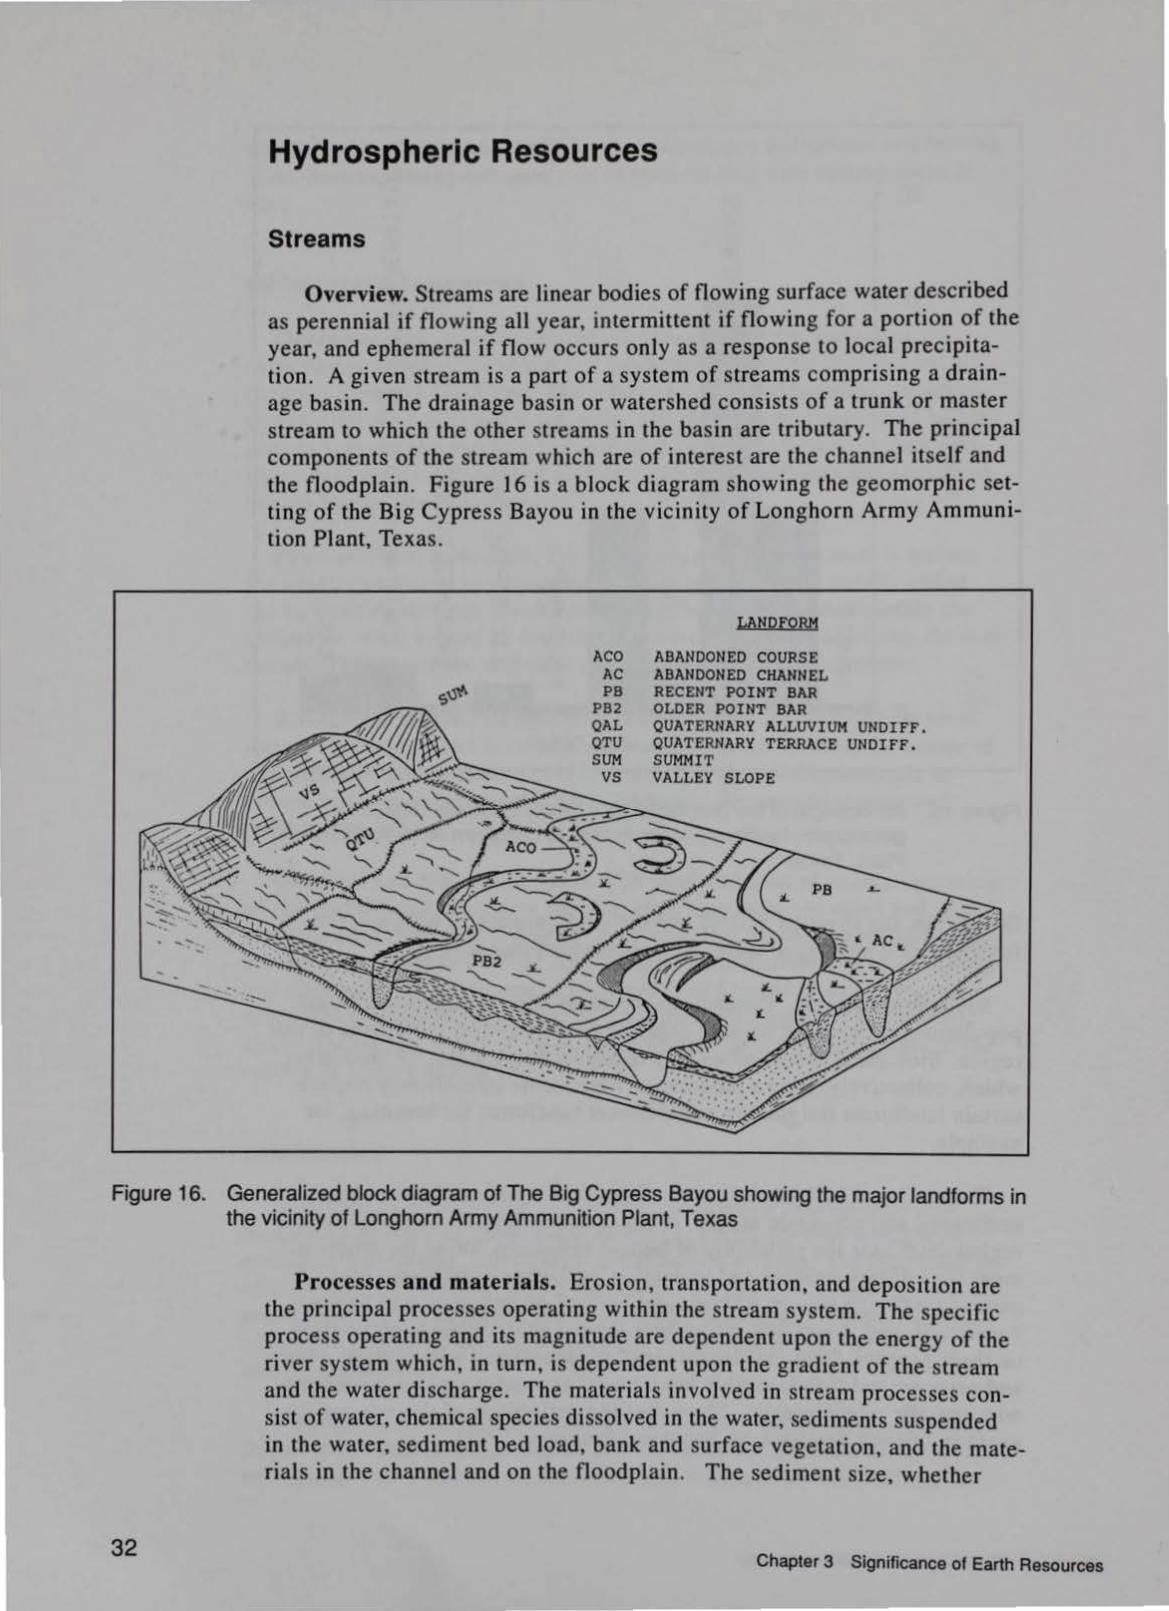
Overview. Streams are linear bodies of flowing surface water described as perennial if flowing all year, intermittent if flowing for a portion of the year, and ephemeral if flow occurs only as a response to local prec ipitation. A given stream is a part of a system of streams comprising a d rainage basin. The drainage basin or watershed consists of a trunk or master stream to which the other streams in the basin are tributary. The principal components of the stream which are of interest are the channel itself and the floodplain. Figure 16 is a block diagram showing the geomorphic setti ng of the Big Cypress Bayou in the vicinity of Longhorn Army Ammunition Plant, Texas.
LANDFORM
ACO ABANDONED COURSE AC ABANDONED CHANNEL PB RECENT POINT BAR
PB2 OLDER POINT BAR QAL QUATERNARY ALLUVIUM UNDIFF. QTU QUATERNARY TERRACE UNDIFF. SUM SUMMIT
VS VALLEY SLOPE
Figure 16. Generalized block diagram of The Big Cypress Bayou showing the major landforms in the vicinity of Longhorn Army Ammunition Plant, Texas
32
Processes and materials. Erosion, transportation, and deposition are the principal processes operating within the stream system. The specific process operating and its magnitude are dependent upon the energy of the river system which, in turn, is dependent upon the gradient of the stream and the water discharge. The materials involved in stream processes consist of water, chemical species dissolved in the water, sediments suspended in the water, sediment bed load, bank and surface vegetation, and the materials in the channel and on the floodplain. The sediment size, whether
Chapter 3 Significance of Earth Resources
predominantly gravel, sand, silt, or clay, and quantity of sediment being eroded, transported, or deposited are, thus, a function of this energy. Furthermore, the energy and sediment size are also a function of the overall geologic setting, tectonic activity, and specific depositional environment along the stream.
Biological impacts. The distribution and character of faunal and floral habitats found in and adjacent to stream systems are often affected by the energy, process, and materials of the system. With regard to channel fauna, water velocity, channel substrate particle size, suspended sediments, and water chemistry, and type and amount of bankline vegetation are important factors in defining the habitats of specific aquatic organisms. Similarly, character and distribution of floral and faunal habitats situated upon the flood plains and terraces (abandoned, former floodplains) of a stream basin are controlled by frequency of flooding and by the nature of overbank sediments deposited upon the present or former floodplain.
Cultural and historical impacts. The history of man is inextricably connected to rivers, from the dawn of civilization to the development of the world's major modern cities. Analysis of the known archeological record of North America shows that most of the record is related in some way to rivers or streams and the landforms directly produced by them. The significance of rivers and streams as a resource to man appears to have increased through time as cultures evolved from nomadic hunting and gathering to agricultural to industrial societies. While man has depended on rivers and streams for resources throughout time, these same rivers and streams have preserved, modified, or destroyed the record of human activities. Identification and evaluation of the cultural resources of riverine landscapes and geomorphic landforms must be accomplished through analysis of the geologic and geomorphic history of the stream system.
Wetlands
Overview. Of the many types of landforms that comprise the world's landscapes, none better illustrate the interaction of earth, biological, and cultural resources as wetlands. Once thought of merely as undesirable "swamps" of foul-smelling quagmires of mud inhabited by inhospitable creatures, wetlands are now recognized to be important ecological, hydrological, and geological features which provide important and recognized environmental functions. Some of the functions that wetlands provide include waterfowl and other types of animal habitat, rare and endangered plant habitat, water quality improvement, sediment stabilization, floodwater storage, and groundwater recharge. In fact, modern science now recognizes that wetlands provide critical links in ecological, hydrological, atmospheric, and geological systems of landscapes of all locations and sizes.
Wetlands vary in many type, size, shape, and location, depending upon the geomorphological and geologic history of the landscape. Classifications of wetlands are numerous, depending upon the intended use of the
Chapter 3 Significance of Earth Resources 33

classification system. A popular and often used classification by Cowardin et. al ( 1979) describes wetlands in ecological terms, primarily the type of vegetative cover. The "Cowardin" c lassification system was adopted by the National Wetlands Inventory, an EPA program to delineate wetland environments in the United States. The legal definition and delineation methods are give in EPA ( 1988). Common terms used to describe wetland environs include marsh, swamp, bottomland, pothole, s lough, peatland, bog, muskeg, moor, wet meadow, wet prairie, fen, mire, and playa. Two typical landscape settings of wetlands are illustrated in Figure 17.
Hillside Seep
Backswamp (Bottomland)
/
Figure 17. An illustration of wetlands depicting two typical types-upland hillside seep and riparian "backswamp"
34
Processes and materials. Wetlands are characterized by physical, chemical, and biological processes and materials. Dominant physical processes of wetlands are geomorphological and hydrological processes. Geomorphological processes are usually responsible for the creation and modification of the wetland, such as the abandonment of a river channel or the progradation of a delta into a body of water. Hydrological processes, including surface flow, groundwater flow, and precipitation, are the lifeblood of wetlands, maintaining the vigor of aquatic plants and animals. Chemical processes occur within the water column and the soil adjacent to and beneath the surface water body. The most important naturaJ chemical reactions that occur in wetlands are oxidation and reduction and photosynthesis. The hydrologic and climatological (especially temperature reg ime) settings play important roles in regulating these and other types of chemical react ions important to larger scale ecological processes such as nutrient retention and maximization of biological diversity.
Chapter 3 Significance of Earth Resources
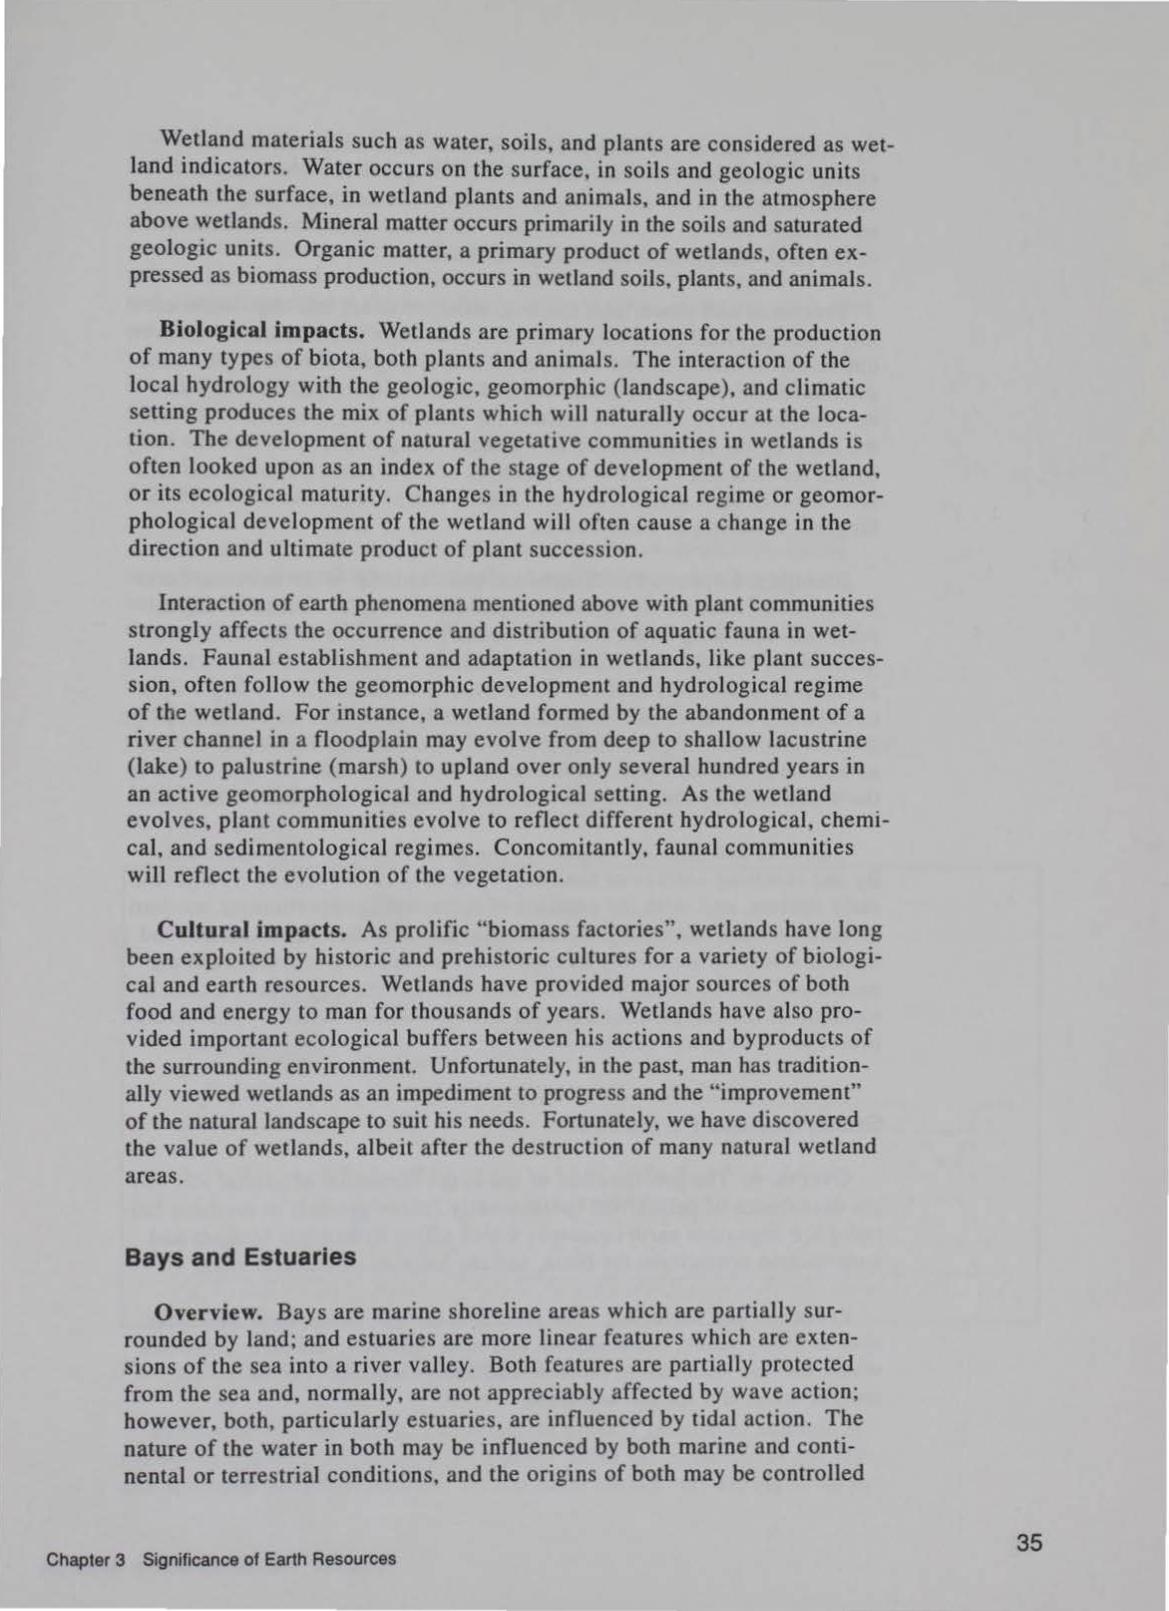
Wetland materials such as water, soils, and plants are considered as wetland indicators. Water occurs on the surface, in soils and geologic units beneath the surface, in wetland plants and animals, and in the atmosphere above wetlands. Mineral matter occurs primarily in the soils and saturated geologic units. Organic matter, a primary product of wetlands, often expressed as biomass production, occurs in wetland soils, plants, and animals.
Biological impacts. Wetlands are primary locations for the production of many types of biota, both plants and animals. The interaction of the local hydrology with the geologic, geomorphic (landscape), and climatic setting produces the mix of plants which will naturally occur at the location. The development of natural vegetative communities in wetlands is often looked upon as an index of the stage of development of the wetland, or its ecological maturity. Changes in the hydrological regime or geomorphological development of the wetland will often cause a change in the direction and ultimate product of plant succession.
Interaction of earth phenomena mentioned above with plant communities strongly affects the occurrence and distribution of aquatic fauna in wetlands. Faunal establishment and adaptation in wetlands, like plant succession, often follow the geomorphic development and hydrological regime of the wetland. For mstance, a wetland formed by the abandonment of a river channel in a floodplain may evolve from deep to shallow lacustrine (lake) to palustrine (marsh) to upland over only several hundred years in an active geomorphological and hydrological setting. As the wetland evolves, plant communities evolve to reflect different hydrological, chemical, and sedimentological regimes. Concomitantly, faunal communities will reflect the evolution of the vegetation.
Cultural impacts. As prolific "biomass factories", wetlands have long been exploited by historic and prehistoric cultures for a variety of biological and earth resources. Wetlands have provided major sources of both food and energy to man for thousands of years. Wetlands have also provided important ecological buffers between his actions and byproducts of the surrounding environment. Unfortunately, in the past, man has traditionally viewed wetlands as an impediment to progress and the "improvement" of the natural landscape to suit his needs. Fortunately, we have discovered the value of wetlands, albe1t after the destruction of many natural wetland areas.
Bays and Estuaries
Overview. Bays are marine shoreline areas which are partially surrounded by land; and estuaries are more linear features which are extensions of the sea into a river valley. Both features are partially protected from the sea and, normally, are not appreciably affected by wave action; however, both, particularly estuaries, are influenced by tidal action. The nature of the water in both may be influenced by both marine and continental or terrestrial conditions, and the origins of both may be controlled
Chapter 3 Significance of Earth Resources 35

36
by tectonics and/or the effects of Pleistocene glaciation and sea-level change. Estuaries, for example, owe their origin to the drowning of river valleys adjacent to the sea during the sea level rise accompanying the most recent deglaciation. Estuaries may also occur due to tectonic subsidence of the land without absolute change in sea level.
Processes and materials. Erosion, transportation, and deposition are important physical processes at work in both bays and estuaries; however, due to the influence of sea water, chemical or physio-chemical processes such as ion exchange, fl occulation, and chemical precipitation may also be important. The materials include the sediment being transported into the body by the rivers feeding it, sediment being transported into the body by the sea, and the chemical constituents of the waters. As bays and estuaries usually have active floral and faunal components, there are also biogenic materials in these bodies.
Biological impacts. The distribution and character of the flora and fauna in bays and estuaries are significantly impacted by the sedimentological processes operating in the water body, the particle size of the sediment, the amount of sediment, and water chemistry. Generally, these interactions are similar to those of streams; however, due to the relatively larger size of bays and estuaries and the greater diversity of the flora and fauna, these interactions take on greater significance. Also, human activities, on land as well as at sea, may pose threats to the biological habitats established in the water body by changing the chemistry and sediment load in the water.
Cultural and historic impacts. The great diversity of biologic activity and resulting sources of food supply have attracted Native Americans, early settlers, and, with the addition of recreational opportunities, modern humans as well. Generally, the character and distribution of cu ltural and historic resources are mainly a function of the biological resources and the nature and history of the shoreline. The Chesapeake Bay area is a classic example of the complex interactions between human activities and natural processes in bays and estuaries.
Snow, Ice, and Permafrost
Overview. The precipitation of snow, the formation of glac ial ice, and the occurrence of permafrost (permanently frozen ground) in northern latitudes are important earth resources which affect hydrologic budgets and construction operations, the biota, and the location of cultural sites.
Processes and materials. The processes include atmospheric processes such as precipitation, condensation, and solar radiation; and earth processes which include weathering, erosion, and sedimentation. The materials include water and ice and sediment.
Chapter 3 Significance of Earth Resources
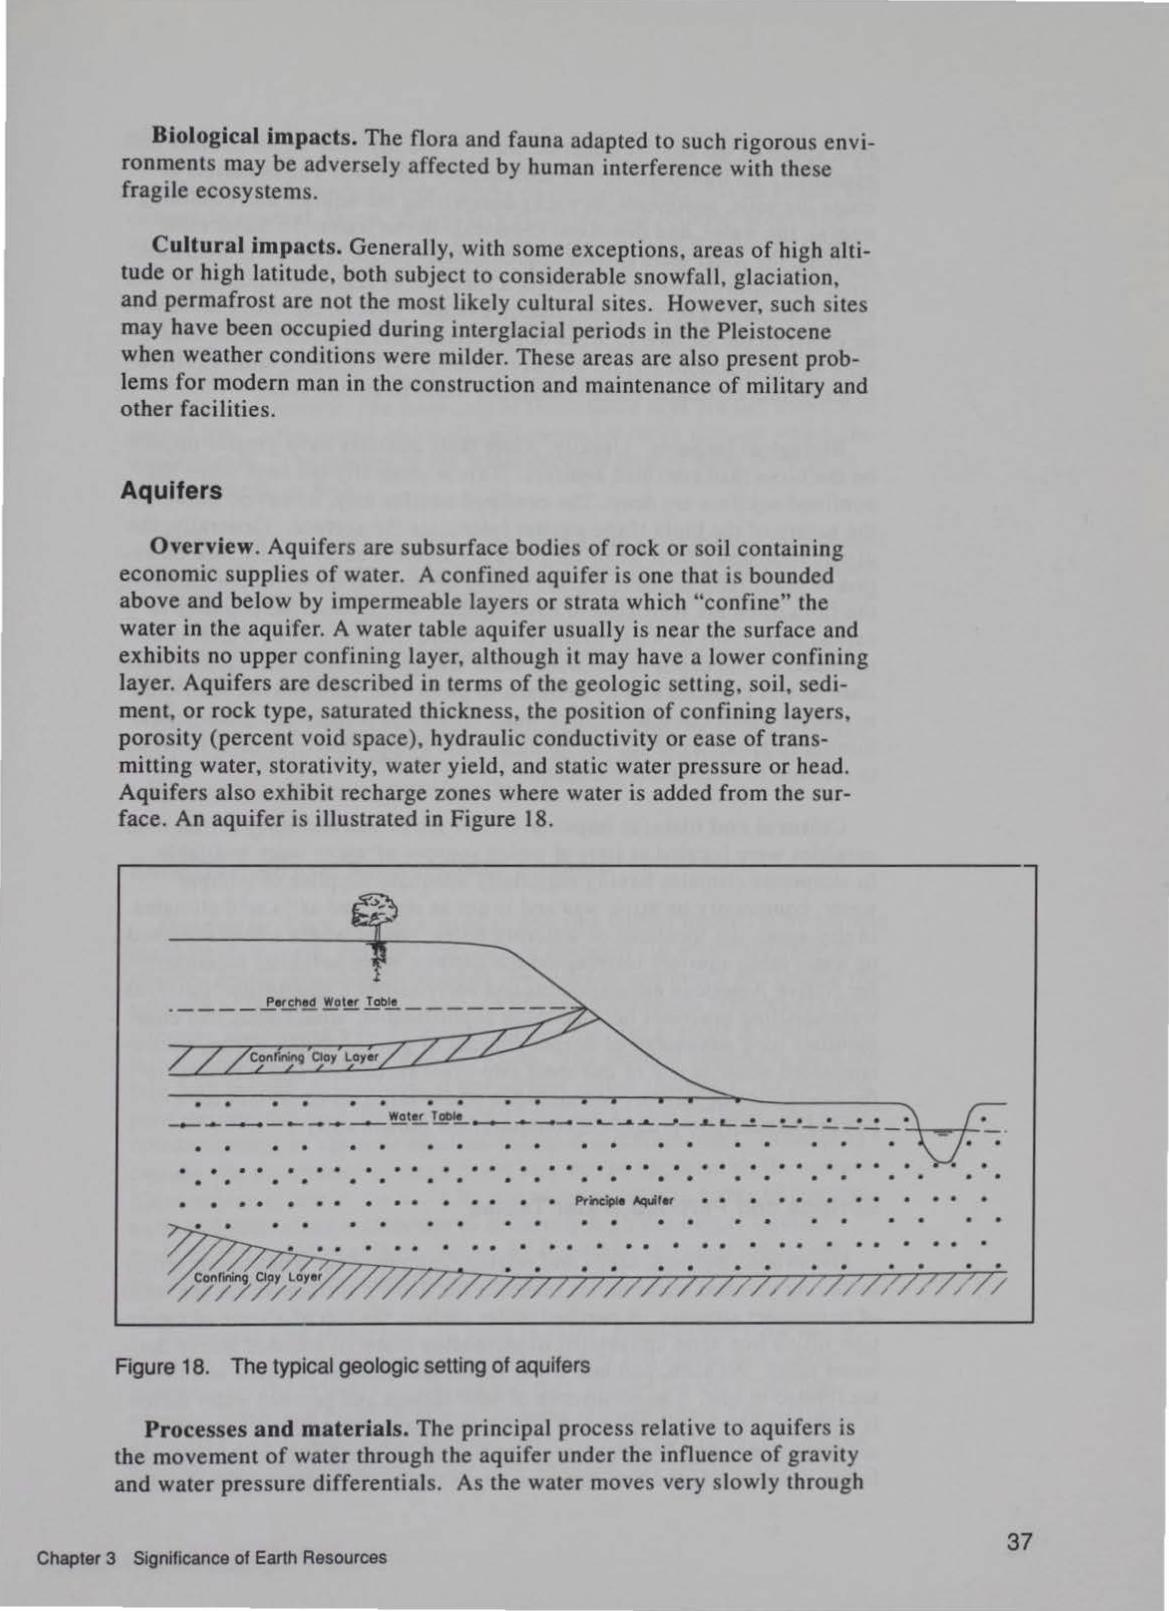
BiologicaJ impacts. The flora and fauna adapted to such rigorous environments may be adversely affected by human interference with these fragile ecosystems.
Cultural impacts. Generally, with some exceptions, areas of high altitude or high latitude, both subject to considerable snowfall, glaciation, and permafrost are not the most likely cultural sites. However, such sites may have been occupied during interglacial periods in the Pleistocene when weather conditions were milder. These areas are also present problems for modern man in the construction and maintenance of military and other facilities.
Aquifers
Overview. Aquifers are subsurface bodies of rock or soil containing economic supplies of water. A confined aquifer is one that is bounded above and below by impermeable layers or strata which "confine" the water in the aquifer. A water table aquifer usually is near the surface and exhibits no upper confining layer, although it may have a lower confining layer. Aquifers are described in terms of the geologic setting, soil, sediment, or rock type, saturated thickness, the position of confining layers, porosity (percent void space), hydraulic conductivity or ease of transmitting water, storativity, water yield, and static water pressure or head. Aquifers also exhibit recharge zones where water is added from the surface. An aquifer is illustrated in Figure 18.
• • • • • • • • • • • water lOb~ ....a... -J 4 '- • • • • • • •
_..,_.,.._..,._._~--..-------_...._._._. ....& - ---------+---+-• • • • • • • • • • • • • • • • • • •
• • • • • • • • • • • • • • • • • • • • • • • • • • • • • • • • • • • • • • • • • • • • • • • • • •
• • • • • • • • • • • • • • • Prncipte JqUier • • • • • • • • • • •
• • • • • • • • • • • • • • • • • • •
•
•
• • • • • • • • • • • • • • • • • • • • • • • • •
Figure 18. The typical geologic setting of aquifers
Processes and materials. The principal process relative to aquifers is the movement of water through the aquifer under the influence of gravity and water pressure differentials. As the water moves very slowly through
Chapter 3 Significance of Earth Resources
•
•
37
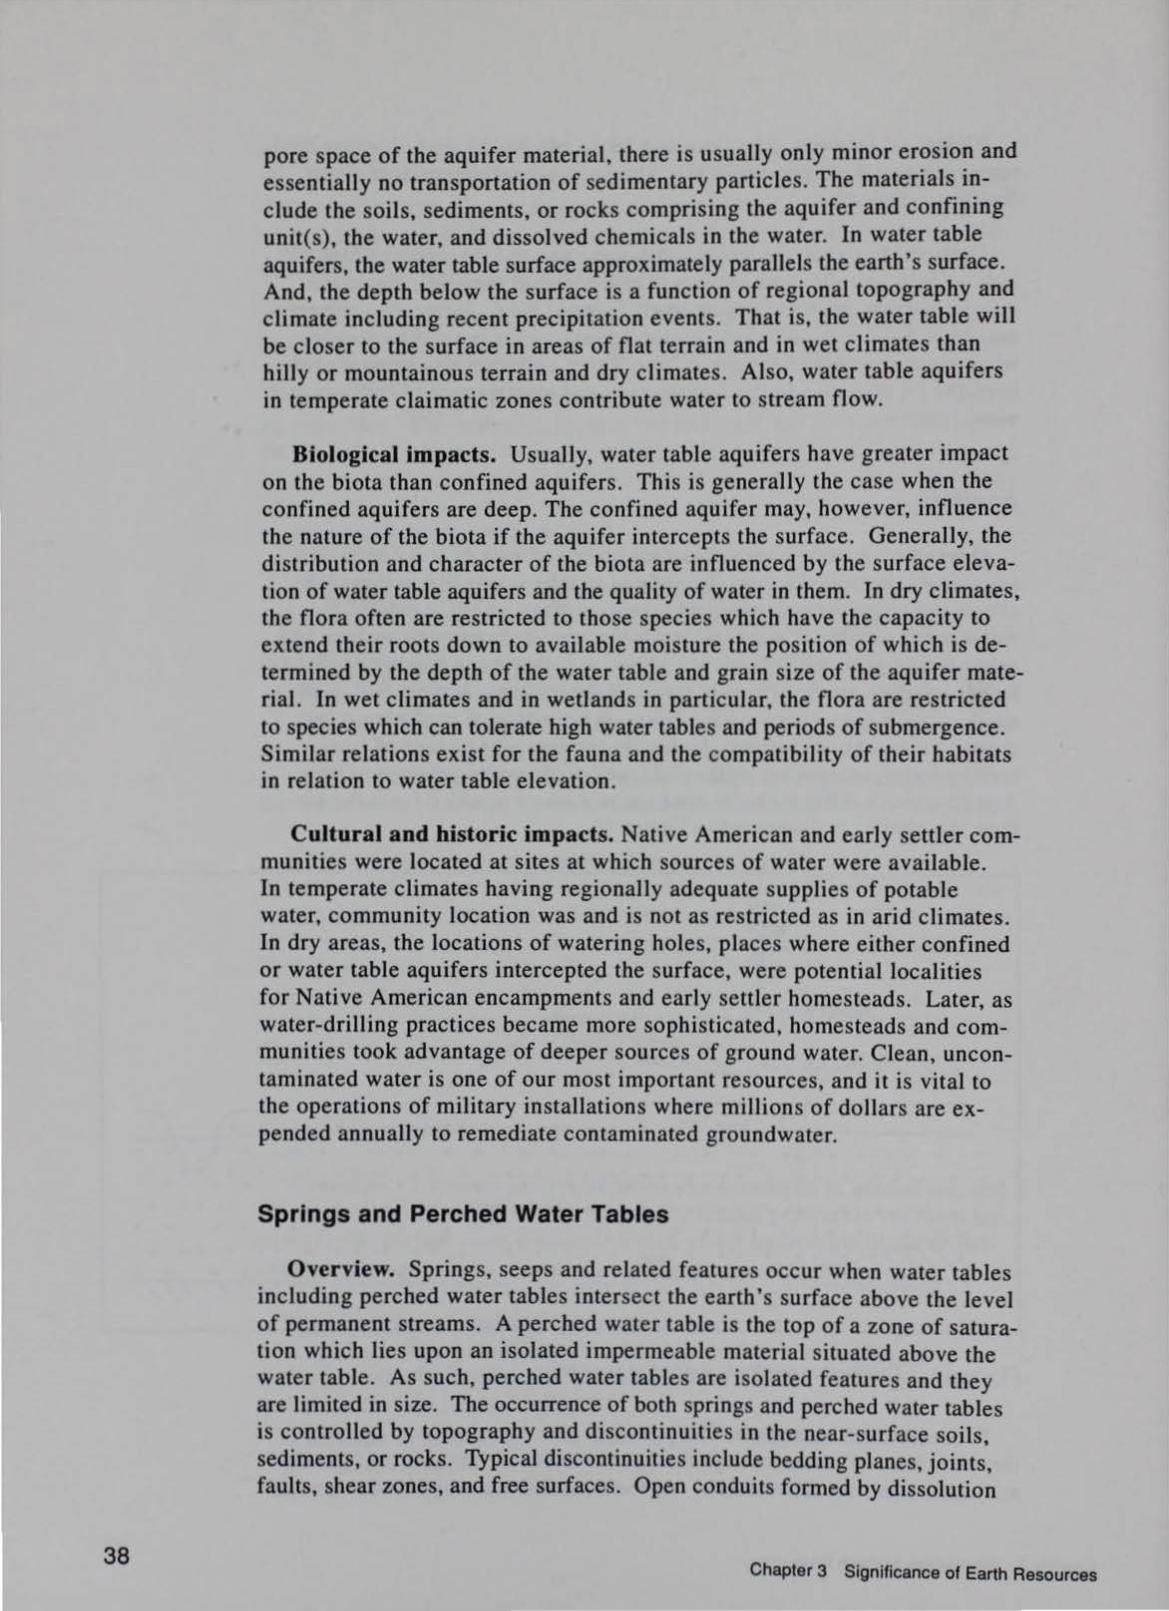
38
pore space of the aquifer material, there is usually only minor erosion and essentially no transportation of sedimentary particles. The materials include the soils, sediments, or rocks comprising the aquifer and confining unit(s), the water, and dissolved chemicals in the water. In water table aquifers, the water table surface approximately parallels the earth's surface. And, the depth below the surface is a function of regional topography and climate including recent precipitation events. That is, the water table will be closer to the surface in areas of flat terrain and in wet climates than hilly or mountainous terrain and dry climates. Also, water table aquifers in temperate claimatic zones contribute water to stream flow.
Biological impacts. Usually, water table aquifers have greater impact on the biota than confined aquifers. This is generally the case when the confined aquifers are deep. The confined aquifer may, however, influence the nature of the biota if the aquifer intercepts the surface. Generally, the distribution and character of the biota are influenced by the surface elevation of water table aquifers and the quality of water in them. In dry climates, the flora often are restricted to those species which have the capacity to extend their roots down to available moisture the position of which is determined by the depth of the water table and grain size of the aquifer material. In wet climates and in wetlands in particular, the flora are restricted to species which can tolerate high water tables and periods of submergence. Similar relations exist for the fauna and the compatibility of their habitats in relation to water table elevation.
Cultural and historic impacts. Native American and early settler communities were located at sites at which sources of water were available. In temperate climates having regionally adequate supplies of potable water, community location was and is not as restricted as in arid climates. In dry areas, the locations of watering holes, places where either confined or water table aquifers intercepted the surface, were potential localities for Native American encampments and early settler homesteads. Later, as water-drilling practices became more sophisticated, homesteads and communities took advantage of deeper sources of ground water. Clean, uncontaminated water is one of our most important resources, and it is vital to the operations of military installations where millions of dollars are expended annually to remediate contaminated groundwater.
Springs and Perched Water Tables
Overview. Springs, seeps and related features occur when water tables including perched water tables intersect the earth's surface above the level of permanent streams. A perched water table is the top of a zone of saturation which lies upon an isolated impermeable material situated above the water table. As such, perched water tables are isolated features and they are limited in size. The occurrence of both springs and perched water tables is controlled by topography and discontinuities in the near-surface soils, sediments, or rocks. Typical discontinuities include bedding planes, joints, faults, shear zones, and free surfaces. Open conduits formed by dissolution
Chapter 3 Significance of Earth Resources

of soluble rocks such as limestone provide some of the highest spring discharges. As with water table aquifers, the water pressure and discharge are usually highly dependent upon nearby or regional precipitation events and climate in general. Some springs in well-developed solution areas flow year-round, and they will often flow when stream flow has ceased during a drought. Seeps and springs may also control the location of slope wetlands.
Processes and materials. The processes include infiltration of water into surface soils, seepage through them to the water table, flow along the water table or flow along the base of confining units, and ultimately, discharge to the surface. The materials of importance here are the water, dissolved ions in the water, and soils, sediments, or rocks through which the water moves. The quality of the water depends largely upon the type of soil, sediment, or rock.
Biological impacts. Perched water tables and springs have the greatest impact on the biosphere in arid regions; they are less important in temperate zones because of the greater quantity of surface water available. However, in arid lands the water available in springs and seeps may be the only water available to support vegetation and animal life in the general vicinity of the seep or spring.
Cultural and historic impacts. Seeps and springs have impacted the locations of Native American and early settler sites similarly to water table aquifers, although, more locally.
Karst Terrain and Subterranean Streams
Overview. Karst is a term used to describe terrain underlain by soluble rocks or sediments, usually limestone or dolomite, in which the flow of slightly acidic groundwater through the rocks or sediments has caused dissolution of the carbonate minerals. Although dissolution features are most common in carbonate rocks, these features are also present in areas underlain by rock salt, gypsum, and anhydrite. The features present in such terrain may include depressions at the surface called sinkholes, the absence, poor development, or dissapearance of surface stream systems, and subterranean caverns or caves or solution-enlarged discontinuities. In some locations, the occurrence of large caves may not be apparent on the surface. Karst terrain is one of the more fragile environments in terms of contamination of subsurface waters due to relatively high discharges through these underground openings. Figure 19 illustrates the karst topography on the Mitchell Plain in southern Indiana.
Processes and materials. In karst terrains, groundwater flow and dissolution and re-precipitation of soluble calcium and magnesium carbonate minerals are the primary processes and they usually occurs along preexisting joints and bedding planes. In some regions where dissolution is extensive and underground openings have become very large, there exist underground streams in which not only solution, but erosion, transporta-
Chapter 3 Significance of Earth Resources 39

CARBOAII FCROUS UN I TS
Figure 19. The physiography and underlying geology in the vicinity of Crane NWSC. Note the karst terrain of the Mitchell Plain
40
tion, and deposition occur. The nature of groundwater flow in karst terrain is potentially more complex and more difficult to predict than flow in areas underlain by insoluble rocks. The materials are the soluble rocks, the water, and dissolved ions. There-precipitation of calcium carbonate produces aesthetic features called speleothems which "decorate" the interior of many caves.
Biological impacts. Caverns and caves support unique and highly specialized biota which have adapted to speci fic and limited temperature ranges and the absence of or limited sunlight beneath the earth 's surface. Because of their specialization, cave biota are highly sensitive to human interference in these habitats.
Cultural and historic impacts. Caves and caverns have been used by Native Americans and early settlers as shelters, campsites, and sources of raw materials such as guano for fertilizer, niter for gunpowder, and water. In some areas, caves may be considered "traditional places" to Native Americans. Today, in many areas, caves, caverns, and speleothems are protected scenic places intended for recreation and scientific study. Because of the complexity and unpredictability of groundwater movement, karst areas are difficult environments in which to implement po llution remediation.
Chapter 3 Significance of Earth Resources

Atmospheric Resources
Precipitation and Condensation
Overview. One of the earth's greatest natural resources is the water contained in the atmosphere. The atmosphere exists as a gaseous envelope surrounding the solid and liquid surface of the earth. Although nitrogen and oxygen comprise 98 percent of the atmosphere, the presence of a smaller amount of water vapor is more important from a climatological standpoint. Atmospheric water vapor serves as the source for all forms of precipitation and condensation. Most normal precipitation is slightly acidic having a pH of approximately 6.0. Man-made atmospheric emissions of oxides of sulfur and nitrogen, and hydrogen chloride resulting from the burning of fossil fuel and the smelting of ores, has resulted in decreased pH, or acid rain, in some regions. Precipitation is considered acidic if the pH is below 5.6. The effects of acid rain may be felt hundreds of miles from the original sources of the polluted emissions.
Processes and materials. Atmospheric condensation and evaporation play a major role in the process of precipitation. Water evaporates from the oceans and is transported as water vapor in the form of clouds. As the water condenses, it can no longer be carried up by the air and it falls from the clouds in the form of precipitation which may occur as rain, hail, sleet, or snow. Most precipitation occurs during cooling of ascending air masses. Precipitation which falls upon the earth's surface or vegetation either infiltrates into the soil, evaporates, is held in storage on the surface, runs off, or is taken in and transpired by plants.
Biological impacts. The types of flora and fauna of a region are affected by the amount, dependability, and seasonal distribution of rainfall, snow, and condensation. The seasonal distribution of precipitation is of importance in the middle latitudes where there is a dormant season for plant growth. The rainfall distribution is also important in some equitorial regions exhibiting rainy and dry seasons. At high elevations, rainfall is effective for plant growth no matter what time of year it falls. The absence of precipitation, or drought, may significantly diminish wildlife populations. Acid rain may adversely affect the terrestrial flora and the fauna of lakes and streams.
Cultural and historic impacts. Human activities are also significantly impacted by either too much or too little precipitation. Excessive rain or snow fall may result in severe flooding (a natural hazard), erosion, loss of crops and property, and loss of life. Hail and sleet may be particularly adverse for some crops. Too little precipitation may result in drought and loss of crops. The lack of dependable rainfall has resulted in the increased use of farm irrigation, even in temperate, wet regions. The adverse effects of acid rain and similar pollutants include respiratory problems among the affected population, and destruction of public and private buildings, tombstones, and statuary by solution of rock.
Chapter 3 Significance of Earth Resources 41

80 'F
(I) 70 L :J ~ () L
~ 60 E (I)
1-
L -<I: 50
40
30 ·c
25
20
15
10
5
0
Humidity
Overview. Humidity is the measure of the amount of water vapor in the atmosphere. Although water vapor comprises only a very small part of the total atmosphere, averaging less than 2 percent of the total mass, it is the single most important component of the air from the standpoint of weather and climate. Humidity is usually reported as a ratio of the actual amount of water in the air to the amount that would be present if the air were saturated, and is termed relative humidity. Absolute humidity is the weight of water vapor per unit volume of air. The weight of water vapor per unit weight of air is identified as specific humidity.
Processes and materials. The amount of water vapor present in the air is a function of the temperature. Figure 20 shows the relationship between air, temperature, and relative humidity. When the maximum amount of moisture in the air has been reached, the air is saturated. The degree of saturation of the air can be increased by decreasing the temperature or increasing the water content. The water content can fluctuate by the mixing of humid and less humid air, or through evaporation. Changes in temperature can be the result of air being cooled by rising and expanding or by contact with a cold surface beneath. The mixing of warm and cold air masses can lower the temperature of the warmer, wetter mass. Radiation by the air itself can also influence the cooling of the air. Absolute humidity will vary if the air expands or contracts, even though the amount of
85
80 A1r T emperoture
75 ~ :n
70 ~ ... "0 ...
65 E :J
J:
60 (I)
> ... 55 ~
() ....... CD
50 a:
Relot1ve 45 Hum1d1 ty
40
M1dmght 6 A.M. Noon 6 P.M. M1dmght
Figure 20. The relationship between air temperature and relative humidity
42 Chapter 3 Significance of Earth Resources

water vapor remains constant. The specific humidity is a more stable property of the air than absolute humidity. The specific humidity will change only if there is an actual variation of the water content of the air. When the reJati ve humidity is high, evaporation is slow since the air is nearly saturated. The relative humidity varies inversely with temperature. Evaporation is the primary means of transporting water from the surface of the earth to the atmosphere.
Biological impacts. Respiration and temperature regulation in animals are influenced by relative humidity and some animals have adapted to specific low or high relative humidity levels. If the relative humidity becomes too low, the water requirements of animals increase. On the other hand, various types of plant diseases, such as mildew, rusts, scabs and blight, reproduce and spread rapidly under high humidity. Long periods of low humidity during the period of active plant growth contributes to the desiccation of soil and plants. However, low humidities are needed to harvest some grains.
Cultural and historic impacts. The impact of excessive humidity on human activities pertains to agriculture as previously described, to corrosion of metal, to deterioration of paints and masonry construction, and to human health and comfort.
Evaporation
Overview. Evaporation is essential in the formation of condensation and precipitation. All the water vapor contained in the atmosphere is obtained through this process. The average annual evaporation over the earth has been estimated to be about 29 in. Evaporation occurs on the earth's surface, on bodies of water, and on vegetation. Vegetation also transpires moisture taken in through its root system back into the atmosphere. Because it is difficult to distinguish between vegetative evaporation and transpiration, this moisture is called evapo-transpiration. The relative amount of water removed from the soil by vegetation may be measured in the field with lysimeters.
Processes and materials. Evaporation is the process through which water in its liquid form is converted into water vapor. A related process, sublimation, is the conversion of solid ice into water vapor without passing through the liquid phase. The amount and rate of evaporation are dependent upon the dryness of the air (the humidity), its temperature, and its movement. The intensity of evaporation increases as the wind velocity and temperature rise. If movement ceases, the air becomes saturated with moisture and evaporation cannot occur. Because of the unlimited supply of water over the oceans, evaporation at sea is usually much greater than that over the continents. Maximum evaporation occurs over the oceans at 10 to 20 degrees latitude north and south of the equator. Evaporation is also greater over areas having the largest exposed surface even if the volume of water in other areas is equal.
Chapter 3 Significance of Earth Resources 43

44
Biological impacts. The removal of soil water by plants is necessary for plant survival. Phreatophytes are a type of plant with long tap roots capable of reaching the water table especially in arid areas. Such plants are able to remove significant amounts of water. Other plants, called hydrophytes, adapted to extreme moisture, must live with their root system totally submerged. The complex interrelationship between evaporation, transpiration, and soil water depletion by plants is an important factor in successful agricultural activities and has resulted in the evolution of a wide array of special plant water conserving adaptations.
Cultural and historic impacts. Excessive evaporation is a contributor to severe weather conditions including hurricanes, contributing to the damage or destruction of property and loss of life . Evaporation is also adverse when lake and reservoir levels are lowered in the process.
Condensation
Overview. Condensation occurs when the air temperature falls below the dew-point temperature and the saturated air converts some of its water vapor into a liquid form. Moisture will form on solid surfaces when there is cooling below the dew point. The dew point of an air mass is directly related to its relative humidity. The most common nuclei of condensation are salt from ocean water. The prevalent forms of condensed moisture include dew, frost, fog, and clouds.
Processes and materials. Dew is moisture that condenses on object surfaces rather than on nuclei in the air. The formation of dew occurs on cold objects above the freezing point. Dark objects, such as vegetation, always cool fastest. Frost forms when condensation takes place on surfaces whose temperatures are below freezing, changing from the vapor state directly into the solid or ice state. Most fogs are formed by cooling processes that do not involve ascent and expansion of the rising air, but rather the cool ing of air masses of high moisture content close to the ground.
Biological impacts. Although condensation is not normally a major contributing factor to most ecosystems, there are some notable situations in which it does significantly increase total soi l moisture. For example, in coastal California, in habitats similar to those at Vandenberg AFB and Fort Ord, condensation of coastal fogs on trees and shrubs added water to the soil equal to more than twice the amount contributed by rain. In some extremely arid parts of the world, such as in coastal Peru and the Namib Desert of Namibia and adjacent regions of Southwest Africa, no measurable precipitation occurs. In these regions, the only moisture to support life comes from the condensation of fog. Depending upon temperature, excessive frost may damage the foliage of sensitive plants. In fact, tolerance to freezing is one of the major determining factors in plant di stribution and this tolerance is a critical factor in any revegetation or landscaping undertaking. However, frost is usually melted by solar radiation before adversely affecting the plant life. Dew and frost may provide water for both plants
Chapter 3 Significance of Earth Resources

and animals, and both fog and clouds may disorient migratory birds and terrestrial animals for a short period of time.
Cultural and historic impacts. The occurrence of ground fog is significant in terms of overall observation, military operations, and transportation activities, particularly aviation and automobile traffic.
Solar radiation
Overview. Radiation is the means by which solar energy reaches the earth. Radiation is the transmission of energy in the form of electromagnetic waves such as visible light, ultraviolet, X-ray, infrared, or radio waves. Solar radiation is a principal driving force for many earth processes, and it is a part of the total heat balance of the earth. As such, it controls the average and seasonal temperatures and produces the climatic areas of the earth. The earth's geological record is evidence that climate and climatic patterns have not remained constant, as indicated by the relatively recent Pleistocene glaciation, evidence of geologically ancient glacial periods, and by fossilized remains of ancient plants and animals that thrived in climates much warmer than that of the present.
Processes and materials. Only part of the incoming solar radiation is retained by the earth and its atmosphere. A substantial 31 percent of the solar energy incident on the top of the atmosphere is reflected to outer space by air molecules and small dust particles, by clouds, and by the surface of the earth which reflects 4 percent back to space. The reflected radiation, averaging about 35 percent of the total, is called the albedo; it is greater in polar regions than at the equator due to ice and snow at the poles.
Biological impacts. Solar radiation, the ultimate energy source, which controls the earth's temperature and precipitation, comprises the principal environmental factors controlling the earth's ecosystems. Figure 21 shows the role of climate on soil and organic processes. Most habitats are geographically restrained by seasonal temperatures and rainfall. Climatic changes occurring during the Pleistocene resulted in geographic shifts, evolution, and extinctions among biological communities. Thus, climatic changes may be important in understanding the paleontological record, and in many cases, the paleontological record may yield information on climatic change. This information may be used manage the future path or trajectory of the system.
Cultural and historic impacts. The greatest effects of climate and climatic change seen in the general paleontologic record may have been in the geographical distribution of human settlements and camps. Generally, the study of archaeological sites or the exploration for such sites must consider the effects of climate and climatic change.
Chapter 3 Significance of Earth Resources 45

46
CLIMATE
Basic input of
eneroy and water
Atmosphere
Hydrosphere and 1 l thospere
~
SOIL I ------- I ORGANIC PROCESS PROCESS I lnt1 ion I
~ + Nutr ient. I I Photosynthesis. prOduction. I 1 ion I respiration.
water storoQe I. ~------- J enerQy storoQe
Nutrient cycltno
Figure 21. The influence of atmospheric processes on soil and organic processes
Atmospheric circulation
Overview. Atmospheric circulation and the development of wind systems are controlled by temperature (radiation), pressure, the earth's orbit, and the position of land masses. Additional controlling factors are pressure differentials, gravity, friction, centrifugal forces, and the Coriolis effect. Atmospheric ci rculation is also important in its relationship to and responsibility for the development of oceanic currents.
Processes and materials. Lateral pressure differences cause air masses to move and wind systems to develop. Because of friction, wind speed falls almost to zero at ground level. Two fundamental climatic functions are achieved by the wind. Wind acts as a transporter of heat from the lower to the higher latitudes. Because of this action, wind systems and oceanic currents are the principal agents in maintaining the latitudinal heat balance of the earth. Wind also delivers to land masses the moisture for precipitation. The action of wind as a geologic agent is apparent in desert regions even though such landscapes have been affected primarily by running water. Desert landscapes consist of wind sculptured erosional features and, in some areas, sand dunes.
Biological impacts. The importance of atmospheric circulation and wind sys tems on biological systems pertains to their effects of modifying or controlling the effects of solar radiation and precipitation, and, consequently, the climate of a region. For example, winds influence the migration of birds and insects, control the dispersal of pollen, spores, and seeds,
Chapter 3 Significance of Earth Resources

affect transpiration and evaporation, and, if strong enough, may destroy or significantly modify natural vegetation and crops.
Cultural and historic impacts. The impacts of atmospheric circulation on human activities are similar to those of solar radiation. Human activities are significantly affected by hurricanes, tornadoes, lightning, and related severe weather conditions. Figure 22 shows the storm track of Hurricane Hugo which caused massive damage on the Atlantic Coast.
~-ATLANTI c
0 C E AN
~~
15 14 13
85' 8C1 75" 7C1 65" ss· 50" 45" 35"
Figure 22. A map of Hurricane Hugo storm track
Chapter 3 Significance of Earth Resources
3(1
• It
25'
2C1
15'
1C1
30" 25'
47

48
4 Methods of Acquiring and Inventorying Earth Resource Data
General
Earth resource data necessary for installation management and planning are described in this section and data sources are given in Appendix C. Descriptions are given for all data elements in terms of (a) definition, (b) purpose/use, (c) source, (d) Limitation, and (e) applicability. Selected data elements are also discussed in terms of (a) units, (b) data needs, (c) acquisition methods, and (d) inventory procedures. The definition is a brief explanation of the type of data, and the purpose or use tells how the particular data element is used in installation management. The data source is the agency or organization providing the data. Some of the data elements may already exist in some type of published format; however, much of the data will not have been collected, and responsibility will accrue to the installation. Usually, the limitations of data elements include the availability of the data, its currency, and often the need to have the data interpreted by specialists.
Another important limitation for some types of data, particularly maps, is scale; usually, the scale of available (published) maps will be too small for specific facilities. For example, state geological maps are often prepared at scales smaller than approximately 1/500,000. A map prepared at this scale will usually not provide sufficiently detailed information, particularly for smaller installations. Generally, geological and related maps published for individual counties are prepared at scales that make these maps more useful for most installations. In many areas, however, larger scale maps may not be available. In these cases, the resource managers must consider having new geologic maps prepared.
Units refer to how the data is reported, data needs refers to the amount or type of data, acquisition methods describe how and when the data are collected, and inventory procedures relate how the data are assembled.
Chapter 4 Methods of Acquiring and Inventorying Earth Resource Data
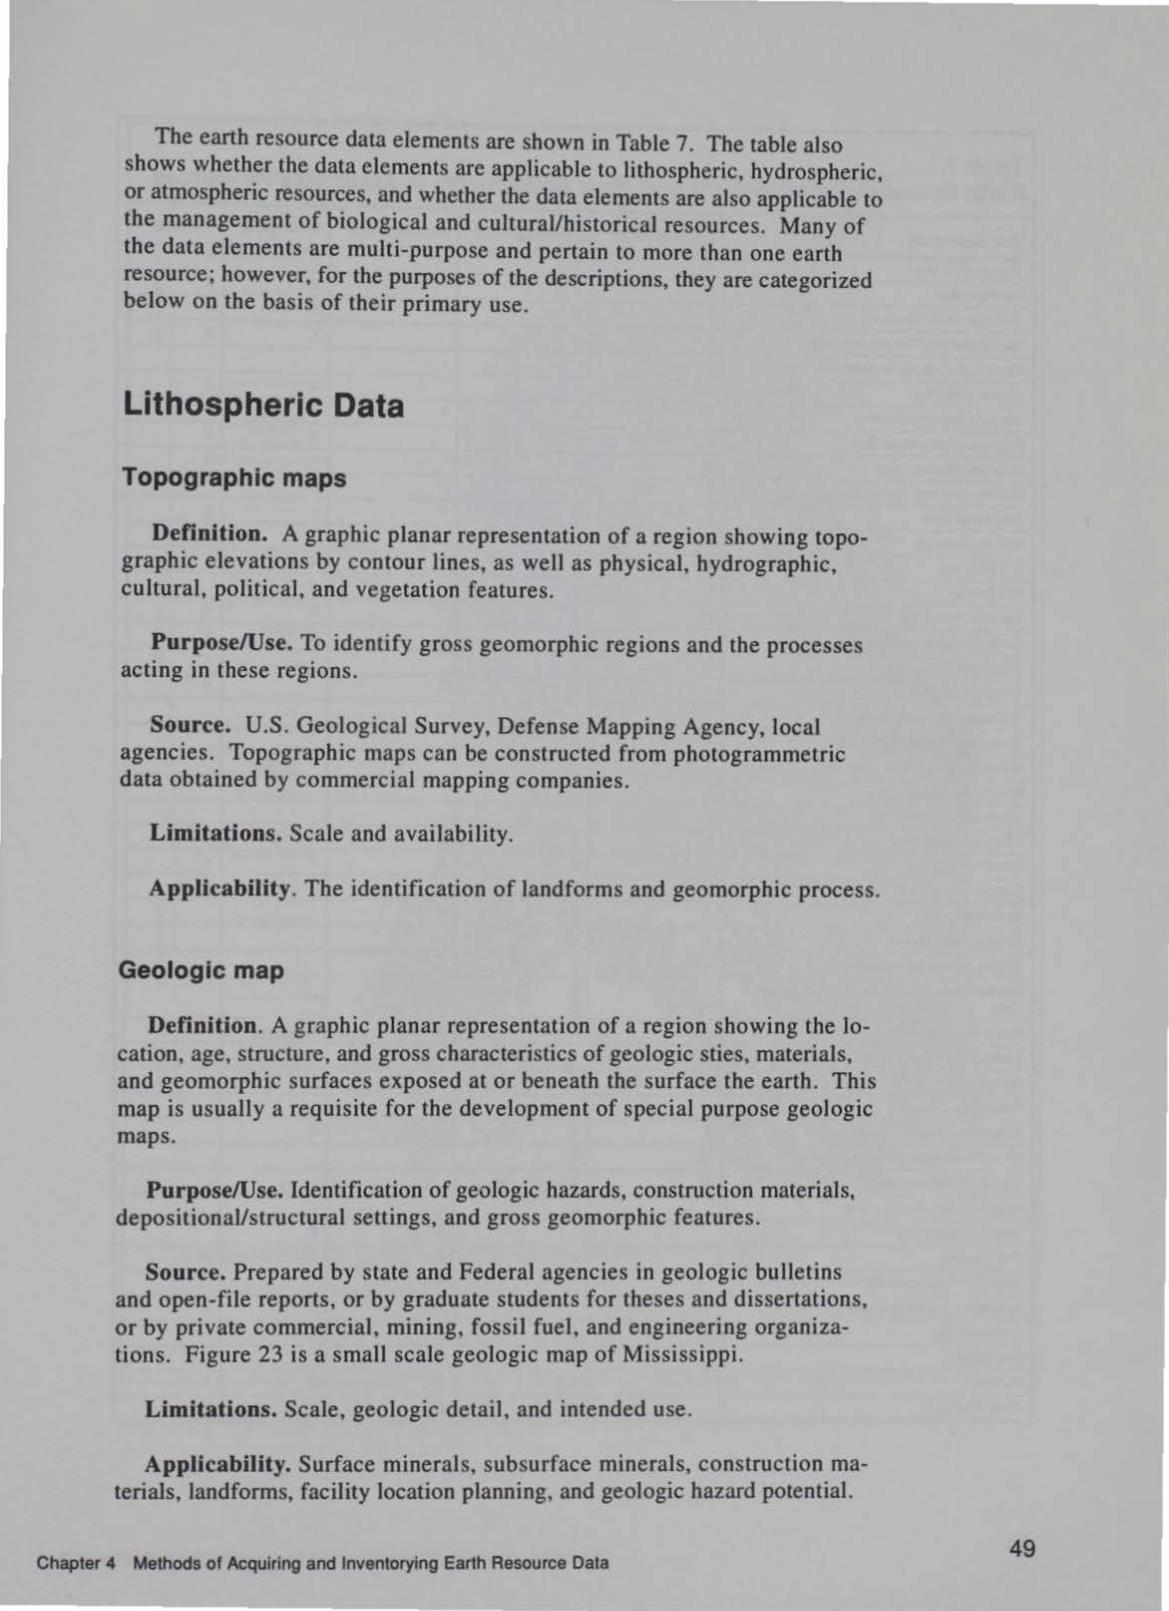
The earth resource data elements are shown in Table 7. The table also shows whether the data elements are applicable to lithospheric, hydrospheric, or atmospheric resources, and whether the data elements are also applicable to the management of biological and cultural/historical resources. Many of the data elements are multi-purpose and pertain to more than one earth resource; however, for the purposes of the descriptions, they are categorized below on the basis of their primary use.
Lithospheric Data
Topographic maps
Definition. A graphic planar representation of a region showing topographic elevations by contour lines, as well as physical, hydrographic, cultural, political, and vegetation features.
Purpose/Use. To identify gross geomorphic regions and the processes acting in these regions.
Source. U.S. Geological Survey, Defense Mapping Agency, local agencies. Topographic maps can be constructed from photogrammetric data obtained by commercial mapping companies.
Limitations. Scale and availability.
Applicability. The identification of landforms and geomorphic process.
Geologic map
Definition. A graphic planar representation of a region showing the location, age, structure, and gross characteristics of geologic sties, materials, and geomorphic surfaces exposed at or beneath the surface the earth. This map is usually a requisite for the development of special purpose geologic maps.
Purpose/Use. Identification of geologic hazards, construction materials, depositional/structural settings, and gross geomorphic features.
Source. Prepared by state and Federal agencies in geologic bulletins and open-file reports, or by graduate students for theses and dissertations, or by private commercial, mining, fossil fuel, and engineering organizations. Figure 23 is a small scale geologic map of Mississippi.
Limitations. Scale, geologic detail, and intended use.
Applicability. Surface minerals, subsurface minerals, construction materials, landforms, facility location planning, and geologic hazard potential.
Chapter 4 Methods of Acquiring and Inventorying Earth Resource Data 49

Table 7 Earth Resource Data Elements and Their Relationship to Applicable Resources
Data Elements Lithospheric Hydrospheric Atmospheric Biological Cultural
Topographic Map X X X X
Geologic Map X X X X
Geclogic Cross-Section X X X X
Glacial Geology/Pleistocene Map X X X X
T ectonlc/Structural Geology Map X
Geomorphic M?p X X X X
Imagery. Remote Sensing X X X X X
Engineering Geologic Map X X X X
Geologic Hazards Map X X X X
Mobility Map and Terrain Data X X X
Soil. Agronomic X X X X X
Soil. Engineering X X
Soil Moisture X X X X X
Soil Survey X X X X
Geologic Well Logs X X X X
Geologic Cores and Cuttings X X X X
Geophysical Surveys X X X
Geophysical Well Logs X X X
Hydroc:a.lbon ProdUCtion Map X
Hydroc:a.lbon Completion Card X
Mineral DepositiProductJOn Map X
Mineral Production Data X -
Construction Materials X
Paleontological Data X X X X X
Geochronology X X X X X
Sample Assays and Analyses X Hydrologic Atlas X X X
Stream Basin Map X X
Gaging Station Location Map X X
Stream Stage/Discharge and Hydrograph X X Data
Flood-Prone Area Map X X X X
Sediment Discharge/Yield Data X X X
Bathymetry X X
Tidal Gage Data X
Substrate Characterization Data X X X
Groun Water and Spring Inventory X X
Aquifer Characterization Data X X
Potenbometnc Surface Map X
Water Budget Data X X X
Precipttation X X X X Atmospheric Ctrcutation X X
Atmospheric Energy (Ughbng) X X X Condensation X X X X Evaporation X X X X Humidtty X X X X Solar Radiation X X X X
50 Chapter 4 Methods of Acquiring and Inventorying Earth Resource Data

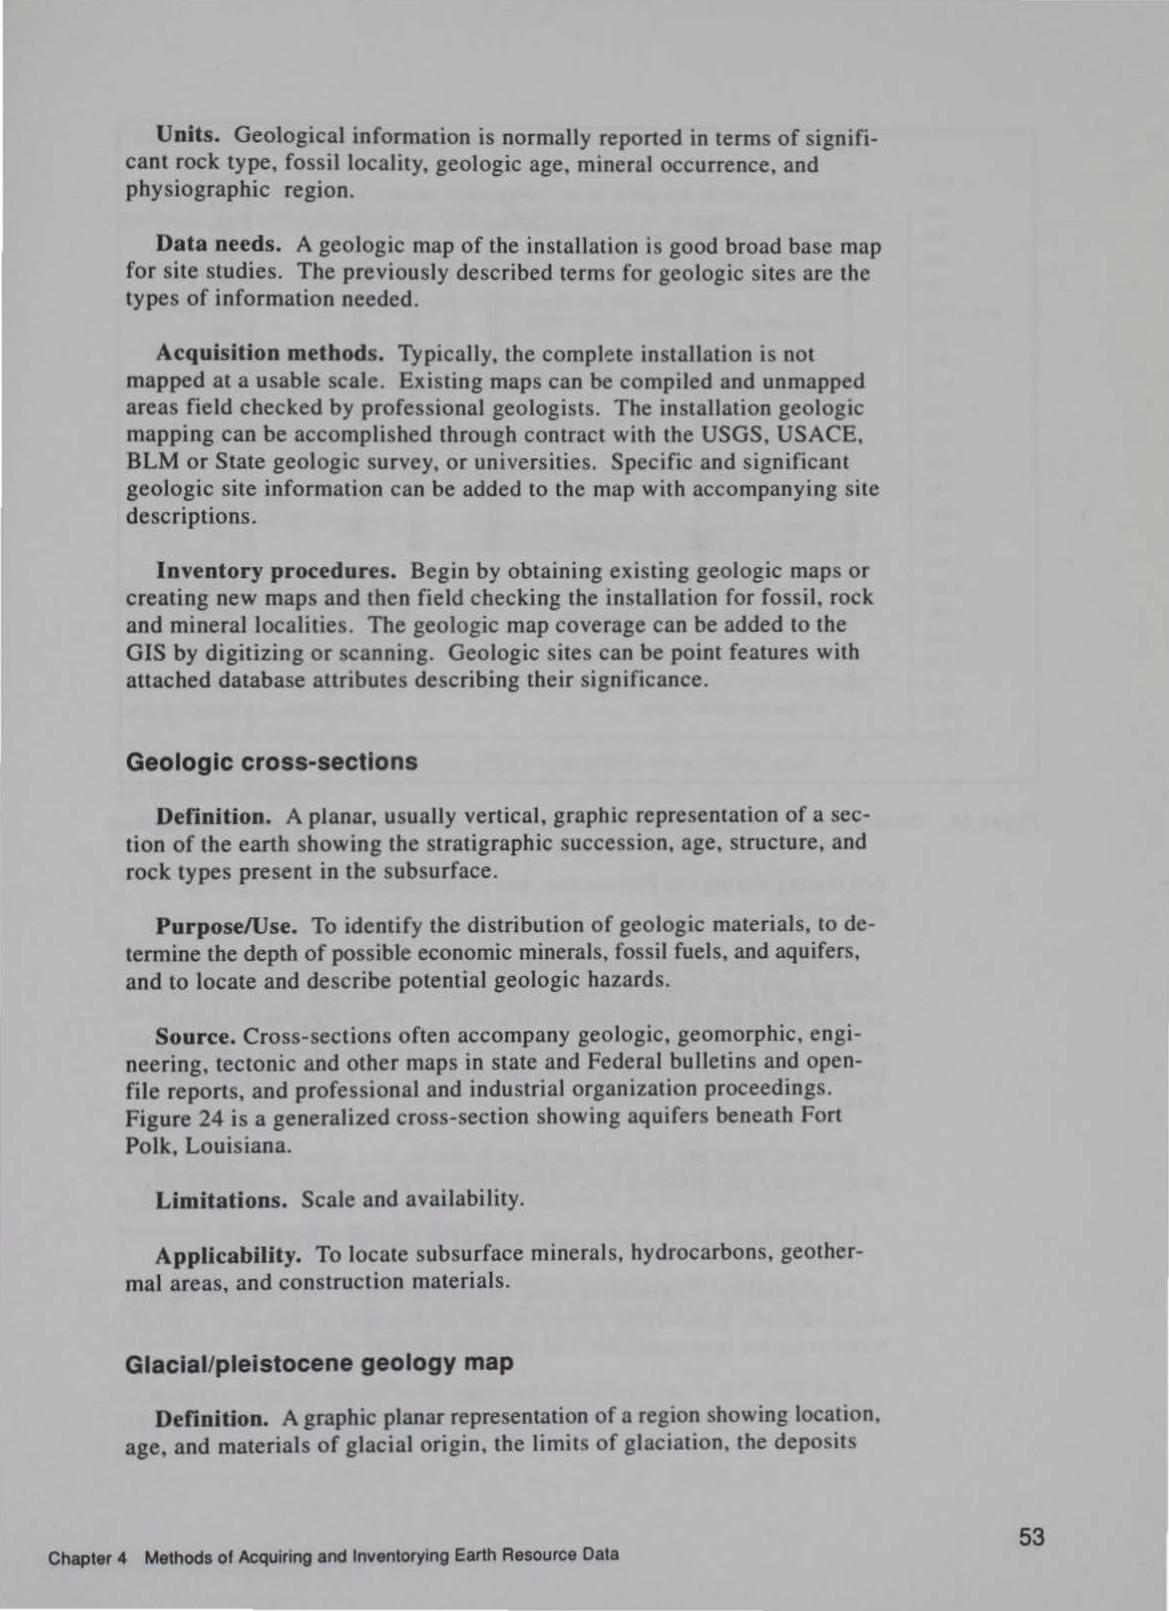
Units. Geological information is normally reported in terms of significant rock type, fossil locality, geologic age, mineral occurrence, and physiographic region.
Data needs. A geologic map of the installation is good broad base map for site studies. The previously described terms for geologic sites are the types of information needed.
Acquisition methods. Typically, the compl'!te installation is not mapped at a usable scale. Existing maps can be compiled and unmapped areas field checked by professional geologists. The installation geologic mapping can be accomplished through contract with the USGS, USACE, BLM or State geologic survey, or universities. Specific and significant geologic site information can be added to the map with accompanying site descriptions.
Inventory procedures. Begin by obtaining existing geologic maps or creating new maps and then field checking the installation for fossil, rock and mineral localities. The geologic map coverage can be added to the GIS by digitizing or scanning. Geologic sites can be point features with attached database attributes describing their significance.
Geologic cross-sections
Definition. A planar, usually vertical, graphic representation of a section of the earth showing the stratigraphic succession, age, structure, and rock types present in the subsurface.
Purpose/Use. To identify the distribution of geologic materials, to determine the depth of possible economic minerals, fossil fuels, and aquifers, and to locate and describe potential geologic hazards.
Source. Cross-sections often accompany geologic, geomorphic, engineering, tectonic and other maps in state and Federal bulletins and openfile reports, and professional and industrial organization proceedings. Figure 24 is a generalized cross-section showing aquifers beneath Fort Polk, Louisiana.
Limitations. Scale and availability.
Applicability. To locate subsurface minerals, hydrocarbons, geothermal areas, and construction materials.
Glacial/pleistocene geology map
Definition. A graphic planar representation of a region showing location, age, and materials of glacial origin, the limits of glaciation, the deposits
Chapter 4 Methods of Acquiring and Inventorying Earth Resource Data 53

\\EST
c F:AST
c· FEET FEET
6A-PO 78-PO 2A-PO 00 400 Ps
4 Hunt 2 Hunt 1 6 PS 4 A 2A-PS
300 300
200 CASTOR CREEK cONFINING UNIT 200
100 100
SEA LEVEL SEA LEVEL WILLIAMSON CREEK AQUIF ER
100 100
200 --··------· · •"' 200 300 300
400 400
G._. '"'\\.\.S CONFINING UNIT
500 p p 500 0 ou
600 600 700 .;.. ..... _ ... .:_.,,.. __ ~ ....... _~ ..:-- ·-- 700
800 800
900 --- .... :"'"'""· ... !"'~-...,.- ... --.~.;~C ... SA-ND·--~-::-- soo
___ :::~···:~:~~~·-·;:::~ ·~·"-"''"' -,; ·J.;.. -·--·~·-·- ..
t.OOO • • .. .. • .. 1,000
1.100 EXPI.ANATION 1,100
1•20° CARNAHAN BAYOU AQUIFER I Sane! Interval 1•200
1,300 0 Clay or •halo 1,300
1,400 tiJ Well seroen 1,400
1,500 6-PS Fort Polk 1,500 1,600 See hg~o~· • t to, touuon ot ntllon well number 1,600
1, 700 .l----,.---.----r---.---,--.,---,--.,----,---,----1. 1, 700
0 4.000 8,000 12,000 16,000 FEET
Figure 24. Generalized geologic cross section at Fort Polk, Louisiana, showing underlying aquifers
54
originating during the Pleistocene, and information relative to glacial movement.
Purpose/Use. To describe Pleistocene history, for delineation of Pleistocene geomorphic surfaces, and to infer relations between these surfaces and the biotic and cultural history of a region. These maps may also be useful for the identification of construction materials and geologic hazards, because glacial/Pleistocene deposits are usually at the surface in proximity to man.
Source. State and Federal geologic bulletins and open-file reports, academic theses and dissertations, proceedings of professional organizations.
Limitations. Scale, and usually limited to glaciated regions.
Applicability. Engineering soils, surface minerals, construction materials, landforms, geomorphic processes and environmental planning, ground water resource investigations, and geologic hazards evaluations.
Chapter 4 Methods of Acquiring and Inventorying Earth Resource Data

Tectonic/structural geology map
Definition. A graphic planar representation of a region showing general geologic and tectonic structure and gross lithology of a region.
Purpose/Use. The identification of major mountain, basin and fault systems, and the overall geologic framework of the region.
Source. State and Federal geologic bulletins and open-file reports, and proceedings of professional organizations.
Limitations. Limited availability, small scale, and broad in scope.
Applicability. For regional geologic studies, and the general location of potential energy sources.
Geologic hazards map
Definition. A planar graphic representation of a region showing areas in which floods, landslides, earthquakes, subsidence or problem soils may be expected to occur.
Purpose/Use. Landuse planning, environmental monitoring, and resource evaluation.
Source. Federal and state agency bulletins and open-file reports, particularly those of the USGS.
Limitations. Availability and scale.
Applicability. Engineering soils, geomorphic processes, impact assessment, and landuse planning; and monitoring of biological and cultural sites.
Geomorphic maps
Definition. A graphic planar representation of a region showing the I ocation, age, materials, and origin of geomorphic surfaces and regional erosional and depositional features.
Purpose. Describes, defines, and relates modern versus Holocene/ Pleistocene or older landscape development processes and their relations to biologic and cultural features on these landscapes.
Source. May be available in state and Federal geologic bulletins and USGS open-file reports, or prepared as a part of special studies for specific projects.
Chapter 4 Methods of Acquiring and Inventorying Earth Resource Data 55
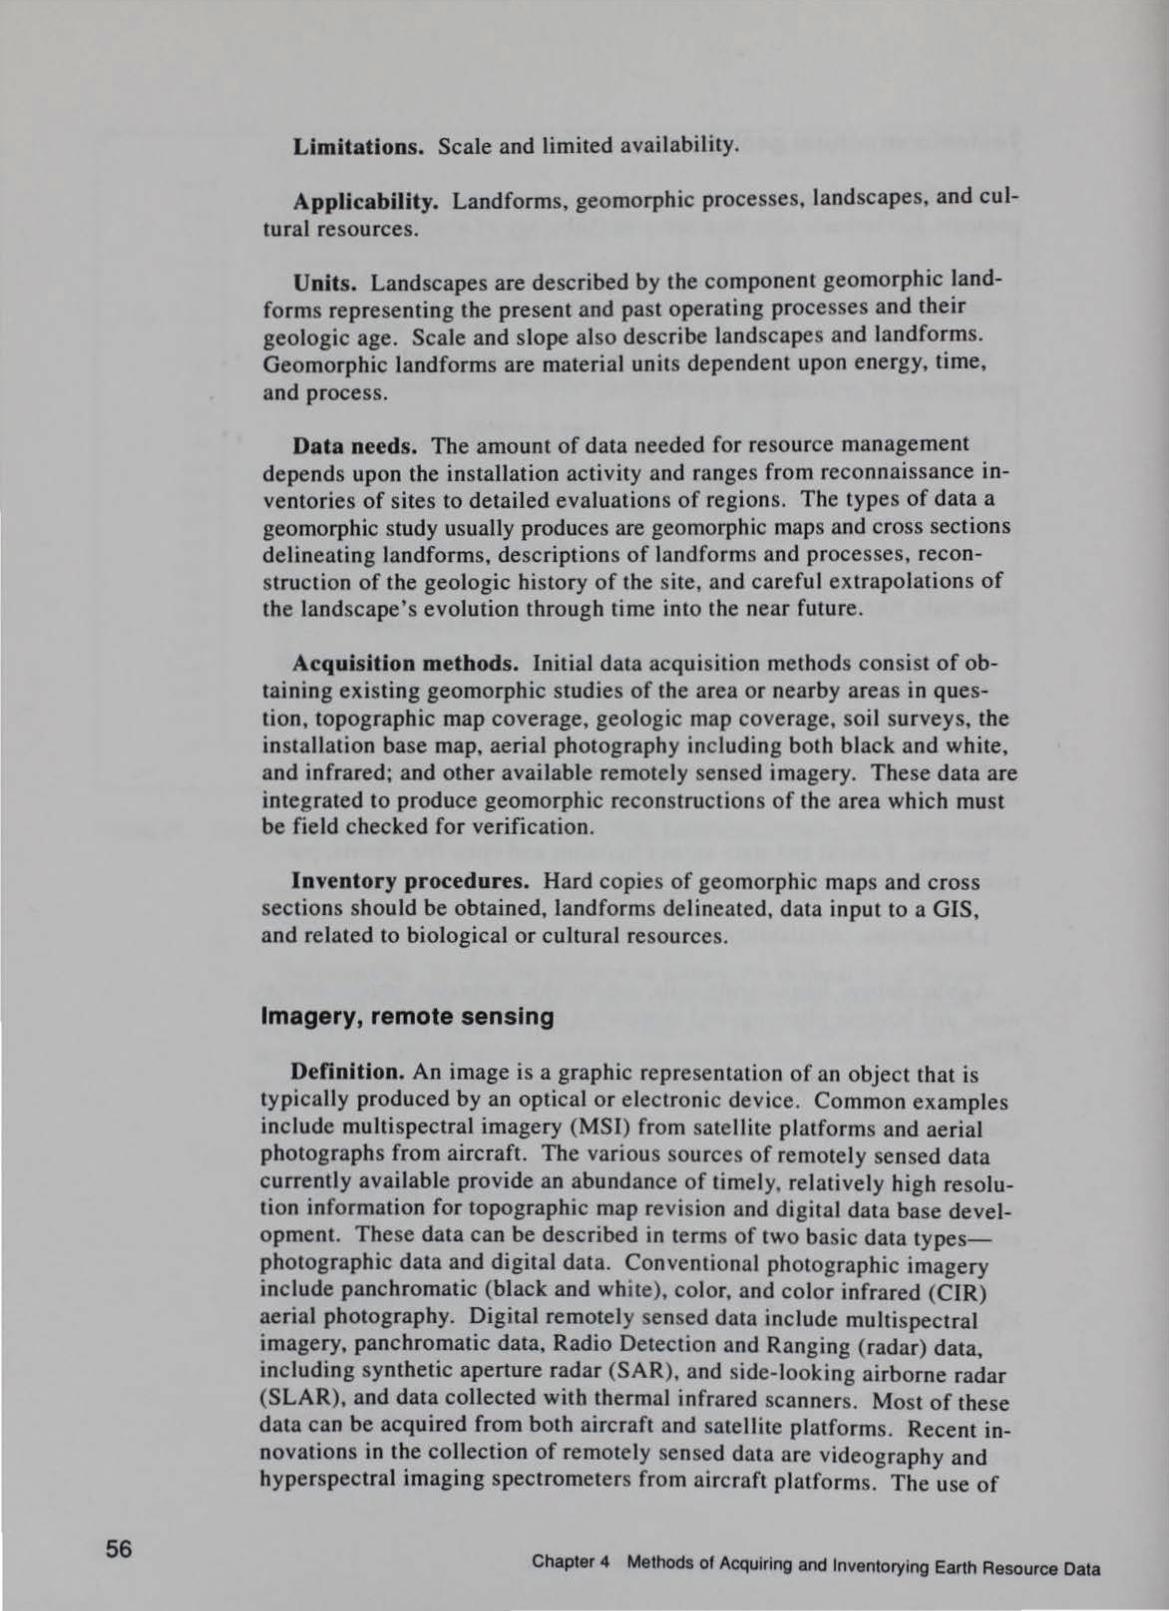
56
Limitations. Scale and limited availability.
Applicability. Landforms, geomorphic processes, landscapes, and cultural resources.
Units. Landscapes are described by the component geomorphic landforms representing the present and past operating processes and their geologic age. Scale and slope also describe landscapes and landforms. Geomorphic landforms are material units dependent upon energy, time, and process.
Data needs. The amount of data needed for resource management depends upon the installation activity and ranges from reconnaissance inventories of sites to detailed evaluations of regions. The types of data a geomorphic study usually produces are geomorphic maps and cross sections delineating landforms, descriptions of landforms and processes, reconstruction of the geologic history of the site, and careful extrapolations of the landscape's evolution through time into the near future.
Acquisition methods. Initial data acquisition methods consist of obtaining existing geomorphic studies of the area or nearby areas in question, topographic map coverage, geologic map coverage, soi l surveys, the installation base map, aerial photography including both black and white, and infrared; and other available remotely sensed imagery. These data are integrated to produce geomorphic reconstructions of the area which must be field checked for verification.
Inventory procedures. Hard copies of geomorphic maps and cross sections should be obtained, landforms delineated, data input to a GIS, and related to biological or cultural resources.
Imagery, remote sensing
Definition. An image is a graphic representation of an object that is typically produced by an optical or electronic device. Common examples include multispectral imagery (MSI) from satellite platforms and aerial photographs from aircraft. The various sources of remotely sensed data currently available provide an abundance of timely, relatively high resolution information for topographic map revision and digital data base development. These data can be described in terms of two basic data typesphotographic data and digital data. Conventional photographic imagery inc lude panchromatic (black and white), color, and color infrared (CIR) aerial photography. Digital remotely sensed data include multispectral imagery, panchromatic data, Radio Detection and Ranging (radar) data, including synthetic aperture radar (SAR), and side-looking airborne radar (SLAR), and data collected with thermal infrared scanners. Most of these data can be acquired from both aircraft and satellite platforms. Recent innovations in the collection of remotely sensed data are videography and hyperspectral imaging spectrometers from aircraft platforms. The use of
Chapter 4 Methods of Acquiring and Inventorying Earth Resource Data
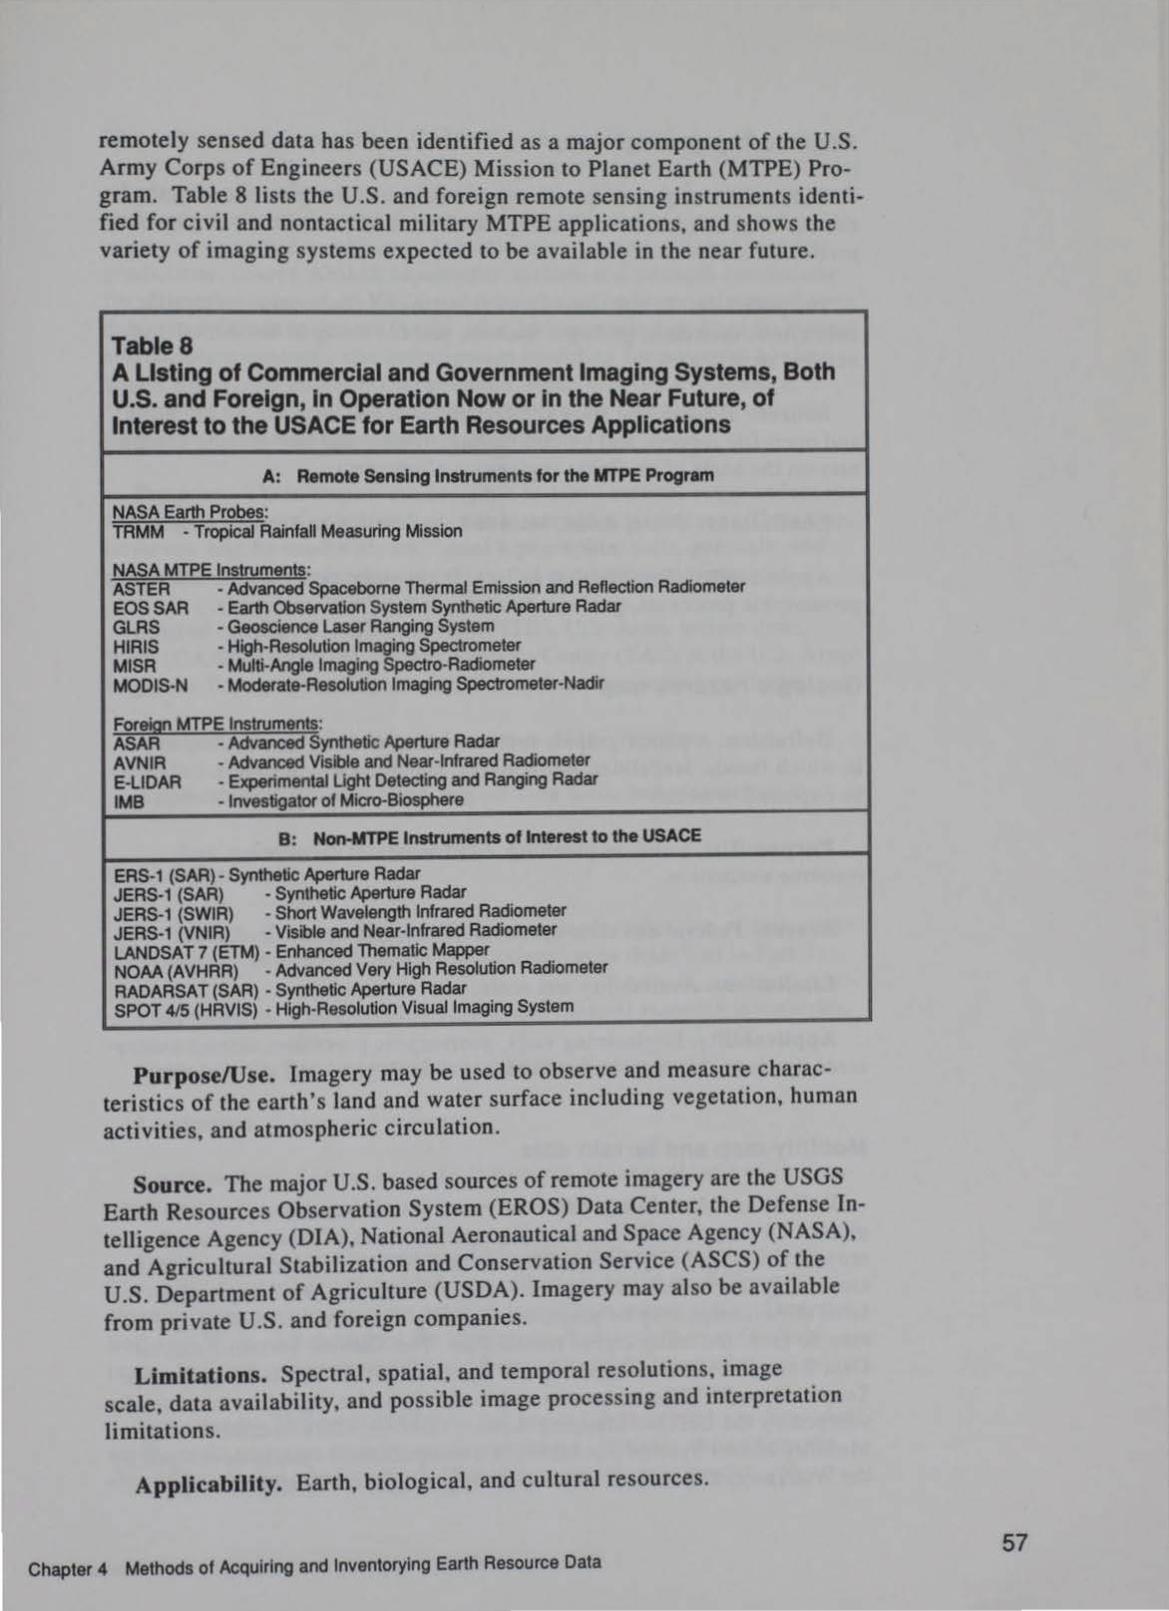
remotely sensed data has been identified as a major component of the U.S. Army Corps of Engineers (USACE) Mission to Planet Earth (MTPE) Program. Table 8 lists the U.S. and foreign remote sensing instruments identified for civil and nontactical military MTPE applications, and shows the variety of imaging systems expected to be available in the near future.
Table 8 A Listing of Commercial and Government Imaging Systems, Both U.S. and Foreign, In Operation Now or in the Near Future, of Interest to the USACE for Earth Resources Applications
A: Remote Sensing Instruments for the MTPE Program
NASA Earth Probes: TRMM - Tropical Rainfall Measuring Mission
NASA MTPE Instruments: ASTER - Advanced Spacebome Thermal Emission and Reflection Radiometer EOSSAR - Earth Observation System Synthetic Aperture Radar GLRS - Geoscience Laser Ranging System HIRIS - High-Resolution Imaging Spectrometer MIS A - Multi-Angle Imaging Spectra-Radiometer MODIS-N - Moderate-Resolution Imaging Spectrometer-Nadir
Foreign MTPE Instruments: ASAR - Advanced Synthetic Aperture Radar AVNIR -Advanced Visible and Near-Infrared Radiometer E·LIDAR • Experimental Ught Detecting and Ranging Radar 1MB • Investigator of Micro-Biosphere
8: Non-MTPE Instruments of Interest to the USACE
ERS-1 (SAR) • Synthetic Aperture Radar • Synthetic Aperture Radar JERS-1 (SAR)
JERS-1 (SWIR) • Short Wavelength Infrared Radiometer • Visible and Near-Infrared Radiometer JERS-1 (VNIR)
LANDSAT 7 (ETM) ·Enhanced Thematic Mapper • Advanced Very High Resolution Radiometer NOAA (AVHRR)
RADAR SAT (SAR) • Synthetic Aperture Radar SPOT 4/5 (HAVIS) - High-Resolution Visual Imaging System
Purpose/Use. Imagery may be used to observe and measure characteristics of the earth's land and water surface including vegetation, human activities, and atmospheric circulation.
Source. The major U.S. based sources of remote imagery are the USGS Earth Resources Observation System (EROS) Data Center, the Defense Intelligence Agency (DIA), National Aeronautical and Space Agency (NASA), and Agricultural Stabilization and Conservation Service (ASCS) of the U.S. Department of Agriculture (USDA). Imagery may also be available from private U.S. and foreign companies.
Limitations. Spectral, spatial, and temporal resolutions, image scale, data availability, and possible image processing and interpretation limitations.
Applicability. Earth, biological, and cultural resources.
Chapter 4 Methods of Acquiring and Inventorying Earth Resource Data 57
58
Engineering geologic map
Definition. A graphic planar representation of a region showing the locations of geologic materials categorized on the basis of their engineering properties and/or uses.
Purpose/Use. Identification and selection of construction materials, deleterious materials, geologic hazards, and for siting of horizontal and vertical structures.
Source. Prepared by state and Federal agencies in geologic bulletins and open-file reports, and by commercial mining and engineering companies on the basis of available regional geologic data.
Limitations. Scale, detail, intended application, and availability.
Applicability. Engineering soils, soil moisture, construction materials, geomorphic processes, geologic hazards, and cultural resources.
Geologic hazards map
Definition. A planar graphic representation of a region showing areas in which floods, landslides, earthquakes, subsidence or problem soils may be expected to occur.
Purpose/Use. Landuse planning, environmental monitoring, and resource evaluation.
Source. Federal and state agency bulletins and open-file reports.
Limitations. Availability and scale.
Applicability. Engineering soils, geomorphic processes, impact assessment, landuse planning, and monitoring of biological and cultural sites.
Mobility map and terrain data
Definition. A mobility map is a type of terrain representation of a region or military installation showing specific areas of relative ease of cross-country mobility for specific military vehicles on the basis of soils, slope, vegetation, and natural and artificial obstacles. Mobility and related terrain maps may be prepared manually or, more frequently, they may be prepared using digital terrain data. The Tactical Terrain Analysis Data Base (TTADB) and the Interim Terrain Data (ITD)/Planning Interim Terrain Data (PITD) are sources and instructions for digital terrain data developed by the Defense Mapping Agency (DMA). The Condensed Army Mobility Model System (CAMMS) is a computerized system developed by the Waterways Experiment Station for the preparation of mobility maps.
Chapter 4 Methods of Acquiring and Inventorying Earth Resource Data

The software implemented in CAMMS is the product of over 40 years of research into vehicle, terrain, and weather interactions. CAMMS provides a comprehensive description of the ability of vehicles and vehicle convoys to transport men and material over virtually any type of terrain and under nearly any weather conditions. In addition to on- and off-road mobility predictions, other CAMMS capabilities include soil strength predictions for all combinations of 16 uses soil types (based on historical precipitation data, precipitation measured for the prior 24-hour period, or from the current soil moisture content), site investigation modeling for potential landing zones, unassisted gap-crossing potential, route network evaluations, "reason maps" showing the limiting terrain factor for mobility or speed predictions, and maneuver damage predictions.
Purpose. These maps were designed to assist tactical commanders in locating avenues of attack and approach through a given area. They may, however, also be used with additional topographic, soils, geologic, and geomorphic data for landuse planning and resource management.
Source. DMA (TTADB, and ITD/PITD), U.S. Army terrain units, WES (CAMMS), and the Terrain Analysis Center {TAC) at the U.S. Army Engineer Topographic Engineering Center for other terrain products.
Limitations. Availability, and currency of information.
Applicability. Unit training, engineering soils, and planning.
Soil, Agronomic
Definition. Data relative to the agronomic classification of soil series according to the USDA Seventh Approximation as described in Part 3.
Purpose/Use. For earth, biological, and cultural resource inventories.
Source. U.S. Department of Agriculture and state agencies.
Limitation. Scale, and accuracy.
Applicability. Lithospheric, hydrospheric, biological, and cultural resources.
Units. A soil series is comprised of soils that have similar profiles. The series are further subdivided into soil phase based on differences of slope, surface texture or some other characteristic which affects land use. Soil capability unit describes the limitation of soil when used for field crops. Soil behavior can be inferred from soil capability.
Data needs. The amount of data and type of data needed are dependent on the scale or scope of resource management. Initially, the soil survey should be obtained and studied. If a closer resolution is needed, the
Chapter 4 Methods of Acquiring and Inventorying Earth Resource Data 59

60
USDA Soil Conservation Service (SCS) should be contacted for large scale mapping and/or agronomic soil management plans.
Acquisition methods. The simplest data acquisition method is to consult the SCS and soil survey. A professional soil scientist is needed to perform agronomic soil data collection. If the so il survey data are available at an acceptable scale, soil data can be digitized into a GIS database. A number of Army installations have soil data in GRASS raster format. The SCS has established three geographic databases: Soil Survey Geographic Database (SSURGO) for detailed county surveys at scales between 1:12000 and 1 :31680, State Soil Geographic Database (STATSGO) for s tate level soil maps at 1:250,000, and National Soil Geographic Data base (NATSGO) for generalized national- level soi l maps at a scale of I :750,000 (Lytle and Maubach, 1991 ).
Inventory procedures. Inventories include accessible soi l surveys and soil maps at the same scale as other installation maps. Ideally, agronomic soil will be a data layer in a unified database GIS. In addition, soi1 management practices, such as fertilizer applications, can be included in the database.
Soil, engineering
Definition. Soil as an engineering material is usually described by the USCS (Part 3) which differentiates soil by grain size, grain sorting, and plasticity parameters. Other classifications such as the American Association of State Highway and Transportation Officials (AASHTO) system are also used. Classifications by both systems are included in recent Soil Survey publications.
Purpose/Use. To classify and evaluate soils for engineering purposes.
Source. Soil Surveys, state and Federal agencies, and private companies.
Limitations. Scale and availability.
Applicability. Earth resource evaluations.
Units. Grain size is reported in millimeters. Specific grain-size diameters are significant to different engineering problems. For example, the grainsize diameter for which 10 weight-percent of the sample is finer is known as the D 10 and it is indicative of the soils permeability. The D35 size is used to determine suitability for rip-rap protection. The D60 size is an approximation of the slot-size for a well screen set in soil. The grain-sized distribution of the soil determines whether the soi l is well graded or poorly graded. Plasticity is measured by Atterberg plasticity limits. The plasticity index (PI) is the difference between the plastic limit (PL) and the liquid limit (LL). Soil strength is measured in terms of ~ounds per square inch, pounds per square foot, or pascals (Newtons/m ).
Chapter 4 Methods of Acquiring and Inventorying Earth Resource Data
Data needs. The amount and type of data needed for resource management is dependent on the geologic setting and engineering requirements of the activity. Geotechnical soil boring logs contain site specific soil data. Geologic cross-sections portray the subsurface from boring data. Consultation with an engineering geologist and/or geotechnical engineer about data needs may be required to determine specific needs and to identify special laboratory or in-situ tests.
Acquisition Methods. A review of existing engineering soil and geotechnical data in Soil Surveys and other publications should precede additional field sampling. Soil samples can be collected on the surface and in the subsurface by standard drilling and sampling techniques (EM 1110-2-1907, Soil Sampling). Soil samples are usually classified in the field and in the laboratory. The USCS was designed to allow approximate in-situ soi l classification from visual inspection and a few simple tests (Costa and Baker, 1981 p. 211; Schroder, 1975 p. 43). Laboratory procedures are more precise than field determinations. Detailed procedures for USCS soi l c lassifications can be found in EM 1110-2-1906, Laboratory Soil Testing.
Inventory procedures. Soil data may be shown on an engineering geologic map of the installation. Records of all previous geotechnical investigations and borings records should be kept on file and maintained GIS for storage, access and retrieval.
Soil moisture
Definition. The amount of water contained in the void space of soil.
Purpose/Use. For construction and related engineering activities, for determining water budgets, environmental assessments, and for biological and cultural resource evaluations.
Source. Laboratory and field measurements, and estimated from soil surveys and soil c lassification data.
Limitations. Availability, and seasonal variability.
Applicability. Earth, biological, and cultural resources.
Units. Soil moisture is usually described as water content and expressed as a percentage of the weight of water in a soil sample to the weight of solid particles. Soil moisture may also be expressed volumetrically and it may be given in inches of water. Soil water potential is the total gravitational, capillary, and osmotic potential in the soil-water system. Field capacity is defined as the weight of water in a soil 2 days after saturation, if the soil is covered to prevent evaporation. The permanent wilting point is the water content of a soil at which a plant can no longer extract enough water to Jive. Available water capacity, the ability of the soil to hold
Chapter 4 Methods of Acquiring and Inventorying Earth Resource Data 61

62
water for plant use, is defined as the difference between field capacity and the permanent wilting point. Available water content is reported as inches of water per inches of soil.
Data needs. Amount of data collected is dependent on the size of area, seasonal variation in rainfall, type of soil, and the nature and severity of the resource problem. In the Corps of Engineers (CE), water content data are stored on Laboratory Reports ENG FORM 3835 and soil boring logs. Available water content is reported for specific soil series in Soil Survey publications but in units different from those used in engineering.
Acquisition methods. The water content of soil can be measured either directly or indirectly. Direct methods require separate samples for each measurement. When one-time data are needed, direct procedures are preferred. If frequent or continuous readings are desired, indirect methods are used. Indirect procedures require calibration to relate to actual water content. Once the relationship is established, the measurements are quick and nondestructive.
Direct methods, consisting of conventional oven drying at I 05 °C is the most common practice (ASTM 1975a, pp. 275-276). Drying by burning alcohol is recommended for rapid (approximately 20 minutes) field determination. A new and expedient method has been developed by Gilbert (1988) using a computer-controlled microwave oven.
Indirect methods, using neutron scattering, gamma-ray attenuation and gas pressure methods, are recommended as indirect procedures for water content determination. Neutron scattering is a reliable field method using a single-probe, bore-hole logging technique. Neutrons, emitted from a radioactive source, collide with hydrogen atoms in the soil and are counted. The gamma-ray attenuation method is a core-logging technique. Gamma rays are emitted from a radioactive source, and the rays not attenuated by the soil core are counted by a detector.
Soil-water potential is measured with tensiometer, electrical resistance blocks, and pyschrometers. Tensiometers measure capillary potential in the field at tensions less than 0.85 bar. Electrical resistance blocks measure potential greater than 0.85 bar. Psychrometers also measure potentials greater than 0.85 bar and have the advantage of measuring total potential.
Inventory procedures. Locations of sampling sites should be plotted on a base map, and water content data should be maintained in a data base. Ideally, a database which contains water contents, sample location coordinates, date of test, method, and name of person who performed the test should be linked to an installation GIS which also contains spatial and temporal precipitation data.
Chapter 4 Methods of Acquiring and Inventorying Earth Resource Data

Soil surveys
Definition. A county or regional bulletin usually prepared by the U.S. Department of Agriculture containing maps and tabulated data describing the agricultural and engineering classification, location, and physical properties of near-surface (upper six feet) soils. See Soils, Agronomic and Soils, Engineering.
Purpose/Use. To identify critical physical properties of near-surface soil materials for agricultural purposes, to locate construction material, for engineering activities and, with interpretation, to relate geological and geomorphological data to biological and cultural resources. The data may infer information on deeper geological materials.
Source. U.S. Department of Agriculture and certain state agencies.
Limitations. The data may require interpretation, and it may be too general in scope for some purposes.
Applicability. Agronomic and engineering soils, surface minerals, soil moisture, construction materials, landuse, recreational potential.
Geologic well logs
Definition. A written description of the geologic materials including their depth, lithology, and drilling rates encountered during the drilling of engineering, environmental assessment, fossil fuel, economic mineral, or water well borings. Descriptions may be based upon drill cuttings or from core samples.
Purpose/Use. These data form the basis for geologic maps and crosssections, and are raw data for earth resource evaluations, and for understanding relations between earth resources and biological and cultural resources.
Source. Usually, drilling records are maintained on file by state and Federal agencies, and they may be included in agency geologic bulletins and open-file reports. Drilling records may also be available from private companies and organizations.
Limitations. Location of interest, site specific, availability, and they may require interpretation. They also vary considerable in precision and content.
Applicability. Agronomic and engineering soils, surface minerals, soil moisture, hydrocarbon and geothermal energy, construction materials, geomorphic processes, landscapes, engineering and environmental assessments.
Chapter 4 Methods of Acquiring and Inventorying Earth Resource Data 63
64
Geologic cores and cuttings
Definition. Retrieved, described, and maintained drill hole cuttings and core samples from engineering, fossil fuel, economic mineral, or water-well test holes.
Purpose/Use. To fully describe the lithology, economic properties, age, and origin of near- and deep-subsurface earth materials. Basic data for geologic mapping, cross-sections, and resource inventories.
Source. State highway departments and geological surveys and Federal agencies, private engineering and energy companies, and academic institutions often maintain core and sample libraries.
Limitations. Some cores and samples may be proprietary and not available to the public; all intervals may not have been sampled, bore hole locations and elevations may be inadequate, and core conditions may be poor.
Applicability. Agronomic and engineering soils, subsurface minerals, hydrocarbon and geothermal energy, construction materials, aquifer studies, and geomorphic processes.
Geophysical well logs
Definition. Geophysical well logs are a type of geophysical survey conducted in a borehole giving response signatures including, but not limited to, spontaneous potential, electrical resistivity, natural gamma, gammagamma, and neutron characteristics. An example of a geophysical well log suite is correlated to a geological graphic log in Figure 25. The logs were taken at Red River Lock and Dam No. 5 approximately 15 miles southeast of Barksdale AFB.
Purpose. To permit the identification of lithology, stratigraphy, physical properties, and economic or water-resource potential of subsurface geologic materials.
Source. Well logs are collected and maintained by libraries in state and Federal agencies, academic institutions, and private organizations.
Limitations. Availability, interpretation, and cal ibration with core samples.
Applicability. Subsurface minerals, geologic studies, hydrocarbon exploration and evaluation.
Chapter 4 Methods of Acquiring and Inventorying Earth Resource Data

130
120-
110-
100-
90-
80 -
0
~ z 70-.... w w ~
f:, 60 -Vl z 0
~ 50-w ...J w
40 -
30
20-
I 0 •
c-
10-
Figure 25.
.....
-
-- + I
I
' .. I I
.....
SP.
I . '
RESISTIVITY ·,:!+-- '· '~ I __, . .. .~l
. ·I·. . o I to . . . . . .. . "'to o I • • • t •• . . I I to . --
I'
. :~ • . . . .
:: l : ;__.j.;
. , . I -·- ·- ·-
' . I
1 • :
• .. ' , ... •
~~a-.-.,-, .. - .• - .• ~~-~--~-r~~~~~~~~~~~~~~ ..... ..,.._ ...... . "' ,., .. ..... ,. ....... ..,... ._. ... .. , .......... ,... .. ,. ,,, \l .. lft . ... ~, ... .,11 ..... l htt ... ...... , ........ , ... ...,.. ..,.. .. •-'a.""'... •• 'I I'
c.a :I WIL I !X.. -:l: I
.. r i 1 I
I • -y -· ·1--
I " '"·' .......... .,
Q.Utt• ..... • ,..,.. I l h I \ .,. MltU'fAr . Q..," ... .., .., .. ".,. I ' '"' ......... , .,.. , . I-
_. -1-. ~ -~~-~--~ ....... 4 -=:;; .... m1
Geophysical well logs with graphic geologic log taken in a boring in the vicinity of Barksdale AFB
Chapter 4 Methods of Acquiring and Inventorying Earth Resource Data
' .
65
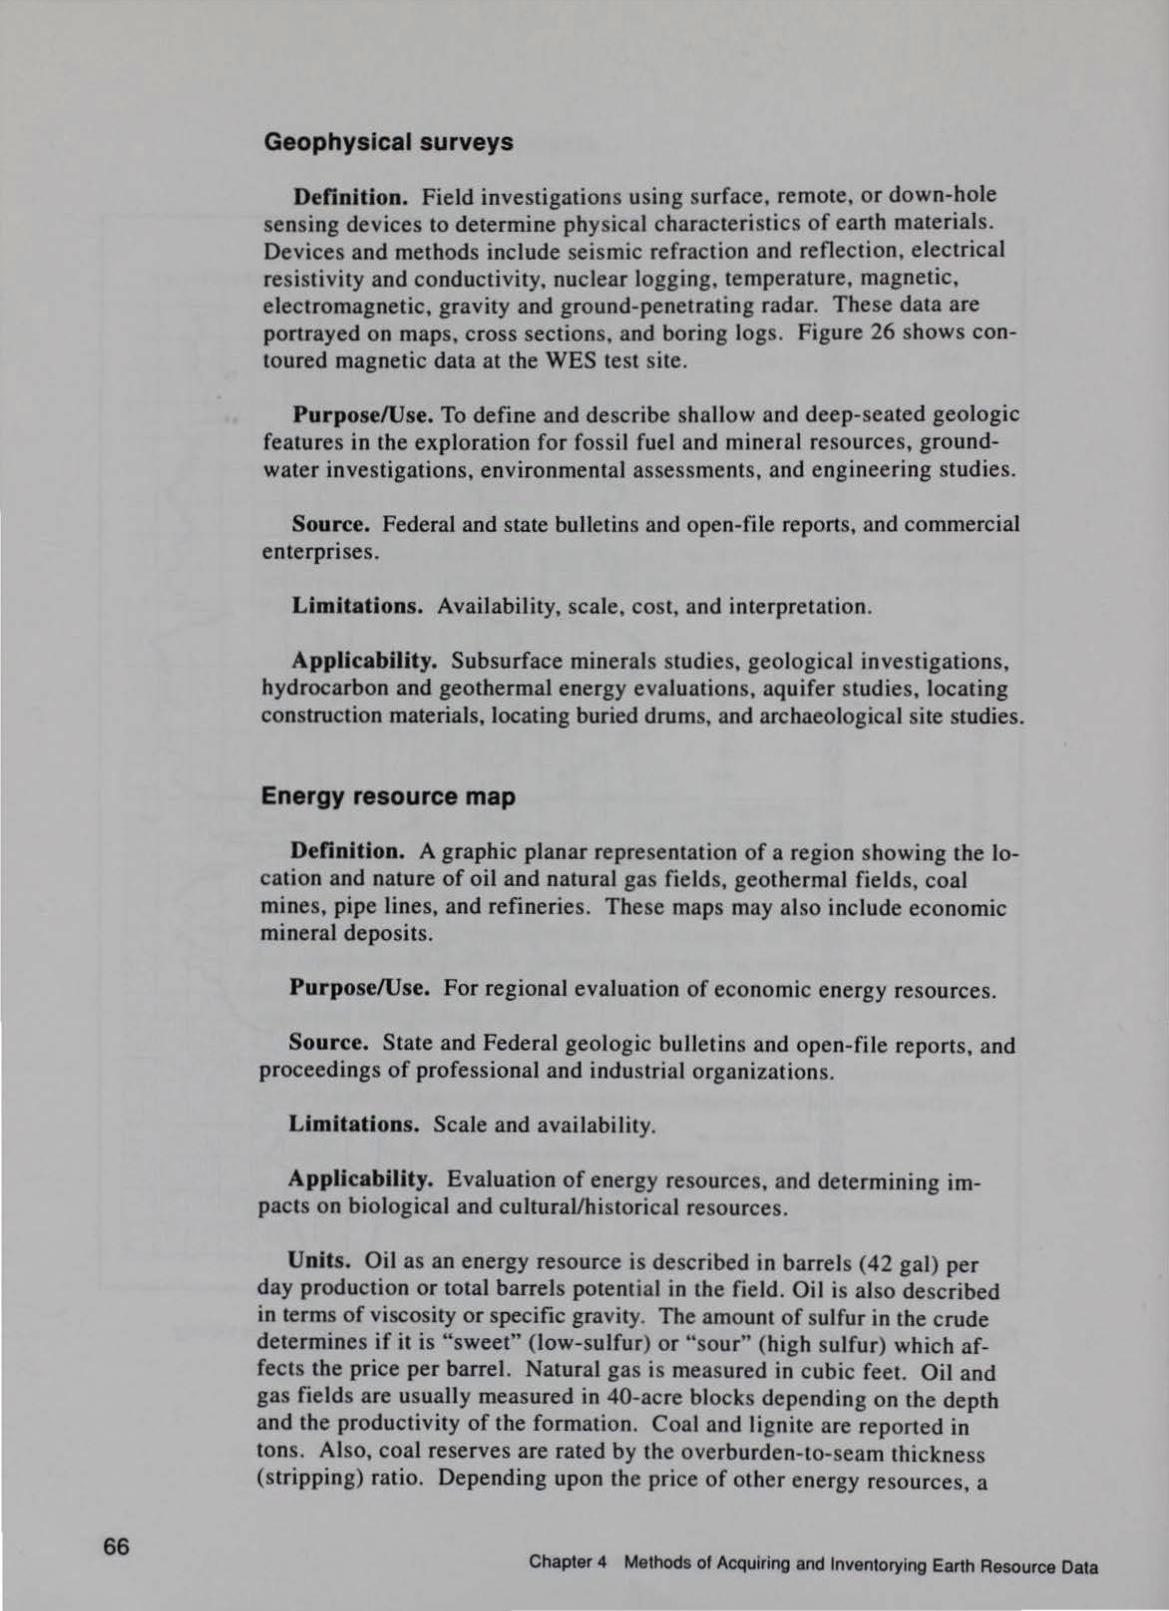
66
Geophysical surveys
Definition. Field investigations using surface, remote, or down-hole sensing devices to determine physical characteri stics of earth materials. Devices and methods include seismic refraction and reflection, electrical resistivity and conductivity, nuclear logging, temperature, magnetic, electromagnetic, gravity and ground-penetrating radar. These data are portrayed on maps, cross sections, and boring logs. Figure 26 shows contoured magnetic data at the WES test site .
Purpose/Use. To define and describe shallow and deep-seated geologic features in the exploration for fossil fuel and mineral resources, groundwater investigations, environmental assessments, and engineering studies.
Source. Federal and state bulletins and open-file reports, and commercial enterprises.
Limitations. Availability, scale, cost, and interpretation.
Applicability. Subsurface minerals studies, geological investigations, hydrocarbon and geothermal energy evaluations, aquifer studies, locating construction materials, locating buried drums, and archaeological site studies.
Energy resource map
Definition. A graphic planar representation of a region showing the location and nature of oil and natural gas fields, geothermal fields, coal mines, pipe lines, and refineries. These maps may also include economic mineral deposits.
Purpose/Use. For regional evaluation of economic energy resources.
Source. State and Federal geologic bulletins and open-file reports, and proceedings of professional and industrial organizations.
Limitations. Scale and availability.
Applicability. Evaluation of energy resources, and determining impacts on biological and cultural/historical resources.
Units. Oil as an energy resource is described in barrels ( 42 gal) per day production or total barrels potential in the field. Oil is also described in terms of viscosity or specific gravity. The amount of sulfur in the crude determines if it is "sweet" (low-sulfur) or "sour" (high sulfur) which affects the price per barrel. Natural gas is measured in cubic feet. Oil and gas fields are usually measured in 40-acre blocks depending on the depth and the productivity of the formation. Coal and lignite are reported in tons. Also, coal reserves are rated by the overburden-to-seam thickness (stripping) ratio. Depending upon the price of other energy resources, a
Chapter 4 Methods of Acquiring and Inventorying Earth Resource Data

0 ::r ~ -CD .., .... 3: CD :T 8. (/)
0 -~
.D c :5: ::J
1.0
~ a. 5' < CD ::J 0 ~-::J
1.0
m
~ :0 CD (/)
0 c 0 CD
0 Ill ~
150 w 125 w 100 w 75 w 50 w 6C N-
50 N-
40 N-
30 N-
20 N-
10 N-
0-
150 w 125 w 100 w 75 w 50 w
25 0 25
{loot)
25 w 0
25 w 0
MAGNETIC SURVEY
TOTAL fiELD OAIUIAS
25 E 50 E
25 E 50 E
75 E
- 60 N
-soN
-40 1\j
-30 N
-20 N
-10 N
-0
75 E 100 E
Figure 26. Magnetic survey conducted at the U.S. Army Engineer Waterways Experiment Station test site. Note the anomalies indicating buried metallic objects
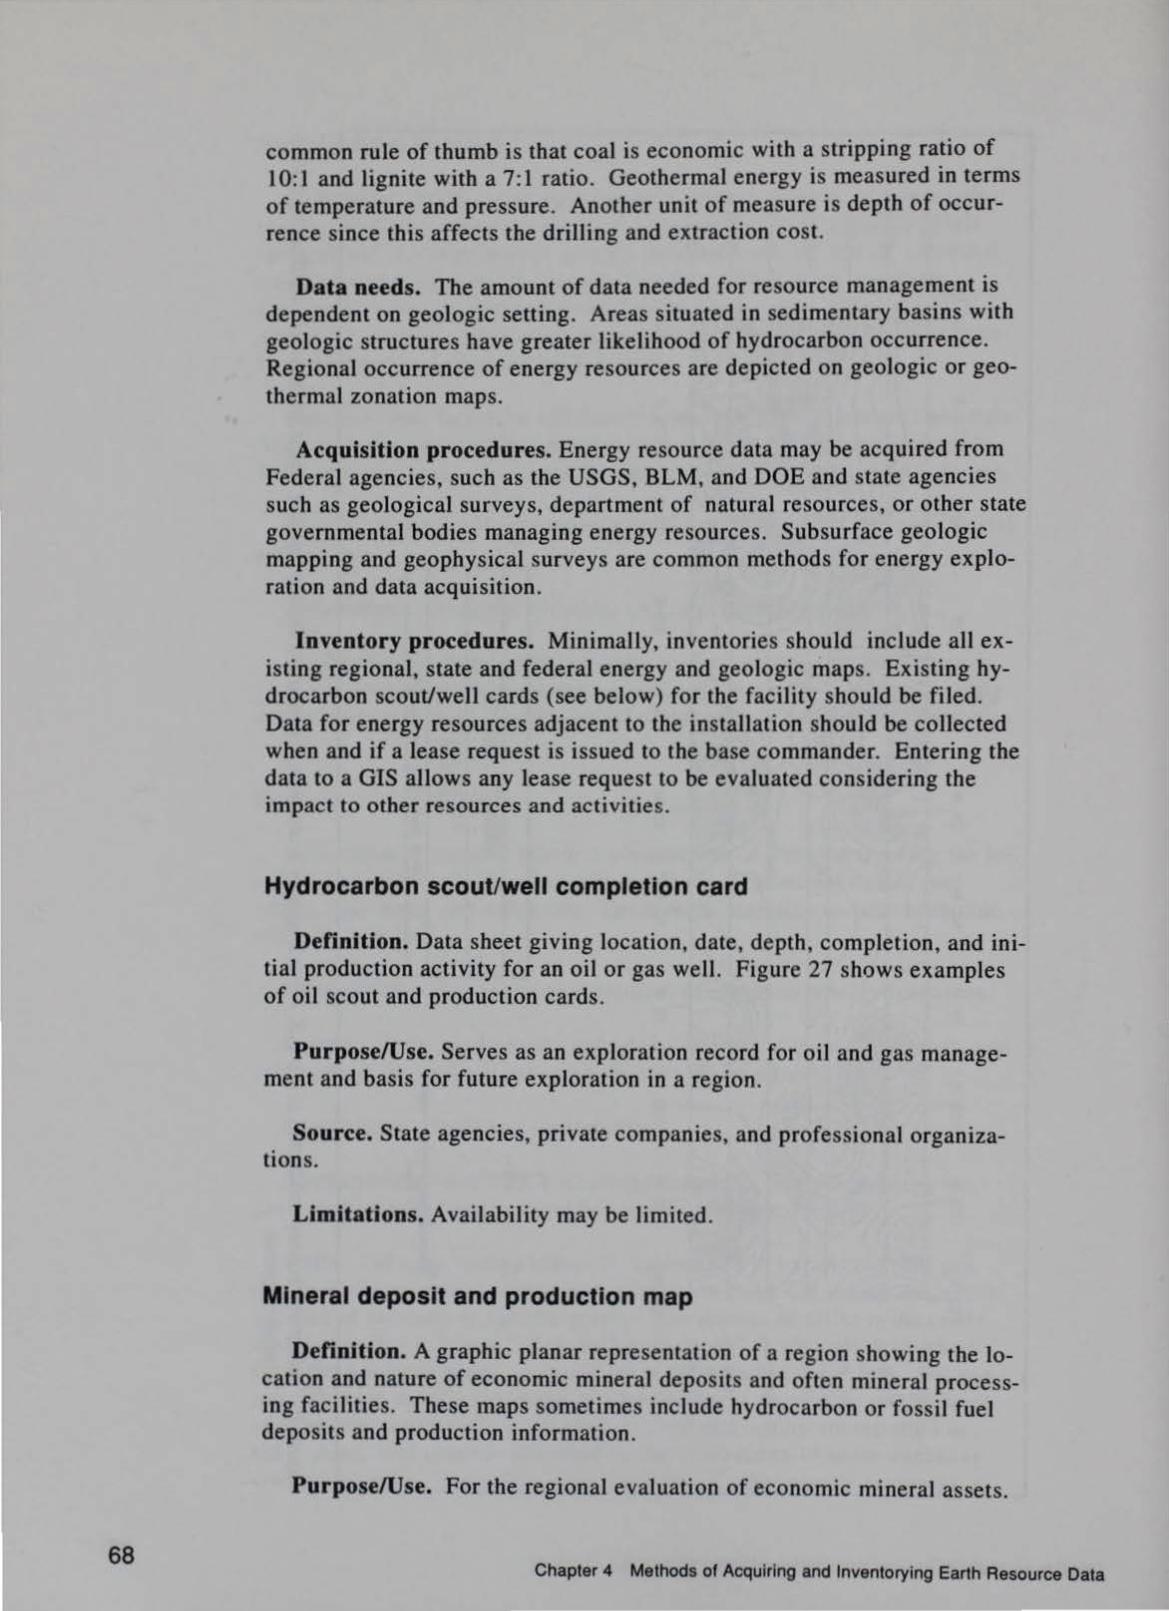
68
common rule of thumb is that coal is economic with a stripping ratio of 10:1 and lignite with a 7:1 ratio. Geothermal energy is measured in terms of temperature and pressure. Another unit of measure is depth of occurrence since this affects the drilling and extraction cost.
Data needs. The amount of data needed for resource management is dependent on geologic setting. Areas situated in sedimentary basins with geologic structures have greater likelihood of hydrocarbon occurrence. Regional occurrence of energy resources are depicted on geologic or geothermal zonation maps.
Acquisition procedures. Energy resource data may be acquired from Federal agencies, such as the USGS, BLM, and DOE and state agencies such as geological surveys, department of natural resources, or other state governmental bodies managing energy resources. Subsurface geologic mapping and geophysical surveys are common methods for energy exploration and data acquisition.
Inventory procedures. Minimally, inventories should include all existing regional, state and federal energy and geologic maps. Existing hydrocarbon scout/well cards (see below) for the facility should be filed. Data for energy resources adjacent to the installation should be collected when and if a lease request is issued to the base commander. Entering the data to a GIS allows any lease request to be evaluated considering the impact to other resources and activities.
Hydrocarbon scout/well completion card
Definition. Data sheet giving location, date, depth, completion, and initial production activity for an oil or gas well. Figure 27 shows examples of oil scout and production cards.
Purpose/Use. Serves as an exploration record for oil and gas management and basis for future exploration in a region.
Source. State agencies, private companies, and professional organizations.
Limitations. Availability may be limited.
Mineral deposit and production map
Definition. A graphic planar representation of a region showing the location and nature of economic mineral deposits and often mineral processing facilities. These maps sometimes include hydrocarbon or fossil fuel deposits and production information.
Purpose/Use. For the regional evaluation of economic mineral assets.
Chapter 4 Methods of Acquiring and Inventorying Earth Resource Data
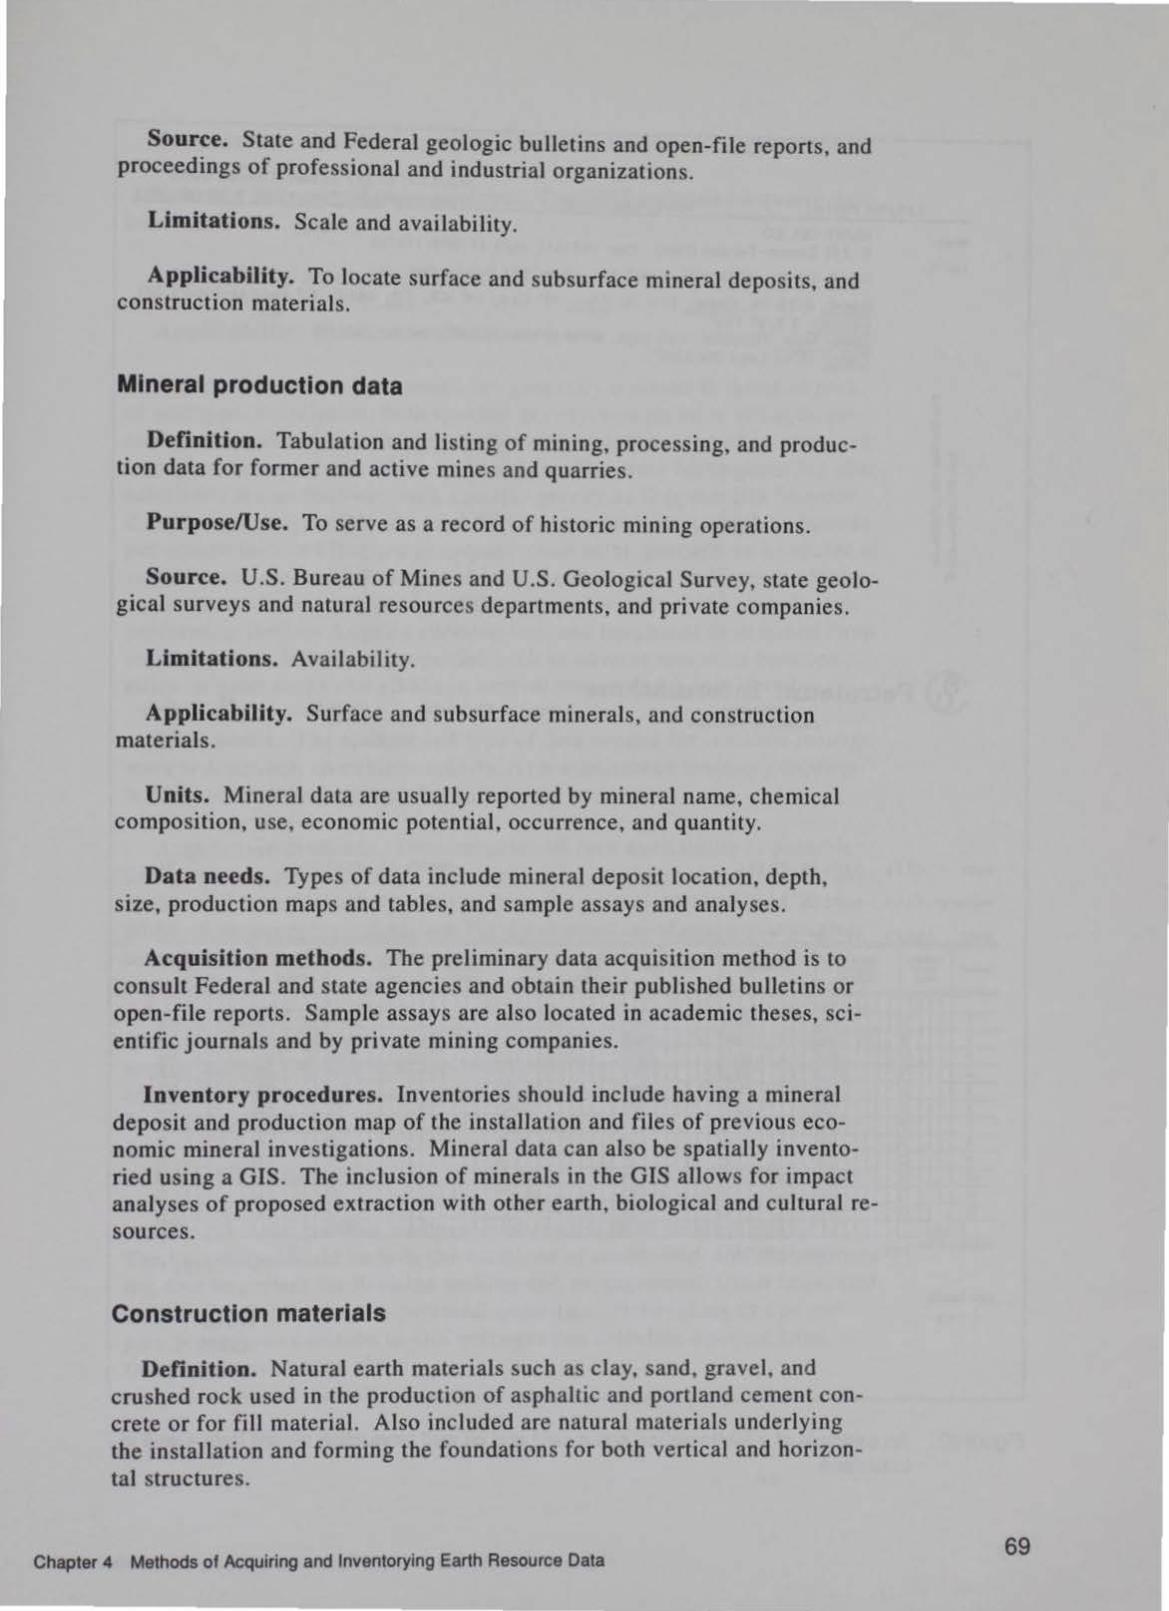
Source. State and Federal geologic bulletins and open-file reports, and proceedings of professional and industrial organizations.
Limitations. Scale and availability.
Applicability. To locate surface and subsurface mineral deposits, and construction materials.
Mineral production data
Definition. Tabulation and listing of mining, processing, and production data for former and active mines and quarries.
Purpose/Use. To serve as a record of historic mining operations.
Source. U.S. Bureau of Mines and U.S. Geological Survey, state geological surveys and natural resources departments, and private companies.
Limitations. Availability.
Applicability. Surface and subsurface minerals, and construction materials.
Units. Mineral data are usually reported by mineral name, chemical composition, use, economic potential, occurrence, and quantity.
Data needs. Types of data include mineral deposit location, depth, size, production maps and tables, and sample assays and analyses.
Acquisition methods. The preliminary data acquisition method is to consult Federal and state agencies and obtain their published bulletins or open-file reports. Sample assays are also located in academic theses, scientific journals and by private mining companies.
Inventory procedures. Inventories should include having a mineral deposit and production map of the installation and files of previous economic mineral investigations. Mineral data can also be spatially inventoried using a GIS. The inclusion of minerals in the GIS allows for impact analyses of proposed extraction with other earth, biological and cultural resources.
Construction materials
Definition. Natural earth materials such as clay, sand, gravel, and crushed rock used in the production of asphaltic and portland cement concrete or for fill material. Also included are natural materials underlying the instaiJation and forming the foundations for both vertical and horizontal structures.
Chapter 4 Methods of Acquiring and Inventorying Earth Resource Data 69
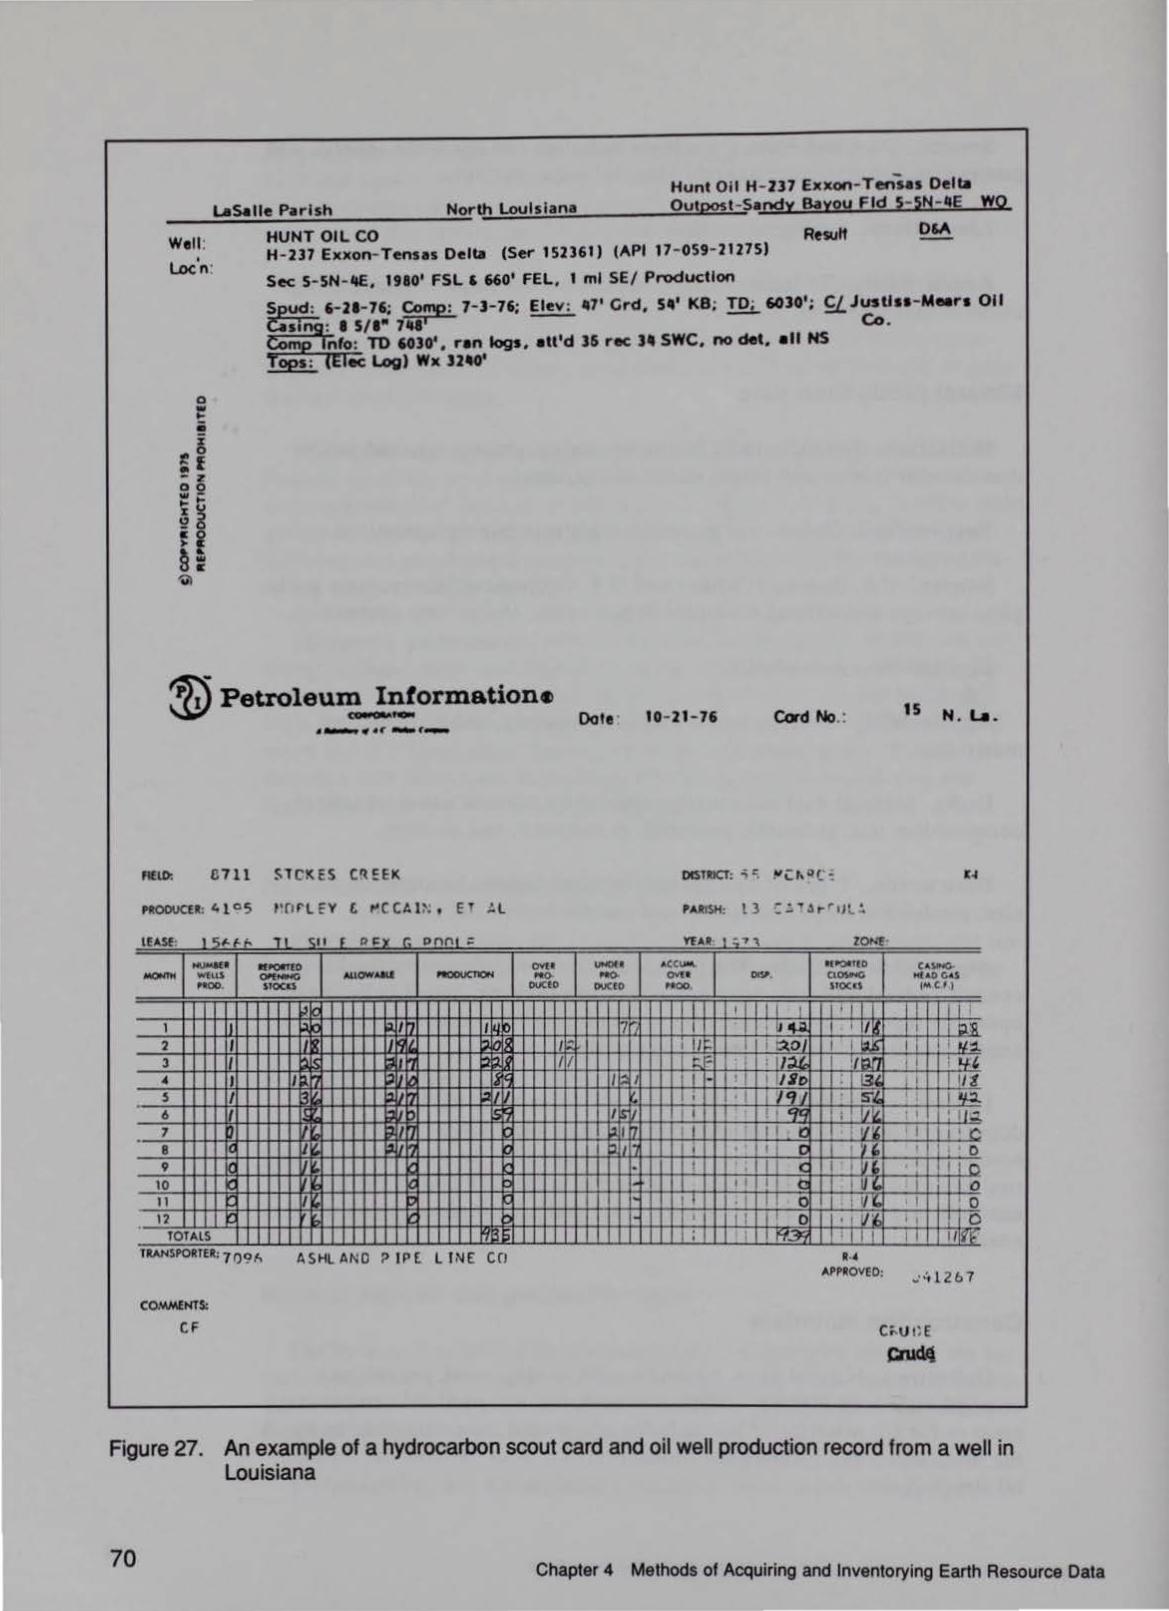
__ ..:LA::;S.::.:.:,IIe::....:..P..:~.:...'":.:Is;:..h:_ ____ ...:N..:..;o~rth louIsiana
Hunt Oil H- 237 Exxon-Tenses Delta Outpost- Sandy Bayou Fld 5- SN- IfE WO
Well: HUNT OIL CO ResuH OM H- 237 Exxon- Tensas Oeltil {Ser 152361) (API 17- 059- 21275)
Sec 5-5N- ItE, 1980' FSL ' 660' FEL, 1 ml SE/ Production • l.o<: n·
~u~: 6- 21- 76; eo;ne: 7-J- 76; Elev: lf7' Crd, 5-' KB; !.Q!._ 6030'; ~ JustJu- M•rs 011 smg: I 5/1" 71JI Co.
COmp Info: TO 60JO', ran logs, atl'd J6 rec J- SWC, no det, ell NS Tops: (Eiec Log) Wx Jl-0'
0 w .. • %
1!0 .f - z 00 w -.... :z:U !?g ~~ §: 'VI
~ Petroleu~ ~ormatione
FIEU>: 67 11 ~T CK ES C~~EK
ffiX>UCfll: 41 °5 t•OrL rY t ,..C CA l '. , E T .:.L
lEASE· 1 <; "- . ;... 'Tt <:.1 r O l'>t r. onnt ;:
OYU H()o
OUClO
Dote 10- 21 - 76 Cord No.: 15 N . l.e.
PAitlSH: t) :;. "'l r- ' tJl:.
Y£AR 1 :; .,. "\ ZON1
0&.
l.!ld I I I I • I T T
8 I I • ' c ' .• T 0 9 I· , < i , • i 1: n
10 ' , C ' I , 0 11 I (l I 0 12
TO TA l'fBI ; ' ! l ~ ' I ~ ; ~ ,w l ltANSPORTER: 7 09:'o ASHL AND ? IP( L IN E CO
COMMEHTS:
CF
··~ APPROVEO: .: "12o7
Figure 27. An example of a hydrocarbon scout card and oil well production record from a well in Louisiana
70 Chapter 4 Methods of Acquiring and Inventorying Earth Resource Data

Purpose/Use. Installation construction and foundation applications.
Source. Federal and state agencies. The WES maintains a quarry data base.
Limitations. Availability of data.
Applicability. Earth and cultural resources.
Units. Construction materials are generally reported in terms of rock or soil type, description, bulk specific gravity, compressive strength, porosity, water absorption, hardness, abrasion, toughness, cost/ton at quarry, transportation cost, and distance from site. The units for engineering characteristics are as follows: bulk specific gravity as G (generally between 2 to 3), unit weight (G times 62.4 lb/ft3), compressive strength as pounds per square inch or kilogram per square centimeter, porosity as a percent of voids to total volume of sample of rock, hardness as 1 to I 0 on the Mohs scale, abrasion as a percentage of the original weight of the sample after performing the Los Angeles abras10n test, and toughness determined from an impact-test. Chemical properties such as adverse reactions between silica in some rocks and alkalis in cement must also be considered.
Data needs. The amount and type of data needed for resource management is dependent on mission activity. A reconnaissance inventory requires less detail than an inventory for full quarry production.
Acquisition methods. Determination of rock availability is possible using existing geologic maps and engineering geologic maps, and the assistance of a professional geologist from the private sector, USACE, BLM, or state geological survey. Field examination of outcrops can also reveal what material are commonly available. Published data from existing quarries would be sufficient for reconnaissance level studies. Quarry selection requires the sites to be cored and sampled on at least 1,000-foot spacing. Quarry design and production requires coring to be conducted at approximately I 00-foot spacing. Rock samples from cores and outcrops are needed for testing at an approved laboratory such as the WES Rock Testing Lab.
Inventory procedures. Results of review of existing geologic maps and quarry investigations should be cataloged. A GIS data structure can include previous, present, and potential construction material sources. The inventory should include the locations of source site, and the engineering data important for decision making and management. Other important data are production and/or potential quantities. Networking or optimal path procedures common to GIS software can calculate distance from source to construction sites.
Chapter 4 Methods of Acquiring and Inventorying Earth Resource Data 71

72
Paleontological data
Definition. Descriptions, illustrations, and samples pertaining to the fossil record of a facility or region.
Purpose/Use. Used to reconstruct and define the geologic age and paleoenvironment of the deposits in which the data occurs. The paleontology of an area is both academically important and of interest to the general public.
Source. Federal and state bulletins and open-file reports, academic theses and dissertations. journals, cuttings, cores, outcrops, and museums.
Limitations. It requires a specialist to interpret findings, it is limited to sediments and sedimentary rocks, and the availability of usable samples is highly variable geographically.
Applicability. Geologic age determinations of geologic units and geomorphic surfaces, identification of paleoenvironments, and public relations.
Geochronology
Definition. Whereas paleontology may be used to determine the approximate geologic age of sediments and sedimentary rocks, geochronology is the application of isotopic and other data to analytically measure time and determine absolute (as opposed to relative) age in years. Age dates are determined using radioactive decay sequences such as PotassiumArgon, Rubidium-Strontium, Uranium-Thorium-Lead, or Carbon-14. Specific decay sequences are used to date materials having specific absolute ages; the suitability of a specific decay sequence is determined from the half-life of that sequence. Techniques other than istopic include age determinations from varved sediments in lakes or ponds, tree ring counts, and lichen growth, for example.
Purpose/Use. These data are used to specify the absolute age of so ils, sediments, and igneous, sedimentary and metamorphic rocks.
Source. Isotopic age data may be found in theses and dissertations, Federal or state bulletins, and journals.
Limitations. Analyses must be conducted by specialists. The material to be dated must contain sufficient quanties of a specific isotopes having the appropriate half-life, and the sample should be unweathered and uncontaminated.
Applicability. These data are useful for paleoenvironmental studies, water resource investigations, and cultural resource evaluations.
Chapter 4 Methods of Acquinng and lnventorymg Earth Resource Data

Acquisition methods. Generally, the isotopes undergoing radioactive decay are presen t in specific minerals in soils, sediments, or rocks. Therefore, the earth materials to be age dated must undergo mineralogical examination in order to determine whether or not they are present. If present, these minerals may be taken from the sample for age determinations. If the mineral is not present, the sample cannot be age dated.
Units. Ages are usually stated in terms of years or millions of years ago (Ma). Because there will always be some e:-ror associated with these analytical procedures, the age will be accompanied by an estimate of the error stated as plus or minus a period of time.
Sample assays and analyses
Definition. Chemical, isotopic, mineralogical, particulate, petrographic, and engineering data for air, soils, sediments, rocks, ores, fossil fuels, or water.
Purpose/Use. To describe the properties of earth materials in terms of their environmental, economic, or engineering impacts.
Source. Federal or state agency bulletins or open-file reports, academic theses or dissertations, professional and scientific journals, and reports by private testing firms.
Limitations. Lack of availability, and the data may require interpretation.
Applicability. Agronomic and engineering soi ls, surface minerals, soil moisture, geologic studies, energy surveys, and location of construction materials.
Hydrospheric Data
Hydrologic atlas
Definition. A collection of maps, tabulated data, and descriptions pertaining to both or either surface or subsurface water resources of a region.
Purpose/Use. To evaluate the distribution, quality and quantity of water in a region, and to conduct environmental assessments.
Source. Local, state, and Federal agencies.
Limitations. Availability may be limited in some regions .
Applicability. All surface and subsurface waters and wetlands.
Chapter 4 Methods of Acquiring and Inventorying Earth Resource Data 73

74
Stream basin map
Definition. A planar graphic representation of the principal stream basins including the trunk and tributary streams and the divides.
Purpose/Use. To identify and evaluate stream drainage systems, to analyze potential flood events, to show land use, and to monitor erosion and sedimentation.
Source. State and Federal agencies.
Limitations. Availability of data.
Applicability. Streams, wetlands, reservoirs, and land use.
Gaging station location map
Definition. A planar graphic representation showing the locations of stream gaging stations in a region.
Purpose/Use. For inventory and evaluation of existing surface hydrologic data.
Source. Locations obtained from U.S. Geological Survey.
Limitations. Gaging stations may be limited in number.
Applicability. Streams, wetlands, lakes reservoirs, and estuaries.
Stream stage/discharge and hydrograph data
Definition. The tabulation and description of relations between discharge, water velocity, and stage versus time at selected locations (gaging stations) along a stream.
Purpose/Use. To evaluate flood potential , water quality, and erosion/sedimentation in a stream basin.
Source. Federal and state agency bulletins and open-file reports.
Limitations. Gaging stations may be limited in number.
Applicability. Studies of streams, wetlands, reservoirs, and estuaries.
Units. Stream stage, the elevation of water surface above a known datum, is expressed in metres or feet. Stream cross-section is reported in square metres or square feet. Stream velocity is measured as metres per second (mls) or feet per second (ft/s). Stream discharge, the volume of
Chapter 4 Methods of Acquiring and Inventorying Earth Resource Data

water flowing through a cross-section is reported in cubic metres per second (m3
Is) or cubic feet per second (cfs). Stream sediment load is also a volume measurement. Flood frequency is expressed in I, 2, 5, 10, 25, 100, and 500 year flood occurrences. See Flood-prone area map.
Data needs. The amount of data needed for resource management is dependent upon the number and size of streams on the installation. Stream stage and discharge data require long periods (years) of synoptic readings to be useful. In humid regions where mean annual flows have only a small variability, 10 to 15 years of record are usually adequate to estimate long term conditions. In arid regions 25 to 30 years of record are needed. Stage data are valuable in evaluating flood damage, in designing water development projects, and managing floodplains (SCS 1972). Other types of data include stream length and cross-sectional area with depth, width, and velocity measurements. Supplementary data associated with the stream are its basin length, width, area, gradient, and sediment load.
Acquisition methods. Guidelmes for the coordinated collection of water data by Federal agencies is prescribed by the Office of Management and Budget Circular A-67. There exists a "network-in-being" in the United States for acquiring surface water data. The simplest method of data acquisition is to contact the USGS Water Resource Division located in each state's capitol. An alternative is to contact the nearest USACE district office Hydraulic Branch. The needed data are possibly on the USGS or USACE database or files. The National Handbook of Recommended Methods for Water-Data Acquisition (USGS, 1979) is an excellent source of information. For additional information, contact Chief, Office of Water Data Coordination, USGS, MS-47, National Center, Reston, VA 22092.
Inventory procedures. Pertinent agencies should first be contacted. Maps depicting the installation's stream network are useful management tools. Flood hazard maps should be developed from flood frequency stage data. Flow duration curves are valuable for scheduling training or construction activities which are sensitive to wet conditions. The previous data types can be stored on data bases in-house or memoranda of agreement can be arranged for accessing state or national databases. Digital data for hydrologic features are available from the USGS as DLG data files for selected areas of the country.
Flood-prone area map
Definition. Planar graphic representation of riparian and adjacenl regions showing areas prone to flooding. The map is usually prepared on a topographic base map. The flood-prone areas of the United States are shown in Figure 28.
Purpose/Use. To show information on flood susceptibility on river floodplains.
Chapter 4 Methods of Acquiring and Inventorying Earth Resource Data 75

76
Source. U.S. Geological Survey.
Limitations. Availability may be limited.
Applicability. Streams and wetlands.
Sediment discharge/yield data
Definition. Tabulation of measurements and description of the sediment discharge of a given stream, or the sediment yield from a given drainage basin.
Purpose/Use. To describe the amount and type of sediment transported by and to streams, and to evaluate the effects of regional erosion.
Source. Federal and state agency bulletins and open-file reports.
Limitations. Availability of data may be limited .
Applicability. Streams, wetlands, reservoirs and near-shore marine.
Bathymetry
Definition. Tabulation or graphical representation of stream, lake, or ocean depths.
Purpose/Use. Environmental assessment, water resource management, coastal engineering, and navigation.
Source. Federal, NOAA, and state bulletin ad open-file reports
Limitations. Availability may be limited.
Applicability. Streams, wetlands, lakes, reservoirs, estuaries, nearshore marine, marine shelf, and deep-water marine.
Tidal gage data
Definition. A tabulation of data giving the daily range of tidal water elevations at coastal or estuarine locations.
Purpose/Use. To monitor coastal processes, and for navigation.
Source. Federal agencies.
Limitations. Local availability.
Chapter 4 Methods of Acquiring and Inventorying Earth Resource Data
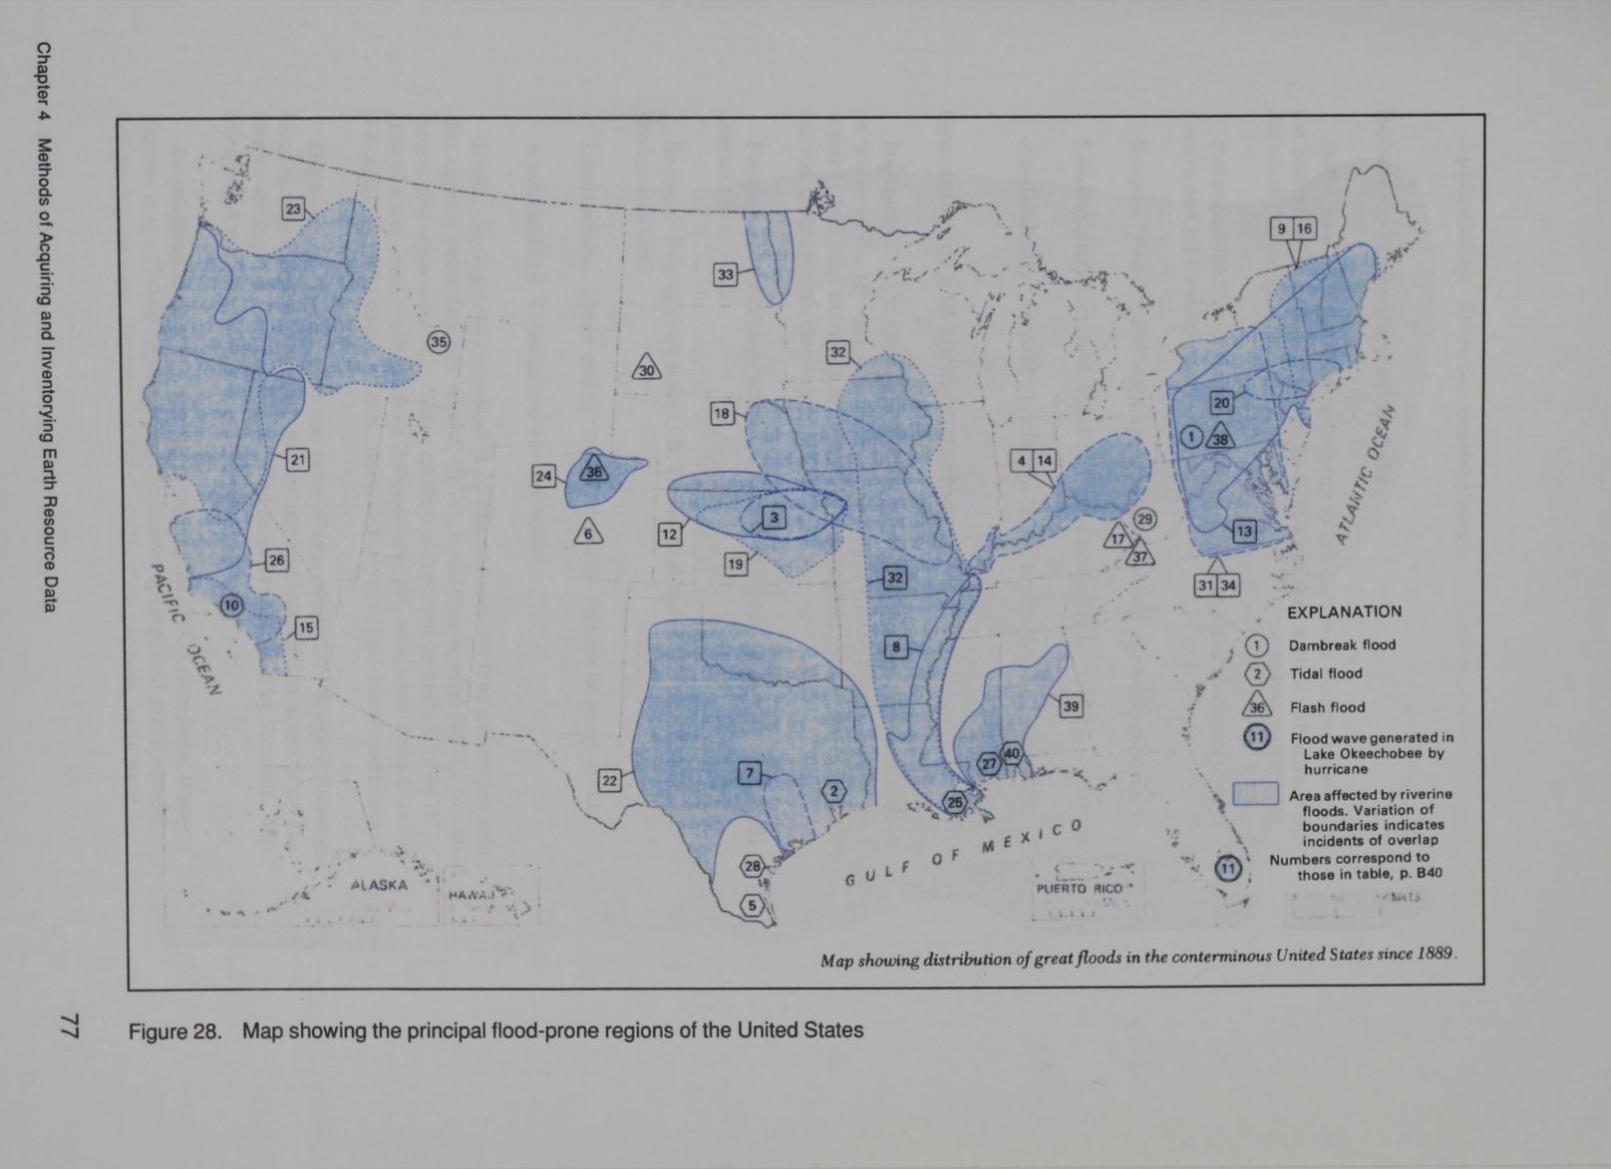

Applicability. Estuaries, coastal zones.
Substrate characterization data
Definition. Information pertaining to the nature of materials lying on the bottom of streams and lakes, as well as in the shallow subsurface underneath the stream, lake, or reservoir.
Purpose/Use. To understand aqueous habitats, and to characterize stream and lake substrates.
Source. Federal and state agency bulletins and open-file reports.
Limitations. Detailed, local data may be limited.
Applicability. Streams, wetlands, lakes, reservoirs, and estuaries.
Groundwater and spring inventory
Definition. U.S. Geological Survey data base containing information on water wells, springs and seeps, including location, depth, discharge, water levels, and lithology within a state or region. See Aquifer Characterization Data for information on wells.
Purpose. To evaluate water resources, and to conduct environmental assessments.
Source. Regional or state U.S. Geological Survey Water Resources Division office.
Limitations. Seeps and springs may not be present in some areas.
Applicability. Ground and surface water.
Units. Springs are measured in discharge units such as gallon per minutes (gpm), cubic feet per second (ft3/s), millilitres/second (ml/s), or cubic metres per second (m3/s). Water quality is reported in units similar to groundwater from wells such as temperature, pH, oxidation-reduction potential, specific conductance, dissolved oxygen, and ionic constituents.
Data needs. The amount and type of data needed for resource management is dependent on the geologic setting and installation activities. The known springs on the installation need to be inventoried by location, discharge and water quality.
Acquisition methods. Having reviewed the USGS data base, topographic maps should be examined for known springs and place names suggesting springs. During the field verification process, additional
Chapter 4 Methods of Acquinng and Inventorying Earth Resource Data 79

springs can be located. Commonly, folklore and oral tradition are helpful in finding springs. For example, in the limestone outcrop area of Crane Naval Surface Warfare Center, springs were located along the hill line where old home sites had been settled. Figure 29 shows springs located in and near Crane. Other, remote spring locations were found to be associated with moonshine legends. Field surveys and folklore can be combined with modem remote sensing techniques to locate springs. The temperature difference between spring water and the surrounding landscape is significant especially during winter months and may produce a visible fog at the spring. Remote sensing can show thermal anomalies indicating springs and seeps. All remotely sensed data must be field checked .
HOlt COHlOUII tiHEIIVAl. 10 n IS{( TUI fi)fl UAP SOUIIC£l
• ... -..... -~"'~ ..... ---*' ~"'-
--- - ~~"-• "t 1
Figure 29. Spring location map of a portion of Crane NWSC. Springs are denoted as "Spr"
80
Inventory procedures. The results of the spring inventory should be marked on an installation map. Associated data such as discharge
Chapter 4 Methods of Acquiring and Inventorying Earth Resource Data
measurements and water quality should be referenced to the map. Ideally. the data are stored in a database and linked to a GIS.
Aquifer characterization data
Definition. Descriptive and numerical data that portray the geological setting and hydraulic properties of subsurface water supplies. Data would normally include aquifer lithology, geologic age and name, thickness, areal extent, depth, potentiometric surface or water table elevations, well draw-down and radius of influence relations, hydraulic conductivity, and storativity. Stratigraphy, the arrangement of permeable and non-permeable units, is also important.
Purpose/Use. These data are used for water resource evaluations, for locating and drilling water supply wells, for estimating discharges, and for environmental assessments.
Source. State and Federal agencies, and private companies including engineering firms, commercial well-drilling and mining companies.
Limitations. Availability of data.
Applicability. The study of aquifers and water resources.
Units. Water levels are recorded as depth below a measuring point or known datum such as the ground surface elevation or top of wel1 casing. Water levels can then be converted to elevation above a datum such as mean sea level. Well discharges are commonly recorded as gallon per minute (gpm), cubic feet per minute (ft3/min) or cubic metre per second (m3/s). Groundwater quality analyses commonly report dissolved compounds in parts per millions (ppm) or the nearly equivalent milligram per liter (mg/1). Hydraulic conductivity is reported in apparent units of velocity (cm/s); however, transmissivity, which is the hydraulic conductivity times the saturated thickness, is also used. Storativity, which quantifies the amount of water released from storage in the aquifer per unit surface area per unit draw down, is a dimensionless number. Transmissivity and storativity are further described in Figure 30.
Data needs. The amount of data needed is dependent on the level of resource management required. Installation remediation investigations, for example, require significant aquifer data collected over an extended period of time. Water levels are fundamental to understanding an aquifer. Water levels and the water-level contour maps (potentiometric surface maps) made from them indicate areas of recharge and discharge, and direction of flow, and permit the evaluation of natural and manmade stresses on the aquifer system.
The frequency of water level measurements is a function of the goals of the resource management study, climate, seasons of the year, and the
Chapter 4 Methods of Acquiring and Inventorying Earth Resource Data
•
81

82
Hydroul ic Conductivi ty IKI
Transmissivity ITl T = Kb
b -AQuifer thlc~ness n- neod difference L - dlstonce between wells
Figure 30. A 3-dimensional diagram depicting the variables involved in determining hydraulic conductivity and transmissivity
fluctuation in aquifer use. For example, at Rocky Mountain Arsenal in Colorado, water levels are measured quarterly to reflect seasonal variations. Groundwater quality data are needed to determine the chemical , physical, and bacteriological content for evaluation of suitability for domestic, industrial and agricultural uses. These data also aid in understanding the geochemical properties of the natural aquifer system and the effects of installation activities on the systems. For a general evaluation of the quality of the aquifer resource, a few important, or "indicator," constituents are monitored over the entire study area in question. Based on an evaluation of these data, selected sites are chosen for complete and comprehensive analysis.
Acquisition methods. Water levels are commonly measured manually with graduated tapes or electronic devices which operate on the principle that a circuit is complete when two electrodes are immersed in water. Automatic water level recorders are also available. Groundwater discharge from wells can be measured in many ways. A stopwatch can be used to measure the time required to fill a known volume of a container. Wells can be bailed with a bailer of known volume to collect preliminary yield and drawdown data. Weirs, flumes, and current meters are also used to calculate discharges. Pump tests or other aquifer tests are used to determine well yield, drawdown, radius of influence, storativity, and hydraulic conductivity. Aquifer tests are controlled field experiments to determine the hydraulic properties of an aquifer. Aquifer tests consist of three steps: design, field data collection, and data analysis. The design requires the
Chapter 4 Methods of Acquiring and Inventorying Earth Resource Data

following information: (a) the geologic and hydraulic setting, (b) aquifer thickness, (c) well design data, and (d) approximate transmissivity or hydraulic conductivity. During design, an estimation of the required cost to develop response curves is made based on the control and boundary conditions. An inventory of equipment needed to produce the necessary measurements in the required precision must be made. A pump test involves pumping one well and recording the drawdown in that well and nearby observation wells. The test measurements are: static water level before pumping is started, pump rate, and dynamic water levels measured at logarithmic time intervals. Routines for analysis of this data have developed and are well documented in the literature. Analytical routines include those described in Groundwater Hydrology by Todd ( 1980); U.S. Army, Navy, and Air Force (1971 ); and Driscoll ( 1986).
Groundwater quality samples can be extracted during a pump test or from an existing well. The sample should be collected as close to the well head as possible before the water reaches the pressure tank, or treatment equipment. Wells must be purged of the water standing in the casing to assure a representative sample. Environmental protection agencies, both state and Federal, have strict guidelines on quality control of sampling activities designed to evaluate aquifers. Published guidelines should be consulted before a water quahty sampling program is instigated. Some measurements such as pH, temperature, specific conductance, dissolved oxygen, hydrogen sulfide, carbonate, bicarbonate, and iron are time sensitive and need to be performed immediately onsite. The National Handbook of Recommended Methods for Water-Data Acquisition, Chapter 5 (USGS 1979), describes methods for both field and laboratory determination of water quality. RCRA Ground-Water Monitoring Technical Enforcement Guidance Document OSWER-9950.1 (USEPA 1986) contains Federal guidance for RCRA investigations.
Inventory procedures. All wells should be surveyed for location and elevation. Elevation should be recorded for the top of the well casing and for ground level. The top of casing then provides a datum for determining water level elevations within the wells. Survey northing and easting coordinates should be provided in a format that permits plotting on published topographic maps. Formats include State Plane and Universal Transverse Mercator. Groundwater elevation contour maps should be constructed from well and stream data for all or selected monitoring events. Care should be taken to assign water level elevations to the correct aquifer, because multiple aquifers may occur in the subsurface.
Copies of all available well logs should accompany the well maps. The lithologic log describes geologic units encountered during drilling of the well bore, depths to geologic contacts, soil and rock sample intervals, drilling characteristics, well installation data, casing installation and grouting data, project or facility designation, dates of boring start and completion, the drilling agency or company, name of driller, name of inspector and type of drill rig used. Geophysical well logs should be stored with the lithologic logs if they are available.
Chapter 4 Methods of Acquiring and Inventorying Earth Resource Data 83
84
Water quality data should be maintained on a database and sorted by date sampled, well number, and sampling parameter for quick retrieval and for automated construction of contaminant contour maps and tables. Maps showing locations of all monitoring and water supply wells, surface water bodies such as lakes and streams, and springs should be prepared, preferably on published topographic base maps. Information on depth and locations of water wells located outside the facility should also be maintained if available. Physical samples, such as rock cores or other samples retrieved during well drilling operations, should be stored in secure containers out of the weather if possible.
Potentiometric surface maps
Definition. The compilation and mapped presentation of water-level elevations, for either or both water table or confined aquifers, measured in borings, monitoring wells, or water supply wells. The potentiometric surface of the Carnahan Bayou Aquifer in the vicinity of Fort Polk, Louisiana, is plotted in Figure 31. Figure 31 indicates a recharge area in the north and a cone of depression from ground water withdrawal in the area around Fort Polk and Leesville, Louisiana. The cone of depression is the roughly circular, map expression of water-levels indicating extraction of water in wells. See Aquifer characterization data.
Purpose/Use. To determine aquifer characteristics, direction and rate of groundwater flow and contaminant migration, interference between wells, and aquifer discharge.
Source. Federal and state agencies, and private companies.
Limitations. Availability may be limited, and data must be interpreted.
Applicability. Aquifers and subsurface water resources.
Water budget data
Definition. Data and the results of studies pertaining to inflow and outflow of water in a region, usually a drainage basin. The data would include precipitation, evaporation, transpiration (from lysimetry), infiltration, runoff, streamflow, and base flow.
Purpose/Use. To calculate the water availability, uses, and balance or budget for a reason, and for environmental assessment.
Source. Federal and state and agencies.
Limitations. Availability of data.
Applicability. Hydrospheric and atmospheric resources.
Chapter 4 Methods of Acquiring and Inventorying Earth Resource Data

~ CD :T 8. Ill
0 -! c 5. c5 I»
~
~ CD ::l 0
~ 0 m I»
~ :D CD Ill 0 c 0 CD
0 I» -I»
({) <( X w 1-
I
/ . 238 222 202
d202
/01 l- !60------
I ,140 I I /t.l I I I I I I I
I t~f-1 I I I 28
I I 1! -a _f \ \I ~~
I \ J ~" I ~ I ~
/ / f 157
tiCJHl ~ 1 c fr POlK - \. 154 -<:S.S. I /
1s4 154 • • 153
,-~-~ /-
1 '\,. •
145
/
/
•
" 150150 // • ~·II IJ
'- PKi--- £•1'\."~t.TIO~
I " ~ i~ /-- 140- -POTENTIOMETRIC CONTOUR--Showa arlit- at
""'ICII wlltr ltvel " 'II rlat In tightly Cattd wob Ollllltd """'' epproolmettly !ocettd Contour Interval 20 lett, Oil""' 11 111 , ... ,
. CONTROl POINT•·Numbe< Ia altit- ol -ttr 150 ltvtt, In fttl e t>ovt ••• le .. l, ol ,..u uotCI
11 contrOl
Rtchergt artl boundary
I " ·115 !., '-. w
(C.
I~ ~--
---~---------- ·---' 1'.\I{ISII II Al.l.t::'\ I'AHISII
DE RIDDER o 5 10 I IS I.'ILES
1---1-1--r- _T..__ ___ _,
0 5 10 15 Kll O'.IET EAS
(X) 0'1 Figure 31_ Potentiometric surface map in the vicinity of Fort Polk, Louisiana
86
Atmospheric Data
Precipitation
Definition. Precipitation is water falling from the atmosphere in liquid or solid form. These forms include rain, hail, sleet, and snow.
Purpose/Use. Water budget determinations, water resources studies, flood routing, and environmental assessments.
Source. The National Weather Service, and instaJiation weather office/detatchment.
Limitations. Locations of gaging stations.
Applicability. Water and atmospheric resources.
Units. Precipitation measurements are reported in inches or millimetres. Precipitation intensity is reported as inches per hour or millimetres per hour. For acid rain, the acidity is measured in pH units.
Data needs. The data should include the amount of precipitation in each drainage basin on the installation over a period of several years. The types of data are rainfaJJ measurements reported in daily, monthly, seasonal or yearly intervals. Intensity of precipitation can also be reported: light (trace to 1 in/hr), moderate ( 1 to 3 in/hr), and heavy (more than 3 in/hr).
Acquisition methods. Measurement can be made manually or automatically. The selection of the gaging site is important since the measurement should reflect rainfall typical of the surrounding area. The rain gage site should be level and in the open but in an area protected from high wind. Commonly, a rain gage consists of a collector attached to a funnel which empties into a container with an automatic measuring device.
Standard (non-recording) gages are recommended for short-term measurements where continuous records are not needed. Two common methods used to measure rain caught in the gage are a graduated cylinder and a graduated dip rod . A graduated cylinder is constructed of clear glass having a low coefficient of expansion with a diameter not exceeding one-third of the gage rim diameter. Measurements are made at the bottom of the water meniscus.
Recording gages are of three types: weighing, tilting bucket, and float. The weighing type is useful for all kinds of precipitation, i.e., rain, ice, and snow. The latter two gages are limited to rainfall measurements. The tilting bucket type is a light weight bucket divided into two equal compartments balanced on a pivot. Rain runs from a conventional collector into the upper compartment. After a preset amount of rain is caught, the bucket becomes unstable and tips. The collected rain drains out of the upper
Chapter 4 Methods of Acquiring and Inventorying Earth Resource Data

compartment into the lower one which is designed to empty itself. The tipping of the bucket operates a relay contact to produce a record. Meanwhile, the upper buckets continue to collect rain. There is error during heavy rains due to loss during tipping and during drizzle due to evaporation. The float type is an instrument in which rain is led into a chamber containing a float. Vertical movement of the float as the water level rises is transmitted to a pen on a chart.
Inventory procedures. Location of data collection stations should be marked on an overlay of the installation map. The movement of float, bucket, and weighing mechanism can be converted into electrical signals and relayed to data-logging equipment. The data for each gage station should be entered into a database. Using geographic coordinates for each station, the rain data can be linked to a GIS.
Atmospheric circulation
Definition. The movement of air masses including wind direction, velocity, and variability over a region, and over time.
Purpose/Use. The data are used to monitor general atmospheric conditions, for weather prediction, evaporation calculations, and for environmental assessments.
Source. The National Weather Service, other Federal and state agencies, and the installation's meteorology office.
Limitations. Availability and currency.
Applicability. Atmospheric, biological, and cultural resources.
Units. Atmospheric circulation is reported as a speed in miles per hour (mph) or meters per second (rnls). Wind direction is recorded by direction or azimuth.
Data needs. The amount of data needed for resource management is dependent on climatic setting and installation activities.
Acquisition methods. The three-cup rotor or fan anemometer are recommended for remote recordings. The fan anemometer provides accurate measurements, with error less than 0.5 meter per second, which is acceptable for evaporation calculations (see Evaporation).
Inventory procedures. The locations of the anemometer stations should be marked on an overlay of the installation map, and the records from the meters should be stored in a database. The geographic coordinates of the stations can be linked to the database for GIS analysis. A common presentation of circulation data is the use of wind roses where the speed and direction of the wind are plotted.
Chapter 4 Methods of Acquiring and Inventorying Earth Resource Data 87
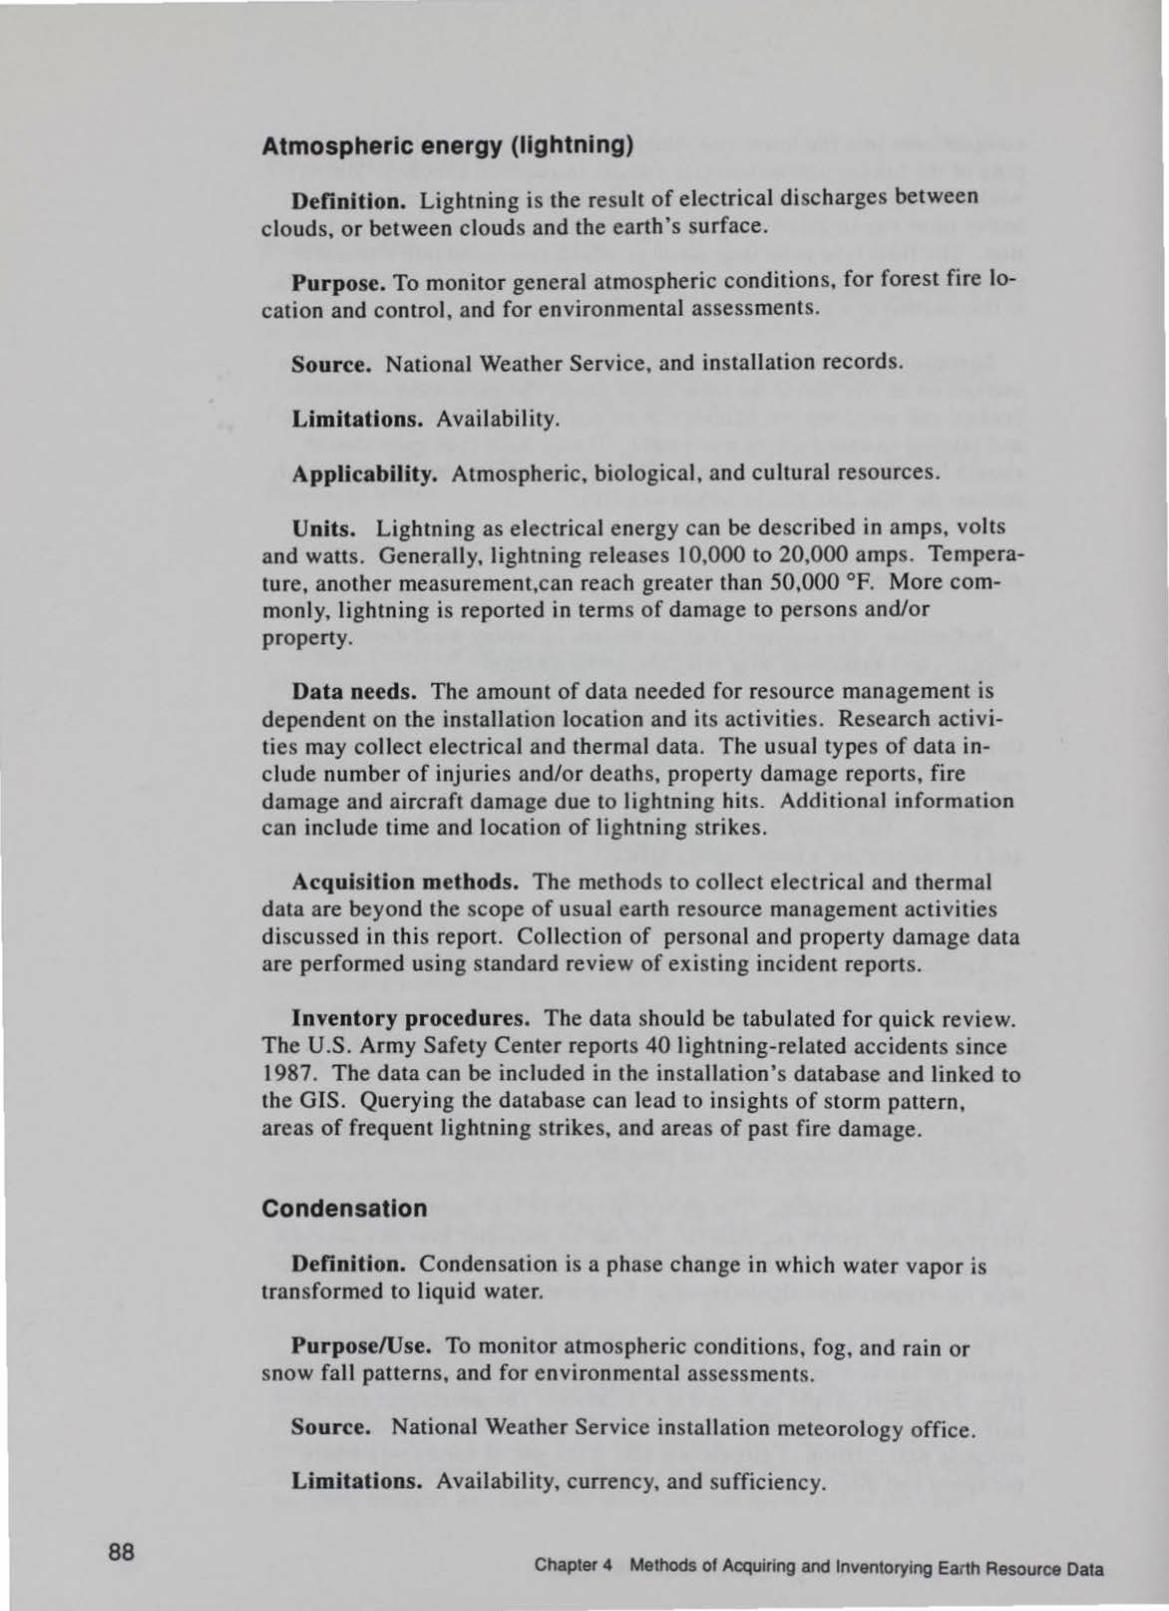
88
Atmospheric energy (lightning)
Definition. Lightning is the result of electrical discharges between clouds, or between clouds and the earth's surface.
Purpose. To monitor general atmospheric conditions, for forest fire location and control, and for environmental assessments.
Source. National Weather Service, and installation records.
Limitations. Availability.
Applicability. Atmospheric, biological, and cultural resources.
Units. Lightning as electrical energy can be described in amps, volts and watts. Generally, lightning releases 10,000 to 20,000 amps. Temperature, another measurement,can reach greater than 50,000 °F. More commonly, lightning is reported in terms of damage to persons and/or property.
Data needs. The amount of data needed for resource management is dependent on the installation location and its activities. Research activities may collect electrical and thermal data. The usual types of data include number of injuries and/or deaths, property damage reports, fire damage and aircraft damage due to lightning hits. Additional information can include time and location of lightning strikes.
Acquisition methods. The methods to collect electrical and thermal data are beyond the scope of usual earth resource management activities discussed in this report. Collection of personal and property damage data are performed using standard review of existing incident reports.
Inventory procedures. The data should be tabulated for quick review. The U.S. Army Safety Center reports 40 lightning-related accidents since 1987. The data can be included in the installation's database and linked to the GIS. Querying the database can lead to insights of storm pattern, areas of frequent lightning strikes, and areas of past fire damage.
Condensation
Def"mition. Condensation is a phase change in which water vapor is transformed to liquid water.
Purpose/Use. To monitor atmospheric conditions, fog, and rain or snow fall patterns, and for environmental assessments.
Source. National Weather Service installation meteorology office.
Limitations. Availability, currency, and sufficiency.
Chapter 4 Methods of Acquiring and Inventorying Earth Resource Data

Applicability. Atmospheric, biological, and cultural resources.
Units. Condensation is reported as dew or frost point temperatures. In the past, the temperatures have been recorded as degrees Fahrenheit (°F) or Celsius (°C). The recommended international standards recommend reporting in Kelvin (K).
Data needs. The amount of data needed for resource management is dependent on the climate and installation activities. The types of data include daily records of dew-points, amount of fog, visibilit} due to fog, cloud cover and cloud ceiling.
Acquisition methods. Hygrometers measure condensation as dewpoint or frost-point. Hygrometers measure the temperature at which dew or frost condenses on a cool surface such as a mirror. There are two types of instruments: (a) manual and (b) automatic type. The dew or frost is visually detected with the manual type and indirectly detected with the automatic type. A stream of test air flows through a test cel1 containing a mirror which may be cooled or heated. Condensation collects on the mirror, and the temperature of condensation is measured.
Inventory procedures. Condensation data should be stored with other atmospheric data in a database. The stations where the data are collected can be plotted on an overlay of the installation map and linked to a GIS.
Evaporation
Definition. Evaporation is a phase change in which liquid water is transformed into water vapor.
Purpose/Use. To monitor general atmospheric conditions, for environmental assessments, and to evaluate reservoir and lake conditions.
Source. Natural Weather Service and installation meteorological office.
Limitations. Availability.
Applicability. Atmospheric, hydrologic, biological and cultural resources.
Units. Evaporation can be described as a volume, or more commonly as a rate expressed as inches per day or centimetres per day.
Data needs. The amount of data needed for resource management is dependent on the amount of lake resource management and or plant studies being conducted at the installation. For example, evaporation estimations are useful in the operating procedures of existing reservoirs and/or planned lake projects. The type of data include onsite measurements of wind speed, humidity, and water and air temperature.
Chapter 4 Methods of Acquiring and Inventorying Earth Resource Data 89

90
Acquisition methods. Evaporation can be determined by several methods such as water budget, energy budget, aerodynamics, and pan evaporation methods. There is no universally recommended method. This section will provide a general overview and suggest consulting The National Handbook of Recommended Methods for Water-Data Acquisition for details on equipment and calculation procedures. The water budget method is simple in theory, but it is often not practicable because of errors in measuring inflow, outflow, and storage, as well as, data on seepage, ungaged inflow and bank storage are usually poor.
The energy budget method measures incoming and outgoing energy for a body of water, allowing for changes in energy storage. The amount of energy affecting evaporation is calculated by knowing the latent heat of water. This method has been used on larger reservoirs in the United States, but it requires expensive equipment, 12 to 18 months of field observations, and time consuming processing of the data.
The aerodynamic method is useful in measuring evaporation rates locally for short time periods. This method requires delicate and expensive instrumentation. The pan method is more commonly used in the United States. The National Weather Service has used a class A pan for many years, and records are available for stations throughout the country. A representative international pan, similar to the Russian GGI-3000, is insulated, white on the outside, black on the inside and has a surface area of 3000 cm2
. Attempts are being made to make the Russian pan a standard , so that directly comparable data can be collected and made available to monitor worldwide areal variability in Jake evaporation.
Inventory procedures. For planning purposes, Kohler and others (1959) "Evaporation Maps for the United States" provide areal variation in lake and pan evaporation over the Continental United States (CONUS). Site-specific measuring stations should be located on installation maps. Records of evaporation can be entered into databases and linked to a geographic information system (GIS).
Humidity
Definition. Humidity is a measure of the relative amount of water vapor in the air.
Purpose/Use. To monitor general atmospheric conditions, for environmental assessments, and for planning of training activities.
Source. National Weather Service installation meteorology office.
Limitations. Availability.
Applicability. Atmospheric, biological, and cultural resources.
Chapter 4 Methods of Acquiring and Inventorying Earth Resource Data

Units. Relative humidity is reported a~ percent of \Hller vnpor in moist air to water vapor in moist air if it were saturated at a gi" en temperature and prcs:.ure. For example, at I 00 percent relative humidity. it i:; u ually raining, foggy, or will be shortly. Specific humidity, the rntio of the mass of water vapor to the total mass of vapor and air, is commonly reported as grams per kilogram (g/kg) but kilogram per kilogram (kg/kg) is now preferred. Absolute humidity, the ratio of the weight of water vapor to the total volume of moist air, has commonly been reported as gram/cubic centimeter (g/cm3) but i:. now preferred to be expn:ssed as kilogram per cubic metre (kg/m3). The dew point and dry and wet bulb temperature have commonly been reported as degrees For C but K (Kelvin) is prdcrred.
Data needs. The amount of data needed for resource management should be sufficient to describe seasonal humidity on the installation for the past several years time. The humidity data complements other atmo..,pheric data.
Acquisition methods. Humidity measurements are taken along with air temperature measurements at the same location. The measuring site must be representative in terms of water vapor in the surrounding air. A measuring spot which is level, with short grass, and removed from an) trees or buildings that could disturb the ambient humidity should be chosen. A psychrometer using thermocouple thermometers may be used for recording. Wet bulb thermocouples need a wick and reservoir and must be protected from direct solar radiation yet still have adequate ventilation to obtain true wet bulb temperatures.
Inventory procedures. The locations of measuring stat ions should be surveyed and plotted on the installation map by geographic coordinates. The values of measured humid1ty and the date measured should be input to a database and linked to a GIS.
Solar radiation
Definition. The amount of !>Olar electromagnetic energy in the form of visible light, ultraviolet, X-ray, infrared. or radio "'aves striking the earth.
Purpose/Use. For general atmospheric monitoring, \\Cather prediction, agriculture, water budgets, and environmental a scssments.
Source. National Weather Sen 1ce
Limitations. Availability of data.
Applicability. Studies of atmospheric, h~dro pheric, biological, and cultural resource ...
Chapter 4 Methods of Acquiring and lnventol)'lng Earth Resource Data 91
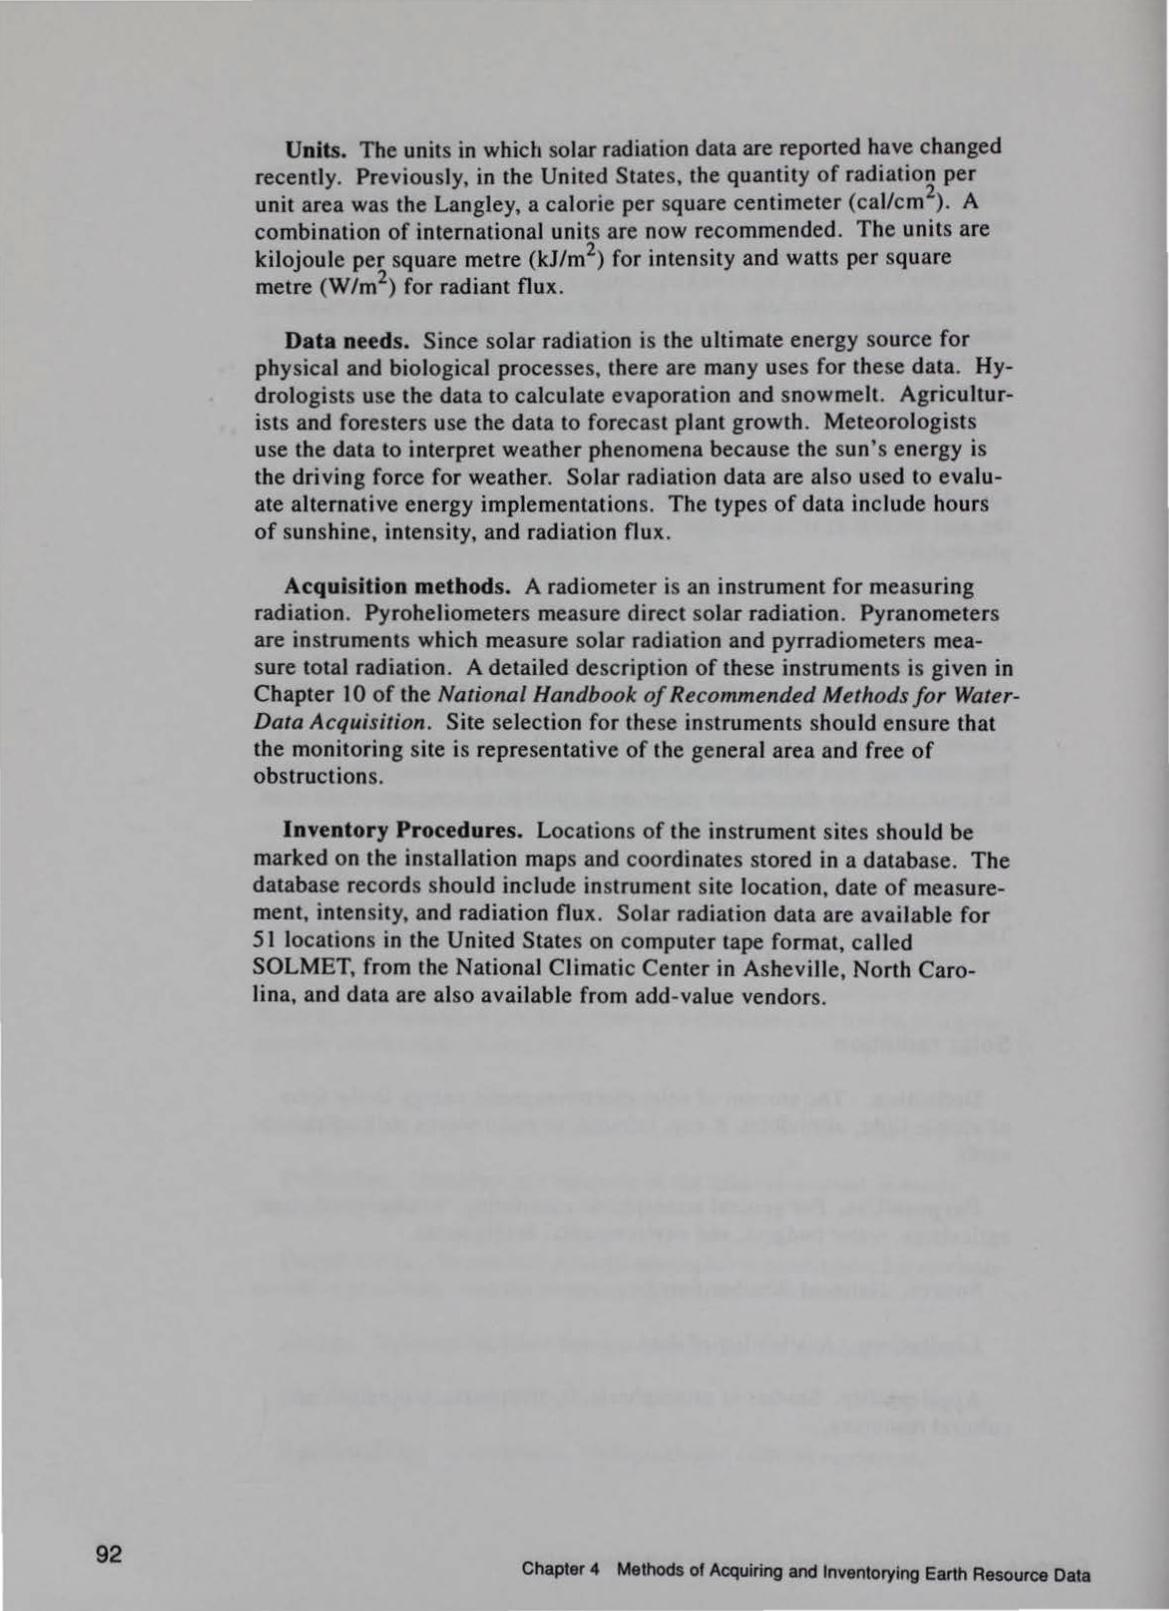
92
Units. The units in which solar radiation data are reported have changed recently. Previously, in the United States, the quantity of radiation per unit area was the Langley, a calorie per square centimeter (cal/cm2
). A combination of international units are now recommended. The units are kilojoule per square metre (kJ/m2) for intensity and watts per square metre (W/m2) for radiant flux.
Data needs. Since solar radiation is the ultimate energy source for physical and biological processes, there are many uses for these data. Hydrologists use the data to calculate evaporation and snowmelt. Agriculturists and foresters use the data to forecast plant growth. Meteorologists use the data to interpret weather phenomena because the sun's energy is the driving force for weather. Solar radiation data are also used to evaluate alternative energy implementations. The types of data include hours of sunshine, intensity, and radiation flux.
Acquisition methods. A radiometer is an instrument for measuring radiation. Pyroheliometers measure direct solar radiation. Pyranometers are instruments which measure solar radiation and pyrradiometers measure total radiation. A detailed description of these instruments is given in Chapter 10 of the National Handbook of Recommended Methods for WaterData Acquisition. Site selection for these instruments should ensure that the monitoring site is representative of the general area and free of obstructions.
Inventory Procedures. Locations of the instrument sites should be marked on the installation maps and coordinates stored in a database. The database records should include instrument site location, date of measurement, intensity, and radiation flux. Solar radiation data are available for 51 locations in the United States on computer tape format, called SOLMET, from the National Climatic Center in Asheville, North Carolina, and data are also available from add-value vendors.
Chapter 4 Methods of Acquiring and Inventorying Earth Resource Data

5 Earth Resource Stewardship
General
The successful stewardship of earth, cultural, and biological resources, requires the development of a solid understanding of the overall geological, hydrological, and atmospheric framework for the installation, and the collection and evaluation of earth resource data pertaining to geology, hydrology, and atmospherics as described previously. These data should be made available to installation resource managers and contract workers either in tabulated format or by means of maps displayed on GIS. At many Army installations, the Geographic Resources Analysis Support System (GRASS) is the GIS of choice; however, a number of other systems are available, and resource managers should consult their computer specialists when selecting a GIS.
These data will contribute to a better understanding of the natural resources of the installation which will, in turn, provide useful data for the prevention of environmental problems, and for the management of earth, biological, and cultural resources. The application of earth resource data in the stewardship of either earth, biological, or cultural/historic resources may, in some situations, be beyond the capabilities of the installation; in such cases, the resource manager must seek assistance from other Federal or state agencies, or from the private sector. Earth resource data should be documented and portrayed on GIS, and they should consist of the following information.
Geologic Framework
The primary step in the management of earth resources is the understanding of basic geologic framework of the installation. Generally, the geologic framework controls hydrologic and, to a certain extent, atmospheric conditions and it is, therefore, a very basic consideration. The geologic framework is a broad definition of the geologic materials underlying the
Chapter 5 Earth Resource Stewardship 93

94
installation, their age and thickness; and the nature and origin of geomorphic surfaces upon which the installation sits.
Scientifically Important Rocks and Fossils
On some installations, there may be exposures or outcrops of rocks which, because of their composition, geologic age, or fossils, may be of great interest to the public in terms of observing them as well as to scientists for studying them. Examples of such rocks and fossils would be reference stratigraphic sections; exposures which, due to color or configuration, are aesthetically attractive; and invertebrate or vertebrate animal remains or tracks or trails of these animals.
These outcrops should, to the extent compatible with installation operations, be protected, and made available to the public and to scientists for observation. That is, scientifically important rocks and fossils should be treated as an important part of the natural environment and managed in a fashion similar to that of biological and cultural resources. What constitutes scientific importance, or even importance due to public interest, may not be readily apparent to the resource manager; however, the manager may call upon the services of state or Federal agencies to assist in this determination. In most cases, the existence of such features exposed on an installation would be known to the scientific community; however, on large, remote installations, there may be little information on this subject and assistance must be requested.
Since scientifically important rocks and fossils are often revealed in outcrops produced by construction activities, the resource manager should ensure that new exposures or outcrops produced by road or building construction are described and mapped by geologists who could assist in determining the scientific importance of the rocks or fossils uncovered by the construction. Usually, the state geological survey would provide personnel to map these outcrops. The geologic descriptions and mapping would then be accessed to the installation resource database. Scientifically important and, possibly, of extremely important value to the installation itself are rock data derived from shallow or deep borings drilled as a part of a construction project. These data should also be maintained in the geographic information system because the data from these test holes may contribute to some unforeseen aspect of installation management.
Scientifically Important Landforms
These features should be treated in a fashion similar to that of scientifically important rocks and fossils . The importance of landforms may pertain to either their uniqueness or even bizarreness which would be of
Chapter 5 Earth Resource Stewardship
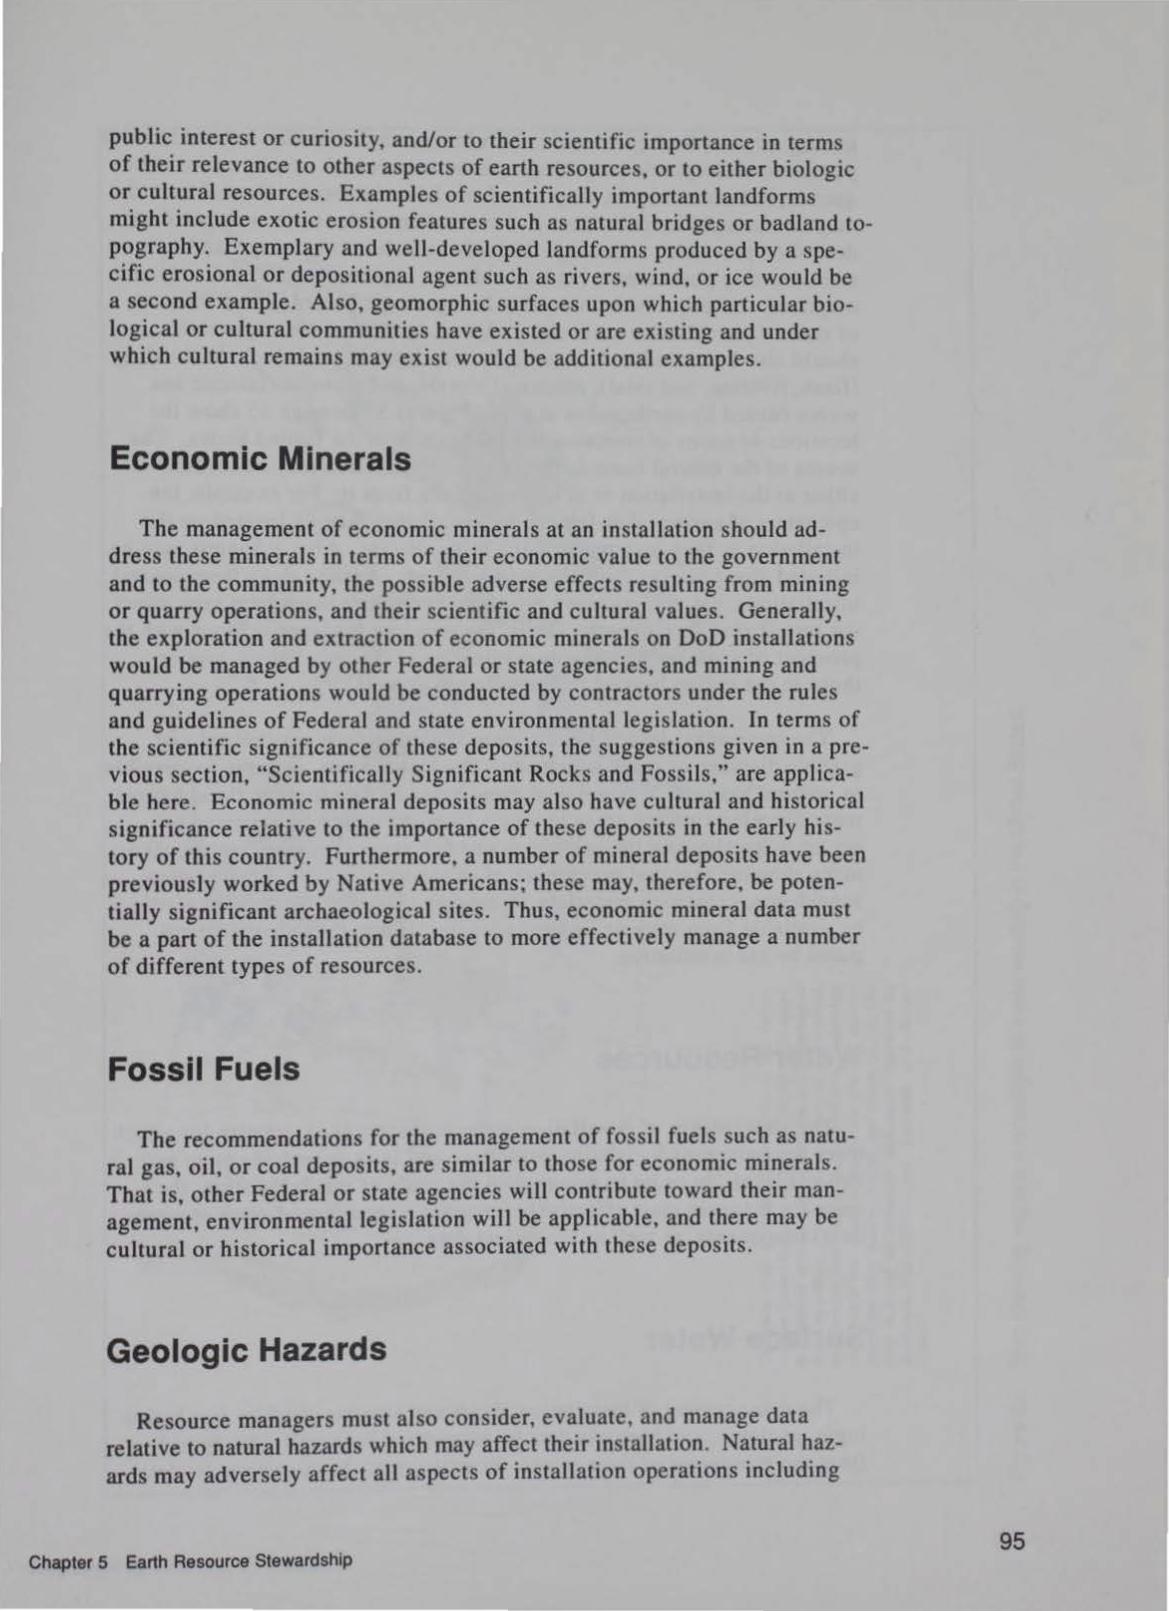
public interest or curiosity, and/or to their scientific importance in terms of their relevance to other aspects of earth resources, or to either biologic or cultural resources. Examples of scientifically important landforms might include exotic erosion features such as natural bridges or badland topography. Exemplary and well-developed landforms produced by a specific erosional or depositional agent such as rivers, wind, or ice would be a second example. Also, geomorphic surfaces upon which particular biological or cultural communities have existed or are existing and under which cultural remains may exist would be additional examples.
Economic Minerals
The management of economic minerals at an installation should address these minerals in terms of their economic value to the government and to the community, the possible adverse effects resulting from mining or quarry operations, and their scientific and cultural values. Generally, the exploration and extraction of economic minerals on DoD installations would be managed by other Federal or state agencies, and mining and quarrying operations would be conducted by contractors under the rules and guidelines of Federal and state environmental legislation. In terms of the scientific significance of these deposits, the suggestions given in a previous section, "Scientifically Significant Rocks and Fossils," are applicable here. Economic mineral deposits may also have cultural and historical significance relative to the importance of these deposits in the early history of this country. Furthermore, a number of mineral deposits have been previously worked by Native Americans; these may, therefore, be potentially significant archaeological sites. Thus, economic mineral data must be a part of the installation database to more effectively manage a number of different types of resources.
Fossil Fuels
The recommendations for the management of fossil fuels such as natural gas, oil, or coal deposits, are similar to those for economic minerals. That is, other Federal or state agencies will contribute toward their management, environmental legislation will be applicable, and there may be cultural or historical importance associated with these deposits.
Geologic Hazards
Resource managers must also consider, evaluate, and manage data relative to natural hazards which may affect their installation. Natural hazards may adversely affect all aspects of installation operations including
Chapter 5 Earth Resource Stewardship 95
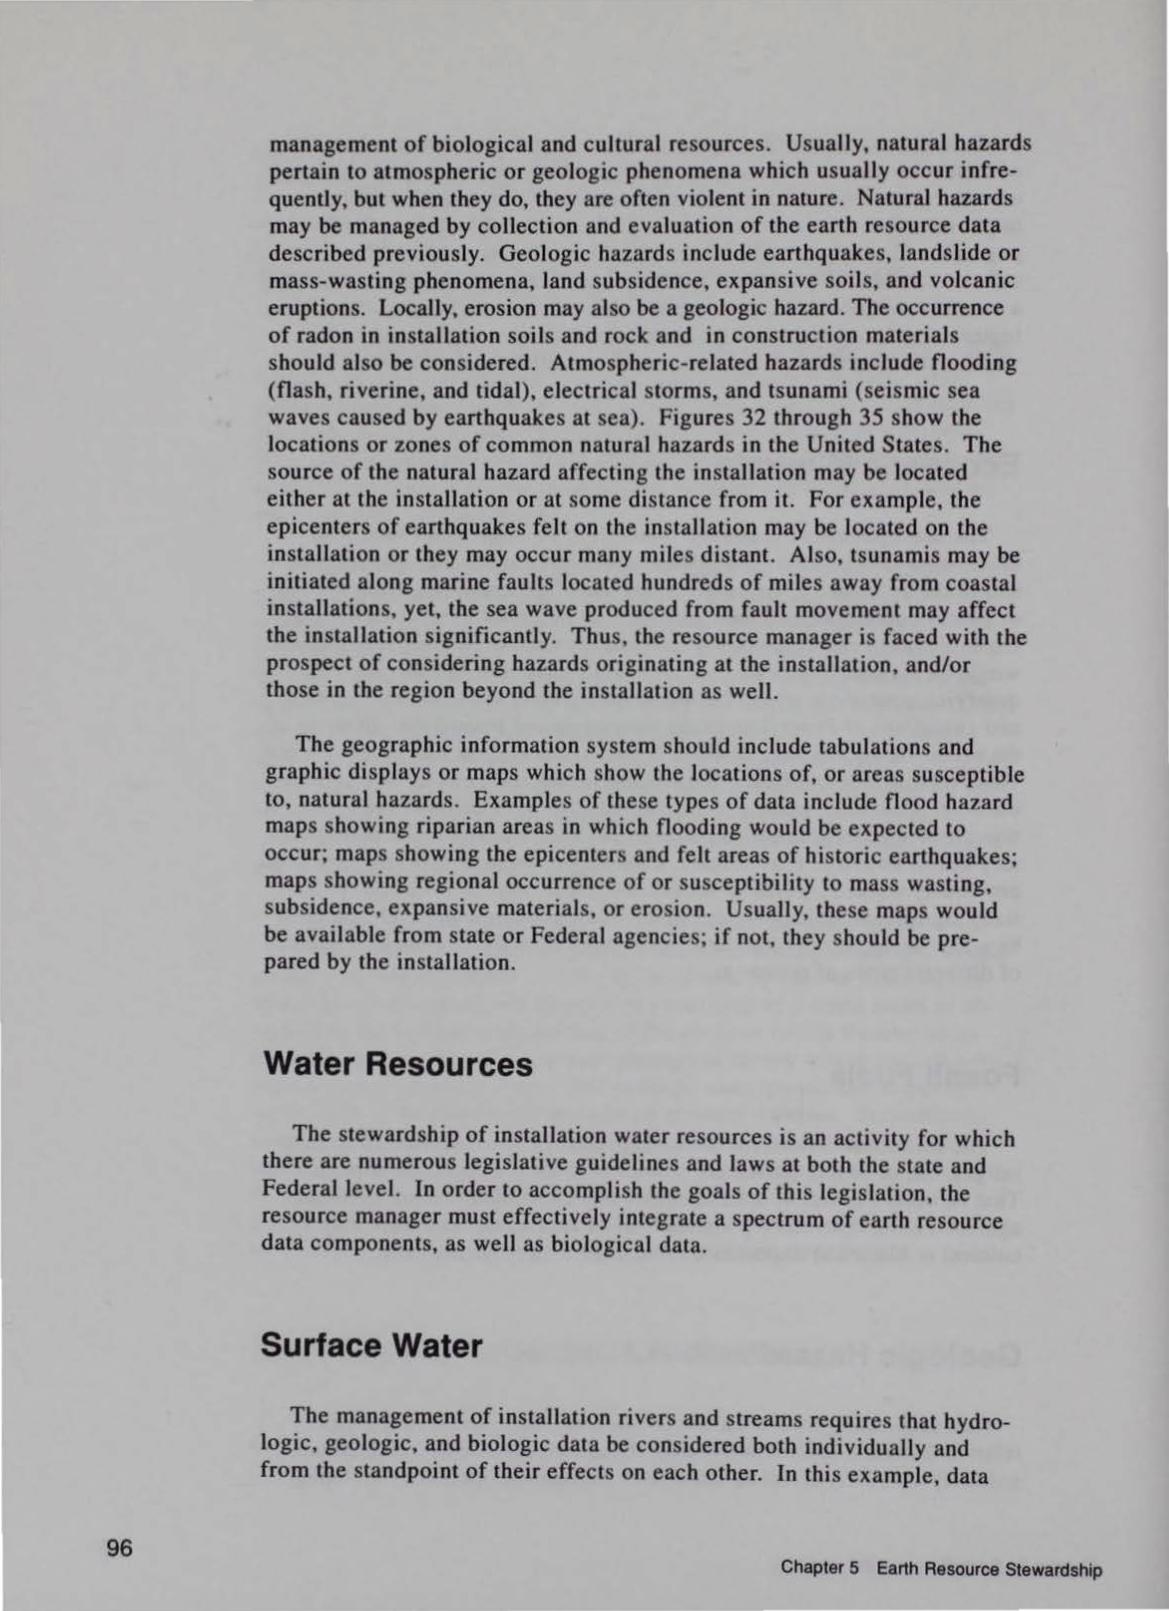
96
management of biological and cultural resources. Usually, natural hazards pertain to atmospheric or geologic phenomena which usually occur infrequently, but when they do, they are often violent in nature. Natural hazards may be managed by collection and evaluation of the earth resource data described previously. Geologic hazards include earthquakes, landslide or mass-wasting phenomena, land subsidence, expansive soils, and volcanic eruptions. Locally, erosion may also be a geologic hazard. The occurrence of radon in installation soils and rock and in construction materials should also be considered. Atmospheric-related hazards include flooding (flash, riverine, and tidal), electrical storms, and tsunami (seismic sea waves caused by earthquakes at sea). Figures 32 through 35 show the locations or zones of common natural hazards in the United States. The source of the natural hazard affecting the installation may be located either at the installation or at some distance from it. For example, the epicenters of earthquakes felt on the installation may be located on the installation or they may occur many miles distant. Also, tsunamis may be initiated along marine faults located hundreds of miles away from coastal installations, yet, the sea wave produced from fault movement may affect the installation significantly. Thus, the resource manager is faced with the prospect of considering hazards originating at the installation, and/or those in the region beyond the installation as well.
The geographic information system should include tabulations and graphic displays or maps which show the locations of, or areas susceptible to, natural hazards. Examples of these types of data include flood hazard maps showing riparian areas in which flooding would be expected to occur; maps showing the epicenters and felt areas of historic earthquakes; maps showing regional occurrence of or suscept ibi lity to mass wasting, subsidence, expansive materials, or erosion. Usually, these maps would be available from state or Federal agencies; if not, they should be prepared by the installation.
Water Resources
The stewardship of installation water resources is an activity for which there are numerous legislative guidelines and laws at both the state and Federal level. In order to accomplish the goals of this legis lation, the resource manager must effectively integrate a spectrum of earth resource data components, as well as biological data.
Surface Water
The management of installation rivers and streams requires that hydrologic, geolog ic, and biologic data be considered both individually and from the standpoint of their effects on each other. In thi s example, data
Chapter 5 Earth Resource Stewardship

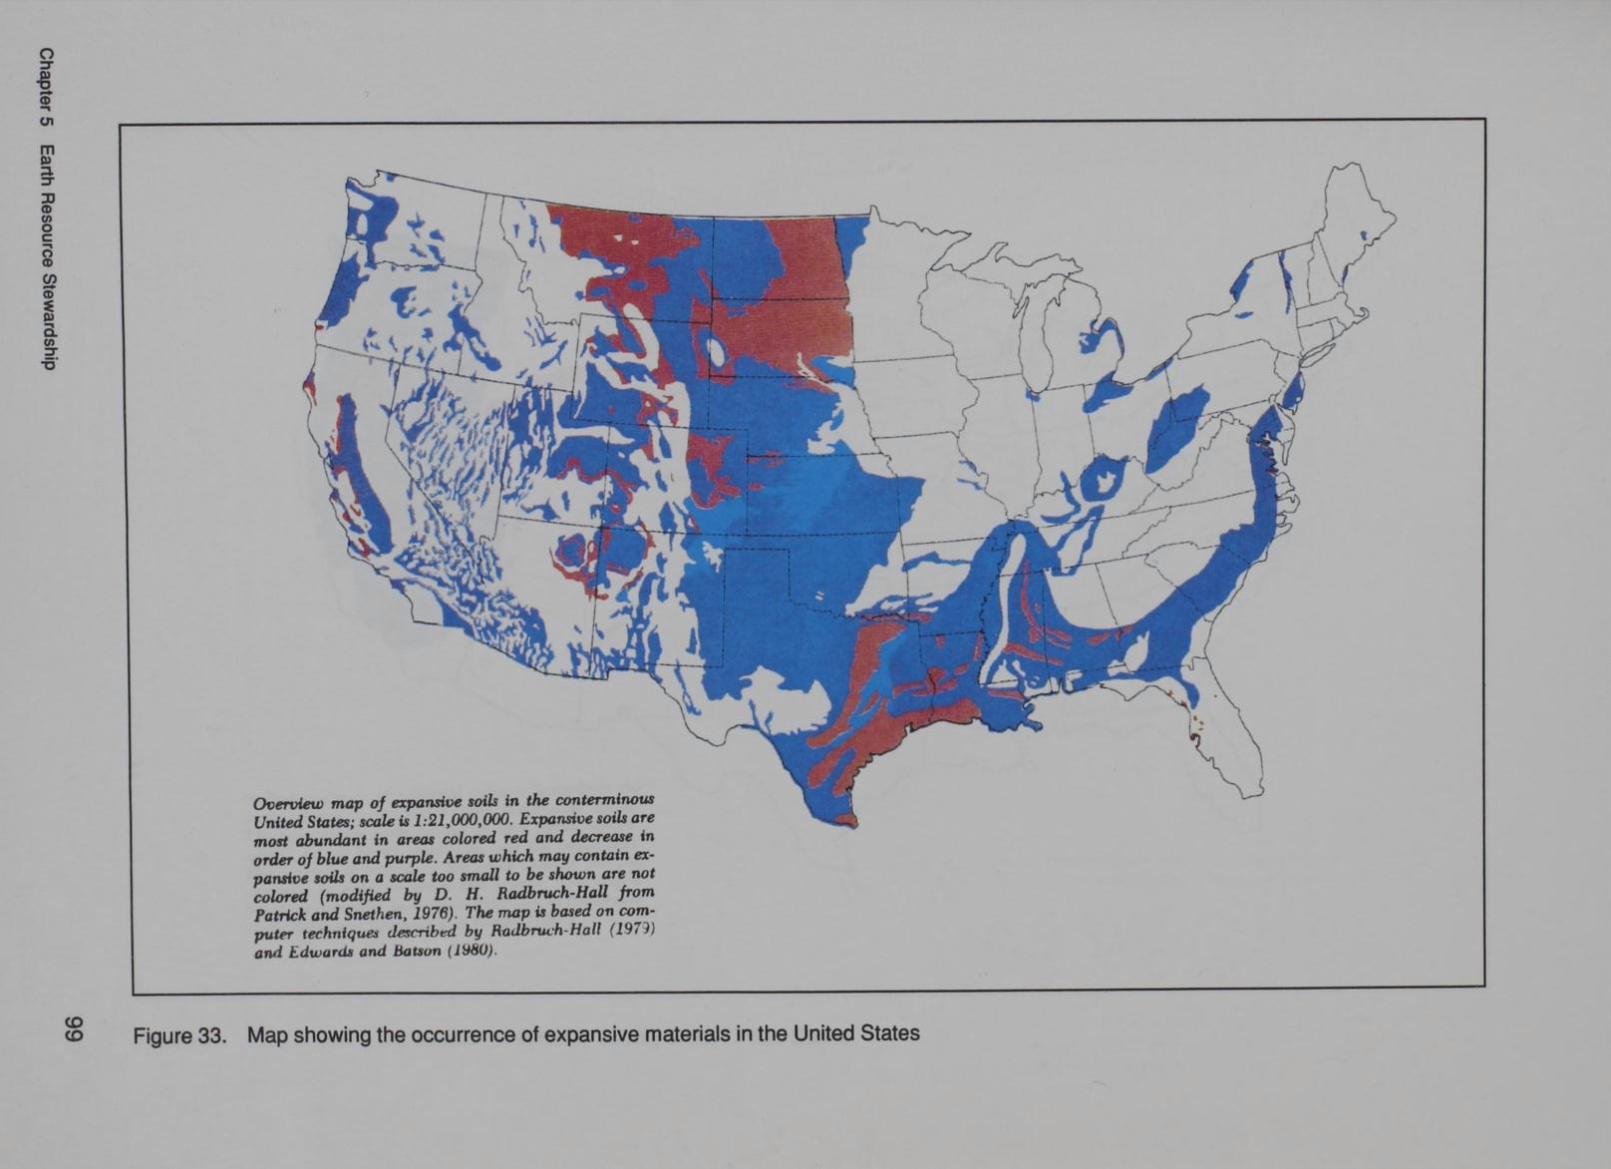

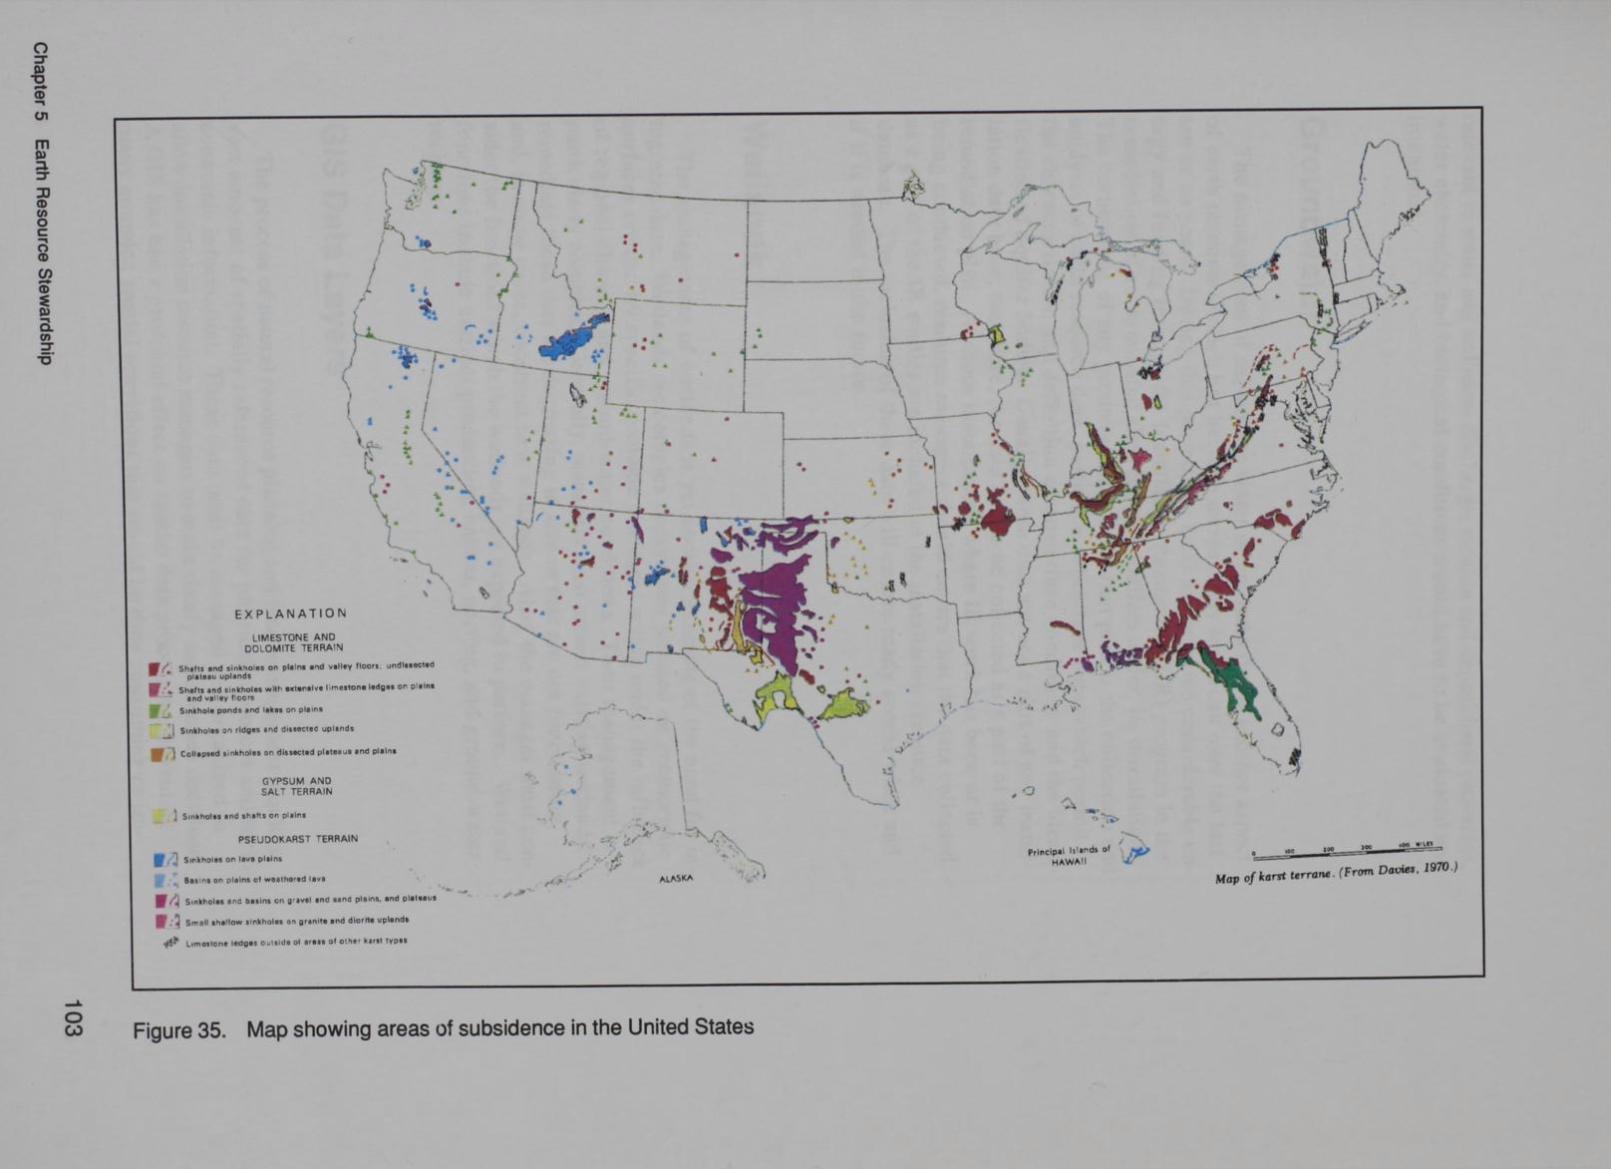

relevant to ~ater and sediment discharge, erosion and depositional processes, water chem1stry, and biological conditions would have to be evaluated and integrated.
Groundwater
The management of subsurface water or groundwater is another aspect of earth resources which has become increasingly important over the last ten or so years. During this period, the DoD has invested considerable energy and funding through the Installation Restoration (IR) program in the remediation of contaminated sites on, and aquifers under, its installations. The cornerstone of any groundwater remediation plan is the collection and analysis of earth resource data, particular subsurface data which permit the characterization and definition of subsurface conditions and the identification of aquifer bodies Usually, these data are not a part of any installation data base; therefore, the data had to be collected as a part of the remediation plan. At those installations where IR work has been or is being conducted, resource managers should ensure that the data collected as a part of the IR studies are included in the installation resource database. The inclusion of these data will ensure ready access when and if it is needed in the future.
Wetlands
The management of wetlands is yet another example of the need for integrated data. Wetlands are complex ecosystems situated on geomorphic surfaces created by specific geologic processes acting under the influence of regional climatic and ground-water conditions. Their management is particularly complex. Generally, managers must protect existing wetlands, remediate those that are decreasing in size or that are not functioning, and, in some cases, construct new wetlands. Also, the manager must consider the functions which the wetlands are expected to perform. Wetland functions include nutrient production, habitat, nesting, and ground-water recharge.
GIS Data Layers
The process of natural resource planning and land management requires vast amounts of spatially referenced data for physical resources and socioeconomic information. These data must be managed and organized to allow installation resource managers to make timely and accurate decisions. A GIS has had a profound effect on spatial data processing, providing many complex spatial operations that would be time consuming or im-
Chapter 5 Earth Resource Stewardship 105
106
practicable otherwise. A GIS also serves as an analytical tool having the capability of identifying spatial relationships between map features. The Environmental Systems Research Institute (ESRI) defines a geographic information system as an organized collection of computer hardware, software, geographic data, and personnel designed to efficiently capture, store, update, manipulate, analyze, and display all forms of geographically referenced information (Environmental Systems Research Institute 1992).
Table 9 shows a conceptualization of recommended earth resource GIS overlays and the data elements used to construct them. Together these GIS data layers form an earth resources digita l database. "Typical GIS Data Layers" in Table 9 refers to an overlay showing specific related earth resource data elements pertaining to the function of that layer. Some data elements, such as topographic data, may be used for several layers. Resource managers may construct layers different from the ones shown in Table 9 in order to integrate earth resources with specific installations missions or functions. The only limitations to the combinations are imagination, software, and common sense.
Basic map concepts
For each required theme, or layer of information, two basic types of information must be maintained, positional (map) data and attribute (descriptive and numerical) data. Spatial data is represented by points, polygons, or arcs whereas the attribute information is stored as character or numeric feature descriptions. A standard coordinate system should be selected on the basis of existing systems and installation requi rements. Relationships between spatial data must be interpreted from the map graphics available as individual laters. A GIS is capable of linking or combining data from separate data sets to analyze or provide answers to spatial queries. These data should be managed and organized to allow installations resource managers to make timely and accurate decisions.
General purpose layer
The general purpose layer would be a base map of the installation, needed by all disciplines and organizational units, showing roads, facilities, structures, training areas, and political boundaries. The layer should include restricted areas, topography, and other data relevant to the mission and functions of the instaJlation. This layer should a lso include basic information relative to land use and land cover.
Geologic layer 1
This layer should include a geo logic map of the installation showing the distribution and structure of geologic materials. The layer should be linked to a stratigraphic column describing the geo logic age and lithology
Chapter 5 Earth Resource Stewardship

of 1he geologic units ho\\ non the la~er. A minamum ofl"o geologac cross- ections, each consuucted normn1 to the other, hould nl o be hnked to this layer or lo additional layer . The layer da pi ~ed "all mclude pnncipnl streams, roads. and topogrnphic dntn.
Table 9 A Conceptual Earth Resource Geographic Information System Showing Individual Layers and Recommended Data Elements. For Small Installations, Layers May Be Combined
Typical GIS Ovet'-Y• O.ta Elements
General Purpose Topographic Data Roads, F acilrues, and Training Ar Slreams and Water Bodies Restricted AI as Land useJland covet
Geologic Layer 1 Rod\ Type {U1hology) GeologiC Age Geologic Structure Streams IRoads
Geologiclayer2 Important Rocks and Fossils Economic Mineral Deposits.
l tMines, Pits, and Ouarrles Oil and Gas Aelcls ~and lest Hoi Engineering Sols
Geomorphology Layer Landlorms GeomorphiC Surfaces MobllltyMap Agronomic Soils
Water Resources Layer 1 Surface Water Drainages Orrunage Basins Lakos, Seeps. and Springs WeUands Gaging Sta!lon$ Aood Prono Aloas Soil Moisture
Water Resources Layer 2 WatetJMonitorlng w locatiOns Water Table 8evatJon Contours PotentiOmetric Surface Contours Waste Burial Sites
Atmospheric Resources Layer Meteorological StatiOnS Seasonal Precipllauon Seasonal EvaporatiOn Seasonal T ranspiTa1iOn Seasonal TempMature Seasonal Retatlve Humicity
Natur Haz.nrds Layer Expansive u • -l tMass Wasting.;. 5ubsldenoe and Sol\ttlon
I Volcalism Earthquake l~e:rt: ....
·-Cont-~ Erosion 1 Add Rain
Chapter 5 Earth R source Stev. rdsh!p
107

108
Geologic layer 2
The second layer should be linked to locations and descriptions of scientifically important rocks, fossils, and landforms; economic mineral deposits including mines, pits, and quarries; oil and natural gas fields, and oil or gas and mineral exploration test holes. Lithologic and geophysical logs for each exploration or test hole should be maintained in a database, and the logs should be digitized for visual display. Engineering information should also be linked with this map layer.
Geomorphology layer
The third layer should consist of a geomorphic map of the installation showing the principal landforms. At those installations for which mobility maps have been prepared, the geomorphic map would include these features as a separate data element. Agronomic soils should be included on another separate layer. The basic geomorphic layer would also be used as a foundation in integrated biological and cultural resource surveys and studies.
Water resources layer 1
The fourth layer would include all surface water drainages, outlines of all drainage basins to the extent the scale of the over permits, flood-prone areas, gaging stations, wetlands, lakes, seeps, and springs.
Water resources layer 2
This fifth layer is for groundwater information and should include locations of all water wells, and other types of monitor wells or borings which have penetrated the principal installation aquifers. Contours showing watertable or potentiometric surface elevations of these aquifers should be shown on this layer. As these contour lines may change with time and increased aquifer usage, this layer must be updated periodically. Upon updating, the previous overlays should be stored for comparison of aquifer changes through time. This layer should also include the locations of all known or suspected, active or inactive (closed) waste burial sites.
Atmospheric resources layers
This layer consists of a series of point data representing measuring stations linked to time series data. The layer should show the locations of all meteorological stations, and seasonal precipitation, evaporation, transpiration, temperature, and relative humidity data.
Chapter 5 Earth Resource Stewardship

Natural hazards layer
The sixth layer should be displayed with a topographic base map, and it should contain the locations of the following data elements-regions underlain by expansive materials, areas susceptible to mass wasting, locations where mass wasting events have occurred, volcanic activity, any regions or points at which subsidence or solution may be expected or has occurred, epicenters of historic earthquakes and/or isoseismals showing the intensities of historic earthquakes felt on the installation having epicenters off the installation, and the areas affected by acid rain. Flood-prone areas would be shown on Water Resource Layer I .
Table 10 shows the maps or layers interfacing earth resources data with cultural and biological resources. Decision making at many installations, depending upon size, and geologic and topographic setting, may be combined.
Table 10 A Conceptual Earth Resource Geographic Information System Interface Layers Showing Individual Overlays and Recommended Data Elements. For Small Installations, Layers May Be Combined
Conceptual GIS Interface of Biological/Cultural Reources
ER Data Decision Making Derived Layers
Geomorphic Process Geomorphic Surface/Process Cultural Reousrce Potential Relative Energy Relative Energy of Process Biological Resource ConstanULayer T and E Species Age of Surface Relevant Human Activities Cultural/Historic Sites
Chapter 5 Earth Resource Stewardship 109

110
6 Earth Resource Information in Cultural Resource Stewardship
General
The integration of earth resources in advancing the stewardship of cultural resources must be based upon a thorough understanding of the geologic, hydrologic, and atmospheric conditions of the installation. The procedures proposed here are considered applicable in the inventory, curation, and management of cultural resources. Much of these data would have been prepared for the stewardship of earth resources; however, in some cases, specific studies may be necessary. Usually, cultural resource management problems are site specific; therefore, the sufficiency of earth resource data may depend upon what is known about the site or region in question. Earth resource data which are important in the management of cultural resources usually pertain to data by which estimations can be made of the likelihood that a site was habitated, and whether or not artifacts are preserved beneath or on the surface of a site. These earth resource data may also indicate the degree of disturbance of once-buried artifacts. The tasks necessary to relate earth and cultural resources are outlined in Table 11, and they are described below.
Geologic Framework
The first step in this process is the development of a general understanding of the overall geologic framework of the installation. This means determining the overall age, character, and distribution of the earth materials.
Chapter 6 Earth Resource Information in Cultural Resource Stewardship

Table 11 Recommended On-Going Procedures for the Identification Classification, and Mangement of Cultural Sites Using Earth Resource Data
Step Task Data Elements
1 Determine Geologic Framework
2 Identify Geomorphic Surfaces Topography Soils River Courses
3 Determine Geomorphic Processes Soils Sediments
4 Determine Relative or Absolute Ages of Surfaces Soils Isotopic Dating Climate Change
5 Map Surfaces by Process and Age
6 Plot Known Cultural Sites
7 Rank Order Surfaces
8 Enter Into GIS Database
9 Develop Cultural Resource GIS Overlay
10 Manage Cultural Resource
Geomorphic Surfaces
Habitation sites are usually associated with geomorphic surfaces. These features have resulted from erosional or depositional processes acting on the earth's surface. Some geomorphic surfaces are considered modern, in that the erosional or depositional processes responsible for their formation are still at work. Paleosurfaces are those on which these processes are no longer active. Paleosurfaces may occur at the earth's surface where they are acted on by current agents, or they may be buried. Thus, buried surfaces must be evaluated in terms of sub-surface geologic data. Geomorphic surfaces are recognized by their topographic expression, the nature of their soils, and their relationship to other physiographic features such as rivers.
Geomorphic Processes
One of the important first steps in applying earth resource data toward cultural resource management is the determination of current and past geomorphic processes acting on the site, and the geomorphic agents conducting the processes. For example, one must determine whether the site is one of erosion or deposition . Erosional sites may be so reworked that artifacts may have been destroyed or may be in strata other than those in which they originated giving false dates; on the other hand, depositional sites may contain deeply buried and well-preserved artifacts. One must also
Chapter 6 Earth Resource Information in Cultural Resource Stewardship 111
112
determine when the erosion or deposition occurred; depositional phases would most likely not be suitable for habitats. Also, the agents conducting the erosion or deposition must be identified; generally, the agents are either water, wind, or ice. Finally, one must determine the relative energies associated with either erosional or depositional phases in order to rank sites in terms of the relative likelihood of discovering sites having undisturbed versus reworked artifacts.
Soil Development
Geomorphic surfaces, even buried ones, will exhibit soils. The relative age of and nature of erosional or depositional processes acting on the surface may be learned from the type and maturity of the soil. For example, older surfaces usually exhibit thicker and more maturely developed soi ls than younger surfaces. Soil data are, therefore, useful for ranking sites. Thin soils may be analyzed from data collected at the surface; however, thick soils may require sub-surface data for their evaluation.
Geologic Ages/Dates
The study and ranking of cultural sites may, in some cases, require absolute rather than relative age determinations. Absolute age determinations are usually isotopic in nature and require the collection of fossil, soil, or rock material and measuring small quantities of radioactive isotopes and their decay products present in the material. The ages determined by these techniques represent the time the rock or soil formed, or the animal died. These methods are time-consuming and expensive; however, the data may confirm estimations based upon relative age determinations. Furthermore, the isotopic age determinations would be useful to exclude areas having ages too old to be of interest.
Climatic Changes
Geomorphic processes such as erosion or deposition, the surfaces produced by their agents, and soil formation are controlled to a great extent by climate. Thus, the study and evaluation of cultural sites must consider the nature and extent of climate change over the time period of interest. For most purposes, the time period of interest extends from the present back through the Pleistocene; thus, the time span of concern may cover several thousand to several hundred thousand years. The effects of older climatic conditions or paleoclimates may have left their mark on regional surfaces and soils and may provide additional information on the ranking of sites.
Chapter 6 Earth Resource Information in Cultural Resource Stewardship

Effects of Human Activities
In many places today. the effects of past and present human activities on the earth's surface are common and evident. Generally, human activities tend to rework or bury natural geomorphic surfaces and. thereby. disturb or bury artifacts on or under that surface. The most adverse effects are produced by modern humans; however, ancient humans also may have made a contribution. Agricultural practices. construction projects, and similar enterprises can cause significant change in the landscape and, thus, alter, destroy. or bury geomorphic surfaces containing archaeological remains.
Cultural Resource Interface Layer
The base map for this GIS layer would be the Geomorphology Layer which shows the installation geomorphology and landforms. All cultural sites should be superimposed on this layer. Geomorphic surfaces also shown on this layer should be classified on the basis of relative energy, geologic process, and age in order to portray the relative probability of discovering cultural sites on the installation. The data elements for this layer are shown in Table 10.
Chapter s Earth Resource Information in Cultural Resource Stewardship 113
114
7 Earth Resource Information in Biological Resource Stewardship
General
As with cultural resources, the geologic, hydrologic, and atmospheric framework of the installation must be established and understood. Most biological communities exist in ecosystems which have evolved upon geomorphic surfaces which, in turn, have originated by erosional or depositional processes acting under specific climatic and hydrologic conditions. Therefore, in order to protect or remediate specific biological habitats one must understand the relationships between the habitat and these geologic, hydrologic, and atmospheric processes. Generally, protection or remediation is necessary because of the adverse or potentially adverse effects of human activities. Thus, it may be necessary to understand the relationships between specific human activities and geologic, hydrologic, and atmospheric processes. Specific tasks which must be accomplished to relate earth to biological resources are outlined in Table J 2. The following discussion will concentrate on the habitat.
Geomorphic Processes
Biological habitats are either aquatic or terrestrial and, in either case, have developed under certain erosional and/or depositional processes. For a given habitat, these processes must be identified and their relative importance determined. These data may be used to develop models of the ecosystem.
Chapter 7 Earth Resource Information in Biological Resource Stewardship

Table 12 Recommended Procedures for the Determination of Relations Between Earth and Biological Resources
Step Task
1 Determine Geologic Framework
2 Identify Geomorphic Surfaces
3 Determme Geomorphic Processes
4 Determine Habitats of Threatened and Endangered Species
5 Determine Energy Requirements for Habitats
6 List Possible Human Impacts
7 Determine Impacts on Geomorphic Processes
8 Select Controlling Impact and Process
9 Identify Remediation Measures
Geomorphic Surfaces
As most biological activity exists at the surface or near-surface of the earth, relevant geomorphic surfaces should be identified, and the erosional or depositional processes acting on the surfaces should be determined. These data would also be important in ecosystem modeling.
Climatic Change
Earth resource studies must also consider the effects of Holocene, as well as Pleistocene, climatic changes on the origin and conditions of existing surfaces, as described in Chapter 6. These data may need to be integrated with that which is known from the historical perspective.
Acid Rain
On installations situated in industrial areas, particularly those of the northeastern and southeastern United States, which may be affected by acid rain, considerations should be given to its effects on base ecosystems.
Effects of Human Activities
In both upland and lowland areas, human activities may completely destroy existing terrestrial ecosystems and may cause increased runoff,
Chapter 7 Earth Resource Information in Biological Resource Stewardship 115

116
upland and channel erosion, changes in the hydraulic character of near-by streams and, in tum, extirpation of species and changes in growth, biomass. and diversity within downstream aquatic ecosystems. Human activities disrupt balances between erosion and deposition which, in turn, may adversely affect the hydraulic regimes of near-by streams.
Agricultural practices
These activities generally result in increased upland erosion, gullying adjacent to fields, sedimentation in nearby streams, higher flood stages, and other adverse effects on stream ecosystems.
Forestry practices
Forestry is a source of revenue at some installations and forestry practices may produce conditions beneficial to wildlife; however, there may be adverse s ide effects. For example, clearing of forests, particularly clear cutting, also increases both water and sediment discharge in nearby streams by upland erosion. Runoff is increased, not only by decreasing interception of rainfall by removal of the forest canopy, but by the decrease in infiltration of rainfall from decreased root activity. Stream ecosystems may suffer from the high sediments loads accompanying the high runoff.
Mining
Generally, surface mining, quarrying, and operation of borrow pits tend to increase erosion during the operation of the pit or quarry. Legislative and statuary requirements to reclaim abandoned or closed surface mining operations have decreased the adverse effects of these old mining operations on nearby streams. Acid mine drainage waters associated with coal strip mines may also adversely affect nearby stream ecosystems. Mining operations conducted within a stream channel will introduce sediment into the stream, and removal of point bars by mining may effectively channelize the stream and initiate headcutting and further excessive erosion and sed imentation in the stream. Mining and exposure of mine tailings may also release or introduce harmful concentrations of chemical compounds to the stream ecosystem.
Urbanization
The construction of buildings, hangers, roads, runways, parking lots and aprons, and related structures leads to increased runoff and decreased infiltration. These effects result in higher storm hydrographs and increased likelihood of flooding which, in turn, may result in increased erosion and sedimentation along and in installation streams. Adverse effects on both
Chapter 7 Earth Resource Information in Biological Resource Stewardsh•p
upland and riparian ecosystems may, therefore, result from these construction activities.
Recreational/hunting activities
The use of installation lands for recreational purposes may result in increased runoff from the use of umimproved roads and trails, erosion accompanying the runoff, and increased flood stages. The abatement of erosion caused by off-the-road recreational vehicles is usually addressed by legislation and regulations as well as by pro-active planning and management.
Construction
The effects of construction of horizontal and vertical structures usually involve increased runoff and erosion which may adversely affect local stream ecosystems. Construction projects conducted on installation streams involving channelization, clearing and de-snagging, and impounding may also adversely affect riparian habitats by altering the hydraulic regime of the stream system.
Troop training activities
Those activities pertaining to the training of either mounted or dismounted troops may produce effects similar to those of construction projects and recreational activities. The processes involved are those of increased runoff, erosion, and sedimentation and their effects on habitats and, in extreme cases, the complete destruction of the habitat. A short list of possible training activities which may produce adverse erosion conditions would include: any off-road maneuvers, fording of streams, and marches on unpaved roads.
Biological Resource Interface Layer
The purpose of this GIS layer is to indicate the locations of threatened or endangered (T&E) species habitats, or locations of other biological resources, in terms of earth resources which may affect these habitats. The layer should, therefore, include the predominant geomorphic processes, the relative energies of these processes, locations ofT &E species, and relevant human activities.
Chapter 7 Earth Resource Information in Biological Resource Stewardship 117

118
8 Integrated Stewardship
General
The previous discussions of earth resources have shown their relevancy and importance in the management and stewardship of biological and cultural resources. There is also a need to integrate biological, cultural, and earth resource management; that is, one must determine the dependencies and interrelationships between all three. Also, there is a need to integrate earth resource data into the resource manager's day-to-day operations and functions such as those described below. Generally, resource integration may be accomplished by using a team approach to conduct the work.
Integrated Resource Management
The integration of earth, biological, and cultural resources in installation management and planning may be accomplished using GIS interfaces between the Biological and Cultural Resource Interface Layers described in Chapters 6 and 7 and additional earth resource data elements mentioned in Chapter 5. The additional earth resource data elements are those that are important in their own right and which may not directly impact either biological or cultural resources. These earth resource data elements are those in Geologic Layer 2, Water Resources Layer 1, and the Natural Hazards Layer of the GIS shown in Table 9. The combining of these earth, biological, and cultural resource layers shown in Table 10 yields an integrated resource map which would assist managers and planners in determining which parts of an installation should be used or should not used for a particular activity. The integrated resource map is outlined in Table 13. Thus, decisions pertaining to construction, lines of communication, training and recreation areas, and impact areas, to name a few, may be made more rationally.
Chapter 8 Integrated Stewardship
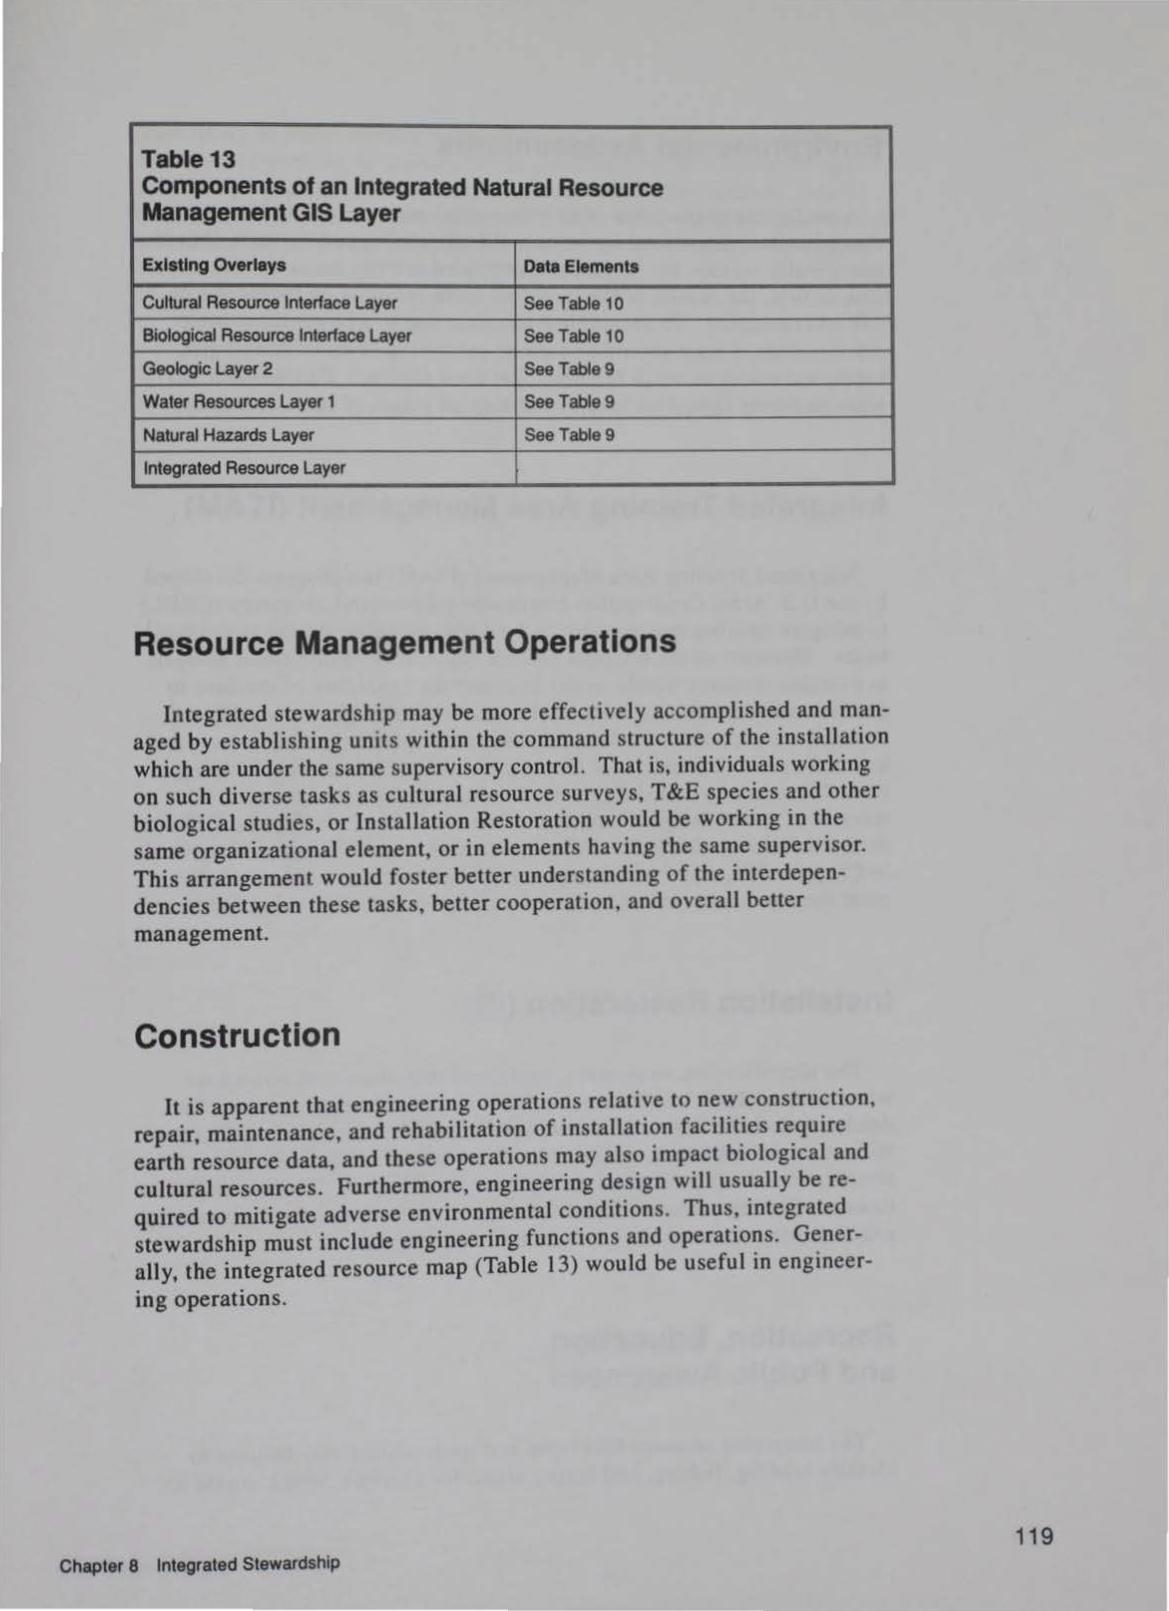
Table 13 Components of an Integrated Natural Resource Management GIS Layer
E.xlstlng Overlays Data Elements
Cultural Resource Interface Layer See Table 10
Biological Resource Interface Layer See Table 10
Geologic Layer 2 See Table9
Water Resources Layer 1 SeeTable9
Natural Hazards Layer See Table9
Integrated Resource Layer
Resource Management Operations
Integrated stewardship may be more effectively accomplished and managed by establishing units within the command structure of the installation which are under the same supervisory control. That is, individuals working on such diverse tasks as cultural resource surveys, T&E species and other biological studies, or Installation Restoration would be working in the same organizational element, or in elements having the same supervisor. This arrangement would foster better understanding of the interdependencies between these tasks, better cooperation, and overall better management.
Construction
It is apparent that engineering operations relative to new construction, repair, maintenance, and rehabilitation of installation facilities require earth resource data, and these operations may also impact biological and cultural resources . Furthermore, engineering design will usually be required to mitigate adverse environmental conditions. Thus, integrated stewardship must include engineering functions and operations. Generally, the integrated resource map (Table 13) would be useful in engineer-
ing operations.
Chapter 8 Integrated Stewardship
119
120
Environmental Assessments
Usually, the preparation of environmental assessments and impact statements, as well as cultural resource and T &E studies and surveys, should specifically include the impact of a proposed activity on earth resources, and, in turn, the results of the impacted earth resource on biological or cultural resources. To accomplish this goal and to address these interrelationships, a team should be formed consisting of an archaeologist, biological scientist, earth scientist, and civil engineer. Furthermore, all team members should be involved during all stages of the assessment.
Integrated Training Area Management (IT AM)
Integrated Training Area Management (ITAM) is a program developed by the U.S. Army Construction Engineering Research Laboratory (CERL) to mitigate training management and environmental problems at military bases. Elements of the program include (a) land condition-trend analysis to examine resource trends on the base and the capability of the base to conduct training, (b) environmental awareness to inspire stewardship among base personnel, (c) land rehabilitation and erosion control to protect and control resources, (d) the optimization of landuse by the integration of resource sustainability with training mission requirements, (e) threatened and endangered species information, and (f) a GRASS GIS for decision making. Addition of the data elements and GIS layers described in Chapters 5, 6, and 7 of this report might be an effective way to implement the concepts presented herein for those installations using ITAM.
Installation Restoration (IR)
The identification, evaluation, study, and remediation of hazardous waste sites on DoD installations depends upon earth resource data. The databases and GIS layers described herein would make significant contributions to the collection, evaluation, and synthesis of data relevant to the remediation of environmental problems at installations. Those installations conducting extensive IR activities may wish to consider constructing a GIS overlay dedicated to groundwater-related data.
Recreation, Education, and Public Awareness
The integrated resource GIS layer and its databases may be used to identify hunting, fishing, and hiking areas, for example, which would be
Chapter 8 Integrated Stewardship

least likely to suffer environmental damage by recreational activities. Also, other portions of the GIS layers could be used for brochures and information packages for the general public. The GIS databases would include descriptions of the general natural history of the installation which would also be of interest to the general public and other installation visitors.
Chapter 8 Integrated Stewardship
121
122
9 Installation Planning
General
Earth resource data must be integ rated with and incorporated into installation short- and long-term planning and planning for installation expansion, consolidation and closure. The GIS systems described previously may be used by installation planners to select planning options which will minimize or prevent adverse effects on the environment and, at the same time, optimize installation operations.
Installation Expansion
The acquisition of nearby lands to expand military faci lities is a complex issue which has come about by the additional space requirements for modern weapon systems. The GIS and database systems described here may be used as a starting point for expansion studies because many of the contained data may be partially applicable to the reg ion surrounding the installation. That is, the surrounding region would exhibit many of the characteristics of the installation itself. Furthermore, s ince many, if not most, earth, biological, and cultural resources are not restrained by installation boundaries, the argument may be made that the GIS system should extend, to the extent practical, some distance beyond the installation boundary. This may be the case without interest or need of future expansion, and it may be required in the case of EPA-mandated IR investigations. In some regions loca l and state governments have developed GIS systems containing portions of the data elements described in this report. Installation planners should consider options for sharing data with these governmental agencies in order to expand the installation 's capabilities.
Chapter 9 Installation Planning

Siting of Critical Structures
The selection of sites for locating and building critical structures on DoD installations requires careful earth resource consideration and evaluation. Critical structures are those structures which, due to their function, design, or cost, would, if failure occurred, result in loss of life or property, or the expenditure of significant funds for reconstruction, or the failure of an important defense mission. Nuclear facilities, hazardous waste sites, dams, important airbases and marshalling areas, ports and harbor entrances, communication facilities, and hardened command and control sites are, or may be, critical structures. Those earth resources which are most important in site selection are those that relate to the strength of the foundation materials, access to water (for hardened sites), and natural or geologic hazards. Natural hazards are important because these processes may result in the release of energy as powerful as or more powerful than that of many conventional or nuclear weapons. The destruction of Clark Air Base in the Philippines by the eruption of a nearby volcano is testimony to the potentially devastating effects of natural hazards.
Installation Consolidation and Closure
The consolidation and closure of DoD installations is necessary because of changing missions, new training requirements, and cost savings. Also, urban encroachment, lack of suitable expansion facilities, and fragile environments may also result in consolidation and closure. The GIS system described here contains the environmental data which would contribute to development of the rationale for consolidation or closure decisions, and it would serve as a guide or checklist to ensure that environmental questions were resolved prior to closure.
Chapter 9 Installation Planning
123
124
10 Examples of Integrated Resource Management
General
Examples in which earth resource data have been applied to the solution of biological or cu lturaJ resource management problems are few, particularly at DoD installations. The examples described here are, therefore, not limited to military facilities, but include ones from the private sector as well. The fo llowing are examples of the interrelationships between earth, biological, and cultural resources at Federal sites.
Historicall y, the application of earth resource data to the management of cultural resources has usually been limited to isotop ic age dating of midden material including bones and charcoal; and surface soi ls or rocks at the site. Other applications have included determining the sources of rocks used for tools on the basis of their lithology in order to establish trading patterns and interrelationships between soc ieties. These applications are still important; however, they do not address the types of information necessary to successfull y conduct cultural resource surveys or s imilar requ irements.
Crane Naval Surface Warfare Center Fossils
Over the last several years, remedial investigations have been conducted at the NSWC, Crane, Indiana. These investigations are a part of Defense Environmental Restoration Program (DERP), and they have involved extensive and detailed geological and groundwater studies which are contributing to environmental res toration of the NSWC. These studies have also lead to the discovery of sc ientifically important paleontological resources at th1s facility.
During geological mapping at the Center, an Indiana Geological Survey geologist discovered fossil tracks of Pennsy lvanian Age (300 million years ago) insects and amphibians. Figure 36 shows the geologist examining
Chapter 1 0 Examples of Integrated Resource Management

Figure 36. A photograph showing fossils tracks discovered at the Crane (Indiana) Naval Weapons Support Center which is conducting DERP studies
6 ft by 3 ft section of slabs of the siltstone which contains J 00-ft prints of at least three amphibians, plus insect markings and a 3-in.-diam fossilized trunk of a calamites horse-tail plant. This fossil find is of such significance that the Smithsonian Institute intends to search for additional footprints to
Chapter 10 Examples of Integrated Resource Management 125

126
study and make a display. Figure 37 is an artist's conception of Pennsylvanian Age environment of the site. In addition, the fossils assist in a regional economic study of low sulfur coals. This is an exciting example of earth resources partnership as envisioned by Legacy.
Red River Waterway Gunboat
This example describes the application of earth resource methods and data for determining the location of a Union gunboat sunk on the Red River in Louisiana near what is now a Federal project on that river. The location and possible excavation of this wreck became an item of considerable interest to the public and to local and Federal governments. Therefore, the task of locating the gunboat was undertaken by the Corps of Engineers (CE). On the basis of historical accounts, the gunboat, the USS Eastport, was known to have been sunk along a particular stretch of the river. The precise location was not known, and the extent that the meandering configuration of the river course had changed since 1864 was also unknown.
Furthermore, there were no established GIS data bases from which earth resource data could be extracted; thus, this information had to be collected as a part of the search for the wreck. The applicable earth resource data needed for this particular situation involved water resources and geomorphological data. The analysis was based upon tht:: assumption that the wreck was lying on a buried geomorphic surface covered with river deposits, and the analysis was begun by identifying the historical changes which had occurred since the sinking in the old channel of the Red River. The historical meander changes were determined from data from topographic, geologic, geomorphic, and engineering geologic maps, some of which had been prepared earlier as a part of other investigations.
The combination of historical accounts and these earth resource data permitted the identification of that part of an abandoned portion of the river under which the wreck may have rested . The location of the wreck was further refined by the use of surface geophysical exploration techniques which pinpointed the location of the gunboat approximately 50 feet below the surface. Borings were drilled to verify the geophysical survey interpretation. The borings revealed the presence of wood fragments and other materials which confirmed the wreck's position. On the basis of these data, estimates are being made for possible excavation of the wreck. Figure 38 depicts the geological and hydrological condition around the buried gunboat.
Chapter 1 0 Examples of Integrated Resource Management

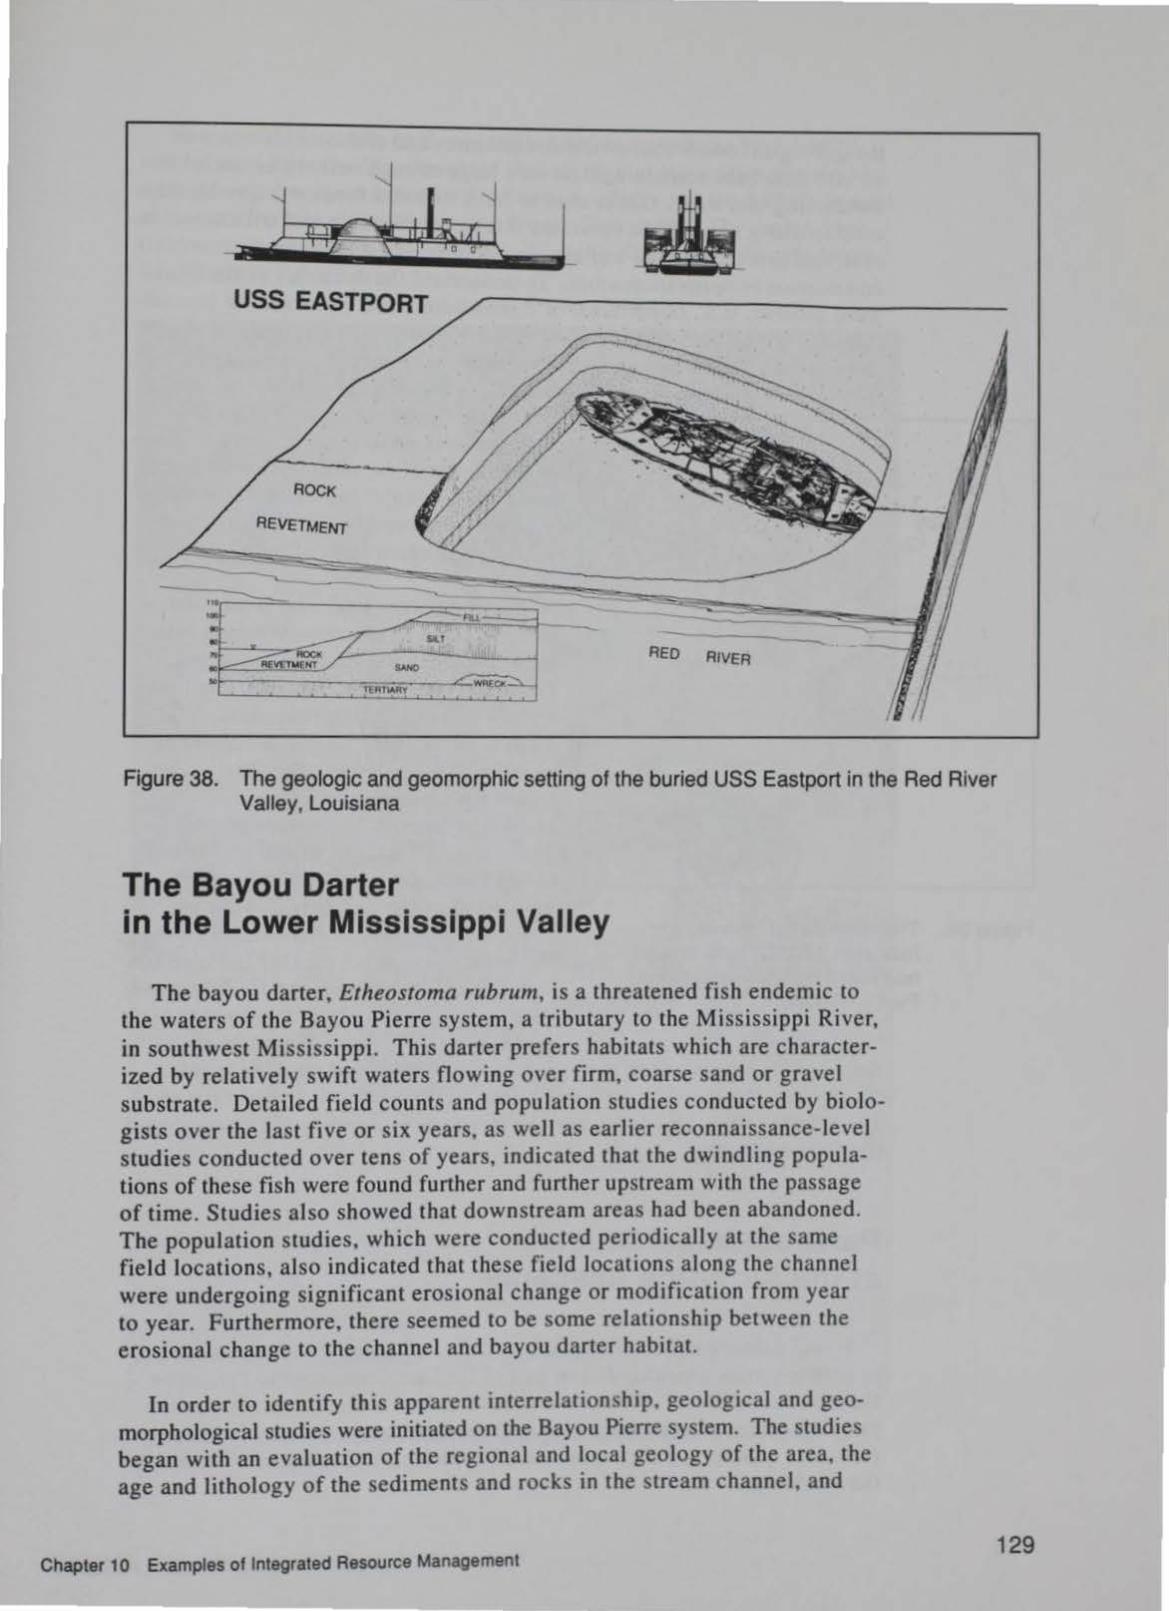
USS EASTPORT
ROCK
REVETMENT
Figure 38. The geologic and geomorphic setting of the buried USS Eastport in the Red River Valley, Louisiana
The Bayou Darter in the Lower Mississippi Valley
The bayou darter, Etheostoma rubrum, is a threatened fish endemic to the waters of the Bayou Pierre system, a tributary to the Mississippi River, in southwest Mississippi. This darter prefers habitats which are characterized by relatively swift waters flowing over firm, coarse sand or gravel substrate. Detailed field counts and population studies conducted by biologists over the last five or six years, as well as earlier reconnaissance-level studies conducted over tens of years, indicated that the dwindling populations of these fish were found further and further upstream with the passage of time. Studies also showed that downstream areas had been abandoned. The population studies, which were conducted periodically at the same field locations, also indicated that these field locations along the channel were undergoing significant erosional change or modification from year to year. Furthermore, there seemed to be some relationship between the erosional change to the channel and bayou darter habitat.
In order to identify this apparent interrelationship. geological and geomorphological studies were initiated on the Bayou Pierre system. The studies began with an evaluation of the regional and local geology of the area, the age and lithology of the sediments and rocks in the stream channel. and
Chapter 1 0 Examples of Integrated Resource Management 129

I IC M
Figure 39.
130
the geological conditions of the streambanks and channels. There was no GIS data base containing data on a large enough scale to be useful in conducting this work. These studies indicated that there was considerable erosion along most of the upstream reaches of the main and tributary channels, and that the erosion had apparently progressed headwordly from downstream to upstream reaches. To understand the dynamics of the headword erosion, U.S. Department of Agriculture aerial photos taken periodically from the 1940's through 1980's were examined. These aerial photos showed the progressive upstream movement of erosion (knickpoint migra-
1976 BAYOU DARTERS
N
t
• Krucllp01nt
The relationship between the habitat of the bayou darter and headward erosion along Bayou Pierre, Mississippi
tion) over the 40-year period. In each photo, the upstream limit of erosion for that year was apparent. The comparison of bayou darter population data with the aerial photography showed that the darter habitats were moving upstream in pace with the upstream limit of erosion.
The temporary upstream limits of erosion occurred at locations at which relatively eros ional res istant bedrock was present in the channel forming small waterfalls and rapids or knickpoints . The swift water at these locations formed favorable darter habitats. Eventually, the waterfall s were undercut by erosion, and erosion proceeded further upstream. These areas of waterfalls and rapids are called knickpoints, and the upstream movement of the knickpoint is called headcutting. These studies indicated that the headcutting was probably initiated by channel ization, mining, and landuse activities conducted mainly in the downstream reaches of the system. Figure 39 shows
the relationships between darter habitats and headword erosion. In this illustration, the locations of knickpoints are shown by tick marks for 1940, 1964, 1978, 1985, and 1990, and the locations of darter habitats are shown for 1976 and 1990.
Paleobotanical Studies at the Air Force Academy
Fossil plants can be found at sites on the Air Force Academy grounds in geologic units considered to be part of the Late Cretaceous to Paleocene Dawson Formation. Fossils occur at several leve ls throughout this principally arkosic sandstone formation, but the best preserved remains come from less widespread claystone and siltsone lenses that are interbedded in the sandstone.
Chapter 1 0 Examples of Integrated Resource Management

No organized studies of these fossils had been conducted until 1992 when a team from the Department of Biology at Fort Hays State University. with principal support from the Air Force Academy and the LRMP. opened an excavation site along Monument Creek (Figure 40). The month-long field season resulted in the recovery of a rich suite of plant fossils dubbed the "Scotty's Palm flora."
J
Figure 40.
• J
Fossil plant excavation site along Monument Creek, Air Force Academy, California
Chapter 10 Examples of Integrated Resource Management
-~
131
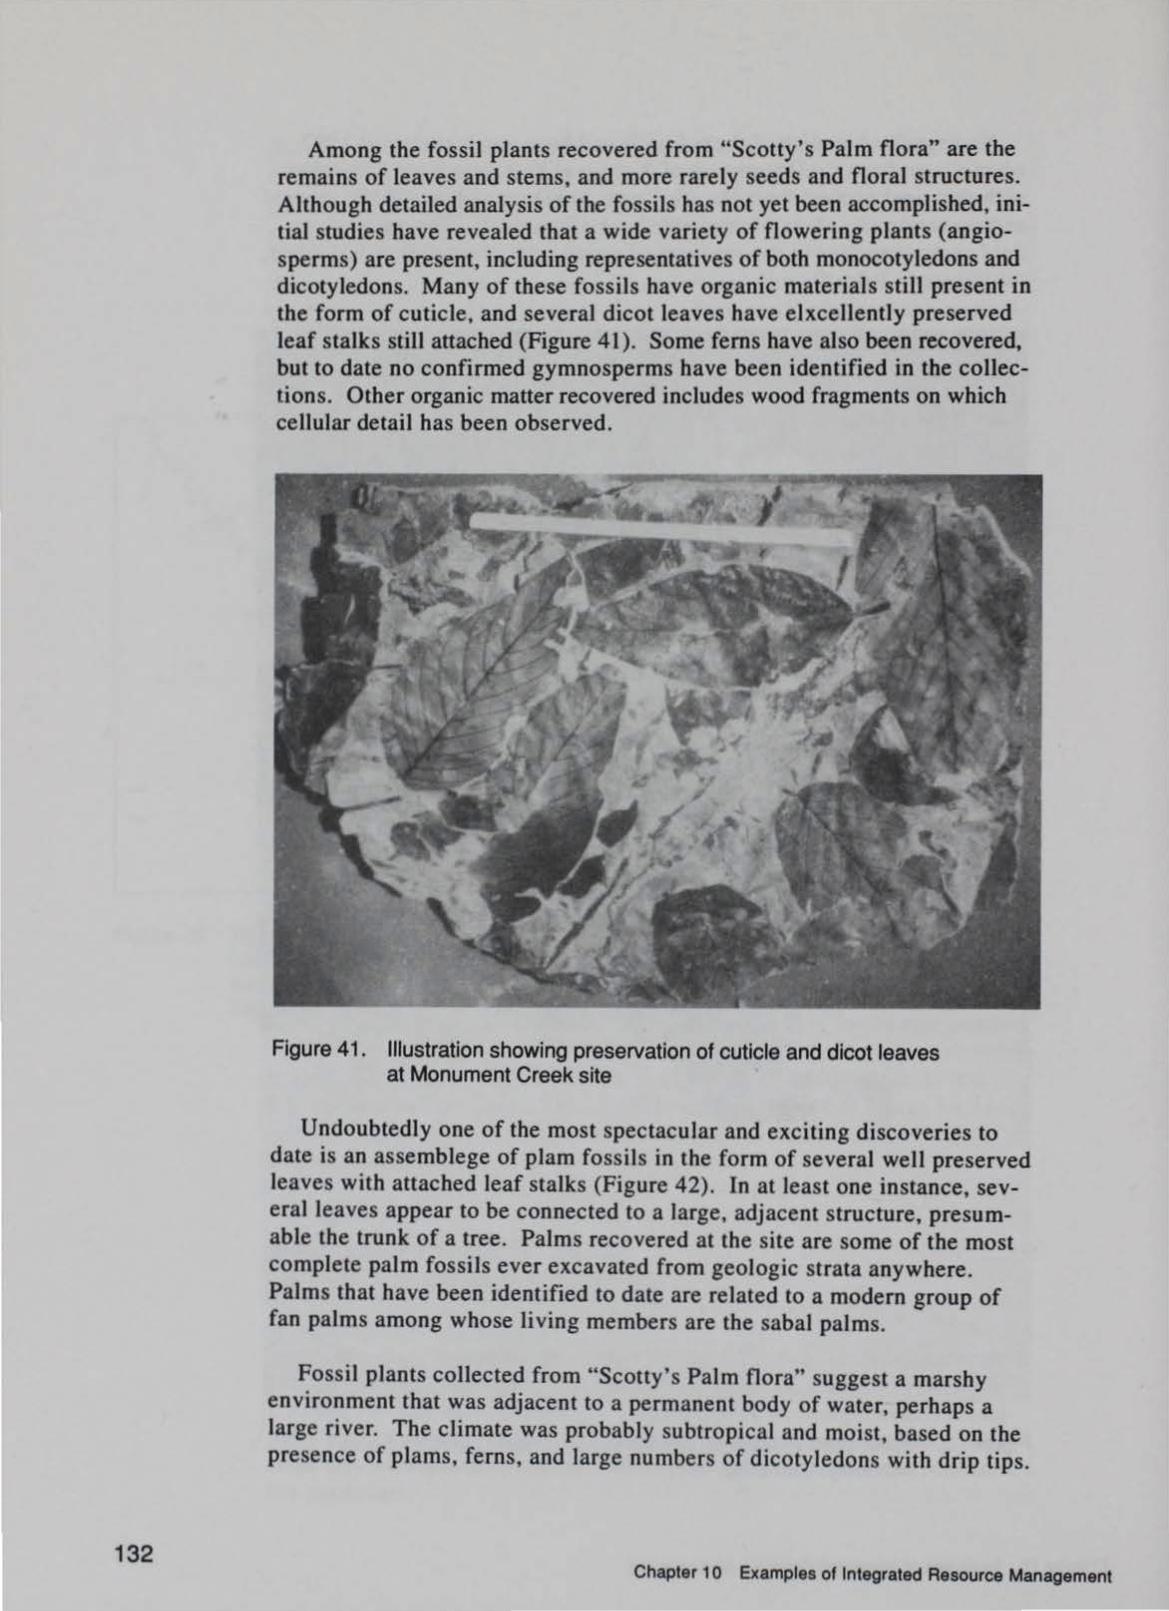
132
Among the fossil plants recovered from "Scotty's Palm flora" are the remains of leaves and stems, and more rarely seeds and floral structures. Although detailed analysis of the fossils has not yet been accomplished, initial studies have revealed that a wide variety of flowering plants (angiosperms) are present, including representatives of both monocotyledons and dicotyledons. Many of these fossils have organic materials still present in the form of cuticle, and several dicot leaves have elxcellently preserved leaf stalks still attached (Figure 41). Some ferns have also been recovered, but to date no confirmed gymnosperms have been identified in the collections. Other organic matter recovered includes wood fragments on which cellular detail has been observed.
Figure 41. Illustration showing preservation of cuticle and dicot leaves at Monument Creek site
Undoubtedly one of the most spectacular and exciting discoveries to date is an assemblege of plam fossiJs in the form of several well preserved leaves with attached leaf stalks (Figure 42). In at least one instance, several leaves appear to be connected to a large, adjacent structure, presumable the trunk of a tree. PaJms recovered at the site are some of the most complete palm fossils ever excavated from geologic strata anywhere. Palms that have been identified to date are related to a modem group of fan palms among whose living members are the sabal palms.
Fossil plants collected from "Scotty's Palm flora" suggest a marshy environment that was adjacent to a permanent body of water, perhaps a large river. The climate was probably subtropical and moist, based on the presence of plams, ferns, and large numbers of dicotyledons with drip tips.
Chapter 10 Examples of Integrated Resource Management

Figure 42. Examples of fossil palm leaves with attached leaf stalks
Integrated Studies at White Sands Missile Range
An integrated earth, biological, and cultural resource management study was conducted by the U.S. Army Engineer Waterways Experiment Station at White Sands Missile Range, New Mexico. The general objective of this work was to develop a geographic resources analysis support system (GRASS) database for a selected portion of the missile range. This pilot study could later be extended to encompass the entire facility. The GIS was intended to serve as a planning tool and to identity environmental compliance problems. The GRASS GIS database consisted of existing data relative to elevation, modern culture, cover, and soils from Land Condition Trend Analysis (LCTA) and ITAM; and the new earth, biological, and cultural databases developed as a part of this study.
The cultural resource study involved collection of all available previous listings and maps of known cultural sites in the pilot area; and the identification of previously unknown sites. Geographic coordinates were determined for each site; the site was identified by type (archaic, formative, multicomponent, etc.), and each site was evaluated in terms of its quality and complexity.
The biological resource study was directed primarily toward potential impacts on rare and endangered plant species. This work was accomplished by collecting previously published information, and by field observations from twenty stations in the pilot area. At each station, a list was made of those plants expected or known to occur at that station which were either
Chapter 10 Examples of Integrated Resource Management 133
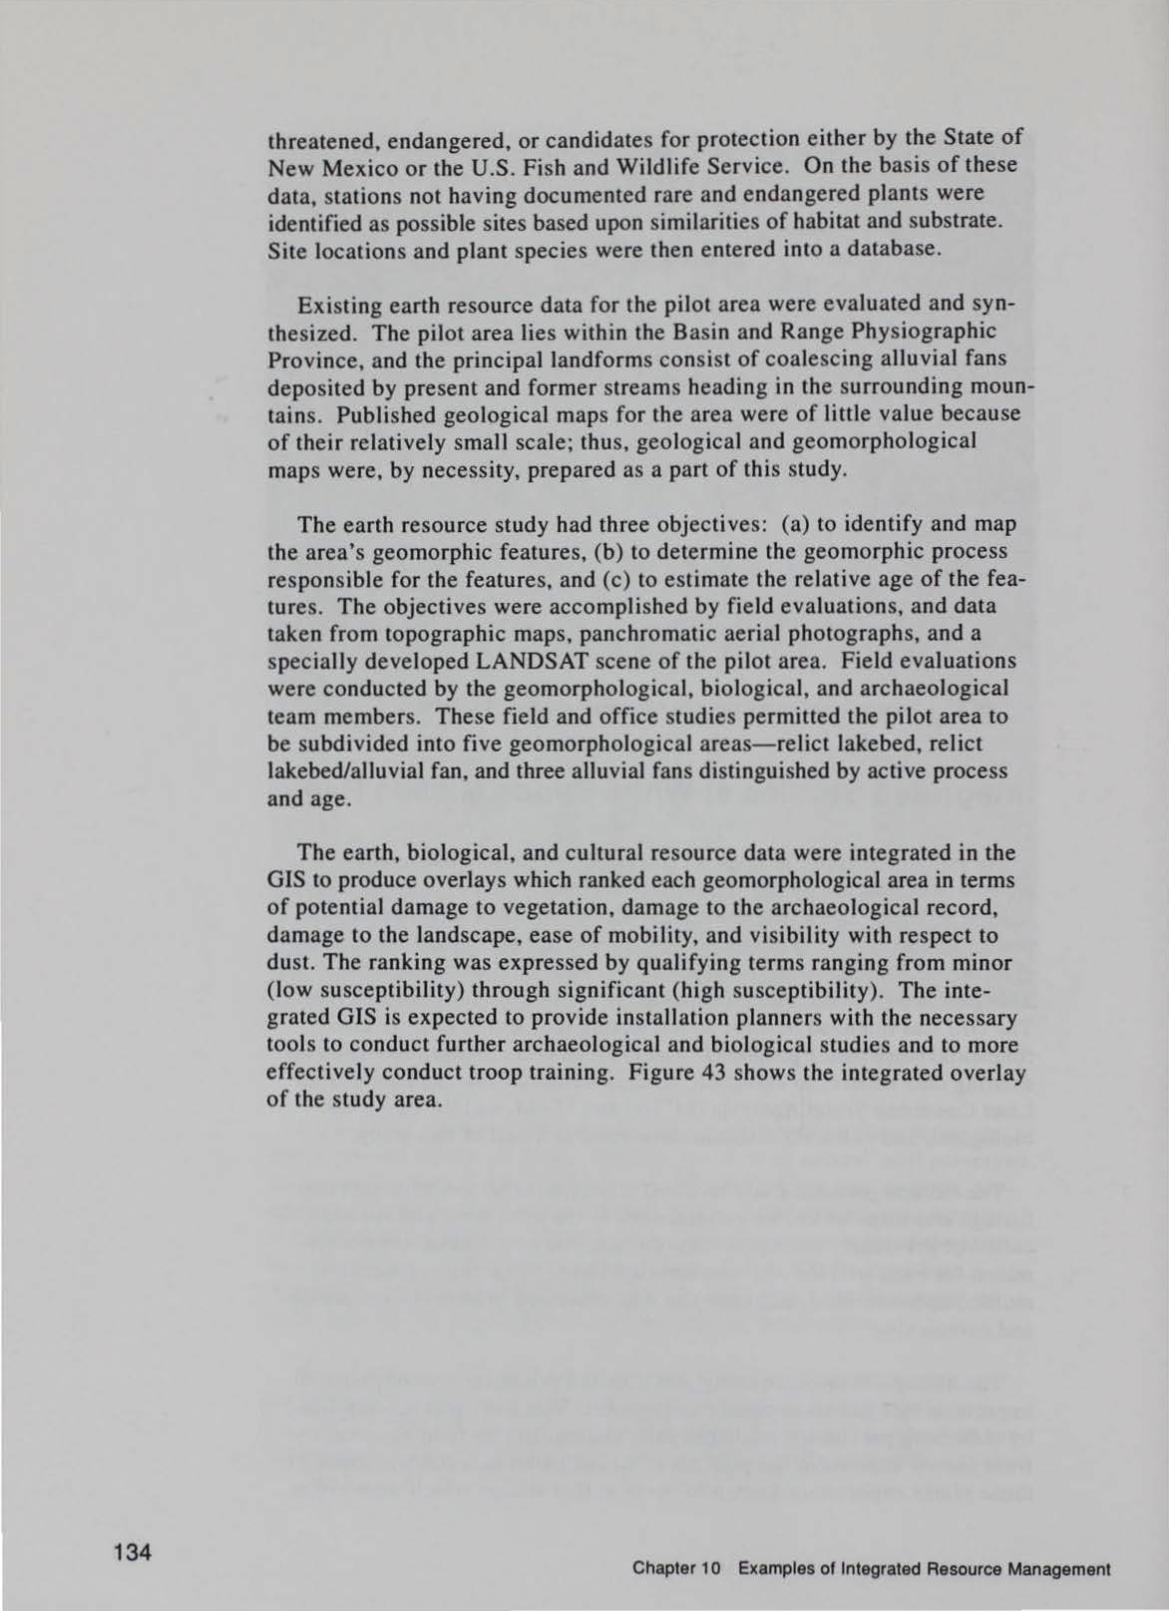
134
threatened, endangered, or candidates for protection either by the State of New Mexico or the U.S. Fish and Wildlife Service. On the basis of these data, stations not having documented rare and endangered plants were identified as possible sites based upon similarities of habitat and substrate. Site locations and plant species were then entered into a database.
Existing earth resource data for the pilot area were evaluated and synthesized. The pilot area lies within the Basin and Range Physiographic Province, and the principal landforms consist of coalescing alluvial fans deposited by present and former streams heading in the surrounding mountains. Published geological maps for the area were of little value because of their relatively small scale; thus, geological and geomorphological maps were, by necessity, prepared as a part of this study.
The earth resource study had three objectives: (a) to identify and map the area's geomorphic features, (b) to determine the geomorphic process responsible for the features, and (c) to estimate the relative age of the features. The objectives were accomplished by field evaluations, and data taken from topographic maps, panchromatic aerial photographs, and a specially developed LANDSAT scene of the pilot area. Field evaluations were conducted by the geomorphological, biological, and archaeological team members. These field and office studies permitted the pilot area to be subdivided into five geomorphological areas-relict lakebed, relict lakebed/alluvial fan, and three alluvial fans distinguished by active process and age.
The earth, biological, and cultural resource data were integrated in the GIS to produce overlays which ranked each geomorphological area in terms of potential damage to vegetation, damage to the archaeological record, damage to the landscape, ease of mobility, and visibility with respect to dust. The ranking was expressed by qualifying terms ranging from minor (low susceptibility) through significant (high susceptibility). The integrated GIS is expected to provide installation planners with the necessary tools to conduct further archaeological and biological studies and to more effectively conduct troop training. Figure 43 shows the integrated overlay of the study area.
Chapter 10 Examples of Integrated Resource Management

m )(
II> 3 "2.. CD (/)
0 -~ -~ ~ Q.
::0 CD
~ c n CD
s:: II> ~
~ CD 3 CD ~ -
Figure 43. An integrated earth, biologic, and cultural GIS overlay for a part of the White Sands Missile Range, New Mexico

136
11 Conclusions and Recommendations
Conclusions
To comprehensively manage natural and cultural resources on DoD lands, attention must be given to earth resources and their interrelationships with biological and cultural resources. Earth resources pertain to the nature and characteristics of the solid earth (the lithosphere), the waters upon and within the earth (the hydrosphere), and the atmosphere above the earth.
The basis for earth resource management is the collection, interpretation, and integration of earth resource data. These data include approximately 45 basic types of earth resource information dealing with the rocks, soils, fossils, mineral deposits, fossil fuels, surface geomorphology, isotopic age dates, streams, takes, wetlands, aquifer characteristics, precipitation, evaporation, and solar radiation to name a few. Some of these data may be acquired from previously published state or Federal documents; however, other types may be obtained from specific studies. Earth resource data may be categorized on the basis of process and energy, and upon the effect on cultural or biological resources. Earth resource stewardship begins with the understanding of the basic geologic framework of the installation; that is, the general origin, age, and nature of the physical processes under which the installation's lands originated and the processes currently acting on the installation. Stewardship must address several principal interrelated features, namely: scientifically significant rocks, fossils, and landforms; economic mineral and rock deposits, fossil fuels, and water resources. These resources must be managed in terms of the potentially adverse effects of natural hazards such as floods, earthquakes, landslides, etc. The resources and the hazards may be managed by the development of seven GIS layers which show the locations of and spatial relationships between these various earth resources and hazards.
The type and nature of installation earth resources control the location and type of cultural and biological resources. For cultural resources, geomorphic surfaces, ages, and processes play an important role in the identification of cultural sites, and the degree to which these sites may have
Chapter 11 Conclusions and Recommendations

been altered or modified by natural processes. Ecosystems and habitats are also controlled to a greater or lesser extent by the nature and age of geomorphic surfaces and the processes acting on them. Biological resources are also highly affected by human activities which, in tum, modify these geomorphic or geologic processes. Both biological and cultural resources may be better understood by the development of GIS layers which include both selected earth resource data combined with selected biological and/or cultural resource data.
Natural and cultural resource stewardship is enhanced when all resources have been integrated. Earth, biological, and cultural resource data may be integrated and included on GIS layers which will portray the locations and interactions between all three resources. This GIS layer is considered to be an important management tool which may be used for a number of installation planning and operational functions.
Those installation functions and operations in which integrated natural and cultural resource data may be applied, almost on a daily basis, include environmental assessments, maintenance and construction operations, integrated training management, and installation restoration; and planning for base expansion, consolidation, and closure.
Recommendations
Based on the findings of this report, the following is recommended.
a. This report should be used as a guide by base commanders, resource managers, installation restoration personnel, and trainers to better understand the scope and significance of earth resources.
b. This report should be used to identify earth resources having common importance among different installation functions and missions, and to appreciate the value of earth resources in the stewardship of biological and cultural resources.
c. Resource managers should review existing data bases, determine the adequacy of earth resource data, and identify critical shortfalls in earth resource information, particularly data important to biological or cultural/historic resources.
d. The options for collecting these earth resource data should be identified and evaluated, and they would include in-house studies and those conducted by contract.
e. Installation commanders should review the management of earth, biological, and cultural resources to e~sure that: thei.r management is truly integrated and a team approach ts used, superv•s.ory chan.nels and organizational units support the flow of resource mformauon
Chapter 11 Conclusions and Recommendations 137
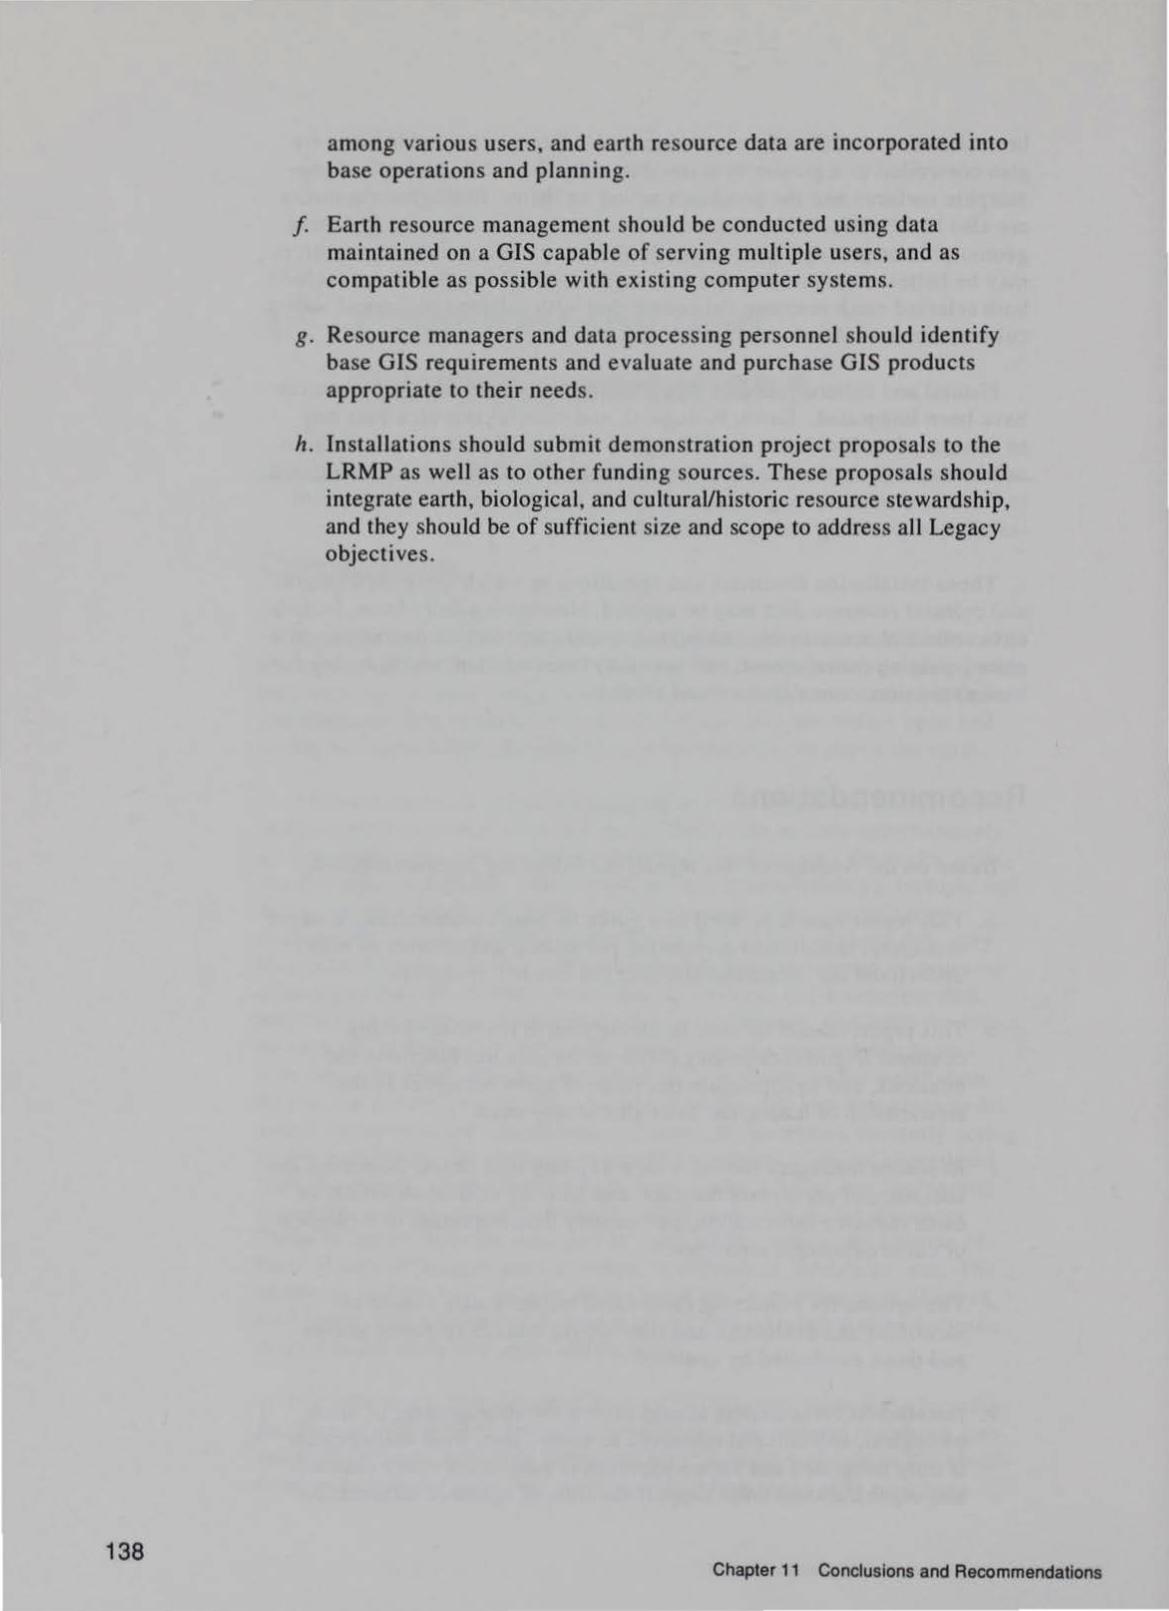
138
among various users, and earth resource data are incorporated into base operations and planning.
f. Earth resource management should be conducted using data maintained on a GIS capable of serving multiple users, and as compatible as possible with existing computer systems.
g. Resource managers and data processing personnel should identify base GIS requirements and evaluate and purchase GIS products appropriate to their needs.
h. Installations should submit demonstration project proposals to the LRMP as well as to other funding sources. These proposals should integrate earth, biological, and cultural/historic resource stewardship, and they should be of sufficient size and scope to address all Legacy objectives.
Chapter 11 Conclusions and Recommendations

12 Annotated References
General References
Driscoll, F. G. ( 1986). Groundwater and wells. 2nd ed., Johnson Division, St. Paul, MN.
Edwards, K., and Baston, R. M. (1980). "Preparation and presentation of digital maps in raster format," American Cartographer 7(1), 39-49.
Environmental Systems Research Institute. (1993). "ARC/INFO 6.0 User's guide: Data model, concepts, and key terms." ESRI, Redlands, CA.-A GIS handbook.
Gilbert, P. ( 1988). "Computer controlled microwave oven system for rapid water content determination," Technical Report GL-88-21, U.S. Army Engineer Waterways Experiment Station, Vicksburg, MS.
Legacy Resource Management Program (LRMP). (1993). "Defending our heritage," Draft Report of the Cultural Resources Program Development Task Area, prepared by the National Conference of State Historic Preservation Officers, in partnership with the Advisory Council on Historic Preservation, the Defense Cultural Resources Council, and the National Park Service.-A Legacy Task Area report describing the status and giving recommendations for cultural resource management in DoD, it provides complete definitions of cultural resource terms.
Siehl, G.H. (1991). "Natural resource issues in national defense programs," Library of Congress, Congressional Research Service, Report for Congress, 91-781 ENR.-Provides an explanation for DoD space requirements.
University of Illinois. ( 1991 ). "Planning information program: Department of Urban and Regional Planning, Environmental technical information system, computer-aided environmental legislative data system, User Manual," Version 5.0 1, Urbana, IL.-A user's manual for entering and using CELDS.
Chapter 12 Annotated References 139
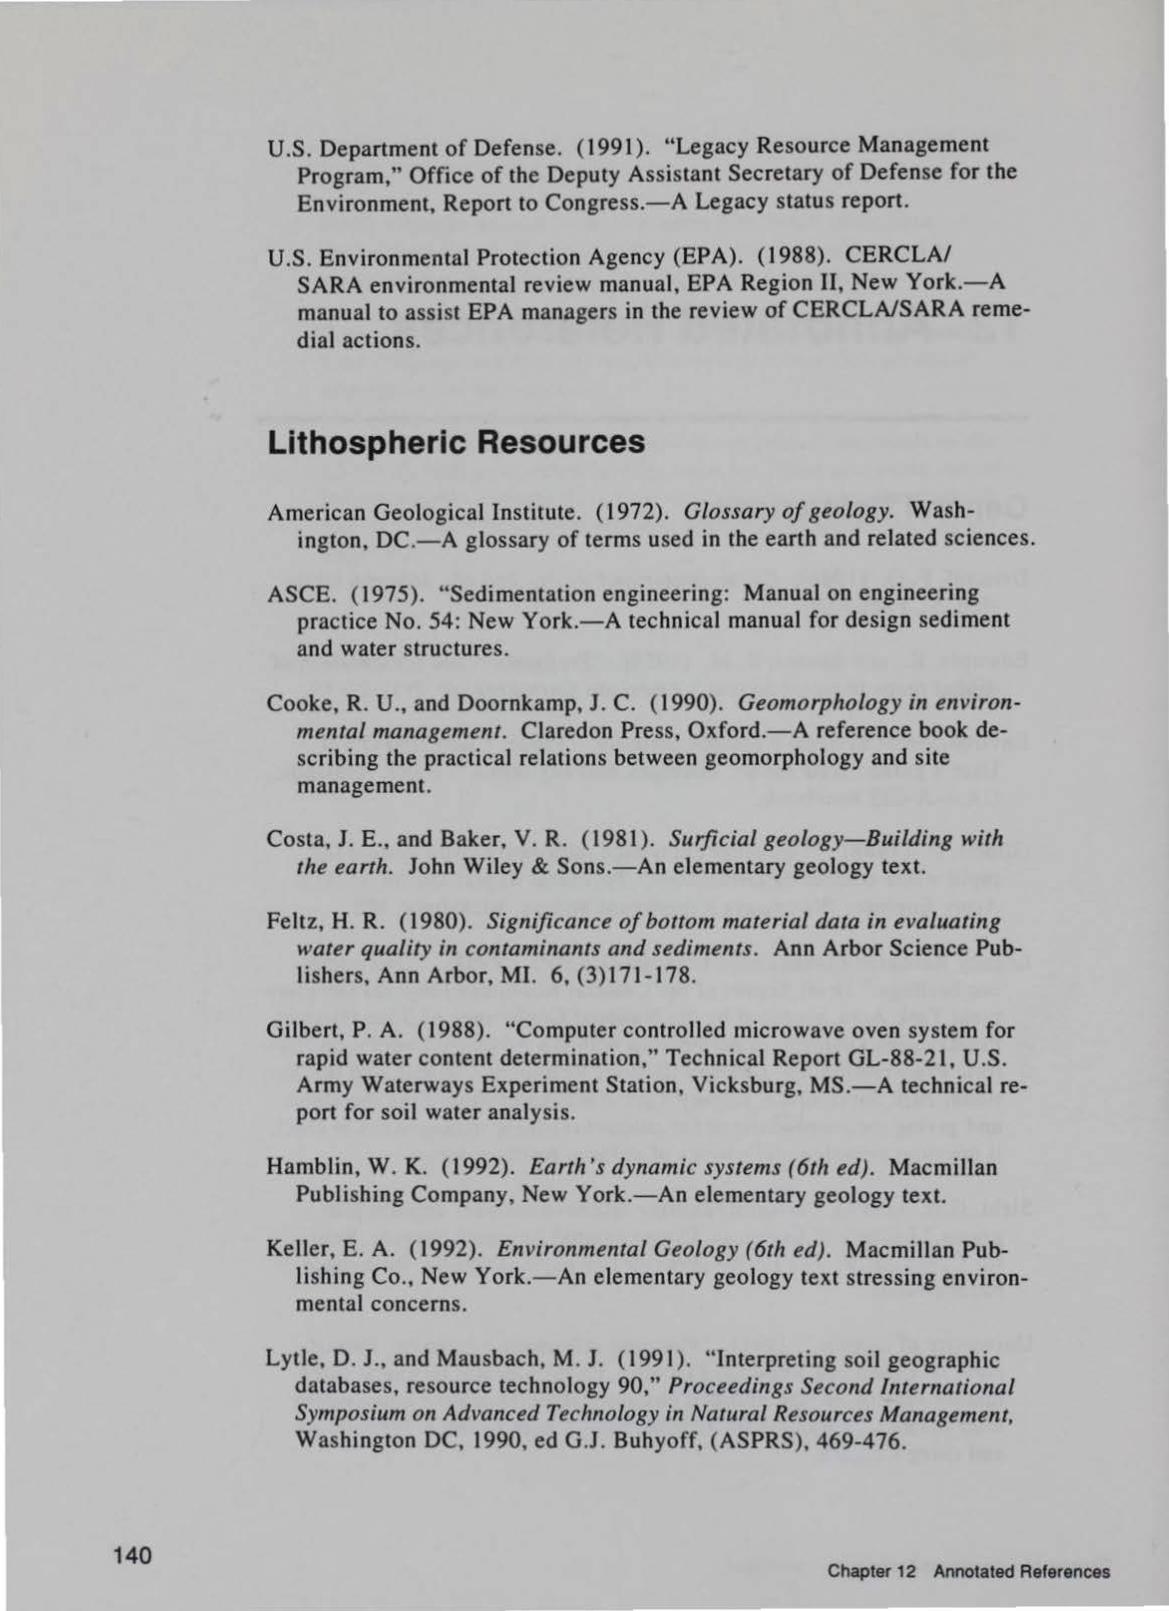
140
U.S. Department of Defense. ( 1991 ). "Legacy Resource Management Program," Office of the Deputy Assistant Secretary of Defense for the Environment, Report to Congress.-A Legacy s tatus report.
U.S. Environmental Protection Agency (EPA). (1988) . CERCLA/ SARA environmental review manual, EPA Region II, New York.-A manual to assist EPA managers in the review of CERCLA/SARA remedial actions.
Lithospheric Resources
American Geological Institute . ( 1972). Glossary of geology. Washington , DC.-A glossary of terms used in the earth and related sciences.
ASCE. ( 1975). "Sedimentation engineering: Manual on engineering practice No. 54: New York.-A technical manual for design sediment and water structures.
Cooke, R. U., and Doomkamp, J. C. (1990). Geomorphology in environmental management. Claredon Press, Oxford.-A reference book describing the practical relations between geomorphology and site management.
Costa, J. E .• and Baker, V. R. (198 1). Surficial geology-Building with the earth. John Wiley & Sons.-An elementary geology text.
Feltz, H. R. (1980). Significance of bottom material data in evaluating water quality in contaminants and sediments. Ann Arbor Science Publishers, Ann Arbor, MI. 6, (3) 171 - 178.
Gilbert, P . A. (1988). "Computer controlled microwave oven system for rapid water content determination," Technical Report GL-88-21, U.S. Army Waterways Experiment Station, Vicksburg, MS.-A technical report for soi l water analysis.
Hamblin, W. K. (1992). Earth's dynamic systems (6th ed). Macmillan Publishing Company, New York.-An elementary geology text.
Keller, E. A. (1992). Environmental Geology (6th ed). Macmillan Publishing Co., New York.-An elementary geo logy text stressing environmental concerns.
Lytle, D. J. , and Mausbach, M. J. ( 1991 ). "Interpreting soil geographic databases, resource technology 90," Proceedings Second International Symposium on Advanced Technology in Natural Resources Management, Washington DC, 1990, ed G.J. Buhyoff, (ASPRS), 469-476.
Chapter 12 Annotated References

Schroder, W. L. (1975). Soils in construction. John Wiley & Sons.-An elementary soil mechanics text.
Soil Survey Staff. ( 1975). Soil taxonomy-A basic system of soil classification for making and interpreting soil surveys: U.S. Department of Agriculture Handbook 436.-Manual describing USDA soil classification systematics as applied to soil surveys.
Patrick, D., and Snethen, D. R. (1976). "Expansive earth material-A survey by physiographic areas of their occurrence and distribution," U.S. Army Engineer Waterways Experiment Station, Vicksburg, MS.
Patrick, D. M., Mao, L., and Ross, S. T. (1991 ). "The impact of geomorphic change on the distribution of bayou darters in the Bayou Pierre system," Museum Technical Report No. 18, Miss issippi Department of Wildlife, Fisheries, and Parks, Museum of Natural Science, Jackson, MS.-A technical report relating fluvial geology and aquatic habitats.
Radbruch-Hall, D., Colton. (1976). "Preliminary landsl ide overview map of the conterminous United States," Miscellaneous field studies map MF-771 , U.S. Geological Survey, Washington, DC.
Rickert, D., Ulman, W. J. (1979). "Synthetic fuels development-Earthscieince considerations." U.S. Geological Survey, Washington, DC.
Hydrospheric Resources
Adamus, P. R. ( 1987). "Wetland evaluation technique (WET), vol. II : methodology," U.S. Army Corps of Engineers Waterways Experiment Station Environmental Laboratory.-A technical describing methodology for defining and delineating wetlands.
Baker, J .M. and Wolff, W.J . (editors). (1987). Biological survey of estuaries and coasts. Cambridge University Press.-Reference book describing coastal and estuarine habitats.
Britton, F. H., Averett, R. C., and Ferreira, R. F. ( 1975). "An introduction to the processes, problems, and management of urban lakes: U.S. Geological Survey Circular 601-K."-A technical report for managing lakes in urban environments.
Coker, R.E. ( 1954). Streams, lakes, and ponds. The University of North Carolina Press.-A reference book for aquatic environments.
Harris, S. A. The permafrost environment. Harris, Barnes and Noble Books, Totowa, New Jersey.-A permafrost reference book.
Chapter 12 Annotated References 141

142
Payne, A.L. ( 1954 ). The ecology of tropical lakes and rivers. John Wiley and Sons.-A biological reference and text.
SCS. ( 1972). "Snow survey and water supply forecasting: National Engineering Handbook," Sec. 22, U.S. Government Printing Office.-A manual of standard practice.
SCS. ( 1972). "Stage-discharge relationships: National Engineering Handbook," Sec. 4 Hydrology Chapter 14, U.S. Government Printing Office.-A manual of standard practice.
Smith, L. M. and Patrick, D. M. (1991 ). "Erosion, sedimentation, and fluvial systems," Chapter 7 in Kiersch, G. A. , ed., The heritage of engineering geology; The first hundred years: Centennial ( DNAG) special volume 3, Geological Society of America, Boulder, Colorado.-An overview of applied fluvial geomorphology.
U.S. Army Corps of Engineers. (1954 ). " Instructions for making and recording snow observations: Snow, ice and permafrost research establishment," Instruction Manual 1.-A manual of recommended practice.
U.S. Army Corps of Engineers. ( 1975). "Bibliography on cold region science and technology: U.S. cold regions research and egineering laboratory," CRREL Report 12. Hanover, N.H.-Reference bibliography.
U.S. Army, Navy, Air Force. (197 1). "Dewatering and ground-water control for deep excavations: TM5-818-5 NAVFAC P-418 AFM 88-5," chap. 6.-A technical manual for soil mechanics and construction.
U.S. Environmental Protection Agency (EPA). "Wetlands identification and delineation manuai."-Basic document for legal determination of a wetland.
USGS. (1979). "National handbook of recommended methods for waterdata acquisition," Office of water data coordination Geologic Survey, U.S. Dept. of the Interior, Reston , Virginia.-A manual of standard practice.
Atmospheric Resources
Battan, Louis, J. ( 1979). Fundamentals of meteorology, Prentice-Hall , Englewood Cliffs, New Jersey .-An elementary meteorology text.
Canter, Larry. (1986). Acid rain and dry deposition, Lewis Publishers, MI.
D'Itri, Frank M. (1982). Acid precipitation: Effects on ecological systems, Ann Arbor Science Publishers, MI.
Chapter 12 Annotated References

Donn, William L. (1975). Meteorology, McGraw-Hill, New York.-Elementary meteorology text.
Lamb, H. H. ( 1972). Climate, present, past, and future, methusen & co., London.-A climatology text.
Ostmann, Robert. ( 1982). Acid rain: A plague upon the waters, Dillion Press. Minnesota.
Pettersen, Sverre. ( 1956). Weather analysis and forecasting, McGrawHill, New York.
Schaefer, V. J. (1981 ). A field guide to the atmosphere, Houghton Mifflin, Boston.
Chapter 12 Annotated References
143

Appendix A Earth Resource Subjects and Key Words in CELDS
ACCELERATED EROSION LAND PRESERVATION
AERIAL CROSSINGS CHANNELIZATION PROJECTS
AQUATIC LIFE BAYS, SPECIFIC LAKES, SPECIFIC RIVERS, SPECIFIC
AQUIFERS GEOLOGICAL FORMATIONS GROUND WATER
ARSENIC GROUND WATER POTABLE WATER
ASBESTOS MINES MINERAL MINES
ASPHALTIC MINERAL MINES MINERAL MINES
BEST AVAILABLE DEMONSTRABLE TECHNOLOGY
ORE MINES
BARITE PROCESSING MINERAL MINES
BARIUM GROUND WATER POTABLE WATER
Appendix A Earth Resource Subjects/Key Words in CELDS
BASINS BAYS, SPECIFIC
BAYS, SPECIFIC COASTAL ZONES OIL AND GAS EXTRACTION SURFACE WATER WETLANDS
BENTONITE PROCESSING MINERAL MINES
BITUMINOUS LIMESTONE MINES MINERAL MINES
BOGS WETLANDS
BORATE MINERAL PROCESSING MINERAL MINES
CADMIUM POTABLE WATER
CASING GAS WELLS OIL AND GAS EXTRACTION OIL WELLS UNDERGROUND INJECTION WELLS
CHANNELS STREAM BEDS WATER RESOURCES FLOODPLAINS
A1

CHLORIDES POTABLE WATER
CHROMIUM GROUND WATER POTABLE WATER
COAL FOSSIL FUEL
COAL PREPARATION PLANTS COAL
COASTAL ZONES BEACHES DUNES
MUDFLATS SHORELANDS TIDELANDS BAYS ESTUARIES
OIL AND GAS EXTRACTION
COLOR GROUND WATER
POTABLE WATER SURFACE WATER
CRUSHED STONE PROJECTS MINERAL MINES
DAMS WATER RESOURCES FLOODPLAINS LAND PRESERVATION SURFACE WATER
DIATOMITE PROCESSING MINERAL MINES
DREDGED MATERIALS BAYS, SPECIFIC FLOOD PLAINS RIVERS, SPECIFIC WATER RESOURCE PROJECTS
DUNES COASTAL ZONES
EFFLUENTS LAKES, SPECIFIC RIVERS, SPECIFIC
EROSION LAND PRESERVATION
A2
ESTUARIES CHANNELS COASTAL ZONES WETLANDS
FECAL COLIFORMS GROUND WATER
FEEDLOTS RUNOFF
FELDSPAR PROCESSING MINERAL MINES
FILL MATERIALS DREDGED MATERIALS
FISSILE MATERIALS RADIOACTIVE SUBSTANCES
FLOOD PROTECTION STRUCTURES FLOODPLAINS LAND PRESERVATION
FLOODPLAINS LAND CLASSIFICATION WATER RESOURCES PROJECTS
FLUORSPAR PROCESSING MINERAL MINES
FUELS COAL NATURAL GAS PETROLEUM SHALE OIL
FRASH SULFUR PROCESSING MINERAL MINES
FUEL OILS FOSSIL FUELS
FULLER'S EARTH MINERAL MINES
GAS WELLS WELLS OIL AND GAS EXTRACTION
GRAPHITE MINES MINERAL MINES
GRAVEL MINES MINERAL MINES
Appendix A Earth Resource Subjects/Key Words in CELDS
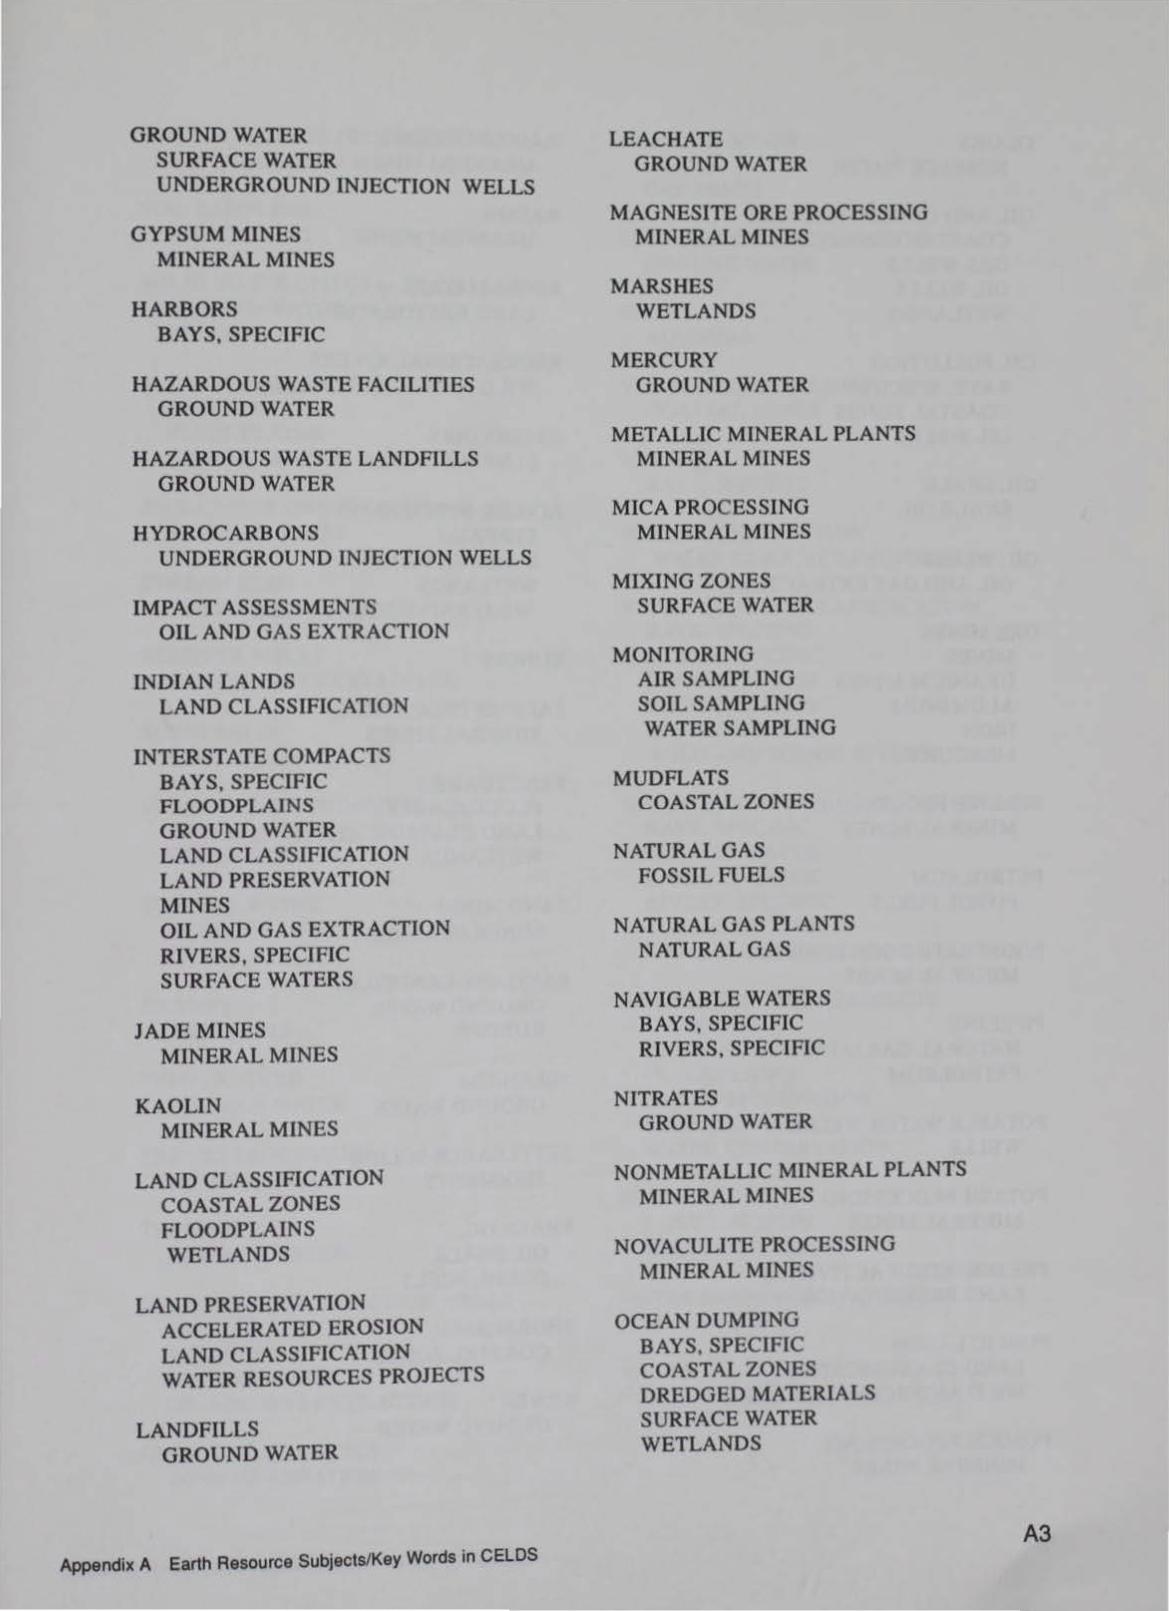
GROUND WATER SURFACE WATER UNDERGROUND INJECTION WELLS
GYPSUM MINES MINERAL MINES
HARBORS BAYS, SPECIFIC
HAZARDOUS WASTE FACILITIES GROUND WATER
HAZARDOUS WASTE LANDFILLS GROUND WATER
HYDROCARBONS UNDERGROUND INJECTION WELLS
IMPACT ASSESSMENTS OIL AND GAS EXTRACTION
INDIAN LANDS LAND CLASSIFICATION
INTERSTATE COMPACTS BAYS, SPECIFIC FLOODPLAINS GROUND WATER LAND CLASSIFICATION LAND PRESERVATION MINES OIL AND GAS EXTRACTION RIVERS, SPECIFIC SURFACE WATERS
JADE MINES MINERAL MINES
KAOLIN MINERAL MINES
LAND CLASSIFICATION COASTAL ZONES FLOODPLAINS WETLANDS
LAND PRESERVATION ACCELERATED EROSION LAND CLASSIFICATION WATER RESOURCES PROJECTS
LANDFILLS GROUND WATER
Appendix A Earth Resource Subjects/Key Words in CELDS
LEACHATE GROUND WATER
MAGNESITE ORE PROCESSING MINERAL MINES
MARSHES WETLANDS
MERCURY GROUND WATER
METALLIC MINERAL PLANTS MINERAL MINES
MICA PROCESSING MINERAL MINES
MIXING ZONES SURFACE WATER
MONITORING AIR SAMPLING SOIL SAMPLING WATER SAMPLING
MUDFLATS COASTAL ZONES
NATURAL GAS FOSSIL FUELS
NATURAL GAS PLANTS NATURAL GAS
NAVIGABLE WATERS BAYS, SPECIFIC RIVERS, SPECIFIC
NITRATES GROUND WATER
NONMETALLIC MINERAL PLANTS MINERAL MINES
NOVACULITE PROCESSING MINERAL MINES
OCEAN DUMPING BAYS, SPECIFIC COASTAL ZONES DREDGED MATERIALS SURFACE WATER WETLANDS
A3

ODORS SURFACE WATER
OIL AND GAS EXTRACTION COASTAL ZONES GAS WELLS OIL WELLS WETLANDS
OIL POLLUTION BAYS, SPECIFIC COASTAL ZONES OIL WELLS
OIL SHALE SHALE OIL
OIL WELLS OIL AND GAS EXTRACTION
ORE MINES MINES URANIUM MINES ALUMINUM IRON MERCURY
PERLITE PROCESSING MINERAL MINES
PETROLEUM FOSSIL FUELS
PHOSPHATE ROCK PLANTS MINERAL MINES
PIPELINE NATURAL GAS PETROLEUM
POTABLE WATER WELLS WELLS
POTASH PROCESSING MINERAL MINES
PRESERVATION ACTIVITIES LAND PRESERVATION
PUBLIC LANDS LAND CLASSIFICATION WILD AND SCENIC RIVERS
PUMICE PROCESSING MINERAL MINES
A4
RADIONUCLIDES URANIUM MINES
RADON URANIUM MINES
RECLAMATION LAND RESTORATION
RECREATIONAL RIVERS WILD AND SCENIC RIVERS
RESERVOIRS SURFACE WATER
RIVERS, SPECIFIC STREAMS SURFACE WATER WETLANDS WILD AND SCENIC RIVERS
RUNOFF
SALINES PROCESSING MINERAL MINES
SANCTUARIES FLOODPLAINS LAND CLASSIFICATION WETLANDS
SAND MINES MINERAL MINES
SANITARY LANDFILLS GROUND WATER RUNOFF
SELENIUM GROUND WATER
SETTLEABLE SOLIDS SEDIMENTS
SHALE OIL OIL SHALE FOSSIL FUELS
SHORELANDS COASTAL ZONES
SILVER GROUND WATER
Appendix A Earth Resource Subjects/Key Words In CELDS
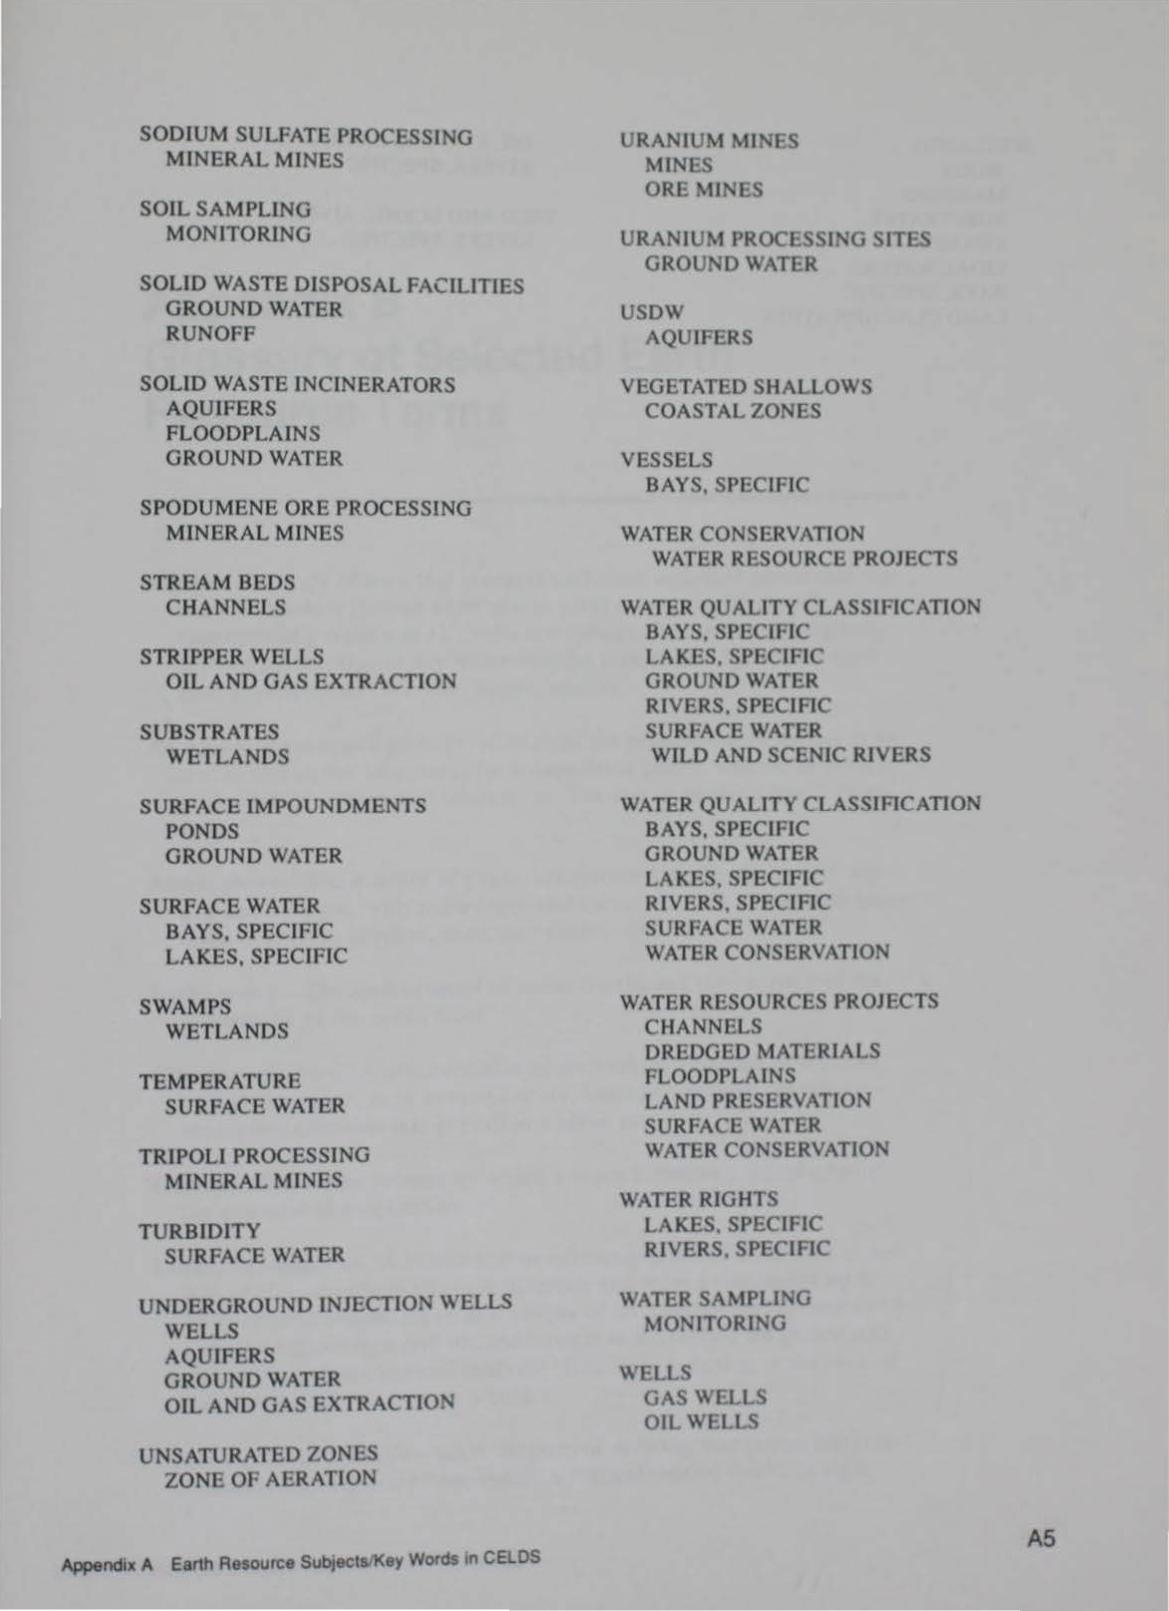
SODIUM SULFATE PROCESSING MINERAL MINES
SOIL SAMPLING MONITORING
SOLID WASTE DISPOSAL FACILITIES GROUND WATER RUNOFF
SOLID WASTE INCINERATORS AQUIFERS FLOODPLAINS GROUND WATER
SPODUMENE ORE PROCESSING MINERAL MINES
STREAM BEDS CHANNELS
STRIPPER WELLS OIL AND GAS EXTRACTION
SUBSTRATES WETLANDS
SURFACE IMPOUNDMENTS PONDS GROUND WATER
SURFACE WATER BAYS. SPECIFIC LAKES, SPECIFIC
SWAMPS WETLANDS
TEMPERATURE SURFACE WATER
TRIPOLI PROCESSING MINERAL MINES
TURBIDITY SURFACE WATER
UNDERGROUND INJECTION WELLS WELLS AQUIFERS GROUND WATER OIL AND GAS EXTRACTIO!'i
UNSATURATED ZONES ZONE OF AERATION
Appendix A Earth Resource SubJ&etsfKey Words in CELDS
URANIUM MINES MINES ORE MINES
URANIUM PROCESSING SITES GROUND WATER
USDW AQUIFERS
VEGETATED SHALLOWS COASTAL ZONES
VESSELS BAYS. SPECIFIC
WATER CONSERVATION WATER RESOURCE PROJECTS
WATER QUALITY CLASSIFICATION BAYS. SPECIFIC LAKES. SPECIFIC GROUND WATER RIVERS, SPECIFIC SURFACE WATER WILD AND SCENIC RIVERS
WATER QUALITY CLASSIFICATION BAYS. SPECIFIC GROUND WATER LAKES. SPECIFIC RIVERS. SPECIFIC SURFACE WATER WATER CONSERVATION
WATER RESOURCES PROJECTS CHANNELS DREDGED MATERIALS FLOODPLAINS LAND PRESERVATION SURFACE WATER WATER CONSERVATION
WATER RIGHTS LAKES. SPECIFIC RIVERS, SPECIFIC
WATER SAMPLING MONITORING
WELLS GAS WELLS OIL WELLS
AS

WETLANDS
A6
BOGS MARSHES SUBSTRATES SWAMPS TIDAL WATERS BAYS, SPECIFIC LAND CLASSIFICATION
OIL AND GAS EXTRACTION RIVERS, SPECIFIC
WILD AND SCENIC RIVERS RIVERS, SPECIFIC
Appendix A Earth Resource Subjects/Key Words in CELDS

Appendix B Glossary of Selected Earth Resource Terms
Aquifer-A body of rock that contains sufficient saturated permeable material to conduct ground water and to yield economically significant quantities of ground water to wells and springs. The term was originally defined by Meinzer as any water-bearing formation. Syn: water horizon; ground-water reservoir; nappe; aquifer.
Assay-v.ln economic geology, to analyze the proportions of metals in an ore; to test an ore or mineral for composition purity, weight, or other properties of commercial interest. n. The test or analysis itself; its results.
Atmosphere-The mixture of gases that surround the Earth: chiefly oxygen and nitrogen, with some argon and carbon dioxide and minute quantities of helium, krypton, neon, and xenon. Syn: air.
Bathymetry-The measurement of ocean depths and the charting of the topography of the ocean floor.
Climate-A characteristic condition of the various elements of weather of a given region, such as temperature, humidity, rainfall, or other atmospheric elements that prevail in a given area.
Condensation-The process by which a vapor becomes a liquid or solid; the opposite of evaporation.
Cores, Geologic-n. A cylindrical or columnar piece of solid rock or section of soi I, usually 5-10 em in diameter and from a centimeter up to 15 m or so in length, taken as a sample of an underground formation by a special hollow-type drill bit, and brought to the surface for geologic examination and/or chemical analysis. It records a section of the rock or soil penetrated. v. To take a core.
Cross-Section, Geologic-(a) A diagram or drawing that shows features transected by a given plane; specif. a vertical section drawn at right
Appendix 8 Glossary of Selected Earth Resource Terms 81

82
angles to the longer axis of a geologic feature, such as a structure section drawn perpendicularly to the strike of the strata or to the trend of an orebody, or a section at right angles to the mean direction of flow of a stream and bounded by the stream's wetted perimeter and free surface. Syn: transverse section. (b) An actual exposure or cut that shows transected geologic features.
Cuttings, Geologic- Rock chips or fragments produced by drilling and brought to the surface by circulating drilling fluid.
Estuary- (a) The seaward end or the widened funnel-shaped tidal mouth of a river valley where freshwater mixes with and measurably dilutes seawater and where tidal effects are evident. (b) A portion of the ocean, as a firth or an arm of the sea, affected by freshwater; e.g., the Baltic Sea. (c) A drowned river mouth formed by the subsidence of land near the coast or by the drowning of the lower portion of a nonglaciated valley due to the rise of sea level.
Evaporation-The process by which a substance passes from the liquid or solid state to the vapor state. Limited by some to evaporation of a liquid, in contrast to sublimation, the direct evaporation of a solid. The opposite of condensation.
Gage, Stream-A device used to measure the velocity of a stream of water in a channel or open conduit and the cross-sectional area of the water, in order to determine discharge.
Geology-The science of the planet Earth. It is concerned with the origin of the planet, the material and morphology of the Earth, and its history and the processes that acted (and act) upon it to affect its historic and present forms. The science considers the physical forces that influenced, and continue to influence, change; the chemistry of its constituent materials; the record and age of its past as revealed by the organic remains that are preserved in the of the layers of the crust or by interpretation of releic morphology and environment.
Geomorphology-The science that treats the general configuration of the Earth's surface; specif. the study of the classification, description, nature, origin, and development of present landforms and their relationships to underlying structures, and of the history of geologic changes as recorded by these surface features.
Ground-Water-(a) That part of the subsurface water that is the zone of saturation, including underground streams. (b) Loosely, all subsurface water (excluding internal water) as distinct from surface water. Syn: subterranean water; underground water.
Hazards, Geologic-Naturally occurring or man-made geologic conditions or phenomenons that present a risk or are potential dangers to life and property. Examples of geologic hazards: landsliding, flooding,
Appendix B Glossary of Selected Earth Resource Terms
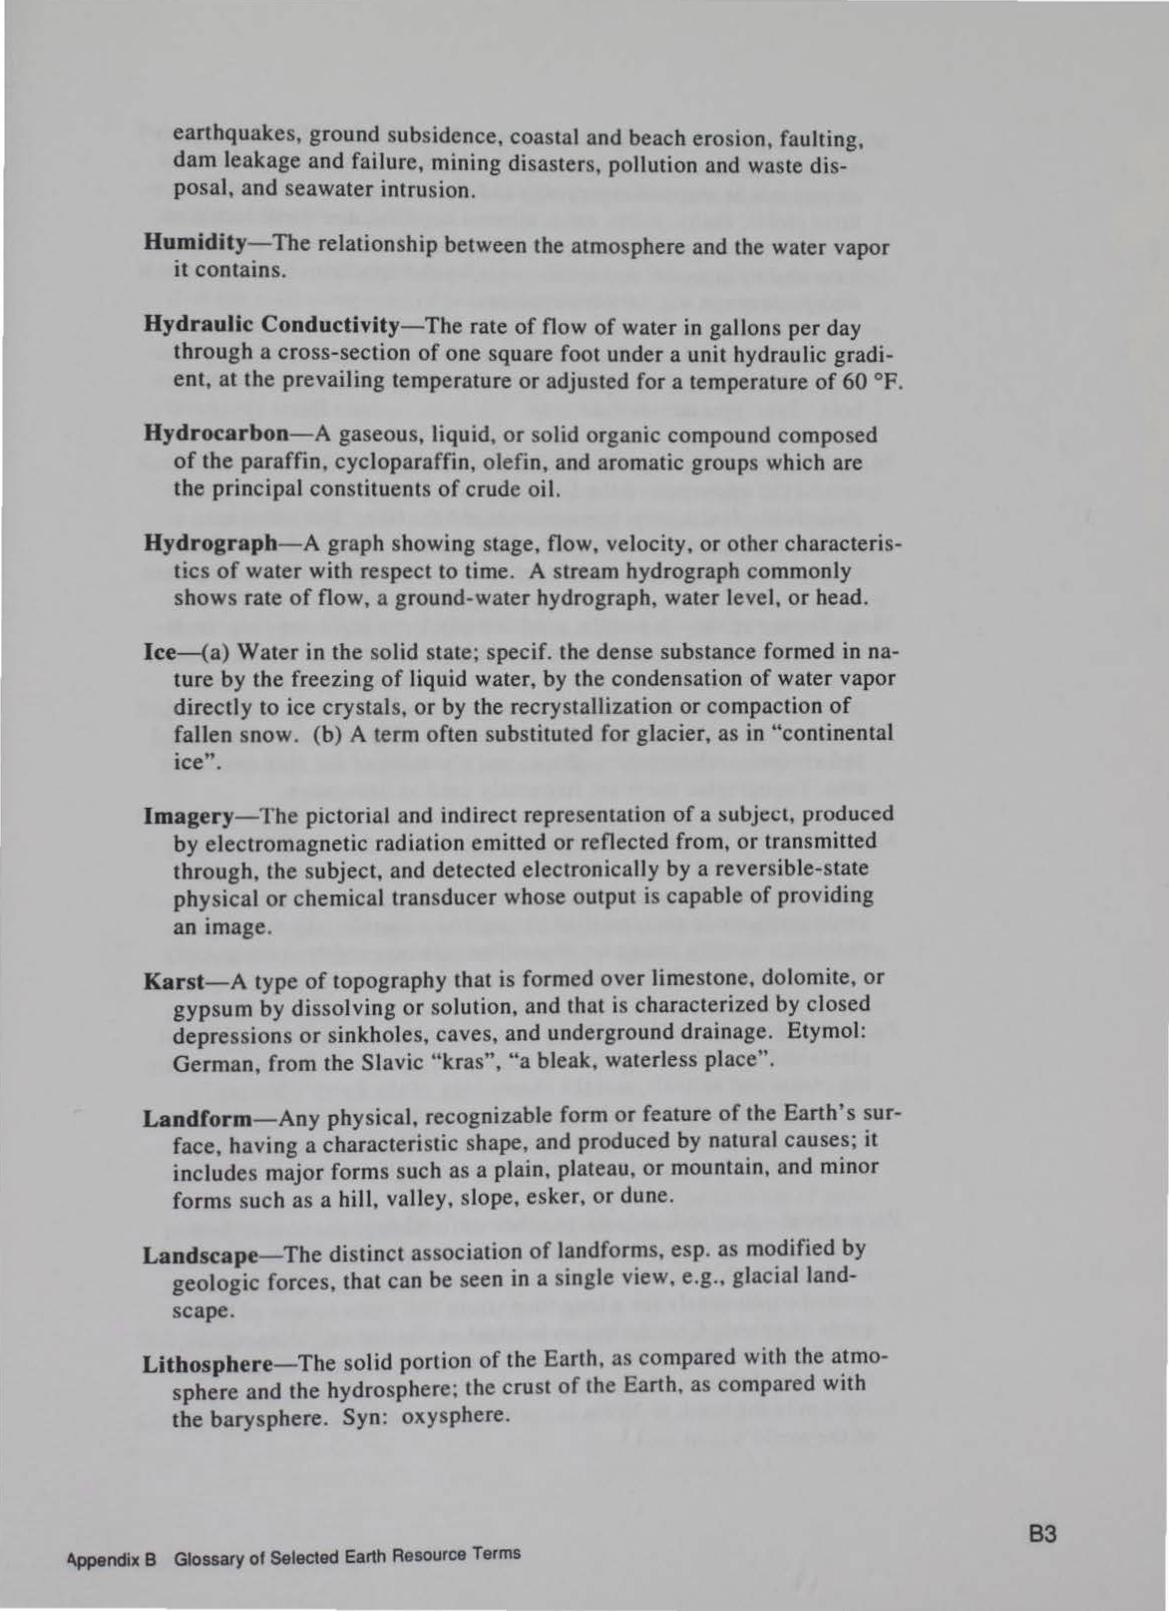
earthquakes, ground subsidence, coastal and beach erosion, faulting, dam leakage and failure, mining disasters, pollution and waste disposal, and seawater intrusion.
Hu.midity-. The relationship between the atmosphere and the water vapor tt contams.
Hydraulic Conductivity-The rate of flow of water in gallons per day through a cross-section of one square foot under a unit hydraulic gradient, at the prevailing temperature or adjusted for a temperature of 60 °F.
Hydrocarbon-A gaseous, liquid, or solid organic compound composed of the paraffin, cycloparaffin, olefin, and aromatic groups which are the principal constituents of crude oil.
Hydrograph-A graph showing stage, flow, velocity, or other characteristics of water with respect to time. A stream hydrograph commonly shows rate of flow, a ground-water hydrograph, water level, or head.
lce-(a) Water in the solid state; specif. the dense substance formed in nature by the freezing of liquid water, by the condensation of water vapor directly to ice crystals, or by the recrystallization or compaction of fallen snow. (b) A term often substituted for glacier, as in "continental ice".
Imagery-The pictorial and indirect representation of a subject, produced by electromagnetic radiation emitted or reflected from, or transmitted through, the subject, and detected electronically by a reversible-state physical or chemical transducer whose output is capable of providing an Image.
Karst-A type of topography that is formed over limestone, dolomite, or gypsum by dissolving or solution, and that is characterized by closed depressions or sinkholes, caves, and underground drainage. Etymol: German, from the Slavic "kras", "a bleak, waterless place".
Landform-Any physical, recognizable form or feature of the Earth's surface, having a characteristic shape, and produced by natural causes; it includes major forms such as a plain, plateau, or mountain, and minor forms such as a hill, valley, slope, esker, or dune.
Landscape-The distinct association of landforms, esp. as modified by geologic forces, that can be seen in a single view, e.g., glacial land-scape.
Lithosphere-The solid portion of the Earth, as compared with the atmosphere and the hydrosphere; the crust of the Earth, as compared with the barysphere. Syn: oxysphere.
b.ppendix 8 Glossary of Selected Earth Resource Terms 83

84
Map, Geologic-A map on which is recorded geologic information such as the distribution and nature of rock units (the surficial deposits may or may not be mapped separately) and the occurrence of structural features (folds, faults, joints, etc.), mineral deposits, and fossil localities. it may indicate geologic structure by means of formational outcrop patterns and by conventional symbols giving the directions and amounts of dip, cleavage, etc., at certain points.
Map, Potentiometric Surface- A map showing the elevation of a potentiometric surface of an aquifer by means of contour lines or other symbols. Syn: pressure-surface map.
Map, Structural Geologyffectonic- A map that portrays the architecture of the upper part of the Earth's crust. The structural portions include folds, faults, structure contours and the like. The tectonic portion presents some indication of the ages and kinds of rocks from which the structures were made, as well as their historical development.
Map, Topographic- A map on a suffic iently large scale showing, in detail, selected man-made and natural features of a part of a land surface, including its relief (generally by means of contour lines) and certain physical and cultural features (vegetation, roads, drainage, etc.). Its distinguishing characteristic is the portrayal of the position (horizontal and vertical), relation, size, shape, and elevation of the features of the area. Topographic maps are frequently used as base maps.
Mineral-(a) A naturally formed chemical element or compound having a definite chemical composition and, usually, a characteristic crystal form. A mineral is generally considered to be inorganic, though organic compounds are classified by some as minerals. (b) A naturally occurring, usually inorganic, crystalline substance with characteristic physical and chemical properties that are due to its atomic arrangement.
Paleontology- The study of life in past geologic periods, based on fossil plants and animals and including phylogeny, their relationships to existing plants and animals, and the chronology of the Earth's history. --- Fossil- And remains, trace, or imprint of a plant or animal that has been preserved, by natural processes, in the Earth's crust since some past geologic time; any evidence of past life.
Permafrost- Any soil, subsoil, or other surficial deposit, or even bedrock, occurring in arctic or subarctic regions at a variable depth beneath the Earth's surface in which a temperature below freezing has existed continuously for a long time (from two years to tens of thousands of years). This definition is based exclusively on temperature, and disregards the texture, degree of compaction, water content, and lithologic character of the material. Its thickness ranges from over 1000 m in the north to 30 em in the south ; it underlies about one-fifth of the world's land area.
Appendix B Glossary of Selected Earth Resource Terms
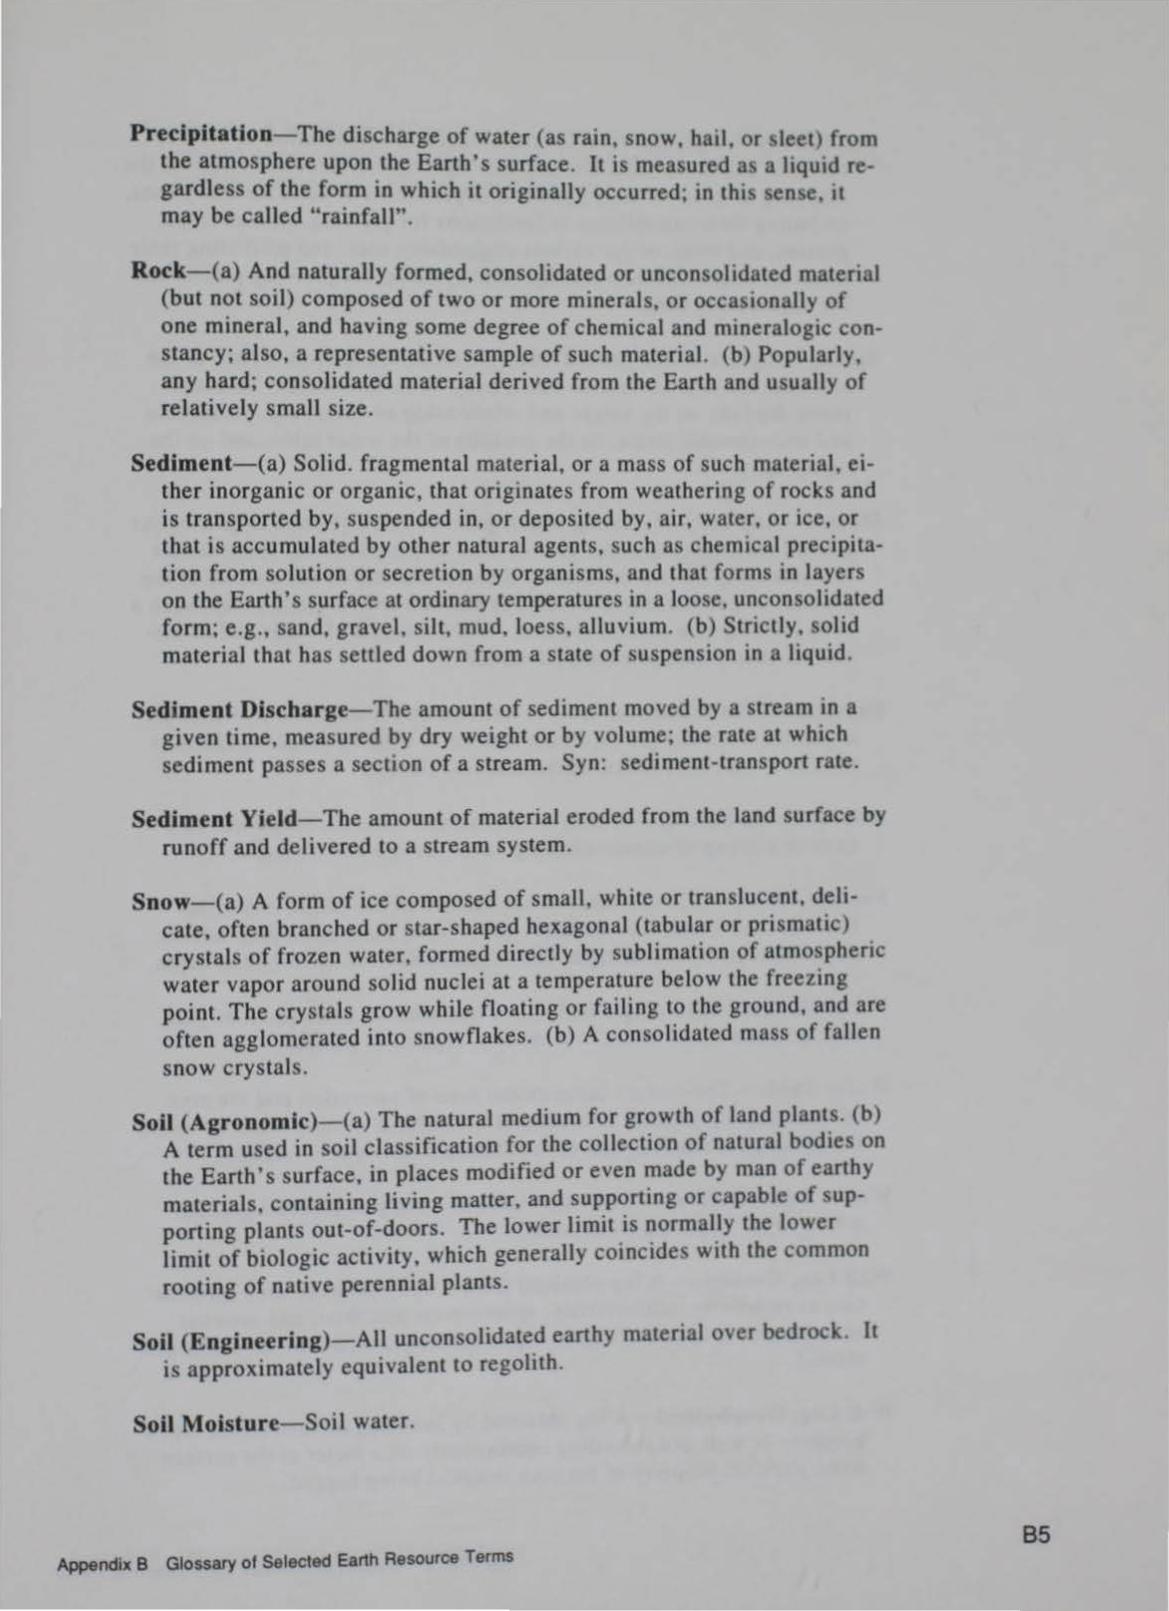
Precipitation-The discharge of water (as rain, snow, hail, or sleet) from the atmosphere upon the Earth's surface. ll is measured as a liquid regardless of the form in which it originally occurred; in this sense, it may be called "rainfall".
Rock-(a) And naturally formed, consolidated or unconsolidated material (but not soil) composed of two or more minerals. or occasionally of one mineral, and having some degree of chemical and mineralogic constancy; also, a representative sample of such material. (b) Popularly, any hard; consolidated material derived from the Earth and usually of relatively small size.
Sediment-(a) Solid. fragmental material, or a mass of such material, either inorganic or organic, that originates from weathering of rocks and is transported by, suspended in, or deposited by, air, water, or ice, or that is accumulated by other natural agents, such as chemical precipitation from solution or secretion by organisms, and that forms in layers on the Earth's surface at ordinary temperatures in a loose, unconsolidated form; e.g., sand, gravel, silt, mud, loess, alluvium. (b) Strictly, solid material that has settled down from a state of suspension in a liquid.
Sediment Discharge-The amount of sediment moved by a stream in a given time, measured by dry weight or by volume; the rate at which sediment passes a section of a stream. Syn: sediment-transport rate.
Sediment Yield-The amount of material eroded from the land surface by runoff and delivered to a stream system.
Snow-( a) A form of ice composed of small. white or translucent, delicate, often branched or star-shaped hexagonal (tabular or prismatic) crystals of frozen water, formed directly by sublimation of atmospheric water vapor around solid nuclei at a temperature below the freezing point. The crystals grow while floating or failing to the ground, and are often agglomerated into snowflakes. (b) A consolidated mass of fallen snow crystals.
Soil (Agronomic)-(a) The natural medium for growth of land plants. (b) A term used in soil classification for the collection of natural bodies on the Earth· s surface, in places modified or even made by man of earthy materials, containing living matter, and supporting or capable of supporting plants out-of-doors. The lower limit is normally the lower limit of biologic activity, which generally coincides with the common rooting of native perennial plants.
Soil (Engineering)-All unconsolidated earthy material over bedrock. It is approximately equivalent to regolith .
Soil Moisture-Soil water.
Appendix 8 Glossary of Selected Earth Resource Terms 85

86
Soil Survey-A general term for the systematic examination of soils in the field and in the laboratories, their description and classification, the mapping of kinds of soil, and the interpretations of soils for many uses, including their suitabilities or limitations for growing various crops, grasses, and trees, or for various engineering uses, and predicting their behavior under different management systems; for growing plants, and for engineering uses.
Spring-A place where ground-water flows naturally from a rock or the soil onto the land surface or into a body of surface water. Its occurrence depends on the nature and relationship of rocks, esp. permeable and impermeable strata, on the position of the water table, and on the topography.
Stream-Any body of running water, great or small (from a large river to a small rill), moving under gravity flow to progressively lower levels in a relatively narrow but clearly defined channel on the surface of the ground, in a subterranean cavern, or beneath or in a glacier; esp. such a body flowing in a natural channel. It is a mixture of water and of dissolved, suspended, or entrained matter
Substrate-The substance, base, or nutrient on (or medium in) which an organism lives and grows, or the surface to which a fixed organism is attached; e.g., soil, rocks, water, and leaf tissues.
Subterranean Stream-A body of subsurface water flowing through a cave or a group of communicating caves, as in a karstic region.
Surface Water-(a) All waters on the surface of the Earth, including fresh and salt water, ice and snow. (b) A water mass of varying salinity and temperature, occurring at this ocean surface or up to 300 m depth.
Water Budget-Hydrologic budget. A quantitative description of gain, loss, and storage of water in a locality, region, or aquifer.
Water Table-The surface between the zone of saturation and the zone of aeration; that surface of a body of unconfined ground water at which the pressure is equal to that of the atmosphere. Syn: waterline.
Water Table, Perched-The water table of a body of perched groundwater. Syn: apparent water table.
Well Log, Geologic-A log obtained from a well, showing such information as resistivity, radioactivity, spontaneous potential, and acoustic velocity as a function of depth; esp. a lithologic record of the rocks penetrated.
Well Log, Geophysical-A log obtained by lowering an instrument into a borehole or well and recording continuously on a meter at the surface some physical property of the rock material being logged.
Appendix B Glossary of Selected Earth Resource Terms
Wetland- A landform defined by its aquatic ecosystem, soil types, ground-water conditions and functions which include nutrient production, habitat, nesting, and ground-water recharge.
Appendix B Glossary of Selected Earth Resource Terms
87

Appendix C Sources of Earth Resource Information
U.S. Geological Survey 345 Middlefield Road Menlo Park, CA 94025
U.S. Geological Survey 7638 Federal Building 300 North Los Angeles St. Los Angeles, CA 90012
U.S. Geological Survey 504 Custom House 555 Battery St. San Francisco, CA 94112
Colorado Geological Survey 1313 Sherman St., Rm. 715 Denver, CO 80203 Phone: (303) 866-26 11
U.S. Geological Survey Denver Federal Center, Bldg. 25 Denver, CO 80225
U.S. Geological Survey 1012 Federal Building I 961 Stout St. Denver, CO 80202
Connecticut Natural Resources Center Department of Environmental Protection State Office Building, Room 553 165 Capitol Avenue Hartford, CT 061 06 Phone: (203) 566-3540
Appendix C Sources of Earth Resource Information
Delaware Geological Survey University of Delaware Newark, DE 19716-750 I Phone: (302) 83 1-2833
District of Columbia U.S. Geological Survey I 028 General Services Bldg I 9th and F Sts., N.W. Washington, DC 20244
Florida Bureau of Geology 903 West Tennessee St. Tallahassee, FL 32304 Phone: (904) 488-4191
Georgia Geologic Survey Department of Natural Resources, Room 400 19 Martin Luther King, Jr., Drive SW Atlanta, GA 30334 Phone: (404) 656-3214
Hawaii Depanment of Land & Natural Resources Box 373 Honolulu, HI 96809 Phone: (808)587-0320
Idaho Geological Survey Room 332 Moscow, ID 83843 Phone· (208) 885-7991
C1

Illinois State Geologtcal Survey Natural Resources Building 615 East Peabody Dr. Champaign, IL 61 820 Phone: (217) 333-4747
Indiana Geological Survey Department of Natural Resources 611 North Walnut Grove Blooomington, IN 47405 Phone: (8 12)855-9350
Iowa Geological Survey Bureau 109 TrwoBridge St. Iowa City, lA 52242-1319 Phone: (319)335-1575
Kansas Geological SurveY 1 930 Constant Avenue Campus West University of Kansas Lawrence, KS 66047 Phone: (913) 864-3965
Kentucky Geological Survey University of Kentucky 311 Brecktnridge Hall Lexington , KY 40506 Phone: (606)257-5500
Louisiana Geological Survey Box G, University Station Baton Rouge, LA 70893 Phone: (504) 388-5320
Maine Geological Survey Department of Conservation State House Station 22 Augusta, ME 04333 Phone: (207) 289-2801
Maryland Geological Survey 2300 Saint Paul Street Baltimore, MD 21218 Phone: (4 10) 554-5559
C2
Massachusetts Executive Office of Environmental Quality Engineering 100 Cambridge Street, 20th Floor Boston, MA 02202 Phone: (617) 727-9800
Michigan Geological Survey Division Department of Natural Resources 735 East Hazel Street P 0 Box 30256 Lansing, MI 48909 Phone: (517) 334-6907
Minnesota Geological Survey 2642 University Avenue St. Paul , MN 55114 Phone: (612) 627-4780
Mississippi Bureau of Geology Department of Natural Resources P.O. Box 5348 Jackson, MS 392 t 6 Phone: (601)354-6328
Missouri Division of Geology and Land Survey P.O. Box 250 Rolla, MO 65401 Phone: (31 4) 368-2100
Mid-Continent Mapping Center U.S. Geological Survey P.O. Box 133 Rolla, MO 65401
Montana Bureau of Mines & Geology Montana College of Mineral Science
& Technology Butte, MT 5970 I Phone: ( 406) 496-4180
Nebraska Conservation & Survey Division 901 North 17th Street Lincoln, NE 68588-0517 Phone: (402) 472 3471
Appendix C Sources of Earth Resource Information

Nevada Bureau of Mines and Geology University of Nevada, MS 178 Reno, NE 89557-0088 Phone: (702) 784-6691
New Hampshire Geological Survey Department of Environmental Services 117 James Hall University of New Hampshire Durham, NH 03824 Phone: (603) 862-3160
New Jersey Geological Survey CN-427 Trenton, NJ 08625 Phone: (609) 292-1185
New Mexico Bureau of Mines and Mineral Resources Campus Station Socorro, NM 8780 I Phone: (505) 835-5420
New York State Geological Survey 3136 Cultural Education Center Empire State Plaza Albany, NY 12230 Phone: (518) 474-5816
North Carolina Geological Survey Environment, Health, and Natural Resources Box 27687 Raleigh, NC 27611 Phone: (929) 733-2423
North Dakota Geological Survey 600 East Boulevard Bismarck, NO 58505-0840 Phone: (70 I) 224-2969
Ohio Division of Geological Survey Bidg. B. Fountain Square Columbus, OH 43224 Phone: (614)265-6576
Appendix C Sources of Earth Resource Information
Oklahoma Geological Survey Energy Center I 00 E. Boyd, Room N- 131 Norman, OK 73019-0628 Phone: (405) 325-3031
Oregon Department of Geology & Mineral Industries 910 State Office Building 1400 SW Fifth Ave. Portland. OR 97201-5528 Phone: (503 '- 73 1-41 00
Pennsylvania Bureau of Topographic & Geologic Survey Department of Environmental Resources P.O. Box 2357 Harrisburg, PA 17105 Phone: (717) 787-2169
Puerto Rico Geological Survey Division Box 5887 Puerta de Terra Station San Juan, PR 00906 Phone: (809) 724-8774
Rhode Island State Geologist Department of Geology University of Rhode Island Kingston, RI 02881 Phone: (40 I) 792-2265
South Carolina Geological SurveY 5 Geology Road Columbia, SC 29210-9998 Phone: (803) 737-9440
South Dakota Geological Survey Science Center Univers1ty of South Dakota Vermillion, SO 57069-2390 Phone: (605) 677-5227
U.S. Geological Survey EROS Data Center Sioux Fans. SO 57198
C3
Tennessee Division of Geology 13th Floor, LC Tower 40 I Church Street Nashville, TN 37243-0445 Phone: (615) 532-1500
Texas Bureau of Economic Geology University of Texas Box X, University Station Austin, TX 78713-7508 Phone: (5 12) 471-1534
Utah Geological & Mineral Survey 606 Black Hawk Way Salt Lake City, UT 84108- 1280
U.S. Geological Survev 8102 Federal Building I 25 South State St. Salt Lake City, UT 84138
Vermont Geological Survey Office of the State Geologist I 03 South Main Street Center Building Waterbury, VT 05671-030 I Phone: (802) 244-5164
Virginia Division of Mineral Resources P.O. Box 3667 Charlottesville, VA 22903 Phone: (804)293-5 121
U.S. Geological Survey (general information) National Center, Rm. IC402 Reston, VA 22092
C4
Eastern Mapping Center (aerial photographs) U.S. Geological Survey 536 National Center Reston, VA 22092
Washington Division of Geology and Earth Resources Department of Natural Resources P 0 Box 47007 Olympia, WA 98504-7007 Phone: (206) 902-1450
U.S. Geological Survey 678 U.S. Court House West 920 Riverside Ave. Spokane, VVA 99201
West Virginia Geological & Economic Survey Mont Chateau Research Center P.O. Box 879 Morgantoivn , VVV 26507-0879 Phone: (304)594-2331
Wisconsin Geological & Natural History Survey 3817 Mineral Point Road Madison, WI 53705 Phone: (608) 262-1705
Wyoming Geological Survey P.O. Box 3008, Un iversity Station Laramie, VVY 82071 Phone: (307) 766-2286
Appendix C Sources of Earth Resource Information
U.S. GEOLOGICAL SURVEY WATER RESOURCES DIVISION
NORTHEASTERN REGION
C~nnecticut, Delaware. l~linois, Indiana, Maine, Maryland, Massnchu etts, Michigan. Mtnnesota, New Hampsh1re. New Jersey, Nev. York, Ohio, Pennsylvania, Rhode I land. Vermont, Virginia, Washington. D.C., West Virginia. Wi con in
OFFICE OF THE REGIONAL HYDROLOGIST Regional Hydrologist
U.S Geological Survey 433National Center Reston. VA 22092
Telephone: (703) 648-5817: FTS 959-5817 Office Hours; 7:45a.m. to 4:15p.m. Eastern Time
CONNECTICUT Su also Massachuseus Hydrologist-in-Charge Connecticut Office. WRD U.S . Geolcgical Survey Abraham A. Ribicoff Federal Bldg .. Rm. 525 450 Main Street Hartford. CT 06103 Telephone: (203) 240-3060, FTS 244-3060 Office hour.~: 7:45 a.m. to 4: 15 p.m. ET
DELAWARE See Also Maryland Hydrologist-in -Charge Delaware Office, WRD U.S. Geological SurveY Federal Bldg., Rm. 1201 300 S. New Street
INDIANA Dt.;trict Chief, WRD U.S . Geological Survey 5951 Lakeside Bhd. Indianapolis, IN 46278 Tel~phone: (317) 290-3333: FTS 335-3333 Office hours: 7:45 a.m. to 4: IS p.m. ET
MAINE See also Ma nchusetts Hydrologi t·tn·Charge Maine Office, WRD U.S. Geological Sur,·ey 26 Ganneston Drive Augusta. ME 04330 Teleplume: (207) 622-820 I : FTS 833-6208 0/fia lwun: 7:30a.m. to 4: 15 p.m. ET
Dover, DE 19901 Telelbhone (302) 734-2506: FTS 487-6241 0/fia hours: 8:00a.m to 4 30 p.m. ET
MARYLAND Mid-Atlantic District (Delaware,
DISTRICT OF COLUMBIA See Maryland
ILLINOIS District Chief, WRD U.S Geological Survey Busey Bank County Plaza 102 E. Main St .. 4th Floor Urbana, IL 61 801 Telepllon~: (217) 398-5353; FFS 958-5353 Office hour:r: 8:00 a.m. to 4:30 p.m. CT
Appendix C Sources of Earth Resource Information
Maryland, Vuginin, W:~shington, D.C.) Dt:.trict Chiel, WRD U.S. Geo1ogtcal Survey 208 Carroll Bldg. 8600 La Salle Road TO\\SOn, MD 21286 Telephone: (410) 828-1535: FTS 922-7872 Office hours: 7:45 a.m. lO 4:15 p.m. ET
C5
MASSACHUSETTS New England District (Connecticut, Massachusetts, Maine, New Hampshire, Rhode Island, and Vermont)
District Chief, WRD U.S. Geological Survey 150 Causeway Street, Suite 1309 Boston, MA 021 14 Telephone: (6 17) 565-6860; FTS 835-6860 Office hours: 8:00a.m. to 4:30p.m. ET
MICHIGAN District Chief, WRD U.S. Geological Survey 6520 Mercantile Way, Suite 5 Lansing, MI 489 I I Telephone: (517) 377-1608; FTS 374-1608 Office hours: 7:45a.m. to 4:15p.m. ET
MINNESOTA District Chief, WRD U.S. Geological Survey 2280 Wcodale Drive Mounds View, MN 551 I 2 Telephone: (612) 783-3 I 00 Office hours: 7:45 a.m. to 4:30p.m. CT
NEW HAMPSHIRE See also Massachusens Hydrologist-in-Charge New Hampshire Office, WRD U S. Geological Survey 525 Clinton St., Bow, NH 03304 Telephone: (603) 225-4681; FTS 834-4611 Office hours: 7:4 5 a. m. to 4.1 5 p. m. ET
NEW JERSEY District Chief, WRD U.S. Geologies( Survey Suite 206, Mountain View Office Park 81 0 Bear Tavern Rd . West Trenton, NJ 08628 Telephone.- (609) 771-3900 Office hours: 7:45 a.m. to 4: 15 p.m. ET
NEW YORK Mailing address: District Chief, WRD U.S. Geological Survey P.O. Box 1669 Albany, NY 12201
C6
Office address: 445 Broadway, Room 343 AlbanV, NY 12207 Telephone: (5 18) 472-31 07; FTS 562-3107 Office hours: 7:45a.m. to 4:30p.m. ET
OHIO District-Chief, WRD U.S. Geological Survey 975 West Third Avenue Columbus, OH 43212 Telephone: (614) 469-5553; FTS 943-5553 Office hours: 7:30 a.m. to 4:00 p.m. ET
PENNSYLVANIA Mailing address: District Chief, WRD U S. Geological SurveV P.O. Box I 107 Harrisburg, PA 17 I 08
Office address: Federal Bldg., 4th Floor 228 Walnut Street Harrisburg, PA 171 08 Telephone: (717) 782-45 I 4; FT-S 590-4514 Office hours: 7:45a.m. to 4:15p.m. ET
RHODE ISLAND See also Massachusetts Hvdrologist-in-Charge Rhode Island Office, WRD U.S.Geological Survey John 0. Pastore Federal Bldg. & U.S- Post Office, Room 237 Providence, Ri 02903 Telephone: (401) 528-5135: FTS 838-5135 Office hours: 8:00a.m. to 4:30p.m. ET
VERMONT See Massachusetts
VIRGINIA See also Maryland Hydrologist-in-Charge Virginia Office, WRD U.S. Geological Survey 3600 West Broad Street, Rm. 606 Richmond, VA 23230 Telephone: (804) 771-2427; FTS 925-2427 Office hours: 8:00a.m. to 4:45p.m. E-T
Appendix C Sources of Earth Resource Information

WEST VIRGINIA District Chief, WRD U.S . Geological Survey 603 Morris Street Charleston, WV 2530 I Telephone: (304) 347-5130; FfS 930-5130 Office hours: 7:30a.m. to 4:00p.m. ET
WISCONSIN Dastrict Chief, WRD U.S. Geological Survey 6417 Normandy Lane Madison. WI 53 719-1133 Telephone: (608) 274-3535 Office hours: 8:00a.m. to 4:30p.m. CT
SOUTHEASTERN REGION
Alabama, Arkansas, Florida, Georgia, Kentucky, Louisiana, Mississippi , North Carolina, Puerto Rico, South Carolina, Tennessee, Virgin Islands
OFFICE OF THE REGIONAL HYDROLOGIST Regioal Hydrologist
ALABAMA District Chief, WRD U.S. Geological Survey 520 19th Avenue Tuscaloosa, AL 35401
U.S. Geological Survey Stalding Business Center
3850 Holcombe Bridge Road, Suite 160 Norcross, GA 30092
Telephone: (404) 447-9803; FfS 242-5174 Office hours: 7:30a.m. to 4:15p.m. ET
GEORGIA District Chief, WRD U.S. Geological Survey Peachtree Business Center
Telephone: (205) 752-81 04; FFS 229-1061 Office hours: 7:30a.m. to 4:00 p.m. CT
3039 Amwilder Road, Suite 130 61 Atlanta, GA 30360-2824 Telepho1le: (404) 447-9803; FfS 242-4858 Office hours: 8:00 a.m. to 4:30 p.m. ET
ARKANSAS District Chief, WRD U.S. Geofogical Survey Federal Office Bldg., Rm. 230 l 700 West Capitol Avenue
KENTUCKY District Chief, WRD U.S. Geological Survey 2301 Bradley Ave. Louisville, KY 40217 Little Rock, AR 72201
Telephone: (50 1) 324-6391; FfS 740-6391 Office hours: 7:30a.m. to 4:00p.m. CT
91 Telephone: (502) 582-5241; FTS 352-5241 Office hours: 8:00a.m. to 4:45 p.m. ET
FLORIDA District Chief, WRD U.S. Geological Survey 227 N. Bronough St., Suite 301 5 Tallahassee, FL 3230 I Telephone: (904) 681-7620; FfS 965-7620 Office hours: 7:45 a.m. to 4:30 p.m. ET
Appendix C So:.~rces of Earth Resource Information
LOUISIANA Mailing address: District Chief, WRD U.S. Geological Survey P.O. Box 66492 20Baton Rouge, LA 70896
C7
Office address: 6554 Florida Boulevard Baton Rouge, LA 70806 Telephone: (504) 291-6211; FTS 687-0281 Office hours: 7:45 a.m. to 4:30p.m. CT
MISSISSIPPI District Chief, WRD U.S. Geological Survey Federal Office Bldg., Suite 710 I 00 West Capitol Street Jackson, MS 39269 Telephone: (601) 965-4600; FTS 490-4600 Office hours: 8:00a.m. to 4:30 p.m. CT
NORTH CAROLINA District Chief, WRD U.S. Geological Survey 3916 Sunset Ridge Road Raleigh, NC 27607 Telephone: (919) 571-4000; FTS 672-4510 Office hours: 8:00a.m. to 4:45 p.m. ET
PUERTO RICO Caribbean District (Puerto Rico and U.S. Virgin Islands)
Mailing addless: District Chief, WRD U.S. Geological Survey GPO Box 4424 San Juan, PR 00936
ca
Office address: GSA Center, Building 652 Highway 28, km. 7.2, Pueblo Viejo '81San Juan, PR 00936 Telephone: (809) 783-4660; FTS 753-4414 Office hours: 7:45 a.m. to 4:30p.m. AT
SOUTH CAROLINA District Chief, WRD U.S. Geological SurveyRStevenson Center ;Oo720 Gracern Road, Suite 129 Columbia, SC 29210-7651 Telephone: (803) 750-61 00, FTS 677-5966 Office hours: 7:45 am to 4:30 p.m. ET
TENNESSEE District Chief, WRD U.S. Geological Survey ' I 0810 Broadway, Suite 500 Nashville, TN 37203 Telephone: (615) 736-5424; FTS 852-5424 RicoOffice hours: 7:45 a.m. to 4:45 p.m. CT
VIRGIN ISLANDS See Puerto Rico
Appendix C Sources of Earth Resource Information

WESTERN REGION
Alaska, Arizona, California. Guam. Hawaii, Idaho, Nevada. Oregon, Wa'>hington
OFFICE OF THE REGIONAL HYDROLOGIST Regional Hydrologist
U.S. Geological Survey 345 Middlefield Road, Main Stop 470
Menlo Park, CA 94025 Telephone: (415) 329-4403; FfS 459-4403
Office hours: 7 :45 a .m . to 4 : 15p.m. Pacific Time
DISTRICT AND STATE OFFICES
ALASKA District Chief, WRD U.S. Geological Survey 4230 University Dr., Suite 201 Anchorage, AK 99508-4664 Telephone: (907) 786· 7100 Office hours: 7:45a.m . to 4: 15p.m. Alaska-Hawaii Time
ARIZONA District Chief, WRD U S Geological Survey 375 South Euclida Avenue Tucson, AZ 85719 Telephone: (602) 670-6671: FfS 762-6671 Office hours: 7:30a.m. to 4:00p.m. MT
CALIFORNIA District Chief, WRD U.S. Geological Survey Federal Bidg., Rm. W-2234 2800 Cottage Way Sacramento, CA 95825 Telephone: (916) 978-4633; FTS 460-4633 Office hours: 7:30a.m. to 4:00p.m PT
GUAM See also Hawaii Mailing address: Hydrologist-in-Charge Subdistrict Office, WRD U.S. Geological Survey P.O. Box 188 FPO San Francisco, CA 96630
Office address U.S . Navy Public Works Center, Bldg. 104 Agana, GU 96910 Tel~phone: (611) 472-7300: FfS 5'i0-7300 Office hours: 7:45a.m. to 4:15pm Kilo Time
Appendtx C Sources of Earth Resource Information
HAWAII Hawaii - Guam District District Chief. WRD U.S. Geological Survey 677 Ala Moana Bhd., Suite 415 Honolulu, HI 96813 Tel~phone: (808) 541 -2653; FrS 551-2653 Office IJour:r: 7:45 p.m. to 4.15 p.m. Alaska-Hawaii Time
IDAHO Dmrict Chief. WRD U.S. Geological Survey 230 Collins Road Boise. lD 83702 Telephone: (208) 334- 1750: FFS 554-1750 Office hours: 7:45 a.m. to 4: 15 p.m. MT
NEVADA District Chief. WRD U S Geological Survey 333 West Nye Lane Carson City, NV 89706 T~lephone: (702) 882-1388 Office hours: 8:00a. m. to 4:30p. m. PT
OREGON Su also Washington Hydrologist-an-Charge Oregon Office, WRD U.S. Geological Survey 10615 SE Cherry Blos:.om Drive Portland. OR 97216-3159 Telephone: (503) 251 -3200; FTS 4:Z9-2009 OffiCi! horm: 7:30a.m. to 4:00p.m. PT
C9

WASHINGTON Pacific Northwest District District Chief, WRD U.S. Geological Survey 1 201 Pacific Avenue, Suite 600 Tacoma, WA 98402 Telephone: (206) 593-651 0; FrS 390-6510 Office hours: 7:30a.m. to 4:00 p.m. PT
CENTRAL REGION
Colorado, Iowa, Kansas, Missouri, Montana, Nebraska, New Mexico, North Dakota, Oklahoma, South Dakota, Texas, Utah, Wyoming
OFFICE OF THE REGIONAL HYDROLOGIST Regional Hydrologist
U.S. Geological Survey Main Stop 406, Box 25046
Denver federal Center Lakewood, CO 80225
Telephone: (303) 236-5920; FfS 776-5920 Office hours: 8:00 a.m. to 4:30p.m. Mountain Time
COLORADO District Chief, WRD U.S. Geological Survey Mail Stop 415, Box 25046 Denver Federal Center, Bldg. 53 Lakewood, CO 80225 Telephone: (303) 236-4882; FrS 776-4882 Office hours: 8:00 a.m. to 4:30 p.m. MT
IOWA Mailing Address: District Chief, WRD U.S. Geological Survey P.O. Box 1230 Iowa City, lA 52244-1230
Office Address: Rrn . 269, Federal Bldg. 400 S. Clinton St. Iowa City, lA 52244-1230 Telephone: (3 19) 337-4 191 Office hours: 7:45 a.m. to 4:30 p.m. CT
KANSAS District Chief, WRD U.S. Geological Survey 1950 Constant Ave. -Campus West Lawrence, KS 66046 Telephone: (9 13) 864-4321 Office hours: 8:00 a.m. to 4:30p.m. CT
C10
MISSOURI District Chief, WRD U.S. Geological Survey 1400 Independence Road, Mail Stop 200 Rol ia, MO 65401 Telephone: (314) 341-0824; FrS 277-0824 Office hours: 7:30a.m. to 4:00 p.m. CT
MONTANA District Chief, WRD U.S. Geological Survey Federal Bldg, Rm. 428 30 I South Park Avenue Helena, MT 59626-0076 Telephone: (406) 449-5263; FrS 585-5263 Office hours: 8:00 a.m. to 4:30 p.m. MT
NEBRASKA District Chief, WRD U.S. Geological Survey Federal Bldg., Rm. 406 1 00 Centennial Mall North Lincoln, NE 68508 Telephone: (402) 437-5082 Office hours: 7:45 a.m. to 4:30 p.m. CT
Appendix C Sources of Earth Resource Information

NEW MEXICO District Chief, WRD U.S. Geological Survey Pinetree Office Park, Suite 200 4501 Indian School Rd., NE Albuquerque, NM 871 1 0 Telephone: (505) 262-6630; FFS 474-6630 Office hours: 7:45 a.m. to 4:30 p.m. CT
TEXAS District Chief, WRD U.S. Geological Survey Building A 80 II Cameron Road Austin, TX 78753 Telephone: (512) 832-5791-0/fice hours: 7:45 a.m. to 4:30 p.m. CT
UTAH District Chief WRD
NORTH DAKOTA District Chief, WRD U.S. Geological Survey 821 E. Interstate Avenue Bismarck, ND 58501
U.S. Geological Survey Administration Bidg., Rm. 1016
Telephone: (701) 250-4601; FTS 783-4610 Office hours: 8:00 a.m. to 4:45 p.m. CT
OKLAHOMA District Chief, WRD U.S. Geological Survey 215 Dean A. McGee Avenue, Rm. 621 Oklahoma City, OK 73102 Telephone: (405) 23 1-4256; FFS 736-4256 Office hours: 8:00 a.m. to 4:45 p.m. CT
SOUTH DAKOTA District Chief, WRD U.S. Geological Survey Federal Bldg., Rm. 317 200 4th Street, SW Huron, SD 57350-2469 Telephone: (605) 353-7176 Office hours: 8:00 a.m. to 5:00 p.m. CT
1745 West 1700 South Salt Lake Citv, UT 84104 Telephone: (80 I) 975-3350; FTS 588-5663 Office trours: 8:00a.m. to 4:30 p.m. MT
WYOMING District Chief, WRD U.S. Geological Survey 261 7 East Lincoln Way, Suite B Cheyenne, WY 8200 I Tele,ohone: (307) 772-2153; FTS 328-2153 Office hours: 8:00a.m. to 4:30p.m.
UNITED STATES DEPARTMENT OF AGRICULTURE SOIL CONSERVATION SERVICE
ALABAMA Ernest V. Todd 665 Opelika Road P. 0. Box 311 Auburn, AL 36830 Telephone: (205) 887-4535 FTS 534-4535
ALASKA Sfeven A. Probst 201 East 9th Avenue, Suite 300 Anchorage, AK 99501-3687 Telephone: (907) 271-2424 FTS 868-2424
STATE CONSERVATIONISTS
ARIZONA Donald W. Gohmert 20 I E. Indianola, Suite 200 Phoenix. AZ 850 12 Telephone: (602)-640-224 7 FTS 26 1-2247
ARKANSAS Ronnie D. Murphy Federal Ekjilding Room 5404 700 West Capitol Avenue Little Rock, AR 72201 Telephone. (50 I )-324-5445 FTS 740-5445
Appendix C Sources of Earth Resource Information
C11

CALIFORNIA Pearlie S. Reed 2 12 1-C 2nd Street, Suite 102 Davis, CA 95616-5475 Telephone: (96 1 )-7 57-8200 FTS 451-8200
COLORADO Duane L. Johnson 655 Parfet Street Room E200C Lakewood, CO 80215-5517 TelePhone: (303)-236-2886 FTS 776-2886
CONNECTICUT P. Dwight Holman l 6 Professional Park Rd. Storrs, CT 06268-1 299 Telephone: (203)-487-40 13
DELAWARE Elesa K. Cottrell 1203 College Park Dr. , Suite A Dover, DE 19901-8713 Telephone: (302)-678-4 160 FTS 678-41 60
FLORIDA T. Niles Glasgow 40 I S.E. I st Avenue, Room 248 Gainesville, FL 3260 I Telephone: (904)-377-0946 FTS 377-0946
GEORGIA Hershel R. Read Federal Building, Box J 3 355 East Hancock Avenue Athens, GA 3060 l Telephone: (404)-546-2272 FTS 250-2272
GUAM Joan Perry Director, Pacific Basin Suite 602, GCIC Bldg. 414 W. So1eded Avenue Agana, Guam 9691 0 Telephone: (67 1 )-472-7490 FTS 550-7490
C12
HAWAII Warren M. Lee 300 Ala Moana Blvd. Room 43 16 P.O. Box 50004 Honolulu, HI 96850 Telephone: (808) -541 -260 I FTS 55 1-260 I
IDAHO Paul H. Calverley 3244 Elder Street Room 124 Boise, ID 83705 Telephone: (208)-334-160 l FTS 554- 160 I
ILLINOIS Charles Whitmore 1902 Fox Drive Champaign, IL 61820 Telephone: (217)-398-5267 FTS 958-5267
INDIANA Robert L. Eddleman 6013 Lakeside Blvd. Indianapolis, IN 46278 Telephone: (3 17)-290-3200 FTS 335-3200
IOWA Jeffrey R. Vonk 693 Federal Building 210 Walnut Street Des Moines, lA 50309 Telephone: (515)-284-4261 FTS 862-426 1
KANSAS James N. Habiger 760 South Broadway Sal ina, KS 67401 Telephone: (913)-623-4565
KENTUCKY Billy W. Milliken 771 Corporate Drive, Suite 110 Lexington, KY 40503 Telephone: (606)-224-7350 FTS 228-7350
Appendix C Sources of Earth Resource Information

LOUISIANA Horace J. Austin 3737 Government Street Alexandria, LA 71302 Telephone: (318)-4 73-7751 FTS 497-7751
MAINE David L. Mussulman 5 Godfrey Drive Orono, ME 04473 Telephone: (207)-866-7241
MARYLAND Robert J. Klumpe J . Hanson Business Ctr 339 Buch's Frontage RD, Suite 301 Annapolis. MD 2140 I Telephone: ( 41 0)-7 57-0861
MASSACHUSETTS Richard A. Gallo 45 I West Street Amherst, MA 0 I 002 Telephone: (413)-253-4351
MICHIGAN Homer R. Hilner 1405 S. Harrison Road, Room 1 01 E.Lansing, Mi 48823-5202 Telephone: (5 17)-337-6702 FTS 374-6702
MINNESOTA Gary R. Nordstrom 600 Farm Credit Building 375 Jackson Street St. Paul, MN 55101-1854 Telephone: (612)-290-3675 FTS 777-3675
MISSISSIPPI L. Pete Heard Federal Building Suite 1321 100 West Capitol Street Jackson, MS 39269 Telephone: (60 I )-965-5205 FTS 490-5205
Appendix C Sources of Earth Resource Information
MISSOURI Russell C. Mills Parkade Center, Suite 250 60 I Business Loop 70 W. Columbia, MO 65203 Telephone: (314 )-876-0900 FrS 273-0900
MONTANA Richard J. Goo by Federal Building I 0 E. Babcock Street, Room 443 Bozeman, MT 59715-4704 Telephone: ( 406)-587-6813 FTS 585-4813
NEBRASKA Ronald E. Moreland Federal Building I 00 Centennial Mall N. , Room 152 Lincoln, NE 68508-3866 Telephone: (402)-437-5300 FTS 541-5300
NEVADA William D. Goddard 530 I Langley Lane Building F. Suite 201 Reno, NV 89511 Telephone: (702)-784-5863 FTS 470-5863
NEW HAMPSHIRE Dawn W. Genes Federal Building Durham, NH 03824 Telephone: (603)-868-758 1 FTS 834-S,r,OS
NEW JERSEY Cecil B. Currin 1370 Hamilton Street Somerset, NJ 08873 Telephone: (908)-246-1662
C13

NEW MEXICO Ray T. Margo, Jr. 517 Gold Avenue S.W., Room 3301 Albuquerque, NM 87102 Telephone: (505)-766-2173 FTS 474-2173
NEW YORK. Paul A. Dodd Federal Building I 00 S. Clinton Street, Room 771 P.O. Box 7248 Syracuse, NY 13261 -7248 Telephone: (315)-423-5521 FTS 950-5521
NORTH CAROLINA Bobbye Jack Jones 4405 Bland Road, Suite 205 Raleigh, NC 27609 Telephone: (9 19)-790-2888 FTS 672-2888
NORTH DAKOTA Ronnie L. Clark Federal Building 220 E. Rosser Avenue, Room 278 P.O. Box 1458 Bismarck, ND 58502-1458 Telephone: (10 I )-250-4421 FTS 783-4421
OHIO Joseph C. Branco 200 North High Street, Room 522 Columbus, OH 43215 Telephone: (614)-469-6962 FTS 943-6962
OKLAHOMA C. Budd Fountain USDA-Agri. Center Bidg Stillwater, OK 74074 Telephone: (405)-624-4360 FTS 744-4360
OREGON Jack P. Kanalz Federal Building 1200 S. W. 3rd Avenue, Room 1640 Portland. OR 97204 Telephone: (503)-326-2751 FTS 423-2751
C14
PENNSYLVANIA Richard N. Duncan I Credit Union Pi. , Suite 340 Harrisburg, PA I 71 I 0 Telephone: (717)-782-2202 FTS 590-2202
CARIBBEAN AREA Humberto Hernandez Dir., Caribbean Area Federal Building, Room 639 I 50 Carlos Chardon St. Hato ReV, PR 00918 Telephone: (809)-766-5206 FTS 498-5206
RHODE ISLAND Anthony T. Dore 60 Quaker Ln., Suite 46 Warwick, RI 02886 Telephone: ( 40 I )-828- I 300
SOUTH CAROLINA BiliV Abercrombie 1835 Assembly St., #950 Strom Thurrfiond Fed Bldg. Columbia, SC 29201 Telephone: (803)-765-568 1 FTS 677-5681
SOUTH DAKOTA Ronald E. Hendricks Federal Building 200 Fourth Street, SW Huron , SO 57350-2475 Telephone: (605)-353-1783
TENNESSEE Jerry S. Lee 675 U.S. Courthouse 80 I Broadway Nashville, TN 37203 Telephone: (615)-736-5471 FFS 852-5471
TEXAS Harry W. Oneth W. R. Poage Building 101 S. Main Street Temple, TX 76501-7682 Telephone: (817)-774-1214 FTS 736-12 14
Appendix C Sources of Earth Resource Information
UTAH Francis T. Holt W. F. Bennett Fed. Bldg. 125 S.State St., Rm 4402 Salt Lake City, UT 84138 P.O. Box 11350 Salt Lake City, UT 84147 Telephone: (80 I )-524-5050 FTS 588-5050
VERMONT John C. Titchner 69 Union Street Winooski. VT 05404 Telephone: (802)-951-6795 FTS 832-6795
VIRGINIA George C. Norris Federal Building 400 North 8th St., Room 920 I Richmond, VA 23240-9999 Telephone: (804)-771-2455 FTS 925-2455/2456
WASHINGTON Lynn A. Brown West 3 I 6 Boone Avenue, Suite 450 Spokane, WA 99201-2348 Telephone: (509)-353-2337 FFS 439-2337
WEST VIRGINIA Rollin N. Swank 75 High Street, Room 301 Morgantown, WV 26505 Telephone: (304)-291-4151 FTS 923-4151
WISCONSIN Earl Cosby 6515 Watts Road, Suite 200 Madison, Wi 53719-2726 Telephone: (608)-264-5577 FTS 364-5577
Appendix C Sources of Earth Resource Information
WYOMING FrankS. Dickson, Jr. Federal Office Building I 00 East B Street, Room 31 24 Casper, WY 8260 I Telephone: (307)-26 I -520 I FTS 328-5201
DIRECTORS, NATIONAL TECHNICAL CENTERS
NORTHEAST-NTC Arthur B. Holland I 60 East 7th Street Chester, PA 19013-6092 Telephone. (2 15)-499-3904 FTS 298-3979
SOUTH-NTC Paul F. Larson Ft. Worth Federal Ctr. Bldg. 23, Room 60 Felix & Hemphill St. P.O. Box 6567 Fort Worth, TX 76116 Telephone: (817)-334-5253 FTS 334-5253
WEST-NTC Tomm V A. George Federal Building 511 N.W. Building, Room 248 Portland, OR 97209 Telephone: (503)-326-2824 FTS 423-2824
C15
NATIONAL OCEANIC AND ATMOSPHIRIC ADMINISTRATION
FIELD ORGANIZATION
NATIONAL WEATHER SERVICE
Alaska Region Richard J. Hutcheon Room 506, No. 23 222 W. 7th Avenue Anchorage, AK 99513-7575 Telephone: 907-271-5136
Central Region Richard P. Augulis 60 I E. 12th Street, Room 1836 Kansas City, MO 64106-2897 Telephone: 816-426-5400
Eastern Region Susan F. Zevin Airport Corporate Center 630 Johnson Avenue Bohemia, NY 11716 Telephone: 516-244-0 I 00
National Meteorological Center Ronald D. McPherson 5200 Auth Road Camp Springs, MD 20746 Telephone: 301-763-8016
Pacific Region Richard Hagermeyer P. 0. Box 50027 Honolulu, Hi 96850 Telephone: 808-541-1641
Southern Region Harry S. Hassel 819 Taylor Street, Rm 1 OA26 Fort Worth, TX 761 02 Telephone: 817-334-2668
Western Region Thomas D. Potter P. 0. Box 1 1 1 88, Federal Bldg. Salt Lake City, UT 84147-01 88 Telephone: 801-524-5122
C16
NATIONAL MARINE FISHERIES SERVICE
Alaska-Region Steven Pennoyer P. 0. Box 21668 Juneau, AK 99802-1668 Telephone: 907-586-7221
Northwest Region Rolland Schmitten 7600 Sand Point WaV NE BIN C I 5700, Bldg. I Seanie, WA 98115-0070 Telephone: 206-526-6150
Northeast Region Richard B. Roe 1 Blackburn Drive Gloucester, MA 01930 Telephone: 61 7-281-921 0
Southeast Region Andrew J. Kemmerer 9450 Koger Blvd. St- Petersburg, FL 33702 Telephone: 813-893-6208
Southwest Region Ellsworth Fullerton 300 S. Ferry Street Terminal Island, CA 90731 Telephone: 213-514-6208
Appendix C Sources of Earth Resource Information
NATIONAL ENVIRONMENTAL SATELLITE,DATA, AND INFORMATION SERVICE
National Climatic Data Center Kenneth D. Hadeen Federal Building Asheville, NC 28801-2696 Telephone: 704-259-0476
National Geophysical Data Center Michael Chinnery RL-3, 325 Broadway Boulder, CO 80303-3328 Telephone: 303-497-6215
National Oceanographic Data Center Gregory W. Withee 1825 Connecticut Avenue, NW Washington, DC 20235 Telephone: 202-673-5594
NATIONAL OCEAN SERVICE
Alaska Office Jawed Hameedi Room Al3 , No. 56 222 W. 8th Avenue Anchorage, AK 99513-7543 Telephone: 907-271-3033
Pacific Office John H. Robinson 7 600 Sandy Point WaV N E Seattle, WA 98115-0070 Telephone, 206-526-6317
Key Largo National Marine Sanctuary Michael W. White P. 0. Box 020 197 Miami, FL 33102-0197 Telephone: 305-526-7152
All Other Sanctuaries and Reserves Joseph A. Uravitch 1825 Connecticut Avenue, NW Washington, DC 20235 Telephone: 202-673-5122
Appendix C Sources of Earth Resource Information
OFFICE OF OCEANIC AND ATMOSPHERIC RESEARCH
Atlantic Oceanographic and Meteorological Laboratory Hugo F. Bezdek 4301 Rickenbacker Causeway Miami, FL 33149 Telephone: 305-361-4450
Environmental Research Laboratories Joseph 0. Fletcher 325 Broadway Boulder, CO 80303-3328 Telephone: 303-497-6000
Geophysical Fluid Dynamics Laboratory J.D. Mahlman P. 0. Box 308 Princeton, NJ 08542 Telephone: 609-452-6502
Great Lakes Environmental Research Laboratory Alfred M. Beeton 2205 Commonwealth Blvd. Ann Arbor, Mi 48105-1593 Telephone: 313-668-2244
National Severe Storms Laboratory Robert A. Maddox I 313 Halley Circle Norman, OK 73069 Telephone: 405-366-0427
Pacific Marine Environmental Research Laboratory Eddie N. Bernard BIN C 15700 7600 Sand Point Way. NE Seattle, WA 98115-0070 Telephone: 206-526-6239
C17
ADMINISTRATIVE SUPPORT CENTERS
Central Administrative Support Center Martha R. Lumpkin 60 I E. I 2th Street Kansas City, MO 64106-2897 Telephone: 8 16-426-2050
Eastern Administrative Support Center Robert S. Smith 253 Monticello Avenue Norfolk, VA 23510-23 14 Telephone: 804-441-6864
NOAA CORPS OPERATIONS CENTERS
Atlantic Marine Center Rear Adm. Freddie Jefferies 439 W. York Street Norfolk, VA 23510-1114 Telephone: 804-441-6776
C18
Commissioned Personnel Center Capt. Theodore Wyzewski 11400 Rockville Pike Rockville, MD 20852 Telephone: 301-443-8950
Pacific Marine Center Rear Adm. Raymond L. Speer 180 I Fairview Avenue, E. Seattle, WA 98102-3767 Telephone: 206-442-7656
Appendix C Sources of Earth Resource Information

REPORT DOCUMENTATION PAGE Form Appr011~d
OMB No 0704-0188
Pubhc rppontng bordf'n for '"''' collt-c110n of •ntorm1U0n ,, P\tn''~"~ltf"d to a , glthf'ftnc'J .. f\CI ml•r!Utnlng thf" dill n~fdfd •nd (Ott'O'tting '"" tPYI!''II"'I or!; ·~;:~~~ P,.O,~o~t f)fr '~fl~. ~nduCIIng \~~ t tnf' tor ff'-;;~ ng lt\!,tfUC"llon1 t-rUCI'\.&f\9 f'•~t.ll dltl '\OUfCft COII~o<>n o f oofOr"'IIIOII, >lld..d•"<) lll99~1tOn' t~r t!'Clllt:On<) If' I\ l)o.jro•n ~ N ~ PC1 en Of 1tlf01"'411Qn ~lid commMt\ I~IIG "9 11\n I>UIOf1\ ~I !NIP Of on Oth~ 1\D«'Ct Of ttl» 0ho\ Hogh,.l1 ~uolr 1101, Arton<)IOn,\IA 1ll0l-4)01, lnG 1- I"• >H, ·p ' ;~ ~"' ongton HP-ulrtPI\ ~f'h>< P\ Oor~OtiiP Of niCifi"IIIOn eo.ro1 om onG 11.:.0,\ 111~ lrHr<tOn
• • ""~"'"" 1 and B..ag•t. •apr,.. or• Rra'"'IOtl PrOj~ (07a.4tl8). Wown;ton. oc ,lO~J
1. AGENCY USE ONLY (L~.tv~ bf•nlc) 2. REPORT DATE ) . REPORT TYPE AND DATES COVERED March 1994 Final report
4. TITLE AND SUBTITLE S. FUNDING NUMBERS
Earth Resources Stewardship at Department of Defense Installations
6. AUTHOR(S)
David M. Patrick, Maureen K. Corcoran, Paul E. Albertson, Lawson M. Smith
1. PERFORMING ORGANIZATION NAME(S) AND ADDRESS(ES) B. PERFORMING ORGANIZATION REPORT NUMBER
See reverse. Technical Report GL-94-9
9. SPONSORING/MONITORING AGENCY NAME(S) AND ADDRESS(ES) 10. SPONSORING I MONITORING AGENCY REPORT NUMBER
U.S. Department of Defense Office of the Deputy Assistant Secretary of Defense for the Environment Washington, DC 22202
11. SUPPLEMENTARY NOTES
Available from National Technical Information Service, 5285 Port Royal Road, Springfield, VA 22161.
12a. DISTRIBUTION I AVAILABILITY STATEMENT 12b. DISTRIBUTION CODE
Approved for public release; distribution is unlimited.
13. ABSTRACT (Max1mum 200 words)
Earth resources consist of natural phenomena of the air, land, and water and include such critical re-sources as wetlands, soils, groundwater, strategic minerals, oil and gas, stream flow, solar radiation, precip-itation, and construction materials. These and other earth resources are not only individually irreplacable, they also play a key role in the distribution and character of biological and cultural resources. Steward-ship of earth resources requires the use of state-of-the-art methods and concepts for inventory, evaluation, and management. This document serves as a guide and source book for resource managers at DoD installa-tions to understand the scope of earth resources stewardship at their installation. Initially, the document provides an overview of the nature, occurrence, and significance of earth resources. Methods of acquiring earth resources data and inventorying and stewardship of lithospheric, hydrospheric, and atmospheric re-sources are then presented. The value and use of earth resources information in the management of cuiLUral and biological resources are discussed in terms of earth resources information required for various manage-ment issues. One of the major themes of the report is the role of earth resources information in developing and executing integrated natural and cuiLUral resources stewardship programs. The report proposes that
(Continued) 1S NUMBER OF PAGES
14. SUBJECT TERMS 189
See reverse.
17. SECURITY CLASSIFICATION 18 . OF REPORT
UNCLASSIFIED
NSN 7540-0 l·280·5500
SECURITY CLASSIFICATION 19. SECURITY CLASSIFICATION
OF THIS PAGE OF ABSTRACT
UNCLASSIFIED
16. PRICE CODE
20. LIMITATION OF ABSTRACT
Standard Form 298 (Rev 2 89) Prncr 11.-d t>y A!.~l \~ 139·1!! 198 1e2

7. (Concluded). Department of Geology, University of Southern Mississippi, Hattiesburg, MS 39406-5044; U.S. Army Engineer Waterways Experiment Station, 3909 Halls Ferry Road, Vicksburg, MS 39180-6199
13. (Concluded).
DoD adopt an integrated comprehensive approach to resource stewardship that is based on the simultaneous inventory, evaluation, and management of earth, biological, and cultural resources that is also integrated with ongoing installation restoration and planning initiatives.
14. (Concluded).
Air Atmosphere Climate Earth resources Energy resources Fossils Geology Geomorphology
GIS Groundwater Hydrosphere Integration Land Lithosphere Legacy Minerals
Natural resource management Precipitation Soils Stream flow Wetlands