
TR-05-01-2007
67
Boston University College of Engineering Department of Electrical and Computer Engineering Opportunistic Pollution Monitor (AKA: Urban Microclimate Monitoring System) MCL Technical Report: TR-05-01-2007 George Bishop Peter Dib Brandi Pitta i
Transcript of TR-05-01-2007

Boston UniversityCollege of Engineering
Department of Electrical and Computer Engineering
Opportunistic Pollution Monitor
(AKA: Urban Microclimate Monitoring System)
MCL Technical Report: TR-05-01-2007
George BishopPeter Dib
Brandi Pitta
i

Noam Yemini
Prof. Thomas Little (Sponsor)
October 12, 2022
ii

Abstract
With the recognition of the impact of humans on our worldand the anticipated effects of global warming there isincreasing interest in the environment. This projectintends to enable localized data monitoring using low-costsensing and computer networking technologies to enableindividuals to acquire data about local smog (air pollution)conditions. The system is intended to use opportunisticnetworking – the exploitation of the now ubiquitous accessto the Internet through wired or wireless means. The urban microclimate monitor tracks certain atmosphericparameters in any location accessible to a wired or wirelessEthernet connection and is exposed to sunlight. Sensedparameters of the device include temperature, humidity,pressure, carbon monoxide (CO), and ozone (O3). The systemis comprised of four subsystems: a sensor module,microprocessor, the power management, and a server/database.Each of these subsystems is powered by an energy harvesterconsisting of photovoltaic cells and a rechargeable NiCadbattery pack. Once data are acquired from the sensors, theyare transmitted, via internet connection, to a remote serverestablished to collect and disseminate time series data. Onthe server, measured data produced from the operatingcircuits are converted to engineering units and stored in aMySQL database. Web access to the MySQL database provides aset of tools for viewing trends and subsequent upload tomore advanced analysis environments.
Table of Contents
Abstract................................................ii1.0 Introduction..........................................1
iii

2.0 System Overview and Installation......................33.0 Operation of the Project.............................104.0 Technical Background.................................135.0 Cost Breakdown.......................................186.0 Appendices...........................................20
iv

1.0 Introduction
1.1 Statement of the Problem
As the harmful effects of air pollution on our planet becomemore widely known, there exists a need to more effectivelymonitor these pollutants. In order to stop these harmfuleffects, scientists need to understand the trends that theseenvironmental factors have. The goal of this project is tocreate a relatively low-cost urban monitoring station thatwould be able to supply large quantities of data to displaythese trends. Ideally, there would be many end users owningthese small stations so as to create a large pool of data.
1.2 General Approach
Our project took a divide-and-conquer general approach. Thesystem was divided into two units: a remote sensing moduleand a database/server module. The remote sensing unit isself-powered by solar panels and a Ni-Cad rechargeablebattery. Contained within the remote unit are four sensorswhich sense five environmental factors: temperature,relative humidity, pressure, carbon monoxide (CO), and ozone(O3). Also in the remote unit is the WildFireMod whichcoordinates the acquisition and sending of data to thedatabase/server module. After processing by the server andstorage into the database, the user is able to view the dataon a website. Our final product is pictured in Figure1.2.1. This project will allow many users to purchase theirown monitoring stations to assist in the creation of a largepool of data on the harmful effects of air pollution.
1

Figure 1.2.1—Final Product
This system has been designed for outdoor use. We recommendthat the unit be installed on a balcony or preferably on aroof. The unit will be autonomous therefore it is theuser’s responsibility to make sure that the system is wellattached to a fixed position especially under high windconditions. The user should manipulate the power circuitwith extreme caution because of the high current (1A)running through any hazardous short circuit. Themanufacturer will not be responsible for any injury or lossof life, loss of or damage to personal equipment andproperty.
1.3 Highlights and Special Features
Our system makes it possible to measure a variety ofenvironmental factors from multiple units. This data isconsolidated onto a server where any interested user with anInternet connection can view the data. This data can alsobe downloaded so users can make their own calculations (i.e.MATLAB integration). However, if the user does not wish to
2

download the data, there are useful on-site applicationssuch as the ability to sort and graph data.
A unique feature of our system is that the system requireslittle maintenance. Once the unit is set up and connectedto a network with internet connectivity, the system operatesindependently of any external sources. The system is self-powering via solar panels and a rechargeable Ni-Cad battery.Furthermore, the microprocessor is able to hibernate andwake itself up using an internal timer to conserve power.The sensors do not require annual calibration – oncecalibrated they can function without replacement for atleast two years. The system was designed to be placed in acertain location and left alone for years at a time.
Another highlight is that our server allows for manyadministrative features. Since our project was designedusing open source software exclusively, all source code isavailable for further improvement. The server uses logfiles that allow the receiving server process to operateverbosely for easy tracking of bugs. Furthermore, thecombination of the Apache webserver, MySQL database, phpcode, and python code is the industry standard for highperformance data driven applications. The MySQL database isalso normalized up to the second normal form to reducedatabase size and increase query efficiency.
1.4 User Manual
The following pages of this document include sections whichdescribe different aspects of our prototype. The followingsection provides an overview of the system block diagram,user interface, physical appearance, installation, andspecifications of our project. Section 3.0 is anelaboration on the two modes of operation, troubleshooting,and issues of safety. Next, is a technical backgroundfollowed by a breakdown of costs. The final section is theappendices which contain all documentation referred to inthe user manual as well as reference sources.
3

4

2.0 System Overview and Installation
2.1 Block Diagram
The block diagram in Appendix A depicts our system overview.We designed a four element system that measuresenvironmental data, transmits it to our server via Ethernetand then displays the readings on our web server. The fourelements consist of a power module, a sensor module, aColdFire Module, and a server module.
2.1.1 Power Module
The power module is made up of a pack of Ni-Cad rechargeablebatteries, four silicon-made photovoltaic (PV) cells, asolar controller, a voltage regulator, and a switch.
2.1.1.1 Battery Pack
The Ni-Cad rechargeable battery stores the energy for thesystem and provides the required amount of power to the loadcircuitry in order to make the urban microclimate monitoringsystem autonomous. A 12V Ni-Cad battery is necessary to runthe system (the solar controller is rated for Ni-Cad only).The battery pack has two connectors with which to connect tothe solar controller and the remote unit’s PCB.
2.1.1.2 Photovoltaic Cells
The blue PV cells are connected so the output can match thebattery characteristics (two cells connected in parallel areconnected in series with two other cells connected in
5

parallel). The cells will charge the battery during the dayat a rate depending on weather conditions.
2.1.1.3 Solar Controller
The solar controller (Morningstar Sunguard) will regulatethe energy between the PV cells and the battery. Itfeatures a built-in diode to prevent any overnightdischarging of the battery to the PV cells. Also the solarcontroller will stop the charging process when the batterygets too hot.
2.1.1.4 Voltage Regulator
The load circuitry of the system requires a 5V DC voltage.The LM2940 voltage regulator converts the battery voltagefrom 12V to 5V and supplies a maximum current of 1A.
2.1.1.5 Switch
There is a CMOS switch which controls the power to thesensors. This switch is controlled through GPIO pin PC0,located on the WildFireMod, and enables the current to flowto the sensors when measurements are being taken.
2.1.2 Sensor Module
The sensor module consists of two separate units that areattached to each other. The exterior unit, which will beexposed to the environment, contains the four sensors.These sensors are the HS-2000V which measures temperatureand relative humidity, the BARO-A-4V-MINI-PRIME whichmeasures pressure, the Eco-Sure (2e) which measures carbonmonoxide, and the O3 7 series which measures ozone. Thesensors sense their respective environmental factors and areprocessed into a useful voltage by their respectiveoperating circuits which are located on the printed circuitboard (Appendix C). Unlike the other operating circuitry,the CO operating circuit is located in the exterior unit.
6

In future iterations of the project, this circuitry wouldalso be moved onto the PCB with the other operatingcircuits.
2.1.3 WildFireMod
The WildFireMod is the development platform that controlsthe remote unit using the ColdFire microprocessor and itsinterfacing capabilities. It is responsible for poweringthe sensors as well as transferring the data that thesensors collect to the server. For every sampling cycle,the microprocessor first turns on the sensors, then waitsfive minutes for the sensors to stabilize. After thisstabilization period, the WildFireMod samples each sensorvia its A/D converters. Once this data has been collected,it turns off the sensors and begins the process for datatransmission. This process entails that the microprocessormake a connection to the server via the established Ethernetconnection. It then is capable of transmitting thecollected data through TCP/IP. After successfullytransmitting the data, it disconnects and goes intohibernation mode for 3 hours until the next sampling cycle.
2.1.4 Database
The MySQL database is used to store all relevant informationfor the system. Here the remote node parameters are storedalong with any data that those nodes have recorded andsuccessfully transmitted. The system has been set up sothat all interactions with the database should be performedthrough the various web interfaces (see Section 2.2: UserInterface). Nodes can be added and data associated withnodes can be viewed and downloaded.
7

2.2 User Interface
The system is set up so that it can be viewed through anyweb browser. The user is presented with the page shown inFigure 2.2.1.
Figure 2.2.1 – Initial Query Form
On this page, the user may select various filters for whichto view the data by filling in the respective select boxesand enabling the filter. By default, if no filters areenabled all data from the database will be returned. Afterselection, the user can press submit and the data will bequeried from the database. The page in Figure 2.2.2 will bedisplayed.
8

Figure 2.2.2 – Query Results
With this page the user can sort the data using the buttonsin the top of the table. The data can also be graphed usingthe buttons at the bottom, or the data can be downloaded byclicking Download CSV. When graphing, the data will begraphed in the order presented on the screen, and only theenvironmental factor selected will be graphed. The graphcan be downloaded in a high resolution PNG format. Anexample of a graph of temperature after sorting byincreasing time is shown in Figure 2.2.3. Data downloadedusing the Download CSV button will be in a CSV formattedfile, suitable for importing into a range of applicationssuch as Microsoft Excel or MATLAB. Figure 2.2.4 shows thedata imported into a spreadsheet after selecting commaseparated.
9

Figure 2.2.3 – Graph
Figure 2.2.4 – CSV Data Imported into a Spreadsheet
10

2.3 Physical Description
The four PV cells (blue-polycrystalline silicon) are mountedon a 45° inclined plastic board (12” x 12”). The connectorslink the cells and the set of two boxes where the system isenclosed.
The first enclosure (6.5” x 6.5” x 3.5”) is rated NEMA-4Xweatherproof plastic-silicon. It contains the Ni-Cad battery(protected by yellow Styrofoam) as well as the main PCBboard. The PCB board is double sided. The top side of thePCB has the voltage regulator, switch, and sensor circuitry.The bottom side supports the microprocessor connectors, andthe two connectors for the 12V battery. On the exterior ofthis box is the black RJ45 connector required for Ethernetaccess.
The second box is gray plastic and weather proof rated. Itis connected to the first box through a small horizontalopening where a ribbon cable connects the main PCB with thesensor breakout board. The opening and the ribbon cable(both sides) have been sealed using silicon to prevent waterintrusion. The sensor board contains all sensors as well asthe operating circuit for the CO sensor. This second boxfeatures a small circular opening covered by mesh at itsbottom to provide allow air to flow into the box.
The two boxes are mounted on a horizontal plastic board werethe solar controller also sits. The solar controller has twocables (yellow and black) going to the leads of the PV cellsand two other cables (red and black) going to the batteryinside the NEMA-4X box.
2.4 Installation, Setup, and Support
Before installation, the user must insert the new node intothe database. Direct your internet browser to “New NodeInsertion”. Then fill out the form shown in Figure 2.4.1.Enter your address and then drag the cursor to the exactlocation of the sensor box. The latitude and longitude will
11

automatically be updated. Enter the MAC address as itappears on the Microclimate Monitor. This must be exact forthe data being sent to register in the server properly.Enter a name for the monitor that will be easy to identify.After this information is entered into the form, the usermust press the submit button and a conformation will be sentshowing the status of the insertion. If successful, thesystem will allow connections from that node.
2.4.1 Node Setup
Installation of a node requires that the location have anEthernet connection and exposure to sunlight. Once asuitable location is found, the remote unit should besecured using whatever means is suitable for that location.After the remote unit is secured, the user must plug in theEthernet connection into the RJ45 weatherproof connector andturn the switch on. The system should then run.
12

Figure 2.4.1 – New Node Insertion Form
2.4.2 Support
If the system fails, either read the additional informationon the website and follow the Troubleshooting steps outlinedin section 3.3.
2.5 Specifications
SpecificationValue, range, tolerance,
unitsCase dimensions 1' x 1' x 1'
Power12V battery, Photovoltaic
cellsBattery 1 day without recharge
13

Data Points 8/day
CommunicationsStore 4 previous data
pointsOperating Temperature -10C to +45CDatabase access time <1 minuteWeather resistance NEMA4x ratings
Temperature Accuracy ± 2CHumidity Accuracy ± 5%Pressure Accuracy ± 1%
CO Accuracy -2ppm / +4ppmO3 Accuracy ± 5%
3.0 Operation of the Project
3.1 Operating Mode 1: Normal Operation
3.1.1 Setup
The setup procedure described below consists of all the actions that a person buying an environmental monitor will have to take:
Register the microclimate monitor online using the “New Node Insertion Form”. Follow the instructions in section 2.4.
Locate an appropriate location for the microclimate monitor. This should be outdoors with ample exposure to the sun.
Place the box in this location with the solar cells facing the direction of greatest exposure to the sun.
Plug the yellow and black cable from the Sunguard solar controller into the connectors coming from the solar cells.
Plug the red and black connector coming from the Sunguardsolar controller into the red and black connector coming out of the primary enclosure.
Plug an Ethernet cord into the Ethernet jack on the outside of the box. Make sure the other end is plugged into a network that is connected to the internet.
14

Flip the switch to turn on the system.
3.1.2 Operation of Remote Unit
The microclimate monitor will turn on and take measurements every 3 hours starting at the time the switch is first flipped. It can now be left alone for extended periods of time.
3.1.3 Operation of Internet Based User Interface
Point your web browser to the website and follow the detailed user interface instructions in Section 2.2.
3.2 Operating Mode 2: Abnormal OperationSeveral abnormal operations can occur during the systemoperating life. We propose several solutions for the user.To avoid abnormal operations, the user should perform aregular system check at least once every six months.
3.2.1 Solar Charger Malfunction
The MorningStar Sunguard Solar Charger will stop anycharging operation if the battery voltage drops below 6.5V.If this happens, the user must remove the battery from thepower circuit and replace it with an equivalent type (1100mAh Ni-Cad). It is preferable that the user charge the newbattery with a charger (rated at 0.6Ah) before installation.
3.2.2 Si-PV Cells Damage
If one of the four photovoltaic panels is damaged, thesystem will not be able to operate properly. The user mayremove the broken photovoltaic cells and replace it with aphotovoltaic cell of an equivalent type. Solder, electricaltape, and a small flat-head screwdriver will be needed forthis re-installation.
3.2.3 Low Temperature Effect
15

This system is rated for outdoor use. All the components ofthe board are to run under extreme conditions of -10°C.However, the battery will have lower performance whencharging and discharging under these conditions. Aprotective Styrofoam chamber has been installed to limitthese effects, but operation outside of the temperaturerange of -20°C to 50°C may cause the system to stopfunctioning.
3.3 Troubleshooting
3.3.1 System Malfunction
If the system has stopped sending data to the server, checkthe following:
1. Is the Ethernet link light on? This can be checked byopening up the main box and removing the PCB. The linklight is located on the WildFireMod Ethernet jack. If itis not on, check the network connections.
2. Has the server IP address changed?3. Reboot the system. This can be done by turning the
outside power switch off and on. After power cycle checkthe link light again. If it is off perform a batterycheck described below.
3.3.2 Sensor Malfunction
Sensors showing no measurable or varying output have eitherbeen damaged or reached the end of their lifecycle.Nonfunctioning sensors must be replaced with equivalenttypes. Failure to do so may cause incorrect readings ordamage to the system.
3.3.3 Power Malfunction
If the system has stopped powering on and transmitting data,there is a problem with the power to the device. The mostcommon cause of a power malfunction is that the battery isnot fully charged. This would be due to low exposure to the
16

sun for extended periods of time. Turn off the switch andleave the system outside with exposure to the sun for 24hours. After this, turn the system on again and it shouldresume operation. If the system still does not power on,the battery has probably exceeded its lifetime and should bereplaced.For those users inclined to test this thoroughly, note thatthe battery voltage should be within 10-15V for normaloperation. Test this by disconnecting the battery andplacing a 2W, 100 ohm resistor over the terminals andmeasuring the resulting voltage across the terminals. Ifthe voltage is below 10V then the battery has exceeded itslifetime and must be replaced. If this is not the case, thebattery is working normally and the SunGuard charger must bereplaced. If the voltage is above 15V, replace the SunGuardcharger. When performing any checks on the power system, donot measure from the solar leads, as the controller may bedamaged.
3.4 Safety Issues
3.4.1 Battery
When the battery reaches the end of its lifecycle, removethe battery pack from the system and dispose it properly.Also, the user must avoid any long term exposure to the sunor the battery might explode. Never short circuit thebattery leads. Make sure the main box is properly shut toensure water tightness—the battery cannot charge ordischarge in a wet environment.
3.4.2 Styrofoam
The Styrofoam chamber is here to make sure that the batteryis isolated from water and moisture. However if there is aleakage from the battery, the Styrofoam may react andundesirable chemical reactions could take place. It is theuser’s responsibility to make sure that the integrity of thebox is not compromised.
17

3.4.3 Power Circuit
The LM2940 voltage regulator will produce heat when thesystem is running. A heat sink has been include (blackindented metal) to dissipate the energy. Never touch theheat sink when the system is running to avoid any seriousburns.
3.4.4 Unit Location
The system is to be placed outdoors in a place with highexposure to the sun. We recommend that the user place thesystem on a roof or a balcony. To protect bystanders, thesystem should be secured to the roof to avoid any mishapsshould there be high winds.
18

4.0 Technical Background
4.1 Sensor Circuitry
4.1.1 Temperature/Humidity
The temperature and relative humidity sensor is the HS-2000V. The sensor is capable of detecting temperature from-30ºC to +85ºC and relative humidity from 0% to 100%. Forrelative humidity it has +/- 2% accuracy, and fortemperature it has +/- 0.4ºC accuracy. A minimum load of50KΩ and a voltage supply of 2V to 5.5V are required forproper operation. We used two 100KΩ in parallel to achievethis load and all of our sensors are powered by 5V fromutilization of a 5V voltage regulator. This circuitry is onthe PCB. The sensor was tested in the lab, as well as withheat applied to it, and it was found to be working. To testrelative humidity, the sensor was tested on a rainy day aswell as a sunny day and the voltages corresponded to thecorrect values.
Figure 4.1.1 – HS-2000V
4.1.2 Pressure
The pressure sensor is the BARO-A-4V-MINI-PRIME sensor. Thesensor is operational in a temperature range of -25ºC to+85ºC with an operating range of 600 mbar to 1100 mbar for
19
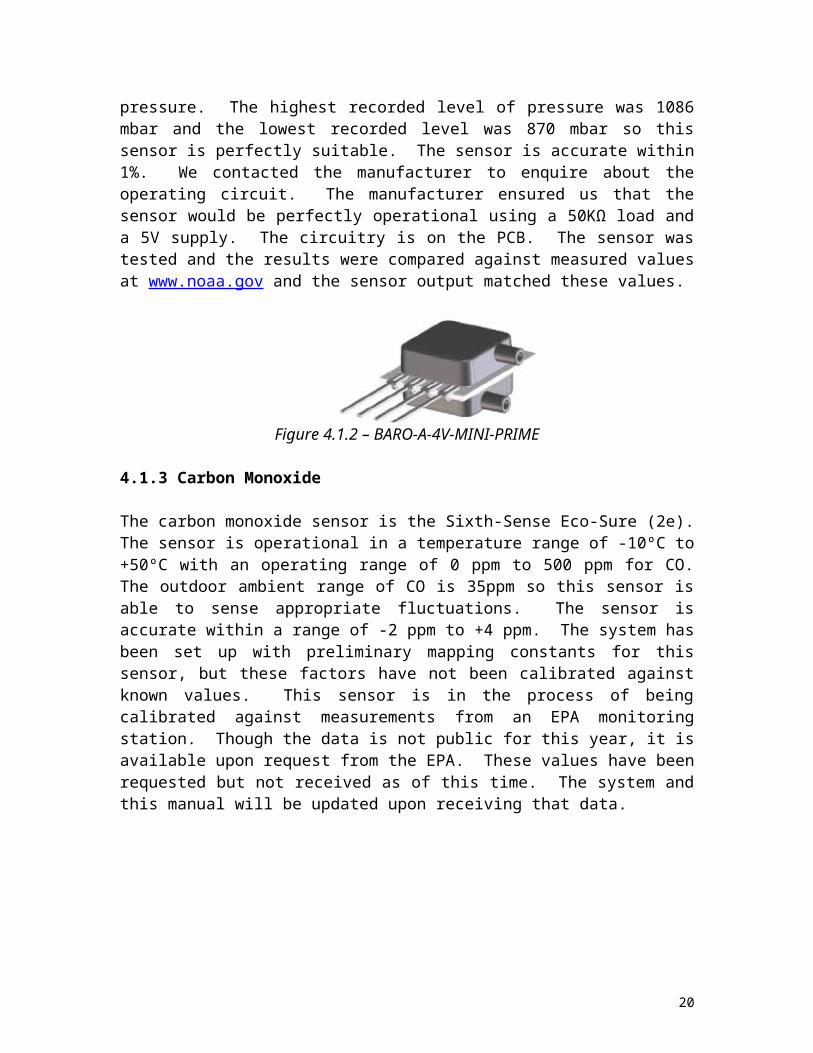
pressure. The highest recorded level of pressure was 1086mbar and the lowest recorded level was 870 mbar so thissensor is perfectly suitable. The sensor is accurate within1%. We contacted the manufacturer to enquire about theoperating circuit. The manufacturer ensured us that thesensor would be perfectly operational using a 50KΩ load anda 5V supply. The circuitry is on the PCB. The sensor wastested and the results were compared against measured valuesat www.noaa.gov and the sensor output matched these values.
Figure 4.1.2 – BARO-A-4V-MINI-PRIME
4.1.3 Carbon Monoxide
The carbon monoxide sensor is the Sixth-Sense Eco-Sure (2e).The sensor is operational in a temperature range of -10ºC to+50ºC with an operating range of 0 ppm to 500 ppm for CO.The outdoor ambient range of CO is 35ppm so this sensor isable to sense appropriate fluctuations. The sensor isaccurate within a range of -2 ppm to +4 ppm. The system hasbeen set up with preliminary mapping constants for thissensor, but these factors have not been calibrated againstknown values. This sensor is in the process of beingcalibrated against measurements from an EPA monitoringstation. Though the data is not public for this year, it isavailable upon request from the EPA. These values have beenrequested but not received as of this time. The system andthis manual will be updated upon receiving that data.
20

Figure 4.1.3 – Sixth-Sense Eco-Sure (2e)
4.1.4 Ozone
The ozone sensor is the 7OZ Citicel. The sensor isoperational in a temperature range -20ºC to +50ºC with anoperating range of 0 ppm to 2 ppm for O3. The outdoorambient range of O3 is .12 ppm so this sensor is able tosense appropriate fluctuations. The sensor is accuratewithin 5%. The operating circuit was provided by themanufacturer. The values for Rgain and Rload were determinedaccording to their limiting conditions. For Rgain the voltageacross the resistor should be less than 10mV. Rload
determines the response time for the circuit to be less than150s. Rgain and Rload were selected to be 220Ω and 33Ωrespectively. This sensor was calibrated againstmeasurements from an EPA monitoring station and found to beproducing correct outputs.
Figure 4.1.4 – 7OZ Citicel
4.2 Microprocessor
The embedded system we are using is the WildfireMod from
21

Steroid Micros (www.steroidmicros.com). The microcontrollerit uses is the ColdFire MCF5282 Module. The module operateson 5V and requires approximately 300mA when in fulloperation. Additional features include an Ethernet port, 8filtered 10 bit A/D converters, 512K fast on-chip FLASHEPROM, 64K fast on-chip SRAM, 4 MB flash memory for programstorage, 16 MB fast SDRAM for program execution, an SD cardslot, 16 general purpose I/O pins, and a Real Time Clock.
Figure 4.2.1 – WildFireMod
The sensors outputs are each connected to a dedicated A/Dconverter. There are 5 environmental parameters beingmeasured which require 5 A/D converters. Two of the generalpurpose I/O pins are being used to power the switch whichturns on the sensors. The Ethernet port is being used tocommunicate with the server. The real time clock is used toallow the microprocessor to hibernate and wake up at theappropriate time. Allprogramming for the microprocessor is done in C.
4.3 Power
4.3.1 Photovoltaic Cells
The photovoltaic cells deliver the power necessary for thesystem to be continuously autonomous. The boom of theenvironmental market enables us to use polycrystallinesilicon-made cells at an affordable price. The efficiency ofthis material is around 12%. To ensure the best sunlightexposure, the cells are mounted on a 45º incline. Theexpected value for the power produced by this cell
22

combination is around 6W (0.5A at 12V) at sun exposure(Figure B11).
Figure 4.3.1 – Photovoltaic Cells
4.3.2 Solar Controller
The Sunguard solar controller was manufactured byMorningstar Corporation. It can support up to 30V/4.5A inputand is rated for Ni-Cad 12V batteries. This specific solarcontroller was chosen because of its regular use inphotovoltaic applications. It is rated for outdoor use andhas a list of important features. The potentiometer shutsdown the charging process should the battery overheat. Italso has a built-in diode that blocks any overnightdischarging of the battery into the solar cells. Its self-consumption is limited to 6mA.
Figure 4.3.2 – Morning Sungard Solar Controller
4.3.3 Ni-Cad Battery Pack
The 12V Ni-Cad battery pack has a series of 10 x AA singlebatteries inside a white protective compartment. It has2000 theoretical life cycles. The current is delivered at arate of 1000mAh. When running, the system will use an
23

instantaneous value of 370mA at 12V. Tested over severaldays, the battery can reach a voltage of 13.8V when chargingunder the PV cells. The battery pack, if initiallydischarged, will need about 3 hours to be fully charged.The threshold at which Ni-Cad ceases to function is -40°C.At that frigid temperature, the Ni-Cad is limited to adischarge rate of 0.2C (200mAh for this battery). Inaddition, the battery will recharge at below freezingprovided the charge rate is reduced to 0.1C (i.e. 100mAh).
Figure 4.3.3 – Ni-Cad Battery
4.3.4 Voltage Regulator
All the sensors and the other loads have an input of 5V,therefore it was essential to include a voltage regulator totransform the output of the 12V battery to a 5V power supplyfor the load circuitry. The LM2940 can provide a 5V voltageand a maximum current of 1A for the load circuitry whichmatches the capacity of the Ni-Cad battery. A heat sink wasadded so that the LM2940 can deliver 500mA for more than 2hours without shutting down.
Figure 4.3.4 – LM2940
4.3.5 Switch
The single switch provides current from the battery to thesensor circuitry. This switch is composed of two
24

transistors (BC107 and BC177). The switch is controlled bythe microprocessor from port PC0. The switch is also ratedfor high current use (up to 700mA).
25

5.0 Cost Breakdown
Project Costs for Production of Urban Microclimate Monitoring SystemAlpha Version
Item Quantity
Description UnitCost
Extended
Cost1 1 Outdoor Box Set NEMA-4X 28.59 28.592 1 Eco-Sure 2e Carbon Monoxide Sensor* 238 2383 1 BARO-4V-MINI-PRIME Pressure Sensor 86 864 1 HS-200V Temperature and Humidity Sensor 29.95 29.955 1 O3-7OZ CiticeL Ozone Sensor* 296 2966 1 Wild-Fire Mod uClinux Development Board* 699 6997 1 Printed Circuit Board 33 338 1 1’ 20 Conductor Ribbon Cable 5 59 1 Plastic Cement 5 510 1 LT1078 Op-Amp 5 511 1 OP77 Op-Amp 5.5 5.412 2 Quick Disconnect 2 pin Assembly 5 1013 4 Silicon Photovoltaic Cell 10 4014 1 Plexiglas Sheet (4’x 4’)* 10 1015 1 Wire Harness 16.49 16.4916 1 Ni-Cad Battery Pack 15.97 15.9718 1 SunGuard Solar Controller 35 3519 - Passive Components (Resistors, - 39.63
26

Capacitors, LED …)Alpha Version-Total Cost 1588.0
3
The table above describes the costs incurred for the production of our prototype. Theitem(s) marked with asterisk were donated to the project. The prices listed next to thosevalues are the current market values for each item if they were not donated. The finalcost of the alpha version is $1588.03; however, the cost of the beta version is less. Thebeta version of our prototype would cost $1078.03, a savings of $520 because there is noneed for the WildFireMod’s development kit, only the ColdFire microprocessor board wouldneed to be purchased.
Project Costs for Production of Urban Microclimate Monitoring SystemBeta Version
Item Quantity
Description UnitCost
Extended
Cost1 1 Outdoor Box Set NEMA-4X 28.59 28.592 1 Eco-Sure 2e Carbon Monoxide Sensor 238 2383 1 BARO-4V-MINI-PRIME Pressure Sensor 86 864 1 HS-200V Temperature and Humidity Sensor 29.95 29.955 1 O3-7OZ CiticeL Ozone Sensor 296 2966 1 ColdFire uClinux Microprocessor 189 1897 1 Printed Circuit Board 33 338 1 1’ 20 Conductor Ribbon Cable 5 59 1 Plastic Cement 5 5
27

10 1 LT1078 Op-Amp 5 511 1 OP77 Op-Amp 5.5 5.412 2 Quick Disconnect 2 pin Assembly 5 1013 4 Silicon Photovoltaic Cell 10 4014 1 Plexiglas Sheet (4’x 4’) 10 1015 1 Wire Harness 16.49 16.4916 1 Ni-Cad Battery Pack 15.97 15.9718 1 SunGuard Solar Controller 35 3519 - Passive Components (Resistors,
Capacitors, LED …)- 39.63
Alpha Version-Total Cost 1078.03
28

6.0 Appendices
29

Appendix A – Block Diagram
30

31

Figure A1: System Block Diagram
32

Appendix B - Figures
33

Solar Controller Circuit
Figure B1: Sunguard Electrical Diagram
34

Vout/Tem p Correspondence
0
1
2
3
4
5
6
0-23.1-16.2-9.3-2.4 4.5 11.418.325.232.1
39 45.952.859.766.673.580.4Tem perature (Celcius)
Vout (V)
Figure B2: HS-2000V Voltage vs. Temperature
Vout/Hum idity Correspondence
0
1
2
3
4
5
6
0 6 12 18 24 30 36 42 48 54 60 66 72 78 84 90 96Relative Hum idity (%)
Vout (V)
Figure B3: HS-2000V Voltage vs. Humidity
35

Vout/Pressure Correspondence
3.36
3.38
3.4
3.42
3.44
3.46
3.48
3.5
993.06994.3995.6997.2997.3997.6998.8999.71000.51002.61003.471004.31004.91005.5Pressure (m bar)
Vout (V)
Figure B4: BARO-A-4V-MINI-PRIME Voltage vs. Pressure
Vout/[O3] Correspondence
0.58
0.59
0.6
0.61
0.62
0.63
0.64
0.65
0.66
0.67
0.68
23 29 33 37 39 43[O3] (ppb)
Vout (V)
Figure B5: Sixth-Sense Eco-Sure (2e) Voltage vs. Ozone Level
36

37
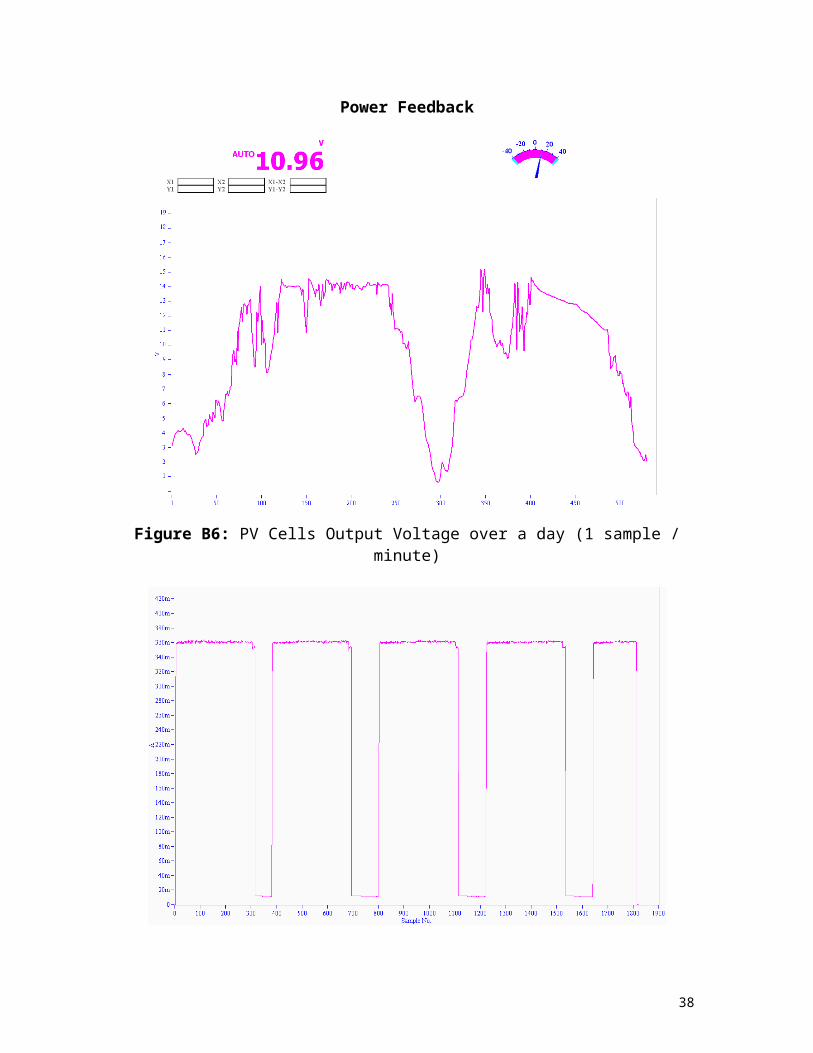
Power Feedback
Figure B6: PV Cells Output Voltage over a day (1 sample /minute)
38

Figure B7: Current Draw From System (1 sample / second)
Appendix C – Schematics &Pictures
39

40

PCB Schematic
Figure C1: Printed Circuit Board Schematic of Alpha Version
41

Figure C2: PDF of Bottom of PCB
42

Figure C3: PDF of Solder Mask of Bottom of PCB
Figure C4: PDF of Top of PCB
43

Figure C5: PDF of Solder Mask of Top of PCB
Figure C6: PDF of Silkscreen Top of PCB
44

Figure C7: View of PCB – Top Layer
45

Figure C8: View of PCB – Bottom Layer
Figure C9: Sensors Breakout Board
46

Figure C10: Styrofoam Battery Chamber
47

48

Figure C11: Printed Circuit Board Schematic of Beta Version
49

50
Appendix D – Datasheets(Please refer to Appendix D on CD)
50

Appendix E – Source Code(Please refer to Appendix E on CD)
51

52

Appendix F – Bill of Materials
53

Quantity Description
UnitCost($)
TotalCost($)
Sensor Board1 Outdoor Box (Small) 10 106 Resistors 0.1 0.61 J177 JFET 0.1 0.11 OP90 Op-Amp 2.94 2.941 Eco-Sure 2e CO Sensor 238 2381 BARO-4V-MINI-PRIME Pressure Sensor 86 861 HS-200V Temperature and Humidity Sensor 29.95 29.951 O3-7OZ CiticeL Ozone Sensor 296 2963 Mounting Pins for Ozone Sensor 0.02 0.061 Ceramic Capacitor 0.1 0.12 Electrolytic Capacitors 0.1 0.21 1' 20 conductor ribbon cable 5 52 20 Pin Dual Row Connectors (female) 1 21 20 Pin Dual Row Connector (Male) 0.2 0.21 LED 0.1 0.11 Wire 1 11 3”x4” Perf Board 2 24 2”x1/8” Flat Head Machine Screws 0.15 0.68 1/8” Coarse Grain Nuts 0.07 0.561 Plastic Cement 5 5
Main Board1 WildFireMod 189 1891 Outdoor Box (Large) 18.59 18.591 PCB 33 3314 Resistors 0.1 1.41 Electrolytic Capacitor 0.1 0.14 Ceramic Capacitor 0.1 0.42 20 Pin Dual Row Connector (Male) 0.2 0.44 Dual Row Jumpers 0.01 0.04
54

1 Philmore Coin Cell Holder 2.9 2.91 CR1225 Battery 2 21 LT1078 Op-AMP 5 51 OP77 Op-AMP 5.4 5.41 J177 JFET 0.1 0.11 LM2940T Voltage Regulator 1.82 1.822 80 Pin Board to Board Connectors 2 43 1 Pin Connector 0.05 0.151 BC177b PNP Transistor 0.5 0.51 BC107 NPN Transistor 0.5 0.51 Heatsink Assembly 0.5 0.54 2”x1/8” Flat Head Machine Screws 0.15 0.68 1/8” Coarse Grain Nuts 0.07 0.562 Quick Disconnect 2 pin Assembly 5 10
Power System and Support4 Solar Cells 10 401 Plexiglass Sheet (4'x4') 10 101 Wire Harness 16.49 16.491 SunGuard Solar Controller 35 351 NiCd Battery 15.97 15.971 Perf Board 2 24 3/4”x1/8” Flat Head Machine Screws 0.15 0.64 1/8” Coarse Grain Nuts 0.08 0.324 1/8” Lock Washers 0.07 0.28
Server1 Computer 0 01 Red Hat Linux Installation Disk Set 0 0
55

56

Appendix G – Vendor Literature &Important Contacts
57

58

59
EPAEnvironmental Databasewww.epa.gov
State of MassachusettsLocal EPA [email protected].
us
Steroid-MicrosWildfire Modwww.steroidmicros.com
AdvancedCircuits PCBwww.4pcb.com
Linear TechnologyElectronic Componentswww.linear.com
Digikey Electronic Componentswww.digikey.com
Sixth Sense CO Sensorwww.sixth-sense.com
City TechnologyO3 Sensorwww.citytech.com
Precon USATemperature & Humidity Sensor
www.preconusa.com
All Sensors CorporationPressurewww.allsensors.com
Battery Space Ni-Cad Battery & Connectorswww.batteryspace.com
Solar EngineeringPV [email protected]
Hammond Manufacturing NEMA-4X Enclosurewww.alliedelec.com
Diversi-Foam ProductsStyrofoamwww.diversifoam.com(763) 477-5854
MorningStar Sunguard Solar Controllerwww.morningstarcorp.com
59

60

61
Appendix H – Team Information
61

George [email protected](267) 249-7330George is a native of Philadelphia, Pennsylvania and will begraduating in May with a Bachelor's Degree in ElectricalEngineering at Boston University. Upon graduation, he willbe completing a Master's Degree in Computer Engineering alsoat Boston University. George's interests include opensource software, social responsibility, and transportationsystems. He enjoys skiing, traveling, and camping.
Peter [email protected](857) 222-7263Peter Dib is a native of Paris, France and will begraduating in May with a Bachelor’s Degree in ElectricalEngineering at Boston University. Upon graduation, he willbe pursuing his Master’s Degree in Electrical Engineering.Peter’s interests include signal processing andcommunication systems. He enjoys traveling, reading, andskiing. Brandi [email protected](949) 939-8099Brandi is a native of Orange County, California and will begraduating in May with a Bachelor’s Degree in ElectricalEngineering at Boston University. Upon graduation, she willbe pursuing her PhD in Electrical and Computer Engineeringat Georgia Tech. Brandi’s interests are in the field of
62

signal and image processing. She enjoys traveling, running,and reading.
Noam [email protected](305) 978-9366Noam is a native of Miami, Florida and will be graduating inMay with a Bachelor’s Degree in Electrical Engineering atBoston University. Upon graduation, he will be pursuing hisMaster’s Degree in Computer Engineering at BostonUniversity. Noam’s interests are widespread, ranging fromprogramming in a variety of languages to computerarchitecture to sound systems. In his free time, he enjoystraveling, working in the recording studio (or anything thathas to do with music), and cooking.
Team HistoryBrandi and Noam have known each other since freshman yearwhen they both were members of the Boston University TerrierMarching Band. Sophomore year they met George when allthree were in Professor Azza Fahim’s Electric Circuit Theorycourse. Also sophomore year, Brandi met Peter and theycompleted the EK301 truss project together. Since junioryear, all four have taken various classes together. In thespring of 2006, Brandi, Noam, and George traveled to PuertoRico which proved to be an interesting bonding experience.Brandi, Noam, George, and Peter have agreed that they willmaintain their friendship throughout the course of seniordesign and beyond.
63