Enrofloxacin—The Ruthless Killer of Eukaryotic Cells ... - MDPI

Mathematical Biosciences 261 (2015) 83–90
Contents lists available at ScienceDirect
Mathematical Biosciences
journal homepage: www.elsevier.com/locate/mbs
Toxin effect on protein biosynthesis in eukaryotic cells:
A simple kinetic model
Vladas Skakauskas a,∗, Pranas Katauskis a, Alex Skvortsov b, Peter Gray b
a Faculty of Mathematics and Informatics, Vilnius University, Naugarduko 24, 03225 Vilnius, Lithuaniab Defence Science and Technology Organisation, 506 Lorimer st., Melbourne, VIC 3207, Australia
a r t i c l e i n f o
Article history:
Received 17 June 2014
Revised 24 December 2014
Accepted 26 December 2014
Available online 5 January 2015
Keywords:
Toxin
Ricin
Antibody
Cell receptor
Protein biosynthesis
a b s t r a c t
A model for toxin inhibition of protein synthesis inside eukaryotic cells is presented. Mitigation of this effect
by introduction of an antibody is also studied. Antibody and toxin (ricin) initially are delivered outside the cell.
The model describes toxin internalization from the extracellular into the intracellular domain, its transport to
the endoplasmic reticulum (ER) and the cleavage inside the ER into the RTA and RTB chains, the release of RTA
into the cytosol, inactivation (depurination) of ribosomes, and the effect on translation. The model consists
of a set of ODEs which are solved numerically. Numerical results are illustrated by figures and discussed.
© 2015 Elsevier Inc. All rights reserved.
1
i
i
a
p
i
s
i
m
t
s
t
u
s
c
m
r
r
r
t
[
d
t
i
i
o
i
o
(
c
f
t
c
c
s
t
m
i
a
(
o
h
0
. Introduction
Ricin, a natural product of the castor bean (Ricinus communis),
s highly toxic to mammalian cells. It has been used for oncolog-
cal cancer treatment, but it also has the potential to be used as
weaponised biological agent because of its stability and ease of
roduction [1,2]. Ricin poisoning can cause severe tissue damage,
nflammatory reactions and can result in death [3]. In spite of inten-
ive biomedical research no treatment is available for ricin poison-
ng. Some promising results have been shown recently using an im-
unotherapeutic approach, i.e. application of high affinity antibodies
o neutralise the effects of ricin [4,5].
The development and production of new antibodies is an expen-
ive process that usually includes extensive experimental studies. In
his context, the retrospective evaluation of antibodies with contin-
ous experimental refinement of its binding parameters aiming at
election of the best candidate may become very time and resource
onsuming. In order to reduce this experimental burden a simple
odelling framework derived from mass-action kinetics has been
ecently proposed [6–8].
The process of toxin entry into a cell, associated with bio-chemical
eactions and their toxic effects, is well documented. This includes
eceptor–toxin binding, toxin internalization, intracellular transport
o the endoplasmic reticulum (ER) and inhibition of protein synthesis
∗ Corresponding author. Tel.: +370 5 2193084; fax: +370 5 2151585.
E-mail address: [email protected] (V. Skakauskas).
o
p
α
ttp://dx.doi.org/10.1016/j.mbs.2014.12.004
025-5564/© 2015 Elsevier Inc. All rights reserved.
9–12]. The modelling framework reported in [6–8] ignores some fine
etails of this complex and multi-stage process and aims to capture
hem by means of a set of coupled mass action kinetics equations.
The aim of the present study is to extend the framework reported
n [6–8] and to model the last stage of the toxicological effect of ricin:
nhibition of protein synthesis in the cell.
Protein synthesis is a complex biochemical process [13,14]. Models
f protein synthesis have been analysed in numerous publications and
t is still a topic of intensive research, see [15–32].
Protein synthesis in eukaryotic cells begins with the transcription
f a messenger RNA (mRNA) by RNA polymerase from a given gene
DNA) in the nucleus of cells. This mRNA then is transported into the
ytosol where a cellular ribosome binds to it to make a new protein
rom the specific amino acids carried by aminoacylated (‘charged’)
ransfer RNAs (tRNAs). Process of incorporation (translation) of tRNA
arried amino acids into a polypeptide chain (protein) is realised ac-
ording to the sequence of the mRNA and can be divided into three
tages: (i) initiation, in which ribosome joins the mRNA and locates
he first (initiation) codon, (ii) elongation, in which the ribosome
oves in a codon by codon stepwise manner along the mRNA, us-
ng tRNA carried molecules to incorporate the appropriate encoded
mino acid at each codon, and (iii) termination, in which the last
stop) codon is recognised by a protein release factor to direct release
f the completed polypeptide from the ribosome.
The effect of ricin on protein synthesis is a result of the ability
f ricin to ‘deactivate’ (damage) a ribosome and exclude it from the
ool of ribosomes available for protein synthesis (by depurinating the
-sarcin/ricin loop of the large rRNA [33,34]). This allows us to

84 V. Skakauskas et al. / Mathematical Biosciences 261 (2015) 83–90
Fig. 1. Ricin pathway to ribosome: 1 – spherical surface of the external compartment
(extracellular domain �e), 2 – cell membrane (external boundary of intracellular do-
main �i , 3 – spherical envelope of ER, 4 – receptor, 5 – toxin, 6 – toxin–receptor
complex, 7 – antibody, 8 – toxin-antibody complex, 9 – ribosome.
Fig. 2. Ricin chemical transformation during pathway to ribosome: values of rate
constants are given in Table 1, notations for chemical species are given in the main
text.
Fig. 3. Chemical bindings of ricin in the ribosome pool in the cell cytoplasm: values
of rate constants are given in Table 1, notations for chemical species are given in the
main text.
s
ρT
b
c
b
(
E
l
s⎧⎪⎪⎪⎪⎨⎪⎪⎪⎪⎩
w
t
r
a
r
a
c
i
i
m
t
t
propose a simple phenomenological model of the process (mass-
action kinetics) that captures the effect of ricin as a ‘supply-demand’
constraint imposed on the ribosome pool. For the sake of simplicity
we disregard the processes of aminoacylation of tRNA (i.e., activa-
tion of tRNA during which a specific amino acid is joined to tRNA),
mRNA transcription and details of its translation by a ribosome (i.e.,
reading and linking together of two neighbouring amino acids into
a polypeptide chain) and neglect post-translational modifications of
the synthesised protein.
By employing this mass-kinetic model we also demonstrate how
introduction of an antibody can mitigate inhibition of protein synthe-
sis. More specifically, we consider a model in which the toxin (ricin)
and an antibody are initially delivered outside the cell and study their
effect on cell protein synthesis in these settings.
The paper is organised as follows. In Section 2 we present the
model. In Section 3 we discuss numerical results and summary in
Section 4 concludes the paper.
2. The model
Our model aims to capture two main bio-chemical processes as-
sociated with the toxicological effect of ricin: ricin transport to the
ribosome and the effect of ricin on the ability of the ribosome to syn-
thesise protein. The geometrical settings of the system are depicted
in Figs. 1 and 3. The schemas of chemical reactions describing trans-
formations in bio-chemical processes are presented in Figs. 2 and 3.
To make predictions that may be validated in a laboratory set-
ting, the model is based on isolated, cultured cells and other factors
involved in in vivo intoxication, such as clearance rate, non-uniform
distribution throughout the tissue, etc., are not considered. The con-
centrations of reacting species used in the model are typical of those
used in laboratory studies and the number of molecules involved is
sufficiently large, so that the system is usually well described by the
deterministic equations for the mean values of fluctuating concentra-
tions. We note that this assumption may not be always valid during
the early stages of ricin transport into the cell when the number of in-
ternalised toxin molecules is small (i.e. stochastic fluctuations caused
by a finite number of molecules in the system may become significant
[35–37]
We begin with consideration of the process of ricin transport to ri-
bosome. In order to model a geometrically extended system with
a single-cell settings we assume a spatial periodicity of the sys-
tem and impose a special boundary condition at some radius of the
ingle-cell ‘compartment’ ρe � ρm (external domain), where ρm and
e are radii of the cell membrane and external sphere, respectively.
he cell is modelled as a sphere surrounded by a permeable mem-
rane (for details see [7,8]) and ER is modelled as an enclosed con-
entric sphere of a smaller radius ρn � ρm with a partially absorbing
oundary. To shorten notations we use �e for extracellular domain
ρe � ρm) and �i for intracellular space (i.e. the domain between the
R envelope and the cell membrane, ρn � ρm), see Fig. 1.
Let toxin (ricin) and antibody be initially delivered in the extracel-
ular domain (i.e. in �e). Then according to [7,8]) the concentration of
pecies in �e is governed by equations
u̇Te = −k1euTeuAe + k−1euCe
− k3er0(k2e(1 − θ)uTe − k−2eθ), uTe(0) = u0Te,
u̇Ae = −k1euTeuAe + k−1euCe, uAe(0) = u0Ae,
u̇Ce = k1euTeuAe − k−1euCe, uCe(0) = 0,
θ̇ = k2e(1 − θ)uTe − k−2eθ − keθ, θ(0) = 0
(1)
here uTe , uAe , uCe , and θ are concentration of toxin (Te), antibody (A),
oxin-antibody complex (C), and fraction of toxin-bound receptors,
espectively, u0Te
and u0Ae
are initial concentrations of the toxin and
ntibody, k1e and k−1e are association and dissociation toxin-antibody
ate constants, k2e and k−2e are association and dissociation toxin-
ntibody rate constants of toxin–receptor binding. Parameter r0 =onst is the concentration of receptors on the cell surface, so that r0θs the concentration of toxin-bound receptors [7,8].
From a solution of this system we can determine the flux of the
nternalised toxin across the cell membrane into the intracellular do-
ain �i (this flux is equal to ker0θ ). Inside �i toxin moves toward
he ER driven by the mechanism of retrograde transport and even-
ually crosses the ER envelope [34]. By applying the mass-balance
V. Skakauskas et al. / Mathematical Biosciences 261 (2015) 83–90 85
a
c
e
u
w
c
a
t
k
F
p
p
P
w
a
o
t⎧⎪⎪⎨⎪⎪⎩
w
R
u
c
E
w
f
i
b
c
a
η
p
T
a
(
c
p
o
c
g
s
s
r
t
o
t
d
f
W
e
c
X
C
C
H
c
α
c
d
⎧⎪⎪⎪⎪⎪⎪⎪⎪⎪⎪⎪⎨⎪⎪⎪⎪⎪⎪⎪⎪⎪⎪⎪⎩
w
i
t
v
⎧⎪⎪⎪⎪⎪⎪⎪⎪⎪⎪⎪⎪⎪⎪⎪⎪⎪⎪⎪⎪⎪⎪⎪⎪⎪⎪⎪⎪⎪⎪⎪⎪⎪⎪⎪⎪⎪⎨⎪⎪⎪⎪⎪⎪⎪⎪⎪⎪⎪⎪⎪⎪⎪⎪⎪⎪⎪⎪⎪⎪⎪⎪⎪⎪⎪⎪⎪⎪⎪⎪⎪⎪⎪⎪⎪⎩
w
t
(
t
s
i
T
X
X + Rd → Cd, (12)
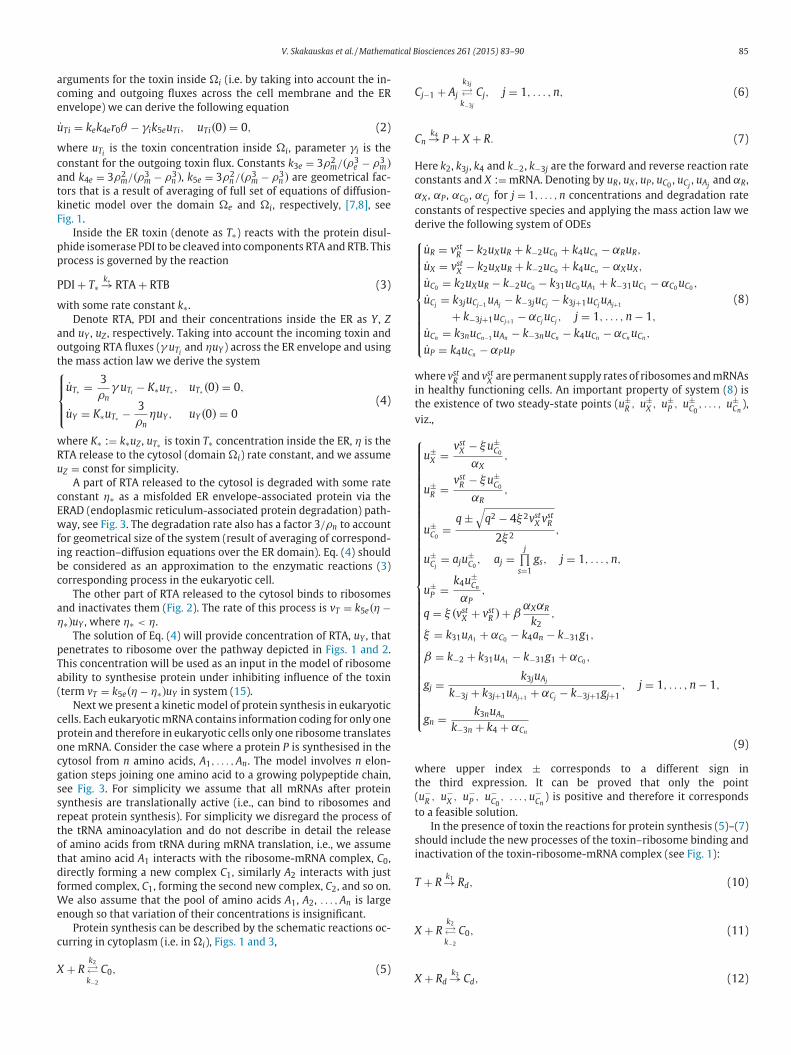
rguments for the toxin inside �i (i.e. by taking into account the in-
oming and outgoing fluxes across the cell membrane and the ER
nvelope) we can derive the following equation
˙ Ti = kek4er0θ − γik5euTi, uTi(0) = 0, (2)
here uTiis the toxin concentration inside �i, parameter γi is the
onstant for the outgoing toxin flux. Constants k3e = 3ρ2m/(ρ3
e − ρ3m)
nd k4e = 3ρ2m/(ρ3
m − ρ3n ), k5e = 3ρ2
n /(ρ3m − ρ3
n ) are geometrical fac-
ors that is a result of averaging of full set of equations of diffusion-
inetic model over the domain �e and �i, respectively, [7,8], see
ig. 1.
Inside the ER toxin (denote as T∗) reacts with the protein disul-
hide isomerase PDI to be cleaved into components RTA and RTB. This
rocess is governed by the reaction
DI + T∗k∗→ RTA + RTB (3)
ith some rate constant k∗.
Denote RTA, PDI and their concentrations inside the ER as Y , Z
nd uY , uZ , respectively. Taking into account the incoming toxin and
utgoing RTA fluxes (γ uTiand ηuY ) across the ER envelope and using
he mass action law we derive the system
u̇T∗ = 3
ρnγ uTi
− K∗uT∗ , uT∗(0) = 0,
u̇Y = K∗uT∗ − 3
ρnηuY , uY(0) = 0
(4)
here K∗ := k∗uZ , uT∗ is toxin T∗ concentration inside the ER, η is the
TA release to the cytosol (domain �i) rate constant, and we assume
Z = const for simplicity.
A part of RTA released to the cytosol is degraded with some rate
onstant η∗ as a misfolded ER envelope-associated protein via the
RAD (endoplasmic reticulum-associated protein degradation) path-
ay, see Fig. 3. The degradation rate also has a factor 3/ρn to account
or geometrical size of the system (result of averaging of correspond-
ng reaction–diffusion equations over the ER domain). Eq. (4) should
e considered as an approximation to the enzymatic reactions (3)
orresponding process in the eukaryotic cell.
The other part of RTA released to the cytosol binds to ribosomes
nd inactivates them (Fig. 2). The rate of this process is vT = k5e(η −∗)uY , where η∗ < η.
The solution of Eq. (4) will provide concentration of RTA, uY , that
enetrates to ribosome over the pathway depicted in Figs. 1 and 2.
his concentration will be used as an input in the model of ribosome
bility to synthesise protein under inhibiting influence of the toxin
term vT = k5e(η − η∗)uY in system (15).
Next we present a kinetic model of protein synthesis in eukaryotic
ells. Each eukaryotic mRNA contains information coding for only one
rotein and therefore in eukaryotic cells only one ribosome translates
ne mRNA. Consider the case where a protein P is synthesised in the
ytosol from n amino acids, A1, . . . , An. The model involves n elon-
ation steps joining one amino acid to a growing polypeptide chain,
ee Fig. 3. For simplicity we assume that all mRNAs after protein
ynthesis are translationally active (i.e., can bind to ribosomes and
epeat protein synthesis). For simplicity we disregard the process of
he tRNA aminoacylation and do not describe in detail the release
f amino acids from tRNA during mRNA translation, i.e., we assume
hat amino acid A1 interacts with the ribosome-mRNA complex, C0,
irectly forming a new complex C1, similarly A2 interacts with just
ormed complex, C1, forming the second new complex, C2, and so on.
e also assume that the pool of amino acids A1, A2, . . . , An is large
nough so that variation of their concentrations is insignificant.
Protein synthesis can be described by the schematic reactions oc-
urring in cytoplasm (i.e. in �i), Figs. 1 and 3,
+ Rk2
�k−2
C0, (5)
j−1 + Aj
k3j
�k−3j
Cj, j = 1, . . . , n, (6)
nk4→ P + X + R. (7)
ere k2, k3j, k4 and k−2, k−3j are the forward and reverse reaction rate
onstants and X := mRNA. Denoting by uR, uX , uP , uC0, uCj
, uAjand αR,
X , αP , αC0, αCj
for j = 1, . . . , n concentrations and degradation rate
onstants of respective species and applying the mass action law we
erive the following system of ODEs
u̇R = vstR − k2uXuR + k−2uC0
+ k4uCn− αRuR,
u̇X = vstX − k2uXuR + k−2uC0
+ k4uCn− αXuX,
u̇C0= k2uXuR − k−2uC0
− k31uC0uA1
+ k−31uC1− αC0
uC0,
u̇Cj= k3juCj−1
uAj− k−3juCj
− k3j+1uCjuAj+1
+ k−3j+1uCj+1− αCj
uCj, j = 1, . . . , n − 1,
u̇Cn= k3nuCn−1
uAn− k−3nuCn
− k4uCn− αCn
uCn,
u̇P = k4uCn− αPuP
(8)
here vstR and vst
X are permanent supply rates of ribosomes and mRNAs
n healthy functioning cells. An important property of system (8) is
he existence of two steady-state points (u±R , u±
X , u±P , u±
C0, . . . , u±
Cn),
iz.,
u±X = vst
X − ξu±C0
αX,
u±R = vst
R − ξu±C0
αR,
u±C0
=q ±
√q2 − 4ξ 2vst
X vstR
2ξ 2,
u±Cj
= aju±C0
, aj =j∏
s=1
gs, j = 1, . . . , n,
u±P = k4u±
Cn
αP,
q = ξ(vstX + vst
R )+ βαXαR
k2,
ξ = k31uA1+ αC0
− k4an − k−31g1,
β = k−2 + k31uA1− k−31g1 + αC0
,
gj = k3juAj
k−3j + k3j+1uAj+1+ αCj
− k−3j+1gj+1
, j = 1, . . . , n − 1,
gn = k3nuAn
k−3n + k4 + αCn
(9)
here upper index ± corresponds to a different sign in
he third expression. It can be proved that only the point
u−R , u−
X , u−P , u−
C0, . . . , u−
Cn) is positive and therefore it corresponds
o a feasible solution.
In the presence of toxin the reactions for protein synthesis (5)–(7)
hould include the new processes of the toxin–ribosome binding and
nactivation of the toxin-ribosome-mRNA complex (see Fig. 1):
+ Rk1→ Rd, (10)
+ Rk2
�k−2
C0, (11)
k3

86 V. Skakauskas et al. / Mathematical Biosciences 261 (2015) 83–90
Table 1
Parameters of simulations (j = 1, 2, . . . , n; mv – model value).
Parameter Values Ref.
ke 3.3 × 10⁻⁵ s−1 [41,42]
k1e 2.6 × 10⁻¹⁶ cm3 s−1 [40]
k2e 2.1 × 10⁻¹⁶ cm3 s−1 [4]
k−1e 5.2 × 10⁻² s−1 [40]
k−2e 1.4 × 10⁻⁴ s−1 [4]
k1 2.15 × 10⁻¹⁶ cm3 s−1 mv
k2 2.15 × 10⁻¹⁶ cm3 s−1 mv
k−2 10−4 s−1 mv
k3 1.66 × 10⁻¹⁵ s−1 mv
k3j 1.5 × 10⁻¹⁴ cm3 s−1 mv
k−3j 10−4 s−1 mv
k4 0.5 s−1 mv
K∗ 0.8 s−1 mv
η, η∗ 2 × 10⁻², 10−2 cm s−1 mv
γi 3 × 10⁻⁴ cm s−1 mv
ρn 2 × 10⁻⁴ cm [46]
ρm 10−3 cm [46]
ρe 1.8 × 10⁻³ cm [46]
u0Ae
6.02 × 1013 cm−3 [46]
u0Te
3.01 × 1013 cm−3 [46]
r0 1.27 × 109 cm−2 [46]
u∗ 6.02 × 1013 cm−3 [46]
uZ , uAj6.02 × 1013 cm−3 mv
vstR 6.02 × 1010 cm−3 s−1 mv
vstX 6.02 × 1010 cm−3 s−1 mv
b
⎧⎪⎪⎪⎪⎪⎪⎪⎪⎪⎪⎪⎪⎪⎪⎪⎪⎨⎪⎪⎪⎪⎪⎪⎪⎪⎪⎪⎪⎪⎪⎪⎪⎪⎩
w
t
b
s
(
3
s
T
n
c
(
M
m
a
a
e
d
Cj−1 + Ai
k3j
�k−3j
Cj, j = 1, . . . , n, (13)
Cnk4→ P + X + R. (14)
Here T is the RTA component of ricin in �i, Rd := RT is an inac-
tive complex of RTA bound to ribosome (R), Cd := XRd is an inactive
complex of Rd bound to mRNA, k1, k2, k3, k3j, k4 and k−2, k−3j are
forward and reverse reaction rate constants, see Figs. 1, 3. Applying
the mass-action law to reactions (10)–(14) of the new processes we
arrive at the following set of equations:
⎧⎪⎪⎪⎪⎪⎪⎪⎪⎪⎪⎪⎪⎪⎪⎪⎪⎪⎪⎪⎪⎪⎪⎪⎪⎪⎪⎪⎪⎪⎪⎪⎨⎪⎪⎪⎪⎪⎪⎪⎪⎪⎪⎪⎪⎪⎪⎪⎪⎪⎪⎪⎪⎪⎪⎪⎪⎪⎪⎪⎪⎪⎪⎪⎩
u̇T = vT − k1uT uR, uT(0) = 0,
u̇R = vR − k1uT uR − k2uXuR + k−2uC0
+ k4uCn− αRuR, uR(0) = u−
R ,
u̇Rd= k1uT uR − k3uXuRd
− αRduRd
, uRd(0) = 0,
u̇X = vX − k2uXuR + k−2uC0− k3uXuRd
+ k4uCn− αXuX,
uX(0) = u−X ,
u̇C0= k2uXuR − k−2uC0
− k31uC0uA1
+ k−31uC1− αC0
uC0,
uC0(0) = u−
C0,
u̇Cj= k3juCj−1
uAj− k−3juCj
− k3j+1uCjuAj+1
+ k−3j+1uCj+1− αCj
uCj, uCj
(0) = u−Cj
, j = 1, . . . , n − 1,
u̇Cn= k3nuCn−1
uAn− k−3nuCn
− k4uCn− αCn
uCn, uCn
(0) = u−Cn
,
u̇P = k4uCn− αPuP, uP(0) = u−
P ,
vR = vstR uP/u−
P ,
vX = vstX uP/u−
P ,
vT = k5e(η − η∗)uY .
(15)
Here vX , vT , vR are supply rates of mRNA (X), RTA (T), and ribosome
(R), uT is RTA concentration in �i. As in Eq. (4), system (15) is used
to approximate enzymatic reactions (10)–(14) corresponding pro-
cesses. Initial values uR(0) = u−R , uX(0) = u−
X , uP(0) = u−P , uCj
(0) = u−Cj
,
j = 0, 1, . . . , n, are determined by Eq. (9) for the positive steady-state
of system (8).
Since the production (supply) rates of ribosomes and mRNAs (pa-
rameters vR and vX in Eq. (15)) are explicitly dependent on protein
concentrations uP , a decrease of uP can eventually make the inhibition
of protein synthesis irreversible (when vR and vX become zero). The
selection of vR = vstR , vX = vst
X (i.e. independent of protein concentra-
tions) corresponds to asymptotic (recovery) state of the cell after all
toxin in the system has been consumed. Both selections have been
used in our simulations.
From pharmacological perspective the most important question
is how introduction of an antibody affects the life functions of the
cell. This effect can be characterised by comparing the cell protein
production with and without antibody. More precisely, we use con-
centrations uP|(u0Ae
=0, u0Te
>0), uP|(u0Ae
>0, u0Te
>0), and define the antibody
protection measure (potential) as a relative reduction of the inter-
nalised toxin concentration
δ(t) =uP|(u0
Ae=0, u0
Te>0)
uP|(u0Ae
>0, u0Te
>0)
. (16)
By definition, 0 ≤ δ(t) ≤ 1 with the lower values of δ(t) corre-
sponding to the more profound therapeutic effect of antibody treat-
ment.
For consistent comparison of the effect of different parameters we
transform Eqs. (1), (2), (4), (8), (9), (15) to the non-dimensional form
by using scales of τ∗ (time), l (length), and u∗ (concentration) that will
e specified in the next section. By substituting variables,
ρ = lρ̄, t = τ∗ t̄, r0 = lu∗r̄0,
f = ¯f u∗, f = uTe, uAe
, uCe, uT∗ , uZ, uY , uT , uR, uX
uRd, uP, uC0
, uCj, uAj
,
f = ¯f u∗/τ∗, f = vX, vR, vstX , vst
R ,
f = ¯f/(τ∗u∗), f = k1e, k2e, k∗, k1, k2, k3, k3j,
f = ¯f l/τ∗, f = γi, η, η∗,f = ¯f/τ∗, f = k−1e, k−2e, ke, k4, k−2, αRd
,
αX, αR, αP, αC0, αCj0, k−3j,
f = ¯f/ l, f = k3e, k4e, k5e
(17)
ith j = 1, . . . , n into Eqs. (1), (2), (4), (8), (9), (15) we can deduce
he same systems, but now in the non-dimensional form expressed
y using the dimensionless (overscored) quantities. Therefore, for
implicity in what follows, we omit the bar and treat system (1), (2),
4), (8), (9), (15) as the non-dimensional.
. Numerical results
To solve Eqs. (1), (2), (4), (15) we initially evaluated a number of
tandard MATLAB ODE solvers, viz. ode45 and ode113, ode15s [38,39].
he solver ode15s found to be most efficient (probably due to the stiff-
ess of underlying problem) and it is mainly used in our numerical
alculations. Our selection of the values of parameters for Eqs. (1),
2), (4), (8), (9), (15) was motivated by the values available in the
literature (see Table 1) with an extended range to allow exploration
and illustration of the various pharmacokinetic regimes possible in-
side the eukaryotic cell. Where experimental data were not available
we assume the value of unknown parameters typical for intracellu-
lar transport processes. Constants k1e and k−1e are from the study by
cGuinness and Mantis [40] on the kinetics of binding of a protective
onoclonal antibody (2B11) to ricin. The rate constants k2e and k−2e
re from paper of Prigent et al. [4]. Constant ke is from study by Lord
nd Spooner [41] and van Deurs et al. [42].
Values of the other kinetic parameters of the model is difficult to
stimate. To the best of our knowledge they have not been measured
irectly and reported literature. The selected values of all parameters
V. Skakauskas et al. / Mathematical Biosciences 261 (2015) 83–90 87
(a)
(b)
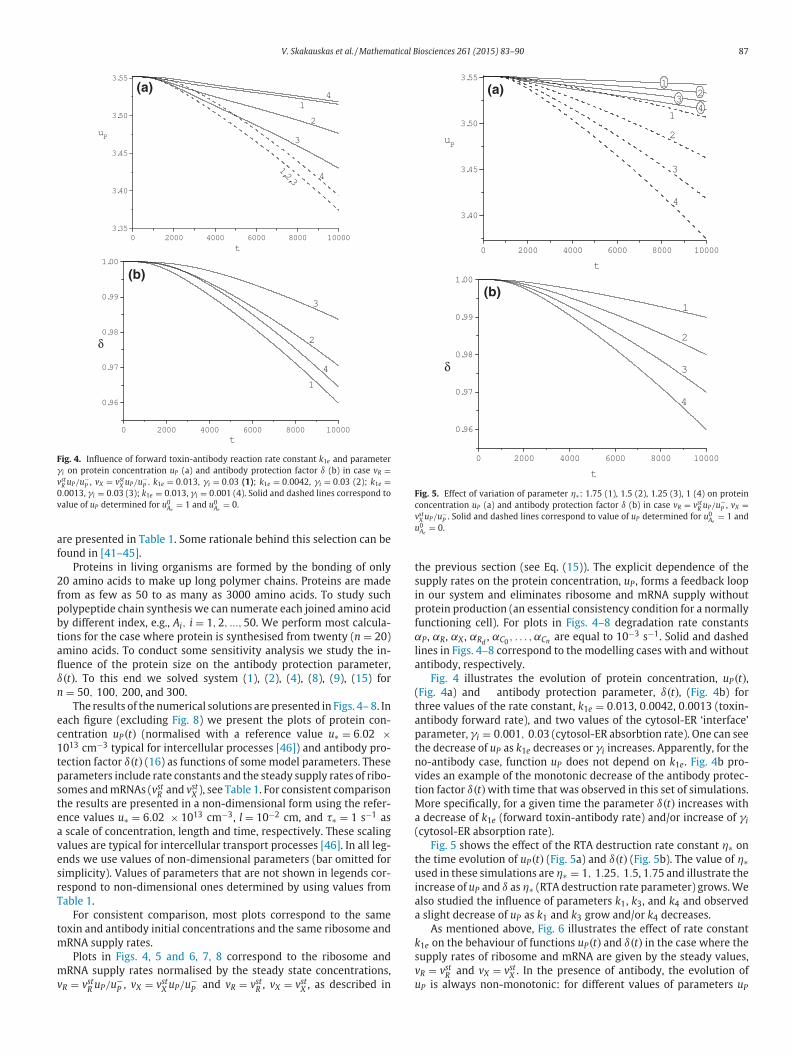
Fig. 4. Influence of forward toxin-antibody reaction rate constant k1e and parameter
γi on protein concentration uP (a) and antibody protection factor δ (b) in case vR =vst
R uP/u−P , vX = vst
X uP/u−P . k1e = 0.013, γi = 0.03 (1); k1e = 0.0042, γi = 0.03 (2); k1e =
0.0013, γi = 0.03 (3); k1e = 0.013, γi = 0.001 (4). Solid and dashed lines correspond to
value of uP determined for u0Ae
= 1 and u0Ae
= 0.
a
f
2
f
p
b
t
a
fl
δn
e
c
1
t
p
s
t
e
a
v
e
s
r
T
t
m
m
v
(a)
(b)
Fig. 5. Effect of variation of parameter η∗: 1.75 (1), 1.5 (2), 1.25 (3), 1 (4) on protein
concentration uP (a) and antibody protection factor δ (b) in case vR = vstR uP/u−
P , vX =vst
X uP/u−P . Solid and dashed lines correspond to value of uP determined for u0
Ae= 1 and
u0Ae
= 0.
t
s
i
p
f
αl
a
(
t
a
p
t
n
v
t
M
a
(
t
u
i
a
a
k
s
v
u
re presented in Table 1. Some rationale behind this selection can be
ound in [41–45].
Proteins in living organisms are formed by the bonding of only
0 amino acids to make up long polymer chains. Proteins are made
rom as few as 50 to as many as 3000 amino acids. To study such
olypeptide chain synthesis we can numerate each joined amino acid
y different index, e.g., Ai, i = 1, 2, ..., 50. We perform most calcula-
ions for the case where protein is synthesised from twenty (n = 20)
mino acids. To conduct some sensitivity analysis we study the in-
uence of the protein size on the antibody protection parameter,
(t). To this end we solved system (1), (2), (4), (8), (9), (15) for
= 50, 100, 200, and 300.
The results of the numerical solutions are presented in Figs. 4– 8. In
ach figure (excluding Fig. 8) we present the plots of protein con-
entration uP(t) (normalised with a reference value u∗ = 6.02 ×013 cm−3 typical for intercellular processes [46]) and antibody pro-
ection factor δ(t) (16) as functions of some model parameters. These
arameters include rate constants and the steady supply rates of ribo-
omes and mRNAs (vstR and vst
X ), see Table 1. For consistent comparison
he results are presented in a non-dimensional form using the refer-
nce values u∗ = 6.02 × 1013 cm−3, l = 10−2 cm, and τ∗ = 1 s−1 as
scale of concentration, length and time, respectively. These scaling
alues are typical for intercellular transport processes [46]. In all leg-
nds we use values of non-dimensional parameters (bar omitted for
implicity). Values of parameters that are not shown in legends cor-
espond to non-dimensional ones determined by using values from
able 1.
For consistent comparison, most plots correspond to the same
oxin and antibody initial concentrations and the same ribosome and
RNA supply rates.
Plots in Figs. 4, 5 and 6, 7, 8 correspond to the ribosome and
RNA supply rates normalised by the steady state concentrations,
R = vstuP/u−, vX = vstuP/u− and vR = vst , vX = vst , as described in
R P X P R Xhe previous section (see Eq. (15)). The explicit dependence of the
upply rates on the protein concentration, uP , forms a feedback loop
n our system and eliminates ribosome and mRNA supply without
rotein production (an essential consistency condition for a normally
unctioning cell). For plots in Figs. 4–8 degradation rate constants
P , αR, αX , αRd, αC0
, . . . , αCn are equal to 10−3 s−1. Solid and dashed
ines in Figs. 4–8 correspond to the modelling cases with and without
ntibody, respectively.
Fig. 4 illustrates the evolution of protein concentration, uP(t),Fig. 4a) and antibody protection parameter, δ(t), (Fig. 4b) for
hree values of the rate constant, k1e = 0.013, 0.0042, 0.0013 (toxin-
ntibody forward rate), and two values of the cytosol-ER ‘interface’
arameter, γi = 0.001, 0.03 (cytosol-ER absorbtion rate). One can see
he decrease of uP as k1e decreases or γi increases. Apparently, for the
o-antibody case, function uP does not depend on k1e. Fig. 4b pro-
ides an example of the monotonic decrease of the antibody protec-
ion factor δ(t)with time that was observed in this set of simulations.
ore specifically, for a given time the parameter δ(t) increases with
decrease of k1e (forward toxin-antibody rate) and/or increase of γi
cytosol-ER absorption rate).
Fig. 5 shows the effect of the RTA destruction rate constant η∗ on
he time evolution of uP(t) (Fig. 5a) and δ(t) (Fig. 5b). The value of η∗sed in these simulations are η∗ = 1, 1.25, 1.5, 1.75 and illustrate the
ncrease of uP and δ as η∗ (RTA destruction rate parameter) grows. We
lso studied the influence of parameters k1, k3, and k4 and observed
slight decrease of uP as k1 and k3 grow and/or k4 decreases.
As mentioned above, Fig. 6 illustrates the effect of rate constant
1e on the behaviour of functions uP(t) and δ(t) in the case where the
upply rates of ribosome and mRNA are given by the steady values,
R = vstR and vX = vst
X . In the presence of antibody, the evolution of
P is always non-monotonic: for different values of parameters uP

88 V. Skakauskas et al. / Mathematical Biosciences 261 (2015) 83–90
(a)
(b)
Fig. 6. Influence of forward toxin-antibody reaction rate constant k1e and parame-
ter γi on protein concentration uP (a) and antibody protection factor δ (b) in case
vR = vX = 0.001. k1e = 0.013, γi = 0.03 (1); k1e = 0.0042, γi = 0.03 (2); k1e = 0.0013,
γi = 0.03 (3); k1e = 0.013, γi = 0.001 (4). Solid and dashed lines correspond to value of
uP determined for u0Ae
= 1 and u0Ae
= 0.
(a)
(b)
Fig. 7. Effect of variation of parameter η∗: 1.75 (1), 1.5 (2), 1.25 (3), 1 (4) on protein
concentration uP (a) and antibody protection factor δ (b) in case vR = vX = 0.001. Solid
and dashed lines correspond to value of uP determined for u0Ae
= 1 and u0Ae
= 0.
(a)
(b)
Fig. 8. Dependence of relative protein concentration uP(t)/u−P (a) and antibody pro-
tection factor δ (b) on amino acids number n: 20 (1), 50 (2), 100 (3), 200 (4), 300 (5) in
case vR = vX = 0.001, k1e = 0.013, γi = 0.001.
monotonically drops to local minima and then monotonically grows
to various saturation limits. But in the case where no antibody is
present uP monotonically decreases to different saturation limits. This
difference is driven by the shape of the rate function vT(t)(rate of toxin
release into the cytosol). In the presence of antibody it has a sharp
maximum at finite times that correspond to a drop of protein produc-
tion uP . The plots in Fig. 6b illustrate the dependence of antibody pro-
tection factor, δ(t), on the same parameters (dependency on the pa-
rameterγi, cytosol-ER absorption rate, is in agreement with the trends
reported in Fig. 4). We remark that contrary to the results presented
in Fig. 4b all curves in Fig. 6b tend to the non-zero stationary values.
Fig. 7 illustrates effect of the RTA destruction rate constant η∗on the time behaviour of protein production uP(t) (Fig. 7a) and
antibody protection factor δ(t) (Fig. 7b). The values of the other
parameters are the same as in Fig. 6. From Figs. 6 and 7 we ob-
serve the similar behaviour of functions uP(t) and δ(t) for cases with
and without antibody (including local minima and various satura-
tion limits). It is worth noting that according to our model when
toxin Te is completely consumed and degraded the protein con-
centration uP will grow and the cell will eventually recover. The
recovery time depends on the initial toxin and antibody concen-
tration and other parameters of the model and for some cases it
may become so large, so it would be impractical to reach the re-
covery stage. In order to explicitly model the event of cell death one
can impose a threshold condition either on recovery time or protein
production.
As a part of the sensitivity analysis of the model we also estimate
the effect of the number amino acids (protein size) on the output
of the model. In Fig. 8 we present functions uP/u−P , δ(t) calculated
for different values of n with all other parameters being equal. Cal-
culations show that the function uP/u− increases with n and tends
P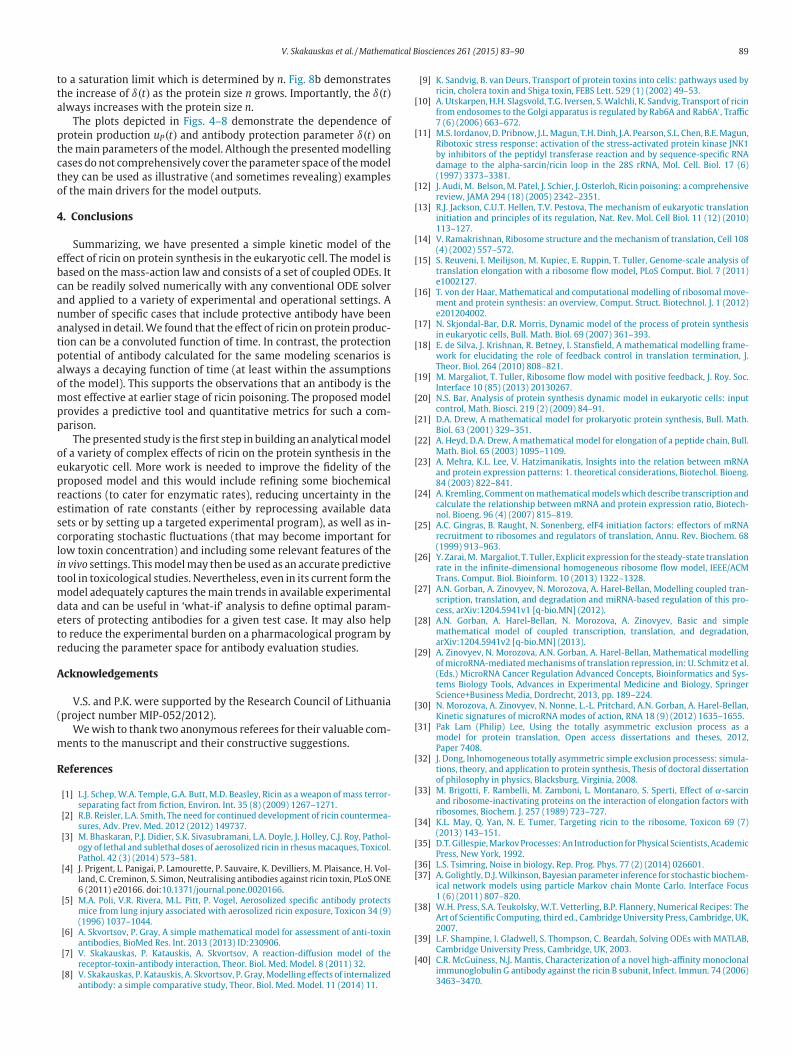
V. Skakauskas et al. / Mathematical Biosciences 261 (2015) 83–90 89
t
t
a
p
t
c
t
o
4
e
b
c
a
n
a
t
p
a
o
m
p
p
o
e
p
r
e
s
c
l
i
t
m
d
e
t
r
A
(
m
R
[
[
[
[
[
[
[
[
[
[
[
[
[
[
[
[
[
[
[
[
[
[
[
[
[
[
[[
[
[
[
3463–3470.
o a saturation limit which is determined by n. Fig. 8b demonstrates
he increase of δ(t) as the protein size n grows. Importantly, the δ(t)lways increases with the protein size n.
The plots depicted in Figs. 4–8 demonstrate the dependence of
rotein production uP(t) and antibody protection parameter δ(t) on
he main parameters of the model. Although the presented modelling
ases do not comprehensively cover the parameter space of the model
hey can be used as illustrative (and sometimes revealing) examples
f the main drivers for the model outputs.
. Conclusions
Summarizing, we have presented a simple kinetic model of the
ffect of ricin on protein synthesis in the eukaryotic cell. The model is
ased on the mass-action law and consists of a set of coupled ODEs. It
an be readily solved numerically with any conventional ODE solver
nd applied to a variety of experimental and operational settings. A
umber of specific cases that include protective antibody have been
nalysed in detail. We found that the effect of ricin on protein produc-
ion can be a convoluted function of time. In contrast, the protection
otential of antibody calculated for the same modeling scenarios is
lways a decaying function of time (at least within the assumptions
f the model). This supports the observations that an antibody is the
ost effective at earlier stage of ricin poisoning. The proposed model
rovides a predictive tool and quantitative metrics for such a com-
arison.
The presented study is the first step in building an analytical model
f a variety of complex effects of ricin on the protein synthesis in the
ukaryotic cell. More work is needed to improve the fidelity of the
roposed model and this would include refining some biochemical
eactions (to cater for enzymatic rates), reducing uncertainty in the
stimation of rate constants (either by reprocessing available data
ets or by setting up a targeted experimental program), as well as in-
orporating stochastic fluctuations (that may become important for
ow toxin concentration) and including some relevant features of the
n vivo settings. This model may then be used as an accurate predictive
ool in toxicological studies. Nevertheless, even in its current form the
odel adequately captures the main trends in available experimental
ata and can be useful in ‘what-if’ analysis to define optimal param-
ters of protecting antibodies for a given test case. It may also help
o reduce the experimental burden on a pharmacological program by
educing the parameter space for antibody evaluation studies.
cknowledgements
V.S. and P.K. were supported by the Research Council of Lithuania
project number MIP-052/2012).
We wish to thank two anonymous referees for their valuable com-
ents to the manuscript and their constructive suggestions.
eferences
[1] L.J. Schep, W.A. Temple, G.A. Butt, M.D. Beasley, Ricin as a weapon of mass terror-separating fact from fiction, Environ. Int. 35 (8) (2009) 1267–1271.
[2] R.B. Reisler, L.A. Smith, The need for continued development of ricin countermea-sures, Adv. Prev. Med. 2012 (2012) 149737.
[3] M. Bhaskaran, P.J. Didier, S.K. Sivasubramani, L.A. Doyle, J. Holley, C.J. Roy, Pathol-
ogy of lethal and sublethal doses of aerosolized ricin in rhesus macaques, Toxicol.Pathol. 42 (3) (2014) 573–581.
[4] J. Prigent, L. Panigai, P. Lamourette, P. Sauvaire, K. Devilliers, M. Plaisance, H. Vol-land, C. Creminon, S. Simon, Neutralising antibodies against ricin toxin, PLoS ONE
6 (2011) e20166. doi:10.1371/journal.pone.0020166.[5] M.A. Poli, V.R. Rivera, M.L. Pitt, P. Vogel, Aerosolized specific antibody protects
mice from lung injury associated with aerosolized ricin exposure, Toxicon 34 (9)(1996) 1037–1044.
[6] A. Skvortsov, P. Gray, A simple mathematical model for assessment of anti-toxin
antibodies, BioMed Res. Int. 2013 (2013) ID:230906.[7] V. Skakauskas, P. Katauskis, A. Skvortsov, A reaction-diffusion model of the
receptor-toxin-antibody interaction, Theor. Biol. Med. Model. 8 (2011) 32.[8] V. Skakauskas, P. Katauskis, A. Skvortsov, P. Gray, Modelling effects of internalized
antibody: a simple comparative study, Theor. Biol. Med. Model. 11 (2014) 11.
[9] K. Sandvig, B. van Deurs, Transport of protein toxins into cells: pathways used byricin, cholera toxin and Shiga toxin, FEBS Lett. 529 (1) (2002) 49–53.
10] A. Utskarpen, H.H. Slagsvold, T.G. Iversen, S. Walchli, K. Sandvig, Transport of ricinfrom endosomes to the Golgi apparatus is regulated by Rab6A and Rab6A′ , Traffic
7 (6) (2006) 663–672.11] M.S. Iordanov, D. Pribnow, J.L. Magun, T.H. Dinh, J.A. Pearson, S.L. Chen, B.E. Magun,
Ribotoxic stress response: activation of the stress-activated protein kinase JNK1by inhibitors of the peptidyl transferase reaction and by sequence-specific RNA
damage to the alpha-sarcin/ricin loop in the 28S rRNA, Mol. Cell. Biol. 17 (6)
(1997) 3373–3381.12] J. Audi, M. Belson, M. Patel, J. Schier, J. Osterloh, Ricin poisoning: a comprehensive
review, JAMA 294 (18) (2005) 2342–2351.13] R.J. Jackson, C.U.T. Hellen, T.V. Pestova, The mechanism of eukaryotic translation
initiation and principles of its regulation, Nat. Rev. Mol. Cell Biol. 11 (12) (2010)113–127.
14] V. Ramakrishnan, Ribosome structure and the mechanism of translation, Cell 108
(4) (2002) 557–572.15] S. Reuveni, I. Meilijson, M. Kupiec, E. Ruppin, T. Tuller, Genome-scale analysis of
translation elongation with a ribosome flow model, PLoS Comput. Biol. 7 (2011)e1002127.
16] T. von der Haar, Mathematical and computational modelling of ribosomal move-ment and protein synthesis: an overview, Comput. Struct. Biotechnol. J. 1 (2012)
e201204002.
17] N. Skjondal-Bar, D.R. Morris, Dynamic model of the process of protein synthesisin eukaryotic cells, Bull. Math. Biol. 69 (2007) 361–393.
18] E. de Silva, J. Krishnan, R. Betney, I. Stansfield, A mathematical modelling frame-work for elucidating the role of feedback control in translation termination, J.
Theor. Biol. 264 (2010) 808–821.19] M. Margaliot, T. Tuller, Ribosome flow model with positive feedback, J. Roy. Soc.
Interface 10 (85) (2013) 20130267.
20] N.S. Bar, Analysis of protein synthesis dynamic model in eukaryotic cells: inputcontrol, Math. Biosci. 219 (2) (2009) 84–91.
21] D.A. Drew, A mathematical model for prokaryotic protein synthesis, Bull. Math.Biol. 63 (2001) 329–351.
22] A. Heyd, D.A. Drew, A mathematical model for elongation of a peptide chain, Bull.Math. Biol. 65 (2003) 1095–1109.
23] A. Mehra, K.L. Lee, V. Hatzimanikatis, Insights into the relation between mRNA
and protein expression patterns: 1. theoretical considerations, Biotechol. Bioeng.84 (2003) 822–841.
24] A. Kremling, Comment on mathematical models which describe transcription andcalculate the relationship between mRNA and protein expression ratio, Biotech-
nol. Bioeng. 96 (4) (2007) 815–819.25] A.C. Gingras, B. Raught, N. Sonenberg, eIF4 initiation factors: effectors of mRNA
recruitment to ribosomes and regulators of translation, Annu. Rev. Biochem. 68
(1999) 913–963.26] Y. Zarai, M. Margaliot, T. Tuller, Explicit expression for the steady-state translation
rate in the infinite-dimensional homogeneous ribosome flow model, IEEE/ACMTrans. Comput. Biol. Bioinform. 10 (2013) 1322–1328.
27] A.N. Gorban, A. Zinovyev, N. Morozova, A. Harel-Bellan, Modelling coupled tran-scription, translation, and degradation and miRNA-based regulation of this pro-
cess, arXiv:1204.5941v1 [q-bio.MN] (2012).28] A.N. Gorban, A. Harel-Bellan, N. Morozova, A. Zinovyev, Basic and simple
mathematical model of coupled transcription, translation, and degradation,
arXiv:1204.5941v2 [q-bio.MN] (2013).29] A. Zinovyev, N. Morozova, A.N. Gorban, A. Harel-Bellan, Mathematical modelling
of microRNA-mediated mechanisms of translation repression, in: U. Schmitz et al.(Eds.) MicroRNA Cancer Regulation Advanced Concepts, Bioinformatics and Sys-
tems Biology Tools, Advances in Experimental Medicine and Biology, SpringerScience+Business Media, Dordrecht, 2013, pp. 189–224.
30] N. Morozova, A. Zinovyev, N. Nonne, L.-L. Pritchard, A.N. Gorban, A. Harel-Bellan,
Kinetic signatures of microRNA modes of action, RNA 18 (9) (2012) 1635–1655.31] Pak Lam (Philip) Lee, Using the totally asymmetric exclusion process as a
model for protein translation, Open access dissertations and theses, 2012,Paper 7408.
32] J. Dong, Inhomogeneous totally asymmetric simple exclusion processess: simula-tions, theory, and application to protein synthesis, Thesis of doctoral dissertation
of philosophy in physics, Blacksburg, Virginia, 2008.
33] M. Brigotti, F. Rambelli, M. Zamboni, L. Montanaro, S. Sperti, Effect of α-sarcinand ribosome-inactivating proteins on the interaction of elongation factors with
ribosomes, Biochem. J. 257 (1989) 723–727.34] K.L. May, Q. Yan, N. E. Tumer, Targeting ricin to the ribosome, Toxicon 69 (7)
(2013) 143–151.35] D.T. Gillespie, Markov Processes: An Introduction for Physical Scientists, Academic
Press, New York, 1992.
36] L.S. Tsimring, Noise in biology, Rep. Prog. Phys. 77 (2) (2014) 026601.37] A. Golightly, D.J. Wilkinson, Bayesian parameter inference for stochastic biochem-
ical network models using particle Markov chain Monte Carlo. Interface Focus1 (6) (2011) 807–820.
38] W.H. Press, S.A. Teukolsky, W.T. Vetterling, B.P. Flannery, Numerical Recipes: TheArt of Scientific Computing, third ed., Cambridge University Press, Cambridge, UK,
2007.
39] L.F. Shampine, I. Gladwell, S. Thompson, C. Beardah, Solving ODEs with MATLAB,Cambridge University Press, Cambridge, UK, 2003.
40] C.R. McGuiness, N.J. Mantis, Characterization of a novel high-affinity monoclonalimmunoglobulin G antibody against the ricin B subunit, Infect. Immun. 74 (2006)

90 V. Skakauskas et al. / Mathematical Biosciences 261 (2015) 83–90
[
[
[
[41] J.M. Lord, R.A. Spooner, Ricin trafficking in plant and mammalian cells, Toxins 3(2011) 787–801.
[42] B. van Deurs, K. Sandvig, O.W. Peterson, S. Olsnes, K. Simons, G. Griffiths, Esti-mation of the amount of internalized ricin that reaches the trans-Golgi network,
J. Cell Biol. 106 (2) (1988) 253–267.[43] J. Wesche, A. Rapak, S. Olsnes, Dependence of ricin toxicity on translocation of the
toxin A-chain from the endoplasmic reticulum to the cytosol, J. Biol. Chem. 274(48) (1999) 34443–34449.
44] K. Sandvig, S. Olsnes, A. Pihl, Kinetics of binding of the toxic lectins abrinand ricin to surface receptors of human cells, J. Biol. Chem. 251 (1976)
3977–3984.45] J.C. Simpson, L.M. Roberts, K. Rmisch, J. Davey, D.H. Wolf, J.M. Lord, Ricin A chain
utilises the endoplasmic reticulum-associated protein degradation pathway toenter the cytosol of yeast, FEBS Lett. 459 (1) (1999) 80–84.
46] G.A. Truskey, F. Yuan, D.F. Katz, Transport Phenomena in Biological Systems, sec-ond ed., Pearson Prentice Hall Bioengineering, 2009.
Copyright © 2022 FDOKUMEN