Town of Weston
351
i Board of Selectmen: Harvey R. Boshart, Chair, Christopher E. Houston, Clerk, Douglas P. Gillespie Beginning July 1, 2018 and ending June 30, 2019 Town of Weston Massachusetts, United States of America Fiscal Year 2019 Operating Budget and Financing Plan
-
Upload
khangminh22 -
Category
Documents
-
view
0 -
download
0
Transcript of Town of Weston

i
Board of Selectmen: Harvey R. Boshart, Chair, Christopher E. Houston, Clerk, Douglas P. Gillespie
Beginning July 1, 2018 and ending June 30, 2019
Town of Weston
Massachusetts, United States of America
Fiscal Year 2019 Operating Budget and Financing Plan

ii

TableofContents
iii
Chapter Budget Category Page
Cover i
GFOA FY2018 Distinguished Budget Award ii
Table of Contents iii-vi
1 Guide to the FY2019 Budget 1:1-1:10
Town Organizational Chart 1:11
Town Boards and Committees
Municipal Staffing Levels
1:12
1:13
2 Town of Weston Overview 2:1-2:11
3 Town Manager's Budget Message 3:1-3:10
4 FY2019 Balanced Budget, Revenue History & Projection
Levy Limit 28-Year History: Fiscal Years 1990 - 2018
Motor Vehicle Excise Revenue
Fee Revenue
Permits and Licenses Revenue
Continuing Balance Accounts
Unreserved Fund Balance History (Free Cash)
Summary of Reserves
Consolidated FY2019 Revenue Projections
4:1-4:13
4:14
4:15
4:16
4:17
4:18
4:19
4:20
4:21-4:22
5 FY2019 Operating Budget & Long-Term Forecast 5:1
FY19 Recommended Operating Budget 5:2-5:4
FY19 Final Budget Summary Chart and Table 5:5
FY19 Budget Highlights, Separate Warrant Articles
Enterprise Funds
Community Preservation Act Budget
Revolving Fund Budget & Expenditures
5:6-5:9
5:10
5:11-5:12
5:13
Actual and Estimated Recap Sheet
Long Term Revenue and Expenditure Forecast
FY19-FY21 Projected Fund Balance Summaries
5:14-5:15
5:16-5:17
5:18-5:20

TableofContents
iv
6 Unclassified Budget 6:1
Organizational Chart & Budget Overview 6:2
Description of Services 6:3-6:4
Budget Detail
6:5-6:6
7 General Government 7:1
Selectmen/Town Manager 7:2-7:4
Assistant Town Manager/Human Resources 7:5-7:6
Salary Adjustments 7:7
Legal 7:8
Facilities (Town Hall, Old Library, Josiah Smith Tavern) 7:9-7:11
Special Committees/Programs/Weston Media Center 7:12-7:16
Town Clerk 7:17-7:19
Information Systems 7:20-7:22
8 Facilities (Town-Wide) 8:1-8:4
9 Finance 9:1
Departmental Overview
Finance Committee
9:2
9:3
Finance Director 9:4-9:5
Town Accountant 9:6-9:7
Assessors & Board of Assessors 9:8-9:9
Treasurer & Collector 9:10-9:11
Finance Department Performance Measures 9:11-9:12
10 Land Use, Inspectional Services & Planning 10:1
Departmental Overview 10:2
Inspectional Services 10:3-10:5
Salaries 10:6-10:7
Board of Appeals (ZBA) 10:8-10:9
Planning Board 10:10-10:11
Conservation Commission 10:12-10:14
Historical Commission & Crescent Street Historical District Commission 10:15-10:16

TableofContents
v
11 Public Safety 11:1
Police Department 11:2-11:4
Animal Control Officer 11:5-11:7
Fire Department
11:8-11:10
12 Education 12:1
Weston School Department 12:2-12:4
Minuteman Regional Vocational Technical High School 12:5
13 Public Works 13:1
Departmental Overview 13:2
Administration and Engineering 13:3-13:4
Equipment Maintenance Division 13:5-13:6
Highway Division 13:7-13:8
Storm-water Division 13:9-13:10
Solid Waste and Recycling Division 13:11-13:12
Parks and Cemeteries Division 13:13-13:14
Tree Warden/Moth Superintendent 13:15-13:16
14 Health & Human Services 14:1
Departmental Overview 14:2
Board of Health 14:3-14:4
E. Middlesex Mosquito Control Project 14:5-14:7
Council on Aging 14:8-14:10
Veterans' Services 14:11-14:13
15 Library 15:1-15:4
16 Brook School Apartments Enterprise Fund 16:1-16:4
17 Water Enterprise Fund 17:1-17:4
18 Recreation Enterprise Fund 18:1-18:7
19 Capital Improvement Program 19:1
CIP Table of Contents 19:2
Capital Improvement Program Process 19:3-19:5

TableofContents
vi
General Fund Projects funded through Exempt Debt 19:6-19:17
General Fund Projects funded through Cash &
Departmental Operations
19:18-19:47
Water Enterprise Projects funded through Exempt Debt 19:48-19:50
Brook School Apartments Projects funded through Exempt Debt 19:51
Community Preservation Act Projects funded through Exempt Debt 19:52
5 Year Capital Improvement Plan - Description 19:53-19:54
5 Year Capital Improvement Plan – Summary Table 19:55-19:56
App. A Fiscal Policies, Relevant Laws & Glossary of Terms A1-A2
Table of Contents A3
Overview A4
Debt Policy A5
Investment Policy A6
Reserve Fund Policy A7-A16
Retained Earnings Policy for Water Enterprise Fund A17
Relevant Laws A18-A19
Glossary of Terms A20-A26
App. B
Financial Indicator Analysis
B1
Table of Contents B2
Executive Summary B3-B5
Introduction B6-B7
Financial Indicators 1-16; Analysis, Outlook, Graph, Table B8-B28
App. C Debt Service - Authorized and Issued Debt Service Payments C1
General Fund – Exempt/Non-Exempt Debt Service C2-C3
Enterprise Fund Debt Service C4
App. D FY17 Audited Financial Statements D1-D10

GuidetotheFY2019Budget–Chapter1
1:1
Town of Weston
Budget Presentation
Chapter 1
GUIDE TO THE FISCAL YEAR 2019
BUDGET

GuidetotheFY2019Budget–Chapter1
1:2
OVERVIEW OF THE ANNUAL BUDGET PROCESS
The process of preparing the annual budget takes place over a period of several months each year.
October – A financial “summit” is held, which is a meeting between the Board of Selectmen, School Committee, and Finance Committee to review a series of financial indicators providing data about the Town’s financial condition and discuss the challenges of the upcoming budget cycle. This meeting is open to the public. A summary of the financial indicators can be found below.
November and December – Departmental budgets are submitted to the Town Manager. Meetings are held between the Town Manager, Finance Director and department managers, to which Finance Committee liaisons are invited, to discuss the details of the budget requests.
January – The School Superintendent presents her recommended budget to the School Committee; the Town Manager presents her recommended budget and financing plan for all departmental budgets, including the Schools, to the Board of Selectmen. Weekly meetings of the Finance Committee commence to review each department’s budget and continue in February and March. These meetings are all open to the public.
March - By the end of March, the Finance Committee and School are ready to vote on the budget they will recommend to the Board of Selectmen.
April – The Board of Selectmen votes on the budget they will recommend to Town Meeting for approval. In addition, they vote to approve the “warrant” or agenda of all items to be considered for approval by Town Meeting, including the annual operating budget, capital spending requests, Community Preservation Act (CPA) spending requests, and any general bylaw, zoning bylaw changes, or other matters to be considered.
October• Financial Summit• Dept. budgets requested
November - Dec.• Dept budgets due• Budget review meetings
January• Town Mgr & School
Superintendent Recommend Budgets
• Budgets posted to website
January - March• Finance Comm, Selectmen,
School Comm budget review
March• Budget completed & voted
by Finance Comm & School Comm
April• Budget & Town Meeting warrant
approved by Selectmen• Budget & Warrant posted to website• Annual Town Report posted to website
May• Budget Hearing• Annual & Special
Town Meetings
June• Year-end transfers
Budget Cycle

GuidetotheFY2019Budget–Chapter1
1:3
May – The annual budget hearing is held the Monday prior to the beginning of Annual Town Meeting. That hearing provides an opportunity for residents to ask more detailed questions about the budget and spending requirements of the Town.
Annual Town Meeting is held each year on the first or second Monday evening in May and generally takes between one and three evenings to complete.
WHAT IS TOWN MEETING?
The legislative body of the Town of Weston is an Open Town Meeting comprised of all registered voters. Town Meeting has the sole authority to appropriate funds for the operating budget and capital projects except for specific instances where appropriation is not required by law. Approval of most spending requires a simple majority vote in favor, but capital projects, if they involve borrowing, must be approved by a two-thirds majority.
Any amendments to appropriations require Town Meeting vote at either a regular or Special Town Meeting. The procedures for Town Meeting are specified in the Town of Weston General Bylaws.
HOW ARE TAXES CALCULATED?
In Weston, the tax rate is a function not only of the total revenues to be raised by real estate taxes (Levy Limit), but also levy exclusions and the contribution to the Community Preservation Act (CPA) surcharge:
What is a Levy Limit?
Proposition 2 ½ was enacted in 1980 to limit the reliance on the property tax and give the voters a greater say in approving property tax increases. With inflation and the cost of living routinely pushing the cost of government beyond 2 ½ % increases, the legislature provided voters the authority to approve increases greater than 2 ½%, enabling them to consider and determine what kind of community they want and can afford.
A general override to Proposition 2 ½ supports the operating budget and requires a majority vote by ballot at the Town Election to pass. Since 1980 the Boards of Selectmen have recommended a general override fifteen times and voters have rejected to do so only once, in 1998. Town leaders are mindful of the tax burden and do everything possible to avoid or limit while maintaining essential services.
There are two components to the law:
1. A levy ceiling, or the maximum levy limit, is 2.5% of the full and fair cash value of taxable real and personal property, as determined by the Town’s assessors. This changes as properties are added or removed from the tax roll and as market values change, but Weston’s Annual Tax Levy cannot exceed the Levy Ceiling.
2. The levy limit for a fiscal year is calculated by increasing the previous year’s limit by 2.5% and adding certified new growth and overrides. The new limit cannot exceed the levy ceiling.
New Growth includes the additional property tax from new construction and additions to properties, exempt real property returned to the tax roll, and new personal property. Although new growth is incorporated into the
Weston’s Annual Tax Levy = Levy Limit + Exclusions + CPA
The Levy Limit = Prior Year Levy Limit + 2.5% + (voter approved override) + New Growth

GuidetotheFY2019Budget–Chapter1
1:4
levy limit calculation, Weston has historically not included projected new growth in revenue calculations for the current year, which results in a more conservative outcome.
This then becomes the base for calculating the levy limit for the next year. The town’s actual levy can be any amount up to the limit. If in one year, the levy is below the limit, the levy increase in the following year could not exceed 2.5%. The difference between the levy and the levy limit is called the excess levy capacity. Currently, Weston’s excess levy capacity is $7.6 million.
What are Exclusions?
Taxpayers may vote to fund debt for projects and choose to exclude these payments from the calculation of the levy limit and, therefore, from the base upon which the levy limit is calculated for future years. Unlike overrides, these Debt Exclusions or Capital Outlay Expenditure Exclusions are temporary increases to the tax levy, lasting the life of the debt or the duration of the capital project.
Exclusions require a majority vote on the ballot and may increase the levy about the levy ceiling. Weston has approved several debt exclusions and no capital outlay expenditures because money for capital projects is typically borrowed.
What is the Community Preservation Act (CPA) Surcharge?
In 2002, Weston voters approved the adoption of the State’s Community Preservation Act (MGL Chapter 44B), which authorizes the Town to charge 3% (after $100,000 assessment exemption) quarterly on top of the tax payment. Thus:
This money is matched, in part, by the State to enable cities and towns to fund the acquisition and preservation of open space, the creation and support of affordable housing, and the acquisition and preservation of historic buildings and landscapes.
The adoption of the CPA reflects the value Weston citizens place on these issues and has enabled the town to maintain the rural character and mix of housing that has defined the Town. To learn more about the CPA in Weston, visit www.weston.org.
The Community Preservation Committee is charged with studying the needs, possibilities, and resources of the Town regarding community preservation and with making recommendations to Town Meeting regarding the appropriation of CPA funds.
WHAT BASIS OF ACCOUNTING & BUDGETING IS USED BY THE TOWN?
Basis of Accounting
The regular method of accounting used by the Town of Weston is the Uniform Massachusetts Accounting System (UMAS). This accounting system is prescribed by the Commonwealth of Massachusetts’ Department of Revenue for local government entities and is intended to demonstrate compliance with state statutes and local near-term decisions (e.g. the budget). This system prescribes the use of the modified accrual basis of accounting, which is the basis used by all governmental fund types. Modified accrual accounting combines accrual-basis accounting with cash-basis accounting and recognizes revenues when they become available and measurable and recognizes expenditures when liabilities are incurred. This system divides available funds into separate entities within the organization to ensure that the money is being spent where it was intended.
Funds for the Community Preservation Act Surcharge = (New Levy Limit + Debt Exclusions) x 3%

GuidetotheFY2019Budget–Chapter1
1:5
The full accrual basis of accounting is used for the Town’s financial statements which conform to generally accepted accounting principles (GAAP). The statements report information about the Town with a broad overview. The statements use accounting methods most like those used by a private-sector business and are typically used to demonstrate the long-term financial position of the Town. The Government Accounting Standards Board (GASB) is the authoritative standard setting body that provides guidance on how to prepare financial statements in conformity with GAAP. Users of these statements (such as investors and rating agencies) rely on the GASB to establish consistent reporting standards for all governments in the United States. This consistent application is the only way users (including citizens, the media, legislators and others) can access the financial condition of one government compared to others. The accrual basis of accounting is utilized by the proprietary and agency funds. Under this method, revenues are recorded when earned and expenses are recorded at the time liabilities are incurred.
Basis of Budgeting
The Town adopts an annual budget for the General Fund and all Enterprise Funds. Although Town Meeting approval is required for capital projects, borrowing authorizations, and other special warrant articles, annual budgets are not prepared for any other fund. The spending for purposes related to the Capital Improvement Plan and the Community Preservation Fund are presented as separate articles from the annual consolidated budget at Town Meeting.
The Town’s annual budget is adopted on a statutory basis, specific to the Commonwealth of Massachusetts, and it differs in some respects from GAAP. The major differences between the budget and GAAP basis are that:
1. Budgeted revenues are recorded when cash is received, except for real estate and personal property taxes, which are recorded as deferred revenue when levied (budget), as opposed to when susceptible to accrual (GAAP).
2. For the budget, encumbrances are treated as expenditures in the year the commitment is made. Also, certain appropriations, known as special articles, do not lapse and are treated as budgetary expenditures in the year they are authorized as opposed to when the liability is incurred (GAAP).
3. The depreciation of Fixed Assets is not recognized as a current expense on a budgetary basis, except to the extent that actual maintenance costs are included in departmental budgets.
Under GASB Statement 34, and further Statement 54, “Major Funds” are defined as individual funds that have reached a significant threshold with respect to total fund balance and have dedicated revenue sources. “Major Funds” must be shown separately from the general fund. The remaining individual funds are aggregated in the “Non-major” category for the purposes of the financial statements.
FUND DESCRIPTIONS
A fund is a grouping of related accounts that is used to maintain control over resources that have been segregated for specific activities or objectives. Fund accounting is used to ensure and demonstrate compliance with finance-related legal requirements. All the funds can be divided into three categories: governmental funds, proprietary funds and fiduciary funds.

GuidetotheFY2019Budget–Chapter1
1:6
Governmental Funds
Governmental funds are used to account for essentially the same functions reported as governmental activities in the government-wide financial statements. However, unlike the government-wide financial statements, governmental fund financial statements focus on near-term inflows and outflows of spendable resources, as well as on balances of spendable resources available at the end of the fiscal year. Such information may be useful in evaluating a government’s near-term financing requirements.
There are four types of governmental funds maintained by the Town: General Fund, Special Revenue Funds, Permanent Funds, and Capital Projects Fund.
General Fund
The General Fund is the major operating fund of the Town and is used to account for most financial resources and activities governed by the normal town meeting appropriations process. The General Fund is supported by revenues from real estate and personal property taxes, state aid, excise taxes, investment income, fines and forfeitures, and fees and charges. All Town departments, including the Weston Public Schools, are supported in whole or in part by the General Fund.
Special Revenue Funds
Special Revenue Funds account for revenues that are legally restricted to specific purposes, except for major capital projects and permanent funds. These revenues are accounted for separately from the General Fund for both legal and practical purposes, as the accounts often span multiple fiscal years. The Town’s Special Revenue Funds are grouped into five categories:

GuidetotheFY2019Budget–Chapter1
1:7
1. Revolving Funds – Revolving Funds allow the Town to raise revenues from a specific Town function and use those revenues to support that function without appropriation. Revolving Funds are established by statute or by-law and may require reauthorization each year at Town Meeting.
2. Receipts Reserved for Appropriation – These funds are restricted to a specific use by statute also require appropriation by Town Meeting. They include monies from Cemetery sale of lots, premiums received on excluded debt and other miscellaneous examples.
3. School Grants – School Grant Funds relate to education programs that are financed with revenue from grants received from the Federal or State government. For more information on school grants, see the Superintendent’s FY2014 Budget.
4. Other Intergovernmental Funds – These funds account for revenues received from the Federal or State government for specific purposes other than education.
5. Other Special Revenue Funds – These funds account for any other miscellaneous special revenues not included in the previous categories. Though this is a “catch-all” category, it namely relates to private donations for specific purposes, such as grants received by private or non-profit foundations or gifts made to specific departments. These funds also include the Community Preservation Fund.
Permanent Funds
Permanent Funds are used to report resources that are restricted to the extent that only earnings, and not principal, may be used to support Town functions. These funds are generally referred to as Trust Funds, and the acceptance of the funds often requires acceptance by Town Meeting for the specifications and requirements tied to the funds.
For example, the Weston Veterans Memorial Education Fund Committee (WVMEF) awards scholarships to Weston High School graduates each year using the income earned from the WVMEF Trust Fund in the previous fiscal year. The principal portion of the WVMEF Trust Fund is non-expendable, meaning that is must remain intact. Permanent Funds are broken into two categories:
1. Expendable Trust Funds – This category accounts for the expendable income portion of the permanent funds. It is also used to account for funds received by the Town in a trustee capacity where both the principal and earnings of the fund may be expended on a restricted basis for the benefit of the Town or its residents.
2. Non-expendable Trust Funds – The term ‘non-expendable’ refers to the principal portion of the trust which cannot be spent. For these funds, the income is generally expendable, and the principal remains intact.
Capital Projects Fund
The Capital Projects Fund is used to account for expenditures on acquisition or construction of major capital projects. The fund does not include projects funded by other dedicated funds, such as the Community Preservation Fund. The Capital Project Fund also accounts for capital outlay for items that relate to the Town’s Capital Improvement Plan. This fund is generally funded through proceeds from issuing bonds or from free cash.

GuidetotheFY2019Budget–Chapter1
1:8
Proprietary Funds
Proprietary Funds refer to the town’s “business-type” activities and are used to separate them from Governmental Funds in financial statements. These statements include the Brook School Apartments Enterprise Fund, the Recreation Enterprise Fund and the Water Enterprise Fund. The purpose of the “enterprise fund” is for all direct and indirect costs to be covered by user fees and or general fund subsidies. The Brook School Apartments Enterprise Fund and the Water Enterprise Fund are both self-sufficient, while the Recreation Enterprise Fund relies on a yearly General Fund subsidy, usually 30% of the Recreation budget. These funds account for their own fixed assets and long- term liabilities. Although long term debt of these enterprise funds is ultimately the legal obligation of the general fund, it is budgeted and paid for by the Enterprise Fund for which the project was approved.
Fiduciary Funds
Fiduciary funds are used to account for resources held for the benefit of parties outside the government. Fiduciary funds are not reflected in the government-wide financial statements because the resources of those funds are not available to support the Town’s own programs. The accounting used for fiduciary funds is much like that used for propriety funds.
See Appendix D for FY17 Audited Financial Statements.
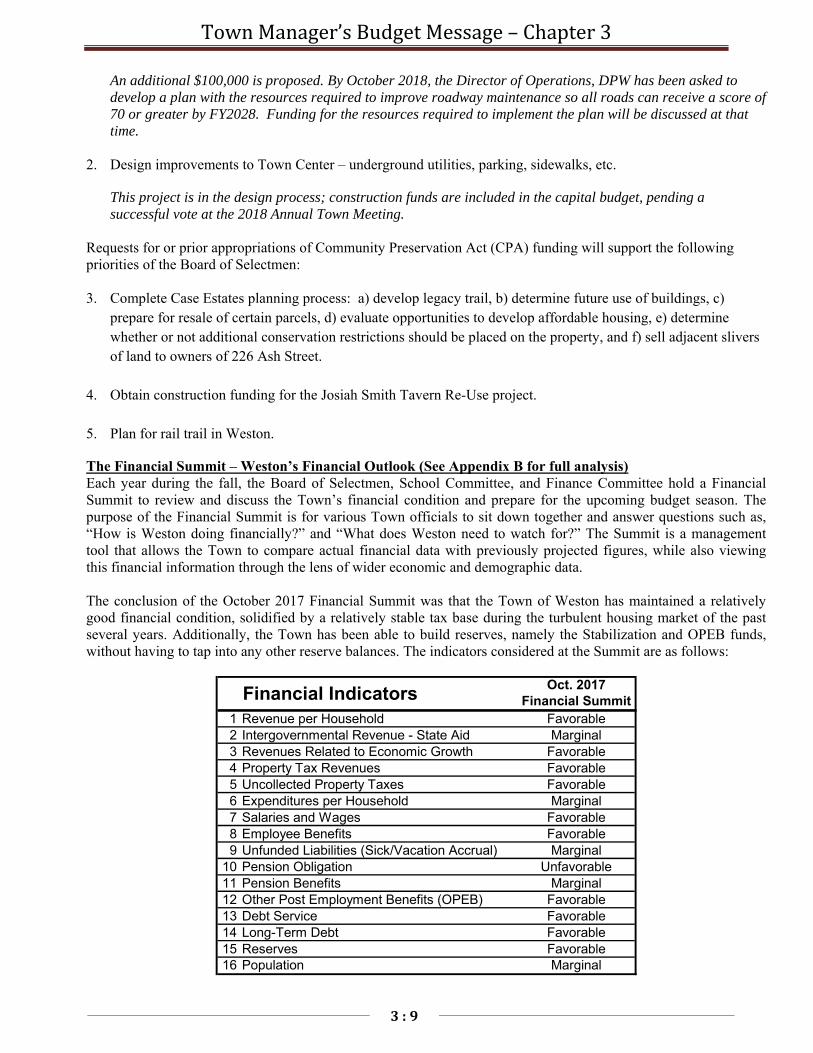
HOW IS THE TOWN MONITORING FINANCIAL TRENDS? Every fall, we update a series of financial indicators which assess Weston’s fiscal condition and are adapted from a system developed by the International City/County Management Association (ICMA). The indicators are used as a management tool, pulling together information from the Town’s budgetary and financial reports, adding the appropriate economic and demographic data, and creating a series of Town-specific financial indicators that, when plotted over a period of time, can be used to monitor changes in the Town’s financial condition. The financial indicators include such areas as revenue and expenditure trends, financial reserves, long term liabilities, debt, and external revenue dependencies. Following is a summary of those indicators for Weston as of the fall of 2017:
Oct. 2017Financial Summit
1 Revenue per Household Favorable2 Intergovernmental Revenue - State Aid Marginal3 Revenues Related to Economic Growth Favorable4 Property Tax Revenues Favorable5 Uncollected Property Taxes Favorable6 Expenditures per Household Marginal7 Salaries and Wages Favorable8 Employee Benefits Favorable9 Unfunded Liabilities (Sick/Vacation Accrual) Marginal
10 Pension Obligation Unfavorable11 Pension Benefits Marginal12 Other Post Employment Benefits (OPEB) Favorable13 Debt Service Favorable14 Long-Term Debt Favorable15 Reserves Favorable16 Population Marginal
Financial Indicators

GuidetotheFY2019Budget–Chapter1
1:9
Highlights of Weston’s financial indicators relate to six main areas of financial condition – Revenue, Expenditures, Employee Benefits, Debt, Reserves, and Population. Revenue Financial Indicator 3 – Revenues Related to Economic Growth
o Economic growth declined slightly in FY17. The ratio is still favorable; however, we will watch this to see if this will become a continuing trend.
o Increasing economic growth revenues, particularly growth in the tax base, will increase the Town’s future operating budget flexibility.
Expenditures Financial Indicator 6 – Expenditures per Household
o The FY2017 increase in expenditures is primarily due to an increase in Unclassified expenses (Primarily Health Insurance & Pension), Education, Public Safety & DPW expenses.
Financial Indicator 7 – Salaries and Wages (as a percentage of total spending) o The rate of employee salary increases, primarily the result of collective bargaining with employee
unions, has been relatively low since 2011. In FY11, there was no cost of living adjustment for any employee. Since then, salary increases have ranged from 1 to 2.5%. FY19 contractual increases range from 1-2%.
Employee Benefits Financial Indicator 10 – Pension Liability (Middlesex Retirement System)
o The 2016 actuarial study indicates that the percent of Weston’s pension liability that is funded has increased by 2.9%. Middlesex Retirement plans to fully fund its pension liability by 2035, with a goal of 6.5% increases in annual assessments to member communities through 2024 and 3.99% thereafter.
o The Town could pay down the unfunded liability quicker by voluntarily contributing more to the mandatory annual assessment. Any additional funds contributed by the Town would not subsidize other communities and members of the Middlesex Retirement System.
Financial Indicator 11 - Pension Benefits Paid o The percentage of total pension assets paid in benefits has increased from 11.1% in 2002 to 14.3%
in 2016. The percentage decreased in 2016 from 2014 as the Pension Assets grew significantly by $8.2 million.
o As long-term employees retire who have contributed 5% and 7% to the Middlesex Retirement System, they are replaced by new employees who pay 9% plus 2% over $30,000, which increases overall contributions. As of FY18, the last employee contributing 5% retired. 83% of employees are currently contributing 9% plus 2%.
Financial Indicator 12 – OPEB Liability o The Actuarial Required Contribution (ARC), per the actuarial valuation, has been funded in the
past 7 years. o Though the Town’s accrued liability has increased, continued funding of the ARC has improved
the OPEB liability funded ratio to 15% in FY16 from 10% in 2014. Debt Financial Indicator 13 – Debt Service
o Debt service exceeding 15 percent of operating revenues is considered a warning indicator; Weston’s debt service has hovered around the 10 percent mark since 2002.
o This indicator is intended for debt that is included in the operating budget, as it could potentially take away from other Town services, if got to be too high. Since Weston’s debt is primarily excluded, it is not included in the operating budget figure, but as an additional amount added to the tax levy.

GuidetotheFY2019Budget–Chapter1
1:10
Financial Indicator 14 – Long Term Debt o Overall long-term debt has declined since 2015. Large projects maturing in 2020 & 2021 will
reduce this amount as well. o High assessed valuation and healthy per capita income help offset any adverse impacts of the
increased debt burden. Reserves Financial Indicator 15 – Reserves/Fund Balance
o The Reserves continue to be funded as planned; reserves are reviewed by the Finance Committee and Board of Selectmen to see if targets should be updated.
o In FY17, the undesignated fund balance increased due to higher departmental expenditure turn backs and actual total revenues being more than projected.
o Weston’s reserve level increased in FY17. The FY17 funding level was 12.2% which was up 0.9% from FY16. Weston continues to fund the Reserves to meet the recommendation of rating agencies, which is that reserves be between 5-15% of operating revenues.
Population Financial Indicator 16 – Population
o The population of residents 60 years of age and older dropped in FY17. However, as baby boomers age, an additional demand for services will be created by this age group.
o The number of students in Weston public schools decreased slightly by 0.3% in FY17.
The definition of these terms and a description of the methodology of the Financial Indicator Analysis can be found in Appendix B of this document

Guide to the FY2019 Budget – Chapter 1
1:11
TOWN OF WESTON – ORGANIZATIONAL CHART
Town Counsel
VOTERS OF WESTON
School Committee
School Superintendent
Board of Selectmen
Town Manager
Facilities Town Wide
Technology Director
Manager of Information
Systems
Assistant Town Manager / HR
Director
Town Clerk
Finance Director / Accountant
Treasurer/
Collector
Assessors **
Fire Department
Police Department
Animal Control Officer
Health & Human Services
Health Department**
Council on Aging
Brook School Apartments Enterprise
Public Works
Water Enterprise
Culture / Leisure
Library **
Recreation Enterprise **
Land Use & Inspections
ZBA
Conservation
Planning **
Moderator Elected Boards **
**Elected Boards There are several departments that report to an elected Board in addition to the Town Manager.

Guide to the FY2019 Budget – Chapter 1
1:12
SELECTMEN APPOINTED
Traffic/Sidewalk Committee
Historical Commission
Conservation Commission
Zoning Board of Appeals
Permanent Building Committee
(appointed with School Committee)
MODERATOR APPOINTED
Finance Committee
Elderly Housing Committee
Community Preservation
Committee - At Large Members (4)
Weston Veterans' Memorial Edu. Fund
Committee
ELECTED BY THE VOTERS
Board of Selectmen
Board of Health
Board of Assessors
Commissioners of Trust Funds
Recreation Commission
School Committee
Moderator
Planning Board
Board of Library Trustees
Measurers of Lumber
Boards and Committees
Boards & Committees
Various boards and committees are appointed by the Selectmen or Moderator or are elected by the voters of Weston.
Affordable Housing Trust
Board of Registrars of Voters
Cable Advisory Committee
Crescent Street Historic District Commission
Cultural Council
Environmental Baseline Committee
Housing Partnership
Tree Advisory Group
Trustees of the Merriam Fund
This list is an overview. In addition to the Boards and Committees listed here, at any time there may also exist several ad hoc committees formed by various bodies to study specific issues. A complete listing can be found in the Annual Town Report.

Guide to the FY2019 Budget – Chapter 1
1:13
Municipal Staffing Levels (stated in Full Time Equivalents or FTEs)
Town GovernmentFY2016
FTEFY2017
FTEFY2018
FTEFY2019
FTE
Change FY18-FY19
Change FY16-FY19
Town Manager's Office 2.42 2.50 2.50 2.50 0.00 0.08Human Resources 2.00 2.00 2.00 2.00 0.00 0.00Facilities (Town Hall, JST/OL) 1.27 1.27 1.27 1.27 0.00 0.00Facilties Town-Wide 4.00 4.00 4.00 5.00 1.00 1.00Finance 10.00 10.00 11.00 10.00 (1.00) 0.00Town Clerk and Registars of Voters 2.32 2.32 2.32 2.32 0.00 0.00Information Systems 3.59 3.59 3.59 3.59 0.00 0.00Land Use and Development 7.39 7.79 7.88 7.83 (0.05) 0.44Police Department 32.00 36.00 36.00 36.00 0.00 4.00Fire Department 36.00 32.00 32.00 34.00 2.00 (2.00)Inspectional Services 2.30 2.30 2.30 2.20 (0.10) (0.10)Animal Control 0.50 0.50 0.50 0.50 0.00 0.00Public Works 28.00 28.00 29.00 29.00 0.00 1.00Board of Health 3.27 3.27 3.27 3.27 0.00 0.00Council on Aging 4.58 4.58 4.69 5.48 0.79 0.90Library 17.88 18.12 18.12 18.12 0.00 0.24Water Division-Enterprise 4.00 4.00 4.00 4.00 0.00 0.00Recreation Department-Enterprise 7.00 7.00 7.00 7.00 0.00 0.00Brook School Apts.-Enterprise 2.32 2.35 2.35 2.48 0.13 0.16Total Municipal FTE 170.84 171.59 173.79 176.56 2.77 5.72

Guide to the FY2019 Budget – Chapter 1
1:14
This page intentionally left blank.

TownofWestonOverview–Chapter2
2:1
Town of Weston
Budget Presentation
Chapter 2
TOWN OF WESTON OVERVIEW

TownofWestonOverview–Chapter2
2:2
The Town of Weston-Overview
Our Town is Unique The Town of Weston is an attractive suburban town of 17 square miles, located approximately 12 miles west of metropolitan Boston. Weston celebrated its 300th year in 2013, as it was incorporated in 1713. In colonial times the town was rural farmland and today it has become a thriving community.
With assistance from private and public partnerships, Weston has protected over 2,000 acres of conservation land for the benefit of people, plants, and wildlife. As a result, Weston has become a model for dozens of communities. With 90 miles of walking trails, Weston’s open space and natural environment are one of the Town’s most treasured resources.
Demographics The total population of Weston has remained approximately 11,500 over the past 5 years with slight fluctuations. The population of individuals over 60 years of age generally increased, while all other age categories decreased, and between 2015 and 2016 and residents of 60 years or older made up 28% of Weston’s population – resulting in a 14.6% increase over the prior year.
The Council on Aging has prepared for the increase in their service population, which included 40% of Weston’s seniors in 2016, particularly adapting programs to the interests of younger “seniors” and providing important services to the very oldest population to allow them to stay in their homes. The Weston Public Schools are also attentive to the decrease in their population and have made the appropriate staffing changes.
* 2000 is U.S. census data with 5-19 and 20-34 ranges

TownofWestonOverview–Chapter2
2:3
Weston Public Schools
The Weston Schools are consistently ranked among the top public schools in Massachusetts. There are five schools in the Weston Public School System: Weston High School (Grades 9-12); Weston Middle School (Grades 6-8); Field School (Grades 4-5); and Country and Woodland Schools (both K-Grade 3). Since 1969 Weston has participated in the Metco program, a voluntary busing program that brings minority students from Boston to suburban schools.
The 2017 Annual Town Meeting approved construction funds for a major renovation of the High School track and Proctor Field complex. The project includes a new all-weather track, a new multipurpose synthetic turf field on Proctor, a new sports lighting system, a sports wall, a new concessions building with bathrooms and storage and the replacement of the carpet on the existing artificial turf field.
Municipal Buildings The November 2017 Special Town Meeting voters overwhelmingly approved the construction funds to preserve, rehabilitate, and restore the Old Library building to be reused as the future home of the Weston Art & Innovation Center (AIC), which will be a department of the Weston Public Library. The building will also house the Weston Media Center. Construction has begun and is anticipated to take approximately one year.

TownofWestonOverview–Chapter2
2:4
Adjacent to the Old Library is the Josiah Smith Tavern, built in 1757 and enlarged in 1804. In 2016, a Request for Proposal for adaptive reuse of the building was issued and the Selectmen designated the
Friends of the Josiah Smith Tavern, a non-profit entity, as the preferred proponent for the reuse of the Tavern, Barn, and Connector. The proposal by the Friends of the Josiah Smith Tavern provides for a 105-seat, "farm to table" restaurant in the Barn, Connector and original Tap Room, with subsidized rental space for Weston Historical Society, Weston Forest & Trail Association and the Women's Community League of Weston. The second-floor ballroom of the Tavern will be available for community and tenant use and landscaping around the buildings will provide a natural garden setting with walking paths and benches. Ownership of the building
will remain with the Town and both taxes and rent will be paid by the restaurant operator.
The Case House, the historic house located on the corner of Wellesley Street on the Case Campus, was gifted to the School Department by the Case Family and has served as the offices for the School Administration for the last 60 years. The late 19th-century house needs to be brought up to code to continue to serve the needs of the department. It also needs exterior restoration to repair the deterioration of the historic exterior. Annual Town Meeting in 2016 approved $270,000 in design funds for the adaptive re-use of the building and to address significant systems, handicap access, fire suppression, and general operational layout upgrades to produce a code compliant, efficient office building within a historical context. Later that year, Special Town Meeting approved a request from the Historical Commission for an additional $27,000 in CPA funds for design funds to specifically address areas where historically and architecturally accurate restoration work is needed for the house that is not inherently part of meeting the School Administration’s program and needs. The design and engineering development drawings are currently being developed.

TownofWestonOverview–Chapter2
2:5
Recreation A grand opening ceremony of the Lamson Park
Playground was hosted on October 14, 2017 with many
members of the community, including business
sponsors, in attendance. Community groups such as
the Weston Community Children’s Association,
Weston Dad’s Foundation, and Women’s Community
League played a big role in the celebration, which
ended with an official ribbon cutting. The Recreation
Department has been receiving many gift donations to
put towards the playground, such as benches, pavers,
trees, etc. The amount received to date is $116,500.
Case Estates As of June 8, 2016 the Town of Weston took ownership of the Case Estates, a process that took 10 years
to accomplish.
Since the closing and the completion of the remediation work taken on by Harvard, the Town has
completed some site work utilizing the remaining appropriations from the original Town Meeting vote.
This work included:
•partial remediation work on Parcel 9
•cleared much of the underbrush and invasive
plants
•restoring many of the fields and meadows, and
developing conservation easements to preserve
the Hillcrest Corridor
•removed dead and overgrown trees and
planted several new trees along Wellesley,
Newton and Ash streets
•studying a walking path connecting existing trails to Ash Street reservoir
•developing the Legacy Trail (from Weston's 300th anniversary) and new Summer House, with
anticipated construction in the summer of 2018
•developing the zoning for residential lots for the existing buildings
•assessing the condition of the existing buildings and maintaining them from further damage

TownofWestonOverview–Chapter2
2:6
Rail Trail The process of converting the abandoned Mass Central Rail Line, a three-mile section of which bisects
Weston, to a rail trail has been gaining momentum since 2011 when the MBTA signed a 99-year lease
with the Massachusetts Department of Conservation and
Recreation (DCR) giving it jurisdiction over the
Massachusetts Central Railroad line. Furthermore,
Eversource, which maintains power lines along the right-
of-way, is preparing to conduct major work to improve
access and upgrade its electrical lines along the right-of-
way. This will include removing the rails and ties and
creating a 16’ wide gravel drive for maintenance use.
Given this activity, the Selectmen formed a rail trail
advisory committee comprised of nine voting members and two non-voting associate members, and
charged them with the following duties:
•conduct community outreach, especially from abutters;
•develop a scope of work, budget and implementation timetable; consider how the connections
in neighboring communities will work in Weston;
•consider where user parking might fit to minimize neighborhood impacts;
•consider access to existing town trails that minimize damage to sensitive ecosystems; and
•consider how the rail trail could support and enhance bicycle and pedestrian safety, as well as
improving access to transportation hubs planned by the Commonwealth.

TownofWestonOverview–Chapter2
2:7
Affordable Housing The Town has had some success in bringing affordable, mixed-family housing options to Weston, and
Town Meeting has consistently approved funding for different affordable housing projects, as well as
approving the establishment of the Weston Affordable Housing Trust. As the demand for mixed housing
options and affordable housing increases, Weston is in a position to catch up and meet the state's
minimum requirement.
The Board of Selectmen began the process of meeting the demand and encouraging greater diversity in
Weston’s housing stock by pursuing a Housing Production Plan, which was approved by the state in
2016. This plan outlines strategies for
Weston to increase its affordable
housing under its terms and needs rather
than being subject to developments that
bypass the Town's Zoning By-laws and
stated policies and preferences for
affordable housing.
One of the strategies outlined in the
Housing Production Plan is for Weston
to partner with a developer and enter
into a "friendly" 40B process. By
partnering with a developer, Weston can avoid assuming the full cost of developing on its own. This
route has proven successful for Weston in the past with partnership developments at Winter Gardens,
Dickson Meadow, 809-811 Boston Post Road, 680 South Avenue, and Highland Meadows. Currently,
the Town is in negotiations with Boston Properties to develop 133 Boston Post Road.
Weston has also had success pursuing its own development of housing, starting in 1980 with the Brook
School Apartments and most recently with the re-purposed municipal buildings on Warren Avenue
through the Weston Affordable Housing Trust. And of course, partnering with the non-profits Weston
Affordable Housing Foundation Inc. (6 units) and Weston Community Housing (62 units) has provided
Weston with more opportunities to increase available options.
TownofWestonOverview–Chapter2
2:8
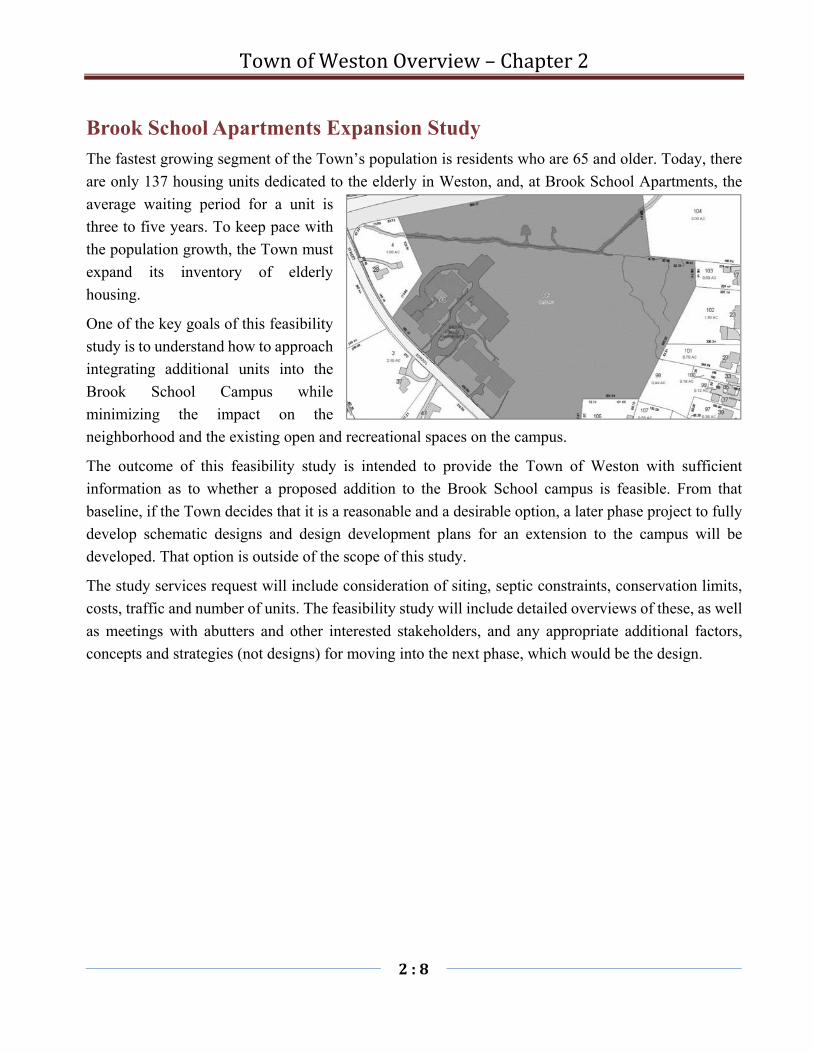
Brook School Apartments Expansion Study The fastest growing segment of the Town’s population is residents who are 65 and older. Today, there
are only 137 housing units dedicated to the elderly in Weston, and, at Brook School Apartments, the
average waiting period for a unit is
three to five years. To keep pace with
the population growth, the Town must
expand its inventory of elderly
housing.
One of the key goals of this feasibility
study is to understand how to approach
integrating additional units into the
Brook School Campus while
minimizing the impact on the
neighborhood and the existing open and recreational spaces on the campus.
The outcome of this feasibility study is intended to provide the Town of Weston with sufficient
information as to whether a proposed addition to the Brook School campus is feasible. From that
baseline, if the Town decides that it is a reasonable and a desirable option, a later phase project to fully
develop schematic designs and design development plans for an extension to the campus will be
developed. That option is outside of the scope of this study.
The study services request will include consideration of siting, septic constraints, conservation limits,
costs, traffic and number of units. The feasibility study will include detailed overviews of these, as well
as meetings with abutters and other interested stakeholders, and any appropriate additional factors,
concepts and strategies (not designs) for moving into the next phase, which would be the design.

TownofWestonOverview–Chapter2
2:9
Town Center Improvements The 2016 Special Town Meeting voted to
approve design and engineering fees for
the Town Center's Master Plan concept.
The 2017 Annual Town Meeting approved
the funds for the design and engineering
fees to bury the utility lines and poles. The
project, if passed, will entail:
Repairing the curbs, streets, and
sidewalks, including the required
improvements for handicapped
accessibility and drainage upgrades
Reconfiguring the location of the curbs and sidewalks to create more continuous and ample
sidewalks, safer crosswalks, new open space, and traffic-calming strategies
Removing the utility poles and overhead wires to allow for new trees to be planted
State Transportation Improvement Projects The State Transportation Improvement Program (TIP) is an
opportunity for municipalities to apply for funding for the
construction of certain transportation projects. An example of a
state TIP project in Weston is the recently completed Rt.
30/Wellesley Street Intersection and Signal Improvement
Project.
Weston has applied for two more TIP projects and they were
approved for design funds at the May 2018 Annual Town Meeting, which is required in order to obtain
the construction grant from the state. They are the Route 20 intersection improvement project and the
Route 30 reconstruction project.

TownofWestonOverview–Chapter2
2:10
Energy Conservation Efforts Weston was designated as a Green Community in 2011. This designation qualifies the Town for receipt of state funds to support the implication of a five-year plan to reduce the Town’s energy consumption by 20 percent. To date, Weston has received approximately $382,000 to replace the Middle School boilers, the Fire Headquarters boiler, and will be doing work to improve the efficiency of the four existing school heating systems.
A solar photovoltaic panel array was installed on the old landfill at the Transfer Station in April 2016. The array has 7,000 panels, each 1 by 2 meters in size. The energy produced will save the Town approximately $300,000 annually in municipal energy costs over the next 20 years.
The Solar PV Panels Exploratory Committee studied additional areas in town for a second installation and moved towards a rooftop installation at the Public Work building. This went live over the summer of 2017. It is a smaller installation and is anticipated to bring in an additional $21,000 in solar credits annually.
Stable Tax Base Weston's sizeable $6.3 billion tax base (2018 equalized value) will remain stable over the medium term with limited annual growth attributable to housing appreciation given the built-out nature of the predominately residential community. Historically, the tax base has shown resilience during the most recent recession, with equalized value only experiencing two years of decline totaling 3.5%. The most recent equalized certification reflected an increase of 11.9% from 2015 to 2017. Additionally, assessed value increased for the fifth consecutive year by 1.3% in 2018, bringing the five-year compound growth rate to 2.4%. Annual new growth revenue of $1.2 million in 2018 is an indication of continued residential redevelopment. Resident wealth and income levels greatly exceed the commonwealth and national averages with median family income equal to 282% and 371%, respectively. The average value of single-family homes is well over $1 million and the 2018 equalized value per capita is a robust $517,120. The town's unemployment rate of 2.6% (October 2017) continues to trend below the Commonwealth and US at 3.3% and 3.9%, respectively.

TownofWestonOverview–Chapter2
2:11
Top Ten Taxpayers
Name Nature of Business
Total AssessedValuation for
2018 Amount
of Tax (1)Percent of Total Levy
BP Weston Quarry LLC Office Space $ 72,863,100
$ 911,5171.21%
Liberty Mutual Insurance Co. Insurance/Office Space
36,443,000455,902
0.61
Individual Residential 19,927,600 249,294 0.33 Weston Alf Property LLC Assisted Living 17,553,000 219,588 0.29
Individual Residential 14,914,000 186,574 0.25 Individual Residential 14,163,900 177,190 0.24 Individual Residential 13,832,100 173,040 0.23 Individual Residential 12,891,600 161,274 0.21 Individual Residential 12,764,600 159,685 0.21 Individual Residential 12,690,200 158,761 0.21 Total $228,043,600 $2,852,825 3.79%

TownofWestonOverview–Chapter2
2:12
This page intentionally left blank.

TownManager’sBudgetMessage–Chapter3
3:1
Town of Weston
Budget Presentation
Chapter 3
TOWN MANAGER’S BUDGET MESSAGE

TownManager’sBudgetMessage–Chapter3
3:2
January 18, 2018 The Honorable Board of Selectmen and Finance Committee: As required by the Town Manager’s Act, Section 2 (f) (ii) and Section 2 (j) (Chapter 80 of the Acts of 2001), I am hereby submitting the Town Manager’s Fiscal Year 2019 Proposed Budget and Financing Plan. Proposed Operating and Capital Budget
The Fiscal Year 2019 recommended budget for Municipal Departments, Unclassified expenses, Reserves, the Superintendent’s proposed School Department budget and Capital projects totals $81,498,671 which is a $3,287,020 or 4.2% increase over the Fiscal Year 2018 appropriated budget. The budget increase has the following major components:
School Department (Superintendent’s Budget) Salaries $630,055 Program Improvements 399,464 Special Education 277,927 Offsets 153,775 Other Changes (101,360) Enrollment (158,109) Sub-total School Budget Increase $1,201,752
Health Insurance & Medicare Tax 448,433 Municipal Increases Above Level Service 398,779
Post-Employment Benefits Reserve 370,154 Middlesex Retirement System 322,149
Salaries (Municipal) 385,223 Cash Capital 260,000 Fire Equipment & Apparatus (110,000) Support for Weston Media Center (110,000) All other changes - Net 120,530 Total increase FY2018 to FY2019 $3,287,020

TownManager’sBudgetMessage–Chapter3
3:3
Summary of Recommended FY2019 Budget
RecommendedFY18 FY19
Budget Budget $ Change % Change
Schools $39,079,529 $40,281,281 $1,201,752 3.1%
Unclassified & Fixed Costs 17,373,770 18,294,164 920,394 5.3%
General Government 18,196,485 18,489,108 292,623 1.6%
Town-Wide Facilities 1,715,387 2,052,484 337,097 19.7%
Separate Articles 1,846,480 2,381,634 535,154 29.0%
Total Budget $78,211,651 $81,498,671 $3,287,020 4.2%
Projected Revenue $78,211,651 $81,498,671 $3,287,020 4.2%
(Shortfall) Surplus $0 $0 $0
Gross Debt Service Exempt from Proposition 2 1/2 $8,905,759 $8,920,548 $14,789 0.2%
Grand Total Budget $87,117,410 $90,419,219 $3,301,809 3.8%
Schools44.6%
Unclassified & Fixed Costs20.2%
General Government
20.4%
Town-Wide Facilities2.3%
OPEB & Cash Capital2.6% Exempt Debt Service
9.9%
FY2019Budget Summary by Category

TownManager’sBudgetMessage–Chapter3
3:4
Proposed Revenue
Fiscal Year 2019 projected revenues are $81,498,671, which is a $3,287,020 or 4.2% increase over FY2018 revenues. Included is an increase of $2,854,011 in the tax levy, which is comprised of $1,246,222 in FY2018 growth in the tax base and a 2.37% increase, a little less than the allowable 2.5% increase under Proposition 2 1/2. Exempt Debt Service
Exempt debt service is principal and interest payments on bonds issued for projects that have previously been approved by Town Meeting and voted to be excluded from the limits of proposition 2½. Fiscal Year 2019 net exempt debt service is projected to be $8,920,548, an increase of $14,789 or 0.2% over Fiscal Year 2018 exempt debt service. Debt service on proposed capital projects to be considered at Annual Town Meeting is not included in the FY2019 budget; because of the expected timing of the borrowing, it will not be an impact on the budget until FY2020. Assuming approval of a debt exclusion question on the Annual Town Election ballot and approval of the proposed projects at Annual Town Meeting, the estimated amount to be added for exempt debt service in FY2020 is $400,905 and $2,355,761 in FY2021. Budget Principles
The development of the Fiscal Year 2019 Proposed Budget and Financing Plan was guided by the following principles:
1. Current revenues should be sufficient to support current expenditures. 2. Debt will not be used to fund current operating expenditures. 3. Expenditures for capital items that recur annually should generally be included in the operating budget. 4. The proposed budget should include adequate reserves and contingency funds. 5. The proposed budget should include sufficient funds for building and other infrastructure maintenance to
ensure that capital facilities and equipment are properly maintained. 6. The operating and capital budget will strive to maintain the core services currently provided. Periodic
changes in service needs may require that additional resources be provided or shifted. Proposed Budget and Financing Plan
There are a number of aspects of this Plan that should be highlighted:
1. School Department Budget – Under the Town Manager Act, the School Department budget is submitted directly to the Finance Committee and, therefore, is not included in this document except in summary form. It is expected that the School Committee will approve its recommended budget in March. In order to provide a general view of the overall Town and School budget, we have included in this document the Superintendent’s proposed budget, as submitted to the School Committee.
2. Revenue Projections – Section 2 of this budget document includes the Fiscal Year 2019 detailed revenue projections to support this proposed budget.
3. Budget Summary – Section 3 of this budget document includes a summary of budget recommendations for all Town departments. Detailed budget recommendations can be found in Sections 6-16.
4. Level Service Budget Requests – Department managers were asked to submit “level service budgets” for Fiscal Year 2019. A level service budget is that amount of funding required to deliver the same level of services in Fiscal Year 2019 as was provided in Fiscal Year 2018. Only increases for contractual, mandated or known additional costs were allowed.
5. New Budget Requests – Municipal department managers were asked to prepare a separate request for any additional staffing, services and capital budget items proposed. Recommended new municipal requests to address increased demands for service result in an increase of $402,979. These requests are included in the budget narrative for each departmental budget and in the budget column labeled “Town Manager’s Recommendation-New Requests.” They are also summarized and ranked in Section 5 of this document with the understanding that the Board of Selectmen may change this ranking as it reviews Town-wide priorities.

TownManager’sBudgetMessage–Chapter3
3:5
6. Reserve Policy – This Proposed Budget and Financing Plan includes the continued implementation of the Reserve Policy updated by the Board of Selectmen in 2017. Weston has made good progress improving reserves, which is especially important to bond rating agencies when evaluating the Town’s Aaa credit rating.
7. Capital Requests – Sections 17-22 of the Fiscal Year 2019 Proposed Budget and Financing Plan include capital requests proposed by funding source. Capital requests are those items generally costing more than $25,000 and having a useful life of more than five years. In addition, a five year projection of future capital projects is included.
8. Debt Exclusion Consideration– In prior years, the Board of Selectmen has placed before the voters Proposition 2½ debt exclusion questions for various capital projects approved or to be considered by Town Meeting. Included in Section 17, Capital Requests-Table I, are those capital projects recommended for Fiscal Year 2019 that the Board of Selectmen will want to consider as debt exclusion questions.
FY19 Budget Initiatives
Every year there are additions to level service proposed because of increased demand for services, and Fiscal Year 2019 is no exception. DPW - Roadway Maintenance - $100,000 The Town has not kept up with roadway maintenance and repaving efforts that often become more complicated projects because of the need to coordinate with utilities, upgrade drainage systems and adjacent sidewalks at the same time. In 2014, a Pavement Management Study concluded that about $1.5 million is needed annually to keep up with proper maintenance of Town roadways; however, this amount will not fund what is needed to “catch up” with past underfunding. In the last two years, the amount of Town funding has been increased from $400,000 to $750,000. In FY19, $850,000 is requested which, combined with State Chapter 90 funds of $480,882, assumed to be the same amount in FY19 as in FY18, will increase the Town’s overall funding to about 89% of the $1.5 million recommendation. We have been proceeding gradually in order to be sure the Department of Public Works can handle the additional work involved, and in FY18, we added a new position of capital projects engineer. Improvement of roadways is a high priority of the Board of Selectmen, and they have asked the DPW Director to analyze by the fall of 2018 the amount of funding and other resources needed to improve roadway maintenance so all roads can be rated at a score of 70 or greater by FY2028. Facilities – Project Manager - $137,815 (includes benefits) A new Project Manager position is proposed to handle small and large capital projects. The Facilities Department has been understaffed nearly since its inception. A paid staff person in this role can relieve the pressure on the Director and Deputy Director and can also reduce outsourcing of work to develop plans and specifications and oversee smaller projects. This person could also apply for grant funds for certain projects. We have not been able to apply for a green communities grant for the last 2 years due to lack of time. Fire – Two Additional Firefighters - $134,342 (includes benefits) Additional firefighters are recommended, with a goal to add one firefighter to each work group, or a total of four. This budget includes two firefighters, with the idea that an additional two will be added in a future budget. The cost of adding firefighters, including benefits, is offset by a reduction in overtime cost and an increase in ambulance revenue, because of the ability to staff the second ambulance more frequently. The net cost is $97,342, which includes increases in salary, health insurance, OPEB, ambulance revenue, and decreases in overtime and the use of call firefighters. Council on Aging – Additional Hours for Part-Time Van Drivers - $16,622 Additional funding of is included for van driver hours to support the increased transportation needs of Weston seniors.

TownManager’sBudgetMessage–Chapter3
3:6
Land Use – Part-Time Land Maintenance Worker - $5,000 A very part-time (2 hours/week) land maintenance worker for the Conservation Commission is proposed to handle basic trail maintenance and improvements, installation of kiosks/trail information, and other miscellaneous maintenance tasks related to conservation land. Police – Domestic Violence Services Network Membership - $5,000 Weston is served by the Domestic Violence Services Network, along with several other communities. A membership contribution of $5,000 is included for the services received by this predominantly volunteer group. Brook School Apartments – Additional Hours for Housing Certification Specialist - $4,200 (Enterprise Fund) An additional 3 hours/week is included for the Housing Certification Specialist to accommodate increased workload due to changing HUD regulations and additional units at the Warren Avenue property. The increase in cost is offset by the management fee received for management of the Warren Avenue units. Other FY2019 Budget Highlights
Salaries All twelve collective bargaining agreements for municipal and school unions are settled. Wage adjustments for FY2019 range from 1% to 2%. Negotiations with unions are conducted by the School Committee for School unions and by the Town Manager in consultation with the Board of Selectmen for Municipal unions. Benefits The projected increase in the Town’s group health insurance budget for all employees is $444,611 or 4.3%, which is based on an expected 8% increase in premium rates from the Group Insurance Commission. The actual increase will not be known until March. Although the premiums are expected to rise by 8%, the overall impact to the Town is less, because we are finding that new employees are opting for lower cost plans, more employees are switching to their spouse’s plan, and there is an increase in the number of employees who are “opting out” of the Town’s health insurance. The increase for the Middlesex Retirement System is $322,149 or 6.7%. Although the Town’s pension liability is only 42% funded, according to the most recent actuarial study, Middlesex Retirement System is required to fully fund the liability by 2035. The Town maintains a Pension Stabilization Fund with approximately $414,000 that can be used to smooth extraordinary increases in this appropriation, if needed. The Town’s Other Post-Employment Benefits (OPEB) contribution is increasing by $385,154 or 22.2% as a result of an updated actuarial study. The Town’s current policy is to contribute the Annual Required Contribution (ARC) each year to a trust fund maintained for the purpose of funding this long term liability over 30 years for retiree health insurance. Energy Savings As a designated Green Community, Weston has taken a number of steps to make the operation of its buildings and facilities more energy efficient, thus saving energy costs. Of particular note is the impact of solar panels that were installed on the Town’s landfill and also on the roof of the DPW building, which produced savings to the Town in electricity costs for Town buildings of more than $317,000 in FY2017. The FY2019 recommended budget includes $300,000 in anticipated savings as a result of the solar panels. FY2019 Capital Budget
Included in Sections 17-22 of this document are the Town’s Annual Capital Budget and FY2019-2022 Capital Improvement Program (CIP). The table below lists the capital requests being made for FY2019. The recommended FY2019 Capital Budget totals $23,488,657, of which $20,045,270 will be proposed for borrowing with excluded debt, $365,000 for borrowing with enterprise fund debt, $140,000 from enterprise fund retained earnings, and $2,938,387 from both general fund and enterprise fund operating budgets, as well as cash

TownManager’sBudgetMessage–Chapter3
3:7
capital. It should be noted that funding for all recommended FY2019 projects requiring borrowing must be approved through separate warrant articles that will be proposed at the May 2018 Annual Town Meeting. The pie chart below shows the breakdown of funding sources by category for the proposed FY2019 Capital Budget. FY2019 Capital Funding Sources
Excluded Debt, 12,844,000
Enterprise Fund Debt, 1,130,050
Operating, 2,600,018
Cash & Retained Earnings, 100,000

TownManager’sBudgetMessage–Chapter3
3:8
FY2019 Capital Budget
How does the recommended FY2019 Budget support the Board of Selectmen’s stated priorities?
Following are projects and priorities on which the Board of Selectmen is currently focusing that are addressed in the FY2019 budget: 1. A) Accelerate roadway maintenance; and B) Develop plan with resources required to improve roadway
maintenance so all roads can receive a score of 70 or greater by 2028.
FUNDINGPROJECTS BY DEPARTMENT SOURCE AMOUNT
DEPARTMENT OF PUBLIC WORKSDrainage Improvements Excluded Debt 450,000Town Center Improvement Project Construction - Master Plan* Excluded Debt 5,607,000Town Center Improvement Project Construction - Bury Utilities* Excluded Debt 4,913,000Route 30 Roadway Reconstruction Transportation Improvement Program Excluded Debt 937,700Roadway Improvements Operating Budget 850,000Departmental Equipment Operating Budget 255,000Sidewalk Reconstruction Operating Budget 165,000Guard Rail Improvements Operating Budget 50,000Route 20/Wellesley Street Transportation Improvement Program Cash Capital 260,000Water Hydrant Rehab Program Operating Budget 50,000Water Distribution Master Plan Operating Budget 59,850Water Main Rehab Program Enterprise Fund Debt 365,000SUBTOTAL $13,962,550
FACILITIES TOWN-WIDETown-Wide Facilities Improvements Operating Budget 566,781Equipment Operating Budget 46,000Irrigation Improvements Operating Budget 85,000SUBTOTAL $697,781
FIRE DEPARTMENTEquipment Replacement Operating Budget 20,000Engine (Pumper) Excluded Debt 750,000SUBTOTAL $770,000
POLICE DEPARTMENTVehicles, Equipment & Maintenance Operating Budget 150,000SUBTOTAL $150,000
SCHOOL DEPARTMENTCase House Rehabilitation Excluded Debt 7,387,570School - Bus Replacement (3) Operating Budget 225,182SUBTOTAL $7,612,752
BROOK SCHOOL APARTMENTS
Repairs & Replacements Operating Budget 155,574Capital Improvements Retained Earnings 140,000SUBTOTAL $295,574
TOTAL FY19 CAPITAL BUDGET $23,488,657
TownManager’sBudgetMessage–Chapter3
3:9
An additional $100,000 is proposed. By October 2018, the Director of Operations, DPW has been asked to develop a plan with the resources required to improve roadway maintenance so all roads can receive a score of 70 or greater by FY2028. Funding for the resources required to implement the plan will be discussed at that time.
2. Design improvements to Town Center – underground utilities, parking, sidewalks, etc.
This project is in the design process; construction funds are included in the capital budget, pending a successful vote at the 2018 Annual Town Meeting.
Requests for or prior appropriations of Community Preservation Act (CPA) funding will support the following priorities of the Board of Selectmen: 3. Complete Case Estates planning process: a) develop legacy trail, b) determine future use of buildings, c)
prepare for resale of certain parcels, d) evaluate opportunities to develop affordable housing, e) determine whether or not additional conservation restrictions should be placed on the property, and f) sell adjacent slivers of land to owners of 226 Ash Street.
4. Obtain construction funding for the Josiah Smith Tavern Re-Use project.
5. Plan for rail trail in Weston.
The Financial Summit – Weston’s Financial Outlook (See Appendix B for full analysis) Each year during the fall, the Board of Selectmen, School Committee, and Finance Committee hold a Financial Summit to review and discuss the Town’s financial condition and prepare for the upcoming budget season. The purpose of the Financial Summit is for various Town officials to sit down together and answer questions such as, “How is Weston doing financially?” and “What does Weston need to watch for?” The Summit is a management tool that allows the Town to compare actual financial data with previously projected figures, while also viewing this financial information through the lens of wider economic and demographic data. The conclusion of the October 2017 Financial Summit was that the Town of Weston has maintained a relatively good financial condition, solidified by a relatively stable tax base during the turbulent housing market of the past several years. Additionally, the Town has been able to build reserves, namely the Stabilization and OPEB funds, without having to tap into any other reserve balances. The indicators considered at the Summit are as follows:
Oct. 2017Financial Summit
1 Revenue per Household Favorable2 Intergovernmental Revenue - State Aid Marginal3 Revenues Related to Economic Growth Favorable4 Property Tax Revenues Favorable5 Uncollected Property Taxes Favorable6 Expenditures per Household Marginal7 Salaries and Wages Favorable8 Employee Benefits Favorable9 Unfunded Liabilities (Sick/Vacation Accrual) Marginal
10 Pension Obligation Unfavorable11 Pension Benefits Marginal12 Other Post Employment Benefits (OPEB) Favorable13 Debt Service Favorable14 Long-Term Debt Favorable15 Reserves Favorable16 Population Marginal
Financial Indicators

TownManager’sBudgetMessage–Chapter3
3:10
These financial indicators highlight potential problems that the Town faces which could impact cash, budgetary, long-term, and service-level solvency. The definition of these terms and a description of the methodology of the Financial Indicator Analysis can be found in Appendix B of this document. Acknowledgments
Preparing a budget document with this level of detail is a significant undertaking. I would like to express my appreciation to all of the Town’s department managers and board and committee members who contributed to the development of this budget. Special thanks to Finance Director/Town Accountant Susan Kelley for coordinating and overseeing the budget process, working with Financial Analyst Charles Young and Treasurer/Collector Peter Forcellese to prepare the budget spreadsheets, debt service and revenue projections, and other analysis. Assistant Town Manager/Human Resources Director Lisa Yanakakis prepared, analyzed and confirmed amounts needed for costs related to employee benefits and salary changes. Conclusions
Exempt debt service has leveled off in FY2019, but large projects expected to be proposed at either the Annual Town Meeting or a fall Special Town Meeting, if approved, will cause exempt debt service to rise again in future years. The Town’s levels of outstanding debt and debt service are analyzed in relation to warning indicators that are monitored by bond rating agencies. Due to the financial strength of the Town, Weston has continued to maintain a Aaa, the highest possible rating that a municipality can receive. The Aaa rating is vital for keeping the long-term costs of voter-supported debt exclusions as low as possible. Nevertheless, the debt service, nearly all of which is excluded from the limits of proposition 2 ½, has an impact on the tax bill. Every year we strive to provide services to Weston residents in the most efficient and cost effective way possible, in order to minimize increases in taxes yet maintain the excellence that is expected. Weston’s tax base is over 96% residential, and property tax bills are substantial. We appreciate the support of Weston taxpayers in funding the level of services currently provided and understand that increases in budgets must be carefully explained and justified in order to maintain that level of support. Further, we recognize that Weston is well served by the partnership that exists between volunteers and paid staff to provide Town services. Without all of you, who spend countless hours of unpaid time for the benefit of the Weston community, we could not accomplish nearly as much. Thank you. Very truly yours,
Donna S. VanderClock Town Manager

TownManager’sBudgetMessage–Chapter3
3:11
This page intentionally left blank.

BalancedBudget,RevenueHistory&RevenueProjection–Chapter4
4:1
Town of Weston
Budget Presentation
Chapter 4
FY2019 Balanced Budget, Revenue History &
FY2019 Revenue Projection

BalancedBudget,RevenueHistory&RevenueProjection–Chapter4
4:2
Fiscal Year 2019 Revenue Projections This revenue projection is being submitted to the Board of Selectmen and Finance Committee as required under Section 2 (f) (ii) (5) of Chapter 80 of the Acts of 2001, the Town Manager Act for the Town of Weston. Revenue projecting is a dynamic process. These projections will be revised as additional data becomes available. The specific revenue projections likely to be revised are noted throughout the assumptions. This revenue projection is organized as follows: Page Table 1: FY19 Revenue Projection Summary………………………..... 4 Table 2: Property Tax - Projections and Assumptions……………….. 5 Table 3: State Aid - Projections and Assumptions……………….…… 6 Table 4: Local Receipts - Projections and Assumptions………….…… 7 Table 5: Prior Year Balances/Other - Projections and Assumptions… 9 Table 6: Reductions in Revenues - Projections and Assumptions……. 11 Table 7: Other Revenues - Projections and Assumptions ……………. 12 Table 8: Available for Excluded Debt Service…………………………. 13 Appendix 1: Levy Limit History …………………………………………..... 14 Appendix 2: Motor Vehicle Excise Tax …………………………………….. 15 Appendix 3: Fees …………………………………………………………….. 16 Appendix 4: Permits and Licenses Revenue ……………………………….. 17 Appendix 5: Continuing Balance Accounts ………………………………… 18 Appendix 6: Unreserved Fund Balance History…………………………….. 19 Appendix 7: Summary of Reserves …………………………………………. 20 Appendix 8: Consolidated FY19 Revenue Projections ….…………………. 21

BalancedBudget,RevenueHistory&RevenueProjection–Chapter4
4:3
FY2019 Revenue Projection Summary
The Town’s General Fund revenue excludes Enterprise Fund revenue (i.e. Water Division, Brook School Apartments, and Recreation). General Fund revenue is broken down into four categories: property taxes (85.4%), state aid (4.9%), local receipts (6.6%), prior year balances (4.1%) and other (0.7%). The final General Fund revenue figure is reached by factoring in revenue offsets (-1.6%) which include State assessments and offsets, overlay for abatements and the General Fund contribution to the Recreation Enterprise Fund. FY19 revenues are projected to increase by $3,287,020 or 4.20% over FY18 Estimated Revenues. This increase, by revenue source, is shown in the table below. Some of the revenue sources may be revised over the coming weeks as better data becomes available. Aspects of this projection which should be highlighted include:
1. Property Taxes: The increase in the tax levy of $2,854,011 or 4.28% consists of the allowed 2.5% increase plus $1,246,222 in unused levy capacity being carried forward from new growth in FY18 (Also see Appendix 1).
2. State Aid: At this time, state aid is projected assuming level funding based on preliminary estimates at the state level. Final State Aid numbers may not be known by Town Meeting.
3. Local Receipts: Local receipts are projected to increase by $348,943 or 6.89%, primarily due to
an increase in motor vehicle excise of $191,000 and an increase in investment income through the consolidation of Town bank accounts of $100,000 in FY19. If approval is given for two additional firefighters, proposed in the Fire Department budget, ambulance receipts are expected to increase by $27,000 because there will be more staff to send the second ambulance on calls.
4. Prior Year Balances/Other: This projection assumes the use of $2,500,000 of the Town’s
6/30/2017 certified Free Cash for the operating budget and $260,000 for one-time capital projects. The Board of Assessors has released $325,000 in surplus overlay. It is also assumed that $125,000 in the remaining principal from the Well Litigation Settlement will again be used to help fund the FY19 budget.
5. Other Revenues: This category includes contributions from two enterprise funds for costs
budgeted in the general fund.

BalancedBudget,RevenueHistory&RevenueProjection–Chapter4
4:4
TABLE I: FY2019 REVENUE PROJECTION SUMMARY
DOLLAR PERCENT
FY2018 FY2019 CHANGE CHANGE
Estimated Projected FY18- 19 FY18- 19
PROPERTY TAX LEVY $66,656,426 $69,510,438 $2,854,011 4.3%
STATE AID - CHERRY SHEET $3,995,401 $3,995,401 $0 0.0%
LOCAL RECEIPTS $5,066,714 $5,415,657 $348,943 6.9%
PRIOR YEAR BALANCES/OTHER $3,213,500 $3,333,141 $119,641 3.7%
TOTAL PROJECTED REVENUES $78,932,041 $82,254,637 $3,322,596 4.2%
REDUCTIONS IN REVENUES (1,266,122) (1,309,884) ($43,762) 3.5%
OTHER REVENUES 545,732 553,918 8,186 1.5%
AVAILABLE FOR APPROPRIATION $78,211,651 $81,498,671 $3,287,020 4.2%
AVAILABLE FOR EXCLUDED DEBT SERVICE $810,988 $799,775 ($11,213) -1.4%

BalancedBudget,RevenueHistory&RevenueProjection–Chapter4
4:5
Property Tax - Projections and Assumptions
Assumptions: 1. Property Tax Levy - $69,510,438 Weston’s property tax levy is anticipated to increase by $2,854,011 or 4.3%. Of this amount, $1,246,222 is from FY18 unused tax levy capacity (new growth). There is additional unused levy capacity of more than $7.6 million that carries forward. As provided under Proposition 2 ½, local governments are permitted to increase property taxes 2.5% over the previous years’ tax levy limit. In addition, a community may increase its property tax levy by what is known as “new growth.” New growth reflects an increase in the property tax levy resulting from new residential and commercial construction in the community. FY19 new growth is projected at $600,000. It has been the Town’s practice not to include estimated new growth in preparing revenue projections for the Annual Town Meeting. By using this conservative revenue projection approach, Weston has consistently had “unused levy capacity” each year. A historical analysis of the property tax levy including unused levy capacity can be found in Appendix 1. The Reserve Policy defines the annual amount of unused tax levy capacity as an unrestricted revenue source to be used prior to setting the tax rate each year for the following purposes: to fund snow and ice deficits from the prior year; to offset any estimated local receipts shortfall or state aid reduction; to be used instead of appropriating from the Stabilization Fund; and to be used in revenue estimates prior to annual town meeting after taking into consideration other uses previously stated.
Table 2 FY2016 FY2017 FY2018 FY2019ACTUAL ACTUAL TAX RECAP PROJ $CHG %CHG
PROPERTY TAX LEVY $63,348,917 $65,583,981 $66,656,426 $69,510,438 $2,854,011 4.3%
new growth 927,176 1,192,004 1,246,222 600,000 (646,222) -51.9%
(unused levy capacity) (927,176) (1,192,004) (1,246,222) (600,000) 646,222 -51.9%
override - - - - - 0.0%
Total Tax Levy $63,348,917 $65,583,981 $66,656,426 $69,510,438 $2,854,011 4.3%

BalancedBudget,RevenueHistory&RevenueProjection–Chapter4
4:6
State Aid - Projections and Assumptions
Assumptions: State Aid - $3,995,401: State aid, which is also referred to as Cherry Sheet aid, is a function of the state budget. At this time, state aid is projected to be level funded in FY19. Weston’s first indication of state aid for FY19 will come when Governor Baker submits his FY19 budget to the Legislature. This happens at the end of January 2018. This budget is known as “House 1” and includes the Governor’s proposal on education aid (Chapter 70) and lottery distributions, two of Weston’s largest categories of state aid. 1. Distributions, Reimbursements and Offsets - $42,599: This category includes amounts reserved for direct expenditure for Public Libraries, as well as reimbursement for charter school tuition, veterans’ benefits paid, and real estate exemptions. 2. Chapter 70 Aid - $3,579,112: Chapter 70 education assistance is Weston’s largest category of state aid. This assistance is provided using a state formula that sets a target of 59% local funding and 41% state funding of the “foundation” budget for education. Weston regularly provides local funding at a much higher level. 3. School Construction -$0: This aid is a function of partial reimbursements for the High School renovation project. This amount, however, must be directly used to reduce the amount of the Proposition 2 ½ debt exclusion for this project and, therefore, is not available for appropriation for other purposes. The annual MSBA school construction payment of $665,538 was reclassified as a revenue source to offset debt service in FY18. It will no longer be classified as a State Aid revenue source for the operating budget going forward through 2020. Instead it will be classified as a revenue source offsetting excluded debt service. 4. Lottery Aid - $373,690: Under State law, cities and towns share in the proceeds of the State lottery.
Table 3 FY2016 FY2017 FY2018 FY2019ACTUAL ACTUAL TAX RECAP PROJ $CHG %CHG
STATE AID
Chapter 70 (school aid) $3,045,154 $3,299,788 $3,579,112 $3,579,112 - -
Unrestricted Gen Govt Aid 344,835 359,663 373,690 373,690 - -
Dist., reimb., offsets 69,342 27,602 42,599 42,599 - -
School Construction 665,538 0 0 0 - -
Total State Aid 4,124,869$ 3,687,053$ $3,995,401 $3,995,401 -$ 0.0%

BalancedBudget,RevenueHistory&RevenueProjection–Chapter4
4:7
Local Receipts - Projections and Assumptions
Assumptions:
Local Receipts - $5,415,657: Local receipts are those fees and charges which may be imposed by a municipality. Massachusetts General Law Chapter 40 Section 22f provides that “any municipal board or officer empowered to issue a license, permit, certificate, or to render a service to perform work for a person or class of persons may, from time to time, fix reasonable fees…” This is a local acceptance statute that Town Meeting approved in May 1996. 1. Motor Vehicle Excise - $2,735,000: Motor vehicle excise receipts are largely dependent on the sale of new vehicles, which is generally tied to economic conditions. A historical analysis of the number of bills issued and collection rates can be found in Appendix 2.
Table 4 FY2016 FY2017 FY2018 FY2019ACTUAL ACTUAL TAX RECAP PROJ $CHG %CHG
LOCAL RECEIPTS
motor vehicle excise $2,982,398 $3,043,210 $2,544,000 $2,735,000 191,000 8%
penalties and interest 142,892 305,670 140,000 150,000 10,000 7%
payment in lieu of taxes 89,222 36,795 37,714 38,657 943 2.5%
charges for services-solid waste 342,217 358,392 340,000 340,000 - -
fees 195,331 248,593 150,000 170,000 20,000 13%
rentals 130,430 125,410 125,000 125,000 - -
departmental revenue-cemeteries 36,443 45,385 30,000 30,000 - -
other departmental revenue 447,605 564,817 430,000 457,000 27,000 6%
licenses and permits 1,328,944 1,080,574 1,075,000 1,075,000 - -
fines and forfeits 101,366 96,434 95,000 95,000 - -
investment income 56,090 215,315 100,000 200,000 100,000 100%
misc. non recurring 307,881 144,276 - - - -
Total Local Receipts 6,160,818$ 6,264,871$ 5,066,714$ 5,415,657$ 348,943$ 6.9%
BalancedBudget,RevenueHistory&RevenueProjection–Chapter4
4:8
2. Penalties and Interest - $150,000: This category includes penalties charged for the late payment of real estate and motor vehicle excise bills, tax lien redemptions and interest accrued on deferred taxes. Large changes in this receipt category are due to payments in deferred taxes (elderly deferral), which cannot be projected with any certainty. 3. PILOT-Payment in Lieu of Taxes - $38,657: The Town has a payment-in-lieu-of–taxes agreement with Weston Community Housing, Inc. for Merriam Village. The FY19 payment is expected to be $14,708. The Town also receives a PILOT for Brook School Apartments, which is $23,949, a 2.5% increase over FY18. 4. Charges for Service - Solid Waste - $340,000: The current fee is $240 per year with a reduced fee of $148 for senior citizens. In addition, households that meet certain income requirements are eligible for a waiver of the fee. In FY17, 43 people took advantage of the transfer station fee waiver. In FY17, transfer station sticker fee revenue funded approximately 68% of the cost of this operation. The Board of Selectmen has set a goal of funding 70-75% of costs with fee revenue, so in FY18 the sticker fee was increased. Approximately $6,400 of transfer station revenue is estimated to be received from recycling of certain materials. 5. Fees - $170,000: This category includes Town Clerk fees, municipal lien certificate fees, Planning Board filing fees, police detail administration fees, storm water review fees, and certain Board of Health inspection fees. A five-year historical average can be found in Appendix 3. 6. Rentals - $125,000: This category consists primarily of lease payments for two cell towers located at the Police Station, and the rental income for the Library. 7. Departmental Revenue - Cemeteries - $30,000: This category includes revenues from interments and foundations. The projection is conservatively based on a five-year historical average. (Also see, Cemetery Trust Fund in Table 5) 8. Other Departmental Revenue - $457,000: This category primarily includes ambulance fees, but also includes emergency alarm system fees, false burglar and fire alarm fees, and other miscellaneous revenue. An additional $27,000 in ambulance revenue is included in anticipation of two additional firefighters added to the staff, allowing the second ambulance to respond to more calls. 9. Licenses and Permits – $1,075,000: This category includes Building Department permit fees, Board of Health and Fire Department permit fees. A five-year historical average can be found in Appendix 4. 10. Fines and Forfeits - $95,000: This category includes parking ticket, court, library and motor vehicle non-renewal fines and fees. The projection is conservatively based on a five-year historical average. 12. Investment Income - $200,000: This projection is based on an average rate of return on the Town’s average monthly cash balance. The average rate of return to date in FY18 is 1.20%

BalancedBudget,RevenueHistory&RevenueProjection–Chapter4
4:9
Prior Year Balances/Other - Projections and Assumptions
Assumptions: Prior Year Balances/Other - $3,333,141: This category includes those accounts that are either required by State law or established by Town Meeting. Appropriating funds from the accounts shown requires Town Meeting approval. While not shown in this table, the Town Meeting annually votes to appropriate funds to several “continuing balance” accounts. These continuing balance accounts also function as a type of dedicated reserve account as the unexpended balance at the close of a fiscal year is carried forward to the next fiscal year. The Town established these continuing balance accounts to provide for annual level funding for a variety of capital type expenditures, such as facilities maintenance and technology-related replacements. The balances in these continuing balance accounts are shown in Appendix 5. In addition, in 2017 the Board of Selectmen revised the reserve categories of the Reserve Policy to address specific needs. The status of the various Reserves is shown in Appendix 7. 1. Unreserved Fund Balance/Free Cash - $2,500,000: The Department of Revenue certified Weston’s Free Cash as of June 30, 2017 at $4,373,690. Use of funds from the Free Cash account takes into consideration the Selectmen’s recently adopted Reserve Policy to leave .75% of the prior year’s operating budget as a reserve in that account.
Undesignated fund balance/free cash is largely a function of: prior year revenue collections more than estimates, and prior year expenditures less than appropriations.
Appendix 6 provides a history of the Town’s unreserved fund balance.
Table 5 FY2016 FY2017 FY2018 FY2019ACTUAL ACTUAL TAX RECAP PROJ $CHG %CHG
PRIOR YR BAL/OTHER
unresv.fund bal. (free cash) $2,100,000 $2,100,000 $2,740,000 $2,500,000 -$240,000 -8.8%
free cash for capital projects 900,000 0 0 260,000 260,000 -
overlay surplus 335,118 335,000 300,000 325,000 25,000 8.3%reserved for approp. (accrued inc. litigation settlement) 10,000 7,500 7,500 7,500 - - reserved for appropriation (well litigation settlement) 125,000 125,000 125,000 125,000 - -
cemetery trust fund 35,000 35,000 35,000 60,000 25,000 71.4%
Josiah Smith Tavern trust fund 6,000 6,000 6,000 6,000 - -
reappropriate continuing balances - 82,515 - 49,641 49,641 -
Total Reserves 3,511,118$ 2,691,015$ 3,213,500$ 3,333,141$ $119,641 3.7%

BalancedBudget,RevenueHistory&RevenueProjection–Chapter4
4:10
2. Free Cash for Capital Projects - $260,000: An additional amount of free cash is proposed to be used for certain capital projects that are generally one-time in nature, not recurring. The capital project to be proposed for approval can be found in Table II of the Capital Improvement Plan. 3. Overlay Surplus - $325,000: A reserve for property tax abatements and exemptions is created each year by way of the Overlay account. Overlay Surplus becomes available when it is determined that all claims for abatements and exemptions of a specific fiscal year have been resolved. Per state statute, this amount must be formally voted by the Board of Assessors before it is available for appropriation. The Board of Assessors has voted to declare surplus of $325,000 from the FY07 - FY17 Overlay accounts. The Reserve Policy calls for a reserve for property tax abatements of $200,000 that is maintained in the overlay accounts.
3. Reserved for Appropriation - Accrued Income - Well Litigation Settlement - $7,500:
This reserve account reflects the investment income from a settlement with the Turnpike Authority over the pollution of Town wells. Over the last three years, this trust fund has earned an average of $12,756 in investment income per year and has an accumulated balance of $114,790 as of June 30, 2017. These funds can be used for any municipal purpose. 4. Reserved for Appropriation - Well Litigation Settlement - $125,000: This reserve account reflects the principal from a settlement with the Turnpike Authority over the pollution of Town wells. When the Town’s reserve policy was implemented in FY06, the Finance Committee proposed using funds from this account to help fund the reserve policy recommendations. The rationale was that this is an undesignated reserve account and town meeting would simply be transferring the funds over time to designated reserve accounts. Since then, an annual appropriation from the Well Litigation Settlement principal has been made. The balance in this account as of June 30, 2017 is $270,725.
5. Cemetery Trust Fund - $60,000: This trust fund is the income earned from the perpetual care charge paid by residents purchasing cemetery plots in the Weston Cemetery. The June 30, 2017 balance in the perpetual care fund is $1,224,990 (non-expendable). There has been an accumulation of interest in this account, which is why the amount proposed has been increased from $35,000.
6. Josiah Smith Tavern Trust Fund - $6,000: This amount reflects the investment income from the Josiah Smith Tavern Trust Fund. The June 30, 2017 balance in this trust fund is $250,367. This is a fully expendable trust fund. 7. Re-appropriate Continuing Balances - $49,641: The unexpended portion of the Field School arsenic remediation project voted at Special Town Meeting in May 2012 will be transferred out of the continuing balance account and available for appropriation in FY19.

BalancedBudget,RevenueHistory&RevenueProjection–Chapter4
4:11
Reductions in Revenues - Projections and Assumptions
Assumptions: Reductions in Revenues - $1,309,884: This table reflects offsets to revenues for certain accounts that do not require Town Meeting appropriation but are, in fact, expenditures of the Town. 1. State (Cherry Sheet) Assessments - $307,590: Cherry Sheet Assessments are charges levied for services provided to the Town by State and other governmental agencies (e.g., MBTA). These charges are projected to be level funded in FY19. 2. State (Cherry Sheet) Offsets - $21,119: State Aid distributions (see Table 3) include certain State categorical grants. The programs that comprise this category include School Lunch and Library grants. These grants must be used for specific purposes and may be expended without Town Meeting appropriation. While they are a component of State Aid revenue (see Table 3), these amounts are shown as a reduction in revenue available for Town Meeting appropriation because of their specific categorical nature. This amount is projected to be level funded in FY19. 3. Overlay - $450,000: The Overlay is a reserve account used for property tax abatements and statutory tax exemptions. The preliminary estimate for this account, subject to approval by the Board of Assessors, has been set at $450,000. Approximately $40,000 is to fund statutory tax exemptions that are granted to the elderly, infirm and veterans. The State reimburses the Town approximately $8,500 for these exemptions. Any Overlay amount not needed in a year is released as overlay surplus by the Board of Assessors for use in funding future operating budgets (see Table 5). The Board of Assessors returned $325,000 by vote to overlay surplus on November 7, 2017. 4. School Building Reimbursements - $0: As part of Weston’s State Aid (Table 3), the Town receives reimbursements for the construction costs associated with the High School renovation project. Since this project is funded through Proposition 2 ½ debt exclusions, the reimbursements must be used to offset the debt service payments associated with this project. The annual MSBA school construction payment of $665,538 will no longer be classified as a
Table 6 FY2016 FY2017 FY2018 FY2019ACTUAL ACTUAL TAX RECAP PROJ $CHG %CHG
REDUCTIONS IN REVENUES
cherry sheet assessments $277,595 $295,111 $307,590 $307,590 - -
cherry sheet offsets 21,509 21,682 21,119 21,119 - -
overlay (abatements) 406,511 446,753 427,107 450,000 22,893 5.4%
school reimbursements 665,538 0 0 - - -
overlay deficits - - - - - -
contribution to recreation enterprise fund 479,150 514,069 510,306 531,175 20,869 4.1%
Total Reductions in Rev. 1,850,303$ 1,277,615$ 1,266,122$ 1,309,884$ $43,762 3.5%

BalancedBudget,RevenueHistory&RevenueProjection–Chapter4
4:12
reduction in revenue for the operating budget going forward through 2020. Instead it will be classified as a revenue source offsetting excluded debt service. 5. Overlay Deficits - $0: There is no overlay deficit contemplated at this time. As recommended by the Reserve Policy, $200,000 has been retained in the overlay account in case of an overlay deficit. The Town also has the ability to fund an overlay deficit from unused levy capacity. 6. Contribution to Recreation Enterprise Fund - $531,175: Approximately 70% of the Recreation Department budget is covered by fee revenue. The remaining 30%, or $531,175 allocated for FY19, is funded by the tax levy. We show this tax contribution in the “reduction in revenues” section since these funds are not otherwise available to fund the general fund portion of the budget. Other Revenues – Projections and Assumptions
Assumptions: 1. Transfer from Water Enterprise Fund - $341,042: This is the amount that the Water
Enterprise fund contributes to the General Fund to offset those Enterprise Fund expenses that are included in the General Fund (e.g., health insurance, pension, liability insurance, billing and collection costs, etc.). A 1.5% increase is projected.
2. Transfer from Brook School Apartments Enterprise Fund - $212,876: This is the amount
that the Brook School Apartments Enterprise fund contributes to the General Fund to offset those Enterprise Fund expenses that are included in the General Fund (e.g., health insurance, pension, liability insurance, etc.). A 1.5% increase is projected.
Table 7 FY2016 FY2017 FY2018 FY2019ACTUAL ACTUAL TAX RECAP PROJ $CHG %CHG
OTHER REVENUES
transfer from water enterprise fund $317,833 $321,191 $336,002 $341,042 $5,040 1.5%
transfer from brook school apts enterprise fund 182,646 208,270 209,730 212,876 3,146 1.5%
Total Other Revenues 500,479$ 529,461$ 545,732$ 553,918$ 8,186$ 1.5%

BalancedBudget,RevenueHistory&RevenueProjection–Chapter4
4:13
Available for Excluded Debt Service - Projections and Assumptions
Assumptions: 1. School Construction - $665,538: This aid is a function of partial reimbursements for the
High School renovation project. This amount, however, must be directly used to reduce the amount of the Proposition 2 ½ debt exclusion for this project and, therefore, is not available for appropriation for other purposes. The annual MSBA school construction payment of $665,538 is classified as a revenue source to offset debt service in FY19. Previously this had been classified as a State Aid revenue source for the operating budget. Going forward through 2020, it will be classified as a revenue source offsetting excluded debt service.
2. Premium Offset - $134,237: Premium is amortized over the life of a bond or note and is recorded as interest is paid down. Previously, premium had been used to offset the gross debt service expense and the appropriation was voted as a net figure. Going forward premium will be used as a revenue source and the debt service expense will be voted as a gross figure. The premium to be amortized in FY19 is $134,237.
Table 8 FY2016 FY2017 FY2018 FY2019ACTUAL ACTUAL TAX RECAP PROJ $CHG %CHG
AVAILABLE FOR EXCL. DEBT SERVICEschool construction $0 $665,538 $665,538 $665,538 - - premium offset - - 145,450 134,247 (11,203) -7.7%
Total Available for Excl. Debt Service -$ 665,538$ 810,988$ 799,785$ (11,203)$ -1.4%

BalancedBudget,RevenueHistory&RevenueProjection–Chapter4
4:14
Appendix 1: Levy Limit 29-Year History: Fiscal Years 1990-2018
Allowable AmountIncrease Exempt Community which may be Unused Actual
Fiscal Starting Annual 2 1/2% Amount of From New Total Levy Debt Preservation Raised from the Levy TaxYear Balance Increase Override Construction Limit Exclusion Act Surcharge Property Tax Capacity Levy % +/-
1990 $16,400,270 $1,101,576 $17,501,846
1991 $16,400,270 $410,007 $800,000 $138,363 $17,748,640 $1,263,054 $19,011,694 $95,980 $18,915,714
1992 $17,748,640 $443,716 $700,000 $86,219 $18,978,575 $1,454,928 $20,433,503 $87,498 $20,346,005 7.56%
1993 $18,978,575 $474,464 $0 $203,406 $19,656,445 $1,463,929 $21,120,374 $347,706 $20,772,668 2.10%
1994 $19,656,445 $491,411 $200,000 $261,247 $20,609,103 $1,483,922 $22,093,025 $366,096 $21,726,929 4.59%
1995 $20,609,103 $515,228 $300,000 $455,789 $21,880,120 $1,884,404 $23,764,524 $899,271 $22,865,253 5.24%
1996 $21,880,120 $547,003 $0 $474,531 $22,901,654 $2,270,573 $25,172,227 $686,855 $24,485,372 7.09%
1997 $22,901,654 $572,541 $0 $460,225 $23,934,420 $2,392,836 $26,327,256 $727,019 $25,600,237 4.55%
1998 $23,934,420 $598,361 $0 $654,277 $25,187,058 $2,439,162 $27,626,220 $598,084 $27,028,136 5.58%
1999 $25,187,058 $629,676 $0 $732,355 $26,549,089 $2,816,518 $29,365,607 $702,499 $28,663,108 6.05%
2000 $26,549,089 $663,727 $0 $682,631 $27,895,447 $2,806,386 $30,701,833 $880,621 $29,821,212 4.04%
2001 $27,895,447 $697,386 $590,000 $676,910 $29,859,743 $4,083,299 $33,943,042 $1,143,212 $32,799,830 9.99%
2002 $29,859,743 $746,494 $500,000 $1,140,934 $32,247,171 $4,625,636 $935,343 $37,808,150 $667,493 $37,140,657 13.23%
2003 $32,247,171 $806,179 $0 $1,222,514 $34,275,864 $5,556,443 $1,051,629 $40,883,936 $258,924 $40,625,012 9.38%
2004 $34,275,864 $856,897 $0 $1,944,757 $37,077,518 $5,599,897 $1,122,336 $43,799,751 $1,056,079 $41,621,336 2.45%
2005 $37,077,518 $926,938 $0 $1,051,747 $39,056,203 $5,664,033 $1,189,090 $45,909,326 $961,844 $43,758,392 5.13%
2006 $39,056,203 $976,405 $1,370,000 $1,322,894 $42,725,502 $5,921,946 $1,315,380 $49,962,828 $334,825 $48,312,623 10.41%
2007 $42,725,502 $1,068,138 $1,100,000 $1,420,504 $46,314,144 $6,476,639 $1,487,807 $54,278,591 $1,348,450 $51,442,333 6.48%
2008 $46,314,143 $1,157,854 $0 $1,049,715 $48,521,712 $7,463,699 $1,487,807 $57,473,218 $1,544,858 $54,440,553 5.83%
2009 $48,521,712 $1,213,043 $0 $1,154,030 $50,888,785 $7,391,435 $1,559,964 $59,840,184 $1,281,886 $56,998,334 4.70%
2010 $50,888,786 $1,271,421 $0 $1,105,302 $53,265,509 $7,205,908 $1,592,001 $62,063,418 $2,396,087 $58,075,330 1.89%
2011 $53,265,509 $1,331,638 $0 $1,470,272 $56,067,419 $6,810,118 $1,640,490 $64,518,027 $2,956,970 $59,920,567 3.18%
2012 $56,067,419 $1,401,685 $0 $897,752 $58,339,946 $7,266,714 $1,730,733 $67,337,393 $2,350,404 $63,256,256 5.57%
2013 $58,339,946 $1,458,499 $0 $1,156,485 $60,954,930 $6,747,256 $1,774,072 $69,476,258 $3,278,851 $64,423,334 1.85%2014 $60,954,930 $1,523,873 $0 $1,020,267 $63,499,070 $7,671,685 $1,876,970 $73,047,725 $3,180,739 $67,990,016 5.54%2015 $63,499,070 $1,587,477 $0 $1,196,208 $66,282,755 $7,027,037 $1,899,998 $75,209,790 $4,388,793 $68,920,999 1.37%2016 $66,282,755 $1,657,069 $0 $927,176 $68,867,000 $8,105,064 $1,966,817 $78,938,881 $5,696,394 $71,275,670 3.42%2017 $68,867,000 $1,721,675 $0 $1,192,004 $71,780,679 $8,084,603 $2,030,978 $81,896,260 $6,196,698 $73,668,584 3.36%2018 $71,780,679 $1,794,517 $0 $1,246,222 $74,821,418 $8,094,771 $2,257,848 $85,174,037 $7,654,592 $75,261,597 2.16%

BalancedBudget,RevenueHistory&RevenueProjection–Chapter4
4:15
Appendix 2: Motor Vehicle Excise Revenue
FY2015 FY2016 FY2017
Comm. # # of bills Amt. billedAvg. per
billlate
commitment # of bills Amt. billedAvg. per
billlate
commitment # of bills Amt. billedAvg. per
billlate
commitment # of bills Amt. billedAvg. per
billlate
commitment234 294 87,174 297 2013 366 147,829 404 2014 355 133,587 376 2015 332 144,408 435 20165 375 89,292 238 2013 359 89,106 248 2014 333 103,281 310 2015 334 88,579 265 20166 269 36,383 135 2013 261 40,612 156 2014 338 55,120 163 2015 348 54,334 156 20167 289 17,907 62 2013 273 17,377 64 2014 135 10,244 76 2015 227 16,604 73 20168 110 5,496 50 20159
9019019019029039039065099 9 1,230 137101 10 3,916 392 2013 3 1276.25 425 2015 4 239 60 2016102 2 433 216103 9 5,189 577 2013 1 416.77 417 2014104 1 151 151 20161051061071089
101112131 9,648 2,059,340 213 2014 9,537 2,138,233 224 2015 9723 2,337,832 240 2016 9672 2,320,626 240 20172 512 326,771 638 2014 537 353,297 658 2015 386 239,678 621 2016 368 274,091 745 20173 404 201,741 499 2014 376 182,380 485 2015 522 278,312 533 2017456789 9 1380 153 2015
99 4 3825 956 2015 11 1665 151 2017102 2 155 78 2017104105106
totals 11,821 2,829,375 239 11,726 2,975,732 254 11,384 2,885,477 253 11,817 3,178,925 269
FY2014

BalancedBudget,RevenueHistory&RevenueProjection–Chapter4
4:16
Appendix 3: Fees
Actual Actual Actual Actual Actual Proj. Proj. FY13-17FY13 FY14 FY15 FY16 FY17 FY18 FY19 average
municipal liens (Finance) 14,675 9,875 9,650 11,025 9,400 8,000 8,000 10,925alarm systems - one-time initial fee (Fire) 6,910 5,810 6,200 6,600 3,550 2,500 2,500 5,814pay as you throw-bags (DPW) - - - 8,750 1,250 - - 2,000town clerk fees/service (Clerk) 13,120 11,241 12,477 12,277 11,545 10,000 10,000 12,132town clerk fees/justice of the peace (Clerk) 500 400 400 1,520.00 600.00 - - 684board of appeals 9,700 8,300 6,750 11,000 58,700 10,000 15,000 18,890planning board- advertising 100 0 0 100planning board- prints & plans 200 0 0 200planning board filings 10,900 21,960 9,150 15,200 19,150 10,000 12,000 15,272Brook School laundry receipts 200 0 0 200police misc. 1,913 1,946 1,837 2,139 1,970 1,000 1,000 1,961Fire - Banner fees - 200 1,150 950 1,150 1,000 1,000 690engineer prints & plans (DPW) 455 910 750 880 723 500 500 744conservation-sale of firewood 100 295 384 125 50 0 0 191conservation- community gardens 1,435 1,530 1,533 1,598 1,823 1,000 1,000 1,584police detail 38,578 39,581 25,387 38,652 86,072 65,000 70,000 45,654constable fees (Police) 100 105 60 15 10 0 0 58BOH soil testing fee 23,250 20,250 28,400 30,725 19,800 15,000 20,000 24,485BOH Title 5 fee 4,350 4,850 4,425 5,175 4,050 4,000 4,000 4,570historical commission-demolition app. 3,375 2,850 3,375 2,100 2,850 2,000 2,000 2,910emergency alarm fees* (Fire) - 69,000 17,700 18,000 17,400 15,000 18,000 24,420stormwater review fees (DPW) 21,650 21,850 22,350 28,600 8,000 5,000 5,000 20,490
TOTAL 151,011 220,953 151,977 195,331 248,593 150,000 170,000 193,973

BalancedBudget,RevenueHistory&RevenueProjection–Chapter4
4:17
Appendix 4: Permits and Licenses Revenue
BUILDING DEPT. FEES Actual Actual Actual Actual Actual Budget Budget FY13-17Bldg. Permits FY13 FY14 FY15 FY16 FY17 FY18 FY19 averageJuly 39,302 33,833 41,811 39,268 33,899 66,250 66,250 37,623August 66,460 108,393 41,884 46,610 124,389 66,250 66,250 77,547September 78,417 92,947 77,833 64,876 115,178 66,250 66,250 85,850October 86,221 59,606 54,575 122,162 39,798 66,250 66,250 72,472November 95,158 52,634 67,903 105,159 36,799 66,250 66,250 71,531December 19,327 120,375 149,501 103,727 74,006 66,250 66,250 93,387January 36,577 61,413 62,803 37,294 32,035 66,250 66,250 46,024February 20,840 96,056 27,611 33,857 77,906 66,250 66,250 51,254March 9,090 75,579 96,727 70,465 37,526 66,250 66,250 57,877April 87,391 32,001 156,228 55,574 37,561 66,250 66,250 73,751May 66,284 193,779 103,339 164,836 56,814 66,250 66,250 117,010June 88,016 104,665 100,462 91,600 32,690 66,250 66,250 83,487Bldg. Permits Subtotal 693,083 1,031,281 980,677 935,428 698,601 795,000 795,000 867,814
Wiring inspection fees 65,950 133,078 79,065 77,655 93,481 70,000 70,000 89,846Gas/plumbing fees 43,368 47,705 61,765 57,650 49,010 35,000 35,000 51,900Sheetmetal fees 24,466 19,389 18,869 19,536 20,004 20,000 20,000 20,453TOTAL BLDG. DEPT. FEES 826,867 1,231,453 1,140,376 1,090,269 861,096 920,000 920,000 1,030,012
BOARD OF HEALTH FEESBd of Health permits 61,750 67,895 62,275 65,720 53,670 43,000 43,000 62,262Bd of Health septic system application permits 43,350 47,625 41,300 48,550 45,850 30,000 30,000 45,335TOTAL BD OF HEALTH FEES 105,100 115,520 103,575 114,270 99,520 73,000 73,000 107,597
TOTAL FEES 931,967 1,346,973 1,243,951 1,204,539 960,616 993,000 993,000 1,137,609
Permits & Licensesfish & game licenses (ACO) - - - - - - - 0victuallers/liquor licenses (Selectmen) 15,850 12,160 10,850 10,550 17,150 10,000 10,000 13,312general club licenses (25) - - town clerk licenses 495 520 450 680 560 500 500 541Bd of Health licenses 19,575 18,300 16,900 18,525 16,300 15,000 15,000 17,920dog licenses (ACO) 15,710 14,601 16,131 16,950 14,590 13,000 13,000 15,596commercial dog walker licenses 17,500 28,025 25,450 26,375 29,400 15,000 15,000 25,350late fee - dog licenses 50 - - - - - - 10firearm permits (Police) 3,025 2,450 2,175 2,125 2,875 2,100 2,100 2,530sealer weights measures permits (Building) 1,300 3,005 1,640 2,045 2,300 250 250 2,058cable rental permits (Selectmen) 1,864 1,888 1,862 1,834 1,841 1,500 1,500 1,858street opening permits (DPW) 11,700 12,400 13,550 12,150 2,850 2,000 2,000 10,530ch. 148 fire permits (Fire) 6,385 4,000 6,964 4,800 5,764 3,500 3,500 5,583oil burner install permits (Fire) 150 425 300 400 575 500 500 370fire alarm system permits (Fire) 16,967 19,732 17,647 16,122 16,149 9,500 9,500 17,323trench/excavation permits (DPW & BOH) 10,350 11,570 10,795 11,490 9,340 9,000 9,000 10,709street access permits 325 150 - - - 158taxi permits (Selectmen) - 50 100 100 100 - - 70raffle permits (Clerk) 125 150 25 110 190 150 150 120TOTAL PERMITS & LICENSES 121,046 129,276 125,164 124,405 119,959 82,000 82,000 124,038
TOTAL - ALL 1,053,013 1,476,249 1,369,115 1,328,944 1,080,574 1,075,000 1,075,000 1,261,647

BalancedBudget,RevenueHistory&RevenueProjection–Chapter4
4:18
Appendix 5: Continuing Balance Accounts
Department Account NameFY18
APPROP. CARRY FWD.
BALANCE AVAIL.
BUDGETYTD
EXPEND. 12/31/17
BALANCE
Selectmen Professional/Consulting 40,000 95,199 135,199 97,777 37,422
Equipment-Town Hall 3,000 9,850 12,850 316 12,535
Town Center Planning (Art 6, STM) 11/15 - 15,018 15,018 - 15,018
Insurance Uninsured Losses/Deductibles - 152,378 152,378 - 152,378
Compensated Absence Fund 200,000 208,219 408,219 20,008 388,211 - -
Facilities Facilities Improvements - Town-Wide 534,699 458,430 993,129 115,140 877,989
Information Systems Computer Hardware & Maintenance 98,300 637 98,937 67,017 31,920
Fiber Network Improvements/Expansions - 12,622 12,622 - 12,622
Police Equipment 150,000 16,381 166,381 97,437 68,945
Fire Emergency Management 2,000 7,423 9,423 450 8,973
Equipment 130,000 52,066 182,065.85 27,541 154,525
Replacement Vehicle (Art 22E) 5/12 - 391 391 - 391
Fire Equipment Art 24A 5/14 - 9,934 9,934 - 9,934
Police/Fire PD Injured Personnel 5,000 - 5,000 6,976 (1,976)
FD Injured Personnel 15,000 18,651 33,651 512 33,139
Public WorksHighways Construction of Public Ways 750,000 895,868 1,645,868 1,062,504 583,364
Sidewalk Maintenance 120,000 176,384 296,384 79,010 217,374
Stone Retaining Wall Repairs 10,000 29,325 39,325 15,355 23,970
Equipment 245,000 592,833 837,833 - 837,833
Guard Rails 50,000 100,000 150,000 77,065 72,935
Dept. Equip (Art22A) 5/12 - 1,188 1,188 - 1,188
Easements, Art. 19 5/13 - 10,000 10,000 - 10,000 Parks & Cemeteries Improve/Develop Cemetery Land - 14,495 14,495 - 14,495
Equipment - 245 245 - 245 Solid Waste Monitoring Groundwater-Landfill 25,500 2,449 27,949 8,075 19,874 Traffic Kendal Green (Art 17A) 5/13 - 22,000 22,000 675 21,325
Traffic Sign Design (Art 17C) 5/13 - 1,018 1,018 - 1,018
Traffic Pedestrian Signal (Art 24B) 5/14 - 57,455 57,455 - 57,455
Traffic/Sidewalk Comm 15,000 3,581 18,581 - 18,581
Schools 1 Ton Truck - 4,897 4,897 - 4,897
Arsenic Field School (Art5 STM) 5/12 - 49,641 49,641 - 49,641
School Bus Replacements (Art15F) 5/11 - 2,334 2,334 - 2,334
Sports Practice Wall (Art 19) 5/15 - 75,000 75,000 42,805 32,195
TOTAL 2,393,499 3,095,910 5,489,409 1,718,662 3,770,747
FISCAL YEAR 2018 (July 1, 2017 - December 31, 2017)

BalancedBudget,RevenueHistory&RevenueProjection–Chapter4
4:19
Appendix 6: Unreserved Fund Balance (Free Cash) History
A B C D E F G
fiscal year
local receipts in excess of estimates
expenditures less than
appropriationsprior year
closeouts/othercontribution to
surplus7/1 free cash certification
Supplemental free cash
cert. total free cash
FY97 347,184 632,474 247,415 1,227,073 1,771,707 856,598 2,628,305 FY98 975,985 619,354 18,551 1,613,890 1,552,996 369,260 1,922,256 FY99 972,015 576,753 190,483 1,739,251 1,083,836 745,643 1,829,479 FY00 1,187,520 513,235 40,836 1,741,591 1,427,227 872,236 2,299,463 FY01 1,795,835 1,661,708 337,000 3,794,543 2,161,718 501,195 2,662,913 FY02 1,022,844 1,499,938 2,950 2,525,732 1,676,247 229,102 1,905,349 FY03 1,108,115 947,051 - 2,055,166 2,067,415 not f iled w ith DOR 2,067,415 FY04 822,688 430,520 - 1,253,208 1,467,051 not f iled w ith DOR 1,467,051 FY05 654,804 587,933 - 1,242,737 1,248,088 not f iled w ith DOR 1,248,088 FY06 1,797,073 1,184,804 30,225 3,012,102 2,366,638 not f iled w ith DOR 2,366,638 FY07 1,728,638 560,002 366,638 2,655,278 2,469,546 not f iled w ith DOR 2,469,546 FY08 1,691,958 1,212,677 35,922 2,940,557 3,153,673 not f iled w ith DOR 3,153,673 FY09 1,408,221 2,305,508 - 3,713,729 2,948,558 not f iled w ith DOR 2,948,558 FY10 921,353 1,814,665 22,010 2,758,028 4,255,473 not f iled w ith DOR 4,255,473 FY11 1,445,168 1,799,743 3,905 3,248,816 3,463,758 not f iled w ith DOR 3,463,758 FY12 1,135,712 2,228,684 - 3,364,396 3,853,659 not f iled w ith DOR 3,853,659 FY13 931,332 1,612,777 370,212 2,914,320 3,182,126 not f iled w ith DOR 3,182,126 FY14 1,811,995 1,988,078 348,770 4,148,843 4,039,334 not f iled w ith DOR 4,039,334 FY15 1,610,672 1,067,951 (174,085) 2,504,539 2,581,323 not f iled w ith DOR 2,581,323 FY16 1,118,040 2,920,747 (409,034) 3,629,753 3,613,421 not f iled w ith DOR 3,613,421 FY17 1,498,748 2,476,158 403,639 4,378,545 4,373,690 not f iled w ith DOR 4,373,690

BalancedBudget,RevenueHistory&RevenueProjection–Chapter4
4:20
Appendix 7: Summary of Reserves
ReserveBalance
12/31/2017
FY19 Recommended Appropriation
FY19 Appropriation + Balance Carried
ForwardReserve Balances Per
Policy Target AmountTarget Date Notes
Unrestricted ReservesFinance Committee Reserve Fund (balance does not carry forward from year to year)
556,900 586,587 586,587 586,587 0.75% of prior year's GF operating budget
met Balance does not carry forward
Free Cash 4,373,690 (2,760,000) 1,613,690 586,587 0.75% of prior year's GF operating budget
met $586,587 will be left in the reserve, leaving $1,027,103 to handle snow removal or other unforeseen expenses.
Stabilization Fund 3,113,691 0 3,113,691 2,737,408 3.5% of prior year's GF operating budget
met
Unused Levy Capacity 7,654,592 0 7,654,592 NA NA This is a one-time reserve each year.
Restricted Reserves: ContingencyProperty and Liab. Insurance-Uninsured Losses
153,868 0 153,868 100,000 100,000 met
Workers' Comp (Police & Fire) 30,597 20,000 50,597 50,000 50,000 metOverlay Reserve for Abatements 200,000 0 200,000 200,000 200,000 met
Restricted Reserves: Known LiabilitiesFacilities Maintenance 877,989 566,781 1,444,770 2,800,000 Starting FY19
increase of 6% over prior year
FY2032 Target is 1% of Town's total insured building value
Post Employment Benefits (OPEB) Trust Fund
15,587,325 2,121,634 17,708,959 76,091,100 $76M total liability, unfunded liability $64.8M per 7/1/16 valuation
FY2048 Annual appropriation to meet ARC specified in most recent actuarial study
Pension Obligation Stabilization Fund 413,643 0 413,643 413,643 400,000 FY2035 Annual assessments to meet requirement for full funding are determined by Middlesex Retirement System.
Compensated Absence Fund (Sick Leave Buyback)
388,211 220,000 608,211 2,445,000 2,445,000 FY2028 Increase appropriation by $20,000 each year.
Total Reserves without OPEB 12/31/17 $17,763,180 (1,366,632) $15,839,648 $9,919,225Total Reserves with OPEB 12/31/17 $33,350,505 755,002 $33,548,607 $86,010,325

BalancedBudget,RevenueHistory&RevenueProjection–Chapter4
4:21
FY2016 FY2017 FY2018 FY2019 FY2019 FY2019
ACTUAL ACTUAL TAX RECAP PROJECTED $ CHANGE%
CHANGE
PROPERTY TAX LEVY 63,348,917 65,583,981 66,656,426 69,510,438 2,854,011 4.28%
new growth 927,176 1,192,004 1,246,222 600,000 (646,222) -51.85%
(unused levy capacity) (927,176) (1,192,004) (1,246,222) (600,000) 646,222 -51.85%
override - - - - - -
Total Tax Levy 63,348,917 65,583,981 66,656,426 69,510,438 2,854,011 4.28%
STATE AID - CHERRY SHEET
Chapter 70 (school aid) 3,045,154 3,299,788 3,579,112 3,579,112 - -
Unrestricted General Government Aid 344,835 359,663 373,690 373,690 - -
Dist., reimb., offsets 69,342 27,602 42,599 42,599 - -
School Construction 665,538 - - - - -
Total State Aid 4,124,869 3,687,053 3,995,401 3,995,401 - 0.00%
LOCAL RECEIPTS
motor vehicle excise (00015) 2,982,398 3,043,210 2,544,000 2,735,000 191,000 7.51%
penalties and interest 142,892 305,670 140,000 150,000 10,000 7.14%payment in lieu of taxes (00013-418**) 89,222 36,795 37,714 38,657 943 2.50%
charges for services-solid waste 342,217 358,392 340,000 340,000 - -
fees 195,331 248,593 150,000 170,000 20,000 13.33%
rentals 130,430 125,410 125,000 125,000 - -
departmental revenue-cemeteries 36,443 45,385 30,000 30,000 - - other departmental revenue 447,605 564,817 430,000 457,000 27,000 6.28%
licenses and permits 1,328,944 1,080,574 1,075,000 1,075,000 - -
fines and forfeits 101,366 96,434 95,000 95,000 - -
investment income (00017-41700) 56,090 215,315 100,000 200,000 100,000 100.00%
misc. non recurring (00081-48*) 307,881 144,276 - - - -
misc. recurring - - - - - -
cherry sheet overestimates - - - - - -
Total Local Receipts 6,160,818 6,264,871 5,066,714 5,415,657 348,943 6.89%
PRIOR YEAR BALANCES/OTHERunreserved fund balance (free cash) 2,100,000 2,100,000 2,740,000 2,500,000 (240,000) -8.76%free cash to be used for one-time capital projects 900,000 - - 260,000 260,000 -
overlay surplus 335,118 335,000 300,000 325,000 25,000 8.33%
reserved for appropriation (accr'd inc. litigation settlement) 10,000 7,500 7,500 7,500 - - reserved for appropriation (well litigation settlement - FY18 last year) 125,000 125,000 125,000 125,000 - -
cemetery trust fund 35,000 35,000 35,000 60,000 25,000 71.43%
Josiah Smith Tavern trust fund 6,000 6,000 6,000 6,000 - -
reappropriate continuing balances - 82,515 - 49,641 49,641 -
Total Prior Year Balances/Other 3,511,118 2,691,015 3,213,500 3,333,141 119,641 3.72%
TOTAL PROJECTED REVENUES 77,145,722 78,226,919 78,932,041 82,254,637 3,322,596 4.21%
APPENDIX 8: CONSOLIDATED FY2019 REVENUE PROJECTIONS
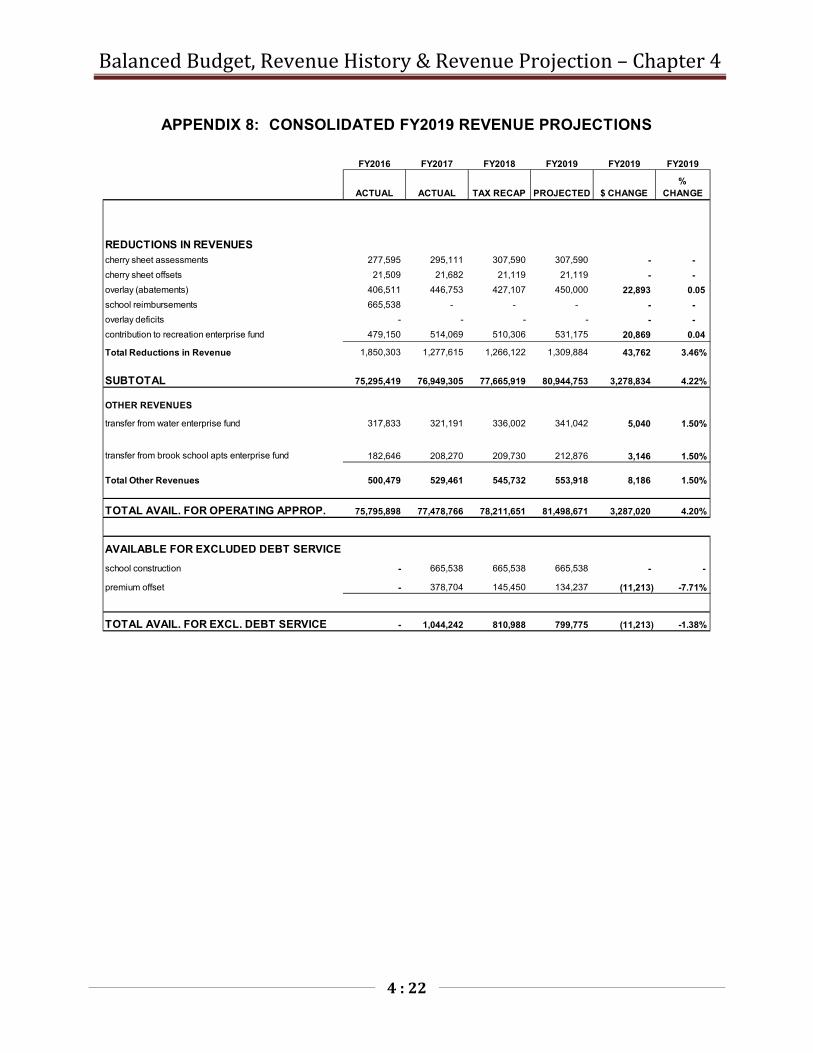
BalancedBudget,RevenueHistory&RevenueProjection–Chapter4
4:22
FY2016 FY2017 FY2018 FY2019 FY2019 FY2019
ACTUAL ACTUAL TAX RECAP PROJECTED $ CHANGE%
CHANGE
REDUCTIONS IN REVENUEScherry sheet assessments 277,595 295,111 307,590 307,590 - -
cherry sheet offsets 21,509 21,682 21,119 21,119 - -
overlay (abatements) 406,511 446,753 427,107 450,000 22,893 0.05
school reimbursements 665,538 - - - - -
overlay deficits - - - - - -
contribution to recreation enterprise fund 479,150 514,069 510,306 531,175 20,869 0.04
Total Reductions in Revenue 1,850,303 1,277,615 1,266,122 1,309,884 43,762 3.46%
SUBTOTAL 75,295,419 76,949,305 77,665,919 80,944,753 3,278,834 4.22%
OTHER REVENUES
transfer from water enterprise fund 317,833 321,191 336,002 341,042 5,040 1.50%
transfer from brook school apts enterprise fund 182,646 208,270 209,730 212,876 3,146 1.50%
Total Other Revenues 500,479 529,461 545,732 553,918 8,186 1.50%
TOTAL AVAIL. FOR OPERATING APPROP. 75,795,898 77,478,766 78,211,651 81,498,671 3,287,020 4.20%
AVAILABLE FOR EXCLUDED DEBT SERVICE
school construction - 665,538 665,538 665,538 - -
premium offset - 378,704 145,450 134,237 (11,213) -7.71%
TOTAL AVAIL. FOR EXCL. DEBT SERVICE - 1,044,242 810,988 799,775 (11,213) -1.38%
APPENDIX 8: CONSOLIDATED FY2019 REVENUE PROJECTIONS

BalancedBudget,RevenueHistory&RevenueProjection–Chapter4
4:23
This page intentionally left blank.

FY2019OperatingBudget&LongTermForecast–Chapter5
5:1
Town of Weston Budget Presentation
Chapter 5
FY2019 Operating Budget & Long Term Forecast

FY2019OperatingBudget&LongTermForecast–Chapter5
5:2
Expended Expended Appropriated RecommendedTITLE OF ACCOUNTS Fiscal Year Fiscal Year Fiscal Year Fiscal Year
2016 2017 2018 2019*
UNCLASSIFIED
Insurance Insurance, Workers' Compensation 188,210 213,908 250,000 320,000Public Safety - Injured on Duty+ 8,287 41,914 20,000 20,000Unemployment Compensation 115,745 32,077 120,000 120,000Insurance-Property & Liability 350,288 334,673 385,000 408,100Uninsured Losses+ 1,338 1,491 - -subtotal 663,868 624,063 775,000 868,100
Fringe Benefits Insurance-Group Health/Life, Medicare 10,367,491 10,512,944 11,017,109 10,852,098Contributory Retirement-Middlesex 4,270,242 4,557,886 4,792,481 5,114,630Compensated Absence Fund+ 131,711 158,369 200,000 220,000subtotal 14,769,444 15,229,199 16,009,590 16,186,728
Reserve Fund (see Appendix 2 for list of transfers) - - 556,900 586,587Debt Service (non-excluded) Principal & Interest 31,401 26,918 32,280 30,860
TOTAL UNCLASSIFIED 15,464,713 15,880,179 17,373,770 17,672,275
GENERAL GOVERNMENT
Town Manager's Office Salaries 442,470 450,762 477,556 496,958Expenses 52,815 53,332 113,410 133,940Consulting & Professional Services+ 26,061 23,857 70,000 80,000Town Center Improvement+ - 69,856 - - subtotal 521,346 597,806 660,966 710,898
Merit Pay Transfer Account 52,050 41,081 113,780 150,292
Legal Expenses 132,898 164,715 170,000 180,000
Facilities Maintenance Salaries 62,983 63,034 69,618 70,615Expenses 82,376 75,558 93,177 98,025Town Hall Equipment+ 909 1,285 3,000 3,000subtotal 146,268 139,878 165,795 171,640
Town Clerk & Registrars Salaries 158,272 171,178 167,146 198,211 of Voters Expenses 51,901 26,153 30,535 33,895
subtotal 210,173 197,331 197,681 232,106
Information Systems Salaries 277,443 287,563 295,408 305,877Expenses 251,981 246,162 303,700 350,000Computer Hardware & Maintenance+ 108,800 140,410 98,300 93,500subtotal 638,224 674,136 697,408 749,377
Weston Veterans Memorial Educational Fund Committee Expenses 2,536 2,494 2,850 2,850Weston Service Program Salaries 10,490 8,585 22,000 14,300
Weston Media Center Grant Expenses 110,000 110,000 110,000 40,000
TOTAL GENERAL GOVERNMENT 1,823,985 1,936,025 2,140,480 2,251,463
FY19 RECOMMENDED OPERATING BUDGET

FY2019OperatingBudget&LongTermForecast–Chapter5
5:3
Expended Expended Appropriated RecommendedTITLE OF ACCOUNTS Fiscal Year Fiscal Year Fiscal Year Fiscal Year
2016 2017 2018 2019*
FACILITIES TOWN-WIDE Salaries 314,434 328,064 370,654 495,163Expenses 688,969 676,563 853,580 866,780Facilities Improvements-Town-wide+ 566,310 354,125 534,699 566,781Equipment Replacement+ - 106,598 228,000 46,000
TOTAL FACILITIES TOWN-WIDE 1,569,714 1,465,350 1,986,933 1,974,724
FINANCE
Finance Committee Expenses 204 204 400 7,750
Finance Salaries 700,184 698,547 789,205 737,359Expenses 124,455 126,225 152,215 142,465subtotal 824,639 824,772 941,420 879,824
TOTAL FINANCE 824,843 824,976 941,820 887,574
LAND USE, PLANNING & INSPECTIONAL SERVICES
Salaries 539,938 540,367 586,817 600,484Expenses 215,747 173,203 206,720 198,560
TOTAL LAND USE , PLANNING & INSPECTIONAL SERVICES 755,685 713,570 793,537 799,044
PUBLIC SAFETY
Police/Animal Control Salaries 2,774,489 3,284,716 3,191,369 3,362,548Expenses 275,330 281,716 335,227 323,350Equipment and Apparatus+ 138,664 136,088 150,000 150,000subtotal 3,188,483 3,702,520 3,676,596 3,835,898
Fire Salaries 2,897,399 2,670,667 2,932,424 3,130,649Expenses 268,587 269,401 313,446 323,470Hydrant Service 42,930 42,930 44,000 44,000Emergency Management+ - 3,800 2,000 2,000Equipment and Apparatus+ 310,527 186,431 130,000 20,000subtotal 3,519,443 3,173,229 3,421,870 3,520,119
TOTAL PUBLIC SAFETY 6,707,926 6,875,749 7,098,466 7,356,017
EDUCATION
School Department Salaries 31,554,445 32,360,707 33,365,622 34,061,069Instructional, Maint. & Other Expenses 5,764,741 5,377,059 5,713,907 6,038,399subtotal 37,319,186 37,737,766 39,079,529 40,099,468
Minuteman Regional Voc. Assessment 91,498 122,810 122,448 104,820 Technical School District
TOTAL EDUCATION 37,410,684 37,860,576 39,201,977 40,204,288
FY19 RECOMMENDED OPERATING BUDGET

FY2019OperatingBudget&LongTermForecast–Chapter5
5:4
Expended Expended Appropriated RecommendedTITLE OF ACCOUNTS Fiscal Year Fiscal Year Fiscal Year Fiscal Year
2016 2017 2018 2019*
PUBLIC WORKS Salaries 1,817,975 1,844,727 2,040,243 2,080,661Expenses 1,028,027 1,111,686 1,215,110 1,214,197Snow and Ice Control 448,422 691,592 252,900 252,900
Continuing Balance Accts. Construction of Public Ways+ 111,963 435,439 750,000 1,250,000Departmental Equipment + 158,092 - 245,000 255,000Reconstruction/Maintenance of Sidewalks+ 23,764 350,917 120,000 165,000Stone Retaining Wall Repairs+ 9,132 37,918 10,000 10,000Guard Rail Rehabilitation Program+ - - 50,000 50,000Monitoring Groundwater - Landfill+ 30,825 26,575 25,500 25,500Traffic & Sidewalk Committee+ 10,526 25,638 15,000 25,000Parks & Cemeteries Improvements+ 12,715 11,327 - - subtotal Cont Bal Accounts 357,017 887,815 1,215,500 1,780,500
TOTAL PUBLIC WORKS 3,651,441 4,535,821 4,723,753 5,328,258
HEALTH & HUMAN SERVICES
Board of Health Salaries 245,384 249,143 260,199 264,518Expenses 7,363 6,909 22,800 7,800Mental Health Services 25,000 25,000 25,000 25,000subtotal 277,747 281,052 307,999 297,318
Mosquito Control, E. Middlesex Project Expenses 38,558 41,718 42,761 43,693
Council on Aging Salaries 278,179 290,072 328,024 347,252Expenses 34,589 36,325 36,325 47,750Contrib. to Community Center Maintenance - 30,000 30,000 30,000subtotal 312,768 356,397 394,349 425,002
Veterans' Services Expenses 63,096 34,761 78,035 47,829
TOTAL HEALTH & HUMAN SERVICES 692,169 713,928 823,144 813,842
PUBLIC LIBRARY
Libraries Salaries 1,020,474 1,046,084 1,121,075 1,153,188Expenses 143,821 125,481 153,120 143,162Library Materials 74,999 75,000 75,000 80,000Minuteman Library Network 40,021 39,045 42,096 42,500
TOTAL PUBLIC LIBRARY 1,279,315 1,285,611 1,391,291 1,418,850
TOTAL OPERATING BUDGET APPROPRIATIONS 70,180,475 72,091,786 76,475,171 78,706,335
DEBT SERVICE (EXCLUDED)** 8,378,664 9,068,321 8,905,759 8,741,482
GRAND TOTAL BUDGET APPROPRIATIONS 78,559,139 81,160,107 85,380,930 87,447,817
In FY19 Net Debt Service is $7,941,707. See Appendix 1 for detail.
*FY19 Recommended Operating Budget does not include amounts to be appropriated under separate articles, such as Enterprise Fund budgets & OPEB Trust Fund.
**FY18 & FY19 Recommended Debt Service (Excluded) are Gross Figures. In prior years the budget was voted as Net
FY19 RECOMMENDED OPERATING BUDGET

FY2019OperatingBudget&LongTermForecast–Chapter5
5:5
Schools44.6%
Unclassified & Fixed Costs20.2%
General Government
20.4%
Town-Wide Facilities
2.3%
OPEB & Cash Capital2.6%
Exempt Debt Service9.9%
FY2019Budget Summary by Category
Fiscal Year 2018 Fiscal Year 2019 $ %Budget Budget Change Change
Unclassified (Insurance, Benefits, Other) 17,373,770 17,672,275 298,505 1.7%General Government 2,140,480 2,251,463 110,983 5.2%Facilities Town-Wide 1,986,933 1,974,724 (12,209) -0.6%Finance 941,820 887,574 (54,246) -5.8%Land Use, Planning, & Inspectional Services 793,537 799,044 5,507 0.7%Public Safety 7,098,466 7,356,017 257,551 3.6%Schools 39,079,529 40,099,468 1,019,939 2.6%Vocational Regional School District 122,448 104,820 (17,628) -14.4%Public Works 4,723,753 5,328,258 604,505 12.8%Health & Human Services 823,144 813,842 (9,302) -1.1%Public Library 1,391,291 1,418,850 27,559 2.0%Appropriations to be made under Separate Articles 1,736,480 2,381,634 645,154 37.2%
Total Operating Budget 78,211,651 81,087,969 2,876,318 3.7%
Excluded Debt Service* 8,905,759 8,741,482 (164,277) -1.8%Water Enterprise Fund Expenditures 4,008,465 3,730,043 (278,422) -6.9%Recreation Enterprise Fund Expenditures 1,731,921 1,770,853 38,932 2.2%Brook School Apartments Expenditures 1,115,671 1,169,022 53,351 4.8%Community Preservation Act Reserve for Projects 2,090,423 2,142,683 52,261 2.5%
Total 96,063,890 98,642,052 2,578,163 2.7%
* Amounts projected for FY19 factor in approval of debt exclusion and are net of state reimbursement for school projects.
BUDGET SUMMARY AND COMPARISON FISCAL YEAR 2019

FY2019OperatingBudget&LongTermForecast–Chapter5
5:6
Fiscal Year 2019 Budget Highlights – Recommended Appropriations The final proposed budget presented on pages 11-13 of this document has been approved by the Finance Committee and is recommended to Town Meeting by the Board of Selectmen. Highlights include:
Unclassified The Unclassified portion of the Town budget represents those fixed costs that are not generally attributed to any one department or service and includes insurances and employee benefits for all Town departments, including the School Department. The category of Insurance, which totals $868,100, and is increasing by $93,100 for fiscal year 2019, includes Workers’ Compensation, Unemployment Compensation, Property, Liability and Motor Vehicle Insurance. Workers’ Compensation is increasing by $70,000 due to salary increases and a new, more thorough, workers compensation audit. Property & Liability Insurance is increasing by $23,100 due to an estimated 6% increase in FY19 insurance premiums. The category of Fringe Benefits is increasing overall by 1% and includes:
Insurance, Group Health/Life, Medicare - $10,852,098: Town employees and retirees are enrolled in the health insurance plans managed by the Commonwealth of Massachusetts’ Group Insurance Commission (GIC). In addition, this budget includes the Town’s share of the Medicare tax paid for most employees. This budget is decreasing by $165,011 or 1.5%.
Contributory Retirement - Middlesex - $5,114,630: The Town is part of the Middlesex Retirement System (MRS), which serves 39 municipalities and a number of special governmental districts. Both employees and the Town contribute to a fund that is used to pay current and future pension benefits. For fiscal year 2019, the Town’s pension assessment is increasing by $322,149 or 6.7%. As of January 1, 2016, an actuarial study determined that the Town’s pension liability was under funded by approximately $60.4 million. The funding schedule adopted by MRS must provide for payment in full of the unfunded liability by 2035.
Remaining line items in the Unclassified budget include:
Reserve Fund - $586,587: The Reserve Fund is available for use by the Finance Committee for extraordinary and unforeseen expenses during the year. A summary of reserve fund transfers for fiscal year 2015 through fiscal year 2018 to date can be found in Appendix 2.
Debt Service - $30,860: This only represents debt service within the tax levy and is a reduction of $1,420. Proposition 2½ excluded debt service is estimated at $7,941,707, including proposed capital projects and assuming passage of the Proposition 2½ debt exclusion question, which is a reduction of $153,064 or 1.9%.
General Government
This category includes the Town Manager’s Office (which staffs the Board of Selectmen and includes the Human Resources function), Legal Expenses, Facilities Maintenance (Town Hall, Josiah Smith Tavern, Old Library), Town Clerk and Registrars of Voters, Information Systems, and Town Meeting Committees. Overall, this category is increasing by $110,983 or 5.2%. Budget highlights include:
Town Manager’s Office - $710,898: This budget is increasing by $49,932, due to increased amounts for consulting services and employee training funds, a higher budget to lease electronic voting devices for Town Meeting, and salary increases.
Merit Pay (Transfer Account) - $150,292: This amount is the recommended budget for merit pay increases for non-union employees.
FY2019OperatingBudget&LongTermForecast–Chapter5
5:7
Legal Expenses - $180,000: This account is for Town Counsel and municipal Labor Counsel services, and it is increasing by $10,000 or 5.9%.
Facilities Maintenance - $171,640: This recommended budget amount covers the cleaning, utilities, and custodial support for the Town Hall and minimal costs related to the Josiah Smith Tavern. The cost of maintaining the Old Library building has been eliminated because that building is currently under construction to become an Art & Innovation Center. All costs for repairs and maintenance are included in the Town-wide Facilities budget.
Town Clerk/Registrars of Voters – $232,106: This budget includes funding for one municipal election and two state elections.
Information Systems - $749,377: This budget supports the technology and information systems for all municipal departments and is increasing primarily to cover the increasing number of software packages used to conduct departmental business.
Weston Service Program - $14,300: The Weston Service Program allows qualified veterans, as well as elderly and disabled property owners to work for the Town. Individuals are paid up to $1,100, which is applied to their property tax bill. A total of thirteen qualified taxpayers may participate in this program.
Facilities Town-Wide Facilities Town-Wide - $1,974,724: This budget includes the repair, maintenance, and oversight of all municipal and school buildings and facilities. It includes the salaries for the Director, Deputy Director, Facilities Coordinator, and Fields Coordinator, as well as the repair and maintenance costs for all buildings (except the Community Center, Brook School Apartments, and Water Division facilities, which are budgeted in enterprise funds), and the Facilities Improvements Town-wide continuing balance account. Utilities, supplies, and the cost of other personnel (custodial, maintenance, school grounds) remain in departmental budgets for each building. Energy improvements to comply with requirements of the Green Communities program are being handled within this budget. The amount for the Town-wide Facilities Improvements account is increasing by $32,082, or 6% as recommended by the Town’s comprehensive reserve policy.
Finance Finance - $887,574: This category includes the Finance Committee, Finance Director, Board of Assessors and Assessors’ Office, Town Accountant’s office, and Treasurer/Collector’s office. Overall, this budget is decreasing by $54,246 or 5.8%, primarily due to the reduction of one full-time Financial Analyst position that is no longer needed.
Planning, Land Use & Inspectional Services Planning, Land Use & Inspectional Services - $799,044: This category includes Inspectional Services, Zoning Board of Appeals, Planning Board, Conservation Commission, Historical Commission and Crescent Street Historic District Commission. The budget includes the salaries for the staff that support these boards and commissions. The Inspector of Buildings has been designated Land Use Coordinator and is responsible for overseeing all land use functions in this category except the Planning Board. Overall, this budget is increasing by $5,507 or 0.7%. A small amount of funding is included to support additional hours necessary for Conservation Commission Staff.
Public Safety This category includes Police/Animal Control and Fire, and it is increasing by $274,051 or 3.9%. Budget highlights include:
Police Department & Animal Control - $3,852,398: This budget is increasing by $175,802 or 4.8%.
FY2019OperatingBudget&LongTermForecast–Chapter5
5:8
This increase includes $80,000 to better reflect the need for Police overtime. In addition, $32,000 is included to make the Animal Control Officer a full-time position, given increased demands due to the large volume of dogs using the Weston trail system. This increase is strongly supported by the Conservation Commission.
Fire Department - $3,520,119: This budget is increasing by $98,249 or 2.9%. The most notable changes in this budget are an $88,712 increase for the cost of two additional firefighter positions offset by $110,000 savings in capital equipment purchases, because the cost of a new fire pumper will be presented as a separate borrowing article.
Public Works
Public Works - $5,328,258: The recommended budget for Public Works is increasing by $604,505 or 12.8% and includes Administration, Highways, Storm Water Management, Recycling and Solid Waste, Vehicle Maintenance, Parks and Cemeteries, Snow and Ice Control, and Tree Warden. The primary increase is an additional $500,000 to increase the funding level for roadway maintenance to a more appropriate level, reflecting the average lifespan of a road and the cost to maintain or replace roads. It is estimated that $1.5 million per year is needed; with this increase and the amount we expect to receive in Chapter 90 funds from the Commonwealth, the Town’s overall funding level will increase to more than $1.7 million to make a small dent in what is needed to start catching up. The Water Division budget is approved separately at the Annual Town Meeting as an enterprise fund. Water Division (Enterprise Fund) - $3,730,043: Overall, the recommended budget is decreasing by $278,422, or 6.9%, primarily because of the decrease in Weston’s water consumption affecting the MWRA assessment.
Health and Human Services
This category includes the Board of Health, Mosquito Control, Council on Aging, and Veterans’ Services, and it is decreasing by $9,302 or 1.1%. Budget highlights include:
Board of Health - $297,318: The Board of Health provides services related to public health, enforcement of the State Sanitary and Environmental codes, and emergency preparedness. In addition, $25,000 is included for mental health services and is paid to Human Relations Service (HRS) in Wellesley to serve as a resource to Town departments and provide direct services to Weston residents.
Mosquito Control, E. Middlesex Project - $43,693: The E. Middlesex Mosquito Control Project conducts a program in Weston consisting of mosquito and wetland surveillance, larval and adult mosquito control, ditch maintenance, wetland surveys and public education. The project also participates in the state’s West Nile Virus surveillance program and a plan to prevent eastern equine encephalitis.
Council on Aging - $425,002: $30,000 is included in this budget as a contribution to the Recreation Enterprise fund to support the cost of operating the Community Center, in which the Council on Aging is housed. Hours worked by volunteers constitute the equivalent of six full-time positions. Weston’s residents aged 60 and older constitute 26% of the town’s total population. Supplemental funding for staff is provided by the Friends of the Council on Aging and the Formula Grant from the Commonwealth.
Veterans’ Services - $47,829: Weston participates in a Veterans’ Services District with the towns of Wellesley, Needham and Wayland. This allows Weston to share the services of a full-time Veterans’ Services staff. The cost of Weston’s participation in the District is decreasing by $206. The amount requested for payment of Veterans’ benefits is $20,000, which has been reduced by $30,000 to reflect actual cases in Weston. When Veterans’ benefits are paid to an individual, 75% is reimbursed by the State.

FY2019OperatingBudget&LongTermForecast–Chapter5
5:9
Cultural and Leisure Services This category includes the Public Library and Recreation Department. Budget highlights include:
Public Library - $1,418,850: An additional $27,559 or 2% is recommended, primarily due to anticipated salary increases. Approximately 65% of the annual funding for materials is provided from trust funds for the benefit of the Library.
Recreation (Enterprise Fund) - $1,770,853: Program fees cover approximately 70% of the salaries and expenses for this department; the remaining 30% is funded by property taxes. For fiscal year 2019, a contribution of $30,000 from the Council on Aging budget to the Recreation Enterprise fund is recommended to support the cost of operating the Community Center, in which the Council on Aging is housed.
Brook School Apartments Brook School Apartments (Enterprise Fund) – $1,169,022: Rental income covers all operating costs of this facility, and Community Preservation funds cover a portion of the debt service. A payment in lieu of taxes of $23,949 is included in recognition of Town services provided to the residents of the Brook School Apartments. A capital improvements account is funded annually by transfers from retained earnings.
Schools Voters are referred to the School Budget report, which is on the School’s website and will be presented at the Budget Hearing on Monday, April 30, 2018. The total budget for the School Department is $40,099,468, which is an increase of $1,019,939, or 2.6%, over the fiscal year 2018 budget. The budget for Minuteman Regional Vocational Technical School District decreased by 14.4% to $104,820. There are three students enrolled currently at Minuteman High School; five students are projected in FY19. Weston withdrew from membership in the Minuteman School District as of FY18. This budget includes the cost of tuition for the five students, transportation, and debt service for previously approved capital projects.
Separate Warrant Articles The following separate articles were approved at Town Meeting covering budget items not included in departmental budgets. These separate items include:
Route 20/Wellesley St. Improvements $260,000
Other Post Employment Benefits 2,121,634
Total $2,381,634

FY2019OperatingBudget&LongTermForecast–Chapter5
5:10
FY2019 Enterprise Fund Budgets
Title of Accounts
Expended Fiscal Year 2016
Expended Fiscal Year 2017
Budget Fiscal Year 2018
Budget Fiscal Year 2019
Brook School Apartments Salaries $165,223 $180,314 $192,585 $201,116
Expenses $336,308 $385,300 $379,180 $383,250
Repairs & Replacements $130,623 $138,460 $146,768 $155,574
Payment In Lieu of Taxes $22,239 $22,795 $23,365 $23,949
Capital Improvements $290,963 $100,000 $100,000 $140,000
Debt Service (Enterprise Fund) $307,917 $282,283 $273,773 $265,133
subtotal $1,253,273 $1,109,152 $1,115,671 $1,169,022
Recreation Salaries $983,334 $1,068,809 $1,171,732 $1,204,153
Expenses $452,133 $439,905 $478,139 $487,850
Community Center $70,094 $77,666 $82,050 $78,850
subtotal $1,505,561 $1,586,380 $1,731,921 $1,770,853
Water Salaries $265,614 $277,255 $289,926 $297,358 Expenses $227,315 $220,118 $231,155 $229,280
MWRA Assessment/Water Purchases
$2,247,535 $2,451,430 $2,867,800 $2,547,457
Debt Service (non-exempt) $526,613 $540,082 $552,084 $531,097
Capital Outlay $81,330 $38,417 $67,500 $124,850
subtotal $3,348,407 $3,527,302 $4,008,465 $3,730,042
TOTAL ENTERPRISE FUNDS
$6,107,241 $6,222,834 $6,856,057 $6,669,917

FY2019OperatingBudget&LongTermForecast–Chapter5
5:11
FY18 FY19FY15 FY16 FY17 Budget Proposed
Community Preservation Act - RevenuePrior Year Balance 9,453,628 6,102,236 7,969,785 8,963,289 8,660,422Property Surcharge 1,893,033 1,962,920 2,039,437 2,090,423 2,142,683State Match 635,954 601,956 434,742 375,780 271,755Investment Income 107,754 90,587 59,557 40,335 38,972Donations/Other 2,301 - - - -
Total Revenues 12,092,670 8,757,699 10,503,521 11,469,827 11,113,832
Use of Community Preservation FundsOpen Space Allocation
Balance - beginning of fiscal year 299 749 74 39,839 128Appropriation not used - - - - - New allocation 444,000 432,000 422,000 334,000 365,000Open Space subtotal 444,299 432,749 422,074 373,839 365,128Less: Appropriations for
Debt Service - Case Estates (443,550) (432,675) (382,235) (373,711) (364,856)Balance at end of fiscal year 749 74 39,839 128 272
Historic Resource AllocationBalance - beginning of fiscal year 175,649 165,649 442,160 96,160 160Appropriation not used - 269,511 - - - New allocation 290,000 262,000 261,000 271,000 282,000Historic Preservation subtotal 465,649 697,160 703,160 367,160 282,160Less: Appropriations for
Old Library - Exterior Preservation/Renovation (300,000) - - - - Farmers' Burial Ground/Central Cemetery Restoration - - - - - Town Archives - - - - - 20 Young Rd. Preservation Restriction - (255,000) - - - Old Library - Weston Art and Innovation Center - Design - - (364,000) - - Debt Service- Old Library - Weston Art and Innovation Center - Construction - - (95,767)55 Coburn Rd Preservation Restriction - - (216,000) - - Case House Rehabilitation-Design Fees - - (27,000) - - Josiah Smith Tavern-Design Fees - - - (367,000) (186,000)
Balance at end of fiscal year 165,649 442,160 96,160 160 393
Community Housing AllocationBalance - beginning of fiscal year 68,193 19 10,655 33,987 717Appropriation not used - - - - - New allocation 290,000 262,000 261,000 271,000 282,000Community Housing subtotal 358,193 262,019 271,655 304,987 282,717Less: Appropriations for
Debt Service - Brook School Apartments (248,189) (235,017) (221,505) (6,040) (5,825)Housing Staff Assistance (14,985) (16,347) (16,163) (19,230) (28,000)Warren Ave. Affordable Housing Project (95,000) - - - - Housing Trust-Affordable Homeownership Opportunity Funds - - - (279,000) - EHC - BSA Expansion Design - - - - -
Balance at end of fiscal year 19 10,655 33,987 717 248,892
FY19 COMMUNITY PRESERVATION ACT BUDGET

FY2019OperatingBudget&LongTermForecast–Chapter5
5:12
FY19 COMMUNITY PRESERVATION ACT BUDGET
Administrative FundsAllocated 115,000 117,000 118,000 120,000 120,000Spent/Budget (71,961) (65,944) (56,977) (120,000) (120,000)Returned to unallocated funds 43,039 51,056 61,023 0 0
Unallocated FundsBalance - beginning of fiscal year 9,209,487 5,935,819 7,516,896 8,793,304 8,659,417New Unallocated Funds 1,500,043 1,582,463 1,471,736 1,510,537 1,404,410Appropriation Not Used - 92,558 88,649 88,711 - Unexpended Administrative funds 43,039 51,056 61,023 - - Unallocated subtotal 10,752,569 7,661,896 9,138,304 10,392,552 10,063,827Less: Appropriations for
Hobbs Hagar House (88 North Ave.) - - - - - Recreation - Design & Construction Fees (200,000) - - - - Field Preservation - - - - - 80 Acre Conservation Area (Hobbs Pond Dam) - - - - - Town Archives - - - - - Preservation/Restoration of Historic Artifacts - - - - - Brook School Apartments Envelope (10% Historic) - - - - - Brook School Apartments Envelope (90% Housing) - - - - - Warren Ave. Affordable Housing Project-Design - - - - - Warren Ave. Affordable Housing Project-Construction (2,593,500) - - (428,600) - Warren Ave. Walkways (340,000) - - - - Walkways (48,000) - (280,000) - (775,000)Lamson Park (225,000) - - - -
Case Campus Walkways (217,150) (50,000) - - - 126-128 Viles St. (1,188,100) - - - - Charles River Eurasian Water Chestnut Removal (5,000) (10,000) (10,000) - - Dickson Riding Ring - (25,000) - - - Community Gardens - (15,000) - - - Town Center Improvements - (45,000) - - - Ash Streeet Design - - (30,000) - - Merriam Street Design - - (25,000) - - Josiah Smith Tavern-Design Fees - - - (263,000) (14,000)EHC - BSA Expansion Feasibility and Design - - - (30,000) - Housing Trust-Affordable Homeownership Opportunity Funds - - - (671,000) - Town Cemeteries - - - (205,000) - Rail Trail Cattle Passes (Historical) - - - (62,535) - Rail Trail Amenities - - - (73,000) (437,000)Case Park - - - - (45,117)
Balance at end of fiscal year 5,935,819 7,516,896 8,793,304 8,659,417 8,792,710
Total of all balances at the end of fiscal year 6,102,236 7,969,785 8,963,289 8,660,422 9,042,267
NOTES:1/ The first $100,000 in valuation is exempt from the surcharge.2/ The Community Preservation Act (CPA) requires that at least 10% of the estimated annual revenue received each fiscal year be spent or
reserved for future spending on each of the Act's three community preservation purposes: a) open space (including recreational use), b) historic resources, and c) community housing. After the minimum 10% has been spent/reserved for these purposes, the remaining 70% may be allocated to any one or a combination of the three primary uses.

FY2019OperatingBudget&LongTermForecast–Chapter5
5:13
Authority FY18 toName of Fund & Use to Spend FY15 FY16 FY17 3/31/2018
Recreation Skating Programs Recreation Budget 50,000 40,000 40,000 40,000(Program costs) Director Beginning Balance 6,517 6,517 6,517 6,247
Receipts 32,325 32,325 32,205 25,325Expenditures 32,325 32,325 32,475 25,325Ending Balance 6,517 6,517 6,247 6,247
Historic Marker Historical Budget 1,500 1,500 1,500 1,500(Costs related to purchase of Commission Beginning Balance 590 714 1,086 560historic markers) Receipts 360 540 180 540
Expenditures 236 168 706 336Ending Balance 714 1,086 560 764
Council on Aging Special Council on Budget 30,000 30,000 40,000 50,000Programs Aging Director Beginning Balance 9,517 11,413 15,706 24,868(Program expenses) Receipts 31,896 39,293 43,478 38,027
Expenditures 30,000 35,000 34,316 39,641Ending Balance 11,413 15,706 24,868 23,253
Town Building Rentals Town Budget 6,000 6,000 6,000 6,000(Utilities, cleaning and Manager Beginning Balance (0) (0) (0) (0) building monitor) Receipts 3,670 3,840 3,475 1,900
Expenditures 3,670 3,840 3,475 - Ending Balance (0) (0) (0) 1,900
Board of Health Health Budget 20,000 20,000 20,000 20,000(Vaccine and medical supplies) Director Beginning Balance 15,249 14,037 11,365 10,791
Receipts 3,988 4,154 10,021 1,500Expenditures 5,200 6,826 10,596 3,208Ending Balance 14,037 11,365 10,791 9,082
Fiske Law Office Town Budget 25,000 55,000 55,000 55,000(Building repairs and maintenance) Manager Beginning Balance 16,515 34,438 32,283 31,492
Receipts 18,575 - - - Expenditures 652 2,154 791 749Ending Balance 34,438 32,283 31,492 30,743
Melone House Conservation Budget - - 10,000 15,000(Building repairs & maintenance, including Commission Beginning Balance - - - - salaries and benefits) Receipts 7,192 6,671
Expenditures 458 4,940Ending Balance 6,734 1,731
Solar Array Revenue Town Budget - 200,000 700,000 700,000(Generation of solar energy from solar arrays) Manager Beginning Balance - - -
Receipts - 235,486 607,755 501,917Expenditures - 235,486 607,755 208,133Ending Balance - - - 293,784
NOTE: This report is provided as required by M.G.L. Chapter 44, Section 53E 1/2.
REVOLVING FUND BUDGETS & EXPENDITURES

FY2019OperatingBudget&LongTermForecast–Chapter5
5:14
Actual DOR Actual DOR Projected DORFY2017 Recap FY2018 Recap FY2019 Recap
REVENUESLOCAL RECEIPTS 5,188,520 5,066,714 5,415,657
Community Preservation Act Surcharge 3,380,351 4,842,233
CHERRY SHEET REVENUE 3,721,206 3,995,401 3,995,401Other State Aid - MSBA 665,538 665,538 665,538Ch 90 486,851 480,882
OTHER (Available Funds) Water Enterprise Receipts 3,832,081 4,094,467 3,942,337
Recreation Enterprise Receipts 1,093,449 1,119,615 1,197,735 Brook School Apartments Receipts 1,217,422 1,225,401 1,241,898
OPEB xfer from health trust 0 0Insurance Proceeds - STM 28,985 0Debt reauthorizationCapital Reserve from Retained Earnings BSA 100,000 100,000 140,000Recreation - Retained Earnings 45,000 102,000 41,943DPW Facility transfer to Police Sta
Water Retained Earnings 117,385 250,000 0BSA Retained EarningsFor Debt Exclusion 145,450 134,237
FREE CASH & Other Avail Funds To balance budget & Overlay, cemetery, JST, etc. 2,691,015 2,773,500 3,333,141
For appropriation STM & ATM 320,000 440,000
TOTAL REVENUES 22,887,803 25,301,201 20,107,887
EXPENDITURESDEPARTMENT BUDGET 35,691,767 37,163,194 38,502,047SCHOOL EXPENSES 38,746,641 39,079,529 40,099,468REG VOCATIONAL SCHOOL EXPENSES 122,810 122,448 104,820Art. 11 - Weston Media ctr 110,000 110,000 0Art 6, 11/16-Memorial Pool 120,000 0 0Art 2, 5/17 (FY17)-Snow & Ice 440,000 0CAPITAL ARTICLE 0 0 260,000
sub-total 74,791,218 76,915,171 78,966,335
STM - Authorizations(May 16 & Nov 16) 246,370 0SPECIAL ARTICLES
Ch 90 486,851 480,882Stabilization & OPEB Trust Funds 1,652,517 1,736,480 2,121,634Budgeted Debt Service 8,862,974 8,976,159 8,741,482
OPEB xfer
OTHER EXPENDITURESAllowance for Abatements 446,753 427,107 450,000Cherry Sheet Offsets 21,682 21,119 21,119Cherry Sheet Charges 295,111 307,590 307,590
3,610,890 4,008,465 3,601,295Recreation Enterprise Fund Expenditures 1,652,518 1,731,921 1,770,853Brook School Enterprise Fund 1,109,152 1,115,671 1,169,022
Community Preservation Act Unreserved 706,883 1,068,117Community Preservation Act Reserved 2,673,468 3,774,116
TOTAL EXPENDITURES 96,556,387 100,562,798 97,149,330
NET AMOUNT TO BE RAISED (Total Expenditures less 73,668,584 75,261,597 77,041,443 Total Revenues. This amount is subject to the levy limit)
TOWN OF WESTON PRELIMINARY RECAP SHEET
COMPARISON OF FISCAL YEAR 2017 TO 2019
Water Enterprise Fund Expenditures

FY2019OperatingBudget&LongTermForecast–Chapter5
5:15
TOWN OF WESTON PRELIMINARY RECAP SHEET
COMPARISON OF FISCAL YEAR 2017 TO 2019
PRIOR FISCAL YEAR LEVY LIMIT - before debt exclusion 68,867,000 71,780,679 74,821,4182 1/2% Increase 1,721,675 1,794,517 1,870,535Current New Growth (Value increases from new building) 1,192,004 1,246,222 600,000Override Articles 0 0 0
LEVY LIMIT - before adding current year debt exclusion 71,780,679 74,821,418 77,291,953One Year Capital Override -
PROP 2 1/2 DEBT EXCLUSION 8,084,603 8,094,771 7,941,707 School Debt, Town Hall/Police Station, Joint Library
LEVY LIMIT - Maximum Allowable Levy 79,865,282 82,916,189 85,233,660(Net Amount To Be Raised cannot be higher than this)
LESS: Amount to be provided for negotiated settlement 0 0 0 of a disputed legal claim
GAP - Levy Limit minus the Net Amount To Be Raised. 6,196,698 7,654,591 8,192,217(If this amount is negative it is beyond the Levy Limit and is not allowable without an override)
PROPERTY VALUATION 5,941,014,800 6,016,114,900 6,016,114,900
TAX RATE -(Net Amount to be Raised divided by Property Valuation x 100 12.40 12.51 12.81
Please note: $100,000 of expenditures equals approximately $0.02 on the tax rate
FY2019OperatingBudget&LongTermForecast–Chapter5
5:16
Long Term Revenue & Expenditure Forecast
As part of our financial planning process, we have made a Long-Term Revenue and Expenditure Forecast for fiscal years 2020 and 2021.
At this time, we anticipate a minimal potential budget shortfall of $450,738 if we maintain the current level of services and educational programs for Fiscal Year 2020. Salary increases are estimated based on settled collective bargaining agreements. We anticipate increases greater than the inflation rate for employee benefits/health insurance, employee pension costs, and continued funding of the Town’s liability for other post-employment benefits or retiree health insurance (OPEB). Reserves are increased in accordance with the Reserve Policy.
A larger potential shortfall of $1,236,856 is estimated for Fiscal Year 2021. Expenditure assumptions were made using the same methodology as was used for Fiscal Year 2020.
Revenue has been forecasted for both years using conservative assumptions. Modest levels of growth in the tax base are assumed for each year, and state aid and other revenue sources are generally assumed to be flat year over year.
The estimated deficits indicated in this forecast are very likely to be resolved during the budget process for each year as conservative assumptions become more informed.
Please see the table on the following page for details of the projected increases for Fiscal Year 2020 and Fiscal Year 2021.

FY2019OperatingBudget&LongTermForecast–Chapter5
5:17
Budget % Inc Requested % Inc Projected % Inc Projected % Inc Projected % Inc
ExpendituresSalariesGeneral Government 12,765,518 5.0% 13,408,075 5.0% 13,810,317 3.0% 13,810,317 3.0% 14,224,627 3.0%Education 33,292,192 2.5% 34,061,069 2.3% 35,082,901 3.0% 35,082,901 3.0% 36,135,388 3.0% sub-total Salaries 46,057,710 3.2% 47,469,144 3.1% 48,893,218 3.0% 48,893,218 3.0% 50,360,015 3.0%
Employee BenefitsGroup Insurance & Medicare 11,017,109 1.1% 10,852,098 -1.5% 11,720,266 8.0% 11,720,266 8.0% 12,657,887 8.0%Retirement Systems 4,792,481 5.1% 5,114,630 6.7% 5,457,310 6.7% 5,457,310 6.7% 5,822,950 6.7%Workers' Comp & Unemployment 370,000 2.5% 440,000 18.9% 453,200 3.0% 453,200 3.0% 466,796 3.0% sub-total Employee Benefits 16,179,590 2.3% 16,406,728 1.4% 17,630,776 7.5% 17,630,776 7.5% 18,947,633 7.5%
Other UnclassifiedInsurance, Property & Liability 385,000 1.05% 408,100 6.0% 416,262 2.0% 416,262 2.0% 424,587 2.0%Separate Articles 110,000 0.00% - -100.0% - - -
All OtherGeneral Government 6,611,655 7.6% 6,959,736 5.3% 7,098,931 2.0% 7,098,931 2.0% 7,240,909 2.0%Cash Capital - 260,000 - - - Education 5,787,337 -7.9% 6,038,399 4.3% 6,159,167 2.0% 6,159,167 2.0% 6,282,350 2.0%Non-Excluded Debt Service 32,280 -4.3% 30,860 -4.4% 29,460 -4.5% 29,460 -4.5% 29,080 -1.3% sub-total All Other 12,431,272 -0.2% 13,288,995 6.9% 13,287,558 0.0% 13,287,558 0.0% 13,552,340 2.0%
ReservesFinance Committee Reserve Fund 556,900 -6.4% 586,587 5.3% 601,252 2.5% 601,252 2.5% 616,283 2.5%Facilities Maintenance 534,699 5.0% 566,781 6.0% 600,788 6.0% 600,788 6.0% 636,835 6.0%Uninsured Losses - 0.0% - 0.0% - 0.0% - 0.0% - 0.0%Workers' Comp Police/Fire 20,000 0.0% 20,000 0.0% 20,000 0.0% 20,000 0.0% 20,000 0.0%Post-Employment Benefits Reserve 1,736,480 5.1% 2,121,634 22.2% 2,199,656 3.7% 2,199,656 3.7% 2,267,423 3.1%Stabilization Fund - 0.0% - 0.0% - 0.0% - 0.0% - 0.0%Pension Stabilization Fund - 0.0% - 0.0% - 0.0% - 0.0% - 0.0%Compensated Absences 200,000 42.9% 220,000 10.0% 240,000 9.1% 240,000 9.1% 260,000 8.3% sub-total Reserves 3,048,079 4.0% 3,515,002 15.3% 3,661,696 4.2% 3,661,696 4.2% 3,800,541 3.8%
Budget Reduction - (225,369)
Total Expenditures 78,211,651 2.5% 81,087,969 3.7% 83,889,510 3.5% 83,664,141 3.2% 87,085,116 3.8%
RevenueProperty Tax Levy 66,656,426 1.6% 69,099,736 3.7% 71,442,230 3.4% 71,442,230 3.4% 73,843,285 3.4% - New Growth 1,246,222 4.5% 600,000 -51.9% 600,000 0.0% 600,000 0.0% 600,000 0.0% - Unused Levy Capacity (1,246,222) 4.5% (600,000) -51.9% (600,000) (600,000) 0.0% (600,000) - Override - - - - - State Aid 3,995,401 -8.9% 3,995,401 0.0% 3,995,401 0.0% 3,995,401 0.0% 3,995,401 0.0%Local Receipts 5,066,714 -0.2% 5,415,657 6.9% 5,415,657 0.0% 5,415,657 0.0% 5,415,657 0.0%Prior Year Balances/Other 3,213,500 19.4% 3,333,141 3.7% 3,333,141 0.0% 3,333,141 0.0% 3,333,141 0.0%Revenue Offsets (1,266,122) -34.8% (1,309,884) 3.5% (1,309,884) 0.0% (1,309,884) 0.0% (1,309,884) 0.0%Other Revenues 545,732 3.1% 553,918 1.5% 562,227 1.5% 562,227 1.5% 570,660 1.5%
Revenue Increase - 225,369.22
Total Revenue 78,211,651 2.5% 81,087,969 3.7% 83,438,772 2.9% 83,664,141 3.2% 85,848,261 2.6%
Budget Surplus (Deficit) - (0) (450,738) - (1,236,856)
FY21
Level Service Increase over Scenario 2
Scenario 1FY20
Level Service Budget
Scenario 2FY20
Level Service with Budget
Reductions/Revenue Increases to resolve
deficit
Level Service Budget
FY18 FY19
As Approved by Town Meeting

FY2019OperatingBudget&LongTermForecast–Chapter5
5:18
General Fund*
Community
Preservation Fund*
Other Non‐Major
Governmental Funds
Proprietary
Funds*
Fiduciary
Funds* Total
Fund Balance, Beginning of Year 16,117,085 11,876,252 22,668,795 11,317,697 13,787,257 75,767,086
0
REVENUES 0
Property Tax Levy 66,978,102 2,121,634 69,099,736
State Aid‐Cherry Sheet 3,995,401 3,995,401
Local Receipts 5,415,657 5,415,657
Prior Year Balances/Other 3,333,141 3,333,141
Reductions in Revenue: 0
Cherry Sheet Assessments (307,590) (307,590)
Cherry Sheet Offsets (21,119) (21,119)
Overlay Abatements (450,000) (450,000)
School MSBA Reimbursement (Offset Excluded Debt Service) 0 0
Recreation Enterprise Fund Subsidy (531,175) (531,175)
Total Reductions in Revenue (1,309,884) (1,309,884)
Other Revenues 553,918 553,918
Excluded Debt Service 8,741,482 8,741,482
Water Enterprise Receipts 3,730,043 3,730,043
Recreation Enterprise Receipts 1,239,678 1,239,678
General Fund Contributions to Recreation Enterprise 531,175 531,175
Brook School Apartment Receipts 1,169,022 1,169,022
Community Preservation Act Surcharge 2,142,683 2,142,683
0
TOTAL REVENUES 87,707,817 2,142,683 0 6,669,918 2,121,634 98,642,052
EXPENDITURES
Unclassified (Insurance, Benefits, Other) 17,672,275 17,672,275
General Government 2,251,463 2,251,463
Facilities Town‐Wide 1,974,724 1,974,724
Finance 887,574 887,574
Land Use, Planning, & Inspectional Services 799,044 799,044
Public Safety 7,356,017 7,356,017
Schools 40,099,468 40,099,468
Vocational Regional School District 104,820 104,820
Public Works 5,328,258 5,328,258
Health & Human Services 813,842 813,842
Public Library 1,418,850 1,418,850
Appropriations to be Made under Separate Articles 260,000 2,121,634 2,381,634
Excluded Debt Service 8,741,482 8,741,482
Water Enterprise Fund Expenditures 3,730,043 3,730,043
Recreation Enterprise Fund Expenditures 1,770,853 1,770,853
Brook School Apartment Fund Expenditures 1,169,022 1,169,022
Community Preservation Act Reserve for Projects 2,142,683 2,142,683
TOTAL EXPENSES 87,707,817 2,142,683 0 6,669,918 2,121,634 98,642,052
Fund Balance, End of Year 16,117,085 11,876,252 22,668,795 11,317,697 13,787,257 75,767,086
CHANGE IN FUND BALANCE 0 0 0 0 0 0
% CHANGE IN FUND BALANCE 0.00% 0.00% 0.00% 0.00% 0.00% 0.00%
* BUDGETED FUNDS
TOWN OF WESTON
FY 2019 ADOPTED BUDGET
FUND BALANCE SUMMARY‐ALL FUNDS
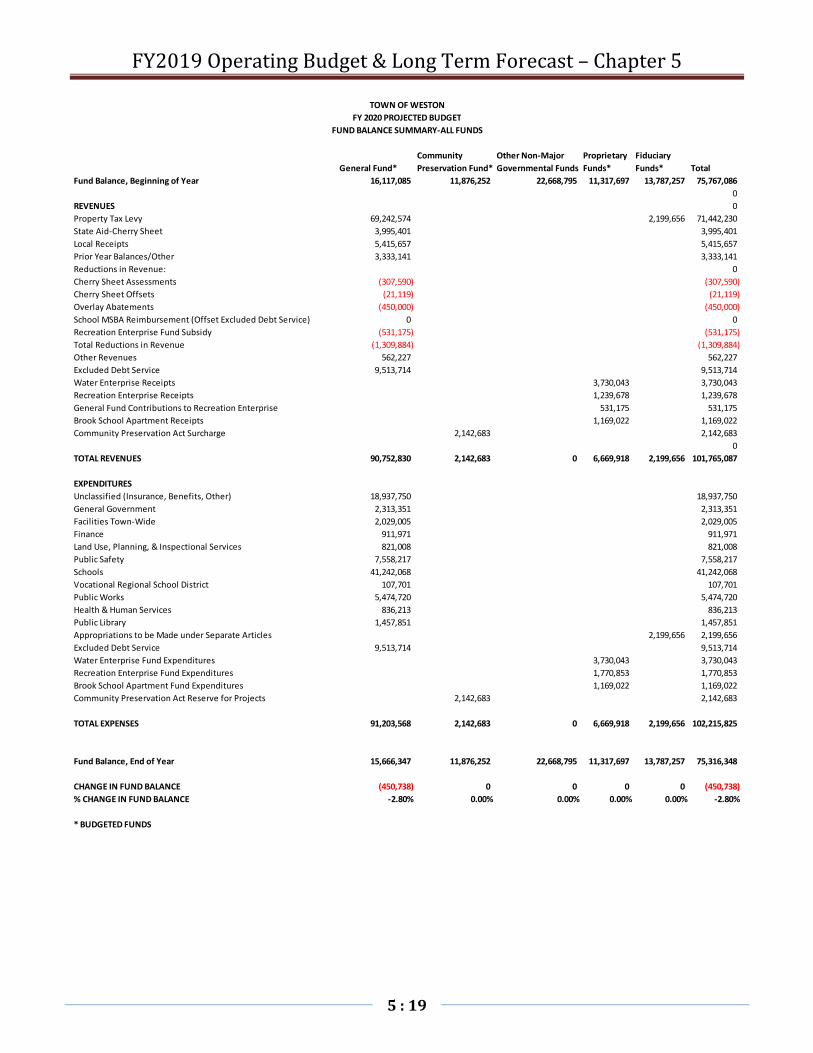
FY2019OperatingBudget&LongTermForecast–Chapter5
5:19
General Fund*
Community
Preservation Fund*
Other Non‐Major
Governmental Funds
Proprietary
Funds*
Fiduciary
Funds* Total
Fund Balance, Beginning of Year 16,117,085 11,876,252 22,668,795 11,317,697 13,787,257 75,767,086
0
REVENUES 0
Property Tax Levy 69,242,574 2,199,656 71,442,230
State Aid‐Cherry Sheet 3,995,401 3,995,401
Local Receipts 5,415,657 5,415,657
Prior Year Balances/Other 3,333,141 3,333,141
Reductions in Revenue: 0
Cherry Sheet Assessments (307,590) (307,590)
Cherry Sheet Offsets (21,119) (21,119)
Overlay Abatements (450,000) (450,000)
School MSBA Reimbursement (Offset Excluded Debt Service) 0 0
Recreation Enterprise Fund Subsidy (531,175) (531,175)
Total Reductions in Revenue (1,309,884) (1,309,884)
Other Revenues 562,227 562,227
Excluded Debt Service 9,513,714 9,513,714
Water Enterprise Receipts 3,730,043 3,730,043
Recreation Enterprise Receipts 1,239,678 1,239,678
General Fund Contributions to Recreation Enterprise 531,175 531,175
Brook School Apartment Receipts 1,169,022 1,169,022
Community Preservation Act Surcharge 2,142,683 2,142,683
0
TOTAL REVENUES 90,752,830 2,142,683 0 6,669,918 2,199,656 101,765,087
EXPENDITURES
Unclassified (Insurance, Benefits, Other) 18,937,750 18,937,750
General Government 2,313,351 2,313,351
Facilities Town‐Wide 2,029,005 2,029,005
Finance 911,971 911,971
Land Use, Planning, & Inspectional Services 821,008 821,008
Public Safety 7,558,217 7,558,217
Schools 41,242,068 41,242,068
Vocational Regional School District 107,701 107,701
Public Works 5,474,720 5,474,720
Health & Human Services 836,213 836,213
Public Library 1,457,851 1,457,851
Appropriations to be Made under Separate Articles 2,199,656 2,199,656
Excluded Debt Service 9,513,714 9,513,714
Water Enterprise Fund Expenditures 3,730,043 3,730,043
Recreation Enterprise Fund Expenditures 1,770,853 1,770,853
Brook School Apartment Fund Expenditures 1,169,022 1,169,022
Community Preservation Act Reserve for Projects 2,142,683 2,142,683
TOTAL EXPENSES 91,203,568 2,142,683 0 6,669,918 2,199,656 102,215,825
Fund Balance, End of Year 15,666,347 11,876,252 22,668,795 11,317,697 13,787,257 75,316,348
CHANGE IN FUND BALANCE (450,738) 0 0 0 0 (450,738)
% CHANGE IN FUND BALANCE ‐2.80% 0.00% 0.00% 0.00% 0.00% ‐2.80%
* BUDGETED FUNDS
TOWN OF WESTON
FY 2020 PROJECTED BUDGET
FUND BALANCE SUMMARY‐ALL FUNDS

FY2019OperatingBudget&LongTermForecast–Chapter5
5:20
General Fund*
Community
Preservation Fund*
Other Non‐Major
Governmental Funds
Proprietary
Funds*
Fiduciary
Funds* Total
Fund Balance, Beginning of Year 15,666,347 11,876,252 22,668,795 11,317,697 13,787,257 75,316,348
0
REVENUES 0
Property Tax Levy 71,575,862 2,267,423 73,843,285
State Aid‐Cherry Sheet 3,995,401 3,995,401
Local Receipts 5,415,657 5,415,657
Prior Year Balances/Other 3,333,141 3,333,141
Reductions in Revenue: 0
Cherry Sheet Assessments (307,590) (307,590)
Cherry Sheet Offsets (21,119) (21,119)
Overlay Abatements (450,000) (450,000)
School MSBA Reimbursement (Offset Excluded Debt Service) 0 0
Recreation Enterprise Fund Subsidy (531,175) (531,175)
Total Reductions in Revenue (1,309,884) (1,309,884)
Other Revenues 570,660 570,660
Excluded Debt Service 8,962,186 8,962,186
Water Enterprise Receipts 3,730,043 3,730,043
Recreation Enterprise Receipts 1,239,678 1,239,678
General Fund Contributions to Recreation Enterprise 531,175 531,175
Brook School Apartment Receipts 1,169,022 1,169,022
Community Preservation Act Surcharge 2,142,683 2,142,683
0
TOTAL REVENUES 92,543,023 2,142,683 0 6,669,918 2,267,423 103,623,047
EXPENDITURES
Unclassified (Insurance, Benefits, Other) 20,297,584 20,297,584
General Government 2,377,055 2,377,055
Facilities Town‐Wide 2,084,879 2,084,879
Finance 937,085 937,085
Land Use, Planning, & Inspectional Services 843,616 843,616
Public Safety 7,766,352 7,766,352
Schools 42,417,738 42,417,738
Vocational Regional School District 110,667 110,667
Public Works 5,625,480 5,625,480
Health & Human Services 859,240 859,240
Public Library 1,497,997 1,497,997
Appropriations to be Made under Separate Articles 2,267,423 2,267,423
Excluded Debt Service 8,962,186 8,962,186
Water Enterprise Fund Expenditures 3,730,043 3,730,043
Recreation Enterprise Fund Expenditures 1,770,853 1,770,853
Brook School Apartment Fund Expenditures 1,169,022 1,169,022
Community Preservation Act Reserve for Projects 2,142,683 2,142,683
TOTAL EXPENSES 93,779,879 2,142,683 0 6,669,918 2,267,423 104,859,903
Fund Balance, End of Year 14,429,491 11,876,252 22,668,795 11,317,697 13,787,257 74,079,492
CHANGE IN FUND BALANCE (1,236,856) 0 0 0 0 (1,236,856)
% CHANGE IN FUND BALANCE ‐7.89% 0.00% 0.00% 0.00% 0.00% ‐7.89%
* BUDGETED FUNDS
TOWN OF WESTON
FY 2021 PROJECTED BUDGET
FUND BALANCE SUMMARY‐ALL FUNDS

FY2019OperatingBudget&LongTermForecast–Chapter5
5:21
This page intentionally left blank.

Unclassified–Chapter6
6:1
Town of Weston
Budget Presentation
Chapter 6 UNCLASSIFIED

Unclassified–Chapter6
6:2
TOWN OF WESTON FY19 FINAL BUDGET AND FINANCING PLAN
UNCLASSIFIED
Board of Selectmen Town Manager
Assistant Town Manager / Human Resources Director
Finance Director/Town Accountant
FinalActual Actual Budget FY19 $ %
FY16 FY17 FY18 Budget Change Change
UNCLASSIFIED
RevenuesTax Levy and General Fund Revenues 15,205,231 15,604,589 17,108,183 17,402,704 294,521 1.7%Brook School Apartments Enterprise Fund 99,268 119,776 123,317 125,167 1,850 1.5%Water Enterprise Fund 162,409 142,969 142,270 144,404 2,134 1.5%Total 15,466,908 15,867,334 17,373,770 17,672,275 298,505 1.7%
Expenditures
InsuranceInsurance, Workers' Compensation 188,210 213,908 250,000 320,000 70,000 28.0%Public Safety - Injured on Duty+ 10,631 41,914 20,000 20,000 - - Unemployment Compensation 115,745 32,077 120,000 120,000 - 0.0%Insurance, Property & Liability 350,288 334,673 385,000 408,100 23,100 6.0%Uninsured Losses+ 1,338 1,491 - - - -subtotal 666,212 624,063 775,000 868,100 93,100 12.0%Fringe Benefits
Insurance, Group Life, Accid, Health, Medicare 10,367,341 10,500,099 11,017,109 10,852,098 (165,011) -1.5%Contributory Retirement-Middlesex 4,270,242 4,557,886 4,792,481 5,114,630 322,149 6.7%Compensated Absence Fund+ 131,711 158,369 200,000 220,000 20,000 10.0%subtotal 14,769,294 15,216,354 16,009,590 16,186,728 177,138 1.1%
Reserve Fund - - 556,900 586,587 29,687 5.3%Debt Service (non-excluded) 31,401 26,918 32,280 30,860 (1,420) -4.4%
Total 15,466,908 15,867,334 17,373,770 17,672,275 298,505 1.7%
CAPITAL & SEPARATE ARTICLES
RevenuesTax Levy and General Fund Revenues 1,856,925 1,652,517 1,736,480 2,381,634 645,154 37.2%Total 1,856,925 1,652,517 1,736,480 2,381,634 645,154 37.2%
ExpendituresCash Capital - - - 260,000 260,000 -Stabilization Fund 250,000 - - - - -Post Employment Benefits Reserve 1,606,925 1,652,517 1,736,480 2,121,634 385,154 22.2%Total 1,856,925 1,652,517 1,736,480 2,381,634 645,154 37.2%
DEBT SERVICE (excluded)
RevenuesTax Levy and General Fund Revenues 7,926,753 8,024,079 8,165,171 7,941,707 (223,464) -2.7%Mass. School Building Authority - 665,538 665,538 665,538 - 0.0%Premium Offset - 378,704 145,450 134,237 (11,213) -7.7%Total 7,926,753 9,068,321 8,976,159 8,741,482 (234,677) -2.6%
Debt Service (excluded)* 7,926,753 9,068,321 8,976,159 8,741,482 (234,677) -2.6%New Debt Service (proposed to be excluded) - - - - - -Total 7,926,753 9,068,321 8,976,159 8,741,482 (234,677) -2.6%
FY18 to FY19

Unclassified–Chapter6
6:3
Town of Weston FY19 Final Budget
UNCLASSIFIED: Employee Benefits and Town Wide Expenses Description of Services The Unclassified portion of the Town budget represents those fixed costs which are not generally attributed to any one department or service.
Budget Recommendations
Workers’ Compensation: The Town’s insurance premium is based on: 1) the Town’s payroll for each insured class of employee; 2) the workers’ compensation rates set by the State; and 3) the Town’s claims experience. Due to recent claims experience, we are expecting an increase in premium beyond the usual amount.
Public Safety, Injured on Duty: This continuing balance account, which covers medical expenses for police officers and firefighters who are injured in the line of duty, is managed by the Human Resources Department. Given the number of police officers and firefighters, the Town has a modest number of claims. This budget is level funded, consistent with the Town’s Reserve Policy.
Unemployment Compensation: The Town self-insures for this benefit. The budget is directly related to the number of former employees qualifying for benefits. Because we are a reimbursement employer, we must pay claims from former employees who lose their jobs with other employers, so the need for these funds is somewhat unpredictable.
Insurance, Property, General Liability, Motor Vehicle: This budget is increasing to cover anticipated premium rate increases. The Town continues to benefit from participation in a loss control program to obtain premium credit for the following year based on certain activities being completed during the current year. Uninsured Losses: The balance in this account is just above the target of $150,000 for this reserve account, so no funds are requested.
Group Health Insurance: The Town’s employees and retirees are enrolled in the health insurance plans of the Commonwealth of Massachusetts, Group Insurance Commission. At this time, we are projecting an 8% increase in premiums for FY19. The GIC does not normally set the FY19 rates until March 2018, although we may get early information in January. In addition, $84,000 is included for those currently “opting out” of the Town’s plans, saving the Town approximately $291,656. Finally, $53,445 is added to account for potential health insurance costs for three new positions proposed in the FY19 budget.
Medicare Tax: The Medicare tax is 1.45 percent of payroll. This budget is increasing by $60,000 due to increasing salaries and continued retirements of longer serving employees who are not subject to the tax.
Contributory Retirement-Middlesex: The Town participates in the Middlesex Retirement System (MRS). An actuarial analysis, which is conducted every two years, determines the Town’s pension liability and funding schedule. Full funding is required by 2035; the most recent actuarial study as of 1/1/16 has determined the Town’s level of funding to be 42%. The amount to be assessed to the Town in FY19 is a 6.7% increase over the FY18 assessment.
Compensated Absence Fund: This reserve account is intended to fund the sick leave buy-back payment for which many employees are eligible at retirement, the liability for which exceeds $2.4 million. The budget request is increased by $20,000 to $220,000, in accordance with the recently revised Reserve Policy. The balance in this account as of 12/31/17 is approximately $388,211.

Unclassified–Chapter6
6:4
Reserve Fund: The Reserve Fund is for unforeseen and extraordinary expenses, subject to Finance Committee review and approval. The Reserve Fund is increased to $586,587, in accordance with recently revised Reserve Policy, which is approximately .75 percent of the adjusted general fund budget for FY18.
Debt Service (non-excluded): This item is for previously authorized non-excluded debt service, debt issuance costs and interest on tax abatements. The Town’s policy is to request that the debt service for capital requests be placed on the ballot for exclusion from the limits of Proposition 2½, so this amount is declining.
Debt Service (excluded): This item is for previously authorized excluded debt service on projects approved by Town Meeting. In order for a project to be excluded from the property tax limits of Proposition 2½, it must be so voted on the ballot at Town Election. As mentioned above, the Town’s policy is to request that the debt service for capital requests be placed on the ballot for exclusion from the limits of Proposition 2 ½.
The amount is included as the gross amount for FY19, without taking into account offsetting state aid for school buildings and premiums from issuance of bonds and BANs. The auditors have recommended that we budget this way, but there is offsetting revenue that reduces the amount of estimated exempt debt service from $8,920,548 or to $8,120,773, or a 0.3% increase over FY18. The actual amount to be requested will be determined after bonds are issued in February. New Debt Service (proposed to be excluded): This item is normally for estimated debt service for capital projects proposed in the next year’s budget. These projects will be placed on the May 2018 ballot for exclusion from the limits of Proposition 2 ½. For FY19, no amount is included because of the expected timing of the borrowings and when the first payment of debt service is due, which will be in FY20.
Stabilization Fund: The current balance in the Stabilization Fund is approximately $3.114 million. The recently revised Reserve Policy calls for a reserve target of 3.5% of the prior fiscal year’s general fund operating budget amount, excluding exempt debt service, which would be $2,737,408. Because the balance exceeds 3.5%, no amount for FY19 is included.
Separate Articles to be Presented:
Post-Employment Benefits: Under State law, all Town and School employees eligible for retirement benefits are also eligible for post-employment health insurance benefits (OPEB). The most recent actuarial study as of 7/1/16, conducted in accordance with the requirements of GASB45, has determined the amount of the unfunded liability to be $65 million if the Town continues to fund on a pay-as-you-go basis. Pre-funding this liability at the rate of an additional $2.1 million or more per year will reduce the long-term unfunded liability to $50.2 million.
A trust fund established for this purpose has a current balance of $15.2 million. Funding for FY19 is proposed at $2,106,634, which is the amount required in the actuarial funding schedule. An additional $15,000 is included to account for three new positions proposed in the FY19 budget.
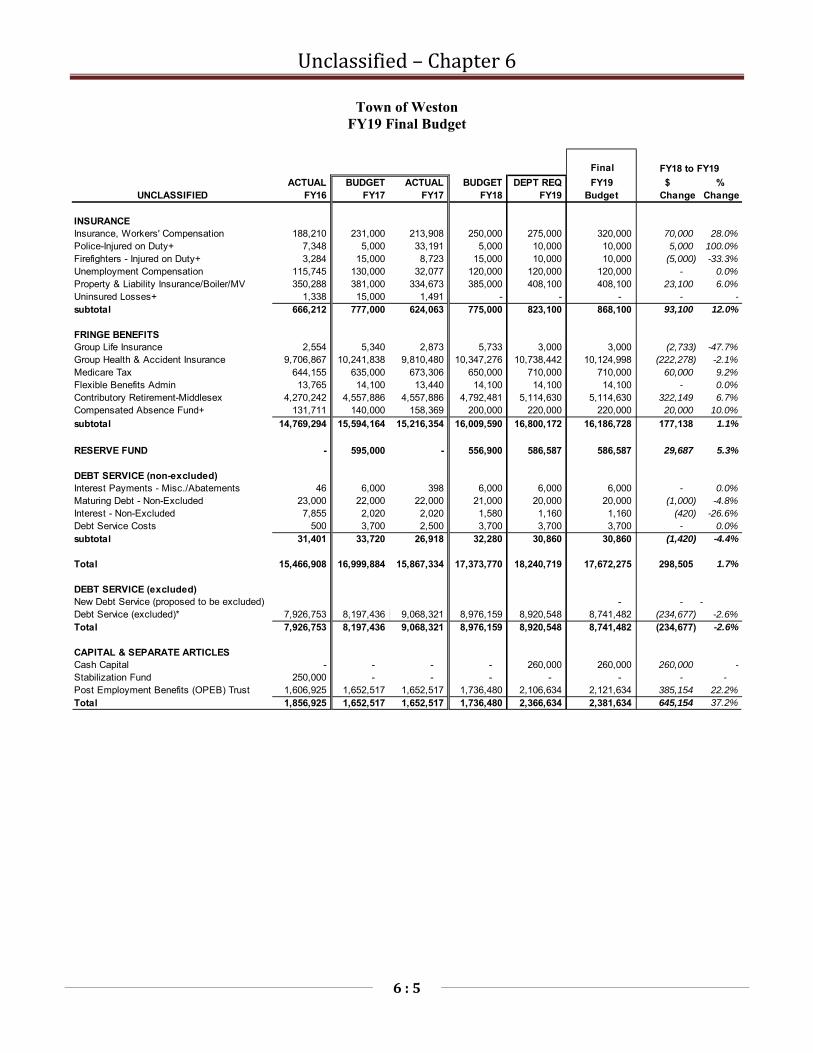
Unclassified–Chapter6
6:5
Town of Weston FY19 Final Budget
Final
ACTUAL BUDGET ACTUAL BUDGET DEPT REQ FY19 $ %UNCLASSIFIED FY16 FY17 FY17 FY18 FY19 Budget Change Change
INSURANCEInsurance, Workers' Compensation 188,210 231,000 213,908 250,000 275,000 320,000 70,000 28.0%Police-Injured on Duty+ 7,348 5,000 33,191 5,000 10,000 10,000 5,000 100.0%Firefighters - Injured on Duty+ 3,284 15,000 8,723 15,000 10,000 10,000 (5,000) -33.3%Unemployment Compensation 115,745 130,000 32,077 120,000 120,000 120,000 - 0.0%Property & Liability Insurance/Boiler/MV 350,288 381,000 334,673 385,000 408,100 408,100 23,100 6.0%Uninsured Losses+ 1,338 15,000 1,491 - - - - -subtotal 666,212 777,000 624,063 775,000 823,100 868,100 93,100 12.0%
FRINGE BENEFITSGroup Life Insurance 2,554 5,340 2,873 5,733 3,000 3,000 (2,733) -47.7%Group Health & Accident Insurance 9,706,867 10,241,838 9,810,480 10,347,276 10,738,442 10,124,998 (222,278) -2.1%Medicare Tax 644,155 635,000 673,306 650,000 710,000 710,000 60,000 9.2%Flexible Benefits Admin 13,765 14,100 13,440 14,100 14,100 14,100 - 0.0%Contributory Retirement-Middlesex 4,270,242 4,557,886 4,557,886 4,792,481 5,114,630 5,114,630 322,149 6.7%Compensated Absence Fund+ 131,711 140,000 158,369 200,000 220,000 220,000 20,000 10.0%subtotal 14,769,294 15,594,164 15,216,354 16,009,590 16,800,172 16,186,728 177,138 1.1%
RESERVE FUND - 595,000 - 556,900 586,587 586,587 29,687 5.3%
DEBT SERVICE (non-excluded)Interest Payments - Misc./Abatements 46 6,000 398 6,000 6,000 6,000 - 0.0%Maturing Debt - Non-Excluded 23,000 22,000 22,000 21,000 20,000 20,000 (1,000) -4.8%Interest - Non-Excluded 7,855 2,020 2,020 1,580 1,160 1,160 (420) -26.6%Debt Service Costs 500 3,700 2,500 3,700 3,700 3,700 - 0.0%subtotal 31,401 33,720 26,918 32,280 30,860 30,860 (1,420) -4.4%
Total 15,466,908 16,999,884 15,867,334 17,373,770 18,240,719 17,672,275 298,505 1.7%
DEBT SERVICE (excluded)New Debt Service (proposed to be excluded) - - -Debt Service (excluded)* 7,926,753 8,197,436 9,068,321 8,976,159 8,920,548 8,741,482 (234,677) -2.6%Total 7,926,753 8,197,436 9,068,321 8,976,159 8,920,548 8,741,482 (234,677) -2.6%
CAPITAL & SEPARATE ARTICLESCash Capital - - - - 260,000 260,000 260,000 -Stabilization Fund 250,000 - - - - - - - Post Employment Benefits (OPEB) Trust 1,606,925 1,652,517 1,652,517 1,736,480 2,106,634 2,121,634 385,154 22.2%Total 1,856,925 1,652,517 1,652,517 1,736,480 2,366,634 2,381,634 645,154 37.2%
FY18 to FY19

Unclassified–Chapter6
6:6
This page intentionally left blank.

GeneralGovernment–Chapter7
7:1
Town of Weston
Budget Presentation
Chapter 7 GENERAL GOVERNMENT

GeneralGovernment–Chapter7
7:2
TOWN OF WESTON FY19 FINAL BUDGET AND FINANCING PLAN
SELECTMEN/TOWN MANAGER
Board of Selectmen Town Manager
Assistant Town Manager / Human Resources Director
Finance DirectorPolice, Fire, DPW,
Inspectional Services, Council on Aging
Land Use, Library, Brook School Apts, Recreation, Board of Health, Facilities
Assistant to Town Manager
FinalActual Actual Budget FY19 $ %
FY16 FY17 FY18 Budget Change ChangeSELECTMEN/TOWN MANAGER/HUMAN RESOURCESRevenuesTax Levy and General Fund Revenues 375,313 370,165 510,399 560,106 49,707 9.7%Permits & Licenses 13,630 19,215 11,600 11,600 - - Cell Tower Revenue 120,471 124,125 124,000 124,000 - - Fees - 200 - - - -Brook School Apartments Enterprise Fund 5,545 5,912 6,374 6,470 96 1.5%Water Enterprise Fund 8,387 8,333 8,593 8,722 129 1.5%Total 523,346 527,950 660,966 710,898 49,932 7.6%
ExpendituresSalaries 442,470 450,762 477,556 496,958 19,402 4.1%Expenses 52,815 53,332 113,410 133,940 20,530 18.1%Consulting & Professional Services+ 28,061 23,857 70,000 80,000 10,000 14.3%Total 523,346 527,950 660,966 710,898 49,932 7.6%
SALARY ADJUSTMENTS-COST OF LIVING & MERITRevenuesTax Levy and General Fund Revenues 107,091 63,152 113,780 150,292 36,512 32.1%Total 107,091 63,152 113,780 150,292 36,512 32.1%
Expenditures 107,091 63,152 113,780 150,292 36,512 32.1%
LEGALRevenuesTax Levy and General Fund Revenues 130,998 162,915 168,300 178,275 9,975 5.9%Water Enterprise Fund 1,900 1,800 1,700 1,726 25 1.5%Total 132,898 164,715 170,000 180,000 10,000 5.9%
Expenditures 132,898 164,715 170,000 180,000 10,000 5.9%
FY18 to FY19

GeneralGovernment–Chapter7
7:3
Town of Weston FY19 Final Budget
GENERAL GOVERNMENT: Selectmen/Town Manager Description of Services The Board of Selectmen represents the executive branch of the Town government. The Board consists of three members, elected for staggered three-year terms. They serve without compensation. The Board acts as the Town’s primary policy making body for a wide variety of issues affecting Town finances and service delivery. They provide oversight in matters of litigation, act as the licensing authority, enact rules and regulations regarding traffic control and are responsible for calling Town Meetings and approving the Town Meeting warrant. Day to day oversight of the Selectmen’s Office is provided by the Town Manager, who is supported by the Assistant Town Manager/Human Resources Director and Finance Director/Town Accountant. The Town Manager’s office provides support to the Board of Selectmen, supervises all departments under the jurisdiction of the Board of Selectmen, serves as liaison between the Selectmen and other Town boards and committees, responds to questions and correspondence from the public and maintains all records of Board of Selectmen’s meetings. The Town Manager’s office prepares the Warrant for the annual and all special town meetings and coordinates the preparation of the Annual Town Report. FY19 Departmental Goals
1. Obtain Town Meeting approval of affordable rental housing units at 133 Boston Post Road in order to achieve the MGL Ch. 40B required 10% goal.
2. Support the request for funding for re-use of the Josiah Smith Tavern, including negotiating deed restriction issues with Historic New England.
3. Continue the Case Estates planning process, including development of the legacy trail and determining future uses of the land and buildings.
4. Continue planning for the rail trail in Weston, working with the Rail Trail Advisory Committee. 5. Expand use of interactive tools available on the Town’s website to engage Weston residents in
Town issues. 6. Improve communication with all employees by instituting a regular employee newsletter and
meeting periodically with employees in their departments.
Budget Recommendations
Level Services: The Merriam Fund Trustees have been reconstituted, and a budget is included to provide for a fundraising mailing. The Education and Training budget is increasing to provide better training opportunities for employees. The amount for electronic voting services is increasing to cover one Special Town Meeting and one Annual Town Meeting. We had a free trial for the 2018 Special Town Meeting. New Requests Recommended by Town Manager: None requested New Requests Not Recommended by Town Manager: None
FY16 FY17 FY18 FY19Funded Funded Funded Requested
Town Manager 1 1 1 1Assistant to Town Mgr/Public Information Officer 1 1 1 1Office Assistant (shared) 0.42 0.5 0.5 0.5
Total FTE 2.42 2.5 2.5 2.5
Staffing Levels

GeneralGovernment–Chapter7
7:4
Town of Weston
FY19 Final Budget
Final
ACTUAL BUDGET ACTUAL BUDGET DEP REQ FY19 $ %GENERAL GOVERNMENT FY16 FY17 FY17 FY18 FY19 Budget Change Change
Selectmen/Town ManagerSalaries-Permanent 249,056 250,145 252,925 268,904 275,298 280,741 11,837 4.4%Salaries-Temporary 15,947 20,495 19,006 21,093 21,093 21,093 - 0.0%Salaries-Town Meeting 4,768 5,100 2,610 5,100 3,000 3,000 (2,100) -41.2%Sub-total Personal Services 269,771 275,740 274,541 295,097 299,391 304,834 9,737 3.3%
SelectmenDues 3,974 8,500 6,758 7,500 7,200 7,200 (300) -4.0%Conference - 200 - 200 200 200 - 0.0%Cultural Council - - - 4,500 4,500 4,500 - 0.0%Merriam Fund Trustees Expenses - - - - 2,850 2,850 2,850 -Agricultural Commission Expenses - 500 - - - - - -Sub-total Selectmen Expenses 3,974 9,200 6,758 12,200 14,750 14,750 2,550 20.9%
AdministrationPrinting & Advertising 102 1,000 114 200 200 200 - 0.0%Education & Training 824 1,500 411 1,500 12,000 12,000 10,500 700.0%Office Supplies 496 600 588 600 600 600 - 0.0%In-State Travel 308 250 204 200 100 100 (100) -50.0%Dues 1,543 1,575 1,562 1,575 1,710 1,710 135 8.6%Conferences 3,453 3,910 3,132 3,910 3,855 3,855 (55) -1.4%All Other 178 1,000 2,167 1,000 2,500 2,500 1,500 150.0%Sub-total Admin Expenses 6,903 9,835 8,178 8,985 20,965 20,965 11,980 133.3%
CommunicationsRent Postage Meter 37 - - - - - -Rent Post Office Box 276 285 280 290 290 290 - 0.0%Telephone 15,975 26,000 15,490 26,000 20,000 26,000 - 0.0%Photocopy 5,822 6,000 5,284 6,000 6,000 6,000 - 0.0%Sub-total Comm Expenses 22,110 32,285 21,054 32,290 26,290 32,290 - 0.0%
Town Meeting
Printing 8,501 8,000 7,037 8,000 8,000 8,000 - 0.0%Postage 3,456 3,500 1,775 3,500 3,500 3,500 - 0.0%Electronic Voting Services - - - 35,000 45,000 45,000 10,000 28.6%All Other - 500 - 200 200 200 - 0.0%Sub-total Town Mtg Expenses 11,957 12,000 8,812 46,700 56,700 56,700 10,000 21.4%
Sub-Total Expenses 44,944 63,320 44,802 100,175 118,705 124,705 24,530 24.5%
Selectmen - Continuing Balance AccountsConsulting & Professional Services+ 28,061 40,000 23,857 70,000 80,000 80,000 10,000 14.3%
Sub-total Selectmen Cont Bal 28,061 40,000 23,857 70,000 80,000 80,000 10,000 14.3%
Total 342,777 379,060 343,199 465,272 498,096 509,539 44,267 9.5%
FY18 to FY19

GeneralGovernment–Chapter7
7:5
Town of Weston FY19 Final Budget
GENERAL GOVERNMENT: Assistant Town Manager/Human Resources Description of Services The Assistant Town Manager/Human Resources Department is responsible for personnel administration for the Town’s general government and benefits management for the general government and school department. This includes administering all personnel policies and collective bargaining agreements for municipal employees, and administering health insurance benefits, the workers’ compensation program, unemployment insurance for all employees, as well as police and fire injured-on-duty leave. The Department is also responsible for the integrity of the MUNIS payroll/personnel system and oversight of Town payroll and School and Town payroll deductions. The Assistant Town Manager oversees the Town IT Department, the Town Clerk’s Office, and the Recreation Department. The Assistant Town Manager participates in meetings of the Board of Selectmen and is responsible for the oversight of Town governance in the absence of the Town Manager. FY19 Departmental Goals
1. Focus on creating successor plans for various Town departments. 2. Recruit and train new staff as many baby boomers plan for retirement 3. Work with the Town Manager to restructure reporting relationships so that another department
manager reports to the Assistant Town Manager.
Budget Recommendations Level Services: The amount for printing and advertising is decreased, because we have found a less expensive way to advertise vacancies. New Requests Recommended by Town Manager: None requested New Requests Not Recommended by Town Manager: None
FY16 FY17 FY18 FY19Funded Funded Funded Requested
Assistant Town Manager/HR Director 1 1 1 1HR Generalist/Benefits Coordinator 1 1 1 1
Total FTE 2 2 2 2
Staffing Levels
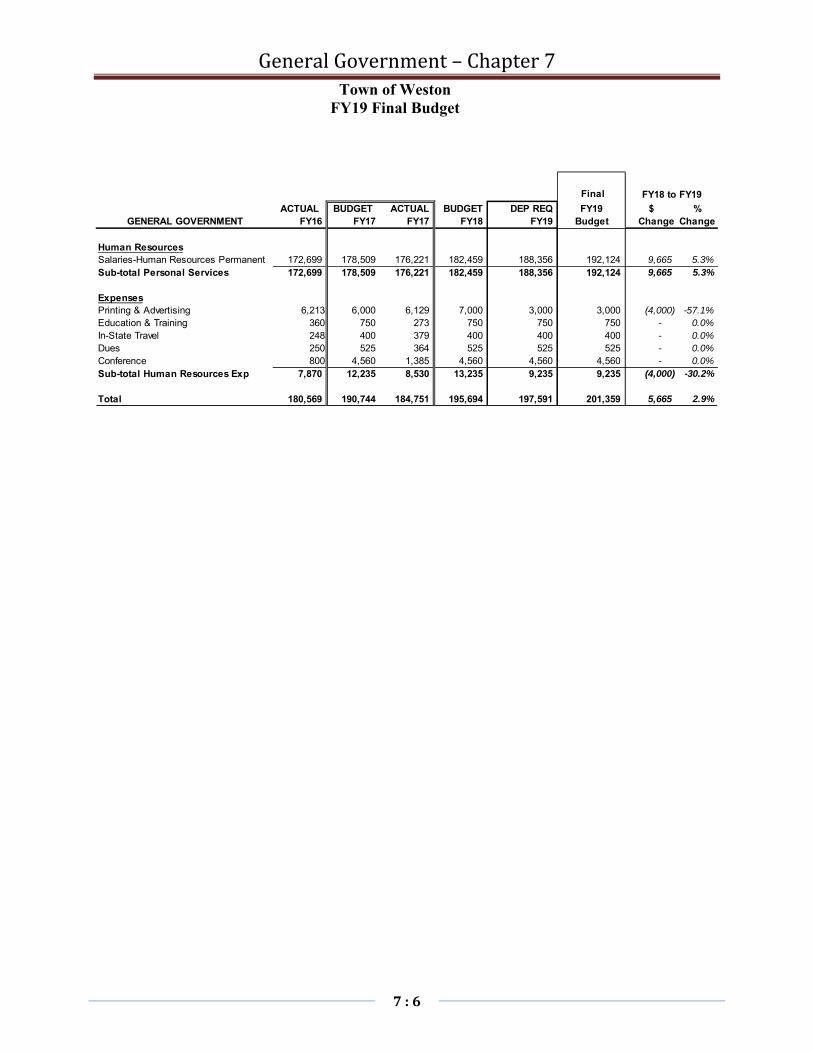
GeneralGovernment–Chapter7
7:6
Town of Weston FY19 Final Budget
Final
ACTUAL BUDGET ACTUAL BUDGET DEP REQ FY19 $ %GENERAL GOVERNMENT FY16 FY17 FY17 FY18 FY19 Budget Change Change
Human ResourcesSalaries-Human Resources Permanent 172,699 178,509 176,221 182,459 188,356 192,124 9,665 5.3%Sub-total Personal Services 172,699 178,509 176,221 182,459 188,356 192,124 9,665 5.3%
ExpensesPrinting & Advertising 6,213 6,000 6,129 7,000 3,000 3,000 (4,000) -57.1%Education & Training 360 750 273 750 750 750 - 0.0%In-State Travel 248 400 379 400 400 400 - 0.0%Dues 250 525 364 525 525 525 - 0.0%Conference 800 4,560 1,385 4,560 4,560 4,560 - 0.0%Sub-total Human Resources Exp 7,870 12,235 8,530 13,235 9,235 9,235 (4,000) -30.2%
Total 180,569 190,744 184,751 195,694 197,591 201,359 5,665 2.9%
FY18 to FY19

GeneralGovernment–Chapter7
7:7
Town of Weston FY19 Final Budget
GENERAL GOVERNMENT: Salary Adjustments Description of Services: The amount for salary adjustments for non-union municipal employees is estimated at this time and included in this budget. When the final budget is prepared for Annual Town Meeting, the amounts will be distributed to the appropriate departmental budgets. All six municipal union contracts are settled for FY19, and those salary adjustments are included in the departmental budgets. Contractual step increases and other non-COLA increases for all employees are included in departmental budgets. Funding for the municipal non-union employees’ merit pay pool is included in this line-item since the Town Manager is responsible for determining all salary adjustments for this group of employees. Merit pay increases are granted with satisfactory performance reviews and completion of established goals.
Final
ACTUAL BUDGET ACTUAL BUDGET DEP REQ FY19 $ %GENERAL GOVERNMENT FY16 FY17 FY17 FY18 FY19 Budget Change Change
Salary Adjustments -Cost-of-Living & Merit
Cost of Living * - - - - 98,050 661 661 -Merit Pay - Transfer Account** 107,091 128,936 63,152 113,780 149,631 149,631 35,851 31.5%
Total 107,091 128,936 63,152 113,780 247,681 150,292 36,512 32.1%
*Covers all municipal union employees without settled contracts and non-union employees**Municipal non-union employees
FY18 to FY19

GeneralGovernment–Chapter7
7:8
Town of Weston FY19 Final Budget
GENERAL GOVERNMENT: Legal Description of Services Town Counsel provides a wide variety of legal assistance to all Town departments including review of all contracts, legal opinions, conflict of interest advice, interpretation of State and federal laws, labor and collective bargaining assistance, drafting of general and zoning by-laws and defense of litigation. The firm of KP Law is Weston’s Town Counsel. In certain situations, special counsel may be retained by the Board of Selectmen. Staffing Levels Law firm of KP Law and special counsel as necessary. Budget Recommendations Level Services: This budget is increased to reflect recent experience. New Requests Recommended by Town Manager: None requested New Requests Not Recommended by Town Manager: None
Final
ACTUAL BUDGET ACTUAL BUDGET DEP REQ FY19 $ %GENERAL GOVERNMENT FY16 FY17 FY17 FY18 FY19 Budget Change Change
Legal
Professional & Consulting Services 129,486 172,000 151,337 162,000 172,000 172,000 10,000 6.2%Miscellaneous Expenses 3,413 8,000 13,378 8,000 8,000 8,000 - 0.0%
Total 132,898 180,000 164,715 170,000 180,000 180,000 10,000 5.9%
FY18 to FY19

GeneralGovernment–Chapter7
7:9
TOWN OF WESTON FY19 FINAL BUDGET AND FINANCING PLAN
FACILITIES (Town Hall, Old Library, Josiah Smith Tavern)
Town Manager
Building Monitors (.27) Custodians (1)
FinalActual Actual Budget FY19 $ %
FY16 FY17 FY18 Budget Change ChangeFACILITIESRevenuesTax Levy and General Fund Revenues 140,268 133,878 159,795 165,640 5,845 3.7%Josiah Smith Tavern Trust Fund 6,000 6,000 6,000 6,000 - - Total 146,268 139,878 165,795 171,640 5,845 3.5%
ExpendituresSalaries 62,983 63,034 69,618 70,615 997 1.4%Expenses 82,376 75,558 93,177 98,025 4,848 5.2%Town Hall Equipment+ 909 1,285 3,000 3,000 - - Total 146,268 139,878 165,795 171,640 5,845 3.5%
FY18 to FY19

GeneralGovernment–Chapter7
7:10
Town of Weston FY19 Final Budget
GENERAL GOVERNMENT: Facilities (Town Hall, Old Library, Josiah Smith
Tavern) Description of Services This Facilities budget includes the cost of custodial care, utilities, and supplies associated with the maintenance of the Town Hall and Josiah Smith Tavern buildings. The maintenance of these facilities is overseen by the Facilities Director and Deputy Director. FY19 Departmental Goals
1. Refinish Board of Selectmen’s conference room table. 2. Perform regular checks on the minimally used Josiah Smith Tavern.
Budget Recommendations Level Services: Costs related to the Old Library are removed from this budget, because the building is under construction and will be part of a different budget in the future. A revolving account capturing rental revenue from use of the Town Hall is used to offset some utility costs. New Requests Recommended by Town Manager: None requested New Requests Not Recommended by Town Manager: None
FY16 FY17 FY18 FY19Funded Funded Funded Requested
Custodian 1 1 1 1Evening Building Monitors 0.27 0.27 0.27 0.27
Total FTE 1.27 1.27 1.27 1.27
Staffing Levels

GeneralGovernment–Chapter7
7:11
Town of Weston FY19 Final Budget
Final
ACTUAL BUDGET ACTUAL BUDGET DEP REQ FY19 $ %GENERAL GOVERNMENT FY16 FY17 FY17 FY18 FY19 Budget Change Change
Facilities MaintenanceSalaries 62,983 68,434 63,034 69,618 69,308 70,615 997 1.4%Sub-total Personal Services 62,983 68,434 63,034 69,618 69,308 70,615 997 1.4%
Town HallElectricity 57,325 51,000 51,137 48,190 51,000 55,000 6,810 14.1%Oil/Gas 15,721 32,000 12,428 32,000 30,000 30,000 (2,000) -6.3%Water 1,083 1,200 2,452 1,300 2,000 2,000 700 53.8%Supplies 3,834 4,300 4,219 4,300 4,400 4,400 100 2.3%In-State Travel 225 325 256 325 325 325 - 0.0%All Other Expense - 500 - 500 500 500 - 0.0%Sub-total Town Hall 78,188 89,325 70,492 86,615 88,225 92,225 5,610 6.5%
Old LibraryElectricity 175 800 224 489 - - (489) -100.0%Water - 50 - - - - - -Sub-total Old Library 175 850 224 489 - - (489) -100.0%
Josiah Smith TavernElectricity 498 1,500 1,048 973 1,200 1,200 227 23.3%Oil/Gas 3,466 5,400 3,737 5,000 4,500 4,500 (500) -10.0%Water 49 100 57 100 100 100 - 0.0%Sub-total Josiah Smith Tavern 4,013 7,000 4,842 6,073 5,800 5,800 (273) -4.5%
Continuing Balance AccountsTown Hall Equipment+ 909 3,000 1,285 3,000 3,000 3,000 - 0.0%Sub-total Continuing Balance Accts 909 3,000 1,285 3,000 3,000 3,000 - 0.0%
Total 146,268 168,609 139,878 165,795 166,333 171,640 5,845 3.5%
FY18 to FY19

GeneralGovernment–Chapter7
7:12
TOWN OF WESTON FY19 FINAL BUDGET AND FINANCING PLAN
SPECIAL COMMITTEES/PROGRAMS
Moderator
Weston Veterans Memorial Educational
Fund Committee
FinalActual Actual Budget FY19 $ %
FY16 FY17 FY18 Budget Change ChangeWESTON VETERANS MEMORIAL EDUC FUND COMMRevenuesTax Levy and General Fund Revenues 2,536 2,494 2,850 2,850 - - Total 2,536 2,494 2,850 2,850 - -
Expenditures 2,536 2,494 2,850 2,850 - -
FY18 to FY19
Council on Aging Director and other Department Managers
Weston Service Program Participants
FinalActual Actual Budget FY19 $ %
FY16 FY17 FY18 Budget Change ChangeWESTON SERVICE PROGRAMRevenuesTax Levy and General Fund Revenues 10,490 8,585 22,000 14,300 (7,700) -35.0%Total 10,490 8,585 22,000 14,300 (7,700) -35.0%
Expenditures 10,490 8,585 22,000 14,300 (7,700) -35.0%
FY18 to FY19

GeneralGovernment–Chapter7
7:13
Town of Weston FY19 Final Budget
GENERAL GOVERNMENT: Special Committees/Programs Description of Services Weston Veterans Memorial Educational Fund Committee: This fund was established in 1953 in honor of the Weston men and women who served in the armed forces. The Committee is charged with making financial aid awards to members of the graduating class or recent graduates of Weston High School to assist with their post-secondary education. The fund has a principal balance of approximately $453,428 (non expendable). The budget is used to assist in fund-raising efforts. Staffing Levels Volunteer Committee Budget Recommendations Level Services: This budget is level funded. New Requests Recommended by Town Manager: None requested New Requests Not Recommended by Town Manager: None Weston Service Program: The Weston Service Program allows qualified elderly and disabled property owners and property owners who are Veterans to work for the Town. Individuals are paid up to $1,100, which is applied to their property tax bill. Staffing Levels The Council on Aging Director coordinates this program. Budget Recommendations Level Services: The amount requested is based on the work available and the number of residents qualified to perform the work. Currently, there is funding requested for 10 Seniors and 3 Veterans to participate. New Requests Recommended by Town Manager: None requested New Requests Not Recommended by Town Manager: None

GeneralGovernment–Chapter7
7:14
Town of Weston FY19 Final Budget
Final
ACTUAL BUDGET ACTUAL BUDGET DEP REQ FY19 $ %GENERAL GOVERNMENT FY16 FY17 FY17 FY18 FY19 Budget Change Change
Weston Veterans Memorial Educational Fund Committee
Printing & Advertising 1,663 1,900 1,833 1,900 1,900 1,900 - 0.0%Postage 873 950 661 950 950 950 - 0.0%Total 2,536 2,850 2,494 2,850 2,850 2,850 - 0.0%
FY18 to FY19
Final
ACTUAL BUDGET ACTUAL BUDGET DEP REQ FY19 $ %GENERAL GOVERNMENT FY16 FY17 FY17 FY18 FY19 Budget Change Change
Weston Service Program
Senior & Disabled Service Program 10,490 15,000 8,585 16,500 11,000 11,000 (5,500) -33.3%Veterans Service Program - 10,000 - 5,500 3,300 3,300 (2,200) -40.0%
10,490 25,000 8,585 22,000 14,300 14,300 (7,700) -35.0%
FY18 to FY19

GeneralGovernment–Chapter7
7:15
TOWN OF WESTON FY19 FINAL BUDGET AND FINANCING PLAN
SUPPORT FOR WESTON MEDIA CENTER
FinalActual Actual Budget FY19 $ %
FY16 FY17 FY18 Budget Change ChangeSUPPORT FOR WESTON MEDIA CENTERRevenuesTax Levy and General Fund Revenues 110,000 110,000 110,000 40,000 (70,000) (0.64) Total 110,000 110,000 110,000 40,000 (70,000) (0.64)
Expenditures 110,000 110,000 110,000 40,000 (70,000) (0.64)
FY18 to FY19

GeneralGovernment–Chapter7
7:16
Town of Weston FY19 Final Budget
GENERAL GOVERNMENT: Weston Media Center Description of Services Weston Media Center Staffing Levels Budget Recommendations Level Services: . New Requests Recommended by Town Manager: New Requests Not Recommended by Town Manager
Final
ACTUAL BUDGET ACTUAL BUDGET DEP REQ FY19 $ %GENERAL GOVERNMENT FY16 FY17 FY17 FY18 FY19 Budget Change Change
Support for Weston Media Center 110,000 110,000 110,000 110,000 - 40,000 (70,000) -63.6%
FY18 to FY19

GeneralGovernment–Chapter7
7:17
TOWN OF WESTON FY19 FINAL BUDGET AND FINANCING PLAN
TOWN CLERK
Board of Selectmen Town Manager
Assistant Town Manager / Human Resources Director
Town Clerk
Assistant to the Town Clerk
Office Assistant (0.32)
FinalActual Actual Budget FY19 $ %
FY16 FY17 FY18 Budget Change Change
TOWN CLERK & REGISTRARS OF VOTERSRevenuesTax Levy and General Fund Revenues 194,941 184,256 186,931 221,356 34,425 18.4%Permits & Licenses 790 750 650 650 - - Fees 14,442 12,325 10,100 10,100 - - Total 210,173 197,331 197,681 232,106 34,425 17.4%
ExpendituresSalaries 158,272 171,178 167,146 198,211 31,065 18.6%Expenses 51,901 26,153 30,535 33,895 3,360 11.0%Total 210,173 197,331 197,681 232,106 34,425 17.4%
FY18 to FY19
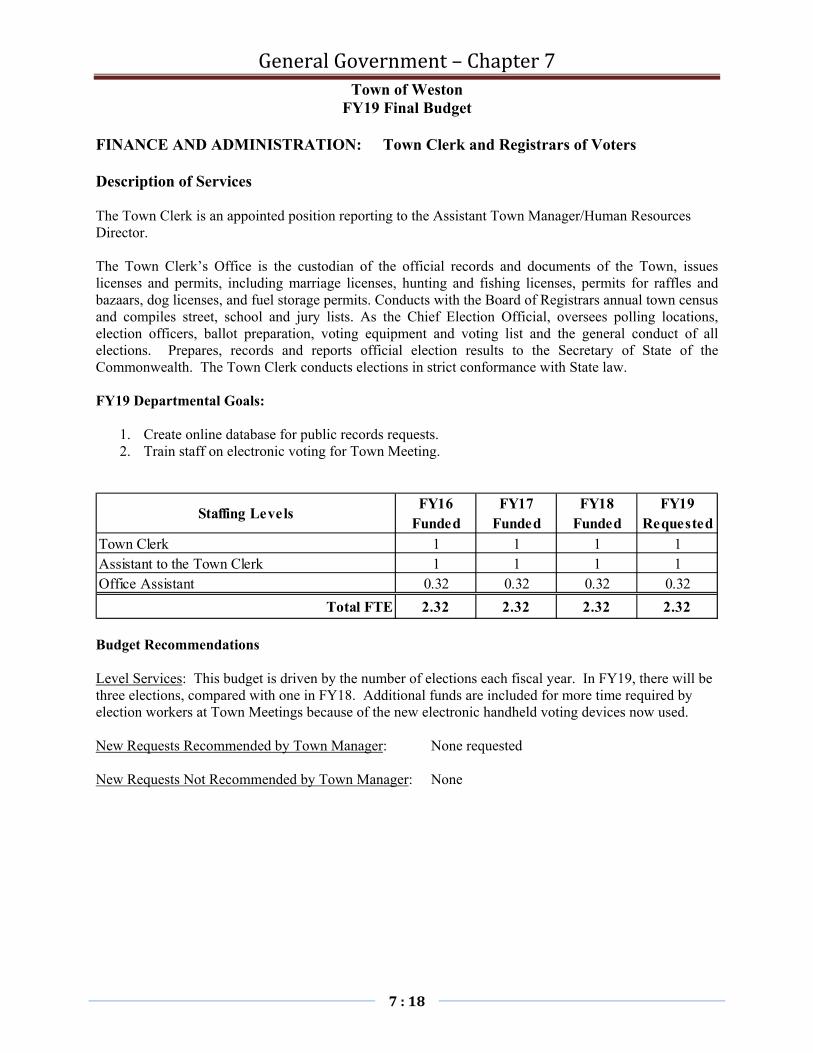
GeneralGovernment–Chapter7
7:18
Town of Weston FY19 Final Budget
FINANCE AND ADMINISTRATION: Town Clerk and Registrars of Voters Description of Services The Town Clerk is an appointed position reporting to the Assistant Town Manager/Human Resources Director. The Town Clerk’s Office is the custodian of the official records and documents of the Town, issues licenses and permits, including marriage licenses, hunting and fishing licenses, permits for raffles and bazaars, dog licenses, and fuel storage permits. Conducts with the Board of Registrars annual town census and compiles street, school and jury lists. As the Chief Election Official, oversees polling locations, election officers, ballot preparation, voting equipment and voting list and the general conduct of all elections. Prepares, records and reports official election results to the Secretary of State of the Commonwealth. The Town Clerk conducts elections in strict conformance with State law. FY19 Departmental Goals:
1. Create online database for public records requests. 2. Train staff on electronic voting for Town Meeting.
Budget Recommendations Level Services: This budget is driven by the number of elections each fiscal year. In FY19, there will be three elections, compared with one in FY18. Additional funds are included for more time required by election workers at Town Meetings because of the new electronic handheld voting devices now used. New Requests Recommended by Town Manager: None requested New Requests Not Recommended by Town Manager: None
FY16 FY17 FY18 FY19Funded Funded Funded Requested
Town Clerk 1 1 1 1Assistant to the Town Clerk 1 1 1 1Office Assistant 0.32 0.32 0.32 0.32
Total FTE 2.32 2.32 2.32 2.32
Staffing Levels

GeneralGovernment–Chapter7
7:19
Town of Weston FY19 Final Budget
Final
ACTUAL BUDGET ACTUAL BUDGET DEP REQ FY19TOWN CLERK/REG OF VOTERS FY16 FY17 FY17 FY18 FY19 Budget +/- %
Town Clerk/Registrars of VotersSalaries-Office 141,955 141,677 148,611 147,358 149,320 152,555 5,197 3.5%Office Staff - Overtime - 1,000 - 500 2,500 2,500 2,000 400.0%Salaries - Temporary 9,633 15,000 3,024 15,000 15,000 15,000 - 0.0%Salaries-Election Workers 6,685 23,764 19,543 4,288 26,956 28,156 23,868 556.6%Sub-total Personal Services 158,272 181,441 171,178 167,146 193,776 198,211 27,830 16.7%
Town ClerkPrinting & Advertising 73 200 - 200 200 200 - 0.0%Postage 15,173 18,600 13,689 18,600 18,600 18,600 - 0.0%Forms 1,614 2,500 2,900 2,500 2,500 2,500 - 0.0%Office Supplies 1,101 1,000 1,056 1,000 1,000 1,000 - 0.0%Binding - 200 - 200 200 200 - 0.0%Dues 150 285 150 285 285 285 - 0.0%Conference 170 750 145 750 750 750 - 0.0%Fidelity Bond 100 100 100 100 100 100 - 0.0%Sub-total Town Clerk Expenses 18,380 23,635 18,040 23,635 23,635 23,635 - 0.0%
Registrars of VotersRental of Polling Places 803 2,120 185 - 2,160 2,160 2,160 -Custodial 163 200 - - 200 200 200 -Printing - Street Lists 1,198 1,200 - 1,300 1,300 1,300 - 0.0%Voting Machine Services 29,433 12,000 6,628 5,000 6,000 6,000 1,000 20.0%Election Supplies 1,868 500 1,190 500 500 500 - 0.0%In-State Travel 56 100 110 100 100 100 - 0.0%Sub-total Reg of Voters Expenses 33,521 16,120 8,113 6,900 10,260 10,260 3,360 48.7%
Total 210,173 221,196 197,331 197,681 227,671 232,106 34,425 17.4%
FY18 to FY9

GeneralGovernment–Chapter7
7:20
TOWN OF WESTON FY19 FINAL BUDGET AND FINANCING PLAN
INFORMATION SYSTEMS
Board of Selectmen Town Manager
Asst. Town Manager / Human Resources
Director
Manager of Information Technology
Systems Administator (2)
GIS Coordinator (.25)
School Committee School Superintendent
Town‐Wide Technology Director (.2)
Town‐Wide Network Manager (.07)
FinalActual Actual Budget FY19 $ %
FY16 FY17 FY18 Budget Change Change
INFORMATION SYSTEMSRevenuesTax Levy and General Fund Revenues 582,115 621,277 645,485 696,675 51,190 7.9%Brook School Apartments Enterprise Fund 32,949 34,712 32,891 33,384 493 1.5%Water Enterprise Fund 23,160 18,147 19,032 19,317 285 1.5%Total 638,224 674,136 697,408 749,377 51,969 7.5%
ExpendituresSalaries 277,443 287,563 295,408 305,877 10,469 3.5%Expenses 251,981 246,162 303,700 350,000 46,300 15.2%Computer Hardware Maintenance+ 108,800 140,410 98,300 93,500 (4,800) -4.9%Total 638,224 674,136 697,408 749,377 51,969 7.5%
FY18 to FY19

GeneralGovernment–Chapter7
7:21
Town of Weston FY19 Final Budget
GENERAL GOVERNMENT: Information Systems Description of Services
The role of Information Systems (IS) is to: 1) support all municipal departments in using technology to improve productivity; 2) streamline the collection, flow and retrieval of information; 3) provide training and technical support to Town offices, 4) be aware of new technologies to improve services, and 5) work with the Town-Wide Technology Director to share technology resources and plan for and implement Town-wide solutions. This office also supports the School department business office in the use of the Town’s financial management applications (MUNIS) and by maintaining the Town-wide network.
FY19 Departmental Goals
1. Implement a cyber security training program that ensures staff is aware of, knows how to prevent, and knows how to respond to cyber security threats.
2. Focus on implementing and maintaining smarter systems that counter emerging cyber threats to deter and negate sophisticated threats such as crypto viruses.
3. Update and refine our resiliency, recovery and contingency plans to effectively manage unforeseen events.
Budget Recommendations
Level Services: Software Maintenance is higher to cover the increasing number of software packages used to conduct departmental business. Education and Training is increasing to provide more software training opportunities for employees. Included in the continuing balance account request is funding for replacement computers, as well as software upgrade licenses, a new software package for use by the Recreation Department, and an additional archiver for security cameras used in several buildings. New Requests Recommended by Town Manager: None requested
New Requests Not Recommended by Town Manager: None
FY16 FY17 FY18 FY19Funded Funded Funded Requested
Manager of Information Technology 1 1 1 1Systems Administrator 2 2 2 2GIS Coordinator 0.32 0.32 0.32 0.32Town-Wide Technology Director 0.2 0.2 0.2 0.2Town-Wide Network Manager 0.07 0.07 0.07 0.07
Total FTE 3.59 3.59 3.59 3.59
Staffing Levels

GeneralGovernment–Chapter7
7:22
Town of Weston FY19 Final Budget
Final
ACTUAL BUDGET ACTUAL BUDGET DEP REQ FY19
INFORMATION SYSTEMS FY16 FY17 FY17 FY18 FY19 Budget +/- %
Information SystemsSalaries 277,443 283,456 287,563 295,408 299,916 305,877 10,469 3.5%Sub-total Personal Services 277,443 283,456 287,563 295,408 299,916 305,877 10,469 3.5%
Information System ExpensesHardware Maintenance 23,538 23,000 24,611 23,000 25,000 25,000 2,000 8.7%Software Maintenance 158,488 190,000 172,182 216,300 250,000 250,000 33,700 15.6%Communications & Network Support 25,000 26,000 18,673 26,000 26,000 26,000 - 0.0%In-State Travel 2,174 700 1,600 1,400 2,000 2,000 600 42.9%Professional & Consulting Services 24,181 20,000 21,781 20,000 20,000 20,000 - 0.0%Education & Training 13,638 20,000 4,143 10,000 20,000 20,000 10,000 100.0%Computer Supplies 4,963 7,000 3,172 7,000 7,000 7,000 - 0.0%Sub-total Expenses 251,981 286,700 246,162 303,700 350,000 350,000 46,300 15.2%
Continuing Balance AccountsComputer Hardware/Software+ 108,800 98,250 140,410 98,300 93,500 93,500 (4,800) -4.9%
108,800 98,250 140,410 98,300 93,500 93,500 (4,800) -4.9%
Total 638,224 668,406 674,136 697,408 743,416 749,377 51,969 7.5%
FY18 to FY19

GeneralGovernment–Chapter7
7:23
This page intentionally left blank.

Facilities(TownWide)–Chapter8
8:1
Town of Weston
Budget Presentation
Chapter 8 FACILITIES (TOWN WIDE)

Facilities(TownWide)–Chapter8
8:2
TOWN OF WESTON FY19 FINAL BUDGET AND FINANCING PLAN
FACILITIES TOWN-WIDE
Asst. Superintendent of Schools
Town Manager
Director of Facilities
Deputy Director of Facilities
Facilities Coordinator
Fields Coordinator
School Buildings & Grounds Staff
Municipal Custodial Staff
Project Manager
FinalActual Actual Budget FY19 $ %
FY16 FY17 FY18 Budget Change ChangeFACILITIES MAINTENANCERevenuesTax Levy and General Fund Revenues 1,613,847 1,479,717 1,954,335 1,941,637 (12,698) -0.6%Rentals 7,913 - - - - -Brook School Apartments Enterprise Fund 30,652 33,149 32,598 33,087 489 1.5%Total 1,652,413 1,512,866 1,986,933 1,974,724 (12,209) -0.6%
ExpendituresSalaries 314,434 328,064 370,654 495,163 124,509 33.6%Expenses 688,970 599,588 853,580 866,780 13,200 1.5%Facilities Improvements-Town-wide+ 649,008 478,616 534,699 566,781 32,082 6.0%Equipment Replacement+ - 106,598 228,000 46,000 (182,000) -79.8%Total 1,652,413 1,512,866 1,986,933 1,974,724 (12,209) -0.6%
FY18 to FY19

Facilities(TownWide)–Chapter8
8:3
Town of Weston FY19 Final Budget
FACILITIES TOWN-WIDE:
Description of Services Facilities Town-Wide includes the repair, maintenance, and oversight of all municipal and school buildings and facilities. The Facilities Director is responsible for staffing the Permanent Building Committee and reports to both the Asst. Superintendent of Schools and the Town Manager.
This budget includes the salaries for the Director, Deputy Director, Facilities Coordinator, and Fields Coordinator positions, the repair and maintenance costs for all buildings, and the Facilities Improvements Town-Wide continuing balance account. Utility costs, the cost of supplies, and the cost of other personnel (custodial, maintenance, school grounds) remain in departmental budgets for each building.
FY19 Departmental Goals 1. Work with the Permanent Building Committee to oversee multiple projects. The Weston Arts and Innovation
Center will be under construction. Construction funds will be requested for the Case House School Administration Building. The Josiah Smith Tavern project has entered the design phase, and construction funds may be requested at the fall 2018 Special Town Meeting.
2. Plan for future energy improvements to comply with the requirements of being a state-designated Green Community.
3. Continue working with the Fields Coordinator and Fields Steering Committee to invest in and improve the quality of all the Town and School green spaces and sports fields.
4. Continue to organize and digitize all the existing building plans for the Town and School to improve efficiency and reduce cost associated with paper copies.
Budget Recommendations
Level Services: Municipal expenses are increased due to higher system maintenance costs. Field maintenance expenses have also increased due to higher product costs and contract increases. There is a 6% increase in the Town-wide Facilities Improvements account, consistent with the Town’s recently revised reserve policy, to address maintenance issues in all buildings. Funds are included in Equipment to replace a 2008 Ford F250 Pickup Truck with plow and to improve the irrigation at Field School.
New Requests Recommended by Town Manager: A new Project Manager position is proposed to handle small and large capital projects. The department has been understaffed nearly since its inception. A paid staff person in this role can relieve the pressure on the Director and Deputy Director and can also reduce outsourcing of work to develop plans and specifications and oversee smaller projects. This person could also apply for grant funds for certain projects. We have not been able to apply for a green communities grant for the last 2 years due to lack of time.
New Requests Not Recommended by Town Manager: None
FY16 FY17 FY18 FY19Funded Funded Funded Requested
Facilities Director 1 1 1 1Deputy Facilities Director 1 1 1 1Project Manager 0 0 0 1Facilities Coordinator 1 1 1 1Fields & Grounds Coordinator 1 1 1 1
Total FTE 4 4 4 5
Staffing Levels

Facilities(TownWide)–Chapter8
8:4
Town of Weston FY19 Final Budget
Final
ACTUAL BUDGET ACTUAL BUDGET DEP REQ FY19 $ %FACILITIES TOWN-WIDE FY16 FY17 FY17 FY18 FY19 Budget Change Change
Facilities Town-WideSalaries 310,247 355,250 323,636 363,654 365,923 488,163 124,509 34.2%Overtime 4,187 7,000 4,427 7,000 7,000 7,000 - 0.0%Sub-total Personal Services 314,434 362,250 328,064 370,654 372,923 495,163 124,509 33.6%
School Expenses 497,606 524,900 463,644 549,380 549,380 549,380 - 0.0%
Grounds Maintenance Expenses 74,913 75,000 - 164,000 170,200 170,200 6,200 3.8%
Municipal Expenses:Facilities Administration 706 - 1,929 - - - - -
Contracts:Fire Alarm/Suppression 6,519 12,500 9,175 12,500 12,500 12,500 - 0.0%Fire Extinguishers 1,654 1,000 1,278 1,800 1,800 1,800 - 0.0%HVAC 5,296 11,000 4,989 11,000 11,000 11,000 - 0.0%Generator 1,760 4,500 1,760 4,500 4,500 4,500 - 0.0%Elevator 9,746 11,500 12,742 12,000 12,000 12,000 - 0.0%Septic Mechanical 2,793 2,000 4,965 3,000 3,000 3,000 - 0.0%Septic Pumping 9,923 12,400 6,864 12,400 12,400 12,400 - 0.0%Sub-total Contracts 37,691 54,900 41,773 57,200 57,200 57,200 - 0.0%
Repairs:Fire Alarm/Suppression 3,832 6,200 10,854 6,200 6,200 6,200 - 0.0%Roof - 3,000 3,750 3,000 3,000 3,000 - 0.0%Oil Separator 2,350 2,000 - 2,400 2,400 2,400 - 0.0%HVAC Repair 24,481 30,000 35,976 30,000 35,000 35,000 5,000 16.7%Generator 3,877 6,500 6,255 6,500 6,500 6,500 - 0.0%Elevator 2,350 5,000 1,449 5,000 5,000 5,000 - 0.0%Garage Doors 8,681 8,000 2,654 8,000 8,000 8,000 - 0.0%Pest Control 125 900 175 900 900 900 - 0.0%Electric 24,011 8,500 15,862 9,000 10,000 10,000 1,000 11.1%Plumbing 4,899 6,000 8,764 6,000 6,000 6,000 - 0.0%Carpentry 3,448 5,000 6,504 6,000 7,000 7,000 1,000 16.7%Sub-total Repairs 78,054 81,100 92,242 83,000 90,000 90,000 7,000 8.4%
Sub-total Municipal Expenses 116,450 136,000 135,944 140,200 147,200 147,200 7,000 5.0%
Total Expenses 688,970 735,900 599,588 853,580 866,780 866,780 13,200 1.5%
Continuing Balance AccountsFacilities Improvements-Town-wide+ 509,237 534,699 566,781 566,781 32,082 6.0% - Municipal Buildings 343,138 - 224,252 - - - - - - School Buildings 305,870 - 147,765 - - - - -Equipment Replacement+ - 108,000 106,598 228,000 131,000 46,000 (182,000) -79.8%Sub-total Continuing Balance Accts 649,008 617,237 478,616 762,699 697,781 612,781 (149,918) -19.7%
Total 1,652,413 1,715,387 1,406,267 1,986,933 1,937,484 1,974,724 (12,209) -0.6%
FY18 to FY19

Facilities(TownWide)–Chapter8
8:5
This page intentionally left blank.

Finance–Chapter9
9:1
Town of Weston
Budget Presentation
Chapter 9 FINANCE

Finance–Chapter9
9:2
TOWN OF WESTON FY19 FINAL BUDGET AND FINANCING PLAN
FINANCE
Board of Selectmen Town Manager
Finance Director/ Town Accountant
Assistant to Town Accountant
Purchasing Agent/Financial
Analyst
Treasurer/Collector
Assistant Treasurer
Financial Assistant
Principal Assessor
Financial
AssistantAssistant to Assessor
Community Preservation Administrator
Financial
Assistant
Board of Assessors
FinalActual Actual Budget FY19 $ %
FY16 FY17 FY18 Budget Change Change
FINANCERevenuesTax Levy and General Fund Revenues 782,589 785,850 901,479 846,748 (54,731) -6.1%Brook School Apartments Enterprise Fund 14,232 14,720 14,551 14,769 218 1.5%Water Enterprise Fund 16,746 14,906 17,790 18,057 267 1.5%Fees & Departmental Revenue 11,277 9,499 8,000 8,000 - 0.0%Total 824,843 824,976 941,820 887,574 (54,246) -5.8%
ExpendituresFinance Committee 204 204 10,400 7,750 (2,650) -25.48%Salaries 700,184 698,547 789,205 737,359 (51,846) -6.6%Expenses 124,455 126,225 142,215 142,465 250 0.2%Total 824,843 824,976 941,820 887,574 (54,246) -5.8%
FY18 to FY19

Finance–Chapter9
9:3
Town of Weston FY19 Final Budget
FINANCE: Finance Committee Description of Services The Weston Finance Committee is comprised of nine members, appointed by the Moderator. Members serve three-year overlapping terms. The role of the Finance Committee is to confer with the Board of Selectmen and other Town officials on all financial matters and to make recommendations to Town Meeting and the voters concerning the Town’s financial position and proposed expenditures. Staffing Levels Volunteer Committee supported by Finance Director and Town Manager Budget Recommendations Level Services: The Finance Committee has requested funds to do several mailings to residents.
Final
ACTUAL BUDGET ACTUAL BUDGET DEPT REQ FY19 $ %FINANCE FY16 FY17 FY17 FY18 FY19 Budget Change Change
Finance CommitteeDues 204 250 204 250 250 250 - 0.0%All Other - 150 - 10,150 7,500 7,500 (2,650) -26.1%Total Finance Committee 204 400 204 10,400 7,750 7,750 (2,650) -25.5%
FY18 to FY19

Finance–Chapter9
9:4
Town of Weston FY19 Final Budget
FINANCE: Finance Director/ Town Accountant Description of Services The Finance Director/Town Accountant is responsible for the management and supervision of the Finance Department (Accounting Office, Assessing Office, Treasurer/Collector’s Office), as well as the administrative office of the Community Preservation Administrator. Oversight of the Assessing Office is shared with an elected board. In addition, the Finance Director coordinates payroll processing working with the Assistant Town Manager/ Human Resource Director, oversees risk management and assists the Town Manager in the annual budget development process and other projects. FY19 Departmental Goals 1. Work with Assessor and Treasurer/Collector to efficiently update processes and streamline workflow
in the Finance Department. 2. Introduce performance measurement in the Finance Department. 3. Work with the Town Manager to efficiently build upon the budget presentation process. 4. Work with Town Manager, Board of Selectmen and Finance Committee to ensure financial policies
are relevant and adhered to.
Budget Recommendations Level Services: Salaries are lower in FY19 due to the Purchasing Agent/Financial Analyst position being budgeted at a higher pay step in FY18. Professional & Consulting includes $3,000 for OPEB actuarial expense previously paid from the Selectmen’s Professional & Consulting account. New Requests Recommended by Town Manager: None requested New Requests Not Recommended by Town Manager: None
FY16 FY17 FY18 FY19Funded Funded Funded Requested
Finance Director/Town Accountant 0 0 1 1Finance Director/Treasurer & Collector 1 1 0 0Financial Assistant 1 1 1 1Purchasing Agent/Financial Analyst 0 0 1 1
Total FTE 2 2 3 3
Staffing Levels

Finance–Chapter9
9:5
Town of Weston FY19 Final Budget
Final
ACTUAL BUDGET ACTUAL BUDGET DEPT REQ FY19 $ %FINANCE FY16 FY17 FY17 FY18 FY19 Budget Change Change
Finance
Salaries 165,376 202,021 56,181 232,623 223,557 223,557 (9,066) -3.9%Parking Clerk 484 500 500 500 500 500 - 0.0%Sub-total Personal Services 165,860 202,521 56,681 233,123 224,057 224,057 (9,066) -3.9%
Finance ExpensesProfessional & Consulting - - - - 3,000 3,000 3,000 -Office Supplies 115 300 - 300 300 300 - 0.0%In-State Travel 285 375 102 375 375 375 - 0.0%Dues/Memberships 579 640 649 640 640 640 - 0.0%Conferences 1,535 2,600 3,524 2,600 2,600 2,600 - 0.0%All Other Expenses 425 - 425 500 500 500 - 0.0%Parking Clerk Expenses 258 500 2,533 500 500 500 - 0.0%Sub-total Expenses 3,198 4,415 7,233 4,915 7,915 7,915 3,000 61.0%
Total Finance 169,058 206,936 63,914 238,038 231,972 231,972 (6,066) -2.5%
FY18 to FY19
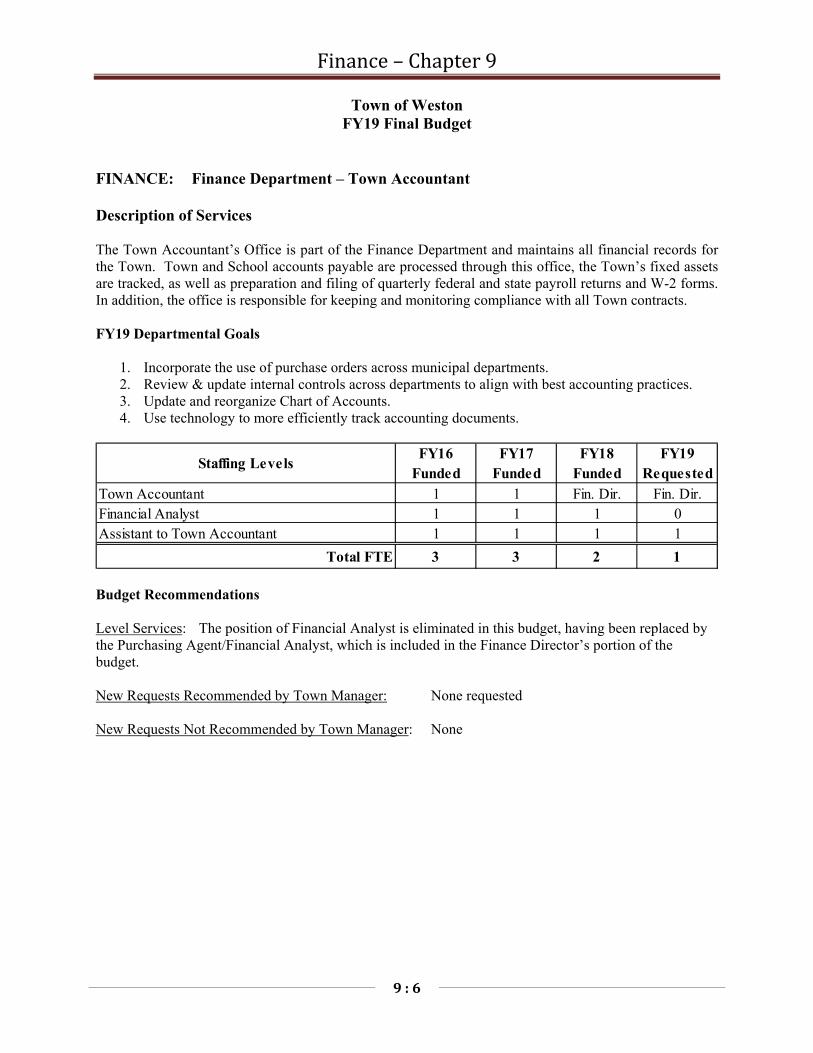
Finance–Chapter9
9:6
Town of Weston FY19 Final Budget
FINANCE: Finance Department – Town Accountant Description of Services The Town Accountant’s Office is part of the Finance Department and maintains all financial records for the Town. Town and School accounts payable are processed through this office, the Town’s fixed assets are tracked, as well as preparation and filing of quarterly federal and state payroll returns and W-2 forms. In addition, the office is responsible for keeping and monitoring compliance with all Town contracts. FY19 Departmental Goals
1. Incorporate the use of purchase orders across municipal departments. 2. Review & update internal controls across departments to align with best accounting practices. 3. Update and reorganize Chart of Accounts. 4. Use technology to more efficiently track accounting documents.
Budget Recommendations Level Services: The position of Financial Analyst is eliminated in this budget, having been replaced by the Purchasing Agent/Financial Analyst, which is included in the Finance Director’s portion of the budget. New Requests Recommended by Town Manager: None requested New Requests Not Recommended by Town Manager: None
FY16 FY17 FY18 FY19Funded Funded Funded Requested
Town Accountant 1 1 Fin. Dir. Fin. Dir.Financial Analyst 1 1 1 0Assistant to Town Accountant 1 1 1 1
Total FTE 3 3 2 1
Staffing Levels
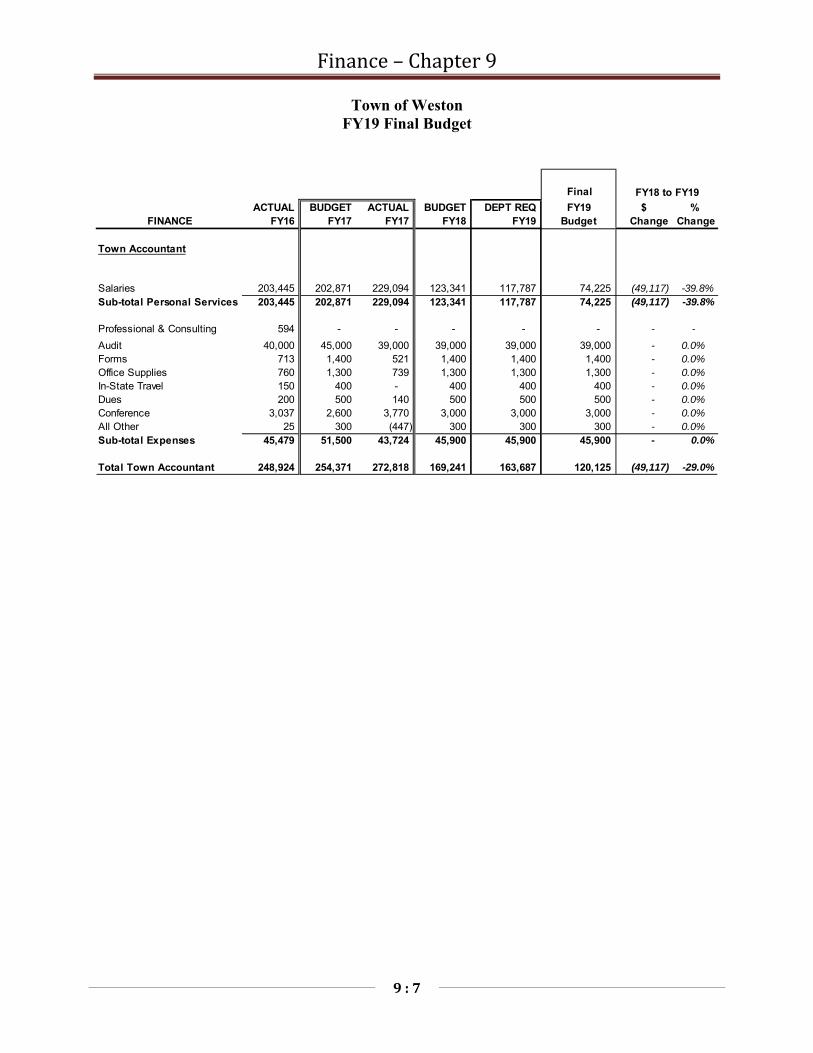
Finance–Chapter9
9:7
Town of Weston FY19 Final Budget
Final
ACTUAL BUDGET ACTUAL BUDGET DEPT REQ FY19 $ %FINANCE FY16 FY17 FY17 FY18 FY19 Budget Change Change
Town Accountant
Salaries 203,445 202,871 229,094 123,341 117,787 74,225 (49,117) -39.8%Sub-total Personal Services 203,445 202,871 229,094 123,341 117,787 74,225 (49,117) -39.8%
Professional & Consulting 594 - - - - - - -Audit 40,000 45,000 39,000 39,000 39,000 39,000 - 0.0%Forms 713 1,400 521 1,400 1,400 1,400 - 0.0%Office Supplies 760 1,300 739 1,300 1,300 1,300 - 0.0%In-State Travel 150 400 - 400 400 400 - 0.0%Dues 200 500 140 500 500 500 - 0.0%Conference 3,037 2,600 3,770 3,000 3,000 3,000 - 0.0%All Other 25 300 (447) 300 300 300 - 0.0%Sub-total Expenses 45,479 51,500 43,724 45,900 45,900 45,900 - 0.0%
Total Town Accountant 248,924 254,371 272,818 169,241 163,687 120,125 (49,117) -29.0%
FY18 to FY19

Finance–Chapter9
9:8
Town of Weston FY19 Final Budget
FINANCE: Finance Department – Board of Assessors Description of Services The Weston Board of Assessors is a five member elected Board. The Board of Assessors has direct supervision of this office for assessing, valuation and related matters. The Finance Director/Town Accountant has supervisory responsibility for personnel, staffing and budgetary issues. The Board of Assessors is responsible for determining the value of all real and personal property in Weston annually as required by the Department of Revenue. The office maintains a complete listing of current property assessments and in conjunction with the Treasurer’s office administers all automobile excise accounts and abatements. Fiscal Year 2019 is a state certification year of all real and personal property accounts. The office prepares appraisals for court appearances before the Appellate Tax Board and prepares all reports necessary for the values of property being certified by the Department of Revenue and setting the tax rate. The office is engaged in community outreach initiatives, providing several mailers to inform property owners of all statutory real estate exemptions, inform seniors of the opportunities for deferral of their property taxes, community preservation act exemptions, and all real estate abatements. FY19 Departmental Goals
1. Complete the Quinquennial Reassessment of all Real and Personal Property for timely completion in October 2018 in compliance with DOR standards.
2. Continue the cyclical inspection and data recollection of all Real and Personal properties as required by DOR.
3. Improve public understanding of the property tax by adding to the website and updating Weston-specific information and elaborating on local issues, such as tax relief programs, from a Weston perspective.
Budget Recommendations
Level Services: This budget is increasing by the amount of the salary increase. New Requests Recommended by Town Manager: None requested New Requests Not Recommended by Town Manager: None
FY16 FY17 FY18 FY19Funded Funded Funded Requested
Principal Assessor 1 1 1 1Assistant to Assessor 1 1 1 1Financial Assistant 1 1 1 1
Total FTE 3 3 3 3
Staffing Levels
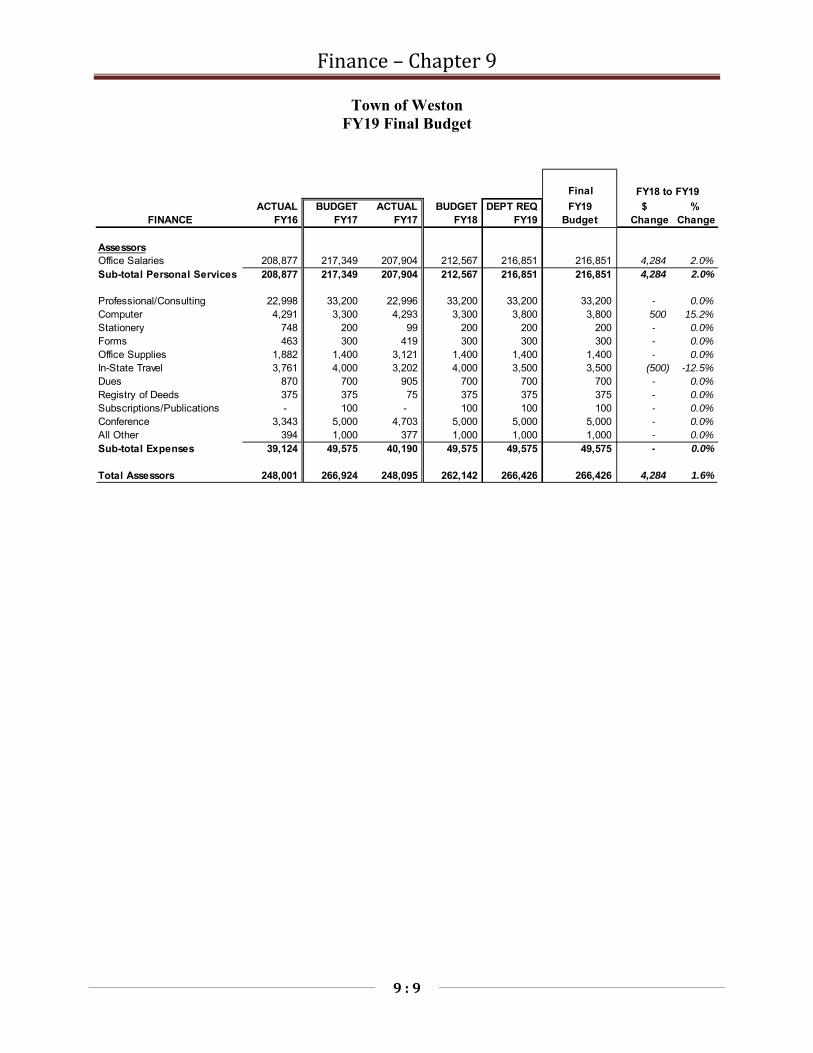
Finance–Chapter9
9:9
Town of Weston FY19 Final Budget
Final
ACTUAL BUDGET ACTUAL BUDGET DEPT REQ FY19 $ %FINANCE FY16 FY17 FY17 FY18 FY19 Budget Change Change
AssessorsOffice Salaries 208,877 217,349 207,904 212,567 216,851 216,851 4,284 2.0%Sub-total Personal Services 208,877 217,349 207,904 212,567 216,851 216,851 4,284 2.0%
Professional/Consulting 22,998 33,200 22,996 33,200 33,200 33,200 - 0.0%Computer 4,291 3,300 4,293 3,300 3,800 3,800 500 15.2%Stationery 748 200 99 200 200 200 - 0.0%Forms 463 300 419 300 300 300 - 0.0%Office Supplies 1,882 1,400 3,121 1,400 1,400 1,400 - 0.0%In-State Travel 3,761 4,000 3,202 4,000 3,500 3,500 (500) -12.5%Dues 870 700 905 700 700 700 - 0.0%Registry of Deeds 375 375 75 375 375 375 - 0.0%Subscriptions/Publications - 100 - 100 100 100 - 0.0%Conference 3,343 5,000 4,703 5,000 5,000 5,000 - 0.0%All Other 394 1,000 377 1,000 1,000 1,000 - 0.0%Sub-total Expenses 39,124 49,575 40,190 49,575 49,575 49,575 - 0.0%
Total Assessors 248,001 266,924 248,095 262,142 266,426 266,426 4,284 1.6%
FY18 to FY19

Finance–Chapter9
9:10
Town of Weston FY19 Final Budget
FINANCE: Finance Department – Treasurer/Collector Description of Services The Treasurer/Collector’s Office is part of the Finance Department and issues over 34,000 real estate, water and motor vehicle excise bills each year. Payments are accepted at Town Hall, via mail (to a lockbox service) or online at the Town’s website. The Treasury office maintains a collection rate of over 99 percent for all property tax bills. Additionally, the office issues over 2,500 transfer station decals annually. Working with Assessing Department, Treasury establishes and maintains deferred taxes and also maintains tax title liens on all delinquent property tax accounts. The Treasury office processes Payroll and Vendor payments. Additional Treasury functions include investing, borrowing and managing all Town funds received or disbursed; and assisting the Commissioners of Trust funds in investing approximately $13,000,000 in stocks, bonds and cash. By statute, the Treasurer/Collector is also the Town’s liaison to the Middlesex Retirement Board. FY19 Departmental Goals
1. Improve investment earnings. 2. Enhance customer service through use of technology and information access. 3. Improve operating efficiency of the Department and workflows in conjunction with the
Accounting office.
Budget Recommendations Level Services: The amount for bank fees has been reduced, because there are fewer bank accounts. New Requests Recommended by Town Manager: None requested New Requests Not Recommended by Town Manager: None
FY16 FY17 FY18 FY19Funded Funded Funded Requested
Treasurer/Collector Fin. Dir. Fin. Dir. 1 1Assistant Treasurer 1 1 1 1Financial Assistant 1 1 1 1
Total FTE 2 2 3 3
Staffing Levels

Finance–Chapter9
9:11
Town of Weston FY19 Final Budget
Finance Department Performance Measures
Performance measures can be used for discussion on how processes within the department can be more efficient and cost effective and then tying this in to future budgeting processes. On the next page are FY18 performance measures for the Finance Department, recommended by the Massachusetts Municipal Management Association.
By looking at this data all together, the Finance Department can discuss how to improve on these factors in FY19. Accounting will look at payroll checks issued to see if there is opportunity for more cost effective direct deposits. The Treasurer/Collector will look at return on investments as compared to MMDT to see if there is opportunity to earn more interest income on deposits. The Assessor will look to improve on interior inspections per year to ensure that assessments are as accurate as can be.
Going forward, if data is available, we can also benchmark against comparable towns, to see where Weston falls in financial operations performance.
Final
ACTUAL BUDGET ACTUAL BUDGET DEPT REQ FY19 $ %FINANCE FY16 FY17 FY17 FY18 FY19 Budget Change Change
Treasurer & CollectorSalaries 122,002 123,708 204,869 220,174 220,174 222,226 2,052 0.9%Sub-total Salaries 122,002 123,708 204,869 220,174 220,174 222,226 2,052 0.9%
Repair Office Equipment 929 800 809 800 800 800 - 0.0%Recording 1,350 1,400 75 1,500 1,500 1,500 - 0.0%Bank Fees 10,076 12,750 7,034 12,750 12,750 10,000 (2,750) -21.6%Advertising 328 200 430 300 300 300 - 0.0%Print Bills 4,293 4,500 9,079 4,500 4,500 4,500 - 0.0%Printing Checks - - 407 - - - - -Postage 11,620 15,000 11,545 15,000 15,000 15,000 - 0.0%Stationery - 500 641 500 500 500 - 0.0%Office Supplies 1,439 2,000 1,766 1,800 1,800 1,800 - 0.0%In-State Travel 50 500 17 500 500 500 - 0.0%Dues 50 175 50 175 175 175 - 0.0%Conference 309 750 256 750 750 750 - 0.0%Fidelity Bond 2,468 2,750 2,468 2,750 2,750 2,750 - 0.0%All Other 3,242 500 - 500 500 500 - 0.0%Debt Service Costs 500 500 - - 0.0%Sub-total Expenses 36,654 41,825 35,077 41,825 41,825 39,075 (2,750) -6.6%
Total Treasurer & Collector 158,656 165,533 239,946 261,999 261,999 261,301 (698) -0.3%
FY18 to FY19

Finance–Chapter9
9:12
Continuous Improvement
Accounting & Payroll
4 Number of full-time equivalents by job title/responsibility$407,279 Department budget most recent fiscal year
$0 Overtime budget/expenditure most recent fiscal year
Payroll checks Accounts payable checks5,678 number processed 11,168 number processed
24 number returned 42 number returned23 number re-issued 46 number re-issued
7,810 Journal entries processed
Number of days from end of fiscal year to:116 Free Cash certification164 Schedule A submitted175 Books closed and audit completed
0 Number of audit findings0 Number of audit adjustments1 Number of audit findings not addressed from prior year's audit (management letter Trust Funds continuing recommendation
Treasurer & Collector
3 Number of full-time equivalents by job title/responsibility$261,999 Department budget most recent fiscal year
$0 Overtime budget/expenditure most recent fiscal year# Bills issued
# Bills after planned % Collected % Collected % Collected Cost to Collectissued issue date in Yr of Commitment in first 60 days Online per bill
Real estate & personal property taxes 16,161 0 >98% >98% 25% -Motor vehicle excise 11,917 0 >98% >98% 25% -Water 7,205 0 >98% >98% 25% -Other bills
Treasurer & Collector (continued)
2,698 Transfer station stickers sold$13,666,500 Amount of debt issued annually Issued in FY1840% to 2.13% % Return on Investments compared to MMDT and CD's 2.13% at MMDT
YES Written investment policy$265.80 Cost of bank services per $1 million in deposits $30 million in deposits$1,519 Cost to issue each $1 million in debt
Assessors
3 Number of full-time equivalents by job title/responsibility$262,142 Department budget most recent fiscal year
$0 Overtime budget/expenditure most recent fiscal year
3,861 Number of residential parcels53 Number of commercial/industrial parcels
1,051 Interior & Exterior Inspections per year318 Exterior Only Inspections per year7 # of corrections identified by property owner
16 Abatement applications filed9 Abatements granted
45 Exemptions processed3 Appeals to ATB- Appeals to ATB in which Town prevails Not yet scheduled
Benchmarking Against Comparable Communities
$96,063,980 Total Town budget Includes Enterprise Funds & CPA funds$76,514,000 Total debt outstanding
Aaa Bond rating
Customer Satisfaction - requires surveySatisfied Department managers & staffSatisfied Public
Massachusetts Municipal Management AssociationMeasuring Performance in Local Government
Finance–Chapter9
9:13
This page intentionally left blank.

LandUse,InspectionalServices&Planning–Chapter10
10:1
Town of Weston
Budget Presentation
Chapter 10
LAND USE, INSPECTIONAL SERVICES
& PLANNING

LandUse,InspectionalServices&Planning–Chapter10
10:2
TOWN OF WESTON FY19 FINAL BUDGET AND FINANCING PLAN
LAND USE, INSPECTIONAL SERVICES & PLANNING
FinalActual Actual Budget FY19 $ %
LAND USE, INSPECTIONAL SERVICES & PLANNING FY16 FY17 FY18 Budget Change Change
RevenuesTax Levy and General Fund Revenues (368,168) (233,793) (150,313) (151,806) (1,493) 1.0%Permits & Licenses, Departmental Revenue 1,092,797 863,905 920,350 920,350 - 0.0%Board of Appeals - Fees 11,000 58,700 10,000 15,000 5,000 50.0%Planning Board - Fees 15,200 19,450 10,000 12,000 2,000 20.0%Conservation Commission - Rentals & Fees 2,294 2,458 1,500 1,500 - 0.0%Historical Commission - Fees 2,100 2,850 2,000 2,000 - 0.0%Total 755,222 713,570 793,537 799,044 5,507 0.7%
ExpendituresSalaries 539,938 540,367 586,817 600,484 13,667 2.3%Expenses 215,284 173,203 206,720 198,560 (8,160) -3.9%Total 755,222 713,570 793,537 799,044 5,507 0.7%
FY18 to FY19
Board of Selectmen Town Manager
Planning Board
Inspector of Buildings / Land Use Coordinator
Town Planner
Permit Administrator
Administrative Assistant
ZBA Staff Assistant (.67)
a Conservation Administrator
Conservation Stewardship Program
Coordinator (.4)
Deputy Building Inspector (.4)
Plumbing Inspector (.4)
Electrical Inspector (.4)
Maintenance Worker
Asst. Town Planner/Historical
Commission

LandUse,InspectionalServices&Planning–Chapter10
10:3
Town of Weston FY19 Final Budget
LAND USE AND DEVELOPMENT: Inspectional Services Description of Services Inspectional Services is responsible for the safe construction of our built environment and the orderly, appropriate and beneficial use of buildings and property in the Town. This work is carried out across the building trades by reviewing proposed plans, issuing permits, performing site inspections and issuing enforcement orders. This office provides: Review of proposed site plans and uses for conformance with Zoning Bylaw. Review of construction plans for conformance with the State Building Code and all appurtenant
codes, the Plumbing and Gas Code, the National Fire Protection Association Regulations and the National Electric Code, the Zoning Act and the Weston Zoning Bylaw.
Oversight of the Land Use permitting process, including Building, Plumbing, Electric and Zoning permits.
The timely investigation and enforcement-abatement of zoning violations. Field inspections to ensure compliance with above listed codes and other Authority issued
permit/special permit/ site plan approval conditions. Enforcement activities for the Planning Board, Historic Commission. Technical assistance to the various Boards and other town departments Works in close contact with the Weston Fire Department to provide code required inspections and
certifications of both public and private structures. Review of proposed land use regulations and zoning proposals. Proposals for ways to streamline the permitting process, including simplifying the Zoning Bylaw,
developing checklists and encouraging departmental collaboration. Planning for and implementation of technical and other work flow and process improvements
such as; on-line permitting, digitalization of office documents, the move to electronic storage of office documents, field inspections tools and software.
Successful delivery of various Board objectives. Safe occupancy of all structures designed for same.
In the calendar year 2017, 514 building permits, 555 electrical permits, 510 plumbing and gas permits, 78 sheet metal permits and 40 Chapter 106 occupancy permits (common area inspections) were issued, a decrease of about 13% from 2016. The total estimated cost of the projects was approximately $73.57 million in 2017. Total fees for permits and inspections collected was $743,594. A large portion of the drop in permit activity is attributed to another mild winter and lack of storm damage to roofs. Other factors that may have contributed to the decrease in permit activity are the close-out of construction at Highland Meadows. The Inspector of Buildings serves as the Land Use Coordinator, working closely with the Town Planner and Planning Board, Board of Health, Conservation Commission, Historical Commission, Zoning Board of Appeals, Fire Department and the Town Engineer. In addition, he oversees the work of the Conservation Administrator, ZBA Staff Assistant, and the Asst. Town Planner.
Receipts from permit fees cover the full cost of this department’s operations.
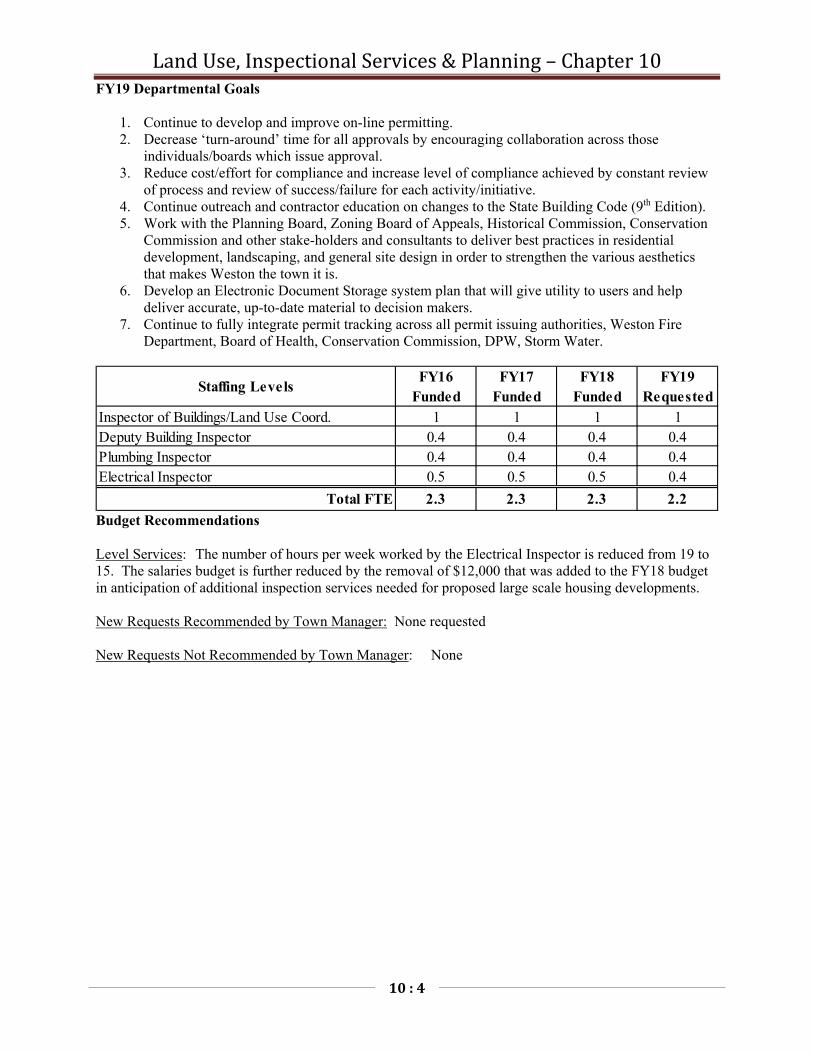
LandUse,InspectionalServices&Planning–Chapter10
10:4
FY19 Departmental Goals
1. Continue to develop and improve on-line permitting. 2. Decrease ‘turn-around’ time for all approvals by encouraging collaboration across those
individuals/boards which issue approval. 3. Reduce cost/effort for compliance and increase level of compliance achieved by constant review
of process and review of success/failure for each activity/initiative. 4. Continue outreach and contractor education on changes to the State Building Code (9th Edition). 5. Work with the Planning Board, Zoning Board of Appeals, Historical Commission, Conservation
Commission and other stake-holders and consultants to deliver best practices in residential development, landscaping, and general site design in order to strengthen the various aesthetics that makes Weston the town it is.
6. Develop an Electronic Document Storage system plan that will give utility to users and help deliver accurate, up-to-date material to decision makers.
7. Continue to fully integrate permit tracking across all permit issuing authorities, Weston Fire Department, Board of Health, Conservation Commission, DPW, Storm Water.
Budget Recommendations Level Services: The number of hours per week worked by the Electrical Inspector is reduced from 19 to 15. The salaries budget is further reduced by the removal of $12,000 that was added to the FY18 budget in anticipation of additional inspection services needed for proposed large scale housing developments. New Requests Recommended by Town Manager: None requested New Requests Not Recommended by Town Manager: None
FY16 FY17 FY18 FY19Funded Funded Funded Requested
Inspector of Buildings/Land Use Coord. 1 1 1 1Deputy Building Inspector 0.4 0.4 0.4 0.4Plumbing Inspector 0.4 0.4 0.4 0.4Electrical Inspector 0.5 0.5 0.5 0.4
Total FTE 2.3 2.3 2.3 2.2
Staffing Levels

LandUse,InspectionalServices&Planning–Chapter10
10:5
Town of Weston FY19 Final Budget
Final
ACTUAL BUDGET ACTUAL BUDGET DEP REQ FY19 $ %FY16 FY17 FY17 FY18 FY19 Budget Change Change
Inspectional ServicesSalaries 189,503 184,756 182,011 199,391 184,167 195,883 (3,508) -1.8%Sub-total Personal Services 189,503 184,756 182,011 199,391 184,167 195,883 (3,508) -1.8%
Education & Training 619 1,000 1,290 1,000 1,400 1,400 400 40.0%Communication 1,291 1,440 1,440 1,440 1,440 1,440 - 0.0%Gasoline 122 360 80 360 100 200 (160) -44.4%Office Supplies 1,700 750 1,746 750 750 750 - 0.0%In-State Travel 6,224 6,500 6,030 6,500 6,500 6,500 - 0.0%Subscriptions & Publications 605 300 - 300 300 300 - 0.0%Conference - 350 - 350 350 350 - 0.0%Equipment 229 400 - 400 400 400 - 0.0%
Sub-total Expenses 10,790 11,100 10,586 11,100 11,240 11,340 240 2.2%
Sealer of Weights & MeasuresMaintenance of Equipment - 200 - 200 200 200 - 0.0%Education & Training - 185 259 185 185 185 - 0.0%Office Supplies - 90 75 90 90 90 - 0.0%Postage - 25 - 25 25 25 - 0.0%Publications - 60 - 60 60 60 - 0.0%In-State Travel - 40 - 40 40 40 - 0.0%Sub-total Sealer Weights/Meas. - 600 334 600 600 600 - 0.0%
Total 200,293 196,456 192,931 211,091 196,007 207,823 (3,268) -1.5%
FY18 to FY19

LandUse,InspectionalServices&Planning–Chapter10
10:6
Town of Weston FY19 Final Budget
LAND USE AND DEVELOPMENT: Salaries Description of Services This budget represents employees who staff various Land Use Departments and functions. The Town Planner staffs the Planning Board and provides general planning assistance to other functions of Town government. The Assistant Town Planner primarily provides support to the Town Planner, but also to the Historical Commission. The Conservation Administrator provides technical and administrative support to the Conservation Commission. The Conservation Stewardship Program Coordinator was created to assist the Conservation Commission in overseeing a number of land management program needs, in particular, monitoring conservation land boundaries. The Staff Assistant to the ZBA provides technical and administrative support to the Zoning Board of Appeals. The Permit Administrator and Administrative Assistant provide administrative support all of the Land Use departments. The salary budget for the Land Use Coordinator and Inspectors is budgeted in Inspectional Services.
Budget Recommendations Level Services: Wetlands Protection Act funds are used to fund 2 hours per week of WPA administration by the part-time Land Manager. The Assistant Town Planner provides 15 hours/week of support to the Planning Board and is budgeted for up to 4 hours/week for the Historical Commission. New Requests Recommended by Town Manager: A very part-time (2 hours/week) land maintenance worker for the Conservation Commission is proposed to handle basic trail maintenance and improvements, installation of kiosks/trail information, and other miscellaneous maintenance tasks related to conservation land. New Requests Not Recommended by Town Manager: None
FY16 FY17 FY18 FY19Funded Funded Funded Requested
Town Planner 1 1 1 1Asst. Town Planner/Historical Comm 0 0.5 0.5 0.5Conservation Administrator 1 1 1 1Conservation Stewardship Program Coordinator 0.27 0.32 0.35 0.35Conservation Maintenance Worker 0 0 0 0.05Staff Asst./ZBA 0.67 0.67 0.67 0.67Permit Administrator 1 1 1 1Administrative Assistant 1 1 1 1Recording Secretary 0.15 0 0.06 0.06
Total FTE 5.09 5.49 5.58 5.63
Staffing Levels

LandUse,InspectionalServices&Planning–Chapter10
10:7
Town of Weston FY19 Final Budget
Final
ACTUAL BUDGET ACTUAL BUDGET DEP REQ FY19 $ %FY16 FY17 FY17 FY18 FY19 Budget Change Change
Planning & Land UseSalaries 350,435 388,341 358,356 387,426 399,601 404,601 17,175 4.4%
FY18 to FY19
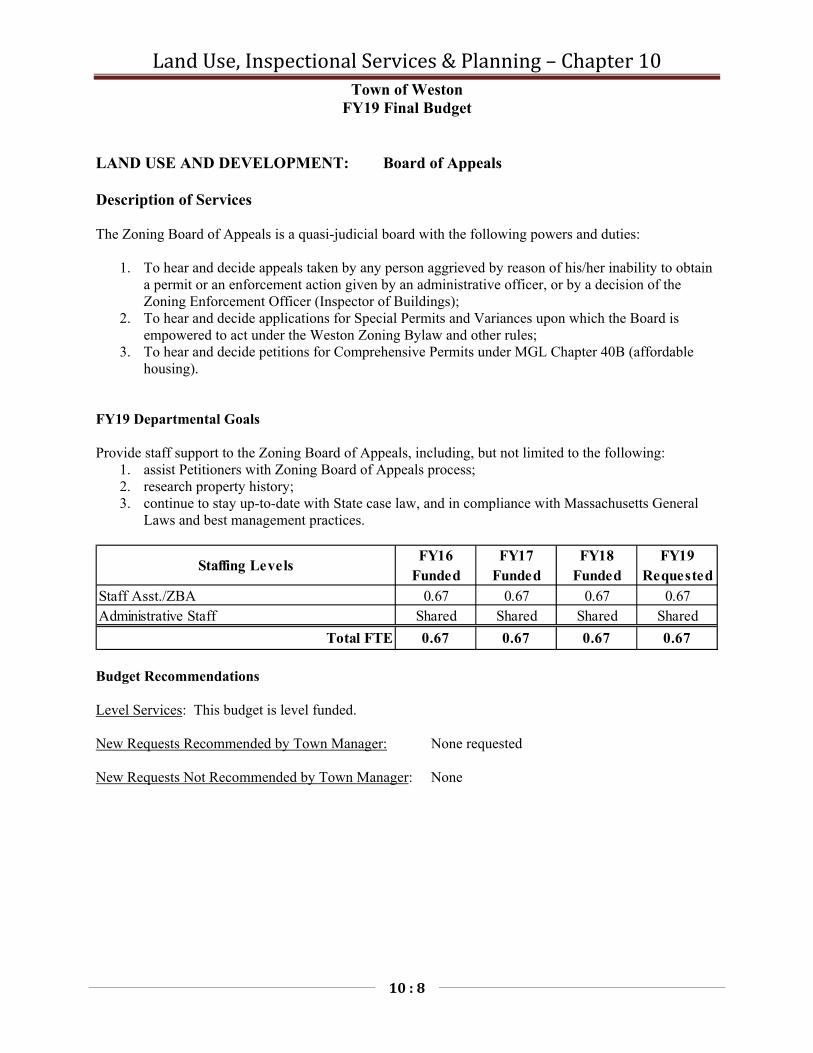
LandUse,InspectionalServices&Planning–Chapter10
10:8
Town of Weston FY19 Final Budget
LAND USE AND DEVELOPMENT: Board of Appeals Description of Services The Zoning Board of Appeals is a quasi-judicial board with the following powers and duties:
1. To hear and decide appeals taken by any person aggrieved by reason of his/her inability to obtain a permit or an enforcement action given by an administrative officer, or by a decision of the Zoning Enforcement Officer (Inspector of Buildings);
2. To hear and decide applications for Special Permits and Variances upon which the Board is empowered to act under the Weston Zoning Bylaw and other rules;
3. To hear and decide petitions for Comprehensive Permits under MGL Chapter 40B (affordable housing).
FY19 Departmental Goals Provide staff support to the Zoning Board of Appeals, including, but not limited to the following:
1. assist Petitioners with Zoning Board of Appeals process; 2. research property history; 3. continue to stay up-to-date with State case law, and in compliance with Massachusetts General
Laws and best management practices.
Budget Recommendations Level Services: This budget is level funded. New Requests Recommended by Town Manager: None requested New Requests Not Recommended by Town Manager: None
FY16 FY17 FY18 FY19Funded Funded Funded Requested
Staff Asst./ZBA 0.67 0.67 0.67 0.67Administrative Staff Shared Shared Shared Shared
Total FTE 0.67 0.67 0.67 0.67
Staffing Levels

LandUse,InspectionalServices&Planning–Chapter10
10:9
Town of Weston FY19 Final Budget
Final
ACTUAL BUDGET ACTUAL BUDGET DEP REQ FY19 $ %FY16 FY17 FY17 FY18 FY19 Budget Change Change
Board of AppealsPrinting & Advertising 516 1,800 552 1,800 1,800 1,800 - 0.0%Office Supplies 1,014 700 1,212 700 700 700 - 0.0%Conference - 200 125 200 200 200 - 0.0%All Other 108 50 91 50 50 50 - 0.0%Total 1,638 2,750 1,979 2,750 2,750 2,750 - 0.0%
FY18 to FY19

LandUse,InspectionalServices&Planning–Chapter10
10:10
Town of Weston FY19 Final Budget
LAND USE AND DEVELOPMENT: Planning Board Description of Services In accordance with Massachusetts General Laws, the Weston Planning Board is charged with three major responsibilities: review of subdivision of land, preparation of a master plan, and review and amendment of the Weston Zoning Bylaw (MGL Chapter 41, Section 81 and 40A) Based on this enabling legislation, the Planning Board’s duties are largely identified and include:
Analyzing development proposals including Subdivisions, Site Plan Approvals and Special Permits
Amending the Weston Zoning Bylaw and updating administrative regulations, site plan approval processes and various other permitting procedures
Conducting field inspections to ensure compliance with Planning Board permits Carrying out the Scenic Road Bylaw Providing technical assistance to the Zoning Board of Appeals on Comprehensive Permits and
other cases, as requested Working with other Town boards, departments and committees on long-range planning issues,
such as affordable housing, town center planning, transportation planning, etc. Developing and/or evaluating land use regulations and zoning proposals.
FY19 Departmental Goals 1. Promote community engagement in planning issues by working cooperatively with other Town
officials and residents on the following current projects: Planning Board Rules and Regulations Update, Scenic Road Design and Maintenance Plan, Town Center Planning Committee, Case Campus Master Plan.
2. Continue to ensure consistent vision for growth and development through Site Plan Review, Flexible Subdivisions, Special Permits and other policy generation.
3. Advocate at the State Level for planning and policy making that considers the unique semi-rural and suburban municipalities, such as Weston, surrounding Boston, particularly with regard to housing and transit
4. Continue to revise and refine reporting, application and approval policies.
Budget Recommendations
Level Services: Funds are included to allow the Town Planner to attend a national conference.
New Requests Recommended by Town Manager: None requested
New Requests Not Recommended by Town Manager: None
FY16 FY17 FY18 FY19Funded Funded Funded Requested
Town Planner 1 1 1 1Asst. Town Planner/Historical Comm 0 0.25 0.4 0.4Administrative Staff Shared Shared Shared Shared Recording Secretary 0.15 0 0.06 0.06
Total FTE 1 1.25 1.46 1.46
Staffing Levels

LandUse,InspectionalServices&Planning–Chapter10
10:11
Town of Weston FY19 Final Budget
Final
ACTUAL BUDGET ACTUAL BUDGET DEP REQ FY19 $ %FY16 FY17 FY17 FY18 FY19 Budget Change Change
Planning BoardProfessional & Consulting Services 45,911 31,500 29,181 31,500 31,500 31,500 - 0.0%Printing & Advertising 1,002 2,000 1,051 2,000 2,480 2,480 480 24.0%Copy Plans - 40 - 40 - - (40) -100.0%Communication - 480 - 480 - - (480) -100.0%Stationery & Supplies 1,035 500 501 500 740 740 240 48.0%In-State Travel 96 600 597 600 600 600 - 0.0%Dues - 500 365 500 400 400 (100) -20.0%Subscriptions & Publications 404 500 266 500 300 300 (200) -40.0%Conference - 500 220 500 2,200 2,200 1,700 340.0%Total 48,447 36,620 32,181 36,620 38,220 38,220 1,600 4.4%
FY18 to FY19

LandUse,InspectionalServices&Planning–Chapter10
10:12
Town of Weston FY19 Final Budget
LAND USE AND DEVELOPMENT: Conservation Commission Description of Services Wetland Protection Act Administration - The Weston Conservation Commission (WCC) is responsible for administering the Massachusetts Wetlands Protection Act (WPA). This includes reviewing all proposed municipal, private, and commercial projects to determine whether local and state wetland laws apply. The Conservation Administrator advises and provides technical expertise to the WCC in the areas of environmental laws and regulations, wetlands delineation, and erosion control measures to avoid legal action against the Town and protect the environment. Staff and Commissioners conduct pre-hearing site inspections and meetings. Other WPA responsibilities of the Conservation Administrator include: managing the day-to-day activities of the Conservation Dept., enforcing and implementing WCC decisions and policies, assisting landowners with filing wetland permits, addressing wetland violations, scheduling, administering and participating in public hearings; conducting numerous site visits during the construction phase of approved projects, and providing environmental education and outreach to residents. Land Management - In addition to their regulatory responsibilities, the WCC actively manages approximately 2,000 acres of conservation land. The Conservation Administrator and WCC oversee four annual land management contracts: (1) sustainable forestry, (2) maple sugaring, (3) community farming and environmental education, and (4) field mowing. Routine trail clearing and maintenance is generously funded by the Weston Forest and Trail Association. Monitoring Conservation Land Boundaries - The Conservation Department has established a Conservation Land Monitoring Program where each property boundary is monitored closely to minimize the potential of future land encroachments. Conservation Department staff continue to rectify and monitor over 45 known encroachments on Conservation Land. Implementation of the Open Space Plan – In June 2017, the Open Space and Recreation Plan Committee completed the 2017 Weston Open Space and Recreation Plan (OSRP), which will help to guide decisions regarding the use, acquisition, and management of Weston’s treasured open spaces, conservation areas, recreation facilities, and natural resources over the next 7 years. The OSRP serves as a tool to help Weston to maintain and improve its green infrastructure, such as conservation land, trails, working farms and forests, wildlife habitat, streams and ponds, parks, playing fields and courts, and swimming facilities. Planning for this green infrastructure is as important to the economic future of a community as is planning for schools, roads, and wastewater infrastructure. Conservation Commission Revenue Sources The Conservation Commission is authorized by the WPA to collect and retain filing fees for permit applications to offset the costs of administering the WPA. $10,805 was collected in FY17 and deposited into the WPA Fund. Money may only be expended from this fund to offset a portion of the WCC’s costs associated with administering the Wetlands Protection Act. Unused funds are carried over from the previous year. In FY17, $3,885 was withdrawn from the WPA fund to pay for outside consultant review, mileage reimbursements, costs to attend professional conferences and training, and field and office equipment. In addition, 2 hours per week of the Conservation Stewardship Program Coordinator’s position is funded through the WPA Fund. The WPA Fund had a balance of $15,520 at the end of FY17.
In addition, the WCC oversees the upkeep and rental use of a residence at 27 Crescent Street (Melone Homestead). This historic home is used as facility space for Land’s Sake Inc. and staff housing for

LandUse,InspectionalServices&Planning–Chapter10
10:13
Land’s Sake employees. Rent collected is deposited into a Revolving Fund. Maintenance and upkeep of the Melone House is funded through this Revolving Fund. FY19 Departmental Goals
1. Continue to identify ways to increase resident knowledge and understanding of wetland laws. 2. Work on protecting 500 Wellesley Street – Wellington Farms Land Protection 3. Per the 2017 Open Space and Recreation Plan’s 7-Year Action Plan, Goal 4D: Seek ways to
distribute trail maps and other open space‐related information to the public through kiosks, social media, apps, websites, local media outlets, and other means.
4. Case Estates Land – Continue to work on Case Estates Master Plan 5. Mass Central Rail Trail – Continue to work with the Rail trail Advisory Committee to identify
goals and priorities to increase public enjoyment (interpretation, signage, parking) of the rail trail.
Budget Recommendations
Level Services: The Open Space and Recreation Plan, completed and approved in 2017, requires funding for its implementation, and $5,000 is included for that purpose. The amount for maintenance of Case Estates land is reduced by $15,000 because after the first year of ownership, we have more knowledge of what will be required. New Requests Recommended by Town Manager: See Land Use Salaries New Requests Not Recommended by Town Manager: None
FY16 FY17 FY18 FY19Funded Funded Funded Requested
Conservation Administrator 1 1 1 1Conservation Stewardship Program Coordinator 0.27 0.32 0.35 0.35Maintenance Worker 0 0 0 0.05Administrative Staff Shared Shared Shared Shared
Total FTE 1.27 1.32 1.35 1.4
Staffing Levels

LandUse,InspectionalServices&Planning–Chapter10
10:14
Town of Weston FY19 Final Budget
Final
ACTUAL BUDGET ACTUAL BUDGET DEP REQ FY19 $ %FY16 FY17 FY17 FY18 FY19 Budget Change Change
Conservation CommissionAdministrationEducation & Training - 240 - 240 240 240 - 0.0%Office Supplies 226 500 233 500 500 500 - 0.0%In-State Travel 279 200 - 200 200 200 - 0.0%Dues 920 870 935 900 900 900 - 0.0%Conference 30 225 70 195 195 195 - 0.0%All Other 31 500 1,177 500 500 500 - 0.0%Sub-total Administration 1,486 2,535 2,415 2,535 2,535 2,535 - 0.0%
Land ManagementLand Management 18,558 30,150 22,073 30,150 30,150 30,150 - 0.0%Land Management/Dams - 2,000 - 2,000 2,000 2,000 - 0.0%Charles River Invasives Removal - - - 5,000 5,000 5,000 - 0.0%Sub-total Land Management 18,558 32,150 22,073 37,150 37,150 37,150 - 0.0%
Open Space & Rec Plan Implemention - - - 5,000 5,000 5,000 100.0%
Case EstatesLand Mgt./Maint. - 40 Acre Field 7,586 6,615 953 6,615 6,615 6,615 - 0.0%Land Mgt./Maint. - Ash & Wellesley - - - 20,000 20,000 5,000 (15,000) -75.0%Sub-total Case Estates 7,586 6,615 953 26,615 26,615 11,615 (15,000) -56.4%
FarmEducation & Training 19,015 18,743 23,850 19,000 19,000 19,000 - 0.0%Gardens 5,246 2,650 5,250 2,750 2,750 2,750 - 0.0%Maple Project 33,233 4,000 4,235 4,000 4,000 4,000 - 0.0%Mowing 31,285 27,640 39,088 30,000 30,000 30,000 - 0.0%Orchard - 1,500 400 1,500 1,500 1,500 - 0.0%Hunger Relief 25,000 25,000 25,000 25,000 25,000 25,000 - 0.0%All Other - 2,500 - 2,500 2,500 2,500 - 0.0%Sub-total Farm 113,779 82,033 97,823 84,750 84,750 84,750 - 0.0%
Total Conservation Comm 141,409 123,333 123,264 151,050 156,050 141,050 (10,000) -6.6%
FY18 to FY19

LandUse,InspectionalServices&Planning–Chapter10
10:15
Town of Weston FY19 Final Budget
LAND USE AND DEVELOPMENT: Historical Commission Crescent Street Historic District Commission Description of Services The Historical Commission identifies and documents town buildings, domestic architecture, and other local features of historical significance and educates the public as to their importance. The Commission also administers the Town’s Demolition Delay By-law and preservation restrictions for several Town buildings. While this is a volunteer Commission, staff support is also provided by the Land Use Coordinator and shared staff in the Land Use departments. Commission members serve on the Community Preservation Committee, the Melone Homestead Task Force and the Case Estates Building Advisory Committee. The Commission uses local consultants to provide expertise, advice and services in support of its goals. The Crescent Street Historic District Commission is charged with reviewing proposed exterior modifications of structures and other features located in the district, in accordance with Article XXVIII for the Town’s general by-law, which was enacted in 1993. FY19 Departmental Goals 1. As needed, manage subcommittee activity to accomplish use and preservation recommendations for
the Josiah Smith Tavern, Old Library and the Fiske Law Office. 2. Continue to monitor and provide oversight for historic information added to the Weston GIS system. 3. Continue the preliminary archival assessment of Weston town artifacts and documents. 4. Complete the identification and documentation of all Weston homes and other important buildings
which may be affected by the demolition delay by-law. 5. Complete preservation restrictions for selected structures. 6. Support Town preservation goals through analysis and recommendation on any proposed
development plans affecting historic properties and historic neighborhoods.
Budget Recommendation Level Services: This budget is level funded.
New Requests Recommended by Town Manager: None requested New Requests Not Recommended by Town Manager: None
FY16 FY17 FY18 FY19Funded Funded Funded Requested
Inspector of Buildings/Land Use Coord. Shared Shared Shared SharedAsst. Town Planner/Historical Comm 0 0.25 0.1 0.1Permit Administrator Shared Shared Shared Shared
Total FTE Shared 0.25 0.25 0.25
Staffing Levels

LandUse,InspectionalServices&Planning–Chapter10
10:16
Town of Weston FY19 Final Budget
Final
ACTUAL BUDGET ACTUAL BUDGET DEP REQ FY19 $ % FY16 FY17 FY17 FY18 FY19 Budget Change Change
Historical CommissionProfessional & Consult - 3,400 1,850 3,400 3,400 3,400 - 0%Printing & Advertising 1,583 600 2,788 600 600 600 - 0%Archive/Office Supplies - 500 10 500 500 500 - 0%All Other 11,417 - - - - - - -Sub-total Historical Comm 13,000 4,500 4,648 4,500 4,500 4,500 - 0%
Crescent Street Historic District CommissionAll Other - 100 212 100 100 100 - 0%Sub-total Crescent St Historic Dist Comm - 100 212 100 100 100 - 0%
Total Historical 13,000 4,600 4,860 4,600 4,600 4,600 - 0%
FY18 to FY19

LandUse,InspectionalServices&Planning–Chapter10
10:17
This page intentionally left blank.

PublicSafety–Chapter11
11:1
Town of Weston
Budget Presentation
Chapter 11 PUBLIC SAFETY

PublicSafety–Chapter11
11:2
TOWN OF WESTON FY19 FINAL BUDGET AND FINANCING PLAN
POLICE DEPARTMENT
FinalActual Actual Budget FY19 $ %
FY16 FY17 FY18 Budget Change ChangePOLICERevenuesTax Levy and General Fund Revenues 3,042,954 3,514,292 3,506,396 3,620,658 114,262 3.3%Fines and forfeits 77,391 73,256 73,100 73,100 - - Permits 2,125 2,875 2,100 2,100 - - Fees 40,806 88,052 66,000 71,000 5,000 0.08 Total 3,163,276 3,678,475 3,647,596 3,766,858 119,262 3.3%
ExpendituresSalaries 2,753,511 3,263,196 3,168,869 3,300,008 131,139 4.1%Expenses 271,100 279,190 328,727 316,850 (11,877) -3.6%Equipment+ 138,664 136,088 150,000 150,000 - 0.0%Total 3,163,276 3,678,475 3,647,596 3,766,858 119,262 3.3%
FY18 to FY19
Board of Selectmen Town Manager
Chief of Police Administrative
Assistant
Operations Lieutenant
Administrative Lieutenant
Patrol Sergeants (6) Detective Sergeant
Patrol Officers (16) Clerk/Dispatchers
(8) Detective
Community Services Officer

PublicSafety–Chapter11
11:3
Town of Weston FY19 Final Budget
PUBLIC SAFETY: Police Department Description of Services The Weston Police Department provides a complete range of public safety and community-based services including criminal investigation, traffic enforcement, preventive patrol and community services. FY19 Departmental Goals
1. Continue to provide appropriate, quality training to all personnel, particularly in the areas of crisis intervention, domestic violence, use of force and other critical areas.
2. Continue to develop and implement best practices and policies with the goal of becoming an accredited Police Department.
3. Working with the Fire Department to develop/improve protocols in the area of Emergency Management
Budget Recommendations Level Services: The amount for Salaries includes negotiated increases and an additional amount for overtime to more accurately reflect what is normally needed. The Equipment & Maintenance request includes funding for three Ford Explorers, used as Police cruisers. New Requests Recommended by Town Manager: Weston is served by the Domestic Violence Services Network, along with several other communities. A membership contribution of $5,000 is included for the services received by this predominantly volunteer group. New Requests Not Recommended by Town Manager: None
FY16 FY17 FY18 FY19Funded Funded Funded Requested
Chief 1 1 1 1Lieutenants 2 2 2 2Sergeants 6 6 6 6Police Officers (patrol) 16 16 16 16Court Prosecutor 1 1 1 1Community Service (schools) 1 1 1 1Civilian Dispatchers 4 8 8 8Administrative Assistant 1 1 1 1
Total FTE 32 36 36 36
Staffing Levels

PublicSafety–Chapter11
11:4
Town of Weston FY19 Final Budget
Final
ACTUAL BUDGET ACTUAL BUDGET DEPT REQ FY19 $ %PUBLIC SAFETY FY16 FY17 FY17 FY18 FY19 Budget Change Change
PoliceSalaries-Other 2,311,291 2,528,094 2,579,244 2,768,869 2,815,102 2,820,008 51,139 1.8%Salaries-Administrative 16 - 14,670 - - - - -Overtime 442,204 355,000 669,282 400,000 480,000 480,000 80,000 20.0%Sub-total Personal Services 2,753,511 2,883,094 3,263,196 3,168,869 3,295,102 3,300,008 131,139 4.1%
Uniforms 29,329 34,000 31,988 34,000 33,000 33,000 (1,000) -2.9%Electricity 33,690 58,000 32,914 55,887 58,000 40,000 (15,887) -28.4%Oil/Gas 5,027 22,000 9,339 15,000 15,000 15,000 - 0.0%Water 1,523 2,500 2,334 2,500 2,500 2,500 - 0.0%Repair/Maintenance-Building 26,458 26,740 22,370 26,740 29,000 29,000 2,260 8.5%Repair-Furnishings 788 500 539 500 500 500 - 0.0%Repair-Vehicles & Equipment 6,685 2,000 3,340 2,000 2,000 2,000 - 0.0%Repair-Office Equipment 2,468 1,200 3,101 1,200 1,200 1,200 - 0.0%Repair-Computer 1,796 500 1,678 500 500 500 - 0.0%Physical Fitness-Medical Services 3,053 3,500 1,625 3,500 3,500 3,500 - 0.0%Education & Training 19,374 24,100 24,607 24,100 25,000 25,000 900 3.7%Cell Phones 10,026 10,000 10,732 10,000 11,000 11,000 1,000 10.0%Postage 551 600 537 600 600 600 - 0.0%CJIS/911 Computer Maintenance 730 3,000 964 3,000 3,000 2,000 (1,000) -33.3%Radio Equipment & Maintenance 6,718 8,000 11,457 8,000 11,000 11,000 3,000 37.5%Gas/Diesel 44,533 60,000 34,518 60,000 57,600 47,600 (12,400) -20.7%Forms 615 500 - 500 500 500 - 0.0%Office Supplies 12,141 10,000 9,950 10,000 10,000 10,000 - 0.0%Signs 1,112 1,000 708 1,000 1,000 1,000 - 0.0%Custodial Supplies 2,486 3,500 2,452 3,500 3,500 3,500 - 0.0%Feed Prisoners 149 50 21 50 50 50 - 0.0%Detective Equipment & Supplies 4,606 2,000 - 2,000 2,000 2,000 - 0.0%Range Maintenance & Remediation 102 2,000 - - - - - -Firearms 1,962 8,500 4,779 8,500 8,500 8,500 - 0.0%Bullet Proof Vests 5,903 500 5,385 500 500 5,000 4,500 900.0%Police Supplies 7,805 11,000 13,829 11,000 11,000 11,000 - 0.0%Community Service Supplies - 2,500 4,406 2,500 3,000 3,000 500 20.0%In-State Travel 604 250 2,447 250 250 250 - 0.0%Out-of-State Travel 450 250 105 250 250 250 - 0.0%Dues 9,725 12,100 12,330 13,900 18,000 18,000 4,100 29.5%Subscriptions & Publications 6,244 2,500 9,701 6,250 6,250 11,250 5,000 80.0%Conference 2,843 5,000 6,294 5,000 5,000 5,000 - 0.0%Legal Defense Fund 7,000 8,500 6,000 8,500 8,500 6,250 (2,250) -26.5%All Other 13,452 5,000 5,492 5,000 5,000 5,000 - 0.0%Equipment 1,149 2,500 3,250 2,500 1,900 1,900 (600) -24.0%Sub-total Expenses 271,100 334,290 279,190 328,727 338,600 316,850 (11,877) -3.6%
Police - Continuing Balance AccountsEquipment & Maintenance+ 138,664 130,000 136,088 150,000 150,000 150,000 - 0.0%Sub-total Police Cont Bal 138,664 130,000 136,088 150,000 150,000 150,000 - 0.0%
Grand Total 3,163,276 3,347,384 3,678,475 3,647,596 3,783,702 3,766,858 119,262 3.3%
FY18 to FY19

PublicSafety–Chapter11
11:5
TOWN OF WESTON FY19 FINAL BUDGET AND FINANCING PLAN
ANIMAL CONTROL OFFICER
Board of Selectmen Town Manager
Police Chief
Animal Control Officer (.5)
FinalActual Actual Budget FY19 $ %
FY16 FY17 FY18 Budget Change ChangeANIMAL CONTROL OFFICERRevenuesTax Levy and General Fund Revenues (17,428) (19,944) 1,000 41,040 40,040 4004.0%Licenses 43,325 43,990 28,000 28,000 - - Total 25,897 24,046 29,000 69,040 40,040 138.1%
ExpendituresSalaries 20,978 21,520 22,500 62,540 40,040 178.0%Expenses 4,919 2,526 6,500 6,500 - 0.0%Total 25,897 24,046 29,000 69,040 40,040 138.1%
TOTAL PUBLIC SAFETY 6,715,306 6,875,750 7,098,466 7,356,017 257,551 3.6%
FY18 to FY19

PublicSafety–Chapter11
11:6
Town of Weston FY19 Final Budget
PUBLIC SAFETY: Animal Control Officer Description of Services The animal control officer patrols the town handling all dog and other animal complaints, enforces the Town bylaws and other laws, educates the public, and ensures that dogs and other animals are licensed as required. The revenue generated from dog licenses and the licensing of commercial dog walkers normally more than covers the cost of providing this service.
Budget Recommendations Level Services: When the previous Animal Control Officer retired, it was necessary to increase the salary to attract a qualified candidate. New Requests Recommended by Town Manager: None New Requests Not Recommended by Town Manager: A request to make the Animal Control Officer full-time requires further study and discussion.
FY16 FY17 FY18 FY19Funded Funded Funded Requested
Animal Control Officer 0.5 0.5 0.5 0.5
Total FTE 0.5 0.5 0.5 0.5
Staffing Levels

PublicSafety–Chapter11
11:7
Town of Weston FY19 Final Budget
Final
ACTUAL BUDGET ACTUAL BUDGET DEPT REQ FY19 $ %PUBLIC SAFETY FY16 FY17 FY17 FY18 FY19 Budget Change Change
Animal Control Officer
Salaries 20,978 21,520 21,520 22,500 30,540 62,540 40,040 178.0%Sub-total Personal Services 20,978 21,520 21,520 22,500 30,540 62,540 40,040 178.0%
Uniforms 80 1,000 305 1,000 1,000 1,000 - 0.0%Gas/Diesel 1,520 2,400 1,186 2,400 2,400 2,400 - 0.0%Equipment - 400 - 600 600 600 - 0.0%All Other Expenses 3,319 2,500 1,035 2,500 2,500 2,500 - 0.0%Sub-total Expenses 4,919 6,300 2,526 6,500 6,500 6,500 - 0.0%
Total 25,897 27,820 24,046 29,000 37,040 69,040 40,040 138.1%
FY18 to FY19

PublicSafety–Chapter11
11:8
TOWN OF WESTON FY19 FINAL BUDGET AND FINANCING PLAN
FIRE DEPARTMENT
Board of Selectmen
Town Manager
Fire Chief
Deputy Fire Chief
Captain
Lieutenant
Firefighters (5)
Captain
Lieutenant
Firefighters (5)
Captain
Lieutenant
Firefighters (5)
Captain
Lieutenant
Firefighters (5)
Administrative Assistant
Call Firefighters
FinalActual Actual Budget FY19 $ %
FY16 FY17 FY18 Budget Change ChangeFIRERevenuesTax Levy and General Fund Revenues 3,053,703 2,600,611 2,962,470 3,030,719 68,249 2.3%Fees and Permits 46,472 44,013 31,500 34,500 3,000 0.10 Ambulance/Other 425,960 528,605 427,900 454,900 27,000 0.06 Total 3,526,134 3,173,229 3,421,870 3,520,119 98,249 2.9%
ExpendituresSalaries 2,904,090 2,670,667 2,932,424 3,130,649 198,225 6.8%Expenses 268,587 269,401 313,446 323,470 10,024 3.2%Hydrant Service 42,930 42,930 44,000 44,000 - - Emergency Management+ - 3,800 2,000 2,000 - -
- -Chief's Vehicle+ 398 547 - - - -Air Packs+ 66 32,515 - - - -Equipment & Apparatus+ 310,063 153,369 130,000 20,000 (110,000) -84.6%Total 3,526,134 3,173,229 3,421,870 3,520,119 98,249 2.9%
FY18 to FY19

PublicSafety–Chapter11
11:9
Town of Weston FY19 Final Budget
PUBLIC SAFETY: Fire Department
Description of Services The Fire Department is responsible for the protection of lives and property from manmade and natural disasters. This is accomplished through fire prevention, public education and fire suppression. Additional responsibilities include the Town’s basic life support, ambulance and emergency management. Including the Fire Chief, the department is funded for 30 permanent, 5 call firefighters, and an administrative assistant. On a daily basis, the Fire Department is staffed with one or two officers and four to five firefighters operating out of two stations. Due to financial limitations, the first vacancy (sick or vacation leave) on any shift is not filled. As a result, approximately 78 percent of all shifts are not fully staffed. In 2017, the department responded to 2,320 calls for service, of which 1,032 were medical emergencies, 184 were motor vehicle accidents with injuries, and 30 were medical assists. This budget also includes funding for emergency management; the Fire Chief also serves as the Town’s Emergency Management Director.
FY19 Departmental Goals 1. Continue to improve radio communication systems and to evaluate and research the need for building bi- directional
antennas (BDA’s), as well as the possible move of the main transmitter from Regis College to Paine Hill. 2. Continue to upgrade and improve department/firefighter safety equipment, replacing turnout gear, nozzles,
hoses, thermal imaging cameras, saws, and other lifesaving equipment. 3. Increase training offered by allowing more members to attend classes at the MA Fire Academy and by hiring
instructors to teach firefighter safety and survival as well as may day training. 4. Continue to improve public education and fire prevention programs, by expanding CPR/AED classes,
working more with the COA on elder safety, fire prevention and preparedness, and spending more time in the schools teaching fire prevention.
Budget Issues
Level Services: The amount for repair/maintenance building is increased due adding a cleaning service to both stations. There is a capital request for replacement of an Engine (Engine 1); more details can be found in the Capital Improvement Plan – Section 17.
New Requests Recommended by Town Manager: Additional firefighters are recommended, with a goal to add one firefighter to each work group, or a total of four. This budget includes two firefighters, with the idea that an additional two will be added in a future budget. The cost of adding firefighters, including benefits, is offset by a reduction in overtime cost and an increase in ambulance revenue, because of the ability to staff the second ambulance more frequently. The net cost is $97,342, which includes increases in salary, health insurance, OPEB, ambulance revenue, and decreases in overtime and the use of call firefighters.
New Requests Not Recommended by Town Manager: None
FY15 FY16 FY17 FY18Funded Funded Funded Requested
Chief 1 1 1 1Deputy Chief 0 1 1 1Captains 4 4 4 4Day Officer/Captain 1 1 1 1Lieutenants 4 4 4 4Firefighters 20 20 20 20Civilian Clerk-Dispatchers 4 4 0 0Administrative Assistant 1 1 1 1
Total FTE 35 36 32 32
Staffing Levels

PublicSafety–Chapter11
11:10
Town of Weston FY19 Final Budget
Final
ACTUAL BUDGET ACTUAL BUDGET DEPT REQ FY19 $ %PUBLIC SAFETY FY16 FY17 FY17 FY18 FY19 Budget Change Change
FireSalaries-Other 2,233,708 2,060,534 2,067,996 2,131,041 2,245,786 2,340,269 209,228 9.8%Salaries-Administrative 179,399 280,440 184,197 192,806 193,012 193,012 206 0.1%Salaries-Administrative (Deputy) - - - 95,433 104,124 104,124 8,691 9.1%Overtime 392,029 308,144 301,363 308,144 314,344 314,344 6,200 2.0%Overtime (Alarm Call Back) 60,668 120,000 76,204 120,000 120,000 120,000 - 0.0%Fire Alarm Salaries 9,285 41,100 5,956 41,100 41,100 15,000 (26,100) -63.5%Mechanic-Overtime 14,723 20,000 26,242 20,000 20,000 20,000 - 0.0%Call Fire Fighters 14,278 23,900 8,710 23,900 23,900 23,900 - 0.0%Sub-total Personal Services 2,904,090 2,854,118 2,670,667 2,932,424 3,062,266 3,130,649 198,225 6.8%
Uniform Allowance 15,206 18,500 18,810 18,500 18,500 18,500 - 0.0%Dress Uniforms 666 5,000 1,593 5,000 5,000 5,000 - 0.0%Water 1,463 1,500 1,483 2,000 2,000 2,000 - 0.0%Electricity 22,817 27,000 20,180 25,976 25,976 25,000 (976) -3.8%Oil/Gas - Heating 15,703 25,000 16,160 25,000 25,000 25,000 - 0.0%Repair/Maint-Building 5,338 4,500 4,756 4,500 15,500 15,500 11,000 244.4%Repair-Vehicles & Equipment 68,073 60,000 56,358 60,000 60,000 60,000 - 0.0%Physical Fitness-Medical Services 6,897 3,500 3,765 3,500 3,500 3,500 - 0.0%Education & Training 5,208 10,000 2,565 10,000 10,000 10,000 - 0.0%Communication 10,247 11,200 10,482 11,200 11,200 11,200 - 0.0%Gas/Diesel 19,664 25,000 16,069 25,000 25,000 25,000 - 0.0%Office Supplies 1,908 4,500 3,799 4,500 4,500 4,500 - 0.0%Custodial Supplies 3,874 5,000 4,474 5,000 5,000 5,000 - 0.0%Protective Work Clothing 26,073 24,270 22,744 24,270 24,270 24,270 - 0.0%First Aid Supplies 16,030 20,000 23,654 20,000 20,000 20,000 - 0.0%Dues 5,933 5,800 5,482 5,800 5,800 5,800 - 0.0%Conferences - - - 3,000 3,000 3,000 - 0.0%All Other 242 3,500 482 1,200 1,200 1,200 - 0.0%Ambulance Collection Charges 17,394 23,000 21,531 23,000 23,000 23,000 - 0.0%Additional New Equipment 833 3,000 4,203 3,000 3,000 3,000 - 0.0%Replacement Equipment 18,119 14,000 11,226 14,000 14,000 14,000 - 0.0%Equipment - Fire Alarm 5,622 15,000 18,702 15,000 15,000 15,000 - 0.0%Fire Prevention 1,278 4,000 886 4,000 4,000 4,000 - 0.0%Sub-total Expenses 268,587 313,270 269,401 313,446 324,446 323,470 10,024 3.2%
Fire Hydrant ServiceHydrant Service 42,930 44,000 42,930 44,000 44,000 44,000 - 0.0%Sub-total Fire Hydrant Service 42,930 44,000 42,930 44,000 44,000 44,000 - 0.0%
Fire - Continuing Balance AccountsCivil Defense - Emergency Mgt.+ - 2,000 3,800 2,000 2,000 2,000 - 0.0%Chief's Vehicle+ 398 - 547 - - - - -Air Packs+ 66 - 32,515 - - - - -Equipment+ 310,063 135,000 153,369 130,000 20,000 20,000 (110,000) -84.6%Sub-total Fire Cont Bal 310,527 137,000 190,231 132,000 22,000 22,000 (110,000) -83.3%
Total 3,526,134 3,348,388 3,173,229 3,421,870 3,452,712 3,520,119 98,249 2.9%
FY18 to FY19

PublicSafety–Chapter11
11:11
This page intentionally left blank.
Education–Chapter12
12:1
Town of Weston
Budget Presentation
Chapter 12
EDUCATION

Education–Chapter12
12:2
TOWN OF WESTON FY19 FINAL BUDGET AND FINANCING PLAN
EDUCATION
School Committee
School Superintendent
FinalActual Actual Budget FY19 $ %FY16 FY17 FY18 Budget Change Change
EDUCATION
RevenuesTax Levy and General Fund Revenues 34,365,530 34,529,155 35,622,765 36,625,076 1,002,311 2.8%Chapter 70 (state aid for schools) 3,045,154 3,299,788 3,579,112 3,579,112 - 0.0%School Departmental Revenue - 31,633 100 100 - 0.0%Total 37,410,684 37,860,576 39,201,977 40,204,288 1,002,311 2.6%
Expenditures
School DepartmentSalaries 31,554,445 32,360,707 33,365,622 34,061,069 695,447 2.1%Instructional, Maint & Other Expenses 5,764,741 5,377,059 5,713,907 6,038,399 324,492 5.7%subtotal School Department 37,319,186 37,737,766 39,079,529 40,099,468 1,019,939 2.6%
Total School Department 37,319,186 37,737,766 39,079,529 40,099,468 1,019,939 2.6%
Minuteman Regional Voc Tech 91,498 122,810 122,448 104,820 (17,628) -14.4%
Total 37,410,684 37,860,576 39,201,977 40,204,288 1,002,311 2.6%
FY18 to FY19

Education–Chapter12
12:3
Town of Weston FY19 Final Budget
EDUCATION: Weston School Department Description of Services The Town Manager does not make a recommendation on this budget. Included here is the budget proposed by the Superintendent of Schools. The budget proposed by the School Committee is expected to be presented to the Finance Committee in March.
FY19 Budget Summary by Major Category
Final
ACTUAL ACTUAL BUDGET DEPT REQ FY19 $ %EDUCATION FY16 FY17 FY18 FY19 Budget Change Change
School DepartmentSalaries 31,554,445 32,360,707 33,365,622 34,316,244 34,061,069 695,447 2.1%Instructional, Maint & Other Expenses 5,764,741 5,377,059 5,713,907 5,965,037 6,038,399 324,492 5.7%
Total School Department 37,319,186 37,737,766 39,079,529 40,281,281 40,099,468 1,019,939 2.6%
*See Superintendent's FY19 Budget for details (2)
FY18 to FY19

Education–Chapter12
12:4
FY19 Budget Summary by Cost Center
FY19 Summary Budget

Education–Chapter12
12:5
Town of Weston FY19 Final Budget
EDUCATION: Minuteman Regional Vocational Technical High School Description of Services Effective July 1, 2017, Weston is no longer a member of the Minuteman Regional Vocational Technical School District. This means that instead of paying an annual assessment based on enrollment for the previous year, Weston is now charged a tuition fee per student plus an amount for debt service incurred while Weston was a member of the District. In the future, a capital fee per student will be assessed based on the cost of designing and constructing a new school building, which is underway. Transportation costs must also be handled by the Town, although some State aid may be available. There are three students enrolled currently at Minuteman High School; five students are projected in FY19.
Final
ACTUAL ACTUAL BUDGET DEPT REQ FY19 $ %EDUCATION FY16 FY17 FY18 FY19 Budget Change Change
Minuteman Regional VocationalTechnical School District
Assessment 91,498 122,810 122,448 104,820 104,820 (17,628) -14.4%subtotal Minuteman 91,498 122,810 122,448 104,820 104,820 (17,628) -14.4%
FY18 to FY19

Education–Chapter12
12:6
This page intentionally left blank.
PublicWorks–Chapter13
13:1
Town of Weston
Budget Presentation
Chapter 13 PUBLIC WORKS

PublicWorks–Chapter13
13:2
TOWN OF WESTON FY19 FINAL BUDGET AND FINANCING PLAN
DEPARTMENT OF PUBLIC WORKS
Board of Selectmen Town Manager
DPW Director of Operations
Deputy Director of Operations
Supervisor
Parks & Cemeteries (3)
Transfer Station (3)
Supervisor
Highway (6) Stormwater (3)
Water Superintendent
Water (3)
Equipment Maintenance (4)
Town Engineer
Stormwater Engineer
Capital Improvement
Engineer
Administrative Support (3)
FinalActual Actual Budget FY19 $ %
FY16 FY17 FY18 Budget Change Change
PUBLIC WORKSRevenuesTax Levy and General Fund Revenues 3,080,735 3,940,866 4,155,635 4,732,940 577,307 13.9%Cemeteries 36,443 45,385 30,000 30,000 - 0.0%Cemetery Trust Fund 35,000 35,000 35,000 60,000 25,000 71.4%Solid Waste and Recycling 342,217 359,642 340,000 340,000 - 0.0%Permits and Fees 53,120 20,913 16,500 16,500 - 0.0%Water Charges (Enterprise Fund) 132,452 134,015 146,618 148,817 2,199 1.5%Total 3,679,966 4,535,821 4,723,753 5,328,257 604,506 12.8%
ExpendituresSalaries 1,817,975 1,844,727 2,040,243 2,080,660 40,419 2.0%Expenses 1,037,101 1,111,686 1,215,110 1,214,197 (913) -0.1%Snow and Ice Control 448,422 691,592 252,900 252,900 - 0.0%
Traffic - Continuing Balance Accounts:Pedestrian Crossing Signal Projects+ 6,745 - - - - -Traffic/Sidewalk Comm Expenses+ 781 25,638 15,000 25,000 10,000 66.7%Kendal Green Parking + 3,000 - - - - -Traffic Signal Design + 2,683 - - - - -sub-total Traffic Cont Bal Accounts 13,209 25,638 15,000 25,000 10,000 66.7%
DPW Continuing Balance Accounts:Construction of Public Ways+ 111,963 435,439 750,000 1,250,000 500,000 66.7%Departmental Equipment+ 158,092 - 245,000 255,000 10,000 4.1%Sidewalk Maintenance+ 40,533 350,917 120,000 165,000 45,000 37.5%Stone Retaining Wall Repairs+ 9,132 37,918 10,000 10,000 - 0.0%Guard Rail Rehab. Program+ - - 50,000 50,000 - 0.0%Monitoring Groundwater-Landfill+ 30,825 26,575 25,500 25,500 - 0.0%Parks & Cemeteries+ 12,715 11,327 - - - -sub-total DPW Cont Bal Accounts 363,260 862,177 1,200,500 1,755,500 555,000 46.2%
Total 3,679,966 4,535,821 4,723,753 5,328,257 604,506 12.8%
FY18 to FY19

PublicWorks–Chapter13
13:3
Town of Weston FY19 Final Budget
PUBLIC WORKS: Administration and Engineering Description of Services The Department of Public Works is responsible for the maintenance of streets, parks and cemeteries, operation of the transfer station, operation of the water division, storm water management and providing certain engineering/labor support to other Town departments. A prorated portion of the costs in the Administration and Engineering division budget is allocated to the Water Enterprise Fund. FY19 Departmental Goals 1. Continue to improve on employee efficiency in the department via the development of standards. 2. Continue recent progress in drainage improvement program, using DPW workforce when feasible. Develop annual mapping for cleaning schedule for outfalls, catch basin cleaning, roadside cutting and vegetative management, etc. 3. Improve the operation, management and structure of all divisions via routine annual schedules including pavement markings on an annual schedule. 4. Improve complaint tracking, employee training and customer service.
Budget Recommendations Level Services: There are small increases for drug & alcohol testing, printing and advertising and water, offset by decreases in conference and property damage claims. An additional $4,000 is included for improved cleaning of the floors. New Requests Recommended by Town Manager: None requested New Requests Not Recommended by Town Manager: None
FY16 FY17 FY18 FY19Funded Funded Funded Requested
Director 1 1 1 1Deputy Director 1 1 1 1Town Engineer 1 1 1 1Stormwater Engineer 1 1 1 1Capital Improvement Engineer 0 0 1 1Office Manager 1 1 1 1Administrative Assistant 1 1 1 1Office Clerk 1 1 1 1
Total FTE 7 7 8 8
Staffing Levels

PublicWorks–Chapter13
13:4
Town of Weston FY19 Final Budget
Final
ACTUAL BUDGET ACTUAL BUDGET DEPT REQ FY19 $ %PUBLIC WORKS FY16 FY17 FY17 FY18 FY19 Budget Change Change
Administration, Traffic & EngineeringSalaries 558,943 572,229 576,097 660,870 671,026 687,582 26,712 4.0%Overtime 541 - - - - - - -Police Details - 12,000 1,238 12,000 12,000 12,000 - 0.0%Sub-total Personal Services 559,484 584,229 577,335 672,870 683,026 699,582 26,712 4.0%
AdministrationRepair/Maint-Office Equipment - 500 302 500 500 500 - 0.0%Drug & Alcohol Testing 1,786 1,400 2,355 1,400 1,700 1,700 300 21.4%Professional & Consulting - - 119 - - - - -Printing & Advertising 5,536 2,000 4,942 2,000 4,000 4,000 2,000 100.0%Communications 15,710 14,175 14,043 14,175 14,175 14,175 - 0.0%Postage 672 1,500 1,394 1,500 1,500 1,500 - 0.0%Weather 1,195 1,195 1,195 1,195 1,195 1,195 - 0.0%Copy Plans - 150 - 150 150 150 - 0.0%Stationery - 150 396 150 150 150 - 0.0%Forms - 1,000 - 1,000 1,000 1,000 - 0.0%Office Supplies 6,235 7,000 9,011 7,000 7,000 7,000 - 0.0%Protective/Work Clothing 9,855 13,030 11,199 13,030 13,030 13,030 - 0.0%Licenses 1,464 500 1,172 500 500 500 - 0.0%First Aid 309 500 591 500 500 500 - 0.0%In-State Travel 1,040 600 680 600 600 600 - 0.0%Out-of-State Travel - 500 - 500 500 500 - 0.0%Dues 1,129 1,700 1,040 1,700 1,700 1,700 - 0.0%Conference 242 2,000 - 2,000 1,000 1,000 (1,000) -50.0%All Other Expense 7,385 1,000 18,060 1,000 1,000 1,000 - 0.0%Property Damage Claims 7 800 53 800 500 500 (300) -37.5%sub-total Administration 52,566 49,700 66,552 49,700 50,700 50,700 1,000 2.0%
Traffic - Continuing Balance AccountsTraffic/Sidewalk Comm Expenses+ 781 15,000 25,638 15,000 15,000 25,000 10,000 66.7%Pedestrian Crossing Signal Projects+ 6,745 - - - - - - -Kendal Green Parking + 3,000 - - - - - - -Traffic Signal Design + 2,683 - - - - - - -sub-total Traffic-Cont Bal Accts 13,209 15,000 25,638 15,000 15,000 25,000 10,000 66.7%
Physical PlantElectricity 45,188 40,000 38,863 43,867 43,867 38,867 (5,000) -11.4%Natural Gas 25,946 32,000 37,639 29,000 30,000 30,000 1,000 3.4%Water 2,479 2,500 1,955 2,500 2,500 2,500 - 0.0%Repair & Cleaning-Building 32,496 29,000 32,590 29,000 33,000 33,000 4,000 13.8%Comfort Supplies 366 1,200 5 1,200 1,200 1,200 - 0.0%Cleaning Supplies 2,452 2,000 2,903 2,000 2,000 2,000 - 0.0%sub-total Physical Plant 108,928 106,700 113,956 107,567 112,567 107,567 - 0.0%
Total Admin, Traffic & Engineering 734,186 755,629 783,482 845,137 861,293 882,849 37,712 4.5%
FY18 to FY19

PublicWorks–Chapter13
13:5
Town of Weston FY19 Final Budget
PUBLIC WORKS: Equipment Maintenance Division Description of Services The Department of Public Works Equipment Maintenance Division is responsible for the maintenance and repair of all DPW, Police and School Department vehicles and equipment which is in excess of 100 pieces of rolling stock. A prorated portion of the salary costs in the Equipment Maintenance division budget is allocated to the Water Enterprise Fund. FY19 Departmental Goals 1. Continue to improve winter equipment readiness. 2. Improve bus maintenance protocols and/or practices. 3. Continue to improve Town vehicle care and upkeep by way of a preventive maintenance program utilizing computerized equipment maintenance, parts inventory logs and work orders for repairs. 4. Continue to decrease the cost of maintaining DPW and Police vehicles, school buses and other Town equipment through oversight and efficiency and equipment replacements at the appropriate time. 5. Continue to develop a co-op plan with a local high school to get students practical experience and to potentially develop a personnel replacement program for the Department.
Budget Recommendations Level Services: This Division’s turnover in fiscal year resulted in 75% of the labor staff being replaced. There is a shift in budget from maintenance of Police vehicles to maintenance of School vehicles. Additional funds are included for shop supplies, to better reflect what is actually needed. New Requests Recommended by Town Manager: None requested New Requests Not Recommended by Town Manager: None
FY16 FY17 FY18 FY19Funded Funded Funded Requested
Mechanics 4 4 4 4Part Time/Seasonal Help 0 0 1 PT 1 PT
Total FTE 4 4 4 4
Staffing Levels

PublicWorks–Chapter13
13:6
Town of Weston FY19 Final Budget
Final
ACTUAL BUDGET ACTUAL BUDGET DEP REQ FY19 $ %PUBLIC WORKS FY16 FY17 FY17 FY18 FY19 Budget Change Change
Equipment MaintenanceSalaries 233,477 236,323 237,296 240,120 238,773 238,773 (1,347) -0.6%Overtime 20,018 35,047 19,388 35,047 35,047 35,047 - 0.0%Temp/Seasonal - - - 11,184 11,184 11,184 - 0.0%Sub-total Personal Services 253,495 271,370 256,683 286,351 285,004 285,004 (1,347) -0.5%
Vehicle Repair & MaintenanceRepair/Maint-School 66,467 70,000 60,123 70,000 80,000 80,000 10,000 14.3%Repair/Maint-Police 15,178 38,000 16,330 38,000 38,000 28,000 (10,000) -26.3%Repair/Maint-Animal Control 645 1,000 205 1,000 1,000 1,000 - 0.0%Repair/Maint-DPW Vehicles 91,059 100,000 100,007 100,000 100,000 100,000 - 0.0%Repair-Small Equipment 4,081 3,000 3,887 3,000 3,000 3,000 - 0.0%Gasoline 16,348 40,000 20,939 38,600 38,600 38,600 - 0.0%Diesel Oil 54,958 26,600 35,256 40,000 40,000 40,000 - 0.0%Motor Oil 11,142 15,000 9,038 15,000 15,000 15,000 - 0.0%Tires & Tubes 13,325 21,000 11,288 21,000 21,000 21,000 - 0.0%Batteries - 1,000 - 1,000 1,000 1,000 - 0.0%Antifreeze - 1,500 - 1,500 1,500 1,500 - 0.0%Inspections 6,450 6,000 6,660 6,000 6,000 6,000 - 0.0%sub-total Vehicle Repair/Maint 279,653 323,100 263,732 335,100 345,100 335,100 - 0.0%
Shop SuppliesPainting - 2,000 - 2,000 2,000 1,000 (1,000) -50.0%Tools 5,966 10,000 7,770 10,000 10,000 10,000 - 0.0%Sundry Shop Supplies 9,878 3,000 10,492 3,000 3,000 7,000 4,000 133.3%Hardware 3,263 7,000 7,934 7,000 7,000 7,000 - 0.0%Safety Equipment 335 900 266 900 900 900 - 0.0%Extinguishers - 350 - 350 350 350 - 0.0%Welding 1,320 4,000 1,479 4,000 4,000 4,000 - 0.0%sub-total Shop Supplies 20,762 27,250 27,940 27,250 27,250 30,250 3,000 11.0%
Equipment-Continuing Balance AccountsDepartmental Equipment+ 158,092 245,000 - 245,000 255,000 255,000 10,000 4.1%sub-total Cont Bal Accts 158,092 245,000 - 245,000 255,000 255,000 10,000 4.1%
Total Equipment Maintenance 712,003 866,720 548,356 893,701 912,354 905,354 11,653 1.3%
FY18 to FY19

PublicWorks–Chapter13
13:7
Town of Weston
FY19 Final Budget PUBLIC WORKS: Highway Division Description of Services The Department of Public Works Highway Division is responsible for the maintenance and repair of 87 miles of Town roads and 31 miles of sidewalks. Specific duties include snow removal, power sweeping, roadside mowing and brush removal including vegetative management, litter control, pavement markings, and leaf removal, as well as trash removal from certain Town buildings. FY19 Departmental Goals 1. Continue to improve the scheduling of traffic markings while eliminating the related complaints and improving safety by developing 3 year scheduling cycle. 2. Continue to build on and maintain aggressive pavement management program utilizing spring/early summer and into fall paving schedule. 3. Continue to improve on the Salt Reduction Program without compromising safety and the environment. 4. Continue to develop annual mapping for cleaning schedule for outfalls, catch basin cleaning, roadside cutting, pavement markings, etc.
Budget Recommendations Level Services: The amount budgeted for snow removal has been historically underfunded; however, the Reserve Policy calls for the use of unused levy capacity to fund snow and ice deficits. An additional $45,000 is included for sidewalk maintenance to reconstruct a well-used sidewalk on Wellesley Street. New Requests Recommended by Town Manager: An additional $100,000 is requested for Construction/ Reconstruction of Public Ways (Roadway Maintenance) to continue increasing this budget to a more appropriate level, reflecting the average lifespan of a road and the cost to maintain or replace roads. It is estimated that the Town should be funding roadway maintenance at more than $1.5 million per year to maintain current conditions, but not necessarily catch up. Assuming the same level of Chapter 90 funding from the Commonwealth in FY19, this will increase the Town’s overall funding to about 89% of that amount. New Requests Not Recommended by Town Manager: None
FY16 FY17 FY18 FY19Funded Funded Funded Requested
Supervisor of Highway/Stormwater 1 1 1 1Traffic Maintenance Specialist 1 1 1 1Heavy Equipment Operator 1 1 1 1Laborers 4 4 4 4Part Time/Seasonal Help 1 PT 1 PT 1 PT 1 PT
Total FTE 7 7 7 7
Staffing Levels
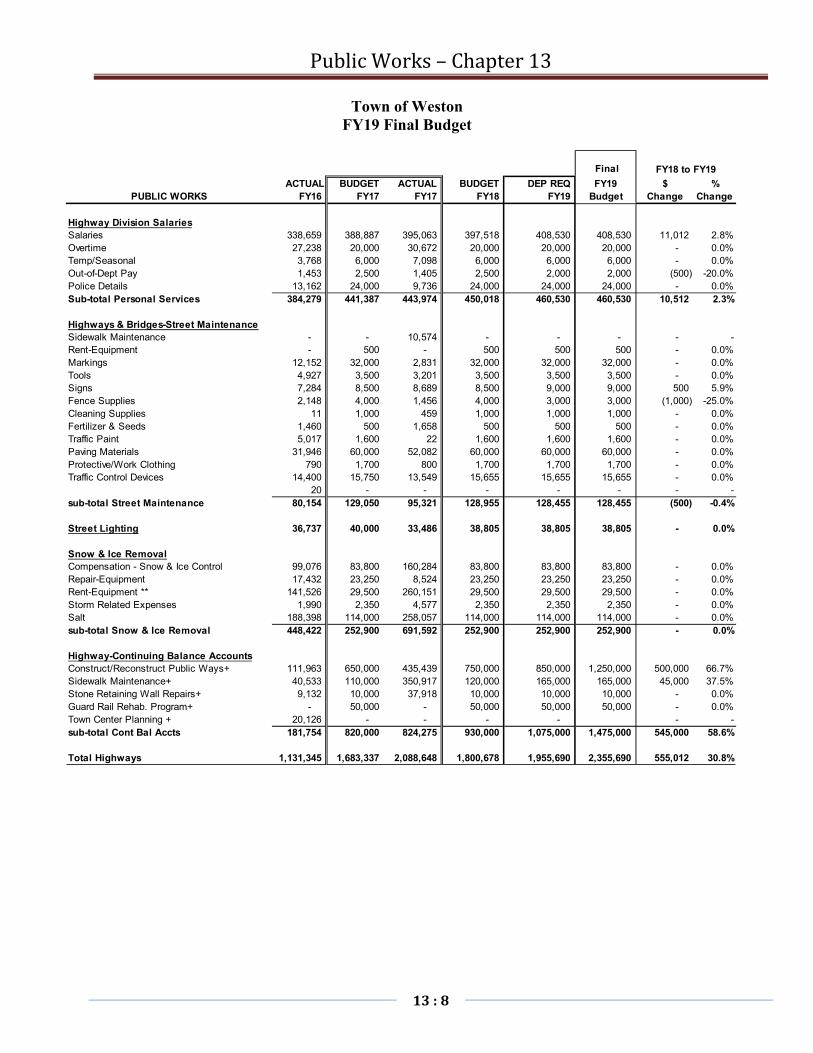
PublicWorks–Chapter13
13:8
Town of Weston
FY19 Final Budget
Final
ACTUAL BUDGET ACTUAL BUDGET DEP REQ FY19 $ %PUBLIC WORKS FY16 FY17 FY17 FY18 FY19 Budget Change Change
Highway Division SalariesSalaries 338,659 388,887 395,063 397,518 408,530 408,530 11,012 2.8%Overtime 27,238 20,000 30,672 20,000 20,000 20,000 - 0.0%Temp/Seasonal 3,768 6,000 7,098 6,000 6,000 6,000 - 0.0%Out-of-Dept Pay 1,453 2,500 1,405 2,500 2,000 2,000 (500) -20.0%Police Details 13,162 24,000 9,736 24,000 24,000 24,000 - 0.0%Sub-total Personal Services 384,279 441,387 443,974 450,018 460,530 460,530 10,512 2.3%
Highways & Bridges-Street MaintenanceSidewalk Maintenance - - 10,574 - - - - -Rent-Equipment - 500 - 500 500 500 - 0.0%Markings 12,152 32,000 2,831 32,000 32,000 32,000 - 0.0%Tools 4,927 3,500 3,201 3,500 3,500 3,500 - 0.0%Signs 7,284 8,500 8,689 8,500 9,000 9,000 500 5.9%Fence Supplies 2,148 4,000 1,456 4,000 3,000 3,000 (1,000) -25.0%Cleaning Supplies 11 1,000 459 1,000 1,000 1,000 - 0.0%Fertilizer & Seeds 1,460 500 1,658 500 500 500 - 0.0%Traffic Paint 5,017 1,600 22 1,600 1,600 1,600 - 0.0%Paving Materials 31,946 60,000 52,082 60,000 60,000 60,000 - 0.0%Protective/Work Clothing 790 1,700 800 1,700 1,700 1,700 - 0.0%Traffic Control Devices 14,400 15,750 13,549 15,655 15,655 15,655 - 0.0%
20 - - - - - - -sub-total Street Maintenance 80,154 129,050 95,321 128,955 128,455 128,455 (500) -0.4%
Street Lighting 36,737 40,000 33,486 38,805 38,805 38,805 - 0.0%
Snow & Ice RemovalCompensation - Snow & Ice Control 99,076 83,800 160,284 83,800 83,800 83,800 - 0.0%Repair-Equipment 17,432 23,250 8,524 23,250 23,250 23,250 - 0.0%Rent-Equipment ** 141,526 29,500 260,151 29,500 29,500 29,500 - 0.0%Storm Related Expenses 1,990 2,350 4,577 2,350 2,350 2,350 - 0.0%Salt 188,398 114,000 258,057 114,000 114,000 114,000 - 0.0%sub-total Snow & Ice Removal 448,422 252,900 691,592 252,900 252,900 252,900 - 0.0%
Highway-Continuing Balance AccountsConstruct/Reconstruct Public Ways+ 111,963 650,000 435,439 750,000 850,000 1,250,000 500,000 66.7%Sidewalk Maintenance+ 40,533 110,000 350,917 120,000 165,000 165,000 45,000 37.5%Stone Retaining Wall Repairs+ 9,132 10,000 37,918 10,000 10,000 10,000 - 0.0%Guard Rail Rehab. Program+ - 50,000 - 50,000 50,000 50,000 - 0.0%Town Center Planning + 20,126 - - - - - -sub-total Cont Bal Accts 181,754 820,000 824,275 930,000 1,075,000 1,475,000 545,000 58.6%
Total Highways 1,131,345 1,683,337 2,088,648 1,800,678 1,955,690 2,355,690 555,012 30.8%
FY18 to FY19

PublicWorks–Chapter13
13:9
Town of Weston FY19 Final Budget
PUBLIC WORKS: Stormwater Division Description of Services The Department of Public Works Storm Water Division is responsible for the maintenance and repair of the Town’s storm drainage system, which includes culvert cleaning, removal of brush and debris from brooks and streams, and expansion of the storm drain system. The work of this division is the implementation of a Storm Water Management Plan, mandated by federal law, requiring the DPW to institute several “best management” practices regarding source identification, public education, and bylaws to manage storm water flow in town. Funding for this ongoing work is included in this budget and in portions of the capital budget. FY19 Departmental Goals 1. Continue completing repairs to drainage systems located on roads scheduled for resurfacing in the off season in order to complete the paving program earlier in the construction year. 2. Continue to improve the efficiency of cleaning and dredging of open drainage ditches to improve water flow. 3. Continue drainage improvement program to eliminate complaints and better manage surface storm water. 4. Continue cross-training within the DPW divisions.
Budget Recommendations Level Services: The only increase in this budget is for salaries and the cost of police details. New Requests Recommended by Town Manager: None requested New Requests Not Recommended by Town Manager: None
FY16 FY17 FY18 FY19Funded Funded Funded Requested
Heavy Equipment Operator 1 1 1 1Laborers 2 2 2 2
Total FTE 3 3 3 3
Staffing Levels

PublicWorks–Chapter13
13:10
Town of Weston FY19 Final Budget
Final
ACTUAL BUDGET ACTUAL BUDGET DEP REQ FY19 $ %PUBLIC WORKS FY16 FY17 FY17 FY18 FY19 Budget Change Change
Stormwater Division SalariesSalaries 164,092 162,319 106,375 155,483 164,043 164,043 8,560 5.5%Overtime 498 5,570 1,094 5,570 5,570 5,570 - 0.0%Out-of-Dept Pay 527 2,000 459 2,000 2,000 2,000 - 0.0%Police Details 4,710 4,000 9,610 4,000 5,000 5,000 1,000 25.0%Sub-total Personal Services 169,827 173,889 117,539 167,053 176,613 176,613 9,560 30.5%
Stormwater ManagementConsulting & Professional Services - 8,350 525 8,350 5,000 5,000 (3,350) -40.1%Tools 738 2,500 1,605 2,500 2,500 2,500 - 0.0%Road Repairs - 2,500 - 2,500 2,500 2,500 - 0.0%Protective/Work Clothing - 1,700 192 1,700 1,700 1,700 - 0.0%Other Traffic Control - 1,000 21 1,000 1,000 1,000 - 0.0%Drainage Maintenance 51,723 66,700 82,570 66,700 66,700 66,700 - 0.0%sub-total Stormwater Management 52,460 82,750 84,913 82,750 79,400 79,400 (3,350) -4.0%
Total Stormwater Management 222,287 256,639 202,452 249,803 256,013 256,013 6,210 2.5%
FY18 to FY19

PublicWorks–Chapter13
13:11
Town of Weston FY19 Final Budget
PUBLIC WORKS: Solid Waste and Recycling Division Description of Services The Department of Public Works Solid Waste and Recycling Division is responsible for the operation of the Transfer Station, yard waste and brush dump areas and conducting the annual household hazardous waste collection day. In FY 2017, approximately 68% of the cost of the Transfer Station operation was paid through user fees (i.e. Transfer Station stickers, commercial tipping fees etc.). Included in this budget is the cost for groundwater monitoring at the closed Weston landfill and newly required third party Transfer Station inspections and DEP reporting. FY19 Departmental Goals 1. Control overtime through sick and vacation time management. 2. Continue to improve customer service at the Transfer Station. 3. Maintain the cleanliness of the Transfer Station facility and grounds. 4. Continue to improve recycling program through clearer signage, education of the public, etc., and seek increased revenue for recyclables. 5. Continue aggressive permit/sticker checking at access to transfer station. 6. Continue efforts to reduce the number of hauls during the fiscal year.
Budget Recommendations Level Services: Due to decreased waste being disposed of, the amount for tipping charges is reduced, although in July 2019 there will be an adjustment to the tipping fees based on the consumer price index. The budget for disposing of recyclables is increased based on the actual cost. New Requests Recommended by Town Manager: None requested New Requests Not Recommended by Town Manager: None
FY16 FY17 FY18 FY19Funded Funded Funded Requested
Disposal Area Operator 3 3 3 3
Total FTE 3 3 3 3
Staffing Levels
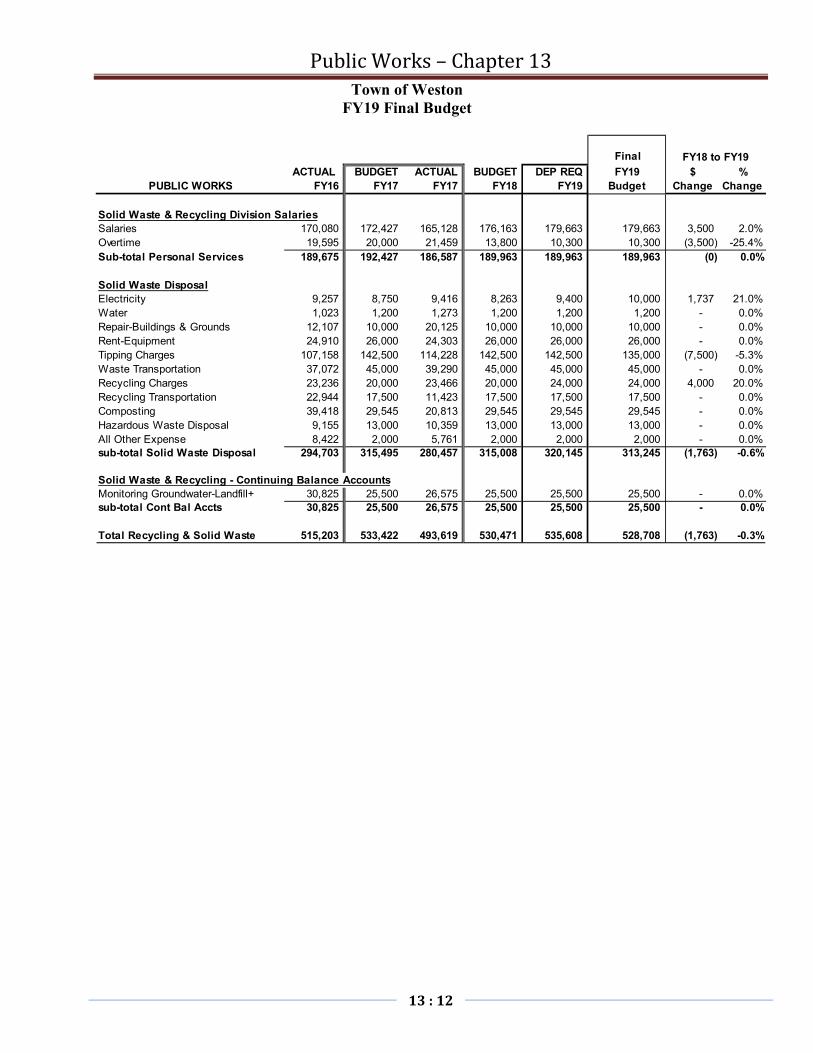
PublicWorks–Chapter13
13:12
Town of Weston FY19 Final Budget
Final
ACTUAL BUDGET ACTUAL BUDGET DEP REQ FY19 $ %PUBLIC WORKS FY16 FY17 FY17 FY18 FY19 Budget Change Change
Solid Waste & Recycling Division SalariesSalaries 170,080 172,427 165,128 176,163 179,663 179,663 3,500 2.0%Overtime 19,595 20,000 21,459 13,800 10,300 10,300 (3,500) -25.4%Sub-total Personal Services 189,675 192,427 186,587 189,963 189,963 189,963 (0) 0.0%
Solid Waste DisposalElectricity 9,257 8,750 9,416 8,263 9,400 10,000 1,737 21.0%Water 1,023 1,200 1,273 1,200 1,200 1,200 - 0.0%Repair-Buildings & Grounds 12,107 10,000 20,125 10,000 10,000 10,000 - 0.0%Rent-Equipment 24,910 26,000 24,303 26,000 26,000 26,000 - 0.0%Tipping Charges 107,158 142,500 114,228 142,500 142,500 135,000 (7,500) -5.3%Waste Transportation 37,072 45,000 39,290 45,000 45,000 45,000 - 0.0%Recycling Charges 23,236 20,000 23,466 20,000 24,000 24,000 4,000 20.0%Recycling Transportation 22,944 17,500 11,423 17,500 17,500 17,500 - 0.0%Composting 39,418 29,545 20,813 29,545 29,545 29,545 - 0.0%Hazardous Waste Disposal 9,155 13,000 10,359 13,000 13,000 13,000 - 0.0%All Other Expense 8,422 2,000 5,761 2,000 2,000 2,000 - 0.0%sub-total Solid Waste Disposal 294,703 315,495 280,457 315,008 320,145 313,245 (1,763) -0.6%
Solid Waste & Recycling - Continuing Balance AccountsMonitoring Groundwater-Landfill+ 30,825 25,500 26,575 25,500 25,500 25,500 - 0.0%sub-total Cont Bal Accts 30,825 25,500 26,575 25,500 25,500 25,500 - 0.0%
Total Recycling & Solid Waste 515,203 533,422 493,619 530,471 535,608 528,708 (1,763) -0.3%
FY18 to FY19

PublicWorks–Chapter13
13:13
Town of Weston FY19 Final Budget
PUBLIC WORKS: Parks and Cemeteries Division Description of Services The Department of Public Works Parks and Cemeteries Division is responsible for: 1) the maintenance of the Linwood, Central, Farmers, and South Burying Ground cemeteries; 2) the care and maintenance of Soldiers Field, Lamson Park, Case Park, Children’s Park, Anniversary Park East and West, South Park; and 3) the grounds of the Town Library, Josiah Smith Tavern and old Library, Fiske Law Office, Police Station, Transfer Station, Town Hall, and a variety of traffic islands. This Division also undertakes tree plantings and pruning in the parks. FY19 Departmental Goals 1. Complete work under phase one of funding for headstone restoration at Farmer’s Burial Ground, temporary shoring of tombs, rehabilitation of stone walls, restoration of iron gate, and design permanent repairs to tombs. 2. Continue to work on headstone restoration at Farmers Burial Ground and Central Cemetery under proposed phase two. 3. Continue to map Linwood Cemetery including street names and cemetery plots. 4. Continue to maintain the numerous green space locations (Cemeteries - Linwood, Farmers, Central, South Ave., and Parks/Other Areas – Island at Route 20/BPR, Fiske House, Fiske Park, Lamson Park, Town Hall, Sidewalk area around Town Green, Watering Can, Corner of School and BPR By-Pass, Corner of BPR and BPR By-Pass, Scout House, Case Park, Library, Pump Station on Wellesley Street, Josiah Tavern/Old Library, Fire Stations, Newton at Route 30, DPW, Police Station, etc. 5. Continue island planting program and beautification of Town green spaces.
Budget Recommendations Level Services: This budget is reduced because of employee turnover. Additional funds are included for part-time summer help to assist in the busy season. New Requests Recommended by Town Manager: None requested New Requests Not Recommended by Town Manager: None
FY16 FY17 FY18 FY19Funded Funded Funded Requested
Supervisor 1 1 1 1Heavy Equipment Operator 1 1 1 1Laborer 2 2 2 2
Total FTE 4 4 4 4
Staffing Levels

PublicWorks–Chapter13
13:14
Town of Weston FY19 Final Budget
Final
ACTUAL BUDGET ACTUAL BUDGET DEP REQ FY19 $ %PUBLIC WORKS FY16 FY17 FY17 FY18 FY19 Budget Change Change
Parks & Cemeteries Division SalariesSalaries 241,442 244,461 238,337 252,684 241,547 241,547 (11,137) -4.4%Overtime 15,740 15,000 20,090 15,000 15,000 15,000 - 0.0%Temp/Seasonal - - - - 6,000 6,000 6,000 100.0%Out of Dept Salaries - 2,032 - 2,032 2,032 2,032 - 0.0%Sub-total Personal Services 257,182 261,493 258,427 269,716 264,579 264,579 (5,137) -1.9%
Parks & Cemeteries DivisionWater 1,466 1,000 12,941 1,000 1,500 1,500 500 50.0%Landscape Design 855 500 - 500 500 500 - 0.0%Tree Care & Pest Control 6,741 6,300 4,311 6,300 6,300 6,300 - 0.0%Power Tools 422 600 7,651 600 600 600 - 0.0%Hand Tools 790 800 240 800 800 800 - 0.0%Loam - 250 905 250 250 250 - 0.0%Fertilizer & Seeds 3,444 4,000 3,688 4,000 4,000 4,000 - 0.0%Trees & Shrubs 2,990 2,000 1,126 2,000 2,000 2,000 - 0.0%Grass, Seeds & Plantings 441 500 - 500 500 500 - 0.0%Cemetery Supplies 3,386 3,500 5,015 3,500 3,500 3,500 - 0.0%Markers 1,798 1,000 1,331 1,000 1,200 1,200 200 20.0%Protective/Work Clothing 517 900 634 900 900 900 - 0.0%Equipment 4,317 5,500 4,457 5,500 5,500 5,500 - 0.0%sub-total Parks & Cemeteries 27,166 26,850 42,300 26,850 27,550 27,550 700 2.6%
Parks & Cemeteries-Cont Bal AcctsImprove/Develop Cemetery Land+ 2,581 - - - - - - -Equipment+ 10,134 11,500 11,327 - - - - -sub-total Cont Bal Accts 12,715 11,500 11,327 - - - - -
-Total Parks & Cemeteries Division 297,064 299,843 312,055 296,566 292,129 292,129 (4,437) -1.5%
FY18 to FY19

PublicWorks–Chapter13
13:15
Town of Weston FY19 Final Budget
PUBLIC WORKS: Tree Warden/Moth Superintendent Description of Services The Tree Warden is responsible for the health and preservation of trees along Weston’s public ways. A public hearing before the Board of Selectmen is required before a shade tree on public land is removed. If a shade tree is on a scenic road listed in the Town’s bylaws, a public hearing before the Planning Board is also required before removal. The Director of Operations, Department of Public Works serves as the Tree Warden. FY19 Departmental Goals 1. Improve the process to remove dead and diseased trees within the Town’s rights-of-way. 2. Improve communication between the office staff, residents, and the Tree Warden. 3. Continue to improve communications with Eversource regarding tree trimming activities. 4. Continue efforts with Inventory, Assessment, and Recommendation of public trees.
Budget Recommendations Level Services: This budget is essentially level funded. Funds are included for the second year of a town-wide tree inventory. New Requests Recommended by Town Manager: None requested New Requests Not Recommended by Town Manager: None
FY16 FY17 FY18 FY19Funded Funded Funded Requested
Tree Warden Stipend Stipend Stipend Stipend
Staffing Levels
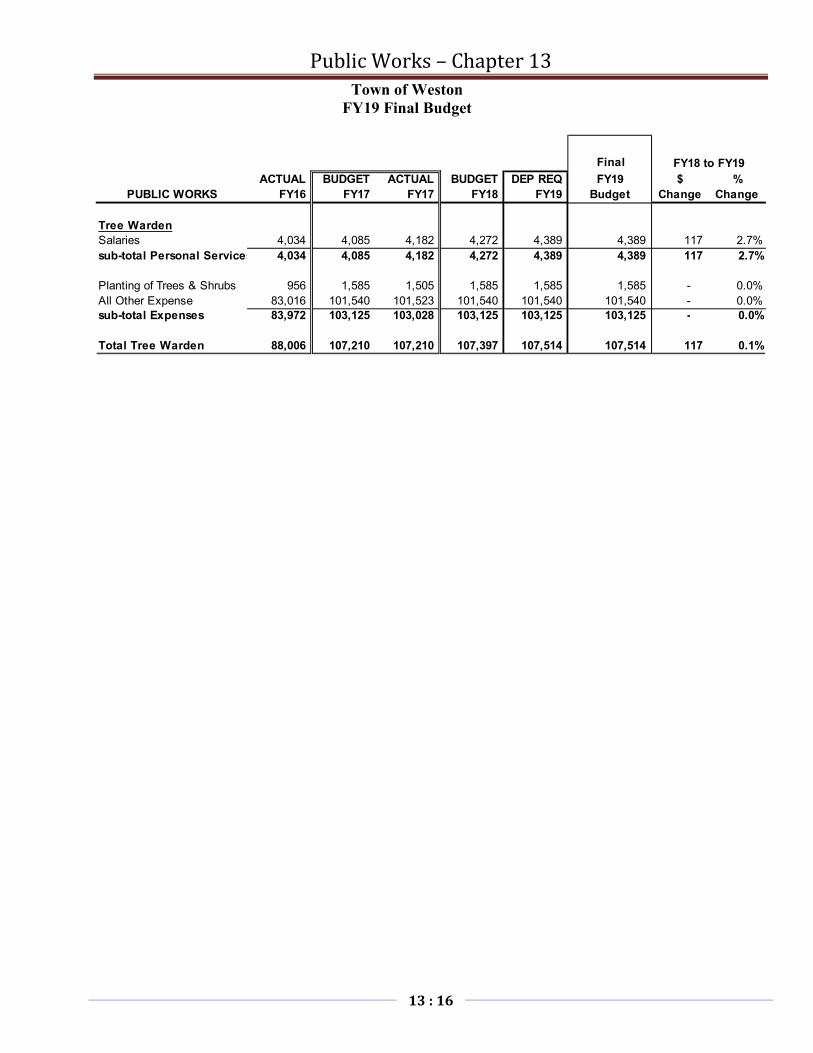
PublicWorks–Chapter13
13:16
Town of Weston FY19 Final Budget
Final
ACTUAL BUDGET ACTUAL BUDGET DEP REQ FY19 $ %PUBLIC WORKS FY16 FY17 FY17 FY18 FY19 Budget Change Change
Tree WardenSalaries 4,034 4,085 4,182 4,272 4,389 4,389 117 2.7%sub-total Personal Services 4,034 4,085 4,182 4,272 4,389 4,389 117 2.7%
Planting of Trees & Shrubs 956 1,585 1,505 1,585 1,585 1,585 - 0.0%All Other Expense 83,016 101,540 101,523 101,540 101,540 101,540 - 0.0%sub-total Expenses 83,972 103,125 103,028 103,125 103,125 103,125 - 0.0%
Total Tree Warden 88,006 107,210 107,210 107,397 107,514 107,514 117 0.1%
FY18 to FY19
PublicWorks–Chapter13
13:17
This page intentionally left blank.

Health&HumanServices–Chapter14
14:1
Town of Weston
Budget Presentation
Chapter 14
HEALTH & HUMAN SERVICES

Health&HumanServices–Chapter14
14:2
TOWN OF WESTON FY19 FINAL BUDGET AND FINANCING PLAN
BOARD OF HEALTH
Board of Health Town Manager
Public Health Director
Health AgentAdministrative
AssistantNurse (.2)
FinalActual Actual Budget FY19 $ %
FY16 FY17 FY18 Budget Change Change
BOARD OF HEALTHRevenuesTax Levy and General Fund Revenues 108,881 141,244 200,899 185,218 (15,681) -7.8%Licenses and Permits 132,795 115,820 88,000 88,000 - - Fees 36,071 23,988 19,100 24,100 5,000 0.26 Total 277,747 281,052 307,999 297,318 (10,681) -3.5%
ExpendituresSalaries 245,384 249,143 260,199 264,518 4,319 1.7%Expenses 7,363 6,909 22,800 7,800 (15,000) -65.8%Mental Health Services 25,000 25,000 25,000 25,000 - - Total 277,747 281,052 307,999 297,318 (10,681) -3.5%
FY18 to FY19

Health&HumanServices–Chapter14
14:3
Town of Weston FY19 Final Budget
HEALTH AND HUMAN SERVICES: Board of Health Description of Services The Board of Health is responsible for the promotion and protection of public health. This is done through flu clinics, public health education efforts, enforcement of environmental, public, medical and mental health laws and regulations. The Board of Health provides enforcement of the State Sanitary Code under the Massachusetts Department of Public Health and the State Environmental Code under the Massachusetts Department of Environmental Protection. The State Sanitary Code includes permitting and regulating housing, food sales and service, pools, camps, lead, asbestos and lead abatement, and surveillance and reporting of communicable disease. The State Environmental Code includes permitting and regulating wells, septic systems and ground water protection. The Board is committed to providing the highest protection of the public health possible with the available resources. Under the Department of Homeland Security, all local Boards of Health have been called upon to prepare their communities for all natural and man-made disasters. The Weston branch of the Region 4A Medical Reserve Corps has been established to provide volunteer medical service to the Town of Weston in the event of an emergency or disaster. The Board of Health is a member of the Emergency Preparedness Region 4A, working with the Massachusetts Department of Public Health and funded by the grants to the MDPH from the Centers for Disease Control. The Weston branch of the Region 4A Medical Reserve Corps is funded through this grant. FY19 Departmental Goals
1. Continue to update emergency plans for Sheltering, Emergency Dispensing Sites and All Hazards. 2. Continue to prepare and scan Title 5 Documents for an electronic filing system. 3. Work with other Town departments to strengthen public health initiatives.
Budget Recommendations
Level Services: The FY18 budget included $15,000 for a one-time project. The remaining FY19 budget is essentially level funded. Additional operating funds are provided through grants.
New Requests Recommended by Town Manager: None requested
New Requests Not Recommended by Town Manager: None
FY16 FY17 FY18 FY19Funded Funded Funded Requested
Health Director 1 1 1 1Health Agent 1 1 1 1Administrative Assistant 1 1 1 1Public Health Nurse 0.27 0.27 0.25 0.25
Total FTE 3.2 3.2 3.3 3.3
Staffing Levels

Health&HumanServices–Chapter14
14:4
Town of Weston FY19 Final Budget
Final
ACTUAL BUDGET ACTUAL BUDGET DEP REQ FY19 $ %HEALTH & HUMAN SERVICES FY16 FY17 FY17 FY18 FY19 Budget Change Change
Board of HealthSalaries 245,384 250,293 249,143 260,199 259,349 264,518 4,319 1.7%Sub-total Personal Services 245,384 250,293 249,143 260,199 259,349 264,518 4,319 1.7%
Consulting & Professional Serv. - - - 15,000 - - (15,000) -100.0%Printing 14 400 110 300 300 300 - 0.0%Professional Development 930 800 855 900 900 900 - 0.0%Telephone - 500 503 500 500 500 - 0.0%Postage 15 - - - - - -Office Supplies 2,296 2,400 1,701 2,400 2,400 2,400 - 0.0%In-State Travel 1,889 2,450 1,810 2,450 2,450 2,450 - 0.0%Dues 462 500 557 500 500 500 - 0.0%Laboratory Testing - 50 - 50 50 50 - 0.0%Contagious Diseases - 100 - 100 100 100 - 0.0%Office Equipment 1,756 600 1,372 600 600 600 - 0.0%Sub-total Expenses 7,363 7,800 6,909 22,800 7,800 7,800 (15,000) -65.8%
Mental Health ServicesHuman Relations Service (HRS) 25,000 25,000 25,000 25,000 25,000 25,000 - 0.0%Sub-total Mental Health Service 25,000 25,000 25,000 25,000 25,000 25,000 - 0.0%
Total 277,747 283,093 281,052 307,999 292,149 297,318 (10,681) -3.5%
FY18 to FY19

Health&HumanServices–Chapter14
14:5
TOWN OF WESTON FY19 FINAL BUDGET AND FINANCING PLAN
E. MIDDLESEX MOSQUITO CONTROL PROJECT
___________________________________________________________________________
Board of Selectmen
Town Manager
Department of Public Works
East Middlesex Mosquito
Control Project
FinalActual Actual Budget FY19 $ %
FY16 FY17 FY18 Budget Change Change
MOSQUITO CONTROL, E. MIDDLESEXRevenuesTax Levy and General Fund Revenues 38,558 41,718 42,761 43,693 932 2.2%Total 38,558 41,718 42,761 43,693 932 2.2%
Expenditures 38,558 41,718 42,761 43,693 932 2.2%
FY18 to FY19

Health&HumanServices–Chapter14
14:6
Town of Weston FY19 Final Budget
HEALTH AND HUMAN SERVICES: East Middlesex Mosquito Control Project Description of Services The East Middlesex Mosquito Control Project serves 26 cities and towns and conducts a program in Weston consisting of mosquito and wetland surveillance, larval and adult mosquito control, ditch maintenance, wetland surveys and public education. The Project also participates in the State’s West Nile Virus surveillance program and in the State’s Vector Control Plan to prevent eastern equine encephalitis. Staffing Levels: This program is staffed by the East Middlesex Mosquito Control Project. The Town’s liaison to EMMCP is the DPW Deputy Director of Operations. Budget Recommendations Level Services: The annual request from EMMCP reflects approximately a 2.2% increase to cover increases in labor and material expenses. New Requests Recommended by Town Manager: None requested New Requests Not Recommended by Town Manager: None

Health&HumanServices–Chapter14
14:7
Town of Weston FY19 Final Budget
Final
ACTUAL BUDGET ACTUAL BUDGET DEP REQ FY19 $ %HEALTH & HUMAN SERVICES FY16 FY17 FY17 FY18 FY19 Budget Change Change
E. Middlesex Mosquito Control Project
Expenses 38,558 41,718 41,718 42,761 43,693 43,693 932 2.2%
Total Mosquito Control 38,558 41,718 41,718 42,761 43,693 43,693 932 2.2%
FY18 to FY19

Health&HumanServices–Chapter14
14:8
TOWN OF WESTON FY19 FINAL BUDGET AND FINANCING PLAN
COUNCIL ON AGING
Board of Selectmen
Council on Aging Town Manager
Executive Director
Social Worker (1.5)
Administrative Assistant (1.38)
Bus Driver (.8)Program and Volunteer
Coordinator (.8)
FinalActual Actual Budget FY19 $ %
FY16 FY17 FY18 Budget Change Change
COUNCIL ON AGINGRevenuesTax Levy and General Fund Revenues 312,767 356,397 394,349 425,002 30,653 7.8%
Other Sources of FundingCOA Program Fees 39,293 43,478 50,000 50,000 - 0.0%Formula Grant - Elder Affairs 24,714 27,460 26,636 26,636 - 0.0%Harvard Pilgrim Grant 500 500 500 - 0.0%Gifts - Misc. Substantial (inc Friends of COA) 22,483 5,553 5,000 5,000 - 0.0%Gifts - Transportation (inc Friends of COA) 13,319 16,615 10,000 12,500 2,500 25.0%Subtotal 99,809 93,622 92,136 94,636 2,500 2.7%
Total 412,576 450,019 486,485 519,638 33,153 6.8%
ExpendituresSalaries 278,179 290,072 328,024 347,252 19,228 5.9%Expenses 34,589 36,325 36,325 47,750 11,425 31.5%Contrib. to Community Center Maintenance - 30,000 30,000 30,000 - 0.0%Subtotal 312,767 356,397 394,349 425,002 30,653 7.8%
Funded Outside the Town BudgetSalaries 72,003 59,897 69,102 70,977 1,875 2.7%Expenses 8,296 19,495 23,034 23,659 625 2.7%Subtotal 80,299 79,392 92,136 94,636 2,500 2.7%
Total 393,066 435,789 486,485 519,638 33,153 6.8%
FY18 to FY19

Health&HumanServices–Chapter14
14:9
Town of Weston FY19 Final Budget
HEALTH AND HUMAN SERVICES: Council on Aging
Description of Services
The Weston Council on Aging offers a wide range of services, resources and programs for Weston residents with a specific focus on those sixty years of age and older and their families. Residents engage with the COA to access our comprehensive information and referral resources, health and wellness programs, social services, transportation as well as fitness, educational and social offerings. This level of programing and resources is possible through the dedication of the Council on Aging Board, Friends of the Council on Aging, volunteers and staff.
FY19 Departmental Goals 1. Pursue a needs assessment with UMASS Boston to study the needs of older adults in Weston. 2. Expand van service and evaluate transportation programs to best serve the increasing transportation need. 3. Increase the awareness of programs and aging resources for Weston seniors, their families, and Weston
residents who are in need of support for their aging parents residing elsewhere. 4. Evaluate and improve the registration, sign-in and payment processes for program and transportation
participation. 5. Offer high quality programs and search for new innovative ideas and programs with broader appeal to
underserved groups such as men, adult children of aging parents or individuals approaching retirement.
Budget Recommendations
Level Services: The cost of transportation is increasing because of an increase in taxi cost and usage. In addition, the cost of producing the monthly newsletter has increased. Funds are included for professional development for the director as well as $6,500 to reupholster 50 program chairs. The Council on Aging is further supported by gifts and fees for programs. The Friends of the Council on Aging provides financial assistance for unexpected emergencies for qualifying individuals and subsidizes the COA’s budget with newsletter printing costs, program costs, the taxi voucher program and for the Volunteer Coordinator position. The Council on Aging also receives yearly funding from the Commonwealth of Massachusetts Executive Office of Elder Affairs formula grant. The formula grant for FY18 is $26,636. New Requests Recommended by Town Manager: Additional funding of $16,622 is included for van driver hours to support the increased transportation needs of Weston seniors.
New Requests Not Recommended by Town Manager: None
FY16 FY17 FY18 FY19Funded Funded Funded Requested
Director 1 1 1 1Social Outreach Worker 1.5 1.5 1.5 1.5Administrative Assistant 1.32 1.32 1.32 1.38Nurse 0.29 0.29 0.4 0Program and Volunteer Coordinator 0.26 0.26 0.26 0.8Bus Driver 0.21 0.21 0.21 0.8
Total FTE 4.58 4.58 4.69 5.48
Staffing Levels

Health&HumanServices–Chapter14
14:10
Town of Weston FY19 Final Budget
Final
ACTUAL BUDGET ACTUAL BUDGET DEP REQ FY19 $ %HEALTH & HUMAN SERVICES FY16 FY17 FY17 FY18 FY19 Budget Change Change
Council on Aging
Salaries 278,179 312,233 290,072 328,024 324,146 347,252 19,228 5.9%Sub-total Personal Services 278,179 312,233 290,072 328,024 324,146 347,252 19,228 5.9%
Repair & Maintain Office Equipment 2,653 1,500 1,300 1,500 750 750 (750) -50.0%Printing & Advertising 5,382 4,450 5,878 6,500 7,500 7,500 1,000 15.4%Postage 427 950 519 800 900 900 100 12.5%Office Supplies 3,106 2,200 1,933 3,000 2,500 2,500 (500) -16.7%In-State Travel 321 900 600 950 900 900 (50) -5.3%Out of State Travel - - - - 1,000 1,000 1,000 -Dues 2,165 2,730 931 1,447 1,700 1,700 253 17.5%Conferences/Training 1,970 800 805 700 2,000 2,000 1,300 185.7%Transportation 13,019 14,800 16,880 14,800 17,000 17,000 2,200 14.9%Other Programs 2,359 7,000 6,180 5,828 6,000 6,000 172 3.0%Equipment 3,188 995 1,299 800 7,500 7,500 6,700 837.5%Sub-total Expenses 34,589 36,325 36,325 36,325 47,750 47,750 11,425 31.5%
Contribution toCommunity Center Maintenance - 30,000 30,000 30,000 30,000 30,000 - 0.0%
Total 312,767 378,558 356,397 394,349 401,896 425,002 30,653 7.8%
FY18 to FY19

Health&HumanServices–Chapter14
14:11
TOWN OF WESTON FY19 FINAL BUDGET AND FINANCING PLAN
VETERANS’ SERVICES
Board of Selectmen
Town Manager
West Suburban Veterans' District
Director of Veterans' Services
FinalActual Actual Budget FY19 $ %
FY16 FY17 FY18 Budget Change Change
VETERANS' SERVICESRevenuesTax Levy and General Fund Revenues 28,848 12,480 38,975 8,769 (30,206) -77.5%State Reimbursement for Veterans' Benefits 34,248 22,281 39,060 39,060 - 0.0%Total 63,096 34,761 78,035 47,829 (30,206) -38.7%
Expenditures 63,096 34,761 78,035 47,829 (30,206) -38.7%
FY18 to FY19

Health&HumanServices–Chapter14
14:12
Town of Weston FY19 Final Budget
HEALTH AND HUMAN SERVICES: Veterans’ Services Description of Services The West Suburban Veterans’ Services District is a regional effort to provide Veterans’ Services to residents of the towns of Wellesley, Needham, Wayland and Weston. This District allows Weston to share the cost of professional, full-time staff focused on providing services to veterans. These staff are employees of the Town of Wellesley. The District staff members assist veterans, widows of veterans and families of members of the armed services in receiving State and Federal services. Staffing is mandated by State law and key positions must be held by veterans.
Budget Recommendations Level Services: Weston’s share of the District budget is determined by its population v. total population of the District. The budget includes the cost of salary and benefits for two full-time staff, as well as shared administrative support. The amount for Veterans’ Benefits is based on actual cases of veterans’ benefits expected to be paid, for which 75% is eventually reimbursed by the State. Weston used to have several active cases, but there are now none, despite increased outreach by the Director. New Requests Recommended by Town Manager: None requested New Requests Not Recommended by Town Manager: None
FY16 FY17 FY18 FY19Funded Funded Funded Requested
Director of Veterans' Services shared shared shared sharedDeputy Director of Veterans' Services shared shared shared 0Head Administrator 0 0 0 sharedAdministrative Assistant shared shared shared shared
Total FTE 0 0 0 0
Staffing Levels (shared)

Health&HumanServices–Chapter14
14:13
Town of Weston FY19 Final Budget
Final
ACTUAL BUDGET ACTUAL BUDGET DEP REQ FY19 $ %HEALTH & HUMAN SERVICES FY16 FY17 FY17 FY18 FY19 Budget Change Change
Veterans' Services
Expenses - Benefits 35,000 50,000 7,000 50,000 20,000 20,000 (30,000) -60.0%Regional Assessment 28,096 27,761 27,761 28,035 27,829 27,829 (206) -0.7%
Total Veterans' Services 63,096 77,761 34,761 78,035 47,829 47,829 (30,206) -38.7%
FY18 to FY19

Health&HumanServices–Chapter14
14:14
This page intentionally left blank.

Library–Chapter15
15:1
Town of Weston
Budget Presentation
Chapter 15 LIBRARY

Library–Chapter15
15:2
TOWN OF WESTON FY19 FINAL BUDGET AND FINANCING PLAN
PUBLIC LIBRARY
______________________________________________________________________________
Final
Actual Actual Budget FY19 $ %FY16 FY17 FY18 Budget Change Change
LIBRARYRevenuesTax Levy and General Fund Revenues 1,248,845 1,257,656 1,366,791 1,394,350 27,559 2.0%Fines and forfeits 29,259 27,255 24,000 24,000 - - Rentals 1,475 700 500 500 - - Total 1,279,580 1,285,611 1,391,291 1,418,850 27,559 2.0%
Other Sources of FundingLibrary State Aid 22,093 21,159 21,119 21,119 - - Gifts 44,107 34,050 30,000 30,000 - - Expendable Trusts 200,713 227,181 125,000 125,000 - - Subtotal 266,913 282,390 176,119 176,119 - -
Total 1,546,493 1,568,001 1,567,410 1,594,969 27,559 1.8%
ExpendituresSalaries 1,020,474 1,046,084 1,121,075 1,153,188 32,113 2.9%Expenses 144,086 125,481 153,120 143,162 (9,958) -6.5%Library Materials 74,999 75,000 75,000 80,000 5,000 6.7%Minuteman Library Network+ 40,021 39,045 42,096 42,500 404 1.0%Total 1,279,580 1,285,611 1,391,291 1,418,850 27,559 2.0%
Funded Outside the Town BudgetExpenses 24,803 67,466 10,000 10,000 - - Materials 199,669 127,940 166,119 166,119 - - Subtotal 224,472 195,406 176,119 176,119 - -
Total 1,504,051 1,481,017 1,567,410 1,594,969 27,559 1.8%
FY18 to FY19
Library Page (1.2)

Library–Chapter15
15:3
Town of Weston FY19 Final Budget
PUBLIC LIBRARY Description of Services The mission of the Weston Public Library is to provide materials, resources and programs for lifelong learning and enjoyment. The Library serves the entire community by making available collections on a broad array of subjects of interest to its patrons. It is a forum for the community, providing a welcoming and well-maintained facility for meetings, informal gatherings, lectures and other cultural events (Mission Statement reaffirmed September 10, 2012).
The Library has two requirements it must meet to maintain its State accreditation: 1. The municipal appropriations for the Library budget must increase by 2.5 percent over the
average of the budget for the prior three years; and 2. 16 percent of the budget must be expended on materials (i.e., books, periodicals, databases). The
funds for materials can come from any source. For the Weston Library, expenditures for materials need to equal approximately $228,063. Approximately $148,063 of this amount comes from Trust funds, with the remaining amount coming from the Town’s appropriation.
FY19 Departmental Goals 1. Consider implementation of One Point of Service 2. Continue to develop plan for Weston Arts & Innovation Center while construction takes place 3. Complete new Long-Range Plan
FY16 FY17 FY18 FY19
Funded Funded Funded RequestedDirector 1 1 1 1Assistant Director 1 1 1 1Professional Staff - Full Time 4 4 4 4Professional Staff - Part Time 2.36 2.6 2.6 2.6Para-Professional Staff - Full Time 1 1 1 1Para-Professional Staff - Part Time 4.52 4.52 4.52 4.52Administrative Assistant 1 1 1 1Pages 1 1 1 1Custodians 2 2 2 2
Total FTE 17.88 18.12 18.12 18.12
Staffing Levels
Budget Recommendations Level Services: Approximately 65% of the annual funding for library materials is provided from trust funds for the benefit of the Library. New Requests Recommended by Town Manager: None
New Requests Not Recommended by Town Manager: None

Library–Chapter15
15:4
Town of Weston FY19 Final Budget
Final
ACTUAL BUDGET ACTUAL BUDGET DEP REQ FY19 $ %PUBLIC LIBRARY FY16 FY17 FY17 FY18 FY19 Budget Change Change
LibrarySalaries 822,768 889,356 841,032 914,247 935,802 941,220 26,973 3.0%Salaries - Admin. 197,706 197,274 205,052 206,828 211,968 211,968 5,140 2.5%Sub-total Personal Services 1,020,474 1,086,630 1,046,084 1,121,075 1,147,770 1,153,188 32,113 2.9%
AdministrationRepair-Office Equipment 11,734 11,000 11,074 11,000 11,000 11,000 - 0.0%Rent-Equipment 2,588 3,200 3,158 3,200 3,200 3,200 - 0.0%Postage 565 1,100 573 1,100 1,100 1,100 - 0.0%Office Supplies 4,075 4,200 4,110 4,200 4,500 4,500 300 7.1%Library Supplies 12,211 12,000 11,811 12,000 12,500 12,500 500 4.2%Computer Supplies 6,417 7,000 6,290 7,000 7,000 7,000 - 0.0%In-State Travel 211 600 263 600 600 600 - 0.0%Out-of-State Travel 965 1,000 490 1,000 1,000 1,000 - 0.0%Dues 768 1,212 770 1,212 1,212 1,212 - 0.0%Subscriptions & Publications 2,340 1,300 4,245 1,300 1,300 1,300 - 0.0%Conference 380 500 235 500 500 500 - 0.0%All Other 3,245 2,500 2,571 2,500 2,500 2,500 - 0.0%Library Equipment 11,048 11,000 11,019 11,000 12,000 12,000 1,000 9.1%Sub-total Administration 56,548 56,612 56,610 56,612 58,412 58,412 1,800 3.2%
Physical PlantElectricity 47,975 69,600 45,397 66,961 66,961 55,000 (11,961) -17.9%Oil/Gas 9,261 17,250 12,001 17,250 17,250 17,250 - 0.0%Water 808 1,000 704 1,000 1,000 1,000 - 0.0%Repair & Maintenance Building 25,439 6,000 6,224 6,000 6,000 6,000 - 0.0%Comfort Supplies 774 1,103 1,071 1,103 1,250 1,250 147 13.3%Sundry Supplies 604 1,194 862 1,194 1,250 1,250 56 4.7%Cleaning Supplies 2,678 3,000 2,613 3,000 3,000 3,000 - 0.0%Sub-total Physical Plant 87,538 99,147 68,872 96,508 96,711 84,750 (11,758) -12.2%
Sub-total Expenses 144,086 155,759 125,481 153,120 155,123 143,162 (9,958) -6.5%
MaterialsFiction/Non-Fiction 34,591 34,000 34,000 34,000 39,000 39,000 5,000 14.7%Periodicals 16,268 16,000 16,076 16,000 16,000 16,000 - 0.0%Microforms 7,741 8,000 7,999 8,000 8,000 8,000 - 0.0%Audio 4,827 5,000 4,931 5,000 5,000 5,000 - 0.0%Other Media 8,998 9,000 9,000 9,000 9,000 9,000 - 0.0%Non-Book 1,846 2,000 1,994 2,000 2,000 2,000 - 0.0%Software 728 1,000 1,000 1,000 1,000 1,000 - 0.0%Sub-total Materials 74,999 75,000 75,000 75,000 80,000 80,000 5,000 6.7%
Minuteman Library NetworkAssessment 40,021 40,520 39,045 42,096 42,500 42,500 404 1.0%Sub-total Minuteman Lib Net 40,021 40,520 39,045 42,096 42,500 42,500 404 1.0%
Total 1,279,580 1,357,909 1,285,611 1,391,291 1,425,393 1,418,850 27,559 2.0%
FY18 to FY19

Library–Chapter15
15:5
This page intentionally left blank.

BrookSchoolApartmentsEnterpriseFund–Chapter16
16:1
Town of Weston
Budget Presentation
Chapter 16
BROOK SCHOOL APARTMENTS ENTERPRISE FUND
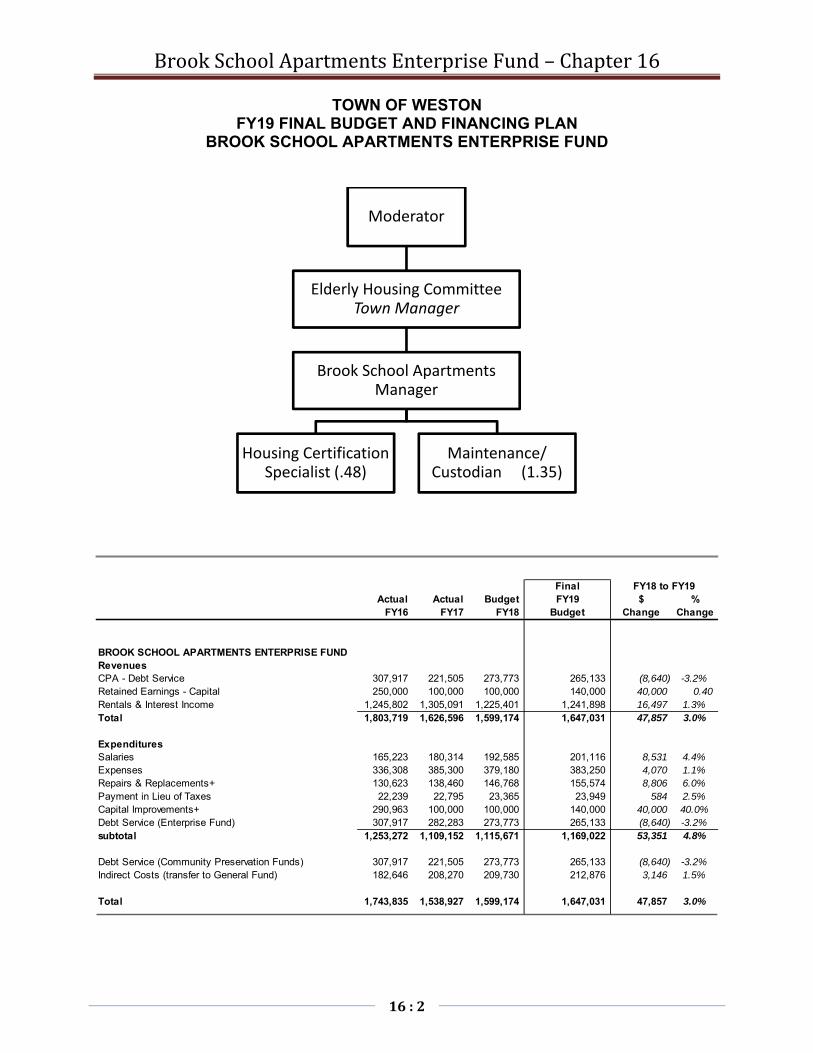
BrookSchoolApartmentsEnterpriseFund–Chapter16
16:2
TOWN OF WESTON FY19 FINAL BUDGET AND FINANCING PLAN
BROOK SCHOOL APARTMENTS ENTERPRISE FUND
Moderator
Elderly Housing Committee Town Manager
Brook School Apartments Manager
Housing Certification Specialist (.48)
Maintenance/ Custodian (1.35)
FinalActual Actual Budget FY19 $ %
FY16 FY17 FY18 Budget Change Change
BROOK SCHOOL APARTMENTS ENTERPRISE FUNDRevenuesCPA - Debt Service 307,917 221,505 273,773 265,133 (8,640) -3.2%Retained Earnings - Capital 250,000 100,000 100,000 140,000 40,000 0.40 Rentals & Interest Income 1,245,802 1,305,091 1,225,401 1,241,898 16,497 1.3%Total 1,803,719 1,626,596 1,599,174 1,647,031 47,857 3.0%
ExpendituresSalaries 165,223 180,314 192,585 201,116 8,531 4.4%Expenses 336,308 385,300 379,180 383,250 4,070 1.1%Repairs & Replacements+ 130,623 138,460 146,768 155,574 8,806 6.0%Payment in Lieu of Taxes 22,239 22,795 23,365 23,949 584 2.5%Capital Improvements+ 290,963 100,000 100,000 140,000 40,000 40.0%Debt Service (Enterprise Fund) 307,917 282,283 273,773 265,133 (8,640) -3.2%subtotal 1,253,272 1,109,152 1,115,671 1,169,022 53,351 4.8%
Debt Service (Community Preservation Funds) 307,917 221,505 273,773 265,133 (8,640) -3.2%Indirect Costs (transfer to General Fund) 182,646 208,270 209,730 212,876 3,146 1.5%
Total 1,743,835 1,538,927 1,599,174 1,647,031 47,857 3.0%
FY18 to FY19

BrookSchoolApartmentsEnterpriseFund–Chapter16
16:3
Town of Weston FY19 Final Budget
HEALTH AND HUMAN SERVICES: Brook School Elderly Housing Complex
Description of Services
The former Brook School was converted to an elderly and handicapped rental housing complex in 1979 with an addition completed in the fall of 2004. The complex now contains 75 apartments for the elderly and disabled. The U.S. Department of Housing and Urban Development provides a subsidy for 42 of these units under the Section 8 program. Another 13 units are deed restricted as affordable units under the Community Preservation Act. The average wait for a subsidized apartment is approximately three-five years. The Complex is managed by a Manager who is overseen by the Elderly Housing Committee.
The funding plan for the Brook School Apartments, developed when the expansion project was brought forward, calls for all operating and debt service expenses, as well as indirect Town costs and an in-lieu of tax payment, to be covered by a combination of rental income and CPA funding. The Brook School Elderly Housing Complex is budgeted in an enterprise fund. The staff also manages the family rental housing on Warren Avenue owned by the Weston Affordable Housing Trust. Five units have been completed and are occupied; another two are being developed. A management fee is paid to the Elderly Housing Committee annually.
FY19 Departmental Goals
1. Improve the energy efficiency at the complex through upgrading of systems. 2. Improve the Weston community awareness of the Brook School Apartments. 3. Upon completion of the remaining two units of Warren Avenue rental property, find and certify
eligible tenants.
Budget Recommendations
Level Services: The increase in the continuing balance account is for ongoing repairs and replacements related to the maintenance of rental units and is consistent with the pro forma financing plan. New Requests Recommended by Town Manager: An additional 3 hours/week is included for the Housing Certification Specialist to accommodate increased workload due to changing HUD regulations and additional units at the Warren Avenue property. The increase in cost is offset by the management fee received for management of the Warren Avenue units.
New Requests Not Recommended by Town Manager: None
FY16 FY17 FY18 FY19Funded Funded Funded Requested
Manager 1 1 1 1Housing Certification Specialist 0.32 0.35 0.35 0.48Maintenance/Custodian 1 1 1 1
Total FTE 2.32 2.35 2.35 2.48
Staffing Levels

BrookSchoolApartmentsEnterpriseFund–Chapter16
16:4
Town of Weston FY19 Final Budget
Final
ACTUAL BUDGET ACTUAL BUDGET DEPT REQ FY19 $ %
FY16 FY17 FY17 FY18 FY19 Budget Change Change
Brook School Apartments Enterprise Fund
Salaries 165,223 180,314 178,032 192,585 193,352 201,116 8,531 4.4%
Sub-total Personnel Salaries 165,223 180,314 178,032 192,585 193,352 201,116 8,531 4.4%
Electricity 47,215 50,000 39,379 47,980 50,000 45,000 (2,980) -6.2%
Oil/Gas 54,561 70,000 48,943 65,000 60,000 60,000 (5,000) -7.7%
Water 13,939 17,000 14,922 17,000 12,000 12,000 (5,000) -29.4%
Repair & Maintenance Building 53,513 70,000 62,549 70,000 70,000 70,000 - 0.0%
Building Safety 34,291 27,000 26,070 27,000 29,000 29,000 2,000 7.4%
Window Cleaning 6,980 12,500 9,730 12,500 10,000 10,000 (2,500) -20.0%
Septic Service 5,733 9,000 5,327 7,000 6,000 6,000 (1,000) -14.3%
Repair - Vehicle & Equipment 538 1,200 7 1,000 500 500 (500) -50.0%
Trash Removal 3,380 3,800 3,380 3,800 14,400 14,400 10,600 278.9%
Snow Removal 29,874 35,000 57,924 35,000 45,000 45,000 10,000 28.6%
Extermination 1,131 1,100 988 1,100 1,100 1,100 - 0.0%
Environmental Maintenance 3,580 8,000 3,844 6,000 4,500 4,500 (1,500) -25.0%
Legal 962 2,000 399 1,500 1,000 1,000 (500) -33.3%
Telephone 5,491 5,200 6,167 5,500 7,750 7,750 2,250 40.9%
Office Supplies 3,591 4,000 2,914 4,000 3,500 3,500 (500) -12.5%
Custodial Supplies 13,173 15,500 11,369 15,500 14,000 14,000 (1,500) -9.7%
Grounds 47,435 45,000 26,634 48,000 48,000 48,000 - 0.0%
Conference/Training 1,674 1,500 2,280 2,000 3,500 3,500 1,500 75.0%
All Other 9,245 7,500 10,055 9,300 8,000 8,000 (1,300) -14.0%
Sub-total Expenses 336,308 385,300 332,882 379,180 388,250 383,250 4,070 1.1%
BSA-Continuing Balance Accts
Repairs & Replacements+ 130,623 138,460 130,266 146,768 155,574 155,574 8,806 6.0%
Capital Improvement Fund+ 290,963 100,000 332,824 100,000 140,000 140,000 40,000 40.0%
Sub-total Cont Bal Accts 421,586 238,460 463,089 246,768 295,574 295,574 48,806 19.8%
Debt Service 307,917 282,283 282,283 273,773 265,133 265,133 (8,640) -3.2%
Payment in Lieu of Taxes 22,239 22,795 22,795 23,365 23,949 23,949 584 2.5%
Total 1,253,272 1,109,152 1,279,080 1,115,671 1,166,258 1,169,022 53,351 4.8%
FY18 to FY19

BrookSchoolApartmentsEnterpriseFund–Chapter16
16:5
This page intentionally left blank.

WaterEnterpriseFund–Chapter17
17:1
Town of Weston
Budget Presentation
Chapter 17
WATER ENTERPRISE FUND

WaterEnterpriseFund–Chapter17
17:2
TOWN OF WESTON FY19 FINAL BUDGET AND FINANCING PLAN
WATER DIVISION ENTERPRISE FUND
_________________________________________________________________________
Board of Selectmen
Town Manager
DPW Director of Operations
Water Superintendent
Water Employees (3)
Part Time/ Seasonal Help
FinalActual Actual Budget FY19 $ %
FY16 FY17 FY18 Budget Change Change
WATER ENTERPRISE
RevenuesWater Charges 3,631,893 4,267,786 4,094,467 4,071,085 (23,382) -0.6%Retained Earnings 217,385 100,000 250,000 - (250,000) -100.0%Total 3,849,278 4,367,786 4,344,467 4,071,085 (273,382) -6.3%
ExpendituresSalaries 265,614 277,255 289,926 297,358 7,432 2.6%Expenses 227,315 220,118 231,155 229,280 (1,875) -0.8%MWRA Assessment/Water Purchases 2,247,535 2,451,430 2,867,800 2,547,457 (320,343) -11.2%Capital Improvement Projects 81,330 38,417 67,500 124,850 57,350 85.0%Debt Service (non-exempt) 526,613 540,082 552,084 531,098 (20,986) -3.8%Indirect Costs (transfer to General Fund) 317,833 321,191 336,002 341,042 5,040 1.5%
Total 3,666,240 3,848,493 4,344,467 4,071,085 (273,382) -6.3%
FY18 to FY19

WaterEnterpriseFund–Chapter17
17:3
Town of Weston FY19 Final Budget
PUBLIC WORKS: Water Division-Enterprise Fund Description of Services The Department of Public Works Water Division is responsible for the maintenance and repair of all aspects of the Town’s water system. Responsibilities include installing water services for new residential and commercial construction, water main replacement, water main repairs, installation of hydrants, leak detection, cross-connection control and the replacement of older water meters. While shown as part of the DPW budget, the Water Division is an Enterprise Fund and, therefore, is not included in the General Fund. 100 percent of the direct and indirect costs for water service are covered by water fees and charges. FY19 Departmental Goals
1. Continue our high standards relating to water quality and maintaining our water distribution system. 2. Continue to improve Water Division services by increasing supervision of division employees. 3. Develop water conservation educational program to reduce water usage. 4. Continue efforts to reduce unaccounted for water with yearly leak detection and timely repair of water
service and water main leaks and replacement of aging existing meters. 5. Utilize the Water System Hydraulic Analysis as a tool to improve water quality, safety and delivery. 6. Continue program of mapping out annual activities such as exercising gates.
Budget Recommendations Level Services: Overall, this budget is decreasing because Weston’s water consumption for calendar year 2017 decreased by approximately 169 million gallons. The FY19 MWRA assessment for water is based on consumption in FY2017. When combined with a projected 5% rate increase, the water assessment is expected to decrease by $500,000. The line item for the DEP Safe Drinking Water Assessment will also decrease due to less water consumption in calendar year 2017. The amount for debt service includes the estimated amount for the water main replacement project in FY19. New Requests Recommended by Town Manager: None requested New Requests Not Recommended by Town Manager: None
FY16 FY17 FY18 FY19Funded Funded Funded Requested
Water Superintendent 1 1 1 1Heavy Equipment Operator 1 1 1 1Meter Reader/Installer 1 1 1 1Water Systems Specialist 1 1 1 1Part Time/Seasonal Help 1 PT 1 PT 1 PT 1 PT
Total FTE 4 4 4 4
Staffing Levels

WaterEnterpriseFund–Chapter17
17:4
Town of Weston FY19 Final Budget
Final
ACTUAL BUDGET ACTUAL BUDGET DEP REQ FY19 $ %PUBLIC WORKS-WATER ENTERPRISE FY16 FY17 FY17 FY18 FY19 Budget Change Change
Water Division SalariesRegular Compensation 241,186 249,062 253,843 258,826 264,502 266,258 7,432 2.9%Overtime Compensation 18,441 17,000 15,136 18,000 18,000 18,000 - 0.0%Temp/Seasonal 1,800 6,000 3,668 6,000 6,000 6,000 - 0.0%Out-of-Dept Pay - 1,500 - 1,500 1,500 1,500 - 0.0%Police Details 4,186 5,600 4,607 5,600 5,600 5,600 - 0.0%Sub-total Personal Services 265,614 279,162 277,255 289,926 295,602 297,358 7,432 2.6%
ExpensesEnergy 75,911 75,000 64,736 71,875 71,875 70,000 (1,875) -2.6%Repairs & Maintenance 2,915 4,000 16 4,000 4,000 4,000 - 0.0%Rentals & Leases 1,788 2,500 1,788 2,500 2,500 2,500 - 0.0%Professional & Consulting Services 19,424 20,400 19,208 20,400 20,400 20,400 - 0.0%Communications 3,111 3,200 3,072 3,200 3,200 3,200 - 0.0%Office Supplies 5,274 7,750 5,886 7,750 7,750 7,750 - 0.0%Building/Equipment Repair & Supplies 10,007 5,800 4,588 5,800 5,800 5,800 - 0.0%Custodial Supplies 120 300 - 300 300 300 - 0.0%Vehicular Supplies 14,821 9,430 11,481 9,430 9,430 9,430 - 0.0%Other DPW Supplies/Materials 5,672 9,500 6,347 9,500 9,500 9,500 - 0.0%Protective Work Clothing 1,631 2,100 2,285 2,100 2,100 2,100 - 0.0%Out-of-State Travel 42 100 - 100 100 100 - 0.0%Dues/Memberships 867 1,000 1,132 1,000 1,000 1,000 - 0.0%Distribution System Improvements 72,333 75,000 63,001 75,000 75,000 75,000 - 0.0%Additional/New Equipment - 1,200 13,148 1,200 1,200 1,200 - 0.0%Cross Connection Test 13,400 15,000 23,430 15,000 15,000 15,000 - 0.0%Survey Cross Connection - 2,000 - 2,000 2,000 2,000 - 0.0%sub-total Expenses 227,315 234,280 220,118 231,155 231,155 229,280 (1,875) -0.8%
MWRA Assessment/Water PurchaseIntergovernmental Expenses 2,242,309 2,485,600 2,445,970 2,860,000 2,360,000 2,541,257 (318,743) -11.1%DEP Safe Drinking Water Act Assessment 5,226 6,000 5,460 7,800 6,200 6,200 (1,600) -20.5%sub-total MWRA/Water Purchase 2,247,535 2,491,600 2,451,430 2,867,800 2,366,200 2,547,457 (320,343) -11.2%
Capital Improvement ProjectsLarge Meter Replacement Program+ 17,161 7,500 2,050 7,500 7,500 7,500 - 0.0%Water Hydrant Rehabilitation Program+ 50,000 50,000 31,977 50,000 50,000 50,000 - 0.0%Water Storage Tank Maint.+ 7,257 7,500 4,390 10,000 7,500 7,500 (2,500) -25.0%Water Distribution Master Plan+ - - - - 59,850 59,850 59,850 -Black Oak Booster Pump Station+ 6,912 - - - - - - -sub-total Capital Improvement Projects 81,330 65,000 38,417 67,500 124,850 124,850 57,350 85.0%
Debt Service (non-exempt)Bond Redemption 396,600 412,400 412,400 420,200 405,167 388,500 (31,700) -7.5%Bond Interest 112,482 110,358 110,616 106,997 114,685 95,935 (11,062) -10.3%BAN Interest 5,031 11,190 10,166 24,887 60,755 43,663 18,776 75.4%BAN Paydowns 12,500 6,900 6,900 - 3,000 3,000 3,000 -sub-total Debt Service 526,613 540,848 540,082 552,084 583,607 531,098 (20,986) -3.8%
Total Water Division 3,348,407 3,610,890 3,527,302 4,008,465 3,601,414 3,730,043 (278,422) -6.9%
FY18 to FY19

WaterEnterpriseFund–Chapter17
17:5
This page intentionally left blank.

RecreationEnterpriseFund–Chapter18
18:1
Town of Weston
Budget Presentation
Chapter 18
RECREATION ENTERPRISE FUND

RecreationEnterpriseFund–Chapter18
18:2
TOWN OF WESTON FY19 FINAL BUDGET AND FINANCING PLAN
RECREATION DEPARTMENT ENTERPRISE FUND
Recreation Commission
Town Manager
Recreation Director
Maintenance Supervisor
Community Center Custodian
Assistant Director
Program CoordinatorAdministrative Assistant (2)
FinalActual Actual Budget FY19 $ %
FY16 FY17 FY18 Budget Change Change
RECREATION ENTERPRISERevenuesTax Levy and General Fund Revenues 485,521 943,063 510,306 531,175 20,869 4.1%Contribution from Council on Aging - 30,000 30,000 30,000 - 0.0%Retained Earnings 68,000 45,000 92,000 41,943 (50,057) -54.4%User/Program Fees 1,034,053 1,086,958 1,089,615 1,167,735 78,120 7.2%Total 1,587,574 2,105,021 1,721,921 1,770,853 48,932 2.8%
ExpendituresSalaries 983,334 1,068,809 1,171,732 1,204,153 32,421 2.8%Expenses 452,133 439,905 468,139 487,850 19,711 4.2%Community Center 70,094 77,666 82,050 78,850 (3,200) -3.9%Memorial Pool Rehabilitation+ - 87,577 - - - -Lamson Park Remediation+ - 331,345 - - - -Emergency Generator+ 49 2,844 - - - -Total 1,505,611 2,008,146 1,721,921 1,770,853 48,932 2.8%
FY18 to FY19

RecreationEnterpriseFund–Chapter18
18:3
Town of Weston FY19 Final Budget
CULTURAL AND LEISURE: Recreation Department – Enterprise Fund
Description of Services
The Recreation Department offers a comprehensive and varied program of public recreation activities, services and resources to Town and area residents. Nearly 500 programs are offered over the course of the year serving over 7,500 participants. Nearly all programs are offered on a fee basis. The Recreation Department is budgeted in an Enterprise Fund. This permits the Town to better track the revenues and expenditures of this department and provide the Recreation Commission with more flexibility in adding or changing program offerings. The Town’s General Fund, however, continues to fund approximately 30% of the total budget. The Recreation Department offers the following programs and services:
- Soccer and baseball field maintenance - Summer Band Series - Preschool programs - After school programs - Weston Junior Broadway - Adult programs - Adult sports - Maintenance of the Playground at Lamson Park - Summer camps - Annual Egg Hunt on Town Green - Memorial Pool - Water Exercise Classes - Swim lessons - Red Waves swim team - Weekend gym and swim programs - 15 tennis courts/three basketball courts - Cooperative programs with community groups - Weston Skating Club co-sponsor - Half-day school day programming - Community Center maintenance and rental - Special events - Joint field scheduling with School Dept. - Maintenance of one outdoor ice rink and Collage Pond skating area FY19 Departmental Goals
1. Continue to develop or support Recreational opportunities to meet the needs of all Weston residents.
2. Continue work with Recreation Master Plan Steering Committee and Field and Grounds Coordinator to improve maintenance efforts on all Town Fields and courts.
3. Keep current on trends and technologies that will assist in providing appropriate recreational programs and services to the residents of Weston.
Budget Recommendations Level Services: Programs, services and operations are regularly evaluated to increase revenue generating efforts while decreasing expenses where possible, yet remaining an affordable, community building program. The Community Center also houses the Council on Aging, programs of which have expanded in recent years. $30,000 is again included in the COA budget to cover a portion of the cost of operating and maintaining the Community Center. This is an additional General Fund revenue source for the Recreation Enterprise Fund. Funds are included in the Information Technology budget to upgrade the software used by the Recreation Department.
New Requests Recommended by Town Manager: None requested
New Requests Not Recommended by Town Manager: None
FY16 FY17 FY18 FY19Funded Funded Funded Requested
Recreation Director 1 1 1 1Assistant Director 1 1 1 1Program Coordinator 1 1 1 1Maintenance Supervisor 1 1 1 1Administrative Assistant 2 2 2 2Custodian 1 1 1 1
Total FTE 7 7 7 7
Staffing Levels (not including seasonal staff)

RecreationEnterpriseFund–Chapter18
18:4
Town of Weston FY19 Final Budget
Final
ACTUAL BUDGET ACTUAL BUDGET DEPT REQ FY19 $ %RECREATION FY16 FY17 FY17 FY18 FY19 Budget Change Change
AdministrationComputer Hardware Maintenance 1,195 700 241 1,000 1,000 1,000 - 0.0%Computer Software Maintenance 3,127 5,000 3,038 4,500 10,000 10,000 5,500 122.2%Bank Service/Credit Card Fees 37,163 24,000 27,426 24,000 32,000 32,000 8,000 33.3%Printing & Advertising 16 - 188 - 200 200 200 -Education & Training 319 200 470 400 5,000 5,000 4,600 1150.0%Postage 748 1,500 1,856 1,000 1,000 1,000 - 0.0%Communications 2,944 4,200 4,136 4,200 4,200 4,200 - 0.0%Stationery 405 - - - 100 100 100 -Photocopying 1,036 1,500 1,556 1,500 1,500 1,500 - 0.0%Office Supplies 6,358 5,000 5,052 5,500 5,500 5,500 - 0.0%First Aid 375 1,000 358 500 500 500 - 0.0%In-State Travel 2,006 1,000 1,739 1,000 1,000 1,000 - 0.0%Out-of-State Travel 930 1,500 1,462 1,500 1,500 1,500 - 0.0%Dues 1,128 500 1,219 1,000 1,500 1,500 500 50.0%Conference 4,434 3,000 1,837 3,000 2,500 2,500 (500) -16.7%All Other Expense 5,429 2,000 1,280 1,000 1,500 1,500 500 50.0%
67,613 51,100 51,859 50,100 69,000 69,000 18,900 37.7%Administrative - PersonnelRegular Compensation 195,428 161,666 201,511 158,523 162,763 162,763 4,240 2.7%Overtime - 1,000 - 1,000 5,331 5,331 4,331 433.1%Temporary Compensation 168 400 - 400 1,600 1,600 1,200 300.0%Estimated COLA - 7,271 - 9,912 10,200 10,200 288 2.9%
195,596 170,337 201,511 169,835 179,894 179,894 10,059 5.9%
sub-total Administration 263,209 221,437 253,370 219,935 248,894 248,894 28,959 13.2%
Adult ProgramsContract Services/Labor 6,893 2,000 8,653 6,000 6,000 6,000 - 0.0%Program Supplies 7,137 4,200 2,739 4,200 4,200 4,200 - 0.0%All Other Expense 497 200 1,017 500 500 500 - 0.0%
14,526 6,400 12,409 10,700 10,700 10,700 - 0.0%Adult Programs-PersonnelRegular Compensation 11,504 15,164 11,792 15,664 15,946 15,946 282 1.8%Temporary Compensation 44,049 52,000 32,615 52,000 48,000 48,000 (4,000) -7.7%
55,554 67,164 44,407 67,664 63,946 63,946 (3,718) -5.5%
sub-total Adult Programs 70,079 73,564 56,816 78,364 74,646 74,646 (3,718) -4.7%
Youth ProgramsContract Services 116,102 116,000 109,492 116,000 120,000 120,000 4,000 3.4%Program Supplies 14,116 22,000 9,433 18,000 15,000 15,000 (3,000) -16.7%All Other Expense 219 1,500 1,053 1,000 1,200 1,200 200 20.0%
130,437 139,500 119,977 135,000 136,200 136,200 1,200 0.9%Youth Programs-PersonnelRegular Compensation 25,839 65,287 26,065 66,817 68,431 68,431 1,614 2.4%Temporary Compensation 224,116 265,000 273,876 255,000 260,000 260,000 5,000 2.0%
249,955 330,287 299,941 321,817 328,431 328,431 6,614 2.1%
sub-total Youth Programs 380,391 469,787 419,918 456,817 464,631 464,631 7,814 1.7%
ConcessionsContract Services/Labor 11,838 9,500 9,636 10,000 10,000 10,000 - 0.0%Program Supplies 2,313 2,000 2,088 3,000 3,000 3,000 - 0.0%All Other Expense - 200 921 200 200 200 - 0.0%
14,151 11,700 12,646 13,200 13,200 13,200 - 0.0%
Concessions-PersonnelRegular Compensation 1,719 2,573 1,773 1,807 1,842 1,842 36 2.0%Temporary Compensation 16,653 11,520 15,694 15,000 16,500 16,500 1,500 10.0%
18,372 14,093 17,467 16,807 18,342 18,342 1,536 9.1%
sub-total Concessions 32,523 25,793 30,113 30,007 31,542 31,542 1,536 5.1%
FY18 to FY19

RecreationEnterpriseFund–Chapter18
18:5
Town of Weston FY19 Final Budget
Final
ACTUAL BUDGET ACTUAL BUDGET DEPT REQ FY19 $ %RECREATION FY16 FY17 FY17 FY18 FY19 Budget Change Change
Camp Outer LimitsProfessional/Consulting Services - - 504 -Recreation Uniforms 1,630 1,500 1,068 1,700 1,500 1,500 (200) -11.8%Program Supplies 751 750 1,261 800 1,000 1,000 200 25.0%All Other Expense 591 300 361 300 300 300 - 0.0%Field Trips Expenses 19,570 23,000 25,163 23,000 25,000 25,000 2,000 8.7%
22,542 25,550 27,852 25,800 27,800 27,800 2,000 7.8%Camp Outer Limits-PersonnelRegular Compensation 1,454 7,048 1,463 7,259 7,525 7,525 266 3.7%Temporary Compensation 11,510 17,760 22,750 22,920 24,020 24,020 1,100 4.8%
12,963 24,808 24,213 30,179 31,545 31,545 1,366 4.5%
sub-total Camp Outer Limits 35,505 50,358 52,065 55,979 59,345 59,345 3,366 6.0%
Camp ABCProfessional/Consulting Services 1,785 4,600 2,315 4,600 4,000 4,000 (600) -13.0%Recreation Uniforms 815 1,100 1,068 1,000 1,100 1,100 100 10.0%Art/Program Supplies 1,361 1,000 1,063 1,600 1,500 1,500 (100) -6.3%All Other Expense 1,451 150 1,401 1,500 1,500 1,500 - 0.0%
5,412 6,850 5,846 8,700 8,100 8,100 (600) -6.9%Camp ABC-PersonnelRegular Compensation 1,454 7,048 1,463 7,259 7,525 7,525 266 3.7%Temporary Compensation 22,181 27,306 28,311 31,812 32,492 32,492 680 2.1%
23,634 34,354 29,774 39,071 40,017 40,017 946 2.4%
sub-total Camp ABC 29,047 41,204 35,620 47,771 48,117 48,117 346 0.7%
Camp AdventureProfessional/Consulting Services 3,995 6,000 4,319 5,000 5,000 5,000 - 0.0%Recreation Uniforms 1,630 1,800 1,525 1,800 1,800 1,800 - 0.0%Program Supplies 2,715 2,400 4,416 2,400 2,500 2,500 100 4.2%All Other Expense 1,581 500 1,149 1,500 1,300 1,300 (200) -13.3%Field Trip Expenses 10,044 10,000 12,042 12,000 12,000 12,000 - 0.0%
19,965 20,700 23,450 22,700 22,600 22,600 (100) -0.4%Camp Adventure-PersonnelRegular Compensation 1,454 7,048 1,463 7,259 7,525 7,525 266 3.7%Temporary Compensation 44,306 49,380 47,389 54,380 54,380 54,380 - 0.0%
45,760 56,428 48,852 61,639 61,905 61,905 266 0.4%
sub-total Camp Adventure 65,725 77,128 72,302 84,339 84,505 84,505 166 0.2%
Memorial Pool/SwimmingElectricity 16,159 14,000 12,130 14,664 16,000 16,000 1,336 9.1%Water 4,152 3,500 5,547 3,500 6,000 6,000 2,500 71.4%Repair & Maintenance 46,606 24,000 38,082 24,000 35,000 35,000 11,000 45.8%Recreation Uniforms 5,876 6,500 6,337 6,500 6,500 6,500 - 0.0%Cleaning Supplies 1,954 1,200 1,795 1,200 1,500 1,500 300 25.0%Chlorine 12,307 14,500 11,250 14,500 14,500 14,500 - 0.0%Chemicals 1,307 2,500 3,242 2,500 3,000 3,000 500 20.0%Program Supplies 4,032 3,000 3,437 4,500 4,500 4,500 - 0.0%All Other Expense 6,402 4,500 13,854 6,000 10,000 10,000 4,000 66.7%
98,795 73,700 95,674 77,364 97,000 97,000 19,636 25.4%
Memorial Pool/Swimming-PersonnelRegular Compensation 20,101 33,846 21,691 38,070 39,115 39,115 1,045 2.7%Temporary Compensation 102,264 120,388 111,286 132,350 132,350 132,350 - 0.0%
122,365 154,234 132,976 170,420 171,465 171,465 1,045 0.6%
sub-total Memorial Pool 221,159 227,934 228,650 247,784 268,465 268,465 20,681 8.3%
FY18 to FY19

RecreationEnterpriseFund–Chapter18
18:6
Town of Weston FY19 Final Budget
Final
ACTUAL BUDGET ACTUAL BUDGET DEPT REQ FY19 $ %RECREATION FY16 FY17 FY17 FY18 FY19 Budget Change Change
Middle School Gym/Pool ProgramsEnergy 16,629 12,000 14,774 15,000 15,000 15,000 - 0.0%Non-energy - Water 1,159 1,000 5,735 1,500 5,000 5,000 3,500 233.3%Chemicals/Pool Supplies 3,252 3,000 2,366 3,000 3,000 3,000 - 0.0%All Other 3,624 2,500 4,206 3,000 3,500 3,500 500 16.7%sub-total Middle School Gym/Pool 24,663 18,500 27,082 22,500 26,500 26,500 4,000 17.8%
Middle School Gym/Pool PersonnelRegular Compensation 4,298 7,479 4,433 6,842 7,019 7,019 177 2.6%Temporary Compensation 19,831 4,680 17,030 3,780 4,030 4,030 250 6.6%
24,129 12,159 21,463 10,622 11,049 11,049 427 4.0%
sub-total Middle School Programs 48,792 30,659 48,545 33,122 37,549 37,549 4,427 13.4%
Facilities/FieldsEnergy (Elec, Oil, Gas) 87 3,300 (929) 1,500 1,500 1,500 - 0.0%Non-energy - Water 77 125 77 500 250 250 (250) -50.0%Repair & Maintenance 19,144 40,000 24,193 35,000 30,000 30,000 (5,000) -14.3%Repair - Vehicles & Equipment 3,663 2,500 5,076 3,000 4,000 4,000 1,000 33.3%Rent-Equipment 2,978 2,500 2,849 2,500 3,000 3,000 500 20.0%Contract Services 95 3,000 106 3,000 3,000 3,000 - 0.0%Sundry Supplies 813 1,200 771 1,200 1,200 1,200 - 0.0%Loam - 250 - 250 250 250 - 0.0%Fertilizer/Seeds 611 200 525 1,000 1,000 1,000 - 0.0%Vehicle Supplies 3,675 7,500 3,256 5,000 4,000 4,000 (1,000) -20.0%Equipment - - - 22,000 - - (22,000) -100.0%
31,142 60,575 35,924 74,950 48,200 48,200 (26,750) -35.7%Facilities/Fields PersonnelRegular Compensation 9,165 67,034 8,620 73,694 74,167 74,167 473 0.6%Temporary Compensation 70,575 16,250 76,745 16,250 16,250 16,250 - 0.0%
79,741 83,284 85,365 89,944 90,417 90,417 473 0.5%
sub-total Facilities/Fields 110,883 143,859 121,289 164,894 138,617 138,617 (26,277) -15.9%
KWEST CampProfessional/Consulting Services - - 196 - Uniforms 815 850 457 850 850 850 - 0.0%Program Supplies 464 350 545 350 350 350 - 0.0%Field Trip Expenses 6,113 9,000 11,284 9,000 10,000 10,000 1,000 11.1%All Other 356 250 298 250 250 250 - 0.0%
7,748 10,450 12,779 10,450 11,450 11,450 1,000 9.6%KWEST Camp PersonnelRegular Compensation 1,163 6,871 1,170 7,080 7,297 7,297 217 3.1%Temporary Compensation - 11,600 - 12,840 12,840 12,840 - 0.0%
1,163 18,471 1,170 19,920 20,137 20,137 217 1.1%
sub-total KWEST Camp 8,911 28,921 13,950 30,370 31,587 31,587 1,217 4.0%
Sports CampProfessional & Consulting Services 610 600 428 600 600 600 - 0.0%Recreation Uniforms 815 850 1,068 850 1,000 1,000 150 17.6%Program Supplies 1,455 725 857 725 1,000 1,000 275 37.9%Field Trip Expenses 4,381 5,000 3,733 5,000 5,000 5,000 - 0.0%All Other 967 200 939 1,000 1,000 1,000 - 0.0%
8,228 7,375 7,024 8,175 8,600 8,600 425 5.2%Sports Camp PersonnelRegular Compensation 1,454 6,871 1,463 7,080 7,297 7,297 217 3.1%Temporary Compensation 13,237 15,840 14,255 16,680 17,780 17,780 1,100 6.6%
14,690 22,711 15,718 23,760 25,077 25,077 1,317 5.5%
sub-total Sports Camp 22,918 30,086 22,742 31,935 33,677 33,677 1,742 5.5%
FY18 to FY19

RecreationEnterpriseFund–Chapter18
18:7
Town of Weston FY19 Final Budget
Final
ACTUAL BUDGET ACTUAL BUDGET DEPT REQ FY19 $ %RECREATION FY16 FY17 FY17 FY18 FY19 Budget Change Change
Red Waves Swim TeamTransportation - 300 - 300 300 300 - 0.0%Uniforms 1,880 3,500 1,312 2,500 2,000 2,000 (500) -20.0%Program Supplies 3,939 3,000 4,613 4,000 4,500 4,500 500 12.5%Dues 990 1,200 1,450 1,200 1,200 1,200 - 0.0%All Other 103 1,000 7 500 500 500 - 0.0%
6,912 9,000 7,382 8,500 8,500 8,500 - 0.0%Red Waves PersonnelRegular Compensation 8,597 6,004 8,866 9,936 11,573 11,573 1,637 16.5%Temporary Compensation 36,241 34,100 43,232 31,225 34,100 34,100 2,875 9.2%
44,837 40,104 52,098 41,161 45,673 45,673 4,512 11.0%
sub-total Red Waves Swim Team 51,749 49,104 59,480 49,661 54,173 54,173 4,512 9.1%
Community CenterElectricity 34,669 38,000 26,883 38,000 36,660 34,000 (4,000) -10.5%Non-energy - Water 1,443 1,500 652 1,800 1,800 1,800 - 0.0%Oil & Gas 7,502 10,000 8,953 10,000 10,000 10,000 - 0.0%Repair & Maintenance 7,382 10,500 20,015 10,500 12,000 12,000 1,500 14.3%Repair/Maint Cleaning Equipment 740 700 - 700 500 500 (200) -28.6%Trash Removal 1,100 1,300 1,040 1,300 1,300 1,300 - 0.0%Contract Services 12,128 15,000 14,393 15,000 15,000 15,000 - 0.0%Sundry Supplies 4,556 4,000 3,008 4,000 3,500 3,500 (500) -12.5%All Other Expense 574 750 2,722 750 750 750 - 0.0%
70,094 81,750 77,666 82,050 81,510 78,850 (3,200) -3.9%Community Center Personnel
Regular Compensation 77,417 86,233 76,351 94,192 96,555 96,555 2,363 2.5%Overtime - 4,000 - 4,000 1,200 1,200 (2,800) -70.0%Temporary Compensation 6,626 3,200 8,387 3,200 10,000 10,000 6,800 212.5%WCC - Event Supervisor 10,533 7,500 9,115 7,500 8,500 8,500 1,000 13.3%
94,576 100,933 93,853 108,892 116,255 116,255 7,363 6.8%
sub-total Community Center 164,670 182,683 171,519 190,942 197,765 195,105 4,163 2.2%
Continuing Balance Accounts
Emergency Generator+ 49 - 2,844 - - - - -Memorial Pool Rehabilitation+ - 120,000 87,577 - - Lamson Park Remediation+ - 350,000 331,345 - -
sub-total Continuing Balance Acct 49 470,000 421,766 - - - - -
Grand Total 1,505,611 2,122,518 2,008,146 1,721,921 1,773,513 1,770,853 48,932 2.8%
FY18 to FY19

RecreationEnterpriseFund–Chapter18
18:8
This page intentionally left blank.

Capital Improvement Program – Chapter 19
19 : 1
TOWN OF WESTON
CAPITAL IMPROVEMENT
PROGRAM (CIP)
FY19

Capital Improvement Program – Chapter 19
19 : 2
Capital Improvement Program (CIP)
Table of Contents Section 19:3 – 19:5 Process Capital Improvement Program – Process 19:6 – 19:17 Table I Recommended Projects – General Fund Debt - Project Request Sheets and Supporting Documents 19:18 - 19:47 Table II Recommended Projects – Cash Capital (Operations) - Project Request Sheets and Supporting Documents 19:48– 19:50 Table III Recommended Projects – Water Debt - Project Request Sheets and Supporting Documents 19:51 Table IV Recommended Projects – Brook School Apartments Debt 19:52 Table V Recommended Projects – Community Preservation Act 19:53 - 19:56 Summary 5 Year CIP – Recommended, Deferred, and Future

Capital Improvement Program – Chapter 19
19 : 3
TOWN OF WESTON CAPITAL IMPROVEMENT PROGRAM (CIP)
-- PROCESS -- Purpose The reasons for administering a formal CIP are many:
• Facilitates coordination between operating budgets and capital needs
• Enhances the community's credit rating, control of its tax rate, and avoids sudden, unplanned changes in its debt service requirements
• Assists in short and long term fiscal planning • Identifies the most economical means of financing capital projects
• Increases opportunities for obtaining federal and state aid
• Relates public facilities to other public and private development and
redevelopment policies and plans
• Focuses attention on community objectives and fiscal capacity
• Keeps the public informed about future needs and projects
• Coordinates activities within units of local government to reduce duplication
• Encourages careful project planning and design to avoid costly mistakes and help reach desired goals
Capital Improvement Defined For the purpose of the Capital Improvement Program (CIP), the term ‘capital improvement’ refers to any non-recurring, capital expenditure for the acquisition, improvement, or replacement of any item(s) or associated project(s) meeting one of the following definitions:
• Item(s) requiring an expenditure of at least $25,000 and having a useful life of more than five years; and/or,
• Project(s) consisting of real property acquisitions, construction, capital asset
improvements, long-life capital equipment, or major maintenance/repair of an existing capital item, as distinguished from a normal operating expenditure.
CIP Development Process All department managers, officers, departments, boards and committees in the Town of Weston shall give to the Town Manager, in a format developed by the Town Manager, information

19 : 4
concerning all capital improvement plans and capital expenditure requests as part of their annual budget request for the next fiscal year. The capital requests will include a project title, description, affect on existing programs, affect on other departments, related improvement and acquisition requests, proposed funding sources, and any other aspects of capital planning that are anticipated as necessary over the next five (5) years. Additional details of the anticipated use and life expectancy of planned capital requests beyond this five year period are encouraged to the extent that such information is known.
The Town Manager will consider all such requests and, in doing so, may confer with any Town officer, department or board, or request additional data necessary in order to compile the Town Manager’s Recommended Capital Improvement Program (CIP). The CIP will be presented to the Finance Committee and Board of Selectmen for consideration, and ultimately submitted for voter approval at the annual town meeting. Evaluating Capital Requests In evaluating capital requests, they will be categorized according to the following priorities:
1. Imminent threat to the health and safety of citizens or property 2. Improvement of asset to avoid costly replacement in the future 3. Replacement of asset to maintain current operations and service levels 4. Requirement of state or federal law or regulation 5. Improvement of productivity 6. Alleviation of an overburdened situation
The relationship of the capital request to other requests and needs will also be considered in the review and prioritization. Requests that can be funded from sources that will not impact the operating budget, and also do not necessitate an exclusion or override of Proposition 2 ½ (such as those funded from an enterprise account, grant or similar source) will be considered separately. Further, capital projects, acquisitions and other capital expenditures from the Community Preservation Act fund shall not be subject to the Capital Improvement Program development process, although the Community Preservation Committee is encouraged to present their projects to the Town Manager to facilitate coordination of efforts, as may be applicable. Department-level Responsibilities For ongoing operational efficiency and the continued success of the Capital Improvement Program (CIP), Town department managers will:
• Project all capital needs and plans for the department and its divisions for the coming five years, being sure to fully cost out future operating and maintenance costs, as well as identifying funding sources and assigning a priority categorization;
• Update the projection each year;

Capital Improvement Program – Chapter 19
19 : 5
• Use the updated plan to: a) build an operating budget request for next fiscal year that provides sufficient funding for the adequate maintenance of existing capital plant and equipment; b) maintain assets at levels that protect capital investment and minimizes maintenance and replacement costs; and, c) develop long term plans for the replacement of capital plant and equipment beyond the next five years.
• Submit the updated plan along with the budget request for the next fiscal year so
departmental capital plans can be considered for inclusion in the Town Manager’s Recommended CIP;
• Verify the accuracy of information that is incorporated into the Town Manager’s
Recommended Capital Improvement Program, and be prepared to be the spokesperson throughout the budget development and approval process for the Capital Improvement Plan as it relates to their department;
• Upon receiving final approval for their projects at the annual town meeting, submit
notice to the Treasurer/Collector of the projected cash flow needs for each project, being sure to send copies of the cash flow needs to the Town Manager and Finance Director.
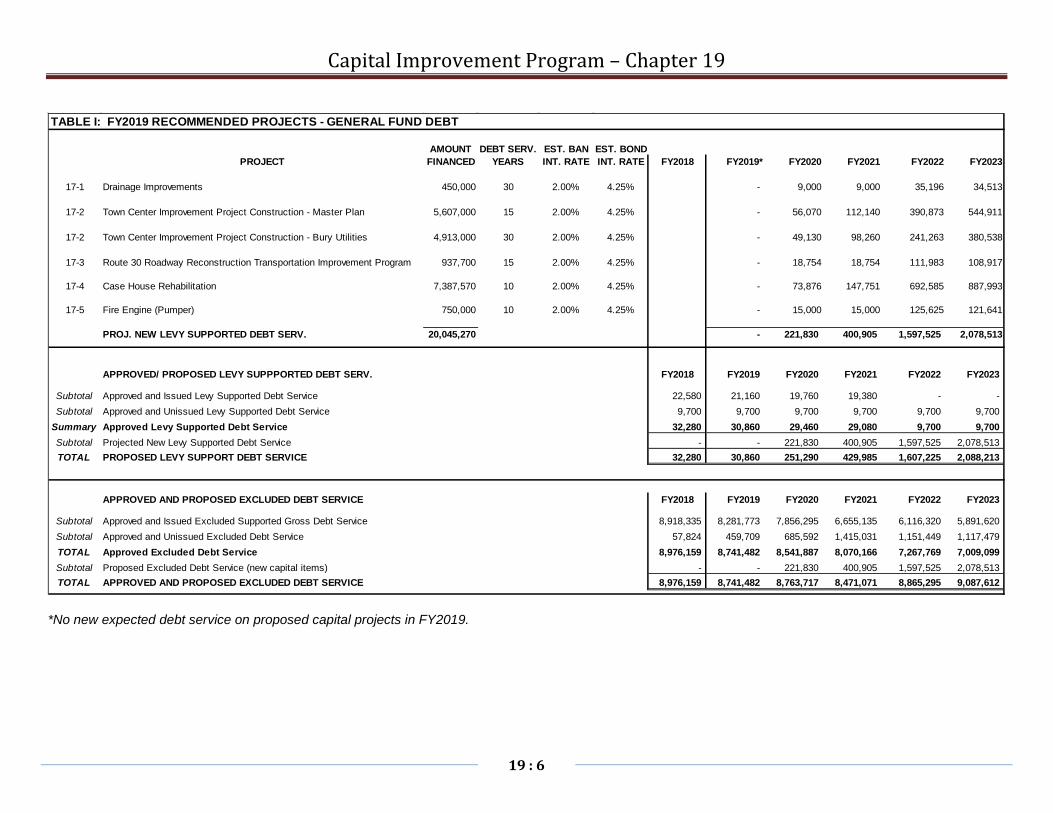
Capital Improvement Program – Chapter 19
19 : 6
*No new expected debt service on proposed capital projects in FY2019.
TABLE I: FY2019 RECOMMENDED PROJECTS - GENERAL FUND DEBT
AMOUNT DEBT SERV. EST. BAN EST. BONDPROJECT FINANCED YEARS INT. RATE INT. RATE FY2018 FY2019* FY2020 FY2021 FY2022 FY2023
17-1 Drainage Improvements 450,000 30 2.00% 4.25% - 9,000 9,000 35,196 34,513
17-2 Town Center Improvement Project Construction - Master Plan 5,607,000 15 2.00% 4.25% - 56,070 112,140 390,873 544,911
17-2 Town Center Improvement Project Construction - Bury Utilities 4,913,000 30 2.00% 4.25% - 49,130 98,260 241,263 380,538
17-3 Route 30 Roadway Reconstruction Transportation Improvement Program 937,700 15 2.00% 4.25% - 18,754 18,754 111,983 108,917
17-4 Case House Rehabilitation 7,387,570 10 2.00% 4.25% - 73,876 147,751 692,585 887,993
17-5 Fire Engine (Pumper) 750,000 10 2.00% 4.25% - 15,000 15,000 125,625 121,641
PROJ. NEW LEVY SUPPORTED DEBT SERV. 20,045,270 - 221,830 400,905 1,597,525 2,078,513
APPROVED/ PROPOSED LEVY SUPPPORTED DEBT SERV. FY2018 FY2019 FY2020 FY2021 FY2022 FY2023
Subtotal Approved and Issued Levy Supported Debt Service 22,580 21,160 19,760 19,380 - - Subtotal Approved and Unissued Levy Supported Debt Service 9,700 9,700 9,700 9,700 9,700 9,700
Summary Approved Levy Supported Debt Service 32,280 30,860 29,460 29,080 9,700 9,700 Subtotal Projected New Levy Supported Debt Service - - 221,830 400,905 1,597,525 2,078,513 TOTAL PROPOSED LEVY SUPPORT DEBT SERVICE 32,280 30,860 251,290 429,985 1,607,225 2,088,213
APPROVED AND PROPOSED EXCLUDED DEBT SERVICE FY2018 FY2019 FY2020 FY2021 FY2022 FY2023
Subtotal Approved and Issued Excluded Supported Gross Debt Service 8,918,335 8,281,773 7,856,295 6,655,135 6,116,320 5,891,620 Subtotal Approved and Unissued Excluded Debt Service 57,824 459,709 685,592 1,415,031 1,151,449 1,117,479 TOTAL Approved Excluded Debt Service 8,976,159 8,741,482 8,541,887 8,070,166 7,267,769 7,009,099 Subtotal Proposed Excluded Debt Service (new capital items) - - 221,830 400,905 1,597,525 2,078,513 TOTAL APPROVED AND PROPOSED EXCLUDED DEBT SERVICE 8,976,159 8,741,482 8,763,717 8,471,071 8,865,295 9,087,612

Capital Improvement Program – Chapter 19
19 : 7
If existing asset is being replaced
Project Title: Drainage Improvement Program Department: DPW Division: Stormwater Yr. Acquired Est. Value DispositionContact: Thomas Cullen Notes: N/A $ Prior Year(s) Requested: $450,000 Present Status of Project: OngoingDescription, Justification and Life Expectancy:
INSERT PHOTO HERE
Impact on Future Operating Budgets, and/or Impact on other Departments:
RECOMMENDED FINANCING PLAN Total Current Estimated Expenditures by Fiscal YearPrior Year Year FY FY FY FY FY Five Yr. TTL
Expenditures Expenditure 2019 2020 2021 2022 2023 FY19-23A. Planning, Design, Engineering - B. Land, ROW, Site Improvements - C. Construction 300,000 300,000 450,000 345,000 300,000 300,000 300,000 1,695,000 D. Equipment - E. Other Costs -
TOTAL $300,000 $300,000 $450,000 $345,000 $300,000 $300,000 $300,000 $1,695,000F. Est. Add'l Annual Maint. & Repair $0
T O W N M A N A G E R U S E O N L YRecommendation Next FY Amt. Funding Source: Priority Category (1-6):
APPROVED DEFERRED (1) G.O. Bond - G.F. (1) Correct threat to health and safetyDENIED TO FY____ $ (2) G.O. Bond - Ent. (2) Improve to avoid costly repair
(3) Cash / Dept. Ops. (3) Replace to maintain service levelsNOTES: (4) Meet legal requirement
(5) Improve productivity(6) Address overburdened situation
WESTON CAPITAL IMPROVEMENT PROGRAM - PROJECT REQUEST & FINANCING PLAN
The annual drainage program is a continuing effort to replace, upgrade or install new storm drainage lines and structures to improve substandard drainage systems within the Town. This program is in its 15th year and has eliminated and/or improved many poor drainage areas. The DPW continues to utilize Town employees to construct and improve the drainage system when cost efficient. The diminishing balance in the drainage account necessitates a request this year. Public/private partnership projects are also funded from this program and helps to resolve deficient drainage systems that affects run-off from public ways through private properties. Drainage funds are also used for street drainage repairs for the road paving program. Future projects include Merriam Street, Highland Street, Summer Street, and Concord Road (culvert replacement).
The repairing of deficient drainage areas will impact future budgets by reducing employee overtime due to flooded road conditions, winter overtime related to frozen run-off and premature road pavement failure due to settlements and erosion. Financial liability to the Town

Capital Improvement Program – Chapter 19
19 : 8
STREET TYPE OF WORK AMOUNT FUNDING SOURCE
FY - 19 Drainage for Paving Program Surface Drains $450,000FY 2019
Merriam Street Phase 2 Drainage $150,000Silver Hill Road to Sunset RoadCulvert & Drainage improvements
Highland Street Drainage $100,000Pine Street to Route 30 Drain Installs, Basins, pipe work
Summer Street Drainage $50,000Robin Road to River RoadDrainage Installs
Concord Road (at/about College Pond) Drainage $150,000Culvert Replacement
Newton Street & Fairview Road Drainage $0 Under FY 17 Capital Plan
TOTAL: FY 19 $450,000 TOTAL: $450,000
FY - 19 D.P.W. CAPITAL BUDGET5 Year Drainage Improvement Program
Updated October 2017

Capital Improvement Program – Chapter 19
19 : 9
FY - 20 Drainage for Paving Program Surface Drains $300,000FY 2020
Concord Road Drainage $75,000Sudbury Road to Lincoln Town Line6 Drainage Installs and/or Adjusts
Glen Road Phase II Drainage $100,000Oak Street to Shady Hill Road 7 Basins installs and/or adjusts, check pipe work
Gail Road Drainage $35,000Entire Length (870' x 24')7 Drainage adjustments and/or Installs
Pembroke Road Drainage $5,0001 Drainage Adjusts
Old Colony Road Drainage $5,0006 Drainage Adjusts
Webster Road Drainage $35,000Entire Length 8 Drain Adjustments and 3 Installs
Arrowhead Road Drainage $50,000Entire Length 4 Drain Adjustments and add structures before low point
Perry Lane Drainage $20,000Entire Length 8 Drain Adjustments
Sutton Place Drainage $20,000Entire Length 12 Drain Adjustments
TOTAL: FY 20 $345,000 TOTAL: $300,000
FY - 19 D.P.W. CAPITAL BUDGET5 Year Drainage Improvement Program
Updated October 2017

Capital Improvement Program – Chapter 19
19 : 10
FY - 21 Drainage for Paving Program Surface Drains $300,000FY 2021
Concord Road Drainage $50,000Sudbury Road to Merriam StreetDrainage Adjusts
October Lane Drainage $40,000Entire Length Drain Adjustments and add another set of CBs
Spring Lane Drainage $20,000Entire Length Drain Adjustments
Ferndale Road Drainage $5,000Entire Length Drain Adjustments
Spruce Hill Road Drainage $25,000Kings Grant Road to Cul-de-Sac Drain Adjustments
Walnut Road (Beaver Rd Ext.) Drainage $10,000Beaver Road to Private Portion Drain Adjustments
Cherry Brook Road Drainage $50,000Merriam Street to Juniper Road Drain Adjustments
Juniper Road Drainage $50,000Dead End N to Dead End S Drain Adjustments
Winter Street Drainage $50,000South Avenue to Brown Street Drain Installs
TOTAL: FY 21 $300,000 TOTAL: $300,000
FY - 19 D.P.W. CAPITAL BUDGET5 Year Drainage Improvement Program
Updated October 2017

Capital Improvement Program – Chapter 19
19 : 11
FY - 22 82 Deerpath Road Drainage $45,000 Surface Drains $300,000Basins, pipe, culvert work (7/30/2010) FY 2022
Drainage for Paving Program
Wellesley Street Drainage $40,000Radcliff Road to Town Line Drain Adjustments and Installs
Church Street Drainage $25,000Conant Road to RR Drain Adjustments
Plymouth Road Drainage $30,000Myles Strandish Way to Kings Grant Road Drain Adjustments and add CBS before and after existing
Bemis Street Drainage $25,000Merriam Street to End Drain Adjustments
Long Meadow Road Drainage $20,000Conant Road to Baker's Hill Road Drain Adjustments
Lantern Lane Drainage $15,000Entire Length Drain Adjustments
Old Coach Road Drainage $20,000Entire Length Drain Adjustments
Columbine Road Drainage $20,000Dean Road to Old Colony Road Drain Adjustments
Dean Road Drainage $20,000Columbine Road to Ridgeway Road Drain Adjustments
Roundhill Road Drainage $20,000North Avenue to Town Line Drain Adjustments
Bakers Hill Road Drainage $20,000October Lane to Dead End Drain Adjustments/pipe work (4/2/2007)
TOTAL: FY 22 $300,000 TOTAL: $300,000
FY - 19 D.P.W. CAPITAL BUDGET5 Year Drainage Improvement Program
Updated October 2017

Capital Improvement Program – Chapter 19
19 : 12
FY - 23 Drainage for Paving Program Surface Drains $300,000FY 2023
South Avenue Drainage $85,000Natick Townline to Wellesley Street Drain Adjustments
South Avenue Drainage $90,000Wellesley Street to Ridgeway Road Drain Adjustments
Brook Road Drainage $75,000Myles Standish Way to Kings Grant Road Drain Installs / Adjustments
Valley View Road Drainage $50,000Viles Street to Brook Road Drain Installs / Adjustments
TOTAL: FY 23 $300,000 TOTAL: $300,000
FY - 19 D.P.W. CAPITAL BUDGET5 Year Drainage Improvement Program
Updated October 2017

95
95
I-95
Glen Rd
Ash S
t
South Ave (Rte 3
0)
Newton St RTE 95
Merria
m St
Winter
StHig
hland
St
Conc
ord R
d
Oak St
Welle
sley S
t
Church
St
River
Rd
Pine S
t
Ridge
way R
d
Love Ln
Brown St
Loring Rd
Lexin
gton S
t
Country Dr
Boston Post Rd
Bogle St
Summ
er St
Viles St
Beav
er Rd
Weste
rly R
d
Scho
ol St
Sudbury Rd
Chestnut St
Byron Rd
Orchard Ave
Montval
e Rd
North Ave (Rte 117)
Cliff R
d
Boston Post Rd By Pass
Radcliffe Rd
Rockport Rd
Park
Rd
Sunset Rd
Sylvan Ln
Conant R
d
Robin Rd
Hickory Rd
Brook Rd
Massachusetts Turnpike (I-90)
Dean Rd
Bullard Rd
Bucks
kin Dr
Recreation Rd
Bradford Rd
Rollin
g Ln
Deer Path Ln
Norum
bega
Rd
Meadowbrook Rd
Cherry Brook Rd
Kings G
rant R
d
Laure
l Rd
Bay S
tate R
d
School
Oxbo
w Rd
Bemis St
Nobscot Rd
Interchange Ramp
Juniper Rd
Woodchester Dr
Shady
Hill Rd
Aberdeen Rd
Black
Oak
Rd
Warren Ave
Scotch Pine Rd
Spring Rd
Fairview Rd
Tyler Rd
Silve
r Hill
Rd
Bakers Hill Rd
Old R
d
Spruce Hill Rd
Chiltern Rd
Autumn Rd
Walnut Rd
Lawrence Rd
Bradyll Rd
Crescent St
Willard Rd
Sears Rd
Drabb
ington
Way
Riverside Rd
Golde
n Ball
Rd
October Ln
Doublet Hill Rd
Alphabet LnColchester Rd
Corwood Dr
Winsor Way
Poss
um R
d
Hillcrest
Rd
Gail Rd
Perry Ln
Legion Rd
Sherburn Cir
Hubbard Rd
Young Rd
Green Ln
Apple Crest Rd
Laxfield Rd
Oakdale Ave
Westcliff Rd
Page
Rd
Pinecroft Rd
Myles
Stan
dish R
d
Derby
Ln
Cedar Rd
BitterSweet Ln
Beech Rd
Blake Rd
Chadwick Rd
Indian Hill Rd
Nonesuch Rd
Webster Rd
Old Colony Rd
Linco
ln St
Westl
and R
d
Holly Cir
Pigeon Hill Rd
Trailside Rd
Carroll Cir
Candleb
erry L
n
Intervale Rd
Ware
St
Lantern Ln
Driftwood L
n
Maple Rd
Gun Club Ln
Ripley Ln
Hobb
s Broo
k Rd
Falmouth Rd
Farm Rd
Hallett Hill Rd
Robin Road
Forest Ridge Rd
Cutters Bluff
Ledgewood Rd
Jericho Rd
Colpi
tts R
d
Coburn Rd
Surrey Ln
Town House Rd
Nash Ln
Sand
erson
Ln
Partridge Hill Rd
Saddle Hill Rd
Fields
Pond
Rd
Whitehouse Ln
Overlook Dr
Wildflower Ln
Hancock Rd
Sutton Pl
Hawt
horne
Ln
Wits End
Old North Ave
Walker St
Pelham Rd
Georgian Rd
Stony Brook Rd
Claridge Dr12
8 Ram
p
Highland Meadow Ln
Wood Ridge Rd
Audubon Rd
Dellbrook Rd
Aspen Rd
Eliot Ln
Hidden
Rd
Colon
ial W
ayKendal Common Rd
Tamarack Rd
Acorn
Ln
Graystone Ln
Irving Rd
Colum
bine R
d
Whitney Tave
rn Rd
Willow
Rd
Gyps
y Trai
l
Drumlin Rd
Livermore Ln
Heml
ock R
d
Dickson Ln
Old Coach Rd
Gree
nridg
e Rd
Fiske
Ln
Summ
it Rd
White Oak Rd
Kingsbury Ln
Dogw
ood R
d
Butto
nwoo
d Ln
Prescott Ln
Nottingham Ln
Elliston Rd
Briar
Ln
Greyloc
k Rd
Raynor
Rd
Cerulean Way
Gowe
ll Ln
Village Rd
Phea
sant
Trail
Harrington Ln
Hastings Rd
Idlewile Ln
Bass Pond Ln
Stonecroft Cir
Ceda
r Roa
d
Winth
rop C
ir
Center St
Shaylor LnFox Chase Ln
Melville Way
Rocky Ledge R
d
Granison Rd
Fairhope Rd
Kettle
Ln
French Rd
Cona
nt Rd North Ave (Rte 117)
Interchange Ramp
Winte
r St
South Ave (Rte 30)
South Ave (Rte 3
0)
RTE 95
Winsor Way
School
RTE
95
Interchange Ramp
Meadowbrook Rd
Massachusetts Turnpike (I-90)
Interc
hang
e Ram
p
Wellesle
y St
North Ave (Rte 117)
Massachusetts Turnpike (I-90)
Interchange Ramp
Park Rd
Winter St
µ0 2,000 4,000
Feet
Drainage Improvement ProgramFY 19 - FY 23
LegendDrainage Improvement
FY 22RoadsFY 19FY 20FY 21FY 22FY 23
TOWN OF WESTONMassachusetts
Path: W:\Projects\DPW\drainage improvement program-FY19.mxdAuthor: KKirmelewicz
19:13

Capital Improvement Program – Chapter 19
19 : 14
If existing asset is being replacedProject Title: Town Center Improvements Department: TCPC / DPW Division: Yr. Aquired Est. Value DispositionContact: Stephen Larocque/Thomas Cullen Notes: $ Prior Year(s) Requested: $150K(Concept)&$988K(Design&Permitting) Present Status of Project: Under Design; Construction anticipated 2018/2019 Construction SeasonDescription, Justification and Life Expectancy:
INSERT PHOTO HERE
Impact on Future Operating Budgets, and/or Impact on other Departments:
RECOMMENDED FINANCING PLAN Total Current Estimated Expenditures by Fiscal YearPrior Year Year FY FY FY FY FY Five Yr. TTL
Expenditures Expenditure 2019 2020 2021 2022 2023 FY19-23A. Planning, Design, Engineering 150,000$ 988,000$ -$ - - - - -$
B. Land, ROW, Site Improvements -$ C. Construction (Master Plan Alternative) 2,803,500$ 2,803,500$ 5,607,000$ C.* Construction (Undergrounding) 2,456,500$ 2,456,500$ 4,913,000$ D. Equipment - E. All Costs - - - - -
TOTAL $150,000 988,000$ $5,260,000 $5,260,000 $0 $0 $0 $10,520,000F. Est. Add'l Annual Maint. & Repair $0
T O W N M A N A G E R U S E O N L YRecommendation Next FY Amt. Funding Source: Priority Category (1-6):
APPROVED DEFERRED (1) G.O. Bond - G.F. (1) Correct threat to health and safetyDENIED TO FY____ $ (2) G.O. Bond - Ent. (2) Improve to avoid costly repair
(3) Cash / Dept. Ops. (3) Replace to maintain service levelsNOTES: (4) Meet legal requirementIt is anticipated that construction will span over (5) Improve productivitytwo construction seasons and therefore so will (6) Address overburdened situationexpenditures.
WESTON CAPITAL IMPROVEMENT PROGRAM - PROJECT REQUEST & FINANCING PLAN
The purpose of the project is to preserve and enhance the historical character & streetscape, upgrades to utilities infrastructure, and consideration of traffic calming improvements to enhance pedestrian and vehicular safety in the Town Center. There have been several appropropriations to date: $150,000 (concept planning), $394,000 (level service design), $138,000 (master plan design), and $456,000 (undergrounding of overhead utility design). Designs and permitting are underway. It is anticipated that two design alternatives will be brought before Town Meeting in May 2018: Master Plan Alternative & Master Plan Alternative with Undergrounding of Overhead Wires. Engineering estimates from July 2016 indicate that the Master Plan Alternative will have an approximate construction cost of $5,607,000 which includes contingencies. Engineering estimate from July 2016 indicate that the Master Plan Alternative with Undergrounding of Overhead Wires will have an approximate construction cost of $10,520,000 with contingencies.
Failure to maintain the Town roadway / sidewalk infrastructure system will lead to deteriorated roadway / sidewalk surfaces and loss of mobility to the motoring and pedestrian public. More extensive repairs and maintenance will result as well as possible liability, increased citizen complaints and inflation related rise in construction costs.

Capital Improvement Program – Chapter 19
19 : 15
If existing asset is being replacedProject Title: Route 30 Reconstruction(Proposed TIP) Department: T&SC / DPW Division: Engineering Yr. Aquired Est. Value DispositionContact: Steve Fogg / Tom Cullen Notes: N/A $ Prior Year(s) Requested: -$ Present Status of Project: PlanningDescription, Justification and Life Expectancy:
INSERT PHOTO HERE
Impact on Future Operating Budgets, and/or Impact on other Departments:
RECOMMENDED FINANCING PLAN Total Current Estimated Expenditures by Fiscal YearPrior Year Year FY FY FY FY FY Five Yr. TTL
Expenditures Expenditure 2019 2020 2021 2022 2023 FY19-FY23A. Planning, Design, Engineering, Permitting 484,700$ 453,000 937,700$ B. Land, ROW, Site Improvements -$ C. Construction -$ D. Equipment -$ E. Other Costs -$
TOTAL -$ -$ 484,700$ $453,000 -$ $0 $0 937,700$ F. Est. Add'l Annual Maint. & Repair $0
T O W N M A N A G E R U S E O N L YRecommendation Next FY Amt. Funding Source: Priority Category (1-6):
APPROVED DEFERRED (1) G.O. Bond - G.F. (1) Correct threat to health and safetyDENIED TO FY____ $ (2) G.O. Bond - Ent. (2) Improve to avoid costly repair
(3) Cash / Dept. Ops. (3) Replace to maintain service levelsNOTES: (4) Meet legal requirement
(5) Improve productivity(6) Address overburdened situation
WESTON CAPITAL IMPROVEMENT PROGRAM - PROJECT REQUEST & FINANCING PLAN
This project includes the planning and design phase services (to the 25% design phase) and is proposing a roadway improvement project along the Route 30 corridor within the Town of Weston. The project limits include the entire length of Route 30 from the Natick town line to the intersection at Cutters Bluff Rd (end of Town layout), excluding the newly constructed portion of Route 30 at the intersection of Wellesley Street (MassDOT project 602000). One of the project goals would be to tie into this new intersection. The total project length is approximately 3.7 miles. The proposed work would include a combination of resurfacing and box widening to achieve a standard pavement width to include 11-foot lanes and 5-foot shoulders/bike lanes in each direction. The preferred alternative would also provide one 5-foot sidewalk along the corridor. The project has been submitted to MassDOT as a proposed Transportation Improvement Project, whereby if funded, the construction costs would be borne by MassDOT. The cost of design must be borne by the Town. This funding request is for 25% design fees only, to get through the Public Hearing process. Future expeditures are for final design and construction phase services, estimated at $484,700.
The goal of this project request is to get the project funded through the Transportation Improvement Program (via State and Federal Funds) so that local funding does not have to be expended. We believe that Route 30 has regional benefits and thereby would be a good candidate for the TIP. Inaction or nonplanning will result in future local roadway reconstruction funding being needed.

Capital Improvement Program – Chapter 19
19 : 16
If existing asset is being replacedProject Title: Case House School Administration Department: Facilities Division: School Yr. Aquired Est. Value DispositionContact: Gary Jarobski Notes: Rehabilitation of School Administration BuildingPrior Year(s) Requested: Present Status of Project: ConstructionDescription, Justification and Life Expectancy:
INSERT PHOTO HERE
Impact on Future Operating Budgets, and/or Impact on other Departments:
RECOMMENDED FINANCING PLAN Total Current Estimated Expenditures by Fiscal YearPrior Year Year FY FY FY FY FY Five Yr. TTL
Expenditures Expenditure 2018 2019 2020 2021 2022 FY18-22A. Planning, Design, Engineering 270,000 329,404 599,404 B. Land, ROW, Site Improvements 350,000 350,000 C. Construction 5,450,000 5,450,000 D. Other Costs and Contigency 892,166 892,166 E. OPM and Clerk 216,000 216,000 F. FF&E 150,000 150,000
TOTAL $0 $0 $270,000 7,387,570 $0 $0 $0 $7,657,570F. Est. Add'l Annual Maint. & Repair $0
T O W N M A N A G E R U S E O N L YRecommendation Next FY Amt. Funding Source: Priority Category (1-6):
APPROVED DEFERRED (1) G.O. Bond - G.F. (1) Correct threat to health and safetyDENIED TO FY____ $ (2) G.O. Bond - Ent. (2) Improve to avoid costly repair
(3) Cash / Dept. Ops. (3) Replace to maintain service levelsNOTES: (4) Meet legal requirement
(5) Improve productivity(6) Address overburdened situation
WESTON CAPITAL IMPROVEMENT PROGRAM - PROJECT REQUEST & FINANCING PLAN
The Case House School Administration Building requires significant improvements to the HVAC, Electrical, Plumbing, Technology and Envelope Systems. Upgrades are required to bring the building up to current Code and Accessibility compliance. New systems, elevator, toilet rooms and layout are needed to accommodate accessiblity and program needs. Also includes improvements to the Wellesley Street side parking area for Case House. This area was not included in the last improvement to the Case Campus project as the building had just begun the design phase. Case House Administration Building has reached the life expectancy of its HVAC systems, currently has a steam boiler for a large portion of the building. Repairs to the exterior shell such as roofing, windows and siding are at the end of their useful life and require upgrade, repair or replacement.

Capital Improvement Program – Chapter 19
19 : 17
If existing asset is being replacedProject Title: Vehicle & Equipment Department: FIRE Division: Yr. Aquired Est. Value DispositionContact: Chief Soar Notes: $ Prior Year(s) Requested: Present Status of Project:Description, Justification and Life Expectency:
INSERT PHOTO HERE
Impact on Future Operating Budgets, and/or Impact on other Departments:
RECOMMENDED FINANCING PLAN Total Current Estimated Expenditures by Fiscal YearPrior Year Year FY FY FY FY FY Five Yr. TTL
Expenditures Expenditure 2019 2020 2021 2022 2023 FY19-23A. Planning, Design, Engineering - B. Land, ROW, Site Improvements - C. Construction - D. Equipment 750,000 325,000 750,000 325,000 2,150,000 E. Other Costs 100,000 200,000 300,000
TOTAL $0 $0 $750,000 $425,000 $200,000 $750,000 $325,000 2,450,000 F. Est. Add'l Annual Maint. & Repair $0
T O W N M A N A G E R U S E O N L YRecommendation Next FY Amt. Funding Source: Priority Category (1-6):
APPROVED DEFERRED (1) G.O. Bond - G.F. (1) Correct threat to health and safetyDENIED TO FY____ $ (2) G.O. Bond - Ent. (2) Improve to avoid costly repair
(3) Cash / Dept. Ops. (3) Replace to maintain service levelsNOTES: (4) Meet legal requirement
(5) Improve productivity(6) Address overburdened situation
WESTON CAPITAL IMPROVEMENT PROGRAM - PROJECT REQUEST & FINANCING PLAN
FY 2019- Equipment: replace engine 1; FY 2020 Equipment: ambulance, radio upgrade FY 2021- protective clothing (life expectancy for gear is 5 years per NFPA, gear at 10 years to be destroyed). FY 2022- Equipment -replace engine 2; FY2023 new ambulance to stay on replacement schedule of first line ambulance and moving the old into back/up reserve.
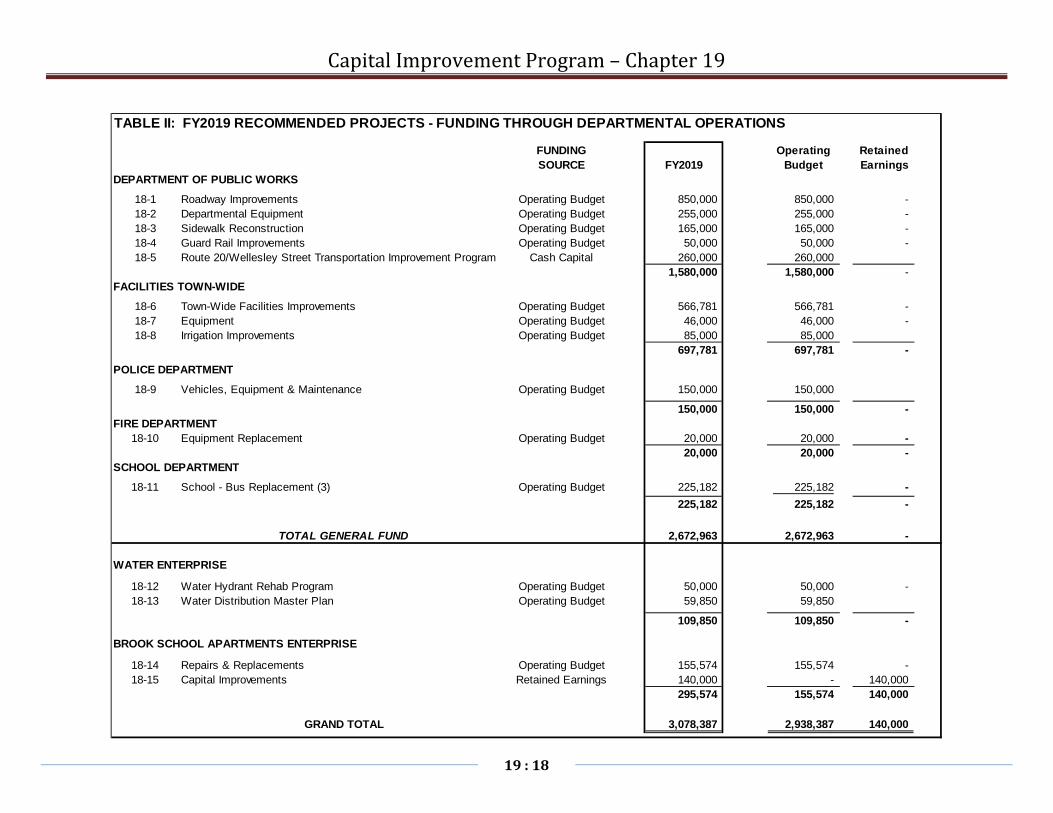
Capital Improvement Program – Chapter 19
19 : 18
TABLE II: FY2019 RECOMMENDED PROJECTS - FUNDING THROUGH DEPARTMENTAL OPERATIONS
FUNDING Operating RetainedSOURCE FY2019 Budget Earnings
DEPARTMENT OF PUBLIC WORKS
18-1 Roadway Improvements Operating Budget 850,000 850,000 - 18-2 Departmental Equipment Operating Budget 255,000 255,000 - 18-3 Sidewalk Reconstruction Operating Budget 165,000 165,000 - 18-4 Guard Rail Improvements Operating Budget 50,000 50,000 - 18-5 Route 20/Wellesley Street Transportation Improvement Program Cash Capital 260,000 260,000
1,580,000 1,580,000 - FACILITIES TOWN-WIDE
18-6 Town-Wide Facilities Improvements Operating Budget 566,781 566,781 - 18-7 Equipment Operating Budget 46,000 46,000 - 18-8 Irrigation Improvements Operating Budget 85,000 85,000
697,781 697,781 -
POLICE DEPARTMENT
18-9 Vehicles, Equipment & Maintenance Operating Budget 150,000 150,000
150,000 150,000 - FIRE DEPARTMENT
18-10 Equipment Replacement Operating Budget 20,000 20,000 - 20,000 20,000 -
SCHOOL DEPARTMENT
18-11 School - Bus Replacement (3) Operating Budget 225,182 225,182 - 225,182 225,182 -
TOTAL GENERAL FUND 2,672,963 2,672,963 -
WATER ENTERPRISE
18-12 Water Hydrant Rehab Program Operating Budget 50,000 50,000 - 18-13 Water Distribution Master Plan Operating Budget 59,850 59,850
109,850 109,850 -
BROOK SCHOOL APARTMENTS ENTERPRISE
18-14 Repairs & Replacements Operating Budget 155,574 155,574 - 18-15 Capital Improvements Retained Earnings 140,000 - 140,000
295,574 155,574 140,000
GRAND TOTAL 3,078,387 2,938,387 140,000

Capital Improvement Program – Chapter 19
19 : 19
If existing asset is being replaced
Project Title: Roadway Improvement Program Department: DPW Division: Administration Yr. Acquired Est. Value DispositionContact: Thomas Cullen Notes: N/A $ Prior Year(s) Requested: $750,000 Present Status of Project: OngoingDescription, Justification and Life Expectancy:
INSERT PHOTO HERE
Impact on Future Operating Budgets, and/or Impact on other Departments:
RECOMMENDED FINANCING PLAN Total Current Estimated Expenditures by Fiscal YearPrior Year Year FY FY FY FY FY Five Yr. TTL
Expenditures Expenditure 2019 2020 2021 2022 2023 FY19-23A. Planning, Design, Engineering - B. Land, ROW, Site Improvements - C. Construction 650,000 750,000 850,000 850,000 850,000 850,000 850,000 4,250,000 D. Equipment - E. Other Costs -
TOTAL $650,000 $750,000 $850,000 $850,000 $850,000 $850,000 $850,000 $4,250,000F. Est. Add'l Annual Maint. & Repair $0
T O W N M A N A G E R U S E O N L YRecommendation Next FY Amt. Funding Source: Priority Category (1-6):
APPROVED DEFERRED (1) G.O. Bond - G.F. (1) Correct threat to health and safetyDENIED TO FY____ $ (2) G.O. Bond - Ent. (2) Improve to avoid costly repair
(3) Cash / Dept. Ops. (3) Replace to maintain service levelsNOTES: (4) Meet legal requirement
(5) Improve productivity(6) Address overburdened situation
WESTON CAPITAL IMPROVEMENT PROGRAM - PROJECT REQUEST & FINANCING PLAN
The Town's roadway system contains 87 miles of public accepted roads and 21 miles of private roads. The maintenance and up-keep of these roads are necessary in order to insure public safety and to preserve the quality of life in Weston. Maintaining the road system infrastructure requires consistent funding in order to prevent premature structural failure of the road base and surface. Maintenance and construction funding of public roads often experience wide fluctuations in material and labor costs due the volatility of the world oil market (a key component in the production and make up of asphalt and the performance construction machinery). As revealed during the Pavement Management Study conducted in April of 2015, there is a current backlog of work totaling in excess of $15M. This past construction season we developed and implemented a crack sealing program and began the process of pavement preservation. The upcoming budget includes additional pavement preservation techniques including rubber chip sealing.
Failure to maintain the Town roadway infrastructure system will lead to deteriorated road surfaces and loss of mobility to the motoring public. More extensive repairs will result as well as possible liability, increased citizen complaints and inflation related rise in construction costs.

Capital Improvement Program – Chapter 19
19 : 20
STREET TYPE OF WORK AMOUNT FUNDING SOURCE PCI
FY - 19 Crack Sealing - Various Crack Sealing 25,000$ Chapter 90 478,573$ Typically >85
Chip Sealing Chip Sealing Construction of Typically >73Cliff Road (2,585' x 28') ($4.85 / SY) 50,000$ Public Ways 850,000$ 80
Merriam Street Phase II Total Reconstruction $308,000 67Silver Hill to Sunset Road (4,875' x 20')
Highland Street (Portion) Total Reconstruction 205,373$ 50Pine Street to Route 30 (2,120' x 24')
Newton Street Phase I Total Reconstruction 436,000$ Varies (66-73)Wellesley St. to South Avenue(5,600 x 26)
Newton Street Phase II Total Reconstruction 304,200$ 77Doublet Hill Rd.to South Ave.(3,900' x 26')
Summer Street (1)Total Reconstruction varies (46-67)
Robin Road to River Road(6,253' x 22')
Fairview Road (2)Total Reconstruction 56
Conant Road to end(2,400' x 20')
(1) Summer Street Roadway Reconstruction will be funded by FY2018 Chapter 90 State Aid Funding. It will be the first roadwayduring the 2019 Construction season to be reconstructed.(2) Fairview Road already has a project started from Chapter 90 State Aid Funding. Will be reconstructed upon completion ofdrainage work at Fairview/Montvale Intersection.
TOTAL: FY 19 1,328,573$ TOTAL: $1,328,573
FY - 19 D.P.W. CAPITAL BUDGET5 Year Roadway Improvement Program
Updated October 2017

Capital Improvement Program – Chapter 19
19 : 21
STREET TYPE OF WORK AMOUNT FUNDING SOURCE PCI
FY - 20 Crack Sealing - Various Crack Sealing 25,000$ Chapter 90 478,573$ Typically >85
Chip Sealing Chip Sealing 100,000$ Construction of Typically >73Brown Street (3,631' x 24') ($4.85 / SY) Public Ways 850,000$ 76Bogel Street (3,031' x 24') 78
Concord Road - Phase I Total Reconstruction 235,000$ 55Sudbury Road to Lincoln Town-line (3,727' x 22')
Glen Road - Phase II Total Reconstruction 348,543$ Varies (44-90)Oak Street to Wellesley Street (5,055' x 24')
Gail Road Total Reconstruction 55,000$ 51Entire Length (870' x 24')
Pembroke Road Total Reconstruction $70,000 48Entire Length(1128' x 20')
Old Colony Rd (FY17 Water Main Project Total Reconstruction 90,000$ 67Entire Length - Ridgeway Road to Coulumbine Road(1,428' x 20')
Webster Road Total Reconstruction 165,000$ 43Entire Length (2,881' x 20')
Arrowhead Road Total Reconstruction 110,000$ 50Entire Length (1,835' x 20')
Perry Lane Total Reconstruction 65,000$ 40Entire Length(977' x 20')
Sutton Place Total Reconstruction 65,000$ 47Entire Length(887' x 24')
TOTAL: FY 20 $1,328,543 TOTAL: $1,328,573
FY - 19 D.P.W. CAPITAL BUDGET5 Year Roadway Improvement Program
Updated October 2017

Capital Improvement Program – Chapter 19
19 : 22
STREET TYPE OF WORK AMOUNT FUNDING SOURCE PCI
FY - 21 Crack Sealing - Various Crack Sealing 25,000$ Chapter 90 478,573$ Typically >85
Chip Sealing Chip Sealing 91,000$ Construction of Typically >73Conant Road (4,819' x 28') ($4.85 / SY) Public Ways 850,000$ 79(Colchester Road to Brook Road)
Concord Road - Phase II Total Reconstruction 260,000$ 65Merriam Street to Sudbury Road (4077' x 22')
October Lane Total Reconstruction 80,000$ 54Entire Length(1,438' x 20')
Spring Lane Total Reconstruction 100,000$ 54Entire Length(1,843' x 20')
Ferndale Rd (FY 17 Water Main Replacem Total Reconstruction 40,000$ 70Entire Length(630' x 20')
Spruce Hill Road Total Reconstruction 155,000$ 40Kings Grant Road to Cul-de-Sac (2579' x 22')
Walnut Road (Beaver Rd Ext.) Total Reconstruction 19,573$ 47Beaver Road to Private Portion(250' x 22')
Cherry Brook Road Total Reconstruction 332,000$ Varies (48-49)Merriam Street to Juniper Road(4,376' x 24')
Juniper Road Total Reconstruction 148,000$ 48Dead End N to Dead End S(1,925' x 24')
Winter Street Total Reconstruction 78,000$ 48South Avenue to Brown Street(1,200' x 22')
TOTAL: FY 21 1,328,573$ TOTAL: $1,328,573
FY - 19 D.P.W. CAPITAL BUDGET5 Year Roadway Improvement Program
Updated October 2017

Capital Improvement Program – Chapter 19
19 : 23
STREET TYPE OF WORK AMOUNT FUNDING SOURCE PCI
FY - 22 Crack Sealing - Various Crack Sealing 25,000$ Chapter 90 478,573$ Typically >85
Chip Sealing Chip Sealing 100,000$ Construction of Typically >73Conant Road (2,378' x 22') ($4.85 / SY) Public Ways 850,000$ 80(North Avenue to Town Line)Conant Road (2,769' x 24') 81(Brook Road to North Avenue)Oxbow Road (1,876' x 24') 79(Town Line to Ridgeway Road)
Wellesley Street (Mill/Overlay) Mill and Overlay 310,000$ Varies (65-98)Radcliffe Road to Town-Line(4,623' x 30')
Church Street (Mill/Overlay) Mill and Overlay 335,573$ varies (79-87)Conant Road to RR(5,730' x 26')
Plymouth Road Total Reconstruction 50,000$ 58Myles Standish Way to Kings Grant Road(699' x 22')
Bemis Street Total Reconstruction 110,000$ 57Merriam Street to End(1582' x 22')
Longmeadow Road (FY 21 Water Main Total Reconstruction 78,000$ 46Entire Length (Conant Rd to Baker's Hill Rd)(1,107' x 22')
Lantern Lane (FY 20 Water Main Replace Total Reconstruction 65,000$ 52Entire Length(1,039' x 20')
Old Coach Road (FY 21 Water Main Rep Total Reconstruction 50,000$ 50Entire Length(682' x 20')
Columbine Rd (FY 18 Water Main Replac Total Reconstruction 50,000$ 82Entire Length (Dean Rd to Old Colony Rd)(752' x 20')
Dean Road (FY 18 Water Main Replaceme Total Reconstruction 50,000$ 79Columbine to Ridgeway(602' x 20')
Roundhill Road Total Reconstruction 55,000$ 45North Avenue to Town Line(589' x 22')
Bakers Hill Road Total Reconstruction 50,000$ 45Pctober Lane to Dead End(408' x 22')
TOTAL: FY 22 $1,328,573 TOTAL: $1,328,573
FY - 19 D.P.W. CAPITAL BUDGET5 Year Roadway Improvement Program
Updated October 2017
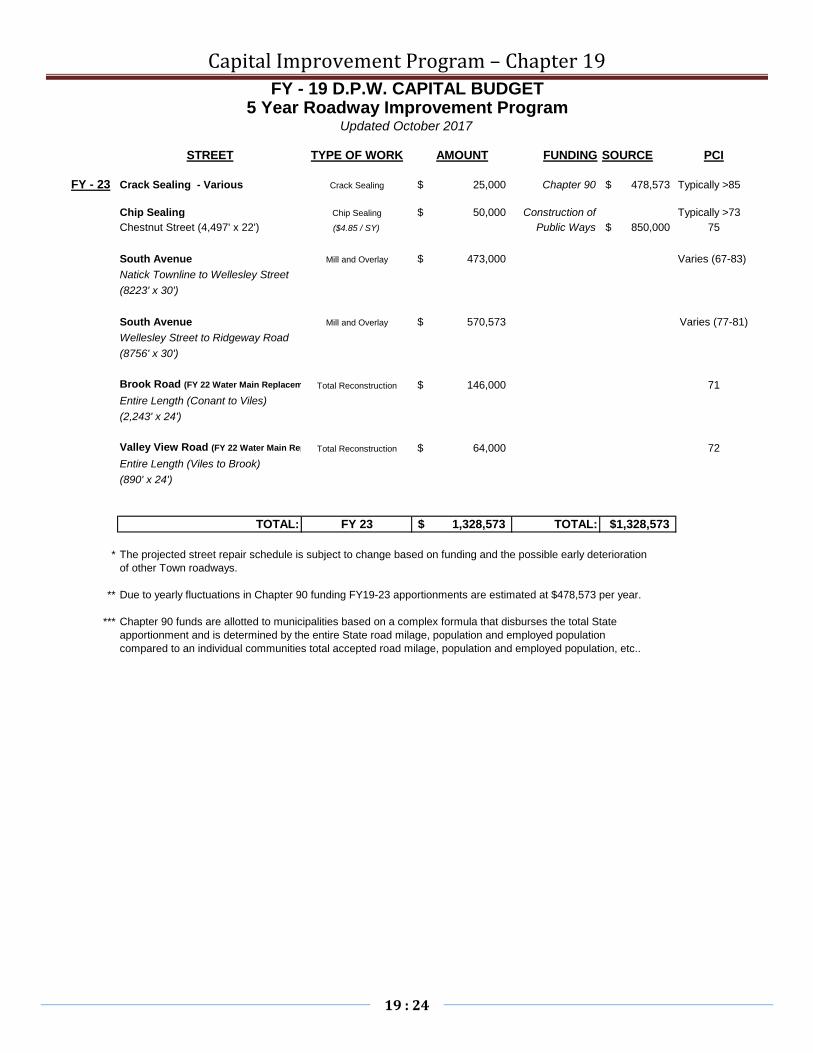
Capital Improvement Program – Chapter 19
19 : 24
STREET TYPE OF WORK AMOUNT FUNDING SOURCE PCI
FY - 23 Crack Sealing - Various Crack Sealing 25,000$ Chapter 90 478,573$ Typically >85
Chip Sealing Chip Sealing 50,000$ Construction of Typically >73Chestnut Street (4,497' x 22') ($4.85 / SY) Public Ways 850,000$ 75
South Avenue Mill and Overlay 473,000$ Varies (67-83)Natick Townline to Wellesley Street(8223' x 30')
South Avenue Mill and Overlay 570,573$ Varies (77-81)Wellesley Street to Ridgeway Road(8756' x 30')
Brook Road (FY 22 Water Main Replacem Total Reconstruction 146,000$ 71Entire Length (Conant to Viles)(2,243' x 24')
Valley View Road (FY 22 Water Main Rep Total Reconstruction 64,000$ 72Entire Length (Viles to Brook)(890' x 24')
TOTAL: FY 23 1,328,573$ TOTAL: $1,328,573
* The projected street repair schedule is subject to change based on funding and the possible early deteriorationof other Town roadways.
** Due to yearly fluctuations in Chapter 90 funding FY19-23 apportionments are estimated at $478,573 per year.
*** Chapter 90 funds are allotted to municipalities based on a complex formula that disburses the total State apportionment and is determined by the entire State road milage, population and employed populationcompared to an individual communities total accepted road milage, population and employed population, etc..
FY - 19 D.P.W. CAPITAL BUDGET5 Year Roadway Improvement Program
Updated October 2017
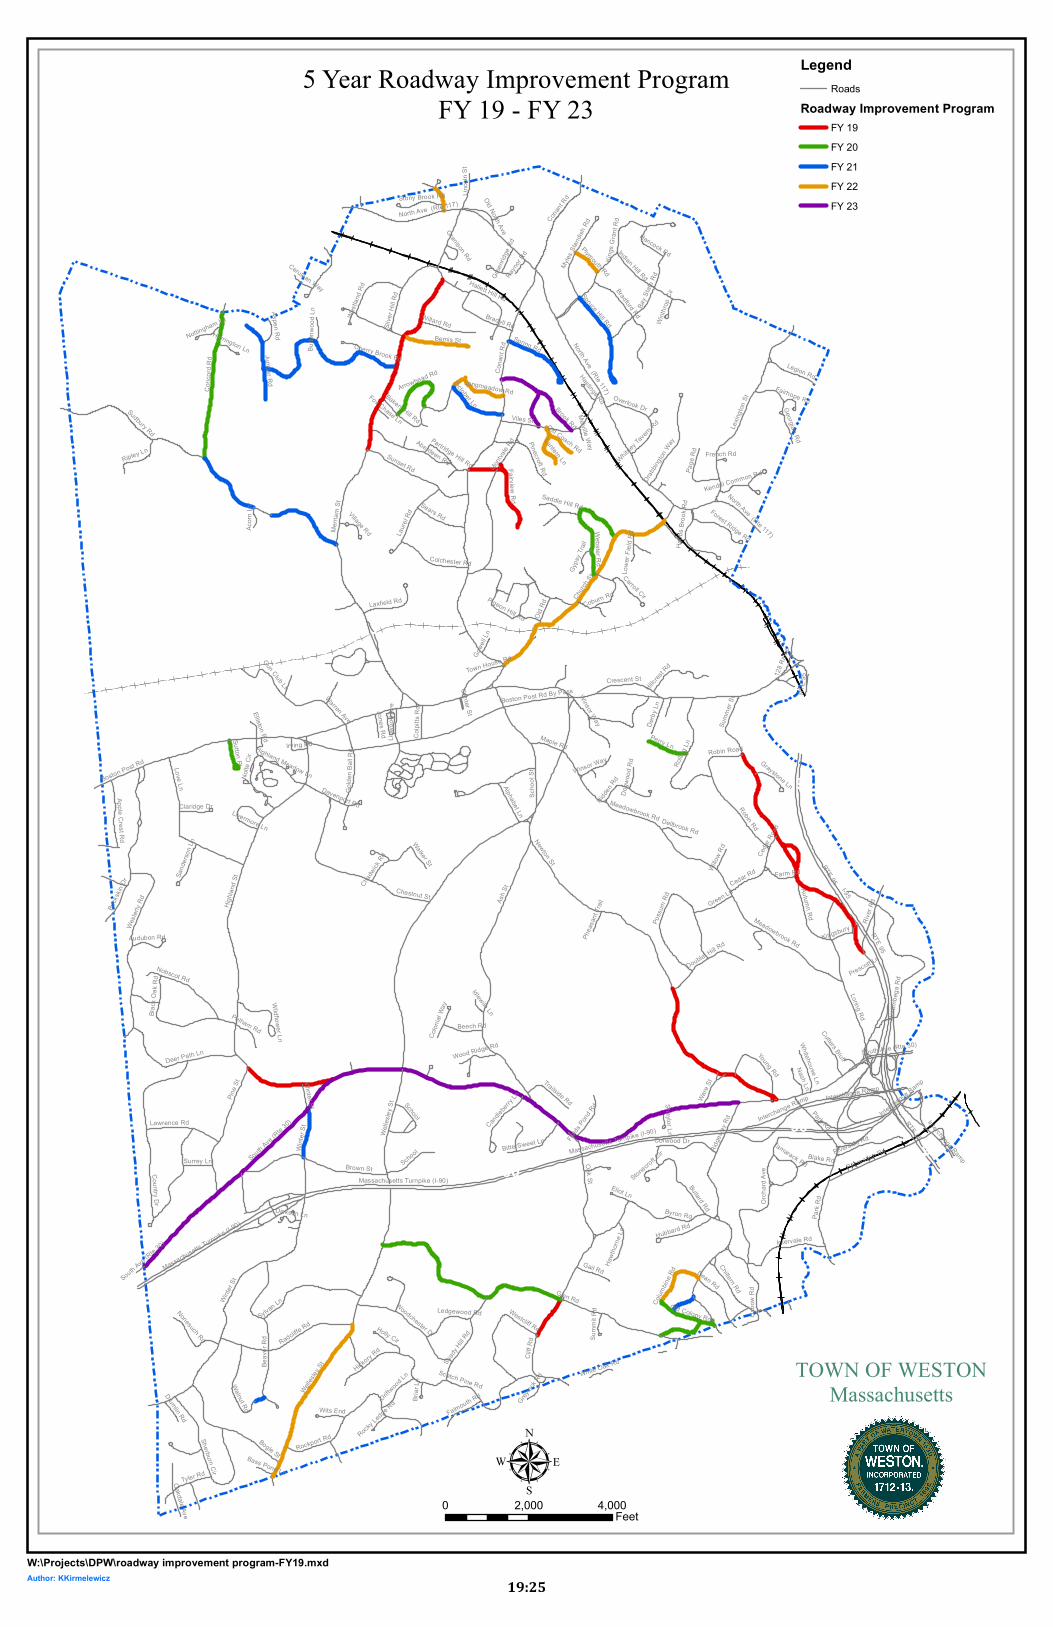
95
9590
90
I-95
Glen Rd
Ash S
t
South Ave (Rte 3
0)
Newton St RTE 95
Merria
m St
Winter
St
Welle
sley S
t
Highla
nd St
Conc
ord R
d
Oak St
Church
St
River
Rd
Pine S
t
Ridge
way R
d
Love Ln
Brown St
Loring Rd
Lexin
gton S
t
Country Dr
Boston Post Rd
Bogle St
Summ
er St
Viles St
Beav
er Rd
Weste
rly R
d
Scho
ol St
Sudbury Rd
Chestnut St
Byron Rd
Orch
ard Av
e
Montval
e Rd
North Ave (Rte 117)
Cliff R
d
Boston Post Rd By Pass
Radcliffe Rd
Rockport Rd
Park
Rd
Sunset Rd
Sylvan Ln
Interchange Ramp
Conant R
d
Robin Rd
Hickory Rd
Brook Rd
Massachusetts Turnpike (I-90)
Dean Rd
Bullard Rd
Bucks
kin Dr
Recreation Rd
Bradford Rd
Rollin
g Ln
Deer Path Ln
Norum
bega
Rd
Meadowbrook Rd
Cherry Brook Rd
Kings
Gran
t Rd
Laure
l Rd
Bay S
tate R
d
School
Oxbo
w Rd
Bemis St
Nobscot Rd
Juniper Rd
Woodchester Dr
Shady
Hill Rd
Aberdeen Rd
Black
Oak
Rd
Warren Ave
Scotch Pine Rd
Spring Rd
Fairview Rd
Tyler Rd
Silve
r Hill
RdBakers Hill Rd
Old R
d
Spruce Hill Rd
Chiltern Rd
Autumn Rd
Walnut Rd
Lawrence Rd
Bradyll Rd
Crescent St
Willard Rd
Sears Rd
Drabb
ington
Way
Golde
n Ball
Rd
October Ln
Doublet Hill Rd
Riverside Rd
Alphabet Ln
Colchester Rd
Corwood Dr
Winsor Way
Poss
um R
d
Hillcrest
Rd
Gail Rd
Perry Ln
Legion Rd
Sherburn Cir
Hubbard Rd
Young Rd
Green Ln
Apple Crest Rd
Laxfield Rd
Oakdale Ave
Westcliff Rd
Page
Rd
Pinecroft Rd
Myles
Stan
dish R
d
Derby
Ln
Cedar Rd
BitterSweet Ln
Beech Rd
Blake Rd
Chadwick
Rd
Indian Hill Rd
Nonesuch Rd
Old Colony Rd
Linco
ln St
Westl
and R
d
Holly Cir
Webster Rd
Pigeon Hill Rd
Trailside Rd
Carroll Cir
Candleb
erry L
n
Intervale Rd
Ware
St
Lantern Ln
Driftwood L
n
Maple Rd
Gun Club Ln
Ripley Ln
Hobb
s Broo
k Rd
Linwo
od Av
e
Falmouth Rd
Farm Rd
Hallett Hill Rd
Robin Road
Forest Ridge Rd
Cutters Bluff
Ledgewood Rd
Colpi
tts R
d
Coburn Rd
Surrey Ln
Town House Rd
Nash Ln
Sand
erson
Ln
Partridge Hill Rd
Saddle Hill Rd
Fields
Pond
Rd
Whitehouse Ln
Overlook Dr
Wildflower Ln
Hancock Rd
Sutton Pl
Hawt
horne
Ln
Wits End
Old North Ave
Walker St
Pelham Rd
Georgian Rd
Stony Brook Rd
Claridge Dr
Longmeadow Rd
128 R
amp
Jones Rd
Highland Meadow Ln
Wood Ridge Rd
Audubon Rd
Dellbrook Rd
Aspen Rd
Eliot Ln
Hidden
Rd
Colon
ial W
ay
Kendal Common RdPlymouth Rd
Tamarack Rd
Willow R
d
Acorn
Ln
Graystone Ln
Irving Rd
Colum
bine R
d
Whitney Tave
rn Rd
Gyps
y Trai
l
Drumlin Rd
Davenport RdLivermore Ln
Dickson Ln
Old Coach Rd
Arrowhead Rd
Gree
nridg
e Rd
Summ
it Rd
White Oak Rd
Kingsbury Ln
Dogw
ood R
d
Butto
nwoo
d Ln
Prescott Ln
Nottingham Ln
Elliston Rd
Briar
Ln
Greyloc
k Rd
Raynor
Rd
Cerulean Way
Gowe
ll Ln
Village Rd
Phea
sant
Trail
Harrington Ln
Hastings Rd
Idlewile Ln
Bass Pond Ln
Stonecroft Cir
Ceda
r Roa
d
Winth
rop C
ir
Center St
Shaylor Ln
Lowe
r Fiel
d Rd
Fox Chase Ln
Melville Way
Rocky Ledge R
d
Granison Rd
Fairhope Rd
Nolte
Cir
French Rd
Massachusetts Turnpike (I-90)
North Ave (Rte 117)
Massachusetts Turnpike (I-90)
South Ave (Rte 30)
Meadowbrook Rd
RTE 95
Winte
r St
RTE 95
South Ave (Rte 3
0)
Interchange Ramp
Cona
nt Rd
Wellesle
y St
North Ave (Rte 117)
Interchange Ramp
RTE
95
Winsor Way
Park Rd
Interchange RampWinter St School
TOWN OF WESTONMassachusetts
µ
LegendRoads
Roadway Improvement ProgramFY 19FY 20FY 21FY 22FY 23
0 2,000 4,000Feet
5 Year Roadway Improvement ProgramFY 19 - FY 23
W:\Projects\DPW\roadway improvement program-FY19.mxdAuthor: KKirmelewicz
19:25
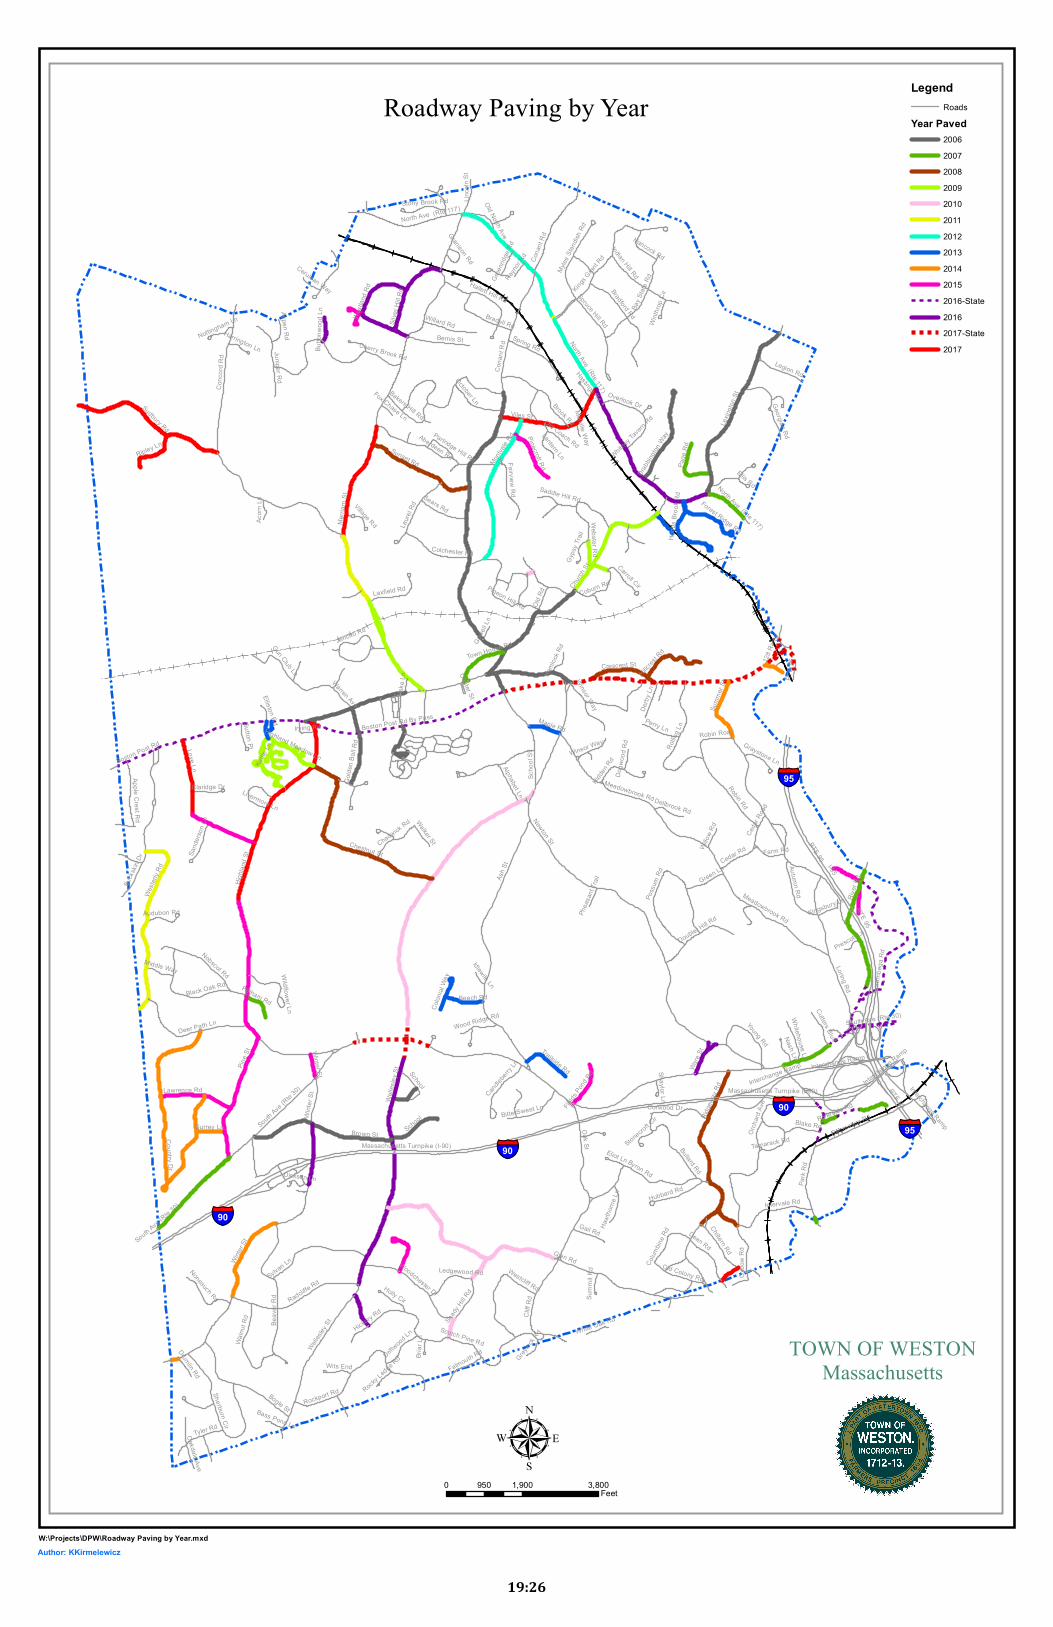
§̈¦95
§̈¦95§̈¦90
§̈¦90
§̈¦90
I-95
Glen Rd
Ash S
t
South Ave (Rte 3
0)
Newton St RTE 95
Merria
m St
Winter
StHig
hland
St
Conc
ord R
d
Oak St
Welle
sley S
t
Church
St
River
Rd
Pine S
t
Ridge
way R
d
Love Ln
Brown St
Loring Rd
Lexin
gton S
t
Country Dr
Boston Post Rd
Bogle St
Summ
er St
Viles St
Beav
er Rd
Weste
rly Rd
Scho
ol St
Sudbury Rd
Chestnut St
Byron Rd
Orch
ard Av
e
Montval
e Rd
North Ave (Rte 117)
Cliff R
d
Boston Post Rd By Pass
Radcliffe Rd
Rockport Rd
Park
Rd
Sunset Rd
Sylvan Ln
Interchange Ramp
Cona
nt Rd
Robin Rd
Hickory Rd
Brook Rd
Massachusetts Turnpike (I-90)
Dean Rd
Bullard Rd
Bucks
kin Dr
Recreation Rd
Bradford Rd
Rollin
g Ln
Deer Path Ln
Norum
bega
Rd
Meadowbrook Rd
Cherry Brook Rd
Kings G
rant R
d
Laure
l Rd
Bay S
tate R
d
School
Oxbo
w Rd
Bemis St
Nobscot Rd
Juniper Rd
Woodchester Dr
Shady
Hill Rd
Aberdeen Rd
Black Oak Rd
Warren Ave
Scotch Pine Rd
Spring Rd
Fairview Rd
Tyler Rd
Silve
r Hill
RdBakers Hill Rd
Old R
d
Spruce Hill Rd
Chiltern Rd
Autumn Rd
Walnu
t Rd
Lawrence Rd
Bradyll Rd
Crescent St
Willard Rd
Sears Rd
Drabb
ington
Way
Riverside Rd
Golde
n Ball
Rd
October Ln
Doublet Hill Rd
Alphabet Ln
Colchester Rd
Corwood Dr
Winsor Way
Poss
um R
d
Hillcrest
Rd
Gail Rd
Perry Ln
Legion Rd
Sherburn Cir
Hubbard Rd
Young Rd
Green Ln
Apple Crest Rd
Laxfield Rd
Oakdale Ave
Westcliff Rd
Page
Rd
Pinecroft Rd
Myles
Stan
dish R
d
Derby
Ln
Cedar Rd
BitterSweet Ln
Beech Rd
Blake Rd
Chadwick Rd
Indian Hill Rd
Nonesuch Rd
Old Colony Rd
Linco
ln St
Westl
and R
d
Holly Cir
Webster Rd
Pigeon Hill Rd
Trailside Rd
Carroll Cir
Candleb
erry L
n
Intervale Rd
Ware
St
Lantern Ln
Driftwood L
n
Maple Rd
Gun Club Ln
Ripley Ln
Hobb
s Broo
k Rd
Falmouth Rd
Farm Rd
Hallett Hill Rd
Robin Road
Forest Ridge Rd
Cutters Bluff
Ledgewood Rd
Jericho Rd
Coburn Rd
Surrey Ln
Town House Rd
Nash Ln
Sand
erson
Ln
Partridge Hill Rd
Saddle Hill Rd
Fields
Pond
Rd
Whitehouse Ln
Overlook Dr
Wildflower Ln
Hancock Rd
Sutton Pl
Hawt
horne
Ln
Wits End
Old North Ave
Walker St
Pelham Rd
Georgian Rd
Stony Brook Rd
Claridge Dr
Middle Way
128 R
amp
Highland Meadow Ln
Wood Ridge Rd
Audubon Rd
Dellbrook Rd
Aspen Rd
Eliot Ln
Hidden
Rd
Colon
ial W
ay
Tamarack Rd
Willow R
d
Acorn
Ln
Graystone Ln
Irving Rd
Colum
bine R
d
Whitney Tave
rn Rd
Gyps
y Trai
l
Drumlin Rd
Livermore Ln
Heml
ock R
d
Dickson Ln
Old Coach Rd
Gree
nridg
e Rd
Fiske
Ln
Summ
it Rd
White Oak Rd
Kingsbury Ln
Dogw
ood R
d
Butto
nwoo
d Ln
Prescott Ln
Nottingham Ln
Elliston Rd
Briar
Ln
Greyloc
k Rd
Raynor
Rd
Cerulean Way
Gowe
ll Ln
Village Rd
Phea
sant
Trail
Harrington Ln
Hastings Rd
Idlewile Ln
Bass Pond Ln
Stonecroft Cir
Ceda
r Roa
d
Winth
rop C
ir
Ellis Rd
Center St
Shaylor LnFox Chase Ln
Melville Way
Rocky Ledge R
d
Granison Rd
Kettle
Ln
Interchange Ramp
South Ave (Rte 30)
RTE 95
Winte
r St
RTE 95
Winsor Way
North Ave (Rte 117)
South Ave (Rte 3
0)
Massachusetts Turnpike (I-90) Interchange Ramp
School
Wellesle
y St
North Ave (Rte 117)
Interchange Ramp
RTE
95
Cona
nt Rd
Winter St
Meadowbrook Rd
TOWN OF WESTONMassachusetts
µ
LegendRoads
Year Paved20062007200820092010201120122013201420152016-State20162017-State2017
0 1,900 3,800950Feet
Roadway Paving by Year
W:\Projects\DPW\Roadway Paving by Year.mxdAuthor: KKirmelewicz
19:26

Capital Improvement Program – Chapter 19
19 : 27
If existing asset is being replacedProject Title: Equipment Replacement Program Division: DPW Yr. Acquired Est. Value DispositionContact: Thomas Cullen Notes: Varies N / A Trade/AuctionPrior Year(s) Requested: $245,000 Present Status of Project: OngoingDescription, Justification and Life Expectancy:
INSERT PHOTO HERE
Impact on Future Operating Budgets, and/or Impact on other Departments:
RECOMMENDED FINANCING PLAN Total Current Estimated Expenditures by Fiscal YearPrior Year Year FY FY FY FY FY Five Yr. TTL
Expenditures Expenditure 2019 2020 2021 2022 2023 FY19-23A. Planning, Design, Engineering - B. Land, ROW, Site Improvements - C. Construction - D. Equipment 245,000$ 245,000$ 255,000$ 258,000$ 250,000$ 260,000$ 245,000$ 1,268,000$ E. Other Costs -
TOTAL $245,000 $245,000 $255,000 $258,000 $250,000 $260,000 $245,000 $1,268,000F. Est. Add'l Annual Maint. & Repair $0
T O W N M A N A G E R U S E O N L YRecommendation Next FY Amt. Funding Source: Priority Category (1-6):
APPROVED DEFERRED (1) G.O. Bond - G.F. (1) Correct threat to health and safetyDENIED TO FY____ $ (2) G.O. Bond - Ent. (2) Improve to avoid costly repair
(3) Cash / Dept. Ops. (3) Replace to maintain service levelsNOTES: (4) Meet legal requirement
(5) Improve productivity(6) Address overburdened situation
WESTON CAPITAL IMPROVEMENT PROGRAM - PROJECT REQUEST & FINANCING PLAN
Two pieces of equipment are proposed to be replaced under this request: 2001 Elgin Pelican SE Street Sweeper and one of the 2006-Trafcon trailer mounted variable message boards. The street sweeper (S22) has 3,798 hours. The variable message board (H35) is a valuable piece of equipment primarily used during the department's roadway contruction projects to advise the public of the project and the traffic impacts. It should be noted that we are recommending replacement of only one of the variable message boards this year to stay within the previously projected equipment expenditures. The cost of the street sweepers has gone up substantially over the last several years ($200,000 to $237,000).
The acquisition of these vehicles/equipment as part of the vehicle replacement program updates the DPW fleet and improves efficiency within the department. The goal is to replace equipment before the cost of ongoing repairs exceeds the vehicles usefulness in means of productivity and cost effectiveness. Annual updating of equipment is a useful tool in stabilizing vehicle repair costs. Improved fuel economy, cleaner emissions and safer state of the art equipment results in a more efficient management of the fleet.

Capital Improvement Program – Chapter 19
19 : 28
If existing asset is being replaced
Project Title: Sidewalk Reconstruction Program Department: DPW Division: Highway Yr. Acquired Est. Value DispositionContact: Thomas Cullen Notes: N/A $165,000Prior Year(s) Requested: $120,000 Present Status of Project:Description, Justification and Life Expectancy:
INSERT PHOTO HERE
Impact on Future Operating Budgets, and/or Impact on other Departments:
RECOMMENDED FINANCING PLAN Total Current Estimated Expenditures by Fiscal YearPrior Year Year FY FY FY FY FY Five Yr. TTL
Expenditures Expenditure 2019 2020 2021 2022 2023 FY19-23A. Planning, Design, Engineering - B. Land, ROW, Site Improvements - C. Construction 120000 120,000 165,000 250,000 210,000 260,000 182,000 1,067,000 D. Equipment - E. Other Costs -
TOTAL $0 $120,000 $165,000 $250,000 $210,000 $260,000 $182,000 $1,067,000F. Est. Add'l Annual Maint. & Repair $0
T O W N M A N A G E R U S E O N L YRecommendation Next FY Amt. Funding Source: Priority Category (1-6):
APPROVED DEFERRED (1) G.O. Bond - G.F. (1) Correct threat to health and safetyDENIED TO FY____ $ (2) G.O. Bond - Ent. (2) Improve to avoid costly repair
(3) Cash / Dept. Ops. (3) Replace to maintain service levelsNOTES: (4) Meet legal requirement
(5) Improve productivity(6) Address overburdened situation
WESTON CAPITAL IMPROVEMENT PROGRAM - PROJECT REQUEST & FINANCING PLAN
The Town of Weston DPW continues its maintenance/replacement program for the 31 miles of sidewalks in the town's inventory. The Sidewalk Reconstruction Program will methodically and efficiently reconstruct sidewalks based on yearly surveys of surface conditions, pedestrian use and other criteria. The sidewalk proposed for reconstruction in FY 19 is on Wellesley Street from Chestnut Street to Case's Corner (approximately 3,000 LFT). This sidewalk sees significant foot traffic and is in a deteriorated condition. The DPW maintains a condition survey of all Town sidewalks and continues to update it in order to prepare and maintain a five year reconstruction plan.
Postponing an ongoing program of sidewalk reconstruction will result in continued deterioration of the Town's pedestrian walkways. Sidewalk safety issues can result in unforeseen liabilities to the Town, citizen complaints and rising costs due to inflation and volatility of the cost associated with fossil fuels.

Capital Improvement Program – Chapter 19
19 : 29
Town of Weston - Highway Division 5 Year Capital Sidewalk Reconstruction Program
Location/Repair Type FY2019 FY2020 FY2021 FY2022 FY2023
1 Wellesley Street (3,000 LFT) 165,000
Case's Corner to Chestnut Street
2 Wellesley Street (4,200 LFT) 250,000
Chestnut Street to South Avenue
3 Highland Street (3,200 LFT) 210,000
Black Oak Road to South Avenue
4 Conant Road (4,300 LFT) 260,000
Church Street to #155 Conant Road
5 Wellesley Street (2,800 LFT) 182,000
Mass Pike Bridge to Sylvan Lane
6 Wellesley Street (5,000 LFT)
Sylvan Lane to Townline
7 Route 30 (South Ave.) (4,500 LFT)
Wellesley Street to Oak Street
8 Highland Street (2,500 LFT)
Chestnut Street to Love Lane
9 Highland Street (1,350 LFT)
Love Lane to Lookout
10 Ash Street (1,700 LFT)
No. 73 to South Avenue
TOTALS 165,000 250,000 210,000 260,000 182,000
5 Year Total: 1,067,000
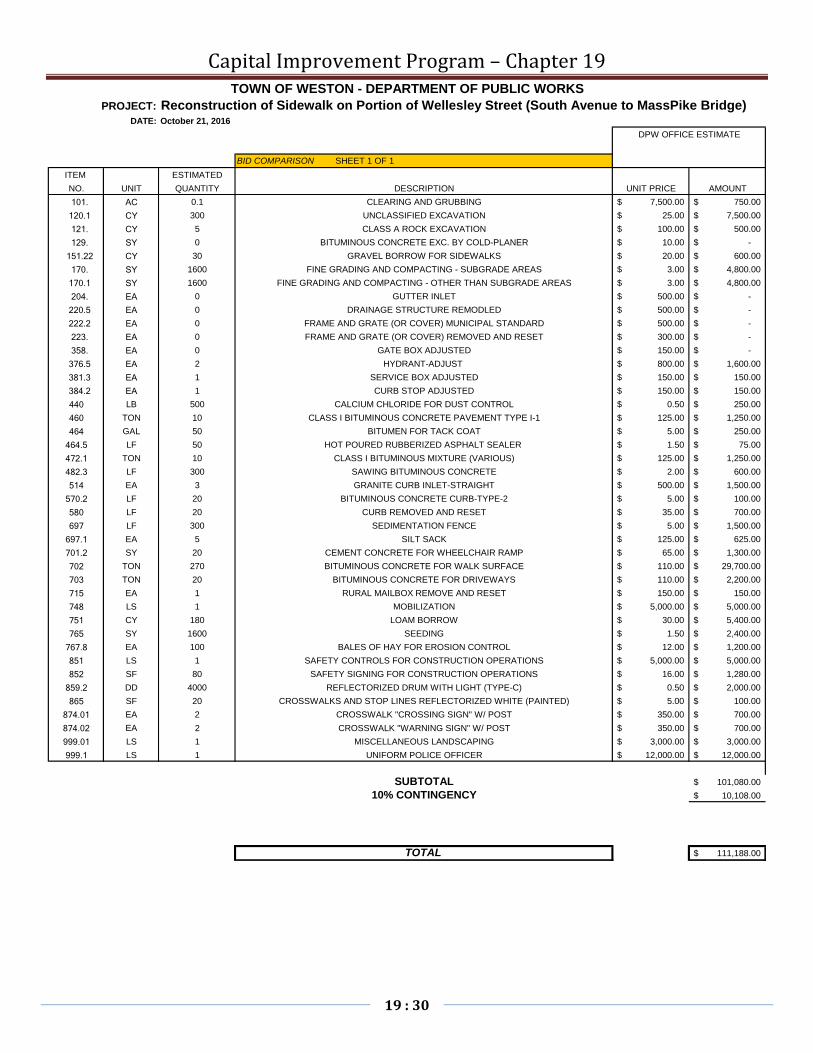
Capital Improvement Program – Chapter 19
19 : 30
PROJECT: Reconstruction of Sidewalk on Portion of Wellesley Street (South Avenue to MassPike Bridge)DATE:
BID COMPARISON SHEET 1 OF 1ITEM ESTIMATEDNO. UNIT QUANTITY DESCRIPTION UNIT PRICE AMOUNT
101. AC 0.1 CLEARING AND GRUBBING 7,500.00$ 750.00$ 120.1 CY 300 UNCLASSIFIED EXCAVATION 25.00$ 7,500.00$ 121. CY 5 CLASS A ROCK EXCAVATION 100.00$ 500.00$ 129. SY 0 BITUMINOUS CONCRETE EXC. BY COLD-PLANER 10.00$ -$
151.22 CY 30 GRAVEL BORROW FOR SIDEWALKS 20.00$ 600.00$ 170. SY 1600 FINE GRADING AND COMPACTING - SUBGRADE AREAS 3.00$ 4,800.00$
170.1 SY 1600 FINE GRADING AND COMPACTING - OTHER THAN SUBGRADE AREAS 3.00$ 4,800.00$ 204. EA 0 GUTTER INLET 500.00$ -$
220.5 EA 0 DRAINAGE STRUCTURE REMODLED 500.00$ -$ 222.2 EA 0 FRAME AND GRATE (OR COVER) MUNICIPAL STANDARD 500.00$ -$ 223. EA 0 FRAME AND GRATE (OR COVER) REMOVED AND RESET 300.00$ -$ 358. EA 0 GATE BOX ADJUSTED 150.00$ -$
376.5 EA 2 HYDRANT-ADJUST 800.00$ 1,600.00$ 381.3 EA 1 SERVICE BOX ADJUSTED 150.00$ 150.00$ 384.2 EA 1 CURB STOP ADJUSTED 150.00$ 150.00$
440 LB 500 CALCIUM CHLORIDE FOR DUST CONTROL 0.50$ 250.00$ 460 TON 10 CLASS I BITUMINOUS CONCRETE PAVEMENT TYPE I-1 125.00$ 1,250.00$ 464 GAL 50 BITUMEN FOR TACK COAT 5.00$ 250.00$
464.5 LF 50 HOT POURED RUBBERIZED ASPHALT SEALER 1.50$ 75.00$ 472.1 TON 10 CLASS I BITUMINOUS MIXTURE (VARIOUS) 125.00$ 1,250.00$ 482.3 LF 300 SAWING BITUMINOUS CONCRETE 2.00$ 600.00$ 514 EA 3 GRANITE CURB INLET-STRAIGHT 500.00$ 1,500.00$
570.2 LF 20 BITUMINOUS CONCRETE CURB-TYPE-2 5.00$ 100.00$ 580 LF 20 CURB REMOVED AND RESET 35.00$ 700.00$ 697 LF 300 SEDIMENTATION FENCE 5.00$ 1,500.00$
697.1 EA 5 SILT SACK 125.00$ 625.00$ 701.2 SY 20 CEMENT CONCRETE FOR WHEELCHAIR RAMP 65.00$ 1,300.00$ 702 TON 270 BITUMINOUS CONCRETE FOR WALK SURFACE 110.00$ 29,700.00$ 703 TON 20 BITUMINOUS CONCRETE FOR DRIVEWAYS 110.00$ 2,200.00$ 715 EA 1 RURAL MAILBOX REMOVE AND RESET 150.00$ 150.00$ 748 LS 1 MOBILIZATION 5,000.00$ 5,000.00$ 751 CY 180 LOAM BORROW 30.00$ 5,400.00$ 765 SY 1600 SEEDING 1.50$ 2,400.00$
767.8 EA 100 BALES OF HAY FOR EROSION CONTROL 12.00$ 1,200.00$ 851 LS 1 SAFETY CONTROLS FOR CONSTRUCTION OPERATIONS 5,000.00$ 5,000.00$ 852 SF 80 SAFETY SIGNING FOR CONSTRUCTION OPERATIONS 16.00$ 1,280.00$
859.2 DD 4000 REFLECTORIZED DRUM WITH LIGHT (TYPE-C) 0.50$ 2,000.00$ 865 SF 20 CROSSWALKS AND STOP LINES REFLECTORIZED WHITE (PAINTED) 5.00$ 100.00$
874.01 EA 2 CROSSWALK "CROSSING SIGN" W/ POST 350.00$ 700.00$ 874.02 EA 2 CROSSWALK "WARNING SIGN" W/ POST 350.00$ 700.00$ 999.01 LS 1 MISCELLANEOUS LANDSCAPING 3,000.00$ 3,000.00$ 999.1 LS 1 UNIFORM POLICE OFFICER 12,000.00$ 12,000.00$
SUBTOTAL 101,080.00$ 10% CONTINGENCY 10,108.00$
TOTAL 111,188.00$
TOWN OF WESTON - DEPARTMENT OF PUBLIC WORKS
October 21, 2016DPW OFFICE ESTIMATE
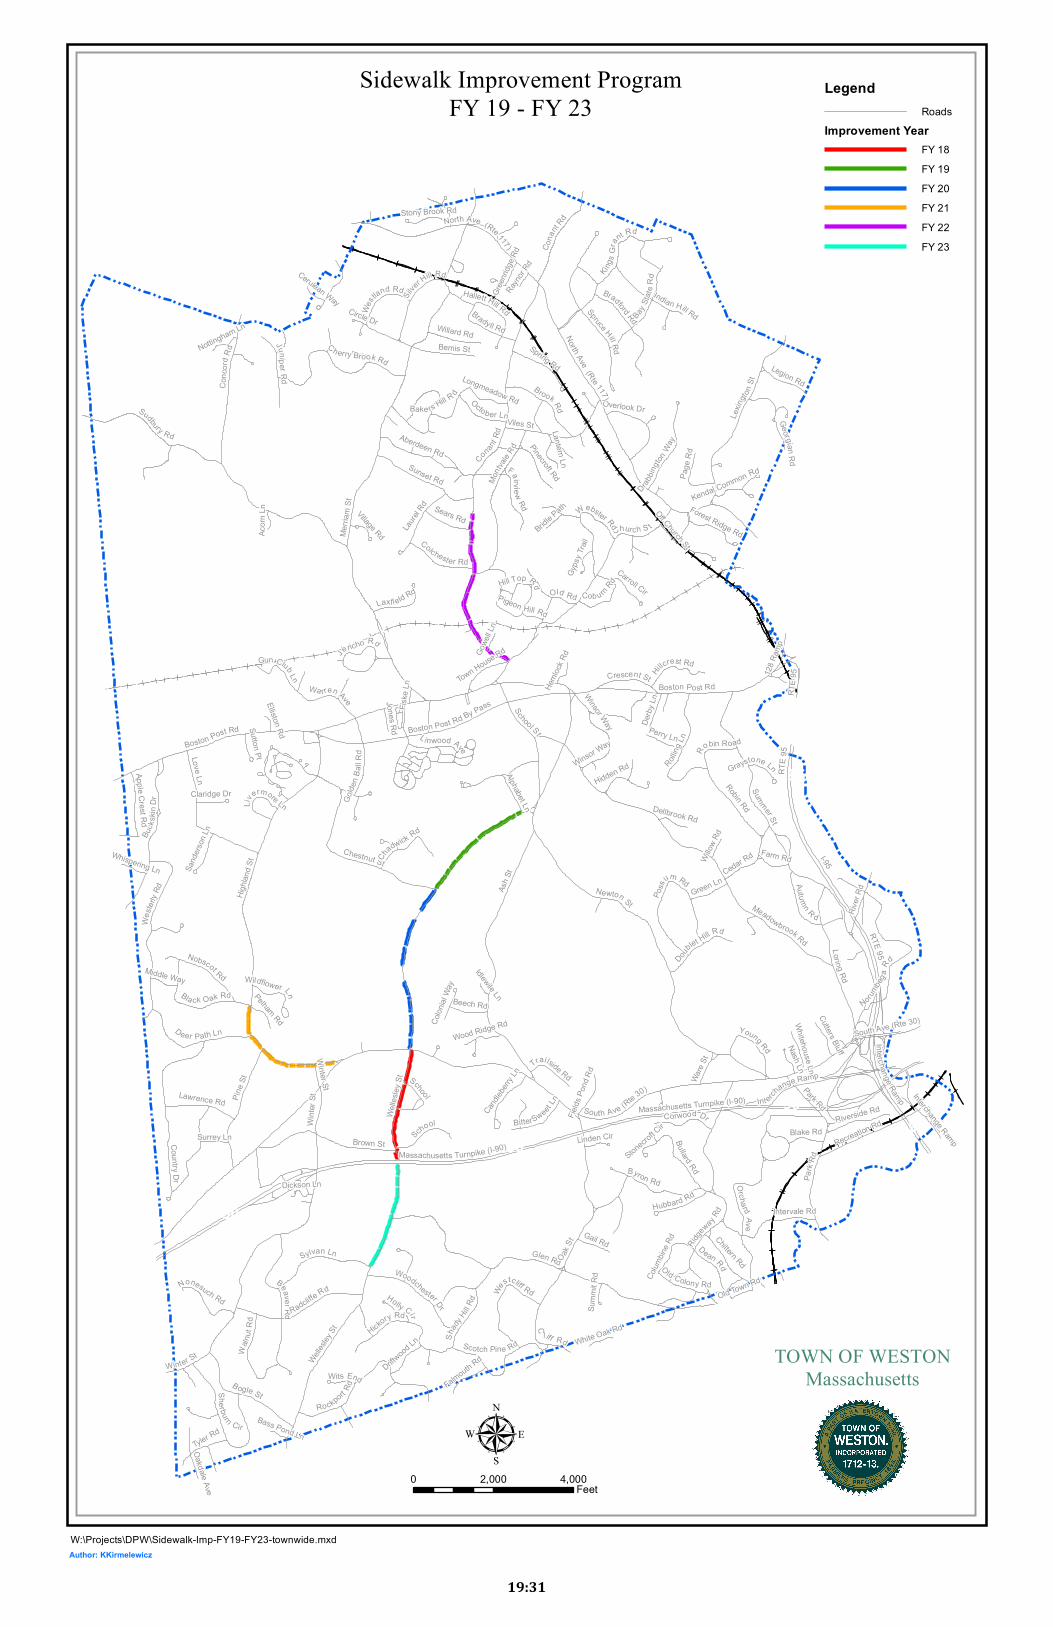
95
9590
90
90
I-95
Glen Rd
Ash S
t
South Ave (Rte 30)
Newton St
RTE 9
5
Merria
m St
Winter St
Welle
sley S
t
Highla
nd St
Con c
ordR d
OakSt
Church S t
River
Rd
Pine S
t
Ridgew
ay Rd
Love Ln
Brown St
Loring Rd
Lexin
gton S
t
Country Dr
Boston Post Rd
B ogle St
Summer St
Viles St
BeaverRd
Weste
rlyRd
School St
Sudbury Rd
Chestnut St
Byron Rd Orcha rd Ave
Montv
aleRd
North Ave (Rte 117)
C
l iff Rd
Park
Rd
Boston Post Rd By Pass
RadcliffeRd
Rockport Rd
Sunset Rd
Sylvan Ln
Cona
nt Rd
Robin Rd
Dean Rd
Hickory Rd
Brook Rd
Massachusetts Turnpike (I-90)
Bullard Rd
School
Buck
ski n
D r
Recreation Rd
Bradford Rd
Rolling
Ln
D eer Path Ln
Norumbeg
aR
d
Meadowbrook Rd
Cherry Brook Rd
Kings G
rant Rd
Laurel
Rd
BaySta
teRd
Int erchange Ramp
Bemis St
Nobscot Rd
Juniper R d
Woodchester Dr
Shady
Hill Rd
Aberdeen Rd
Bla ck Oak Rd
Scotch Pine Rd
Spring Rd
Fairv iew Rd
Wa rren Ave
Tyler Rd
Silv
er Hill Rd
Bake rs Hill R d
L inwood AveOld Rd
Spruce Hill Rd
Chiltern Rd
Autumn R d
Lawrence Rd
Waln
utR d
Bradyll Rd
Crescent St
Willard Rd
Sears Rd
Drabbin
gton Way
Golde
n Ba ll
Rd
Hallett Hill Rd
GeorgianRd
October Ln
Riverside Rd
Colchester Rd
Corwood Dr
Poss
um Rd
Winsor Way
Hillcrest RdDoub
let Hill Rd
Gail Rd
Perry Ln
Legion Rd
She rburn Cir
Hubbard Rd
Green Ln
Apple Crest Rd
Young Rd
Laxfi eld Rd
Nonesuch Rd
Oakdale Ave
Page
Rd
Westcliff Rd
Pinecroft Rd
Derby
Ln
Cedar Rd
BitterSweet Ln
Beech Rd
Blake Rd
Ch
adwick Rd
Indian Hill Rd
Old Colony Rd
Westla
nd Rd
Holly Cir
Webster Rd
Pigeon Hill Rd
Trailside Rd
Carroll Cir
Candleb
erry L
n
Intervale Rd
Ware
St
Lantern Ln
Driftwood
Ln
Falmouth Rd
Alphabet Ln
Gun Club Ln
Farm Rd
Robin Road
Forest Ridge Rd
Cutters Bluff
Jericho Rd
Hill Top Rd
Cob u rn Rd
Surrey Ln
Nash Ln
Town House Rd
Sand
erson
Ln
Fields
Pond
Rd
Whitehouse Ln
Overlook Dr
Wildflower Ln
Sutton Pl
Wits End
Pelham Rd
Stony Brook Rd
Claridge Dr
Longmeadow Rd
128 R
amp
Middle Way
Jones Rd
Wood Ridge Rd
Dellbrook Rd
Hidden Rd
Colon
ial Wa
y
Kendal Common Rd
Linden Cir
Acorn
Ln
Graystone Ln
Colum
bine R
d
Willow R
d
Gyps
y Trai
l
Liv
ermore Ln
Dickson Ln
Heml
ock Rd
Bridle Path
Gowe
ll Ln
Nottingham Ln
Off Church St
Whispering Ln
White Oak Rd
Gree
nridg
e Rd
Fiske
Ln
Old Town Rd
Summ
it Rd
Elliston Rd
Cerulean Way
Raynor R
d
Village Rd
Circle Dr
Bass Pond Ln
Idlewile Ln
Stonecroft Cir
Massachusetts Turnpike (I-90)
North Ave (Rte 117)
South Ave (Rte 30)
RTE 9
5
School Interchange Ramp
Inte rchange Ramp
Co
nantRd
RTE 95
Boston Post Rd
Winter St
Wellesle
y St
Park Rd
Winte
r St
Winsor Way
TOWN OF WESTONMassachusetts
µ0 2,000 4,000
Feet
Sidewalk Improvement ProgramFY 19 - FY 23
W:\Projects\DPW\Sidewalk-Imp-FY19-FY23-townwide.mxd
LegendRoads
Improvement YearFY 18FY 19FY 20FY 21FY 22FY 23
Author: KKirmelewicz
19:31

Capital Improvement Program – Chapter 19
19 : 32
If existing asset is being replaced
Project Title: Guardrail Improvement Plan Department: DPW Division: Highway Yr. Acquired Est. Value DispositionContact: Thomas Cullen, P.E. Notes: $ Prior Year(s) Requested: $50,000 Present Status of Project: OngoingDescription, Justification and Life Expectancy:
INSERT PHOTO HERE
Impact on Future Operating Budgets, and/or Impact on other Departments:
RECOMMENDED FINANCING PLAN Total Current Estimated Expenditures by Fiscal YearPrior Year Year FY FY FY FY FY Five Yr. TTL
Expenditures Expenditure 2019 2020 2021 2022 2023 FY19-23A. Planning, Design, Engineering - B. Land, ROW, Site Improvements - C. Construction - - 50,000 50,000 25,000 105,400 146,200 376,600 D. Equipment - E. Other Costs -
TOTAL $0 $0 $50,000 $50,000 $25,000 $105,400 $146,200 $376,600F. Est. Add'l Annual Maint. & Repair $0
T O W N M A N A G E R U S E O N L YRecommendation Next FY Amt. Funding Source: Priority Category (1-6):
APPROVED DEFERRED (1) G.O. Bond - G.F. (1) Correct threat to health and safetyDENIED TO FY____ $ (2) G.O. Bond - Ent. (2) Improve to avoid costly repair
(3) Cash / Dept. Ops. (3) Replace to maintain service levelsNOTES: (4) Meet legal requirement
(5) Improve productivity(6) Address overburdened situation
WESTON CAPITAL IMPROVEMENT PROGRAM - PROJECT REQUEST & FINANCING PLAN
The Guardrail Improvement Plan is intended to methodically install new guardrails in areas that have significant safety issues for vehicular traffic and/or to replace existing deteriorated guardrails in Town. The completed guardrail inventory and condition report shows the Town has a guardrail inventory of 5.5 miles in length and replacement value of approximately $1.2 million that are in varying states of age and condition. This program will systematically install or replace the roadside barriers according to parameters that will prioritize work based on the need for safety, the amount of vehicular and pedestrian traffic and existing guardrail conditions. The amount funded will over time begin to upkeep and maintain the Town's guardrail into a system of road barriers that is safer for our residents. The life expectancy of the typical guardrail is about 20-30 years. In FY14 the $50,000 guardrail appropriation resulted in the replacement of 2,700 linear feet of guardrail in various locations in Weston.
The long-term effects of a successful guardrail improvement program are that it will reduce the Town's liability from accidents and reduce the future inflationary price increases for guardrail as a result of waiting too long to repair them.
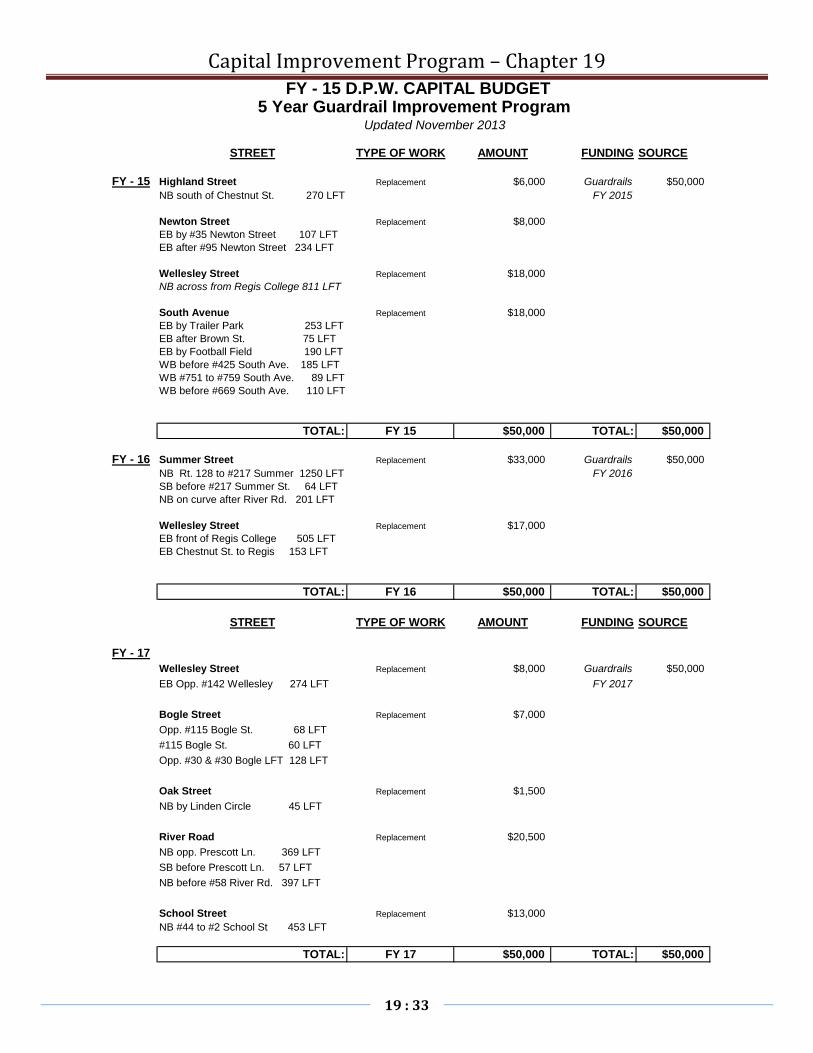
Capital Improvement Program – Chapter 19
19 : 33
FY - 15 D.P.W. CAPITAL BUDGET 5 Year Guardrail Improvement Program Updated November 2013
STREET TYPE OF WORK AMOUNT FUNDING SOURCE
FY - 15 Highland Street Replacement $6,000 Guardrails $50,000NB south of Chestnut St. 270 LFT FY 2015
Newton Street Replacement $8,000EB by #35 Newton Street 107 LFTEB after #95 Newton Street 234 LFT
Wellesley Street Replacement $18,000NB across from Regis College 811 LFT
South Avenue Replacement $18,000EB by Trailer Park 253 LFTEB after Brown St. 75 LFTEB by Football Field 190 LFTWB before #425 South Ave. 185 LFTWB #751 to #759 South Ave. 89 LFTWB before #669 South Ave. 110 LFT
TOTAL: FY 15 $50,000 TOTAL: $50,000
FY - 16 Summer Street Replacement $33,000 Guardrails $50,000NB Rt. 128 to #217 Summer 1250 LFT FY 2016SB before #217 Summer St. 64 LFTNB on curve after River Rd. 201 LFT
Wellesley Street Replacement $17,000EB front of Regis College 505 LFTEB Chestnut St. to Regis 153 LFT
TOTAL: FY 16 $50,000 TOTAL: $50,000
STREET TYPE OF WORK AMOUNT FUNDING SOURCE
FY - 17Wellesley Street Replacement $8,000 Guardrails $50,000EB Opp. #142 Wellesley 274 LFT FY 2017
Bogle Street Replacement $7,000Opp. #115 Bogle St. 68 LFT#115 Bogle St. 60 LFTOpp. #30 & #30 Bogle LFT 128 LFT
Oak Street Replacement $1,500NB by Linden Circle 45 LFT
River Road Replacement $20,500NB opp. Prescott Ln. 369 LFTSB before Prescott Ln. 57 LFTNB before #58 River Rd. 397 LFT
School Street Replacement $13,000NB #44 to #2 School St 453 LFT
TOTAL: FY 17 $50,000 TOTAL: $50,000

Capital Improvement Program – Chapter 19
19 : 34
FY - 18Park Road Replacement $5,000 Guardrails $50,000NB by Bridge 104 LFT FY 2018SB after Intervale Rd. 75 LFT
Intervale Road Replacement $28,000EB @ Golf Course 858 LFTWB towards Park Rd 504 LFT
Merriam StreetSB #318 to #306 Merriam Street 280 LFT $8,000NB Opp. #318 Merriam Street 60 LFT
Church Street Replacement $9,000NB #73 Church to Coburn 219 LFT
TOTAL: FY 18 $50,000 TOTAL: $50,000
FY - 19 Merriam Street Replacement $8,000 Guardrails $16,000NB from #141 to # 149 Merriam 205 LFT FY 2019NB from #271 Merriam to RR Bridge 140 LFT
School Street Replacement $8,000NB from Rt. 20 to #2 School St. 218 LFT NB from #28 School to Rt. 20 120 LFT
TOTAL: FY 19 $16,000 TOTAL: $16,000
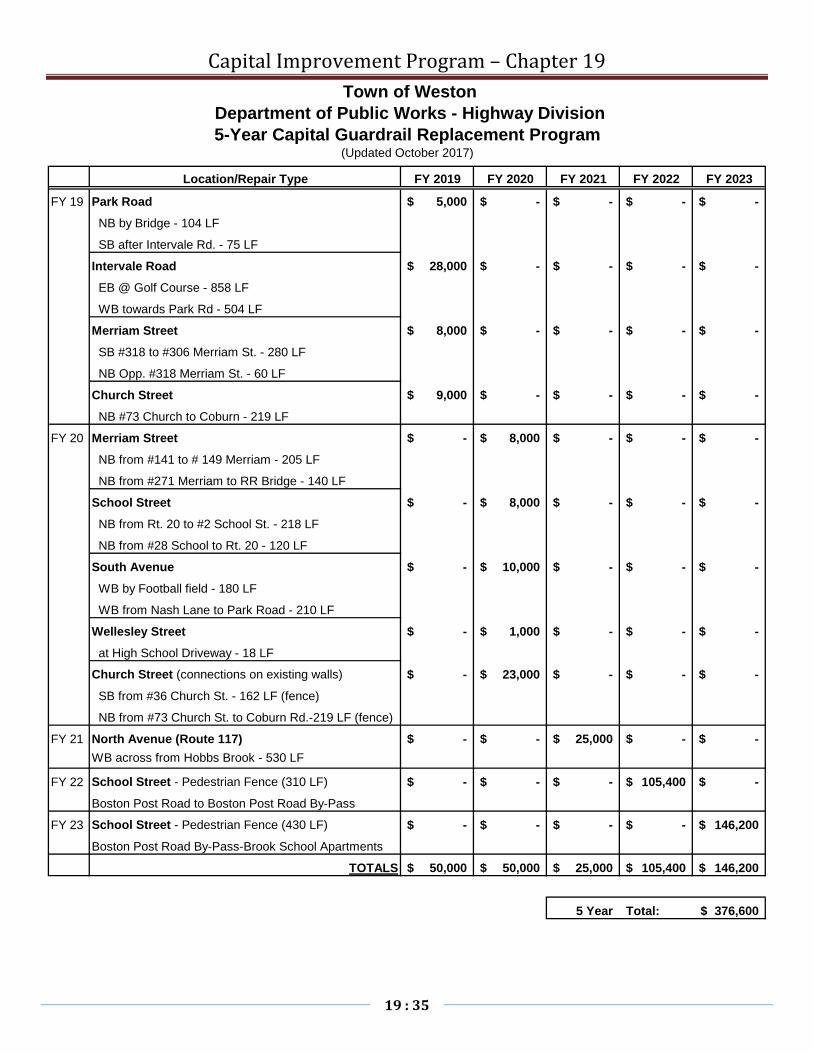
Capital Improvement Program – Chapter 19
19 : 35
Location/Repair Type FY 2019 FY 2020 FY 2021 FY 2022 FY 2023
FY 19 Park Road 5,000$ -$ -$ -$ -$
NB by Bridge - 104 LF
SB after Intervale Rd. - 75 LF
Intervale Road 28,000$ -$ -$ -$ -$
EB @ Golf Course - 858 LF
WB towards Park Rd - 504 LF
Merriam Street 8,000$ -$ -$ -$ -$
SB #318 to #306 Merriam St. - 280 LF
NB Opp. #318 Merriam St. - 60 LF
Church Street 9,000$ -$ -$ -$ -$
NB #73 Church to Coburn - 219 LF
FY 20 Merriam Street -$ 8,000$ -$ -$ -$
NB from #141 to # 149 Merriam - 205 LF
NB from #271 Merriam to RR Bridge - 140 LF
School Street -$ 8,000$ -$ -$ -$
NB from Rt. 20 to #2 School St. - 218 LF
NB from #28 School to Rt. 20 - 120 LF
South Avenue -$ 10,000$ -$ -$ -$
WB by Football field - 180 LF
WB from Nash Lane to Park Road - 210 LF
Wellesley Street -$ 1,000$ -$ -$ -$
at High School Driveway - 18 LF
Church Street (connections on existing walls) -$ 23,000$ -$ -$ -$
SB from #36 Church St. - 162 LF (fence)
NB from #73 Church St. to Coburn Rd.-219 LF (fence)
FY 21 North Avenue (Route 117) -$ -$ 25,000$ -$ -$ WB across from Hobbs Brook - 530 LF
FY 22 School Street - Pedestrian Fence (310 LF) -$ -$ -$ 105,400$ -$
Boston Post Road to Boston Post Road By-Pass
FY 23 School Street - Pedestrian Fence (430 LF) -$ -$ -$ -$ 146,200$
Boston Post Road By-Pass-Brook School Apartments
TOTALS 50,000$ 50,000$ 25,000$ 105,400$ 146,200$
5 Year Total: 376,600$
Town of Weston Department of Public Works - Highway Division5-Year Capital Guardrail Replacement Program
(Updated October 2017)

!!
!!
!!
!!
!!
!!
!!
!!
!!
! !
! !
!!
!!
!!
!!
!!
!!
!!
!!
!!
!
!
!!
!!
!!
!!
!!
!!
!!
!!
!!
!!
!!
!!
!!
!!
!!
!!
!!
!!
!!
!!
!!
!!
!!
!!
!!
!
!
!!
!!
!
!
!
!
!
!
!
!
!!
!!
!!
!!
!
!
!!
!!
!!
!!
!
!
!
!
!
!
!!
!
!!
!!
!
!!
!
!
!
!
!
!
!!
!
!
!
!
!
!
!
!
!
!
!!
!!
!
!
!!
!!
!!
!
!
!!
!!
!!
!!
!!
!
!
!!
!!
!!
!!
! !
! !
! !
!!
!
!
!!
!!
!
!
!
!
!
!
!!
!
!
!!
!!
!!
!!
!!
!!
!!
!
!
!!
!!!
!
!!
!!
!!
!!
!!
!!
!!
!!
!!
!!
!!
!!
!!
!!
!!
!!
!!
!!
!!
!!
!!
!!
!!
!!
!!
!!
!!
!!
!!
!!
!!
!!
!!
!!
!!
!!
!!
!!
!!
!!
!!
!!
!!
!!
!!
!!
!!
!!
!!
!!
!!
!!
!!
!!
!!
!!
!!
!!
!!
!!
!!
!!
!!
!!
!!
!!
!!
!!
!!
!!
!!
!!
!!
!!
!!
!!
!!
!!
!!
!!
!!
!!
!!
!!
!!
!!
!!
!!
!!
!!
!!
!!
!!
!!
!!
!!
!!
!!
!!
!!
!!
!!
!!
!!
!!
!!
!!
!!
!!
!!
!!
!!
!!
!!
!!
!!
!!
!!
!!
!!
!!
!!
!!
!!
!!
!!
!!
!!
!!
!!
!!
!!
!!
!!
!!
!!
!!
!!
!!
!!
!!
!!
!!
!!
!!
!!
!!
!!
!!
!!
!!
!!
!!
!!
!!
!!
!!
!!
!!
!!
! !
!!
! !
!!
!!
!!
!!
!!
!!
!!
! !
!!
!!
!!
!!
!!
! !
!!
!!
!!
! !
!!
!!
!!
! !
!!
!!
!!
! !
I-95
Glen Rd
Ash S
t
South Ave (Rte 3
0)
Newton St
RTE 95
Merria
m St
Winter
St
Welle
sley S
t
Highla
nd St
Conc
ord R
d
Oak St
Church
St
River
Rd
Pine S
t
Ridge
way R
d
Love Ln
Brown St
Loring Rd
Lexin
gton S
t
Country Dr
Boston Post Rd
Bogle St
Summer St
Viles St
BeaverR d
Weste
rlyRd
Scho
ol St
Sudbury R d
Chestnut St
Byron R d
Orchard Ave
Montv
aleRd
North Ave (Rte 117)
Cliff Rd
Park
Rd
Boston Post Rd By Pass
RadcliffeRd
Rockport Rd
Sunset Rd
Sylvan Ln
Cona
nt Rd
Robin Rd
Dean Rd
Hicko ry Rd
Brook Rd
Massachusetts Turnpike (I-90)
Bulla rd Rd
School
Bucks
kinDr
Recreation Rd
Bradford Rd
Rolling
Ln
Deer P ath Ln
Norumbeg
aRd
Meadowbrook Rd
Che rry Brook Rd
K ings G
ra
nt Rd
Laure
l Rd
BaySta
teRd
OxbowRd
I nterch
ange Ramp
Bemis St
Nobscot R d
Jun iper Rd
Woodchester Dr
Shad
y Hill Rd
Aberdeen Rd
Black Oak Rd
Scotch Pine Rd
Spring Rd
Fai rvi ewRd
W arren Ave
Tyler Rd
Si lve
r Hill R
d
Bakers Hill R d
Linw ood Ave
Old Rd
Spruce Hil l Rd
Chiltern Rd
Autumn R d
Lawrence Rd
W
alnut Rd
Bradyll Rd
Crescent St
Willard Rd
Sears Rd
Drab
bingto
n Way
Golde
n Ba ll
R d
Hallett Hill Rd
Georgian Rd
Octob er Ln
Riverside Rd
Colchester Rd
Corwood Dr
Poss
um Rd
Winsor Way
Hillcrest Rd
Gail Rd
Perry Ln
Legion Rd
Sherburn C ir
Hubbard Rd
Doub
let Hill Rd
Green Ln
Apple Crest Rd
Young Rd
Laxfiel d Rd
None such R d
Oakdale Ave
Pag e Rd
Westcliff Rd
Pinecroft Rd
Myles
Stand
ishRd
Derby
Ln
Cedar Rd
BitterSweet Ln
Beech Rd
Blake Rd
Chadwick R d
Linco
ln St
Indian Hill Rd
Webster Rd
Old Colony Rd
Westland Rd
Ska ting Pond Rd
Holly Cir
Pig eon Hill Rd
Trailside Rd
Carroll Cir
Candleb
erry L
n
Intervale Rd
Ware
St
Driftwood L
n
Falmouth Rd
Maple Rd
Alphabet Ln
Gun Club Ln
Ripley Ln
F arm Rd
Robin Road
Forest Ridge Rd
Ledgewood Rd
Cutters Bluff
Jericho Rd
Hill Top RdCoburn Rd
Surrey Ln
Nash Ln
Town House Rd
Sanders
o nLn
Partr idge Hill R d
Saddle Hill Rd
Fields
Pond
R d
Whitehouse Ln
Overlook Dr
Wildflow er Ln
Hancock Rd
Sutton Pl
PelhamRd
B rent o n R d
Walker St
Stony Brook Rd
Claridge Dr
Longmeadow Rd
128 R
amp
Middle Way
Jones Rd
Highland Meadow Ln
Wood Ridge Rd
Dellbrook Rd
Hidd
en Rd
Colon
ial W
ayKendal Common Rd
Plymouth Rd
Locust Rd
Acorn
Ln
Tamarack Rd
Graystone Ln
Irving Rd
Colum
bine R
d
Willow R
d
Blueberry Hill Rd
Gyps
y Trai
l
Drumlin Rd
Liv
ermore Ln
Dic
k son Ln
Heml
ock R
d
Old Coach Rd
Gowe
ll Ln
Arrow
head Rd
Westgate Rd
Nottingham Ln
Off Church St
White Oak Rd
Gree
nridg
e Rd
Fiske
Ln
Blossom Ln
Summ
it Rd
Kingsbury Ln
Butto
nwoo
d Ln
Prescott Ln
Elliston Rd
Cerulean Way
Raynor
Rd
Village Rd
Harrington Ln
Circle Dr
Bass Pond Ln
Idlewile Ln
Stonecroft Cir
Boulder Rd
Winth
rop C
ir
Shaylor Ln
Fox Chase Ln
Rocky Ledge R
d
Melville Way
Sibley Rd
Interchange Ramp
Interchange Ramp
Massachusetts Turnpike (I-90)
North Ave (Rte 117)
North Ave(Rte 117)
Winte
r St
South Ave (Rte 30)
South Ave (Rte 3
0)
RTE 95
Meadowbrook Rd
School
Massachusetts Turnpike (I-90)
Interchange Ramp
Boston Post Rd
Wellesle
y St
W insor Way
Park Rd
Con antRd
Winter St
LegendRoads
Guardrail Improvement PlanFY 19FY 20FY 21FY22FY 23
µ
Guardrail Improvement ProgramFY 19 - FY 23
W:\Projects\DPW\Guardrail-FY19.mxd
0 2,000 4,000Feet
TOWN OF WESTONMassachusetts
Author: KKirmelewicz
19:36

Capital Improvement Program – Chapter 19
19 : 37
If existing asset is being replacedProject Title: Rte. 20@Wellesley St. Signal(Proposed TIP) Department: T&SC / DPW Division: Engineering Yr. Aquired Est. Value DispositionContact: Steve Fogg / Tom Cullen Notes: N/A $ Prior Year(s) Requested: -$ Present Status of Project: PlanningDescription, Justification and Life Expectancy:
INSERT PHOTO HERE
Impact on Future Operating Budgets, and/or Impact on other Departments:
RECOMMENDED FINANCING PLAN Total Current Estimated Expenditures by Fiscal YearPrior Year Year FY FY FY FY FY Five Yr. TTL
Expenditures Expenditure 2019 2020 2021 2022 2023 FY19-FY23A. Planning, Design, Engineering, Permitting 260,000$ 260,000$ B. Land, ROW, Site Improvements -$ C. Construction -$ D. Equipment -$ E. Other Costs -$
TOTAL -$ -$ 260,000$ -$ -$ $0 $0 260,000$ F. Est. Add'l Annual Maint. & Repair -$
T O W N M A N A G E R U S E O N L YRecommendation Next FY Amt. Funding Source: Priority Category (1-6):
APPROVED DEFERRED (1) G.O. Bond - G.F. (1) Correct threat to health and safetyDENIED TO FY____ $ (2) G.O. Bond - Ent. (2) Improve to avoid costly repair
(3) Cash / Dept. Ops. (3) Replace to maintain service levelsNOTES: (4) Meet legal requirement
(5) Improve productivity(6) Address overburdened situation
WESTON CAPITAL IMPROVEMENT PROGRAM - PROJECT REQUEST & FINANCING PLAN
The project scope includes planning and engineering services invovled in the design of intersection improvements and traffic control (proposed signal) for the intersection of Boston Post Road Bypass (Route 20), Wellesley Street, Winsor Way and Boston Post Road. The project goals will include reconstructing the intersection of Route 20 at Wellesely Street which will reduce the amount of pavement, simplify turning movements, alleviate congestion on the minor roadways, and reduce driver confusion (thereby reduce accident history). Simplifying the geometry of the intersection requires the relocation and introduction of a curve along Windsor Way, which can be accomplished within existing rights-of-way (ROW). The improvements include installation of a traffic signal and crosswalks across the east and north approaches to the intersection. As part of the Town’s long term vision, it is expected that the improvements made as part of this project can facilitate changes to traffic circulation and access in the town center and at the intersection of Route 20 and School Street, improving the overall operations through this congested area. This request is for funds for design, permitting, and construuction phase
i C t ti t ld b b b th M DOT Th j t h b b itt d t M DOT f
If accident history is improved by the project, then the number of responses required by emergency personnel will also be reduced. By reducing overall traffic congestion, the may be benefits relating to impacts on school bus routes.

Capital Improvement Program – Chapter 19
19 : 38
If existing asset is being replacedProject Title: Town Wide Capital Improvement Program Department: Facilities Division: Yr. Aquired Est. Value DispositionContact: Gary Jarobski Notes: $ Prior Year(s) Requested: Present Status of Project: OngoingDescription, Justification and Life Expectancy:
Impact on Future Operating Budgets, and/or Impact on other Departments:
RECOMMENDED FINANCING PLAN Total Current Estimated Expenditures by Fiscal YearPrior Year Year FY FY FY FY FY Five Yr. TTL
Expenditures Expenditure 2019 2020 2021 2022 2023 FY19-23A. Planning, Design, Engineering - B. Land, ROW, Site Improvements - C. Construction - D. Equipment - E. Other Costs 566,781 600,788 636,835 675,045 715,548 3,194,997
TOTAL $0 $566,781 $600,788 $636,835 $675,045 $715,548 $3,194,997F. Est. Add'l Annual Maint. & Repair
T O W N M A N A G E R U S E O N L YRecommendation Next FY Amt. Funding Source: Priority Category (1-6):
APPROVED DEFERRED (1) G.O. Bond - G.F. (1) Correct threat to health and safetyDENIED TO FY____ $ (2) G.O. Bond - Ent. (2) Improve to avoid costly repair
(3) Cash / Dept. Ops. (3) Replace to maintain service levelsNOTES: (4) Meet legal requirement
(5) Improve productivity(6) Address overburdened situation
WESTON CAPITAL IMPROVEMENT PROGRAM - PROJECT REQUEST & FINANCING PLAN
The program is used to maintain Town Buildings . A Capital Improvement Plan develops an anticipated plan on the replacement of small capital projects as equipment and building materials are at the end of their useful life cycle. The program also addresses unexpected failures to systems and equipment that arise.
The funding of this program assist Departments in maintenance and capital improvements for their individual buildings.

Capital Improvement Program – Chapter 19
19 : 39
If existing asset is being replacedProject Title: Equipment Replacement Department: Facilities Division: School Yr. Aquired Est. Value DispositionContact: Gary Jarobski Notes: Grounds Field and Snow Plow Truck $2,000 TradePrior Year(s) Requested: Present Status of Project:Description, Justification and Life Expectancy:
INSERT PHOTO HERE
Impact on Future Operating Budgets, and/or Impact on other Departments:
RECOMMENDED FINANCING PLAN Total Current Estimated Expenditures by Fiscal YearPrior Year Year FY FY FY FY FY Five Yr. TTL
Expenditures Expenditure 2019 2020 2021 2022 2023 FY19-23A. Planning, Design, Engineering - B. Land, ROW, Site Improvements - C. Construction - D. Equipment 46,000 46,000 E. Other Costs -
TOTAL $0 $0 $46,000 $0 $0 $0 $0 $46,000F. Est. Add'l Annual Maint. & Repair $0
T O W N M A N A G E R U S E O N L YRecommendation Next FY Amt. Funding Source: Priority Category (1-6):
APPROVED DEFERRED (1) G.O. Bond - G.F. (1) Correct threat to health and safetyDENIED TO FY____ $ (2) G.O. Bond - Ent. (2) Improve to avoid costly repair
(3) Cash / Dept. Ops. (3) Replace to maintain service levelsNOTES: (4) Meet legal requirement
(5) Improve productivity(6) Address overburdened situation
WESTON CAPITAL IMPROVEMENT PROGRAM - PROJECT REQUEST & FINANCING PLAN
Replacing 2008 Ford 250 Pickup with lift gate and 8 foot snow plow. The vehicle age and condition warrants replacement with similar truck with Plow for replacement. Vehicle shall be used for daily grounds operation and snow plowing for town and school properties.
Replacement of Truck will lessen burden of repairs by DPW and ensure a reliable plow truck for the school campuses.
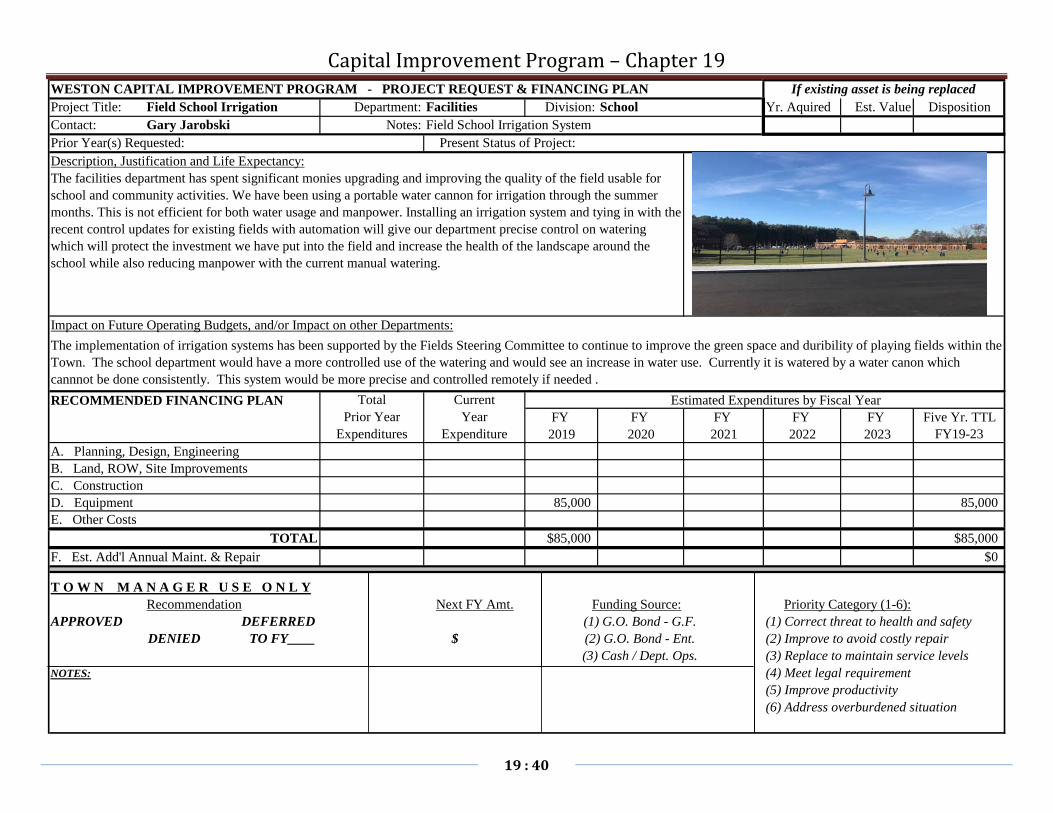
Capital Improvement Program – Chapter 19
19 : 40
If existing asset is being replacedProject Title: Field School Irrigation Department: Facilities Division: School Yr. Aquired Est. Value DispositionContact: Gary Jarobski Notes: Field School Irrigation System Prior Year(s) Requested: Present Status of Project:Description, Justification and Life Expectancy:
INSERT PHOTO HERE
Impact on Future Operating Budgets, and/or Impact on other Departments:
RECOMMENDED FINANCING PLAN Total Current Estimated Expenditures by Fiscal YearPrior Year Year FY FY FY FY FY Five Yr. TTL
Expenditures Expenditure 2019 2020 2021 2022 2023 FY19-23A. Planning, Design, Engineering - B. Land, ROW, Site Improvements - C. Construction - D. Equipment 85,000 85,000 E. Other Costs -
TOTAL $0 $0 $85,000 $0 $0 $0 $0 $85,000F. Est. Add'l Annual Maint. & Repair $0
T O W N M A N A G E R U S E O N L YRecommendation Next FY Amt. Funding Source: Priority Category (1-6):
APPROVED DEFERRED (1) G.O. Bond - G.F. (1) Correct threat to health and safetyDENIED TO FY____ $ (2) G.O. Bond - Ent. (2) Improve to avoid costly repair
(3) Cash / Dept. Ops. (3) Replace to maintain service levelsNOTES: (4) Meet legal requirement
(5) Improve productivity(6) Address overburdened situation
WESTON CAPITAL IMPROVEMENT PROGRAM - PROJECT REQUEST & FINANCING PLAN
The facilities department has spent significant monies upgrading and improving the quality of the field usable for school and community activities. We have been using a portable water cannon for irrigation through the summer months. This is not efficient for both water usage and manpower. Installing an irrigation system and tying in with the recent control updates for existing fields with automation will give our department precise control on watering which will protect the investment we have put into the field and increase the health of the landscape around the school while also reducing manpower with the current manual watering.
The implementation of irrigation systems has been supported by the Fields Steering Committee to continue to improve the green space and duribility of playing fields within the Town. The school department would have a more controlled use of the watering and would see an increase in water use. Currently it is watered by a water canon which cannnot be done consistently. This system would be more precise and controlled remotely if needed .

Capital Improvement Program – Chapter 19
19 : 41
If existing asset is being replacedProject Title: Vehicles, Equipment, Maint. Department: Police Division: Yr. Aquired Est. Value DispositionContact: Michael Goulding Notes: $ Prior Year(s) Requested: Present Status of Project:Description, Justification and Life Expectancy:
INSERT PHOTO HERE
Impact on Future Operating Budgets, and/or Impact on other Departments:
RECOMMENDED FINANCING PLAN Total Current Estimated Expenditures by Fiscal YearPrior Year Year FY FY FY FY FY Five Yr. TTL
Expenditures Expenditure 2019 2020 2021 2022 2023 FY19-23A. Planning, Design, Engineering - B. Land, ROW, Site Improvements - C. Construction - D. Equipment 150,000 150,000 150,000 150,000 150,000 750,000 E. Other Costs -
TOTAL $0 $0 $150,000 $150,000 $150,000 $150,000 $150,000 $750,000F. Est. Add'l Annual Maint. & Repair $0
T O W N M A N A G E R U S E O N L YRecommendation Next FY Amt. Funding Source: Priority Category (1-6):
APPROVED DEFERRED (1) G.O. Bond - G.F. (1) Correct threat to health and safetyDENIED TO FY____ $ (2) G.O. Bond - Ent. (2) Improve to avoid costly repair
(3) Cash / Dept. Ops. (3) Replace to maintain service levelsNOTES: (4) Meet legal requirement
(5) Improve productivity(6) Address overburdened situation
WESTON CAPITAL IMPROVEMENT PROGRAM - PROJECT REQUEST & FINANCING PLAN
This request is to replace 3 Police Cruisers- 2 marked and 1 unmarked for approximately $144,000. These purchases will allow the Police Department to fully eliminate the prior Dodge purchase and will streamline all parts and repairs to Ford Explorers. Approximately $5,000 is included for remediation and maintenance of the shooting range. Any remaining funds plus any amount left over from FY18 will be used to begin to replace portable radios currently being carried by the Weston Police Department were purchased in 2010 and have a life expectancy of approximately 7 years.
None

Capital Improvement Program – Chapter 19
19 : 42
If existing asset is being replacedProject Title: Equipment Replacement Department: FIRE Division: Yr. Aquired Est. Value DispositionContact: Notes: $ Prior Year(s) Requested: Present Status of Project:Description, Justification and Life Expectancy:
INSERT PHOTO HERE
Impact on Future Operating Budgets, and/or Impact on other Departments:
RECOMMENDED FINANCING PLAN Total Current Estimated Expenditures by Fiscal YearPrior Year Year FY FY FY FY FY Five Yr. TTL
Expenditures Expenditure 2019 2020 2021 2022 2023 FY19-23A. Planning, Design, Engineering - B. Land, ROW, Site Improvements - C. Construction - D. Equipment 20,000 20,000 E. Other Costs -
TOTAL $0 $0 $20,000 $0 $0 $0 $0 $20,000F. Est. Add'l Annual Maint. & Repair $0
T O W N M A N A G E R U S E O N L YRecommendation Next FY Amt. Funding Source: Priority Category (1-6):
APPROVED DEFERRED (1) G.O. Bond - G.F. (1) Correct threat to health and safetyDENIED TO FY____ $ (2) G.O. Bond - Ent. (2) Improve to avoid costly repair
(3) Cash / Dept. Ops. (3) Replace to maintain service levelsNOTES: (4) Meet legal requirement
(5) Improve productivity(6) Address overburdened situation
WESTON CAPITAL IMPROVEMENT PROGRAM - PROJECT REQUEST & FINANCING PLAN
Training Simulators, SCBA (thermal imaging cameras), station equipment

Capital Improvement Program – Chapter 19
19 : 43
If existing asset is being replacedProject Title: School Bus Replacement Department: School Dept. Division: Transportation Yr. Aquired Est. Value DispositionContact: Cynthia D. Mahr Notes: $1,500/each AuctionPrior Year(s) Requested: Present Status of Project: Funded in the School Department Operating BudgetDescription, Justification and Life Expectancy:
INSERT PHOTO HERE
Impact on Future Operating Budgets, and/or Impact on other Departments:
RECOMMENDED FINANCING PLAN Total Current Estimated Expenditures by Fiscal YearPrior Year Year FY FY FY FY FY Five Yr. TTL
Expenditures Expenditure 2019 2020 2021 2022 2023 FY19-23A. Planning, Design, Engineering - B. Land, ROW, Site Improvements - C. Construction - D. Equipment 227,991 192,746 225,182 229,686 234,280 238,965 243,745 1,171,858 E. Other Costs -
TOTAL $227,991 $192,746 $225,182 $229,686 $234,280 $238,965 $243,745 $1,171,858F. Est. Add'l Annual Maint. & Repair $0
T O W N M A N A G E R U S E O N L YRecommendation Next FY Amt. Funding Source: Priority Category (1-6):
APPROVED DEFERRED (1) G.O. Bond - G.F. (1) Correct threat to health and safetyDENIED TO FY____ $ (2) G.O. Bond - Ent. (2) Improve to avoid costly repair
(3) Cash / Dept. Ops. (3) Replace to maintain service levelsNOTES: (4) Meet legal requirement
(5) Improve productivity(6) Address overburdened situation
WESTON CAPITAL IMPROVEMENT PROGRAM - PROJECT REQUEST & FINANCING PLAN
Weston Public Schools owns and operates our own school buses for in-town, METCO, field trips and athletic events. The replacment schedule is based on three attributes: age (10 or more years old); mileage (100,000 or more miles); and repair that are considered unjustified in terms of the expected life after the repair. In FY'19, we anticipate replacing three 71-passenger vehicles. In FY'20 - FY'23, the projection includes three 71-passenger vehicles annually.
Bus maintenance is done through the Weston Department of Public Works (DPW). By maintaining a regular replacement schedule, the financial impact on the DPW should be lessened.
Capital Improvement Program – Chapter 19
19 : 44
If existing asset is being replacedProject Title: Water Hydrant Rehab Program Department: DPW Division: Water Division Yr. Acquired Est. Value DispositionContact: Thomas Cullen Notes: 1950s $50,000Prior Year(s) Requested: FY18 Present Status of Project: N / ADescription, Justification and Life Expectancy:
INSERT PHOTO HERE
Impact on Future Operating Budgets, and/or Impact on other Departments:
RECOMMENDED FINANCING PLAN Total Current Estimated Expenditures by Fiscal YearPrior Year Year FY FY FY FY FY Five Yr. TTL
Expenditures Expenditure 2019 2020 2021 2022 2023 FY19-23A. Planning, Design, Engineering - B. Land, ROW, Site Improvements - C. Construction -$ $50,000 $50,000 $50,000 $50,000 $50,000 $50,000 250,000 D. Equipment - E. Other Costs -
TOTAL $0 $50,000 $50,000 $50,000 $50,000 $50,000 $50,000 $250,000F. Est. Add'l Annual Maint. & Repair $0
T O W N M A N A G E R U S E O N L YRecommendation Next FY Amt. Funding Source: Priority Category (1-6):
APPROVED DEFERRED (1) G.O. Bond - G.F. (1) Correct threat to health and safetyDENIED TO FY____ $ (2) G.O. Bond - Ent. (2) Improve to avoid costly repair
(3) Cash / Dept. Ops. (3) Replace to maintain service levelsNOTES: (4) Meet legal requirement
(5) Improve productivity(6) Address overburdened situation
WESTON CAPITAL IMPROVEMENT PROGRAM - PROJECT REQUEST & FINANCING PLAN
This is the third year of the Water Hydrant Rehabilitation Program. The program is intended to methodically rehabilitate or replace hydrants that are at the end of their service life, typically 50 years with annual maintenance. The Water Division operates 955 hydrants throughout the water distribution system. The majority of the hydrants were installed in the 1930's to the late 1960's. There are currently no hydrants out-of service, there are numerous hydrants that are difficult to open or are placed too low to ground. The Water Superintent continues to work with the Fire Chief in determining the priority hydrant replacements. The project for FY 2019 will replace six hydrants.
Postponing the scheduled replacement of these hydrants will impact the fire prevention system, emergency response times, and in some instance impact the water distribution flushing program.
Capital Improvement Program – Chapter 19
19 : 45
If existing asset is being replacedProject Title: Water Distribution Master Plan Department: DPW Division: Water Division Yr. Acquired Est. Value DispositionContact: Thomas Cullen Notes: N / APrior Year(s) Requested: N / A Present Status of Project: N / ADescription, Justification and Life Expectancy:
INSERT PHOTO HERE
Impact on Future Operating Budgets, and/or Impact on other Departments:
RECOMMENDED FINANCING PLAN Total Current Estimated Expenditures by Fiscal YearPrior Year Year FY FY FY FY FY Five Yr. TTL
Expenditures Expenditure 2019 2020 2021 2022 2023 FY19-23A. Planning, Design, Engineering 59,850 59,850 B. Land, ROW, Site Improvements - C. Construction -$ $0 $0 $0 $0 $0 $0 - D. Equipment - E. Other Costs -
TOTAL $0 $0 $59,850 $0 $0 $0 $0 $59,850F. Est. Add'l Annual Maint. & Repair $0 $0 $0 $0 $0
T O W N M A N A G E R U S E O N L YRecommendation Next FY Amt. Funding Source: Priority Category (1-6):
APPROVED DEFERRED (1) G.O. Bond - G.F. (1) Correct threat to health and safetyDENIED TO FY____ $ (2) G.O. Bond - Ent. (2) Improve to avoid costly repair
(3) Cash / Dept. Ops. (3) Replace to maintain service levelsNOTES: (4) Meet legal requirement
(5) Improve productivity(6) Address overburdened situation
WESTON CAPITAL IMPROVEMENT PROGRAM - PROJECT REQUEST & FINANCING PLAN
The purpose of this project is to master plan the Town's water distribution system rehabilitation and/or replacements including piping, gates, tanks, high pressure and low pressure zones. This master plan will be a definitive plan so the administration can plan (funding wise) properly. As the infrastructure ages, I want the Town to have a short term (5-Year) capital plan, a mid term (10-year) capital plan, and a long term (20 + year) capital plan. The first part of this work is to have a working hydraulic model of the distribution system and coordinate those efforts with the MWRA. The next step off that model to evaluate the water system (e.g. low and high pressure zones and what corrective actions can be taken and what are those consequences), and then develop the short term to long term capital plans which will be the roadmap for the future.
Short term impacts for this project will be minimal to budgets. The mid and long term capital plans will have impacts to the budget due to the capital investments that may be necessary such as significant rehabilitaiton and/or replacement costs for water tanks, etc.

Capital Improvement Program – Chapter 19
19 : 46
If existing asset is being replacedProject Title: Continuing Repairs & Replacements Department: Brook School Apts Division: Yr. Aquired Est. Value DispositionContact: Sara Dosamantes Notes: $ Prior Year(s) Requested: Present Status of Project: Description, Justification and Life Expectancy:
Impact on Future Operating Budgets, and/or Impact on other Departments:
RECOMMENDED FINANCING PLAN Total Current Estimated Expenditures by Fiscal YearPrior Year Year FY FY FY FY FY Five Yr. TTL
Expenditures Expenditure 2019 2020 2021 2022 2023 FY19-23A. Planning, Design, Engineering - B. Land, ROW, Site Improvements - C. Construction - D. Equipment - E. All Costs 138,460 146,768 155,574 164,908 174,802 185,291 196,408 876,983
TOTAL $138,460 $146,768 $155,574 $164,908 $174,802 $185,291 $196,408 $876,983F. Est. Add'l Annual Maint. & Repair $0
T O W N M A N A G E R U S E O N L YRecommendation Next FY Amt. Funding Source: Priority Category (1-6):
APPROVED DEFERRED (1) G.O. Bond - G.F. (1) Correct threat to health and safetyDENIED TO FY____ $ (2) G.O. Bond - Ent. (2) Improve to avoid costly repair
(3) Cash / Dept. Ops. (3) Replace to maintain service levelsNOTES: (4) Meet legal requirement
(5) Improve productivity(6) Address overburdened situation
WESTON CAPITAL IMPROVEMENT PROGRAM - PROJECT REQUEST & FINANCING PLAN
This is an on-going contribution to the Continuing Repairs and Replacement Account. The pro-forma for the expansion provided that there would be an annual increase in the contribution level to accommodate the needs of the buildings.
This request will be ongoing with an annual increase in contribution levels which is reflected below.

Capital Improvement Program – Chapter 19
19 : 47
If existing asset is being replacedProject Title: Ongoing capital fund Department: Brook School Apts Division: Yr. Aquired Est. Value DispositionContact: Sara Dosamantes Notes: $ Prior Year(s) Requested: Present Status of Project: Description, Justification and Life Expectancy:
Impact on Future Operating Budgets, and/or Impact on other Departments:
RECOMMENDED FINANCING PLAN Total Current Estimated Expenditures by Fiscal YearPrior Year Year FY FY FY FY FY Five Yr. TTL
Expenditures Expenditure 2019 2020 2021 2022 2023 FY19-23A. Planning, Design, Engineering - B. Land, ROW, Site Improvements - C. Construction - D. Equipment - E. All Costs 100,000 100,000 140,000 100,000 100,000 100,000 100,000 540,000
TOTAL $100,000 $100,000 $140,000 $100,000 $100,000 $100,000 $100,000 $540,000F. Est. Add'l Annual Maint. & Repair $0
T O W N M A N A G E R U S E O N L YRecommendation Next FY Amt. Funding Source: Priority Category (1-6):
APPROVED DEFERRED (1) G.O. Bond - G.F. (1) Correct threat to health and safetyDENIED TO FY____ $ (2) G.O. Bond - Ent. (2) Improve to avoid costly repair
(3) Cash / Dept. Ops. (3) Replace to maintain service levelsNOTES: (4) Meet legal requirement
(5) Improve productivity(6) Address overburdened situation
WESTON CAPITAL IMPROVEMENT PROGRAM - PROJECT REQUEST & FINANCING PLAN
This Fund is reserved for various larger capital improvements to the buildings.
The funding of this account is based upon the cash reserves from the retained earnings account.

Capital Improvement Program – Chapter 19
19 : 48
TABLE III: FY2019 RECOMMENDED PROJECTS - WATER DEBT
AMOUNT DEBT SERV. EST. BAN EST. BONDPROJECT FINANCED YEARS INT. RATE INT. RATE FY2018 FY2019* FY2020 FY2021 FY2022 FY2023
19-1 Water Main Rehab Program 365,000 30 2.00% 4.25% - 7,300 28,099 27,564 27,029
PROJ. REVENUE (WATER) SUPPORTED DEBT SERV. 365,000 - 7,300 28,099 27,564 27,029
APPROVED REVENUE SUPPPORTED DEBT SERV. FY2018 FY2019* FY2020 FY2021 FY2022 FY2023
Subtotal Approved and Issued Revenue Supported Debt Service 537,947 519,852 447,144 429,659 424,124 411,454 Subtotal Approved and Unissued Revenue Supported Debt Service 14,138 63,755 142,845 154,427 156,695 161,700
Summary Approved Revenue Supported Debt Service 552,084 583,607 589,990 584,087 580,819 573,154 Subtotal Projected New Revenue Supported Debt Service - - 7,300 28,099 27,564 27,029 TOTAL PROPOSED REVENUE SUPPORTED DEBT SERVICE 552,084 583,607 597,290 612,185 608,383 600,183

Capital Improvement Program – Chapter 19
19 : 49
If existing asset is being replacedProject Title: Water Main Rehab Program Department: DPW Division: Water Division Yr. Acquired Est. Value DispositionContact: Thomas Cullen Notes: 1962 $365,000Prior Year(s) Requested: $271,000 Present Status of Project: OngoingDescription, Justification and Life Expectancy:
INSERT PHOTO HERE
Impact on Future Operating Budgets, and/or Impact on other Departments:
RECOMMENDED FINANCING PLAN Total Current Estimated Expenditures by Fiscal YearPrior Year Year FY FY FY FY FY Five Yr. TTL
Expenditures Expenditure 2019 2020 2021 2022 2023 FY19-23A. Planning, Design, Engineering - B. Land, ROW, Site Improvements - C. Construction 140,000$ $271,000 $365,000 $199,000 $124,400 $367,400 $196,000 1,251,800 D. Equipment - E. Other Costs -
TOTAL $140,000 $271,000 $365,000 $199,000 $124,400 $367,400 $196,000 $1,251,800F. Est. Add'l Annual Maint. & Repair $0
T O W N M A N A G E R U S E O N L YRecommendation Next FY Amt. Funding Source: Priority Category (1-6):
APPROVED DEFERRED (1) G.O. Bond - G.F. (1) Correct threat to health and safetyDENIED TO FY____ $ (2) G.O. Bond - Ent. (2) Improve to avoid costly repair
(3) Cash / Dept. Ops. (3) Replace to maintain service levelsNOTES: (4) Meet legal requirement
(5) Improve productivity(6) Address overburdened situation
WESTON CAPITAL IMPROVEMENT PROGRAM - PROJECT REQUEST & FINANCING PLAN
The Water Main Rehabilitation Program has been designed to replace the distribution systems older water mains that have exceeded their expected life spans. The Water Division is now focused on replacing all asbestos cement (transite) water mains in the water system and cast iron water mains that have an excessive amount of water leaks over their life span. The transite mains are no longer used in water transmission service because of their material content and are considered to be classified as hazardous material when removed from the ground and thus, need to be disposed of accordingly. Transite mains however are safe for the distribution of drinking water to our residents. The only way to address the concerns of these aged pipes is to replace them. The project for FY 2019 is for the proposed replacement of 1778 feet of transite water main on Chiltern Road that was installed in 1962. The engineering design for this project will be completed in house by the Town Engineer office.
Postponing the scheduled replacement of these old and outdated water distribution lines can impact the operating budgets by necessitating overtime costs for dirty water complaints and other water quality issues. Older types of water mains are more susceptible to leakage, bacteria and turbidity problems.

95
9590
90
90
I-95
Glen Rd
Ash S
t
South Ave (Rte 3
0)
Newton St RTE 95
Merria
m St
Winter
StHig
hland
St
Conc
ord R
d
Welle
sley S
t
Oak St
Church
St
River
Rd
Pine S
t
Ridge
way R
d
Love Ln
Brown St
Loring Rd
Lexin
gton S
t
Country Dr
Boston Post Rd
Bogle St
Summ
er St
Viles St
Beav
er Rd
Weste
rly R
d
Scho
ol St
Sudbury Rd
Chestnut St
Byron Rd
Orch
ard Av
e
North Ave (Rte 117)
Montval
e Rd
Cliff R
d
Park
Rd
Boston Post Rd By Pass
Radcliffe Rd
Rockport Rd
Sunset Rd
Sylvan Ln
Conant R
d
Robin Rd
Dean Rd
Hickory Rd
Brook Rd
Massachusetts Turnpike (I-90) Bullard Rd
School
Bucks
kin Dr
Recreation Rd
Bradford Rd
Rollin
g Ln
Deer Path Ln
Norum
bega
Rd
Meadowbrook Rd
Cherry Brook Rd
Kings G
rant R
d
Laure
l Rd
Interchange Ramp
Bay S
tate R
d
Oxbo
w Rd
Bemis St
Nobscot Rd
Juniper Rd
Woodchester Dr
Shady
Hill Rd
Aberdeen Rd
Black
Oak
Rd
Warren Ave
Scotch Pine Rd
Spring Rd
Fairview Rd
Tyler Rd
Silve
r Hill
RdBakers Hill Rd
Linwood Ave
Old R
d
Spruce Hill Rd
Chiltern Rd
Autumn Rd
Walnut Rd
Lawrence Rd
Bradyll Rd
Crescent St
Willard Rd
Sears Rd
Drabb
ington
Way
Golde
n Ball
Rd
Hallett Hill RdGeorgian Rd
October Ln
Riverside Rd
Winsor Way
Colchester Rd
Corwood Dr
Poss
um R
d
Hillcrest
Rd
Gail Rd
Perry Ln
Legion Rd
Sherburn Cir
Hubbard Rd
Doublet Hill Rd
Young Rd
Green Ln
Apple Crest Rd
Laxfield Rd
Oakdale Ave
Nonesuch Rd
Westcliff Rd
Page
Rd
Pinecroft Rd
Myles
Stan
dish R
d
Derby
Ln
Cedar Rd
BitterSweet Ln
Beech Rd
Blake Rd
Chadwick Rd
Linco
ln St
Indian Hill Rd
Webster Rd
Old Colony Rd
Westl
and R
d
Holly Cir
Pigeon Hill Rd
Trailside Rd
Carroll Cir
Candleb
erry L
n
Intervale Rd
Ware
St
Lantern Ln
Driftwood L
n
Falmouth Rd
Maple Rd
Alphabet Ln
Gun Club Ln
Hobb
s Broo
k Rd
Ripley Ln
Farm Rd
Robin Road
Forest Ridge Rd
Cutters Bluff
Ledgewood Rd
Jericho Rd
Colpi
tts R
d
Surrey Ln
Town House Rd
Nash Ln
Sand
erson
Ln
Partridge Hill Rd
Saddle Hill Rd
Fields
Pond
Rd
Whitehouse Ln
Overlook Dr
Wildflower Ln
Hancock Rd
Sutton Pl
Hawt
horne
Ln
Wits End
Old North Ave
Walker St
Pelham Rd
Round Hill RdStony Brook Rd
Claridge Dr
128 R
amp
Highland Meadow Ln
Audubon Rd
Wood Ridge Rd
Dellbrook Rd
Aspen Rd
Eliot Ln
Hidden
Rd
Colon
ial W
ay
Kendal Common Rd
Tamarack Rd
Acorn
Ln
Graystone Ln
Irving Rd
Colum
bine R
d
Willow R
d
Whitney Tave
rn Rd
Gyps
y Trai
l
Drumlin Rd
Livermore Ln
Greyloc
k Rd
Dickson Ln
Heml
ock R
d
Old Coach Rd
Gowe
ll Ln
Nottingham Ln
White Oak Rd
Gree
nridg
e Rd
Fiske
Ln
Summ
it Rd
Kingsbury Ln
Dogw
ood R
d
Butto
nwoo
d Ln
Prescott Ln
Elliston Rd
Briar
Ln
Cerulean Way
Raynor
Rd
Village Rd
Harrington Ln
Hastings Rd
Bass Pond Ln
Idlewile Ln
Stonecroft Cir
Ceda
r Roa
d
Winth
rop C
ir
Center St
Shaylor Ln
Phea
sant
Trail
Fox Chase Ln
Melville Way
Rocky Ledge R
d
Sibley Rd
Granison Rd
Kettle
Ln
French Rd
South Ave (Rte 30)
Massachusetts Turnpike (I-90)
North Ave (Rte 117)
Interchange Ramp
RTE 95
Winte
r St
Meadowbrook Rd
Interchange Ramp
Interc
hang
e Ram
p
South Ave (Rte 3
0)
Boston Post Rd
Interchange Ramp
Massachusetts Turnpike (I-90)
Wellesle
y St
Winsor Way
North Ave (Rte 117)
RTE 95
School
Park Rd
Cona
nt Rd
Winter St
TOWN OF WESTONMassachusetts
µ
LegendRoads
Water Main Rehabilitation ProgramFY19FY20FY21FY22FY23Future Projects
0 2,000 4,000Feet
5 Year Water Main Rehabilitation ProgramFY 19 - FY 23
W:\Projects\DPW\WaterMainImp-FY19.mxd
19:50

Capital Improvement Program – Chapter 19
19 : 51
TABLE IV: FY2019 RECOMMENDED PROJECTS - BROOK SCHOOL APARTMENTS DEBT
AMOUNT DEBT SERV. EST. BAN EST. BONDPROJECT FINANCED YEARS INT. RATE INT. RATE FY2018 FY2019* FY2020 FY2021 FY2022 FY2023
None recommended at this time
PROJ. REVENUE SUPPORTED DEBT SERV.(BROOK SCHOOL APTS) - - - - -
APPROVED REVENUE SUPPPORTED DEBT SERV. FY2018 FY2019 FY2020 FY2021 FY2022 FY2023
Subtotal Approved and Issued Revenue Supported Debt Service 273,773 265,133 256,567 247,873 239,353 231,398 Subtotal Approved and Unissued Revenue Supported Debt Service - - - - - -
Summary Approved Revenue Supported Debt Service 273,773 265,133 256,567 247,873 239,353 231,398 Subtotal Projected New Revenue Supported Debt Service - - - - - - TOTAL PROPOSED REVENUE SUPPORTED DEBT SERVICE 273,773 265,133 256,567 247,873 239,353 231,398

Capital Improvement Program – Chapter 19
19 : 52
TABLE V: FY2019 RECOMMENDED PROJECTS - FUNDING THROUGH COMMUNITY PRESERVATION ACT
AMOUNT DEBT SERV. EST. BAN EST. BONDPROJECT FINANCED YEARS INT. RATE INT. RATE FY2018 FY2019* FY2020 FY2021 FY2022 FY2023
None recommended at this time - - - - - -
PROJ. NEW CPASUPPORTED DEBT SERVICE - - - - - -
APPROVED CPA DEBT SERVICE FY2018 FY2019 FY2020 FY2021 FY2021 FY2022
Subtotal Approved and Issued CPA Supported Debt Service 379,751 370,681 358,206 346,751 336,376 324,876
Subtotal Approved and Unissued CPA Debt Service - 54,000 90,000 260,750 376,075 368,025
Summary Approved CPA Debt Service 379,751 424,681 448,206 607,501 712,451 692,901 Subtotal Projected CPA Debt Service - - - - - - TOTAL PROPOSED CPA DEBT SERVICE 379,751 424,681 448,206 607,501 712,451 692,901

Capital Improvement Program – Chapter 19
19 : 53
Town of Weston FY19 Town Manager’s Proposed Budget
CAPITAL REQUESTS: 5 Year Capital Plan, FY2019 – FY2023 The following table shows the current five year plan for capital expenditures that exceed $25,000. Projects with an amount appearing in the FY2019 column are recommended in the FY2019 Town Manager’s Proposed Budget. Projects shown with amounts in the FY2020 – FY2023 columns are for planning purposes only and do not represent the Town Manager’s recommendation for funding in future years. Department of Public Works There are certain annual costs required to maintain the Town’s public works infrastructure, including roadway reconstruction, drainage rehabilitation, sidewalk maintenance and reconstruction, and replacement of departmental equipment. To the extent possible, these annual costs are being moved into the operating budget rather than financing through debt. The Town Center Improvement Plan, including the option of burying utilities in the town center, is also included in FY19. Costs related to the water distribution system, such as water main replacement, storage tank maintenance, and equipment replacement, are budgeted in the Water Enterprise Fund. Facilities Town-Wide The Facilities Director has developed a capital maintenance plan for all municipal and school buildings. Projects that cost less than $25,000 are included in the Facilities Improvements - Town-Wide account. More significant expenditures are listed separately in the 5 Year Capital Plan. Improvements related to energy savings as required by the Green Communities program are currently being handled in this account. Irrigation improvements and equipment replacements are included in FY19. Fire Department Fire equipment varies greatly in size and cost, which makes it difficult to allocate a consistent annual amount for capital purchases. Fire pumpers should generally be replaced every 5 years. The Fire Department has two first response pumpers and two backup pumpers. One pumper truck is included for replacement in FY19. Ambulances should generally be replaced every 5 years due to the mileage driven. The Town operates two ambulances. The Department’s Ladder Truck should last for at least 15-20 years. Police Department The Police Department replaces two - three cruisers each year. When a cruiser is replaced, it becomes an unmarked car and is used for other purposes. Communication and other equipment are also included in this category.

Capital Improvement Program – Chapter 19
19 : 54
School Department A certain number of school buses must be replaced each year. In addition, non-facilities School projects are included in this category. Construction funds for the Case House Renovation and Rehabilitation are included in FY19. Brook School Apartments An amount for ongoing repairs and replacements, required by HUD, is included annually. In addition, a capital improvements fund has been established to handle larger capital projects for these buildings.

Capital Improvement Program – Chapter 19
19 : 55
SUMMARY 5 YEAR CIP - Recommended, Deferred and Future
FY19 - FY23 FUNDINGTable Tab PROJECT TITLE COST SOURCE FY2019 FY2020 FY2021 FY2022 FY2023
DEPARTMENT OF PUBLIC WORKS
I 17 Drainage Improvements 1,695,000 Excluded Debt 450,000 345,000 300,000 300,000 300,000 South Side Drainage Improvements 1,349,600 Excluded Debt - 1,349,600 - -
I 17 Town Center Improvement Project Construction - Master Plan 5,607,000 Excluded Debt 5,607,000 I 17 Town Center Improvement Project Construction - Bury Utilities 4,913,000 Excluded Debt 4,913,000 I 17 Route 30 Roadway Reconstruction Transportation Improvement Program 937,700 Excluded Debt 937,700 II 18 Roadway Improvements 4,250,000 Operating Budget 850,000 850,000 850,000 850,000 850,000 II 18 Departmental Equipment 1,268,000 Operating Budget 255,000 258,000 250,000 260,000 245,000 II 18 Sidewalk Reconstruction 1,067,000 Operating Budget 165,000 250,000 210,000 260,000 182,000 II 18 Guard Rail Improvements 376,600 Operating Budget 50,000 50,000 25,000 105,400 146,200 II 18 Route 20/Wellesley Street Transportation Improvement Program 260,000 Cash Capital 260,000 - - - - II 18 Water Hydrant Rehab Program 250,000 Operating Budget 50,000 50,000 50,000 50,000 50,000 II 18 Water Distribution Master Plan 59,850 Operating Budget 59,850 - - - - III 19 Water Main Rehab Program 1,251,800 Enterprise Fund Debt 365,000 199,000 124,400 367,400 196,000
SUBTOTAL 23,285,550 13,962,550 3,351,600 1,809,400 2,192,800 1,969,200
FACILITIES TOWN-WIDE
II 18 Town-Wide Facilities Improvements 3,194,997 Operating Budget 566,781 600,788 636,835 675,045 715,548 II 18 Equipment 46,000 Operating Budget 46,000 - - - - II 18 Irrigation Improvements 85,000 Operating Budget 85,000 - - - -
SUBTOTAL 3,325,997 697,781 600,788 636,835 675,045 715,548
FIRE DEPARTMENT
II 18 Equipment Replacement 320,000 Operating Budget 20,000 100,000 200,000 - - Ambulance 650,000 Operating Budget - 325,000 - - 325,000
I 17 Engine (Pumper) 1,500,000 Excluded Debt 750,000 - - 750,000 -
SUBTOTAL 2,470,000 770,000 425,000 200,000 750,000 325,000
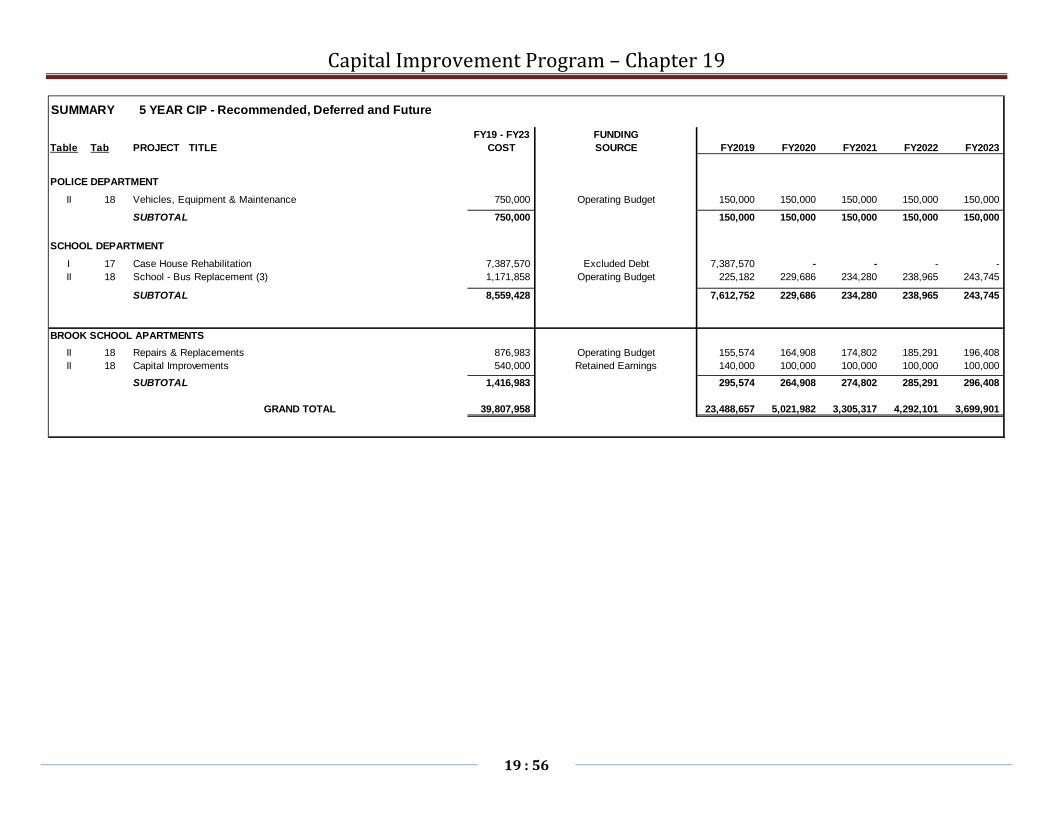
Capital Improvement Program – Chapter 19
19 : 56
SUMMARY 5 YEAR CIP - Recommended, Deferred and Future
FY19 - FY23 FUNDINGTable Tab PROJECT TITLE COST SOURCE FY2019 FY2020 FY2021 FY2022 FY2023
POLICE DEPARTMENT
II 18 Vehicles, Equipment & Maintenance 750,000 Operating Budget 150,000 150,000 150,000 150,000 150,000
SUBTOTAL 750,000 150,000 150,000 150,000 150,000 150,000
SCHOOL DEPARTMENT
I 17 Case House Rehabilitation 7,387,570 Excluded Debt 7,387,570 - - - - II 18 School - Bus Replacement (3) 1,171,858 Operating Budget 225,182 229,686 234,280 238,965 243,745
SUBTOTAL 8,559,428 7,612,752 229,686 234,280 238,965 243,745
BROOK SCHOOL APARTMENTSII 18 Repairs & Replacements 876,983 Operating Budget 155,574 164,908 174,802 185,291 196,408 II 18 Capital Improvements 540,000 Retained Earnings 140,000 100,000 100,000 100,000 100,000
SUBTOTAL 1,416,983 295,574 264,908 274,802 285,291 296,408
GRAND TOTAL 39,807,958 23,488,657 5,021,982 3,305,317 4,292,101 3,699,901

Capital Improvement Program – Chapter 19
19 : 57
This page intentionally left blank.

Appendix A – Fiscal Policies, Relevant Laws & Glossary of Terms
A1
Appendix A
Town of Weston Fiscal Policies
& Relevant Laws

Appendix A – Fiscal Policies, Relevant Laws & Glossary of Terms
A2
This page intentionally left blank.

Appendix A – Fiscal Policies, Relevant Laws & Glossary of Terms
A3
Appendix A- Table of Contents
Page
Overview A4
Municipal Audit A4
Debt Policy A5
Investment Policy A6
Reserve Fund Policy A7
1. Introduction A9
2. Unrestricted Reserves
a. Aggregate Target for Unrestricted Reserves A9
b. Finance Committee Reserve Fund A10
c. Free Cash A10
d. Stabilization Fund A11
e. Unused Tax Levy Capacity (new growth) A12
3. Restricted Reserves: Contingency
a. Property and Liability Insurance Reserve A12
b. Workers’ Compensation (Police/Fire) Reserve A13
c. Overlay Reserve for Abatements A13
4. Restricted Reserves: Known Liabilities
a. Facilities Maintenance Reserve A14
b. Post-Employment Benefits Trust Fund (OPEB) A14
c. Pension Obligation Reserve A14
d. Compensated Absence Reserve A15
Summary Table of Reserves A16
Retained Earnings Policy for Water Enterprise Fund A17
Relevant Laws A18
Glossary of Terms A20

Appendix A – Fiscal Policies
A4
Town of Weston Financial Management Policies
Overview
The Board of Selectmen has worked with the Finance Committee to develop a comprehensive set of financial policies that aim to shelter the Town from environmental conditions while ensuring that the Town government is operating efficiently and effectively.
By agreeing on processes and procedures before issues arise, both boards save time and avoid disagreements during the budget process.
The Board of Selectmen and Finance Committee revisit these policies periodically to ensure that the language and goals set forth in the policies continues to represent the Town’s current and future needs.
Municipal Audit
The Town engages in an audit on a yearly basis, in accordance with M.G.L. Ch. 44, Section 40. A municipal audit is an independent review of a town’s financial position to determine its reasonableness and completeness. The Board of Selectmen are responsible for ensuring that Town officials go through the proper Request for Proposal (RFP) process on a yearly basis and that review the audit to make sure that it represents the interest of the Town.
Audit reports should also include a management letter from the firm conducting the audit commenting on any material weaknesses in the management process. If an audit management letter reveals improper or inadequate procedures in the Town’s financial management, the problems should be corrected as soon as possible. The Selectmen should provide the impetus to see that corrective recommendations take place, and should also monitor the implementation of those recommendations.

Appendix A – Fiscal Policies
A5
Debt Policy
Adopted By: Board of Selectmen
Policy No. 2007.001
Debt Policy
Date Approved/Revised: June 5, 2007
Debt is an effective way to finance capital improvements. Properly managed debt preserves our credit rating, enhances flexibility in current and future operating budgets, and provides us with long-term assets that maintain or improve our quality of life. To provide for the appropriate issuance and responsible use of debt, the Board of Selectmen of the Town of Weston have adopted the following debt management policies:
1. Long-term borrowing will take place only for objects or purposes authorized by state law under M.G.L. Ch. 44, sec. 7 and 8, and will be confined to capital improvements too expensive to be financed from current revenues. In general, the Town will attempt to finance purchases costing less than $25,000 with operating revenues. For qualifying projects, the Town will prefer to use debt, rather than lease purchases.
2. Bonds will be paid back within a period not to exceed the expected useful life of the capital project or the period defined by state law, whichever is shorter.
3. The Town will strive to limit annual increases in debt to a level that will not materially jeopardize the Town’s AAA credit rating.
4. The Town will consolidate debt issuance events to minimize costs of borrowing.
5. The Town’s Finance Committee will annually provide its opinion on the potential effect of current and anticipated future borrowings on the Town’s financial profile.
6. The Town will maintain good communications with bond rating agencies, bond counsel, banks,
financial advisors and others involved in debt issuance and management.
7. The Town will select service providers (financial advisors, banks, etc.) through a competitive process based on periodic requests for proposals.
8. The Town’s annual Town Report, Town Manager’s Budget Request and annual town meeting warrant will give comprehensive summaries of the debt obligations of the Town.
9. To the extent practicable, user fees will be set to cover the capital costs of Enterprise type services or activities - whether purchased on a pay-as-you-go basis or through debt financing - to avoid imposing a burden on the property tax levy.

Appendix A – Fiscal Policies
A6
Investment Policy
Board of Selectmen
Policy No. 2007.002
Date Approved/Revised: June 5, 2007
The purpose of this investment policy is to set general guidelines for the investment of the Town of Weston's available general, enterprise and agency funds in a manner that ensures the following: the preservation of capital of the overall portfolio through diversification and prudent selection of investment instruments; sufficient liquidity to meet all operating and debt service requirements; attaining a market average rate of return throughout budgetary and economic cycles, taking into account the legal requirements and the cash flow characteristics of the portfolio.
1. The primary objectives, in priority order, of investment activities shall be safety, liquidity, and yield.
2. The Town funds shall be the responsibility of the Treasurer with the guidance of the Finance Director.
3. Massachusetts General Laws Chapter 44 §55B requires that all funds of the Town which are not required to be kept liquid for purposes of immediate distribution shall be invested at the highest possible rate reasonably available while meeting the daily cash requirements for the operation of the Town’s business.
4. The Town will invest in securities limited to Massachusetts General Laws Chapter 44 §55. These investment options are Certificates of Deposit (CDs) with a maturity of less than one year, Money Market Deposit Accounts, Repurchase Agreement with a maturity of less than 90 days, Pooled Investment Fund operated under the authority of the State Treasurer, and U.S. Treasury instruments or U.S. Government Agency obligation with a maturity of less than one year.
5. The Town of Weston will diversify its investments by security type, institution and maturity.
6. The Treasurer will provide as much security as possible for the Town of Weston's bank investments through the use of third party collateralization.
7. It is the responsibility of the Treasurer to assess the financial condition of the banks that the Town of Weston invests with according to MGL Chapter 44 §55.
8. The Town Treasurer shall prepare an investment report yearly for the Finance Committee that includes a succinct management summary that provides a clear picture of the status of the current investment portfolio. The report should include the weighted average yield, diversification by Financial Institution, diversification by Security type and Current Fund balances.
9. Investments shall be made with judgment and care, under circumstances prevailing, which persons of prudence, discretion, and intelligence exercise in the management of their own affairs, not for speculation, but for investment, considering the probable safety of their capital as well as the probable income to be derived.
10. The investment policy shall be formally approved by the Board of Selectmen and the Finance Committee and reviewed annually.

Appendix A – Fiscal Policies
A7
Town of Weston
Reserve Policy
Approved April 2017 (for implementation beginning FY2018)

Appendix A – Fiscal Policies
A8
TOWN OF WESTON
RESERVE POLICY April 2017
Contents I. Introduction II. Unrestricted Reserves A. Aggregate Target for Unrestricted Reserves B. Finance Committee Reserve Fund C. Free Cash D. Stabilization Fund E. Unused Tax Levy Capacity III. Restricted Reserves: Contingency A. Property and Liability Insurance Reserve (for Self-Insurance and Uninsured Losses) B. Workers’ Compensation Reserve (for Police and Fire) C. Overlay Reserve for Abatements IV. Restricted Reserves: Known Liabilities A. Facilities Maintenance Reserve B. Other Post-Employment Benefits (OPEB) Trust Fund C. Pension Obligation Stabilization Fund D. Compensated Absence Reserve (for Sick Leave Buyback)

Appendix A – Fiscal Policies
A9
I. Introduction Municipalities establish and maintain reserves in order to accommodate the usual variability and unpredictability in revenue and expenditure patterns, to provide budgetary flexibility for unexpected events and expenditures, to withstand financial emergencies, to meet ongoing cash flow needs and reduce the need for short-term borrowing, to provide for the maintenance and depreciation of facilities, equipment, and other assets, and to save for incurred or expected but unpaid liabilities. In addition to these direct objectives, maintaining appropriate and sufficient reserves is also an important factor in a municipality’s credit rating. The Town of Weston seeks to maintain appropriate and sufficient reserves as described in this Reserve Policy, to meet the direct objectives described in this document and to preserve and maintain its high credit rating. Reserves in this policy may be categorized along two dimensions: (i) unrestricted reserves versus restricted reserves and (ii) contingency reserves versus known liability reserves. Unrestricted Reserves: Reserves that can be used for any purpose Restricted Reserves: Reserves that are to be used for specified purposes Contingency Reserves: Reserves for unpredictable/unforeseen events or expenditures Known Liability Reserves: Reserves for known liabilities, incurred or expected This policy shall ordinarily be reviewed and either affirmed or revised by the Board of Selectmen every five years, in consultation with the Town Manager and Finance Director. The Board of Selectmen is also encouraged to solicit input from the Finance Committee and other relevant parties. Based on this five-year timetable, the next review of this policy should occur during FY2022, in time for the affirmed or revised policy to be reflected in the FY2023 budget. Spreadsheets and other supporting materials providing updated reserve balances and reserve target computations should be maintained and reviewed at least annually by the Board of Selectman, Town Manager, and Finance Director, in connection with the regular budget process.
II. Unrestricted Reserves
Unrestricted reserves are also (perhaps inherently) contingency reserves, and they provide most broadly and flexibly for unforeseen events and expenditures. A. Aggregate Target for Unrestricted Reserves The Government Finance Officers Association (GFOA) recommends that local governments maintain aggregate unrestricted reserves (unrestricted fund balances) of five to fifteen percent of general fund revenues, depending on the needs of the community. Based on the financial strength and other characteristics of Weston and its residents, along with the additional restricted reserves described elsewhere herein, this policy targets aggregate unrestricted reserves equal to

Appendix A – Fiscal Policies
A10
five percent (5%) of the prior fiscal year’s general operating budget amount excluding exempt debt service. For purposes of this five percent (5%) target, unrestricted reserves shall be deemed to include the Finance Committee Reserve Fund, Free Cash, and the Stabilization Fund. These reserves differ in their means and thresholds of availability and utilization, as described below. These reserves are augmented by Unused Tax Levy Capacity, which is also described below but is not considered toward the five percent (5%) target. B. Finance Committee Reserve Fund Reserve Type: Unrestricted – Contingency Statutory Reference: M.G.L. Ch. 40 § 6 Description and Use: This reserve is for extraordinary or unforeseen events or expenditures and may be utilized pursuant to a vote of the Finance Committee. This reserve is reestablished on an ongoing annual basis. Reserve Target: Beginning with FY2019, the reserve target is 0.75% of the prior fiscal year’s general fund operating budget amount excluding exempt debt service. Notes re Status, Prior Policy, and/or Transition to New Policy: Prior to FY2018, the target for this reserve was 0.85% of an adjusted general fund operating budget amount from the prior fiscal year. In transitioning from the prior policy, the reserve amount for FY2018 will be a close approximation to the new target and $50,000 less than the prior policy would have provided. C. Free Cash Reserve Type: Unrestricted – Contingency Statutory Reference: None Description and Use: A consistent amount of recurring free cash will be used to support the general fund operating budget each year. Non-recurring free cash above the target may be used to fund one-time cash capital needs or for other non-recurring purposes. In addition, functioning as a reserve, free cash may be utilized pursuant to a majority vote of Town Meeting and is often used to cover unforeseen expenses, such as snow and ice removal in excess of the budget, as such expenses may be ascertainable by the time of the relevant Town Meeting. Reserve Target: Beginning with FY2019, the reserve target is 0.75% of the prior fiscal year’s general fund operating budget amount excluding exempt debt service. However, if projected free cash remaining at the end of a fiscal year is substantially below this target but reestablishing the target amount solely in the subsequent fiscal year would be unnecessarily onerous, given projected cash flows, the target amount may be achieved gradually over the two or three

Appendix A – Fiscal Policies
A11
subsequent fiscal years, as determined by the Board of Selectmen in consultation with the Town Manager and Finance Director. Notes re Status, Prior Policy, and/or Transition to New Policy: Prior to FY2018, free cash was not included in the reserve policy, nor has a target amount of free cash been incorporated into the general fund operating budget as a reserve, including in FY2018. However, as a practical matter, free cash has often met or exceeded the target level now being prescribed as a reserve, and this is expected to remain the case for FY2018. D. Stabilization Fund Reserve Type: Unrestricted – Contingency Statutory Reference: M.G.L. Ch. 40 § 5B Description and Use: Of the town’s reserves, the Stabilization Fund is perhaps most akin to a “rainy day fund”, and a two-thirds (2/3) vote of Town Meeting is required for any appropriation out of the Stabilization Fund. While this reserve is unrestricted, appropriations may only be requested from the Stabilization Fund as follows:
1. An appropriation from the Stabilization Fund may be requested if state aid receipts are reduced from estimates after the budget is voted by Town Meeting.
2. An appropriation from the Stabilization Fund may be requested if net state aid (meaning receipts – excluding those from the School Building Authority – less assessments) is less than the average of the two prior fiscal years.
3. An appropriation from the Stabilization Fund may be requested if local receipts are projected to be less than the average of the three prior fiscal years, in which case the request from the Stabilization Fund would be in an amount to offset that three-year local receipts reduction.
4. An appropriation from the Stabilization Fund may be requested for catastrophic or emergency events if the financial impact of the event is in excess of an amount which the Finance Committee Reserve Fund can cover.
Reserve Target: Beginning with FY2018, the reserve target is 3.50% of the prior fiscal year’s general fund operating budget amount excluding exempt debt service. However, funds used from this reserve may be replenished (if and to the extent such replenishment is necessary to reestablish the target amount) gradually over the five subsequent fiscal years, as determined by the Board of Selectmen in consultation with the Town Manager and Finance Director. Notes re Status, Prior Policy, and/or Transition to New Policy: Consistent with its status as the Town’s “rainy day fund”, no appropriations have been made from the Stabilization Fund to date. Prior to FY2018, the reserve target was a flat $2,000,000, but some appropriations were made to the reserve even after that target was reached. For FY2018, the starting reserve balance exceeds the new target, so no additional appropriation will be made.

Appendix A – Fiscal Policies
A12
E. Unused Tax Levy Capacity Reserve Type: Unrestricted – Contingency (but see Description and Use below) Statutory Reference: M.G.L. Ch. 59 § 21C Description and Use: Unused tax levy capacity is cumulative, and it arises from the Town’s practice of not appropriating at Annual Town Meeting anticipated new growth in the tax base (from new construction) in order to maintain unused levy capacity for the uses stated below. It is also more generally the result of not using the entire, allowable 2.5% increase in the tax levy to support annual appropriations. While not a true reserve, unused tax levy capacity would be considered an unrestricted revenue source, though it ceases to be available for a given fiscal year once the tax rate is determined for such fiscal year (typically in December). Subject to that constraint, unused tax levy capacity may be used as follows:
1. Unused levy capacity will generally be used to offset any snow and ice deficits remaining from the prior fiscal year.
2. Prior to Annual Town Meeting, some unused levy capacity may be used in revenue estimates if local receipts are estimated to be less than the average of the three prior fiscal years. Unused levy capacity may also be used to offset any estimated local receipt shortfall in making the tax rate setting calculation.
3. Unused levy capacity may be used prior to appropriating from the Stabilization Fund as outlined above.
4. Prior to Annual Town Meeting, some unused levy capacity may be used in revenue estimates after taking into consideration the other uses described above.
Reserve Target: The Town will continue its practice of not appropriating new growth in the tax base (from new construction) in order to maintain unused levy capacity as described above. Notes re Status, Prior Policy, and/or Transition to New Policy: The foregoing reflects no change from the prior policy.
II. Restricted Reserves: Contingency
Restricted reserves are established for specified purposes, and the restricted reserves in this section are also contingency reserves, providing for unforeseen events and expenditures. A. Property and Liability Insurance Reserve (for Self-Insurance and Uninsured Losses) Reserve Type: Restricted – Contingency Statutory Reference: None Description and Use: This reserve is for uninsured losses and policy deductibles, in each case with respect to property and liability coverage.

Appendix A – Fiscal Policies
A13
Reserve Target: Beginning with FY2018, the reserve target is $100,000. Notes re Status, Prior Policy, and/or Transition to New Policy: Prior to FY2018, the target for this reserve was $150,000, but annual use in recent years only ranged from approximately $1,000 to $16,000, with the Town’s deductibles at $5,000 for property insurance and $10,000 for public officer liability insurance. For FY2018, the starting reserve balance exceeds the new target, so no additional appropriation will be made. B. Workers’ Compensation Reserve (for Police and Fire) Reserve Type: Restricted – Contingency Statutory Reference: M.G.L. Ch. 40 §§ 13A, 13C; Ch. 41 § 111F, Ch. 41 § 100 Description and Use: This reserve is for the payment of medical bills of Police and Fire personnel injured on duty. The Town is self-insured for Police and Fire injuries on the job; the workers’ compensation insurance policy for all other employees does not cover these employees. Reserve Target: The reserve target is $50,000. Notes re Status, Prior Policy, and/or Transition to New Policy: The foregoing reflects no change from the prior policy. Also, based on prior claims experience, the Town has determined that stop-loss insurance is not needed to supplement or mitigate the use of this reserve for the foreseeable future. C. Overlay Reserve for Abatements Reserve Type: Restricted – Contingency Statutory Reference: M.G.L. Ch. 59 §§ 25, 70A Description and Use: This reserve is to fund the overlay account beyond typical amounts and to fund overlay deficits. The overlay is an amount raised every year from which abatements of tax bills are granted by the Board of Assessors. If the amount of the abatements exceeds the amount of the overlay, a deficit will occur. Reserve Target: The reserve target is $200,000. Notes re Status, Prior Policy, and/or Transition to New Policy: The foregoing reflects no change from the prior policy.
II. Restricted Reserves: Known Liabilities
Restricted reserves are established for specified purposes, and the restricted reserves in this section are for known expenses and liabilities that are incurred or expected but not yet paid.

Appendix A – Fiscal Policies
A14
A. Facilities Maintenance Reserve Reserve Type: Restricted – Known Liability Statutory Reference: None Description and Use: This reserve is for the replacement and repair of buildings and equipment, based on a five-year “cash capital” plan recommended by Facilities Director and approved by the Permanent Building Committee. This reserve is a continuing balance account, so unexpended balances carry forward to subsequent years. Reserve Target: The long-term target is for this reserve to equal at least 1% of the Town’s total insured building value. As of the date of this policy, the reserve balance is substantially below this target (at approximately 0.27%), so the policy calls for the long-term target to be reached over a 15-year period. Accordingly, beginning with FY2019, the target appropriation to this reserve each fiscal year will be 6% greater than the prior fiscal year’s. Notes re Status, Prior Policy, and/or Transition to New Policy: Prior to and including FY2018, the annual appropriations to this reserve have increased by 5% each year. Prior to the next review of this policy in FY2022, the Facilities Director and Permanent Building Committee should develop updated expense and cash capital projections, and the Town’s total insured building values should be updated, to reassess whether the approach described above will result in reaching the long-term target in FY2032 or whether the approach (and/or the long-term target) should be revised. B. Other Post-Employment Benefits (OPEB) Trust Fund Reserve Type: Restricted – Known Liability Statutory Reference: M.G.L. Ch. 32B § 20 Description and Use: This reserve is to fund future post-employment health benefits that are owed to retired town employees. It is structured as a trust fund. Reserve Target: The reserve target is for the Town to fund, to the extent possible, the Annual Required Contribution (ARC) as specified in the funding schedule from the periodic actuarial reports provided every two years. Notes re Status, Prior Policy, and/or Transition to New Policy: The foregoing reflects no change from the prior policy. C. Pension Obligation Stabilization Fund Reserve Type: Restricted – Known Liability

Appendix A – Fiscal Policies
A15
Statutory Reference: M.G.L. Ch. 40 § 5D Description and Use: This reserve is to hold funds that may be used to smooth any future sharp increases in the pension obligation assessment from Middlesex Retirement System (MRS). Reserve Target: The reserve target is $400,000. Notes re Status, Prior Policy, and/or Transition to New Policy: The foregoing reflects no change from the prior policy. As of the date of this policy, the MRS pension obligation assessments are intended to result in the Town’s pension obligation being fully funded by 2035, though the Town may provide for early or additional funding if it chooses. D. Compensated Absence Reserve (for Sick Leave Buyback) Reserve Type: Restricted – Known Liability Statutory Reference: None Description and Use: This reserve is for future compensated absence (i.e., sick leave buyback) payments that are due to certain town employees at retirement. This reserve is currently a continuing balance account, so unexpended balances carry forward to subsequent years. Note that vacation pay buyback is covered not from this reserve but from the operating budget on a current basis. Reserve Target: The long-term target is for this reserve to equal the outstanding compensated absence (sick leave buyback) liability as of the given fiscal year, as determined by the auditors. As of the date of this policy, the reserve balance is substantially below this target, so the policy calls for the long-term target to be reached over a 10-year period. Accordingly, for FY2018, the appropriation to this reserve will be $60,000 greater than the prior fiscal year’s (that is, $50,000 greater than it would have been under the prior policy), and beginning with FY2019, the target appropriation to this reserve each fiscal year will be $20,000 greater than the prior fiscal year’s. Notes re Status, Prior Policy, and/or Transition to New Policy: Prior to FY2018, the annual appropriations to this reserve increased by $10,000 each year; this was generally enough to meet sick leave buyback payments in each current year but not enough to build the reserve for potentially higher payments that may be due in coming years, as baby boomers retire. Given that the Town is seeking to reduce this benefit going forward, the Town Manager should develop updated projections in connection with the next review of this policy in FY2022, to reassess whether the approach described above will result in reaching the long-term target in FY2027 or whether the approach (and/or the long-term target) should be revised. Approved: April 5, 2017 BOARD OF SELECTMEN, TOWN OF WESTON

Appendix A – Fiscal Policies
A16
ReserveBalance
06/30/2018FY19
Appropriation
FY19 Appropriation + Balance Carried
ForwardReserve Balances Per
Policy Target AmountTarget Date Notes
Unrestricted ReservesFinance Committee Reserve Fund (balance does not carry forward from year to year)
556,900 586,587 586,587 586,587 0.75% of prior year's GF operating budget
met Balance does not carry forward
Free Cash 4,373,690 (2,760,000) 1,613,690 586,587 0.75% of prior year's GF operating budget
met $586,587 will be left in the reserve, leaving $1,027,103 to handle snow removal or other unforeseen expenses.
Stabilization Fund 3,137,275 0 3,137,275 2,737,408 3.5% of prior year's GF operating budget
met
Unused Levy Capacity 7,654,592 0 7,654,592 NA NA This is a one-time reserve each year.
Restricted Reserves: ContingencyProperty and Liab. Insurance-Uninsured Losses
149,878 0 149,878 100,000 100,000 met
Workers' Comp (Police & Fire) 26,275 20,000 46,275 50,000 50,000 metOverlay Reserve for Abatements 200,000 0 200,000 200,000 200,000 met
Restricted Reserves: Known LiabilitiesFacilities Maintenance 604,846 566,781 1,171,627 2,800,000 Starting FY19
increase of 6% over prior year
FY2032 Target is 1% of Town's total insured building value
Post Employment Benefits (OPEB) Trust Fund 16,277,730 2,121,634 18,399,364 76,091,100 $76M total liability, unfunded liability $64.8M per 7/1/16 valuation
FY2048 Annual appropriation to meet ARC specified in most recent actuarial study
Pension Obligation Stabilization Fund 416,786 0 416,786 416,786 400,000 FY2035 Annual assessments to meet requirement for full funding are determined by Middlesex Retirement System.
Compensated Absence Fund (Sick Leave Buyback)
361,197 220,000 581,197 2,445,000 2,445,000 FY2028 Increase appropriation by $20,000 each year.
Total Reserves without OPEB 06/30/18 $17,481,439 (1,366,632) $15,557,907 $9,922,369Total Reserves with OPEB 06/30/18 $33,759,169 755,002 $33,957,271 $86,013,469
Summary of Reserves

Appendix A – Fiscal Policies
A17
Retained Earnings Policy for Water Enterprise Fund
Board of Selectmen Policy No. 2009.002 Date Approved/Revised: January 28, 2009 It shall be the policy of the Board of Selectmen to maintain a level of unreserved retained earnings in the Water Enterprise Fund that is sufficient to address the financing of: working capital, revenue shortfalls, and unanticipated and emergency expenditures. Unreserved retained earnings are cumulative surplus funds, as certified by the Massachusetts Department of Revenue, that are available for appropriation by Town Meeting to support any capital expense of the enterprise or to reduce user charges. The rationale for, and the calculation of, unreserved retained earnings to be maintained by the Town are described below. The total amount of retained earnings is to be maintained at 12.5 percent of the total water enterprise operating budget. This general calculation is based on 50 percent of the sum of the following individual calculations: [The factor of 50 percent is based on the assumption that the likelihood of all factors occurring in one fiscal year is small; therefore, there is no need to maintain one hundred percent of the calculated level of retained earnings.] 1. Working Capital: For those periods when monthly expenses exceed available cash, the water
enterprise must have access to sufficient working capital so that General Fund cash is not used as working capital for water operations. The amount retained for this purpose shall be equal to the average of the largest single month operating deficit (revenue minus expense) occurring in each of the prior three years. [In the absence of retained earnings, operations would require the use of General Fund cash, which would reduce General Fund cash available for investment, and consequently reduce General Fund revenue.]
2. Revenue Shortfall: Annual water revenue is a function of the amount of water purchased by
customers, which is referred to as ‘consumption.’ If, in any year, actual consumption is less than projected, a revenue shortfall will occur. Retained earnings shall be maintained at a level sufficient to offset any loss in revenue due to unanticipated decreases in consumption. That level shall be equal to the difference of the average 6 year consumption versus the lowest level of consumption for that time period, multiplied by the current water rates shown as block 2 of the Town’s rate structure. [Block 2 is selected as it generally represents the point at which discretionary purchases of water begin. The scenario envisioned is a wet year in which customers will not need to make discretionary purchases of water.]
3. Reserve for Unanticipated and Emergency Expenditures: Retained earnings shall be maintained at a
level sufficient to fund unanticipated or emergency capital and operating expenditures. It shall be a goal to maintain an amount equal to 2.5% of the annual water operating budget for this purpose.
Restoration of depleted Retained Earnings: If, in any year, retained earnings fall below the targets established by this policy, it shall be the policy of the Board of Selectmen to set future rates to restore retained earnings to the target level over the following three year period.

Appendix A – Relevant Laws
A18
Town of Weston Relevant Laws
Description M.G.L. Summary Appropriations - Changes
Ch.44, §33B
Town Meeting may transfer monies appropriated for a specific use to another use.
Audit of Accounts Ch.44, §40 The town shall cause an audit to be made of its accounts annually. Budget - Operating Ch.39, §9
The operating budget must be approved by Town Meeting by June 30th, notwithstanding a contrary charter provision. The budget need not be a balanced budget until the Town submits to the Department of Revenue its recap sheet for certification of the Town's tax rate.
Budget - School Ch.71, §34
Town Meeting may only vote the bottom line budget for a School Department.
Debt - Exclusion Ch.59, §21C(m)
Appropriations by borrowing may be made contingent on a Proposition 2 1/2 debt exclusion vote.
Debt - Exclusion (cont.) Ch.59, §21C(k)
A Town may temporarily exclude from the levy limit the amounts to pay the principal and interest on a borrowing by approving a debt exclusion question at a regular or special election.
Debt - Inside Debt Limit
Ch.44, §7 A Town may borrow for certain purposes within the debt limit.
Debt - Outside Debt Limit
Ch.44, §8 A Town may borrow for certain purposes outside of the debt limit.
Debt - Temporary Ch.44, §4 A Town may do temporary borrowing without a Town Meeting vote in anticipation of revenue, or in anticipation of grants. Ch.44, §6A
Debt - Vote Ch.44, §2
Borrowing under any general law or special act requires a two-thirds vote of Town Meeting unless the applicable statute provides otherwise.
Enterprise Funds Ch.44, §53F½
Town Meeting may establish enterprise funds for certain public utilities.
Finance Committee Ch.39, §16
Every town whose valuation exceeds one million dollars shall provide for the election or the appointment of an advisory or finance committee.
Free Cash Ch.59, §21D
Free cash is not available for appropriation until the amount has been certified by the Department of Revenue.
Gifts & Grants Ch.44, §53A
Gifts and grants may be expended with the approval of the Board of Selectmen without further appropriation of Town Meeting.
Land Purchase Ch.40, §14 An appropriation of money to purchase land regardless of the funding source requires a two-thirds vote, unless the money is appropriated to acquire conservation land pursuant to M.G.L. Ch. 40, Sec. 8C, or Community Preservation Funds are utilized pursuant to M.G.L. Ch. 44B, in which cases a simple majority vote is sufficient.
Liability in Excess of Appropriations
Ch.44, §31
A Town may not incur a liability in excess of appropriation, except for major disasters as approved by the Board of Selectmen and the Department of Revenue.

Appendix A – Relevant Laws
A19
Town of Weston Relevant Laws
Description - Alphabetical M.G.L. Summary
Payment of Judgments Ch.59, §23
Amounts required to pay final judgments rendered prior to the fixing of the tax rate are added to the tax levy without further appropriation by Town Meeting.
Payment of Judgments (Cont.)
Ch.44, §31
Authority to pay a final judgment after the tax rate is set requires Department of Revenue approval if the judgment exceeds $10,000
Override Ch.59, §21C(g)
A Town may override the 2 1/2 levy increase by a specific amount voted at a regular or special election. The override amount becomes a permanent increase in the Town's levy limit.
Override (Cont.) Ch.59, §21C(m)
Appropriations from the tax levy for operating expenses may be made contingent on a Proposition 2 1/2 general override vote.
Prior Fiscal Year - Bills Ch.44, §64
Town Meeting may appropriate money to pay bills of a prior fiscal year by a four-fifths vote at an Annual Town Meeting and a nine-tenths vote at a Special Town Meeting.
Proposition 2 1/2 Ch.59, §21C(b)
A Town may not appropriate from the tax levy funds in excess of the levy limit established by Proposition 2 1/2 which is 2 1/2 percent of the full and fair cash valuation of all real estate and personal property in the Town.
Proposition 2 1/2 Ch.59, §21C(f)
A Town may not assess an amount in taxes which is greater than 102 1/2 percent of the previous year's levy limit.
Proposition 2 1/2 Ch.59, §21C(f) Taxes on new growth permanently increase the levy limit. Receipts - General Fund
Ch.44, §53
Unless otherwise provided by law, all monies received by a Town must be placed in the general fund and may be appropriated by Town Meeting for special use.
Receipts - Offset Accounts
Ch.44, §53E Town may establish off-set receipt accounts.
Reserve Fund Ch.40, §6
Town Meeting may establish a reserve fund for use by the Finance Committee to provide for extraordinary and unforeseen expenditures.
Revolving Funds Ch.44, §53E½ Town Meeting may authorize revolving funds for certain services. Stabilization Fund Ch.40, §5B
Town Meeting may appropriate money into and from the stabilization fund for any purpose by a two-thirds vote. Funds in stabilization may be earmarked for a particular purpose.
Taxation Ch.59, §23
The amount to be raised by taxation is determined by the Assessors after taking into account local receipts, state aid, and amounts to be transferred from previous appropriations.
Taxation (cont.) Ch.59, §23
A Town cannot issue tax bills until the tax rate has been certified by the Department of Revenue.

Appendix A – Glossary of Terms
A20
Glossary Below are some of the most commonly used terms in budgeting, capital planning and debt management. It should be kept in mind that these terms are generic for the most part; some are specific to Massachusetts, none are particular to Weston. Where applicable, the relevant State statute is also cited. ABATEMENT A complete or partial cancellation of a tax levy imposed by a governmental unit. Administered by the local board of assessors. APPROPRIATION An authorization by town meeting to make obligations and payments from the treasury for a specific purpose AUDIT A study of the Town’s accounting system to ensure that financial records are accurate and in compliance with all legal requirements for handling of public funds, including state law and town by-laws. BOND A written promise to pay a specified sum of money, called the face value or principal amount, at a specified date or dates in the future, called the maturity date(s), together with periodic interest at a specified rate. The difference between a note and a bond is that the latter runs for a longer period of time and requires greater legal formality. BOND ANTICIPATION NOTE Short-term interest-bearing notes issued by a government in anticipation of bonds to be issued at a later date. The notes are retired from proceeds from the bond issue to which they are related. Also referred to as a BAN. CAPITAL OUTLAY EXCLUSION c. 59, §21c(I1/2) A Town may exclude from the levy limit, in one year, the amount raised for capital expenditures by a capital outlay question at a regular or special election. CAPITAL IMPROVEMENT PLAN (CIP) Sometimes referred to as a capital improvement program, is a financial planning and management tool which: identifies public facility and equipment requirements; places these requirements in order of priority, and; schedules them for funding and implementation. CAPITAL PROJECT Major non-recurring expenditure involving one or more of the following:
- acquisition of land for a public purpose, - construction of or addition to a facility such as a public building, water lines, play field, etc.; - rehabilitation or repair of a building, facility, or equipment; provided the cost is $25,000 or more and
the improvement will have a useful life of 5 years or more, - purchase of equipment costing $25,000 or more, with a useful life of 5 years or more - any planning,
engineering or design study related to an individual capital project.

Appendix A – Glossary of Terms
A21
CHAPTER 90 c. 90, §34 This law authorizes the Commonwealth to allocate funds to municipalities, through the Transportation Bond Issue, for highway construction, preservation and improvement projects that create or extend the life of capital facilities; routine maintenance operations such as pothole filling and snow and ice removal are not covered. The formula for determining the Chapter 90 level of funding is based on a municipality's miles of public ways, population and level of employment. Municipalities only receive Chapter 90 funds on pre-approved projects on a reimbursement basis. CHERRY SHEET The official notification by the Massachusetts Commissioner of Revenue to municipalities and school districts of estimated state aid to be paid and charges to be assessed over the next fiscal year. As the state budget process unfolds updated local aid proposals are posted. Cherry Sheets are issued once the state budget is enacted by the Legislature and approved by the Governor. COLLECTIVE BARGAINING The process of negotiating workers’ wages, hours, benefits, working conditions, etc., between employer and some of all employees, who are represented by a recognized labor union. COMMUNITY PRESERVATION ACT (CPA) In 2001, residents of the Town accepted the Community Preservation Act (CPA) which allows the Town to impose a surcharge of 3% on real estate taxes. Property exempt from this tax includes the first $100,000 of residential property as well as certain low-income properties. By enacting the CPA, the Town will receive the maximum available matching funds from the state. Proceeds from both the amount raised by the Town and the amount matched by the State will be used to fund renovations to, and the construction of affordable housing, open space acquisition and historic preservation. DEBT EXCLUSION c. 59, §21C(m) and (k) Results in a temporary increase in a municipality's levy limit (and possibly the levy ceiling) when a municipality's voters elect to exclude the payment of particular debt service from the constraints of Proposition 2 1/2. The debt service is then added to the levy limit for the life of the debt only. To place a debt exclusion question on the ballot requires a 2/3 vote of the entire Board of Selectmen. A simple majority vote by the voters is required for passage. DEBT LIMIT c. 44, §10 The maximum amount of gross or net debt which is legally permitted under State Law. DEBT SERVICE The amount paid annually to cover the cost of both principal and interest on a debt issuance until its retirement. ENCUMBRANCE Obligations in the form of purchase orders and contracts which are chargeable to an appropriation and are reserved. They cease to be encumbrances when paid or when an actual liability is set up.

Appendix A – Glossary of Terms
A22
ENTERPRISE FUNDS c. 44 , §53F1/2 A municipal fund established for the operation of a municipal utility, health care, recreational, or transportation facility whereby the operations are fully funded by the fees associated with that enterprise vs. the tax levy. The "surplus" or retained earnings generated by the operation of the enterprise remain with the fund to offset future capital improvements, extraordinary maintenance expenses, or to reduce future fees and charges of the fund. EXCESS LEVY CAPACITY The difference between the levy limit and the amount of real and personal property taxes actually levied in a given year. FISCAL YEAR A fiscal year runs July 1 through June 30. For example, fiscal year 2014 runs from July 1, 2013 through June 30, 2014. FIXED ASSETS Assets of a long-term character which are intended to continue to be held or used, such as land, building, improvements other than buildings, machinery, and equipment. FREE CASH c. 59, §21D A type of reserve fund also known as unreserved fund balance. Free Cash can be appropriated by Town Meeting. Free Cash is the result of unexpended appropriations, revenues in excess of estimates and prior years’ property tax collections. Free Cash is not available for appropriation until the amount has been certified by DOR. This is done when the Town submits its balance sheet to the DOR. For example, the July 1, 2011 certified amount may be used to fund supplemental appropriations voted during fiscal year 2012, or applied as a revenue source to support the fiscal 2013 budget voted in the Spring of 2012. FULL FAITH AND CREDIT A pledge of the general taxing power for the payment of debt obligations. Bonds carrying such pledges are referred to as general obligation bonds or full faith and credit bonds. FUND BALANCE The Government Accounting Standards Board (GASB) defines fund balance as the excess of assets of a fund over its liabilities and reserves. Fund balance is classified as non-spendable, restricted, committed, assigned and unassigned based on the relative strength of constraints that control how specific amounts can be spent. GASB34 An audit reporting standard that requires municipalities to:
1. report on the overall financial health of the governmental unit (Management Discussion and Analysis); and
2. include information about the Town’s public infrastructure assets such a bridges, roads and storm sewers.

Appendix A – Glossary of Terms
A23
GASB45 This is another Governmental Accounting Standards Board major pronouncement that each public entity account for and report other post-employment benefits (See OPEB) in its accounting statements. Through actuarial analysis, municipalities must identify the true costs of the OPEB earned by employees over their estimated years of actual service. GASB54 A major pronouncement of the Governmental Accounting Standards Board that requires the classification of fund balances based primarily on the extent to which the government is bound to follow constraints on the use of governmental fund resources. GENERAL OBLIGATION BONDS Bonds for the payment of which the full faith and credit of the issuing government are pledged. GENERALLY ACCEPTED ACCOUNTING PRINCIPLES (GAAP) A set of uniform accounting and financial reporting rules and procedures that define accepted accounting practice INFRASTRUCTURE The Town’s roads, bridges, buildings, land, water and drainage systems and natural resources. LEVY CEILING A Levy Ceiling is 1st of two types of levy restriction imposed by Massachusetts General Law Chapter 59 Section 21C. It states, in any year, the personal property taxes imposed may not exceed the 2.5% of the total full and fair cash value of all taxable real and personal property, as determined by the Town’s assessors. This changes as properties are added or removed from the tax roll and as market values change, but the Annual Tax Levy cannot exceed the Levy Ceiling. LEVY LIMIT (also see Proposition 2 ½) Property tax levy limits, used in twenty-seven states, constrain the total amount of revenue that can be raised from the property tax. It is the 2nd type of levy restricition in Massachusetts, since FY1982, levy limits have been governed by the law know as Proposition 2 ½. This law can be found in Chapter 59, section 21C of the Massachusetts General Laws. LOCAL RECEIPTS This amount represents the amount of local taxes (excluding property taxes) and fees from all departmental operations retained directly by the town. MASSACUSETTS WATER RATE AUTHORITY (MWRA) The MWRA is a public authority established by an act of the Legislature in 1084 to provide wholesale water and sewer services to 2.5 million people and more that 5,500 large industrial users in 61 metropolitan Boston area communities.

Appendix A – Glossary of Terms
A24
MASSACUSETTS WATER POLLUTION ABATEMENT TRUST (MWPAT) A statewide revolving fund that commenced operations in 1990 to address necessary environmental actions outlined in the Federal Clean water Act. This fund revolves by the MWPAT issuing large pooled bond issues for various environmental construction projects and the loaning these funds to communities, with subsidies from the state reducing the debt service payments for these communities. NEW GROWTH New Growth is when a homeowner or investor makes improvements to their existing home by increasing the square footage, thereby increasing the assessed value and the levy capacity. NOTE PAYABLE In general, an unconditional written promise signed by the Town to pay a certain sum in money on demand or at a fixed or determinable time either to the bearer or to the person designated therein.
OFFICIAL STATEMENT A document prepared for potential investors that contains information about a prospective bond or note issue and the issuer.
OPERATING BUDGET c. 39, §9 The operating budget must be approved by Town Meeting by June 30th. The budget need not be balanced until the Town submits to the Department of Revenue its tax rate for certification.
OVERLAY OR ALLOWANCE FOR ABATEMENT The amount raised by the assessors in excess of appropriations and other charges for the purpose of creating a fund to cover abatements and exemptions..
OVERRIDE c. 59, §21C(g) Results in a permanent increase of a municipality's levy limit (but not the levy ceiling) when the majority of voters in a municipal election approve such an override. The override amount becomes part of the levy base when setting the next year's levy limit. To place an Override question on the ballot requires a majority vote of the Board of Selectmen. A simple majority by voters is required for passage. PAY-AS-YOU-GO CAPITAL FINANCING A term used to describe the financial policy of a government which finances all of its capital outlays from current revenues rather than by borrowing. A government which pays for some improvements from current revenues and others by borrowing is said to be on a partial or modified pay-as-you-go basis. PAY-AS-YOU-USE CAPITAL FINANCING A term used to describe the financial policy of a government which finances its capital outlays from borrowing proceeds and pays for capital assets over their useful life.

Appendix A – Glossary of Terms
A25
PAYMENT IN LIEU OF TAXES An agreement between a municipality and an entity not subject to taxation, such as charitable or educational organizations, in which the payer agrees to make voluntary payment to the municipality. By law, a city or town must make such a payment to any other community in which it owns land used for public purposes. PROPERTY TAX The property tax levy is the revenue a city or town raises through real and personal property taxes. PROPOSITION 2 ½ c. 59, §21C(b) In Massachusetts, effective July 1, 1981, limits municipal property taxes to 2.5 percent of full and fair cash value (the levy ceiling); limits the amount of revenue a municipality can raise through property taxes (the levy limit), which increases by 2.5 percent each year, plus a factor for new growth. A municipality may exceed its levy limit in two ways: by voting an override or debt exclusion. RATING AGENCIES This term usually refers to Moody’s Investors Service, Standard and Poor’s Corporation and Fitch Ratings. These are the three major agencies that issue credit ratings on municipal bonds. REFUNDING BONDS The retirement of an existing bond issue through the sale of a new bond issue. When interest rates have fallen, issuers may want to exercise the call feature of a bond and replace it with another debt instrument paying a lower interest rate. RESERVE FUND c. 40, §6 Town Meeting may establish a Reserve Fund for use by the Finance Committee to provide for extraordinary and unforeseen expenditures. REVOLVING FUNDS c. 44, §53E1/2 Town Meeting may establish revolving funds for certain services, allowed either by a specific statute (e.g., school department revolving funds) or under Chapter 44, section 53E1/2 (e.g., for general purposes). Revolving funds are typically used for fee based services. SCHOOL BUDGET c. 70, §8 Town Meeting may only vote the bottom line budget for the school department. STABILIZATION FUND c. 40, §5B A Stabilization Fund is a reserve or “rainy day” fund. In Massachusetts, a municipality may appropriate annually to such fund. The aggregate amount in the fund shall not exceed ten percent of the equalized valuation of the municipality. The treasurer is the custodian of the fund and may invest the proceeds. The Stabilization Fund may be appropriated at a town meeting by a two-thirds vote. The appropriation may be used for any lawful purpose. State law allows multiple Stabilization Funds, with each fund having a specific purpose (e.g., equipment replacement, building repairs).

Appendix A – Glossary of Terms
A26
SCHOOL BUDGET c. 70, §8 Town Meeting may only vote the bottom line budget for the school department. TAX RATE The amount of tax levy stated per 1,000 in value of the tax base. Prior to a 1978 amendment to the Massachusetts Constitution, a single tax rate applied to all of the taxable real and personal property in a city or town. The 1978 amendment allowed the legislature to create three classes of taxable property: 1) residential real property, 2)open space land, and 3) all other (commercial, industrial and personal) property, each of which may be tax at a different rate.Within limits, cities and town are given the option of determining the share. UNRESERVED FUND BALANCE See Free Cash

Appendix A – Fiscal Policies, Relevant Laws & Glossary of Terms
A27
This page intentionally left blank.

Appendix B – Financial Indicator Analysis
B1
Financial Indicator Analysis
Presented at Financial Summit
October 30, 2017
Weston Board of Selectmen Weston Finance Committee Weston School Committee

B2
Table of Contents
Executive Summary B3 Introduction to Financial Indicator Analysis B6
Financial Forecast
Level Service – Prelim. Revenue and Expenditure Proj.: FY19-FY21 B8
Financial Indicators
Indicator 1 Revenues per Household B10 Indicator 2 State Aid B11 Indicator 3 Revenues Related to Economic Growth B12
Indicator 4 Property Tax Revenues B13 Indicator 5 Uncollected Property Taxes B14 Indicator 6 Expenditures per Household B15 Indicator 7 Salaries and Wages B16 Indicator 8 Employee Benefits B17 Indicator 9 Unfunded Liabilities B18 Indicator 10 Pension Liability B19
Indicator 11 Pension Benefits B20 Indicator 12 OPEB Liability B21
Indicator 13 Debt Service B22 Indicator 14 Long Term Debt B23 Indicator 15 Reserves/Fund Balance B24 Indicator 16 Population B25 Supplemental Data 1 Chapter 70 Assistance B26
Supplemental Data 2 FY17 Average Single Family Tax Bill B27 Notes/Assumptions B28
Prepared by: Christina Hansberry, Financial Analyst, Susan Kelley, Finance Director, Donna S. VanderClock, Town Manager, Pete Forcellese,
Treasurer/Collector, Cynthia Mahr, Director of Finance & Operations, School Department, Lisa Yanakakis, Asst. Town Manager/Human Resources Director
Based on: Evaluating Financial Condition, ICMA, 2003

B3
Executive Summary
1. Assuming a level service budget, the following is projected:
a. FY2019 - a budget gap of $341,981 b. FY2020 – a budget gap of $763,886 c. FY2021 – a budget gap of $1,593,681
2. Highlights of Weston’s financial indicators relate to six main areas of financial condition – Revenue, Expenditures,
Employee Benefits, Debt, Reserves, and Population.
Revenue See Financial Indicator 3 – Revenues Related to Economic Growth
o Economic growth declined slightly in FY17. The ratio is still favorable; however we will watch this to see if this will become a continuing trend.
o Increasing economic growth revenues, particularly growth in the tax base, will increase the Town’s future operating budget flexibility.
Expenditures
See Financial Indicator 6 – Expenditures per Household o The FY2017 increase in expenditures is primarily due to an increase in Unclassified expenses
(Primarily Health Insurance & Pension), Education, Public Safety & DPW expenses.
See Financial Indicator 7 – Salaries and Wages (as a percentage of total spending) o The rate of employee salary increases, primarily the result of collective bargaining with employee
unions, has been relatively low since 2011. In FY11, there was no cost of living adjustment for any employee. Since then, salary increases have ranged from 1 to 2.5%. FY19 contractual increases range from 1-2%.

B4
Employee Benefits See Financial Indicator 10 – Pension Liability (Middlesex Retirement System)
o The 2016 actuarial study indicates that the percent of Weston’s pension liability that is funded has increased by 2.9%. Middlesex Retirement plans to fully fund its pension liability by 2035, with a goal of 6.5% increases in annual assessments to member communities through 2024 and 3.99% thereafter.
o The Town could pay down the unfunded liability quicker by voluntarily contributing more to the mandatory annual assessment. Any additional funds contributed by the Town would not subsidize other communities and members of the Middlesex Retirement System.
See Financial Indicator 11 - Pension Benefits Paid o The percentage of total pension assets paid in benefits has increased from 11.1% in 2002 to 14.3%
in 2016. The percentage decreased in 2016 from 2014 as the Pension Assets grew significantly by $8.2 million.
o As long term employees retire who have contributed 5% and 7% to the Middlesex Retirement System, they are replaced by new employees who pay 9% plus 2% over $30,000, which increases overall contributions. As of FY18, the last employee contributing 5% retired. 83% of employees are currently contributing 9% plus 2%.
See Financial Indicator 12 – OPEB Liability o The Actuarial Required Contribution (ARC), per the actuarial valuation, has been funded in the past
7 years. o Though the Town’s accrued liability has increased, continued funding of the ARC has improved the
OPEB liability funded ratio to 15% in FY16 from 10% in 2014.
Debt See Financial Indicator 13 – Debt Service
o Debt service exceeding 15 percent of operating revenues is considered a warning indicator; Weston’s debt service has hovered around the 10 percent mark since 2002.
o This indicator is intended for debt that is included in the operating budget, as it could potentially take away from other Town services, if got to be too high. Since Weston’s debt is primarily excluded, it is not included in the operating budget figure, but as an additional amount added to the tax levy.
See Financial Indicator 14 – Long Term Debt o Overall long term debt has declined since 2015. Large projects maturing in 2020 & 2021 will
reduce this amount as well.

B5
o High assessed valuation and healthy per capita income help offset any adverse impacts of the increased debt burden.
Reserves
See Financial Indicator 15 – Reserves/Fund Balance o The Reserves continue to be funded as planned; reserves are reviewed by the Finance Committee
and Board of Selectmen to see if targets should be updated. o In FY17, the undesignated fund balance increased due to higher departmental expenditure turn
backs and actual total revenues being more than projected. o Weston’s reserve level increased in FY17. The FY17 funding level was 12.2% which was up 0.9%
from FY16. Weston continues to fund the Reserves in order to meet the recommendation of rating agencies, which is that reserves be between 5-15% of operating revenues.
Population See Financial Indicator 16 – Population
o The population of residents 60 years of age and older dropped in FY17. However, as baby boomers age, an additional demand for services will be created by this age group.
o The number of students in Weston public schools decreased slightly by 0.3% in FY17.

B6
Introduction to Financial Indicator Analysisi What is financial condition? The term “financial condition” can be broadly defined as a municipality’s ability to finance its services on a continuing basis. That is, the Town must be able to (1) maintain existing levels of service, (2) withstand local, regional and national economic disruptions, and (3) meet the demands of natural growth, decline, and change. More specifically, financial condition can be viewed in the following ways:
1. Cash Solvency – In accounting terms, Weston’s financial condition refers to the Town’s ability to generate the cash required to pay its bills for thirty to sixty days.
2. Budgetary Solvency – The Town must also demonstrate the ability to generate enough revenues over its normal budgetary period (July 1st through June 30th) to meet its expenditures and not incur deficits. Unlike other levels of government, municipalities cannot legally run at a deficit, with limited exceptions (i.e. snow and ice removal costs).
3. Long-Run Solvency – A short-run financial analysis (one to five years) covers cash and budgetary solvency issues, highlighting any possibilities that could affect cash flow or create budget short-falls. But there are many financial issues facing municipalities than span into the future, namely, pension costs and other post employment benefits (OPEB).
4. Service-Level Solvency – Often, financial condition refers to a municipality’s ability to provide services at the level and quality that are required for the health and safety of the community and any further services that its residents desire. A municipality that does not have service-level solvency may be in strong financial condition but not be able to support necessary services at a desirable level. The municipality then cannot begin to provide adequate services without creating cash, budgetary or long-run solvency problems.
The Town aims to identify current or potential financial problems and develop detailed strategies for addressing them. By engaging yearly in the systematic process of the Financial Indicator Analysis, the Town is able to monitor changes and anticipate future problems.

B7
What is the purpose of the Financial Indicator Analysis? The Financial Indicator Analysis is designed to help municipalities make sense of the many factors that affect financial condition and develop quantifiable financial issues to monitor. These indicators help Weston to:
Develop a better understanding of the Town’s financial condition
Identify hidden and emerging problems before they reach serious proportions
Present a straightforward picture of the Town’s financial strengths and weaknesses to elected officials, citizens, credit-rating firms and other groups with a need to know
Introduce long-range considerations into the annual budgeting process
Provide a starting point for elected officials in setting financial policies
Quantify a significant amount of information
Place the events of a single year into a longer perspective, permitting Town officials to follow changes over time
Incorporate benchmarks normally used by credit-rating agencies
Final Thoughts Sound financial condition implies the ability to withstand local, regional, and national economic disruptions. The market turbulence that began in 2008 is a good example of why the Town must not only continue to monitor potential problems, but assume future disruptions and act accordingly. The indicators below have been chosen because they demonstrate the cash, budgetary, long-run and service-level solvency which the Town strives to maintain.
i Evaluating Financial Condition, ICMA, 2003

FinancialIndicatorAnalysis
B8
TOWN OF WESTON PRELIMINARY REVENUE AND EXPENDITURE PROJECTION FY19-FY21
LEVEL SERVICE BUDGET
Budget % Inc Requested % Inc Projected % Inc Projected % Inc Projected % Inc
ExpendituresSalariesGeneral Government 12,765,518 5.0% 13,148,484 3.0% 13,542,938 3.0% 13,542,938 3.0% 13,949,226 3.0%Education 33,292,192 2.5% 34,089,352 2.4% 35,112,033 3.0% 35,112,033 3.0% 36,165,394 3.0% sub-total Salaries 46,057,710 3.2% 47,237,836 2.6% 48,654,970 3.0% 48,654,970 3.0% 50,114,620 3.0%
Employee BenefitsGroup Insurance & Medicare 11,017,109 1.1% 11,898,478 8.0% 12,850,356 8.0% 12,850,356 8.0% 13,878,384 8.0%Retirement Systems 4,792,481 5.1% 5,114,630 6.7% 5,457,310 6.7% 5,457,310 6.7% 5,822,950 6.7%Workers' Comp & Unemployment 370,000 2.5% 381,100 3.0% 392,533 3.0% 392,533 3.0% 404,309 3.0% sub-total Employee Benefits 16,179,590 2.3% 17,394,208 7.5% 18,700,199 7.5% 18,700,199 7.5% 20,105,643 7.5%
Other UnclassifiedInsurance, Property & Liability 385,000 1.05% 392,700 2.0% 400,554 2.0% 400,554 2.0% 408,565 2.0%Separate Articles 110,000 0.00% - -100.0% - - -
All OtherGeneral Government 6,611,655 7.6% 6,687,872 1.2% 6,821,629 2.0% 6,821,629 2.0% 6,958,062 2.0%Cash Capital - - - - - Education 5,787,337 -7.9% 6,153,907 6.3% 6,276,985 2.0% 6,276,985 2.0% 6,402,525 2.0%Non-Excluded Debt Service 32,280 -4.3% 30,860 -4.4% 29,460 -4.5% 29,460 -4.5% 29,080 -1.3% sub-total All Other 12,431,272 -0.2% 12,872,639 3.6% 13,128,075 2.0% 13,128,075 2.0% 13,389,667 2.0%
ReservesFinance Committee Reserve Fund 556,900 -6.4% 586,587 5.3% 601,252 2.5% 601,252 2.5% 616,283 2.5%Facilities Maintenance 534,699 5.0% 566,781 6.0% 600,788 6.0% 600,788 6.0% 636,835 6.0%Uninsured Losses - 0.0% - 0.0% - 0.0% - 0.0% - 0.0%Workers' Comp Police/Fire 20,000 0.0% 20,000 0.0% 20,000 0.0% 20,000 0.0% 20,000 0.0%Post-Employment Benefits Reserve 1,736,480 5.1% 2,106,634 21.3% 2,199,656 4.4% 2,199,656 4.4% 2,267,423 3.1%Stabilization Fund - 0.0% - 0.0% - 0.0% - 0.0% - 0.0%Pension Stabilization Fund - 0.0% - 0.0% - 0.0% - 0.0% - 0.0%Compensated Absences 200,000 42.9% 220,000 10.0% 240,000 9.1% 240,000 9.1% 260,000 8.3% sub-total Reserves 3,048,079 4.0% 3,500,002 14.8% 3,661,696 4.6% 3,661,696 4.6% 3,800,541 3.8%
Budget Reduction - (381,945)
Total Expenditures 78,211,651 2.5% 81,397,384 4.1% 84,545,494 3.9% 84,163,551 3.4% 87,819,036 3.9%
FY21
Level Service Increase over Scenario 2
Scenario 1FY20
Level Service Budget
Scenario 2FY20
Level Service with Budget
Reductions/Revenue Increases to resolve
deficit
Level Service Budget
FY18 FY19
As Approved by Town Meeting

FinancialIndicatorAnalysis
B9
TOWN OF WESTON PRELIMINARY REVENUE AND EXPENDITURE PROJECTION FY19-FY21
LEVEL SERVICE BUDGET
Budget % Inc Requested % Inc Projected % Inc Projected % Inc Projected % Inc
RevenueProperty Tax Levy 67,389,927 2.8% 70,099,675 4.0% 72,817,697 3.9% 72,817,698 3.9% 75,253,140 3.3% - New Growth 1,000,000 -16.1% 600,000 -40.0% 600,000 0.0% 600,000 0.0% 600,000 0.0% - Unused Levy Capacity (1,000,000) -16.1% (600,000) -40.0% (600,000) (600,000) 0.0% (600,000) - Override - - - - - State Aid 3,721,206 -15.2% 3,721,206 0.0% 3,721,206 0.0% 3,721,206 0.0% 3,721,206 0.0%Local Receipts 5,066,714 -0.2% 5,067,657 0.0% 5,067,657 0.0% 5,067,657 0.0% 5,067,657 0.0%Prior Year Balances/Other 2,773,500 3.1% 2,898,500 4.5% 2,898,500 0.0% 2,898,500 0.0% 2,898,500 0.0%Revenue Offsets (1,277,099) -34.3% (1,277,099) 0.0% (1,277,099) 0.0% (1,277,099) 0.0% (1,277,099) 0.0%Other Revenues 537,403 1.5% 545,464 1.5% 553,646 1.5% 553,646 1.5% 561,951 1.5%
Revenue Increase - 381,943
Total Revenue 78,211,651 2.5% 81,055,403 3.6% 83,781,607 3.4% 84,163,551 3.8% 86,225,355 2.4%
Budget Surplus (Deficit) - (341,981) (763,886) - (1,593,681)
Add Net Exempt Debt Service - Estimated 8,165,171 -0.4% 8,652,539 6.0% 9,513,714 10.0% 8,962,186 -5.8%
Total Estimated Property Tax Levy* 75,555,098 2.6% 79,094,195 4.7% 82,331,411 4.1% 84,215,326 2.3%*Assumes resolution of deficit through spending cuts or increases in other revenue sources.
FY21
Level Service Increase over Scenario 2
Scenario 1FY20
Level Service Budget
Scenario 2FY20
Level Service with Budget
Reductions/Revenue Increases to resolve
deficit
Level Service Budget
FY18 FY19
As Approved by Town Meeting

FinancialIndicatorAnalysis
B10
FINANCIAL INDICATOR 1- Revenues per Household
A decrease in net operating revenues per household (constant dollars) is considered a warning indicator.
Weston TrendX favorable
marginalunfavorableuncertain
Formula:
fiscal year 2008 2009 2010 2011 2012 2013 2014 2015 2016 2017Gross operating revenues/transfers 68,327,434 70,220,100 70,641,472 73,117,964 72,957,723 73,630,500 77,985,914 78,786,936 81,010,808 84,151,435Less: excluded debt (net) 7,463,699 7,391,436 7,205,908 6,810,118 7,266,714 6,747,256 7,646,500 7,220,241 8,105,064 8,084,603Net operating revenues 60,863,735 62,828,664 63,435,564 66,307,846 65,691,009 66,883,244 70,339,414 71,566,695 72,905,744 76,066,832CPI-U, 1982-84 base year 241.3 233.0 236.1 244.3 246.3 251.1 255.3 257.0 260.8 266.4CPI-U, 2000 base year 131.7 127.2 128.9 133.3 134.5 137.0 139.4 140.3 142.4 145.4CPI-U, 2000 base, adj. constant dollars 75.9% 78.6% 77.6% 75.0% 74.4% 73.0% 71.8% 71.3% 70.2% 68.8%Net operating revenues (constant dollars) 46,217,063 49,396,232 49,215,673 49,732,242 48,856,365 48,803,747 50,475,451 51,017,621 51,212,931 52,310,224Households (taxable parcels w/dwelling) 3,589 3,595 3,595 3,613 3,618 3,629 3,641 3,658 3,659 3,654Net Operating Revenues per Household (constant dollars) 12,877 13,740 13,690 13,765 13,504 13,448 13,863 13,947 13,996 14,316Percent change from prior year -0.05% 6.70% -0.37% 0.55% -1.90% -0.41% 2.66% 0.60% 0.36% 2.28%
Weston's revenue growth, in constant dollars (used instead of current dollars to adjust for inflation), has generally been positive due to growth in the residential tax base and tax increases (i.e., overrides). FY2017's increase in net operating revenue per household is due to a constant number of households coupled with a 3.8% increase in gross operating revenues/transfers.
Outlook: Revenues from general government have remained strong and net operating revenues have been steadily increasing. In order to shelter the Town from short-term fluctuations in any one revenue source, a concerted effort has been made to increase reserves.
Net operating revenues (constant dollars)Households (taxable parcels w/dwelling)
Analysis: Revenues per Household is one measure of the Town's ability to maintain existing service levels. For most general government services, costs increase as the number of households increase. The increase in gross operating revenue is due mostly to Economic Growth revenues such as Motor Vehicle Excise tax, and it reflects a positive trend. Licenses and Permit Revenue went down considerably in FY17 due to a decrease in building permit revenue by $250K . Other increases were from Penalties and Interest on Taxes, and other Local Receipts. Interest revenue increased by $160K due to the consolidation of Town bank accounts at higher rates. The largest portion of operating revenues is from Real Estate taxes. The Net Operating Revenues have been increasing annually which indicates the continuing willingness of residents to fund a budget that maintains the current level of service.
0
5,000
10,000
15,000
2008 2009 2010 2011 2012 2013 2014 2015 2016 2017rev
en
ue
s p
er
ho
us
eh
old
fiscal year
Revenues Per Household

FinancialIndicatorAnalysis
B11
FINANCIAL INDICATOR 2 - State Aid
Weston Trendfavorable
X marginal
unfavorableuncertain
Formula:
fiscal year 2008 2009 2010 2011 2012 2013 2014 2015 2016 2017Net operating revenues 60,863,735 62,828,664 63,435,564 66,307,846 65,691,009 66,883,244 70,339,414 71,566,695 72,905,744 76,066,832State Aid (Cherry Sheet) revenues 4,295,040 4,722,852 4,435,150 4,269,484 3,664,945 3,747,352 3,726,848 4,135,489 4,124,869 4,386,744 Less: School building reimbursements 1,426,237 1,436,390 1,454,017 1,454,017 816,230 816,234 741,853 724,226 665,538 665,538 Net State aid revenues 2,868,803 3,286,462 2,981,133 2,815,467 2,848,715 2,931,118 2,984,995 3,411,263 3,459,331 3,721,206 State aid as a percentage of operating revenues 4.7% 5.2% 4.7% 4.2% 4.3% 4.4% 4.2% 4.8% 4.7% 4.9%
Outlook: The Town cannot depend on any significant increase in State Aid. There is a trickle down effect of cutbacks at the federal level impacting state and municipal budgets and cutbacks on the state level impacting municipal budgets. We continue to estimate this revenue source conservatively.
Reductions in State Aid, as a percentage of operating revenues, is considered a warning indicator particularly if the Town does not have adequate reserves to offset reductions.
Operating RevenuesState Aid
Analysis: Though the Town does not have a significant reliance on State Aid, any dependence on such aid may be difficult to manage when there is a reduction in funding. Net State Aid revenues dropped from 2009 to 2011, but have risen gradually since then, with a $260K increase in FY17. The amount for school building reimbursement decreased by over 40% in 2012 because the MSBA provided a lump sum reimbursement for the balance due on the 1997 Middle School renovation project at the time the Town refunded the bonds. This reimbursement will end in FY20. A further reduction is from the refunding done in February 2014, February 2015, February 2016. State aid for school projects is now provided while the project is being constructed, so the Town borrows only its share.
0.0%
2.0%
4.0%
6.0%
2008 2009 2010 2011 2012 2013 2014 2015 2016 2017
% o
f re
ve
nu
e
fiscal year
Intergovernmental Revenues

FinancialIndicatorAnalysis
B12
FINANCIAL INDICATOR 3 - Revenues Related to Economic Growth
Decreasing economic growth revenues, as a percentage of net operating revenues, is considered a warning indicator.
X favorablemarginal
unfavorableuncertain
Formula:
fiscal year 2008 2009 2010 2011 2012 2013 2014 2015 2016 2017Net (non-exempt) operating revenues 60,863,735 62,828,664 63,435,564 66,307,846 65,691,009 66,883,244 70,339,414 71,566,695 72,905,744 76,066,832Building permit fees 838,047 1,184,174 800,122 843,286 824,166 693,083 1,031,281 980,677 935,428 698,601Motor vehicle excise 2,557,093 2,587,461 2,039,944 2,614,061 2,418,788 2,445,833 2,808,327 2,910,707 2,982,398 3,043,210Tax levy from new construction 1,094,715 1,122,064 1,111,655 1,470,272 897,752 1,156,485 1,020,267 1,196,208 927,176 1,192,004Total: economic growth revenues 4,489,855 4,893,699 3,951,721 4,927,619 4,140,706 4,295,401 4,859,875 5,087,592 4,845,002 4,933,815
Economic Growth revenues as a percentage of operating revenues 7.4% 7.8% 6.2% 7.4% 6.3% 6.4% 6.9% 7.1% 6.6% 6.5%
Weston Trend
Analysis: Economic growth revenues are responsive to changes in the economic base and inflation. A balance between growth and other (non growth) revenues mitigates the effect of economic growth or decline. During a recession, a high percentage of non growth revenues is an advantage. This insulates the tax base to some degree during a recession. In FY17, Motor Vehicle Excise tax was 49% higher than a low in FY10 of just over $2 Million. In FY17, building permit fees saw a 25% decrease over FY16. New growth increased by 28% in FY17.
Outlook: Although there has been a recent downturn in economic growth, this could change in future. If the 40(B) project at 133 Boston Post Road is approved this would have a positive impact on building permit fees and new growth. Construction of Highland Meadows condominims, which has contributed significantly to new growth in prior years, is set to be completed soon. With a 95% residential tax base, this is an indicator to watch.
Economic Growth RevenuesOperating Revenues
0.0%1.0%2.0%3.0%4.0%5.0%6.0%7.0%8.0%9.0%
2008 2009 2010 2011 2012 2013 2014 2015 2016 2017
fiscal years
Economic Growth Revenues

FinancialIndicatorAnalysis
B13
FINANCIAL INDICATOR 4 - Property Tax Revenues
A decline in property tax revenues (constant dollars) is considered a warning indicator.
X favorablemarginal
unfavorableuncertain
Formula:
fiscal year 2008 2009 2010 2011 2012 2013 2014 2015 2016 2017Property tax levy limit (incl. unused levy capacity) 57,473,218 59,808,218 62,037,805 64,491,774 67,337,393 69,477,740 73,047,725 75,209,790 78,938,881 82,113,668Less: debt exemptions (net) 7,463,699 7,391,436 7,205,908 6,810,118 7,266,714 6,747,256 7,646,500 7,220,241 8,105,064 8,084,603Less: community preservation act surcharge 1,488,000 1,574,790 1,605,810 1,622,366 1,675,490 1,717,377 1,876,970 1,872,045 1,962,920 2,039,437Net property tax revenues 48,521,519 50,841,992 53,226,087 56,059,290 58,395,189 61,013,107 63,524,255 66,117,504 68,870,897 71,989,628 CPI-U, 2000 base year 131.7 127.2 128.9 133.3 134.5 137.0 139.4 140.3 142.4 145.4 CPI-U, 2000 base, adj. constant dollars 75.9% 78.6% 77.6% 75.0% 74.4% 73.0% 71.8% 71.3% 70.2% 68.8%
Property tax revenues (constant dollars) 36,844,964 39,972,246 41,294,781 42,045,615 43,430,245 44,520,392 45,584,903 47,133,066 48,378,636 49,506,381 Percent increase over prior year (constant dollars) -1.7% 8.5% 3.3% 1.8% 3.3% 2.5% 2.4% 3.4% 2.6% 2.3%
Weston Trend
Analysis: Property tax revenues are analyzed separately because they are the Town's primary revenue source for both operating and capital spending. Any decrease in property tax revenues should be monitored to ensure that the collection rate of taxes remains high. Any increases due to operating overrides should be noted for their impact on future override requests.
Outlook: There has not been a Proposition 2 1/2 override since FY07, and unused tax levy capacity in FY2018 is anticipated to be over $6.5 million.
25,000,000
35,000,000
45,000,000
2008 2009 2010 2011 2012 2013 2014 2015 2016 2017
rev
enu
es
fiscal year
Property Tax Revenues - Constant Dollars

FinancialIndicatorAnalysis
B14
FINANCIAL INDICATOR 5 - Uncollected Property Taxes
Uncollected property taxes (as a percent of the property tax levy) of 5-8 percent is considered a warning indicator.
X favorablemarginal
unfavorableuncertain
Formula:
fiscal year 2008 2009 2010 2011 2012 2013 2014 2015 2016 2017Property tax levy (actual tax levy) 54,440,553 56,998,334 58,075,330 59,920,567 63,256,256 64,423,334 67,990,016 68,920,999 71,275,670 73,668,584Reserved for abatements and exemptions 442,790 436,493 385,361 423,816 458,354 430,916 434,643 450,988 406,511 446,753Net property tax levy 53,997,763 56,561,841 57,689,969 59,496,751 62,797,902 63,992,418 67,555,373 68,470,011 70,869,159 73,221,831Uncollected taxes as of June 30 600,281 705,134 729,004 705,380 668,147 723,116 611,362 530,925 599,863 627,866Uncollected taxes as a percentage of net property tax levy 1.1% 1.2% 1.3% 1.2% 1.1% 1.1% 0.9% 0.8% 0.8% 0.9%note: includes CPA surcharge beginning FY02
Analysis: An increase in uncollected property taxes may indicate an inability by property owners to pay their taxes due to economic constraints. Additionally, as uncollected property taxes rise, liquidity decreases, resulting in less cash on hand for the Town to invest or reserve. The credit rating organizations generally consider uncollected taxes in excess of five percent as a warning trend.
Outlook: Weston's tax base has always maintained excellent collection rates. Deferral and payment plans have been used to keep collections positive and avoid properties ending up in Tax Title lien process.
Weston Trend
Uncollected Property Taxes
Net Property Tax Levy
0.0%
1.0%
2.0%
un
coll
ect
ed
pro
per
ty ta
xes
fiscal year
Uncollected Property Taxes

FinancialIndicatorAnalysis
B15
FINANCIAL INDICATOR 6 - Expenditures per Household
Increasing net operating expenditures per household, in constant dollars, may be considered a warning indicator.
favorableX marginal
unfavorableuncertain
Formula:
fiscal year 2008 2009 2010 2011 2012 2013 2014 2015 2016 2017School department and Minuteman 28,681,804 30,204,852 31,885,479 32,171,523 33,315,728 34,135,541 35,755,525 36,645,994 37,258,085 38,197,705 Unclassified (excluding exempt debt) 13,058,251 12,482,601 11,914,297 13,090,855 13,488,568 13,814,611 14,216,205 14,784,855 15,458,337 15,814,738 Administration and finance 2,322,914 2,102,833 2,155,132 2,224,643 2,449,451 2,374,386 2,467,132 2,420,075 2,646,743 2,823,852 Facilities Town-wide 541,614 426,499 547,325 742,305 577,352 806,272 893,593 922,628 1,692,199 1,444,447 Planning and land use 540,079 540,746 646,049 619,286 663,402 637,679 696,374 694,934 738,015 733,443 Public safety 5,517,744 5,651,779 5,697,165 5,703,795 6,077,856 6,090,823 6,729,720 6,668,289 6,709,154 6,886,651 Public works (excl. water div., incl. snow) 3,176,818 3,518,161 3,229,052 3,272,007 3,573,603 3,978,143 4,931,669 4,546,070 3,659,410 4,570,919 Health and human service (excl. BSA as of FY06) 472,802 529,860 549,221 611,325 621,280 638,293 670,911 687,076 689,736 716,581 Cultural and leisure 1,455,504 1,465,715 1,583,132 1,642,244 1,643,800 1,640,180 1,653,113 1,667,066 1,767,463 1,290,388 Net operating expenditures 55,767,530 56,923,046 58,206,852 60,077,983 62,411,040 64,115,928 68,014,242 69,036,987 70,619,141 72,478,724 CPI-U, 2000 base year 131.7 127.2 128.9 133.3 134.5 137.0 139.4 140.3 142.4 145.4CPI-U, 2000 base, adj. constant dollars 75.9% 78.6% 77.6% 75.0% 74.4% 73.0% 71.8% 71.3% 70.2% 68.8%Net operating expenditures (constant dollars) 42,347,244 44,753,204 45,159,044 45,059,717 46,416,954 46,784,476 48,806,911 49,214,273 49,606,697 49,842,726 Households 3,589 3,595 3,595 3,613 3,618 3,629 3,641 3,658 3,659 3,654
Net Operating Expenditures per Household (constant dollars) 11,799 12,449 12,562 12,472 12,829 12,892 13,405 13,454 13,557 13,641
Note: Health and Human Services does not include Brook School Apartments beginning FY06, since it was made an enterprise fund.
Net operating expenditures and transfers (constant dollars)Households
Analysis: Increasing per household expenditures can indicate that the cost of providing service is increasing more rapidly than the Town's ability to pay, especially if spending is increasing faster than the residents' collective personal income. Increasing expenditures may also indicate that the demographics of the Town are changing, requiring increased spending in related services (i.e. Schools or Council on Aging services). Weston's increase in expenditures has largely been related to increasing costs for personnel and benefits. This trend was slowed by the Town's switch in FY10 to GIC provided health plans and a reduction in the overall level of salary increase, however, the GIC increased premiums significantly in FY17. The largest percentage expenditure increase in FY17 was in the Public Works Department, due to the demand for infrastructure improvements.
Outlook: With most of the Town's buildings having been replaced or significantly upgraded in the last 10-15 years, facilities maintenance costs should level off; however, a higher level of investment in public works infrastructure is warranted. Increases in salaries are impacted by the low rate of inflation. The cost of employee health insurance, which previously had moderate increases due to the Town's participation in the GIC, has now seen a larger increase but the recently negotiated 2% reduction in the Town's premium contribution, which took effect in fiscal year 2016, assisted in mitigating some of the increased premium. The impact of federal health care requirements is unknown at this time, but may result in larger increases.
Weston Trend
8,000
10,000
12,000
14,000
2008 2009 2010 2011 2012 2013 2014 2015 2016 2017
pe
r h
ou
seh
old
exp
en
dit
ure
s
fiscal year
Expenditures per Household

FinancialIndicatorAnalysis
B16
FINANCIAL INDICATOR 7 - Salaries and Wages
Increasing personnel costs as a percentage of total spending is considered a warning indicator.
X favorablemarginal
unfavorableuncertain
Formula:
fiscal year 2008 2009 2010 2011 2012 2013 2014 2015 2016 2017Net operating expenditures 55,767,530 56,923,046 58,206,852 60,077,983 62,411,040 64,115,928 68,014,242 69,036,987 70,619,141 72,478,724 Less: Minuteman high school 73,250 73,164 49,338 49,889 81,140 81,634 104,311 110,127 91,498 122,810 Net operating expenditures 55,694,280 56,849,882 58,157,514 60,028,094 62,329,900 64,034,294 67,909,931 68,926,860 70,527,643 72,355,914General government and school wages 37,299,815 39,382,480 41,101,146 41,452,090 42,165,600 43,278,158 45,309,953 46,957,921 47,365,337 48,683,795 Salaries and wages as a percentage of operating expenditures 67.0% 69.3% 70.7% 69.1% 67.6% 67.6% 66.7% 68.1% 67.2% 67.3%
Weston Trend
Analysis: Increasing salaries and wages as a percent of operating expenditures may be an indicator of two trends: First, it may point to future pension and health insurance costs since both of these items are related to the number and compensation level of employees. Second, if salaries and wages as a percent of operating expenditures are increasing because the Town is reducing its expenditures on maintenance and capital outlay, it may be an indicator of deferred maintenance of the Town's infrastructure. The latter is less of a concern due to the creation of the Town-wide Facilities Department in FY07 with a corresponding increase in the budget for facilities maintenance and consistent expenditures for public works infrastructure improvements.
Outlook: The rate of employee salary increases, primarily the result of collective bargaining with employee unions, has been relatively low since 2011. In FY11, there was no cost of living adjustment for any employee. Since then, salary increases have ranged from 1 to 2.5%. FY19 contractual increases range from 1-2%.
Salaries and wagesNet operating expenditures
0%
20%
40%
60%
80%
100%
2008 2009 2010 2011 2012 2013 2014 2015 2016 2017sa
lari
es
as
a %
of
ex
pe
nd
itu
res
fiscal years
Salaries and Wages
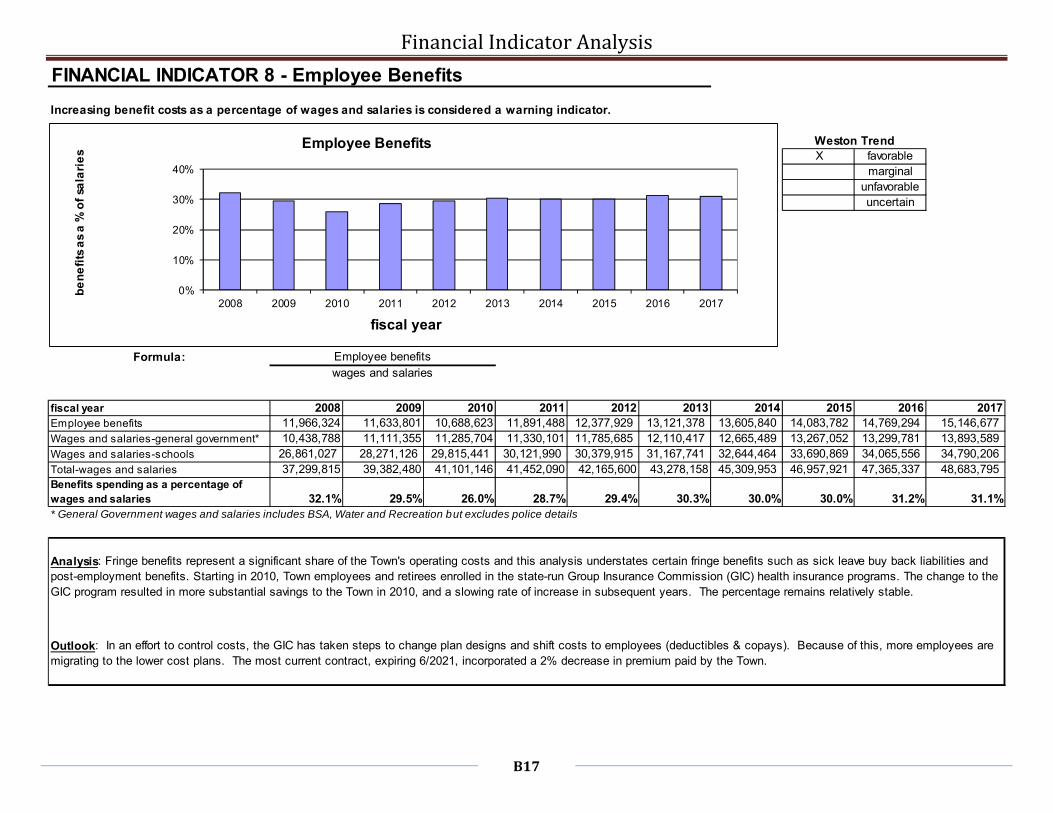
FinancialIndicatorAnalysis
B17
FINANCIAL INDICATOR 8 - Employee Benefits
Increasing benefit costs as a percentage of wages and salaries is considered a warning indicator.
X favorablemarginal
unfavorableuncertain
Formula:
fiscal year 2008 2009 2010 2011 2012 2013 2014 2015 2016 2017Employee benefits 11,966,324 11,633,801 10,688,623 11,891,488 12,377,929 13,121,378 13,605,840 14,083,782 14,769,294 15,146,677 Wages and salaries-general government* 10,438,788 11,111,355 11,285,704 11,330,101 11,785,685 12,110,417 12,665,489 13,267,052 13,299,781 13,893,589 Wages and salaries-schools 26,861,027 28,271,126 29,815,441 30,121,990 30,379,915 31,167,741 32,644,464 33,690,869 34,065,556 34,790,206 Total-wages and salaries 37,299,815 39,382,480 41,101,146 41,452,090 42,165,600 43,278,158 45,309,953 46,957,921 47,365,337 48,683,795 Benefits spending as a percentage of wages and salaries 32.1% 29.5% 26.0% 28.7% 29.4% 30.3% 30.0% 30.0% 31.2% 31.1%* General Government wages and salaries includes BSA, Water and Recreation but excludes police details
Analysis: Fringe benefits represent a significant share of the Town's operating costs and this analysis understates certain fringe benefits such as sick leave buy back liabilities and post-employment benefits. Starting in 2010, Town employees and retirees enrolled in the state-run Group Insurance Commission (GIC) health insurance programs. The change to the GIC program resulted in more substantial savings to the Town in 2010, and a slowing rate of increase in subsequent years. The percentage remains relatively stable.
Outlook: In an effort to control costs, the GIC has taken steps to change plan designs and shift costs to employees (deductibles & copays). Because of this, more employees are migrating to the lower cost plans. The most current contract, expiring 6/2021, incorporated a 2% decrease in premium paid by the Town.
Weston Trend
Employee benefitswages and salaries
0%
10%
20%
30%
40%
2008 2009 2010 2011 2012 2013 2014 2015 2016 2017
be
ne
fits
as
a %
of
sala
rie
s
fiscal year
Employee Benefits

FinancialIndicatorAnalysis
B18
FINANCIAL INDICATOR 9 - Unfunded Liabilities (Sick/Vacation Leave)
Increasing unfunded liabilities per municipal employee is considered a warning indicator.
favorableX marginal
unfavorableuncertain
Formula:
fiscal year 2008 2009 2010 2011 2012 2013 2014 2015 2016 2017Unfunded sick and vacation leave (per audit) 2,107,386 2,091,441 2,047,400 1,994,554 2,149,802 2,390,353 2,251,364 2,444,959 2,621,000 2,673,000Amount funded (compensated absence fund bal.) 108,783 140,951 153,686 183,964 259,180 320,073 220,402 228,299 226,588 208,219Net unfunded liability 1,998,603 1,950,490 1,893,714 1,810,590 1,890,622 2,070,280 2,030,961 2,216,660 2,394,412 2,464,781Number of eligible employees 181 177 177 177 178 178 176 172 167 169Accrued unfunded sick/vacation liability per employee 11,042 11,020 10,699 10,229 10,621 11,631 11,540 12,888 14,338 14,585*unaudited
Weston Trend
accrued sick/vacation leavenumber of employees
Analysis: The Town allows municipal and some school employees to accumulate a portion of unused sick leave to be paid upon retirement or resignation after 12 years of service. Non-union employees hired after 1/1/11 are no longer eligible, as well as members of the Police Superior Officers' union and the Town Manager. These changes have slowed the rate of increase per employee. Vacation accrual is limited and by law must also be paid. There were 6 sick time payouts ($153K) from retirements in FY2017. This liability was funded with $200K in FY18 and funding will increase by $20K each year per the revised policy in FY17 .
Outlook: Through the establishment of a reserve fund, a small portion of this liability has been funded. An effort has been made to reduce the sick leave buyback benefit, any change to which is subject to the collective bargaining process. The reduction in the number of eligible employees reflects changes made to reduce the benefit.
8,0009,000
10,00011,00012,00013,00014,00015,000
2008 2009 2010 2011 2012 2013 2014 2015 2016 2017
lia
bil
ity
pe
r e
lig
ible
e
mp
loye
e
fiscal years
Accrued Sick / Vacation Leave

FinancialIndicatorAnalysis
B19
FINANCIAL INDICATOR 10 - Pension LiabilityAn unfunded pension liability or increase in the unfunded liability is considered a warning indicator.
favorablemarginal
X unfavorableuncertain
Formula:
calendar year 2002 2004 2006 2008 2010 2012 2014 2016Pension assets 23,079,156 23,709,310 24,953,073 31,001,714 31,583,111 32,345,383 36,802,655 45,081,826Pension liability 40,999,698 47,936,250 55,649,871 63,518,002 75,443,253 85,081,793 92,382,444 105,460,405Percent funded 56.3% 49.5% 44.8% 48.8% 41.9% 38.0% 39.8% 42.7%
Analysis: Weston is a member of the Middlesex Retirement System (MRS), a regional system which pools and manages the pension system assets. The assets are derived from the employee and employer (town) contributions. The MRS also manages the payment of retirement benefits, in accordance with State law, for all retirees of the system. A previous 1988 law change required the retirement liability to be fully funded by 2028. The Municipal Relief Bill, Ch. 188 of the Acts of 2010 provides the option to extend that to June 30, 2040, and MRS has since decided to extend the funding schedule to June 30, 2035. Many retirement systems in Massachusetts made substantial progress in reaching this requirement during the strong stock market period of the mid to late 1990's, but the MRS, was less successful, choosing instead to reduce employer contributions rather than fund the liability. When implementing Weston's reserve policy, it was determined that no additional amount beyond what is assessed by MRS should be set aside. In FY10, the MRS assessment decreased unexpectedly due to a five-year smoothing used to calculate assessments. In order to be prepared for an unexpected increase in the future, the FY10 and FY11 budgets included $200,000 each year for a pension reserve. Assets are managed by PRIT.
Outlook: Weston continues to fund the assessment needed to fully fund by 2035 with an additional $411,000 in Pension Stabilization Fund to smooth any large assessments. As the market and economy continue to improve, returns should follow. Weston is in a good position relative to other communities, and past extensions of fully funded mandates may happen again. Weston may want to consider accelerating funding based on available funds.
Weston Trend
pension assetspension liability
0.0%10.0%20.0%30.0%40.0%50.0%60.0%70.0%80.0%
2002 2004 2006 2008 2010 2012 2014 2016
% f
un
de
d
calendar year
Pension Liability
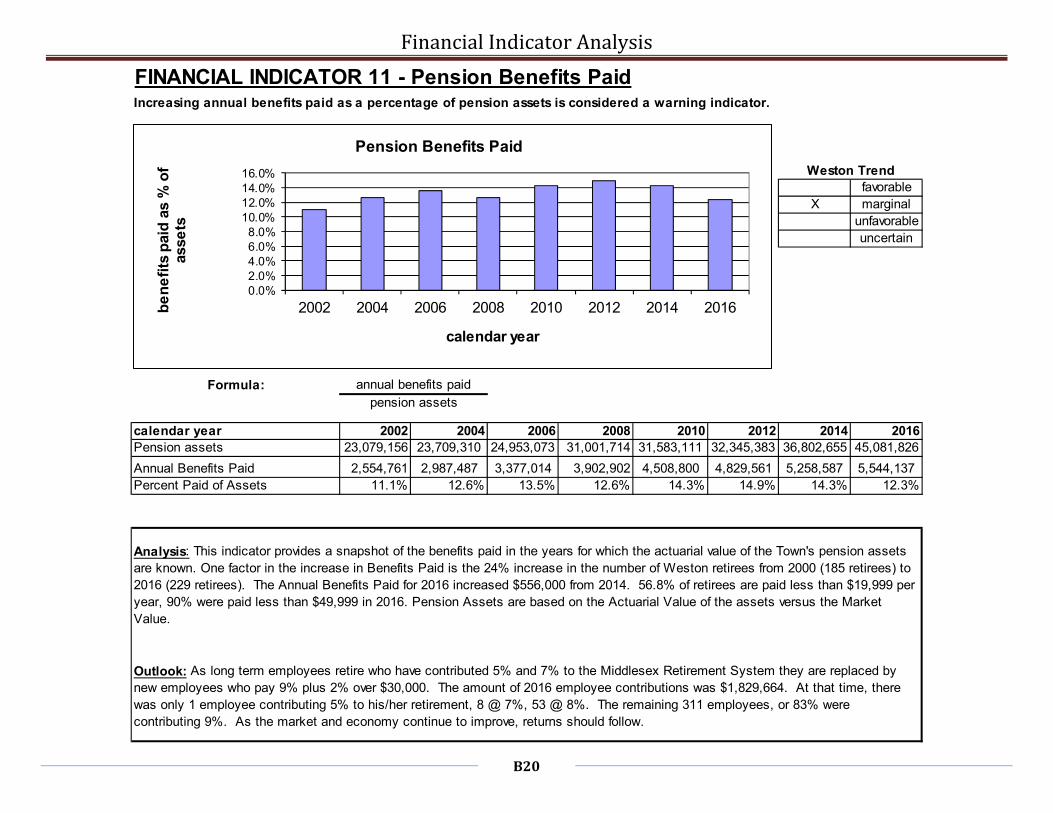
FinancialIndicatorAnalysis
B20
FINANCIAL INDICATOR 11 - Pension Benefits PaidIncreasing annual benefits paid as a percentage of pension assets is considered a warning indicator.
favorableX marginal
unfavorableuncertain
Formula:
calendar year 2002 2004 2006 2008 2010 2012 2014 2016Pension assets 23,079,156 23,709,310 24,953,073 31,001,714 31,583,111 32,345,383 36,802,655 45,081,826
Annual Benefits Paid 2,554,761 2,987,487 3,377,014 3,902,902 4,508,800 4,829,561 5,258,587 5,544,137Percent Paid of Assets 11.1% 12.6% 13.5% 12.6% 14.3% 14.9% 14.3% 12.3%
Weston Trend
annual benefits paidpension assets
Analysis: This indicator provides a snapshot of the benefits paid in the years for which the actuarial value of the Town's pension assets are known. One factor in the increase in Benefits Paid is the 24% increase in the number of Weston retirees from 2000 (185 retirees) to 2016 (229 retirees). The Annual Benefits Paid for 2016 increased $556,000 from 2014. 56.8% of retirees are paid less than $19,999 per year, 90% were paid less than $49,999 in 2016. Pension Assets are based on the Actuarial Value of the assets versus the Market Value.
Outlook: As long term employees retire who have contributed 5% and 7% to the Middlesex Retirement System they are replaced by new employees who pay 9% plus 2% over $30,000. The amount of 2016 employee contributions was $1,829,664. At that time, there was only 1 employee contributing 5% to his/her retirement, 8 @ 7%, 53 @ 8%. The remaining 311 employees, or 83% were contributing 9%. As the market and economy continue to improve, returns should follow.
0.0%2.0%4.0%6.0%8.0%
10.0%12.0%14.0%16.0%
2002 2004 2006 2008 2010 2012 2014 2016be
ne
fits
pai
d a
s %
of
asse
ts
calendar year
Pension Benefits Paid

FinancialIndicatorAnalysis
B21
FINANCIAL INDICATOR 12 - OPEB Liability (Retiree Health Insurance)An unfunded liability for post employment benefits or increase in the unfunded liability is considered a warning indicator.
X favorablemarginal
unfavorableuncertain
Formula: actuarial valuation date7/1/2014 7/1/2014 7/1/2016
fiscal year 2008 2009 2010 2011 2012 2013 2014 2015 2016 2017 2018*OPEB trust fund balance (7/1) 60,000 103,800 156,820 217,792 3,510,050 4,867,924 7,187,802 9,359,265 9,336,348 11,223,287 13,787,257 Contribution to OPEB Trust Fund 30,000 40,000 50,000 60,000 3,286,313 1,606,000 1,631,367 1,648,512 1,606,925 1,652,517 1,736,480 Pay As You Go - Retiree Health Payments 2,407,843 2,694,219 1,873,202 2,000,171 2,163,847 2,203,004 2,348,908 2,364,490 2,526,952 2,629,392 2,968,864Annual required contribution (ARC)** 5,449,403 5,729,664 3,466,896 3,628,626 3,846,696 3,828,592 4,105,067 4,282,387 4,700,370 4,900,171 5,015,383Percent of ARC funded 44.7% 47.7% 55.5% 56.8% 141.7% 99.5% 97.0% 93.7% 87.9% 87.4% 93.8%*Value as of June 2017 bank statement plus annual contribution**Normal cost + 30 years amortization of unfunded actuarial accrued liability
Analysis: Weston has been required to report its liability for post employment benefits (retiree health insurance) on its audited financial statements since fiscal year 2007. The last actuarial study has determined the long-term liability to be approximately $78 million with no pre-funding. There is currently no legal requirement to fund this liability; however, there may be in the future, and financial prudence dictates that efforts should be made to address the OPEB liability. Beginning in fiscal year 2012, a significant effort was made to fund the long-term liability. Fiscal years 2014-2017 contributions matched the annual required contribution (ARC) set forth in the actuarial reports commissioned by the Town. In FY2014 the OPEB funds were invested with Bartholomew and Company. A higher rate of return (6.04% since inception, after fees - June 2017) has been achieved which will contribute to a higher percent funded.
Outlook: Weston has contributed to the ARC for 7 straight years and aggressively addressing this liability has been noted by the Ratings Agency. The market value of the fund in June 2017 was $13.78 million before FY18 contribution of $1.73 million. Actions by the Town such as continuing with the GIC and market returns on funds should lead to better actuarial analyses in years to come.
Weston Trend
OPEB trust fund balance + Actual contributionsAnnual Required Contribution (ARC)
40.0%50.0%60.0%70.0%80.0%90.0%
100.0%110.0%120.0%130.0%140.0%150.0%
2008 2009 2010 2011 2012 2013 2014 2015 2016 2017
% o
f A
RC
fu
nd
ed
fiscal year
OPEB Liability

FinancialIndicatorAnalysis
B22
FINANCIAL INDICATOR 13 - Debt ServiceDebt Service per Operating Revenues
X favorablemarginal
unfavorableuncertain
X favorablemarginal
unfavorableuncertain
Formula:
fiscal year 2008 2009 2010 2011 2012 2013 2014 2015 2016 2017Net Exempt debt service 7,391,436 7,421,531 7,205,902 6,810,118 7,266,714 6,747,256 7,646,500 7,220,241 8,105,064 8,084,603 Non exempt debt service 62,806 71,752 63,181 51,317 48,283 44,159 46,968 38,121 36,817 33,720 Total debt service 7,454,242 7,493,283 7,269,083 6,861,435 7,314,997 6,791,415 7,693,468 7,258,362 8,141,881 8,118,323 Gross operating revenues/transfers 68,327,434 70,220,100 70,641,472 73,117,964 72,957,723 73,630,500 77,985,914 78,786,936 81,010,808 84,151,435 Households 3,589 3,595 3,595 3,613 3,618 3,629 3,641 3,658 3,659 3,654Debt service as a % of gross oper. rev. 10.91% 10.67% 10.29% 9.38% 10.03% 9.22% 9.87% 9.21% 10.05% 9.65%Debt service per household 2,077 2,084 2,022 1,899 2,022 1,871 2,113 1,984 2,225 2,222
Debt service exceeding 15 percent of operating revenues is considered a warning indicator by the credit rating organizations.
Weston Trend
Weston Trend
Analysis: Though Weston's debt service has increased due to the effort in the last 10-15 years to address deferred maintenance of municipal and school buildings, nearly all of the debt is exempt from the limits of Proposition 2 1/2. As such, this fixed cost does not place a demand on the Town's operating budget. It does, however, mean that the portion of total property taxes funding debt will remain significant for a number of years. The best way to keep these indicators below warning levels is to time new debt service for proposed capital projects with retiring debt, which the Town has been careful to do. Acknowledging the growing importance of monitoring debt, a formal Debt Policy was adopted in FY07.
Outlook: Maintaining AAA rating and project timing are key to keeping this indicator stable. Interest rates should increase in the future as the Federal Reserve moves off the historical low-rate policy, but no spikes are anticipated. Weston has 67% of debt principal maturing in the next 10 years.
debt serviceoperating revenues/household
-1.00%1.00%3.00%5.00%7.00%9.00%
11.00%13.00%15.00%
2008 2009 2010 2011 2012 2013 2014 2015 2016 2017
% o
pe
rati
ng
re
ve
nu
e
fiscal year
Debt Service per Gross Oper. Revenue
0
1,000
2,000
3,000
2008 2009 2010 2011 2012 2013 2014 2015 2016 2017de
bt
pe
r h
ou
seh
old
fiscal year
Debt service per household

FinancialIndicatorAnalysis
B23
FINANCIAL INDICATOR 14 - Long Term Debt
Overall debt exceeding 10 percent of assessed valuation is considered a warning indicator by the credit rating organizations.Overall debt exceeding 15 percent of per capita income is considered a warning indicator by the credit rating organizations.
X favorablemarginal
unfavorableuncertain
X favorablemarginal
unfavorableuncertain
Formula: outstanding long term debtassessed valuation or per capita income
fiscal year 2008 2009 2010 2011 2012 2013 2014 2015 2016 2017outstanding long term debt 64,314,932 58,214,199 57,744,457 67,690,004 62,474,332 74,723,333 71,425,000 87,927,000 85,069,900 83,772,258assessed valuation 5,102,207,400 5,172,262,600 5,232,011,700 5,260,804,800 5,223,472,800 5,195,430,200 5,340,928,200 5,612,459,200 5,861,486,000 5,941,014,800per household income est. (U.S. Census & 96,475 148,299 148,512 180,815 176,875 192,563 192,563 192,563 201,200 201,200Long term debt as a % of assessed valuation 1.26% 1.13% 1.10% 1.29% 1.20% 1.44% 1.34% 1.57% 1.45% 1.41%Long term debt as a % of personal income per household* 5.95% 3.52% 3.37% 3.26% 3.04% 3.35% 3.20% 3.93% 3.65% 3.60%
Weston Trend
Weston Trend
0%
3%
5%
8%
10%
2008 2009 2010 2011 2012 2013 2014 2015 2016 2017As
se
ss
ed
Va
lua
tio
n
fiscal year
Long Term Debt as a Percent of Assessed Valuation
0%
5%
10%
15%
2008 2009 2010 2011 2012 2013 2014 2015 2016 2017
% o
f h
ou
se
ho
ld in
com
e
fiscal year
Long Term Debt as a % of Household Income
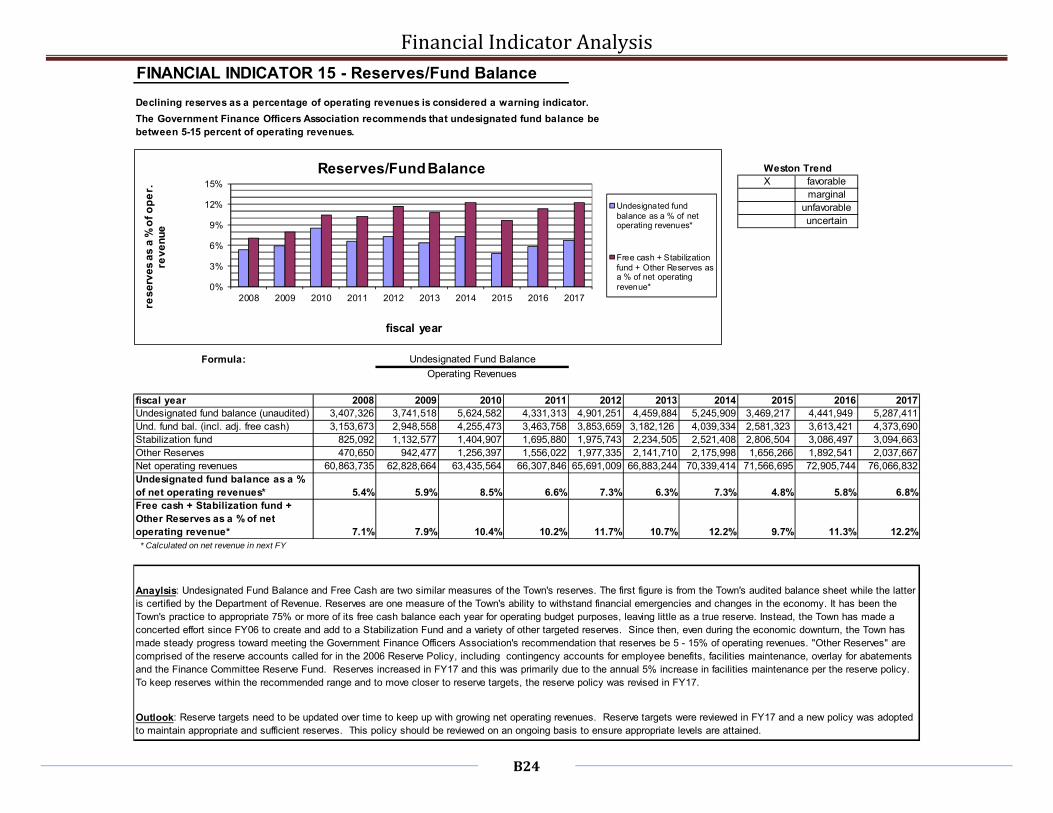
FinancialIndicatorAnalysis
B24
FINANCIAL INDICATOR 15 - Reserves/Fund Balance
Declining reserves as a percentage of operating revenues is considered a warning indicator.
X favorablemarginal
unfavorableuncertain
Formula:
fiscal year 2008 2009 2010 2011 2012 2013 2014 2015 2016 2017Undesignated fund balance (unaudited) 3,407,326 3,741,518 5,624,582 4,331,313 4,901,251 4,459,884 5,245,909 3,469,217 4,441,949 5,287,411Und. fund bal. (incl. adj. free cash) 3,153,673 2,948,558 4,255,473 3,463,758 3,853,659 3,182,126 4,039,334 2,581,323 3,613,421 4,373,690Stabilization fund 825,092 1,132,577 1,404,907 1,695,880 1,975,743 2,234,505 2,521,408 2,806,504 3,086,497 3,094,663Other Reserves 470,650 942,477 1,256,397 1,556,022 1,977,335 2,141,710 2,175,998 1,656,266 1,892,541 2,037,667Net operating revenues 60,863,735 62,828,664 63,435,564 66,307,846 65,691,009 66,883,244 70,339,414 71,566,695 72,905,744 76,066,832Undesignated fund balance as a % of net operating revenues* 5.4% 5.9% 8.5% 6.6% 7.3% 6.3% 7.3% 4.8% 5.8% 6.8%Free cash + Stabilization fund + Other Reserves as a % of net operating revenue* 7.1% 7.9% 10.4% 10.2% 11.7% 10.7% 12.2% 9.7% 11.3% 12.2%
Outlook: Reserve targets need to be updated over time to keep up with growing net operating revenues. Reserve targets were reviewed in FY17 and a new policy was adopted to maintain appropriate and sufficient reserves. This policy should be reviewed on an ongoing basis to ensure appropriate levels are attained.
Weston Trend
The Government Finance Officers Association recommends that undesignated fund balance be between 5-15 percent of operating revenues.
Undesignated Fund Balance
Operating Revenues
* Calculated on net revenue in next FY
Anaylsis: Undesignated Fund Balance and Free Cash are two similar measures of the Town's reserves. The first figure is from the Town's audited balance sheet while the latter is certified by the Department of Revenue. Reserves are one measure of the Town's ability to withstand financial emergencies and changes in the economy. It has been the Town's practice to appropriate 75% or more of its free cash balance each year for operating budget purposes, leaving little as a true reserve. Instead, the Town has made a concerted effort since FY06 to create and add to a Stabilization Fund and a variety of other targeted reserves. Since then, even during the economic downturn, the Town has made steady progress toward meeting the Government Finance Officers Association's recommendation that reserves be 5 - 15% of operating revenues. "Other Reserves" are comprised of the reserve accounts called for in the 2006 Reserve Policy, including contingency accounts for employee benefits, facilities maintenance, overlay for abatements and the Finance Committee Reserve Fund. Reserves increased in FY17 and this was primarily due to the annual 5% increase in facilities maintenance per the reserve policy. To keep reserves within the recommended range and to move closer to reserve targets, the reserve policy was revised in FY17.
0%
3%
6%
9%
12%
15%
2008 2009 2010 2011 2012 2013 2014 2015 2016 2017
res
erv
es
as
a %
of
op
er.
re
ve
nu
e
fiscal year
Reserves/Fund Balance
Undesignated fundbalance as a % of netoperating revenues*
Free cash + Stabilizationfund + Other Reserves asa % of net operatingrevenue*

FinancialIndicatorAnalysis
B25
FINANCIAL INDICATOR 16 - Population
Rapid changes in population which may affect service levels may be considered a warning indicator.
favorableX marginal
unfavorableuncertain
year 2000* 2009 2010 2011 2012 2013 2014 2015 2016 20170-17 years old 3,532 2,971 3,000 2,954 2,945 2,870 2,822 2,709 2,701 2,64418 - 34 years old 1,084 1,733 1,892 1,883 1,968 2,008 2,056 2,044 2,113 2,10135 - 59 years old 4,390 3,858 3,933 3,911 3,928 3,872 3,859 3,803 3,410 3,69960 years and older 2,463 2,604 2,702 2,723 2,763 2,814 2,832 2,833 3,246 2,942unknown 0 0 7 7 4 16 12 2 2 2Total 11,469 11,166 11,534 11,478 11,608 11,580 11,581 11,391 11,472 11,388
students in Weston public schools 2,215 2,332 2,315 2,304 2,322 2,281 2,206 2,139 2,111 2,104 * 2000 is U.S. census data with 5-19 and 20-34 ranges
Weston Trend
Analysis: Weston's population has remained relatively stable since 2015, returning to a level prior to 2010. The school-aged population of the Town has dropped over the past 5 years, and the student population for Weston's public schools decreased by less than 1% in 2017. A decrease in students can reduce expenditures, but it may also reduce the many intergovernmental revenues and grants that are distributed according to population. That impact has been minimal since the Town does not rely heavily on State or Federal funding. The 60 years and older group makes up 26% of the population.
Outlook: As the baby boomers age, the population of residents 60 years of age and older has steadily increased since 2010, creating additional demand for Council on Aging services.
0
2,000
4,000
6,000
8,000
10,000
12,000
2000* 2009 2010 2011 2012 2013 2014 2015 2016 2017
po
pu
lati
on
year
Population
60 years and older
35 - 59 years old
18 - 34 years old
0-17 years old

FinancialIndicatorAnalysis
B26
Students as of
10/2016FY17 Chapter
70 Aid
State Aid per
PupilBedford 2,608 4,352,414 1,669$ Belmont 4,466 7,111,769 1,592$ Cohasset 1,586 2,499,864 1,576$ Concord-Carlisle* 3,974 6,258,842 1,575$ Dedham 2,693 4,525,098 1,680$ Dover-Sherborn* 2,087 3,212,394 1,539$ Duxbury 3,121 5,031,584 1,612$ Hingham 4,317 6,950,213 1,610$ Lexington 7,072 11,631,074 1,645$ Lincoln-Sudbury* 5,571 8,654,939 1,554$ Natick 5,472 9,117,845 1,666$ Needham 5,588 8,671,395 1,552$ Newton 12,827 21,180,365 1,651$ Waltham 5,461 10,863,166 1,989$ Wayland 2,646 4,042,462 1,528$ Wellesley 5,018 8,198,827 1,634$ Westwood 3,162 4,971,878 1,572$ Winchester 4,623 7,924,363 1,714$ Average 1,631$ Weston 2,111 3,299,788$ 1,563$ *includes Ch. 70 aid to both regional and local district
Supplemental Data 1 - Chapter 70 Assistance
Analysis: The Chapter 70 formula is based on a variety of educational factors and is used by the State for determining the distribution of certain State aid received by Weston. Weston spends $23,898 per pupil on education as of FY16 per DESE, and state aid contributes 6% of that amount. Weston's Chapter 70 aid increased 8% in FY17 from FY16.
Outlook: The Town recognizes that future increases in Chapter 70 Assistance are unlikely and has planned accordingly.
$500
$750
$1,000
$1,250
$1,500
$1,750
$2,000
Ch
ap
ter
70 A
idP
er P
up
il
Community
Chapter 70 Assistance

FinancialIndicatorAnalysis
B27
Supplemental Data 2 - FY17 Average Single Family Tax Bill
Average Single
Family Value 2016
Average Single Family
Value 2017
Percent Change in Value
Residential Tax Rate
FY2016
Residential Tax Rate
FY2017
Percent Change in Rate
Average Single
Family Tax Bill 2016
Average Single Family
Tax Bill 2017
Percent Change
in Tax Bill
Bedford 595,748 642,026 7.8% 15.28 14.81 -3.1% 9,103 9,508$ 4.45%Carlisle 790,001 798,061 1.0% 17.20 17.62 2.4% 13,588 14,062 3.49%Concord 969,131 987,567 1.9% 13.92 14.07 1.1% 13,490 13,895 3.00%Dover 1,098,503 1,113,148 1.3% 12.88 13.05 1.3% 14,149 14,527 2.67%Duxbury 626,629 639,897 2.1% 15.55 15.51 -0.3% 9,744 9,925 1.85%Lexington 887,355 932,084 5.0% 14.60 14.49 -0.8% 12,955 13,506 4.25%Lincoln 1,108,423 1,149,169 3.7% 13.70 13.60 -0.7% 15,185 15,629 2.92%Needham 830,791 843,913 1.6% 11.54 11.89 3.0% 9,587 10,034 4.66%Sherborn 753,929 802,876 6.5% 20.46 19.30 -5.7% 15,425 15,496 0.45%Sudbury 678,738 705,763 4.0% 17.80 17.74 -0.3% 12,082 12,520 3.63%Wayland 676,477 690,698 2.1% 17.34 18.14 4.6% 11,730 12,529 6.81%Wellesley 1,180,996 1,215,729 2.9% 11.83 11.79 -0.3% 13,971 14,333 2.59%Westwood 703,380 727,247 3.4% 14.66 14.57 -0.6% 10,312 10,596 2.76%
Average 838,469 865,244 3.3% 15.14 15.12 0.1% 12,409 12,812 3.25%
Weston 1,542,898 1,562,870 1.3% 12.16 12.40 2.0% 18,762 19,380 3.29%
Analysis: Weston's tax bill remains the highest among its comparable communities, in large part because the average single family value is 28.5% higher than the next highest average value (Wellesley). The Town's 2.0% increase in tax rate from 2016 to 2017 was higher than the average increase of these comparable communities.
$2,500
$5,000
$7,500
$10,000
$12,500
$15,000
$17,500
$20,000
FY17 Average Single Family Tax Bill

FinancialIndicatorAnalysis
B28
Notes on Projection FY19: 1. Projected salary increases are based on negotiated collective bargaining agreements. 2. The amount budgeted for the Middlesex Retirement System is the actual assessment.
3. The budget for Health Insurance assumes an 8% increase in GIC premiums, but a decision on actual premium rates will not be made by the GIC until
March. Utilization of the Town’s plans has dropped to 78% from a high of at least 90% in the past.
4. The category of Separate Articles includes funding for Weston Media Center, which will not be needed in FY19 when the new contract takes effect. 5. Additional funds are included for roadway maintenance.
6. No new non-exempt debt service has been added; the amount for exempt debt service is estimated at this time, with more information available after bonds are issued in February.
7. In the category of Reserves, this projection includes full implementation of the reserve policy updated in FY17. There is an amount included to fund the Town’s post-employment benefits (OPEB) liability in accordance with the most recent actuarial valuation.
8. The budget projection for FY19 is based on maintaining the current level of services provided by Town departments.
9. A comprehensive revenue projection has not yet been made, but it is assumed that state aid, other than school construction reimbursement payments,
will be level funded.
FY20 and FY21: 1. There are no collective bargaining agreements settled for FY20 and FY21; the salary increases are estimated at this time. 2. Employee benefits are increased by approximately 7.5% in each year; all other expenses are increased by 2-3% in each year.
3. With the implementation of an updated reserve policy in FY17, facilities maintenance increases 6% each year and compensated absences increase by
$20K each year.
4. In Scenario 2 for FY20, in order to balance the projected budget to develop the projected budget for FY21, the shortfall has been handled by making a lump sum budget reduction in half the amount and applying increased revenues to cover the other half.

B29
This page intentionally left blank.
Appendix C - Authorized and Issued Debt Service Payments
C1
Appendix C
Debt Service
Authorized and Issued Debt Service Payments
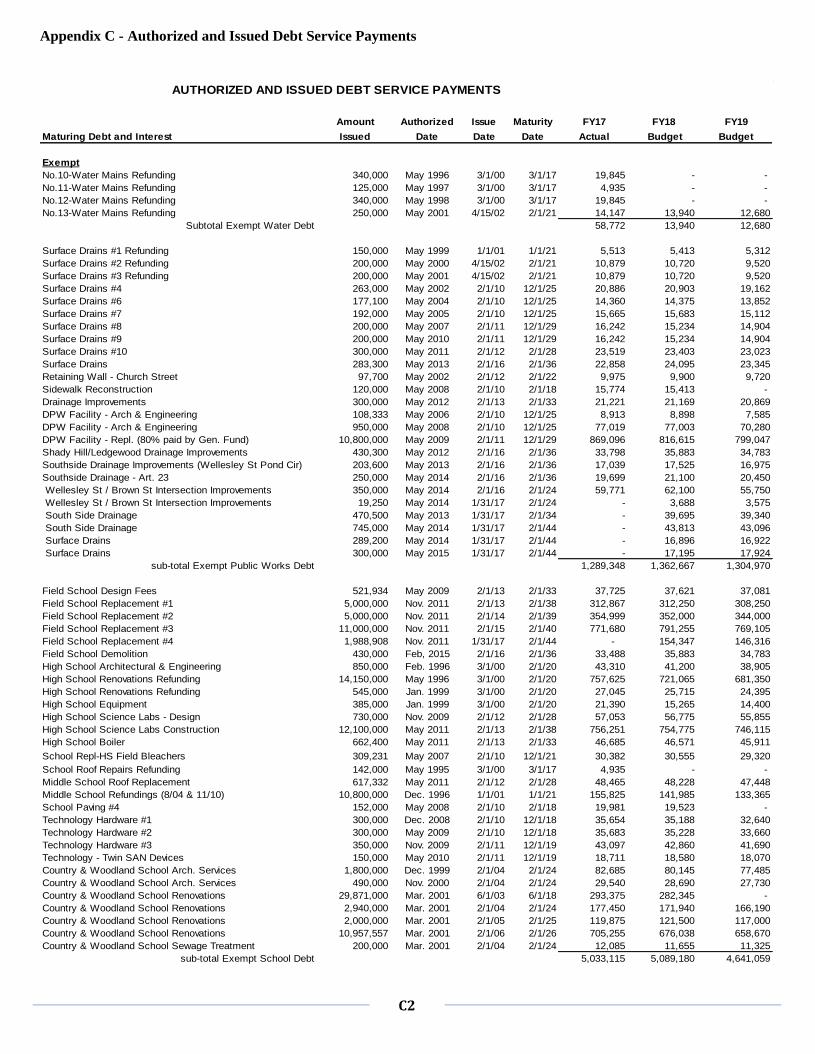
Appendix C - Authorized and Issued Debt Service Payments
C2
Amount Authorized Issue Maturity FY17 FY18 FY19Maturing Debt and Interest Issued Date Date Date Actual Budget Budget
ExemptNo.10-Water Mains Refunding 340,000 May 1996 3/1/00 3/1/17 19,845 - - No.11-Water Mains Refunding 125,000 May 1997 3/1/00 3/1/17 4,935 - - No.12-Water Mains Refunding 340,000 May 1998 3/1/00 3/1/17 19,845 - - No.13-Water Mains Refunding 250,000 May 2001 4/15/02 2/1/21 14,147 13,940 12,680
Subtotal Exempt Water Debt 58,772 13,940 12,680
Surface Drains #1 Refunding 150,000 May 1999 1/1/01 1/1/21 5,513 5,413 5,312Surface Drains #2 Refunding 200,000 May 2000 4/15/02 2/1/21 10,879 10,720 9,520Surface Drains #3 Refunding 200,000 May 2001 4/15/02 2/1/21 10,879 10,720 9,520Surface Drains #4 263,000 May 2002 2/1/10 12/1/25 20,886 20,903 19,162Surface Drains #6 177,100 May 2004 2/1/10 12/1/25 14,360 14,375 13,852Surface Drains #7 192,000 May 2005 2/1/10 12/1/25 15,665 15,683 15,112Surface Drains #8 200,000 May 2007 2/1/11 12/1/29 16,242 15,234 14,904Surface Drains #9 200,000 May 2010 2/1/11 12/1/29 16,242 15,234 14,904Surface Drains #10 300,000 May 2011 2/1/12 2/1/28 23,519 23,403 23,023Surface Drains 283,300 May 2013 2/1/16 2/1/36 22,858 24,095 23,345Retaining Wall - Church Street 97,700 May 2002 2/1/12 2/1/22 9,975 9,900 9,720Sidewalk Reconstruction 120,000 May 2008 2/1/10 2/1/18 15,774 15,413 - Drainage Improvements 300,000 May 2012 2/1/13 2/1/33 21,221 21,169 20,869DPW Facility - Arch & Engineering 108,333 May 2006 2/1/10 12/1/25 8,913 8,898 7,585DPW Facility - Arch & Engineering 950,000 May 2008 2/1/10 12/1/25 77,019 77,003 70,280DPW Facility - Repl. (80% paid by Gen. Fund) 10,800,000 May 2009 2/1/11 12/1/29 869,096 816,615 799,047Shady Hill/Ledgewood Drainage Improvements 430,300 May 2012 2/1/16 2/1/36 33,798 35,883 34,783Southside Drainage Improvements (Wellesley St Pond Cir) 203,600 May 2013 2/1/16 2/1/36 17,039 17,525 16,975Southside Drainage - Art. 23 250,000 May 2014 2/1/16 2/1/36 19,699 21,100 20,450Wellesley St / Brown St Intersection Improvements 350,000 May 2014 2/1/16 2/1/24 59,771 62,100 55,750Wellesley St / Brown St Intersection Improvements 19,250 May 2014 1/31/17 2/1/24 - 3,688 3,575South Side Drainage 470,500 May 2013 1/31/17 2/1/34 - 39,695 39,340South Side Drainage 745,000 May 2014 1/31/17 2/1/44 - 43,813 43,096Surface Drains 289,200 May 2014 1/31/17 2/1/44 - 16,896 16,922Surface Drains 300,000 May 2015 1/31/17 2/1/44 - 17,195 17,924
sub-total Exempt Public Works Debt 1,289,348 1,362,667 1,304,970
Field School Design Fees 521,934 May 2009 2/1/13 2/1/33 37,725 37,621 37,081Field School Replacement #1 5,000,000 Nov. 2011 2/1/13 2/1/38 312,867 312,250 308,250Field School Replacement #2 5,000,000 Nov. 2011 2/1/14 2/1/39 354,999 352,000 344,000Field School Replacement #3 11,000,000 Nov. 2011 2/1/15 2/1/40 771,680 791,255 769,105Field School Replacement #4 1,988,908 Nov. 2011 1/31/17 2/1/44 - 154,347 146,316Field School Demolition 430,000 Feb, 2015 2/1/16 2/1/36 33,488 35,883 34,783High School Architectural & Engineering 850,000 Feb. 1996 3/1/00 2/1/20 43,310 41,200 38,905High School Renovations Refunding 14,150,000 May 1996 3/1/00 2/1/20 757,625 721,065 681,350High School Renovations Refunding 545,000 Jan. 1999 3/1/00 2/1/20 27,045 25,715 24,395High School Equipment 385,000 Jan. 1999 3/1/00 2/1/20 21,390 15,265 14,400High School Science Labs - Design 730,000 Nov. 2009 2/1/12 2/1/28 57,053 56,775 55,855High School Science Labs Construction 12,100,000 May 2011 2/1/13 2/1/38 756,251 754,775 746,115High School Boiler 662,400 May 2011 2/1/13 2/1/33 46,685 46,571 45,911School Repl-HS Field Bleachers 309,231 May 2007 2/1/10 12/1/21 30,382 30,555 29,320School Roof Repairs Refunding 142,000 May 1995 3/1/00 3/1/17 4,935 - - Middle School Roof Replacement 617,332 May 2011 2/1/12 2/1/28 48,465 48,228 47,448Middle School Refundings (8/04 & 11/10) 10,800,000 Dec. 1996 1/1/01 1/1/21 155,825 141,985 133,365School Paving #4 152,000 May 2008 2/1/10 2/1/18 19,981 19,523 - Technology Hardware #1 300,000 Dec. 2008 2/1/10 12/1/18 35,654 35,188 32,640Technology Hardware #2 300,000 May 2009 2/1/10 12/1/18 35,683 35,228 33,660Technology Hardware #3 350,000 Nov. 2009 2/1/11 12/1/19 43,097 42,860 41,690Technology - Twin SAN Devices 150,000 May 2010 2/1/11 12/1/19 18,711 18,580 18,070Country & Woodland School Arch. Services 1,800,000 Dec. 1999 2/1/04 2/1/24 82,685 80,145 77,485Country & Woodland School Arch. Services 490,000 Nov. 2000 2/1/04 2/1/24 29,540 28,690 27,730Country & Woodland School Renovations 29,871,000 Mar. 2001 6/1/03 6/1/18 293,375 282,345 - Country & Woodland School Renovations 2,940,000 Mar. 2001 2/1/04 2/1/24 177,450 171,940 166,190Country & Woodland School Renovations 2,000,000 Mar. 2001 2/1/05 2/1/25 119,875 121,500 117,000Country & Woodland School Renovations 10,957,557 Mar. 2001 2/1/06 2/1/26 705,255 676,038 658,670Country & Woodland School Sewage Treatment 200,000 Mar. 2001 2/1/04 2/1/24 12,085 11,655 11,325
sub-total Exempt School Debt 5,033,115 5,089,180 4,641,059
AUTHORIZED AND ISSUED DEBT SERVICE PAYMENTS

Appendix C - Authorized and Issued Debt Service Payments
C3
Church St. Land Acquisition Refunding 1,700,000 May 1997 4/15/02 4/15/17 23,426 - - Case Complex Roads/Parking 50,000 May 2002 2/1/10 2/1/18 6,310 6,165 - Case Complex Road Repairs 59,300 May 2002 2/1/12 2/1/20 7,494 7,420 7,280Case Complex Road Repairs 10,000 May 2002 2/1/15 2/1/24 1,289 1,325 1,275Case Estates Land 5,300,000 Nov. 2006 2/1/11 12/1/24 489,166 486,980 475,610Case Estates Land 400,000 Nov. 2006 1/31/17 2/1/36 - 38,703 36,776Town Hall Renov. & Addition 5,690,000 Nov. 2000 4/15/02 2/1/21 326,678 310,820 295,000Case Campus Phase 1 Design 499,000 May 2013 2/1/15 2/1/28 54,471 54,055 52,155Case Campus Phase 1 Pathways 210,000 May 2013 2/1/15 2/1/28 23,100 22,760 21,960Case Campus Phase 2 835,000 Dec. 2013 2/1/15 2/1/29 84,392 87,023 84,022Case Campus Phase 3 1,255,200 May 2014 2/1/16 2/1/29 134,123 142,509 136,559Case Campus 461,500 May 2014 1/31/17 2/1/29 - 60,100 58,500Police Station Design 800,000 May 2013 2/1/15 2/1/40 55,820 57,320 55,720Police Station Construction 9,000,000 May 2014 2/1/15 2/1/40 627,972 644,850 626,850Police Station Construction 1,100,000 May 2014 2/1/16 2/1/36 87,551 93,750 90,850Police Station Construction 1,300,000 May 2014 1/31/17 2/1/44 - 99,971 97,870Fiber I-Net - FD/PD Comm Equipment 115,555 May 2008 2/1/10 2/1/18 13,670 13,358 - Fire Station Extraordinary Repairs 350,000 May 2004 2/1/06 2/1/24 23,940 23,070 22,300Fire Station Extraordinary Repairs 250,000 Nov. 2004 2/1/06 2/1/25 17,745 17,075 11,505Fire Station Extraordinary Repairs 30,000 May 2005 2/1/11 12/1/24 2,581 2,600 2,540Fire Ladder Truck 525,000 May 2007 2/1/10 12/1/19 55,553 55,255 50,920Library Windows 60,000 May 2003 12/15/06 12/15/16 5,094 - - Library Roof Repairs 450,000 May 2005 12/15/06 12/1/25 33,173 30,395 28,575Community Center Construction 2,400,000 Jan. 1999 1/1/01 1/1/20 136,543 124,983 119,602Council on Aging Design Fees 33,300 May 2014 1/31/17 2/1/19 - 18,202 17,430Sewage Treatment C&W Schools & Mem. Pool 319,000 May 1999 6/1/03 6/1/18 21,258 19,520 - Sewage Treatment - Comm. Ctr. Refunding 315,000 Jan. 1999 1/1/01 1/1/21 15,413 15,133 13,852Sewage Treatment - Town Hall 24,000 Jan. 1999 6/1/03 6/1/18 1,013 978 - Sewage Treatment - Town Hall Refunding 20,000 Dec. 1999 1/1/01 1/1/21 1,108 1,088 1,068Town Hall Sewage Treatment Refunding 200,000 May 2000 4/15/02 2/1/21 10,879 10,720 9,520Sewage Treatment - Comm. Ctr. 27,000 Jan. 1999 2/1/13 2/1/33 2,448 2,431 1,391Sewage Treatment - Comm. Ctr. 50,000 Jan. 1999 2/1/13 2/1/33 4,008 3,993 3,933
sub-total Exempt General Govt Debt 2,266,216 2,452,548 2,323,063
Sub-Total Exempt 8,647,450 8,918,335 8,281,772
Short Term Debt Service - Exempt 226,298 57,824 459,709
Total Exempt from Proposition 2 1/2 Limit (Budget) 8,873,748 8,976,159 8,741,482
Premiums Applied to Debt Service (145,450) (134,237)MSBA Reimbursement (665,538) (665,538) (665,538)Excluded Debt Service Prior Year Budget Overage Reduction (10,774) (70,400) - Total Exempt from Proposition 2 1/2 Limit (Net State Reimb & Premium Applied) 8,197,436 8,094,771 7,941,707
Non-ExemptDPW Facility Const.-Salt Shed 425,000 May 2001 4/15/02 4/15/21 24,020 22,580 19,760
Sub-Total Non-Exempt from Prop. 2 1/2 Limit 24,020 22,580 19,760
Short Term Debt Service- Non-Exempt - - - Anticipation of Revenue/Interest on Abatements 6,000 6,000 6,000Debt Issuance Costs 3,700 3,700 3,700Total Non-Exempt from Proposition 2 1/2 Limit 33,720 32,280 29,460
Total General Fund Debt Service 8,231,156 8,127,051 7,971,167

Appendix C - Authorized and Issued Debt Service Payments
C4
Water Enterprise FundWater Equipment - Wellesley St. Water Pump 25,000 May 2008 2/1/10 2/1/18 3,158 3,103 - Water Equipment - Wellesley St. Water Pump 575,000 May 2008 2/1/10 12/1/18 69,250 68,219 63,240Water Equipment - Wellesley St. Water Pump 87,500 May 2008 2/1/16 2/1/23 17,875 16,700 16,050Water Main Repl. - Ash Street 97,200 May 2007 2/1/10 12/1/25 7,845 7,830 6,565Water Main Repl. - Shady Hill Rd. 100,000 May 2009 2/1/11 12/1/29 7,644 7,059 6,909Water Main Rehabilitation - Art. 16 216,000 May 2011 2/13/13 2/1/33 15,503 15,283 15,063Water Main Rehabilitation - Art. 23 216,000 May 2012 2/13/13 2/1/33 15,503 15,283 15,063Water Equip. - Rehab Doublet Hill 222,222 May 2007 2/1/10 2/1/18 28,418 27,743 - Water Equip. - Rehab Black Oak Tank 85,000 May 2009 2/1/11 12/1/19 10,015 9,860 9,590DPW Facility - Water Ent. (20% project) 2,700,000 May 2009 2/1/11 12/1/29 219,943 203,989 199,596Water Main Rehabilitation - Art. 19 100,000 May 2010 2/1/10 12/1/29 7,644 7,059 6,909Black Oak Booster Pump Station 900,000 May 2014 8/15/14 8/15/24 90,000 90,000 90,000Water Main Rehabilitation - Art. 18 253,000 May 2013 2/1/15 2/1/40 19,463 17,913 17,412Paine's Hill Water Tank Improvements - Art. 14 105,000 May 2015 8/24/15 8/15/25 10,500 10,500 10,500Water Mains 253,100 May 2014 1/31/17 2/1/44 - 14,748 14,810Water Mains 212,000 May 2015 1/31/17 2/1/44 - 11,909 12,728
Sub-Total Water Enterprise Fund 522,758 527,197 484,435
Short Term Debt Service - Water Enterprise Fund 18,090 24,887 46,663Total Water Enterprise Fund 540,848 552,084 531,098
Brook School Apartments Enterprise FundBrook School Apts. Addition - Construction 2,520,332 Nov. 2002 2/1/06 2/1/23 170,970 165,260 159,420Brook School Apts Envelope Project 1,375,000 May 2012 2/1/14 2/1/34 111,313 108,513 105,713Total Brook School Apartments Enterprise Fund 282,283 273,773 265,133
Community Preservation Act FundBrook School Elderly Housing 2,600,000 May 2004 2/1/05 2/1/17 215,250 - - Brook School Elderly Housing 112,000 May 2004 2/1/06 2/1/25 6,255 6,040 5,825Case Estates Land Acquisition 6,000,000 Nov. 2006 12/15/06 12/15/26 421,800 373,711 364,856
Short Term Debt Service - CPA Fund - - 95,767
Total Community Preservation Act Fund 643,306 379,751 466,448
TOTAL DEBT SERVICE 9,697,592 9,332,659 9,233,846

Appendix C - Authorized and Issued Debt Service Payments
C5
This page intentionally left blank.
Appendix D- Audited Financial Statements
D1
Appendix D
FY17 Audited Financial Statements

STATEMENT OF NET POSITION
JUNE 30, 2017
Primary Government
Governmental Business-typeActivities Activities Total
ASSETSCURRENT:
Cash and cash equivalents…………………………………$ 39,418,252 $ 2,700,949 $ 42,119,201 Investments………………………………………………… 18,921,293 - 18,921,293 Receivables, net of allowance for uncollectibles:
Real estate and personal property taxes……………… 1,363,565 - 1,363,565 Tax liens………………………………………………… 922,821 - 922,821 Motor vehicle excise taxes……………………………… 130,033 - 130,033 User fees………………………………………………… - 2,818,228 2,818,228 Departmental and other………………………………… 127,281 - 127,281 Intergovernmental……………………………………… 1,463,838 52,956 1,516,794
NONCURRENT: Receivables, net of allowance for uncollectibles:
Intergovernmental……………………………………… 1,284,044 - 1,284,044 Capital Assets:
Nondepreciable………………………………………… 55,126,282 161,596 55,287,878 Depreciable……………………………………………… 131,504,757 14,633,624 146,138,381
TOTAL ASSETS………………………………………………… 250,262,166 20,367,353 270,629,519
DEFERRED OUTFLOWS OF RESOURCESDeferred outflows of resources related to pensions…… 6,242,400 131,644 6,374,044 Deferred loss on refunded debt…………………………… 840,909 141,180 982,089
TOTAL DEFERRED OUTFLOWS OF RESOURCES……… 7,083,309 272,824 7,356,133
LIABILITIES CURRENT:
Warrants payable…………………………………………… 1,133,621 285,508 1,419,129 Accrued liabilities…………………………………………… 186,000 - 186,000 Accrued payroll……………………………………………… 1,965,923 44,717 2,010,640 Accrued interest…………………………………………… 1,135,595 87,696 1,223,291 Other liabilities……………………………………………… 2,315,438 - 2,315,438 Customer deposits payable………………………………… - 65,996 65,996 Landfill closure……………………………………………… 25,000 - 25,000 Compensated absences…………………………………… 1,306,000 112,000 1,418,000 Notes payable……………………………………………… 2,689,500 500,000 3,189,500 Bonds payable……………………………………………… 7,260,707 681,526 7,942,233
NONCURRENT: Landfill closure……………………………………………… 50,000 - 50,000 Compensated absences…………………………………… 989,000 94,000 1,083,000 Other postemployment benefits…………………………… 19,074,000 454,000 19,528,000 Net pension liability………………………………………… 62,108,458 1,309,789 63,418,247 Bonds payable……………………………………………… 74,328,097 5,662,087 79,990,184
TOTAL LIABILITIES…………………………………………… 174,567,339 9,297,319 183,864,658
DEFERRED INFLOWS OF RESOURCESDeferred inflows of resources related to pensions……… 1,193,097 25,161 1,218,258
NET POSITIONNet investment in capital assets……………………………… 110,191,748 8,390,024 118,581,772 Restricted for:
Permanent funds: Expendable……….……………………………………… 7,227,785 - 7,227,785 Nonexpendable………………………………………… 8,679,021 - 8,679,021
Gifts and grants……………………………………………… 2,890,217 - 2,890,217 Unrestricted……………………………………………………… (47,403,732) 2,927,673 (44,476,059)
TOTAL NET POSITION…………………………………………$ 81,585,039 $ 11,317,697 $ 92,902,736
See notes to basic financial statements.
------------------------------------------------------------- D2 --------------------------------------------------------
kelley.s
Typewritten Text
kelley.s
Typewritten Text

Community Nonmajor TotalPreservation Capital Governmental Governmental
General Fund Projects Funds FundsASSETSCash and cash equivalents……………………… $ 21,177,362 $ 4,937,535 $ 5,243,599 $ 8,059,756 $ 39,418,252 Investments………………………………………… - 6,787,393 - 12,133,900 18,921,293 Receivables, net of uncollectibles:
Real estate and personal property taxes…… 1,345,312 18,253 - - 1,363,565 Tax liens………………………………………… 897,989 24,832 - - 922,821 Motor vehicle excise taxes…………………… 130,033 - - - 130,033 Departmental and other……………………… 126,346 - - 935 127,281 Intergovernmental……………………………… 1,916,940 298,000 - 532,942 2,747,882
TOTAL ASSETS……………………………………$ 25,593,982 $ 12,066,013 $ 5,243,599 $ 20,727,533 $ 63,631,127
LIABILITIESWarrants payable………………………………$ 680,088 $ 139,142 $ 144,914 $ 169,477 $ 1,133,621 Accrued liabilities……………………………… 186,000 - - - 186,000 Accrued payroll………………………………… 1,915,389 421 - 50,113 1,965,923 Other liabilities………………………………… 2,308,323 7,115 - - 2,315,438 Notes payable………………………………… - - 2,689,500 - 2,689,500
TOTAL LIABILITIES……………………………… 5,089,800 146,678 2,834,414 219,590 8,290,482
DEFERRED INFLOWS OF RESOURCESUnavailable revenues………………………… 4,387,097 43,083 - 248,333 4,678,513
FUND BALANCESNonspendable………………………………… - - - 8,679,021 8,679,021 Restricted……………………………………… - 11,876,252 3,163,177 11,580,589 26,620,018 Committed……………………………………… 3,091,725 - - - 3,091,725 Assigned………………………………………… 2,765,396 - - - 2,765,396 Unassigned……………………………………… 10,259,964 - (753,992) - 9,505,972
TOTAL FUND BALANCES……………………… 16,117,085 11,876,252 2,409,185 20,259,610 50,662,132
TOTAL LIABILITIES, DEFERRED INFLOWS OFRESOURCES AND FUND BALANCES…… $ 25,593,982 $ 12,066,013 $ 5,243,599 $ 20,727,533 $ 63,631,127
See notes to basic financial statements.
GOVERNMENTAL FUNDSBALANCE SHEET
JUNE 30, 2017
------------------------------------------------------------- D3 --------------------------------------------------------
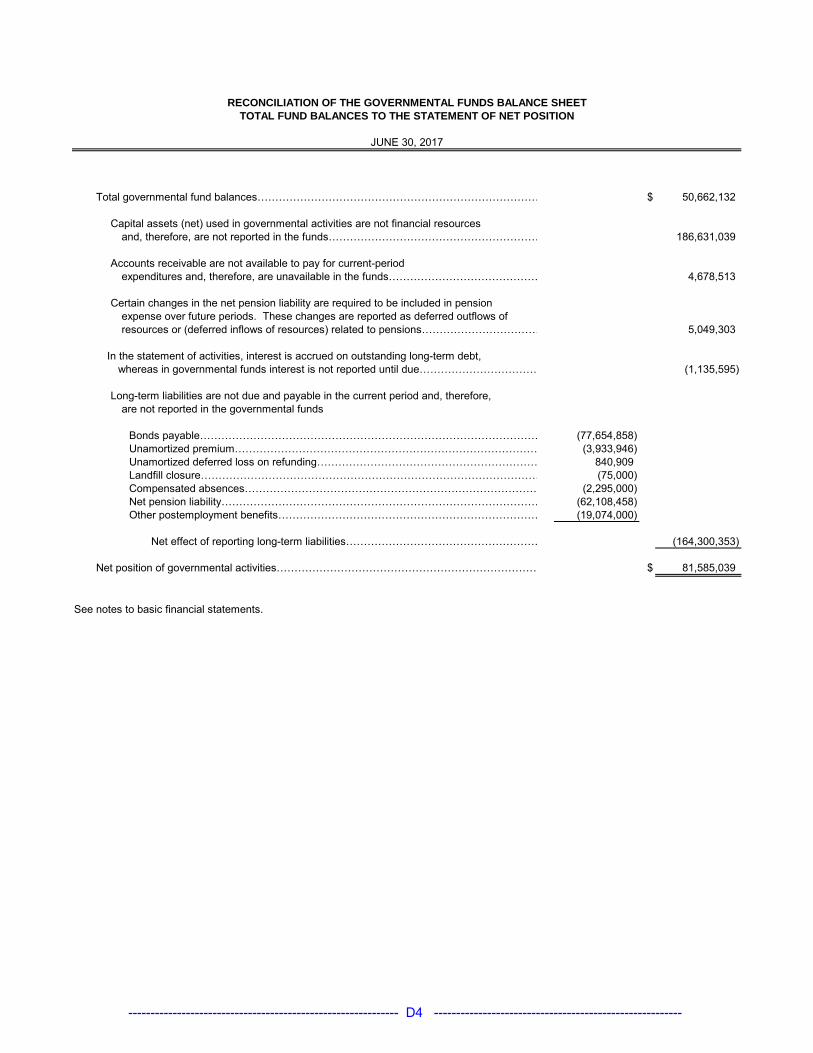
Total governmental fund balances……………………………………………………………………… $ 50,662,132
Capital assets (net) used in governmental activities are not financial resources and, therefore, are not reported in the funds…………………………………………………… 186,631,039
Accounts receivable are not available to pay for current-period
expenditures and, therefore, are unavailable in the funds…………………………………… 4,678,513
Certain changes in the net pension liability are required to be included in pensionexpense over future periods. These changes are reported as deferred outflows ofresources or (deferred inflows of resources) related to pensions…………………………… 5,049,303
In the statement of activities, interest is accrued on outstanding long-term debt,
whereas in governmental funds interest is not reported until due…………………………… (1,135,595)
Long-term liabilities are not due and payable in the current period and, therefore, are not reported in the governmental funds
Bonds payable…………………………………………………………………………………… (77,654,858) Unamortized premium…………………………………………………………………………… (3,933,946) Unamortized deferred loss on refunding……………………………………………………… 840,909 Landfill closure…………………………………………………………………………………… (75,000) Compensated absences………………………………………………………………………… (2,295,000) Net pension liability……………………………………………………………………………… (62,108,458) Other postemployment benefits………………………………………………………………… (19,074,000)
Net effect of reporting long-term liabilities……………………………………………… (164,300,353)
Net position of governmental activities………………………………………………………………… $ 81,585,039
See notes to basic financial statements.
JUNE 30, 2017
TOTAL FUND BALANCES TO THE STATEMENT OF NET POSITIONRECONCILIATION OF THE GOVERNMENTAL FUNDS BALANCE SHEET
------------------------------------------------------------- D4 --------------------------------------------------------

Nonmajor TotalCommunity Capital Governmental Governmental
General Preservation Projects Funds FundsREVENUES: Real estate and personal property taxes,
net of tax refunds……………………………………………… $ 73,260,890 $ 2,032,138 $ - $ - $ 75,293,028 Tax liens…………………………………………………………… 86,809 551 - - 87,360 Motor vehicle excise taxes……………………………………… 3,043,210 - - - 3,043,210 Charges for services……………………………………………… 358,392 - - 623,553 981,945 Penalties and interest on taxes………………………………… 305,941 6,747 - - 312,688 Fees and rentals………………………………………………… 374,004 - - - 374,004 Payments in lieu of taxes………………………………………… 36,795 - - - 36,795 Licenses and permits…………………………………………… 1,080,575 - - - 1,080,575 Fines and forfeitures……………………………………………… 96,434 - - - 96,434 Intergovernmental………………………………………………… 12,341,312 363,742 216,560 4,603,761 17,525,375 Departmental and other………………………………………… 754,479 78,178 - 882,923 1,715,580 Contributions……………………………………………………… - - - 506,320 506,320 Investment income……………………………………………… 212,550 58,197 - 769,584 1,040,331
TOTAL REVENUES………………………………………… 91,951,391 2,539,553 216,560 7,386,141 102,093,645
EXPENDITURES:Current:
General government…………………………………………… 2,035,660 - 63,156 634,102 2,732,918 Facilities town-wide…………………………………………… 1,444,450 - - - 1,444,450 Finance………………………………………………………… 824,024 - - - 824,024 Planning, land use & inspectional services………………… 754,943 - 530,807 - 1,285,750 Public safety…………………………………………………… 6,854,474 - 64,466 68,743 6,987,683 Education……………………………………………………… 38,197,718 - 628,128 4,913,939 43,739,785 Public works…………………………………………………… 4,570,918 - 563,361 602,299 5,736,578 Health & human services……………………………………… 686,580 - - 109,155 795,735 Public library…………………………………………………… 1,290,387 - - 167,602 1,457,989 Community preservation……………………………………… - 2,416,507 - - 2,416,507 Insurance……………………………………………………… 641,144 - - - 641,144 Employee benefits……………………………………………… 24,787,915 - - - 24,787,915
State and county charges……………………………………… 300,620 - - - 300,620 Debt service:
Principal………………………………………………………… 6,175,000 322,000 - - 6,497,000 Principal - current refunding…………………………………… 3,330,000 - - - 3,330,000 Interest………………………………………………………… 2,766,091 72,440 - - 2,838,531
TOTAL EXPENDITURES…………………………………… 94,659,924 2,810,947 1,849,918 6,495,840 105,816,629
EXCESS (DEFICIENCY) OF REVENUESOVER (UNDER) EXPENDITURES…………………………… (2,708,533) (271,394) (1,633,358) 890,301 (3,722,984)
OTHER FINANCING SOURCES (USES):Issuance of bonds……………………….……………………… - - 6,007,658 - 6,007,658 Issuance of refunding bonds…………………………………… 12,890,000 - - - 12,890,000 Premium from issuance of bonds……………………………... 319,958 - - - 319,958 Premium from issuance of refunding bonds…………………… 1,145,450 - - - 1,145,450 Payments to refund bond escrow agent……………………… (10,599,334) - - - (10,599,334) Transfers in…………………………………….………………… 703,328 - 98,250 341,570 1,143,148 Transfers out…………………………………………………...… (1,496,814) (209,300) - (173,867) (1,879,981)
TOTAL OTHER FINANCING SOURCES (USES)……… 2,962,588 (209,300) 6,105,908 167,703 9,026,899
NET CHANGE IN FUND BALANCES…………………………… 254,055 (480,694) 4,472,550 1,058,004 5,303,915
FUND BALANCES AT BEGINNING OF YEAR………………… 15,863,030 12,356,946 (2,063,365) 19,201,606 45,358,217
FUND BALANCES AT END OF YEAR……………………………$ 16,117,085 $ 11,876,252 $ 2,409,185 $ 20,259,610 $ 50,662,132
See notes to basic financial statements.
GOVERNMENTAL FUNDSSTATEMENT OF REVENUES, EXPENDITURES AND CHANGES IN FUND BALANCES
YEAR ENDED JUNE 30, 2017
------------------------------------------------------------- D5 --------------------------------------------------------

BrookSchool
Water Recreation Apartments TotalASSETSCURRENT:
Cash and cash equivalents………………………………………… $ 1,304,005 $ 886,667 $ 510,277 $ 2,700,949 Receivables, net of allowance for uncollectibles:
User fees…………………………………………………………… 2,818,228 - - 2,818,228 Intergovernmental………………………………………………… - - 52,956 52,956
Total current assets…………………………………………… 4,122,233 886,667 563,233 5,572,133
NONCURRENT: Capital assets:
Nondepreciable…………………………………………………… - 161,596 - 161,596 Depreciable………………………………………………………… 7,663,400 505,263 6,464,961 14,633,624
Total noncurrent assets……………………………………… 7,663,400 666,859 6,464,961 14,795,220
TOTAL ASSETS………………………………………………………… 11,785,633 1,553,526 7,028,194 20,367,353
DEFERRED OUTFLOWS OF RESOURCESDeferred outflows of resources related to pensions…………… 77,834 - 53,810 131,644 Deferred loss on refunded debt………………………….………… 141,180 - - 141,180
TOTAL DEFERRED OUTFLOWS OF RESOURCES……………… 219,014 - 53,810 272,824
LIABILITIES CURRENT:
Warrants payable…………………………………………………… 25,743 244,698 15,067 285,508 Accrued payroll……………………………………………………… 5,469 35,875 3,373 44,717 Accrued interest……………………………………………………… 54,899 - 32,797 87,696 Customer deposits payable………………………………………… - - 65,996 65,996 Compensated absences…………………………………………… 31,000 70,000 11,000 112,000 Notes payable………………………………………………………… 500,000 - - 500,000 Bonds payable………………………………………………………… 456,378 - 225,148 681,526
Total current liabilities………………………………………… 1,073,489 350,573 353,381 1,777,443
NONCURRENT: Compensated absences…………………………………………… 59,000 35,000 - 94,000 Other postemployment benefits…………………………………… 47,000 361,000 46,000 454,000 Net pension liability…………………………………………………… 774,401 - 535,388 1,309,789 Bonds payable………………………………………………………… 3,833,748 - 1,828,339 5,662,087
Total noncurrent liabilities…………………………………… 4,714,149 396,000 2,409,727 7,519,876
TOTAL LIABILITIES……………………………………………………… 5,787,638 746,573 2,763,108 9,297,319
DEFERRED INFLOWS OF RESOURCES Deferred inflows of resources related to pension………………… 14,876 - 10,285 25,161
NET POSITIONNet investment in capital assets………………….…………………… 3,478,032 666,859 4,411,474 8,556,365 Unrestricted……………………………………………………………… 2,724,101 140,094 (102,863) 2,761,332
TOTAL NET POSITION………………………………………………… $ 6,202,133 $ 806,953 $ 4,308,611 $ 11,317,697
See notes to basic financial statements.
JUNE 30, 2017
STATEMENT OF NET POSITIONPROPRIETARY FUNDS
Business-type Activities - Enterprise Funds
------------------------------------------------------------- D6 --------------------------------------------------------
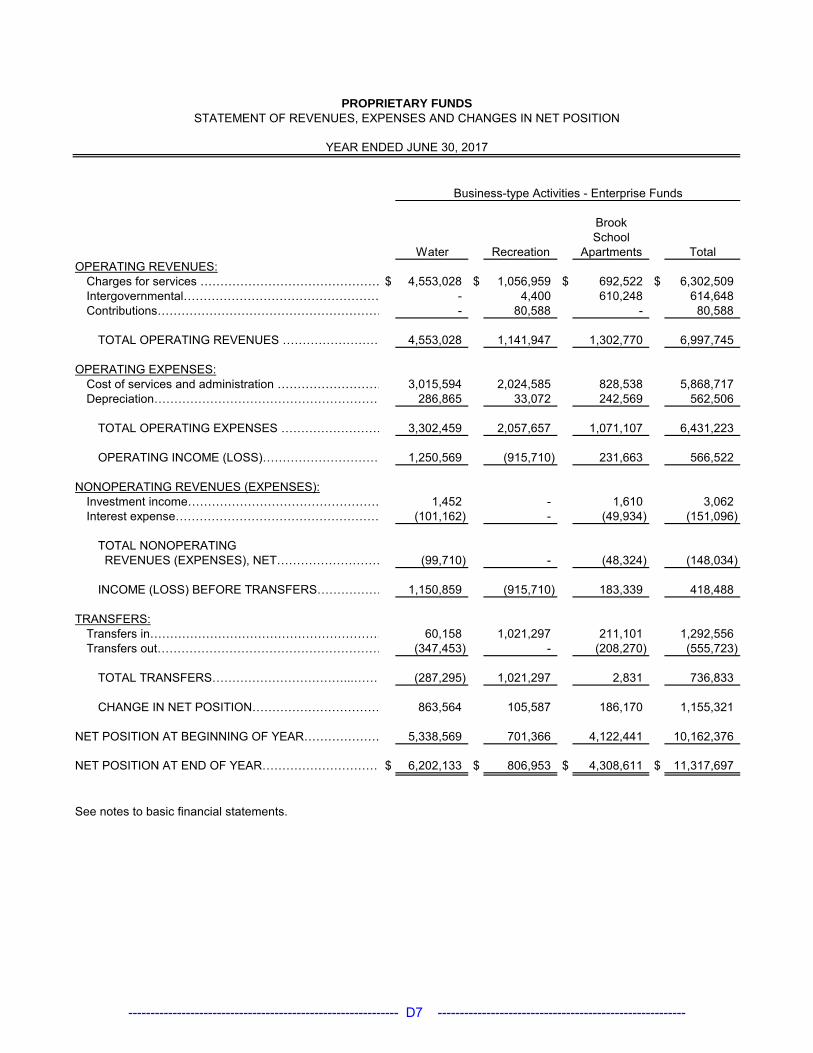
BrookSchool
Water Recreation Apartments TotalOPERATING REVENUES:
Charges for services ……………………………………… $ 4,553,028 $ 1,056,959 $ 692,522 $ 6,302,509 Intergovernmental…………………………………………… - 4,400 610,248 614,648 Contributions………………………………………………… - 80,588 - 80,588
TOTAL OPERATING REVENUES ……………………… 4,553,028 1,141,947 1,302,770 6,997,745
OPERATING EXPENSES:Cost of services and administration ……………………… 3,015,594 2,024,585 828,538 5,868,717 Depreciation………………………………………………… 286,865 33,072 242,569 562,506
TOTAL OPERATING EXPENSES ……………………… 3,302,459 2,057,657 1,071,107 6,431,223
OPERATING INCOME (LOSS)………………………… 1,250,569 (915,710) 231,663 566,522
NONOPERATING REVENUES (EXPENSES):Investment income………………………………………… 1,452 - 1,610 3,062 Interest expense…………………………………………… (101,162) - (49,934) (151,096)
TOTAL NONOPERATING REVENUES (EXPENSES), NET……………………… (99,710) - (48,324) (148,034)
INCOME (LOSS) BEFORE TRANSFERS……………… 1,150,859 (915,710) 183,339 418,488
TRANSFERS:Transfers in…………………………………………………… 60,158 1,021,297 211,101 1,292,556 Transfers out………………………………………………… (347,453) - (208,270) (555,723)
TOTAL TRANSFERS……………………………...……… (287,295) 1,021,297 2,831 736,833
CHANGE IN NET POSITION…………………………… 863,564 105,587 186,170 1,155,321
NET POSITION AT BEGINNING OF YEAR………………… 5,338,569 701,366 4,122,441 10,162,376
NET POSITION AT END OF YEAR………………………… $ 6,202,133 $ 806,953 $ 4,308,611 $ 11,317,697
See notes to basic financial statements.
Business-type Activities - Enterprise Funds
PROPRIETARY FUNDSSTATEMENT OF REVENUES, EXPENSES AND CHANGES IN NET POSITION
YEAR ENDED JUNE 30, 2017
------------------------------------------------------------- D7 --------------------------------------------------------

FIDUCIARY FUNDSSTATEMENT OF FIDUCIARY NET POSITION
JUNE 30, 2017
OtherPostemployment Agency
Benefit Fund FundsASSETSCURRENT:
Cash and cash equivalents………..……………………… $ 68,616 $ 1,179,438 Investments:
Equity Mutual Funds…………………………………… 9,002,247 - Bond Mutual Funds……………………………………… 4,716,394
Receivables, net of allowance for uncollectibles: Departmental and other………………………………… - 113,056
TOTAL ASSETS………………………………………………… 13,787,257 1,292,494
LIABILITIES
Warrants payable…………………………………………… - 33,413 Accrued liabilities…………………………………………… - 36,968 Liabilities due depositors…………………………………… - 1,127,202 Other liabilities……………………………………………… - 94,911
TOTAL LIABILITIES…………………………………………… - 1,292,494
NET POSITIONHeld in trust for other postemployment benefits………… $ 13,787,257 $ -
See notes to basic financial statements.
------------------------------------------------------------- D8 --------------------------------------------------------

FIDUCIARY FUNDSSTATEMENT OF CHANGES IN FIDUCIARY NET POSITION
YEAR ENDED JUNE 30, 2017
OtherPostemployment
Benefit FundADDITIONS:Contributions:
Employer contribution to the trust…………………………………………$ 1,652,517 Employer contribution to pay for OPEB benefits………………………… 2,773,623
Total contributions……………………………………………………… 4,426,140
Net investment income (loss):Net change in fair value of investments…………………………………… 502,977 Investment income………………………………………………………… 408,476
Net investment income (loss)……………………………………………… 911,453
TOTAL ADDITIONS…………………………………………………… 5,337,593
DEDUCTIONS:OPEB benefits……………………………………………………………… 2,773,623
CHANGE IN NET POSITION…………………………………………… 2,563,970
NET POSITION AT BEGINNING OF YEAR………………………………… 11,223,287
NET POSITION AT END OF YEAR………………………………………… $ 13,787,257
See notes to basic financial statements.
------------------------------------------------------------- D9 --------------------------------------------------------

AmountsActual Carried
Original Final Budgetary Forward Variance toBudget Budget Amounts To Next Year Final Budget
REVENUES: Real estate and personal property taxes,
net of tax refunds…………………………………………… $ 73,221,831 $ 73,221,831 $ 73,446,890 $ - $ 225,059 Tax liens………………………………………………………… - - 86,809 - 86,809 Motor vehicle excise taxes…………………………………… 2,544,000 2,544,000 3,043,210 - 499,210 Charges for services…………………………………………… 340,000 340,000 358,392 - 18,392 Penalties and interest on taxes……………………………… 140,000 140,000 305,941 - 165,941 Payments in lieu of taxes……………………………………… 36,795 36,795 36,795 - - Licenses and permits…………………………………………… 1,110,000 1,110,000 1,080,575 - (29,425) Fines and forfeitures…………………………………………… 100,000 100,000 96,434 - (3,566) Fees and rentals………………………………………………… 275,000 275,000 374,004 - 99,004 Intergovernmental……………………………………………… 4,365,061 4,365,061 4,352,591 - (12,470) Departmental and other……………………………………… 460,000 460,000 754,479 - 294,479 Investment income……………………………………………… 60,000 60,000 215,315 - 155,315
TOTAL REVENUES……………………………………… 82,652,687 82,652,687 84,151,435 - 1,498,748
EXPENDITURES:Current:
General government………………………………………… 2,997,613 2,349,940 1,929,544 189,205 231,191 Facilities town-wide………………………………………… 2,076,786 2,084,263 1,444,450 537,414 102,399 Finance……………………………………………………… 861,286 900,412 824,024 - 76,388 Planning, land use & inspectional services……………… 771,973 802,525 754,943 - 47,582 Public safety………………………………………………… 6,888,174 7,196,148 6,854,474 91,877 249,797 Education……………………………………………………… 39,531,239 39,588,693 38,197,718 324,659 1,066,316 Public works………………………………………………… 6,259,544 6,654,304 4,570,918 1,950,831 132,555 Health & human services…………………………………… 783,783 715,177 686,580 - 28,597 Public Library………………………………………………… 1,363,597 1,368,694 1,290,387 911 77,396 Insurance……………………………………………………… 986,814 878,814 641,144 184,328 53,342 Fringe benefits……………………………………………… 17,473,269 17,473,269 16,799,194 277,896 396,179
State and county charges……………………………………… 295,111 295,111 300,620 - (5,509) Debt service:
Principal……………………………………………………… 6,205,500 6,230,500 6,230,500 - - Interest………………………………………………………… 2,923,345 2,786,016 2,766,091 - 19,925
TOTAL EXPENDITURES………………………………… 89,418,034 89,323,866 83,290,587 3,557,121 2,476,158
EXCESS (DEFICIENCY) OF REVENUESOVER (UNDER) EXPENDITURES…………………………… (6,765,347) (6,671,179) 860,848 (3,557,121) 3,974,906
OTHER FINANCING SOURCES (USES):Use of prior year fund balance reserve for articles
and encumbrances………………………………………… 3,752,858 3,752,858 - - (3,752,858) Use of prior year fund balance reserve for debt service…… 265,871 265,871 - - (265,871) Use of free cash………………………………………………… 2,220,000 2,660,000 - - (2,660,000) Use of overlay surplus………………………………………… 335,000 335,000 - - (335,000) Premium from issuance of bonds and notes………………… 122,726 122,726 319,958 - 197,232 Transfers in……………………………………………………… 702,961 702,961 703,328 - 367 Transfers out…………………………………………………… (634,069) (1,168,237) (1,441,314) - (273,077)
TOTAL OTHER FINANCING SOURCES (USES)…… 6,765,347 6,671,179 (418,028) - (7,089,207)
NET CHANGE IN FUND BALANCE……………………………… - - 442,820 (3,557,121) (3,114,301)
BUDGETARY FUND BALANCE, Beginning of year…………… 12,354,488 12,354,488 12,354,488 - -
BUDGETARY FUND BALANCE, End of year………………… $ 12,354,488 $ 12,354,488 $ 12,797,308 $ (3,557,121) $ (3,114,301)
See notes to required supplementary information.
Budgeted Amounts
GENERAL FUNDSCHEDULE OF REVENUES, EXPENDITURES AND CHANGES IN FUND BALANCE -
BUDGET AND ACTUAL
YEAR ENDED JUNE 30, 2017
------------------------------------------------------------- D10 --------------------------------------------------------

D11
This page intentionally left blank.