Town Investment Plan – Peravurani - Tamil Nadu Government ...
179
-
Upload
khangminh22 -
Category
Documents
-
view
0 -
download
0
Transcript of Town Investment Plan – Peravurani - Tamil Nadu Government ...


Town Investment Plan – Peravurani
TNUIFSL
T
N
U
D
P
III
I
Final
Report
Disclaimer…
The contents of this report are based primarily on discussions with Peravurani
Town Panchayat and information, secondary data /Reports available with the
Town Panchayat including our discussions with the Stakeholders of the Town.
Based on the available data and information provided to us, M/s Darashaw &
Company Pvt. Ltd has prepared the Final report.

Town Investment Plan – Peravurani
TNUIFSL
T
N
U
D
P
III
II
Final
Report
Table of Contents…
1 Project Background .................................................................................................................. 1-1
1.1 Project Objectives............................................................................................................ 1-1
1.2 Scope of work .................................................................................................................. 1-2
1.3 Methodology Adopted .................................................................................................... 1-3
1.3.1 Database identification........................................................................................... 1-5
1.4 Detailed approach and methodology.............................................................................. 1-6
1.4.1 Inception stage report............................................................................................. 1-6
1.4.2 Draft Final Stage .................................................................................................... 1-8
1.4.3 Final Stage .............................................................................................................. 1-9
2 Town Profile ............................................................................................................................. 2-1
2.1 Regional setting and network linkages .......................................................................... 2-1
2.2 Demography..................................................................................................................... 2-3
2.2.1 Population projections............................................................................................ 2-4
2.3 Social Characteristics ...................................................................................................... 2-5
2.3.1 Social Composition ................................................................................................ 2-5
2.3.2 Gender Ratio........................................................................................................... 2-6
2.3.3 Literacy levels......................................................................................................... 2-6
2.4 Physical characteristics ................................................................................................... 2-7
2.4.1 Geology and Soil Type .......................................................................................... 2-7
2.4.2 Climate and Rainfall .............................................................................................. 2-7
3 Economic profile ...................................................................................................................... 3-1
3.1 Economic Base of the town ............................................................................................ 3-1
3.2 Occupational Pattern ....................................................................................................... 3-1
3.3 Industries .......................................................................................................................... 3-2
3.4 Tourism potential............................................................................................................. 3-2
4 Physical Infrastructure.............................................................................................................. 4-1
4.1 Water Supply ................................................................................................................... 4-1
4.1.1 Water Supply Sources ............................................................................................ 4-1
4.1.2 Water Supply System............................................................................................. 4-2
4.1.3 Water Availability .................................................................................................. 4-3
4.1.4 Service Adequacy................................................................................................... 4-4
4.1.5 Sectoral Issues ........................................................................................................ 4-4
4.1.6 Water Supply Demand Assessment ...................................................................... 4-4

Town Investment Plan – Peravurani
TNUIFSL
T
N
U
D
P
III
III
Final
Report
4.2 Sewerage and Sanitation ................................................................................................. 4-6
4.2.1 Sewerage system in Peravurani ............................................................................. 4-6
4.2.2 Sectoral issues......................................................................................................... 4-6
4.2.3 Sewerage and sanitation demand assessment....................................................... 4-7
4.3 Storm Water Drainage..................................................................................................... 4-8
4.3.1 Service adequacy.................................................................................................... 4-8
4.3.2 Sectoral Issues ........................................................................................................ 4-8
4.3.3 Storm Water Drainage Demand Assessment........................................................ 4-8
4.4 Solid Waste Management ............................................................................................... 4-9
4.4.1 Generation and Collection ..................................................................................... 4-9
4.4.2 Disposal and treatment Facilities .......................................................................... 4-9
4.4.3 Adequacy of services ........................................................................................... 4-10
4.4.4 Sectoral issues....................................................................................................... 4-10
4.4.5 Solid Waste Management Demand Assessment ................................................ 4-10
4.5 Roads, Traffic and Transportation................................................................................ 4-11
4.5.1 Regional Network................................................................................................. 4-11
4.5.2 City level Road Network ..................................................................................... 4-12
4.5.3 Public Transport System...................................................................................... 4-12
4.5.4 Sectoral issues....................................................................................................... 4-12
4.5.5 Road network demand assessment...................................................................... 4-13
4.6 Street Lighting ............................................................................................................... 4-13
4.6.1 Adequacy of services ........................................................................................... 4-14
4.6.2 Sectoral Issues ...................................................................................................... 4-14
4.6.3 Street Lighting Demand Assessment .................................................................. 4-14
5 Socio-Economic Infrastructure................................................................................................ 5-1
5.1 Health ............................................................................................................................... 5-1
5.2 Education ......................................................................................................................... 5-2
5.3 Recreation ........................................................................................................................ 5-3
5.4 Other Amenities............................................................................................................... 5-3
5.5 Sectoral Issues ................................................................................................................. 5-4
6 Slums and Urban Poverty ........................................................................................................ 6-1
6.1 Slums in peravurani......................................................................................................... 6-1
6.2 Urban poor in peravurani................................................................................................ 6-2
6.3 Problems and Issues ........................................................................................................ 6-3
7 Fiscal status..................................................................................................................................... 7-1

Town Investment Plan – Peravurani
TNUIFSL
T
N
U
D
P
III
IV
Final
Report
7.1 Background ............................................................................................................................. 7-1
7.2 Financials................................................................................................................................. 7-2
7.3 Analysis Of Income ................................................................................................................ 7-4
7.3.1 Own Sources.................................................................................................................... 7-5
7.3.2 External Sources.............................................................................................................. 7-7
7.4 Analysis Of Expenditure ........................................................................................................ 7-8
7.5 Source & Use Of Funds........................................................................................................ 7-11
7.6 Demand, Collection And Balance ....................................................................................... 7-13
7.7 Outstanding Loan And Non-Debt Liability ........................................................................ 7-15
8 Institutional capacity assessment................................................................................................... 8-1
8.1 Staff Strength .......................................................................................................................... 8-1
8.2 Institutional Strengthening & Capacity Building ................................................................. 8-2
9 S W O T .................................................................................................................................... 9-1
10 Stakeholders Consultation................................................................................................. 10-1
10.1 Operational Working Group ......................................................................................... 10-1
10.2 Priority based on OWG opinion survey....................................................................... 10-7
10.2.1 Physical infrastructure priority ............................................................................ 10-7
10.2.2 Social infrastructure priority................................................................................ 10-8
11 Asset management plan..................................................................................................... 11-1
11.1 List of Assets: ................................................................................................................ 11-2
11.2 Operations and Maintenance ........................................................................................ 11-3
11.2.1 O&M of social infrastructure assets.................................................................... 11-4
11.2.2 O&M Physical Infrastructure .............................................................................. 11-5
11.3 AMP - Recommendations............................................................................................. 11-7
11.3.1 Asset Register ....................................................................................................... 11-7
11.3.2 Asset Value and Life Cycle Management .......................................................... 11-7
11.3.3 Sustainability ........................................................................................................ 11-7
11.3.4 Integration of Technical and Financial Plans ..................................................... 11-8
11.3.5 Condition Assessment Survey (CAS) ................................................................. 11-8
11.3.6 Risk Assessment ................................................................................................... 11-8
11.3.7 Monitoring and Evaluation .................................................................................. 11-9
11.3.8 Budgeting.............................................................................................................. 11-9
11.3.9 Training in Database management...................................................................... 11-9
12 Consolidated issues............................................................................................................ 12-1
13 Strategic Planning .............................................................................................................. 13-1

Town Investment Plan – Peravurani
TNUIFSL
T
N
U
D
P
III
V
Final
Report
13.1 Action plan for sectoral development .......................................................................... 13-1
14 Capital Investment Plan..................................................................................................... 14-1
14.1 Physical Infrastructure .................................................................................................. 14-2
14.1.1 Water Supply ........................................................................................................ 14-3
14.1.2 Sewerage and Sanitation...................................................................................... 14-4
14.1.3 Storm Water Drainage ......................................................................................... 14-5
14.1.4 Solid Waste Management .................................................................................... 14-7
14.1.5 Roads, Traffic and Transportation ...................................................................... 14-9
14.1.6 Street Lighting .................................................................................................... 14-11
14.2 Slums and Urban Poverty ........................................................................................... 14-12
14.3 Socio-economic Infrastructure ................................................................................... 14-13
14.4 Consolidated Capital Investment Plan ....................................................................... 14-15
14.4.1 First Phase Investment Plan (2009-10 to 2013 – 14) ....................................... 14-15
14.4.2 Second Phase Investment Plan (2014-15 to 2018 – 19) .................................. 14-17
14.4.3 third Phase Investment Plan (2019-20 to 2023-24).......................................... 14-19
15 Reforms and Resource mobilization ......................................................................................... 15-1
15.1 Overview ............................................................................................................................. 15-1
15.2 Reform measures for Peravurani Town Panchayat .......................................................... 15-2
15.2.1 Financial & Accounting reforms................................................................................ 15-2
15.2.2 Institutional Reforms .................................................................................................. 15-7
15.2.3 Reforms in Physical Infrastructure .......................................................................... 15-11
15.3 Additional Resource Mobilization................................................................................... 15-15
16 Financial Operating Plan............................................................................................................ 16-1
16.1 Background- need for an FOP ........................................................................................... 16-1
16.2 Financial Sustainability ...................................................................................................... 16-2
16.2.1 Base Case Scenario ..................................................................................................... 16-3
16.2.2 Full project Scenario based on prudent funding norms ............................................ 16-3
16.2.3 Full Project Scenario based on borrowing capacity of the Town ............................ 16-4
16.3 Assumptions for FOP ......................................................................................................... 16-5
16.3.1 Revenue Income.......................................................................................................... 16-5
16.3.2 Revenue Expenditure.................................................................................................. 16-8
16.3.3 Funding Mechanism.................................................................................................... 16-9
16.4 Outcome of Financial Operating Plan ............................................................................. 16-10
16.4.1 Base Case Scenario (“Business as Usual Scenario”).............................................. 16-10
16.4.2 Full Project Scenario with suggested Reforms ....................................................... 16-12

Town Investment Plan – Peravurani
TNUIFSL
T
N
U
D
P
III
VI
Final
Report
List of Tables…
Table 2-A : Population growth trends in Peravurani....................................................................... 2-3
Table 2-B Ward wise Population details.......................................................................................... 2-3
Table 2-C : Population projections by various methods ................................................................. 2-5
Table 2-D Social Composition ......................................................................................................... 2-5
Table 2-E Gender Ratio..................................................................................................................... 2-6
Table 2-F Literacy levels .................................................................................................................. 2-6
Table 3-A Occupational Pattern and its comparison – 2001 .......................................................... 3-1
Table 4-A: Bore well with Pump set details in Peravurani............................................................. 4-1
Table 4-B : Performance Indicators for water supply in Peravurani.............................................. 4-4
Table 4-C : Demand Assessment for the next fifteen year period.................................................. 4-5
Table 4-D : Demand Assessment for the next fifteen year period ................................................. 4-7
Table 4-E : Performance indicators for Storm Water Drainage in Peravurani .............................. 4-8
Table 4-F : Demand Assessment for the next fifteen year period .................................................. 4-8
Table 4-G Waste Composition ......................................................................................................... 4-9
Table 4-H : Performance Indicators for Solid Waste Management ............................................. 4-10
Table 4-I : Demand Assessment for the next fifteen year period................................................. 4-10
Table 4-J: Road network in Peravurani.......................................................................................... 4-12
Table 4-K : Demand Assessment for the next fifteen year period ............................................... 4-13
Table 4-L : Street lighting system in Peravurani ........................................................................... 4-13
Table 4-M : Performance Indicators related to Street lighting in Peravurani.............................. 4-14
Table 4-N : Demand Assessment for the next fifteen year period ............................................... 4-14
Table 5-A : List of hospitals in Peravurani...................................................................................... 5-1
Table 5-B : List of Schools and Colleges in Peravurani ................................................................. 5-2
Table 5-C : List of ponds and lakes in Peravurani .......................................................................... 5-4
Table 5-D : Issues pertaining to Socio-economic Infrastructure in Peravurani............................. 5-4
Table 6-A : Ward wise BPL population in Peravurani .................................................................. 6-2
Table 6-B : Ward wise percentage share of BPL population.......................................................... 6-3
Table 7-A Income & Expenditure Account ..................................................................................... 7-3
Table 7-B : Income Analysis ............................................................................................................ 7-4
Table 7-C Property Tax Particulars .................................................................................................. 7-5
Table 7-D Property Tax Particulars.................................................................................................. 7-6
Table 7-E Profession Tax Particulars ............................................................................................... 7-6

Town Investment Plan – Peravurani
TNUIFSL
T
N
U
D
P
III
VII
Final
Report
Table 7-F No of assessments in Professional Tax........................................................................... 7-6
Table 7-G : Expenditure Analysis .................................................................................................... 7-8
Table 7-H Balance Sheet................................................................................................................. 7-11
Table 7-I: Fixed Assets Rs. in Lakhs........................................................................ 7-11
Table 7-J: DCB for the Past 5 years Rs. In Lakhs. ................................. 7-13
Table 7-K : Collection Efficiency (%) ........................................................................................... 7-14
Table 7-L : Outstanding Loan and Non-Debt Liability................................................................ 7-15
Table 8-A : Staff strength of the Peravurani Town Panchayat....................................................... 8-1
Table 10-A: Suggestions and projects............................................................................................ 10-2
Table 11-A: Details of various social & physical infrastructure assets ....................................... 11-2
Table 11-B: O&M and Revenue generation .................................................................................. 11-4
Table 11-C Past Growth trends in O & M expenses relating to key physical infrastructure...... 11-6
Table 11-D O&M rates as a % of proposed capital works ........................................................... 11-6
Table 12-A : Consolidated Issues ................................................................................................... 12-1
Table 14-A : Consolidated Sector wise Capital Investment requirements .................................. 14-1
Table 14-B : Project List and Budget Estimates for Water Supply Works.................................. 14-3
Table 14-C : Goals and Service outcomes related to Water Supply sector ................................. 14-4
Table 14-D : Project List and Budget Estimates for Sewerage and Sanitation Works ............... 14-5
Table 14-E : Project List and Budget Estimates for Storm Water Drainage works .................... 14-5
Table 14-F : Goals and Service outcomes related to Storm Water Drainage sector ................... 14-7
Table 14-G : Project List and Budget Estimates for Soild Waste Management works .............. 14-8
Table 14-H : Goals and Service outcomes related to Solid Waste Management works............. 14-8
Table 14-I : Project List and Budget Estimates for Roads, Traffic and Transportation works .. 14-9
Table 14-J : Goals and Service outcomes related to Roads, Traffic and Transportation sector14-10
Table 14-K : Project List and Budget Estimates for Street lighting works................................ 14-11
Table 14-L : Goals and Service outcomes related to Street lighting sector............................... 14-12
Table 14-M : Project List and Budget Estimates for Slums and Urban Poverty....................... 14-13
Table 14-N : Project List and Budget Estimates for Socio-Economic Infrastructure works.... 14-13
Table 14-O First Phase Capital Investment Plan for Peravurani Town Panchayat.................. 14-15
Table 14-P First Phase Capital Investment Plan for Peravurani Town Panchayat (after
considering escalation cost) .......................................................................................................... 14-16
Table 14-Q Second Phase Capital Investment Plan for Peravurani Town Panchayat .............. 14-17
Table 14-R Second Phase Capital Investment Plan for Peravurani Town Panchayat (after
considering escalation cost) .......................................................................................................... 14-18
Table 14-S Third Phase Capital Investment Plan for Peravurani Town Panchayat.................. 14-19

Town Investment Plan – Peravurani
TNUIFSL
T
N
U
D
P
III
VIII
Final
Report
Table 14-T Third Phase Capital Investment Plan for Peravurani Town Panchayat (after
considering escalation cost) .......................................................................................................... 14-20
Table 15-A: Collection Efficiency of key revenue sources .......................................................... 15-3
Table 15-B: Efficiency parameters of key taxes and water charges ............................................ 15-3
Table 15-C: Reforms in property Taxes......................................................................................... 15-4
Table 15-D: Accounting Reforms .................................................................................................. 15-6
Table 15-E: Possible areas of privatization/outsourcing............................................................... 15-8
Table 15-F: Reforms in Physical Infrastructure .......................................................................... 15-11
Table 16-A : Key assumptions for forecasting income from Property Taxes ............................. 16-5
Table 16-B: Key assumptions for forecasting income from Water Charges ............................... 16-6
Table 16-C: Assumption for Income.............................................................................................. 16-7
Table 16-D: Assumption for Revenue Expenditure ...................................................................... 16-8
Table 16-E: Key assumptions for forecasting future debt obligations......................................... 16-8
Table 16-F: Financing Pattern for Proposed projects as per prudent Funding norms................. 16-9
Table 16-G : Financial Operating Plan of Peravurani- Base Case Scenario.............................. 16-11
Table 16-H: Full Project Cash Flow - As per Prudent Financial norms .................................... 16-13
Table 16-I: Financial Operating Plan of Peravurani- Full Project with Reforms-Prudent Funding
Norms ............................................................................................................................................. 16-14
Table 16-J: Calculation of Debt Service Coverage Ratio (DSCR) With FULL PROJECT WITH
REFORMS- As per Prudent Financial Norms............................................................................. 16-14
Table 16-K: Full Project Cash Flow - As per Borrowing Capacity ........................................... 16-16
Table 16-L: Financial Operating Plan of Peravurani - Full Project with Reforms-Borrowing
Capacity.......................................................................................................................................... 16-17
Table 16-M: Calculation of Debt Service Coverage Ratio (DSCR) With FULL PROJECT
WITH REFORMS- As per Borrowing Capacity......................................................................... 16-17
Table 16-N: FULL PROJECT SCENARIO WITH REFORMS -Funding requirements as per
Prudent Funding Norms vs. Funding Possibilities based on borrowing capacity ..................... 16-18
Table 16-O Sector-wise Full Project Investments....................................................................... 16-19

Town Investment Plan – Peravurani
TNUIFSL
T
N
U
D
P
III
IX
Final
Report
List of Figures…
Figure 1-1 Approach and Methodology for Town Investment Plan .............................................. 1-4
Figure 1-2 Approach and Methodology for Inception stage........................................................... 1-7
Figure 2-1 Regional Setting and Network Linkages ....................................................................... 2-2
Figure 4-1 : Regional Network Linkages....................................................................................... 4-11
Figure 7-1 Income & Expenditure Account..................................................................................... 7-2
Figure 7-2: Break up of Income for the year 2007-08 (Budget) ................................................... 7-5
Figure 7-3 Break up of Expenditure for the year 2007-08 (Budget)............................................. 7-9
Figure 7-4 : Source of Funds as on-2007-08(Budget)................................................................... 7-12
Figure 7-5 Use of Funds as on 2007-08(Budget) .......................................................................... 7-12
Figure 10-1 : First Formal Meeting on 15th July 2009 ................................................................. 10-2
Figure 10-2 Sector prioritization by the Stakeholders (Physical Infrastructure) ......................... 10-8
Figure 10-3 Sector prioritization by the Stakeholders (Social Infrastructure)............................. 10-9
Figure 10-4 Consultation in Peravurani Town Panchayat ............................................................ 10-9
Figure 14-1 Sector wise percentage share...................................................................................... 14-2

Town Investment Plan – Peravurani
TNUIFSL
T
N
U
D
P
III
X
Final
Report
Annexure……
Annexure I Population projection
Annexure II Norms Vs Current Status
Annexure III Town Map
Annexure IV Project Implementation Schedule
Annexure V Reforms Implementation Schedule
Annexure VI Minutes of the Review Committee Meeting on Inception & Draft
Final Report
Annexure VII Salary Slip of Staff
Annexure VIII OWG attendees list
Annexure IX Council Resoultion

Town Investment Plan – Peravurani
TNUIFSL
T
N
U
D
P
III
XI
Final
Report
Acronyms…
AMP : Asset Management Plan
BE : Budget estimates
BPL : Below Poverty Line
BOT : Build-Operate-Transfer
BOOT : Build-Own-Operate-Transfer
BOLT : Build-Own-Lease-Transfer
BT : Bitumen
CAGR : Compounded Annual Growth Rate
CC : Cement Concrete
CIP : Capital investment Plan
CMA : Commissionerate of Municipal Administration
CMWSSB : Chennai Metro Water Supply & Sewerage Board
CPHEEO : Central Public Health & Environmental Engineering Organization
DSCR : Debt Service Coverage Ratio
DPR : Detailed Project Report
ESR : Elevated Storage Reservoir
ESA : Environmental and Social Assessment
FAS : Financial Accounting System
FOP : Financial Operating Plan
FY : Financial Year
GIS : Geographical Information System
Govt. : Government
G.O : Government Order
GSR : Ground Level Reservoir
HH : House hold
HP : Horse Power
HSC : House Hold Connections

Town Investment Plan – Peravurani
TNUIFSL
T
N
U
D
P
III
XII
Final
Report
HSS : Higher Secondary School
HUDCO : Housing and Urban Development Corporation
IHSDP : Integrated Housing & Slum Development Program
Kg : Kilo Gram
Km : Kilometer
JNNURM : Jawaharlal Nehru National Urban Renewal Mission
Sq.Km : Square Kilometer
Lpcd : Litre per capita per day
LL : Lakh Litre
LIC : Life Insurance corporation of India
OHT : Over Head Tanks
m : Meter
m2 : Square Meter
m3 : Cubic Meter
MIS : Management Information System
Mld : Million litres per day
MOA : Memorandum of Association
Mm
MRTS
MTC
:
:
:
Millimeter
Mass Rapid Transit System
Metropolitan Transport Corporation
MUDF : Municipal Urban Development Funds
MUDP : Madras Urban Development Project
NA : Not Available/Not Applicable
NGO : Non Government Organization
NH : National Highway
NHAI : National Highway Authority of India
O&M : Operations and Maintenance
PF : Public Fountains
PPP : Public Private Participation

Town Investment Plan – Peravurani
TNUIFSL
T
N
U
D
P
III
XIII
Final
Report
PSP : Private Sector Participation
PWD : Public Works Department
RE : Revised Budget estimates
SEZ : Special Economic Zone
Sq ft : Square Feet
Sq Km : Square Kilometer
SC/ST : Scheduled Castes/Schedule Tribes
SHG : Self Help Group
SH : State Highway
SWD : Storm Water Drains
SWM : Solid Waste Management
TIP : Town Investment Plan
TOR : Terms of Reference
TNUDP : Tamil Nadu Urban Development Project
TNUIFSL : Tamil Nadu Urban Infrastructure Financial Services Limited
TUFIDCO : Tamil Nadu Urban Finance & Infrastructure Development Corporation Limited
TWAD : Tamil Nadu Water Supply & Drainage Board
UDPFI : Urban Development Planning Formulation and Implementation
UIDSSMT : Urban Infrastructure Development Scheme for Small & Medium Towns
UGD : Under Ground Sewerage
ULB : Urban Local Bodies
WBM : Water Bound Macadam
WFPR : Work Force Participation Rate
WS : Water Supply

Town Investment Plan – Peravurani
TNUIFSL 1-1
T
N
U
D
P
III
Final
Report
1111 PROJECT BACKGROUND
Government of Tamilnadu and The World Bank as a partner has been involved
in Urban Reform program in Tamilnadu through Tamilnadu Urban
Development Project – TNUDP-I, TNUDP-II, TNUDP-III (in progress).
Government of Tamilnadu is now implementing TNUDP-III with focus on
furthering the urban reforms initiated under TNUDP-II.
As a financial intermediary, TNUIFSL intends to assist Annamalai Nagar,
Vadalur, Tharangampadi, Ottenchatram, Thudiyalur, Thirupattur, S.Kannanur
and Peravurani Town Panchayats in identifying infrastructure gaps and propose
capital investment needs for providing better service delivery.
In this regard, the task of preparation of Town Investment plan for the aforesaid
towns has been awarded to Darashaw & Company Private Limited. This report
pertains to the Town Investment Plan for Peravurani.
1.1 PROJECT OBJECTIVES
The objective of this exercise is to:
� Assess the demand for the projects specified by the towns and come out
with gap in services considering the population growth and growth
direction of towns;
� Broadly outline the short term and long term infrastructure needs;
� Define specific rehabilitation and capital improvement needs with regard
to priority of town infrastructure in both slums and other areas;
� Define revenue enhancement and revenue management improvements
required

Town Investment Plan – Peravurani
TNUIFSL 1-2
T
N
U
D
P
III
Final
Report
1.2 SCOPE OF WORK
The scope of works covers but not limited to the following:
� Assess the demand for the projects listed out by these Town Panchayats.
� Current coverage and additional population in the medium term (10
years) and unit costs, indicate town level investment requirement for
up gradation of town wide infrastructure.
� to improve service coverage and asset quality and define priority
assets and indicative costs of rehabilitation
� Financial assessment of the ULBs- an assessment of local finances (past
5 years) in terms of sources and uses of funds, base and basis of levy,
revision history and impacts, State assignments and transfers- base and
basis of transfer and its predictability; uses of funds outstanding
liabilities (loans, power dues, pension etc) and, a review of revenue and
service management arrangements, levels of service, coverage and
quality of municipal services in both poor and non-poor localities.
Staffing and management arrangements in delivery of services
� Initiate consultations with council and local stakeholders on the
priorities; redefine priorities and work with the Council to resolve on
adoption of the Town Investment Plan.
� Prepare a financial and operating plan (FOP). The FOP is a medium term
framework of the ULBs, and shall present the following–
� Break up of energy cost on UG, WS etc.
� Salary for all the departments including staff and payments to private
operators
� Finding out the benchmark cost i.e. at ideal condition what will be
the cost of the identified investments, a table indicating the
investment plan for next 5 years with identified source of finance.
Areas of reduction in expenditure
� Energy audit resulting in savings in energy.

Town Investment Plan – Peravurani
TNUIFSL 1-3
T
N
U
D
P
III
Final
Report
� Leak detection resulting either in connections or in the tariff (or)
maintaining the same supply and achieving a reduction in energy
cost.
� Privatizing the MSW collection and identifying a BoT operator for
elim9inating, composting etc, items of revenue can be identified.
� Laying of Cement concrete road / Fly ash and savings on
maintenance cost resulting in increasing operating surplus.
� Water recycling / reuse
� Rejuvenation of tanks and reduction of cost / liters of water produced
� Privatization & option for revenue raising.
Options for increasing the revenues through non-traditional methods
� Land development for raising revenue (not the traditional
commercial complexes)
� Suggestion for improvement of revenues
� Finalize Action Plan for the Town, with a resolution from the council on
the priorities
1.3 METHODOLOGY ADOPTED
The whole exercise is divided into four stages, which are further subdivided into
tasks and several sub-tasks or activities within them. Figure below shows the
adopted study methodology and is followed by a brief description on each of the
stages.

Town Investment Plan – Peravurani
TNUIFSL 1-4
T
N
U
D
P
III
Final
Report
Figure 1-1 Approach and Methodology for Town Investment Plan

Town Investment Plan – Peravurani
TNUIFSL 1-5
T
N
U
D
P
III
Final
Report
1.3.1 DATABASE IDENTIFICATION
� Database Identification and compilation
Database forms the backbone of any kind of research works and also
helps in focusing the study towards the definite approach. Under this
task, the database required and the departments responsible for such
kind of data was identified at town levels. A detailed checklist was
prepared of all the sectors, along with identifying the probable
departments for the collection of the data.
� Field survey and data collection
Secondary data was collected from Town Panchayat in relation to
different sectors identified like:
i. Town Infrastructure Services
ii. Town Economic Development
iii. Roads, Traffic and Transportation
iv. Slums and Urban Poverty
v. Human resources and Institutional Issues
vi. Financial management
vii. Environmental Management
viii. Asset Management
ix. O&M Requirements, Energy Saving Mechanism &
Capacity assessment
Data was also collected on the Finance and Institutional Arrangement of the
ULB. It Included accounts and budgets for the last five years, loan status, capital
works in the last five years with sector-wise breakup, Audit Report, Properties,
Water connections, Sewer connections registered and assessment of unregistered
properties and assets of each town Panchayats and their condition. In addition,
staffing and management arrangements in delivery of services was also collected
and assessed.

Town Investment Plan – Peravurani
TNUIFSL 1-6
T
N
U
D
P
III
Final
Report
1.4 DETAILED APPROACH AND
METHODOLOGY
1.4.1 INCEPTION STAGE REPORT
1.4.1.1 DEMAND ASSESSMENT
RFP document specifies that the ULBs have on their own identified certain
projects to be implemented, for which demand assessment has to be carried out
and sustainable investment plan has to be prepared for the same.
Hence, Inception stage in essence assessed the demand for various projects
proposed by the ULBs. Furthermore, Investment Plan for such projects was
reviewed (or) Investment Plan was prepared for such projects, if not attempted
by the concerned Town Panchayats. Further, Overall Demand Supply Gap
analysis in terms of Physical and Social Infrastructure for the next 15 years for
the ULB was carried out.
1.4.1.2 RAPID TOWN PERFORMANCE ASSESSMENT
Here, all the information collected from Secondary sources was analyzed to
arrive, current development status at town area level. The analysis includes all
the sectors mentioned below:
i. Town Infrastructure Services
ii. Town Economic Development
iii. Roads, Traffic and Transportation
iv. Slums and Urban Poverty
v. Human resources and Institutional Issues
vi. Financial management
vii. Environmental Management
viii. Asset Management
ix. O&M Requirements, Energy Saving Mechanism &
Capacity assessment

Town Investment Plan – Peravurani
TNUIFSL 1-7
T
N
U
D
P
III
Final
Report
Figure 1-2 Approach and Methodology for Inception stage
Demand Assessment and Rapid Urban assessment undertaken in the
Inception stage was approved and accepted by the Review Committee on
28th August 2009.
1.4.1.3 SUGGESTIONS OF THE REVIEW COMMITTEE ON THE
INCEPTION REPORT
The Suggestions given by the Review Committee during the meeting has been
given as under.
� To conduct stakeholders’ consultations to ascertain the demands from
public to identify infrastructure gaps.
� To present the draft final report to respective ULBs in the council after
incorporating the suggestions of stake holders meeting.
� To recheck the financials of ULBs including debt status.
� To Analyse last 5 years financials and furnish the data on existing loan,
loan repaid on due date, overdue loan, loan balance and loans sanctioned
but yet to be availed. In this regard, all Town Panchayats were requested

Town Investment Plan – Peravurani
TNUIFSL 1-8
T
N
U
D
P
III
Final
Report
to provide 5 years audited accounts and recent years’ un-audited
accounts along with DCB and loan statements and any other relevant
details to the consultants.
� To study on the unused / under utilized assets of the ULB and suggest
ways for the better utilization of the same.
� To identify any vacant land for development.
1.4.2 DRAFT FINAL STAGE
In draft final stage, four tasks were carried out and are described briefly as
below:
1.4.2.1 DEVELOPMENT SCENARIO
Future Development Scenario for the ULB was developed based on Rapid Town
Performance Assessment, Demand Assessment, S-W-O-T analysis and on the
basis of Citizen’s perception and viewpoint.
1.4.2.2 SECTORAL VISION AND STRATEGIES
On the basis of the sectoral issues identified during rapid Town Performance
assessment, the sectoral vision and strategies were worked out to overcome
those issues. These strategies were further converted into Action plans and
projects. The projects were then phased on the basis of demand and stakeholders
priorities.
During Strategic plan preparation; emphasis was mainly given to Areas/ sectors
related to local Economic Development and poverty reduction
1.4.2.3 TOWN INVESTMENT PLAN
The budget cost estimates for the proposed projects was worked out to
determine the financial requirements for meeting the demand for infrastructure
and services. The project phasing was also worked out so that the financials of
the ULB would not be burdened much and at the same time the objective of
provision of basic services would be achieved.

Town Investment Plan – Peravurani
TNUIFSL 1-9
T
N
U
D
P
III
Final
Report
1.4.2.4 ASSET MANAGEMENT PLAN
The life cycle O&M costs for the services proposed were worked out and in
addition, O&M for lands and assets vested with the ULBs were also worked out.
On that basis, a detailed Asset Management Plan was prepared for the ULB.
The above 4 tasks were covered in this Draft Final stage report.
The Draft Final Stage was approved and accepted by the Review
Committee on 23rd December 2009.
1.4.2.5 SUGGESTIONS OF THE REVIEW COMMITTEE ON THE
DRAFT FINAL REPORT
The Suggestions given by the Review Committee during the meeting has been
given as under.
� Strengthening banks in ward 13 & 14 has to be checked as the same is
repeated twice in the CIP.
1.4.3 FINAL STAGE
In final Stage, there are two tasks, which have been carried out and are described
briefly as below:
1.4.3.1 FINANCIAL OPERATING PLAN
The projected FOP under four broad scenarios has been worked out to highlight
the importance of the reforms suggested to implement all identified projects
required for the development of the ULB.
The four broad scenarios under which FOP has been worked out for each ULB
are as under:
� Base case scenario (“Business as usual scenario”) - In this scenario “No
New Projects” and “No reforms” over the next 15 year period is
considered.

Town Investment Plan – Peravurani
TNUIFSL 1-10
T
N
U
D
P
III
Final
Report
� Full Project Scenario without undertaking the Suggested Reforms
� Full Project Scenario with Full Reforms implementation
� Sustainable Investment Scenario
1.4.3.2 DRAFT MEMORANDUM OF ASSOCIATION
Draft Memorandum of Association has been prepared which would outline the
base line (based on the Situation Analysis) and the performance benchmarks to
be monitored, apart from other financial and loan covenants. This Draft MoA
has covered two sub tasks. One is the Policy Intervention in the form of
Institutional and policy reforms for effective governance and financial
management. The other one is the technical assistance to each ULB for effective
implementation of the Town Investment Plan.
1.4.3.3 COUNCIL RESOLUTION
Council Resolution has been obtained from the ULB accepting all suggested
reforms and proposed Investments for the next 15 years period.
The final report has covered all the above stages along with incorporating the
suggestions and modifications given by the review committee and local
stakeholders.

Town Investment Plan – Peravurani
TNUIFSL 2-1
T
N
U
D
P
III
Final
Report
2222 TOWN PROFILE
Peravurani is in Thanjavur district in the Indian state of Tamilnadu. Peravurani
is a selection grade Town Panchayat and it got the status of Town Panchayat by
Tamil Nadu Government order No. 1118/L.A. dated 04.06.1951. Peravurani is
about 370 km south of Chennai, 26 Kms North East of Aranthangi and at a
distance of 75 kms from Thanjavur.
Pattukkottai is the nearest big Town at a distance of 30 kms from Peravurani on
the highway to Thanjavur. In the west side, Pudukkottai town is located at a
distance of 48 Km. Perumagalur and Keeramangalam are the nearest Town
Panchayats to Peravurani. It is a Taluk Head quarter and also Assembly head
quarter.
2.1 REGIONAL SETTING AND NETWORK
LINKAGES
Peravurani is located at 10°3′ North of the Equator 79.18° East of the prime
Meridian. It has an average elevation of 16 metres (52 feet). Peravurani has
railway station, connected to Karaikudi and Thiruthuraipoondi by a meter gauge
railway line. 3 meter gauge trains are running between Karaikudi and
Thiruthuraipoondi via Peravurani.
Two Karaikudi Thiruthuraipoondi passanger trains and one Thiruthuraipoondi
Karaikudi express train passes through Peravurani. Peravurani is well connected
with Thanjavur, the district head quarters and Chennai, the state head quarters
and with other towns of Aranthangi, Pudukottai, Pattukottai and
Adiramapattinam by road transport facilities. The main mode of transportation is
buses operated both by Government Transport Corporation and private owners.
The nearest airport is located in Trichy at a distance of around 90 Km.

Town Investment Plan – Peravurani
TNUIFSL 2-2
T
N
U
D
P
III
Final
Report
Figure 2-1 Regional Setting and Network Linkages

Town Investment Plan – Peravurani
TNUIFSL 2-3
T
N
U
D
P
III
Final
Report
2.2 DEMOGRAPHY
Peravurani has a population of 21045 as per 2001 census and having male
population of 10327 and female population of 10718. Peravurani has shown a
growth rate of 22 percent between 1981 and 1991 whereas it has shown a high
growth percentage of 151% between 1991 and 2001 mainly due to increase in its
jurisdiction area from 6.8 Sq.Km to 18.7 Sq.Km. The growth of population and
decadal variation from the year 1981 is illustrated in Table 2-A.
Table 2-A : Population growth trends in Peravurani
Census year Pop Percentage Increase
1981 6853
1991 8375 22.21
2001 21045 151.28
The ward wise population as per 2001 census is shown in Table 2-B.
Table 2-B Ward wise Population details
Ward No Male Female Total
1 786 814 1600
2 536 464 1000
3 464 495 959
4 666 865 1531
5 887 929 1816
6 329 350 679
7 430 434 864
8 571 608 1179
9 471 467 938
10 382 390 772
11 593 618 1211
12 560 524 1084
13 426 424 850

Town Investment Plan – Peravurani
TNUIFSL 2-4
T
N
U
D
P
III
Final
Report
Ward No Male Female Total
14 415 427 842
15 503 492 995
16 683 680 1363
17 746 810 1556
18 879 927 1806
Total 10327 10718 21045
Source: data collected from Peravurani Town Panchayat
2.2.1 POPULATION PROJECTIONS
Sine there is a change in the jurisdiction area of Peravurani Town Panchayat,
Population of 1981 census is scaled up to match the current town panchayat area
by multiplying the area ratio (current area 18.7 Sq.Km /earlier area 6.8 Sq.Km)
with the actual census population 1981 (6853). For 1991, the ward wise
population figures obtained from Peravurani Town Panchayat is taken into
consideration.
After undertaking the above exercise, Population projections for the next fifteen
year period have been done using various methods like Arithmetic Increase,
Geometric Increase, Incremental Increase, Least Squares and Graphical
Methods.
The low and high end projected population based on the methods mentioned
above in 2023 could be 23,500 and 29,500. Since it is predominantly an
agricultural based town, depends mainly on fishing and Coir Industry, it is
prudent to consider moderate level growth for future planning purposes. Hence
the projection done under Incremental Increase method is adopted for future
planning purposes. Projections by various methods are shown below.

Town Investment Plan – Peravurani
TNUIFSL 2-5
T
N
U
D
P
III
Final
Report
Table 2-C : Population projections by various methods
Year
Arithmetic
Increase
Geometric
Increase
Incremental
Increase
Least
Squares
Graphical
Method
1981 186261 18626 18626 18626 18626
1991 192572 19257 19257 19257 19257
2001 21045 21045 21045 21045 21045
2009 22013 21984 22656 21820 25000
2013 22496 22469 23676 22304 26500
2018 23101 23091 25153 22908 28000
2023 23706 23729 26853 23513 29500
2.3 SOCIAL CHARACTERISTICS
2.3.1 SOCIAL COMPOSITION
As per census 2001, SC population is about 7 percent of the total population
whereas ST population is insignificant which comes around 0.2 percent of the
total population as shown in Table 2-D.
Table 2-D Social Composition
Social Composition Male Female Total % share to total
SC Population 735 737 1472 6.99
ST Population 26 32 58 0.28
Others 9566 9949 19515 92.73
Total Population 10327 10718 21045 100.00
1 1981 figures are worked out to match the current jurisdiction area population for projection
purpose ( Census 1981 : 6853 for an area of 690.9 Hectares)
2 1991 figures are obtained from Peravurani Town Panchayat (Census 1991 : 8375 for an area of
688.88 hectares)

Town Investment Plan – Peravurani
TNUIFSL 2-6
T
N
U
D
P
III
Final
Report
2.3.2 GENDER RATIO
Gender ratio in Peravurani is much higher than district
urban and state urban gender ratio. Gender ratio in the
case of population below 6 years of age is also higher
than state and district urban figures but little lower than
the general gender ratio of Peravurani. Gender ratio in the town and its
comparison with state and district urban figures are shown in Table 2-E. Gender
ratio between 1981 and 2001 has increased in Peravurani which is shown above.
Table 2-E Gender Ratio
Sex ratio Population Population below 06 SC
Male 10327 1249 735
Female 10718 1264 737
Gender ration in Peravurani 1038 1012 1003
In Thanjavur Urban district 1022 963 1009
In Tamilnadu urban 982 955 1001
2.3.3 LITERACY LEVELS
As per census 2001, 79 percent of total population (excluding 0-6 years of age)
are literates of which male accounted for 88 percent and female accounted for
70 percent. Literacy levels in Peravurani and its comparison with state urban and
district urban figures are shown below:
Table 2-F Literacy levels
Literacy levels Total Male Female
Peravurani 79.02 88.44 69.97
Thanjavur dist Urban 84.59 90.98 78.39
Tamilnadu State Urban 82.53 88.97 75.99
Year Gender
ratio
1981 1006
2001 1038

Town Investment Plan – Peravurani
TNUIFSL 2-7
T
N
U
D
P
III
Final
Report
2.4 PHYSICAL CHARACTERISTICS
2.4.1 GEOLOGY AND SOIL TYPE
Thanjavur district has coastal and riverine alluvium, red loam, lateritic and black
soil types in which the alluvial soil being the predominant type.
2.4.2 CLIMATE AND RAINFALL
Temperature in Thanjavur district varies between 37.48 degree Celsius and
20.82 degree Celsius. Rainfall during North East Monsoon varies between 545.7
mm and 953.2 mm and during South West Monsoon it varies between 342.0 and
303.1 mm

Town Investment Plan – Peravurani
TNUIFSL 3-1
T
N
U
D
P
III
Final
Report
3333 ECONOMIC PROFILE
3.1 ECONOMIC BASE OF THE TOWN
Peravurani is dependent mainly on agriculture for its economic activities. Fish
net companies, coir and coir making factories, are the major factories providing
employment for the people residing in this area. There are 2 fish net companies,
3 coir factories and one coir making factories are running within Peravurani
town. Banana and coconuts are exported from here to other states in India.
3.2 OCCUPATIONAL PATTERN
Peravurani is predominantly an agro based town and hence its dependency on
primary sector is very high when compared to district urban and state urban
areas. In contrast to other towns, its dependency on other service related activity
is very low (39.3% to total workers) when compared to the Thanjavur district
urban and state urban occupational figures as shown in Table 3-A. However, non
workers percentage to total population is low when compared to Thanjavur
district and state urban non workers share.
Table 3-A Occupational Pattern and its comparison – 2001
Area Indicators Primary
Household
Industry Others
total
workers
Non
workers
Peravurani % to total workers 57.6 3.1 39.3
District Urban % to total workers 18.7 8.6 72.8
State Urban % to total workers 14.0 6.3 79.6
Peravurani % to total population 23.5 1.3 16.1 40.9 59.1
District Urban % to total population 6.2 2.8 24.2 33.2 66.8
State Urban % to total population 5.3 2.4 29.9 37.5 62.5

Town Investment Plan – Peravurani
TNUIFSL 3-2
T
N
U
D
P
III
Final
Report
3.3 INDUSTRIES
Peravurani has no major industries in operation. Opal Energy Solution (P) Ltd
and R.G.Fibers,Peravurani are the only two notable factories in operation in this
area.
3.4 TOURISM POTENTIAL
Peravurani has famous Hindu Temple for Lord Ganesh in the name of Sri
Neelakanda pillaiyar. 10 days famous festival is conducted to the Lord Ganesh
in the Tamil month Chithrai. It attracts devotees from surrounding villages in
approximately 30 Km radius as indicated by the local stakeholders.
The surrounding villages of this town are very beautiful covered with coconut
plantations. Manora, an eight storeyed victory tower built by the Maratha King
Saraboji in 1814 to commemorate the victory of the British over Napoleon
Bonaparte at Waterloo, is a well known tourist center locally. The name Manora
is derived from the minaret meaning small minar. From the top of this tower,
one has a panoramic view of the palm-fringed Bay of Bengal. The tower has
also served as a light house. Manora is located about 15 km east of Peravurani.
Boating, Boarding and canteen facilities are also available in Manora. Buses are
frequently available from Peravurani to reach “Manora”

Town Investment Plan – Peravurani
TNUIFSL 4-1
T
N
U
D
P
III
Final
Report
4444 PHYSICAL INFRASTRUCTURE
Infrastructure facilities play an important role in fostering economic growth and
enhancing public welfare. By and large, the infrastructure may be divided into
two categories:
� Physical infrastructure including Water supply, Drainage, Sewerage,
Solid Waste Management, Electricity, Telecommunications and so forth;
and
� Socio-economic infrastructure including Education, Health, other
Community facilities, Cold storages, Warehouses, Markets, Banks and
Financial Institutions.
This chapter deals with Physical Infrastructure which includes Water Supply,
Sewerage and Sanitation, Storm water drainage, Solid Waste Management
Roads and Street Lighting.
4.1 WATER SUPPLY
4.1.1 WATER SUPPLY SOURCES
Peravurani is served by bore well water initiated in 1991, supplies 26 lakh litres
per day. All bore wells are located within the town panchayat limit and are listed
below:
Table 4-A: Bore well with Pump set details in Peravurani
Ward Nos. No. of Bore Wells Pump sets HP Capacity
Pump set I Pump set II Pump set III
3 2 7.5 10
4 2 7.5
5 2 7.5 10

Town Investment Plan – Peravurani
TNUIFSL 4-2
T
N
U
D
P
III
Final
Report
Ward Nos. No. of Bore Wells Pump sets HP Capacity
Pump set I Pump set II Pump set III
8 1 10
7 1 7.5
9 3 10 7.5 10
10 1 7.5
12 2 12 10
11 1 7.5
18 1 7.5
17 2 10 10
12 1 7.5
Weekly Market 1 3.5
Bus Stand 2 7.5 7.5
Total 22
4.1.2 WATER SUPPLY SYSTEM
Nine over head tanks
and two mini tanks
with a combined
capacity of 13.52
lakh litres are
serving the water
requirements of the
town. Peravurani has
1853 no of assessments having house service connections out of total 7476
assessments. Out of 1853 household service connections, 1802 are domestic
water connections and 51 are Non domestic connections. In addition, 381 public
fountains (stand Posts) are provided within the town for drinking purpose.
Further more, 12 public hand pumps are provided all over the town for non-
drinking purpose. Chlorination method is followed for treating raw water in all
Inches Year of Installation Length in Kms
8" 1991 5
6" 1991 9
4" 1991 7
3" 2007-08 5
2.5" 2007-08 3
Total distribution length 29

Town Investment Plan – Peravurani
TNUIFSL 4-3
T
N
U
D
P
III
Final
Report
the tanks. Town has 29 Km distribution network of varying sizes laid at different
years as tabulated above:
4.1.3 WATER AVAILABILITY
Water is supplied twice a day for three hours in the morning from 06-09 am and
two hours in the evening from 4.30 to 6.30 pm.
Description Details
Source of Water Supply : Bore wells
Water Supply Agency : Town Panchayat
Description regarding Storage Capacity in Lakh Litres
OHT in Ward No. 9 : 4
OHT in Ward No. 5 : 2.5
OHT in Ward No. 12 : 2
OHT in Ward No. 17 2
OHT in Ward No. 3 1
OHT in Ward No. 4 1
OHT in Ward No. 12 0.3
OHT in Ward No. 7 0.3
OHT in Ward No. 10 0.4
Mini tank in Ward No. 8 0.01
Mini Tank in Ward No. 13 0.01
Total Storage Capacity : 13.52
Description regarding Connections
Domestic : 1809
Commercial : 51
Total : 1860
No of Stand posts 65
No of Hand Pumps 47

Town Investment Plan – Peravurani
TNUIFSL 4-4
T
N
U
D
P
III
Final
Report
Overall, 115 LPCD water is being supplied by taking into consideration the population
for 2009 would be 22650.
4.1.4 SERVICE ADEQUACY
Table 4-B : Performance Indicators for water supply in Peravurani
S.No Indicators Unit Current status Normative
standard
1 Daily per capita supply Litres 115
70/100
2 Roads covered with distribution network Percent 42
> 100
3 Storage capacity with respect to supply Percent 52 33
4 Available Treatment capacity with respect to
supply Percent
100 100
5 Assessments covered by service connections Percent 25 85
6 Proportion of non domestic service connections Percent 3
>5
4.1.5 SECTORAL ISSUES
� Town has Low Household Service Connections (only 24% of the
assessments are covered)
� Dependent entirely on Bore well water supply
4.1.6 WATER SUPPLY DEMAND ASSESSMENT
Demand Assessment for Peravurani for the next fifteen year period under water
supply sector has been worked out and is tabulated below.

Town Investment Plan – Peravurani
TNUIFSL 4-5
T
N
U
D
P
III
Final
Report
Table 4-C : Demand Assessment for the next fifteen year period
Particulars 2009-10 2013-14 2018-19 2023-24
Peravurani projected population 22656 23676 25153 26853
Water Supply MLD 2009-10 2013-14 2018-19 2023-24
Peravurani water demand @ 70
lpcd 1.59 1.66 1.76 1.88
Existing and proposed Supply in
MLD 2.60 2.60 2.60 2.60
Gap -1.0 -0.9 -0.8 -0.7
Water Treatment Plant
capacity in MLD 2009-10 2013-14 2018-19 2023-24
Demand for treatment plant
capacity 1.59 1.66 1.76 1.88
Treated water supply
(Chlorination) 2.6 2.6 2.6 2.6
Gap -1.0 -0.9 -0.8 -0.7
Water Distribution Network
in Kms 2009-10 2013-14 2018-19 2023-24
Existing distribution length in
Kms 29.0 29.0 29.0 29.0
Road length in Kms (exisitng and
proposed) 68.3 68.3 68.3 68.3
Gap 39.3 39.3 39.3 39.3
Per Capita road length of 1.5 meter is considered for calculation
Water Service connections 2009-10 2013-14 2018-19 2023-24
No of Assessments 7476 7813 8300 8861
No of service connections 1853 3505 5389 7532
% service connections existing &
proposed 24.8 44.9 64.9 85.0
Gap 75.2 55.1 35.1 15.0
Assessments increased on the basis of Assessment / population ratio
Service connections are proposed to be 85% by 2023-24
Storage capacity 2009-10 2013-14 2018-19 2023-24
Existing & Proposed Storage
Capacity in MLD 1.35 1.35 1.35 1.35
Storage capacity demand in MLD 0.52 0.55 0.58 0.62
Gap in MLD -0.8 -0.8 -0.8 -0.7

Town Investment Plan – Peravurani
TNUIFSL 4-6
T
N
U
D
P
III
Final
Report
4.2 SEWERAGE AND SANITATION
4.2.1 SEWERAGE SYSTEM IN PERAVURANI
Sewage is mostly the waste water of the community draining into the sewer
system with some ground water infiltration. Domestic sewage is the waste water
from kitchen, bathroom and toilets. Generally 80 percent of the water supplied
gets drained into the sewerage system.
Peravurani currently has no underground sewerage system. Night soil is
disposed normally through individual toilets having septic tanks and through
low cost sanitation facilities. In Peravurani, nearly 6000 households have private
sanitation facilities with septic tank as safe mode of disposal. In addition, 2750
low cost sanitation facilities were constructed in the year 2000 and additional 50
LCS in the year 2008. 4 public convenience units have been constructed in the
town with 2 Pay and Use and another 2 maintained by the SHGs. The road side
drains constructed are used for disposing both waste water and rainwater. Public
toilets are required in ward Nos. 10, 11, 12 and 06 as indicated by stakeholders.
S.No Ward No Facilities (No of seats provided) Location
1 09 6 (ladies) and 6 (gents) Bus stand
2 09 2 (ladies) and 2 (gents) Gandhi park
3 18 4 (bath) and 7 seats - For Ladies
4 11 4 (bath) and 7 seats - For Ladies
4.2.2 SECTORAL ISSUES
� Town has no Sullage lorry for cleaning septic tanks.
� Inadequate public conveniences in ward Nos. 10, 11, 12 and 06.

Town Investment Plan – Peravurani
TNUIFSL 4-7
T
N
U
D
P
III
Final
Report
4.2.3 SEWERAGE AND SANITATION DEMAND
ASSESSMENT
Demand Assessment for Peravurani for the next fifteen year period under
Sewerage and Sanitation sector has been worked out and is tabulated below.
Since the sewage generation is quite low, it is not viable to propose under
ground drainage system in Peravurani.
Table 4-D : Demand Assessment for the next fifteen year period
Particulars 2009-10 2013-14 2018-19 2023-24
Peravurani projected population 22656 23676 25153 26853
Sewage generation 2009-10 2013-14 2018-19 2023-24
Peravurani sewage generation 1.3 1.3 1.4 1.5
Peravurani proposed Sewage
Collection 0.0 0.0 0.0 0.0
Gap 1.3 1.3 1.4 1.5
STP capacity in MLD 2009-10 2013-14 2018-19 2023-24
Capacity of proposed treatment
plant 0.0 0.0 0.0 0.0
Gap 1.3 1.3 1.4 1.5
Sewer connections 2009-10 2013-14 2018-19 2023-24
Proposed connections under UGSS 0 0 0 0
Demand for sewer connections 5233 5469 5810 6203
Gap 5233.2 5468.8 5810.0 6202.6
Sewer Network in Kms 2009-10 2013-14 2018-19 2023-24
Sewer Network in Kms (Proposed ) 0.0 0.0 0.0 0.0
Sewer Network Demand 58.0 58.0 58.0 58.0
Gap 58.0 58.0 58.0 58.0

Town Investment Plan – Peravurani
TNUIFSL 4-8
T
N
U
D
P
III
Final
Report
4.3 STORM WATER DRAINAGE
The total length of the Storm Water Drains constructed in the Town is around
2.7 Kms with 1 Km closed brick lining drains and 1.7 Km kutcha drains.
4.3.1 SERVICE ADEQUACY
Table 4-E : Performance indicators for Storm Water Drainage in Peravurani
4.3.2 SECTORAL ISSUES
� Town has just 1.5% of the roads covered by SWDs
4.3.3 STORM WATER DRAINAGE DEMAND
ASSESSMENT
Demand Assessment for Peravurani for the next fifteen year period under Storm
Water Drainage sector has been worked out and is tabulated below.
Table 4-F : Demand Assessment for the next fifteen year period
Particulars 2009-10 2013-14 2018-19 2023-24
Peravurani projected population 22656 23676 25153 26853
Storm water drainage 2009-10 2013-14 2018-19 2023-24
Peravurani existing SWD 1.000 1.000 1.000 1.000
Storm water drain demand 89 89 89 89
Gap 88 88 88 88
S.No Indicators Unit Current
Status
Normative
Standard
1 Road length covered
with pucca storm water drainage Percent 1.46 130

Town Investment Plan – Peravurani
TNUIFSL 4-9
T
N
U
D
P
III
Final
Report
4.4 SOLID WASTE MANAGEMENT
4.4.1 GENERATION AND COLLECTION
Peravurani Town generates around 1.5 ton garbage per day at the rate of 66
grams per capita per day. Waste is being collected in all the 18 wards. 30% of
the total assessments are covered under Door to Door waste collection system
and waste segregation at source. Waste collected is segregated into degradable,
non-degradable and recyclable and its details are shown in Table 4-G .
Table 4-G Waste Composition
S.No Waste Type Quantity in MT Percentage share
1 Biodegradable 1 67
2 Non bio degradable /
Recyclable
0.5
33
3 Total 1.5 100
36 concrete waste bins and 18 dumper placer bins are placed all over the town
for collection purpose. Town Panchayat has the staff strength of 1 sanitary
inspector, 2 sanitary supervisors and 20 sanitary workers. Other than
departmental workers, 12 Self Help Group members are also been involved in
waste collection and segregation. As a part of primary collection system, 13
pushcarts are engaged.
4.4.2 DISPOSAL AND TREATMENT FACILITIES
One mini lorry and two tractor trailer is in operation for secondary waste
collection and disposal. Town Panchayat has 1.57 acre land for waste disposal
and treatment. Currently, Waste being collected is segregated and converted into
manure using vermin compost method. For treatment purpose, 10 rectangular
tanks, 8 vermi compost tanks along with 18 wind rows have been constructed in
this 1.57 acre land. However, town has no scientific land fill site for dumping of

Town Investment Plan – Peravurani
TNUIFSL 4-10
T
N
U
D
P
III
Final
Report
non-biodegradable waste as on today. Town generates nearly 21.5 ton manure in
a month (20 Ton from Ordinary method and 1.5 ton from Vermi-compost
method).Non-biodegradable waste other than recyclable waste is dumped in a
land nearer to the compost yard.
4.4.3 ADEQUACY OF SERVICES
Table 4-H : Performance Indicators for Solid Waste Management
Indicators Unit
Current
Status
Normative
Standard
Waste generation per Capita per day Grams 66.2 < 350 grams
Collection efficiency Percent 100 100
% of assessments covered by Door to Door
collection Percent 30.1 100
% of assessments involved in waste segregation Percent 30.1 100
Conservancy staff per Km persons 0.3 2
% capacity of Fleet vehicles to waste generated percent 80
4.4.4 SECTORAL ISSUES
� Town has no scientific land fill site
� Only 30% of the assessments are covered by Door to Door collection and
waste segregation.
4.4.5 SOLID WASTE MANAGEMENT DEMAND
ASSESSMENT
Table 4-I : Demand Assessment for the next fifteen year period
Solid waste generation 2009-10 2013-14 2018-19 2023-24
Per capita waste generation in
grams per day 66 72 79 87
Peravurani waste generation 1.5 1.7 2.0 2.3
Growth rate assumed 2.00%

Town Investment Plan – Peravurani
TNUIFSL 4-11
T
N
U
D
P
III
Final
Report
4.5 ROADS, TRAFFIC AND TRANSPORTATION
4.5.1 REGIONAL NETWORK
Peravurani has railway station, connected to Karaikudi and Thiruthuraipoondi
by a meter gauge railway line. 3 meter gauge trains are running between
Karaikudi and Thiruthuraipoondi via Peravurani.
Figure 4-1 : Regional Network Linkages
Two Karaikudi Thiruthuraipoondi passanger trains and one Thiruthuraipoondi
Karaikudi express train passes through Peravurani. Peravurani is well connected
with Thanjavur, the district head quarters and Chennai, the state head quarters
and with other towns of Aranthangi, Pudukottai, Pattukottai and
Adiramapattinam by road transport facilities. The main mode of transportation is

Town Investment Plan – Peravurani
TNUIFSL 4-12
T
N
U
D
P
III
Final
Report
buses operated both by Government Transport Corporation and private owners.
The nearest airport is located in Trichy at a distance of around 90 Km.
4.5.2 CITY LEVEL ROAD NETWORK
The total road length within Peravurani is 68.26 Km. Out of 68.26 km road
length, 29.185 km are built with bituminous road, 4 km roads are made up of
Cement Concrete, 3.350 Km are made up of metal road and Kutcha road
constitutes 31.720 kms. Road length and its type are shown below.
Table 4-J: Road network in Peravurani
Road type Length in Kms Percentage Share
BT road 29.185
CC road 4.0
Metal road 3.350
Kutcha road 31.720
Total 68.26
BT road
43%
CC road
6%
metal road
5%
Kutcha road
46%
4.5.3 PUBLIC TRANSPORT SYSTEM
The main mode of transportation is buses operated both by Government
Transport Corporation and private owners from Peravurani. Town has C grade
bus stand located nearer to the Panchayat office with CC pavement. Bus stand
has two wheeler parking shed in an area of 2000 Sq.feet. Taxi stand is proposed
to be constructed as suggested by the stakeholders.
4.5.4 SECTORAL ISSUES
� Intersections are poor in geometrics in Sedhu road, Avanam road,
Railway station road and Railway TCMF road junction.
� Railway crossings obstruct traffic movement and hence creating
congestion (6 railway crossings)
� 46 percent of the existing roads are Kutcha

Town Investment Plan – Peravurani
TNUIFSL 4-13
T
N
U
D
P
III
Final
Report
4.5.5 ROAD NETWORK DEMAND ASSESSMENT
Demand Assessment for Peravurani for the next fifteen year period under Road
sector has been worked out and is tabulated below.
Table 4-K : Demand Assessment for the next fifteen year period
Particulars 2009-10 2013-14 2018-19 2023-24
Peravurani projected population 22656 23676 25153 26853
Road network 2009-10 2013-14 2018-19 2023-24
Existing road network in Kms 68.3 68.3 68.3 68.3
Road length demand 68.3 68.3 68.3 68.3
Gap 0.0 0.0 0.0 0.0
4.6 STREET LIGHTING
Peravurani has 1547 street lights positioned all over the Town Panchayat area in
which 1065 lights are 40 W tube lights, 228 lights are 250 W Sodium Vapor
lamps, 29 are 150W sodium vapor lamps, 17 are 70W sodium vapor lamps, 206
are 65W CFL lamps and 2 High Mast lights of each 2400W combined capacity.
As a part of energy saving mechanism, Town Panchayat has converted 45
manual switches into automatic timer switches. However, all the lamps have
conventional copper chokes.
Table 4-L : Street lighting system in Peravurani
Sl.No. Type of Lights Nos Watts
1 Sodium Light 228 250
2 Sodium Light 29 150
3 Sodium Light 17 70
4 CFL Light 206 65
5 Tube Light 1065 40
6 High Mast 2 2400
Total 1547

Town Investment Plan – Peravurani
TNUIFSL 4-14
T
N
U
D
P
III
Final
Report
Sl.No. Type of Lights Nos Watts
Less: Stopped Sodium Lights from burning -78 250
Total lights burning 1469
4.6.1 ADEQUACY OF SERVICES
Table 4-M : Performance Indicators related to Street lighting in Peravurani
Indicators Unit Current status Norms/Standards
Spacing between lamps Meters 46.5 30
Proportion of tube lights W.R.T to total Percent 72.50 60
Proportion of high power fixtures W.R.T to
total Percent
27.50 40
4.6.2 SECTORAL ISSUES
� Spacing between lights is 46 meters against the norm of 30 meter
spacing
� All lights have conventional copper chokes
4.6.3 STREET LIGHTING DEMAND ASSESSMENT
Table 4-N : Demand Assessment for the next fifteen year period
Street Lighting 2009-10 2013-14 2018-19 2023-24
Peravurani existing lights 1547 1547 1547 1547
Road length in Kms 68.3 68.3 68.3 68.3
Street light demand @ one light
per 30 m 2275 2275 2275 2275
Gap 728 728 728 728

Town Investment Plan – Peravurani
TNUIFSL 5-1
T
N
U
D
P
III
Final
Report
5555 SOCIO-ECONOMIC INFRASTRUCTURE
The Socio-economic infrastructure determines the development status of any
human settlement and this chapter covers Health, Education, Recreation and
other amenities.
5.1 HEALTH
Peravurani has one Government hospital with 3 doctors and 30 beds serving
both the town and its surroundings. Other than this hospital, town has 8 private
hospitals / clinics whose details are shown in Table 5-A. In addition, Town has 4
health centers in ward Nos. 1, 9, 11 and 18.
Table 5-A : List of hospitals in Peravurani
Ward No. Name of the Hospital Doctors (In Nos.) Beds (In Nos.)
1 Govt. Hospital 3 30
1 Selvi Hospital 1 15
2 Dhanabal Hospital 1 5
3 Jamal Hospital 1 10
4 Jayabal Hospital 1 20
5 Andal Hospital 1 15
6 Jawahar Hospital 1 5
7 Ayyappa hospital 1 10
9 Savkat ali 1 3
Total 11 113

Town Investment Plan – Peravurani
TNUIFSL 5-2
T
N
U
D
P
III
Final
Report
5.2 EDUCATION
Peravurani has both boys and girls Government higher secondary school in ward
No. 03 and 04. Further, One private high school is there in ward No. 07. In
addition, Town has 8 primary schools and 3 middle schools whose locations are
mentioned in Table 5-B.
Table 5-B : List of Schools and Colleges in Peravurani
Ward No. HS / HSS / College
3 Government Boys HSS
4 Government Girls HSS
7 Kumarappa H School
12 Veerappa VR H School
13 Venkateswara Arts College
1 Private ITI
Ward. No Primary Schools
9 Primary East
6 Primary west
10 Adanur east and Adanur north east
12 kublikadu and kublikadu west
8 Neelakandapuram
3 Attalur
Ward No Middle Schools
5 Nattani Kottai North
6 Ponkadu
11 Punitha Annal Aadanur

Town Investment Plan – Peravurani
TNUIFSL 5-3
T
N
U
D
P
III
Final
Report
5.3 RECREATION
Peravurani has Gandhi Park developed by Peravurani Town Panchayat.
However, it has no approved layouts handed over to the Town Panchayat for
developing parks and playgrounds. Road Side Park can be developed in ward
No. 02 along Pattukottai road as suggested by the local stakeholders. They have
also suggested developing another park in a portion of 1 acre land available in
Selva Vinayakapuram.
5.4 OTHER AMENITIES
Peravurani has banking facilities
provided by State Bank of India
and Co-op bank in ward No.09
and Lakshmi Vilas bank in ward
No.04. It has Adimuthu Saroja
theatre in ward No.16 and
Sakkaram theatre in ward No. 02
for entertainment purpose.
Town has weekly market in an area of 2 acres located nearer to the bus stand.
Fish market is located in ward No.04 in an area of 24 cents. Daily market has no
designated space and it operates along the main road side. Community hall is
located in ward No. 09 with all facilities provided.
Slaughter house is located near old bus stand near fish market in ward No. 04 in
an area of 120 Sq. ft. The existing Town Panchayat office located nearer to the
bus stand would be shifted to new building which is under construction in ward
No. 15 in an area of 2400 sq. ft at a cost of Rs. 20 lakhs. After shifting, existing
office space would be allotted for shops as suggested by stakeholders.
Town has 7 burial grounds located in Avanam road, Pattukottai road, Sethu
road, Koblikadu, Athanur, Athalur and in Nattankottai South.
Ward No. Name of the lodge
4 C V Lodge
4 Gega Lodge
4 Sriram Lodge
17 STD Lodge
9 Kandappan Complex

Town Investment Plan – Peravurani
TNUIFSL 5-4
T
N
U
D
P
III
Final
Report
Town Panchayat has revenue generating assets like commercial complexes in
Bus stand, in Gandhi Park and nearby weekly market.
Town has 4 PWD controlled ponds and 5 ULB controlled ponds as listed below:
Table 5-C : List of ponds and lakes in Peravurani
S.No Name of the Pond Ward No Managing Agency
1 Periya kulam 16 PWD
2 Adanur Periya Eri 10 PWD
3 Vimatha Tank 11 PWD
4 Nattanikuttai 5 PWD
5 Vannan Kulam 15 ULB
6 Old Peravurani Theppa kulam 13 and 14 ULB
7 Kublikadu kulam (2 Nos) 12 ULB
9 Selva Vinayagar Kulam 17 ULB
5.5 SECTORAL ISSUES Table 5-D : Issues pertaining to Socio-economic Infrastructure in Peravurani
Sector Issues
Socio-economic
Infrastructure
• Town has inadequate green spaces
• Town has 4 PWD controlled ponds and 5 ULB controlled ponds
which are not maintained properly
• All burial grounds have infrastructure inadequacies
• Market areas have infrastructure inadequacies

Town Investment Plan – Peravurani
TNUIFSL 6-1
T
N
U
D
P
III
Final
Report
6666 SLUMS AND URBAN POVERTY
As per Census of India, the slum areas are broadly defined as :-
� All specified areas in a town or city notified as ‘Slum’ by State/Local
Government and UT Administration under any Act including a ‘Slum
Act’.
� All areas recognized as ‘Slum’ by State/Local Government and UT
Administration, Housing and Slum Boards, which may have not been
formally notified as slum under any act;
� A compact area of at least 300 persons or about 60-70 households of
poorly built congested tenements, in unhygienic environment usually
with inadequate infrastructure and lacking in proper sanitary and
drinking water facilities.
6.1 SLUMS IN PERAVURANI
In Peravurani, 24% of the 2001 census population is living in slums. In 1981 the
town slum population was 18% and it has increased to 21% in 1991 and 24% in
2001. IHSDP project report has already been prepared by the Town Panchayat
for an estimated cost of Rs.111.8 lakhs in order to improve the living conditions
in slum areas. Population to be served under this scheme is 5067 in which
SC/ST population constitutes 28%, OBC constitutes 66 % and the remaining 6%
belongs to general category.
Project components Cost in lakhs
Dwelling Houses 64.00
Roads 31.00
Drains 4.30
IEC and social activities 12.5
Total project cost 111.8

Town Investment Plan – Peravurani
TNUIFSL 6-2
T
N
U
D
P
III
Final
Report
6.2 URBAN POOR IN PERAVURANI
Peravurani has 9% of the total population living below poverty line. Ward Nos
01, 04 and 18 has maximum share of BPL population which accounts for more
than 30% of the total BPL population in Peravurani. Ward wise BPL population
is shown in Table 6-A.
Table 6-A : Ward wise BPL population in Peravurani
Total BPL Population
S.No Ward No As Per 2003
Survey As per 2007 Verification
1 1 57 202
2 2 74 104
3 3 76 130
4 4 102 204
5 5 96 147
6 6 57 94
7 7 92 114
8 8 96 30
9 9 49 113
10 10 119 27
11 11 122 107
12 12 85 80
13 13 88 109
14 14 80 95
15 15 81 104
16 16 83 118

Town Investment Plan – Peravurani
TNUIFSL 6-3
T
N
U
D
P
III
Final
Report
17 17 119 51
18 18 118 224
Total 1594 2053
Current population 22656
% share 9
Table 6-B : Ward wise percentage share of BPL population
1
10% 2
5%3
6%
4
10%
5
7%6
5%7
6%
8
1%
9
6%
10
1%
11
5%
12
4%
13
5%
14
5%
15
5%
16
6%
17
2%
18
11%
6.3 PROBLEMS AND ISSUES
IHSDP project is still on paper and not yet implemented due to financial
constraints.
24% of the total population is living in slum areas.

Town Investment Plan – Peravurani
TNUIFSL
T
N
U
D
P
III
7-1
Final
Report
7777 FISCAL STATUS
7.1 BACKGROUND
Tamil Nadu is the first State to have introduced a classification in the status of
local bodies as ‘Town Panchayat’, which was planned as a transitional body
between Rural and Urban Local Bodies. The Town Panchayats were conferred
with individual administrative powers and unique functional characters have
been in existence for over a century. The Town Panchayats adopt well devised
accounting and auditing procedures and the service delivery to the public has
been better. Town Panchayats are under the administrative control Municipal
Administration and Water Supply Department, at Government level.
Till 1981, the Town Panchayats were under the administrative control of
Directorate of Rural Development. During 1981, the Government vide G.O. Ms.
828 Dated 7.5.1981, constituted a separate Directorate for the Town Panchayats
with the nomenclature of ‘Directorate of Town Panchayats’. However the
administrative control of the Directorate of Town Panchayats continued to be
with the Rural Development Department at the Secretariat as they were
governed under the Tamil Nadu Panchayats Act 1958.
Following the introduction of 73rd and 74th amendments to the Constitution of
India in the year 1993, all the Town Panchayats were reconstituted under the
Tamil Nadu District Municipalities Act, 1920 and treated as transitional area.
i.e. an area in transition from rural area to an Urban area. Necessary
amendments were brought on to the Tamil Nadu District Municipalities Act,
1920 for this purpose and a separate chapter in respect of Town Panchayats was
inserted in the said Act. Consequently though the nomenclature ‘Town
Panchayat’ remained unchanged, the administrative control of the Directorate of
Town Panchayats was brought under the Municipal Administration and Water
Supply Department at the Secretariat.

Town Investment Plan – Peravurani
TNUIFSL
T
N
U
D
P
III
7-2
Final
Report
Municipal Corporation Acts and the District Municipalities Act of the Tamil
Nadu authorizes Urban local bodies to levy, collect and appropriate such taxes,
duties, tolls and fees in accordance with the procedures subject to limits as
specified by the legislature. Besides these, the urban local bodies are also
empowered with certain other financial powers.
The Sources of income for a Town Panchayat can be broadly categorized as
own sources (Includes both Tax and Non Tax Revenues), and External Sources
(Assigned Revenues, Devolution Funds, Grants and Contribution). Besides the
Town Panchayats can also avail of loans/ Grants/ Contribution from
Government(Central and State) and loans from various funding agencies such as
TUFIDCO, TNUIFSL, HUDCO, LIC and Banks etc, for undertaking specific
projects based on their credit worthiness.
The Town Panchayat’s Revenue Expenditure can be broadly categorized into
Personnel cost and Terminal and Retirement benefits, Operating Expenses,
Repairs & Maintenance Expenses, Programme Expenses Administrative
Expenses, Finance Expense, Provision for Depreciation. Besides the above,
significant amounts are required for undertaking capital works.
7.2 FINANCIALS
Figure 7-1 Income & Expenditure Account
Income & Expenditure Account
0.00
50.00
100.00
150.00
200.00
250.00
2003-04 2004-05 2005-06 2006-07 2007-08
Budget
Years
Rs.
in l
ak
hs
TOTAL INCOME
TOTAL EXPENDITURE
Source : Annual Accounts of Peravurani Town Panchayat

Town Investment Plan – Peravurani
TNUIFSL
T
N
U
D
P
III
7-3
Final
Report
Table 7-A Income & Expenditure Account
Rs. in lakhs
Particulars
2003-04
2004-05
2005-06
2006-07
2007-08
Revised
Budget
2008-09
Budget
INCOME
Property Tax 13.98 15.44 16.16 17.08 17.21 28.03
Other Taxes(Profession Tax) 2.92 3.86 4.71 6.42 5.21 6.25
Asigned Revenue 7.43 14.36 1.55 7.85 1.16 29.20
Devolution Fund 26.37 25.08 35.50 53.42 56.32 85.44
Service Charges & Fees 16.73 15.27 18.05 17.15 25.13 20.83
License Fees 0.84 0.59 0.68 0.64 0.80 0.79
License fees under PFA act 0.08 0.07 0.10 0.10 0.15 0.19
Building License Fees 1.69 1.40 1.71 1.36 2.50 2.28
Fees for bay and other receipts in the Bus Stand
4.78 1.36 1.60 1.28 5.88 1.49
Slaughter House Fees 0.10 0.07 0.14 0.11 0.15 0.26
Cart Stand – Lorry Stand - Taxi Stand Fees 0.00 0.57 1.00 1.14 0.00 1.33
Fees for Pay & Use toilets 0.34 0.90 0.93 0.96 1.00 0.80
Copy Application Fees 0.08 0.09 0.26 0.08 0.15 0.02
Initial amount for new water supply under ground
1.10 1.45 1.35 1.45 3.00 2.80
Water supply connection charges 0.18 0.33 0.24 0.20 0.50 0.36
Metered / Tap rate water supply under /ground
7.35 8.10 8.96 9.28 11.00 10.49
Charges for maintenance of Sewerage System
0.14 0.27 0.38 0.54 0.00 0.03
Others 0.05 0.08 0.71 0.00 0.00 0.00
Granted Contribution 0.00 0.00 0.00 1.04 3.25 0.97
Sales and Hire Charges 0.00 0.00 0.00 0.00 0.00 0.00
Other Income 16.97 26.49 32.36 26.69 25.71 39.35
Marker Fees – daily market 2.61 1.80 1.88 2.17 2.60 3.90
Market fees – weekly market 0.00 0.00 2.67 3.07 3.11 6.21
Rent on and lease of lands 0.00 0.75 0.59 0.67 0.00 0.75
Rent on shopping complex 3.81 7.13 6.11 8.06 0.00 9.08
Rent on Community Hall / Kalyana Mandapam 0.00 0.00 1.61 1.85 0.00 2.13
Road Cut Restoration charges 0.00 0.00 0.02 0.03 0.00 0.02
Avenue Receipts including receipts from Tope 3.12 2.60 0.05 0.06 0.00 0.05
Interest from Bank 0.94 1.68 1.40 3.28 5.00 1.02
Projects Overhead Appropriation – Expenses 3.71 10.60 2.68 0.96 15.00 8.76
Prior Year Income 1.66 0.00 0.00 4.42 0.00 3.48
Others 1.12 1.93 15.35 2.11 0.00 3.96
TOTAL INCOME 84.40 100.50 108.33 129.65 133.99 210.06
EXPENDITURE
Personnel Cost 24.21 22.12 23.35 26.50 38.22 49.65
Terminal and Retirement Benefits 0.00 0.14 0.18 0.23 6.05 19.62
Operating Expenses 27.73 24.49 19.25 23.39 33.01 45.36

Town Investment Plan – Peravurani
TNUIFSL
T
N
U
D
P
III
7-4
Final
Report
Power charges for Head water works / pumping station / Booster station – water supply
0.00 0.09 3.67 0.00 10.00 8.47
Power charges for street lights 20.87 3.98 6.43 9.72 9.00 12.84
Maintains Expenses for street light 5.98 19.48 7.20 7.29 5.00 14.00
Sanitary / conservancy expenses 0.65 0.94 0.92 3.46 4.00 7.45
Expenses on sanitary materials 0.14 0.00 1.03 2.92 5.01 2.60
Hire charges for water supply through lorries 0.00 0.00 0.00 0.00 0.00 0.00
Others 0.08 0.00 0.00 0.00 0.00 0.00
Repairs and Maintenance Expenses 7.33 5.85 4.45 9.10 20.19 28.53
Light Vehicle Maintenance 0.10 0.01 0.00 0.00 0.00 0.00
Heavy Vehicle – Maintenance 1.13 1.10 1.13 1.99 1.99 5.32
Repairs & Maintenance Roads & Pavement concrete
0.00 0.00 0.00 0.97 0.97 0.18
Repairs & Maintenance – Building 0.00 0.40 0.15 0.00 0.00
Repairs & Maintenance – storm water Drains & Open Drains and Culverts
0.01 0.00 0.08 0.28 0.28 3.38
Maintenance expenses – water supply / sewerage system
6.08 4.34 3.01 4.42 11.50 15.77
Others 0.00 0.00 0.08 1.43 5.45 3.87
Programme Expenses 2.51 4.33 15.53 3.85 32.58 2.67
Administrative Expenses 3.38 3.49 2.94 7.31 12.59 9.69
Finance Expenses 9.11 11.00 10.59 7.36 11.86 7.60
Depreciation 25.47 27.76 17.82 29.38 41.30 45.55
TOTAL EXPENDITURE 99.74 99.17 94.12 107.10 195.80 208.67
SURPLUS OR DEFICIT -15.34 1.33 14.22 22.54 -61.82 1.39
Source: Annual Accounts of. Peravurani Town Panchayat
7.3 ANALYSIS OF INCOME
Table 7-B : Income Analysis
Particulars 2003-04 2004-05 2005-06 2006-07
2007-08
BE
Sectoral Contribution to the Total Income
Property Tax 16.56% 15.36% 17.24% 13.17% 12.85%
Profession Tax 3.45% 3.84% 5.03% 4.95% 3.88%
Assigned Revenue 8.80% 14.29% 1.65% 6.05% 0.87%
Devolution Fund 31.25% 24.96% 37.88% 41.20% 42.03%
Service Charges & Fees 21.79% 15.20% 19.26% 13.23% 18.76%
Granted Contribution 0.00% 0.00% 0.00% 0.80% 2.43%
Sales and Hire Charges 0.00% 0.00% 0.00% 0.00% 19.19%
Other Income 18.14% 26.36% 18.93% 20.59% 0.00% Source: Analysis based on data provided by Peravurani Town Panchayat
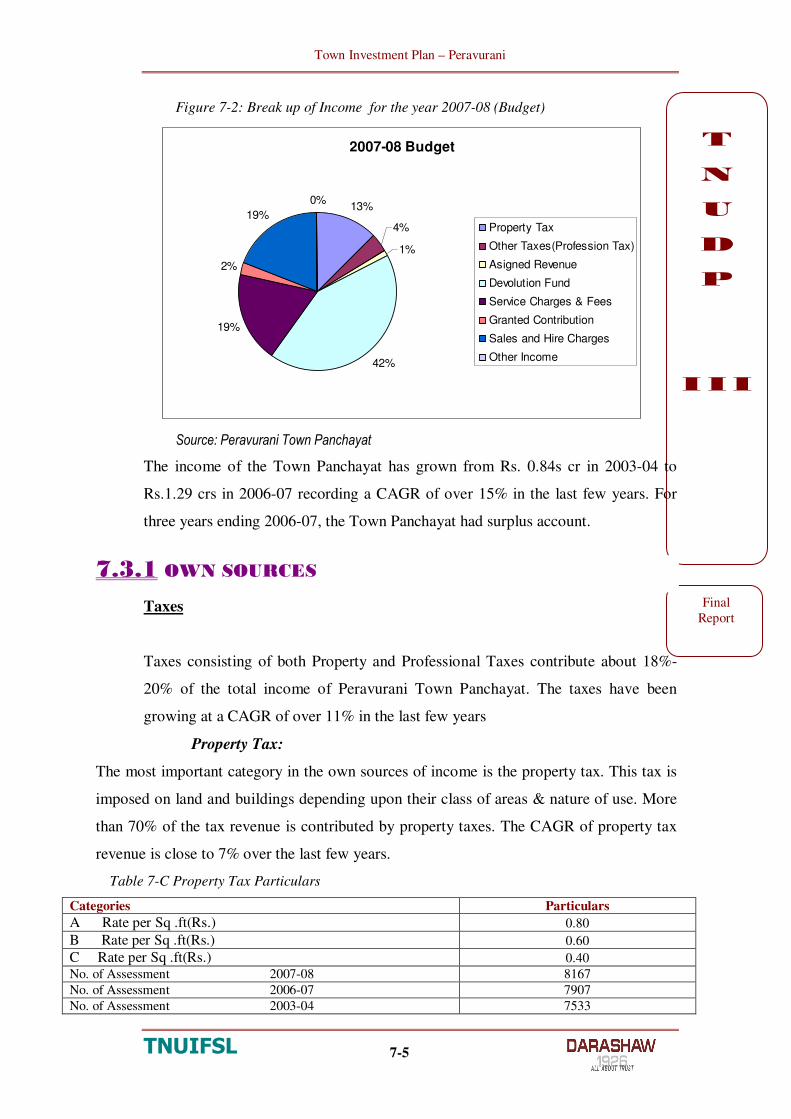
Town Investment Plan – Peravurani
TNUIFSL
T
N
U
D
P
III
7-5
Final
Report
Figure 7-2: Break up of Income for the year 2007-08 (Budget)
2007-08 Budget
13%
4%
1%
42%
19%
2%
19%
0%
Property Tax
Other Taxes(Profession Tax)
Asigned Revenue
Devolution Fund
Service Charges & Fees
Granted Contribution
Sales and Hire Charges
Other Income
Source: Peravurani Town Panchayat
The income of the Town Panchayat has grown from Rs. 0.84s cr in 2003-04 to
Rs.1.29 crs in 2006-07 recording a CAGR of over 15% in the last few years. For
three years ending 2006-07, the Town Panchayat had surplus account.
7.3.1 OWN SOURCES
Taxes
Taxes consisting of both Property and Professional Taxes contribute about 18%-
20% of the total income of Peravurani Town Panchayat. The taxes have been
growing at a CAGR of over 11% in the last few years
Property Tax:
The most important category in the own sources of income is the property tax. This tax is
imposed on land and buildings depending upon their class of areas & nature of use. More
than 70% of the tax revenue is contributed by property taxes. The CAGR of property tax
revenue is close to 7% over the last few years.
Table 7-C Property Tax Particulars
Categories Particulars
A Rate per Sq .ft(Rs.) 0.80
B Rate per Sq .ft(Rs.) 0.60
C Rate per Sq .ft(Rs.) 0.40
No. of Assessment 2007-08 8167
No. of Assessment 2006-07 7907
No. of Assessment 2003-04 7533

Town Investment Plan – Peravurani
TNUIFSL
T
N
U
D
P
III
7-6
Final
Report
% Increase in Number Assessments for the Past 5 years 2.04%
CAGR in Property Tax Revenue over the Last 5 years 6.9%
Total Property Tax (Rs. in Lakhs in 2007-08 Budget ) 17.21
Number of sanctioned Staff in Revenue Department – Bill Collector 4
Revenue per sanctioned person in revenue section (Rs. in Lakhs) 4.30
Average Tax Demand per property (Rs.) 210.74
Source: Peravurani Town Panchayat Table 7-D Property Tax Particulars
Year Residential Commercial Total
2003-04 7166 367 7533
2004-05 7271 372 7643
2005-06 7381 387 7768
2006-07 7508 399 7907
2007-08 6766 356 7122
2008-09 7102 374 7476
Source: Peravurani Town Panchayat
Profession Taxes:
It accounts for about 30% of the total taxes of the town Panchayat The revenue from
professional taxes has been growing at a CAGR of over 30% in the last few years
Table 7-E Profession Tax Particulars
Total Professional Tax Revenue (Rs. In Lakhs 2007-08) 5.21
No. of Assessment 2007-08 746
Slab for Professional Tax ( Half yearly) w.e.f. 01-10-2008
Rs.21000 Nil
Rs.21001to Rs.30000 Rs.95
Rs.30001 to Rs.45000 Rs.240
Rs.45001 to Rs.60000 Rs.470
Rs.60001 to Rs.75000 Rs.710
Above Rs.75001 Rs.940 Source: Peravurani Town Panchayat
Table 7-F No of assessments in Professional Tax
Year No. of Assessments
2003-04 610
2004-05 637
2005-06 647
2006-07 697
2007-08 746
2008-09 746
Source: Peravurani Town Panchayat

Town Investment Plan – Peravurani
TNUIFSL
T
N
U
D
P
III
7-7
Final
Report
Non Tax Revenues
The Town Panchayat earns revenue from Non-Tax sources such as revenue from
Service Charges and Fees and Other Income. The Non-Tax Revenue has grown at
a CAGR of over 9% in the last few years. The share of non tax revenue to total
revenue of the Town Panchayat has ranged from 34% to 47% for the last few years
Service Charges and Fees
The major sources of income under this head are Building License Fees, initial
amount for new water supply and metered tap rate water charges etc. The CAGR
of service charges and fees has grown marginally at less than 1% in the last few
years.
Other Income
The “Other income” mainly consists of revenue mainly from daily markets,
Weekly market fee and Rent from shopping complex. Overall the CAGR of “other
Income” has been over 16% in the last few years
7.3.2 EXTERNAL SOURCES
Assigned Revenue
Assigned revenues include revenues transferred to the Town Panchayats by the
GoTN under specific acts. These are transferred to the Town Panchayats as their
share of taxes levied and collected by the GoTN. These include duty on transfer of
property, entertainment tax, surcharge on sales tax, and other assigned revenues if
any. Among all these, duty on transfer of property and entertainment tax is the
most significant ones. The inflows from Assigned Revenue has grown by less than
2% in the last few years

Town Investment Plan – Peravurani
TNUIFSL
T
N
U
D
P
III
7-8
Final
Report
Devolution Fund
Based on the Second State Finance Commission recommendations, GOTN
transfers 8% of its state revenue to the local government. Inflows from devolution
funds have increased from Rs.26.37 lakhs in 2003-04 to Rs.53.42 lakhs in 2006-07.
The inflows from Devolution Funds has grown by over 26% in the last few years
7.4 ANALYSIS OF EXPENDITURE
The Revenue Expenditure of the Town Panchayat has been analyzed based on
expenditure heads which can be broadly classified under the major heads outlined
below:
• Personnel costs
• Operating Expenses
• Repairs & Maintenance Expenses
• Programme Expense
• Administrative Expenses
• Finance Expenses
• Depreciation
Table 7-G : Expenditure Analysis
Particulars 2003-04 2004-05 2005-06 2006-07
2007-08
BE
Percentage share of expenses to total expenses
Personnel Cost 24.27% 22.30% 24.81% 24.74% 19.52%
Terminal and Retirement Benefits 0.00% 0.14% 0.19% 0.21% 3.09%
Operating Expenses 27.80% 24.70% 20.46% 21.84% 16.86%
Repairs and Maintenance Expenses 7.35% 5.90% 4.73% 8.49% 10.31%
Programme Expenses 2.52% 4.37% 16.50% 3.60% 16.64%
Administrative Expenses 3.39% 3.52% 3.13% 6.83% 6.43%
Finance Expenses 9.14% 11.09% 11.25% 6.87% 6.06%
Depreciation 25.54% 27.99% 18.93% 27.43% 21.09%
Source: Analysis based on data provided by Peravurani Town Panchayat

Town Investment Plan – Peravurani
TNUIFSL
T
N
U
D
P
III
7-9
Final
Report
Figure 7-3 Break up of Expenditure for the year 2007-08 (Budget)
2007-08 Budget
17%
10%17%
6%
6%
21%
20%
3%
Personnel Cost
Terminal and Retirement
Benefits
Operating Expenses
Repairs and Maintenance
Expenses
Programme Expenses
Administrative Expenses
Finance Expenses
Depreciation
Source Annual Accounts of Peravurani Town Panchayat
The expenditure of the Town Panchayat has been under Rs.1 crs for the years
2003-04 to 2005-06 and then marginally increase to Rs.1.07 crs during 2006-07.
The CAGR of expenditure has been 2.4% over the last few years.
Personnel Costs:-
This expense mainly includes the staff salaries, Terminal and retirement benefits
and allowances paid to the employees of the local body. This expense has grown
by over 3% in the last few years.
Operating Expenses / Repairs & Maintenance
Expenses relating to operations and Repairs and Maintenance are very critical
indicators of the service management and maintenance capabilities and
performance of the local body.
Operating Expenses:-
The Operating expense mainly consists of such expenses which are met towards the
infrastructure facilities provided by the local body like Power charges for Street Lights,
Maintenance Expenses for Street Lights, Sanitary Conservancy Expenses, and Expenses

Town Investment Plan – Peravurani
TNUIFSL
T
N
U
D
P
III
7-10
Final
Report
on sanitary material etc. The operating expenses have been under Rs.25 lakhs for the last
few years.
Repairs & Maintenance:-
Repairs & Maintenance expenses mainly consist of such expenses such as Heavy
Vehicle Maintenance, Maintenance expenses on account of water supply. Repairs
and maintenance expenses have grown at a CAGR of 7.5% over the last few years.
Energy Costs:-
The energy costs for Water Supply for the year 2007-08 is 10.00 lakhs and that for
Street lighting is Rs. 9.00 lakhs. This accounts for 47% of the water supply
expenditure and 64% of the street lighting expenditure respectively. By
implementation of energy efficiency measures in water supply service delivery and
street lighting systems the reduction in costs can be achieved and monitored for
continuous energy savings.
Finance Expenses:-
Loan outstanding as on 31st March 2008 was Rs.80.70 lakhs.

Town Investment Plan – Peravurani
TNUIFSL
T
N
U
D
P
III
7-11
Final
Report
7.5 SOURCE & USE OF FUNDS
Table 7-H Balance Sheet
Rs. in lakhs
Source : Annual Accounts of Peravurani Town Panchayat
Table 7-I: Fixed Assets Rs. in Lakhs
Fixed Assets 2003-04 2004-05 2005-06 2006-07 2007-
08 BE
Tree 0.55 0.55 0.55 0.55 0.55
Land - Gross Block 443.45 443.45 443.45 443.45 443.45
Buildings - Gross Block 16.41 104.23 110.67 110.66 114.05
Bridges 0.52 0.52 0.52 0.52 0.52
Storm Water Drains, Open Drains And Culv 17.70 17.70 18.02 18.90 20.55
Heavy Vehicles - Gross Block 3.00 3.00 3.00 9.63 16.24
Light Vehicles - Gross Block 1.35 1.35 1.35 1.35 1.35
Vehicles - Others 1.10 1.10 1.10 1.09 2.06
Furniture , Fixtures And Office
Equipment 0.62 0.62 0.62 1.12 1.64
Plant & Machinery 0.00 0.00 0.00 1.01 17.88
Electrical Installations - Lamps - Light 10.97 12.24 12.24 14.58 3.29
Roads And Pavements - Concrete - Gross 0.19 0.19 0.19 18.46 38.19

Town Investment Plan – Peravurani
TNUIFSL
T
N
U
D
P
III
7-12
Final
Report
Roads And Pavements - Black Topped -
Gro 17.07 17.07 18.46 79.52 111.24
Roads And Pavements - Bitumen 50.83 64.20 77.38 0.00 0.00
Roads And Pavements - Others - Gross
Blo 1.78 1.78 1.78 1.78 1.78
Water Supply Head Works, Oht Etc. And Wa 54.56 58.24 58.24 58.24 58.24
Ground Water Wells / Deep Bore - Wells 2.10 7.80 7.80 7.80
TOTAL 620.10 728.34 755.37 768.66 838.83
Figure 7-4 : Source of Funds as on-2007-08(Budget)
Sources of Funds 2007-08
8%3%
15%
0%
2%
17%
54%
1%
Loans & Advances
Deposits
Government contribution/Mpl fund /
Private Parties/Government Grants
Diversion of funds
Provision for doubtful Collection of
Revenue Items
Accumulated depreciation
Accumulated surplus
Others
Source : Peravurani Town Panchayat
Figure 7-5 Use of Funds as on 2007-08(Budget)
Uses of Funds 2007-08
86%
0%
0%
0%
0%4%
10%Fixed Assets
Project in progress
Tax & Non Tax recoverable
Stock
Others
Receivable/Recoverable
Cash on Hand
Cash in Bank
Source : Peravurani Town Panchayat
More than 85% of the funds have been deployed in creation of Fixed Assets About 16% of
the funds invested have been deployed in Infrastructure relating to storm water drains and
road works.

Town Investment Plan – Peravurani
TNUIFSL
T
N
U
D
P
III
7-13
Final
Report
7.6 DEMAND, COLLECTION AND BALANCE
Table 7-J: DCB for the Past 5 years Rs. In Lakhs.
Particulars
20
03
-04
20
04
-05
20
05
-06
20
06
-07
20
07
-08
Property Tax- Demand, Collection and Balance
Total Number of
Assessment 7533 7643 7768 7907 7122
Demand
1.Arrears 20.23 23.73 25.47 17.51
2.Current 13.98 15.44 16.16 17.08
3.Total 34.21 39.16 41.63 34.59 36.04
Collection
1.Arrears 5.18 6.46 15.92 8.00
2.Current 5.31 6.26 8.20 10.53
3.Total 10.49 12.71 24.12 18.53 24.02
Balance
1.Arrears 15.05 17.27 9.55 9.52
2.Current 8.67 9.18 7.96 6.55
3.Total 23.72 26.45 17.51 16.07 12.02
Profession Tax- Demand, Collection and Balance
Total Number of
Assessments 610 637 647 697 746
Demand
1.Arrears 0.58 0.64 0.53 0.52
2.Current 2.44 3.10 3.31 4.45
3.Total 3.02 3.74 3.84 4.97 0.00
Collection
1.Arrears 0.16 0.14 0.12 0.15
2.Current 2.22 2.98 3.21 4.11
3.Total 2.38 3.12 3.33 4.26 0.00
Balance
1.Arrears 0.42 0.50 0.41 0.37
2.Current 0.22 0.12 0.10 0.34
3.Total 0.64 0.61 0.51 0.71 0.00
Water charges- Demand, Collection and Balance
Total Number of
Assessments 1525 1600 1724
Demand
1.Arrears 7.44 11.09 14.65 9.11
2.Current 7.35 8.10 8.96 9.28
3.Total 14.79 19.18 23.61 18.39 0.00
Collection
1.Arrears 1.40 2.06 9.52 2.89
2.Current 2.30 2.47 4.97 5.04

Town Investment Plan – Peravurani
TNUIFSL
T
N
U
D
P
III
7-14
Final
Report
3.Total 3.70 4.53 14.49 7.93 0.00
Balance
1.Arrears 6.04 9.02 5.13 6.22
2.Current 5.05 5.63 3.99 4.24
3.Total 11.09 14.65 9.12 10.46 0.00
Others
Library Cess Demand, Collection and Balance
Demand
1.Arrears 2.02 2.37 2.54 1.74
2.Current 1.40 1.54 1.61 1.70
3.Total 3.42 3.91 4.15 3.44 0.00
Collection
1.Arrears 0.52 0.65 1.58 0.79
2.Current 0.53 0.62 0.81 1.05
3.Total 1.05 1.27 2.39 1.84 0.00
Balance
1.Arrears 1.50 1.72 0.96 0.95
2.Current 0.87 0.92 0.80 0.65
3.Total 2.37 2.64 1.76 1.60 0.00 Source : Peravurani Town Panchayat
The Collection Efficiency of important revenue sources of Peravurani Town Panchayat for
the last 4 years is given as under:
Table 7-K : Collection Efficiency (%)
Particulars 2003
-04
2004
-05
2005
-06
2006
-07
Property Taxes
Arrears 25.59% 27.21% 62.50% 45.66%
Current 37.98% 40.54% 50.74% 61.65%
Total 30.65% 32.47% 57.94% 53.56%
Professional Taxes
Arrears 27.59% 22.17% 22.64% 28.85%
Current 90.98% 96.26% 96.98% 92.36%
Total 78.81% 83.57% 86.72% 85.71%
Water Charges
Arrears 18.82% 18.60% 64.98% 31.72%
Current 31.29% 30.51% 55.47% 54.31%
Total 25.02% 23.62% 61.37% 43.12%
Library Cess
Arrears 25.70% 27.29% 62.13% 45.40%
Current 37.91% 40.52% 50.31% 61.76%
Total 30.69% 32.51% 57.55% 53.49% Source : DCB of Peravurani Town Panchayat

Town Investment Plan – Peravurani
TNUIFSL
T
N
U
D
P
III
7-15
Final
Report
7.7 OUTSTANDING LOAN AND NON-DEBT
LIABILITY
The Outstanding Loan balance and Non-Debt Liability of key components of
Peravurani Town Panchayat is represented in the table below:
Table 7-L : Outstanding Loan and Non-Debt Liability
Rs. in Lakhs
Sl.No Particulars 2007-08
1.Outstanding Principal on Loans
1 Loans From The Government 67.85
2 Loan From TUFIDCO 12.85
3 Loan From TNUDF 0.00
4 Advance 0.00
Total Loan Outstanding 80.70
2 Non-Debt Liability
1 Library cess 1.66
2 Sales Tax Payable 0.26
3 Income Tax Payable 1.33
4 Interest Payable 9.43
5 Group Insurance Schemes 13.68 Source: Peravurani Town Panchayat

Town Investment Plan – Peravurani
TNUIFSL
T
N
U
D
P
III
8-1
Final
Report
8888 INSTITUTIONAL CAPACITY ASSESSMENT
8.1 STAFF STRENGTH
Table 8-A : Staff strength of the Peravurani Town Panchayat
Executive Staff Sanctioned Appointed Post Vacant
Executive Officer 1 1 0
Head Clerk 1 1 0
Junior Assistant 3 1 2
Office Assistant 1 1 0
Night Watchman 1 1 0
Line Man 1 1 0
Lighter 1 0 1
Tank Watchman 1 1 0
Tractor Driver 1 1 0
Bill Collectors 4 1 3
Record Clerk 1 1 0
Market Watchman 1 1 0
Avenue Cooley 1 1 0
Sanitary Inspector 1 0 1
Sanitary Supervisor 2 2 0
Sanitary Workers 20 20 0
Source : Peravurani Town Panchayat
o Presently there are 3 vacancies in the post of Bill Collector against the sanctioned post
of 4 nos.
o Staff Salary pay slip for all the sections have been enclosed in the Annexure

Town Investment Plan – Peravurani
TNUIFSL
T
N
U
D
P
III
8-2
Final
Report
8.2 INSTITUTIONAL STRENGTHENING &
CAPACITY BUILDING
The following are some of the steps undertaken by the Town Panchayat for Institutional
Strengthening and Capacity building by introducing a system of accountability and
responsibility within the system
1. Computerization & E-Governance
2. Training
3. Public Grievance Redressal Mechanism
4. Public Private Partnership including Privatization initiatives
5. Tendering Process
• Computerization & E-Governance
The Town Panchayat has initiated steps for computerization of Birth & Death, Accounts
and Property Tax records
• Training
Training to the staff are provided in the areas of Sectoral Training, Human Resources
Training, Accounts Training, Computerization and E-governance and other programmes
organized by Directorate of Town Panchayat. Training at Bhavani Sagar has been
provided to the Head Clerk during the year 2004 and to the Junior Assistant in the year
2008
• Public Grievance Redressal Mechanism
Public Register to record complaints is maintained for all the sectors in the Town Panchayat.
The Public also approach their respective ward councilors with their complaints on service
delivery system. Complaints are also received during Grievance day meetings held at the
Collector office
• Public Private Partnership including Privatization initiatives
None of the services of the Town Panchayat are privatized
• Tendering process
The projects required for the infrastructure works are decided by the Council.The Engineer
prepares the estimate and bids received for the same have to be approved by the elected
members.

Town Investment Plan – Peravurani
TNUIFSL 9-1
T
N
U
D
P
III
Final
Report
9999 S W O T
Based on Stake holder’s perception and view points expressed during our
consultation with the local stakeholders and on the basis of assessment done by
the consultants, an attempt has been made to evaluate Strength, Weakness,
Opportunities and threats of the town which is shown below:
Strength
� Peravurani has good connectivity in terms
of rail and roadways.
� Agro based town as well as dependent on
fishing and its allied activities
� Proximity to Tourist spots like Manora
� Well known for Neelakanda pillaiyar
temple.
Opportunities
� Improving Infrastructure status of the
town.
� Creating environment friendly town by
developing green spaces, preserving
small water bodies.
� Abundant Land available for future
development
Weakness
� Railway connectivity is only through
Meter gauge railway line
� Dependent entirely on bore well source
for meeting water supply requirements.
� Town has just 1.5% roads covered by
SWD
� 46% of the roads are kutcha
Threats
� Flooding due to absence of proper
drainage channels
� Water bodies are poorly maintained
� Poor financials deters Municipality
from taking Capital Intensive projects

Town Investment Plan – Peravurani
TNUIFSL 10-1
T
N
U
D
P
III
Final
Report
10101010 STAKEHOLDERS CONSULTATION
10.1 OPERATIONAL WORKING GROUP
The success of the Town Investment Plan depends on the extent of participation
by the various agencies involved in urban governance and service delivery. As it
is very rightly said “Planning is an exercise ‘For’ the people, ‘Of’ the people and
‘By’ the people.” perception and views of the representatives from the Town
Panchayat and various Para-Statal agencies are of paramount importance.
To bring all the agencies involved in urban governance and service delivery
under one platform for the consultation process, Operational Working Group
(OWG) was formed. The first formal meeting was held in Peravurani Town
Panchayat on 15th July 2009 and subsequently Stakeholders meeting was held in
05th October 2009. The stakeholders meeting had a wide representation from
1. Administrative members of the Municipality
2. Elected members of the Municipality
3. Representatives from Slums /SC /ST
4. Senior Citizens
5. Self Help Groups
6. Women Groups
7. NGO members
8. Officials from Para-Statal agencies

Town Investment Plan – Peravurani
TNUIFSL 10-2
T
N
U
D
P
III
Final
Report
Figure 10-1 : First Formal Meeting on 15th July 2009
During the stakeholders meeting, the Consultants made a presentation on the
current status of the Peravurani Town in terms of Infrastructure, Financial and
Institutional aspects, findings from Rapid Urban Assessment and demand
assessment.
Further, projects already identified by Peravurani Town Panchayat and
additional projects proposed by the Consultants based on the Demand Supply
Gap analysis taking into consideration current and future needs and
requirements were also presented and discussed during the meeting. Sector wise
Capital Investment requirements and its phasing were also presented.
During the presentation and subsequent interaction, many ideas and suggestions
were made and the same has been encapsulated below and the same has been
considered and incorporated in this Report.
Table 10-A: Suggestions and projects
Physical
Infrastructure Sector Components Key Suggestions / Projects identified
Water Sources • Ponds and lakes needs to be protected for
water harvesting
ESR / GSR • Require one ESR in Nellakandan II street in
ward No.08.
Water Supply
Distribution Network • 15 Kms distribution network needs to be

Town Investment Plan – Peravurani
TNUIFSL 10-3
T
N
U
D
P
III
Final
Report
developed to cater future developing areas
Underground Drainage • Not required Sewerage and
Sanitation Public Conveniences • Required in ward Nos. 10,11,12 and 06
Renovating existing
drains • Nil
Storm Water
Drainage Creating New Drain
• Creating double side drainage line in
Avanam road for a length of 1.5 Km
• Creating double side drainage line in
Pattukottai road for a length of 1 Km
• Creating double side drainage line in
Aranthangi road for a length of 2 Km
• Creating double side drainage line in Sedhu
road for a length of 2 Km
• Creating single side drainage in pudhu road
in ward No.15 for a length of 2 Km
• Creating drainage line in Neelakandapuram
II street in ward Nos. 08 and 09 for a length
of 2 Km
• Creating drainage line connecting Hospital
Chidambaram, Devadas road and
Anandavalli vaikkal for a length of 3 Km
• Creating 3 Km drainage in KK nagar and
Pandhakulam in ward No. 04
• Creating 3 Km drainage in ward No. 05
connecting Muthalagappa road and crossing
roads to CMB vaikkal
• Creating 5 Km drainage in ward No. 13 and
14
• Creating 1 Km drainage in ward No. 07
• Creating 500 meter drainage in ward No. 16
• Creating 1 Km drainage in ward No. 17
• Creating 2 Km drainage in ward No.18

Town Investment Plan – Peravurani
TNUIFSL 10-4
T
N
U
D
P
III
Final
Report
Kutcha road
upgradation
• 31.72 Km Kutcha road needs to be converted
into BT road
Pucca road
improvement
• Converting 7 Km BT single lane road into
intermediate lane road.
Building New Roads /
Links
• 2 lane road around Nellakanda pillaiyar
temple for a length of 2 Km
Roads
Bye pass / Highway
projects
• Creating Bye-pass from Avanam road undil
stop to Old Peravurani road for a length of 3
Kms (2 lane road)
Traffic Management /
Junction Improvement
• Creating round about in Sedhu road
junction, Avanam road junction, Railway
station road junction and in Railway TCMF
road junction
Sub Ways
• Creating Subway near Boys higher
secondary school in ward No.03
• Creating Subway in sethu road railway
crossing in ward No. 04
• Creating Subway near TCMF go down in
ward no.09
• Creating Subway in Nellakandan II street in
ward No. 08
• Creating Subway in Kuplikadu road in ward
No.13
• Creating Subway in ward No. 07
Traffic and
Transportation
Parking sheds • Two wheeler parking building needs to be
constructed in an area of 2500 Sq. ft.
Door to Door
collection and
Segregation
• Procuring segregation bins for each
assessments for door-door collection and
segregation
Man power /
Privatisation
• Procuring protective gear for conservancy
workers
Solid Waste
Management
Vehicle requirements • One sullage lorry is required

Town Investment Plan – Peravurani
TNUIFSL 10-5
T
N
U
D
P
III
Final
Report
Dumping site /
Compost yard • Creating scientific land fill site
User Charges • Not possible
Public Awareness
• Public awareness for Waste segregation and
D-D collection
• Creating awareness about protective gear
among conservancy workers
Street Lighting Energy Saving
Initiatives
• Adopting solar lights, energy saving fixtures
and equipments like Timer switches, 36 W tube
lights instead of 40W, T5 lamps and electronic
chokes.
Particulars Demand from Stakeholders
Parks and Playfields
development
• Road Side Park can be developed in ward No. 02 along
Pattukottai road,
• Park can be developed in a portion of 1 acre land
available in Selva Vinayakapuram.
Market Improvement
• Market Improvement Scheme by providing RCC shed,
CC pavement and one side compound wall for 800
meters in the existing weekly market area.
• Creating separate vegetable market building near
existing fish market in an area of 11,000 Sq.ft..
Community Hall • Not required
Slaughter house up gradation
• Slaughter house up gradation is required by laying tiles
and providing water supply provision in the existing
block.
Municipal building renovation • New Office building is almost ready for shifting
Burial ground / Gasifier • Creating compound wall in all burial grounds except
Avanam road burial ground.

Town Investment Plan – Peravurani
TNUIFSL 10-6
T
N
U
D
P
III
Final
Report
• Providing all other infrastructure facilities in all burial
grounds except Kooblikadu burial ground.
• Creating Gassifier crematorium in Kooblikadu burial
ground.
Creating new commercial
complexes
• Existing office building would be used as a commercial /
official space after shifting
Water Bodies Improvement
• Improving the condition of Periya Kulam water body by
desilting in Ward No. 16, controlled by PWD
• Improving the condition of Adanur Periya Eri by
desilting in Ward No. 10, controlled by PWD
• Improving the condition of Vimatha Tank by desilting
in Ward No. 11, controlled by PWD
• Improving the condition of Nattani Kuttai by desilting
in Ward No. 05, controlled by PWD
• Converting all kutcha bank roads in all the above water
bodies into Pucca BT road.
• Creating 500 meter walking track, providing ornamental
lights, desilting 3 acre lake area, providing boating
facilities in Vannan kulam in ward No. 15.
• Strengthening banks and desilting 3 acre Old Peravurani
Theppa Kulam in ward no. 13 and 14.
• Strengthening banks and desilting 3 acre Old Peravurani
Theppa Kulam in ward no. 13 and 14.
• Creating steps for bathing in Theppa Kulam
• Strengthening banks and desilting Kublikadu Kulam (2
Nos) in ward no. 12.
• Strengthening banks and desilting 1.5 acre Selva
Vinayagar Kulam in ward no. 17.

Town Investment Plan – Peravurani
TNUIFSL 10-7
T
N
U
D
P
III
Final
Report
Sector Sector Components Key Suggestions
Slums and Urban
Poverty
Other Infrastructure
provisions • Implementing IHSDP project
10.2 PRIORITY BASED ON OWG OPINION
SURVEY
Projects identified both by the Town Panchayat and by the consultants cannot be
taken at one step for implementation due to constraints like finance, institutional
capabilities etc. Thus, phasing of the projects based on stake holder’s priority
could be a viable option for implementing projects. During stakeholders
meeting, they have been asked to prioritize the sectors pertaining to Physical
infrastructure, Social Infrastructure and Environment through a survey called
City Opinion survey and is presented in a scale of 0-1001 scores.
10.2.1 PHYSICAL INFRASTRUCTURE PRIORITY
Based on the opinion survey conducted during stakeholders meeting,
Stakeholders have given priority to the sectors related to Physical infrastructure
on the following order:
1. Road Network
2. Storm Water Drainage
3. Under Ground Drainage
4. Drinking Water Supply
5. Solid Waste Disposal
6. Parking facilities
7. Street lighting
1 Sector is highly prioritized by the Stakeholders if it gets 100 score and least prioritized if it
gets 0 score.

Town Investment Plan – Peravurani
TNUIFSL 10-8
T
N
U
D
P
III
Final
Report
Figure 10-2 Sector prioritization by the Stakeholders (Physical Infrastructure)
100.00
65.38
82.05
85.90
25.64
0.00
12.82
0 20 40 60 80 100
Road
Drinking Water
UG Drainage
SW Drainage
SW Disposal
Street Lighting
Parking Facilities
10.2.2 SOCIAL INFRASTRUCTURE PRIORITY
Based on opinion survey conducted during stakeholders meeting, they have
given priority to the sectors related to Social infrastructure on the following
order:
1. Health facilities (Maternity Center)
2. Market
3. Burial ground / Gasifier crematorium
4. Community Hall
5. Public Transport
6. Schools / Colleges
7. Parks, Playfields
8. Slaughter House

Town Investment Plan – Peravurani
TNUIFSL 10-9
T
N
U
D
P
III
Final
Report
Figure 10-3 Sector prioritization by the Stakeholders (Social Infrastructure)
22.1134.74
31.58
100.00
45.26
52.63
0.00
68.42
0.00 20.00 40.00 60.00 80.00 100.00
Park and P layfield
Public Transport
Schoo ls & Colleges
Health facilities
Community Hall
Burial Ground/Crematorium
Slaughter House
M arket
Figure 10-4 Consultation in Peravurani Town Panchayat
Note: Stakeholder’s haven’t emphasized much on environment except
improving the condition of water bodies.

Town Investment Plan – Peravurani
TNUIFSL 11-1
T
N
U
D
P
III
Final
Report
11111111 ASSET MANAGEMENT PLAN
Asset Management Plan involves maintenance management for preventive and
predictive maintenance, equipment recording and tracking, replacement parts
inventory, and maintenance labor scheduling. The goal of asset management is
to optimize asset use and manage all maintenance efforts involved in making
assets as reliable, accurate, and efficient as possible. Asset management Plan is
the plan developed for one or more physical assets within the Town Panchayat
that combines multi disciplinary management techniques including technical and
financial over the life cycle of the asset to a specified level of service in a most
cost effective manner.
The key aspects of asset management plan therefore involve asset inventory,
information of assets owned by the Town Panchayat and appropriate strategy to
manage the assets and increase the productivity of the same. The asset
management plan is therefore critical for maintaining, upgrading and operating
physical assets in a cost effective manner.
Peravurani Town Panchayat has several assets that require regular maintenance
for sustenance of reasonable service delivery levels. Given the high impact of
the O&M expenses on the finances of the Town Panchayat, it is prudent to
undertake a proper review of the assets under its control. This would aid in
identifying the revenue generating assets as well as the ones that are causing a
drain on municipal revenues. A comprehensive asset management plan aids in
achieving the same.

Town Investment Plan – Peravurani
TNUIFSL 11-2
T
N
U
D
P
III
Final
Report
11.1 LIST OF ASSETS:
The assets of Peravurani Town Panchayat can be classified as assets relating to basic
physical infrastructure such as water supply, roads, storm water drains, street lights,
light and heavy vehicles etc and those relating to social infrastructure which include
community halls, maternity centers, burial grounds etc. Among basic physical
infrastructure only water supply services can be considered revenue generating as the
Town Panchayat is able to collect taxes, connection charges, initial deposit charges and
metering/tap rate charges and hence expenses are met mainly through dedicated water
supply fund set up for the purpose. With regard to social infrastructure, Peravurani has
revenue generating assets like Markets, bus stand, shopping complex, community halls,
pay & use toilets, etc currently with the panchayat and others such as burial grounds,
community hall, slaughter house, parks, public toilets, maternity centre etc; are not
revenue generating or revenue generation is extremely nominal and may not be self
sustaining. The panchayat earns a substantial income of Rs.17.52 Lakhs (2006-07) from
the remunerative social assets .Some of the social infrastructure is required to be
provided by the Town Panchayat as the functions remain obligatory functions of the
Town Panchayat and also help to fund the non remunerative activities of the Town
Panchayat. These are also required to maintain the cleanliness and sanitation of the city.
The various physical and social infrastructure of the Town Panchayat are listed below:
Table 11-A: Details of various social & physical infrastructure assets
Particulars Unit
Area /
Description Details / Location
Bus Stand 1 2 Acres located nearer to the Panchayat office
Office Buildings 1
(New) 2400 Sq.Ft.
Old office building to be renovated for construction of shopping complexes
Commercial Complexes 3
Office Building(8 nos) , Bus stand (22 nos) and Gandhi Market (8 nos)

Town Investment Plan – Peravurani
TNUIFSL 11-3
T
N
U
D
P
III
Final
Report
Markets-Within Local Body Limits-Daily
1
Markets-Within Local Body Limits-Weekly
1
2 acres located nearer to the bus stand
Public Toilet & Pay and Use Latrines 4
a) Bus stand b)Gandhi Market c) Ward 18 d) Ward 11.
Slaughterhouse 1
120 Sq. Ft.
Ward no.4
Community Hall 1 Ward no.9
TV Rooms 1 Not in use (For Grama Panchayat)
Radio Rooms 1 Not in use
Parks & Play Grounds 1 Gandhi Park
Overhead Tank
OHT in different locations with a total capacity of 13.52 Lakh Litres
Burial Ground 5 nos. 4500 Sq. Ft.
a) Avaram Road b) Pattukkottai Road c), Sethu Road d) Koovili Kadu e) Athanur
Number of Motor Vehicles for different departments (Including SWM) 3 Tractors for SWM
Tanker 1 For Septic Tank Cleaning
Source: Peravurani Town Panchayat
11.2 OPERATIONS AND MAINTENANCE
The revenue generation and the operations and maintenance activities currently being
followed and suggestions for comprehensive Asset Management including ways and

Town Investment Plan – Peravurani
TNUIFSL 11-4
T
N
U
D
P
III
Final
Report
means to meet the expenses involved & make it a self sustaining for various assets
are listed below:-
11.2.1 O&M OF SOCIAL INFRASTRUCTURE ASSETS
Table 11-B: O&M and Revenue generation
Asset
Average
Annual
income
Current
O&M
practice
Recommendations
Markets Rs.5.24 Lakhs Adhoc basis
Periodic inspection and
maintenance is required
As per OWG discussions and
our demand estimation, a
market improvement and
creating a new vegetable
market is proposed in the CIP
costing for Rs.169 Lakhs
Commercial Complex Rs.8.06 Lakhs Adhoc basis Periodic maintenance of these
assets are required
Office Building Nil Adhoc basis -Periodic inspection and
maintenance is required
Slaughter House Rs.0.11 Lakhs NA Periodic inspection and
maintenance is required
Community Hall Rs.1.61 Lakhs Ad hoc basis Periodic inspection and
maintenance is required
Pay and Use Latrines Rs.0.96 Lakhs Ad hoc basis
Burial Ground NIL Ad hoc basis
Periodic inspection and
maintenance is required
As per OWG discussions
Improvement of all burial
grounds is proposed in the

Town Investment Plan – Peravurani
TNUIFSL 11-5
T
N
U
D
P
III
Final
Report
CIP and Creating Gassifier
crematorium in Kooblikadu
burial ground
Parks & Play Grounds / Gardens
Nil
Can be maintained jointly
with private sector or
maintained exclusively by the
private sector on sponsorship
basis.
As per OWG discussions
there is a need for Creating
green spaces in approved
layouts
Source: Analysis based on Information provided by Peravurani Town Panchayat
11.2.2 O&M PHYSICAL INFRASTRUCTURE
Operation and Maintenance of the assets related to Physical and socio-economic
infrastructure is divided under two heads;
• To maintain the existing assets for the next five years and
• To maintain the assets proposed to be created under various capital works
proposed.
Since the O & M of the existing assets related to Socio- Economic Infrastructure has
already been assessed in the above sections of this chapter, the O & M of the existing
physical Infrastructure assets and the proposed O & M for the capital works identified is
broadly discussed in this section. Past growth trends in O&M expenses relating to
existing physical infrastructure and O&M rates as a percentage of capital cost assumed
for the proposed capital works are tabulated below:

Town Investment Plan – Peravurani
TNUIFSL 11-6
T
N
U
D
P
III
Final
Report
Table 11-C Past Growth trends in O & M expenses relating to key physical
infrastructure
Description Current level
Existing Assets CAGR of growth rate from 2003-04 to 2006-07 (%)
Water Supply
Operating Expenses Fluctuating Trend
Power Charges for Head Water Works
Fluctuating Trend
Maintenance expense for Water Supply Works
Fluctuating Trend
Solid Waste Management
Heavy vehicle expenditure 20.83%
Street lighting
Maintenance Expense for Street Lights
6.84%
Power charges for street lighting Fluctuating Trend
Table 11-D O&M rates as a % of proposed capital works
Description Current level Assumption
FOR CAPITAL WORKS
Water Supply NA 6% of the project cost
Sewerage & Sanitation NA 4% of the project cost
Roads and Traffic Management
NA 3% of the project cost
Storm Water Drainage NA 2% of the project cost
Solid Waste Management NA 10% of the project cost
Street Lighting NA 5% of the project cost
considering Energy saving mechanism
Slum up gradation NA 1% of the project cost
Others NA 2% of the project cost

Town Investment Plan – Peravurani
TNUIFSL 11-7
T
N
U
D
P
III
Final
Report
11.3 AMP - RECOMMENDATIONS
The following are some of the suggestions with regard to formulation and
implementation of a comprehensive asset management plan:-
11.3.1 ASSET REGISTER
A comprehensive Asset register needs to be maintained containing details of the list of
assets, year and cost of acquisition, particulars such as the location, size of the
area/building, ownership records and all supporting documents required for the same.
These details are required for assessing the condition of the asset. The reforms
programme under TNUDP has initiated the process of computerizing and digitalizing
the asset inventory for all municipalities in Tamil Nadu. Computerization of asset
register is required with focus on proper designing, testing, installing a database
management system for municipal assets. Data thus compiled would need to be
classified on the basis of sector specific infrastructure facilities, land and properties etc
11.3.2 ASSET VALUE AND LIFE CYCLE
MANAGEMENT
The Town Panchayat needs to determine the value of various assets in regular intervals.
As all assets have a limited life expectancy, concerted efforts need to be undertaken by
the Town Panchayat on regular basis before investing further in a new asset or up
gradation of the existing assets. In case of an asset (service) that is handed over to a
private contractor for O&M, periodic review and inspection needs to be made to prevent
misuse and damage to the assets.
11.3.3 SUSTAINABILITY
Sustainable management of assets is an important element of asset management plan.
Sustainable development has been defined as “meeting the needs of present generation

Town Investment Plan – Peravurani
TNUIFSL 11-8
T
N
U
D
P
III
Final
Report
without compromising the ability of future generations to meet their own needs”. A
long term financial plan to provide necessary resources to operate, rehabilitate and
ultimately replace the asset at the optimal time to achieve lowest life cycle cost is
required. Preventive and operational maintenance at regular intervals can prevent higher
cost associated with the full replacement of the asset. Such a plan would ensure that the
current users pay a fair share for the service they receive so the future users do not have
the burden to pay a higher cost for the same level of the service. Sustainable
management calls for a contribution from the users to meet partially or fully the O&M
cost associated with the utilization of assets. Hence user charges and fees is critical for a
sustainable and a successful asset management programme
11.3.4 INTEGRATION OF TECHNICAL AND
FINANCIAL PLANS
An integrated plan combining technical aspects (to minimize life cycle cost & reduce
the risk level) and financial aspects (Financial plan) are required to quantify the level of
service and the cost associated with the same. The technical and financial plans need to
be flexible enough to suit the changing requirements of the public.
11.3.5 CONDITION ASSESSMENT SURVEY (CAS)
The Town Panchayat could look to undertake CAS for various assets owned by the
ULB, which could bring to light the deficiencies in a system or a component, the extent
of defects, estimated cost of repairs and the prioritizing the work to be undertaken. This
systematic review could enhance the life of the asset and minimize huge capital outlay
on account of delay in taking remedial actions.
11.3.6 RISK ASSESSMENT
Asset management needs to take into account various risk factors such as financials,
environmental, regulatory, legal, public health and safety.

Town Investment Plan – Peravurani
TNUIFSL 11-9
T
N
U
D
P
III
Final
Report
11.3.7 MONITORING AND EVALUATION
To optimize an asset management plan, performance of the assets and rehabilitation
strategies should be monitored regularly, and adjustments made at the appropriate stage
in the asset life cycle to achieve an acceptable balance between cost and the
performance (Level of service). It is also imperative to monitor and take damage control
measures when the Town Panchayat takes up any development works to prevent
damage to the other assets of the Town Panchayat. Prioritizing the works to be
undertaken can prevent unnecessary maintenance and capital cost.
11.3.8 BUDGETING
A regular budgeting exercise regarding the possible O&M cost for various assets needs
to be undertaken by the Town Panchayat. There should be a clear link to the financials
plans and the budgeting exercise undertaken by the Town Panchayat. An Asset
Management Plan should incorporate expenses relating to maintenance, renewal and
augmentation of the asset of the Town Panchayat.
11.3.9 TRAINING IN DATABASE MANAGEMENT
All the above requires proper training to the concerned staff. Training would involve
various issues such as methods of simplified updation of data, methods of monitoring
and follow up and training in issues relating to infrastructure facilities management,
land use, litigation, encroachment etc.

Town Investment Plan – Peravurani
TNUIFSL 12-1
T
N
U
D
P
III
Final
Report
12121212 CONSOLIDATED ISSUES
The issues identified during Rapid Urban Assessment and the issues indicated
by the review committee and stakeholders were consolidated sector wise and are
presented below:
Table 12-A : Consolidated Issues
Sector Issues
Water Supply
• Town has Low Household Service Connections (only 24% of the
assessments are covered)
• Dependent entirely on Bore well water supply
Sewerage and
Sanitation
• Town has no Sullage lorry for cleaning septic tanks.
• Inadequate public conveniences in ward Nos. 10, 11, 12 and 06.
Storm water drainage • Town has just 1.5% of the roads covered by SWDs
Roads, Traffic and
Transportation
• Intersections are poor in geometrics in Sedhu road, Avanam
road, Railway station road and Railway TCMF road junction.
• Railway crossings obstruct traffic movement and hence creating
congestion (6 railway crossings)
• 46 percent of the existing roads are Kutcha
Solid Waste
management
• Town has no scientific land fill site
• Only 30% of the assessments are covered by Door to Door
collection and waste segregation.
Street lighting
• Spacing between lights is 46 meters against the norm of 30 meter
spacing
• All lights have conventional copper chokes
Slums and
Urban Poverty
• IHSDP project is still on paper and not yet implemented due to
financial constraints.
• 24% of the total population is living in slum areas.

Town Investment Plan – Peravurani
TNUIFSL 12-2
T
N
U
D
P
III
Final
Report
Sector Issues
Socio-Economic
Infrastructure
• Town has inadequate green spaces
• Town has 4 PWD controlled ponds and 5 ULB controlled ponds
which are not maintained properly
• All burial grounds have infrastructure inadequacies
• Market areas have infrastructure inadequacies

Town Investment Plan – Peravurani
TNUIFSL 13-1
T
N
U
D
P
III
Final
Report
13131313 STRATEGIC PLANNING
In order to address the issues identified during Rapid Urban Assessment stage
and during Review Committee meeting as well as during the OWG meeting, the
sectoral strategies and action plans have been proposed in this stage. Such action
plans and strategies are converted into projects and are phased out based on the
priority suggested by the review committee members which is explained in the
subsequent chapters.
13.1 ACTION PLAN FOR SECTORAL
DEVELOPMENT
Action plans for improving the existing situation of various sectoral components
as well as for creating new infrastructure facilities have been formulated in
consultation with the Operational Working Group members and are listed
below:
Sector Action plan
Land Use and
Growth
Management
• Preparing development plan for Peravurani Town Panchayat area for
the next twenty five years
• Setting up local planning authority
• Laying Distribution network for 15 Kms (equivalent to one third of the
demand length of 39.3 Km) by 2023-24 in phases Water
Supply • Providing 1 No 1 lakh capacity OHT in Nellakandan II Street in ward
No.08.
• Purchasing Sullage lorry for waste water collection purpose Sewerage and
Sanitation • Creating public conveniences in ward Nos. 06, 10, 11 and 12
Storm water • Creating double side drainage line in Avanam road for 1.5 Km

Town Investment Plan – Peravurani
TNUIFSL 13-2
T
N
U
D
P
III
Final
Report
Sector Action plan
drainage • Creating double side drainage line in Pattukottai road for a length of
1 Km
• Creating double side drainage line in Aranthangi road for a length of
2 Km
• Creating double side drainage line in Sedhu road for a length of 2 Km
• Creating single side drainage in pudhu road in ward No.15 for a
length of 2 Km
• Creating drainage line in Neelakandapuram II street in ward Nos. 08
and 09 for a length of 2 Km
• Creating drainage line connecting Hospital Chidambaram, Devadas
road and Anandavalli vaikkal for a length of 3 Km
• Creating 3 Km drainage in KK nagar and Pandhakulam in ward No.
04
• Creating 3 Km drainage in ward No. 05 connecting Muthalagappa
road and crossing roads to CMB vaikkal
• Creating 5 Km drainage in ward No. 13 and 14
• Creating 1 Km drainage in ward No. 07
• Creating 500 meter drainage in ward No. 16
• Creating 1 Km drainage in ward No. 17
• Creating 2 Km drainage in ward No.18
• Creating scientific land fill site
• Public awareness for Waste segregation and D-D collection
• Procuring segregation bins for each assessments and procuring
protective gear for conservancy workers
Solid Waste
Management
• Creating awareness about protective gear among conservancy
workers
Traffic and
Transportation
• Converting 3.35 Km WBM road into BT road
• Converting 31.72 Km Kutcha road into BT road

Town Investment Plan – Peravurani
TNUIFSL 13-3
T
N
U
D
P
III
Final
Report
Sector Action plan
• Creating round about in Sedhu road junction, Avanam road junction,
Railway station road junction and in Railway TCMF road junction
• Subways to be created based on the priority mentioned below:
1. Creating Subway near Boys higher secondary school in ward
No.03
2. Creating RoB in sethu road railway crossing in ward No.
04(Highway - Implementing agency)
3. Creating Subway near TCMF go down in ward no.09
(immediately not required)"
4. Creating Subway in Nellakandan II street in ward No. 08
(immediately not required)
5. Creating Subway in Kuplikadu road in ward No.13(immediately
not required)"
6. Creating Subway in ward No. 07 (immediately not required)"
• Converting 7 Km BT single lane road into intermediate lane road.
Street Lighting
• Replacing 40W Tube lights into 36 W
• Installing electronic chokes for all tube light fittings
• Replacing 250 W 228 Nos SVL with (4 X 24) W T5 lamps
• Replacing 150 W 29 Nos SVL with (4 X 24) W T5 lamps
• Replacing 70 W 17 Nos SVL with (4 X 24) W T5 lamps
• Providing 243 additional fittings to cater future demand (30%
considered)
Slums and
Urban Poverty • Implementing IHSDP project proposed
Water bodies
Improvement
• Improving the condition of water bodies (Periya Kulam, Adanur
periya eri, Vimatha tank, Nattanikuttai) by dredging, creating banks,
creating bathing ghat, providing lighting and providing road along the
boundary - PWD Implementing agency
• Creating 500 meter walking track, providing ornamental lights,

Town Investment Plan – Peravurani
TNUIFSL 13-4
T
N
U
D
P
III
Final
Report
Sector Action plan
desilting 3 acre lake area, providing boating facilities in Vannan kulam
in ward No. 15.
• Strengthening banks and desilting 3 acre Old Peravurani Theppa
Kulam in ward no. 13 and 14.
• Strengthening banks and desilting 3 acre Old Peravurani Theppa
Kulam in ward no. 13 and 14.
• Strengthening banks and desilting Kublikadu Kulam (2 Nos) in ward
no. 12.
• Strengthening banks and desilting 1.5 acre Selva Vinayagar Kulam in
ward no. 17.
Socio-Economic
Infrastructure
• Improving weekly market infrastructure by providing RCC shed, CC
pavement and one side compound wall for 800 meters.
• Creating vegetable market building near fish market in an area of
11,000 Sq.ft.
• Creating parking cum commercial complex in an area of 2500 Sq. feet
• Laying tiles and providing water supply provision in the existing
Slaughter house block
• Creating compound wall in all burial grounds except Avanam road
burial ground and provide all other infrastructure facilities in all burial
grounds
• Creating Gassifier crematorium in Kooblikadu burial ground
• Creating green spaces in approved layouts (Road Side Park can be
developed in ward No. 02 along Pattukottai road, park in a portion of 1
acre land available in Selva Vinayakapuram)

14-1
Tow
n In
vest
men
t Pla
n –
Pera
vura
ni
TNUIFSL
T
N
U
D
P
III
Fina
l
Rep
ort
14
14
14
14
CAP
ITAL I
NVESTM
EN
T P
LAN
The
Cap
ital In
vest
men
t Pl
an (
CIP
) id
entifies
the
inv
estm
ent re
quirem
ent of
the
tow
n fo
r th
e ne
xt f
ifte
en y
ear
period
witho
ut t
akin
g in
to c
onsi
dera
tion
the
fina
ncia
l fe
asib
ility
of t
he p
roje
cts, w
hich
wou
ld b
e co
vere
d in
Fin
anci
al
Ope
ratin
g Pl
an (
FOP)
. Pe
ravu
rani
inv
estm
ent
requ
irem
ent
for
the
next
fifte
en y
ear
period
is
Rs. 2393.48 la
khs.
Con
solida
ted
Sect
or w
ise
Inve
stm
ent r
equi
rem
ent f
or P
erav
uran
i Tow
n Pa
ncha
yat i
s sh
own
in T
able
14-A
.
Table
14-A
: C
onso
lidate
d S
ecto
r w
ise
Capit
al In
vest
men
t re
quir
emen
ts
Sect
or
Tota
l Invest
ment
in L
akhs
Perce
nta
ge
share
2009-1
0 to
2013-1
4
2014-1
5 to
2018-1
9
2019-2
0 to
2023-2
4
Wat
er S
uppl
y 10
0.00
4.
18
40.0
0 30
.00
30.0
0 Se
wer
age
and
Sani
tation
35
.00
1.46
10
.00
25.0
0 0.
00
Stor
m W
ater
Dra
inag
e 71
0.00
29
.66
520.
00
190.
00
0.00
So
lid W
aste
Man
agem
ent
210.
04
8.78
68
.39
70.2
3 71
.42
Roa
ds, T
raffic
and
Tra
nspo
rtat
ion
587.
66
24.5
5 24
0.80
34
6.86
0.
00
Stre
et L
ight
ing
36.3
2 1.
52
14.5
1 14
.51
7.29
Sl
ums an
d U
rban
Pov
erty
11
1.80
4.
67
111.
80
0.00
0.
00
Soci
o-Eco
nom
ic Inf
rast
ruct
ure
602.
66
25.1
8 33
0.38
27
2.28
0.
00
Total
2393.48
100.00
1335.88
948.89
108.71
% Share
55.81
39.64
4.54

14-2
Tow
n In
vest
men
t Pla
n –
Pera
vura
ni
TNUIFSL
T
N
U
D
P
III
Fina
l
Rep
ort
Fig
ure
14-1
Sec
tor
wis
e per
centa
ge
share
Socio
-Econom
ic
Infrastr
uctu
re
25%
Solid
Waste
Managem
ent
9%
Roads,
Tra
ffic
and
Tra
nsport
ation
25%
Str
eet
Lig
hting
2%
Slu
ms a
nd
Urb
an P
ove
rty
5%
Wate
r S
upply
4%
Sew
era
ge a
nd
Sanitation
1% S
torm
Wate
r
Dra
inage
29%
14.1
PH
YSICAL I
NFR
ASTR
UCTUR
E
Dur
ing
Rev
iew
Com
mitte
e m
eeting
s, s
take
hold
er c
onsu
ltat
ion
mee
tings
and
on
the
basi
s of
dem
and
supp
ly g
ap
anal
ysis
, va
riou
s w
orks
hav
e be
en i
dent
ifie
d un
der
diff
eren
t se
ctor
s like
Wat
er S
uppl
y, S
ewer
age,
Sol
id W
aste
Man
agem
ent,
Stor
m W
ater
Dra
ins, R
oads
and
Stree
t Lig
htin
g w
hich
are
cla
ssifie
d as
Phy
sica
l In
fras
truc
ture
sec
tors
.
The
Bud
get Est
imat
es f
or the
ide
ntifie
d pr
ojec
ts h
ave
been
car
ried
out
bas
ed o
n TW
AD
Boa
rd S
tand
ard
Sche
dule
of
Rat
es, m
arke
t ra
tes
and
with
som
e as
sum
ptio
ns o
n th
e te
chni
cal as
pect
s an
d w
here
ver th
e es
timat
es a
re a
vaila
ble
with
Tow
n Pa
ncha
yat t
he sam
e ha
s be
en c
onsi
dere
d fo
r th
ose
wor
ks.

14-3
Tow
n In
vest
men
t Pla
n –
Pera
vura
ni
TNUIFSL
T
N
U
D
P
III
Fina
l
Rep
ort
14.1
.1
WATER
SUP
PLY
Var
ious
wor
ks h
ave
been
ide
ntifie
d un
der
Wat
er S
uppl
y Se
ctor
on
the
basi
s of
Sta
keho
lder
’s s
ugge
stio
n an
d on
the
basi
s of
Dem
and
Supp
ly G
ap a
naly
sis.
The
wor
ks ide
ntifie
d an
d ph
ase
wis
e in
vest
men
t fo
r th
e va
riou
s w
orks
are
list
ed in
Table
14-B
.
Table
14-B
: P
roje
ct L
ist and B
udget
Est
imate
s fo
r W
ate
r Supply
Work
s
S.N
o
Proje
ct C
om
ponents
Capital Invest
ment
in lakhs
2009-1
0 to
2013-1
4
2014-1
5 to
2018-1
9
2019-2
0 to
2023-2
4
A
Water Supply
1 C
reat
ing
Dis
trib
utio
n ne
twor
k fo
r 15
Km
by
2023
-24
in p
hase
s 90
.00
30.0
0 30
.00
30.0
0
2 Pr
ovid
ing
1 N
o 1
lakh
cap
acity
OH
T in
N
ella
kand
an II st
reet
in w
ard
No.
08.
10.0
0 10
.00
0.00
0.
00
Subtotal
100.00
40.00
30.00
30.00
It is
sug
gest
ed th
at P
erav
uran
i Tow
n Pan
chay
at h
as to
und
erta
ke w
ater
aud
it, e
nerg
y au
dit a
nd le
ak d
educ
tion
stu
dies
to
min
imiz
e U
nacc
ount
ed W
ater
Flo
w (
UFW
) an
d m
inim
ize
the
ener
gy e
xpen
ditu
re. T
he g
oals
and
ser
vice
out
com
es
base
d on
the
prop
osed
strat
egy
for th
e ho
rizo
n pe
riod
is p
rese
nted
in T
able
14-C
.

14-4
Tow
n In
vest
men
t Pla
n –
Pera
vura
ni
TNUIFSL
T
N
U
D
P
III
Fina
l
Rep
ort
Table
14-C
: G
oals
and S
ervi
ce o
utc
om
es r
elate
d to W
ate
r Supply
sec
tor
Goals
2009-1
0
Up to
2013-1
4
2014-1
5 to
2018-1
9
2019-2
0 to
2023-2
4
Net
wor
k co
vera
ge in
% o
f av
aila
ble
road
net
wor
k 42
.4
50
57
65
Per C
apita
Sup
ply
in L
PCD
11
5 70
70
70
Serv
ice
conn
ectio
ns in
% o
f as
sess
men
ts
24.8
44
.9
64.9
85
.0
To
addr
ess
syst
em reh
abilita
tion
in the
upc
omin
g ye
ars, m
appi
ng a
nd e
stab
lishi
ng a
GIS
sys
tem
is
pertin
ent to
det
ail
out
syst
em l
ocat
ion,
cha
ract
eris
tics, a
ge a
nd c
ondi
tion.
Thi
s w
ould
ena
ble
iden
tify
ing
dila
pida
ted
sect
ions
of
the
netw
ork
and
thos
e th
at req
uire
rep
lace
men
t.
14.1
.2
SEW
ER
AGE A
ND
SAN
ITATIO
N
Dur
ing
stak
ehol
der’
s m
eeting
, to
ilet
blo
ck req
uire
men
ts h
ave
been
ide
ntifie
d. F
urth
er, Su
llage
lor
ry is
prop
osed
to
be
purc
hase
d fo
r cl
eani
ng S
eptic
tan
ks s
ince
the
tow
n is
dep
ende
nt o
n se
ptic
tan
ks f
or s
afe
disp
osal
of
sullag
e w
aste
.
Det
aile
d list
of w
orks
, cos
ting
and
pha
se w
ise
inve
stm
ent p
lan
is g
iven
in T
able
14-D
.
14-5
Tow
n In
vest
men
t Pla
n –
Pera
vura
ni
TNUIFSL
T
N
U
D
P
III
Fina
l
Rep
ort
Table
14-D
: P
roje
ct L
ist and B
udget
Est
imate
s fo
r Sew
erage
and S
anit
ation W
ork
s
S.N
o
Proje
ct C
om
ponents
Capital In
vest
ment
in lakhs
2009-1
0 to
2013-1
4
2014-1
5 to
2018-1
9
2019-2
0 to
2023-2
4
B
Sewerage and Sanitation
3 Pu
rcha
sing
Sul
lage
lorr
y fo
r w
aste
wat
er c
olle
ctio
n pu
rpos
e 15
.00
0.00
15
.00
0.00
4 C
reat
ing
publ
ic c
onvi
nien
ces in
war
d N
os. 0
6, 1
0, 1
1 an
d 12
20
.00
10.0
0 10
.00
0.00
Subtotal
35.00
10.00
25.00
0.00
14.1
.3
STOR
M W
ATER
DR
AIN
AGE
Und
er S
torm
Wat
er D
rain
age
sect
or, w
orks
lik
e co
nstruc
tion
of ne
w d
rain
s id
entified
dur
ing
Rap
id T
own
Ass
essm
ent
and
during
sta
keho
lder
’s c
onsu
ltat
ion
are
cons
ider
ed.
The
wor
ks i
dent
ifie
d an
d ph
ase
wis
e in
vest
men
ts a
re l
iste
d
belo
w.
Table
14-E
: P
roje
ct L
ist and B
udget
Est
imate
s fo
r Sto
rm W
ate
r D
rain
age
work
s
S.N
o
Proje
ct C
om
ponents
Capital Invest
ment
in lakhs
2009-1
0 to
2013-1
4
2014-1
5 to
2018-1
9
2019-2
0 to
2023-2
4
C
Storm Water Drainage
5 C
reat
ing
doub
le sid
e dr
aina
ge li
ne in
Ava
nam
ro
ad for
a le
ngth
of 1.
5 K
m
60.0
0 60
.00
0.00
0.
00
6 C
reat
ing
doub
le sid
e dr
aina
ge li
ne in
Pat
tuko
ttai
road
for
a le
ngth
of 1
Km
40
.00
40.0
0 0.
00
0.00

14-6
Tow
n In
vest
men
t Pla
n –
Pera
vura
ni
TNUIFSL
T
N
U
D
P
III
Fina
l
Rep
ort
7 C
reat
ing
doub
le sid
e dr
aina
ge li
ne in
Ara
ntha
ngi
road
for
a le
ngth
of 2
Km
80
.00
80.0
0 0.
00
0.00
8 C
reat
ing
doub
le sid
e dr
aina
ge li
ne in
Sed
hu roa
d fo
r a
leng
th o
f 2
Km
80
.00
80.0
0 0.
00
0.00
9 C
reat
ing
sing
le sid
e dr
aina
ge in
pud
hu roa
d in
w
ard
No.
15 for
a le
ngth
of 2
Km
40
.00
40.0
0 0.
00
0.00
10
Cre
atin
g dr
aina
ge li
ne in
Nee
laka
ndap
uram
II
stre
et in
war
d N
os. 0
8 an
d 09
for
a le
ngth
of 2
Km
40
.00
40.0
0 0.
00
0.00
11
Cre
atin
g dr
aina
ge li
ne c
onne
ctin
g H
ospi
tal
Chi
dam
bara
m, D
evad
as roa
d an
d A
nand
aval
li va
ikka
l for
a le
ngth
of 3
Km
60
.00
60.0
0 0.
00
0.00
12
Cre
atin
g 3
Km
dra
inag
e in
KK
nag
ar a
nd
Pand
haku
lam
in w
ard
No.
04
60.0
0 60
.00
0.00
0.
00
13
Cre
atin
g 3
Km
dra
inag
e in
war
d N
o. 0
5 co
nnec
ting
Mut
hala
gapp
a ro
ad a
nd c
ross
ing
road
s to
CM
B v
aikk
al
60.0
0 60
.00
0.00
0.
00
14
Cre
atin
g 5
Km
dra
inag
e in
war
d N
o. 1
3 an
d 14
10
0.00
0.
00
100.
00
0.00
15
Cre
atin
g 1
Km
dra
inag
e in
war
d N
o. 0
7 20
.00
0.00
20
.00
0.00
16
Cre
atin
g 50
0 m
eter
dra
inag
e in
war
d N
o. 1
6 10
.00
0.00
10
.00
0.00
17
Cre
atin
g 1
Km
dra
inag
e in
war
d N
o. 1
7 20
.00
0.00
20
.00
0.00
18
Cre
atin
g 2
Km
dra
inag
e in
war
d N
o.18
40
.00
0.00
40
.00
0.00
Subtotal
710.00
520.00
190.00
0.00
The
goa
ls a
nd ser
vice
out
com
es b
ased
on
the
prop
osed
strat
egy
for th
e ho
rizo
n pe
riod
is p
rese
nted
in Table 14-F
.

14-7
Tow
n In
vest
men
t Pla
n –
Pera
vura
ni
TNUIFSL
T
N
U
D
P
III
Fina
l
Rep
ort
Table 14-F : Goals and Service outcomes related to Storm Water Drainage sector
Goals
2009-1
0
Up to
2013-1
4
2014-1
5 to
2018-1
9
2019-2
0 to
2023-2
4
Stor
m W
ater
Dra
inag
e C
over
age
(% o
f ro
ad le
ngth
) 1.
5 30
44
14.1
.4
SO
LID
WASTE M
AN
AG
EM
EN
T
Prot
ective
gea
r fo
r co
nser
vanc
y w
orke
rs is
prop
osed
in
such
a w
ay tha
t w
orke
rs w
ould
get
pro
tect
ive
gear
onc
e in
tw
o
year
s (5
0% w
orke
rs is
pla
nned
to b
e co
vere
d ea
ch y
ear). I
n ad
ditio
n, H
ouse
hold
seg
rega
tion
bins
(2
Nos
) ar
e pr
opos
ed
for
each
ass
essm
ent
in P
erav
uran
i Tow
n Pa
ncha
yat
with
due
con
side
ratio
n gi
ven
to p
roje
cted
ass
essm
ents a
lso.
Hou
seho
ld seg
rega
tion
bins
are
pro
pose
d to
be
repl
aced
onc
e in
5 y
ears
.
Aw
aren
ess
driv
e to
im
prov
e D
oor-
Doo
r co
llec
tion
effici
ency
, w
aste
seg
rega
tion
effici
ency
and
aw
aren
ess
abou
t th
e
impo
rtan
ce o
f pr
otec
tive
gea
r am
ong
the
cons
erva
ncy
wor
kers
is
prop
osed
to
be c
ondu
cted
by
the
Tow
n Pa
ncha
yat.
Tow
n Pa
ncha
yat’s
cont
ribu
tion
for se
tting
up
regi
onal
land
fill s
ite
in a
ssoc
iation
with
near
by M
unic
ipal
ities
and
Tow
n
Panc
haya
ts is
als
o co
nsid
ered
. The
wor
ks id
entif
ied
and
phas
e w
ise
inve
stm
ent f
or th
e va
riou
s w
orks
are
list
ed in
Table
14-G

14-8
Tow
n In
vest
men
t Pla
n –
Pera
vura
ni
TNUIFSL
T
N
U
D
P
III
Fina
l
Rep
ort
Table
14-G
: P
roje
ct L
ist and B
udget
Est
imate
s fo
r Soil
d W
ast
e M
anagem
ent w
ork
s
S.N
o
Proje
ct C
om
ponents
Capital
Invest
ment
in lakhs
2009-1
0 to
2013-1
4
2014-1
5 to
2018-1
9
2019-2
0 to
2023-2
4
D
Solid Waste Management
19
Con
trib
utio
n fo
r cr
eating
sci
entif
ic la
nd fill
site
3.
11
0.00
3.
11
0.00
20
Publ
ic a
war
enes
s fo
r W
aste
seg
rega
tion
and
D-D
co
llect
ion
and
Cre
atin
g aw
aren
ess ab
out p
rote
ctiv
e ge
ar
amon
g co
nser
vanc
y w
orke
rs
5.00
5.
00
0.00
0.
00
21
Proc
urin
g se
greg
atio
n bi
ns for
eac
h as
sess
men
ts
191.
43
59.8
9 63
.62
67.9
2
22
Proc
urin
g pr
otec
tive
gear
for
con
serv
ancy
wor
kers
10
.50
3.50
3.
50
3.50
Subtotal
210.04
68.39
70.23
71.42
The
goa
ls a
nd ser
vice
out
com
es b
ased
on
the
prop
osed
strat
egy
for th
e ho
rizo
n pe
riod
is p
rese
nted
in Table 14-H
.
Table 14-H : Goals and Service outcomes related to Solid Waste Management works
Goals
2009-1
0
Up to
2013-1
4
2014-1
5 to
2018-1
9
2019-2
0 to
2023-2
4
Doo
r to
Doo
r C
olle
ctio
n (%
of as
sess
men
ts c
over
ed)
30
100
100
100
Sour
ce S
egre
gation
(%
of as
sess
men
ts c
over
ed)
30
100
100
100
Scie
ntific
dis
posa
l 0
0 √
√ Col
lect
ion
effici
ency
in %
10
0 10
0 10
0 10
0

14-9
Tow
n In
vest
men
t Pla
n –
Pera
vura
ni
TNUIFSL
T
N
U
D
P
III
Fina
l
Rep
ort
14.1
.5
RO
AD
S, TR
AFFIC A
ND
TR
AN
SP
OR
TATION
Und
er th
is sec
tor it is
pro
pose
d to
con
stru
ct n
ew roa
ds, w
iden
ing
exis
ting
roa
ds, c
onve
rtin
g ea
rthe
n an
d W
BM
roa
ds in
to B
T ro
ads. Fu
rthe
r, su
bway
s, ro
tary
in
ters
ectio
ns ar
e pr
opos
ed af
ter
havi
ng di
scus
sion
w
ith
stak
ehol
ders
in
stak
ehol
der’s
cons
ulta
tion
mee
ting.
Pro
ject
s, for
whi
ch the
im
plem
entin
g ag
enci
es a
re H
ighw
ays
and
othe
r pa
ra-s
tata
l
agen
cies
, ha
ve a
lso
been
ide
ntifie
d. F
or b
udge
t co
st e
stim
ates
uni
t ra
tes
per
km l
engt
h ar
e co
nsid
ered
. The
wor
ks
iden
tified
and
pha
se w
ise
inve
stm
ent f
or th
e va
riou
s w
orks
are
list
ed in
Table 14-I.
Table 14-I : Project List and Budget Estimates for Roads, Traffic and Transportation works
S.N
o
Proje
ct C
om
ponents
Capital
Invest
ment
in lakhs
2009-1
0 to
2013-1
4
2014-1
5 to
2018-1
9
2019-2
0 to
2023-2
4
E
Roads, Traffic and Transportation
23
Con
vertin
g 3.
35 K
m W
BM
roa
d in
to B
T roa
d 26
.80
26.8
0 0.
00
0.00
24
Con
vertin
g 31
.72
Km
Kut
cha
road
into
BT roa
d 41
2.36
20
8.00
20
4.36
0.
00
25
Cre
atin
g ro
und
abou
t in
Sedh
u ro
ad ju
nctio
n, A
vana
m
road
junc
tion,
Rai
lway
sta
tion
road
junc
tion
and
in
Rai
lway
TC
MF
road
junc
tion
12.0
0 6.
00
6.00
0.
00
26
Subw
ays to
be
crea
ted
base
d on
the
prio
rity
men
tione
d be
low
: 0.
00
0.00
0.
00
0.00
A
Cre
ati
ng S
ubw
ay
nea
r B
oys
hig
her
sec
ondary
sch
ool
in w
ard
No.0
3
0.00
0.
00
0.00
0.
00
B
Cre
ati
ng R
oB
in s
ethu r
oad r
ailw
ay
cross
ing in w
ard
No. 04(H
ighw
ay
- Im
ple
men
ting a
gen
cy)
0.00
0.
00
0.00
0.
00

14-10
Tow
n In
vest
men
t Pla
n –
Pera
vura
ni
TNUIFSL
T
N
U
D
P
III
Fina
l
Rep
ort
C
Cre
ati
ng S
ubw
ay
nea
r TC
MF
go d
ow
n in w
ard
no.0
9(i
mm
edia
tely
not re
quir
ed)
0.00
0.
00
0.00
0.
00
D
Cre
ati
ng S
ubw
ay
in N
ella
kandan I
I st
reet
in w
ard
No.
08 (
imm
edia
tely
not re
quir
ed)
0.00
0.
00
0.00
0.
00
E
Cre
ati
ng S
ubw
ay
in K
upli
kadu r
oad in w
ard
No.1
3
(im
med
iate
ly n
ot re
quir
ed)
0.00
0.
00
0.00
0.
00
F
Cre
ati
ng S
ubw
ay
in w
ard
No. 07
(im
med
iate
ly n
ot re
quir
ed)
0.00
0.
00
0.00
0.
00
27
Con
vertin
g 7
Km
BT sin
gle
lane
roa
d in
to
inte
rmed
iate
lane
roa
d.
136.
50
0.00
13
6.50
0.
00
Subtotal
587.66
240.80
346.86
0.00
The
goa
ls a
nd ser
vice
out
com
es b
ased
on
the
prop
osed
strat
egy
for th
e ho
rizo
n pe
riod
is p
rese
nted
in Table 14-J
.
Table 14-J : Goals and Service outcomes related to Roads, Traffic and Transportation sector
Goals
2009-1
0
Up to
2013-1
4
2014-1
5 to
2018-1
9
2019-2
0 to
2023-2
4
Per
Cap
ita
road
leng
th in
met
ers
3.0
2.9
2.7
2
.5
Per
cent
age
of k
utch
a an
d W
BM
roa
ds to
to
tal r
oad
leng
th
51
23
0 0
Tra
ffic
con
flic
ts a
t int
erse
ctio
ns a
nd a
t ra
ilw
ay c
ross
ings
Pr
evai
ling
W
ould
be
redu
ced
subs
tant
ially
Wou
ld b
e re
duce
d su
bsta
ntia
lly
Wou
ld b
e re
duce
d su
bsta
ntia
lly

14-11
Tow
n In
vest
men
t Pla
n –
Pera
vura
ni
TNUIFSL
T
N
U
D
P
III
Fina
l
Rep
ort
14.1
.6
STR
EET L
IG
HTIN
G
It is
prop
osed
to
conv
ert al
l co
nven
tiona
l ligh
ts int
o en
ergy
sav
ing
ligh
ting
sys
tem
s to
sav
e m
ore
ener
gy a
nd r
educ
e
carb
on e
mis
sion
. It is
pro
pose
d to
rep
lace
40W
tub
e ligh
ts int
o 36
W e
nerg
y sa
ving
lam
ps w
hen
the
life
of ex
istin
g 40
W l
amp
gets
ove
r. I
t is
pro
pose
d to
ins
tall e
lect
roni
c ch
okes
in
all fittin
gs. It is
furthe
r pr
opos
ed to
repl
ace
250
W
Sodi
um V
apor
with
(4X
24)
W T
5 la
mps
, 15
0 W
Sod
ium
Vap
or w
ith
(2X
36)
W T
% lam
ps a
nd 7
0 W
Sod
ium
Vap
or
with
(2 X
24)
W T
5 la
mps
. The
ten
der
proc
ess
for
proc
urem
ent of
T5
lam
ps c
an h
ave
the
prov
isio
n fo
r pu
rcha
se o
f
exis
ting
Sodi
um V
apor
lam
ps a
t a c
ompe
titiv
e ra
te. I
t is pr
opos
ed to
inst
all n
early
240
addi
tiona
l lig
ht fittin
gs in
pha
ses
to c
ater
fut
ure
dem
and
(1/3
rd
dem
and
is c
onsi
dere
d).
Table 14-K : Project List and Budget Estimates for Street lighting works
S.N
o
Proje
ct C
om
ponents
Capital Invest
ment
in lakhs
2009-1
0 to
2013-1
4
2014-1
5 to
2018-1
9
2019-2
0 to
2023-2
4
F
Street Lighting
28
Rep
laci
ng 4
0W T
ube
light
s in
to 3
6 W
0.
75
0.37
0.
37
0.00
29
Inst
allin
g el
ectron
ic c
hoke
s fo
r al
l tub
e ligh
t fitti
ngs
3.46
1.
73
1.73
0.
00
30
Rep
laci
ng 2
50 W
228
Nos
SV
L w
ith (4
X 2
4)
W T
5 la
mps
9.
69
4.85
4.
85
0.00
31
Rep
laci
ng 1
50 W
29
Nos
SV
L w
ith
(2 X
36)
W
T5
lam
ps
0.36
0.
18
0.18
0.
00
32
Rep
laci
ng 7
0 W
17
Nos
SV
L w
ith
(2 X
24)
W
T5
lam
ps
0.19
0.
09
0.09
0.
00
33
Prov
idin
g 24
3 ad
ditio
nal f
ittin
gs to
cat
er fut
ure
dem
and
(30%
dem
and
is c
onsi
dere
d)
21.8
7 7.
29
7.29
7.
29
Subtotal
36.32
14.51
14.51
7.29

14-12
Tow
n In
vest
men
t Pla
n –
Pera
vura
ni
TNUIFSL
T
N
U
D
P
III
Fina
l
Rep
ort
It is
sugg
este
d th
at T
own
Panc
haya
t has
to u
nder
take
ene
rgy
audi
t st
udie
s be
fore
and
after
inst
alling
ene
rgy
save
rs a
nd
devi
ces to
fin
d ou
t the
exa
ct e
nerg
y sa
ving
s.
The
goa
ls a
nd ser
vice
out
com
es b
ased
on
the
prop
osed
strat
egy
for th
e ho
rizo
n pe
riod
is p
rese
nted
in Table 14-L
.
Table 14-L : Goals and Service outcomes related to Street lighting sector
Goals
2009-1
0
Up to
2013-1
4
2014-1
5 to
2018-1
9
2019-2
0 to
2023-2
4
Spac
ing
betw
een
lam
ps in
met
ers
46.5
42
40
38
Ene
rgy
audi
ting
Not
don
e To
be d
one
to
be
done
Ene
rgy
savi
ng in
itiat
ives
D
one
partia
lly
to b
e do
ne c
ompl
etel
y
14.2
SLUM
S A
ND
UR
BAN
PO
VER
TY
IHSD
P pr
ojec
t re
port h
as a
lrea
dy b
een
prep
ared
by
the
Tow
n Pa
ncha
yat
for
an e
stim
ated
cos
t of
Rs.11
1.8
lakh
s in
ord
er t
o im
prov
e th
e liv
ing
cond
ition
s in
slu
m a
reas
. H
ousi
ng c
ompo
nent
, ro
ad,
drai
n, I
EC
and
Soci
al a
ctiv
ities
com
pone
nt a
re c
onsi
dere
d un
der th
is sch
eme.
Proje
ct c
om
ponents
Cost
in lakhs
Dw
ellin
g H
ouse
s 64
.00
Roa
ds
31.0
0
Dra
ins
4.30
IEC
and
soc
ial a
ctiv
ities
12
.5
Tot
al p
roje
ct c
ost
111.
8

14-13
Tow
n In
vest
men
t Pla
n –
Pera
vura
ni
TNUIFSL
T
N
U
D
P
III
Fina
l
Rep
ort
Table 14-M : Project List and Budget Estimates for Slums and Urban Poverty
S.N
o
Proje
ct C
om
ponents
Capital Invest
ment
in lakhs
2009-1
0 to
2013-1
4
2014-1
5 to
2018-1
9
2019-2
0 to
2023-2
4
G
Slums and Urban Poverty
34
Impl
emen
ting
IHSD
P pr
ojec
t pro
pose
d
111.
80
111.
80
0.00
0.
00
Subtotal
111.80
111.80
0.00
0.00
14.3
SO
CIO-E
CO
NO
MIC I
NFR
ASTR
UCTUR
E
Soci
o-Eco
nom
ic I
nfra
stru
ctur
e w
orks
are
ide
ntifie
d ba
sed
on D
eman
d Sup
ply
Gap
ana
lysi
s an
d du
ring
Sta
keho
lder
cons
ulta
tion
mee
tings
. The
se w
orks
incl
ude
impr
ovin
g th
e ex
isting
wee
kly
and
fish
mar
ket,
crea
ting
gre
en s
pace
s like
park
s an
d pl
aygr
ound
s, c
reat
ing
gass
ifie
r cr
emat
oriu
m a
nd i
mpr
ovin
g bu
rial
gro
und
infr
astruc
ture
, re
nova
tion
of
slau
ghte
r ho
use
and
impr
ovin
g th
e co
nditi
on o
f w
ater
bod
ies. P
roje
ct lis
t an
d B
udge
t es
timat
es f
or S
ocio
-Eco
nom
ic
Infras
truc
ture
wor
ks a
re li
sted
out
in Table 14-N
.
Table 14-N : Project List and Budget Estimates for Socio-Economic Infrastructure works
S.N
o
Proje
ct C
om
ponents
Capital Invest
ment
in lakhs
2009-1
0 to
2013-1
4
2014-1
5 to
2018-1
9
2019-2
0 to
2023-2
4
H
Socio-Economic Infrastructure
35
Impr
ovin
g w
eekl
y m
arke
t inf
rast
ruct
ure
by p
rovi
ding
RC
C she
d, C
C p
avem
ent a
nd o
ne sid
e co
mpo
und
wal
l for
800
met
ers.
70.0
0 70
.00
0.00
0.
00
36
Cre
atin
g ve
geta
ble
mar
ket b
uild
ing
near
fis
h m
arke
t in
an
area
of 11
,000
Sq.
ft.
99.0
0 99
.00
0.00
0.
00
37
Cre
atin
g pa
rkin
g cu
m c
omm
erci
al c
ompl
ex in
an
40.0
0 0.
00
40.0
0 0.
00

14-14
Tow
n In
vest
men
t Pla
n –
Pera
vura
ni
TNUIFSL
T
N
U
D
P
III
Fina
l
Rep
ort
area
of 25
00 S
q. fee
t
38
Lay
ing
tiles
and
pro
vidi
ng w
ater
sup
ply
prov
isio
n in
th
e ex
istin
g Sl
augh
ter ho
use
bloc
k 1.
00
1.00
0.
00
0.00
39
Cre
atin
g co
mpo
und
wal
l in
all b
uria
l gro
unds
exc
ept
Ava
nam
roa
d bu
rial
gro
und
and
prov
ide
all o
ther
in
fras
truc
ture
fac
ilities
in a
ll bu
rial
gro
unds
60
.00
30.0
0 30
.00
0.00
40
Cre
atin
g G
assi
fier
cre
mat
oriu
m in
Koo
blik
adu
burial
gr
ound
90
.00
0.00
90
.00
0.00
41
Cre
atin
g gr
een
spac
es in
app
rove
d la
yout
s (R
oad
Sid
e P
ark
can b
e dev
eloped
in w
ard
No. 02 a
long
Patt
uko
ttai ro
ad, park
in a
port
ion o
f 1 a
cre
land
ava
ilable
in S
elva
Vin
aya
kapura
m)
10.0
0 10
.00
0.00
0.
00
42
Impr
ovin
g th
e co
nditi
on o
f w
ater
bod
ies (P
eriy
a K
ulam
, Ada
nur pe
riya
eri, V
imat
ha ta
nk,
Nat
tani
kutta
i) b
y dr
edgi
ng, c
reat
ing
bank
s, c
reat
ing
bath
ing
ghat
, pro
vidi
ng li
ghtin
g an
d pr
ovid
ing
road
al
ong
the
boun
dary
- P
WD
Im
plem
entin
g ag
ency
0.
00
0.00
0.
00
0.00
43
Cre
atin
g 50
0 m
eter
wal
king
trac
k, p
rovi
ding
or
nam
enta
l lig
hts, d
esilt
ing
3 ac
re la
ke a
rea,
pr
ovid
ing
boat
ing
faci
litie
s in
Van
nan
kula
m in
war
d N
o. 1
5.
63.0
2 63
.02
0.00
0.
00
44
Stre
ngth
enin
g ba
nks an
d de
silti
ng 3
acr
e O
ld
Pera
vura
ni T
hepp
a K
ulam
in w
ard
no. 1
3 an
d 14
. 57
.36
57.3
6 0.
00
0.00
45
Stre
ngth
enin
g ba
nks an
d de
silti
ng K
ublika
du K
ulam
(2
Nos
) in
war
d no
. 12.
57
.36
0.00
57
.36
0.00
46
Stre
ngth
enin
g ba
nks an
d de
silti
ng 1
.5 a
cre
Selv
a V
inay
agar
Kul
am in
war
d no
. 17.
54
.93
0.00
54
.93
0.00
Subtotal
602.66
330.38
272.28
0.00

14-15
Tow
n In
vest
men
t Pla
n –
Pera
vura
ni
TNUIFSL
T
N
U
D
P
III
Fina
l
Rep
ort
14.4
CO
NSO
LID
ATED
CAP
ITAL I
NVESTM
EN
T P
LAN
14.4
.1
FIR
ST P
HASE I
NVESTM
EN
T P
LAN
(2009-1
0 T
O 2
013 –
14)
First
Pha
se inv
estm
ent pl
an f
or P
erav
uran
i is
giv
en in Table 14-O
. The
tot
al E
stim
ated
Cos
t fo
r al
l th
e Se
ctor
s is
Rs.
1335.88 lak
hs.
The
tot
al e
stim
ated
cos
t af
ter co
nsid
erin
g es
cala
tion
for
I p
hase
is
Rs. 1581.72 la
khs
whi
ch is
show
n in
Table 14-P
.
Table 14-O First Phase Capital Investment Plan for Peravurani Town Panchayat
Rs. in
Lak
hs
Proje
ct S
ect
or
2009-1
0
2010-1
1
2011-1
2
2012-1
3
2013-1
4
Invest
ment
in p
hase
I
Wat
er S
uppl
y 6.
00
16.0
0 6.
00
6.00
6.
00
40.0
0 Se
wer
age
0.00
0.
00
0.00
0.
00
0.00
0.
00
Sani
tatio
n 0.
00
10.0
0 0.
00
0.00
0.
00
10.0
0 St
orm
Wat
er D
rain
age
0.00
10
0.00
16
0.00
14
0.00
12
0.00
52
0.00
So
lid
Was
te M
anag
emen
t witho
ut g
ear an
d bi
ns
0.00
5.
00
0.00
0.
00
0.00
5.
00
Solid
Was
te M
anag
emen
t (B
ins an
d G
ears
) 12
.68
12.6
8 12
.68
12.6
8 12
.68
63.3
9 R
oads
, Tra
ffic
and
Tra
nspo
rtat
ion
26.8
0 52
.00
52.0
0 52
.00
58.0
0 24
0.80
St
reet
Lig
htin
g 2.
90
2.90
2.
90
2.90
2.
90
14.5
1 Sl
ums an
d U
rban
Pov
erty
0.
00
0.00
0.
00
111.
80
0.00
11
1.80
So
cio-
Eco
nom
ic Inf
rast
ruct
ure
0.00
70
.00
100.
00
103.
02
57.3
6 33
0.38
Total
48.38
268.58
333.58
428.40
256.94
1335.88

14-16
Tow
n In
vest
men
t Pla
n –
Pera
vura
ni
TNUIFSL
T
N
U
D
P
III
Fina
l
Rep
ort
Table 14-P First Phase Capital Investment Plan for Peravurani Town Panchayat (after considering escalation cost)
Rs. in
Lak
hs
Proje
ct S
ect
or
2009-1
0
2010-1
1
2011-1
2
2012-1
3
2013-1
4
Invest
ment in
Phase
I
Wat
er S
uppl
y 6.
30
17.6
4 6.
95
7.29
7.
66
45.8
4 Se
wer
age
0.00
0.
00
0.00
0.
00
0.00
0.
00
Sani
tatio
n 0.
00
11.0
3 0.
00
0.00
0.
00
11.0
3 St
orm
Wat
er D
rain
age
0.00
11
0.25
18
5.22
17
0.17
15
3.15
61
8.79
So
lid
Was
te M
anag
emen
t w
itho
ut
gear
and
bin
s 0.
00
5.51
0.
00
0.00
0.
00
5.51
So
lid
Was
te M
anag
emen
t B
ins
and
Gea
rs
13.3
1 13
.98
14.6
8 15
.41
16.1
8 73
.55
Roa
ds, T
raffic
and
Tra
nspo
rtat
ion
28.1
4 57
.33
60.2
0 63
.21
74.0
2 28
2.90
St
reet
Lig
htin
g 3.
05
3.20
3.
36
3.53
3.
70
16.8
4 Sl
ums an
d U
rban
Pov
erty
0.
00
0.00
0.
00
135.
89
0.00
13
5.89
So
cio-
Eco
nom
ic Inf
rast
ruct
ure
0.00
77
.18
115.
76
125.
23
73.2
0 39
1.37
Total
50.80
296.11
386.16
520.73
327.92
1581.72

14-17
Tow
n In
vest
men
t Pla
n –
Pera
vura
ni
TNUIFSL
T
N
U
D
P
III
Fina
l
Rep
ort
14.4
.2
SECON
D P
HASE I
NVESTM
EN
T P
LAN
(2014-1
5 T
O 2
018 –
19)
Sec
ond
Phas
e in
vest
men
t pl
an for
Per
avur
ani is
giv
en in Table 14-Q
. The
tot
al E
stim
ated
Cos
t fo
r al
l th
e Se
ctor
s is
Rs.
948.89 lak
hs. T
he tot
al e
stim
ated
cos
t af
ter
cons
ider
ing
esca
lation
for
II
phas
e is
Rs. 1360.60 lak
hs w
hich
is
show
n
belo
w.
Table 14-Q Second Phase Capital Investment Plan for Peravurani Town Panchayat
Rs. in
Lak
hs
Proje
ct S
ect
or
2014-1
5
2015-1
6
2016-1
7
2017-1
8
2018-1
9
Invest
ment in
phase
II
Wat
er S
uppl
y 6.
00
6.00
6.
00
6.00
6.
00
30.0
0 Se
wer
age
15.0
0 0.
00
0.00
0.
00
0.00
15
.00
Sani
tatio
n 10
.00
0.00
0.
00
0.00
0.
00
10.0
0 St
orm
Wat
er D
rain
age
100.
00
50.0
0 40
.00
0.00
0.
00
190.
00
Solid
Was
te M
anag
emen
t w
itho
ut
gear
and
bin
s 3.
11
0.00
0.
00
0.00
0.
00
3.11
So
lid W
aste
Man
agem
ent
13.4
2 13
.42
13.4
2 13
.42
13.4
2 67
.12
Roa
ds, T
raffic
and
Tra
nspo
rtat
ion
81.0
0 75
.00
75.0
0 75
.00
40.8
7 34
6.86
St
reet
Lig
htin
g 2.
90
2.90
2.
90
2.90
2.
90
14.5
1 Sl
ums an
d U
rban
Pov
erty
0.
00
0.00
0.
00
0.00
0.
00
0.00
So
cio-
Eco
nom
ic Inf
rast
ruct
ure
70.0
0 90
.00
112.
28
0.00
0.
00
272.
28
Total
301.43
237.32
249.61
97.32
63.20
948.89

14-18
Tow
n In
vest
men
t Pla
n –
Pera
vura
ni
TNUIFSL
T
N
U
D
P
III
Fina
l
Rep
ort
Table 14-R Second Phase Capital Investment Plan for Peravurani Town Panchayat (after considering escalation cost)
Rs. in
Lak
hs
Proje
ct S
ect
or
2014-1
5
2015-1
6
2016-1
7
2017-1
8
2018-1
9
Invest
ment in
Phase
II
Wat
er S
uppl
y 8.
04
8.44
8.
86
9.31
9.
77
44.4
3 Se
wer
age
20.1
0 0.
00
0.00
0.
00
0.00
20
.10
Sani
tatio
n 13
.40
0.00
0.
00
0.00
0.
00
13.4
0 St
orm
Wat
er D
rain
age
134.
01
70.3
6 59
.10
0.00
0.
00
263.
46
Solid
Was
te M
anag
emen
t w
ithou
t ge
ar a
nd
bins
4.
17
0.00
0.
00
0.00
0.
00
4.17
So
lid
Was
te M
anag
emen
t Bin
s an
d G
ears
17
.99
18.8
9 19
.83
20.8
3 21
.87
99.4
1 R
oads
, Tra
ffic
and
Tra
nspo
rtat
ion
108.
54
105.
53
110.
80
116.
34
66.5
8 50
7.80
St
reet
Lig
htin
g 3.
89
4.08
4.
29
4.50
4.
73
21.4
9 Sl
ums an
d U
rban
Pov
erty
0.
00
0.00
0.
00
0.00
0.
00
0.00
So
cio-
Eco
nom
ic Inf
rast
ruct
ure
93.8
1 12
6.64
16
5.90
0.
00
0.00
38
6.34
Total
403.95
333.94
368.79
150.98
102.94
1360.60

14-19
Tow
n In
vest
men
t Pla
n –
Pera
vura
ni
TNUIFSL
T
N
U
D
P
III
Fina
l
Rep
ort
14.4
.3
TH
IR
D P
HASE I
NVESTM
EN
T P
LAN
(2019-2
0 T
O 2
023-2
4)
Thi
rd p
hase
inv
estm
ent pl
an f
or P
erav
uran
i is
giv
en in Table 14-S
. The
tot
al E
stim
ated
Cos
t fo
r al
l th
e Se
ctor
s is
Rs.
108.71 lak
hs. T
he tot
al e
stim
ated
cos
t af
ter
cons
ider
ing
esca
latio
n fo
r III
phas
e is
Rs. 205.48 lak
hs w
hich
is
show
n
belo
w.
Table 14-S Third Phase Capital Investment Plan for Peravurani Town Panchayat
Rs. in
Lak
hs
Proje
ct S
ect
or
2019-2
0
2020-2
1
2021-2
2
2022-2
3
2023-2
4
Invest
ment in
phase
III
Wat
er S
uppl
y 6.
00
6.00
6.
00
6.00
6.
00
30.00
Sew
erag
e 0.
00
0.00
0.
00
0.00
0.
00
0.00
Sani
tatio
n 0.
00
0.00
0.
00
0.00
0.
00
0.00
Stor
m W
ater
Dra
inag
e 0.
00
0.00
0.
00
0.00
0.
00
0.00
Solid
Was
te M
anag
emen
t witho
ut g
ear an
d bi
ns
0.00
0.
00
0.00
0.
00
0.00
0.00
Solid
Was
te M
anag
emen
t 14
.28
14.2
8 14
.28
14.2
8 14
.28
71.42
Roa
ds, T
raffic
and
Tra
nspo
rtat
ion
0.00
0.
00
0.00
0.
00
0.00
0.00
Stre
et L
ight
ing
1.46
1.
46
1.46
1.
46
1.46
7.29
Slum
s an
d U
rban
Pov
erty
0.
00
0.00
0.
00
0.00
0.
00
0.00
Soci
o-Eco
nom
ic Inf
rast
ruct
ure
0.00
0.
00
0.00
0.
00
0.00
0.00
Total
21.74
21.74
21.74
21.74
21.74
108.71

14-20
Tow
n In
vest
men
t Pla
n –
Pera
vura
ni
TNUIFSL
T
N
U
D
P
III
Fina
l
Rep
ort
Table 14-T Third Phase Capital Investment Plan for Peravurani Town Panchayat (after considering escalation cost)
Rs. in
Lak
hs
Proje
ct S
ect
or
2019-2
0
2020-2
1
2021-2
2
2022-2
3
2023-2
4
Invest
ment in
Phase
III
Wat
er S
uppl
y 10
.26
10.7
8 11
.31
11.8
8 12
.47
56.7
0 Se
wer
age
0.00
0.
00
0.00
0.
00
0.00
0.
00
Sani
tatio
n 0.
00
0.00
0.
00
0.00
0.
00
0.00
St
orm
Wat
er D
rain
age
0.00
0.
00
0.00
0.
00
0.00
0.
00
Solid
Was
te
Man
agem
ent
witho
ut
gear
and
bin
s 0.
00
0.00
0.
00
0.00
0.
00
0.00
Solid
Was
te M
anag
emen
t B
ins
and
Gea
rs
24.4
3 25
.65
26.9
3 28
.28
29.7
0 13
4.99
Roa
ds, T
raffic
and
Tra
nspo
rtat
ion
0.00
0.
00
0.00
0.
00
0.00
0.
00
Stre
et L
ight
ing
2.49
2.
62
2.75
2.
89
3.03
13
.78
Slum
s an
d U
rban
Pov
erty
0.
00
0.00
0.
00
0.00
0.
00
0.00
So
cio-
Eco
nom
ic Inf
rast
ruct
ure
0.00
0.
00
0.00
0.
00
0.00
0.
00
Total
37.19
39.05
41.00
43.05
45.20
205.48

Town Investment Plan – Peravurani
TNUIFSL
T
N
U
D
P
III
15-1
Final
Report
15151515 REFORMS AND RESOURCE
MOBILIZATION
15.1 OVERVIEW
Urban reforms are the main focus of good governance and service delivery to the
inhabitants of the urban area. Several initiatives and reforms have been taken up at the
national level and state level. These reforms need to be replicated and implemented by
the ULBs completely in a time bound manner. The State Government and the Urban
Local Bodies have executed a Memorandum of Agreement with the Government of
India, committing to implement the reform programme.
Under the Urban Local Bodies level, reforms committed viz., E-Governance, shift to
Accrual based double entry accounting, property tax (85% coverage), property tax
collection efficiency (90%). 100% cost recovery for water supply and solid waste
services have been committed to be achieved in the year 2012. Internal earmarking of
funds for services to Urban Poor has been done and provision of Basic services to urban
poor has been committed to be achieved in the year 2012.
Encouragement of Public Private Partnership to be carried on through outsourcing in
solid waste management, street light maintenance, pumping station maintenance, STP
maintenance and hiring of vehicles. Many of the suggested reforms have been
implemented to some extent though at the ULB level further refinement and qualitative
implementation needs to be carried out. Besides these mandatory reforms the ULBs have
initiated Institutional Strengthening, Capacity building for administrative and elected
representatives under various reform programs of TNUDP and State Government.

Town Investment Plan – Peravurani
TNUIFSL
T
N
U
D
P
III
15-2
Final
Report
15.2 REFORM MEASURES FOR
PERAVURANI TOWN PANCHAYAT
The reform measures to be undertaken by the Town Panchayat can be broadly classified
into 3 broad heads:
� Financial and Accounting Reforms
� Institutional reforms
� Reforms in physical infrastructure
15.2.1 FINANCIAL & ACCOUNTING REFORMS
15.2.1.1 FINANCIAL REFORMS
As a part of financial reforms, tax mobilization reforms in tax and non tax collection
needs to be taken up for improving the financial position of the Town Panchayat. The
reform process of tax collection should be comprehensive and should focus on structural
and systematic changes so that the increase in efficiency is sustained. This is vital for
achieving self-sufficiency and improving its financial health to make it possible for the
TP to undertake various projects for the welfare of the people.
The Executive officer and the bill collectors are responsible for collection of various
taxes and charges from its citizens including raising the demand for key revenue items
like property tax, profession tax, water charges etc., follow up on outstanding payment
and prepare the Demand Collection Balance (DCB) statement. There is only one filled up
post for Bill Collector in the revenue collection department as against sanctioned post of
four nos. of Bill Collectors.

Town Investment Plan – Peravurani
TNUIFSL
T
N
U
D
P
III
15-3
Final
Report
One of the most important yard stick for measuring the robustness of tax collection is
collection efficiency. The Collection Efficiency of important revenue sources of
Peravurani Town Panchayat for the last 6 years ending 2008-09 is given as under:
Table 15-A: Collection Efficiency of key revenue sources
Particulars 20
03
-04
20
04
-05
20
05
-06
20
06
-07
20
08
-09
Property Taxes
Arrears 25.59% 27.21% 62.50% 45.66% 47.83%
Current 37.98% 40.54% 50.74% 61.65% 64.80%
Total 30.65% 32.47% 57.94% 53.56% 58.29%
Professional Taxes
Arrears 27.59% 22.17% 22.64% 28.85% 100.00%
Current 90.98% 96.26% 96.98% 92.36% 100.00%
Total 78.81% 83.57% 86.72% 85.71% 100.00%
Water Charges
Arrears 18.82% 18.60% 64.98% 31.72% 34.35%
Current 31.29% 30.51% 55.47% 54.31% 62.88%
Total 25.02% 23.62% 61.37% 43.12% 48.87%
Library Cess
Arrears 25.70% 27.29% 62.13% 45.40% 48.72%
Current 37.91% 40.52% 50.31% 61.76% 64.92%
Total 30.69% 32.51% 57.55% 53.49% 58.66%
Source: DCB of Peravurani Town Panchayat
Table 15-B: Efficiency parameters of key taxes and water charges
Particulars Current Collection efficiency
Arrears Collection efficiency
CAGR in no of assessments (%)
Last 5 years
CAGR in the terms of value (%)
Property taxes (2008-09)
64.80% 47.83% 2% 14.93%
Profession Taxes (2008-09)
100 % 100% 5% 16.48%
Water Charges
(2008-09)
62.88% 34.35% 7% 7.38%
Source: Peravurani Town Panchayat

Town Investment Plan – Peravurani
TNUIFSL
T
N
U
D
P
III
15-4
Final
Report
15.2.1.1.1 Property taxes:
The most important category in the own sources of income is the property tax. This tax is
imposed on land and buildings depending upon their class of areas & nature of use.
About 80% of the tax revenue comes through property taxes. The CAGR of property tax
revenue has been around 14.93% over the last few years. (2003-04 till 2008-09). The
Town Panchayat enjoys a very good current and arrear collection efficiency
15.2.1.1.2 Profession Tax:
Profession tax has contributed about 20% of the total Taxes in the last few years. The
CAGR has been close to 16.48% for the past few years. The collection efficiency of the
Town Panchayat has to be improved its collection efficiency level to achieve a Standard.
Issues:
a) Arrear collection efficiency of property taxes and water charges is less at 47.83%
and 34.35% respectively
b) Growth rate in no of assessment of property tax is less than 2.04%
c) Growth rate in water charges in value terms is less than 5.16%
Robust growth in Taxes is required to fund the projects. Proper implementation of reforms is a
pre-requisite for healthy revenue generation. Healthy growth in number of assessments,
updated tax demand, periodic revisions and high collection efficiency is important for strong
growth in property tax collection. Hence the following reforms have been suggested to bring
about improvement in property tax collection
Table 15-C: Reforms in property Taxes
Suggested Property taxes Reforms
• Mandatory Implementation of Revision of Property Tax once in every five years
is required
• Digitization of the property maps through GIS to identify un-assessed and under
assessed properties is required. GIS based mapping system is advisable for each
property identified on GIS (Whether it is residential, commercial or
industrial).The above database can be crossed checked with the data from various
governmental authorities/sources such as Income Tax, Profession Tax, and
Electricity Bills etc. Such database also would help the Town Panchayat to verify
the utility of the property against the purpose for which permission was taken.

Town Investment Plan – Peravurani
TNUIFSL
T
N
U
D
P
III
15-5
Final
Report
Suggested Property taxes Reforms
• Computerization of records of encroached properties, action taken, list of
encroachers through MIS would enable linking the same with GIS.
• Making the payment of property tax more convenient for the assesses through the
use of various alternative modes can be explored through a decentralized
approach such as :
1. Through banks
2. Through Post Offices, Bus terminus, Kiosks etc.
3. Through online payment through using internet.
4. Through ECS/ EFT
• Using special schemes and incentives to encourage people to make the payment
of property tax before the lapse of the due date can be considered. Rebates can be
offered for advance payment of property taxes.
• The Town Panchayat can do more initiatives to increase the number of self
assessed tax payers by creating well awareness among the people themselves
about the social responsibility of paying tax in time
• Collection of arrears through innovative means such as community participation
and fast track litigation methods need to be attempted. Law enforcement powers
should be given to the Town Panchayat to compel payment of taxes and other
charges levied by them.
• Improve enforcement against defaulters by modifying byelaws with adequate
recourse to Town Panchayat within the current framework for enforcing
disconnections on defaulters.
• PSP involvement in computerization, billing, collections and survey of properties
can be explored.
• Rewarding collection efforts of the employees to encourage more aggressive
collection.
• List of consistent major defaulters can be published in the notice board of the
Town Panchayat office. This can be resorted in the case of extreme default.
• Suitable legislation at state level to ensure that in the case of disputed property
tax the assessee should first pay the tax under protest and then can take the
necessary legal recourse as done in customs/excise duties can be considered.

Town Investment Plan – Peravurani
TNUIFSL
T
N
U
D
P
III
15-6
Final
Report
Suggested Property taxes Reforms
• Currently the payment of property taxes is possible only in the Town Panchayat
office. The ULB can look to the possibility of introducing additional collection
centers to enable the citizens to pay the taxes easily
• Late payment of property tax after the grace period can be penalized with
nominal charges as being done in the case of insurance payments etc
15.2.1.2 ACCOUNTING REFORMS
The administrative section is responsible for maintenance of all income and expenditure
statements, payment, preparation and implementation of budget. The system of accounting has
undergone a transformation from cash based accounting system to accrual accounting system
in line with the State government’s reforms initiative. Presently they do not have fully
computerized accounts department. As on date Peravurani Town Panchayat has completed
finalizing its accounts up to FY 2007-08. s
The following reform measures are suggested:
Table 15-D: Accounting Reforms
Suggested Accounting Reforms
� Zero based budgeting would need to be carried out for continual monitoring of budgets and
cash flow management.
� As a part of a larger accounting reform process at the State level, it is suggested that the ULB
can include disclosures in its Annual Accounts and other published documents details on cost
recovery of essential services through direct “user charges”, indirect “taxes” and
Environmental status report. This information can be made available to the public through
various channels (Such as hosted the details on the website, distribution of pamphlets,
Involving SHGs/NGOs/Woman Groups for spreading awareness, Public announcements etc)
in simple effective language to facilitate substantial/full recovery of O&M costs of the
various essential services such as Water Supply, Solid Waste Management, etc. The
awareness creation at various levels will increase the “willingness to pay” actions of the
citizens of the area.

Town Investment Plan – Peravurani
TNUIFSL
T
N
U
D
P
III
15-7
Final
Report
Suggested Accounting Reforms
� The audited annual accounts can contain ULB Discussion and Analysis Report (UDAR)
providing a holistic view on the financial health, quality of service level rendered, initiatives
taken/proposed by the ULB to improve the city, areas of concern, targets and action plan to
achieve the same etc. This report along with the Urban Performance indicators can provide a
qualitative edge to the accounting and financial reporting system that can go a long way
towards achieving high levels transparency, accountability and easy and smoother facilitation
of the reform process required. Thus the support from the stake holders of the city would
become easier if the awareness is created with these qualitative reports being prepared and
shared with the key stake holders of the city.
15.2.2 INSTITUTIONAL REFORMS
The Institutional reforms suggested for Peravurani Town Panchayat can be broadly divided
into the following heads:
� Training and Capacity Building for administrative staff and elected officials
� Private Sector Participation
� User charges
� E-Governance
15.2.2.1 TRAINING AND CAPACITY BUILDING FOR
ADMINISTRATIVE STAFF AND ELECTED OFFICIALS
• Training
The various training undergone by the staff of Peravurani Town Panchayat has been
elaborated as under:
Training to the staff are provided in the areas of Sectoral Training, Human Resources
Training, Accounts Training, Computerization and E-governance and other programmes
organized by Directorate of Town Panchayat. Training at Bhavani Sagar has been
provided to the Head Clerk during the year 2004 and to the Junior Assistant in the year
2008
• Public Grievance Redressal Mechanism
Public Grievance registers maintained for all key sectors such as Public Health, Water
Supply, and Street Lights. The Public also approach their respective ward councilors with

Town Investment Plan – Peravurani
TNUIFSL
T
N
U
D
P
III
15-8
Final
Report
their complaints on service delivery system. Complaints are also received during
Grievance day meetings held at the Collector office
It is recommended that the periodicity of the training can be enhanced coupled with more
qualitative in-depth focus on the type of training offered. This would result in increased
awareness among the administrative staff on various issues there by enhancing their
productivity and creating awareness about their responsibility towards the public. For
both elected and administrative members educational and awareness tours can be
organized to understand the best practices in various services of other ULBs. As the ULB
is already maintaining a public grievance register for all key sectors, it should now
depute one person as the in charge for this grievance book and the complaints needs to
be redressed within 24 hours.
15.2.2.2 PRIVATE SECTOR PARTICIPATION
Government of Tamil Nadu (GoTN) has laid down a policy clearance order for the ULBs in
the State, indicating the areas of privatization in the sectors of Solid Waste Management,
Water Supply, Sewerage, Drain Cleaning, Public Toilets, Road Maintenance, Street Lighting,
Parking lots, parks and play grounds, and vehicle maintenance. The GoTN states that this list
is indicative and local bodies are free to investigate other areas of privatization. The local
body would be saving the indirect cost towards pension, gratuity, etc if privatization efforts
are initiated and effective monitoring and evaluation on the delivery of services of private
contractor is adopted. Presently, none of the services of the Town Panchayat are privatized.
Table 15-E: Possible areas of privatization/outsourcing
Areas of privatization
� Privatization of Solid Waste Management covering all wards of the town.
� Providing household segregation bins once in five years for source
segregation and D-D collection.
� Procuring protective gear (gumboots, gloves and masks) for conservancy
workers once in two years
� The ULB can also seek private sponsorship for purchase of household bins for waste
segregation once awareness is created among the public on the waste segregation

Town Investment Plan – Peravurani
TNUIFSL
T
N
U
D
P
III
15-9
Final
Report
15.2.2.3 USER CHARGES
There is a need to introduce in phases “User Charges” for various infrastructure amenities
provided by the Town Panchayat. Cross subsidization of tariff, Innovative product
structuring and community participation are some of the measures which could be
explored to provide services for the urban poor.
Currently only for water supply the ULB is able to generate direct revenue in the form of
water charges, initial deposit and connection charges and indirectly through water tax
which is a component of property tax. For other services the ULB depends on its taxes
and external funds to fund its activities. As these are inadequate the ULB faces
constraints to initiate any major improvement scheme for development of the city.
To enhance its revenue the ULB would need to increase the deposit charges for new
connections and can explore the option of increasing the water charges. This backed by
higher collection efficiency and enhanced service coverage of water connections can
minimize revenue leakages from water sources.
15.2.2.4 E-GOVERNANCE & COMPUTERIZATION
E-governance is the application of information & communication technologies to
transform the efficiency, effectiveness, transparency and accountability of informational
& transactional exchanges with in government, between govt. & govt. agencies of
National, State, Municipal & Local levels, citizen & businesses, and to empower citizens
through access & use of information.
At ULB level, an e-governance shall serve the following three basic requirements in a
user friendly manner
� Information to the office bearers for their effective discharges of their duties, safeguard
the assets of the municipality and for future planning and development of their city.
� Information to councilors to do effective service delivery to their constituents.
� Information to public to pay their duty, update the information on assessment and to get
the right services of the ULB in time.

Town Investment Plan – Peravurani
TNUIFSL
T
N
U
D
P
III
15-10
Final
Report
Best Practices in e-governance:
Five key components of best practices in e-governance system are as below:
� Better service delivery to citizens.
� Improved services for business.
� Transparent & anticorruption.
� Empowerment through information.
� Efficient Government purchasing.
Current Status in Peravurani Town Panchayat
The Town Panchayat has initiated steps for computerization of Birth & Death, Accounts
and Property Tax records. The GoTN has prescribed a list of E-Governance Module to all
the municipalities; hence the Town Panchayat should also start working on E-
Governance module. The following are the standard module suggested by GoTN
• Birth & Death,
• Property Tax
• Non-Tax
• Water Charges
• Building Plan
• F.A.S
• Vehicle Maintenance
• Pay Roll
• Professional Tax
• D&O
• Movable& immovable
• Solid Waste Management
• Grievance Records

Town Investment Plan – Peravurani
TNUIFSL
T
N
U
D
P
III
15-11
Final
Report
15.2.3 REFORMS IN PHYSICAL
INFRASTRUCTURE
Table 15-F: Reforms in Physical Infrastructure
Sectors Suggested Reforms
Water Supply
� Service coverage of water connections to be increased from
current 25% to 85% by 2023-24
� Water supply charges and connection charges need to be revised
on periodic basis i.e. once in 5 years to fund its future investments
in water supply.
� Monthly service charges for the consumers can be increased
minimum of 25% every 5 years.
� For funding its investments in water supply, the Town Panchayat
can consider alternative payment structures for water. It could
offer one-time payment options, where the connection fee is
bundled with usage fees for a number of years. The packages
could be made attractive by offering suitable levels of discounts.
This could result in reduction in collection risk and reduced cost
of billing and collections. The same could be used for other
services, where the collection requires the effort of the municipal
staff.
� To improve the collection levels, the Town Panchayat could look
at providing an incentive and penalty structure for payment of
water taxes and charges.
� For reducing operating and maintenance costs, water leakage
audit, installation of leak detection equipment and replacement of
pipes needs to be done on regular basis.
� Prior to the year 1987-88, there existed a water supply leak
detection system for minimizing the cost of water supply. It can
be now redefined and updated to serve as a record maintained for
Unaccounted for Water (UFW). UFW is the difference between
the volume of water delivered into the distribution system and the
water sold/billed or accounted for by legitimate consumption.

Town Investment Plan – Peravurani
TNUIFSL
T
N
U
D
P
III
15-12
Final
Report
Sectors Suggested Reforms
There is need for maintaining such a record for reducing the
possibilities of revenue leak through unauthorized/illegal
connections.
� It may be mentioned that the percentage of non-revenue water is
ascertained based on the condition assessment of the water supply
system. It is necessary to carry out a detailed study to estimate the
non-revenue losses to enhance the efficiency of the water supply
system. In addition, the Town Panchayat has to under take a
series of initiatives to arrest illegal water connections and
enhance the coverage of House Service Connections (HSC).
� Pumps, motors and distribution network which undergo severe
wear and tear impact power costs of the Town Panchayat besides
reducing operational efficiency. Hence periodic maintenance of
the system with regular investments in up gradation and
replacement of pipelines, motors and pumps needs to be followed
to avoid huge one time expenditure to the maximum extent
possible.
� Privatization in routine maintenance relating to water supply
such as hand pumps can be considered
� Periodic technical training to its engineering cell is required.
� Implementation of 24/7 water supply system with the main
features of:
� Anytime full availability of water.
� Confessional water user charges to slum dwellers and
higher charges for commercial users.
� Reduction of water wastages and unaccounted water
flow by installing water audit equipments, energy
saving equipments, water metering and conducting
periodic water audits, energy audits etc.
� 100% accounting of water received and distributed.
� Water quality monitoring system on daily basis.
� Chlorinators at each pumping station.

Town Investment Plan – Peravurani
TNUIFSL
T
N
U
D
P
III
15-13
Final
Report
Sectors Suggested Reforms
� Increased collection of revenue on water charges at
ULB level by using GIS based billing system on 24*7
systems.
Solid Waste
Management
� Door to door collection of garbage at household level and
segregation of waste at source need to be implemented after
creating suitable awareness level. In case of Peravurani 30 % of
assessments covered by Door to Door collection and 30 % of
assessments involved in waste segregation
� Private sponsorship of bins for waste segregation at house hold
level can be looked into
� Vehicles used in SWM and conservancy activities such as tipper
lorries, tractors; dumper blazer etc can be maintained through
outsourcing arrangement with reputed contractors. The Annual
Maintenance Contract should be all comprehensive covering
various critical clauses in order to protect the Town Panchayat
from possible claims from the Ways to improve the revenue from
charges that are being collected from different commercial
establishments like hotels including kiosks, eating houses,
restaurants, star hotels and retail markets should be studied.
� The Town Panchayat can identify the ways to generate revenue
from Solid Waste by selling compost at market.
� The Town Panchayat can auction to the private parties for
disposal of recyclables.
� Potential for getting carbon credit benefit through the Clean
Development Mechanism (CDM) need to be studied in making a
comprehensive solid waste management scheme.
� Privatization of services for the following activities should be
undertaken to reduce the establishment charges and O&M
charges of Town Panchayat:
o Door to door collection of domestic waste
o Door to door collection of commercial waste, construction
waste and Market waste.

Town Investment Plan – Peravurani
TNUIFSL
T
N
U
D
P
III
15-14
Final
Report
Sectors Suggested Reforms
o Setting up and operation and maintenance of waste treatment
plants.
o Supplying vehicles on rent
o Transportation of waste on contract basis.
� Delegation of powers and fixing accountability should be done for
better management of the system. .
� Human Resources Development
� Special training to unqualified staff
� Refresher courses for all levels of staff about
advances in the field of SWM
� Exposure to elected members
� Design of SWM course to Public Health staff
Street lights
� As a measure to save energy, the The Town Panchayat shall
replace its other existing non-energy saving lamps to energy
saving lamps.
� Meeting the norms of one pole per 30 meters by 2012-13
� Energy Audit needs to be conducted periodically.
� Private parties can be involved for financing, operation and
maintenance of energy efficient street light projects to reduce the
cost incurred for the same.
Roads
� Relaying Bitumen roads once in three years with patch works to
be undertaken based on the need in between years
� Future roads to be laid with dedicated service lanes.
� Relaying roads with recyclable materials like fly ash, can be
explored.

Town Investment Plan – Peravurani
TNUIFSL
T
N
U
D
P
III
15-15
Final
Report
15.3 ADDITIONAL RESOURCE
MOBILIZATION
Peravurani has initiated both the traditional and non-traditional alternatives for resource
mobilization. Resource Mobilization efforts need to be directed towards generating
additional revenue from existing avenues such as property taxes, profession tax, water
charges, service charges and fees and remunerative assets of the Town Panchayat.
Besides this the Town Panchayat would need to take measures to control expenditure in
water supply, solid waste management, street lighting etc.
Additional resource mobilization options such as Daily market fees, Weekly market fees,
Bus stand fees, Fess from Pay & Use toilets, rent from commercial complex and rent
from shopping mall and community hall for the Town Panchayat are discussed in detail
in subsequent paragraphs.
Incase of Peravurani the share Non-Tax revenue to the total revenue has been more than
75% in the last few years. The Non-Tax Revenue has grown at a CAGR of around 16%
in the last 6 years ending .The “Other income” under the Non-tax revenue consists
mainly of Income from Weekly market and Rent from shopping complex accounting for
about 40% of this income. The income from the market fees and the shopping complex
has grown at a CAGR of over 24.48 % in the last few years.
Revenue from Social Assets
Particulars 2003
-04
2004
-05
2005
-06
2006
-07
2007
-08
(Bu
dget
)
2008
-09
(Bu
dget
)
Fees for bay and other
receipts in the Bus Stand 4.78 1.36 1.60 1.28 5.88 1.49
Fees for Pay & Use toilets 0.34 0.90 0.93 0.96 1.00 0.80
Market fees – Daily market
2.61 1.80 1.88 2.17 2.60 3.90
Market fees – weekly
market 0.00 0.00 2.67 3.07 3.11 6.21
Rent on Shopping
Complex 3.81 7.13 6.11 8.06 0.00 9.08
Rent on Community Hall 0.00 0.00 1.61 1.85 0.00 2.13

Town Investment Plan – Peravurani
TNUIFSL
T
N
U
D
P
III
15-16
Final
Report
Particulars Area
Annual Income
(2008-09)
Budget in Rs.Lakhs
Fees for bay and other
receipts in the Bus Stand
2 Acres (located nearer to
the Panchayat office) 1.49
Fees for Pay & Use toilets
a) Bus stand b)Gandhi
Market c) Ward 18 d)
Ward 11.
0.80
Market fees – Daily market NA 3.90
Market fees – weekly
market
2 acres located nearer to
the bus stand 6.21
Rent on Shopping Complex
Office Building(8 nos) ,
Bus stand (22 nos) and
Gandhi Market (8 nos)
9.08
Rent on Community Hall 1 No. at Ward no.9 2.13
From the above table it is clear that Peravurani Town Panchayat earns an average of Rs.5.00
Lakhs from Market fees (Daily & Weekly) and about Rs. 5.69 Lakhs from shopping complex
rentals. The Bus stand fees also significantly contribute a significant share to the Non-Tax
revenue with an average fee of about Rs.2.73 Lakhs.
Based on our analysis and discussions with the officials/stake holders, the following are
additional revenue projects which are conceived in the Capital Investment Plan of the Town
Panchayat:
� Improving weekly market infrastructure by providing RCC shed, CC
pavement and one side compound wall for 800 meters. at an estimated cost of
Rs.70 Lakhs
� Creating vegetable market building near fish market in an area of 11,000
Sq.ft. at an estimated cost of Rs.99 Lakhs
� Creating parking cum commercial complex in an area of 2500 Sq. feet at an
estimated cost of Rs.40 Lakhs

Town Investment Plan – Peravurani
TNUIFSL
T
N
U
D
P
III
16-1
Final
Report
16161616 FINANCIAL OPERATING PLAN
16.1 BACKGROUND- NEED FOR AN FOP
The Financial Operating Plan (FOP) assesses the financial strength of the Town
Panchayat to implement the identified investments. The Financial Operating Plan (FOP)
forecasts the Town’s finances on the basis of certain assumptions on income and
expenditure. The primary objective of the FOP is to ascertain the investment sustenance
capacity of the Town Panchayat under full project scenario of revenue enhancement and
expenditure control.
In the FOP following scenarios are envisaged
Scenarios Details
Base Case Scenario No New Projects and No Reforms
(“Business as Usual” Scenario)
Full Project - Scenario II (Funding
pattern based on Prudent Financial
Norms)
Implementation of all Projects required
for the next 15 years with Reform
implementation
Full Project – Scenario III (Funding
pattern based on borrowing capacity of
the Town)
Implementation of all Projects required
for the next 15 years with Reform
implementation with additional External
support to cater the financial needs of the
Town

Town Investment Plan – Peravurani
TNUIFSL
T
N
U
D
P
III
16-2
Final
Report
The key reforms are highlighted in Table below. The total reforms suggested have been
elaborated in Reforms Implementation Schedule (Annexure IV
Key reforms
Particulars Current practice Reform suggested
Revision in
Property tax rates
Revision once in 10 years 25% increase in every 5
years
Service level
Coverage (Water
Supply- Number of
assessments)
24.80% 4% to 5% increase every
year achieving 85%
coverage by 2023-24
Revision in Initial
Deposit for New
Water Connections
Adhoc revision Rs.2000 increase every 5
years for each new
connection
Revision in Water
Charges
Adhoc revision 25% increase every 5 years
Revision in Initial
Deposit for New
UGD Connections
No UGD currently No UGD Proposed in
Capital Investment Plan
Revision in
Monthly user
charges for UGD
No UGD currently No UGD Proposed in
Capital Investment Plan
16.2 FINANCIAL SUSTAINABILITY
The financial sustainability Analysis is carried out with the basic assumption that the
Town Panchayat will carry out reforms and projects envisaged under full project
scenario. The Financial Operating plan prepared for Peravurani Town Panchayat
evaluates the Town Panchayat’s financial position based on the base care scenario and
the full project scenario which are described below:

Town Investment Plan – Peravurani
TNUIFSL
T
N
U
D
P
III
16-3
Final
Report
16.2.1 BASE CASE SCENARIO
In the base case scenario, the finances of the Town are forecast for next 15 years without
taking into consideration any new projects envisaged in Capital Investment Plan. .
Current practices with regard to tariff revision of key services are only considered.
Additional resources mobilized through various initiatives such as resource mobilization
through enhanced revision of property tax rates and the number of assessments (based on
projected population increase), increased revenue realization through faster growth in
service charges and fees including revision of user charges and connection charges for
water supply, other income etc are loaded to the FOP in the base case scenario. Routine
revenue expenses including Operations and Maintenance of existing assets have also
been considered and loaded to the FOP. Revenue surplus thus generated indicates
Town’s capacity to service the usual capital expenditure in the normal course of running
its operations.
16.2.2 FULL PROJECT SCENARIO BASED ON
PRUDENT FUNDING NORMS
Full Project scenario for Peravurani has been worked out based on estimated demand
supply analysis of various physical and social infrastructure requirements of the Town
and feedback of Operating Working Group’s (OWG’S) consultation on the Town’s needs
for the next 15 years. The financial mix for funding these projects has been based on
prudent financial norms of funding and existing practices of funding currently being
followed today. The projects identified are vital for meeting the basic requirements of the
Town as per the infrastructure standards. Furthermore all the projects identified fall under
the obligatory functions under the 12th Schedule. In the event of the Town not
undertaking the project, the key problems would be poor infrastructure resulting in poor
service delivery and loss of potential revenue from new revenue streams. To overcome
these issues the framework for FOP is developed taking into account existing strengths of
the Town and also reducing the inefficiencies in the system.

Town Investment Plan – Peravurani
TNUIFSL
T
N
U
D
P
III
16-4
Final
Report
Phasing of the identified projects is done based on the possible year of construction,
demand supply gap analysis and investment priority of the OWG. Implications of the
investments worked out in terms of external borrowing required & the resulting debt
servicing commitments, external support in form of grants and additional operation and
maintenance expenditure anticipated due to the new projects identified have been worked
out for the next 15 years. Debt servicing capabilities, gaps in required investments from
Town for the said projects vs the actual availability with the Town Panchayat for the
Town’s contribution for the said projects has been worked out to estimate the extent of
Town’s capability to meet its contribution for financing the new projects identified under
Capital Investment Plan.
The implications on the investment and borrowing capability of the Town for all the
identified projects is worked out taking into consideration of all suggested reforms.
The objective of working out with all the reforms mainly to highlight the importance of
implementing the reforms on improving the financial capability of the Town for
successful implementation of the projects envisaged in CIP.
16.2.3 FULL PROJECT SCENARIO BASED ON
BORROWING CAPACITY OF THE TOWN
Full project scenario based on borrowing capacity of the town is worked out to overcome
the financial inability of the Town in order to bring in all the projects envisaged in the
Capital Investment Plan. In this case Town’s own contribution for the project has been
reduced to match with its constraint financial position by increasing an additional
external funding pattern to suit the financial leverage of the Town on implementing all
the suggested Capital Investment Plan.

Town Investment Plan – Peravurani
TNUIFSL
T
N
U
D
P
III
16-5
Final
Report
16.3 ASSUMPTIONS FOR FOP
This FOP is based on a whole range of assumptions related to income and expenditure.
These are critical to understand the financial projections worked out, sustenance of the
projected increase in revenue and expenditure under various scenarios and surplus thus
generated. Assumptions regarding interest rates, repayment terms and conditions,
financing pattern have also been explained in subsequent paragraphs. Assumptions
regarding additional Operation and Maintenance Expenses for the new projects identified
have also been provided. The assumptions would help in understanding the extent of
investment sustenance for future projects envisaged.
16.3.1 REVENUE INCOME
In case of taxes and non tax revenue such as property taxes, water charges and solid
waste management charges where the base and basis of revenue is fairly well known and
predictable the likely revenue is forecast based on certain assumptions regarding growth
in number of assessment, revision in average revenue per property (for property taxes),
revision in charges/Tariffs (water charges and solid waste charges). Table 16-A and
Table 16-B, lists out the assumptions with regard to forecasting income from property
tax, water charges and solid waste charges respectively. Assumptions regarding other
sources of revenue income have been given in Table 16 C. Tables indicate the
assumptions in revenue income in base case scenario and investment scenario.
16.3.1.1 PROPERTY TAXES
Table 16-A : Key assumptions for forecasting income from Property Taxes
Description Current Level Base Case Scenario Investment Scenario
Annual Growth in
Number of Assessment
2 %
(From 2003-04
till 2007-08)
Projected based on the
estimated increase in
population of the city
Projected based on the
estimated increase in
population of the city

Town Investment Plan – Peravurani
TNUIFSL
T
N
U
D
P
III
16-6
Final
Report
Source: Analysis
16.3.1.2 WATER CHARGES
Table 16-B: Key assumptions for forecasting income from Water Charges
Description Current Level Base Case Scenario Investment Scenario
% OF WATER CONNECTIONS TO PROPERTY TAX ASSESSMENT
2007-08 24.80%
2013-14 45% 45%
2017-18 61% 61%
2023-24 85% 85%
INITIAL DEPOSIT FOR NEW WATER SUPPLY CONNECTIONS ( Rs. per connection)
Domestic (Rs.)
From 2009-10 till 2013-14 Rs.2000 Rs.2000 Rs.2000
From 2014-15 till 2018-19 Rs.2000 Rs.4000
From 2019-20 till 2023-24 Rs.4000 Rs.6000
Non-Domestic (Rs.)
From 2008-09 till 2012-13 Rs.4000 Rs.4000 Rs.4000
From 2013-14 till 2017-18 Rs.4000 Rs.6000
From 2018-19 till 2022-23 Rs.6000 Rs.8000
WATER CHARGES (per month)
Domestic (Rs.)
From 2009-10 till 2013-14 Rs. 50 Rs. 50
From 2014-15 till 2018-19 Rs. 50 Rs. 62.50 (25%
increase)
From 2019-20 till 2023-24 Rs. 62.50(25% increase)
Rs. 78.13 (25% increase)
Non-Domestic (Rs.)
From 2009-10 till 2013-14 Rs.100 Rs.100
From 2014-15 till 2018-19 Rs.100 Rs.125 (25% increase)
From 2019-20 till 2023-24 Rs.125 (25%
increase)
Rs.156.25 (25%
increase)
Source: Analysis
Periodic Increase in
Average Revenue per
property (%)
25% increase in every
10 years
25% increase in every
5 years

Town Investment Plan – Peravurani
TNUIFSL
T
N
U
D
P
III
16-7
Final
Report
16.3.1.3 OTHER SOURCES OF REVENUE INCOME
Table 16-C: Assumption for Income
Particulars CAGR-(%) Projected
growth
Rates
(%)
Notes
Profession
Tax
16%
(2003-04 till
2008-09)
15% -
External
Sources
(Assigned
Revenue+
Devolution
Funds + Grants
&
Contribution)
> 20% (2003-
04 till 2008-09)
15%
Service
Charges &
fees(
Excluding
Water
Charges)
4% 7% to 8% 8% growth rate assumed on
account Service charges & other
fees excluding water charges.
Other Income Inconsistent
trend
10% 2009-10 (Budget) is taken as the
base year for projections. This
includes project overhead
appropriation expenses.
Source: Analysis based on past financials provided by Peravurani Town Panchayat

Town Investment Plan – Peravurani
TNUIFSL
T
N
U
D
P
III
16-8
Final
Report
16.3.2 REVENUE EXPENDITURE
16.3.2.1 CURRENT REVENUE EXPENDITURE
Table 16-D: Assumption for Revenue Expenditure
Particulars CAGR-(%) Projected Growth
Rates (%)
Personnel Cost &
Retirement Benefits ( Salaries)
Salaries- 12% (2003-04
till 2007-08)
Retirement Benefits-
Inconsistent trend
6%
Operating Expenses 5% 7%
Repairs & Maintenance Inconsistent Trend 6%
Administrative Expenses Inconsistent Trend 5%
Source: Analysis based on past financials provided by Peravurani Town Panchayat
16.3.2.2 ADDITIONAL O&M EXPENDITURE DUE TO SUB-PROJECTS
This has already been covered in Chapter 11: Asset Management Plan: Table 11 E- O&M
for Proposed works
16.3.2.3 FUTURE DEBT OBLIGATIONS
Table 16-E: Key assumptions for forecasting future debt obligations
Sector Tenure Moratorium Rate of Interest (%)
Water Supply, UGD 20 5 10.00
Roads, Storm Water Drains 10 2 9.00
Others 5 NIL 9.00
Source: Analysis

Town Investment Plan – Peravurani
TNUIFSL
T
N
U
D
P
III
16-9
Final
Report
16.3.3 FUNDING MECHANISM
Table 16-F: Financing Pattern for Proposed projects as per prudent Funding norms
Particulars Loan Grant TOWN Share/
Public
Contribution
Notes
Water Supply 50 30 20
Sanitation 50 50
Storm Water Drainage 60 30 10
Solid Waste
Management
60 30 10
Roads, Traffic and
Transportation
60 30 10
Street Lighting 60 30 10
Socio-Economic Infrastructure
School Building 100
Parks and Playgrounds 50 50
Daily and Weekly Market 90 10 PPP
Slum Improvement- IHSDP
80
20**
** Equal
Contribution from
the TOWN and the
beneficiaries
Burial Ground Improvement 50 50
Gassifier 50 50
Slaughter House 50 50
Land Development 90 10
Community Hall 50 50
Municipal Building 50 50
Source: Analysis

Town Investment Plan – Peravurani
TNUIFSL
T
N
U
D
P
III
16-10
Final
Report
16.4 OUTCOME OF FINANCIAL OPERATING
PLAN
16.4.1 BASE CASE SCENARIO (“BUSINESS AS USUAL
SCENARIO”)
In the Base Case Scenario, the finances of TOWN are forecast for the next 15 years without
taking into consideration any new projects envisaged in Capital Investment Plan (CIP). The
past trends in growth rates in revenue income and expenditure are assumed to continue over
the next 15 years. No new revenue sources such as user charges for service delivery systems
of the Town are envisaged under this scenario. Revenue surplus thus generated indicates
Town’s capacity to service the usual capital expenditure in the normal course of running its
operations. Table 16 G indicates the revenue surplus position of the Town over the 15 year
period.
The following are the outcome under this scenario:-
The projected cumulative revenue surplus (Closing Balance) of the TOWN shows a healthy
surplus position over the 15 year period with a revenue surplus touching Rs.3562.60 Lakhs in the
year 2023-24 after meeting its current debt obligations.

Town Investment Plan – Peravurani
TNUIFSL
16-11
Final
Report
Table 16-G : Financial Operating Plan of Peravurani- Base Case Scenario

Town Investment Plan – Peravurani
TNUIFSL
16-12
Final
Report
T
N
U
D
P
III
16.4.2 FULL PROJECT SCENARIO WITH SUGGESTED
REFORMS
Under FULL REFORM Scenario, the FOP for full project has been worked out as under:
• Funding pattern as per Prudent Financial norms of funding – Scenario II
• Funding pattern based on the borrowing capacity of the TOWN – Scenario III
The same has been elaborated under heading 16.4.2.1 and 16.4.2.2 respectively
16.4.2.1 FULL PROJECT SCENARIO WITH REFORMS AND FUNDING
PATTERN BASED ON PRUDENT FINANCIAL NORMS
The cash flows from the new projects under this scenario are shown in Table 16 H. The
financial impact for the TOWN in implementing full projects through additional resources
generated on account of reforms suggested and as per the prudent financial norms of funding
is given in Table 16 I
The following are the outcome under this scenario:-
Financing Criteria Results obtained
Whether new project O&M is being met by the
revenue of the TOWN?
The TOWN is able to meet the O&M of the new
projects after implementing all reforms
suggested as additional revenues are realized.
Whether TOWN is able to meet its debt
repayment obligations?
TOWN is unable to meet its loan repayment
obligations. The same has been shown in Table 16 J
with DSCR is less than 1.25 times (Minimum
acceptable DSCR norms)
Whether TOWN is able to contribute the
required amount as per prudent funding norms?
The TOWN would not be able to meet its
financial contribution to new projects as
required under prudent financial norms of
funding
To address this issue, the TOWN would require additional external support as the
capacity of the TOWN to borrow and meet its contribution under this scenario is limited.
Hence additional external support over and above the prudent financial norms is required
to match with that of the borrowing capacity of the town. The same has been discussed
under heading 16.4.2.2

Town Investment Plan – Peravurani
TNUIFSL
16-13
Final
Report
T
N
U
D
P
III
Table 16-H: Full Project Cash Flow - As per Prudent Financial norms

Town Investment Plan – Peravurani
TNUIFSL
16-14
Final
Report
T
N
U
D
P
III
Table 16-I: Financial Operating Plan of Peravurani- Full Project with Reforms-Prudent Funding Norms
Table 16-J: Calculation of Debt Service Coverage Ratio (DSCR) With FULL PROJECT WITH REFORMS- As per Prudent Financial Norms

Town Investment Plan – Peravurani
TNUIFSL
16-15
Final
Report
16.4.2.2 FULL PROJECT SCENARIO WITH REFORMS BASED ON THE
BORROWING CAPACITY OF THE TOWN
Under this FULL REFORM Scenario, to match the limited borrowing capacity of the
town, an additional external support has been introduced in the funding pattern; the FOP
for full project has been worked out as under:
The cash flows from new projects is shown in Table 16 K and the financial impact in
implementing the Full projects WITH reforms but with additional external support is
given in Table 16 L
The following are the outcome under this scenario:-
Financing Criteria Results obtained
Whether new project O&M is being met by the
revenue of the TOWN?
The TOWN is able to meet the O&M of the new
projects after implementing all reforms
suggested as additional revenues are realized
Whether TOWN is able to meet its debt
repayment obligations?
TOWN is now able to borrow only limited funds
required for the full project implementation. The
same has been shown in Table 16 M where the
DSCR is more than 1.25 times for the current &
new loans (Minimum acceptable DSCR norms is
1.25 )
Whether TOWN is able to contribute the
required amount as per additional external
support based on its borrowing capacity?
TOWN is now able to contribute only a
minimum amount required for the projects
based on its financial strength with additional
external funding.

Town Investment Plan – Peravurani
TNUIFSL
16-16
Final
Report
Table 16-K: Full Project Cash Flow - As per Borrowing Capacity

Town Investment Plan – Peravurani
TNUIFSL
16-17
Final
Report
Table 16-L: Financial Operating Plan of Peravurani - Full Project with Reforms-Borrowing Capacity
Table 16-M: Calculation of Debt Service Coverage Ratio (DSCR) With FULL PROJECT WITH REFORMS- As per Borrowing Capacity

Town Investment Plan – Peravurani
TNUIFSL
16-18
Final
Report
The table below shows the funding and borrowing capacity of the TOWN under “Full Project
Scenario WITH Reforms”
Table 16-N: FULL PROJECT SCENARIO WITH REFORMS -Funding requirements as
per Prudent Funding Norms vs. Funding Possibilities based on borrowing capacity
Particulars
Full project Scenario-
Funding based on
prudent financial
norms (Rs.lakhs)
Full Project Scenario –
Funding based on
borrowing capacity
(Rs.lakhs)
Loan Amount 1299.11 111.71
External Support 1276.28 2671.76
TOWN’s
Contribution 572.41 364.33
Public Contribution 0 0
PPP 0 0
Project Cost 3147.80 3147.80
% of loan on
Project cost 41% 4%
Funding pattern based on Borrowing Capacity of the Town
Loan
4%
Grant
84%
TP's Share
12%
Loan
Grant
TP's Share

Town Investment Plan – Peravurani
TNUIFSL
16-19
Final
Report
• As seen from the above table, the TOWN can contribute Rs.3.64 Crores as its
share towards funding of projects identified under CIP on account of reform
implementation which is 65% of the required contribution of Rs.5.72 Crores
under the prudential funding norms.
• The TOWN’s capability to borrow is Rs.1.12 crores which is 3% of the total
project cost.
• Total external support required would be Rs.26.72 Crores in order to implement
all the identified projects envisaged under CIP.
The full project investment proposed for the Town is to the tune of Rs. 3147.80 lakhs, the
details of sector wise financing pattern is presented in the following tables.
Table 16-O Sector-wise Full Project Investments.
Project Sector
Total Investment
(Rs. In Lakhs)
Water Supply 146.97
Sewerage 20.10
Sanitation 24.43
Storm Water Drainage 882.26
Solid Waste Management 317.63
Roads, Traffic and Transportation 790.70
Street Lighting 52.11
Slums and Urban Poverty 135.89
Socio-Economic Infrastructure 777.71
Total 3147.80

Town Investment Plan – Peravurani
TNUIFSL
16-20
Final
Report
Storm Water
Drainage
27%
Solid Waste
Management with
gear and bins
10%
Roads, Traffic and
Transportation
25%
Street Lighting
2%
Slums and Urban
Poverty
4%
Socio-Economic
Infrastructure
25%
Water Supply
5%Sanitation
1%
Sewerage
1%
Out of the total project costs, the share of Town Panchayat is Rs. 364.33 lakhs, which
would be financed through internal accruals, after implementing the reforms with
additional external borrowings. The Town Panchayat would mobilize the resources to the
tune of 12% from their internal accruals with the remaining 88 % funding from lending
agencies by way of Grant and Loan components.
Full reform implementation by the Town within the scheduled time frame (as shown in
Annexure V – Reform Implementation schedule) backed by strong external support is a must
for bringing in projects required for improving the Town over the next 15 years. The reform
efforts of the Town need to be supported and rewarded by financial assistance from funding
agencies and strong external support in order to implement all projects suggested under CIP.

POPULATION PROJECTIONS FOR PERAVURANI
Arithmetical
Increase
Projected population = P
+ni
Where P = Present
Population
And ni = Average
increase per decade
Year Population Increment
1981 18626
1991 19257 631 3.4
2001 21045 1788 9.3
Total 2419
Average 1210
Projected Population
Percentage
Increase
2009 22013 0.8 4.60 2024
2013 22496 1.2 2.20
2018 23101 1.7 2.69
2023 23706 2.2 2.62 14 2009
2010
2014
Geometrical
Increase
Method 2015
Projected Population
Pn = P(1+Rg)^n 2016
where Rg = Geometric
mean 2017
n=number of decades 2018
2019
Census year Pop Increment
Geometric
growth 2020
1981 18626 2022
1991 19257 631 0.03 2023
2001 21045 1788 0.09 2024
Geometric mean Rg 0.06
Year Projected Population
Percentage
increase
2009 21984 0.8 4.46
2013 22469 1.2 2.21
2018 23091 1.7 2.77
2023 23729 2.2 2.77

POPULATION PROJECTIONS FOR PERAVURANI
Incremental
Increase
Projected Population Pn
= P2001+nx+(n(n+1)/2)y
Where P = Present
Population
Pn = Projected
population for nth decade
n= number of decades
x=average increase per
decade
y=average incremental
increase per decade
Year Population Increment
Incremental
increase
1981 18626
1991 19257 631 631
2001 21045 1788 1157
Total 2419 1788
Average 1210 894
Year projected population
Percentage
increase
2009 22656 0.8 7.66
2013 23676 1.2 4.50
2018 25153 1.7 6.24
2023 26853 2.2 6.76

POPULATION PROJECTIONS FOR PERAVURANI
Least
Squares
Year (X) Population (Y) in lakhs X^2 XY
1981 18626 3924361 36898106
1991 19257 3964081 38340687
2001 21045 4004001 42111045
5973 58928 11892443 117349838.00
n = number of items = 3
Y = a + bX
ΣY = a(n) + bΣX Eq 01
ΣXY = aΣX + bΣX^2 Eq 02
3a + 5973b = 58928
5973a + 11892443b 117349838.00
rough work
5973a+11892243b 117325648 1991 5973 11892243
5973a + 11892443b 117349838 11892443
200b = 24190 200
b = 120.95
3a + 5973b = 58928 1668747.15
3a = -663506.35
a = -221168.7833
Solving the equation Y =
a + bX
Year Projected Population
Percentage
Increase
2009 21820 3.68
2013 22304 2.22
2018 22908 2.71
2023 23513 2.64

POPULATION PROJECTIONS FOR PERAVURANI
Graphical
Method
Year Population
Percentage
increase
1981 18626 #REF!
1991 19257 3.39
2001 21045 9.28
2009 25000 38000 80.57
2013 26500 40000 5.26
2018 28000 42500 6.25
2023 29500 47000 10.59
Year
Arithmetic
Increase
Geometric
Increase
Incremental
Increase
Least
Squares
Graphical
Method Average
1981 18626 18626 18626 18626 18626 18626
1991 19257 19257 19257 19257 19257 19257
2001 21045 21045 21045 21045 21045 21045
2009 22013 21984 22656 21820 25000 22695
2013 22496 22469 23676 22304 26500 23489
2018 23101 23091 25153 22908 28000 24451
2023 23706 23729 26853 23513 29500 25460
R2 = 0.9449
0100002000030000400005000060000700008000090000
100000110000120000
1961 1971 1981 1991 2001 2011 2021

Annexure II: Norms Vs Current Status for Peravurani
Reform Agenda for Peravurani Town Panchayat
Sector Indicators Unit Current Status Norms/Standard
Daily per capita supply Litres 115 70/100
Roads covered with distribution
network Percent 41 100
Storage capacity with respect to supply Percent 52 33
Service connection Percent 25 85
Collection efficiency in water charges Percent 62.88% (2008-09) 100
Storm Water Drainage
Roads covered with Storm water
drainage Percent 1.46 130
Waste generation per Capita per day Grams 66.2 < 350 grams
Collection efficiency Percent 100 100
Conservancy staff per Km Persons 0.3 2
Door-Door collection
efficiency(Assessments covered) Percent 30.1 100
Assessments involved in waste
segregation Percent 30.1 100
Per capita road length Meters/Person 3 1.5
Percentage of Surface roads Percent 49 100
Street Lighting Spacing between lamps Meters 46.5 30
Collection efficiency in Property taxes Percent 64.80%(2008-09) 100
Revision in Property tax Years Once in 10 years Once in 5 years
Privatisation Areas
There is no privatization of any
sectoral services
Solid Waste Management,
Street Light Maintenance,
Pumping Station Maintenance,
STP Maintenance and Hiring of
Vehicles
E-Governance Modules
The Town Panchayat has
initiated steps for
computerization of Birth &
Death, Accounts and Property
Tax records 18Institutional Reforms
Urban Finance
Water Supply
Roads
Solid Waste management


Annexure IV: Project Implementation Schedule for Peravurani
Peravurani
Particulars Current Status 2009-10
2010-11
2011-12
2012-13
2013-14
2014-15
2015-16
2016-17
2017-18
2018-19
2019-20
2020-21
2021-22
2022-23
2023-24
Technical Financial
Water Supply
Creating Distribution network for 15 Km by 2023-24 in
phases
Identiifed based on Demand supply Gap Analysis and to be implemented in phases ULB
Government/Financial Institution. ULB
Providing 1 No 1 lakh capacity OHT in Nellakandan II
street in ward No.08.
Identiifed based on Demand supply Gap Analysis & OWG Meeting and to be implemented during 2010-11 ULB
Government/Financial Institution. ULB
Sewerage and Sanitation
Purchasing Sullage lorry for waste water collection
purpose
Identified during OWG meeting and to be implemented in 2014-15 ULB
Government/Financial Institution. ULB
Creating public conviniences in ward Nos. 06, 10, 11 and
12
Identified during OWG meeting and to be implemented in Phases ULB
Support from Government/ULB
Assistance

Annexure IV: Project Implementation Schedule for Peravurani
Particulars Current Status 2009-10
2010-11
2011-12
2012-13
2013-14
2014-15
2015-16
2016-17
2017-18
2018-19
2019-20
2020-21
2021-22
2022-23
2023-24
Assistance
Storm Water Drainage
Creating double sided drains for 20 Kms by 2013-14,
Identified during OWG meeting
and to be implemented in
Phases ULB
Support from Government ,
Financial Institution and ULB
Creating single side drainage in pudhu road in ward No.15
for a length of 2 Km by 2013-14
Identified during OWG meeting
and to be implemented in
Phases ULB
Support from Government ,
Financial Institution and ULB
Creating drainage line in Neelakandapuram II street in ward
Nos. 08 and 09 for a length of 2 Km by 2013-14
Identified during OWG meeting
and to be implemented in
Phases ULB
Support from Government ,
Financial Institution and ULB
Creating drainage line connecting Hospital Chidambaram,
Devadas road and Anandavalli vaikkal for a length of 3 Km
by 2013-14
Identified during OWG meeting
and to be implemented in
Phases ULB
Support from Government ,
Financial Institution and ULB
Creating 3 Km drainage in KK nagar and Pandhakulam in
ward No. 04 by 2013-14
Identified during OWG meeting
and to be implemented in
Phases ULB
Support from Government ,
Financial Institution and ULB
Creating 3 Km drainage in ward No. 05 connecting
Muthalagappa road and crossing roads to CMB vaikkal by
2013-14
Identified during OWG meeting
and to be implemented in
Phases ULB
Support from Government ,
Financial Institution and ULB
Creating totally 59.5Km drainage in ward No. 13
,07,16,,14,17&18 by 2016-17
Identified during OWG meeting
and to be implemented in
Phases ULB
Support from Government ,
Financial Institution and ULB
Solid Waste Management
Contribution for creating scientific land fill site
Identified during OWG meeting and Demand and Supply Analysis ULB
Support from Government , Financial Institution and ULB
Public awareness for Waste segregation and D-D collection
Identified during Demand and Supply Analysis ULB
Support from Government , Financial Institution and ULB
Procuring segregation bins for each assessmentsIdentified during Demand and Supply Analysis ULB
Support from Government , Financial Institution and ULB
Purchasing protective gear for conservancy workersIdentified during Demand and Supply Analysis ULB
Support from Government , Financial Institution and ULB

Annexure IV: Project Implementation Schedule for Peravurani
Particulars Current Status 2009-10
2010-11
2011-12
2012-13
2013-14
2014-15
2015-16
2016-17
2017-18
2018-19
2019-20
2020-21
2021-22
2022-23
2023-24
Assistance
Roads, Traffic & Transportation
Converting 3.35 Km WBM road into BT road
Identiifed based on Demand
supply Gap Analysis and to be
implemented ULB
Support from
Government/Financial
institution, ULB Contribution
Converting 31.72 Km Kutcha road into BT road
Identiifed based on Demand
supply Gap Analysis and to be
implemented during 2010-11 to
2018-19 ULB
Support from
Government/Financial
institution, ULB Contribution
Creating round about in Sedhu road junction, Avanam
road junction, Railway station road junction and in
Railway TCMF road junction
Identiifed based on Demand
supply Gap Analysis and to be
implemented in Phases ULB
Support from
Government/Financial
institution, ULB Contribution
Converting 7 Km BT single lane road into intermediate
lane road.
Identiifed based on Demand
supply Gap Analysis and to be
implemented ULB
Support from
Government/Financial
institution, ULB Contribution

Annexure IV: Project Implementation Schedule for Peravurani
Particulars Current Status 2009-10
2010-11
2011-12
2012-13
2013-14
2014-15
2015-16
2016-17
2017-18
2018-19
2019-20
2020-21
2021-22
2022-23
2023-24
Assistance
Street Lighting & Energy Saving
Mechanism
Replacing 40W Tube lights into 36 W
Identiifed based on Demand
supply Gap Analysis and to be
implemented in Phases PSP
Support from
Government/Financial
institution, ULB Contribution
Installing electronic chokes for all tube light fittings
Identiifed based on Demand
supply Gap Analysis and to be
implemented in Phases PSP
Support from
Government/Financial
institution, ULB Contribution
Replacing 250 W 274 Nos SVL with (4 X 24) W T5 lamps
Identiifed based on Demand
supply Gap Analysis and to be
implemented in Phases PSP
Support from
Government/Financial
institution, ULB Contribution
Providing 243 additional fittings to cater future demand
(30% considered)
Identiifed based on Demand
supply Gap Analysis and to be
implemented in Phases PSP
Support from
Government/Financial
institution, ULB Contribution

Annexure IV: Project Implementation Schedule for Peravurani
Particulars Current Status 2009-10
2010-11
2011-12
2012-13
2013-14
2014-15
2015-16
2016-17
2017-18
2018-19
2019-20
2020-21
2021-22
2022-23
2023-24
Assistance
Slums and Urban Poverty
Infrastructure scheme for un-notified slum areas
Identified based on Demand
Supply Gap analysis and during
OWG's consultation meetings ULB
Support from Government
and ULB
Socio-Economic InfrastructureImproving weekly market infrastructure by providing
RCC shed, CC pavement and one side compound wall for
800 meters. Identified during OWG meeting ULB
Support from Government
and ULB
Creating vegetable market building near fish market in an
area of 11,000 Sq.ft.
Identified during OWG meeting
and to be implemented in 2011-
12 ULB
Support from Government
and ULB
Creating parking cum commercial complex in an area of
2500 Sq. feet
Identified during OWG meeting
and to be implemented in 2014-
15 ULB
Support from Government
and ULB
Laying tiles and providing water supply provision in the
existing Slaughter house block Identified during OWG meeting ULB
Support from Government
and ULBCreating compound wall in all burial grounds except
Avanam road burial ground and provide all other
infrastructure facilities in all burial grounds Identified during OWG meeting ULB
Support from Government
and ULB
Creating Gassifier crematorium in Kooblikadu burial
ground Identified during OWG meeting ULB
Support from Government
and ULB
Creating green spaces in approved layouts (Road Side
Park can be developed in ward No. 02 along Pattukottai
road, park in a portion of 1 acre land available in Selva
Vinayakapuram ) Identified during OWG meeting ULB
Support from Government
and ULB
Creating 500 meter walking track, providing ornamental
lights, desilting 3 acre lake area, providing boating
facilities in Vannan kulam in ward No. 15. Identified during OWG meeting ULB
Support from Government
and ULB
Strengthening banks and desilting 3 acre Old Peravurani
Theppa Kulam in ward no. 13 and 14. Identified during OWG meeting ULB
Support from Government
and ULB
Strengthening banks and desilting Kublikadu Kulam (2
Nos) in ward no. 12. Identified during OWG meeting ULB
Support from Government
and ULB
Strengthening banks and desilting 1.5 acre Selva
Vinayagar Kulam in ward no. 17. Identified during OWG meeting ULB
Support from Government
and ULB

Annexure V: Reforms Implementation Schedule For Peravurani
Reforms
Current status 20
09
-10
20
10
-11
20
11
-12
20
12
-13
20
13
-14
20
14
-15
20
15
-16
20
16
-17
20
17
-18
20
18
-19
20
19
-20
20
20
-21
20
21
-22
20
22
-23
20
23
-24
Property Tax
100% Collection Efficiency
64.80% (current
collection)
Mandatory Implementation of Revision of Property
Tax once in every five years is required Once in 10 years
Digitization of the property maps through GIS Not done
Computerization of Property tax records To be Initiated
Introducing alternate methods of tax payment
(ECS/EFT/Online Payment)
Currently in Municipal
office only
Other Reforms in property taxes as mentioned in
Chapter 15 of this report Limited extent
Water Supply
Service coverage of water connections to be
increased from current 24% to 85% 24% 29% 33% 37% 41% 45% 49% 53% 57% 61% 65% 69% 73% 77% 81% 0.85
Revision of Water supply charges and initial deposit
for new water connection Ad hoc basis
Peravurani
85%

Annexure V: Reforms Implementation Schedule For Peravurani
Reforms
Current status 20
09
-10
20
10
-11
20
11
-12
20
12
-13
20
13
-14
20
14
-15
20
15
-16
20
16
-17
20
17
-18
20
18
-19
20
19
-20
20
20
-21
20
21
-22
20
22
-23
20
23
-24
One time payment options for monthly water
charges Not done
Incentive and penalty structure for payment of water
taxes and charges. Not done
Water Leakage Audit for Un-accounted for Water
(UFW) Not done
Periodic maintenance of Water supply systems Ad hoc maintenance
Periodic Training to Water Supply Staff
Not done. To be
imparted on a regular
basis
Privatization in routine maintenance relating to water
supply Not done

Annexure V: Reforms Implementation Schedule For Peravurani
Reforms
Current status 20
09
-10
20
10
-11
20
11
-12
20
12
-13
20
13
-14
20
14
-15
20
15
-16
20
16
-17
20
17
-18
20
18
-19
20
19
-20
20
20
-21
20
21
-22
20
22
-23
20
23
-24
Storm Water Drainage
Achieving drain length of 44 percent of road length
by 2018-19 1.50% 30%
Solid Waste Management
Door to door collection of garbage at household
level and segregation of waste at source
30% of assessments
covered by Door to
Door collection and 30
% of assessments
involved in waste
segregation
Private Sponsorship of bins for waste segregation at
source Not done
Annual Maintenance Contract for Vehicles used in
SWM Not done
Potential for getting carbon credit benefit through
the Clean Development Mechanism (CDM) need to
be studied in making a comprehensive solid waste
management scheme Not undertaken
Periodic Training to Public Health Staff Regularly
44%

Annexure V: Reforms Implementation Schedule For Peravurani
Reforms
Current status 20
09
-10
20
10
-11
20
11
-12
20
12
-13
20
13
-14
20
14
-15
20
15
-16
20
16
-17
20
17
-18
20
18
-19
20
19
-20
20
20
-21
20
21
-22
20
22
-23
20
23
-24
Roads, Traffic & Transportation
Relaying Bitumen roads once in three years with
patch works to be undertaken based on the need in
between years ( Through use of recyclable materials
) Adhoc basis
Street Lighting & Energy Saving
Mechanism
Achieving 38 meters street light spacing by 2023-24 46.50 metres 42 Meters 40 Meters
Energy Audit Studies
To be Initiated. At
present None
Private parties can be involved for financing,
operation and maintenance of energy efficient street
light projects to reduce the cost incurred for the
same. Not initiated
38
Meter

Annexure V: Reforms Implementation Schedule For Peravurani
Reforms
Current status 20
09
-10
20
10
-11
20
11
-12
20
12
-13
20
13
-14
20
14
-15
20
15
-16
20
16
-17
20
17
-18
20
18
-19
20
19
-20
20
20
-21
20
21
-22
20
22
-23
20
23
-24
Municipal Assets
Creation and updating the Comprehensive asset
register with regard to land and building Not Comprehensive
Valuation of assets and liabilities of the Municipality Not done
Periodic maintenance of Social Infrastructure Ad hoc
Accounting Reforms
Comprehensive Budgeting incorporating O&M costs
of various assets Not Done
Periodic Training to Accounting Staff Regularly
Finalisation of accounts and completion of audit of
accounts with in that specific year Not done
Zero based budgeting would need to be carried out
for continual monitoring of budgets and cash flow
management Not done

Page 1 of 3
Minutes of the Inception Report review meeting for the consultancy
assignment for City Investment Plan (CIP) prepared by M/s. Darashaw &
Company Limited for Annamalai Nagar, Vadalur, Tharangampadi,
Ottenchataram, Thudiyalur, Thirupattur, S. Kannanur and Peravurani Town
Panchayats (Cluster 1) held on 28.08.2009 at 3.00 PM at TNUIFSL office.
Members Present:
S.No. Name Designation / Organisation
1 Mr.T.P.Subramanian President, Thudiyalur
2 Mr.A.Mahalingam EO, Thudiyalur
3 Mr.R.Subramanian Sanitary Inspector, Tharangampadi
4 Mr.A.Amanulla EO, Tirupattur
5 Mr.M.Jeyakodi EO, Ottenchataram
6 Mr.S.Gunalan EO, S.Kannanur
7 Mr.T.Srinivasan Junior Assistant, Vadalur
8 Mr.D.Ranganathan EO, Annamalai Nagar
9 Mr.B.Janarthanan EO,Peravurani
10 Mr.G.Habeeb Raja Jr.Asst, Tirupattur
11 Mr.D.Rajendiran AVP,TNUIFSL
12 Mr.U.Vijayaraghavan DM, TNUIFSL
13 Ms.K.Vyjayanthi Head-Southern Region,Darashaw
14 Mr.C.Gandhiraj Sr.Associate, Darashaw
15 Ms.R.Devi Associate, Darashaw
The consultants made the presentation through power point for inception report
for the consultancy assignment for City Investment Plan (CIP) for Annamalai
Nagar, Vadalur, Tharangampadi, Ottenchataram, Thudiyalur, Thirupattur, S.
Kannanur and Peravurani Town Panchayats (Cluster 1) in detail and the
consultants are requested to
1. To conduct stakeholders’ consultations to ascertain the demands from
public to identify infrastructure gaps.

Page 2 of 3
2. To present the draft final report to respective ULBs in the council after
incorporating the suggestions of stake holders meeting.
3. Recheck the financials of ULBs including debt status.
4. Analyse last 5 years financials and furnish the data on existing loan, loan
repaid on due date, overdue loan, loan balance and loans sanctioned but
yet to be availed. In this regard, all Town Panchayats were requested to
provide 5 years audited accounts and recent years’ un-audited accounts
along with DCB and loan statements and any other relevant details to the
consultants.
5. Study on the unused / under utilized assets of the ULB and suggest ways
for the better utilization of the same.
6. To identify any vacant land for development.
Annamalai Nagar:
- The consultants were requested to include the Storm Water Drain Project.
- Street light provision calculation to be rechecked with ULB.
Vadalur:
- DCB presented to be rechecked with ULB.
Tarangambadi:
- The consultants were requested to include the treatment plant in the
Water Supply Project.
- Reason for reduction in property tax assessment to be addressed
Ottanchataram:
- SWM on wastage generated in the markets area to be addressed and
suggest the ways / methodologies for improvement.

Page 3 of 3
Thudiyalur:
- Address the land issue for UGSS project.
- Address the need of the commercial centre
- Street light provision calculation to be rechecked with ULB.
Tirupathur:
- Address the need of the water body improvement.
The representatives of ULBs were requested to provide details of all the assets to
the consultants and the consultants were requested to include the same and
suggest optimum utilization of the assets.
The inception report submitted by the consultant is approved and consultant
was requested to incorporate the above comments in draft final report and
adhere to the schedule as per the Term of Reference for submitting the Draft
Final Report.

Minutes of the Draft Final Report review meeting for the consultancy
assignment for Town Investment Plan (TIP) submitted by M/s. Darashaw &
Company Limited for Annamalai Nagar, Vadalur, Tharangambadi,
Ottenchataram, Thudiyalur, Thirupattur, S. Kannanur and Peravurani Town
Panchayats (Cluster 1) held on 23.12.2009 at 2.30 P M at Directorate of Town
Panchayats office, Chennai - 108.
Members Present:
S.No. Name Designation / Organisation
1 Mr. D. Rajendiran, IAS Director of Town Payanchayat
2 Mr. T.P. Subramanian President, Tudiyalur TP
3 Mr. G. Rajendiran EE / DTP
4 Mr. Nellai Sivagaminathan AEE / DTP
5 Mr. U. Vijayaraghavan DM / TNUIFSL
6 Mr. A. Sadayappan ADTP / Cuddalore
7 Ms. R. Joychirstel ADTP / Coimbatore
8 Mr. M. Balasubramanian ADTP / Thanjavore
9 Mr. K.S. Rajagopalan Asst. / DTP
10 Mr. M. Jayakodi EO, Ottanchatiram
11 Mr. S. Gunalan EO, S. Kannanur
12 Mr. D. Ranganathan EO, Annamalai Nagar
13 Mr. A. Mahalingam EO, Tudiyalur
14 Mr. G. Mangaleswaran EO, Tiruppattur
15 Mr. K. Balasubramanian EO, Tarangambadi
16 Mr. B. Janarthanan EO, Peravurani
17 Mr. K. Sridhar Associate, Darashaw & Co.,
18 Mr. C. Gandhiraj Sr. Associate, Darashaw & Co.,
19 Ms. R. Devi Associate, Darashaw & Co.,
The consultants submitted the draft final report and made presentation for the
consultancy assignment for Town Investment Plan (TIP) for Annamalai Nagar,
Vadalur, Tharangampadi, Ottenchataram, Thudiyalur, Thirupattur, S. Kannanur
and Peravurani Town Panchayats (Cluster 1) in detail and the consultants are
requested to incorporate the following suggestions / comments in the final report
which are listed below:

Thudiyalur:
� To recheck the financial of ULB for the financial year 2007-08, 2008-09
based on the actuals financial statement and do the FOP.
� Any changes in the rates, etc may be obtained from ULB and incorpoorate
the same in final report.
Vadalur:
� The ULB is requested to provide the break up of Programme expense for
preparation of FOP for the town.
Tharangambadi:
� The land ownership details of the agricultural office building in the same
premises of the Town Panchayat Office has to be provided by the ULB to
the consultants and the project cost of Rs. 30 lakhs for the same can be
shifted to second phase.
Oddanchatram:
� After consultation with EO, TP the Combined Water Supply Scheme the
finalise the priority of the project from second phase to third phase in CIP.
� Creating Green spaces in the Gassifier crematorium ground – As the town
has already taken up the project worth Rs. 5 Lakhs the same needs to be
removed from the CIP.
� The cost of ponnagramkulam improvement project which was earlier
suggested under revenue department purview can be implemented by TP
and the cost for the same needs to be incorporated in the CIP.

� After consultation with EO the cost of office building to be included in the
CIP.
� The ULB is requested to provide the break up of Programme expense to
consultants in detail.
Peravurani:
� Strengthening banks in ward 13 & 14 has to be checked as the same is
repeated twice in the CIP.
The representatives of TPs were requested to provide details of their updated
financials, Loan details, and also on the works/projects already taken up by them
to the consultants. The Draft Final Report submitted by the consultant is hereby
approved and consultants were requested to incorporate the above comments in
Final Report and adhere to the schedule as per the Term of Reference for
submitting the Final Report.