Towards sustainable cities through an environmental ...
280
ADVERTIMENT. Lʼaccés als continguts dʼaquesta tesi queda condicionat a lʼacceptació de les condicions dʼús establertes per la següent llicència Creative Commons: http://cat.creativecommons.org/?page_id=184 ADVERTENCIA. El acceso a los contenidos de esta tesis queda condicionado a la aceptación de las condiciones de uso establecidas por la siguiente licencia Creative Commons: http://es.creativecommons.org/blog/licencias/ WARNING. The access to the contents of this doctoral thesis it is limited to the acceptance of the use conditions set by the following Creative Commons license: https://creativecommons.org/licenses/?lang=en
-
Upload
khangminh22 -
Category
Documents
-
view
0 -
download
0
Transcript of Towards sustainable cities through an environmental ...
ADVERTIMENT. Lʼaccés als continguts dʼaquesta tesi queda condicionat a lʼacceptació de les condicions dʼúsestablertes per la següent llicència Creative Commons: http://cat.creativecommons.org/?page_id=184
ADVERTENCIA. El acceso a los contenidos de esta tesis queda condicionado a la aceptación de las condiciones de usoestablecidas por la siguiente licencia Creative Commons: http://es.creativecommons.org/blog/licencias/
WARNING. The access to the contents of this doctoral thesis it is limited to the acceptance of the use conditions setby the following Creative Commons license: https://creativecommons.org/licenses/?lang=en

Towards sustainable cities through
an environmental, economic and
eco-efficiency analysis of urban
sanitation and drainage systems
By
Anna Petit Boix
A thesis submitted in fulfilment of the requirements of the
PhD degree in Environmental Science and Technology
May 2017
The present doctoral thesis was developed thanks to the pre-doctoral fellowships
awarded to Anna Petit Boix by Generalitat de Catalunya (FI-DGR 2014; March to
September, 2014) and the Spanish Ministry of Education, Culture and Sports
(FPU13/01273; September, 2014 – until end of training). It was conducted in a “María de
Maeztu” Unit of Excellence in R&D (MDM-2015-0552) thanks to the support of the
Spanish Ministry of Economy and Competitiveness


Today
I’m laughing the clouds away
I hear what the flowers say
and drink every drop of rain
And I see
places that I have been
in ways that I've never seen
my side of the grass is green
Oh I can't believe that it's so simple
It feels so natural to me
[Love is easy – Mcfly]
Avi, ho he tornat a aconseguir

The present thesis entitled Towards sustainable cities through an environmental, economic and
eco-efficiency analysis of urban sanitation and drainage systems, by Anna Petit Boix, was carried
out at the Institute of Environmental Science and Technology (ICTA), at Universitat
Autònoma de Barcelona (UAB)
Anna Petit Boix
under the supervision of Dr. Joan Rieradevall and Dr. Xavier Gabarrell, from ICTA and the
Department of Chemical, Biological and Environmental Engineering (UAB), and Dr.
Alejandro Josa, from the Department of Civil and Environmental Engineering and the
Institute of Sustainability at the Technical University of Catalonia (UPC).
Joan Rieradevall Pons Xavier Gabarrell Durany Alejandro Josa García-Tornel
Bellaterra (Cerdanyola del Vallès), May 5, 2017

IX
Contents
Abbreviations ........................................................................................................................ XV Acknowledgements ............................................................................................................ XVII Summary .............................................................................................................................. XIX Resum ................................................................................................................................ XXIV Resumen ............................................................................................................................. XXIX Preface .............................................................................................................................. XXXV Dissemination and training ............................................................................................ XXXIX
PART I - BACKGROUND AND METHODOLOGICAL FRAMEWORK 1
Introduction ......................................................................................................... 5 1.1 Cities and sustainability ................................................................................................. 5
1.1.1 Key issues towards urban sustainability ............................................................ 5 1.1.2 Industrial ecology applied at the city scale ........................................................ 6
1.2 The role of water in the metabolism of cities ................................................................ 7 1.2.1 Water and cities: supply, sanitation and drainage ............................................. 7 1.2.2 Sustainability challenges of current water management models ..................... 9 1.2.3 Conventional and alternative sanitation and drainage systems ..................... 11
Motivations, research questions and objectives ............................................ 15
2.1 Motivations of this dissertation ................................................................................... 15 2.2 Research questions and objectives .............................................................................. 17
Methodology ..................................................................................................... 21 3.1 Method overview ......................................................................................................... 21 3.2 Environmental tools: life cycle assessment ................................................................. 22
3.2.1 Theoretical framework....................................................................................... 22 3.2.2 LCA applications in this research ..................................................................... 25
3.3 Economic tools: life cycle costing ................................................................................ 29 3.4 Integrated evaluation: eco-efficiency assessment ....................................................... 29 3.5 Experimental and statistical tools................................................................................ 30 3.6 Case study selection ..................................................................................................... 32
PART II - SEWER CONSTRUCTION IN URBAN AREAS – AN ENVIRONMENTAL
ASSESSMENT 35
Environmental assessment of sewer construction in small to medium sized
cities using life cycle assessment ......................................................................................... 39
Integrated structural analysis and life cycle assessment of equivalent
trench-pipe systems for sewerage ........................................................................................ 63
PART III - ENVIRONMENTAL EFFECTS OF SEWER OPERATION AT THE CITY
SCALE 65
Assessing the energetic and environmental impacts of the operation and
maintenance of Spanish sewer networks from a life cycle perspective .......................... 81
X
Municipal sewer networks as sources of nitrous oxide, methane and
hydrogen sulfide emissions: A review and case studies ................................................... 97
PART IV - CONVENTIONAL AND ALTERNATIVE WASTEWATER MANAGEMENT
IN URBAN AREAS 99
Addressing the life cycle of sewers in contrasting cities through an eco-
efficiency approach ............................................................................................................. 119
8.1 Introduction ................................................................................................................ 120 8.2 Materials and Methods .............................................................................................. 121
8.2.1 Case study definition ....................................................................................... 121 8.2.2 Eco-efficiency assessment method .................................................................. 123 8.2.3 Goal and scope definition ............................................................................... 123 8.2.4 Life cycle inventory (LCI) ................................................................................ 124 8.2.5 Life cycle impact assessment (LCIA) and indicator selection ....................... 126 8.2.6 Economic indicator selection .......................................................................... 127
8.3 Results and Discussion .............................................................................................. 127 8.3.1 Environmental and economic characterization of the sewers ...................... 127 8.3.2 Assessing the eco-efficiency of sewers ........................................................... 131 8.3.3 On the application of eco-efficiency ............................................................... 132
8.4 Conclusions ................................................................................................................ 133 The centralization paradigm: life cycle assessment of sanitation scenarios
in an island’s seasonal suburban settlement .................................................................... 137 9.1 Introduction ................................................................................................................ 138 9.2 Materials and Methods .............................................................................................. 139
9.2.1 Case study and scenario definition................................................................. 139 9.2.2 Life cycle assessment of the treatment scenarios ........................................... 142 9.2.3 Monte Carlo simulation................................................................................... 144
9.3 Results and Discussion .............................................................................................. 145 9.3.1 Environmental comparison of the treatment scenarios ................................. 145 9.3.2 Variability and sensitivity to modeling parameters ...................................... 147
9.4 Implications of this analysis ...................................................................................... 149
PART V - ENVIRONMENTAL AND ECONOMIC FLOOD DAMAGE ASSESSMENT
IN WATER SENSITIVE URBAN AREAS 151
Are we preventing flood damage eco-efficiently? An integrated method
applied to post-disaster emergency actions in the Mediterranean ................................ 155
Environmental and economic assessment of a stormwater infiltration
system for flood prevention in Brazil................................................................................ 171
Floods and consequential life cycle assessment: integrating flood damage
into the environmental assessment of stormwater Best Management Practices .......... 189 12.1 Introduction ................................................................................................................ 190 12.2 Materials and Methods .............................................................................................. 192
12.2.1 Consequential life cycle assessment (CLCA) ................................................. 192 12.2.2 Steps for calculating the environmental payback (EP) and net environmental
impact (NEI) of a BMP ................................................................................................. 193
XI
12.2.3 Case study: implementation of an FST in São Carlos (Brazil) ....................... 195 12.3 Results ......................................................................................................................... 199 12.4 Discussion ................................................................................................................... 200 12.5 Conclusions ................................................................................................................ 201
PART VI – FINAL REMARKS AND FUTURE RESEARCH 203
Discussion of the main contributions ........................................................... 207
13.1 An integrated assessment of sanitation and drainage systems ............................... 207 13.1.1 Analysis of different urban scales ................................................................... 208 13.1.2 A complete life cycle perspective with an integrated essence ...................... 208 13.1.3 The role of eco-efficiency in a system’s net balance ....................................... 209
13.2 Application in the context of the urban water cycle ................................................ 210 13.3 Tools and open data for decision-making ................................................................ 211
Conclusions ..................................................................................................... 215 Future research ................................................................................................ 225
15.1 Sustainability assessment of sewer networks in big cities ....................................... 225 15.2 Analysis of decentralized systems at different scales .............................................. 226 15.3 Predictive modeling of flooding consequences ........................................................ 226 15.4 Integration of the ecosystem services approach into the LCA of flood management
227 References .............................................................................................................................. 229 Appendix ............................................................................................................................... 257
XII
Tables
Table 1.1 Global European water and wastewater management data based on Eurostat
(2015) ......................................................................................................................................... 9 Table 3.1 Methods applied in each part and chapter of the dissertation ............................ 22 Table 3.2 LCIA methods and impact indicators used in each chapter of the dissertation 26 Table 3.3 Description of the impact categories used in the studies based on their following
baseline reports ....................................................................................................................... 27 Table 3.4 Technical features of the gas analyzer and gas conditioner ................................ 31 Table 3.5 Analytical methods applied during the experimental process ........................... 31 Table 8.1 Main features of the sewer networks in the cities analyzed. Based on data
provided by the local water managers for the year 2011. .................................................. 122 Table 8.2 Life cycle inventory divided into the construction and O&M in the case study
cities. Data per FU (1 m3 of wastewater) ............................................................................. 125 Table 8.3 Environmental and economic results of Calafell and Betanzos divided into life
cycle stages (Data per FU: 1 m3) ........................................................................................... 128 Table 9.1 Characterization of the seasonal suburban settlement ...................................... 140 Table 9.2 Parameters and data used in the Monte Carlo simulation ................................ 144 Table 9.3 Estimated ENEI indicators for each scenario ..................................................... 147 Table 12.1 Heavy rainfall events registered in São Carlos and their consequences on the
natural and urban environment. Data from INMET (2014) and IPMet (2014) ................. 195 Table 12.2 Life cycle inventories of a car and concrete sidewalk ............................................. 198 Table 12.3 Unitary impacts of the FST, car and sidewalk and environmental payback of the
FST ......................................................................................................................................... 199 Table 12.4 NEI per event of the implementation of FSTs in RDI, considering 179 FSTs, six
cars, 150 m2 of sidewalk and an average of three intense flooding events per year ........ 200 Table 13.1 Environmental and economic impacts of the urban water cycle in Calafell and
Betanzos based on Chapter 8 and Aquaenvec (2015) ......................................................... 210 Table 14.1 Environmental results of the sewer constructive solutions and potential
recommendations ................................................................................................................. 215
XIII
Figures
Figure 1.1 Simplified diagram of the metabolism of cities..................................................... 7 Figure 1.2 Diagram of the stages of the urban water cycle. The colors refer to the type of
water that is managed in each step .......................................................................................... 8 Figure 1.3 Sustainability challenges of sanitation and drainage systems from a causal
perspective .............................................................................................................................. 10 Figure 1.4 Evolution of flooding events and associated monetary damage from 1960 to 2014.
Based on Guha-Sapir et al. (2009) .......................................................................................... 11 Figure 1.5 Simplified diagram of conventional and alternative sanitation and drainage
systems .................................................................................................................................... 12 Figure 2.1 Motivations of this dissertation ............................................................................ 15 Figure 3.1 Overview of the methods applied in the dissertation ........................................ 21 Figure 3.2 Phases of the LCA method. Based on ISO 14040:2006 ........................................ 22 Figure 3.3 Phases of the LCC method. Based on Swarr et al. (2011) ................................... 29 Figure 3.4 Phases of an eco-efficiency assessment. Based on ISO 14045:2012 .................... 30 Figure 3.5 Flows, systems and infrastructure covered in this dissertation ......................... 32 Figure 3.6 Geographic distribution of the case study areas ................................................. 33 Figure 8.1 System boundaries of the LCA and LCC of sewers .......................................... 124 Figure 8.2 Distribution of the environmental and economic impacts of the sewer
components and O&M flows of the sewers in Calafell and Betanzos ............................... 129 Figure 8.3 Eco-efficiency portfolio illustrating the differences amongst life cycle stages in
Betanzos and Calafell ........................................................................................................... 131 Figure 9.1 Wastewater treatment scenarios considered in the assessment and their
distribution in the case study area ....................................................................................... 141 Figure 9.2 Comparison of the treatment scenarios in the CM context and contribution of
each of the stages involved. Data refer to the functional unit (one cubic meter). ............. 146 Figure 9.3 Variability in the eutrophication impacts of the scenarios’ life cycle based on a
Monte Carlo simulation. The probability density functions are presented for the single
score indicator. All the results are significantly different at a confidence level of 95% and
p-value <0.0001, except for the pair highlighted in the graph. .......................................... 148 Figure 9.4 Effect on the single score outputs of each parameter modeled displayed using
tornado diagrams. The broken line represents the average value of each scenario and
indicator. ................................................................................................................................ 149 Figure 12.1 Integration of the consequences of implementing BMPs for flood prevention
into the CLCA framework and steps for calculating the EP and NEI ............................... 193 Figure 12.2 System boundaries of the systems under analysis, i.e., FST, car and sidewalk
................................................................................................................................................ 197 Figure 13.1 Contributions of this dissertation in the field of sanitation and drainage systems
................................................................................................................................................ 207 Figure 13.2 Sewer sub-section of the Aquaenvec tool available at http://tool.life-
aquaenvec.eu/en.................................................................................................................... 211 Figure 13.3 Sewer LCI available at the LCADB.sudoe database ....................................... 212 Figure 14.1 Parameters involved in the operation of sewers. The thickness of the arrows
gives an idea of the effect of each parameter ...................................................................... 216 Figure 14.2 Life cycle stages with the greatest room for improvement ............................ 218 Figure 14.3 Integrated approach for assessing stormwater drainage and flood prevention
................................................................................................................................................ 220 Figure 14.4 Eco-efficiency ratios for two flood prevention strategies ............................... 221

XIV
XV
Abbreviations
1,4 DB eq
A
AD
ALCA
ALO
A/V
BOD
BMP
CED
C2H4 eq
CH4
CFC -11 eq
CLCA
CML
CO2 eq
COD
DO
DU
E
ENEI
FD
FE
FET
FST
FU
GHG
GW
H2S
HDPE
HRT
HT
ICTA
IE
ILCD
IPCC
IR
ISO
LCA
LCC
LCI
LCIA
LCSA
LDPE
ME
MET
MJ
MD
1,4 dichlorobenzene equivalent emissions
Acidification
Abiotic depletion
Attributional life cycle assessment
Agricultural land occupation
Biofilm area-to-liquid volume
Biological Oxygen Demand
Best Management Practices
Cumulative energy demand
Ethylene equivalent emissions
Methane
Trichlorofluoromethane equivalent emissions
Consequential life cycle assessment
Institute of Environmental Sciences (Leiden)
Carbon dioxide equivalent emissions
Chemical Oxygen Demand
Dissolved oxygen
Declared unit
Eutrophication
Eutrophication Net Environmental Impact
Fossil depletion
Freshwater eutrophication
Freshwater ecotoxicity
Filter, swale, infiltration trench
Functional unit
Greenhouse gas
Global warming
Hydrogen sulfide
High-density polyethylene
Hydraulic retention time
Human toxicity
Institute of Environmental Science and Technology (UAB)
Industrial ecology
International Reference Life Cycle Data System
Intergovernmental Panel on Climate Change
Ionizing radiation
International Organization for Standardization
Life cycle assessment
Life cycle costing
Life cycle inventory
Life cycle impact assessment
Life cycle sustainability assessment
Low-density polyethylene
Marine eutrophication
Marine ecotoxicity
Mega joules
Metal depletion

XVI
NEI
NLT
N2O
NO3-
NO2-
OD
PMF
POC
POF
PO43-
PP
PVC
PWTP
Sb eq
SBR
SETAC
S-LCA
SO2 eq
Sostenipra
TA
TC
TET
TN
TP
TSS
UAB
ULO
UNEP
VFA
WD
WWTP
Net Environmental Impact
Natural land transformation
Nitrous oxide
Nitrate ion
Nitrite ion
Ozone depletion
Particulate matter formation
Photochemical ozone creation
Photochemical ozone formation
Phosphate
Payback period
Polyvinylchloride
Potable water treatment plant
Antimony equivalent emissions
Sulfate reducing bacteria
Society of Environmental Toxicology and Chemisty
Social life cycle assessment
Sulphur dioxide equivalent emissions
Sustainability and Environmental Prevention research group
Terrestrial acidification
Total cost
Terrestrial ecotoxicity
Total nitrogen
Total phosphorus
Total suspended solids
Universitat Autònoma de Barcelona
Urban land occupation
United Nations Environment Program
Volatile fatty acids
Water depletion
Wastewater treatment plant
XVII
Acknowledgements
I would like to thank a series of people who helped me during my training period. I am
positive that this thesis would have not been possible without them.
Als meus de sempre: M’és impossible començar d’una altra manera que no sigui agraint
infinitament l’ajuda i suport de la meva família. Sense els meus pares no hagués arribat
fins aquí, i sense la meva mare no hagués marxat a l’altra punta del món quan era
impensable creuar el carrer. Gràcies per la paciència i per no deixar que abandonés ni quan
era difícil trobar el camí, ni quan semblava que no podia més.
Als meus directors: Vull agrair de tot cor l’oportunitat que m’han donat els Dr Joan
Rieradevall, Dr Xavier Gabarrell i Dr Alejandro Josa. Gràcies per haver confiat en mi per
fer aquesta feina i creure que era capaç de fer-la. He après infinitat de coses durant aquests
anys. Gràcies per haver-me ajudat a saber què és la recerca.
Als de cada dia: Ha estat fantàstic començar i acabar aquest camí al costat del David i el
Pere. Gràcies per veure-hi quan ningú hi veia i per ser amics de veritat! Ana, gracias por
los buenos momentos y estar allí. Gràcies a tots els que heu compartit una part del vostre
temps amb mi a l’ICTA (Mireia, Martí, Susana, Aniol, Perla, Ana María, Aurélie, Eva, Joan
Manuel, Sara, Julia, Farah, Charlie, Ana Arahuetes, Esme, Cinzia...). I a les que estan lluny,
però a prop cada dia – Esther, Violeta, Katherine i Elena.
To the ones on the other side: I would like to thank Dr Defne Apul for her warm welcome
while I was in the US. I really appreciate the way you made me feel like home and thank
you for listening. Thanks to Robert, Jay and Youcan. We had a great time and literally
worked like nobody was watching. Also big thank you to Sonia, Ilke, Jazzy and Elizabeth
– because I also learned from you.
Als qui fan el que no sé fer: Perquè no tot el que he fet, ho he fet sola, vull agrair el suport
de l’equip del projecte Aquaenvec. Gràcies als inèdits i a enginyeria química pel cop de mà
que em doneu de tant en tant. Albert, Pau, Núria: sento que m’ho hagueu d’explicar tot
molts cops. Gràcies per tenir paciència amb les meves preguntes poc intel·ligents sobre
estructures! También quiero dar las gracias al equipo de la UFSCar por la ayuda con la
investigación sobre inundaciones.
But because nobody is perfect, I would also like to apologize:
Als que m’han sentit queixar-me: Perdó si mai he estat pesada!
Als meus estudiants: Si mai he demanat massa, ho sento! La meva intenció era ajudar!
To you, reader: I am deeply sorry if this dissertation is too long or too tough. All of my
energy and good will were invested in this research. I hope it is interesting and useful
enough to make the world a better place.

XVIII
XIX
Summary
The growth of cities worldwide is associated with an increasing demand for sanitation and
drainage infrastructure in the context of the water cycle. Combined with the effects of
climate change, which alter the rainfall patterns, the situation of these systems in urban
environments is critical. Part of the existing sewer networks require an imminent
renovation, others must be constructed in developing areas, whereas stormwater runoff
becomes a threat in terms of flooding because of the soil imperviousness. In this context,
we must determine the best practices aimed at reducing these issues from an innovative
environmental and economic viewpoint and at the same time adapt cities to climate change.
However, there is a lack of environmental and economic data that define the main impacts
of sewer management and different types of flood prevention systems. To this end, the
combination of different tools is key to obtaining integrated information about these
infrastructures. Furthermore, it is essential to determine the implications of different
sanitation and drainage management scenarios at the urban, suburban, neighborhood and
building scales.
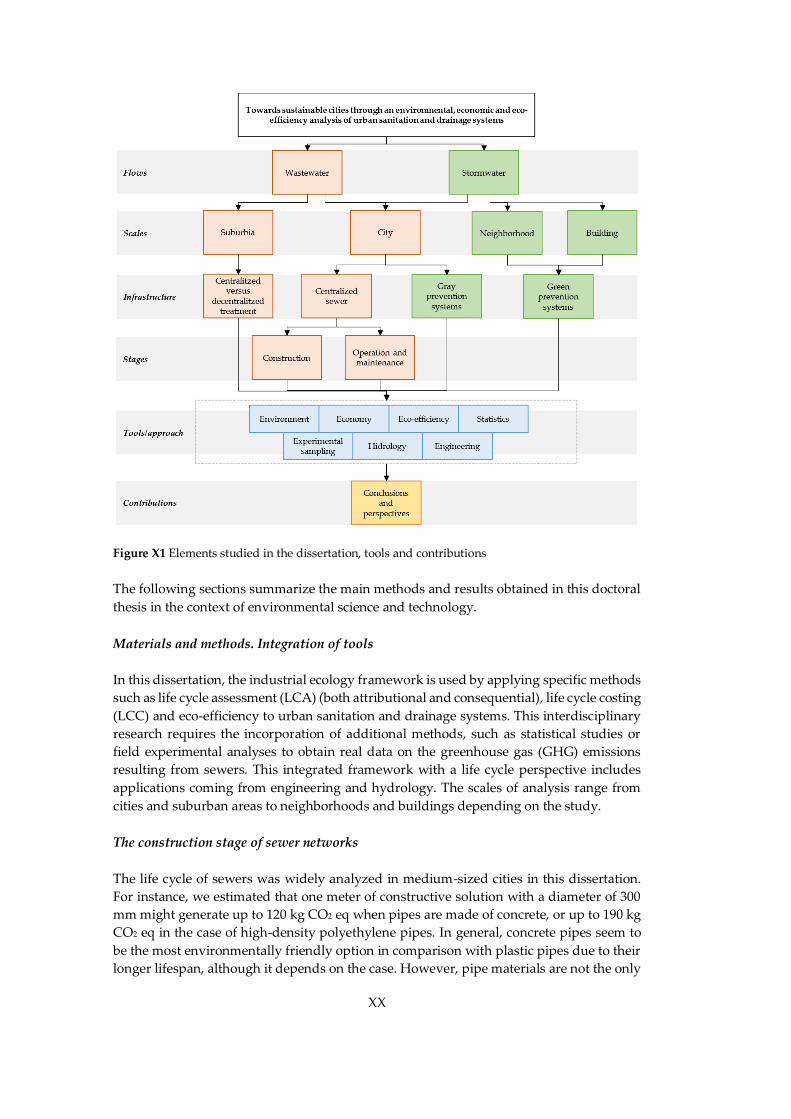
In response to this demand, this dissertation revolves around the following questions,
which are studied based on the structure illustrated in Figure X1:
(1) What are the environmental and economic hotspots of sewer networks and the
parameters that affect this outcome in medium-sized cities? (2) Is decentralized sanitation a better environmental option in small suburban
areas when dealing with peak sanitation demand? (3) Do flood prevention strategies result in a positive environmental and
economic performance when avoided damage is accounted for? If so, are green
BMPs better than gray systems?
XX
Figure X1 Elements studied in the dissertation, tools and contributions
The following sections summarize the main methods and results obtained in this doctoral
thesis in the context of environmental science and technology.
Materials and methods. Integration of tools
In this dissertation, the industrial ecology framework is used by applying specific methods
such as life cycle assessment (LCA) (both attributional and consequential), life cycle costing
(LCC) and eco-efficiency to urban sanitation and drainage systems. This interdisciplinary
research requires the incorporation of additional methods, such as statistical studies or
field experimental analyses to obtain real data on the greenhouse gas (GHG) emissions
resulting from sewers. This integrated framework with a life cycle perspective includes
applications coming from engineering and hydrology. The scales of analysis range from
cities and suburban areas to neighborhoods and buildings depending on the study.
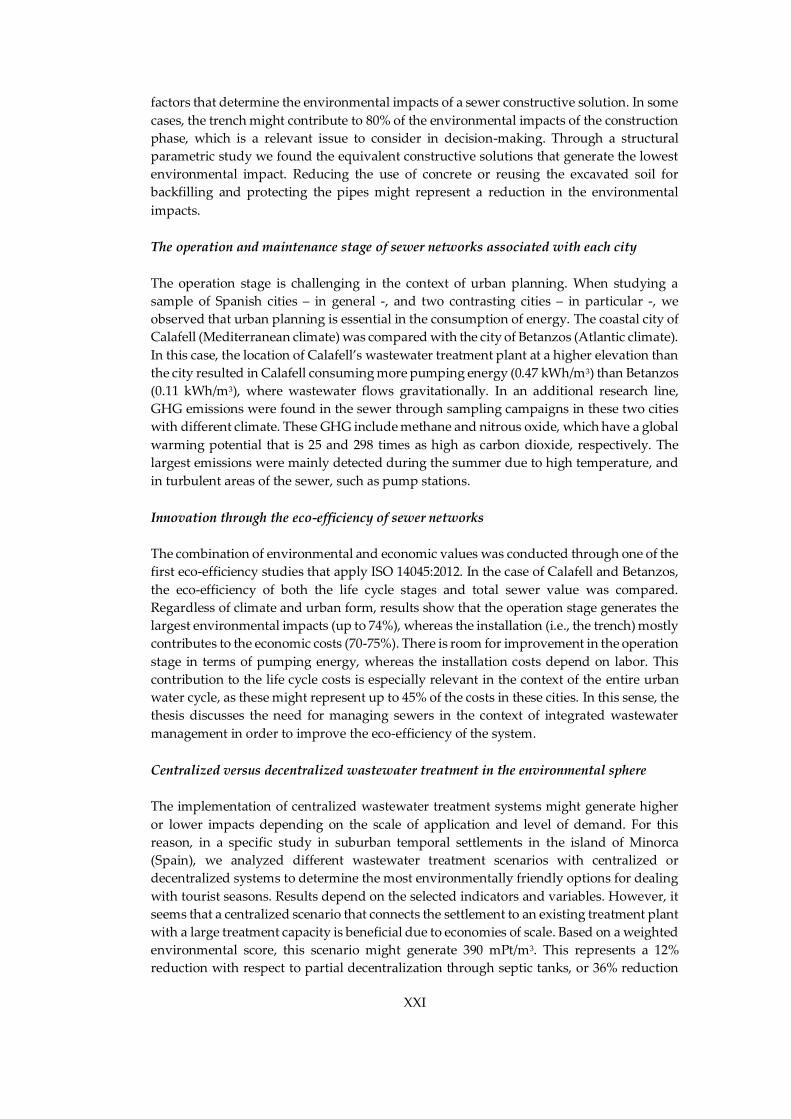
The construction stage of sewer networks
The life cycle of sewers was widely analyzed in medium-sized cities in this dissertation.
For instance, we estimated that one meter of constructive solution with a diameter of 300
mm might generate up to 120 kg CO2 eq when pipes are made of concrete, or up to 190 kg
CO2 eq in the case of high-density polyethylene pipes. In general, concrete pipes seem to
be the most environmentally friendly option in comparison with plastic pipes due to their
longer lifespan, although it depends on the case. However, pipe materials are not the only
XXI
factors that determine the environmental impacts of a sewer constructive solution. In some
cases, the trench might contribute to 80% of the environmental impacts of the construction
phase, which is a relevant issue to consider in decision-making. Through a structural
parametric study we found the equivalent constructive solutions that generate the lowest
environmental impact. Reducing the use of concrete or reusing the excavated soil for
backfilling and protecting the pipes might represent a reduction in the environmental
impacts.
The operation and maintenance stage of sewer networks associated with each city
The operation stage is challenging in the context of urban planning. When studying a
sample of Spanish cities – in general -, and two contrasting cities – in particular -, we
observed that urban planning is essential in the consumption of energy. The coastal city of
Calafell (Mediterranean climate) was compared with the city of Betanzos (Atlantic climate).
In this case, the location of Calafell’s wastewater treatment plant at a higher elevation than
the city resulted in Calafell consuming more pumping energy (0.47 kWh/m3) than Betanzos
(0.11 kWh/m3), where wastewater flows gravitationally. In an additional research line,
GHG emissions were found in the sewer through sampling campaigns in these two cities
with different climate. These GHG include methane and nitrous oxide, which have a global
warming potential that is 25 and 298 times as high as carbon dioxide, respectively. The
largest emissions were mainly detected during the summer due to high temperature, and
in turbulent areas of the sewer, such as pump stations.
Innovation through the eco-efficiency of sewer networks
The combination of environmental and economic values was conducted through one of the
first eco-efficiency studies that apply ISO 14045:2012. In the case of Calafell and Betanzos,
the eco-efficiency of both the life cycle stages and total sewer value was compared.
Regardless of climate and urban form, results show that the operation stage generates the
largest environmental impacts (up to 74%), whereas the installation (i.e., the trench) mostly
contributes to the economic costs (70-75%). There is room for improvement in the operation
stage in terms of pumping energy, whereas the installation costs depend on labor. This
contribution to the life cycle costs is especially relevant in the context of the entire urban
water cycle, as these might represent up to 45% of the costs in these cities. In this sense, the
thesis discusses the need for managing sewers in the context of integrated wastewater
management in order to improve the eco-efficiency of the system.
Centralized versus decentralized wastewater treatment in the environmental sphere
The implementation of centralized wastewater treatment systems might generate higher
or lower impacts depending on the scale of application and level of demand. For this
reason, in a specific study in suburban temporal settlements in the island of Minorca
(Spain), we analyzed different wastewater treatment scenarios with centralized or
decentralized systems to determine the most environmentally friendly options for dealing
with tourist seasons. Results depend on the selected indicators and variables. However, it
seems that a centralized scenario that connects the settlement to an existing treatment plant
with a large treatment capacity is beneficial due to economies of scale. Based on a weighted
environmental score, this scenario might generate 390 mPt/m3. This represents a 12%
reduction with respect to partial decentralization through septic tanks, or 36% reduction
XXII
with respect to treating seasonal wastewater at a constructed wetland. Nevertheless, the
peak population, seasonal wastewater generation, and duration of the seasonal period
were varied through a probabilistic analysis to extrapolate these results to similar areas. In
this case, treating wastewater in septic systems and transporting the effluent to the
neighboring treatment plant can have the best average results (520 mPt/m3). In general,
results depend on the duration of the seasonal period. The centralized scenario has the
highest variability (77%) because of the wastewater generation, which is associated with
pumping. For this reason, seasonal and permanent settlements should be assessed in
different types of analyses.
Flood analysis from a life cycle perspective
In the field of flood prevention, this thesis provides a new vision and an innovative
approach, as these are the first studies that integrate the avoided impacts of damage
prevention into the environmental and economic effects of investing in preventive
measures. These studies are of interest in the framework of urban planning and focus on
particular case studies with different climate and urban context. From a methodological
perspective, flooding analyses provide some ideas in the field of LCA methods and discuss
how to deal with the consequences of flooding from an integrated viewpoint and
considering the sustainability of cities.
Environmental and economic balance of flood prevention systems
To determine the net balance of the environmental impacts and economic costs of certain
preventive actions, two contrasting areas were studied. On the one hand, ephemeral
streams pose a threat in the Mediterranean coast. In this area, we studied the historical
evolution of the damage generated in three cities of the Maresme region (Catalonia, Spain)
before and after the implementation of post-disaster emergency actions. These consisted of
wall reconstructions, or channeling and/or adapting the streams. When comparing the
impacts and costs invested in prevention with the avoided damage, it was estimated that
these actions have an economic and environmental payback time of 2 and 25 years,
respectively. This result highlights one of the environmental and economic consequences
of investing in material-intensive (but durable) systems, which in this case use large
amounts of concrete. In contrast, an existing green prevention system was also studied,
this time in the city of São Carlos (Brazil), where frequent rainfall generates a large number
of damaged goods every year. In this area, we observed that the eco-efficiency ratio of the
system (0.38 kg CO2 eq/€) is lower than in the actions applied in the ephemeral streams (1.2
kg CO2 eq/€). Although these systems are not equivalent, using a green system with a
carbon capture potential might be beneficial; besides, it also fosters the natural infiltration
of stormwater. In this case, it was estimated that the carbon footprint of the system can be
paid off once the destruction of one car is avoided.
Upcoming challenges of urban sanitation and drainage research
The results obtained in this dissertation open up future research lines. It is interesting to
determine if the trends observed in the sewers of small to medium sized cities also apply
in big cities, where there is a greater urban complexity. On the other hand, the
centralization debate in suburban areas presents more challenges, such as studying the
possibilities of wastewater treatment at different scales, climates and tourist contexts, as

XXIII
well as the symbiosis that natural systems can provide by storing stormwater for
decentralized uses. In this field, we should also understand the applications of rainwater
and/or reclaimed water in agriculture and services to close the urban water cycle in the
most sustainable manner. In the case of floods, additional predictive models are needed to
determine the exact consequences of flooding and its prevention. Lastly, the life cycle
approach of this dissertation could be completed by analyzing the ecosystem services (i.e.,
benefits to humans) of different sanitation and drainage alternatives. By doing so, their
benefits and impacts would be clearly defined to ease decision-making processes at the
urban scale.
XXIV
Resum
El creixement de les ciutats arreu del món porta associat un increment en la demanda
d’infraestructures de sanejament i drenatge associades al cicle de l’aigua. Combinat amb
els efectes del canvi climàtic, que estan alterant els patrons de pluviometria, la situació
d’aquests sistemes en entorns urbans és crítica. Bona part de les xarxes de clavegueram
existents requereixen una renovació urgent, d’altres han de ser construïdes en zones en
creixement, mentre que l’escolament superficial d’aigua pluvial esdevé una amenaça quant
a inundacions degut a la impermeabilització del sòl. En aquest context, cal determinar a
través d’una nova visió ambiental i econòmica quines són les millors pràctiques per reduir
aquestes problemàtiques i al mateix temps adaptar les ciutats al canvi climàtic.
Tot i així, existeix una manca de dades ambientals i econòmiques que descriguin els
principals impactes de la gestió de les xarxes de clavegueram, així com de diferents
sistemes de prevenció d’inundacions. Per aquesta finalitat, la combinació de diferents eines
és clau en l’obtenció d’informació integrada sobre aquestes infraestructures. A més, també
és essencial determinar les implicacions de diferents escenaris de gestió del sanejament i
drenatge a escala urbana, periurbana, de barri i d’edifici.
En resposta a aquestes demandes, la tesi es desenvolupa a l’entorn de les següents
preguntes, les quals s’estudien d’acord a l’estructura de la Figura X1:
(1) Quins són els punts crítics ambientals i econòmics de les xarxes de clavegueram i
els paràmetres que afecten aquests resultats en ciutats mitjanes?
(2) És el sanejament descentralitzat una opció ambientalment millor en zones
suburbanes petites quan cal gestionar una demanda pic?
(3) Tenen les estratègies de prevenció d’inundacions un comportament ambiental i
econòmic positiu quan es comptabilitzen les pèrdues evitades en inundacions? En
cas afirmatiu, és millor aplicar pràctiques de gestió verdes o grises?
XXV
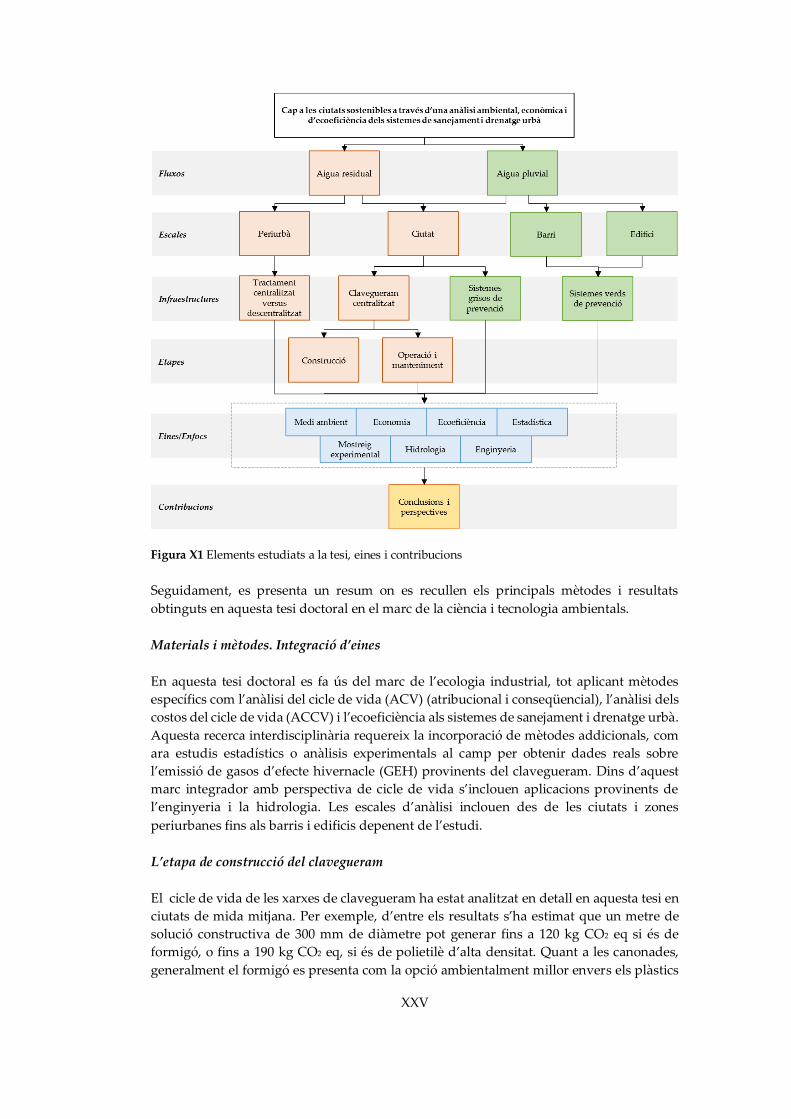
Figura X1 Elements estudiats a la tesi, eines i contribucions
Seguidament, es presenta un resum on es recullen els principals mètodes i resultats
obtinguts en aquesta tesi doctoral en el marc de la ciència i tecnologia ambientals.
Materials i mètodes. Integració d’eines
En aquesta tesi doctoral es fa ús del marc de l’ecologia industrial, tot aplicant mètodes
específics com l’anàlisi del cicle de vida (ACV) (atribucional i conseqüencial), l’anàlisi dels
costos del cicle de vida (ACCV) i l’ecoeficiència als sistemes de sanejament i drenatge urbà.
Aquesta recerca interdisciplinària requereix la incorporació de mètodes addicionals, com
ara estudis estadístics o anàlisis experimentals al camp per obtenir dades reals sobre
l’emissió de gasos d’efecte hivernacle (GEH) provinents del clavegueram. Dins d’aquest
marc integrador amb perspectiva de cicle de vida s’inclouen aplicacions provinents de
l’enginyeria i la hidrologia. Les escales d’anàlisi inclouen des de les ciutats i zones
periurbanes fins als barris i edificis depenent de l’estudi.
L’etapa de construcció del clavegueram
El cicle de vida de les xarxes de clavegueram ha estat analitzat en detall en aquesta tesi en
ciutats de mida mitjana. Per exemple, d’entre els resultats s’ha estimat que un metre de
solució constructiva de 300 mm de diàmetre pot generar fins a 120 kg CO2 eq si és de
formigó, o fins a 190 kg CO2 eq, si és de polietilè d’alta densitat. Quant a les canonades,
generalment el formigó es presenta com la opció ambientalment millor envers els plàstics
XXVI
degut a la seva llarga vida útil, tot i que depèn dels casos considerats. No obstant, s’ha
determinat que els materials de la canonada no són els únics determinants de l’impacte
ambiental d’una solució constructiva per clavegueram. En alguns casos, la contribució de
la rasa pot representar fins un 80% dels impactes ambientals de l’etapa constructiva, fet
que no és irrellevant de cara a la presa de decisions. Mitjançant un estudi estructural
paramètric s’han pogut trobar les solucions constructives equivalents que generen el
menor impacte ambiental. Així, reduir l’ús de formigó en les rases i reutilitzar els materials
del sòl excavats per reomplir i protegir les canonades pot significar una reducció dels
impactes ambientals.
L’etapa d’operació i manteniment de xarxes de clavegueram relacionades a cada ciutat
L’etapa d’operació inclou importants reptes en l’àmbit del planejament urbà. Estudiant una
mostra de municipis d’Espanya, en general, i dos municipis contrastats, en particular,
s’observa que el planejament és clau en el consum d’energia. S’han comparat el municipi
costaner de Calafell (clima mediterrani) i Betanzos (clima atlàntic). En aquest cas, la
ubicació de l’estació depuradora de Calafell a una cota més elevada que el municipi fa que
el consum d’energia de bombeig (0.47 kWh/m3) sigui major que a Betanzos (0.11 kWh/m3),
on l’aigua circula per gravetat. En una línia de recerca addicional, s’han observat emissions
de GEH al clavegueram a través de campanyes de mostreig en aquests dos municipis de
climes diferents. Aquests GEH inclouen el metà i el monòxid de dinitrogen, els quals tenen
un potencial d’escalfament global 25 i 298 cops més elevat que el diòxid de carboni,
respectivament. Principalment es van detectar majors emissions durant l’estiu associades
a les elevades temperatures i en zones de turbulència del clavegueram, com ara abans de
les estacions de bombeig.
Innovació a través de l’ecoeficiència de xarxes
La combinació de valors ambientals i econòmics del clavegueram es du a terme a través
d’un dels primers estudis d’ecoeficiència que aplica la ISO 14045:2012. En els casos de
Calafell i Betanzos s’ha comparat l’ecoeficiència tant de les diferents etapes del cicle de vida
com dels valors totals dels municipis. Els resultats indiquen que, independentment del
clima i l’estructura urbana, l’etapa d’operació és la que genera més impactes ambientals
(fins el 74% dels impactes), mentre que la instal·lació (és a dir, la rasa) contribueix més a la
generació de costos econòmics (70-75%). L’operació té marge de millora quant al consum
d’energia associada al bombeig, mentre que els costos de la instal·lació depenen de la mà
d’obra. Aquesta contribució en els costos del cicle de vida és especialment rellevant en el
context del cicle urbà de l’aigua complet, donat que poden representar fins al 45% dels
costos d’aquests municipis. En aquest sentit, queda clara la necessitat de gestionar el
clavegueram en context de la gestió integrada de les aigües residuals per millorar
l’ecoeficiència del sistema.
Tractament de l’aigua residual centralitzat front a descentralitzat en l’esfera ambiental
La implementació d’aquests sistemes centralitzats del tractament d’aigua residual pot ser
més o menys impactant depenent de l’escala d’aplicació i el grau de demanda. Per aquest
motiu, en un estudi específic en assentaments urbans temporals a l’illa de Menorca s’han
estudiat ambientalment diferents escenaris de tractament de l’aigua residual amb sistemes
centralitzats o descentralitzats per tal de determinar les millors opcions per fer front a les
XXVII
èpoques turístiques. Els resultats depenen dels indicadors estudiats i les variables
considerades. Tot i així, sembla que un escenari centralitzat en què es connecta
l’assentament a un depuradora existent de gran capacitat és beneficiós degut a les
economies d’escala. Segons una puntuació ambiental ponderada, aquest escenari generaria
390 mPt/m3, que representa un 12% menys que descentralitzar parcialment amb fosses
sèptiques o un 36% respecte a tractar el flux estacional en uns aiguamolls construïts. No
obstant, mitjançant un estudi probabilístic s’ha variat la població punta, la generació
d’aigua residual estival i la duració de l’època turística per tal d’extrapolar a altres zones
similars. En aquest cas, tractar l’aigua en fosses sèptiques i transportar l’efluent a la
depuradora veïna pot presentar els millors resultats mitjans (520 mPt/m3). En general, els
resultats depenen de la duració de l’època turística. L’escenari centralitzat és el que més
variabilitat presenta (77%) en funció de la generació d’aigua, que va lligada al bombeig. És
per això que cal estudiar de manera diferenciada els sistemes urbans temporals i els
permanents.
Anàlisi de les inundacions des d’una perspectiva de cicle de vida
En l’àmbit de la prevenció d’inundacions, la tesi aporta una nova visió i un enfoc innovador,
ja que es tracta d’uns dels primers estudis que integren l’impacte ambiental i econòmic
d’invertir en mesures preventives amb l’impacte dels danys evitats. Aquests estudis poden
ser de gran interès de cara a la planificació urbana i, en particular, depenent dels climes i
entorns. Des d’una perspectiva metodològica, els estudis d’inundacions aporten una
discussió en l’àmbit de les metodologies d’ACV i en com abordar les conseqüències de les
inundacions des d’un punt de vista integrador i de la sostenibilitat de les ciutats.
Balanç ambiental i econòmic dels sistemes de prevenció d’inundacions
Per determinar el balanç net d’impactes ambientals i costos econòmics de determinades
accions preventives, s’han estudiat dues zones diferenciades. Per una banda, les rieres són
una amenaça a la costa mediterrània. En aquest entorn, s’ha estudiat l’evolució històrica
dels danys causats a tres municipis del Maresme (Catalunya) abans i després de la
implementació d’actuacions d’emergència. Aquestes consistien en la reconstrucció de murs
o la canalització i/o restauració de les rieres. Tot comparant els impactes i costos invertits
en la prevenció i els danys evitats, s’observa que aquestes accions es podrien amortitzar
econòmicament en 2 anys i ambientalment, en 25 anys. Aquest resultat posa de manifest
una de les conseqüències econòmiques i ambientals d’invertir en sistemes intensius en
materials i amb alta durabilitat, com el formigó. Pel contrari, també s’ha estudiat un sistema
de prevenció verd existent a la ciutat de São Carlos (Brasil), on les elevades precipitacions
resulten en gran quantitat de danys cada any. En aquest entorn, s’ha observat que la ràtio
d’ecoeficiència del sistema (0.38 kg CO2 eq/€) és menor que en el cas de les actuacions a les
rieres (1.2 kg CO2 eq/€). Tot i que no són sistemes equivalents, l’ús d’un sistema verd que
pot captar carboni pot ser en alguns casos beneficiós, a banda que també fomenta la
infiltració natural de l’aigua. En aquest darrer cas, es va comprovar que l’impacte del
sistema pot ser amortitzat un cop s’evita la destrucció d’un cotxe en termes de petjada de
carboni.
XXVIII
Reptes de futur en la recerca del sanejament i drenatge urbà
Els resultats obtinguts obren un ventall de noves línies de recerca per al futur. És
interessant determinar si les tendències observades en el clavegueram de ciutats mitjanes
també tenen lloc a grans ciutats, on la complexitat urbana és major. Per altra banda, el debat
de la centralització en zones periurbanes presenta més reptes de futur, com ara estudiar-
ne les possibilitats de tractament d’aigua a diferents escales, climes i entorns turístics, així
com la simbiosi que els sistemes naturals poden aportar en l’emmagatzemament d’aigua
pluvial per un ús descentralitzat. En aquest àmbit, caldria també entendre les aplicacions
de les aigües pluvials i/o regenerades en l’agricultura i els serveis per tancar el cicle de
l’aigua de la manera més sostenible en sistemes urbans. En el cas de les inundacions, calen
més models predictius que permetin determinar les conseqüències concretes de les
inundacions i la seva prevenció. Per últim, l’enfocament de cicle de vida d’aquesta tesi es
podria completar analitzant els serveis ecosistèmics (és a dir, beneficis per les persones) de
diferents alternatives de sanejament i drenatge. D’aquesta manera, els seus beneficis i
impactes quedarien clarament establerts de cara a la presa de decisions a escala urbana.
XXIX
Resumen
El crecimiento de las ciudades alrededor del mundo lleva asociado un incremento en la
demanda de infraestructuras de saneamiento y drenaje asociadas al ciclo del agua.
Combinado con los efectos del cambio climático, que están alterando los patrones de
pluviometría, la situación de estos sistemas en entornos urbanos es crítica. Buena parte de
las redes de alcantarillado existentes requieren una renovación urgente, otras han de ser
construidas en zonas en crecimiento, mientras que la escorrentía superficial de agua
pluvial es una amenaza en cuanto a inundaciones debido a la impermeabilización del suelo.
En este contexto, se debe determinar a través de una nueva visión ambiental y económica
cuáles son las mejoras prácticas para reducir estas problemáticas y al mismo tiempo
adaptar a las ciudades al cambio climático.
Aun así, existe una falta de datos ambientales y económicos que describan los principales
impactos de la gestión de las redes de alcantarillado, así como de diferentes sistemas de
prevención de inundaciones. Con este fin, la combinación de diferentes herramientas es
clave en la obtención de información integrada sobre estas infraestructuras. Además,
también es esencial determinar las implicaciones de diferentes escenarios de gestión del
saneamiento y drenaje a escala urbana, periurbana, barrio y edificio.
En respuesta a estas demandas, la siguiente tesis se desarrolla en torno a las siguientes
preguntas, las cuales se estudian de acuerdo a la estructura de la Figura X1:
(1) ¿Cuáles son los puntos críticos ambientales y económicos de las redes de
alcantarillado y los parámetros que afectan estos resultados en ciudades
medianas? (2) ¿Es el saneamiento descentralizado una opción ambientalmente mejor en
zonas suburbanas pequeñas cuando se debe gestionar una demanda punta? (3) ¿Tienen las estrategias de prevención de inundaciones un comportamiento
ambiental y económico positivo cuando se contabilizan las pérdidas evitadas
en inundaciones? En caso afirmativo, ¿es mejor aplicar prácticas de gestión
verdes o grises?
XXX
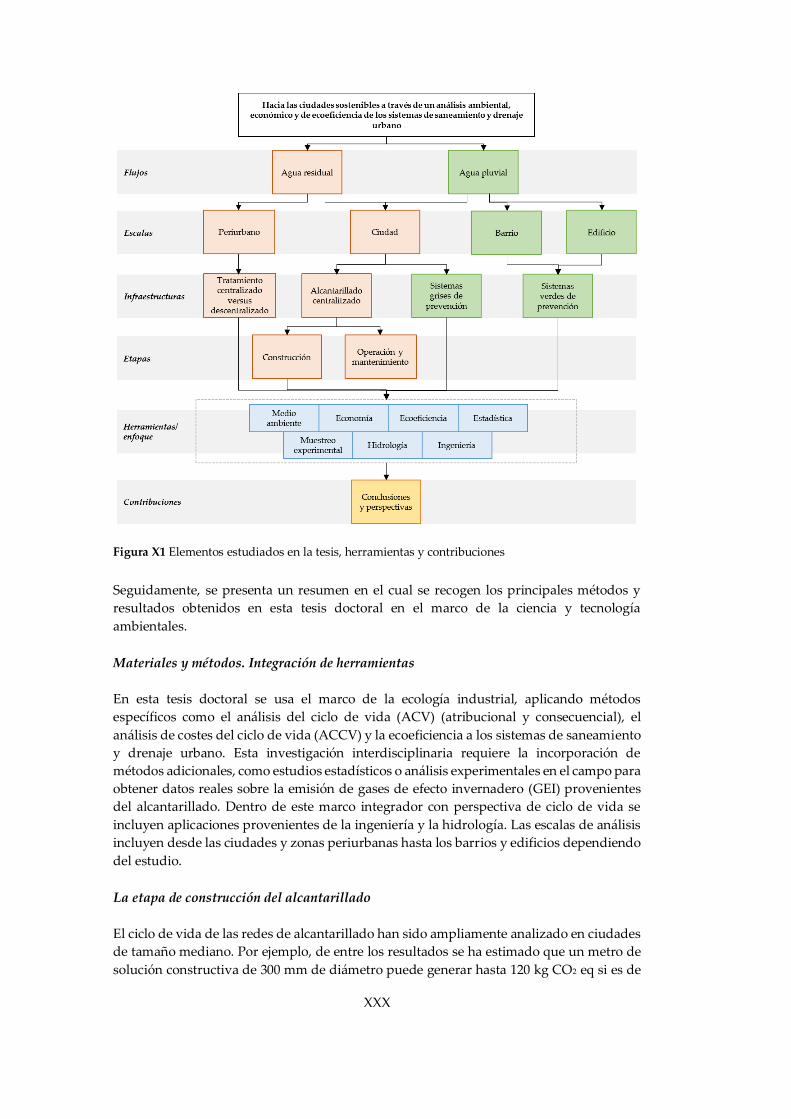
Figura X1 Elementos estudiados en la tesis, herramientas y contribuciones
Seguidamente, se presenta un resumen en el cual se recogen los principales métodos y
resultados obtenidos en esta tesis doctoral en el marco de la ciencia y tecnología
ambientales.
Materiales y métodos. Integración de herramientas
En esta tesis doctoral se usa el marco de la ecología industrial, aplicando métodos
específicos como el análisis del ciclo de vida (ACV) (atribucional y consecuencial), el
análisis de costes del ciclo de vida (ACCV) y la ecoeficiencia a los sistemas de saneamiento
y drenaje urbano. Esta investigación interdisciplinaria requiere la incorporación de
métodos adicionales, como estudios estadísticos o análisis experimentales en el campo para
obtener datos reales sobre la emisión de gases de efecto invernadero (GEI) provenientes
del alcantarillado. Dentro de este marco integrador con perspectiva de ciclo de vida se
incluyen aplicaciones provenientes de la ingeniería y la hidrología. Las escalas de análisis
incluyen desde las ciudades y zonas periurbanas hasta los barrios y edificios dependiendo
del estudio.
La etapa de construcción del alcantarillado
El ciclo de vida de las redes de alcantarillado han sido ampliamente analizado en ciudades
de tamaño mediano. Por ejemplo, de entre los resultados se ha estimado que un metro de
solución constructiva de 300 mm de diámetro puede generar hasta 120 kg CO2 eq si es de

XXXI
hormigón, o hasta 190 kg CO2 eq si es de polietileno de alta densidad. En cuanto a las
tuberías, generalmente el hormigón se presenta como la opción ambientalmente mejor
frente a los plásticos debido a su larga vida útil, aunque depende de los casos considerados.
No obstante, se ha determinado que los materiales de la tubería no son los únicos
determinantes del impacto ambiental de una solución constructiva para alcantarillado. En
algunos casos, la contribución de la zanja puede representar hasta un 80% de los impactos
ambientales de la etapa constructiva, hecho que no es irrelevante de cara a la toma de
decisiones. Mediante un estudio estructural paramétrico se han podido encontrar las
soluciones constructivas equivalentes que generan el menor impacto ambiental. Así,
reducir el uso de hormigón en las zanjas y reutilizar los materiales del suelo excavado para
rellenar y proteger las tuberías puede significar una reducción de los impactos ambientales.
La etapa de operación y mantenimiento de las redes de alcantarillado relacionadas a cada
ciudad
La etapa de operación incluye importantes retos en el ámbito del planeamiento urbano.
Estudiando una muestra de municipios de España, en general, y dos municipios
contrastados, en particular, se observa que el planeamiento es clave en el consumo de
energía. Se han comparado el municipio costero de Calafell (clima mediterráneo) y
Betanzos (clima atlántico). En este caso, la ubicación de la estación depuradora de Calafell
a una cota más elevada que el municipio hace que el consumo de energía de bombeo (0.47
kWh/m3) sea mayor que en Betanzos (0.11 kWh/m3), donde el agua circula por gravedad.
En una línea de investigación adicional, se han observado emisiones de GEI en el
alcantarillado a través de campañas de muestreo en estos dos municipios de climas
diferentes. Estos GEI incluyen el metano y el monóxido de dinitrógeno, los cuales tienen
un potencial de calentamiento global 25 y 298 más elevado que el dióxido de carbono,
respectivamente. Principalmente se detectaron mayores emisiones durante el verano
asociadas a las elevadas temperaturas y en zonas de turbulencia del alcantarillado, como
antes de las estaciones de bombeo.
Innovación a través de la ecoeficiencia de redes
La combinación de valores ambientales y económicos del alcantarillado se lleva a cabo a
través de uno de los primeros estudios de ecoeficiencia que aplica la ISO 14045:2012. En los
casos de Calafell y Betanzos se ha comparado la ecoeficiencia tanto de las diferentes etapas
del ciclo de vida como de los valores totales de los municipios. Independientemente del
clima y la estructura urbana, la etapa de operación es la que genera más impactos
ambientales (hasta el 74% de los impactos), mientras que la instalación (es decir, la zanja)
contribuye más a la generación de costes económicos (70-75%). La operación tiene margen
de mejora en cuanto al consumo de energía asociada al bombeo, mientras que a los costes
de la instalación dependen de la mano de obra. Esta contribución en los costes de ciclo de
vida es especialmente relevante en el contexto del ciclo urbano del agua completo, dado
que pueden representar hasta un 45% de los costes de estos municipios. En este sentido, se
discute la necesidad de gestionar el alcantarillado en el contexto de la gestión integrada de
las aguas residuales para mejorar la ecoeficiencia del sistema.

XXXII
Tratamiento del agua residual centralizado frente a descentralizado en la esfera ambiental
La implementación de estos sistemas centralizados del tratamiento del agua residual
puede ser más o menos impactante dependiendo de la escala de aplicación y el grado de
demanda. Por este motivo, en un estudio específico en asentamientos urbanos temporales
en la isla de Menorca se han estudiado ambientalmente diferentes escenarios de
tratamiento del agua residual con sistemas centralizados o descentralizados para
determinar las mejores opciones para hacer frente a las épocas turísticas. Los resultados
dependen de los indicadores estudiados y las variables consideradas. Aun así, parece que
un escenario centralizado en el que se conecta el asentamiento a una depuradora existente
de gran capacidad es beneficioso debido a las economías de escala. Según una puntuación
ambiental ponderada, este escenario generaría 390 mPt/m3, que representa un 12% menos
que descentralizar parcialmente con fosas sépticas o un 36% respecto a tratar el flujo
estacional en un humedal construido. No obstante, mediante un estudio probabilístico se
ha variado la población punta, la generación de agua residual estival y la duración de la
época turística para extrapolar a otras zonas similares. En este caso, tratar el agua en fosas
sépticas y transportar el efluente a la depuradora vecina puede presentar los mejores
resultados medios (520 mPt/m3). En general, los resultados dependen de la duración de la
época turística. El escenario centralizado es el que más variabilidad presenta (77%) en
función de la generación del agua, que va ligada al bombeo. Por este motivo, se deben
estudiar de forma diferenciada los sistemas urbanos temporales y los permanentes.
Análisis de las inundaciones desde una perspectiva de ciclo de vida
En el ámbito de la prevención de inundaciones, se aporta una nueva visión y un enfoque
innovador, pues se trata de los primeros estudios que integran el impacto ambiental y
económico de invertir en medidas preventivas con el impacto de los daños evitados. Estos
estudios pueden ser de gran interés de cara a la planificación urbana y, en particular,
dependiendo de climas y entornos. Desde una perspectiva metodológica, los estudios de
inundaciones aportan una discusión en el ámbito de las metodologías de ACV y en cómo
abordar las consecuencias de las inundaciones desde un punto de vista integrador y de la
sostenibilidad de las ciudades.
Balance ambiental y económico de los sistemas de prevención de inundaciones
Para determinar el balance neto de los impactos ambientales y costes económicos de
determinadas acciones preventivas, se han estudiado dos zonas diferenciadas. Por un lado,
las rieras son una amenaza en la costa mediterránea. En este entorno, se ha estudiado la
evolución histórica de los daños causados en tres municipios del Maresme (Cataluña,
España) antes y después de la implementación de actuaciones de emergencia.
Comparando los impactos y costes invertidos en la prevención y los daños evitados, se
observa que estas acciones se podrían amortizar económicamente en 2 años y
ambientalmente, en 25 años. Este resultado pone de manifiesto una de las consecuencias
ambientales y económicas de invertir en sistemas intensivos en materiales y de larga
durabilidad, como el hormigón. Por el contrario, también se ha estudiado un sistema de
prevención verde existente en la ciudad de São Carlos (Brasil), donde las elevadas
precipitaciones resultan en gran cantidad de daños cada año. En este entorno, se ha
observado que la ratio de ecoeficiencia del sistema (0.38 kg CO2 eq/€) es menor que en el
caso de las actuaciones en las rieras (1.2 kg CO2 eq/€). Aunque no son sistemas equivalentes,
XXXIII
el uso de un sistema verde que puede captar carbono puede ser beneficioso en algunos
casos, además de que también fomenta la infiltración natural del agua. En este último caso,
se comprobó que el impacto del sistema puede ser amortizado una vez se evita la
destrucción de un coche en términos de huella de carbono.
Retos de futuro en la investigación del saneamiento y drenaje urbano
Los resultados obtenidos abren un abanico de nuevas líneas de investigación de futuro. Es
interesante determinar si las tendencias observadas en el alcantarillado de ciudades
medianas también tienen lugar en grandes ciudades, donde la complejidad urbana es
mayor. Por otro lado, el debate de la centralización en zonas periurbanas presenta más
retos de futuro, como estudiar las posibilidades del tratamiento de agua a diferentes escalas,
climas y entornos turísticos, así como la simbiosis que los sistemas naturales pueden
aportar en el almacenaje del agua pluvial para un uso descentralizado. En este ámbito, se
deberían comprender las aplicaciones de las aguas pluviales y/o regeneradas en la
agricultura y servicios para cerrar el ciclo del agua de la manera más sostenible en sistemas
urbanos. En el caso de las inundaciones, son necesarios más modelos predictivos que
permitan determinar las consecuencias concretas de las inundaciones y su prevención. Por
último, el enfoque de ciclo de vida de esta tesis se podría completar analizando los servicios
ecosistémicos (es decir, beneficios para las personas) de diferentes alternativas de
saneamiento y drenaje. De esta forma, sus beneficios e impactos quedarían claramente
establecidos en vistas a la toma de decisiones a escala urbana.

XXXIV
XXXV
Preface
This thesis was developed during the period from October 2013 to April 2017 in compliance
with the PhD program in Environmental Science and Technology of the Universitat
Autònoma de Barcelona. This training period took place within the Sostenipra research
group (2014 SGR 1412) at the Institute of Environmental Science and Technology (ICTA),
including an international mobility at the University of Toledo (Ohio, USA) from April to
June 2016, and teaching assistance at the Department of Chemical, Biological and
Environmental Engineering. The thesis was supported by the pre-doctoral fellowships
awarded by Generalitat de Catalunya (FI-DGR 2014; March to September, 2014) and the
Spanish Ministry of Education, Culture and Sports (FPU13/01273; September, 2014 – until
end of training). In addition, research was conducted in a “María de Maeztu” Unit of
Excellence in R&D (MDM-2015-0552) thanks to the support of the Spanish Ministry of
Economy and Competitiveness.
The dissertation addresses urban wastewater and drainage systems through an integrated
approach that combines environmental and economic costs and benefits of different urban
water systems. The novelty of this research is the assessment of a set of conventional and
alternative solutions using innovative and integrated methods that will support decision-
making at different urban scales. The systems under analysis are thoroughly analyzed to
provide sound results. Additionally, engineering, hydrologic, urban planning and
experimental tools were applied accordingly.
Different parts of the dissertation were elaborated in the framework of funded research
projects. The eco-efficiency assessment of sewers was conducted within the LIFE+
Aquaenvec project (LIFE10/ENV/ES/520) “Assessment and improvement of the urban
water cycle ecoefficiency using LCA and LCC”. The stormwater management studies
based on Brazilian case studies were supported by the “Smart Parks” project funded by
the Spanish (HBP-2012-0216) and Brazilian governments (CAPES ref. 5206).
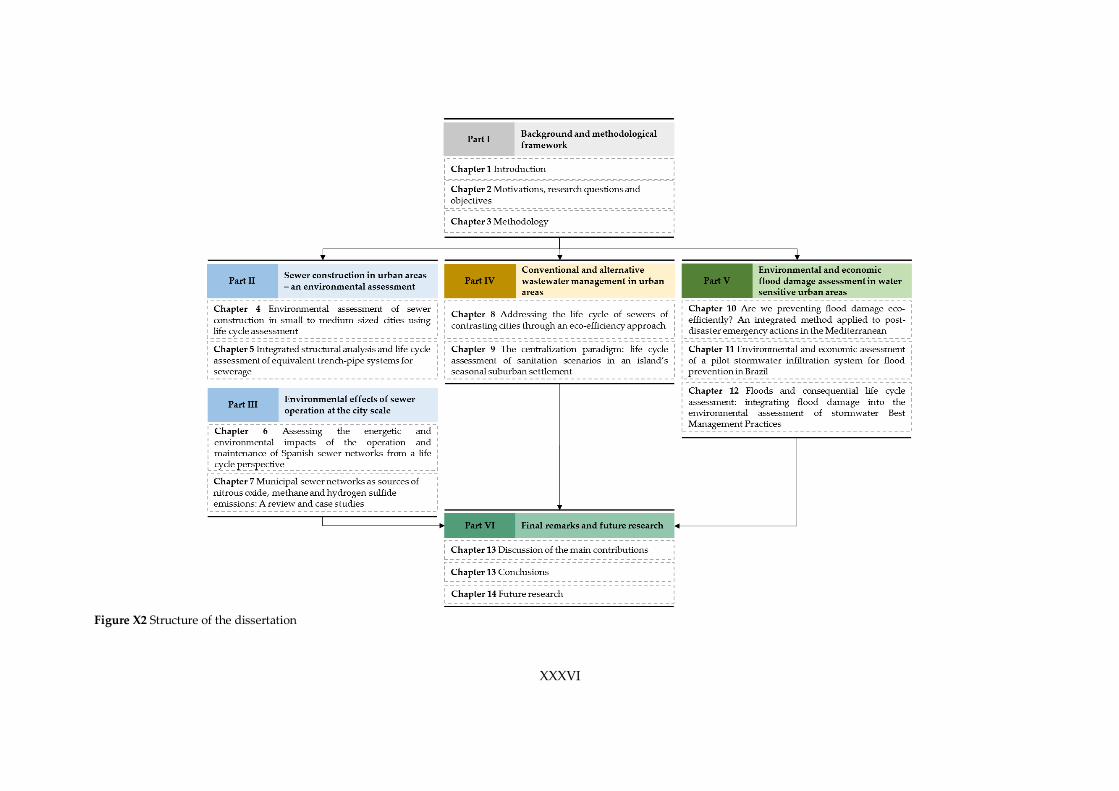
This thesis is composed of five parts as illustrated in Figure X2. Each part consists of a
group of chapters that deal with a variety of contents related to the main topic of the
dissertation.
XXXVI
Figure X2 Structure of the dissertation
XXXVII
Part I. Background and methodological framework
Part I is composed of three chapters. Chapter 1 [Introduction] explains the issues associated with
sustainability in cities and the potentialities of industrial ecology for quantifying urban
sustainability. It later focuses on the effects of population growth and climate change on current
sanitation and drainage systems and discusses the need for environmentally sound infrastructure.
The motivations that inspired the elaboration of this dissertation are presented in Chapter 2
[Motivations, research questions and objectives], along with the questions that addresses this research.
Chapter 3 [Methodology] provides a general description of the tools applied in each chapter and
the case studies under analysis.
Part II. Sewer construction in urban areas – an environmental assessment
Part II addresses the environmental impacts of the construction of sewer networks. First, Chapter
4 [Environmental assessment of sewer construction in small to medium sized cities using life cycle
assessment] conducts a life cycle assessment (LCA) of constructive solutions and compares
different types of pipe materials (i.e., concrete, fibrocement, polyvinylchloride, and high-density
polyethylene), trench designs and diameters. Besides comparing, it offers a basic method for
calculating the impacts of urban sewers that is tested on a case study. Chapter 5 [Integrated
structural analysis and life cycle assessment of equivalent trench-pipe systems for sewerage] integrates
LCA and a parametric study to obtain technically feasible designs based on construction
regulations. Equivalent designs are compared and assessed under traffic stress conditions and
pavement degradation.
Part III. Environmental effects of sewer operation at the city scale
Part III deals with the elements involved in the operation of sewers. Chapter 6 [Assessing the
energetic and environmental impacts of the operation and maintenance of Spanish sewer networks from a
life cycle perspective] is a statistical analysis of a sample of cities that aims to determine the trends
and parameters that affect the energy consumption in sewers. Chapter 7 [Municipal sewer networks
as sources of nitrous oxide, methane and hydrogen sulfide emissions: A review and case studies] has two
main parts. First, it reviews current literature on greenhouse gas emissions generated in sewers
to understand the potential sources of methane and nitrous oxide that result from wastewater
degradation. Second, it provides the first experimental results of sampling campaigns conducted
in two case study cities to determine the main drivers for these emissions and their contribution
to a sewer’s life cycle impacts.
Part IV. Conventional and alternative wastewater management in urban areas
Part IV is composed of two different studies. Chapter 8 [Addressing the life cycle of sewers of
contrasting cities through an eco-efficiency approach] applies the eco-efficiency method to two cities
with a centralized sewer system by combining environmental and economic values. This study
aims to find differences between these cities and determine the main reasons. Chapter 9 [The
centralization paradigm: life cycle assessment of sanitation scenarios in an island’s seasonal suburban
settlement] discusses the environmental performance of centralized and decentralized sanitation
scenarios in the context of suburban settlements in islands that deal with an increased sanitation
demand during the seasonal periods.
XXXVIII
Part V. Environmental and economic flood damage assessment in water-sensitive urban areas
Part V addresses the environmental and economic effects of stormwater management systems
under different conditions. Chapter 10 [Are we preventing flood damage eco-efficiently? An integrated
method applied to post-disaster emergency actions in the Mediterranean] presents a novel approach that
estimates the environmental and economic balance and payback time of post-disaster emergency
actions. These are applied in ephemeral streams in the Mediterranean and feed on historical
records and insurance data. Chapter 11 [Environmental and economic assessment of a pilot stormwater
infiltration system for flood prevention in Brazil] is based on an existing green prevention system
located in Brazil. The chapter estimates the impacts of this system and its potential infiltration
benefits. Chapter 12 [Floods and consequential life cycle assessment: integrating flood damage into the
environmental assessment of stormwater Best Management Practices] discusses the integration of flood
damage into the CLCA of prevention systems and proposes a methodology that is tested on the
case study presented in Chapter 11.
Part VI. Final remarks and future research
Part VI is the last section of the dissertation. Chapter 13 [Discussion of the main contributions] brings
together the knowledge generated in this research to present the main contributions and
applications. Chapter 14 [Conclusions] answers the questions posed in Chapter 2 based on the
results of the analysis. Finally, Chapter 15 [Future research] proposes upcoming research
challenges and applications that might be interesting in the field of urban sustainability and the
water cycle resulting from the work conducted.
XXXIX
Dissemination and training
This thesis is based on a set of peer-reviewed or submitted articles and the inventory data
published at the LCADB.Sudoe database (http://lcadb.sudoe.ecotech.cat):
Petit-Boix A, Sanjuan-Delmás D, Gasol C, Villalba G, Suárez-Ojeda ME, Gabarrell X, Josa A,
Rieradevall J, 2014. Environmental assessment of sewer construction in small to medium
sized cities using life cycle assessment. Water Resources Management 28, 979–997 (doi:
10.1007/s11269-014-0528-z)
Petit-Boix A, Sanjuan-Delmás D, Chenel S, Marín D, Gasol C, Farreny R, Villalba G, Suárez-
Ojeda ME, Gabarrell X, Josa A, Rieradevall J, 2015. Assessing the energetic and
environmental impacts of the operation and maintenance of Spanish sewer networks from a
life-cycle perspective. Water Resources Management 29, 2581–2597 (doi: 10.1007/s11269-015-
0958-2)
Eijo-Río E, Petit-Boix A, Villalba G, Suárez-Ojeda ME, Marin D, Amores MJ, Aldea X,
Rieradevall J, Gabarrell X, 2015. Municipal sewer networks as sources of nitrous oxide,
methane and hydrogen sulphide emissions: A review and case studies. Journal of
Environmental Chemical Engineering 3(3): 2084–2094 (doi: 10.1016/j.jece.2015.07.006)
Petit-Boix A, Sevigné-Itoiz E, Rojas-Gutierrez LA, Barbassa AP, Josa A, Rieradevall J,
Gabarrell X, 2015. Environmental and economic assessment of a pilot stormwater infiltration
system for flood prevention in Brazil. Ecological Engineering 84, 194-201 (doi:
10.1016/j.ecoleng.2015.09.010)
Petit-Boix A, Roigé N, de la Fuente A, Pujadas P, Gabarrell X, Rieradevall J, Josa A, 2016.
Integrated structural analysis and life cycle assessment of equivalent trench-pipe systems for
sewerage. Water Resources Management 30, 1117–1130 (doi: 10.1007/s11269-015-1214-5)
Petit-Boix A, Arahuetes A, Josa A, Rieradevall J, Gabarrell X, 2017. Are we preventing flood
damage eco-efficiently? An integrated method applied to post-disaster emergency actions.
Science of the Total Environment 580, 873-881 (doi: 10.1016/j.scitotenv.2016.12.034)
Petit-Boix A, Sevigné-Itoiz E, Rojas-Gutierrez LA, Barbassa AP, Josa A, Rieradevall J,
Gabarrell X. Floods and consequential Life Cycle Assessment: integrating flood damage into
the environmental assessment of stormwater Best Management Practices. Accepted with
minor revisions
Petit-Boix A, Arnal C, Marin D, Josa A, Gabarrell X, Rieradevall J. Addressing the life cycle
of sewers through an eco-efficiency approach. The case of opposite urban environments.
Accepted with major revisions
In addition, some preliminary results were presented in international conferences of interest:
Sanjuan-Delmás D, Petit-Boix A, Marín D, Gabarrell X, Josa A, Rieradevall J “Drinking water
and sewer networks in Spanish medium-sized cities: an environmental assessment from an
industrial ecology perspective” Oral presentation. ISIE Americas 2016 Meeting (May 25-27,
2016; Bogotá, Colombia)
Sanjuan-Delmás D, Petit-Boix A, Marín D, Gabarrell X, Josa A, Rieradevall J “Environmental
assessment of drinking water supply and sewer networks for small to medium cities”. Poster.
XL
LCM2015. Mainstreaming Life Cycle Management for sustainable value creation (August 1
– September 2, 2015; Bordeaux, France)
Arnal C, Marín D, Termes M, Planas M, Petit-Boix A, Sanjuan-Delmás A, Amores MJ, Prieto
M, Aldea X “Life Cycle Costing assessment of water supply and sewer networks in small-
medium cities” Poster. Mainstreaming Life Cycle Management for sustainable value
creation (August 1 – September 2, 2015; Bordeaux, France)
Petit-Boix A, Sanjuan-Delmás D, Arnal C, Marín D, Gabarrell X, Josa A, Rieradevall J “LCA
and LCC Integration for Supporting Decisions in the Design and Construction of Sewer
Networks in Future Smart Cities” Poster. CILCA2015. VI Conferencia Internacional de
Análisis de Ciclo de Vida en Latinoamérica (July 13-16, 2015; Perú, Lima) – Third place at
poster awards
Eijo-Río E, Petit-Boix A, Amores MJ, Marín D, Villalba G, Suárez-Ojeda ME, Rieradevall J,
Gabarrell X “Gas emissions in municipal sewer networks in two climatic regions” Poster.
SETAC Europe 25th Annual Meeting (May 3-7, 2015; Barcelona, Spain)
Rojas-Gutierrez LA, Petit-Boix A, Barbassa AP, Teixeira B, Josa A, Rieradevall J, Gabarrell X
“Environmental assessment of stormwater infrastructures built with the best management
practices” Oral presentation. ICFM 6. 6th International Conference on Flood Management.
"Floods in a changing Environment" (September 16-18, 2014; São Paulo, Brazil)
Petit-Boix A, Sevigné E, Barbassa AP, Teixeira B, de Lima Nascimento Sirio D, Rojas-
Gutierrez LA, Marin D, Rieradevall J, Gabarrell X “Environmental consequences of
stormwater harvesting for flood prevention” Oral presentation. SETAC Europe 24th Annual
Meeting (May 11-16, 2014; Basel, Switzerland)
Furthermore, additional training and knowledge was obtained through collaborations in a
number projects, articles, conferences, books, and scientific activities during the PhD training
process.
Participation in projects:
LIFE SAVING-E: Two-Stage Autotrophic N-remoVal for maINstream sewaGe treatment
(LIFE14-ENV_ES_000633). EU funds
Desdemona: DESarrollo de una DEpuradora urbana autosuficiente energéticamente
Mediante la eliminación autOtrófica de Nitrógeno en la línea principal de Aguas y la
recuperación de fósforo. MINECO funds
Collaborative Research: IRES (International Research Experience for Undergraduates) - Life
Cycle Management and Ecosystem Services Applied to Urban Agriculture. National Science
Foundation funds
Fertilecity (CTM2013-47067-C2-1-R). Agrourban sustainability through rooftop greenhouses.
Ecoinnovation on residual flows of energy, water and CO2 for food production. MINECO
funds
Collaborative Research: Analysis of Decentralized Harvested Rainwater Systems using the
Urban Water Infrastructure Sustainability Evaluation (uWISE) Framework. National Science
Foundation funds
XLI
M-ECO, Investigación para la mejora de la sostenibilidad del sector de la madera y mueble
en Andalucía a través de la Eco-innovación. Junta de Andalucía funds
Participation in articles and book chapters:
Petit-Boix A, Sanyé-Mengual E, Llorach-Massana P, Sanjuan-Delmás D, Sierra-Pérez J,
Vinyes E, Gabarrell X, Rieradevall J. Research on strategies towards sustainable cities from
a life cycle perspective: a review. Accepted with major revisions
Devkota J, Petit-Boix A, Phillips R, Vargas-Parra V, Josa A, Gabarrell X, Rieradevall J, Apul
D. Life Cycle Assessment of Rainwater Harvesting in Urban Neighborhoods: Implications
of Urban Form and Water Demand Patterns in the US and Spain. Under review
Angrill S, Petit-Boix A, Morales-Pinzón T, Josa A, Rieradevall J, Gabarrell X, 2017. Urban
rainwater runoff quantity and quality – A potential endogenous resource in cities? Journal
of Environmental Management 189, 14-21 (doi: 10.1016/j.jenvman.2016.12.027)
Angrill S, Segura-Castillo L, Petit-Boix A, Rieradevall J, Gabarrell X, Josa A, 2017.
Environmental performance of rainwater harvesting strategies in Mediterranean buildings.
International Journal of Life Cycle Assessment 22(3), 398-409 (doi: 10.1007/s11367-016-1174-
x)
Sanjuan-Delmás D, Petit-Boix A, Martínez-Blanco J, Rieradevall J, 2016. Environmental
metabolism of educational services. Case study of nursery schools in the city of Barcelona.
Energy Efficiency 9(5), 981-992 (doi: 10.1007/s12053-015-9403-x)
Sanjuan-Delmás D, Petit-Boix A, Gasol CM, Farreny R, Villalba G, Suárez-Ojeda ME,
Gabarrell X, Josa A, Rieradevall J, 2015. Environmental assessment of drinking water
transport and distribution network use phase for small to medium-sized municipalities in
Spain. Journal of Cleaner Production 87, 573-582 (doi: 10.1016/j.jclepro.2014.09.042)
Sanjuan-Delmás D, Petit-Boix A, Gasol CM, Villalba G, Suárez-Ojeda ME, Gabarrell X, Josa
A, Rieradevall J, 2014. Environmental assessment of different pipelines for drinking water
transport and distribution network in small to medium cities: a case from Betanzos, Spain.
Journal of Cleaner Production 66, 588-598 (doi: 10.1016/j.jclepro.2013.10.055)
Petit-Boix A, Sanjuan-Delmás D, Martínez-Blanco J, Rieradevall J, 2013. La petjada
ambiental d'un infant a l'escola bressol. Guix d’Infantil 73, 33-36
Gabarrell X, Rieradevall J, Josa A, Oliver-Solà J, Mendoza JMF, Sanjuan-Delmás D, Petit-
Boix A, Sanyé-Mengual E, 2015. Life Cycle Management Applied to Urban Fabric Planning,
In: Life Cycle Management. Part V: Implementation and Case Studies of Life Cycle
Management in Different Business and Industry Sectors. In LCA Compendium - The
Complete World of Life Cycle Assessment (ISBN: 978-94-017-7220-4). Pages 307-317
XLII
Collaboration in journals
From November, 2015, until present, the abstracts of the Journal of Industrial Ecology were
translated into Spanish.
Participation in conferences:
Uzunogullari D, Apul D, Gruden C, Petit-Boix A “Net Environmental Impact of Urban and
Conventional Agriculture Estimated Using Urban Water Metabolism” Poster. 2017
Borchardt Conference. 24th Triennial Symposium on Advancements in Water & Wastewater
(February 21-22, 2017; Ann Arbor, Michigan, US)
Duch C, Peña A, Roch M, Nieto S, Rieradevall J, Petit-Boix A “Eco-efficiency of the meat and
leather production in a transitional stockbreeding system located in a Mediterranean island”
Poster. LCAFood2016. 10th International Conference on Life Cycle Assessment of Food 2016
(October 19-21, 2016; Dublin, Ireland)
Petit-Boix A, Feng Y, Burian S, Apul D, Josa A, Rieradevall J, Gabarrell X “Environmental
map of water and food self-sufficiency: integrating rainwater harvesting and urban
agriculture in different climates” Poster. LCAFood2016. 10th International Conference on
Life Cycle Assessment of Food 2016 (October 19-21, 2016; Dublin, Ireland)
Benítez M, Codina G, Domènech J, Moreno J, Sanz S, Rieradevall J, Petit-Boix A
“Environmental and eco-efficiency assessment of artisan cheese production with Protected
Designation of Origin in the Mediterranean island of Minorca” Poster. LCAFood2016. 10th
International Conference on Life Cycle Assessment of Food 2016 (October 19-21, 2016;
Dublin, Ireland)
Toboso S, Aynès J, Liarte R, Torres C, Muñiz I, Rieradevall J, Petit-Boix A “Integrating
geographic, social and environmental tools for urban garden sustainability in Barcelona”
Oral presentation. GROWING IN CITIES. Interdisciplinary Perspectives on Urban
Gardening International Conference (September 9-10, 2016; Basel, Switzerland)
XLIII
Sanjuan-Delmás D, Petit-Boix A, Rieradevall J, Gabarrell X “Ecoinnovación en el sector del
agua en Sostenipra” Poster. META2016. XII Reunión de la Mesa Española de Tratamiento de
Aguas (June 20-22, 2016; Madrid, Spain)
Llorach-Massana P, Petit-Boix A, Sanyé-Mengual E, Rieradevall J, Gabarrell X, Garcia
Lozano R, Gasol CM, Vázquez V, Rodríguez G, Rodríguez-Acuña R “Tools for implementing
and communicating eco-design in the furniture sector” Oral presentation. ISIE Americas
2016 Meeting (May 25-27, 2016; Bogotá, Colombia)
Feng Y, Burian S, Petit-Boix A, Josa A, Rieradevall J, Gabarrell X, Apul D “Life Cycle
Assessment of the Cost and the Social and Ecosystem Services of Rainwater Harvesting in
Dry Climates” Poster. EWRI. World Environmental & Water Resources Congress 2016 (May
22-26, 2016; Palm Beach, Florida, US)
Sanjuan-Delmás D, Petit-Boix A, Arnal C, Marín D, Gabarrell X, Josa A, Rieradevall J
“Ecoefficiency assessment of the drinking water distribution network of Calafell (Spain)”
Poster. GCPC2015. Global Cleaner Production and Sustainable Consumption Conference
2015 (November 1-4, 2016; Sitges, Spain)
Petit-Boix A, Sanyé-Mengual E, Llorach-Massana P, Rieradevall J, Gabarrell X, Garcia
Lozano R, Gasol CM, Vázquez V, Rodríguez R, Rodríguez G “Sustainable production
through innovation in the furniture sector: promoting policy-making and eco-design tools
from a joint research-industry project” Oral presentation. GCPC2015. Global Cleaner
Production and Sustainable Consumption Conference 2015 (November 1-4, 2016; Sitges,
Spain)
Sanyé-Mengual E, Petit-Boix A, Ometto A, Camargo Felicio M, Gonçalves LM,Siloto da Silva
R, Bovo Peres R, Barbassa AP, Teixeira BAN, Rieradevall J, Gabarrell X “Towards the design
of "Smart Parks": development of industrial ecology tools for industrial and service parks in
Brazil and Spain” Oral presentation. CILCA2015. VI Conferencia Internacional de Análisis
de Ciclo de Vida en Latinoamérica (July 13-16, 2015; Perú, Lima)
Sanjuan-Delmás D, Arnal C, Petit-Boix A, Gabarrell X, Josa A, Rieradevall J “Comparison of
HDPE and ductile iron pipes for drinking water supply networks in future smart cities
through LCA and LCC” Poster. CILCA2015. VI Conferencia Internacional de Análisis de
Ciclo de Vida en Latinoamérica (July 13-16, 2015; Perú, Lima)
Petit-Boix A, Pereira Silva S, Ometto A, Yuri Hanai F, Barbassa AP, Josa A, Gabarrell X,
Rieradevall J “Integrated assessment of water flows and urban water networks in smart
parks” Oral presentation. ISIE Conference 2015. Taking Stock of Industrial Ecology (July 7-
11, 2015; Guildford, UK)
Sanjuan-Delmás D, Petit-Boix A, Gasol CM, Villalba V, Suárez-Ojeda ME, Gabarrell X, Josa
A, Rieradevall J “LCA of PVC and HDPE pipes for drinking water distribution networks in
cities” Poster. IWA World Water Congress & Exhibition (September 21-26, 2014; Lisbon,
Portugal)

XLIV

1
PART I - BACKGROUND AND METHODOLOGICAL FRAMEWORK
Part I Background and methodological
framework

Picture: Residential area in the Village of Ottawa Hills (Ohio, USA)
Introduction
Chapter 1

5
Introduction
This chapter elaborates on the need to consider sustainability in urban water management.
First, problems associated with urban expansion are presented in the context of sustainable
development, considering the specific application of industrial ecology tools to improve
the performance of cities. Second, the need for sustainable water management systems is
discussed.
1.1 Cities and sustainability
It is no longer an assumption but a fact that our society is highly dependent on resources.
We rely on technologies that improve our quality of life and wellbeing, but a cost is always
associated with any decision. Deciding on a place to live or work or the type of products
that we consume has a direct effect on the society, economy and environment. In the
following sections, we explore the concept of sustainability, how it relates to cities, which
are population hotspots, and specific tools that we can apply to quantify and evaluate the
performance of a city.
1.1.1 Key issues towards urban sustainability
Sustainability is a central value in most political agendas at the national, regional and local
level since the Brundtland Report defined in 1987 that sustainable development is a
“development that meets the needs of the present without compromising the ability of
future generations to meet their own needs” (WCED 1987). To achieve sustainability,
action plans should account for the environmental, economic and social effects that they
might trigger and the potential interconnections among these three pillars. In this context,
the Agenda 21 program, which resulted from the Río Conference in 1992, promoted the
implementation of sustainability actions based on different program areas (United
Nations, UN 1992).
Within the 2030 Agenda for Sustainable Development, the United Nations Development
Program (UNDP) defined in 2015 a set of seventeen strategic goals that covered a variety
of core dimensions related to sustainability. One of these was to make cities inclusive, safe,
resilient and sustainable (United Nations, UN 2016). In fact, cities are known population
hubs and a focus of concern given the increase in urban population that the world
experienced during the last century. At present, more than half of the world’s population
lives in urban areas (The World Bank 2016) and this rate is not expected to decrease in the
coming years. The expansion of cities and development of new metropolis is associated
with an increasing demand for resources to meet the needs of potential new citizens.
The form these urban areas take will directly affect the per capita resource use and impact
generation in the short and long term, which requires immediate action (McDonald 2008).
Research has already acknowledged that cities contribute to local and global impacts, such
as climate change or resource depletion (Kennedy et al. 2012). Nevertheless, the extent to
which cities relate to these effects is still a controversial matter. For instance, UN-HABITAT
(2011) reported that cities are responsible for 70% of the greenhouse gas emissions (GHG).
Satterthwaite (2008) rebutted this claim by stating that we need to clearly define the
boundaries of a city when accounting for its performance, as the production of food, energy
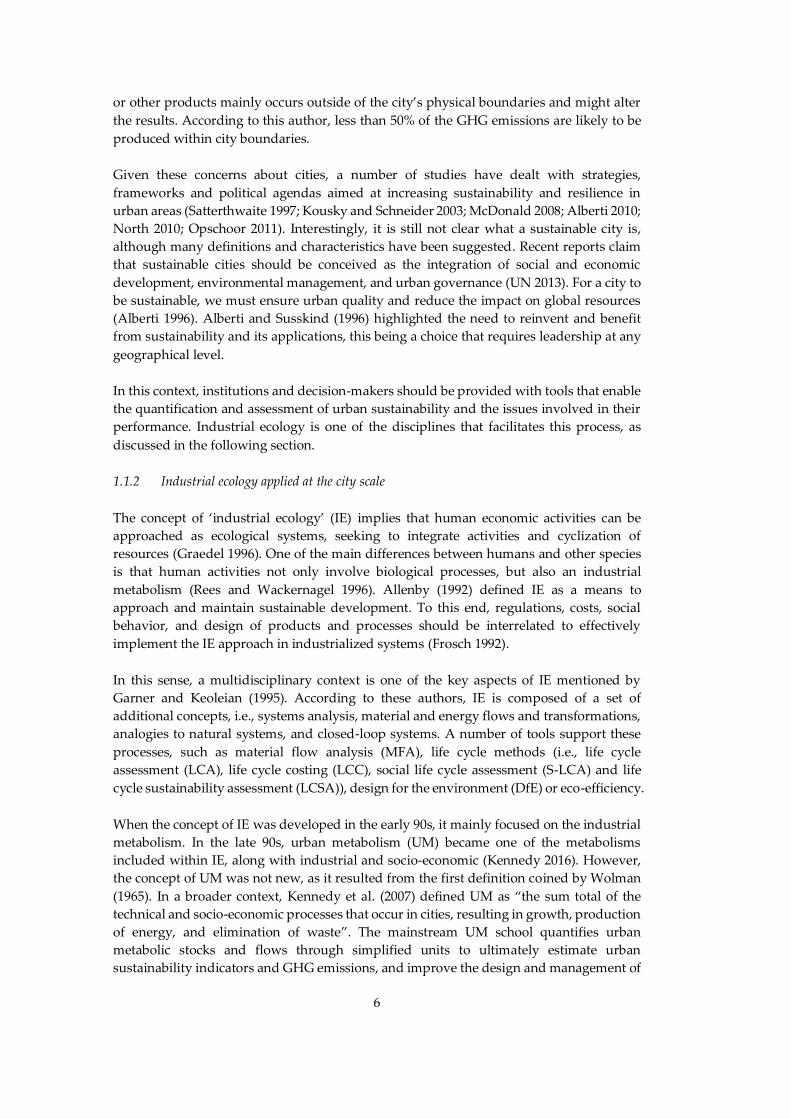
6
or other products mainly occurs outside of the city’s physical boundaries and might alter
the results. According to this author, less than 50% of the GHG emissions are likely to be
produced within city boundaries.
Given these concerns about cities, a number of studies have dealt with strategies,
frameworks and political agendas aimed at increasing sustainability and resilience in
urban areas (Satterthwaite 1997; Kousky and Schneider 2003; McDonald 2008; Alberti 2010;
North 2010; Opschoor 2011). Interestingly, it is still not clear what a sustainable city is,
although many definitions and characteristics have been suggested. Recent reports claim
that sustainable cities should be conceived as the integration of social and economic
development, environmental management, and urban governance (UN 2013). For a city to
be sustainable, we must ensure urban quality and reduce the impact on global resources
(Alberti 1996). Alberti and Susskind (1996) highlighted the need to reinvent and benefit
from sustainability and its applications, this being a choice that requires leadership at any
geographical level.
In this context, institutions and decision-makers should be provided with tools that enable
the quantification and assessment of urban sustainability and the issues involved in their
performance. Industrial ecology is one of the disciplines that facilitates this process, as
discussed in the following section.
1.1.2 Industrial ecology applied at the city scale
The concept of ‘industrial ecology’ (IE) implies that human economic activities can be
approached as ecological systems, seeking to integrate activities and cyclization of
resources (Graedel 1996). One of the main differences between humans and other species
is that human activities not only involve biological processes, but also an industrial
metabolism (Rees and Wackernagel 1996). Allenby (1992) defined IE as a means to
approach and maintain sustainable development. To this end, regulations, costs, social
behavior, and design of products and processes should be interrelated to effectively
implement the IE approach in industrialized systems (Frosch 1992).
In this sense, a multidisciplinary context is one of the key aspects of IE mentioned by
Garner and Keoleian (1995). According to these authors, IE is composed of a set of
additional concepts, i.e., systems analysis, material and energy flows and transformations,
analogies to natural systems, and closed-loop systems. A number of tools support these
processes, such as material flow analysis (MFA), life cycle methods (i.e., life cycle
assessment (LCA), life cycle costing (LCC), social life cycle assessment (S-LCA) and life
cycle sustainability assessment (LCSA)), design for the environment (DfE) or eco-efficiency.
When the concept of IE was developed in the early 90s, it mainly focused on the industrial
metabolism. In the late 90s, urban metabolism (UM) became one of the metabolisms
included within IE, along with industrial and socio-economic (Kennedy 2016). However,
the concept of UM was not new, as it resulted from the first definition coined by Wolman
(1965). In a broader context, Kennedy et al. (2007) defined UM as “the sum total of the
technical and socio-economic processes that occur in cities, resulting in growth, production
of energy, and elimination of waste”. The mainstream UM school quantifies urban
metabolic stocks and flows through simplified units to ultimately estimate urban
sustainability indicators and GHG emissions, and improve the design and management of
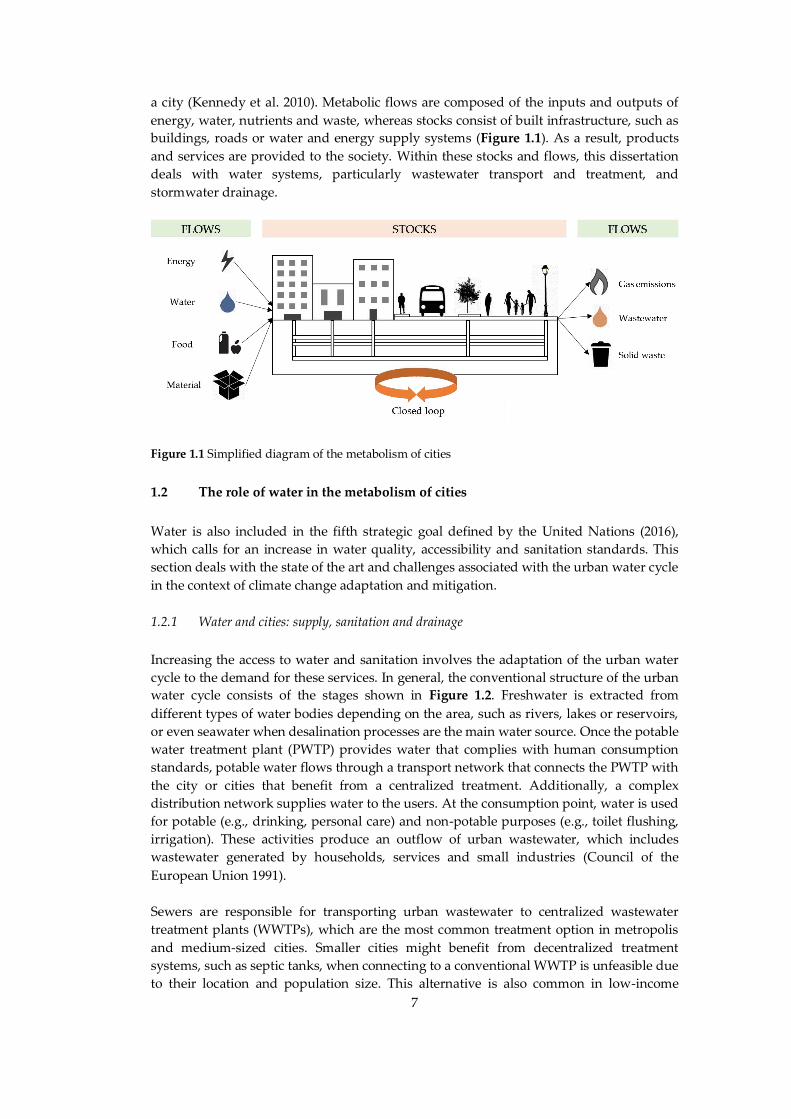
7
a city (Kennedy et al. 2010). Metabolic flows are composed of the inputs and outputs of
energy, water, nutrients and waste, whereas stocks consist of built infrastructure, such as
buildings, roads or water and energy supply systems (Figure 1.1). As a result, products
and services are provided to the society. Within these stocks and flows, this dissertation
deals with water systems, particularly wastewater transport and treatment, and
stormwater drainage.
Figure 1.1 Simplified diagram of the metabolism of cities
1.2 The role of water in the metabolism of cities
Water is also included in the fifth strategic goal defined by the United Nations (2016),
which calls for an increase in water quality, accessibility and sanitation standards. This
section deals with the state of the art and challenges associated with the urban water cycle
in the context of climate change adaptation and mitigation.
1.2.1 Water and cities: supply, sanitation and drainage
Increasing the access to water and sanitation involves the adaptation of the urban water
cycle to the demand for these services. In general, the conventional structure of the urban
water cycle consists of the stages shown in Figure 1.2. Freshwater is extracted from
different types of water bodies depending on the area, such as rivers, lakes or reservoirs,
or even seawater when desalination processes are the main water source. Once the potable
water treatment plant (PWTP) provides water that complies with human consumption
standards, potable water flows through a transport network that connects the PWTP with
the city or cities that benefit from a centralized treatment. Additionally, a complex
distribution network supplies water to the users. At the consumption point, water is used
for potable (e.g., drinking, personal care) and non-potable purposes (e.g., toilet flushing,
irrigation). These activities produce an outflow of urban wastewater, which includes
wastewater generated by households, services and small industries (Council of the
European Union 1991).
Sewers are responsible for transporting urban wastewater to centralized wastewater
treatment plants (WWTPs), which are the most common treatment option in metropolis
and medium-sized cities. Smaller cities might benefit from decentralized treatment
systems, such as septic tanks, when connecting to a conventional WWTP is unfeasible due
to their location and population size. This alternative is also common in low-income
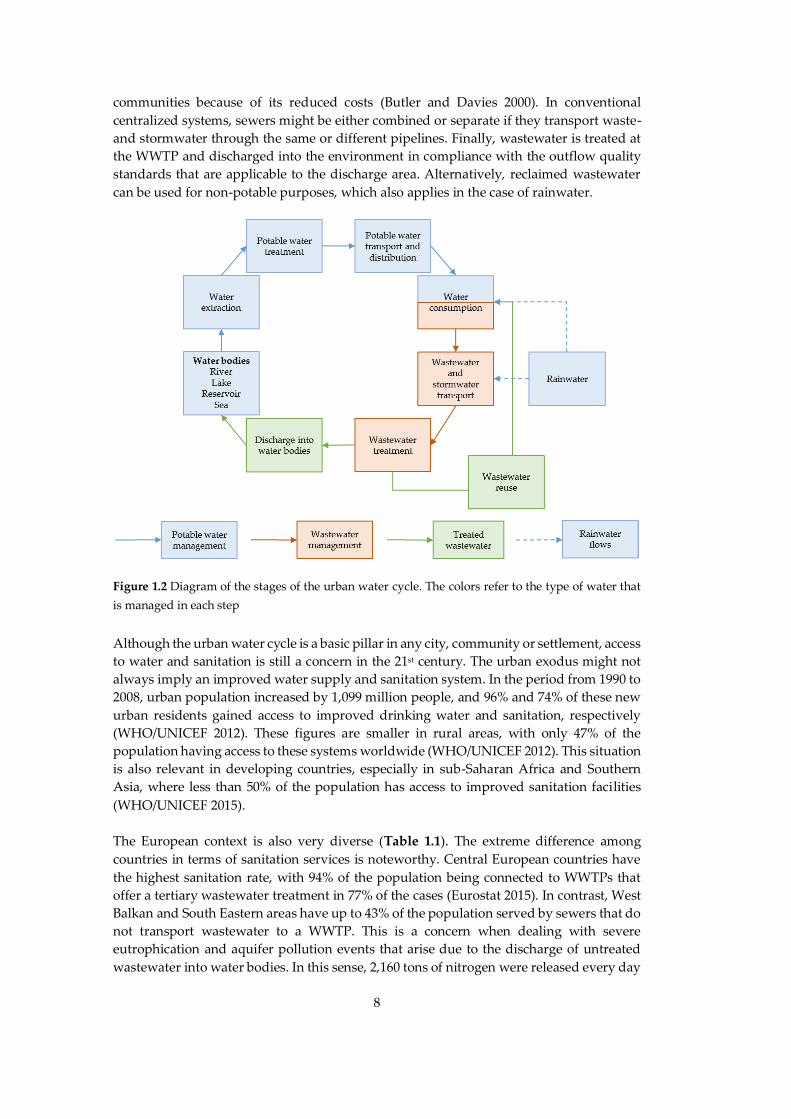
8
communities because of its reduced costs (Butler and Davies 2000). In conventional
centralized systems, sewers might be either combined or separate if they transport waste-
and stormwater through the same or different pipelines. Finally, wastewater is treated at
the WWTP and discharged into the environment in compliance with the outflow quality
standards that are applicable to the discharge area. Alternatively, reclaimed wastewater
can be used for non-potable purposes, which also applies in the case of rainwater.
Figure 1.2 Diagram of the stages of the urban water cycle. The colors refer to the type of water that
is managed in each step
Although the urban water cycle is a basic pillar in any city, community or settlement, access
to water and sanitation is still a concern in the 21st century. The urban exodus might not
always imply an improved water supply and sanitation system. In the period from 1990 to
2008, urban population increased by 1,099 million people, and 96% and 74% of these new
urban residents gained access to improved drinking water and sanitation, respectively
(WHO/UNICEF 2012). These figures are smaller in rural areas, with only 47% of the
population having access to these systems worldwide (WHO/UNICEF 2012). This situation
is also relevant in developing countries, especially in sub-Saharan Africa and Southern
Asia, where less than 50% of the population has access to improved sanitation facilities
(WHO/UNICEF 2015).
The European context is also very diverse (Table 1.1). The extreme difference among
countries in terms of sanitation services is noteworthy. Central European countries have
the highest sanitation rate, with 94% of the population being connected to WWTPs that
offer a tertiary wastewater treatment in 77% of the cases (Eurostat 2015). In contrast, West
Balkan and South Eastern areas have up to 43% of the population served by sewers that do
not transport wastewater to a WWTP. This is a concern when dealing with severe
eutrophication and aquifer pollution events that arise due to the discharge of untreated
wastewater into water bodies. In this sense, 2,160 tons of nitrogen were released every day
9
in 2013 in the European Union (28 countries). This is not irrelevant, especially depending
on the discharge location. Until recently, several coastal locations released untreated
sewage into the sea, for instance in Malta (WSC 2011) or Spain (Vida and Arroyo 2005).
In terms of global environmental impacts, European water and wastewater facilities
account for less than 2% of the CO2 eq emissions of the economy (Eurostat 2015). At the
global level, the European Commission (2009) estimated that WWTPs generate 9% and 3%
of the methane (CH4) and nitrous oxide (N2O) emissions worldwide. However, depending
on the calculation methods and assumptions, the relative importance of water and
wastewater systems can be higher or lower, as demonstrated in the Third Catalan Climate
Change Report (Institut d’Estudis Catalans and Generalitat de Catalunya 2016). This
distortion in the results poses a question: what should be included in the sustainability
assessments of the urban water cycle, and what are the challenges that might alter this
outcome? In the following section, these additional challenges are described with the
objective of identifying potential areas of interest in sustainability assessments.
Table 1.1 Global European water and wastewater management data based on Eurostat (2015)
Parameter
Values for
European Union
(EU-28)
Gross surface and groundwater abstraction (million m3) (2013) 30,306
Volumetric wastewater generation and discharge (million m3) (2013)
Point sources 7,750
Urban wastewater treatment 3,570
Discharges of WWTPs 4,340
Discharges to inland water bodies 7,680
Discharges to the sea 340
Point source pollutant emissions (tons/day) (2013)
Total nitrogen 2,160
Total phosphorus 284
Available sanitation services (%) (2012)
Population with wastewater treatment Range: 8 - 94%
Population with wastewater collection, but without treatment Range: 0.2 - 43%
GHG emissions (2014)
Water supply, sewerage and waste management (million tons CO2 eq) 45.4
Contribution to sectorial emissions 2%
1.2.2 Sustainability challenges of current water management models
Assessing the sustainability of the urban water cycle is complex due to the number of
variables involved in its performance. This dissertation focuses on the metabolism of water
in cities, specifically those elements related to the sustainability of sanitation and drainage.
To this end, Figure 1.3 screens potential challenges of sanitation and drainage systems from
a causal perspective. This chain is an adaptation of the DPSIR (Driving forces, Pressure,
State, Impact, Response) framework, which is used in the definition of strategies towards
integrated environmental assessments (EEA 1999). In this case, we seek to define the
relationship between driving forces, pressure on water resources, responses to these
pressures and final impacts.
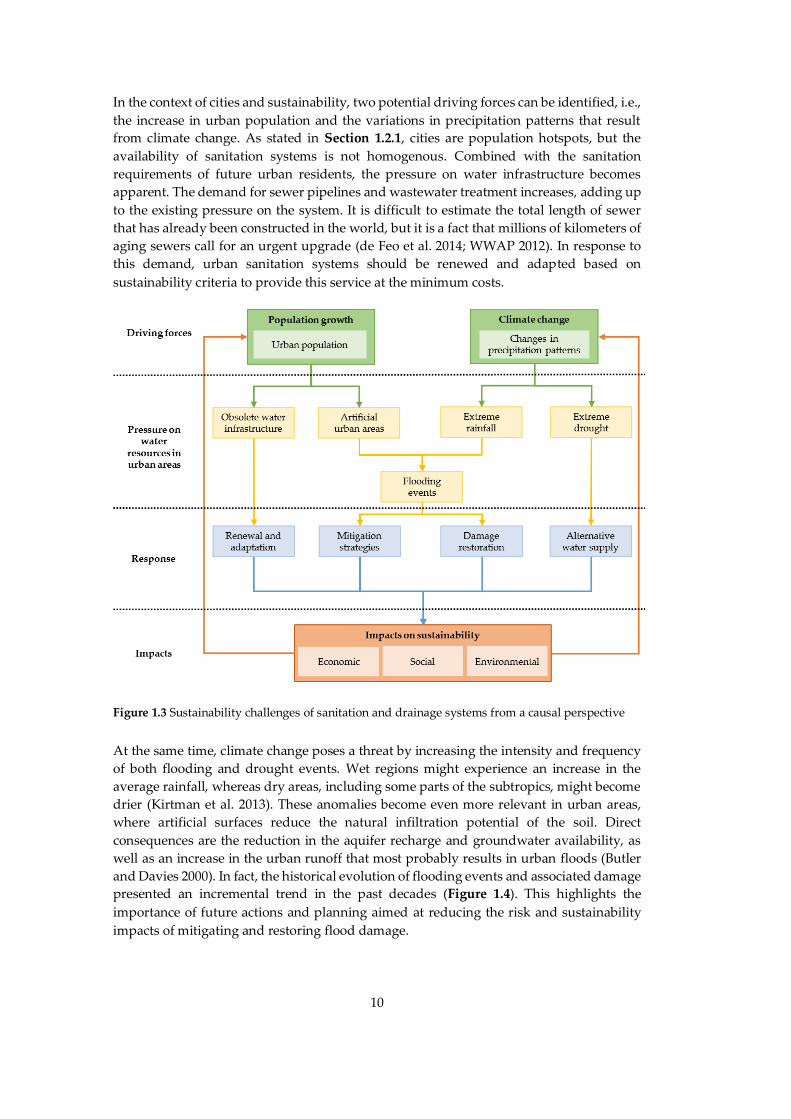
10
In the context of cities and sustainability, two potential driving forces can be identified, i.e.,
the increase in urban population and the variations in precipitation patterns that result
from climate change. As stated in Section 1.2.1, cities are population hotspots, but the
availability of sanitation systems is not homogenous. Combined with the sanitation
requirements of future urban residents, the pressure on water infrastructure becomes
apparent. The demand for sewer pipelines and wastewater treatment increases, adding up
to the existing pressure on the system. It is difficult to estimate the total length of sewer
that has already been constructed in the world, but it is a fact that millions of kilometers of
aging sewers call for an urgent upgrade (de Feo et al. 2014; WWAP 2012). In response to
this demand, urban sanitation systems should be renewed and adapted based on
sustainability criteria to provide this service at the minimum costs.
Figure 1.3 Sustainability challenges of sanitation and drainage systems from a causal perspective
At the same time, climate change poses a threat by increasing the intensity and frequency
of both flooding and drought events. Wet regions might experience an increase in the
average rainfall, whereas dry areas, including some parts of the subtropics, might become
drier (Kirtman et al. 2013). These anomalies become even more relevant in urban areas,
where artificial surfaces reduce the natural infiltration potential of the soil. Direct
consequences are the reduction in the aquifer recharge and groundwater availability, as
well as an increase in the urban runoff that most probably results in urban floods (Butler
and Davies 2000). In fact, the historical evolution of flooding events and associated damage
presented an incremental trend in the past decades (Figure 1.4). This highlights the
importance of future actions and planning aimed at reducing the risk and sustainability
impacts of mitigating and restoring flood damage.
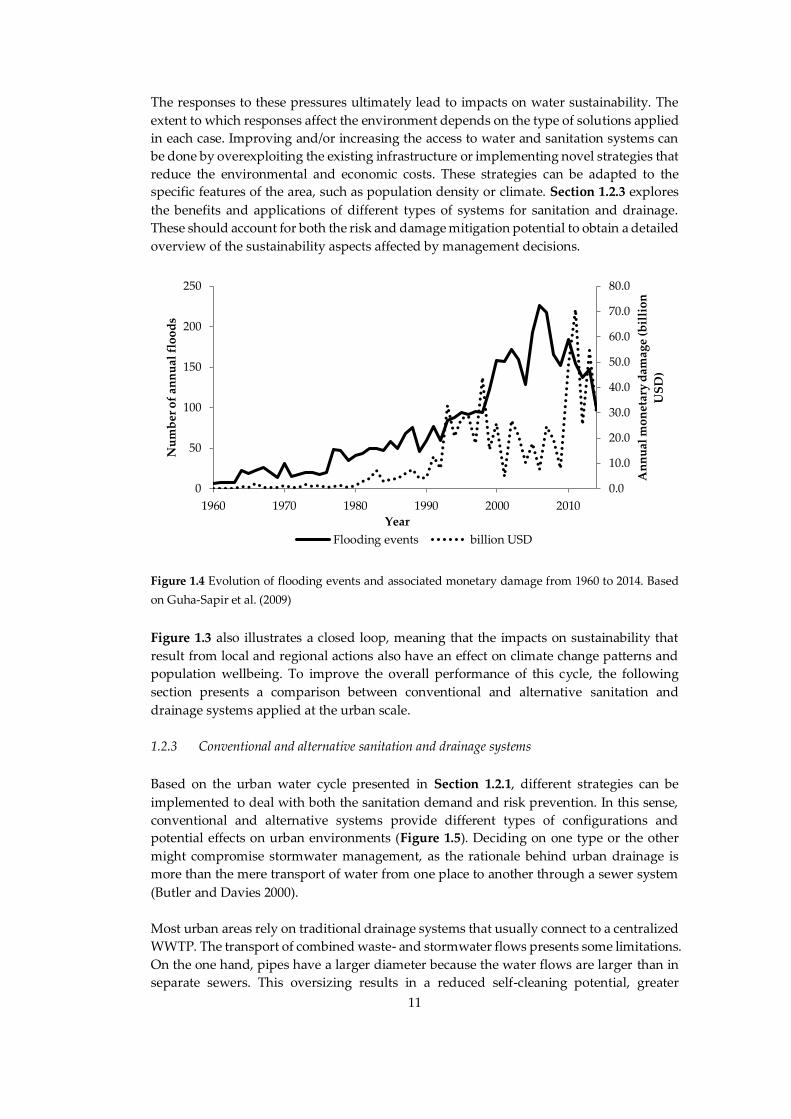
11
The responses to these pressures ultimately lead to impacts on water sustainability. The
extent to which responses affect the environment depends on the type of solutions applied
in each case. Improving and/or increasing the access to water and sanitation systems can
be done by overexploiting the existing infrastructure or implementing novel strategies that
reduce the environmental and economic costs. These strategies can be adapted to the
specific features of the area, such as population density or climate. Section 1.2.3 explores
the benefits and applications of different types of systems for sanitation and drainage.
These should account for both the risk and damage mitigation potential to obtain a detailed
overview of the sustainability aspects affected by management decisions.
Figure 1.4 Evolution of flooding events and associated monetary damage from 1960 to 2014. Based
on Guha-Sapir et al. (2009)
Figure 1.3 also illustrates a closed loop, meaning that the impacts on sustainability that
result from local and regional actions also have an effect on climate change patterns and
population wellbeing. To improve the overall performance of this cycle, the following
section presents a comparison between conventional and alternative sanitation and
drainage systems applied at the urban scale.
1.2.3 Conventional and alternative sanitation and drainage systems
Based on the urban water cycle presented in Section 1.2.1, different strategies can be
implemented to deal with both the sanitation demand and risk prevention. In this sense,
conventional and alternative systems provide different types of configurations and
potential effects on urban environments (Figure 1.5). Deciding on one type or the other
might compromise stormwater management, as the rationale behind urban drainage is
more than the mere transport of water from one place to another through a sewer system
(Butler and Davies 2000).
Most urban areas rely on traditional drainage systems that usually connect to a centralized
WWTP. The transport of combined waste- and stormwater flows presents some limitations.
On the one hand, pipes have a larger diameter because the water flows are larger than in
separate sewers. This oversizing results in a reduced self-cleaning potential, greater
0.0
10.0
20.0
30.0
40.0
50.0
60.0
70.0
80.0
0
50
100
150
200
250
1960 1970 1980 1990 2000 2010
An
nu
al m
on
etar
y d
amag
e (b
illi
on
US
D)
Nu
mb
er o
f an
nu
al f
loo
ds
Year
Flooding events billion USD
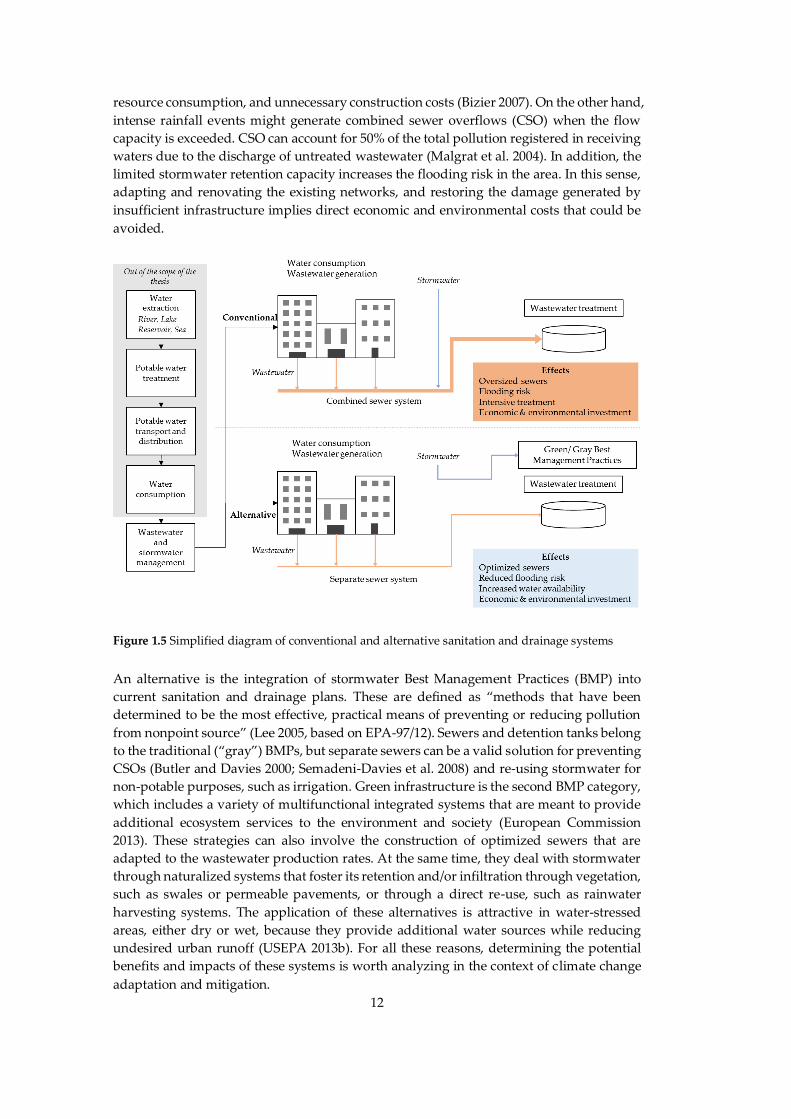
12
resource consumption, and unnecessary construction costs (Bizier 2007). On the other hand,
intense rainfall events might generate combined sewer overflows (CSO) when the flow
capacity is exceeded. CSO can account for 50% of the total pollution registered in receiving
waters due to the discharge of untreated wastewater (Malgrat et al. 2004). In addition, the
limited stormwater retention capacity increases the flooding risk in the area. In this sense,
adapting and renovating the existing networks, and restoring the damage generated by
insufficient infrastructure implies direct economic and environmental costs that could be
avoided.
Figure 1.5 Simplified diagram of conventional and alternative sanitation and drainage systems
An alternative is the integration of stormwater Best Management Practices (BMP) into
current sanitation and drainage plans. These are defined as “methods that have been
determined to be the most effective, practical means of preventing or reducing pollution
from nonpoint source” (Lee 2005, based on EPA-97/12). Sewers and detention tanks belong
to the traditional (“gray”) BMPs, but separate sewers can be a valid solution for preventing
CSOs (Butler and Davies 2000; Semadeni-Davies et al. 2008) and re-using stormwater for
non-potable purposes, such as irrigation. Green infrastructure is the second BMP category,
which includes a variety of multifunctional integrated systems that are meant to provide
additional ecosystem services to the environment and society (European Commission
2013). These strategies can also involve the construction of optimized sewers that are
adapted to the wastewater production rates. At the same time, they deal with stormwater
through naturalized systems that foster its retention and/or infiltration through vegetation,
such as swales or permeable pavements, or through a direct re-use, such as rainwater
harvesting systems. The application of these alternatives is attractive in water-stressed
areas, either dry or wet, because they provide additional water sources while reducing
undesired urban runoff (USEPA 2013b). For all these reasons, determining the potential
benefits and impacts of these systems is worth analyzing in the context of climate change
adaptation and mitigation.

Picture: Questioning ourselves
Motivations, research questions
and objectives
Chapter 2
©Anna Petit-Boix

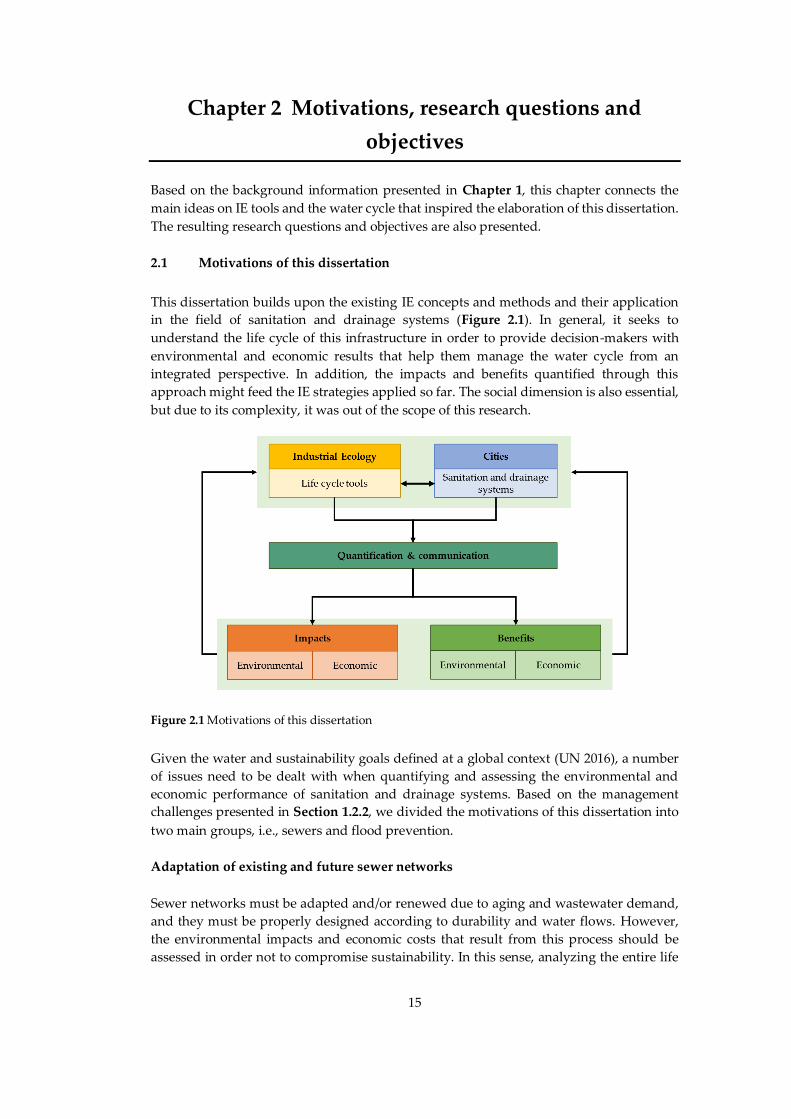
15
Motivations, research questions and
objectives
Based on the background information presented in Chapter 1, this chapter connects the
main ideas on IE tools and the water cycle that inspired the elaboration of this dissertation.
The resulting research questions and objectives are also presented.
2.1 Motivations of this dissertation
This dissertation builds upon the existing IE concepts and methods and their application
in the field of sanitation and drainage systems (Figure 2.1). In general, it seeks to
understand the life cycle of this infrastructure in order to provide decision-makers with
environmental and economic results that help them manage the water cycle from an
integrated perspective. In addition, the impacts and benefits quantified through this
approach might feed the IE strategies applied so far. The social dimension is also essential,
but due to its complexity, it was out of the scope of this research.
Figure 2.1 Motivations of this dissertation
Given the water and sustainability goals defined at a global context (UN 2016), a number
of issues need to be dealt with when quantifying and assessing the environmental and
economic performance of sanitation and drainage systems. Based on the management
challenges presented in Section 1.2.2, we divided the motivations of this dissertation into
two main groups, i.e., sewers and flood prevention.
Adaptation of existing and future sewer networks
Sewer networks must be adapted and/or renewed due to aging and wastewater demand,
and they must be properly designed according to durability and water flows. However,
the environmental impacts and economic costs that result from this process should be
assessed in order not to compromise sustainability. In this sense, analyzing the entire life
16
cycle of this infrastructure might be the key to understanding how sewers contribute to the
environmental and economic performance of an urban area.
To do so, we need to identify all of the materials and processes involved in the construction
and operation of sewers. So far, a variety of authors have studied the environmental
impacts of sewers (Morera et al. 2016; Vahidi et al. 2015, 2016; Venkatesh et al. 2009; Risch
et al. 2015) and a few have provided economic data (Akhtar et al. 2014; Thomas et al. 2016;
Murla et al. 2016). However, integrating these results based on both general and specific
case studies is essential to detecting the main factors that affect sewer performance. Site-
specific features, such as topography or location (Roux et al. 2011), might influence the way
sewers demand energy and materials, but these might be common in different cities. In
this sense, we should identify where, how and why sewers have a different or similar
performance.
In addition, if WWTPs contribute to the direct CH4 and N2O emissions (European
Commission 2009), sewers might also play a similar role, as the wastewater degradation
process starts in sewers. This is apparent because of the typical odor and corrosion issues
that occur in the networks (USEPA 1974; Guisasola et al. 2008; Sharma et al. 2008;
Vollertsen et al. 2008). For this reason, we need to quantify the direct GHG emissions
generated in sewers and include them in the environmental impacts of this system. This
process is not straightforward, but a first simple attempt might be helpful.
Furthermore, the way these results are communicated to users and decision-makers might
influence their level of understanding and, thus, the level of success in transferring
scientific knowledge to the society. Eco-efficiency assessments, which combine the
environmental and economic dimensions of a product system, are a field to explore
because they were quite recently regulated through ISO 14045:2012. Applying this method
to the case of sewers might be helpful to determine the relationship between environmental
impacts and economic costs.
Finally, some studies suggested that there is a strong relationship between the distance to
urban centers and adverse environmental effects (McDonnell and Pickett 1990). However,
Alberti (2010) concluded that we do not have enough information about the effects of
different urban patterns, housing options and types of infrastructure (i.e., conventional
and/or alternative) on ecological systems, to cite a few examples. For this reason, we need
to study different types of urban/suburban areas to determine the best sanitation strategies
(e.g., centralized or decentralized) from an environmental standpoint. This will provide
information about the need to implement additional sewer pipelines or to prioritize
alternative decentralized treatment systems.
Climate change mitigation and adaptation to intense rainfall events
The increasing frequency and intensity of rainfall and flooding events calls for the
implementation of flood prevention systems that help cities adapt to climate change.
However, not all the solutions are equally valid from an environmental and economic
perspective. A priori, gray BMPs seem to perform environmentally worse than green
alternatives because of the role of vegetation in carbon sequestration (De Sousa et al. 2012).
So far, a number of studies have assessed the environmental impacts of different types of
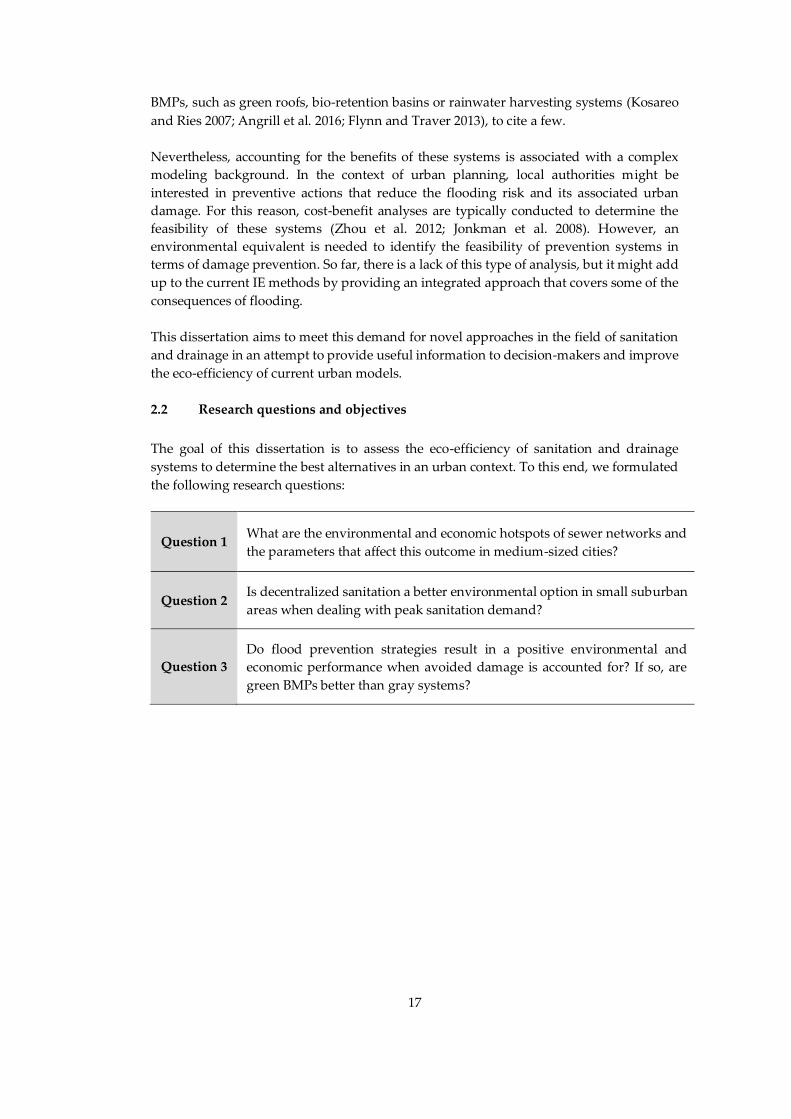
17
BMPs, such as green roofs, bio-retention basins or rainwater harvesting systems (Kosareo
and Ries 2007; Angrill et al. 2016; Flynn and Traver 2013), to cite a few.
Nevertheless, accounting for the benefits of these systems is associated with a complex
modeling background. In the context of urban planning, local authorities might be
interested in preventive actions that reduce the flooding risk and its associated urban
damage. For this reason, cost-benefit analyses are typically conducted to determine the
feasibility of these systems (Zhou et al. 2012; Jonkman et al. 2008). However, an
environmental equivalent is needed to identify the feasibility of prevention systems in
terms of damage prevention. So far, there is a lack of this type of analysis, but it might add
up to the current IE methods by providing an integrated approach that covers some of the
consequences of flooding.
This dissertation aims to meet this demand for novel approaches in the field of sanitation
and drainage in an attempt to provide useful information to decision-makers and improve
the eco-efficiency of current urban models.
2.2 Research questions and objectives
The goal of this dissertation is to assess the eco-efficiency of sanitation and drainage
systems to determine the best alternatives in an urban context. To this end, we formulated
the following research questions:
Question 1 What are the environmental and economic hotspots of sewer networks and
the parameters that affect this outcome in medium-sized cities?
Question 2 Is decentralized sanitation a better environmental option in small suburban
areas when dealing with peak sanitation demand?
Question 3
Do flood prevention strategies result in a positive environmental and
economic performance when avoided damage is accounted for? If so, are
green BMPs better than gray systems?
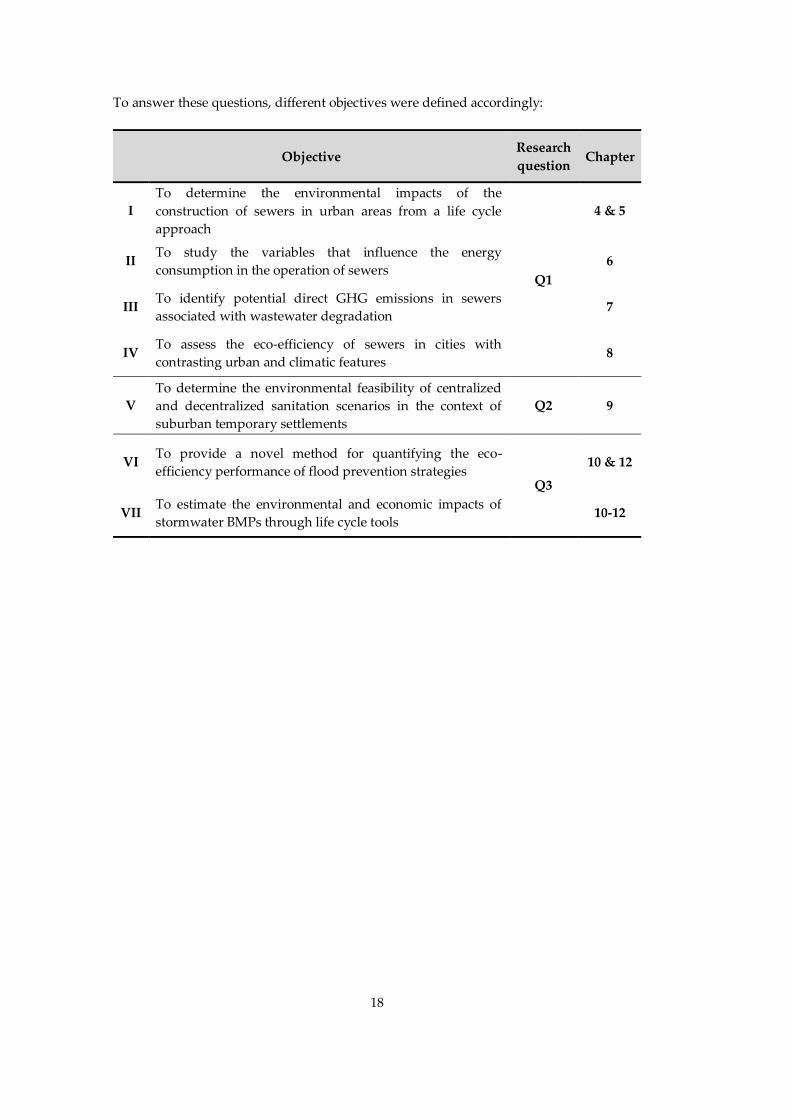
18
To answer these questions, different objectives were defined accordingly:
Objective Research
question Chapter
I
To determine the environmental impacts of the
construction of sewers in urban areas from a life cycle
approach
Q1
4 & 5
II To study the variables that influence the energy
consumption in the operation of sewers 6
III To identify potential direct GHG emissions in sewers
associated with wastewater degradation 7
IV To assess the eco-efficiency of sewers in cities with
contrasting urban and climatic features 8
V
To determine the environmental feasibility of centralized
and decentralized sanitation scenarios in the context of
suburban temporary settlements
Q2 9
VI To provide a novel method for quantifying the eco-
efficiency performance of flood prevention strategies Q3
10 & 12
VII To estimate the environmental and economic impacts of
stormwater BMPs through life cycle tools 10-12

Picture: Tools at grandad’s studio
Methodology
Chapter 3

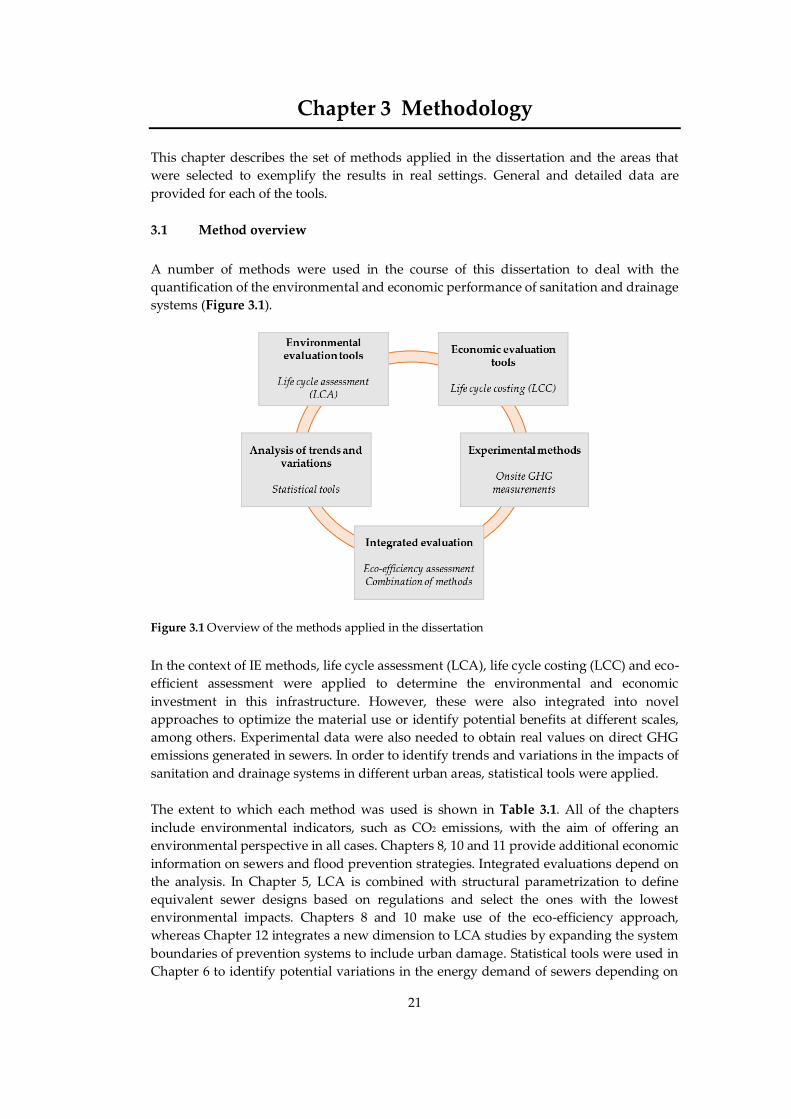
21
Methodology
This chapter describes the set of methods applied in the dissertation and the areas that
were selected to exemplify the results in real settings. General and detailed data are
provided for each of the tools.
3.1 Method overview
A number of methods were used in the course of this dissertation to deal with the
quantification of the environmental and economic performance of sanitation and drainage
systems (Figure 3.1).
Figure 3.1 Overview of the methods applied in the dissertation
In the context of IE methods, life cycle assessment (LCA), life cycle costing (LCC) and eco-
efficient assessment were applied to determine the environmental and economic
investment in this infrastructure. However, these were also integrated into novel
approaches to optimize the material use or identify potential benefits at different scales,
among others. Experimental data were also needed to obtain real values on direct GHG
emissions generated in sewers. In order to identify trends and variations in the impacts of
sanitation and drainage systems in different urban areas, statistical tools were applied.
The extent to which each method was used is shown in Table 3.1. All of the chapters
include environmental indicators, such as CO2 emissions, with the aim of offering an
environmental perspective in all cases. Chapters 8, 10 and 11 provide additional economic
information on sewers and flood prevention strategies. Integrated evaluations depend on
the analysis. In Chapter 5, LCA is combined with structural parametrization to define
equivalent sewer designs based on regulations and select the ones with the lowest
environmental impacts. Chapters 8 and 10 make use of the eco-efficiency approach,
whereas Chapter 12 integrates a new dimension to LCA studies by expanding the system
boundaries of prevention systems to include urban damage. Statistical tools were used in
Chapter 6 to identify potential variations in the energy demand of sewers depending on
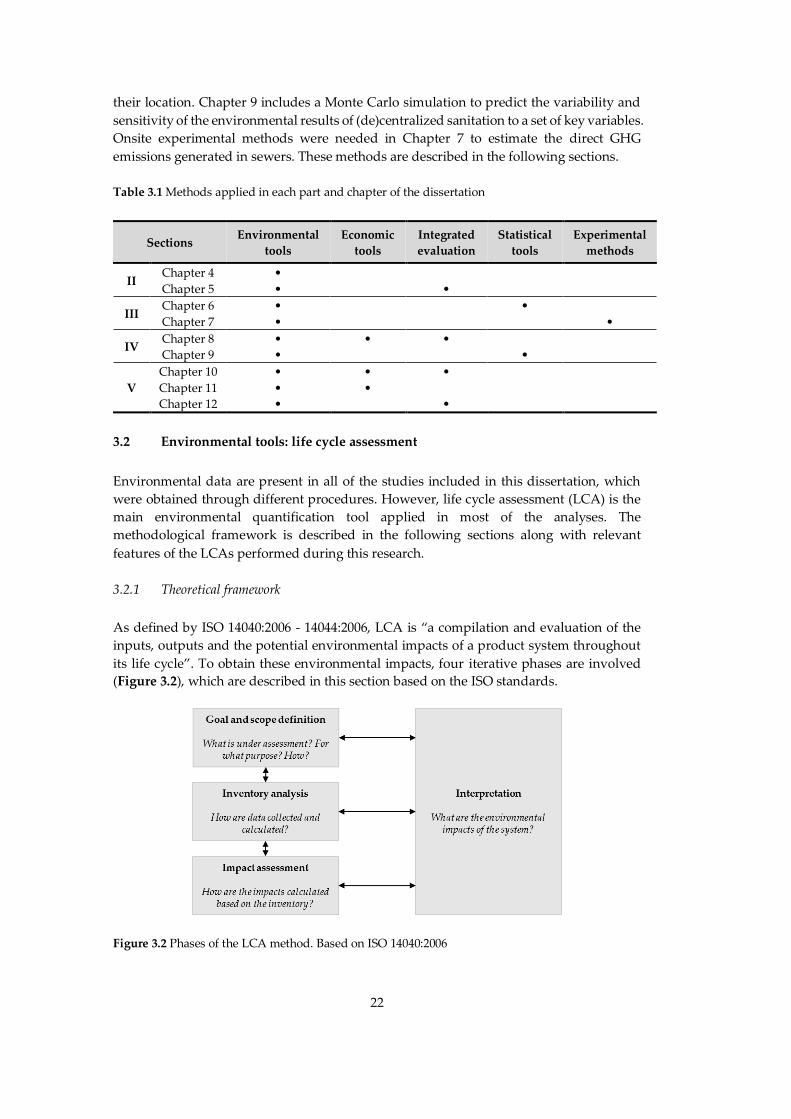
22
their location. Chapter 9 includes a Monte Carlo simulation to predict the variability and
sensitivity of the environmental results of (de)centralized sanitation to a set of key variables.
Onsite experimental methods were needed in Chapter 7 to estimate the direct GHG
emissions generated in sewers. These methods are described in the following sections.
Table 3.1 Methods applied in each part and chapter of the dissertation
Sections Environmental
tools
Economic
tools
Integrated
evaluation
Statistical
tools
Experimental
methods
II Chapter 4 •
Chapter 5 • •
III Chapter 6 • •
Chapter 7 • •
IV Chapter 8 • • •
Chapter 9 • •
V
Chapter 10 • • •
Chapter 11 • •
Chapter 12 • •
3.2 Environmental tools: life cycle assessment
Environmental data are present in all of the studies included in this dissertation, which
were obtained through different procedures. However, life cycle assessment (LCA) is the
main environmental quantification tool applied in most of the analyses. The
methodological framework is described in the following sections along with relevant
features of the LCAs performed during this research.
3.2.1 Theoretical framework
As defined by ISO 14040:2006 - 14044:2006, LCA is “a compilation and evaluation of the
inputs, outputs and the potential environmental impacts of a product system throughout
its life cycle”. To obtain these environmental impacts, four iterative phases are involved
(Figure 3.2), which are described in this section based on the ISO standards.
Figure 3.2 Phases of the LCA method. Based on ISO 14040:2006
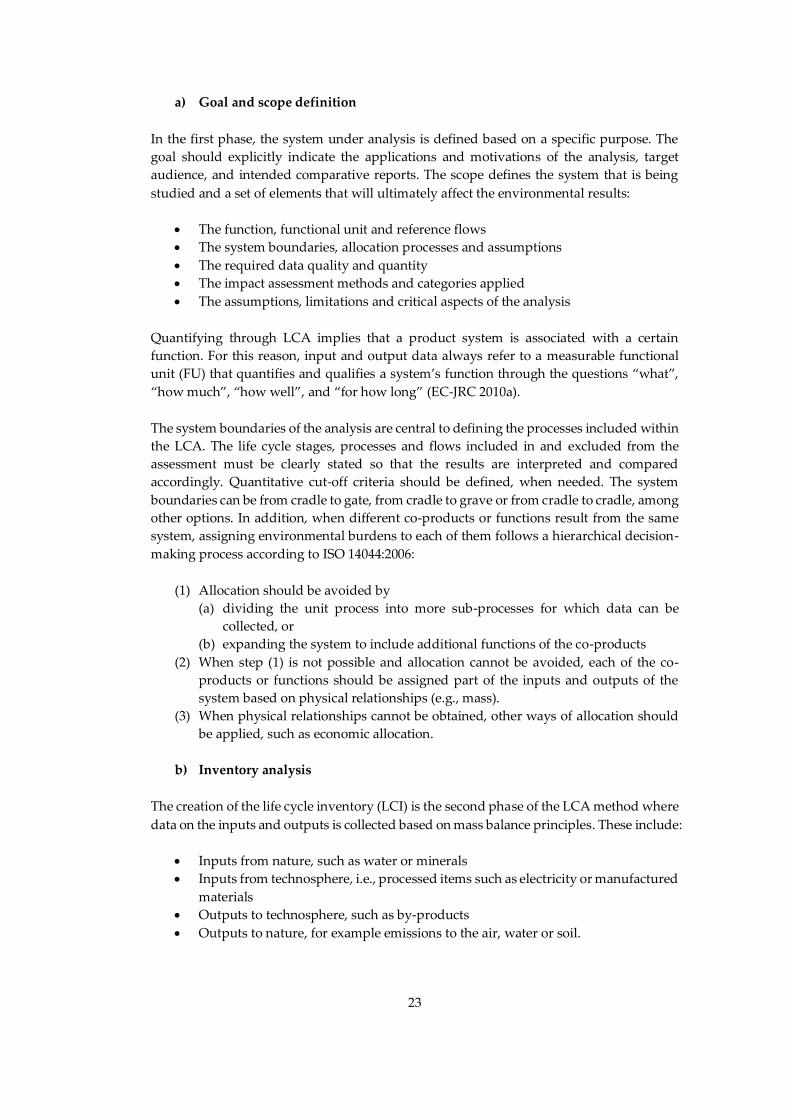
23
a) Goal and scope definition
In the first phase, the system under analysis is defined based on a specific purpose. The
goal should explicitly indicate the applications and motivations of the analysis, target
audience, and intended comparative reports. The scope defines the system that is being
studied and a set of elements that will ultimately affect the environmental results:
The function, functional unit and reference flows
The system boundaries, allocation processes and assumptions
The required data quality and quantity
The impact assessment methods and categories applied
The assumptions, limitations and critical aspects of the analysis
Quantifying through LCA implies that a product system is associated with a certain
function. For this reason, input and output data always refer to a measurable functional
unit (FU) that quantifies and qualifies a system’s function through the questions “what”,
“how much”, “how well”, and “for how long” (EC-JRC 2010a).
The system boundaries of the analysis are central to defining the processes included within
the LCA. The life cycle stages, processes and flows included in and excluded from the
assessment must be clearly stated so that the results are interpreted and compared
accordingly. Quantitative cut-off criteria should be defined, when needed. The system
boundaries can be from cradle to gate, from cradle to grave or from cradle to cradle, among
other options. In addition, when different co-products or functions result from the same
system, assigning environmental burdens to each of them follows a hierarchical decision-
making process according to ISO 14044:2006:
(1) Allocation should be avoided by
(a) dividing the unit process into more sub-processes for which data can be
collected, or
(b) expanding the system to include additional functions of the co-products
(2) When step (1) is not possible and allocation cannot be avoided, each of the co-
products or functions should be assigned part of the inputs and outputs of the
system based on physical relationships (e.g., mass).
(3) When physical relationships cannot be obtained, other ways of allocation should
be applied, such as economic allocation.
b) Inventory analysis
The creation of the life cycle inventory (LCI) is the second phase of the LCA method where
data on the inputs and outputs is collected based on mass balance principles. These include:
Inputs from nature, such as water or minerals
Inputs from technosphere, i.e., processed items such as electricity or manufactured
materials
Outputs to technosphere, such as by-products
Outputs to nature, for example emissions to the air, water or soil.
24
These data can be obtained from different types of sources. Primary or foreground data
result from fieldwork, lab experiments or data registered in the system under analysis.
Secondary or background data can be retrieved from reports, databases or previous
literature. An example of background data are LCI databases, such as the ecoinvent
database (Weidema et al. 2013), which provides key data on the life cycle of materials and
processes.
There are two main LCI modeling principles, i.e., attributional (ALCA) or consequential
(CLCA) (EC-JRC 2010a). The ALCA approach, also known as “accounting” or
“descriptive”, was defined as a “system modelling approach in which inputs and outputs
are attributed to the functional unit of a product system by linking and/or partitioning the
unit processes of the system according to a normative rule” (Sonnemann and Vigon 2011).
In contrast, CLCA is a change-oriented approach “in which activities in a product system
are linked so that activities are included in the product system to the extent that they are
expected to change as a consequence of a change in demand for the functional unit”
(Sonnemann and Vigon 2011). In other words: Whereas ALCA describes the system as it is
or was, CLCA integrates market mechanisms and looks at the consequences of decisions,
which might happen outside of its immediate system boundaries (Weidema et al. 2009;
Earles and Halog 2011; EC-JRC 2010a).
c) Impact assessment
Using the LCI, the life cycle impact assessment (LCIA) phase calculates the potential
environmental impacts of the system through a set of impact categories. To do so, ISO
14040:2006 defines three mandatory steps, i.e., (1) selection of impact assessment models
and indicators, (2) classification of the LCI into category indicators, and (3) characterization
of each item through the impact assessment models to obtain the LCIA results.
When selecting impact categories, the type of information estimated and communicated
through each indicator must be considered. In this sense, LCIA methods link the LCI with
areas of protection (AoP) (i.e., at the endpoint level) or somewhere along the impact
pathway (i.e., at the midpoint level) (EC-JRC 2010b). Midpoint-oriented methods are at an
intermediate position of the impact pathways where a common mechanism exists for a
group of substances (Jolliet et al. 2004; EC-JRC 2010b). An example is the contribution of
CO2 or CH4 emissions to global warming due to radiative forcing. Characterization at the
endpoint level involves indicators that can be more easily interpreted because they are
closer to societal concerns (Hertwich and Hammitt 2001), although the modeling principles
and choices are more complex and result in more uncertainty (Bare et al. 2000). The AoP
include the impacts to human health, natural resources and ecosystems. Midpoint and/or
endpoint indicators can be optionally normalized, weighted or grouped in order to provide
a single value to the target audience and reduce the complexity of the interpretation
process (Bare et al. 2000). This process should not only include scientific choices, but also
social and economic preferences.
d) Interpretation
In the last phase, the environmental results are interpreted to identify hotspots and
improvement actions based on the selected set of categories. Iterations can be conducted
to improve the LCI, modeling methods or objectives. Here, data consistency, completeness
25
and sensitivity are evaluated (EC-JRC 2010a). Finally, the study provides conclusions,
recommendations and limitations, and can be compared to other systems if needed.
3.2.2 LCA applications in this research
Seven of the chapters of this dissertation explicitly use LCA as the main environmental
assessment method. Different methodological aspects were considered depending on the
goal of the analysis. The particular specifications are explained in each chapter.
a) Goal and scope definition
A set of FUs was defined in the different research topics under assessment. The most
common FU was one cubic meter (m3) of wastewater or stormwater collected, transported
and/or treated, depending on the specific goals of the study. In the case of sewer
infrastructure, an additional concept was used to simplify the calculation process, i.e.,
declared units (DU). According to the environmental product declaration (EPD) rules for
construction products (EN 15804:2011), a DU is defined when the precise function of a
product is not known, usually due to the multiple applications of basic products, such as
beams or other concrete structures. In this sense, the DUs used in this dissertation were
one linear meter of pipeline and one unit of sewer appurtenance (i.e., a sewer’s supporting
elements, such as pumps or manholes) (see Chapters 4 and 5). More complex FUs were
used in Chapters 10 and 12 when dealing with the balance of flood and damage prevention.
The system boundaries of the LCA studies were generally from cradle to grave, except for
sewer infrastructure, where the end of life was not included. No allocation procedures
were applied in any of the analyses.
b) Inventory analysis
Water companies were the main suppliers of primary data, such as wastewater
consumption or features of the sanitation systems. Sewer studies implied an intensive
relationship with water managers especially through the LIFE+ Aquaenvec project
(LIFE10/ES/ENV/520), which involved local water agencies that provided raw data on
municipal systems. In addition, stormwater prevention systems were assessed using real
data obtained via the Brazilian “Smart Parks” project (HBP-2012-0216, CAPES ref. 5206)
(Chapters 11 and 12) and the archive of the Catalan Water Agency (Chapter 10). The
Spanish Insurance Compensation Consortium also provided real flood damage estimates
that were used in Chapter 10. For this reason, primary data is believed to have a good
quality.
Two main types of background data were applied. On the one hand, construction-related
datasets were retrieved from construction databases, particularly MetaBase ITeC (2010).
This database offers open data on the material, energy and economic requirements of a
wide set of constructive solutions that were needed in the LCA studies. On the other hand,
background LCI unit processes were obtained from ecoinvent v2.2 (Frischknecht et al. 2005)
and ecoinvent v3 (Weidema et al. 2013).
The general modeling principle applied in the LCA studies was the ALCA approach.
However, Chapter 12 attempts to assess flood prevention systems from a CLCA
perspective by integrating avoided flood damage as one of the consequences of planning
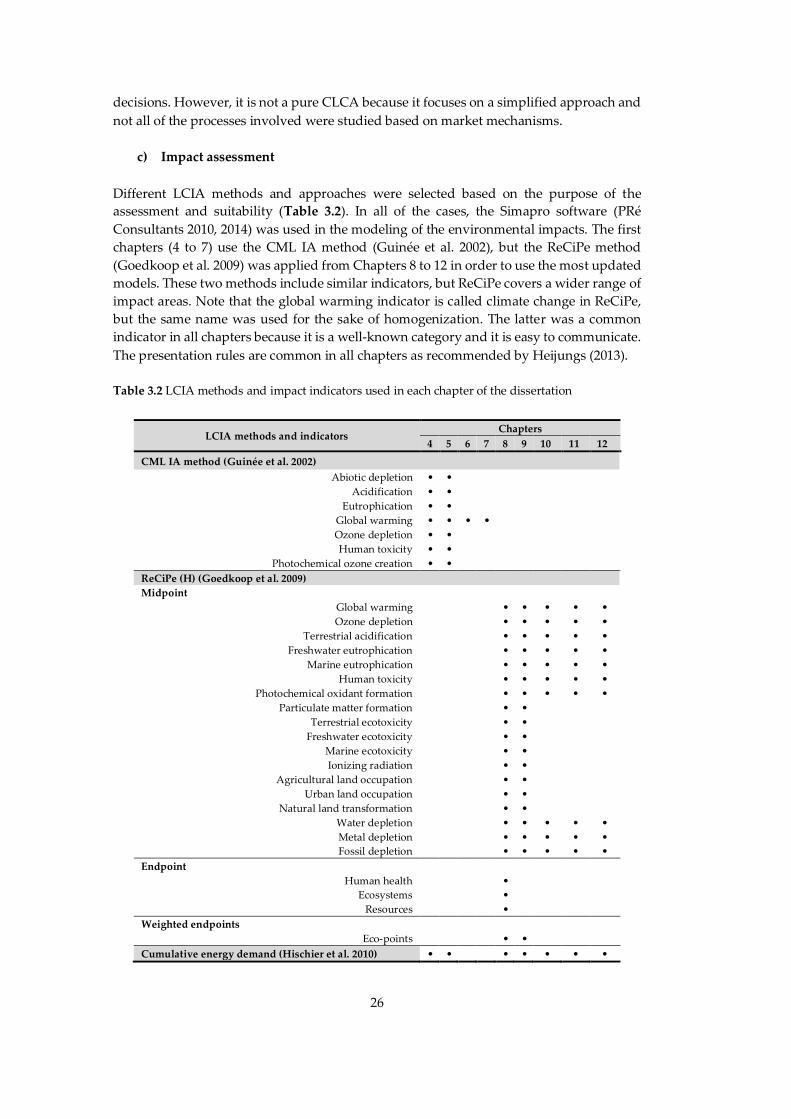
26
decisions. However, it is not a pure CLCA because it focuses on a simplified approach and
not all of the processes involved were studied based on market mechanisms.
c) Impact assessment
Different LCIA methods and approaches were selected based on the purpose of the
assessment and suitability (Table 3.2). In all of the cases, the Simapro software (PRé
Consultants 2010, 2014) was used in the modeling of the environmental impacts. The first
chapters (4 to 7) use the CML IA method (Guinée et al. 2002), but the ReCiPe method
(Goedkoop et al. 2009) was applied from Chapters 8 to 12 in order to use the most updated
models. These two methods include similar indicators, but ReCiPe covers a wider range of
impact areas. Note that the global warming indicator is called climate change in ReCiPe,
but the same name was used for the sake of homogenization. The latter was a common
indicator in all chapters because it is a well-known category and it is easy to communicate.
The presentation rules are common in all chapters as recommended by Heijungs (2013).
Table 3.2 LCIA methods and impact indicators used in each chapter of the dissertation
LCIA methods and indicators Chapters
4 5 6 7 8 9 10 11 12
CML IA method (Guinée et al. 2002)
Abiotic depletion • •
Acidification • •
Eutrophication • •
Global warming • • • •
Ozone depletion • •
Human toxicity • •
Photochemical ozone creation • •
ReCiPe (H) (Goedkoop et al. 2009)
Midpoint
Global warming • • • • •
Ozone depletion • • • • •
Terrestrial acidification • • • • •
Freshwater eutrophication • • • • •
Marine eutrophication • • • • •
Human toxicity • • • • •
Photochemical oxidant formation • • • • •
Particulate matter formation • •
Terrestrial ecotoxicity • •
Freshwater ecotoxicity • •
Marine ecotoxicity • •
Ionizing radiation • •
Agricultural land occupation • •
Urban land occupation • •
Natural land transformation • •
Water depletion • • • • •
Metal depletion • • • • •
Fossil depletion • • • • •
Endpoint
Human health •
Ecosystems •
Resources •
Weighted endpoints
Eco-points • •
Cumulative energy demand (Hischier et al. 2010) • • • • • • •
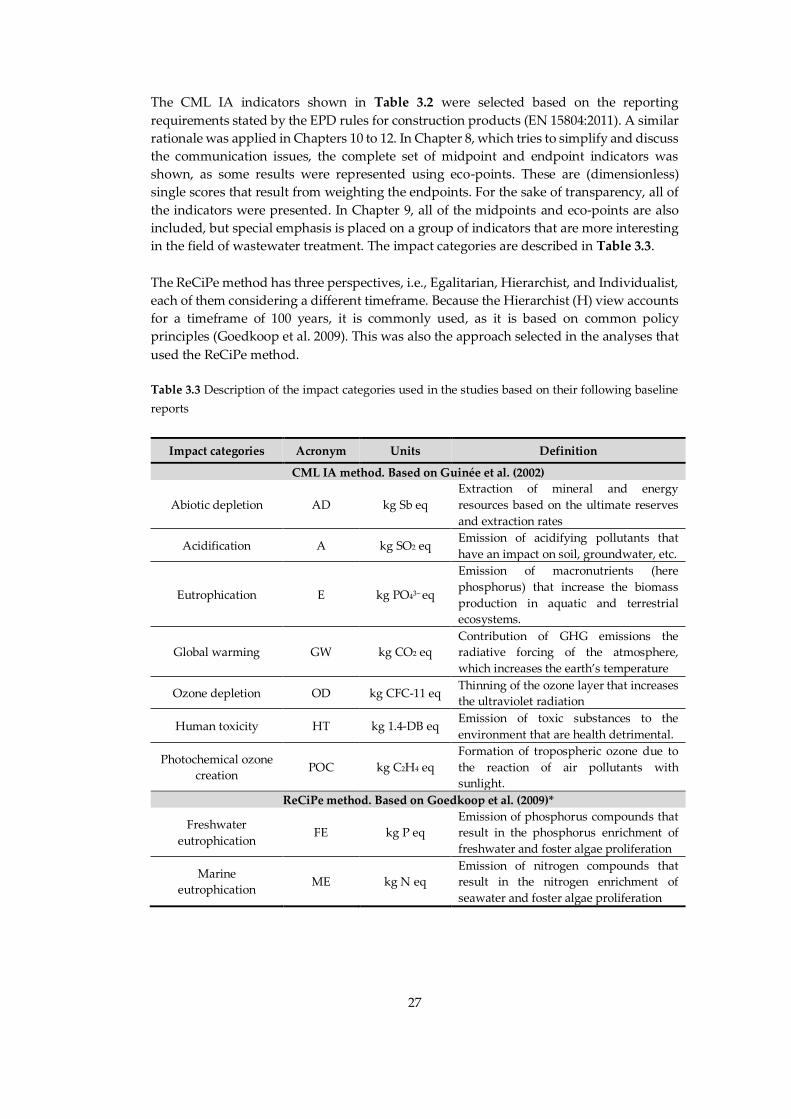
27
The CML IA indicators shown in Table 3.2 were selected based on the reporting
requirements stated by the EPD rules for construction products (EN 15804:2011). A similar
rationale was applied in Chapters 10 to 12. In Chapter 8, which tries to simplify and discuss
the communication issues, the complete set of midpoint and endpoint indicators was
shown, as some results were represented using eco-points. These are (dimensionless)
single scores that result from weighting the endpoints. For the sake of transparency, all of
the indicators were presented. In Chapter 9, all of the midpoints and eco-points are also
included, but special emphasis is placed on a group of indicators that are more interesting
in the field of wastewater treatment. The impact categories are described in Table 3.3.
The ReCiPe method has three perspectives, i.e., Egalitarian, Hierarchist, and Individualist,
each of them considering a different timeframe. Because the Hierarchist (H) view accounts
for a timeframe of 100 years, it is commonly used, as it is based on common policy
principles (Goedkoop et al. 2009). This was also the approach selected in the analyses that
used the ReCiPe method.
Table 3.3 Description of the impact categories used in the studies based on their following baseline
reports
Impact categories Acronym Units Definition
CML IA method. Based on Guinée et al. (2002)
Abiotic depletion AD kg Sb eq
Extraction of mineral and energy
resources based on the ultimate reserves
and extraction rates
Acidification A kg SO2 eq Emission of acidifying pollutants that
have an impact on soil, groundwater, etc.
Eutrophication E kg PO43− eq
Emission of macronutrients (here
phosphorus) that increase the biomass
production in aquatic and terrestrial
ecosystems.
Global warming GW kg CO2 eq
Contribution of GHG emissions the
radiative forcing of the atmosphere,
which increases the earth’s temperature
Ozone depletion OD kg CFC-11 eq Thinning of the ozone layer that increases
the ultraviolet radiation
Human toxicity HT kg 1.4-DB eq Emission of toxic substances to the
environment that are health detrimental.
Photochemical ozone
creation POC kg C2H4 eq
Formation of tropospheric ozone due to
the reaction of air pollutants with
sunlight.
ReCiPe method. Based on Goedkoop et al. (2009)*
Freshwater
eutrophication FE kg P eq
Emission of phosphorus compounds that
result in the phosphorus enrichment of
freshwater and foster algae proliferation
Marine
eutrophication ME kg N eq
Emission of nitrogen compounds that
result in the nitrogen enrichment of
seawater and foster algae proliferation

28
Impact categories Acronym Units Definition
Particulate matter
formation PMF kg PM10 eq
Emission of a mixture of organic and
inorganic substances with a diameter
<10µm (PM10) that can reach the lungs
when inhaled and ultimately cause health
issues
Terrestrial ecotoxicity TET kg 1,4-DB eq
Persistence, accumulation and effect of
chemicals released to urban air that can be
later inhaled by humans
Freshwater
ecotoxicity FET kg 1,4-DB eq
Emission of chemicals to rural air that
have a potential fate and effect on
freshwater bodies
Marine ecotoxicity MET kg 1,4-DB eq Emission of chemicals that have a
potential fate and effect on seawater
Ionizing radiation IR kBq U235 eq Release of radioactive material to the
environment
Agricultural land
occupation ALO m2a
Effects of occupying agricultural land
during a specific period
Urban land
occupation ULO m2a
Effects of occupying urban land during a
specific period
Natural land
transformation NLT m2
Effects of transforming natural systems
into artificial areas
Water depletion WD m3
Consumption of freshwater both as a
scarce and abundant resource depending
on the extraction area
Metal depletion MD kg Fe eq Extraction of minerals and associated
quality loss
Fossil depletion FD kg oil eq
Consumption of the group of resources
that contain hydrocarbons due to
anthropogenic activities
Human health HH DALY Disability-adjusted loss of life years
associated with different types of diseases
Ecosystems ED species.year
Decreased quality of an ecosystem
associated with the loss of species during
a year
Resources RA $ Increase in the market prices of basic
resources that results from its depletion
Cumulative energy demand. Based on Hischier et al. (2010)
Cumulative energy
demand CED MJ
Primary energy use from renewable and
non-renewable origin
* The categories defined in the CML IA section are not provided again for the ReCiPe method, as the
meaning of the concepts is similar or the same. Note that the photochemical oxidant formation (POF)
can be considered an equivalent to the photochemical ozone creation. This also applies in the case of
terrestrial acidification (TA)
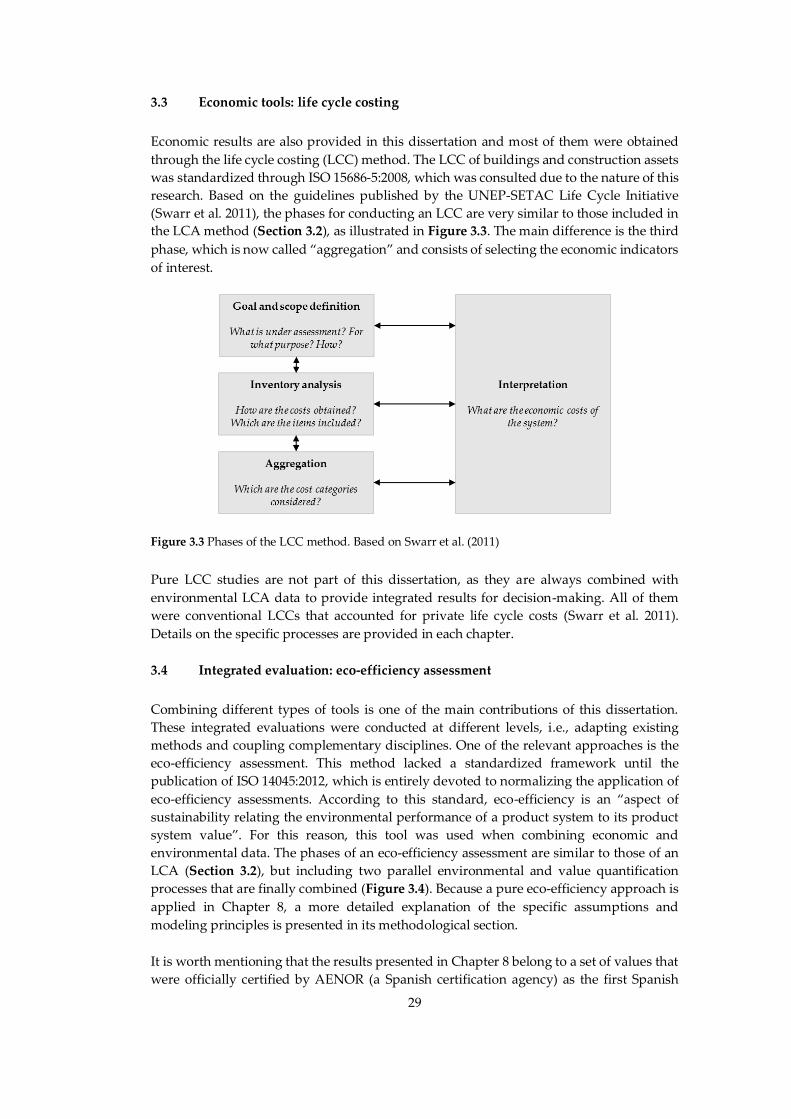
29
3.3 Economic tools: life cycle costing
Economic results are also provided in this dissertation and most of them were obtained
through the life cycle costing (LCC) method. The LCC of buildings and construction assets
was standardized through ISO 15686-5:2008, which was consulted due to the nature of this
research. Based on the guidelines published by the UNEP-SETAC Life Cycle Initiative
(Swarr et al. 2011), the phases for conducting an LCC are very similar to those included in
the LCA method (Section 3.2), as illustrated in Figure 3.3. The main difference is the third
phase, which is now called “aggregation” and consists of selecting the economic indicators
of interest.
Figure 3.3 Phases of the LCC method. Based on Swarr et al. (2011)
Pure LCC studies are not part of this dissertation, as they are always combined with
environmental LCA data to provide integrated results for decision-making. All of them
were conventional LCCs that accounted for private life cycle costs (Swarr et al. 2011).
Details on the specific processes are provided in each chapter.
3.4 Integrated evaluation: eco-efficiency assessment
Combining different types of tools is one of the main contributions of this dissertation.
These integrated evaluations were conducted at different levels, i.e., adapting existing
methods and coupling complementary disciplines. One of the relevant approaches is the
eco-efficiency assessment. This method lacked a standardized framework until the
publication of ISO 14045:2012, which is entirely devoted to normalizing the application of
eco-efficiency assessments. According to this standard, eco-efficiency is an “aspect of
sustainability relating the environmental performance of a product system to its product
system value”. For this reason, this tool was used when combining economic and
environmental data. The phases of an eco-efficiency assessment are similar to those of an
LCA (Section 3.2), but including two parallel environmental and value quantification
processes that are finally combined (Figure 3.4). Because a pure eco-efficiency approach is
applied in Chapter 8, a more detailed explanation of the specific assumptions and
modeling principles is presented in its methodological section.
It is worth mentioning that the results presented in Chapter 8 belong to a set of values that
were officially certified by AENOR (a Spanish certification agency) as the first Spanish
30
analysis with an ISO 14045 award in the context of the LIFE+ Aquaenvec project
(Aquaenvec 2015). The results of the assessment were arranged in an Excel file and a
certified evaluator made a random selection of values. These were then traced back
through equations, assumptions and raw data in order to justify the calculation process
and prove their validity.
Figure 3.4 Phases of an eco-efficiency assessment. Based on ISO 14045:2012
3.5 Experimental and statistical tools
Experimental methods were only used in Chapter 7 in the detection of GHG emissions
from real-life sewers. The particular specifications of this process are presented in the
corresponding section of this chapter. Here, a list of analytical methods is provided so that
the features of the gas analyzer and analytical procedure can be consulted (Table 3.4 and
Table 3.5). Personnel from a water company were responsible for setting up and managing
the equipment at the sampling sites, and later providing measurement records.
Wastewater samples were also collected at each site, but they were processed by one of the
partners of the LIFE+ Aquaenvec project.
Statistical tools, such as correlation models and Monte Carlo simulations, were applied in
Chapters 6 and 9 and their particularities are explained in these chapters, as these are not
general methods that apply to all of the studies.
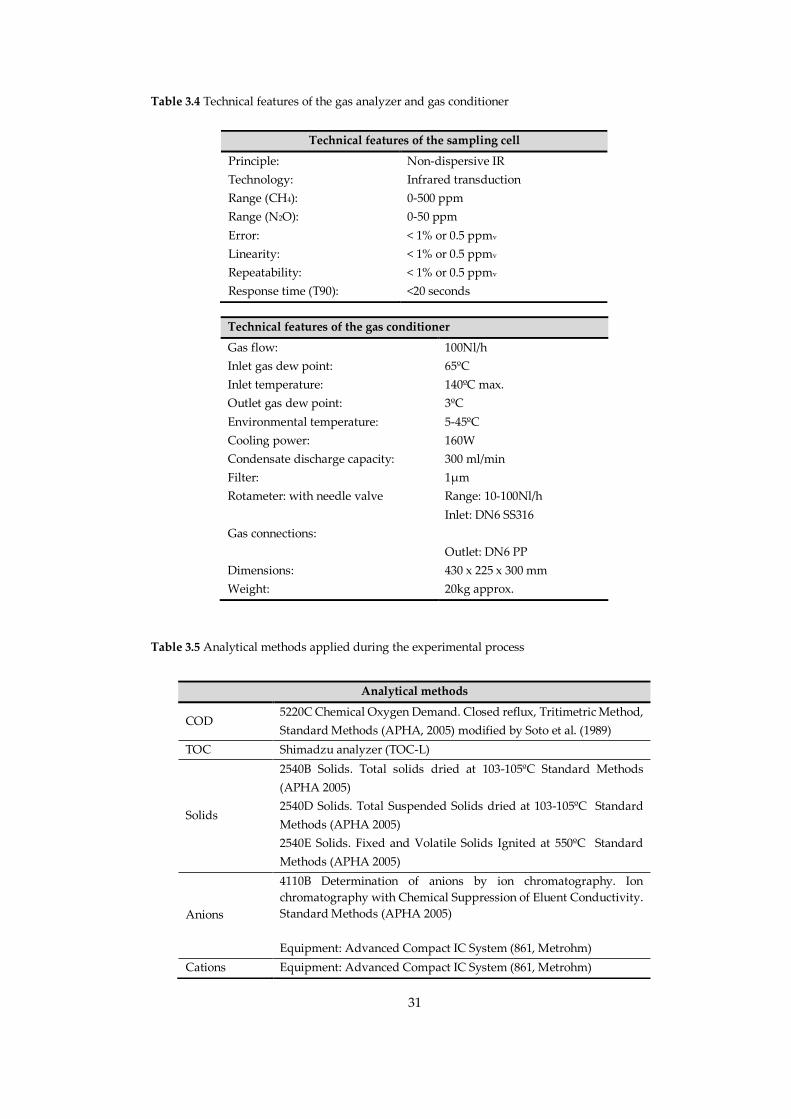
31
Table 3.4 Technical features of the gas analyzer and gas conditioner
Table 3.5 Analytical methods applied during the experimental process
Technical features of the sampling cell
Principle: Non-dispersive IR
Technology: Infrared transduction
Range (CH4): 0-500 ppm
Range (N2O): 0-50 ppm
Error: < 1% or 0.5 ppmv
Linearity: < 1% or 0.5 ppmv
Repeatability: < 1% or 0.5 ppmv
Response time (T90): <20 seconds
Technical features of the gas conditioner
Gas flow: 100Nl/h
Inlet gas dew point: 65ºC
Inlet temperature: 140ºC max.
Outlet gas dew point: 3ºC
Environmental temperature: 5-45ºC
Cooling power: 160W
Condensate discharge capacity: 300 ml/min
Filter: 1µm
Rotameter: with needle valve Range: 10-100Nl/h
Gas connections:
Inlet: DN6 SS316
Outlet: DN6 PP
Dimensions: 430 x 225 x 300 mm
Weight: 20kg approx.
Analytical methods
COD 5220C Chemical Oxygen Demand. Closed reflux, Tritimetric Method,
Standard Methods (APHA, 2005) modified by Soto et al. (1989)
TOC Shimadzu analyzer (TOC-L)
Solids
2540B Solids. Total solids dried at 103-105ºC Standard Methods
(APHA 2005)
2540D Solids. Total Suspended Solids dried at 103-105ºC Standard
Methods (APHA 2005)
2540E Solids. Fixed and Volatile Solids Ignited at 550ºC Standard
Methods (APHA 2005)
Anions
4110B Determination of anions by ion chromatography. Ion
chromatography with Chemical Suppression of Eluent Conductivity.
Standard Methods (APHA 2005)
Equipment: Advanced Compact IC System (861, Metrohm)
Cations Equipment: Advanced Compact IC System (861, Metrohm)
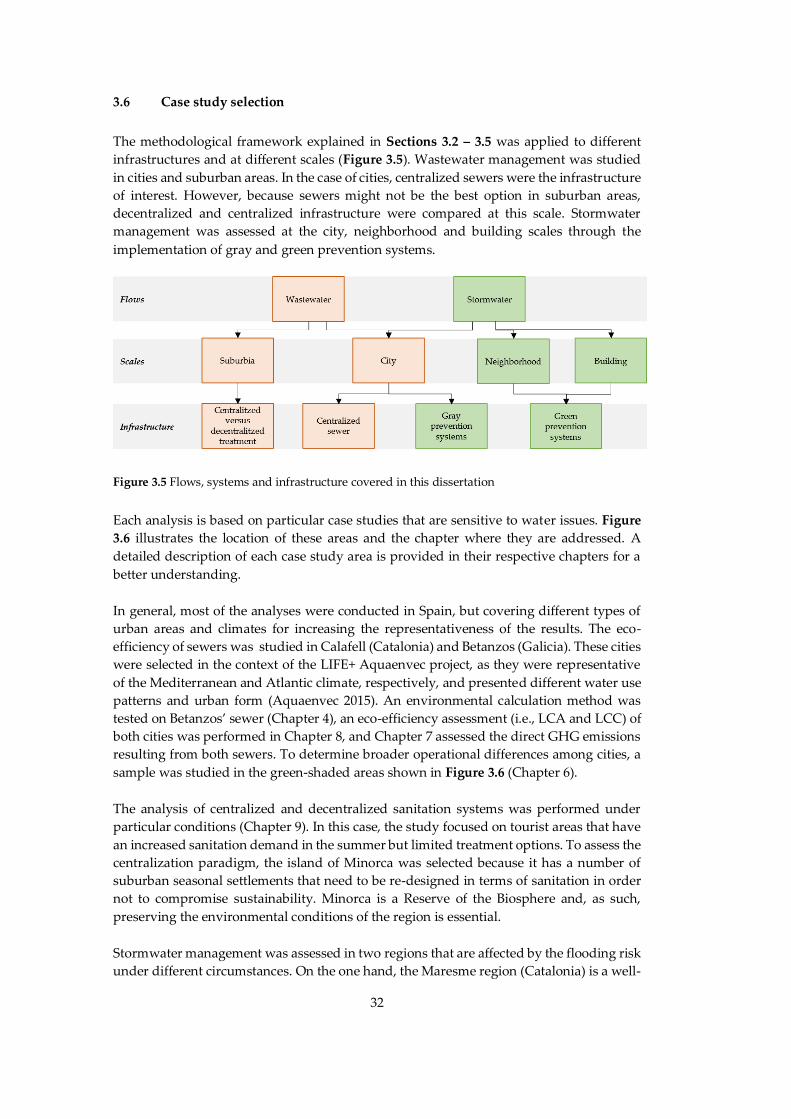
32
3.6 Case study selection
The methodological framework explained in Sections 3.2 – 3.5 was applied to different
infrastructures and at different scales (Figure 3.5). Wastewater management was studied
in cities and suburban areas. In the case of cities, centralized sewers were the infrastructure
of interest. However, because sewers might not be the best option in suburban areas,
decentralized and centralized infrastructure were compared at this scale. Stormwater
management was assessed at the city, neighborhood and building scales through the
implementation of gray and green prevention systems.
Figure 3.5 Flows, systems and infrastructure covered in this dissertation
Each analysis is based on particular case studies that are sensitive to water issues. Figure
3.6 illustrates the location of these areas and the chapter where they are addressed. A
detailed description of each case study area is provided in their respective chapters for a
better understanding.
In general, most of the analyses were conducted in Spain, but covering different types of
urban areas and climates for increasing the representativeness of the results. The eco-
efficiency of sewers was studied in Calafell (Catalonia) and Betanzos (Galicia). These cities
were selected in the context of the LIFE+ Aquaenvec project, as they were representative
of the Mediterranean and Atlantic climate, respectively, and presented different water use
patterns and urban form (Aquaenvec 2015). An environmental calculation method was
tested on Betanzos’ sewer (Chapter 4), an eco-efficiency assessment (i.e., LCA and LCC) of
both cities was performed in Chapter 8, and Chapter 7 assessed the direct GHG emissions
resulting from both sewers. To determine broader operational differences among cities, a
sample was studied in the green-shaded areas shown in Figure 3.6 (Chapter 6).
The analysis of centralized and decentralized sanitation systems was performed under
particular conditions (Chapter 9). In this case, the study focused on tourist areas that have
an increased sanitation demand in the summer but limited treatment options. To assess the
centralization paradigm, the island of Minorca was selected because it has a number of
suburban seasonal settlements that need to be re-designed in terms of sanitation in order
not to compromise sustainability. Minorca is a Reserve of the Biosphere and, as such,
preserving the environmental conditions of the region is essential.
Stormwater management was assessed in two regions that are affected by the flooding risk
under different circumstances. On the one hand, the Maresme region (Catalonia) is a well-

33
known area that is affected by intense flooding due to its coastal location and the presence
of ephemeral streams that are always dry except for the occasional rainfall events. Chapter
10 deals with the investment in (gray) post-disaster emergency actions in this area and the
resulting flood damage.
On the other hand, green BMPs were assessed in another flood-sensitive area, this time in
São Carlos (Brazil). In the framework of the “Smart Parks” project (HBP-2012-0216, CAPES
ref. 5206), the hydrologic, environmental and economic performance of a particular green
BMP was studied, i.e., a filter, swale and infiltration trench. Chapter 11 includes an LCA
and LCC of this system, together with its potential to reducing stormwater runoff. This
study was conducted at the building scale, because this was the real-life setting of this
infrastructure. Chapter 12 exemplifies the integration of damage prevention into the CLCA
of BMPs through a theoretical analysis of a neighborhood in São Carlos. The FST was
hypothetically located in available green spaces of the neighborhood to show how the
method proposed in this chapter can be used in other cases.
Figure 3.6 Geographic distribution of the case study areas

34
PART II - SEWER CONSTRUCTION IN URBAN AREAS – AN
ENVIRONMENTAL ASSESSMENT
Part II Sewer construction in urban areas –
an environmental assessment


Picture: Collection of manhole covers from around the globe
Environmental assessment of sewer
construction in small to medium sized
cities using life cycle assessment
Chapter 4

39
Environmental assessment of sewer
construction in small to medium sized cities using life
cycle assessment
This chapter is based on the following paper:
Petit-Boix, A., Sanjuan-Delmás, D., Gasol, C., Villalba, G., Suárez-Ojeda, M., Gabarrell, X.,
Josa, A., Rieradevall, J., 2014. Environmental assessment of sewer construction in small to
medium sized cities using life cycle assessment. Water Resources Management 28, 979–997
doi: 10.1007/s11269-014-0528-z
DDD link: http://ddd.uab.cat/record/141547
Abstract
In a world with an increasing urban population, analyzing the construction impacts of
sanitation infrastructures through life cycle assessment (LCA) is necessary for defining the
best environmental management strategies. In this study, the environmental impacts of
one linear meter of sewer constructive solution were analyzed for different pipe materials
and diameters used in Southern Europe; a unit of different sewer appurtenances (pump,
manhole and inspection chamber) was also considered. The impacts of the pipe materials
were compared considering different lifespan periods and high-density polyethylene
(HDPE) turned out to be the worst option, being polyvinyl chloride (PVC) and concrete
the most favorable ones. Few data are available on the material and energy flows in the
installation stage; therefore, a comparative analysis of trenches with sand and concrete
bedding was conducted. The results show that the installation stage represents up to 80%
of the total life cycle impact of the constructive solutions. Concrete pipes with half-
concrete/half-sand bedding are the best option and produce 20-30% of the impact of HDPE
pipes with concrete bedding. Hence, designers should focus not only on the pipe but also
on the trench model. A methodology was presented to enable the impact aggregation of
different sewer elements, and Betanzos (Spain) was selected to conduct a pilot study in
small cities. In the future, studies will need to incorporate the operation and maintenance
stage, as it is not standard and varies according to the physical features of the cities. Finally,
this study provides basic concepts for developing eco-efficiency indicators.
Keywords: pipe, appurtenance, LCI, urban, construction, smart cities

Picture: Construction of a sewer stretch in Basel (Switzerland)
Integrated structural analysis and life
cycle assessment of equivalent trench-
pipe systems for sewerage
Chapter 5

63
Integrated structural analysis and life cycle
assessment of equivalent trench-pipe systems for
sewerage
This chapter is based on the following paper:
Petit-Boix, A., Roigé, N., de la Fuente, A., Pujadas, P., Gabarrell, X., Rieradevall, J., Josa, A.,
2016. Integrated structural analysis and life cycle assessment of equivalent trench-pipe
systems for sewerage. Water Resources Management 30, 1117–1130.
doi: 10.1007/s11269-015-1214-5
DDD link: http://ddd.uab.cat/record/146023
Abstract
The demand for sanitation infrastructures is increasing due to a rise in the urban
population. To meet the need for wastewater collection, the construction of sewer networks
must comply with a series of technical parameters that indicate whether a solution is
feasible or not. Considering that this construction implies a series of environmental impacts,
this study coupled a structural analysis of one linear meter of sewer constructive solutions
with their life cycle impacts. Different pipe materials (i.e., concrete, polyvinylchloride (PVC)
and high-density polyethylene (HDPE)) were combined with different trench designs and
their environmental performance was assessed using life cycle assessment (LCA). These
solutions complied with technical parameters consisting of traffic loads and pavement
conditions, among others. Concrete pipes embedded in granular matter result in fewer
environmental impacts, such as the global warming or cumulative energy demand. Further,
re-using the excavated soil results in up to 80% of environmental savings with respect to
extracting new materials. Concerning traffic loads and pavement conditions, failures in
plastic pipes could be avoided if these are embedded in concrete. Moreover, the
environmental impacts of this solution are similar to those resulting from the substitution
of pipes that do not comply with the mechanical requirements of the construction site.
Therefore, proper planning is needed to provide cities with sewers that are resilient to time
and external loads and reduce the urban environmental impacts.
Keywords: sewer, pipe, trench, construction, LCA, urban design

64
65
PART III - ENVIRONMENTAL EFFECTS OF SEWER OPERATION AT THE
CITY SCALE
Part III Environmental effects of sewer
operation at the city scale

Picture: Maintenance truck cleaning a retention tank in Calafell (Catalonia, Spain)
Assessing the energetic and
environmental impacts of the
operation and maintenance of Spanish
sewer networks from a life cycle
perspective
Chapter 6

81
Assessing the energetic and environmental
impacts of the operation and maintenance of Spanish
sewer networks from a life cycle perspective
This chapter is based on the following paper:
Petit-Boix, A., Sanjuan-Delmás, D., Chenel, S., Marín, D., Gasol, C., Farreny, R., Villalba, G.,
Suárez-Ojeda, M., Gabarrell, X., Josa, A., Rieradevall, J., 2015. Assessing the energetic and
environmental impacts of the operation and maintenance of Spanish sewer networks from
a life-cycle perspective. Water Resources Management 29, 2581–2597
doi: 10.1007/s11269-015-0958-2
DDD link: http://ddd.uab.cat/record/132053
Abstract
The environmental impacts resulting from sewer networks are best analyzed from a life
cycle perspective to integrate the energy requirements into the infrastructure design. The
energy requirements for pumping wastewater depend on the configuration of the city (e.g.,
climate, population, length of the sewer, topography, etc.). This study analyzes and models
the effect of such site-specific features on energy consumption and related effects in a
sample of Spanish cities. The results show that the average annual energy used by sewers
(6.4 kWh/capita and 0.014 kWh/m3 of water flow) must not be underestimated because they
may require up to 50% of the electricity needs of a typical treatment plant in terms of
consumption per capita. In terms of global warming, pumping results in an average of 2.3
kg CO2 eq/capita. A significant positive relationship was demonstrated between the kWh
consumed and the length of the sewer and between other factors such as the population
and wastewater production. In addition, Atlantic cities can consume five times as much
energy as Mediterranean or Subtropical regions. A similar trend was shown in coastal cities.
Finally, a simple predictive model of the electricity consumption was presented that
considers the analyzed parameters.
Keywords: Energy, sewer, LCA, operation, city

82
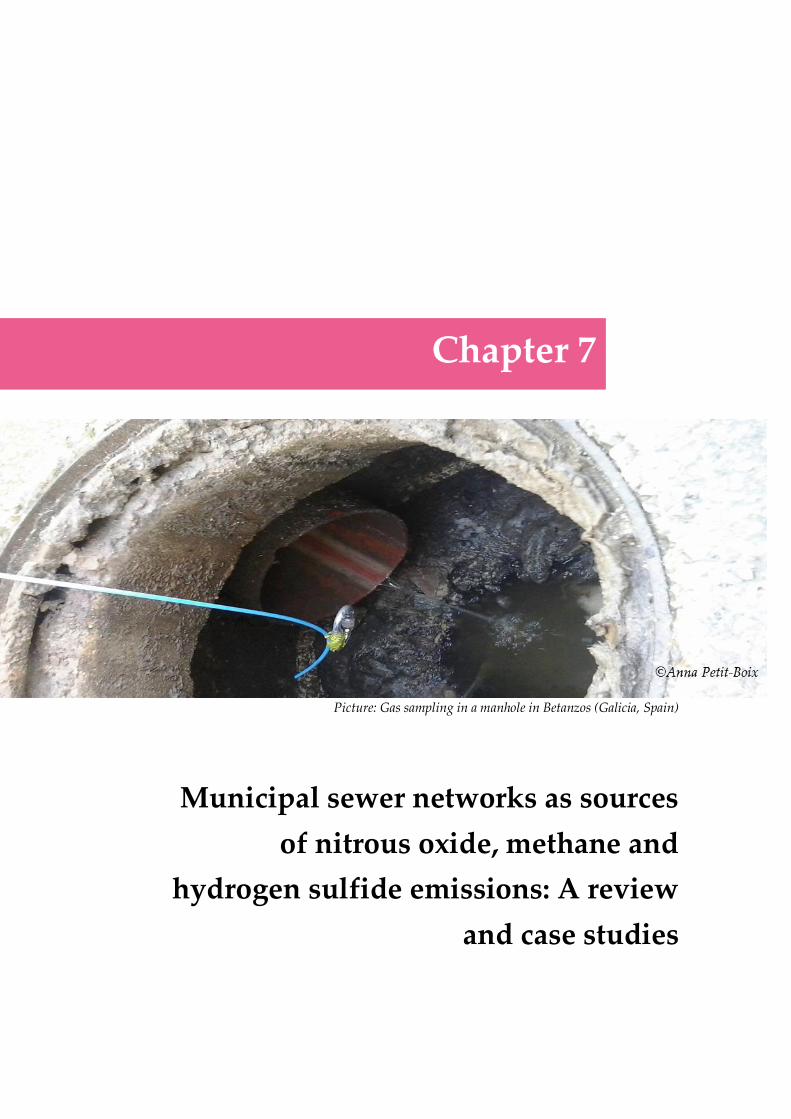
Picture: Gas sampling in a manhole in Betanzos (Galicia, Spain)
Municipal sewer networks as sources
of nitrous oxide, methane and
hydrogen sulfide emissions: A review
and case studies
Chapter 7

97
Municipal sewer networks as sources of
nitrous oxide, methane and hydrogen sulfide
emissions: A review and case studies
This chapter is based on the following paper:
Eijo-Río, E., Petit-Boix, A., Villalba, G., Suárez-Ojeda, M.E., Marin, D., Amores, M.J., Aldea,
X., Rieradevall, J., Gabarrell, X., 2015. Municipal sewer networks as sources of nitrous oxide,
methane and hydrogen sulphide emissions: A review and case studies. Journal of
Environmental Chemical Engineering 3(3), 2084–2094
doi: 10.1016/j.jece.2015.07.006
DDD link: http://ddd.uab.cat/record/145988
Abstract
Sewers are known as longitudinal reactors where gases such as methane, nitrous oxide and
hydrogen sulfide can be produced. However, gaseous emissions in wastewater
infrastructures have been mainly assessed in wastewater treatment plants (WWTP). The
aim of this study is to present a critical review of studies that quantify the generation of
these gases in sewers and to identify the existing research gaps. Differences in sampling
methods and site selection, as well as a very limited number of studies, result in incoherent
comparisons amongst sewers. In order to address some of these gaps, sampling campaigns
were conducted in two Spanish cities in winter and summer. Results showed that wet wells
were the most important sources of gases with concentrations up to 317 µg CH4/Lair and
6.8 µg N2O/Lair. Regarding emission factors, in the case of Calafell, the estimated annual
emissions were 18.6 kg CH4/year and 0.3 kg H2S/year in summer and 3.8 kg CH4/year and
0.5 kg H2S/year in winter. Regarding Betanzos, these values were 24.6 kg CH4/year and 0.5
kg N2O/year in summer and 10 kg CH4/year in winter. The summer campaign resulted in
greater gas concentration than in the winter season for both cities, suggesting that
temperature is a key parameter. We conclude that gas emissions from sewers are
significant compared to those of WWTPs, resulting in an important contribution to the
carbon footprint. Further work is needed to assess the gas production along the entire
sewer networks, which can result in very different emission factors depending on the
sewer components.
Keywords: Sewers, greenhouse gases, urban wastewater, N2O, CH4, H2S, sustainability

98
99
PART IV - CONVENTIONAL AND ALTERNATIVE WASTEWATER
MANAGEMENT IN URBAN AREAS
Part IV Conventional and alternative
wastewater management in urban areas

Picture: Concrete pipes piled at the storage area (Lleida, Spain)
Addressing the life cycle of sewers in
contrasting cities through an eco-
efficiency approach
Chapter 8

119
Addressing the life cycle of sewers in
contrasting cities through an eco-efficiency approach
This chapter had the following collaborators:
Petit-Boix, A., Arnal, C., Marín, D., Josa, A., Gabarrell, X., Rieradevall, J.
Abstract
Evaluating the sustainability of the urban water cycle is not straightforward, although a
variety of methods have been proposed. Given the lack of integrated data about sewers,
we applied the eco-efficiency approach to two case studies located in Spain with
contrasting climate, population, and urban and sewer configurations. Our goal was to
determine critical variables and life cycle stages and provide results for decision-making.
We used life cycle assessment (LCA) and life cycle costing (LCC) to evaluate their
environmental and economic impacts. Results showed that both cities have a similar
profile albeit their contrasting features, i.e., operation and maintenance (O&M) was the
main environmental issue (50-70% of the impacts) and pipe installation registered the
greatest economic capital expenditure (70-75%) due to labor. The location of the
wastewater treatment plant (WWTPs) is an essential factor in our analysis mainly due to
the topography effects, e.g., annual pump energy was thirteen times greater in Calafell.
Using the eco-efficiency portfolio, we observed that sewers might be less eco-efficient than
WWTPs and that we need to envision their design in the context of an integrated WWTP-
sewer management to improve sewer performance. In terms of methodological approach,
the bi-dimensional nature of eco-efficiency enables the benchmarking of product systems
and might be more easily interpreted by the general public. However, there are still some
constraints that should be addressed to improve communication, such as the selection of
indicators discussed in the paper.
Keywords: water cycle, life cycle assessment, life cycle costing, industrial ecology, eco-
innovation
120
8.1 Introduction
Meeting sustainability standards in cities is essential to ensuring the provision of urban
services at low environmental, economic and social costs. One of these services is the urban
water system, which calls for special attention given the increasing demand for water and
sanitation that results from growing urban populations (UN 2012). However, evaluating
the sustainability of this system is not straightforward. A variety of methods can be applied
to assess the performance of the urban water cycle. For instance, multiple indicators have
been used to cover some environmental, economic, socio-cultural, and/or functional
criteria (Balkema et al. 2002; Venkatesh and Brattebø 2013; Hellström et al. 2000; van
Leeuwen et al. 2012; Muga and Mihelcic 2008; Lemos et al. 2013; Fragkou et al. 2016). These
were often combined through multi-criteria approaches to assess diverse sustainability
objectives at different scales (Makropoulos et al. 2008; Marques et al. 2015).
Still, objective and comparable quantification is a challenge. We need to provide robust
models and data to water facility managers so that they can apply the most viable options.
In this respect, the eco-efficiency concept, normalized through ISO 14045:2012, can be
particularly useful. This standard describes eco-efficiency assessment as “a quantitative
management tool which enables the study of life-cycle environmental impacts of a product
system along with its product system value for a stakeholder”. This tool lacks the social
dimension of sustainability (Ehrenfeld 2005), but eco-efficiency is especially attractive
because it might provide intrinsic information about potential social benefits (Ekins 2005).
For instance, the product system value might be defined through consumer preferences.
The need for a consistent approach (Brattebø 2005) is covered through ISO 14045:2012,
which sets a methodological framework for assessing the eco-efficiency of products and
systems.
In the field of urban water management, the eco-efficiency of sewer networks is worth
analyzing. In general, there is an apparent interest in the absolute and relative
environmental impacts of wastewater treatment plants (WWTP) around the world
(Corominas et al. 2013), which have mainly been evaluated through life cycle assessment
(LCA). However, few of these LCAs include the pipe infrastructure (Loubet et al. 2014). As
opposed to WWTPs, which are generally affected by climatic conditions, a particularity of
sewers is the effect of urban configuration on the energy required to operate the system
(Petit-Boix et al. 2015a). Within the existing literature, articles have mainly focused on the
environmental impacts of the construction or full life cycle of sewers (Morera et al. 2016;
Vahidi et al. 2015, 2016, Petit-Boix et al. 2016, 2014; Venkatesh et al. 2009; Risch et al. 2015)
and a few studies have provided economic data (Akhtar et al. 2014; Thomas et al. 2016;
Murla et al. 2016). Only Lorenzo-Toja et al. (2016) conducted an eco-efficiency
benchmarking of WWTPs following ISO 14045:2012, but sewers were not analyzed.
In this context, what are the hotspots that might alter the eco-efficiency of sewers? Our goal
was to apply the eco-efficiency approach to sewer networks in order to determine critical
variables and life cycle stages and provide results and discussion for decision-making in
the context of the urban water cycle. To address our questions, we based our assessment
on two cities with contrasting urban conditions and climate in an attempt to represent
major areas of the globe, i.e., an Atlantic city with year-round population and a
Mediterranean, coastal city with seasonal population. To quantify the eco-efficiency of the
systems, we followed the guidelines described in ISO 14045:2012.
121
8.2 Materials and Methods
4.2.1 Case study definition
To answer our research question, we studied two Spanish cities with different urban and
climatic features in the framework of the LIFE+ Aquaenvec project (LIFE10/ENV/ES/520).
These cities present different conditions that we used to test whether the eco-efficiency of
sewers varies depending on the climate, population, and sewer and urban configurations.
Betanzos is located in the northwest of Spain and has an Atlantic climate that results in
more than 1,000 mm of rainfall every year. Wastewater flows from households to a WWTP
located at sea level and most of the network is a gravity sewer due to the topography. In
contrast, Calafell is a coastal, Mediterranean city with an annual rainfall of around 500 mm.
Because of land price and usually odor control, the WWTP was constructed inland and 40
m above sea level, which results in greater pumping requirements and length of sewer than
in Betanzos (Table 8.1). Both cities can be considered medium-sized based on their
population (10,000 – 50,000 inhabitants), although in Calafell it usually doubles in the
summer (Idescat 2016).
The sewer components were identified through the water managers and the SGO
(Operation Management System) and CONTEC (Technical Control of the Integral Water
Cycle) databases (©Suez services company 2012). These were mainly combined sewers,
with a portion of stormwater network in Calafell. The network has a total length of 77 and
173 km in Betanzos and Calafell, respectively. They consisted of concrete, fibrocement,
high-density polyethylene (HDPE) and polyvinylchloride (PVC) pipes. Both cities had a
greater share of plastic pipes, i.e., 66% of PVC in Betanzos and 73% of HDPE in Calafell,
and diameters of 300-315 mm dominated (50-75% of the network). In the case of sewer
appurtenances, the number of manholes and inspection chambers was estimated assuming
one unit every 50 meters of sewer (Petit-Boix et al. 2014). The CONTEC database provided
the number of scuppers, wastewater connections and submersible pumps (©Suez services
company 2012). However, the power of the pumps was unknown and we tested a scenario
with a 60 m3/h pump to account for pump production, which is the highest flow we found
in construction databases (MetaBase ITeC 2010). We did know the real electricity
consumption of the system, and the wastewater production was registered at the WWTP.
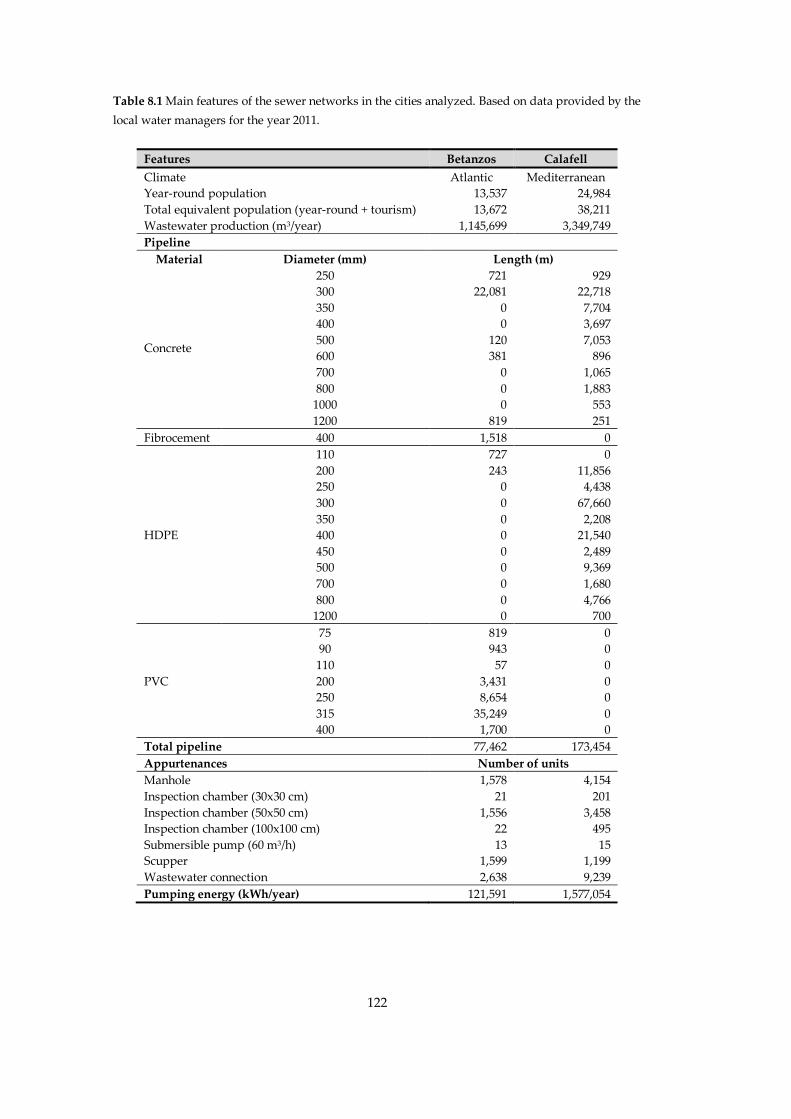
122
Table 8.1 Main features of the sewer networks in the cities analyzed. Based on data provided by the
local water managers for the year 2011.
Features Betanzos Calafell
Climate Atlantic Mediterranean
Year-round population 13,537 24,984
Total equivalent population (year-round + tourism) 13,672 38,211
Wastewater production (m3/year) 1,145,699 3,349,749
Pipeline
Material Diameter (mm) Length (m)
Concrete
250 721 929
300 22,081 22,718
350 0 7,704
400 0 3,697
500 120 7,053
600 381 896
700 0 1,065
800 0 1,883
1000 0 553
1200 819 251
Fibrocement 400 1,518 0
HDPE
110 727 0
200 243 11,856
250 0 4,438
300 0 67,660
350 0 2,208
400 0 21,540
450 0 2,489
500 0 9,369
700 0 1,680
800 0 4,766
1200 0 700
PVC
75 819 0
90 943 0
110 57 0
200 3,431 0
250 8,654 0
315 35,249 0
400 1,700 0
Total pipeline 77,462 173,454
Appurtenances Number of units
Manhole 1,578 4,154
Inspection chamber (30x30 cm) 21 201
Inspection chamber (50x50 cm) 1,556 3,458
Inspection chamber (100x100 cm) 22 495
Submersible pump (60 m3/h) 13 15
Scupper 1,599 1,199
Wastewater connection 2,638 9,239
Pumping energy (kWh/year) 121,591 1,577,054
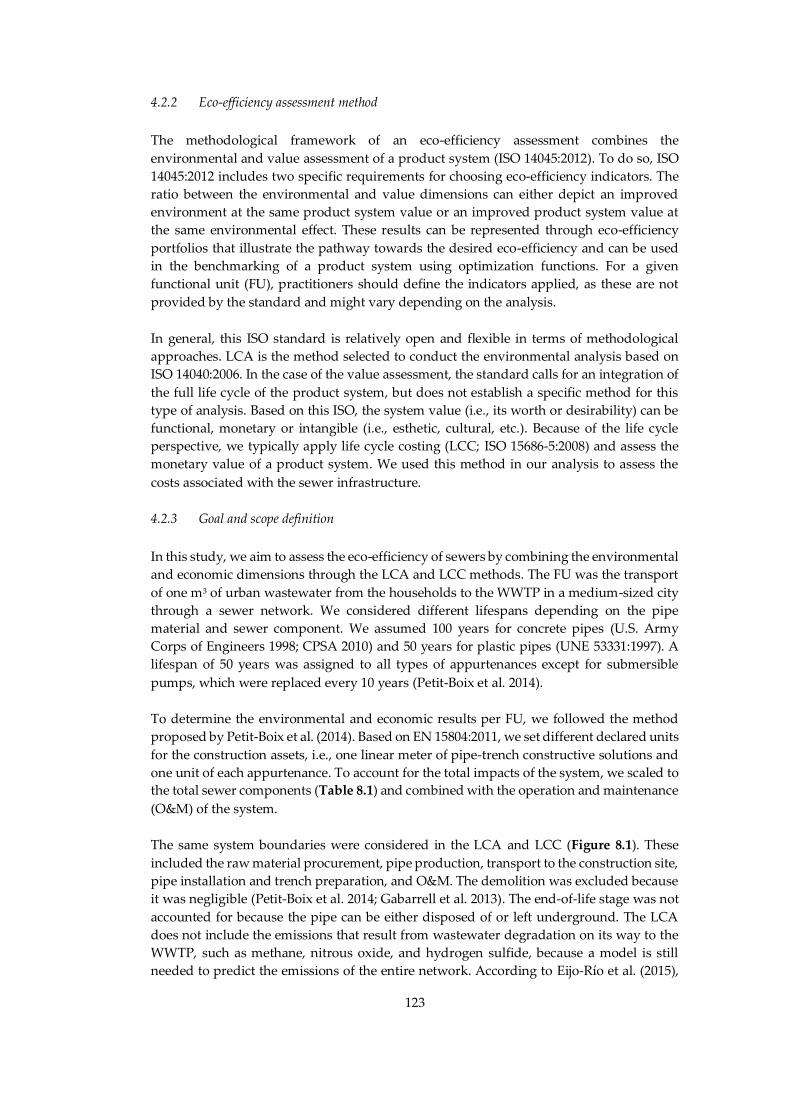
123
4.2.2 Eco-efficiency assessment method
The methodological framework of an eco-efficiency assessment combines the
environmental and value assessment of a product system (ISO 14045:2012). To do so, ISO
14045:2012 includes two specific requirements for choosing eco-efficiency indicators. The
ratio between the environmental and value dimensions can either depict an improved
environment at the same product system value or an improved product system value at
the same environmental effect. These results can be represented through eco-efficiency
portfolios that illustrate the pathway towards the desired eco-efficiency and can be used
in the benchmarking of a product system using optimization functions. For a given
functional unit (FU), practitioners should define the indicators applied, as these are not
provided by the standard and might vary depending on the analysis.
In general, this ISO standard is relatively open and flexible in terms of methodological
approaches. LCA is the method selected to conduct the environmental analysis based on
ISO 14040:2006. In the case of the value assessment, the standard calls for an integration of
the full life cycle of the product system, but does not establish a specific method for this
type of analysis. Based on this ISO, the system value (i.e., its worth or desirability) can be
functional, monetary or intangible (i.e., esthetic, cultural, etc.). Because of the life cycle
perspective, we typically apply life cycle costing (LCC; ISO 15686-5:2008) and assess the
monetary value of a product system. We used this method in our analysis to assess the
costs associated with the sewer infrastructure.
4.2.3 Goal and scope definition
In this study, we aim to assess the eco-efficiency of sewers by combining the environmental
and economic dimensions through the LCA and LCC methods. The FU was the transport
of one m3 of urban wastewater from the households to the WWTP in a medium-sized city
through a sewer network. We considered different lifespans depending on the pipe
material and sewer component. We assumed 100 years for concrete pipes (U.S. Army
Corps of Engineers 1998; CPSA 2010) and 50 years for plastic pipes (UNE 53331:1997). A
lifespan of 50 years was assigned to all types of appurtenances except for submersible
pumps, which were replaced every 10 years (Petit-Boix et al. 2014).
To determine the environmental and economic results per FU, we followed the method
proposed by Petit-Boix et al. (2014). Based on EN 15804:2011, we set different declared units
for the construction assets, i.e., one linear meter of pipe-trench constructive solutions and
one unit of each appurtenance. To account for the total impacts of the system, we scaled to
the total sewer components (Table 8.1) and combined with the operation and maintenance
(O&M) of the system.
The same system boundaries were considered in the LCA and LCC (Figure 8.1). These
included the raw material procurement, pipe production, transport to the construction site,
pipe installation and trench preparation, and O&M. The demolition was excluded because
it was negligible (Petit-Boix et al. 2014; Gabarrell et al. 2013). The end-of-life stage was not
accounted for because the pipe can be either disposed of or left underground. The LCA
does not include the emissions that result from wastewater degradation on its way to the
WWTP, such as methane, nitrous oxide, and hydrogen sulfide, because a model is still
needed to predict the emissions of the entire network. According to Eijo-Río et al. (2015),
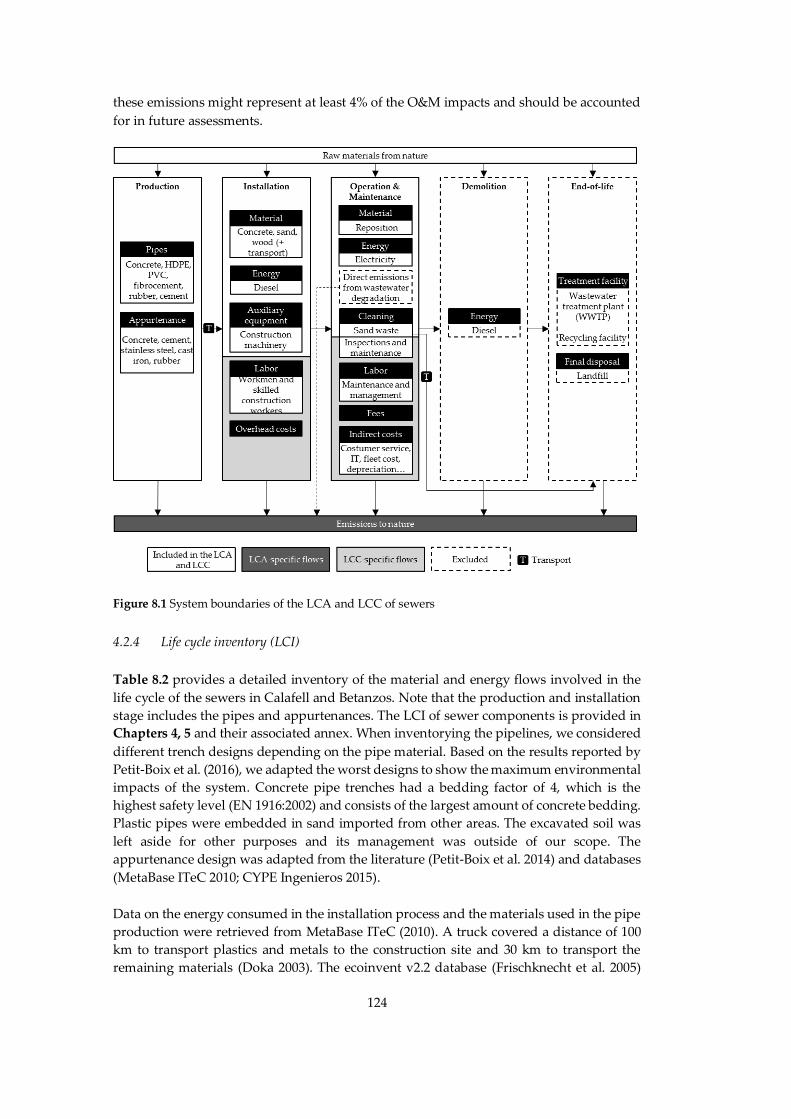
124
these emissions might represent at least 4% of the O&M impacts and should be accounted
for in future assessments.
Figure 8.1 System boundaries of the LCA and LCC of sewers
4.2.4 Life cycle inventory (LCI)
Table 8.2 provides a detailed inventory of the material and energy flows involved in the
life cycle of the sewers in Calafell and Betanzos. Note that the production and installation
stage includes the pipes and appurtenances. The LCI of sewer components is provided in
Chapters 4, 5 and their associated annex. When inventorying the pipelines, we considered
different trench designs depending on the pipe material. Based on the results reported by
Petit-Boix et al. (2016), we adapted the worst designs to show the maximum environmental
impacts of the system. Concrete pipe trenches had a bedding factor of 4, which is the
highest safety level (EN 1916:2002) and consists of the largest amount of concrete bedding.
Plastic pipes were embedded in sand imported from other areas. The excavated soil was
left aside for other purposes and its management was outside of our scope. The
appurtenance design was adapted from the literature (Petit-Boix et al. 2014) and databases
(MetaBase ITeC 2010; CYPE Ingenieros 2015).
Data on the energy consumed in the installation process and the materials used in the pipe
production were retrieved from MetaBase ITeC (2010). A truck covered a distance of 100
km to transport plastics and metals to the construction site and 30 km to transport the
remaining materials (Doka 2003). The ecoinvent v2.2 database (Frischknecht et al. 2005)
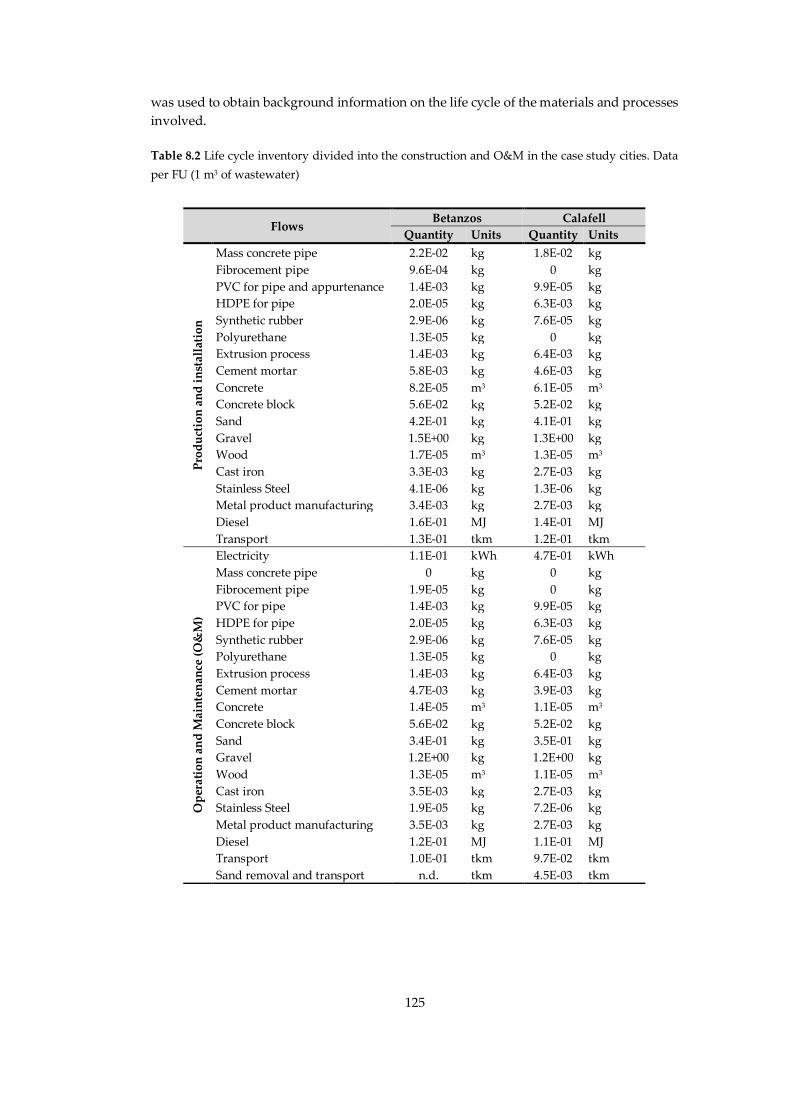
125
was used to obtain background information on the life cycle of the materials and processes
involved.
Table 8.2 Life cycle inventory divided into the construction and O&M in the case study cities. Data
per FU (1 m3 of wastewater)
Flows Betanzos Calafell
Quantity Units Quantity Units
Pro
du
ctio
n a
nd
in
stal
lati
on
Mass concrete pipe 2.2E-02 kg 1.8E-02 kg
Fibrocement pipe 9.6E-04 kg 0 kg
PVC for pipe and appurtenance 1.4E-03 kg 9.9E-05 kg
HDPE for pipe 2.0E-05 kg 6.3E-03 kg
Synthetic rubber 2.9E-06 kg 7.6E-05 kg
Polyurethane 1.3E-05 kg 0 kg
Extrusion process 1.4E-03 kg 6.4E-03 kg
Cement mortar 5.8E-03 kg 4.6E-03 kg
Concrete 8.2E-05 m3 6.1E-05 m3
Concrete block 5.6E-02 kg 5.2E-02 kg
Sand 4.2E-01 kg 4.1E-01 kg
Gravel 1.5E+00 kg 1.3E+00 kg
Wood 1.7E-05 m3 1.3E-05 m3
Cast iron 3.3E-03 kg 2.7E-03 kg
Stainless Steel 4.1E-06 kg 1.3E-06 kg
Metal product manufacturing 3.4E-03 kg 2.7E-03 kg
Diesel 1.6E-01 MJ 1.4E-01 MJ
Transport 1.3E-01 tkm 1.2E-01 tkm
Op
erat
ion
an
d M
ain
ten
ance
(O
&M
)
Electricity 1.1E-01 kWh 4.7E-01 kWh
Mass concrete pipe 0 kg 0 kg
Fibrocement pipe 1.9E-05 kg 0 kg
PVC for pipe 1.4E-03 kg 9.9E-05 kg
HDPE for pipe 2.0E-05 kg 6.3E-03 kg
Synthetic rubber 2.9E-06 kg 7.6E-05 kg
Polyurethane 1.3E-05 kg 0 kg
Extrusion process 1.4E-03 kg 6.4E-03 kg
Cement mortar 4.7E-03 kg 3.9E-03 kg
Concrete 1.4E-05 m3 1.1E-05 m3
Concrete block 5.6E-02 kg 5.2E-02 kg
Sand 3.4E-01 kg 3.5E-01 kg
Gravel 1.2E+00 kg 1.2E+00 kg
Wood 1.3E-05 m3 1.1E-05 m3
Cast iron 3.5E-03 kg 2.7E-03 kg
Stainless Steel 1.9E-05 kg 7.2E-06 kg
Metal product manufacturing 3.5E-03 kg 2.7E-03 kg
Diesel 1.2E-01 MJ 1.1E-01 MJ
Transport 1.0E-01 tkm 9.7E-02 tkm
Sand removal and transport n.d. tkm 4.5E-03 tkm
126
The O&M consisted of different variables. First, the energy required to pump wastewater
to the WWTP was provided by the facility managers. The electricity was modeled using
the Spanish mix of the year 2011 (REE 2012), which is the year that we obtained data from.
Second, the length of sewer and number of appurtenances renovated every year was
unknown. We assumed a certain number of repositions depending on their lifespan, e.g.,
when a component had a 50-year lifespan, we considered one reposition in 100 years. Only
in the case of fibrocement did we assume a 2% renovation rate according to local estimates.
Third, maintenance involved cleaning tasks, e.g., removal and transport of sediments
accumulated in the sewers. This data was available in the case of Calafell and we
considered the number of trips covered by the inspection and maintenance service (48
trips/year; 75 km) and the average amount of sediments (4,000 kg/year). We could not
apply these estimates to Betanzos, but assumed a negligible maintenance based on onsite
observations.
All the construction flows were translated into monetary values through MetaBase ITeC
(2010) and CYPE Ingenieros (2015). The value assessment includes additional costs, such
as labor, overheads, fees and indirect costs (Figure 8.1). Labor and overhead data related
to construction processes were available in the aforementioned databases. O&M costs were
retrieved from financial statements and invoices provided by utility managers. In this case,
the reposition costs of 2011 were obtained, but the reposition rate was not available. Due
to limited data availability, the economic costs were not broken down into basic flows. The
total cost of each sewer component is provided in the Appendix 5.1.
4.2.5 Life cycle impact assessment (LCIA) and indicator selection
The selection of environmental indicators might be more complex when communicating
eco-efficiency results. In the eco-efficiency portfolios, only one indicator can be represented
and selecting one or another might lead to the common tradeoffs that occur in LCA studies.
For this reason, we conducted the impact assessment at three levels, i.e., using midpoints,
endpoints, and a single score indicator. These were modeled with the ReCiPe (H) method
(Goedkoop et al. 2009) and the Simapro 8 software (PRé Consultants 2014).
We used endpoints to determine the specific damage of the production, installation, and
O&M to human health, ecosystems and resources. As we were interested in determining
hotspots in the eco-efficiency of sewers, endpoints might reduce the complexity of
interpretations because decision-makers do not need to identify the environmental
relevance of each midpoint indicator (Bare et al. 2000). This can also be achieved through
an integrated single score indicator, which represents the weighted endpoints in terms of
eco-points (Pt). Although endpoint and single score indicators have an increased
uncertainty and subjectivity with respect to midpoints, we used them in the eco-efficiency
assessment for an easier understanding and communication. Some argue that endpoints
provide a more structured factor weighting when comparing (Udo de Haes et al. 2002), as
they are closer to our concerns, such as health issues, and can be easily valuated (Hertwich
and Hammitt 2001). Nevertheless, there is a loss of comprehensiveness and increased
uncertainty in endpoint and damage analysis due to the modeling principles, assumptions
and value choice (Bare et al. 2000).
For this reason, a recommendation is to provide both the midpoint and endpoint results to
increase the transparency of the analysis (Kägi et al. 2016). We used a set of 18 ReCiPe
127
midpoints and the cumulative energy demand (CED) (Hischier et al. 2010) to break down
the environmental impacts into sewer components and O&M flows. By doing so, we
identified the impacts generated by basic flows (e.g., materials, energy, etc.) at early stages
of the cause-effect chain, such as the potential resource depletion or pollutant emissions.
4.2.6 Economic indicator selection
The economic costs were calculated differently in the construction and O&M processes.
The O&M costs were based on the financial statement of the water facilities, which include
the energy, fees and indirect operation costs. In the case of the pipe production and
installation, the direct unit costs (DUC) resulting from the LCI were converted into
equivalent annual costs (EAC). By doing so, we accounted for the annual costs of the sewer
construction considering a time horizon of 100 years, which is the potential maximum
lifespan of concrete pipes. Equations 8.1, 8.2 and 8.3 illustrate the conversion of the DUC
into EAC. To calculate the total unit cost (TUC), we considered that the indirect costs (IUC)
were 10% of the DUC. The general costs (GUC) and industrial profit (IP) represented 13%
and 6% of the execution material budget (i.e., direct plus indirect costs), respectively (BOE
2001a). A 3% interest rate was assumed to estimate the present value (PV) and EAC, with
a time horizon of 100 years according to the FU of the analysis.
TUC = DUC + IUC + GUC + IP = 1.309 DUC Equation 8.1
PV = TUC
(1+i)t Equation 8.2
EAC = PV × i
1-(1+i)-n Equation 8.3
Where TUC: total unit cost; DUC: direct unit cost; IUC: indirect unit cost; GUC: general
unit cost; IP: industrial profit; PV: present value; EAC: equivalent annual costs; i: interest
rate (3%); t: lifespan (present, t = 0); n: time horizon (100 years).
8.3 Results and Discussion
In this section, we identified the life cycle stages with a poor environmental and economic
performance and sought possible explanations. These dimensions were compared and eco-
efficiency results were discussed in the context of the urban water cycle.
4.3.1 Environmental and economic characterization of the sewers
A set of environmental and economic results is shown in Table 8.3. The environmental and
economic hotspots were similar in both cities, but the total impacts of Betanzos and Calafell
were especially different. For instance, the impacts to human health were 4.1E-07 and 6.9E-
07 DALYs/m3, respectively, whereas the total economic costs amounted to approximately
one €/m3 in both cases.
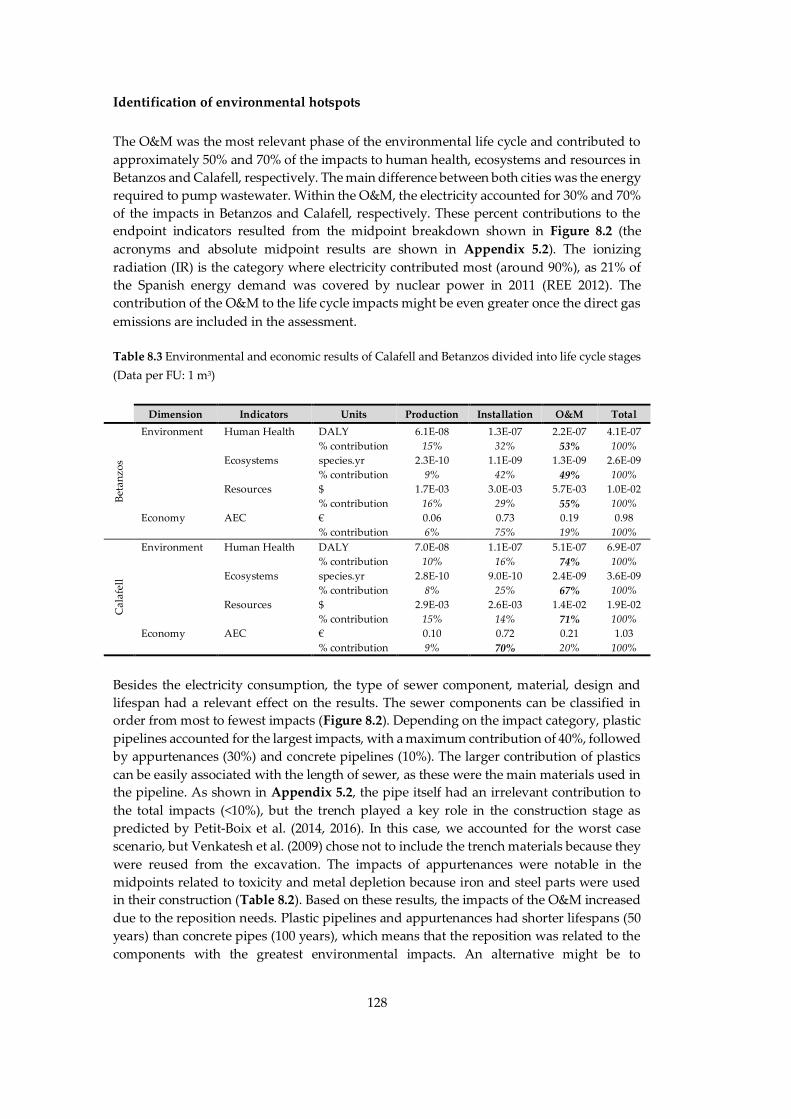
128
Identification of environmental hotspots
The O&M was the most relevant phase of the environmental life cycle and contributed to
approximately 50% and 70% of the impacts to human health, ecosystems and resources in
Betanzos and Calafell, respectively. The main difference between both cities was the energy
required to pump wastewater. Within the O&M, the electricity accounted for 30% and 70%
of the impacts in Betanzos and Calafell, respectively. These percent contributions to the
endpoint indicators resulted from the midpoint breakdown shown in Figure 8.2 (the
acronyms and absolute midpoint results are shown in Appendix 5.2). The ionizing
radiation (IR) is the category where electricity contributed most (around 90%), as 21% of
the Spanish energy demand was covered by nuclear power in 2011 (REE 2012). The
contribution of the O&M to the life cycle impacts might be even greater once the direct gas
emissions are included in the assessment.
Table 8.3 Environmental and economic results of Calafell and Betanzos divided into life cycle stages
(Data per FU: 1 m3)
Dimension Indicators Units Production Installation O&M Total
Bet
an
zo
s
Environment Human Health DALY 6.1E-08 1.3E-07 2.2E-07 4.1E-07
% contribution 15% 32% 53% 100%
Ecosystems species.yr 2.3E-10 1.1E-09 1.3E-09 2.6E-09
% contribution 9% 42% 49% 100%
Resources $ 1.7E-03 3.0E-03 5.7E-03 1.0E-02
% contribution 16% 29% 55% 100%
Economy AEC € 0.06 0.73 0.19 0.98
% contribution 6% 75% 19% 100%
Ca
lafe
ll
Environment Human Health DALY 7.0E-08 1.1E-07 5.1E-07 6.9E-07
% contribution 10% 16% 74% 100%
Ecosystems species.yr 2.8E-10 9.0E-10 2.4E-09 3.6E-09
% contribution 8% 25% 67% 100%
Resources $ 2.9E-03 2.6E-03 1.4E-02 1.9E-02
% contribution 15% 14% 71% 100%
Economy AEC € 0.10 0.72 0.21 1.03
% contribution 9% 70% 20% 100%
Besides the electricity consumption, the type of sewer component, material, design and
lifespan had a relevant effect on the results. The sewer components can be classified in
order from most to fewest impacts (Figure 8.2). Depending on the impact category, plastic
pipelines accounted for the largest impacts, with a maximum contribution of 40%, followed
by appurtenances (30%) and concrete pipelines (10%). The larger contribution of plastics
can be easily associated with the length of sewer, as these were the main materials used in
the pipeline. As shown in Appendix 5.2, the pipe itself had an irrelevant contribution to
the total impacts (<10%), but the trench played a key role in the construction stage as
predicted by Petit-Boix et al. (2014, 2016). In this case, we accounted for the worst case
scenario, but Venkatesh et al. (2009) chose not to include the trench materials because they
were reused from the excavation. The impacts of appurtenances were notable in the
midpoints related to toxicity and metal depletion because iron and steel parts were used
in their construction (Table 8.2). Based on these results, the impacts of the O&M increased
due to the reposition needs. Plastic pipelines and appurtenances had shorter lifespans (50
years) than concrete pipes (100 years), which means that the reposition was related to the
components with the greatest environmental impacts. An alternative might be to
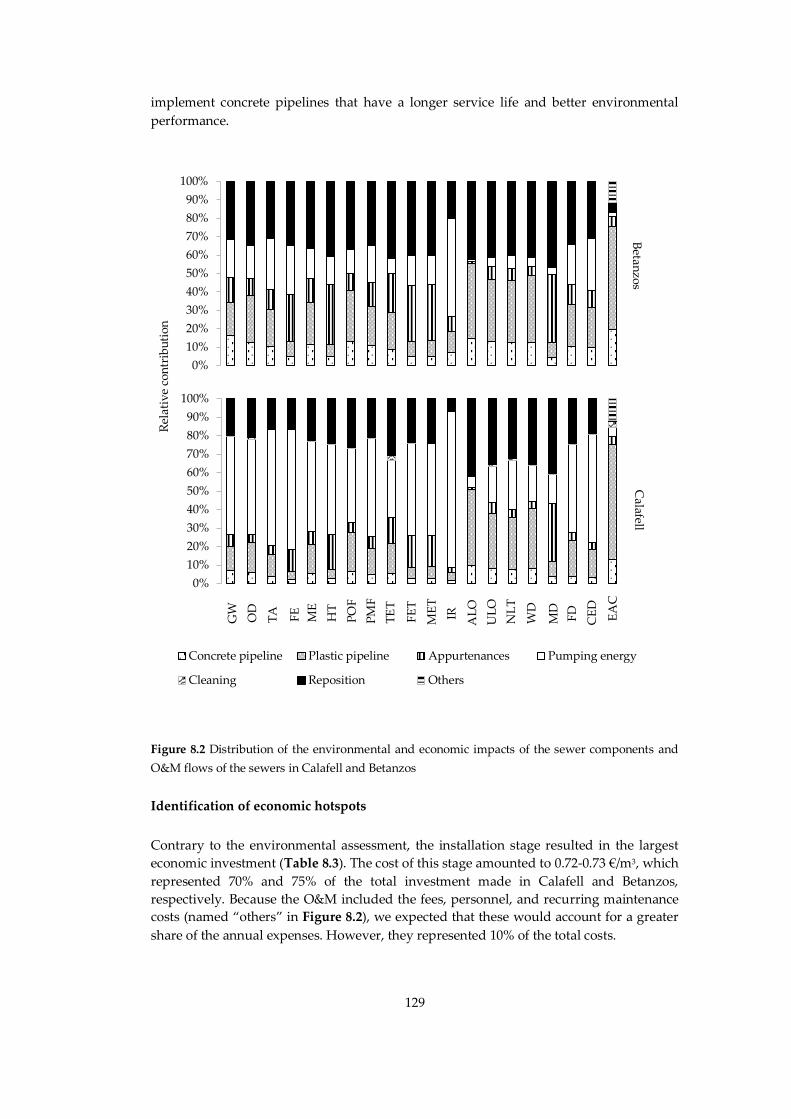
129
implement concrete pipelines that have a longer service life and better environmental
performance.
Figure 8.2 Distribution of the environmental and economic impacts of the sewer components and
O&M flows of the sewers in Calafell and Betanzos
Identification of economic hotspots
Contrary to the environmental assessment, the installation stage resulted in the largest
economic investment (Table 8.3). The cost of this stage amounted to 0.72-0.73 €/m3, which
represented 70% and 75% of the total investment made in Calafell and Betanzos,
respectively. Because the O&M included the fees, personnel, and recurring maintenance
costs (named “others” in Figure 8.2), we expected that these would account for a greater
share of the annual expenses. However, they represented 10% of the total costs.
0%
20%
40%
60%
80%
100%
Concrete pipeline Plastic pipeline Appurtenances Pumping energy
Cleaning Reposition Others
0%
10%
20%
30%
40%
50%
60%
70%
80%
90%
100%
GW
P
OD
P
TA
P
FE
P
ME
P
HT
P
PC
OP
PM
F
TE
TP
FE
TP
ME
TP IR
AL
OP
UL
OP
NL
TP
WD
P
MD
P
FD
P
CE
D
AE
C
0%
10%
20%
30%
40%
50%
60%
70%
80%
90%
100%
Betan
zos
Calafell
Rel
ativ
e co
ntr
ibu
tio
n
EA
C
GW
OD
TA
FE
ME
HT
PO
F
PM
F
TE
T
FE
T
ME
T
IR
AL
O
UL
O
NL
T
WD
FD
MD
CE
D
130
Labor was the reason why the installation was more expensive on an annual basis. The
need for skilled construction workers resulted in 50% of the investment at this stage of the
life cycle (see Appendix 5.1). In social terms, this investment might result in positive effects,
as it enhances the staff recruitment in the area. It was also notable that plastic pipelines
were the most expensive item in the system and accounted for 60% of the construction
costs in both cities, which was also associated with the installation stage. As opposed to
the LCA, note that we obtained real reposition costs and did not apply the equivalent costs
of the initial construction of the sewer. In this case, the reposition was almost negligible.
Explanatory variables to local differences
The environmental and economic trends were very similar in both case studies.
Nevertheless, the environmental effects of the O&M stage were greater in Calafell (e.g.,
5.1E-07 DALY/m3) than in Betanzos (e.g., 2.2E-07 DALY/m3). Previous analyses tried to
explain general variations in the O&M of sewers (Petit-Boix et al. 2015a), but an analysis of
specific case studies might help to delve deeper into the differences among cities.
Different reasons might be associated with the energy requirements of these sewers, which
are 0.11 and 0.47 kWh/m3 in Betanzos and Calafell, respectively. Some of them include the
rainfall patterns, population, length of sewer, and location of the WWTP. We checked each
of these variables to determine which one might be contributing most to the results of each
city. Betanzos was expected to have an increased energy demand because the Atlantic
climate results in constant rainfall throughout the year. Additionally, tides affect this
region and might result in tidewater entries to the combined sewer (Day 2000). However,
these effects were not apparent when comparing Betanzos to Calafell. The influence of
population can be assessed through the wastewater generation per capita. Based on Table
8.1, we estimated a wastewater production of 84 and 135 m3/capita/year in Betanzos and
Calafell, respectively. Nevertheless, Calafell had a seasonal inflow of 13,227 tourists that
doubled the number of residents, so the total equivalent population should be applied
instead (Table 8.1) (Idescat 2016). The resulting wastewater generation was 87
m3/capita/year, which is similar to that of Betanzos and does not explain the difference in
energy consumption. The length of sewer needed to connect the city to the WWTP might
influence the electricity consumption as predicted by Petit-Boix et al. (2015). Based on
Table 8.1, the length per m3 of wastewater was 0.05-0.07 km, which does not explain the
difference between the cities.
The last variable that we addressed was the location of the WWTP. Looking at urban
planning, Calafell’s WWTP was located at a higher altitude than that of Betanzos. Although
Betanzos had intermediate pumping stations to deal with topographic variations, the
WWTP was at sea level. Consequently, the annual energy intensity of the pumping system
was thirteen times greater in Calafell. A set of pumping stations directed the wastewater
flow to a larger station that was responsible for connecting the city to the WWTP through
a rising sewer. The WWTP was three kilometers away from this point and 40 m above sea
level. For this reason, we believe that the main variable that affected the O&M was the
location of the WWTP.
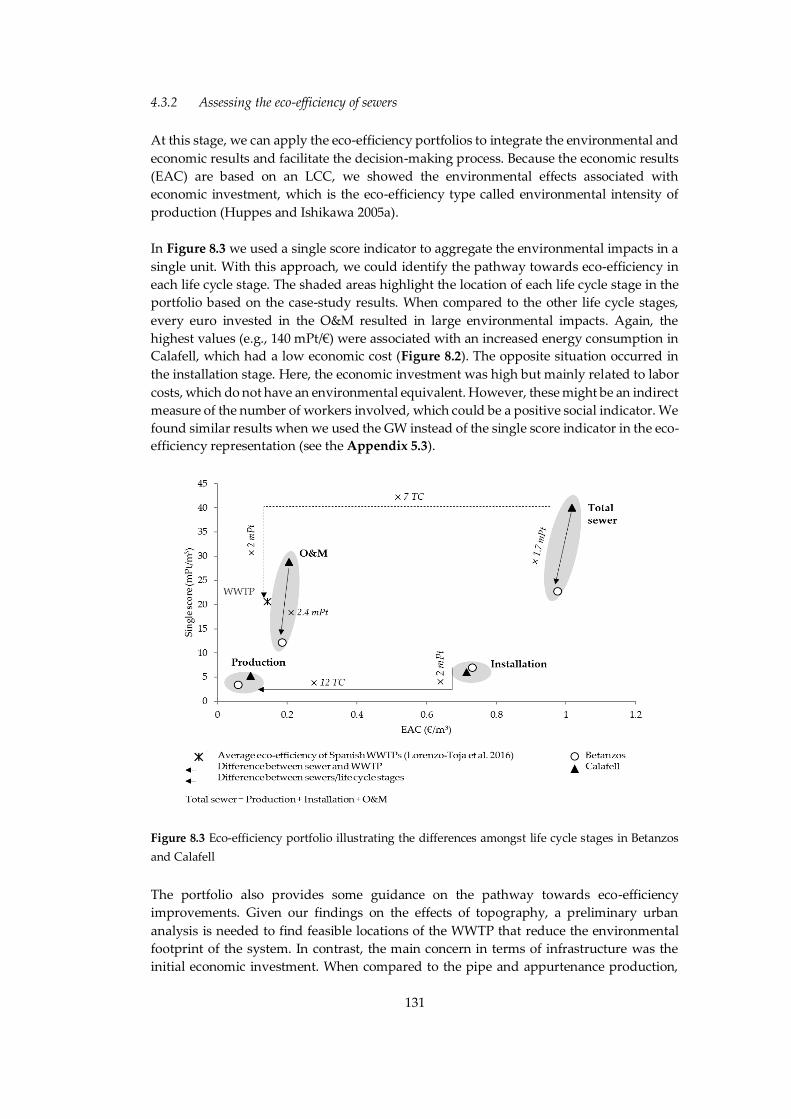
131
4.3.2 Assessing the eco-efficiency of sewers
At this stage, we can apply the eco-efficiency portfolios to integrate the environmental and
economic results and facilitate the decision-making process. Because the economic results
(EAC) are based on an LCC, we showed the environmental effects associated with
economic investment, which is the eco-efficiency type called environmental intensity of
production (Huppes and Ishikawa 2005a).
In Figure 8.3 we used a single score indicator to aggregate the environmental impacts in a
single unit. With this approach, we could identify the pathway towards eco-efficiency in
each life cycle stage. The shaded areas highlight the location of each life cycle stage in the
portfolio based on the case-study results. When compared to the other life cycle stages,
every euro invested in the O&M resulted in large environmental impacts. Again, the
highest values (e.g., 140 mPt/€) were associated with an increased energy consumption in
Calafell, which had a low economic cost (Figure 8.2). The opposite situation occurred in
the installation stage. Here, the economic investment was high but mainly related to labor
costs, which do not have an environmental equivalent. However, these might be an indirect
measure of the number of workers involved, which could be a positive social indicator. We
found similar results when we used the GW instead of the single score indicator in the eco-
efficiency representation (see the Appendix 5.3).
Figure 8.3 Eco-efficiency portfolio illustrating the differences amongst life cycle stages in Betanzos
and Calafell
The portfolio also provides some guidance on the pathway towards eco-efficiency
improvements. Given our findings on the effects of topography, a preliminary urban
analysis is needed to find feasible locations of the WWTP that reduce the environmental
footprint of the system. In contrast, the main concern in terms of infrastructure was the
initial economic investment. When compared to the pipe and appurtenance production,
132
the installation might double the production impacts, but the costs had the largest room
for improvement, these being twelve times greater. In this case, the type of trench design,
which is concrete intensive, might require more labor hours than other solutions,
suggesting that an optimized system is needed.
It is also interesting to put the sewers into the context of the water cycle. As a first
estimation, we compared the eco-efficiency of our case studies with the average eco-
efficiency of Spanish WWTPs based on Lorenzo-Toja et al. (2016). Through this comparison,
we observed that the economic and environmental costs of Calafell’s sewer were seven and
two times greater than the WWTP average. When comparing it to Betanzos, the
environmental impacts did not differ, but the economic costs were also seven times greater
in the sewer. This is related to the construction phase, as the environmental impacts of
constructing WWTPs are negligible when compared to the O&M (Lorenzo-Toja et al. 2016b;
Termes-Rifé et al. 2013) because of the lifetime of the infrastructure. This showed that
sewers are not irrelevant in the framework of the urban water cycle, meaning that decisions
made at the design phase will determine their performance.
However, this can be challenging. The complexity of WWTPs is associated with the
efficiency of the O&M to meet water quality standards. In the case of sewers, indirect
decisions might result in greater effects than the mere selection of pipe materials. Urban
planning could have two main consequences on the eco-efficiency of sewers. A distant
WWTP results in a longer pipeline; if it is located at a higher altitude than the city, this also
involves more pumping energy. These decisions translate into avoidable economic
investments in infrastructure and environmental burdens related to pumping energy.
Therefore, there is a need to envision sewers in the context of the water cycle in order to
design the system more eco-efficiently.
Still, sewer studies are underrepresented as compared to those dealing with the impacts
and costs of water and wastewater treatment. Loubet et al. (2014) found that the
environmental footprint of sewers is minimal in most studies, and the O&M contributed
to less than 10% of the total economic costs in a water cycle analysis elaborated by
Venkatesh and Brattebø (2011). Most of these analyses do not account for trench materials
or appurtenances and for this reason our results might be higher. In general, more efforts
are needed to characterize sewers under different conditions to better understand their role
in the water cycle.
4.3.3 On the application of eco-efficiency
Similarly to life cycle analyses, eco-efficiency is a robust communication tool, but we
believe that it has a greater outreach potential. The bi-dimensional nature of this approach
enables the benchmarking of product systems and it can be easily interpreted by the
general public. Some problems arise, though, when deciding the environmental and
economic indicators that define the product system. In our case, we used a measure of the
environmental intensity of production. This means that the optimum eco-efficiency
accounts for reduced environmental impacts generated through reduced production costs.
On the one hand, monetary costs and LCC are commonly used when addressing the
economic dimension, but one might argue that this approach is not complete because it
does not cover aspects such as economic growth or value creation (Haes et al. 2004). On
the other hand, we selected a set of indicators, but standards should provide some
133
guidance and discuss the suitability of aggregated indicators in the context of eco-
efficiency communication tools.
We proved that the procedure presented in ISO 14045:2012 can be applied to urban systems
and provided integrated data for the decision-making process. An optimized system might
serve as a reference for sewer benchmarking, but we did not provide this result because
several parameters are at play. For instance, policies and social perceptions should be
accounted for, as these determine the location and configuration of the sewer. Our
approach serves as a first step towards integrating economic and environmental variables
in the context of urban sanitation, which is helpful to decision-makers and might in fact
change the social aspects associated with the impacts of sewers. Urban systems are a good
example of micro-scale effects to macro-scale eco-efficiency, which is an approach to
consider in order to avoid tradeoffs (Huppes and Ishikawa 2005b). If service providers (e.g.,
pipe manufacturers) improve their eco-efficiency, these might become more competitive
in the market and result in further positive effects in the context of the urban water cycle
and the overall performance of our cities.
8.4 Conclusions
The eco-efficiency approach helped us to determine key hotspots in the environmental and
economic performance of sewers. We studied two case studies with contrasting features in
terms of population, climate, urban and sewer configuration, and yet we obtained similar
trends. The critical life cycle stages were the O&M in environmental terms, and the
installation in economic terms. The impacts of the O&M were associated with the location
of the WWTP and the consequent energy needs. Labor was the main economic flow that
affected the investment in the installation of sewers. This factor should be further assessed,
as it might entail social benefits that are not directly captured by the eco-efficiency
approach. Additionally, one of the sewers resulted in seven and two times as many
economic and environmental impacts as an average WWTP. This means that sewers are in
a critical and challenging position that calls for an integrated assessment of the urban water
cycle.
To the authors’ knowledge, this is the first application of ISO 14045:2012 to sewers. We
believe that this is a method with a great potential in terms of communication, although
integrating further social aspects should be considered. This study suggests that this type
of assessment may well encourage water managers and local administrations to implement
more sustainable alternatives in facility planning and management. Benchmarking their
performance might be a compelling approach, as it shows their improvements with respect
to similar services and drives their pathway towards a more eco-efficient behavior.

134
Picture: Constructed wetland in Maumee Bay State Park, Oregon (Ohio, USA)
The centralization paradigm: life cycle
assessment of sanitation scenarios in
an island’s seasonal suburban
settlement
Chapter 9

137
The centralization paradigm: life cycle
assessment of sanitation scenarios in an island’s
seasonal suburban settlement
This chapter had the following collaborators:
Petit-Boix, A., Josa, A., Gabarrell, X., Rieradevall, J., Apul, D.
Abstract
Islands are tourist destinations where wastewater management is an environmental issue,
especially in seasonal suburban settlements that host most residents in the summer. Our
goal was to identify if, in this specific case, centralized systems are beneficial due to
economies of scale or if partial/total decentralization is an environmental advantage in
suburban areas. We analyzed a case study in Minorca (Spain) that faces these problems
and compared five scenarios, i.e., septic tanks; septic tanks combined with local wastewater
treatment plant (WWTP); constructed wetland combined with local WWTP; and
connection to a neighboring, larger WWTP. A life cycle assessment showed that the large
WWTP was the best scenario because of economies of scale, but it scored unsatisfactorily
in some indicators because of the sewer needs. In terms of eutrophication, centralization
and partial decentralization through septic tanks achieved the largest improvements in
phosphorus emissions, whereas the constructed wetland generated the smallest nitrogen
emissions. Through a probabilistic approach, we generalized these results to other insular
regions. Values were sensitive to the duration of the tourist season, which is related to the
type of accommodation (i.e., mass or second-home tourism), but also to wastewater
generation because of the sewer pumping demand.
Keywords: cities, industrial ecology, tourism, wastewater treatment, sustainability
138
9.1 Introduction
Wastewater management is crucial in islands, where limited land availability usually leads
to importing resources and exporting waste. Additionally, islands are frequently tourist
destinations that host a large flow of seasonal population. In this context, tourism might
lead to conflicts between permanent and seasonal residents because of the pressure on
water systems, among others (Müller et al. 2004). However, tourism might also result in
local improvements, as cities might decide to upgrade their wastewater treatment to meet
the visitors’ expectations (Gössling et al. 2012). According to Scoullos (2003), sewers collect
more than 80% of the total effluent generated in the Mediterranean, but only half of these
networks connect to a wastewater treatment plant (WWTP), which results in significant
discharges of untreated water into the sea. Considering that 40% of the world’s population
lives in coastal areas (Crossland et al. 2005), wastewater treatment issues become apparent.
Seasonal suburban settlements are one of the areas that lack an organized wastewater
management plan. These host a reduced number of residents throughout the year, but
experience an abrupt population increase in the summer. In this sense, engineering
solutions should be adapted to insular tourist hubs to deal with seasonal wastewater
treatment at the minimum environmental costs based on existing centralized and
decentralized technologies.
The environmental performance of WWTPs was studied based on the size of the
population served (Rodriguez-Garcia et al. 2011; Hospido et al. 2008; Gallego et al. 2008;
Lorenzo-Toja et al. 2015). Lassaux et al. (2007) determined that treating larger quantities of
wastewater results in fewer environmental impacts. In fact, some studies identified
environmental economies of scale, with large centralized WWTPs being beneficial for some
environmental indicators (Lundin et al. 2000; Tillman et al. 1998; Shehabi et al. 2012;
Cornejo et al. 2016). Both the construction and operation phase might result in lower
environmental burdens per cubic meter (m3) of wastewater in large-scale systems.
However, it is not clear whether connecting a suburban area to an existing, neighboring
WWTP might also result in economies of scale, as new sewerage infrastructure is required.
When communities are scattered, different decentralized solutions should also be analyzed
in order to meet sustainability criteria.
The particularity of decentralized and satellite systems is that they might be a solution to
water stress issues and peak wastewater generation (Gikas and Tchobanoglous 2009).
Decentralized systems can be applied at different scales, such as houses or suburbs, but
their feasibility depends on site-specific features. For instance, septic tanks are suitable in
large properties where wastewater discharge can be absorbed by the soil (Sharma et al.
2010). This absorption is possible by connecting septic tanks to sand filters or wetlands. In
this sense, some authors studied the environmental impacts of septic tanks attached to
wetlands (Pan et al. 2011; Fuchs et al. 2011; Yıldırım and Topkaya 2012). Lehtoranta et al.
(2014) compared this system with other treatment alternatives and determined that
composting toilets resulted in the lowest life cycle impacts, whereas sequencing batch
reactors and bio-filters performed environmentally worse.
In this analysis, we question whether seasonal suburban settlements might benefit from
economies of scale by connecting to a neighboring WWTP or whether total or partial
decentralization is a better option from an environmental standpoint. Here, the seasonal
sanitation demand should be considered in terms of population increase and duration of
139
the seasonal period. Our goal was to compare the environmental performance of a set of
treatment scenarios in an insular context through LCA so that the sanitation needs of the
permanent and seasonal residents are covered at the minimum environmental cost. To do
so, we based our assessment on a case study located in Minorca (Balearic Islands, Spain),
where improving the status of wastewater management is an urgent short-term objective
(Goverment of the Balearic Islands 2016). Through a Monte Carlo simulation, we assessed
the sensitivity and variability of the results according to some tourist-related parameters
to determine the applicability in other tourist hubs.
9.2 Materials and Methods
5.2.1 Case study and scenario definition
The Balearic Islands are a Mediterranean archipelago hosting around 13.5 million tourists
every year (IBESTAT, 2015). The island of Minorca has a medium size, being smaller than
other Mediterranean islands, such as Majorca, Sicily or Sardinia, but with an area of 694.79
km2 it welcomes 1.2 million visitors annually. Some areas have become mass tourism
destinations. However, seasonal suburban settlements are also popular tourist hubs where
the permanent population might range between 4 and 20% of the residents (Sanyé-
Mengual et al. 2014).
In Minorca, Cala Morell (CM) is one of the settlements that experiences wastewater
management issues because it is not connected to conventional sanitation systems. The
main features of CM are shown in Table 9.1. Based on GIS data (ESRI, 2016), we identified
246 buildings, most of which were detached houses. Around 244 people reside in these
houses all year, but 1,390 additional residents spend the summer in CM in either private
detached houses or hotels. Because water consumption is higher in the summer (Domene
and Saurí 2006), wastewater management is a concern for residents and local authorities,
as it compromises the environmental, economic and social conditions of the region. In this
sense, wastewater was treated at a small WWTP and an infiltration trench that offered basic
treatment to the area but that was unable to meet the seasonal demand. Some buildings
had private septic tanks, but it was complex to estimate the exact amount.
In this analysis, we assessed different alternatives that could potentially be implemented
based on their environmental performance (Figure 9.1). We included different degrees of
decentralization for treating permanent and/or seasonal wastewater flows, considering the
technologies described in previous literature (for instance, Fuchs et al., 2011; Lehtoranta et
al., 2014) and local priorities. Partial decentralization was included in scenarios SC1 and
SC2. In scenario SC1, we analyzed the implementation of septic tanks in all buildings, with
the consequent extraction and transportation of the pre-treated wastewater to a
neighboring WWTP. SC2 was similar to the sanitation system used in CM at the time of
the analysis, with part of the wastewater being treated at a local facility with basic
equipment and later discharged into an infiltration trench. We assumed that this system
served the permanent residents, whereas seasonal wastewater flows were treated through
septic tanks. SC3 and SC4 were examples of decentralized sanitation. A constructed
wetland replaced the neighboring WWTP in SC3, which implies the construction of a septic
tank effluent pump (STEP) pressure sewer. SC4 excluded septic tanks, and instead the total
wastewater was transported through a local sewer to the local WWTP for primary
sedimentation and later connected to the constructed wetland, which was in the same place
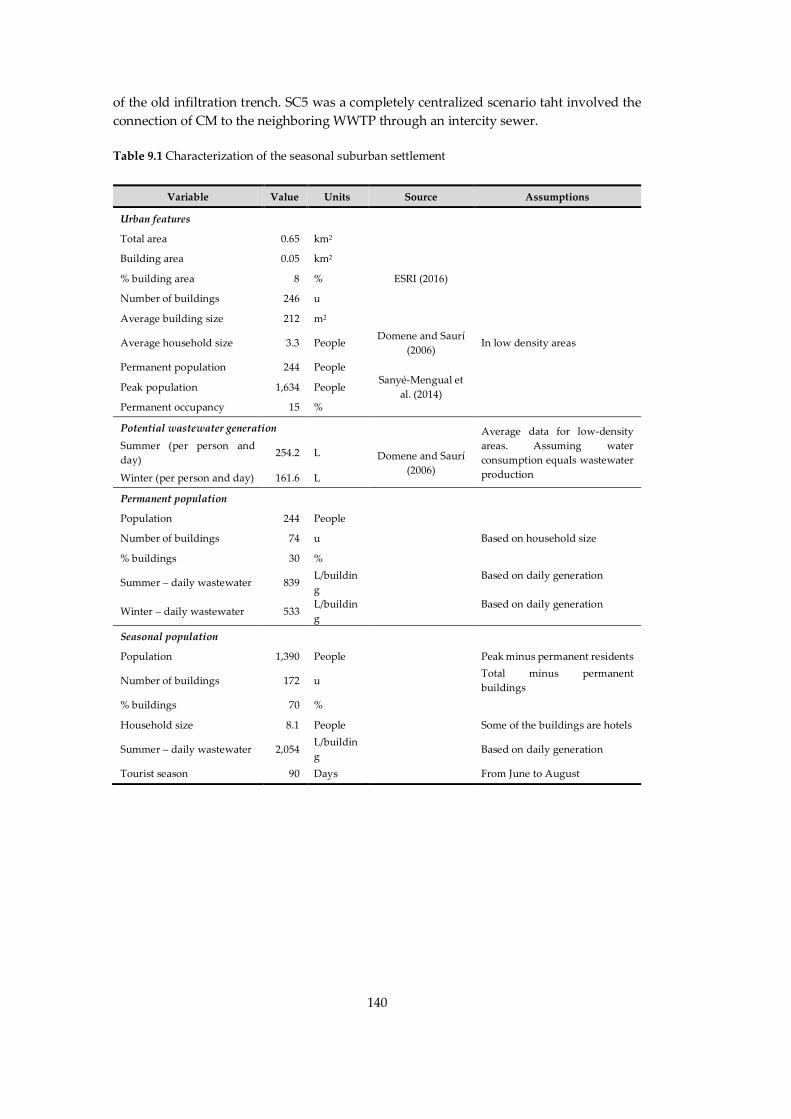
140
of the old infiltration trench. SC5 was a completely centralized scenario taht involved the
connection of CM to the neighboring WWTP through an intercity sewer.
Table 9.1 Characterization of the seasonal suburban settlement
Variable Value Units Source Assumptions
Urban features
Total area 0.65 km2
ESRI (2016)
Building area 0.05 km2
% building area 8 %
Number of buildings 246 u
Average building size 212 m2
Average household size 3.3 People Domene and Saurí
(2006) In low density areas
Permanent population 244 People Sanyé-Mengual et
al. (2014)
Peak population 1,634 People
Permanent occupancy 15 %
Potential wastewater generation Average data for low-density
areas. Assuming water
consumption equals wastewater
production
Summer (per person and
day) 254.2 L Domene and Saurí
(2006) Winter (per person and day) 161.6 L
Permanent population
Population 244 People
Number of buildings 74 u Based on household size
% buildings 30 %
Summer – daily wastewater 839 L/buildin
g
Based on daily generation
Winter – daily wastewater 533 L/buildin
g
Based on daily generation
Seasonal population
Population 1,390 People Peak minus permanent residents
Number of buildings 172 u
Total minus permanent
buildings
% buildings 70 %
Household size 8.1 People Some of the buildings are hotels
Summer – daily wastewater 2,054 L/buildin
g Based on daily generation
Tourist season 90 Days From June to August
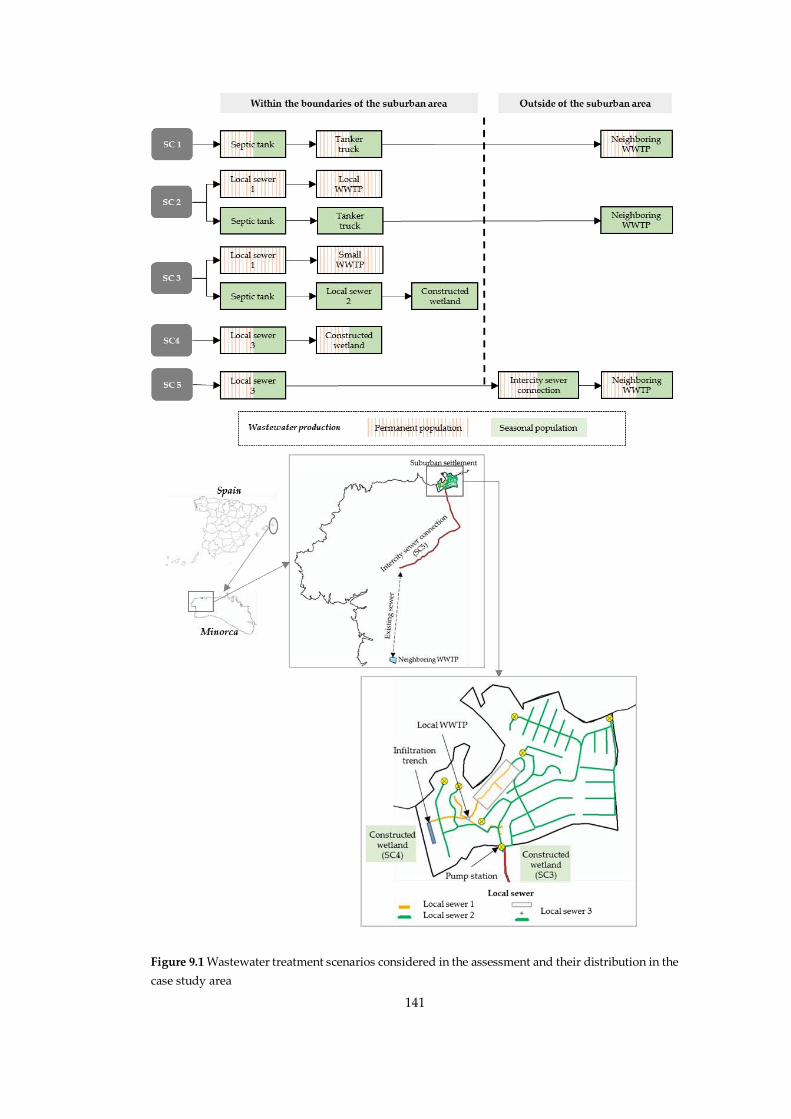
141
Figure 9.1 Wastewater treatment scenarios considered in the assessment and their distribution in the
case study area
142
5.2.2 Life cycle assessment of the treatment scenarios
We conducted an LCA to evaluate the environmental performance of the five scenarios. In
the following sections, we describe each of the steps as defined in ISO 14040:2006.
Goal and scope
To answer our research question, the functional unit of the analysis was one m3 of
wastewater produced every year by the permanent and seasonal residents of CM.
Stormwater was not considered to reduce the effects of climate variability. A lifespan of 30
years was assigned to the infrastructure according to previous literature (Lehtoranta et al.
2014; Risch et al. 2015). The system boundaries included the raw material extraction,
construction, operation and maintenance, and end of life. The detailed system boundaries
of each scenario are shown in Appendix 6.1.
Life cycle inventory
The inventory of each treatment phase was elaborated based on literature and real data
(see Appendix 6.2 for details). Background life cycle data for materials and energy was
retrieved from ecoinvent v3 (Weidema et al. 2013).
Influent and effluent quality: Domestic wastewater quality was estimated for total nitrogen
(TN; 86.6 mg/L) and total phosphorus (TP; 16.6 mg/L) (Fuchs et al. 2011), which fall within
the range defined by Kadlec and Wallace (2009). The quality of the effluent depended on
the treatment technology. Septic tanks were not able to remove these components. In the
local WWTP, we assumed that the infiltration trench might remove 30% and 10% of the
TN and TP concentrations, respectively, thanks to soil microorganisms. Hu et al. (2007)
reported a 50% removal, but we assigned more conservative values. In constructed
wetlands, we considered 5 mg NH4+-N/L, 35 mg NO3--N/L, and 4 mg PO34--P/L (Søvik et al.
2006; Fuchs et al. 2011). The effluent of the WWTP, which was located in the city of
Ciutadella, was based on average data supplied by the WWTP (>50,000 population
equivalent) for the period from 2013 to 2016, i.e., 5.3 mg NH4+-N/L, 0.71 mg NO2--N/L, 15.5
mg NO3--N/L and 5.7 mg TP/L.
Septic tank components (SC1 and SC2): Septic tanks were sized according to the equations
suggested by Crites and Tchobanoglous (1998) (see Appendix 6.3). A tanker truck
extracted and transported wastewater and sludge to the neighboring WWTP (13 km) once
a year for advanced treatment. The energy needed to pump out wastewater was estimated
using similar data for sewer maintenance (Petit-Boix et al. 2015a). We calculated the sludge
production through a carbon balance that accounted for the influent and effluent BOD (450
and 180 mg/L) (Kadlec and Wallace 2009) and CH4 emissions from wastewater degradation
(Diaz-Valbuena et al. 2011; US EPA 2016). CO2 and N2O were also included because of their
global warming potential (Diaz-Valbuena et al. 2011).
STEP system + constructed wetland (SC3 and SC4): In the case of the STEP system linked
to a community-based constructed wetland, wastewater was pumped out to the main
sewer line an average of six times per day (Crites and Tchobanoglous 1998). The
pressurized sewer included seven pump stations with two backup pumps each. We
estimated the electricity consumption through the wastewater production and power of
143
the system (1.5 kW) (Crites and Tchobanoglous 1998). Data on sewer and pump
infrastructure were retrieved from Petit-Boix et al. (2014). Because septic tank effluent has
a reduced amount of solids, the pipeline of a STEP system has a smaller diameter than that
of SC4 and the trench is shallower (Crites and Tchobanoglous 1998).
In SC3, a horizontal subsurface flow wetland was hypothetically located in a green area
that was close to the suburban settlement (Figure 9.1). In SC4, it replaced the infiltration
trench and was connected to the local WWTP, where primary sedimentation took place.
Wetland and material sizing were calculated based on a nitrogen effluent of 5 mg NH4+-
N/L (Crites and Tchobanoglous 1998; Kadlec and Wallace 2009; Fuchs et al. 2011) (see
Appendix 6.3). A six-cell wetland was sized according to the peak flow. We considered
that the system remains in place after decommissioning. CH4, CO2, and N2O emissions
were adapted from Fuchs et al. (2011) and Søvik et al. (2006). Carbon sequestration was
estimated considering the dry weight biomass production and carbon content of Phragmites
australis (de Klein and van der Werf 2014).
Local and neighboring WWTP (SC2, SC3 and SC5): WWTP data on energy and chemicals
were provided by facility managers. Waste and sludge production was estimated
(Lorenzo-Toja et al. 2015), and although sludge was later used in agriculture, we did not
consider the impacts of its application due to limited data availability. In SC2 and SC3, we
measured the length of sewer using ArcGIS (ESRI, 2016), but in SC5 we knew the length
projected by local authorities in their quest to improve the sanitation system. One of
Ciutadella’s WWTPs is located at a distance of 13 km from CM. 10 km of local sewer, 8
pump stations, and 6.4 km of intercity sewer were needed to connect CM with the WWTP.
The intercity sewer connects CM’s outlet with Ciutadella’s first sewer stretch (Figure 9.1).
The construction and demolition of the pavement was included in all scenarios with sewers.
In SC4 and SC5, we assumed that existing septic tanks would be removed. Ciutadella’s
internal network was not included, as it already existed. The construction of CM’s and
Ciutadella’s WWTP was not considered because it is usually negligible when compared to
the operation (Termes-Rifé et al. 2013; Lorenzo-Toja et al. 2015). We assumed that treating
the additional wastewater input from CM would not increase the resource needs of the
WWTP due to economies of scale.
Life cycle impact assessment
We used Simapro 8 (PRé Consultants 2014) and the ReCiPe (H) method (Goedkoop et al.
2009) up to the characterization step. We present the 18 ReCiPe midpoints and the
cumulative energy demand (CED) in Appendix 6.4, but the Results section specially
focuses on global warming (GW, kg CO2 eq), freshwater eutrophication (FE, kg P eq),
marine eutrophication (ME, kg N eq), and CED (MJ). A single score was also calculated to
obtain a single value (in millipoints, mPt) that weights the damage generated by each
alternative (Goedkoop et al. 2009). FE and ME are relevant in this analysis due to the
effluent emissions. To get a better insight of these two indicators and obtain comparable
results for each scenario, we calculated the Eutrophication Net Environmental Impact
(ENEI) elaborated by Lorenzo-Toja et al. (2016). This approach estimates the net impacts of
the system by accounting for the discharge of untreated water, the indirect and direct
impacts of the system, and the effluent limits set by water regulations (see Equation 9.1).
For the latter, we considered the regulation of the Balearic Islands (Government of the
Balearic Islands 2015), which limits the discharge of medium-sized WWTPs to 15 mg TN/L
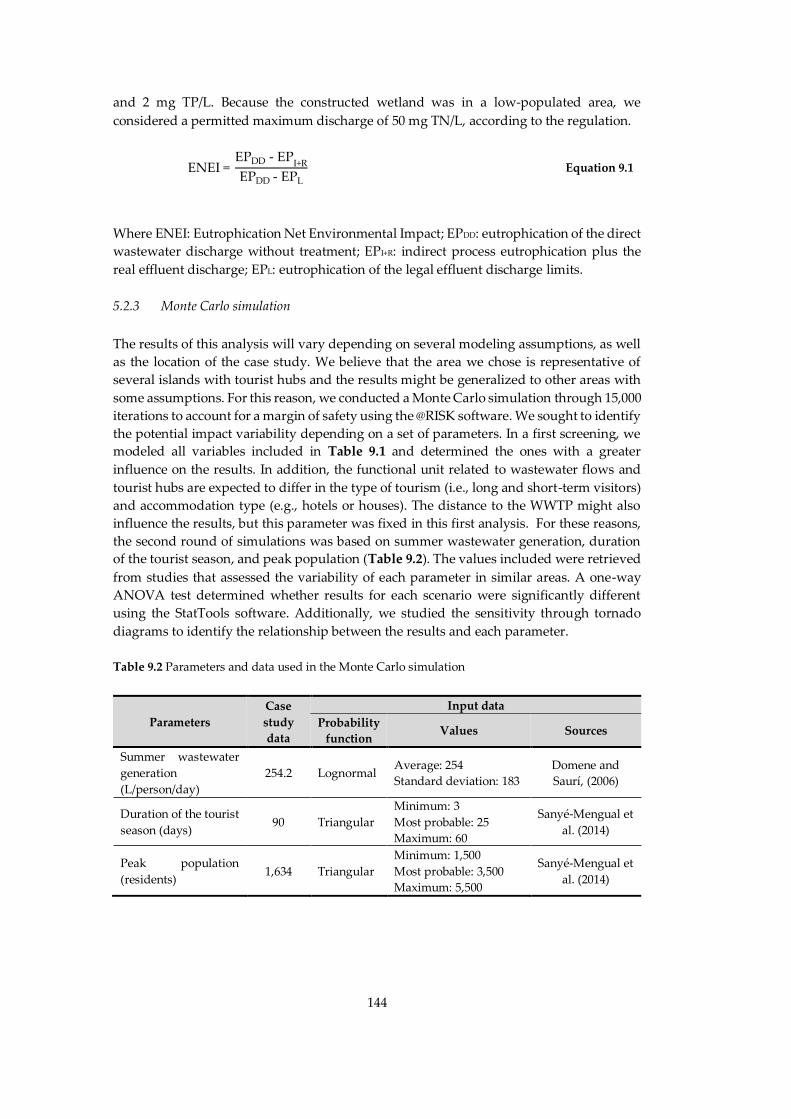
144
and 2 mg TP/L. Because the constructed wetland was in a low-populated area, we
considered a permitted maximum discharge of 50 mg TN/L, according to the regulation.
ENEI = EPDD - EP
I+R
EPDD - EPL
Equation 9.1
Where ENEI: Eutrophication Net Environmental Impact; EPDD: eutrophication of the direct
wastewater discharge without treatment; EPI+R: indirect process eutrophication plus the
real effluent discharge; EPL: eutrophication of the legal effluent discharge limits.
5.2.3 Monte Carlo simulation
The results of this analysis will vary depending on several modeling assumptions, as well
as the location of the case study. We believe that the area we chose is representative of
several islands with tourist hubs and the results might be generalized to other areas with
some assumptions. For this reason, we conducted a Monte Carlo simulation through 15,000
iterations to account for a margin of safety using the @RISK software. We sought to identify
the potential impact variability depending on a set of parameters. In a first screening, we
modeled all variables included in Table 9.1 and determined the ones with a greater
influence on the results. In addition, the functional unit related to wastewater flows and
tourist hubs are expected to differ in the type of tourism (i.e., long and short-term visitors)
and accommodation type (e.g., hotels or houses). The distance to the WWTP might also
influence the results, but this parameter was fixed in this first analysis. For these reasons,
the second round of simulations was based on summer wastewater generation, duration
of the tourist season, and peak population (Table 9.2). The values included were retrieved
from studies that assessed the variability of each parameter in similar areas. A one-way
ANOVA test determined whether results for each scenario were significantly different
using the StatTools software. Additionally, we studied the sensitivity through tornado
diagrams to identify the relationship between the results and each parameter.
Table 9.2 Parameters and data used in the Monte Carlo simulation
Parameters
Case
study
data
Input data
Probability
function Values Sources
Summer wastewater
generation
(L/person/day)
254.2 Lognormal Average: 254
Standard deviation: 183
Domene and
Saurí, (2006)
Duration of the tourist
season (days) 90 Triangular
Minimum: 3
Most probable: 25
Maximum: 60
Sanyé-Mengual et
al. (2014)
Peak population
(residents) 1,634 Triangular
Minimum: 1,500
Most probable: 3,500
Maximum: 5,500
Sanyé-Mengual et
al. (2014)
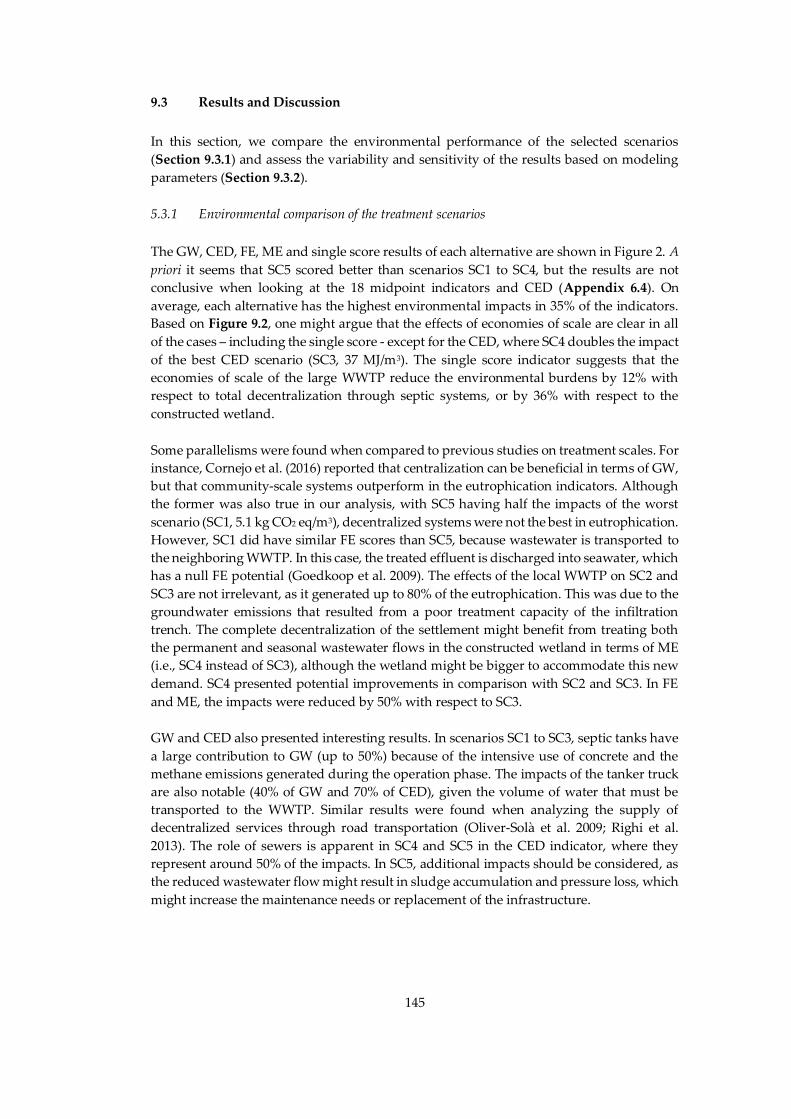
145
9.3 Results and Discussion
In this section, we compare the environmental performance of the selected scenarios
(Section 9.3.1) and assess the variability and sensitivity of the results based on modeling
parameters (Section 9.3.2).
5.3.1 Environmental comparison of the treatment scenarios
The GW, CED, FE, ME and single score results of each alternative are shown in Figure 2. A
priori it seems that SC5 scored better than scenarios SC1 to SC4, but the results are not
conclusive when looking at the 18 midpoint indicators and CED (Appendix 6.4). On
average, each alternative has the highest environmental impacts in 35% of the indicators.
Based on Figure 9.2, one might argue that the effects of economies of scale are clear in all
of the cases – including the single score - except for the CED, where SC4 doubles the impact
of the best CED scenario (SC3, 37 MJ/m3). The single score indicator suggests that the
economies of scale of the large WWTP reduce the environmental burdens by 12% with
respect to total decentralization through septic systems, or by 36% with respect to the
constructed wetland.
Some parallelisms were found when compared to previous studies on treatment scales. For
instance, Cornejo et al. (2016) reported that centralization can be beneficial in terms of GW,
but that community-scale systems outperform in the eutrophication indicators. Although
the former was also true in our analysis, with SC5 having half the impacts of the worst
scenario (SC1, 5.1 kg CO2 eq/m3), decentralized systems were not the best in eutrophication.
However, SC1 did have similar FE scores than SC5, because wastewater is transported to
the neighboring WWTP. In this case, the treated effluent is discharged into seawater, which
has a null FE potential (Goedkoop et al. 2009). The effects of the local WWTP on SC2 and
SC3 are not irrelevant, as it generated up to 80% of the eutrophication. This was due to the
groundwater emissions that resulted from a poor treatment capacity of the infiltration
trench. The complete decentralization of the settlement might benefit from treating both
the permanent and seasonal wastewater flows in the constructed wetland in terms of ME
(i.e., SC4 instead of SC3), although the wetland might be bigger to accommodate this new
demand. SC4 presented potential improvements in comparison with SC2 and SC3. In FE
and ME, the impacts were reduced by 50% with respect to SC3.
GW and CED also presented interesting results. In scenarios SC1 to SC3, septic tanks have
a large contribution to GW (up to 50%) because of the intensive use of concrete and the
methane emissions generated during the operation phase. The impacts of the tanker truck
are also notable (40% of GW and 70% of CED), given the volume of water that must be
transported to the WWTP. Similar results were found when analyzing the supply of
decentralized services through road transportation (Oliver-Solà et al. 2009; Righi et al.
2013). The role of sewers is apparent in SC4 and SC5 in the CED indicator, where they
represent around 50% of the impacts. In SC5, additional impacts should be considered, as
the reduced wastewater flow might result in sludge accumulation and pressure loss, which
might increase the maintenance needs or replacement of the infrastructure.
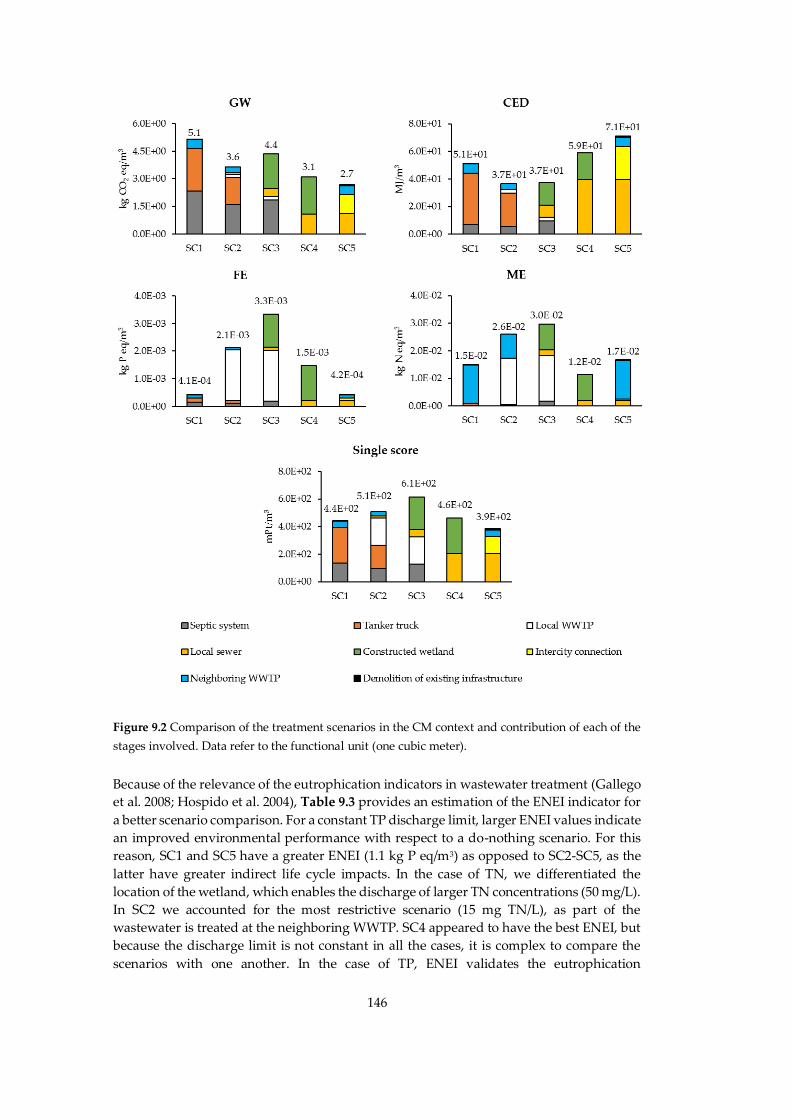
146
Figure 9.2 Comparison of the treatment scenarios in the CM context and contribution of each of the
stages involved. Data refer to the functional unit (one cubic meter).
Because of the relevance of the eutrophication indicators in wastewater treatment (Gallego
et al. 2008; Hospido et al. 2004), Table 9.3 provides an estimation of the ENEI indicator for
a better scenario comparison. For a constant TP discharge limit, larger ENEI values indicate
an improved environmental performance with respect to a do-nothing scenario. For this
reason, SC1 and SC5 have a greater ENEI (1.1 kg P eq/m3) as opposed to SC2-SC5, as the
latter have greater indirect life cycle impacts. In the case of TN, we differentiated the
location of the wetland, which enables the discharge of larger TN concentrations (50 mg/L).
In SC2 we accounted for the most restrictive scenario (15 mg TN/L), as part of the
wastewater is treated at the neighboring WWTP. SC4 appeared to have the best ENEI, but
because the discharge limit is not constant in all the cases, it is complex to compare the
scenarios with one another. In the case of TP, ENEI validates the eutrophication

147
comparison obtained through the LCA (Figure 2). In any case, we did not obtain ENEI < 0,
which indicates that treating wastewater is always better than the direct discharge.
Table 9.3 Estimated ENEI indicators for each scenario
5.3.2 Variability and sensitivity to modeling parameters
Through the probabilistic analysis applied to peak population, summer wastewater
generation, and duration of the tourist season (Table 9.2), we obtained the single score
distributions shown in Figure 9.3 (statistical values for all impact categories are provided
in Appendix 6.5). Again, the worst score was related to SC3, with an average of 950 mPt.
In general, there is a certain range of variability, but the highest was registered in SC5,
where 90% of the values are expected to range between 250 and 1,100 mPt (77% difference).
These variations implied that SC2 and SC5 are not significantly different based on the
ANOVA test, although there was a 24% difference in the case study results (Figure 9.2).
SC1 was the best scenario with 520 mPt, with a 13% distance ahead from SC2 and SC5.
Eutrophication indicators Wastewater management scenarios
SC1 SC2 SC3 SC4 SC5
Freshwater
eutrophication
(kg P eq/m3)
Indirect process impacts
+ real effluent discharge 4.1E-04 2.1E-03 3.3E-03 1.5E-03 4.2E-04
Direct wastewater
discharge (no treatment) 5.5E-03
Legal effluent discharge
limits 6.6E-04
Eutrophication Net
Environmental Impact
(ENEI)
1.1E+00 7.0E-01 4.4E-01 8.2E-01 1.1E+00
Marine
eutrophication
(kg N eq/m3)
Indirect process impacts
+ real effluent discharge 1.5E-02 2.6E-02 3.0E-02 1.2E-02 1.5E-02
Direct wastewater
discharge (no treatment) 9.6E-02
Legal effluent discharge
limits 1.2E-02 1.2E-02 3.9E-02 3.9E-02 1.2E-02
Eutrophication Net
Environmental Impact
(ENEI)
9.6E-01 8.3E-01 1.3E+00 2.0E+00 1.0E+00
148
Figure 9.3 Variability in the eutrophication impacts of the scenarios’ life cycle based on a Monte Carlo
simulation. The probability density functions are presented for the single score indicator. All the
results are significantly different at a confidence level of 95% and p-value <0.0001, except for the pair
highlighted in the graph.
To understand the causes of this variability, Figure 9.4 displays the sensitivity of the single
score indicator the local parameters. In general, the results were particularly sensitive to
changes in the duration of the tourist season, with the impacts being up to 23% lower and
34% higher than the average data. This might set a difference between different types of
tourist areas. The highest impacts might be related to either mass tourism destinations,
where hotels are the most popular accommodation option and there is a continuous tourist
flow during the summer days, or second-home owners who spend the entire summer in a
private property. The lowest impacts might be assigned to areas that are more rural with
occasional visitors.
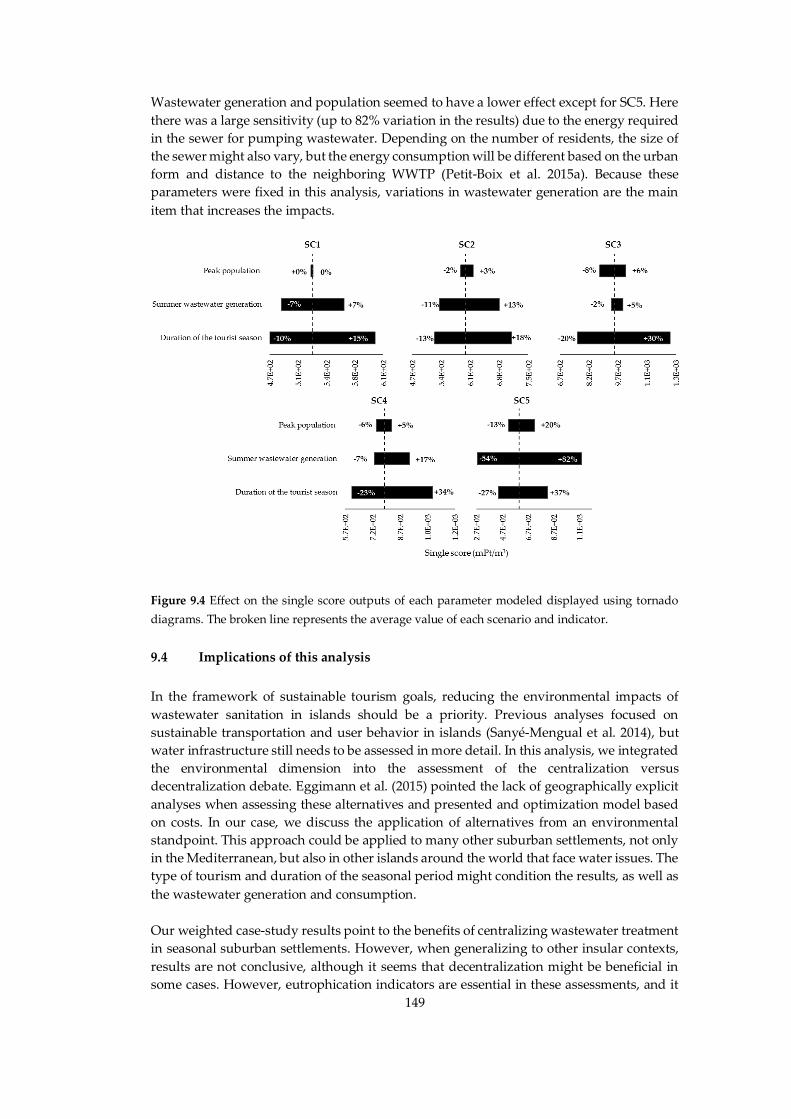
149
Wastewater generation and population seemed to have a lower effect except for SC5. Here
there was a large sensitivity (up to 82% variation in the results) due to the energy required
in the sewer for pumping wastewater. Depending on the number of residents, the size of
the sewer might also vary, but the energy consumption will be different based on the urban
form and distance to the neighboring WWTP (Petit-Boix et al. 2015a). Because these
parameters were fixed in this analysis, variations in wastewater generation are the main
item that increases the impacts.
Figure 9.4 Effect on the single score outputs of each parameter modeled displayed using tornado
diagrams. The broken line represents the average value of each scenario and indicator.
9.4 Implications of this analysis
In the framework of sustainable tourism goals, reducing the environmental impacts of
wastewater sanitation in islands should be a priority. Previous analyses focused on
sustainable transportation and user behavior in islands (Sanyé-Mengual et al. 2014), but
water infrastructure still needs to be assessed in more detail. In this analysis, we integrated
the environmental dimension into the assessment of the centralization versus
decentralization debate. Eggimann et al. (2015) pointed the lack of geographically explicit
analyses when assessing these alternatives and presented and optimization model based
on costs. In our case, we discuss the application of alternatives from an environmental
standpoint. This approach could be applied to many other suburban settlements, not only
in the Mediterranean, but also in other islands around the world that face water issues. The
type of tourism and duration of the seasonal period might condition the results, as well as
the wastewater generation and consumption.
Our weighted case-study results point to the benefits of centralizing wastewater treatment
in seasonal suburban settlements. However, when generalizing to other insular contexts,
results are not conclusive, although it seems that decentralization might be beneficial in
some cases. However, eutrophication indicators are essential in these assessments, and it

150
is a fact that Minorca’s aquifers are highly polluted and discharge P and N to the sea
(OBSAM 2015; Garcia-Solsona et al. 2010). An optimized wetland system that treats the
entire demand without the support of a local WWTP can be a promising decentralized
alternative, but groundwater discharge is still an issue that should be monitored. In this
sense, partial decentralization through septic tanks and treatment at a neighboring WWTP
might be another solution that produces the same ENEI as complete decentralization.
However, this might compromise other environmental indicators, and the single score
depends on the importance given to each damage category. In this sense, the relevance of
each indicator in islands might be a field to explore.
151
PART V - ENVIRONMENTAL AND ECONOMIC FLOOD DAMAGE
ASSESSMENT IN WATER SENSITIVE URBAN AREAS
Part V Environmental and economic flood
damage assessment in water-sensitive
urban areas


Picture: Flooding alert sign in Cambrils’ ephemeral stream (Tarragona, Spain)
Are we preventing flood damage eco-
efficiently? An integrated method
applied to post-disaster emergency
actions in the Mediterranean
Chapter 10

155
Are we preventing flood damage eco-
efficiently? An integrated method applied to post-
disaster emergency actions in the Mediterranean
This chapter is based on the following paper:
Petit-Boix, A., Arahuetes, A., Josa, A., Rieradevall, J., Gabarrell, X., 2017. Are we preventing
flood damage eco-efficiently? An integrated method applied to post-disaster emergency
actions. Science of the Total Environment 580, 873-881.
doi: 10.1016/j.scitotenv.2016.12.034
DDD link: http://ddd.uab.cat/record/169388
Abstract
Flood damage results in economic and environmental losses in the society, but flood
prevention also entails an initial investment in infrastructure. This study presents an
integrated eco-efficiency approach for assessing flood prevention and avoided damage.
We focused on ephemeral streams in the Maresme region (Catalonia, Spain), which is an
urbanized area affected by damaging torrential events. Our goal was to determine the
feasibility of post-disaster emergency actions implemented after a major event through an
integrated hydrologic, environmental and economic approach. Life cycle assessment (LCA)
and costing (LCC) were used to determine the eco-efficiency of these actions, and their net
impact and payback were calculated by integrating avoided flood damage. Results showed
that the actions effectively reduced damage generation when compared to the water flows
and rainfall intensities registered. The eco-efficiency of the emergency actions resulted in
1.2 kg CO2 eq per invested euro. When integrating the avoided damage into the initial
investment, negative net impacts were obtained (e.g., -5.2E+05 € and -2.9E+04 kg CO2 eq
per event), which suggests that these interventions contributed with environmental and
economic benefits to the society. The economic investment was recovered in two years,
whereas the design could be improved to reduce their environmental footprint, which is
recovered in 25 years. Our method and results highlight the effects of integrating the
environmental and economic consequences of decisions at an urban scale and might help
the administration and insurance companies in the design of prevention plans and climate
change adaptation.
Keywords: risk management, life cycle assessment, life cycle costing, damage prevention,
climate change

156
Picture: Carolyn Edwards Memorial Rain Garden, The University of Toledo (Ohio, USA)
Environmental and economic
assessment of a stormwater infiltration
system for flood prevention in Brazil
Chapter 11

171
Environmental and economic
assessment of a stormwater infiltration system for
flood prevention in Brazil
This chapter is based on the following paper:
Petit-Boix, A., Sevigné-Itoiz, E., Rojas-Gutierrez, L.A., Barbassa, A.P., Josa, A., Rieradevall,
J., Gabarrell, X., 2015. Environmental and economic assessment of a pilot stormwater
infiltration system for flood prevention in Brazil. Ecological Engineering 84, 194-201.
doi: 10.1016/j.ecoleng.2015.09.010
DDD link: http://ddd.uab.cat/record/145553
Abstract
Green and gray stormwater management infrastructures, such as the filter, swale and
infiltration trench (FST), can be used to prevent flooding events. The aim of this study was
to determine the environmental and economic impacts of a pilot FST that was built in São
Carlos (Brazil) using life cycle assessment (LCA) and life cycle costing (LCC). As a result,
the components with the greatest contributions to the total impacts of the FST were the
infiltration trench and the grass cover. The system has a carbon footprint of 0.13 kg CO2
eq/m3 of infiltrated stormwater and an eco-efficiency ratio of 0.35 kg CO2 eq/USD.
Moreover, the FST prevented up to 95% of the runoff in the area. Compared to a gray
infrastructure, this system is a good solution with respect to PVC stormwater pipes, which
require a long pipe length (1070 m) and have a shorter lifespan. In contrast, concrete pipes
are a better solution, and their impacts are similar to those of the FST. Finally, a sensitivity
analysis was conducted to assess the changes in the impacts with the varying lifespan of
the system components. Thus, the proper management of the FST can reduce the economic
and environmental impacts of the system by increasing its durability.
Keywords: life cycle assessment, life cycle costing, Best Management Practices, climate
change adaptation, urban flood, filter, swale and infiltration trench

172
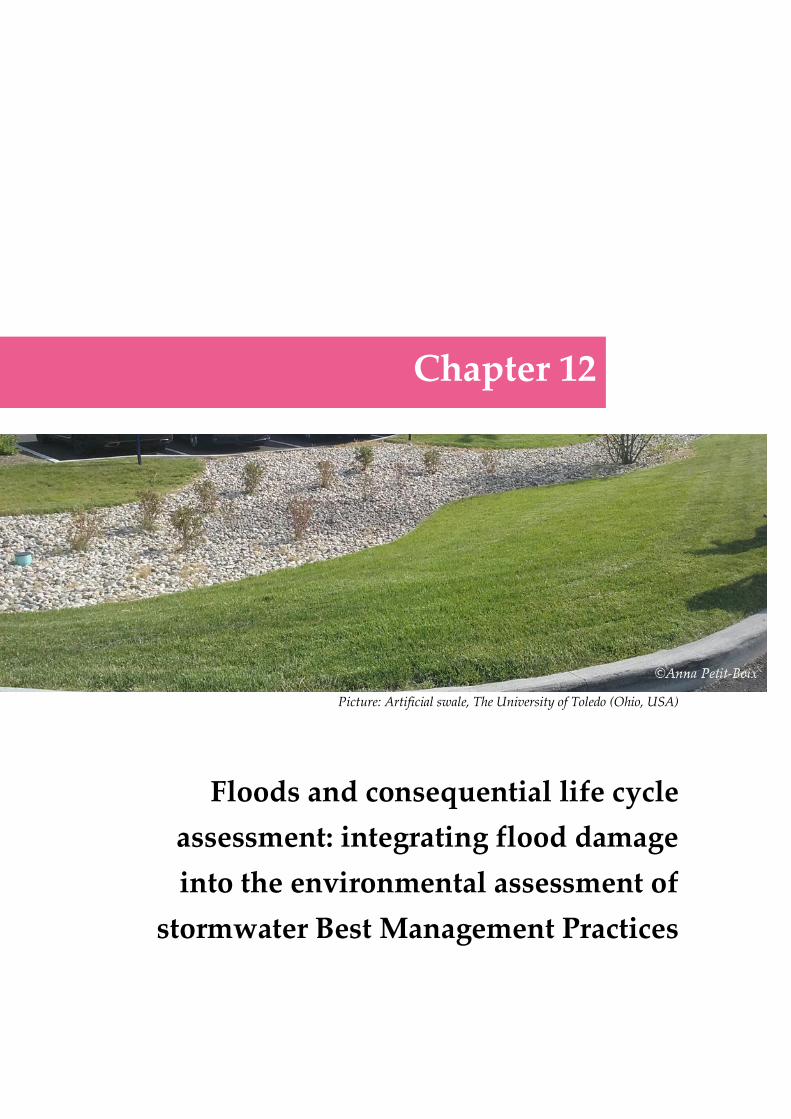
Picture: Artificial swale, The University of Toledo (Ohio, USA)
Floods and consequential life cycle
assessment: integrating flood damage
into the environmental assessment of
stormwater Best Management Practices
Chapter 12

189
Floods and consequential life cycle
assessment: integrating flood damage into the
environmental assessment of stormwater Best
Management Practices
This chapter had the following collaborators:
Petit-Boix, A., Sevigné-Itoiz, E., Rojas-Gutierrez, L.A., Barbassa, A.P., Josa, A., Rieradevall,
J., Gabarrell, X.
Abstract
Stormwater management is essential to reducing the occurrence of flooding events in
urban areas and to adapting to climate change. The construction of stormwater Best
Management Practices (BMPs) entails a series of life cycle environmental impacts but also
implies avoided burdens, such as replacing urban infrastructure after flooding. The aim of
this paper is to integrate flood damage prevention into the life cycle assessment (LCA) of
BMPs for quantifying their net environmental impact (NEI) and environmental payback
(EP) from a consequential LCA standpoint. As a case study, the application of a filter, swale
and infiltration trench (FST) in a Brazilian neighborhood was assessed considering a high-
intensity rainfall event. The potential avoided impacts were related to cars and sidewalks
that were not destroyed due to flooding. In terms of CO2 eq emissions, the environmental
investment related to the FST was recovered when the destruction of one car or 84 m2 of
sidewalk was prevented. The NEI of the FSTs resulted in significant impact reductions (up
to 700%) with respect to not accounting for the avoided products. This approach can be
implemented to any type of BMP, and more accurate estimations can be made with data
for different events and different types of material damage.
Keywords: flood, Best Management Practices, consequential LCA, urban infrastructure,
water, city
190
12.1 Introduction
Flood risk management is crucial in several parts of the world. From 1960 to 2014, flooding
events accounted for 34% of the natural disasters registered worldwide (17 floods/year),
representing more than 2.5 billion USD/year in terms of monetary damage and 1,254
deaths/year (Guha-Sapir et al. 2009). Currently, 53% of the world’s population lives in
urban areas (The World Bank 2016), a figure that is expected to increase to 70% by 2020
(UN, 2012), implying an increasing demand for new construction and infrastructure, and
decreasing the proportion of permeable areas and sometimes improper land-use planning
(Jha et al. 2012). Combined with a forecasted increase in the precipitation intensity, this
increase would result in a greater risk of potential flooding events, especially in mid and
high latitudes (Meehl et al. 2007). Most of the major flooding events that have been
recorded occur in highly populated urban areas (Jha et al. 2011).
Therefore, there is a need for proper stormwater management practices in cities to reduce
the occurrence and consequences of these events. To do so, stormwater Best Management
Practices (BMPs) are commonly used and at present are usually classified into gray and
green infrastructure BMPs. Gray infrastructure BMPs are traditional drainage strategies
(e.g., sewers or detention tanks), whereas green infrastructure BMPs provide ecosystem
services, such as aquifer recharge or environmental restoration (European Commission
2013). Examples of green BMPs include decentralized systems, such as green roofs,
permeable pavements, bio-retention basins and rainwater harvesting systems, among
others.
In the context of Low Impact Development (LID), these techniques are based on the
premise that stormwater management should not be envisioned as stormwater disposal.
Implementing source-control BMPs might result in a reduction of the flooding risk, given
that these systems can effectively reduce the runoff volume (Lee et al. 2013; Mentens et al.
2006; Zahmatkesh et al. 2015). Another benefit is the effect on the runoff quality. Especially
green infrastructure BMPs have the potential to retain and filtrate runoff pollutants, such
as heavy metals, hydrocarbons, nutrients or suspended solids (Deletic and Fletcher, 2006;
Dierkes et al., 2002; Llopart-Mascaró et al., 2015). This performance depends on the type of
drainage system, soil characteristics and slope (Czemiel Berndtsson 2010), among other
factors.
However, the construction of these infrastructures also entails a series of environmental
impacts, such as GHG emissions or resource depletion. To address this issue, life cycle
assessment (LCA) offers a method for calculating and discussing the environmental
burdens that are associated with the life cycle stages of a product or system, i.e., from raw
material extraction to end-of-life (ISO 14040:2006). Several analyses have been conducted
to calculate the life cycle impacts of different BMPs, such as green roofs (Saiz et al. 2006;
Kosareo and Ries 2007), bio-infiltration basins (Flynn and Traver 2013), constructed
wetlands (Risch et al. 2014), rainwater harvesting systems (Angrill et al. 2016; Devkota et
al. 2015) or a combination of BMPs (De Sousa et al. 2012). These analyses mainly focus on
determining the contribution of the materials and energy to the total environmental
impacts of the system (i.e., attributional LCA; ALCA), as well as potential positive effects,
such as carbon sequestration.
191
The construction of BMPs has broader consequences on the market and the society that
could be assessed using consequential LCA (CLCA) (the relationship between ALCA and
CLCA is presented in Section 12.1). Given that a reduction in the runoff volume results in
less water being treated, some studies assessed the avoided impacts of wastewater
treatment plants (WWTP) (Wang and Zimmerman 2015; Spatari et al. 2011;
Catalano De Sousa et al. 2011). In another study, Wang et al. (2013) calculated the economic
and environmental impacts related to reducing the eutrophication for different BMP
combinations, such as bio-retention basins or separate stormwater networks. Nevertheless,
the lack of studies that include CLCA in the assessment of BMPs hinders the effects of BMP
implementation at an urban scale and from a life cycle perspective.
Implementing a certain type of BMP for preventing urban flooding might also prevent the
destruction of goods that would otherwise need to be replaced. In such scenario, the
impacts associated with the production of the affected goods would be avoided (e.g., urban
infrastructure, buildings, etc.). However, given that a previous environmental investment
was made to produce the BMP, the net balance between the impacts and benefits should
be determined. This approach was already applied considering the net environmental
impact (NEI) as the difference between the avoided and induced eutrophication potential
in WWTPs (Lorenzo-Toja et al. 2015), and in the damage evolution resulting from post-
disaster emergency actions implemented in ephemeral streams after flooding (Petit-Boix
et al. 2017).
Additionally, the NEI might vary depending on the type of BMP and the area of application.
This analysis is especially interesting in flood-sensitive countries. A study area could be
Brazil, where there are great variations between social strata and urban densities, a fact
that might influence the space that is available for constructing a BMP. In this country,
floods account for 60% of the total natural disasters and an average of 200 million USD in
terms of damage (Guha-Sapir et al. 2009). Additionally, the number of flooding events has
generally increased over time (Guha-Sapir et al. 2009) and may increase in the future
because of climate change. Given a certain urban density, the implementation of a BMP
could be analyzed in a Brazilian neighborhood. In this paper, the BMP that was selected
for a first case study analysis was a filter, swale and infiltration trench (FST) that had been
previously constructed in a Brazilian city for experimental purposes. The specific design
features and storage capacity of this BMP were thoroughly analyzed in previous studies
(Lucas 2011; Lucas et al. 2013), and it was thus applied to this first assessment of flood
damage prevention.
Our goal was to integrate flood damage into the LCA of stormwater Best Management
Practices (BMP) for quantifying their net environmental impact (NEI) and environmental
payback (EP) from a consequential LCA (CLCA) perspective. To do so, we based this
analysis on a case study BMP. The specific objectives were (1) to define the steps involved
in the calculation of the EP and NEI of a BMP; (2) to calculate the EP and NEI of an FST
with respect to the material losses, considering the implementation of this system in Brazil;
(3) to discuss the environmental implications of this approach in the field of flood
prevention.
192
12.2 Materials and Methods
12.2.1 Consequential life cycle assessment (CLCA)
Consequential modeling is defined as “a system modeling approach in which activities in
a product system are linked so that activities are included in the product system to the
extent that they are expected to change as a consequence of a change in demand for the
functional unit” (Sonnemann and Vigon 2011). In this sense, CLCA offers a causal
explanation for the consequences of future actions (Weidema et al. 2009) and attempts to
forecast in the short or long term the environmental impacts of decisions that are made in
the present (e.g., implementing a BMP). This broader analysis is not provided by ALCA,
which assesses the environmental status of a product system as an account of the history
of the product (ISO 14040:2006), and does not include the processes that are outside of the
product’s immediate system boundaries (Earles and Halog 2011). The ALCA approach
analyzes the entire life cycle of a selected system but does not account for the processes
that are directly or indirectly affected by the existence of this system. In contrast, the CLCA
approach integrates market mechanisms into environmental modeling, which is often
associated with inconsistency because LCA practitioners deal with different assumptions
in their studies, such as the definition of the system boundaries (Zamagni et al. 2012).
However, CLCA might help to determine certain beneficial outcomes related to the system
under analysis, and to inform policy-makers on the indirect environmental implications of
a system (Vázquez-Rowe et al. 2014; Sanchez et al. 2012).
The consequences of flooding vary greatly depending on their type (e.g., flash floods,
coastal floods, and urban floods), location and extent of flooding, and vulnerability and
value of the natural and constructed environment. For example, in the same area flooding
events might lead to different consequences over time because of the types of built
infrastructure (e.g., conventional or prevention-oriented). The impacts of flooding may
include damage to properties (e.g., buildings, vehicles, roads, and public utilities), the
environment (e.g., livestock or crops) and the society (e.g., casualties, damage to cultural
heritage, etc.). From a CLCA system perspective, modeling should include all of the
processes that are expected to be affected by a decision, regardless of whether they are part
of the existing supply chain or not (Wolf and Ekvall 2011). In this study, the decision of
implementing BMPs for flood prevention may contribute to diminish its effects or damage.
Modeling these consequences may become a very complicated and uncertain task due to
the variety and unpredictability of flooding consequences and the effect of flood protection
infrastructures. This is not the purpose of this analysis. This study is an attempt to highlight
the potential environmental benefits related to flood prevention by including possible
processes affected beyond the system evaluated (i.e., BMPs) in accordance with CLCA
approaches. Our study aspires to contribute to the flood prevention and planning debate,
as strategies that decrease damage might result in important environmental savings that
are currently not captured.
In our study, we assessed the effects of implementing a BMP on the market by considering
a decrease in the demand for two properties (i.e., cars and sidewalks) which are generally
damaged during flooding events. Both products could be representative of possible
damages resulting from any type of flood and region. In this case, it is interesting to
determine the trade-offs between the construction of a BMP and the material losses,
assuming that these would be reconstructed after an event (Figure 12.1).
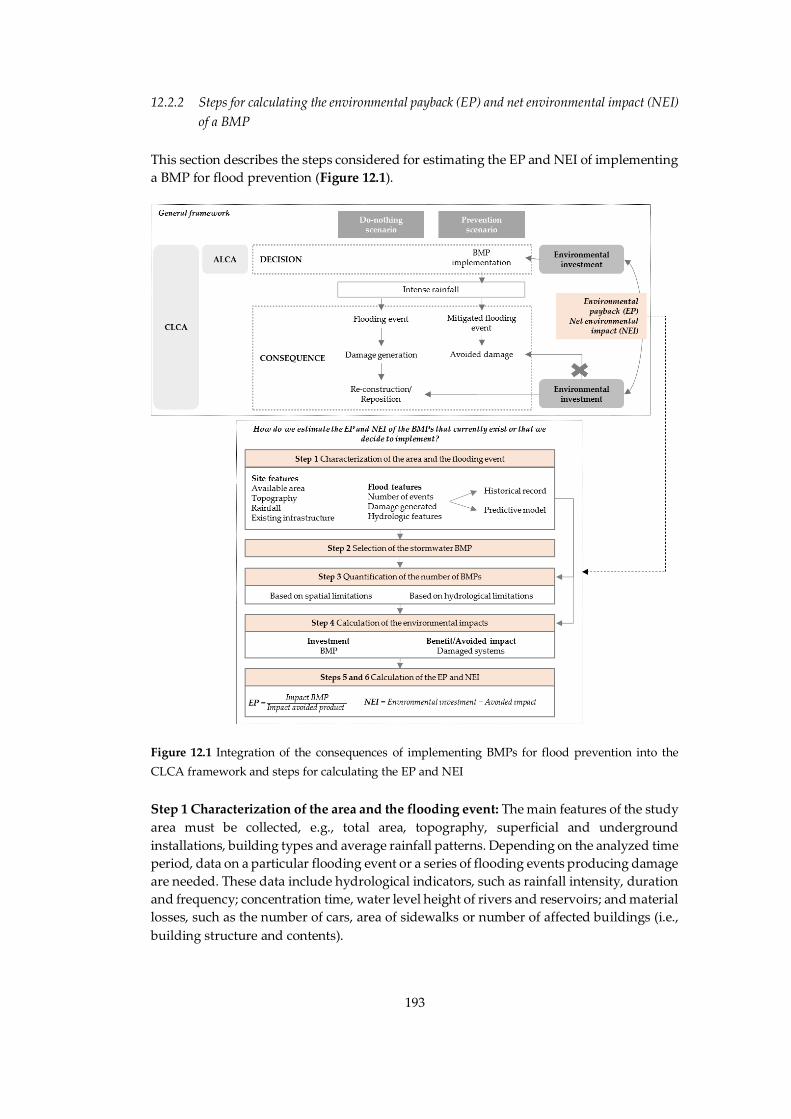
193
12.2.2 Steps for calculating the environmental payback (EP) and net environmental impact (NEI)
of a BMP
This section describes the steps considered for estimating the EP and NEI of implementing
a BMP for flood prevention (Figure 12.1).
Figure 12.1 Integration of the consequences of implementing BMPs for flood prevention into the
CLCA framework and steps for calculating the EP and NEI
Step 1 Characterization of the area and the flooding event: The main features of the study
area must be collected, e.g., total area, topography, superficial and underground
installations, building types and average rainfall patterns. Depending on the analyzed time
period, data on a particular flooding event or a series of flooding events producing damage
are needed. These data include hydrological indicators, such as rainfall intensity, duration
and frequency; concentration time, water level height of rivers and reservoirs; and material
losses, such as the number of cars, area of sidewalks or number of affected buildings (i.e.,
building structure and contents).
194
Step 2 Selection of the stormwater BMP: The selection of a suitable BMP for a specific area
depends on different parameters, such as the features of the study area (Step 1), space and
infiltration requirements, need for pollutant removal, land use, safety and maintenance
needs (UDFCD, 2011).
Step 3 Quantification of the number of BMPs: The number of BMPs required to prevent
the flooding events defined in Step 1 can be estimated as (1) the number of BMPs that could
collect the total volume of stormwater, or (2) the number of BMPs that could be
implemented in the area according to the space requirements. Based on hydrological
parameters and a similar stormwater storage potential, the option that results in fewer
BMPs is recommended. When a combination of different types of BMPs is implemented,
the number of systems could be estimated through option (1), and a series of scenarios
could be assessed with a varying amount of each type of BMP.
Step 4 Calculation of the environmental impacts of the BMP and avoided products: The
LCA of the BMP and the avoided products is conducted based on the steps defined by ISO
14040:2006 (i.e., goal and scope definition, inventory analysis, impact assessment and
interpretation). It should consider the site-specific features of the products, such as design,
electricity mix, lifespan, etc.
Given that the system boundaries of this study include different elements, defining a
functional unit (FU) is not straightforward (Zamagni et al. 2012). In this case, the FU could
be the implementation of one or a set of BMPs, with a certain lifespan, for preventing a
flooding event and its associated material damage, given a rainfall intensity of X mm/h. If
the environmental impacts of the avoided damage are assessed from an LCA standpoint,
the particular impacts of each element can be related to the production of a unit of urban
infrastructure (avoided product), whose destruction can be prevented by implementing a
BMP. The FU should be adapted to the period of analysis, number of flooding events and
rainfall intensity assessed, because the prevented damage is not a fixed parameter, but
varies depending on the event(s) and features defined in Step 1.
Step 5 Calculation of the EP: After conducting the LCA, it is interesting to know when the
environmental investment made during the implementation of the BMP might be
recovered. To do so, the ratio between the impacts of one BMP and one unit of avoided
product can be calculated. The results show the product units that should be prevented
through the lifespan of the BMP to recover the environmental investment.
Step 6 Calculation of the NEI: The net balance per flooding event can be determined
applying Equation 12.1. For comparing different types of BMP, the total NEI per event
could be expressed in terms of NEI per cubic meter of stormwater, for instance.
NEI
event= A ×
ImpactBMP
L×F – ∑ (Xi × Impact
i)
n
i=1
Equation 12.1
where NEI: net environmental impact for a given impact indicator; A: number of BMPs
implemented with a certain storage capacity; ImpactBMP: environmental impacts of the
BMP under assessment; L: lifespan of the BMP (years); F: average annual flooding events;
i: type of avoided product (e.g., car, sidewalk, building, etc.); X: units of avoided product
per event; and Impacti: environmental impact of the avoided product.
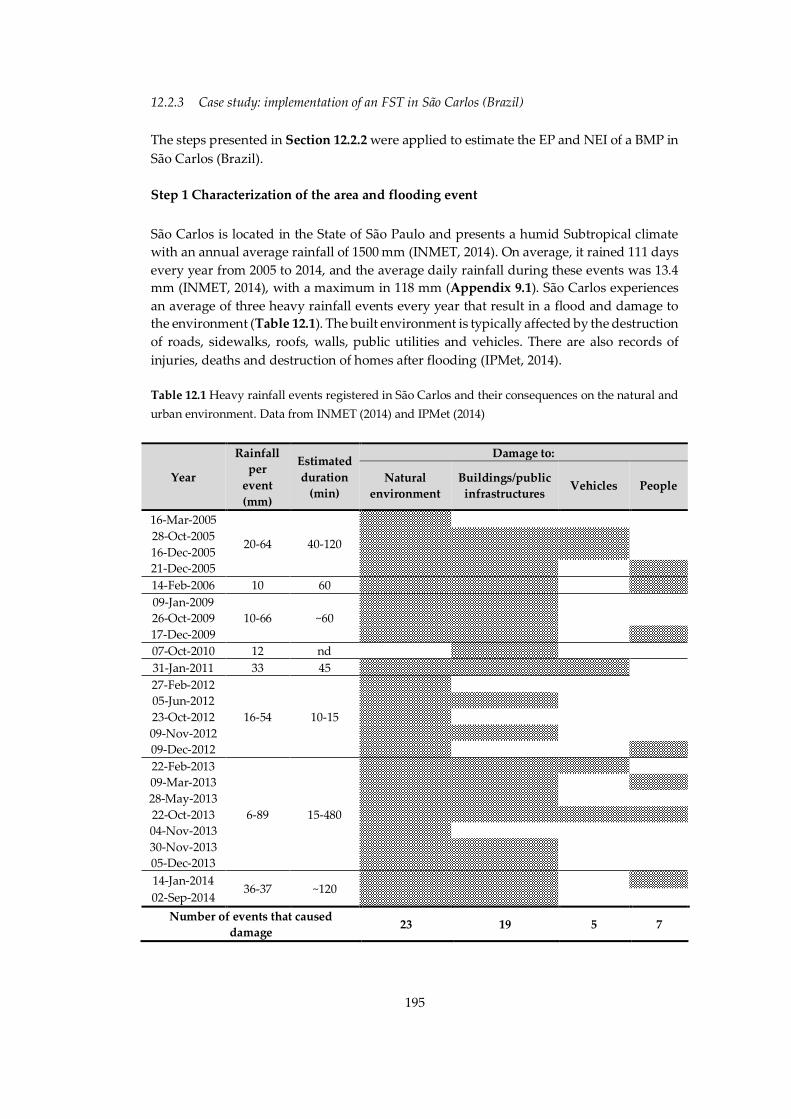
195
12.2.3 Case study: implementation of an FST in São Carlos (Brazil)
The steps presented in Section 12.2.2 were applied to estimate the EP and NEI of a BMP in
São Carlos (Brazil).
Step 1 Characterization of the area and flooding event
São Carlos is located in the State of São Paulo and presents a humid Subtropical climate
with an annual average rainfall of 1500 mm (INMET, 2014). On average, it rained 111 days
every year from 2005 to 2014, and the average daily rainfall during these events was 13.4
mm (INMET, 2014), with a maximum in 118 mm (Appendix 9.1). São Carlos experiences
an average of three heavy rainfall events every year that result in a flood and damage to
the environment (Table 12.1). The built environment is typically affected by the destruction
of roads, sidewalks, roofs, walls, public utilities and vehicles. There are also records of
injuries, deaths and destruction of homes after flooding (IPMet, 2014).
Table 12.1 Heavy rainfall events registered in São Carlos and their consequences on the natural and
urban environment. Data from INMET (2014) and IPMet (2014)
Year
Rainfall
per
event
(mm)
Estimated
duration
(min)
Damage to:
Natural
environment
Buildings/public
infrastructures Vehicles People
16-Mar-2005
20-64 40-120
28-Oct-2005
16-Dec-2005
21-Dec-2005
14-Feb-2006 10 60
09-Jan-2009
10-66 ~60
26-Oct-2009
17-Dec-2009
07-Oct-2010 12 nd
31-Jan-2011 33 45
27-Feb-2012
16-54 10-15
05-Jun-2012
23-Oct-2012
09-Nov-2012
09-Dec-2012
22-Feb-2013
6-89 15-480
09-Mar-2013
28-May-2013
22-Oct-2013
04-Nov-2013
30-Nov-2013
05-Dec-2013
14-Jan-2014 36-37 ~120
02-Sep-2014
Number of events that caused
damage 23 19 5 7
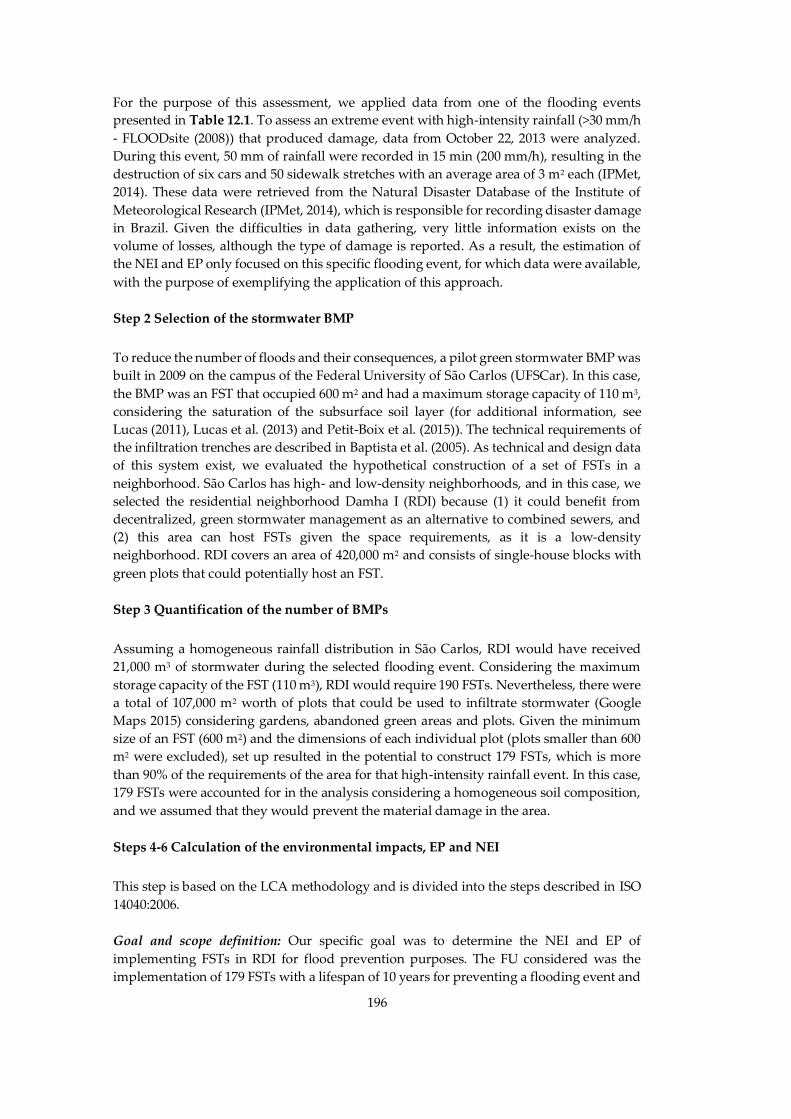
196
For the purpose of this assessment, we applied data from one of the flooding events
presented in Table 12.1. To assess an extreme event with high-intensity rainfall (>30 mm/h
- FLOODsite (2008)) that produced damage, data from October 22, 2013 were analyzed.
During this event, 50 mm of rainfall were recorded in 15 min (200 mm/h), resulting in the
destruction of six cars and 50 sidewalk stretches with an average area of 3 m2 each (IPMet,
2014). These data were retrieved from the Natural Disaster Database of the Institute of
Meteorological Research (IPMet, 2014), which is responsible for recording disaster damage
in Brazil. Given the difficulties in data gathering, very little information exists on the
volume of losses, although the type of damage is reported. As a result, the estimation of
the NEI and EP only focused on this specific flooding event, for which data were available,
with the purpose of exemplifying the application of this approach.
Step 2 Selection of the stormwater BMP
To reduce the number of floods and their consequences, a pilot green stormwater BMP was
built in 2009 on the campus of the Federal University of São Carlos (UFSCar). In this case,
the BMP was an FST that occupied 600 m2 and had a maximum storage capacity of 110 m3,
considering the saturation of the subsurface soil layer (for additional information, see
Lucas (2011), Lucas et al. (2013) and Petit-Boix et al. (2015)). The technical requirements of
the infiltration trenches are described in Baptista et al. (2005). As technical and design data
of this system exist, we evaluated the hypothetical construction of a set of FSTs in a
neighborhood. São Carlos has high- and low-density neighborhoods, and in this case, we
selected the residential neighborhood Damha I (RDI) because (1) it could benefit from
decentralized, green stormwater management as an alternative to combined sewers, and
(2) this area can host FSTs given the space requirements, as it is a low-density
neighborhood. RDI covers an area of 420,000 m2 and consists of single-house blocks with
green plots that could potentially host an FST.
Step 3 Quantification of the number of BMPs
Assuming a homogeneous rainfall distribution in São Carlos, RDI would have received
21,000 m3 of stormwater during the selected flooding event. Considering the maximum
storage capacity of the FST (110 m3), RDI would require 190 FSTs. Nevertheless, there were
a total of 107,000 m2 worth of plots that could be used to infiltrate stormwater (Google
Maps 2015) considering gardens, abandoned green areas and plots. Given the minimum
size of an FST (600 m2) and the dimensions of each individual plot (plots smaller than 600
m2 were excluded), set up resulted in the potential to construct 179 FSTs, which is more
than 90% of the requirements of the area for that high-intensity rainfall event. In this case,
179 FSTs were accounted for in the analysis considering a homogeneous soil composition,
and we assumed that they would prevent the material damage in the area.
Steps 4-6 Calculation of the environmental impacts, EP and NEI
This step is based on the LCA methodology and is divided into the steps described in ISO
14040:2006.
Goal and scope definition: Our specific goal was to determine the NEI and EP of
implementing FSTs in RDI for flood prevention purposes. The FU considered was the
implementation of 179 FSTs with a lifespan of 10 years for preventing a flooding event and
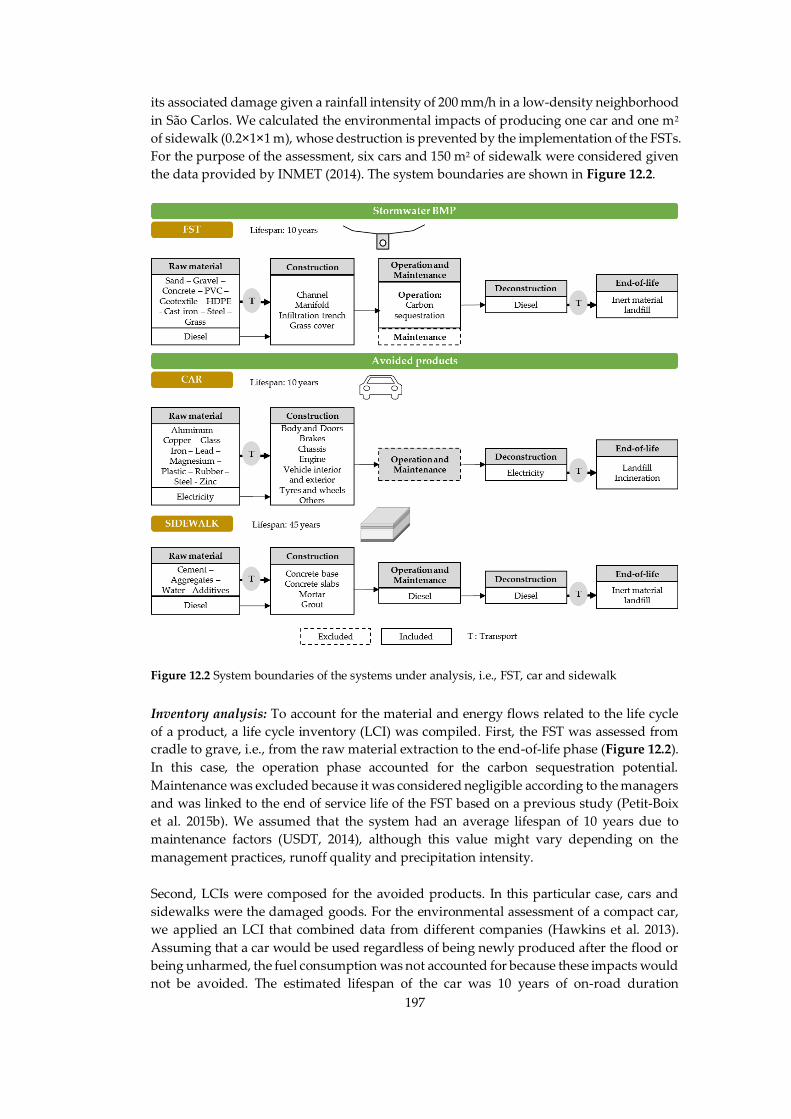
197
its associated damage given a rainfall intensity of 200 mm/h in a low-density neighborhood
in São Carlos. We calculated the environmental impacts of producing one car and one m2
of sidewalk (0.2×1×1 m), whose destruction is prevented by the implementation of the FSTs.
For the purpose of the assessment, six cars and 150 m2 of sidewalk were considered given
the data provided by INMET (2014). The system boundaries are shown in Figure 12.2.
Figure 12.2 System boundaries of the systems under analysis, i.e., FST, car and sidewalk
Inventory analysis: To account for the material and energy flows related to the life cycle
of a product, a life cycle inventory (LCI) was compiled. First, the FST was assessed from
cradle to grave, i.e., from the raw material extraction to the end-of-life phase (Figure 12.2).
In this case, the operation phase accounted for the carbon sequestration potential.
Maintenance was excluded because it was considered negligible according to the managers
and was linked to the end of service life of the FST based on a previous study (Petit-Boix
et al. 2015b). We assumed that the system had an average lifespan of 10 years due to
maintenance factors (USDT, 2014), although this value might vary depending on the
management practices, runoff quality and precipitation intensity.
Second, LCIs were composed for the avoided products. In this particular case, cars and
sidewalks were the damaged goods. For the environmental assessment of a compact car,
we applied an LCI that combined data from different companies (Hawkins et al. 2013).
Assuming that a car would be used regardless of being newly produced after the flood or
being unharmed, the fuel consumption was not accounted for because these impacts would
not be avoided. The estimated lifespan of the car was 10 years of on-road duration
198
(Schweimer and Levin 2000). Regarding sidewalks, we adapted the design that was
presented in a previous study for one m2 of concrete sidewalks with an average lifespan of
45 years (Mendoza et al. 2012). In both cases, the end-of-life phase was included, given that
the damaged products must be disposed of after the flooding event. All of the production
processes that were included in the LCI were adapted with the marginal electricity mix for
Brazil (Schmidt and Thrane 2009), which is the most competitive technology that would be
used in the production of one extra unit of product. The ecoinvent 2.2 (Frischknecht et al.
2005) database was used for retrieving background data on the life cycle of the materials
and processes involved in each system. For data on the LCI of the FST and avoided
products, see Chapter 11 and Table 12.2, respectively. In this first analysis, the impacts on
land use change were not accounted for because this was already an artificialized area, and
we considered that the new system provided a greater carbon sequestration potential.
Table 12.2 Life cycle inventories of a car and concrete sidewalk
LCI of one m2 of sidewalk (0.2x1x1 m)
Source: Mendoza et al. (2012)
LCI of one car
Source: Hawkins et al. (2013)
Amount Units Amount Units
Construction
Portland cement
Gravel
Water
Silica sand
Diesel
Transport
6.3E+01
2.4E+02
3.5E+01
1.9E+02
7.3E+00
7.1E+01
kg
kg
kg
kg
MJ
tkm
Steel 8.5E+02 kg
Iron 1.2E+02 kg
Aluminum 5.4E+01 kg
Copper 2.2E+01 kg
Lead 3.0E-01 kg
Mg 2.0E-01 kg
Zn 1.0E-01 kg
Glass 6.1E+01 kg
Plastic 1.5E+02 kg
Rubber 2.5E+01 kg
Paint 1.4E+01 kg
Oxygen 8.2E-02 kg
Acetylene 6.5E-03 kg
Nitrogen 1.2E-01 kg
Carbon dioxide 5.5E-01 kg
Drinking water 3.2E+00 m3
Operating water 3.1E+01 m3
Heat, natural gas, <100kW 3.4E+03 MJ
Heat, natural gas >100kW 1.9E+02 MJ
Compressed Air (6 bar) 7.7E+02 Nm3
Compressed Air (12 bar) 2.1E+02 Nm3
Natural gas 3.2E+01 kg
Electricity 1.3E+03 kWh
Operation and Maintenance
Diesel 8.8E+00 MJ
Demolition
Diesel 1.7E+01 MJ Electricity 4.1E+02 kWh
End-of-life
Transport to landfill 3.7E+02 tkm Transport to landfill 3.3E+01 tkm
Landfill 3.7E+02 kg Landfill 2.4E+02 kg
Impact assessment: Of all of the stages that are included in the impact assessment stage
(ISO 14040:2006), only the classification and characterization were considered. Using the
SimaPro 8.0.4 (PRé Consultants 2010) software, the method that was applied was the
hierarchical approach of ReCiPe 2008 (Goedkoop et al. 2009). The selected midpoint
indicators were global warming (GW, kg CO2 eq), ozone depletion (OD, kg CFC-11 eq),
terrestrial acidification (TA, kg SO2 eq), freshwater eutrophication (FE, kg P eq), marine
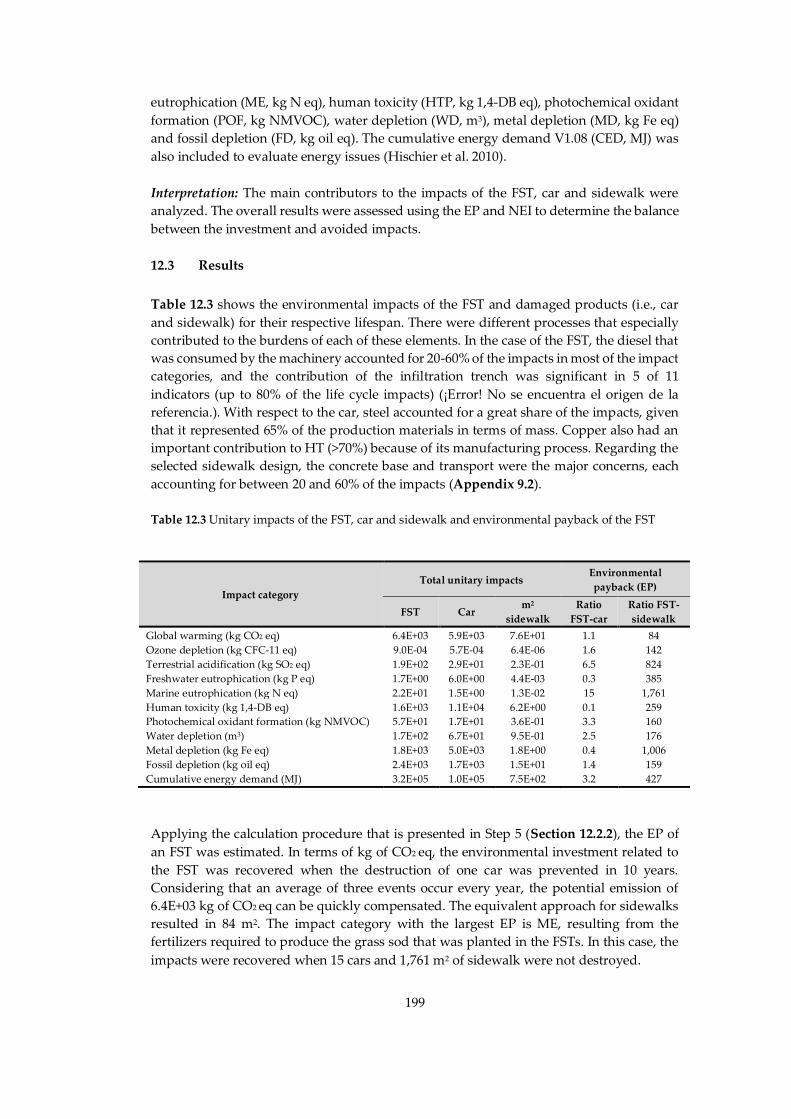
199
eutrophication (ME, kg N eq), human toxicity (HTP, kg 1,4-DB eq), photochemical oxidant
formation (POF, kg NMVOC), water depletion (WD, m3), metal depletion (MD, kg Fe eq)
and fossil depletion (FD, kg oil eq). The cumulative energy demand V1.08 (CED, MJ) was
also included to evaluate energy issues (Hischier et al. 2010).
Interpretation: The main contributors to the impacts of the FST, car and sidewalk were
analyzed. The overall results were assessed using the EP and NEI to determine the balance
between the investment and avoided impacts.
12.3 Results
Table 12.3 shows the environmental impacts of the FST and damaged products (i.e., car
and sidewalk) for their respective lifespan. There were different processes that especially
contributed to the burdens of each of these elements. In the case of the FST, the diesel that
was consumed by the machinery accounted for 20-60% of the impacts in most of the impact
categories, and the contribution of the infiltration trench was significant in 5 of 11
indicators (up to 80% of the life cycle impacts) (¡Error! No se encuentra el origen de la
referencia.). With respect to the car, steel accounted for a great share of the impacts, given
that it represented 65% of the production materials in terms of mass. Copper also had an
important contribution to HT (>70%) because of its manufacturing process. Regarding the
selected sidewalk design, the concrete base and transport were the major concerns, each
accounting for between 20 and 60% of the impacts (Appendix 9.2).
Table 12.3 Unitary impacts of the FST, car and sidewalk and environmental payback of the FST
Applying the calculation procedure that is presented in Step 5 (Section 12.2.2), the EP of
an FST was estimated. In terms of kg of CO2 eq, the environmental investment related to
the FST was recovered when the destruction of one car was prevented in 10 years.
Considering that an average of three events occur every year, the potential emission of
6.4E+03 kg of CO2 eq can be quickly compensated. The equivalent approach for sidewalks
resulted in 84 m2. The impact category with the largest EP is ME, resulting from the
fertilizers required to produce the grass sod that was planted in the FSTs. In this case, the
impacts were recovered when 15 cars and 1,761 m2 of sidewalk were not destroyed.
Impact category
Total unitary impacts Environmental
payback (EP)
FST Car m2
sidewalk
Ratio
FST-car
Ratio FST-
sidewalk
Global warming (kg CO2 eq) 6.4E+03 5.9E+03 7.6E+01 1.1 84
Ozone depletion (kg CFC-11 eq) 9.0E-04 5.7E-04 6.4E-06 1.6 142
Terrestrial acidification (kg SO2 eq) 1.9E+02 2.9E+01 2.3E-01 6.5 824
Freshwater eutrophication (kg P eq) 1.7E+00 6.0E+00 4.4E-03 0.3 385
Marine eutrophication (kg N eq) 2.2E+01 1.5E+00 1.3E-02 15 1,761
Human toxicity (kg 1,4-DB eq) 1.6E+03 1.1E+04 6.2E+00 0.1 259
Photochemical oxidant formation (kg NMVOC) 5.7E+01 1.7E+01 3.6E-01 3.3 160
Water depletion (m3) 1.7E+02 6.7E+01 9.5E-01 2.5 176
Metal depletion (kg Fe eq) 1.8E+03 5.0E+03 1.8E+00 0.4 1,006
Fossil depletion (kg oil eq) 2.4E+03 1.7E+03 1.5E+01 1.4 159
Cumulative energy demand (MJ) 3.2E+05 1.0E+05 7.5E+02 3.2 427
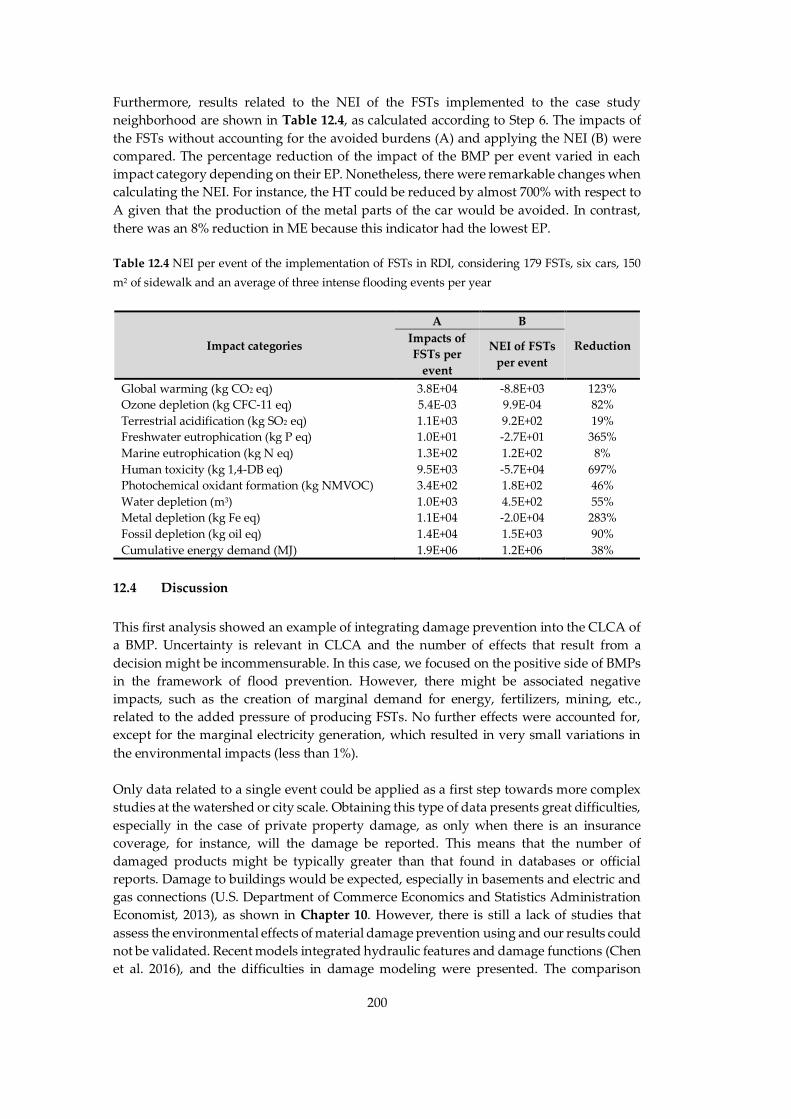
200
Furthermore, results related to the NEI of the FSTs implemented to the case study
neighborhood are shown in Table 12.4, as calculated according to Step 6. The impacts of
the FSTs without accounting for the avoided burdens (A) and applying the NEI (B) were
compared. The percentage reduction of the impact of the BMP per event varied in each
impact category depending on their EP. Nonetheless, there were remarkable changes when
calculating the NEI. For instance, the HT could be reduced by almost 700% with respect to
A given that the production of the metal parts of the car would be avoided. In contrast,
there was an 8% reduction in ME because this indicator had the lowest EP.
Table 12.4 NEI per event of the implementation of FSTs in RDI, considering 179 FSTs, six cars, 150
m2 of sidewalk and an average of three intense flooding events per year
Impact categories
A B
Reduction Impacts of
FSTs per
event
NEI of FSTs
per event
Global warming (kg CO2 eq) 3.8E+04 -8.8E+03 123%
Ozone depletion (kg CFC-11 eq) 5.4E-03 9.9E-04 82%
Terrestrial acidification (kg SO2 eq) 1.1E+03 9.2E+02 19%
Freshwater eutrophication (kg P eq) 1.0E+01 -2.7E+01 365%
Marine eutrophication (kg N eq) 1.3E+02 1.2E+02 8%
Human toxicity (kg 1,4-DB eq) 9.5E+03 -5.7E+04 697%
Photochemical oxidant formation (kg NMVOC) 3.4E+02 1.8E+02 46%
Water depletion (m3) 1.0E+03 4.5E+02 55%
Metal depletion (kg Fe eq) 1.1E+04 -2.0E+04 283%
Fossil depletion (kg oil eq) 1.4E+04 1.5E+03 90%
Cumulative energy demand (MJ) 1.9E+06 1.2E+06 38%
12.4 Discussion
This first analysis showed an example of integrating damage prevention into the CLCA of
a BMP. Uncertainty is relevant in CLCA and the number of effects that result from a
decision might be incommensurable. In this case, we focused on the positive side of BMPs
in the framework of flood prevention. However, there might be associated negative
impacts, such as the creation of marginal demand for energy, fertilizers, mining, etc.,
related to the added pressure of producing FSTs. No further effects were accounted for,
except for the marginal electricity generation, which resulted in very small variations in
the environmental impacts (less than 1%).
Only data related to a single event could be applied as a first step towards more complex
studies at the watershed or city scale. Obtaining this type of data presents great difficulties,
especially in the case of private property damage, as only when there is an insurance
coverage, for instance, will the damage be reported. This means that the number of
damaged products might be typically greater than that found in databases or official
reports. Damage to buildings would be expected, especially in basements and electric and
gas connections (U.S. Department of Commerce Economics and Statistics Administration
Economist, 2013), as shown in Chapter 10. However, there is still a lack of studies that
assess the environmental effects of material damage prevention using and our results could
not be validated. Recent models integrated hydraulic features and damage functions (Chen
et al. 2016), and the difficulties in damage modeling were presented. The comparison
201
between damage estimates and national expenditures also highlights great errors related
to inaccurate estimations (Downton and Pielke 2005). Therefore, this first approach should
be combined with robust predictive models in order to provide more information about
the NEI of these systems.
Nevertheless, modeling these consequences was out of the scope of this study. We
illustrate how the environmental assessment of damage might provide more information
about the benefits of green BMPs at a local scale. So far, the European Flood Directive
(European Council 2007) has resulted in policies that tend to promote non-structural
strategies, such as land use regulations. In this sense, investing in BMPs might not be
attractive in certain areas, but decisions might change when further effects are considered.
Here, we did not include an economic assessment because our goal was to highlight the
environmental relevance of these decisions. However, the economic and environmental
payback of these actions should be considered in future analyses.
The outcome of this approach might be of interest in the field of communication and policy-
making. We believe that urban planners, local authorities and insurance companies might
benefit from these results because they provide information about indirect consequences
that might have a large impact on the society. For instance, managing green areas in low-
density neighborhoods might be key to approaching a more sustainable urban model. The
design of the FST could vary depending on the plot dimensions so as not to affect aesthetics
and other functionalities, such as leisure or private use. Moreover, the design should
comply with the technical requirements to prevent soil compaction and ensure the proper
infiltration of stormwater. In addition, this multi-functional approach would also foster
biodiversity and prevent a reduction in the ecological connectivity of the area.
12.5 Conclusions
This analysis provided insight into the environmental effects of integrating flood damage
prevention into the LCA of BMPs. Our first example was based on a Brazilian residential
neighborhood. The environmental payback of an FST was related to the prevention of at
least one car or 84 m2 of sidewalk during 10 years, which is a short payback time
considering the frequency of flooding events in the area. Subtracting the material damage
of a historic flooding event to the potential environmental investment made for
implementing a set of FSTs resulted in a net positive performance of these systems. The
most favorable impact category was the HT, as a gross estimate showed an impact
reduction of almost 700%.
Nevertheless, there are limitations in this analysis. When addressing this hydrological
phenomenon, a risk assessment is needed to determine the frequency of this type of
flooding event. Return periods, maximum water flows and population exposure, among
other parameters, should be determined in a regional case study and included in the
proposed methodology. In this way, the potential effect of the BMP on the water flow can
be identified. Additional data are required regarding the material losses of the events. In
this case, only a hypothetical analysis could be presented with data from a single flooding
event with damage, but a statistical analysis would provide a more accurate idea in an
attempt to generalize. However, it is currently very difficult to find registers for damage in
specific locations and to predict future damage.

202
Future research should couple the economic value of the predicted material and ecological
damage, risk assessment models and environmental impacts of the BMPs. Hence, this
approach would be of great interest to insurance companies and governments for the
planning and reduction of their financial budget. Combined with the environmental
implications of these events, decision-makers and urban planners would be provided with
more data for managing flooding risks.
203
PART VI – FINAL REMARKS AND FUTURE RESEARCH
Part VI Final remarks and future research

Picture: Brainstorming with middle-school students about water sustainability
Discussion of the main
contributions
Chapter 13

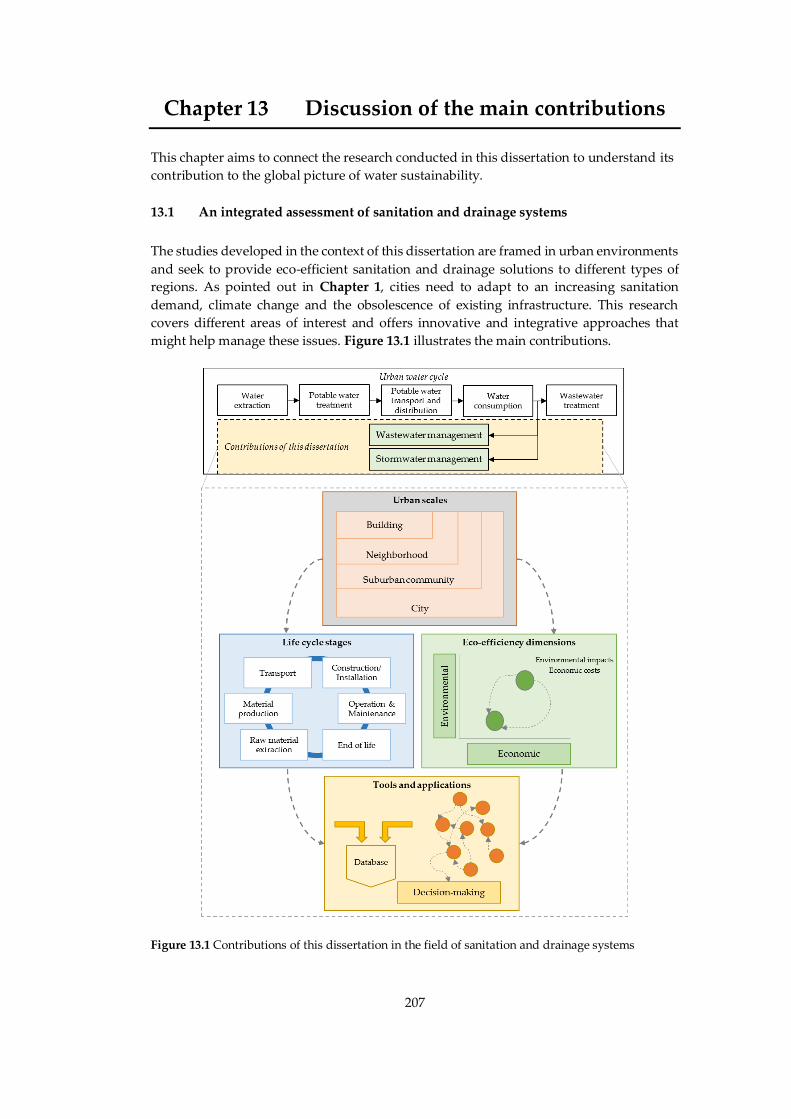
207
Discussion of the main contributions
This chapter aims to connect the research conducted in this dissertation to understand its
contribution to the global picture of water sustainability.
13.1 An integrated assessment of sanitation and drainage systems
The studies developed in the context of this dissertation are framed in urban environments
and seek to provide eco-efficient sanitation and drainage solutions to different types of
regions. As pointed out in Chapter 1, cities need to adapt to an increasing sanitation
demand, climate change and the obsolescence of existing infrastructure. This research
covers different areas of interest and offers innovative and integrative approaches that
might help manage these issues. Figure 13.1 illustrates the main contributions.
Figure 13.1 Contributions of this dissertation in the field of sanitation and drainage systems

208
13.1.1 Analysis of different urban scales
Although the concept of “city” is always present in the definition of all the assessments,
different scales were considered to adapt the analysis to various needs. On the one hand,
the research on sewer networks focused on the city as an entity, as illustrated through the
cases of Calalell and Betanzos in different climatic regions (Mediterranean versus Atlantic),
urban forms (coastal versus inland configurations) and populations (seasonal versus
permanent). This was indeed helpful to provide a great level of detail on the life cycle of
sewers and to stablish potential parameters that might affect their performance. However,
the sanitation alternatives of suburban settlements were also considered because these
have a different sanitation demand than a larger urban area. In addition, they are typically
located far away from existing treatment systems and need to be provided with
environmentally sound solutions. This assessment is believed to be the first
decentralization/centralization analysis developed in an island (i.e., Minorca), which is
especially relevant given the treatment difficulties faced by seasonal areas.
On the other hand, drainage systems were addressed at three different scales because of
the complexity of this infrastructure. In order from smallest to largest urban scale, the FST
(i.e., green BMP) was designed based on a single building and later assessed in the context
of a low-density neighborhood in Brazil; in contrast, ephemeral streams covered three
different cities in a Mediterranean watershed. However, the studies had a strong focus on
the environmental effects associated with urban runoff, without accounting for alternative
uses of rainwater in buildings or neighborhoods. These aspects were already covered in
previous analyses of rainwater harvesting systems (Vargas-Parra et al. 2013, 2014; Vargas-
Parra 2015; Angrill et al. 2012, 2016), among others. The flood prevention studies included
in this dissertation are believed to be the first step towards the implementation of eco-
efficient measures at the urban scale. Nevertheless, their complexity requires that future
analyses broaden their scope and methods as explained in Chapter 15.
13.1.2 A complete life cycle perspective with an integrated essence
Another particularity of this research is the life cycle approach. Each of the analyses
covered one or more life cycle stages related to the system of interest. Especially in the case
of sewer networks, there is a lack of in-depth studies that assess their variations and
requirements under different circumstances. This research gap was addressed through
different tools in this dissertation:
At the construction stage, a parametric analysis was combined with LCA to
determine the effects of traffic loads and pavement degradation on the impacts of
sewers. In addition, the designs that were proposed were technically feasible in
compliance with regulations and conducted thanks to the collaboration of civil
engineers.
The operation and maintenance (O&M) presented several challenges because it is
extremely heterogeneous depending on the city. On the one hand, energy issues
vary by site based on climate and urban form and they were evaluated through a
statistical analysis of a sample of cities covering typical scenarios. This modeling
effort offered some guidance for understanding how urban sanitation should be
envisioned in the context of urban complexity. On the other hand, the direct GHG
emissions that result from wastewater degradation are still a field to explore in
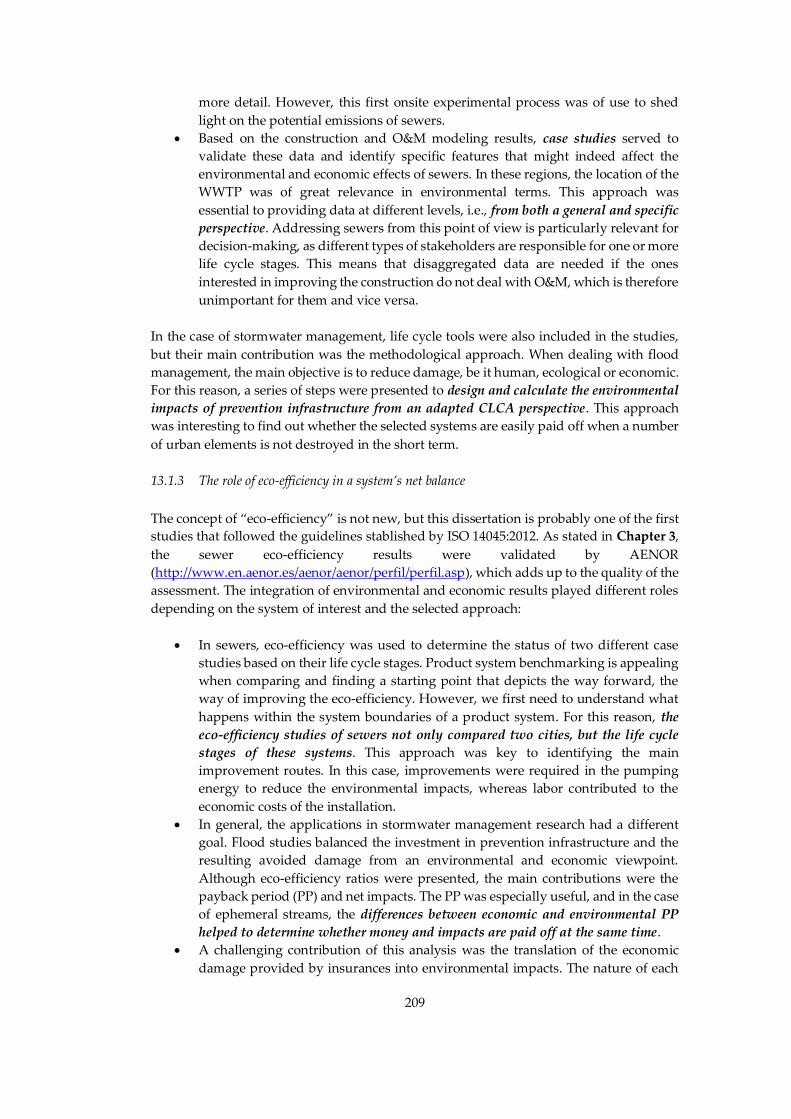
209
more detail. However, this first onsite experimental process was of use to shed
light on the potential emissions of sewers.
Based on the construction and O&M modeling results, case studies served to
validate these data and identify specific features that might indeed affect the
environmental and economic effects of sewers. In these regions, the location of the
WWTP was of great relevance in environmental terms. This approach was
essential to providing data at different levels, i.e., from both a general and specific
perspective. Addressing sewers from this point of view is particularly relevant for
decision-making, as different types of stakeholders are responsible for one or more
life cycle stages. This means that disaggregated data are needed if the ones
interested in improving the construction do not deal with O&M, which is therefore
unimportant for them and vice versa.
In the case of stormwater management, life cycle tools were also included in the studies,
but their main contribution was the methodological approach. When dealing with flood
management, the main objective is to reduce damage, be it human, ecological or economic.
For this reason, a series of steps were presented to design and calculate the environmental
impacts of prevention infrastructure from an adapted CLCA perspective. This approach
was interesting to find out whether the selected systems are easily paid off when a number
of urban elements is not destroyed in the short term.
13.1.3 The role of eco-efficiency in a system’s net balance
The concept of “eco-efficiency” is not new, but this dissertation is probably one of the first
studies that followed the guidelines stablished by ISO 14045:2012. As stated in Chapter 3,
the sewer eco-efficiency results were validated by AENOR
(http://www.en.aenor.es/aenor/aenor/perfil/perfil.asp), which adds up to the quality of the
assessment. The integration of environmental and economic results played different roles
depending on the system of interest and the selected approach:
In sewers, eco-efficiency was used to determine the status of two different case
studies based on their life cycle stages. Product system benchmarking is appealing
when comparing and finding a starting point that depicts the way forward, the
way of improving the eco-efficiency. However, we first need to understand what
happens within the system boundaries of a product system. For this reason, the
eco-efficiency studies of sewers not only compared two cities, but the life cycle
stages of these systems. This approach was key to identifying the main
improvement routes. In this case, improvements were required in the pumping
energy to reduce the environmental impacts, whereas labor contributed to the
economic costs of the installation.
In general, the applications in stormwater management research had a different
goal. Flood studies balanced the investment in prevention infrastructure and the
resulting avoided damage from an environmental and economic viewpoint.
Although eco-efficiency ratios were presented, the main contributions were the
payback period (PP) and net impacts. The PP was especially useful, and in the case
of ephemeral streams, the differences between economic and environmental PP
helped to determine whether money and impacts are paid off at the same time.
A challenging contribution of this analysis was the translation of the economic
damage provided by insurances into environmental impacts. The nature of each
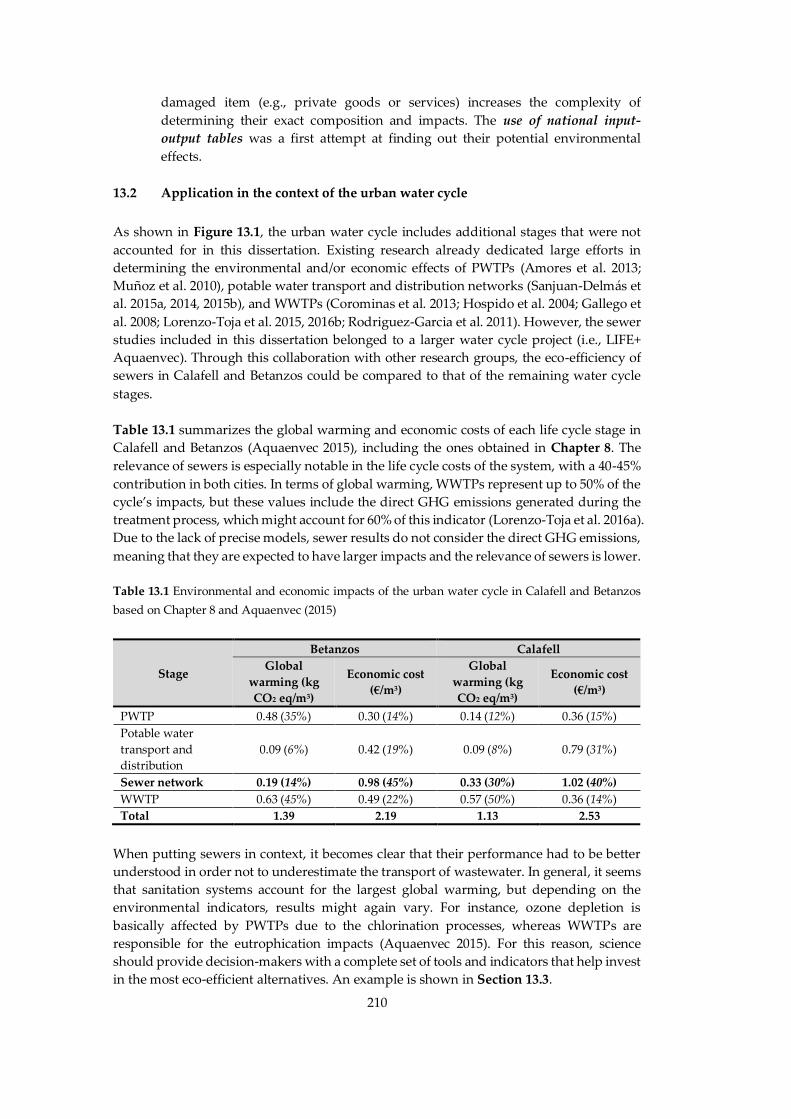
210
damaged item (e.g., private goods or services) increases the complexity of
determining their exact composition and impacts. The use of national input-
output tables was a first attempt at finding out their potential environmental
effects.
13.2 Application in the context of the urban water cycle
As shown in Figure 13.1, the urban water cycle includes additional stages that were not
accounted for in this dissertation. Existing research already dedicated large efforts in
determining the environmental and/or economic effects of PWTPs (Amores et al. 2013;
Muñoz et al. 2010), potable water transport and distribution networks (Sanjuan-Delmás et
al. 2015a, 2014, 2015b), and WWTPs (Corominas et al. 2013; Hospido et al. 2004; Gallego et
al. 2008; Lorenzo-Toja et al. 2015, 2016b; Rodriguez-Garcia et al. 2011). However, the sewer
studies included in this dissertation belonged to a larger water cycle project (i.e., LIFE+
Aquaenvec). Through this collaboration with other research groups, the eco-efficiency of
sewers in Calafell and Betanzos could be compared to that of the remaining water cycle
stages.
Table 13.1 summarizes the global warming and economic costs of each life cycle stage in
Calafell and Betanzos (Aquaenvec 2015), including the ones obtained in Chapter 8. The
relevance of sewers is especially notable in the life cycle costs of the system, with a 40-45%
contribution in both cities. In terms of global warming, WWTPs represent up to 50% of the
cycle’s impacts, but these values include the direct GHG emissions generated during the
treatment process, which might account for 60% of this indicator (Lorenzo-Toja et al. 2016a).
Due to the lack of precise models, sewer results do not consider the direct GHG emissions,
meaning that they are expected to have larger impacts and the relevance of sewers is lower.
Table 13.1 Environmental and economic impacts of the urban water cycle in Calafell and Betanzos
based on Chapter 8 and Aquaenvec (2015)
Stage
Betanzos Calafell
Global
warming (kg
CO2 eq/m3)
Economic cost
(€/m3)
Global
warming (kg
CO2 eq/m3)
Economic cost
(€/m3)
PWTP 0.48 (35%) 0.30 (14%) 0.14 (12%) 0.36 (15%)
Potable water
transport and
distribution
0.09 (6%) 0.42 (19%) 0.09 (8%) 0.79 (31%)
Sewer network 0.19 (14%) 0.98 (45%) 0.33 (30%) 1.02 (40%)
WWTP 0.63 (45%) 0.49 (22%) 0.57 (50%) 0.36 (14%)
Total 1.39 2.19 1.13 2.53
When putting sewers in context, it becomes clear that their performance had to be better
understood in order not to underestimate the transport of wastewater. In general, it seems
that sanitation systems account for the largest global warming, but depending on the
environmental indicators, results might again vary. For instance, ozone depletion is
basically affected by PWTPs due to the chlorination processes, whereas WWTPs are
responsible for the eutrophication impacts (Aquaenvec 2015). For this reason, science
should provide decision-makers with a complete set of tools and indicators that help invest
in the most eco-efficient alternatives. An example is shown in Section 13.3.

211
13.3 Tools and open data for decision-making
The results of this research constituted the framework of some tools and data that can be
easily consulted for decision-making purposes. One of the products of the LIFE+
Aquaenvec project was an open web-based software (http://tool.life-aquaenvec.eu/en).
This tool enables the calculation of a city’s eco-efficiency based on the complete or partial
stages of the water cycle. Some city council’s and water managers can be assisted by this
tool to understand the performance of their water and wastewater systems. A specific
subsection is dedicated to sewer networks. The design and creation of this subsection was
based on the structure, models and results of the sewer studies included in this dissertation.
Figure 13.2 shows the data input requirements of the construction phase, where the type
of pipe materials, diameter, length, and trench design must be indicated.
Figure 13.2 Sewer sub-section of the Aquaenvec tool available at http://tool.life-aquaenvec.eu/en
This software provides the estimates of four environmental indicators (i.e., global warming,
ozone depletion, eutrophication and cumulative energy demand), and the economic cost.
However, LCA practitioners interested in conducting specific eco-efficiency assessments
have specialized data available for use. Most of the life cycle inventories (LCI) elaborated
during this research were submitted, validated and published at the LCADB.sudoe
database (http://lcadb.sudoe.ecotech.cat). This database focuses on the southwest of
Europe to offer representative LCIs than can be used in the studies conducted in this region.
Figure 13.3 presents an example of the LCI of one meter of sewer, which results from
Chapter 4. Some of the LCIs associated with this dissertation are available for further case
studies and contributes to the pool of LCA-related data demanded by research and
companies. These are meant to reduce the complexity and workload of modeling processes
by providing background data.

212
Figure 13.3 Sewer LCI available at the LCADB.sudoe database

Picture: Answering and justifying our questions
Conclusions
Chapter 14

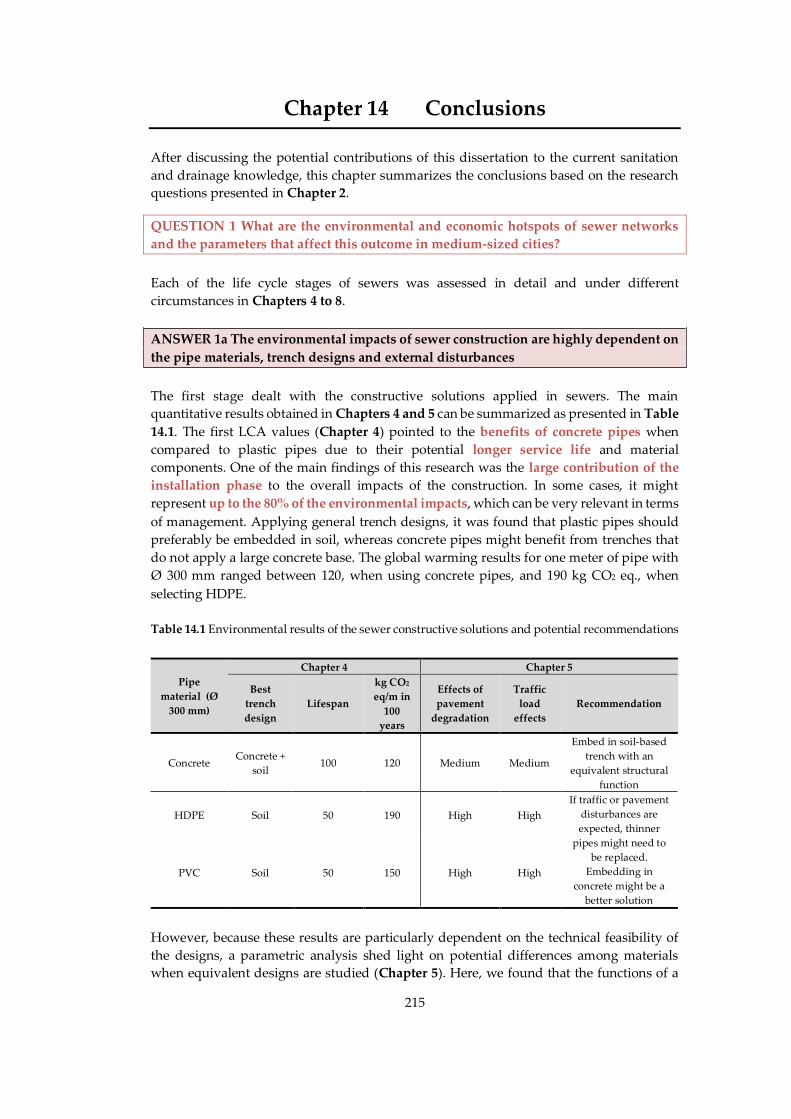
215
Conclusions
After discussing the potential contributions of this dissertation to the current sanitation
and drainage knowledge, this chapter summarizes the conclusions based on the research
questions presented in Chapter 2.
QUESTION 1 What are the environmental and economic hotspots of sewer networks
and the parameters that affect this outcome in medium-sized cities?
Each of the life cycle stages of sewers was assessed in detail and under different
circumstances in Chapters 4 to 8.
ANSWER 1a The environmental impacts of sewer construction are highly dependent on
the pipe materials, trench designs and external disturbances
The first stage dealt with the constructive solutions applied in sewers. The main
quantitative results obtained in Chapters 4 and 5 can be summarized as presented in Table
14.1. The first LCA values (Chapter 4) pointed to the benefits of concrete pipes when
compared to plastic pipes due to their potential longer service life and material
components. One of the main findings of this research was the large contribution of the
installation phase to the overall impacts of the construction. In some cases, it might
represent up to the 80% of the environmental impacts, which can be very relevant in terms
of management. Applying general trench designs, it was found that plastic pipes should
preferably be embedded in soil, whereas concrete pipes might benefit from trenches that
do not apply a large concrete base. The global warming results for one meter of pipe with
Ø 300 mm ranged between 120, when using concrete pipes, and 190 kg CO2 eq., when
selecting HDPE.
Table 14.1 Environmental results of the sewer constructive solutions and potential recommendations
Pipe
material (Ø
300 mm)
Chapter 4 Chapter 5
Best
trench
design
Lifespan
kg CO2
eq/m in
100
years
Effects of
pavement
degradation
Traffic
load
effects
Recommendation
Concrete Concrete +
soil 100 120 Medium Medium
Embed in soil-based
trench with an
equivalent structural
function
HDPE Soil 50 190 High High
If traffic or pavement
disturbances are
expected, thinner
pipes might need to
be replaced.
Embedding in
concrete might be a
better solution
PVC Soil 50 150 High High
However, because these results are particularly dependent on the technical feasibility of
the designs, a parametric analysis shed light on potential differences among materials
when equivalent designs are studied (Chapter 5). Here, we found that the functions of a
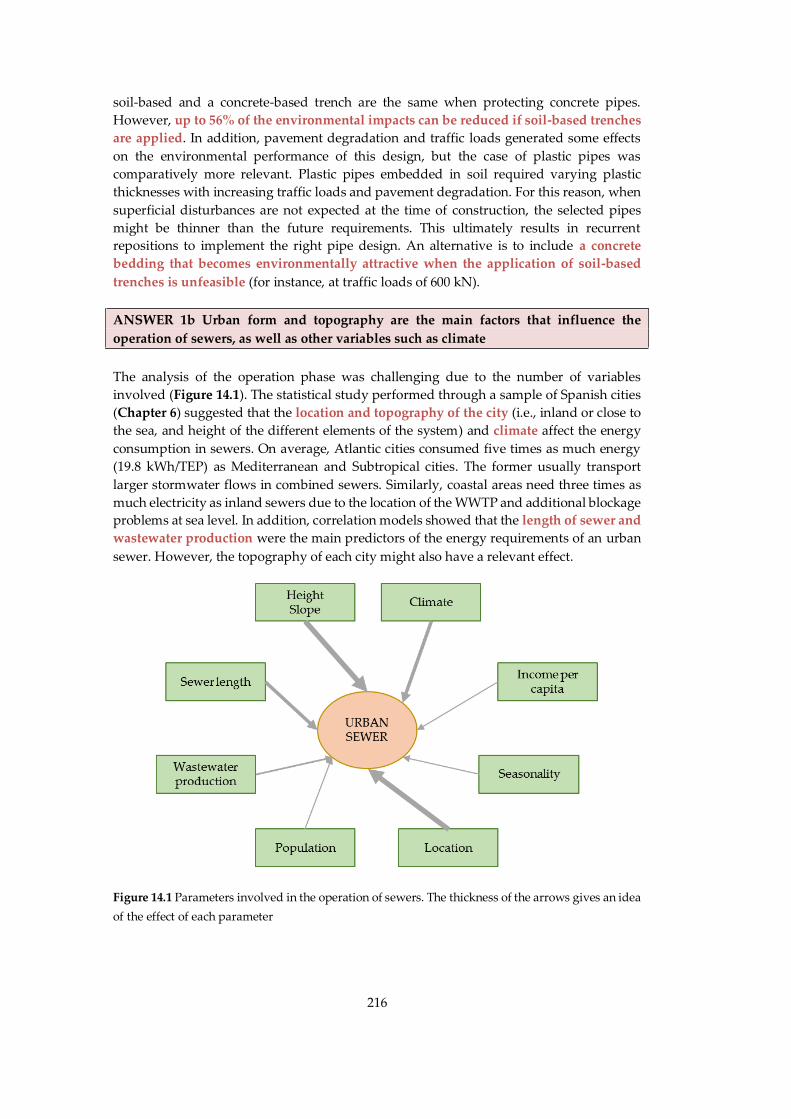
216
soil-based and a concrete-based trench are the same when protecting concrete pipes.
However, up to 56% of the environmental impacts can be reduced if soil-based trenches
are applied. In addition, pavement degradation and traffic loads generated some effects
on the environmental performance of this design, but the case of plastic pipes was
comparatively more relevant. Plastic pipes embedded in soil required varying plastic
thicknesses with increasing traffic loads and pavement degradation. For this reason, when
superficial disturbances are not expected at the time of construction, the selected pipes
might be thinner than the future requirements. This ultimately results in recurrent
repositions to implement the right pipe design. An alternative is to include a concrete
bedding that becomes environmentally attractive when the application of soil-based
trenches is unfeasible (for instance, at traffic loads of 600 kN).
ANSWER 1b Urban form and topography are the main factors that influence the
operation of sewers, as well as other variables such as climate
The analysis of the operation phase was challenging due to the number of variables
involved (Figure 14.1). The statistical study performed through a sample of Spanish cities
(Chapter 6) suggested that the location and topography of the city (i.e., inland or close to
the sea, and height of the different elements of the system) and climate affect the energy
consumption in sewers. On average, Atlantic cities consumed five times as much energy
(19.8 kWh/TEP) as Mediterranean and Subtropical cities. The former usually transport
larger stormwater flows in combined sewers. Similarly, coastal areas need three times as
much electricity as inland sewers due to the location of the WWTP and additional blockage
problems at sea level. In addition, correlation models showed that the length of sewer and
wastewater production were the main predictors of the energy requirements of an urban
sewer. However, the topography of each city might also have a relevant effect.
Figure 14.1 Parameters involved in the operation of sewers. The thickness of the arrows gives an idea
of the effect of each parameter
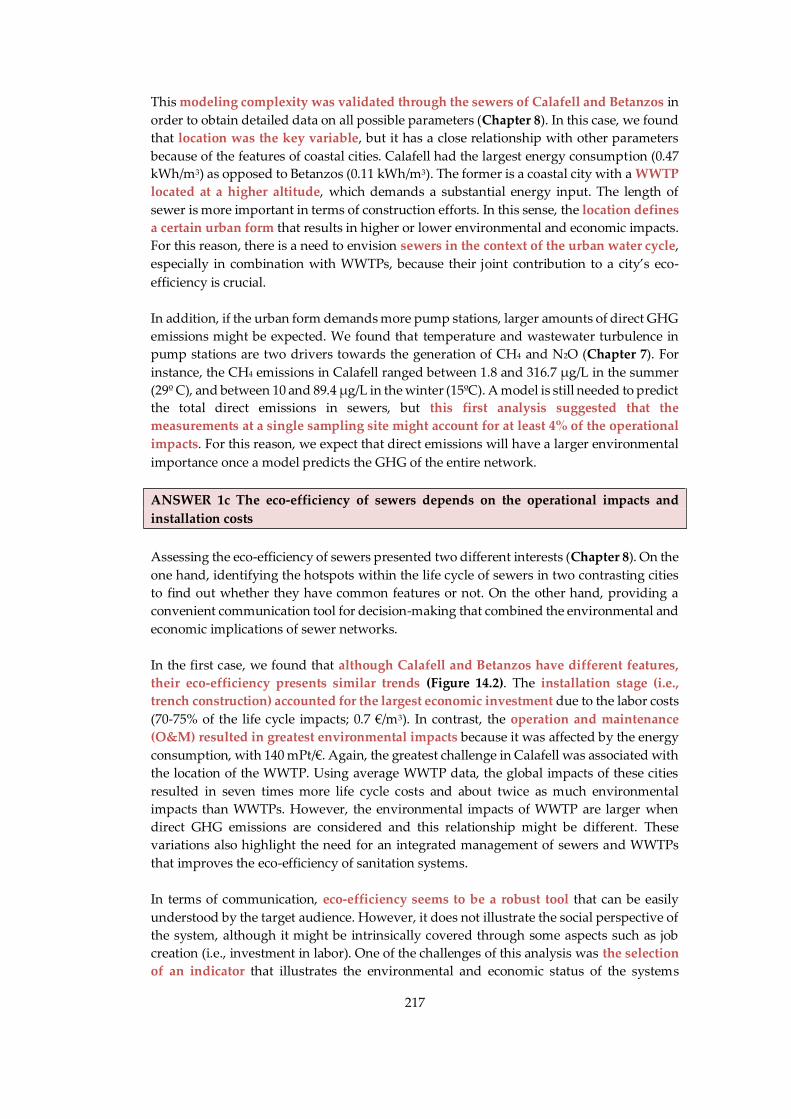
217
This modeling complexity was validated through the sewers of Calafell and Betanzos in
order to obtain detailed data on all possible parameters (Chapter 8). In this case, we found
that location was the key variable, but it has a close relationship with other parameters
because of the features of coastal cities. Calafell had the largest energy consumption (0.47
kWh/m3) as opposed to Betanzos (0.11 kWh/m3). The former is a coastal city with a WWTP
located at a higher altitude, which demands a substantial energy input. The length of
sewer is more important in terms of construction efforts. In this sense, the location defines
a certain urban form that results in higher or lower environmental and economic impacts.
For this reason, there is a need to envision sewers in the context of the urban water cycle,
especially in combination with WWTPs, because their joint contribution to a city’s eco-
efficiency is crucial.
In addition, if the urban form demands more pump stations, larger amounts of direct GHG
emissions might be expected. We found that temperature and wastewater turbulence in
pump stations are two drivers towards the generation of CH4 and N2O (Chapter 7). For
instance, the CH4 emissions in Calafell ranged between 1.8 and 316.7 µg/L in the summer
(29º C), and between 10 and 89.4 µg/L in the winter (15ºC). A model is still needed to predict
the total direct emissions in sewers, but this first analysis suggested that the
measurements at a single sampling site might account for at least 4% of the operational
impacts. For this reason, we expect that direct emissions will have a larger environmental
importance once a model predicts the GHG of the entire network.
ANSWER 1c The eco-efficiency of sewers depends on the operational impacts and
installation costs
Assessing the eco-efficiency of sewers presented two different interests (Chapter 8). On the
one hand, identifying the hotspots within the life cycle of sewers in two contrasting cities
to find out whether they have common features or not. On the other hand, providing a
convenient communication tool for decision-making that combined the environmental and
economic implications of sewer networks.
In the first case, we found that although Calafell and Betanzos have different features,
their eco-efficiency presents similar trends (Figure 14.2). The installation stage (i.e.,
trench construction) accounted for the largest economic investment due to the labor costs
(70-75% of the life cycle impacts; 0.7 €/m3). In contrast, the operation and maintenance
(O&M) resulted in greatest environmental impacts because it was affected by the energy
consumption, with 140 mPt/€. Again, the greatest challenge in Calafell was associated with
the location of the WWTP. Using average WWTP data, the global impacts of these cities
resulted in seven times more life cycle costs and about twice as much environmental
impacts than WWTPs. However, the environmental impacts of WWTP are larger when
direct GHG emissions are considered and this relationship might be different. These
variations also highlight the need for an integrated management of sewers and WWTPs
that improves the eco-efficiency of sanitation systems.
In terms of communication, eco-efficiency seems to be a robust tool that can be easily
understood by the target audience. However, it does not illustrate the social perspective of
the system, although it might be intrinsically covered through some aspects such as job
creation (i.e., investment in labor). One of the challenges of this analysis was the selection
of an indicator that illustrates the environmental and economic status of the systems
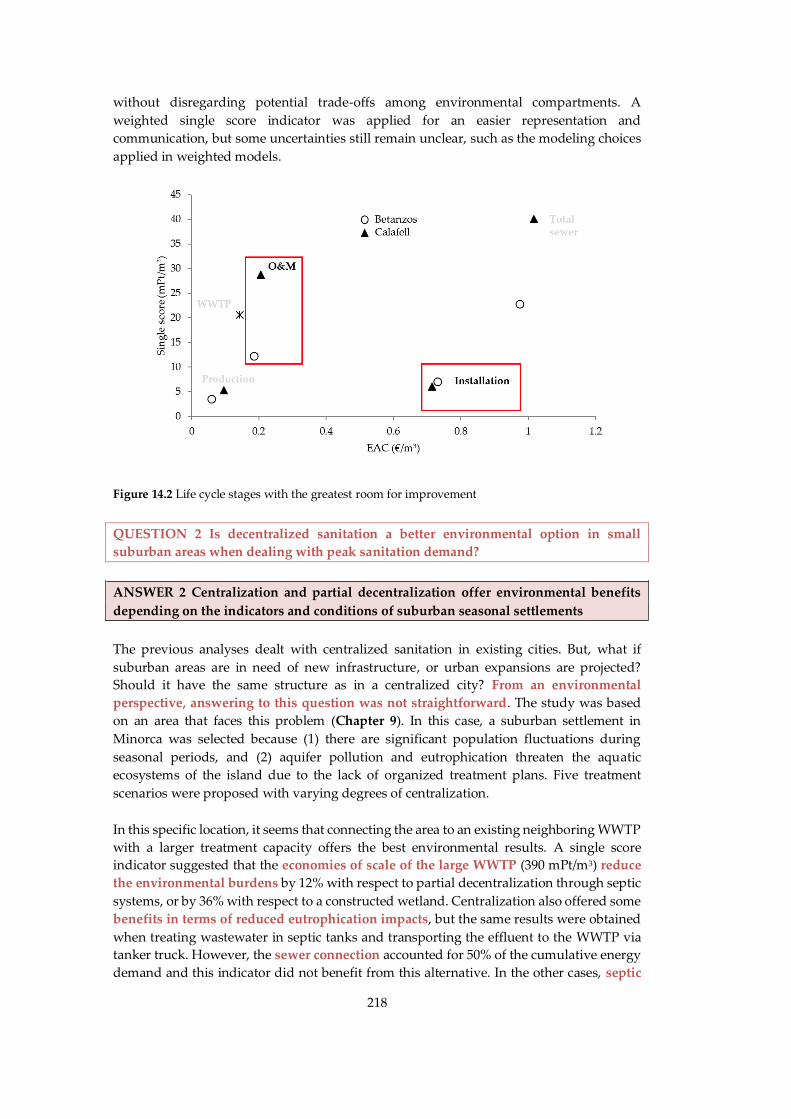
218
without disregarding potential trade-offs among environmental compartments. A
weighted single score indicator was applied for an easier representation and
communication, but some uncertainties still remain unclear, such as the modeling choices
applied in weighted models.
Figure 14.2 Life cycle stages with the greatest room for improvement
QUESTION 2 Is decentralized sanitation a better environmental option in small
suburban areas when dealing with peak sanitation demand?
ANSWER 2 Centralization and partial decentralization offer environmental benefits
depending on the indicators and conditions of suburban seasonal settlements
The previous analyses dealt with centralized sanitation in existing cities. But, what if
suburban areas are in need of new infrastructure, or urban expansions are projected?
Should it have the same structure as in a centralized city? From an environmental
perspective, answering to this question was not straightforward. The study was based
on an area that faces this problem (Chapter 9). In this case, a suburban settlement in
Minorca was selected because (1) there are significant population fluctuations during
seasonal periods, and (2) aquifer pollution and eutrophication threaten the aquatic
ecosystems of the island due to the lack of organized treatment plans. Five treatment
scenarios were proposed with varying degrees of centralization.
In this specific location, it seems that connecting the area to an existing neighboring WWTP
with a larger treatment capacity offers the best environmental results. A single score
indicator suggested that the economies of scale of the large WWTP (390 mPt/m3) reduce
the environmental burdens by 12% with respect to partial decentralization through septic
systems, or by 36% with respect to a constructed wetland. Centralization also offered some
benefits in terms of reduced eutrophication impacts, but the same results were obtained
when treating wastewater in septic tanks and transporting the effluent to the WWTP via
tanker truck. However, the sewer connection accounted for 50% of the cumulative energy
demand and this indicator did not benefit from this alternative. In the other cases, septic
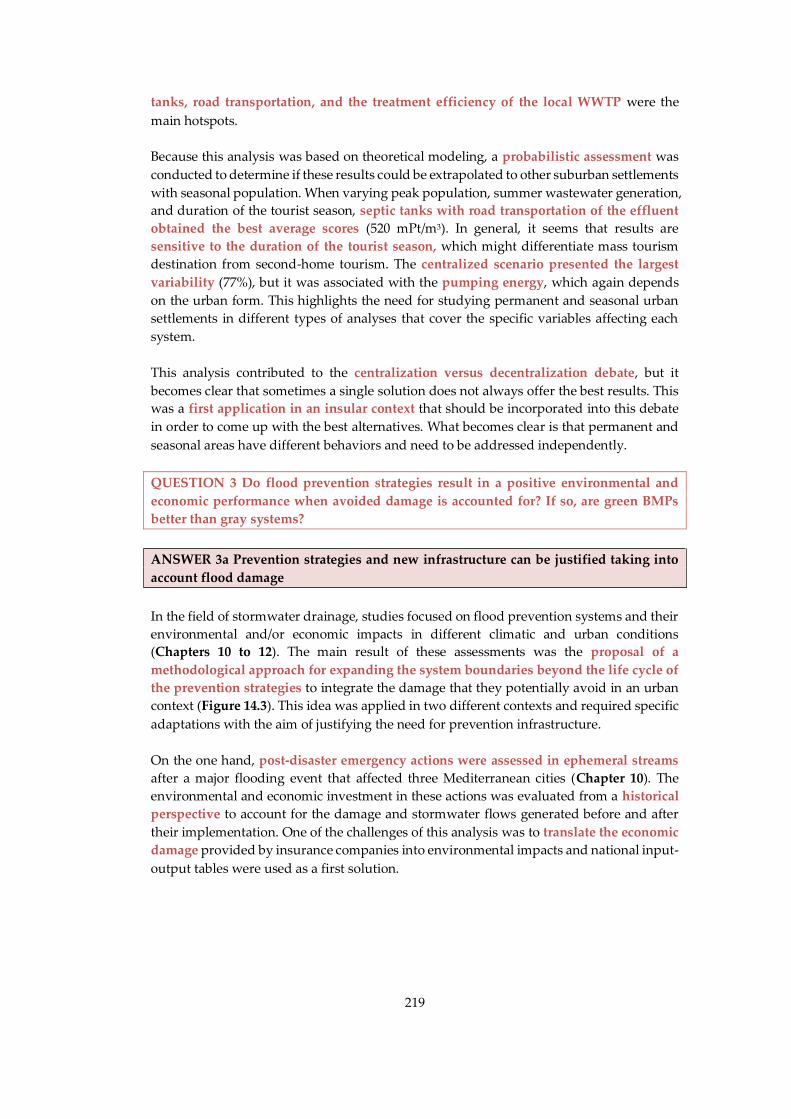
219
tanks, road transportation, and the treatment efficiency of the local WWTP were the
main hotspots.
Because this analysis was based on theoretical modeling, a probabilistic assessment was
conducted to determine if these results could be extrapolated to other suburban settlements
with seasonal population. When varying peak population, summer wastewater generation,
and duration of the tourist season, septic tanks with road transportation of the effluent
obtained the best average scores (520 mPt/m3). In general, it seems that results are
sensitive to the duration of the tourist season, which might differentiate mass tourism
destination from second-home tourism. The centralized scenario presented the largest
variability (77%), but it was associated with the pumping energy, which again depends
on the urban form. This highlights the need for studying permanent and seasonal urban
settlements in different types of analyses that cover the specific variables affecting each
system.
This analysis contributed to the centralization versus decentralization debate, but it
becomes clear that sometimes a single solution does not always offer the best results. This
was a first application in an insular context that should be incorporated into this debate
in order to come up with the best alternatives. What becomes clear is that permanent and
seasonal areas have different behaviors and need to be addressed independently.
QUESTION 3 Do flood prevention strategies result in a positive environmental and
economic performance when avoided damage is accounted for? If so, are green BMPs
better than gray systems?
ANSWER 3a Prevention strategies and new infrastructure can be justified taking into
account flood damage
In the field of stormwater drainage, studies focused on flood prevention systems and their
environmental and/or economic impacts in different climatic and urban conditions
(Chapters 10 to 12). The main result of these assessments was the proposal of a
methodological approach for expanding the system boundaries beyond the life cycle of
the prevention strategies to integrate the damage that they potentially avoid in an urban
context (Figure 14.3). This idea was applied in two different contexts and required specific
adaptations with the aim of justifying the need for prevention infrastructure.
On the one hand, post-disaster emergency actions were assessed in ephemeral streams
after a major flooding event that affected three Mediterranean cities (Chapter 10). The
environmental and economic investment in these actions was evaluated from a historical
perspective to account for the damage and stormwater flows generated before and after
their implementation. One of the challenges of this analysis was to translate the economic
damage provided by insurance companies into environmental impacts and national input-
output tables were used as a first solution.
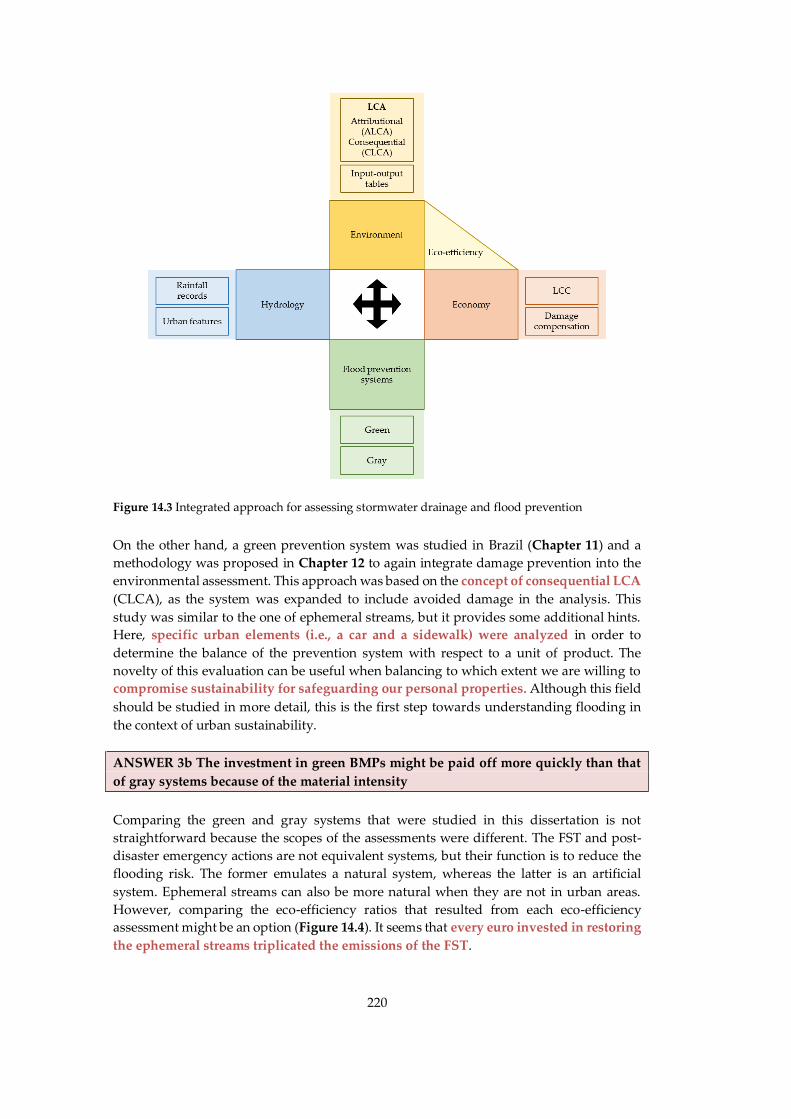
220
Figure 14.3 Integrated approach for assessing stormwater drainage and flood prevention
On the other hand, a green prevention system was studied in Brazil (Chapter 11) and a
methodology was proposed in Chapter 12 to again integrate damage prevention into the
environmental assessment. This approach was based on the concept of consequential LCA
(CLCA), as the system was expanded to include avoided damage in the analysis. This
study was similar to the one of ephemeral streams, but it provides some additional hints.
Here, specific urban elements (i.e., a car and a sidewalk) were analyzed in order to
determine the balance of the prevention system with respect to a unit of product. The
novelty of this evaluation can be useful when balancing to which extent we are willing to
compromise sustainability for safeguarding our personal properties. Although this field
should be studied in more detail, this is the first step towards understanding flooding in
the context of urban sustainability.
ANSWER 3b The investment in green BMPs might be paid off more quickly than that
of gray systems because of the material intensity
Comparing the green and gray systems that were studied in this dissertation is not
straightforward because the scopes of the assessments were different. The FST and post-
disaster emergency actions are not equivalent systems, but their function is to reduce the
flooding risk. The former emulates a natural system, whereas the latter is an artificial
system. Ephemeral streams can also be more natural when they are not in urban areas.
However, comparing the eco-efficiency ratios that resulted from each eco-efficiency
assessment might be an option (Figure 14.4). It seems that every euro invested in restoring
the ephemeral streams triplicated the emissions of the FST.
221
Figure 14.4 Eco-efficiency ratios for two flood prevention strategies
Because the systems and climatic conditions (i.e., Spanish and Brazilian cities) are not the
same, one might argue that perhaps the FST is comparatively more expensive than the
restoration actions and this comparison might be inconclusive. However, the
environmental impacts and economic costs of these actions were balanced with the
potential damage that they prevented. Here, we found that they have an economic
payback of two years, whereas 25 years are needed to offset the environmental
investment. One of the reasons of these environmental results is the material intensity of
the infrastructure, which implies the reconstruction of walls, or restoration of the streams,
and is meant to be durable. In contrast, the FST enabled the sequestration of carbon and
was not concrete intensive, which might have reduced the global warming scores obtained
in the LCA. In fact, the global warming of an FST is expected to be paid off once the
destruction of one car is avoided during a flooding event. In the short term, this might
happen quickly due to the frequency of flooding in the area. Furthermore, the FST
provided additional benefits in terms of stormwater infiltration and storage, and resulted
in a more convenient drainage solution when compared to storing and transporting
stormwater through a pipeline.
Again, this field still requires more analyses that define the actual comparison of green and
gray systems in urban areas. Some ideas were provided in this analysis to enhance the
debate and ease the decision-making process through comparisons that are close to public
concerns.

Picture: Wetland at Maumee Bay State Park, Oregon (Ohio, USA)
Future research
Chapter 15

225
Future research
This research might inspire the elaboration of future analyses in the field of urban
sanitation and drainage that help to improve local sustainability and be a step closer to
sustainable cities.
Potential future research lines might revolve around the following topics:
(1) Sustainability assessment of sewer networks in big cities
(2) Analysis of decentralized systems at different scales
(3) Predictive modeling of flooding consequences
(4) Integration of the ecosystem services approach into the LCA of flood management
15.1 Sustainability assessment of sewer networks in big cities
The results of this dissertation refer to the behavior of small to medium sized cities, which
dominate in most areas of the world. However, the proliferation of big metropolis implies
the creation of large and complex sewer networks that might not follow the same trends
that smaller cities do. For this reason, specific analyses should focus on a sample of big
cities to study:
a) their urban structure and network composition to identify the main materials and
diameters applied.
b) the creation of a model that builds upon the features of each neighborhood (e.g.,
urban form, water consumption, etc.), which are possibly similar to those of a small
city.
c) the environmental, economic and social impacts of these networks, considering
that direct GHG emissions might affect a greater share of the population and social
effects might be more relevant.
With these ideas, the sustainability of sewers might be the result of modeling layers that
combine the social structure of the city, physical properties of the area and the investment
in sanitation infrastructure. To do so, different types of tools are needed. GIS-LCA/LCC
based models might be helpful to associate the environmental impacts with certain sites of
the city. Direct GHG emissions should also be modelled in more detail to predict the
emissions produced along the network, not only at specific sites.
The social dimension can also be monitored through odor maps or sections with recurrent
leakages and maintenance needs that generated traffic delays, noise or dust. In addition,
the features of the stakeholders involved in all life cycle stages might be interesting, such
as working conditions, equality, etc. Life cycle sustainability assessment (LCSA) might be
a feasible method for connecting all data layers and coming up with a piece of information
that is easily understood by citizens and local authorities. As a result, the relationship
between the optimum sewer design and sustainability should lead to improvements at the
city and neighborhood scale and within each life cycle stage.
226
15.2 Analysis of decentralized systems at different scales
Because the centralization debate is usually inconclusive, real-life systems can provide
accurate data for calculating the actual service demand, material use, treatment efficiency,
etc. Still, modeling efforts are highly valuable for addressing variations and potential
applications of a given system, as exemplified in this dissertation. However, scanning a
number of urban, suburban and rural areas might lead to different results under different
conditions.
For example, sprawled suburban areas are on the rise, but they only host permanent
residents, which means that there are no variations in the wastewater generation in the
summer – it might even decrease. In contrast, all-inclusive resorts might also be far away
from urban areas and produce the largest sanitation demand during seasonal periods.
Rural areas are also interesting because they might consist of a very small house ensemble
with different consumption needs.
A precise analysis of different treatment and population scales would provide more
insightful information about potential environmental and economic trends. Different
treatment systems should be assessed in buildings, rural communities, suburban
settlements, and urban neighborhoods. The distance to existing sanitation systems will
condition the results, but they should be considered in a complete set of variables that
includes the population type, density, water consumption patterns and status of the water
bodies.
In this line, parallel research on decentralized systems should also address the provision
of water in these areas. Stormwater was not included in the decentralization debate of this
dissertation, but the variety of options that it offers to users should be assessed from a
technical and sustainability point of view. For instance, suburban areas might benefit from
existing green areas that act as retention systems and provide water during the driest
seasons. This symbiosis is also interesting in the field of food production, as rainwater or
reclaimed water can be used in urban agriculture or other production systems and reduce
the demand for centralized potable water supply. In this sense, different scenarios should
be analyzed to define the optimum systems that provide water for food production or
services at the lowest costs.
15.3 Predictive modeling of flooding consequences
The exact consequences of a flooding event are very difficult to predict. However,
hydrologic models are being adapted to this application in order to identify the areas of a
city that might be most affected by urban runoff. For instance, Ciervo et al. (2015) simulated
flash floods in a small city through numerical modeling and surveys. Still, the
environmental dimension is not present in these assessments.
For this reason, future research should combine sustainability assessments with predictive
risk models that map the specific damage and areas affected by flooding events. This
analysis should also account for climate change patterns in the short and long terms to
obtain more information about the frequency and intensity of future events. This should
enable the quantification and comparison of past, present and future flooding events.
227
Prevention systems should be sized accordingly to determine the environmental and
economic investment needed under each of these conditions. In this context, the
methodologies proposed in this dissertation could be applied, modified and expanded to
include more items and compare different systems with one another. CLCA is one the
fields to explore, as the prospection would not only be accounted for in terms of hydrologic
modeling, but in terms of impacts on sustainability. The modeling principles should be
well defined, with system boundaries that include different expanded systems, such as the
ones related to the materials and energy needed to produce the prevention technologies.
A complete CLCA perspective is complex due to the number of processes involved in the
products and systems, but each assessment should aim to move a step forward to give a
clear picture of the consequences of our decisions.
15.4 Integration of the ecosystem services approach into the LCA of flood
management
The consequences of flooding go beyond the effects on urban infrastructure. Prevention
strategies can be provide additional benefits to humans, such as clean air, water availability
or biodiversity. These benefits should be further addressed and integrated into the current
modeling framework to understand the general effects of these systems. In this context, the
incorporation of the ecosystem services approach into LCA is a field under development
(Zhang et al. 2010a, 2010b).
This type of analysis would be helpful to identify the prevention systems, locations and
conditions that increase the benefits of each alternative. When combined with LCA it
should aim at providing more data for the decision-making process, although quantifying
cultural services, for instance, might complicate this task. LCA models should be adapted
to accommodate these parameters, which might ultimately cover all of the social, economic
and environmental implications of prevention strategies in a comprehensive sustainability
approach.
In fact, damage prevention might as well be considered an ecosystem service, because
humans benefit from not having to replace their cars, furniture, etc. Including this aspect
was complex, which means that ecosystem service analyses should first identify a set of
aspects that stand out as the main problems identified by the society, for instance.
Understanding how each of these services is created is of paramount importance if we seek
to explain why cities must adapt to climate change and become more resilient.

228
229
References
©Suez services company. 2012. CONTEC (Control Técnico del Ciclo Integral del Agua) and SGO
(Sistema de Gestión Operativa). ©Aqualogy services company.
Abril, P. and R. Argemí. 2009. Application of an energy saving and efficiency programme to wastewater
treatment plants: methodology and first results (Aplicació del programa d’estalvi i eficiència energética
a les estacions de depuració d’aigües residuals: metodologia i primers resulta. IV Jornades Tècniques de
Gestió de Sistemes de Sanejament D’aigües Residuals.
AEMET. Spanish National Meteorological Agency. 2013. Standard Climate Values.
http://www.aemet.es/en/serviciosclimaticos/datosclimatologicos/valoresclimatologicosAccess
ed November 2013.
AG. GEBERIT INTERNATIONAL. 1998. Environmental comparison of domestic sewage pipes of
different materials (Ökobilanz von Rohren zur Hausentwässerung). Geberit International AG,
Switzerland.
Ahn, Y.-H. 2006. Sustainable nitrogen elimination biotechnologies: A review. Process Biochemistry
41(8): 1709–1721. http://linkinghub.elsevier.com/retrieve/pii/S1359511306001280. Accessed
July 30, 2014.
Akhtar, S., B. Reza, K. Hewage, A. Shahriar, A. Zargar, and R. Sadiq. 2014. Life cycle sustainability
assessment (LCSA) for selection of sewer pipe materials. Clean Technologies and Environmental
Policy 17(4): 973–992. http://link.springer.com/10.1007/s10098-014-0849-x. Accessed March 13,
2015.
Alberti, M. 1996. Measuring urban sustainability. Environmental Impact Assessment Review 16(4–6):
381–424. http://linkinghub.elsevier.com/retrieve/pii/S0195925596000832. Accessed January 30,
2017.
Alberti, M. 2010. Maintaining ecological integrity and sustaining ecosystem function in urban areas.
Current Opinion in Environmental Sustainability.
Alberti, M. and L. Susskind. 1996. Managing urban sustainability: An introduction to the special issue.
Environmental Impact Assessment Review 16(4–6): 213–221.
http://linkinghub.elsevier.com/retrieve/pii/S0195925596000704. Accessed January 30, 2017.
Allenby, B.R. 1992. Achieving sustainable development through industrial ecology. International
Environmental Affairs 4(1): 56–68.
Amores, M.J., M. Meneses, J. Pasqualino, A. Antón, and F. Castells. 2013. Environmental assessment
of urban water cycle on Mediterranean conditions by LCA approach. Journal of Cleaner
Production 43: 84–92. http://dx.doi.org/10.1016/j.jclepro.2012.12.033.
Anders, K. and A. Anders. 1997. Environmental assessment of sewage pipes in PVC, PE, PP and
concrete (Miljøvurdering af afløbsrør i PVC, PE, PP og beton). DOR/Nordiska Plaströrgruppen,
Stockholm, Sweden.
Angrill, S., R. Farreny, C.M. Gasol, X. Gabarrell, B. Viñolas, A. Josa, and J. Rieradevall. 2012.
Environmental analysis of rainwater harvesting infrastructures in diffuse and compact urban
models of Mediterranean climate. The International Journal of Life Cycle Assessment 17(1): 25–42.

230
http://link.springer.com/10.1007/s11367-011-0330-6. Accessed July 14, 2014.
Angrill, S., L. Segura-Castillo, A. Petit-Boix, J. Rieradevall, X. Gabarrell, and A. Josa. 2016.
Environmental performance of rainwater harvesting strategies in Mediterranean buildings.
The International Journal of Life Cycle Assessment in press: 1–12.
http://link.springer.com/10.1007/s11367-016-1174-x. Accessed August 25, 2016.
Aparicio, F. 1999. Fundamentos de hidrología de superfície. Limusa, México.
Aquaenvec. 2015. Assessment and improvement of the urban water cycle eco-efficiency using LCA
and LCC. Layman’s report 2012-2015. http://www.life-aquaenvec.eu/wp-
content/uploads/2016/05/AF-LAYMANS-AQUAENVEC-LR.pdf.
Arpke, A. and N. Hutzler. 2006. Domestic Water Use in the United States. A Life-Cycle Approach.
Journal of Industrial Ecology 10(1): 169–184.
ASTM Standard C118. 2011. Standard Specification for Concrete Pipe for Irrigation or Drainage. DOI:
10.1520/C0118-11, www.astm.org.
ASTM Standard D2321. 2014. Standard Practice for Underground Installation of Thermoplastic Pipe for
Sewers and Other Gravity-Flow Applications. DOI: 10.1520/D2321-14, www.astm.org.
Augas de Galicia. Xunta de Galicia. 2011. Annex III: Water use and demand. Galicia-Costa
Hydrological Demarcation (Anejo III: Usos y demandas de agua. Demarcación Hidrográfica
de Galicia-Costa). http://augasdegalicia.xunta.es/PHGC/PHGC-
ES/PHGC_Anexo_3_Usos_Demandas.pdf Accessed January 2014.
Balkema, A.J., H.A. Preisig, R. Otterpohl, and F.J.. Lambert. 2002. Indicators for the sustainability
assessment of wastewater treatment systems. Urban Water 4(2): 153–161.
Baptista, M., N. Nascimento, and S. Barraud. 2005. Compensatory techniques in urban drainage (Técnicas
compensatórias em Drenagem Urbana). Brazilian Association of Water Resources. Porto Alegre.
Barbosa, A.E., J.N. Fernandes, and L.M. David. 2012. Key issues for sustainable urban stormwater
management. Water Research 46(20): 6787–6798.
Bare, J.C., P. Hofstetter, D.W. Pennington, and H.A.U. de Haes. 2000. Midpoints versus endpoints:
The sacrifices and benefits. The International Journal of Life Cycle Assessment 5(6): 319–326.
http://link.springer.com/10.1007/BF02978665. Accessed August 18, 2016.
Barjoveanu, G., I.M. Comandaru, G. Rodriguez-Garcia, A. Hospido, and C. Teodosiu. 2014.
Evaluation of water services system through LCA. A case study for Iasi City, Romania. The
International Journal of Life Cycle Assessment 19(2): 449–462.
http://link.springer.com/10.1007/s11367-013-0635-8. Accessed July 30, 2014.
Barrera, A., M.C. Llasat, and M. Barriendos. 2006. Estimation of extreme flash flood evolution in
Barcelona County from 1351 to 2005. Natural Hazards and Earth System Sciences 6(4): 505–518.
Beale, D.J., D.R. Marlow, and S. Cook. 2013. Estimating the Cost and Carbon Impact of a Long Term
Water Main Rehabilitation Strategy. Water Resources Management 27(11): 3899–3910.
http://link.springer.com/10.1007/s11269-013-0386-0. Accessed July 30, 2014.
Bizier, P. 2007. Gravity Sanitary Sewer Design and Construction. ASCE 2nd E. ASCE Publications: ASCE
231
Publications. http://books.google.com/books?id=Ya3vPw0guGIC&pgis=1. Accessed August 25,
2014.
Blanco, A., P. Pujadas, S.H.P. Cavalaro, and A. Aguado. 2014. Methodology for the design of
controlled low-strength materials. Application to the backfill of narrow trenches. Construction
and Building Materials 72: 23–30.
http://www.sciencedirect.com/science/article/pii/S095006181401023X. Accessed December 10,
2015.
Bobylev, N. 2011. Comparative analysis of environmental impacts of selected underground
construction technologies using the analytic network process. Automation in Construction 20(8):
1030–1040. http://linkinghub.elsevier.com/retrieve/pii/S0926580511000537. Accessed August
28, 2014.
BOE. 2001a. Real Decreto 1098/2001 de 12 de octubre, por el que se aprueba el Reglamento general
de la Ley de Contratos de las Administraciones Públicas 257.
BOE. 2001b. Real Decreto Legislativo 1/2001, de 20 de julio, por el que se aprueba el texto refundido
de la Ley de Aguas (BOE-A-2001-14276) 176.
Boon, A. 1995. Septicity in sewers - Causes, consequences and containment. Water Sci. Technol 31(7):
237–253.
Boon, A., A. Vincent, and K. Boon. 1998. Avoiding the problems of septic sewage. Water Sci. Technol
37(1): 223–231.
Bottero, M. and D. Peila. 2005. The use of the Analytic Hierarchy Process for the comparison between
microtunnelling and trench excavation. Tunnelling and Underground Space Technology 20(6):
501–513. http://linkinghub.elsevier.com/retrieve/pii/S0886779805000210. Accessed August 28,
2014.
Bouchard, N.R., D.L. Osmond, R.J. Winston, and W.F. Hunt. 2013. The capacity of roadside vegetated
filter strips and swales to sequester carbon. Ecological Engineering 54: 227–232.
http://linkinghub.elsevier.com/retrieve/pii/S0925857413000335. Accessed July 30, 2014.
Brattebø, H. 2005. Toward a Methods Framework for Eco-efficiency Analysis? Journal of Industrial
Ecology 9(4): 9–11. http://doi.wiley.com/10.1162/108819805775247837.
Brouwer, R. and R. van Ek. 2004. Integrated ecological, economic and social impact assessment of
alternative flood control policies in the Netherlands. Ecological Economics 50(1): 1–21.
Bueno, S.M. 2010. What lies underground? Trenchless technology polls Municipalities on sewer pipe
usage. 2010. Pipe Materials Guide, Trenchless Technology Special Supplement: 8–11.
Butler, D. and J.W. Davies. 2000. Urban Drainage. 3rd Ed. Spon Press, an imprint of Taylor & Francis.
London and New York.
Camarasa Belmonte, A.M. and F. Segura Beltrán. 2001. Flood events in Mediterranean ephemeral
streams (ramblas) in Valencia region, Spain. CATENA 45(3): 229–249.
http://www.sciencedirect.com/science/article/pii/S0341816201001461. Accessed March 23, 2015.
Catalan Water Agency. 2003. Technical recommendations for flooding studies at a local level (Recomanacions
tècniques per als estudis dínundabilitat d’àmbit local). Barcelona, Spain.
232
Catalan Water Agency. 2015. Official project documents provided by the archive of the Catalan Water
Agency, Barcelona.
Catalan Water Agency. 2016. Data consultation. http://aca-
web.gencat.cat/aca/appmanager/aca/aca?_nfpb=true&_pageLabel=P3800245291211883042687.
Catalano De Sousa, M., A. Erispaha, S. Spatari, and F. Montalto. 2011. LCA as a Tool to Evaluate
Green Infrastructure’s Environmental Performance. American Geophysical Union.
http://adsabs.harvard.edu/abs/2011AGUFMGC43B0896C. Accessed September 23, 2015.
CEDEX. Centre for Hydrographic Studies. 2009. Technical guide on sewer networks and urban drain (Guía
técnica sobre redes de saneamiento y drenaje urbano). 3rd ed. Centro de Publicaciones, Madrid:
Ministerio de Fomento. Secretaría General Técnica.
Chan, A.L.S. and T.T. Chow. 2013. Energy and economic performance of green roof system under
future climatic conditions in Hong Kong. Energy and Buildings 64: 182–198.
http://linkinghub.elsevier.com/retrieve/pii/S0378778813002910. Accessed July 15, 2014.
Chen, A.S., M.J. Hammond, S. Djordjević, D. Butler, D.M. Khan, and W. Veerbeek. 2016. From hazard
to impact: flood damage assessment tools for mega cities. Natural Hazards.
http://link.springer.com/10.1007/s11069-016-2223-2. Accessed March 1, 2016.
Chen, D. and P. Szostak. 2013. Factor analysis of H2S emission at a wastewater lift station: a case
study. Environmental Monitoring and Assessment 185(4): 3551–60.
http://www.ncbi.nlm.nih.gov/pubmed/22941185. Accessed December 23, 2013.
Ciervo, F., M.N. Papa, V. Medina, and A. Bateman. 2015. Simulation of flash floods in ungauged
basins using post-event surveys and numerical modelling. Journal of Flood Risk Management 8(4):
343–355. http://doi.wiley.com/10.1111/jfr3.12103. Accessed April 24, 2017.
CLABSA. Clavegueram de Barcelona; S.A. 2013. Personal Communication. Acer, 16, 08038 Barcelona,
Spain.
Cleemput, O. Van. 1998. Subsoils: chemo- and biological denitrification, N2O and N2 emissions.
Nutrient Cycling in Agroecosystems 52(2–3): 187–194.
Clemens, J. and B. Haas. 1997. Nitrous Oxide Emissions in Sewer Systems. Acta Hydrochimica et
Hydrobiologica 25(2): 96–99. http://doi.wiley.com/10.1002/aheh.19970250207.
Cohen R, G. Wolff, E. Cousins, and B. Greenfield. 2004. Energy Down the Drain. The Hidden Costs of
California’s Water Supply. Natural Resources Defense Council, Pacific Institute, Oakland,
California.
Cornejo, P.K., Q. Zhang, and J.R. Mihelcic. 2016. How does scale of implementation impact the
environmental sustainability of wastewater treatment integrated with resource recovery?
Environmental Science & Technology. http://dx.doi.org/10.1021/acs.est.5b05055. Accessed March
28, 2016.
Corominas, L., J. Foley, J.S. Guest, A. Hospido, H.F. Larsen, S. Morera, and A. Shaw. 2013. Life cycle
assessment applied to wastewater treatment: state of the art. Water Research 47(15): 5480–92.
http://www.sciencedirect.com/science/article/pii/S004313541300540X. Accessed October 1,
2014.
233
Council Directive. EC 2000/60/EC of 23 October 2000 on establishing a framework for Community
action in the field of water policy.
Council of the European Union. 1991. Council Directive of 21 May 1991 concerning Urban Waste
Water Treatment (91/271/EEC). Official J. Eur. Commun. L 34(May 1991): 1–16.
http://scholar.google.com/scholar?hl=en&btnG=Search&q=intitle:COUNCIL+DIRECTIVE+of+
21+May+1991+concerning+urban+waste+water+treatment+(91/271/EEC)#1.
CPSA. Concrete Pipeline Systems Association. 2010. PAS 2050- partial lifecycle assessment. Cradle-
to-gate analysis for concrete pipeline. Manhole Ring and Cover Slab. Leicester.
CREM. Centro Regional de Estadística de Murcia. 2011. Evolution of the total Gross Available Income
per home and per capita (Evolución de la Renta Disponible Bruta total de los hogares y per
cápita). http://www.carm.es/econet/sicrem/PU_datosBasicos/sec167.html Accessed November
2013.
Crites, R.W. and G. Tchobanoglous. 1998. Small and decentralized wastewater management systems.
McGrawHill Series in Water Resources and Environmental Engineering: 1084.
http://books.google.com/books?id=yx9SAAAAMAAJ&pgis=1.
Crossland, C.J., D. Baird, J.-P. Ducrotoy, H. Lindeboom, R.W. Buddemeier, W.C. Dennison, B.A.
Maxwell, S. V. Smith, and D.P. Swaney. 2005. The Coastal Zone — a Domain of Global
Interactions. In Coastal Fluxes in the Anthropocene. The Land-Ocean Interactions in the Coastal Zone
Project of the International Geosphere-Biosphere. Editors: Crossland, C.J., Kremer, H.H., Lindeboom,
H., Marshall Crossland, J.I., Le Tissier, M.D.A. (Eds.) Programme.
CYPE Ingenieros. 2015. Construction costs generator [Generador de precios de la construcción]
http://www.generadordeprecios.info/.
Czemiel Berndtsson, J. 2010. Green roof performance towards management of runoff water quantity
and quality: A review. Ecological Engineering 36(4): 351–360.
http://www.sciencedirect.com/science/article/pii/S0925857410000029. Accessed April 15, 2015.
Czepiel, P., P. Crill, and R. Harriss. 1995. Nitrous oxide emissions from municipal wastewater
treatment. Environmental Science & Technology 29(9): 2352–6.
http://www.ncbi.nlm.nih.gov/pubmed/22280278.
Daelman, M.R.J., B. De Baets, M.C.M. van Loosdrecht, and E.I.P. Volcke. 2013. Influence of sampling
strategies on the estimated nitrous oxide emission from wastewater treatment plants. Water
Research 47(9): 3120–30. http://www.ncbi.nlm.nih.gov/pubmed/23557698. Accessed December
23, 2013.
Davies, J., B. Clarke, J. Whiter, R. Cunningham, and A. Leidi. 2001. The structural condition of rigid
sewer pipes: a statistical investigation. Urban Water 3(4): 277–286.
http://linkinghub.elsevier.com/retrieve/pii/S146207580100036X.
Davis, J.L., N. Dana, S. Kameron, and D.. J. Roberts. 1998. Analysis of concrete from corroded sewer
pipe. International Biodeterioration & Biodegradation 42(1): 75–84.
http://linkinghub.elsevier.com/retrieve/pii/S0964830598000493.
Day, T.J. 2000. Sewer management systems. John Wiley & Sons.
Debruyn, W., G. Lissens, J. Rensbergen, and M. Wevers. 1994. Nitrous oxide emissions from waste
234
water 31(1): 159–165.
Deletic, A. and T.D. Fletcher. 2006. Performance of grass filters used for stormwater treatment—a
field and modelling study. Journal of Hydrology 317(3–4): 261–275.
http://linkinghub.elsevier.com/retrieve/pii/S0022169405002726. Accessed July 30, 2014.
Dennison, F.J., A. Azapagic, R. Clift, and F.S. Coulbourne. 1999. Life Cycle Assessment: Comparing
strategic options for the mains infrastructure - Part I. Water Science and Technology 39(10): 315–
319.
Desloover, J., S.E. Vlaeminck, P. Clauwaert, W. Verstraete, and N. Boon. 2012. Strategies to mitigate
N2O emissions from biological nitrogen removal systems. Current Opinion in Biotechnology
23(3): 474–82. http://www.ncbi.nlm.nih.gov/pubmed/22244791. Accessed December 23, 2013.
Devkota, J., H. Schlachter, and D. Apul. 2015. Life Cycle Based Evaluation of Harvested Rainwater
Use in Toilets and for Irrigation. Journal of Cleaner Production.
http://www.sciencedirect.com/science/article/pii/S0959652615001341. Accessed February 23,
2015.
Diaz-Valbuena, L.R., H.L. Leverenz, C.D. Cappa, G. Tchobanoglous, W.R. Horwath, and J.L. Darby.
2011. Methane, carbon dioxide, and nitrous oxide emissions from septic tank systems.
Environmental Science & Technology 45(7): 2741–7. http://dx.doi.org/10.1021/es1036095. Accessed
March 15, 2016.
Dierkes, C., L. Kuhlmann, J. Kandasamy, and G. Angelis. 2002. Pollution Retention Capability and
Maintenance of Permeable Pavements. In Global Solutions for Urban Drainage, 1–13. ASCE.
http://cedb.asce.org/cgi/WWWdisplay.cgi?133447. Accessed February 18, 2015.
Dincer, F. and A. Muezzinoglu. 2007. Odor Determination at Wastewater Collection Systems:
Olfactometry versus H2S Analyses. CLEAN – Soil, Air, Water 35(6): 565–570.
http://doi.wiley.com/10.1002/clen.200700057. Accessed February 14, 2013.
Doka, G. 2003. Ecoinvent report No. 13, Part IV: Wastewater Treatment. Ecoinvent report for v1.3.
Domene, E. and D. Saurí. 2003. Urban Models and Water Consumption. Watering of private gardens
in the Metropolitan Region of Barcelona (Modelos Urbanos y Consumo de Agua. El Riego de
Jardines Privados en la Región Metropolitana de Barcelona). Investigaciones Geográficas 32: 5–
17.
Domene, E. and D. Saurí. 2006. Urbanisation and water consumption: Influencing factors in the
metropolitan region of Barcelona. Urban Studies 43(9): 1605–1623.
Doorn, M.R.J., S. Towprayoon, S.M. Manso Vieira, W. Irving, C. Palmer, R. Pipatti, and C. Wang.
2006. 2006 IPCC Guidelines for National Greenhouse Gas Inventories, Chapter 6: Wastewater
Treatment and Discharge. Japan.
Downton, M.W. and R.A. Pielke. 2005. How Accurate are Disaster Loss Data? The Case of U.S. Flood
Damage. Natural Hazards 35(2): 211–228. http://link.springer.com/10.1007/s11069-004-4808-4.
Accessed March 3, 2016.
Drunen, M., Tukker, A., Rioolbuizen, M. Van. 2000. Life cycle of wastewater pipes made from PVC,
concrete and HD-PE. Pub: Institute for Environmental Studies (IVM) and TNO-STB, DELFT,
Netherlands.
235
EA. The Environment Agency. 2008. Greenhouse gas emissions of water supply and demand management
options. Science Report - SC070010. Environment Agency, Bristol, UK.
EA. The Environment Agency. 2010. Energy and carbon implications of rainwater harvesting and
greywater recycling. Science Report SC090018.
Earles, J.M. and A. Halog. 2011. Consequential life cycle assessment: a review. The International
Journal of Life Cycle Assessment 16(5): 445–453. http://link.springer.com/10.1007/s11367-011-
0275-9. Accessed November 19, 2014.
EC-JRC. 2010a. International Reference Life Cycle Data System (ILCD) handbook: General guide for Life
Cycle Assessment - Detailed guidance. Luxembourg: European Commission - Joint Research
Centre - Institute for Environment and Sustainability. Publications Office of the European
Union.
EC-JRC. 2010b. Framework and Requirements for Life Cycle Impact Assessment Models and Indicators.
International Reference Life Cycle Data System (ILCD) Handbook.
http://eplca.jrc.ec.europa.eu/uploads/ILCD-Handbook-LCIA-Framework-Requirements-
ONLINE-March-2010-ISBN-fin-v1.0-EN.pdf%5Cnhttp://eplca.jrc.ec.europa.eu/.
EEA. 1999. Environmental indicators : Typology and overview. European Environment Agency. Vol. 25.
Eggimann, S., B. Truffer, and M. Maurer. 2015. To connect or not to connect? Modelling the optimal
degree of centralisation for wastewater infrastructures. Water Research 84: 218–231.
http://linkinghub.elsevier.com/retrieve/pii/S004313541530107X. Accessed March 17, 2017.
Ehrenfeld, J.R. 2005. Eco-efficiency Philosophy, Theory, and Tools. Journal of Industrial Ecology 9(4):
6–8.
Eijo-Río, E., A. Petit-Boix, G. Villalba, M.E. Suárez-Ojeda, D. Marin, M.J. Amores, X. Aldea, J.
Rieradevall, and X. Gabarrell. 2015. Municipal sewer networks as sources of nitrous oxide,
methane and hydrogen sulphide emissions: A review and case studies. Journal of Environmental
Chemical Engineering 3(3): 2084–2094.
http://www.sciencedirect.com/science/article/pii/S2213343715001773. Accessed August 24,
2015.
Ekins, P. 2005. Eco-efficiency: Motives, Drivers, and Economic Implications. Journal of Industrial
Ecology 9(4): 12–15.
El-Fadel, M. and M. Massoud. 2001. Methane emissions from wastewater management.
Environmental Pollution 114(2): 177–85. http://www.ncbi.nlm.nih.gov/pubmed/11504340.
EN 1401-1:2009. Plastic piping systems for non-pressure underground drainage and sewerage. Unplasticized
poly(vinyl chloride) (PVC-U). Specifications for pipes, fittings and the system. British Standards
Institution.
EN 15804:2011. Sustainability of construction works - Environmental product declarations - Core
rules for the product category of construction works. European Standard. Brussels, Belgium:
European Committee for Standardization.
EN 1916:2002. Concrete pipes and fitting, unreinforced, steel fibre and reinforced. AENOR, Madrid, Spain.
ESRI (Environmental Systems Resource Institute). 2016. ArcGIS Desktop: Release 10.4. Redlands CA.
236
European Commission. 2013. Building a Green Infrastructure for Europe. European Union ISBN 978-92-
79-33428-3.
European Commission. Joint Research Centre (JRC)/ Netherlands Environmental Assessment
Agency (PBL). 2009. Emission Database for Global Atmospheric Research (EDGAR), release
version 4.0. http://edgar.jrc.ec.europa.eu.
European Council. 2007. Directive 2007/60/EC of the European Parliament and of the Council of 23
October 2007 on the assessment and management of flood risks.
Eurostat. 2015. Water statistics on national level. http://ec.europa.eu/eurostat/data/database.
Farmani, R. and D. Butler. 2014. Implications of Urban Form on Water Distribution Systems
Performance. Water Resources Management 28: 83–97.
Farreny, R., X. Gabarrell, and J. Rieradevall. 2011. Cost-efficiency of rainwater harvesting strategies
in dense Mediterranean neighbourhoods. Resources, Conservation and Recycling 55(7): 686–694.
http://linkinghub.elsevier.com/retrieve/pii/S0921344911000103. Accessed July 27, 2014.
Fenner, R.A. 2000. Approaches to sewer maintenance: a review. Urban Water 2: 343–356.
Feo, G. de, G. Antoniou, H.F. Fardin, F. El-Gohary, X.Y. Zheng, I. Reklaityte, D. Butler, S.
Yannopoulos, and A.N. Angelakis. 2014. The historical development of sewers worldwide.
Sustainability (Switzerland).
Filion, Y.R. 2008. Impact of Urban Form on Energy Use in Water Distribution Systems. J. Infrastruct.
Syst. 14(December): 337–346.
FLOODsite. 2008. Intensity of rainfall.
http://www.floodsite.net/juniorfloodsite/html/en/student/thingstoknow/hydrology/rainfallint
ensity.html. Accessed February 19, 2015.
Flynn, K.M. and R.G. Traver. 2013. Green infrastructure life cycle assessment: A bio-infiltration case
study. Ecological Engineering 55: 9–22.
http://linkinghub.elsevier.com/retrieve/pii/S0925857413000190. Accessed July 9, 2014.
Foley, J. and P. Lant. 2009. Direct Methane and Nitrous Oxide emissions from full-scale wastewater
treatment systems. Water Services Association of Australia Ltd(24).
Fragkou, M.C., T. Vicent, and X. Gabarrell. 2016. An ecosystemic approach for assessing the urban
water self-sufficiency potential: lessons from the Mediterranean. Urban Water Journal 13(7):
663–675.
Friedrich, E., S. Pillay, and C.A. Buckley. 2009. Carbon footprint analysis for increasing water supply
and sanitation in South Africa: a case study. Journal of Cleaner Production 17(1): 1–12.
http://linkinghub.elsevier.com/retrieve/pii/S0959652608000486. Accessed January 31, 2013.
Frischknecht, R., N. Jungbluth, H.-J. Althaus, G. Doka, R. Dones, T. Heck, S. Hellweg, et al. 2005. The
ecoinvent database: Overview and methodological framework. International Journal of Life Cycle
Assessment 10: 3–9.
Frosch, R.A. 1992. Industrial ecology: a philosophical introduction. Proceedings of the National Academy
of Sciences of the United States of America 89(3): 800–3.
237
http://www.ncbi.nlm.nih.gov/pubmed/11607255. Accessed February 1, 2017.
Fuchs, V.J., J.R. Mihelcic, and J.S. Gierke. 2011. Life cycle assessment of vertical and horizontal flow
constructed wetlands for wastewater treatment considering nitrogen and carbon greenhouse
gas emissions. Water Research 45(5): 2073–81.
http://www.sciencedirect.com/science/article/pii/S0043135410008687. Accessed April 14, 2016.
Gabarrell, X., J. Rieradevall, and C. Gasol. 2013. LCADB.sudoe. Base de datos para la realización de
Análisis del Ciclo de Vida para la región Sudoe. Register of Community Trade Marks No:
010999373.
Gallego, A., A. Hospido, M.T. Moreira, and G. Feijoo. 2008. Environmental performance of
wastewater treatment plants for small populations. Resources, Conservation and Recycling 52(6):
931–940. http://www.sciencedirect.com/science/article/pii/S092134490800030X. Accessed April
12, 2016.
Garcia-Solsona, E., J. Garcia-Orellana, P. Masqué, E. Garcés, O. Radakovitch, A. Mayer, S. Estradé,
and G. Basterretxea. 2010. An assessment of karstic submarine groundwater and associated
nutrient discharge to a Mediterranean coastal area (Balearic Islands, Spain) using radium
isotopes. Biogeochemistry 97(2–3): 211–229. http://link.springer.com/10.1007/s10533-009-9368-y.
Accessed March 17, 2017.
Garner, A. and G.A. Keoleian. 1995. Industrial ecology: an introduction. Ann Arbor, Michigan: National
Pollution Prevention Center for Higher Education, University of Michigan.
Getter, K.L., D.B. Rowe, and J. a. Andresen. 2007. Quantifying the effect of slope on extensive green
roof stormwater retention. Ecological Engineering 31(4): 225–231.
http://linkinghub.elsevier.com/retrieve/pii/S0925857407001309. Accessed July 10, 2014.
Getter, K.L., D.B. Rowe, G.P. Robertson, B.M. Cregg, and J. a Andresen. 2009. Carbon sequestration
potential of extensive green roofs. Environmental Science & Technology 43(19): 7564–70.
http://www.ncbi.nlm.nih.gov/pubmed/19848177.
Gikas, P. and G. Tchobanoglous. 2009. Sustainable use of water in the Aegean Islands. Journal of
Environmental Management 90(8): 2601–11.
http://www.sciencedirect.com/science/article/pii/S0301479709000243. Accessed March 16, 2016.
GISAgua. 2012. ©Aqualogy Services Company.
Gleick, P. 1996. Basic water requirements for human activities: meeting basic needs. Water
International 21: 83–92.
Goedkoop, M., R. Heijungs, and R. Huijbregts M, De Schryver A, Struijs J, Van Zelm. 2009. ReCiPe
2008, A Life Cycle Impact Assessment Method Which Comprises Harmonised Category Indicators at
the Midpoint and the Endpoint Level. Report I: Characterisation. First Ed. Available at:
http://www.lcia-recipe.net.
Google Maps. 2015. Res. Damha I - Google Maps.
https://www.google.es/maps/place/Res.+Damha+I,+SP,+Brazil/@-21.9642108,-
47.9018604,995m/data=!3m2!1e3!4b1!4m2!3m1!1s0x94b8705d8cf52391:0xd2a66e30c1e9ecea7.90
18604,995m/data=!3m2!1e3!4b1!4m2!3m1!1s0x94b8705d8cf52391:0xd2a66e30c1e9ecea.
Accessed February 19, 2015.
238
Gössling, S., P. Peeters, C.M. Hall, J.-P. Ceron, G. Dubois, L.V. Lehmann, and D. Scott. 2012. Tourism
and water use: Supply, demand, and security. An international review. Tourism Management
33(1): 1–15. http://www.sciencedirect.com/science/article/pii/S0261517711000793. Accessed
August 14, 2015.
Goverment of the Balearic Islands. 2016. Agreement of the Council of Government issued on
September 23, 2016, whereby the Council of Government of the Balearic Islands ratifies the
Annual Plan for Sustainable Tourism Promotion for the period 2016. Butlletí Oficial de Les Illes
Balears 122: 28893–28897.
Government of the Balearic Islands. 2015. Hydrologic plan of the Balearic Islands (Pla Hidrològic de les
Illes Balears, Real Decret 701/2015).
Graedel, T.E. 1996. On the concept of industrial ecology. Annual Review of Energy and the Environment
21(1): 69–98. http://www.annualreviews.org/doi/10.1146/annurev.energy.21.1.69. Accessed
February 1, 2017.
Griffiths-Sattenspiel, B. and W. Wilson. 2009. The Carbon Footprint of Water.
Guha-Sapir, D., R. Below, and P. Hoyois. 2009. EM-DAT: International Disaster Database. Université
Catholique de Louvain – Brussels – Belgium. www.emdat.be Accessed December 2014.
Guinée JB, Gorrée M, Heijungs R, Huppes G, Kleijn R, Koning A de, Oers L van, Wegener Sleeswijk
A, Suh S, Udo de Haes HA, Bruijn H de, Duin R van, H.M. 2002. Handbook on life cycle assessment.
Operational guide to the ISO standards. I: LCA in perspective. IIa: Guide. IIb: Operational annex. III:
Scientific background. Kluwer Academic Publishers, ISBN 1-4020-0228-9, Dordrecht, 692 pp.
Guisasola, A., D. de Haas, J. Keller, and Z. Yuan. 2008. Methane formation in sewer systems. Water
Research 42(6–7): 1421–30. http://www.ncbi.nlm.nih.gov/pubmed/17988709. Accessed February
12, 2013.
Guisasola, A., K.R. Sharma, J. Keller, and Z. Yuan. 2009. Development of a model for assessing
methane formation in rising main sewers. Water Research 43(11): 2874–84.
http://www.ncbi.nlm.nih.gov/pubmed/19423146. Accessed December 23, 2013.
Gutierrez, O., D. Park, K.R. Sharma, and Z. Yuan. 2009. Effects of long-term pH elevation on the
sulfate-reducing and methanogenic activities of anaerobic sewer biofilms. Water Research 43(9):
2549–57. http://www.ncbi.nlm.nih.gov/pubmed/19345393. Accessed December 23, 2013.
Gutierrez, O., G. Sudarjanto, G. Ren, R. Ganigué, G. Jiang, and Z. Yuan. 2014. Assessment of pH
shock as a method for controlling sulfide and methane formation in pressure main sewer
systems. Water Research 48: 569–78. http://www.ncbi.nlm.nih.gov/pubmed/24210545. Accessed
July 29, 2014.
Haes, H.A.U., R. Heijungs, S. Suh, and G. Huppes. 2004. Three Strategies to Overcome the Limitations
of Life-Cycle Assessment. Journal of Industrial Ecology 8(3): 19–32.
http://doi.wiley.com/10.1162/1088198042442351. Accessed September 1, 2016.
Haghighi, A. and A.E. Bakhshipour. 2012. Optimization of Sewer Networks Using an Adaptive
Genetic Algorithm. Water Resources Management 26(12): 3441–3456.
http://link.springer.com/10.1007/s11269-012-0084-3. Accessed August 29, 2014.
Hawkins, T.R., B. Singh, G. Majeau-Bettez, and A.H. Strømman. 2013. Comparative Environmental
239
Life Cycle Assessment of Conventional and Electric Vehicles. Journal of Industrial Ecology 17(1):
53–64. http://doi.wiley.com/10.1111/j.1530-9290.2012.00532.x. Accessed July 10, 2014.
Haynes, H., R. Haynes, and G. Pender. 2008. Integrating socio-economic analysis into decision-
support methodology for flood risk management at the development scale (Scotland). Water
and Environment Journal 22(2): 117–124. http://doi.wiley.com/10.1111/j.1747-6593.2007.00086.x.
Accessed November 3, 2016.
Heijungs, R. 2013. Ten easy lessons for good communication of LCA. International Journal of Life Cycle
Assessment: 1–4.
Hellström, D., U. Jeppsson, and E. Kärrman. 2000. A framework for systems analysis of sustainable
urban water management. Environmental Impact Assessment Review 20(3): 311–321.
Hertwich, E.G. and J.K. Hammitt. 2001. A decision-analytic framework for impact assessment. The
International Journal of Life Cycle Assessment 6(5): 265–272.
http://link.springer.com/10.1007/BF02978787. Accessed February 13, 2017.
Hischier, R., B. Weidema, H. Althaus, C. Bauer, G. Doka, R. Dones, R. Frischknecht, et al. 2010.
Implementation of life cycle impact assessment methods. Final report ecoinvent v2.2 No. 3.
Swiss Centre for Life Cycle Inventories, Dübendorf. Swiss Centre for Life Cycle Inventories,
Dübendorf.
Hodges, S.H. and J.I. Enyart. 1993. Standard installation. International Conference on Pipeline
Infrastructure. Texas.
Hospido, A., M.T. Moreira, and G. Feijoo. 2008. A Comparison of Municipal Wastewater Treatment
Plants for Big Centres of Population in Galicia ( Spain ). International Journal of Life Cycle
Assessment 13(1): 57–64.
Hospido, A., M.T. Moreira, M. Fernández-Couto, and G. Feijoo. 2004. Environmental performance of
a municipal wastewater treatment plant. The International Journal of Life Cycle Assessment 9(4):
261–271. http://link.springer.com/10.1007/BF02978602.
Hu, H.-Y., Y.-L. Cheng, and J.-Y. Lin. 2007. On-Site Treatment of Septic Tank Effluent by Using a Soil
Adsorption System. Practice Periodical of Hazardous, Toxic, and Radioactive Waste Management
11(3): 197–206. http://ascelibrary.org/doi/10.1061/%28ASCE%291090-
025X%282007%2911%3A3%28197%29. Accessed April 13, 2017.
Huppes, G. and M. Ishikawa. 2005a. Eco-efficiency and Its Terminology. Journal of Industrial Ecology
9(4): 43–46.
Huppes, G. and M. Ishikawa. 2005b. A framework for quantified eco-efficiency analysis. Journal of
Industrial Ecology 9(4): 25–41.
Hvitved-Jacobsen, T. Vollertsen, J. and N. Tanaka. 2000. An integrated aerobic/anaerobic approach
for prediction of sulphide formation in sewer. Water Sci. Technol 41(6): 107–115.
Hvitved-Jacobsen, T., J. Vollertsen, and A.H. Nielsen. 2002. Sewer Processes: Microbial and Chemical
Process Engineering of Sewer Networks. 2nd ed. CRC Press.
IBESTAT. Statistical Institute of the Balearic Islands. 2015. Tourism.
http://www.ibestat.es/ibestat/estadistiques/economia/turisme/0b70b294-81e0-413a-b7b2-
240
3cc3a33593a8.
ICGC. Institut Cartogràfic i Geològic de Catalunya. 2016. Cartography and geodesy. http://icgc.cat/.
Idescat. Statistical Institute of Catalonia. 2016. Municipal database.
http://www.idescat.cat/territ/BasicTerr?TC=9.
IEA. International Energy Agency. 2014. Spain: Electricity and Heat for 2011.
http://www.iea.org/statistics/statisticssearch/report/?country=SPAIN&product=electricityand
heat&year=2011. Accessed April 2014.
IECA. Instituto de Estadística y Cartografía de Andalucía. 2010. Andalusian Municipalities. Basic Data
2010 (Municipios Andaluces. Datos Básicos 2010). Consejería de Economía y Hacienda.
ieex. Instituto Estadístico de Extremadura. 2011. Socioeconomic atlas of Extremadura 2011 -
Summary (Atlas Socioeconómico de Extremadura 2011- Resumen). http://estadistica.gobex.es/
Accessed November 2013.
IGE. Instituto Galego de Estadística. 2009. Primary and secondary distribution of the income per
council (Contas de asignación primaria e de distribución secundaria da renda por concellos).
http://www.ige.eu/igebdt/esq.jsp?ruta=verEjes.jsp%3FCOD%3D4221%26M%3D%26S%3D%2
6RET%3D%26ORD%3D&paxina=001&c=0307007004 Accessed November 2013.
IMF. International Monetary Fund. 2015. World Economic Outlook Database.
http://www.imf.org/external/pubs/ft/weo/2014/01/weodata/weorept.aspx?sy=2008&ey=2014&
scsm=1&ssd=1&sort=country&ds=.&br=1&pr1.x=47&pr1.y=4&c=223&s=PCPIE%252CPCPIEP
CH&grp=0&a= Accessed October 2014.
INE. Instituto Nacional de Estadística. 2013. Population and household census, Press notice (Censos
de Población y Viviendas 2011, Notas de prensa). http://www.ine.es/prensa/np824.pdf
Accessed January 2014.
INE. Spanish Statistical Office. 2014. Air emissions accounting, 2008-2012.
http://www.ine.es/jaxi/Tabla.htm?path=/t26/p084/serie/l0/&file=01001.px&L=0.
INE. Spanish Statistical Office. 2015. Spanish National Accounting, 2010.
http://www.ine.es/jaxi/menu.do?type=pcaxis&path=/t35/p008/&file=inebase.
INMET. Instituto Nacional de Meteorologia. 2014. Daily accumulated rainfall of Sao Carlos 1961-
2014. http://www.inmet.gov.br/portal/ Accessed October 2014.
Institut d’Estudis Catalans and Generalitat de Catalunya. 2016. Tercer Informe sobre el Canvi Climàtic
a Catalunya.
Insurance Compensation Consortium (Consorcio de Compensación de Seguros). 2015. Extraordinary
risks, Series 1971-2014 (Riesgos extraordinarios, Serie 1971-2014). Madrid, Spain.
INTRON. 1995. Environmental profile and environmental measures of a concrete external sewer
[Intron report No. 95027] and Environmental profile and environmental measures of an
external sewer of PVC and vitrified clay in comparison to concrete [Intron report No. 95195].
INTRON, Netherlands.
IPMet. Instituto de Pesquisas Meteorológicas. 2014. Natural Disaster Database (Banco de Dados de
241
Desastres Naturais).
http://www.ipmet.unesp.br/index2.php?abre=ipmet_html/defesa_civil/index.php Accessed
January 2015.
ISO 14040:2006. Environmental management - Life cycle assessment - Principles and framework.
Geneva, Switzerland: International Organization for Standardization.
ISO 14044:2006. Environmental management - Life cycle assessment - Requirements and guidelines.
Geneva, Switzerland: International Organization for Standardization.
ISO 14045:2012. Environmental management — Ecoefficiency assessment of product systems —
Principles, requirements and guidelines. Geneva, Switzerland: International Organization for
Standardization.
ISO 15686-5:2008. Buildings and constructed assets - Sevice-life planning - Part 5: Life-cycle costing.
Geneva, Switzerland: International Organization for Standardization.
Jha, A., R. Bloch, and J. Lamond. 2012. Cities and Flooding. A Guide to Integrated Urban Flood Risk
Management for the 21st Century. The World Bank, Washington, D.C.
Jha, A., J. Lamond, R. Bloch, N. Bhattacharya, A. Lopez, N. Papachristodoulou, A. Bird, D. Proverbs,
J. Davies, and R. Barker. 2011. Five Feet High and Rising. Cities and Flooding in the 21st Century.
Policy Research Working Paper. http://www-
wds.worldbank.org/external/default/WDSContentServer/IW3P/IB/2011/05/03/000158349_2011
0503095951/Rendered/PDF/WPS5648.pdf. Accessed January 15, 2016.
Jiang, F., D.H.-W. Leung, S. Li, G.-H. Chen, S. Okabe, and M.C.M. van Loosdrecht. 2009a. A biofilm
model for prediction of pollutant transformation in sewers. Water Research 43(13): 3187–98.
http://www.ncbi.nlm.nih.gov/pubmed/19487008. Accessed July 30, 2014.
Jiang, G., O. Gutierrez, K.R. Sharma, and Z. Yuan. 2010. Effects of nitrite concentration and exposure
time on sulfide and methane production in sewer systems. Water Research 44(14): 4241–51.
http://www.ncbi.nlm.nih.gov/pubmed/20554309. Accessed February 12, 2013.
Jiang, G., K.R. Sharma, A. Guisasola, J. Keller, and Z. Yuan. 2009b. Sulfur transformation in rising
main sewers receiving nitrate dosage. Water Research 43: 4430–4440.
Jin, N.J., H.G. Hwang, and J.H. Yeon. 2013. Structural analysis and optimum design of GRP pipes
based on properties of materials. Construction and Building Materials 38: 316–326.
http://linkinghub.elsevier.com/retrieve/pii/S0950061812006411. Accessed September 1, 2014.
Jolliet, O., R. Müller-Wenk, J. Bare, A. Brent, M. Goedkoop, R. Heijungs, N. Itsubo, et al. 2004. The
LCIA midpoint-damage framework of the UNEP/SETAC life cycle initiative. The International
Journal of Life Cycle Assessment 9(6): 394–404. http://link.springer.com/10.1007/BF02979083.
Accessed April 5, 2017.
Jonkman, S.N., M. Bočkarjova, M. Kok, and P. Bernardini. 2008. Integrated hydrodynamic and
economic modelling of flood damage in the Netherlands. Ecological Economics 66(1): 77–90.
Junta d’Aigües. 1992. Master plan for flood protection in Maresme (Pla Director de protecció contra
avingudes al Maresme).
Kadlec, R.H. and S.D. Wallace. 2009. Treatment Wetlands, Second Edition. In Treatment Wetlands,
242
Second Edition, 965.
Kägi, T., F. Dinkel, R. Frischknecht, S. Humbert, J. Lindberg, S. De Mester, T. Ponsioen, S. Sala, and
U.W. Schenker. 2016. Session “Midpoint, endpoint or single score for decision-making?”—
SETAC Europe 25th Annual Meeting, May 5th, 2015. The International Journal of Life Cycle
Assessment 21(1): 129–132. http://link.springer.com/10.1007/s11367-015-0998-0. Accessed
August 18, 2016.
Kampschreur, M.J., H. Temmink, R. Kleerebezem, M.S.M. Jetten, and M.C.M. van Loosdrecht. 2009.
Nitrous oxide emission during wastewater treatment. Water Research 43(17): 4093–103.
http://www.ncbi.nlm.nih.gov/pubmed/19666183. Accessed December 11, 2013.
Kennedy, C.A. 2016. Industrial Ecology and Cities. In Taking Stock of Industrial Ecology, 69–86. Cham:
Springer International Publishing. http://link.springer.com/10.1007/978-3-319-20571-7_4.
Accessed February 1, 2017.
Kennedy, C., L. Baker, S. Dhakal, and A. Ramaswami. 2012. Sustainable Urban Systems: An
Integrated Approach. Journal of Industrial Ecology.
Kennedy, C., J. Cuddihy, and J. Engel-Yan. 2007. The Changing Metabolism of Cities. Journal of
Industrial Ecology 11(2): 43–59. http://doi.wiley.com/10.1162/jie.2007.1107. Accessed February 1,
2017.
Kennedy, C., S. Pincetl, and P. Bunje. 2010. The study of urban metabolism and its applications to
urban planning and design. Environmental Pollution 159(8–9): 1965–73.
http://www.ncbi.nlm.nih.gov/pubmed/21084139.
Kirtman, B., S.B. Power, J.A. Adedoyin, G.J. Boer, R. Bojariu, I. Camilloni, F.J. Doblas-Reyes, et al.
2013. Near-term Climate Change: Projections and Predictability. Climate Change 2013: The
Physical Science Basis. Contribution of Working Group I to the Fifth Assessment Report of the
Intergovernmental Panel on Climate Change: 953–1028.
Klein, J.J.M. de and A.K. van der Werf. 2014. Balancing carbon sequestration and GHG emissions in
a constructed wetland. Ecological Engineering 66: 36–42.
Klein G, Krebs M, Hall V, O’Brien T, B.B. 2005. California â€TM s Water – Energy Relationship. Final Staff
Report.
Knoeri, C., E. Sanyé-Mengual, and H. Althaus. 2013. Comparative LCA of recycled and conventional
concrete for structural applications. International Journal of Life Cycle Assessment (online)(DOI
10.1007/s11367-012-0544-2).
Kosareo, L. and R. Ries. 2007. Comparative environmental life cycle assessment of green roofs.
Building and Environment 42(7): 2606–2613.
http://linkinghub.elsevier.com/retrieve/pii/S0360132306001648. Accessed July 10, 2014.
Kousky, C. and S.H. Schneider. 2003. Global climate policy: Will cities lead the way? Climate Policy
3(4): 359–372.
Kubal, C., D. Haase, V. Meyer, and S. Scheuer. 2009a. Integrated urban flood risk assessment –
adapting a multicriteria approach to a city. Natural Hazards and Earth System Science 9(6): 1881–
1895.
243
Kubal, C., D. Haase, V. Meyer, and S. Scheuer. 2009b. Integrated urban flood risk assessment –
adapting a multicriteria approach to a city. Natural Hazards and Earth System Science 9(6): 1881–
1895. http://www.nat-hazards-earth-syst-sci.net/9/1881/2009/. Accessed November 3, 2016.
Kundzewicz, Z.W., L.J. Mata, N.W. Arnell, P. Döll, P. Kabat, B. Jiménez, K.A. Miller, T. Oki, Z. Sen,
and I.A. Shiklomanov. 2007. Freshwater resources and their management. Climate Change 2007:
Impacts, Adaptation and Vulnerability. Contribution of Working Group II to the Fourth Assessment
Report of the Intergovernmental Panel on Climate Change, M.L. Parry, O.F. Canziani, J.P. Palut.
Cambridge University Press, Cambridge, UK, 173-210.
La Fuente, A. De, R.C. Escariz, A.D. De Figueiredo, and A. Aguado. 2013. Design of macro-synthetic
fibre reinforced concrete pipes. Construction and Building Materials 43: 523–532.
la Fuente A, Escariz RC, de Figueiredo AD, Molins C, Aguado A, de. 2012. A new design method for
steel fibre reinforced concrete pipes. Construction and Building Materials 30: 547–555.
http://www.sciencedirect.com/science/article/pii/S0950061811006921. Accessed August 29,
2014.
Lahav, O., A. Sagiv, and E. Friedler. 2006. A different approach for predicting H2S(g) emission rates
in gravity sewers. Water Research 40(2): 259–66.
http://www.ncbi.nlm.nih.gov/pubmed/16343590. Accessed February 14, 2013.
Lassaux, S., R. Renzoni, and A. Germain. 2007. Life Cycle Assessment of Water: from the Pumping
Station to the Wastewater Treatment Plant. International Journal 12(2): 118–126.
http://www.csa.com/partners/viewrecord.php?requester=gs&collection=TRD&reci
d=08130351EN.
Lee, C.C. 2005. Environmental engineering dictionary. Government Institutes.
https://books.google.es/books?id=f1lnQwrvOSEC&pg=PA81&lpg=PA81&dq=methods+that+h
ave+been+determined+to+be+the+most+effective,+practical+means+of+preventing+or+reduci
ng+pollution+from+nonpoint+source&source=bl&ots=LRW-
FRguzI&sig=YLpH84PvFW0qeUzT0ppCuM_4cdU. Accessed April 27, 2017.
Lee, J.Y., H.J. Moon, T.I. Kim, H.W. Kim, and M.Y. Han. 2013. Quantitative analysis on the urban
flood mitigation effect by the extensive green roof system. Environmental Pollution (Barking,
Essex : 1987) 181: 257–61. http://www.ncbi.nlm.nih.gov/pubmed/23892044. Accessed July 16,
2014.
Leeuwen, C.J. van, J. Frijns, A. van Wezel, and F.H.M. van de Ven. 2012. Cities Blueprints: 24
Indicators to Assess the Sustainability of the Urban Water Cycle. Water Resources Management
26(8): 2177–2197. http://link.springer.com/10.1007/s11269-012-0009-1. Accessed July 30, 2014.
Lehtoranta, S., R. Vilpas, and T.J. Mattila. 2014. Comparison of carbon footprints and eutrophication
impacts of rural on-site wastewater treatment plants in Finland. Journal of Cleaner Production 65:
439–446. http://www.sciencedirect.com/science/article/pii/S0959652613005647. Accessed
February 5, 2016.
Lemos, D., A.C. Dias, X. Gabarrell, and L. Arroja. 2013. Environmental assessment of an urban water
system. Journal of Cleaner Production 54: 157–165.
http://linkinghub.elsevier.com/retrieve/pii/S0959652613002643. Accessed July 30, 2014.
Listowski, A., H.H. Ngo, W.S. Guo, S. Vigneswaran, H.S. Shin, and H. Moon. 2011. Greenhouse Gas
(GHG) Emissions from Urban Wastewater System : Future Assessment Framework and
Methodology. Journal of Water Sustainability 1(1): 113–125.
244
Lleonart, I. and X. Tarruella. 2010. Municipal urban plan of Cabrils - Preliminary sustainability report.
http://www.cabrils.cat/pdf/poum/av/textes/IAP%20POUM%20CABRILS_280210.pdf.
Llopart-Mascaró A, Farreny, R, Gabarrell, X, Rieradevall, J, Gil, A, Martínez, M, Puertas, J, Suárez, J.,
H. Río, and M. Paraira. 2015. Storm tank against combined sewer overflow: Operation
strategies to minimise discharges impact to receiving waters. Urban Water Journal 12(3): 219–
228. http://dx.doi.org/10.1080/1573062X.2013.868499. Accessed August 1, 2014.
Lorenzo-Toja, Y., C. Alfonsín, M.J.M.J. Amores, X. Aldea, D. Marin, M.T.M.T. Moreira, G. Feijoo, D.
Marín-Navarro, M.T.M.T. Moreira, and G. Feijoo. 2016a. Beyond the conventional life cycle
inventory in wastewater treatment plants. Science of Total Environment 553: 71–82.
Lorenzo-Toja, Y., I. Vázquez-Rowe, M.J. Amores, M. Termes-Rifé, D. Marín-Navarro, M.T. Moreira,
and G. Feijoo. 2016b. Benchmarking wastewater treatment plants under an eco-efficiency
perspective. Science of The Total Environment 566: 468–479.
Lorenzo-Toja, Y., I. Vázquez-Rowe, S. Chenel, D. Marín-Navarro, M.T. Moreira, and G. Feijoo. 2015.
Eco-efficiency analysis of Spanish WWTPs using the LCA+DEA method. Water Research 68:
651–666. http://www.sciencedirect.com/science/article/pii/S0043135414007386. Accessed
November 3, 2014.
Lotito, A.D., P. Wunderlin, A. Joss, M. Kipf, and H. Siegrist. 2012. Nitrous oxide emissions from the
oxidation tank of a pilot activated sludge plant. Water Research 46: 3563–3573.
Loubet, P., P. Roux, E. Loiseau, and V. Bellon-Maurel. 2014. Life cycle assessments of urban water
systems: A comparative analysis of selected peer-reviewed literature. Water Research 67: 187–
202. http://www.sciencedirect.com/science/article/pii/S004313541400623X. Accessed
September 19, 2014.
Lü, Y., S. Liu, and B. Fu. 2012. Ecosystem Service: From Virtual Reality to Ground Truth.
Environmental Science & Technology 46(7): 4255–4255. http://dx.doi.org/10.1021/es300911q.
Accessed June 26, 2015.
Lucas, A.H. 2011. Monitoramento e modelagem de um sistema filtro-vala-trincheira de infiltração
em escala real. PhD Thesis. Universidade Federal de São Carlos.
Lucas, A.H., A.P. Barbassa, and R.B. Moruzzi. 2013. Modelagem de um sistema filtro-vala-trincheira
de infiltração pelo método de Puls adaptado para calibração de parâmetros. Revista Brasileira
de Recursos Hídricos 18: 135–236.
Lundin, M., M. Bengtsson, and S. Molander. 2000. Life Cycle Assessment of Wastewater
Systems: Influence of System Boundaries and Scale on Calculated Environmental Loads.
Environmental Science & Technology 34(1): 180–186. http://dx.doi.org/10.1021/es990003f.
Accessed March 23, 2015.
Lundström, H., Ölund, G., RydbergG, T. 1996. Life cycle assessment of a concrete sewage pipe. CIT
Ekologik, The Nordic Project on Sustainable Concrete Technology. Chalmers Industriteknik.
Maa, C., M.T. Ju, X.C. Zhang, and H.Y. Li. 2011. Energy consumption and carbon emissions in a
coastal city in China. In Procedia Environmental Sciences, 4:1–9.
Mahgoub, E.-S.M.M., N.P. van der Steen, K. Abu-Zeid, and K. Vairavamoorthy. 2010. Towards
sustainability in urban water: a life cycle analysis of the urban water system of Alexandria City,
245
Egypt. Journal of Cleaner Production 18(10–11): 1100–1106.
http://linkinghub.elsevier.com/retrieve/pii/S0959652610000478. Accessed July 30, 2014.
Makropoulos, C.K., K. Natsis, S. Liu, K. Mittas, and D. Butler. 2008. Decision support for sustainable
option selection in integrated urban water management. Environmental Modelling & Software
23(12): 1448–1460.
Malgrat, P., J.M. Verdejo, and A. Vilalta. 2004. Los depósitos de retención de aguas pluviales de
Barcelona. Tecno Ambiente 144: 13–17.
Marques, R.C., N.F. da Cruz, and J. Pires. 2015. Measuring the sustainability of urban water services.
Environmental Science & Policy 54: 142–151.
Marston, A. 1930. The theory of external loads on closed conduits in the light of the latest experiments. Bulletin
96. Vol. Iowa Engin. Bulletin 96, Iowa Engineering Experiments Station, Ames, Iowa.
McDonald, R.I. 2008. Global urbanization: Can ecologists identify a sustainable way forward?
Frontiers in Ecology and the Environment.
McDonnell, M.J. and S.T.A. Pickett. 1990. Ecosystem structure and function along urban-rural
gradients: an unexploited opportunity for ecology. Ecology.
McGrath, T.J., R.E. Chambers, and P.A. Sharff. 1990. Recent trends in installation standards for plastic
pipe. Buried plastic pipe technology. ASTM STP 1093: 281–293.
Meehl, G.A., T.F. Stocker, W.D. Collins, P. Friedlingstein, A.T. Gaye, J.M. Gregory, A. Kitoh, et al.
2007. Global Climate Projections. In: Climate Change 2007: The Physical Science Basis. Contribution
of Working Group I to the Fourth Assessment Report of the Intergovernmental Panel on Climate Change
[Solomon, S., D. Qin, M. Manning, Z. Chen, M. Marquis, K.B. A. Cambridge University Press,
Cambridge, United Kingdom and New York, NY, USA.
Mendoza, J.-M., J. Oliver-Solà, X. Gabarrell, and A. Rieradevall J, Josa. 2012. Planning strategies for
promoting environmentally suitable pedestrian pavements in cities. Transportation Research
Part D: Transport and Environment 17(6): 442–450.
http://linkinghub.elsevier.com/retrieve/pii/S1361920912000533. Accessed May 23, 2013.
Mentens, J., D. Raes, and M. Hermy. 2006. Green roofs as a tool for solving the rainwater runoff
problem in the urbanized 21st century? Landscape and Urban Planning 77(3): 217–226.
http://linkinghub.elsevier.com/retrieve/pii/S0169204605000496. Accessed July 9, 2014.
MetaBase ITeC. 2010. Online ITeC database: prices, technical details, companies, certificates, product
pictures and environmental data. http://www.itec.cat/metabase. Accessed February 2013.
Metcalf and Eddy. Inc. 1991. Wastewater Engineering: Treatment, Disposal and Reuse. 3rd ed. McGraw-
Hill, New York.
Meteocat. Servei Meteorològic de Catalunya. 2014. Automatic stations (Estacions automàtiques).
http://www.meteo.cat/xema/AppJava/Mapper.do Accessed April 2014.
Meteogalicia. 2014. Estacións meteorolóxicas.
http://www2.meteogalicia.es/galego/observacion/estacions/estacionsHistorico.asp?Nest=1904
5&prov=Pontevedra&red=102109&tiporede=agro&idprov=3#. Accessed July 1, 2014.
246
Mohanakrishnan, J., O. Gutierrez, R.L. Meyer, and Z. Yuan. 2008. Nitrite effectively inhibits sulfide
and methane production in a laboratory scale sewer reactor. Water Research 42(14): 3961–71.
http://www.ncbi.nlm.nih.gov/pubmed/18675440. Accessed December 23, 2013.
Morera, S., C. Remy, J. Comas, and L. Corominas. 2016. Life cycle assessment of construction and
renovation of sewer systems using a detailed inventory tool. The International Journal of Life
Cycle Assessment 21(8): 1121–1133. http://link.springer.com/10.1007/s11367-016-1078-9.
Accessed August 3, 2016.
Moser, A.P. 2001. Buried Plastic Pipe Technology, Issue 1093. ASTM International.
http://books.google.com/books?id=nTf6qPe3lBgC&pgis=1. Accessed August 29, 2014.
Muga, H.E. and J.R. Mihelcic. 2008. Sustainability of wastewater treatment technologies. Journal of
Environmental Management 88(3): 437–447.
Müller, D.K., C.M. Hall, and D. Keen. 2004. Second home tourism impact, planning and management.:
15–32.
http://www.cabdirect.org/abstracts/20043135949.html;jsessionid=F0459400AE8D3561B114D6E
7F43F1E06. Accessed April 13, 2016.
Muñoz, I., L. Milà-I-Canals, and A.R. Fernández-Alba. 2010. Life Cycle Assessment of Water Supply
Plans in Mediterranean Spain: The Ebro River Transfer Versus the AGUA Programme. Journal
of Industrial Ecology 14: 902–918.
Murla, D., O. Gutierrez, M. Martinez, D. Suñer, P. Malgrat, and M. Poch. 2016. Coordinated
management of combined sewer overflows by means of environmental decision support
systems. Science of The Total Environment 550: 256–264.
Nielsen, A.H., P. Lens, J. Vollertsen, and T. Hvitved-Jacobsen. 2005. Sulfide-iron interactions in
domestic wastewater from a gravity sewer. Water Research 39(12): 2747–55.
http://www.ncbi.nlm.nih.gov/pubmed/15978649. Accessed July 30, 2014.
Nielsen, A.H., J. Vollertsen, H.S. Jensen, T. Wium-Andersen, and T. Hvitved-Jacobsen. 2008.
Influence of pipe material and surfaces on sulfide related odor and corrosion in sewers. Water
Research 42: 4206–4214.
Nielsen, C.B., J. Schaumann, S. Hvorslev, and P. Sejersen. 1998. Sewage pipe components in PVC, PP,
HDPE and concrete (Afløbskomponenter af PVC, PP, HDPE og beton). Danish EPA, Denmark.
Nielsen, P.H., K. Raunkjaer, and T. Hvitved-Jacobsen. 1992. Transformation of wastewater in sewer
system—a review. Water Sci. Technol 25(6): 17–31.
North, P. 2010. Unsustainable urbanism? Cities, climate change and resource depletion: A Liverpool
case study. Geography Compass.
Ntelekos, A.A., M. Oppenheimer, J.A. Smith, and A.J. Miller. 2010. Urbanization, climate change and
flood policy in the United States. Climatic Change 103(3–4): 597–616.
http://link.springer.com/10.1007/s10584-009-9789-6. Accessed July 30, 2014.
OBSAM. 2015. Inidicadors bàsics. Qualitat de l’aigua dels aqüífers. Percentatge de pous que superen els
llindars de clorurs i nitrats http://www.obsam.cat/indicadors/medi-fisic/aigua/qualitat/qualitat-aigua-
aquifers-1997-2013.pdf.
247
Olcina, J. 1994. Tormentas y granizadas en las tierras alicantinas. Instituto Universitario de Geografía,
Alicante (Spain).
Olcina, J. and A.M. Rico. 2000. Estudios sobre lluvias torrenciales e inundaciones en la Provincia de
Alicante (1982-1999). Universidad de Alcalá. Servicio de Publicaciones 9: 71–92.
Oliver-Solà, J., X. Gabarrell, and J. Rieradevall. 2009. Environmental impacts of natural gas
distribution networks within urban neighborhoods. Applied Energy 86(10): 1915–1924.
Opschoor, H. 2011. Local sustainable development and carbon neutrality in cities in developing and
emerging countries. International Journal of Sustainable Development & World Ecology 18(3): 190–
200. http://www.tandfonline.com/doi/abs/10.1080/13504509.2011.570800.
Osada, T., K. Kuroda, and M. Yonaga. 1995. Reducing nitrous oxide gas emissions from fill-and-draw
type activated sludge process. Water Research 29(6): 1607–1608.
Othman, F. and S. Mortezania. 2010. Efficiency assessment of operational and maintenance
techniques to optimize sewer gas amount. International Journal of the Physical Sciences 5(9): 1381–
1388.
Pacione, M. 2009. Urban geography: a global perspective. 3rd ed. London: Routledge.
Pan, T., X.-D. Zhu, and Y.-P. Ye. 2011. Estimate of life-cycle greenhouse gas emissions from a vertical
subsurface flow constructed wetland and conventional wastewater treatment plants: A case
study in China. Ecological Engineering 37(2): 248–254.
http://www.sciencedirect.com/science/article/pii/S0925857410003083. Accessed April 14, 2016.
Park, K.Y., Y. Inamori, M. Mizuochi, and K.H. Ahn. 2000. Emission and control of nitrous oxide from
a biological wastewater treatment system with intermittent aeration. Journal of Bioscience and
Bioengineering 90(3): 247–52. http://www.ncbi.nlm.nih.gov/pubmed/16232852.
Pearson, L.J., A. Coggan, W. Proctor, and T.F. Smith. 2009. A Sustainable Decision Support
Framework for Urban Water Management. Water Resources Management 24(2): 363–376.
http://link.springer.com/10.1007/s11269-009-9450-1. Accessed July 30, 2014.
Petit-Boix, A., A. Arahuetes, A. Josa, J. Rieradevall, and X. Gabarrell. 2017. Are we preventing flood
damage eco-efficiently? An integrated method applied to post-disaster emergency actions.
Science of The Total Environment 580: 873–881.
Petit-Boix, A., N. Roigé, A. de la Fuente, P. Pujadas, X. Gabarrell, J. Rieradevall, and A. Josa. 2016.
Integrated Structural Analysis and Life Cycle Assessment of Equivalent Trench-Pipe Systems
for Sewerage. Water Resources Management 30(3): 1117–1130.
Petit-Boix, A., D. Sanjuan-Delmás, S. Chenel, D. Marín, C. Gasol, R. Farreny, G. Villalba, et al. 2015a.
Assessing the energetic and environmental impacts of the operation and maintenance of
Spanish sewer networks from a life-cycle perspective. Water Resources Management 29(8): 2581–
2597.
Petit-Boix, A., D. Sanjuan-Delmás, C. Gasol, G. Villalba, M. Suárez-Ojeda, X. Gabarrell, A. Josa, and
J. Rieradevall. 2014. Environmental Assessment of Sewer Construction in Small to Medium
Sized Cities Using Life Cycle Assessment. Water Resources Management 28(4): 979–997.
http://link.springer.com/10.1007/s11269-014-0528-z. Accessed April 29, 2014.
248
Petit-Boix, A., E. Sevigné-Itoiz, L.A. Rojas-Gutierrez, A.P. Barbassa, A. Josa, J. Rieradevall, and X.
Gabarrell. 2015b. Environmental and economic assessment of a pilot stormwater infiltration
system for flood prevention in Brazil. Ecological Engineering 84: 194–201.
http://www.sciencedirect.com/science/article/pii/S0925857415301427. Accessed September 21,
2015.
Peyvandi, A., P. Soroushian, and S. Jahangirnejad. 2014. Structural design methodologies for concrete
pipes with steel and synthetic fiber reinforcement. ACI Structural Journal 111(1): 83–91.
Pons, X. 2000. MiraMon v7.1: Geographic Information System and Remote Sensing software. World
Administrative Boundaries [ESRI]. http://www.creaf.uab.es/miramon.
Porro, J., L. Guo, K. Sharma, L. Benedetti, S. Van Hulle, P.A. Vanrolleghem, Y. Amerlinck, Z. Yuan,
A. Shaw, and I. Nopens. 2011. Towards a benchmarking tool for minimizing wastewater utility
greenhouse gas footprints. In Watermatex 2011 Conference Proceedings, 8th IWA Symposium on
Systems Analysis and Integrated Assessment, San Sebastian, Spain., 66:2483–95. January.
http://www.ncbi.nlm.nih.gov/pubmed/23032782.
PRé Consultants. 2010. SimaPro 7.2.0. PRé Consultants, Amersfoort.
PRé Consultants. 2014. SimaPro 8.0.4. PRé Consultants, Amersfoort.
Pujadas, P., A. Blanco, S. Cavalaro, and A. Aguado. 2015. Performance-Based Procedure for the
Definition of Controlled Low-Strength Mixtures. Journal of Materials in Civil Engineering 27(11):
6015003. http://ascelibrary.org/doi/abs/10.1061/(ASCE)MT.1943-5533.0001283. Accessed
December 10, 2015.
REE. Red Eléctrica de España. 2012. The Spanish electric system (El sistema eléctrico español).
Retrieved from
http://www.ree.es/sites/default/files/downloadable/inf_sis_elec_ree_2011_v3.pdf.
Rees, W. and M. Wackernagel. 1996. Urban ecological footprints: Why cities cannot be sustainable—
And why they are a key to sustainability. Environmental Impact Assessment Review 16(4): 223–
248.
Righi, S., L. Oliviero, M. Pedrini, A. Buscaroli, and C. Della Casa. 2013. Life Cycle Assessment of
management systems for sewage sludge and food waste: centralized and decentralized
approaches. Journal of Cleaner Production 44: 8–17.
http://www.sciencedirect.com/science/article/pii/S0959652612006488. Accessed April 14, 2017.
Risch, E., C. Boutin, P. Roux, S. Gillot, and A. Héduit. 2011. LCA in wastewater treatment –
Applicability and limitations for constructed wetland systems: using vertical Reed Bed Filters.
In LCM 2011 International Conference on Life Cycle Management, August 28-31, 2011 Berlin,
Germany, 12 Pages.
Risch, E., O. Gutierrez, P. Roux, C. Boutin, and L. Corominas. 2015. Life cycle assessment of urban
wastewater systems: Quantifying the relative contribution of sewer systems. Water Research 77:
35–48.
Risch, E., P. Loubet, M. Núñez, and P. Roux. 2014. How environmentally significant is water
consumption during wastewater treatment? Application of recent developments in LCA to
WWT technologies used at 3 contrasted geographical locations. Water Research 57: 20–30.
http://www.ncbi.nlm.nih.gov/pubmed/24704901. Accessed July 30, 2014.
249
Roberts, D.W., D. Kubel, A. Carrie, D. Schoeder, and C. Sorenson. 2008. Cost and Benefits of
Complete Water Treatment Plant Automation. AwwaRF and IWA, London.
Rodriguez-Garcia, G., M. Molinos-Senante, A. Hospido, F. Hernández-Sancho, M.T. Moreira, and G.
Feijoo. 2011. Environmental and economic profile of six typologies of wastewater treatment
plants. Water Research 45(18): 5997–6010.
Roux, P., I. Mur, E. Risch, and C. Boutin. 2011. Urban planning of sewer infrastructure : Impact of
population density and land topography on environmental performances of wastewater
treatment systems. In Presented at the Life Cycle Conference 2011, “Policy: LCM in Public Policy”
Session, Berlin.
RuralCat. 2016. Agrometeorological data - Cabrils.
https://www.ruralcat.net/web/guest/agrometeo.estacions?p_p_id=234&p_p_lifecycle=0&p_p_
state=normal&p_p_mode=view&p_p_col_id=column-
3&p_p_col_count=1&_234_struts_action=%2Fadasasistemas%2Fagrometeo%2Festacio.
Saiz, S., C. Kennedy, B. Bass, and K. Pressnail. 2006. Comparative life cycle assessment of standard
and green roofs. Environmental Science & Technology 40(13): 4312–6.
http://www.ncbi.nlm.nih.gov/pubmed/16856752.
San Francisco Stormwater Design Guidelines. 2010. Appendix A: BMP Fact Sheets.
www.sfwater.org/modules/showdocument.aspx?documentid=2778 Accessed October 2014.
San Millán, J. 2008. Estudi d’inundabilitat de la Riera de Cabrils, al seu pas pel sector C/Manuel Roca - El
Barato. Modificació puntual del Pla General d’Ordenació Urbanística Municipal. Vilassar de Mar
(Maresme).
Sanchez, S.T., J. Woods, M. Akhurst, M. Brander, M. O’Hare, T.P. Dawson, R. Edwards, A.J. Liska,
and R. Malpas. 2012. Accounting for indirect land-use change in the life cycle assessment of
biofuel supply chains. Journal of the Royal Society, Interface / the Royal Society 9(71): 1105–19.
http://rsif.royalsocietypublishing.org/content/9/71/1105. Accessed February 29, 2016.
Sanjuan-Delmás, D., E. Hernando-Canovas, P. Pujadas, A. de la Fuente, X. Gabarrell, J. Rieradevall,
and A. Josa. 2015a. Environmental and geometric optimisation of cylindrical drinking water
storage tanks. International Journal of Life Cycle Assessment 20(12): 1612–1624.
Sanjuan-Delmás, D., A. Petit-Boix, C. Gasol, G. Villalba, M. Suárez-Ojeda, X. Gabarrell, A. Josa, and
J. Rieradevall. 2014. Environmental assessment of different pipelines for drinking water
transport and distribution network in small to medium cities: a case from Betanzos, Spain.
Journal of Cleaner Production 66: 588–598.
http://linkinghub.elsevier.com/retrieve/pii/S0959652613007488. Accessed April 29, 2014.
Sanjuan-Delmás, D., A. Petit-Boix, C.M. Gasol, R. Farreny, G. Villalba, M.E. Suárez-Ojeda, X.
Gabarrell, A. Josa, and J. Rieradevall. 2015b. Environmental assessment of drinking water
transport and distribution network use phase for small to medium-sized municipalities in
Spain. Journal of Cleaner Production 87: 573–582.
http://linkinghub.elsevier.com/retrieve/pii/S095965261400972X. Accessed January 8, 2015.
Sanyé-Mengual, E., H. Romanos, C. Molina, M.A. Oliver, N. Ruiz, M. Pérez, D. Carreras, et al. 2014.
Environmental and self-sufficiency assessment of the energy metabolism of tourist hubs on
Mediterranean Islands: The case of menorca (Spain). Energy Policy 65: 377–387.
250
Satterthwaite, D. 1997. Sustainable cities or cities that contribute to sustainable development? Urban
Studies 34(10): 1667–1691. http://discovery.ucl.ac.uk/1333706/.
Satterthwaite, D. 2008. Cities’ contribution to global warming: notes on the allocation of greenhouse
gas emissions. Environment and Urbanization 20(2): 539–549.
http://eau.sagepub.com/cgi/doi/10.1177/0956247808096127%5Cnpapers2://publication/doi/10.
1177/0956247808096127.
Schmidt, J.H. and M. Thrane. 2009. Life cycle assessment of aluminium production in new Alcoa smelter in
Greenland. Aalborg, Denmark.
Schweimer, G.W. and M. Levin. 2000. Life Cycle Inventory for the Golf A4.
Scoullos, M.J. 2003. Impact of anthropogenic activities in the coastal region of the Mediterranean Sea.
In International Conference on the Sustainable Development of the Mediterranean and Black Sea
Environment, May, Thessaloniki, Greece.
Semadeni-Davies, A., C. Hernebring, G. Svensson, and L.-G. Gustafsson. 2008. The impacts of climate
change and urbanisation on drainage in Helsingborg, Sweden: Combined sewer system.
Journal of Hydrology 350(1–2): 100–113.
http://linkinghub.elsevier.com/retrieve/pii/S0022169407002910. Accessed July 11, 2014.
Sharma, A., G. Tjandraatmadja, A. Grant, T. Grant, and F. Pamminger. 2010. Sustainable sewerage
servicing options for peri-urban areas with failing septic systems. Water Science & Technology
62(3): 570–585. http://eds.a.ebscohost.com/eds/detail/detail?sid=5d43e025-1300-44f9-af35-
20b55aacba64%40sessionmgr4005&vid=0&hid=4110&bdata=JnNpdGU9ZWRzLWxpdmU%3
D&preview=false#AN=53834193&db=a9h. Accessed April 5, 2016.
Sharma, K.R., Z. Yuan, D. de Haas, G. Hamilton, S. Corrie, and J. Keller. 2008. Dynamics and dynamic
modelling of H2S production in sewer systems. Water Research 42(10–11): 2527–38.
http://www.ncbi.nlm.nih.gov/pubmed/18336860. Accessed February 14, 2013.
Shehabi, A., J.R. Stokes, and A. Horvath. 2012. Energy and air emission implications of a
decentralized wastewater system. Environmental Research Letters 7(2): 24007.
http://iopscience.iop.org/article/10.1088/1748-9326/7/2/024007. Accessed April 5, 2016.
Shimizu, Y., S. Dejima, and K. Toyosada. 2012. The CO2 Emission Factor of Water in Japan. Water
4(4): 759–769. http://www.mdpi.com/2073-4441/4/4/759/. Accessed May 25, 2013.
Short, M.D., A. Daikeler, G.M. Peters, K. Mann, N.J. Ashbolt, R.M. Stuetz, and W.L. Peirson. 2014.
Municipal gravity sewers: An unrecognised source of nitrous oxide. The Science of the Total
Environment 468–469: 211–8. http://www.ncbi.nlm.nih.gov/pubmed/24029693. Accessed
December 23, 2013.
Short, M.D., W.L. Peirson, G.M. Peters, and R.J. Cox. 2012. Managing Adaptation of Urban Water
Systems in a Changing Climate. Water Resources Management 26(7): 1953–1981.
http://link.springer.com/10.1007/s11269-012-0002-8. Accessed July 11, 2014.
Silva, J.L. da, M.K. El Debs, and A.T. Beck. 2008. Reliability evaluation of reinforced concrete pipes
in crack opening limit state. RIEM 1(4): 314–330.
SMRC. The Stormwater Manager’s Resource Center. 2014. Stormwater Management Fact Sheets.
http://www.stormwatercenter.net/ Accessed October 2014.
251
Solomon, S., D. Qin, M. Manning, Z. Chen, M. Marquis, K.B. Averyt, M. Tignor, and H.L. (eds) Miller.
2007. Contribution of Working Group I to the Fourth Assessment Report of the Intergovernmental Panel
on Climate Change, 2007. Cambridge University Press, Cambridge, United Kingdom and New
York, NY, USA.
Sonnemann, G. and B. Vigon. 2011. Global Guidance Principles for Life Cycle Assessment Databases. A
basis for greener processes and products. UNEP SETAC, Life Cycle Initative.
http://www.unep.fr/scp/publications/details.asp?id=DTI/1410/PA. Accessed January 12, 2015.
Sousa, M.R.C. De, F.A. Montalto, and S. Spatari. 2012. Using Life Cycle Assessment to Evaluate Green
and Grey Combined Sewer Overflow Control Strategies. Journal of Industrial Ecology 16(6): 901–
913. http://doi.wiley.com/10.1111/j.1530-9290.2012.00534.x. Accessed July 30, 2014.
Søvik, A.K., J. Augustin, K. Heikkinen, J.T. Huttunen, J.M. Necki, S.M. Karjalainen, B. Kløve, et al.
2006. Emission of the greenhouse gases nitrous oxide and methane from constructed wetlands
in europe. Journal of Environmental Quality 35(6): 2360–73.
https://xpv.uab.cat/publications/jeq/abstracts/35/6/,DanaInfo=.admBvgnkukn2zovs8yv-
S8A2,SSL+2360. Accessed May 15, 2016.
Spangler, M.G. 1941. The structural design of flexible pipe culverts. In Bulletin 153. Ames: Iowa
Engineering Experiment Station.
Spanish Ministry of Development. 1999. Maximum daily rainfall in the Peninsular Spain (Máximas lluvias
diarias en la España Peninsular). Madrid, Spain.
Spatari, S., Z. Yu, and F. a Montalto. 2011. Life cycle implications of urban green infrastructure.
Environmental Pollution 159(8–9): 2174–9. http://www.ncbi.nlm.nih.gov/pubmed/21330022.
Accessed July 9, 2014.
SPSS Inc. 2009. PASW Statistics for Windows, Version 18.0. Chicago: SPSS Inc.
Strutt, J., S. Wilson, H. Shorney-Darby, A. Shaw, and A. Byers. 2008. Assessing the carbon footprint
of water production. American Water Works Association Journal 100(6): 80–91.
Swamee, P.K. and A.K. Sharma. 2013. Optimal design of a sewer line using Linear Programming.
Applied Mathematical Modelling 37(6): 4430–4439.
http://linkinghub.elsevier.com/retrieve/pii/S0307904X12005380. Accessed August 15, 2014.
Swarr, T.E., D. Hunkeler, W. Klöpffer, H.-L. Pesonen, A. Ciroth, A.C. Brent, and R. Pagan. 2011.
Environmental life-cycle costing: a code of practice. The International Journal of Life Cycle
Assessment 16(5): 389–391. http://link.springer.com/10.1007/s11367-011-0287-5. Accessed April
6, 2017.
Témez, J. 1991. Extended and Improved Rational Method. Version of the Highways Administration of Spain.
Proc. XXIV Congress. Madrid, Spain. Vol A.
Termes-Rifé, M., M. Molinos-Senante, F. Hernández-Sancho, and R. Sala-Garrido. 2013. Life cycle
costing: a tool to manage the urban water cycle. Journal of Water Supply: Research and
Technology—AQUA. IWA Publishing, September 7. file:///C:/Users/1218319/Downloads/2.
Termes-Rifé etal WSJ 2013.pdf. Accessed April 9, 2015.
The World Bank. 2016. Urban population (% of total).
http://data.worldbank.org/indicator/SP.URB.TOTL.IN.ZS Accessed July 2014.
252
Thomas, A., B.R.K. Mantha, and C.C. Menassa. 2016. A Framework to Evaluate the Life Cycle Costs
and Environmental Impacts of Water Pipelines. In Pipelines 2016, 1152–1163. Reston, VA:
American Society of Civil Engineers, July 11.
http://ascelibrary.org/doi/10.1061/9780784479957.107. Accessed August 2, 2016.
Tillman, A.-M., M. Svingby, and H. Lundström. 1998. Life cycle assessment of municipal waste water
systems. The International Journal of Life Cycle Assessment 3(3): 145–157.
http://link.springer.com/10.1007/BF02978823. Accessed April 12, 2016.
Twort, A.C., D.D. Ratnayaka, and M.J. Brandt. 2000. Water Supply. Butterworth-Heinemann.
http://books.google.com/books?id=wjI_7A8ZMeIC&pgis=1. Accessed September 25, 2014.
U.S. Army Corps of Engineers. 1998. Engineering and Design. Conduits, culverts, and pipes. Engineer
Manual 1110-2-2902. Washington, DC 20314-1000.
U.S. Department of Commerce Economics and Statistics Administration Economist. Office of the
Chief Economist. 2013. Economic impact of Hurricane Sandy. Potential economic activity lost and
gained in New Jersey and New York. U.S. Department of Commerce.
UDFCD. Urban Drainage and Flood Control District. 2011. Urban Storm Drainage Criteria Manual
Volume 3. Chapter 2: BMP Selection. Denver, US.
Udo de Haes, H.A., G. Finnveden, M. Goedkoop, E. Hertwich, P. Hofstetter, W. Klöpffer, W. Krewitt,
and E. Lindeijer. 2002. Life Cycle Impact Assessment: Striving towards best practice.
Proceedings.
UN-HABITAT. 2011. Hot Cities: Battle-ground for climate change. Global Report on Human
Settlement 2011. http://mirror.unhabitat.org/downloads/docs/E_Hot_Cities.pdf. Accessed
May 7, 2016.
UN. United Nations. 2013. World Economic and Social Survey 2013. Chapter III Towards sustainable cities.
http://www.un.org/en/development/desa/policy/wess/wess_current/wess2013/Chapter3.pdf.
UN. United Nations. Department of Economic and Social Affairs. Population Division. 2012. World
Urbanization Prospects: The 2011 Revision, CD-ROM Edition.
UNE 53331:1997. Plastics. Unplastized poly(vinyl chloride) and high and medium density polyethylene (PE)
pipes. Criterion for the assessment of pipes for plastics piping systems with car without pressure under
external loads. AENOR, Madrid, Spain.
United Nations. 1992. Agenda 21. In United Nations Conference on Environment and Development
(UNCED). http://www.un.org/esa/dsd/agenda21/.
United Nations. 2016. Sustainable Development GOALS - 17 Goals to transform our world.
Sustainable Development Goals - United Nations.
http://www.un.org/sustainabledevelopment/sustainable-development-goals/.
US EPA. 2016. Inventory of U.S. Greenhouse Gas Emissions and Sinks: 1990-2014. Washington DC, USA.
https://www.epa.gov/ghgemissions/inventory-us-greenhouse-gas-emissions-and-sinks-1990-
2014. Accessed September 2, 2016.
USDT. United States Department of Transportation. 2014. Stormwater Best Management Practices in
an Ultra-Urban Setting: Selection and Monitoring.
253
http://environment.fhwa.dot.gov/ecosystems/ultraurb/ Accessed December 2014.
USEPA. 1974. Process Design Manual for Sulfide Control in Sanitary Sewerage Systems.
USEPA. 2014. Greenhouse Gas Equivalencies Calculator. http://www.epa.gov/cleanenergy/energy-
resources/calculator.html#results Accessed December 2014.
USEPA. United States Environmental Protection Agency. 1991. Handbook: Sewer System Infrastructure
Analysis and Rehabilitation. Office of Research and Development. Cincinnati OH 45268.
USEPA. United States Environmental Protection Agency. 2013a. Best Management Practices (BMPs).
http://www.epa.gov/nrmrl/wswrd/wq/stormwater/bmp.html Accessed July 2014.
USEPA. United States Environmental Protection Agency. 2013b. Overview of Greenhouse Gases.
http://epa.gov/climatechange/ghgemissions/gases.html Accessed September 2013.
Vahidi, E., E. Jin, M. Das, M. Singh, and F. Zhao. 2015. Comparative Life Cycle Analysis of Materials
in Wastewater Piping Systems. Procedia Engineering 118: 1177–1188.
http://www.sciencedirect.com/science/article/pii/S1877705815021165. Accessed September 23,
2015.
Vahidi, E., E. Jin, M. Das, M. Singh, and F. Zhao. 2016. Environmental life cycle analysis of pipe
materials for sewer systems. Sustainable Cities and Society.
Valderrama, C., R. Granados, J.L. Cortina, C.M. Gasol, M. Guillem, and A. Josa. 2012. Implementation
of best available techniques in cement manufacturing: a life-cycle assessment study. Journal of
Cleaner Production 25: 60–67. http://linkinghub.elsevier.com/retrieve/pii/S095965261100494X.
Accessed March 8, 2013.
Valderrama C, Granados R, Cortina JL, Gasol CM, Josa A. 2013. Comparative LCA of sewage sludge
valorisation as both fuel and raw material substitute in clinker production. Journal of Cleaner
Production 51: 205–213.
Vargas-Parra, M.V. 2015. Optimizing rainwater harvesting systems in urban areas. Doctoral thesis.
Universitat Autònoma de Barcelona.
Vargas-Parra, M.V., M.R. Rovira, X. Gabarrell, and G. Villalba. 2014. Cost effective rainwater
harvesting system in the Metropolitan area of Barcelona. Journal of Water Supply: Research and
Technology – AQUA.
Vargas-Parra, M.V., G. Villalba, and X. Gabarrell. 2013. Applying exergy analysis to rainwater
harvesting systems to assess resource. Resources, Conservation and Recycling 72: 50–59.
Vázquez-Rowe, I., A. Marvuglia, S. Rege, and E. Benetto. 2014. Applying consequential LCA to
support energy policy: land use change effects of bioenergy production. The Science of the Total
Environment 472: 78–89. http://www.sciencedirect.com/science/article/pii/S0048969713012412.
Accessed February 29, 2016.
Venkatesh, G. and H. Brattebø. 2011. Energy consumption, costs and environmental impacts for
urban water cycle services: Case study of Oslo (Norway). Energy 36(2): 792–800.
http://linkinghub.elsevier.com/retrieve/pii/S0360544210007309. Accessed January 29, 2013.
Venkatesh, G. and H. Brattebø. 2013. Typifying cities to streamline the selection of relevant
254
environmental sustainability indicators for urban water supply and sewage handling systems:
a recommendation. Environment, Development and Sustainability 15(3): 765–782.
http://link.springer.com/10.1007/s10668-012-9405-1. Accessed August 2, 2016.
Venkatesh, G., J. Hammervold, and H. Brattebø. 2009. Combined MFA-LCA for Analysis of
Wastewater Pipeline Networks. Journal of Industrial Ecology 13(4): 532–550.
http://doi.wiley.com/10.1111/j.1530-9290.2009.00143.x. Accessed February 1, 2013.
Vida, N. and F. Arroyo. 2005. Medio Ambiente decide instalar la depuradora del Maresme en Santa
Susanna. El País.
Viñolas, B. 2011. Applications and methodology advances in MIVES multicriteria valorations
(Aplicaciones y avances de la metodología MIVES en valoraciones multicriterio). Doctoral
Thesis. Universitat Politècnica de Catalunya.
Vollertsen, J., A.H. Nielsen, H.S. Jensen, T. Wium-Andersen, and T. Hvitved-Jacobsen. 2008.
Corrosion of concrete sewers--the kinetics of hydrogen sulfide oxidation. The Science of the Total
Environment 394(1): 162–70. http://www.ncbi.nlm.nih.gov/pubmed/18281080. Accessed
December 23, 2013.
Wang, B., G. Parcsi, E.C. Sivret, S. Kenny, X. Wang, R.M. Stuetz, and S. Wales. 2012a. Volatile Organic
Compound (VOC) Emissions From Sewer Networks in Sydney. In Proceedings: Ozwater 2012.
Wang, J., J. Zhang, H. Xie, P. Qi, Y. Ren, and Z. Hu. 2011. Methane emissions from a full-scale A/A/O
wastewater treatment plant. Bioresource Technology 102(9): 5479–85.
http://www.ncbi.nlm.nih.gov/pubmed/21084185. Accessed February 14, 2013.
Wang, R., M.J. Eckelman, and J.B. Zimmerman. 2013. Consequential environmental and economic
life cycle assessment of green and gray stormwater infrastructures for combined sewer systems.
Environmental Science & Technology 47(19): 11189–98.
http://www.ncbi.nlm.nih.gov/pubmed/23957532.
Wang, R. and J.B. Zimmerman. 2015. Economic and environmental assessment of office building
rainwater harvesting systems in various U.S. cities. Environmental Science & Technology 49(3):
1768–78. http://dx.doi.org/10.1021/es5046887. Accessed September 23, 2015.
Wang, X., G. Parcsi, E. Sivret, H. Le, B. Wang, and R.M. Stuetz. 2012b. Odour emission ability (OEA)
and its application in assessing odour removal efficiency. Water Science and Technology : A
Journal of the International Association on Water Pollution Research 66(9): 1828–33.
http://www.iwaponline.com/wst/06609/wst066091828.htm. Accessed June 8, 2015.
Ward, M., R. Corsi, R. Morton, T. Knapp, D. Apgar, C. Quigley, C. Easter, J. Witherspoon, A.
Pramanik, and W. Parker. 2011. Characterization of natural ventilation in wastewater collection
systems. Water Environmental Research 83(3): 265–273.
WCED. World Commission On Environment And Development. 1987. Our Common Future. Oxford
Paperbacks. Vol. f. http://www.un-documents.net/wced-ocf.htm.
Weidema, B., C. Bauer, R. Hischier, C. Mutel, T. Nemecek, J. Reinhard, C. Vadenbo, and G. Wernet.
2013. The ecoinvent database: Overview and methodology, Data quality guideline for the
ecoinvent database version 3, www.ecoinvent.org.
Weidema, B., T. Ekvall, and R. Heijungs. 2009. Guidelines for application of deepened and broadened LCA.
255
Co-ordination Action for innovation in Life-Cycle Analysis for Sustainability (CALCAS), Deliverable
D18 of work package 5.
WHO/UNICEF. 2015. 25 YEARS Progress on Sanitation and Drinking Water: 2015 Update and MDG
Assessment. New York, NY: UNICEF and World Health Organisation: 4.
http://www.who.int/water_sanitation_health/publications/jmp-2015-update/en/.
WHO/UNICEF Joint Monitoring Programme for Water Supply and Sanitation. 2012. Progress on
Drinking Water and Sanitation. Update.
http://www.wssinfo.org/fileadmin/user_upload/resources/JMP-report-2012-en.pdf.
Willis, J., R. Barnes, L. Fillmore, and A. Shah. 2010. Quantifying Methane Evolution from Sewers :
Phase 1 Results of the. In Proceedings of the Water Environment Federation, WEFTEC 2010, October
2-6, New Orleans, LA, 5411–9.
Wolf, M.-A. and T. Ekvall. 2011. Life Cycle Inventory (LCI) Modelling and
Attributional/Consequential Issues. SETAC Globe-Environmental Quality through Science 12(10).
http://globe.setac.org/2011/october/modelling.html. Accessed March 21, 2016.
Wolman, A. 1965. The metabolism of cities. Scientific American 213(3): 179–190.
Wong, N.H., S.F. Tay, R. Wong, C.L. Ong, and A. Sia. 2003. Life cycle cost analysis of rooftop gardens
in Singapore. Building and Environment 38(3): 499–509.
http://linkinghub.elsevier.com/retrieve/pii/S0360132302001312.
WSC. 2011. Water and Wastewater facilities. WSC Annual report.
http://www.wsc.com.mt/portals/0/Annual%20Report%202011/Annual_Report_2011_-
_Water_&_Wastewater_Facilities_3.pdf.
WWAP (World Water Assessment Programme). 2012. World Water Development Report Volume 4:
Managing Water under Uncertainty and Risk. UNESCO.
http://www.unesco.org/new/fileadmin/MULTIMEDIA/HQ/SC/pdf/WWDR4 Volume 1-
Managing Water under Uncertainty and Risk.pdf.
Yıldırım, M. and B. Topkaya. 2012. Assessing Environmental Impacts of Wastewater Treatment
Alternatives for Small-Scale Communities. CLEAN - Soil, Air, Water 40(2): 171–178.
http://doi.wiley.com/10.1002/clen.201000423. Accessed April 14, 2016.
Yongsiri, C., S.M. Asce, J. Vollertsen, and T. Hvitved-jacobsen. 2005. Influence of Wastewater
Constituents on Hydrogen Sulfide Emission in Sewer Networks. Journal of Environmental
Engineering 131(12): 1676–1683.
Zahmatkesh, Z., S.J. Burian, M. Karamouz, H. Tavakol-Davani, and E. Goharian. 2015. Low-Impact
Development Practices to Mitigate Climate Change Effects on Urban Stormwater Runoff: Case
Study of New York City. Journal of Irrigation and Drainage Engineering 141(1): 4014043.
http://ascelibrary.org/doi/10.1061/(ASCE)IR.1943-4774.0000770. Accessed September 23, 2015.
Zamagni, A., J. Guinée, R. Heijungs, P. Masoni, and A. Raggi. 2012. Lights and shadows in
consequential LCA. The International Journal of Life Cycle Assessment 17(7): 904–918.
http://link.springer.com/10.1007/s11367-012-0423-x. Accessed October 5, 2015.
Zhang, L., P. De Schryver, B. De Gusseme, W. De Muynck, N. Boon, and W. Verstraete. 2008.
Chemical and biological technologies for hydrogen sulfide emission control in sewer systems:
256
a review. Water Research 42(1–2): 1–12. http://www.ncbi.nlm.nih.gov/pubmed/17692889.
Accessed July 11, 2014.
Zhang, X. and K. Caldeira. 2015. Time scales and ratios of climate forcing due to thermal versus
carbon dioxide emissions from fossil fuels. Geophysical Research Letters: n/a-n/a.
http://doi.wiley.com/10.1002/2015GL063514. Accessed June 9, 2015.
Zhang, X., W. Chen, C. Ma, and S. Zhan. 2012. Modeling the effect of humidity on the threshold
friction velocity of coal particles. Atmospheric Environment 56: 154–160.
Zhang, X., W. Chen, C. Ma, and S. Zhan. 2013. Modeling particulate matter emissions during mineral
loading process under weak wind simulation. Science of the Total Environment 449: 168–173.
Zhang, Y., S. Singh, and B.R. Bakshi. 2010a. Accounting for ecosystem services in life cycle assessment,
Part I: a critical review. Environmental Science & Technology 44(7): 2232–2242.
Zhang, Y.I., B. Anil, and B.R. Bakshi. 2010b. Accounting for ecosystem services in life cycle
assessment part II: Toward an ecologically based LCA. Environmental Science and Technology
44(7): 2624–2631.
Zhou, Q., P.S. Mikkelsen, K. Halsnæs, and K. Arnbjerg-Nielsen. 2012. Framework for economic
pluvial flood risk assessment considering climate change effects and adaptation benefits.
Journal of Hydrology 414: 539–549.
257
Appendix
Appendix 1.1 Overall impacts of the constructive solutions (IC: Impact category) 259 Appendix 2.1 Parameters considered in the design of (A) plastic and (B) concrete pipes.
OD: outer diameter; ID: internal diameter; ND: nominal diameter 260 Appendix 2.2 Soil types defined by UNE 53331:1997 261 Appendix 2.3 Inventory of the pipe subsystem considering different pavement conditions
and traffic loads. Data for one linear metre of pipe and the lifespan of each material 262 Appendix 2.4 Contribution of the material and energy flows of three different trench
configurations to the environmental impacts of the trench subsystem of concrete pipes 264 Appendix 2.5 Contribution of pipe and trench subsystems to the total impacts of concrete
pipes solutions with a BF=1.1 and diameters of 300, 500 and 1000 mm 265 Appendix 2.6 Contribution of the pipe and trench subsystems to the total environmental
impacts of the constructive solutions for PVC and HDPE pipes with a diameter of 1000 mm,
null traffic load and a pavement layer. A) In PVC pipes, the native soil is replaced with
newly extracted materials. B) In PVC pipes, the native soil is re-used as backfilling material.
C) In HDPE pipes the native soil is replaced with newly extracted materials. D) In HDPE,
the native soil is re-used as backfilling material 266 Appendix 2.7 Variation of the Global Warming Potential depending on the wastewater
flow and the traffic loads, considering the accomplishment of the mechanical requirements
of degraded or inexistent pavements. The three diameters analyzed in this study were
considered (300, 500 and 1000 mm). A) No traffic load (0 kN). B) Traffic load = 260 kN 267 Appendix 2.8 Sensitivity analysis of the annual GWP of pipes with a diameter of: A) 1000
mm, B) 300 mm and C) 500 mm during a time span of 100 years. Different service lives are
attributed to the constructive solutions: 1) 100 years to concrete and 50 years to plastics; 2)
50 years to concrete and 25 years to plastics. 268 Appendix 3.1 Data for each city of the sample (year 2011) 269 Appendix 3.2 Comparison of the total electricity consumption in kWh under different
regional conditions 273 Appendix 3.3 Comparison of the electricity consumption per m3 of water flow in kWh
under different regional conditions 274 Appendix 4.1 Biological reactions leading to the production of H2S, CH4 and N2O in a
generic sewer pipe. Figure adapted from (Hvitved-Jacobsen et al. 2002) 275 Appendix 4.2 Summary of CH4, N2O and H2S from the literature and calculation process
276 Appendix 4.3 Characteristics of Betanzos and Calafell needed for the GHG accounting
process 284 Appendix 4.4 Location of the sampling sites in Calafell and Betanzos. Maps created using
MiraMon v7.1 (Pons 2000) 285 Appendix 4.5 Average and integrated results of the summer and winter sampling
campaigns in Calafell and Betanzos 287 Appendix 5.1 Partial breakdown of the economic costs of each sewer component. Note that
these are the total initial costs. 288 Appendix 5.2 Midpoint, endpoint and single score results per m3 of wastewater. Relative
contribution of the production and installation of pipes and appurtenances to the impacts
and costs 289 Appendix 5.3 Eco-efficiency portfolio illustrating the differences amongst life cycle stages
in Betanzos and Calafell through the GW indicator 293 Appendix 6.1 System boundaries of treatment scenarios 1, 2, 3, 4 and 5 294
258
Appendix 6.2 Life cycle inventory data of each scenario (nd: no data) 299 Appendix 6.3 Septic tank and wetland sizing methods 307 Appendix 6.4 Complete set of environmental results of each scenario 308 Appendix 6.5 Mean and standard deviation of each scenario and impact indicator obtained
through the Monte Carlo simulation. Shaded cells highlight the pairs of scenarios that are
not significantly different from each other according to the ANOVA test (95% confidence,
p-value < 0.0001) 309 Appendix 7.1 Location of the ephemeral streams under analysis and urban areas. Vilassar:
Stream A, Cabrils: Stream B and Cintet: Stream C. 310 Appendix 7.2 Parameters and method applied for assessing the hydrologic performance
of the streams 310 Appendix 7.3 Life cycle inventory of the emergency actions. Breakdown of material,
energy and money flows. *The transport of materials is embedded in the price of the
material itself 312 Appendix 7.4 Environmental, economic and hydrologic data for flooding events with
damage (1997-2014) 315 Appendix 8.1 Environmental impacts of the different components of the FST under
analysis 317 Appendix 9.1 Evolution of the daily rainfall events in São Carlos from 2005-2014. Data from
INMET (2014) 319 Appendix 9.2 Relative contribution of the processes considered in the life cycle of one car
and one m2 of concrete sidewalk. 319
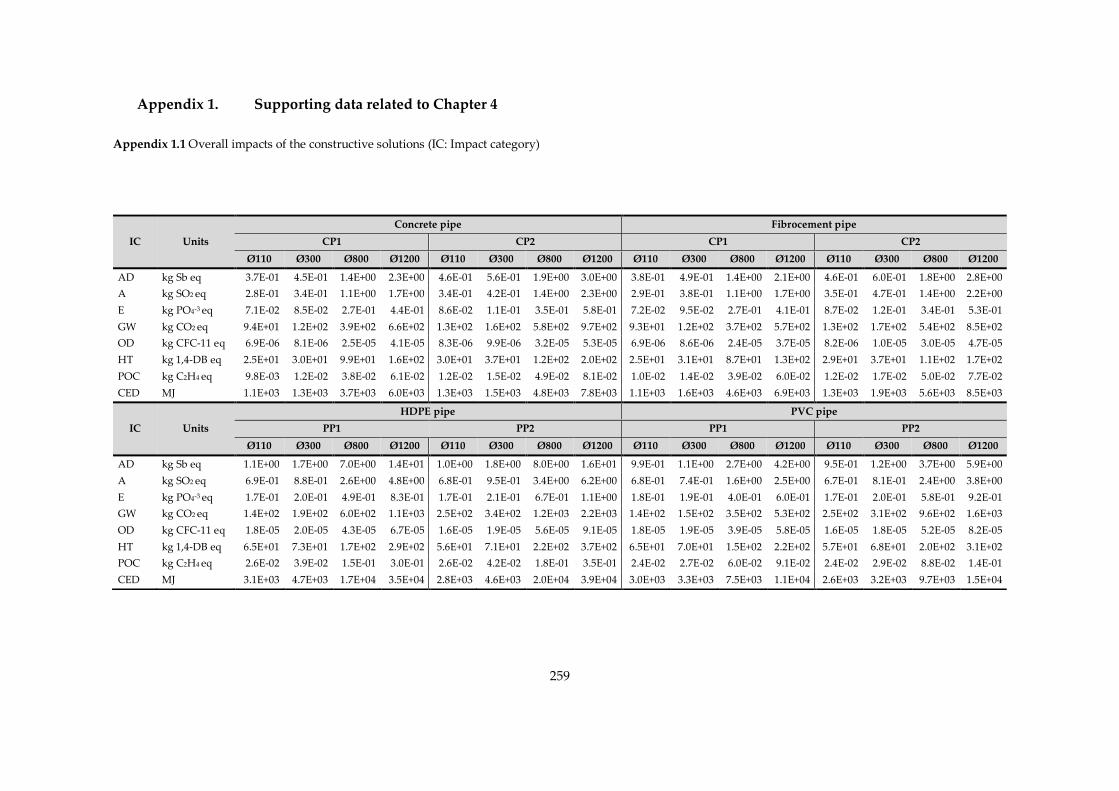
259
Appendix 1. Supporting data related to Chapter 4
Appendix 1.1 Overall impacts of the constructive solutions (IC: Impact category)
IC Units
Concrete pipe Fibrocement pipe
CP1 CP2 CP1 CP2
Ø110 Ø300 Ø800 Ø1200 Ø110 Ø300 Ø800 Ø1200 Ø110 Ø300 Ø800 Ø1200 Ø110 Ø300 Ø800 Ø1200
AD kg Sb eq 3.7E-01 4.5E-01 1.4E+00 2.3E+00 4.6E-01 5.6E-01 1.9E+00 3.0E+00 3.8E-01 4.9E-01 1.4E+00 2.1E+00 4.6E-01 6.0E-01 1.8E+00 2.8E+00
A kg SO2 eq 2.8E-01 3.4E-01 1.1E+00 1.7E+00 3.4E-01 4.2E-01 1.4E+00 2.3E+00 2.9E-01 3.8E-01 1.1E+00 1.7E+00 3.5E-01 4.7E-01 1.4E+00 2.2E+00
E kg PO4-3 eq 7.1E-02 8.5E-02 2.7E-01 4.4E-01 8.6E-02 1.1E-01 3.5E-01 5.8E-01 7.2E-02 9.5E-02 2.7E-01 4.1E-01 8.7E-02 1.2E-01 3.4E-01 5.3E-01
GW kg CO2 eq 9.4E+01 1.2E+02 3.9E+02 6.6E+02 1.3E+02 1.6E+02 5.8E+02 9.7E+02 9.3E+01 1.2E+02 3.7E+02 5.7E+02 1.3E+02 1.7E+02 5.4E+02 8.5E+02
OD kg CFC-11 eq 6.9E-06 8.1E-06 2.5E-05 4.1E-05 8.3E-06 9.9E-06 3.2E-05 5.3E-05 6.9E-06 8.6E-06 2.4E-05 3.7E-05 8.2E-06 1.0E-05 3.0E-05 4.7E-05
HT kg 1,4-DB eq 2.5E+01 3.0E+01 9.9E+01 1.6E+02 3.0E+01 3.7E+01 1.2E+02 2.0E+02 2.5E+01 3.1E+01 8.7E+01 1.3E+02 2.9E+01 3.7E+01 1.1E+02 1.7E+02
POC kg C2H4 eq 9.8E-03 1.2E-02 3.8E-02 6.1E-02 1.2E-02 1.5E-02 4.9E-02 8.1E-02 1.0E-02 1.4E-02 3.9E-02 6.0E-02 1.2E-02 1.7E-02 5.0E-02 7.7E-02
CED MJ 1.1E+03 1.3E+03 3.7E+03 6.0E+03 1.3E+03 1.5E+03 4.8E+03 7.8E+03 1.1E+03 1.6E+03 4.6E+03 6.9E+03 1.3E+03 1.9E+03 5.6E+03 8.5E+03
IC Units
HDPE pipe PVC pipe
PP1 PP2 PP1 PP2
Ø110 Ø300 Ø800 Ø1200 Ø110 Ø300 Ø800 Ø1200 Ø110 Ø300 Ø800 Ø1200 Ø110 Ø300 Ø800 Ø1200
AD kg Sb eq 1.1E+00 1.7E+00 7.0E+00 1.4E+01 1.0E+00 1.8E+00 8.0E+00 1.6E+01 9.9E-01 1.1E+00 2.7E+00 4.2E+00 9.5E-01 1.2E+00 3.7E+00 5.9E+00
A kg SO2 eq 6.9E-01 8.8E-01 2.6E+00 4.8E+00 6.8E-01 9.5E-01 3.4E+00 6.2E+00 6.8E-01 7.4E-01 1.6E+00 2.5E+00 6.7E-01 8.1E-01 2.4E+00 3.8E+00
E kg PO4-3 eq 1.7E-01 2.0E-01 4.9E-01 8.3E-01 1.7E-01 2.1E-01 6.7E-01 1.1E+00 1.8E-01 1.9E-01 4.0E-01 6.0E-01 1.7E-01 2.0E-01 5.8E-01 9.2E-01
GW kg CO2 eq 1.4E+02 1.9E+02 6.0E+02 1.1E+03 2.5E+02 3.4E+02 1.2E+03 2.2E+03 1.4E+02 1.5E+02 3.5E+02 5.3E+02 2.5E+02 3.1E+02 9.6E+02 1.6E+03
OD kg CFC-11 eq 1.8E-05 2.0E-05 4.3E-05 6.7E-05 1.6E-05 1.9E-05 5.6E-05 9.1E-05 1.8E-05 1.9E-05 3.9E-05 5.8E-05 1.6E-05 1.8E-05 5.2E-05 8.2E-05
HT kg 1,4-DB eq 6.5E+01 7.3E+01 1.7E+02 2.9E+02 5.6E+01 7.1E+01 2.2E+02 3.7E+02 6.5E+01 7.0E+01 1.5E+02 2.2E+02 5.7E+01 6.8E+01 2.0E+02 3.1E+02
POC kg C2H4 eq 2.6E-02 3.9E-02 1.5E-01 3.0E-01 2.6E-02 4.2E-02 1.8E-01 3.5E-01 2.4E-02 2.7E-02 6.0E-02 9.1E-02 2.4E-02 2.9E-02 8.8E-02 1.4E-01
CED MJ 3.1E+03 4.7E+03 1.7E+04 3.5E+04 2.8E+03 4.6E+03 2.0E+04 3.9E+04 3.0E+03 3.3E+03 7.5E+03 1.1E+04 2.6E+03 3.2E+03 9.7E+03 1.5E+04
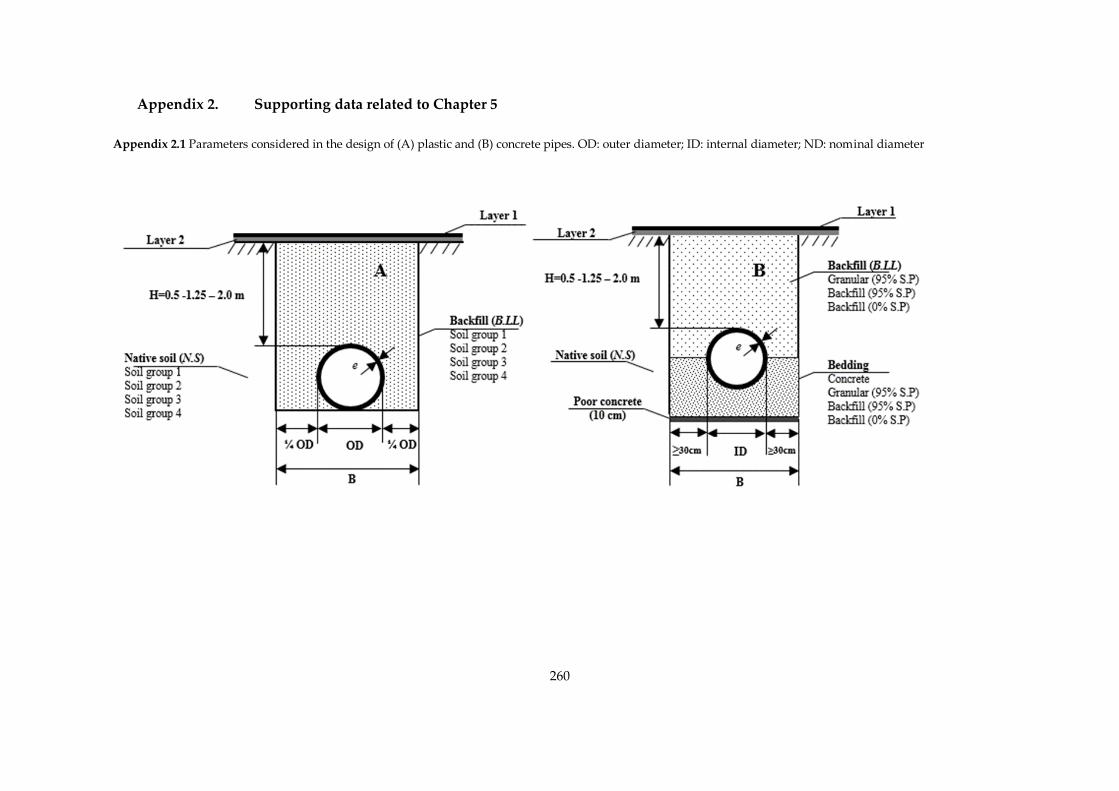
260
Appendix 2. Supporting data related to Chapter 5
Appendix 2.1 Parameters considered in the design of (A) plastic and (B) concrete pipes. OD: outer diameter; ID: internal diameter; ND: nominal diameter

261
Appendix 2.2 Soil types defined by UNE 53331:1997
Soil group Level of soil cohesion Composition
Group 1 Non-cohesive Gravel and sand, with less than 5% of particles
having a diameter (ϕ) ≤ 0.06 mm
Group 2 Slightly cohesive Gravel and a bit clayey or silty sands. Between
5% and 15% of the particles have ϕ ≤ 0.06 mm
Group 3 Moderately cohesive
Gravels and clayey or silty sands. Between 15%
and 40% of the particles have ϕ ≤ 0.06 mm and
it has silt with low plasticity
Group 4 Cohesive Clay, silt and organic soils
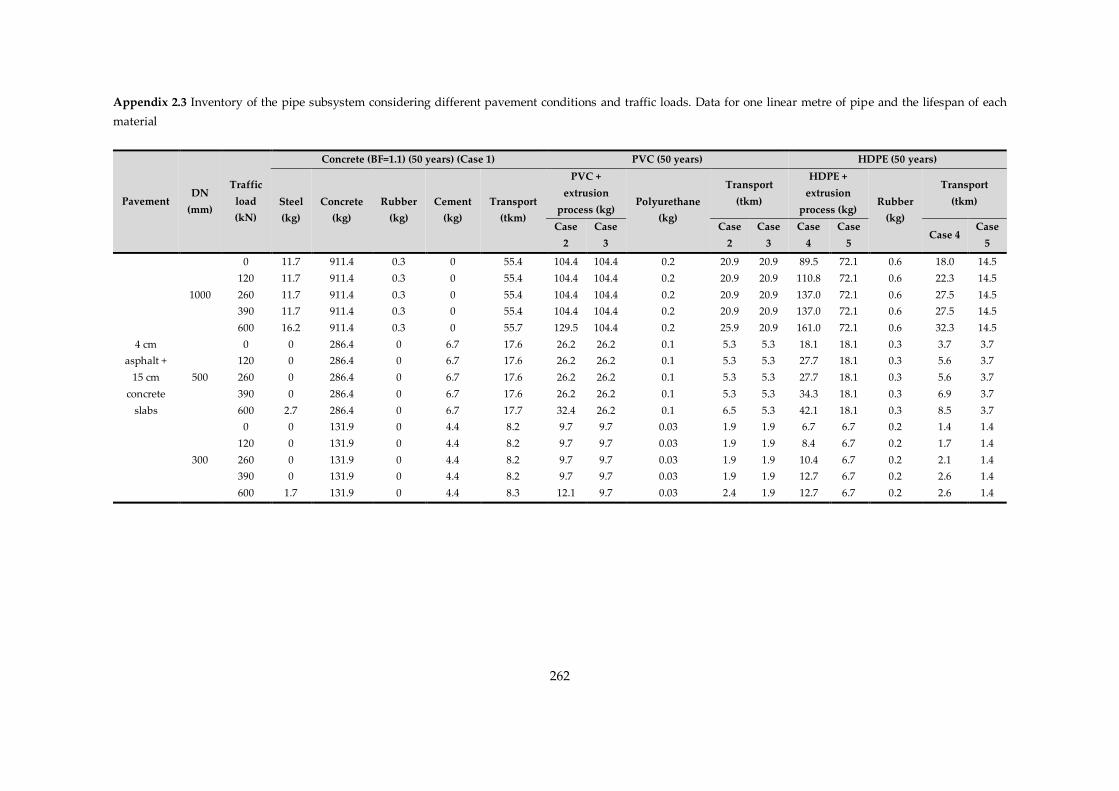
262
Appendix 2.3 Inventory of the pipe subsystem considering different pavement conditions and traffic loads. Data for one linear metre of pipe and the lifespan of each
material
Pavement DN
(mm)
Traffic
load
(kN)
Concrete (BF=1.1) (50 years) (Case 1) PVC (50 years) HDPE (50 years)
Steel
(kg)
Concrete
(kg)
Rubber
(kg)
Cement
(kg)
Transport
(tkm)
PVC +
extrusion
process (kg) Polyurethane
(kg)
Transport
(tkm)
HDPE +
extrusion
process (kg) Rubber
(kg)
Transport
(tkm)
Case
2
Case
3
Case
2
Case
3
Case
4
Case
5 Case 4
Case
5
4 cm
asphalt +
15 cm
concrete
slabs
1000
0 11.7 911.4 0.3 0 55.4 104.4 104.4 0.2 20.9 20.9 89.5 72.1 0.6 18.0 14.5
120 11.7 911.4 0.3 0 55.4 104.4 104.4 0.2 20.9 20.9 110.8 72.1 0.6 22.3 14.5
260 11.7 911.4 0.3 0 55.4 104.4 104.4 0.2 20.9 20.9 137.0 72.1 0.6 27.5 14.5
390 11.7 911.4 0.3 0 55.4 104.4 104.4 0.2 20.9 20.9 137.0 72.1 0.6 27.5 14.5
600 16.2 911.4 0.3 0 55.7 129.5 104.4 0.2 25.9 20.9 161.0 72.1 0.6 32.3 14.5
500
0 0 286.4 0 6.7 17.6 26.2 26.2 0.1 5.3 5.3 18.1 18.1 0.3 3.7 3.7
120 0 286.4 0 6.7 17.6 26.2 26.2 0.1 5.3 5.3 27.7 18.1 0.3 5.6 3.7
260 0 286.4 0 6.7 17.6 26.2 26.2 0.1 5.3 5.3 27.7 18.1 0.3 5.6 3.7
390 0 286.4 0 6.7 17.6 26.2 26.2 0.1 5.3 5.3 34.3 18.1 0.3 6.9 3.7
600 2.7 286.4 0 6.7 17.7 32.4 26.2 0.1 6.5 5.3 42.1 18.1 0.3 8.5 3.7
300
0 0 131.9 0 4.4 8.2 9.7 9.7 0.03 1.9 1.9 6.7 6.7 0.2 1.4 1.4
120 0 131.9 0 4.4 8.2 9.7 9.7 0.03 1.9 1.9 8.4 6.7 0.2 1.7 1.4
260 0 131.9 0 4.4 8.2 9.7 9.7 0.03 1.9 1.9 10.4 6.7 0.2 2.1 1.4
390 0 131.9 0 4.4 8.2 9.7 9.7 0.03 1.9 1.9 12.7 6.7 0.2 2.6 1.4
600 1.7 131.9 0 4.4 8.3 12.1 9.7 0.03 2.4 1.9 12.7 6.7 0.2 2.6 1.4
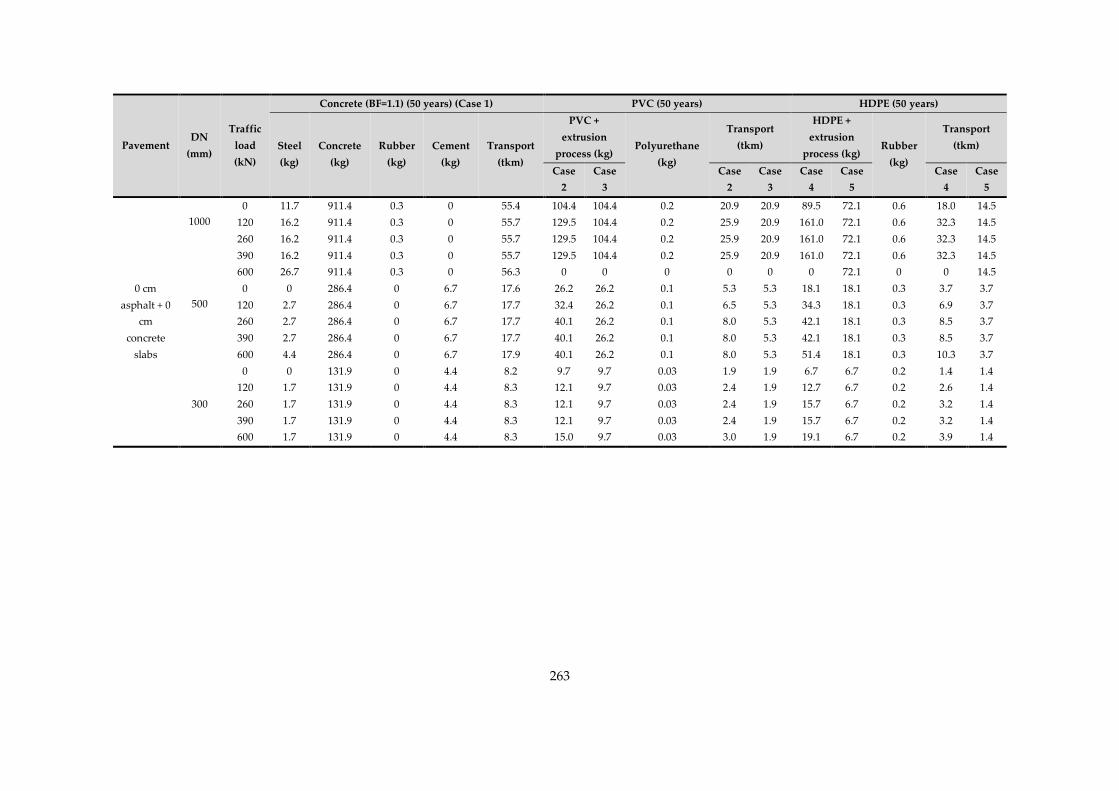
263
Pavement DN
(mm)
Traffic
load
(kN)
Concrete (BF=1.1) (50 years) (Case 1) PVC (50 years) HDPE (50 years)
Steel
(kg)
Concrete
(kg)
Rubber
(kg)
Cement
(kg)
Transport
(tkm)
PVC +
extrusion
process (kg) Polyurethane
(kg)
Transport
(tkm)
HDPE +
extrusion
process (kg) Rubber
(kg)
Transport
(tkm)
Case
2
Case
3
Case
2
Case
3
Case
4
Case
5
Case
4
Case
5
0 cm
asphalt + 0
cm
concrete
slabs
1000
0 11.7 911.4 0.3 0 55.4 104.4 104.4 0.2 20.9 20.9 89.5 72.1 0.6 18.0 14.5
120 16.2 911.4 0.3 0 55.7 129.5 104.4 0.2 25.9 20.9 161.0 72.1 0.6 32.3 14.5
260 16.2 911.4 0.3 0 55.7 129.5 104.4 0.2 25.9 20.9 161.0 72.1 0.6 32.3 14.5
390 16.2 911.4 0.3 0 55.7 129.5 104.4 0.2 25.9 20.9 161.0 72.1 0.6 32.3 14.5
600 26.7 911.4 0.3 0 56.3 0 0 0 0 0 0 72.1 0 0 14.5
500
0 0 286.4 0 6.7 17.6 26.2 26.2 0.1 5.3 5.3 18.1 18.1 0.3 3.7 3.7
120 2.7 286.4 0 6.7 17.7 32.4 26.2 0.1 6.5 5.3 34.3 18.1 0.3 6.9 3.7
260 2.7 286.4 0 6.7 17.7 40.1 26.2 0.1 8.0 5.3 42.1 18.1 0.3 8.5 3.7
390 2.7 286.4 0 6.7 17.7 40.1 26.2 0.1 8.0 5.3 42.1 18.1 0.3 8.5 3.7
600 4.4 286.4 0 6.7 17.9 40.1 26.2 0.1 8.0 5.3 51.4 18.1 0.3 10.3 3.7
300
0 0 131.9 0 4.4 8.2 9.7 9.7 0.03 1.9 1.9 6.7 6.7 0.2 1.4 1.4
120 1.7 131.9 0 4.4 8.3 12.1 9.7 0.03 2.4 1.9 12.7 6.7 0.2 2.6 1.4
260 1.7 131.9 0 4.4 8.3 12.1 9.7 0.03 2.4 1.9 15.7 6.7 0.2 3.2 1.4
390 1.7 131.9 0 4.4 8.3 12.1 9.7 0.03 2.4 1.9 15.7 6.7 0.2 3.2 1.4
600 1.7 131.9 0 4.4 8.3 15.0 9.7 0.03 3.0 1.9 19.1 6.7 0.2 3.9 1.4
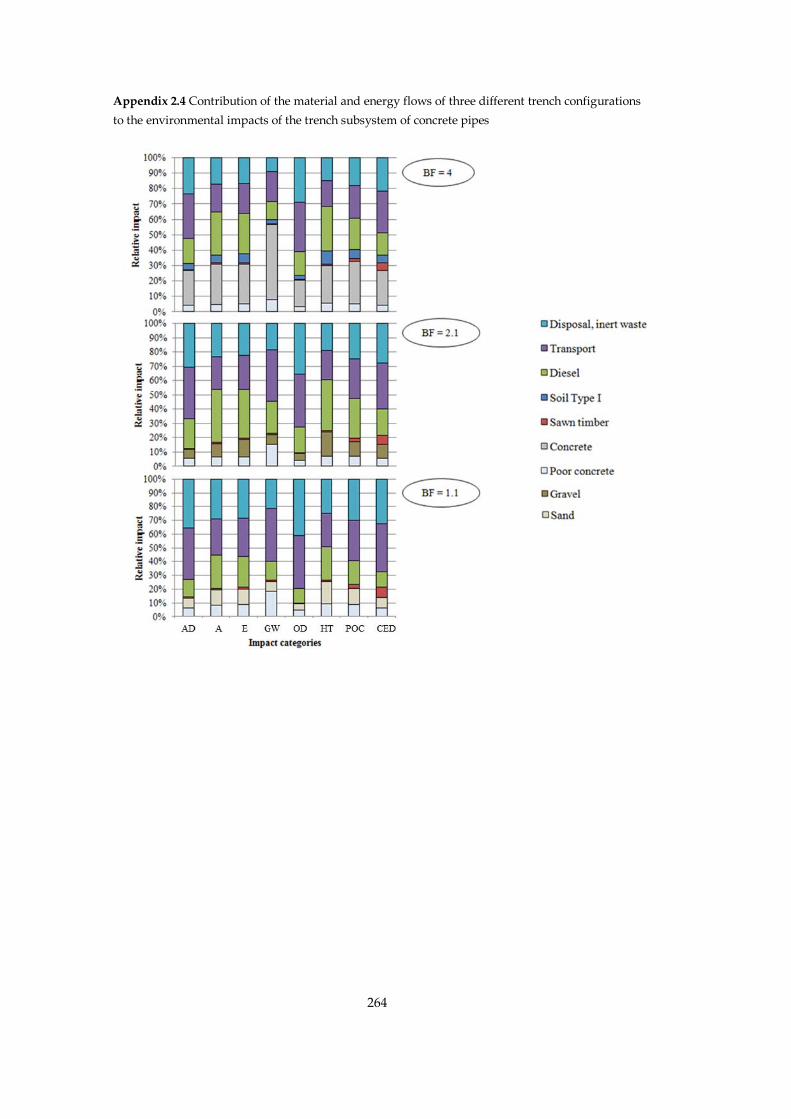
264
Appendix 2.4 Contribution of the material and energy flows of three different trench configurations
to the environmental impacts of the trench subsystem of concrete pipes
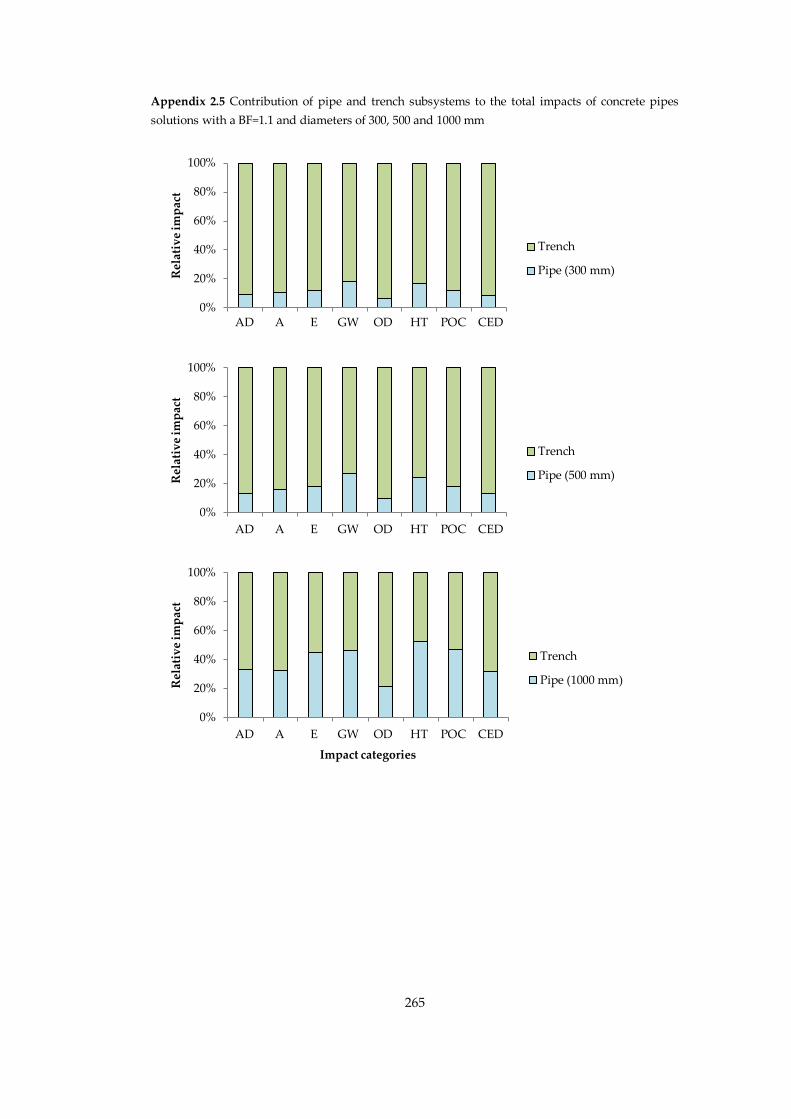
265
Appendix 2.5 Contribution of pipe and trench subsystems to the total impacts of concrete pipes
solutions with a BF=1.1 and diameters of 300, 500 and 1000 mm
0%
20%
40%
60%
80%
100%
ADP AP EP GWP ODP HTP PCOP CED
Rel
ativ
e im
pac
t
Impact categories
Trench
Pipe (1000 mm)
0%
20%
40%
60%
80%
100%
ADP AP EP GWP ODP HTP PCOP CED
Rel
ativ
e im
pac
t
Impact categories
Trench
Pipe (300 mm)
0%
20%
40%
60%
80%
100%
ADP AP EP GWP ODP HTP PCOP CED
Rel
ativ
e im
pac
t
Impact categories
Trench
Pipe (500 mm)
AD A E GW OD HT POC CED
AD A E GW OD HT POC CED
AD A E GW OD HT POC CED
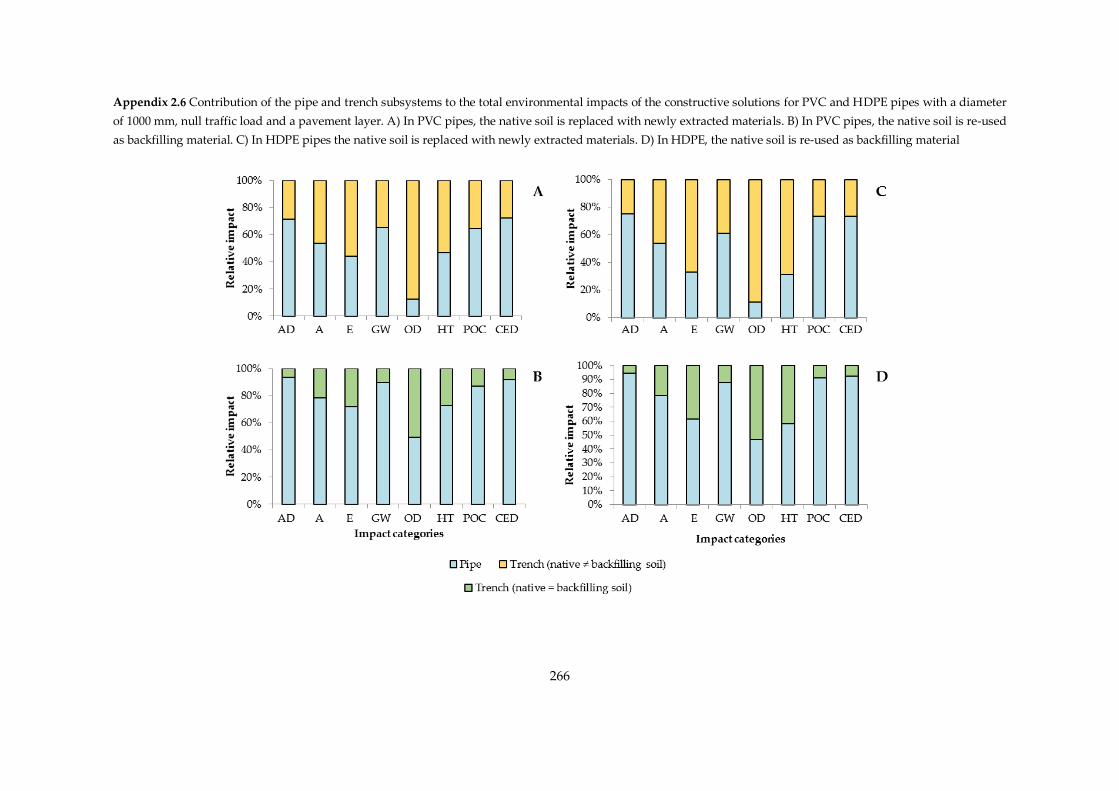
266
Appendix 2.6 Contribution of the pipe and trench subsystems to the total environmental impacts of the constructive solutions for PVC and HDPE pipes with a diameter
of 1000 mm, null traffic load and a pavement layer. A) In PVC pipes, the native soil is replaced with newly extracted materials. B) In PVC pipes, the native soil is re-used
as backfilling material. C) In HDPE pipes the native soil is replaced with newly extracted materials. D) In HDPE, the native soil is re-used as backfilling material
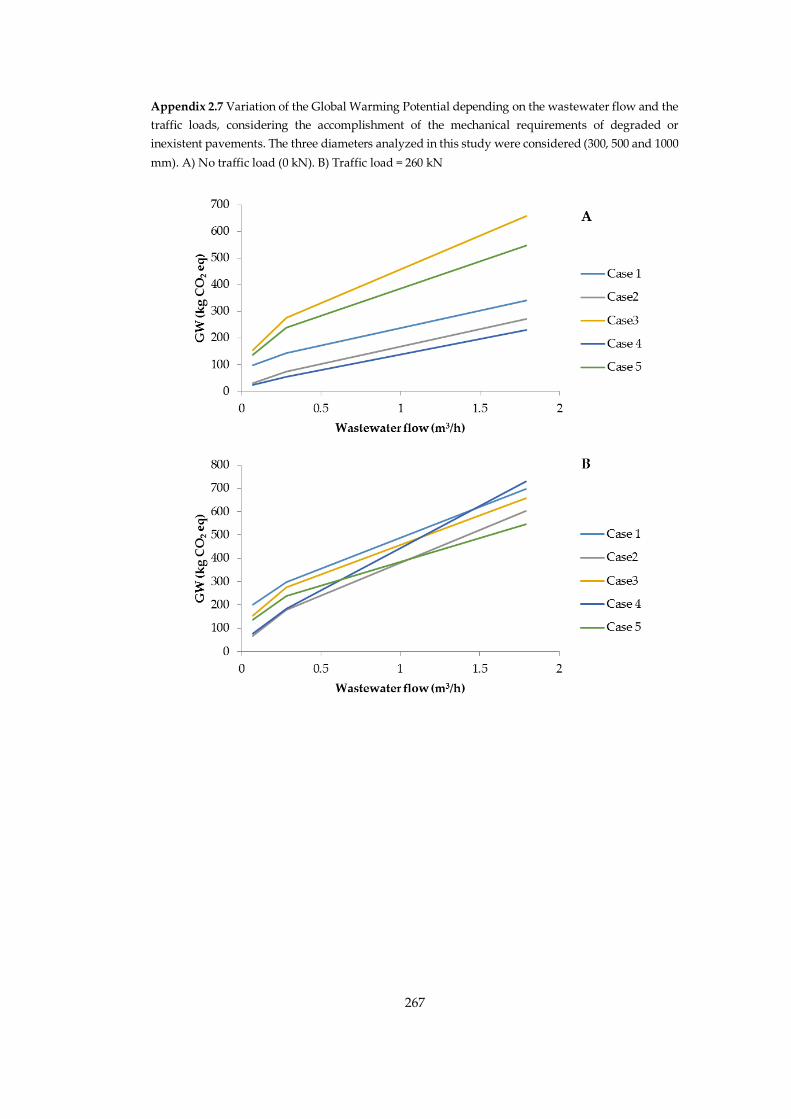
267
Appendix 2.7 Variation of the Global Warming Potential depending on the wastewater flow and the
traffic loads, considering the accomplishment of the mechanical requirements of degraded or
inexistent pavements. The three diameters analyzed in this study were considered (300, 500 and 1000
mm). A) No traffic load (0 kN). B) Traffic load = 260 kN
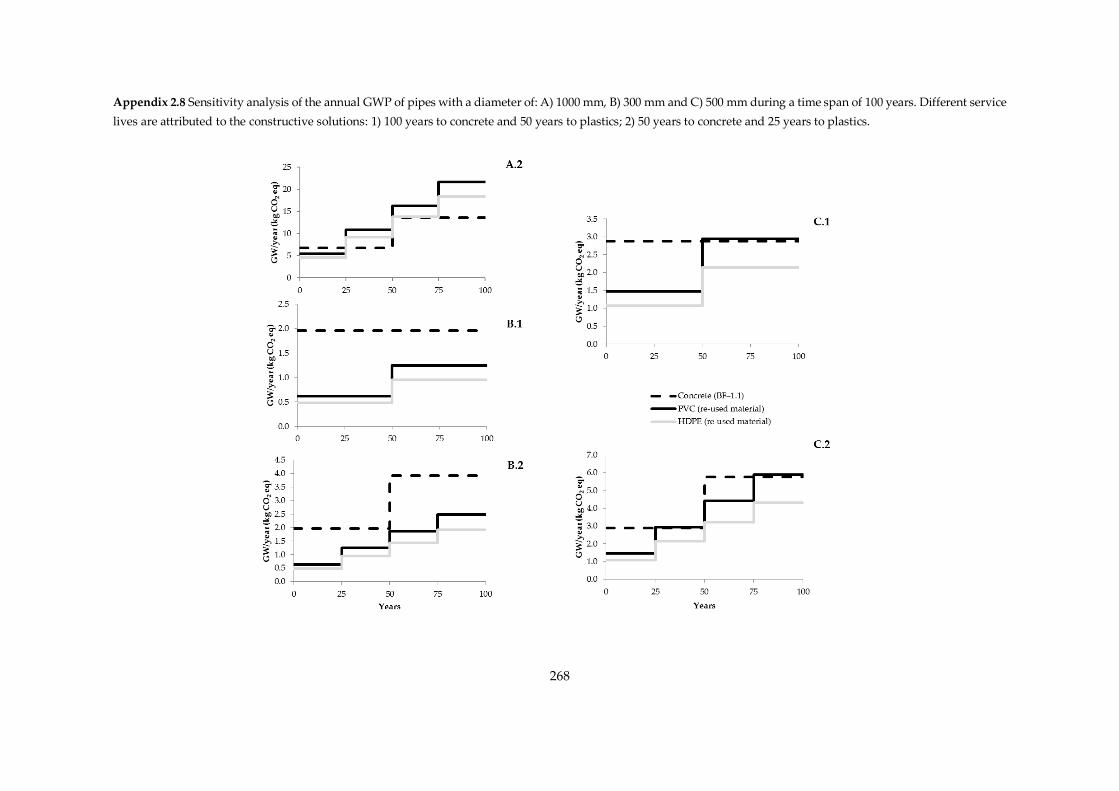
268
Appendix 2.8 Sensitivity analysis of the annual GWP of pipes with a diameter of: A) 1000 mm, B) 300 mm and C) 500 mm during a time span of 100 years. Different service
lives are attributed to the constructive solutions: 1) 100 years to concrete and 50 years to plastics; 2) 50 years to concrete and 25 years to plastics.
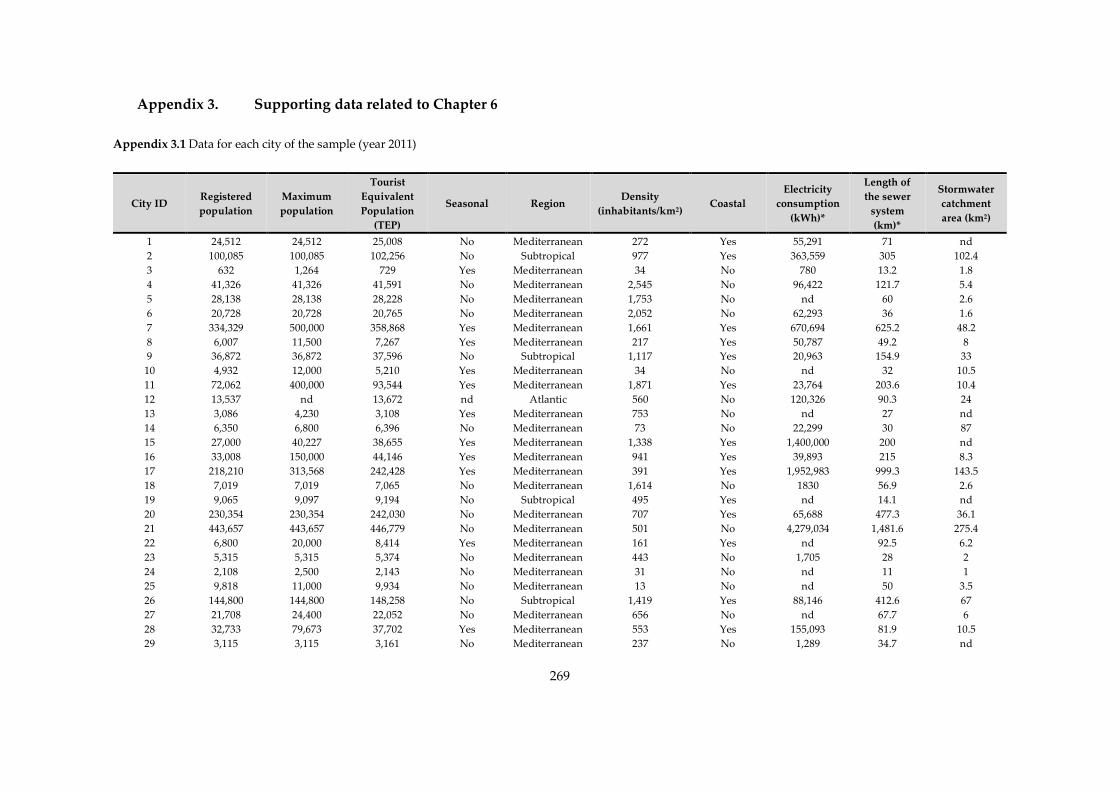
269
Appendix 3. Supporting data related to Chapter 6
Appendix 3.1 Data for each city of the sample (year 2011)
City ID Registered
population
Maximum
population
Tourist
Equivalent
Population
(TEP)
Seasonal Region Density
(inhabitants/km2) Coastal
Electricity
consumption
(kWh)*
Length of
the sewer
system
(km)*
Stormwater
catchment
area (km2)
1 24,512 24,512 25,008 No Mediterranean 272 Yes 55,291 71 nd
2 100,085 100,085 102,256 No Subtropical 977 Yes 363,559 305 102.4
3 632 1,264 729 Yes Mediterranean 34 No 780 13.2 1.8
4 41,326 41,326 41,591 No Mediterranean 2,545 No 96,422 121.7 5.4
5 28,138 28,138 28,228 No Mediterranean 1,753 No nd 60 2.6
6 20,728 20,728 20,765 No Mediterranean 2,052 No 62,293 36 1.6
7 334,329 500,000 358,868 Yes Mediterranean 1,661 Yes 670,694 625.2 48.2
8 6,007 11,500 7,267 Yes Mediterranean 217 Yes 50,787 49.2 8
9 36,872 36,872 37,596 No Subtropical 1,117 Yes 20,963 154.9 33
10 4,932 12,000 5,210 Yes Mediterranean 34 No nd 32 10.5
11 72,062 400,000 93,544 Yes Mediterranean 1,871 Yes 23,764 203.6 10.4
12 13,537 nd 13,672 nd Atlantic 560 No 120,326 90.3 24
13 3,086 4,230 3,108 Yes Mediterranean 753 No nd 27 nd
14 6,350 6,800 6,396 No Mediterranean 73 No 22,299 30 87
15 27,000 40,227 38,655 Yes Mediterranean 1,338 Yes 1,400,000 200 nd
16 33,008 150,000 44,146 Yes Mediterranean 941 Yes 39,893 215 8.3
17 218,210 313,568 242,428 Yes Mediterranean 391 Yes 1,952,983 999.3 143.5
18 7,019 7,019 7,065 No Mediterranean 1,614 No 1830 56.9 2.6
19 9,065 9,097 9,194 No Subtropical 495 Yes nd 14.1 nd
20 230,354 230,354 242,030 No Mediterranean 707 Yes 65,688 477.3 36.1
21 443,657 443,657 446,779 No Mediterranean 501 No 4,279,034 1,481.6 275.4
22 6,800 20,000 8,414 Yes Mediterranean 161 Yes nd 92.5 6.2
23 5,315 5,315 5,374 No Mediterranean 443 No 1,705 28 2
24 2,108 2,500 2,143 No Mediterranean 31 No nd 11 1
25 9,818 11,000 9,934 No Mediterranean 13 No nd 50 3.5
26 144,800 144,800 148,258 No Subtropical 1,419 Yes 88,146 412.6 67
27 21,708 24,400 22,052 No Mediterranean 656 No nd 67.7 6
28 32,733 79,673 37,702 Yes Mediterranean 553 Yes 155,093 81.9 10.5
29 3,115 3,115 3,161 No Mediterranean 237 No 1,289 34.7 nd
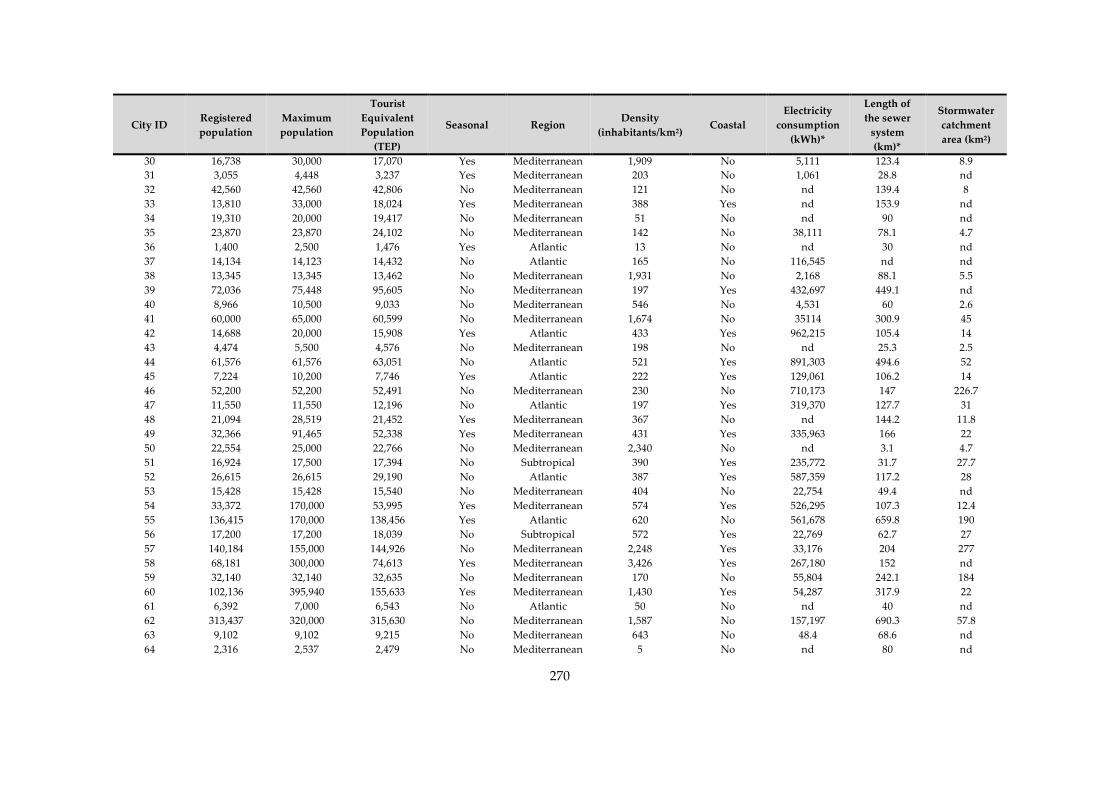
270
City ID Registered
population
Maximum
population
Tourist
Equivalent
Population
(TEP)
Seasonal Region Density
(inhabitants/km2) Coastal
Electricity
consumption
(kWh)*
Length of
the sewer
system
(km)*
Stormwater
catchment
area (km2)
30 16,738 30,000 17,070 Yes Mediterranean 1,909 No 5,111 123.4 8.9
31 3,055 4,448 3,237 Yes Mediterranean 203 No 1,061 28.8 nd
32 42,560 42,560 42,806 No Mediterranean 121 No nd 139.4 8
33 13,810 33,000 18,024 Yes Mediterranean 388 Yes nd 153.9 nd
34 19,310 20,000 19,417 No Mediterranean 51 No nd 90 nd
35 23,870 23,870 24,102 No Mediterranean 142 No 38,111 78.1 4.7
36 1,400 2,500 1,476 Yes Atlantic 13 No nd 30 nd
37 14,134 14,123 14,432 No Atlantic 165 No 116,545 nd nd
38 13,345 13,345 13,462 No Mediterranean 1,931 No 2,168 88.1 5.5
39 72,036 75,448 95,605 No Mediterranean 197 Yes 432,697 449.1 nd
40 8,966 10,500 9,033 No Mediterranean 546 No 4,531 60 2.6
41 60,000 65,000 60,599 No Mediterranean 1,674 No 35114 300.9 45
42 14,688 20,000 15,908 Yes Atlantic 433 Yes 962,215 105.4 14
43 4,474 5,500 4,576 No Mediterranean 198 No nd 25.3 2.5
44 61,576 61,576 63,051 No Atlantic 521 Yes 891,303 494.6 52
45 7,224 10,200 7,746 Yes Atlantic 222 Yes 129,061 106.2 14
46 52,200 52,200 52,491 No Mediterranean 230 No 710,173 147 226.7
47 11,550 11,550 12,196 No Atlantic 197 Yes 319,370 127.7 31
48 21,094 28,519 21,452 Yes Mediterranean 367 No nd 144.2 11.8
49 32,366 91,465 52,338 Yes Mediterranean 431 Yes 335,963 166 22
50 22,554 25,000 22,766 No Mediterranean 2,340 No nd 3.1 4.7
51 16,924 17,500 17,394 No Subtropical 390 Yes 235,772 31.7 27.7
52 26,615 26,615 29,190 No Atlantic 387 Yes 587,359 117.2 28
53 15,428 15,428 15,540 No Mediterranean 404 No 22,754 49.4 nd
54 33,372 170,000 53,995 Yes Mediterranean 574 Yes 526,295 107.3 12.4
55 136,415 170,000 138,456 Yes Atlantic 620 No 561,678 659.8 190
56 17,200 17,200 18,039 No Subtropical 572 Yes 22,769 62.7 27
57 140,184 155,000 144,926 No Mediterranean 2,248 Yes 33,176 204 277
58 68,181 300,000 74,613 Yes Mediterranean 3,426 Yes 267,180 152 nd
59 32,140 32,140 32,635 No Mediterranean 170 No 55,804 242.1 184
60 102,136 395,940 155,633 Yes Mediterranean 1,430 Yes 54,287 317.9 22
61 6,392 7,000 6,543 No Atlantic 50 No nd 40 nd
62 313,437 320,000 315,630 No Mediterranean 1,587 No 157,197 690.3 57.8
63 9,102 9,102 9,215 No Mediterranean 643 No 48.4 68.6 nd
64 2,316 2,537 2,479 No Mediterranean 5 No nd 80 nd
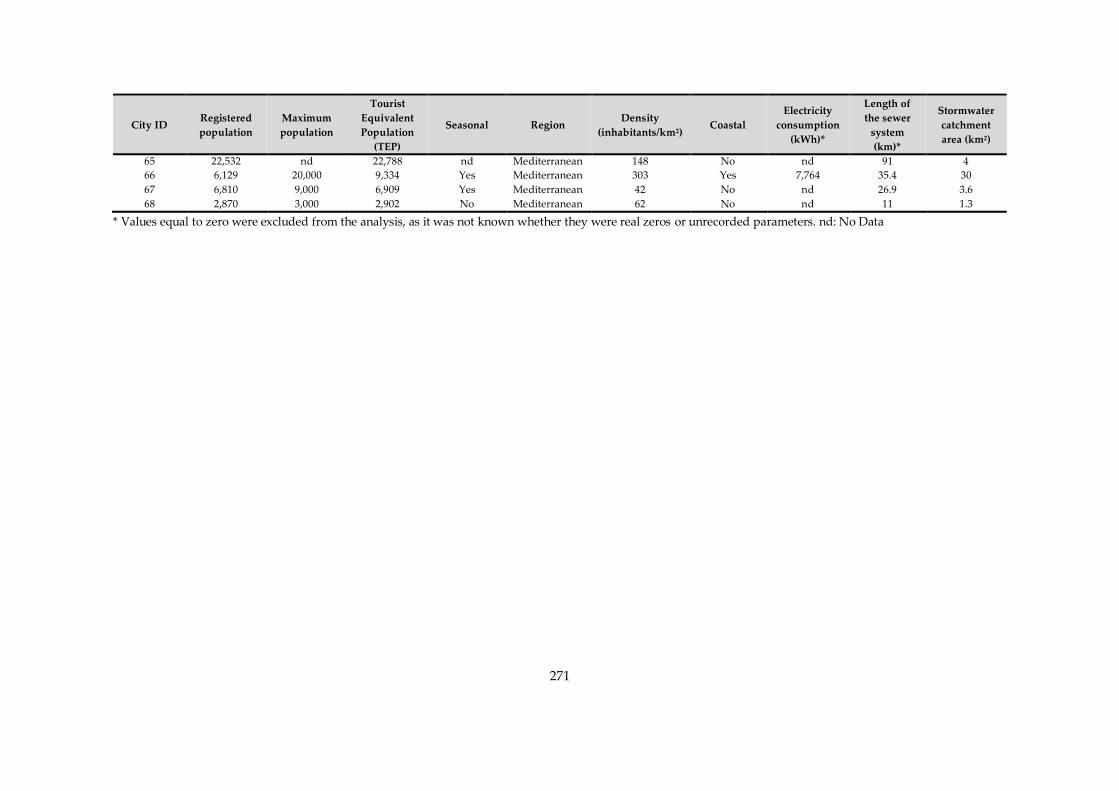
271
City ID Registered
population
Maximum
population
Tourist
Equivalent
Population
(TEP)
Seasonal Region Density
(inhabitants/km2) Coastal
Electricity
consumption
(kWh)*
Length of
the sewer
system
(km)*
Stormwater
catchment
area (km2)
65 22,532 nd 22,788 nd Mediterranean 148 No nd 91 4
66 6,129 20,000 9,334 Yes Mediterranean 303 Yes 7,764 35.4 30
67 6,810 9,000 6,909 Yes Mediterranean 42 No nd 26.9 3.6
68 2,870 3,000 2,902 No Mediterranean 62 No nd 11 1.3
* Values equal to zero were excluded from the analysis, as it was not known whether they were real zeros or unrecorded parameters. nd: No Data
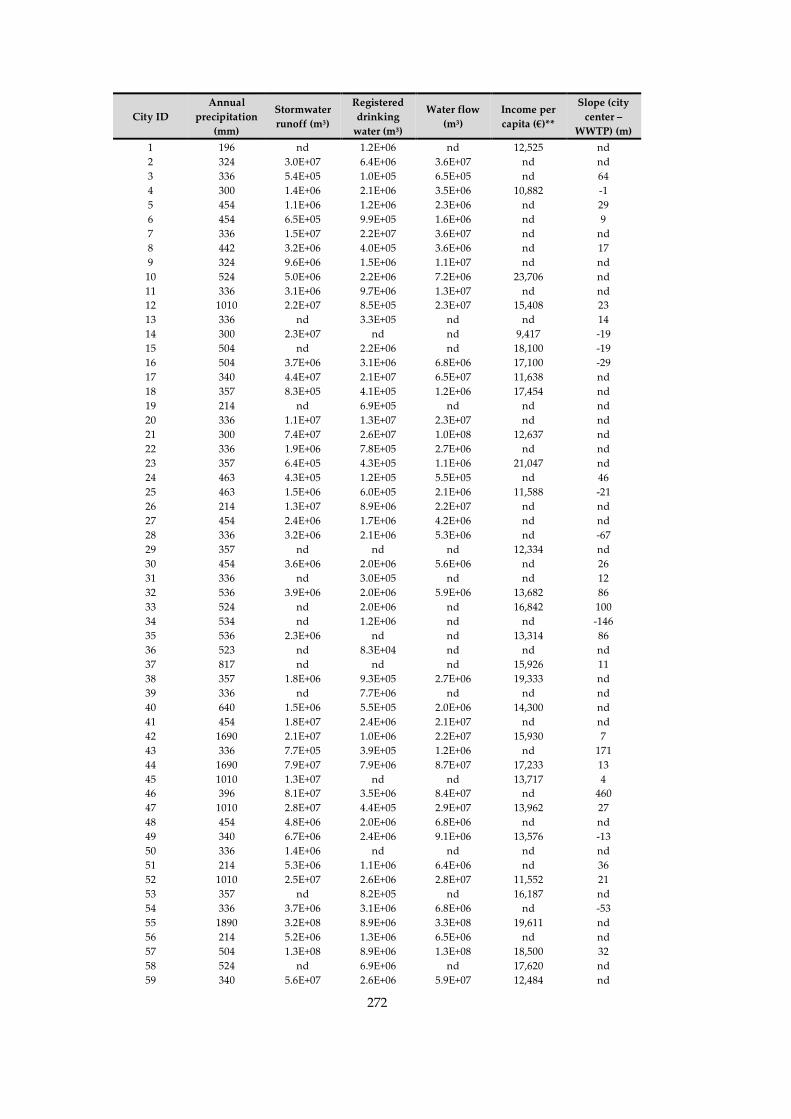
272
City ID
Annual
precipitation
(mm)
Stormwater
runoff (m3)
Registered
drinking
water (m3)
Water flow
(m3)
Income per
capita (€)**
Slope (city
center –
WWTP) (m)
1 196 nd 1.2E+06 nd 12,525 nd
2 324 3.0E+07 6.4E+06 3.6E+07 nd nd
3 336 5.4E+05 1.0E+05 6.5E+05 nd 64
4 300 1.4E+06 2.1E+06 3.5E+06 10,882 -1
5 454 1.1E+06 1.2E+06 2.3E+06 nd 29
6 454 6.5E+05 9.9E+05 1.6E+06 nd 9
7 336 1.5E+07 2.2E+07 3.6E+07 nd nd
8 442 3.2E+06 4.0E+05 3.6E+06 nd 17
9 324 9.6E+06 1.5E+06 1.1E+07 nd nd
10 524 5.0E+06 2.2E+06 7.2E+06 23,706 nd
11 336 3.1E+06 9.7E+06 1.3E+07 nd nd
12 1010 2.2E+07 8.5E+05 2.3E+07 15,408 23
13 336 nd 3.3E+05 nd nd 14
14 300 2.3E+07 nd nd 9,417 -19
15 504 nd 2.2E+06 nd 18,100 -19
16 504 3.7E+06 3.1E+06 6.8E+06 17,100 -29
17 340 4.4E+07 2.1E+07 6.5E+07 11,638 nd
18 357 8.3E+05 4.1E+05 1.2E+06 17,454 nd
19 214 nd 6.9E+05 nd nd nd
20 336 1.1E+07 1.3E+07 2.3E+07 nd nd
21 300 7.4E+07 2.6E+07 1.0E+08 12,637 nd
22 336 1.9E+06 7.8E+05 2.7E+06 nd nd
23 357 6.4E+05 4.3E+05 1.1E+06 21,047 nd
24 463 4.3E+05 1.2E+05 5.5E+05 nd 46
25 463 1.5E+06 6.0E+05 2.1E+06 11,588 -21
26 214 1.3E+07 8.9E+06 2.2E+07 nd nd
27 454 2.4E+06 1.7E+06 4.2E+06 nd nd
28 336 3.2E+06 2.1E+06 5.3E+06 nd -67
29 357 nd nd nd 12,334 nd
30 454 3.6E+06 2.0E+06 5.6E+06 nd 26
31 336 nd 3.0E+05 nd nd 12
32 536 3.9E+06 2.0E+06 5.9E+06 13,682 86
33 524 nd 2.0E+06 nd 16,842 100
34 534 nd 1.2E+06 nd nd -146
35 536 2.3E+06 nd nd 13,314 86
36 523 nd 8.3E+04 nd nd nd
37 817 nd nd nd 15,926 11
38 357 1.8E+06 9.3E+05 2.7E+06 19,333 nd
39 336 nd 7.7E+06 nd nd nd
40 640 1.5E+06 5.5E+05 2.0E+06 14,300 nd
41 454 1.8E+07 2.4E+06 2.1E+07 nd nd
42 1690 2.1E+07 1.0E+06 2.2E+07 15,930 7
43 336 7.7E+05 3.9E+05 1.2E+06 nd 171
44 1690 7.9E+07 7.9E+06 8.7E+07 17,233 13
45 1010 1.3E+07 nd nd 13,717 4
46 396 8.1E+07 3.5E+06 8.4E+07 nd 460
47 1010 2.8E+07 4.4E+05 2.9E+07 13,962 27
48 454 4.8E+06 2.0E+06 6.8E+06 nd nd
49 340 6.7E+06 2.4E+06 9.1E+06 13,576 -13
50 336 1.4E+06 nd nd nd nd
51 214 5.3E+06 1.1E+06 6.4E+06 nd 36
52 1010 2.5E+07 2.6E+06 2.8E+07 11,552 21
53 357 nd 8.2E+05 nd 16,187 nd
54 336 3.7E+06 3.1E+06 6.8E+06 nd -53
55 1890 3.2E+08 8.9E+06 3.3E+08 19,611 nd
56 214 5.2E+06 1.3E+06 6.5E+06 nd nd
57 504 1.3E+08 8.9E+06 1.3E+08 18,500 32
58 524 nd 6.9E+06 nd 17,620 nd
59 340 5.6E+07 2.6E+06 5.9E+07 12,484 nd
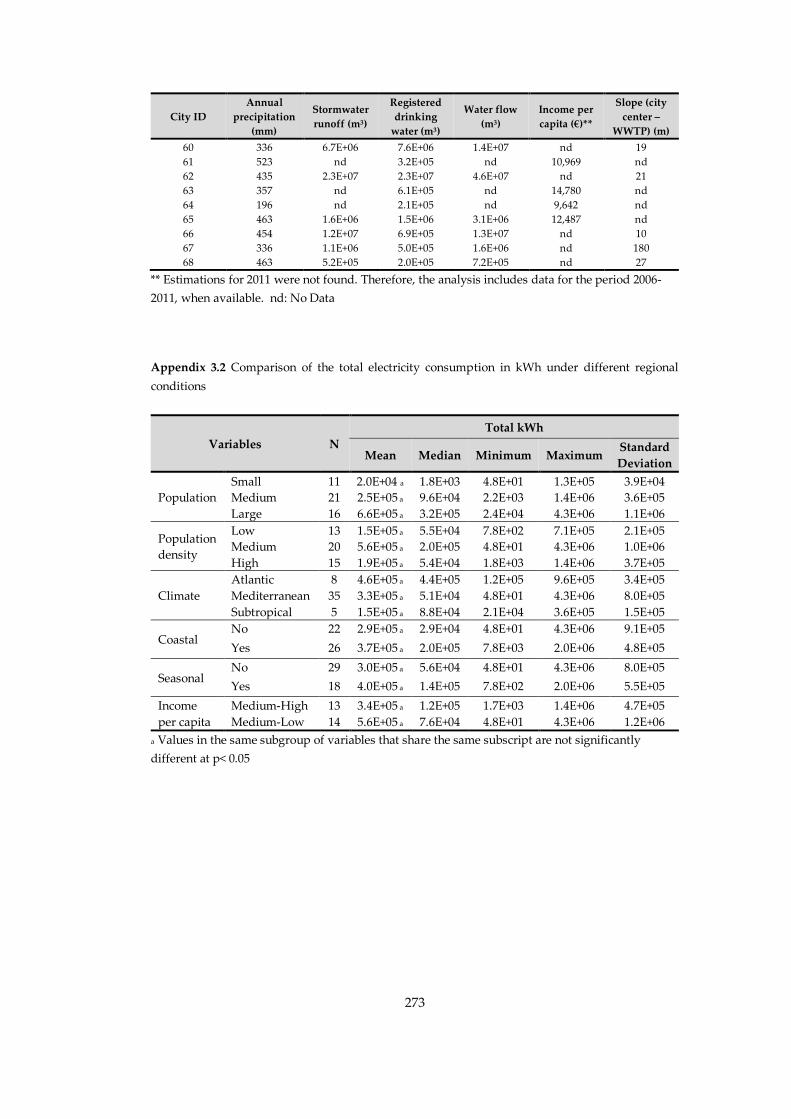
273
City ID
Annual
precipitation
(mm)
Stormwater
runoff (m3)
Registered
drinking
water (m3)
Water flow
(m3)
Income per
capita (€)**
Slope (city
center –
WWTP) (m)
60 336 6.7E+06 7.6E+06 1.4E+07 nd 19
61 523 nd 3.2E+05 nd 10,969 nd
62 435 2.3E+07 2.3E+07 4.6E+07 nd 21
63 357 nd 6.1E+05 nd 14,780 nd
64 196 nd 2.1E+05 nd 9,642 nd
65 463 1.6E+06 1.5E+06 3.1E+06 12,487 nd
66 454 1.2E+07 6.9E+05 1.3E+07 nd 10
67 336 1.1E+06 5.0E+05 1.6E+06 nd 180
68 463 5.2E+05 2.0E+05 7.2E+05 nd 27
** Estimations for 2011 were not found. Therefore, the analysis includes data for the period 2006-
2011, when available. nd: No Data
Appendix 3.2 Comparison of the total electricity consumption in kWh under different regional
conditions
Variables N
Total kWh
Mean Median Minimum Maximum Standard
Deviation
Population
Small 11 2.0E+04 a 1.8E+03 4.8E+01 1.3E+05 3.9E+04
Medium 21 2.5E+05 a 9.6E+04 2.2E+03 1.4E+06 3.6E+05
Large 16 6.6E+05 a 3.2E+05 2.4E+04 4.3E+06 1.1E+06
Population
density
Low 13 1.5E+05 a 5.5E+04 7.8E+02 7.1E+05 2.1E+05
Medium 20 5.6E+05 a 2.0E+05 4.8E+01 4.3E+06 1.0E+06
High 15 1.9E+05 a 5.4E+04 1.8E+03 1.4E+06 3.7E+05
Climate
Atlantic 8 4.6E+05 a 4.4E+05 1.2E+05 9.6E+05 3.4E+05
Mediterranean 35 3.3E+05 a 5.1E+04 4.8E+01 4.3E+06 8.0E+05
Subtropical 5 1.5E+05 a 8.8E+04 2.1E+04 3.6E+05 1.5E+05
Coastal No 22 2.9E+05 a 2.9E+04 4.8E+01 4.3E+06 9.1E+05
Yes 26 3.7E+05 a 2.0E+05 7.8E+03 2.0E+06 4.8E+05
Seasonal No 29 3.0E+05 a 5.6E+04 4.8E+01 4.3E+06 8.0E+05
Yes 18 4.0E+05 a 1.4E+05 7.8E+02 2.0E+06 5.5E+05
Income
per capita
Medium-High 13 3.4E+05 a 1.2E+05 1.7E+03 1.4E+06 4.7E+05
Medium-Low 14 5.6E+05 a 7.6E+04 4.8E+01 4.3E+06 1.2E+06
a Values in the same subgroup of variables that share the same subscript are not significantly
different at p< 0.05
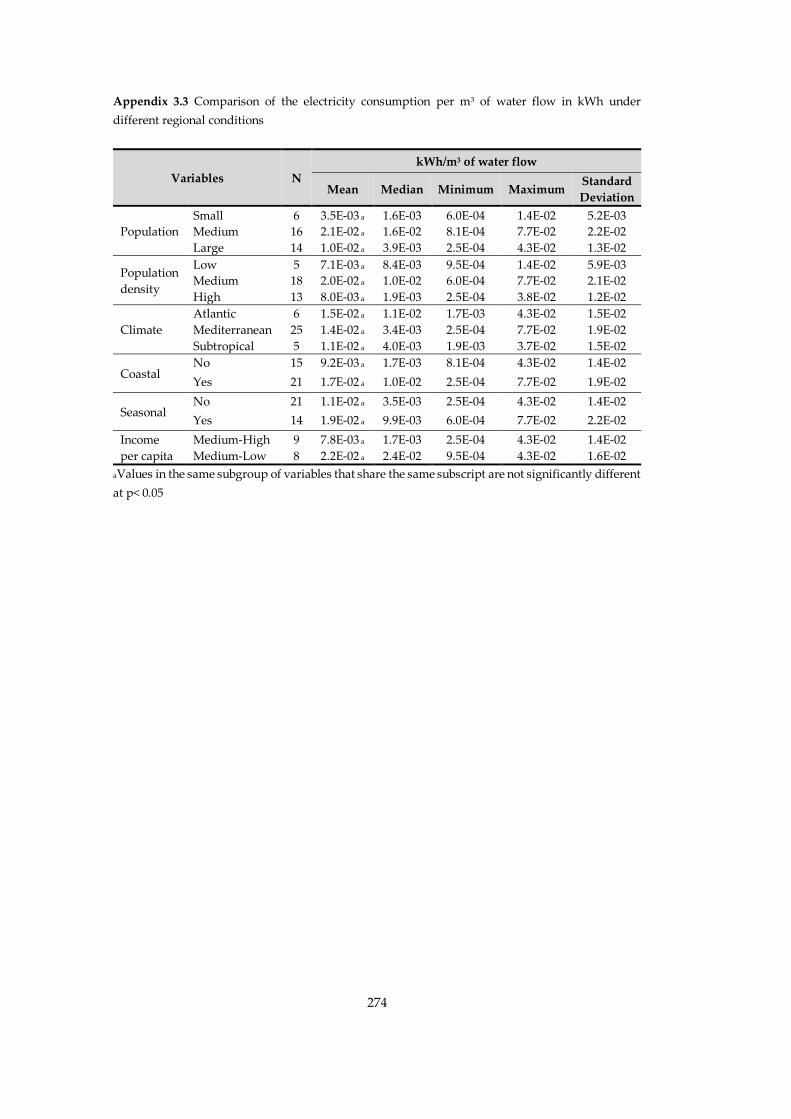
274
Appendix 3.3 Comparison of the electricity consumption per m3 of water flow in kWh under
different regional conditions
Variables N
kWh/m3 of water flow
Mean Median Minimum Maximum Standard
Deviation
Population
Small 6 3.5E-03 a 1.6E-03 6.0E-04 1.4E-02 5.2E-03
Medium 16 2.1E-02 a 1.6E-02 8.1E-04 7.7E-02 2.2E-02
Large 14 1.0E-02 a 3.9E-03 2.5E-04 4.3E-02 1.3E-02
Population
density
Low 5 7.1E-03 a 8.4E-03 9.5E-04 1.4E-02 5.9E-03
Medium 18 2.0E-02 a 1.0E-02 6.0E-04 7.7E-02 2.1E-02
High 13 8.0E-03 a 1.9E-03 2.5E-04 3.8E-02 1.2E-02
Climate
Atlantic 6 1.5E-02 a 1.1E-02 1.7E-03 4.3E-02 1.5E-02
Mediterranean 25 1.4E-02 a 3.4E-03 2.5E-04 7.7E-02 1.9E-02
Subtropical 5 1.1E-02 a 4.0E-03 1.9E-03 3.7E-02 1.5E-02
Coastal No 15 9.2E-03 a 1.7E-03 8.1E-04 4.3E-02 1.4E-02
Yes 21 1.7E-02 a 1.0E-02 2.5E-04 7.7E-02 1.9E-02
Seasonal No 21 1.1E-02 a 3.5E-03 2.5E-04 4.3E-02 1.4E-02
Yes 14 1.9E-02 a 9.9E-03 6.0E-04 7.7E-02 2.2E-02
Income
per capita
Medium-High 9 7.8E-03 a 1.7E-03 2.5E-04 4.3E-02 1.4E-02
Medium-Low 8 2.2E-02 a 2.4E-02 9.5E-04 4.3E-02 1.6E-02
aValues in the same subgroup of variables that share the same subscript are not significantly different
at p< 0.05
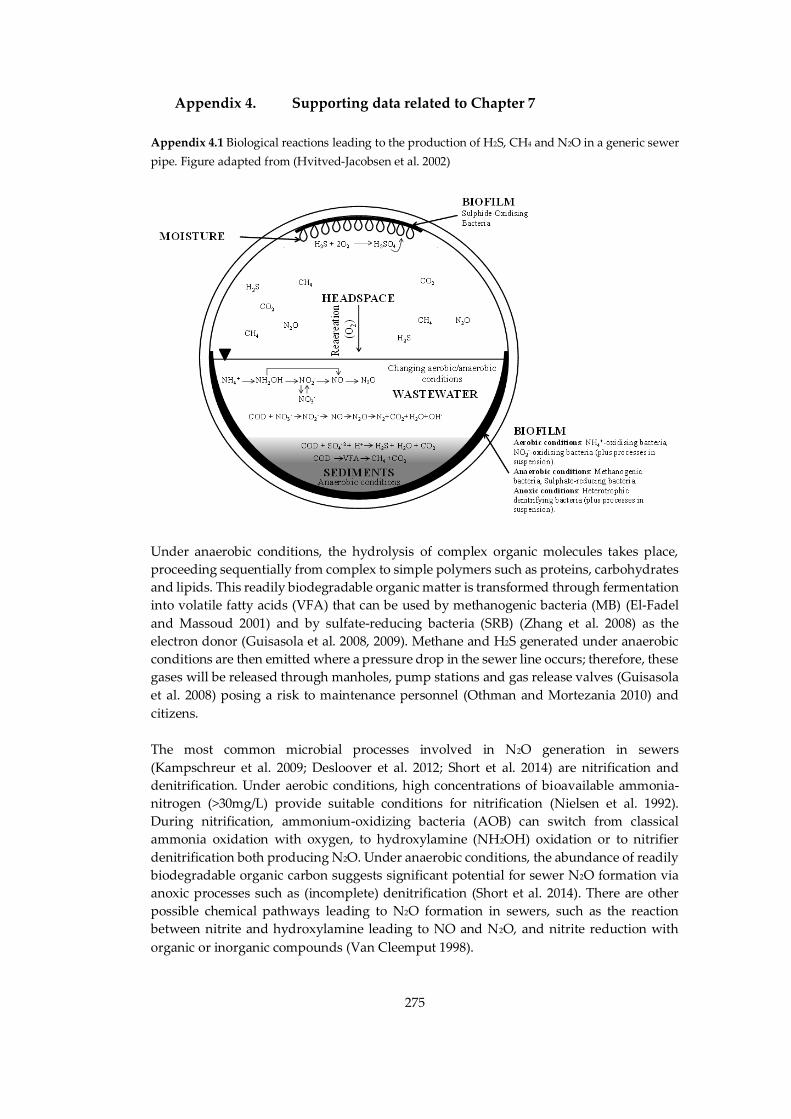
275
Appendix 4. Supporting data related to Chapter 7
Appendix 4.1 Biological reactions leading to the production of H2S, CH4 and N2O in a generic sewer
pipe. Figure adapted from (Hvitved-Jacobsen et al. 2002)
Under anaerobic conditions, the hydrolysis of complex organic molecules takes place,
proceeding sequentially from complex to simple polymers such as proteins, carbohydrates
and lipids. This readily biodegradable organic matter is transformed through fermentation
into volatile fatty acids (VFA) that can be used by methanogenic bacteria (MB) (El-Fadel
and Massoud 2001) and by sulfate-reducing bacteria (SRB) (Zhang et al. 2008) as the
electron donor (Guisasola et al. 2008, 2009). Methane and H2S generated under anaerobic
conditions are then emitted where a pressure drop in the sewer line occurs; therefore, these
gases will be released through manholes, pump stations and gas release valves (Guisasola
et al. 2008) posing a risk to maintenance personnel (Othman and Mortezania 2010) and
citizens.
The most common microbial processes involved in N2O generation in sewers
(Kampschreur et al. 2009; Desloover et al. 2012; Short et al. 2014) are nitrification and
denitrification. Under aerobic conditions, high concentrations of bioavailable ammonia-
nitrogen (>30mg/L) provide suitable conditions for nitrification (Nielsen et al. 1992).
During nitrification, ammonium-oxidizing bacteria (AOB) can switch from classical
ammonia oxidation with oxygen, to hydroxylamine (NH2OH) oxidation or to nitrifier
denitrification both producing N2O. Under anaerobic conditions, the abundance of readily
biodegradable organic carbon suggests significant potential for sewer N2O formation via
anoxic processes such as (incomplete) denitrification (Short et al. 2014). There are other
possible chemical pathways leading to N2O formation in sewers, such as the reaction
between nitrite and hydroxylamine leading to NO and N2O, and nitrite reduction with
organic or inorganic compounds (Van Cleemput 1998).
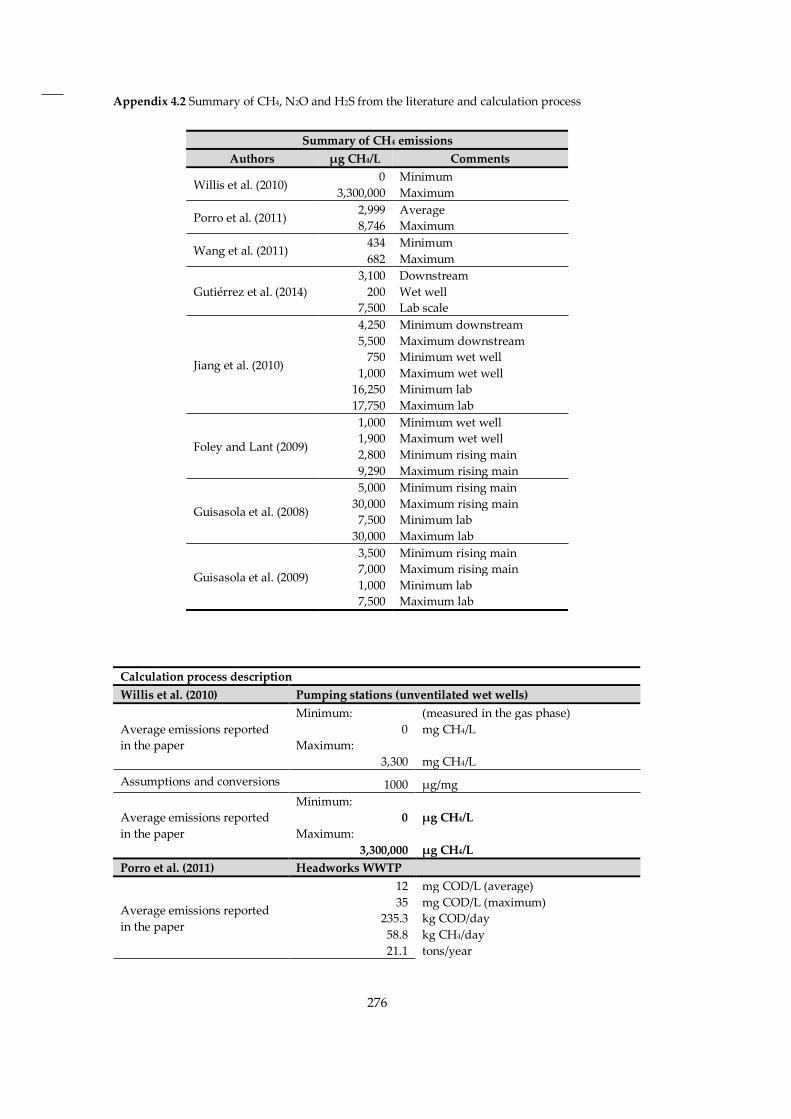
276
Appendix 4.2 Summary of CH4, N2O and H2S from the literature and calculation process
Summary of CH4 emissions
Authors µg CH4/L Comments
Willis et al. (2010) 0 Minimum
3,300,000 Maximum
Porro et al. (2011) 2,999 Average
8,746 Maximum
Wang et al. (2011) 434 Minimum
682 Maximum
Gutiérrez et al. (2014)
3,100 Downstream
200 Wet well
7,500 Lab scale
Jiang et al. (2010)
4,250 Minimum downstream
5,500 Maximum downstream
750 Minimum wet well
1,000 Maximum wet well
16,250 Minimum lab
17,750 Maximum lab
Foley and Lant (2009)
1,000 Minimum wet well
1,900 Maximum wet well
2,800 Minimum rising main
9,290 Maximum rising main
Guisasola et al. (2008)
5,000 Minimum rising main
30,000 Maximum rising main
7,500 Minimum lab
30,000 Maximum lab
Guisasola et al. (2009)
3,500 Minimum rising main
7,000 Maximum rising main
1,000 Minimum lab
7,500 Maximum lab
Calculation process description
Willis et al. (2010) Pumping stations (unventilated wet wells)
Average emissions reported
in the paper
Minimum: (measured in the gas phase)
0 mg CH4/L
Maximum:
3,300 mg CH4/L
Assumptions and conversions 1000 µg/mg
Average emissions reported
in the paper
Minimum:
0 µg CH4/L
Maximum:
3,300,000 µg CH4/L
Porro et al. (2011) Headworks WWTP
Average emissions reported
in the paper
12 mg COD/L (average)
35 mg COD/L (maximum)
235.3 kg COD/day
58.8 kg CH4/day
21.1 tons/year
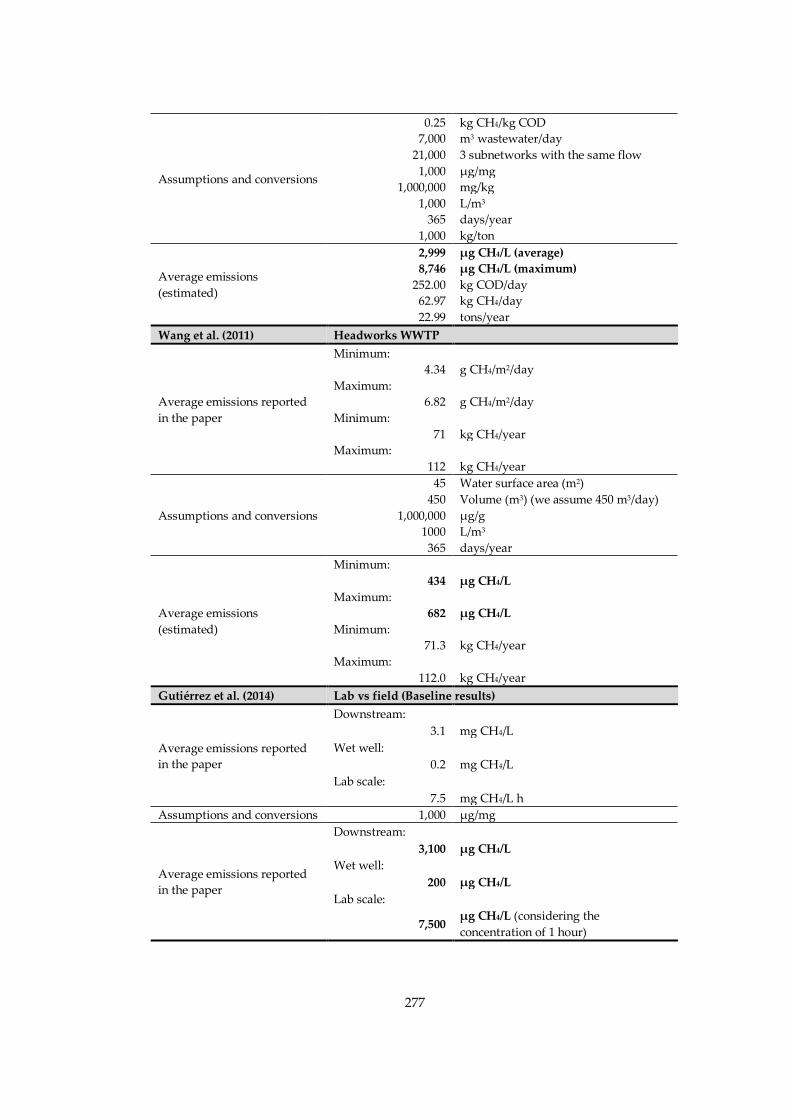
277
Assumptions and conversions
0.25 kg CH4/kg COD
7,000 m3 wastewater/day
21,000 3 subnetworks with the same flow
1,000 µg/mg
1,000,000 mg/kg
1,000 L/m3
365 days/year
1,000 kg/ton
Average emissions
(estimated)
2,999 µg CH4/L (average)
8,746 µg CH4/L (maximum)
252.00 kg COD/day
62.97 kg CH4/day
22.99 tons/year
Wang et al. (2011) Headworks WWTP
Average emissions reported
in the paper
Minimum:
4.34 g CH4/m2/day
Maximum:
6.82 g CH4/m2/day
Minimum:
71 kg CH4/year
Maximum:
112 kg CH4/year
Assumptions and conversions
45 Water surface area (m2)
450 Volume (m3) (we assume 450 m3/day)
1,000,000 µg/g
1000 L/m3
365 days/year
Average emissions
(estimated)
Minimum:
434 µg CH4/L
Maximum:
682 µg CH4/L
Minimum:
71.3 kg CH4/year
Maximum:
112.0 kg CH4/year
Gutiérrez et al. (2014) Lab vs field (Baseline results)
Average emissions reported
in the paper
Downstream:
3.1 mg CH4/L
Wet well:
0.2 mg CH4/L
Lab scale:
7.5 mg CH4/L h
Assumptions and conversions 1,000 µg/mg
Average emissions reported
in the paper
Downstream:
3,100 µg CH4/L
Wet well:
200 µg CH4/L
Lab scale:
7,500 µg CH4/L (considering the
concentration of 1 hour)
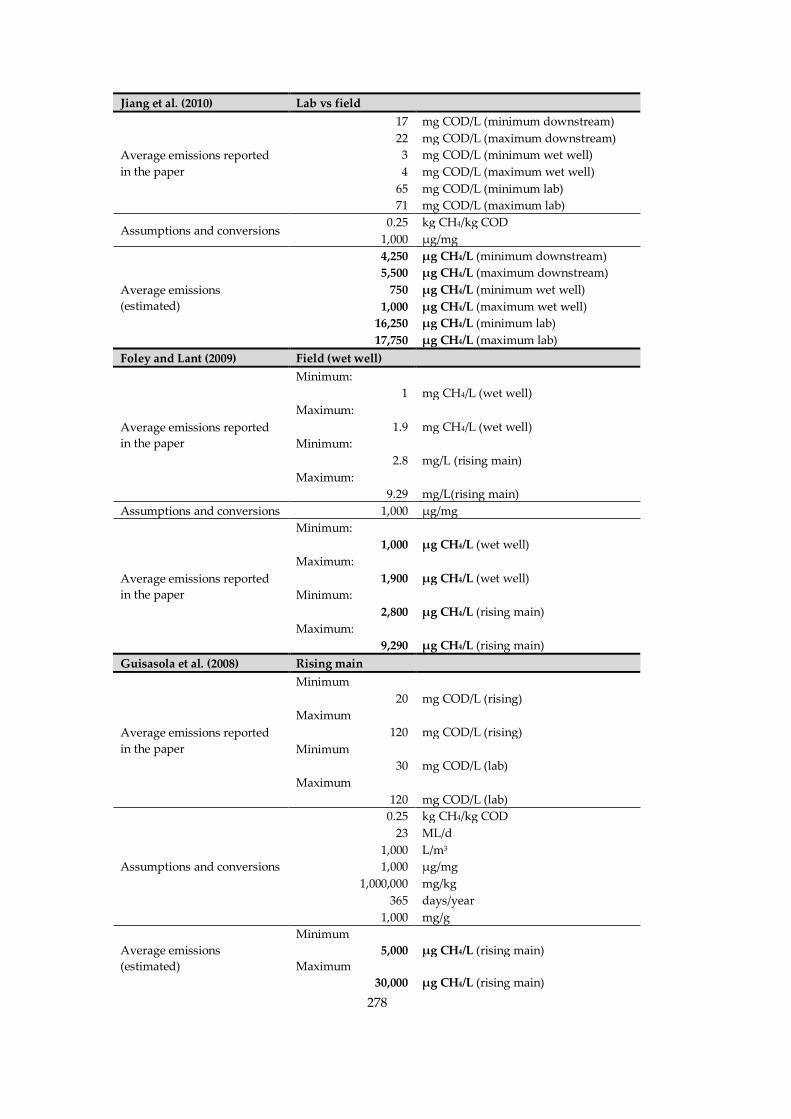
278
Jiang et al. (2010) Lab vs field
Average emissions reported
in the paper
17 mg COD/L (minimum downstream)
22 mg COD/L (maximum downstream)
3 mg COD/L (minimum wet well)
4 mg COD/L (maximum wet well)
65 mg COD/L (minimum lab)
71 mg COD/L (maximum lab)
Assumptions and conversions 0.25 kg CH4/kg COD
1,000 µg/mg
Average emissions
(estimated)
4,250 µg CH4/L (minimum downstream)
5,500 µg CH4/L (maximum downstream)
750 µg CH4/L (minimum wet well)
1,000 µg CH4/L (maximum wet well)
16,250 µg CH4/L (minimum lab)
17,750 µg CH4/L (maximum lab)
Foley and Lant (2009) Field (wet well)
Average emissions reported
in the paper
Minimum:
1 mg CH4/L (wet well)
Maximum:
1.9 mg CH4/L (wet well)
Minimum:
2.8 mg/L (rising main)
Maximum:
9.29 mg/L(rising main)
Assumptions and conversions 1,000 µg/mg
Average emissions reported
in the paper
Minimum:
1,000 µg CH4/L (wet well)
Maximum:
1,900 µg CH4/L (wet well)
Minimum:
2,800 µg CH4/L (rising main)
Maximum:
9,290 µg CH4/L (rising main)
Guisasola et al. (2008) Rising main
Average emissions reported
in the paper
Minimum
20 mg COD/L (rising)
Maximum
120 mg COD/L (rising)
Minimum
30 mg COD/L (lab)
Maximum
120 mg COD/L (lab)
Assumptions and conversions
0.25 kg CH4/kg COD
23 ML/d
1,000 L/m3
1,000 µg/mg
1,000,000 mg/kg
365 days/year
1,000 mg/g
Average emissions
(estimated)
Minimum
5,000 µg CH4/L (rising main)
Maximum
30,000 µg CH4/L (rising main)

279
Minimum
7,500 µg CH4/L (lab)
Maximum
30,000 µg CH4/L (lab)
Guisasola et al. (2009) Rising main
Average emissions reported
in the paper
Minimum
14 g COD/m3 (rising main)
Maximum
28 g COD/m3 (rising main)
Minimum
4 g COD/m3 (lab)
Maximum
30 g COD/m3 (lab)
Assumptions and conversions
0.25 kg CH4/kg COD
23 ML/d
1,000 L/m3
1,000 µg/mg
1,000,000 mg/kg
365 days/year
1,000 mg/g
Average emissions
(estimated)
Minimum
3,500 µg CH4/L (rising main)
Maximum
7,000 µg CH4/L (rising main)
Minimum
1,000 µg CH4/L (lab)
Maximum
7,500 µg CH4/L (lab)
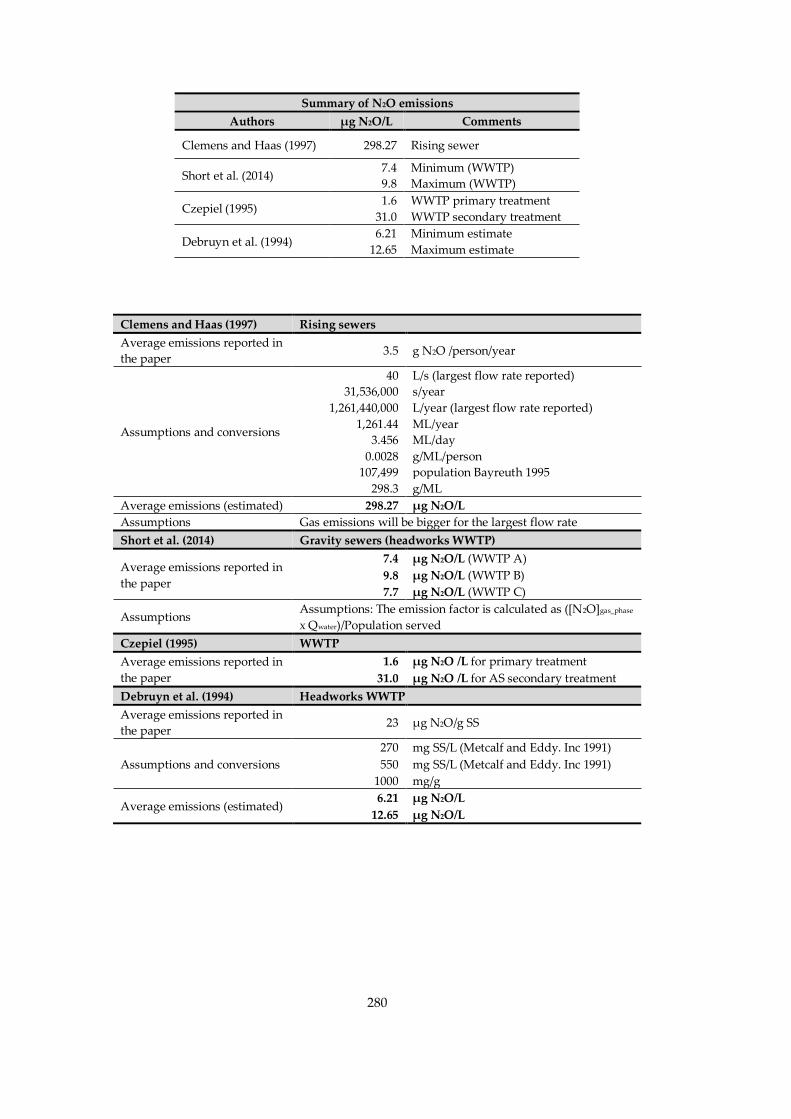
280
Summary of N2O emissions
Authors µg N2O/L Comments
Clemens and Haas (1997) 298.27 Rising sewer
Short et al. (2014) 7.4 Minimum (WWTP)
9.8 Maximum (WWTP)
Czepiel (1995) 1.6 WWTP primary treatment
31.0 WWTP secondary treatment
Debruyn et al. (1994) 6.21 Minimum estimate
12.65 Maximum estimate
Clemens and Haas (1997) Rising sewers
Average emissions reported in
the paper 3.5 g N2O /person/year
Assumptions and conversions
40 L/s (largest flow rate reported)
31,536,000 s/year
1,261,440,000 L/year (largest flow rate reported)
1,261.44 ML/year
3.456 ML/day
0.0028 g/ML/person
107,499 population Bayreuth 1995
298.3 g/ML
Average emissions (estimated) 298.27 µg N2O/L
Assumptions Gas emissions will be bigger for the largest flow rate
Short et al. (2014) Gravity sewers (headworks WWTP)
Average emissions reported in
the paper
7.4 µg N2O/L (WWTP A)
9.8 µg N2O/L (WWTP B)
7.7 µg N2O/L (WWTP C)
Assumptions Assumptions: The emission factor is calculated as ([N2O]gas_phase
х Qwater)/Population served
Czepiel (1995) WWTP
Average emissions reported in
the paper
1.6 µg N2O /L for primary treatment 31.0 µg N2O /L for AS secondary treatment
Debruyn et al. (1994) Headworks WWTP
Average emissions reported in
the paper 23 µg N2O/g SS
Assumptions and conversions
270 mg SS/L (Metcalf and Eddy. Inc 1991)
550 mg SS/L (Metcalf and Eddy. Inc 1991)
1000 mg/g
Average emissions (estimated) 6.21 µg N2O/L
12.65 µg N2O/L
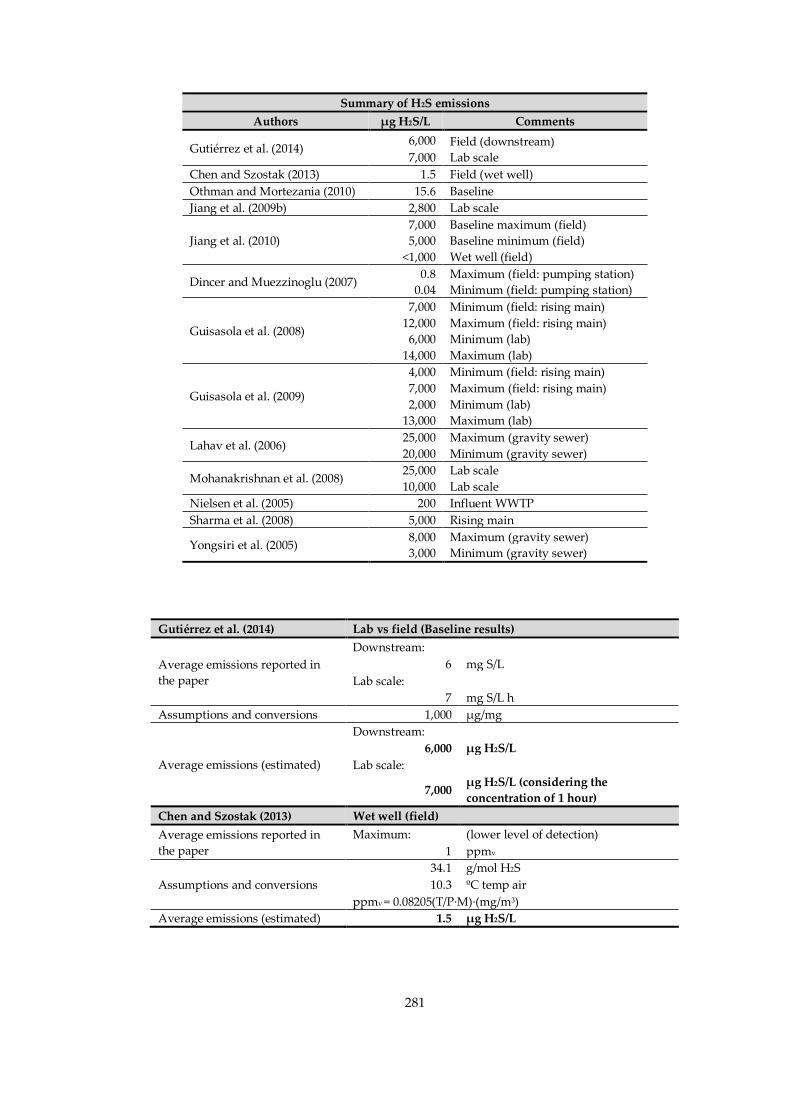
281
Summary of H2S emissions
Authors µg H2S/L Comments
Gutiérrez et al. (2014) 6,000 Field (downstream)
7,000 Lab scale
Chen and Szostak (2013) 1.5 Field (wet well)
Othman and Mortezania (2010) 15.6 Baseline
Jiang et al. (2009b) 2,800 Lab scale
Jiang et al. (2010)
7,000 Baseline maximum (field)
5,000 Baseline minimum (field)
<1,000 Wet well (field)
Dincer and Muezzinoglu (2007) 0.8 Maximum (field: pumping station)
0.04 Minimum (field: pumping station)
Guisasola et al. (2008)
7,000 Minimum (field: rising main)
12,000 Maximum (field: rising main)
6,000 Minimum (lab)
14,000 Maximum (lab)
Guisasola et al. (2009)
4,000 Minimum (field: rising main)
7,000 Maximum (field: rising main)
2,000 Minimum (lab)
13,000 Maximum (lab)
Lahav et al. (2006) 25,000 Maximum (gravity sewer)
20,000 Minimum (gravity sewer)
Mohanakrishnan et al. (2008) 25,000 Lab scale
10,000 Lab scale
Nielsen et al. (2005) 200 Influent WWTP
Sharma et al. (2008) 5,000 Rising main
Yongsiri et al. (2005) 8,000 Maximum (gravity sewer)
3,000 Minimum (gravity sewer)
Gutiérrez et al. (2014) Lab vs field (Baseline results)
Average emissions reported in
the paper
Downstream:
6 mg S/L
Lab scale:
7 mg S/L h
Assumptions and conversions 1,000 µg/mg
Average emissions (estimated)
Downstream:
6,000 µg H2S/L
Lab scale:
7,000 µg H2S/L (considering the
concentration of 1 hour)
Chen and Szostak (2013) Wet well (field)
Average emissions reported in
the paper
Maximum: (lower level of detection)
1 ppmv
Assumptions and conversions
34.1 g/mol H2S
10.3 ºC temp air
ppmv = 0.08205(T/P·M)·(mg/m3)
Average emissions (estimated) 1.5 µg H2S/L
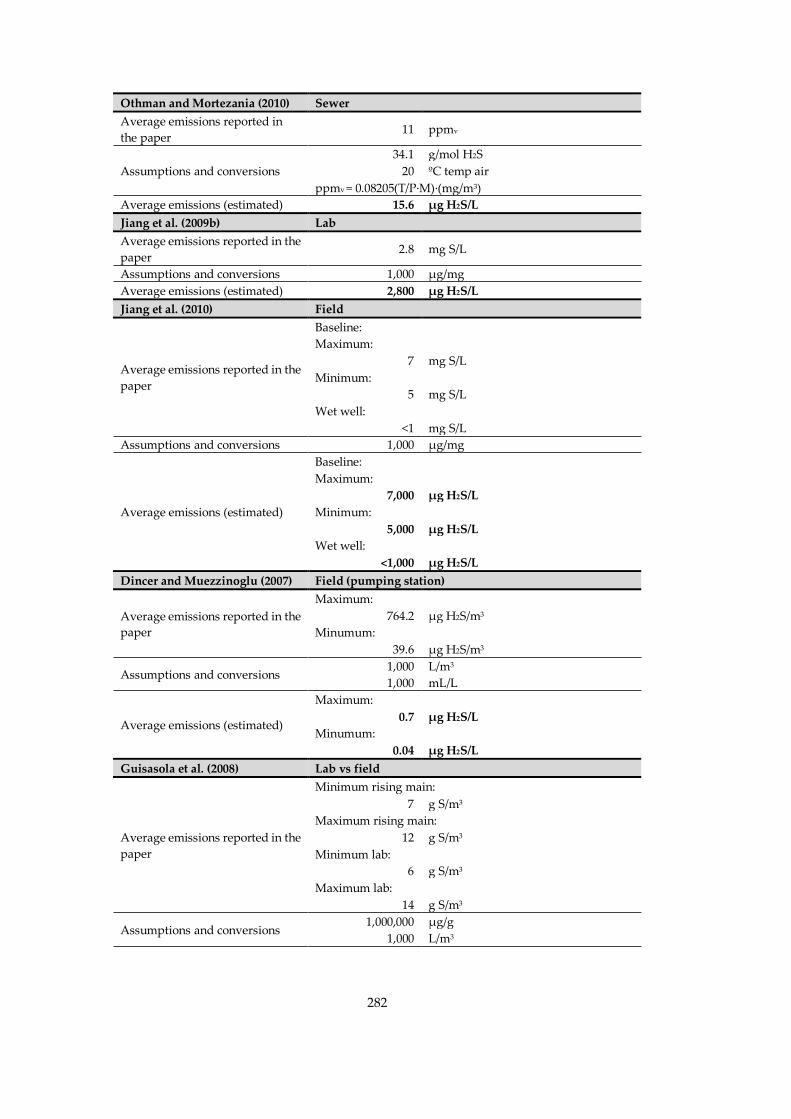
282
Othman and Mortezania (2010) Sewer
Average emissions reported in
the paper 11 ppmv
Assumptions and conversions
34.1 g/mol H2S
20 ºC temp air
ppmv = 0.08205(T/P·M)·(mg/m3)
Average emissions (estimated) 15.6 µg H2S/L
Jiang et al. (2009b) Lab
Average emissions reported in the
paper 2.8 mg S/L
Assumptions and conversions 1,000 µg/mg
Average emissions (estimated) 2,800 µg H2S/L
Jiang et al. (2010) Field
Average emissions reported in the
paper
Baseline:
Maximum:
7 mg S/L
Minimum:
5 mg S/L
Wet well:
<1 mg S/L
Assumptions and conversions 1,000 µg/mg
Average emissions (estimated)
Baseline:
Maximum:
7,000 µg H2S/L
Minimum:
5,000 µg H2S/L
Wet well:
<1,000 µg H2S/L
Dincer and Muezzinoglu (2007) Field (pumping station)
Average emissions reported in the
paper
Maximum:
764.2 µg H2S/m3
Minumum:
39.6 µg H2S/m3
Assumptions and conversions 1,000 L/m3
1,000 mL/L
Average emissions (estimated)
Maximum:
0.7 µg H2S/L
Minumum:
0.04 µg H2S/L
Guisasola et al. (2008) Lab vs field
Average emissions reported in the
paper
Minimum rising main:
7 g S/m3
Maximum rising main:
12 g S/m3
Minimum lab:
6 g S/m3
Maximum lab:
14 g S/m3
Assumptions and conversions 1,000,000 µg/g
1,000 L/m3
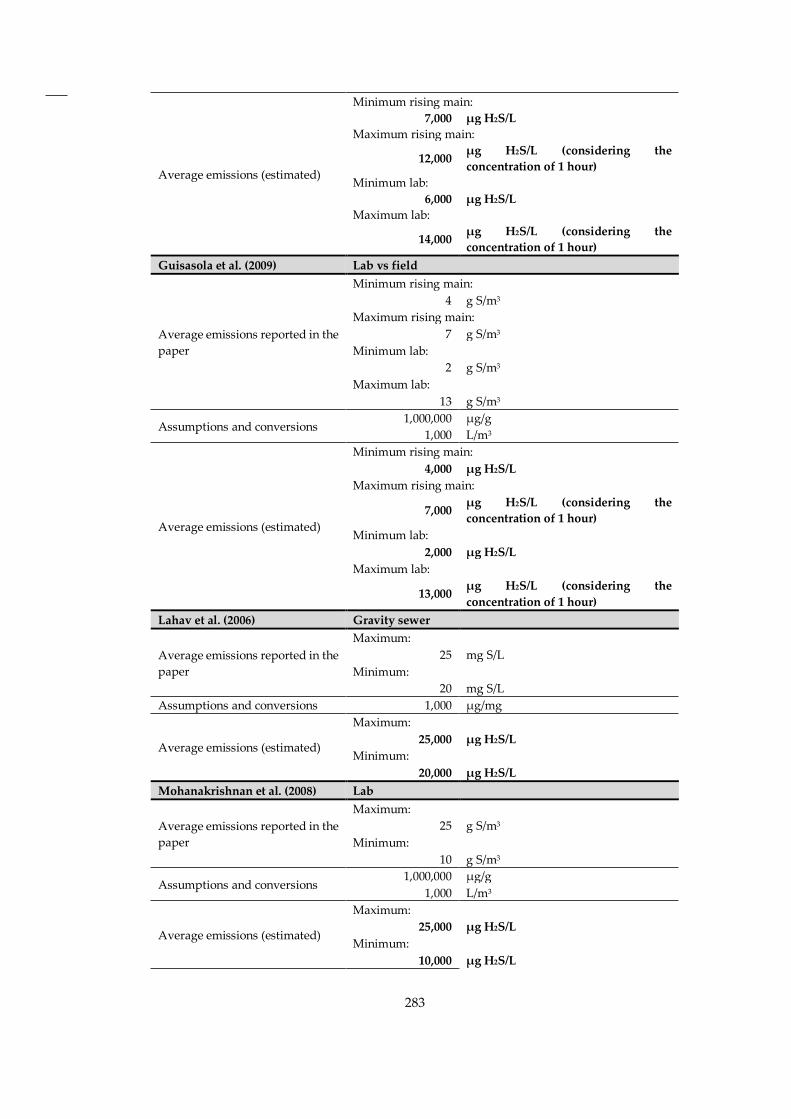
283
Average emissions (estimated)
Minimum rising main:
7,000 µg H2S/L
Maximum rising main:
12,000 µg H2S/L (considering the
concentration of 1 hour)
Minimum lab:
6,000 µg H2S/L
Maximum lab:
14,000 µg H2S/L (considering the
concentration of 1 hour)
Guisasola et al. (2009) Lab vs field
Average emissions reported in the
paper
Minimum rising main:
4 g S/m3
Maximum rising main:
7 g S/m3
Minimum lab:
2 g S/m3
Maximum lab:
13 g S/m3
Assumptions and conversions 1,000,000 µg/g
1,000 L/m3
Average emissions (estimated)
Minimum rising main:
4,000 µg H2S/L
Maximum rising main:
7,000 µg H2S/L (considering the
concentration of 1 hour)
Minimum lab:
2,000 µg H2S/L
Maximum lab:
13,000 µg H2S/L (considering the
concentration of 1 hour)
Lahav et al. (2006) Gravity sewer
Average emissions reported in the
paper
Maximum:
25 mg S/L
Minimum:
20 mg S/L
Assumptions and conversions 1,000 µg/mg
Average emissions (estimated)
Maximum:
25,000 µg H2S/L
Minimum:
20,000 µg H2S/L
Mohanakrishnan et al. (2008) Lab
Average emissions reported in the
paper
Maximum:
25 g S/m3
Minimum:
10 g S/m3
Assumptions and conversions 1,000,000 µg/g
1,000 L/m3
Average emissions (estimated)
Maximum:
25,000 µg H2S/L
Minimum:
10,000 µg H2S/L
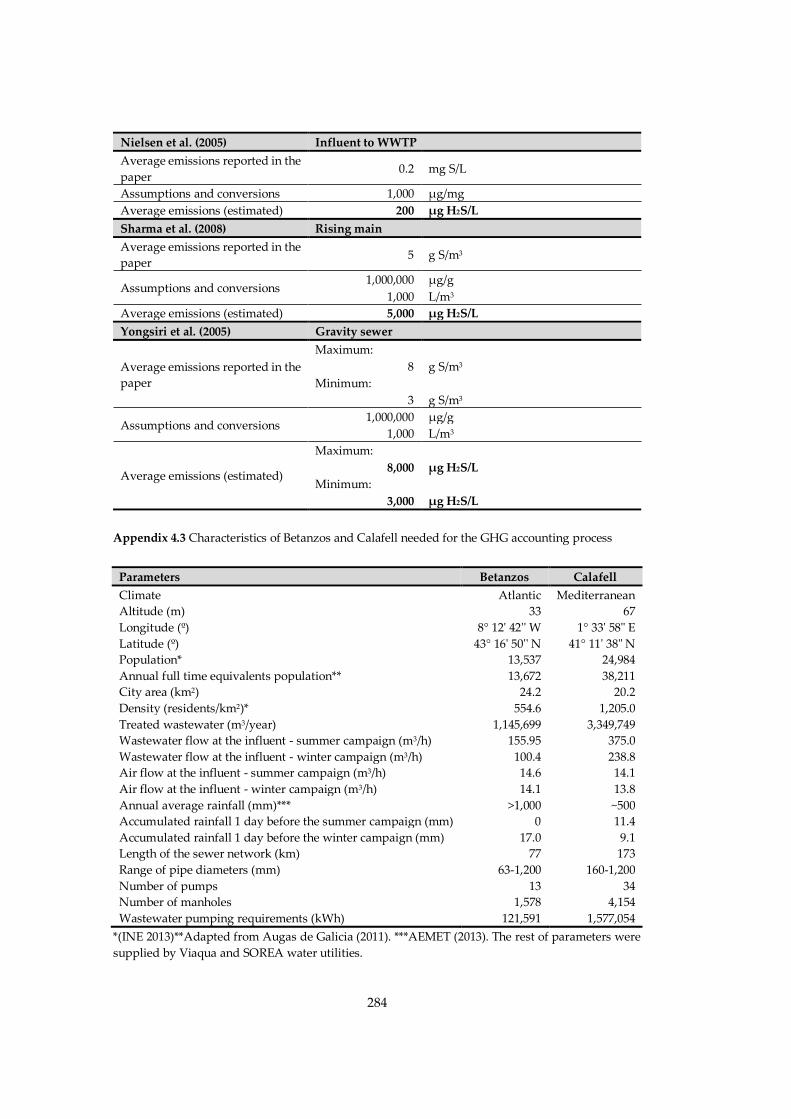
284
Nielsen et al. (2005) Influent to WWTP
Average emissions reported in the
paper 0.2 mg S/L
Assumptions and conversions 1,000 µg/mg
Average emissions (estimated) 200 µg H2S/L
Sharma et al. (2008) Rising main
Average emissions reported in the
paper 5 g S/m3
Assumptions and conversions 1,000,000 µg/g
1,000 L/m3
Average emissions (estimated) 5,000 µg H2S/L
Yongsiri et al. (2005) Gravity sewer
Average emissions reported in the
paper
Maximum:
8 g S/m3
Minimum:
3 g S/m3
Assumptions and conversions 1,000,000 µg/g
1,000 L/m3
Average emissions (estimated)
Maximum:
8,000 µg H2S/L
Minimum:
3,000 µg H2S/L
Appendix 4.3 Characteristics of Betanzos and Calafell needed for the GHG accounting process
Parameters Betanzos Calafell
Climate Atlantic Mediterranean
Altitude (m) 33 67
Longitude (º) 8° 12' 42'' W 1° 33' 58" E
Latitude (º) 43° 16' 50'' N 41° 11' 38" N
Population* 13,537 24,984
Annual full time equivalents population** 13,672 38,211
City area (km2) 24.2 20.2
Density (residents/km2)* 554.6 1,205.0
Treated wastewater (m3/year) 1,145,699 3,349,749
Wastewater flow at the influent - summer campaign (m3/h) 155.95 375.0
Wastewater flow at the influent - winter campaign (m3/h) 100.4 238.8
Air flow at the influent - summer campaign (m3/h) 14.6 14.1
Air flow at the influent - winter campaign (m3/h) 14.1 13.8
Annual average rainfall (mm)*** >1,000 ~500
Accumulated rainfall 1 day before the summer campaign (mm) 0 11.4
Accumulated rainfall 1 day before the winter campaign (mm) 17.0 9.1
Length of the sewer network (km) 77 173
Range of pipe diameters (mm) 63-1,200 160-1,200
Number of pumps 13 34
Number of manholes 1,578 4,154
Wastewater pumping requirements (kWh) 121,591 1,577,054
*(INE 2013)**Adapted from Augas de Galicia (2011). ***AEMET (2013). The rest of parameters were
supplied by Viaqua and SOREA water utilities.
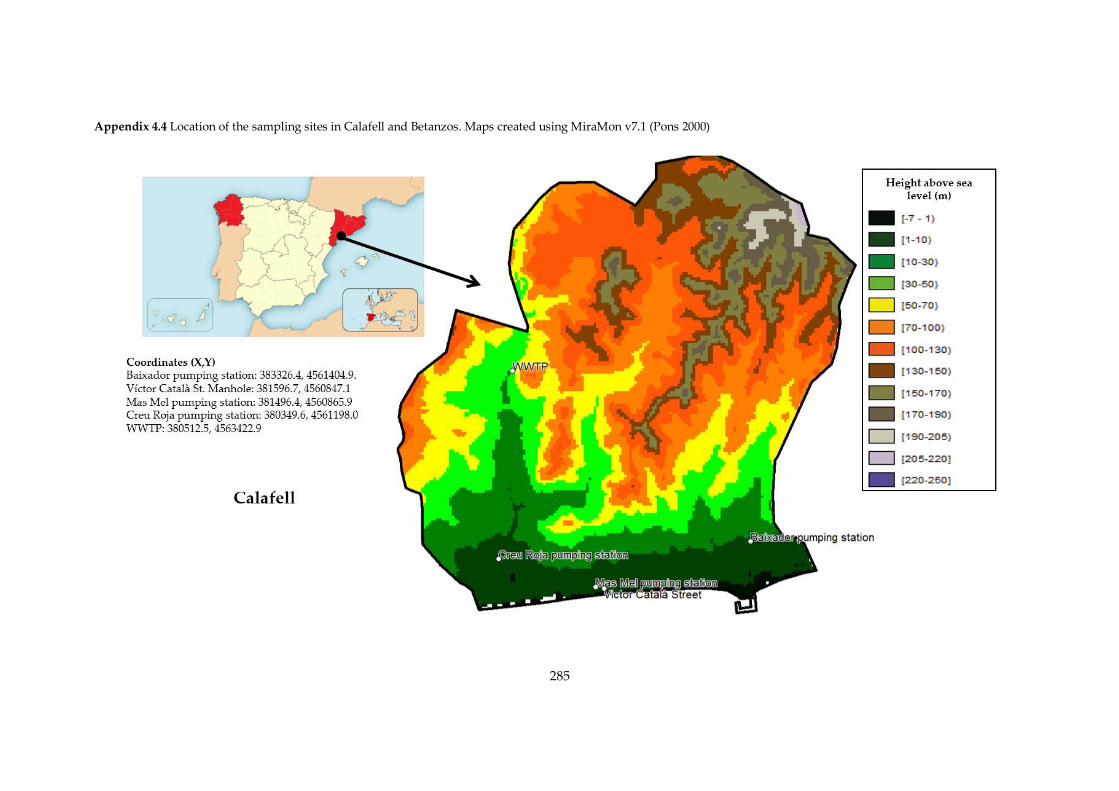
285
Appendix 4.4 Location of the sampling sites in Calafell and Betanzos. Maps created using MiraMon v7.1 (Pons 2000)
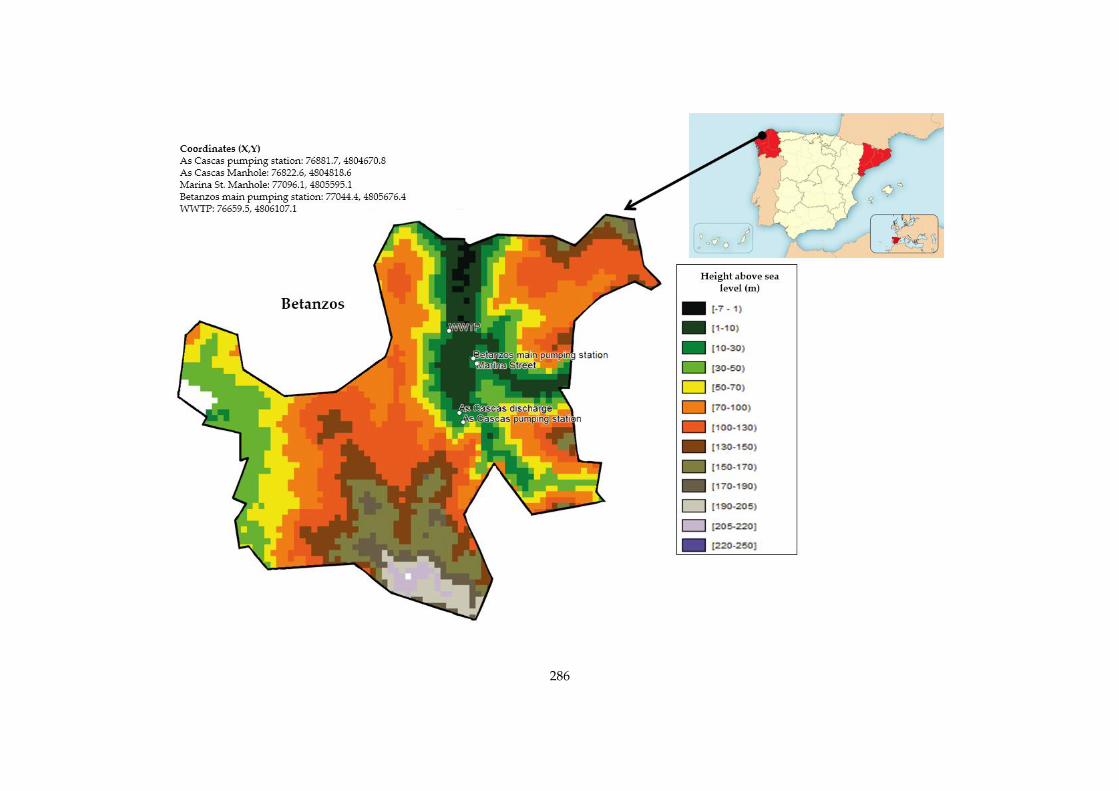
286
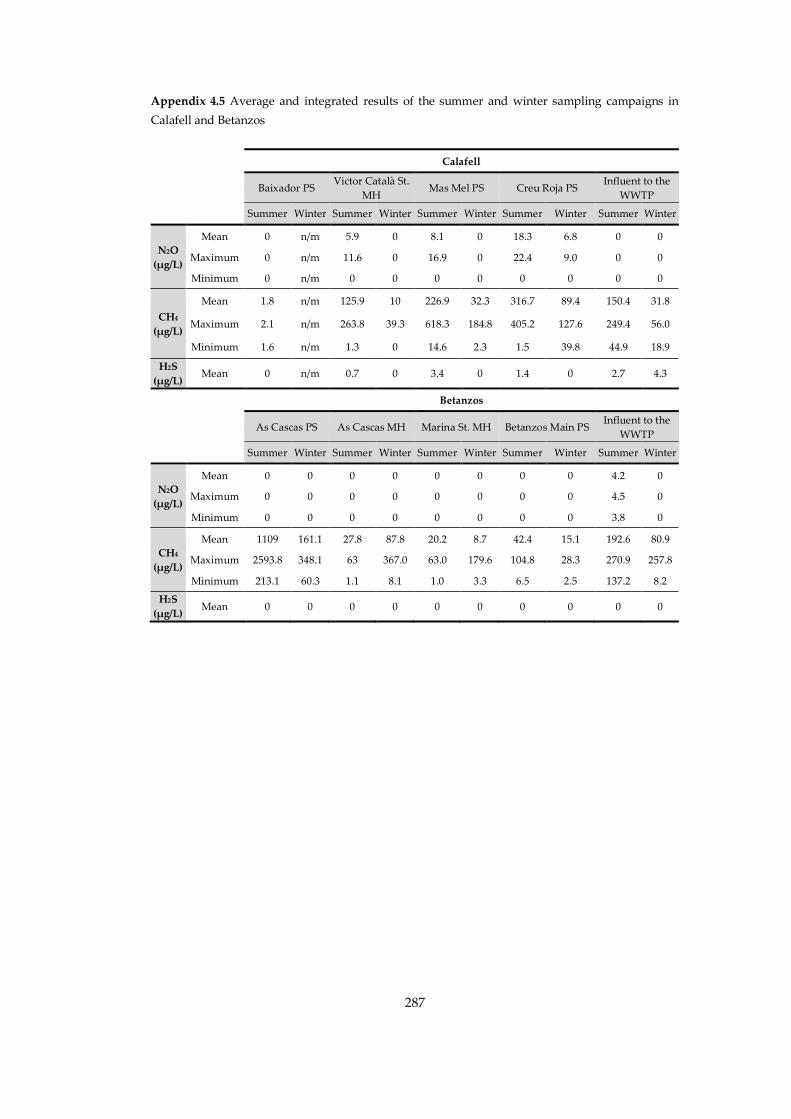
287
Appendix 4.5 Average and integrated results of the summer and winter sampling campaigns in
Calafell and Betanzos
Calafell
Baixador PS Victor Català St.
MH Mas Mel PS Creu Roja PS
Influent to the
WWTP
Summer Winter Summer Winter Summer Winter Summer Winter Summer Winter
N2O
(µg/L)
Mean 0 n/m 5.9 0 8.1 0 18.3 6.8 0 0
Maximum 0 n/m 11.6 0 16.9 0 22.4 9.0 0 0
Minimum 0 n/m 0 0 0 0 0 0 0 0
CH4
(µg/L)
Mean 1.8 n/m 125.9 10 226.9 32.3 316.7 89.4 150.4 31.8
Maximum 2.1 n/m 263.8 39.3 618.3 184.8 405.2 127.6 249.4 56.0
Minimum 1.6 n/m 1.3 0 14.6 2.3 1.5 39.8 44.9 18.9
H2S
(µg/L) Mean 0 n/m 0.7 0 3.4 0 1.4 0 2.7 4.3
Betanzos
As Cascas PS As Cascas MH Marina St. MH Betanzos Main PS Influent to the
WWTP
Summer Winter Summer Winter Summer Winter Summer Winter Summer Winter
N2O
(µg/L)
Mean 0 0 0 0 0 0 0 0 4.2 0
Maximum 0 0 0 0 0 0 0 0 4.5 0
Minimum 0 0 0 0 0 0 0 0 3.8 0
CH4
(µg/L)
Mean 1109 161.1 27.8 87.8 20.2 8.7 42.4 15.1 192.6 80.9
Maximum 2593.8 348.1 63 367.0 63.0 179.6 104.8 28.3 270.9 257.8
Minimum 213.1 60.3 1.1 8.1 1.0 3.3 6.5 2.5 137.2 8.2
H2S
(µg/L) Mean 0 0 0 0 0 0 0 0 0 0
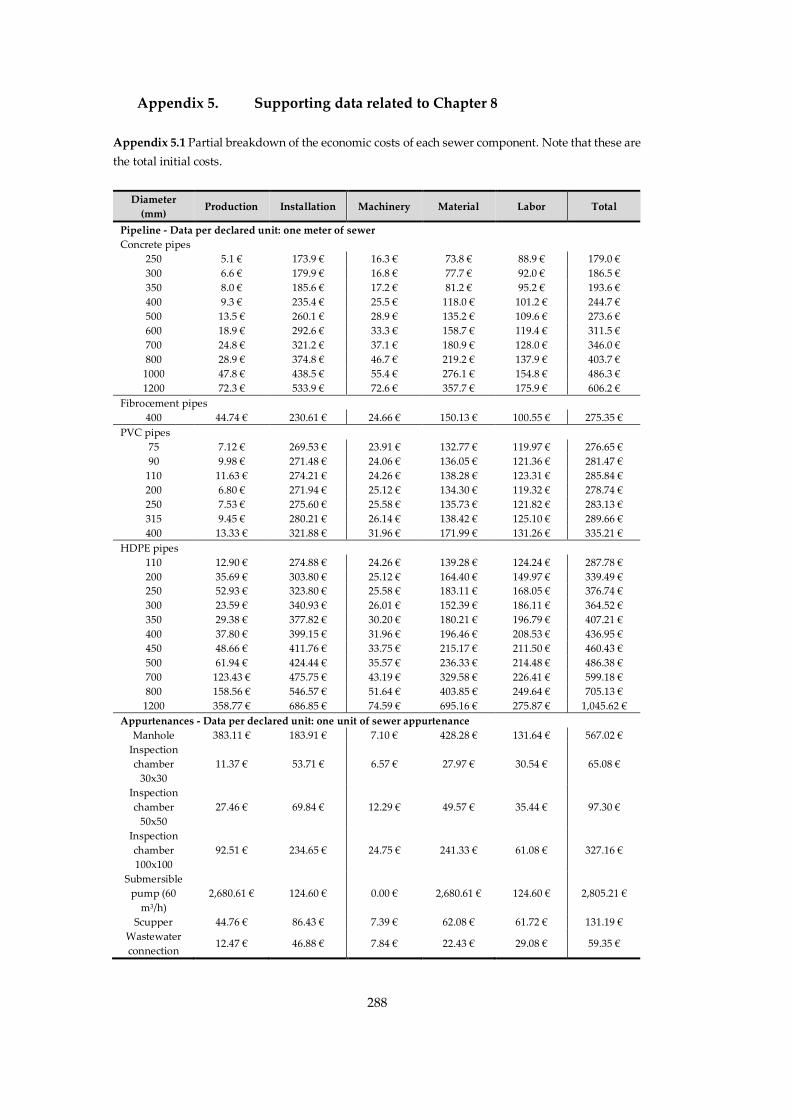
288
Appendix 5. Supporting data related to Chapter 8
Appendix 5.1 Partial breakdown of the economic costs of each sewer component. Note that these are
the total initial costs.
Diameter
(mm) Production Installation Machinery Material Labor Total
Pipeline - Data per declared unit: one meter of sewer
Concrete pipes
250 5.1 € 173.9 € 16.3 € 73.8 € 88.9 € 179.0 €
300 6.6 € 179.9 € 16.8 € 77.7 € 92.0 € 186.5 €
350 8.0 € 185.6 € 17.2 € 81.2 € 95.2 € 193.6 €
400 9.3 € 235.4 € 25.5 € 118.0 € 101.2 € 244.7 €
500 13.5 € 260.1 € 28.9 € 135.2 € 109.6 € 273.6 €
600 18.9 € 292.6 € 33.3 € 158.7 € 119.4 € 311.5 €
700 24.8 € 321.2 € 37.1 € 180.9 € 128.0 € 346.0 €
800 28.9 € 374.8 € 46.7 € 219.2 € 137.9 € 403.7 €
1000 47.8 € 438.5 € 55.4 € 276.1 € 154.8 € 486.3 €
1200 72.3 € 533.9 € 72.6 € 357.7 € 175.9 € 606.2 €
Fibrocement pipes
400 44.74 € 230.61 € 24.66 € 150.13 € 100.55 € 275.35 €
PVC pipes
75 7.12 € 269.53 € 23.91 € 132.77 € 119.97 € 276.65 €
90 9.98 € 271.48 € 24.06 € 136.05 € 121.36 € 281.47 €
110 11.63 € 274.21 € 24.26 € 138.28 € 123.31 € 285.84 €
200 6.80 € 271.94 € 25.12 € 134.30 € 119.32 € 278.74 €
250 7.53 € 275.60 € 25.58 € 135.73 € 121.82 € 283.13 €
315 9.45 € 280.21 € 26.14 € 138.42 € 125.10 € 289.66 €
400 13.33 € 321.88 € 31.96 € 171.99 € 131.26 € 335.21 €
HDPE pipes
110 12.90 € 274.88 € 24.26 € 139.28 € 124.24 € 287.78 €
200 35.69 € 303.80 € 25.12 € 164.40 € 149.97 € 339.49 €
250 52.93 € 323.80 € 25.58 € 183.11 € 168.05 € 376.74 €
300 23.59 € 340.93 € 26.01 € 152.39 € 186.11 € 364.52 €
350 29.38 € 377.82 € 30.20 € 180.21 € 196.79 € 407.21 €
400 37.80 € 399.15 € 31.96 € 196.46 € 208.53 € 436.95 €
450 48.66 € 411.76 € 33.75 € 215.17 € 211.50 € 460.43 €
500 61.94 € 424.44 € 35.57 € 236.33 € 214.48 € 486.38 €
700 123.43 € 475.75 € 43.19 € 329.58 € 226.41 € 599.18 €
800 158.56 € 546.57 € 51.64 € 403.85 € 249.64 € 705.13 €
1200 358.77 € 686.85 € 74.59 € 695.16 € 275.87 € 1,045.62 €
Appurtenances - Data per declared unit: one unit of sewer appurtenance
Manhole 383.11 € 183.91 € 7.10 € 428.28 € 131.64 € 567.02 €
Inspection
chamber
30x30
11.37 € 53.71 € 6.57 € 27.97 € 30.54 € 65.08 €
Inspection
chamber
50x50
27.46 € 69.84 € 12.29 € 49.57 € 35.44 € 97.30 €
Inspection
chamber
100x100
92.51 € 234.65 € 24.75 € 241.33 € 61.08 € 327.16 €
Submersible
pump (60
m3/h)
2,680.61 € 124.60 € 0.00 € 2,680.61 € 124.60 € 2,805.21 €
Scupper 44.76 € 86.43 € 7.39 € 62.08 € 61.72 € 131.19 €
Wastewater
connection 12.47 € 46.88 € 7.84 € 22.43 € 29.08 € 59.35 €

289
Appendix 5.2 Midpoint, endpoint and single score results per m3 of wastewater. Relative
contribution of the production and installation of pipes and appurtenances to the impacts and costs
BETANZOS
Indicator Units Concrete pipes Plastic pipes
Production Installation Production Installation
Midpoints Global warming GW kg CO2 eq 3.3E-03 2.8E-02 3.1E-03 3.1E-02
Ozone depletion OD kg CFC-11
eq 1.3E-10 2.0E-09 4.5E-11 4.3E-09
Terrestrial
acidification TA kg SO2 eq 7.4E-06 8.2E-05 9.0E-06 1.6E-04
Freshwater
eutrophication FE kg P eq 3.6E-07 2.0E-06 1.8E-07 3.5E-06
Marine
eutrophication ME kg N eq 3.9E-07 4.4E-06 4.8E-07 9.1E-06
Human toxicity HT kg 1,4-DB
eq 4.9E-04 2.6E-03 3.4E-04 4.1E-03
Photochemical
oxidant
formation
POF kg
NMVOC 8.2E-06 1.2E-04 1.4E-05 2.6E-04
Particulate
matter formation PMF
kg PM10
eq 3.3E-06 3.7E-05 3.2E-06 7.7E-05
Terrestrial
ecotoxicity TET
kg 1,4-DB
eq 8.4E-08 1.0E-06 1.1E-07 2.3E-06
Freshwater
ecotoxicity FET
kg 1,4-DB
eq 1.1E-05 5.9E-05 8.9E-06 1.1E-04
Marine
ecotoxicity MET
kg 1,4-DB
eq 1.1E-05 6.4E-05 8.3E-06 1.2E-04
Ionising
radiation IR kBq U235 eq 4.8E-04 3.4E-03 2.1E-04 6.0E-03
Agricultural
land occupation ALO m2a 1.3E-03 9.3E-03 1.3E-04 2.9E-02
Urban land
occupation ULO m2a 4.6E-05 4.3E-04 5.1E-06 1.2E-03
Natural land
transformation NLT m2 5.9E-07 9.5E-06 1.2E-07 2.7E-05
Water depletion WD m3 4.8E-05 7.6E-04 1.6E-05 2.3E-03
Metal depletion MD kg Fe eq 2.8E-04 8.8E-04 3.4E-05 2.0E-03
Fossil depletion FD kg oil eq 4.0E-04 5.1E-03 1.5E-03 1.0E-02
& CED Cumulative
energy demand CED MJ 3.1E-02 3.0E-01 9.0E-02 6.5E-01
Endpoints Human health DALY 5.9E-09 5.1E-08 5.3E-09 6.6E-08
Ecosystems species.yr 4.4E-11 3.6E-10 2.6E-11 6.7E-10
Resources $ 8.6E-05 9.0E-04 2.6E-04 1.9E-03
Single score Pt 2.5E-04 2.4E-03 4.4E-04 4.0E-03
Economic
cost
Equivalent
annual cost EAC € 1.0E-02 1.8E-01 1.7E-02 5.2E-01

290
BETANZOS
Indicator Units Appurtenance Pumping
energy Cleaning Reposition Others
Production Installation
Mid
po
ints
Global
warming GW kg CO2 eq 1.8E-02 7.3E-03 3.9E-02 0.0E+00 6.0E-02 0.0E+00
Ozone
depletion OD
kg CFC-
11 eq 9.6E-10 5.4E-10 3.0E-09 0.0E+00 5.9E-09 0.0E+00
Terrestrial
acidification TA kg SO2 eq 6.4E-05 2.4E-05 2.4E-04 0.0E+00 2.6E-04 0.0E+00
Freshwater
eutrophication FE kg P eq 1.1E-05 4.3E-07 1.2E-05 0.0E+00 1.6E-05 0.0E+00
Marine
eutrophication ME kg N eq 4.1E-06 1.3E-06 6.8E-06 0.0E+00 1.5E-05 0.0E+00
Human toxicity HT kg 1,4-DB
eq 2.1E-02 6.0E-04 1.0E-02 0.0E+00 2.7E-02 0.0E+00
Photochemical
oxidant
formation
POF kg
NMVOC 5.2E-05 3.6E-05 1.3E-04 0.0E+00 3.6E-04 0.0E+00
Particulate
matter
formation
PMF kg PM10
eq 3.8E-05 1.1E-05 7.4E-05 0.0E+00 1.3E-04 0.0E+00
Terrestrial
ecotoxicity TET
kg 1,4-DB
eq 2.4E-06 2.6E-07 1.0E-06 0.0E+00 5.2E-06 0.0E+00
Freshwater
ecotoxicity FET
kg 1,4-DB
eq 4.3E-04 1.3E-05 2.3E-04 0.0E+00 5.8E-04 0.0E+00
Marine
ecotoxicity MET
kg 1,4-DB
eq 4.4E-04 1.4E-05 2.4E-04 0.0E+00 6.0E-04 0.0E+00
Ionising
radiation IR
kBq U235
eq 3.9E-03 6.7E-04 2.9E-02 0.0E+00 1.1E-02 0.0E+00
Agricultural
land occupation ALO m2a 6.4E-04 1.5E-04 8.5E-04 0.0E+00 3.0E-02 0.0E+00
Urban land
occupation ULO m2a 2.3E-04 5.1E-05 1.7E-04 0.0E+00 1.5E-03 0.0E+00
Natural land
transformation NLT m2 3.4E-06 1.8E-06 5.6E-06 0.0E+00 3.3E-05 0.0E+00
Water
depletion WD m3 2.2E-04 8.5E-05 3.1E-04 0.0E+00 2.6E-03 0.0E+00
Metal depletion MD kg Fe eq 9.2E-03 1.8E-04 8.7E-04 0.0E+00 1.2E-02 0.0E+00
Fossil depletion FD kg oil eq 4.2E-03 1.4E-03 1.1E-02 0.0E+00 1.8E-02 0.0E+00
& C
ED
Cumulative
energy demand CED MJ 2.5E-01 6.4E-02 9.7E-01 0.0E+00 1.1E+00 0.0E+00
En
dp
oin
ts Human Health DALY 5.0E-08 1.4E-08 8.2E-08 0.0E+00 1.4E-07 0.0E+00
Ecosystems species.yr 1.6E-10 6.4E-11 3.3E-10 0.0E+00 9.3E-10 0.0E+00
Resources $ 1.4E-03 2.4E-04 1.9E-03 0.0E+00 3.8E-03 0.0E+00
Single score Pt 2.8E-03 6.2E-04 4.3E-03 0.0E+00 8.0E-03 0.0E+00
Equivalent annual cost EAC € 3.2E-02 2.4E-02 2.3E-02 0.0E+00 5.2E-02 1.1E-01
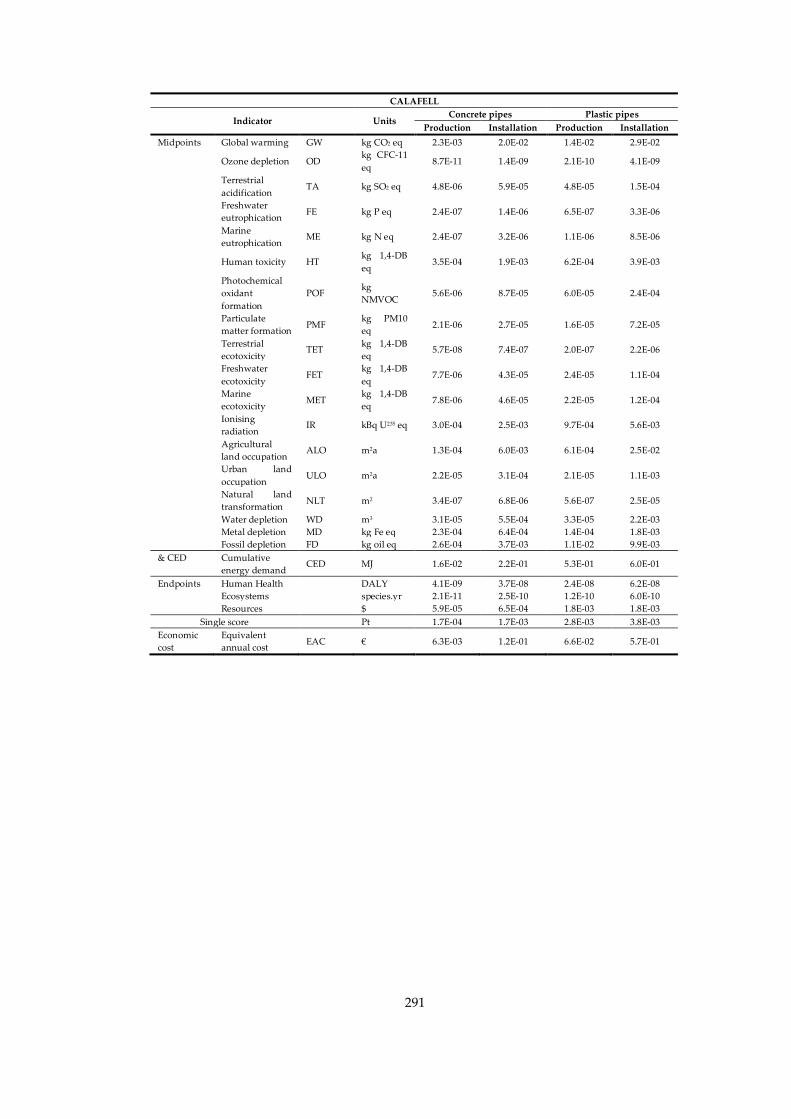
291
CALAFELL
Indicator Units Concrete pipes Plastic pipes
Production Installation Production Installation
Midpoints Global warming GW kg CO2 eq 2.3E-03 2.0E-02 1.4E-02 2.9E-02
Ozone depletion OD kg CFC-11
eq 8.7E-11 1.4E-09 2.1E-10 4.1E-09
Terrestrial
acidification TA kg SO2 eq 4.8E-06 5.9E-05 4.8E-05 1.5E-04
Freshwater
eutrophication FE kg P eq 2.4E-07 1.4E-06 6.5E-07 3.3E-06
Marine
eutrophication ME kg N eq 2.4E-07 3.2E-06 1.1E-06 8.5E-06
Human toxicity HT kg 1,4-DB
eq 3.5E-04 1.9E-03 6.2E-04 3.9E-03
Photochemical
oxidant
formation
POF kg
NMVOC 5.6E-06 8.7E-05 6.0E-05 2.4E-04
Particulate
matter formation PMF
kg PM10
eq 2.1E-06 2.7E-05 1.6E-05 7.2E-05
Terrestrial
ecotoxicity TET
kg 1,4-DB
eq 5.7E-08 7.4E-07 2.0E-07 2.2E-06
Freshwater
ecotoxicity FET
kg 1,4-DB
eq 7.7E-06 4.3E-05 2.4E-05 1.1E-04
Marine
ecotoxicity MET
kg 1,4-DB
eq 7.8E-06 4.6E-05 2.2E-05 1.2E-04
Ionising
radiation IR kBq U235 eq 3.0E-04 2.5E-03 9.7E-04 5.6E-03
Agricultural
land occupation ALO m2a 1.3E-04 6.0E-03 6.1E-04 2.5E-02
Urban land
occupation ULO m2a 2.2E-05 3.1E-04 2.1E-05 1.1E-03
Natural land
transformation NLT m2 3.4E-07 6.8E-06 5.6E-07 2.5E-05
Water depletion WD m3 3.1E-05 5.5E-04 3.3E-05 2.2E-03
Metal depletion MD kg Fe eq 2.3E-04 6.4E-04 1.4E-04 1.8E-03
Fossil depletion FD kg oil eq 2.6E-04 3.7E-03 1.1E-02 9.9E-03
& CED Cumulative
energy demand CED MJ 1.6E-02 2.2E-01 5.3E-01 6.0E-01
Endpoints Human Health DALY 4.1E-09 3.7E-08 2.4E-08 6.2E-08
Ecosystems species.yr 2.1E-11 2.5E-10 1.2E-10 6.0E-10
Resources $ 5.9E-05 6.5E-04 1.8E-03 1.8E-03
Single score Pt 1.7E-04 1.7E-03 2.8E-03 3.8E-03
Economic
cost
Equivalent
annual cost EAC € 6.3E-03 1.2E-01 6.6E-02 5.7E-01
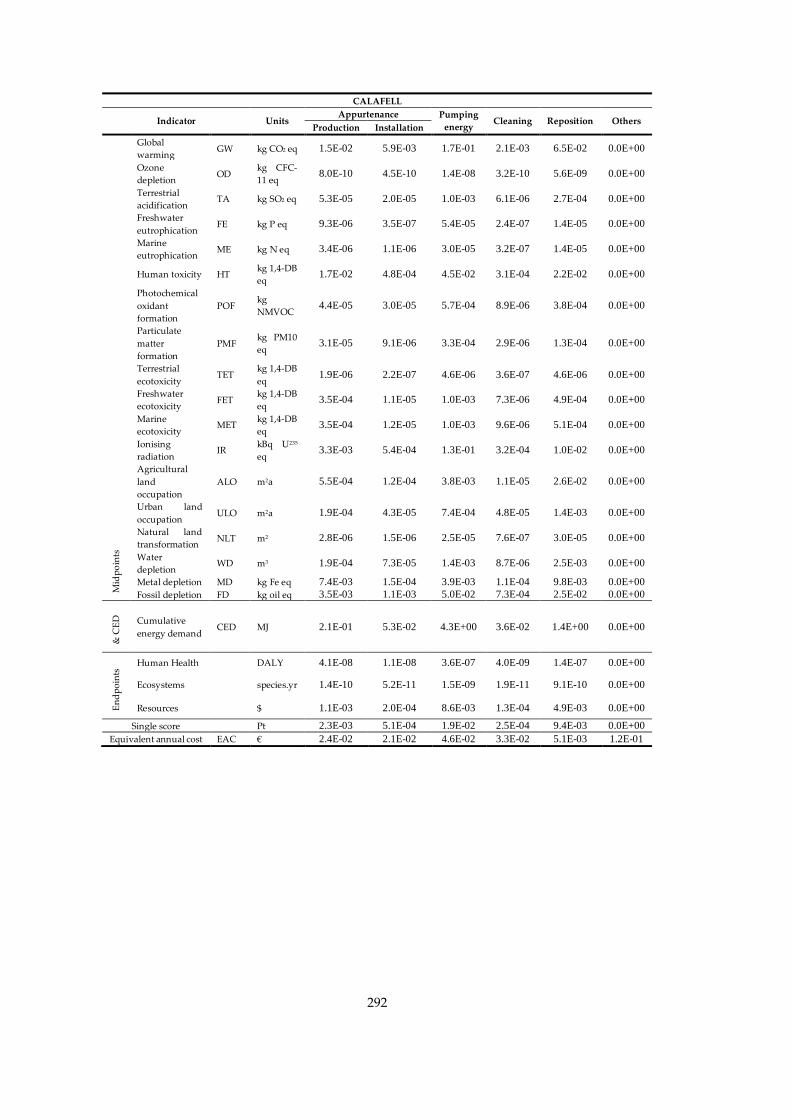
292
CALAFELL
Indicator Units Appurtenance Pumping
energy Cleaning Reposition Others
Production Installation
Mid
po
ints
Global
warming GW kg CO2 eq 1.5E-02 5.9E-03 1.7E-01 2.1E-03 6.5E-02 0.0E+00
Ozone
depletion OD
kg CFC-
11 eq 8.0E-10 4.5E-10 1.4E-08 3.2E-10 5.6E-09 0.0E+00
Terrestrial
acidification TA kg SO2 eq 5.3E-05 2.0E-05 1.0E-03 6.1E-06 2.7E-04 0.0E+00
Freshwater
eutrophication FE kg P eq 9.3E-06 3.5E-07 5.4E-05 2.4E-07 1.4E-05 0.0E+00
Marine
eutrophication ME kg N eq 3.4E-06 1.1E-06 3.0E-05 3.2E-07 1.4E-05 0.0E+00
Human toxicity HT kg 1,4-DB
eq 1.7E-02 4.8E-04 4.5E-02 3.1E-04 2.2E-02 0.0E+00
Photochemical
oxidant
formation
POF kg
NMVOC 4.4E-05 3.0E-05 5.7E-04 8.9E-06 3.8E-04 0.0E+00
Particulate
matter
formation
PMF kg PM10
eq 3.1E-05 9.1E-06 3.3E-04 2.9E-06 1.3E-04 0.0E+00
Terrestrial
ecotoxicity TET
kg 1,4-DB
eq 1.9E-06 2.2E-07 4.6E-06 3.6E-07 4.6E-06 0.0E+00
Freshwater
ecotoxicity FET
kg 1,4-DB
eq 3.5E-04 1.1E-05 1.0E-03 7.3E-06 4.9E-04 0.0E+00
Marine
ecotoxicity MET
kg 1,4-DB
eq 3.5E-04 1.2E-05 1.0E-03 9.6E-06 5.1E-04 0.0E+00
Ionising
radiation IR
kBq U235
eq 3.3E-03 5.4E-04 1.3E-01 3.2E-04 1.0E-02 0.0E+00
Agricultural
land
occupation
ALO m2a 5.5E-04 1.2E-04 3.8E-03 1.1E-05 2.6E-02 0.0E+00
Urban land
occupation ULO m2a 1.9E-04 4.3E-05 7.4E-04 4.8E-05 1.4E-03 0.0E+00
Natural land
transformation NLT m2 2.8E-06 1.5E-06 2.5E-05 7.6E-07 3.0E-05 0.0E+00
Water
depletion WD m3 1.9E-04 7.3E-05 1.4E-03 8.7E-06 2.5E-03 0.0E+00
Metal depletion MD kg Fe eq 7.4E-03 1.5E-04 3.9E-03 1.1E-04 9.8E-03 0.0E+00
Fossil depletion FD kg oil eq 3.5E-03 1.1E-03 5.0E-02 7.3E-04 2.5E-02 0.0E+00
& C
ED
Cumulative
energy demand CED MJ 2.1E-01 5.3E-02 4.3E+00 3.6E-02 1.4E+00 0.0E+00
En
dp
oin
ts Human Health DALY 4.1E-08 1.1E-08 3.6E-07 4.0E-09 1.4E-07 0.0E+00
Ecosystems species.yr 1.4E-10 5.2E-11 1.5E-09 1.9E-11 9.1E-10 0.0E+00
Resources $ 1.1E-03 2.0E-04 8.6E-03 1.3E-04 4.9E-03 0.0E+00
Single score Pt 2.3E-03 5.1E-04 1.9E-02 2.5E-04 9.4E-03 0.0E+00
Equivalent annual cost EAC € 2.4E-02 2.1E-02 4.6E-02 3.3E-02 5.1E-03 1.2E-01
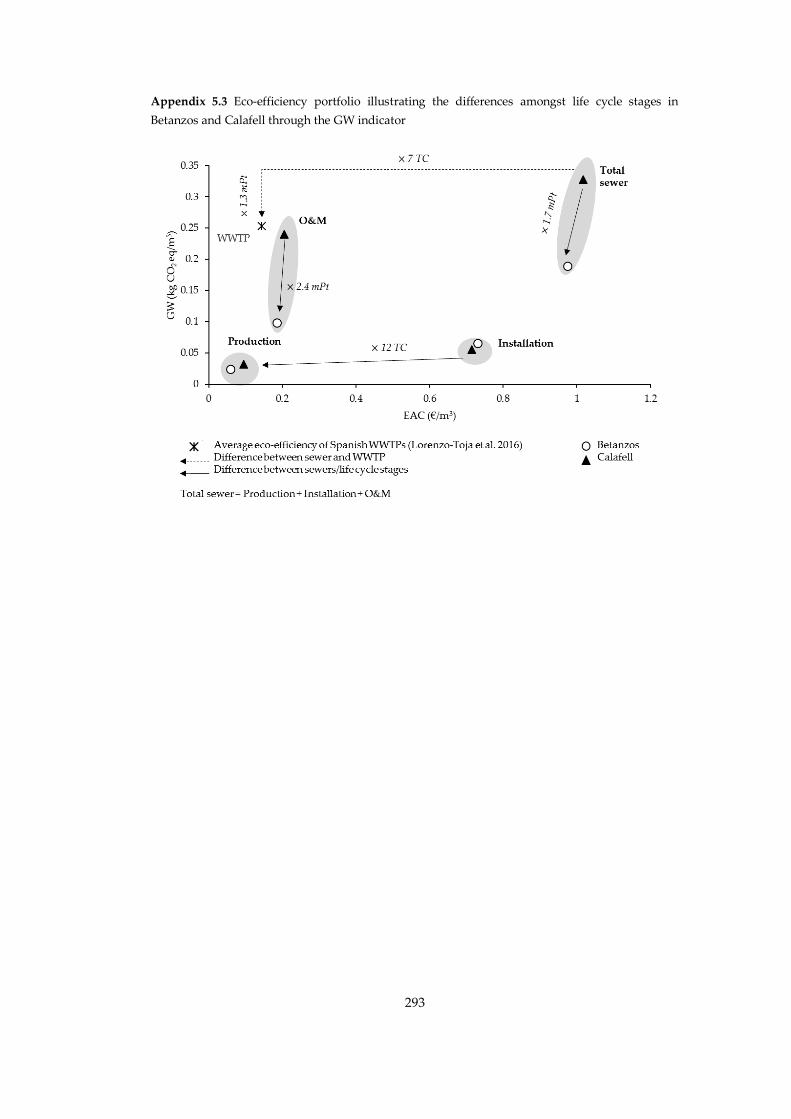
293
Appendix 5.3 Eco-efficiency portfolio illustrating the differences amongst life cycle stages in
Betanzos and Calafell through the GW indicator
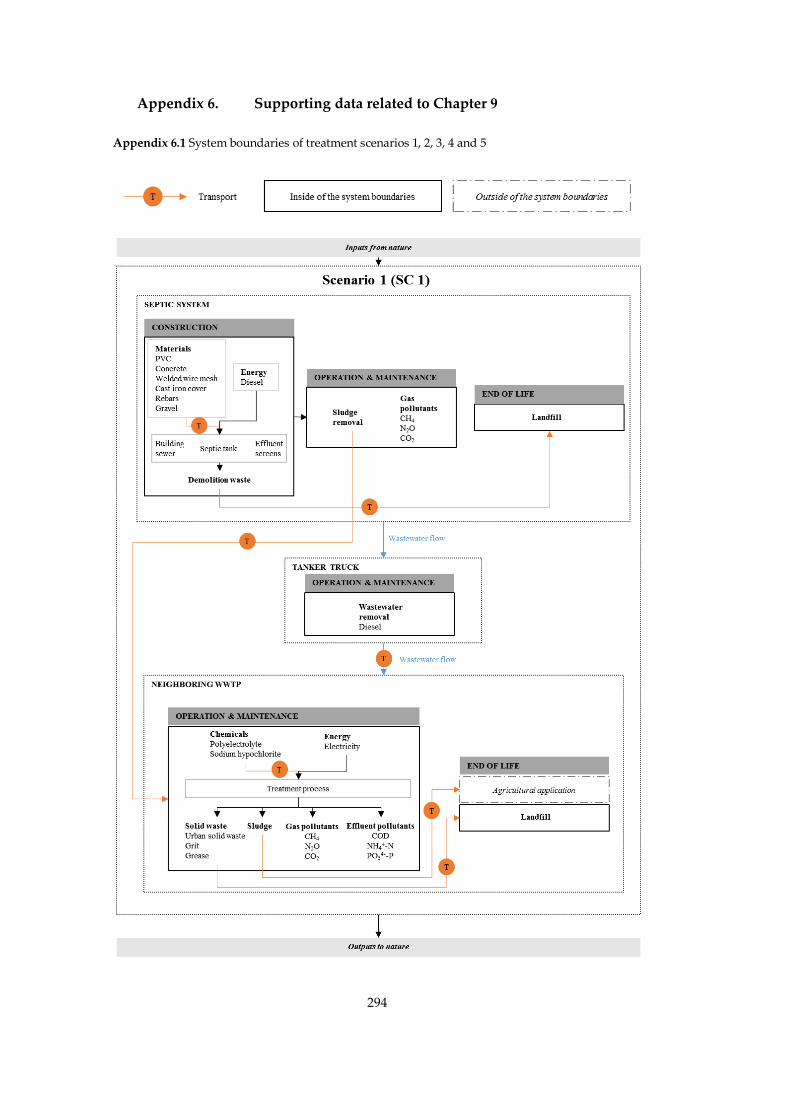
294
Appendix 6. Supporting data related to Chapter 9
Appendix 6.1 System boundaries of treatment scenarios 1, 2, 3, 4 and 5
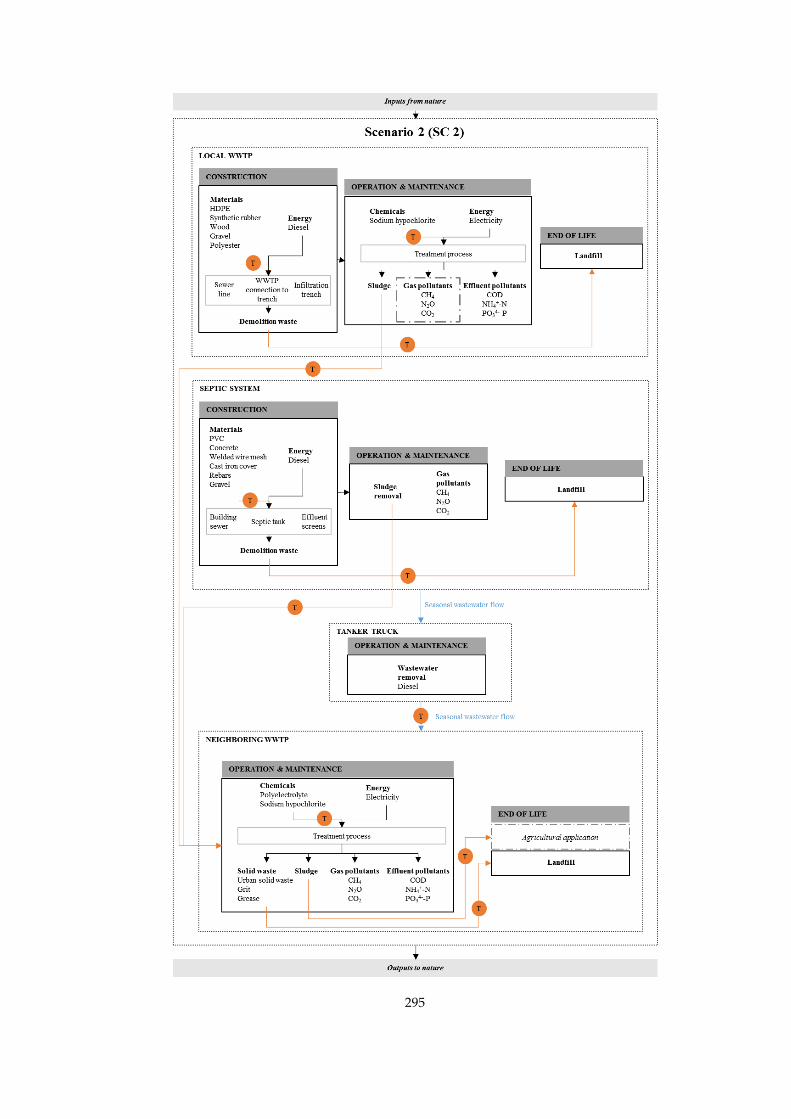
295
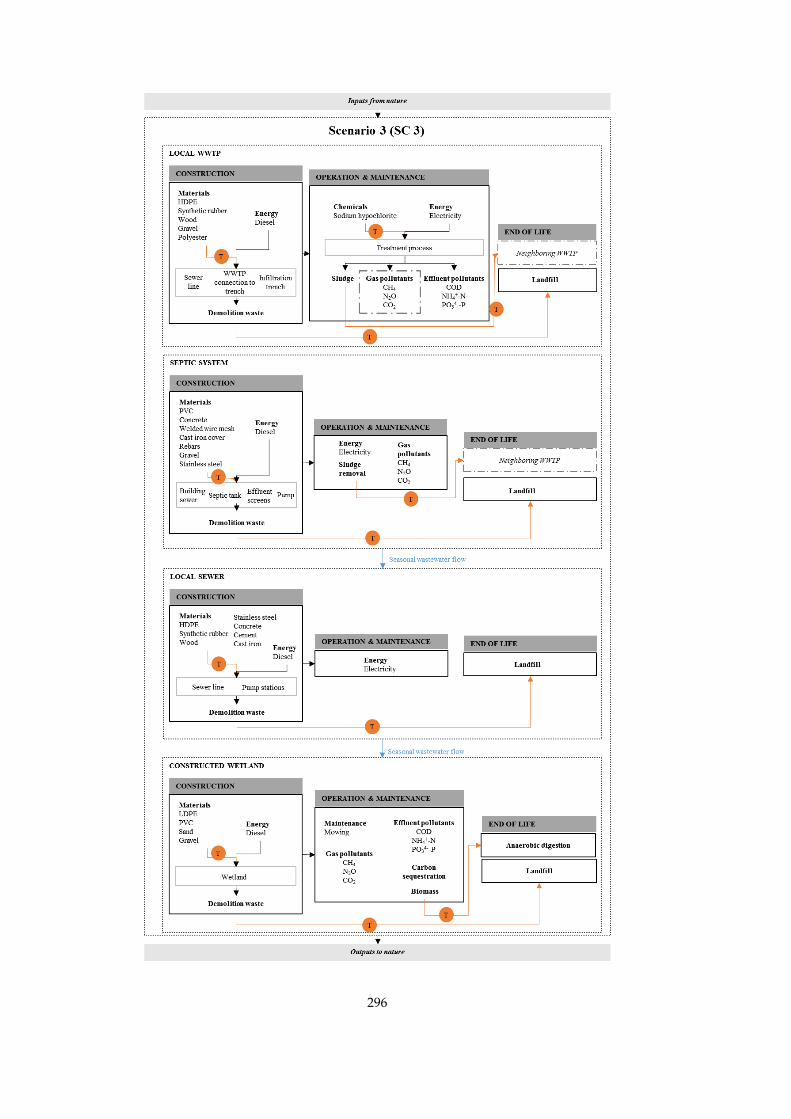
296
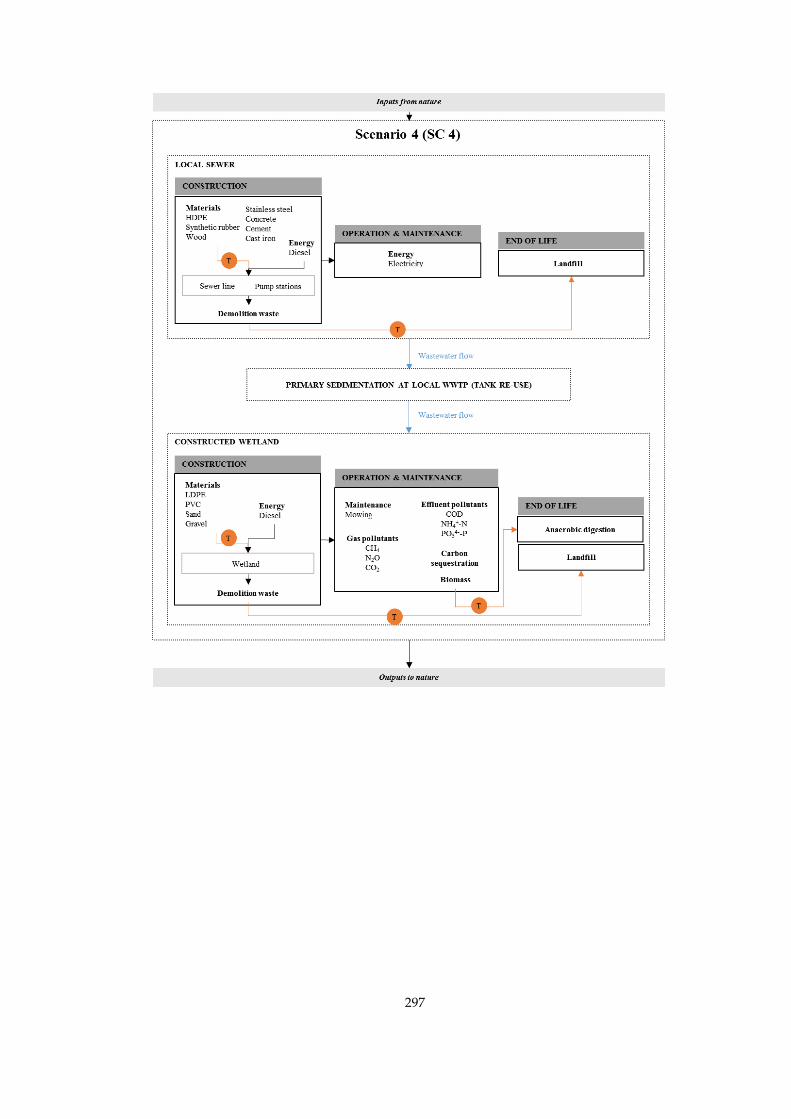
297
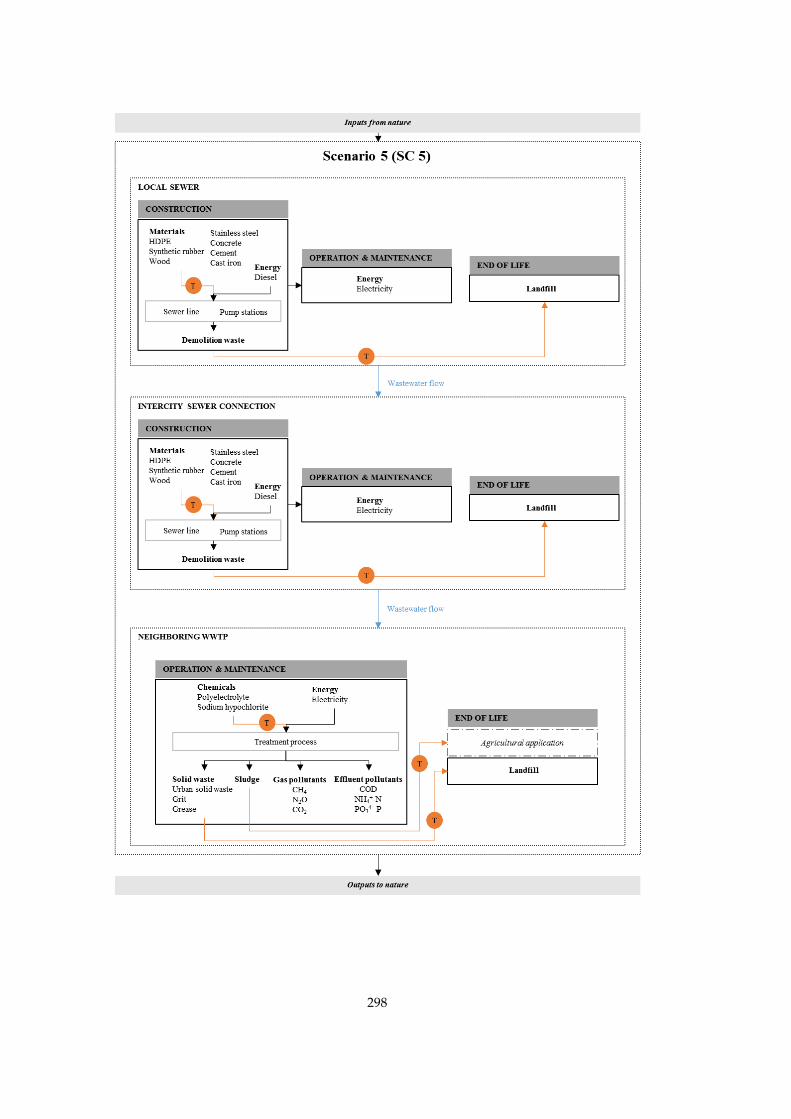
298
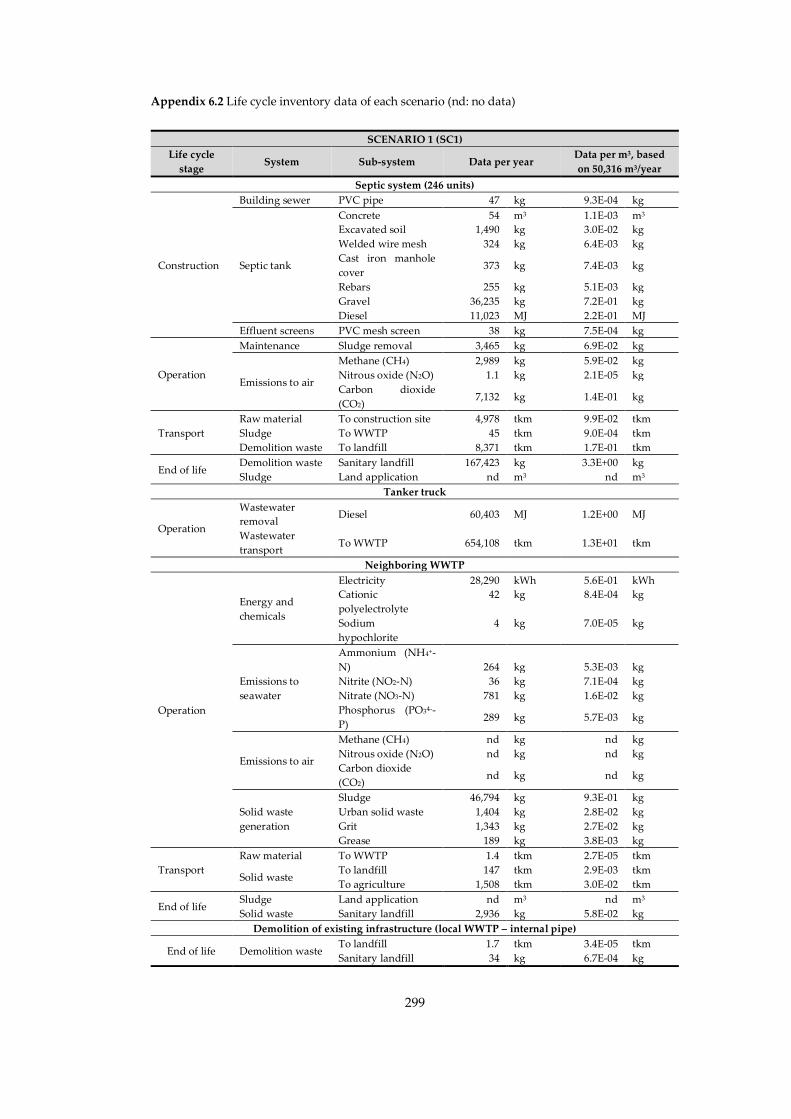
299
Appendix 6.2 Life cycle inventory data of each scenario (nd: no data)
SCENARIO 1 (SC1)
Life cycle
stage System Sub-system Data per year
Data per m3, based
on 50,316 m3/year
Septic system (246 units)
Construction
Building sewer PVC pipe 47 kg 9.3E-04 kg
Septic tank
Concrete 54 m3 1.1E-03 m3
Excavated soil 1,490 kg 3.0E-02 kg
Welded wire mesh 324 kg 6.4E-03 kg
Cast iron manhole
cover 373 kg 7.4E-03 kg
Rebars 255 kg 5.1E-03 kg
Gravel 36,235 kg 7.2E-01 kg
Diesel 11,023 MJ 2.2E-01 MJ
Effluent screens PVC mesh screen 38 kg 7.5E-04 kg
Operation
Maintenance Sludge removal 3,465 kg 6.9E-02 kg
Emissions to air
Methane (CH4) 2,989 kg 5.9E-02 kg
Nitrous oxide (N2O) 1.1 kg 2.1E-05 kg
Carbon dioxide
(CO2) 7,132 kg 1.4E-01 kg
Transport
Raw material To construction site 4,978 tkm 9.9E-02 tkm
Sludge To WWTP 45 tkm 9.0E-04 tkm
Demolition waste To landfill 8,371 tkm 1.7E-01 tkm
End of life Demolition waste Sanitary landfill 167,423 kg 3.3E+00 kg
Sludge Land application nd m3 nd m3
Tanker truck
Operation
Wastewater
removal Diesel 60,403 MJ 1.2E+00 MJ
Wastewater
transport To WWTP 654,108 tkm 1.3E+01 tkm
Neighboring WWTP
Operation
Energy and
chemicals
Electricity 28,290 kWh 5.6E-01 kWh
Cationic
polyelectrolyte
42 kg 8.4E-04 kg
Sodium
hypochlorite
4 kg 7.0E-05 kg
Emissions to
seawater
Ammonium (NH4+-
N) 264 kg 5.3E-03 kg
Nitrite (NO2-N) 36 kg 7.1E-04 kg
Nitrate (NO3-N) 781 kg 1.6E-02 kg
Phosphorus (PO34--
P) 289 kg 5.7E-03 kg
Emissions to air
Methane (CH4) nd kg nd kg
Nitrous oxide (N2O) nd kg nd kg
Carbon dioxide
(CO2) nd kg nd kg
Solid waste
generation
Sludge 46,794 kg 9.3E-01 kg
Urban solid waste 1,404 kg 2.8E-02 kg
Grit 1,343 kg 2.7E-02 kg
Grease 189 kg 3.8E-03 kg
Transport
Raw material To WWTP 1.4 tkm 2.7E-05 tkm
Solid waste To landfill 147 tkm 2.9E-03 tkm
To agriculture 1,508 tkm 3.0E-02 tkm
End of life Sludge Land application nd m3 nd m3
Solid waste Sanitary landfill 2,936 kg 5.8E-02 kg
Demolition of existing infrastructure (local WWTP – internal pipe)
End of life Demolition waste To landfill 1.7 tkm 3.4E-05 tkm
Sanitary landfill 34 kg 6.7E-04 kg
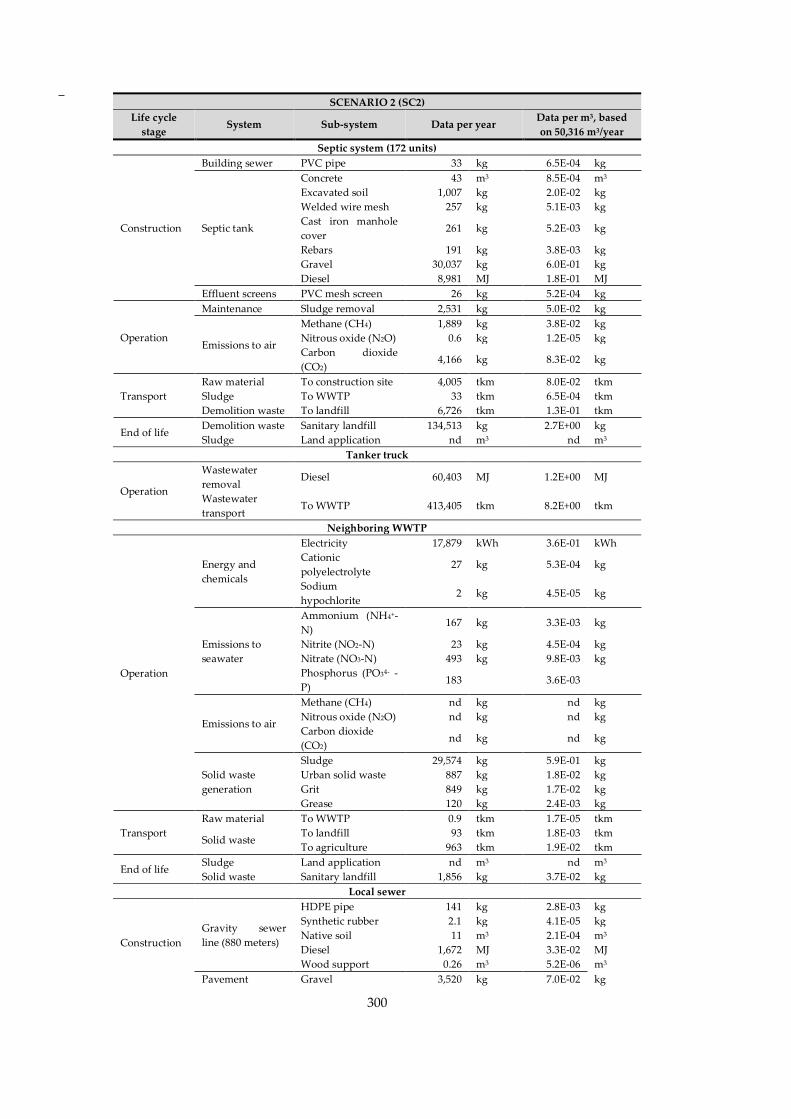
300
SCENARIO 2 (SC2)
Life cycle
stage System Sub-system Data per year
Data per m3, based
on 50,316 m3/year
Septic system (172 units)
Construction
Building sewer PVC pipe 33 kg 6.5E-04 kg
Septic tank
Concrete 43 m3 8.5E-04 m3
Excavated soil 1,007 kg 2.0E-02 kg
Welded wire mesh 257 kg 5.1E-03 kg
Cast iron manhole
cover 261 kg 5.2E-03 kg
Rebars 191 kg 3.8E-03 kg
Gravel 30,037 kg 6.0E-01 kg
Diesel 8,981 MJ 1.8E-01 MJ
Effluent screens PVC mesh screen 26 kg 5.2E-04 kg
Operation
Maintenance Sludge removal 2,531 kg 5.0E-02 kg
Emissions to air
Methane (CH4) 1,889 kg 3.8E-02 kg
Nitrous oxide (N2O) 0.6 kg 1.2E-05 kg
Carbon dioxide
(CO2) 4,166 kg 8.3E-02 kg
Transport
Raw material To construction site 4,005 tkm 8.0E-02 tkm
Sludge To WWTP 33 tkm 6.5E-04 tkm
Demolition waste To landfill 6,726 tkm 1.3E-01 tkm
End of life Demolition waste Sanitary landfill 134,513 kg 2.7E+00 kg
Sludge Land application nd m3 nd m3
Tanker truck
Operation
Wastewater
removal Diesel 60,403 MJ 1.2E+00 MJ
Wastewater
transport To WWTP 413,405 tkm 8.2E+00 tkm
Neighboring WWTP
Operation
Energy and
chemicals
Electricity 17,879 kWh 3.6E-01 kWh
Cationic
polyelectrolyte 27 kg 5.3E-04 kg
Sodium
hypochlorite 2 kg 4.5E-05 kg
Emissions to
seawater
Ammonium (NH4+-
N) 167 kg 3.3E-03 kg
Nitrite (NO2-N) 23 kg 4.5E-04 kg
Nitrate (NO3-N) 493 kg 9.8E-03 kg
Phosphorus (PO34- -
P) 183 3.6E-03
Emissions to air
Methane (CH4) nd kg nd kg
Nitrous oxide (N2O) nd kg nd kg
Carbon dioxide
(CO2) nd kg nd kg
Solid waste
generation
Sludge 29,574 kg 5.9E-01 kg
Urban solid waste 887 kg 1.8E-02 kg
Grit 849 kg 1.7E-02 kg
Grease 120 kg 2.4E-03 kg
Transport
Raw material To WWTP 0.9 tkm 1.7E-05 tkm
Solid waste To landfill 93 tkm 1.8E-03 tkm
To agriculture 963 tkm 1.9E-02 tkm
End of life Sludge Land application nd m3 nd m3
Solid waste Sanitary landfill 1,856 kg 3.7E-02 kg
Local sewer
Construction
Gravity sewer
line (880 meters)
HDPE pipe 141 kg 2.8E-03 kg
Synthetic rubber 2.1 kg 4.1E-05 kg
Native soil 11 m3 2.1E-04 m3
Diesel 1,672 MJ 3.3E-02 MJ
Wood support 0.26 m3 5.2E-06 m3
Pavement Gravel 3,520 kg 7.0E-02 kg
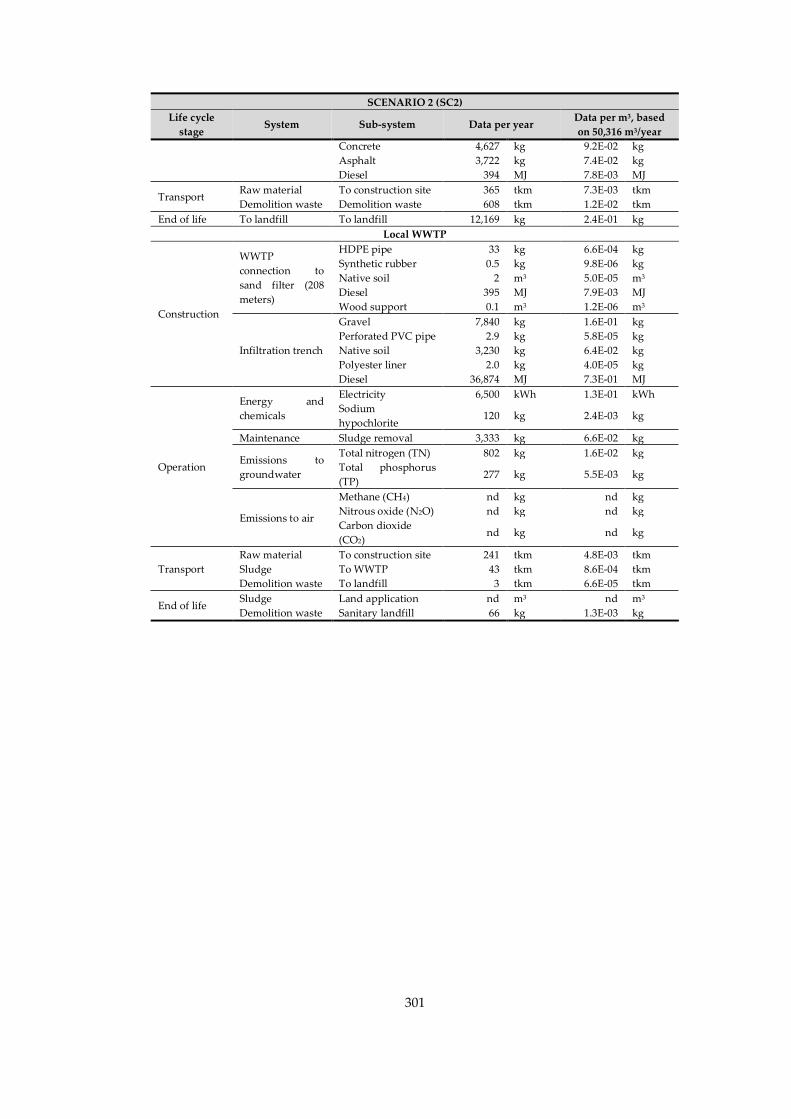
301
SCENARIO 2 (SC2)
Life cycle
stage System Sub-system Data per year
Data per m3, based
on 50,316 m3/year
Concrete 4,627 kg 9.2E-02 kg
Asphalt 3,722 kg 7.4E-02 kg
Diesel 394 MJ 7.8E-03 MJ
Transport Raw material To construction site 365 tkm 7.3E-03 tkm
Demolition waste Demolition waste 608 tkm 1.2E-02 tkm
End of life To landfill To landfill 12,169 kg 2.4E-01 kg
Local WWTP
Construction
WWTP
connection to
sand filter (208
meters)
HDPE pipe 33 kg 6.6E-04 kg
Synthetic rubber 0.5 kg 9.8E-06 kg
Native soil 2 m3 5.0E-05 m3
Diesel 395 MJ 7.9E-03 MJ
Wood support 0.1 m3 1.2E-06 m3
Infiltration trench
Gravel 7,840 kg 1.6E-01 kg
Perforated PVC pipe 2.9 kg 5.8E-05 kg
Native soil 3,230 kg 6.4E-02 kg
Polyester liner 2.0 kg 4.0E-05 kg
Diesel 36,874 MJ 7.3E-01 MJ
Operation
Energy and
chemicals
Electricity 6,500 kWh 1.3E-01 kWh
Sodium
hypochlorite 120 kg 2.4E-03 kg
Maintenance Sludge removal 3,333 kg 6.6E-02 kg
Emissions to
groundwater
Total nitrogen (TN) 802 kg 1.6E-02 kg
Total phosphorus
(TP) 277 kg 5.5E-03 kg
Emissions to air
Methane (CH4) nd kg nd kg
Nitrous oxide (N2O) nd kg nd kg
Carbon dioxide
(CO2) nd kg nd kg
Transport
Raw material To construction site 241 tkm 4.8E-03 tkm
Sludge To WWTP 43 tkm 8.6E-04 tkm
Demolition waste To landfill 3 tkm 6.6E-05 tkm
End of life Sludge Land application nd m3 nd m3
Demolition waste Sanitary landfill 66 kg 1.3E-03 kg
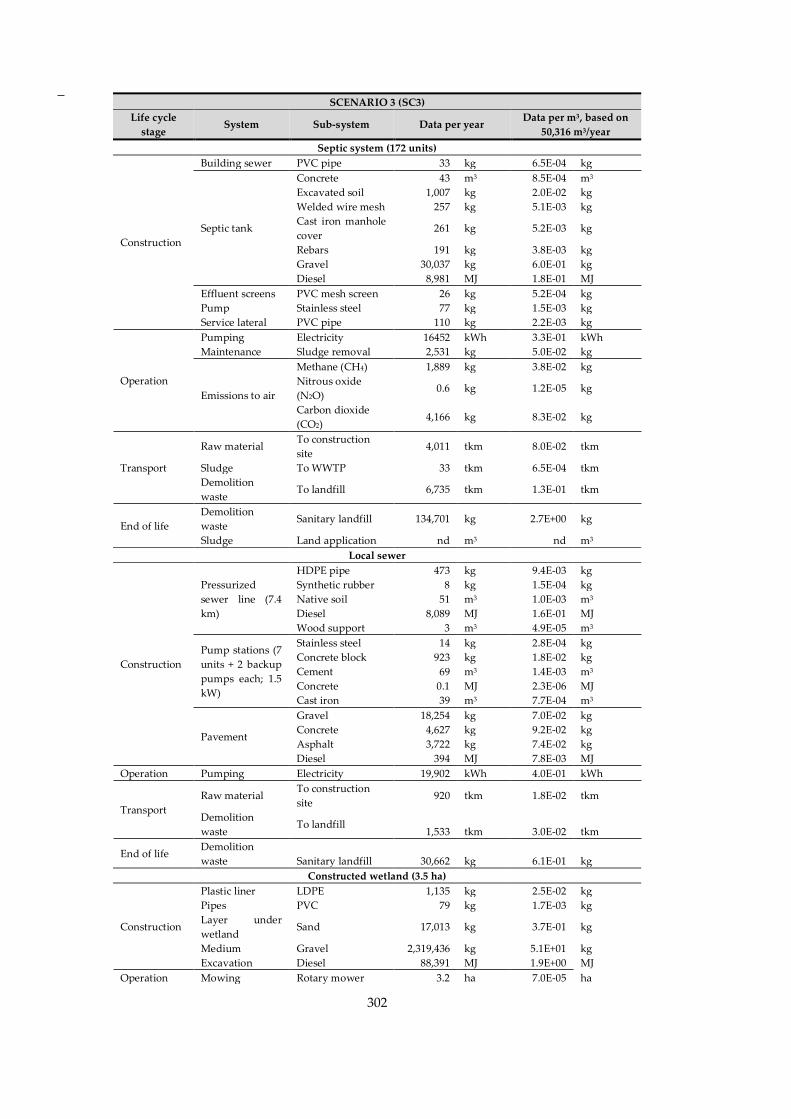
302
SCENARIO 3 (SC3)
Life cycle
stage System Sub-system Data per year
Data per m3, based on
50,316 m3/year
Septic system (172 units)
Construction
Building sewer PVC pipe 33 kg 6.5E-04 kg
Septic tank
Concrete 43 m3 8.5E-04 m3
Excavated soil 1,007 kg 2.0E-02 kg
Welded wire mesh 257 kg 5.1E-03 kg
Cast iron manhole
cover 261 kg 5.2E-03 kg
Rebars 191 kg 3.8E-03 kg
Gravel 30,037 kg 6.0E-01 kg
Diesel 8,981 MJ 1.8E-01 MJ
Effluent screens PVC mesh screen 26 kg 5.2E-04 kg
Pump Stainless steel 77 kg 1.5E-03 kg
Service lateral PVC pipe 110 kg 2.2E-03 kg
Operation
Pumping Electricity 16452 kWh 3.3E-01 kWh
Maintenance Sludge removal 2,531 kg 5.0E-02 kg
Emissions to air
Methane (CH4) 1,889 kg 3.8E-02 kg
Nitrous oxide
(N2O) 0.6 kg 1.2E-05 kg
Carbon dioxide
(CO2) 4,166 kg 8.3E-02 kg
Transport
Raw material To construction
site 4,011 tkm 8.0E-02 tkm
Sludge To WWTP 33 tkm 6.5E-04 tkm
Demolition
waste To landfill 6,735 tkm 1.3E-01 tkm
End of life
Demolition
waste Sanitary landfill 134,701 kg 2.7E+00 kg
Sludge Land application nd m3 nd m3
Local sewer
Construction
Pressurized
sewer line (7.4
km)
HDPE pipe 473 kg 9.4E-03 kg
Synthetic rubber 8 kg 1.5E-04 kg
Native soil 51 m3 1.0E-03 m3
Diesel 8,089 MJ 1.6E-01 MJ
Wood support 3 m3 4.9E-05 m3
Pump stations (7
units + 2 backup
pumps each; 1.5
kW)
Stainless steel 14 kg 2.8E-04 kg
Concrete block 923 kg 1.8E-02 kg
Cement 69 m3 1.4E-03 m3
Concrete 0.1 MJ 2.3E-06 MJ
Cast iron 39 m3 7.7E-04 m3
Pavement
Gravel 18,254 kg 7.0E-02 kg
Concrete 4,627 kg 9.2E-02 kg
Asphalt 3,722 kg 7.4E-02 kg
Diesel 394 MJ 7.8E-03 MJ
Operation Pumping Electricity 19,902 kWh 4.0E-01 kWh
Transport
Raw material To construction
site 920 tkm 1.8E-02 tkm
Demolition
waste To landfill
1,533 tkm 3.0E-02 tkm
End of life Demolition
waste Sanitary landfill 30,662 kg 6.1E-01 kg
Constructed wetland (3.5 ha)
Construction
Plastic liner LDPE 1,135 kg 2.5E-02 kg
Pipes PVC 79 kg 1.7E-03 kg
Layer under
wetland Sand 17,013 kg 3.7E-01 kg
Medium Gravel 2,319,436 kg 5.1E+01 kg
Excavation Diesel 88,391 MJ 1.9E+00 MJ
Operation Mowing Rotary mower 3.2 ha 7.0E-05 ha
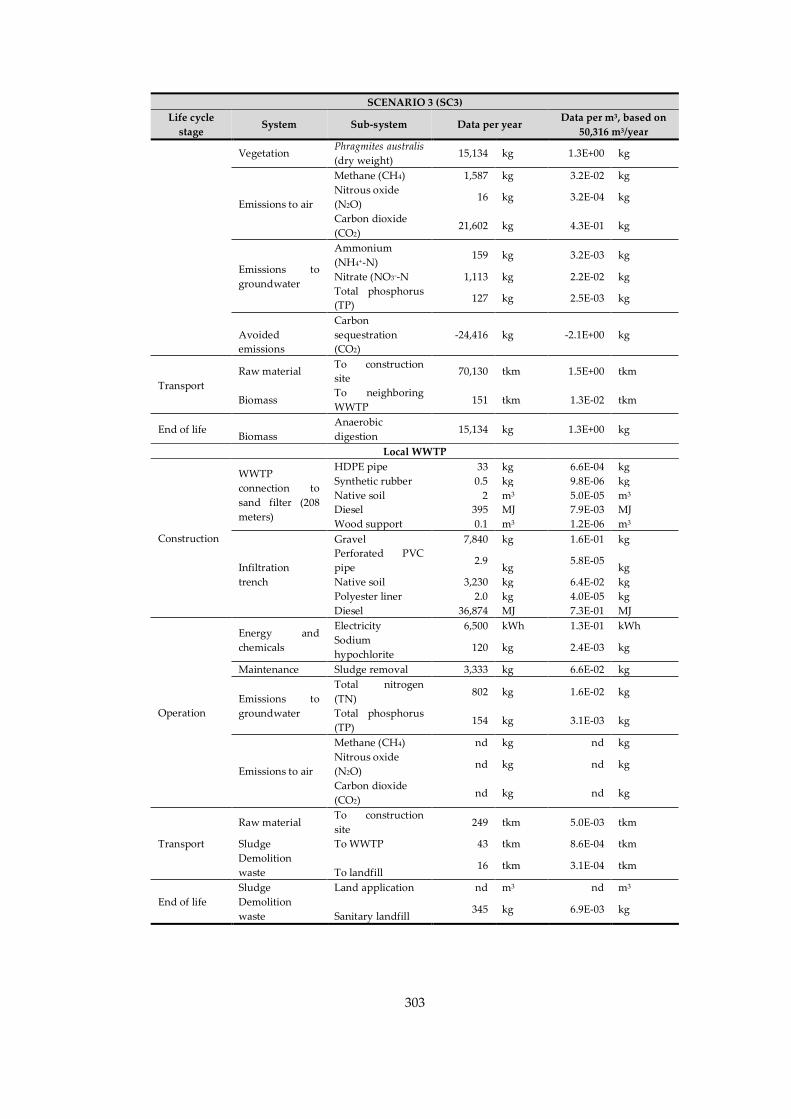
303
SCENARIO 3 (SC3)
Life cycle
stage System Sub-system Data per year
Data per m3, based on
50,316 m3/year
Vegetation Phragmites australis
(dry weight) 15,134 kg 1.3E+00 kg
Emissions to air
Methane (CH4) 1,587 kg 3.2E-02 kg
Nitrous oxide
(N2O) 16 kg 3.2E-04 kg
Carbon dioxide
(CO2) 21,602 kg 4.3E-01 kg
Emissions to
groundwater
Ammonium
(NH4+-N) 159 kg 3.2E-03 kg
Nitrate (NO3--N 1,113 kg 2.2E-02 kg
Total phosphorus
(TP) 127 kg 2.5E-03 kg
Avoided
emissions
Carbon
sequestration
(CO2)
-24,416 kg -2.1E+00 kg
Transport
Raw material To construction
site 70,130 tkm 1.5E+00 tkm
Biomass To neighboring
WWTP 151 tkm 1.3E-02 tkm
End of life Biomass
Anaerobic
digestion 15,134 kg 1.3E+00 kg
Local WWTP
Construction
WWTP
connection to
sand filter (208
meters)
HDPE pipe 33 kg 6.6E-04 kg
Synthetic rubber 0.5 kg 9.8E-06 kg
Native soil 2 m3 5.0E-05 m3
Diesel 395 MJ 7.9E-03 MJ
Wood support 0.1 m3 1.2E-06 m3
Infiltration
trench
Gravel 7,840 kg 1.6E-01 kg
Perforated PVC
pipe 2.9
kg 5.8E-05
kg
Native soil 3,230 kg 6.4E-02 kg
Polyester liner 2.0 kg 4.0E-05 kg
Diesel 36,874 MJ 7.3E-01 MJ
Operation
Energy and
chemicals
Electricity 6,500 kWh 1.3E-01 kWh
Sodium
hypochlorite 120 kg 2.4E-03 kg
Maintenance Sludge removal 3,333 kg 6.6E-02 kg
Emissions to
groundwater
Total nitrogen
(TN) 802 kg 1.6E-02 kg
Total phosphorus
(TP) 154 kg 3.1E-03 kg
Emissions to air
Methane (CH4) nd kg nd kg
Nitrous oxide
(N2O) nd kg nd kg
Carbon dioxide
(CO2) nd kg nd kg
Transport
Raw material To construction
site 249 tkm 5.0E-03 tkm
Sludge To WWTP 43 tkm 8.6E-04 tkm
Demolition
waste To landfill 16 tkm 3.1E-04 tkm
End of life
Sludge Land application nd m3 nd m3
Demolition
waste Sanitary landfill 345 kg 6.9E-03 kg
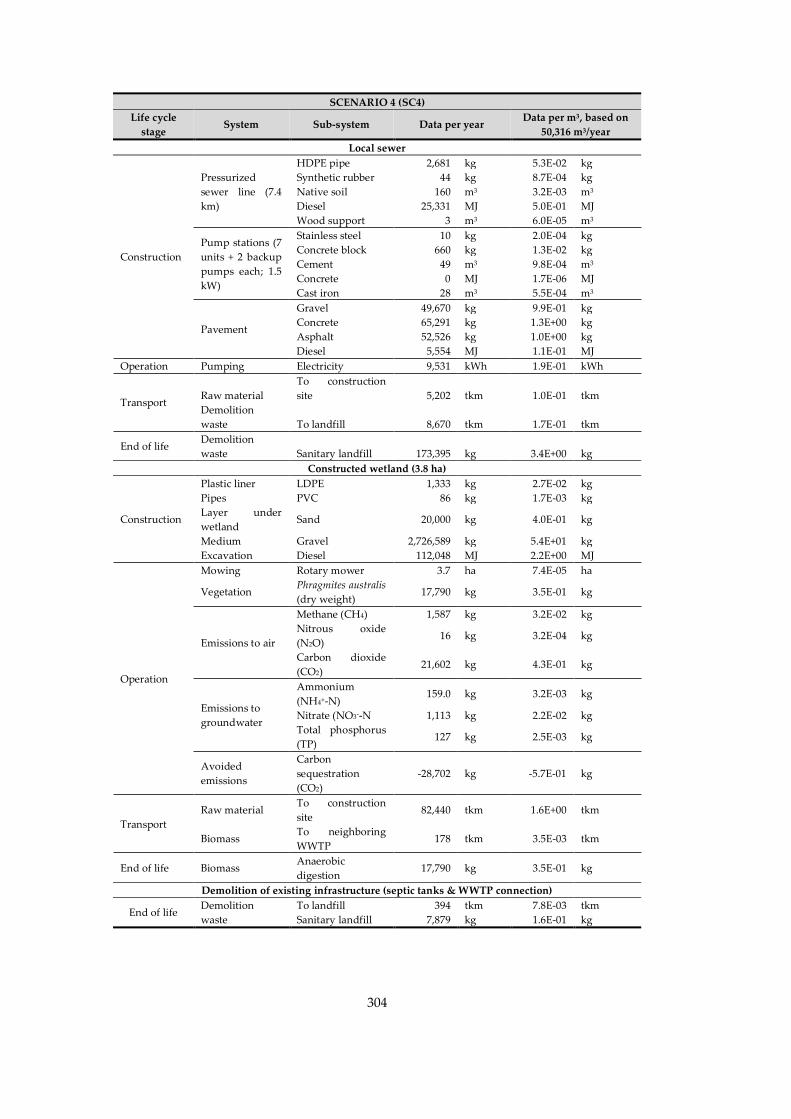
304
SCENARIO 4 (SC4)
Life cycle
stage System Sub-system Data per year
Data per m3, based on
50,316 m3/year
Local sewer
Construction
Pressurized
sewer line (7.4
km)
HDPE pipe 2,681 kg 5.3E-02 kg
Synthetic rubber 44 kg 8.7E-04 kg
Native soil 160 m3 3.2E-03 m3
Diesel 25,331 MJ 5.0E-01 MJ
Wood support 3 m3 6.0E-05 m3
Pump stations (7
units + 2 backup
pumps each; 1.5
kW)
Stainless steel 10 kg 2.0E-04 kg
Concrete block 660 kg 1.3E-02 kg
Cement 49 m3 9.8E-04 m3
Concrete 0 MJ 1.7E-06 MJ
Cast iron 28 m3 5.5E-04 m3
Pavement
Gravel 49,670 kg 9.9E-01 kg
Concrete 65,291 kg 1.3E+00 kg
Asphalt 52,526 kg 1.0E+00 kg
Diesel 5,554 MJ 1.1E-01 MJ
Operation Pumping Electricity 9,531 kWh 1.9E-01 kWh
Transport Raw material
To construction
site 5,202 tkm 1.0E-01 tkm
Demolition
waste To landfill 8,670 tkm 1.7E-01 tkm
End of life Demolition
waste Sanitary landfill 173,395 kg 3.4E+00 kg
Constructed wetland (3.8 ha)
Construction
Plastic liner LDPE 1,333 kg 2.7E-02 kg
Pipes PVC 86 kg 1.7E-03 kg
Layer under
wetland Sand 20,000 kg 4.0E-01 kg
Medium Gravel 2,726,589 kg 5.4E+01 kg
Excavation Diesel 112,048 MJ 2.2E+00 MJ
Operation
Mowing Rotary mower 3.7 ha 7.4E-05 ha
Vegetation Phragmites australis
(dry weight) 17,790 kg 3.5E-01 kg
Emissions to air
Methane (CH4) 1,587 kg 3.2E-02 kg
Nitrous oxide
(N2O) 16 kg 3.2E-04 kg
Carbon dioxide
(CO2) 21,602 kg 4.3E-01 kg
Emissions to
groundwater
Ammonium
(NH4+-N) 159.0 kg 3.2E-03 kg
Nitrate (NO3--N 1,113 kg 2.2E-02 kg
Total phosphorus
(TP) 127 kg 2.5E-03 kg
Avoided
emissions
Carbon
sequestration
(CO2)
-28,702 kg -5.7E-01 kg
Transport
Raw material To construction
site 82,440 tkm 1.6E+00 tkm
Biomass To neighboring
WWTP 178 tkm 3.5E-03 tkm
End of life Biomass Anaerobic
digestion 17,790 kg 3.5E-01 kg
Demolition of existing infrastructure (septic tanks & WWTP connection)
End of life Demolition
waste
To landfill 394 tkm 7.8E-03 tkm
Sanitary landfill 7,879 kg 1.6E-01 kg
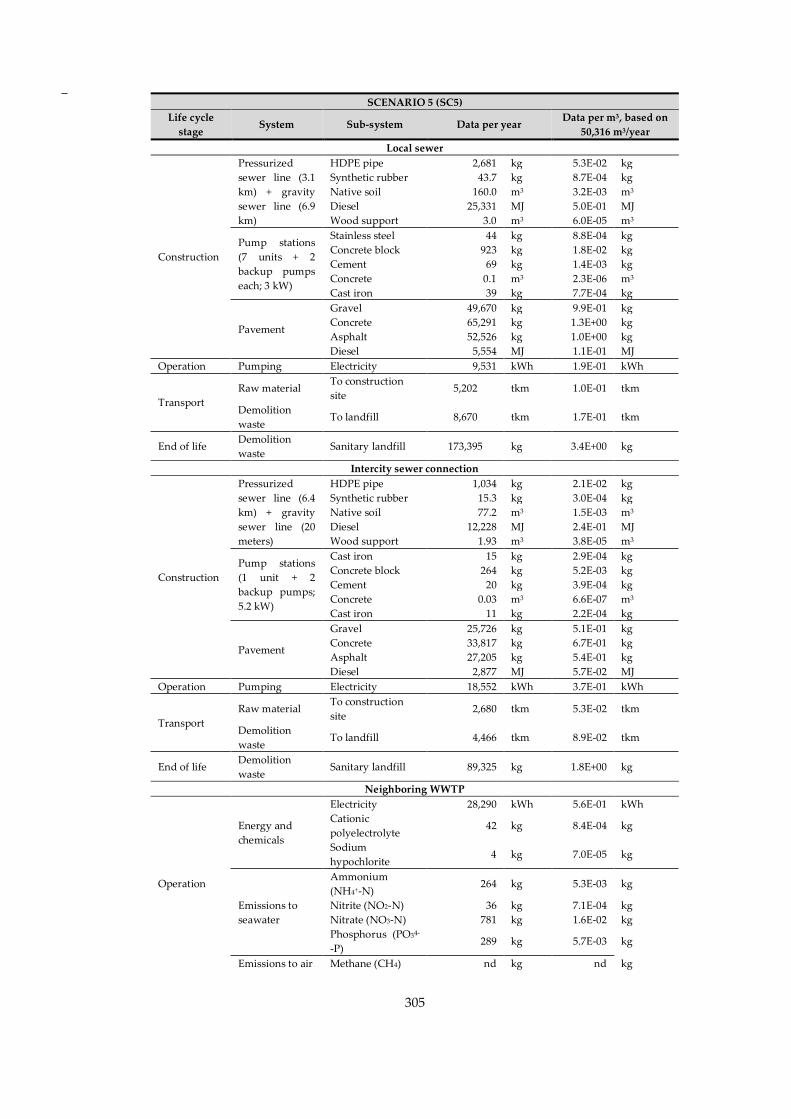
305
SCENARIO 5 (SC5)
Life cycle
stage System Sub-system Data per year
Data per m3, based on
50,316 m3/year
Local sewer
Construction
Pressurized
sewer line (3.1
km) + gravity
sewer line (6.9
km)
HDPE pipe 2,681 kg 5.3E-02 kg
Synthetic rubber 43.7 kg 8.7E-04 kg
Native soil 160.0 m3 3.2E-03 m3
Diesel 25,331 MJ 5.0E-01 MJ
Wood support 3.0 m3 6.0E-05 m3
Pump stations
(7 units + 2
backup pumps
each; 3 kW)
Stainless steel 44 kg 8.8E-04 kg
Concrete block 923 kg 1.8E-02 kg
Cement 69 kg 1.4E-03 kg
Concrete 0.1 m3 2.3E-06 m3
Cast iron 39 kg 7.7E-04 kg
Pavement
Gravel 49,670 kg 9.9E-01 kg
Concrete 65,291 kg 1.3E+00 kg
Asphalt 52,526 kg 1.0E+00 kg
Diesel 5,554 MJ 1.1E-01 MJ
Operation Pumping Electricity 9,531 kWh 1.9E-01 kWh
Transport
Raw material To construction
site 5,202 tkm 1.0E-01 tkm
Demolition
waste To landfill 8,670 tkm 1.7E-01 tkm
End of life Demolition
waste Sanitary landfill 173,395 kg 3.4E+00 kg
Intercity sewer connection
Construction
Pressurized
sewer line (6.4
km) + gravity
sewer line (20
meters)
HDPE pipe 1,034 kg 2.1E-02 kg
Synthetic rubber 15.3 kg 3.0E-04 kg
Native soil 77.2 m3 1.5E-03 m3
Diesel 12,228 MJ 2.4E-01 MJ
Wood support 1.93 m3 3.8E-05 m3
Pump stations
(1 unit + 2
backup pumps;
5.2 kW)
Cast iron 15 kg 2.9E-04 kg
Concrete block 264 kg 5.2E-03 kg
Cement 20 kg 3.9E-04 kg
Concrete 0.03 m3 6.6E-07 m3
Cast iron 11 kg 2.2E-04 kg
Pavement
Gravel 25,726 kg 5.1E-01 kg
Concrete 33,817 kg 6.7E-01 kg
Asphalt 27,205 kg 5.4E-01 kg
Diesel 2,877 MJ 5.7E-02 MJ
Operation Pumping Electricity 18,552 kWh 3.7E-01 kWh
Transport
Raw material To construction
site 2,680 tkm 5.3E-02 tkm
Demolition
waste To landfill 4,466 tkm 8.9E-02 tkm
End of life Demolition
waste Sanitary landfill 89,325 kg 1.8E+00 kg
Neighboring WWTP
Operation
Energy and
chemicals
Electricity 28,290 kWh 5.6E-01 kWh
Cationic
polyelectrolyte 42 kg 8.4E-04 kg
Sodium
hypochlorite 4 kg 7.0E-05 kg
Emissions to
seawater
Ammonium
(NH4+-N) 264 kg 5.3E-03 kg
Nitrite (NO2-N) 36 kg 7.1E-04 kg
Nitrate (NO3-N) 781 kg 1.6E-02 kg
Phosphorus (PO34-
-P) 289 kg 5.7E-03 kg
Emissions to air Methane (CH4) nd kg nd kg
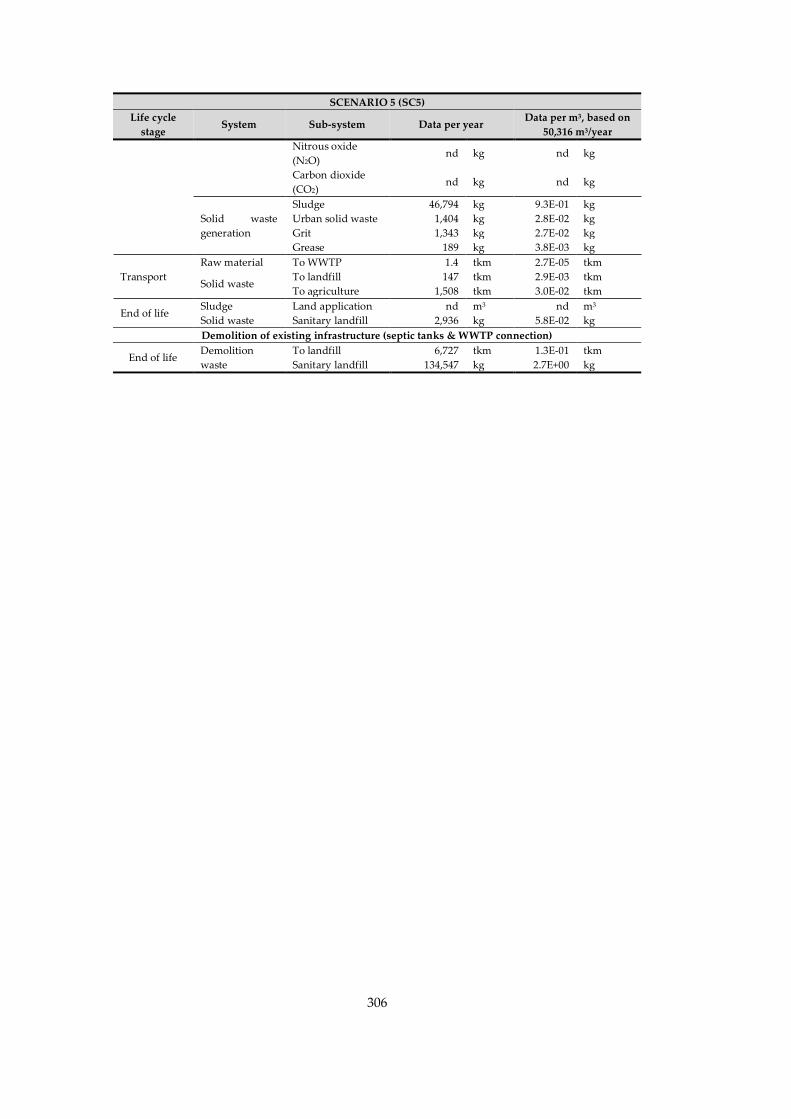
306
SCENARIO 5 (SC5)
Life cycle
stage System Sub-system Data per year
Data per m3, based on
50,316 m3/year
Nitrous oxide
(N2O) nd kg nd kg
Carbon dioxide
(CO2) nd kg nd kg
Solid waste
generation
Sludge 46,794 kg 9.3E-01 kg
Urban solid waste 1,404 kg 2.8E-02 kg
Grit 1,343 kg 2.7E-02 kg
Grease 189 kg 3.8E-03 kg
Transport
Raw material To WWTP 1.4 tkm 2.7E-05 tkm
Solid waste To landfill 147 tkm 2.9E-03 tkm
To agriculture 1,508 tkm 3.0E-02 tkm
End of life Sludge Land application nd m3 nd m3
Solid waste Sanitary landfill 2,936 kg 5.8E-02 kg
Demolition of existing infrastructure (septic tanks & WWTP connection)
End of life Demolition
waste
To landfill 6,727 tkm 1.3E-01 tkm
Sanitary landfill 134,547 kg 2.7E+00 kg
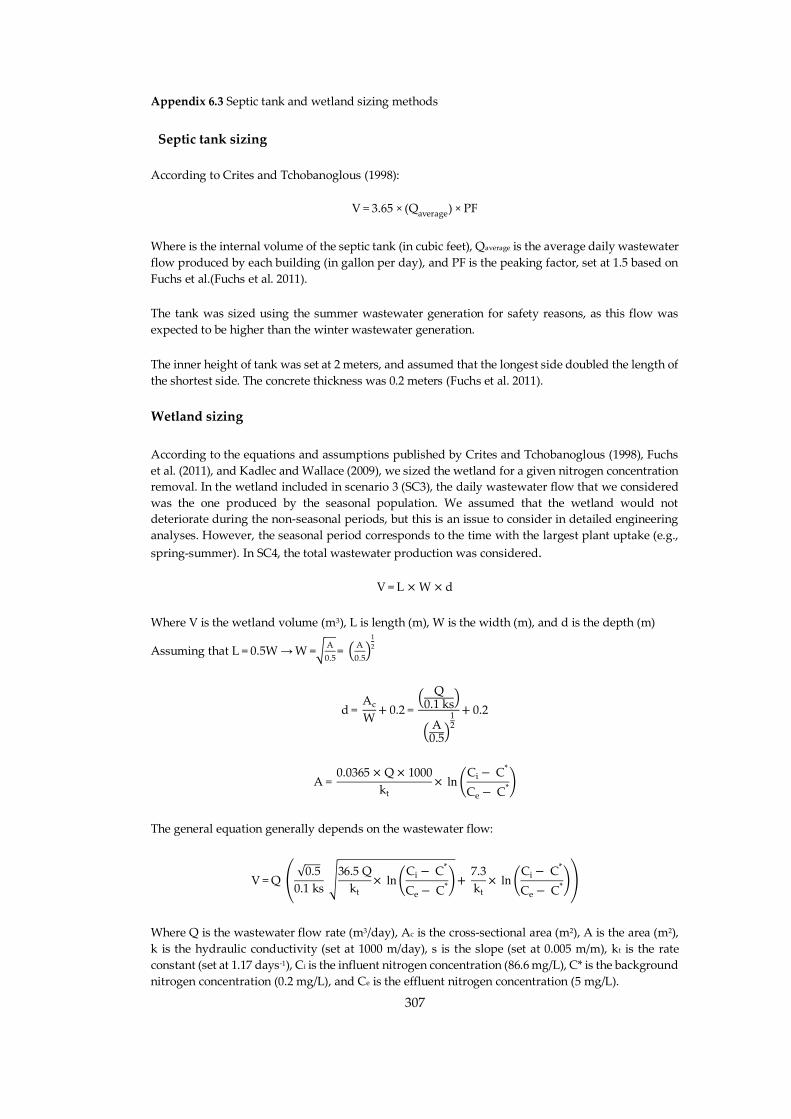
307
Appendix 6.3 Septic tank and wetland sizing methods
Septic tank sizing
According to Crites and Tchobanoglous (1998):
V = 3.65 × (Qaverage) × PF
Where is the internal volume of the septic tank (in cubic feet), Qaverage is the average daily wastewater
flow produced by each building (in gallon per day), and PF is the peaking factor, set at 1.5 based on
Fuchs et al.(Fuchs et al. 2011).
The tank was sized using the summer wastewater generation for safety reasons, as this flow was
expected to be higher than the winter wastewater generation.
The inner height of tank was set at 2 meters, and assumed that the longest side doubled the length of
the shortest side. The concrete thickness was 0.2 meters (Fuchs et al. 2011).
Wetland sizing
According to the equations and assumptions published by Crites and Tchobanoglous (1998), Fuchs
et al. (2011), and Kadlec and Wallace (2009), we sized the wetland for a given nitrogen concentration
removal. In the wetland included in scenario 3 (SC3), the daily wastewater flow that we considered
was the one produced by the seasonal population. We assumed that the wetland would not
deteriorate during the non-seasonal periods, but this is an issue to consider in detailed engineering
analyses. However, the seasonal period corresponds to the time with the largest plant uptake (e.g.,
spring-summer). In SC4, the total wastewater production was considered.
V = L × W × d
Where V is the wetland volume (m3), L is length (m), W is the width (m), and d is the depth (m)
Assuming that L = 0.5W → W =√A
0.5= (
A
0.5)
1
2
d = Ac
W+ 0.2 =
(Q
0.1 ks)
(A0.5)
12
+ 0.2
A = 0.0365 × Q × 1000
kt× ln (
Ci − C*
Ce − C*)
The general equation generally depends on the wastewater flow:
V = Q (√0.5
0.1 ks √
36.5 Q
kt× ln (
Ci − C*
Ce − C*) +
7.3
kt× ln (
Ci − C*
Ce − C*))
Where Q is the wastewater flow rate (m3/day), Ac is the cross-sectional area (m2), A is the area (m2),
k is the hydraulic conductivity (set at 1000 m/day), s is the slope (set at 0.005 m/m), kt is the rate
constant (set at 1.17 days-1), Ci is the influent nitrogen concentration (86.6 mg/L), C* is the background
nitrogen concentration (0.2 mg/L), and Ce is the effluent nitrogen concentration (5 mg/L).
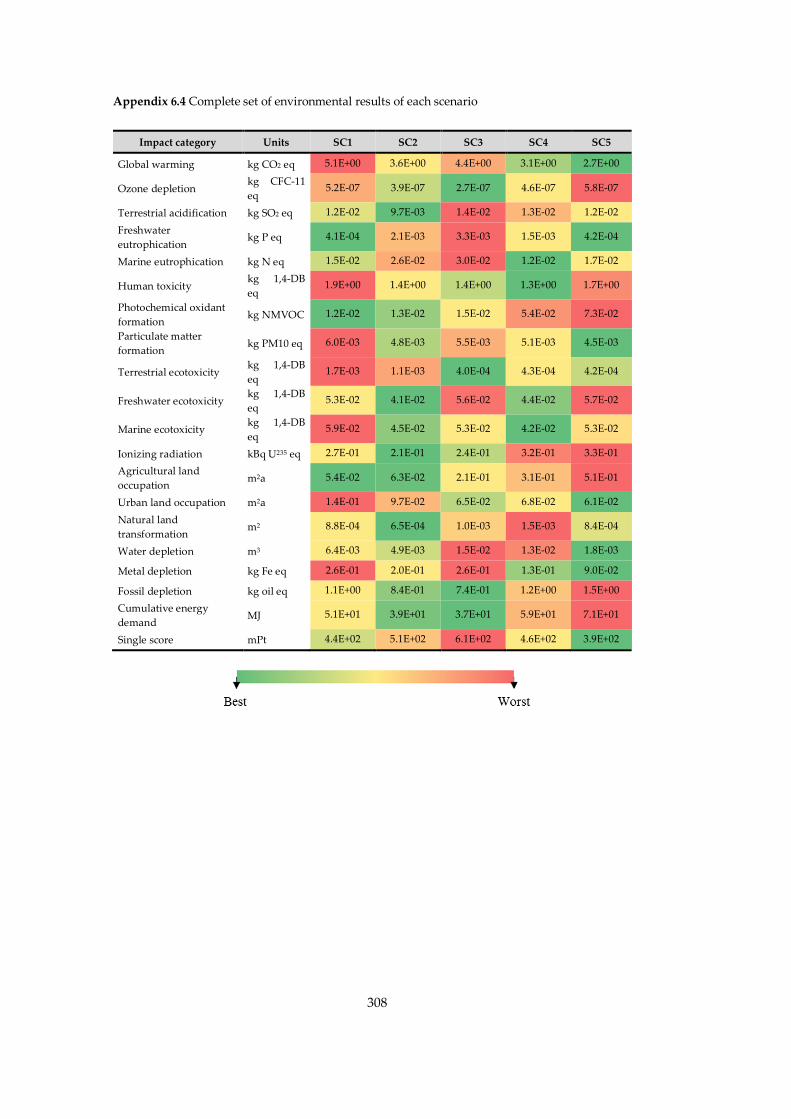
308
Appendix 6.4 Complete set of environmental results of each scenario
Impact category Units SC1 SC2 SC3 SC4 SC5
Global warming kg CO2 eq 5.1E+00 3.6E+00 4.4E+00 3.1E+00 2.7E+00
Ozone depletion kg CFC-11
eq 5.2E-07 3.9E-07 2.7E-07 4.6E-07 5.8E-07
Terrestrial acidification kg SO2 eq 1.2E-02 9.7E-03 1.4E-02 1.3E-02 1.2E-02
Freshwater
eutrophication kg P eq 4.1E-04 2.1E-03 3.3E-03 1.5E-03 4.2E-04
Marine eutrophication kg N eq 1.5E-02 2.6E-02 3.0E-02 1.2E-02 1.7E-02
Human toxicity kg 1,4-DB
eq 1.9E+00 1.4E+00 1.4E+00 1.3E+00 1.7E+00
Photochemical oxidant
formation kg NMVOC 1.2E-02 1.3E-02 1.5E-02 5.4E-02 7.3E-02
Particulate matter
formation kg PM10 eq 6.0E-03 4.8E-03 5.5E-03 5.1E-03 4.5E-03
Terrestrial ecotoxicity kg 1,4-DB
eq 1.7E-03 1.1E-03 4.0E-04 4.3E-04 4.2E-04
Freshwater ecotoxicity kg 1,4-DB
eq 5.3E-02 4.1E-02 5.6E-02 4.4E-02 5.7E-02
Marine ecotoxicity kg 1,4-DB
eq 5.9E-02 4.5E-02 5.3E-02 4.2E-02 5.3E-02
Ionizing radiation kBq U235 eq 2.7E-01 2.1E-01 2.4E-01 3.2E-01 3.3E-01
Agricultural land
occupation m2a 5.4E-02 6.3E-02 2.1E-01 3.1E-01 5.1E-01
Urban land occupation m2a 1.4E-01 9.7E-02 6.5E-02 6.8E-02 6.1E-02
Natural land
transformation m2 8.8E-04 6.5E-04 1.0E-03 1.5E-03 8.4E-04
Water depletion m3 6.4E-03 4.9E-03 1.5E-02 1.3E-02 1.8E-03
Metal depletion kg Fe eq 2.6E-01 2.0E-01 2.6E-01 1.3E-01 9.0E-02
Fossil depletion kg oil eq 1.1E+00 8.4E-01 7.4E-01 1.2E+00 1.5E+00
Cumulative energy
demand MJ 5.1E+01 3.9E+01 3.7E+01 5.9E+01 7.1E+01
Single score mPt 4.4E+02 5.1E+02 6.1E+02 4.6E+02 3.9E+02

309
Appendix 6.5 Mean and standard deviation of each scenario and impact indicator obtained through
the Monte Carlo simulation. Shaded cells highlight the pairs of scenarios that are not significantly
different from each other according to the ANOVA test (95% confidence, p-value < 0.0001)
Impact category Units SC1 SC2 SC3 SC4 SC5
Global warming kg CO2 eq 5.9E+00
± 4.5E-01
4.0E+00
± 3.0E-01
5.8E+00
± 8.0E-01
4.6E+00
± 6.4E-01
3.8E+00
± 1.5E-01
Ozone depletion kg CFC-11 eq 5.9E-07
± 4.1E-08
4.0E-07
± 2.8E-08
5.8E-07
± 1.5E-07
8.9E-07
± 2.5E-07
9.1E-07
± 4.4E-07
Terrestrial
acidification kg SO2 eq
1.5E-02
± 1.8E-03
1.2E-02
± 1.6E-03
2.7E-02
± 6.6E-03
2.7E-02
± 6.5E-03
1.7E-02
± 6.7E-03
Freshwater
eutrophication kg P eq
5.3E-04
± 7.5E-05
2.9E-03
± 7.3E-04
4.6E-03
± 6.9E-04
2.0E-03
± 2.8E-04
6.0E-04
± 2.2E-04
Marine
eutrophication kg N eq
1.5E-02
± 2.0E-04
2.2E-02
± 2.2E-03
2.8E-02
± 2.5E-03
1.4E-02
± 1.6E-03
1.8E-02
± 1.4E-03
Human toxicity kg 1,4-DB eq 2.7E+00
± 4.2E-01
2.1E+00
± 3.0E-01
2.8E+00
± 6.3E-01
2.4E+00
± 7.1E-01
3.0E-00
± 1.4E-00
Photochemical
oxidant formation kg NMVOC
1.5E-02
± 2.1E-03
1.3E-02
± 2.2E-03
3.3E-02
± 7.6E-03
9.5E-02
± 3.7E-02
1.2E-01
± 6.0E-02
Particulate matter
formation kg PM10 eq
7.4E-03
± 8.7E-04
5.7E-03
± 6.9E-04
1.2E-02
± 3.1E-03
1.1E-02
± 2.9E-03
6.5E-03
± 2.6E-03
Terrestrial
ecotoxicity kg 1,4-DB eq
1.8E-03
± 3.8E-05
9.7E-04
± 2.0E-04
9.5E-04
± 2.6E-04
9.8E-04
± 2.5E-04
6.7E-04
± 3.1E-04
Freshwater
ecotoxicity kg 1,4-DB eq
7.5E-02
± 1.1E-02
5.9E-02
± 7.8E-03
1.1E-01
± 2.1E-02
8.5E-02
± 2.0E-02
8.8E-02
± 2.6E-02
Marine ecotoxicity kg 1,4-DB eq 8.0E-02
± 1.0E-02
6.0E-02
± 6.8E-03
1.0E-01
± 2.1E-02
8.1E-02
± 1.9E-02
8.3E-02
± 2.6E-02
Ionizing radiation kBq U235 eq 3.2E-01
± 2.5E-02
2.2E-01
± 1.5E-02
5.1E-01
± 1.2E-01
6.4E-01
± 1.5E-01
5.0E-01
± 2.3E-01
Agricultural land
occupation m2a
6.9E-02
± 7.7E-03
5.5E-02
± 6.1E-03
3.8E-01
± 1.2E-01
5.4E-01
± 2.1E-01
8.2E-01
± 4.2E-01
Urban land
occupation m2a
1.7E-01
± 1.1E-02
1.0E-01
± 1.2E-02
1.5E-01
± 4.0E-02
1.5E-01
± 3.5E-02
1.0E-01
± 4.1E-02
Natural land
transformation m2
8.8E-04
± 3.6E-05
5.3E-04
± 8.2E-05
2.6E-03
± 7.8E-04
3.3E-03
± 8.2E-04
1.2E-03
± 7.1E-04
Water depletion m3 1.1E-02
± 2.0E-03
8.6E-03
± 1.6E-03
3.7E-02
± 1.0E-02
3.1E-02
± 9.1E-03
3.0E-03
± 7.9E-04
Metal depletion kg Fe eq 4.1E-01
± 8.5E-02
3.2E-01
± 6.3E-02
5.4E-01
± 1.3E-01
2.9E-01
± 7.0E-02
1.4E-01
± 6.5E-02
Fossil depletion kg oil eq 1.3E+00
± 9.3E-02
8.6E-01
± 5.9E-02
1.5E+00
± 3.6E-01
2.3E+00
± 6.3E-01
2.3E+00
± 1.1E+00
Cumulative
energy demand MJ
5.9E+01
± 4.4E+00
4.1E+01
± 2.8E+00
7.7E+01
± 1.8E+01
1.1E+02
± 3.1E+01
1.1E+02
± 5.2E+01
Single score mPt 5.2E+02
± 4.4E+01
6.0E+02
± 6.9E+01
9.5E+02
± 1.5E+02
7.8E+02
± 1.5E+02
6.0E+02
± 2.7E+02
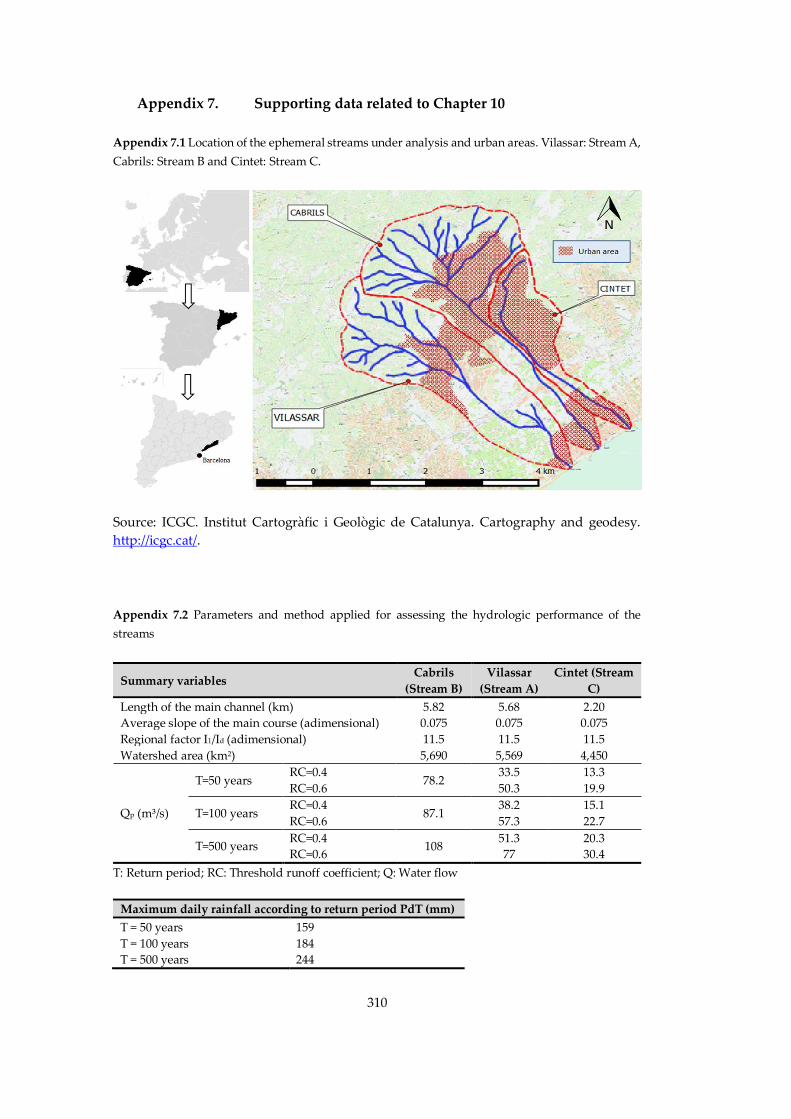
310
Appendix 7. Supporting data related to Chapter 10
Appendix 7.1 Location of the ephemeral streams under analysis and urban areas. Vilassar: Stream A,
Cabrils: Stream B and Cintet: Stream C.
Source: ICGC. Institut Cartogràfic i Geològic de Catalunya. Cartography and geodesy.
http://icgc.cat/.
Appendix 7.2 Parameters and method applied for assessing the hydrologic performance of the
streams
Summary variables Cabrils
(Stream B)
Vilassar
(Stream A)
Cintet (Stream
C)
Length of the main channel (km) 5.82 5.68 2.20
Average slope of the main course (adimensional) 0.075 0.075 0.075
Regional factor I1/Id (adimensional) 11.5 11.5 11.5
Watershed area (km2) 5,690 5,569 4,450
Qp (m³/s)
T=50 years RC=0.4
78.2 33.5 13.3
RC=0.6 50.3 19.9
T=100 years RC=0.4
87.1 38.2 15.1
RC=0.6 57.3 22.7
T=500 years RC=0.4
108 51.3 20.3
RC=0.6 77 30.4
T: Return period; RC: Threshold runoff coefficient; Q: Water flow
Maximum daily rainfall according to return period PdT (mm)
T = 50 years 159
T = 100 years 184
T = 500 years 244
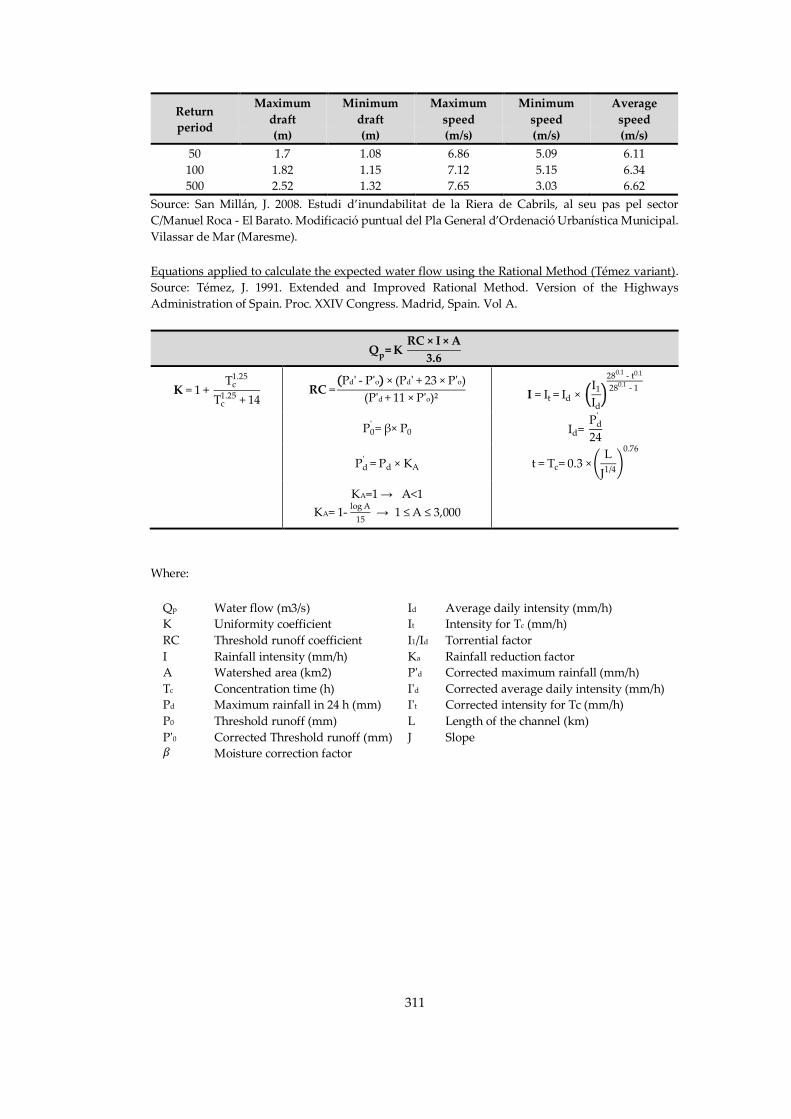
311
Return
period
Maximum
draft
Minimum
draft
Maximum
speed
Minimum
speed
Average
speed
(m) (m) (m/s) (m/s) (m/s)
50 1.7 1.08 6.86 5.09 6.11
100 1.82 1.15 7.12 5.15 6.34
500 2.52 1.32 7.65 3.03 6.62
Source: San Millán, J. 2008. Estudi d’inundabilitat de la Riera de Cabrils, al seu pas pel sector
C/Manuel Roca - El Barato. Modificació puntual del Pla General d’Ordenació Urbanística Municipal.
Vilassar de Mar (Maresme).
Equations applied to calculate the expected water flow using the Rational Method (Témez variant).
Source: Témez, J. 1991. Extended and Improved Rational Method. Version of the Highways
Administration of Spain. Proc. XXIV Congress. Madrid, Spain. Vol A.
Qp= K RC × I × A
3.6
K = 1 + Tc
1.25
Tc1.25 + 14
RC =(Pd' - P'o) × (Pd' + 23 × P'o)
(P'd + 11 × P'o)² I = It = Id × (
I1
Id)
280.1 - t0.1
280.1 - 1
P0' = β× P0 Id=
Pd'
24
Pd ' = Pd × KA t = Tc= 0.3 × (
L
J1/4)
0.76
KA=1 → A<1
KA= 1- log A
15 → 1 ≤ A ≤ 3,000
Where:
Qp Water flow (m3/s) Id Average daily intensity (mm/h)
K Uniformity coefficient It Intensity for Tc (mm/h)
RC Threshold runoff coefficient I1/Id Torrential factor
I Rainfall intensity (mm/h) Ka Rainfall reduction factor
A Watershed area (km2) P'd Corrected maximum rainfall (mm/h)
Tc Concentration time (h) I'd Corrected average daily intensity (mm/h)
Pd Maximum rainfall in 24 h (mm) I't Corrected intensity for Tc (mm/h)
P0 Threshold runoff (mm) L Length of the channel (km)
P'0 Corrected Threshold runoff (mm) J Slope 𝛽 Moisture correction factor
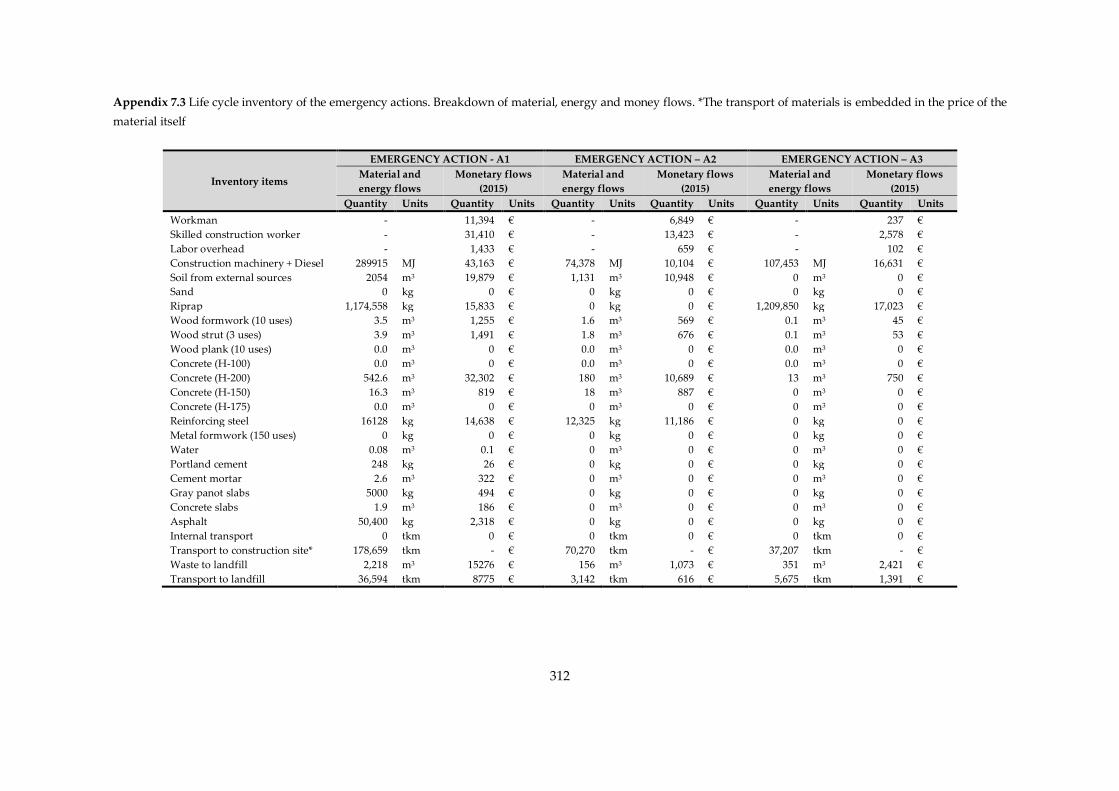
312
Appendix 7.3 Life cycle inventory of the emergency actions. Breakdown of material, energy and money flows. *The transport of materials is embedded in the price of the
material itself
Inventory items
EMERGENCY ACTION - A1 EMERGENCY ACTION – A2 EMERGENCY ACTION – A3
Material and
energy flows
Monetary flows
(2015)
Material and
energy flows
Monetary flows
(2015)
Material and
energy flows
Monetary flows
(2015)
Quantity Units Quantity Units Quantity Units Quantity Units Quantity Units Quantity Units
Workman - 11,394 € - 6,849 € - 237 €
Skilled construction worker - 31,410 € - 13,423 € - 2,578 €
Labor overhead - 1,433 € - 659 € - 102 €
Construction machinery + Diesel 289915 MJ 43,163 € 74,378 MJ 10,104 € 107,453 MJ 16,631 €
Soil from external sources 2054 m3 19,879 € 1,131 m3 10,948 € 0 m3 0 €
Sand 0 kg 0 € 0 kg 0 € 0 kg 0 €
Riprap 1,174,558 kg 15,833 € 0 kg 0 € 1,209,850 kg 17,023 €
Wood formwork (10 uses) 3.5 m3 1,255 € 1.6 m3 569 € 0.1 m3 45 €
Wood strut (3 uses) 3.9 m3 1,491 € 1.8 m3 676 € 0.1 m3 53 €
Wood plank (10 uses) 0.0 m3 0 € 0.0 m3 0 € 0.0 m3 0 €
Concrete (H-100) 0.0 m3 0 € 0.0 m3 0 € 0.0 m3 0 €
Concrete (H-200) 542.6 m3 32,302 € 180 m3 10,689 € 13 m3 750 €
Concrete (H-150) 16.3 m3 819 € 18 m3 887 € 0 m3 0 €
Concrete (H-175) 0.0 m3 0 € 0 m3 0 € 0 m3 0 €
Reinforcing steel 16128 kg 14,638 € 12,325 kg 11,186 € 0 kg 0 €
Metal formwork (150 uses) 0 kg 0 € 0 kg 0 € 0 kg 0 €
Water 0.08 m3 0.1 € 0 m3 0 € 0 m3 0 €
Portland cement 248 kg 26 € 0 kg 0 € 0 kg 0 €
Cement mortar 2.6 m3 322 € 0 m3 0 € 0 m3 0 €
Gray panot slabs 5000 kg 494 € 0 kg 0 € 0 kg 0 €
Concrete slabs 1.9 m3 186 € 0 m3 0 € 0 m3 0 €
Asphalt 50,400 kg 2,318 € 0 kg 0 € 0 kg 0 €
Internal transport 0 tkm 0 € 0 tkm 0 € 0 tkm 0 €
Transport to construction site* 178,659 tkm - € 70,270 tkm - € 37,207 tkm - €
Waste to landfill 2,218 m3 15276 € 156 m3 1,073 € 351 m3 2,421 €
Transport to landfill 36,594 tkm 8775 € 3,142 tkm 616 € 5,675 tkm 1,391 €
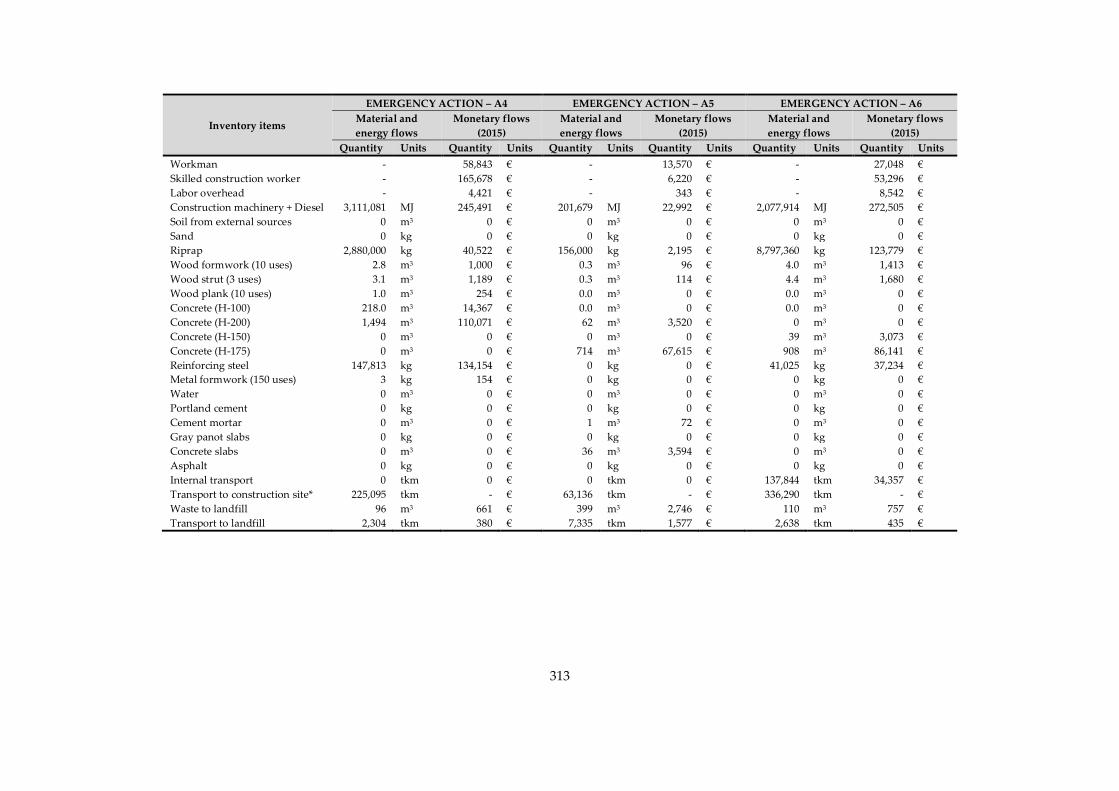
313
Inventory items
EMERGENCY ACTION – A4 EMERGENCY ACTION – A5 EMERGENCY ACTION – A6
Material and
energy flows
Monetary flows
(2015)
Material and
energy flows
Monetary flows
(2015)
Material and
energy flows
Monetary flows
(2015)
Quantity Units Quantity Units Quantity Units Quantity Units Quantity Units Quantity Units
Workman - 58,843 € - 13,570 € - 27,048 €
Skilled construction worker - 165,678 € - 6,220 € - 53,296 €
Labor overhead - 4,421 € - 343 € - 8,542 €
Construction machinery + Diesel 3,111,081 MJ 245,491 € 201,679 MJ 22,992 € 2,077,914 MJ 272,505 €
Soil from external sources 0 m3 0 € 0 m3 0 € 0 m3 0 €
Sand 0 kg 0 € 0 kg 0 € 0 kg 0 €
Riprap 2,880,000 kg 40,522 € 156,000 kg 2,195 € 8,797,360 kg 123,779 €
Wood formwork (10 uses) 2.8 m3 1,000 € 0.3 m3 96 € 4.0 m3 1,413 €
Wood strut (3 uses) 3.1 m3 1,189 € 0.3 m3 114 € 4.4 m3 1,680 €
Wood plank (10 uses) 1.0 m3 254 € 0.0 m3 0 € 0.0 m3 0 €
Concrete (H-100) 218.0 m3 14,367 € 0.0 m3 0 € 0.0 m3 0 €
Concrete (H-200) 1,494 m3 110,071 € 62 m3 3,520 € 0 m3 0 €
Concrete (H-150) 0 m3 0 € 0 m3 0 € 39 m3 3,073 €
Concrete (H-175) 0 m3 0 € 714 m3 67,615 € 908 m3 86,141 €
Reinforcing steel 147,813 kg 134,154 € 0 kg 0 € 41,025 kg 37,234 €
Metal formwork (150 uses) 3 kg 154 € 0 kg 0 € 0 kg 0 €
Water 0 m3 0 € 0 m3 0 € 0 m3 0 €
Portland cement 0 kg 0 € 0 kg 0 € 0 kg 0 €
Cement mortar 0 m3 0 € 1 m3 72 € 0 m3 0 €
Gray panot slabs 0 kg 0 € 0 kg 0 € 0 kg 0 €
Concrete slabs 0 m3 0 € 36 m3 3,594 € 0 m3 0 €
Asphalt 0 kg 0 € 0 kg 0 € 0 kg 0 €
Internal transport 0 tkm 0 € 0 tkm 0 € 137,844 tkm 34,357 €
Transport to construction site* 225,095 tkm - € 63,136 tkm - € 336,290 tkm - €
Waste to landfill 96 m3 661 € 399 m3 2,746 € 110 m3 757 €
Transport to landfill 2,304 tkm 380 € 7,335 tkm 1,577 € 2,638 tkm 435 €
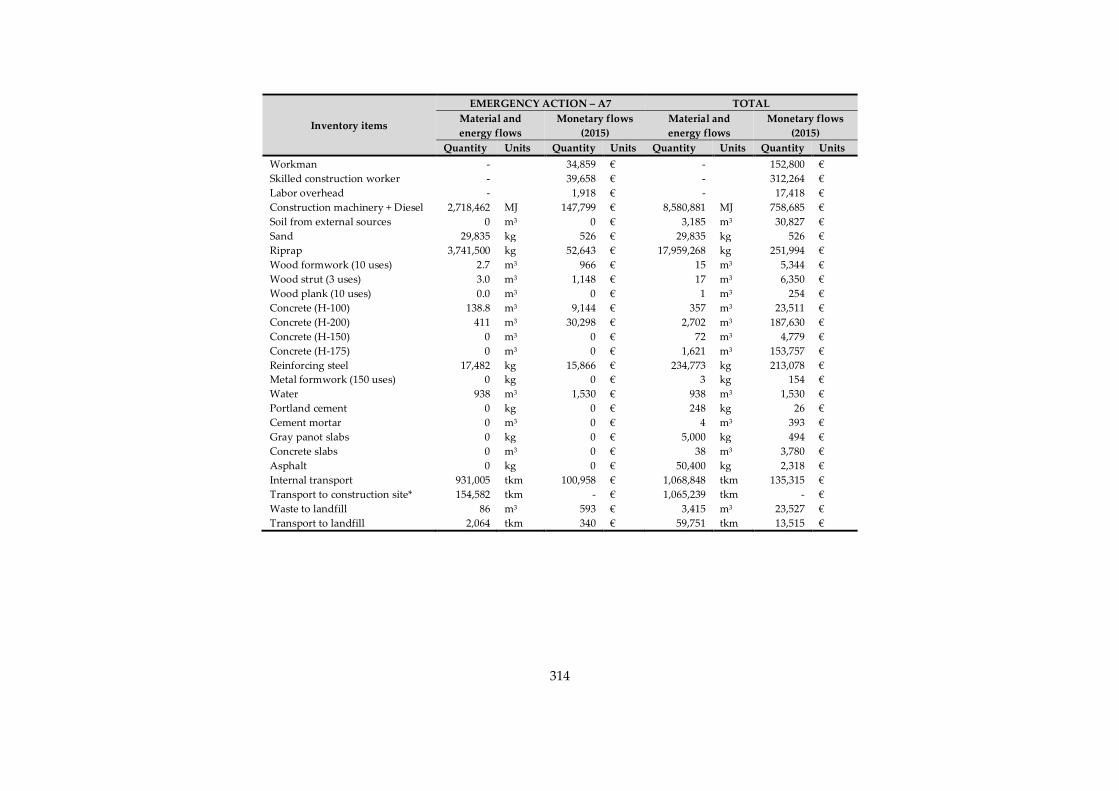
314
Inventory items
EMERGENCY ACTION – A7 TOTAL
Material and
energy flows
Monetary flows
(2015)
Material and
energy flows
Monetary flows
(2015)
Quantity Units Quantity Units Quantity Units Quantity Units
Workman - 34,859 € - 152,800 €
Skilled construction worker - 39,658 € - 312,264 €
Labor overhead - 1,918 € - 17,418 €
Construction machinery + Diesel 2,718,462 MJ 147,799 € 8,580,881 MJ 758,685 €
Soil from external sources 0 m3 0 € 3,185 m3 30,827 €
Sand 29,835 kg 526 € 29,835 kg 526 €
Riprap 3,741,500 kg 52,643 € 17,959,268 kg 251,994 €
Wood formwork (10 uses) 2.7 m3 966 € 15 m3 5,344 €
Wood strut (3 uses) 3.0 m3 1,148 € 17 m3 6,350 €
Wood plank (10 uses) 0.0 m3 0 € 1 m3 254 €
Concrete (H-100) 138.8 m3 9,144 € 357 m3 23,511 €
Concrete (H-200) 411 m3 30,298 € 2,702 m3 187,630 €
Concrete (H-150) 0 m3 0 € 72 m3 4,779 €
Concrete (H-175) 0 m3 0 € 1,621 m3 153,757 €
Reinforcing steel 17,482 kg 15,866 € 234,773 kg 213,078 €
Metal formwork (150 uses) 0 kg 0 € 3 kg 154 €
Water 938 m3 1,530 € 938 m3 1,530 €
Portland cement 0 kg 0 € 248 kg 26 €
Cement mortar 0 m3 0 € 4 m3 393 €
Gray panot slabs 0 kg 0 € 5,000 kg 494 €
Concrete slabs 0 m3 0 € 38 m3 3,780 €
Asphalt 0 kg 0 € 50,400 kg 2,318 €
Internal transport 931,005 tkm 100,958 € 1,068,848 tkm 135,315 €
Transport to construction site* 154,582 tkm - € 1,065,239 tkm - €
Waste to landfill 86 m3 593 € 3,415 m3 23,527 €
Transport to landfill 2,064 tkm 340 € 59,751 tkm 13,515 €
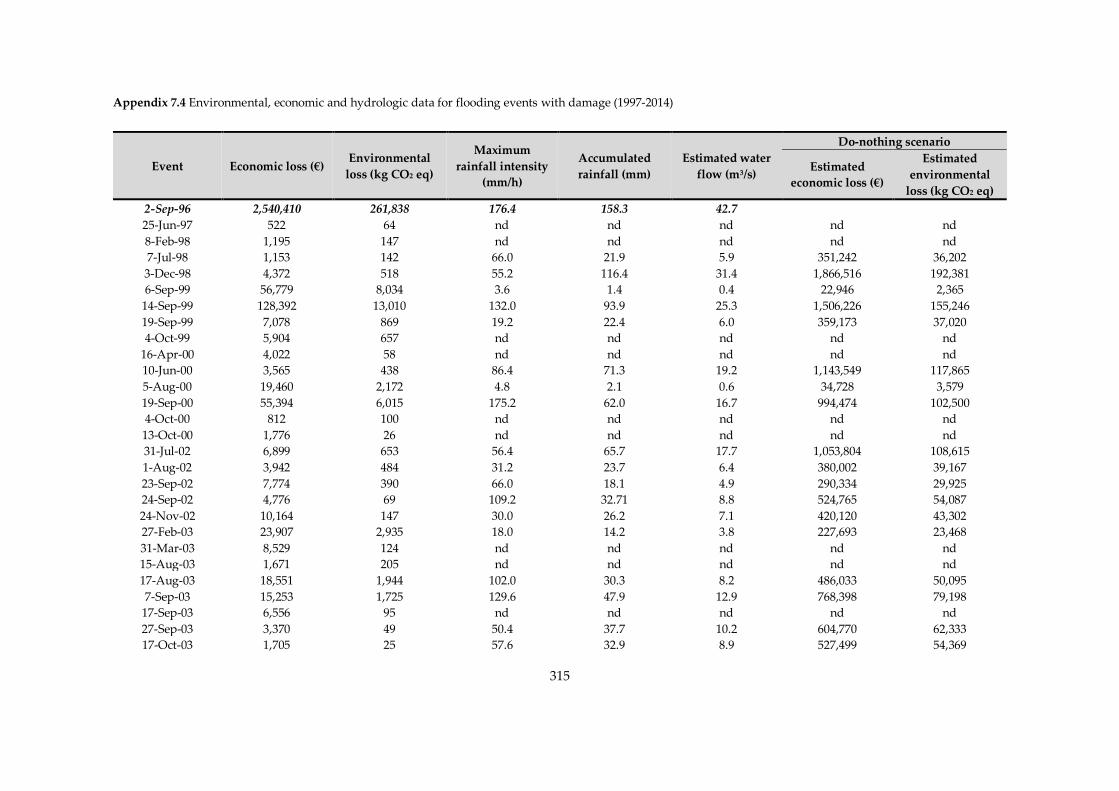
315
Appendix 7.4 Environmental, economic and hydrologic data for flooding events with damage (1997-2014)
Event Economic loss (€) Environmental
loss (kg CO2 eq)
Maximum
rainfall intensity
(mm/h)
Accumulated
rainfall (mm)
Estimated water
flow (m3/s)
Do-nothing scenario
Estimated
economic loss (€)
Estimated
environmental
loss (kg CO2 eq)
2-Sep-96 2,540,410 261,838 176.4 158.3 42.7
25-Jun-97 522 64 nd nd nd nd nd
8-Feb-98 1,195 147 nd nd nd nd nd
7-Jul-98 1,153 142 66.0 21.9 5.9 351,242 36,202
3-Dec-98 4,372 518 55.2 116.4 31.4 1,866,516 192,381
6-Sep-99 56,779 8,034 3.6 1.4 0.4 22,946 2,365
14-Sep-99 128,392 13,010 132.0 93.9 25.3 1,506,226 155,246
19-Sep-99 7,078 869 19.2 22.4 6.0 359,173 37,020
4-Oct-99 5,904 657 nd nd nd nd nd
16-Apr-00 4,022 58 nd nd nd nd nd
10-Jun-00 3,565 438 86.4 71.3 19.2 1,143,549 117,865
5-Aug-00 19,460 2,172 4.8 2.1 0.6 34,728 3,579
19-Sep-00 55,394 6,015 175.2 62.0 16.7 994,474 102,500
4-Oct-00 812 100 nd nd nd nd nd
13-Oct-00 1,776 26 nd nd nd nd nd
31-Jul-02 6,899 653 56.4 65.7 17.7 1,053,804 108,615
1-Aug-02 3,942 484 31.2 23.7 6.4 380,002 39,167
23-Sep-02 7,774 390 66.0 18.1 4.9 290,334 29,925
24-Sep-02 4,776 69 109.2 32.71 8.8 524,765 54,087
24-Nov-02 10,164 147 30.0 26.2 7.1 420,120 43,302
27-Feb-03 23,907 2,935 18.0 14.2 3.8 227,693 23,468
31-Mar-03 8,529 124 nd nd nd nd nd
15-Aug-03 1,671 205 nd nd nd nd nd
17-Aug-03 18,551 1,944 102.0 30.3 8.2 486,033 50,095
7-Sep-03 15,253 1,725 129.6 47.9 12.9 768,398 79,198
17-Sep-03 6,556 95 nd nd nd nd nd
27-Sep-03 3,370 49 50.4 37.7 10.2 604,770 62,333
17-Oct-03 1,705 25 57.6 32.9 8.9 527,499 54,369
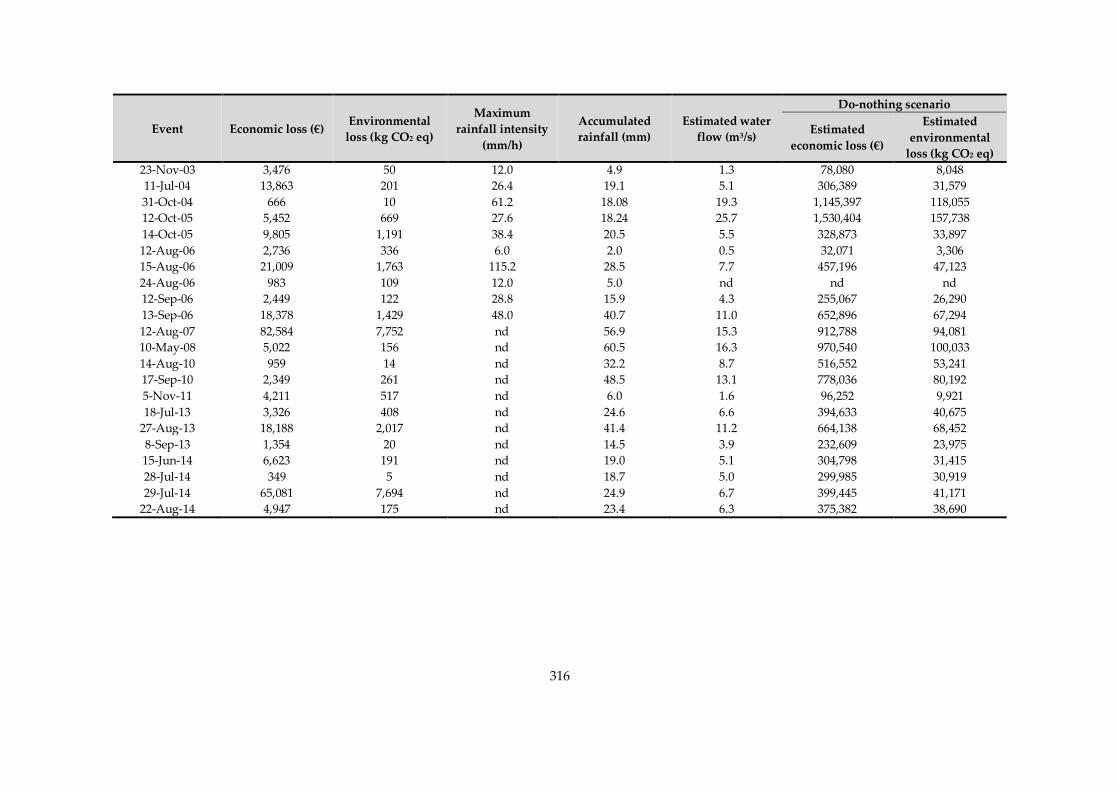
316
Event Economic loss (€) Environmental
loss (kg CO2 eq)
Maximum
rainfall intensity
(mm/h)
Accumulated
rainfall (mm)
Estimated water
flow (m3/s)
Do-nothing scenario
Estimated
economic loss (€)
Estimated
environmental
loss (kg CO2 eq)
23-Nov-03 3,476 50 12.0 4.9 1.3 78,080 8,048
11-Jul-04 13,863 201 26.4 19.1 5.1 306,389 31,579
31-Oct-04 666 10 61.2 18.08 19.3 1,145,397 118,055
12-Oct-05 5,452 669 27.6 18.24 25.7 1,530,404 157,738
14-Oct-05 9,805 1,191 38.4 20.5 5.5 328,873 33,897
12-Aug-06 2,736 336 6.0 2.0 0.5 32,071 3,306
15-Aug-06 21,009 1,763 115.2 28.5 7.7 457,196 47,123
24-Aug-06 983 109 12.0 5.0 nd nd nd
12-Sep-06 2,449 122 28.8 15.9 4.3 255,067 26,290
13-Sep-06 18,378 1,429 48.0 40.7 11.0 652,896 67,294
12-Aug-07 82,584 7,752 nd 56.9 15.3 912,788 94,081
10-May-08 5,022 156 nd 60.5 16.3 970,540 100,033
14-Aug-10 959 14 nd 32.2 8.7 516,552 53,241
17-Sep-10 2,349 261 nd 48.5 13.1 778,036 80,192
5-Nov-11 4,211 517 nd 6.0 1.6 96,252 9,921
18-Jul-13 3,326 408 nd 24.6 6.6 394,633 40,675
27-Aug-13 18,188 2,017 nd 41.4 11.2 664,138 68,452
8-Sep-13 1,354 20 nd 14.5 3.9 232,609 23,975
15-Jun-14 6,623 191 nd 19.0 5.1 304,798 31,415
28-Jul-14 349 5 nd 18.7 5.0 299,985 30,919
29-Jul-14 65,081 7,694 nd 24.9 6.7 399,445 41,171
22-Aug-14 4,947 175 nd 23.4 6.3 375,382 38,690
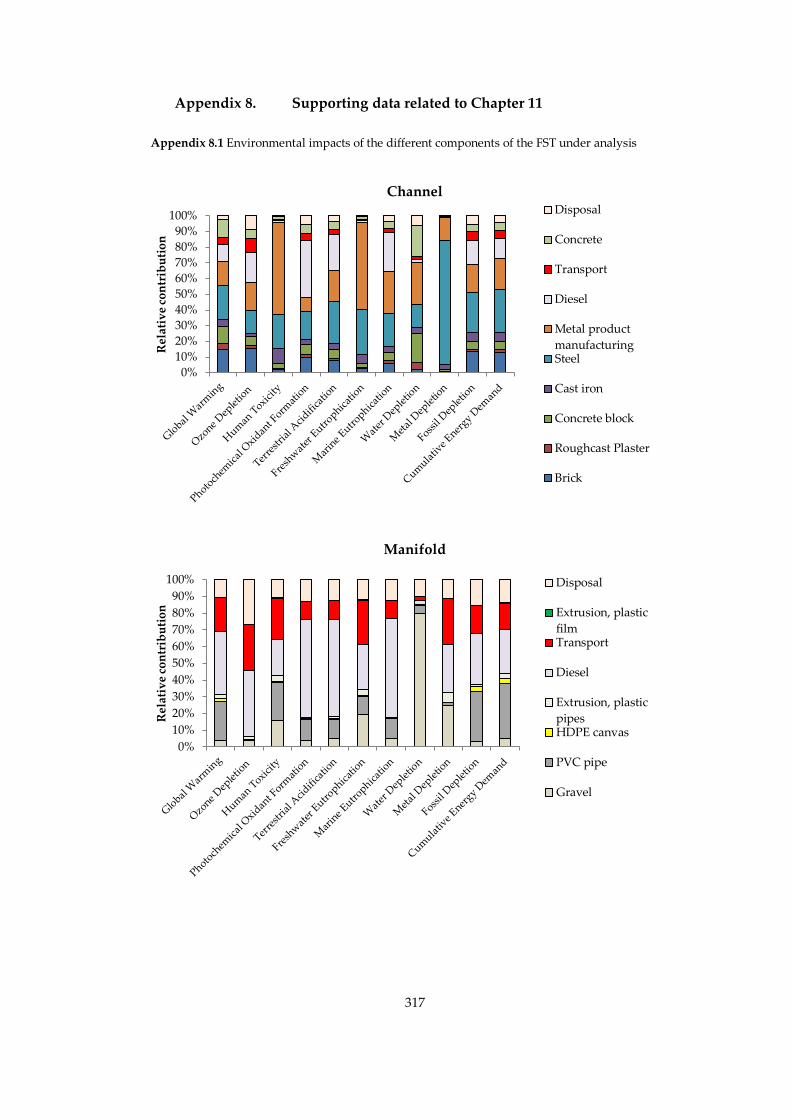
317
Appendix 8. Supporting data related to Chapter 11
Appendix 8.1 Environmental impacts of the different components of the FST under analysis
0%
10%
20%
30%
40%
50%
60%
70%
80%
90%
100%
Rel
ativ
e co
ntr
ibu
tio
n
ChannelDisposal
Concrete
Transport
Diesel
Metal product
manufacturingSteel
Cast iron
Concrete block
Roughcast Plaster
Brick
0%
10%
20%
30%
40%
50%
60%
70%
80%
90%
100%
Rel
ativ
e co
ntr
ibu
tio
n
Manifold
Disposal
Extrusion, plastic
filmTransport
Diesel
Extrusion, plastic
pipesHDPE canvas
PVC pipe
Gravel
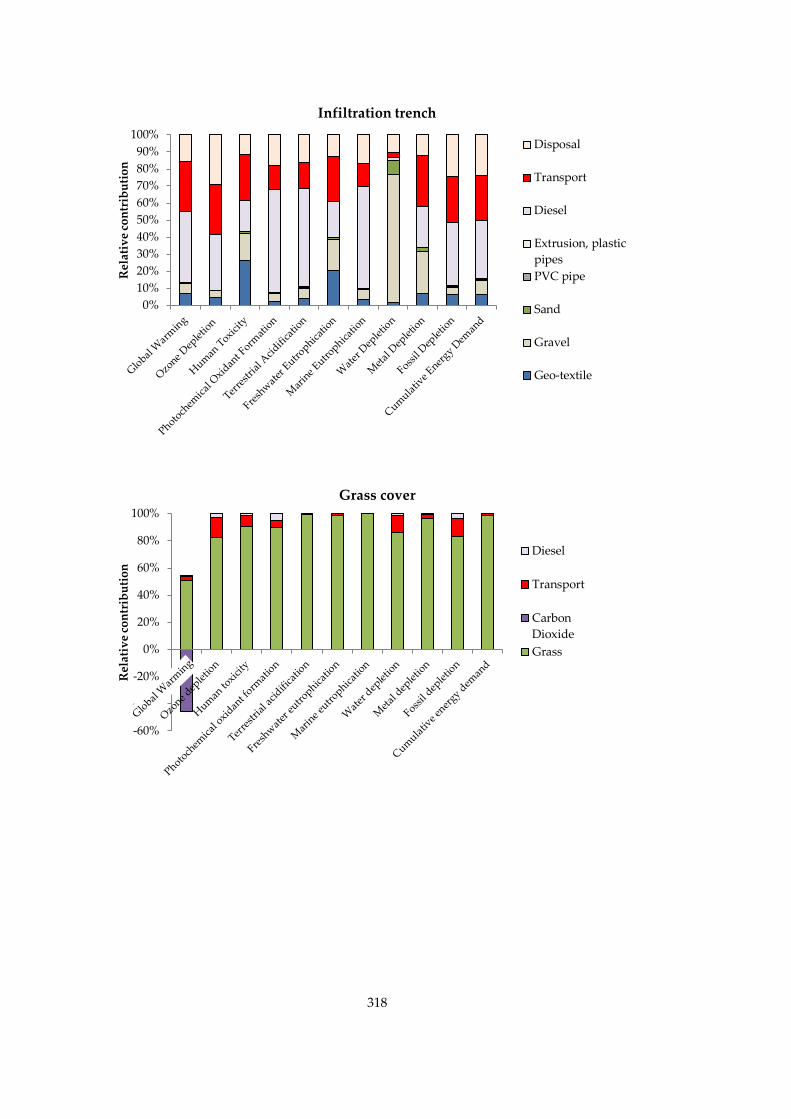
318
0%
10%
20%
30%
40%
50%
60%
70%
80%
90%
100%R
elat
ive
con
trib
uti
on
Infiltration trench
Disposal
Transport
Diesel
Extrusion, plastic
pipes
PVC pipe
Sand
Gravel
Geo-textile
-60%
-40%
-20%
0%
20%
40%
60%
80%
100%
Rel
ativ
e co
ntr
ibu
tio
n
Grass cover
Diesel
Transport
Carbon
Dioxide
Grass
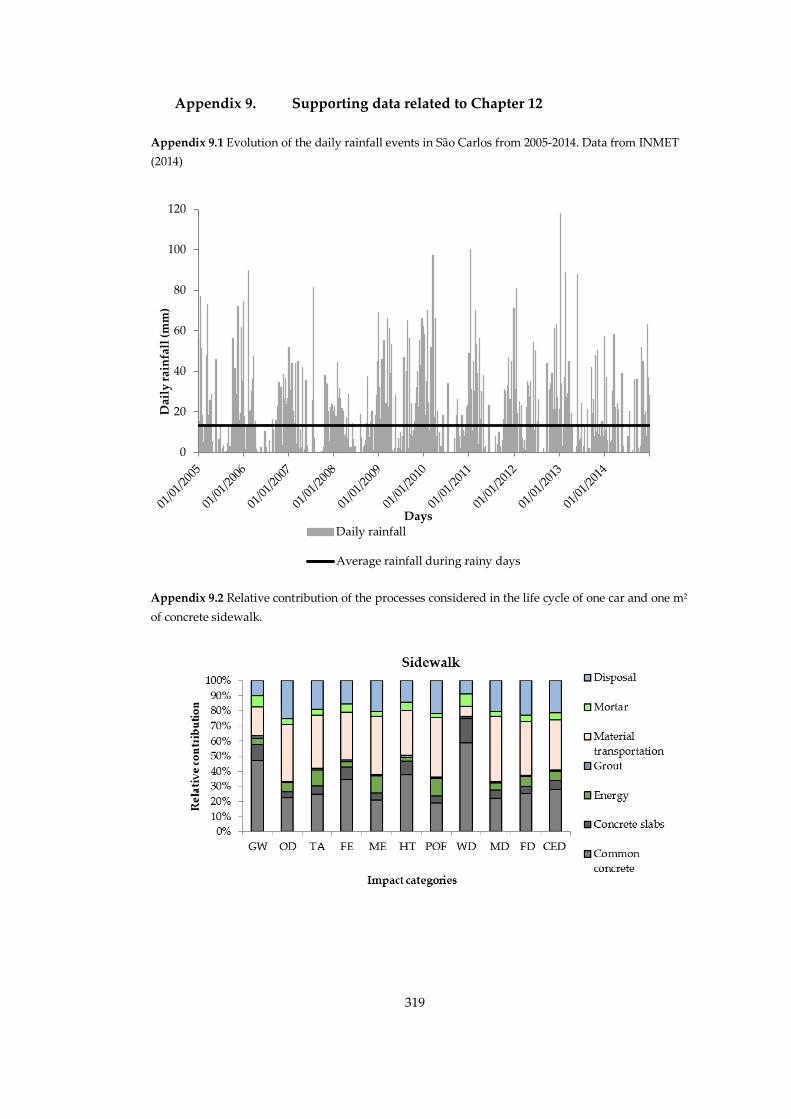
319
Appendix 9. Supporting data related to Chapter 12
Appendix 9.1 Evolution of the daily rainfall events in São Carlos from 2005-2014. Data from INMET
(2014)
0
20
40
60
80
100
120
Dai
ly r
ain
fall
(m
m)
DaysDaily rainfall
Average rainfall during rainy days
Appendix 9.2 Relative contribution of the processes considered in the life cycle of one car and one m2
of concrete sidewalk.
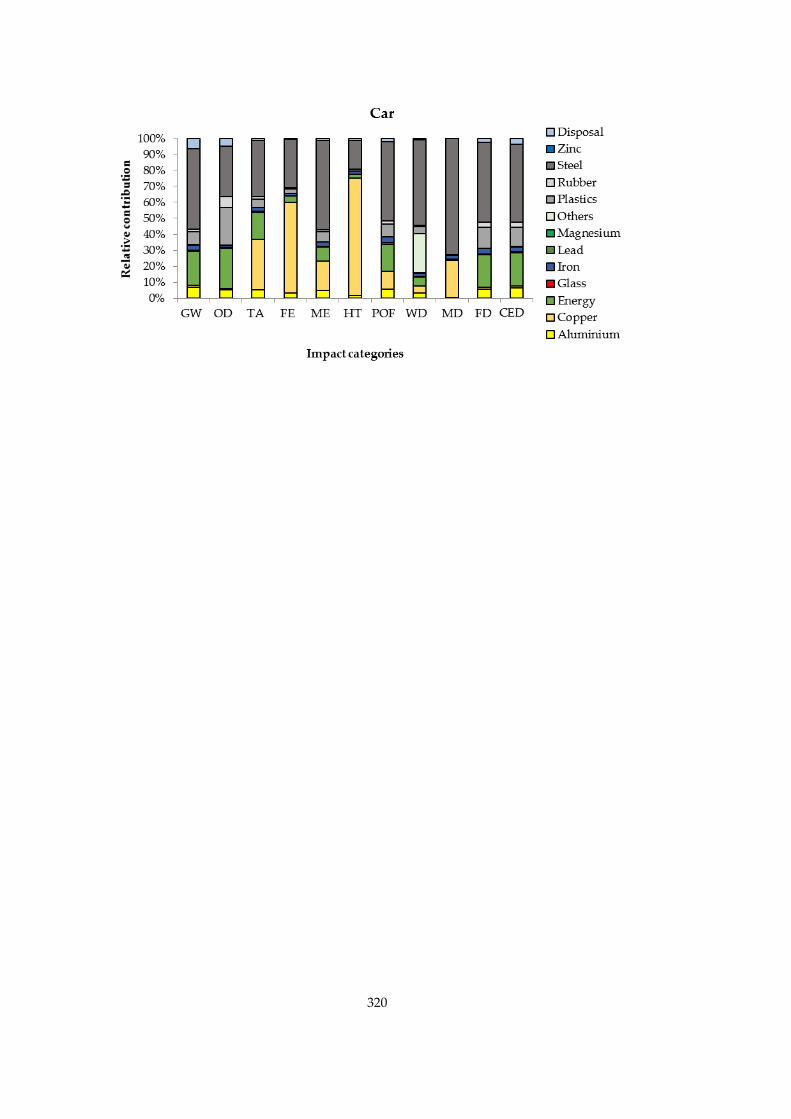
320

321