
Polycity Energy Networks in Sustainable Cities The ...
141
POLYCITY Energy Networks in Sustainable Cities The International Conference “Visions of Sustainable Urban Energy Systems” took place in Stuttgart, Germany, in September 2010. The conference as well as this publication were realised within the project POLYCITY – energy networks in sustainable cities. POLYCITY is part of the European CONCERTO initiative, co-funded by the European Commission under the 6th Research Framework Programme (REF EC: TREN/05FP6EN/S07.43964/513481).
-
Upload
khangminh22 -
Category
Documents
-
view
3 -
download
0
Transcript of Polycity Energy Networks in Sustainable Cities The ...

Polycity
Energy Networks in Sustainable Cities
The International Conference “Visions of Sustainable Urban Energy Systems” took place in Stuttgart, Germany, in September 2010. The conference as well as this publication were realised within the project POLYCITY – energy networks in sustainable cities. POLYCITY is part of the European CONCERTO initiative, co-funded by the European Commission under the 6th Research Framework Programme (REF EC: TREN/05FP6EN/S07.43964/513481).

© Karl Krämer Verlag Stuttgart + Zürich 2012Alle Rechte vorbehalten. All rights reservedDruck: Offizin Scheufele, StuttgartPrinted in Germany
ISBN 978-3-7828-4051-4
Editor: Ursula Eicker
Coeditors: Silvio Barta, Ursula Pietzsch
Book design and layout: Silvio Barta
UrsUla EickEr (ED.)
PolycityEnErgy nEtworks in sUstainablE citiEs

4 5
Polycity – EnErgy nEtworks in sUstainablE citiEs
table of contents Preface Ursula Eicker 8
Towards a Sustainable Community 101.1 CONCERTO — The Beginning of a Europe-wide Initiative 14
Ursula Pietzsch1.2 POLYCITY — Energy Networks in Sustainable Cities 16
Ursula Pietzsch
European Building Performance and Energy Supply — State of the Art 202.1 Political Frameworks 22
Francesc Xavier Martí Rague2.2 European Building Energy Standards 26
Aysegül Tereci, Francesc Xavier Martí Rague, Silvio Barta
2.3 From Current Practices to Zero Emission Buildings 32Francesc Xavier Martí Rague
2.4 Renewable Energy Sources for Urban Areas 34Joan Carles Bruno
Building Specifications — Demand 44
Demo Buildings and Innovative Measures 463.1 Public Buildings 48
Frank HettlerCity Hall, Scharnhauser Park 50
Frank HettlerL-Quadrat Youth Centre 54
Frank Hettler, Felix ThummSports Hall 60
Frank Hettler3.2 Office Buildings 62
Silvio BartaElektror 64
Ilyes BenHassine, Petra FischbachATC Office Building 68
Barbara BelliosoSynchrotron 72
Francesc Xavier Martí Rague
Demo Buildings and Innovative Measures 3.3 Residential Buildings 74
Silvio BartaSWG Buildings 76
Aneta StrzalkaArquata Residential Buildings 84
Barbara BelliosoLa Clota 88
Francesc Xavier Martí RagueCòrdova Street 90
Francesc Xavier Martí Rague, Jordi Carbonell, Stoyan Danov
Energy Supply Specifications 92
Energy Supply — Concepts and Performance 944.1 Biomass Cogeneration 96
Tobias Erhart, Rafal Strzalka4.2 Thermal Cooling/ Solar Cooling 110
Jesús López Villada, Uli Jakob, Barbara Bellioso
4.3 District Heating Networks 116Ilyes BenHassine, Carlos Dapena González
4.4 Polygeneration 126Carlos Dapena Gonzáles, Jordi Ortiga
4.5 Gas Cogeneration 136Barbara Bellioso
4.5 Biomass Gasification 138Maria Puig Arnavat
4.6 Photovoltaics 146Éric Duminil, Alessandra Guerrisi, Luca Giaccone
4.7 Hydro Power Turbine 154Marc Hagenloch

6 7
Polycity – EnErgy nEtworks in sUstainablE citiEs
Communal Energy Management 1605.1 Monitoring 162
Tatiana Sivenova, Tobias Erhart, Rafal Strzalka
5.2 Data Visualisation with Geographic Information Systems 174Aneta Strzalka
5.3 Online Simulation 178Éric Duminil
5.4 Application in Germany: Scharnhauser Park 182Tatiana Sivenova, Frank Hettler, Aneta Strzalka, Rafal Strzalka, Tobias Erhart, Éric Duminil
5.5 Application in Italy: Arquata 188Alessandro Destefanis, Franco Anzioso
5.6 Application in Spain: Cerdanyola 192Jordi Carbonell, Stoyan Danov
Performance Assessment 1966.1 Future Assessment for Scharnhauser Park 198
Till Jenssen, Ludger Eltrop6.2 Optimisation of Energy Supply in Parc de l’Alba 204
Jordi Ortiga Guillen6.3 Balances and Scenarios for Arquata 210
Luca Giaccone, Alessandro Destefanis6.4 Lessons Learned — Some Thesis on Performance Assessments 214
Till Jenssen, Ludger Eltrop
Socio-Economic Issues 2207.1 Ecological Model District on a Military Area — Scharnhauser Park 224
Till Jenssen, Ludger Eltrop7.2 Sustainable Greenfield Development in Cerdanyola del Vallès 226
Francesc Xavier Martí Rague7.3 New Technologies in Old Districts — Arquata 228
Elisabetta Nodari, Francesca Bandera7.4 Key Aspects and Lessons Learned 230
Till Jenssen, Ludger Eltrop
Knowledge Transfer 2348.1 Public Perception 236
Ursula Pietzsch8.2 Training 238
Izabela Samson-Brek, Ursula Pietzsch8.3 University Teaching Modules 242
Ursula Pietzsch, Maria Puig Arnavat, Mariapia Martino
8.4 Public Training Modules 244Ursula Pietzsch
8.5 Replication Projects 246Ursula Pietzsch
Appendices 248 Authors, Photographers 250 Partner Institutions 254 List of Tables, Figures and Charts 262 Glossary 272 Selected Bibliography 274

8 9
PrEfacE
Polycity – energy networks in sustainable citiesUrban energy efficiency and renewable energy supply are of crucial importance for the future, as more than 50% of the world’s population already lives and consumes energy in cities and the easy availability of fossil fuels comes to an end.
The European CONCERTO research and demonstration programme was launched in the first decade of the new millennium and initiated urban energy projects on a city neighbourhood scale in nearly 60 European cities. The POLYCITY project was one of the first funded projects in 2005 with urban energy installations in Germany, Spain and Italy. The lessons learned from large scale implementation of renewable energy systems, efficient buildings on a city quarter scale and the monitoring and urban energy management efforts are reported on in this book.
The POLYCITY project deals with different aspects of urban development: new construction and tri-generation energy supply in Cerdanyola del Vallès at the city edges of Barcelona, Spain; the conversion of an old city quarter in Turin, Italy, with energy distribution based on the heating network and with thermal cooling; and, new building constructions on a large former military ground in the town of Ostfildern near Stuttgart, Germany, with biomass heat and electricity supply. In each of the three regional projects, the relevant actors from local and regional authorities, site developers, energy supply companies and research institutions cooperate to achieve energy efficiency on the demand site, to integrate renewable energy and to manage supply and demand. The project is co-ordinated by Prof. Dr. Ursula Eicker from the Centre of Applied Research Sustainable Energy Technology (zafh.net) at the Stuttgart University of Applied Sciences.
In Germany, the town of Ostfildern is developing the site with a total of 178 000 m² of newly constructed surface area for 10 000 people. They prescribed high building standards when selling plots to private and commercial investors. Demonstration buildings within the POLYCITY project are a highly energy-efficient youth centre, an innovative office building project of the company Elektror, residential buildings with improved building energy standards and public buildings like the Stadthaus and a school building.
The energy supply company SWE constructed an ORC biomass cogeneration plant to provide the whole site with district heat. They also implemented photovoltaic systems in the facade and roof of the power plant and are contractors for biomass powered thermal cooling.
In Spain, the project developer is responsible for developing 340 ha of property for a new community of 50 000 inhabitants. A synchrotron in the science and technology centre is supplied with a highly efficient heat, cooling and electricity network. One of two power plants will host a biomass gasification plant, and the roof is used for large solar thermal cooling installations.
The rehabilitation project in Turin covers 87 500 m² in an old city quarter. The building society ATC owns and operates the residential buildings as well as their own high rise headquarter building. They developed and implemented a rehabilitation concept for their office building including building integrated photovoltaics and a cogeneration system for the whole district. Socio-economic research was carried out by the Fiat research centre.
All in all, about 17 million Euros were invested in demonstration measures and accompanying research. 18 project partners implemented a wide range of energy technologies and about 100 engineers and scientists were involved in engineering design, IT based monitoring and data analysis, simulation tool development, socio-economic work and most of all intensive communication across the European borders. The work would not have been possible without an excellent, all female management team – many thanks to Ursula Pietzsch and Valerie Bahr.
The book layout and design was prepared by Silvio Barta, who also spent a lot of time collecting data from all project partners — a difficult task at the end of each large demonstration project.
Finally, thanks to all partners, who actively contributed to the research and demonstration activities, who accepted the risks of implementing innovative and complex new technology and last, but not least, to the European Commission with the directorate general of transport and energy, who supported the work financially.
Stuttgart, April 2011Ursula Eicker
towarDs a sUstainablE commUnityUrsula Pietzsch
12 13
towarDs a sUstainablE commUnity chaPtEr 1
Cities provide a good basis for carrying out measures geared toward reducing CO2 emissions. One reason for this is the fact that existing urban buildings and urban traffic are the greatest producers of CO2, but also (in a more positive light) because it is primarily policy makers on the urban level that set the course for effective approaches to energy issues. It is here that the greatest potential can be found for reducing consumption and increasing the use of renewable energy sources. If mayors and their city councils really want to, much could be done at the city level against global warming.
More than fifty percent of the world’s population lives in cities, where over seventy percent of all emissions are created. In Europe, the urban density is even higher with 72 % of the population living in urban areas. This number will increase to 84 % by 20501. Hence cities with a low energy consumption and high renewable energy proportion are crucial to achieving the ambitious goals of climate protection.
Since 2007, the EU’s 20-20-20 strategy has set the the goal of achieving a 20 % cut in greenhouse gas emissions by 2020 (compared with 1990 levels); a 20 % increase in the portion of renewables in the energy mix; and a 20 % cut in energy consumption through improved energy efficiency. The long-term goal is to have cities with zero carbon emissions by 2050.
The EU package builds on the international commitments made under the 1997 Kyoto Protocol. Linked to the United Nations Framework Convention on Climate Change, this international agreement was implemented in 2005 in all states that ratified the protocol2. The European community (then EU-15) ratified the protocol in 1998 and set binding targets intended to reduce greenhouse gas emissions by 8 % compared to 1990 levels over the five-year period from 2008-20123.
In fact, between the Kyoto base year and 2008, greenhouse gas emissions in the EU fell by approximately 7 %. But not all member states were able to reduce emissions, in some cases far from it. Spain recorded the highest increase (40 %), followed by Portugal (30 %), Ireland (21 %) and Greece (19 %). In contrast, significant decreases were observed in Latvia (-54 %), Estonia (-53 %), Lithuania (-51 %), Romania (-48 %) and Bulgaria (-45 %)4. However, it seems that the EU states will be able to meet the Kyoto protocol commitment, even though, the total final energy consumption in Europe today, which consists now of 27 member states, has actually increased by about 5 % from 1998-2008.
Compared to the industry or transport sectors, the current building sector — including residential and commercial buildings — is the largest consumer of energy and the largest CO2 emitter in the EU: the building sector is responsible for about 40 % of the EU’s total final energy consumption and 33 % of its CO2 emissions5. It is therefore critical that the EU objectives be met here. This would also provide many cost-saving opportunities, which in turn will create a number of benefits: reduced energy needs, reduced dependency on imported energy, less money spent on energy that can be used for other communal purposes, reduced energy costs for citizens, industry, trade and commerce, which can lead to an encouragement of local development and — almost surely — more jobs in the energy-efficient technologies and services sector.
Energy efficient cities absolutely need an integrated energy plan. It makes no sense to optimise single buildings as long as splinter development causes long transportation distances, energy loss in district heat grids, or if rival supply systems reduce the good results achieved by single projects. Energy efficient cities are characterized by an efficient settlement structure and integrated urban planning, which regards buildings and supply systems as part of one central plan in which energy efficiency plays a leading role. The future smart city will have an communal energy management system that shows all of the energy flows, so the path towards a zero carbon city can be monitored and controlled.
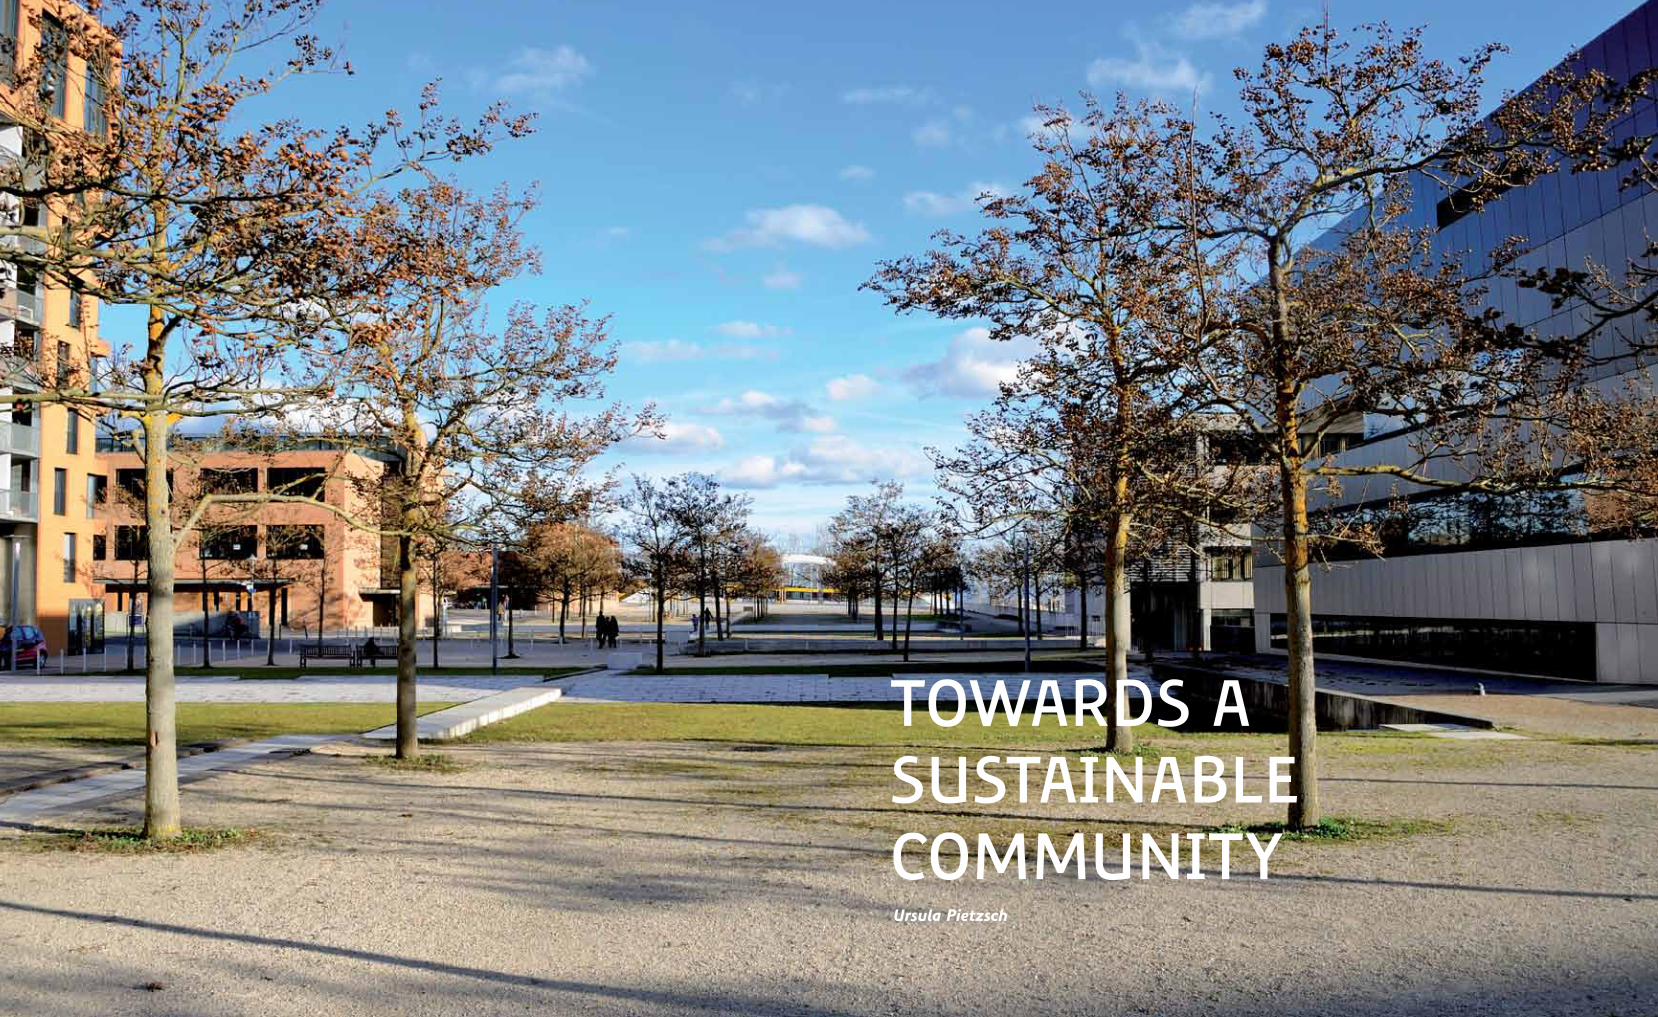
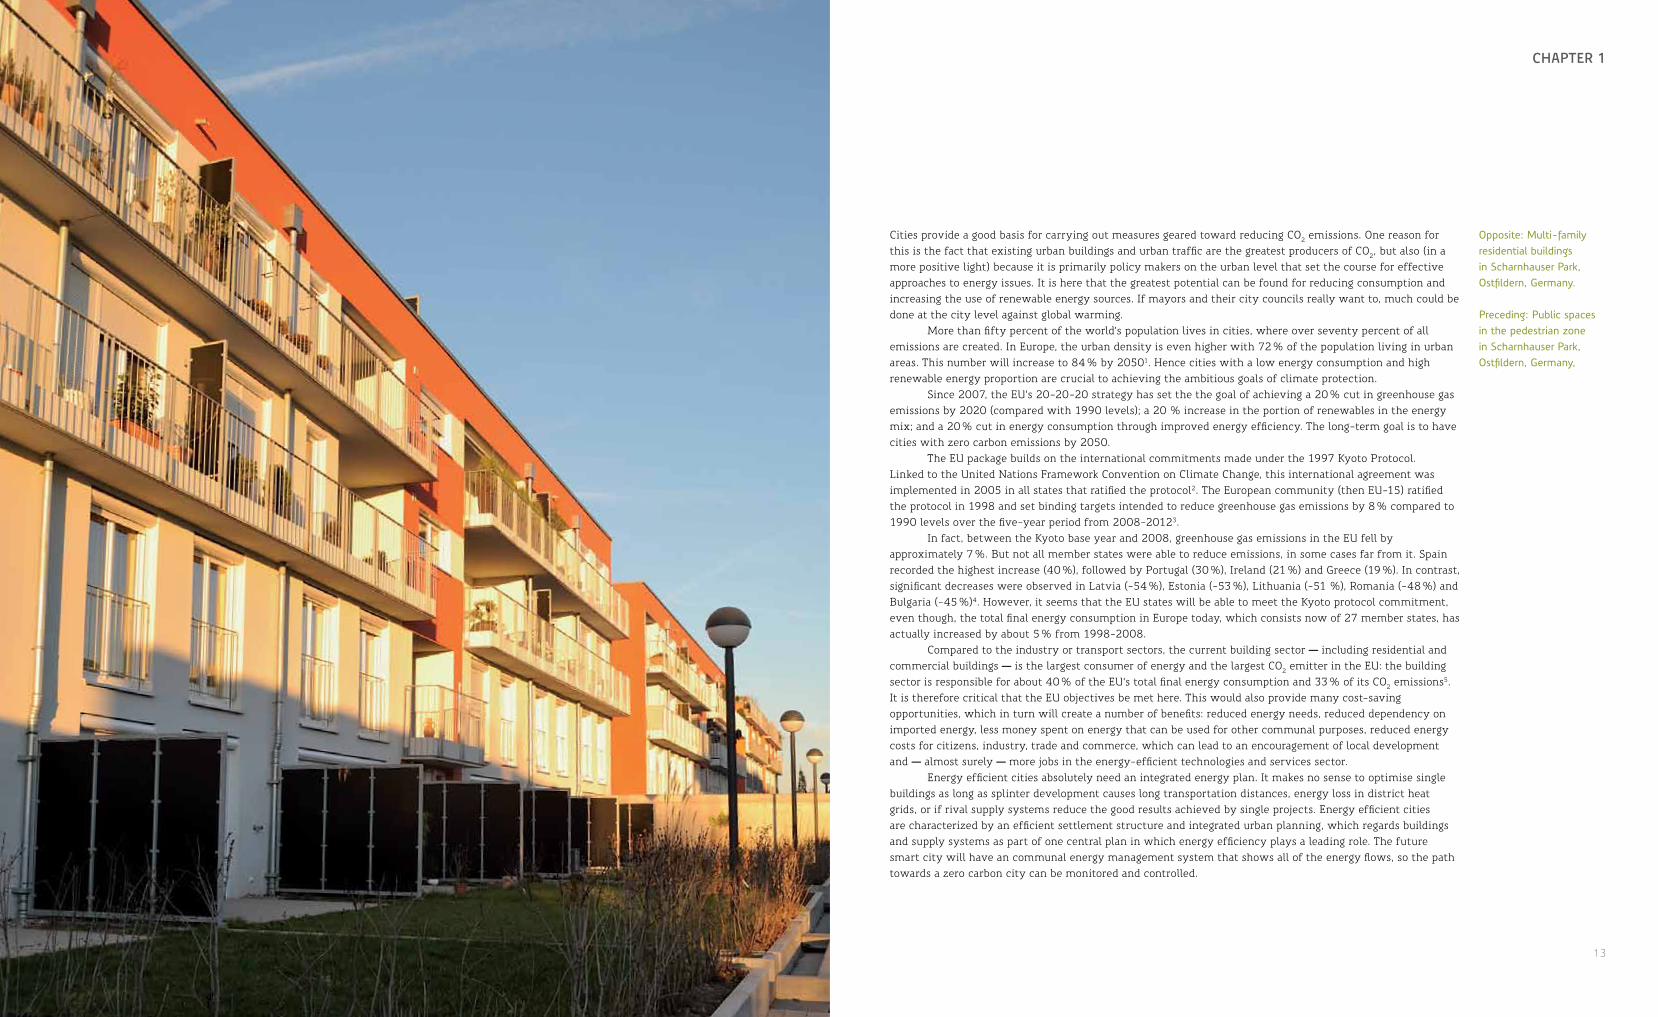
Opposite: Multi-family residential buildings in Scharnhauser Park, Ostfildern, Germany.
Preceding: Public spaces in the pedestrian zone in Scharnhauser Park, Ostfildern, Germany,
14 15
towarDs a sUstainablE commUnity chaPtEr 1
1.1 concErto — thE bEginning of a EUroPE-wiDE initiativEThe CONCERTO initiative was established by the European Commission in 2004, three years before the 20-20-20 targets were defined. The European Commission’s goal in supporting this programme was to establish real-life examples in cities committed to making sustainability their top priority by increasing the amount of renewable energy sources in their energy supply systems and minimizing the energy demand. The extraordinary aspect of this initiative is its combination of showcase projects and research within a clearly-defined urban area. Other criteria required included the use of innovative technologies, the implementation of cost-effective measures and possible replication projects for city-scale projects.
Briefly summarized, the initiative as a whole, “focuses on the integration of renewable energy sources (RES) and energy efficiency (EE) measures. This involves eco-buildings that integrate on-site RES with energy efficient building design and management, poly-generation, combined heat and power (CHP), district heating (ideally using biomass), green electricity and thermal cooling. In addition, intelligent management of demand as well as local distribution grids and distributed generation are included.”(6)
The CONCERTO initiative has the same intent as the EU’s political energy goals: • Minimise dependence on oil and gas sources
that are outside of the Union. To this end, the use of local sources of renewable, environmentally-friendly energy is to be supported.
• Energy-saving measures and innovative technical solutions whose purpose is to lower the energy demand.
The CONCERTO projects started in 2005 with an initial network of 26 cities involved in a total of nine projects. Today, six years later, 58 cities in 23 European countries and more than 70 associated communities have benefited from the growing stock of knowledge and are saving about 530 000 t CO2 emissions per year. 1 830 000 m2 of buildings were
built as part of this initiative and approximately 5.2 million people live in the CONCERTO cities7.
Each community chose its own approach depending on the given factors specific to its area, for example the need for renovating old buildings or existing and possibly usable renewable energy sources. In some cases highly innovative ideas were implemented, for example in Heerlen in the Netherlands, where in the REMINING-LOWEX project geothermally-heated ground water in flooded old mine shafts is used for heating and cooling a centralized town district. The city of Genève in Switzerland uses waters from Lake Genève with its constant temperature of eight degrees, to make the heating and cooling buildings more energy-efficient in the TETRAENER project. The main principle of this initiative is to use renewable energy sources that are right at one’s doorstep. Thus, in heavily-wooded rural or agricultural communities such as Mödling, Austria (HOLISTIC) and Słubice, Poland (SEMS), the use of combined heat and power (CHP) (biomass and biogas) is a key aspect of their energy supply concepts8.
Most of the CONCERTO cities are however, cities in industrialized regions that cannot focus on solely one renewable energy source. These cities’ approaches show how many different energy sources can be made usable, and how their coordinated interaction as well as cascade use is planned, realised, controlled and optimised using urban scale, integrated intelligent management systems.
The project results and progress are analysed for all projects in terms of effective CO2 reductions also regarding the chosen implementation strategies. Together these results were used for policy recommendations. Thus the CONCERTO projects have contributed to the recast of the Energy Performance of Buildings Directive in May 2010.
Even though the initiative focuses on technical solutions, it also has an aspect that goes beyond technical questions. All of the communities rely on the cooperation of interdisciplinary teams that consist of city administrations, architects, energy utility representatives, engineers and scientists. In many cases these individuals have
joined forces for the first time in order to work together on energy issues at the city level, share their knowledge and their experience. Since most projects have two or three international showcase sites, the flow of information spills over international borders.
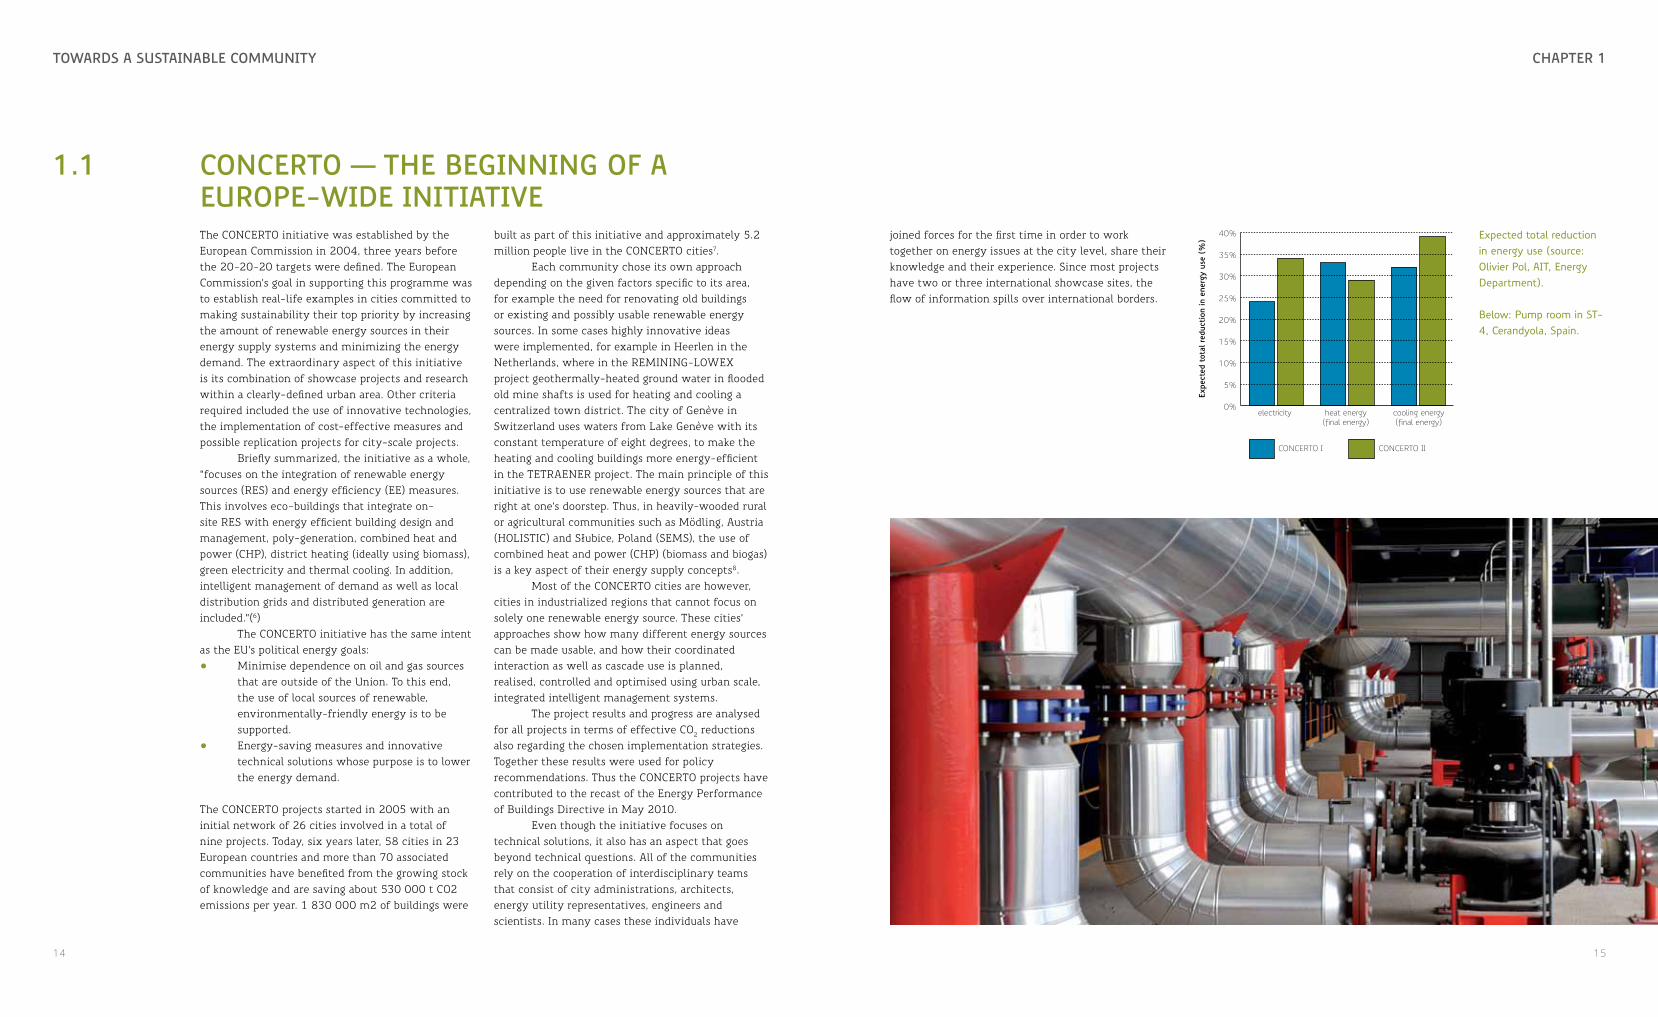
CONCERTO I CONCERTO II
Expe
cted
tot
al r
educ
tion
in e
nerg
y us
e (%
)
0%
5%
10%
15%
20%
25%
30%
35%
40%
electricity heat energy (final energy)
cooling energy(final energy)
Expected total reduction in energy use (source: Olivier Pol, AIT, Energy Department).
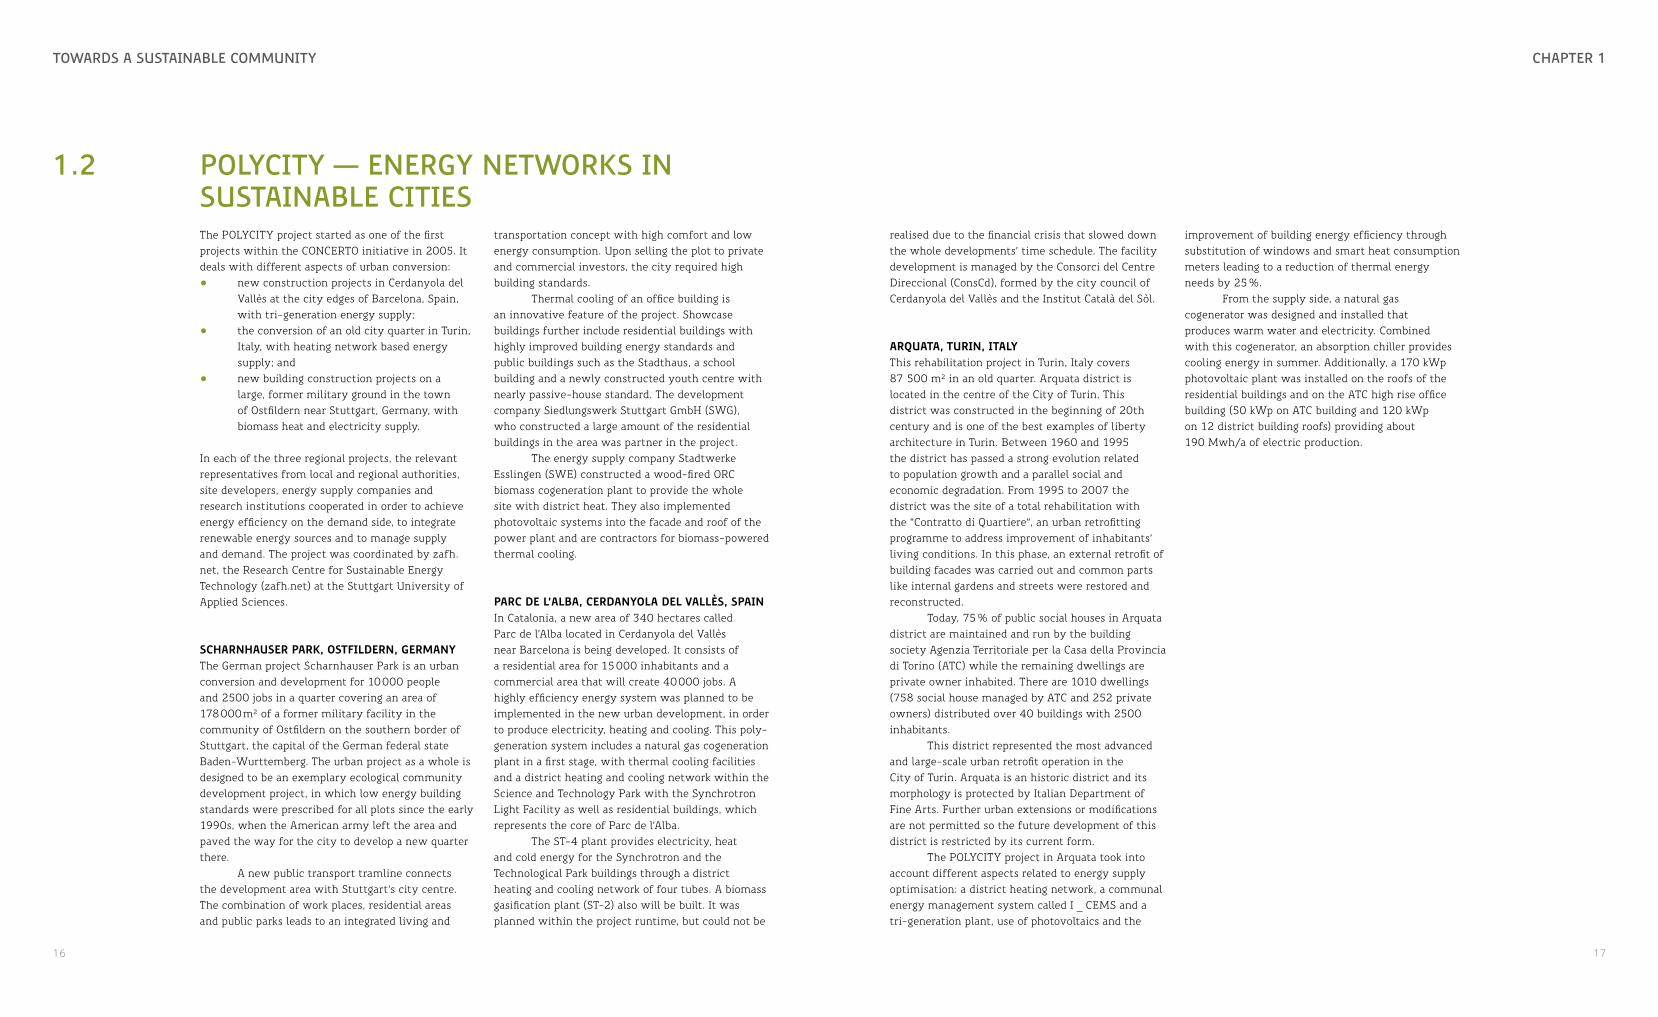
Below: Pump room in ST-4, Cerandyola, Spain.
16 17
towarDs a sUstainablE commUnity chaPtEr 1
1.2 Polycity — EnErgy nEtworks in sUstainablE citiEsThe POLYCITY project started as one of the first projects within the CONCERTO initiative in 2005. It deals with different aspects of urban conversion: • new construction projects in Cerdanyola del
Vallès at the city edges of Barcelona, Spain, with tri-generation energy supply;
• the conversion of an old city quarter in Turin, Italy, with heating network based energy supply; and
• new building construction projects on a large, former military ground in the town of Ostfildern near Stuttgart, Germany, with biomass heat and electricity supply.
In each of the three regional projects, the relevant representatives from local and regional authorities, site developers, energy supply companies and research institutions cooperated in order to achieve energy efficiency on the demand side, to integrate renewable energy sources and to manage supply and demand. The project was coordinated by zafh.net, the Research Centre for Sustainable Energy Technology (zafh.net) at the Stuttgart University of Applied Sciences.
scharnhauser Park, ostfildern, germanyThe German project Scharnhauser Park is an urban conversion and development for 10 000 people and 2500 jobs in a quarter covering an area of 178 000 m² of a former military facility in the community of Ostfildern on the southern border of Stuttgart, the capital of the German federal state Baden-Wurttemberg. The urban project as a whole is designed to be an exemplary ecological community development project, in which low energy building standards were prescribed for all plots since the early 1990s, when the American army left the area and paved the way for the city to develop a new quarter there.
A new public transport tramline connects the development area with Stuttgart’s city centre. The combination of work places, residential areas and public parks leads to an integrated living and
transportation concept with high comfort and low energy consumption. Upon selling the plot to private and commercial investors, the city required high building standards.
Thermal cooling of an office building is an innovative feature of the project. Showcase buildings further include residential buildings with highly improved building energy standards and public buildings such as the Stadthaus, a school building and a newly constructed youth centre with nearly passive-house standard. The development company Siedlungswerk Stuttgart GmbH (SWG), who constructed a large amount of the residential buildings in the area was partner in the project.
The energy supply company Stadtwerke Esslingen (SWE) constructed a wood-fired ORC biomass cogeneration plant to provide the whole site with district heat. They also implemented photovoltaic systems into the facade and roof of the power plant and are contractors for biomass-powered thermal cooling.
Parc de l’alba, cerdanyola del Vallès, sPainIn Catalonia, a new area of 340 hectares called Parc de l’Alba located in Cerdanyola del Vallès near Barcelona is being developed. It consists of a residential area for 15 000 inhabitants and a commercial area that will create 40 000 jobs. A highly efficiency energy system was planned to be implemented in the new urban development, in order to produce electricity, heating and cooling. This poly-generation system includes a natural gas cogeneration plant in a first stage, with thermal cooling facilities and a district heating and cooling network within the Science and Technology Park with the Synchrotron Light Facility as well as residential buildings, which represents the core of Parc de l’Alba.
The ST-4 plant provides electricity, heat and cold energy for the Synchrotron and the Technological Park buildings through a district heating and cooling network of four tubes. A biomass gasification plant (ST-2) also will be built. It was planned within the project runtime, but could not be
realised due to the financial crisis that slowed down the whole developments’ time schedule. The facility development is managed by the Consorci del Centre Direccional (ConsCd), formed by the city council of Cerdanyola del Vallès and the Institut Català del Sòl.
arquata, turin, italy This rehabilitation project in Turin, Italy covers 87 500 m² in an old quarter. Arquata district is located in the centre of the City of Turin. This district was constructed in the beginning of 20th century and is one of the best examples of liberty architecture in Turin. Between 1960 and 1995 the district has passed a strong evolution related to population growth and a parallel social and economic degradation. From 1995 to 2007 the district was the site of a total rehabilitation with the “Contratto di Quartiere“, an urban retrofitting programme to address improvement of inhabitants’ living conditions. In this phase, an external retrofit of building facades was carried out and common parts like internal gardens and streets were restored and reconstructed.
Today, 75 % of public social houses in Arquata district are maintained and run by the building society Agenzia Territoriale per la Casa della Provincia di Torino (ATC) while the remaining dwellings are private owner inhabited. There are 1010 dwellings (758 social house managed by ATC and 252 private owners) distributed over 40 buildings with 2500 inhabitants.
This district represented the most advanced and large-scale urban retrofit operation in the City of Turin. Arquata is an historic district and its morphology is protected by Italian Department of Fine Arts. Further urban extensions or modifications are not permitted so the future development of this district is restricted by its current form.
The POLYCITY project in Arquata took into account different aspects related to energy supply optimisation: a district heating network, a communal energy management system called I _ CEMS and a tri-generation plant, use of photovoltaics and the
improvement of building energy efficiency through substitution of windows and smart heat consumption meters leading to a reduction of thermal energy needs by 25 %.
From the supply side, a natural gas cogenerator was designed and installed that produces warm water and electricity. Combined with this cogenerator, an absorption chiller provides cooling energy in summer. Additionally, a 170 kWp photovoltaic plant was installed on the roofs of the residential buildings and on the ATC high rise office building (50 kWp on ATC building and 120 kWp on 12 district building roofs) providing about 190 Mwh/a of electric production.
18 19
towarDs a sUstainablE commUnity chaPtEr 1
notes1. UN-HABITAT, State of the World’s Cities 2008/2009, ISBN 978-92-1-132010-7, 20082. Today 189 nations have ratified the Kyoto Protocol. Among them all EU member states, Kanada, New
Zealand, Norway, Japan and major developing and emerging nations as Brazil, China, Mexico, India, South Africa and South Korea. After hesitating initially, Australia ratified the Protocol in 2007. Thus the USA remains the only reluctant industrialised nation.
3. Roman Enescu, Ruxandra et al: Energy, transport and environment indicators, Eurostat, eurostat pocketbooks, 2010 edition, page 139, ISBN 978-92-79-16303-6, ISSN 1725-4566
4. European Commission, Directorate-General Energy, Brussels, Invitation To Tender No. ENER/C2/59-1/2010/CONCERTO Premium, p. 7
5. Today 188 states have signed the protocol.6. CONCERTO website www.concertoplus.eu, „About CONCERTO“7. Maria Rosaria DiNucci, Olivier Pol, Simona Costa, Ute Gigler, Branislav Iglar, Katarszyna Makovka,
Christina Spitzbart, Ryszard Wnuk: Planning and Implementation Process Assessment Report – Executive Summary, p. 7 (internal report)
8. European Commission/ CONCERTO Plus: Cities demonstrate Energy and Climate Change Policy, 2010, p. 11, p. 16, p. 43 and p. 48
literatureErhorn, H., Erhorn-Kluttig H., Schrade J., Schmidt G.-D.: Energetische Quartiersplanung: Methoden
– Technologien – Praxisbeispiele, Fraunhofer Irb Verlag, 2011, ISBN 978-3816784111
Evans B., Joas M., Sundback S., Theobald K.: Governing Sustainable Cities, Earthscan London, 2005, ISBN 1-84407-168-5
Van Staden m., Musco F.: Local Governments and Climate Change – Sustainable Energy Planning and Implementation in Small and Medium Sized Communities, Springer, 2010, ISBN 978-1-4020-9350-6, e-ISBN 978-14020-9531-3
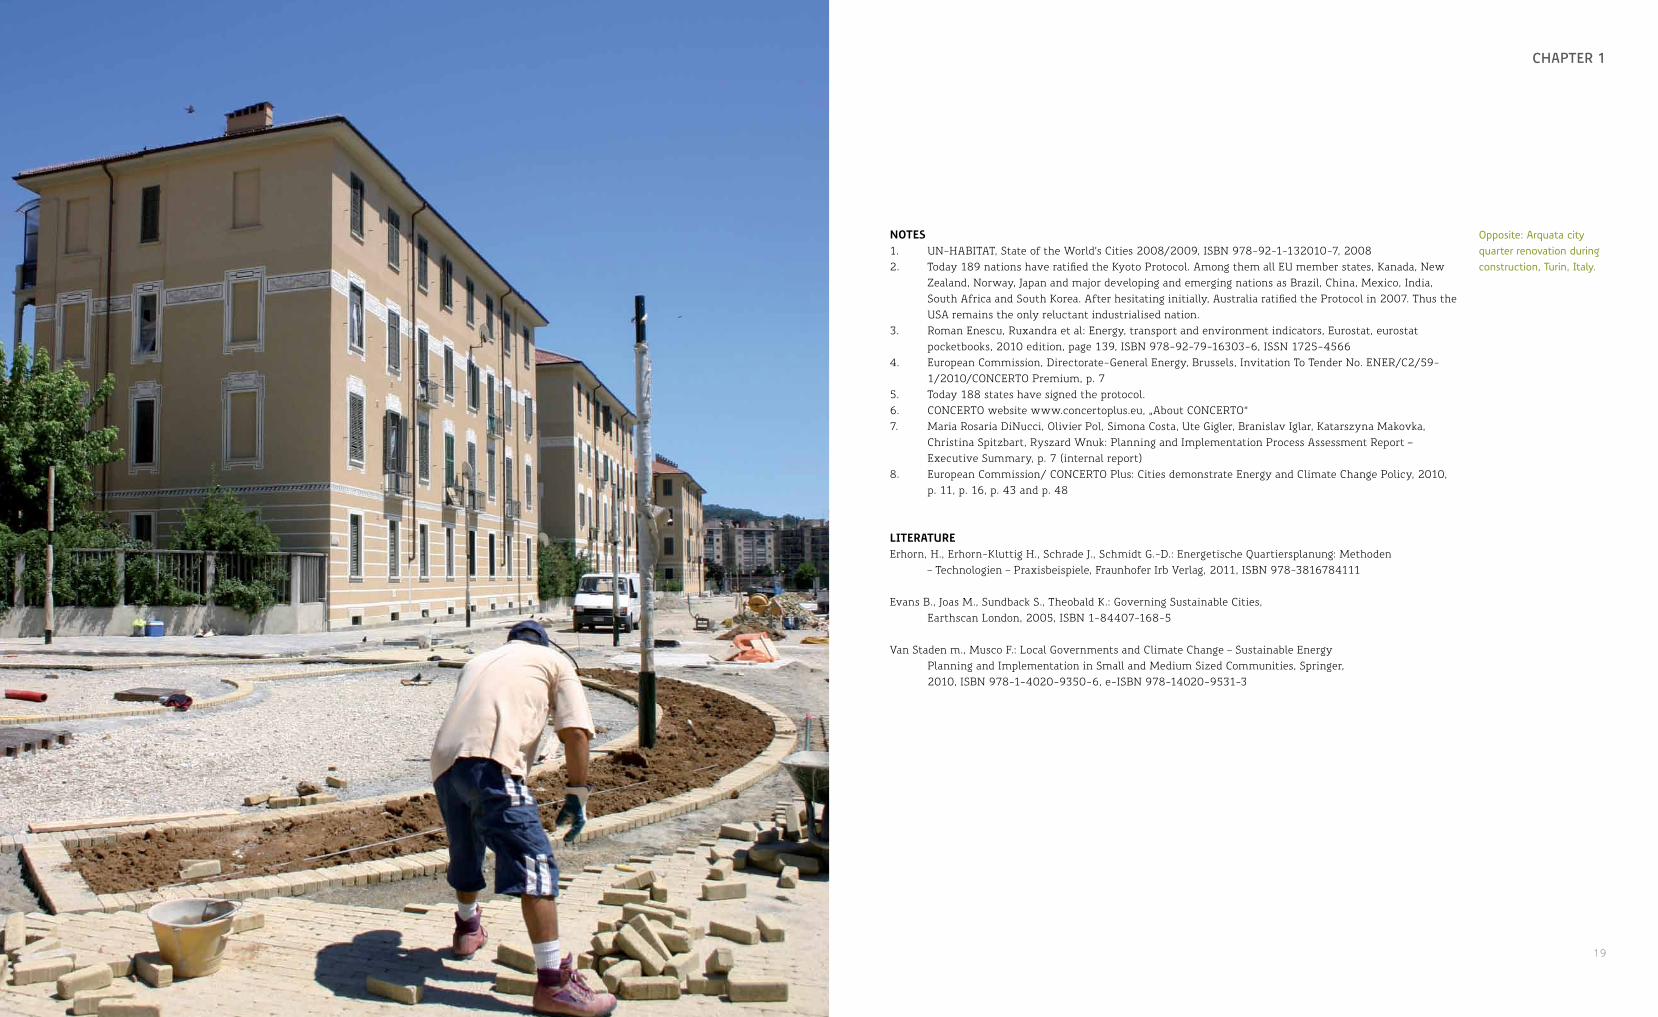
Opposite: Arquata city quarter renovation during construction, Turin, Italy.

EUroPEan bUilDing PErformancE anD EnErgy sUPPly — statE of thE artSilvio Barta, Joan Carles Bruno, Francesc Xavier Martí Rague, Aysegül Tereci
22 23
EUroPEan bUilDing PErformancE anD EnErgy sUPPly – statE of thE art chaPtEr 2
2.1 Political framEworks
Europe is one of the most urbanized continents on Earth. As concentrations of human activity, Europe’s cities and towns account for 69 % of the continent’s energy (EEA Briefing 4/2006 - Urban sprawl in Europe). According to recorded data and scenarios in the existing predictions on energy consumption, fossil fuel resources, CO2 emissions and energy prices have shown undesirable and unsustainable developments for cities.
The EU has been working on energy efficiency and climate change policies in different legislative packages. In March 2007 the EU Commission proposed to integrate these different approaches in an “energy and climate change package”. This was the first fundament of a policy thematic vision on integrated energy and climate change policy. In the aftermath the EU established a series of energy policy objectives. In January 2008 the Commission proposed binding legislation to implement the 20-20-20 targets, which was approved by the European Parliament in December 2008 and entered into force in June 2009. The EU has made a commitment to increase these targets to 30 % in June 2010 “…provided that other developed countries commit themselves to comparable emission reductions and that developing countries contribute adequately according to their responsibilities and respective capabilities” (European Council, 17 June 2010, Conclusions, EUCO 13/10, p. 11).
The climate and energy package consists of several legislative proposals (climate, efficiency and RES). The climate part is summarized as follows:
CLIMATIC ASPECTS OF THE FRAMEWORK• a new Directive revising the EU Emissions Trading System (EU ETS)• an “effort-sharing” decision setting binding national targets for emissions from sectors not covered by
the EU ETS• a new Directive creating a legal framework for use of carbon capture and storage• regulation requiring a reduction in CO2 emissions from new cars 120 g/km• revision of the fuel quality Directive
ENERGY EFFICIENCY ASPECTS OF THE FRAMEWORK• recast of the Energy Performance of Buildings Directive (which was done in May 2010)• revision of the Energy Labelling Directive (done in May 2010)• commission decision establishing guidelines clarifying the calculation of the amount of electricity
produced from cogeneration • communication on cogeneration which stresses that Europe can save energy by combining heat and
power generation
The current EU legislation for energy efficiency can be organized along five lines: energy efficiency in buildings, end-use efficiency and energy services, cogeneration-combined heat and power, eco-design of energy-using products and energy labelling of domestic appliances. The RES part of the framework is represented by the new directive setting binding national targets for increasing the share of renewable energy sources in the energy mix. The actual EU legislation in RES can be structured in biofuels and promotion of electricity from renewable energy sources.
EU urban strategy plans on sustainable development play an important role in delivering the objectives of energy efficiency and climate change policies to ensure that those concerned can refer to these policies. With these plans, the member countries aim to save more energy in cities, increase the renewable energy use, increase recycled waste and increase the sustainable urban transport.
the administratiVe leVels Vision The European building performance and energy supply policy framework is affected by the different administrative levels. Each country, region or municipality has its own characteristics, specificities and targets. There are countries, regions or municipalities in Europe with a strong will to establish top targets, but also on the other hand, countries, regions and municipalities not adequately motivated to implement EU targets.
Another question is the facility to observe important differences in the technical, administrative and economical capacities to achieve EU targets. And finally the results obtained at each administrative level can also be very different. This important variability is one of the main difficulties for policy framework application and development.
The POLYCITY experience shows, for instance, that the methodologies for the classification of buildings are different in each country. The difference between German, Spanish and Italian methods depends on different factors. In Italy the limits for residential buildings are calculated from an index that depends on the heating and DHW performance, whereas the Spanish method consider an index that depends on the relation between the real building and the reference building which fulfils the Spanish regulations. In contrast the German results are based on the metered consumption for three years. The final conclusion is that it’s impossible to compare building classification in Spain with the classification in Italy or in Germany.
from global targets to local imPlementationThe European building performance and energy supply policy framework and the climate policy debate are focused primarily on the international level and the contents are always global targets. The CONCERTO initiative tries to facilitate the local implementation of such policy framework, but the CONCERTO experience and other initiatives also show the difficulties, barriers and challenges for the local level implementation.
These barriers and challenges can be classified in Economics, Informational, Institutional, Political and Cultural (Jensen, 2009) and represent the basis to improve of the existing situation and trend.
It’s clear for all that the improvement of the climate and energy governance at the local level are very important for reaching the defined global targets. In this sense, during the last 20 years the European municipalities have been working hard in different frameworks (Agenda 21, Local Sustainability Strategies, etc.). Nowadays the EU Commission has launched the Covenant of Mayors (www.eumayors.eu) with more than 2700 signatory cities and towns from 36 countries. The cities and towns that sign the covenant are committed to reaching the EU global targets through a local plan of sustainable energy (2009-2020). In this sense, the Covenant of Mayors is an opportunity to improve the climatic local governance.
Despite this, it is important to consider, also, that there are a lot of emissions produced at local level such as housing, mobility or industries that represents normally more than the 90 % of the total amount of CO2 emissions, and that the municipalities are not always responsible for their management. In this sense, the sustainable local energy plans included in the Covenant of Mayors should take into account that the majority of CO2 emissions are produced in the cities or towns. This goal can be reached only with a very effective coordination structure between the EU, national, regional and local administration levels.
Preceding: Multifamily residential buildings in Scharnhauser Park, Ostfildern, Germany.
Following: Public spaces in Arquata district, Turin, Italy.

25

26 27
EUroPEan bUilDing PErformancE anD EnErgy sUPPly – statE of thE art chaPtEr 2
2.2 EUroPEan bUilDing EnErgy stanDarDs
One of the main lines in the EU energy efficiency framework is the establishment of energy standards in buildings in order to reduce their demand. Establishing binding standards for all EU member states is an important target in order to reach the EU 20-20-20 objectives, primarily an increase of the energy efficiency by 20 %.
the energy Performance building directiVe The Directive on the Energy Performance of Buildings (EPBD, Directive 2002/91/EG) came into force on 4 January 2003 and was inspired by the Kyoto Protocol with the aim of reducing energy use in buildings and thus the amount of CO2 produced.
A key part of the Directive was that all European Union (EU) countries introduce energy certification for buildings and create ambitious building regulations. Furthermore, mandatory inspections for boilers and air-conditioners were introduced. During the implementation of this Directive and as it was adopted into national laws, the EU became aware of certain requirements which should be eliminated and other areas that needed to be expanded in order to meet the overall goal of making buildings in the EU more energy efficient.
This reworking of the Directive is called the EPBD recast (Directive 2010/31/EU) and was adopted on 19 May 2010. The main aim here was that all new buildings from 31 December 2020 onwards will consume almost zero energy and that energy must originate from renewal energy sources (RES); this definition was agreed upon in the recast. This goal will be accomplished through the following detailed measures:• Public buildings serve as role models and will
become nearly zero energy by 31 December 2018.
• A 1000 m2 exemption threshold for major renovations has been removed and will take effect when the national regulations have been implemented and applied, probably at the beginning of 2014.
• Member states must draft national plans to increase of the number of low energy buildings and by mid-2011 develop financial as well as non-financial incentives to achieve this, including technical assistance, subsidies and credit possibilities.
• Minimum requirements for components are introduced, although the holistic calculation methodology is preferred. The Directive also outlines a harmonised calculation methodology for minimal energy performance to aim for the cost-optimal level. If the variance between current requirements and cost optimal requirements is more than 15 %, member states have to justify this difference.
• A more detailed and rigorous procedure for issuing energy performance certificates is not required in member states and a control system is introduced to verify the correctness of the issued certificates. Member states are required to ensure that energy performance certificates are issued for all newly constructed buildings and all buildings when sold or rented out, as well as for buildings occupied by a public authority to over 500 m2 and from 2015 onwards to over 250 m2.
• The mandatory inspection of boilers and air-conditioners will be made more rigorous.
• Member states can set targets to stimulate investments for low energy buildings.
• Member states can penalise non-compliance.
The EPBD recast is much more stringent than the original Directive in order to enforce the implementation of the measures and to achieve the full expected energy savings.
The transposition of the recast is planned for June 2012. The new Directive must be implemented into national legislation by 2013.
Prior to that recast, the CONCERTO communities had prepared a position paper in the recasting procedure of the Directive 2002, which partly were incorporated. This paper focused on six main topics:
• The EPBD should be combined with a sustainable development territorial strategy, in an integrated approach that considers energy and climate policies along with economic and social issues.
• The interest of an inspection report and the necessity to clarify what does mind inspection.
• New systematic, technical, legal and financial supporting mechanisms must be defined at the national level to undergo buildings major renovation (lowering of 1000 m2).
• The energy performance certificate should include energy need and final energy use figures as well as the corresponding primary energy and CO2 emissions ratings.
• The quality of inspections and energy performance certificates can only be ensured if a certified professional category legally recognized for certification is defined at national level.
• Considering the public sector, every public building should act as front runner in energy performance aspects.
euroPean building energy standardsDirective 2010/31/EU on the energy performance of buildings requires several different measures to achieve prudent and rational use of energy resources and to reduce the environmental impact of the energy use of buildings. The application of the Directive is monitored by the EU Commission. The energy performance of buildings is calculated using a methodology based on the common framework and is sometimes differentiated at a regional level. Out of this reason, around 40 standards have been developed by the European Standardisation Organisation (CEN). Standards are being written in CEN that shall support the Directive. The European Standards (ENs) support the EPBD by describing a common European concept and method for energy performance certification and energy inspections of buildings. The CEN standards that support
the European Energy Performance of Buildings Directive requirement for calculation of the energy consumption of buildings allow various methods to be used for the same calculation. The standards can be categorised according to the concerned theme as follows:• calculation of overall energy use in buildings• calculation of delivered energy• calculation of energy needs for heating and
cooling• supporting standards (thermal performance
of building components, ventilation and air infiltration, overheating and solar protection, indoor conditions and external climate, definitions and terminology)
• monitoring and verification of energy performance
The energy performance standards will specify what should be included in the energy use of a building in order to express energy performance or an energy label (e.g. heating, cooling, hot water, lighting) and set out how energy from different sources (e.g. electricity, gas, oil, biomass) can be combined to one or more numeric indicators (e.g. primary energy, CO2 emissions). Overall energy performance criteria can be based on asset rating obtained from (weighted) delivered energy, primary energy, CO2 emissions, or energy costs, while regulations are based on (weighted) delivered energy, primary energy and CO2 emissions.
There aren’t any consumption limits defined for types of the buildings in the European Norm. The member state countries regulate their consumption limits on the national level of their building energy standards. These limits or ranges should be related with building use type and climatic zone in the country. Complete mechanisms, numeric requirements and ways of implementation are defined at the country or regional level. Investigation of recent energy standards in different countries in the EU is a way to understand the basic methodology for integrated energy performance standards for buildings.

28 29
EUroPEan bUilDing PErformancE anD EnErgy sUPPly – statE of thE art chaPtEr 2
In order to have a vision of different national and regional regulations it’s very interesting to consider the following cases: Belgium, Austria, France and Netherlands.
belgium In Belgium the implementation of the EPBD is a regional responsibility. The main insulation standards for new buildings and retrofitting in the residential and tertiary sector have been implemented in the three regions. In the Flemish Region, for new buildings in the tertiary sector (e.g. hospitals, hotels, boarding schools, barracks and prisons) the K45
building component u-value (w/m2k)normative common
Practicelow energy Passive house
Wall, existing building 0.45 0.31 0.24 0.13Wall 0.30 0.24 0.24 0.11Roof 0.39 0.14 0.14 0.13 - 0.11Floor 0.35 - 0.39 0.32 - 0.21 0.20 0.12Window 1.30 1.10 1.10 0.60
other regulationsAir tightness (h-1) 9.3 4.0 1.0 0.6
EPBD K45-E98 K35-E67 K30-E38 K20-E23
PHPP (net energy demand from heating: kWh/m2)
118 77 43 15
EPBD E-level is the ratio between the annual calculated primary energy consumption of the new building and the reference annual primary energy consumption.
Maximum K value (global insulation value) — the K ratio concerns the total level of thermal insulation calculated on the basis of a technical standard established by the Belgian Institute for Standardisation (IBN). It takes into account mainly the insulation of the various shells but neither solar heat, nor occupant behaviour nor the efficiency of heating. The lower the K factor the better the total insulation of a dwelling.
Heating requirements and energy regulations for buildings in the Brussels Capital Region of Belgium
standard and k max values is enforced and the standards consider thermal insulation (U-values and overall insulation of the building, K-level), the overall energy performance level (E-level) and the indoor climate. In the Brussels Capital Region, the method is identical to the one established in the Flemish Region and very similar to the one in the Walloon Region. The certificate of new buildings will be issued by the administration after proof of compliance by the “EPB advisor”. The certificate for existing buildings (sold-rented-public) will be issued by registered certifiers. The Walloon Region has had a thermal regulation for new and existing dwellings, schools and offices for many years. A specific software tool has been
building component u Value (w/m2k)
Wall 0.35Walls and floors in earth contact 0.40Roof 0.20Window 1.40
heating: residential kwh/m2aNew buildings max 66.50Major renovations max 87.50
heating: non-residential kwh/m2aNew buildings max 22.75Major renovations max 30.00
building component
climatic Zone
min insulation(w/m2k)
External opaque walls H1-2 0.43H3 0.50
Window H1-3 2.00
type of heating max consumption (kwh*/m2/a
Fossil fuels H1 130H2 110H3 80
Electric heating (including heat pumps)
H1 250H2 190H3 130
*Primary energy
developed for the certification of new dwellings, which makes a calculation of the primary energy consumption of the building.
austriaOne of the regional and national implementation example countries is Austria. The responsibility for the implementation is split between the Federal Republic of Austria and the nine autonomous provinces. The national institute prepared the guidelines which provide a common basis for standards and the provinces harmonised their standards according to these standards. The energy performance certificate is to be prepared on the base of provincial legislation.
franceFrance introduced the preceding regulation on new buildings (RT2000), based on the same principles as prEN 13790. The implementation of the requirements for existing buildings was introduced into French legislation through the Building Code.
the netherlandsIn the Netherlands, the methodology for new buildings already complies with the current Energy Performance Standard (EPN). Since 1995 the EPN has been in use. This method can be used to express the energy efficiency of a building in a single figure; the energy performance coefficient (EPC). The Building Code lays down threshold values for the maximum permissible EPC. For existing buildings the Energy Performance Advice (EPA) methodology is being simplified and enhanced. The quality assurance system and the calculation procedures for this have ready been in use since December 2006.
Heating requirements and energy regulations for buildings in Austria
Heating requirements and energy regulations for buildings in France
30 31
towarDs a sUstainablE commUnity chaPtEr 2
Polycitydemo buildings
u-Value (w/m2k)
Ventilation rate (ren/hour)
facade and wall roof ground floor windows
germany, scharnhauser Park, ostfildernPublic Stadthaus Scharnhauser Park 0.45 / 0.24 0.30 / 0.20 0.45 / 0.35 1.70 / 1.10 0.70 / 0.50 Youth centre 0.45 / 0,17 0.30 / 0.10 0.45 / 0.16 1.70 / 1.24 0.70 / 0.70office Elektror 0.45 / 0.26 0.30 /
0.19, 0.26 5)
0.45 / 0.38 1.70 / 1.60 0.70 / 0.70
residential SWG Building 1 0.45 / 0.30 0.30 / 0.27 0.36 / 0.53 1.60 / 1.20 0.70 / 0.55 SWG Buildings 2,3 0.45 / 0.18 0.30 / 0.24 0.45 / 0.28 1.60 / 1.20 0.70 / 0.70
italy, arquata, turin 1)
office ATC Building 0.35-0.72 /
na 2)
0.31-0.42 / 0.40
0.36-0.74 / 0.40
2.20-5.00 / 1.65
0.50 / 0.50 4)
residential Arquata Buildings 0.35-0.72 /
not modifiable 3)
0.31-0.42 / 1.08
0.36-0.74 / not modifiable 3)
2.20-5.00 / 1.60
0.50 / 0.50 4)
spain, Parc de l’alba, cerdanyola del Vallès 1)
office Synchrotron 0.70 / 0.94 0.40 / 0.30 0.50 / 0.50 3.50 / 1.98 1.00 / 0.62residential La Clota 0.74-1.22 /
0.400.46-0.65 /
0.300.62-0.69 /
0.303.10-5.70 / 2.70
0.90 / 0.48
Córdoba Street 0.74-1.22 / 0.44
0.46-0.65 / 0.28
0.62-0.69 / 0.37
3.10-5.70 / 1.30
0.90 / 0.90
All values: regulated / realised1) U-values in Italy and Spain depend on the climatic zone2) not applicable due to curtain wall system, U value is identical with windows3) not modifiable due to heritage designation restrictions4) natural ventilation5) roof 5th floor, roof terrace 4th floor
building component u Value (w/m2k)
Walls 0.40Roof 0.40Window 2.30Wall to ground 0.40
air change m3/m2 s-1
Residential 9 x 10⁻⁴
Non-residential function related
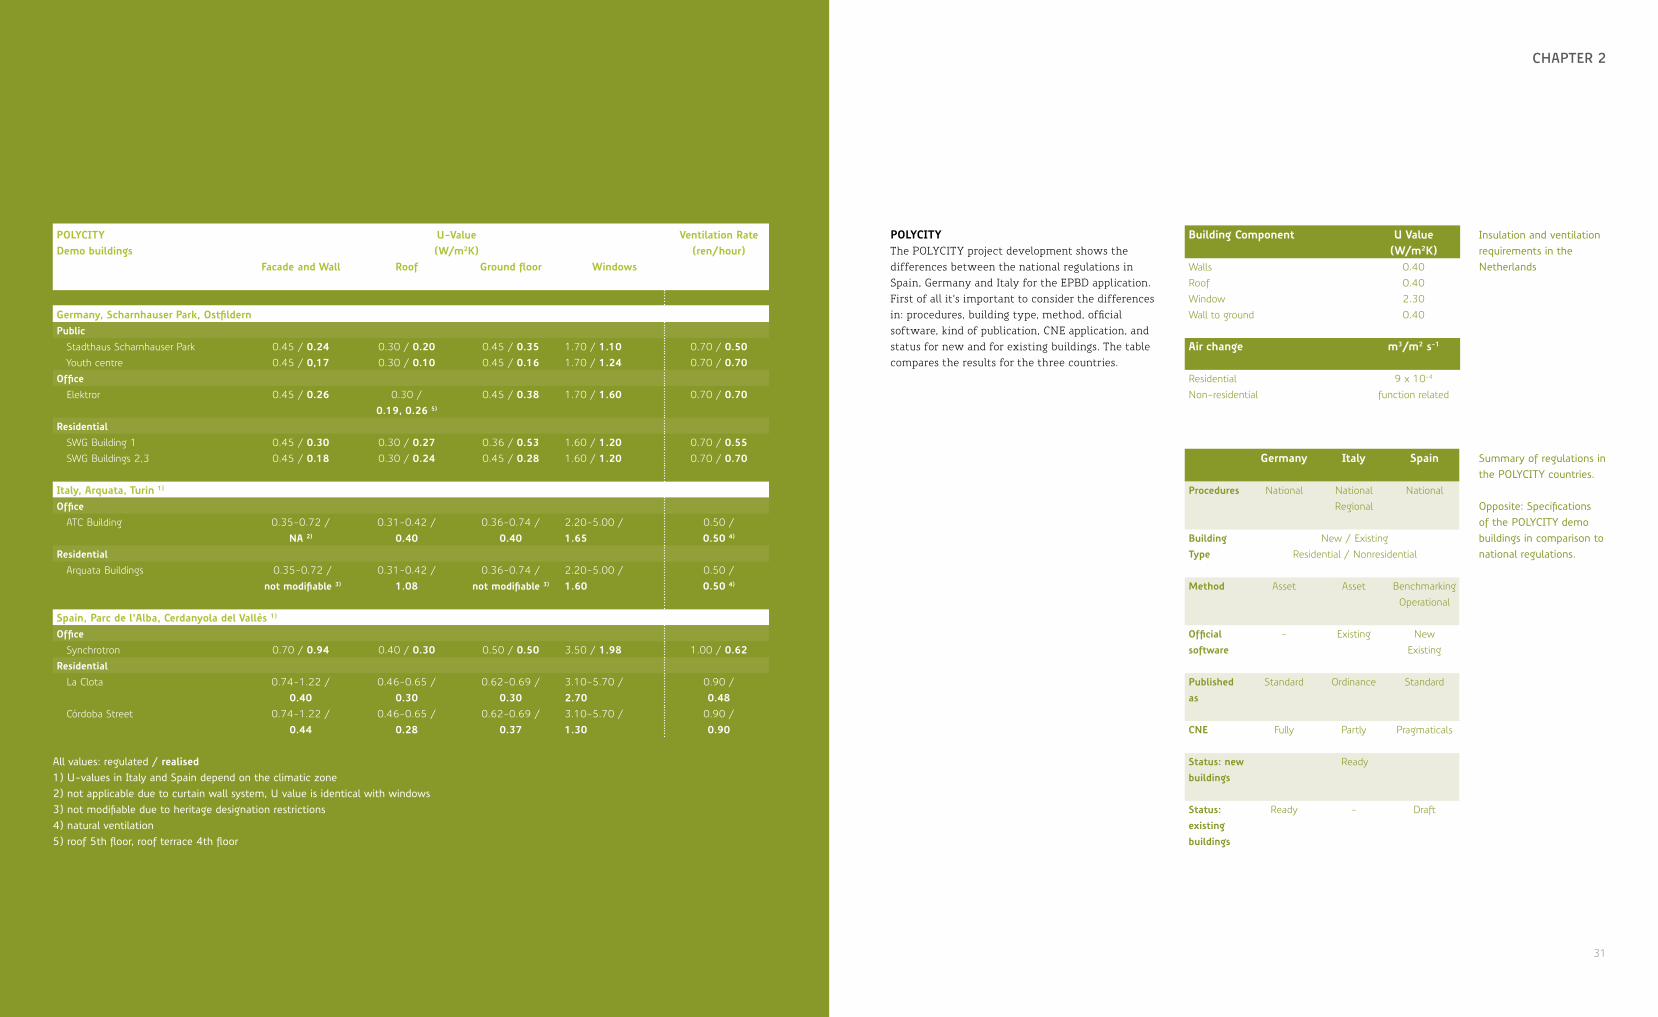
PolycityThe POLYCITY project development shows the differences between the national regulations in Spain, Germany and Italy for the EPBD application. First of all it’s important to consider the differences in: procedures, building type, method, official software, kind of publication, CNE application, and status for new and for existing buildings. The table compares the results for the three countries.
Insulation and ventilation requirements in the Netherlands
Summary of regulations in the POLYCITY countries.
Opposite: Specifications of the POLYCITY demo buildings in comparison to national regulations.
germany italy spain
Procedures
National National Regional
National
building type
New / Existing Residential / Nonresidential
method
Asset Asset Benchmarking Operational
official software
- Existing New Existing
Published as
Standard Ordinance Standard
cne Fully Partly Pragmaticals
status: new buildings
Ready
status: existing buildings
Ready - Draft
32 33
EUroPEan bUilDing PErformancE anD EnErgy sUPPly – statE of thE art chaPtEr 2
2.3 from cUrrEnt PracticEs to ZEro Emission bUilDingsAs we have seen previously, the process towards zero emission buildings has started especially with important efforts in the reduction of emissions generated by the heating systems of the new buildings. Nevertheless, it’s important to consider that this general strategy (zero emission buildings) in the long-term must be defined and discussed further in order to organise the efficient use of the resources, tools and skills available.
In this sense we need to define the main lines of work and a first vision of the performance achievable for each line. A first important criterion to organise the strategy is to consider the differences, complementaries and synergies between the efforts applied in the existing buildings and in the new buildings. Producing zero emissions buildings is a very important objective, but it’s necessary to consider what this line of work achieves when the objective will be reached, because emissions from new buildings represent only a very small part of emissions from all buildings. Reducing the emissions from existing buildings is the most important goal in order to obtain visible results related to the EU targets defined above.
The second important criterion is the typology of building. The design of zero emissions buildings depends also a lot on the typology of building. For example, the electrical consumption in office buildings is very difficult to reduce, so it’s only possible to introduce some kind of compensation, such as a production of electricity (PV or micro-cogeneration) by the building.
The third important criterion to consider must be to differentiate the origin of the emissions that we want to reduce. And finally the fourth important criterion to be considered in the strategy definition should be the different technologies to apply.
In this sense the application progress in new buildings should be complemented with a very important effort in the energy renovation of existing buildings. The developments achieved in new building design, construction and use should have possible applications in existing buildings.
Despite this, the two main issues to be defined are the origin of emissions produced and the measures applied for reduction. In this sense, it’s necessary examine all these questions in depth.
the origin of emissions It’s very important to clarify the origin of emissions for each building. It’s clear that the architectural design (passive measures) of the building determines the emissions associated with the thermal demand. In this sense one of the most important lines of improvement is the design. The second question related to the design is the CO2 emissions needed for the production of the materials used. The third question is the system used in the building construction. The fourth question is the user’s behaviour. The fifth question is the building energy management system and the last one is the capacity of energy production in the building.
A preliminary hypothesis can be put forth as to the importance of each criterion, but more monitoring and research data is needed to obtain realistic results.
CONSTRUCTION SYSTEMThe emissions generated in the building process are really very difficult to reduce. The transport of materials and workers can be reduced with a general measures, but in the end there will always be a minimum quantity of emissions in this sense. The same applies for the energy costs related to connect all materials and construction elements. Despite the use of prefabrication systems, energy will always be required for these tasks.
MATERIALS USEDThe production of construction materials generates different levels of emissions. Aluminium is the most expensive material in terms of energy and emissions costs, the use of wood and natural materials could be very interesting in order to reduce this part of the C02 equation.
THERMAL CONSUMPTIONIn the design of the building (e.g. solar protection, insulation, ventilation), the passive measures are very important for the reduction of emissions, but also the user behaviour of the building can affect the final CO2 amount. The reduction of emissions related to passive measures depends on climate characteristics and the adaptation of measures to the climate, but generally the more effective the passive measures, the lower the CO2 emissions.
ELECTRICAL CONSUMPTIONIn this case the user’s behaviour is decisive because not only does the choice and therefore the efficiency of building equipment depend on the user, but so does how this equipment is used.
BUILDING MANAGEMENT SYSTEM (BMS)The existence of a building management system is critical, because one can reduce energy consumption by 15 %. In this sense the Information and Communication Technologies (ICT) are a key factor in facilitating and adjusting the user’s decisions to energy and emissions reduction.
ENERGY DELIVERED BY THE BUILDINGThe building is, always, an opportunity to produce energy. Different technologies can be used: solar thermal, photovoltaics, biomass, geothermal, micro-cogeneration, etc. These technologies improve the energy balance of the building and also reduce the CO2 emissions. The problem can be the economic balance, as these investments are expensive and have long payback periods. Nevertheless these possibilities can be studied (at design level), which are the most interesting alternatives to produce energy in each building.
the technologies aPPlied The progress to reduce emissions related to the use of buildings depends specially on the technologies applied in the six typologies of the origin of CO2 emissions, as we have seen above: • construction system • materials • thermal consumption• electrical consumption • building management system, and• energy delivered by the building
The technological research in these six fields is not coordinated enough and it would be very interesting to leverage these efforts together in order to define and promote the best solutions in all fields. Until this happens, the building certification models related to the EPB Directive focus on thermal demand and consumption, only one aspect of the CO2 equation. It seems that the new EU Directive has not changed a lot in the application and the other five fields remain relatively overlooked.
In this sense, technological research should be applied considering the real reduction of CO2 emissions of each technology.
34 35
EUroPEan bUilDing PErformancE anD EnErgy sUPPly – statE of thE art chaPtEr 2
2.4 rEnEwablE EnErgy soUrcEs for Urban arEasThe renewable energy sources, derived principally from the enormous power of the sun’s radiation, are at once the most ancient and the most modern sources of energy. Continuing concerns about the sustainability of both fossil and nuclear fuels use have been the major driving force of renewed interest in the renewable energy sources in recent decades.
The use of renewable energy technologies to produce energy can provide many benefits: use of secure and local resources, reduction of the dependence on non-renewable energy, help to keep the air clean, reduction of carbon dioxide and other greenhouse gases and create new jobs in renewable industries.
Renewable energy technologies can provide electricity, heating and cooling using thermally driven chiller technologies in combination with solar or biomass energy technologies.
This chapter outlines technical renewable energy solutions for sustainable urban areas to reduce the primary energy consumption of fossil fuels and their associated environmental impact. More detailed and case specific descriptions of these technologies can be found in other related chapters of this book regarding the technical description of the demonstration projects.
biomass technologiesBiomass in terms of energy production refers to living and recently living biological material which can be used as fuel. There are many processes available to convert that potential energy of biomass into useful fuel sources that can be broadly categorised as: biological and thermo-chemical conversion processes.
Biomass covers a wide range of products, by-products and waste resources in:• the agricultural sector, both in the form of
crop or crop residues or animal waste (farm slurry and poultry litter)
• the forestry sector, biomass material not harvested or removed from forests as well as material resulting from forest management
• the industrial sector of wood manufacture and food industries
• the waste sector, in the form of residues of parks maintenance and of municipal biodegradable wastes (municipal solid waste and sewage water treatment)
Biomass can be used as fuel for cogeneration of power and heat. Current biomass Combined Heat and Power (CHP) technologies include:• conventional superheated steam turbines
above 1-2 MWe• Organic Rankine Cycles (ORC) plants for
small to medium scale energy plants at lower driving temperatures. Typically in a range of 300 kWe–1.5 MWe
• stirling engines with a typical electrical output from 1 kWe to about 75 kWe
• gasification of biomass, where the gas produced is cleaned and cooled and used in an internal combustion engine
• there are also developments to use fuel cells systems as a CHP
BIOMASS COMBUSTIONIn combustion, carbon and hydrogen in biomass combine with sufficient oxygen (usually from ambient air) for complete oxidation with release of heat. The emissions from a wood fired boiler are similar to those from oil or gas fired boilers but the advantage is that wood absorbs CO2 during growth and thus tends to be neutral after combustion and gasification. For the most part, wood is combusted in the form of wood chips, pellets or firewood. Pellets and wood chips have the advantage that the boiler can be fed automatically and the combustion can be regulated.
Biomass heating plants are used at a wide power range (15 kW to several MW) in the municipal and commercial sector to heat single buildings, like schools, but also to provide local and district heat or
even process heat. To make the system more efficient the heating plant can be combined with an electric power generation.
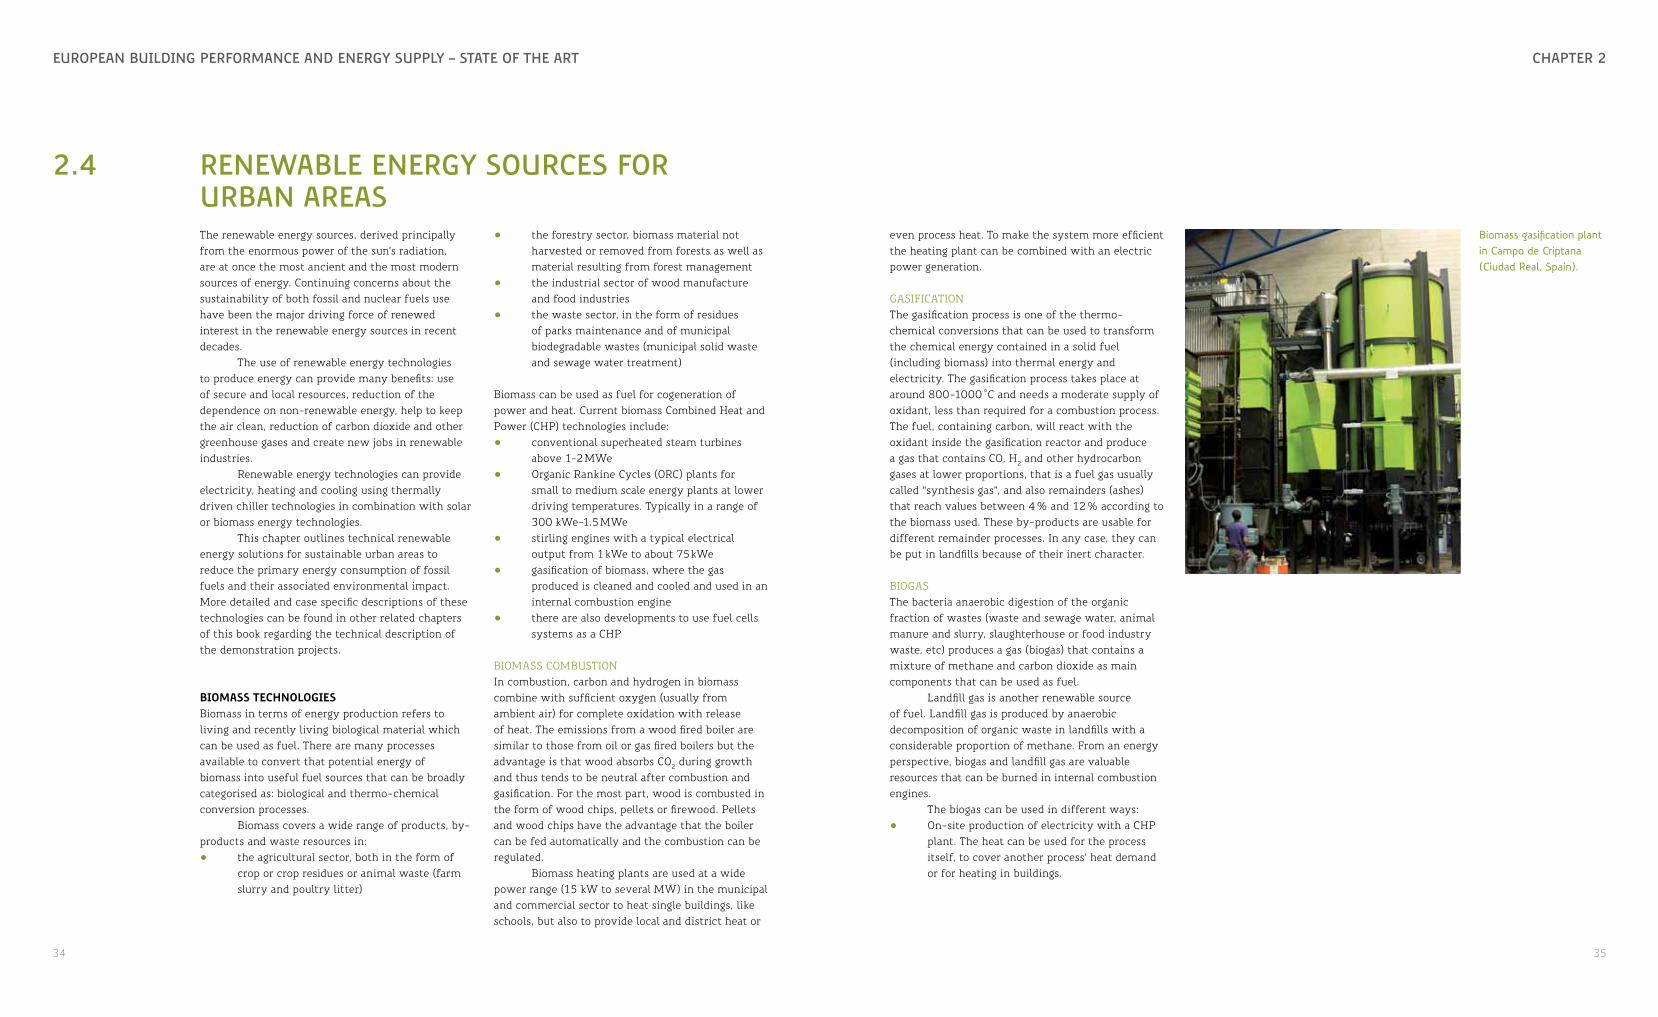
GASIFICATIONThe gasification process is one of the thermo-chemical conversions that can be used to transform the chemical energy contained in a solid fuel (including biomass) into thermal energy and electricity. The gasification process takes place at around 800-1000 °C and needs a moderate supply of oxidant, less than required for a combustion process. The fuel, containing carbon, will react with the oxidant inside the gasification reactor and produce a gas that contains CO, H2 and other hydrocarbon gases at lower proportions, that is a fuel gas usually called “synthesis gas”, and also remainders (ashes) that reach values between 4 % and 12 % according to the biomass used. These by-products are usable for different remainder processes. In any case, they can be put in landfills because of their inert character.
BIOGASThe bacteria anaerobic digestion of the organic fraction of wastes (waste and sewage water, animal manure and slurry, slaughterhouse or food industry waste, etc) produces a gas (biogas) that contains a mixture of methane and carbon dioxide as main components that can be used as fuel.
Landfill gas is another renewable source of fuel. Landfill gas is produced by anaerobic decomposition of organic waste in landfills with a considerable proportion of methane. From an energy perspective, biogas and landfill gas are valuable resources that can be burned in internal combustion engines.
The biogas can be used in different ways:• On-site production of electricity with a CHP
plant. The heat can be used for the process itself, to cover another process’ heat demand or for heating in buildings.
Biomass gasification plant in Campo de Criptana (Ciudad Real, Spain).

36 37
EUroPEan bUilDing PErformancE anD EnErgy sUPPly – statE of thE art chaPtEr 2
• Feeding into a biogas network. The advantage in this case is that the CHP plant does not need to be located close to the place where the consumer for heat is located.
• Enrichment of methane content of the biogas, to meet the quality of natural gas, and feeding it into the natural gas network.
LIQUID BIOFUELSCommon liquid biofuel sources that can be used as fuel in cogeneration engines are oils from various oilseeds, such as palm oil, palm stearin, rapeseed oil, sunflower oil or jatropha oil. The transesterification of liquid biofuels produces biodiesel that can be also used in cogeneration engines.
With respect to the environmental impact, the sulphur emissions are insignificant compared to those associated with fossil fuels because vegetable oils do not contain significant amounts of sulphur. The selective catalyst reduction technologies for NOX abatement typically enables an 85 % to 90 % reduction of NOX emissions from the exhaust gases. Particle emissions (PM) in liquid-biofuel based power plants depend mainly on the ash content of the source fuel. Experience has shown that with good-quality liquid biofuels it is possible to reach low PM levels that meet stringent European standards.
INTEGRATION INTO SUSTAINABLE URBAN AREASBiomass is not an intermittent renewable energy source and can be used to replace traditional heat and power supply systems.
The challenge for biomass based combustion and gasification systems is space. A biomass boiler is typically no less efficient than its more conventional counterparts but requires additional space (usually covered and dry) for fuel storage.
The biomass supply chain is currently the major barrier. Transported biomass material needs to be of a reasonable bulk density in order to keep transport costs and its associated carbon emissions low. There is also a concern on displacing food production.
Biomass combustion is a mature technology while gasification is nearing maturity.
The upgrading and feeding of biogas into the local natural gas grid or a dedicated grid is becoming an interesting alternative of biogas utilisation that creates a flexible and easy to use fuel source independent from the place of production.
Economic aspects are the most relevant non-technical barriers in urban areas. Main specific barriers are the location of the plant and the emissions (pollutants and also noise).
The integration of centralised biomass technologies into the energy supply system of urban district heating and cooling networks is an efficient alternative to reduce the consumption of fossil primary energy sources and increase the energy efficiency of the global energy supply for the supplied urban area.
solar thermal technologiesSolar collectors can provide significant amounts of medium temperature heat that can be used to provide a significant fraction of both water (DHW, Domestic Hot Water) and space heating needs with substantial displacement of fossil fuel.
The basic principle common to all solar thermal systems is simple: solar radiation is collected and the resulting heat conveyed to a heat transfer medium, usually a fluid but also air in the case of air collectors. The heated medium is used either directly (for example to heat swimming pools) or indirectly, by means of a heat exchanger which transfers the heat to its final destination (for instance: space heating). System design, costs and solar yield are constantly being improved. During recent years the use of solar heat to drive thermal cooling systems is becoming more popular.
There are different solar collector types, and their use depends on the energy demand, the climatic region and the load — these are mainly: flat plate collectors (FPC) or evacuated tube collectors (ETC), or collectors using concentration of the solar radiation such as Linear Fresnel (LF) or parabolic
through collectors (PTC). Concentration of the incident solar radiation using reflectors to increase the intensity of the radiation at the absorber and/or reducing the heat loss from the absorber allows higher operating temperatures to be achieved that can be used in highly efficient thermally driven cooling systems or even for power generation.
Due to the varying nature of solar radiation and the mismatch between supply and demand, solar thermal systems in general require a thermal storage system.
The main form of thermal solar energy is the supply of hot water to urban and rural residents. Another technological application are the so-called solar thermoelectric plants that can deliver electricity and heat. Solar thermoelectric energy generation concentrates the radiation from the sun to generate heat used to run a heat engine (usually a steam power plant), which turns a generator to produce electricity. The working fluid that is heated by the concentrated sunlight can be a liquid or steam. Different engine types suitable for this application include steam engines, Stirling engines, gas turbines, etc.
Solar thermoelectric energy is usually classified into medium temperature and high temperature systems. The most highly developed medium temperature systems at present are plants using parabolic trough collectors. High temperature systems use a central tower installation or solar dish/engine systems.
INTEGRATION INTO SUSTAINABLE URBAN AREASSolar collectors which can supply a wide temperature range are a mature and readily applicable technology for the built environment sector. Solar thermal collectors are easily integrated into new and refurbished buildings. They have significant potential to reduce CO2 emissions depending on the available solar resource and the type of displaced fossil fuel. Solar collectors are not only an interesting alternative for the production of hot water in individual dwellings but also for their integration into urban district heating and cooling networks, decreasing
the consumption of non-renewable fuels and their associated emissions.
Some of the main barriers for their use are the high requirement of space and the economic cost that is still quite high compared with the existing conventional alternatives.
PhotoVoltaic technologiesA photovoltaic (PV) cell is a solid-state device which converts solar radiation into direct electric current. PV cells consist of a junction between two thin layers of dissimilar semiconducting materials (‘p’ and ‘n’ type semiconductors) usually made of silicon. The photovoltaic effect is obtained by the absorption of photons in this semi-conductor which generates an electrical current. Several cells connected together form a so-called PV module.
Nowadays, there are different kinds of PV technologies. The most important cell types are: monocrystalline silicon, polycrystalline silicon and thin film cells. The monocrystalline silicon cells reach the highest efficiency, where the thin film cells have lower production costs.
INTEGRATION INTO SUSTAINABLE URBAN AREASOne of the main advantages of photovoltaics for the building sector is their ease of integration in the urban environment where they can totally replace certain construction materials such as for roofs, walls and even windows.
All PV technologies have reached a significant level of maturity and are widely available on the market. Unfortunately PV manufacturing and installation costs are still high although it is expected that they will decline in the near future. Most European countries support the PV market with several kinds of economic incentives.
Greenhouse gas emissions during production are higher than all other renewable technologies but they are still lower than fossil fuel based options, and once installed and correctly maintained, PV electricity is totally CO2 free.
38 39
EUroPEan bUilDing PErformancE anD EnErgy sUPPly – statE of thE art chaPtEr 2
As is the case for solar thermal technologies some of the main barriers for their use are the high requirement of space and the economic cost that is still very high compared with the existing conventional alternatives. Thus the economic viability is highly dependent on public subsidies for the electricity feed into the grid.
geothermal technologiesGeothermal energy is the energy contained within the Earth. It originates from the gravitational energy that formed the planet and from the decay of long-life radioactive elements. Depending on their geological environment and depth, aquifers (bodies of water) contained naturally in the ground can be brought to temperatures that give them an energy content that can be exploited industrially, either to generate electricity by thermo-electrical conversion or for the direct production of heat that is well-suited, in particular, to supplying urban heating networks.
NEAR SURFACE GEOTHERMAL ENERGY TECHNOLOGIESAfter a depth of about 15 m, the impact of the ambient environment (sunlight, rain, ambient temperature...) is negligible. A positive influence for energy efficiency can be a deep groundwater layer. To use these technologies for heating, a heat pump is necessary to raise the low energy source to a useful temperature level. Beside the use of heating in winter, this technology can also be used for cooling in summer. Near surface geothermal energy includes the following technologies:• borehole heat exchanger• earth collectors• groundwater wells
DEEP GEOTHERMAL ENERGY TECHNOLOGIESWith greater depth, higher temperatures can be achieved with the deep geothermal technology. Therefore it is possible to generate electricity besides using additional recovered heat for supplying a
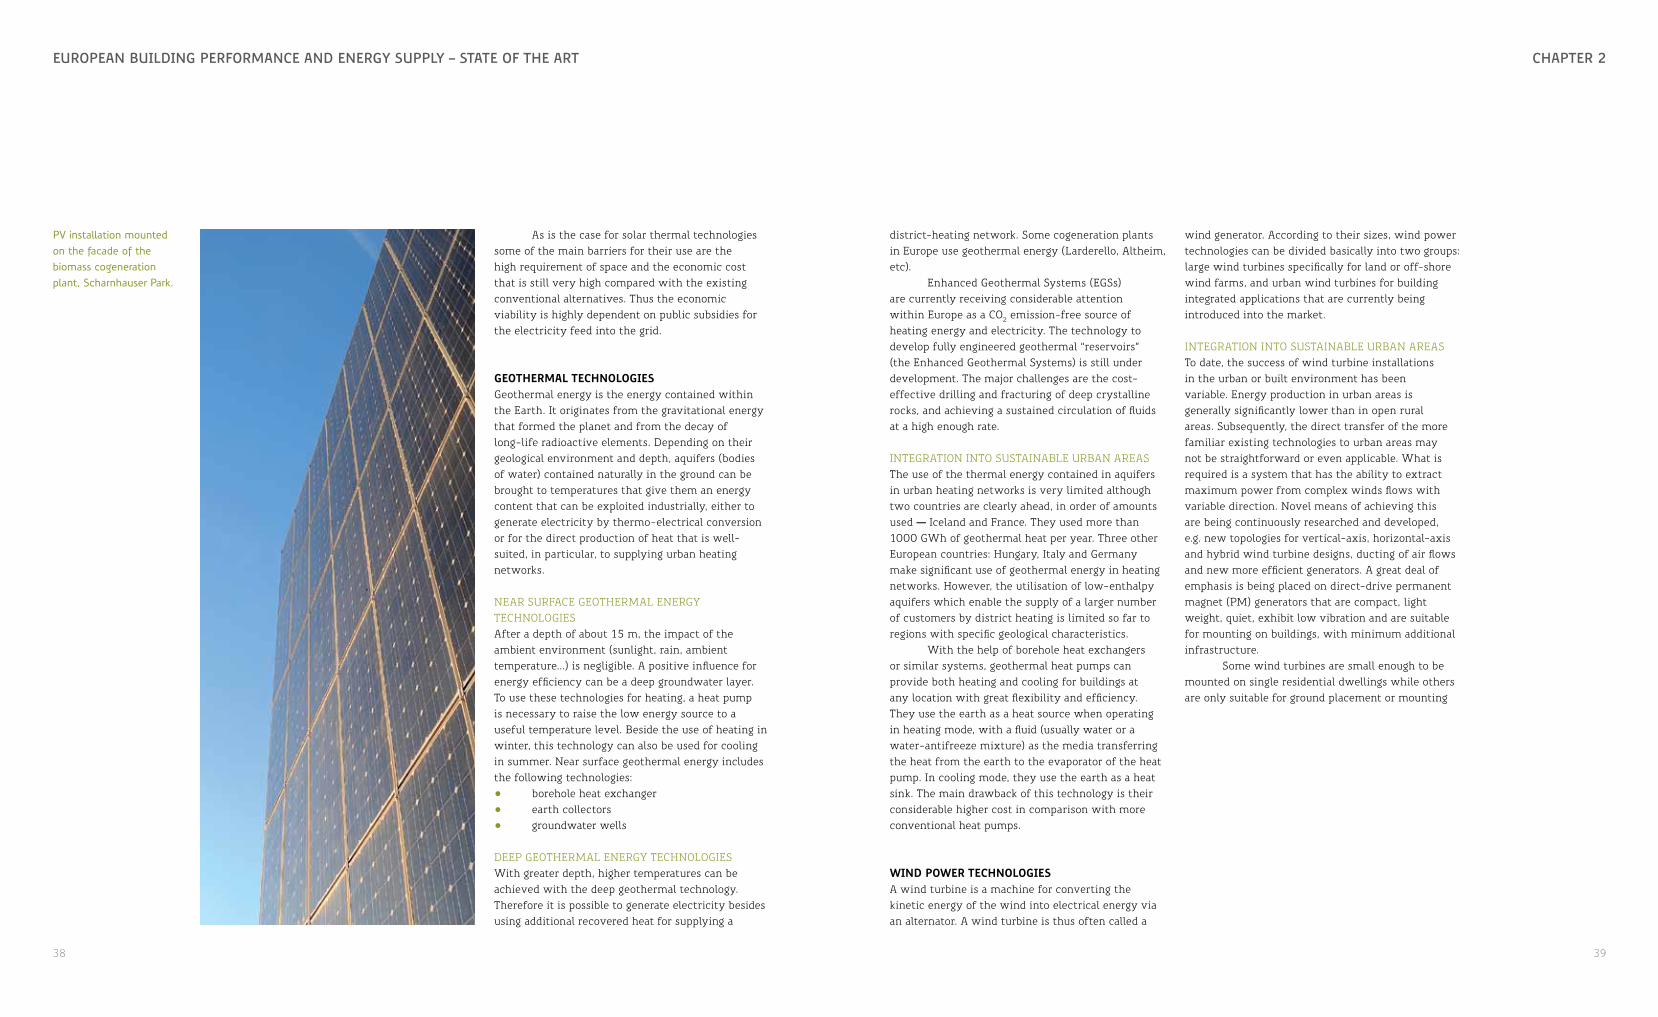
PV installation mounted on the facade of the biomass cogeneration plant, Scharnhauser Park.
district-heating network. Some cogeneration plants in Europe use geothermal energy (Larderello, Altheim, etc).
Enhanced Geothermal Systems (EGSs) are currently receiving considerable attention within Europe as a CO2 emission-free source of heating energy and electricity. The technology to develop fully engineered geothermal “reservoirs” (the Enhanced Geothermal Systems) is still under development. The major challenges are the cost-effective drilling and fracturing of deep crystalline rocks, and achieving a sustained circulation of fluids at a high enough rate.
INTEGRATION INTO SUSTAINABLE URBAN AREASThe use of the thermal energy contained in aquifers in urban heating networks is very limited although two countries are clearly ahead, in order of amounts used — Iceland and France. They used more than 1000 GWh of geothermal heat per year. Three other European countries: Hungary, Italy and Germany make significant use of geothermal energy in heating networks. However, the utilisation of low-enthalpy aquifers which enable the supply of a larger number of customers by district heating is limited so far to regions with specific geological characteristics.
With the help of borehole heat exchangers or similar systems, geothermal heat pumps can provide both heating and cooling for buildings at any location with great flexibility and efficiency. They use the earth as a heat source when operating in heating mode, with a fluid (usually water or a water-antifreeze mixture) as the media transferring the heat from the earth to the evaporator of the heat pump. In cooling mode, they use the earth as a heat sink. The main drawback of this technology is their considerable higher cost in comparison with more conventional heat pumps.
wind Power technologiesA wind turbine is a machine for converting the kinetic energy of the wind into electrical energy via an alternator. A wind turbine is thus often called a
wind generator. According to their sizes, wind power technologies can be divided basically into two groups: large wind turbines specifically for land or off-shore wind farms, and urban wind turbines for building integrated applications that are currently being introduced into the market.
INTEGRATION INTO SUSTAINABLE URBAN AREASTo date, the success of wind turbine installations in the urban or built environment has been variable. Energy production in urban areas is generally significantly lower than in open rural areas. Subsequently, the direct transfer of the more familiar existing technologies to urban areas may not be straightforward or even applicable. What is required is a system that has the ability to extract maximum power from complex winds flows with variable direction. Novel means of achieving this are being continuously researched and developed, e.g. new topologies for vertical-axis, horizontal-axis and hybrid wind turbine designs, ducting of air flows and new more efficient generators. A great deal of emphasis is being placed on direct-drive permanent magnet (PM) generators that are compact, light weight, quiet, exhibit low vibration and are suitable for mounting on buildings, with minimum additional infrastructure.
Some wind turbines are small enough to be mounted on single residential dwellings while others are only suitable for ground placement or mounting

40 41
EUroPEan bUilDing PErformancE anD EnErgy sUPPly – statE of thE art chaPtEr 2
on very large buildings although this integration has still not been clearly demonstrated.
hydrogen Production from renewable energyHydrogen is not a primary energy source but it is usually considered a candidate as a promising energy carrier for the future. Its use as fuel has many advantages:• it can act as even long-term (seasonal) storage
for renewable energy• it can act as a transport fuel• clean combustion specially when fuel cells
are used
Hydrogen is already used in large quantities as a feedstock for the chemical industry, mainly in the manufacture of fertilizers. Currently, it is mainly produced by steam reforming of natural gas (methane), partial oxidation of heavy hydrocarbons and of carbon which necessarily also produces carbon dioxide. However, renewable hydrogen can be produced mainly by (although other processes are available):• Electrolysis of water using electricity from
non-fossil sources. Basically, in this process direct current electricity is passed between two electrodes immersed in water, and hydrogen and oxygen can be collected at the electrodes.
• Gasification of biomass can produce large amounts of hydrogen. Unlike electrolysis, this hydrogen generation process is not yet commercialised.
When burned, 1 kg of hydrogen will produce 120 MJ of heat, assuming that the resulting water is released as vapour. Although this is nearly three times the energy per unit mass of petrol or diesel fuel, hydrogen has the disadvantage of being a gas, with a low energy per unit volume at atmospheric pressure (10 MJ/m3).
Hydrogen can be stored in a number of ways:• As a gas in pressurised containers, typically at
around 300 atm. These containers obviously have a weight penalty.
• By absorbing it into various metals, where it reacts to form a metal hydride. Hydrogen can be released by heating.
• As a liquid, although this requires reducing its temperature to -253 ºC and the use of highly insulated storage.
INTEGRATION INTO SUSTAINABLE URBAN AREASImproved technology and post-combustion treatments for conventional power technologies are continuously reducing pollutant emissions. Nevertheless, oxides of nitrogen and particulates remain a problem in certain areas, while the global trend towards urbanisation emphasises the need for clean energy solutions and improved public transport. Vehicles and stationary power generation fuelled by hydrogen are zero emission devices at the point of use with the corresponding local air quality benefits that can be in the future an important alternative or complementary energy source for the supply of energy.
thermally driVen cooling technologies using renewable energy sourcesRenewable energy technologies can provide electricity, heating and also cooling using thermally driven chiller technologies in combination with solar or biomass energy sources.
The heat source for cooling can be either the exhaust heat from a CHP plant, which could run with a biofuel, the heat from a solar collector or direct heat from the combustion of a biomass boiler. The use of solar energy has the great advantage, that there is a good congruence in the high cooling energy demand in the summer months with the good solar energy availability in the same period. For both cases, commercially obtainable machines with a high efficiency are available in larger sizes. However there
are also offered small scale refrigeration machines with a cooling capacity in the range of 5-30 kW.
Beside the closed absorption/adsorption cooling systems, there is another technology, the desiccant evaporative cooling system (DEC), which could also use solar energy. This is an open sorption process and these systems are working with solid desiccant material using either rotating wheels or with liquid desiccants using appropriate contact systems between the liquid desiccant solution and the air to be dehumidified and cooled.
INTEGRATION INTO SUSTAINABLE URBAN AREASThermally driven chillers can be used as decentralised systems in single buildings using solar thermal energy in a wide range of cooling capacities from a few up to hundreds of kW for large buildings. The chilled water could also be generated in a centralised energy supply system and distributed through a district heating and cooling network. In some cases chillers can be decentralised and use a hot water distribution network to supply cooling to a single user. Some technical compatibility aspects have to be solved in this case, such as the difference between the supply and return temperatures of the hot water in the district heating and that required in the chiller.
cogeneration technologies using renewable energy sourcesCogeneration or combined heat and power (CHP) plants are based on the combustion of a primary fuel to produce electricity and heat. Commonly fossil fuels like diesel, natural gas or oil are used, however it is also possible to use wood, wood chips or other biomass fuel sources.
Besides generating electricity, the recovered heat is used for heating or cooling applications. This makes the total efficiency (thermal and electrical) from a CHP plant much higher than from a single power plant which only produces electricity. It can reach 65-90 %, compared to a combined gas turbine cycle that reaches a maximum of about 55 %.
The following technologies can be used with renewable energy sources:• Internal combustion engines, driven by biogas,
biodiesel or bio-oil.• Steam turbines. Here a biomass is combusted
and produces high temperature steam, which is expanded in a turbine and drives a generator.
• Organic Rankine Cycle (ORC). This technology is similar to the steam process, but it uses an organic fluid instead of water and thus the pressure and the temperature of this process are lower.
• Stirling engines. • Fuel cell systems convert hydrogen in an
electrochemical reaction with oxygen directly into electricity, water and heat. In a prior stage, the hydrogen can be produced in a reforming process of bio-ethanol, biogas or wood gasifier process.
The power to heat ratio in a cogeneration system ranges between 0.5 to 2.4 depending on the prime engine used.
INTEGRATION INTO SUSTAINABLE URBAN AREASCogeneration systems using renewable energy sources such as biomass derived fuels can be used as decentralised systems in single buildings using biofuels in a wide range of power capacities from a few kW (residential and office buildings) up to some hundreds for large buildings (hospitals and big hotels). Cogeneration is also an excellent technology for centralised energy supply systems connected to a district heating and cooling network.
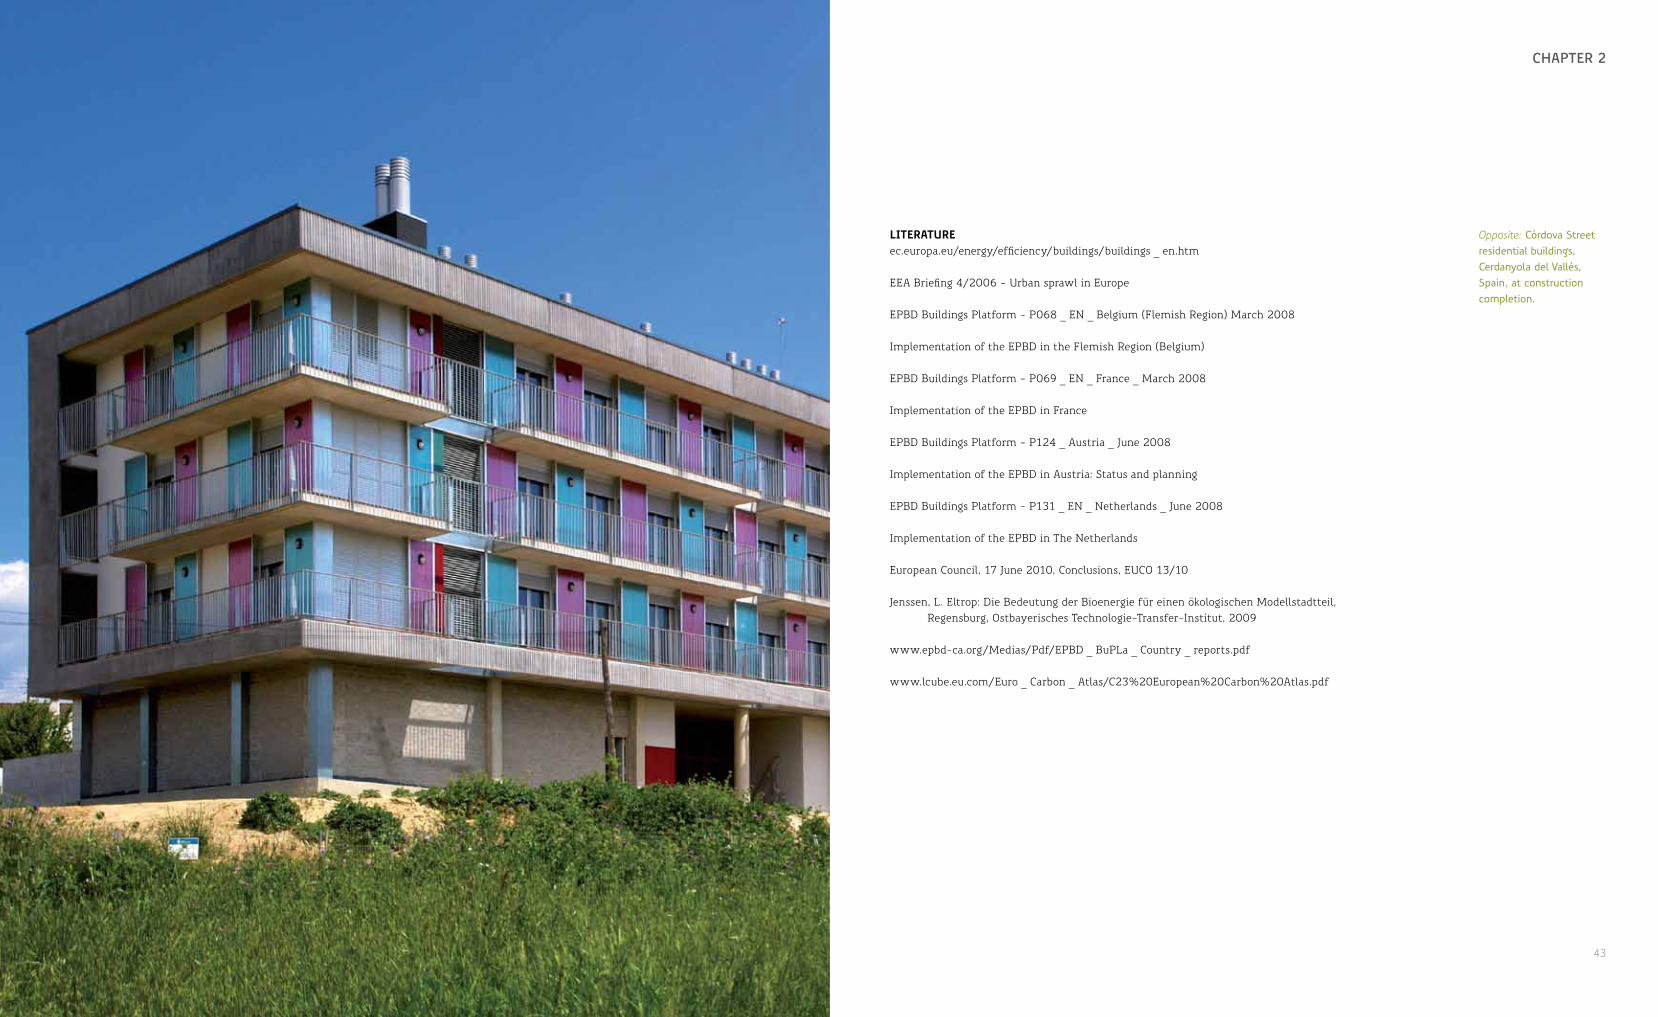
42 43
towarDs a sUstainablE commUnity chaPtEr 2
literatureec.europa.eu/energy/efficiency/buildings/buildings _ en.htm
EEA Briefing 4/2006 - Urban sprawl in Europe
EPBD Buildings Platform - P068 _ EN _ Belgium (Flemish Region) March 2008
Implementation of the EPBD in the Flemish Region (Belgium)
EPBD Buildings Platform - P069 _ EN _ France _ March 2008
Implementation of the EPBD in France
EPBD Buildings Platform - P124 _ Austria _ June 2008
Implementation of the EPBD in Austria: Status and planning
EPBD Buildings Platform - P131 _ EN _ Netherlands _ June 2008
Implementation of the EPBD in The Netherlands
European Council, 17 June 2010, Conclusions, EUCO 13/10
Jenssen, L. Eltrop: Die Bedeutung der Bioenergie für einen ökologischen Modellstadtteil, Regensburg, Ostbayerisches Technologie-Transfer-Institut, 2009
www.epbd-ca.org/Medias/Pdf/EPBD _ BuPLa _ Country _ reports.pdf
www.lcube.eu.com/Euro _ Carbon _ Atlas/C23%20European%20Carbon%20Atlas.pdf
Opposite: Còrdova Street residential buildings, Cerdanyola del Vallès, Spain, at construction completion.

type of use construction area Volume Ve costs energy demand energetic regulation
gross (m2) net (m2)heated external
(m3)construction
(M ¤)energy related
(M ¤)Heating
(kWh/m2 a)Other
(kWh/m2 a)
germany, scharnhauser Park, ostfildernStadthaus Multiple use building:
Public administrationAssociation/ educational centreArts museumLibrary
2000-2002 4 808 4 039 14 437 9.0 0.450 70.0 65.0 WschVO 1995 -25 %
L-Quadrat Youth centre 2006-2007 475 413 2 012 1.7 0.085 50.0 65.0 EnEV 2004
Sports Hall Sports hall 2001 2 565 2 206 15 000 22.5 1.125 70.0 65.0 WschVO 1995 -25%
Elektror Office building 2006-2008 2 962 2 809 9 744 7.2 0.408 68.0 34.0 EnEV 2004
SWG Building 1 Residential 2005-2006 1 688 1 605 5 015 1.0 0.031 56.0 40.5 kfW-60 -30%SWG Buildings 2, 3 2007-2008 3 873 3 814 11 918 4.2 0.174 56.0 40.5 kfW-60 -30%
italy, arquata, turinATC Office Building Office building 2007-2008 11 868 11 350 34 050 NA 1) 0.787 74.5 65.0 - -
Residential Buildings Residential 2007-2008 35 827 29 855 99 444 NA 1) 0.502 62.5 17.0 - -
spain, Parc de l’alba, cerdanyola del VallèsSynchrotron Alba Office building 2006-2008 5 483 4 054 9 729 18.0 0.293 20.0 126.0 NBE-CT-79
La Clota Residential 2007-2009 3 936 2 786 5 122 4.5 0.119 16.0 84.5 NBE-CT-79
Còrdova Street Residential 2007-2009 4 296 3 231 6 326 3.5 0.094 10.0 84.5 NBE-CT-79
1) Energetic renovation of existing building
bUilDing sPEcifications — DEmanD
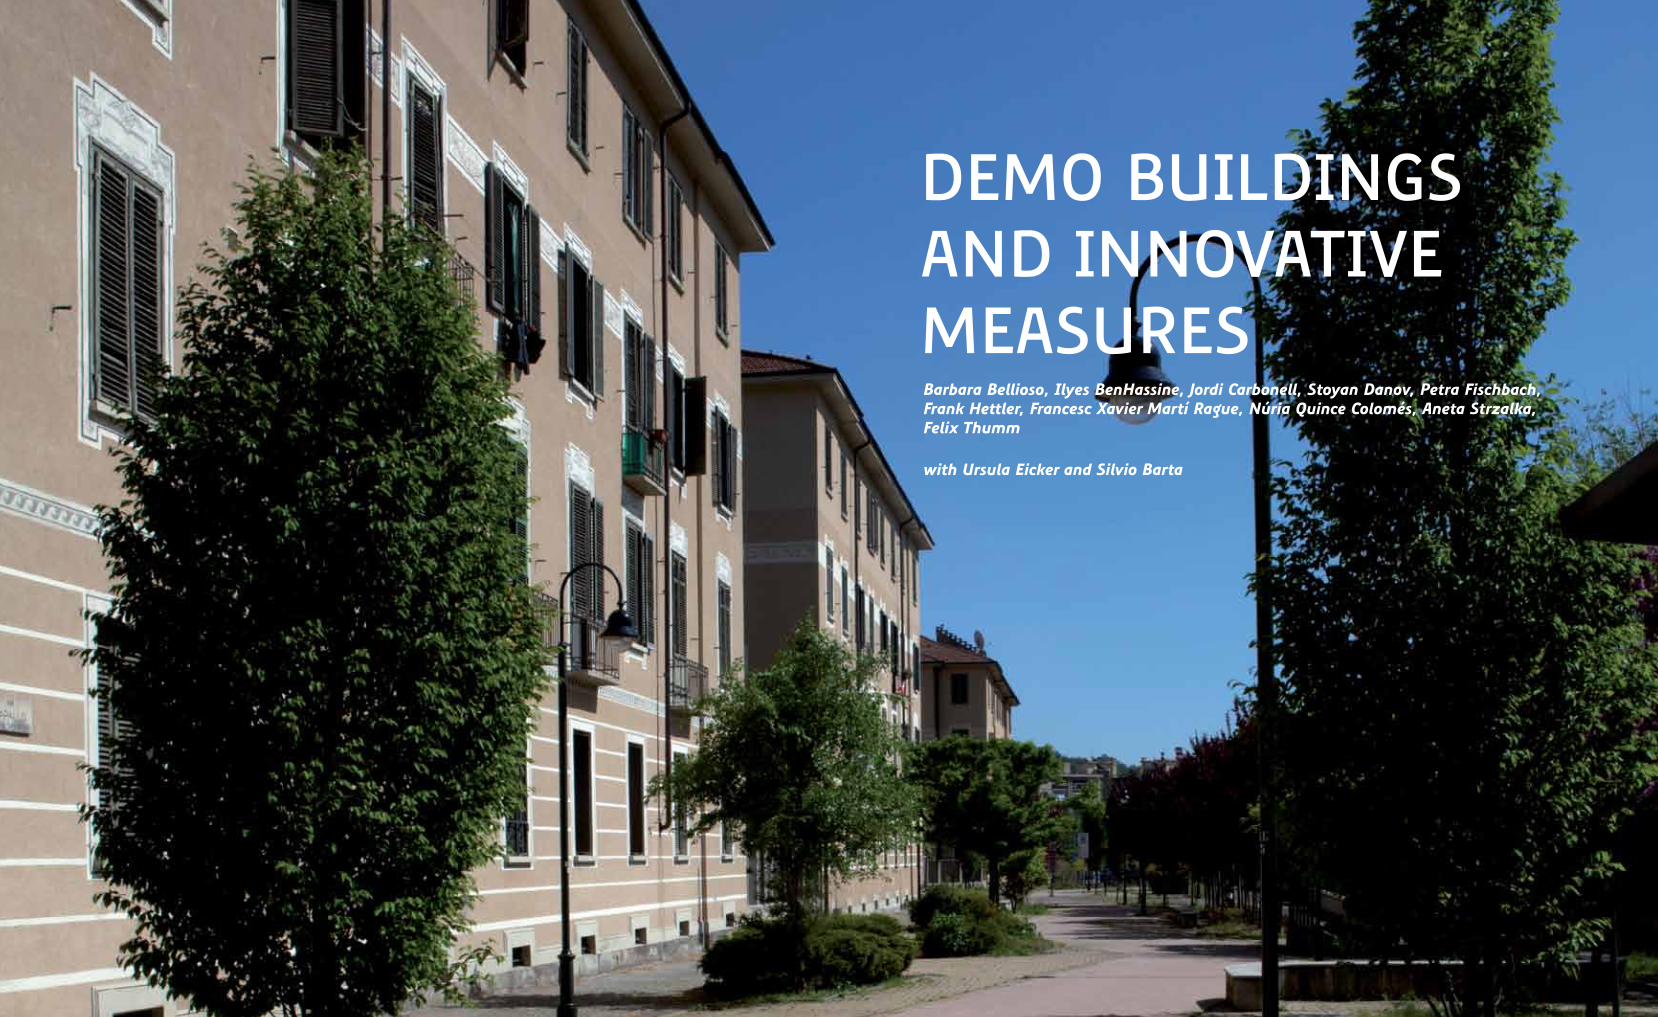
DEmo bUilDings anD innovativE mEasUrEsBarbara Bellioso, Ilyes BenHassine, Jordi Carbonell, Stoyan Danov, Petra Fischbach, Frank Hettler, Francesc Xavier Martí Rague, Núria Quince Colomés, Aneta Strzalka, Felix Thumm
with Ursula Eicker and Silvio Barta

48 49
chaPtEr 3DEmo bUilDings anD innovativE mEasUrEs
3.1 PUblic bUilDings
Energy performance of public buildings is an interesting issue for all urban energy projects. Here consumption values can be made publicly available because the problem of data privacy does not exist. Combined with the common interest in saving energy and public money, public buildings offer a field of interesting energetic saving strategies.
In this chapter three public buildings are introduced, all of them situated at the German project site Scharnhauser Park: • Jugendhaus L Quadrat - youth centre• Stadthaus - Stadthaus• Schule im Park - school building with sports hall
For all of them a detailed performance assessment was done and optimisation potentials were explored and realised. The Stadthaus and school building already existed before the POLYCITY project began in 2005. The main issue here was to improve the existing energy performance of the buildings without making costly investments to buildings, which where all built after the year 2000 and are therefore relatively new.
The youth centre was supported by the POLYCITY project already during the planning process and it became in most aspects an energy efficiency example for all future public buildings. For this reason it is explained in more detail below.
Master plan for the Scharnhauser Park development, with the POLYCITY buildings: 1) Jugendhaus – youth centre; 2) Stadthaus; and 3) Schule im Park - School building with sports hall.
12 3
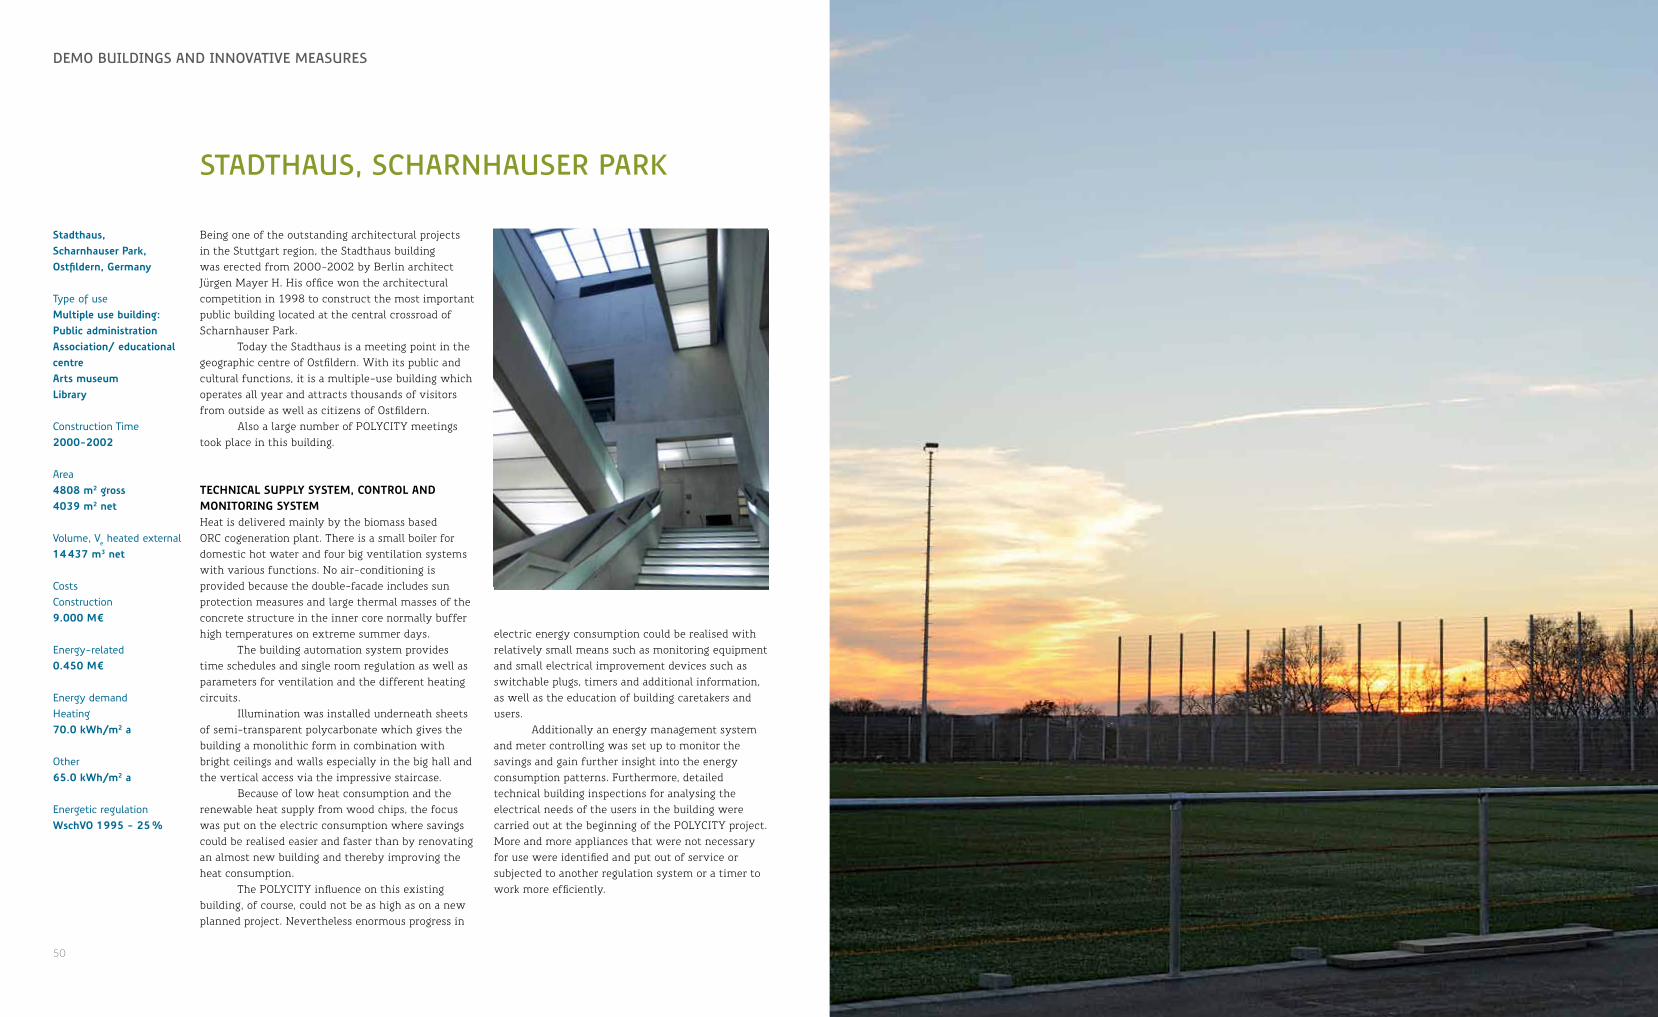
50 51
chaPtEr 1DEmo bUilDings anD innovativE mEasUrEs
staDthaUs, scharnhaUsEr Park
Being one of the outstanding architectural projects in the Stuttgart region, the Stadthaus building was erected from 2000-2002 by Berlin architect Jürgen Mayer H. His office won the architectural competition in 1998 to construct the most important public building located at the central crossroad of Scharnhauser Park.
Today the Stadthaus is a meeting point in the geographic centre of Ostfildern. With its public and cultural functions, it is a multiple-use building which operates all year and attracts thousands of visitors from outside as well as citizens of Ostfildern.
Also a large number of POLYCITY meetings took place in this building.
technical suPPly system, control and monitoring systemHeat is delivered mainly by the biomass based ORC cogeneration plant. There is a small boiler for domestic hot water and four big ventilation systems with various functions. No air-conditioning is provided because the double-facade includes sun protection measures and large thermal masses of the concrete structure in the inner core normally buffer high temperatures on extreme summer days.
The building automation system provides time schedules and single room regulation as well as parameters for ventilation and the different heating circuits.
Illumination was installed underneath sheets of semi-transparent polycarbonate which gives the building a monolithic form in combination with bright ceilings and walls especially in the big hall and the vertical access via the impressive staircase.
Because of low heat consumption and the renewable heat supply from wood chips, the focus was put on the electric consumption where savings could be realised easier and faster than by renovating an almost new building and thereby improving the heat consumption.
The POLYCITY influence on this existing building, of course, could not be as high as on a new planned project. Nevertheless enormous progress in
stadthaus, scharnhauser Park, ostfildern, germany
Type of usemultiple use building:Public administrationassociation/ educational centrearts museumlibrary
Construction Time2000-2002
Area4808 m2 gross 4039 m2 net
Volume, Ve heated external14 437 m3 net
CostsConstruction9.000 m¤
Energy-related0.450 m¤
Energy demandHeating70.0 kwh/m2 a
Other65.0 kwh/m2 a
Energetic regulationwschVo 1995 - 25 %
electric energy consumption could be realised with relatively small means such as monitoring equipment and small electrical improvement devices such as switchable plugs, timers and additional information, as well as the education of building caretakers and users.
Additionally an energy management system and meter controlling was set up to monitor the savings and gain further insight into the energy consumption patterns. Furthermore, detailed technical building inspections for analysing the electrical needs of the users in the building were carried out at the beginning of the POLYCITY project. More and more appliances that were not necessary for use were identified and put out of service or subjected to another regulation system or a timer to work more efficiently.

52 53
chaPtEr 3DEmo bUilDings anD innovativE mEasUrEs
Opposite: Development of the energy consumption in the Stadthaus. In the future, further improvements especially in the field of illumination technologies (LEDs) could bring even more savings and improve the overall energy balance of the Stadthaus.
consumPtion data and future imProVementsDuring the first years of operation, the Stadthaus building had a high electrical consumption of >40 kWh/m2a.
Each year an increase of about 5 % was observed, which followed the public trend of electric consumption in Germany. At the end of 2005, the first measures were taken and during 2007 additionally an external construction yard around the Stadthaus “supported” the electrical savings by shutting down the energy consuming fountain which was reopened in 2008. Nevertheless also in 2008, the consumption was below the former values, and even in 2009 with the fountain in operation year round, the consumption stayed almost constant. In comparison, assuming further stable linear increases in electric consumption of up to more than 250 000 kWh/a, the difference today would be more than 100 000 kWh which means around 15 000 ¤/a!
before POLYCITY measures
after POLYCITY measures
Elec
tric
al c
onsu
mpt
ion
(kW
h)
2003 2004 2005 2006 2007 2008 2009 20100
50k
100k
150k
200k
250k
300kProgrnosis without POLYCITY measures
Main ventilation system in the Stadthaus.
Opposite: The Stadthaus in Scharnhauser Park.
Preceding: Interior, main circulation in the Stadthaus.
Preceding: Sports fields at the L-Quadrat youth centre.
energy consumption
Heating (kWh/m2)90.0 national regulation50.0 CONCERTOActual measured (gross)31.2 200531.1 200629.0 200730.0 200834.4 2009
Cooling (kWh/m2)30.0 CONCERTOActual (no cooling equipment) 0.0
Lighting (kWh/m2)12.0 CONCERTOActual measured12.6 200810.9 200910.9 2010
Total electricity (kWh/m2)Actual measured41.2 200535.7 200631.0 200729.6 200831.5 200929.3 2010

54 55
chaPtEr 3DEmo bUilDings anD innovativE mEasUrEs
l-QUaDrat yoUth cEntrE
The location of the youth centre is special in the sense of urban planning in Scharnhauser Park because the building is situated outside the main area of the urban master plan at the end of a series of sports fields declining from north to south. The sports facilities are orientated parallel to the nearby landscape stairs that form the central urban element of the quarter of Scharnhauser Park. They were created from earth movements at the beginning of the Scharnhauser Park construction period around the year 2000. Another regulation of the urban master plan was that the building should not be seen from the surface of the trend sports field. The name “L-Quadrat” was elected by the youth users based on the ground floor plan of the building.
Due to its surroundings outside the infra-structure-equipped area of Scharnhauser Park, there was a necessity to use an independent source for heating energy. The distance of the youth centre to
which is -30 % to the EnEV from 2004 and 2007. Public buildings, which were planned in the time before the EnEV 2009 became effective had to follow a communal decision to be build -30 % to the EnEV 2007.
geothermal heat suPPlyFinally all the requirements led to a concept for heating supply based on a heat pump in connection with geothermal energy. The necessary drilling took place in March 2007 when two bore holes (each 134m deep) were made. The U-formed tubes are of polyethylene (PE) with a diameter of 1½” and are installed as double U-tubes. Within 1.5 days the drilling was finished and later on connected to the heat pump. At the same time a geothermal profile of the soil coming out of the drilling hole was established and the heat-gains could be calculated more in detail.
The geothermal circuit was connected to the heat pump which is a Vitocal 300 Type BW from Viessmann that works on two levels. The maximum output power is 16.6 kW. The thermal energy goes into a storage tank where temperatures up to +35 °C are provided for the floor heating and the ventilation. The calculated temperature levels range from 25-35 °C for the supply temperature related to an outside temperature of a minimum of -12 °C.
The coefficient of performance in the data-sheet of Viessmann is specified with 4,61 (calculated by DIN EN 255; supply temperature 35 °C and 0 °C heat source temperature). In its primary circle, 4200 l/h are circulating with a temperature minimum between 0 and 4 °C, in its secondary circle 1400 l/h with temperatures of 25/35 °C.
The supply system for the heat with the geothermal heat exchangers is also the source for cooling in summer. In the framework of a natural cooling system cool water goes directly into the floor heating which operates in that case as cooling equipment. Then the primary circle is driven with 10/14 °C and the secondary circle within 12/20 °C supply temperature.
l-quadrat, scharnhauser Park,ostfildern, germany
Type of useyouth centre
Construction Time2006-2007
Area475 m2 gross 413 m2 net
Volume, Ve heated external2012 m3 net
CostsConstruction1.700 m¤
Energy-related0.085 m¤
Energy demandHeating50.0 kwh/m2 a
Other65.0 kwh/m2 a
Energetic regulationenev 2004
Control system for the three main circuit groups of the geothermal heat supply.
Opposite: L-Quadrat Youth centre in Scharnhauser Park.
the last building supplied by district heating in the residential urban quarter No. I of Scharnhauser Park was too long and the calculated heating demand was too small in relation to the effort to connect the building to the grid. Furthermore there would have been hydraulic problems because of the small flow of heating energy to the dead-end pipe. Another supply system of natural gas could also be excluded because a new gas pipe to the youth centre building would have had high costs. Systems based on other fossil combustibles like oil where not taken into account.
From the point of building legal requirements, the youth centre had to fulfil the German EnEV 2004 (Energieeinsparverordnung) which guarantees a certain level of maximum U-Values. Additionally, the POLYCITY guidelines of a reduction of -25 % better than national standard were in any case more than fulfilled. This has to do with the announced reduction of the EnEV standard in the EnEV 2009, The heat pump has an integrated regulation
(CD 60) that works outside temperature based and is connected to the building management system.
Heating distribution goes from the storage tank to several low temperature floor heating distributors. Altogether there are 30 circuits divided into three main groups: • entrance, activities area and kitchen (12
circuits with altogether 672 l/h) • sanitary rooms (5 circuits with altogether
194 l/h) • group rooms, dancing room and secondary
rooms (13 circuits with altogether 647 l/h)
All the heating circulation pumps are automatically regulated pumps from the Stratos series of the pump producer Wilo. The adjusting of the pumps was done by a special technician from Wilo.
VentilationThe ventilation system is a central ventilation unit (Zehnder Comfoair 3200 B with a size of 2.45 x 1.40 x 1.40 m). Additionally it is equipped with a summer by-pass in case that the use of the earth heat exchanger is not necessary. The maximum electric
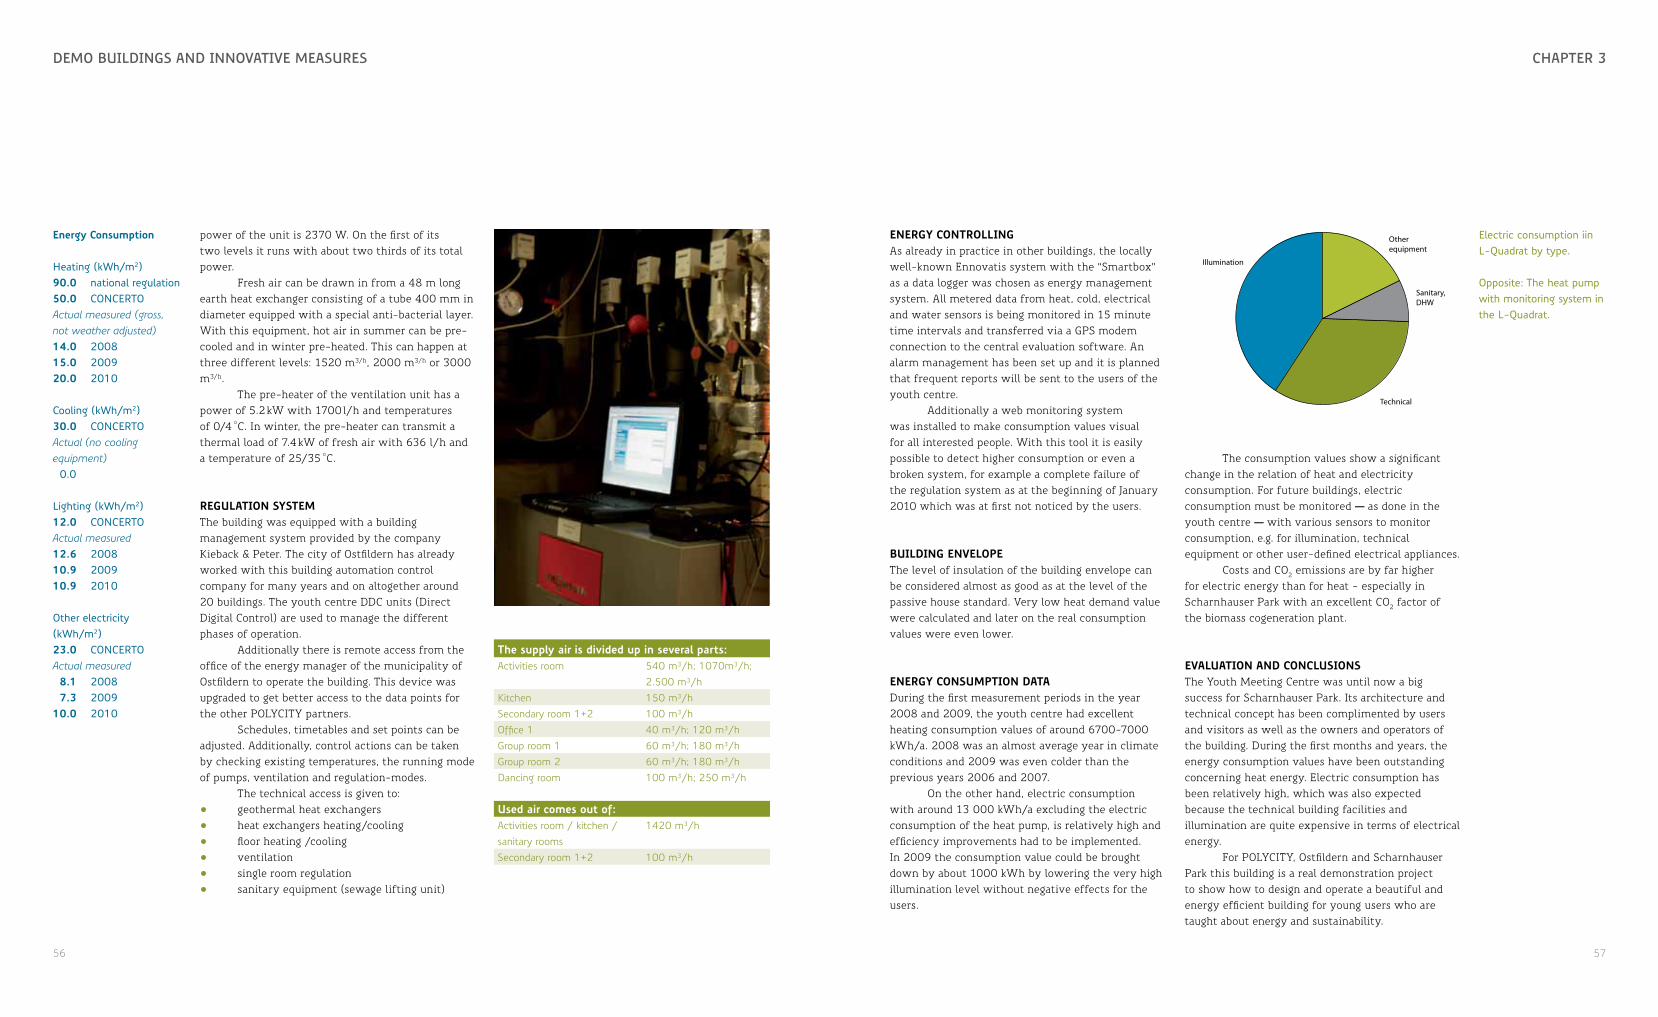
56 57
chaPtEr 3DEmo bUilDings anD innovativE mEasUrEs
power of the unit is 2370 W. On the first of its two levels it runs with about two thirds of its total power.
Fresh air can be drawn in from a 48 m long earth heat exchanger consisting of a tube 400 mm in diameter equipped with a special anti-bacterial layer. With this equipment, hot air in summer can be pre-cooled and in winter pre-heated. This can happen at three different levels: 1520 m3/h, 2000 m3/h or 3000 m3/h.
The pre-heater of the ventilation unit has a power of 5.2 kW with 1700 l/h and temperatures of 0/4 °C. In winter, the pre-heater can transmit a thermal load of 7.4 kW of fresh air with 636 l/h and a temperature of 25/35 °C.
regulation systemThe building was equipped with a building management system provided by the company Kieback & Peter. The city of Ostfildern has already worked with this building automation control company for many years and on altogether around 20 buildings. The youth centre DDC units (Direct Digital Control) are used to manage the different phases of operation.
Additionally there is remote access from the office of the energy manager of the municipality of Ostfildern to operate the building. This device was upgraded to get better access to the data points for the other POLYCITY partners.
Schedules, timetables and set points can be adjusted. Additionally, control actions can be taken by checking existing temperatures, the running mode of pumps, ventilation and regulation-modes.
The technical access is given to:• geothermal heat exchangers• heat exchangers heating/cooling• floor heating /cooling• ventilation• single room regulation• sanitary equipment (sewage lifting unit)
energy controllingAs already in practice in other buildings, the locally well-known Ennovatis system with the “Smartbox” as a data logger was chosen as energy management system. All metered data from heat, cold, electrical and water sensors is being monitored in 15 minute time intervals and transferred via a GPS modem connection to the central evaluation software. An alarm management has been set up and it is planned that frequent reports will be sent to the users of the youth centre.
Additionally a web monitoring system was installed to make consumption values visual for all interested people. With this tool it is easily possible to detect higher consumption or even a broken system, for example a complete failure of the regulation system as at the beginning of January 2010 which was at first not noticed by the users.
building enVeloPeThe level of insulation of the building envelope can be considered almost as good as at the level of the passive house standard. Very low heat demand value were calculated and later on the real consumption values were even lower.
energy consumPtion data During the first measurement periods in the year 2008 and 2009, the youth centre had excellent heating consumption values of around 6700-7000 kWh/a. 2008 was an almost average year in climate conditions and 2009 was even colder than the previous years 2006 and 2007.
On the other hand, electric consumption with around 13 000 kWh/a excluding the electric consumption of the heat pump, is relatively high and efficiency improvements had to be implemented. In 2009 the consumption value could be brought down by about 1000 kWh by lowering the very high illumination level without negative effects for the users.
the supply air is divided up in several parts:Activities room 540 m³/h; 1070m³/h;
2.500 m³/hKitchen 150 m³/hSecondary room 1+2 100 m³/hOffice 1 40 m³/h; 120 m³/hGroup room 1 60 m³/h; 180 m³/hGroup room 2 60 m³/h; 180 m³/hDancing room 100 m³/h; 250 m³/h
used air comes out of:Activities room / kitchen / sanitary rooms
1420 m³/h
Secondary room 1+2 100 m³/h
The consumption values show a significant change in the relation of heat and electricity consumption. For future buildings, electric consumption must be monitored — as done in the youth centre — with various sensors to monitor consumption, e.g. for illumination, technical equipment or other user-defined electrical appliances.
Costs and CO2 emissions are by far higher for electric energy than for heat - especially in Scharnhauser Park with an excellent CO2 factor of the biomass cogeneration plant.
eValuation and conclusionsThe Youth Meeting Centre was until now a big success for Scharnhauser Park. Its architecture and technical concept has been complimented by users and visitors as well as the owners and operators of the building. During the first months and years, the energy consumption values have been outstanding concerning heat energy. Electric consumption has been relatively high, which was also expected because the technical building facilities and illumination are quite expensive in terms of electrical energy.
For POLYCITY, Ostfildern and Scharnhauser Park this building is a real demonstration project to show how to design and operate a beautiful and energy efficient building for young users who are taught about energy and sustainability.
Electric consumption iin L-Quadrat by type.
Opposite: The heat pump with monitoring system in the L-Quadrat.
energy consumption
Heating (kWh/m2)90.0 national regulation50.0 CONCERTOActual measured (gross, not weather adjusted)14.0 200815.0 200920.0 2010
Cooling (kWh/m2)30.0 CONCERTOActual (no cooling equipment) 0.0
Lighting (kWh/m2)12.0 CONCERTOActual measured12.6 200810.9 200910.9 2010
Other electricity (kWh/m2)23.0 CONCERTOActual measured 8.1 2008 7.3 200910.0 2010
Illumination
Technical
Sanitary, DHW
Other equipment
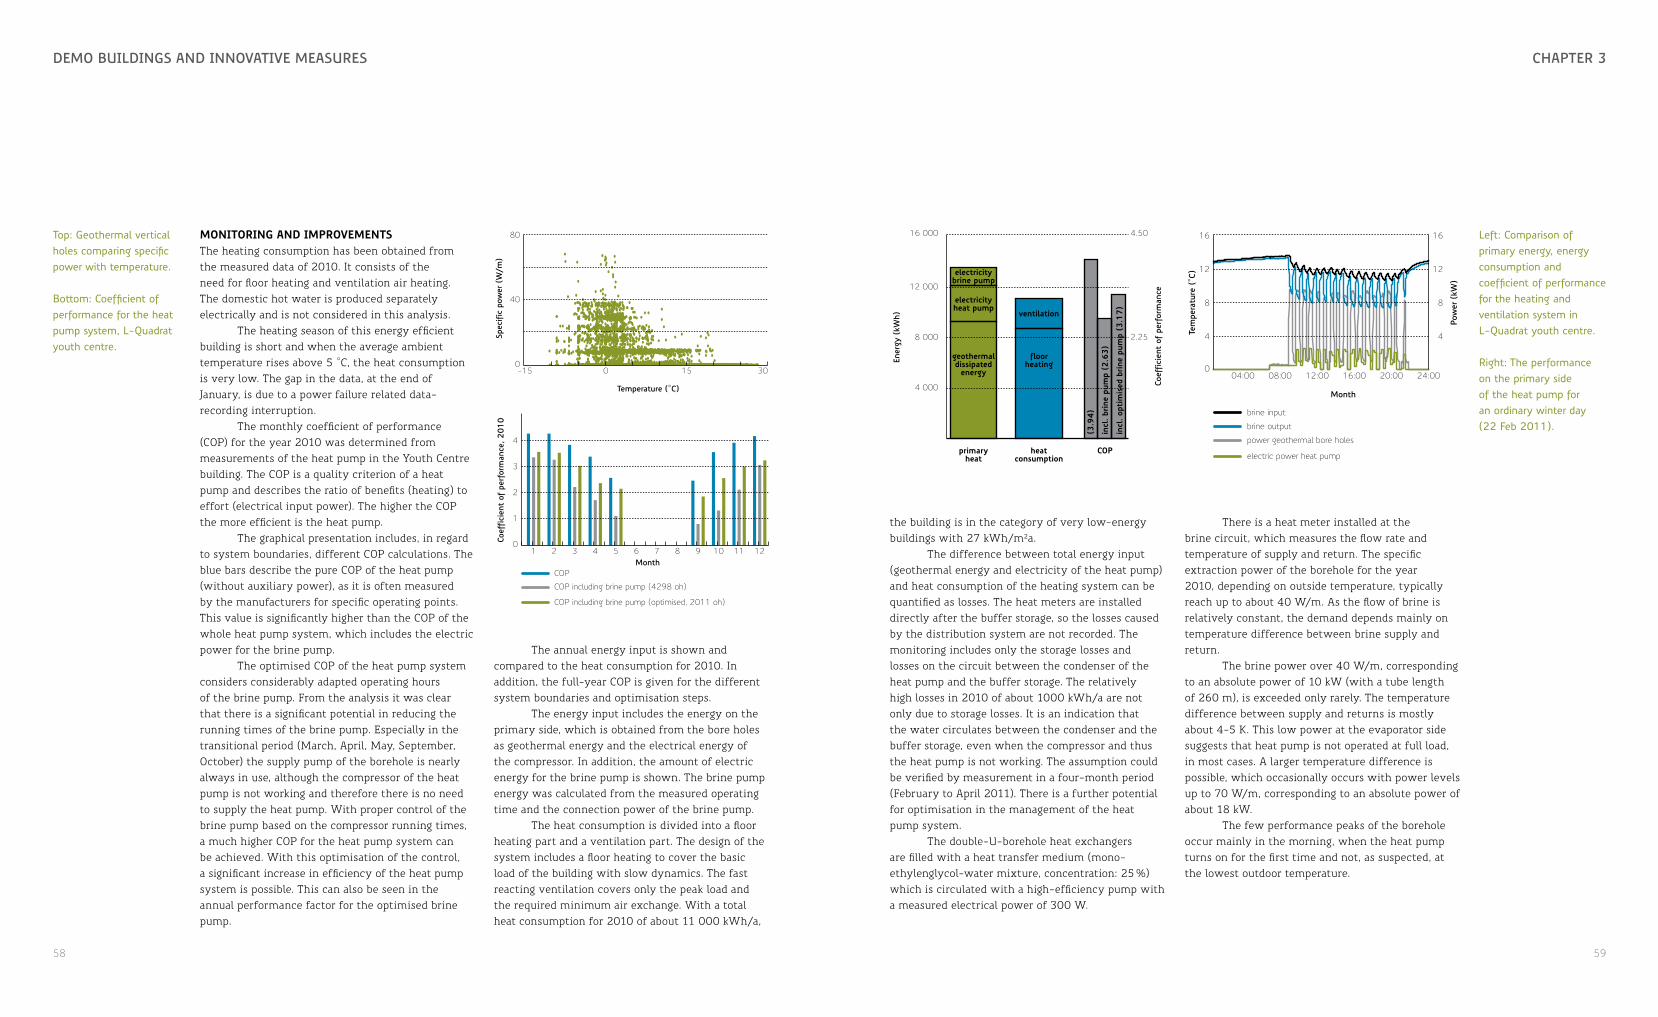
58 59
chaPtEr 3DEmo bUilDings anD innovativE mEasUrEs
monitoring and imProVementsThe heating consumption has been obtained from the measured data of 2010. It consists of the need for floor heating and ventilation air heating. The domestic hot water is produced separately electrically and is not considered in this analysis.
The heating season of this energy efficient building is short and when the average ambient temperature rises above 5 °C, the heat consumption is very low. The gap in the data, at the end of January, is due to a power failure related data-recording interruption.
The monthly coefficient of performance (COP) for the year 2010 was determined from measurements of the heat pump in the Youth Centre building. The COP is a quality criterion of a heat pump and describes the ratio of benefits (heating) to effort (electrical input power). The higher the COP the more efficient is the heat pump.
The graphical presentation includes, in regard to system boundaries, different COP calculations. The blue bars describe the pure COP of the heat pump (without auxiliary power), as it is often measured by the manufacturers for specific operating points. This value is significantly higher than the COP of the whole heat pump system, which includes the electric power for the brine pump.
The optimised COP of the heat pump system considers considerably adapted operating hours of the brine pump. From the analysis it was clear that there is a significant potential in reducing the running times of the brine pump. Especially in the transitional period (March, April, May, September, October) the supply pump of the borehole is nearly always in use, although the compressor of the heat pump is not working and therefore there is no need to supply the heat pump. With proper control of the brine pump based on the compressor running times, a much higher COP for the heat pump system can be achieved. With this optimisation of the control, a significant increase in efficiency of the heat pump system is possible. This can also be seen in the annual performance factor for the optimised brine pump.
The annual energy input is shown and compared to the heat consumption for 2010. In addition, the full-year COP is given for the different system boundaries and optimisation steps.
The energy input includes the energy on the primary side, which is obtained from the bore holes as geothermal energy and the electrical energy of the compressor. In addition, the amount of electric energy for the brine pump is shown. The brine pump energy was calculated from the measured operating time and the connection power of the brine pump.
The heat consumption is divided into a floor heating part and a ventilation part. The design of the system includes a floor heating to cover the basic load of the building with slow dynamics. The fast reacting ventilation covers only the peak load and the required minimum air exchange. With a total heat consumption for 2010 of about 11 000 kWh/a,
Coef
ficie
nt o
f pe
rfor
man
ce, 2
010
Month1 2 3 4 5 6 7 8 9 10 11 12
0
1
2
3
4
COP including brine pump (4298 oh)
COP including brine pump (optimised, 2011 oh)
COP
the building is in the category of very low-energy buildings with 27 kWh/m²a.
The difference between total energy input (geothermal energy and electricity of the heat pump) and heat consumption of the heating system can be quantified as losses. The heat meters are installed directly after the buffer storage, so the losses caused by the distribution system are not recorded. The monitoring includes only the storage losses and losses on the circuit between the condenser of the heat pump and the buffer storage. The relatively high losses in 2010 of about 1000 kWh/a are not only due to storage losses. It is an indication that the water circulates between the condenser and the buffer storage, even when the compressor and thus the heat pump is not working. The assumption could be verified by measurement in a four-month period (February to April 2011). There is a further potential for optimisation in the management of the heat pump system.
The double-U-borehole heat exchangers are filled with a heat transfer medium (mono-ethylenglycol-water mixture, concentration: 25 %) which is circulated with a high-efficiency pump with a measured electrical power of 300 W.
There is a heat meter installed at the brine circuit, which measures the flow rate and temperature of supply and return. The specific extraction power of the borehole for the year 2010, depending on outside temperature, typically reach up to about 40 W/m. As the flow of brine is relatively constant, the demand depends mainly on temperature difference between brine supply and return.
The brine power over 40 W/m, corresponding to an absolute power of 10 kW (with a tube length of 260 m), is exceeded only rarely. The temperature difference between supply and returns is mostly about 4-5 K. This low power at the evaporator side suggests that heat pump is not operated at full load, in most cases. A larger temperature difference is possible, which occasionally occurs with power levels up to 70 W/m, corresponding to an absolute power of about 18 kW.
The few performance peaks of the borehole occur mainly in the morning, when the heat pump turns on for the first time and not, as suspected, at the lowest outdoor temperature.
Top: Geothermal vertical holes comparing specific power with temperature.
Bottom: Coefficient of performance for the heat pump system, L-Quadrat youth centre.
Left: Comparison of primary energy, energy consumption and coefficient of performance for the heating and ventilation system in L-Quadrat youth centre.
Right: The performance on the primary side of the heat pump for an ordinary winter day (22 Feb 2011).
Ener
gy (
kWh)
Coef
ficie
nt o
f pe
rfor
man
ce
ventilation
floorheating
electricityheat pump
geothermaldissipated
energy
primaryheat
heatconsumption
COP
electricitybrine pump
(3.9
4)
incl
. brin
e pu
mp
(2.6
3)
incl
. opt
imis
ed b
rine
pum
p (3
.17)
4 000
8 000
12 000
16 000
2.25
4.50
Tem
pera
ture
(°C
)
Pow
er (
kW)
Month
04:00 08:00 12:00 16:00 20:00 24:000
4
8
12
16
4
8
12
16
power geothermal bore holes
electric power heat pump
brine output
brine input
Spec
ific
pow
er (
W/m
)
Temperature (°C)
-15 0 15 300
40
80

60 61
chaPtEr 3DEmo bUilDings anD innovativE mEasUrEs
sPorts hall
Another architectural award winning building in Scharnhauser Park is the school building in connection with the sports hall. As in the nearby Stadthaus, heat comes from the ORC cogeneration plant. Another similarity to the Stadthaus is the building management system from Kieback & Peter that was installed in the school building in 2001 to regulate all adjacent buildings from one central point. Within the framework of the POLYCITY project, an OPC Server was installed in 2007 to get consumption data from automated readout via the building management system.
The heating consumption of the school and sports hall is quite low and there is almost no potential for energetic renovations. On the other hand, like in the Stadthaus, electric consumption still had potential for energy efficiency measures.
Especially in the sports hall, the consumption values were between 80 000 and 100 000 kWh/a, which is about twice the amount of the consumption of an average sports hall. The high consumption was caused by the inefficient illumination system, which for architectural reasons could not be replaced easily. The system consists of more than sixty 400 W mercury vapour fluorescent lamps. Daylight illumination is totally insufficient, so artificial light is needed during the whole year all day long.
With support from the POLYCITY project, a complex system of presence detectors in combination with the EIB control switches alternates between the two illumination groups. As a result, the electric consumption could be lowered in 2008 to a level of 53 000 kWh/a, which is an impressive reduction. Nevertheless technical problems in combination with bus modules from the building management system and wrong user behaviour by a new caretaker caused high consumption in the first half of 2009. After repairing the bus modules and presence detectors, the consumption fell back to 2008 levels in the second half of 2009.
sports hall, scharnhauser Park, ostfildern, germany
Construction Time2001
Area2565 m2 gross 2206 m2 net
Volume, Ve heated external15 000 m3 net
CostsConstruction22.500 m¤
Energy-related1.125 m¤
Energy demandHeating70.0 kwh/m2 a
Other65.0 kwh/m2 a
Energetic regulationwschVo 1995 - 25 %
energy consumption
Heating (kWh/m2)90.0 national regulation50.0 CONCERTOActual measured (gross, not weather adjusted)23.5 200529.9 200629.8 200742.9 200845.9 2009
Total electricity (kWh/m2)Actual measured38.9 200533.9 200632.0 200720.9 200829.6 2009
Interior of the sports centre, Schule im Park school building, Scharnhauser Park.
Opposite: Monthly consumption data, 2006-2009.
Elec
tric
ity c
onsu
mpt
ion
(MW
h)
Month
1 2 3 4 5 6 7 8 9 10 11 12
2
4
8
10
12
2008
2009
2007
2006
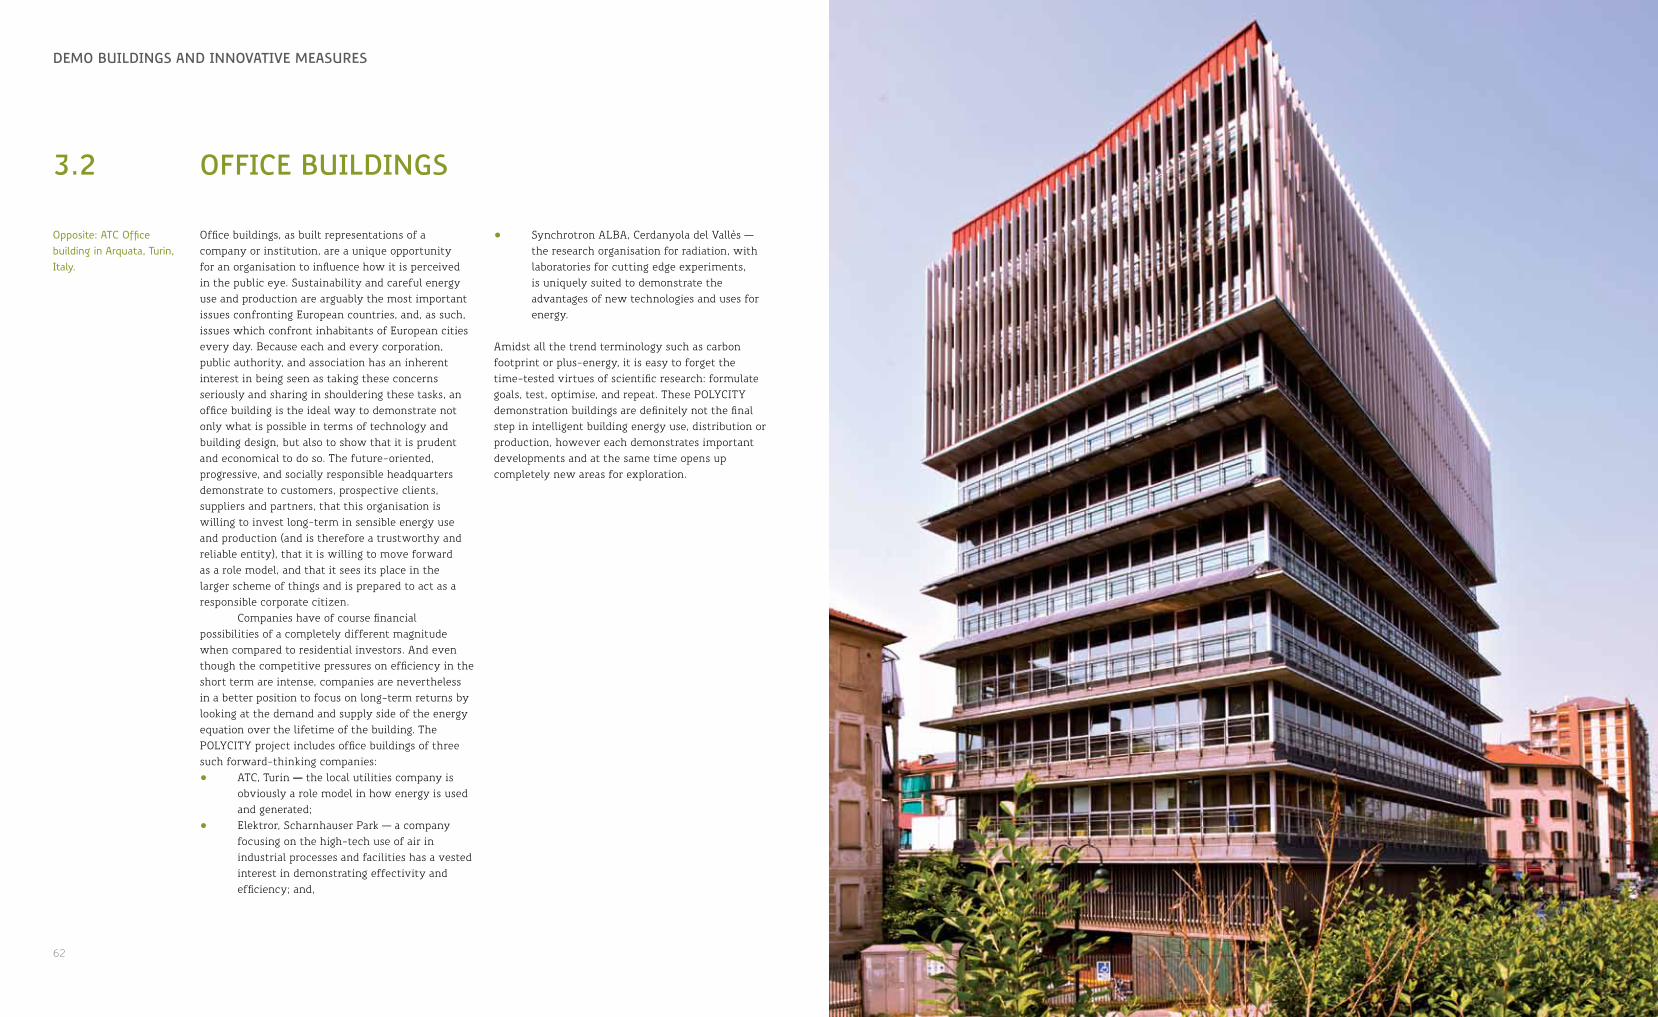
62 63
chaPtEr 1DEmo bUilDings anD innovativE mEasUrEs
3.2 officE bUilDings
Office buildings, as built representations of a company or institution, are a unique opportunity for an organisation to influence how it is perceived in the public eye. Sustainability and careful energy use and production are arguably the most important issues confronting European countries, and, as such, issues which confront inhabitants of European cities every day. Because each and every corporation, public authority, and association has an inherent interest in being seen as taking these concerns seriously and sharing in shouldering these tasks, an office building is the ideal way to demonstrate not only what is possible in terms of technology and building design, but also to show that it is prudent and economical to do so. The future-oriented, progressive, and socially responsible headquarters demonstrate to customers, prospective clients, suppliers and partners, that this organisation is willing to invest long-term in sensible energy use and production (and is therefore a trustworthy and reliable entity), that it is willing to move forward as a role model, and that it sees its place in the larger scheme of things and is prepared to act as a responsible corporate citizen.
Companies have of course financial possibilities of a completely different magnitude when compared to residential investors. And even though the competitive pressures on efficiency in the short term are intense, companies are nevertheless in a better position to focus on long-term returns by looking at the demand and supply side of the energy equation over the lifetime of the building. The POLYCITY project includes office buildings of three such forward-thinking companies:• ATC, Turin — the local utilities company is
obviously a role model in how energy is used and generated;
• Elektror, Scharnhauser Park — a company focusing on the high-tech use of air in industrial processes and facilities has a vested interest in demonstrating effectivity and efficiency; and,
• Synchrotron ALBA, Cerdanyola del Vallès — the research organisation for radiation, with laboratories for cutting edge experiments, is uniquely suited to demonstrate the advantages of new technologies and uses for energy.
Amidst all the trend terminology such as carbon footprint or plus-energy, it is easy to forget the time-tested virtues of scientific research: formulate goals, test, optimise, and repeat. These POLYCITY demonstration buildings are definitely not the final step in intelligent building energy use, distribution or production, however each demonstrates important developments and at the same time opens up completely new areas for exploration.
Opposite: ATC Office building in Arquata, Turin, Italy.
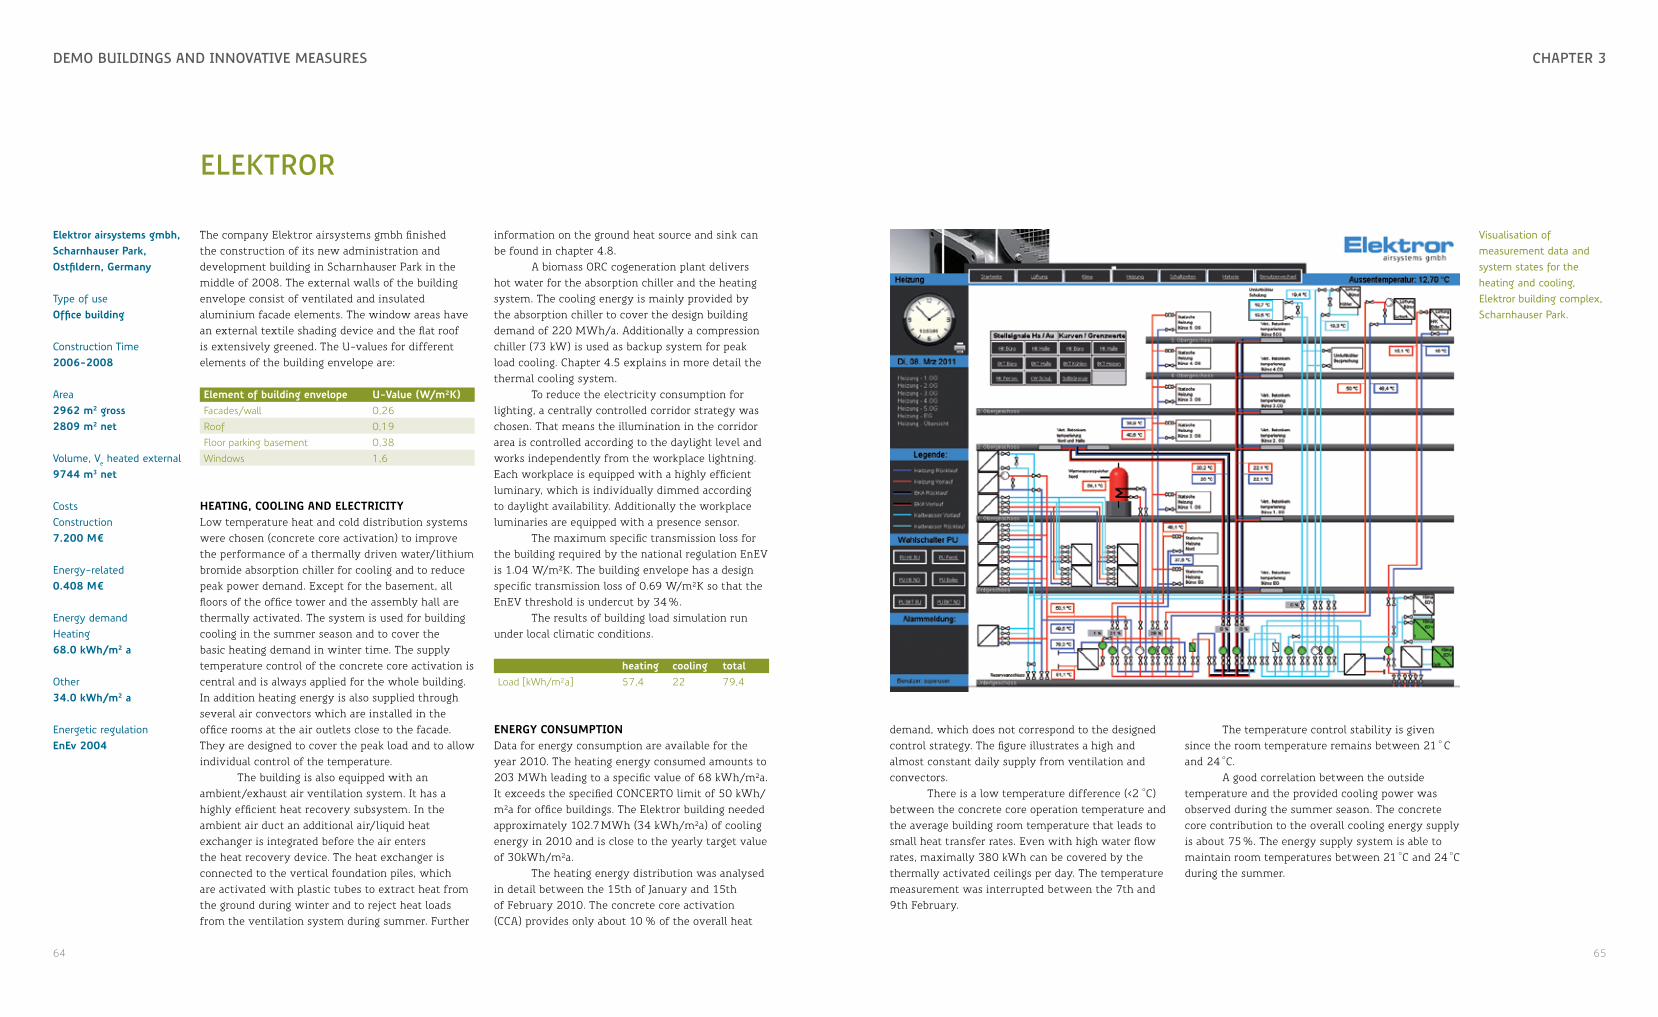
64 65
chaPtEr 3DEmo bUilDings anD innovativE mEasUrEs
ElEktror
The company Elektror airsystems gmbh finished the construction of its new administration and development building in Scharnhauser Park in the middle of 2008. The external walls of the building envelope consist of ventilated and insulated aluminium facade elements. The window areas have an external textile shading device and the flat roof is extensively greened. The U-values for different elements of the building envelope are:
element of building envelope u-Value (w/m²k)Facades/wall 0,26Roof 0,19Floor parking basement 0,38Windows 1,6
heating, cooling and electricityLow temperature heat and cold distribution systems were chosen (concrete core activation) to improve the performance of a thermally driven water/lithium bromide absorption chiller for cooling and to reduce peak power demand. Except for the basement, all floors of the office tower and the assembly hall are thermally activated. The system is used for building cooling in the summer season and to cover the basic heating demand in winter time. The supply temperature control of the concrete core activation is central and is always applied for the whole building. In addition heating energy is also supplied through several air convectors which are installed in the office rooms at the air outlets close to the facade. They are designed to cover the peak load and to allow individual control of the temperature.
The building is also equipped with an ambient/exhaust air ventilation system. It has a highly efficient heat recovery subsystem. In the ambient air duct an additional air/liquid heat exchanger is integrated before the air enters the heat recovery device. The heat exchanger is connected to the vertical foundation piles, which are activated with plastic tubes to extract heat from the ground during winter and to reject heat loads from the ventilation system during summer. Further
demand, which does not correspond to the designed control strategy. The figure illustrates a high and almost constant daily supply from ventilation and convectors.
There is a low temperature difference (<2 °C) between the concrete core operation temperature and the average building room temperature that leads to small heat transfer rates. Even with high water flow rates, maximally 380 kWh can be covered by the thermally activated ceilings per day. The temperature measurement was interrupted between the 7th and 9th February.
elektror airsystems gmbh, scharnhauser Park, ostfildern, germany
Type of useoffice building
Construction Time2006-2008
Area2962 m2 gross 2809 m2 net
Volume, Ve heated external9744 m3 net
CostsConstruction7.200 m¤
Energy-related0.408 m¤
Energy demandHeating68.0 kwh/m2 a
Other34.0 kwh/m2 a
Energetic regulationenev 2004
information on the ground heat source and sink can be found in chapter 4.8.
A biomass ORC cogeneration plant delivers hot water for the absorption chiller and the heating system. The cooling energy is mainly provided by the absorption chiller to cover the design building demand of 220 MWh/a. Additionally a compression chiller (73 kW) is used as backup system for peak load cooling. Chapter 4.5 explains in more detail the thermal cooling system.
To reduce the electricity consumption for lighting, a centrally controlled corridor strategy was chosen. That means the illumination in the corridor area is controlled according to the daylight level and works independently from the workplace lightning. Each workplace is equipped with a highly efficient luminary, which is individually dimmed according to daylight availability. Additionally the workplace luminaries are equipped with a presence sensor.
The maximum specific transmission loss for the building required by the national regulation EnEV is 1.04 W/m²K. The building envelope has a design specific transmission loss of 0.69 W/m²K so that the EnEV threshold is undercut by 34 %.
The results of building load simulation run under local climatic conditions.
heating cooling totalLoad [kWh/m²a] 57,4 22 79,4
energy consumPtionData for energy consumption are available for the year 2010. The heating energy consumed amounts to 203 MWh leading to a specific value of 68 kWh/m²a. It exceeds the specified CONCERTO limit of 50 kWh/m²a for office buildings. The Elektror building needed approximately 102.7 MWh (34 kWh/m²a) of cooling energy in 2010 and is close to the yearly target value of 30kWh/m²a.
The heating energy distribution was analysed in detail between the 15th of January and 15th of February 2010. The concrete core activation (CCA) provides only about 10 % of the overall heat
Visualisation of measurement data and system states for the heating and cooling, Elektror building complex, Scharnhauser Park.
The temperature control stability is given since the room temperature remains between 21 ° C and 24 °C.
A good correlation between the outside temperature and the provided cooling power was observed during the summer season. The concrete core contribution to the overall cooling energy supply is about 75 %. The energy supply system is able to maintain room temperatures between 21 °C and 24 °C during the summer.
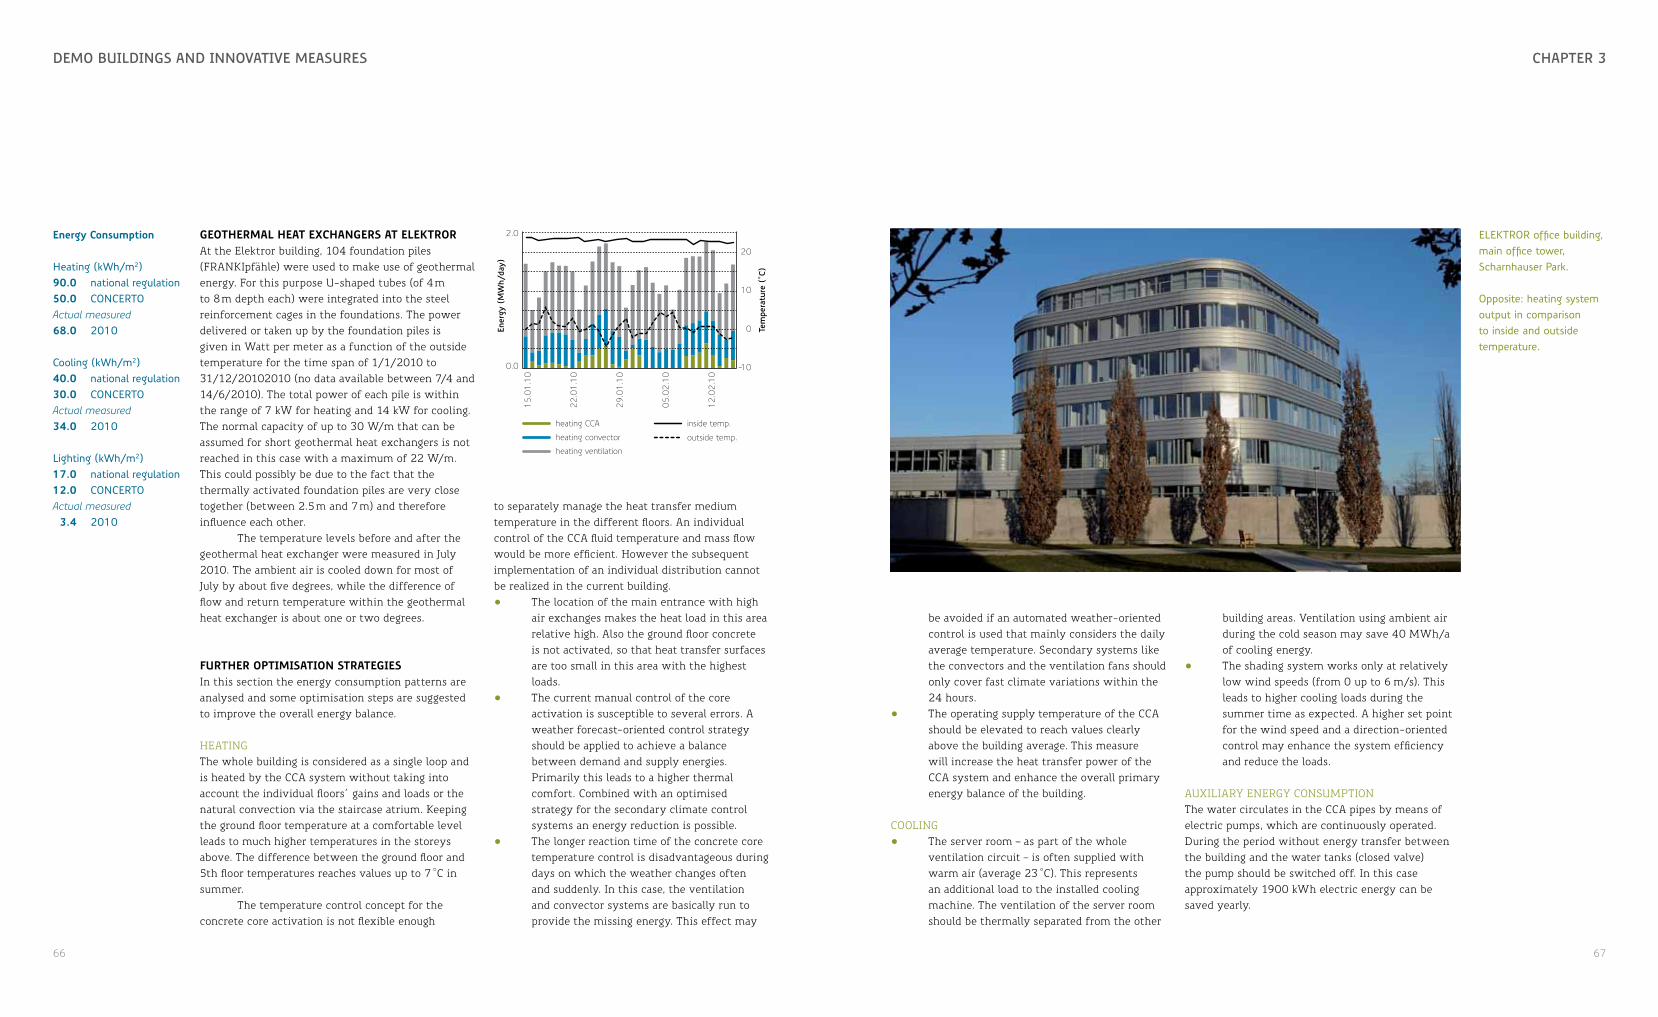
66 67
chaPtEr 3DEmo bUilDings anD innovativE mEasUrEs
geothermal heat eXchangers at elektrorAt the Elektror building, 104 foundation piles (FRANKIpfähle) were used to make use of geothermal energy. For this purpose U-shaped tubes (of 4 m to 8 m depth each) were integrated into the steel reinforcement cages in the foundations. The power delivered or taken up by the foundation piles is given in Watt per meter as a function of the outside temperature for the time span of 1/1/2010 to 31/12/20102010 (no data available between 7/4 and 14/6/2010). The total power of each pile is within the range of 7 kW for heating and 14 kW for cooling. The normal capacity of up to 30 W/m that can be assumed for short geothermal heat exchangers is not reached in this case with a maximum of 22 W/m. This could possibly be due to the fact that the thermally activated foundation piles are very close together (between 2.5 m and 7 m) and therefore influence each other.
The temperature levels before and after the geothermal heat exchanger were measured in July 2010. The ambient air is cooled down for most of July by about five degrees, while the difference of flow and return temperature within the geothermal heat exchanger is about one or two degrees.
further oPtimisation strategiesIn this section the energy consumption patterns are analysed and some optimisation steps are suggested to improve the overall energy balance.
HEATINGThe whole building is considered as a single loop and is heated by the CCA system without taking into account the individual floors gains and loads or the natural convection via the staircase atrium. Keeping the ground floor temperature at a comfortable level leads to much higher temperatures in the storeys above. The difference between the ground floor and 5th floor temperatures reaches values up to 7 °C in summer.
The temperature control concept for the concrete core activation is not flexible enough
be avoided if an automated weather-oriented control is used that mainly considers the daily average temperature. Secondary systems like the convectors and the ventilation fans should only cover fast climate variations within the 24 hours.
• The operating supply temperature of the CCA should be elevated to reach values clearly above the building average. This measure will increase the heat transfer power of the CCA system and enhance the overall primary energy balance of the building.
COOLING• The server room – as part of the whole
ventilation circuit – is often supplied with warm air (average 23 °C). This represents an additional load to the installed cooling machine. The ventilation of the server room should be thermally separated from the other
energy consumption
Heating (kWh/m2)90.0 national regulation50.0 CONCERTOActual measured68.0 2010
Cooling (kWh/m2)40.0 national regulation30.0 CONCERTOActual measured34.0 2010
Lighting (kWh/m2)17.0 national regulation12.0 CONCERTOActual measured 3.4 2010
Ener
gy (
MW
h/da
y)
Tem
pera
ture
(°C
)
15.0
1.1
0
22.0
1.1
0
29.0
1.1
0
05.0
2.1
0
12.0
2.1
0
0.0
2.0
heating ventilation
inside temp.
outside temp.heating convector
heating CCA
10
0
20
-10
to separately manage the heat transfer medium temperature in the different floors. An individual control of the CCA fluid temperature and mass flow would be more efficient. However the subsequent implementation of an individual distribution cannot be realized in the current building. • The location of the main entrance with high
air exchanges makes the heat load in this area relative high. Also the ground floor concrete is not activated, so that heat transfer surfaces are too small in this area with the highest loads.
• The current manual control of the core activation is susceptible to several errors. A weather forecast-oriented control strategy should be applied to achieve a balance between demand and supply energies. Primarily this leads to a higher thermal comfort. Combined with an optimised strategy for the secondary climate control systems an energy reduction is possible.
• The longer reaction time of the concrete core temperature control is disadvantageous during days on which the weather changes often and suddenly. In this case, the ventilation and convector systems are basically run to provide the missing energy. This effect may
building areas. Ventilation using ambient air during the cold season may save 40 MWh/a of cooling energy.
• The shading system works only at relatively low wind speeds (from 0 up to 6 m/s). This leads to higher cooling loads during the summer time as expected. A higher set point for the wind speed and a direction-oriented control may enhance the system efficiency and reduce the loads.
AUXILIARY ENERGY CONSUMPTIONThe water circulates in the CCA pipes by means of electric pumps, which are continuously operated. During the period without energy transfer between the building and the water tanks (closed valve) the pump should be switched off. In this case approximately 1900 kWh electric energy can be saved yearly.
ELEKTROR office building, main office tower, Scharnhauser Park.
Opposite: heating system output in comparison to inside and outside temperature.
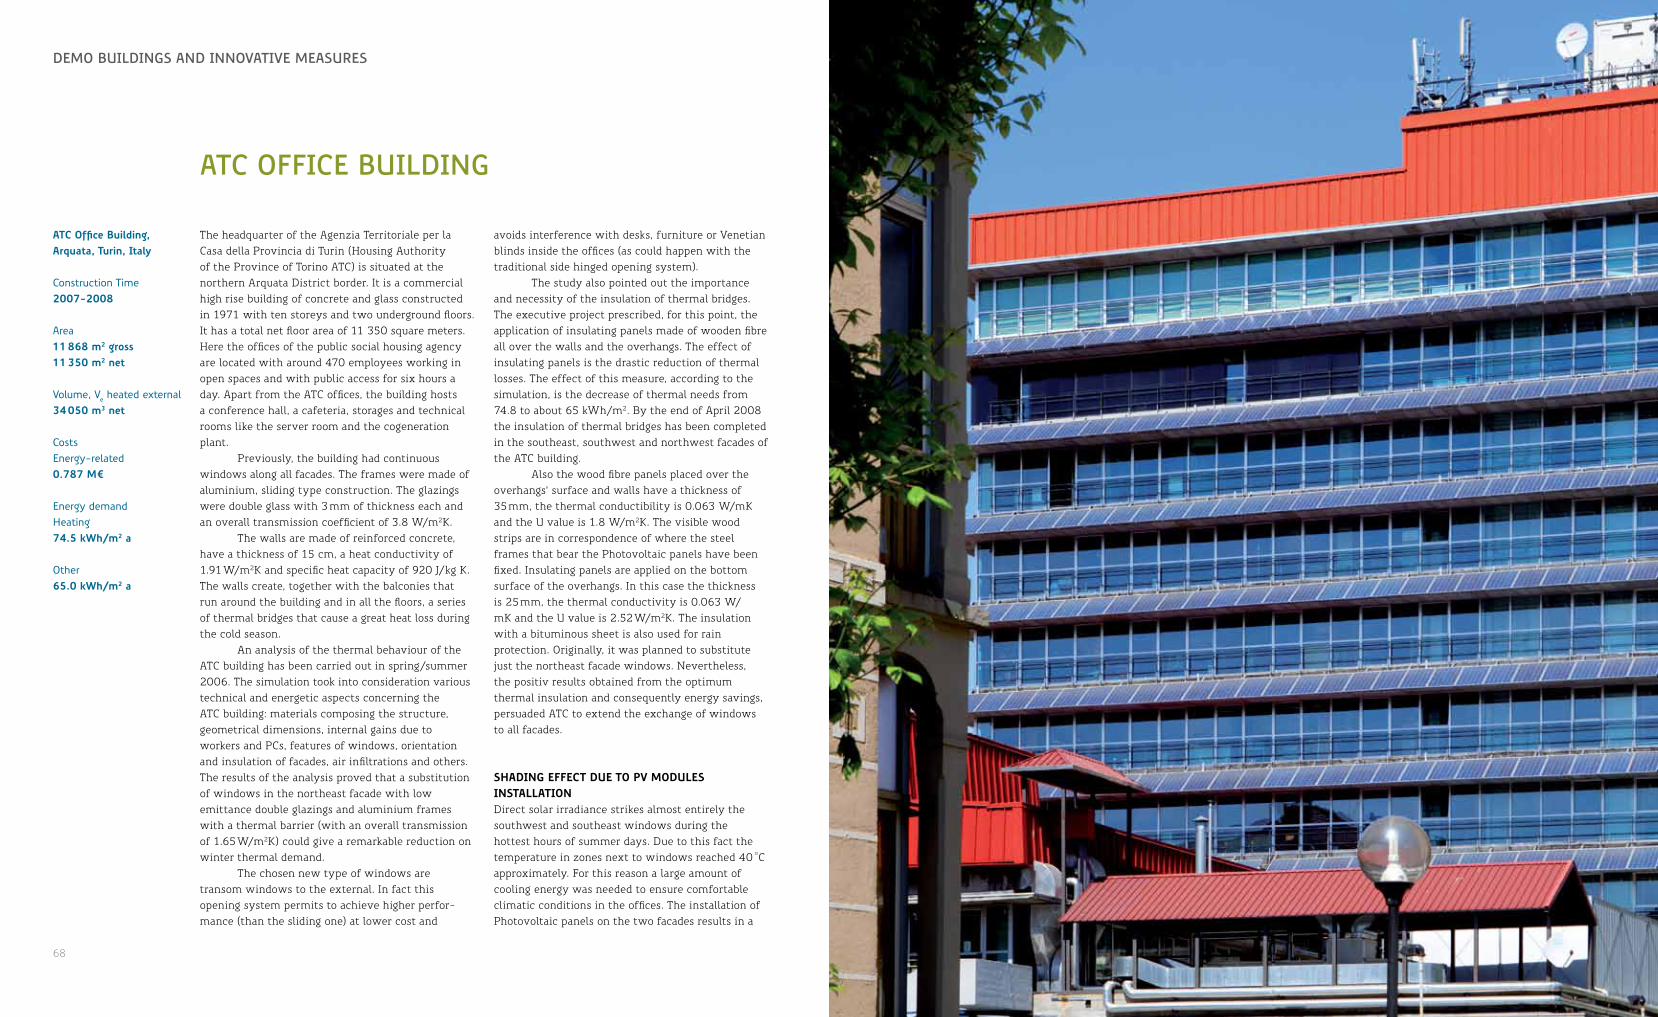
68 69
chaPtEr 1DEmo bUilDings anD innovativE mEasUrEs
atc officE bUilDing
The headquarter of the Agenzia Territoriale per la Casa della Provincia di Turin (Housing Authority of the Province of Torino ATC) is situated at the northern Arquata District border. It is a commercial high rise building of concrete and glass constructed in 1971 with ten storeys and two underground floors. It has a total net floor area of 11 350 square meters. Here the offices of the public social housing agency are located with around 470 employees working in open spaces and with public access for six hours a day. Apart from the ATC offices, the building hosts a conference hall, a cafeteria, storages and technical rooms like the server room and the cogeneration plant.
Previously, the building had continuous windows along all facades. The frames were made of aluminium, sliding type construction. The glazings were double glass with 3 mm of thickness each and an overall transmission coefficient of 3.8 W/m2K.
The walls are made of reinforced concrete, have a thickness of 15 cm, a heat conductivity of 1.91 W/m2K and specific heat capacity of 920 J/kg K. The walls create, together with the balconies that run around the building and in all the floors, a series of thermal bridges that cause a great heat loss during the cold season.
An analysis of the thermal behaviour of the ATC building has been carried out in spring/summer 2006. The simulation took into consideration various technical and energetic aspects concerning the ATC building: materials composing the structure, geometrical dimensions, internal gains due to workers and PCs, features of windows, orientation and insulation of facades, air infiltrations and others. The results of the analysis proved that a substitution of windows in the northeast facade with low emittance double glazings and aluminium frames with a thermal barrier (with an overall transmission of 1.65 W/m2K) could give a remarkable reduction on winter thermal demand.
The chosen new type of windows are transom windows to the external. In fact this opening system permits to achieve higher perfor-mance (than the sliding one) at lower cost and
atc office building, arquata, turin, italy
Construction Time2007-2008
Area11 868 m2 gross 11 350 m2 net
Volume, Ve heated external34 050 m3 net
CostsEnergy-related0.787 m¤
Energy demandHeating74.5 kwh/m2 a
Other65.0 kwh/m2 a
avoids interference with desks, furniture or Venetian blinds inside the offices (as could happen with the traditional side hinged opening system).
The study also pointed out the importance and necessity of the insulation of thermal bridges. The executive project prescribed, for this point, the application of insulating panels made of wooden fibre all over the walls and the overhangs. The effect of insulating panels is the drastic reduction of thermal losses. The effect of this measure, according to the simulation, is the decrease of thermal needs from 74.8 to about 65 kWh/m2. By the end of April 2008 the insulation of thermal bridges has been completed in the southeast, southwest and northwest facades of the ATC building.
Also the wood fibre panels placed over the overhangs’ surface and walls have a thickness of 35 mm, the thermal conductibility is 0.063 W/mK and the U value is 1.8 W/m2K. The visible wood strips are in correspondence of where the steel frames that bear the Photovoltaic panels have been fixed. Insulating panels are applied on the bottom surface of the overhangs. In this case the thickness is 25 mm, the thermal conductivity is 0.063 W/mK and the U value is 2.52 W/m2K. The insulation with a bituminous sheet is also used for rain protection. Originally, it was planned to substitute just the northeast facade windows. Nevertheless, the positiv results obtained from the optimum thermal insulation and consequently energy savings, persuaded ATC to extend the exchange of windows to all facades.
shading effect due to PV modules installation Direct solar irradiance strikes almost entirely the southwest and southeast windows during the hottest hours of summer days. Due to this fact the temperature in zones next to windows reached 40 °C approximately. For this reason a large amount of cooling energy was needed to ensure comfortable climatic conditions in the offices. The installation of Photovoltaic panels on the two facades results in a

70 71
chaPtEr 3DEmo bUilDings anD innovativE mEasUrEs
shading effect for the offices behind them, especially in the middle of the day.
The dynamic building energy simulations mentioned above also included the shading effect of PV panels. Different tilt angles and panels’ positioning have been compared to give the best energetic performance, taking into account the corresponding production of electric energy.
The solution giving the best combined result, also considering architectural aspects and installation constraints, is the one with a tilt angle of 35° and the panels hanging out of the balconies for half their length. The overhangs are thus horizontally extended by 60 cm and consequently the shadowing effect of the windows is amplified.
energy consumPtionThe analysis of the ATC office building heating consumption takes into account the following points:• The ATC Building is an office building
which includes a number of very large spaces difficult to heat, such as a hall open to the public, a conference hall, a lounge with doors open to the public, a mess hall and a warehouse floor. For such spaces the consumption is assumed nearly twice as high as for the offices.
• Heating is also active on Saturdays, when the offices are occupied.
Data for energy consumption are available for the last three years (2007/2008 - 2008/2009 - 2009/2010). The following data show the heating consumption (kWh/m2), considering only the areas used as “office” and normalized to five operating days instead of the real six days a week of functioning.
Thermal cooling for climatisation balances the heat demand over the year and presents a good way to use excessive district heat during the summer. The ATC building needed approximately 293.4 MWh or 26 kWh/m2 of cooling energy in 2010.
energy consumption
Heating (kWh/m2)74.0 national regulation50.0 CONCERTOActual measured64.0 200871.0 200966.0 2010
Cooling (kWh/m2)58.8 national regulation30.6 CONCERTOActual measured22.0 200830.0 200926.0 2010
Total electricity (kWh/m2)Actual measured127.5 2008112.5 2009112.3 2010
Ventilation system in the ATC office buiding.
Preceding: ATC Office building in Arquata, Turin.
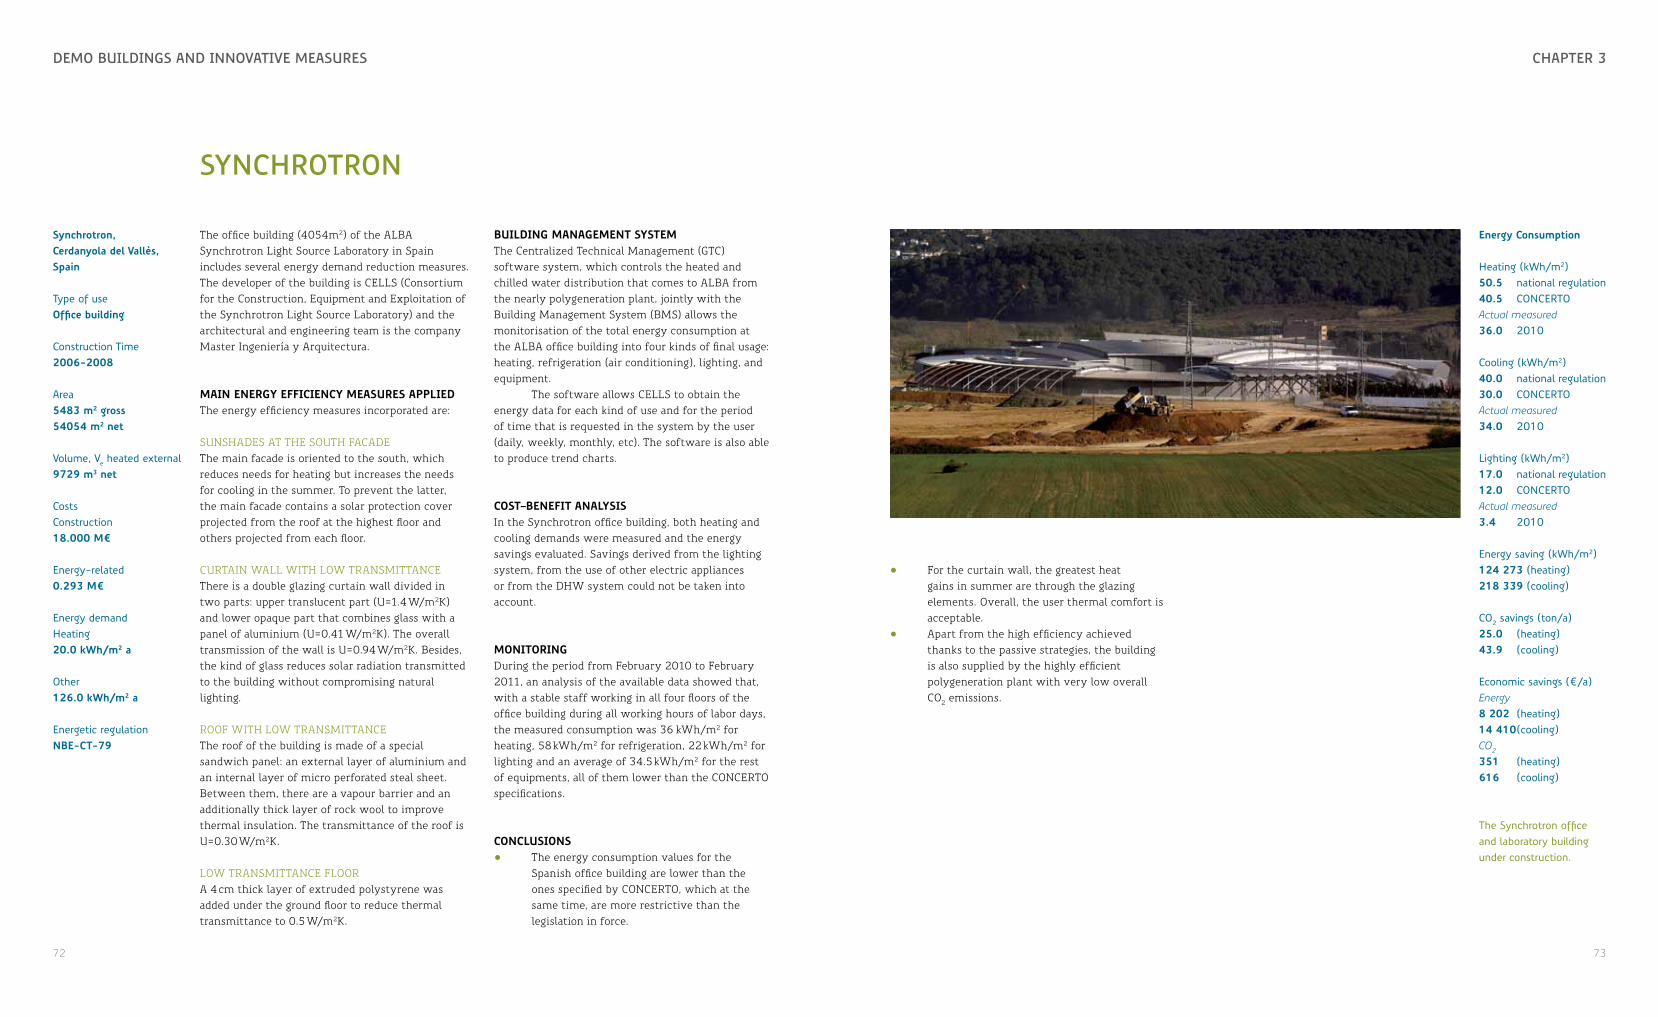
72 73
chaPtEr 3DEmo bUilDings anD innovativE mEasUrEs
synchrotron
The office building (4054m2) of the ALBA Synchrotron Light Source Laboratory in Spain includes several energy demand reduction measures. The developer of the building is CELLS (Consortium for the Construction, Equipment and Exploitation of the Synchrotron Light Source Laboratory) and the architectural and engineering team is the company Master Ingeniería y Arquitectura.
main energy efficiency measures aPPliedThe energy efficiency measures incorporated are:
SUNSHADES AT THE SOUTH FACADEThe main facade is oriented to the south, which reduces needs for heating but increases the needs for cooling in the summer. To prevent the latter, the main facade contains a solar protection cover projected from the roof at the highest floor and others projected from each floor.
CURTAIN WALL WITH LOW TRANSMITTANCEThere is a double glazing curtain wall divided in two parts: upper translucent part (U=1.4 W/m2K) and lower opaque part that combines glass with a panel of aluminium (U=0.41 W/m2K). The overall transmission of the wall is U=0.94 W/m2K. Besides, the kind of glass reduces solar radiation transmitted to the building without compromising natural lighting.
ROOF WITH LOW TRANSMITTANCEThe roof of the building is made of a special sandwich panel: an external layer of aluminium and an internal layer of micro perforated steal sheet. Between them, there are a vapour barrier and an additionally thick layer of rock wool to improve thermal insulation. The transmittance of the roof is U=0.30 W/m2K.
LOW TRANSMITTANCE FLOORA 4 cm thick layer of extruded polystyrene was added under the ground floor to reduce thermal transmittance to 0.5 W/m2K.
• For the curtain wall, the greatest heat gains in summer are through the glazing elements. Overall, the user thermal comfort is acceptable.
• Apart from the high efficiency achieved thanks to the passive strategies, the building is also supplied by the highly efficient polygeneration plant with very low overall CO2 emissions.
synchrotron, cerdanyola del Vallès, spain
Type of useoffice building
Construction Time2006-2008
Area5483 m2 gross 54054 m2 net
Volume, Ve heated external9729 m3 net
CostsConstruction18.000 m¤
Energy-related0.293 m¤
Energy demandHeating20.0 kwh/m2 a
Other126.0 kwh/m2 a
Energetic regulationnbe-ct-79
building management systemThe Centralized Technical Management (GTC) software system, which controls the heated and chilled water distribution that comes to ALBA from the nearly polygeneration plant, jointly with the Building Management System (BMS) allows the monitorisation of the total energy consumption at the ALBA office building into four kinds of final usage: heating, refrigeration (air conditioning), lighting, and equipment.
The software allows CELLS to obtain the energy data for each kind of use and for the period of time that is requested in the system by the user (daily, weekly, monthly, etc). The software is also able to produce trend charts.
cost–benefit analysisIn the Synchrotron office building, both heating and cooling demands were measured and the energy savings evaluated. Savings derived from the lighting system, from the use of other electric appliances or from the DHW system could not be taken into account.
monitoringDuring the period from February 2010 to February 2011, an analysis of the available data showed that, with a stable staff working in all four floors of the office building during all working hours of labor days, the measured consumption was 36 kWh/m2 for heating, 58 kWh/m2 for refrigeration, 22 kWh/m2 for lighting and an average of 34.5 kWh/m2 for the rest of equipments, all of them lower than the CONCERTO specifications.
conclusions• The energy consumption values for the
Spanish office building are lower than the ones specified by CONCERTO, which at the same time, are more restrictive than the legislation in force.
energy consumption
Heating (kWh/m2)50.5 national regulation40.5 CONCERTOActual measured36.0 2010
Cooling (kWh/m2)40.0 national regulation30.0 CONCERTOActual measured34.0 2010
Lighting (kWh/m2)17.0 national regulation12.0 CONCERTOActual measured3.4 2010
Energy saving (kWh/m2)124 273 (heating)218 339 (cooling)
CO2 savings (ton/a)25.0 (heating)43.9 (cooling)
Economic savings (¤/a)Energy8 202 (heating)14 410 (cooling)CO2
351 (heating)616 (cooling)
The Synchrotron office and laboratory building under construction.
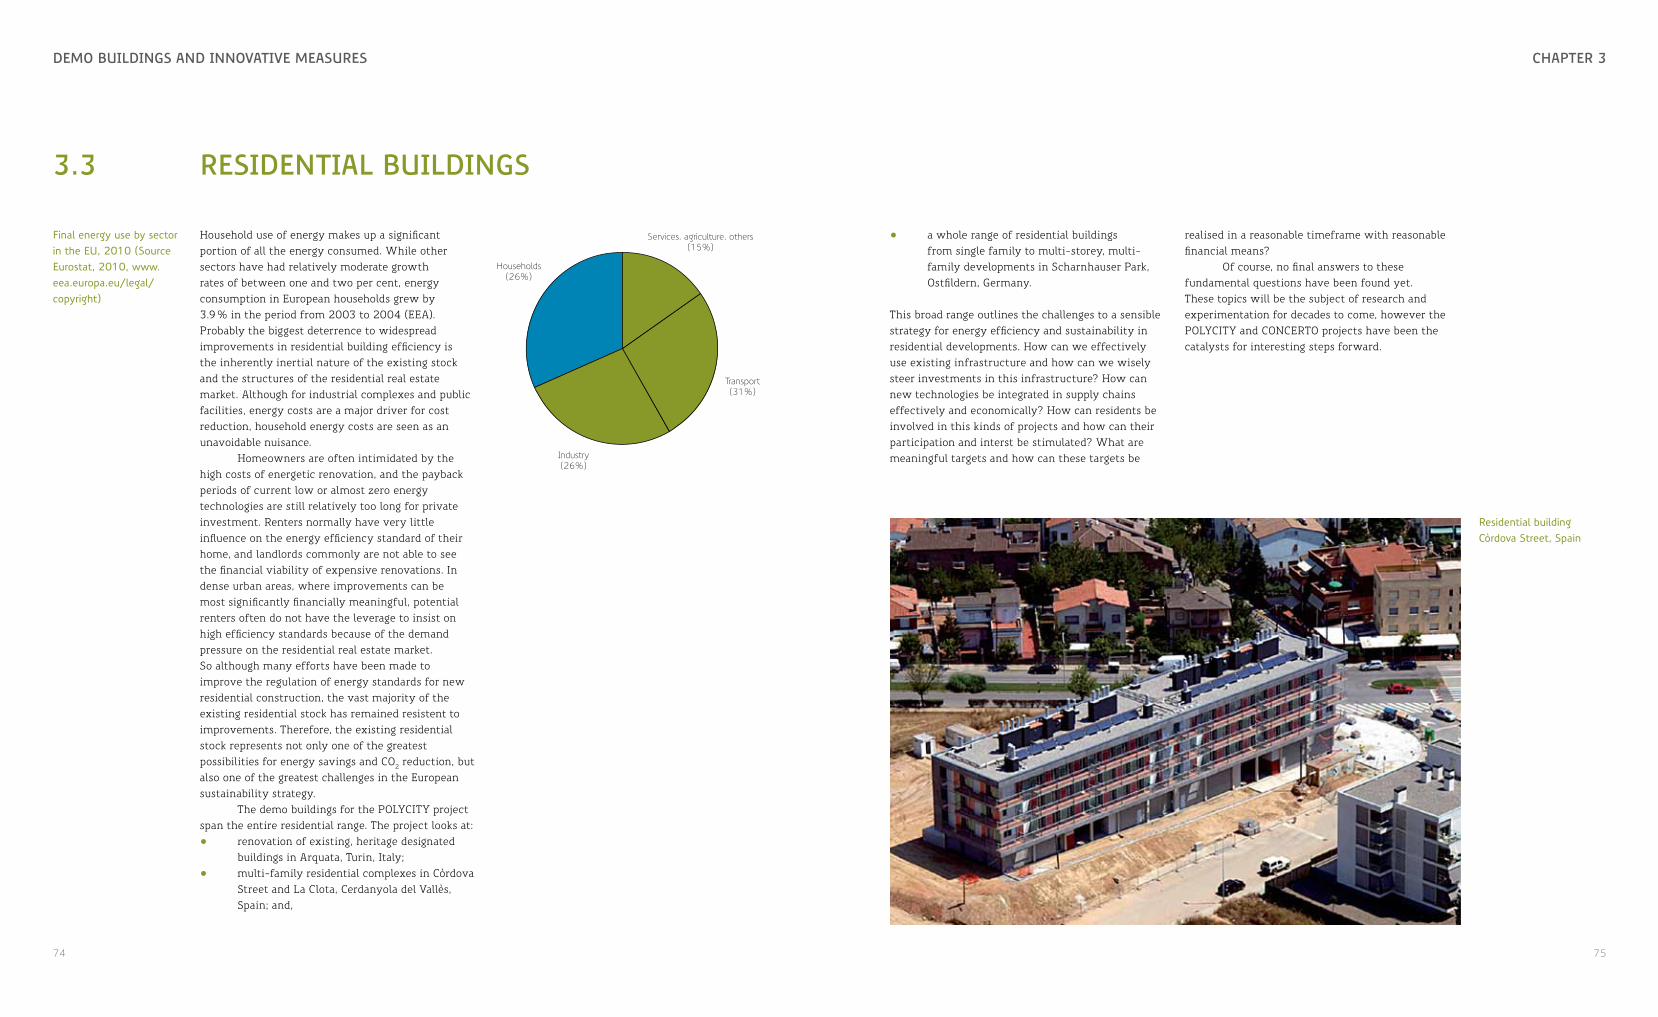
74 75
chaPtEr 3DEmo bUilDings anD innovativE mEasUrEs
3.3 rEsiDEntial bUilDings
Household use of energy makes up a significant portion of all the energy consumed. While other sectors have had relatively moderate growth rates of between one and two per cent, energy consumption in European households grew by 3.9 % in the period from 2003 to 2004 (EEA). Probably the biggest deterrence to widespread improvements in residential building efficiency is the inherently inertial nature of the existing stock and the structures of the residential real estate market. Although for industrial complexes and public facilities, energy costs are a major driver for cost reduction, household energy costs are seen as an unavoidable nuisance.
Homeowners are often intimidated by the high costs of energetic renovation, and the payback periods of current low or almost zero energy technologies are still relatively too long for private investment. Renters normally have very little influence on the energy efficiency standard of their home, and landlords commonly are not able to see the financial viability of expensive renovations. In dense urban areas, where improvements can be most significantly financially meaningful, potential renters often do not have the leverage to insist on high efficiency standards because of the demand pressure on the residential real estate market. So although many efforts have been made to improve the regulation of energy standards for new residential construction, the vast majority of the existing residential stock has remained resistent to improvements. Therefore, the existing residential stock represents not only one of the greatest possibilities for energy savings and CO2 reduction, but also one of the greatest challenges in the European sustainability strategy.
The demo buildings for the POLYCITY project span the entire residential range. The project looks at:• renovation of existing, heritage designated
buildings in Arquata, Turin, Italy;• multi-family residential complexes in Còrdova
Street and La Clota, Cerdanyola del Vallès, Spain; and,
• a whole range of residential buildings from single family to multi-storey, multi-family developments in Scharnhauser Park, Ostfildern, Germany.
This broad range outlines the challenges to a sensible strategy for energy efficiency and sustainability in residential developments. How can we effectively use existing infrastructure and how can we wisely steer investments in this infrastructure? How can new technologies be integrated in supply chains effectively and economically? How can residents be involved in this kinds of projects and how can their participation and interst be stimulated? What are meaningful targets and how can these targets be
Services, agriculture, others(15%)
Households(26%)
Industry(26%)
Transport(31%)
Final energy use by sector in the EU, 2010 (Source Eurostat, 2010, www.eea.europa.eu/legal/copyright)
Residential building Còrdova Street, Spain
realised in a reasonable timeframe with reasonable financial means?
Of course, no final answers to these fundamental questions have been found yet. These topics will be the subject of research and experimentation for decades to come, however the POLYCITY and CONCERTO projects have been the catalysts for interesting steps forward.
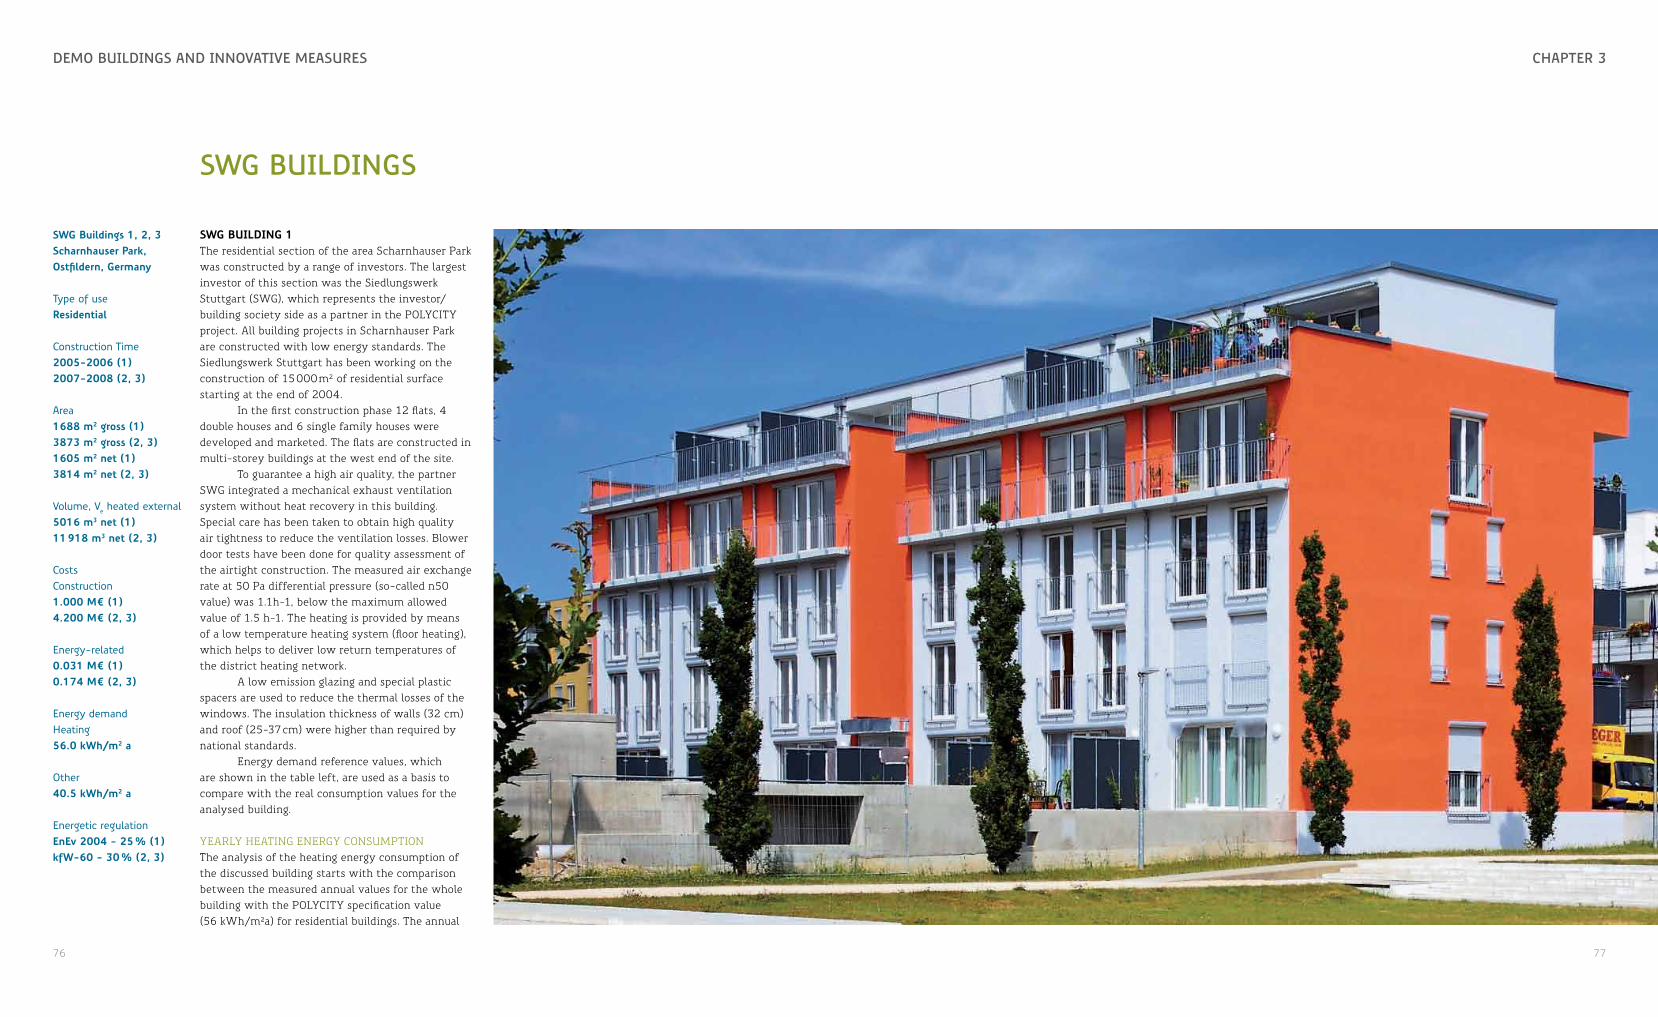
76 77
chaPtEr 3DEmo bUilDings anD innovativE mEasUrEs
swg bUilDings
swg building 1 The residential section of the area Scharnhauser Park was constructed by a range of investors. The largest investor of this section was the Siedlungswerk Stuttgart (SWG), which represents the investor/building society side as a partner in the POLYCITY project. All building projects in Scharnhauser Park are constructed with low energy standards. The Siedlungswerk Stuttgart has been working on the construction of 15 000 m² of residential surface starting at the end of 2004.
In the first construction phase 12 flats, 4 double houses and 6 single family houses were developed and marketed. The flats are constructed in multi-storey buildings at the west end of the site.
To guarantee a high air quality, the partner SWG integrated a mechanical exhaust ventilation system without heat recovery in this building. Special care has been taken to obtain high quality air tightness to reduce the ventilation losses. Blower door tests have been done for quality assessment of the airtight construction. The measured air exchange rate at 50 Pa differential pressure (so-called n50 value) was 1.1h-1, below the maximum allowed value of 1.5 h-1. The heating is provided by means of a low temperature heating system (floor heating), which helps to deliver low return temperatures of the district heating network.
A low emission glazing and special plastic spacers are used to reduce the thermal losses of the windows. The insulation thickness of walls (32 cm) and roof (25-37 cm) were higher than required by national standards.
Energy demand reference values, which are shown in the table left, are used as a basis to compare with the real consumption values for the analysed building.
YEARLY HEATING ENERGY CONSUMPTIONThe analysis of the heating energy consumption of the discussed building starts with the comparison between the measured annual values for the whole building with the POLYCITY specification value (56 kWh/m²a) for residential buildings. The annual
swg buildings 1, 2, 3 scharnhauser Park, ostfildern, germany
Type of useresidential
Construction Time2005-2006 (1)2007-2008 (2, 3)
Area1688 m2 gross (1)3873 m2 gross (2, 3)1605 m2 net (1)3814 m2 net (2, 3)
Volume, Ve heated external5016 m3 net (1)11 918 m3 net (2, 3)
CostsConstruction1.000 m¤ (1)4.200 m¤ (2, 3)
Energy-related0.031 m¤ (1)0.174 m¤ (2, 3)
Energy demandHeating56.0 kwh/m2 a
Other40.5 kwh/m2 a
Energetic regulationenev 2004 - 25 % (1)kfw-60 - 30 % (2, 3)

78 79
chaPtEr 3DEmo bUilDings anD innovativE mEasUrEs
0
10
20
30
40
50
60
70
80
2009 2010200820072006
Hea
ting
ener
gy c
onsu
mpt
ion
in k
Wh/
m2 a
Year
Weather corrected
Annual heating energy consumption
Best value
Weather corrected
Heating energy/ warm water consumption
Hea
ting
ener
gy c
onsu
mpt
ion
in k
Wh/
m2
Month
0
15
Jan
08
Jul 0
8
Jan
09
Jul 0
9
Jan
10
Jul 1
0
Jan
11
Jul 1
1
Hea
ting
ener
gy c
onsu
mpt
ion
in k
Wh
Time of Day
0
5
10
15
20
25
30
Transition: Spring/ Autumn
Summer
Winter
01:0
0
06:0
0
12:0
0
18:0
0
24:0
0
Daily heating energy consumption:Hourly average profiles for the whole building (2009).
Opposite, top: Comparison between measured annual values and POLYCITY building energy specification (BEST) values.
Opposite, bottom: Monthly heating energy consumption data.
heating energy consumption values between the years 2007-2010 fulfil this requirement for heating energy demand. Only in the year 2006 (first year after construction of this building) the required specification value was exceeded.
MONTHLY HEATING ENERGY CONSUMPTIONZafh.net installed the M-Bus data logger in April 2008 to monitor the heating energy consumption of the whole building and of the separate 12 flats in hourly resolution. This system was replaced in July 2008 by a so called TIXI GSM-modem with M-Bus interface and integrated data logger in order to transfer the measured data via email automatically using a mobile phone interface into the zafh.net server.
DAILY HEATING ENERGY CONSUMPTIONThe average daily profiles of the heating energy consumption for the three seasons summer, spring/autumn and winter of 2009 show two peaks of the heating energy consumption occurring in the morning and evening hours. In the afternoon hours (working hours) there is a significant reduction of the heating energy consumed.
DETAILED PERFORMANCE ANALYSIS Two versions of models have been used to calculate the heating energy demand of this building. The first one (model 1) calculates the heating energy demand taking into consideration only the transmission losses through the outer envelope of the building. The second one (model 2) considers the whole energy balance with all heating gains and losses by using the calculation procedure from European Directive DIN V 18599.
The calculation was done using the assumptions of a constant internal temperature of 20 °C, heating limit temperature of 15 °C, internal heat gains of 5 W/m² and air exchange rate of 0.55 1/h. The comparison of the measured and calculated values using model 2 shows a good agreement. Model 1 is not as accurate as model 2.
energy consumption
Heating (kWh/m2)90.0 national regulation56.0 CONCERTOActual measured (1)73.1 200658.1 200755.1 200856.9 200957.0 2010Actual measured (2, 3)48.0 2010
Domestic hot water (kWh/m2)12.5 CONCERTOActual measured (1) 6.5 2006 7.5 200713.0 200811.4 200912.8 2010Actual measured (2, 3)19 2010
Total electricity (kWh/m2)Actual measured (1)20.8 2010
Weather corrected
Model 1
Hea
ting
ener
gy c
onsu
mpt
ion
in k
Wh/
m2
Month
0
12
1 2 3 4 5 6 7 8 9 10 11 12
Model 2
SEPARATE FLATSThe annual heating energy and electricity consumption values for separate flats of the analysed multi-family house are compared to the POLYCITY specification value of 56 kWh/m²a, and the electricity to the POLYCITY specification value of 28 kWh/m²a. Considering the heating energy consumption, more than half of the flats fulfil the required heating energy demand, but there are some flats which considerably exceed the specification value. In case of electricity consumption almost all flats consume less electrical energy than required.
In the next step, a calculation of the hourly heating demand profile using the energy balance method was done, in which standard user behaviour parameters, like set-point temperature of 20 °C, internal gains of 5 W/m² and air exchange rate of 0.55 1/h, were set. This profile was then compared with five example measured hourly profiles of the heating energy consumption.
Although the compared apartments have almost the same constructional properties, the heating energy consumption values differ a lot. The calculated values based on the directive DIN V 18599, which is based on standard user behaviour, shows a reduction of demand from 10.00 h onwards, when solar gains become important. There is a good correlation of measured and calculated values regarding their shape (reduction in the afternoon hours), but most of the flats consume more heating energy than is needed considering the standard user behaviour.
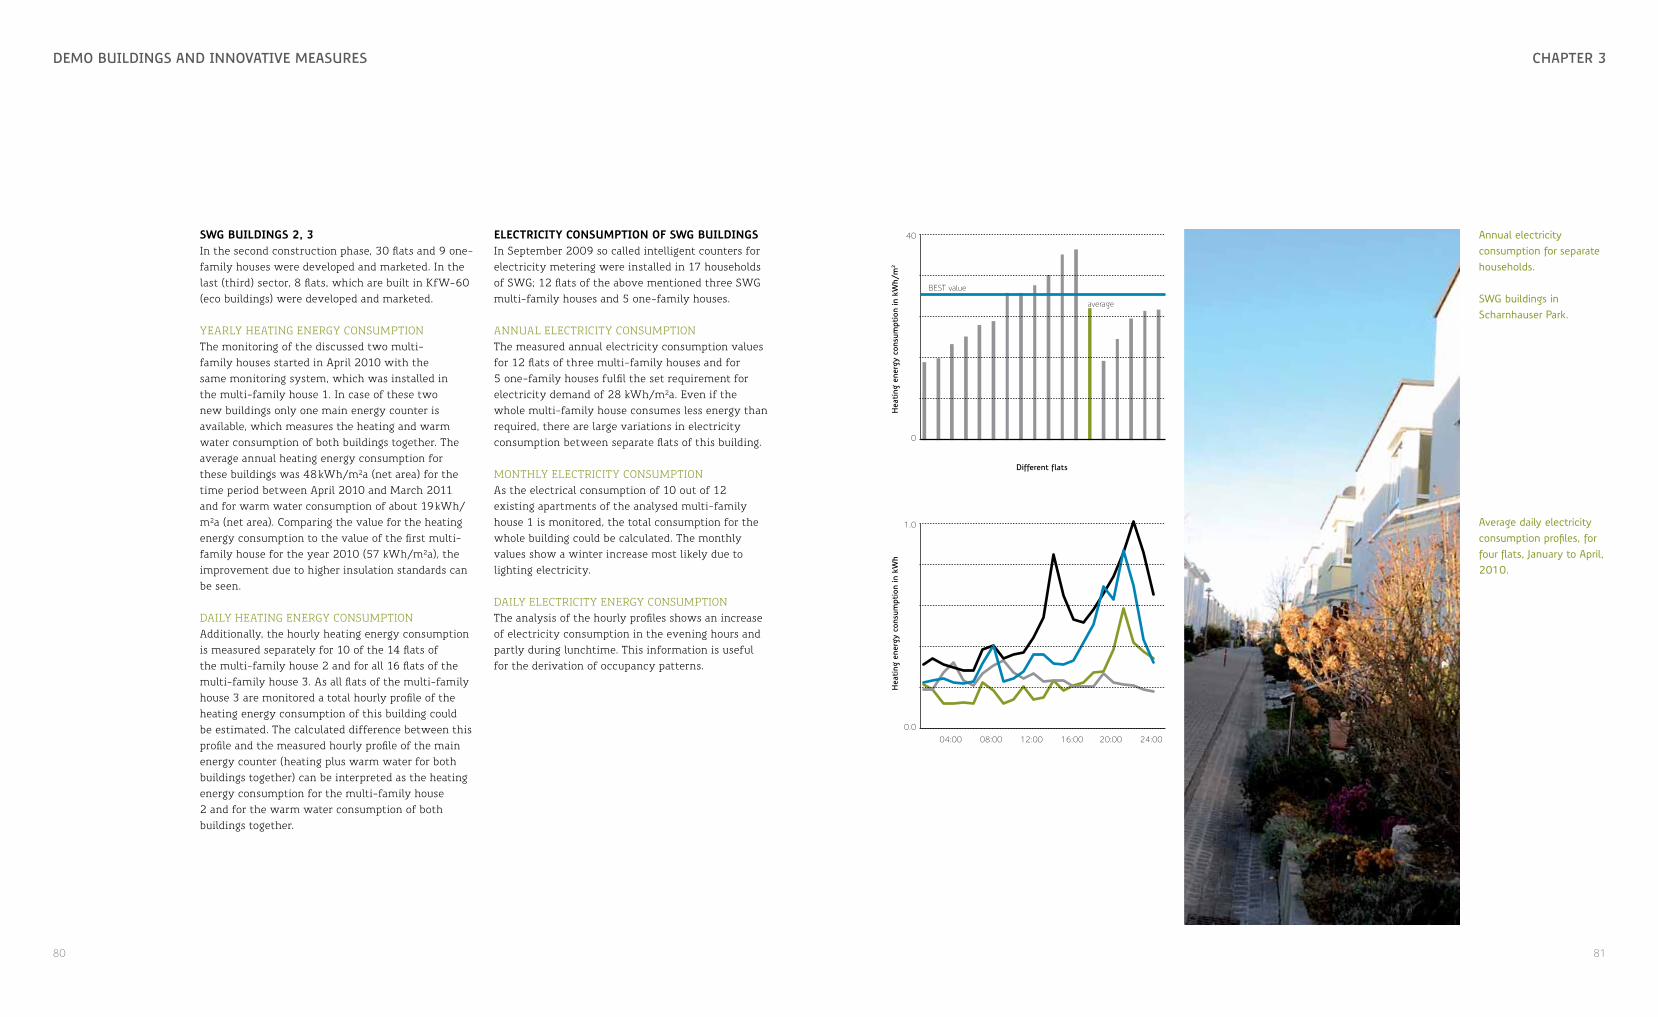
80 81
chaPtEr 3DEmo bUilDings anD innovativE mEasUrEs
swg buildings 2, 3In the second construction phase, 30 flats and 9 one-family houses were developed and marketed. In the last (third) sector, 8 flats, which are built in KfW-60 (eco buildings) were developed and marketed.
YEARLY HEATING ENERGY CONSUMPTIONThe monitoring of the discussed two multi-family houses started in April 2010 with the same monitoring system, which was installed in the multi-family house 1. In case of these two new buildings only one main energy counter is available, which measures the heating and warm water consumption of both buildings together. The average annual heating energy consumption for these buildings was 48 kWh/m²a (net area) for the time period between April 2010 and March 2011 and for warm water consumption of about 19 kWh/m²a (net area). Comparing the value for the heating energy consumption to the value of the first multi-family house for the year 2010 (57 kWh/m²a), the improvement due to higher insulation standards can be seen.
DAILY HEATING ENERGY CONSUMPTIONAdditionally, the hourly heating energy consumption is measured separately for 10 of the 14 flats of the multi-family house 2 and for all 16 flats of the multi-family house 3. As all flats of the multi-family house 3 are monitored a total hourly profile of the heating energy consumption of this building could be estimated. The calculated difference between this profile and the measured hourly profile of the main energy counter (heating plus warm water for both buildings together) can be interpreted as the heating energy consumption for the multi-family house 2 and for the warm water consumption of both buildings together.
electricity consumPtion of swg buildingsIn September 2009 so called intelligent counters for electricity metering were installed in 17 households of SWG; 12 flats of the above mentioned three SWG multi-family houses and 5 one-family houses.
ANNUAL ELECTRICITY CONSUMPTIONThe measured annual electricity consumption values for 12 flats of three multi-family houses and for 5 one-family houses fulfil the set requirement for electricity demand of 28 kWh/m²a. Even if the whole multi-family house consumes less energy than required, there are large variations in electricity consumption between separate flats of this building.
MONTHLY ELECTRICITY CONSUMPTIONAs the electrical consumption of 10 out of 12 existing apartments of the analysed multi-family house 1 is monitored, the total consumption for the whole building could be calculated. The monthly values show a winter increase most likely due to lighting electricity.
DAILY ELECTRICITY ENERGY CONSUMPTIONThe analysis of the hourly profiles shows an increase of electricity consumption in the evening hours and partly during lunchtime. This information is useful for the derivation of occupancy patterns.
Hea
ting
ener
gy c
onsu
mpt
ion
in k
Wh/
m2
Different flats
0
40
BEST value
average
Annual electricity consumption for separate households.
SWG buildings in Scharnhauser Park.
Average daily electricity consumption profiles, for four flats, January to April, 2010.
Hea
ting
ener
gy c
onsu
mpt
ion
in k
Wh
0.0
1.0
04:00 08:00 12:00 16:00 20:00 24:00

number of units
Polycity name(cf. p. 80)
construction time
energy standard area, net(m2)
extra energy related costs total construction costs energy related from total costs(¤/m2) (total ¤) (¤/m2) (total ¤)
Multi-family building 12 SWG Building 1 2005 - 2006 EnEV -25% 1 667 18.50 30 839 1 013 1 690 000 1.8 %
Single family houses 10 - 2005 - 2007 EnEV -25% 2 000 18.50 36 993 877 1 754 000 2.1 %
Row houses 17 - 2006 - 2007 EnEV -25% 3 100 18.50 57 344 919 2 850 000 2.0 %
Multi-family buildings 14 SWG Building 2 2007 - 2009 kfw-60 3 873 45.00 174 281 1 074 4 162 000 4.2 %16 SWG Building 3
Single family houses 9 - 2008 - 2009 EnEV -25% 1 784 20.72 36 964 956 1 707 000 2.2 %
Multi-family building 8 - 2008 - 2009 kfw-60 784 45.00 35 285 1 451 1 138 000 3.1 %
totals 86 13 207 371 705 13 301 000
Summary of data for the SWG residential buildings.

84 85
chaPtEr 3DEmo bUilDings anD innovativE mEasUrEs
arQUata rEsiDEntial bUilDings
Arquata is a densely populated district of the city of Turin, constituted by 42 large council buildings, with approximately 900 dwellings, built at the beginning of the 20th century. The Housing Authority of the Province of Torino (ATC) almost entirely owns and develops the whole district.
Arquata is located close to the city centre of Torino, but is isolated from the surrounding urban areas by physical barriers such as two railway tracks and one bridge. The physical isolation generated a progressive social separation and marginalisation of the district. The social and occupational situation became critical and was accompanied by a progressive urban deterioration. Services and economical activities have been always absent locally.
The demonstration site for POLYCITY covers an area of 87 500 m2 with 30 residential buildings with 622 dwellings. The population involved is between 2500 and 2600 persons, of which 2200–2300 are inhabitants of the council buildings and 300 are employees of ATC.
The POLYCITY project completes the overall Arquata District Contract, a detailed programme including several measures of urban and social requalification carried out in the period from 1998 to 2007, completely approved and funded by the Contractors: Municipality, Region and State.
The POLYCITY project and previous measures introduced new services in the district (space heating, sanitary hot water and increased lighting in the roads), some of which imply an additional energy demand in the council buildings. Appropriate countermeasures on energy demand and supply were studied in order to improve the energy efficiency.
In the council buildings the following measures were introduced:• extra thermal insulation (mainly under the
roof)• low emitting glazing
The selection of the measures was strongly influenced by the constraints to be applied on the
improvement and financial expenditure. Also the window frames have been substituted.
The total window transmission factor (frame plus glass) decreased from Uw = 4 to Uw = 1.6 W/m2K.
cems - communal energy management systemThe most innovative measure is the realisation of the Integrated Energy Manager, named I-CEMS (Italian Communal Energy Management System). It is an automated control system that will enable the energy management of the entire Arquata district, through the local integration of supply and demand. The integration of demand and supply plays a relevant role for the overall sustainability of the POLYCITY measures
Arquata buildings, especially on the facades, due to their historical and architectural value.
The rehabilitation of the Arquata building stock is combined with the difficult task of introducing district heating/cooling networks within a densely populated area. This has socio-economic implications. Apart from very cost effective technological solutions, this rehabilitation project has therefore taken special care of involving the citizens living in the district, who are often reluctant to change.
The Italian community monitors the impact of POLYCITY - and consequently its sustainability - through a general framework that encompasses social, environmental and economic aspects.
main efficiency measures aPPliedTHERMAL INSULATION OF ROOFSA thermal insulation of roofs has been provided for the 30 residential buildings pertaining to the POLYCITY project. These works were completed by February 2006. The insulation has been applied to the floor of the garrets using a layer made of sintered expanded polystyrene. The application of the material pans has been more difficult than usual because of the curvilinear shape of the garrets.
The insulating material used is a product called “BITUROLL AE 20/G2V”. It is an insulating system in rolls, obtained with the coupling of a waterproof membrane of bitumen-polymer and panelists of sintered expanded polystyrene, with a thickness of 30 mm.
APPLICATION OF HIGH EFFICIENCY GLAZINGHigh efficiency glazings have been applied in the ATC owned apartments (on average 2 or 3 frames per apartment and 20-22 for each building with a total of approximately 500 windows). The conventional glazings have been substituted with low emittance glazing on the windows with large surface and mainly on the northeast and southwest sides, since they give the best ratio between energetic/comfort
council district buildings, arquata, turin, italy
Type of useresidential
Construction Time2007-2008
Area35 827 m2 gross 29 855 m2 net
Volume, Ve heated external99 444 m3 net
Costs
Energy-related0.502 m¤
Energy demandHeating62.5 kwh/m2 a
Other17.0 kwh/m2 a
Heating season 2008-09, 2009-10, 2010-11
Hea
ting
ener
gy c
onsu
mpt
ion
in k
Wh/
m2
Individual residential units
120
140
100
80
60
40
20
In fact, the POLYCITY measures have to reach the following goals:• to increase energy efficiency by managing
demand response on a local base;• to increase profitability of energy services by
managing demand response on a local base;• to provide the monitoring service suitable
to support information actions aimed at favouring more rational consumption behaviours by the inhabitants.
heating energy consumPtionAll buildings were monitored for three years within the project. The consumption data shown have not been degree day corrected.
Heating energy consumption comparison of individual units per heating season in Arquata, Turin.

86 87
chaPtEr 1DEmo bUilDings anD innovativE mEasUrEs
The average consumption per square meter of buildings in the Arquata district is higher than the CONCERTO goals of 70 kWh/m2 but better than the national average for existing buildings, that is estimated at 110 kWh/m2. It must be considered that the apartments have an average height of 3.34 meters, while the national average height is 2.70 meters. This means that the same surface heated corresponds to more heated volume in the Arquata dwellings and, consequently, more heating consumption.
As shown on the chart, there are differences in consumption between the various buildings, which can be caused by several factors:• each flat is able to control its temperature by
a digital controller, but there is the possibility that some tenants are not aware of how to use the heating system properly;
• different insulation in the buildings and replacement of windows only in some apartments owned by ATC.
ATC is currently investigating the cause of the rather high consumption, bearing in mind that it is not possible to make changes to the facades, which are listed. ATC is planning to implement new measures to improve energy efficiency without altering the district historical and architectural features: • add another insulation panel with a higher
thickness on the garrets under the roofs;• improve the insulation of the vertical
distribution pipes within the buildings using Light Expanded Clay Aggregate (LECA) after dividing the distribution shafts with horizontal layers.
Moreover, ATC plans to introduce a new tariff policy in order to increase the number of connections to the district heating network.
The monthly thermal consumption in a single apartment is shown for several months on the previous page. The daily variations follow changing weather conditions and the manual regulation
performed by users. Thermal consumption is thus influenced by users’ needs and profiles.
ATC is now conducting a new campaign to check the accuracy of the counters and to train tenants about the regulation of temperature, which is sometimes too high.
energy consumption
Heating (kWh/m2)110.0 national regulation70.0 CONCERTOActual measured (without degree day adjustment)122.0 200784.0 200894.0 200978.0 2010
Domestic hot water (kWh/m2)110.0 national regulation70.0 CONCERTOActual measured (DHW plus losses)77.0 200751.0 200856.0 200946.0 2010
Lighting (kWh/m2)10.0 national regulation10.0 CONCERTOActual measured 3.5 2008

88 89
chaPtEr 3DEmo bUilDings anD innovativE mEasUrEs
la clota
One of the residential buildings in the Spanish part of the POLYCITY project is “Clota Social Residences, Block B” developed by the public company INCASOL and designed by architect Jaime Pastor Sánchez. The building has a built area of 2786 m2 and has 53 dwellings of between 40 and 43 m2 each. These dwellings are designed to be rented to young people.
The energy efficient measures applied to the building are:
INCREASED INSULATION THICKNESSThe envelope of the building has additional insulation thickness, which results in a lower thermal transmittance of the walls than the CONCERTO specification. Besides, the ground floor (adjacent to the underground parking garage) includes a 0.09 m layer of extruded polystyrene with a heat conductivity of 0.034 W/(m2K).
GLAZED GALLERYIn the southwest facade, there is a glazed gallery. Balconies have double glass sliding windows with external blinds on the outside, and one double glass sliding door on the inside. This allows preheating in winter and solar protection in summer.
NATURAL VENTILATIONAll apartments are designed to allow cross ventilation, by having windows in both facades. Furthermore, they have access to a chimney with operable openings, which promotes natural (stack driven) ventilation.
cost–benefit analysisAll buildings involved in the POLYCITY project have been simulated with DesignBuilder in order to predict their energy demand and the savings that they represent compared with conventional buildings. Thus, building energy demand data from simulations was used to determine the economical benefits. Also using the obtained energy savings, the associated
CO2 savings were calculated (in ton CO2/year) and translated into economic terms too.
Only the heating demand was taken into account to calculate the energy savings, as these buildings do not have a cooling system. Savings derived from the lighting system, from the use of other electric appliances or from the DHW system were not taken into account due to the lack of information about these topics.
conclusions• The heating demand of la Clota residential
building is below the requirements of CONCERTO and it represents a remarkable improvement compared with other conventional buildings.
• The reduction of heating demand is mainly due to the envelope optimisation and to the glazed gallery.
• The building does not have any active cooling system. The simulated cooling load is actually low (about 3 kWh/m2·y), but thermal comfort should still be improved in summer, since indoor operative temperatures are predicted to be above 25 ºC during 30 % of the occupied hours.
la clota, cerdanyola del Vallès, spain
Type of useresidential
Construction Time2007-2009
Area3936 m2 gross 2786 m2 net
Volume, Ve heated external5123 m3 net
CostsConstruction4.500 m¤
Energy-related0.119 m¤
Energy demandHeating16.0 kwh/m2 a
Other84.5 kwh/m2 a
Energetic regulationnbe-ct-79
energy consumption
Energy saving (kWh/m2)74 990 (heating)
CO2 savings (ton/a)15.1 (heating)
Economic savings (¤/a)Energy4 949 (heating)CO2
211 (heating)
The La Clota residential building under construction.

90 91
chaPtEr 3DEmo-bUilDings anD innovativE mEasUrEs
còrDova strEEt
monitoringIn the analysis of the building energy consumption the available measured data from all 15 actually occupied dwellings (from the total of 24 dwellings) in the Còrdova residential building have been used. The rest of 9 dwellings are not yet occupied.
The available data used in the analysis comprises the period from October 2010 to January 2011 including measurement data from the two dwellings contracted by INCASOL, data from four other dwellings monitored by CIMNE and data from Gas Natural for the rest of the occupied dwellings in the building.
The data on which the analysis is based includes:• detailed measurement in the two dwellings
described above, frequency of data acquisition: 15 min
• detailed measurement of the electricity (lighting and appliances) and gas in three other dwellings, frequency of data acquisition: 15 min
• total electricity consumption measurement of all occupied dwellings, frequency of data acquisition: 15 min
• the gas consumption of all dwellings is provided by the Gas Natural utility company, frequency of data acquisition: 1 day
From the ratio of the useful energy for heating and the gas consumption the boiler efficiency has been calculated. The boiler efficiency varies between 53 % and 76 %, with an average weighted value of 64.5 %. This value is much lower than the nominal efficiency of 90 % specified by the manufacturer, as the boiler operates usually at partial load. As the same types of boilers (model Roca Neobit 24) are installed in all dwellings in the Còrdova Street building, the estimated boiler efficiency of 65 % has been considered as the representative value to be adopted in the analysis.
The annual specific energy consumption for heating, lighting and electric appliances per square meter was obtained for all of the 24 dwellings with a surface area of 77 m2.
conclusions• Both heating and cooling demand complies
with the requirements set by CONCERTO and the building represents a remarkable improvement compared with other conventional buildings.
• Regarding the heating demand, the improved insulation of the building achieves more savings than the Trombe walls.
• Concerning cooling savings, cross ventilation is the most effective measure. The user thermal comfort is acceptable, also in summer.
Another residential building of the POLYCITY Project in Cerdanyola del Vallès, Spain, has 24 subsidised dwellings rented to families and is located in the Parc de l’Alba. It was also developed by the public company INCASOL and was designed by the Frutos-Sanmartín firm of architects. The building has a built area of 2172m2 with residences with a net usable area of between 71 and 77 m2 each.
main energy efficiency measures aPPliedThe energy efficiency measures applied to the building are:
BUILDING ENVELOPEThe envelope of the building has an additional insulation thickness made of recycled materials, which provides thermal transmittances lower than the CONCERTO specifications:• Walls: U-value < 0.6 W/m2K• Roof: U-value < 0.3 W/m2K• Ground floor: U-value < 0.5 W/m2K
còrdova street, cerdanyola del Vallès, spain
Type of useresidential
Construction Time2007-2009
Area4296 m2 gross 3231 m2 net
Volume, Ve heated external6326 m3 net
CostsConstruction3.457 m¤
Energy-related0.094 m¤
Energy demandHeating10.0 kwh/m2 a
Other84.5 kwh/m2 a
Energetic regulationnbe-ct-79
energy consumption
Heating (kWh/m2)54.0 national regulation43.0 CONCERTOActual measured (gross)27.0 2010
Domestic hot water (kWh/m2)Actual measured (gross) 6.5 2010
Lighting (kWh/m2) 4.5 national regulation 3.0 CONCERTOActual measured (gross) 2.2 2010
Other electricity (kWh/m2)52.5 national regulation47.0 CONCERTOActual measured (gross)19.4 2010
Energy saving (kWh/m2)73 869 (heating)
CO2 savings (ton/a)14.8 (heating)
Economic savings (¤/a)Energy4 875 (heating)CO2
207 (heating)
All windows have double glazing, with a maximum thermal transmittance of 1.3 W/m2K.
TROMBE WALLSAll the flats have modules of Trombe walls in the south facade, that work as thermal collectors. They are constructed with polycarbonate glazing and two adjustable vents on the outside (top and bottom), and cellular concrete with two internal manual dampers added to the top and bottom, to allow natural convection towards the inside. This allows preheating in winter and ventilating the facade in summer. Besides, there are balconies that provide solar protection in summer.
NATURAL VENTILATIONAll the flats are designed to promote natural ventilation, either by having windows in both facades (cross ventilation) or by having access to a chimney with operable openings (stack ventilation).
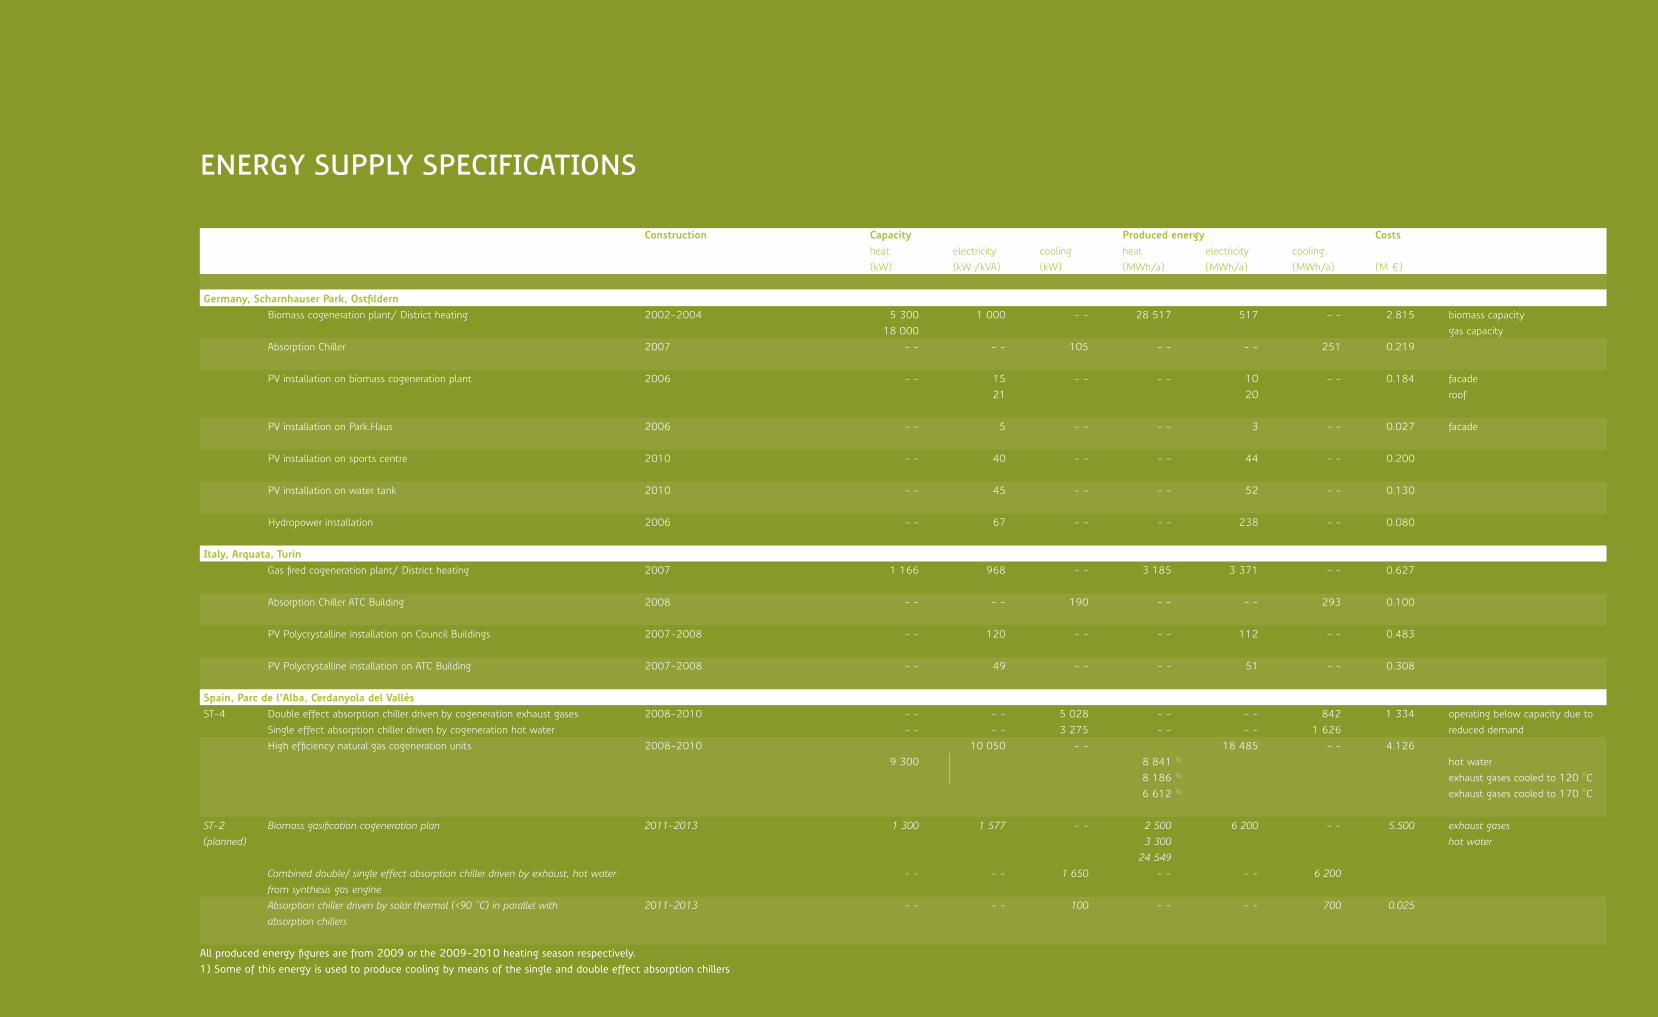
EnErgy sUPPly sPEcifications
construction capacity Produced energy costs heat (kW)
electricity (kW /kVA)
cooling (kW)
heat(MWh/a)
electricity(MWh/a)
cooling(MWh/a) (M ¤)
germany, scharnhauser Park, ostfildernBiomass cogeneration plant/ District heating 2002-2004 5 300
18 0001 000 - - 28 517 517 - - 2.815 biomass capacity
gas capacityAbsorption Chiller 2007 - - - - 105 - - - - 251 0.219
PV installation on biomass cogeneration plant 2006 - - 1521
- - - - 10 20
- - 0.184 facaderoof
PV installation on Park.Haus 2006 - - 5 - - - - 3 - - 0.027 facade
PV installation on sports centre 2010 - - 40 - - - - 44 - - 0.200
PV installation on water tank 2010 - - 45 - - - - 52 - - 0.130
Hydropower installation 2006 - - 67 - - - - 238 - - 0.080
italy, arquata, turinGas fired cogeneration plant/ District heating 2007 1 166 968 - - 3 185 3 371 - - 0.627
Absorption Chiller ATC Building 2008 - - - - 190 - - - - 293 0.100
PV Polycrystalline installation on Council Buildings 2007-2008 - - 120 - - - - 112 - - 0.483
PV Polycrystalline installation on ATC Building 2007-2008 - - 49 - - - - 51 - - 0.308
spain, Parc de l’alba, cerdanyola del VallèsST-4 Double effect absorption chiller driven by cogeneration exhaust gases
Single effect absorption chiller driven by cogeneration hot water2008-2010 - -
- -- -- -
5 0283 275
- -- -
- -- -
8421 626
1 334 operating below capacity due to reduced demand
High efficiency natural gas cogeneration units 2008-2010 10 050 - - 18 485 - - 4.1269 300 8 841 1) hot water
8 186 1) exhaust gases cooled to 120 °C6 612 1) exhaust gases cooled to 170 °C
ST-2(planned)
Biomass gasification cogeneration plan
Combined double/ single effect absorption chiller driven by exhaust, hot water from synthesis gas engine
2011-2013 1 300
- -
1 577
- -
- -
1 650
2 5003 300
24 549- -
6 200
- -
- -
6 200
5.500 exhaust gaseshot water
Absorption chiller driven by solar thermal (<90 °C) in parallel with absorption chillers
2011-2013 - - - - 100 - - - - 700 0.025
All produced energy figures are from 2009 or the 2009-2010 heating season respectively.1) Some of this energy is used to produce cooling by means of the single and double effect absorption chillers
EnErgy sUPPly — concEPts anD PErformancEBarbara Bellioso, Ilyes BenHassine, Carlos Dapena González, Éric Duminil, Tobias Erhart, Luca Giaccone, Alessandra Guerrisi, Marc Hagenloch, Uli Jakob, Jesús López Villada, Maria Puig Arnavat, Rafal Strzalka
with Ursula Eicker and Silvio Barta

96 97
chaPtEr 4EnErgy sUPPly – concEPts anD PErformancE
4.1 biomass cogEnEration
In the early 1990s the energy supply system for Scharnhauser Park had been modernised on behalf of the US Government. The hard coal fired furnaces were replaced by gas boilers (11 MW and 5 MW) and the energy supply company Stadtwerke Esslingen (SWE) have been charged with the operation of the boilers. In 1993 SWE took over the energy systems of Nellingen Barracks from the US Forces, at that time the network was supplied with steam. The former infrastructure has been taken out of operation and was replaced by a new hot water network. The structure of the heating network was coordinated with the development plan of the road system in this area. The district heating consists of three major loops connecting several side branches with each other. The topology is not homogeneous and therefore various pump and valve stations in the network are necessary to control the operation.
GAS BOILERS With the installation of the 6 MW biomass furnace in 2004 one of the previous 9 MW gas boilers has been replaced. The installed peak power until 2010 was 24 MW. The second gas boiler has been replaced by a 9 MW system. For the security of supply two liquid gas tanks with a capacity of 170 m. each have been installed. The gas boilers serve now as redundancy for revision periods and for peak load coverage.
BIOMASS COMBUSTION Biomass is widely used for energy purposes and it is believed that energetic utilisation of solid biomass will become the major contributor to the global energy balance among renewable energy sources. Within the conversion technologies, biomass combustion is the most mature and market-proven technology, which provides over 90 % of the total energy generated from biomass1. The main advantage of biomass combustion is the relatively high efficiency of modern furnaces and the economic feasibility of bioenergy projects. However, problems still occur due to changing fuel properties and unstable operation of biomass combustion systems2.
Biomass wood chip combustion utilizing a grate furnace with 7 MW maximum thermal output.
Combustion with multiple recirculation vents, multi cyclone and electric filter system, Economiser for
Electric cogeneration based upon ORC-technology. 1000 kVA maximum design power.
Temperature levels: 300 °C (feeding primary), 240 °C (return primary), 70 °C (district heating feeding), 55 °C (district heating return).
Further ORC features: Recuperator, single stage turbine, silicone oil MDM as cycle fluid
Diagram of the biomass facility in Scharnhauser Park. The storage and the furnace are shown in the front. The building in the background is the turbine house where the gas boilers are situated as well. The scheme shows delivery zone, furnace and exhaust treatment.
To meet the growing requirements for conversion efficiency, ease of operation and stability of the combustion process it is necessary to continuously develop the biomass combustion systems. This development should be based on practical experience from existing biomass combustion plants.
BIOMASS GRATE FURNACE The core of the Scharnhauser Park is a state of the art biomass grate furnace, which serves as the thermal energy source for the ORC module, where electricity is generated. In fact, the biomass boiler can be seen as the “masterpiece” of the conversion system as its efficiency influences substantially the overall system efficiency. The main purpose of the biomass combustion system is to keep the thermal efficiency as high as possible and prevent, among others, problems related to fouling and slagging, which can be produced by biofuels.
Grate firing is one of the mainly used technologies for biomass combustion, as it combines high efficiency with reasonable investment and
operating costs. Biomass furnaces can deal with varying fuel properties and thus represent a promising alternative for energy generation from biomass3. In large-scale biomass combustion appliances separation of different stages of thermal decomposition of the fuel on the grate as well as staged air combustion are applied, where the combustion air supply in the combustion chamber is divided into sections according to the requirements of the individual steps of thermal decomposition of the fuel on the grate. This complex combustion air management allows smooth operation of grate furnaces at partial load down to the 25 % of the nominal load4. In modern biomass furnaces staged air combustion is also applied in order to simultaneously reduce both the emissions from incomplete combustion and NOx emissions. The combustion chamber is divided into primary and secondary zone. In the primary zone thermal decomposition of the biomass on the grate occurs in fuel-rich conditions (.<1), where the heat release from the fuel bed is determined by the amount of air fed to the grate
Biomass cogeneration plant, Scharnhauser Park.
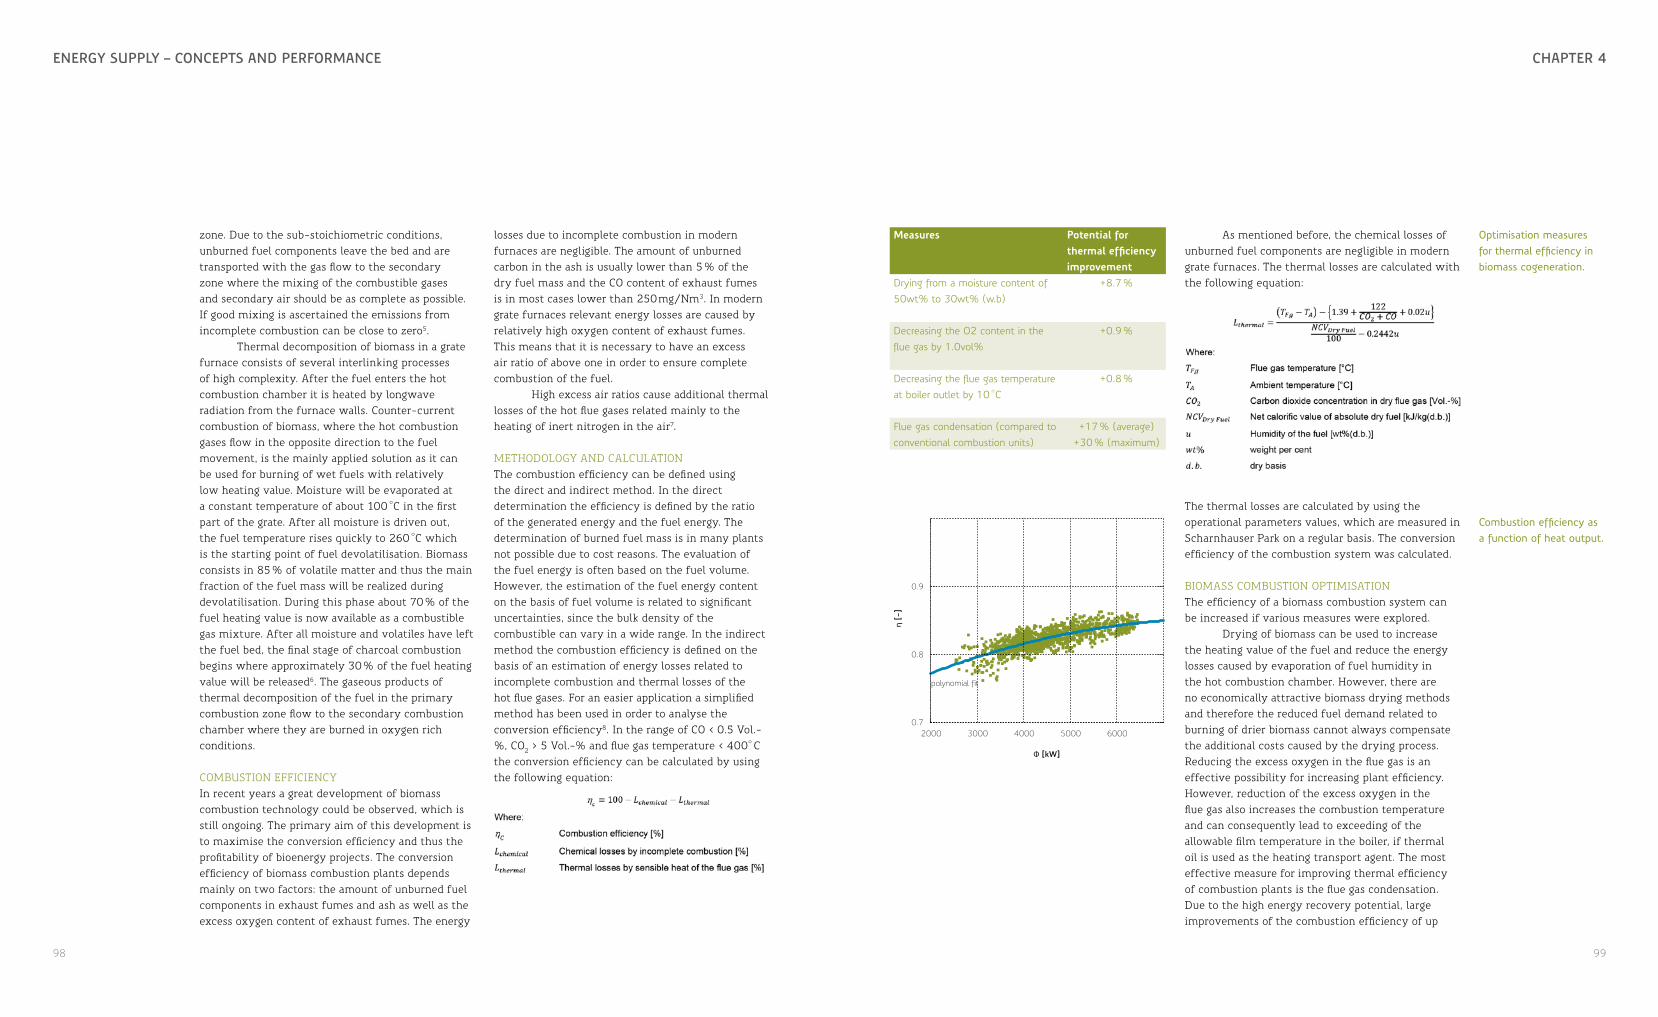
98 99
chaPtEr 4EnErgy sUPPly – concEPts anD PErformancE
zone. Due to the sub-stoichiometric conditions, unburned fuel components leave the bed and are transported with the gas flow to the secondary zone where the mixing of the combustible gases and secondary air should be as complete as possible. If good mixing is ascertained the emissions from incomplete combustion can be close to zero5.
Thermal decomposition of biomass in a grate furnace consists of several interlinking processes of high complexity. After the fuel enters the hot combustion chamber it is heated by longwave radiation from the furnace walls. Counter-current combustion of biomass, where the hot combustion gases flow in the opposite direction to the fuel movement, is the mainly applied solution as it can be used for burning of wet fuels with relatively low heating value. Moisture will be evaporated at a constant temperature of about 100 °C in the first part of the grate. After all moisture is driven out, the fuel temperature rises quickly to 260 °C which is the starting point of fuel devolatilisation. Biomass consists in 85 % of volatile matter and thus the main fraction of the fuel mass will be realized during devolatilisation. During this phase about 70 % of the fuel heating value is now available as a combustible gas mixture. After all moisture and volatiles have left the fuel bed, the final stage of charcoal combustion begins where approximately 30 % of the fuel heating value will be released6. The gaseous products of thermal decomposition of the fuel in the primary combustion zone flow to the secondary combustion chamber where they are burned in oxygen rich conditions.
COMBUSTION EFFICIENCY In recent years a great development of biomass combustion technology could be observed, which is still ongoing. The primary aim of this development is to maximise the conversion efficiency and thus the profitability of bioenergy projects. The conversion efficiency of biomass combustion plants depends mainly on two factors: the amount of unburned fuel components in exhaust fumes and ash as well as the excess oxygen content of exhaust fumes. The energy
losses due to incomplete combustion in modern furnaces are negligible. The amount of unburned carbon in the ash is usually lower than 5 % of the dry fuel mass and the CO content of exhaust fumes is in most cases lower than 250 mg/Nm3. In modern grate furnaces relevant energy losses are caused by relatively high oxygen content of exhaust fumes. This means that it is necessary to have an excess air ratio of above one in order to ensure complete combustion of the fuel.
High excess air ratios cause additional thermal losses of the hot flue gases related mainly to the heating of inert nitrogen in the air7.
METHODOLOGY AND CALCULATION The combustion efficiency can be defined using the direct and indirect method. In the direct determination the efficiency is defined by the ratio of the generated energy and the fuel energy. The determination of burned fuel mass is in many plants not possible due to cost reasons. The evaluation of the fuel energy is often based on the fuel volume. However, the estimation of the fuel energy content on the basis of fuel volume is related to significant uncertainties, since the bulk density of the combustible can vary in a wide range. In the indirect method the combustion efficiency is defined on the basis of an estimation of energy losses related to incomplete combustion and thermal losses of the hot flue gases. For an easier application a simplified method has been used in order to analyse the conversion efficiency8. In the range of CO < 0.5 Vol.-%, CO2 > 5 Vol.-% and flue gas temperature < 400° C the conversion efficiency can be calculated by using the following equation:
As mentioned before, the chemical losses of unburned fuel components are negligible in modern grate furnaces. The thermal losses are calculated with the following equation:
The thermal losses are calculated by using the operational parameters values, which are measured in Scharnhauser Park on a regular basis. The conversion efficiency of the combustion system was calculated.
BIOMASS COMBUSTION OPTIMISATION The efficiency of a biomass combustion system can be increased if various measures were explored.
Drying of biomass can be used to increase the heating value of the fuel and reduce the energy losses caused by evaporation of fuel humidity in the hot combustion chamber. However, there are no economically attractive biomass drying methods and therefore the reduced fuel demand related to burning of drier biomass cannot always compensate the additional costs caused by the drying process. Reducing the excess oxygen in the flue gas is an effective possibility for increasing plant efficiency. However, reduction of the excess oxygen in the flue gas also increases the combustion temperature and can consequently lead to exceeding of the allowable film temperature in the boiler, if thermal oil is used as the heating transport agent. The most effective measure for improving thermal efficiency of combustion plants is the flue gas condensation. Due to the high energy recovery potential, large improvements of the combustion efficiency of up
measures Potential for thermal efficiency improvement
Drying from a moisture content of 50wt% to 30wt% (w.b)
+8.7 %
Decreasing the O2 content in the flue gas by 1.0vol%
+0.9 %
Decreasing the flue gas temperature at boiler outlet by 10 °C
+0.8 %
Flue gas condensation (compared to conventional combustion units)
+17 % (average)+30 % (maximum)
Optimisation measures for thermal efficiency in biomass cogeneration.
Φ [kW]
η [-
]
polynomial fit
0.7
0.8
0.9
2000 3000 4000 5000 6000
Combustion efficiency as a function of heat output.
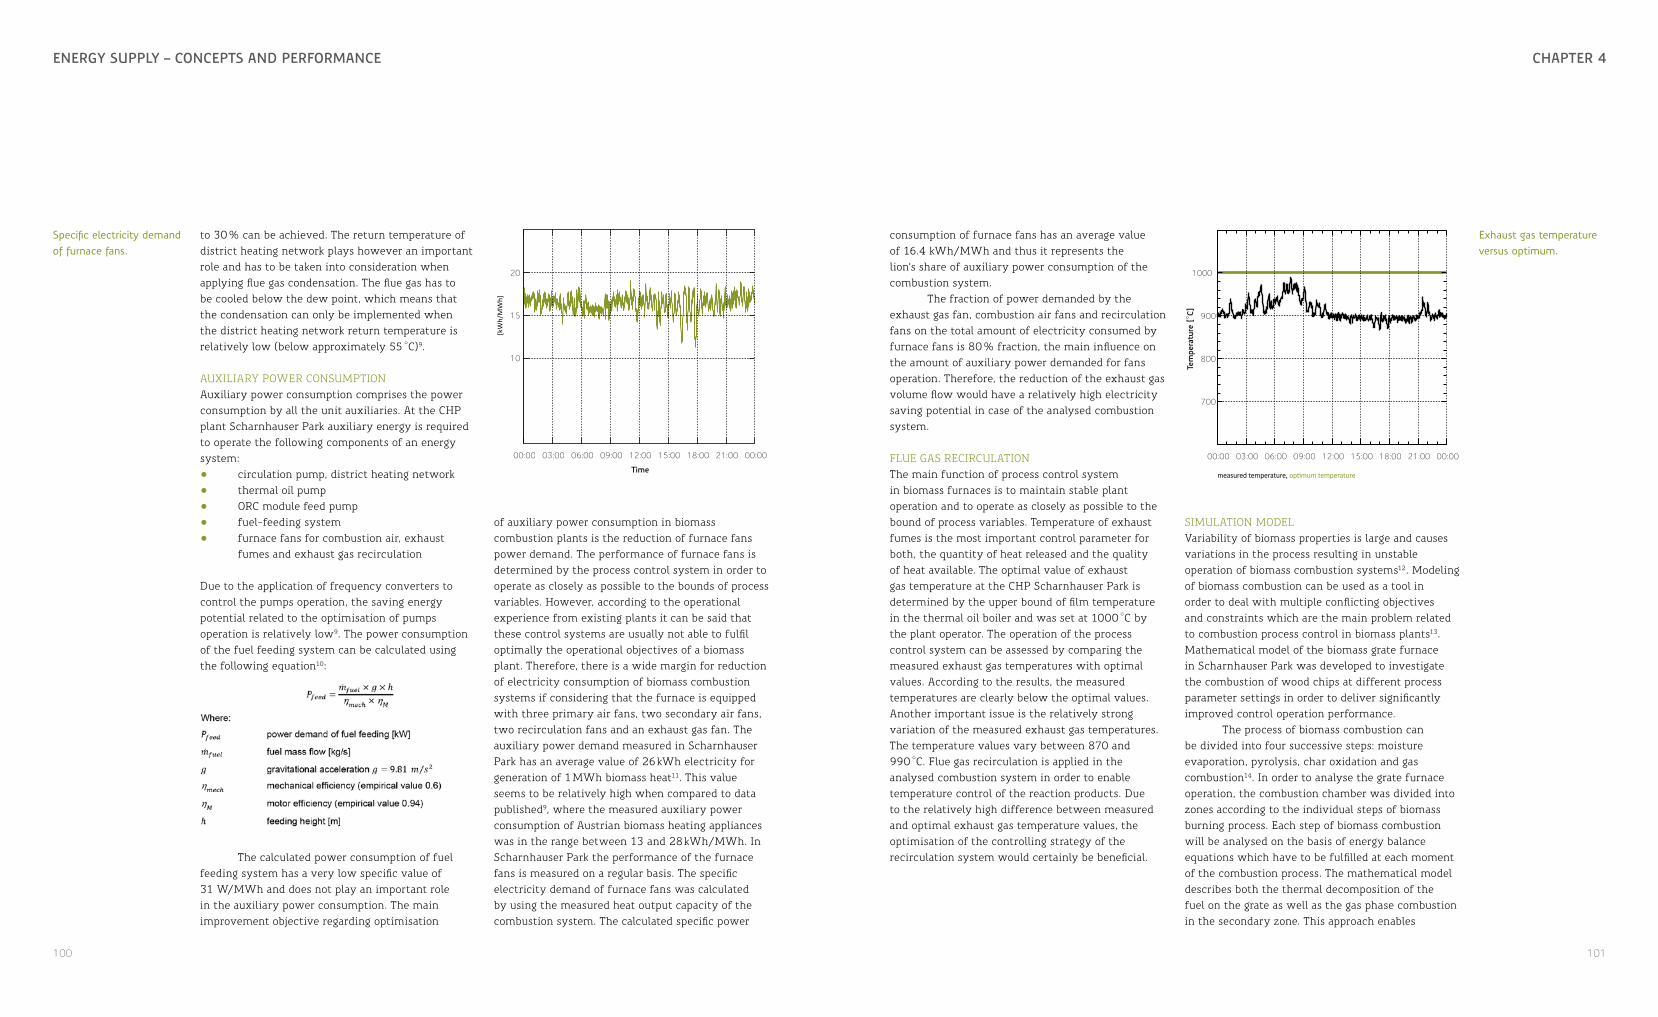
100 101
chaPtEr 4EnErgy sUPPly – concEPts anD PErformancE
to 30 % can be achieved. The return temperature of district heating network plays however an important role and has to be taken into consideration when applying flue gas condensation. The flue gas has to be cooled below the dew point, which means that the condensation can only be implemented when the district heating network return temperature is relatively low (below approximately 55 °C)9.
AUXILIARY POWER CONSUMPTION Auxiliary power consumption comprises the power consumption by all the unit auxiliaries. At the CHP plant Scharnhauser Park auxiliary energy is required to operate the following components of an energy system: • circulation pump, district heating network • thermal oil pump • ORC module feed pump • fuel-feeding system • furnace fans for combustion air, exhaust
fumes and exhaust gas recirculation
Due to the application of frequency converters to control the pumps operation, the saving energy potential related to the optimisation of pumps operation is relatively low9. The power consumption of the fuel feeding system can be calculated using the following equation10:
The calculated power consumption of fuel feeding system has a very low specific value of 31 W/MWh and does not play an important role in the auxiliary power consumption. The main improvement objective regarding optimisation
SIMULATION MODEL Variability of biomass properties is large and causes variations in the process resulting in unstable operation of biomass combustion systems12. Modeling of biomass combustion can be used as a tool in order to deal with multiple conflicting objectives and constraints which are the main problem related to combustion process control in biomass plants13. Mathematical model of the biomass grate furnace in Scharnhauser Park was developed to investigate the combustion of wood chips at different process parameter settings in order to deliver significantly improved control operation performance.
The process of biomass combustion can be divided into four successive steps: moisture evaporation, pyrolysis, char oxidation and gas combustion14. In order to analyse the grate furnace operation, the combustion chamber was divided into zones according to the individual steps of biomass burning process. Each step of biomass combustion will be analysed on the basis of energy balance equations which have to be fulfilled at each moment of the combustion process. The mathematical model describes both the thermal decomposition of the fuel on the grate as well as the gas phase combustion in the secondary zone. This approach enables
[kW
h/M
Wh]
10
15
20
00:00 03:00 06:00 09:00 12:00 15:00 18:00 21:00 00:00
Time
Specific electricity demand of furnace fans.
of auxiliary power consumption in biomass combustion plants is the reduction of furnace fans power demand. The performance of furnace fans is determined by the process control system in order to operate as closely as possible to the bounds of process variables. However, according to the operational experience from existing plants it can be said that these control systems are usually not able to fulfil optimally the operational objectives of a biomass plant. Therefore, there is a wide margin for reduction of electricity consumption of biomass combustion systems if considering that the furnace is equipped with three primary air fans, two secondary air fans, two recirculation fans and an exhaust gas fan. The auxiliary power demand measured in Scharnhauser Park has an average value of 26 kWh electricity for generation of 1 MWh biomass heat11. This value seems to be relatively high when compared to data published9, where the measured auxiliary power consumption of Austrian biomass heating appliances was in the range between 13 and 28 kWh/MWh. In Scharnhauser Park the performance of the furnace fans is measured on a regular basis. The specific electricity demand of furnace fans was calculated by using the measured heat output capacity of the combustion system. The calculated specific power
consumption of furnace fans has an average value of 16.4 kWh/MWh and thus it represents the lion’s share of auxiliary power consumption of the combustion system.
The fraction of power demanded by the exhaust gas fan, combustion air fans and recirculation fans on the total amount of electricity consumed by furnace fans is 80 % fraction, the main influence on the amount of auxiliary power demanded for fans operation. Therefore, the reduction of the exhaust gas volume flow would have a relatively high electricity saving potential in case of the analysed combustion system.
FLUE GAS RECIRCULATION The main function of process control system in biomass furnaces is to maintain stable plant operation and to operate as closely as possible to the bound of process variables. Temperature of exhaust fumes is the most important control parameter for both, the quantity of heat released and the quality of heat available. The optimal value of exhaust gas temperature at the CHP Scharnhauser Park is determined by the upper bound of film temperature in the thermal oil boiler and was set at 1000 °C by the plant operator. The operation of the process control system can be assessed by comparing the measured exhaust gas temperatures with optimal values. According to the results, the measured temperatures are clearly below the optimal values. Another important issue is the relatively strong variation of the measured exhaust gas temperatures. The temperature values vary between 870 and 990 °C. Flue gas recirculation is applied in the analysed combustion system in order to enable temperature control of the reaction products. Due to the relatively high difference between measured and optimal exhaust gas temperature values, the optimisation of the controlling strategy of the recirculation system would certainly be beneficial.
Exhaust gas temperature versus optimum.
Tem
pera
ture
[°C
]
measured temperature, optimum temperature
700
800
900
1000
00:00 03:00 06:00 09:00 12:00 15:00 18:00 21:00 00:00
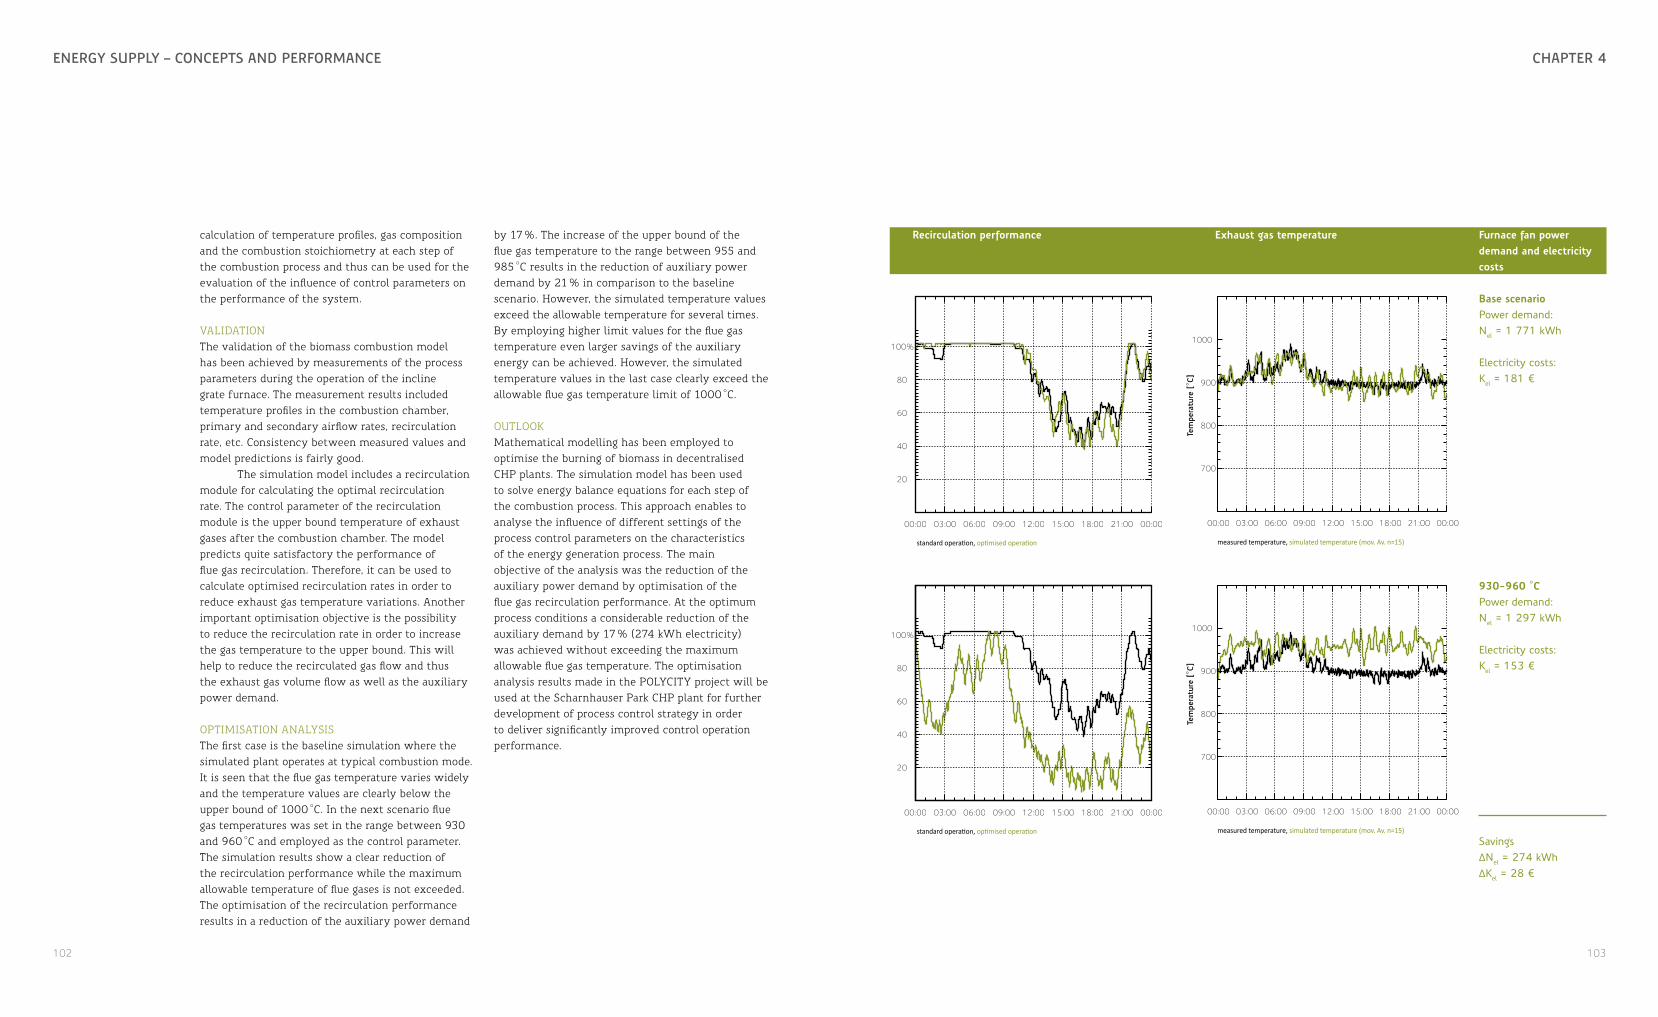
102 103
chaPtEr 4EnErgy sUPPly – concEPts anD PErformancE
calculation of temperature profiles, gas composition and the combustion stoichiometry at each step of the combustion process and thus can be used for the evaluation of the influence of control parameters on the performance of the system.
VALIDATION The validation of the biomass combustion model has been achieved by measurements of the process parameters during the operation of the incline grate furnace. The measurement results included temperature profiles in the combustion chamber, primary and secondary airflow rates, recirculation rate, etc. Consistency between measured values and model predictions is fairly good.
The simulation model includes a recirculation module for calculating the optimal recirculation rate. The control parameter of the recirculation module is the upper bound temperature of exhaust gases after the combustion chamber. The model predicts quite satisfactory the performance of flue gas recirculation. Therefore, it can be used to calculate optimised recirculation rates in order to reduce exhaust gas temperature variations. Another important optimisation objective is the possibility to reduce the recirculation rate in order to increase the gas temperature to the upper bound. This will help to reduce the recirculated gas flow and thus the exhaust gas volume flow as well as the auxiliary power demand.
OPTIMISATION ANALYSIS The first case is the baseline simulation where the simulated plant operates at typical combustion mode. It is seen that the flue gas temperature varies widely and the temperature values are clearly below the upper bound of 1000 °C. In the next scenario flue gas temperatures was set in the range between 930 and 960 °C and employed as the control parameter. The simulation results show a clear reduction of the recirculation performance while the maximum allowable temperature of flue gases is not exceeded. The optimisation of the recirculation performance results in a reduction of the auxiliary power demand
by 17 %. The increase of the upper bound of the flue gas temperature to the range between 955 and 985 °C results in the reduction of auxiliary power demand by 21 % in comparison to the baseline scenario. However, the simulated temperature values exceed the allowable temperature for several times. By employing higher limit values for the flue gas temperature even larger savings of the auxiliary energy can be achieved. However, the simulated temperature values in the last case clearly exceed the allowable flue gas temperature limit of 1000 °C.
OUTLOOK Mathematical modelling has been employed to optimise the burning of biomass in decentralised CHP plants. The simulation model has been used to solve energy balance equations for each step of the combustion process. This approach enables to analyse the influence of different settings of the process control parameters on the characteristics of the energy generation process. The main objective of the analysis was the reduction of the auxiliary power demand by optimisation of the flue gas recirculation performance. At the optimum process conditions a considerable reduction of the auxiliary demand by 17 % (274 kWh electricity) was achieved without exceeding the maximum allowable flue gas temperature. The optimisation analysis results made in the POLYCITY project will be used at the Scharnhauser Park CHP plant for further development of process control strategy in order to deliver significantly improved control operation performance.
Tem
pera
ture
[°C
]
measured temperature, simulated temperature (mov. Av. n=15)
700
800
900
1000
00:00 03:00 06:00 09:00 12:00 15:00 18:00 21:00 00:00
Tem
pera
ture
[°C
]
measured temperature, simulated temperature (mov. Av. n=15)
700
800
900
1000
00:00 03:00 06:00 09:00 12:00 15:00 18:00 21:00 00:00
standard operation, optimised operation
20
40
60
80
100%
00:00 03:00 06:00 09:00 12:00 15:00 18:00 21:00 00:00
standard operation, optimised operation
20
40
60
80
100%
00:00 03:00 06:00 09:00 12:00 15:00 18:00 21:00 00:00
recirculation performance exhaust gas temperature furnace fan power demand and electricity costs
base scenarioPower demand:Nel = 1 771 kWh
Electricity costs:Kel = 181 ¤
930-960 °cPower demand:Nel = 1 297 kWh
Electricity costs:Kel = 153 ¤
SavingsΔNel = 274 kWhΔKel = 28 ¤
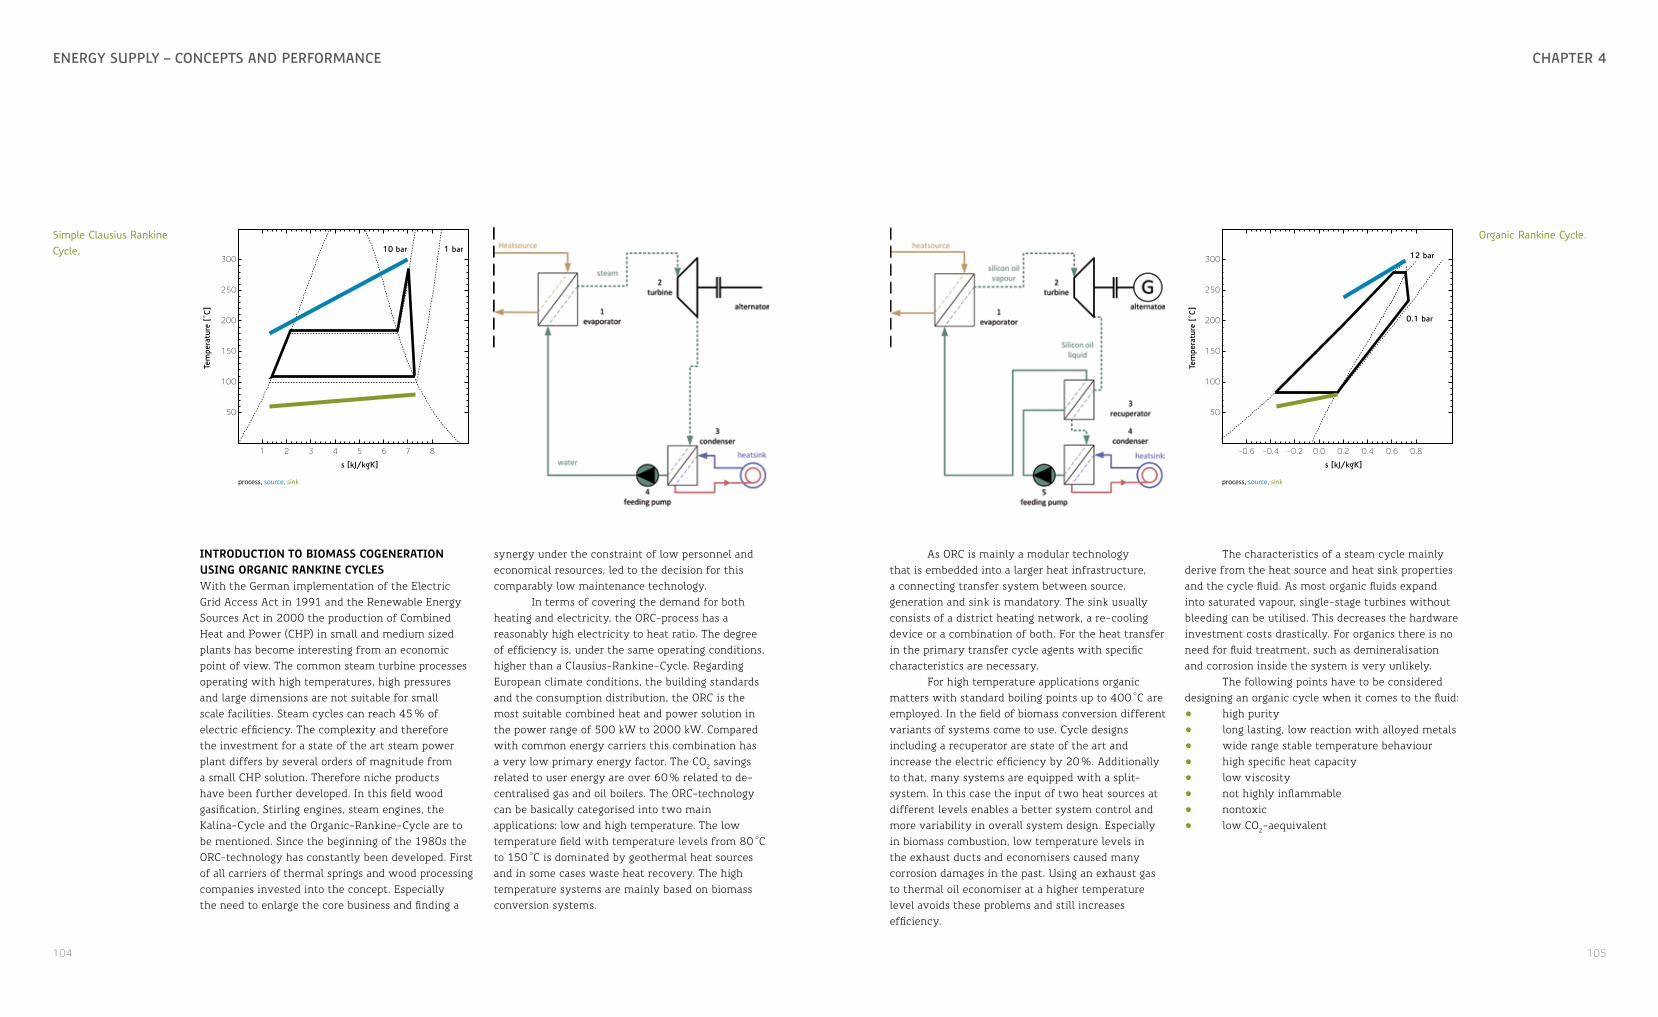
104 105
chaPtEr 4EnErgy sUPPly – concEPts anD PErformancE
introduction to biomass cogeneration using organic rankine cycles With the German implementation of the Electric Grid Access Act in 1991 and the Renewable Energy Sources Act in 2000 the production of Combined Heat and Power (CHP) in small and medium sized plants has become interesting from an economic point of view. The common steam turbine processes operating with high temperatures, high pressures and large dimensions are not suitable for small scale facilities. Steam cycles can reach 45 % of electric efficiency. The complexity and therefore the investment for a state of the art steam power plant differs by several orders of magnitude from a small CHP solution. Therefore niche products have been further developed. In this field wood gasification, Stirling engines, steam engines, the Kalina-Cycle and the Organic-Rankine-Cycle are to be mentioned. Since the beginning of the 1980s the ORC-technology has constantly been developed. First of all carriers of thermal springs and wood processing companies invested into the concept. Especially the need to enlarge the core business and finding a
synergy under the constraint of low personnel and economical resources, led to the decision for this comparably low maintenance technology.
In terms of covering the demand for both heating and electricity, the ORC-process has a reasonably high electricity to heat ratio. The degree of efficiency is, under the same operating conditions, higher than a Clausius-Rankine-Cycle. Regarding European climate conditions, the building standards and the consumption distribution, the ORC is the most suitable combined heat and power solution in the power range of 500 kW to 2000 kW. Compared with common energy carriers this combination has a very low primary energy factor. The CO2 savings related to user energy are over 60 % related to de-centralised gas and oil boilers. The ORC-technology can be basically categorised into two main applications: low and high temperature. The low temperature field with temperature levels from 80 °C to 150 °C is dominated by geothermal heat sources and in some cases waste heat recovery. The high temperature systems are mainly based on biomass conversion systems.
As ORC is mainly a modular technology that is embedded into a larger heat infrastructure, a connecting transfer system between source, generation and sink is mandatory. The sink usually consists of a district heating network, a re-cooling device or a combination of both. For the heat transfer in the primary transfer cycle agents with specific characteristics are necessary.
For high temperature applications organic matters with standard boiling points up to 400 °C are employed. In the field of biomass conversion different variants of systems come to use. Cycle designs including a recuperator are state of the art and increase the electric efficiency by 20 %. Additionally to that, many systems are equipped with a split-system. In this case the input of two heat sources at different levels enables a better system control and more variability in overall system design. Especially in biomass combustion, low temperature levels in the exhaust ducts and economisers caused many corrosion damages in the past. Using an exhaust gas to thermal oil economiser at a higher temperature level avoids these problems and still increases efficiency.
Tem
pera
ture
[°C
]
process, source, sink
50
100
150
200
250
300
1 2 3 4 5 6 7 8
10 bar 1 bar
s [kJ/kgK]
The characteristics of a steam cycle mainly derive from the heat source and heat sink properties and the cycle fluid. As most organic fluids expand into saturated vapour, single-stage turbines without bleeding can be utilised. This decreases the hardware investment costs drastically. For organics there is no need for fluid treatment, such as demineralisation and corrosion inside the system is very unlikely.
The following points have to be considered designing an organic cycle when it comes to the fluid: • high purity • long lasting, low reaction with alloyed metals • wide range stable temperature behaviour • high specific heat capacity • low viscosity • not highly inflammable • nontoxic • low CO2-aequivalent
Simple Clausius Rankine Cycle.
Tem
pera
ture
[°C
]
process, source, sink
50
100
150
200
250
300
-0.6 -0.4 -0.2 0.0 0.2 0.4 0.6 0.8
s [kJ/kgK]
12 bar
0.1 bar
Organic Rankine Cycle.

106 107
chaPtEr 4EnErgy sUPPly – concEPts anD PErformancE
AVAILABILITY AND PRICE All these constraints offer the opportunity to design a simple but still efficient cycle. In general biomass driven ORCs can reach up to 20 % electric efficiency. This is roughly 50 % of their Carnot efficiency. Under the same conditions and with a comparable level of complexity the ORC performs better than the Clausius Cycle.
In the most simple layout the Clausius-Rankine-Cycle consists of an evaporator, a turbine, a condenser and a feeding pump. The Organic-Rankine layout is similar; except that a recuperator is used. In a single stage water steam process this is not necessary as the turbine expands near to the saturation curve.
Both models have a life steam temperature of 280 °C. With the heat transfer coefficients of a common evaporator a temperature difference of 20 K from the sink to the cycle fluid can be assumed. This leads to a life steam pressure of 11.9 bar for Octamethyltrisiloxane (MDM) and 11 bar for water.
Both cycles have a single stage turbine. In the ORC case it expands to the condensing pressure of the fluid at sink temperature. Using water the expansion has to stop at 1.9 bar else droplets would cause turbine damages. A further expansion is only possible by applying a second turbine stage and a re-heater. In terms of electric efficiency the ORC is more than five percentage points better. Regarding the auxiliary power for the feeding pump, the Clausius cycle performs significantly better. This is due to the heat capacity of water, which is the highest of all known liquids. A higher mass has to be transported to achieve the same heat with an organic matter.
ORC-MODULE In this case the heat source has a temperature level of about 300 °C and the heat sink of 55 °C to 90 °C. The systems pressures are between 6 bar and 11.5 bar on the source side and 0.1 bar to 0.25 bar on the sink side. The following table shows the specifications of the cycle, given by the manufacturer.
in the quarter in the last years has been linear. Taking into account an extraordinarily warm winter (3321.8 Kelvin days26) of 2007, the overall demand is mainly depending on the number of inhabitants. The maximum annual energy in the district heating, as expected in the design phase with 35 000 MWh, will be exceeded when the quarter reaches the final population of over 10 000.
ELECTRIC PERFORMANCE OF ORC The electric generation from the OR-cycle has been monitored. The plot shows the hourly means of the alternator output versus the thermal input of the module over the year 2008.
AUXILIARY POWER DEMAND Assessing the overall performance in terms of primary energy, the auxiliary power demand for a power plant facility has be observed as well. According to manufacturer’s design data most cogeneration systems have a low power input. But
organic rankine clausius rankine
Spec
ifica
tions
Source temperature 300 °C/240 °C 300 °C/200 °C Source input 6300 kW 6300 kW Sink temperature 80 °C / 60 °C 80 °C / 60 °C Sink output 4882 kW 5256 kW Fluid Octamethyltrisiloxane Water Mass flow 22.88 kg/s 2.34 kg/s Volume flow (turbine) 0.19 m3/s 0.53 m3/s Source pressure 11.9 bar 11 bar Sink pressure 0.15 bar 1.9 bar
Turbine single stage Turbine efficiency 78 % Alternator efficiency 95 % Feed pump efficiency 80 %
Resu
lts
Gross efficiency 16.76 % 10.93 % Net efficiency 15.96 % 10.87 % Thermal efficiency 77.50 % 83.43 % Total efficiency 93.46 % 94.31 %
technical specifications orc
Thermal input 6 356 kW Electrical output (net) 950 kVA Thermal output (condenser) 5 300 kW Electrical efficiency (@100%) 0.15 Thermal efficiency 0.78 Electrical and thermal losses 156 kW
UP-/DOWN-TIMES The operational charts show that the scheduled annual operation times of 11 month could not be achieved over the years. Damages on one system either had consequences for both or revisions and repairs took far more time than expected. The complexity and the fact that most aggregates are not off-the-shelf are a major risk to the availability of those types of systems.
BIOMASS COVERAGE OF OVERALL DEMAND The development of the first years of operation since 2004 show, that the coverage through biogene fuels of the overall heat demand could be increased. Furthermore the demand in 2008 and 2009 again rose, but due to a malfunction that caused a fire in the thermal oil system in November 2008, the redundant gas systems had to take over. This caused unexpected and unusual low biomass fractions. The coverage of the main energy demands with biomass has the biggest influence on CO2-emissions reduction. In terms of sustainable cities, a maximum coverage has to be achieved. Biomass systems are sluggish and therefore mainly well suited for rather constant loads. Low peaks or peak shaving lead to high overall efficiencies as well as high biomass fractions.
The efficiency in terms of primary energy and emission is correlating with the biomass fraction of the fuel composition.
With exception of the years 2008 and 2009 the overall trend shows a growing biomass heating energy production. The overall demand is steadily increasing. The population development
especially wood based biomass combustions need various additional systems that transport huge masses in gaseous, fluid or solid state. Over a period of six years all auxiliary supply has been monitored. The manufacturer of the furnace indicates auxiliary electric energy consumption for this power plant of 25 kWhel/MWhth, respectively 2.5 %. This threshold could not be reached except in the year 2006.
SAFETY AND MODIFICATIONS In 2004, a short period after taking the power plant into operation, the transfer system showed contamination with silicone oil. Due to the pressure difference between silicone oil cycle (max. 11.5 bar) and the thermal oil cycle (max. 3.5 bar) and a leakage in the evaporator a backflow appeared. Contaminations in this case are dangerous because lower evaporation temperatures of two mixing fluid can lead to spontaneous evaporation and therefore cavitation in the system. These cavitation
Comparison of the Organic Rankine Cycle versus Clausius Rankine Cycle.

108 109
chaPtEr 4EnErgy sUPPly – concEPts anD PErformancE
effects may cause damage to pumps and valves but furthermore are likely to cause a stall in the piping system.
Later on in 2004 the ORC-module had to be shut down. Within the evaporator, major leakage damage was found and repaired. In August 2005 the problem appeared again, this time in larger scale, due to the fact that the aggregate was operating at full power this time. An analysis showed that plate evaporators with this specific geometry are not suitable for silicone oil applications. In consequence the evaporator was replaced by a tube-shell type.
In 2007 the air pre-heater and the district heating economiser had to be replaced. Light operation caused by low heat demand in the quarter led to on-going corrosion in the heat exchangers. During this revision period the turbine shaft has been refurbished. Investigations showed notch marks on the shaft caused by assembling failures and this led to a slight displacement of the stage. In November 2008 a malfunction of the combustion air recirculation system caused an overheating of the thermal oil in the boiler. Both expansion vessels exceeded their capacity and could not prevent the evaporated thermal oil from being exposed to the
ambient. This led to strong incinerating reaction between ambient air and hot thermal oil vapour. From the pump pit the fire spread upwards over two storeys. Immediate reaction of the staff and the professional operation of the firemen avoided further damage to the facility. After this event the power plant was refurbished until March 2010.
conclusion In order to provide heat to the quarter from the very beginning the power plant has been taken into operation in 2004. In 2008 the population of the area was about 5000, not even 50 % of the demand the design of the plant is based upon. Up to the present day the system has not reached its final dimensions. This is one of the reasons for the low performance of exhaust system components as the economiser. Low mass flows and heating demand lead to a bad exhaust gas quality with relatively high acidity. Corrosion and leaks are the consequences. The overall performance lacks appropriate demands in summer. Based on the 2008 and 2009 figures the summer heat demand, mainly consisting of domestic hot water, should at least double. Economic operation
and lower wear can only be achieved with a higher load over the whole year. It is to be assumed that based on the past population development this may take up to ten more years.
The electric efficiency of the ORC module was expected to be around 17 %. Apart from the low availability of the ORC even in good years, the annual efficiency never exceeded 12 % and maximum values of 14.5 % over short periods were reached. Despite the enormous advantages concerning CO2 and primary energy saving the success of biomass facilities is very much depending on the annual load distribution. High standard housing such as in Scharnhauser Park reduce the demand for heat to a minimum. Therefore in summer only very low loads have to be covered. This leads to several economical and technical challenges. To keep the ORC online, a certain amount of sink heat (2 MW to 3 MW) needs to be transferred. Additionally the cooling system of the generator is limited to 85 °C in partial load. Low loads of 1 MW during the summer are pretty common. In these cases 1 to 2 MW of power have to be excessed by the re-cooler. One solution to this problem would be the usage of thermal cooling systems during summer time as there is an increased
Q (M
Wh)
2004 2005 2006 2007 2008 2009 2010
5
10
15
20
25
30
thermal output, biomass fraction
revision period
3.2%2.8%
2.5%
3.7%
4.3%4.5% 4.7%
Φ [kW]
η [-
]
2nd degree fit
0.05
0.10
0.15
2000 3000 4000 5000 6000
Development of biomass fraction with the electrical output in percent.
Right: Hourly means of electrical output versus thermal input (2008).
The biomass cogeneration in Scharnhauser Park.
demand for the compensation of internal loads in buildings. The graph shows very clearly that constant re-cooling is necessary. In this case of the year 2008 that period lasted for three month.
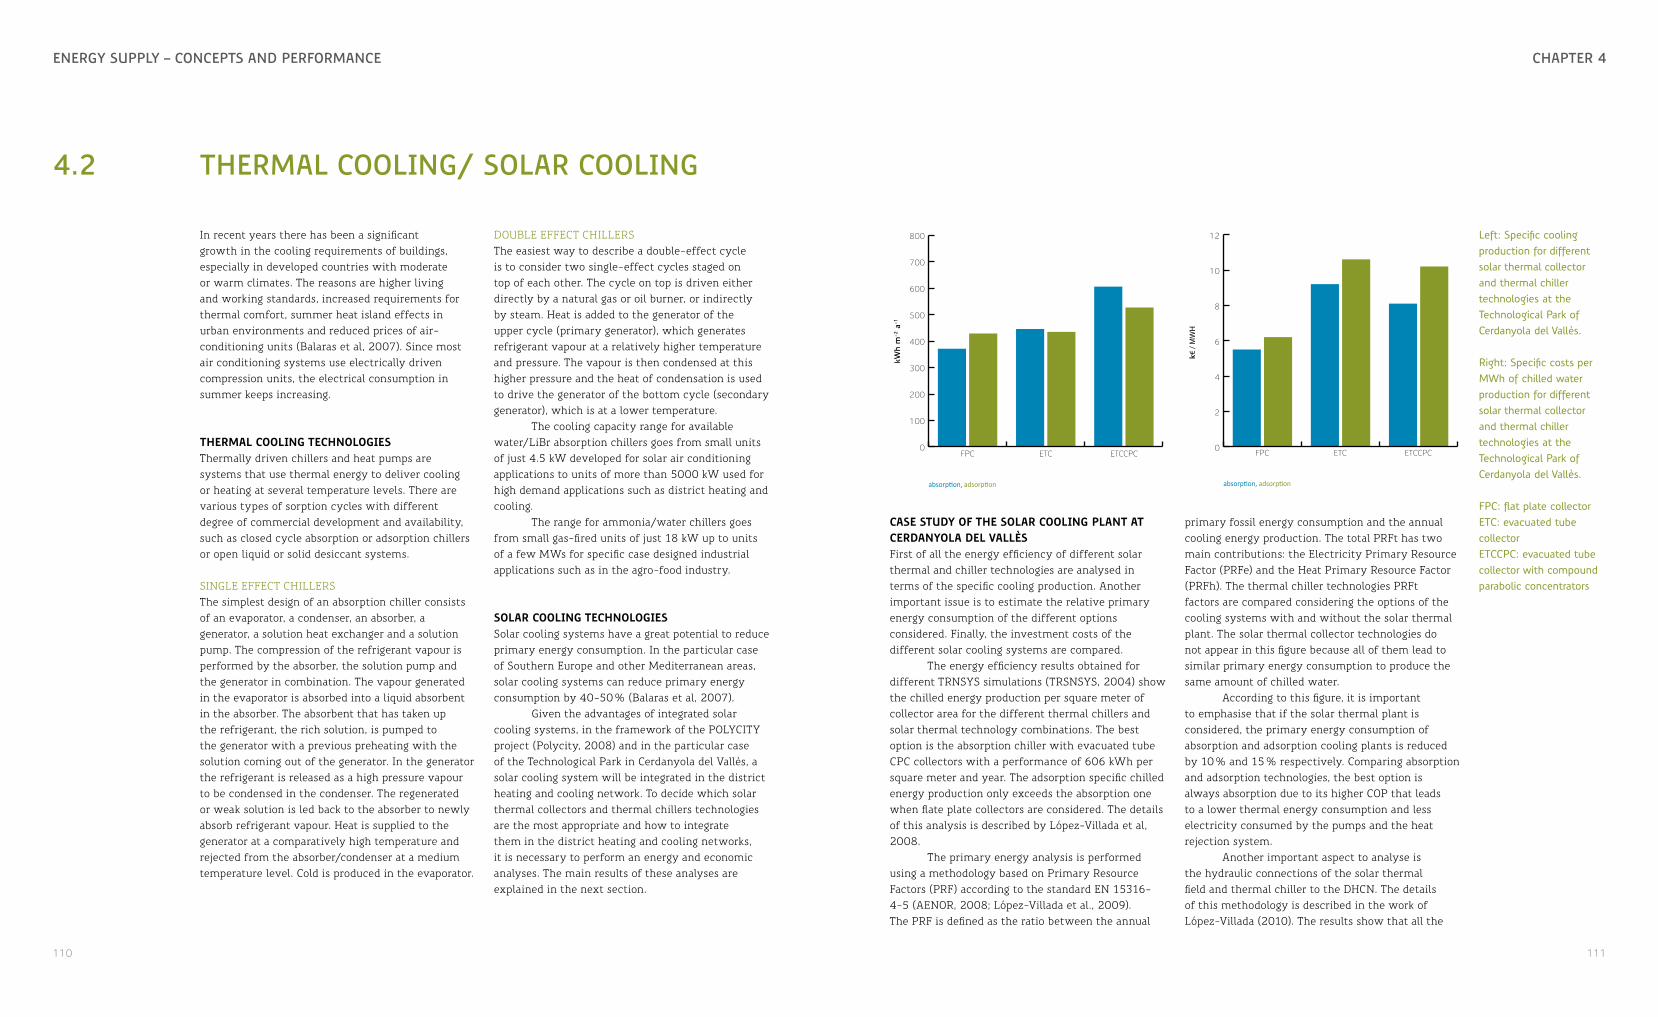
110 111
chaPtEr 4EnErgy sUPPly – concEPts anD PErformancE
4.2 thErmal cooling/ solar cooling
In recent years there has been a significant growth in the cooling requirements of buildings, especially in developed countries with moderate or warm climates. The reasons are higher living and working standards, increased requirements for thermal comfort, summer heat island effects in urban environments and reduced prices of air-conditioning units (Balaras et al, 2007). Since most air conditioning systems use electrically driven compression units, the electrical consumption in summer keeps increasing.
thermal cooling technologiesThermally driven chillers and heat pumps are systems that use thermal energy to deliver cooling or heating at several temperature levels. There are various types of sorption cycles with different degree of commercial development and availability, such as closed cycle absorption or adsorption chillers or open liquid or solid desiccant systems.
SINGLE EFFECT CHILLERSThe simplest design of an absorption chiller consists of an evaporator, a condenser, an absorber, a generator, a solution heat exchanger and a solution pump. The compression of the refrigerant vapour is performed by the absorber, the solution pump and the generator in combination. The vapour generated in the evaporator is absorbed into a liquid absorbent in the absorber. The absorbent that has taken up the refrigerant, the rich solution, is pumped to the generator with a previous preheating with the solution coming out of the generator. In the generator the refrigerant is released as a high pressure vapour to be condensed in the condenser. The regenerated or weak solution is led back to the absorber to newly absorb refrigerant vapour. Heat is supplied to the generator at a comparatively high temperature and rejected from the absorber/condenser at a medium temperature level. Cold is produced in the evaporator.
DOUBLE EFFECT CHILLERSThe easiest way to describe a double-effect cycle is to consider two single-effect cycles staged on top of each other. The cycle on top is driven either directly by a natural gas or oil burner, or indirectly by steam. Heat is added to the generator of the upper cycle (primary generator), which generates refrigerant vapour at a relatively higher temperature and pressure. The vapour is then condensed at this higher pressure and the heat of condensation is used to drive the generator of the bottom cycle (secondary generator), which is at a lower temperature.
The cooling capacity range for available water/LiBr absorption chillers goes from small units of just 4.5 kW developed for solar air conditioning applications to units of more than 5000 kW used for high demand applications such as district heating and cooling.
The range for ammonia/water chillers goes from small gas-fired units of just 18 kW up to units of a few MWs for specific case designed industrial applications such as in the agro-food industry.
solar cooling technologiesSolar cooling systems have a great potential to reduce primary energy consumption. In the particular case of Southern Europe and other Mediterranean areas, solar cooling systems can reduce primary energy consumption by 40-50 % (Balaras et al, 2007).
Given the advantages of integrated solar cooling systems, in the framework of the POLYCITY project (Polycity, 2008) and in the particular case of the Technological Park in Cerdanyola del Vallès, a solar cooling system will be integrated in the district heating and cooling network. To decide which solar thermal collectors and thermal chillers technologies are the most appropriate and how to integrate them in the district heating and cooling networks, it is necessary to perform an energy and economic analyses. The main results of these analyses are explained in the next section.
case study of the solar cooling Plant at cerdanyola del VallèsFirst of all the energy efficiency of different solar thermal and chiller technologies are analysed in terms of the specific cooling production. Another important issue is to estimate the relative primary energy consumption of the different options considered. Finally, the investment costs of the different solar cooling systems are compared.
The energy efficiency results obtained for different TRNSYS simulations (TRSNSYS, 2004) show the chilled energy production per square meter of collector area for the different thermal chillers and solar thermal technology combinations. The best option is the absorption chiller with evacuated tube CPC collectors with a performance of 606 kWh per square meter and year. The adsorption specific chilled energy production only exceeds the absorption one when flate plate collectors are considered. The details of this analysis is described by López-Villada et al, 2008.
The primary energy analysis is performed using a methodology based on Primary Resource Factors (PRF) according to the standard EN 15316-4-5 (AENOR, 2008; López-Villada et al., 2009). The PRF is defined as the ratio between the annual
absorption, adsorption
kWh
m-2
a-1
0
100
200
300
400
500
600
700
800
FPC ETC ETCCPC
Left: Specific cooling production for different solar thermal collector and thermal chiller technologies at the Technological Park of Cerdanyola del Vallès.
Right: Specific costs per MWh of chilled water production for different solar thermal collector and thermal chiller technologies at the Technological Park of Cerdanyola del Vallès.
FPC: flat plate collectorETC: evacuated tube collectorETCCPC: evacuated tube collector with compound parabolic concentrators
primary fossil energy consumption and the annual cooling energy production. The total PRFt has two main contributions: the Electricity Primary Resource Factor (PRFe) and the Heat Primary Resource Factor (PRFh). The thermal chiller technologies PRFt factors are compared considering the options of the cooling systems with and without the solar thermal plant. The solar thermal collector technologies do not appear in this figure because all of them lead to similar primary energy consumption to produce the same amount of chilled water.
According to this figure, it is important to emphasise that if the solar thermal plant is considered, the primary energy consumption of absorption and adsorption cooling plants is reduced by 10 % and 15 % respectively. Comparing absorption and adsorption technologies, the best option is always absorption due to its higher COP that leads to a lower thermal energy consumption and less electricity consumed by the pumps and the heat rejection system.
Another important aspect to analyse is the hydraulic connections of the solar thermal field and thermal chiller to the DHCN. The details of this methodology is described in the work of López-Villada (2010). The results show that all the
absorption, adsorption
k€ /
MW
H
FPC ETC ETCCPC0
2
4
6
8
10
12
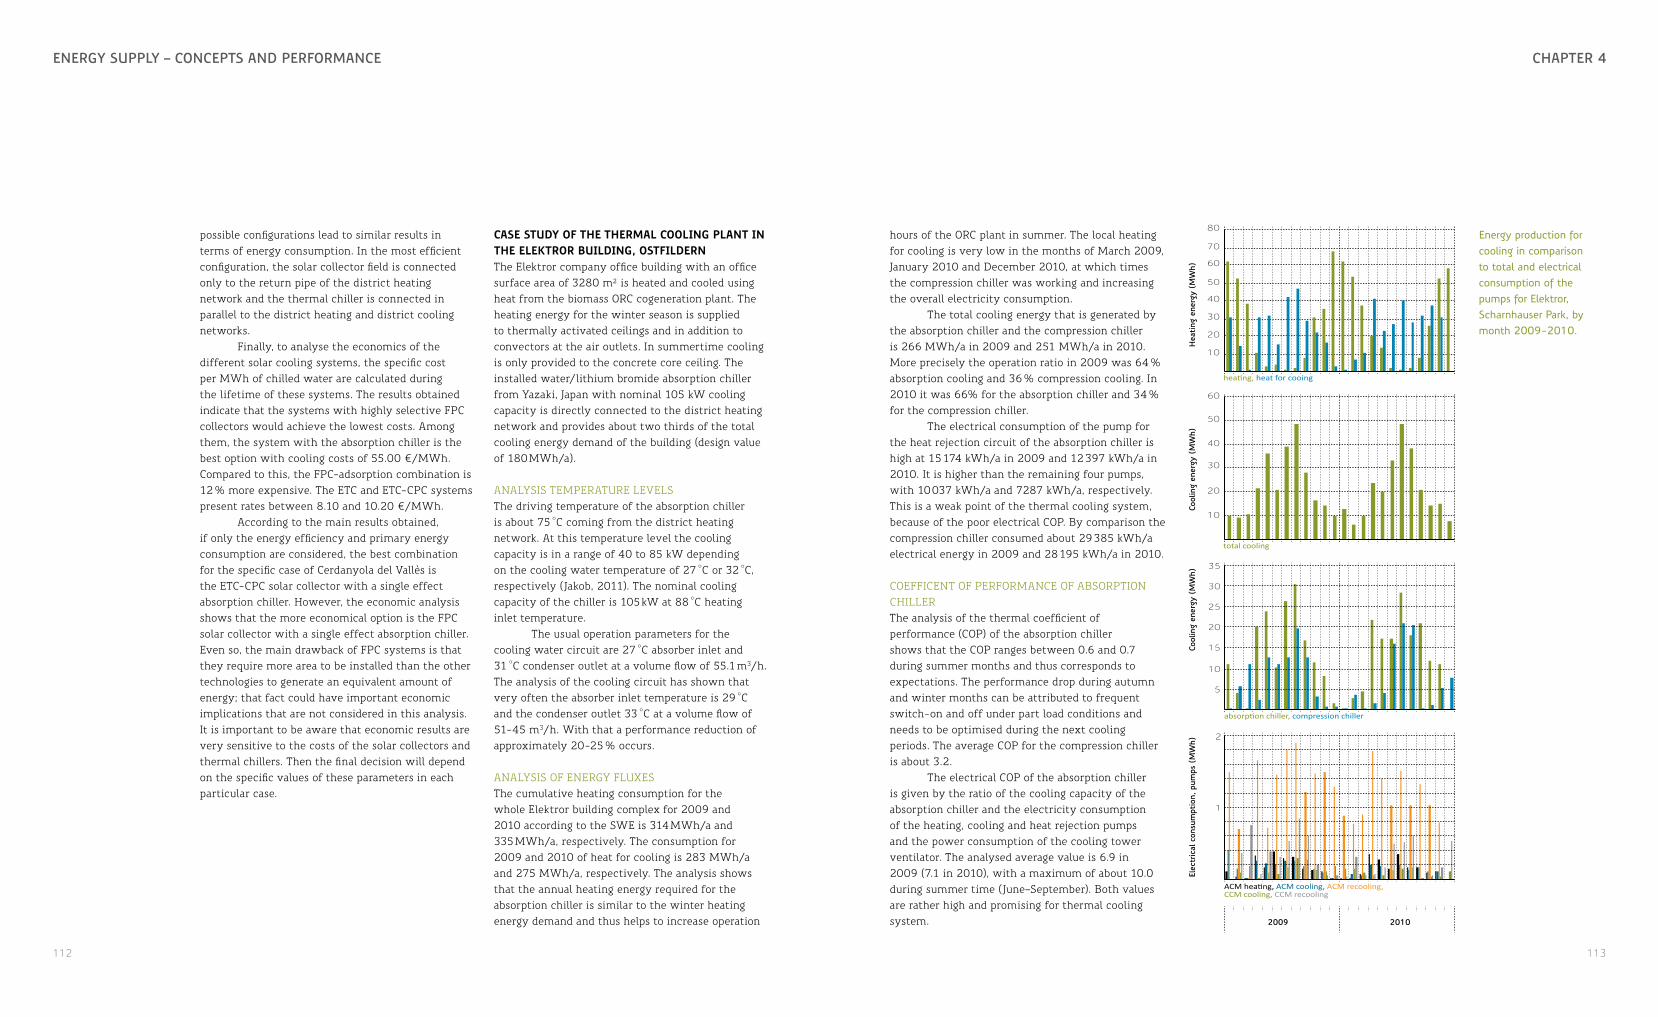
112 113
chaPtEr 4EnErgy sUPPly – concEPts anD PErformancE
possible configurations lead to similar results in terms of energy consumption. In the most efficient configuration, the solar collector field is connected only to the return pipe of the district heating network and the thermal chiller is connected in parallel to the district heating and district cooling networks.
Finally, to analyse the economics of the different solar cooling systems, the specific cost per MWh of chilled water are calculated during the lifetime of these systems. The results obtained indicate that the systems with highly selective FPC collectors would achieve the lowest costs. Among them, the system with the absorption chiller is the best option with cooling costs of 55.00 ¤/MWh. Compared to this, the FPC-adsorption combination is 12 % more expensive. The ETC and ETC-CPC systems present rates between 8.10 and 10.20 ¤/MWh.
According to the main results obtained, if only the energy efficiency and primary energy consumption are considered, the best combination for the specific case of Cerdanyola del Vallès is the ETC-CPC solar collector with a single effect absorption chiller. However, the economic analysis shows that the more economical option is the FPC solar collector with a single effect absorption chiller. Even so, the main drawback of FPC systems is that they require more area to be installed than the other technologies to generate an equivalent amount of energy; that fact could have important economic implications that are not considered in this analysis. It is important to be aware that economic results are very sensitive to the costs of the solar collectors and thermal chillers. Then the final decision will depend on the specific values of these parameters in each particular case.
case study of the thermal cooling Plant in the elektror building, ostfildernThe Elektror company office building with an office surface area of 3280 m² is heated and cooled using heat from the biomass ORC cogeneration plant. The heating energy for the winter season is supplied to thermally activated ceilings and in addition to convectors at the air outlets. In summertime cooling is only provided to the concrete core ceiling. The installed water/lithium bromide absorption chiller from Yazaki, Japan with nominal 105 kW cooling capacity is directly connected to the district heating network and provides about two thirds of the total cooling energy demand of the building (design value of 180 MWh/a).
ANALYSIS TEMPERATURE LEVELSThe driving temperature of the absorption chiller is about 75 °C coming from the district heating network. At this temperature level the cooling capacity is in a range of 40 to 85 kW depending on the cooling water temperature of 27 °C or 32 °C, respectively (Jakob, 2011). The nominal cooling capacity of the chiller is 105 kW at 88 °C heating inlet temperature.
The usual operation parameters for the cooling water circuit are 27 °C absorber inlet and 31 °C condenser outlet at a volume flow of 55.1 m3/h. The analysis of the cooling circuit has shown that very often the absorber inlet temperature is 29 °C and the condenser outlet 33 °C at a volume flow of 51-45 m3/h. With that a performance reduction of approximately 20-25 % occurs.
ANALYSIS OF ENERGY FLUXESThe cumulative heating consumption for the whole Elektror building complex for 2009 and 2010 according to the SWE is 314 MWh/a and 335 MWh/a, respectively. The consumption for 2009 and 2010 of heat for cooling is 283 MWh/a and 275 MWh/a, respectively. The analysis shows that the annual heating energy required for the absorption chiller is similar to the winter heating energy demand and thus helps to increase operation
hours of the ORC plant in summer. The local heating for cooling is very low in the months of March 2009, January 2010 and December 2010, at which times the compression chiller was working and increasing the overall electricity consumption.
The total cooling energy that is generated by the absorption chiller and the compression chiller is 266 MWh/a in 2009 and 251 MWh/a in 2010. More precisely the operation ratio in 2009 was 64 % absorption cooling and 36 % compression cooling. In 2010 it was 66% for the absorption chiller and 34 % for the compression chiller.
The electrical consumption of the pump for the heat rejection circuit of the absorption chiller is high at 15 174 kWh/a in 2009 and 12 397 kWh/a in 2010. It is higher than the remaining four pumps, with 10 037 kWh/a and 7287 kWh/a, respectively. This is a weak point of the thermal cooling system, because of the poor electrical COP. By comparison the compression chiller consumed about 29 385 kWh/a electrical energy in 2009 and 28 195 kWh/a in 2010.
COEFFICENT OF PERFORMANCE OF ABSORPTION CHILLERThe analysis of the thermal coefficient of performance (COP) of the absorption chiller shows that the COP ranges between 0.6 and 0.7 during summer months and thus corresponds to expectations. The performance drop during autumn and winter months can be attributed to frequent switch-on and off under part load conditions and needs to be optimised during the next cooling periods. The average COP for the compression chiller is about 3.2.
The electrical COP of the absorption chiller is given by the ratio of the cooling capacity of the absorption chiller and the electricity consumption of the heating, cooling and heat rejection pumps and the power consumption of the cooling tower ventilator. The analysed average value is 6.9 in 2009 (7.1 in 2010), with a maximum of about 10.0 during summer time (June–September). Both values are rather high and promising for thermal cooling system. 2009 2010
2
1
Hea
ting
ener
gy (
MW
h)Co
olin
g en
ergy
(M
Wh)
Cool
ing
ener
gy (
MW
h)El
ectr
ical
con
sum
ptio
n, p
umps
(M
Wh)
total cooling
60
50
40
30
20
10
heating, heat for cooing
80
70
60
50
40
30
20
10
absorption chiller, compression chiller
ACM heating, ACM cooling, ACM recooling, CCM cooling, CCM recooling
35
30
25
20
15
10
5
Energy production for cooling in comparison to total and electrical consumption of the pumps for Elektror, Scharnhauser Park, by month 2009-2010.
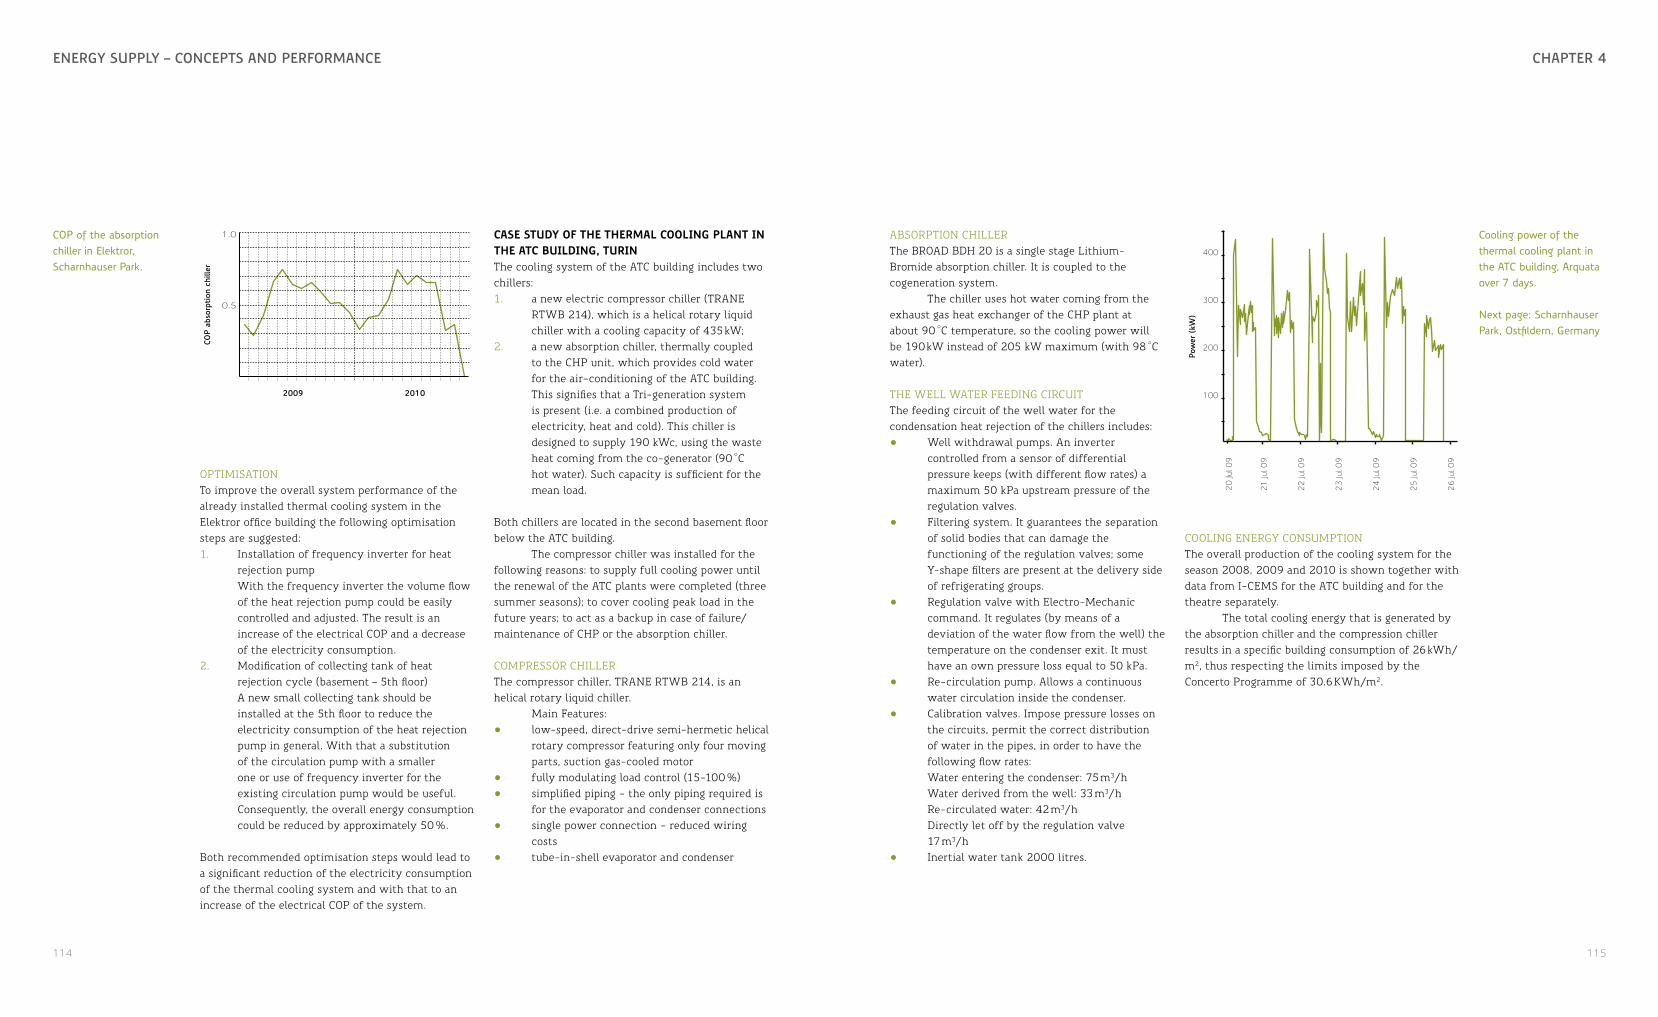
114 115
chaPtEr 4EnErgy sUPPly – concEPts anD PErformancE
OPTIMISATION To improve the overall system performance of the already installed thermal cooling system in the Elektror office building the following optimisation steps are suggested:1. Installation of frequency inverter for heat
rejection pump With the frequency inverter the volume flow of the heat rejection pump could be easily controlled and adjusted. The result is an increase of the electrical COP and a decrease of the electricity consumption.
2. Modification of collecting tank of heat rejection cycle (basement – 5th floor) A new small collecting tank should be installed at the 5th floor to reduce the electricity consumption of the heat rejection pump in general. With that a substitution of the circulation pump with a smaller one or use of frequency inverter for the existing circulation pump would be useful. Consequently, the overall energy consumption could be reduced by approximately 50 %.
Both recommended optimisation steps would lead to a significant reduction of the electricity consumption of the thermal cooling system and with that to an increase of the electrical COP of the system.
case study of the thermal cooling Plant in the atc building, turinThe cooling system of the ATC building includes two chillers: 1. a new electric compressor chiller (TRANE
RTWB 214), which is a helical rotary liquid chiller with a cooling capacity of 435 kW;
2. a new absorption chiller, thermally coupled to the CHP unit, which provides cold water for the air-conditioning of the ATC building. This signifies that a Tri-generation system is present (i.e. a combined production of electricity, heat and cold). This chiller is designed to supply 190 kWc, using the waste heat coming from the co-generator (90 °C hot water). Such capacity is sufficient for the mean load.
Both chillers are located in the second basement floor below the ATC building.
The compressor chiller was installed for the following reasons: to supply full cooling power until the renewal of the ATC plants were completed (three summer seasons); to cover cooling peak load in the future years; to act as a backup in case of failure/ maintenance of CHP or the absorption chiller.
COMPRESSOR CHILLER The compressor chiller, TRANE RTWB 214, is an helical rotary liquid chiller.
Main Features:• low-speed, direct-drive semi-hermetic helical
rotary compressor featuring only four moving parts, suction gas-cooled motor
• fully modulating load control (15-100 %)• simplified piping - the only piping required is
for the evaporator and condenser connections• single power connection - reduced wiring
costs• tube-in-shell evaporator and condenser
2009 2010
1.0
0.5
COP
abso
rptio
n ch
iller
COP of the absorption chiller in Elektror, Scharnhauser Park.
ABSORPTION CHILLER The BROAD BDH 20 is a single stage Lithium-Bromide absorption chiller. It is coupled to the cogeneration system.
The chiller uses hot water coming from the exhaust gas heat exchanger of the CHP plant at about 90 °C temperature, so the cooling power will be 190 kW instead of 205 kW maximum (with 98 °C water).
THE WELL WATER FEEDING CIRCUITThe feeding circuit of the well water for the condensation heat rejection of the chillers includes: • Well withdrawal pumps. An inverter
controlled from a sensor of differential pressure keeps (with different flow rates) a maximum 50 kPa upstream pressure of the regulation valves.
• Filtering system. It guarantees the separation of solid bodies that can damage the functioning of the regulation valves; some Y-shape filters are present at the delivery side of refrigerating groups.
• Regulation valve with Electro-Mechanic command. It regulates (by means of a deviation of the water flow from the well) the temperature on the condenser exit. It must have an own pressure loss equal to 50 kPa.
• Re-circulation pump. Allows a continuous water circulation inside the condenser.
• Calibration valves. Impose pressure losses on the circuits, permit the correct distribution of water in the pipes, in order to have the following flow rates:Water entering the condenser: 75 m3/hWater derived from the well: 33 m3/hRe-circulated water: 42 m3/hDirectly let off by the regulation valve 17 m3/h
• Inertial water tank 2000 litres.
COOLING ENERGY CONSUMPTIONThe overall production of the cooling system for the season 2008, 2009 and 2010 is shown together with data from I-CEMS for the ATC building and for the theatre separately.
The total cooling energy that is generated by the absorption chiller and the compression chiller results in a specific building consumption of 26 kWh/m2, thus respecting the limits imposed by the Concerto Programme of 30.6 KWh/m2.
21 Ju
l 09
20 Ju
l 09
22 Ju
l 09
23 Ju
l 09
24 Ju
l 09
25 Ju
l 09
26 Ju
l 09
400
300
200
100
Pow
er (
kW)
Cooling power of the thermal cooling plant in the ATC building, Arquata over 7 days.
Next page: Scharnhauser Park, Ostfildern, Germany
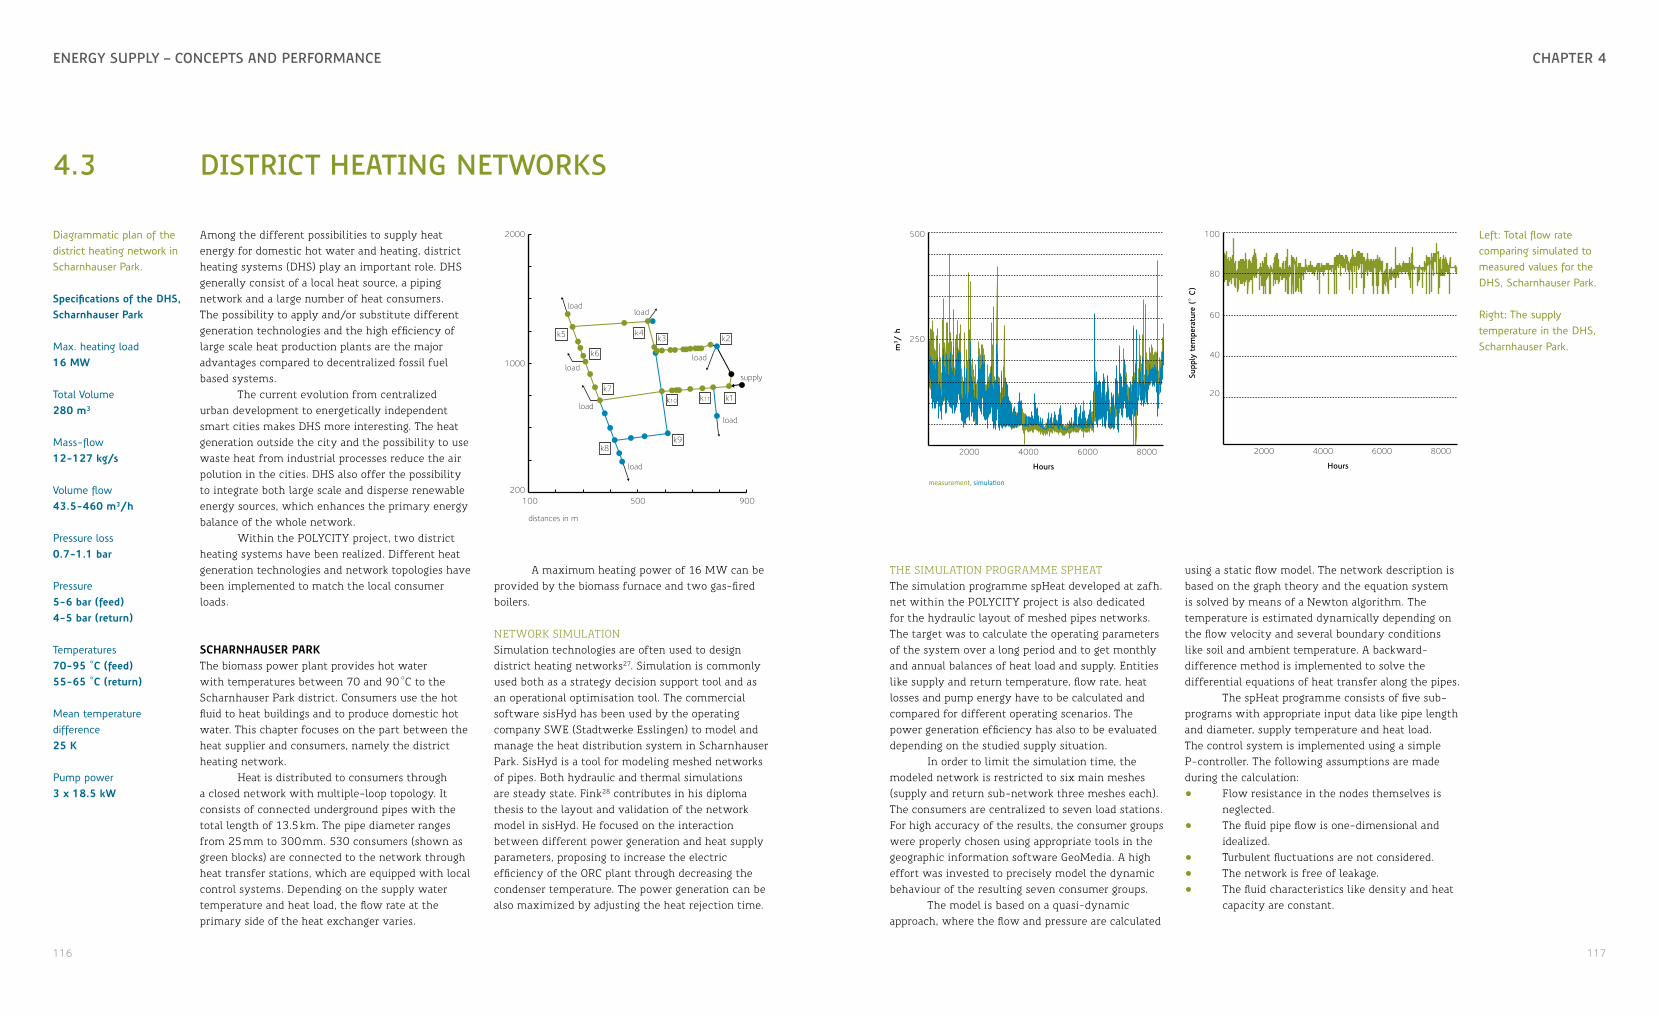
116 117
chaPtEr 4EnErgy sUPPly – concEPts anD PErformancE
4.3 District hEating nEtworks
Among the different possibilities to supply heat energy for domestic hot water and heating, district heating systems (DHS) play an important role. DHS generally consist of a local heat source, a piping network and a large number of heat consumers. The possibility to apply and/or substitute different generation technologies and the high efficiency of large scale heat production plants are the major advantages compared to decentralized fossil fuel based systems.
The current evolution from centralized urban development to energetically independent smart cities makes DHS more interesting. The heat generation outside the city and the possibility to use waste heat from industrial processes reduce the air polution in the cities. DHS also offer the possibility to integrate both large scale and disperse renewable energy sources, which enhances the primary energy balance of the whole network.
Within the POLYCITY project, two district heating systems have been realized. Different heat generation technologies and network topologies have been implemented to match the local consumer loads.
scharnhauser ParkThe biomass power plant provides hot water with temperatures between 70 and 90 °C to the Scharnhauser Park district. Consumers use the hot fluid to heat buildings and to produce domestic hot water. This chapter focuses on the part between the heat supplier and consumers, namely the district heating network.
Heat is distributed to consumers through a closed network with multiple-loop topology. It consists of connected underground pipes with the total length of 13.5 km. The pipe diameter ranges from 25 mm to 300 mm. 530 consumers (shown as green blocks) are connected to the network through heat transfer stations, which are equipped with local control systems. Depending on the supply water temperature and heat load, the flow rate at the primary side of the heat exchanger varies.
THE SIMULATION PROGRAMME SPHEATThe simulation programme spHeat developed at zafh.net within the POLYCITY project is also dedicated for the hydraulic layout of meshed pipes networks. The target was to calculate the operating parameters of the system over a long period and to get monthly and annual balances of heat load and supply. Entities like supply and return temperature, flow rate, heat losses and pump energy have to be calculated and compared for different operating scenarios. The power generation efficiency has also to be evaluated depending on the studied supply situation.
In order to limit the simulation time, the modeled network is restricted to six main meshes (supply and return sub-network three meshes each). The consumers are centralized to seven load stations. For high accuracy of the results, the consumer groups were properly chosen using appropriate tools in the geographic information software GeoMedia. A high effort was invested to precisely model the dynamic behaviour of the resulting seven consumer groups.
The model is based on a quasi-dynamic approach, where the flow and pressure are calculated
Diagrammatic plan of the district heating network in Scharnhauser Park.
specifications of the dhs, scharnhauser Park
Max. heating load16 mw
Total Volume280 m³
Mass-flow12-127 kg/s
Volume flow 43.5-460 m³/h
Pressure loss0.7-1.1 bar
Pressure5-6 bar (feed)4-5 bar (return)
Temperatures70-95 °c (feed)55-65 °c (return)
Mean temperature difference25 k
Pump power3 x 18.5 kw
100 500 900200
1000
2000
distances in m
load
load
load
loadload
load
load
supply
k1
k2k3k4k5
k6
k7
k8k9
k10 k11
A maximum heating power of 16 MW can be provided by the biomass furnace and two gas-fired boilers.
NETWORK SIMULATION Simulation technologies are often used to design district heating networks27. Simulation is commonly used both as a strategy decision support tool and as an operational optimisation tool. The commercial software sisHyd has been used by the operating company SWE (Stadtwerke Esslingen) to model and manage the heat distribution system in Scharnhauser Park. SisHyd is a tool for modeling meshed networks of pipes. Both hydraulic and thermal simulations are steady state. Fink28 contributes in his diploma thesis to the layout and validation of the network model in sisHyd. He focused on the interaction between different power generation and heat supply parameters, proposing to increase the electric efficiency of the ORC plant through decreasing the condenser temperature. The power generation can be also maximized by adjusting the heat rejection time.
using a static flow model. The network description is based on the graph theory and the equation system is solved by means of a Newton algorithm. The temperature is estimated dynamically depending on the flow velocity and several boundary conditions like soil and ambient temperature. A backward-difference method is implemented to solve the differential equations of heat transfer along the pipes.
The spHeat programme consists of five sub-programs with appropriate input data like pipe length and diameter, supply temperature and heat load. The control system is implemented using a simple P-controller. The following assumptions are made during the calculation:• Flow resistance in the nodes themselves is
neglected. • The fluid pipe flow is one-dimensional and
idealized.• Turbulent fluctuations are not considered.• The network is free of leakage.• The fluid characteristics like density and heat
capacity are constant.
measurement, simulation
m3 /
h
8000600040002000
500
250
Hours
Supp
ly t
empe
ratu
re (
° C)
8000600040002000
100
80
60
40
20
Hours
Left: Total flow rate comparing simulated to measured values for the DHS, Scharnhauser Park.
Right: The supply temperature in the DHS, Scharnhauser Park.
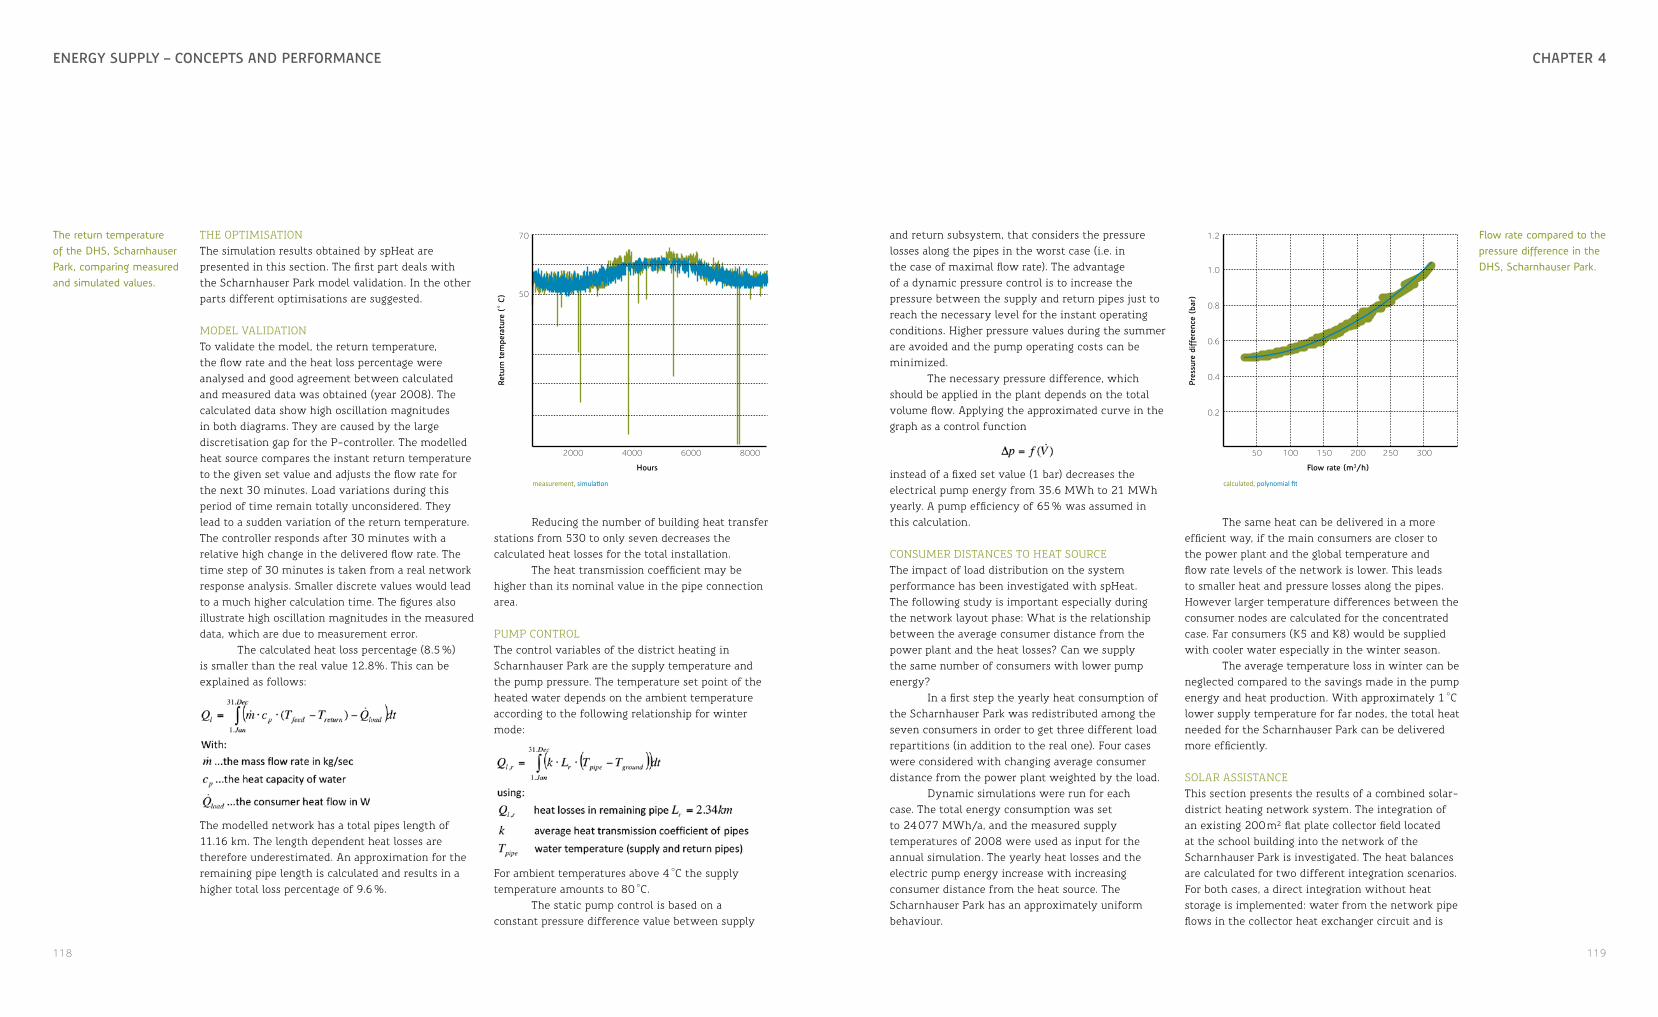
118 119
chaPtEr 4EnErgy sUPPly – concEPts anD PErformancE
THE OPTIMISATIONThe simulation results obtained by spHeat are presented in this section. The first part deals with the Scharnhauser Park model validation. In the other parts different optimisations are suggested.
MODEL VALIDATIONTo validate the model, the return temperature, the flow rate and the heat loss percentage were analysed and good agreement between calculated and measured data was obtained (year 2008). The calculated data show high oscillation magnitudes in both diagrams. They are caused by the large discretisation gap for the P-controller. The modelled heat source compares the instant return temperature to the given set value and adjusts the flow rate for the next 30 minutes. Load variations during this period of time remain totally unconsidered. They lead to a sudden variation of the return temperature. The controller responds after 30 minutes with a relative high change in the delivered flow rate. The time step of 30 minutes is taken from a real network response analysis. Smaller discrete values would lead to a much higher calculation time. The figures also illustrate high oscillation magnitudes in the measured data, which are due to measurement error.
The calculated heat loss percentage (8.5 %) is smaller than the real value 12.8%. This can be explained as follows:
The modelled network has a total pipes length of 11.16 km. The length dependent heat losses are therefore underestimated. An approximation for the remaining pipe length is calculated and results in a higher total loss percentage of 9.6 %.
and return subsystem, that considers the pressure losses along the pipes in the worst case (i.e. in the case of maximal flow rate). The advantage of a dynamic pressure control is to increase the pressure between the supply and return pipes just to reach the necessary level for the instant operating conditions. Higher pressure values during the summer are avoided and the pump operating costs can be minimized.
The necessary pressure difference, which should be applied in the plant depends on the total volume flow. Applying the approximated curve in the graph as a control function
instead of a fixed set value (1 bar) decreases the electrical pump energy from 35.6 MWh to 21 MWh yearly. A pump efficiency of 65 % was assumed in this calculation.
CONSUMER DISTANCES TO HEAT SOURCEThe impact of load distribution on the system performance has been investigated with spHeat. The following study is important especially during the network layout phase: What is the relationship between the average consumer distance from the power plant and the heat losses? Can we supply the same number of consumers with lower pump energy?
In a first step the yearly heat consumption of the Scharnhauser Park was redistributed among the seven consumers in order to get three different load repartitions (in addition to the real one). Four cases were considered with changing average consumer distance from the power plant weighted by the load.
Dynamic simulations were run for each case. The total energy consumption was set to 24 077 MWh/a, and the measured supply temperatures of 2008 were used as input for the annual simulation. The yearly heat losses and the electric pump energy increase with increasing consumer distance from the heat source. The Scharnhauser Park has an approximately uniform behaviour.
The same heat can be delivered in a more efficient way, if the main consumers are closer to the power plant and the global temperature and flow rate levels of the network is lower. This leads to smaller heat and pressure losses along the pipes. However larger temperature differences between the consumer nodes are calculated for the concentrated case. Far consumers (K5 and K8) would be supplied with cooler water especially in the winter season.
The average temperature loss in winter can be neglected compared to the savings made in the pump energy and heat production. With approximately 1 °C lower supply temperature for far nodes, the total heat needed for the Scharnhauser Park can be delivered more efficiently.
SOLAR ASSISTANCEThis section presents the results of a combined solar-district heating network system. The integration of an existing 200 m² flat plate collector field located at the school building into the network of the Scharnhauser Park is investigated. The heat balances are calculated for two different integration scenarios. For both cases, a direct integration without heat storage is implemented: water from the network pipe flows in the collector heat exchanger circuit and is
measurement, simulation
Retu
rn t
empe
ratu
re (
° C)
8000600040002000
Hours
70
50
The return temperature of the DHS, Scharnhauser Park, comparing measured and simulated values.
Reducing the number of building heat transfer stations from 530 to only seven decreases the calculated heat losses for the total installation.
The heat transmission coefficient may be higher than its nominal value in the pipe connection area.
PUMP CONTROLThe control variables of the district heating in Scharnhauser Park are the supply temperature and the pump pressure. The temperature set point of the heated water depends on the ambient temperature according to the following relationship for winter mode:
For ambient temperatures above 4 °C the supply temperature amounts to 80 °C.
The static pump control is based on a constant pressure difference value between supply
calculated, polynomial fit
Pres
sure
diff
eren
ce (
bar)
50 100 150 200 250 300
Flow rate (m3/h)
1.2
1.0
0.8
0.6
0.4
0.2
Flow rate compared to the pressure difference in the DHS, Scharnhauser Park.
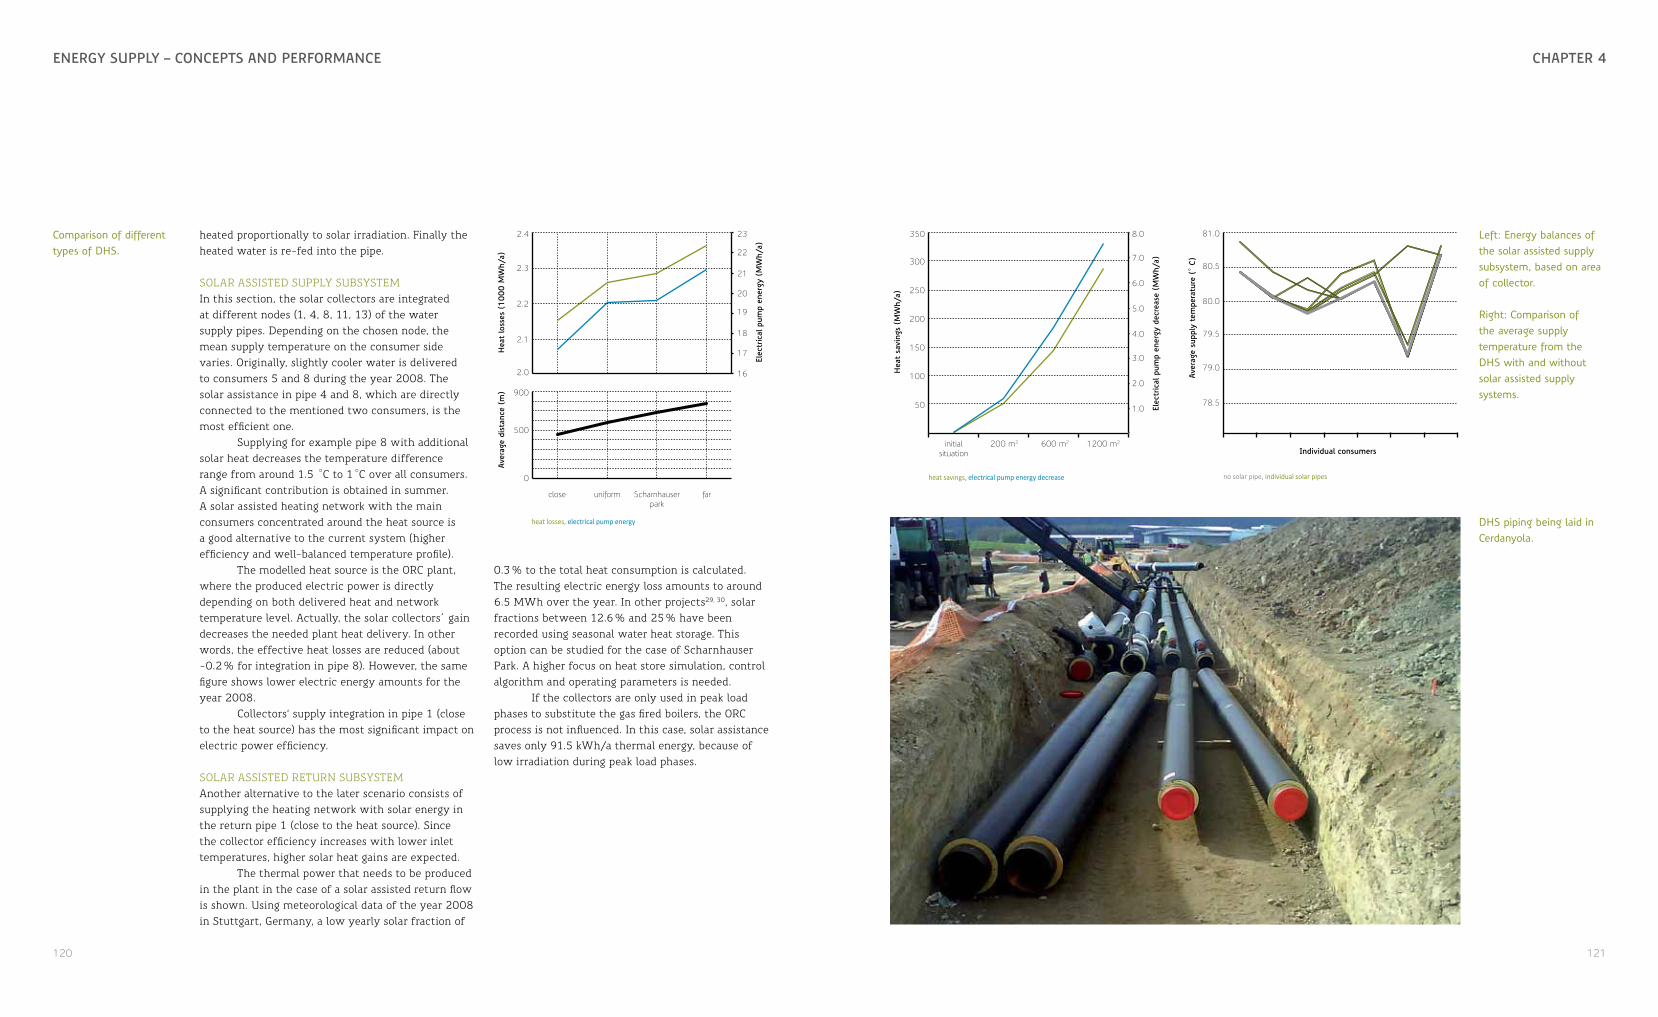
120 121
chaPtEr 4EnErgy sUPPly – concEPts anD PErformancE
heated proportionally to solar irradiation. Finally the heated water is re-fed into the pipe.
SOLAR ASSISTED SUPPLY SUBSYSTEMIn this section, the solar collectors are integrated at different nodes (1, 4, 8, 11, 13) of the water supply pipes. Depending on the chosen node, the mean supply temperature on the consumer side varies. Originally, slightly cooler water is delivered to consumers 5 and 8 during the year 2008. The solar assistance in pipe 4 and 8, which are directly connected to the mentioned two consumers, is the most efficient one.
Supplying for example pipe 8 with additional solar heat decreases the temperature difference range from around 1.5 °C to 1 °C over all consumers. A significant contribution is obtained in summer. A solar assisted heating network with the main consumers concentrated around the heat source is a good alternative to the current system (higher efficiency and well-balanced temperature profile).
The modelled heat source is the ORC plant, where the produced electric power is directly depending on both delivered heat and network temperature level. Actually, the solar collectors gain decreases the needed plant heat delivery. In other words, the effective heat losses are reduced (about -0.2 % for integration in pipe 8). However, the same figure shows lower electric energy amounts for the year 2008.
Collectors’ supply integration in pipe 1 (close to the heat source) has the most significant impact on electric power efficiency.
SOLAR ASSISTED RETURN SUBSYSTEMAnother alternative to the later scenario consists of supplying the heating network with solar energy in the return pipe 1 (close to the heat source). Since the collector efficiency increases with lower inlet temperatures, higher solar heat gains are expected.
The thermal power that needs to be produced in the plant in the case of a solar assisted return flow is shown. Using meteorological data of the year 2008 in Stuttgart, Germany, a low yearly solar fraction of
heat losses, electrical pump energy
Hea
t lo
sses
(10
00 M
Wh/
a)Av
erag
e di
stan
ce (
m)
Elec
tric
al p
ump
ener
gy (
MW
h/a)
close uniform Scharnhauserpark
far
2.4 23
22
21
20
19
18
17
16
2.3
2.2
2.1
2.0
900
500
0
0.3 % to the total heat consumption is calculated. The resulting electric energy loss amounts to around 6.5 MWh over the year. In other projects29, 30, solar fractions between 12.6 % and 25 % have been recorded using seasonal water heat storage. This option can be studied for the case of Scharnhauser Park. A higher focus on heat store simulation, control algorithm and operating parameters is needed.
If the collectors are only used in peak load phases to substitute the gas fired boilers, the ORC process is not influenced. In this case, solar assistance saves only 91.5 kWh/a thermal energy, because of low irradiation during peak load phases.
heat savings, electrical pump energy decrease
Hea
t sa
ving
s (M
Wh/
a)
Elec
tric
al p
ump
ener
gy d
ecre
ase
(MW
h/a)
350 8.0
7.0
6.0
5.0
4.0
3.0
2.0
1.0
300
250
200
150
100
50
initialsituation
200 m2 600 m2 1200 m2
Aver
age
supp
ly t
empe
ratu
re (
° C)
81.0
80.5
80.0
79.5
79.0
78.5
Individual consumers
no solar pipe, individual solar pipes
Comparison of different types of DHS.
Left: Energy balances of the solar assisted supply subsystem, based on area of collector.
Right: Comparison of the average supply temperature from the DHS with and without solar assisted supply systems.
DHS piping being laid in Cerdanyola.
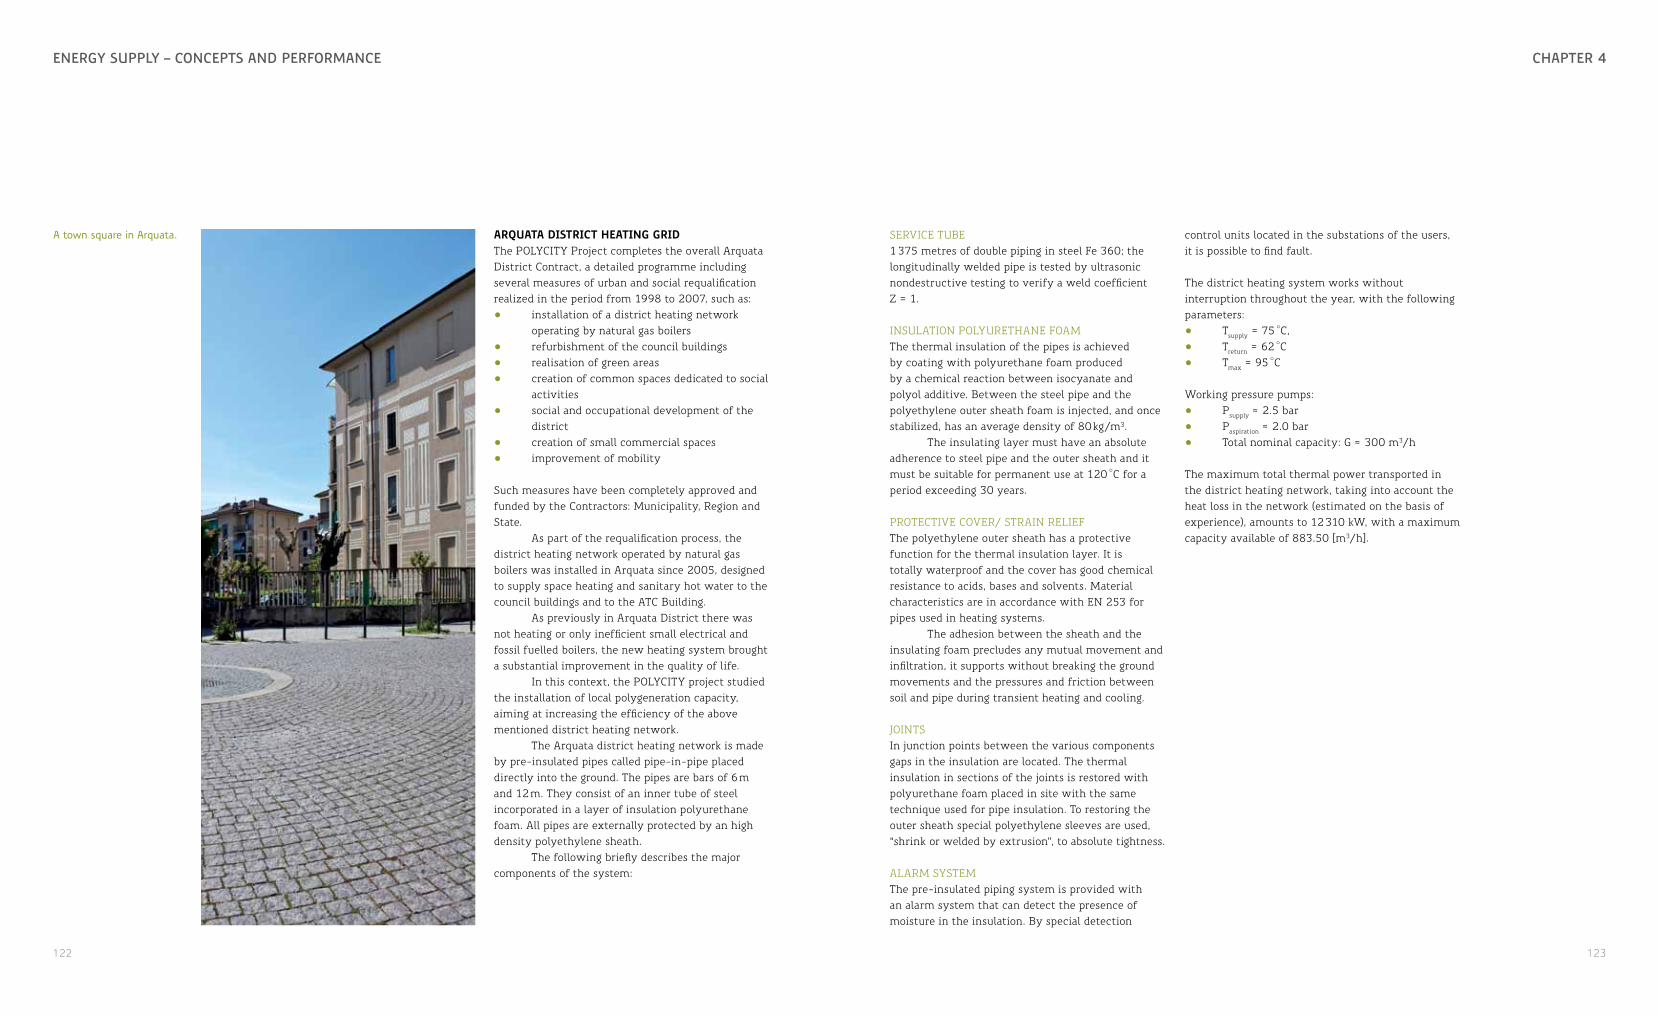
122 123
chaPtEr 4EnErgy sUPPly – concEPts anD PErformancE
arquata district heating gridThe POLYCITY Project completes the overall Arquata District Contract, a detailed programme including several measures of urban and social requalification realized in the period from 1998 to 2007, such as:• installation of a district heating network
operating by natural gas boilers • refurbishment of the council buildings • realisation of green areas • creation of common spaces dedicated to social
activities • social and occupational development of the
district• creation of small commercial spaces• improvement of mobility
Such measures have been completely approved and funded by the Contractors: Municipality, Region and State.
As part of the requalification process, the district heating network operated by natural gas boilers was installed in Arquata since 2005, designed to supply space heating and sanitary hot water to the council buildings and to the ATC Building.
As previously in Arquata District there was not heating or only inefficient small electrical and fossil fuelled boilers, the new heating system brought a substantial improvement in the quality of life.
In this context, the POLYCITY project studied the installation of local polygeneration capacity, aiming at increasing the efficiency of the above mentioned district heating network.
The Arquata district heating network is made by pre-insulated pipes called pipe-in-pipe placed directly into the ground. The pipes are bars of 6 m and 12 m. They consist of an inner tube of steel incorporated in a layer of insulation polyurethane foam. All pipes are externally protected by an high density polyethylene sheath.
The following briefly describes the major components of the system:
SERVICE TUBE1 375 metres of double piping in steel Fe 360; the longitudinally welded pipe is tested by ultrasonic nondestructive testing to verify a weld coefficient Z = 1.
INSULATION POLYURETHANE FOAM The thermal insulation of the pipes is achieved by coating with polyurethane foam produced by a chemical reaction between isocyanate and polyol additive. Between the steel pipe and the polyethylene outer sheath foam is injected, and once stabilized, has an average density of 80 kg/m³.
The insulating layer must have an absolute adherence to steel pipe and the outer sheath and it must be suitable for permanent use at 120 °C for a period exceeding 30 years.
PROTECTIVE COVER/ STRAIN RELIEF The polyethylene outer sheath has a protective function for the thermal insulation layer. It is totally waterproof and the cover has good chemical resistance to acids, bases and solvents. Material characteristics are in accordance with EN 253 for pipes used in heating systems.
The adhesion between the sheath and the insulating foam precludes any mutual movement and infiltration, it supports without breaking the ground movements and the pressures and friction between soil and pipe during transient heating and cooling.
JOINTS In junction points between the various components gaps in the insulation are located. The thermal insulation in sections of the joints is restored with polyurethane foam placed in site with the same technique used for pipe insulation. To restoring the outer sheath special polyethylene sleeves are used, “shrink or welded by extrusion”, to absolute tightness.
ALARM SYSTEMThe pre-insulated piping system is provided with an alarm system that can detect the presence of moisture in the insulation. By special detection
A town square in Arquata. control units located in the substations of the users, it is possible to find fault.
The district heating system works without interruption throughout the year, with the following parameters:• Tsupply = 75 °C,• Treturn = 62 °C • Tmax = 95 °C
Working pressure pumps:• Psupply ≈ 2.5 bar• Paspiration ≈ 2.0 bar• Total nominal capacity: G ≈ 300 m3/h
The maximum total thermal power transported in the district heating network, taking into account the heat loss in the network (estimated on the basis of experience), amounts to 12 310 kW, with a maximum capacity available of 883.50 [m3/h].

124 125
chaPtEr 1EnErgy sUPPly – concEPts anD PErformancE
disctrict heating networks in cerdanyola’s Parc de l’albaIn Cerdanyola’s Parc de l’Alba new urban development, a District Heating and Cooling network has been implemented within the Science and Technology Park, which represents the core of Parc de l’Alba, as well as the commercial area and some of the public and private equipment buildings. The residential area has not been included in the DH&C network, since its demand profile does not justify the additional investment required. As a result, the DH&C network covers heating and cooling demands of a total floor area of above 1.63 million m2. This network, as a part of the Cerdanyola polygeneration system, has been designed according to criteria of maximum availability and modularity, and it will be connected to four cogeneration plants that will supply both hot and chilled water. The total length of the network will be 32.6 km.
The implementation of the first stage of the district heating and cooling network has already been finished. It is a 4-tube network with diameters ranging from DN150 to DN800. It interconnects two cogeneration plants with all the land plots of this stage of urban development (around 600 000 m2 of built surface) and has a total length of 15.3 km. The design temperatures are as follows:• chilled water: supply 6 °C / return 13 °C• hot water: supply 90 °C / return 75 °C
Regardless of the district network, specific interconnecting pipelines have been designed to meet the requirements of the Synchrotron Light Laboratory. The Synchrotron building has been connected directly to ST-4 polygeneration plant, with the following pipelines:• chilled water: DN500 (508/630 mm) pre-
insulated pipe, with diffusion barrier and built-in surveillance system. Total length: 770 m
• hot water: DN150 (168/250 mm) pre-insulated pipe, with diffusion barrier and built-in surveillance system. Total length: 770 m
An underground chilled water storage tank of 3 750 m3 has been erected in ST-4 plant in order to act as a buffer to meet higher cooling demands during peak loads. In the current situation, with only one customer connected, this storage tank is capable to supply all cooling demand during nights and weekends, thus allowing switching off the cogeneration engines.
Opposite: DHS piping being laid in Cerdanyola.
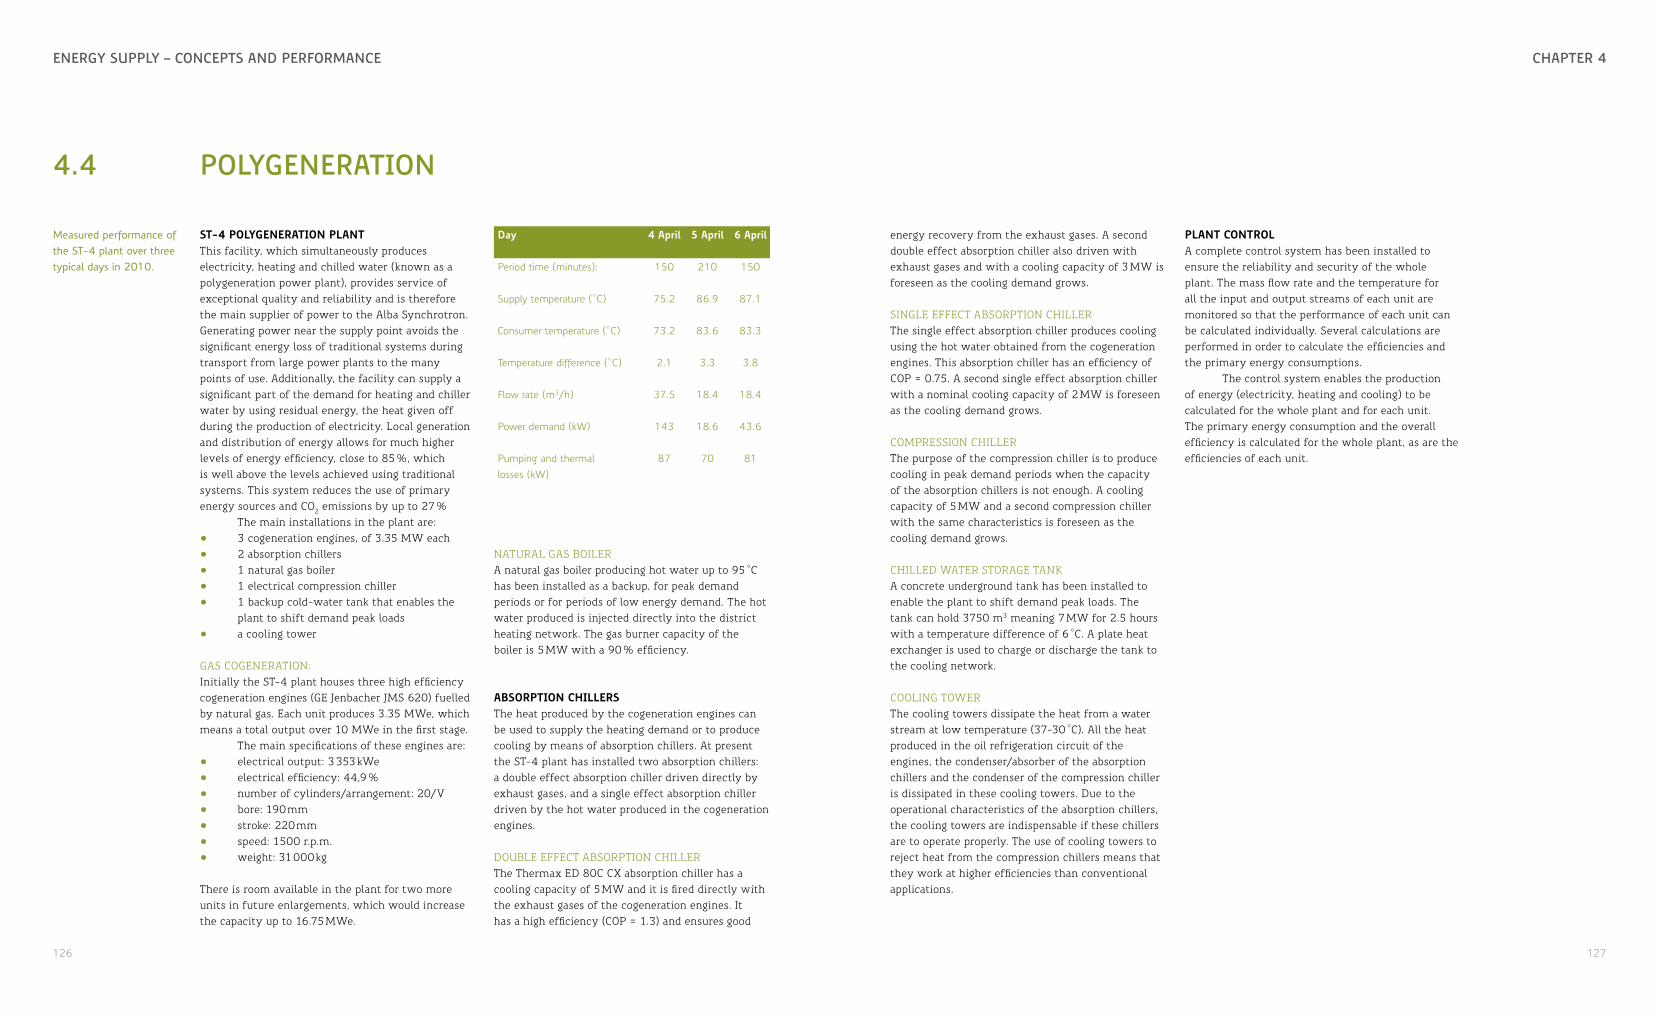
126 127
chaPtEr 4EnErgy sUPPly – concEPts anD PErformancE
4.4 PolygEnEration
st-4 Polygeneration PlantThis facility, which simultaneously produces electricity, heating and chilled water (known as a polygeneration power plant), provides service of exceptional quality and reliability and is therefore the main supplier of power to the Alba Synchrotron. Generating power near the supply point avoids the significant energy loss of traditional systems during transport from large power plants to the many points of use. Additionally, the facility can supply a significant part of the demand for heating and chiller water by using residual energy, the heat given off during the production of electricity. Local generation and distribution of energy allows for much higher levels of energy efficiency, close to 85 %, which is well above the levels achieved using traditional systems. This system reduces the use of primary energy sources and CO2 emissions by up to 27 %
The main installations in the plant are: • 3 cogeneration engines, of 3.35 MW each• 2 absorption chillers • 1 natural gas boiler • 1 electrical compression chiller • 1 backup cold-water tank that enables the
plant to shift demand peak loads • a cooling tower
GAS COGENERATION:Initially the ST-4 plant houses three high efficiency cogeneration engines (GE Jenbacher JMS 620) fuelled by natural gas. Each unit produces 3.35 MWe, which means a total output over 10 MWe in the first stage.
The main specifications of these engines are: • electrical output: 3 353 kWe• electrical efficiency: 44,9 %• number of cylinders/arrangement: 20/V• bore: 190 mm• stroke: 220 mm• speed: 1500 r.p.m.• weight: 31 000 kg
There is room available in the plant for two more units in future enlargements, which would increase the capacity up to 16.75 MWe.
energy recovery from the exhaust gases. A second double effect absorption chiller also driven with exhaust gases and with a cooling capacity of 3 MW is foreseen as the cooling demand grows.
SINGLE EFFECT ABSORPTION CHILLERThe single effect absorption chiller produces cooling using the hot water obtained from the cogeneration engines. This absorption chiller has an efficiency of COP = 0.75. A second single effect absorption chiller with a nominal cooling capacity of 2 MW is foreseen as the cooling demand grows.
COMPRESSION CHILLERThe purpose of the compression chiller is to produce cooling in peak demand periods when the capacity of the absorption chillers is not enough. A cooling capacity of 5 MW and a second compression chiller with the same characteristics is foreseen as the cooling demand grows.
CHILLED WATER STORAGE TANKA concrete underground tank has been installed to enable the plant to shift demand peak loads. The tank can hold 3750 m3 meaning 7 MW for 2.5 hours with a temperature difference of 6 °C. A plate heat exchanger is used to charge or discharge the tank to the cooling network.
COOLING TOWERThe cooling towers dissipate the heat from a water stream at low temperature (37-30 °C). All the heat produced in the oil refrigeration circuit of the engines, the condenser/absorber of the absorption chillers and the condenser of the compression chiller is dissipated in these cooling towers. Due to the operational characteristics of the absorption chillers, the cooling towers are indispensable if these chillers are to operate properly. The use of cooling towers to reject heat from the compression chillers means that they work at higher efficiencies than conventional applications.
day 4 april 5 april 6 april
Period time (minutes): 150 210 150
Supply temperature (°C) 75.2 86.9 87.1
Consumer temperature (°C) 73.2 83.6 83.3
Temperature difference (°C) 2.1 3.3 3.8
Flow rate (m3/h) 37.5 18.4 18.4
Power demand (kW) 143 18.6 43.6
Pumping and thermal losses (kW)
87 70 81
NATURAL GAS BOILERA natural gas boiler producing hot water up to 95 °C has been installed as a backup, for peak demand periods or for periods of low energy demand. The hot water produced is injected directly into the district heating network. The gas burner capacity of the boiler is 5 MW with a 90 % efficiency.
absorPtion chillersThe heat produced by the cogeneration engines can be used to supply the heating demand or to produce cooling by means of absorption chillers. At present the ST-4 plant has installed two absorption chillers: a double effect absorption chiller driven directly by exhaust gases, and a single effect absorption chiller driven by the hot water produced in the cogeneration engines.
DOUBLE EFFECT ABSORPTION CHILLERThe Thermax ED 80C CX absorption chiller has a cooling capacity of 5 MW and it is fired directly with the exhaust gases of the cogeneration engines. It has a high efficiency (COP = 1.3) and ensures good
Plant controlA complete control system has been installed to ensure the reliability and security of the whole plant. The mass flow rate and the temperature for all the input and output streams of each unit are monitored so that the performance of each unit can be calculated individually. Several calculations are performed in order to calculate the efficiencies and the primary energy consumptions.
The control system enables the production of energy (electricity, heating and cooling) to be calculated for the whole plant and for each unit. The primary energy consumption and the overall efficiency is calculated for the whole plant, as are the efficiencies of each unit.
Measured performance of the ST-4 plant over three typical days in 2010.
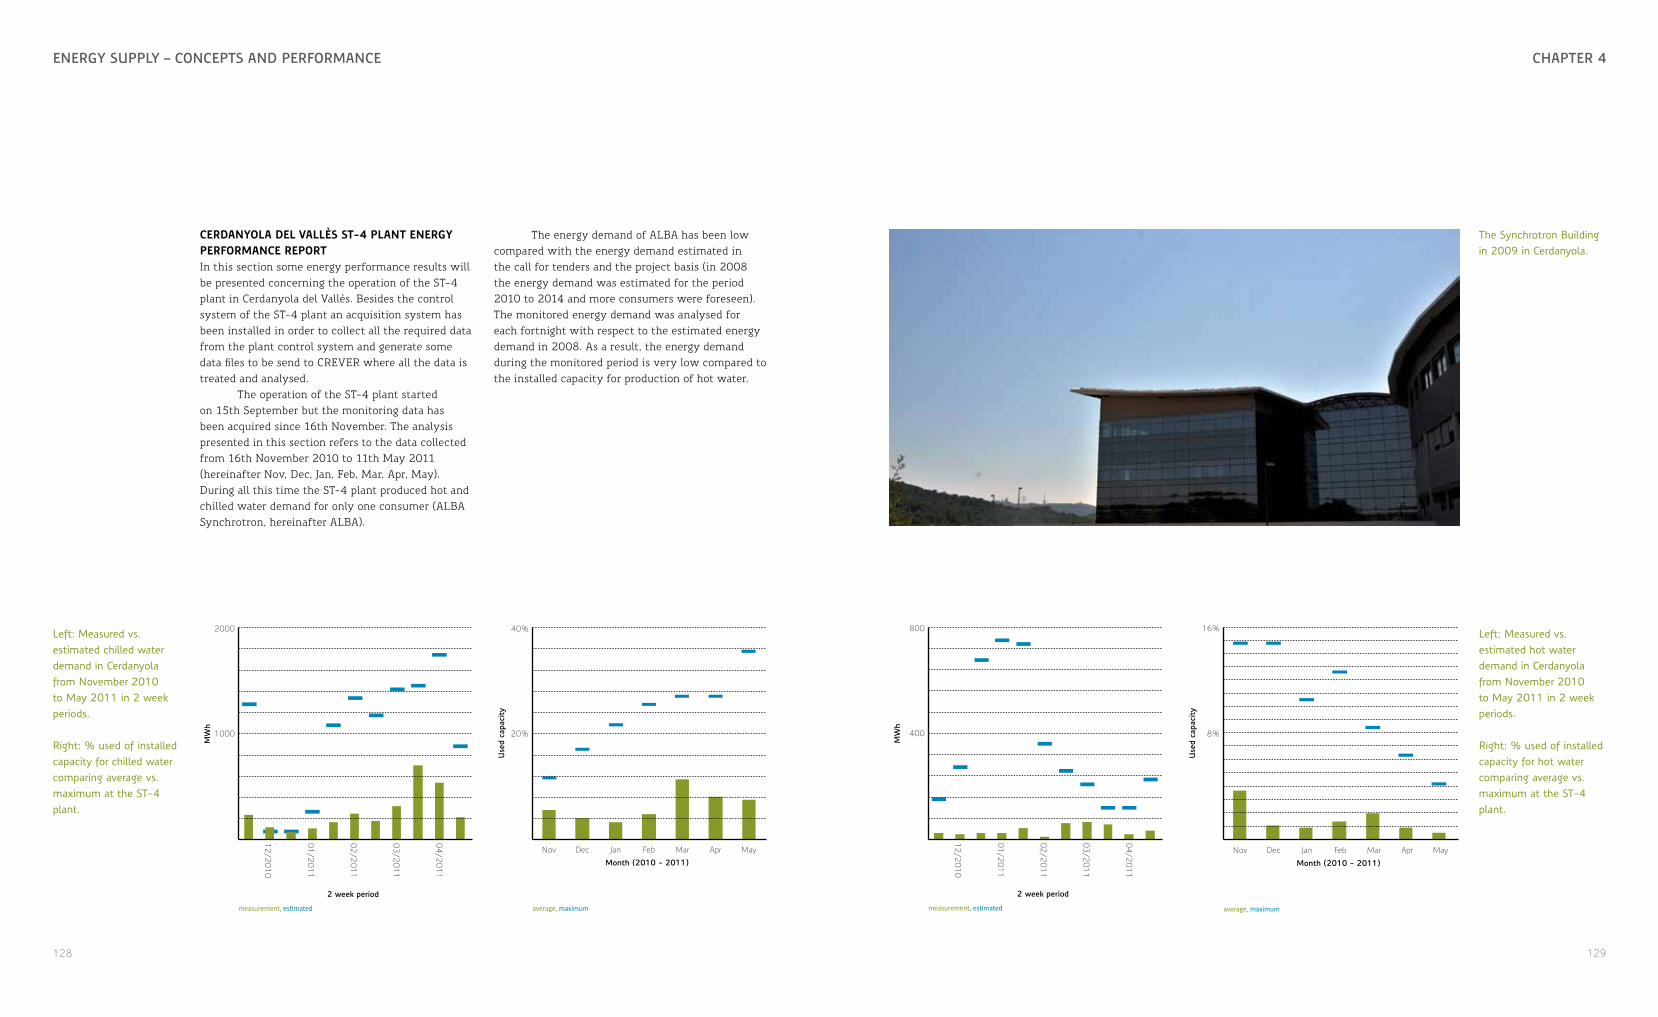
128 129
chaPtEr 4EnErgy sUPPly – concEPts anD PErformancE
cerdanyola del Vallès st-4 Plant energy Performance rePortIn this section some energy performance results will be presented concerning the operation of the ST-4 plant in Cerdanyola del Vallès. Besides the control system of the ST-4 plant an acquisition system has been installed in order to collect all the required data from the plant control system and generate some data files to be send to CREVER where all the data is treated and analysed.
The operation of the ST-4 plant started on 15th September but the monitoring data has been acquired since 16th November. The analysis presented in this section refers to the data collected from 16th November 2010 to 11th May 2011 (hereinafter Nov, Dec, Jan, Feb, Mar, Apr, May). During all this time the ST-4 plant produced hot and chilled water demand for only one consumer (ALBA Synchrotron, hereinafter ALBA).
measurement, estimated
MW
h
12/2
010
01/2
011
02/2
011
03/2
011
04/2
011
2000
1000
2 week period
measurement, estimatedM
Wh
12/2
010
01/2
011
02/2
011
03/2
011
04/2
011
800
400
2 week period
Left: Measured vs. estimated chilled water demand in Cerdanyola from November 2010 to May 2011 in 2 week periods.
Right: % used of installed capacity for chilled water comparing average vs. maximum at the ST-4 plant.
Left: Measured vs. estimated hot water demand in Cerdanyola from November 2010 to May 2011 in 2 week periods.
Right: % used of installed capacity for hot water comparing average vs. maximum at the ST-4 plant.
average, maximum
Use
d ca
paci
ty
40%
20%
Nov Dec Jan Feb Mar Apr May
Month (2010 - 2011)
average, maximum
Use
d ca
paci
ty
16%
8%
Nov Dec Jan Feb Mar Apr May
Month (2010 - 2011)
The energy demand of ALBA has been low compared with the energy demand estimated in the call for tenders and the project basis (in 2008 the energy demand was estimated for the period 2010 to 2014 and more consumers were foreseen). The monitored energy demand was analysed for each fortnight with respect to the estimated energy demand in 2008. As a result, the energy demand during the monitored period is very low compared to the installed capacity for production of hot water.
The Synchrotron Building in 2009 in Cerdanyola.
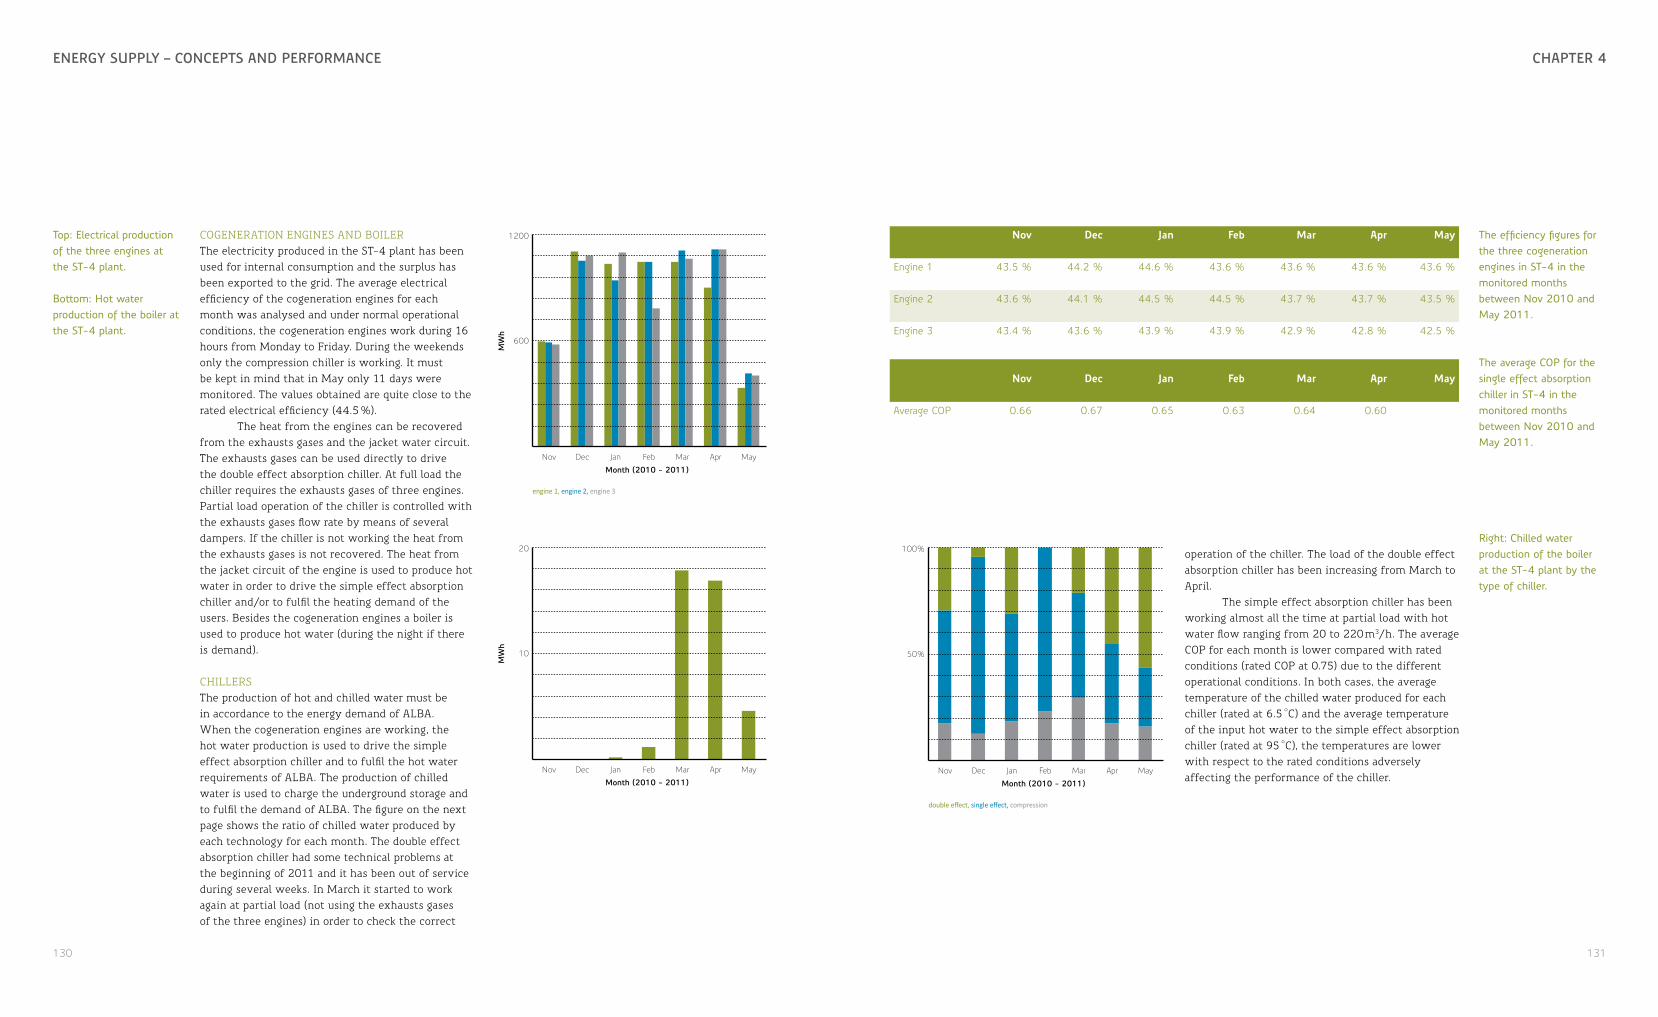
130 131
chaPtEr 4EnErgy sUPPly – concEPts anD PErformancE
COGENERATION ENGINES AND BOILERThe electricity produced in the ST-4 plant has been used for internal consumption and the surplus has been exported to the grid. The average electrical efficiency of the cogeneration engines for each month was analysed and under normal operational conditions, the cogeneration engines work during 16 hours from Monday to Friday. During the weekends only the compression chiller is working. It must be kept in mind that in May only 11 days were monitored. The values obtained are quite close to the rated electrical efficiency (44.5 %).
The heat from the engines can be recovered from the exhausts gases and the jacket water circuit. The exhausts gases can be used directly to drive the double effect absorption chiller. At full load the chiller requires the exhausts gases of three engines. Partial load operation of the chiller is controlled with the exhausts gases flow rate by means of several dampers. If the chiller is not working the heat from the exhausts gases is not recovered. The heat from the jacket circuit of the engine is used to produce hot water in order to drive the simple effect absorption chiller and/or to fulfil the heating demand of the users. Besides the cogeneration engines a boiler is used to produce hot water (during the night if there is demand).
CHILLERSThe production of hot and chilled water must be in accordance to the energy demand of ALBA. When the cogeneration engines are working, the hot water production is used to drive the simple effect absorption chiller and to fulfil the hot water requirements of ALBA. The production of chilled water is used to charge the underground storage and to fulfil the demand of ALBA. The figure on the next page shows the ratio of chilled water produced by each technology for each month. The double effect absorption chiller had some technical problems at the beginning of 2011 and it has been out of service during several weeks. In March it started to work again at partial load (not using the exhausts gases of the three engines) in order to check the correct
nov dec Jan feb mar apr may
Engine 1 43.5 % 44.2 % 44.6 % 43.6 % 43.6 % 43.6 % 43.6 %
Engine 2 43.6 % 44.1 % 44.5 % 44.5 % 43.7 % 43.7 % 43.5 %
Engine 3 43.4 % 43.6 % 43.9 % 43.9 % 42.9 % 42.8 % 42.5 %
nov dec Jan feb mar apr may
Average COP 0.66 0.67 0.65 0.63 0.64 0.60
The efficiency figures for the three cogeneration engines in ST-4 in the monitored months between Nov 2010 and May 2011.
The average COP for the single effect absorption chiller in ST-4 in the monitored months between Nov 2010 and May 2011.
Right: Chilled water production of the boiler at the ST-4 plant by the type of chiller.
engine 1, engine 2, engine 3M
Wh
Nov Dec Jan Feb Mar Apr May
1200
600
Month (2010 - 2011)
Top: Electrical production of the three engines at the ST-4 plant.
Bottom: Hot water production of the boiler at the ST-4 plant.
MW
h
Nov Dec Jan Feb Mar Apr May
20
10
Month (2010 - 2011)
operation of the chiller. The load of the double effect absorption chiller has been increasing from March to April.
The simple effect absorption chiller has been working almost all the time at partial load with hot water flow ranging from 20 to 220 m3/h. The average COP for each month is lower compared with rated conditions (rated COP at 0.75) due to the different operational conditions. In both cases, the average temperature of the chilled water produced for each chiller (rated at 6.5 °C) and the average temperature of the input hot water to the simple effect absorption chiller (rated at 95 °C), the temperatures are lower with respect to the rated conditions adversely affecting the performance of the chiller.
Nov Dec Jan Feb Mar Apr May
100%
50%
double effect, single effect, compression
Month (2010 - 2011)
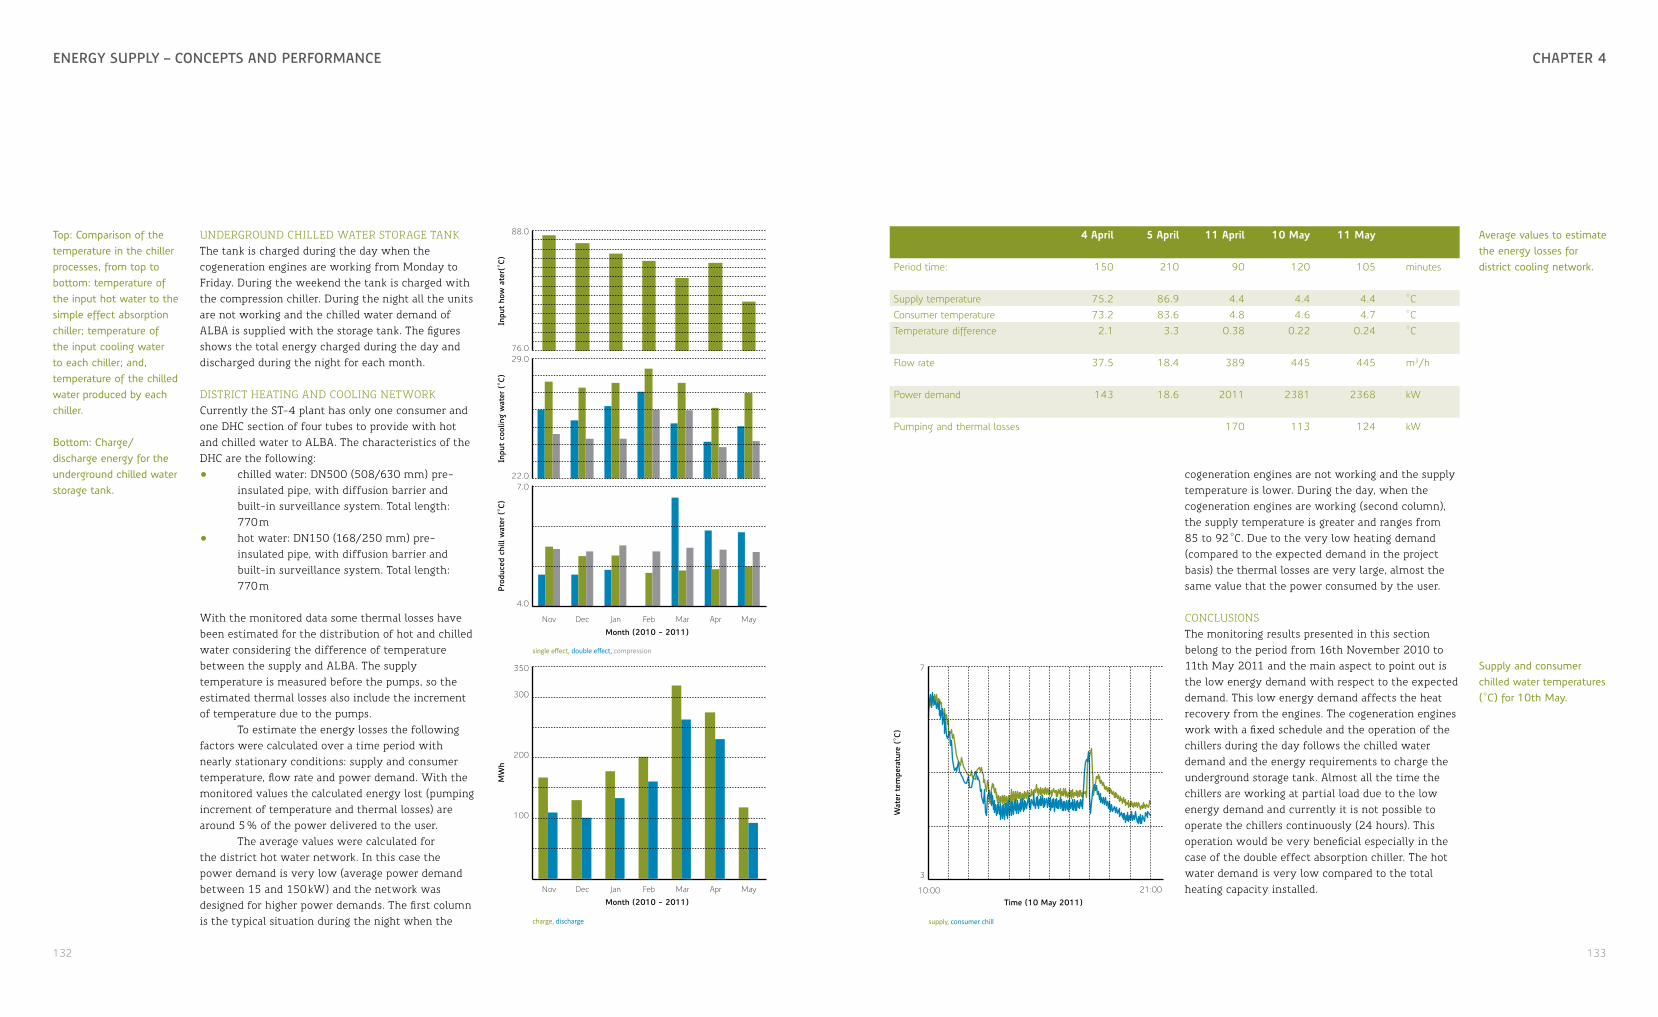
132 133
chaPtEr 4EnErgy sUPPly – concEPts anD PErformancE
single effect, double effect, compression
Inpu
t ho
w a
ter(
°C)
Inpu
t co
olin
g w
ater
(°C
)Pr
oduc
ed c
hill
wat
er (
°C)
Nov Dec Jan Feb Mar Apr May
88.0
76.029.0
22.07.0
4.0
Month (2010 - 2011)
Top: Comparison of the temperature in the chiller processes, from top to bottom: temperature of the input hot water to the simple effect absorption chiller; temperature of the input cooling water to each chiller; and, temperature of the chilled water produced by each chiller.
Bottom: Charge/ discharge energy for the underground chilled water storage tank.
UNDERGROUND CHILLED WATER STORAGE TANKThe tank is charged during the day when the cogeneration engines are working from Monday to Friday. During the weekend the tank is charged with the compression chiller. During the night all the units are not working and the chilled water demand of ALBA is supplied with the storage tank. The figures shows the total energy charged during the day and discharged during the night for each month.
DISTRICT HEATING AND COOLING NETWORKCurrently the ST-4 plant has only one consumer and one DHC section of four tubes to provide with hot and chilled water to ALBA. The characteristics of the DHC are the following:• chilled water: DN500 (508/630 mm) pre-
insulated pipe, with diffusion barrier and built-in surveillance system. Total length: 770 m
• hot water: DN150 (168/250 mm) pre-insulated pipe, with diffusion barrier and built-in surveillance system. Total length: 770 m
With the monitored data some thermal losses have been estimated for the distribution of hot and chilled water considering the difference of temperature between the supply and ALBA. The supply temperature is measured before the pumps, so the estimated thermal losses also include the increment of temperature due to the pumps.
To estimate the energy losses the following factors were calculated over a time period with nearly stationary conditions: supply and consumer temperature, flow rate and power demand. With the monitored values the calculated energy lost (pumping increment of temperature and thermal losses) are around 5 % of the power delivered to the user.
The average values were calculated for the district hot water network. In this case the power demand is very low (average power demand between 15 and 150 kW) and the network was designed for higher power demands. The first column is the typical situation during the night when the charge, discharge
MW
h
350
300
200
100
Nov Dec Jan Feb Mar Apr May
Month (2010 - 2011)
4 april 5 april 11 april 10 may 11 may
Period time: 150 210 90 120 105 minutes
Supply temperature 75.2 86.9 4.4 4.4 4.4 °CConsumer temperature 73.2 83.6 4.8 4.6 4.7 °CTemperature difference 2.1 3.3 0.38 0.22 0.24 °C
Flow rate 37.5 18.4 389 445 445 m3/h
Power demand 143 18.6 2011 2381 2368 kW
Pumping and thermal losses 170 113 124 kW
Average values to estimate the energy losses for district cooling network.
cogeneration engines are not working and the supply temperature is lower. During the day, when the cogeneration engines are working (second column), the supply temperature is greater and ranges from 85 to 92 °C. Due to the very low heating demand (compared to the expected demand in the project basis) the thermal losses are very large, almost the same value that the power consumed by the user.
CONCLUSIONSThe monitoring results presented in this section belong to the period from 16th November 2010 to 11th May 2011 and the main aspect to point out is the low energy demand with respect to the expected demand. This low energy demand affects the heat recovery from the engines. The cogeneration engines work with a fixed schedule and the operation of the chillers during the day follows the chilled water demand and the energy requirements to charge the underground storage tank. Almost all the time the chillers are working at partial load due to the low energy demand and currently it is not possible to operate the chillers continuously (24 hours). This operation would be very beneficial especially in the case of the double effect absorption chiller. The hot water demand is very low compared to the total heating capacity installed.
supply, consumer chill
Wat
er t
empe
ratu
re (
°C)
7
3
10:00 21:00
Time (10 May 2011)
Supply and consumer chilled water temperatures (°C) for 10th May.
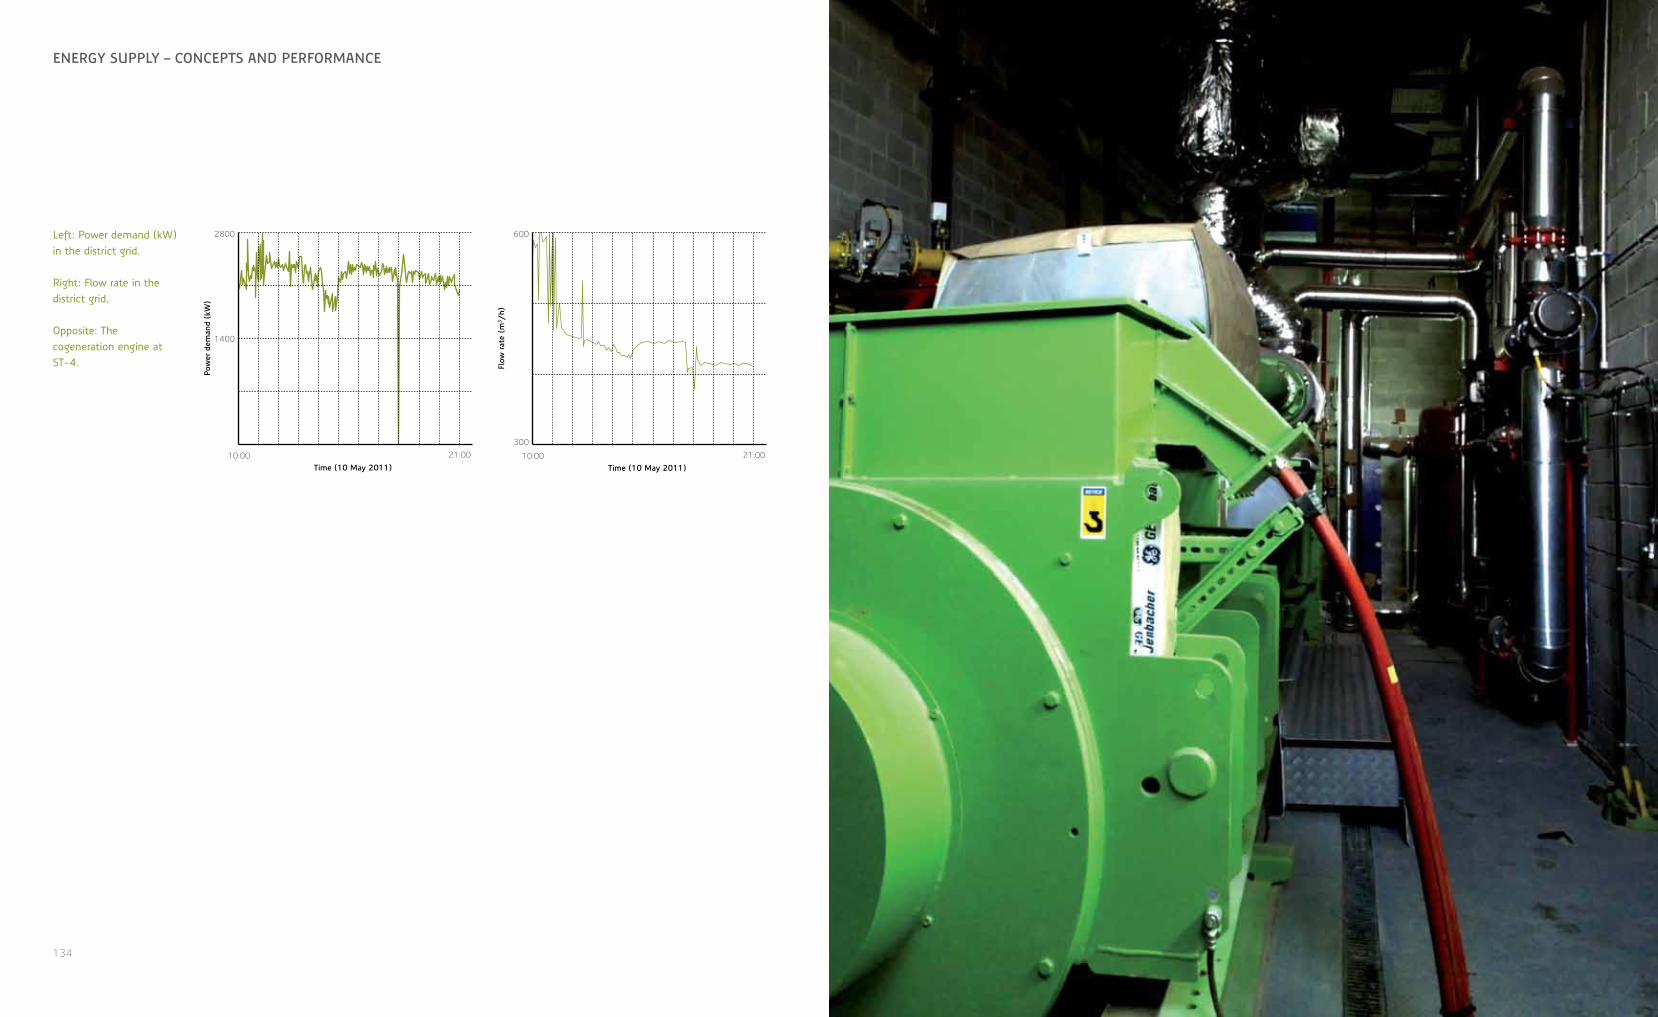
134 135
chaPtEr 1EnErgy sUPPly – concEPts anD PErformancE
Pow
er d
eman
d (k
W)
2800
1400
10:00 21:00
Time (10 May 2011)
Flow
rate
(m
3 /h)
600
300
10:00 21:00
Time (10 May 2011)
Left: Power demand (kW) in the district grid.
Right: Flow rate in the district grid.
Opposite: The cogeneration engine at ST-4.
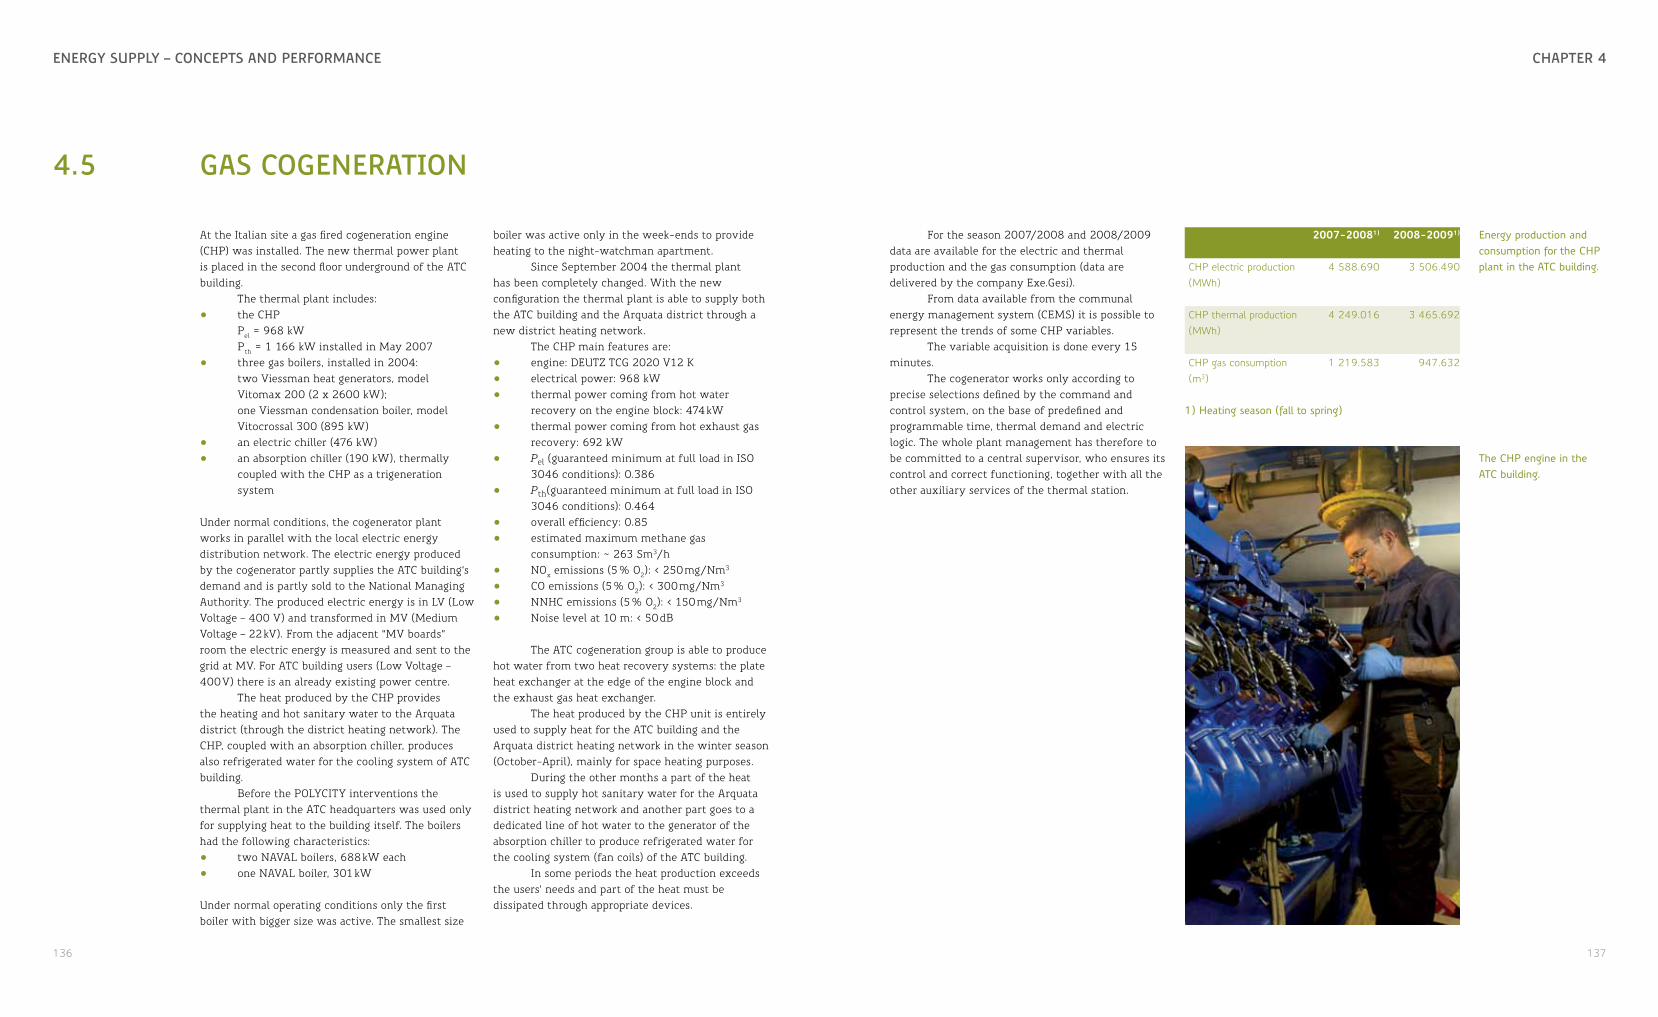
136 137
chaPtEr 4EnErgy sUPPly – concEPts anD PErformancE
4.5 gas cogEnEration
At the Italian site a gas fired cogeneration engine (CHP) was installed. The new thermal power plant is placed in the second floor underground of the ATC building.
The thermal plant includes:• the CHP
Pel = 968 kW Pth = 1 166 kW installed in May 2007
• three gas boilers, installed in 2004: two Viessman heat generators, model Vitomax 200 (2 x 2600 kW); one Viessman condensation boiler, model Vitocrossal 300 (895 kW)
• an electric chiller (476 kW)• an absorption chiller (190 kW), thermally
coupled with the CHP as a trigeneration system
Under normal conditions, the cogenerator plant works in parallel with the local electric energy distribution network. The electric energy produced by the cogenerator partly supplies the ATC building’s demand and is partly sold to the National Managing Authority. The produced electric energy is in LV (Low Voltage – 400 V) and transformed in MV (Medium Voltage – 22 kV). From the adjacent “MV boards” room the electric energy is measured and sent to the grid at MV. For ATC building users (Low Voltage – 400 V) there is an already existing power centre.
The heat produced by the CHP provides the heating and hot sanitary water to the Arquata district (through the district heating network). The CHP, coupled with an absorption chiller, produces also refrigerated water for the cooling system of ATC building.
Before the POLYCITY interventions the thermal plant in the ATC headquarters was used only for supplying heat to the building itself. The boilers had the following characteristics:• two NAVAL boilers, 688 kW each• one NAVAL boiler, 301 kW
Under normal operating conditions only the first boiler with bigger size was active. The smallest size
boiler was active only in the week-ends to provide heating to the night-watchman apartment.
Since September 2004 the thermal plant has been completely changed. With the new configuration the thermal plant is able to supply both the ATC building and the Arquata district through a new district heating network.
The CHP main features are:• engine: DEUTZ TCG 2020 V12 K• electrical power: 968 kW• thermal power coming from hot water
recovery on the engine block: 474 kW• thermal power coming from hot exhaust gas
recovery: 692 kW • Pel (guaranteed minimum at full load in ISO
3046 conditions): 0.386 • Pth(guaranteed minimum at full load in ISO
3046 conditions): 0.464• overall efficiency: 0.85• estimated maximum methane gas
consumption: ~ 263 Sm3/h• NOx emissions (5 % O2): < 250 mg/Nm3
• CO emissions (5 % O2): < 300 mg/Nm3
• NNHC emissions (5 % O2): < 150 mg/Nm3
• Noise level at 10 m: < 50 dB
The ATC cogeneration group is able to produce hot water from two heat recovery systems: the plate heat exchanger at the edge of the engine block and the exhaust gas heat exchanger.
The heat produced by the CHP unit is entirely used to supply heat for the ATC building and the Arquata district heating network in the winter season (October-April), mainly for space heating purposes.
During the other months a part of the heat is used to supply hot sanitary water for the Arquata district heating network and another part goes to a dedicated line of hot water to the generator of the absorption chiller to produce refrigerated water for the cooling system (fan coils) of the ATC building.
In some periods the heat production exceeds the users’ needs and part of the heat must be dissipated through appropriate devices.
For the season 2007/2008 and 2008/2009 data are available for the electric and thermal production and the gas consumption (data are delivered by the company Exe.Gesi).
From data available from the communal energy management system (CEMS) it is possible to represent the trends of some CHP variables.
The variable acquisition is done every 15 minutes.
The cogenerator works only according to precise selections defined by the command and control system, on the base of predefined and programmable time, thermal demand and electric logic. The whole plant management has therefore to be committed to a central supervisor, who ensures its control and correct functioning, together with all the other auxiliary services of the thermal station.
2007-20081) 2008-20091)
CHP electric production (MWh)
4 588.690 3 506.490
CHP thermal production (MWh)
4 249.016 3 465.692
CHP gas consumption (m3)
1 219.583 947.632
1) Heating season (fall to spring)
Energy production and consumption for the CHP plant in the ATC building.
The CHP engine in the ATC building.
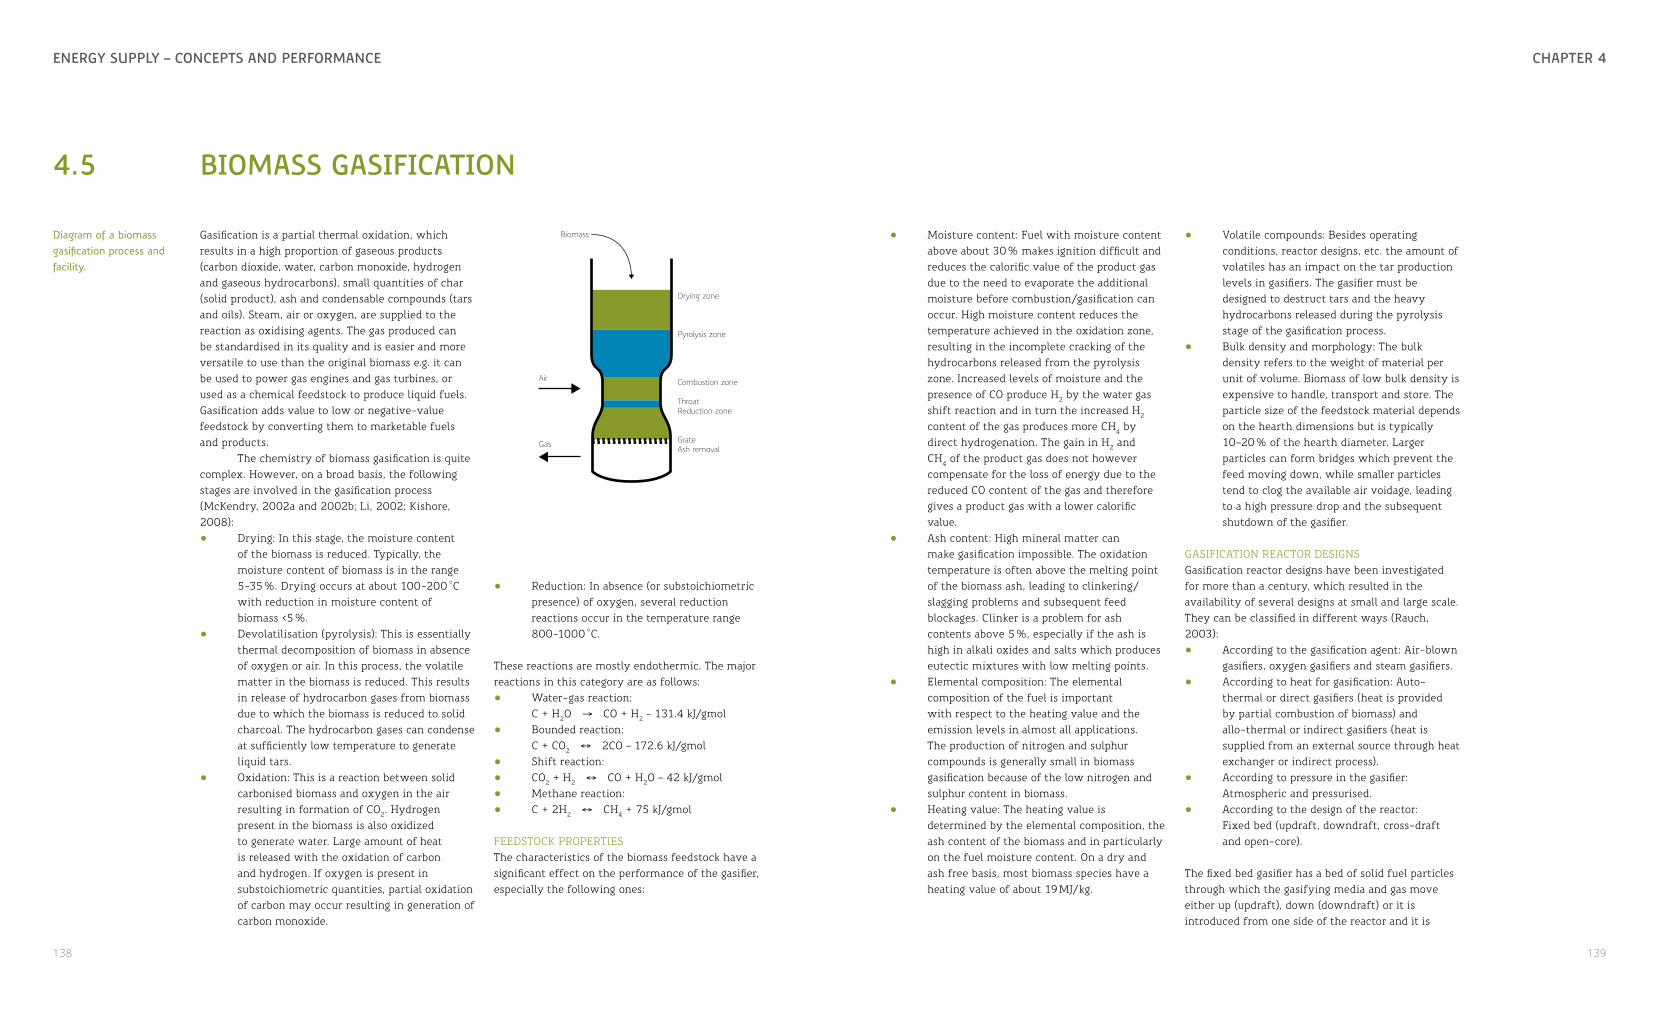
138 139
chaPtEr 4EnErgy sUPPly – concEPts anD PErformancE
4.5 biomass gasification
Gasification is a partial thermal oxidation, which results in a high proportion of gaseous products (carbon dioxide, water, carbon monoxide, hydrogen and gaseous hydrocarbons), small quantities of char (solid product), ash and condensable compounds (tars and oils). Steam, air or oxygen, are supplied to the reaction as oxidising agents. The gas produced can be standardised in its quality and is easier and more versatile to use than the original biomass e.g. it can be used to power gas engines and gas turbines, or used as a chemical feedstock to produce liquid fuels. Gasification adds value to low or negative-value feedstock by converting them to marketable fuels and products.
The chemistry of biomass gasification is quite complex. However, on a broad basis, the following stages are involved in the gasification process (McKendry, 2002a and 2002b; Li, 2002; Kishore, 2008):• Drying: In this stage, the moisture content
of the biomass is reduced. Typically, the moisture content of biomass is in the range 5-35 %. Drying occurs at about 100-200 °C with reduction in moisture content of biomass <5 %.
• Devolatilisation (pyrolysis): This is essentially thermal decomposition of biomass in absence of oxygen or air. In this process, the volatile matter in the biomass is reduced. This results in release of hydrocarbon gases from biomass due to which the biomass is reduced to solid charcoal. The hydrocarbon gases can condense at sufficiently low temperature to generate liquid tars.
• Oxidation: This is a reaction between solid carbonised biomass and oxygen in the air resulting in formation of CO2. Hydrogen present in the biomass is also oxidized to generate water. Large amount of heat is released with the oxidation of carbon and hydrogen. If oxygen is present in substoichiometric quantities, partial oxidation of carbon may occur resulting in generation of carbon monoxide.
• Reduction: In absence (or substoichiometric presence) of oxygen, several reduction reactions occur in the temperature range 800-1000 °C.
These reactions are mostly endothermic. The major reactions in this category are as follows:• Water-gas reaction:
C + H2O → CO + H2 – 131.4 kJ/gmol• Bounded reaction:
C + CO2 ↔ 2CO – 172.6 kJ/gmol• Shift reaction: • CO2 + H2 ↔ CO + H2O – 42 kJ/gmol• Methane reaction: • C + 2H2 ↔ CH4 + 75 kJ/gmol
FEEDSTOCK PROPERTIESThe characteristics of the biomass feedstock have a significant effect on the performance of the gasifier, especially the following ones:
• Moisture content: Fuel with moisture content above about 30 % makes ignition difficult and reduces the calorific value of the product gas due to the need to evaporate the additional moisture before combustion/gasification can occur. High moisture content reduces the temperature achieved in the oxidation zone, resulting in the incomplete cracking of the hydrocarbons released from the pyrolysis zone. Increased levels of moisture and the presence of CO produce H2 by the water gas shift reaction and in turn the increased H2 content of the gas produces more CH4 by direct hydrogenation. The gain in H2 and CH4 of the product gas does not however compensate for the loss of energy due to the reduced CO content of the gas and therefore gives a product gas with a lower calorific value.
• Ash content: High mineral matter can make gasification impossible. The oxidation temperature is often above the melting point of the biomass ash, leading to clinkering/slagging problems and subsequent feed blockages. Clinker is a problem for ash contents above 5 %, especially if the ash is high in alkali oxides and salts which produces eutectic mixtures with low melting points.
• Elemental composition: The elemental composition of the fuel is important with respect to the heating value and the emission levels in almost all applications. The production of nitrogen and sulphur compounds is generally small in biomass gasification because of the low nitrogen and sulphur content in biomass.
• Heating value: The heating value is determined by the elemental composition, the ash content of the biomass and in particularly on the fuel moisture content. On a dry and ash free basis, most biomass species have a heating value of about 19 MJ/kg.
• Volatile compounds: Besides operating conditions, reactor designs, etc. the amount of volatiles has an impact on the tar production levels in gasifiers. The gasifier must be designed to destruct tars and the heavy hydrocarbons released during the pyrolysis stage of the gasification process.
• Bulk density and morphology: The bulk density refers to the weight of material per unit of volume. Biomass of low bulk density is expensive to handle, transport and store. The particle size of the feedstock material depends on the hearth dimensions but is typically 10–20 % of the hearth diameter. Larger particles can form bridges which prevent the feed moving down, while smaller particles tend to clog the available air voidage, leading to a high pressure drop and the subsequent shutdown of the gasifier.
GASIFICATION REACTOR DESIGNSGasification reactor designs have been investigated for more than a century, which resulted in the availability of several designs at small and large scale. They can be classified in different ways (Rauch, 2003):• According to the gasification agent: Air-blown
gasifiers, oxygen gasifiers and steam gasifiers.• According to heat for gasification: Auto-
thermal or direct gasifiers (heat is provided by partial combustion of biomass) and allo-thermal or indirect gasifiers (heat is supplied from an external source through heat exchanger or indirect process).
• According to pressure in the gasifier: Atmospheric and pressurised.
• According to the design of the reactor: Fixed bed (updraft, downdraft, cross-draft and open-core).
The fixed bed gasifier has a bed of solid fuel particles through which the gasifying media and gas move either up (updraft), down (downdraft) or it is introduced from one side of the reactor and it is
Biomass
Air
Gas
Drying zone
Pyrolysis zone
Combustion zone
ThroatReduction zone
GrateAsh removal
Diagram of a biomass gasification process and facility.
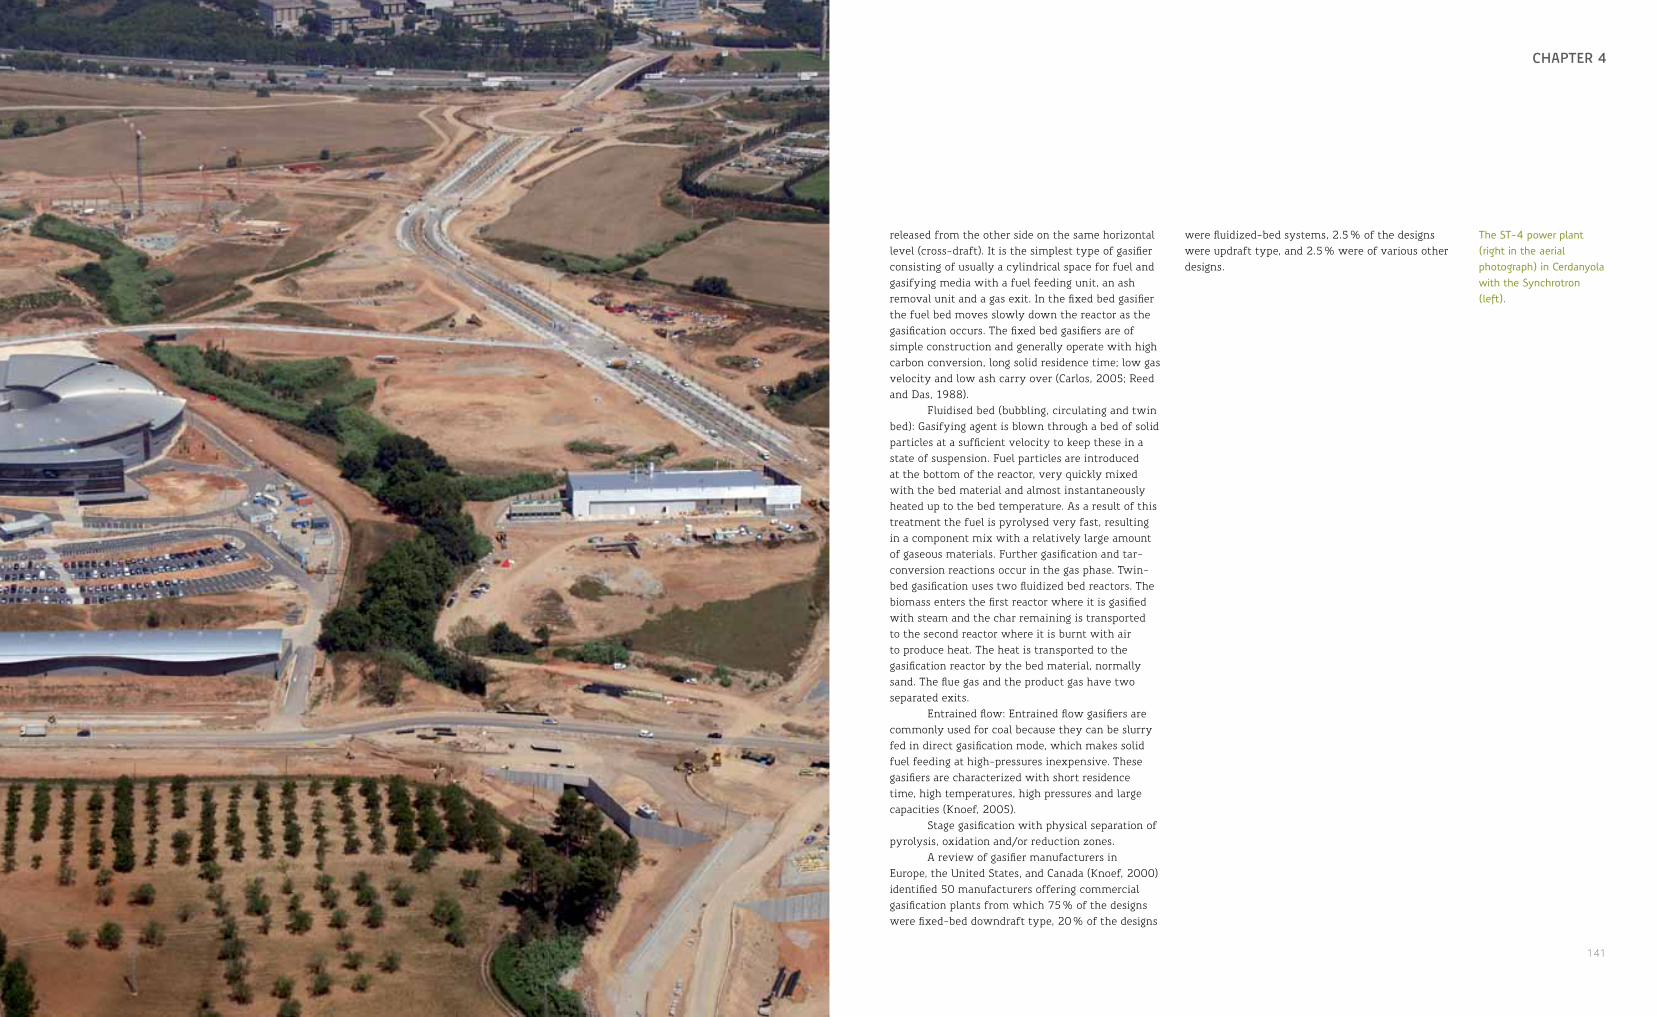
140 141
towarDs a sUstainablE commUnity chaPtEr 4
released from the other side on the same horizontal level (cross-draft). It is the simplest type of gasifier consisting of usually a cylindrical space for fuel and gasifying media with a fuel feeding unit, an ash removal unit and a gas exit. In the fixed bed gasifier the fuel bed moves slowly down the reactor as the gasification occurs. The fixed bed gasifiers are of simple construction and generally operate with high carbon conversion, long solid residence time; low gas velocity and low ash carry over (Carlos, 2005; Reed and Das, 1988).
Fluidised bed (bubbling, circulating and twin bed): Gasifying agent is blown through a bed of solid particles at a sufficient velocity to keep these in a state of suspension. Fuel particles are introduced at the bottom of the reactor, very quickly mixed with the bed material and almost instantaneously heated up to the bed temperature. As a result of this treatment the fuel is pyrolysed very fast, resulting in a component mix with a relatively large amount of gaseous materials. Further gasification and tar-conversion reactions occur in the gas phase. Twin-bed gasification uses two fluidized bed reactors. The biomass enters the first reactor where it is gasified with steam and the char remaining is transported to the second reactor where it is burnt with air to produce heat. The heat is transported to the gasification reactor by the bed material, normally sand. The flue gas and the product gas have two separated exits.
Entrained flow: Entrained flow gasifiers are commonly used for coal because they can be slurry fed in direct gasification mode, which makes solid fuel feeding at high-pressures inexpensive. These gasifiers are characterized with short residence time, high temperatures, high pressures and large capacities (Knoef, 2005).
Stage gasification with physical separation of pyrolysis, oxidation and/or reduction zones.
A review of gasifier manufacturers in Europe, the United States, and Canada (Knoef, 2000) identified 50 manufacturers offering commercial gasification plants from which 75 % of the designs were fixed-bed downdraft type, 20 % of the designs
were fluidized-bed systems, 2.5 % of the designs were updraft type, and 2.5 % were of various other designs.
The ST-4 power plant (right in the aerial photograph) in Cerdanyola with the Synchrotron (left).
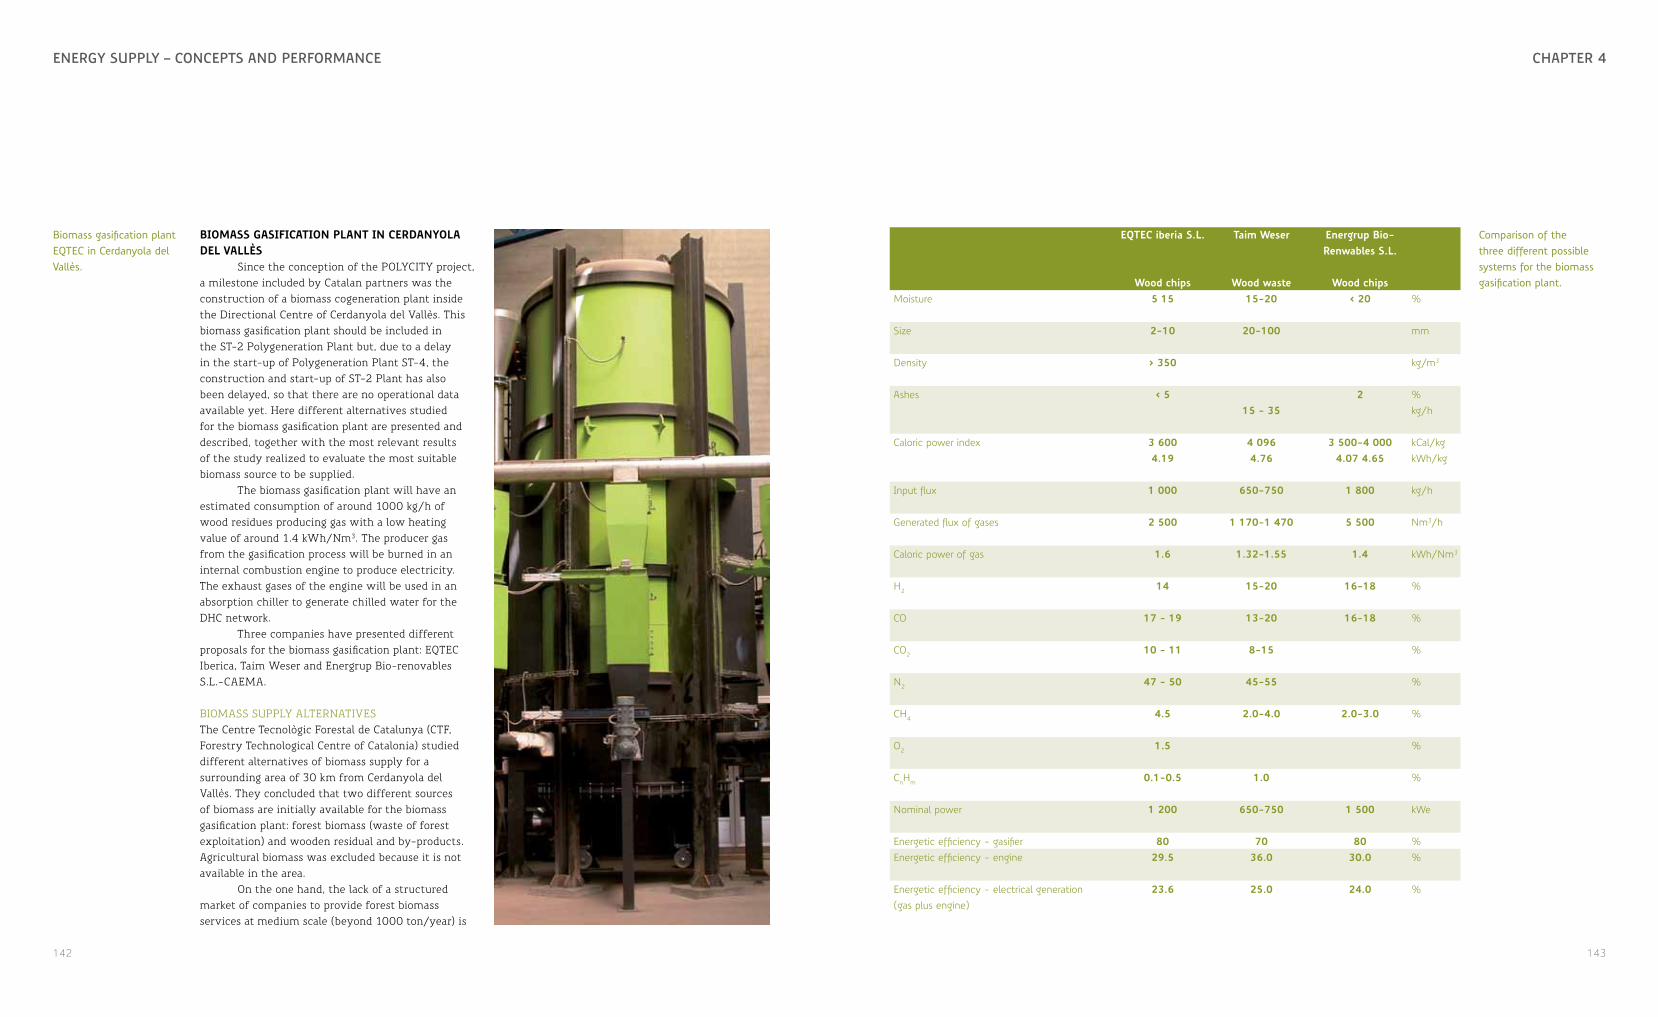
142 143
chaPtEr 4EnErgy sUPPly – concEPts anD PErformancE
biomass gasification Plant in cerdanyola del Vallès
Since the conception of the POLYCITY project, a milestone included by Catalan partners was the construction of a biomass cogeneration plant inside the Directional Centre of Cerdanyola del Vallès. This biomass gasification plant should be included in the ST-2 Polygeneration Plant but, due to a delay in the start-up of Polygeneration Plant ST-4, the construction and start-up of ST-2 Plant has also been delayed, so that there are no operational data available yet. Here different alternatives studied for the biomass gasification plant are presented and described, together with the most relevant results of the study realized to evaluate the most suitable biomass source to be supplied.
The biomass gasification plant will have an estimated consumption of around 1000 kg/h of wood residues producing gas with a low heating value of around 1.4 kWh/Nm3. The producer gas from the gasification process will be burned in an internal combustion engine to produce electricity. The exhaust gases of the engine will be used in an absorption chiller to generate chilled water for the DHC network.
Three companies have presented different proposals for the biomass gasification plant: EQTEC Iberica, Taim Weser and Energrup Bio-renovables S.L.-CAEMA.
BIOMASS SUPPLY ALTERNATIVES The Centre Tecnològic Forestal de Catalunya (CTF, Forestry Technological Centre of Catalonia) studied different alternatives of biomass supply for a surrounding area of 30 km from Cerdanyola del Vallès. They concluded that two different sources of biomass are initially available for the biomass gasification plant: forest biomass (waste of forest exploitation) and wooden residual and by-products. Agricultural biomass was excluded because it is not available in the area.
On the one hand, the lack of a structured market of companies to provide forest biomass services at medium scale (beyond 1000 ton/year) is
Biomass gasification plant EQTEC in Cerdanyola del Vallès.
eqtec iberia s.l.
wood chips
taim weser
wood waste
energrup bio-renwables s.l.
wood chipsMoisture 5 15 15-20 < 20 %
Size 2-10 20-100 mm
Density > 350 kg/m3
Ashes < 5 2 %15 - 35 kg/h
Caloric power index 3 6004.19
4 0964.76
3 500-4 0004.07 4.65
kCal/kgkWh/kg
Input flux 1 000 650-750 1 800 kg/h
Generated flux of gases 2 500 1 170-1 470 5 500 Nm3/h
Caloric power of gas 1.6 1.32-1.55 1.4 kWh/Nm3
H2 14 15-20 16-18 %
CO 17 - 19 13-20 16-18 %
CO2 10 - 11 8-15 %
N2 47 - 50 45-55 %
CH4 4.5 2.0-4.0 2.0-3.0 %
O2 1.5 %
CnHm 0.1-0.5 1.0 %
Nominal power 1 200 650-750 1 500 kWe
Energetic efficiency - gasifier 80 70 80 %Energetic efficiency - engine 29.5 36.0 30.0 %
Energetic efficiency - electrical generation (gas plus engine)
23.6 25.0 24.0 %
Comparison of the three different possible systems for the biomass gasification plant.

144 145
chaPtEr 1EnErgy sUPPly – concEPts anD PErformancE
a difficulty in ensuring the supply and to minimise the risks associated with a not complete supply (quality and quantity). On the other hand, wooden residuals and by-products are available in the Metropolitan area of Barcelona and their supply for the biomass gasification plant can be guaranteed.
Wooden residuals and by-products are better options than forest biomass from a logistic point of view, but also in economic, energetic and environmental terms. The study also pointed out that wooden residuals collected from recycling points are the most advantageous source of biomass for energy production in Cerdanyola and in other Catalan urban areas.
The economic analysis concluded that the total cost of forest biomass in Cerdanyola is between 16 and 32 ¤/ton and for wooden residuals this cost is reduced to 9-15 ¤/ton.
The energy balance made in the life cycle analysis concluded that the energy consumption of firewood pre-treatment and transport at a maximum distance of 50 km is 1 144.35 MJ/T, three times greater than the energy consumption of wooden by-products collected from recycling points (390.08 MJ/T) and almost twice of the energy consumption of wooden by-products from the collection of bulky wastes (608.11 MJ/T).
DIFFERENT GASIFICATION TECHNOLOGIES FOR THE BIOMASS GASIFICATION PLANT IN CERDANYOLAThe aim of this chapter is to describe the three different alternatives proposed by three companies for the biomass gasification plant of Cerdanyola del Vallès:
Bubbling fluidised bed gasifier (EQTEC Iberia S.L.)The biomass gasification plant proposed by EQTEC Iberia S.L. is based on bubbling fluidised bed technology. This company has already another gasification plant in the alcohol distillery of the company Mostos, Vinos y Alcoholes S.A. (Movialsa) in Campo de Criptana (Ciudadreal, Spain). This cogeneration plant has an electrical output of 5.9 MW
and produces 5600 kg/h of saturated steam at 6 bar(g) and 159 m3/h of hot water at 90 °C.
Downdraft gasifier (Taim Weser)The biomass gasification plant offered by Taim Weser is based on a downdraft gasification vessel with descending parallel flow, which is characterised by the low tar content in the produced gas.
Downdraft gasifier (Energrup Bio-renovables S.L.)The biomass gasification plant offered by Energrup Bio-renovables S.L. is based on Caema Ankur Scientific downdraft gasifier. The selection of the most suitable technology for a biomass gasification plant depends on numerous factors like producer gas composition, processing conditions (pressure, temperature, etc), emissions (PM, tar), capital costs and supporting equipment (process complexity).
For instance, the selection of updraft or downdraft gasifier would mainly depend upon the available fuel and the requirements of the application. Downdraft wood gasifier requires wood chips, biomass briquettes or wood-like agro-residues (such as stems, stalks). This type produces little tar which makes it more suitable for engine applications. However, it requires more strict fuel specifications (moisture, size) and its scalability is limited. For this reason, if fuel flexibility is required and need for fuel switching is anticipated, the updraft gasifier would be suitable. Updraft gasifier has high efficiency and is relatively insensitive to biomass variations. However, the raw gas contains large amounts of tar which, depending on the application, may need to be removed. Bubbling fluidised bed gasifier is also less sensitive to fuel variations but produces larger amounts of tar and dust. It is more compact but also more complex, and usually used at larger scales.
In addition to these general criteria, there are site specific requirements which need to be analysed in detail while making the final selection.
The ST-4 power plant under construction.

146 147
chaPtEr 4EnErgy sUPPly – concEPts anD PErformancE
4.6 Photovoltaics
Seventeen building integrated photovoltaic (BIPV) power plants have been designed, installed and monitored in the POLYCITY project. They have been built in Scharnhauser Park, Germany, and Turin, Italy. With slightly more than 300 kWp nominal capacity, the installations deliver around 370 MWh/a on average.
imPortance of monitoringMonitoring is often associated with multi MWp large scale photovoltaic power plants because of significant financial investments, rough climatic conditions (hail, soiling) and remote uninhabited areas (theft). Small scale BIPV might not be linked to the same pitfalls, but could still work at less than optimal operation conditions.
Several technical difficulties have been detected and fixed during the monitoring phase of the BIPV plants:• building fire• power disconnection of the monitoring device• power failure in the building where the
monitoring server was installed• disconnection of the router to which the
inverter was connected• inverter failure
The goal of monitoring for small-scale BIPV is to accurately and reliably detect avoidable losses while being unobtrusive for the occupants. The whole monitoring system should also consume as little power as possible: The expected value of the average energy yield should be higher with monitoring than without.
integration with online simulationOnline simulation has been extensively used for PV monitoring during the project. The complete automation of the process has enabled monitoring to take place daily, and notification emails have been sent as soon as either one of the data sources (e.g. AC output from the inverter, temperature and irradiance
from the weather station) went missing. Reports have been automatically delivered to ensure the systems were working as planned.
One shared server based in UAS has been used to launch the simulations for every installation, thus reducing the specific power consumption dedicated to the monitoring process to about 0.2 % of the produced PV energy.
scharnhauser ParkFour BIPV power plants have been installed in Scharnhauser Park (48.72°N, 9.27°E) with a total nominal power of 125 kWp. The location has an average horizontal irradiance of around 130 W/m², and the optimum plane (tilt of 33°) receives around 145 W/m². Specific energy yields of more than 1100 kWh/kWp/a are achievable provided the PV installation works with a performance ratio of 88 % or more.
The total flat roof area of the quarter is 9.8 ha, 58 % of which would be available for photovoltaic power plants. Coverage of the whole suitable surface would represent 3.3 MWp and would enable to supply 35 % of the electrical consumption from the 7200 inhabitants.
Park.haus PhotoVoltaic Power PlantA 4.95 kWp PV system has been installed in October 2005 on the south facade of the parish hall of a Christian community called “Park.Haus” (48.7147°N, 9.2702°E). The PV system consists of 45 Engcotec W1000-110 modules with 110 Wp each. Due to shading effects caused by adjacent buildings, the system is divided into two strings, one string with 18 modules in the lower part and one string with 27 modules in the upper part. The two strings are connected to a SMA Sunny Boy 4200 TL with a nominal power of 4.2 kW and two independent MPP trackers. As with every other described installation, the produced electricity is fed into the local grid.
MONITORINGThe inverter is connected to a SMA Sunny WebBox via RS485, which is itself connected to Internet via a router which forwards ports 80 (http) and 21 (ftp).
The Sunny WebBox logs DC and AC power outputs as well as voltages for each string, every 5 minutes. Those data have been retrieved via ftp every 15 minutes since July 2007 on a Ubuntu Linux 8.04 LTS server, located at the UAS.
This server also retrieves data available from the weather station installed on the CHP power
plant, and merges the files into daily, monthly and yearly reports.
ENERGY PERFORMANCEThe average irradiance on a south facade since July 2007 has been approximately 850 kWh/m²a. This average has been calculated over full years only, which means it contains as many winters as summers.
Since there is no pyranometer installed on a south vertical plane in Scharnhauser Park, this value has been transposed (with INSEL v7) from the horizontal pyranometer located on the roof of the CHP plant. The sensor measured an average of 1140 kWh/m²a during this period.
The Park.Haus PV plant has delivered 3160 kWh/a on average, which amounts to a specific production of 640 kWh/kWp/a.
The associated Performance Ratio is 75 %, which is a bit lower than the German average (~80 % according to unofficial reports by meteocontrol). This difference could be explained by the shadowing from the opposite building and antenna.
The PV installation on the Park.Haus.
PV array 34 kW, PV array 6 kW
AC e
nerg
y yi
eld
(MW
h/a)
37.4
44.1
Year
AC energy produced by the 40 kW facility on the sports field change room building, Scharnhauser Park.
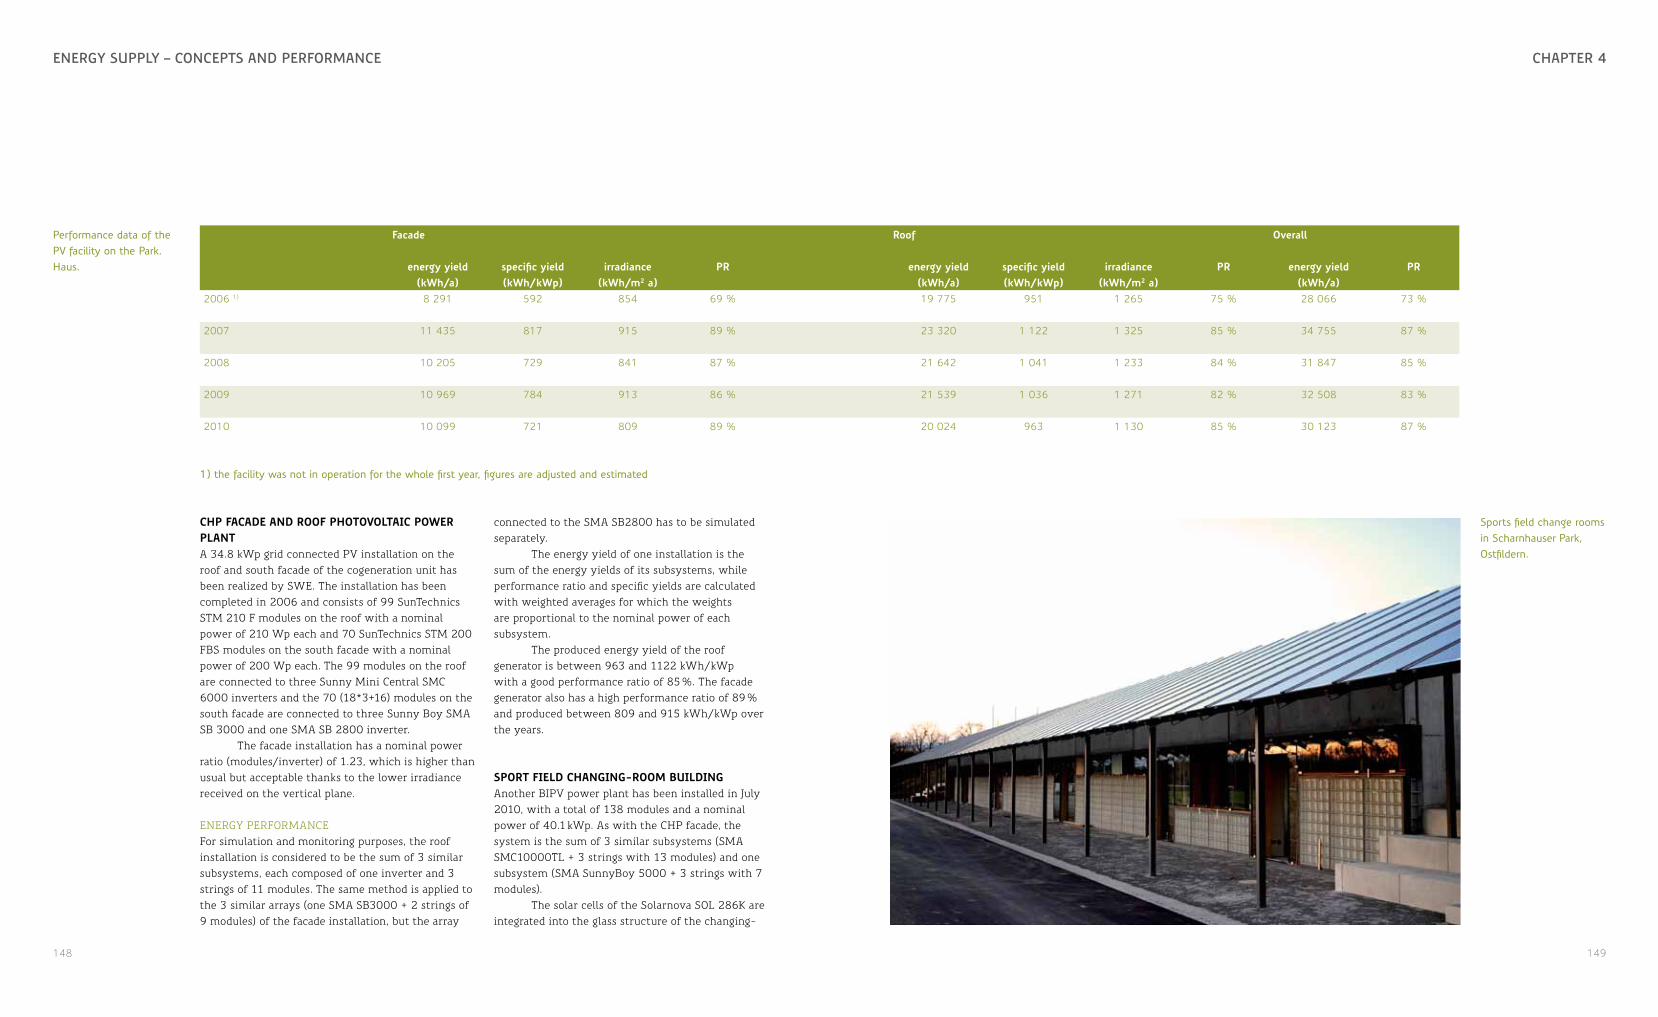
148 149
chaPtEr 4EnErgy sUPPly – concEPts anD PErformancE
chP facade and roof PhotoVoltaic Power PlantA 34.8 kWp grid connected PV installation on the roof and south facade of the cogeneration unit has been realized by SWE. The installation has been completed in 2006 and consists of 99 SunTechnics STM 210 F modules on the roof with a nominal power of 210 Wp each and 70 SunTechnics STM 200 FBS modules on the south facade with a nominal power of 200 Wp each. The 99 modules on the roof are connected to three Sunny Mini Central SMC 6000 inverters and the 70 (18*3+16) modules on the south facade are connected to three Sunny Boy SMA SB 3000 and one SMA SB 2800 inverter.
The facade installation has a nominal power ratio (modules/inverter) of 1.23, which is higher than usual but acceptable thanks to the lower irradiance received on the vertical plane.
ENERGY PERFORMANCEFor simulation and monitoring purposes, the roof installation is considered to be the sum of 3 similar subsystems, each composed of one inverter and 3 strings of 11 modules. The same method is applied to the 3 similar arrays (one SMA SB3000 + 2 strings of 9 modules) of the facade installation, but the array
facade roof overall
energy yield(kwh/a)
specific yield(kwh/kwp)
irradiance(kwh/m2 a)
Pr energy yield(kwh/a)
specific yield(kwh/kwp)
irradiance(kwh/m2 a)
Pr energy yield(kwh/a)
Pr
2006 1) 8 291 592 854 69 % 19 775 951 1 265 75 % 28 066 73 %
2007 11 435 817 915 89 % 23 320 1 122 1 325 85 % 34 755 87 %
2008 10 205 729 841 87 % 21 642 1 041 1 233 84 % 31 847 85 %
2009 10 969 784 913 86 % 21 539 1 036 1 271 82 % 32 508 83 %
2010 10 099 721 809 89 % 20 024 963 1 130 85 % 30 123 87 %
1) the facility was not in operation for the whole first year, figures are adjusted and estimated
connected to the SMA SB2800 has to be simulated separately.
The energy yield of one installation is the sum of the energy yields of its subsystems, while performance ratio and specific yields are calculated with weighted averages for which the weights are proportional to the nominal power of each subsystem.
The produced energy yield of the roof generator is between 963 and 1122 kWh/kWp with a good performance ratio of 85 %. The facade generator also has a high performance ratio of 89 % and produced between 809 and 915 kWh/kWp over the years.
sPort field changing-room buildingAnother BIPV power plant has been installed in July 2010, with a total of 138 modules and a nominal power of 40.1 kWp. As with the CHP facade, the system is the sum of 3 similar subsystems (SMA SMC10000TL + 3 strings with 13 modules) and one subsystem (SMA SunnyBoy 5000 + 3 strings with 7 modules).
The solar cells of the Solarnova SOL 286K are integrated into the glass structure of the changing-
Performance data of the PV facility on the Park.Haus.
Sports field change rooms in Scharnhauser Park, Ostfildern.
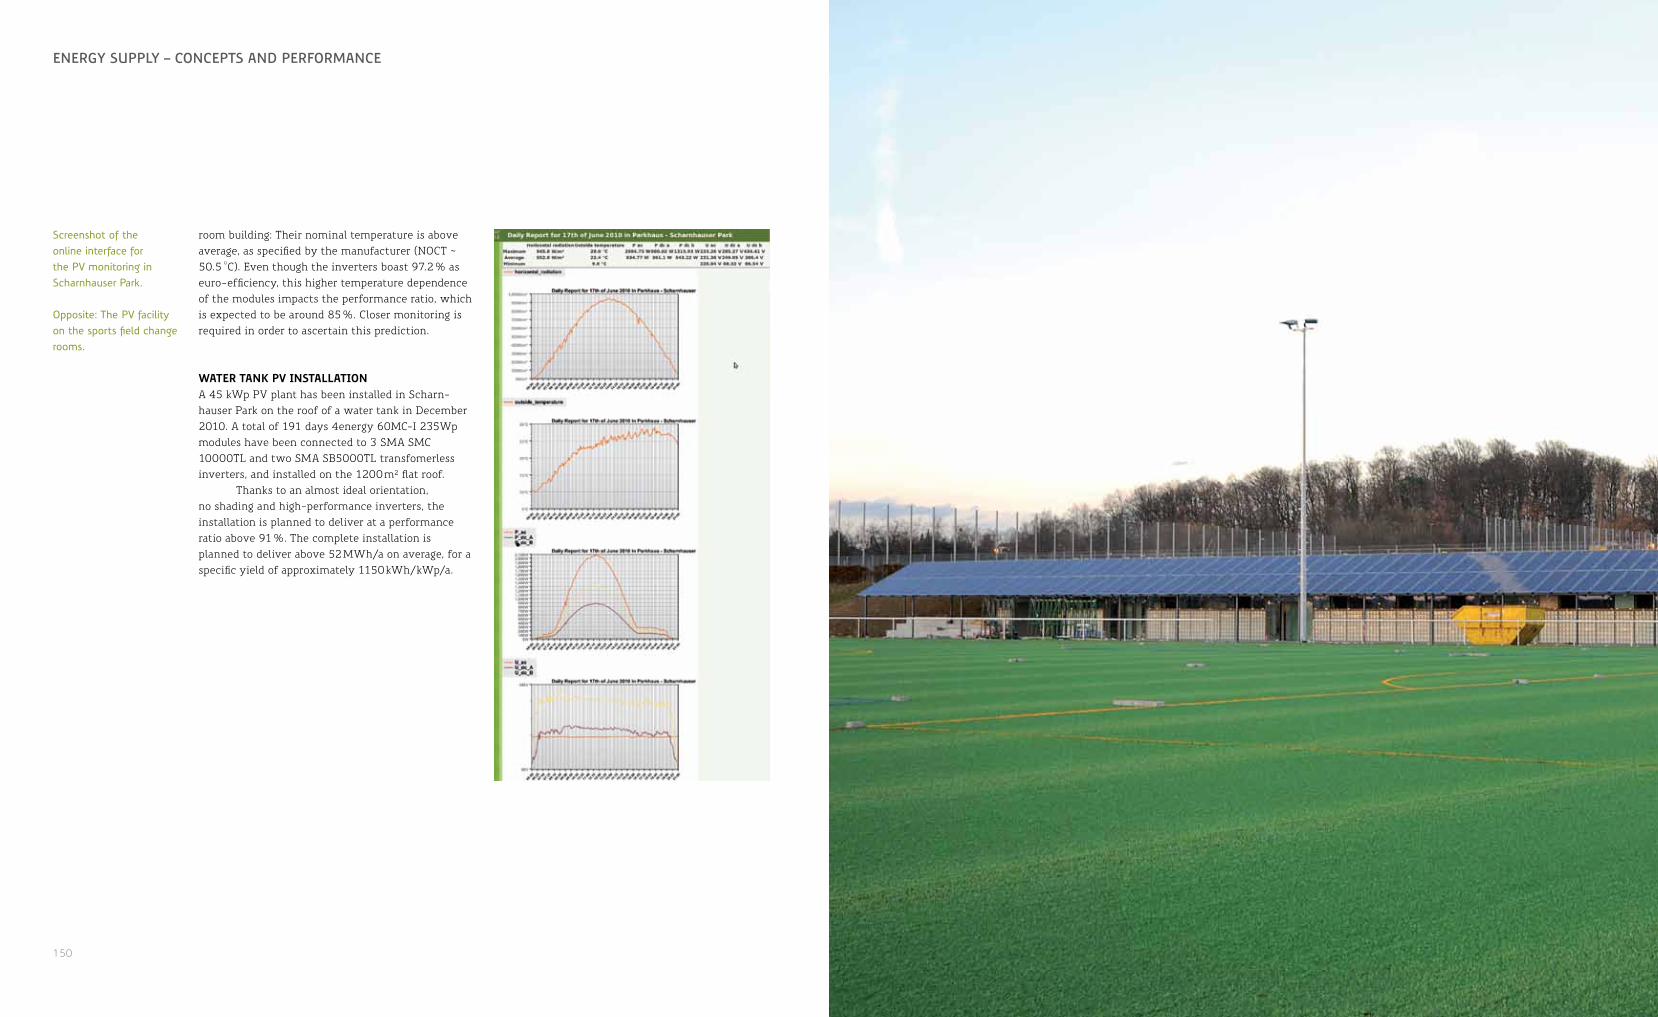
150 151
chaPtEr 1EnErgy sUPPly – concEPts anD PErformancE
Screenshot of the online interface for the PV monitoring in Scharnhauser Park.
Opposite: The PV facility on the sports field change rooms.
room building: Their nominal temperature is above average, as specified by the manufacturer (NOCT ~ 50.5 °C). Even though the inverters boast 97.2 % as euro-efficiency, this higher temperature dependence of the modules impacts the performance ratio, which is expected to be around 85 %. Closer monitoring is required in order to ascertain this prediction.
water tank PV installationA 45 kWp PV plant has been installed in Scharn-hauser Park on the roof of a water tank in December 2010. A total of 191 days 4energy 60MC-I 235Wp modules have been connected to 3 SMA SMC 10000TL and two SMA SB5000TL transfomerless inverters, and installed on the 1200 m² flat roof.
Thanks to an almost ideal orientation, no shading and high-performance inverters, the installation is planned to deliver at a performance ratio above 91 %. The complete installation is planned to deliver above 52 MWh/a on average, for a specific yield of approximately 1150 kWh/kWp/a.
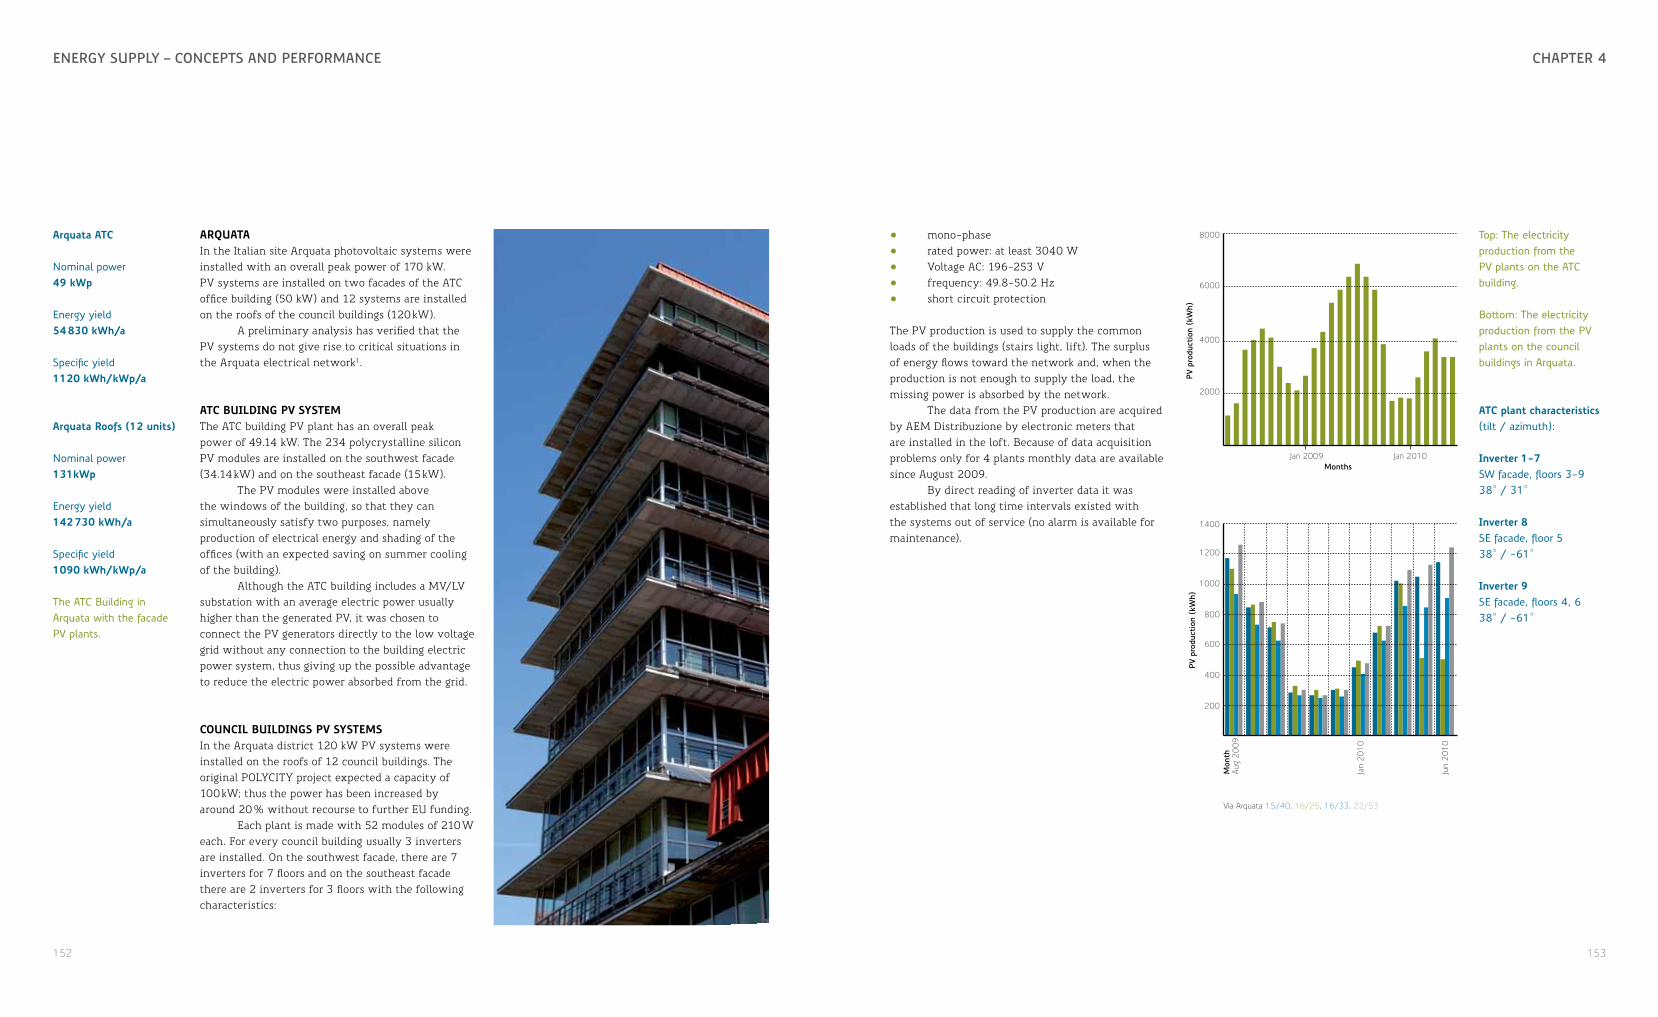
152 153
chaPtEr 4EnErgy sUPPly – concEPts anD PErformancE
arquataIn the Italian site Arquata photovoltaic systems were installed with an overall peak power of 170 kW. PV systems are installed on two facades of the ATC office building (50 kW) and 12 systems are installed on the roofs of the council buildings (120 kW).
A preliminary analysis has verified that the PV systems do not give rise to critical situations in the Arquata electrical network1.
atc building PV system The ATC building PV plant has an overall peak power of 49.14 kW. The 234 polycrystalline silicon PV modules are installed on the southwest facade (34.14 kW) and on the southeast facade (15 kW).
The PV modules were installed above the windows of the building, so that they can simultaneously satisfy two purposes, namely production of electrical energy and shading of the offices (with an expected saving on summer cooling of the building).
Although the ATC building includes a MV/LV substation with an average electric power usually higher than the generated PV, it was chosen to connect the PV generators directly to the low voltage grid without any connection to the building electric power system, thus giving up the possible advantage to reduce the electric power absorbed from the grid.
council buildings PV systemsIn the Arquata district 120 kW PV systems were installed on the roofs of 12 council buildings. The original POLYCITY project expected a capacity of 100 kW; thus the power has been increased by around 20 % without recourse to further EU funding.
Each plant is made with 52 modules of 210 W each. For every council building usually 3 inverters are installed. On the southwest facade, there are 7 inverters for 7 floors and on the southeast facade there are 2 inverters for 3 floors with the following characteristics:
• mono-phase• rated power: at least 3040 W• Voltage AC: 196-253 V• frequency: 49.8-50.2 Hz• short circuit protection
The PV production is used to supply the common loads of the buildings (stairs light, lift). The surplus of energy flows toward the network and, when the production is not enough to supply the load, the missing power is absorbed by the network.
The data from the PV production are acquired by AEM Distribuzione by electronic meters that are installed in the loft. Because of data acquisition problems only for 4 plants monthly data are available since August 2009.
By direct reading of inverter data it was established that long time intervals existed with the systems out of service (no alarm is available for maintenance).
arquata atc
Nominal power49 kwp
Energy yield54 830 kwh/a
Specific yield1120 kwh/kwp/a
arquata roofs (12 units)
Nominal power131kwp
Energy yield142 730 kwh/a
Specific yield1090 kwh/kwp/a
The ATC Building in Arquata with the facade PV plants.
PV p
rodu
ctio
n (k
Wh)
Jan 2010Jan 2009
8000
6000
4000
2000
Months
Top: The electricity production from the PV plants on the ATC building.
Bottom: The electricity production from the PV plants on the council buildings in Arquata.
atc plant characteristics(tilt / azimuth):
inverter 1-7SW facade, floors 3-938° / 31°
inverter 8SE facade, floor 538° / -61°
inverter 9SE facade, floors 4, 638° / -61°
PV p
rodu
ctio
n (k
Wh)
Jun
2010
Jan
2010
Aug
2009
Via Arquata 15/40, 16/25, 16/33, 22/53
1400
1200
1000
800
600
400
200
Mon
th
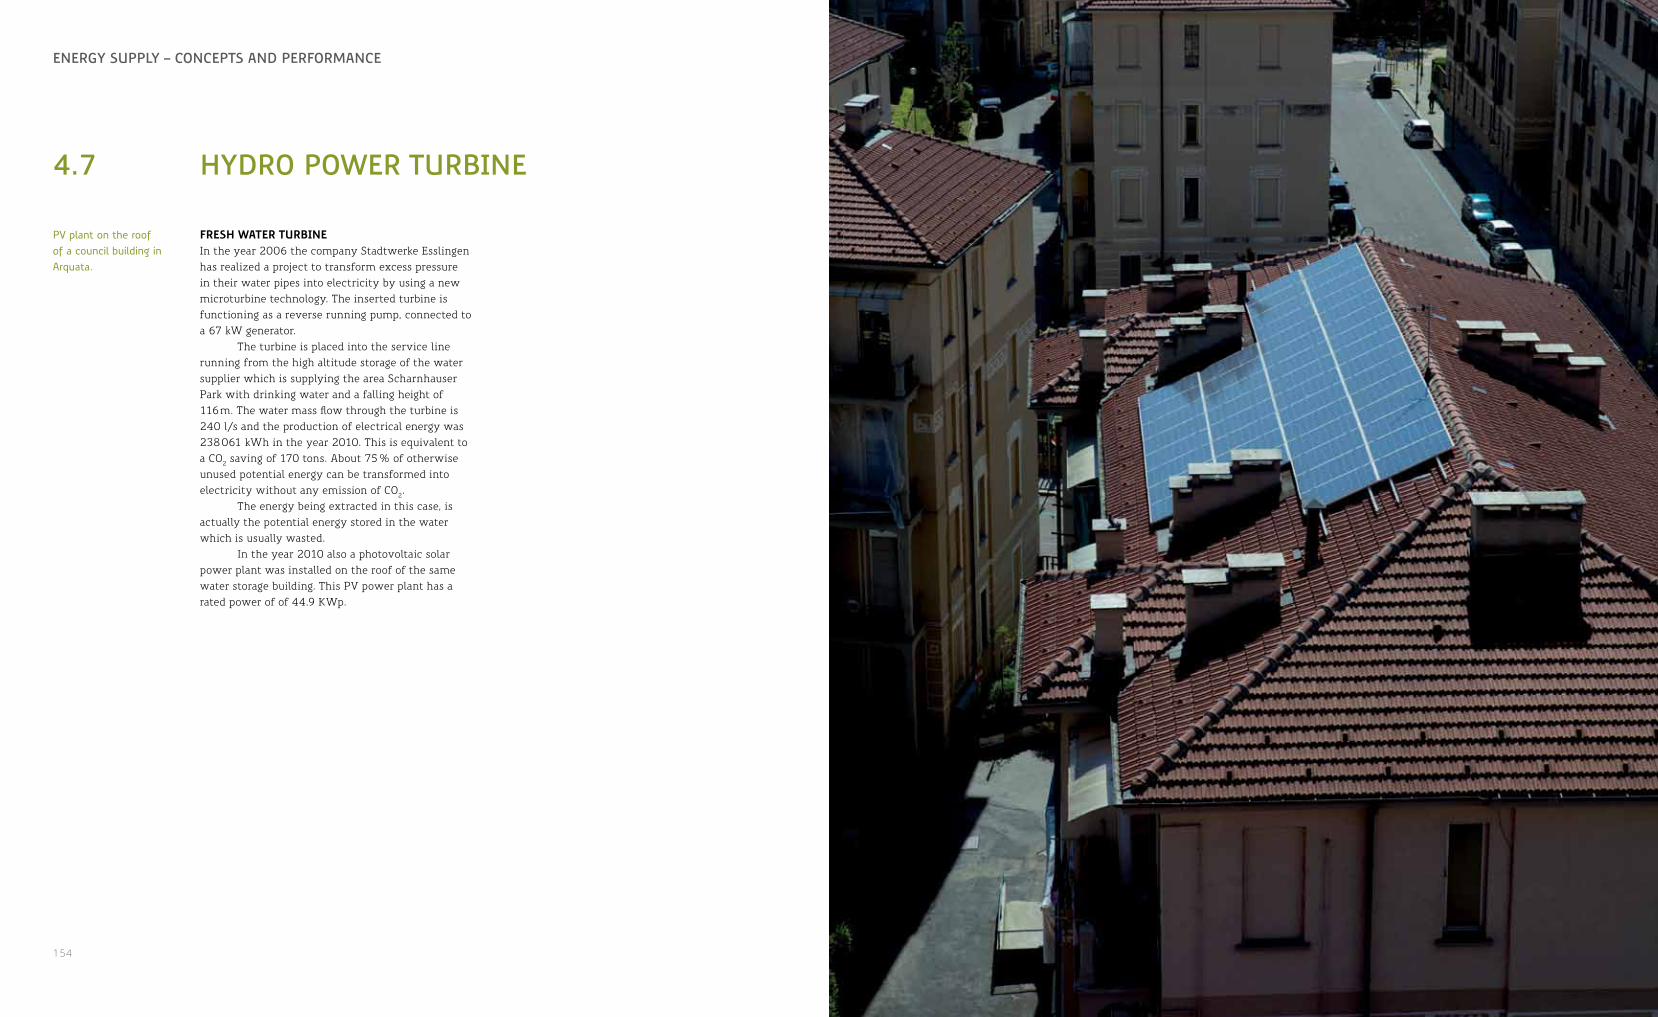
154 155
chaPtEr 1EnErgy sUPPly – concEPts anD PErformancE
4.7 hyDro PowEr tUrbinE
fresh water turbineIn the year 2006 the company Stadtwerke Esslingen has realized a project to transform excess pressure in their water pipes into electricity by using a new microturbine technology. The inserted turbine is functioning as a reverse running pump, connected to a 67 kW generator.
The turbine is placed into the service line running from the high altitude storage of the water supplier which is supplying the area Scharnhauser Park with drinking water and a falling height of 116 m. The water mass flow through the turbine is 240 l/s and the production of electrical energy was 238 061 kWh in the year 2010. This is equivalent to a CO2 saving of 170 tons. About 75 % of otherwise unused potential energy can be transformed into electricity without any emission of CO2.
The energy being extracted in this case, is actually the potential energy stored in the water which is usually wasted.
In the year 2010 also a photovoltaic solar power plant was installed on the roof of the same water storage building. This PV power plant has a rated power of of 44.9 KWp.
PV plant on the roof of a council building in Arquata.

156 157
chaPtEr 4EnErgy sUPPly – concEPts anD PErformancE
notes1. Obernberger, I.: Reached Development of Biomass Combustion Technologies and Future Outlook,
Proceedings of the17th European Biomass Conference, (2009) 2. Shin, D., Choi, S.: The combustion of simulated waste particles in a fixed bed, Combustion and Flame
No. 121 (2000) 3. Yin, C., et al.: Grate- firing of biomass for heat and power production, Progress in Energy and
Combustion Science, No. 34 (2008) 4. Van Loo, S., Koopejan, J.: The Handbook of Biomass Combustion and Co-firing, Earthscan London (2008) 5. Nussbaumer, Th.: Combustion and Co-combusiton of Biomass: Fundamentals, Technologies and Primary
Measures for Emission Reduction, Energy and Fuels, No. 17 (2003) 6. Walter, H.: Nachhaltige Energiesysteme, Vieweg+Teubner Wiesbaden (2009) 7. Kaltschmitt, M., Hartmann, H.: Energie aus Biomasse, Grundlagen, Techniken und Verfahren, Springer
(2009) 8. Good, J., et al.: Determination of the Efficiencies of Automatic Biomass Combustion Plants, IEA Report
(2006) 9. Obernberger, I.: Nutzung fester Biomasse in Verbrennungsanlagen, TU Graz (2005) 10. Schaumann, G., Schmitz, K. W.: Kraft-Wärme-Kopplung, Springer (2010) 11. Eicker, U., Strzalka, A., Erhart, E.: Energy efficient buildings and renewable supply within the German
POLYCITY project, In the proceedings of the POLYCITY final conference, Stuttgart (2010) 12. Dare, P., et al.: Combustion performance of biomass residue and purpose grown species, Biomass and
Bioenergy No. 21 (2001) 13. Leskens, M., et al.: Model predictive control as a tool for improving the process operation of MSW
combustion plants, Waste Management (2005) 14. Yang, Y. B., et al.: Modeling waste combustion in grate furnaces, Process safety and environmental
protection No. 82 (2004) 15. Erhart, T. G.: Optimierung biogen befeuerter ORC-Anlagen mit Hilfe von Computersimulationsmodellen,
Master Thesis, University of Applied Sciences Ulm, 2006 16. Duvia, A.: Technical and economic aspects of Biomass fuelled CHP plants based on ORC turbogenerators
feeding existing district heating networks, 2009 17. Obernberger, I., Hammerschmid, A., Bini, R.: VDI-Bericht 1588, Biomasse-Kraft-Wärme-Kopplungen
auf Basis des ORC-Prozesses – EU-Thermie-Projekt Admont (A), 2001 18. Obernberger, I., .Thonhofer, P., Reisenhofer, E.: Description and evaluation of the new 1,000 kWel
Organic Rankine Cycle process integrated in the biomass CHP plant in Lienz, Austria, (2002), pag. 17 19. Good, J., Nussbaumer, Th.: Systemoptimierung automatischer Holzheizungen, Swiss Federal Office of
Energy, Project No. 44278, Switzerland, December 2005 20. Technical Report 07A03061e, List of Recent Projects, Turboden Srl, 31.05.2008, Brescia, Italy 21. References of Turboden, Turboden s.r.l. Via Cernaia 10, 25124 Brescia, Italy 22. DIN EN 1434 Heat meters – Part 1: General requirements; German Version 2007 23. Municipal Registry of the City of Ostfildern 24. http://kamstrup.de/media/934/file.pdf Maxical 401 heat meter specifications 25. http://kamstrup.de/media/881/file.pdf Maxical III heat meter specifications 26. http://www.iwu.de/fileadmin/user _ upload/dateien/energie/werkzeuge/Gradtagsza hlen _
Deutschland.xls Degree days Germany, Institut für Wohnen und Umwelt, 01.02.2011
27. Simulation Of District Heating Systems For Evaluation Of Real-Time Control Strategies. Fredrik Wernstedt. Paul Davidsson. Christian Johansson
28. Verbesserte Betriebsführung von Biomasse-Nahwärmesystemen mit Kraft-Wärme-Kopplung am Beispiel des Scharnhauser Parks, Diplomarbeit Jochen Fink, September 2006
29. Solar unterstützte Nahwärme und Langzeit-Wärmespeicher (Februar 2003 bis Mai 2005), Solar- und Wärmetechnik Stuttgart.
30. Nahwärme solar nachrüsten, BINE Informationsdienst, BMU, ISSN 0937-836731. Canova, A., Giaccone, L., Spertino, F., Tartaglia, M.: Electrical Impact of Photovoltaic Plant in Distributed
Network, IEEE Transactions on Industry Applicatios, Vol. 45, No. 1, January/February 2009, pp. 341-347
32. UNI 84774, Solar energy – Calculation of energy gains for building applications – Evaluation of radiant received energy, May 1983
33. CEI 82-25, Guide for design and installation of photovoltaic (PV) systems connected to MV and LV

158 159
chaPtEr 4EnErgy sUPPly – concEPts anD PErformancE
literatureBalaras, C., Grossmann, G., Henning, H. M., Infante Ferreira, C., Podesser, E.,
Wang, L., Wiemken, E. (2007): Solar Air Conditioning in Europe – an overview. Renewable & Sustanaible Energy Reviews, 11(2), 299-314
De Antonellis, S.; Joppolo, C.M.; Molinarolli, L. (2010): Simulation, performance and optimisation of dessicant wheels. Energy and Buildings 42(9), 1386-1393
Kim, D., Infante Ferreira, C. (2008): Solar refrigeration options – a state-of-the-art review. International Journal of Refrigeration 31(1), 3-15
Kishore VVN, editor. (2008): Renewable energy engineering & technology: a knowledge compendium. New Delhi: TERI Press
Knoef H.A.M. (2000): Inventory of biomass gasifier manufacturers and installations. Final Report to European Commission, Contract DIS/1734/98-NL, Biomass Technology Group BV, University of Twente, Enschede
Knoef, H.A.M. (2005): Handbook biomass gasification. BTG biomass technology group B.V, Meppel, The Nederlands
Li X. (2002): Biomass gasification in circulating fluidized bed. PhD dissertation. Vancouver, Canada, University of British Columbia
López-Villada, J. (2010): Integración de Sistemas de Refrigeración Solar en Redes de Distrito de Frío y de Calor, Tarragona, Ph.D. Thesis
López-Villada, J., Bruno, J. C., Coronas, A. (2009): Primary Energy Saving Analysis of a Solar Cooling Plant Connected to a District Heating and Cooling Network, III International Conference Solar Air Conditioning, Palermo
López-Villada, J., Bruno, J. C., Coronas, A. (2008): Comparison of Solar Thermal Cooling Technologies for District Heating and Cooling Applications – Case Study of the Cerdanyola del Vallès Plant (Spain), Proceedings of the EUROSUN 2008 Conference, Lisbon
McKendry, P. (2002): Energy production from biomass (Part 1); overview of biomass. Bioresource Technology, 83: 37–46
McKendry, P. (2002): Energy production from biomass (Part 3); gasification technologies. Bioresource Technology, 83: 55–63
Puig-Arnavat, M., López-Villada, J., Bruno, J. C., Coronas, A. (2010): Analysis and parameter identification for characteristic equations of single- and double-effect absorption chillers by means of multivariable regression. International Journal of Refrigeration 33 (1), 70-78
Rauch, R. (2003): Biomass gasification to produce synthesis gas for fuels and chemicals, report made for IEA Bioenergy Agreement, Task 33: Thermal Gasification of Biomass
Ziegler, F. (2009): Sorption heat pumping technologies; comparison and challenges. International Journal of Refrigeration 32(4), 566-576

commUnal EnErgy managEmEntFranco Anzioso, Jordi Carbonell, Stoyan Danov, Alessandro Destefanis, Éric Duminil, Tobias Erhart, Frank Hettler, Tatiana Sivenova, Aneta Strzalka, Rafal Strzalka
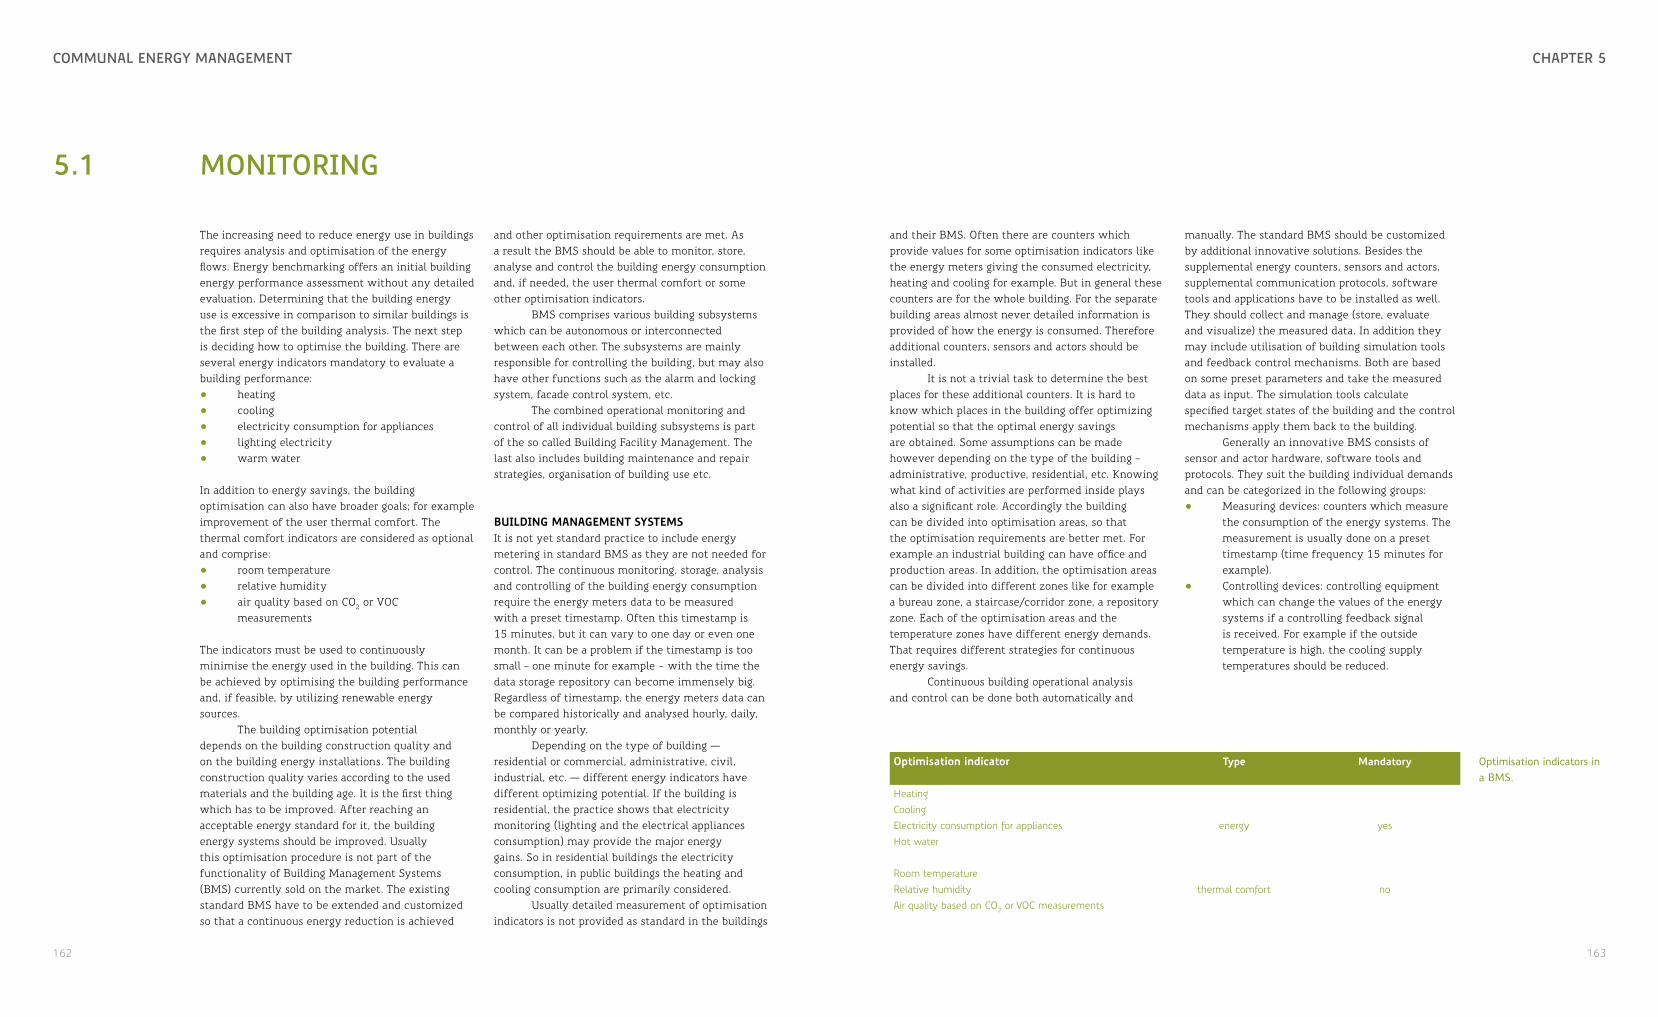
162 163
chaPtEr 5commUnal EnErgy managEmEnt
5.1 monitoring
The increasing need to reduce energy use in buildings requires analysis and optimisation of the energy flows. Energy benchmarking offers an initial building energy performance assessment without any detailed evaluation. Determining that the building energy use is excessive in comparison to similar buildings is the first step of the building analysis. The next step is deciding how to optimise the building. There are several energy indicators mandatory to evaluate a building performance:• heating• cooling• electricity consumption for appliances• lighting electricity• warm water
In addition to energy savings, the building optimisation can also have broader goals; for example improvement of the user thermal comfort. The thermal comfort indicators are considered as optional and comprise:• room temperature• relative humidity• air quality based on CO2 or VOC
measurements
The indicators must be used to continuously minimise the energy used in the building. This can be achieved by optimising the building performance and, if feasible, by utilizing renewable energy sources.
The building optimisation potential depends on the building construction quality and on the building energy installations. The building construction quality varies according to the used materials and the building age. It is the first thing which has to be improved. After reaching an acceptable energy standard for it, the building energy systems should be improved. Usually this optimisation procedure is not part of the functionality of Building Management Systems (BMS) currently sold on the market. The existing standard BMS have to be extended and customized so that a continuous energy reduction is achieved
and other optimisation requirements are met. As a result the BMS should be able to monitor, store, analyse and control the building energy consumption and, if needed, the user thermal comfort or some other optimisation indicators.
BMS comprises various building subsystems which can be autonomous or interconnected between each other. The subsystems are mainly responsible for controlling the building, but may also have other functions such as the alarm and locking system, facade control system, etc.
The combined operational monitoring and control of all individual building subsystems is part of the so called Building Facility Management. The last also includes building maintenance and repair strategies, organisation of building use etc.
building management systemsIt is not yet standard practice to include energy metering in standard BMS as they are not needed for control. The continuous monitoring, storage, analysis and controlling of the building energy consumption require the energy meters data to be measured with a preset timestamp. Often this timestamp is 15 minutes, but it can vary to one day or even one month. It can be a problem if the timestamp is too small – one minute for example - with the time the data storage repository can become immensely big. Regardless of timestamp, the energy meters data can be compared historically and analysed hourly, daily, monthly or yearly.
Depending on the type of building — residential or commercial, administrative, civil, industrial, etc. — different energy indicators have different optimizing potential. If the building is residential, the practice shows that electricity monitoring (lighting and the electrical appliances consumption) may provide the major energy gains. So in residential buildings the electricity consumption, in public buildings the heating and cooling consumption are primarily considered.
Usually detailed measurement of optimisation indicators is not provided as standard in the buildings
and their BMS. Often there are counters which provide values for some optimisation indicators like the energy meters giving the consumed electricity, heating and cooling for example. But in general these counters are for the whole building. For the separate building areas almost never detailed information is provided of how the energy is consumed. Therefore additional counters, sensors and actors should be installed.
It is not a trivial task to determine the best places for these additional counters. It is hard to know which places in the building offer optimizing potential so that the optimal energy savings are obtained. Some assumptions can be made however depending on the type of the building – administrative, productive, residential, etc. Knowing what kind of activities are performed inside plays also a significant role. Accordingly the building can be divided into optimisation areas, so that the optimisation requirements are better met. For example an industrial building can have office and production areas. In addition, the optimisation areas can be divided into different zones like for example a bureau zone, a staircase/corridor zone, a repository zone. Each of the optimisation areas and the temperature zones have different energy demands. That requires different strategies for continuous energy savings.
Continuous building operational analysis and control can be done both automatically and
manually. The standard BMS should be customized by additional innovative solutions. Besides the supplemental energy counters, sensors and actors, supplemental communication protocols, software tools and applications have to be installed as well. They should collect and manage (store, evaluate and visualize) the measured data. In addition they may include utilisation of building simulation tools and feedback control mechanisms. Both are based on some preset parameters and take the measured data as input. The simulation tools calculate specified target states of the building and the control mechanisms apply them back to the building.
Generally an innovative BMS consists of sensor and actor hardware, software tools and protocols. They suit the building individual demands and can be categorized in the following groups:• Measuring devices: counters which measure
the consumption of the energy systems. The measurement is usually done on a preset timestamp (time frequency 15 minutes for example).
• Controlling devices: controlling equipment which can change the values of the energy systems if a controlling feedback signal is received. For example if the outside temperature is high, the cooling supply temperatures should be reduced.
optimisation indicator type mandatory
Heating
energy yesCoolingElectricity consumption for appliancesHot water
Room temperaturethermal comfort noRelative humidity
Air quality based on CO2 or VOC measurements
Optimisation indicators in a BMS.

164 165
chaPtEr 5commUnal EnErgy managEmEnt
BMS structure in the Elektror building complex, Scharnhauser Park.
• Transmission systems: equipment which determines how the different BMS subsystems are connected and communicate within each other and with the central BMS
• Communication standards, protocols and tools, via which the measured values are transmitted and collected in a data repository
• Data storage software: repositories like database or files for example, where the measured values are stored.
• Data evaluation software: software tools and applications which process the data in a way that meaningful conclusions can be made. E.g. calculating the total daily energy consumption, comparing these values for different days, months or years and so on. The data is usually represented in visual form – tables, diagrams and charts.
• Controlling software: command tools that correct the values of the energy devices or set an alarm if a large deviation from the expected values occurs
• Simulation software: specialised programs which can simulate the expected energy demand of a building. Statistical data or weather forecasts can be used to calculate and control the future states of the energy systems.
In practice often the categories overlap.
measuring and controlling deVicesBuilding management systems are constantly advancing with the technological development.However, standard commercial systems offer limited management functions. The building facilities are usually equipped with devices which only have controlling function. For the mandatory energy indicators like electricity, heating and cooling supplementary sensors, actors, energy meters as well as supplementary hardware and software should be always additionally provided and integrated.
This addition of new features to the BMS (referred as retrofitting) typically requires a complex transformation of the existing BMS. Structural changes and extensions should be fulfilled and integrated in the ongoing systems. It is almost never a trivial nor a cheap task. In Germany, Scharnhauser Park, for example, the overall costs for a retrofitted data point such as an energy meter can be 2000-4000 ¤ depending on its type and size. A partial solution of the problem is an early integration of the additional energy meters, preferably during the planning phase of the building. This approach is advantageous because it helps to save a large part of the integration costs.
transmission systems Building management systems should be able to transfer control signals and, when enhanced, measured data from the energy meters and some additional information such as status messages or feedback settings. If the building optimisation aims to improve also the optional thermal comfort indicators,
the data measured from their devices should be transferred as well.
Transmission systems used in BMS can be distinguished by three different topologies. Each of them suits different purposes and has therefore different applications:• Singular• Peer-to-peer• Multi-level
A BMS with singular topology can only be designed in the planning stage of the building. This topology has the advantage that the centralized management level can be very well integrated to the BMS communication network. In BMS with singular topology it is common practice that the hardware and software components are chosen to be produced from the same manufacturer. That in most cases guarantees a BMS network with an error-free communication.
Peer-to-peer topology is primarily used in BMS subsystems which function as autonomous unities. Often these subsystems are manufactured as separate controllers which form an intelligent system by communicating in real-time.
The BMS with multilevel topology is needed when various devices and different communication levels are incorporated and should work together. Then one or more additional automation levels have to be installed between the base level where are all sensors, actors and energy meters and the centralized management level. These additional levels assure intermediate error free communication between the base and the management level as well as mutual integration between the different devices and protocols.
A system with singular topology transfers the data between its multiple subsystems or devices on a common transmission path. The different units normally operate together in a parent-child relation. There is a mechanism which addresses the subsystems and the devices which are relevant for the current transfer. All other units, although connected to the transmission path, are not
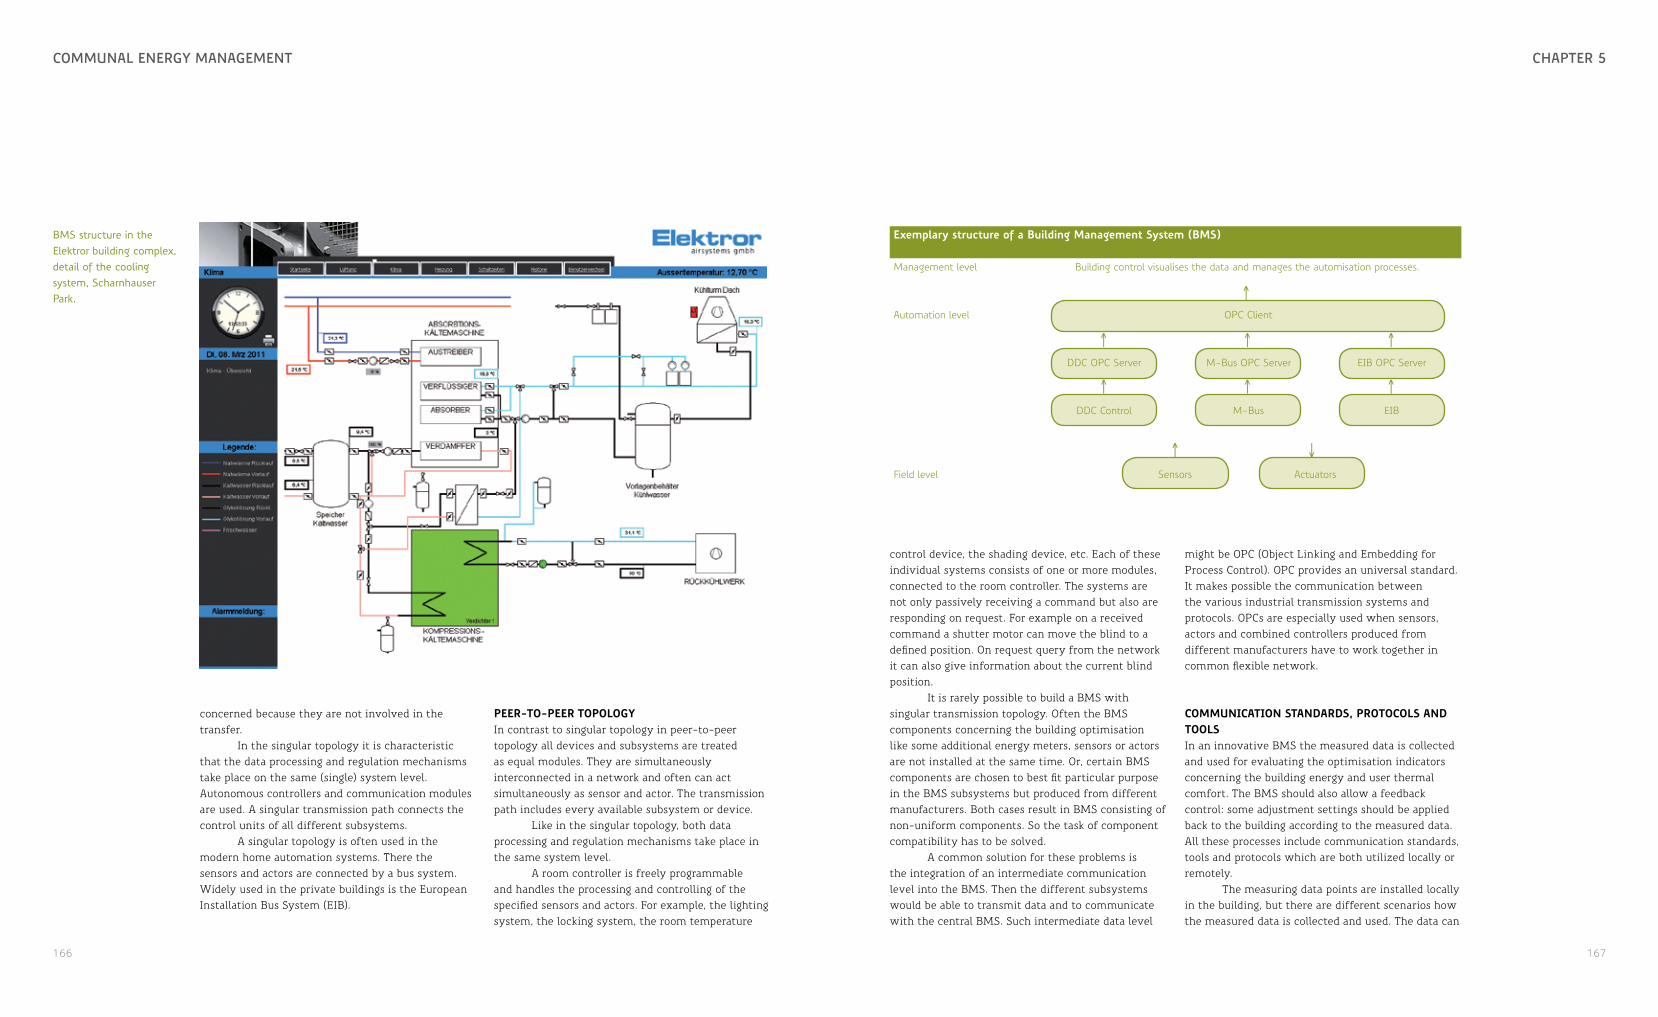
166 167
chaPtEr 5commUnal EnErgy managEmEnt
concerned because they are not involved in the transfer.
In the singular topology it is characteristic that the data processing and regulation mechanisms take place on the same (single) system level. Autonomous controllers and communication modules are used. A singular transmission path connects the control units of all different subsystems.
A singular topology is often used in the modern home automation systems. There the sensors and actors are connected by a bus system. Widely used in the private buildings is the European Installation Bus System (EIB).
Peer-to-Peer toPologyIn contrast to singular topology in peer-to-peer topology all devices and subsystems are treated as equal modules. They are simultaneously interconnected in a network and often can act simultaneously as sensor and actor. The transmission path includes every available subsystem or device.
Like in the singular topology, both data processing and regulation mechanisms take place in the same system level.
A room controller is freely programmable and handles the processing and controlling of the specified sensors and actors. For example, the lighting system, the locking system, the room temperature
BMS structure in the Elektror building complex, detail of the cooling system, Scharnhauser Park.
↑ ↓
↑
↑
↑
↑
↑
↑
↑
exemplary structure of a building management system (bms)
Management level Building control visualises the data and manages the automisation processes.
Automation level OPC Client
DDC OPC Server M-Bus OPC Server EIB OPC Server
DDC Control M-Bus EIB
Field level Sensors Actuators
control device, the shading device, etc. Each of these individual systems consists of one or more modules, connected to the room controller. The systems are not only passively receiving a command but also are responding on request. For example on a received command a shutter motor can move the blind to a defined position. On request query from the network it can also give information about the current blind position.
It is rarely possible to build a BMS with singular transmission topology. Often the BMS components concerning the building optimisation like some additional energy meters, sensors or actors are not installed at the same time. Or, certain BMS components are chosen to best fit particular purpose in the BMS subsystems but produced from different manufacturers. Both cases result in BMS consisting of non-uniform components. So the task of component compatibility has to be solved.
A common solution for these problems is the integration of an intermediate communication level into the BMS. Then the different subsystems would be able to transmit data and to communicate with the central BMS. Such intermediate data level
might be OPC (Object Linking and Embedding for Process Control). OPC provides an universal standard. It makes possible the communication between the various industrial transmission systems and protocols. OPCs are especially used when sensors, actors and combined controllers produced from different manufacturers have to work together in common flexible network.
communication standards, Protocols and toolsIn an innovative BMS the measured data is collected and used for evaluating the optimisation indicators concerning the building energy and user thermal comfort. The BMS should also allow a feedback control: some adjustment settings should be applied back to the building according to the measured data. All these processes include communication standards, tools and protocols which are both utilized locally or remotely.
The measuring data points are installed locally in the building, but there are different scenarios how the measured data is collected and used. The data can

168 169
chaPtEr 1commUnal EnErgy managEmEnt
be utilized either for real-time building management or for some historical building energy statistics or analysis. In any case the measured data is collected and saved first locally in the building. Then it can be transferred and saved remotely, on the computers of the BMS operator for example. The data transfer strongly depends on the BMS subsystems and their components therefore various communication standards, protocols and tools are used.
If the data is automatically transferred with a reasonably frequent timestamp and some controlling feedback is executed the communication can be classified as automatic and real-time. So the BMS is able to optimise the monitored indicators in real-time and the energy demand is reduced dynamically, according to the actual building needs.
If the communication is manual the data is often transferred with big time step, for example one month. The optimisation of energy efficiency is still feasible but not in real-time but with a time delay.
automated communicationThe automated BMS are usually provided with data-handling communication standards, protocols and tools. Often they are offered as complete client-server solutions like DataSocket or OPC for example. They collect the measured data locally in the building and then, on a preset time frequency, transfer it remotely and save it in a centralised database. The data can be then evaluated and feedback information (if any) can be transferred back and applied to the building devices. As a result the building indicators
have to be optimised – adjusted to the actual demands of the environment. If the timestamp is reasonably small (15 minutes) we consider that process as real-time. If the timestamp is too big, like 1 day for example, we cannot speak of real-time building optimisation anymore.
Unfortunately the automated data transfer is not always reliable. Some of the many problems can occur like:• Data loss due to delay in the connection
speed: if the timestamp is too small (1 minute for example) the data can be overwritten and therefore be lost.
• Data loss due to security settings: some companies have strict security regulations, so the data transfer can be banned.
• Data break due to the files size: if the files are too big their transmission becomes too cumbersome and might be prohibited.
• Communication failure: data loss due to failure in the communication line.
In order to deal with some of these problems, in the public buildings in Scharnhauser Park (Ostfildern, Germany) the data values are taken also manually from the energy meters each month. Thus the automatically collected data could be verified and in case of loss partly recovered.
In BMS handling automated real-time processes OPC is very commonly used. It defines a standard set of objects, interfaces and methods for use in process control and manufacturing automation applications to facilitate interoperability. Without
application transmission type available product
BMS without retrofitting points, home automation systems singular EIB
Programmable multisystem controllers peer-to-peer LON
Lighting control peer-to-peer DALI
Gas, electricity or other types of consumption meters; other applications are alarm systems, flexible illumination installations, heating control systems
singular M-Bus
Programmable multisystem controllers peer-to-peer DDC
Summary of BMS products by application.
Opposite: Elektror building in Scharnhauser Park.

170 171
chaPtEr 5commUnal EnErgy managEmEnt
OPC detailed knowledge about the communication capabilities of each device would be required to exchange some data between two devices. When OPC is used, the system could be equipped not only with an OPC server but with an OPC client which handles the data as well.
The OPC server provides a temporary storage for the current value of each measurement point. With the arrival of a new value the last value is overwritten. Therefore in the OPC server always only the last measured value is available. The OPC client fetches the temporal data from the OPC server on a preset time frequency. Then, provided with a
Visualisation of measurement data and system states for the heating and cooling of the Elektror building complex, Scharnhauser Park, Ostfildern.
timestamp, it stores it permanently in a centralised database. The OPC client thus allows centralised data storage which is crucial for further data evaluation.
manual/semi-automatic communicationAs in the automated building management in this case the measured data is also first stored locally in the building and then transferred and saved remotely in a suitable database. The timestamp though is too big to speak of real-time communication – from one day to one month. The data is not transferred automatically but semi-automatically or manually.
automated real-time software solutionsThey are mostly used in the automated BMS but are also applicable in manual building management. Real-time solutions are essential for the building monitoring and controlling, especially in larger building complexes.
The data is updated in “real-time”, with frequent timestamp (15 minutes or less). Afterwards it is evaluated and according to the evaluation output a real-time controlling feedback is produced and sent to the building.
There are different types of data evaluation. Many sophisticated techniques are used in the practice. The easiest method is to classify the data with some priority flags so that the information with greatest importance is instantly detected and flagged for further analysis.
Some predefined conditions like value boundaries for the energy meters can also be set. So if a value goes out of the boundaries, emergency alarms, alerts or notifications can be triggered automatically. Messages like emergency alarms can be sent to email addresses or mobile devices as instant notifications.
The data evaluation should be able to provide the facility manager with correct and detailed information about the arisen problems so that the problems are adequately understood and appropriately solved.
However, it is often difficult to interpret the detailed monitoring information. The data analysis is a hard task for the expert software and sometimes even for highly qualified BMS personnel. Moreover, there is often - except for the time series measurements - little opportunity for clear graphical representation of the energy consumption data, like for example by the so-called scatter- or carpetplots.
static software solutionsAlthough it does not allow dynamic response to the current demands for improving the building optimisation indicators, the static time-delayed data accumulation and interpretation might be
For example, the following scenario is implemented within the project in the residential demonstration buildings in Scharnhauser Park. An internet/modem connection is used between the local and the remote repository. The measured data is first automatically stored on a local data logger. Then it is manually downloaded with a FTP (file transfer protocol) software tool and manually entered into a remote repository. Another scenario implemented in the residential buildings in Scharnhauser Park is communication via a modem installed in addition to the building energy metering system. It sends the recorded data once a day per email automatically. After reception, the data is manually entered into a remote MS Access database.
data storage, eValuation and controlling softwareA database is rarely used as a stand-alone application. Mostly it is utilized together with data interpretation and analysis software. There are also software solutions consisting of both together: data storage and data evaluation tools. The evaluation tools should allow executing statistical requests as well as data comparison for different time periods (i.e. daily, monthly or yearly). Another very important feature is visual data representation. In case of automated BMS the software solution can also have controlling functions.
For the automatic data evaluation and controlling it is crucial that the measurements are locally collected (in the building), but then remotely stored in a central database, installed on a server of the BMS operator for example. The advantage of the centralised database is that the data management is centrally performed, not on the local place. Locally, in the building, a problem may occur and a large amount of data is then lost. However, even with a fully automatic BMS, the operation of qualified personnel is often needed.
According to the BMS requirements automated real-time or static software solutions are used.
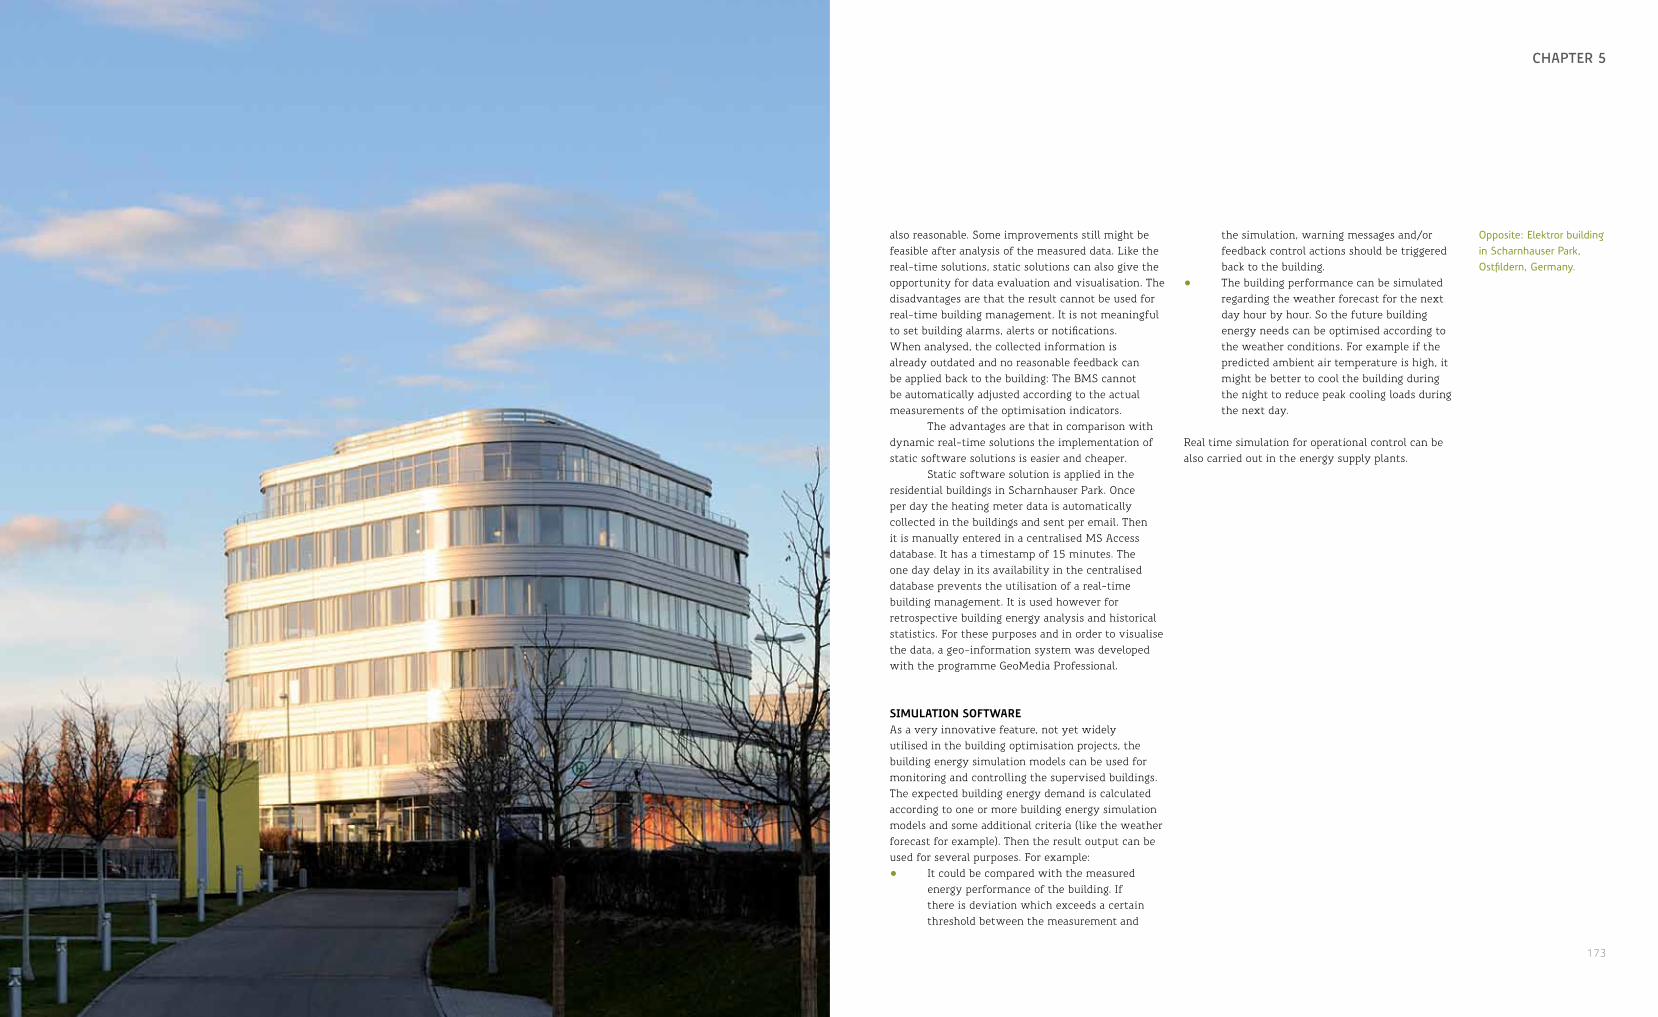
172 173
towarDs a sUstainablE commUnity chaPtEr 5
also reasonable. Some improvements still might be feasible after analysis of the measured data. Like the real-time solutions, static solutions can also give the opportunity for data evaluation and visualisation. The disadvantages are that the result cannot be used for real-time building management. It is not meaningful to set building alarms, alerts or notifications. When analysed, the collected information is already outdated and no reasonable feedback can be applied back to the building: The BMS cannot be automatically adjusted according to the actual measurements of the optimisation indicators.
The advantages are that in comparison with dynamic real-time solutions the implementation of static software solutions is easier and cheaper.
Static software solution is applied in the residential buildings in Scharnhauser Park. Once per day the heating meter data is automatically collected in the buildings and sent per email. Then it is manually entered in a centralised MS Access database. It has a timestamp of 15 minutes. The one day delay in its availability in the centralised database prevents the utilisation of a real-time building management. It is used however for retrospective building energy analysis and historical statistics. For these purposes and in order to visualise the data, a geo-information system was developed with the programme GeoMedia Professional.
simulation softwareAs a very innovative feature, not yet widely utilised in the building optimisation projects, the building energy simulation models can be used for monitoring and controlling the supervised buildings. The expected building energy demand is calculated according to one or more building energy simulation models and some additional criteria (like the weather forecast for example). Then the result output can be used for several purposes. For example:• It could be compared with the measured
energy performance of the building. If there is deviation which exceeds a certain threshold between the measurement and
the simulation, warning messages and/or feedback control actions should be triggered back to the building.
• The building performance can be simulated regarding the weather forecast for the next day hour by hour. So the future building energy needs can be optimised according to the weather conditions. For example if the predicted ambient air temperature is high, it might be better to cool the building during the night to reduce peak cooling loads during the next day.
Real time simulation for operational control can be also carried out in the energy supply plants.
Opposite: Elektror building in Scharnhauser Park, Ostfildern, Germany.
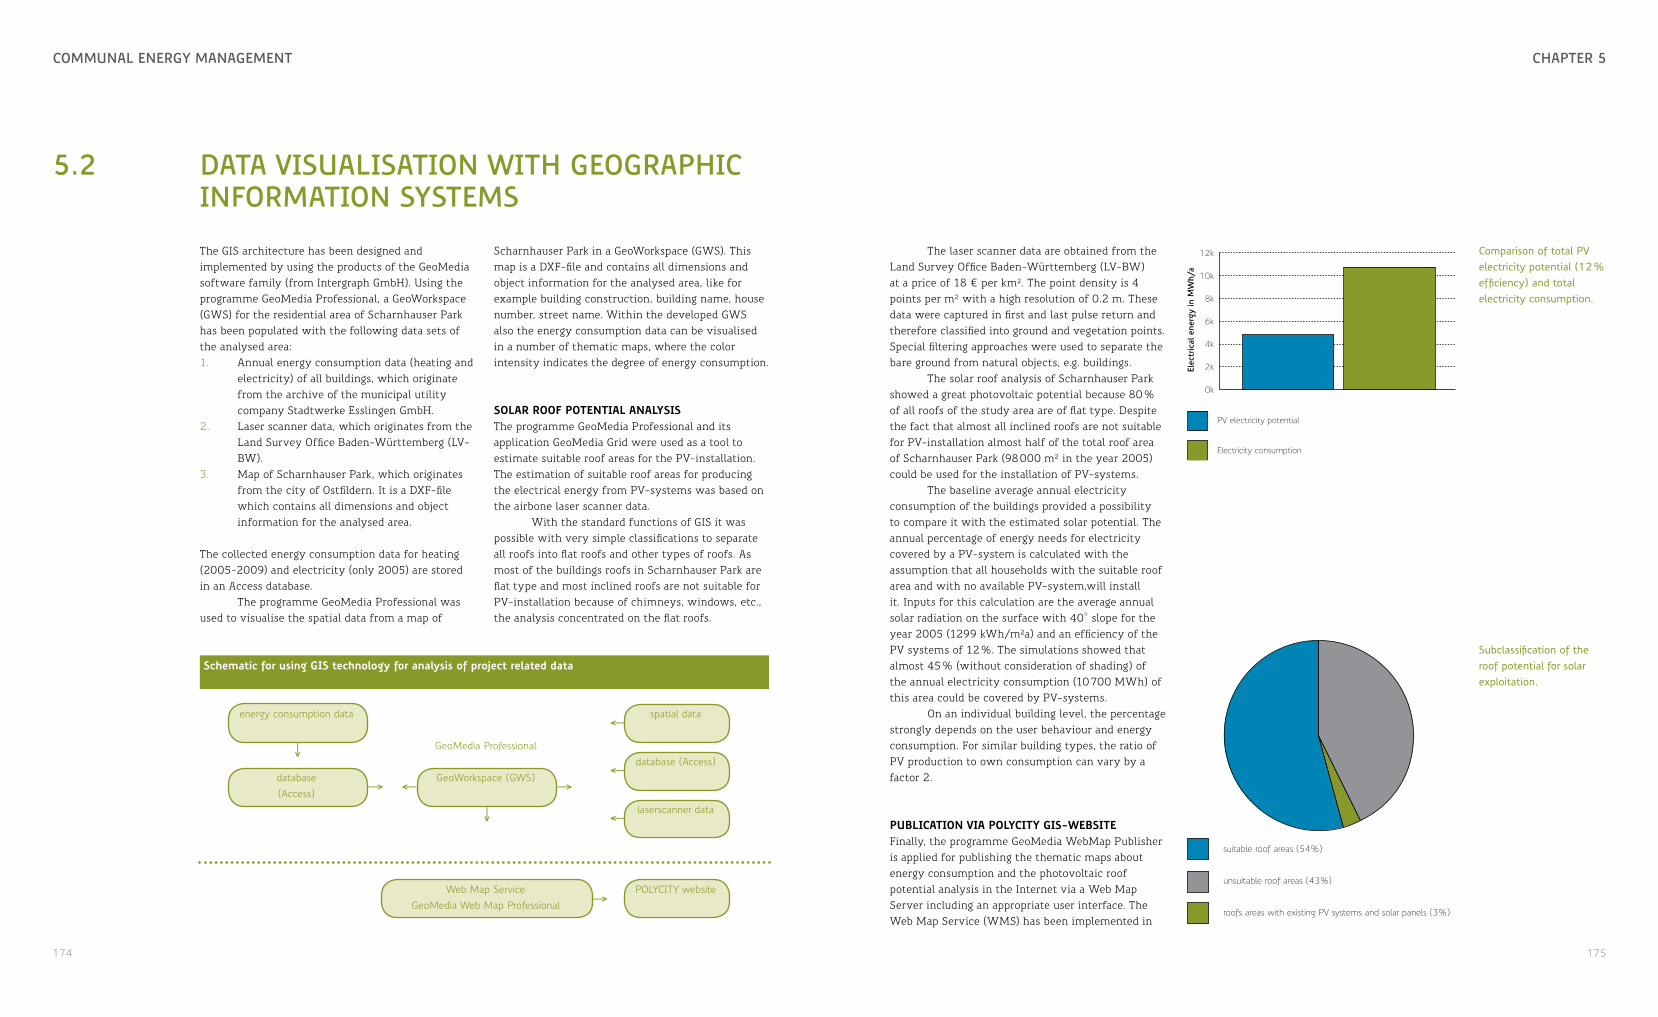
174 175
chaPtEr 5commUnal EnErgy managEmEnt
5.2 Data visUalisation with gEograPhic information systEms
The GIS architecture has been designed and implemented by using the products of the GeoMedia software family (from Intergraph GmbH). Using the programme GeoMedia Professional, a GeoWorkspace (GWS) for the residential area of Scharnhauser Park has been populated with the following data sets of the analysed area:1. Annual energy consumption data (heating and
electricity) of all buildings, which originate from the archive of the municipal utility company Stadtwerke Esslingen GmbH.
2. Laser scanner data, which originates from the Land Survey Office Baden-Württemberg (LV-BW).
3. Map of Scharnhauser Park, which originates from the city of Ostfildern. It is a DXF-file which contains all dimensions and object information for the analysed area.
The collected energy consumption data for heating (2005-2009) and electricity (only 2005) are stored in an Access database.
The programme GeoMedia Professional was used to visualise the spatial data from a map of
Scharnhauser Park in a GeoWorkspace (GWS). This map is a DXF-file and contains all dimensions and object information for the analysed area, like for example building construction, building name, house number, street name. Within the developed GWS also the energy consumption data can be visualised in a number of thematic maps, where the color intensity indicates the degree of energy consumption.
solar roof Potential analysisThe programme GeoMedia Professional and its application GeoMedia Grid were used as a tool to estimate suitable roof areas for the PV-installation. The estimation of suitable roof areas for producing the electrical energy from PV-systems was based on the airbone laser scanner data.
With the standard functions of GIS it was possible with very simple classifications to separate all roofs into flat roofs and other types of roofs. As most of the buildings roofs in Scharnhauser Park are flat type and most inclined roofs are not suitable for PV-installation because of chimneys, windows, etc., the analysis concentrated on the flat roofs.
↓
↓
←←
←
←
→
→
schematic for using gis technology for analysis of project related data
energy consumption data
GeoMedia Professional
GeoWorkspace (GWS)
spatial data
database (Access)
laserscanner data
database(Access)
Web Map Service POLYCITY websiteGeoMedia Web Map Professional
→
The laser scanner data are obtained from the Land Survey Office Baden-Württemberg (LV-BW) at a price of 18 ¤ per km². The point density is 4 points per m² with a high resolution of 0.2 m. These data were captured in first and last pulse return and therefore classified into ground and vegetation points. Special filtering approaches were used to separate the bare ground from natural objects, e.g. buildings.
The solar roof analysis of Scharnhauser Park showed a great photovoltaic potential because 80 % of all roofs of the study area are of flat type. Despite the fact that almost all inclined roofs are not suitable for PV-installation almost half of the total roof area of Scharnhauser Park (98 000 m² in the year 2005) could be used for the installation of PV-systems.
The baseline average annual electricity consumption of the buildings provided a possibility to compare it with the estimated solar potential. The annual percentage of energy needs for electricity covered by a PV-system is calculated with the assumption that all households with the suitable roof area and with no available PV-system,will install it. Inputs for this calculation are the average annual solar radiation on the surface with 40° slope for the year 2005 (1299 kWh/m²a) and an efficiency of the PV systems of 12 %. The simulations showed that almost 45 % (without consideration of shading) of the annual electricity consumption (10 700 MWh) of this area could be covered by PV-systems.
On an individual building level, the percentage strongly depends on the user behaviour and energy consumption. For similar building types, the ratio of PV production to own consumption can vary by a factor 2.
Publication Via Polycity gis-websiteFinally, the programme GeoMedia WebMap Publisher is applied for publishing the thematic maps about energy consumption and the photovoltaic roof potential analysis in the Internet via a Web Map Server including an appropriate user interface. The Web Map Service (WMS) has been implemented in
suitable roof areas (54%)
unsuitable roof areas (43%)
roofs areas with existing PV systems and solar panels (3%)
Subclassification of the roof potential for solar exploitation.
Comparison of total PV electricity potential (12 % efficiency) and total electricity consumption.
Elec
tric
al e
nerg
y in
MW
h/a
0k
2k
4k
6k
8k
10k
12k
PV electricity potential
Electricity consumption

176 177
chaPtEr 5commUnal EnErgy managEmEnt
Publication of the consumption data per building using the POLYCITY website.
the POLYCITY website to publish all the data via Internet (http://www.polycity.net/GIS).
This publication gives users a possibility to access the web portal in order to evaluate the status of their energy consumption. Regarding the data privacy protection only the average annual energy consumption values of each of the buildings types are visualised. Also the results of the above described solar roof potential analysis can be viewed for each building separately: suitable roof area for PV-installation and the amount of the potentially produced electrical energy.
gis for heating energy forecastThe geo information system of Scharnhauser Park was additionally used to extract the building heating volume, which was used as an input for the
calculation of the heating energy demand of the buildings. The building volume, which consists of the building footprints and the measured building heights (from airborne laser scanning) enables the generation of a 3D city model of the analysed area. Based on this 3D city model an input file, which can be read by the Building Simulation Model, is generated.
The data needed for this task are the same like in case of the solar roof potential analysis, which is described above. The overlapped building footprints with the laser scanner data (building heights) are the basis for the estimation of the building’s heated volume. Based on this data, the total area of outer walls (divided into south, west, north and east orientation), walls between buildings (especially by row houses), ground floor and roof could be calculated per building.
The so prepared data for each of the buildings provide a “GIS interface file”, which was finally fed into the Building Simulation Model by using the software INSEL (www.insel.eu). On the basis of the geometries from this file the heating energy demand of each building can be calculated.
electricity consumPtion of scharnhauser ParkRegarding the whole area of Scharnhauser Park, only annual electricity consumption values for the year 2005 were available. A comparison of the distributions of the electricity consumption values based on the number of occupants and on gross area could be done. Both normalisations show comparable distributions, the occupant based normalisation being slightly narrower than the surface area distribution.
Example of building data extraction.
building area (m2)ground floor
internal wall
outer wall
roof
ID 1 64 80 177 64ID 2 73 138 162 73ID 3 62 115 141 62ID 4 53 115 96 53
Num
ber o
f dw
ellin
gs
Num
ber o
f us
ers
0
60
120
0
60
120
Electricity consumption (kWh a-1 m-2)
Electricity consumption (kWh a-1 capita-1)
Electricity consumption:per personper gross area
1000
10 20 30 40 50 60 70 80
2000 3000 4000
ID1
ID2
ID3
ID4
178 179
chaPtEr 5commUnal EnErgy managEmEnt
5.3 onlinE simUlation
Online simulation is a process designed to automatically extract the most valuable information from measured data, with the highest accuracy in the least amount of time and effort.
Its characteristics are:• Methodical. The complete data workflow
should be traceable and available for scrutiny. If the simulation delivers a result, it should be clear what the input data and the successive algorithms were.
• Non-interactive. The whole process should be entirely scripted. The goal is to prevent error-prone human interaction during the simulation, which could otherwise lead to different results from the same data.
• Parametric. It should be possible to modify exactly one variable at a time and see what the results variations are.
• Scalable. The amount of work should grow much slower than the amount of data processed. If a workflow has been designed to simulate a photovoltaic installation in Stuttgart, it should be easy and fast to modify it to apply the simulation to every other city in Europe.
• Testable. The process should be checked automatically. The lack of human interaction only leads to more reliable information if the workflow is correct in the first place. A bug could go unnoticed for years if nobody is there to look for it.
• Flexible. The whole point of investing time in designing and implementing a complex automated process is to use it as much as possible once it is available. It should be easy to output the extracted information as a webpage, a chart, a pdf document, an SMS, a spreadsheet, an email or as an input data for another simulation program.
methodLaunching a simulation programme from another programme is the general approach of online simulations. The core of the online simulation process is a wrapper:• A simulation model is written in plain text
format by concatenating strings one after the other into a file.
• The simulation programme is launched.• The output is parsed in order to extract the
results of the simulation.
INSEL & RUBYFor the examples described below, the simulation programme INSEL has been wrapped by a Ruby script. Even though INSEL is a powerful and fast calculation tool for simulation of renewable energy systems, it is not well suited for scripting tasks such as parsing data from the Internet, organising a file hierarchy or sending SMS.
Ruby is a dynamic open-source programming language. It can be used to parse many different file types or databases and can create maps, presentations or websites. The goal of combining both programs is to achieve accuracy, speed and flexibility.
OTHER PAIRSMany other programs could have been chosen depending on the desired results, but the simulation programme does need to offer a command-line interface so that the wrapper can execute it.
Examples of such simulation programs are MATLAB, EnergyPlus, Maxima, TRNSYS, R, Mathematica or EES. MS Excel could also be used, albeit with a different system structure. Proprietary software without any available API (e.g. PVSOL as of 2011) cannot be used for this purpose.
Ruby could be replaced by any other high-level programming language such as Java or Python.
temPlatesINSELRuby can use templates instead of creating every simulation model from scratch. Templates are almost complete INSEL models where placeholders have been used for some parameters. Before launching the simulation program, Ruby just needs to read the template, look for placeholders, replace them with corresponding parameters and launch the simulation programme with the completed model.
For example, if “average _ irradiance.insel” is a model designed to retrieve the average irradiance in W/m² for a given location, replacing the location parameters with $latitude$ and $longitude$ placeholders would enable Ruby to calculate the irradiance in Stuttgart. With this template, it would be easy to find the German city with the highest irradiance.
The only piece of code that would need to be modified whenever a better algorithm becomes available is the corresponding INSEL template, without having to change anything in the Ruby code.
The underlying model is not important to Ruby as long as it answers with an average irradiance in [W/m²] when coordinates are given.
The algorithm could use satellite data, long-term monthly mean values, locally measured weather data or interpolated data from different sources.
OTHER PROGRAMSThis method can be applied to other programs such as Gnuplot, LaTeX or GMT (Generic Mapping Tools). Any other programme could be chosen as long as it accepts plain text files as an input.
Every included figure in this chapter has been automatically generated via templates.
outPut ValidationIn order to ease the implementation process, it is primordial to ensure that the simulation output is launched successfully:
• Did the simulation programme exited correctly or has it been stopped by some critical error?
• Did the simulation programme deliver an output?
• Is the output in the expected format? (e.g. String, Float, Array or Matrix)
• Did the simulation programme issue some warnings? (e.g. Input file too short for the simulation)
• It is too early to ensure that the output is correct, but is it at least plausible? (e.g. The average ambient temperature for some location in France should probably be between 0 °C and 25 °C)
Since the output of one simulation is often used as the input of another process, failing to recognise an error directly could hint to the wrong direction while looking downstream for a bug!
online simulation aPPlied to PhotoVoltaicsThe aforementioned method has been applied to simulation and monitoring of photovoltaic
Snippet: Irradiance in Stuttgart (W/m2)template.average_irradiance(:latitude => 48.722, :longitude => 138.68
Snippet: Sunniest city in Germanyclass City def average_irradiance Template.average_irradiance(:latitude => self.latitude, :longitude => self.longitude) endend
Germany.cities.sort_by{|city| city.average_irradiance}.last=> ‘Freiburg’
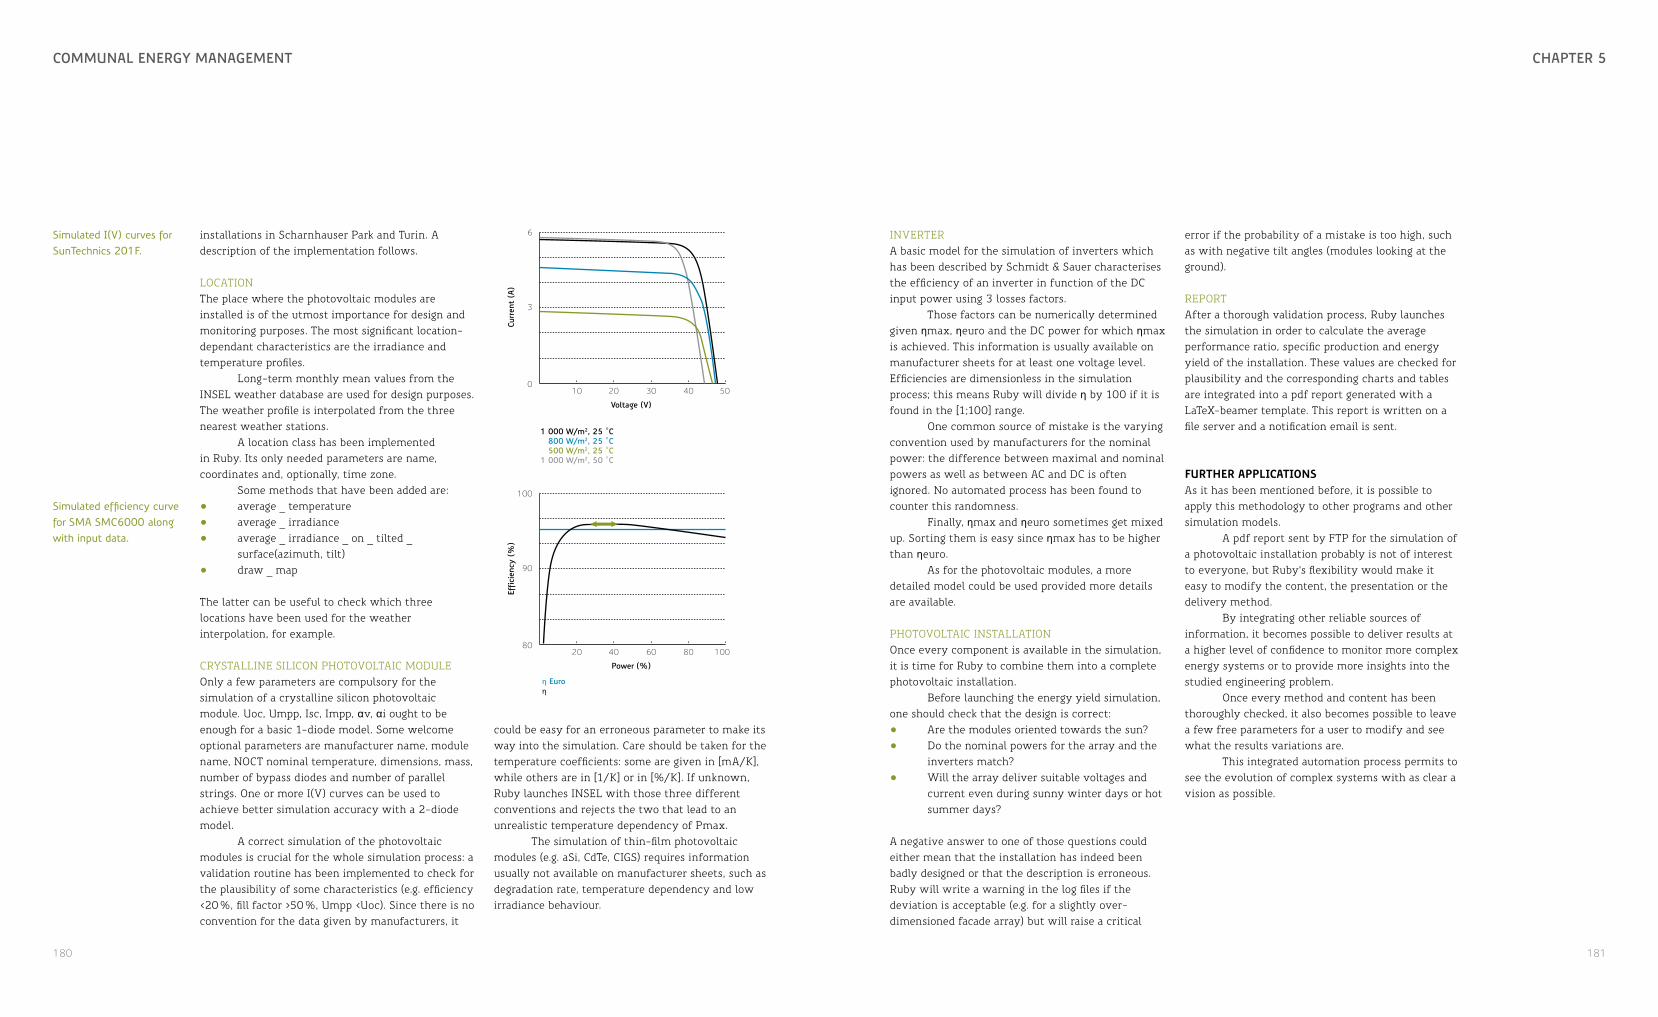
180 181
chaPtEr 5commUnal EnErgy managEmEnt
installations in Scharnhauser Park and Turin. A description of the implementation follows.
LOCATIONThe place where the photovoltaic modules are installed is of the utmost importance for design and monitoring purposes. The most significant location-dependant characteristics are the irradiance and temperature profiles.
Long-term monthly mean values from the INSEL weather database are used for design purposes. The weather profile is interpolated from the three nearest weather stations.
A location class has been implemented in Ruby. Its only needed parameters are name, coordinates and, optionally, time zone.
Some methods that have been added are:• average _ temperature• average _ irradiance• average _ irradiance _ on _ tilted _
surface(azimuth, tilt)• draw _ map
The latter can be useful to check which three locations have been used for the weather interpolation, for example.
CRYSTALLINE SILICON PHOTOVOLTAIC MODULEOnly a few parameters are compulsory for the simulation of a crystalline silicon photovoltaic module. Uoc, Umpp, Isc, Impp, αv, αi ought to be enough for a basic 1-diode model. Some welcome optional parameters are manufacturer name, module name, NOCT nominal temperature, dimensions, mass, number of bypass diodes and number of parallel strings. One or more I(V) curves can be used to achieve better simulation accuracy with a 2-diode model.
A correct simulation of the photovoltaic modules is crucial for the whole simulation process: a validation routine has been implemented to check for the plausibility of some characteristics (e.g. efficiency <20 %, fill factor >50 %, Umpp <Uoc). Since there is no convention for the data given by manufacturers, it
Curr
ent
(A)
0
3
6
Voltage (V)
1 000 W/m2, 25 °C800 W/m2, 25 °C500 W/m2, 25 °C
1 000 W/m2, 50 °C
10 20 30 40 50
Simulated I(V) curves for SunTechnics 201F.
Effic
ienc
y (%
)
80
90
100
Power (%)
20 40 60 80 100
η Euroη
Simulated efficiency curve for SMA SMC6000 along with input data.
could be easy for an erroneous parameter to make its way into the simulation. Care should be taken for the temperature coefficients: some are given in [mA/K], while others are in [1/K] or in [%/K]. If unknown, Ruby launches INSEL with those three different conventions and rejects the two that lead to an unrealistic temperature dependency of Pmax.
The simulation of thin-film photovoltaic modules (e.g. aSi, CdTe, CIGS) requires information usually not available on manufacturer sheets, such as degradation rate, temperature dependency and low irradiance behaviour.
INVERTERA basic model for the simulation of inverters which has been described by Schmidt & Sauer characterises the efficiency of an inverter in function of the DC input power using 3 losses factors.
Those factors can be numerically determined given ηmax, ηeuro and the DC power for which ηmax is achieved. This information is usually available on manufacturer sheets for at least one voltage level.Efficiencies are dimensionless in the simulation process; this means Ruby will divide η by 100 if it is found in the [1;100] range.
One common source of mistake is the varying convention used by manufacturers for the nominal power: the difference between maximal and nominal powers as well as between AC and DC is often ignored. No automated process has been found to counter this randomness.
Finally, ηmax and ηeuro sometimes get mixed up. Sorting them is easy since ηmax has to be higher than ηeuro.
As for the photovoltaic modules, a more detailed model could be used provided more details are available.
PHOTOVOLTAIC INSTALLATIONOnce every component is available in the simulation, it is time for Ruby to combine them into a complete photovoltaic installation.
Before launching the energy yield simulation, one should check that the design is correct:• Are the modules oriented towards the sun?• Do the nominal powers for the array and the
inverters match?• Will the array deliver suitable voltages and
current even during sunny winter days or hot summer days?
A negative answer to one of those questions could either mean that the installation has indeed been badly designed or that the description is erroneous. Ruby will write a warning in the log files if the deviation is acceptable (e.g. for a slightly over-dimensioned facade array) but will raise a critical
error if the probability of a mistake is too high, such as with negative tilt angles (modules looking at the ground).
REPORTAfter a thorough validation process, Ruby launches the simulation in order to calculate the average performance ratio, specific production and energy yield of the installation. These values are checked for plausibility and the corresponding charts and tables are integrated into a pdf report generated with a LaTeX-beamer template. This report is written on a file server and a notification email is sent.
further aPPlicationsAs it has been mentioned before, it is possible to apply this methodology to other programs and other simulation models.
A pdf report sent by FTP for the simulation of a photovoltaic installation probably is not of interest to everyone, but Ruby’s flexibility would make it easy to modify the content, the presentation or the delivery method.
By integrating other reliable sources of information, it becomes possible to deliver results at a higher level of confidence to monitor more complex energy systems or to provide more insights into the studied engineering problem.
Once every method and content has been thoroughly checked, it also becomes possible to leave a few free parameters for a user to modify and see what the results variations are.
This integrated automation process permits to see the evolution of complex systems with as clear a vision as possible.

182 183
chaPtEr 5commUnal EnErgy managEmEnt
5.4 aPPlication in gErmany: scharnhaUsEr Park
At the German project site, the building management systems (BMS) are mostly used for monitoring and controlling the building energy supply systems.
electricity consumPtionTypically the building is divided into different electricity areas in order to carry out a more precise monitoring. In these areas different electricity circuits are regarded, e.g. lighting or electrical appliances circuits. The monitoring includes analysis of the automatically controlled electrical appliances as well as of the occupant behavior. The user behaviour is hard to predict and regulate.
heating/cooling energy consumPtionIt is considered to be the most difficult energy value in terms of monitoring and controlling since it strongly depends on the outside conditions like air temperature, humidity, wind, solar irradiation as well as on the human factor. It is difficult to judge if the building control system works efficiently
from the measured values. The analysis of the measured energy data has to be made according to some statistics over the historical figures and also concerning some assumptions about the building. For instance:• the number of the people living or working
there• the type of the building (public or private)• the expected ambient temperature according
to the weather forecast or some expectations depending on the season of the year
• the quality of the building
Only experienced consultants can make the right guesses interpreting the detailed monitoring information.
Degree day corrections based on normalisation and comparison of the measured historical data can be used for heating and cooling analysis.
Monthly degree days corrections referenced to the base temperature in Stuttgart are used for comparison and normalisation of the main heating data for the school.
energy suPPly PlantsThe energy demand in the project area is mainly covered by renewable energy systems (RES) for heating and part of the electricity demand. Three renewable sources are being used in the quarter: cogeneration based on biomass, photovoltaic generators and a hydro power system. Since the hydro power system has only an electric design power of 50 kW and furthermore the constant pressure difference in the system assures a feed-in without fluctuation, detailed monitoring is not necessary.
The main energy source and thus the main monitoring object is the biomass-fired cogeneration plant. Local waste wood is converted into thermal power (8 MW maximum thermal gross power) and fed into the district heating. A 1 MWel Organic-
before POLYCITY measures
after POLYCITY measures
Elec
tric
al c
onsu
mpt
ion
(kW
h)
2003 2004 2005 2006 2007 2008 2009 20100
50k
100k
150k
200k
250k
300kProgrnosis without POLYCITY measures
Example of electricity consumption, Stadthaus, Scharnhauser Park.
Rankine-Cycle is utilised for electricity production. Additionally the power plant building has 38 kWp of photovoltaic generator integrated in the facade and on the roof top.
A weather station is situated in the power plant as well. This system provides the necessary reference data for ambient temperature and irradiance.
monitoring and communication technologies in scharnhauser ParkBMS are used to monitor and control the consumed and produced energy in the public buildings like the school, the Stadthaus, the youth centre as well as in the residential buildings and in the energy supply plants. In addition to the building energy data meteorological data is collected as well.
Public buildings monitoringIn the public buildings in Scharnhauser Park two innovative BMS solutions for the electricity, heating and water consumption were implemented.
YOUTH CENTRE SOLUTIONIn the youth centre the Ennovatis system with the Smartbox as a data logger was chosen as energy management system. Smartbox is a micro-controller unit produced by the company Ennovatis which has an integrated modem and internet software interface. Heating, cooling, electrical and water meters are monitored in the youth centre. The preset timestamp is 15 minutes.
The data is first saved locally and once per day it is transferred via GPS-modem connection to a central evaluation software. The software is situated on the data warehouse provided and supported by the company Ennovatis. The data warehouse allows downloading and storing the data on another computer. So a replica of the monitored data recorded is available on a configured PC provided and supported by qualified personnel in the Stadthaus. The PC is equipped with the software energy management tool “Ennovatis Controlling”. It allows importing the downloaded data from Ennovatis Smartboxes as well as importing data collected from other energy devices and tools. So once a day the data warehouse (Ennovatis server) and the “Ennovatis Controlling” (PC of Stadthaus,
Degree day correctionMain heatingM
onth
ly d
egre
e da
y co
rrec
tions
0
120
2006 2007 2008 2009
60
School main heating, Scharnhauser Park, with monthly degree day corrections
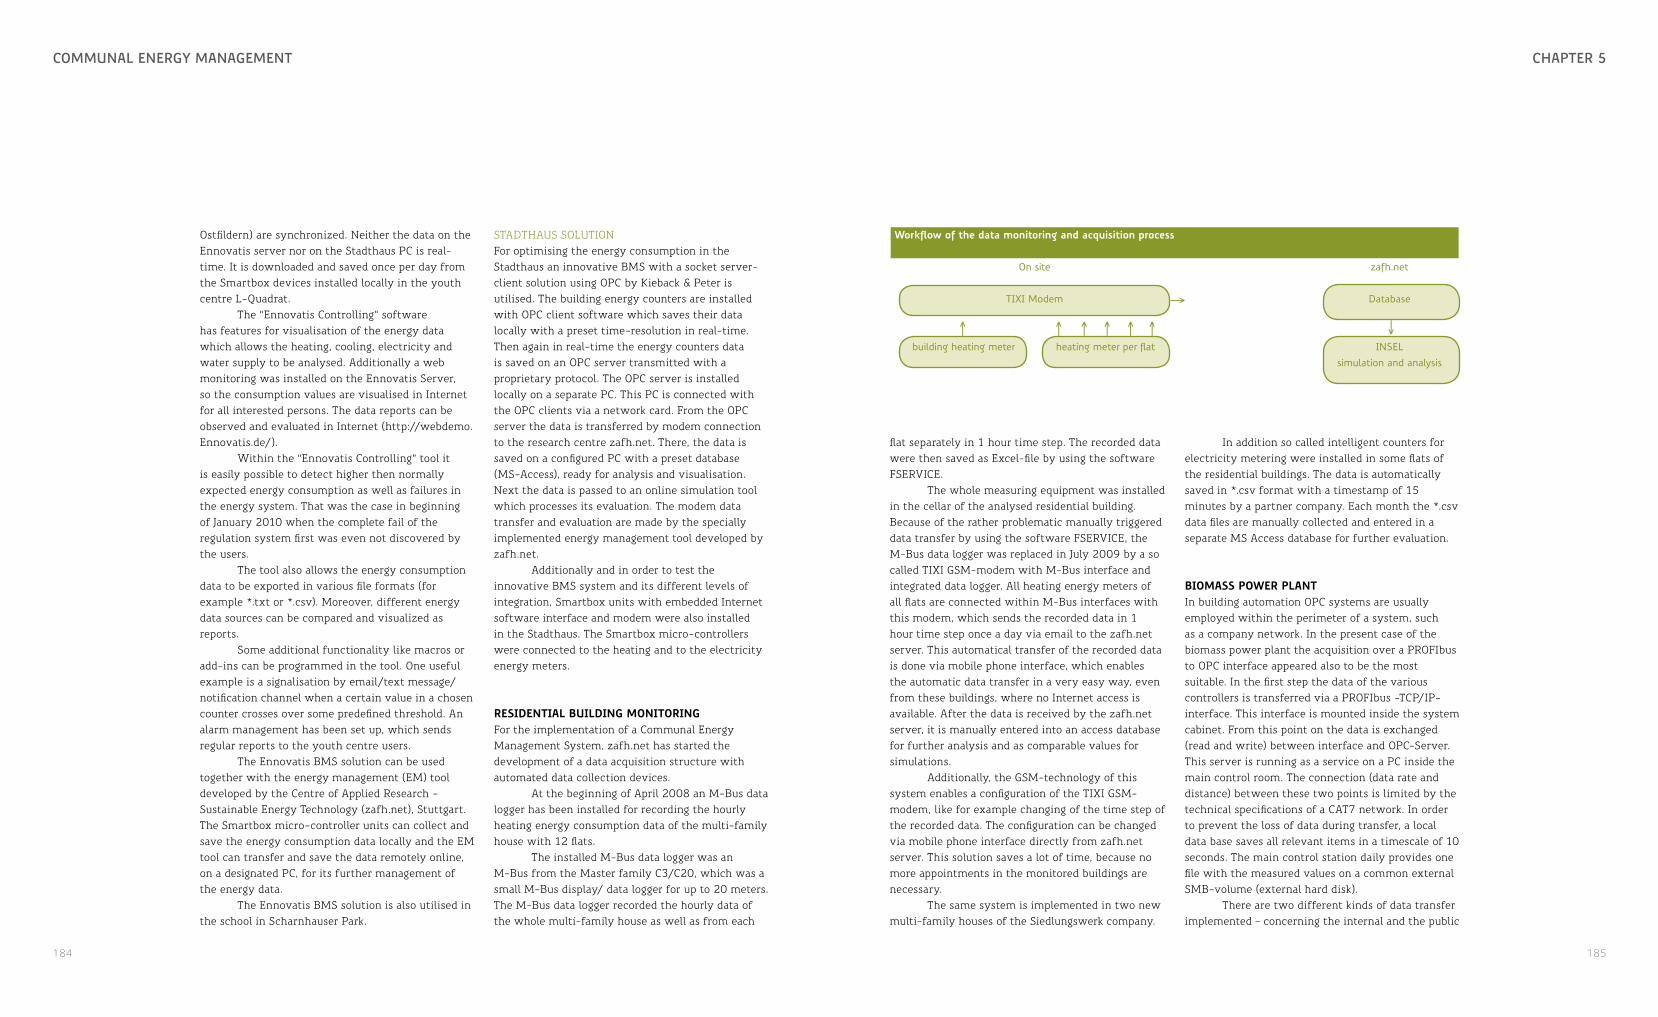
184 185
chaPtEr 5commUnal EnErgy managEmEnt
Ostfildern) are synchronized. Neither the data on the Ennovatis server nor on the Stadthaus PC is real-time. It is downloaded and saved once per day from the Smartbox devices installed locally in the youth centre L-Quadrat.
The “Ennovatis Controlling” software has features for visualisation of the energy data which allows the heating, cooling, electricity and water supply to be analysed. Additionally a web monitoring was installed on the Ennovatis Server, so the consumption values are visualised in Internet for all interested persons. The data reports can be observed and evaluated in Internet (http://webdemo.Ennovatis.de/).
Within the “Ennovatis Controlling” tool it is easily possible to detect higher then normally expected energy consumption as well as failures in the energy system. That was the case in beginning of January 2010 when the complete fail of the regulation system first was even not discovered by the users.
The tool also allows the energy consumption data to be exported in various file formats (for example *.txt or *.csv). Moreover, different energy data sources can be compared and visualized as reports.
Some additional functionality like macros or add-ins can be programmed in the tool. One useful example is a signalisation by email/text message/notification channel when a certain value in a chosen counter crosses over some predefined threshold. An alarm management has been set up, which sends regular reports to the youth centre users.
The Ennovatis BMS solution can be used together with the energy management (EM) tool developed by the Centre of Applied Research - Sustainable Energy Technology (zafh.net), Stuttgart. The Smartbox micro-controller units can collect and save the energy consumption data locally and the EM tool can transfer and save the data remotely online, on a designated PC, for its further management of the energy data.
The Ennovatis BMS solution is also utilised in the school in Scharnhauser Park.
STADTHAUS SOLUTIONFor optimising the energy consumption in the Stadthaus an innovative BMS with a socket server-client solution using OPC by Kieback & Peter is utilised. The building energy counters are installed with OPC client software which saves their data locally with a preset time-resolution in real-time. Then again in real-time the energy counters data is saved on an OPC server transmitted with a proprietary protocol. The OPC server is installed locally on a separate PC. This PC is connected with the OPC clients via a network card. From the OPC server the data is transferred by modem connection to the research centre zafh.net. There, the data is saved on a configured PC with a preset database (MS-Access), ready for analysis and visualisation. Next the data is passed to an online simulation tool which processes its evaluation. The modem data transfer and evaluation are made by the specially implemented energy management tool developed by zafh.net.
Additionally and in order to test the innovative BMS system and its different levels of integration, Smartbox units with embedded Internet software interface and modem were also installed in the Stadthaus. The Smartbox micro-controllers were connected to the heating and to the electricity energy meters.
residential building monitoringFor the implementation of a Communal Energy Management System, zafh.net has started the development of a data acquisition structure with automated data collection devices.
At the beginning of April 2008 an M-Bus data logger has been installed for recording the hourly heating energy consumption data of the multi-family house with 12 flats.
The installed M-Bus data logger was an M-Bus from the Master family C3/C20, which was a small M-Bus display/ data logger for up to 20 meters. The M-Bus data logger recorded the hourly data of the whole multi-family house as well as from each
flat separately in 1 hour time step. The recorded data were then saved as Excel-file by using the software FSERVICE.
The whole measuring equipment was installed in the cellar of the analysed residential building. Because of the rather problematic manually triggered data transfer by using the software FSERVICE, the M-Bus data logger was replaced in July 2009 by a so called TIXI GSM-modem with M-Bus interface and integrated data logger. All heating energy meters of all flats are connected within M-Bus interfaces with this modem, which sends the recorded data in 1 hour time step once a day via email to the zafh.net server. This automatical transfer of the recorded data is done via mobile phone interface, which enables the automatic data transfer in a very easy way, even from these buildings, where no Internet access is available. After the data is received by the zafh.net server, it is manually entered into an access database for further analysis and as comparable values for simulations.
Additionally, the GSM-technology of this system enables a configuration of the TIXI GSM-modem, like for example changing of the time step of the recorded data. The configuration can be changed via mobile phone interface directly from zafh.net server. This solution saves a lot of time, because no more appointments in the monitored buildings are necessary.
The same system is implemented in two new multi-family houses of the Siedlungswerk company.
In addition so called intelligent counters for electricity metering were installed in some flats of the residential buildings. The data is automatically saved in *.csv format with a timestamp of 15 minutes by a partner company. Each month the *.csv data files are manually collected and entered in a separate MS Access database for further evaluation.
biomass Power PlantIn building automation OPC systems are usually employed within the perimeter of a system, such as a company network. In the present case of the biomass power plant the acquisition over a PROFIbus to OPC interface appeared also to be the most suitable. In the first step the data of the various controllers is transferred via a PROFIbus -TCP/IP-interface. This interface is mounted inside the system cabinet. From this point on the data is exchanged (read and write) between interface and OPC-Server. This server is running as a service on a PC inside the main control room. The connection (data rate and distance) between these two points is limited by the technical specifications of a CAT7 network. In order to prevent the loss of data during transfer, a local data base saves all relevant items in a timescale of 10 seconds. The main control station daily provides one file with the measured values on a common external SMB-volume (external hard disk).
There are two different kinds of data transfer implemented – concerning the internal and the public
↑ ↑ ↓↑ ↑ ↑ ↑
↑
workflow of the data monitoring and acquisition process
On site zafh.net
TIXI Modem Database
building heating meter heating meter per flat INSEL simulation and analysis
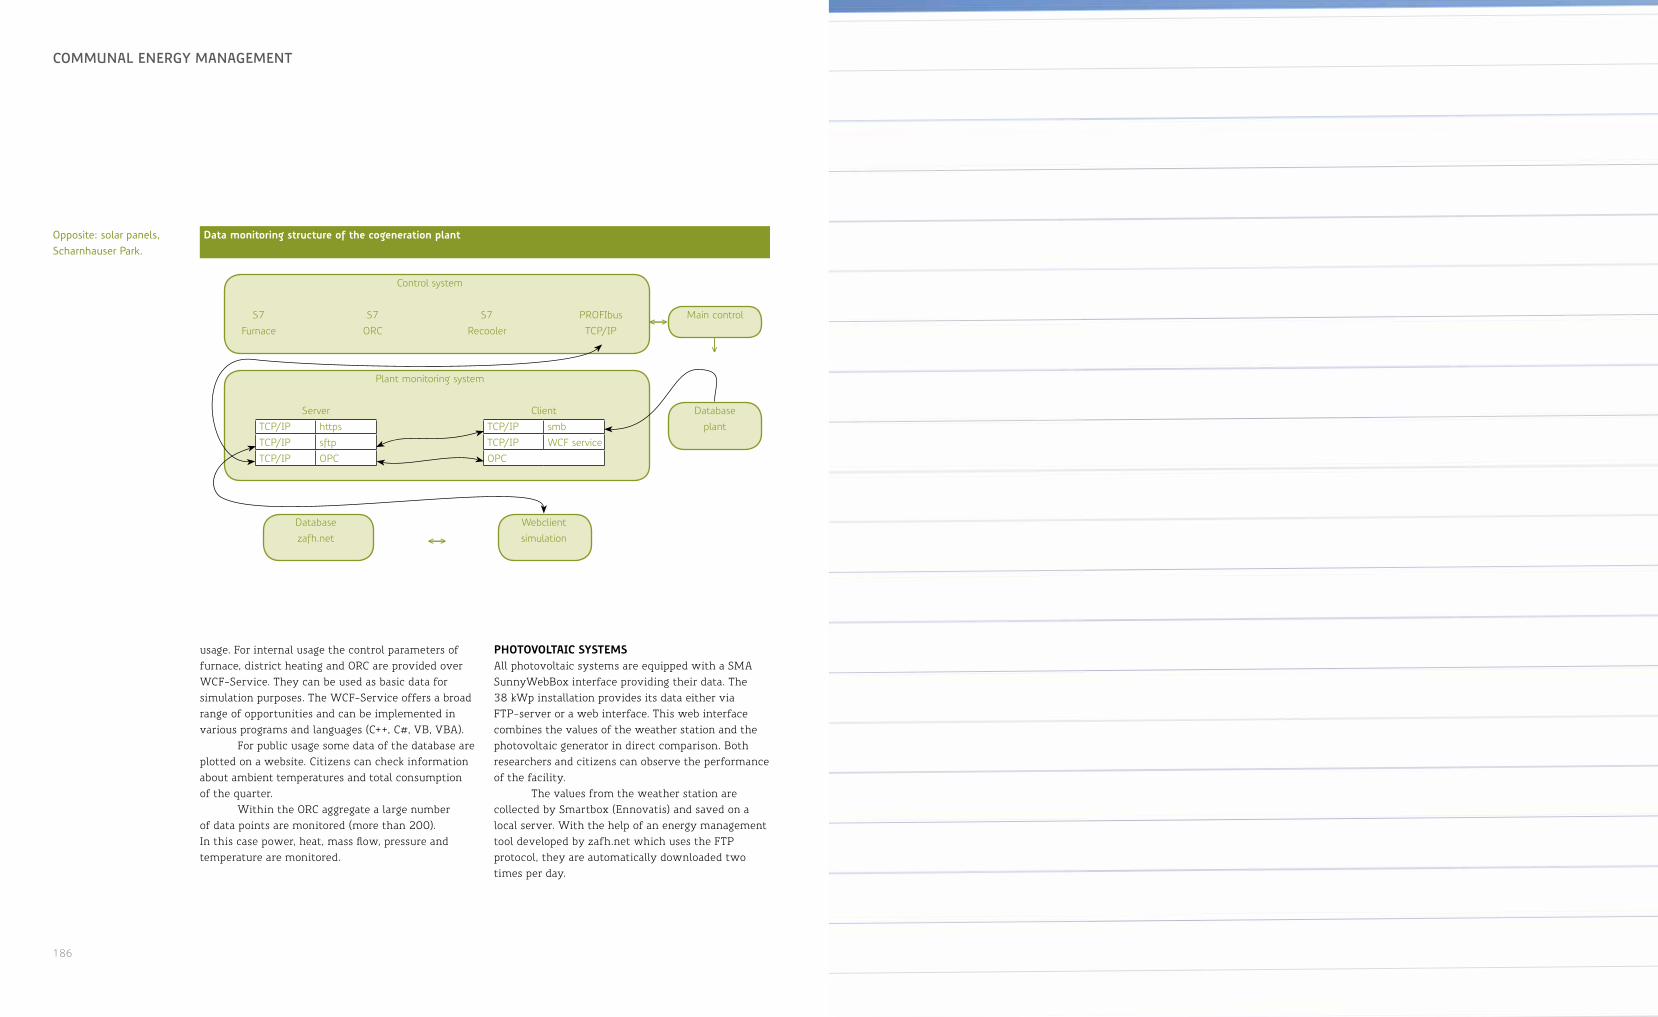
186 187
chaPtEr 1commUnal EnErgy managEmEnt
usage. For internal usage the control parameters of furnace, district heating and ORC are provided over WCF-Service. They can be used as basic data for simulation purposes. The WCF-Service offers a broad range of opportunities and can be implemented in various programs and languages (C++, C#, VB, VBA).
For public usage some data of the database are plotted on a website. Citizens can check information about ambient temperatures and total consumption of the quarter.
Within the ORC aggregate a large number of data points are monitored (more than 200). In this case power, heat, mass flow, pressure and temperature are monitored.
data monitoring structure of the cogeneration plant
Control system
S7 Furnace
S7 ORC
S7 Recooler
PROFIbusTCP/IP
Main control
Plant monitoring system
ServerTCP/IP httpsTCP/IP sftpTCP/IP OPC
ClientTCP/IP smbTCP/IP WCF serviceOPC
Database plant
Databasezafh.net
Webclientsimulation
↓
↑
↑
↑
↑
PhotoVoltaic systemsAll photovoltaic systems are equipped with a SMA SunnyWebBox interface providing their data. The 38 kWp installation provides its data either via FTP-server or a web interface. This web interface combines the values of the weather station and the photovoltaic generator in direct comparison. Both researchers and citizens can observe the performance of the facility.
The values from the weather station are collected by Smartbox (Ennovatis) and saved on a local server. With the help of an energy management tool developed by zafh.net which uses the FTP protocol, they are automatically downloaded two times per day.
Opposite: solar panels, Scharnhauser Park.
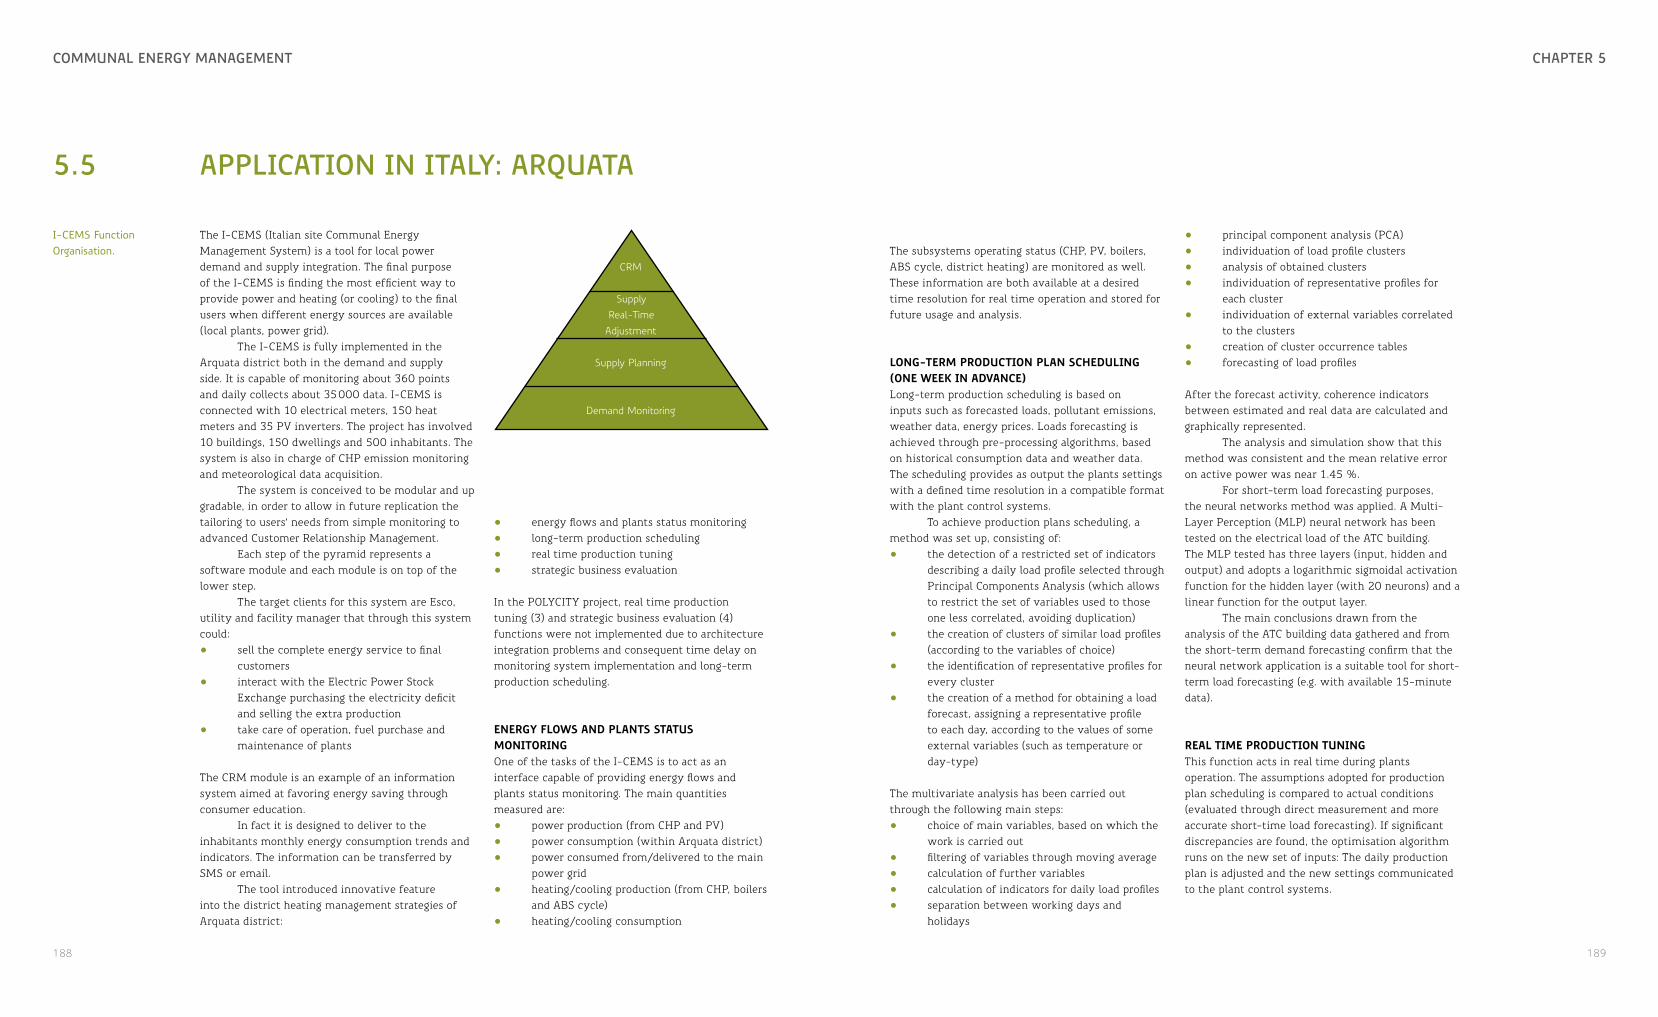
188 189
chaPtEr 5commUnal EnErgy managEmEnt
5.5 aPPlication in italy: arQUata
The I-CEMS (Italian site Communal Energy Management System) is a tool for local power demand and supply integration. The final purpose of the I-CEMS is finding the most efficient way to provide power and heating (or cooling) to the final users when different energy sources are available (local plants, power grid).
The I-CEMS is fully implemented in the Arquata district both in the demand and supply side. It is capable of monitoring about 360 points and daily collects about 35 000 data. I-CEMS is connected with 10 electrical meters, 150 heat meters and 35 PV inverters. The project has involved 10 buildings, 150 dwellings and 500 inhabitants. The system is also in charge of CHP emission monitoring and meteorological data acquisition.
The system is conceived to be modular and up gradable, in order to allow in future replication the tailoring to users’ needs from simple monitoring to advanced Customer Relationship Management.
Each step of the pyramid represents a software module and each module is on top of the lower step.
The target clients for this system are Esco, utility and facility manager that through this system could:• sell the complete energy service to final
customers• interact with the Electric Power Stock
Exchange purchasing the electricity deficit and selling the extra production
• take care of operation, fuel purchase and maintenance of plants
The CRM module is an example of an information system aimed at favoring energy saving through consumer education.
In fact it is designed to deliver to the inhabitants monthly energy consumption trends and indicators. The information can be transferred by SMS or email.
The tool introduced innovative feature into the district heating management strategies of Arquata district:
• energy flows and plants status monitoring • long-term production scheduling• real time production tuning• strategic business evaluation
In the POLYCITY project, real time production tuning (3) and strategic business evaluation (4) functions were not implemented due to architecture integration problems and consequent time delay on monitoring system implementation and long-term production scheduling.
energy flows and Plants status monitoringOne of the tasks of the I-CEMS is to act as an interface capable of providing energy flows and plants status monitoring. The main quantities measured are:• power production (from CHP and PV)• power consumption (within Arquata district)• power consumed from/delivered to the main
power grid• heating/cooling production (from CHP, boilers
and ABS cycle)• heating/cooling consumption
I-CEMS Function Organisation.
CRM
Supply Real-Time Adjustment
Supply Planning
Demand Monitoring
The subsystems operating status (CHP, PV, boilers, ABS cycle, district heating) are monitored as well. These information are both available at a desired time resolution for real time operation and stored for future usage and analysis.
long-term Production Plan scheduling (one week in adVance)Long-term production scheduling is based on inputs such as forecasted loads, pollutant emissions, weather data, energy prices. Loads forecasting is achieved through pre-processing algorithms, based on historical consumption data and weather data. The scheduling provides as output the plants settings with a defined time resolution in a compatible format with the plant control systems.
To achieve production plans scheduling, a method was set up, consisting of:• the detection of a restricted set of indicators
describing a daily load profile selected through Principal Components Analysis (which allows to restrict the set of variables used to those one less correlated, avoiding duplication)
• the creation of clusters of similar load profiles (according to the variables of choice)
• the identification of representative profiles for every cluster
• the creation of a method for obtaining a load forecast, assigning a representative profile to each day, according to the values of some external variables (such as temperature or day-type)
The multivariate analysis has been carried out through the following main steps:• choice of main variables, based on which the
work is carried out• filtering of variables through moving average• calculation of further variables• calculation of indicators for daily load profiles• separation between working days and
holidays
• principal component analysis (PCA)• individuation of load profile clusters• analysis of obtained clusters• individuation of representative profiles for
each cluster• individuation of external variables correlated
to the clusters• creation of cluster occurrence tables• forecasting of load profiles
After the forecast activity, coherence indicators between estimated and real data are calculated and graphically represented.
The analysis and simulation show that this method was consistent and the mean relative error on active power was near 1.45 %.
For short-term load forecasting purposes, the neural networks method was applied. A Multi-Layer Perception (MLP) neural network has been tested on the electrical load of the ATC building. The MLP tested has three layers (input, hidden and output) and adopts a logarithmic sigmoidal activation function for the hidden layer (with 20 neurons) and a linear function for the output layer.
The main conclusions drawn from the analysis of the ATC building data gathered and from the short-term demand forecasting confirm that the neural network application is a suitable tool for short-term load forecasting (e.g. with available 15-minute data).
real time Production tuningThis function acts in real time during plants operation. The assumptions adopted for production plan scheduling is compared to actual conditions (evaluated through direct measurement and more accurate short-time load forecasting). If significant discrepancies are found, the optimisation algorithm runs on the new set of inputs: The daily production plan is adjusted and the new settings communicated to the plant control systems.
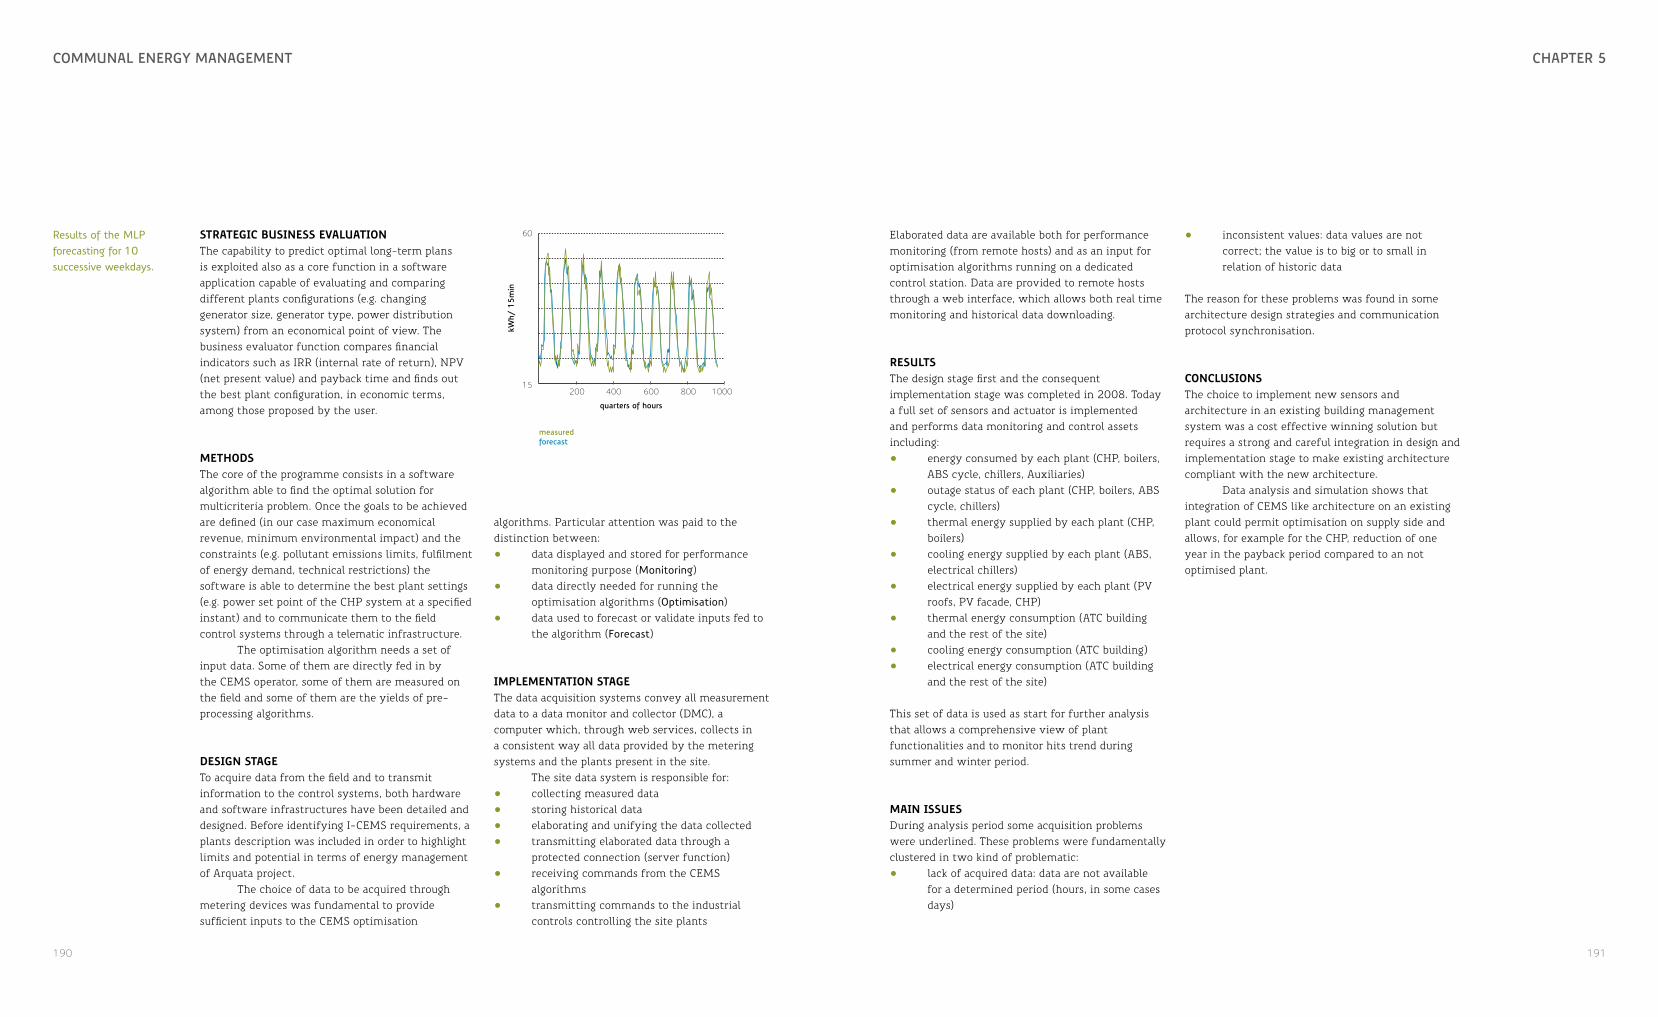
190 191
chaPtEr 5commUnal EnErgy managEmEnt
strategic business eValuationThe capability to predict optimal long-term plans is exploited also as a core function in a software application capable of evaluating and comparing different plants configurations (e.g. changing generator size, generator type, power distribution system) from an economical point of view. The business evaluator function compares financial indicators such as IRR (internal rate of return), NPV (net present value) and payback time and finds out the best plant configuration, in economic terms, among those proposed by the user.
methods The core of the programme consists in a software algorithm able to find the optimal solution for multicriteria problem. Once the goals to be achieved are defined (in our case maximum economical revenue, minimum environmental impact) and the constraints (e.g. pollutant emissions limits, fulfilment of energy demand, technical restrictions) the software is able to determine the best plant settings (e.g. power set point of the CHP system at a specified instant) and to communicate them to the field control systems through a telematic infrastructure.
The optimisation algorithm needs a set of input data. Some of them are directly fed in by the CEMS operator, some of them are measured on the field and some of them are the yields of pre-processing algorithms.
design stageTo acquire data from the field and to transmit information to the control systems, both hardware and software infrastructures have been detailed and designed. Before identifying I-CEMS requirements, a plants description was included in order to highlight limits and potential in terms of energy management of Arquata project.
The choice of data to be acquired through metering devices was fundamental to provide sufficient inputs to the CEMS optimisation
Results of the MLP forecasting for 10 successive weekdays.
algorithms. Particular attention was paid to the distinction between:• data displayed and stored for performance
monitoring purpose (Monitoring)• data directly needed for running the
optimisation algorithms (Optimisation)• data used to forecast or validate inputs fed to
the algorithm (Forecast)
imPlementation stageThe data acquisition systems convey all measurement data to a data monitor and collector (DMC), a computer which, through web services, collects in a consistent way all data provided by the metering systems and the plants present in the site.
The site data system is responsible for:• collecting measured data• storing historical data• elaborating and unifying the data collected• transmitting elaborated data through a
protected connection (server function)• receiving commands from the CEMS
algorithms• transmitting commands to the industrial
controls controlling the site plants
kWh/
15m
in
15
60
quarters of hours
measuredforecast
200 400 600 800 1000
Elaborated data are available both for performance monitoring (from remote hosts) and as an input for optimisation algorithms running on a dedicated control station. Data are provided to remote hosts through a web interface, which allows both real time monitoring and historical data downloading.
resultsThe design stage first and the consequent implementation stage was completed in 2008. Today a full set of sensors and actuator is implemented and performs data monitoring and control assets including:• energy consumed by each plant (CHP, boilers,
ABS cycle, chillers, Auxiliaries)• outage status of each plant (CHP, boilers, ABS
cycle, chillers)• thermal energy supplied by each plant (CHP,
boilers)• cooling energy supplied by each plant (ABS,
electrical chillers)• electrical energy supplied by each plant (PV
roofs, PV facade, CHP)• thermal energy consumption (ATC building
and the rest of the site)• cooling energy consumption (ATC building)• electrical energy consumption (ATC building
and the rest of the site)
This set of data is used as start for further analysis that allows a comprehensive view of plant functionalities and to monitor hits trend during summer and winter period.
main issuesDuring analysis period some acquisition problems were underlined. These problems were fundamentally clustered in two kind of problematic:• lack of acquired data: data are not available
for a determined period (hours, in some cases days)
• inconsistent values: data values are not correct; the value is to big or to small in relation of historic data
The reason for these problems was found in some architecture design strategies and communication protocol synchronisation.
conclusionsThe choice to implement new sensors and architecture in an existing building management system was a cost effective winning solution but requires a strong and careful integration in design and implementation stage to make existing architecture compliant with the new architecture.
Data analysis and simulation shows that integration of CEMS like architecture on an existing plant could permit optimisation on supply side and allows, for example for the CHP, reduction of one year in the payback period compared to an not optimised plant.

192 193
chaPtEr 5commUnal EnErgy managEmEnt
5.6 aPPlication in sPain: cErDanyola
Two of the dwellings in the Còrdova Street residential buildings have been equipped with meters for detailed measurement of the electricity consumption (split-up by lighting, main household equipment, plug power points), and the thermal energy consumption for heating, domestic hot water (DHW) and solar energy contribution for hot water.
The centralized solar thermal system has not been put into operation by the date of the present study, so the evaluated solar contribution is zero.
The measurements have been registered with smart data loggers model SET90 (AFEISA). The loggers integrate the measured data in time intervals of 15 minutes and send it through secure VPN connection using GPRS to a web server, where data is stored. In order to avoid data loss, SET90 disposes of internal memory capable to acquire and store data
autonomously for several months if connection with the server is not available.
Two different modifications of SET90 equipment have been used in each dwelling. The model SET90A has been used to measure the electricity consumption and model SET90B has been used to measure the thermal energy consumption. Both are installed in the electric distribution box of the dwelling. The SET90B is wire-connected to the temperature and flow-meters installed in heating and DHW circuits.
electrical energy measurement The electrical energy measurement is done with the SET90A meter. The meter admits 3 analogue inputs for the measurement of the effective voltage and
Absorption chiller in the ST-4 Power Plant, Cerdanyola, Spain.
3 analogue inputs for current transformers through which the effective current can be measured. From the measured parameters the equipment calculates the active and reactive powers, the power factor, and integrates the corresponding active and reactive energy consumption.
The available inputs in the SET90A have been used to measure the split up electrical energy consumption respectively for lighting, appliances and plug power sources.
The SET90A disposes also of one additional analogue input and 8 digital inputs, 3 of which for pulse counting, for monitoring of other parameters of the electrical system if necessary.
thermal energy measurementThe thermal energy consumption of the dwelling is measured with the SET90B meter. SET90B has similar characteristics as SET90A, but with a higher number of analogue inputs which are freely configurable for reading of 0-2 V, 0-20 mA analogue signal or for direct connection of Pt1000 temperature sensors. This makes it more appropriate for thermal energy measurement applications.
The heating and the DHW for the dwelling is provided by a mixed boiler from the manufacturer Roca, model Neobit 24, with two independent circuits for heating and DHW. The arrangement of the circuits includes the DHW circuit (T1 – T2 – T3) and the heating circuit (T4 – T5).
The cold water from the public network is preheated in the heat exchanger (T1 – T2) in the DHW circuit by the central solar energy system. Afterwards it is heated by the boiler up to the final hot water temperature (path T2 – T3).
In the heating circuit (T4 – T5) the return water from the heating system at temperature T4 is reheated to the distribution temperature T5 by the boiler.
The boiler operates with preference to serve the DHW production and the heating is cut off while DHW is produced. This mode of operation adopted by the manufacturer assures higher efficiency of the
boiler and does not affect noticeably the heating system operation, as DHW is normally not consumed over long periods of time.
There are 5 temperature sensors type PT1000 installed in the water circuits, the position of which is indicated by T1, T2, T3, T4 and T5. The water flows of DHW and heating water are measured with turbine water meters with pulse output, indicated respectively by C1 and C2.
The useful energies delivered by the boiler for DHW and heating are calculated from the corresponding measurement of the temperature lift in the circuit and the water flow. The arrangement permits to determine also the fraction of solar energy delivered to the DHW from the centralised solar thermal system of the building.
T4 C2
T5 T3ACS
AFST1
C1
T2
Heating and air conditioning Solar
Heating circuit for the residential units, Cerdanyola, Spain.

PErformancE assEssmEntAlessandro Destefanis, Ludger Eltrop, Luca Giaccone, Till Jenssen, Jordi Ortiga Guillen
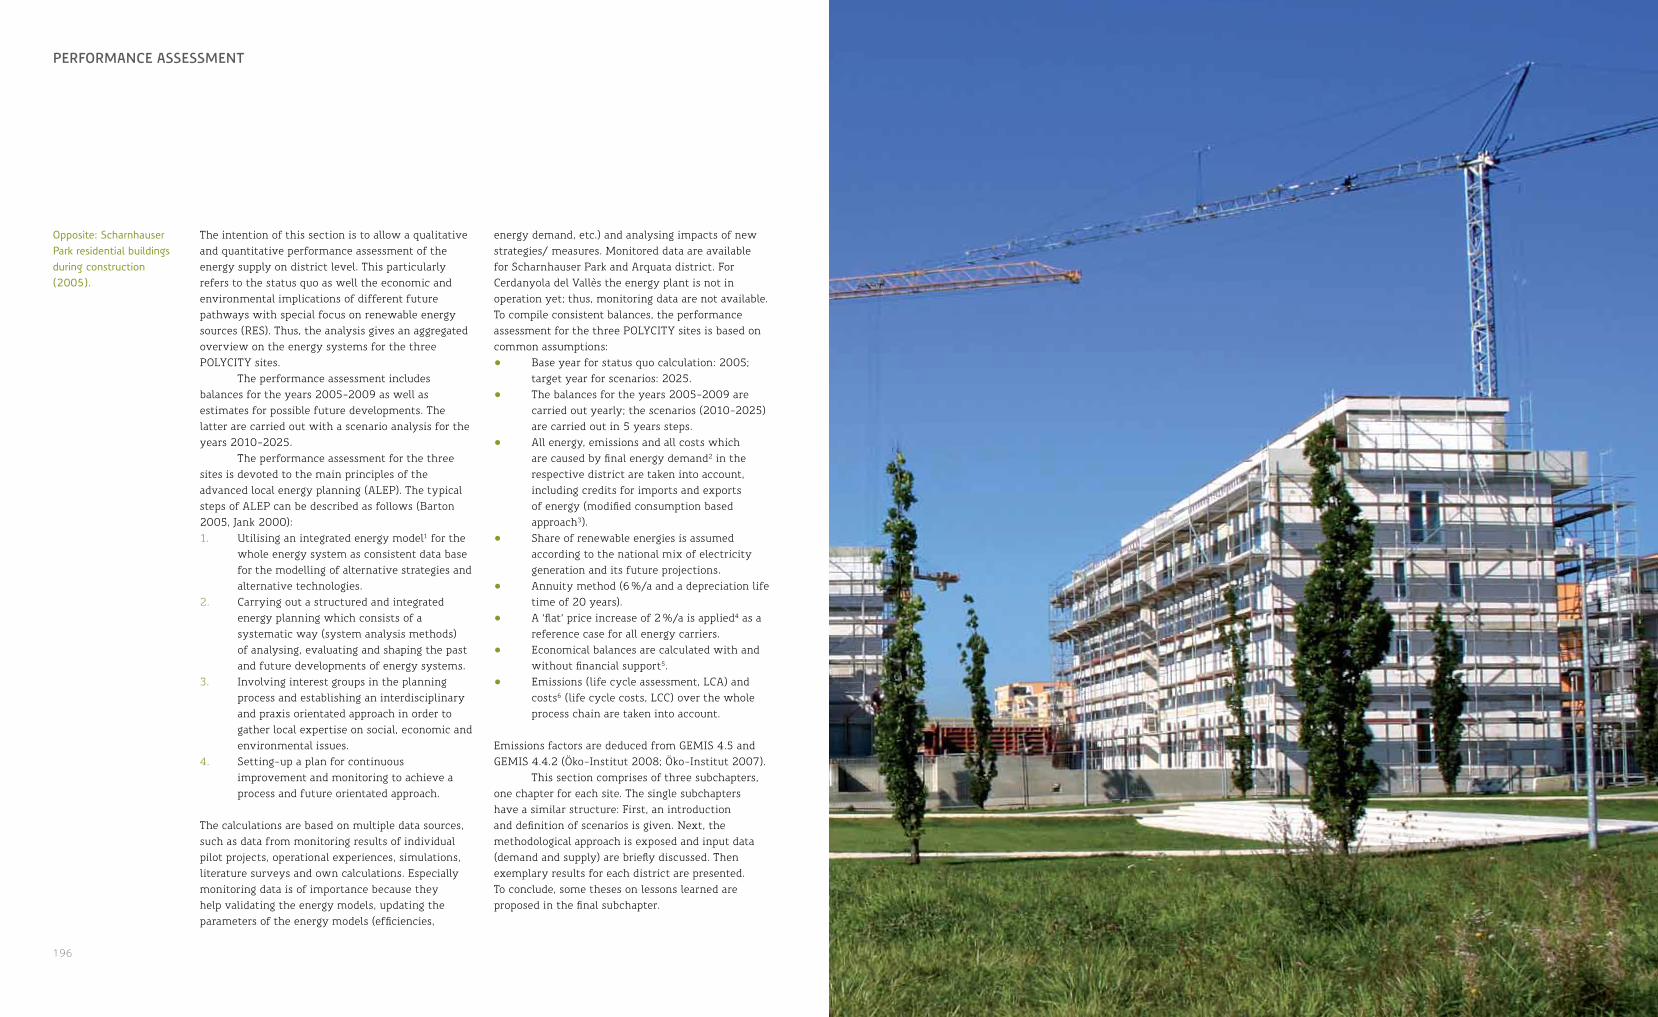
196 197
chaPtEr 1PErformancE assEssmEnt
The intention of this section is to allow a qualitative and quantitative performance assessment of the energy supply on district level. This particularly refers to the status quo as well the economic and environmental implications of different future pathways with special focus on renewable energy sources (RES). Thus, the analysis gives an aggregated overview on the energy systems for the three POLYCITY sites.
The performance assessment includes balances for the years 2005-2009 as well as estimates for possible future developments. The latter are carried out with a scenario analysis for the years 2010-2025.
The performance assessment for the three sites is devoted to the main principles of the advanced local energy planning (ALEP). The typical steps of ALEP can be described as follows (Barton 2005, Jank 2000):1. Utilising an integrated energy model1 for the
whole energy system as consistent data base for the modelling of alternative strategies and alternative technologies.
2. Carrying out a structured and integrated energy planning which consists of a systematic way (system analysis methods) of analysing, evaluating and shaping the past and future developments of energy systems.
3. Involving interest groups in the planning process and establishing an interdisciplinary and praxis orientated approach in order to gather local expertise on social, economic and environmental issues.
4. Setting-up a plan for continuous improvement and monitoring to achieve a process and future orientated approach.
The calculations are based on multiple data sources, such as data from monitoring results of individual pilot projects, operational experiences, simulations, literature surveys and own calculations. Especially monitoring data is of importance because they help validating the energy models, updating the parameters of the energy models (efficiencies,
energy demand, etc.) and analysing impacts of new strategies/ measures. Monitored data are available for Scharnhauser Park and Arquata district. For Cerdanyola del Vallès the energy plant is not in operation yet; thus, monitoring data are not available. To compile consistent balances, the performance assessment for the three POLYCITY sites is based on common assumptions:• Base year for status quo calculation: 2005;
target year for scenarios: 2025. • The balances for the years 2005-2009 are
carried out yearly; the scenarios (2010-2025) are carried out in 5 years steps.
• All energy, emissions and all costs which are caused by final energy demand2 in the respective district are taken into account, including credits for imports and exports of energy (modified consumption based approach3).
• Share of renewable energies is assumed according to the national mix of electricity generation and its future projections.
• Annuity method (6 %/a and a depreciation life time of 20 years).
• A ‘flat’ price increase of 2 %/a is applied4 as a reference case for all energy carriers.
• Economical balances are calculated with and without financial support5.
• Emissions (life cycle assessment, LCA) and costs6 (life cycle costs, LCC) over the whole process chain are taken into account.
Emissions factors are deduced from GEMIS 4.5 and GEMIS 4.4.2 (Öko-Institut 2008; Öko-Institut 2007).
This section comprises of three subchapters, one chapter for each site. The single subchapters have a similar structure: First, an introduction and definition of scenarios is given. Next, the methodological approach is exposed and input data (demand and supply) are briefly discussed. Then exemplary results for each district are presented. To conclude, some theses on lessons learned are proposed in the final subchapter.
Opposite: Scharnhauser Park residential buildings during construction (2005).
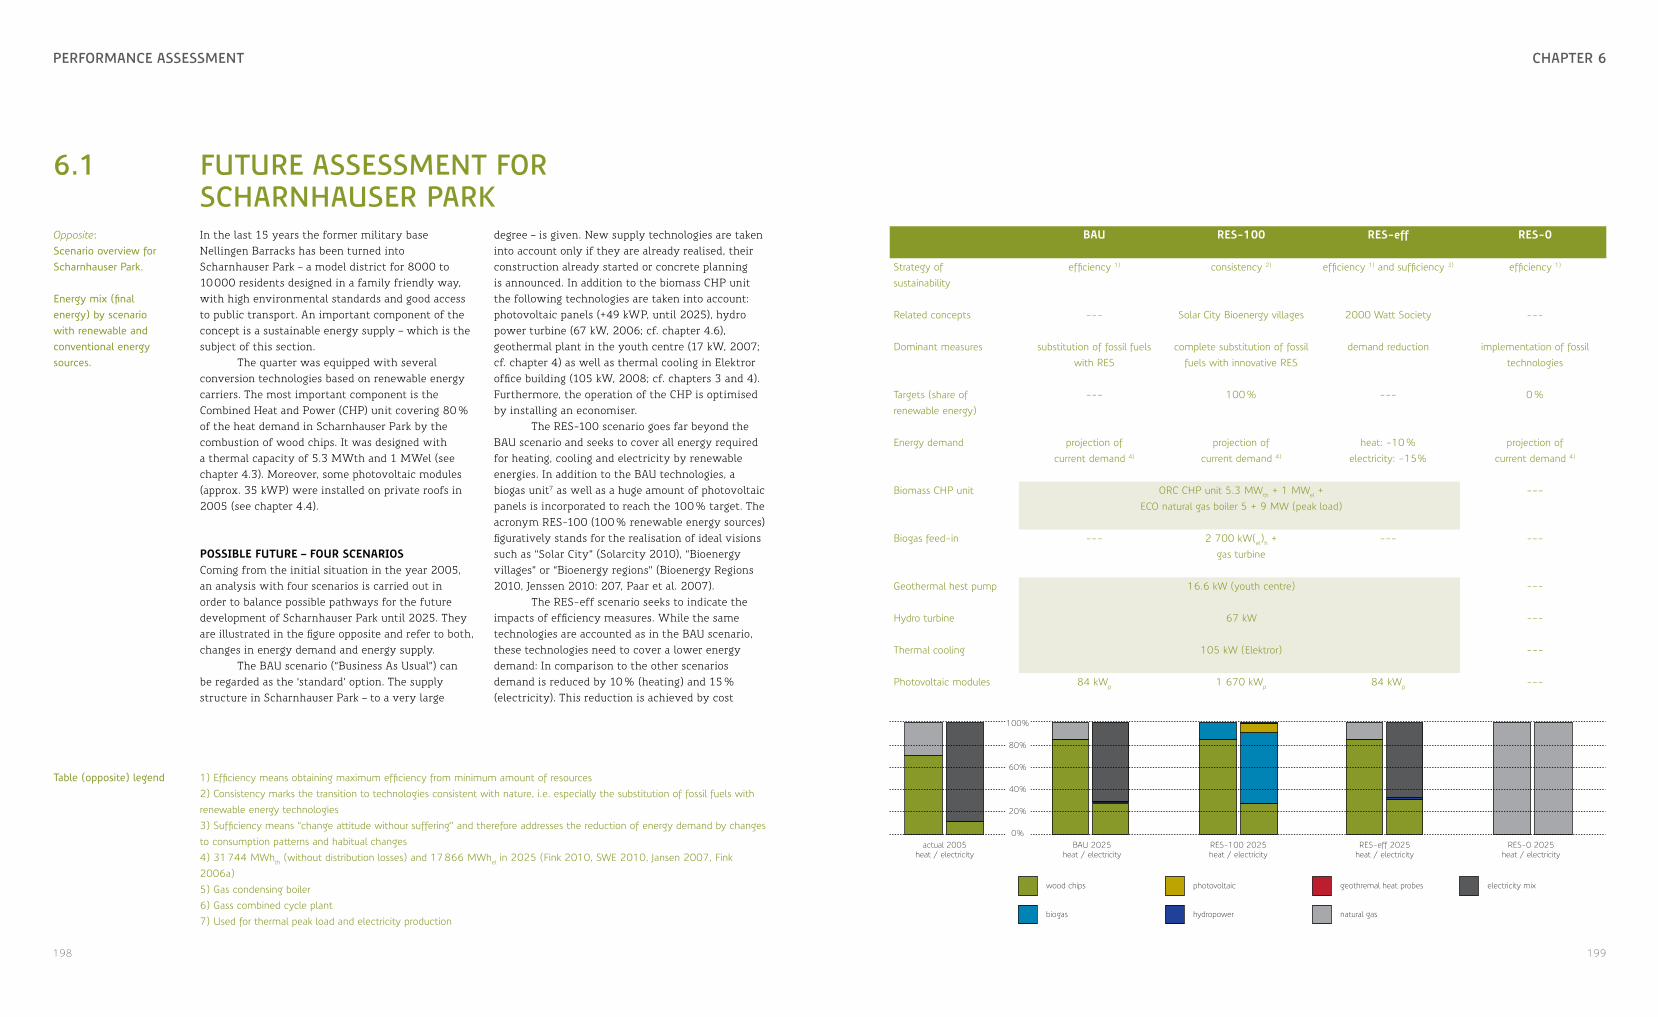
198 199
PErformancE assEssmEnt chaPtEr 6
In the last 15 years the former military base Nellingen Barracks has been turned into Scharnhauser Park – a model district for 8000 to 10 000 residents designed in a family friendly way, with high environmental standards and good access to public transport. An important component of the concept is a sustainable energy supply – which is the subject of this section.
The quarter was equipped with several conversion technologies based on renewable energy carriers. The most important component is the Combined Heat and Power (CHP) unit covering 80 % of the heat demand in Scharnhauser Park by the combustion of wood chips. It was designed with a thermal capacity of 5.3 MWth and 1 MWel (see chapter 4.3). Moreover, some photovoltaic modules (approx. 35 kWP) were installed on private roofs in 2005 (see chapter 4.4).
Possible future – four scenariosComing from the initial situation in the year 2005, an analysis with four scenarios is carried out in order to balance possible pathways for the future development of Scharnhauser Park until 2025. They are illustrated in the figure opposite and refer to both, changes in energy demand and energy supply.
The BAU scenario (“Business As Usual”) can be regarded as the ‘standard’ option. The supply structure in Scharnhauser Park – to a very large
6.1 fUtUrE assEssmEnt for scharnhaUsEr Park
Opposite: Scenario overview for Scharnhauser Park.
Energy mix (final energy) by scenario with renewable and conventional energy sources.
Table (opposite) legend 1) Efficiency means obtaining maximum efficiency from minimum amount of resources2) Consistency marks the transition to technologies consistent with nature, i.e. especially the substitution of fossil fuels with renewable energy technologies3) Sufficiency means “change attitude withour suffering” and therefore addresses the reduction of energy demand by changes to consumption patterns and habitual changes4) 31 744 MWhth (without distribution losses) and 17 866 MWhel in 2025 (Fink 2010, SWE 2010, Jansen 2007, Fink 2006a)5) Gas condensing boiler6) Gass combined cycle plant7) Used for thermal peak load and electricity production
degree – is given. New supply technologies are taken into account only if they are already realised, their construction already started or concrete planning is announced. In addition to the biomass CHP unit the following technologies are taken into account: photovoltaic panels (+49 kWP, until 2025), hydro power turbine (67 kW, 2006; cf. chapter 4.6), geothermal plant in the youth centre (17 kW, 2007; cf. chapter 4) as well as thermal cooling in Elektror office building (105 kW, 2008; cf. chapters 3 and 4). Furthermore, the operation of the CHP is optimised by installing an economiser.
The RES-100 scenario goes far beyond the BAU scenario and seeks to cover all energy required for heating, cooling and electricity by renewable energies. In addition to the BAU technologies, a biogas unit7 as well as a huge amount of photovoltaic panels is incorporated to reach the 100 % target. The acronym RES-100 (100 % renewable energy sources) figuratively stands for the realisation of ideal visions such as “Solar City” (Solarcity 2010), “Bioenergy villages” or “Bioenergy regions” (Bioenergy Regions 2010, Jenssen 2010: 207, Paar et al. 2007).
The RES-eff scenario seeks to indicate the impacts of efficiency measures. While the same technologies are accounted as in the BAU scenario, these technologies need to cover a lower energy demand: In comparison to the other scenarios demand is reduced by 10 % (heating) and 15 % (electricity). This reduction is achieved by cost
bau res-100 res-eff res-0
Strategy of sustainability
efficiency 1) consistency 2) efficiency 1) and sufficiency 3) efficiency 1)
Related concepts --- Solar City Bioenergy villages 2000 Watt Society ---
Dominant measures substitution of fossil fuels with RES
complete substitution of fossil fuels with innovative RES
demand reduction implementation of fossil technologies
Targets (share of renewable energy)
--- 100 % --- 0 %
Energy demand projection of current demand 4)
projection of current demand 4)
heat: -10 % electricity: -15%
projection of current demand 4)
Biomass CHP unit ORC CHP unit 5.3 MWth + 1 MWel + ECO natural gas boiler 5 + 9 MW (peak load)
---
Biogas feed-in --- 2 700 kW(el)h + gas turbine
--- ---
Geothermal hest pump 16.6 kW (youth centre) ---
Hydro turbine 67 kW ---
Thermal cooling 105 kW (Elektror) ---
Photovoltaic modules 84 kWp 1 670 kWp 84 kWp ---
actual 2005heat / electricity
BAU 2025heat / electricity
RES-100 2025heat / electricity
RES-eff 2025heat / electricity
RES-0 2025heat / electricity
wood chips
biogas
photovoltaic
hydropower
geothremal heat probes
natural gas
electricity mix
0%
20%
40%
60%
80%
100%
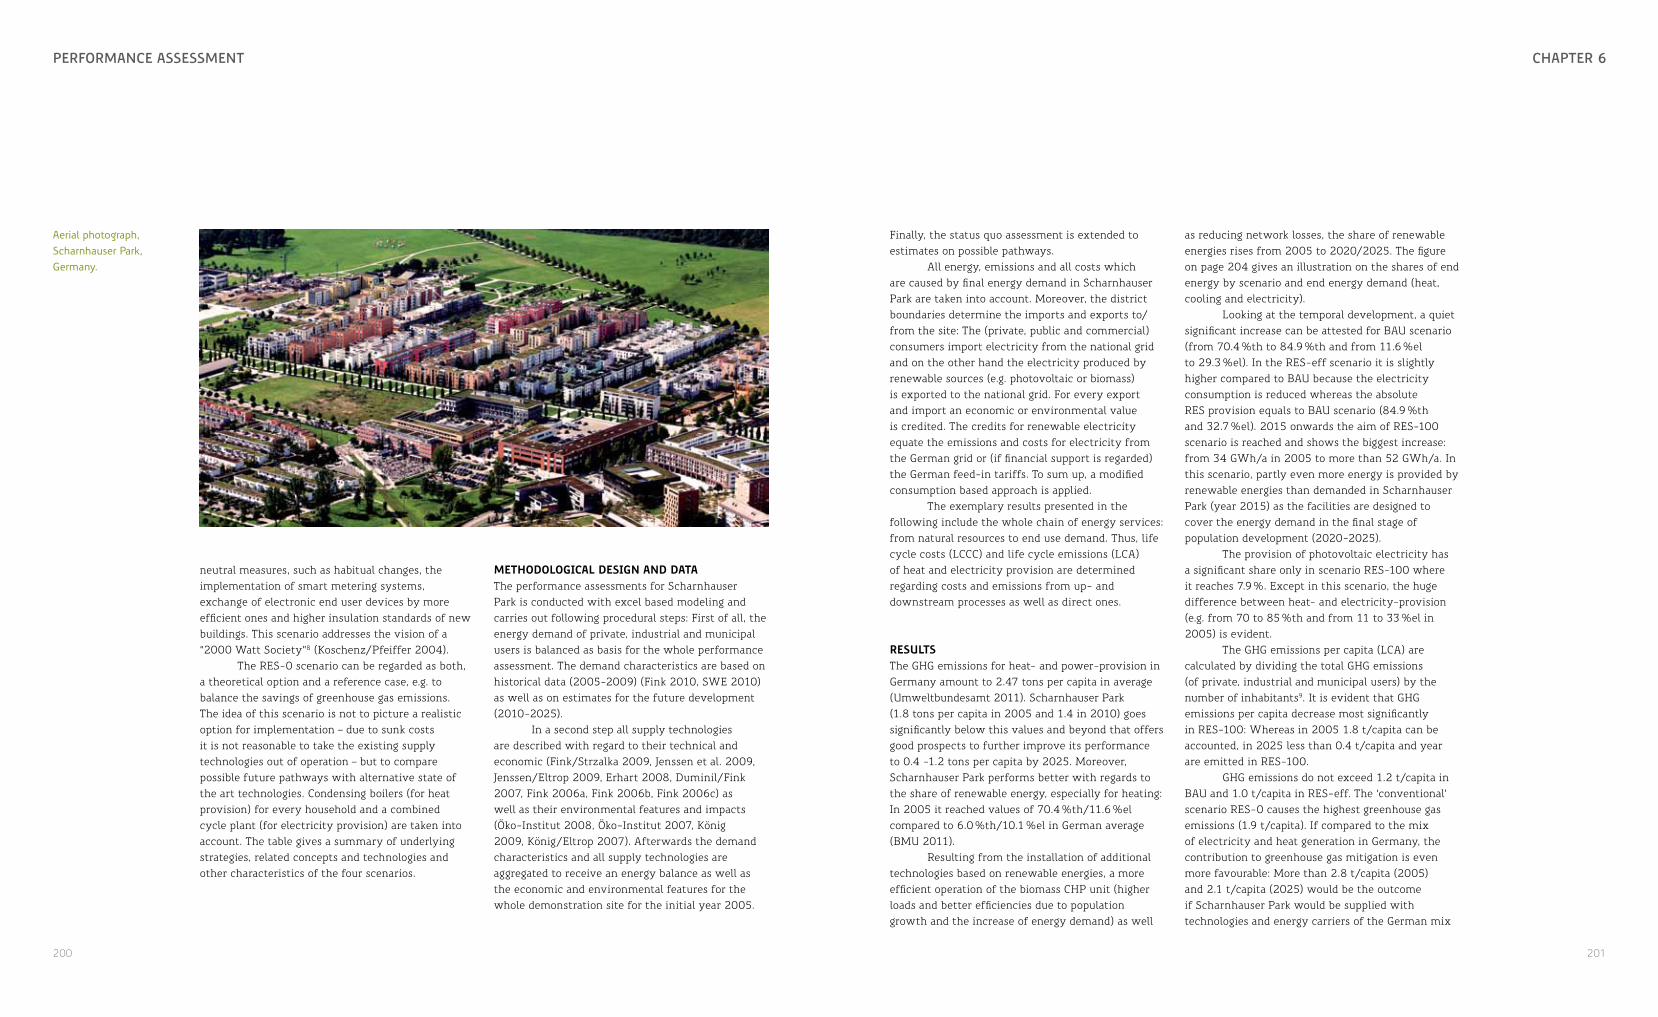
200 201
PErformancE assEssmEnt chaPtEr 6
neutral measures, such as habitual changes, the implementation of smart metering systems, exchange of electronic end user devices by more efficient ones and higher insulation standards of new buildings. This scenario addresses the vision of a “2000 Watt Society”8 (Koschenz/Pfeiffer 2004).
The RES-0 scenario can be regarded as both, a theoretical option and a reference case, e.g. to balance the savings of greenhouse gas emissions. The idea of this scenario is not to picture a realistic option for implementation – due to sunk costs it is not reasonable to take the existing supply technologies out of operation – but to compare possible future pathways with alternative state of the art technologies. Condensing boilers (for heat provision) for every household and a combined cycle plant (for electricity provision) are taken into account. The table gives a summary of underlying strategies, related concepts and technologies and other characteristics of the four scenarios.
methodological design and data The performance assessments for Scharnhauser Park is conducted with excel based modeling and carries out following procedural steps: First of all, the energy demand of private, industrial and municipal users is balanced as basis for the whole performance assessment. The demand characteristics are based on historical data (2005-2009) (Fink 2010, SWE 2010) as well as on estimates for the future development (2010-2025).
In a second step all supply technologies are described with regard to their technical and economic (Fink/Strzalka 2009, Jenssen et al. 2009, Jenssen/Eltrop 2009, Erhart 2008, Duminil/Fink 2007, Fink 2006a, Fink 2006b, Fink 2006c) as well as their environmental features and impacts (Öko-Institut 2008, Öko-Institut 2007, König 2009, König/Eltrop 2007). Afterwards the demand characteristics and all supply technologies are aggregated to receive an energy balance as well as the economic and environmental features for the whole demonstration site for the initial year 2005.
Aerial photograph, Scharnhauser Park, Germany.
Finally, the status quo assessment is extended to estimates on possible pathways.
All energy, emissions and all costs which are caused by final energy demand in Scharnhauser Park are taken into account. Moreover, the district boundaries determine the imports and exports to/from the site: The (private, public and commercial) consumers import electricity from the national grid and on the other hand the electricity produced by renewable sources (e.g. photovoltaic or biomass) is exported to the national grid. For every export and import an economic or environmental value is credited. The credits for renewable electricity equate the emissions and costs for electricity from the German grid or (if financial support is regarded) the German feed-in tariffs. To sum up, a modified consumption based approach is applied.
The exemplary results presented in the following include the whole chain of energy services: from natural resources to end use demand. Thus, life cycle costs (LCCC) and life cycle emissions (LCA) of heat and electricity provision are determined regarding costs and emissions from up- and downstream processes as well as direct ones.
resultsThe GHG emissions for heat- and power-provision in Germany amount to 2.47 tons per capita in average (Umweltbundesamt 2011). Scharnhauser Park (1.8 tons per capita in 2005 and 1.4 in 2010) goes significantly below this values and beyond that offers good prospects to further improve its performance to 0.4 -1.2 tons per capita by 2025. Moreover, Scharnhauser Park performs better with regards to the share of renewable energy, especially for heating: In 2005 it reached values of 70.4 %th/11.6 %el compared to 6.0 %th/10.1 %el in German average (BMU 2011).
Resulting from the installation of additional technologies based on renewable energies, a more efficient operation of the biomass CHP unit (higher loads and better efficiencies due to population growth and the increase of energy demand) as well
as reducing network losses, the share of renewable energies rises from 2005 to 2020/2025. The figure on page 204 gives an illustration on the shares of end energy by scenario and end energy demand (heat, cooling and electricity).
Looking at the temporal development, a quiet significant increase can be attested for BAU scenario (from 70.4 %th to 84.9 %th and from 11.6 %el to 29.3 %el). In the RES-eff scenario it is slightly higher compared to BAU because the electricity consumption is reduced whereas the absolute RES provision equals to BAU scenario (84.9 %th and 32.7 %el). 2015 onwards the aim of RES-100 scenario is reached and shows the biggest increase: from 34 GWh/a in 2005 to more than 52 GWh/a. In this scenario, partly even more energy is provided by renewable energies than demanded in Scharnhauser Park (year 2015) as the facilities are designed to cover the energy demand in the final stage of population development (2020-2025).
The provision of photovoltaic electricity has a significant share only in scenario RES-100 where it reaches 7.9 %. Except in this scenario, the huge difference between heat- and electricity-provision (e.g. from 70 to 85 %th and from 11 to 33 %el in 2005) is evident.
The GHG emissions per capita (LCA) are calculated by dividing the total GHG emissions (of private, industrial and municipal users) by the number of inhabitants9. It is evident that GHG emissions per capita decrease most significantly in RES-100: Whereas in 2005 1.8 t/capita can be accounted, in 2025 less than 0.4 t/capita and year are emitted in RES-100.
GHG emissions do not exceed 1.2 t/capita in BAU and 1.0 t/capita in RES-eff. The ‘conventional’ scenario RES-0 causes the highest greenhouse gas emissions (1.9 t/capita). If compared to the mix of electricity and heat generation in Germany, the contribution to greenhouse gas mitigation is even more favourable: More than 2.8 t/capita (2005) and 2.1 t/capita (2025) would be the outcome if Scharnhauser Park would be supplied with technologies and energy carriers of the German mix

202 203
PErformancE assEssmEnt chaPtEr 6
of energy generation. The indicated range highlights the differences between LCA emissions and direct emissions.
Regarding the development of the average costs (LCC) of renewable heat and electricity generation for each scenario (including financial support), the average costs are mainly influenced by the heat generation by the CHP. For 2005 costs of about 722 ¤/capita or 10.9 cent/kWh have been calculated. For the years 2010 to 2025 costs of energy provision scenarios are cut to about 440-550 or 8-9 cent/kWh respectively. Although the wood and natural gas prices are increasing by 2 % per year, heat and electricity generation costs can be reduced which is due to the efficiency of the CHP plant (the increasing heat demand leads to a better load and efficiency). Moreover, it is evident that the renewable scenarios can compete with the conventional one, 2020 onwards BAU, RES-100 and RES-eff are below the values of RES-0 – some even earlier. The two scenarios BAU and RES-eff show comparable values as these scenarios differ from each other only by the different demand characteristics but not concerning the installed RES power.
The picture changes when looking at the costs without financial support10 (indicated by the range). The conventional RES-0 is the most favourable scenario. With costs up to 792 ¤/capita and 13 cent/kWh, the costs for RES-100 differ significantly from the other scenarios.
Finally, it can be stated that an “optimal” technology or an “optimal” supply system for Scharnhauser Park which provides low emission and low cost energy at the same time does not exist. Rather analysis clearly demonstrates that conflicting aims in regard to various environmental-economic indicators as well as inner-environmental ones exist. Higher costs for instance are connected with lower greenhouse gas emissions and vice versa. RES-eff to a certain extent is capable of harmonising both, environmental responsibility and economic interests and can therefore be recommended.
Even though the main structures for demand and supply are given already in Scharnhauser Park,
t/ c
apita
l ·a
0
0.5
1.0
1.5
2.0
2.5
3.0
balance
BAU
RES-100
RES-eff
reference
2005 2006 2007 2008 2009 2010 2025
€/ c
apita
0
200
400
600
800
1000
1200
balance
BAU
RES-100
RES-eff
reference
2005 2006 2007 2008 2009 2010 2025
Development of yearly GHG emissions by scenario.
Development of yearly costs by scenario, with and without financial support.
the scenario analysis clearly shows the potentials for changing the energy supply system. Comparing the four scenarios, there are tremendous differences with respect to the environmental and economic indicators.
The technologies with the best ability to influence the results are bioenergy technologies. Their installation triggers a huge improvement of the environmental balances but also deteriorates the economic balance. The other technologies (photovoltaic, hydro power and geothermal plant) carry out only minor deviations.
The cumulated costs provide in-depth insight on the economic impacts of different energy pathways for Scharnhauser Park. The cumulated costs for the most ambitious scenario RES-100 for example are (including financial support) just 11 % higher than the most cost effective scenario RES-eff. However, when looking at the cumulated cost without financial support the disadvantages of RES-100 are evident: compared to RES-0 the costs amount to 152 %.
But on the other side, RES-0 is dependent on one energy carrier only which carries the inherent danger of high vulnerabilities in case of increasing prices for energy carriers. The parametric variation demonstrates that costs of RES-0 rise by 16 % if the yearly increase is changed from 2 % to 3 %. The energy supply in all the other scenarios is more diversified and shows much less dependency on a single energy carrier.
BAU
RES-eff
RES-100
-20
0
20
40
60
80
100shareRES
RES capacity
GHG
SO2
NOx
yearly costs(w/o financial support 2025)
financialsupport
cumulated costs(with financialsupport)
Various indicators and conflicting aims by scenario.
Parameter variation of price development for energy source carriers (yearly costs 2025 with financial support).(
% )
70
80
90
100
110
120
130
RES-100(wood chips)
BAU(natural gas)
RES-0(natural gas)
RES-100(energy crops)
BAU(wood chips)
0% 1% 2% 3% 4%
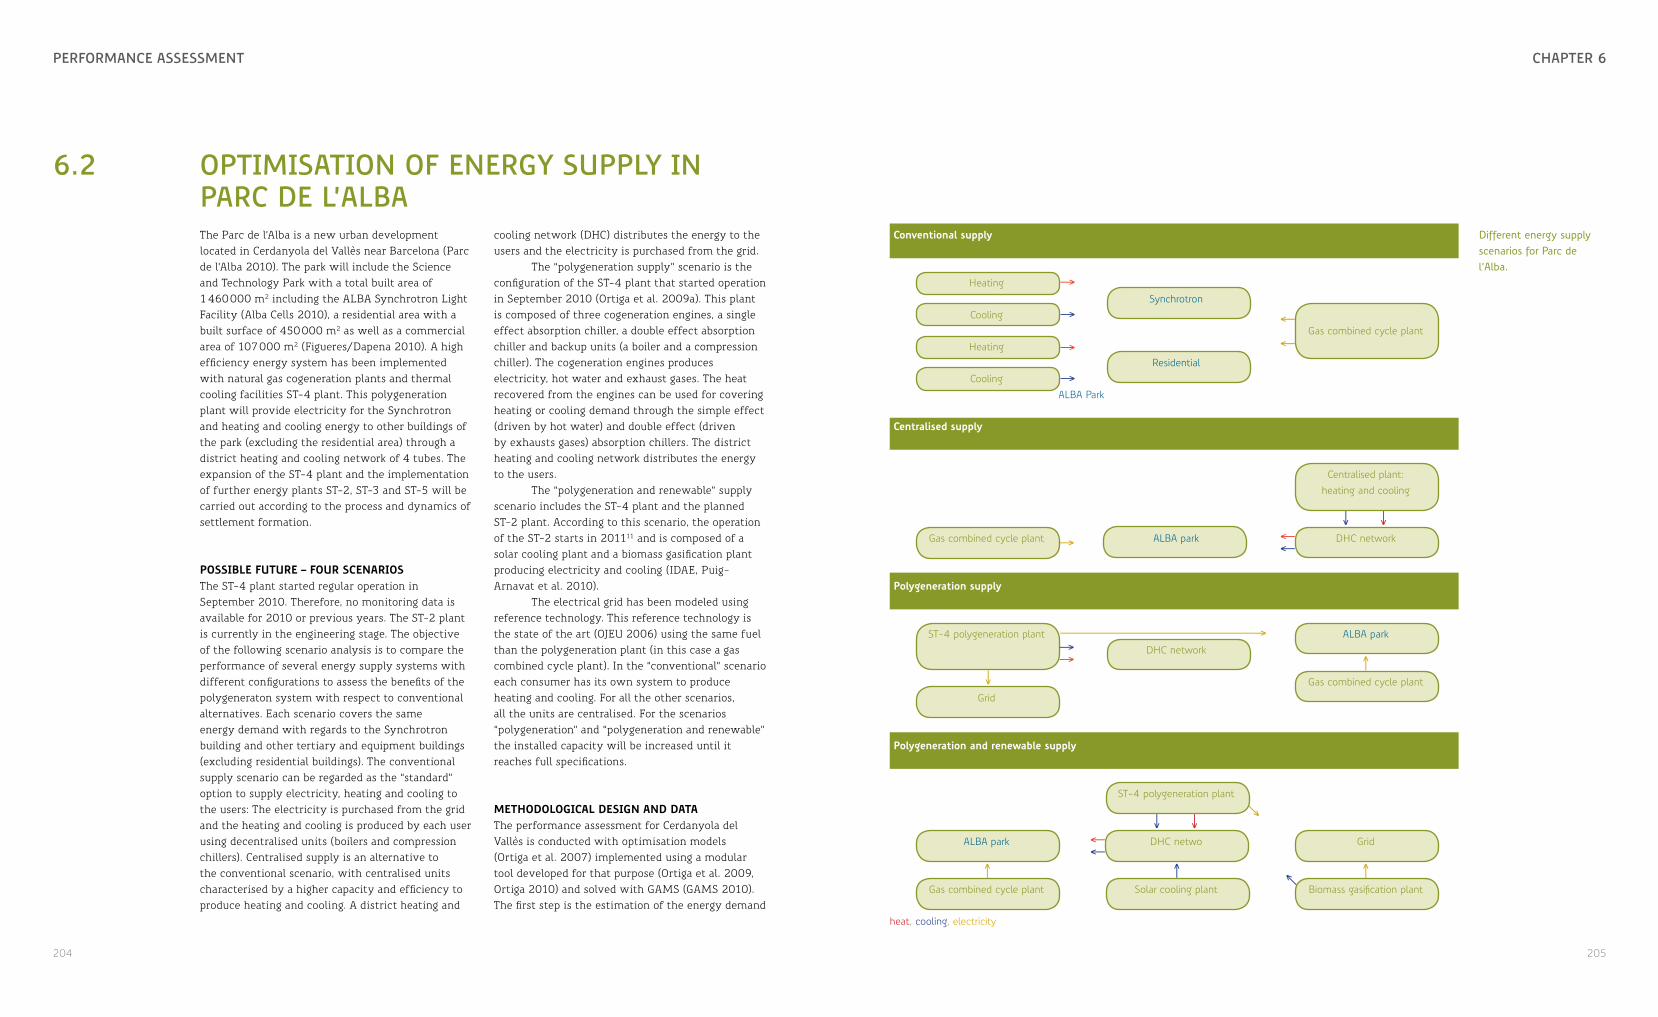
204 205
PErformancE assEssmEnt chaPtEr 6
6.2 oPtimisation of EnErgy sUPPly in Parc DE l’albaThe Parc de l’Alba is a new urban development located in Cerdanyola del Vallès near Barcelona (Parc de l’Alba 2010). The park will include the Science and Technology Park with a total built area of 1 460 000 m2 including the ALBA Synchrotron Light Facility (Alba Cells 2010), a residential area with a built surface of 450 000 m2 as well as a commercial area of 107 000 m2 (Figueres/Dapena 2010). A high efficiency energy system has been implemented with natural gas cogeneration plants and thermal cooling facilities ST-4 plant. This polygeneration plant will provide electricity for the Synchrotron and heating and cooling energy to other buildings of the park (excluding the residential area) through a district heating and cooling network of 4 tubes. The expansion of the ST-4 plant and the implementation of further energy plants ST-2, ST-3 and ST-5 will be carried out according to the process and dynamics of settlement formation.
Possible future – four scenariosThe ST-4 plant started regular operation in September 2010. Therefore, no monitoring data is available for 2010 or previous years. The ST-2 plant is currently in the engineering stage. The objective of the following scenario analysis is to compare the performance of several energy supply systems with different configurations to assess the benefits of the polygeneraton system with respect to conventional alternatives. Each scenario covers the same energy demand with regards to the Synchrotron building and other tertiary and equipment buildings (excluding residential buildings). The conventional supply scenario can be regarded as the “standard” option to supply electricity, heating and cooling to the users: The electricity is purchased from the grid and the heating and cooling is produced by each user using decentralised units (boilers and compression chillers). Centralised supply is an alternative to the conventional scenario, with centralised units characterised by a higher capacity and efficiency to produce heating and cooling. A district heating and
cooling network (DHC) distributes the energy to the users and the electricity is purchased from the grid.
The “polygeneration supply” scenario is the configuration of the ST-4 plant that started operation in September 2010 (Ortiga et al. 2009a). This plant is composed of three cogeneration engines, a single effect absorption chiller, a double effect absorption chiller and backup units (a boiler and a compression chiller). The cogeneration engines produces electricity, hot water and exhaust gases. The heat recovered from the engines can be used for covering heating or cooling demand through the simple effect (driven by hot water) and double effect (driven by exhausts gases) absorption chillers. The district heating and cooling network distributes the energy to the users.
The “polygeneration and renewable” supply scenario includes the ST-4 plant and the planned ST-2 plant. According to this scenario, the operation of the ST-2 starts in 201111 and is composed of a solar cooling plant and a biomass gasification plant producing electricity and cooling (IDAE, Puig-Arnavat et al. 2010).
The electrical grid has been modeled using reference technology. This reference technology is the state of the art (OJEU 2006) using the same fuel than the polygeneration plant (in this case a gas combined cycle plant). In the “conventional” scenario each consumer has its own system to produce heating and cooling. For all the other scenarios, all the units are centralised. For the scenarios “polygeneration” and “polygeneration and renewable” the installed capacity will be increased until it reaches full specifications.
methodological design and dataThe performance assessment for Cerdanyola del Vallès is conducted with optimisation models (Ortiga et al. 2007) implemented using a modular tool developed for that purpose (Ortiga et al. 2009, Ortiga 2010) and solved with GAMS (GAMS 2010). The first step is the estimation of the energy demand
↑↑
↓
↓
↓
↓↓ ↓↓
↑
↑
↑
↑
↑
↑↑
↑
↑
↑
↑
↑↑
↑↑
conventional supply
Heating
CoolingSynchrotron
Gas combined cycle plantHeating
CoolingResidential
ALBA Park
centralised supply
Centralised plant: heating and cooling
Gas combined cycle plant ALBA park DHC network
Polygeneration supply
ST-4 polygeneration plantDHC network
ALBA park
GridGas combined cycle plant
Polygeneration and renewable supply
ST-4 polygeneration plant
ALBA park DHC netwo Grid
Gas combined cycle plant Solar cooling plant Biomass gasification plant
heat, cooling, electricity
Different energy supply scenarios for Parc de l’Alba.
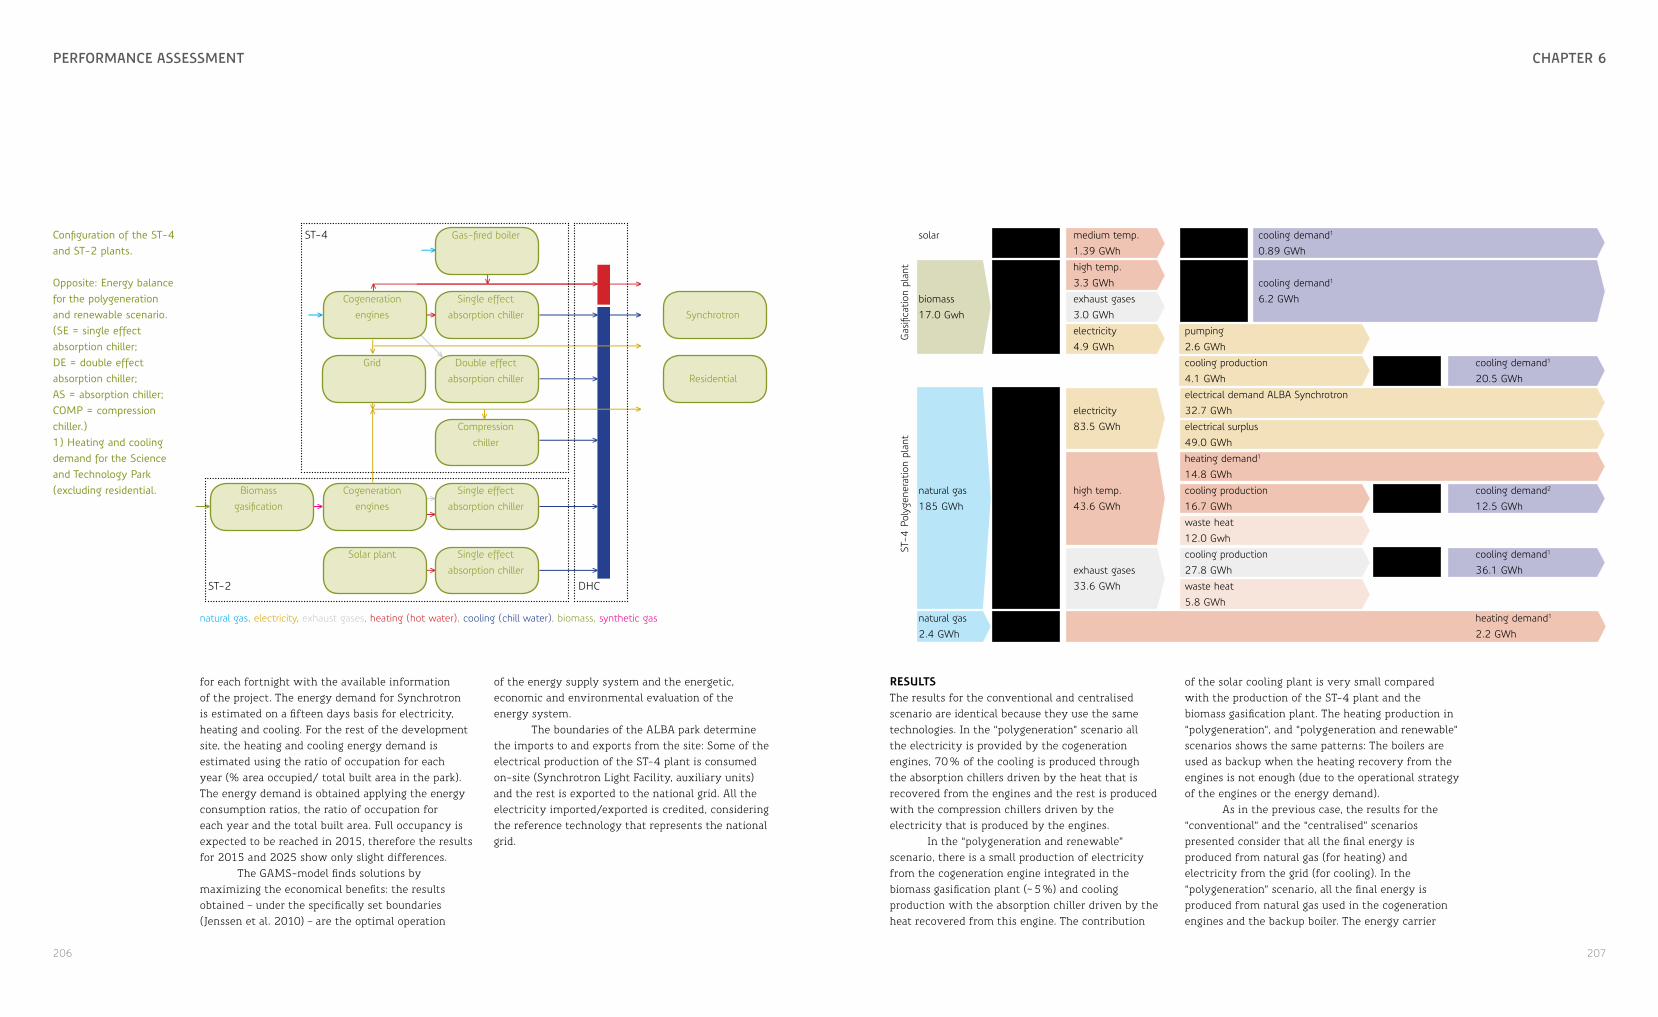
206 207
PErformancE assEssmEnt chaPtEr 6
↑ ↑↑
↑
↑
↑
↑
↑
↑
↑
↑
↑ Gas-fired boiler
Cogeneration engines
Single effect absorption chiller Synchrotron
Grid Double effect absorption chiller Residential
Compression chiller
Biomass gasification
Cogeneration engines
Single effect absorption chiller
Solar plant Single effect absorption chiller
natural gas, electricity, exhaust gases, heating (hot water), cooling (chill water), biomass, synthetic gas
ST-4
ST-2 DHC
Configuration of the ST-4 and ST-2 plants.
Opposite: Energy balance for the polygeneration and renewable scenario. (SE = single effect absorption chiller; DE = double effect absorption chiller; AS = absorption chiller; COMP = compression chiller.)1) Heating and cooling demand for the Science and Technology Park (excluding residential.
for each fortnight with the available information of the project. The energy demand for Synchrotron is estimated on a fifteen days basis for electricity, heating and cooling. For the rest of the development site, the heating and cooling energy demand is estimated using the ratio of occupation for each year (% area occupied/ total built area in the park). The energy demand is obtained applying the energy consumption ratios, the ratio of occupation for each year and the total built area. Full occupancy is expected to be reached in 2015, therefore the results for 2015 and 2025 show only slight differences.
The GAMS-model finds solutions by maximizing the economical benefits: the results obtained – under the specifically set boundaries (Jenssen et al. 2010) – are the optimal operation
of the energy supply system and the energetic, economic and environmental evaluation of the energy system.
The boundaries of the ALBA park determine the imports to and exports from the site: Some of the electrical production of the ST-4 plant is consumed on-site (Synchrotron Light Facility, auxiliary units) and the rest is exported to the national grid. All the electricity imported/exported is credited, considering the reference technology that represents the national grid.
resultsThe results for the conventional and centralised scenario are identical because they use the same technologies. In the “polygeneration” scenario all the electricity is provided by the cogeneration engines, 70 % of the cooling is produced through the absorption chillers driven by the heat that is recovered from the engines and the rest is produced with the compression chillers driven by the electricity that is produced by the engines.
In the “polygeneration and renewable” scenario, there is a small production of electricity from the cogeneration engine integrated in the biomass gasification plant (~ 5 %) and cooling production with the absorption chiller driven by the heat recovered from this engine. The contribution
of the solar cooling plant is very small compared with the production of the ST-4 plant and the biomass gasification plant. The heating production in “polygeneration”, and “polygeneration and renewable” scenarios shows the same patterns: The boilers are used as backup when the heating recovery from the engines is not enough (due to the operational strategy of the engines or the energy demand).
As in the previous case, the results for the “conventional” and the “centralised” scenarios presented consider that all the final energy is produced from natural gas (for heating) and electricity from the grid (for cooling). In the “polygeneration” scenario, all the final energy is produced from natural gas used in the cogeneration engines and the backup boiler. The energy carrier
solar solar plant medium temp.1.39 GWh
absorption chiller
cooling demand1
0.89 GWh
Gas
ifica
tion
plan
t
biomass17.0 Gwh
gasification/ CHP
high temp.3.3 GWh
single/ double effect absorption chiller
cooling demand1
6.2 GWhexhaust gases3.0 GWhelectricity4.9 GWh
pumping2.6 GWh
ST-4
Pol
ygen
erat
ion
plan
t
cooling production4.1 GWh
compression chiller
cooling demand1
20.5 GWh
natural gas185 GWh
CHP
electricity83.5 GWh
electrical demand ALBA Synchrotron32.7 GWhelectrical surplus49.0 GWh
high temp.43.6 GWh
heating demand1
14.8 GWhcooling production16.7 GWh
single effect absorption
cooling demand2
12.5 GWhwaste heat12.0 Gwh
exhaust gases33.6 GWh
cooling production27.8 GWh
double effect absorption
cooling demand1
36.1 GWhwaste heat5.8 GWh
natural gas2.4 GWh
boiler heating demand1
2.2 GWh
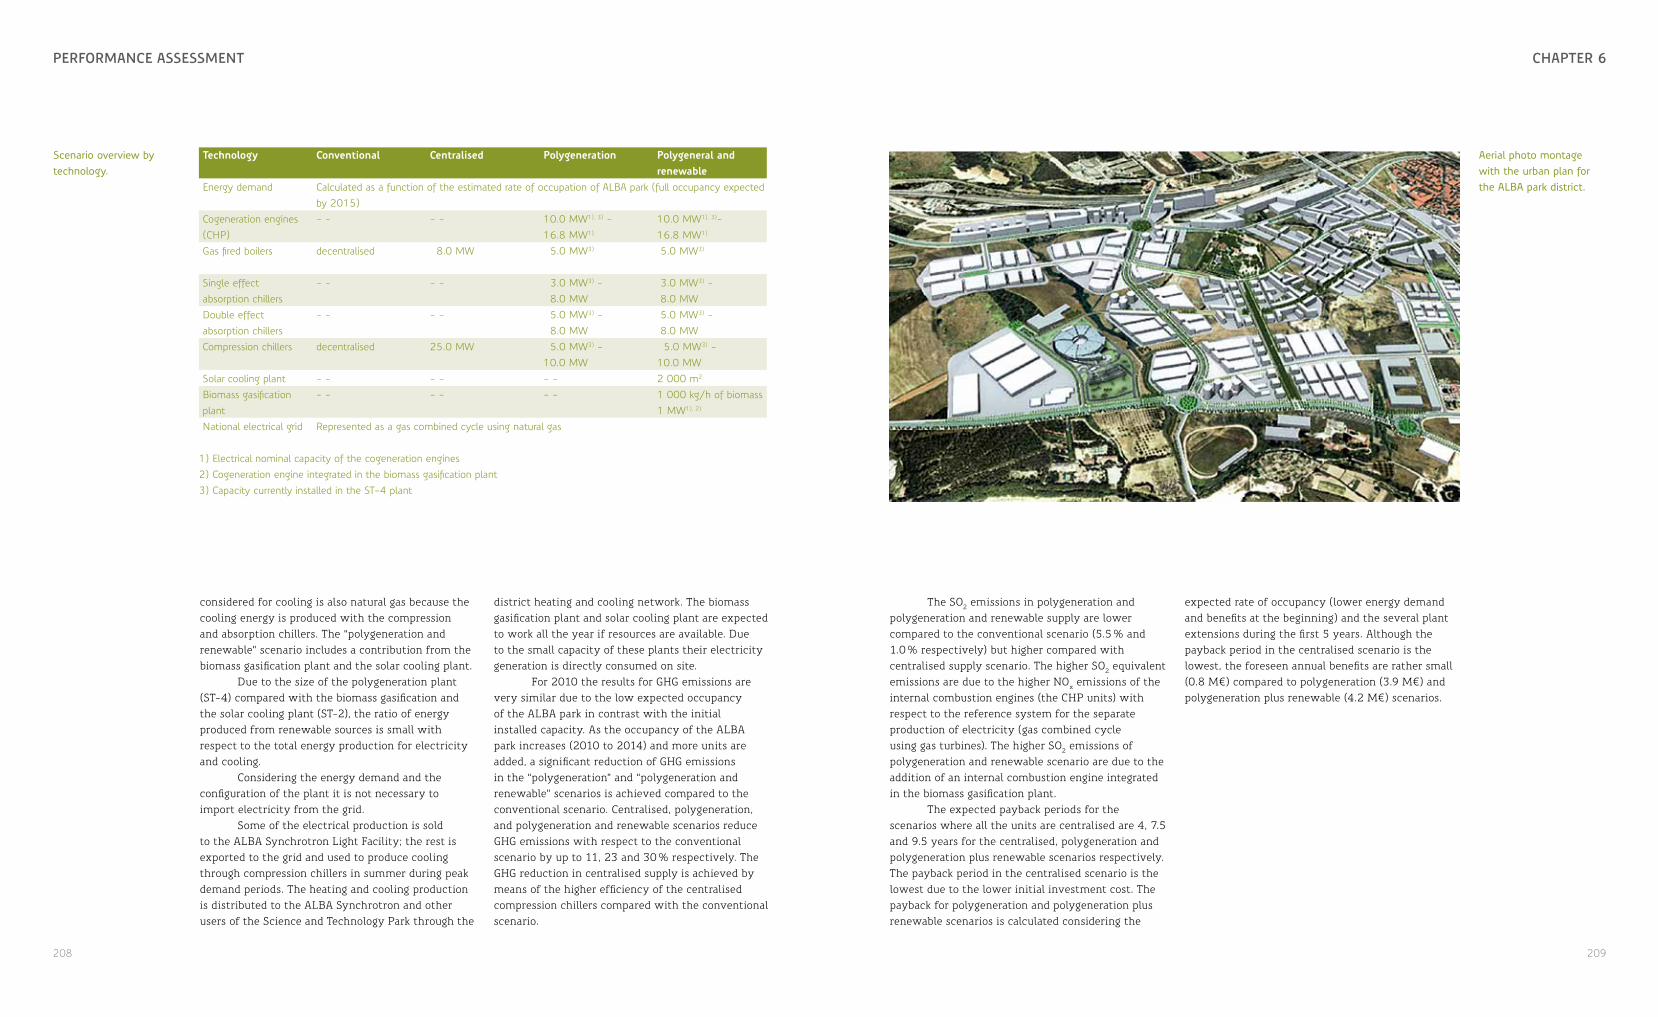
208 209
PErformancE assEssmEnt chaPtEr 6
considered for cooling is also natural gas because the cooling energy is produced with the compression and absorption chillers. The “polygeneration and renewable” scenario includes a contribution from the biomass gasification plant and the solar cooling plant.
Due to the size of the polygeneration plant (ST-4) compared with the biomass gasification and the solar cooling plant (ST-2), the ratio of energy produced from renewable sources is small with respect to the total energy production for electricity and cooling.
Considering the energy demand and the configuration of the plant it is not necessary to import electricity from the grid.
Some of the electrical production is sold to the ALBA Synchrotron Light Facility; the rest is exported to the grid and used to produce cooling through compression chillers in summer during peak demand periods. The heating and cooling production is distributed to the ALBA Synchrotron and other users of the Science and Technology Park through the
technology conventional centralised Polygeneration Polygeneral and renewable
Energy demand Calculated as a function of the estimated rate of occupation of ALBA park (full occupancy expected by 2015)
Cogeneration engines (CHP)
- - - - 10.0 MW1), 3) - 16.8 MW1)
10.0 MW1), 3)- 16.8 MW1)
Gas fired boilers decentralised 8.0 MW 5.0 MW3) 5.0 MW3)
Single effect absorption chillers
- - - - 3.0 MW3) - 8.0 MW
3.0 MW3) - 8.0 MW
Double effect absorption chillers
- - - - 5.0 MW3) - 8.0 MW
5.0 MW3) - 8.0 MW
Compression chillers decentralised 25.0 MW 5.0 MW3) - 10.0 MW
5.0 MW3) - 10.0 MW
Solar cooling plant - - - - - - 2 000 m2
Biomass gasification plant
- - - - - - 1 000 kg/h of biomass1 MW1), 2)
National electrical grid Represented as a gas combined cycle using natural gas
1) Electrical nominal capacity of the cogeneration engines2) Cogeneration engine integrated in the biomass gasification plant3) Capacity currently installed in the ST-4 plant
Scenario overview by technology.
district heating and cooling network. The biomass gasification plant and solar cooling plant are expected to work all the year if resources are available. Due to the small capacity of these plants their electricity generation is directly consumed on site.
For 2010 the results for GHG emissions are very similar due to the low expected occupancy of the ALBA park in contrast with the initial installed capacity. As the occupancy of the ALBA park increases (2010 to 2014) and more units are added, a significant reduction of GHG emissions in the “polygeneration” and “polygeneration and renewable” scenarios is achieved compared to the conventional scenario. Centralised, polygeneration, and polygeneration and renewable scenarios reduce GHG emissions with respect to the conventional scenario by up to 11, 23 and 30 % respectively. The GHG reduction in centralised supply is achieved by means of the higher efficiency of the centralised compression chillers compared with the conventional scenario.
The SO2 emissions in polygeneration and polygeneration and renewable supply are lower compared to the conventional scenario (5.5 % and 1.0 % respectively) but higher compared with centralised supply scenario. The higher SO2 equivalent emissions are due to the higher NOx emissions of the internal combustion engines (the CHP units) with respect to the reference system for the separate production of electricity (gas combined cycle using gas turbines). The higher SO2 emissions of polygeneration and renewable scenario are due to the addition of an internal combustion engine integrated in the biomass gasification plant.
The expected payback periods for the scenarios where all the units are centralised are 4, 7.5 and 9.5 years for the centralised, polygeneration and polygeneration plus renewable scenarios respectively. The payback period in the centralised scenario is the lowest due to the lower initial investment cost. The payback for polygeneration and polygeneration plus renewable scenarios is calculated considering the
expected rate of occupancy (lower energy demand and benefits at the beginning) and the several plant extensions during the first 5 years. Although the payback period in the centralised scenario is the lowest, the foreseen annual benefits are rather small (0.8 M¤) compared to polygeneration (3.9 M¤) and polygeneration plus renewable (4.2 M¤) scenarios.
Aerial photo montage with the urban plan for the ALBA park district.
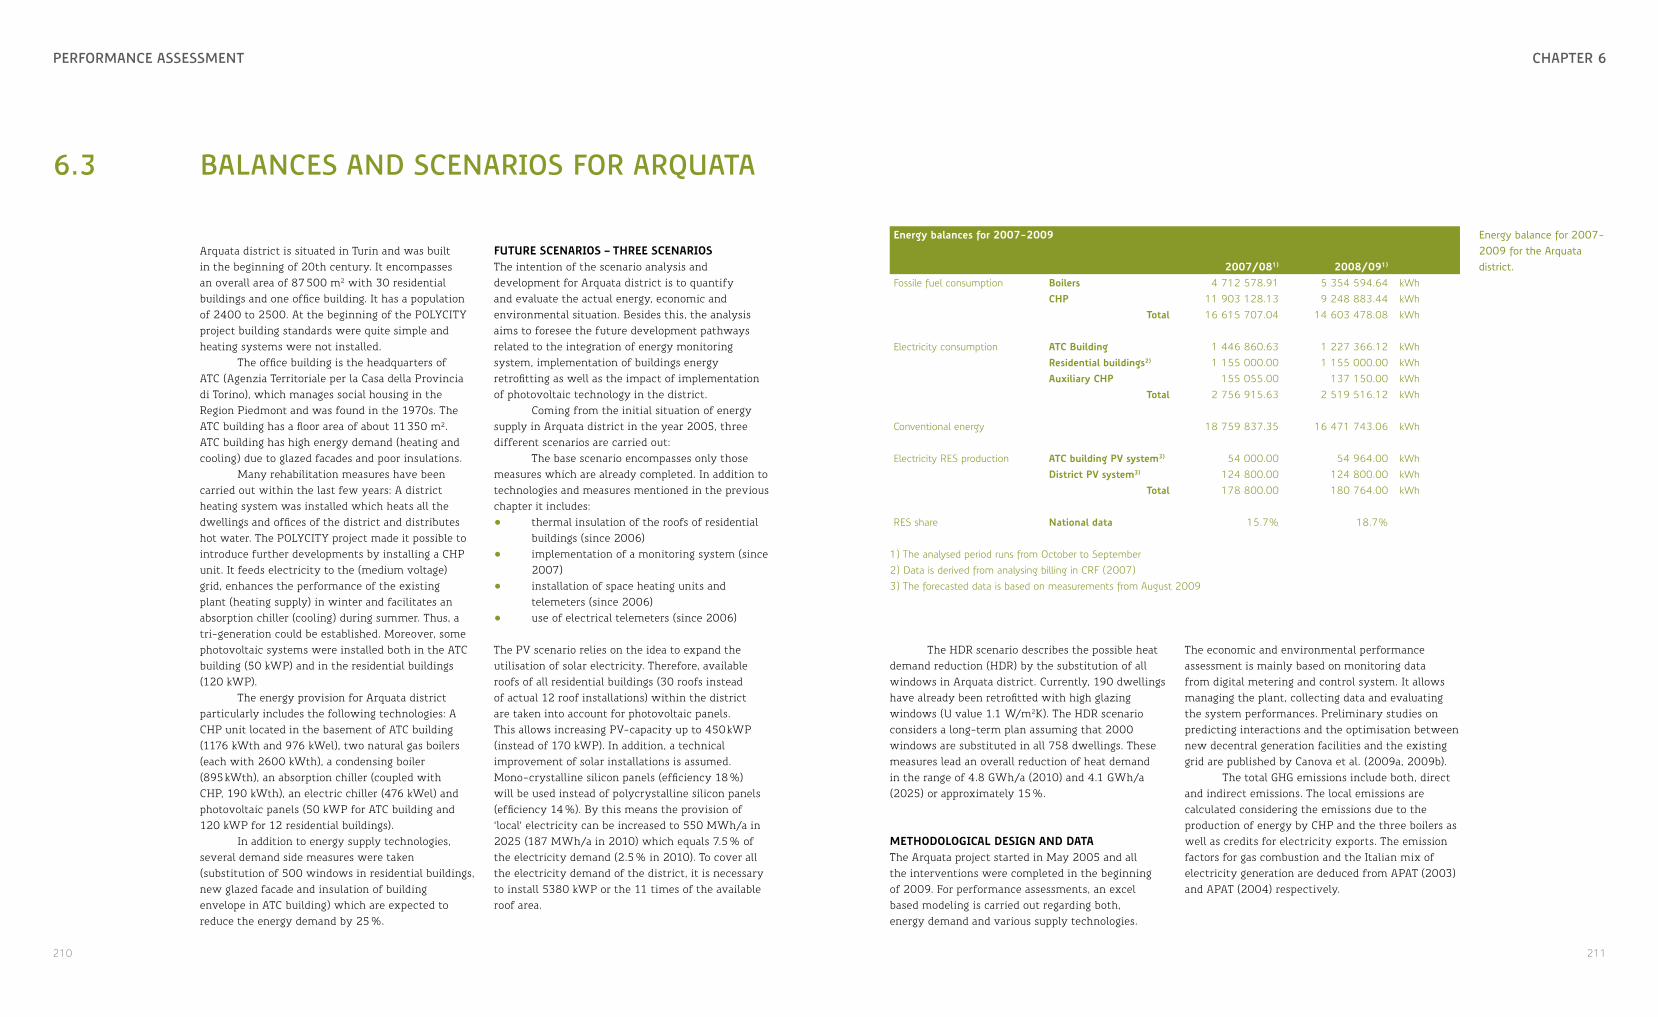
210 211
PErformancE assEssmEnt chaPtEr 6
6.3 balancEs anD scEnarios for arQUata
Arquata district is situated in Turin and was built in the beginning of 20th century. It encompasses an overall area of 87 500 m2 with 30 residential buildings and one office building. It has a population of 2400 to 2500. At the beginning of the POLYCITY project building standards were quite simple and heating systems were not installed.
The office building is the headquarters of ATC (Agenzia Territoriale per la Casa della Provincia di Torino), which manages social housing in the Region Piedmont and was found in the 1970s. The ATC building has a floor area of about 11 350 m². ATC building has high energy demand (heating and cooling) due to glazed facades and poor insulations.
Many rehabilitation measures have been carried out within the last few years: A district heating system was installed which heats all the dwellings and offices of the district and distributes hot water. The POLYCITY project made it possible to introduce further developments by installing a CHP unit. It feeds electricity to the (medium voltage) grid, enhances the performance of the existing plant (heating supply) in winter and facilitates an absorption chiller (cooling) during summer. Thus, a tri-generation could be established. Moreover, some photovoltaic systems were installed both in the ATC building (50 kWP) and in the residential buildings (120 kWP).
The energy provision for Arquata district particularly includes the following technologies: A CHP unit located in the basement of ATC building (1176 kWth and 976 kWel), two natural gas boilers (each with 2600 kWth), a condensing boiler (895 kWth), an absorption chiller (coupled with CHP, 190 kWth), an electric chiller (476 kWel) and photovoltaic panels (50 kWP for ATC building and 120 kWP for 12 residential buildings).
In addition to energy supply technologies, several demand side measures were taken (substitution of 500 windows in residential buildings, new glazed facade and insulation of building envelope in ATC building) which are expected to reduce the energy demand by 25 %.
future scenarios – three scenariosThe intention of the scenario analysis and development for Arquata district is to quantify and evaluate the actual energy, economic and environmental situation. Besides this, the analysis aims to foresee the future development pathways related to the integration of energy monitoring system, implementation of buildings energy retrofitting as well as the impact of implementation of photovoltaic technology in the district.
Coming from the initial situation of energy supply in Arquata district in the year 2005, three different scenarios are carried out:
The base scenario encompasses only those measures which are already completed. In addition to technologies and measures mentioned in the previous chapter it includes: • thermal insulation of the roofs of residential
buildings (since 2006)• implementation of a monitoring system (since
2007) • installation of space heating units and
telemeters (since 2006) • use of electrical telemeters (since 2006)
The PV scenario relies on the idea to expand the utilisation of solar electricity. Therefore, available roofs of all residential buildings (30 roofs instead of actual 12 roof installations) within the district are taken into account for photovoltaic panels. This allows increasing PV-capacity up to 450 kWP (instead of 170 kWP). In addition, a technical improvement of solar installations is assumed. Mono-crystalline silicon panels (efficiency 18 %) will be used instead of polycrystalline silicon panels (efficiency 14 %). By this means the provision of ‘local’ electricity can be increased to 550 MWh/a in 2025 (187 MWh/a in 2010) which equals 7.5 % of the electricity demand (2.5 % in 2010). To cover all the electricity demand of the district, it is necessary to install 5380 kWP or the 11 times of the available roof area.
The HDR scenario describes the possible heat demand reduction (HDR) by the substitution of all windows in Arquata district. Currently, 190 dwellings have already been retrofitted with high glazing windows (U value 1.1 W/m2K). The HDR scenario considers a long-term plan assuming that 2000 windows are substituted in all 758 dwellings. These measures lead an overall reduction of heat demand in the range of 4.8 GWh/a (2010) and 4.1 GWh/a (2025) or approximately 15 %.
methodological design and data The Arquata project started in May 2005 and all the interventions were completed in the beginning of 2009. For performance assessments, an excel based modeling is carried out regarding both, energy demand and various supply technologies.
energy balances for 2007-2009
2007/081) 2008/091)
Fossile fuel consumption boilers 4 712 578.91 5 354 594.64 kWhchP 11 903 128.13 9 248 883.44 kWh
total 16 615 707.04 14 603 478.08 kWh
Electricity consumption atc building 1 446 860.63 1 227 366.12 kWhresidential buildings2) 1 155 000.00 1 155 000.00 kWhauxiliary chP 155 055.00 137 150.00 kWh
total 2 756 915.63 2 519 516.12 kWh
Conventional energy 18 759 837.35 16 471 743.06 kWh
Electricity RES production atc building PV system3) 54 000.00 54 964.00 kWhdistrict PV system3) 124 800.00 124 800.00 kWh
total 178 800.00 180 764.00 kWh
RES share national data 15.7% 18.7%
1) The analysed period runs from October to September2) Data is derived from analysing billing in CRF (2007)3) The forecasted data is based on measurements from August 2009
The economic and environmental performance assessment is mainly based on monitoring data from digital metering and control system. It allows managing the plant, collecting data and evaluating the system performances. Preliminary studies on predicting interactions and the optimisation between new decentral generation facilities and the existing grid are published by Canova et al. (2009a, 2009b).
The total GHG emissions include both, direct and indirect emissions. The local emissions are calculated considering the emissions due to the production of energy by CHP and the three boilers as well as credits for electricity exports. The emission factors for gas combustion and the Italian mix of electricity generation are deduced from APAT (2003) and APAT (2004) respectively.
Energy balance for 2007-2009 for the Arquata district.

212 213
PErformancE assEssmEnt chaPtEr 6
resultsThe installed capacity of innovative technologies in Arquata consists of the CHP unit and photovoltaic panels. While the base and HDR scenarios achieve identical results, the PV scenario benefits from the installation of additional panels (450 kWP). This correlates more or less with the shares of RES: In the base scenario only 2.5 % of the energy demand is covered, whereas PV scenario can achieve a value of 10 %. Due to demand reductions the HDR scenario reaches 15 %.
In the base scenario the per capita GHG emission amounts to 1.17 t/ year. This is only marginally higher than the PV and HDR scenarios, which achieve identical results (1.10 t/ year). Thus, their reduction compared to the base scenario amounts to 70 kg per capita and year or 6 %.
The economic analysis demonstrates that modest payback periods can be achieved. The overall payback period for the measures defined in the base scenario amounts to 9 years (static calculations) and 11 years (discounted calculations). Moreover, a parametrical variation of revenues for heat sells (from –20 % to +20 %) is given. This factor can affect the payback period by approximately ± 2 years. By lowering heating and electricity consumption, payback periods can be significantly reduced due to
lower fuel costs. Lowering heating and electricity consumption would also influence the GHG-balance positively.
To sum up, due to costs and the limited potential of solar energy (roof area), only minor improvements are likely with regard to supply technologies (especially improving shares of RES) in Arquata district. Therefore it is suggested to pay more attention on retrofitting than on innovative technology implementation. In other words: the future energy performance of Arquata strongly depends on demand side measures even though – in recognition of its historic value – this may carry inherent conflicts with preservation of historic buildings.
kW
Scenario
0
1000
1500
500
PVCHP
base PV HDR
Proportion of RES energy by scenario in Arquata.
Right: Pay back calculation for the Arquata investments with variants (-20 %, -10 %, +10 %, and +20 %).
M€
Year
-3
3
2010 2015 2020
energy and ghg balance for 2007-2009
2007/08 2008/09Local emissions emission factor for natural gas combustion 0.202 0.202 kg GHG/ kWh
natural gas import 16 615 707.04 14 603 478.08 kWhlocal ghg emissions 3 356.37 2 949.90 t/ a
Global emissions emission factor for italian electrical system 0.614 0.614 kg GHG/ kWhelectricity import 1 030 200.00 1 030 200.00 kWhelectricity export 3 195 829.00 2 334 087.88 kWhghg emissions for imported electricity 632.54 632.54 t/ aghg reduction for exported electricity - 1 962.54 - 1 433.13 t/ a
total ghg emissions 2 026.68 2 149.32 t/ a

214 215
PErformancE assEssmEnt chaPtEr 6
6.4 lEssons lEarnED – somE thEsis on PErformancE assEssmEnts
With this research a status quo assessment as well as the analysis of possible future pathways is carried out for the three POLYCITY sites, their environmental impacts (e.g. emission reduction) and related economic parameters (e.g. energy costs). The analysis takes into account the increased complexity of today’s energy provision – the effects and interaction of subsystems such as local energy facilities, distribution, storage as well as end users’ consumptions.
The applied calculation schemes allow the user to model individual supply technologies, their respective efficiencies, capacities and availability as well as their impacts on the supply system. Most important, they go beyond single technologies and give an aggregated overview on the whole energy supply system of the districts.
To conclude with, some thesis on energy performance assessments on the district level are proposed reflecting the experiences from the three POLYCITY sites:• From cradle to grave! Especially for renewable technologies it is important to determine emissions and
costs with regards to the whole process chain. Therefore, life cycle analysis (LCA) and life cycle costing (LCC) are strongly recommended. As the execution of LCAs demands tremendous time and effort, a deduction of emission factors from (international) online data bases and their adjustment offer a sensible alternative to produce solid results.
• Using a modified consumption based approach! There is no universally accepted definition of which energy, emissions or costs should be attributed to a district. Traditionally, production based (territorial principle) approaches are employed on the regional and local level. We, however, suggest applying a modified consumption based approach including the energy, emissions and costs to cover the energy demand in the district; certainly by including credits for imports and exports of energy by local facilities. Otherwise, the impact of local facilities can not be adequately taken into account.
• One size does just not fit all! The three sites strongly differ with regards to stage of development, data sources, applied technologies or building standards. Such differences have to be considered when developing the methodological design. In combination with defining a common evaluation framework (in particular a set of indicator), the application of multi method and multi tool approaches proved successful to address such a huge variety of frame conditions.
• Making it explicit! During the analysis, conflicting aims became evident. Technologies or technology-mixes offering lowest emissions and lowest costs at the same time can hardly be identified. These conflicts may become especially palpable at the local level. An important task for performance assessments therefore is to make these conflicts explicit. Thereby, a good basis for decision making is prepared.
• Thinking in alternatives! The future development of districts is not determined and offers many possible pathways with regards to building standards, user behaviour, applied technologies or energy prices. The application of contrasting scenarios and parameter variations offers good opportunities to reflect the bandwidth of uncertainties and opportunities.
notes1. Based on network representation of the energy flows from natural resources to end use demand for
services2. Energy demand in this case refers to heat, cooling and electricity only. Demand for transport is not
taken into account.3. A consumption-based approach looks at different consumers (e.g. private, industrial and municipal
users), their demand and the associated economic and environmental impacts. It includes imports and exports to/from the investigation site but it does not particularly consider local energy facilities. In turn, a production based mechanism only looks at the impacts (e.g. emissions) from facilities within the territorial boundaries and neglects whether a positive or negative energy balance (compared to the demand) exists. To give better insight into climate policy and mitigation the consumption based approach was modified by taking credits for energy provided within the demonstration site into account (modified consumption based approach).
4. Additional sensitivity analyses offer a good view on the impacts of changes in the costs/prices for (single) energy carriers.
5. Financial support contains of actual POLYCITY –support and other investment-grants as well the difference of national feed-in tariffs and the average costs of the national electricity production (for instance in Germany 5.5 EURct/kWh in 2005).
6. This includes of costs for investments, operation and fuels. Moreover, heating distribution network and heating transfer station are taken into account.
7. A conversion unit is erected producing biogas and upgrading it to natural gas quality. The upgraded biogas is then used for both heat peak load (subsition of natural gas) and electricity provision.
8. Without reducing living standards each person in the developed world should not require more than 2,000 watts (this equals with 17,520 kWh/year) according to this concept. In RES-eff-scenario, the installed capacity in Scharnhauser Park (heat and electricity provision) can be amounted to roughly 800 watts per capita. Negative effects of this reduction such as higher network losses or lower efficiencies of conversion technologies are also taken into account.
9. To illustrate the importance of the calculative approaches behind the balances: if a production based approach is applied, yearly emissions account to 0.53 t/capita (2005), 0.32 t/capita (BAU, 2025), 0.37 t/capita (RES-100, 2025) and 0.96 t/capita (RES-0, 2025) respectively. In turn, when using consumption based approach is employed, they amount to 1.97 t/capita (2005), 1.50 t/capita (BAU, 2025), 1.35 t/capita (RES-100, 2025) and 2.16 t/capita (RES-0, 2025).
10. The financial support for the use of renewable energies is composed by feed-in tariffs for the RES power generation and investment subsidies for the different RES units.
11. (López-Villada et al. 2008, 2009, López-Villada 2010)
216 217
PErformancE assEssmEnt chaPtEr 6
literatureAlba Cells: http://www.cells.es/, last accessed in September 2010
APAT (Agenzia per la protezione dell’ambiente e per i servizi tecnici): Analisi dei fattori di emissione di CO2 dal settore dei trasporti”), Roma, 2003
APAT (Agenzia per la protezione dell’ambiente e per i servizi tecnici): Thermo-electric production emission factors – from Italian Greenhouse Gas Inventory 1990-2003, Roma, 2004
Barton (ed.): Technical Synthesis Report Annexes 22 & 33 – Energy efficient communities & Advanced Local Energy Planning (ALEP), Hertfordshire, Faber Maunsell Ltd., 2005
Bioenergy Regions: http://www.bioenergie-regionen.de/regionen/uebersichtskarte.html, last accessed in August 2010
BMU 2011: http://www.erneuerbare-energien.de/files/pdfs/allgemein/application/pdf/ee _ zeitreihe.pdf
Canova, C. Cavallero, F. Freschi, L. Giaccone, M. Tartaglia: Optimal Energy management, IEEE Industry Applications Magazine, March/April 2009, pp. 62-65
Canova, L. Giaccone, F. Spertino, M. Tartaglia: Electrical Impact of Photovoltaic Plant in Distributed Network, IEEE Transactions on Industry Applications, Vol. 45, No. 1, January/February 2009, pp. 34-347
CRF (Centro Ricerche Fiat): Report on methodology for energy performance assessment in the CONCERTO communities, Torino, Polycity-Deliverable DR 2.1a, 2007
Duminil, J. Fink: Demonstrator thermal cooling ELEKTROR. Stuttgart, Esslingen, Polycity-Deliverable DD 2A.3, 2007
Erhart: Simulation data results for 2010-2025 CHP-plant operation, Stuttgart, zafh.net., 2008
Figueres, C. Dapena: Description of Parc de l’Alba Polygeneration system: A Large Scale Trigeneration System with District Heating and Cooling and Renewable Energy Sources, within the Spanish Polycity Project, Proceedings of the Polycity Final Conference, Stuttgart, 2010
Fink, A. Strzalka: Report on supply and demand profiles of the three sites, Esslingen, Stuttgart, Polycity-Deliverable DD 3.7, 2009
Fink: Demonstrator for clean biomass combustion in urban areas. Esslingen, DD 2A.1 – Polycity-Deliverable DD 2A.1, 2006b
Fink: Demonstrator hydropower, Esslingen, Polycity-Deliverable DD 2A.3, 2007
Fink: Feasibility study for thermal cooling system. Esslingen, Polycity-Deliverable DD 2A.2, 2006c
Fink: Operating data for Scharnhauser Park CHP-Plant. Data for the years 2005-2009. Esslingen, Stadtwerke Esslingen, 2010
Fink: Verbesserte Betriebsführung von Biomasse-Nahwärmesystemen mit Kraft-Wärme-Kopplung am Beispiel des Scharnhauser Parks. Ansbach, Diploma thesis, 2006a
GAMS, General Algebraic Modeling System: www.gams.com, last accessed 2010
IDAE (Instituto para la Diversificación y Ahorro de la Energía): Biomasa, Gasificación; Biomasa, Producción eléctrica y cogeneración, www.idae.es, last accessed 2010
Jank (ed.): Advanced Local Energy Planning (ALEP) - A Guidebook, Karlsruhe, Klimaschutz- und Energieagentur, 2000
Jansen: Bevölkerungsentwicklung und Infrastruktur, Ostfildern, City of Ostfildern, 2007
Jenssen, A. Destefanis, J. Ortiga: Report on Energy Scenarios for each of the communities involved. Stuttgart, Tarragona, Torino, Polycity Deliverable DR 1.3, 2010
Jenssen, B. Rühle: Definition of environmental, economic, and sociological indicators”, Stuttgart, DD 4.2– Polycity-Deliverable DD 4.2, 2007
Jenssen: Einsatz der Bioenergie in Abhängigkeit von der Raum- und Siedlungsstruktur. Wärmetechnologien zwischen technischer Machbarkeit, ökonomischer Tragfähigkeit, ökologischer Wirksamkeit und sozialer Akzeptanz. Wiesbaden, Vieweg Teubner Research, 2010
Jenssen, L. Eltrop: Die Bedeutung der Bioenergie für einen ökologischen Modellstadtteil, Regensburg, Ostbayerisches Technologie-Transfer-Institut, 2009
Jenssen, M. Härdtlein, C. Kruck, L. Eltrop: Möglichkeiten und Implikationen der Energieversorgung mit erneuerbaren Energien, Energiewirtschaftliche Tagesfragen 8/2009
König, Andreas: Ganzheitliche Analyse und Bewertung konkurrierender energetischer Nutzungspfade für Biomasse im Energiesystem Deutschland bis zum Jahr 2030, Stuttgart, PhD-Thesis, 2009
König, L. Eltrop: Biomasse effizienter nutzen – Konkurrierende Nutzung fester flüssiger und gasförmiger Bioenergieträger im Vergleich, Regensburg, Ostbayerisches Technologie-Transfer-Institut, 2007
Koschenz, A. Pfeiffer: Energie- und Gebäudetechnik für die 2000-Watt-Gesellschaft – Reduktionspotential Wohngebäude Schweiz, Dübendorf, Empa - Materials Science and Technology, 2004

218 219
PErformancE assEssmEnt chaPtEr 6
López-Villada: Integración de Sistemas de Refrigeración Solar en Redes de Distrito de Frío y de Calor, Tarragona, Ph-D Thesis, 2010
López-Villada, J. C. Bruno, A., Coronas: Comparison of Solar Thermal Cooling Technologies for District Heating and Cooling Applications – Case Study of the Cerdanyola del Vallès Plant (Spain). Proceedings of the EUROSUN 2008 Conference, Lisbon, 2008
López-Villada, J. C. Bruno, A., Coronas: Primary Energy Saving Analysis of a Solar Cooling Plant Connected to a District Heating and Cooling Network, III International Conference Solar Air Conditioning, Palermo, 2009
OJEU (Official Journal of the European Union), Commission Decision of 21 December 2006 establishing harmonised efficiency reference values for separate producing of electricity and heat in application of Directive 2004/8/EC of the European Parliament and of the Council.Öko-Institut (Institute for Applied Ecology), Global Emission Model for Integrated Systems (GEMIS) Version 4.5, 2008, http://www.oeko.de/service/gemis/de/index.htm, last accessed in August 2010
Öko-Institut (Institute for Applied Ecology), Global Emission Model for Integrated Systems (GEMIS) Version 4.4.2, 2007, http://www.oeko.de/service/gemis/de/index.htm, last accessed in August 2010
Ortiga, J.C. Bruno, A. Coronas, A Modular Formulation of Mathematical Programming Models for the Optimisation of Energy Supply Systems, 19th European Symposium on Computer Aided Process Engineering, Cracow, 2009
Ortiga, J. C. Bruno, A. Coronas, I. E. Grossmann: Review of optimisation models for the design of polygeneration systems in district heating and cooling networks, 17th European Symposium on Computer Aided Process Engineering, Bucharest, 2007
Ortiga, M. Moya, M. A. Marimon, J. C. Bruno, A. Coronas: Sistemas Avanzados de Refrigeración para Edificios y Redes de Distrito de Frío y Calor, V Congreso Ibérico y III Congreso Iberoamericano de Ciencias y Técnias del Frío, CYTEF 2009, Castellón.
Ortiga: Modelling Environment for the Design and Optimisation of Energy Polygeneration Systems, Tarragona, Ph-D Thesis, 2010
Paar, Angelika; Duscha, Markus; Hertle, Hans; Pehnt, Martin; Ramesohl, Stephan; Fischedick, Manfred; Irrek, Wolfgang; Merten, Frank: Vom Bioenergiedorf zur 2000-Watt- Gesellschaft: Energiepolitische Zielkonzepte im Spannungsfeld zwischen erneuerbaren Energien und Energieeffizienz. Heidelberg; Wuppertal: ifeu-Institut für Energie- und Umweltforschung; Wuppertal-Institut für Klima, Umwelt, Energie, 2007
Parc de l’Alba: http://www.parcdelalba.com/, last accessed in September 2010
Puig-Arnavat, J. C. Bruno, A. Coronas: Review and analysis of biomass gasification models, Renewable and Sustainable Energy Reviews, 14, 2010, 2841-2851
Solar City: http://www.solarcity.org/, last accessed in August 2010
UMWELTBUNDESAMT 2011: Der CO2-Rechner. Internet: http://uba.klima-aktiv.de/ umleitung _ uba.html, accessed on 3.6.2011

socio-Economic issUEsBarbara Bellioso, Ludger Eltrop, Till Jenssen, Francesc Xavier Martí Rague, Elisabetta Nodari
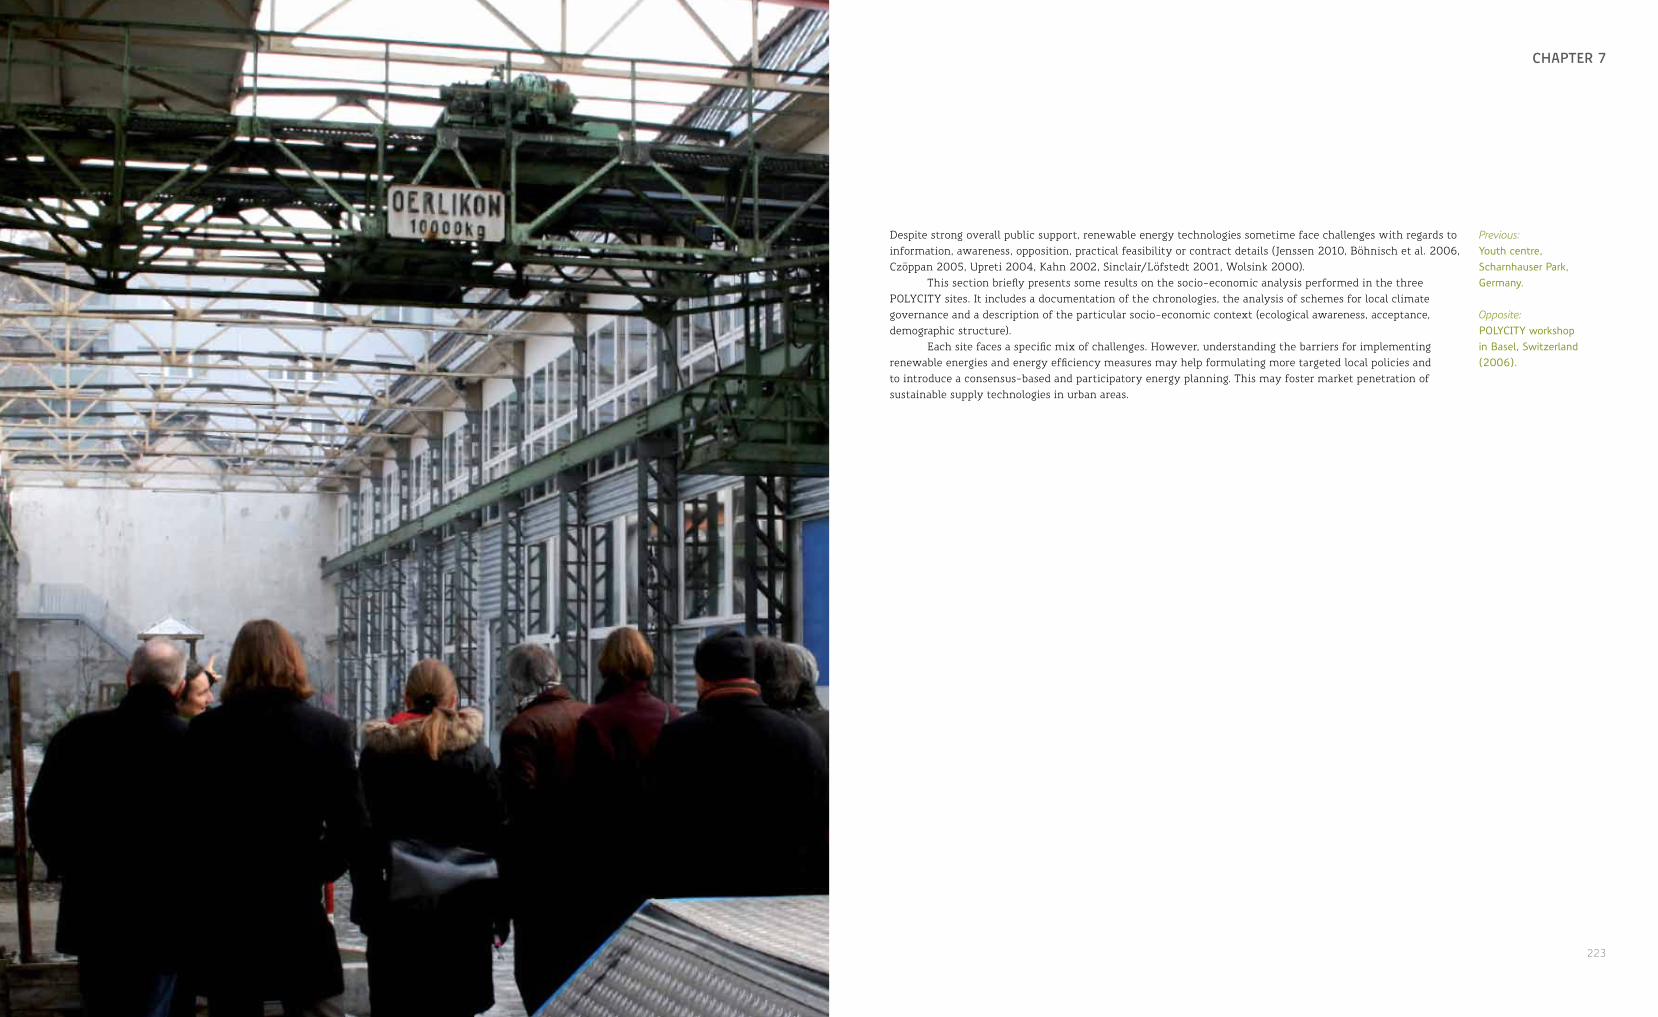
222 223
towarDs a sUstainablE commUnity chaPtEr 7
Despite strong overall public support, renewable energy technologies sometime face challenges with regards to information, awareness, opposition, practical feasibility or contract details (Jenssen 2010, Böhnisch et al. 2006, Czöppan 2005, Upreti 2004, Kahn 2002, Sinclair/Löfstedt 2001, Wolsink 2000).
This section briefly presents some results on the socio-economic analysis performed in the three POLYCITY sites. It includes a documentation of the chronologies, the analysis of schemes for local climate governance and a description of the particular socio-economic context (ecological awareness, acceptance, demographic structure).
Each site faces a specific mix of challenges. However, understanding the barriers for implementing renewable energies and energy efficiency measures may help formulating more targeted local policies and to introduce a consensus-based and participatory energy planning. This may foster market penetration of sustainable supply technologies in urban areas.
Previous:Youth centre, Scharnhauser Park, Germany.
Opposite:POLYCITY workshop in Basel, Switzerland (2006).
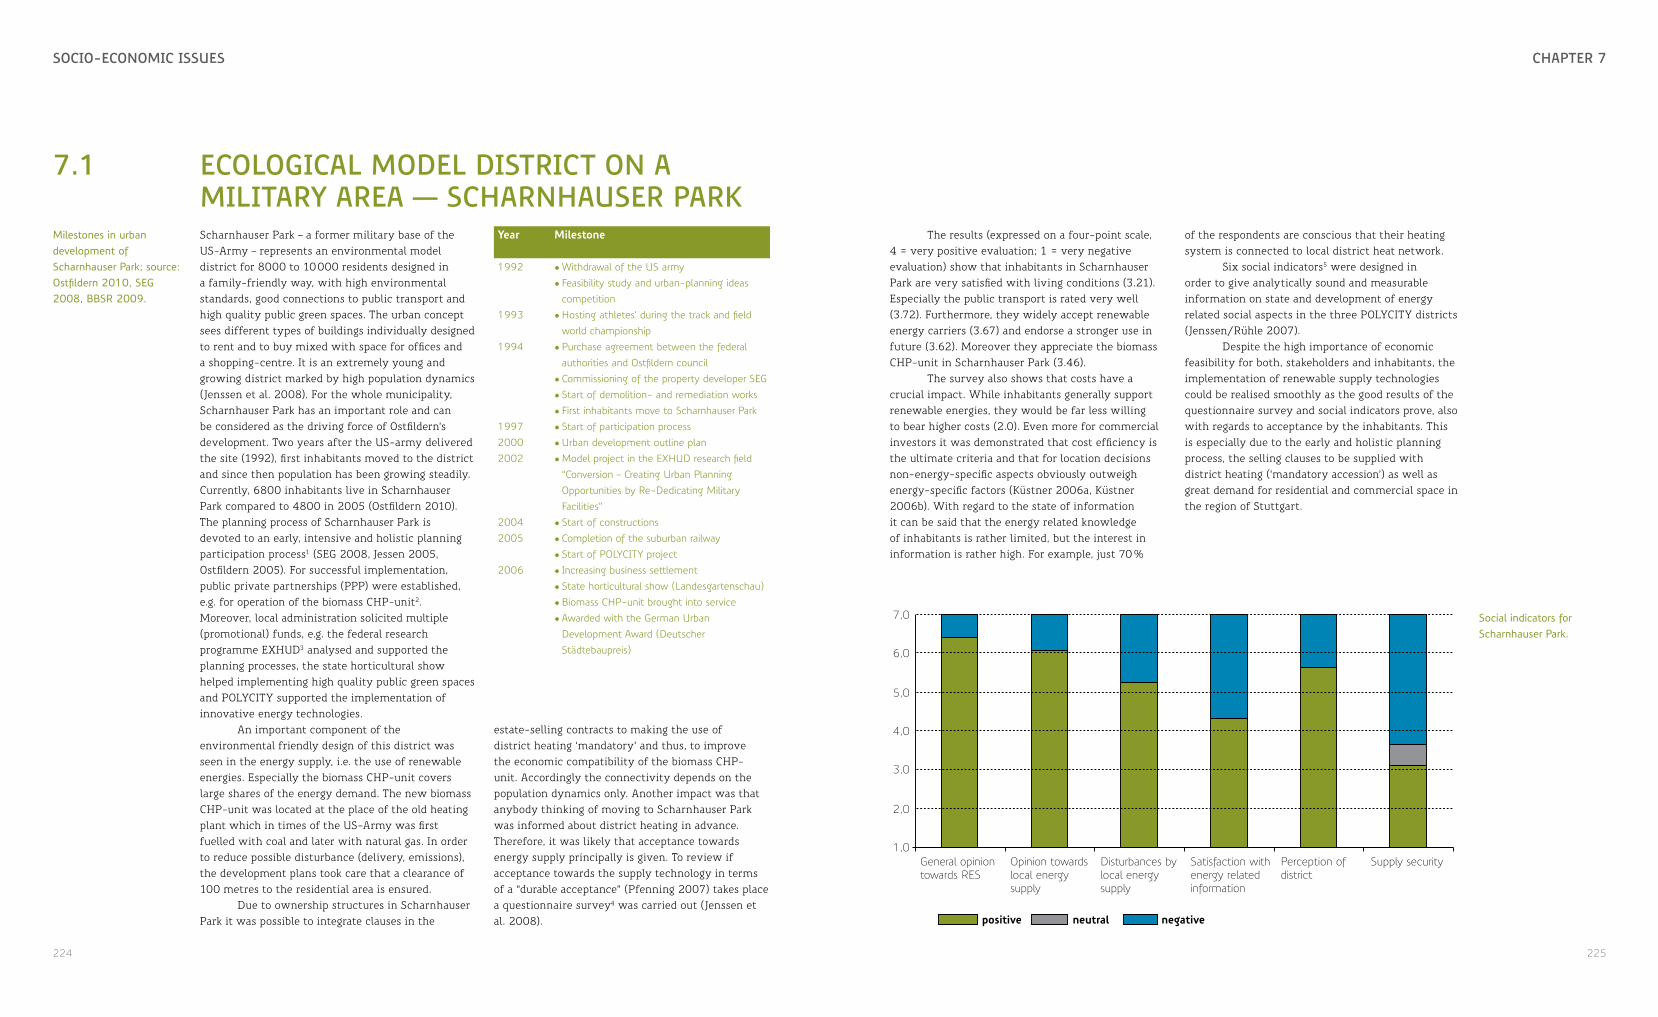
224 225
chaPtEr 7socio-Economic issUEs
7.1 Ecological moDEl District on a military arEa — scharnhaUsEr ParkScharnhauser Park – a former military base of the US-Army – represents an environmental model district for 8000 to 10 000 residents designed in a family-friendly way, with high environmental standards, good connections to public transport and high quality public green spaces. The urban concept sees different types of buildings individually designed to rent and to buy mixed with space for offices and a shopping-centre. It is an extremely young and growing district marked by high population dynamics (Jenssen et al. 2008). For the whole municipality, Scharnhauser Park has an important role and can be considered as the driving force of Ostfildern’s development. Two years after the US-army delivered the site (1992), first inhabitants moved to the district and since then population has been growing steadily. Currently, 6800 inhabitants live in Scharnhauser Park compared to 4800 in 2005 (Ostfildern 2010). The planning process of Scharnhauser Park is devoted to an early, intensive and holistic planning participation process1 (SEG 2008, Jessen 2005, Ostfildern 2005). For successful implementation, public private partnerships (PPP) were established, e.g. for operation of the biomass CHP-unit2. Moreover, local administration solicited multiple (promotional) funds, e.g. the federal research programme EXHUD3 analysed and supported the planning processes, the state horticultural show helped implementing high quality public green spaces and POLYCITY supported the implementation of innovative energy technologies.
An important component of the environmental friendly design of this district was seen in the energy supply, i.e. the use of renewable energies. Especially the biomass CHP-unit covers large shares of the energy demand. The new biomass CHP-unit was located at the place of the old heating plant which in times of the US-Army was first fuelled with coal and later with natural gas. In order to reduce possible disturbance (delivery, emissions), the development plans took care that a clearance of 100 metres to the residential area is ensured.
Due to ownership structures in Scharnhauser Park it was possible to integrate clauses in the
year milestone
1992 • Withdrawal of the US army• Feasibility study and urban-planning ideas
competition1993 • Hosting athletes’ during the track and field
world championship1994 • Purchase agreement between the federal
authorities and Ostfildern council• Commissioning of the property developer SEG• Start of demolition- and remediation works• First inhabitants move to Scharnhauser Park
1997 • Start of participation process2000 • Urban development outline plan2002 • Model project in the EXHUD research field
“Conversion – Creating Urban Planning Opportunities by Re-Dedicating Military Facilities”
2004 • Start of constructions2005 • Completion of the suburban railway
• Start of POLYCITY project2006 • Increasing business settlement
• State horticultural show (Landesgartenschau)• Biomass CHP-unit brought into service• Awarded with the German Urban
Development Award (Deutscher Städtebaupreis)
Milestones in urban development of Scharnhauser Park; source: Ostfildern 2010, SEG 2008, BBSR 2009.
estate-selling contracts to making the use of district heating ‘mandatory’ and thus, to improve the economic compatibility of the biomass CHP-unit. Accordingly the connectivity depends on the population dynamics only. Another impact was that anybody thinking of moving to Scharnhauser Park was informed about district heating in advance. Therefore, it was likely that acceptance towards energy supply principally is given. To review if acceptance towards the supply technology in terms of a “durable acceptance” (Pfenning 2007) takes place a questionnaire survey4 was carried out (Jenssen et al. 2008).
The results (expressed on a four-point scale, 4 = very positive evaluation; 1 = very negative evaluation) show that inhabitants in Scharnhauser Park are very satisfied with living conditions (3.21). Especially the public transport is rated very well (3.72). Furthermore, they widely accept renewable energy carriers (3.67) and endorse a stronger use in future (3.62). Moreover they appreciate the biomass CHP-unit in Scharnhauser Park (3.46).
The survey also shows that costs have a crucial impact. While inhabitants generally support renewable energies, they would be far less willing to bear higher costs (2.0). Even more for commercial investors it was demonstrated that cost efficiency is the ultimate criteria and that for location decisions non-energy-specific aspects obviously outweigh energy-specific factors (Küstner 2006a, Küstner 2006b). With regard to the state of information it can be said that the energy related knowledge of inhabitants is rather limited, but the interest in information is rather high. For example, just 70 %
of the respondents are conscious that their heating system is connected to local district heat network.
Six social indicators5 were designed in order to give analytically sound and measurable information on state and development of energy related social aspects in the three POLYCITY districts (Jenssen/Rühle 2007).
Despite the high importance of economic feasibility for both, stakeholders and inhabitants, the implementation of renewable supply technologies could be realised smoothly as the good results of the questionnaire survey and social indicators prove, also with regards to acceptance by the inhabitants. This is especially due to the early and holistic planning process, the selling clauses to be supplied with district heating (‘mandatory accession’) as well as great demand for residential and commercial space in the region of Stuttgart.
Social indicators for Scharnhauser Park.
positive neutral negative
1,0
2,0
3,0
4,0
5,0
6,0
7,0
General opinion towards RES
Opinion towards local energy supply
Disturbances by local energy supply
Satisfaction with energy related information
Perception of district
Supply security
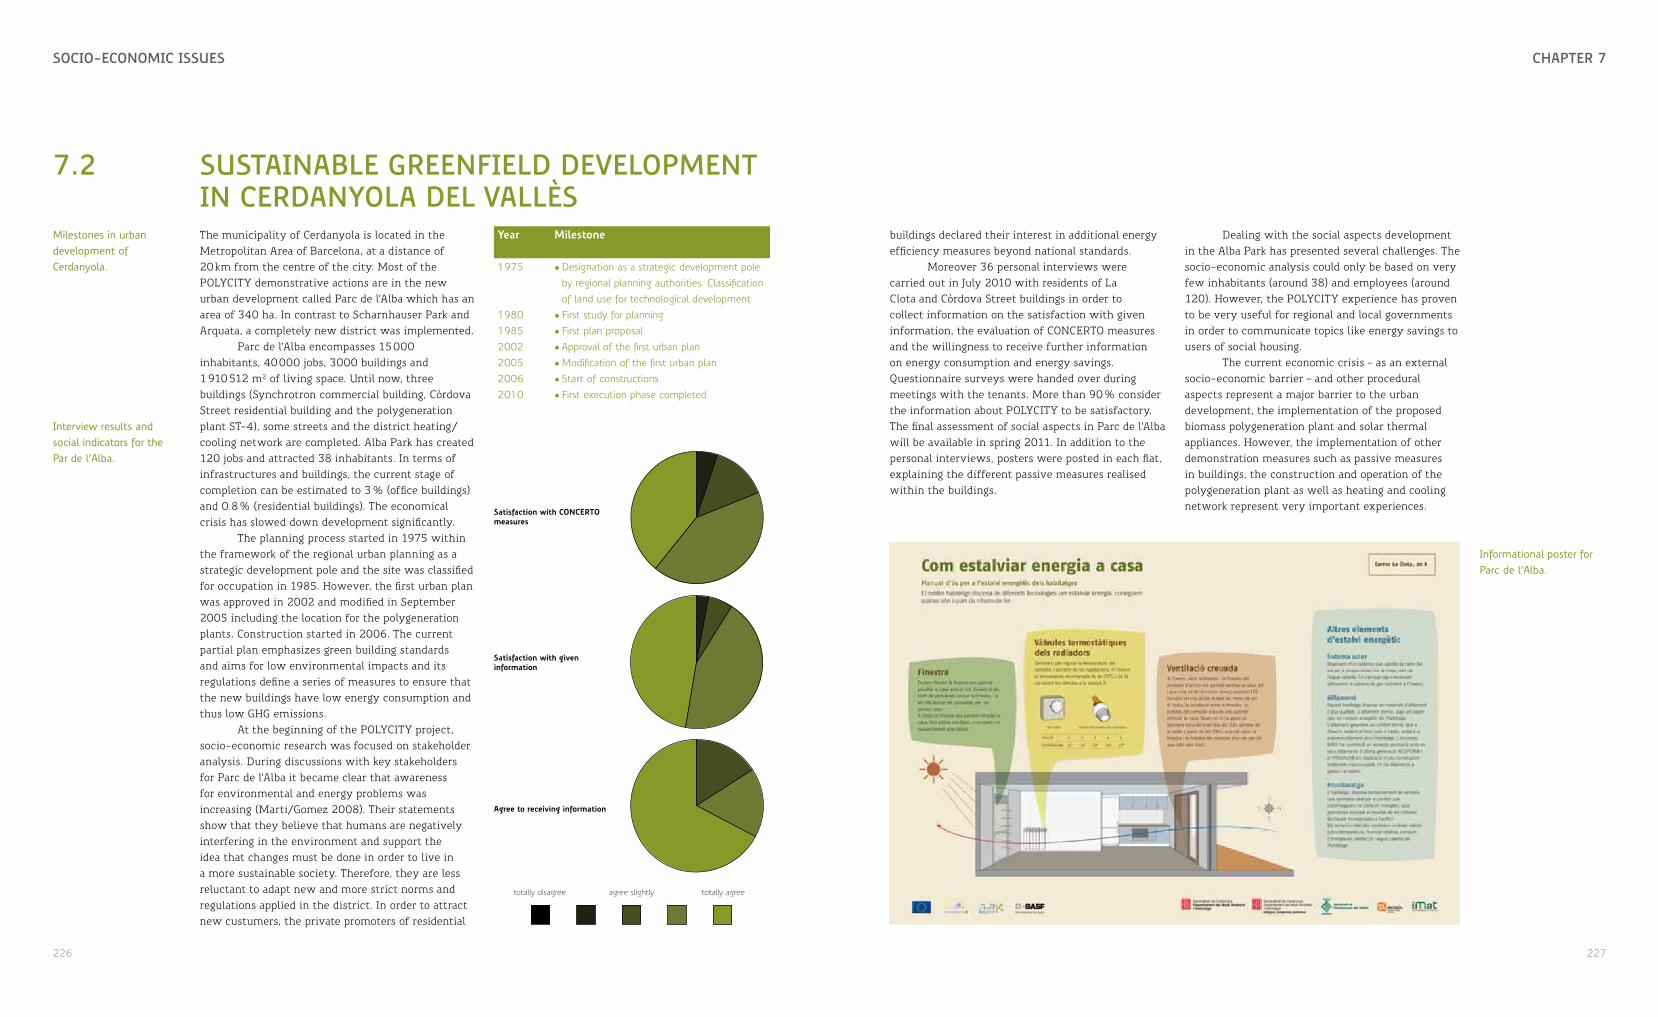
226 227
chaPtEr 7socio-Economic issUEs
7.2 sUstainablE grEEnfiElD DEvEloPmEnt in cErDanyola DEl vallèsThe municipality of Cerdanyola is located in the Metropolitan Area of Barcelona, at a distance of 20 km from the centre of the city. Most of the POLYCITY demonstrative actions are in the new urban development called Parc de l’Alba which has an area of 340 ha. In contrast to Scharnhauser Park and Arquata, a completely new district was implemented.
Parc de l’Alba encompasses 15 000 inhabitants, 40 000 jobs, 3000 buildings and 1 910 512 m2 of living space. Until now, three buildings (Synchrotron commercial building, Còrdova Street residential building and the polygeneration plant ST-4), some streets and the district heating/cooling network are completed. Alba Park has created 120 jobs and attracted 38 inhabitants. In terms of infrastructures and buildings, the current stage of completion can be estimated to 3 % (office buildings) and 0.8 % (residential buildings). The economical crisis has slowed down development significantly.
The planning process started in 1975 within the framework of the regional urban planning as a strategic development pole and the site was classified for occupation in 1985. However, the first urban plan was approved in 2002 and modified in September 2005 including the location for the polygeneration plants. Construction started in 2006. The current partial plan emphasizes green building standards and aims for low environmental impacts and its regulations define a series of measures to ensure that the new buildings have low energy consumption and thus low GHG emissions.
At the beginning of the POLYCITY project, socio-economic research was focused on stakeholder analysis. During discussions with key stakeholders for Parc de l’Alba it became clear that awareness for environmental and energy problems was increasing (Marti/Gomez 2008). Their statements show that they believe that humans are negatively interfering in the environment and support the idea that changes must be done in order to live in a more sustainable society. Therefore, they are less reluctant to adapt new and more strict norms and regulations applied in the district. In order to attract new custumers, the private promoters of residential
Milestones in urban development of Cerdanyola.
year milestone
1975 • Designation as a strategic development pole by regional planning authorities. Classification of land use for technological development
1980 • First study for planning1985 • First plan proposal2002 • Approval of the first urban plan2005 • Modification of the first urban plan2006 • Start of constructions2010 • First execution phase completed
Satisfaction with CONCERTO measures
Satisfaction with given information
Agree to receiving information
totally disagree agree slightly totally agree
Interview results and social indicators for the Par de l’Alba.
buildings declared their interest in additional energy efficiency measures beyond national standards.
Moreover 36 personal interviews were carried out in July 2010 with residents of La Clota and Còrdova Street buildings in order to collect information on the satisfaction with given information, the evaluation of CONCERTO measures and the willingness to receive further information on energy consumption and energy savings. Questionnaire surveys were handed over during meetings with the tenants. More than 90 % consider the information about POLYCITY to be satisfactory. The final assessment of social aspects in Parc de l’Alba will be available in spring 2011. In addition to the personal interviews, posters were posted in each flat, explaining the different passive measures realised within the buildings.
Informational poster for Parc de l’Alba.
Dealing with the social aspects development in the Alba Park has presented several challenges. The socio-economic analysis could only be based on very few inhabitants (around 38) and employees (around 120). However, the POLYCITY experience has proven to be very useful for regional and local governments in order to communicate topics like energy savings to users of social housing.
The current economic crisis – as an external socio-economic barrier – and other procedural aspects represent a major barrier to the urban development, the implementation of the proposed biomass polygeneration plant and solar thermal appliances. However, the implementation of other demonstration measures such as passive measures in buildings, the construction and operation of the polygeneration plant as well as heating and cooling network represent very important experiences.
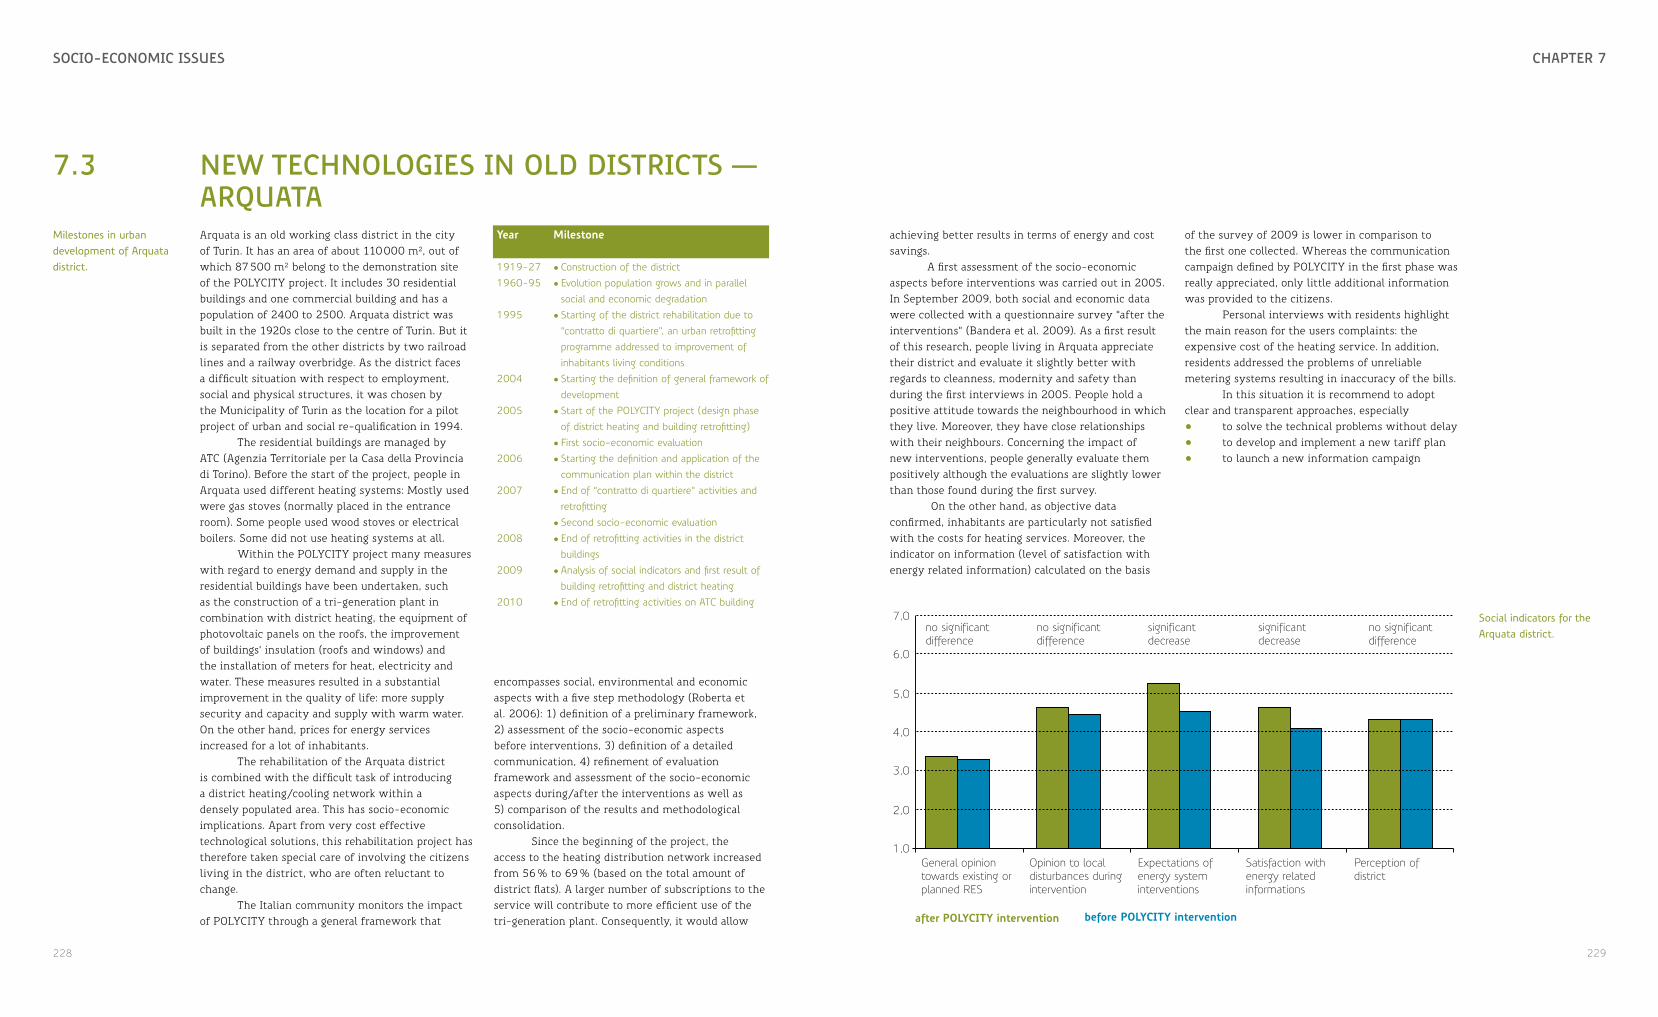
228 229
chaPtEr 7socio-Economic issUEs
7.3 nEw tEchnologiEs in olD Districts — arQUataArquata is an old working class district in the city of Turin. It has an area of about 110 000 m², out of which 87 500 m² belong to the demonstration site of the POLYCITY project. It includes 30 residential buildings and one commercial building and has a population of 2400 to 2500. Arquata district was built in the 1920s close to the centre of Turin. But it is separated from the other districts by two railroad lines and a railway overbridge. As the district faces a difficult situation with respect to employment, social and physical structures, it was chosen by the Municipality of Turin as the location for a pilot project of urban and social re-qualification in 1994.
The residential buildings are managed by ATC (Agenzia Territoriale per la Casa della Provincia di Torino). Before the start of the project, people in Arquata used different heating systems: Mostly used were gas stoves (normally placed in the entrance room). Some people used wood stoves or electrical boilers. Some did not use heating systems at all.
Within the POLYCITY project many measures with regard to energy demand and supply in the residential buildings have been undertaken, such as the construction of a tri-generation plant in combination with district heating, the equipment of photovoltaic panels on the roofs, the improvement of buildings’ insulation (roofs and windows) and the installation of meters for heat, electricity and water. These measures resulted in a substantial improvement in the quality of life: more supply security and capacity and supply with warm water. On the other hand, prices for energy services increased for a lot of inhabitants.
The rehabilitation of the Arquata district is combined with the difficult task of introducing a district heating/cooling network within a densely populated area. This has socio-economic implications. Apart from very cost effective technological solutions, this rehabilitation project has therefore taken special care of involving the citizens living in the district, who are often reluctant to change.
The Italian community monitors the impact of POLYCITY through a general framework that
Milestones in urban development of Arquata district.
year milestone
1919-27 • Construction of the district1960-95 • Evolution population grows and in parallel
social and economic degradation1995 • Starting of the district rehabilitation due to
“contratto di quartiere”, an urban retrofitting programme addressed to improvement of inhabitants living conditions
2004 • Starting the definition of general framework of development
2005 • Start of the POLYCITY project (design phase of district heating and building retrofitting)
• First socio-economic evaluation2006 • Starting the definition and application of the
communication plan within the district2007 • End of “contratto di quartiere” activities and
retrofitting• Second socio-economic evaluation
2008 • End of retrofitting activities in the district buildings
2009 • Analysis of social indicators and first result of building retrofitting and district heating
2010 • End of retrofitting activities on ATC building
encompasses social, environmental and economic aspects with a five step methodology (Roberta et al. 2006): 1) definition of a preliminary framework, 2) assessment of the socio-economic aspects before interventions, 3) definition of a detailed communication, 4) refinement of evaluation framework and assessment of the socio-economic aspects during/after the interventions as well as 5) comparison of the results and methodological consolidation.
Since the beginning of the project, the access to the heating distribution network increased from 56 % to 69 % (based on the total amount of district flats). A larger number of subscriptions to the service will contribute to more efficient use of the tri-generation plant. Consequently, it would allow
achieving better results in terms of energy and cost savings.
A first assessment of the socio-economic aspects before interventions was carried out in 2005. In September 2009, both social and economic data were collected with a questionnaire survey “after the interventions” (Bandera et al. 2009). As a first result of this research, people living in Arquata appreciate their district and evaluate it slightly better with regards to cleanness, modernity and safety than during the first interviews in 2005. People hold a positive attitude towards the neighbourhood in which they live. Moreover, they have close relationships with their neighbours. Concerning the impact of new interventions, people generally evaluate them positively although the evaluations are slightly lower than those found during the first survey.
On the other hand, as objective data confirmed, inhabitants are particularly not satisfied with the costs for heating services. Moreover, the indicator on information (level of satisfaction with energy related information) calculated on the basis
of the survey of 2009 is lower in comparison to the first one collected. Whereas the communication campaign defined by POLYCITY in the first phase was really appreciated, only little additional information was provided to the citizens.
Personal interviews with residents highlight the main reason for the users complaints: the expensive cost of the heating service. In addition, residents addressed the problems of unreliable metering systems resulting in inaccuracy of the bills.
In this situation it is recommend to adopt clear and transparent approaches, especially• to solve the technical problems without delay• to develop and implement a new tariff plan• to launch a new information campaign
Social indicators for the Arquata district.
before POLYCITY interventionafter POLYCITY intervention
no significant difference
no significant difference
no significant difference
significant decrease
significant decrease
1,0
2,0
3,0
4,0
5,0
6,0
7,0
General opinion towards existing or planned RES
Opinion to local disturbances during intervention
Expectations of energy system interventions
Satisfaction with energy related informations
Perception of district

230 231
chaPtEr 1socio-Economic issUEs
7.4 kEy asPEcts anD lEssons lEarnED
The three POLYCITY demonstration sites face a specific mix of challenges and furthermore the special funding within the CONCERTO initiative makes a direct transfer to other places difficult. The following thesis may, however, help to understand barriers and to create feasible concepts for implementing sustainable supply technologies in urban areas:• There are no ways around costs! Costs (still) have a crucial impact for the realisation of renewable
technologies. This applies to both, inhabitants and stakeholders. The urgency to develop feasible supply concepts in terms of money is especially important in economically disadvantaged districts.
• Connecting energy-specific and non-energy-specific measures! Location decisions of private and commercial investors are currently dominated by non-energy-specific aspects. Therefore, marketing strategies should combine both aspects (e.g. estate-selling contracts and using district heating) in order to promote innovative technologies.
• Building trust! For building trust with the inhabitants’ face-to-face contact and a permanent contact person are vital for ‘persuasion’ and thus for implementing innovative technologies or efficiency measures.
• A consensus based and participatory energy planning helps to reach the renewable potentials! Acceptance and opposition manifest on the local level. Moreover acceptance and opposition can directly affect economic figures (depending if people use and pay for technology or not). A participatory energy planning may help to realise innovative technology concepts smoothly.
Aerial photograph, Scharnhauser Park, Ostfildern, Germany,
232 233
chaPtEr 7socio-Economic issUEs
notes1. This included 30 workshop meetings called “Forum”, an open space workshop, guided excursions and a
monthly “jour fixe” for administration and citizens.2. Executed by Holzheizkraftwerk Scharnhauser Park GmbH, a newly found company owned by City of
Ostfildern, Stadtwerke Esslingen (SWE) and KWA Contracting AG.3. Experimental Housing and Urban Development (BBR 2009)4. The selected sample is composed by 123 randomly chosen interviewees representing 2.5 % of the
inhabitants or 6 % of the households in Scharnhauser Park. The survey was carried out in 2006 and was conducted as a drop-off survey where the researcher goes to the respondent’s home and delivers the questionnaire in the hands of the respondent personally.
5. These are either based on the questionnaire survey (single item or aggregations of a few items) or deduced from the environmental performance assessment (see chapter 6.). All figures were converted to a 5-point scale.
literatureBandera, E. Nodari, F. Anzioso: Analysis of the social aspects during the different
POLYCITY applications, Polycity-Deliverable DD 4.7, 2009
BBSR (Federal Institute for Research on Building, Urban Affairs and Spatial Development), http://www.werkstatt-stadt.de/de/projekte/122/, updated February 2009, last accessed in August 2010
Böhnisch, J. Deuschle, M. Nast, U. Pfenning: Nahwärmeversorgung und erneuerbare Energien im Gebäudebestand – Initiierung von Pilotprojekten in Baden-Württemberg, Hemmnisanalyse und Untersuchung der Einsatzbereiche, Stuttgart, 2006
Czöppan: Bürgerinitiativen gegen Windkraftanlagen – Mitglieder, Motive, Strategien, Freiburg, Diploma thesis, 2005
Jenssen, B. Rühle: Definition of environmental, economic, and sociological indicators, Stuttgart, Polycity-Deliverable DD 4.2, 2007
Jenssen: Einsatz der Bioenergie in Abhängigkeit von der Raum- und Siedlungsstruktur. Wärmetechnologien zwischen technischer Machbarkeit, ökonomischer Tragfähigkeit, ökologischer Wirksamkeit und sozialer Akzeptanz. Wiesbaden, Vieweg Teubner Research, 2010
Jenssen, L. Eltrop, E. Nodari, L. Borgarello, F. Anzioso, P. Campanile, X. Martí, S. Gómez, L.. Gelabert, C. Dapena: Comparative analysis of the local reports concerning the acceptance by inhabitants and stakeholders, Stuttgart, Torino, Barcelona, Polycity-Deliverable DR 3.5, 2008
Jessen: Quartierszenario Ostfildern Scharnhauser Park 2030, disP 4/2005, 36-49
Kahn: Siting Struglgles: The Unique Challenge of Permitting Renewable Energy Power Plants, The Electricity Journal 13, 2002
Küstner: Concept for integrating commercial investors in the POLYCITY project, Stuttgart, Polycity-Deliverable DR 3.3, 2006b
Küstner: Implementing the concept of integrating investors in the POLYCITY project, Stuttgart, Polycity-Deliverable DR 3.4, 2006a
Marti, S. Gomez: Local report on acceptance by inhabitants and stakeholders – Cerdanyola, Polycity-Deliverable DR 3.5c, 2008
Ostfildern, Plakate zur Bürgerbeteiligung Scharnhauser Park - Konzept und Bausteine, http://weeberpartner.de/files/520 _ Ostfildern _ ScharnhauserPark _ Plakate.pdf , 2005, last accessed in August 2010
Pfenning: Akzeptanz, Nutzung und Image neuer Energiesysteme, Stuttgart: presentation at the University of Stuttgart, 2007
Roberta, E. Nodari, V. Albizzati: Refined evaluation framework, report and training of the local teams, Polycity-Deliverable DR 3.2, 2006
SEG (Limited Redevelopment and Development Company Ostfildern): dialog, Ostfildern, self published, 2008
Sinclair, R. Löfstedt: The influence of trust in a biomass plant application; the case study of Sutton, UK, Biomass & Bioenergy 21, 2001
Upreti: Conflict over biomass energy development in the United Kingdom: some observations and lessons from England and Wales, Energy Policy 32, 2004
Wolsink: Wind power and the NIMBY-myth: institutional capacity and the limited signicance of public support, Renewable Energy 21, 2000

knowlEDgE transfErMaria Puig Arnavat, Mariapia Martino, Izabela Samson-Brek, Ursula Pietzsch
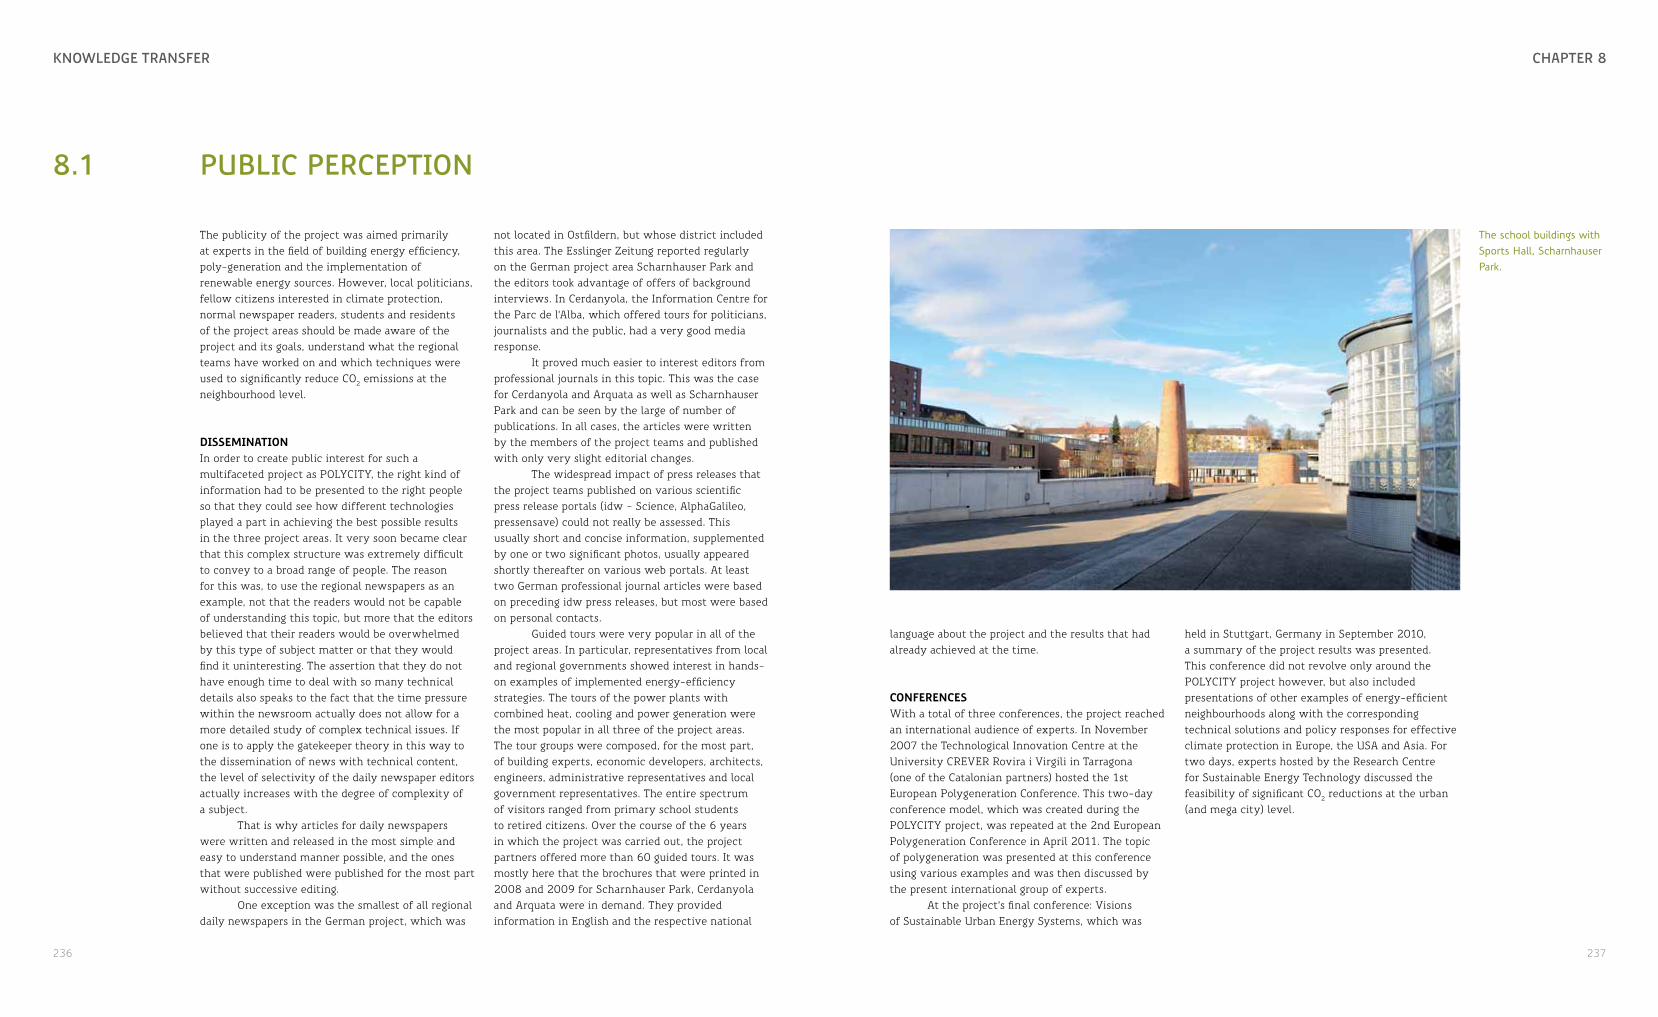
236 237
chaPtEr 8knowlEDgE transfEr
8.1 PUblic PErcEPtion
The publicity of the project was aimed primarily at experts in the field of building energy efficiency, poly-generation and the implementation of renewable energy sources. However, local politicians, fellow citizens interested in climate protection, normal newspaper readers, students and residents of the project areas should be made aware of the project and its goals, understand what the regional teams have worked on and which techniques were used to significantly reduce CO2 emissions at the neighbourhood level.
disseminationIn order to create public interest for such a multifaceted project as POLYCITY, the right kind of information had to be presented to the right people so that they could see how different technologies played a part in achieving the best possible results in the three project areas. It very soon became clear that this complex structure was extremely difficult to convey to a broad range of people. The reason for this was, to use the regional newspapers as an example, not that the readers would not be capable of understanding this topic, but more that the editors believed that their readers would be overwhelmed by this type of subject matter or that they would find it uninteresting. The assertion that they do not have enough time to deal with so many technical details also speaks to the fact that the time pressure within the newsroom actually does not allow for a more detailed study of complex technical issues. If one is to apply the gatekeeper theory in this way to the dissemination of news with technical content, the level of selectivity of the daily newspaper editors actually increases with the degree of complexity of a subject.
That is why articles for daily newspapers were written and released in the most simple and easy to understand manner possible, and the ones that were published were published for the most part without successive editing.
One exception was the smallest of all regional daily newspapers in the German project, which was
not located in Ostfildern, but whose district included this area. The Esslinger Zeitung reported regularly on the German project area Scharnhauser Park and the editors took advantage of offers of background interviews. In Cerdanyola, the Information Centre for the Parc de l’Alba, which offered tours for politicians, journalists and the public, had a very good media response.
It proved much easier to interest editors from professional journals in this topic. This was the case for Cerdanyola and Arquata as well as Scharnhauser Park and can be seen by the large of number of publications. In all cases, the articles were written by the members of the project teams and published with only very slight editorial changes.
The widespread impact of press releases that the project teams published on various scientific press release portals (idw - Science, AlphaGalileo, pressensave) could not really be assessed. This usually short and concise information, supplemented by one or two significant photos, usually appeared shortly thereafter on various web portals. At least two German professional journal articles were based on preceding idw press releases, but most were based on personal contacts.
Guided tours were very popular in all of the project areas. In particular, representatives from local and regional governments showed interest in hands-on examples of implemented energy-efficiency strategies. The tours of the power plants with combined heat, cooling and power generation were the most popular in all three of the project areas. The tour groups were composed, for the most part, of building experts, economic developers, architects, engineers, administrative representatives and local government representatives. The entire spectrum of visitors ranged from primary school students to retired citizens. Over the course of the 6 years in which the project was carried out, the project partners offered more than 60 guided tours. It was mostly here that the brochures that were printed in 2008 and 2009 for Scharnhauser Park, Cerdanyola and Arquata were in demand. They provided information in English and the respective national
language about the project and the results that had already achieved at the time.
conferencesWith a total of three conferences, the project reached an international audience of experts. In November 2007 the Technological Innovation Centre at the University CREVER Rovira i Virgili in Tarragona (one of the Catalonian partners) hosted the 1st European Polygeneration Conference. This two-day conference model, which was created during the POLYCITY project, was repeated at the 2nd European Polygeneration Conference in April 2011. The topic of polygeneration was presented at this conference using various examples and was then discussed by the present international group of experts.
At the project’s final conference: Visions of Sustainable Urban Energy Systems, which was
held in Stuttgart, Germany in September 2010, a summary of the project results was presented. This conference did not revolve only around the POLYCITY project however, but also included presentations of other examples of energy-efficient neighbourhoods along with the corresponding technical solutions and policy responses for effective climate protection in Europe, the USA and Asia. For two days, experts hosted by the Research Centre for Sustainable Energy Technology discussed the feasibility of significant CO2 reductions at the urban (and mega city) level.
The school buildings with Sports Hall, Scharnhauser Park.

238 239
chaPtEr 8knowlEDgE transfEr
8.2 training
The training concept that was developed during the POLYCITY project included three kinds of training activities dedicated to the different target groups:• thematic workshops • university teaching modules • public training modules
thematic workshoPsThe process of training was initiated by the project coordinator in collaboration with the Institute for Fuels and Renewable Energy (IPiEO) in Warsaw. This research institute under the Polish Ministry of Economy (IPiEO) was the partner responsible for the overall training conception and the maintenance of an Eastern European associated communities network. Mainly the associated communities were to be targeted, not only in Eastern Europe, but also the regional associated communities centreed around the project sites in Italy, Spain and Germany.
The central idea for the conception of thematic workshops was to motivate and enable other municipalities, property developers, decision-makers on the local and national levels, city planners and investors in the building sector or engineering companies to pursue their own strategies for establishing sustainable urban energy systems.
IPiEO developed a workshop prototype which was held in October 2006 in Gdansk. This two-day thematic workshop on the topic of biomass not only covered technical issues, but also alluded to financial questions, suggested possible financial support through national or EU-funded programmes and explained legal frameworks on national and EU level. Using this workshop as a template, the regional course managers then developed their training workshops using a similar layout suitable for each approach. Each organizing partner institution was responsible for the preparation of lecture programmes and materials, invitation of speakers, course announcements and advertisement, assistance in accommodations, providing information for the website/platform and the electronic newsletters. The workshops were offered first to the associated
communities integrated in POLYCITY, but then also to interested bodies outside of the project. All offered training events were free of charge.
All topics presented were, as much as possible, tailored to the expectations and background of the groups of participants and always included best practice examples from the POLYCITY project and other examples combined with an excursion, implementation steps, financial issues and social and environmental impacts. The agenda also included presentations of the planned investments in the associated communities. During the project run-time the following thematic workshops were held:• Sustainable Town Planning and Energy
Benchmarking of Buildings. Workshop in Basel, Switzerland, in February 2006
• Biomass in Communities. Workshop in Gdansk, Poland, in October 2006
• Communal Energy Management Systems in Turin, Italy, in May 2007
• National Working Day for German speaking CONCERTO communities and technical monitoring workshop in Ostfildern, Germany, in September 2007
• energy in minds! and POLYCITY. Workshop and International Meeting in Turin, Italy, in March 2008
• Eco-Buildings and Demand-Supply Integration. CONCERTO strategy for a sustainable city. Workshop in Turin, Italy, within the context of the XXII UIA World Congress of Architecture in June/July 2008
• Sustainable Urban Energy Concepts. Summer School in Warsaw, Poland, in August/September 2009
• Renewable Energy Technologies and Polygeneration, International Seminar within the International Poznan Fair POLEKO and Conference in November 2009
• From Urban Communities to Sustainable Cities. Workshop of the Italian CONCERTO communities in Turin, Italy, in November 2009
Maria Puig Arnavat, Iza Samson-Bręk, Ursula Pietzsch
• Renewable energy Sources and energy Demand: State of the Art and future Developments. Winter School in Sestriere, in January 2011
sPecial eVent 1: concerto workshoP and coVenant of mayors at the uia world congress of architecture in turinThe UIA World Congress of Architecture, which was held in Turin in 2008, was a perfect frame for a special event addressed to the CONCERTO communities. Centro Richerche Fiat and the Politechnico di Torino organized a forum in which the communities could present, interact and actively exchange experiences and discuss the results achieved with the wide assembly of UIA delegates and attendees (architects, students and qualified professionals from the construction sector). All of the existing CONCERTO communities at the time were invited. 27 communities from the CONCERTO I projects were at the time almost half way into the project implementation, right in the middle of the realisation stage. 19 communities elected for CONCERTO II were in the middle of the design phase - the moment when the main decisions are made.
Six communities participated with presentations: POLYCITY Ostfildern/Cerdanyola/Arquata, ECOSTILER, SESAC, ENERGY IN MINDS!, HOLISTIC and CONCERTO AL PIANO. This workshop was also opened to the general UIA audience and was attended by about 200 participants during one day.
Additionally there was an exhibition in the “CONCERTO Piazza” in Lingotto Exhibition Hall, near where the main sessions of the UIA Congress were held. Here CONCERTO I and II communities showcased their projects in an open scaffold design that facilitated the visibility of the projects in the free flow of congress attendees.
The UIA Congress also served as a platform for the European Initiative “Covenant of Mayors”. Here a panel discussion was held of European Mayors that had signed or were about to sign the Covenant of Mayors. This event was attended by about 450 participants.
The Covenant of Mayors was launched by the European Commission in January 2008 as the most ambitious initiative to involve cities and citizens in the achievement of the objectives of EU sustainable energy policy. It is open to cities of all sizes in Europe. The mayors commit to go beyond the objectives set up by the EU for 2020, reducing
↓
↓ ↓ ↓ ↓ ↓
↓ ↓ ↓ ↓
coordination of Polycity training events
Concept development
POLYCITY project coordinator zafh.net
Coordinator of WP training IPiEO
Regional course manager
IPiEO
Regional course manager PoliTo
Regional course manager DMAH
Regional course manager CREVER
Regional course manager zafh.net
Training workshops Training workshops Training workshops Training workshops Training workshops
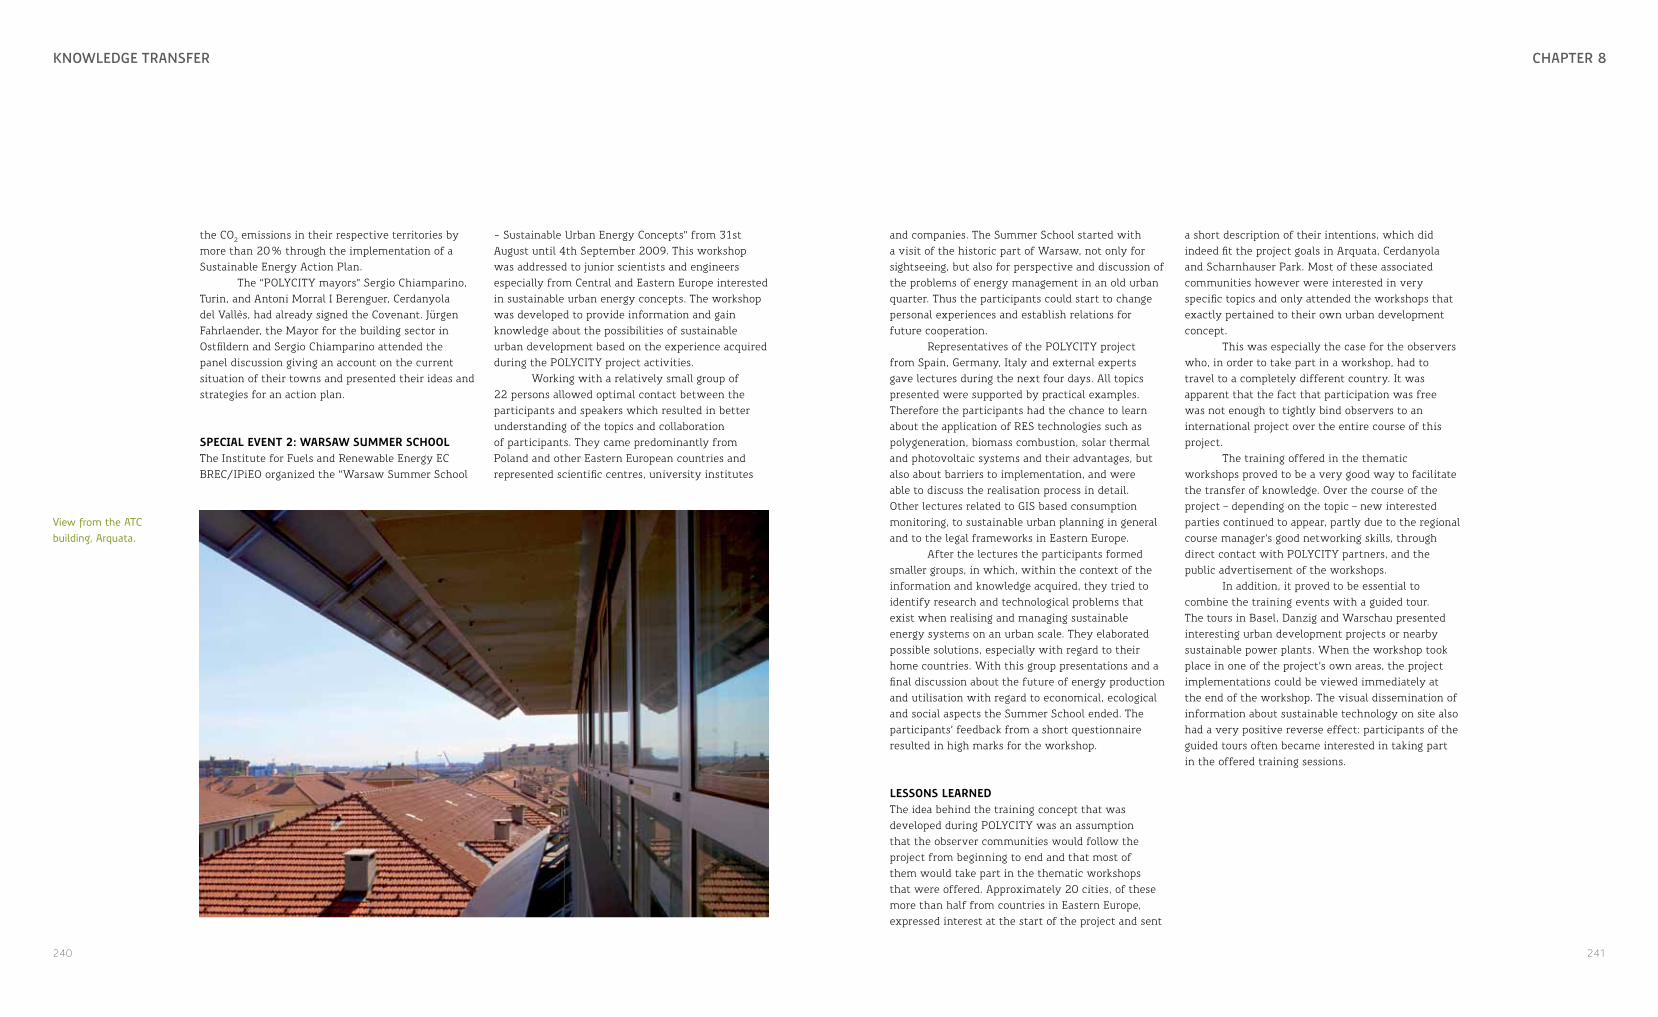
240 241
chaPtEr 8knowlEDgE transfEr
the CO2 emissions in their respective territories by more than 20 % through the implementation of a Sustainable Energy Action Plan.
The “POLYCITY mayors” Sergio Chiamparino, Turin, and Antoni Morral I Berenguer, Cerdanyola del Vallès, had already signed the Covenant. Jürgen Fahrlaender, the Mayor for the building sector in Ostfildern and Sergio Chiamparino attended the panel discussion giving an account on the current situation of their towns and presented their ideas and strategies for an action plan.
sPecial eVent 2: warsaw summer school The Institute for Fuels and Renewable Energy EC BREC/IPiEO organized the “Warsaw Summer School
- Sustainable Urban Energy Concepts” from 31st August until 4th September 2009. This workshop was addressed to junior scientists and engineers especially from Central and Eastern Europe interested in sustainable urban energy concepts. The workshop was developed to provide information and gain knowledge about the possibilities of sustainable urban development based on the experience acquired during the POLYCITY project activities.
Working with a relatively small group of 22 persons allowed optimal contact between the participants and speakers which resulted in better understanding of the topics and collaboration of participants. They came predominantly from Poland and other Eastern European countries and represented scientific centres, university institutes
and companies. The Summer School started with a visit of the historic part of Warsaw, not only for sightseeing, but also for perspective and discussion of the problems of energy management in an old urban quarter. Thus the participants could start to change personal experiences and establish relations for future cooperation.
Representatives of the POLYCITY project from Spain, Germany, Italy and external experts gave lectures during the next four days. All topics presented were supported by practical examples. Therefore the participants had the chance to learn about the application of RES technologies such as polygeneration, biomass combustion, solar thermal and photovoltaic systems and their advantages, but also about barriers to implementation, and were able to discuss the realisation process in detail. Other lectures related to GIS based consumption monitoring, to sustainable urban planning in general and to the legal frameworks in Eastern Europe.
After the lectures the participants formed smaller groups, in which, within the context of the information and knowledge acquired, they tried to identify research and technological problems that exist when realising and managing sustainable energy systems on an urban scale. They elaborated possible solutions, especially with regard to their home countries. With this group presentations and a final discussion about the future of energy production and utilisation with regard to economical, ecological and social aspects the Summer School ended. The participants’ feedback from a short questionnaire resulted in high marks for the workshop.
lessons learned The idea behind the training concept that was developed during POLYCITY was an assumption that the observer communities would follow the project from beginning to end and that most of them would take part in the thematic workshops that were offered. Approximately 20 cities, of these more than half from countries in Eastern Europe, expressed interest at the start of the project and sent
a short description of their intentions, which did indeed fit the project goals in Arquata, Cerdanyola and Scharnhauser Park. Most of these associated communities however were interested in very specific topics and only attended the workshops that exactly pertained to their own urban development concept.
This was especially the case for the observers who, in order to take part in a workshop, had to travel to a completely different country. It was apparent that the fact that participation was free was not enough to tightly bind observers to an international project over the entire course of this project.
The training offered in the thematic workshops proved to be a very good way to facilitate the transfer of knowledge. Over the course of the project – depending on the topic – new interested parties continued to appear, partly due to the regional course manager’s good networking skills, through direct contact with POLYCITY partners, and the public advertisement of the workshops.
In addition, it proved to be essential to combine the training events with a guided tour. The tours in Basel, Danzig and Warschau presented interesting urban development projects or nearby sustainable power plants. When the workshop took place in one of the project’s own areas, the project implementations could be viewed immediately at the end of the workshop. The visual dissemination of information about sustainable technology on site also had a very positive reverse effect: participants of the guided tours often became interested in taking part in the offered training sessions.
View from the ATC building, Arquata.
242 243
chaPtEr 8knowlEDgE transfEr
8.3 UnivErsity tEaching moDUlEs
Synergies with education existed especially on the curriculum level of the participating universities, the Stuttgart University of Applied Sciences, Germany, the Universitat Rovira i Virgili, Tarragona, Spain, and the Politecnico di Torino. The project offered numerous case studies and practical examples suitable for integration into the regular study courses. Approaches and results in the different technological areas (biomass, PV, polygeneration, thermal cooling, building performance assessment, simulation, modeling of energy systems, etc.), as well as energy efficient urban development as an integrative task was integrated into academic education in graduate and postgraduate courses. In most cases the topics are directly connected with the research and development work done within the POLYCITY project.
Examples of training modules related to topics in research and technological development are: energy supply and demand modeling for urban quarters, PV system simulation, mathematical modeling of biomass plants, absorption cooling systems, solid sorption cooling systems, solar thermal systems, biomass, technologies of energetic conversion, open sorption based air conditioning systems, combined energy systems for heat, cold and electricity production, implantation of bio-energy projects in urban areas, calculation and design of solar thermal systems, GIS based consumption monitoring of buildings, calculation and design of solar photovoltaic systems, advanced applications of renewable energies and socio-economical aspects of renewable energies.
Such topics on technical and research aspects of the project became part of the following study courses and PhD programmes.
In Germany at the Stuttgart University of Applied Sciences:• Bachelor of Building Physics • Bachelor of Climate Engineering• Master course SENCE – Sustainable Energy
Competence
In Italy at the Politechnico di Torino: • Master course in Electrical Engineering• Master course in Energy Engineering• Master course in Architecture/City
Construction• Master course in Achitecture for the Built
Environment• Master course in Sustainable Architecture
In Catalonia at the Universitat Rovira i Virgili• Master course in Air-Conditioning
Technologies and Energy Efficiency in Buildings
• Master course in Thermodynamic Engineering of Fluids
• Postgraduate course and Master’s Degree on Renewable Energies.
• Master’s Degree in Chemical and Process Engineering
The following training modules, seminars and lectures were held in addition to the usual university course schedule and partly in cooperation with other universities:• Seminar on building energy concepts, supply
concepts, data handling and geoinformation system in Scharnhauser Park for the students of the German master course Sustainable Energy Competence (SENCE) and students of the Politechnico di Torino, October 2006
• Seminar “Getting higher spending less – Eco-efficiency in urban areas” for students from different European countries at the Politechnico di Torino in April 2007
• “Low energy climatisation and active cooling”, master programme on sustainable energies at the University of Barcelona in May 2007
• “Low energy cooling of sustainable buildings”, International European Summer Workshop at the University of Corte, Corsica, in June 2007
• POLYCITY Summer School on modular simulation of advanced absorption systems and optimal design and configuration of energy supply systems at the University of Rovira i Virgili, Tarragona, in July 2010
• POLYCITY Winter School on renewable energy sources and energy demand: State of the art and future developments in the Olympic Village Sestriere, Italy, organised by Politechnico di Torino in January 2011
• Alta Scuola Politecnica (ASP) - PhD course on rational use of energy organised by Politecnico di Torino and Politecnico di Milano
All three universities participated in the Marie Curie Research Training Network CITYNET, a four year European PhD programme on Sustainable Energy Management, which was coordinated by Centre of Applied Research - Sustainable Energy Technology (zafh.net) from 2007-2010. The PhD candidates located in Stuttgart, in Turin and in Tarragona carried out research on topics that were part of the RTD work in Scharnhauser Park, Arquata and Cerdanyola. Some of the international seminars held within this programme focused on POLYCITY topics, for example the International Seminar on thermal cooling systems and Polygeneration (Tarragona), solar heating, simulation tools and GIS (Stuttgart) and energy assessment of buildings (Turin),
The overall assessment of the training modules and summer school in Tarragona was very positive, especially on the usefulness of information provided and methods applied. The majority of participants had a positive impression. They could understand the contents, tools and methods explained. In addition, several participants expected to be able to apply some of the presented tools and methods in their own context in the future.
The attendees highly appreciated the combination between course content and practical experience and underlined the advantages of combining introductory lectures and the presentation of practical implementations. Practical activities and work in small groups were seen as the most
attractive part of the training by some of the attendees. It is essential for the success of the training events that participants have enough time for practical exercises and discussion.
The speakers and teaching methods received high ratings. A special effort was taken to invite speakers from different companies that could talk about real-life examples and could prepare hands-on exercises. These two points were usually highly appreciated by the students.
Looking back, the things that had the strongest influence on the creation of successful results from the organisation university teaching modules were:• linking with site visits• accompanying the presented topics with
practical examples• active involvement of students in lectures• time for discussion
The high number of study projects, bachelor and master thesis on project topics at all universities involved also shows a lively interest on research topics related to energy efficient urban quarters.
244 245
chaPtEr 8knowlEDgE transfEr
8.4 PUblic training moDUlEs
The POLYCITY project was geared right from the start not only toward an expert audience but also toward the general public. Training events were offered and information was made available in order to increase understanding of climate change problems and to inform about technical solutions and the basic knowledge needed for implementing clean energy solutions. It was clear that POLYCITY findings and results would be unsuitable for the average audience that has no deeper technical knowledge. The teams concerned with the development of public training modules in Italy and Germany also focused on possible changes in user behaviour, which still is one of the most crucial imponderables in communal energy planning.
For the town of Ostildern and zafh.net, which were responsible for developing the public training modules, the following aspects turned out to be a good basis for addressing a non-expert adult audience:• Get people interested in saving energy
(= saving money) by reducing heating and electricity consumption and give advice on how to save energy in private households.
• Take up topics that are in the media such as the good amortisation rate for private PV systems supported by feed in tariffs (2007 and 2008), the new laws in Baden-Württemberg and Germany on sustainable energies (EWärmeG Baden-Württemberg 2007 and EEWärmeG 2009) and the EU ban on light bulbs, which are to be replaced by energy-efficient fluorescent lights and LEDs from 2008-2012, etc.
• Explain and discuss abstract, but popular terms such as “ecological footprint”.
• Lower the complexity of information by giving examples and creating intelligible graphs.
And for children:
• Develop playful educational activities assisting children in discovering and learning about energy efficiency techniques and renewable energy.
In 2007, the state of Baden-Württemberg launched the first “Energy Day”, a state-wide recognised weekend geared toward the promotion of renewable energies each year in September. The local events were organized by local city teams. There were give-aways, and a wide range of informational brochures on sustainable energies were passed out. It was at this event in 2007 that the German POLYCITY team started to offer an ambitious and elaborately-staged, high level programme - too high for many visitors, as the team had to admit after the first year. The programme consisted of public lectures, an exhibition and a multimedia show on different sustainable energy technologies in the Stadthaus, an energy quiz, children’s theatre on energy topics and a solar toy construction workshop for children.
Activities that were low-threshold, playful and communicative offers turned out to be the ones that came across the best over the following years. The programme was altered accordingly and people seemed to be more interested as soon as green energy was not the topic of the whole event. When linked to other events, the POLYCITY Energy Day stand had a large audience, for example at the opening of the new market place or at a kite festival. It was also confirmed in a survey, that people who are not very interested in this topic – and in absolute terms, this is the majority – do not go to topic-specific events at all. A low-threshold event involving energy is popular however, when staged as part of another event.
There were also both good and less good experiences with the content of the events – popular topics were repeated in succeeding years and less popular ones were removed from the programme. For instance, a calculator for electrical energy consumption turned out to be not applicable, because most people didn’t know the volume and costs of their yearly purchased electricity. But with
an experimental set-up for light bulbs and heating advice (along with much discussion), POLYCITY was able to reach a large adult audience.
An energy quiz for children and a solar toy workshop were always very popular. The children had questions, such as “How does a PV module work?”, for which they received an understandable explanation. Children teaching their parents – the team was able to experience this phenomenon directly at the stand.
lessons learned• Information must start in a low-threshold
environment, otherwise the target audience of citizens, children and students will not show any interest.
• As soon as information is entertaining, a public audience is more readily willing to concern itself with a subject of higher complexity and is open for discussion.
• People are more apt to discuss sustainable energies, when topics are linked to current topics in the public debate.
• Adult people with little knowledge of technical topics assimilate information, for example on PV technology, while working together with their children on constructing solar toys or debating on the correct answers to a children’s energy quiz.
• Linked to other events, low threshold drop-in offers can attract persons that have no special interest in the subject.
site Visits for school classesThis kind of public training was offered in Ostfildern, especially by the city’s energy manager. The POLYCITY team didn’t develop special training modules, because the classes were of varying age and it was much easier to prepare for the visits by talking to the teacher in advance and adapting the level of information to fit the communicated requirements. Therefore, the visits that in most cases involved a
tour of the biomass plant, were integrated into the course matter and, in some cases, were elaborated on later in the classroom.
One of the first training modules of this kind was realised in November 2006 through a cooperative effort between zafh.net and BBQ - Berufliche Bildung gGmbH. BBQ is an educational organisation aiming especially to empower young people for a technical career. BBQ initiates cooperative training modules with the purpose of encouraging students to start a course of study in the field of engineering sciences when they have finished school. 16 technically-gifted 12th-grade students from a grammar school in Leonberg near Stuttgart thus participated in a seminar at the Stadthaus in Scharnhauser Park on facility management, energy saving strategies in public buildings, and on the development of the GIS application for the district.
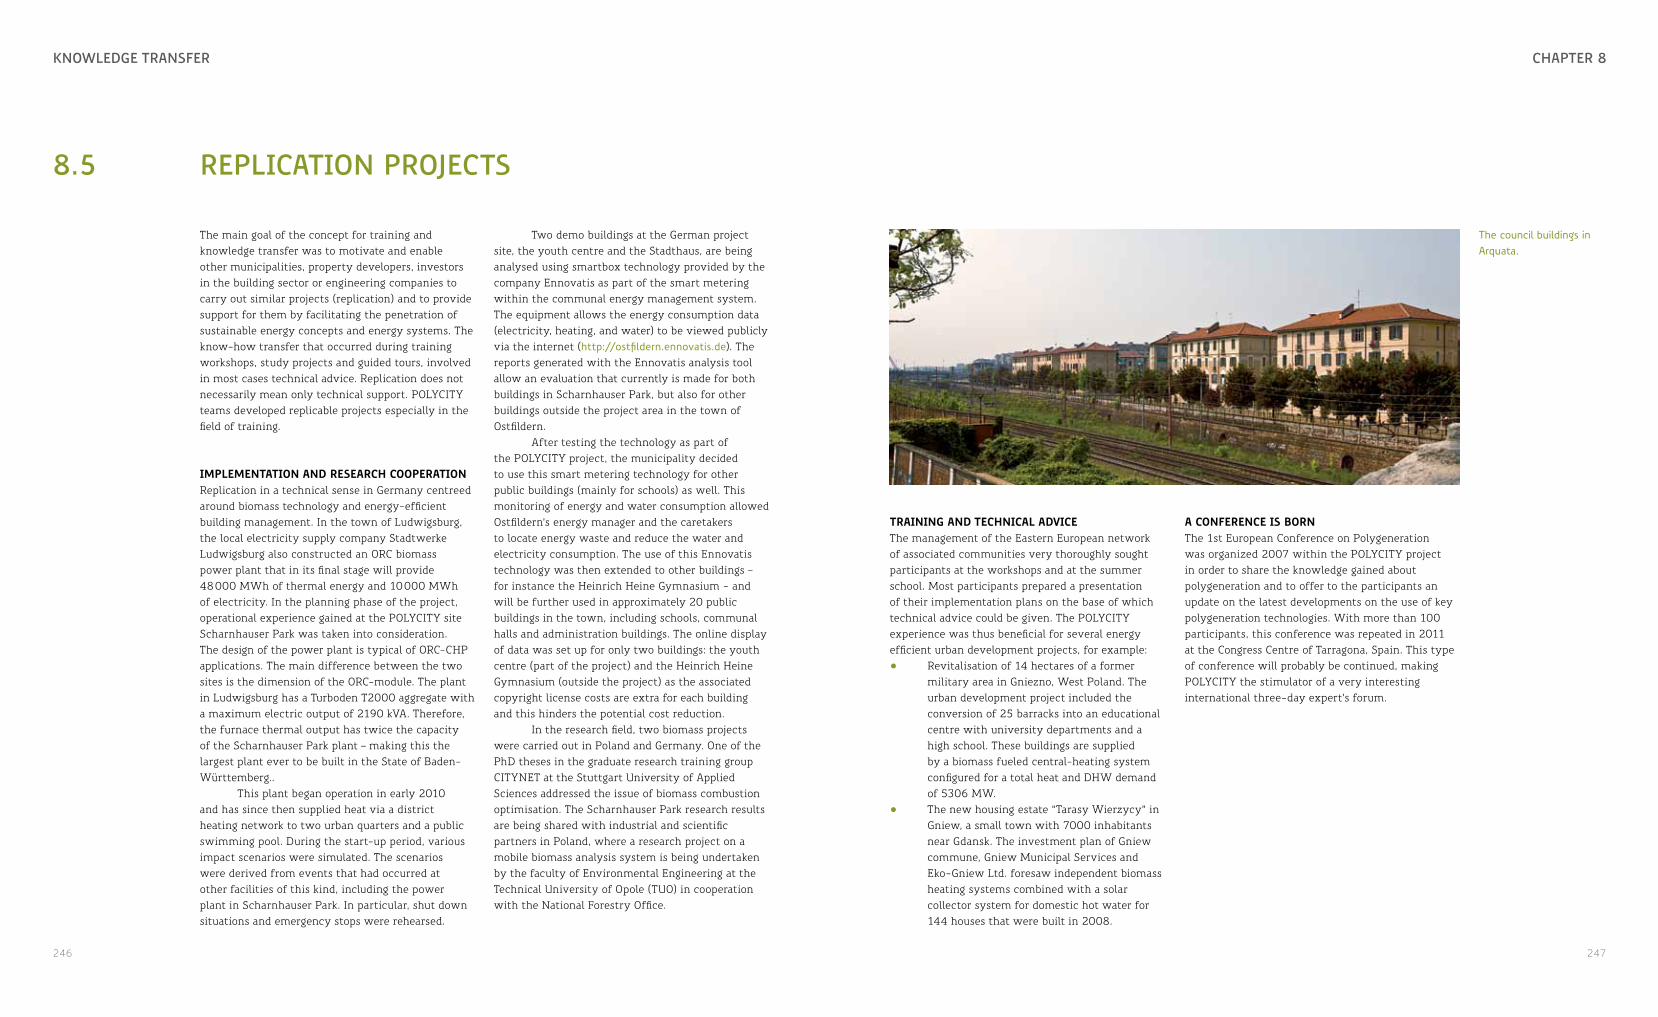
246 247
chaPtEr 8knowlEDgE transfEr
8.5 rEPlication ProjEcts
The main goal of the concept for training and knowledge transfer was to motivate and enable other municipalities, property developers, investors in the building sector or engineering companies to carry out similar projects (replication) and to provide support for them by facilitating the penetration of sustainable energy concepts and energy systems. The know-how transfer that occurred during training workshops, study projects and guided tours, involved in most cases technical advice. Replication does not necessarily mean only technical support. POLYCITY teams developed replicable projects especially in the field of training.
imPlementation and research cooPerationReplication in a technical sense in Germany centreed around biomass technology and energy-efficient building management. In the town of Ludwigsburg, the local electricity supply company Stadtwerke Ludwigsburg also constructed an ORC biomass power plant that in its final stage will provide 48 000 MWh of thermal energy and 10 000 MWh of electricity. In the planning phase of the project, operational experience gained at the POLYCITY site Scharnhauser Park was taken into consideration. The design of the power plant is typical of ORC-CHP applications. The main difference between the two sites is the dimension of the ORC-module. The plant in Ludwigsburg has a Turboden T2000 aggregate with a maximum electric output of 2190 kVA. Therefore, the furnace thermal output has twice the capacity of the Scharnhauser Park plant – making this the largest plant ever to be built in the State of Baden-Württemberg..
This plant began operation in early 2010 and has since then supplied heat via a district heating network to two urban quarters and a public swimming pool. During the start-up period, various impact scenarios were simulated. The scenarios were derived from events that had occurred at other facilities of this kind, including the power plant in Scharnhauser Park. In particular, shut down situations and emergency stops were rehearsed.
Two demo buildings at the German project site, the youth centre and the Stadthaus, are being analysed using smartbox technology provided by the company Ennovatis as part of the smart metering within the communal energy management system. The equipment allows the energy consumption data (electricity, heating, and water) to be viewed publicly via the internet (http://ostfildern.ennovatis.de). The reports generated with the Ennovatis analysis tool allow an evaluation that currently is made for both buildings in Scharnhauser Park, but also for other buildings outside the project area in the town of Ostfildern.
After testing the technology as part of the POLYCITY project, the municipality decided to use this smart metering technology for other public buildings (mainly for schools) as well. This monitoring of energy and water consumption allowed Ostfildern’s energy manager and the caretakers to locate energy waste and reduce the water and electricity consumption. The use of this Ennovatis technology was then extended to other buildings – for instance the Heinrich Heine Gymnasium - and will be further used in approximately 20 public buildings in the town, including schools, communal halls and administration buildings. The online display of data was set up for only two buildings: the youth centre (part of the project) and the Heinrich Heine Gymnasium (outside the project) as the associated copyright license costs are extra for each building and this hinders the potential cost reduction.
In the research field, two biomass projects were carried out in Poland and Germany. One of the PhD theses in the graduate research training group CITYNET at the Stuttgart University of Applied Sciences addressed the issue of biomass combustion optimisation. The Scharnhauser Park research results are being shared with industrial and scientific partners in Poland, where a research project on a mobile biomass analysis system is being undertaken by the faculty of Environmental Engineering at the Technical University of Opole (TUO) in cooperation with the National Forestry Office.
training and technical adViceThe management of the Eastern European network of associated communities very thoroughly sought participants at the workshops and at the summer school. Most participants prepared a presentation of their implementation plans on the base of which technical advice could be given. The POLYCITY experience was thus beneficial for several energy efficient urban development projects, for example: • Revitalisation of 14 hectares of a former
military area in Gniezno, West Poland. The urban development project included the conversion of 25 barracks into an educational centre with university departments and a high school. These buildings are supplied by a biomass fueled central-heating system configured for a total heat and DHW demand of 5306 MW.
• The new housing estate “Tarasy Wierzycy” in Gniew, a small town with 7000 inhabitants near Gdansk. The investment plan of Gniew commune, Gniew Municipal Services and Eko-Gniew Ltd. foresaw independent biomass heating systems combined with a solar collector system for domestic hot water for 144 houses that were built in 2008.
a conference is bornThe 1st European Conference on Polygeneration was organized 2007 within the POLYCITY project in order to share the knowledge gained about polygeneration and to offer to the participants an update on the latest developments on the use of key polygeneration technologies. With more than 100 participants, this conference was repeated in 2011 at the Congress Centre of Tarragona, Spain. This type of conference will probably be continued, making POLYCITY the stimulator of a very interesting international three-day expert’s forum.
The council buildings in Arquata.

aPPEnDicEs

250 251
chaPtEr 9aPPEnDicEs
aUthors, PhotograPhErs
authorsFranco Anzioso, Centro Ricerche Fiat, Project
Management Fuel Economy & Vehicle Systems Efficiency, Orbassano, Italy
Silvio Barta, Centre of Applied Research - Sustainable Energy Technology (zafh.net), University of Applied Sciences Stuttgart, Germany
Francesca Bandera, Centro Ricerche Fiat, Orbassano, Italy
Barbara Bellioso, Agenzia Territoriale per la Casa della Provincia di Torino (ATC), Turin, Italy
Ilyes Ben Hassine, Centre of Applied Research - Sustainable Energy Technology (zafh.net), University of Applied Sciences Stuttgart, Germany
Joan Carles Bruno, CREVER – Group of Applied Thermal Engineering, Universitat Rovira i Virgili, Tarragona, Spain
Jordi Carbonell Morera, beegroup – Building Energy and Environment Group, CIMNE, Terrassa, Spain
Stoyan Danov, beegroup – Building Energy and Environment Group, CIMNE, Terrassa, Spain
Carlos Dapena González, Consorci urbanístic del Centre Direccional de Cerdanyola del Vallès
Alessandro Destefanis, Centro Ricerche Fiat, Fuel Economy & Vehicle Systems Efficiency, Orbassano, Italy
Éric Duminil, Centre of Applied Research - Sustainable Energy Technology (zafh.net), University of Applied Sciences Stuttgart, Germany
Ursula Eicker, Head of the Centre Centre of Applied Research - Sustainable Energy Technology (zafh.net), University of Applied Sciences Stuttgart, Germany
Ludger Eltrop, Head of Dept. System analysis and Renewable Energies – SEE, IER, University of Stuttgart, Germany
Tobias Erhart, Centre of Applied Research - Sustainable Energy Technology (zafh.net), University of Applied Sciences Stuttgart
Petra Fischbach, Centre of Applied Research - Sustainable Energy Technology (zafh.net), University of Applied Sciences Stuttgart, Germany
Luca Giaccone, Dept. of Electrical Engineering, Politecnico di Torino, Turin, Italy
Alessandra Guerrisi, Dept. of Electrical Engineering, Politecnico di Torino, Turin, Italy
Marc Hagenloch, Stadtwerke Esslingen am Neckar GmbH & Co. KG, Esslingen, Germany
Frank Hettler, Energiemanagement Stadt Ostfildern, Germany
Till Jenssen, Dept. System analysis and Renewable Energies – SEE, IER, University of Stuttgart, Germany
Uli Jakob, dr. jakob energy research, Weinstadt, Germany
Jesús López Villada, CREVER – Group of Applied Thermal Engineering , Universitat Rovira i Virgili, Tarragona, Spain
Francesc Xavier Martí Rague, Head of the Studies Area, Department of Territory and Sustainability, Generalitat of Catalonia, Barcelona, Spain
Mariapia Martino, Dept. of Electrical Engineering, Politecnico di Torino, Turin, Italy
Elisabetta Nodari, Centro Ricerche Fiat, Fuel Economy & Vehicle Systems Efficiency, Orbassano, Italy
Jordi Ortiga Guillen, CREVER – Group of Applied Thermal Engineering , Universitat Rovira i Virgili, Tarragona, Spain
Ursula Pietzsch, Centre of Applied Research - Sustainable Energy Technology (zafh.net), University of Applied Sciences Stuttgart, Germany
Maria Puig Arnavat, CREVER – Group of Applied Thermal Engineering , Universitat Rovira i Virgili, Tarragona, Spain
Núria Quince Colomés, CREVER – Group of Applied Thermal Engineering , Universitat Rovira i Virgili, Tarragona, Spain
Izabela Samson-Brek, Institute for Fuels and Renewable Energy IPiEO, Warsaw, Poland
Tatiana Sivenova, Centre of Applied Research - Sustainable Energy Technology (zafh.net), University of Applied Sciences Stuttgart, Germany
Aneta Strzalka, Centre of Applied Research - Sustainable Energy Technology (zafh.net), University of Applied Sciences Stuttgart, Germany
Rafal Strzalka, Centre of Applied Research - Sustainable Energy Technology (zafh.net), University of Applied Sciences Stuttgart, Germany
Aysegül Tereci, Centre of Applied Research - Sustainable Energy Technology (zafh.net), University of Applied Sciences Stuttgart, Germany
Felix Thumm, Centre of Applied Research - Sustainable Energy Technology (zafh.net), University of Applied Sciences Stuttgart, Germany

252 253
chaPtEr 1aPPEnDicEs
PhotograPhersPhotographers were employed to document the buildings at the three project sites:
Michel Seibert for Scharnhauser Park, GermanyGiancarlo Tovo for Arquata, Turin, Italy
All other photographs were provided by the authors of the articles, unless otherwise noted.
Opposite: Aerial view of the town centre, Scharnhauser Park.
254 255
chaPtEr 9aPPEnDicEs
PartnEr institUtions
germanyZAFH.NET STUTTGART – CENTRE OF APPLIED RESEARCH - SUSTAINABLE ENERGY TECHNOLOGYThe Centre for Applied Research – Sustainable Energy Technology (zafh.net), directed by Prof. Dr. Ursula Eicker, conducts research into energy consumption of buildings and communities. It was founded in 2002 in Stuttgart as one of three centres of excellence in the state of Baden-Württemberg and allows universities of applied science from this region to pool their expertise in the field of applied research and development.
zafh.net researches new technologies for the year-round use of renewable energies for cooling, heating and electricity production. Sustainable air-conditioning of buildings is a particularly innovative field of research as it involves the development of solar-thermal cooling machines, the use of near-surface geothermal technology as well as potential passive cooling.
New information technology solutions for building automation, automatic adjustment control of systems and the management of energy enable the optimisation of buildings and plants while they are being used. The research team develops simulation models that are useful not only in the planning phase but can also be used to monitor operation online in order to detect errors and to optimise automatic regulation.
In POLYCITY zafh.net was responsible for the overall scientific co-ordination. RTD focused on the optimisation of a ORC biomass plant, the development of a communal energy management including simulation and the application of a GIS tool for visualisation. zafh.net also administrated public relations and POLYCITY events.
SEZ – STEINBEIS-EUROPA-ZENTRUM STUTTGARTThe Steinbeis Innovation gGmbH is part of the Steinbeis Network which is a well known, Germany-based but internationally acting technology transfer organisation with more than 3000 researchers, consultants and engineers, who carry out more than 20 000 company projects each year.
Steinbeis-Europa-Zentrum (SEZ) is the unit responsible for the support of European RTD projects and trans-national technology transfer and has 20 years experience in management and monitoring of European research projects. SEZ is also partner for technology transfer and exploitation of EU RTD results in the Enterprise Europe Network in Baden-Württemberg, Germany.
In the POLYCITY project SEZ was responsible for the financial and administrative co-ordination of the project. SEZ disseminated the overall project results and organised the POLYCITY final conference. Together with the zafh.net SEZ ensured that POLYCITY met the goals of the gender action plan.
TOWN OF OSTFILDERNOstfildern is a young town with approximately 37 000 inhabitants situated at the south borders of Stuttgart. The town of Ostfildern has a good infrastructure with schools, public buildings, indoor swimming pools and facilities as child care and old people’s nursing. The town authorities with altogether 300 employees is managed by one Lord Mayor and two mayors. Until the beginning of the 1990s Ostfildern’s geographical centre was a large American military area with barracks and an helicopter airport. After the American troops left in 1992 this area was developed by the town to the new district Scharnhauser Park.
In the POLYCITY project Ostfildern worked especially on energy efficiency measures in public buildings and the enlargement of renewable energy supply e.g. in the field of photovoltaic in connection with public buildings. A communal management system was setup to make public consumption more transparent.
SWG – SIEDLUNGSWERK GMBH STUTTGART The Siedlungswerk Stuttgart is a large building society with a long experience in low energy building construction combined with solar thermal heating plants, biomass heating systems and heating networks based on renewable energies. Founded in 1948 the Siedlungswerk has built 27 260 appartments and houses in Baden-Württemberg and maintains more than 23 000 housing units. There are 200 employees working for SWG company, thereof 160 in the headquarter based in the centre of Stuttgart.
In The POLYCITY project the Siedlungswerk was the main partner for building construction at the German project site. SWG constructed multy-family houses, one-family-houses and row houses in Scharnhauser Park.
SWE – STADTWERKE ESSLINGENSWE is an energy service company which is responsible for the classical gas and water supply and also for the long-distance energy supply. Short-distance districts are ecologically and efficiently supplied by modern thermal power stations. Facility management, contracting as well as further services about the topics water and energy round off the task fields of the company. With an energy output of more than 1 billion kWh and 14 000 gas and heat costumers the SWE supplies the city of Esslingen and further communities.
In the POLYCITY project SWE co-worked in the optimisation of the Scharnhauser Park biomass plant and realised the thermal cooling supply for an office building in a contracting model. SWE further constructed 2 photovoltaic systems (35 kWp und 45 kWp) and realized the expansion of the DHC grid including new buffer systems for energy storage. SWE realized a 67 kW hydropower turbine situated on the water tower.
IER - INSTITUTE OF ENERGY ECONOMICS AND THE RATIONAL USE OF ENERGY/UNIVERSITY OF STUTTGARTAs part of the University of Stuttgart, IER is actively involved in interdisciplinary research and advanced teaching in the fields of energy economics, system analysis of energy and environment and the rational use of energy. Important research topics are: Technology assessment, environmental analysis, analysis and assessment of new energy technologies and systems, development and evaluation of models and decision support systems for energy economics and policy.
In the POLYCITY project IER worked on the economic and socio-economic evaluation and impact of the implementation of new energy technologies in the urban systems. The perception by the inhabitants for new energy installations was measured and the acceptance was evaluated. Also a monitoring was done on the overall achievements and GHG emission reduction for the case study area Scharnhauser Park in the City of Ostfildern was done, including a scenario assessment for future alternative options.
WRS – WIRTSCHAFTSFÖRDERUNG REGION STUTTGART GMBHStuttgart Region Economic Development Corporation (WRS) was founded in 1995 by the Greater Stuttgart Association (Verband Region Stuttgart) to strengthen the position of the Stuttgart Region as an economically attractive location. The WRS has the mandate of attracting interested companies to settle in the Stuttgart region and to support them during all the phases of their investments and to support also companies already present in their market activities.
In the POLYCITY project, WRS conducted the dissemination and exploitation of results, designed, implemented and currently updated the project homepage, organised the publication of all kinds of brochures and acted as info point on the German site. WRS also maintained the German associated community network.
www.zafh.net
www.steinbeis-europa.de
www.ostfildern.de
www.siedlungswerk.de
www.swe.de
www.ier.uni-stuttgart.de
wrs.region-stuttgart.de
zafh•net

256 257
chaPtEr 9aPPEnDicEs
sPainDMAH - DEPARTAMENT DE MEDI AMBIENT I HABITATGE OFT HE GENERALITAD DE CATAUNYADMAH is the Environment Department of the Catalonian Administration, Generalitat de Catalunya. It has the responsibility of preparing and executing environmental policies and plans, in addition to many issues concerning the environment, for instance, climate change strategy and environmental education. As one of its tasks, it supports sustainable buildings and urban development.
DMAH played an important role in the supply side innovation at the Spanish project area Parc de l’Alba in Cerdanyola del Vallès. DMAH supported and accompanied the work on the biomass feasibility study, developed the ecological performance assessment jointly with the Institut Cerdà and the socio-economic analysis and technological risk assessment as well as the dissemination strategy. The Cerdanyola case study served as a pattern for planning of replication projects in Catalonia.
ICAEN - INSTITUT CATALà D’ENERGIA The Institut Català d’Energia is a public corporation founded in 1991 which has independent legal status. ICAEN is attached to the Generalitat of Catalonia’s Department of Business and Job and works in the development of strategies for energy saving and energy efficiency in Catalonia, e.g. the Energy Plan of Catalonia 2006-2015, the design of the Renewable Energy Plan and Energy Infrastructures Plan and the Government Agreement on energy saving and energy efficiency measures in Catalonian government buildings. ICAEN also collaborates in the development of the programme for the promotion of energy technology research and development.
ICAEN worked in the data generation and design of the supply side –cogeneration, heat and cold generation with solar thermal energy, PV systems – and in the development of the urban plan for Cerdanyola including the parameterisation of buildings energy demand and energy efficiency solutions.
URBANISTIC CONSORTIUM OF THE DIRECTIONAL CENTRE OF CERDANYOLA DEL VALLèS The Consorci Urbanístic del Centre Direccional de Cerdanyola del Vallès is a public consortium formed by the municipality of Cerdanyola del Vallès and the INCASOL (Catalan Institute for the Land, part of the Catalan Ministry of Territory and Sustainability). The Consortium is responsible to execute the urban plan of Parc de l’Alba, a new urban development with the aim to become a model of sustainable growth located in Cerdanyola del Vallès, a city of 50 000 inhabitants in the metropolitan area of Barcelona.
In the POLYCITY project the Consortium worked on the implementation via third parties of all efficiency measures included in the Spanish project in both, demand and supply side. The Consortium was especially involved in the implementation of a new polygeneration system with a district heating and cooling network by awarding a public concession and participating in the shareholder structure of the ESCO.
www.gencat.cat/dmah
www.gencat.cat/icaen
www.parcdelalba.com
CREVER/URV – GROUP OF APPLIED THERMAL ENGINEERING, UNIVERSITAT ROVIRA I VIRGILI, TARRAGONAThe Group of Applied Thermal Engineering (CREVER) is a research group of the Mechanical Engineering Department of the Rovira i Virgili University, Tarragona. Its tasks and objectives are focused on the development of advanced energy conversion technologies and integration of renewable energies in cooperation with partners from industry and the public sector. CREVER has carried out a number of various developments and projects in the following areas of expertise:• heat pumping and sorption refrigeration technologies, including the development of machines and
industrial absorption refrigeration plants• audits, diagnoses and solutions for energy optimisation in industrial plants or buildings• advanced monitoring and energy management in building and district heating and cooling networks• development of modeling, mathematical programming optimisation and energy management software
tools• solar cooling plants analyses and simulations using different software tools including the development
of components for simulation purposesIn POLYCITY project, CREVER focused specially on the integration of new technologies, optimisation of the energy system and performance analysis life time monitoring. Concerning the buildings, CREVER has also participated in the simulation and analysis of the energy consumption in POLYCITY buildings. They also collaborated in the dissemination and training strategy, particularly in the organisation of some university training modules and the 1st and 2nd European Conferences on Polygeneration.
INSTITUT CERDàThink tank and consulting organisation, the institute was created in 1984 as a private and independent foundation willing to dynamise society through the analysis and development of sustainable projects. Over the past decades, the institute concentrated in the fields of economic geography, energy and the environment, as well as participated in important projects in commerce, R&D and innovation.
In the project Parc de l’Alba in Cerdanyola del Vallès (Barcelona), the institute developed theoretical and conceptual models for evaluating energy efficiency, worked on building energy certification procedures, on the definition of energy indicators, and on the development of a monitoring system for residential and tertiary building, which analyses the economic, environmental and social dimensions.
www.crever.urv.cat
www.icerda.es

258 259
chaPtEr 9aPPEnDicEs
CRF - CENTRO RICERCHE FIATCentro Ricerche FIAT is an industrial organisation that promotes, develops and tranfers innovation for the competitiveness of its clients and partners which include the different companies in the FIAT Group, automotive suppliers, companies from other sectors of industry, SMEs, and national and international research agencies. Priority areas of R&D include energy and the environment, safety and well-being, and sustainable growth. Increasingly over recent years, CRF has been an active participant in European, national and regional projects. CRF currently has approximately 980 employees.
The main role of CRF in the POLYCITY project was the development and implementation of an intelligent communal energy management system and the set-up of a communication plan for the Arquata district inhabitants.
AEMDAEM Distribuzione S.p.a. is part of IREN Group which operates in the energy infrastructure business area through the management, renovation and development of the distribution networks of electricity, gas and district heating, as well as the construction of gasification plants. Through a medium and low voltage network of 7200 kilometres in Parma and Turin, AEMD supplies electricity to over 710 000 end users. The volume of electricity distributed in 2010 reached about 4282 GWh.
In the technological services business area, AEMD and the IREN Group is active in the management of public lighting systems, traffic light systems, electrical and special systems, in the management of telecommunication infrastructure. In the public lighting service, the Group handles over 120 000 lighting installations in the cities of Turin, Genoa and Parma.
In the Arquata district, AEMD installed more then 800 meters in order to acquire consumption data from flats and condominium common areas, to monitor the solar panels installed on residential buildings and civilian building and to measure the total energy supplied to the Arquata district. After a process of validation AEMD sends validated data to the communal energy management system.
www.comune.torino.it
italyPOLITECNICO DI TORINO The Politecnico di Torino offers technical and scientific education. It promotes the ability to carry out theoretical or applied research. Education goes beyond a technical knowledge of engineering and architecture. Students acquire competence in the interdisciplinary nature of the various fields of the contemporary scientific world while still aware of the needs of people and society. 748 professors (full and associate professors, and researchers) and more than 600 persons work in the technical and administrative management. 22 000 students are enrolled and more than 600 courses are currently run.
The Dipartimento di Ingegneria Elettrica carries out research also in the field of energy savings achieved through “intelligent” redesign of user systems, full integration of renewable energies in urban areas, optimisation of smart and intelligent grids, integration of existing energy networks with the new distributed generation network, reduction of emission such as CO2 and NOx.
In the POLYCITY project Politecnico di Torino worked on the analysis and monitoring of a polygeneration system and user consumptions in the Arquata district, a photovoltaic facade and roof systems inside an urban electric grid has been studied with particular interest to power penetration. An optimisation procedure has been elaborated and proposed to the project partners which allows to manage the energy system according to single or multi-objective criteria. Politecnico di Torino also contributed to several measures of urban and social requalification, organised open workshops, round tables and a Winter School with the aim of promoting the share of knowledge in the field of sustainability.
CITY OF TURINComune di Torino is the municipal government of the City of Torino, the capital of the Piemonte region. In particular the Assessorato alle Politiche per la Casa e Sviluppo delle Periferie was involved in the project. Its responsibility covers the following areas: technical and administrative management of public buildings, chairmanship in the commission for the housing emergency, electrical and special plants and public lighting, development of projects for peripheral areas and programs for urban requalification.
ATC TORINOThe Agenzia Territoriale per la Casa della Provincia di Torino (ATC) is the Housing Authority of the Province of Torino, a public agency which has the social obligation to provide low-cost apartments for specific categories of low-income citizens, to manage and administer its own estates and the ones other Public Agencies entrust to it. ATC is involved in house building and plant engineering, project management and public works execution. ATC is responsible for the implementation of the rehabilitation measures in the Arquata district.
In the POLYCITY project ATC carried out the implementation of low emitting glazing, a solar shading system (integrated with the photovoltaic), insulation of thermal bridges, photovoltaic mono-christalline modules installed on the roofs of 11 council buildings and on the facades of the ATC building. Furthermore ATC installed a gas fired cogeneration plant that supplies the bulk of the district heating service and improved the insulation of the district network horizontal pipes connecting the primary to the secondary grids.
The rehabilitation of the Arquata building stock was combined with the difficult task of introducing district heating/cooling networks within a densely populated area.
www.atc.torino.it
www.crf.it
www.aemdistribuzione.torino.it
www.polito.it

260 261
aPPEnDicEs chaPtEr 9
PolandECBREC/IPIEOECBREC is a department within the Institute for Fuels and Renewable Energy (IPiEO), a research institute under the Polish Ministry of Economy. ECBREC/IPiEO’s mission is to stimulate development of bio-energy in Poland through research, development of innovative technologies, implementation of bio-energy projects, support in creation of policy framework at all levels. The institute cooperates with domestic industry, investors, independent suppliers of energy as well as power industry implementing bioenergy. IPiEO provides assistance to the government administration and to local governments in shaping the strategy and legislation regulating the use of renewable energy sources in Poland. The IPiEO participates in the transfer of scientific knowledge, pilot programmes and modern technical solutions implementation.
IPiEO has a multidisciplinary team joining experience from agricultural, forestry and energy sector. In the POLYCITY project IPiEO maintained an Eastern European associated community network and organised several training events. On 1st January 2011 IPiEO was incorporated into Automotive Industry Institute PIMOT.
canadaÉCOLE POLYTECHNIQUE MONTRÉALThe École Polytechnique Montréal is one of the three largest engineering schools in Canada, founded 1873. With a significant growth in research revenues, 40 % of which comes from private and public organisations, the school is one of Canada’s most active educational institutions involved in research. Over 200 members of Polytechnique’s faculty and 100 researchers are active in research in 15 industrial chairs and a number of Canada Research Chairs.
In the POLYCITY project, EPM worked on the integration of supply and demand, on the implantation of pulp and paper mill-based eco-industrial clusters incorporating forest bio-refinery units and district heating and on the efficient use of absortion cycles in industrial processes. The scientific staff from Polytechnique Montreal involved in the Polycity project are Professors Jean Paris and Robert Legros, Doctor Mariya Marinova and several students.
www.polymtl.ca
www.pimot.org.pl

262 263
chaPtEr 9aPPEnDicEs
list of tablEs, figUrEs anD charts
Multi-family residential buildings in Scharnhauser Park, Ostfildern, Germany 12
Expected total reduction in energy use (Source: Olivier Pol, AIT, Energy Department) 15
Pump room in ST-4, Cerandyola, Spain (Source: Synchrotron) 15
Arquata city quarter renovation during construction, Turin, Italy 18
Public spaces in Arquata district, Turin, Italy 24
Heating requirements and energy regulations for buildings in the Brussels Capital Region of Belgium 28
Heating requirements and energy regulations for buildings in Austria 29
Heating requirements and energy regulations for buildings in France 29
Specifications of the POLYCITY demo buildings in comparison to national regulations 30
Insulation and ventilation requirements in the Netherlands 31
Summary of regulations in the POLYCITY countries 31
Biomass gasification plant in Campo de Criptana (Ciudad Real, Spain) 35
PV installation mounted on the facade of the biomass cogeneration plant, Scharnhauser Park 38
Còrdova Street residential buildings at construction completion 42
Building specifications – demand 44
Master plan for the Scharnhauser Park development, with the POLYCITY buildings: 1) Jugendhaus – youth centre; 2) Stadthaus; and 3) Schule im Park - school building with sports hall 49
Interior, main circulation in the Stadthaus, Scharnhauser Park 50
Sports fields at the L-Quadrat youth centre, Scharnhauser Park 51
The Stadthaus in Scharnhauser Park 52
Development of the energy consumption in the Stadthaus 52
Main ventilation system in the Stadthaus, Scharnhauser Park 53
L-Quadrat youth centre in Scharnhauser Park 54
Control system for the three main circuit groups of the geothermal heat supply 55
The heat pump with monitoring system in the L-Quadrat 56
Electric consumption in L-Quadrat by type 57
Geothermal vertical holes comparing specific power with temperature 58
Coefficient of performance for the heat pump system, L-Quadrat youth centre 58
Comparison of primary energy, energy consumption and coefficient of performance for the heating and ventilation system in L-Quadrat youth centre 59
The performance on the primary side of the heat pump for an ordinary winter day (22 Feb 2011) 59
Monthly consumption data, 2006-2009 60
Interior of the sports centre, Schule im Park school building, Scharnhauser Park 61
ATC Office building in Arquata, Turin, Italy 63
Visualisation of measurement data and system states for the heating and cooling, Elektror building complex, Scharnhauser Park 65
Heating system output in comparison to inside and outside temperature 66
Elektror office building, main office tower, Scharnhauser Park 67
ATC office building in Arquata, Turin 69
Ventilation system in the ATC office buiding 71
The Synchrotron office and laboratory building under construction 73

264 265
chaPtEr 9aPPEnDicEs
Final energy use by sector in the EU, 2010 (Source Eurostat, 2010, www.eea.europa.eu/legal/copyright) 74
Residential building Còrdova Street 75
SWG buildings in Scharnhauser Park 77
Comparison between measured annual values and POLYCITY building energy specification (BEST) values 78
Monthly heating energy consumption data 78
Daily heating energy consumption 79
Hourly average profiles for the whole building (2009) 79
Annual electricity consumption for separate households 81
Average daily electricity consumption profiles, for four flats, January to April, 2010 81
SWG buildings in Scharnhauser Park 81
Summary of data for the SWG residential buildings 82
Heating energy consumption comparison of individual units per heating season in Arquata, Turin 85
Arquata residential building, Turin 87
The La Clota residential building under construction 89
Còrdova Street residential building 90
Energy supply specifications 92
Diagram of the biomass facility in Scharnhauser Park 96
Biomass wood chip combustion utilizing a grate furnace with 7 MW maximum thermal output 96
Biomass cogeneration plant, Scharnhauser Park 97
Optimisation measures for thermal efficiency in biomass cogeneration 99
Combustion efficiency as a function of heat output 99
Specific electricity demand of furnace fans 100
Exhaust gas temperature versus optimum 101
Measurements of the process parameters 103
Simple Clausius Rankine Cycle 104
Organic Rankine Cycle 105
Comparison of the Organic Rankine Cycle versus Clausius Rankine Cycle 107
Development of biomass fraction with the electrical output in percent 108
Hourly means of electrical output versus thermal input (2008) 108
The biomass cogeneration in Scharnhauser Park 109
Specific cool production for different solar thermal collector and thermal chiller technologies at the Technological Park of Cerdanyola del Vallès 111
Specific cost per MWh of chilled water production for different solar thermal collector and thermal chiller technologies at the Technological Park of Cerdanyola del Vallès 111
Energy production for cooling in comparison to total and electrical consumption of the pumps for Elektror, Scharnhauser Park by month 2009-2010 113
COP of the absorption chiller in Elektror, Scharnhauser Park 114
Cooling power of the thermal cooling plant in the ATC building, Arquata over 7 days 115
Diagrammatic plan of the district heating network in Scharnhauser Park 116
Total flow rate comparing simulated to measured values for the DHS, Scharnhauser Park 117
The supply temperature in the DHS, Scharnhauser Park 117
266 267
chaPtEr 9aPPEnDicEs
The return temperature of the DHS, Scharnhauser Park, comparing measured and simulated values 118
Flow rate compared to the pressure difference in the DHS, Scharnhauser Park 119
Comparison of different types of DHS 120
Energy balances of the solar assisted supply subsystem, based on area of collector 121
Comparison of the average supply temperature from the DHS with and without solar assisted supply systems 121
DHS piping being laid in Cerdanyola 121
Town square in Arquata 122
DHS piping being laid in Cerdanyola 125
Measured performance of the ST-4 plant over three typical days in 2010 126
Measured vs. estimated chilled water demand in Cerdanyola from November 2010 to May 2011 in 2 week periods 128
% used of installed capacity for chilled water comparing average vs. maximum at the ST-4 plant 128
The Synchrotron Building in 2009 in Cerdanyola 129
Measured vs. estimated hot water demand in Cerdanyola from November 2010 to May 2011 in 2 week periods 129
% used of installed capacity for hot water comparing average vs. maximum at the ST-4 plant 129
Electrical production of the three engines at the ST-4 plant 130
Hot water production of the boiler at the ST-4 plant 130
The efficiency figures for the three cogeneration engines in ST-4 in the monitored months between Nov 2010 and May 2011 131
The average COP for the single effect absorption chiller in ST-4 in the monitored months between Nov 2010 and May 2011 131
Chilled water production of the boiler at the ST-4 plant by the type of chiller 131
Comparison of the temperature in the chiller processes 132
Charge/ Discharge energy for the underground chilled water storage tank 132
Average values to estimate the energy losses for district cooling network 133
Supply and consumer chilled water temperatures (ºC) for 10 May 133
Power demand (kW) in the district grid 134
Flow rate in the district grid 134
The cogeneration engine at ST-4 135
Energy production and consumption for the CHP plant in the ATC building 137
The CHP engine in the ATC building 137
Diagram of a biomass gasification process and facility 138
The ST-4 power plant (aerial photograph) in Cerdanyola with the Synchrotron 140
Biomass gasification plant EQTEC in Cerdanyola del Vallès 142
Comparison of the three different possible systems for the biomass gasification plant 143
The ST-4 power plant under construction 145
AC energy produced by the 40 kW facility on the sports field change room building, Scharnhauser Park 146
The PV installation on the Park.Haus 147
Performance data of the PV facility on the Park.Haus 148
Sports field change rooms in Scharnhauser Park, Ostfildern 149
268 269
chaPtEr 9aPPEnDicEs
Screenshot of the online interface for the PV monitoring in Scharnhauser Park 150
The PV facility on the sports field change rooms 151
The ATC Building in Arquata with the facade PV plants 152
The electricity production from the PV plants on the ATC building 153
The electricity production from the PV plants on the council buildings building in Arquata 153
PV plant on the roof of a council building in Arquata 155
Optimisation indicators in a BMS 163
BMS structure in the Elektror building complex, Scharnhauser Park 164
BMS structure in the Elektror building complex, detail of the cooling system, Scharnhauser Park 166
Exemplary structure of a building management system 167
Elektror building in Scharnhauser Park 169
Summary of BMS products by application. 170
Visualisation of measurement data and system states for the heating and cooling, Elektror building complex, Scharnhauser Park 170
Elektror building in Scharnhauser Park 172
Schematic für using GIS technology for analysis of project related data 174
Comparison of total PV electricity potential (12% efficiency) and total electricity consumption 175
Subclassification of the roof potential for solar exploitation 175
Publication of the project related data using the POLYCITY website 176
Example of building data extraction 177
Simulated I(V) curves for SunTechnics 201F 180
Simulated efficiency curve for SMA SMC6000 along with input data 180
Example of electricity consumption, Stadthaus, Scharnhauser Park 182
School main heating, Scharnhauser Park, with monthly degree day corrections 183
Workflow of the data monitoring acquisition process 185
Data monitoring structure of the cogeneration plant 186
Solar panels, Scharnhauser Park 187
I-CEMS Function Organisation 188
Results of the MLP forecasting for 10 successive weekdays 190
Absorption chiller in the ST-4 Power Plant, Cerdanyola 192
Heating circuit for the residential units, Cerdanyola 193
Scharnhauser Park buildings during construction (2005) 197
Scenario overview for Scharnhauser Park 199
Energy mix (final energy) by scenario with renewable and conventional energy sources 199
Aerial photograph, Scharnhauser Park 200
Development of yearly GHG emissions by scenario 202
Development of yearly costs by scenario, with and without financial support 202
Various indicators and conflicting aims by scenario 203
Parameter variation of price development for energy source carriers (yearly costs 2025 with financial support) 203
Different energy supply scenarios for Parc de l’Alba 205
Configuration of the ST-4 and ST-2 plants 206
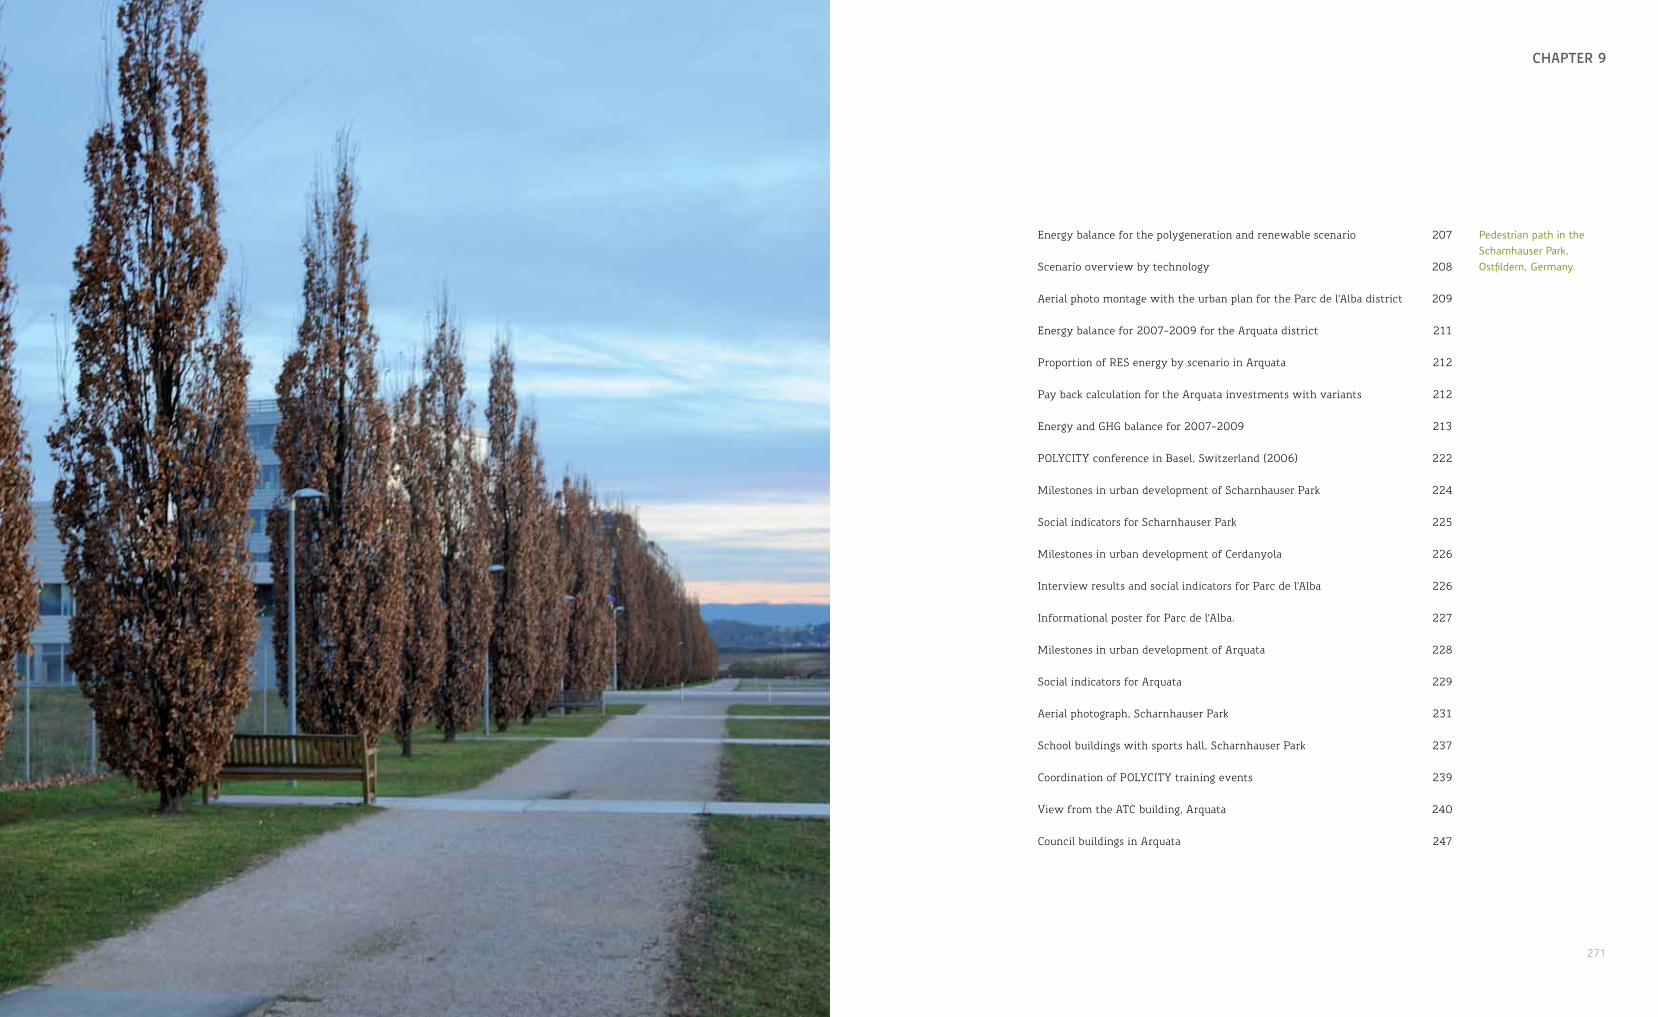
270 271
towarDs a sUstainablE commUnity chaPtEr 9
Energy balance for the polygeneration and renewable scenario 207
Scenario overview by technology 208
Aerial photo montage with the urban plan for the Parc de l’Alba district 209
Energy balance for 2007-2009 for the Arquata district 211
Proportion of RES energy by scenario in Arquata 212
Pay back calculation for the Arquata investments with variants 212
Energy and GHG balance for 2007-2009 213
POLYCITY conference in Basel, Switzerland (2006) 222
Milestones in urban development of Scharnhauser Park 224
Social indicators for Scharnhauser Park 225
Milestones in urban development of Cerdanyola 226
Interview results and social indicators for Parc de l’Alba 226
Informational poster for Parc de l’Alba. 227
Milestones in urban development of Arquata 228
Social indicators for Arquata 229
Aerial photograph, Scharnhauser Park 231
School buildings with sports hall, Scharnhauser Park 237
Coordination of POLYCITY training events 239
View from the ATC building, Arquata 240
Council buildings in Arquata 247
Pedestrian path in the Scharnhauser Park, Ostfildern, Germany.
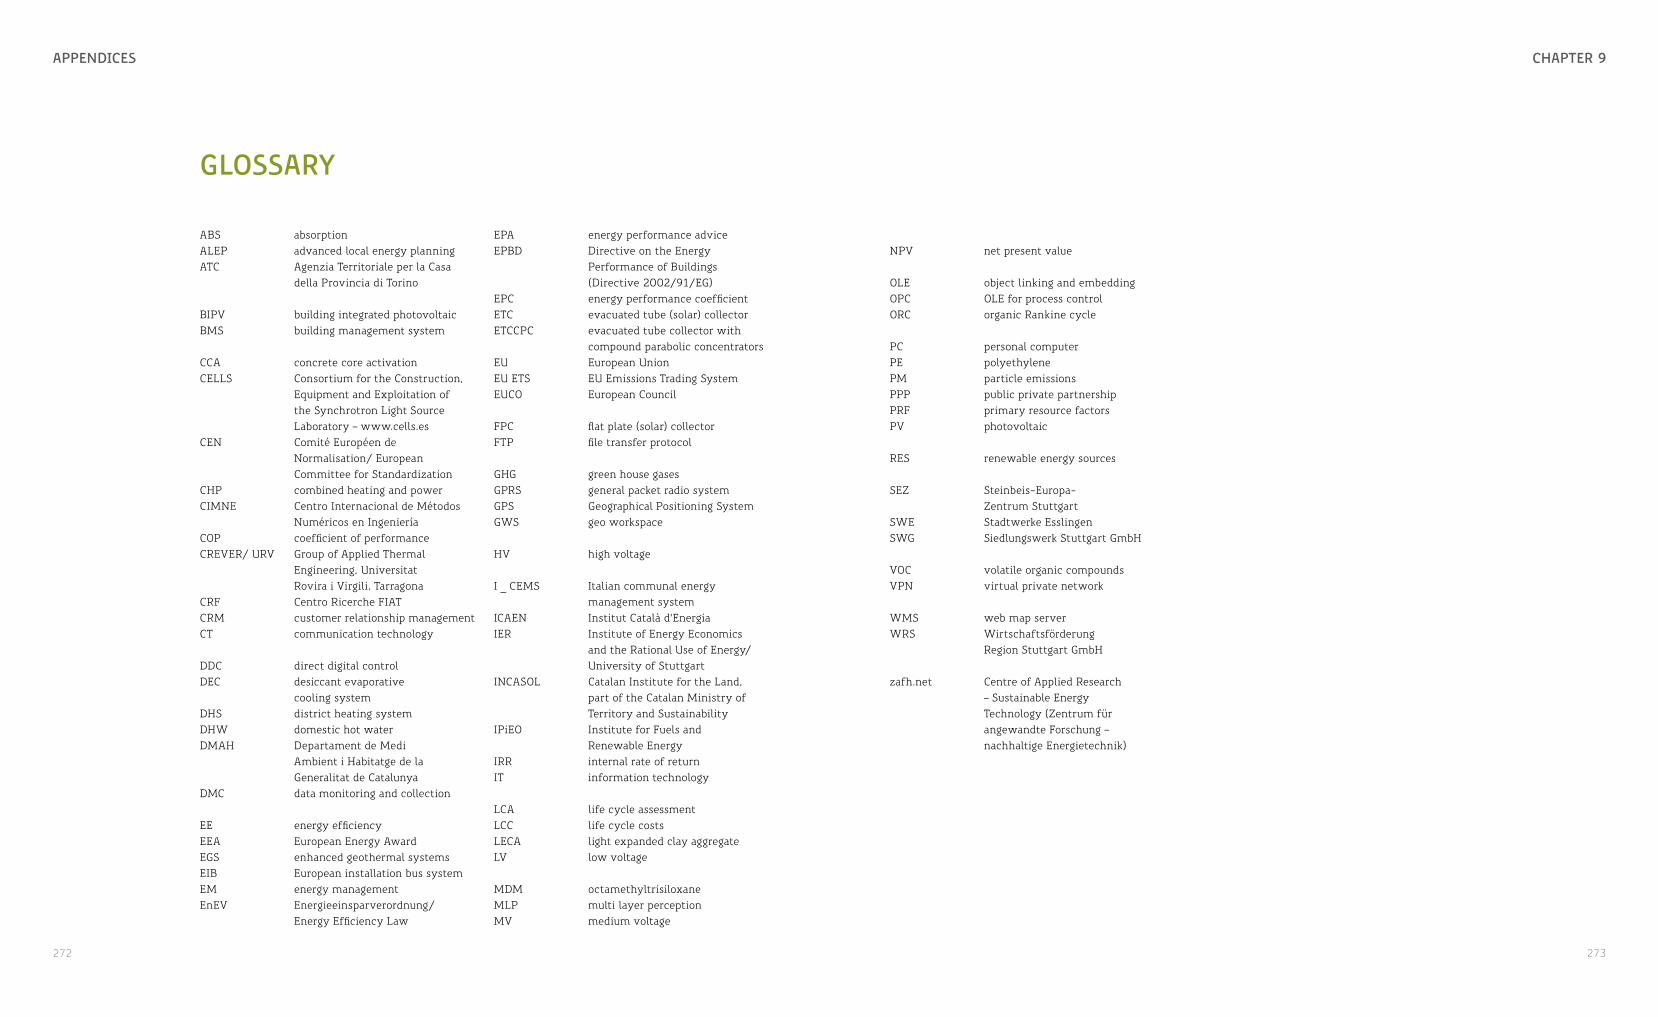
272 273
chaPtEr 9aPPEnDicEs
glossary
ABS absorptionALEP advanced local energy planningATC Agenzia Territoriale per la Casa
della Provincia di Torino
BIPV building integrated photovoltaicBMS building management system
CCA concrete core activationCELLS Consortium for the Construction,
Equipment and Exploitation of the Synchrotron Light Source Laboratory – www.cells.es
CEN Comité Européen de Normalisation/ European Committee for Standardization
CHP combined heating and powerCIMNE Centro Internacional de Métodos
Numéricos en IngenieríaCOP coefficient of performanceCREVER/ URV Group of Applied Thermal
Engineering, Universitat Rovira i Virgili, Tarragona
CRF Centro Ricerche FIATCRM customer relationship managementCT communication technology
DDC direct digital controlDEC desiccant evaporative
cooling systemDHS district heating systemDHW domestic hot water DMAH Departament de Medi
Ambient i Habitatge de la Generalitat de Catalunya
DMC data monitoring and collection
EE energy efficiency EEA European Energy AwardEGS enhanced geothermal systemsEIB European installation bus systemEM energy managementEnEV Energieeinsparverordnung/
Energy Efficiency Law
EPA energy performance adviceEPBD Directive on the Energy
Performance of Buildings (Directive 2002/91/EG)
EPC energy performance coefficientETC evacuated tube (solar) collectorETCCPC evacuated tube collector with
compound parabolic concentratorsEU European UnionEU ETS EU Emissions Trading SystemEUCO European Council
FPC flat plate (solar) collectorFTP file transfer protocol
GHG green house gasesGPRS general packet radio system GPS Geographical Positioning SystemGWS geo workspace
HV high voltage
I _ CEMS Italian communal energy management system
ICAEN Institut Català d’Energia IER Institute of Energy Economics
and the Rational Use of Energy/University of Stuttgart
INCASOL Catalan Institute for the Land, part of the Catalan Ministry of Territory and Sustainability
IPiEO Institute for Fuels and Renewable Energy
IRR internal rate of returnIT information technology
LCA life cycle assessmentLCC life cycle costsLECA light expanded clay aggregateLV low voltage
MDM octamethyltrisiloxaneMLP multi layer perceptionMV medium voltage
NPV net present value
OLE object linking and embeddingOPC OLE for process controlORC organic Rankine cycle
PC personal computerPE polyethylenePM particle emissionsPPP public private partnershipPRF primary resource factorsPV photovoltaic
RES renewable energy sources
SEZ Steinbeis-Europa-Zentrum Stuttgart
SWE Stadtwerke EsslingenSWG Siedlungswerk Stuttgart GmbH
VOC volatile organic compoundsVPN virtual private network
WMS web map serverWRS Wirtschaftsförderung
Region Stuttgart GmbH
zafh.net Centre of Applied Research – Sustainable Energy Technology (Zentrum für angewandte Forschung –nachhaltige Energietechnik)

274 275
chaPtEr 9aPPEnDicEs
sElEctED bibliograPhy
Alba Cells: http://www.cells.es/, last accessed in September 2010
APAT (Agenzia per la protezione dell’ambiente e per i servizi tecnici): Analisi dei fattori di emissione di CO2 dal settore dei trasporti”), Roma, 2003
APAT (Agenzia per la protezione dell’ambiente e per i servizi tecnici): Thermo-electric production emission factors – from Italian Greenhouse Gas Inventory 1990-2003, Roma, 2004
Bandera, E. Nodari, F. Anzioso: Analysis of the social aspects during the different POLYCITY applications, Polycity-Deliverable DD 4.7, 2009
Barton (ed.): Technical Synthesis Report Annexes 22 & 33 – Energy efficient communities & Advanced Local Energy Planning (ALEP), Hertfordshire, Faber Maunsell Ltd., 2005
BBSR (Federal Institute for Research on Building, Urban Affairs and Spatial Development): http://www.werkstatt-stadt.de/de/projekte/122/, updated February 2009, last accessed in August 2010
Bioenergy Regions: http://www.bioenergie-regionen.de/regionen/uebersichtskarte.html, last accessed in August 2010
BMU 2011: http://www.erneuerbare-energien.de/files/pdfs/allgemein/application/pdf/ee _ zeitreihe.pdf
Böhnisch, J. Deuschle, M. Nast, U. Pfenning: Nahwärmeversorgung und erneuerbare Energien im Gebäudebestand - Initiierung von Pilotprojekten in Baden-Württemberg, Hemmnisanalyse und Untersuchung der Einsatzbereiche, Stuttgart, 2006
Canova, C. Cavallero, F. Freschi, L. Giaccone, M. Tartaglia: Optimal Energy management, IEEE Industry Applications Magazine, March/April 2009, pp. 62-65
Canova, L. Giaccone, F. Spertino, M. Tartaglia: Electrical Impact of Photovoltaic Plant in Distributed Network, IEEE Transactions on Industry Applications, Vol. 45, No. 1, January/February 2009, pp. 34-347
CRF (Centro Ricerche Fiat): Report on methodology for energy performance assessment in the CONCERTO communities, Torino, Polycity-Deliverable DR 2.1a, 2007
Czöppan, Bürgerinitiativen gegen Windkraftanlagen – Mitglieder, Motive, Strategien, Freiburg, Diploma thesis, 2005
Duminil, J. Fink: Demonstrator thermal cooling ELEKTROR. Stuttgart, Esslingen, Polycity-Deliverable DD 2A.3, 2007
ec.europa.eu/energy/efficiency/buildings/buildings _ en.htm
EEA Briefing 4/2006 - Urban sprawl in Europe, European Council, 17 June 2010, Conclusions, EUCO 13/10
EPBD Buildings Platform - P068 _ EN _ Belgium (Flemish Region) March 2008, Implementation of the EPBD in the Flemish Region (Belgium)
EPBD Buildings Platform - P069 _ EN _ France _ March 2008, Implementation of the EPBD in France
EPBD Buildings Platform - P124 _ Austria _ June 2008, Implementation of the EPBD in Austria: Status and planning
EPBD Buildings Platform - P131 _ EN _ Netherlands _ June 2008, Implementation of the EPBD in The Netherlands
Erhart: Simulation data results for 2010-2025 CHP-plant operation, Stuttgart, zafh.net., 2008
Erhorn, H., Erhorn-Kluttig H., Schrade J., Schmidt G.-D.: Energetische Quartiersplanung: Methoden – Technologien – Praxisbeispiele, Fraunhofer Irb Verlag, 2011
Evans B., Joas M., Sundback S., Theobald K.: Governing Sustainable Cities, Earthscan London, 2005
Figueres, C. Dapena: Description of Parc de l’Alba Polygeneration system: A Large Scale Trigeneration System with District Heating and Cooling and Renewable Energy Sources, within the Spanish Polycity Project, Proceedings of the Polycity Final Conference, Stuttgart, 2010
Fink, A. Strzalka: Report on supply and demand profiles of the three sites, Esslingen, Stuttgart, Polycity-Deliverable DD 3.7, 2009
Fink: Demonstrator for clean biomass combustion in urban areas. Esslingen, DD 2A.1 – Polycity-Deliverable DD 2A.1, 2006b
Fink: Demonstrator hydropower, Esslingen, Polycity-Deliverable DD 2A.3, 2007
Fink: Feasibility study for thermal cooling system. Esslingen, Polycity-Deliverable DD 2A.2, 2006c
Fink: Operating data for Scharnhauser Park CHP-Plant. Data for the years 2005-2009. Esslingen, Stadtwerke Esslingen, 2010
Fink: Verbesserte Betriebsführung von Biomasse-Nahwärmesystemen mit Kraft-Wärme-Kopplung am Beispiel des Scharnhauser Parks. Ansbach, Diploma thesis, 2006a
GAMS, General Algebraic Modeling System: www.gams.com, last accessed 2010
IDAE (Instituto para la Diversificación y Ahorro de la Energía): Biomasa, Gasificación; Biomasa, Producción eléctrica y cogeneración, www.idae.es, last accessed 2010
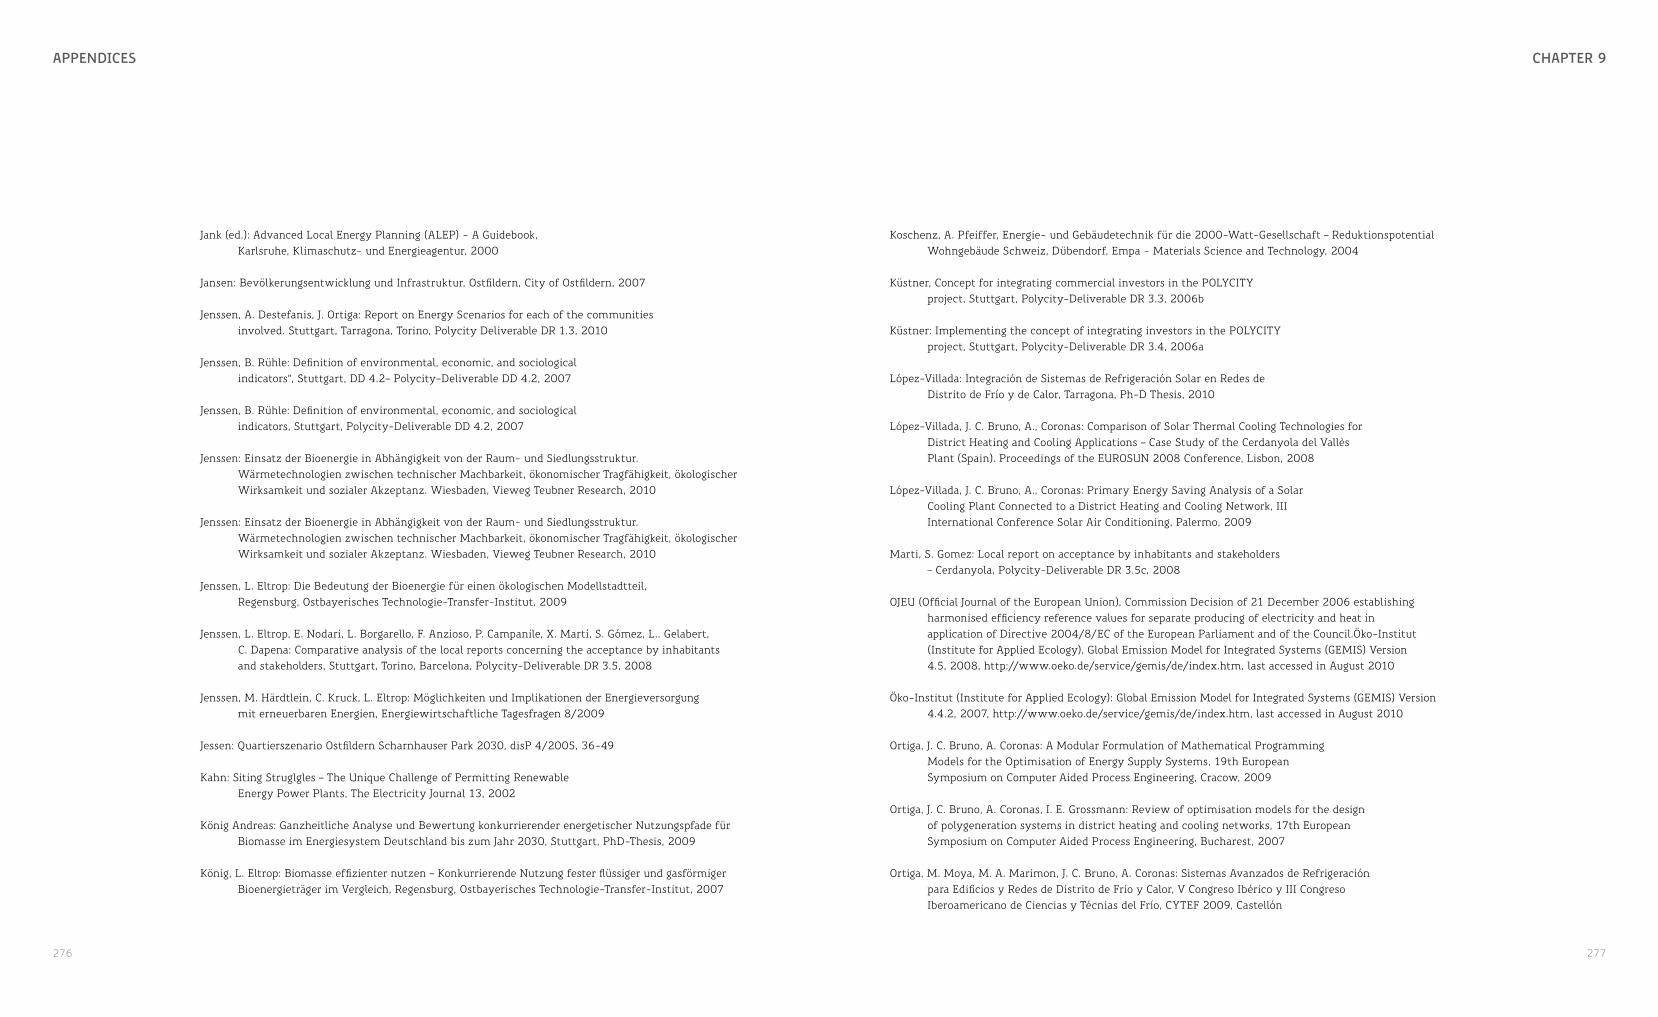
276 277
chaPtEr 9aPPEnDicEs
Jank (ed.): Advanced Local Energy Planning (ALEP) - A Guidebook, Karlsruhe, Klimaschutz- und Energieagentur, 2000
Jansen: Bevölkerungsentwicklung und Infrastruktur, Ostfildern, City of Ostfildern, 2007
Jenssen, A. Destefanis, J. Ortiga: Report on Energy Scenarios for each of the communities involved. Stuttgart, Tarragona, Torino, Polycity Deliverable DR 1.3, 2010
Jenssen, B. Rühle: Definition of environmental, economic, and sociological indicators”, Stuttgart, DD 4.2– Polycity-Deliverable DD 4.2, 2007
Jenssen, B. Rühle: Definition of environmental, economic, and sociological indicators, Stuttgart, Polycity-Deliverable DD 4.2, 2007
Jenssen: Einsatz der Bioenergie in Abhängigkeit von der Raum- und Siedlungsstruktur. Wärmetechnologien zwischen technischer Machbarkeit, ökonomischer Tragfähigkeit, ökologischer Wirksamkeit und sozialer Akzeptanz. Wiesbaden, Vieweg Teubner Research, 2010
Jenssen: Einsatz der Bioenergie in Abhängigkeit von der Raum- und Siedlungsstruktur. Wärmetechnologien zwischen technischer Machbarkeit, ökonomischer Tragfähigkeit, ökologischer Wirksamkeit und sozialer Akzeptanz. Wiesbaden, Vieweg Teubner Research, 2010
Jenssen, L. Eltrop: Die Bedeutung der Bioenergie für einen ökologischen Modellstadtteil, Regensburg, Ostbayerisches Technologie-Transfer-Institut, 2009
Jenssen, L. Eltrop, E. Nodari, L. Borgarello, F. Anzioso, P. Campanile, X. Martí, S. Gómez, L.. Gelabert, C. Dapena: Comparative analysis of the local reports concerning the acceptance by inhabitants and stakeholders, Stuttgart, Torino, Barcelona, Polycity-Deliverable DR 3.5, 2008
Jenssen, M. Härdtlein, C. Kruck, L. Eltrop: Möglichkeiten und Implikationen der Energieversorgung mit erneuerbaren Energien, Energiewirtschaftliche Tagesfragen 8/2009
Jessen: Quartierszenario Ostfildern Scharnhauser Park 2030, disP 4/2005, 36-49
Kahn: Siting Struglgles – The Unique Challenge of Permitting Renewable Energy Power Plants, The Electricity Journal 13, 2002
König Andreas: Ganzheitliche Analyse und Bewertung konkurrierender energetischer Nutzungspfade für Biomasse im Energiesystem Deutschland bis zum Jahr 2030, Stuttgart, PhD-Thesis, 2009
König, L. Eltrop: Biomasse effizienter nutzen – Konkurrierende Nutzung fester flüssiger und gasförmiger Bioenergieträger im Vergleich, Regensburg, Ostbayerisches Technologie-Transfer-Institut, 2007
Koschenz, A. Pfeiffer, Energie- und Gebäudetechnik für die 2000-Watt-Gesellschaft – Reduktionspotential Wohngebäude Schweiz, Dübendorf, Empa - Materials Science and Technology, 2004
Küstner, Concept for integrating commercial investors in the POLYCITY project, Stuttgart, Polycity-Deliverable DR 3.3, 2006b
Küstner: Implementing the concept of integrating investors in the POLYCITY project, Stuttgart, Polycity-Deliverable DR 3.4, 2006a
López-Villada: Integración de Sistemas de Refrigeración Solar en Redes de Distrito de Frío y de Calor, Tarragona, Ph-D Thesis, 2010
López-Villada, J. C. Bruno, A., Coronas: Comparison of Solar Thermal Cooling Technologies for District Heating and Cooling Applications – Case Study of the Cerdanyola del Vallès Plant (Spain). Proceedings of the EUROSUN 2008 Conference, Lisbon, 2008
López-Villada, J. C. Bruno, A., Coronas: Primary Energy Saving Analysis of a Solar Cooling Plant Connected to a District Heating and Cooling Network, III International Conference Solar Air Conditioning, Palermo, 2009
Marti, S. Gomez: Local report on acceptance by inhabitants and stakeholders – Cerdanyola, Polycity-Deliverable DR 3.5c, 2008
OJEU (Official Journal of the European Union), Commission Decision of 21 December 2006 establishing harmonised efficiency reference values for separate producing of electricity and heat in application of Directive 2004/8/EC of the European Parliament and of the Council.Öko-Institut (Institute for Applied Ecology), Global Emission Model for Integrated Systems (GEMIS) Version 4.5, 2008, http://www.oeko.de/service/gemis/de/index.htm, last accessed in August 2010
Öko-Institut (Institute for Applied Ecology): Global Emission Model for Integrated Systems (GEMIS) Version 4.4.2, 2007, http://www.oeko.de/service/gemis/de/index.htm, last accessed in August 2010
Ortiga, J. C. Bruno, A. Coronas: A Modular Formulation of Mathematical Programming Models for the Optimisation of Energy Supply Systems, 19th European Symposium on Computer Aided Process Engineering, Cracow, 2009
Ortiga, J. C. Bruno, A. Coronas, I. E. Grossmann: Review of optimisation models for the design of polygeneration systems in district heating and cooling networks, 17th European Symposium on Computer Aided Process Engineering, Bucharest, 2007
Ortiga, M. Moya, M. A. Marimon, J. C. Bruno, A. Coronas: Sistemas Avanzados de Refrigeración para Edificios y Redes de Distrito de Frío y Calor, V Congreso Ibérico y III Congreso Iberoamericano de Ciencias y Técnias del Frío, CYTEF 2009, Castellón

278 279
chaPtEr 9aPPEnDicEs
Ortiga: Modelling Environment for the Design and Optimisation of Energy Polygeneration Systems, Tarragona, Ph-D Thesis, 2010
Ostfildern, personal communication by Ms. Christa Kammermeier, September 22nd 2010
Ostfildern, Plakate zur Bürgerbeteiligung Scharnhauser Park - Konzept und Bausteine, http://weeberpartner.de/files/520 _ Ostfildern _ ScharnhauserPark _ Plakate.pdf , 2005, last accessed in August 2010
Paar, Angelika; Duscha, Markus; Hertle, Hans; Pehnt, Martin; Ramesohl, Stephan; Fischedick, Manfred; Irrek, Wolfgang; Merten, Frank: Vom Bioenergiedorf zur 2000-Watt-Gesellschaft – Energiepolitische Zielkonzepte im Spannungsfeld zwischen erneuerbaren Energien und Energieeffizienz. Heidelberg; Wuppertal: ifeu-Institut für Energie- und Umweltforschung; Wuppertal-Institut für Klima, Umwelt, Energie, 2007
Parc de l’Alba: http://www.parcdelalba.com/, last accessed in September 2010
Pfenning: Akzeptanz, Nutzung und Image neuer Energiesysteme, Stuttgart: presentation at the University of Stuttgart, 2007
Puig-Arnavat, J. C. Bruno, A. Coronas: Review and analysis of biomass gasification models, Renewable and Sustainable Energy Reviews, 14, 2010, 2841-2851
Roberta, E. Nodari, V. Albizzati: Refined evaluation framework, report and training of the local teams, Polycity-Deliverable DR 3.2, 2006
SEG (Limited Redevelopment and Development Company Ostfildern): dialog, Ostfildern, self published, 2008
Sinclair, R. Löfstedt: The influence of trust in a biomass plant application – the case study of Sutton, UK, Biomass & Bioenergy 21, 2001
Solar City: http://www.solarcity.org/, last accessed in August 2010
SWE (Stadtwerke Esslingen), personal communication by Mr. Marc Hagenloch, September 24nd 2010
UMWELTBUNDESAMT 2011: Der CO2-Rechner. Internet: http://uba.klima-aktiv.de/ umleitung _ uba.html, accessed on 3.6.2011
Upreti: Conflict over biomass energy development in the United Kingdom – some observations and lessons from England and Wales, Energy Policy 32, 2004
Van Staden M., Musco F.: Local Governments and Climate Change – Sustainable Energy Planning and Implementation in Small and Medium Sized Communities, Springer, 2010
Wolsink: Wind power and the NIMBY-myth: institutional capacity and the limited signicance of public support, Renewable Energy 21, 2000
www.epbd-ca.org/Medias/Pdf/EPBD _ BuPLa _ Country _ reports.pdf
www.lcube.eu.com/Euro _ Carbon _ Atlas/C23%20European%20Carbon%20Atlas.pdf