Towards statistical standards for children’s non economic work: A discussion based on household...
66
Towards statistical standards for children’s non economic work: a discussion based on household survey data L. Guarcello S. Lyon F. C. Rosati C. A. Valdivia May 2005 Understanding Children’s Work Project Working Paper Series, May 2005
-
Upload
mondodomani -
Category
Documents
-
view
3 -
download
0
Transcript of Towards statistical standards for children’s non economic work: A discussion based on household...

Towards statistical standards for children’s non economic work:
a discussion based on householdsurvey data
L. GuarcelloS. Lyon
F. C. RosatiC. A. Valdivia
May 2005
Und
erst
andi
ng C
hild
ren’
s Wor
k Pr
ojec
t Wor
king
Pap
er S
erie
s, M
ay 2
005


Towards statistical standards for children’s non economic work:
a discussion based on household survey data
L. Guarcello*
S. Lyon*
F. C. Rosati*
C. A. Valdivia*
Working Paper May 2005
Understanding Children’s Work (UCW) Project
University of Rome “Tor Vergata” Faculty of Economics
V. Columbia 2 00133 Rome Tor Vergata
Tel: +39 06.7259.5618 Fax: +39 06.2020.687
Email: [email protected] As part of broader efforts toward durable solutions to child labor, the International Labour Organization (ILO), the United Nations Children’s Fund (UNICEF), and the World Bank initiated the interagency Understanding Children’s Work (UCW) project in December 2000. The project is guided by the Oslo Agenda for Action, which laid out the priorities for the international community in the fight against child labor. Through a variety of data collection, research, and assessment activities, the UCW project is broadly directed toward improving understanding of child labor, its causes and effects, how it can be measured, and effective policies for addressing it. For further information, see the project website at www.ucw-project.org. This paper is part of the research carried out within UCW (Understanding Children's Work), a joint ILO, World Bank and UNICEF project. The views expressed here are those of the authors' and should not be attributed to the ILO, the World Bank, UNICEF or any of these agencies’ member countries.
* UCW-Project and University of Rome “Tor Vergata”

Towards statistical standards for children’s non economic work:
a discussion based on household survey data
Working Paper May 2005
ABSTRACT
The current study forms part of a broader research effort directed towards arriving eventually at an internationally acceptable consensus on the statistical definition of child labour. It looks specifically at children’s non-market activity, its classification (i.e., economic or non-economic), its impact on health and education outcomes, and at some of the issues linked to the inclusion of non-market activity in the definition of child labour. The study should be seen as an initial contribution to the discussion, aimed at raising key measurement questions requiring further investigation and deliberation.

Towards statistical standards for children’s non economic work:
a discussion based on household survey data
Working Paper May 2005
CONTENTS
1. Introduction ................................................................................................... 1
2. Data sources ................................................................................................... 3
3. Children’s non-economic activity: a review of concepts and current research .. 4
3.1 Non-Market Household Production .......................................................... 4 3.2 SNA and Non-SNA Activities ................................................................... 7 3.3 Children’s Non-Market Household Activities: Current Research ............... 9
4. Measurement of children’s non-economic work ........................................... 12
4.1 Accounting for non-market economic activity ............................................. 12 4.2 Revised estimates of economic and non-economic activity ...................... 14 4.3 Summary ................................................................................................. 18
5. Empirical evidence on the impact of children’s non-market activity on health outcomes ..................................................................................................... 19
5.1 Introduction ............................................................................................ 19 5.2 Involvement in non-economic activity and health: Descriptive evidence . 19 5.3 Involvement in non-economic activity and health: Causal links ............... 21
5.3.1 Variable definitions .................................................................................... 22 5.3.2 Estimation results: Cambodia .................................................................. 24 5.3.3 Estimation results: Guatemala ................................................................. 25 5.3.4 Summary ...................................................................................................... 28
6. Empirical evidence on the impact of children’s non-economic activity on educational outcomes ................................................................................... 30
6.1 Introduction ............................................................................................ 30

6.2 Involvement in non-economic activity and schooling: Descriptive evidence . 31 6.3 Involvement in non-economic activity and school attendance: Identifying
causal links in China using CHNS data ................................................... 32 6.4 Involvement in non-economic activity and school attendance: Synthetic
indicators based on effective working hours ........................................... 34 6.4.1 Estimation approach ................................................................................. 35 6.4.2 Estimation results: Guatemala ................................................................. 37 6.4.3 Estimation results: Cambodia .................................................................. 41 6.4.4 Estimation results: Senegal ....................................................................... 44
6.5 Summary ................................................................................................. 48 7. Incorporating children’s non-economic activity into the estimation of child
labour ........................................................................................................... 50
7.1 Child labour estimates based on hours thresholds for non-economic activity 50 7.2 Child labour estimates based on “effective working hours” ..................... 51
8. Discussion and conclusion ............................................................................ 52
References ................................................................................................................ 55


1 UCW WORKING PAPER SERIES, MAY 2005
1. INTRODUCTION 1. The UN Convention on the Rights of the Child and ILO Convention No. 182 (Worst Forms), two of the main international legal instruments relating to child labour, both recognise children’s right to be protected from forms of work that adversely affect their health and development, regardless of whether this work is economic or non-economic, market or non-market, in nature.1 But these norms have not been translated into a universally-accepted statistical definition of child labour. Widely differing positions prevail among researchers about what kind of activities performed by children should be classified as children’s work, and progressively, as child labour. 2. At one end of the range, some take the view that all non-school and non-leisure activities of children constitute child labour. From this perspective, child labour would include light work after school in a household enterprise, or even help in domestic chores such as home cleaning or looking after a younger sibling. Others adopt a more stringent view and assert that child labour should include only those economic activities that deny a child the possibility of normal development into a responsible adult, such as, strenuous and/or hazardous employment in economic activities by younger children, and children in worst forms of child labour (WFCL). 3. As a result, a wide variety of terms of statistical definitions and measures are employed in the child labour literature and in UN documentation on child labour, obscuring the precise nature of the problem and complicating efforts to address it. 4. The current study forms part of a broader research effort directed towards arriving eventually at an internationally acceptable consensus on the statistical definition of child labour. It looks specifically at children’s non-market activity, its classification (i.e., economic or non-economic), its impact on health and education outcomes, and at some of the issues linked to the inclusion of non-market activity in the definition of child labour. The study should be seen as an initial contribution to the discussion, aimed at raising key measurement questions requiring further investigation and deliberation. 5. The study is structured as follows. Section 2 briefly discusses data requirements and constraints, criteria applied for selecting the countries included in the analysis, and the main characteristics of the survey datasets used. Section 3 reviews concepts and current research in the area of children’s non-economic activity, and serves as a background for the sections that follow. 6. Section 4 focuses looks at the statistical definition of children’s non-economic “work”. It presents revised estimates of children’s economic and non-economic work involvement based on a more accurate separation of those non-market activities that fall within the SNA2 production boundary and those that do not.
1 The UN Convention on the Rights of the Child (CRC) recognises children’s right to be protected from forms of work that are likely to be hazardous or to interfere with children’s education, or to be harmful to children’s health or physical, mental, spiritual, moral or social development. Activities targeted by ILO Convention No. 182 as worst forms include any activity or occupation, which, by its nature or type, has, or leads to, adverse affects on the child’s safety, health (physical or mental), and moral development. 2 United Nations System of National Accounts.

2
TOWARDS STATISTICAL STANDARDS FOR CHILDREN’S NON ECONOMIC WORK. A DISCUSSION BASED ON HOUSEHOLD SURVEY DATA.
7. Section 5 looks at the impact of children’s market and non-market activity on child health outcomes. Descriptive evidence is first presented on two child health indicators – occurrence rate of injury/illness and incidence density – each broken down by the type of children’s work activity (i.e. market, non-market, or both). Marginal effects after a logit estimate are then calculated in an attempt to determine the impact of additional hours in market and non-market activity on probability of self-reported illness and/or injury. Measurement difficulties encountered in attempting to establish causal links between children’s work and health outcomes are also briefly discussed. 8. Section 6 examines how children’s involvement in market and non-market activity affects their ability to attend and succeed in school. Descriptive evidence is presented on two education indicators – school attendance rate and grade repetition rate – each again broken down by the type of children’s work activity (i.e. market, non-market, or both). Panel data from China is then exploited in attempting to identify causality conditioning current behaviour in terms of schooling to past behaviour in terms of hours of non-market activity. Both conditional fixed-effects and random logistic regressions are estimated to determine the extent to which hours spent in non-market activity affects the probability of school attendance. 9. For additional countries where panel data is lacking, synthetic indicators (based on logit regressions) are developed to describe the probabilistic link between hours of work and schooling. An experimental approach is proposed for estimating total ‘effective working hours’, i.e., an approach for combining hours spent on market and non-market activity based on the relative impact of each on children’s schooling. This approach enables the assessment of the total effort exerted by children in various (market and non-market) work activities on a single ‘child work’ scale that has effective ‘hours of work’ as the measurement unit. 10. Section 7 addresses the quantification of child labour when non-market activity is also considered. The data are used to test how different hours thresholds and different definitions for non-economic work influence child labour estimates. Critical threshold regions, i.e., threshold value or values for which the largest changes in the non-economic work and child labour indicators are observed, are identified. For a subset of countries, the data is also used to empirically verify computational procedures by which hours spent on market and non-market activity may be combined as “effective hours of work”, following the experimental approach described in Section 4. The concept of effective working hours is then applied in revising estimates of child labour.

3 UCW WORKING PAPER SERIES, MAY 2005
2. DATA SOURCES 11. The study draws on household survey data from five countries: Cambodia; China; Ghana; Guatemala; and India. Table 1 lists the main characteristics of each of the five surveys. Table 2 presents the data requirements for the indicators and analyses developed in the study, juxtaposed against the information contained in the different survey datasets. The table illustrates the fact that no single dataset contains all the information required for the indicators and analyses developed in the study. For this reason, it was not possible to use the same datasets across all study components. Rather, the study utilises different sets of information depending the nature of the analysis carried out. Table 1. - Survey characteristics
Country Survey name Survey type Reference period Sample size (household)
Cambodia Cambodia Child Labour Survey SIMPOCe 2001 12000
China China Economic, Population, Nutrition and Health Survey Household Survey 1989-91-93 3800
Ghana Ghana Living Standard Survey LSMS 1998/99 5998
Guatemala Encuesta de Condiciones de Vida (ENCOVI) SIMPOC/LSMS 2000 7,276
India National Sample Survey (NSS) Integrated Survey 2000 165,244
Table 2. - Information requirements and availability, by survey
Survey
Info. Requirement(1) Indicator
Market activity
Housework(
2) Non-market economic activity(3)
Working hours
housework
Working hours non-
market economic
activity
School attendance
Reported illness/injur
y
Cambodia
Revised eco-/non-econ. work rate
Schooling effects
Health effects
Guatemala
Revised eco-/non-econ. work rate
Schooling effects
Health effects
Ghana
Revised eco-/non-econ. work rate
Schooling effects
Health effects
India
Revised eco-/non-econ. work rate
Schooling effects
Health effects
Notes: (1) Shaded areas denote information required for each indicator. (2) Housework is defined as household activities performed by household members in service to the household and its members, and is therefore work that is non-market and non-economic (see main text and Table 7 for further discussion of terminology. (3) With the exception of India, information on non-market economic activity is limited to water fetching and fuel wood collection.

4
TOWARDS STATISTICAL STANDARDS FOR CHILDREN’S NON ECONOMIC WORK. A DISCUSSION BASED ON HOUSEHOLD SURVEY DATA.
3. CHILDREN’S NON-ECONOMIC ACTIVITY: A REVIEW OF CONCEPTS AND CURRENT RESEARCH
3.1 Non-Market Household Production
12. Non-market household production is the production of goods and services by the members of a household, for their own consumption, using their own capital and their own unpaid labour. Non-market household production plays a vital role in the economies of all countries, since many goods and services are not obtained on the market, but are produced by unpaid work done within a home and are consumed within the household, instead of being sold on the market. This is particularly true for developing countries, where the geographic separation between home and work often does not exist and household production covers a very large part of the economy. 13. Economics theory generally focuses on households as consumers rather than productive units using their own labour and capital. However, comparing the household to a productive unit, instead of restricting it to a consuming unit, is conceptually correct; households have always combined labour, capital goods and intermediate goods to produce what is required to satisfy their needs. In fact, the market does not supply the final good consumed by the household. Albeit at different rates, each good or services consumed by the household is produced by a combination of good bought in the market, labour and capital of the household. In the mid 1960s a major theoretical development took place, known as the “new household economics" (Becker, 1981; Ironmonger, 1972; Lancaster, 1971). This theory regards the household as a productive sector with household activities modelled as a set of industries providing goods and services. Household production can be considered as the production of goods and services by a separate economy, complementary to and competitive with the market economy. The process of household production involves the transformation of intermediate commodities (for example, electricity) into final consumption commodities (meals and clean clothes) which households produce by using their own capital (for example, kitchen equipment) and their own labour (hours spent in cooking, laundry, etc.). Subsistence production, which includes activities very common in developing countries, such as collecting wood and water, fishing, growing vegetables and other food, making clothing, fits the definition of household production when the goods are used within the household that produced them. Measures of national income should include the values of the final goods and services consumed by the household and hence attribute a value not only to good and services exchanged in the market but also to those produced directly by the households. 14. Since the 1970s there’s been a growing interest in the macroeconomic magnitude of the household economy. It has been estimated that by incorporating unpaid household work and subsistence agriculture into national accounts the amount of global production would increase by a third (United Nations Development Programme, 1990). Studies show that unpaid work in households is of the same magnitude as paid work in the market. For example, surveys across 12 OECD countries, covering various years from 1985 to 1992, show that the mean time spent in paid and unpaid work were respectively 24 hours and 26 hours per adult per week (Goldschmidt-Clermont and Pagnossin-Aligisakis, 1995).

5 UCW WORKING PAPER SERIES, MAY 2005
15. It has been proposed that the total economic value added by households should be named Gross Household Product (GHP) (Eisner, 1989; Ironmonger, 1996). 16. The UNSNA (United Nations System of National Accounts), SNA for short, is the set of accounts which national governments compile routinely to track the activities of their economies. SNA data are used to calculate major economic indicators, including Gross Domestic Product (GDP) and Gross National Product (GNP). The SNA has been much criticised for failing to include in GDP and GNP estimates of the value that is added by household productive activities for use of their own members. Aggregates which only take into account market output are not accurate indicators of economic growth and overall standard of living in any one country and most of all in developing countries. The incorporation of non-market activity into the national statistics is especially important to developing countries, as the aid to these countries is usually based on economic statistics of work and production that leave out household production and subsistence agriculture. In certain cases this has led to poor development planning; for example, programmes which benefit only the people who are included in the statistics, that is, only economically active people, such as agricultural extension programmes which do not include subsistence farmers. 17. Several development organizations have started recognizing these problems. The World Bank has begun to pay attention to subsistence agriculture when investing in agriculture. The United Nations Development Programme introduced the Human Development Reports starting in 1990, in which the UNDP claims that the traditional measures of economic development based on GNP and GDP are insufficient for determining the human development of all societies. Furthermore, GDP has been widely criticised for failing to account adequately for women’s economic participation. 18. As a response to such criticisms, the UN Statistical Commission, in the 1993 revision of the SNA, has recommended that national statistical offices prepare accounts for economic activities outside the presently defined production boundary, that is, “satellite” accounts, separate but consistent with the main SNA accounts of the market economy. Among them is the Household Satellite Accounts, which has the aim of providing an overall picture of the productive activities performed by households and of giving an estimate of the value of household production. Work to develop Household National Accounts, to measure and value the unpaid goods and services produced by households, is now going on in a number of national statistical offices, for example in Australia, Canada, Finland, Germany, Norway and Sweden (Ironmonger, 1996). 19. The concept of production in the household satellite is broader than in SNA; it applies the so-called general production boundary, which covers all production of goods and services both in the market and in households. The SNA production boundary includes all household production of goods, whether sold or not, but it excludes household production of services, this way ignoring the unpaid work of many women and children. Since 1993, the SNA production boundary includes the fetching of fuel and water, time-consuming activities which are thought to account for significant amounts of the time of rural women and children. This represents a progress in gender-terms. The Platform for Action of the 1995 Beijing Women’s Conference has reiterated the need to estimate women’s work more fully, especially their unpaid work.

6
TOWARDS STATISTICAL STANDARDS FOR CHILDREN’S NON ECONOMIC WORK. A DISCUSSION BASED ON HOUSEHOLD SURVEY DATA.
Table 3. - Measuring Household Production
The household economy can be “viewed” from an input or from an output “angle”, or from both: 1) Input method: This method regards the household as a source of labour input and is based on time-use studies. Time-use studies capture work inside the household, by assessing how the individuals spend time on a daily or weekly basis. Non monetary measures of household work, which measure household work in number of hours, present certain advantages; they allow direct comparison between total quantities of work supplied in the market and household sectors, since the unit of measure (the hour of work) is common to both, and they facilitate the process of giving an order of magnitude to household work. Regarding monetary measures of household work, there are different ways of attributing a shadow price to unpaid household labour and of conferring a money value to it. One approach consists in measuring a foregone expense, by evaluating what it would cost to hire and pay someone else to do the work (Chadeau, 1985). The foregone expense measures expenditures saved by performing the work oneself and may be valued by multiplying time spent on housework by an observed market wage rate. Two
alternatives are possible: the wage rate may be that of a housekeeper performing all household tasks ("an overall substitute”) or alternatively, wage rates may be differentiated according to tasks accomplished (“specialized substitutes”). The second alternative consists in measuring the foregone wage, by evaluating the money income each person would have earned if, instead of spending a certain number of hours on unpaid household work, he/she had spent the same amount of time working on the market for a wage. Here again two alternatives are possible: the wage rate may be that of a domestic servant or alternatively, the wage rate may be the one the person engaged in housework is entitled to expect on the market considering his/her qualifications. This method, is referred to as "opportunity cost" when values are net of taxes and social security contributions. Another method is based on the assumption that the value of time also includes social security contributions, since they open up a right to benefits in the future, and incorporates them in the measurement of potential earnings.
2) Output method: This method regards the household as a full scale producing unit, which provides housing/accommodation, meals/nutrition, clean clothes, transport, child and adult care and voluntary work, and not just as a source of labour input. Household outputs can be directly counted using personal consumption diaries, which count what the household produces, rather than the time spent on productive activities. Many household activities are considered “ancillary” activities, for which outputs need not be counted, making the measurement of household outputs a more
manageable task. The value of the household output can then be calculated by multiplying the amount of output by the market price of the market equivalent of that output. Specifically, household output is valued using the price of market substitutes. From household output, actual household expenditure on intermediate consumption and capital consumption is subtracted. A net added value by unpaid household labour is thus derived and it measures the "imputed income generated by unpaid household work”.
Choice of a market substitute for household output [Evaluation of household output at market price] minus Actual household expenditure incurred by the productive process
(non- or semi-durable market goods or services) [Evaluation of intermediate consumption]
minus Net interest paid out on loans contracted to acquire dwellings and
durable equipment [Treated here as a production cost]
minus Capital consumption of household equipment [Depreciation of capital goods] equals Imputed income of unpaid household labour [Estimation of net value added by unpaid household labour] including Fictitious VAT which would be levied on equivalent market transactions 3) Input-output method: Data on outputs of household production can complement data on inputs of unpaid labour and the use of household capital. The input-output approach to measuring and modelling the industries of the market economy associated with the work of Wassily Leontief (1941) has been applied to measuring and modelling the industries of the household economy. This was started for Australian
households (Ironmonger 1989). Input-output tables showing the uses of labour, capital, energy and materials in each of the main and ancillary industries of the household economy have now been prepared for Australia, Canada, Finland, Norway and the United States. The following table, adapted from the first published household input-output table, is for the Australian household economy.
Household productive activities, Australia, 1975-76 $million INPUT OUTPUT
Intermediate Inputs Factors of Production TOTAL Materials Energy Labour Capital
Meal preparation 6 219 144 7 922 1 140 15 425 Cleaning and laundry 271 32 8140 813 9 256 Childcare 1208 187 4 717 588 6 700 Shopping 745 224 4 969 453 6 390 Repairs and maintenance 483 7 1825 283 2 599 Other domestic work 362 7 1743 172 2 283 Education and community 392 8 2 088 122 2 609 Gardening 46 - 1 496 182 1 725 TOTAL 9 726 609 32 900 3 753 46 986 Source: Ironmonger D, Sonius E 1989 Household productive activities. In: Ironmonger D (ed.), Households Work Allen & Unwin, Sydney Table 2.3 p.30
These methods all present drawbacks, which restrict the possibility of international comparisons. In particular, they are based on actual standards of production and social protection, existing price systems, which differ from one country to another. Furthermore, when different evaluation methods are applied to the same set of data, results appear very sensitive to the method used, making it hazardous to simply sum up market and non-market aggregates. To date, time-use studies are the most valuable source of information on household activities, but they present a limit, because they omit the contribution from non human capital (land, dwellings and equipment owned by households).
Statistical data on the nature and volume of household output remain scarce; only few surveys of the household production outputs appear to have been undertaken. The output approach, because of the more comprehensive representation it gives of economic interaction between market and household sectors, may appear superior to the time input approach. It has been accepted that a complete input-output method gives the most accurate picture of the household economy. The household input-output tables are exactly the satellite accounts that have been recommended in the 1993 revision of the SNA.

7 UCW WORKING PAPER SERIES, MAY 2005
21. A variety of time-use surveys, time-use questionnaires, direct observations, detailed time-use diaries, are among the techniques that have been used to gather data on “non-market” work in the household sector. Time-use surveys have been developed in a systematic way since the 1960’s, when the sociologist Szalai (1972) organized a cross-national time budget study in 12 countries under the sponsorship of UNESCO and the International Social Science Council. Since then, national statistical offices in many OECD countries have used the Szalai methodology collecting diary-based national surveys of time use from representative samples of households. Time-use studies are now being conducted mainly in developed regions, but interest in these studies is also growing in developing countries, where numerous time-use studies have been undertaken, even if small and restricted to single or a few localities. The National Statistical Offices of several countries have produced estimates of time spent on household work and of household production based on their time use surveys (Australia, Austria, Canada, Sweden, Italy, Finland, Norway, Germany, Denmark, New Zealand, France, Netherlands) . Time-use studies have found also other applications in this field. In the UK, the net value added by households measured in the UK Household Satellite Account (experimental) for the year 2000 was linked to data from the UK 2000 Time Use Survey to calculate an hourly effective return to labour. Other surveys, like the National Sample Survey of India, provide information that allow to identify individual carrying out non-market economic activity.
3.2 SNA and Non-SNA Activities 22. Above we have discussed concepts relating to non-market household production and illustrated different methods for estimating the contribution of household production to the economy, in order to provide a comprehensive picture of the issues related to the household economy. The current study focuses on children’s participation in non-market household activities. We will therefore proceed with an issue of particular relevance to the present study; the identification of which non-market activities are economic and fall into the SNA production boundary and which do not. 23. To do this, we will consider the UN International Trial Classification System. In the time-use context, an activity is considered whatever activity an individual spends time on. There is a distinction between productive activities and personal activities. Productive activities are those whose performance can be delegated to another person with the same desired results (the production of all goods and the provision of services to others, within or outside the individual’s household).3 24. Internationally, there are several existing activity classification systems (Eurostat Classification System, Australian Classification System, UN International Trial Classification System, etc.). According to the UN International Trial Classification System, based on the SNA and consistent with other existing classification systems and concepts,4 activities are classified into 3 Personal activities instead cannot be delegated to another person without precluding the achievement of the desired effects (as eating, drinking, sleeping etc). A method used to distinguish between productive and non-productive activities is the often used “third person principle”, according to which an activity is productive if it may be delegated to a paid worker (Reid, 1934). 4 Namely the concept of economic activity, which is related to the SNA and the occupational and industrial classifications, International Standard Classification of Occupations (ISCO) and International Standard Industrial Classification (ISIC).

8
TOWARDS STATISTICAL STANDARDS FOR CHILDREN’S NON ECONOMIC WORK. A DISCUSSION BASED ON HOUSEHOLD SURVEY DATA.
four conceptual categories and ten major activity groups, as shown in Table 4 below. Table 4. - Activity classification according to UN International Trial Classification System
Activity category Activity group
A. SNA (productive and economic) activities 1. Market-oriented economic activities 2. Non-market economic activities within SNA production boundary
B. Non-SNA (productive but non-economic) activities
3. Housework 4. Child and family care - care of children, the sick, disabled and elderly 5. Shopping for (household) goods and services 6. Community service and organizational volunteer work
C. Personal (non-productive) activities-
7. Education, training and study 8. Social, arts and culture (media use) 9. Personal care, religion and personal maintenance
D. Travel and residual 10. Travel
Source: United Nations Secretariat, 1997
25. Activities which fall within the production boundary of the SNA include (i) market production; and (ii) non-market economic production. Market production and market-oriented economic activities involve activities leading to the production of goods and services which are intended for sale or are sold on the market. Some of the outputs from market production may be retained for own consumption or capital formation. 26. When most of the goods are retained for own consumption, the production is classified as non-market. Activities performed by the members of the household are classified as non-market activities within SNA production boundary when intended primarily to produce goods for own final consumption, including own-account production of goods and own-account construction and substantial repair services by owners of dwellings (see Table 5). Table 5. - Non-market activities within the SNA production boundary
Activity type Activities
1. Own-account production of goods The production of agricultural products and their subsequent storage; the gathering of berries or other uncultivated crops; forestry; wood-cutting and the collection of firewood; hunting and fishing; The production of other primary products such as mining salt, cutting peat, the supply of water, etc. The processing of agricultural products; the production of grain by threshing; the production of flour by milling; the curing of skins and the production of leather; the production and preservation of meat and fish products, the preservation of fruit by drying, bottling, etc.; the production of dairy products such as butter or cheese; the production of beer, wine, or spirits; the production of baskets or mats; etc.; Other kinds of processing such as weaving cloth; dressmaking and tailoring; the production of footwear; the production of pottery, utensils or durables; making furniture.
2. Own-account construction and substantial repair services by owners of dwellings
replastering of walls; repairing of roofs; and major renovations or extensions to dwellings.
Source: Commission of the European Communities and others, 1993; para. 6.27.
27. We can observe that also water and fuel collection are included, which are relevant activities in most developing countries. The production of domestic and personal services for consumption within the same household, such as the preparation of meals, care of children, cleaning, repairs, are within the SNA production boundary only if produced by employing paid domestic staff. 28. All activities which fall outside the SNA production boundary are considered non-economic activities. This includes the category of housework,

9 UCW WORKING PAPER SERIES, MAY 2005
comprising activities performed by members of the household for the general consumption of or in service to the household and its members. Housework activities include: cooking/washing up; indoor cleaning and upkeep of abode; care of textiles; installation, servicing and repair of personal and household goods; outdoor cleaning and upkeep of surroundings; home improvements, maintenance and repair; and pet care. 29. Productive and non-economic activities also include the care of family members (i.e., of children, sick, elderly people) and shopping (time invested in searching for and purchasing household goods and services, whether or not purchases are made). Travel can be classified within the same group as the activity for which it was required, or alternatively all travel activities can be presented under one category, irrespective of the activity to which it is related.
3.3 Children’s Non-Market Household Activities: Current Research 30. Several studies highlight that in developing countries children (especially girls) are largely involved in non-market household activities. Non-market household activities consist on one hand in the production of certain goods which are to be consumed by the household and on the other hand in non-market service activities which include household chores, small repairs and the care of children, disabled, sick and elderly. Most studies which deal with non-market household activities refer to “housework” and rarely define such concept explicitly. The definition of housework varies among studies. The core of such a definition, common to all studies comprises the typical housework activities, such as housecleaning, cooking, laundry etc. Some studies include also the care of children, the sick and elderly (Ilahi, 2001). For developing countries, the collection of water and the fetching of fuel is often considered as part of housework. It must also be stressed that surveys do not allow, in general, to distinguish between non-market economic activities (within the production boundary of SNA) and the rest of household chores. 31. Housework may be carried out by children within their own household and/or in other people’s households (children performing household chores in other people’s household are called “child domestic workers”). Domestic work may pass unobserved because in certain societies using children for household chores is seen as a normal feature of society and housework is not considered labour, but a duty. The accepted definition of “economic activity” does not generally include children involved in housework in their own household even if, for many children, it represents a full-time occupation. Regarding domestic work in other people’s household, child domestic workers may not receive the wages they have been promised. Employment practices need not involve the exchange of money. Many child domestics (particularly those under the age of 12) have been given by parents or guardians to another person to be “fostered”, but in reality the child becomes an unpaid servant for the host family (Black, 1996). Domestic work is excluded from the SNA production boundary when it’s not remunerated in cash or in kind. In the 1990’s studies were conducted for developed countries (US, Australia) which analyzed children’s housework within their own household (Blair, 1992; Gill,1998; Goodnow et al, 1991; Hilton and Haldeman, 1991; McHale et al, 1990, Antill et al, 1996; Benin and Edwards, 1990; Goldscheider and Waite, 1991; Demo and Acock, 1993; Manke et al, 1994). These studies will be briefly discussed below.

10
TOWARDS STATISTICAL STANDARDS FOR CHILDREN’S NON ECONOMIC WORK. A DISCUSSION BASED ON HOUSEHOLD SURVEY DATA.
32. For developing countries, little is known about children who effectively ‘work’ as domestics in their own home. Among the exceptions, is a time-use survey in South Africa which showed that about 587,000 children under 17 did household chores at home for “excessive hours”. This excluded collecting fuel and water (ILO-IPEC, 2002). The majority of studies focus on the work of children performing domestic tasks in the home of a third party or “employer”. As for child domestic workers, ILO estimates that domestic work is the largest employment category of girls under age 16 in the world (ILO, 1996) and local studies have attempted to estimate its prevalence (Minnesota Lawyers International Human Rights Committee, 1990; Blagbrough, 1995; Pradhan, 1995; Friedman, 1997; Philippines, Government of, National Statistics Office, 1995). Other studies indicate proportions of the child workforce employed as domestic workers (ILO, 1996), and only a few studies indicate trends. 33. Very few studies analyze the determinants of children’s housework. What emerges from the studies for developed countries mentioned above, is that among these determinants are age, gender, household’s level of income, the educational level of parents, parents’ work hours. Younger children’s housework is less typed by gender than that of adults or teenagers (Hilton and Haldeman, 1991; McHale et al, 1990). As children become teenagers, they take on more tasks, which are more segregated by gender (Antill et al., 1996; Benin & Edwards, 1990; Goldscheider & Waite, 1991; Goodnow et al., 1991). Some researchers have found that children in two-parent dual-earner families and children of highly educated parents do less housework than children in other family types (Benin & Edwards, 1990; Demo & Acock, 1993; Manke et al., 1994; Goldscheider & Waite, 1992). If the mother’s hours of employment are longer, children (especially girls) perform more of the housework, suggesting that daughters are mother substitutes (Bergen, 1991; Blair, 1992; Goldscheider & Waite, 1991). For developing countries, Ilahi (2001) has produced an interesting study which includes an analysis of the determinants of children’s housework. Using panel data from Peru, the author investigates the determinants of time allocation of boys and girls to schooling, housework and income-generating activities. Among the determinants of children’s housework he finds age, household size and age structure of females in the household. 34. There is relatively little experience in measuring children’s housework and child care hours. We do not know how many children are involved in housework, nor we know much about the age range of the workers. There are a number of reasons for the lack of information related to this “invisible” child workforce. First of all, children in housework are difficult to count as they do not exist as a group; each child works in a separate household. As for child domestic workers, arrangements about the job are frequently informal. The jobs are not registered and do not feature in employment statistics. 35. Information on housework principally may be collected using diary-based time-use studies or questionnaires on time spent on housework. Household surveys and child labour surveys may include questions on housework and time spent on different household chores. However, housework is often not covered in child labour surveys, which may then be complemented by time-use surveys since these may be the only available source of information on unpaid domestic and personal services rendered by children in their own households. For example, Hirway (2000) uses a pilot time-use study, organized by the Government of India in the Department of Statistics, to throw light on children’s economic and non-economic activities and to examine the time use pattern of children on unpaid household work, education, learning, rest etc.

11 UCW WORKING PAPER SERIES, MAY 2005
36. Several studies have shown that housework activities tend to be over-reported in questionnaires, suggesting that time spent on unpaid work is more precisely measured through time-use studies based on time diaries. Random error, recall or memory problems in questionnaires and double counting of simultaneous tasks are some possible explanations. What can happen when analyzing data from surveys other than diary-based time-use studies, is that after summing up the hours spent by children in different activities, the result is higher than 24 hours, that is, the hours available in a day. Children actually perceive time differently than older people do; time goes faster for a child than it does for an adult. Consequently, children may report more hours than the ones in which they are effectively engaged in different housework activities. In general, inaccurate reporting may derive from varying conceptions of which activities should be considered as housework. For child domestic workers (especially girls), the problem is that their presence in the home may not show up in census or household survey data. 37. While the impact of economic activity on children’s health has been the subject of a number of recent studies,5 the relationship between household chores and child health has had very little research. According to the results of three studies of Anti-Slavery International on child domestic workers for Benin, Costa Rica and Chennai in India, children in all three countries suffered from a high incidence of health problems, including regular headaches, stomach aches and breathing difficulties. These findings suggest that long hours in housework, regardless of where they are carried out, most likely have adverse effects on health. The threshold in terms of number of hours above which housework may be considered damaging is obtained by comparing school performance and health status (in this case by relying on two sets of measures: self-reported health problems and injuries) of children engaging in different number of housework hours. 38. Evidence on the effects of non-market household activities on children’s health and schooling does not emerge from these studies, not allowing us to draw any conclusion on the extent to which such activities are damaging for children’s health and development. In the following sections we will proceed in two directions. Firstly, we will evaluate the advisability and feasibility of redefining the concept of “economically active children” on the basis of an accurate separation between non-market activities which fall into the SNA production boundary and non-market activities which do not. Second, we will discuss the problem of fixing a threshold in terms of number of hours, above which housework can be considered child labour, based on the effects of housework on health and education outcomes.
5 See, for example, O’Donnell, Rosati, and van Doorslaer 2002; O’Donnell, Rosati, and van Doorslaer 2003; Fassa, Facchini, Dall'Agnol and Christiani 2000; and Rosati and Straub 2003.

4. ME
4.1 Ac39. the Sthe usedmark Table The stinvolveactivityQuestioimplicittypicallLSMS
Other scategofrom thbelow)there iscited inchildrein a fam
To bchanCopyNOW3. DURIPASTWEEK(namDO ANOF WSOMEIS NOMEMBOF THHOUS If yes 1 YES (CAKIND)2 YES3 NO
12
EASUREME
ccounting foWe have obSNA producdefinition o
d in most chket activity t
6. - Household sutructure of survey quement in non-market y. onnaire modules on wtly or explicitly excludy cover only work in fsurvey conducted in 2
Boliv
surveys contain questries in sufficient detai
hose that are non-eco. It contains a questis no follow-up question the questionnaire mn, etc.). The MICS qumily business, and ma
e administered to carnge age range througy line number of each
W I WOULD LIKE TO ASK A
NG THE
K, DID me)
NY KIND ORK FOR
EONE WHO OT A BER HIS SEHOLD?
s: FOR PAY?
S, FOR PAY ASH OR ) S, UNPAID TO Q.5
4. If yes:SINCE (day owk.), ABOUTMANY HOURSHE/SHEDO THIFOR SOWHO ISMEMBEHOUSE If moreone joincludall houall jobs Recorresponthen
ENT OF C
or non-mabserved that ction boundarf economicahild labour that is econom
urvey questionnaiuestionnaire moduleseconomic activities, a
work in many surveysde non-market own-acfamily enterprise and 2000, LSMS surveys dvia, Living Standards
tions on involvement il to distinguish betwe
onomic in nature. Theon concerning involvon in the case of a “y
mix both own-accounuestionnaire also contakes no specific refere
UNIretaker of each child gh to age 17. eligible child from ho
ABOUT ANY WORK CHILDR
: LAST
of the
T HOW
S DID E S WORK
OMEONE S NOT A ER OF THIS EHOLD?
re than ob, de urs at s.
rd nse
Q.6
5. AT ANY TDURING PAST YEDID (namDO ANY OF WORSOMEONIS NOT AMEMBEROF THIS HOUSEH If yes: F 1 YES, F (CASHKIND) 2 YES, U3 NO
TOWARDSECONOMIC WSURVEY DATA.
CHILDREN
rket econocertain non
ry (e.g., ownally active chsurveys is tmic in nature
re modules on chs on children’s work and, concomitantly, th
look only at market account production. W agriculture, activities do not typically exams Monitoring Survey
in the general categoeen activities that con standard UNICEF Mement in “housekeepyes” answer as to tht production (e.g., feains a question on “faence to own account pCEF Multiple Indicatresident in the house
usehold listing. REN IN THIS HOUSEHOLD
TIME THE
EAR, me) KIND
RK FOR NE WHO A R
HOLD?
FOR PAY?
FOR PAY OR
UNPAID
6. DURING TWEEK, DIDHELP WITHHOUSEKECHORES SUCH AS COOKINGSHOPPINGCLEANINGWASHINGCLOTHESFETCHINGWATER, OCARING FOCHILDREN 1 YES 2 NO T
STATISTICAL SWORK. A DISC.
’S NON-
omic activit-market hou
n-account prohildren basetoo restrictive (see Table
hildren’s work acti activities typically phe accurate measure
activity falling within thorld Bank Living Stan for pay, and productiine involvement in ow
y, 2000 (Encuesta co
ories of “household chstitute own-account pultiple Indicator Clust
ping chores”, but the e type of chores perftching water) and no
amily work”, but defineproduction activities. tor Cluster Survey, 2
ehold age 5 through 1
D MAY DO.
THE PAST D (name) H EPING
, G, G, ,
G OR OR
N?
TO Q.8
7. If yes: SINCE LA(day of tweek), ABOUT HOMANY HOURS DHE/SHE SDOING THCHORES?
STANDARDS FOCUSSION BASED
ECONOM
ty usehold activoduction). Thed solely on ve, in that i6).
ivities revent the accurate ment of children’s tot
he standard industry/ondards Monitoring Suon activities for sale.
wn-account productionntinua de hogares, 2
hores” or “family workproduction (and are thter Survey questionnarespondent is limited
formed. The exampleon-economic activitieses family work to inclu
2000 14 years. ** Country-
AST the
OW
ID SPEND HESE ?
8. DURING THPAST WEEKDID (nameANY OTHERFAMILY WO(ON THE FAOR IN A BUSINESS) 1 YES 2 NO NEXT LIN
OR CHILDREN’S D ON HOUSEH
IC WORK
vities fall wihis suggests market acti
t excludes n
measurement of chtal involvement in eco
occupation codes, andurveys (LSMS), for ex As illustrated by the
n or in household chor2000)
k”, but do not examineherefore economic in aire illustrates this poid to a “yes/no” answees of “housekeeping cs (e.g., shopping, carude only farm work an
-specific adaptation
HE K, e) DO R ORK ARM
)?
NE
9. If yes: SINCE LAST(day of theweek), ABOUT HOWMANY HOURS DID HE/SHE DO THIS WORK?
NON HOLD
ithin that
ivity non-
ildren’s onomic
d either xample, Bolivia res.
e these nature) nt (see er, and chores” ring for nd work
may
W
?

13 UCW WORKING PAPER SERIES, MAY 2005
40. The exclusion of non-market economic activity leads to the underestimation of the total extent of child involvement in economic activity. For example, water and fuel collection are typically considered as housework, whereas they are in fact (non-market) economic activities. Furthermore, girls, differently from boys, may have a tendency to define themselves as performing housework when instead they are engaged in activities that involve the production and processing of agricultural, dairy and fishery products for the household’s own consumption, and that are therefore economic. Examples include the production of flour by milling, bottling, dressmaking and tailoring, the production of baskets and mats, the production of butter and cheese on the farm, and the preservation of meat and fish. Table 7. - Categorising children’s work activities
41. A redefinition of child labour indicators on the basis of an accurate separation between economic and non-economic activities is of great interest. For this purpose, information is needed on children’s activities beyond those classified as market- oriented. Current child labour surveys typically either completely exclude non-market activities, or fail to examine non-market activities in sufficient detail to permit a distinction between those that are economic in nature and those that are not (see Table 6). 42. The India Socio-Economic Survey (NSS 2000) is one of the few surveys that categorised activities in strict accordance with the SNA production boundary concept. It collected information on water and fuel wood collection as well as on a range of other non-market economic household activities (e.g., vegetable collection, cattle feeding, tailoring, sewing and weaving) (see Table 8), thus permitting a more accurate measurement of children’s total involvement in economic activity.

14
TOWARDS STATISTICAL STANDARDS FOR CHILDREN’S NON ECONOMIC WORK. A DISCUSSION BASED ON HOUSEHOLD SURVEY DATA.
Table 8. - Questions used in determining child involvement in non-market household activity, India Socio-Economic Survey (NSS 2000)
[8] follow-up questions for females (code 2 in col. 4, bl.4) with usual activity status code 92 or 93 3. were you required to spend most of your time on domestic duties almost throughout the last 365 days?
(yes-1, no-2) 4. if code 1 in item 3, reason thereof (no other member to carry out the
domestic duties-1, cannot afford hired help-2, for social and/or religious constraints-3, others-9)
5. if code 2 in item 3, reason for still pursuing domestic duties (non-availability of work-1, by preference-2, others-9)
for items 6 to 19 along with your domestic duties did you more or less regularly carry out during the last 365 days: 6. maintenance of kitchen gardens, orchards etc.? (yes-1, no-2) 7. work in household poultry, dairy, etc.? (yes-1, no-2) 8. free collection of fish, small game, wild fruits, vegetables, etc. for household consumption? (yes-1, no-2) 9. free collection of fire-wood, cowdung, cattle feed etc. for household consumption? (yes-1, no-2) 10. husking of paddy for household consumption? (code) 11. grinding of foodgrains for household consumption? (code) 12. preparation of gur for household consumption? (code) 13. preservation of meat and fish for household consumption? (code) 14. making baskets and mats for household use? (code) 15. preparation of cow-dung cake for use as fuel in the household? (yes-1, no-2) 16. sewing, tailoring, weaving etc. for household use? (yes-1, no-2) 17. tutoring of own children or others' children free of charge? (yes-1, no-2) 18. bringing water from outside the household premises? (yes-1, no-2) Only rural
19. bringing water from outside the village? (yes-1, no-2) 20. if yes in item 19: distance in kilometers
43. The time-use modules of the Cambodia Labour Force Survey (SIMPOC 2001) and the Guatemala Living Conditions Survey (ENCOVI 2000)6 also contain information on fetching water and gathering fuel wood, but not on other non-market economic activity performed by children. This information on non-market activity from the India, Cambodia and Guatemala surveys is used in generating revised estimates of children’s involvement in economic and non-economic work in the section below.
4.2 Revised estimates of economic and non-economic activity 44. In this section, we distinguish between children’s non-market activity inside and outside the SNA production function in estimating total rates of children’s economic and non-economic activity. The information available restricts us to consider mainly two forms of non-market activity that are technically inside the SNA production boundary7 - fetching water and collecting wood - with the exception of India, for which a larger set of non-market economic activities are recorded (see Table 8 above). These estimates are compared with “standard” estimates that exclude all forms of non-market activity when considering economic work. 45. Estimates of children’s involvement economic activity by whether or not non-market economic activity is considered are provided in Table 9. The table
6 Encuesta Nacional sobre Condiciones de Vida 2000. 7 Again, these activities constitute own-account production of goods, as described in category 1.2.1 of Table 7.

15 UCW WORKING PAPER SERIES, MAY 2005
illustrates that including water and fuel wood collection8 can dramatically affect estimated economic activity rates. In Ghana, the rate of 7-14 year-old involvement in economic activities rises from 16 to 66 percent, in Cambodia from 52 to 67 percent, and in Guatemala from 20 to 38 percent, when these non-market economic activities are included. In India, the inclusion of non-market economic activities results in a rise in the economic work rate from four to five percent for the 5-14 age group; not a large variation in absolute terms, but very significant in relative terms, as estimated economic work would rise by 25 percent.
Table 9. - Percentage of children performing economic work,(1) by whether or not non-market economic activities are considered,(2) by sex, age and country
Country
Age 7 8 9 10 11 12 13 14 7-14 (3)
Def. Sex
Non-market economic activity(2) included in estimate of total involvement in economic activity?
Not
includ
ed
Includ
ed
Not
includ
ed
Includ
ed
Not
includ
ed
Includ
ed
Not
includ
ed
Includ
ed
Not
includ
ed
Includ
ed
Not
includ
ed
Includ
ed
Not
includ
ed
Includ
ed
Not
includ
ed
Includ
ed
Not
inclu
ded
Inclu
ded
Cambodia
Male 24.7 35.8 35.4 48.9 39.8 56.9 56.4 73.8 59.7 78.2 64.0 83.8 73.1 89.1 74.6 91.6 52.4 68.6
Female 22.9 36.2 31.6 43.7 46.0 61.7 50.9 68.3 59.7 73.4 69.6 82.0 69.6 82.6 74.9 86.7 52.1 65.8
Total 23.8 36.0 33.5 46.4 42.7 59.2 53.6 71.0 59.7 75.8 66.8 82.8 71.4 86.0 74.7 89.3 52.3 67.2
Guatemala
Male 6.0 20.4 10.3 27.7 13.4 31.5 19.8 38.3 28.1 45.8 35.3 51.6 47.5 57.3 54.7 65.9 25.7 41.2
Female 4.0 18.1 4.1 22.4 8.8 29.5 11.6 35.7 17.4 37.7 16.2 42.9 22.2 43.2 31.3 49.2 13.9 34.2
Total 5.1 19.3 7.1 24.9 11.1 30.5 16 37.1 23.1 42.0 26.5 47.6 34.3 49.9 43.1 57.6 20 37.8
Ghana
Male 5.7 36.6 9.7 41.1 11.7 52.8 15.9 63.5 15.9 75.7 20.4 78.1 23.4 79.1 27.6 81.2 15.8 62.3
Female 6.2 41.8 6.5 53.4 10.2 60.1 13.9 71.2 16.4 76.8 24.7 85.5 23.1 84.0 21.2 83.8 15.2 69.4
Total 6.0 39.0 8.1 47.2 11.0 56.2 14.9 67.3 16.2 76.2 22.6 81.8 23.2 81.6 24.3 82.5 15.5 65.8
India
Male 0.3 0.3 1.0 1.1 1.4 1.4 3.0 3.4 3.0 3.1 7.5 8.1 11.0 11.3 17.3 0.3 4.1 4.3
Female 0.5 0.6 0.8 1.2 1.4 2.1 3.0 5 4.7 6.7 7.9 11.7 10.1 15.2 13.9 0.5 4.0 6.1
Total 0.4 0.4 0.9 1.2 1.4 1.7 3.0 4.1 3.8 4.8 7.7 9.8 10.6 13.2 15.7 0.4 4.1 5.2
Notes: (1) For at least one hour during the reference week; (2) Non-market economic activities considered are limited to water gathering and firewood collection with the exception of India, for which a broader range of non-market economic activities are considered (see main text). (3) India, percentage based on the age group 5-14 Sources: UCW calculations based on Cambodia SIMPOC 2001; Guatemala LSMS 2000, Ghana LSMS 1998/99, India NSS 2000 .
8 In Guatemala and Ghana, only water and fuel wood collection were considered, whereas in India a broader range of HH non-market economic activities were included.

16
TOWARDS STATISTICAL STANDARDS FOR CHILDREN’S NON ECONOMIC WORK. A DISCUSSION BASED ON HOUSEHOLD SURVEY DATA.
Table 10. - Percentage of children performing non-economic work,(1) by whether or not non-market economic activities are considered,(2) by sex, age and country
Country
Age 7 8 9 10 11 12 13 14 7-14 (3)
Def. Sex
Non-market economic activity(2) included in estimate of total involvement in non-economic activity?
Includ
ed
Not
includ
ed
Includ
ed
Not
includ
ed
Includ
ed
Not
includ
ed
Includ
ed
Not
includ
ed
Includ
ed
Not
includ
ed
Includ
ed
Not
includ
ed
Includ
ed
Not
includ
ed
Includ
ed
Not
includ
ed
Inclu
ded
Not
inclu
ded
Cambodia
Male 47.4 40.4 64.8 57.1 71.4 64.5 82.2 71.2 85.8 76.8 91.3 80.1 92.8 81.4 92.6 83.3 77.7 68.6
Female 55.0 53.7 61.3 58.9 78.4 75.2 85.3 81.2 88.6 86.4 93.7 91.1 95.8 93.5 96.3 94.8 81.0 78.5
Total 51.0 46.8 63.1 58.0 74.8 69.6 83.8 76.2 87.2 81.6 92.5 85.8 94.2 87.2 94.3 88.7 79.3 73.4
Guatemala
Male 46.5 41.7 54.5 47 54.5 44.9 61.9 53.4 60.3 50.7 60.2 50.5 59.1 47.7 53.9 43.7 56.1 47.4
Female 65.9 63.2 73.3 72 79 77.1 78.6 76.1 88.5 86.8 91.9 91.4 89.1 88.7 85.3 85 80.8 79.4
Total 55.5 51.7 64.3 60 66.5 60.6 69.7 64.1 73.6 67.7 74.8 69.3 74.7 69.1 69.5 64.2 68.2 63
Ghana
Male 60.5 55.5 65.2 59.1 76.6 70.2 84.6 79.8 90.8 86.2 y 86.9 90.8 84.8 91.2 87.0 80.7 75.3
Female 69.3 64.1 79.1 76.4 81.9 81.0 87.6 85.7 89.8 89.4 91.2 90.0 92.5 92.2 91.1 90.3 85.2 83.5
Total 64.6 59.5 72.1 67.7 79.1 75.3 86.1 82.7 90.3 87.7 92.0 88.5 91.7 88.7 91.1 88.7 83.0 79.4
India
Male 0.1 0.1 0.3 0.1 0.2 0.1 0.6 0.3 0.2 0.2 1.2 0.6 0.7 0.4 1.0 0.6 0.5 0.3
Female 0.4 0.3 0.9 0.5 1.9 1.1 4.9 2.8 6.0 3.7 11.3 7.1 15.5 9.5 22.2 12.8 5.9 3.6
Total 0.3 0.2 0.6 0.3 1.0 0.6 2.5 1.4 2.9 1.8 5.9 3.6 8.0 4.9 11.1 6.4 3.1 1.8
Notes: (1) For at least one hour during the reference week; (2) Non-market economic activities considered are limited to water gathering and firewood collection with the exception of India, for which a broader range of non-market economic activities are considered (see main text); (3) India, percentage based on the age-group 5-14 Sources: UCW calculations based on Cambodia SIMPOC 2001; Guatemala LSMS 2000, Ghana LSMS 1998/99, India NSS 2000 .
47. Table 10 indicates that the change in overall involvement in non-economic work when water and fuel wood collection are excluded is less dramatic. In Guatemala, the non-economic work rate for 7-14 year-olds falls from 68 to 63 percent, in Cambodia from 79 to 73 percent, and in Ghana only from 83 to 80 percent. This is not surprising, in that many children also perform other forms of housework, and therefore remain in the category of non-economic work even when water and fuel wood collection are excluded. This is especially the case for girls, who typically shoulder a disproportionate burden of the responsibility for housework. Figure 1. - Percentage of children involved in economic and non-economic work, by whether non-market economicactivities(4) are considered as part of economic or non-economic work, by sex and by country
(a) Cambodia
ECONOMIC WORK(1) ECONOMIC WORK ONLY(2) NON-ECONOMIC WORK ONLY(3)
(b) Guatemala
ECONOMIC WORK(1) ECONOMIC WORK ONLY(2) NON-ECONOMIC WORK ONLY(3)
52.4
52.1
52.3
0.0 2.5 1.5 2.0
27.8 30.4
29.1
68.6
65.8
67.2
11.6
4.0 7.9 11.6 16
.7
14.1
male female total male female total male female total
perce
nt
non-market economic activity grouped as part of NON-ECONOMIC work
non-market economic activity grouped as part of ECONOMIC work
25.7
13.9 20
.0
0.0
11.7
2.2
7.1
0.0
42.2
69.1
55.3
41.2
34.2 37
.8
20.5
3.7
12.3
26.7
48.9
37.5
male female total male female total male female total
perce
nt
non-market economic activity grouped as part of NON-ECONOMIC work
non-market economic activity grouped as part of ECONOMIC work

17 UCW WORKING PAPER SERIES, MAY 2005
(c) Ghana
ECONOMIC WORK(1) ECONOMIC WORK ONLY(2) NON-ECONOMIC WORK ONLY(3)
(d) India
ECONOMIC WORK(1) ECONOMIC WORK ONLY(2) NON-ECONOMIC WORK ONLY(3)
Notes: (1)The category “economic work” refers to children involved in economic activity for at least one hour during the reference week,independent of their involvement in non-economic work. (2) The category “economic work only” refers to children involved in economic activityfor at least one hour during the reference week, but not performing non-economic work. (3) The category “non-economic work only” refers tochildren involved in non-economic work for at least one hour during the reference week, but not performing economic work. (4) Non-marketeconomic activities considered are limited to water gathering and firewood collection, with the exception of India, for which a broader range ofnon-market economic activities are considered (see main text). Source: UCW calculations based on Cambodia SIMPOC 2001; Guatemala LSMS 2000, Ghana LSMS 1998/99, India NSS 2000
48. Of most significance for the purposes of this paper, however, is the group of children performing non-economic work exclusively. Current measures of child labour, based solely on economic activity, do not capture this group.9 It is this category of working but non-economically active children, therefore, for which the discussion of statistical standards is most relevant. 49. As illustrated in Figure 1, excluding own-account production of goods such as firewood and water supply can dramatically reduce the size of the group of children performing non-economic work exclusively. In Ghana, the proportion of 7-14 year-olds in non-economic work falls more than three-fold, from 67 to 20 percent, in Guatemala from 55 to 38 percent, and in Cambodia from 29 to 14 percent, when water and fuel wood collection are excluded. In India, the proportion of children in non-economic work exclusively falls by over a third, though this group is very small, even applying the original, expanded definition. 9 Whereas children performing housework non-exclusively, of course, are captured as part of the economically-active group in measuring child labour. Children performing both economic (market or non-market) work and non-economic work are a subgroup requiring special consideration. Detailed analysis of this group, however, is beyond the scope of the current paper.
15.8
15.2
15.5
0.0 1.8 0.8 1.3 0.0
65 69.1 6762.3
69.4
65.8
7.3 2.5 4.9
21.6
19.1
20.3
male female total male female total male female total
perce
nt
non-market economic activity grouped as part of NON-ECONOMIC work
non-market economic activity grouped as part of ECONOMIC work
4.1 4.0 4.1
0.0
4.1
3.5 3.8
0.0
0.5
5.4
2.8
4.3
6.1 5.2
4.3
5.9
5.0
0.3
3.3
1.7
male female total male female total male female total
perce
nt
non-market economic activity grouped as part of NON-ECONOMIC work
non-market economic activity grouped as part of ECONOMIC work

18
TOWARDS STATISTICAL STANDARDS FOR CHILDREN’S NON ECONOMIC WORK. A DISCUSSION BASED ON HOUSEHOLD SURVEY DATA.
Table 11. - Average weekly working hours in non-economic work, by whether or not non-market economic activities are considered,(1) by sex, age and country
Country
Age 7 8 9 10 11 12 13 14 7-14
Def. Sex
Non-market economic activity(2) included as part of non-economic work?
Includ
ed
Not
includ
ed
Includ
ed
Not
includ
ed
Includ
ed
Not
includ
ed
Includ
ed
Not
includ
ed
Includ
ed
Not
includ
ed
Includ
ed
Not
includ
ed
Includ
ed
Not
includ
ed
Includ
ed
Not
includ
ed
Includ
ed
Not
includ
ed
Guatemala
Male 13.7 10.3 15.6 12.7 13.6 9.7 14.8 11.5 13.5 10.4 16.3 11.8 14.7 10.9 12.3 8.5 14.4 10.8
Female 16.7 16.7 19.1 17.5 20.1 19.3 24.6 23.4 23.7 22.6 27.2 26.9 27.6 26.9 28.6 27.6 23.5 22.7
Total 15.4 14.0 17.7 15.7 17.4 15.6 19.8 18.0 19.3 17.8 22.2 20.9 22.5 21.4 21.9 20.7 19.6 18.0
Ghana
Male 4.4 3.0 4.2 2.6 6.5 3.9 8.4 5.5 8.8 5.8 11.3 7.2 10.9 6.6 10.9 6.9 8.0 5.1
Female 4.9 3.2 7.6 5.4 11.3 8.0 11.1 7.6 13.4 9.0 16.8 11.9 18.1 13.6 19.2 14.5 12.7 9.1
Total 4.6 3.1 5.9 4.0 8.8 5.9 9.8 6.6 11.1 7.4 14.1 9.6 14.7 10.3 15.2 10.8 10.3 7.0
Notes: (1) Original definition classifies water gathering and firewood collection as non-economic work while the revised definition classifies them as economic work. Sources: UCW calculations based on Guatemala LSMS 2000, Ghana LSMS 1998/99.
50. Table 11 indicates the extent to which the intensity of non-economic work is affected by the exclusion of non-market economic activity. In Guatemala, average weekly working hours in non-economic work fall only by 1.6 hours in total, and for less than one hour for girls, indicating that the water and wood collection activities constitute a very minor part of children’s household work responsibilities. The reduction in weekly hours is also relatively small in Ghana, at three hours, with little difference by sex.
4.3 Summary 51. Extending the current definition of economic activity to also include non-market economic activity substantially increases the numbers of working children. It also substantially reduces the group of children that is performing household chores exclusively and therefore potentially left out of child labour estimates. However, depending on the country in question, there is still a non-negligible number of children performing (non-economic) household chores exclusively. If and how these children should be included in the definition of child labour remains an open question. A revised definition for child labour could have spillover effects or create consistency problems with other definition and statistics currently used. 52. Implementation of an approach based on the inclusion of non market economic activity into the definition of child labour would require an effort of revision of data collection instruments, possibly in the direction taken by the NSS of India. We suggest that, whatever the definition of child labour used, an effort should be made to collect information that allows a distinction between what is currently loosely called “household chores” into non-market economic activities and housework.

19 UCW WORKING PAPER SERIES, MAY 2005
5. EMPIRICAL EVIDENCE ON THE IMPACT OF CHILDREN’S NON-MARKET ACTIVITY ON HEALTH OUTCOMES
5.1 Introduction 53. This section explores the relationship between working hours (in both market and non-market activity)10 and levels of self-reported child illness and injury. It builds on the methodology developed for a similar UCW study of the health impact of time spent on economic activity.11 54. Many measurement complications arise when trying to compare the health of working with respect to non-working children. In this study, a simpler approach is taken by concentrating only on the relative effects of working hours on the health of children involved in economic and non-economic work activities. While this approach has the advantage of producing sound estimates, it will obviously limit the validity of the analysis to the working children population.
5.2 Involvement in non-economic activity and health: Descriptive evidence 55. As is well-known, satisfactory measures of health status are difficult to identify and obtain. Occurrence of illness/injury is far from being the optimal measure and it should therefore be kept in mind that results in terms of injury and illnesses do not necessarily translate into conclusions in terms of health. 56. An additional complication stems from the fact that the reference period for the self reported injury/illness is not clearly defined. In the case of Cambodia it is not clear from the question whether the reference period is last year, any time in the past or last week.12 This necessitates a series of assumptions for deriving the standard incidence and occurrence indicators. 57. We have therefore decided to use two sets of indicators: occurrence rates and incidence density.13 The occurrence rate is defined as the number of working children suffering from injury/illness divided the number of working children. The calculation of this indicator is straightforward, but we have to underline that the reference periods for work and injury do not coincide. Unfortunately, there is no way to overcome this problem.
10 Data limitations do not permit carrying over into the current analysis the distinction drawn in the previous section between non-market work inside and outside the SNA production function. This section, therefore, distinguishes only between “market” and “non-market” work, where the latter refers to both non-market economic work (specifically, water fetching and fuel wood collection) and non-market non-economic work (specifically, housework). (Table 7 provides further clarification on terminology.) 11 Guarcello, L, Lyon S. and Rosati F.C., 2004. 12 The questionnaire for Cambodia asks about “any work related illness/injury at any time in the past” and that for Guatemala “last month (name) suffer any illness, accident, or health problems even if it was not serious”, and that for Ghana “during the past 2 weeks has suffered from either an illness or an injury”. The manuals for the countries do not help to clarify the issue. 13 For a synthetic definition of these standard indicators refer to www.hc-sc-gc.ca

20
TOWARDS STATISTICAL STANDARDS FOR CHILDREN’S NON ECONOMIC WORK. A DISCUSSION BASED ON HOUSEHOLD SURVEY DATA.
Table 12. - Children’s reported occurrence of work-related injury and/or illness, by country, activity status and weekly working hours
Country Activity status Average weekly working hours
1-5 6-10 11-15 16-20 21-25 26-30 31-35 36-40 41-45 46-50 50+
Guatemala
Non-market activity only(1) 32.5 26.8 29.8 15.4 22.1 26.6 25.9 42.7 10.2 16.5 31.4
Market activity only(2) 31.5 16.5 23.5 16.5 22.5 22.1 40.0 9.5 22.4 18.1 18.7
Both(3) 45.4 19.5 15.5 41.8 26.4 37.8 29.6 25 14 23.9 27.2
Ghana
Non-market activity only(1) 16.6 15.7 15.8 21.9 20.2 18.6 15.5 20.6 32.5 22.5 16.6
Market activity only(2) 0.0 0.0 0.0 53.8 0.0 45.7 0.0 0.0 0.0 0.0 18.5
Both(3) 23.2 18.7 18.8 16.6 22.2 23.8 30.2 7.1 35.4 18.6 19.3
Cambodia
Non-market activity only(1) N.A.
Market activity only(2) 20.3 5.1 38.2 29.8 43.0 34.4 16.9 83.5 26.3 5.0 50.3
Both(3) 50.0 41.1 39.1 41.9 49.1 53.3 61.2 50.0 52.9 44.8 50.8
Notes: (1) Children working at least one hour on non-market activity and no time on market activity during the reference week; (2) Children working at least one hour in market activity and no time on non-market activity during the reference week; (3) Children working at least one hour on both market activity and non-market activity during the reference week. Sources: UCW calculations based on UCW calculations based on Cambodia SIMPOC 2001; Guatemala LSMS 2000, and Ghana LSMS 1998/99
58. Occurrence of self-reported illness/injury bears no obvious relationship to hours worked (in non-market activity, market activity, or both) in the three countries examined. Indeed, comparing the two extremes of the hours range, ill health incidence for those working only 1-5 hours per week is at least as great as ill health incidence for those working 46 or more hours per week in the three countries. Incidence of ill health also shows no clear relationship to work type (i.e., non-market activity, market activity or both). 59. The occurrence rate does not take into consideration that differences in observed occurrence can be due to differences in exposure. To take exposure into consideration, a standard incidence density is computed as follows:
time person total
time of period specified a during injured children=Density Incidence
where “total person-time” is cumulated exposure for all the individuals considered. In our case it should be defined as average weekly working hours multiplied by the number of weeks worked during the reference period (assumed to be one year). 60. Given the information available, the calculation of the incidence density is rather difficult and requires some strong assumptions. Only in the case of Cambodia do we have information on the number of months, but not the hours of work, worked by the child during the previous year. In the cases of Guatemala and Ghana, the only exposure measure available is the average hours worked

21 UCW WORKING PAPER SERIES, MAY 2005
during the reference week. In light of this information structure, we have computed incidence density for all three countries assuming as individual exposure the average hours worked during the reference week. This amounts to assuming that hours worked during the last year are proportional, for each individual, to the hours worked during last week. This is certainly a strong assumption (but necessary if we were to compute an incidence index at all). In the case of Cambodia, given that information was available also on the number of months worked during last year, we could compute an incidence density that relaxed the assumption of exposure proportional to last week working hours.14 61. Incidence density, presented in Figure 2, reveals no clear pattern in terms of the relative health impact of the three categories of work. Indeed, incidence density patterns differ in each of the three countries considered. In Cambodia, ill-health incidence density is highest among children performing both market and non-market activity, in Ghana among children performing only market activity, and in Guatemala among children performing only non-market activity. Figure 2. - Children’s work-related injury and/or illness,(1) incidence density indicator, by activity status
Notes: (1) Children working at least one hour on non-market activity and no time on market activity during the reference week; (2) Children working at least one hour in market activity and no time on non-market activity during the reference week; (3) Children working at least one hour on both market activity and non-market activity during the reference week. Sources: UCW calculations based on UCW calculations based on Cambodia SIMPOC 2001; Guatemala LSMS 2000, and Ghana LSMS 1998/99
62. Descriptive evidence based on self-reported ill-health therefore offers little grounds for establishing a threshold beyond which non-market activity should be targeted as child labour, or for arguing that market activity and non-market activity differ in terms of their health impact on children.15
5.3 Involvement in non-economic activity and health: Causal links 63. This section will move beyond a simple description of the child work-health relationship and attempt to unravel its causal nature, using survey data from
14 We had to assume, however, constant weekly hours of work for the whole reference period. The only additional variation with respect to the other density index computed stems in this case from the variation in the number of months worked., 15 However, it should be kept in mind that self-reported ill-health is an imperfect indicator at best. The health consequences of work, for example, may be obscured by the selection of the healthiest children for work, or by the fact these health consequences may not become apparent until a later stage in a child’s life. Perceptions of health may also differ across groups of children. Finally, it could be that it is not work per se that is damaging to health, but certain kinds of work, a fact that is concealed when looking at prevalence of health problems averaged across the broad categories of household chores and economic activity.
NA
1.7 1.51.2
2.0
0.7
Cambodia Ghana Guatemala
incide
nce d
ensit
y
Non-market activity only(1)
Market work activity(2)
Both(3)

22
TOWARDS STATISTICAL STANDARDS FOR CHILDREN’S NON ECONOMIC WORK. A DISCUSSION BASED ON HOUSEHOLD SURVEY DATA.
Cambodia16 and Guatemala.17 As discussed in detail elsewhere,18 this is not an easy task, as it requires dealing with two difficult issues – individuals’ health endowments and the endogeneity of the child labour decision. 64. Many of these complications arise when trying to compare the health of working with respect to non-working children. In this study, we take a simpler approach by concentrating only on the relative effects of working hours and work type (i.e., market or non-market) on the health of working children. As discussed in the introduction, the focus of the study is on the effects of working hours and other conditions on the health of working children, and not on the comparison of the health status of working versus non-working children. Obviously, even within the group of working children, unobserved individual health endowments can play a role. It is reasonable to assume that such effects should be smaller in comparison, for example, to the classic case of the “healthy worker” effect. 5.3.1 Variable definitions
65. The Guatemala and Cambodia and surveys collected information on a set of individual and household characteristics including, in the case of Cambodia, an additional module on child labour for children in the 5-17 age range, and a module on work related illness\injuries. As most of our attention will be devoted to the relevant variables included in these sections, we will discuss their exact definitions below.
• Children’s health: The study relies on indicators built on self-reported illness and injuries for examining children’s health, as this is the only health information available for the countries considered. In the case of Cambodia, we define the variable Injury as a dummy variable taking value 1 if a working child has ever experienced any illness\injury at the workplace or because of her job.
• Children’s work: Both surveys contain a set of questions related to the main market activity carried out during the last seven days. We define as working children in market activity, children involved in market activity during the last seven days for pay or not, for family or for own final use or consumption.19 Cambodia was unique in collecting information on the
16 The following sections are based on data from national household surveys conducted the Cambodian Child Labour Survey (CCLS). CCLS 2001 was designed to provide information on child labour for applied research in various fields of social and economic study. The survey followed a two-stage sample selection, based on the results of the general population census in 1998. The sample of 12,000 households was representative at the national level, as well as at the urban and rural levels; urban areas were oversampled in order to achieve more representative information on the targeted children aged 5-17 years. CCLS 2001 collected information from all usual residents of a selected household and persons who had been living in the selected household the night before the interview. The survey contained two separate sections based on similar questions about children aged 5-17 years. In one section, the questions are addressed to parents of guardian or to the head of the household. In the other section, the questions are addressed directly to the children in the 5-17 years age group. Through these sections, the survey investigated children’s work status, working hours, children’s satisfaction in the workplace, injuries/disabilities related to work and use of mechanical equipment. 17 Information on poverty, household conditions and other variables was collected in Guatemala through the 2000 Living Standards Measurement Survey (ENCOVI, 2000). The survey followed a probabilistic survey design, covering 7,276 households (3,852 rural and 3,424 urban) . The survey is representative at the national and regional level as well as in urban and rural areas. ENCOVI included questions to elicit a unique level of detail (for a representative sample) on different themes related to education, working activity and time use. 18 See Guarcello, L, Lyon S. and Rosati F.C. (2004) and O’Donnell O., Rosati F.C. and Van Doorslaer E., Child Labour and Health: Evidence and Research Issues, Understanding Children’s Work (UCW) Project working paper, December 2001 19 Non-market economic activity is not included in the definition.
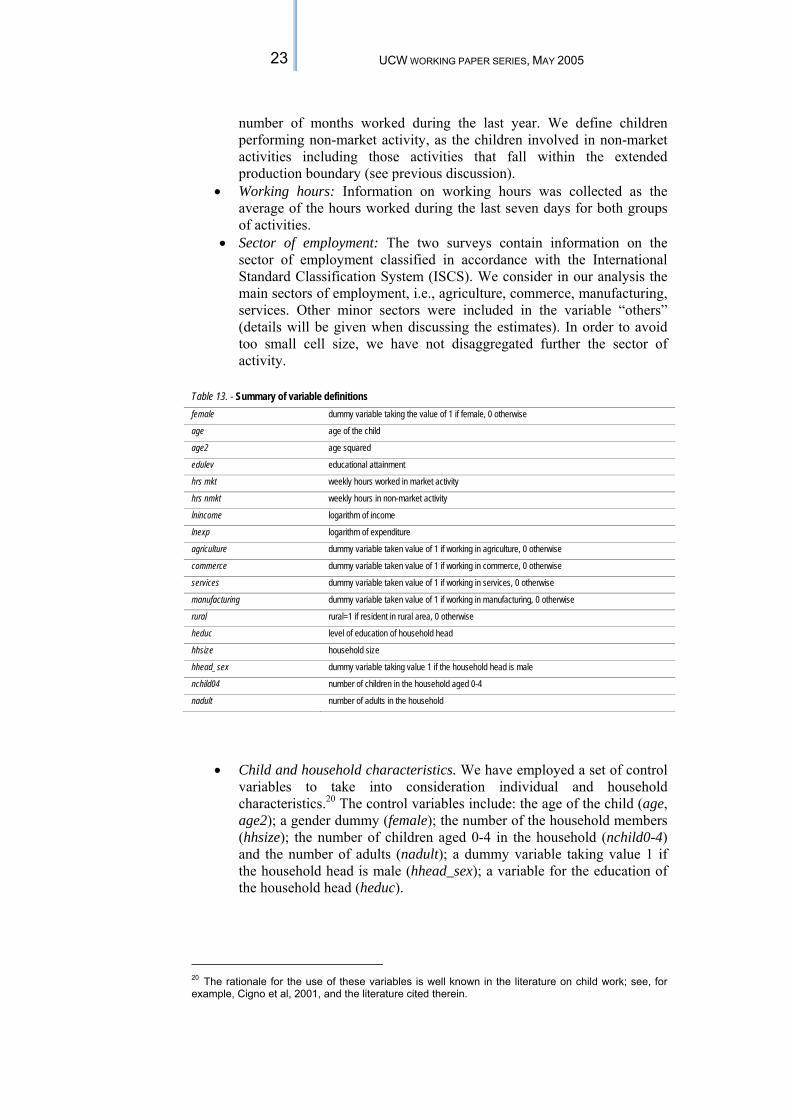
23 UCW WORKING PAPER SERIES, MAY 2005
number of months worked during the last year. We define children performing non-market activity, as the children involved in non-market activities including those activities that fall within the extended production boundary (see previous discussion).
• Working hours: Information on working hours was collected as the average of the hours worked during the last seven days for both groups of activities.
• Sector of employment: The two surveys contain information on the sector of employment classified in accordance with the International Standard Classification System (ISCS). We consider in our analysis the main sectors of employment, i.e., agriculture, commerce, manufacturing, services. Other minor sectors were included in the variable “others” (details will be given when discussing the estimates). In order to avoid too small cell size, we have not disaggregated further the sector of activity.
Table 13. - Summary of variable definitions female dummy variable taking the value of 1 if female, 0 otherwise
age age of the child
age2 age squared
edulev educational attainment
hrs mkt weekly hours worked in market activity
hrs nmkt weekly hours in non-market activity
lnincome logarithm of income
lnexp logarithm of expenditure
agriculture dummy variable taken value of 1 if working in agriculture, 0 otherwise
commerce dummy variable taken value of 1 if working in commerce, 0 otherwise
services dummy variable taken value of 1 if working in services, 0 otherwise
manufacturing dummy variable taken value of 1 if working in manufacturing, 0 otherwise
rural rural=1 if resident in rural area, 0 otherwise
heduc level of education of household head
hhsize household size
hhead_sex dummy variable taking value 1 if the household head is male
nchild04 number of children in the household aged 0-4
nadult number of adults in the household
• Child and household characteristics. We have employed a set of control
variables to take into consideration individual and household characteristics.20 The control variables include: the age of the child (age, age2); a gender dummy (female); the number of the household members (hhsize); the number of children aged 0-4 in the household (nchild0-4) and the number of adults (nadult); a dummy variable taking value 1 if the household head is male (hhead_sex); a variable for the education of the household head (heduc).
20 The rationale for the use of these variables is well known in the literature on child work; see, for example, Cigno et al, 2001, and the literature cited therein.

24
TOWARDS STATISTICAL STANDARDS FOR CHILDREN’S NON ECONOMIC WORK. A DISCUSSION BASED ON HOUSEHOLD SURVEY DATA.
5.3.2 Estimation results: Cambodia
66. The questions concerning injuries and illnesses were addressed only to children involved in market activity in the Cambodia survey. We could therefore only estimate the model separately for children in market activity (exclusively or in combination with non-market activity). We could not estimate a model for children involved only non-market activity. 67. The results for children performing market activity without performing non-market activity are presented in Tables 14 and 15. The results indicate that the number of working hours in market activity positively affects the probability of being injured/ill. The effects of the other variables are not well defined, most likely because of the small size of the sample of children working in market activity without also performing non-market activity. Table 14. - Logit estimates, children in market activity only, Cambodia Number of obs = 312 LR chi2(12) = 27.41 Prob > chi2 = 0.0067 Log likelihood = -174.63051 Pseudo R2 = 0.0728 ------------------------------------------------------------------------------ injury2 | Coef. Std. Err. z P>|z| [95% Conf. Interval] -------------+---------------------------------------------------------------- age | .1465624 .4366891 0.34 0.737 -.7093325 1.002457 age2 | -.0080673 .0211304 -0.38 0.703 -.0494821 .0333475 female | -.3026014 .2834606 -1.07 0.286 -.858174 .2529713 agricult | .2114685 .5979859 0.35 0.724 -.9605623 1.383499 commerce | -.9399683 .6582503 -1.43 0.153 -2.230115 .3501786 services | -.7441425 .7304409 -1.02 0.308 -2.17578 .6874953 manufact | .2493342 .6878978 0.36 0.717 -1.098921 1.597589 heduc | -.0945093 .1863689 -0.51 0.612 -.4597856 .270767 edulev | -.2578967 .3201643 -0.81 0.421 -.8854072 .3696138 rural | -.1319979 .2890174 -0.46 0.648 -.6984616 .4344658 lnexp2 | .3798439 .1911952 1.99 0.047 .0051081 .7545796 hrs mkt | .0265621 .0086273 3.08 0.002 .0096529 .0434712 _cons | -5.485547 3.096365 -1.77 0.076 -11.55431 .5832166 ------------------------------------------------------------------------------ Source : UCW calculation based on Cambodia Child Labour Survey, 2001 Table 15. - Marginal effects after logit, children in market activity only, Cambodia y = Pr(injury2) (predict) = .27277902 ------------------------------------------------------------------------------ variable | dy/dx Std. Err. z P>|z| [ 95% C.I. ] X ---------+-------------------------------------------------------------------- age | .0290737 .0866 0.34 0.737 -.140663 .198811 10.3718 age2 | -.0016003 .00419 -0.38 0.703 -.009813 .006612 114.571 female*| -.0591361 .05444 -1.09 0.277 -.16583 .047558 .397436 agricult*| .0418827 .11816 0.35 0.723 -.189711 .273476 .512821 commerce*| -.1659432 .10121 -1.64 0.101 -.364307 .032421 .25641 services*| -.1261854 .10276 -1.23 0.219 -.327595 .075224 .089744 manufact*| .0516552 .14825 0.35 0.728 -.238909 .342219 .092949 heduc | -.0187479 .03697 -0.51 0.612 -.091215 .05372 2.06731 edulev | -.0511591 .06345 -0.81 0.420 -.175524 .073206 1.64103 rural*| -.0260347 .05663 -0.46 0.646 -.13702 .084951 .407051 lnexp2 | .0753499 .03775 2.00 0.046 .001354 .149346 11.1176 hours mkt| .0052691 .0017 3.10 0.002 .001942 .008597 24.6571 ------------------------------------------------------------------------------ Notes: (*) dy/dx is for discrete change of dummy variable from 0 to 1 Source : UCW calculation based on Cambodia Child Labour Survey, 2001
68. Hours of market activity also significantly affects the probability of ill health for the group of children working both in market and non-market activity (Tables 16 and 17). Hours logged in non-market activity, on the contrary, do not have any defined effect on the probability of ill health. We also tried several other explorations of the data, including regression using only hours of non-market activity and more complex non-linear specifications, with no relevant changes in the results.

25 UCW WORKING PAPER SERIES, MAY 2005
Table 16. - Logit estimates, children involved in both market and non-market activity, Cambodia Number of obs = 8274 LR chi2(13) = 267.99 Prob > chi2 = 0.0000 Log likelihood = -5539.3076 Pseudo R2 = 0.0236 ------------------------------------------------------------------------------ injury2 | Coef. Std. Err. z P>|z| [95% Conf. Interval] -------------+---------------------------------------------------------------- age | -.1105584 .0866669 -1.28 0.202 -.2804225 .0593057 age2 | .0056367 .0040595 1.39 0.165 -.0023197 .0135931 female | .0052258 .0452008 0.12 0.908 -.083366 .0938177 agricult | .2476659 .1553729 1.59 0.111 -.0568595 .5521912 commerce | -.4728356 .1585947 -2.98 0.003 -.7836755 -.1619956 services | -.2383293 .1979922 -1.20 0.229 -.626387 .1497283 manufact | -.2801848 .1784265 -1.57 0.116 -.6298943 .0695248 heduc | -.0618199 .0330287 -1.87 0.061 -.126555 .0029151 edulev | -.0409607 .0583786 -0.70 0.483 -.1553806 .0734593 rural | -.1348416 .050352 -2.68 0.007 -.2335298 -.0361534 lnexp2 | .0054506 .0317807 0.17 0.864 -.0568385 .0677396
hrs mkt | .0139149 .0020953 6.64 0.000 .0098083 .0180215 hrs nmkt | -.0032581 .0045351 -0.72 0.473 -.0121467 .0056306 _cons | .1898455 .5849711 0.32 0.746 -.9566768 1.336368 ------------------------------------------------------------------------------
Table 17. - Marginal effects after logit, children involved in both market and non-market activity, Cambodia
y = Pr(injury2) (predict) = .4366204
------------------------------------------------------------------------------
variable | dy/dx Std. Err. z P>|z| [ 95% C.I. ] X
---------+--------------------------------------------------------------------
age | -.0271955 .02132 -1.28 0.202 -.068979 .014588 11.1244
age2 | .0013865 .001 1.39 0.165 -.000571 .003344 128.938
female*| .0012855 .01112 0.12 0.908 -.020507 .023078 .495407
agricult*| .0606149 .03778 1.60 0.109 -.013437 .134666 .616026
commerce*| -.1139253 .03716 -3.07 0.002 -.186754 -.041097 .271936
services*| -.057564 .04676 -1.23 0.218 -.149202 .034074 .031665
manufact*| -.0674971 .04187 -1.61 0.107 -.149556 .014562 .058738
heduc | -.0152067 .00812 -1.87 0.061 -.03113 .000717 2.06454
edulev | -.0100756 .01436 -0.70 0.483 -.038221 .01807 1.78608
rural*| -.033081 .01231 -2.69 0.007 -.057218 -.008944 .370438
lnexp2 | .0013407 .00782 0.17 0.864 -.013981 .016663 11.1233
hrs mkt | .0034228 .00052 6.64 0.000 .002413 .004433 19.8899
hrs nmkt | -.0008014 .00112 -0.72 0.473 -.002988 .001385 9.47196
------------------------------------------------------------------------------
Notes: (*) dy/dx is for discrete change of dummy variable from 0 to 1 Source : UCW calculation based on Cambodia Child Labour Survey, 2001
69. There are several possible reasons for this outcome, two of which seem most relevant. The first is sample limitation. The question about the occurrence of injuries/illnesses is asked only to children working in market activities. The question is also formulated in a way that seems to refer to events linked to work performed in market activity. This could obviously lead to underestimation of the effects of non-market activity. The second reason is that children work relative few hours in non-market activity - the vast majority of the children work for less than two hours a day on non-market activity. We might, therefore, not be able to observe children working long enough hours in non-market activity for health damage to result. 5.3.3 Estimation results: Guatemala
70. The questions about the health status are asked to all household members in the survey for Guatemala. They record any illness or injury occurred during the last four weeks. As shown in Table 12, the incidence of ill health is generally lower than in the case of Cambodia. This can be due to structural reasons, but also to the way in which the two questionnaires are built. The results for the group of children only in market activity do not show any evident link between

26
TOWARDS STATISTICAL STANDARDS FOR CHILDREN’S NON ECONOMIC WORK. A DISCUSSION BASED ON HOUSEHOLD SURVEY DATA.
hours worked and health. In fact, none of the other variables seems to bear any causal relationship with health (Tables 18 and 19). Table 18. - Logit estimates, children involved in market activity only, Guatemala
Logit estimates Number of obs = 621
LR chi2(13) = 16.73
Prob > chi2 = 0.2122
Log likelihood = -304.86629 Pseudo R2 = 0.0267
------------------------------------------------------------------------------
health1 | Coef. Std. Err. z P>|z| [95% Conf. Interval]
-------------+----------------------------------------------------------------
age | -.5018448 .566156 -0.89 0.375 -1.61149 .6078006
age2 | .0214099 .0254719 0.84 0.401 -.0285141 .0713338
female | .4985114 .3319063 1.50 0.133 -.152013 1.149036
Agriculture | .3625458 .5673656 0.64 0.523 -.7494704 1.474562
Manufact.| -1.113199 .9228423 -1.21 0.228 -2.921937 .6955383
commerce | .1991135 .6272668 0.32 0.751 -1.030307 1.428534
HPS(1)| -.5079688 .7798128 -0.65 0.515 -2.036374 1.020436
lnincome | -.1647949 .1277037 -1.29 0.197 -.4150895 .0854996
m_none | -.9180033 .5658673 -1.62 0.105 -2.027083 .1910762
m_primary | -.954487 .5776172 -1.65 0.098 -2.086596 .1776219
f_none | .2674755 .4646937 0.58 0.565 -.6433073 1.178258
f_primary | .3226742 .4666877 0.69 0.489 -.5920168 1.237365
hrs mkt | -.0063613 .0053168 -1.20 0.232 -.0167821 .0040596
_cons | 3.021544 3.321116 0.91 0.363 -3.487725 9.530812
------------------------------------------------------------------------------
(1) HPS (health and personal services) Source: UCW calculations based on Encuesta de Condiciones de Vida (ENCOVI), 2000
Table 19. - Marginal effects after logit, children involved in market activity only, Guatemala
Marginal effects after logit y = Pr(health1) (predict) = .19358161 ------------------------------------------------------------------------------ variable | dy/dx Std. Err. z P>|z| [ 95% C.I. ] X ---------+-------------------------------------------------------------------- age | -.0783419 .08831 -0.89 0.375 -.251435 .094751 11.8261 age2 | .0033422 .00397 0.84 0.400 -.004446 .01113 143.781 female*| .0868331 .06347 1.37 0.171 -.037575 .211242 .120773 Agricult*| .0538778 .08007 0.67 0.501 -.103049 .210805 .719807 Manufac.*| -.1252929 .0687 -1.82 0.068 -.25995 .009364 .048309 Commerce*| .0324963 .1068 0.30 0.761 -.176821 .241814 .128824 HPS*| -.0687244 .08986 -0.76 0.444 -.244841 .107393 .057971 lnincome | -.0257258 .01988 -1.29 0.196 -.064684 .013232 6.04877 m_none*| -.1552469 .10237 -1.52 0.129 -.355896 .045402 .648953
m_primary*| -.1337899 .07244 -1.85 0.065 -.275763 .008183 .31401 f_none*| .0418343 .0728 0.57 0.566 -.100856 .184525 .489533
f_primary*| .0510174 .07468 0.68 0.495 -.095357 .197392 .436393 hrs_mkt | -.000993 .00083 -1.20 0.230 -.002616 .00063 36.942 ------------------------------------------------------------------------------ Notes: (*) dy/dx is for discrete change of dummy variable from 0 to 1 Source: UCW calculations based on Encuesta de Condiciones de Vida (ENCOVI), 2000

27 UCW WORKING PAPER SERIES, MAY 2005
Table 20. - Logit estimates, children involved in non-market activity only, Guatemala
Logit estimates Number of obs = 4405
LR chi2(9) = 53.07
Prob > chi2 = 0.0000
Log likelihood = -2352.418 Pseudo R2 = 0.0112
------------------------------------------------------------------------------
health1 | Coef. Std. Err. z P>|z| [95% Conf. Interval]
-------------+----------------------------------------------------------------
age | .0889335 .168863 0.53 0.598 -.242032 .419899
age2 | -.0066145 .0081312 -0.81 0.416 -.0225513 .0093223
female | .2117058 .0767413 2.76 0.006 .0612957 .362116
m_none | .0983113 .1483545 0.66 0.508 -.1924581 .3890808
m_primary | .0158867 .1390604 0.11 0.909 -.2566666 .2884401
f_none | .1220794 .1373899 0.89 0.374 -.1471998 .3913586
f_primary | .1276391 .1250528 1.02 0.307 -.1174598 .3727381
lnincome | .2536555 .0442367 5.73 0.000 .1669531 .3403579
hrs_nmkt | -.0029387 .0019173 -1.53 0.125 -.0066966 .0008192
_cons | -3.240539 .9242241 -3.51 0.000 -5.051985 -1.429093
Source: UCW calculations based on Encuesta de Condiciones de Vida (ENCOVI), 2000 Table 21. - Marginal effects after logit, children involved in non-market activity only, Guatemala
Marginal effects after logit y = Pr(health1) (predict) = .22732496 ------------------------------------------------------------------------------ variable | dy/dx Std. Err. z P>|z| [ 95% C.I. ] X ---------+-------------------------------------------------------------------- age | .015621 .02966 0.53 0.598 -.042508 .07375 10.2586 age2 | -.0011618 .00143 -0.81 0.416 -.003961 .001637 110.125 female*| .0367356 .01313 2.80 0.005 .010993 .062478 .604086 m_none*| .0172642 .02604 0.66 0.507 -.033778 .068306 .503973 m_prim~y*| .0027936 .02448 0.11 0.909 -.045186 .050773 .372077 f_none*| .0216599 .02462 0.88 0.379 -.026586 .069906 .347333 f_prim~y*| .0224306 .02198 1.02 0.308 -.020653 .065515 .492395 lnincome | .0445542 .00772 5.77 0.000 .029425 .059684 6.34354 hrs_nmkt| -.0005162 .00034 -1.53 0.125 -.001176 .000144 21.9549 ------------------------------------------------------------------------------ (*) dy/dx is for discrete change of dummy variable from 0 to 1 Source: UCW calculations based on Encuesta de Condiciones de Vida (ENCOVI), 2000
Table 22. - Logit estimates, children involved in both market and non-market activity, Guatemala Logit estimates Number of obs = 996
LR chi2(10) = 5.36
Prob > chi2 = 0.8659
Log likelihood = -562.83257 Pseudo R2 = 0.0047
------------------------------------------------------------------------------
health1 | Coef. Std. Err. z P>|z| [95% Conf. Interval]
-------------+----------------------------------------------------------------
age | .3493122 .4004756 0.87 0.383 -.4356054 1.13423
age2 | -.0155181 .0181005 -0.86 0.391 -.0509944 .0199583
female | -.1092005 .1595637 -0.68 0.494 -.4219396 .2035386
m_none | -.1728678 .3657395 -0.47 0.636 -.8897041 .5439684
m_primary | -.1746246 .3624882 -0.48 0.630 -.8850885 .5358393
f_none | -.0595736 .3330317 -0.18 0.858 -.7123037 .5931565
f_primary | .1959799 .3158446 0.62 0.535 -.4230641 .8150238
lnincome | -.0082127 .0816962 -0.10 0.920 -.1683343 .151909
hrs_nmkt | .0027866 .0042693 0.65 0.514 -.0055811 .0111543
hrs_mkt | -.0036401 .0039376 -0.92 0.355 -.0113577 .0040775
_cons | -2.734746 2.289257 -1.19 0.232 -7.221607 1.752115
------------------------------------------------------------------------------
Source: UCW calculations based on Encuesta de Condiciones de Vida (ENCOVI), 2000

28
TOWARDS STATISTICAL STANDARDS FOR CHILDREN’S NON ECONOMIC WORK. A DISCUSSION BASED ON HOUSEHOLD SURVEY DATA.
Table 23. - Marginal effects after logit, children involved in both market and non-market activity, Guatemala
Marginal effects after logit y = Pr(health1) (predict) = .25369428 ------------------------------------------------------------------------------ variable | dy/dx Std. Err. z P>|z| [ 95% C.I. ] X ---------+-------------------------------------------------------------------- age | .0661365 .07578 0.87 0.383 -.082398 .214671 11.7028 age2 | -.0029381 .00343 -0.86 0.391 -.009652 .003775 140.982 female*| -.020617 .03003 -0.69 0.492 -.079473 .038239 .448795 m_none*| -.0329861 .07031 -0.47 0.639 -.17079 .104818 .594378 m_prim~y*| -.032636 .06684 -0.49 0.625 -.163644 .098372 .35241 f_none*| -.0112535 .06276 -0.18 0.858 -.134265 .111758 .422691 f_prim~y*| .0370939 .05974 0.62 0.535 -.079988 .154175 .501004 lnincome | -.0015549 .01547 -0.10 0.920 -.031871 .028761 6.15843 hrs_nmkt| .0005276 .00081 0.65 0.514 -.001056 .002112 20.0507 hrs_mkt | -.0006892 .00075 -0.92 0.355 -.00215 .000771 30.0633 ------------------------------------------------------------------------------
(*) dy/dx is for discrete change of dummy variable from 0 to 1 Source: UCW calculations based on Encuesta de Condiciones de Vida (ENCOVI), 2000
71. Similar results are obtained in the case of children working in non-market activity only (Tables 20 and 21) and working in both market and non-market activity (Tables 22 and 23). 72. As discussed in above and in more detail in O’Donnel et al. (2001), it is very difficult to identify relationship between child work and health. The evidence for the countries considered here adds another consideration to the list of difficulties: one linked to the structure of the questionnaire. We have seen that in the case of Cambodia was possible to isolate effects of working hours on children’s health. Similar results were also obtained also for other countries that shared roughly the same kind of questionnaire.21 The question asked to the children made direct reference to injuries/illness linked to their work activity. In the case of Guatemala, as well as of several other countries, the questions on health are asked without any explicit relationship to the work carried out. This might affect the way episodes are reported and contribute to explain the difference in the results. 5.3.4 Summary
73. The analysis shows that it is not possible to identify ant clear relationship between hours in non-market activity and health status. There are several possible explanations for this. As we have already pointed out, the relationship between child work and health is very difficult to capture, both for theoretical reasons and because of lack of appropriate data.22 74. There is, however, another observation that stems from the analysis carried out in this section. While not of direct relevance to our aims, it merits a brief discussion. While hours spent in non-market activity never turn out be significant in determining children’ s health, this is not the case for hours spent in economic activities. In fact, we have seen that in the case of Cambodia they are significant, while they are not in other cases. In a previous study,23 hours of work proved to be significant in several cases. It is difficult to understand the reasons of such a difference. However, in all the cases in which it was possible to identify a relationship between hours of work and health, the relevant survey 21For a more detailed discussion see L. Guarcello, S. Lyon and F. Rosati, Impact of Working Time on Children’s Health, draft study, UCW and ILO-IPEC, September 2004 22 For the more detailed discussion, we reader can refer to the literature already cited. 23 L. Guarcello, S. Lyon and F. Rosati, Impact of Working Time on Children’s Health, draft study, UCW and ILO-IPEC, September 2004.

29 UCW WORKING PAPER SERIES, MAY 2005
questionnaire asked explicitly about illnesses/injuries related to work. While this is far from being conclusive evidence, it points to the importance of questionnaire formulation in identifying the health effects of child labour.

30
TOWARDS STATISTICAL STANDARDS FOR CHILDREN’S NON ECONOMIC WORK. A DISCUSSION BASED ON HOUSEHOLD SURVEY DATA.
6. EMPIRICAL EVIDENCE ON THE IMPACT OF CHILDREN’S NON-ECONOMIC ACTIVITY ON EDUCATIONAL OUTCOMES
6.1 Introduction
75. This section analyses the relationship between working hours (in market and non-market activities)24 and levels of school attendance and attainment. It will address two related questions of direct relevance for setting standards relating to non-market activity: first, the extent to which involvement in non-market activity is compatible with education; and, second, the time threshold(s) beyond which non-market activity interferes with schooling. 76. Disentangling the causal links between work and schooling is complicated by the fact that decisions relating to them are typically jointly determined. Decisions concerning allocations of children’s time are also influenced by factors such as talent, family behaviour and family preferences, which are unobservable to the researcher. In order to identify a causal link, panel data, providing repeated observations for each individual, are needed. With these data, individual and household “unobservables” can be “eliminated” using the usual data random effects or fixed effects tools. In the absence of panel data, causality cannot be asserted, but it is still possible to examine the association between work and school attendance and to identify children at high risk of leaving school. 77. With this technical limitation in mind, the study addresses the issue of causality only in one country – China – for which panel data are available. Using panel data from the China Health and Nutrition Survey25 for the years 1989, 1991, 1993 and 1997, the effect of time spent on non-market activity will be determined using appropriate estimation methods. In the remaining countries included in the study, cross-sectional data is used to look at the association 24 Again, data limitations do not permit carrying over into the current analysis the distinction drawn in the Section 4 between non-market work inside and outside the SNA production function. This section, therefore, also distinguishes only between “market” and “non-market” work, where the latter refers to both non-market economic work (specifically, water fetching and fuel wood collection) and non-market non-economic work (specifically, housework). (Table 7 provides further clarification on terminology.) 25 The China Health and Nutrition Survey (CHNS) was designed to examine the effects of the health, nutrition, and family planning policies and programs implemented by national and local governments and to see how the social and economic transformation of Chinese society is affecting the health and nutritional status of its population. CHNS took place using a multistage, random cluster process to draw a sample of about 3800 households with a total of 16,000 individuals. The sample covered the following nine provinces, Guangxi, Guizhou, Heilongjiang,Henan, Hubei, Hunan, Jiangsu, Liaoning and Shandong, that vary substantially in geography, economic development, public resources, and health indicators. Detailed demographic, economic, time use, labor force participation, asset ownership, and expenditure data were obtained. In addition, detailed community data were collected in surveys of food markets, health facilities, family planning officials, and other social services and community leaders. CHNS89 included 3,795 households. In CHNS91, 3,616 households participated, in CHNS93, 3,441 households participated, and in CHNS97, approximately 3875 households participated. All individuals in each household were surveyed in 1991, 1993 and 1997 for all data; however in 1989, health and nutritional data were only collected from preschoolers and adults aged 20-45. CHNS89 surveyed 15,917 individuals. CHNS91 only surveyed individuals belonging to the original sample households which resulted in a total of about 14,778 individuals. In CHNS93, all new households formed from sample households who resided in sample areas were added to this sample, resulting in a total of about 13,893 individuals. In CHNS97, all newly-formed households who resided in sample areas and additional households to replace those no longer participating were added to the sample. New communities were also added to replace communities no longer participating, and Heilongjiang province replaced Liaoning province. A total of about 14,426 individuals participated in 1997.

31 UCW WORKING PAPER SERIES, MAY 2005
between time on non-market and schooling. Specifically, logit regressions are used to develop synthetic indicators describing the probabilistic links between hours of work (in market and non-market activity), school attendance and class repetition.
6.2 Involvement in non-economic activity and schooling: Descriptive evidence 78. Attendance rates appear to be negatively affected by work only beyond relatively high weekly hours thresholds in the countries examined (Table 24). In the case of Guatemala, attendance appears drop off beyond 30 hours of work in non-market activity and beyond 25 hours of work in market activity, but there is no obvious threshold for combined work. For Cambodia, attendance drops off beyond 30 hours per week in market activity and only beyond 40 hours per week in market activity. In the case of Ghana, there is no clear hours threshold beyond which work affects attendance. Indeed, for non-market activity only, attendance is actually lower among children putting in only 1-5 weekly working hours than among children logging over 40 weekly working hours. Table 24. – Children’s school attendance rate, by country, activity status and weekly working hours
Country Activity status Average weekly working hours 1-5 6-10 11-15 16-20 21-25 26-30 31-35 36-40 41-45 46-50 50+
Cambodia
Non-economic activity only(1)
84.4 87.1 77.7 80.3 78.6 69.9 73.0 74.2 8.3 0.0 2.8
Market activity only(2)
84.1 87.4 99.4 97.9 83.2 91.7 24.0 5.0 77.1 70.1 48.5
Both(3) - - - - - - - - - - -
Ghana
Non-economic activity only(1) 55.4 65.1 72.3 67.1 70.6 68.5 66.5 66.4 70.1 72.1 58.2 Market activity only(2) - - - - - - - - - - - Both(3) 48.0 51.5 55.0 45.3 37.0 39.5 36.5 46.7 27.3 35.2 33.2
Guatemala
Non-economic activity only(1) 82.4 79.8 78.7 80.8 76.5 81.6 73.2 73.5 71.4 57.9 61.3
Market activity only(2) 77.7 80.2 84.5 82.4 81.4 61.8 49.7 57.7 49.6 32.1 27 Both(3) 81.5 64.8 76.3 70.1 85.5 80.7 71.7 81.1 73.5 62.8 53
Notes: (1) Children working at least one hour on non-market activity and no time on market activity during the reference week; (2) Children working at least one hour in market activity and no time on non-economic activity during the reference week; (3) Children working at least one hour on both market and non-economic activity during the reference week. Sources: UCW calculations based on Cambodia SIMPOC 2001; Guatemala LSMS 2000, and Ghana LSMS 1998/99
Table 25. – Children’s grade repetition rate, by country, activity status and weekly working hours
Country Activity status Average weekly working hours 1-5 6-10 11-15 16-20 21-25 26-30 31-35 36-40 41-45 46-50 50+
Guatemala
Non-economic activity only(1) 87.6 88.3 91.1 91.1 86.3 80.8 81.7 87.1 77.4 84.0 88.8 Market activity only(2) 71.4 95.1 78.6 80.8 92.5 92.8 95.9 93.7 96.5 92.4 92.1 Both(3) 87.3 88.3 89.8 88.8 88.0 84.0 84.8 88.2 81.5 87.0 86.7
Notes: (1) Children working at least one hour on non-economic activity and no time on market activity during the reference week; (2) Children working at least one hour in market activity and no time on non-economic activity during the reference week; (3) Children working at least one hour on both market and non-economic activity during the reference week. Sources: UCW calculations based on Guatemala LSMS 2000.

32
TOWARDS STATISTICAL STANDARDS FOR CHILDREN’S NON ECONOMIC WORK. A DISCUSSION BASED ON HOUSEHOLD SURVEY DATA.
79. Working hours also bear no clear link to the ability of children to proceed successfully from one grade to the next in Guatemala, the only country where data on repetition were available (Table 25). Comparing the two extremes of the working hours range, Guatemalan children working only 1-5 hours per week were just as likely to have to repeat a grade as children working 46 hours or more per week, in all three work categories.
6.3 Involvement in non-economic activity and school attendance: Identifying causal links in China using CHNS data 80. The links between the involvement of children in work and/or household chores and school attendance have been studied in various populations using cross-sectional data (see for example, Grootaert and Patrinos (1999), Pushkar and Ray (2002)) with the general finding that child labour is associated with lower school attendance and thus lower accumulation of human capital. While there has been considerable discussion of the causal mechanism behind this association, there have been very few analyses where the causal link could be definitively identified. 81. One reason for this difficulty is the fact that, as noted above, child labour and school attendance are usually the result of a joint decision. This decision is also influenced by possibly unobserved factors such as talent, family behavior and preferences, so that, unless longitudinal data are available, it is difficult to know, for example, whether it is low talent that induce people not to go to school and because of that people start to work, or if it is the preference or need to work that then induce people to drop out of school. 82. The use of panel data can help to address at least some of these issues and to get firmer results in terms of causal links. The panel data from China Health and Nutrition Survey is one of the few, the only one at our disposal in fact, that can be used for the identification of causal links behind observed association. China Health and Nutrition Survey is based on a multistage random sample, covering 3800 household and about 16,000 individuals. The sample cover the following nine provinces of China: Guangxi, Guizhou, Heilongjiang,Henan, Hubei, Hunan, Jiangsu, Liaoning and Shandong. The survey contains information on demographic, economic, time use, labor force participation, asset ownership, and expenditure. In addition, detailed community data were collected. The survey has been carried out (with similar, albeit slight different sample sizes) in 1989, 1991, 1993 and 1997. We hav eused only the first three waves, as 1997 present a different structure. 83. Information on economically active children is present only in 1989. The following graph presents the age distribution and gender distribution of these children.

33 UCW WORKING PAPER SERIES, MAY 2005
Figure 3. - Age and gender distribution of sample, China Health and Nutrition Survey
84. Few children are involved in economic activities. As the following table shows more seems to be involved in performing non-market activity. Table 26. - Percentage of children aged 7-14 performing non-economic activity, by activity status
Type of Activity Male Female Total
Working, not attending school 35.7 48.6 43.1
Attending school, not working 8.4 14.0 11.1
Working and attending school 7.7 20.0 11.1
Not working, not attending school 10.8 14.6 12.8
Total 9.2 15.3 12.1
Source:UCW calculations based on China Health and Nutrition Survey
85. We exploit the panel structure of our data by trying to identify causality conditioning current behavior in terms of schooling to past behavior in terms of hours of work. Intuitively, if at time t we can identify two (groups of) individuals a and b with the same characteristics and the same school attendance history, but one doing xa hours of non-market activity and the other doing xb hours of non-market activity, we can then compare their school attendance at time t+1, to verify if it has been affected by the different amount of non-market activity performed. In addition, if we have repeated observations for such individuals (at t, t+1, t+2) we can try to remove also unobserved differences between individuals, using the usual panel data random effects or fixed effects tools. 86. More formally, let St denote the school attendance indicator at time t, HCt denote the number of hours of non-market activity at time t and Xt denote a vector of observed child and household characteristics at time t. To convey our ideas, we focus on first-order Markov processes, where only the most recent history conveys information; let
f(St+1, HCt+1 | St, HCt, Xt) = f1(St+1| St, HCt, Xt) f2(HCt+1 | St+1,St, HCt, Xt) = f3(HCt+1| St, HCt, Xt) f4(St+1 | HCt+1,St, HCt, Xt)
87. denote two different models of the joint conditional distribution of St+1, HCt+1 given past history. While it is difficult to interpret and use either f2 or f4 as representing a causal link between HCt+1, St+1, because they could be simultaneously determined, we can certainly do so for f1 and f3. The conditional model f1, in particular, can be used and estimated to find evidence on the causal link between HC and S.
1.6
0.9 1.3
3
0.8
8.2
11.9
3.6
0.8
3.9
0.8
2.3 2.2
7.6
12.8
3.9
7 8 9 10 11 12 13 14 Total
perce
nt
age in years
Male Female

34
TOWARDS STATISTICAL STANDARDS FOR CHILDREN’S NON ECONOMIC WORK. A DISCUSSION BASED ON HOUSEHOLD SURVEY DATA.
88. We estimated the conditional model f1 by means of a dynamic panel model, which allows us also to control for unobserved individual characteristics. The results of the random effects regression are reported in Table 2 Table 27. - Random effects logistic regression School attendance Coef. Std. Err. z
Female -0.114 0.082 -1.39
attend89 0.788 0.104 7.61
Household size -0.089 0.035 -2.54
Number of children -0.101 0.090 -1.12
Hours non-market wk -0.043 0.011 -3.89
Age 0.999 0.141 7.1
age2 -0.055 0.006 -9.33
Head female 0.170 0.132 1.29
Water access 0.255 0.098 2.61
Source: UCW calculations based on China Health and Nutrition Survey.
89. The results clearly point to a significant causal link between hours spent on non-market activity and school attendance in the China context. The regression estimations indicate that hours spent on non-market activity negatively affect the likelihood of school attendance. 90. Again, these results highlight the fact that engagement in non-market activity can interfere with children’s development and right to education in the same way as involvement in market activity, arguing for their consideration in legislation against child labour and in policies addressing it.
6.4 Involvement in non-economic activity and school attendance: Synthetic indicators based on effective working hours 91. As discussed above, data limitations prevent us from presenting an easy replicable approach to identify the causal effects of working hours on education. Therefore, we presented a causal analysis using a set of panel data for some provinces of China in the previous section. 92. In this section, we make use of synthetic indicators (based on logit regressions) to offer a more direct and synthetic view of the relationship between hours of work and schooling. Instruments like these26 are suitable to describe the probabilistic link between variables, but cannot be used to derive strict causal interpretations. 93. If the required data are not available, but also for monitoring and policy design purposes, we can use a synthetic indicator to identify a relationship among a set of variable. It should be remembered, however, that these instruments are basically reduced form estimates. The relationship estimated is subject to change if the underlying structure changes (for example, if the gender distribution of employment changes). They must hence be considered with care.
26 We have decided to estimated the probabilistic link between working hours and schooling using a logit regression rather than, for example, a Kernel regression for reason that will become clear later on.

35 UCW WORKING PAPER SERIES, MAY 2005
6.4.1 Estimation approach
94. We aim here to assess the correlation between working hours in non-market activity and school attendance and to compare such effects with those of hours working in market activities. In order to do this, we have proceeded in the following way. We have considered separately children performing non-market activity only (i.e. not involved in market activities), children performing market activities only and children performing both. 95. We have modelled the probability of observing a given school outcome S (attendance, grade for age, etc.) as a function of a polynomial g(h) in the hours of work h:
P(S)=f(g(h))
96. In our exercise, we have defined f as a logistic function. 97. The application of such an approach is straightforward in the case of children only working in market or non-market activity exclusively. An interesting complication arises, when we consider children performing both. As the outcome might obviously be the result of the total hours worked (both in market activities and in non-market activity) we have to take in to account both the total numbers of hours worked and their sectoral composition. To consider only the total hours worked would be equivalent to imposing the restriction that an hour of work in market activities is equivalent to an hour of work in non-market activities. 98. We have hence decided to follow an approach based on ‘effective working hours’, i.e., an approach that allows us to combine hours spent on market activity and non-market activity based on the relative impact of each on children’s schooling . This will enable the assessment of the total effort exerted by children in various non-school and non-leisure activities on a single ‘child work’ scale that has effective ‘hours of work’ as the measurement unit. 99. The approach assumes the existence of an indicator of the impact of work (I) that is a function of effective working hours (h) and a range of other individual and household characteristics (z):
I = f (h, z)
100. Effective working hours, in turn, are a function of hours spent on market activity (hE) and on non-market activity (hHC), and of a vector of the characteristics relevant to each kind of work (sector of work, task carried out by the child, etc.) Ө(k). 101. Effective hours of work can be then defined as:
h= ))(
,)(
(k
hk
h HCE
θθ
102. The choice of a specific functional form is necessary in order to obtain an estimable function. The following form allows for different weights (effects) to be attached to the hours performed in each activity (economic and non economic).

36
TOWARDS STATISTICAL STANDARDS FOR CHILDREN’S NON ECONOMIC WORK. A DISCUSSION BASED ON HOUSEHOLD SURVEY DATA.
h= )))(
()(
(k
hk
h HCE
θα
θ+
103. If the available data do not allow recovering the effects in )(kθ or they are deemed not to be very important, the expression can be further simplified to:
h= )( HCE hh α+
104. It is then be possible to estimate an outcome function of the following form.
I= f( βα )( HCE hh + , z)
105. In our exercise, I=P(S) and f takes the form of a logistic. 106. The estimates of the parameter α gives information of the relative impact of hours spent in the two activities in determining the outcome. 107. In fact, as can be seen by differentiating the previous equation, α is the ratio of marginal effects27 of working hours in non market activities with respect to market activities and this define precisely the interpretation to be given to the relative impact of hours in the different sector at the base of our measure of effective working hours . 108. The specification just discussed allows for non constant marginal effects of hours worked, but it constraints the ratio of marginal effects to be constant. The “equivalence” between hours spent in market activities and in non-market activity hence is assumed to be independent of the number of hours worked in (either of) the two sectors. 109. To avoid imposing such a restriction we include in the equation to be estimated an interaction term28 to obtain:
I= f( βγδ )( HCEHCE hhhh ⋅⋅++ , z)
110. Again we define the “equivalence” between the effects of the working hours in the two sectors as the ratio of marginal effects. In this case such a ratio is not constant, but is given by:
)1()(
)1()(
HC
E
HC
E
hh
fhfh
⋅+⋅+
=′⋅⋅+′⋅⋅+
=′γγδ
γβγδβ
α
27 The marginal effects can be written as
fMFEh ′⋅= β
and fMF
HCh ′⋅=αβ and then the definition of α follows. 28 We have also experimented with higher order polynomial, but the results were substantially unchanged with respect to those obtained using the specification reported above.

37 UCW WORKING PAPER SERIES, MAY 2005
111. Theoretically, the “equivalence” parameter α′can be used to combine the hours spent in market and non market activity in a single measure of effective hours of work performed by the child. Observe that the formulation adopted normalises the hours worked in non-market activity in terms of hours worked in market activities. Also, in this formulation the ratio of marginal effects that define our “equivalence”, is not constant but varies as a function of the hours worked in the two sectors. 6.4.2 Estimation results: Guatemala
112. We used school attendance as the dependent variable. Table 28 shows the results for children performing only non-market activity. The model with hours and hours squared was selected after some preliminary testing. A higher order of polynomial did not add any explanatory power. Table 28. - Logit estimates, children involved in non-economic activity only, Guatemala ------------------------------------------------------------------------------------------ School attendance | Coef. Std. Err. z P>|z| [95% Conf. Interval] --------------------- +---------------------------------------------------------------- hrs_nmkt | -.0142954 .007299 -1.96 0.050 -.0286011 .0000103 hrs_nmkt2 | -.0001526 .0001206 -1.27 0.206 -.0003889 .0000838 _cons | 1.722583 .0834393 20.64 0.000 1.559045 1.886121 ------------------------------------------------------------------------------------------- Source: UCW calculations based on Encuesta de Condiciones de Vida (ENCOVI), 2000
113. Hours of work in non-market activity only seems to negatively associated with school attendance. Figure 4 helps to interpret the results more easily. The rate at which work in non-market activity affects the probability of schooling increases with the number of hours worked. Work up to 20 hours per week is associated with a reduction of the probability of attending school of about five percentage points. An increase in working hours from 20 to 40 hours per week is associated with a reduction twice as large in the probability of attending school Figure 4. - Probability of school attendance by hours in non-economic activity
Source: UCW calculations based on Encuesta de Condiciones de Vida (ENCOVI), 2000
114. For children working in economic activities only, the linear model seems to give the best fit. However, these results should be interpreted with care, as the number of observations is relatively small.
0.48
0.53
0.58
0.63
0.68
0.73
0.78
0.83
0.88
0 10 20 30 40 50 60 70
weekly hours in Hh. chores
Prob
. of s
choo
l att
enda
nce

38
TOWARDS STATISTICAL STANDARDS FOR CHILDREN’S NON ECONOMIC WORK. A DISCUSSION BASED ON HOUSEHOLD SURVEY DATA.
Table 29. - Logit estimates, children involved in market activity only, Guatemala Number of obs = 572 LR chi2(2) = 89.47 Prob > chi2 = 0.0000 Log likelihood = -342.95786 Pseudo R2 = 0.1154 ------------------------------------------------------------------------------------- attend1 | Coef. Std. Err. z P>|z| [95% Conf. Interval] --------------- +---------------------------------------------------------------- hrs_mkt | -.0488182 .0248352 -1.97 0.049 -.0974944 -.0001421 hrs_mkt2 | 1.69e-06 .0003604 0.00 0.996 -.0007047 .0007081 _cons | 2.029054 .3762447 5.39 0.000 1.291628 2.76648 ------------------------------------------------------------------------------------- Source: UCW calculations based on Encuesta de Condiciones de Vida (ENCOVI), 2000 115. Figure 5 illustrates the impact of an increase in working hours for children engaged in market activity only. The effect appears to be much larger than that of hours worked in non-market activity only. In fact, an increase in working hours from 20 to 40 per week is associated with a reduction of school attendance of about 20 percentage points: from about 70 percent to 50 percent.
Figure 5. - Probability of school attendance by hours in market activity only
Source: UCW calculations based on Encuesta de Condiciones de Vida (ENCOVI), 2000
116. In Guatemala, a large number of children combine market and non-market activity. For this group of children, we followed the modelling approach described above. The results of the estimates are shown in Table 30.
Table 30. - Estimation of effective working hours, Guatemala Source SS df MS Number of obs = 957 F( 4, 953) = 577.47 Model 448.117297 4 112.029324 Prob > F = 0.0000 Residual 184.882703 953 .194000738 R-squared = 0.7079 Adj R-squared = 0.7067 Total 633 957 .661442006 Root MSE = .4404551 Res. dev. = 1142.462 --------------------+----------------------------------------------------------------------------- School attendance Coef. Std. Err. t P>|t| [95% Conf. Interval] B0 2.842 0.293 9.7 0.000 2.2668 3.4162 β -0.060 0.007 -8.0 0.000 -0.0745 -0.0452 δ 0.664 0.108 6.2 0.000 0.4522 0.8765 γ -0.012 0.003 -3.5 0.001 -0.0186 -0.0051 (SEs, P values, CIs, and correlations are asymptotic approximations)
Source: UCW calculations based on Encuesta de Condiciones de Vida (ENCOVI), 2000
00.10.20.30.40.50.60.70.80.9
1
0 10 20 30 40 50 60 70 80
w eekly hours in market activity
Prob
. of s
choo
l atte
ndan
ce

39 UCW WORKING PAPER SERIES, MAY 2005
Figure 6. - Equivalence ratio between hours worked in market and non market activity
Source: UCW calculations based on Encuesta de Condiciones de Vida (ENCOVI), 2000
117. Figure 6 illustrates the ratio of marginal effects on school attendance between the hours worked in non-market activity and hours worked in market activities. The graph is drawn assuming one hour per week is spent on market activity. As it is easy to see, the “equivalence” ratio of hours worked in non-market activity with respect to hours worked in market activities increases with the number of hours actually worked. For example, in the case illustrated here of a child working one hours in market activities, if a child works 10 hours in non-market activity each of this hours produces an effect that is equivalent to 0.75 of the effects produced by working in market activity. If the child works about 29 hours per week, the effects of each hours on school attendance are almost identical to those generated by work in market activities. 118. Such “equivalence” varies not only in function of the hours worked in household chore, but also as a function of the hours worked in market activities. Remember that the effects on school attendance depend on both the level and the composition of working hours in a non linear way. The following graph illustrates this point. Each of the curves represents the “equivalence” ratio discussed above relative at different levels of hours spent in market activities. As it is easy to see the ratio raises with the number of hours spent in non-market activity, but decreases with the hours worked in market activity. For example, if a child work 29 hours in non-market activity the relative effect on school attendance with respect to hours spent in market activities is equal almost to one if the child works one hour in market activities and to about 0.60 if the child works 24 hours in market activities.
0.60.65
0.70.75
0.80.85
0.90.95
11.05
1.1
1 3 5 7 9 11 13 15 17 19 21 23 25 27 29 31 33Hours in hhchores

40
TOWARDS STATISTICAL STANDARDS FOR CHILDREN’S NON ECONOMIC WORK. A DISCUSSION BASED ON HOUSEHOLD SURVEY DATA.
Figure 7. - “Equivalence” ratio between hours worked in market and non-economic activity
Source: UCW calculations based on Encuesta de Condiciones de Vida (ENCOVI), 2000
119. In fact, given the high non linearity, we should think of an equivalence surface between hours spent in market and non-market activity, as illustrated in Figure 8. Figure 8. - “Equivalence surface” between hours worked in market and non-economic activity
Source: UCW calculations based on Encuesta de Condiciones de Vida (ENCOVI), 2000
120. In conclusion, the relative importance of hours spent in non-market activity with respect to those spent in household activities is not constant. It increases with the numbers of hours worked in non-market activity, but decreases the higher is the number of hours spent in the market activities. 121. Finally, we should remember that not only the relative effects of hours spent in the two activities considered do change, but also their absolute effect. The effects of hours worked in non-market activity on school attendance increase both with the number of hours worked in non-market activity and with the hours worked in the market, as illustrated in Figure 9.
0
0.2
0.4
0.6
0.8
1
1.2
1.4
1 3 5 7 9 11 13 15 17 19 21 23 25 27 29 31 33 35 37 39hours in household chores
"Equ
ival
ence
" rat
io
1 Hr in the market 7 Hrs in the market 14 Hrs in the market21 Hrs in the market 28 Hrs in the market 35 Hrs in the market
1 2 4 8 16 241
4
16
0.3
0.4
0.5
0.6
0.7
0.8
0.9
1
Prob
. of s
choo
l atte
ndan
ce
hours in household chores
hour
s in
th
e m
arke
t
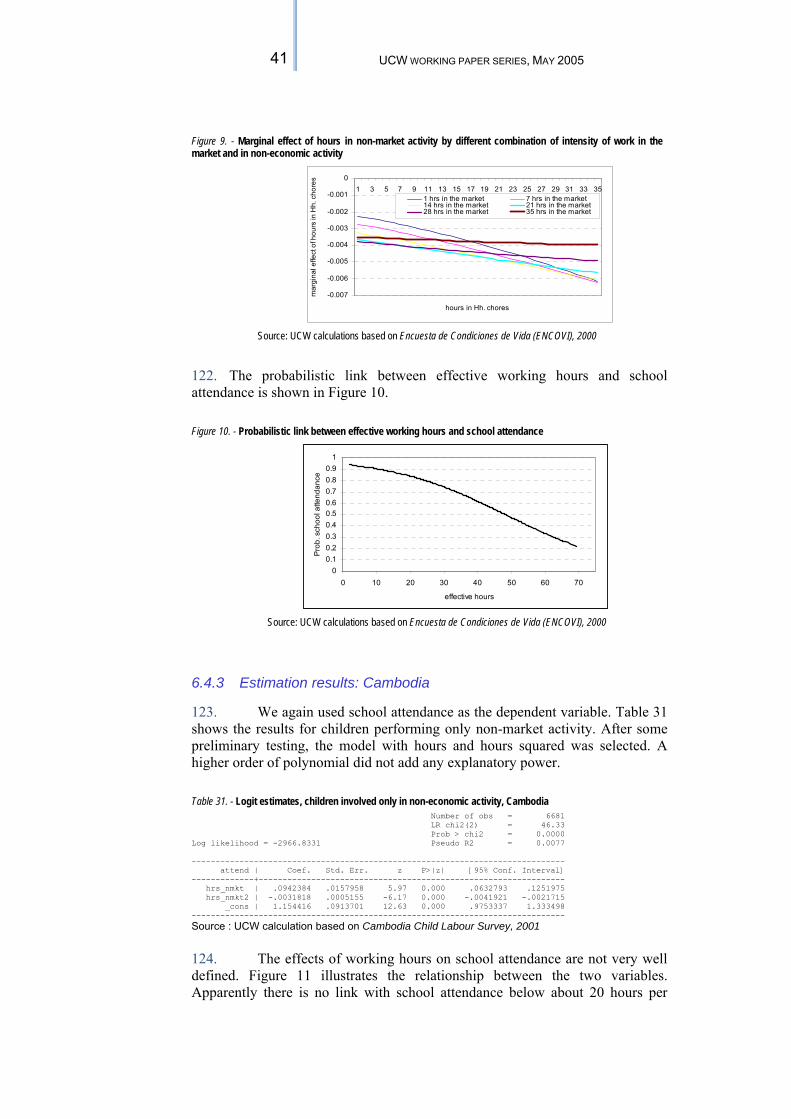
41 UCW WORKING PAPER SERIES, MAY 2005
Figure 9. - Marginal effect of hours in non-market activity by different combination of intensity of work in the market and in non-economic activity
Source: UCW calculations based on Encuesta de Condiciones de Vida (ENCOVI), 2000
122. The probabilistic link between effective working hours and school attendance is shown in Figure 10. Figure 10. - Probabilistic link between effective working hours and school attendance
Source: UCW calculations based on Encuesta de Condiciones de Vida (ENCOVI), 2000
6.4.3 Estimation results: Cambodia
123. We again used school attendance as the dependent variable. Table 31 shows the results for children performing only non-market activity. After some preliminary testing, the model with hours and hours squared was selected. A higher order of polynomial did not add any explanatory power. Table 31. - Logit estimates, children involved only in non-economic activity, Cambodia
Number of obs = 6681 LR chi2(2) = 46.33 Prob > chi2 = 0.0000 Log likelihood = -2966.8331 Pseudo R2 = 0.0077 ------------------------------------------------------------------------------ attend | Coef. Std. Err. z P>|z| [95% Conf. Interval] -------------+---------------------------------------------------------------- hrs_nmkt | .0942384 .0157958 5.97 0.000 .0632793 .1251975 hrs_nmkt2 | -.0031818 .0005155 -6.17 0.000 -.0041921 -.0021715 _cons | 1.154416 .0913701 12.63 0.000 .9753337 1.333498 ------------------------------------------------------------------------------
Source : UCW calculation based on Cambodia Child Labour Survey, 2001
124. The effects of working hours on school attendance are not very well defined. Figure 11 illustrates the relationship between the two variables. Apparently there is no link with school attendance below about 20 hours per
-0.007
-0.006
-0.005
-0.004
-0.003
-0.002
-0.001
01 3 5 7 9 11 13 15 17 19 21 23 25 27 29 31 33 35
hours in Hh. choresm
argi
nal e
ffect
of h
ours
in H
h. c
hore
s
1 hrs in the market 7 hrs in the market14 hrs in the market 21 hrs in the market28 hrs in the market 35 hrs in the market
00.10.20.30.40.50.60.70.80.9
1
0 10 20 30 40 50 60 70
effective hours
Pro
b. s
choo
l atte
ndan
ce

42
TOWARDS STATISTICAL STANDARDS FOR CHILDREN’S NON ECONOMIC WORK. A DISCUSSION BASED ON HOUSEHOLD SURVEY DATA.
week. Above that threshold, longer working time is associated with reduced school attendance.
Figure 11. - Probability of school attendance by hours in non-economic activity
Source : UCW calculation based on Cambodia Child Labour Survey, 2001
125. Similar results are obtained for children working only in economic activities. Again the quadratic form seems to work better. Table 32. - Logit estimates, children involved in market activity only, Cambodia
Number of obs = 295 LR chi2(2) = 29.90 Prob > chi2 = 0.0000 Log likelihood = -147.84709 Pseudo R2 = 0.0918 ------------------------------------------------------------------------------ attend | Coef. Std. Err. z P>|z| [95% Conf. Interval] -------------+---------------------------------------------------------------- hrs_mkt | .0547382 .0367511 1.49 0.136 -.0172926 .126769 hrs_mkt2| -.0015602 .0005877 -2.65 0.008 -.002712 -.0004084 _cons | 1.11411 .4456701 2.50 0.012 .2406126 1.987607
Source : UCW calculation based on Cambodia Child Labour Survey, 2001
Figure 12. - Probability of school attendance by hours in market activity only
Source : UCW calculation based on Cambodia Child Labour Survey, 2001
126. Again, we observe no association at low level of working time. A negative association shows only above 30 hours per week. The estimation for the group of children working both in market activity and non-market activity did not bring well defined results. 127. The results of the estimation of effective working hours are shown in Table 33. It appears that hours spent in non-market activity add little to the probability of not attending school with respect to hours spent in economic activities. We have, nonetheless, estimated the probability of school attendance
00.10.20.30.40.50.60.70.80.9
1
0 10 20 30 40 50 60
hours in Hh. chores
Pro
b. s
choo
l atte
ndan
ce
00.1
0.20.3
0.40.5
0.60.7
0.80.9
0 10 20 30 40 50 60 70
hours in economic activity only
Pro
b. s
choo
l atte
ndan
ce

43 UCW WORKING PAPER SERIES, MAY 2005
with respect to effective working hours, where effective working hours have been constructed using the estimated α’. Table 33. - Estimation of effective working hours, Cambodia Source | SS df MS Number of obs = 8002 F( 4, 7998) = 12592.05 Model | 5869.04951 4 1467.26238 Prob > F = 0.0000 Residual | 931.95049 7998 .116522942 R-squared = 0.8630 Adj R-squared = 0.8629 Total | 6801 8002 .849912522 Root MSE = .3413546 Res. dev. = 5503.055 attend Coef. Std. t P>|t| [95% Conf. Interval] B0 3.538 0.149 23.74 0.000 3.246 3.830 β -0.070 0.004 -16.33 0.000 -0.078 -0.061 δ 0.488 0.153 3.18 0.001 0.187 0.789 γ -0.011 0.004 -2.54 0.011 -0.019 -0.002 (SEs, P values, CIs, and correlations are asymptotic approximations)
Source : UCW calculation based on Cambodia Child Labour Survey, 2001
Figure 13. - Marginal effect of hours in non-economic activity by different combination of intensity of work in the market and in non-economic activity
Source : UCW calculation based on Cambodia Child Labour Survey, 2001
128. As Figure 14 shows, the estimated curve is similar to that estimated for children working only in market activity. On the one hand, this is not surprising, given the low estimated weight of hours spent on non-market activity; on the other hand, it is also a test of the robustness of the estimates as the two samples are different.
-0.003
-0.002
-0.002
-0.001
-0.001
0.0001 3 5 7 9 11 13 15 17 19 21 23 25 27 29 31 33 35
hours in hhchores
mar
gina
l effe
ct o
f hou
rs in
the
mar
ket
1 hour in the market 7 hours in the market14 hours in the market 21 hours in the market28 hours in the market 35 hours in the market

44
TOWARDS STATISTICAL STANDARDS FOR CHILDREN’S NON ECONOMIC WORK. A DISCUSSION BASED ON HOUSEHOLD SURVEY DATA.
Figure 14. - Probability of school attendance by effective work hours
Source : UCW calculation based on Cambodia Child Labour Survey, 2001
129. A possible explanation of the low weight that hours worked in non-market activity bears in terms of school attendance is the relatively small numbers of hours performed weekly by children in non-market activity. 130. Figure 15 presents the distribution of weekly hours of market activity and non-market activity. As it is easy to see, a large majority of the children spend less than 20 hours a week (less than three hours a day) in non-market activity. It is hence not surprising that on the observed sample of children it is not easy to identify any significant association between hours of work in non-market activity and school attendance (independently of whether non-market activity is carried out in combination with market activity or not). Figure 1. Distribution of weekly hours of market and non-economic activity
0
.05
.1
.15
0 20 40 60x
Hours economic activity Hours household chores
Source : UCW calculation based on Cambodia Child Labour Survey, 2001
6.4.4 Estimation results: Senegal
131. The estimations for Senegal are based on the 2000 MICS survey. We begin by presenting the results for the group of children performing non-market activity only. As for the other countries, the model with a quadratic on hours worked yielded the best results.
0
0.2
0.4
0.6
0.8
1
1.2
0 10 20 30 40 50 60 70 80
effective working hours
Pro
b. o
f sch
ool a
ttend
ance

45 UCW WORKING PAPER SERIES, MAY 2005
Table 34. Logit estimates, children performing non-economic activity only, Senegal Number of obs = 9777 LR chi2(2) = 278.20 Prob > chi2 = 0.0000 Log likelihood = -6551.7815 Pseudo R2 = 0.0208 ------------------------------------------------------------------------------ Attend | Coef. Std. Err. z P>|z| [95% Conf. Interval] ------------ +---------------------------------------------------------------- hrs_nmkt | .0236721 .0059173 4.00 0.000 .0120744 .0352699 hrs_nmkt2 | -.0012471 .0001482 -8.42 0.000 -.0015374 -.0009567 _cons | -.2152242 .0441418 -4.88 0.000 -.3017406 -.1287078 ------------- +---------------------------------------------------------------- Source: UCW calculation based on Senegal MICS, 2000
Figure 15. - Probability of school attendance by hours in non-economic activity
Source: UCW calculation based on Senegal MICS, 2000
132. The probability of attending school starts to decrease beyond about 15 hours of work per week, with a rate that is increasing after about 20 hours per week. The effects of hours of work in market activity on school attendance have a linear form, so that the probability of attending school is apparently decreasing at a constant rate with hours worked. Table 35. - Logit estimates, children involved in market activity only, Senegal
Number of obs = 776
LR chi2(2) = 55.23
Prob > chi2 = 0.0000
Log likelihood = -492.80642 Pseudo R2 = 0.0531
------------ -----------------------------------------------------------------
Attend | Coef. Std. Err. z P>|z| [95% Conf. Interval]
------------ +----------------------------------------------------------------
hrs_mkt | -.0394697 .018502 -2.13 0.033 -.075733 -.0032064
hrs_mkt2 | -3.20e-06 .0003447 -0.01 0.993 -.0006788 .0006724
_cons | .3749202 .1997633 1.88 0.061 -.0166086 .76644
------------ +----------------------------------------------------------------
Source: UCW calculation based on Senegal MICS, 2000
Figure 16. - Probability of school attendance by hours in market activity only
00.050.1
0.150.2
0.250.3
0.350.4
0.450.5
0 10 20 30 40 50 60 70
Hours in household chores
Prob
of s
choo
l atte
ndan
ce

46
TOWARDS STATISTICAL STANDARDS FOR CHILDREN’S NON ECONOMIC WORK. A DISCUSSION BASED ON HOUSEHOLD SURVEY DATA.
Source: UCW calculation based on Senegal MICS, 2000
133. The link between time in market activity and school attendance appears to be larger than that of time in non-market activity. In fact working for twenty hours a week is associated with a reduction is the probability of attending from just below 60 per cent to just below 40 per cent. Note also that effect of working hours in market activity begins from the first hour worked, while the effect of time in non-market activity on the probability of school attendance starts only at about 20 hours per week. 134. For the children working both in market activity and non-market activity, we estimated the model on effective hours, as discussed above. The following table presents the estimates of the model. Table 36. - Estimation of effective working hours, Senegal Source | SS df MS Number of obs = 4851
-------------+------------------------------ F( 4, 4847) = 966.65
Model | 870.179626 4 217.544906 Prob > F = 0.0000
Residual | 1090.82037 4847 .225050624 R-squared = 0.4437
-------------+------------------------------ Adj R-squared = 0.4433
Total | 1961 4851 .404246547 Root MSE = .474395
Res. dev. = 6527.614
(logit)
attend
Coef.
Std.
t P>|t| [95% Conf. Interval]
B0 0.4285 0.0600 7.14 0.000 0.3109 0.5460
β -0.0374 0.0040 -9.30 0.000 -0.0453 -0.0296
δ 0.7462 0.0906 8.24 0.000 0.5686 0.9238
γ -0.0070 0.0065 -1.08 0.279 -0.0197 0.0057
(SEs, P values, CIs, and correlations are asymptotic approximations)
Source: UCW calculation based on Senegal MICS, 2000
135. The following graph shows the ratio of marginal effects on school attendance between hours worked in non-market activity and hours worked in market activity. As in the case of Guatemala, the graph is drawn assuming that a child spent one hour per week in market activity. As we can see, the equivalence ratio of the hours spent in non-market activity with respect to the hours worked in market activities increases with the number of hours actually worked. Figure 17. - “Equivalence” ratio between hours worked in market and non-economic activity
0
0.1
0.2
0.3
0.4
0.5
0.6
0.7
0 10 20 30 40 50 60 70 80
Hours in economic activity only
Prob
. of s
choo
l atte
ndan
ce

47 UCW WORKING PAPER SERIES, MAY 2005
Source: UCW calculation based on Senegal MICS, 2000
136. This equivalence varies not only in function of the hours worked in non-market activity, but also as a function of hours worked in market activity. The following graph illustrates the “equivalence” ratio between hours worked in market and non-market activity. Figure 18. - “Equivalence” ratio between hours worked in market and non-economic activity
Source: UCW calculation based on Senegal MICS, 2000
137. Again, given the high non linearity, we should talk of an equivalence surface between hours spent in market and non-market activity, as illustrated in Figure 20.
Figure 19. - “Equivalence surface” ratio between hours worked in market and non-economic activities
Source: UCW calculation based on Senegal MICS, 2000
0.6
0.7
0.7
0.8
0.8
0.9
0.9
1.0
1.0
1.1
1 3 5 7 9 11 13 15 17 19 21 23 25 27 29 31 33
Hours in household chores
0
0.2
0.4
0.6
0.8
1
1.2
1 3 5 7 9 11 13 15 17 19 21 23 25 27 29 31
hours in household chores
"Equ
ival
ence
" ra
tio
1 Hr in the market 7 Hrs in the market14 Hrs in the market 21 Hrs in the market28 Hrs in the market
1 2 4 8 16 241
4
16
0.3
0.4
0.5
0.6
0.7
0.8
0.9
1
Prob
. of s
choo
l atte
ndan
ce
hours in househld chores
hour
s in
th
e m
arke
t

48
TOWARDS STATISTICAL STANDARDS FOR CHILDREN’S NON ECONOMIC WORK. A DISCUSSION BASED ON HOUSEHOLD SURVEY DATA.
Figure 20. - Marginal effect of hours in non-market activity by different combination of intensity of work in market and non-economic activity
Source: UCW calculation based on Senegal MICS, 2000
139. Figure 22 illustrates the estimated relationship in terms of effective working hours. Figure 21. - Probability of school attendance by effective working hours
Source: UCW calculation based on Senegal MICS, 2000
6.5 Summary 140. There is evidence that hours spent in non-market activity are negatively associated with school attendance. The test carried out for China indicates that such effects can indeed be assumed to be causal. For the subgroup of children performing only non-market activity, the association of hours spent working and school attendance appears to be smaller than for children performing market oriented activities. When children perform both non-market activity and market activities, the negative effects of time spent in non-market activity on school attendance is confirmed. In such a case the effects of non-market activity seems to be smaller with respect to those associated with hours spent in market activities. 141. However, the “equivalence” ratio of the effect of hours of work in the two sectors varies substantially with the number of hours spent working. It increases with the numbers of hours spent in non-market activity and decreases with the number of hours spent in market activities. The use of such an “equivalence” ratio for the purpose of a comprehensive definition of child labour is complex. Decisions have to be taken whether using a “mean” equivalence ratio is
-0.008
-0.007
-0.006
-0.005
-0.004
-0.003
-0.002
-0.001
0.0001 3 5 7 9 11 13 15 17 19 21 23 25 27 29 31 33 35
hours in hh chores
mar
gina
l effe
ct o
f hou
rs in
the
mar
ket
1 hrs in the market 7 hrs in the market14 hrs in the market 21 hrs in the market28 hrs in the market 35 hrs in the market
0
0.1
0.2
0.3
0.4
0.5
0.6
0.7
0 20 40 60 80 100
effective working hours
Prob
. of s
choo
l atte
ndan
ce

49 UCW WORKING PAPER SERIES, MAY 2005
acceptable as the use of the “equivalence “surface seems to be too complex. Also, the issue of the cross country difference in the equivalence ratio needs to be dealt with.

50
TOWARDS STATISTICAL STANDARDS FOR CHILDREN’S NON ECONOMIC WORK. A DISCUSSION BASED ON HOUSEHOLD SURVEY DATA.
7. INCORPORATING CHILDREN’S NON-ECONOMIC ACTIVITY INTO THE ESTIMATION OF CHILD LABOUR 142. This section tests empirically two approaches for incorporating children’s non-economic work into the estimation of child labour, using survey data from three countries. The first approach involves including as child labour only non-economic work performed beyond particular weekly hours thresholds. The second approach utilizes the concept of effective working hours developed in Sections 5 and 6 of this paper. This second approach enables the assessment of the total effort exerted by children in various (market and non-market) work activities on a single ‘child work’ scale that has effective ‘hours of work’ as the measurement unit. Both approaches are based on ILO Convention No.138 (Minimum Age).29
7.1 Child labour estimates based on hours thresholds for non-economic activity 143. Table 37 and Figure 23 illustrate the implications of different maximum permissible working time thresholds for non-market work on child labour estimates in Cambodia, Ghana and Guatemala. They suggest that the critical time threshold region for non-market work is relatively low, between 7 and 14 hours. For all three countries, raising the threshold from 7 to 14 weekly hours leads to a large fall in estimated child labour rates, but rises in the time threshold beyond 14 hours lead to much smaller further falls in child labour estimates. This underscores the fact that most children in the three countries perform non-market work only for relatively limited amounts of time each week. At all hours thresholds for non-market work, the rise in child labour estimates is higher for girls than boys, not surprising in that girls typically shoulder the largest share of the burden for household non-market work. Table 37. - Child labour rates for children aged 7-14 years,(1) by hours threshold for non-economic work
Country
(a) % children aged 7-11 years in
market work
(b) % children aged 12-14
years in market excluding those in light market-
work(2)
(a)+(b)
(c) % children aged 7-14 years
performing non-market work by average weekly hours threshold(3
(a)+(b)+(c) % children aged 7-14 years in child
labour, by hours threshold employed for non-market work
>7 >14 >21 >28 >35 >42 >7 >14 >21 >28 >35 >42
Cambodia M 42.6 46.7 44.0 34.6 5.8 1.5 0.4 0.2 0.1 57.7 46.2 44.7 44.3 44.2 44.1 F 41.8 45.1 43.0 39.6 7.8 1.8 0.4 0.2 0.2 59.0 45.4 43.6 43.2 43.1 43.1 T 42.2 45.9 43.5 37.0 6.8 1.7 0.4 0.2 0.1 58.3 45.8 44.2 43.8 43.7 43.6
Ghana M 11.7 22.6 15.5 36.3 18.6 10.6 5.6 3.1 1.9 45.4 31.8 26.0 22.5 20.8 20.2 F 10.5 21.8 14.7 55.3 35.7 22.9 15.7 10.3 7 59.1 43.3 32.7 27.5 23.5 21.1 T 11.1 22.2 15.1 45.6 26.9 16.6 10.5 6.6 4.4 52.1 37.5 29.2 24.9 22.1 20.6
Guatemala M 15.0 38.2 23.2 31.2 18.6 12.1 7.8 4.9 2.9 47.2 37.2 32.5 29.1 27.0 25.2 F 8.7 19.6 12.6 57.7 44.9 34.6 25.9 18.6 12.2 62.0 50.7 42.0 35.1 28.8 23.3 T 11.9 29.1 18.1 44.1 31.4 23.1 16.6 11.5 7.4 54.4 43.8 37.2 32.0 27.8 24.3
Notes: (1) Data on non-market work is not available for children aged 5-6 years in Guatemala; therefore, for consistency and comparability the 7-11, rather than the 5-11 age group, is used; (2) For the purposes of comparability, 12-14 years is used as the age range for which light work is allowed; it should be again noted, however, that Convention No. 138 allows ratifying states some flexibility in setting minimum ages, and in some countries the age range for light work is higher than 12-14 years. “Light work” is operationally defined for this indicator as economic activity that does not exceed 14 hours per week. Source: UCW calculations based on Cambodia SIMPOC 2001; Guatemala LSMS 2000, Ghana LSMS 1998/99.
29 It should be kept in mind that these estimates, though incorporating non-economic work, remain incomplete. This is because they do not include children in unconditional worst forms of child labour, a group beyond the scope of household surveys. The estimates also do not include older, 15-17 year-old working children, because data on the nature of work performed by these children are not available in sufficient detail.

51 UCW WORKING PAPER SERIES, MAY 2005
Figure 22. - Child labour estimates by hours threshold for non-market work
Notes: (1) Market work refers to (a)+(b) in Table 37. Source: UCW calculations based on Cambodia SIMPOC 2001; Guatemala LSMS 2000, Ghana LSMS 1998/99
7.2 Child labour estimates based on “effective working hours” 144. Data for Senegal and Guatemala are used to empirically verify computational procedures by which hours spent on market work and non-market work may be combined as “effective hours of work”, following the experimental approach described in Sections 5 and 6 above. The concept of effective working hours is then applied in revising estimates of child labour. 145. Initial estimates for Guatemala and Senegal using effective working hours based on education effects are presented in Table 38. They show a dramatic rise for both sexes in child labour rates compared to estimates based on involvement in market work alone. Indeed, in both countries, estimated child labour rates triple when non-market work is incorporated making use of equivalence scales. 146. This suggests that both equivalence scales and hours thresholds may need to be applied in generating child labour estimates that constitute realistic policy targets. As also shown in Table 38, applying the equivalence scale and a cut-off of seven effective working hours (for 7-11 year-olds) greatly reduces the size of the increase in child labour estimates.
58.3
45.4 47
.2
45.8
31.8 37
.2
44.2
26
32.5
43.8
22.5
29.1
43.7
20.8 27
43.6
20.2 25
.2
43.5
15.5
23.2
Cambodia Ghana Guatemala
perce
nt
mkt work(1)& non-mkt wk>7 hrs/wk
mkt work(1)& non-mkt wk>14 hrs/wk
mkt work(1)& non-mkt wk>21 hrs/wk
mkt work(1)& non-mkt wk>28 hrs/wk
mkt work(1)& non-mkt wk>35 hrs/wk
mkt work(1)& non-mkt wk>42 hrs/wk
mkt wk only(1)
Table 38. - Child labour rates for children aged 7-14 years, employing effective working hours based on education effects
Country
(a) Regular work, 7-11 year-olds
(b) Non-light work, 12-14 year-olds (i.e. ,work for more than 14 hours per
week)
(a) + (b) Child labour
(a1) % performing at least 1 hour of market work (excluding non-market work)
(a2) % performing at least 1 effective working hour (mkt work and/or non-mkt work) based on equiv. scale
(a3) % performing work beyond a threshold of 7 effective working hours (mkt work and/or non-mkt work) based on equiv. scale
(b1) % performing market work for more than 14 hours per week (excluding non-market work)
(b2) % performing work for more than 14 effective working hours (mkt work and/or non-mkt work) based on equiv. scale
(a1)+(b1) (a2)+(b2) (a3)+(b2)
Senegal
35.4 76.5 41.1 29.9 44.1 33.9 67.7 41.9
24.0 84.1 49.1 11.8 58.8 20.6 77.0 51.94
29.7 80.3 45.1 20.7 51.6 27.2 72.4 46.9
Guatemala
15.0 57.5 35.9 38.2 49.0 23.2 54.5 40.7
8.7 73.9 51.3 19.6 61.7 12.6 69.5 54.9
11.9 65.5 43.2 29.1 55.2 18.1 61.8 47.4
Source: UCW calculation based on Guatemala LSMS 2000 and Senegal MICS 2000.

52
TOWARDS STATISTICAL STANDARDS FOR CHILDREN’S NON ECONOMIC WORK. A DISCUSSION BASED ON HOUSEHOLD SURVEY DATA.
8. DISCUSSION AND CONCLUSION 147. The study began by evaluating the impact and feasibility of redefining the concept of “economically active children” on the basis of an accurate separation between non-market activities that fall into the SNA production boundary and non-market activities that do not. It was shown that the inclusion of non-market economic activities substantially increases the numbers of economically-active children, and substantially reduces the group of children that is performing non-economic work exclusively, and therefore potentially left out of child labour estimates. 148. The implications of these findings for overall estimates of child labour merit further exploration. Next steps in this context could include the following:
(a) a review of additional datasets to identify any further countries where
revised estimates are possible; (b) a revision of data collection instruments, as most current child labour
surveys either completely exclude non-market activities or fail to examine non-market activities in sufficient detail to permit a distinction between those that are economic in nature and those that are not.
(c) A useful initial measure in this regard would be the development of a pilot survey module covering non-market work, which could be discussed and reviewed with local statistical offices and tested as part of upcoming household surveys or as stand-alone small-scale pilot surveys. The India National Sample Survey (2000), one of the few to look in detail at non-market work from an SNA production boundary framework, could serve as a useful model for this process.
149. The study went on the examine the impact of children’s non-market work on health and education outcomes, as part of a broader effort to identify what forms of non-market work, performed beyond what levels of intensity, should be targeted as child labour for elimination. Such a discussion appears relevant because even when non-market economic work is excluded, there remained a non-negligible number of children performing (non-economic) housework exclusively in the countries analysed. Identifying health and education effects is especially important to determining if and how this group of children should be included in the definition of child labour. 150. In case of health, the analysis failed to establish any clear causal relationship between hours in non-market activity and health status. But it was pointed out that the relationship between child work and health is very difficult to capture, both for theoretical reasons and because of lack of appropriate data, and that this finding should therefore be interpreted with caution. It was also shown that children worked relatively few hours in non-market activity in the countries examined, suggesting that we may have been unable to observe children working long enough hours in non-market activity for health damage to result. 151. Possible next steps in terms of investigating the impact of children’s non-market work on health outcomes include the following:
(a) strengthen the analysis of links between health and non-market work making use of panel or retrospective, rather than cross-sectional data. The Brazil PNAD repeated cross-section data might be a useful starting

53 UCW WORKING PAPER SERIES, MAY 2005
point in this context; (b) a revision of survey questionnaires, in order to improve information
collected on the health effects of work. As noted above, in all the cases in which it was possible to identify a relationship between hours of work and health, the relevant survey questionnaire asked explicitly about illnesses/injuries related to work. While this is far from being conclusive evidence, it points to the importance of questionnaire formulation in identifying the health effects of child labour.
(c) Again, a useful initial measure in this regard would be the development of a pilot survey module that could be discussed and reviewed with local statistical offices
152. In the case of education, panel data revealed a significant causal link between hours spend on non-market work and school attendance in the Chinese context. The regression estimations indicated that hours spent on non-market activity negatively affected the likelihood of school attendance, though the effect was smaller than that of market activity. These results indicate that engagement in non-market work can also interfere with children’s development and right to education, arguing for their consideration in legislation against child labour and in policies addressing it. 153. For additional countries where panel data was lacking, an experimental approach was proposed for estimating an ‘equivalence ratio’, i.e., an approach for combining hours spent on market and non-market activity based on the relative impact of each on children’s schooling. The equivalence ratio of the educational effect of market and non-market activity was found to vary substantially with the number of hours spent in each. It increased with the numbers of hours spent in non-market activity and decreased with the number of hours spent in market activities. 154. This points to the complexity of using such an equivalence ratio for the purpose of a comprehensive definition of child labour. Decisions have to be taken whether using a “mean” equivalence ratio is acceptable as the use of the “equivalence surface” seems to be too complex. In addition, it was shown that the calculation of child labour using “effective working hours” based on equivalence ratios can lead to child labour estimates that are too high to be realistic policy targets. 155. Possible next steps in terms of investigating the impact of children’s non-market work on schooling include the following:
(a) more in-depth research on the causal links between non-economic activity and school attendance. Ideally, additional panel data would be necessary to try to disentangle such links. However, survey instruments containing retrospective questions about intensity of work and drop-out date, as well as interviews with recent drop outs, would also be useful;
(b) extending the analysis to look at the impact of non-economic activity on achievement as well as attendance. Measures of school achievement could be developed and piloted in large size household surveys, possibly integrated with school surveys; and
(c) revising and testing the “effective working hours” concept on additional country datasets.
156. Close involvement of country-level counterparts will be important in the next stage of research in order to ensure that any new measurement approaches
54
TOWARDS STATISTICAL STANDARDS FOR CHILDREN’S NON ECONOMIC WORK. A DISCUSSION BASED ON HOUSEHOLD SURVEY DATA.
to children’s non-economic “work” are appropriate and feasible at the country level. Most national statistical offices have little experience in the measurement of child involvement in non-market activities, or in how non-market activities could be considered alongside market activities in the measurement of children’s “work” and child labour. They therefore could benefit from research collaboration in these areas. 157. Specific areas of possible cooperation with national statistical offices include:
(a) conduct of pilot studies of children’s non-market activities. These studies would be based on survey modules developed jointly with national counterparts, and would be designed to collect detailed information on the nature and extent of children’s involvement in non-market activity. Particular attention would be given to the accurate separation of non-market economic activity (e.g. firewood and water collection) and non-market non-economic activity (e.g. housework in own home), a distinction which is frequently unclear in current survey questionnaires; and
(b) identifying and testing criteria for classifying non-market activities as child labour. This would involve examining the impact of children’s non-market work on selected child vulnerability indicators, in order to help identify what forms of non-market work, performed beyond what levels of intensity, should be targeted as child labour for elimination.

55 UCW WORKING PAPER SERIES, MAY 2005
REFERENCES
Antill, J. K., Goodnow, J. J., Russell, G., & Cotton, S. (1996). “The influence of parents and family context on children’s involvement in household tasks”. Sex Roles: A Journal of Research, 34, 215–236. Anti-Slavery International (2000). “Child domestic workers in Benin, Costa Rica and India”. Report submitted to the United Nations, June
Becker, G. (1981). “A Treatise on the Family”. Harvard University Press Benin, M. H., & Edwards, D. A. (1990). “Adolescents’ chores: The difference between dual and single-earner families”. Journal of Marriage and the Family, 52, 361–373. Bergen, E. (1991). “The economic context of labor allocation: Implications for gender stratification”. Journal of Family Issues, 12, 140–157.
Black, M. (1996). “Child domestic workers: A handbook for research and Action”. Child Labour Series No. 15, Anti-Slavery International, London. Blagbrough, J. (1995), “Child Domestic Work in Indonesia, a preliminary situation analysis”. Anti-Slavery International, supported by ILO/IPEC, London. Blair, S. L. (1992). “Children’s participation in household labor: Child socialization versus the need for household labor”. Journal of Youth and Adolescence, 21, 241–258. Bryant, W. K., Kang H., Zick C. D., and Chan A. Y. (2004). "Measuring Housework in Time Use Surveys.” Review of Economics of the Household, 2(1), 23-47. Chadeau, A. (1985). “Measuring Household Activities: Some International Comparisons”. The Review of Income and Wealth, Series 31, No. 3. Coltrane, S. (2000). “Research on Household Labor: Modeling and Measuring the Social Embeddness of Routine Family Work”. Journal of Marriage and the Family, 62, 1208-1233. Commission of the European Communities and others (1993). “System of National Accounts 1993”. (United Nations, Sales No.E.94.XVII.4). Demo, D. H., & Acock, A. C. (1993). “Family diversity and the division of domestic labor: How much have things really changed?”. Family Relations, 42, 323–331.

56
TOWARDS STATISTICAL STANDARDS FOR CHILDREN’S NON ECONOMIC WORK. A DISCUSSION BASED ON HOUSEHOLD SURVEY DATA.
Eisner, R., (1989). “The total incomes system of accounts”. Chicago: The University of Chicago Press Fassa, A.G., Facchini L.A., Dall'Agnol M.M. & Christiani D.C. (2000). “Child labor and health: Problems and perspectives”, International Journal of Occupational and Environmental Health, 6(1): 55-62. Friedman, S. A. (1997). “Because They’re Girls: Targeting the Most Intolerable Forms of Child Labour and Addressing the Invisible Labour of Girls”. Paper prepared for the IL0, Geneva. Gill, G. K. (1998). “The strategic involvement of children in housework: An Australian case of two-income families”. International Journal of Comparative Sociology, 39, 301–314. Goldscheider, F. K., & Waite, L. J. (1991). “New families, no families?”. Berkeley, CA: University of California Press. Goldschmidt-Clermont. L., & Pagnossin-Aligisakis, E. (1995). “Measures of unrecorded economic activities in fourteen countries”. Human Development Report Office Occasional Papers 20, United Nations Development Programme, New York Goodnow, J. J., Bowes, J. M., Warton, P. M., Dawes, L. J., & Taylor, A. J. (1991). “Would you ask someone else to do this task? Parents’ and children’s ideas about household work requests”. Developmental Psychology, 27, 817–828. Grootaert, Christiaan ; Patrinos, Harry Anthony (1999) “The Policy Analysis of Child Labor”, St. Martin's Press Hilton, J. M., & Haldeman, V. A. (1991). “Gender differences in the performance of household tasks by adults and children in single-parent and two-parent, two-earner families”. Journal of Family Issues, 12, 114–130. Hirway I. (2000). “Understanding Children's Work in India: An Analysis of Their Time Use”, Paper Presented at a Consultative Workshop on "Food Insecurity and Child Work in Rural India" - March 15-17, 2001, Jointly organised by World Food Programme and Institute of Human Development ILO, Child Labour: Targeting the Intolerable, ILO, Geneva, November 1996.
Ilahi, N. (2001). “Children’s Work and Schooling: Does Gender Matter? Evidence from the Peru LSMS Panel Data, LAC-PREM”. The World Bank, Paper for The Policy Research Report on Gender. ILO (1996). “Child Labour: Targeting the Intolerable”. Geneva, November.

57 UCW WORKING PAPER SERIES, MAY 2005
ILO-IPEC (2002). “South Africa: Child domestic workers: a national report”. Geneva. Ironmonger, D.S. (1972). “New Commodities and Consumer Behaviour”. Cambridge University Press, Cambridge Ironmonger, D.S., (1989), “Research on the household economy”. In Ironmonger, D.S. (ed.) “Households Work” Allen & Unwin, Sydney Ironmonger, D. S. (1996). “Counting outputs, capital inputs and caring labor: estimating gross household product”. Feminist Economics 2:(3) 37-64 Ironmonger, D.S. (1999).“An overview of time use surveys”, Paper presented to the International Seminar on Time Use Studies, Ministry of Statistics and Programme Implementation, India Ironmonger, D.S., (2000). “Household production and the household economy”, Department of Economics Research Paper 759, Melbourne: University of Melbourne. Lancaster, K. (1971). “Consumer Demand: A New Approach”. Columbia University Press, New York. Leontief ,W. W. (1941). “The Structure of the American Economy, 1919-1939”. Oxford University Press, Oxford. Manke, B. S. B. L., Crouter, A. C., & McHale, S. M. (1994). “The three corners of domestic labor: Mother’s, father’s, and children’s weekday and weekend housework”. Journal of Marriage and the Family, 56, 657–668. McHale, S. M., Bartko, W. T., Crouter, A. C., & Perry- Jenkins, M. (1990).”Children’s housework and psychosocial functioning: The mediating effects of parents’ sex-role behaviors and attitudes”. Child Development, 61, 1413–1426. Minnesota Lawyers International Human Rights Committee (1990). "Restavek: Child Labour in Haiti”. Case report, Minneapolis. Nordhaus, W. & Tobin, J. (1972). “Is Growth Obsolete?”. National Bureau of Economic Research. O’Donnell, O., Rosati, F.C., van Doorslaer E. (2002). “Child labour and health: Evidence and research issues”, Understanding Children’s Work Discussion Paper (UCW). Innocenti Research Centre, Florence. O'Donnell, O., van Doorslaer, E., & Rosati F.C. (2004). "Health Effects of Child Work:

58
TOWARDS STATISTICAL STANDARDS FOR CHILDREN’S NON ECONOMIC WORK. A DISCUSSION BASED ON HOUSEHOLD SURVEY DATA.
Evidence from Rural Vietnam”, Journal of Population Economics, forthcoming. Philippines, Government of, National Statistics Office, “1995 Labour Force Survey”. Pradhan, G. (1995). “Urban child domestic labour in Nepal”. Child Workers in Nepal, Kathmandu. Pushkar, M andm R Ray, (2002) “The Joint Estimation of Child Participation in Schooling and Employment: Comparative Evidence from Three Continents”, Oxford development studies, Vol, 30, pp. 41-62 Reid, M. (1934). “The Economics of Household Production”. New York: John Riley. Rosati, F. C. & Straub, R. (2003). “Does child labour have a deleterious effect on adult’s health?”. Working Paper at Understanding Child Work Project (UCW). Szalai, A., editor (1972). “The Use of Time: Daily Activities of Urban and Suburban Populations in Twelve Countries”. Publication of the European Coordination Centre for Research and Documentation in the Social Sciences. Mouton, The Hague. UNICEF (1999). “Child Domestic Work”. Innocenti Digest No5, UNICEF International Child Development Centre, May.
United Nations Development Programme. (1990). “Human Development Report 1990”. New York: Oxford University Press.
United Nations et al. (1993), “System of National Accounts 1993”, New York: United Nations Publication.
United Nations Secretariat (1997). “Trial International Classification for International Time Use Activities”. Expert Group Meeting on Trial International Classification for Time Use Activities, October 13-16, 1997. New York.