Towards dynamic efficiency: Innovation and its implications for antitrust
54
Towards dynamic efficiency: Innovation and its implications for antitrust BY MELISSA A. SCHILLING* _________________________________________________________________ _____________ There is growing consensus that the goal of antitrust enforcement should be to manage for dynamic efficiency, i.e., an appropriate balance between short-run static efficiencies such as reducing costs and maximizing consumer surplus, and the longer term gains that arise from innovation. However, determining how to incorporate innovation into efficiency goals is complicated; innovation typically entails great uncertainty, long time horizons, and interdependencies across projects. This means there are no easy solutions for estimating the welfare impact of any given innovation investment or strategy. We can, however, use what we know about how firms manage the innovation process, including how they choose and value projects and ration their capital to meet their short and long-term needs, to gain insight into how we can best foster firms’ incentives to innovate in ways
Transcript of Towards dynamic efficiency: Innovation and its implications for antitrust

Towards dynamic efficiency:
Innovation and its implications for antitrust
BY MELISSA A. SCHILLING*
_________________________________________________________________
_____________
There is growing consensus that the goal of antitrust enforcement
should be to manage for dynamic efficiency, i.e., an appropriate
balance between short-run static efficiencies such as reducing
costs and maximizing consumer surplus, and the longer term gains
that arise from innovation. However, determining how to
incorporate innovation into efficiency goals is complicated;
innovation typically entails great uncertainty, long time
horizons, and interdependencies across projects. This means there
are no easy solutions for estimating the welfare impact of any
given innovation investment or strategy. We can, however, use
what we know about how firms manage the innovation process,
including how they choose and value projects and ration their
capital to meet their short and long-term needs, to gain insight
into how we can best foster firms’ incentives to innovate in ways

that improve long-run economic welfare. I provide some
illustrative examples for how these insights can be incorporated
into antitrust enforcement.
KEY WORDS: dynamic efficiency, innovation, pharmaceuticals, R&D portfolios,
concentration, mergers, Hatch-Waxman laws
______________________________________________________________________________
*Professor of Management and Organizations at New York
University. Contact at [email protected]
AUTHOR’S NOTE: I wish to thank Noah Brumfield, Albert Foer, and Gregory Gundlach
for their helpful suggestions.

I. THE IMPORTANCE OF INNOVATION AND DYNAMIC EFFICIENCY
Innovation is one of the most powerful drivers of increased human
welfare available to us. Innovation enables the development of
new products, the improvement of processes, and the creation and
improvement of social institutions. Innovation has yielded a
wider range of goods and services to be delivered to people
worldwide. It has made the production of food and other
necessities more efficient, yielded medical treatments that
improve health conditions, and enabled people to travel to and
communicate with almost every part of the world. Innovation can
sometimes result in negative externalities; for example,
production technologies may generate pollution, agricultural and
fishing technologies can result in erosion and depletion of
natural resources, and medical technologies can result in
unanticipated consequences such as antibiotic-resistant strains
of bacteria. However, innovation is, in its purest essence, the
creation and application of new knowledge—knowledge to solve our
problems and pursue our goals.1 Sometimes this knowledge is
applied to problems hastily, without full consideration of the
1 H. A. Simon, Technology and Environment. 19 MANAGEMENT SCI (1973)

consequences and alternatives, but overall it serves us better to
have more knowledge than less.
There is widespread consensus that the goal of antitrust
laws are to promote economic welfare.2 Given the contribution of
innovation to economic welfare, it should be clear that antitrust
laws must pursue dynamic efficiency, that is, an appropriate balance
between short-run static efficiencies such as reducing costs and
maximizing consumer surplus (productive efficiency and allocative efficiency)
with longer term efficiencies that arise from innovation.
Efficiency as an abstract ideal is relatively clear. It
refers to producing or performing in the best possible way, with
a minimum of waste. In its use in antitrust, however, efficiency
has taken on many more meanings, some of which are very difficult
to define and measure. Productive efficiency refers to production
and distribution at the lowest feasible cost. This definition
adheres most closely to the layman’s definition of efficiency,
though even this definition yields a range of potential outcomes
2 RA POSNER, ANTITRUST LAW ix (2nd edition)(2001).

spanning from maximizing production for a given level of input to
minimizing inputs for a given level of output. Defining
allocative efficiency is more complicated, for it necessitates
assumptions about the type of welfare distribution we deem to be
best. Foer’s description of allocative efficiency as the
allocation of resources to their most valued uses3 corresponds
most closely to what is also known as distributive efficiency, whereby
goods are distributed to those who can gain the most utility from
them.4 Under this utilitarian framework, social welfare is
maximized under perfect economic equality, implying that wealth
should be redistributed from the rich to the poor. The challenge
with such a framework, of course, is that it diminishes the
relationship between action and consequence (which many would
regard as unjust), and consequently reduces the incentives for
economic development and growth (reducing long-term welfare
creation).
3 AA Foer, On the inefficiencies of efficiency as the single-minded goal of antitrust. In this issue of ANTITRUST BULLETIN (2015).
4 AP LERNER, THE ECONOMICS OF CONTROL: PRINCIPLES OF WELFARE ECONOMICS (1944).

Dynamic efficiency is even more complicated. Dynamic
efficiency requires us to take into account the benefits achieved
through research, development, and innovation. This means that
whatever model of welfare optimization we wish to adhere to, we
should be optimizing it over some time frame that extends into
the future, as we do not wish to unduly discount the future for
the sake of the present. In essence, we would like to maximize
the net discounted flow of benefits to total social welfare
(including profit distributions, wages, technological
advancements, etc.) that accrue from now until some time horizon
in the future. However, all of the problems with discounted cash
flow that will be presented later in the paper with respect to
valuing an innovation project apply here also, but are a
magnitude of order greater: The innovation outcomes of
investments and policy decisions are difficult or impossible to
predict, people are heterogeneous in the degree to which they
would value different outcomes, and all the parts of the system
(input costs, technological options, competitors, development of
complements, etc.) are moving. Quantitative approaches to
analyzing the potential dynamic efficiency implications of a firm
strategy should thus be interpreted with extreme caution; they
have the potential to lend an artificial sense of certainty to
something that is, in fact, unknowable. We can, however, use what
we know about innovation, competition, appropriability, and
collaboration to better incorporate dynamic efficiency into
antitrust enforcement.
I will begin here by reviewing what we know about how firms
manage the innovation process, including how they choose and
value projects and ration their capital to meet their short and
long-term needs. This yields several insights into how we can
foster and preserve firms’ incentives to innovate in ways that
best improve long-run economic welfare. I will then provide some
illustrative implications for how these insights can be
incorporated into antitrust enforcement, including, 1. Shifting
from thinking about concentration to thinking about firm size
distributions, 2. Implications of (and for) Hatch-Waxman and
automatic substitution laws in pharmaceuticals, and 3.
Collaboration agreements and merger analysis.

II. THE INNOVATION PROCESS
In a seminal paper on organizational learning, James March
demonstrated the trade-offs between exploration and exploitation:
exploiting local, known solutions is efficient and generates
reliable returns, but offers little hope of creating highly novel
or radical innovation; exploring broader, less familiar domains
increases the variance of outcomes, resulting both in a higher
likelihood of finding no beneficial innovation, and a higher
likelihood of generating breakthrough innovation.5
In general the theoretical and empirical research on
organizational learning has concluded that we need a balance
between exploitation and exploration. If a firm (or economy)
focuses only on exploitation, it may do well in the short run,
but then eventually run out of growth prospects as its existing
technological trajectories mature. It will likely be
technologically leapfrogged by competitors who made longer-term,
riskier bets. On the other hand, a firm (or economy) that invests
only in exploration risks not being able to meet its short term 5 JG March, Exploration and exploitation in organizational learning. 2 ORGANIZATION SCI 71
(1991).

needs. As Jack Welch, former CEO of GE once famously said, “You
can’t grow long term if you can’t eat short term. Anyone can
manage short. Anyone can manage long. Balancing those two things
is what management is.”6
The synergy between exploration and exploitation strengthens
this point: most breakthrough innovations accrue much of their
ultimate performance and potential for benefiting society through
the myriad incremental improvements that are made to them.7 The
first airplanes or first automobiles, for example, were
interesting novelties, but of little use to most people. It was
the many thousands of improvements that transformed them into the
enormously beneficial means of transportation they are now. Pure
exploration will tend to yield breakthrough discoveries that are
never fully assimilated or made useful; pure exploitation will
tend to yield very little discovery at all. This has important
6 J. A. Byrne, How Jack Welch Runs GE, BUSINESSWEEK, June 8, 1998, at 90. 7 MA SCHILLING, STRATEGIC MANAGEMENT OF TECHNOLOGICAL INNOVATION, 4th ed. (2013); ML
Tushman & P Anderson, Technological discontinuities and organizational environments. 31 ADMINISTRATIVE SCI QUART 439 (1986); P Anderson & ML Tushman, Technological discontinuities and dominant designs: A cyclical model of technological change. 35 ADMINISTRATIVE SCI QUART 604 (1990).

implications for how firms allocate capital to innovation
investments and the importance of R&D portfolios.
A. Capital rationing and the R&D portfolio
Most firms face serious constraints in the capital and other
resources they can generate internally or obtain externally,
forcing them to choose between multiple potentially valuable
projects. Furthermore, innovation is risky – new product
development failure rates are consistently estimated to be over
95% -- and even successful innovations can often take a very long
time to payoff. Firms must thus be very strategic in their
allocation of financial and human resources to innovation
projects. Managers must construct their R&D portfolio in a way
that takes into account projects of different risk, projects with
different payoff horizons, and projects with different kinds of
synergies with the firm’s existing capabilities.
Many firms use a form of capital rationing in formulating
their new product development plans. Under capital rationing, the
firm sets a fixed research and development budget (often some
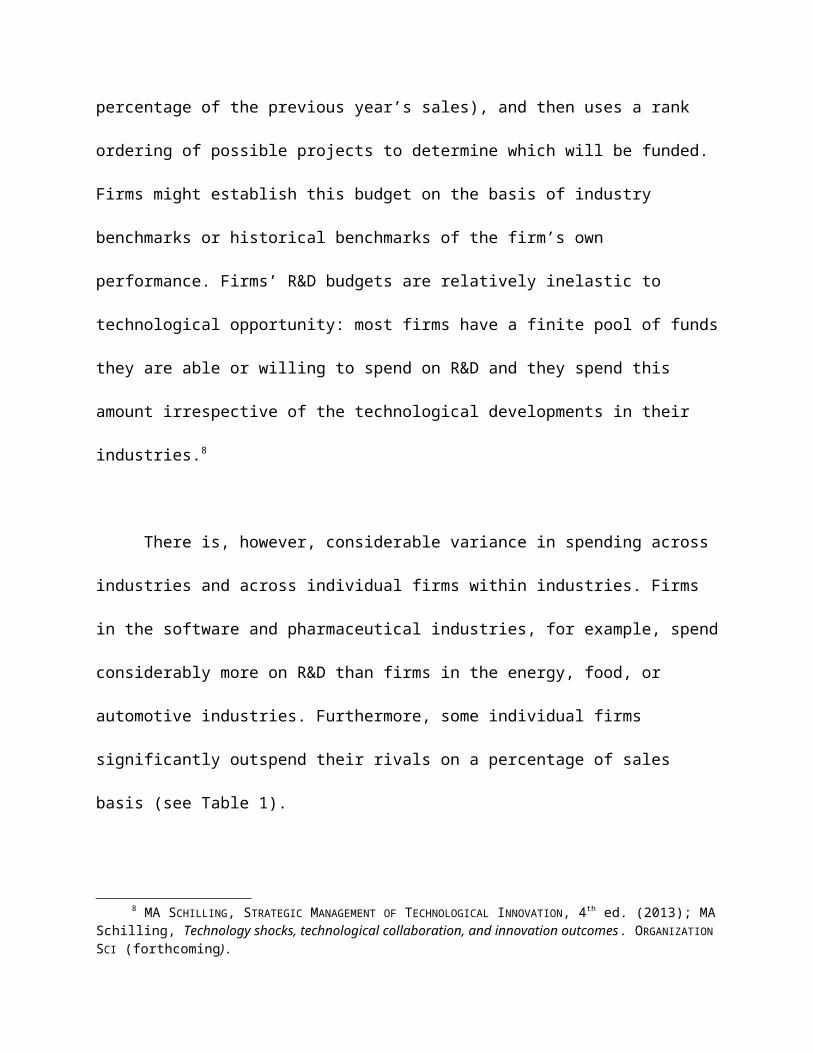
percentage of the previous year’s sales), and then uses a rank
ordering of possible projects to determine which will be funded.
Firms might establish this budget on the basis of industry
benchmarks or historical benchmarks of the firm’s own
performance. Firms’ R&D budgets are relatively inelastic to
technological opportunity: most firms have a finite pool of funds
they are able or willing to spend on R&D and they spend this
amount irrespective of the technological developments in their
industries.8
There is, however, considerable variance in spending across
industries and across individual firms within industries. Firms
in the software and pharmaceutical industries, for example, spend
considerably more on R&D than firms in the energy, food, or
automotive industries. Furthermore, some individual firms
significantly outspend their rivals on a percentage of sales
basis (see Table 1).
8 MA SCHILLING, STRATEGIC MANAGEMENT OF TECHNOLOGICAL INNOVATION, 4th ed. (2013); MASchilling, Technology shocks, technological collaboration, and innovation outcomes. ORGANIZATIONSCI (forthcoming).

---------------------Insert Table 1 About
here--------------------------------
Firms also vary significantly in their allocation of R&D
funds across particular kinds of projects. Firms might vary in
their degree of diversification or specialization, for example.
They might also vary in the distribution of risk in their
projects, with some firms choosing mostly lower risk projects,
and others taking on broader range of projects with a multitude
of risk profiles. Google, for example, has an R&D portfolio that
is incredibly diversified both in terms of technological domain
and risk level, with projects ranging from incremental projects
to improve their advertising algorithms to radical projects such
as driverless cars and the Calico project which seeks to cure
aging.
Thinking about the R&D budget as a fixed percentage of sales
also reveals a rather obvious point about firm size: other things
being equal, a large firm can invest significantly more in R&D
than a small firm, permitting it to pursue more projects, or

projects of greater size.9 In general, only large firms will have
large enough R&D budgets to allocate some of their funds to
extremely long-term or risky projects. The development of
fundamentally new technologies, however, often requires such
long-term and risky investment. Consider, for example, the recent
development of ZF-TFs (zinc-finger transcription factors), CRISPR
(clustered regularly interspaced palindromic repeats) or TALEN
(transcriptor activator-like effector nucleases) technologies,
all of which offer the potential for “editing” the genetic code
of a living individual to correct genetically-based diseases
(e.g., cystic fibrosis, sickle cell anemia, Huntington’s, and
many others) or confer genetic resistance to non-genetically-
based diseases (e.g., Sangamo is using a ZF-TF approach to
developing a potential vaccine for HIV). These potential
9 A long historical debate on the advantages of R&D investment by large versus small firms does not conclude that one is superior to the other; rathereach has its strengths. For example, large firms may reap greater economies ofscale in R&D, amass greater learning due to involvement in a greater number ofprojects, and be able to take on projects of greater scale or risk; small firms may be more nimble due to fewer inertia-inducing commitments, may make better choices about projects due to constrained resources, and have higher-powered incentives for employees to innovate due to the potential for more direct risk and profit sharing. See for example WM Cohen, Fifty years of empirical studies of innovative activity and performance. Chapter 4 in the 1 HANDBOOK OF THE ECONOMICS OF INNOVATION, 129 (2010); also ZJ Acs & DB Audretsch, Innovation, market structure, andfirm size. 69 REV ECON STAT, 567 (1987); and TR Zenger & WS Hesterly, The disaggregation of corporations: Selective intervention, high-powered incentives, and molecular units. 8 ORGANIZATION SCI, 209 (1997).

treatment modalities have come about only because of the enormous
amounts of research that have gone into understanding the human
genome, and the ways it might be safely modified. Furthermore,
these gene editing approaches still require years of further
funding to develop effective delivery methods and get through the
process of clinical testing. In the end, they will compete with
each other, and potentially with other modalities developed in
the future. Though these technologies offer huge potential for
easing human suffering, they are clearly extremely risky
investments. How do organizations justify investment in such
risky projects with such a long-term payoff?
B. Valuing innovation investments
In business schools around the world, students are taught
how to use discounted cash flow methods, and option-based methods
to enable investment valuation. Such quantitative approaches can
help managers to consider the timing of investment and cash
flows, and explore the financial implications of particular what-
if scenarios. They can make the returns of a project seem
unambiguous, and managers often find them very reassuring.

However, this minimization of ambiguity is often illusory;
discounted cash flow estimates are only as accurate as the
original estimates of the profits from the technology, and in
many situations it is extremely difficult to anticipate the
returns of the technology. Furthermore, such methods discriminate
heavily against projects that are long term or risky, and the
methods may fail to capture the strategic importance of the
investment decision. Technology development projects play a
crucial role in building and leveraging firm capabilities, and
creating options for the future. Investments in new core
technologies are investments in the organization’s capabilities
and learning, and they create opportunities for the firm that
might otherwise be unavailable. Thus, standard discounted cash
flow analysis has the potential to severely undervalue a
development project’s contribution to the firm. For example,
Intel’s investment in DRAM technology would have been considered
a total loss by NPV methods (Intel exited the DRAM business after
Japanese competitors drove the price of DRAM to levels Intel
could not match). However, the investment in DRAM technology laid

the foundation for Intel’s ability to develop microprocessors—and
this business has proved to be enormously profitable for Intel.
Options-based methods might offer a better conceptual
framework for innovation investments, yet here too there are
problems in applying the valuation methods literally. Implicit in
the value of options is the assumption that one can acquire or
retain the option for a small price, and then wait for a signal
to determine if the option should be exercised.While this
assumption might hold true for an outside firm investing venture
capital in another firm’s innovation projects, it would be rare
for this assumption to hold for a company investing in its own
development efforts. In the case of a firm undertaking solo new
product development, it may not be possible to secure this option
at a small price; it may require full investment in the
technology before a firm can determine if the technology will be
successful.Furthermore, while the value of a stock is independent
of the call holder’s behavior (that is, the call holder can
simply wait and observe whether the value of the stock rises or
falls), the value of an R&D investment is not independent of the

investor’s behavior. A firm’s degree of investment, its
development capabilities, its complementary assets, and its
strategies can all significantly influence the future returns of
the development project. Therefore, rather than simply waiting
and observing the value of the investment, the investor is an
active driver of the value of the investment.
In practice, innovation investment decisions tend to be
based heavily on qualitative criteria, such as assessments of
what customers are likely to want in the future, and what
projects will best build the firm’s strategic capabilities and
potential for creating a valuable and differentiated position.
Quantitative methods are, in fact, often used to defend or
buttress a decision that has already been made on qualitative
grounds, and it is fortunate for society that this is the case,
as analysis of innovation (and entrepreneurial) investments by
strictly financial means, based on the tools currently available,
would likely result in far less technological development.
C. Innovation portfolios and the investment horizon

As noted previously, many firms manage their R&D investment
as a portfolio, balancing their investment objectives with
respect to risk, timing of payoffs, and breadth of search,
against their current resource position (e.g., cash, man-hours,
capabilities). An example of one well-known portfolio model (the
Aggregate Project Planning Framework) is provided in Figure 1,
with some examples from Toyota’s innovation pipeline as of 2014.
Managers are often exhorted to use such a model because without
such explicit consideration, firms can easily become imbalanced
in their investments, or find that they have many more projects
underway than can be realistically supported.
------------------------Insert Figure 1 About
here---------------------------
The model shown in Figure 1 shows that projects might be
classified into different types based on the amount of product
and process change they require and their expected payoff timing.
Platform projects, for example, offer fundamental improvements in
the cost, quality, and performance of a technology over preceding
generations. Derivative projects, on the other hand, involve
incremental changes in products and/or processes. A platform

project is designed to serve a core group of consumers, whereas
derivative projects are often modifications of the basic platform
design to appeal to different niches within that core group. For
example, in Figure 1, Toyota’s Prius family of hybrid cars is a
platform that includes the Prius, Prius C, Prius V, and Prius
Plug-In. While all the models are based on the same basic design,
each offers a different combination of features to appeal to
different market segments. Toyota also has a platform project it
calls the Toyota New Global Architecture – a sweeping overhaul of
its powertrain system that will create more commonality of parts
across different engines. At the same time, Toyota is developing
a number of incremental projects -- features such as better
headlights, infra-red rear-view backup cameras, and more, to
enhance the value of its existing cars.
Breakthrough projects may take ten years or more before
resulting in a new product or process, and advanced R&D projects
may not even be tied to one particular commercial objective, but
rather are expected to develop new capabilities that might be
important in the future. Toyota, for example, is working on

advanced R&D and breakthrough projects in its fuel-cell vehicle
lineup, which it began developing in 1996 and is expected to
launch in 2015.
Advanced R&D projects and breakthrough projects often do not
recoup their investments directly; rather they pay off when they
enable later investments in new platforms and derivative
projects. Consider, for example, Boeing’s development of the
Sonic Cruiser. Boeing considered the project to be necessary for
preserving the company’s development capabilities, even though
quantitative analysis suggested that the project would never be
profitable. As noted by Walt Gillette, Boeing’s development
program manager, “If the company doesn’t create a new airplane
every 12 to 15 years, the needed skills and experience will be
gone. Too many of the people who created the last new airplane
will have retired or moved on to other companies, and their
skills and experience will not have been passed on to the next
generation of Boeing employees.”10 Toyota’s FV2, a futuristic
single-person concept car that has no gas pedal or steering wheel
10 L. Gunter, The Need for Speed, BOEING FRONTIERS. Retrieved November 20, 2002,from www.boeing.com/news/frontiers/archive/2002/july/i_ca2.html.

but instead responds to shifts in the user’s body weight, also
falls into this category. The project helps Toyota explore
concepts for future product development but it has no immediate
commercialization objectives.
The preceding suggests that firms in technology-intensive
industries typically have to manage their innovation investments
and products with a long-term lifecycle approach. A firm that
invests heavily in derivative projects that may be immediately
commercialized with little risk may appear to have good returns
on its R&D investment in the short run, but then be unable to
compete when the market shifts to a newer technology. On the
other hand, a firm that invests heavily in advanced R&D or
breakthrough projects may be on the leading edge of technology,
but run into cash flow problems from a lack of revenues generated
from recently commercialized platform or derivative projects. For
the purposes of evaluating dynamic efficiency, this highlights
the importance of evaluating entire research programs rather than
the gains or losses from individual innovation projects.

D. Organizational slack and appropriability mechanisms
It should now be apparent that strong pressure for current
cash flows will tend to induce a firm to focus on derivative
innovation, if any innovation at all. Though innovation is a
powerful competitive lever, it is too simplistic to posit that
more competition will lead to more innovation in an industry. We
must first think about innovation as a distribution over types of
innovation that range from long-term to short-term, and with
varying levels of probability of success. How a firm invests over
that distribution will be influenced by 1) the degree to which it
can spare funds in the present to invest in the future
(“organizational slack”), 2) the risk/return payoff the firm
estimates will arise from its investments, 3) interdependencies
between long-term and short-term projects, and 4) the firm’s
assessment of competitors’ investments and how they are likely to
influence the firm’s future. Firms with healthy margins and/or
large cash reserves can afford to make investments in projects
with longer-term payoff horizons and/or high risk-return
profiles, and are more likely to do so when they perceive
competitors are placing similarly long-term bets. Firms with low

margins and small cash reserves will be forced to focus on a
relatively short payoff horizon of investment, and will not be
able to undertake the riskier projects.
It is well understood that organizational slack permits the
organization to make investments in projects other than those
required by short-term optimization, enhancing greater
experimentation and risk taking.11 More generally, scarcity of
resources required for survival will narrow the scope (both
breadth of activities and length of time horizon) of that to
which an individual or firm will attend; excess resources (or
“slack”) permit (though do not necessarily induce) the individual
or firm to broaden the scope of that in which they can plan and
invest.12 Notably, this suggests that the presence or lack of
organizational slack should also directly influence investment in
activities related to environmental sustainability, employee
welfare, and long-term social welfare more generally.
11 RM CYERT & JG MARCH, A BEHAVIORAL THEORY OF THE FIRM (1964); N Nohria & R Gulati, Is slack good or bad for innovation? 39 ACADEMY OF MANAGEMENT J. 1245 (1996).
12 This is consistent with Perelman’s observation that in a stagnant or contracting economy, businesses tend to focus on cutting costs, while in a growing economy, firms focus on investment for the future (M PERELMAN, RAILROADING ECONOMICS: THE CREATION OF THE FREE MARKET MYTHOLOGY 2006)

It should also be apparent that firms cannot afford to make
large investments in innovation if the results of their efforts
can be readily expropriated by others. Without some form of
appropriability mechanism that enables the firm to capture the
returns of their innovations, they will have neither resources
nor incentive to invest in innovation projects. Consider, for
example, the pharmaceutical industry. Drug development is hugely
expensive and has a very high failure rate. Most studies indicate
that it costs at least $1.5 billion and a decade of research to
bring a new FDA-approved pharmaceutical product to market.13 As a
result, on average, branded pharmaceutical companies spend a much
larger portion of their revenues on R&D than firms in most other
industries, as previously shown in table 1. The statistics on
drug development costs are, in fact, an understatement because
they do not fully account for the costs of the many failed drugs
that are abandoned earlier in the development process. In the
pharmaceutical industry, only one out of every 5,000 compounds
tested makes it to the pharmacist’s shelf, and only one-third of
13 See Joseph A. DiMasi & Henry G. Grabowski, The Costs of Biopharmaceutical R&D: Is Biotech Different?, 28 MANAGERIAL & DECISION ECON. 469 (2007).

those will be successful enough to recoup the investment in
researching and developing the original 5,000 compounds (see
Figure 2).14
--------------------Insert Figure 2 about
here-------------------------
Accounting for investment in failed drug efforts suggests
that the cost of drug development is much higher than is
typically reported. A study of R&D spending and new drug
approvals published in Forbes in 2012, for example, found that
firms spent over $6 billion per approved drug (see Table3
below).15 16 A firm’s incentive to make such long-term, high cost,
and high risk investments is directly related to the strength of
appropriability mechanisms that will enable them to recoup their
14 Pharmaceutical Industry, 2008, STANDARD & POOR’S INDUSTRY SURVEYS. See also H Grabowski, J Vernon & JA DiMasi, Returns on research and development for 1990s new drug introductions, PHARMACOECONOMICS (2002); Innovation.org, Drug Discovery and Development: Understanding the R&D Process, Washington, DC: PhRMA, (February 2007), available athttp://www.innovation.org/drug_discovery/objects/pdf/RD_Brochure.pdf.
15 M Herper, The truly staggering costs of inventing new drugs. FORBES, February 10th , 2012.
16 According to a study by the Manhattan Institute for Policy Research, the majority of the drug development expense is due to the extremely costly and time-consuming process of clinical trials: if analysis is limited to drugsthat are ultimately approved by the FDA, phase III clinical trials representedover 90% of the total cost of development. (Project FDA Report, MANHATTAN INSTITUTE FOR POLICY RESEARCH, No. 5 April 2012)

costs.17 One study concluded that about 65% of pharmaceutical
inventions would not have been introduced into the market absent
patent protection.18
-----------------------Insert Table 3 About
here---------------------------
III. IMPLICATIONS FOR MANAGING FOR DYNAMIC EFFICIENCY
The fact that innovation typically entails great
uncertainty, long time horizons, and interdependencies across
projects, means that there are no easy solutions for estimating
the welfare impact of any given innovation investment or
strategy. We can, however, use what we know about the innovation
process to improve how we manage for dynamic efficiency in
antitrust enforcement. I will provide three examples below: 1.
Shifting from thinking about concentration to thinking about firm17 See H. Grabowski, H. Patents, innovation and access to new pharmaceuticals. 5 J.
INTERNATIONAL ECON LAW, 849 (2012); Henry G. Grabowski & John M. Vernon, Effective Patent Life in Pharmaceuticals, 19 INT’L J. TECH. MGMT. 98 (2000) (pharmaceutical industry particularly sensitive to patent incentives); Bronwyn H. Hall & Dietmar Harhoff, Recent Research on the Economics of Patents, 4 ANN. REV. ECON. 541 (2012) (describing a survey that found that patents effectively increase innovation primarily in the pharmaceutical industry); B.N. Roin, Unpatentable Drugs and the Standards of Patentability, 87 TEX. L. REV. 503 (2008) (describing the pharmaceutical industry’s unique dependence on patent protection to spur research and development investment).
18 Edwin Mansfield, Patents and Innovation: An Empirical Study, 32 MGMT. SCI. 173 tbl.1 (1986).

size distributions, 2. Implications of (and for) Hatch-Waxman and
automatic substitution laws in pharmaceuticals, and 3.
Collaboration agreements and merger analysis.
A. Firm size distributions versus concentration
In the preceding, I described three fundamentally new
medical technologies being developed for editing the human genome
in situ, CRISPRs, TALENs, and ZF-TFs. It is worth noting that the
advances in these technologies have been due to a synergistic
combination of efforts among university scientists, small-to-
medium sized biotechnology firms, and large pharmaceutical firms.
For example, though early research into zinc fingers was
primarily conducted in university labs by small teams of
researchers, a U.S. based biotechnology firm called Sangamo (with
$24 million in revenues in 2013), has been responsible for many
of its advances into potential gene therapy treatments, and
developed ZF-TF applications for hemophilia, Huntington’s, HIV,
and more. Sangamo, in turn, signed a collaboration and licensing
agreement with the much larger Shire, a UK-based pharmaceutical
firm (with nearly $5 billion in revenues in 2013). Under the

agreement, Shire will be responsible for clinical testing and
commercialization of the hemophilia related products. This value
chain of drug development and commercialization aptly illustrates
a key point of this article: different kinds of organizations
have different incentives and capabilities to perform different
kinds of innovation, and we need different kinds of innovation to sustain
optimal technological advance.
For most industries, there is no single optimal size of firm
for maximizing innovation -- most industries require a
distribution of firm sizes. There are some types of projects and
innovation activities that only large firms can realistically
pursue. Microsoft spent about $500 million developing the Xbox
game console, spent another $500 million advertising it, and then
had to be able to sustain losses while it sold the console at a
loss until it recouped profits through game royalties. Toyota
spent about $1 billion developing the Prius – about average for
the cost of developing a new car. Boeing spent $32 billion
creating the 787 Dreamliner. Clearly these innovations could not
have been developed by small firms. However, in each of these

industries, small and/or new firms also keep the pressure on
large players by investing in different kinds of projects: Ouya
and MOJO, for example, released microconsoles for video gaming
based on Android software for a small fraction of the development
cost of a regular console; Tesla woke up the auto industry with
its surprisingly successful development of an electric vehicle
based on 18650 lithium-ion batteries (the type used in laptops);
and Terrafugia hopes to disrupt commercial aircraft manufacturing
with its breakthrough flying car. Many of these start-ups will
not survive, but they foster innovation and competition by
bringing fundamentally new ideas into their industries.
The previous suggests that rather than focusing simply on
market concentration, greater empirical research should attempt
to identify the characteristics of productive distributions for
different kinds of industries. Work has begun to emerge that
examines the distribution of firm sizes in industries, and
generally concludes that most industries exhibit a power law
distribution 19in firm sizes, though industries vary considerably
19 A power law is a function where one quantity varies as a power of another, e.g, f(x) = axk. Many natural and social phenomena exhibit power law

on the length and width of the “tail” of such distributions.20 A
deeper base of knowledge in this area could move us from thinking
overly simply about concentration thresholds, to a more nuanced
and multidimensional understanding of how different sizes of
firms influence different kinds of innovation and competition.
Relatedly, it would be useful for us to have a richer
understanding of how different levels of organizational slack
influence the amount and types of innovation produced in
different kinds of industries. In industries with greater risk or
longer payoff horizons for innovation, for instance, we may need
mechanisms that ensure firms have more organizational slack.
B. Hatch Waxman and automatic substitution laws
In 1984, the United States passed The Drug Price Competition
and Patent Term Restoration Act (known as the Hatch-Waxman Act)
in hopes of increasing competition by generic drugs. Under the
Act, generic drugs can avoid the regular clinical testing process
distributions. For example, the number of cities tends to vary as a power of the size of the city, creating a distribution that has a peak at a relatively small size but has a long right tail because there are some cities that are very large.
20 RL Axtell. Zipf distribution of U.S. firm sizes. 293 SCIENCE (5536):1818 (2001); X Gabaix, YM Ioannides, Chapter 53 The evolution of city size distributions. 4 HANDBOOK OF REGIONAL AND URBAN ECONOMICS, 2341 (2004).

– their manufacturers need only submit an Abbreviated New Drug
Application (ANDA) to prove the product is “bioequivalent” to the
original branded drug. A drug is considered to be bioequivalent
if its bioavailability is between 80% to 120% of the original
drug. Manufacturers can only apply for an ANDA and enter the
market after the original branded drug’s patent has expired. Once
generic substitutes are available for a branded drug, automatic
substitution laws in most states either permit (or even require)
pharmacists to automatically substitute a generic for a patient’s
branded drug prescription. At this point there is little left for
the branded drug maker to do but to abandon the drug – money
spent on promoting the drug will be wasted as the drug will be
swapped out for that of another manufacturer at point of sale.
Though patent protection in the drug industry is considered
relatively strong (compared to, for example, electronics where it
is easier to “invent around” a patent),21 it can still be
difficult for pharmaceutical firms to appropriate the returns to
21 R Levin, A Klevorick, R Nelson, & S Winter, Appropriating the Returns from Industrial Research and Development, 3 BROOKINGS PAPERS ON ECONOMIC ACTIVITY, MICROECONOMICS 783 (1987).

their drug development investments. First, because patents are
applied for before the drug enters the clinical testing process,
by the time a drug reaches the market, its patent protection is
surprisingly brief. In the US, new drugs are commonly awarded a
patent of roughly twenty years, but approximately half of those
years will be spent in pre-clinical testing and clinical trials.
The firm can apply for up to five years extension of its patent
to make up for some of that time spent in the approval process,
but the average drug ends up with only seven to twelve years to
recoup its development expense under patent protection before
generics enter the market and drive the price of the drug down by
as much as 80%. Because generics spend significantly less on
development and testing, and also choose to spend little on
marketing (because they only enter markets where physicians and
caregivers have already been educated about the value of an
existing drug), they have an enormous cost advantage over the
branded pharmaceutical manufacturer who developed the drug.
It is also important to note that many drugs face
competition from substitute treatments even before their patents

expire, because other branded pharmaceutical companies may offer
treatments that address the same problem via different compounds,
route of administration (e.g., dissolvable tablets, liquid oral
suspension, extended release capsules), or with other
pharmokinetic or pharmacodynamic properties. For example, in the
cholesterol medication market, Pfizer’s Lipitor, AstraZeneca’s
Crestor, Merck’s Zocor and Vytorin all competed against each
other as patented products. Pfizer’s Lipitor (atorvastatin) had
an early mover advantage that by 2003 had made it the best-
selling pharmaceutical of all time. However, other statins
quickly and successfully entered the market and took share away
from Lipitor by offering functional alternatives and enhancements
to the product long before its patent had expired.
As a consequence of the extremely challenging nature of drug
development, competition among branded pharmaceutical companies,
and competition with generic pharmaceutical companies, the
industry has relatively slim returns given its level of risk. In
2013, for example, the median return on assets (ROA) in the U.S.
pharmaceutical industry was 2.04%. The top branded pharmaceutical

firms earned returns that averaged between 7% and 11% over the
last five years. Those are not exceptional returns; in every year
but one their returns were exceeded by the Standard & Poor’s 500
index, which averaged nearly 18% over the same five years (see
Figure 4).
---------------------------------Insert Figure 4 about here
-----------------------------------
As noted in the section on R&D portfolios, firms have to
balance their R&D investments across advanced R&D, breakthrough
projects, platform projects and derivative projects in a way that
balances their short-term cash flow needs and long-term strategic
momentum. Firms make long-term investments in breakthrough
innovation in order to avoid being technologically leapfrogged by
competitors who are also making investments in breakthrough
technology. This suggests that pharmaceutical firms invest in
developing fundamentally new drugs that offer major improvements
in functional performance in anticipation of, or response to,
competition from other branded pharmaceuticals who are making
similar investments. Generic drug manufacturers do not provide
this form of competition; they compete primarily on price. A

branded pharmaceutical’s best defense against price competition
from the generics is to find ways to extend their patent
protection for a given compound by developing improvements in the
product that are significant enough to meet the “useful, novel,
and non-obvious” requirement of the patent office. This is far
more easily accomplished with incremental improvements in things
like route of administration, extended release capabilities,
incorporation of additional features that address side effects
and similar derivative enhancements, than the development of a
fundamentally new compound that offers major improvements in
functional performance. This reveals that the balance between
generic and branded competition in the drug industry directly
influences the balance of incremental and breakthrough innovation
in the drug industry: greater competition from other branded
pharmaceuticals will tend to induce firms to invest in more
breakthrough innovation; greater competition from generic
pharmaceuticals will tend to induce firms to invest in more
incremental innovation.

Furthermore, generic competition can also induce a
deleterious gaming of the timing of innovation: A branded
pharmaceutical company that has discovered ways to make valuable
enhancements to its product that could justify a new patent is
incentivized to hold back those improvements until just before
patent expiration of the original product. By introducing its
enhancements just before patent expiry of its original product,
it maximizes the length of total patent protection from which the
product can benefit. Generic competition may thus not only induce
a focus on incremental innovation; it has the potential to cause
firms to delay the introduction of their innovations.
Competition between branded pharmaceutical competitors does
not induce such timing games. When competitors are competing
through the differential performance of patented products, there
is little to be gained, and much to be lost, in delaying entry.
First, in industries with strong patent protection, firms that
are innovating in similar technology domains must race to be
first to patent lest they be locked out by others who secure

patents that bar their entry.22 Second, firms that introduce a
superior product earlier capture revenues that they can reinvest
in innovation to get even further ahead of competitors.23 Such
reinvestment is one of the sources of increasing return to
adoption that can lead to long-lived market dominance.24 Third,
earlier entry can enable firms to capture advantages in brand
awareness and loyalty;25 this can be particularly valuable in the
pharmaceutical industry where physicians can be reluctant to
switch a patient’s medication once they have found a medication
that works well for them.
The preceding suggests that the combination of Hatch Waxman
and automatic substitution laws have the potential to shift the
balance of competition in the pharmaceutical industry in ways
that encourage incremental innovations that are timed to extend
patent protection, and to undermine incentives for platform and
22 W Mitchell, Whether and When? Probability of Incumbent’s Entry into Emerging Technical Subfields, 38 ADMINISTRATIVE SCI QUART. 208 (1989).
23 R. Makadok, Can First-Mover and Early-Mover Advantages Be Sustained in an Industry with Low Barriers to Entry/Imitation? 19 STRATEGIC MANAGEMENT J.683 (1998)
24 WB Arthur, Competing Technologies, Increasing Returns, and Lock-In by Historical Events, ECON J. March, 116 (1989).
25 M Lieberman & D Montgomery, First Mover Advantages: A Survey, 9 STRATEGIC MANAGEMENT J. 41 (1988).

breakthrough innovation. By doing so they could significantly
impair dynamic efficiency. A very large portion of the cost of
developing drugs in the Unites States is due to the clinical
testing process, and it thus makes sense to find ways to avoid
redundant testing of already proven drugs, as the Hatch Waxman
laws accomplish. The Hatch Waxman laws, however, result in
branded pharmaceutical companies being at a significant cost
disadvantage to generic manufacturers. Furthermore, automatic
substitution laws greatly amplify this disadvantage by a)
undermining the branded pharmaceutical company’s investment in
market education and brand reputation, and b) causing the loss of
market share to be sudden and extreme – a situation that is very
difficult for any company to manage. This suggests that we may
need to rethink how these laws are structured and employed.
Legislators and researchers should work together to revise the
laws so that they do not influence firms to focus too heavily on
incremental innovation, or to intentionally delay innovation.
C. Collaborative relationships and merger analysis

In the preceding I argued that due to the high cost and risk
of some types of breakthrough innovation projects, they can
typically only be pursued by large firms. This points to an
important caveat, however: Through collaborative agreements
organizations can pool their resources and skills, and share the
risk of a project.26 By providing firms access to a wider range
of resources than they individually possess, technology
collaboration agreements enable firms to achieve much more than
they could achieve individually.27 Numerous large sample studies
have found that alliance relationships enhance the innovative
performance of firms.28 Even when controlling for changes in the
opportunity structure that might lead to alliances, it has been
26 R Gulati 1998 Alliances and networks. 19 STRATEGIC MANAGEMENT J. 293 (1998); WWPowell, D White, KW Koput & J Owen-Smith, Network Dynamics and Field Evolution: The Growth of Interorganizational Collaboration in the Life Sciences. AMER. J. SOCIOL. 110: 1132-1205(2005); FT Rothaermel, Incumbent’s advantage through exploiting complementary assets via interfirm cooperation. 22 STRATEGIC MANAGEMENT J. 687 (2001); MA Schilling & C Phelps, Interfirm Collaboration Networks: The Impact of Large-Scale Network Structure on Firm Innovation. 53 MANAGEMENT SCI. 1113 (2007).
27 KM Eisenhardt & CB Schoonhoven, Resource-based view of strategic alliance formation:Strategic and social effects in entrepreneurial firms. 7 ORGAN. SCI. 136 (1996); L Rosenkopf & P Almeida, Overcoming Local Search through Alliances and Mobility. 49 MANAGEMENT SCI. 751 (2003).
28 G Ahuja, Collaboration Networks, Structural Holes, and Innovation: A Longitudinal Study. 45 ADMIN. SCI. QUART. 425 (2000); DL Deeds, & CWL Hill, Strategic alliances and the rate of new product development: An empirical study of entrepreneurial firms. 11 J. BUS. VENTURING 41 (1996); DC Mowery, JE Oxley, & BS Silverman, Strategic alliances and interfirm knowledge transfer. 17 STRATEGIC MANAGEMENT J. 77 (1996).

shown that increases in alliances lead to a significant increase
in patents.29
Awareness of the opportunities for enhancing innovation
through collaboration agreements is what led to the passage of
the 1984 National Cooperative Research Act which relaxed
antitrust restrictions against cooperative R&D agreements between
otherwise competing firms.30 I do not know of any study that has
rigorously examined the influence of the NCRA on innovation
outcomes, but it is worth noting that the number of patent
applications filed with the US Patent and Trademark Office was
basically flat from 1963 to 1984, and then began to climb steeply
from 1984 onwards (see figure 5).
-----------------------------Insert Figure 5 about
here-----------------------------
Occasionally concerns are expressed that collaboration could
lead to a loss of requisite variety in innovation ideas –
seemingly superior ideas could diffuse so quickly and widely that
29 MA Schilling, Technology shocks, technological collaboration, and innovation outcomes. ORGANIZATION SCI (forthcoming).
30 DM Hart, 2001. Antitrust and technological innovation in the US: Ideas, institutions, decisions, and impacts, 1890-2000. 1286 RESEARCH POLICY 1 (2001).

they create technological monocultures that would extinguish
further innovation. Empirical evidence on industry-level and
global-level collaboration networks does not support this claim,
at least at the current time. Inter-firm collaboration networks
are typically sparse, resulting in loosely-coupled and/or
disconnected networks.31 Furthermore, collaboration between two
firms does not mean that both firms converge on a single solution
that dominates all of their other efforts. There is significant
variance in the degree to which firms are willing or able to
adopt the solutions used by other firms, and as discussed
previously many firms pursue a portfolio of technological paths
simultaneously.32 In terms March would have used, the world has
plenty of “slow learners,” that help to preserve requisite
variety. That said, this discussion suggests that it would be
worthwhile to monitor the collaboration structures of industries
to gain a better understanding of which structures have yielded
31 MA Schilling, Technology shocks, technological collaboration, and innovation outcomes. ORGANIZATION SCI (forthcoming).
32 E Green, Parallel search as a competitive response: How technological positioning affects R&D strategy. ACADEMY OF MANAGEMENT PROCEEDINGS (2014), January; A Leiponen & CE Helfat, Innovation objectives, knowledge sources, and the benefits of breadth. 31 STRATEGIC MANAGEMENT J. 224 (2010); B Simonin, 1999. Ambiguity and the process of knowledge transferin strategic alliances. 20 STRATEGIC MANAGEMENT J. 595 (1999); G Szulanski, Exploring internal stickiness: Impediments to the transfer of best practice within the firm. 17 STRATEGIC MANAGEMENTJ. 27 (1996).

the most innovative advance, and identify opportunities to
improve collaborative structure through either greater
fragmentation or connectivity. There is an opportunity for
antitrust officials to play a more sophisticated role in
fostering industry innovation and growth through their influence
on license agreements, joint ventures, research consortia, and
standards coalitions.
The evidence on the relationship between mergers and
innovation is more equivocal. Many studies find mixed or negative
results for the influence of mergers on innovation. 33 This
should not be surprising – the potential benefits of a merger to
innovation (e.g., greater scale of R&D investment, knowledge
sharing, coordination between complementary technologies, etc.)
33 WS Comanor & FM Scherer, Mergers and innovation in the pharmaceutical industry. 32 J. HEALTH ECON. 106 (2013); C Ornaghi, Mergers and innovation in big pharma. 27 INTERNATIONAL J. INDUSTRIAL ORGANIZATION 70 (2009); M Cloodt, J Hagedoorn & H Van Kranenburg, Mergers and acquisitions: Their effect on the innovative performance of companies in high-tech industries. 35 RESEARCH POLICY 642 (2005); B Cassiman, MG Colombo, P Garrone & R. Veugelers. The impact of M&A on the R&D process, 34 RESEARCH POLICY 195 (2005); G Ahuja, & R Katila, Technological acquisitions and the innovation performance of acquiring firms: a longitudinal study, 22 STRATEGIC MANAGEMENT J. 197 (2001); MA Hitt, RE Hoskisson, RA Johnson & DD Moesel. The market for corporate control and firm innovation, 39 ACADEMY OF MANAGEMENT J. 1084 (1996); A Chakrabarti, J Hauschildt & C Sueverkruep, Does it pay to acquire technological firms?, 24 R&D MANAGEMENT 47 (1994); MA Hitt, RE Hoskisson, RD Ireland & JS Harrison, Effects of acquisitions on R&D inputs and outputs, 34 ACADEMY OF MANAGEMENT J. 693 (1991).

may be more than offset by the costs of mergers (e.g., cost and
difficulty of integration, loss of focus and flexibility,
significant managerial and employee churn due to elimination of
redundant roles, dilution of entrepreneurial incentives due to
greater firm size, etc.).
Furthermore, many of the innovation benefits that might be
sought through mergers can typically be obtained through
collaboration agreements that do not pose such high costs to the
firm nor impede long-term competition. Alliances have been
successful modes for innovation even when it requires the
exchange of highly sensitive and proprietary technology (see, for
example, the cooperative development of the B2 Stealth Bomber–
considered at the time to be “America’s biggest military secret
since the Atom Bomb”-- by Northrop, Boeing, Vaught, and General
Electric34), or when it requires the cooperation of firms that
compete vigorously head-to-head in their end markets (see, for
34 NS Argyres, The impact of information technology on coordination: Evidence from the B-2 “Stealth” Bomber. 10 ORGANIZATION SCIENCE, 162 (1999); B SCOTT, INSIDE THE STEALTH BOMBER: THE B-2 STORY (1991).

example, the development of the PowerPC by Apple, IBM, and
Motorola).
The preceding suggests that we do more to examine how firms
could be encouraged to use such temporary arrangements (while
retaining their incentives to compete individually) in lieu of
consolidation. Relatedly, it might also be useful to examine the
alliance databases (e.g., Thomson SDC Platinum, Recombinant
Capital, Bioscan, etc.) to create a framework of the kinds of
innovation projects that have been pursued through different
types of collaboration modes (e.g., R&D alliances, licensing,
outsourcing, joint ventures) to give antitrust enforcement
officials more evidence upon which to evaluate claims that a
merger is required to achieve a particular innovation outcome.
IV. CONCLUSION
There is growing consensus among those involved in antitrust
that we should be managing for dynamic efficiency: long-run
economic welfare requires striking an appropriate balance between
mechanisms that encourage short-run static efficiencies and the

long-term gains achievable through innovation. However, agreeing
on dynamic efficiency as an ideal does not necessarily lead to
consensus on how it should be achieved. Innovation is a
particularly complex and uncertain phenomenon. Innovation
projects are often long-term investments whose outcomes are
unknowable. New product development failure rates are extremely
high, yet even failed projects may give rise to important
knowledge or capabilities. Furthermore, innovation projects are
rarely one-shot investments whose costs and returns can be
assessed independently; rather innovation projects are more often
part of complex portfolios and lifecycles wherein some projects
lay groundwork for others, and each project has a different role
in a firm’s attempt to balance its long-term growth and short-
term cash flow needs.
Despite this high degree of uncertainty, we can use what we
know about the innovation process and innovation portfolios to
improve how we manage for dynamic efficiency. We know, for
example, that many of the innovation objectives that firms
purport to use mergers for can be achieved as well – if not

better – through collaboration agreements. Armed with this
knowledge we can develop better standards for merger analysis. We
also know that firms (and economies) benefit from having a
distribution of innovation types; any regulatory mechanism that
induces an undue amount of focus on a particular kind of
innovation will tend to undermine long-term technological
advance. Furthermore, we know that inadequate organizational
slack or weak appropriability mechanisms can undermine investment
in innovation – particularly in long-term or risky projects.
Fortunately, a considerable amount of research is being focused
on how intellectual property protection mechanisms influence
innovation around the world, and knowledge in this area is
accruing rapidly.
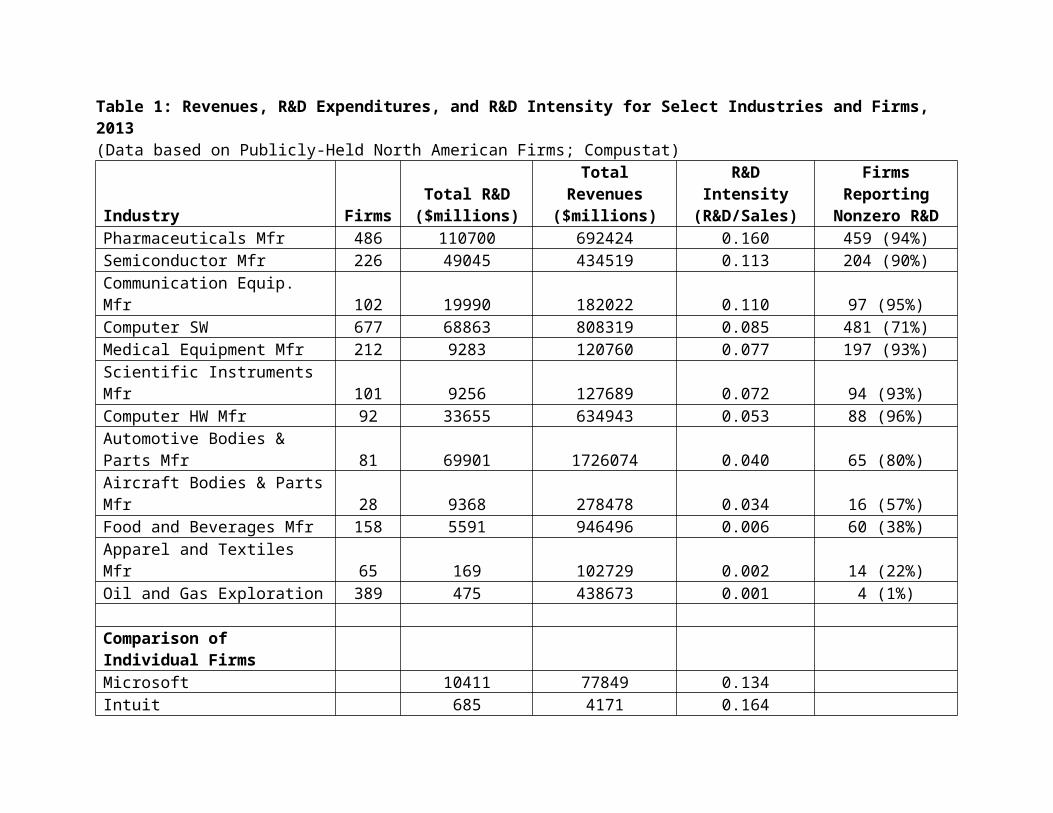
Table 1: Revenues, R&D Expenditures, and R&D Intensity for Select Industries and Firms, 2013(Data based on Publicly-Held North American Firms; Compustat)
Industry FirmsTotal R&D($millions)
TotalRevenues
($millions)
R&DIntensity
(R&D/Sales)
FirmsReporting
Nonzero R&DPharmaceuticals Mfr 486 110700 692424 0.160 459 (94%)Semiconductor Mfr 226 49045 434519 0.113 204 (90%)Communication Equip. Mfr 102 19990 182022 0.110 97 (95%)Computer SW 677 68863 808319 0.085 481 (71%)Medical Equipment Mfr 212 9283 120760 0.077 197 (93%)Scientific Instruments Mfr 101 9256 127689 0.072 94 (93%)Computer HW Mfr 92 33655 634943 0.053 88 (96%)Automotive Bodies & Parts Mfr 81 69901 1726074 0.040 65 (80%)Aircraft Bodies & PartsMfr 28 9368 278478 0.034 16 (57%)Food and Beverages Mfr 158 5591 946496 0.006 60 (38%)Apparel and Textiles Mfr 65 169 102729 0.002 14 (22%)Oil and Gas Exploration 389 475 438673 0.001 4 (1%)
Comparison of Individual FirmsMicrosoft 10411 77849 0.134Intuit 685 4171 0.164

Google 7952 59825 0.133
Toyota 8575 234327 0.037General Motors 7200 155427 0.046Volkswagen 14035 274454 0.051
Abbott Laboratories 1452 21848 0.066GlaxoSmithKline 6502 46434 0.140Mylan 526 6909 0.076Sangamo Biosciences 37 24 1.542

Figure 1: The Aggregate Project Planning Framework (or “R&D Map”), with Examples from Toyota’s Innovation Pipeline


Figure 2: The New Product Development Funnel in Pharmaceuticals
5,000 Compound
s
125 Leads
2-3 drugs tested
1 drug Rx
Discovery & Preclinical3-6 years
Clinical Trials6-7 years
Approval½-2 years

Table 3: Research Spending and New Drug Approvals35
CompanyNumber of drugsapproved
R&D Spending Per Drug($Mil)
Total R&D Spending 1997-2011 ($Mil)
AstraZeneca 5 11,790.93 58,955GlaxoSmithKline 10 8,170.81 81,708Sanofi 8 7,909.26 63,274Roche Holding 11 7,803.77 85,841Pfizer 14 7,727.03 108,178Johnson & Johnson 15 5,885.65 88,285Eli Lilly & Co 11 4,577.04 50,347Abbott Laboratories 8 4,496.21 35,970
Merck & Co Inc 16 4,209.99 67,360Bristol-Myers Squibb Co 11 4,152.26 45,675
Novartis 21 3,983.13 83,646Amgen Inc 9 3,692.14 33,229AVERAGE: 11.58 6,199.85 66,872.33
Sources: InnoThink Center For Research In Biomedical Innovation; Thomson Reuters Fundamentals via FactSet Research Systems
35 Herper, M. 2012. The truly staggering costs of inventing new drugs. Forbes, February 10th.

Figure 3: Return on Assets for Selected Pharma Firms and the S&P 500 Index, 2009-2013.

Figure 4: US Patent Applications, 1963-2013
1963
1966
1969
1972
1975
1978
1981
1984
1987
1990
1993
1996
1999
2002
2005
2008
2011
0
100,000
200,000
300,000
400,000
500,000
600,000
700,000