City of Phoenix Fire Department Innovation and Efficiency Study
284
February 2012 City of Phoenix Fire Department Innovation and Efficiency Study
-
Upload
khangminh22 -
Category
Documents
-
view
3 -
download
0
Transcript of City of Phoenix Fire Department Innovation and Efficiency Study

February 2012
City of Phoenix
Fire Department Innovation and Efficiency Study

2107 North First Street Suite 470 www.managementpartners.com 408 437 5400 San Jose, CA 95131 Fax 453 6191
February 23, 2012
Mr. David Krietor Deputy City Manager Phoenix City Hall 200 W. Washington Street, 12th floor Phoenix, AZ 85003
Dear Mr. Krietor:
Management Partners is pleased to transmit this project report to you. It contains the results of the Innovation and Efficiency Study of the Phoenix Fire Department, which focused on identifying ways the Fire Department can enhance services by implementing innovative practices or utilizing staff or other resources more efficiently. If fully implemented, the recommendations will provide estimated savings of over $5.1 million and potential new revenues of over $39 million.
This report was reviewed by the Fire Department as well as members of the Steering Committee prior to being finalized. All comments were carefully considered and many changes were made based on additional facts and suggestions from reviewers of this document. We have prepared a recommended Action Plan to assist the Fire Department in implementing the recommendations in this report. It is included as Attachment G.
Staff members from the Fire Department and City departments were extremely helpful and forthcoming with information throughout this project. We appreciate their efforts to provide professional and timely responses to our questions and requests for information. The Steering Committee helped guide our work and provided important feedback and we appreciate their efforts as well.
Sincerely,
Gerald E. Newfarmer
President and CEO


Fire Department Innovation and Efficiency Study Table of Contents Management Partners
i
Table of Contents
Executive Summary .................................................................................................................................. 1 Introduction ............................................................................................................................................... 4 Background ............................................................................................................................................... 5
Fiscal Overview ................................................................................................................................ 5 Project Approach ..................................................................................................................................... 14
Focus Groups .................................................................................................................................. 14 Employee Survey ........................................................................................................................... 16
Highlights ................................................................................................................................. 16 Respondent Demographics ........................................................................................................ 17 Staffing 18 Employee Safety, Skills and Training ....................................................................................... 19 Technology, Facilities and Equipment ...................................................................................... 19 Organization, Support Services and Technical Response ........................................................ 20 Customer Service and Community Involvement ...................................................................... 20
Benchmarking ................................................................................................................................. 20 Best Practices in the Phoenix Fire Department ................................................................................. 28
Automatic Aid and the Regional Dispatch Center .................................................................... 28 Labor/Management Collaboration............................................................................................... 29 Community Assistance Program ................................................................................................. 31 Emergency Medical Transportation and Billing for Services .................................................. 31 Standardized Capability and Training of Auto Aid Departments.......................................... 31
Standards of Cover Analysis of Emergency Response Operations ............................................... 33 Primary Applicable National Standards ..................................................................................... 34
Fire Fighting ............................................................................................................................. 34 Emergency Medical Service ...................................................................................................... 35
Mapping .......................................................................................................................................... 36 Fire Department Resources Applied to SOC .............................................................................. 37
Fire Station Distribution within the City of Phoenix ............................................................... 37 Service Demand ........................................................................................................................ 39

Fire Department Innovation and Efficiency Study Table of Contents Management Partners
ii
GIS Computer Generated Maps ............................................................................................... 39 SOC Analysis and Observations .................................................................................................. 43 Conclusion ....................................................................................................................................... 44
Innovations and Efficiencies ................................................................................................................ 47 Organizational Structure and Management Level Staffing ..................................................... 47
Span of Control ......................................................................................................................... 49 Levels of Management .............................................................................................................. 51 Allocation of Sworn/Non‐Sworn Mid‐Management Positions ................................................ 57
Human Resources .......................................................................................................................... 61 Personnel/Payroll Section ......................................................................................................... 61 Rotational Assignments ............................................................................................................ 62 Grievances and Discipline ........................................................................................................ 63 Succession Planning ................................................................................................................. 64 Certifications/Special Pays ....................................................................................................... 65 Bilingual Capability .................................................................................................................. 66 Workers’ Compensation Usage ................................................................................................. 67
Financial and Business Practices .................................................................................................. 72 Purchasing and Inventory Services .......................................................................................... 72 Health Center Capacity ............................................................................................................. 74 New Revenue Sources ............................................................................................................... 77
Training ........................................................................................................................................... 80 Public Affairs .................................................................................................................................. 87 Fire Prevention ............................................................................................................................... 89
General Fire Code and Hazardous Material Inspections .......................................................... 90 Inspection Program Fees and Charges ...................................................................................... 94 Fire Code Development Services ............................................................................................... 96
Technology ...................................................................................................................................... 99 Systems ..................................................................................................................................... 99 IT Program Management ....................................................................................................... 101 Online Training Systems........................................................................................................ 103
Fleet and Facilities ........................................................................................................................ 106 Equipment Management Division Organization and Staffing .............................................. 106 Fire Fleet Management Division Organization and Staffing ................................................. 108 Maintaining the Fire Fleet ...................................................................................................... 110 Facilities Management ............................................................................................................ 118
Performance Management .......................................................................................................... 119

Fire Department Innovation and Efficiency Study Table of Contents Management Partners
iii
Savings from Efficiencies and Innovations ..................................................................................... 123 Attachment A – List of Recommendations ....................................................................................... 128 Attachment B – Standards of Cover ................................................................................................... 131 Attachment C – Employee Survey Results ....................................................................................... 132 Attachment D – Phoenix Fire Department Organization Chart ................................................... 133 Attachment E – Peer Organization Charts ........................................................................................ 134 Attachment F – Sample Service Level Agreement .......................................................................... 135 Attachment G – Draft Implementation Action Plan ...................................................................... 136

Fire Department Innovation and Efficiency Study Table of Contents Management Partners
iv
Tables
Table 1. Position of Survey Respondents .................................................................................. 17 Table 2. Tenure of Survey Respondents .................................................................................... 17 Table 3. Peer Data ........................................................................................................................... 21 Table 4. Operating Budget Comparisons for FY 2009/10 ........................................................ 25 Table 5. Square Miles per Station and Number of Stations per 100,000 Population ........ 25 Table 6. Average Response Time for Fire and EMS Calls ...................................................... 26 Table 7. Automatic Aid Incidents from April 1, 2010 through March 31, 2011 ................... 29 Table 8. Phoenix Fire Department Staffing per Shift .............................................................. 37 Table 9. Incidents in 2010 .............................................................................................................. 39 Table 10. Fire Department Executive Management Hierarchy Peer Comparison ................ 52 Table 11. Fire Department Management Hierarchy Peer Comparison .................................. 54 Table 12. Peer Comparison of Human Resources and Finance Management Hierarchy ... 58 Table 13. Deputy Chief Assignment Tenure for Previous Three Assignments ................... 62 Table 14. Deputy Chief Shift Commander Assignment Tenure ............................................. 63 Table 15. Disciplinary Statistics for 2009 and 2010 .................................................................... 64 Table 16. Projected Retirements Resulting from the Deferred Retirement Option
Program (DROP) ............................................................................................................. 64 Table 17. Special Pay for Certifications........................................................................................ 65 Table 18. Total Workers’ Compensation Cases by Year ............................................................ 67 Table 19. Cases as a Percentage of Department FTEs for 2010/11 ........................................... 68 Table 20. Fire Department Work Injuries Compared with Exercise Injuries ....................... 70 Table 21. Number of Employees with Multiple Claims from 2008 through 2010 ................ 71 Table 22. Technology Use by Organizational Unit .................................................................... 86 Table 23. General Fire Code Inspections ..................................................................................... 91 Table 24. Hazardous Materials Inspections ................................................................................. 91 Table 25. Denver Inspection Fee Revenues ................................................................................. 95 Table 26. Service Providers for Fire Code Plan Check and New Construction
Inspection* ....................................................................................................................... 97 Table 27. Fire Apparatus Replacement Criteria Comparison ................................................ 116 Table 28. Fire Apparatus Ratios of Reserve Units to Front Line Units ................................ 117 Table 29. Potential Savings from Recommendations and Implementation Priorities ...... 124

Fire Department Innovation and Efficiency Study Table of Contents Management Partners
v
Figures
Figure 1. City of Phoenix Projected Population Growth ............................................................ 6 Figure 2. Percentage Change in Assessed Valuation and Personal Income in Phoenix ....... 7 Figure 3. Percentage Change in Fire Department Expenditures and FTE ............................... 8 Figure 4. Fire Expenditures per Capita (in 2003 dollars) ............................................................ 8 Figure 5. Comparison of Privilege License Taxes and Fees to Fire Department Costs ....... 10 Figure 6. Fire Department Revenue Components ..................................................................... 11 Figure 7. General Fund Privilege License Taxes and Fees – Actual Revenues and
Forecast ............................................................................................................................ 12 Figure 8. Graphic Comparison of General Fund Privilege License Taxes and Fees to Fire
Department Costs with Associated Forecasts ............................................................ 13 Figure 9. Comparison of Sworn and Non‐Sworn Personnel ................................................... 22 Figure 10. Calls for Service per 1,000 population ......................................................................... 23 Figure 11. Number of Sworn Staff per Station ............................................................................. 24 Figure 12. Percent of Responses within Industry Standard* ..................................................... 26 Figure 13. Annual Total Workers’ Compensation Cases for Fire, Police, and All Other
Departments ..................................................................................................................... 68 Figure 14. Summary of Open Cases by Department ................................................................... 69 Figure 15. Percentage of 2010 Cases for Work Injuries Compared with Exercise Injuries .. 70 Figure 16. Fire Prevention Management Hierarchy .................................................................... 98 Figure 17. Technical Services Division Organization Chart .................................................... 102 Figure 18. Equipment Management Division Organization ................................................... 106 Figure 19. Equipment Management Division Positions........................................................... 108 Figure 20. Fleet Management Organization Chart .................................................................... 109 Figure 21. Example of a Performance ʺDashboardʺ Data Display .......................................... 122


Fire Department Innovation and Efficiency Study Executive Summary Management Partners
1
Executive Summary
Management Partners was retained by the City of Phoenix in April 2011 to conduct an innovation and efficiency study of the Fire Department. As part of the budget process for fiscal year 2010/11, the Mayor and City Council authorized staff to hire outside experts to conduct innovation and efficiency studies for all public safety‐related functions. As a result of a competitive process, Management Partners was selected to complete this study for the Fire Department. The work was guided by a seven‐member Steering Committee consisting of City and Fire Department officials, a labor representative and a community representative.
The Phoenix Fire Department has a long history of visionary leadership, best practices and labor‐management cooperation. These attributes have contributed to the department’s highly respected national stature. The department is a large, urbanized, full service fire‐rescue department which provides advanced life support and hospital transport services as well as a full range of fire suppression, technical rescue and hazardous materials emergency response. The department also conducts code enforcement, public safety education, and various innovative customer service programs, many of which are discussed later in this report.
The current economic contraction follows a period of significant population growth and budgetary expansion for the City of Phoenix and its Fire Department. Transitioning from rapid growth (which averaged almost 10% per year) to a period of contraction to a period in which more moderate increases will be the norm (such as the 3% to 4.5% expected in the underlying economy) presents significant management challenges.
Management Partners used a variety of analytical and management techniques in completing this study. We examined a myriad of documents and conducted over 70 interviews with Fire Department executive staff and program managers, City officials from pertinent departments, Steering Committee members, and representatives from the Fire Department’s labor associations. To solicit stakeholder input we surveyed all Fire Department employees utilizing an electronic survey and facilitated four employee focus groups. We also conducted

Fire Department Innovation and Efficiency Study Executive Summary Management Partners
2
benchmarking with comparable municipalities. As mentioned previously, a Steering Committee provided guidance throughout this project. In addition, a Standards of Cover (SOC) document, which assesses the availability of resources in relation to demands for service, was prepared.
The results of the analysis confirm that the City of Phoenix Fire Department is a leader in implementing best practices. Generally, its employees are well‐trained and take pride in the well‐earned good reputation of the department. Because the City has been a national leader in creating an automatic aid system with neighboring municipalities, it has been able to provide high quality service at relatively low cost when compared with benchmark comparable cities.
There is always a balance between maintaining adequate response and controlling expenditures. In the area of direct response the benchmarking and SOC analysis show that Phoenix has a good system that is doing a commendable job of reaching this balance. However, the Fire Department is not meeting some national standards, such as the National Fire Protection Association’s 1710 standard, and it struggles to remain in compliance with others (such as the Certificate of Need for ambulance service. It is important to recognize that the system’s current performance, which is in many ways outstanding, is directly linked to and dependent on the automatic aid response system unique to the Phoenix metropolitan area. If this system was diluted, Phoenix as well as other surrounding cities could have to expend more resources to obtain the same level of system performance.
Our detailed examination of the organization and staffing of the department identified a number of situations where positions duplicate management responsibility. This offers an area for cost savings by removing organizational redundancy. In most cases, that can be accomplished over time through normal attrition and will not result in any diminution of the quality of service.
Fleet management similarly offers an opportunity for improvement. At the time of this study, the Fire Department had 592 units of rolling stock, which accounts for a major element of the cost of doing business. Because of deficiencies in the maintenance program the department has found it necessary to staff its own fleet maintenance unit. This results in some duplication with the Public Works Department’s Equipment Management Division which has responsibility for fleet maintenance. Given the substantial cost of the fleet component of the service delivery

Fire Department Innovation and Efficiency Study Executive Summary Management Partners
3
system, changes in this area will save money and result in improved operations.
Technology is another area offering potential savings, particularly with respect to training. An investment in web‐based training that enables personnel to view modules at fire stations (or other venues) will yield significant savings by reducing fuel costs as well as overtime. Substituting web‐based training for on‐site training in topic areas where fire operations personnel do not need to be physically present will provide greater efficiencies than are currently available.
This report contains 50 recommendations which, if fully implemented, would enable the already fine Phoenix Fire Department to improve service and reduce the net cost to the taxpayers by an estimated $5.1 million. And, if implemented, the City would add new revenues totaling over $39 million. We know that the department will not agree with all of the recommendations in this report. Nevertheless, Management Partners was tasked with identifying innovations and efficiencies and we have fulfilled that responsibility.
Attachment A provides a summary of the recommendations.
Fire Department Innovation and Efficiency Study Introduction Management Partners
4
Introduction
Management Partners was retained in April 2011 by the City of Phoenix to conduct an innovation and efficiency study of the Fire Department. Like most municipalities throughout the country, Phoenix has suffered from the effects of the Great Recession. A rapid decrease in revenues has resulted in major expenditure reductions in all departments. In addition to cutting spending, positions have been cut and vacancies have not been filled. The Fire Department is no exception. The department reduced 152 sworn positions and 72 non‐sworn positions (from over 1,700 in total) from fiscal year (FY) 2008/09 to FY 2010/11.
As part of the 2010/11 budget process, the Mayor and City Council authorized staff to hire outside experts to conduct innovation and efficiency studies for all public safety‐related functions. As a result of a competitive process, Management Partners was selected to complete this study for the Fire Department.
A Steering Committee, consisting of the individuals below, provided input, refined ideas and reviewed preliminary observations and recommendations. Steering Committee members are:
• David Krietor, Deputy City Manager • Kara Kalkbrenner, Assistant Fire Chief • Bill Greene, Acting City Auditor • Jeff DeWitt, Finance Director • Pete Gorraiz, President Local 493 • Diane Scherer, Community Representative • Janet Smith, Human Resources Director
The Steering Committee received regular status reports and provided feedback throughout the project.
Fire Department Innovation and Efficiency Study Background Management Partners
5
Background
The Phoenix Fire Department has a long history of visionary leadership, best practices and labor‐management cooperation. These attributes have contributed to the department’s highly respected national stature. The department is a large, urbanized, full service fire‐rescue department which provides advanced life support and hospital transport services as well as a full range of fire suppression, technical rescue and hazardous materials emergency response. The department also conducts code enforcement, public safety education, and various innovative customer service programs, many of which are discussed later in this report.
From a financial standpoint, until recently, the most significant challenge faced by the PFD was trying to keep up with growth within the City. While growth did result in additional revenues, the department constantly struggled to put resources in place to serve the new population in a City with multiple growing demands on the available resources. While growth is still anticipated in Phoenix, the fiscal environment changed radically starting in 2008, and for the first time in the modern era, the City experienced a drastic drop in growth and revenue generation. The following fiscal overview describes the current environment faced by the Fire Department and the City. An appreciation for the underlying fiscal environment is important in the context of understanding the rationale for the innovation and efficiency recommendations contained in this report.
Fiscal Overview
The most significant recession since the Great Depression has compromised the financial health of many cities throughout the nation. To remain economically viable, municipalities such as Phoenix have had to reduce programs and services, eliminate positions and utilize reserves. Unfortunately, the depth of the recession is such that even cities with adequate reserves are finding it necessary to further reduce costs as the steep decline in revenues, coupled with slow economic recovery, will

Fire Department Innovation and Efficiency Study Background Management Partners
6
exhaust reserves before revenues grow enough to match ongoing expenditures.
The City of Phoenix’s recent history has been marked by a lasting period of rapid population and structural growth, which resulted in increasing demands for services. However, the recession has forced an abrupt adjustment to respond to economic changes. Figures 1 through 8 help explain recent fiscal circumstances and provide context for Management Partners’ study.
Figure 1 details population growth and projected growth from 2005 through 2035. As Phoenix is poised to experience relatively rapid population growth over the next two decades, the Fire Department will need to respond to the corresponding increase in services during a time of constrained resources.
Figure 1. City of Phoenix Projected Population Growth
Source: Maricopa Association of Governments January 2009 Socioeconomic Projections
This level of growth allowed the underlying city economy to grow as well and allowed the Fire Department and other municipal government functions to grow to serve the larger population base. Between 2004 and 2009 department expenditures grew at a rate of between 7% and 11% annually. During the Great Recession in 2008/09 community wealth (as measured by personal income and assessed value) dropped precipitously, and fire expenditures have declined as well, albeit more slowly than the
1,510,1771,695,549
1,990,4502,201,843
2,303,633
0
500,000
1,000,000
1,500,000
2,000,000
2,500,000
2005 2010 2020 2030 2035
Proj
ecte
d Po
pula
tion
Year
Fire Department Innovation and Efficiency Study Background Management Partners
7
drop in wealth metrics, largely because the underlying population remains in place requiring services.
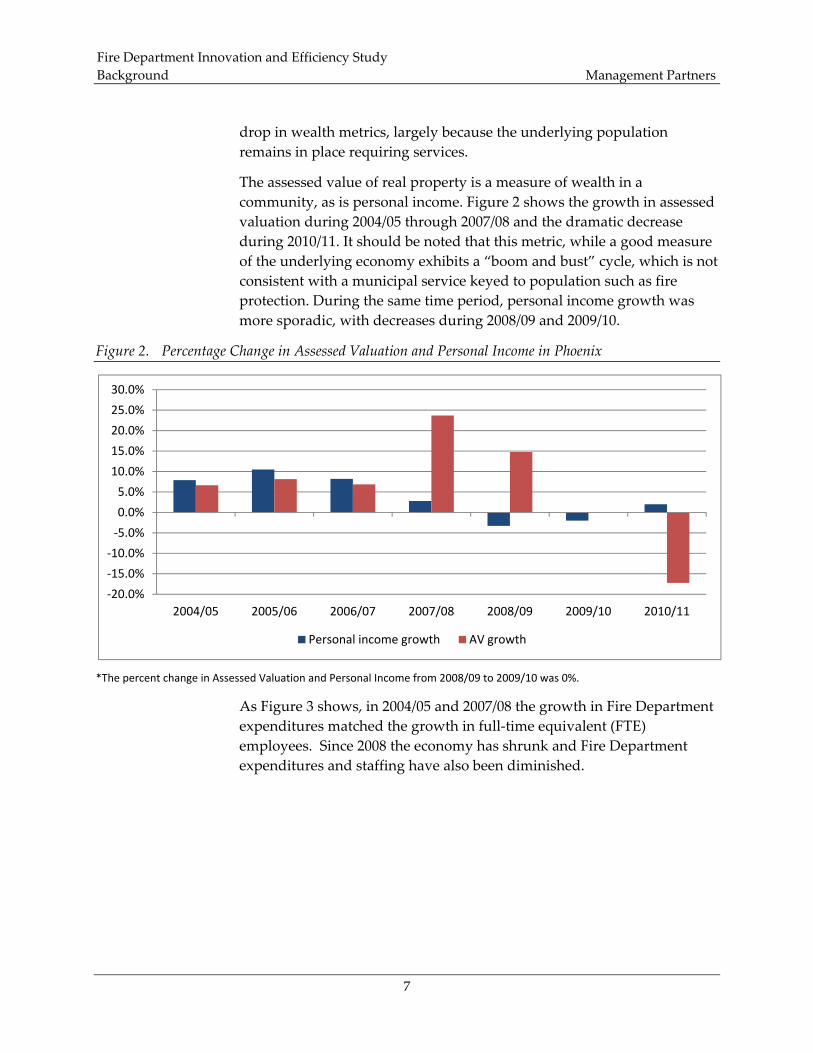
The assessed value of real property is a measure of wealth in a community, as is personal income. Figure 2 shows the growth in assessed valuation during 2004/05 through 2007/08 and the dramatic decrease during 2010/11. It should be noted that this metric, while a good measure of the underlying economy exhibits a “boom and bust” cycle, which is not consistent with a municipal service keyed to population such as fire protection. During the same time period, personal income growth was more sporadic, with decreases during 2008/09 and 2009/10.
Figure 2. Percentage Change in Assessed Valuation and Personal Income in Phoenix
*The percent change in Assessed Valuation and Personal Income from 2008/09 to 2009/10 was 0%.
As Figure 3 shows, in 2004/05 and 2007/08 the growth in Fire Department expenditures matched the growth in full‐time equivalent (FTE) employees. Since 2008 the economy has shrunk and Fire Department expenditures and staffing have also been diminished.
‐20.0%
‐15.0%
‐10.0%
‐5.0%
0.0%
5.0%
10.0%
15.0%
20.0%
25.0%
30.0%
2004/05 2005/06 2006/07 2007/08 2008/09 2009/10 2010/11
Personal income growth AV growth

Fire Department Innovation and Efficiency Study Background Management Partners
8
Figure 3. Percentage Change in Fire Department Expenditures and FTE
Note: The percent change in FTE growth from 2009/10 to 2010/11 is 0%.
As shown in Figure 4, Fire Department expenditures per capita rose from about $125 in 2003/04 to a high of approximately $147 in 2009/10. The following year they dropped to approximately $134, a level close to what was observed in 2004‐05
Figure 4. Fire Expenditures per Capita (in 2003 dollars)
‐6.0%‐4.0%‐2.0%0.0%2.0%4.0%6.0%8.0%10.0%12.0%14.0%16.0%
2004/05 2005/06 2006/07 2007/08 2008/09 2009/10 2010/11
Fire expenditure growth FTE growth
$0
$20
$40
$60
$80
$100
$120
$140
$160
$180
2003/04 2004/05 2005/06 2006/07 2007/08 2008/09 2009/10 2010/11

Fire Department Innovation and Efficiency Study Background Management Partners
9
The Fire Department faces a challenge in transitioning from an environment of growth which averaged almost 10% per year to one where more moderate increases, such as the 3% to 4.5% expected in the underlying economy, will be the norm. This is occurring at a time when emergency call activity has increased.
A sustainable approach to government operations presupposes that operating costs should change at a rate relatively equal to the change in economic activity supporting public services. While the major revenue source for the City of Phoenix is the Privilege License Tax and Fees (“sales tax”), voters have also authorized additional dedicated funding sources in the past, to help support fire operations. The Privilege License Tax is associated with general government purposes and accounts for approximately 27.1% of City General Fund revenues. The share of Privilege License Tax and Fees increases to 65.8% if utility and franchise fees as well as sales taxes earmarked for specific purposes are included. By extension, the sales tax constitutes the largest revenue source supporting the Fire Department.
In Figure 5 below, we show the amount of sales tax collected each year during the period 2001 to 2010 and compare this to Fire Department total operations spending from 2004 to 2010 (all dollars expressed in thousands). The purpose of the comparison is to display the relative economic activity, expressed by the sales tax, with the operating activity of the Fire Department expressed by total operating expenditures.
Prior to the recession starting in late 2007, sales tax earmarked for general operations increased from $234 million to $339.9 million (an annual rate of increase of approximately 8.9%). Using publicly available data starting in 2004 for comparison, the average rate of growth in the sales tax from the period 2004 to 2007 was approximately 9.4%. Overall sales tax revenues grew a little more than 9% per year, and population increased by approximately 12% per year.
The rate of increase in Fire Department operating costs during the same period grew an average of 11.6%. Thus Fire Department spending was roughly in line with underlying revenue and population growth, and hence sustainable from a financing standpoint.
Economic activity has generally decreased with the recession. Sales tax revenues have decreased approximately 11.2% annually during the period 2008 to 2010. This was a reversal of historic proportions.
In Phoenix, Fire Department operating costs continued to increase after the recession, albeit at a significantly lower annual rate of approximately

Fire Department Innovation and Efficiency Study Background Management Partners
10
3.9% each year. Comparing the period 2004 to 2010, the sales tax revenues first increased until the recession and then decreased dramatically for an overall rate of change equal to ‐0.3% during the period. In contrast, Fire Department operating costs increased an average of 7.8% each year.
Figure 5. Comparison of Privilege License Taxes and Fees to Fire Department Costs
From a theoretical standpoint a sustainable approach would propose adjusting the level of operating costs to match changes in operating revenues. This has not happened with Fire Department operating costs. In a service business such as fire that is population‐driven, this result cannot feasibly be achieved in such a short timeframe. The reality is that other mechanisms need to be used with the City striving to achieve efficiencies consistent with continued quality service delivery through such approaches as this innovation and efficiency study. One example of how Phoenix has handled the short‐term challenge is the fact that the City has been able to gain approval for some additional dedicated funding sources, which support fire operations and thus moderate the imbalance, while long‐term alignment is sought.
As noted, it is difficult for a public organization such as the Fire Department to rapidly reduce expenditures because most are keyed to labor costs, and the population served. For these reasons the first approach typically used is to utilize reserve funds to buffer local government operations from economic downturns. In addition the City has proactively responded by expanding the base of revenues supporting public safety generally and the Fire Department specifically. Additional resources are provided by both voter‐approved taxes as well as through internally developed resources from grants, fees and fines. Figure 7

Fire Department Innovation and Efficiency Study Background Management Partners
11
below presents a summary of the major resources supporting the Fire Department and how they have changed between fiscal years 2004 and 2011.
The presentation in Figure 6 shows the additional sources of revenue beyond General Fund tax support that provide funding for Fire Department operations. These include the following:
• Special Revenue Funds – These are revenues developed through voter‐approved taxes intended to increase support for public safety activities (Neighborhood Protection Funds, Public Safety Enhancement Funds, and Public Safety Expansion Funds).
• General Fund Internal – These represent revenue developed by the Fire Department through grants, fines, fees and charges for services that are accounted for in the General Fund.
• Other Funds Internal – These represent revenues developed by the Fire Department through grants, fines, fees and charges for services that are accounted for in funds other than the General Fund.
Figure 6. Fire Department Revenue Components
Source: Phoenix Fire Department (excludes Emergency Food Tax Special Revenue)
0%
10%
20%
30%
40%
50%
60%
70%
80%
90%
100%
2004 2005 2006 2007 2008 2009 2010 2011
General Funds
Special Revenue Funds
Other Funds Internal

Fire Department Innovation and Efficiency Study Background Management Partners
12
While total General Fund tax support has increased more than 36% during the period, the relative share provided from General Fund tax support has decreased from approximately 94% to 84% of all sources of revenue supporting department operations. The Fire Department has developed additional revenue through grants, fees and fines (approximate 56% increase) as well as through voter approved taxes supporting public safety (approximate five‐fold increase during the period). This has helped to soften the blow on the City associated with the Great Recession, but it is not a large enough change to fully offset the impact.
Figure 7 presents the Privilege License Tax and Fees (sales tax) from several government funds from 2001 to 2010 as well as a forecast of future revenues from 2011 to 2015. This forecast is based on the Arizona State University Blue Chip Economic Forecast (updated for 2nd quarter) “consensus” rate of increase for retail sales in 2011 (5.7%) and 2012 (7.3%). The forecast then increases incrementally during 2013 through 2015 to reach the average annual growth rate in sales tax revenue during the pre‐recession period 2001 to 2007 (8.8%). The forecasts show that growth in major revenue sources will likely not return to pre‐recession levels until 2014.
Figure 7. Privilege License Taxes and Fees – Actual Revenues and Forecast
Figure 8 shows this same sales tax data overlaid with actual Fire Department expenditures and with two forecasts of Fire Department
$‐
$50,000
$100,000
$150,000
$200,000
$250,000
$300,000
$350,000
$400,000
2001
2002
2003
2004
2005
2006
2007
2008
2009
2010
2011
2012
2013
2014
2015
Privilege License Tax and Fees Forecast

Fire Department Innovation and Efficiency Study Background Management Partners
13
expenditures: one based on growth during the 2004 to 2010 pre‐recession and recession periods, and a final projection using the expenditure growth rate during the recessionary period and immediate aftermath. (A return to growth at the levels between 2004 and 2007 is deemed to be unlikely and too optimistic, so it is not shown.)
Figure 8. Graphic Comparison of Privilege License Taxes and Fees to Fire Department Costs with Associated Forecasts
This shows that growth even at a more modest pace than observed in the “bubble” economy, may not keep pace with reasonable estimates of the need to increase Fire Department expenditures. The implication is that because growth in the underlying economy is expected to moderate, growth in Fire Department expenditures will have to be very carefully controlled over the next several years.
This innovation and efficiency study is particularly timely in providing ways the PFD can continue to provide excellence in operations and customer service while resources are projected to be limited. To be sustainable, the Fire Department will need to continue to carefully control expenditures and develop additional revenues.
$‐
$100,000
$200,000
$300,000
$400,000
$500,000
$600,000
2001
2002
2003
2004
2005
2006
2007
2008
2009
2010
2011
2012
2013
2014
2015
Privilege License Tax and Fees Forecast
Fire Department Operating Cost Forecast Growth 8.3%
Forecast Growth 4.0%

Fire Department Innovation and Efficiency Study Project Approach Management Partners
14
Project Approach
Management Partners used a variety of analytical and management techniques in completing this study. We examined a myriad of documents and conducted over 70 interviews with Fire Department executive staff and program managers, City officials from pertinent departments, Steering Committee members, and representatives from the Fire Department’s labor associations.
To solicit stakeholder input we surveyed all Fire Department employees utilizing an electronic survey and facilitated four employee focus groups. We also conducted benchmarking with comparable municipalities. As mentioned previously, a Steering Committee also provided guidance throughout this project.
In addition, a Standards of Cover (SOC) document was prepared at the request of the Steering Committee. It functions as a framework for evaluating key aspects of emergency response and provides information on the capability, availability and capacity of the emergency services provided by the department. The SOC is included as Attachment B.
The following sections summarize the focus groups, survey results and benchmarking.
Focus Groups
Management Partners facilitated four focus groups with Phoenix Fire Department employees. Two of the focus groups were with sworn employees and two were with non‐sworn employees. An email invitation was sent from Chief Khan to all employees in the department and all respondents wishing to participate were able to do so. A total of 11 sworn and 14 non‐sworn employees participated. The purpose of the focus groups was to provide an opportunity for staff to suggest ideas for innovation and efficiency.
Themes among sworn personnel were quite different than those among the non‐sworn participants, with one exception. Participants in both groups mentioned the department is well‐respected in the community
Fire Department Innovation and Efficiency Study Project Approach Management Partners
15
and in the country. Tension between sworn and non‐sworn personnel was expressed as a concern among non‐sworn participants and was pervasive in both focus groups.
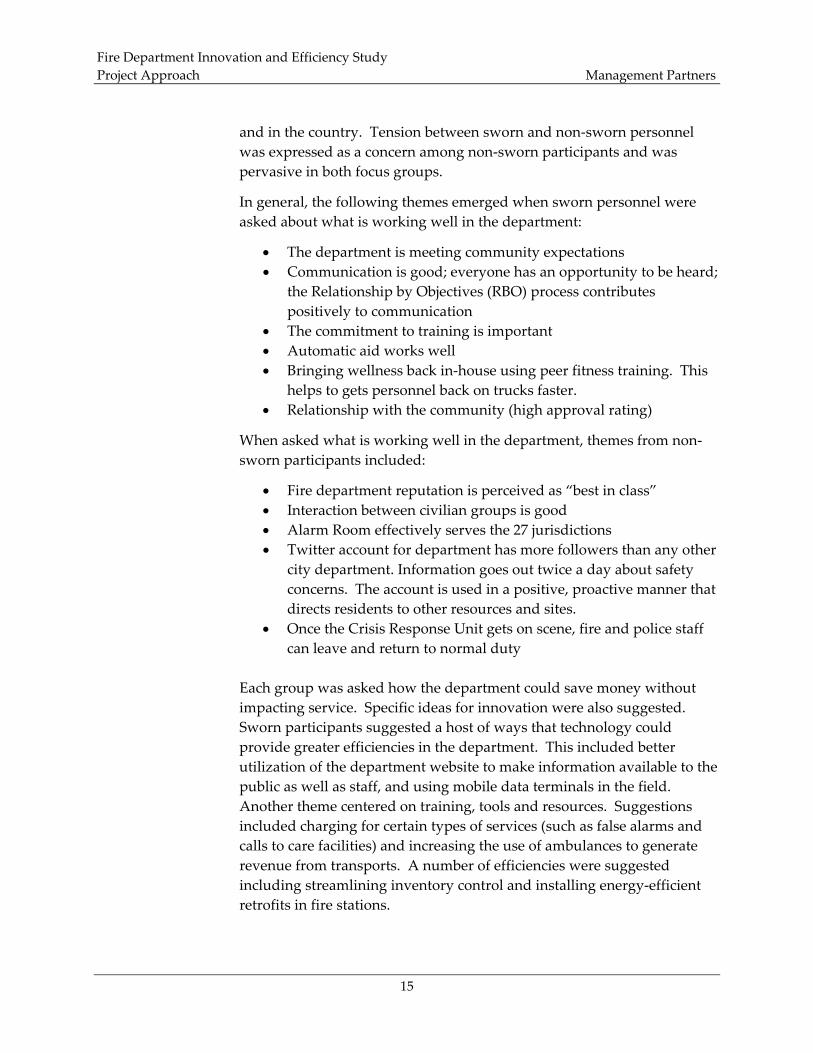
In general, the following themes emerged when sworn personnel were asked about what is working well in the department:
• The department is meeting community expectations • Communication is good; everyone has an opportunity to be heard;
the Relationship by Objectives (RBO) process contributes positively to communication
• The commitment to training is important • Automatic aid works well • Bringing wellness back in‐house using peer fitness training. This
helps to gets personnel back on trucks faster. • Relationship with the community (high approval rating)
When asked what is working well in the department, themes from non‐sworn participants included:
• Fire department reputation is perceived as “best in class” • Interaction between civilian groups is good • Alarm Room effectively serves the 27 jurisdictions • Twitter account for department has more followers than any other
city department. Information goes out twice a day about safety concerns. The account is used in a positive, proactive manner that directs residents to other resources and sites.
• Once the Crisis Response Unit gets on scene, fire and police staff can leave and return to normal duty
Each group was asked how the department could save money without impacting service. Specific ideas for innovation were also suggested. Sworn participants suggested a host of ways that technology could provide greater efficiencies in the department. This included better utilization of the department website to make information available to the public as well as staff, and using mobile data terminals in the field. Another theme centered on training, tools and resources. Suggestions included charging for certain types of services (such as false alarms and calls to care facilities) and increasing the use of ambulances to generate revenue from transports. A number of efficiencies were suggested including streamlining inventory control and installing energy‐efficient retrofits in fire stations.

Fire Department Innovation and Efficiency Study Project Approach Management Partners
16
Non‐sworn participants also suggested many ideas for improvements related to areas where they felt non‐sworn staff could be used more effectively. These included staffing the Alarm Room to Association of Public Safety Communications Officials (APCO) standards, utilizing non‐sworn staff for management positions, and taking behavioral health‐related calls through the Alarm Room rather than sending out a truck. Areas of discussion included creating more promotional opportunities/career ladders for non‐sworn staff, recent supervisory issues as a result of downsizing in the department, and training.
Specifically, cross‐training of inspectors, Alarm Room and Hazmat training were mentioned. As with sworn staff, better use of technology was also mentioned by many of the non‐sworn focus group participants. Non‐sworn staff also suggested process changes related to fire prevention processes, including vehicle use policies and more efficient scheduling.
Finally, a recurring theme that emerged was tension between sworn and non‐sworn staff. Non‐sworn staff members perceive that sworn staff “come first” and are treated better within the organization than non‐sworn staff. This is a typical issue in public safety organizations and one which needs constant attention from leadership.
Employee Survey
Management Partners prepared a survey to solicit input from all Fire Department employees. Chief Khan sent an initial email to all employees inviting participation, as well as a reminder email. The response rate was an impressive 39.9%. Of the 776 surveys completed, 651 (84%) were from sworn personnel and 125 (16%) were from non‐sworn personnel. A detailed breakdown of the respondent demographics is shown below.
The survey results were tallied by sworn and non‐sworn responses as some questions applied more directly to one area compared with another (e.g., whether frequency of firefighter training is sufficient).
Highlights
The survey results are reported in the following sections: • Respondent Demographics • Staffing • Employee Safety, Skills and Training • Technology, Facilities and Equipment • Organization, Support Services and Technical Response • Customer Service and Community Involvement

Fire Department Innovation and Efficiency Study Project Approach Management Partners
17
We have not commented on every question or issued raised; rather, we have highlighted those items where answers may signal differences of opinion between sworn and non‐sworn employees or where the majority indicate changes may be needed.
Respondent Demographics
The tables below show respondents by position as well as by years of service with the PFD.
Table 1. Position of Survey Respondents
Position Sworn Non‐Sworn
Firefighter 279 (36%)
Engineer 143 (18.4%)
Captain 204 (26.3%
Battalion or Division Chief 28 (3.6%)
Any other Chief level title 25 (3.2%)
Civilian staff member 94 (12.1%) 94 (75.2%)
Civilian manager or supervisor 37 (4.8%) 37 (4.8%)
Other 4 (0.6%) 1 (0.8%)
Total 651 125
Table 2. Tenure of Survey Respondents
Years in Phoenix Fire Department Sworn Non‐Sworn
Less than 1 year 13 (2%)
1 to 5 years 108 (17%) 32 (26%)
6 to 10 years 123 (19%) 31 (25%)
11 to 15 years 111 (17%) 21 (17%)
16 to 20 years 92 (14%) 20 (16%)
21 to 25 years 90 (14%) 10 (8%)
26 to 30 years 79 (12%) 10 (8%)
Over 30 years 32 (5%) 1 (1%)
Fire Department Innovation and Efficiency Study Project Approach Management Partners
18
Staffing
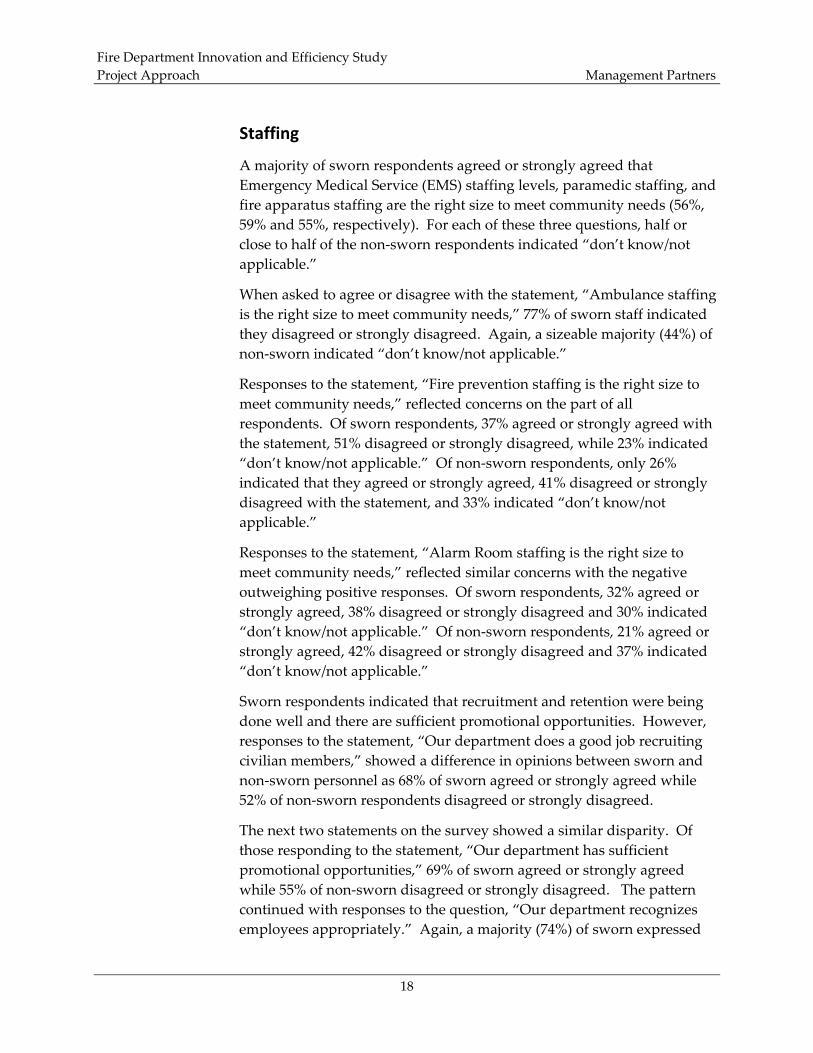
A majority of sworn respondents agreed or strongly agreed that Emergency Medical Service (EMS) staffing levels, paramedic staffing, and fire apparatus staffing are the right size to meet community needs (56%, 59% and 55%, respectively). For each of these three questions, half or close to half of the non‐sworn respondents indicated “don’t know/not applicable.”
When asked to agree or disagree with the statement, “Ambulance staffing is the right size to meet community needs,” 77% of sworn staff indicated they disagreed or strongly disagreed. Again, a sizeable majority (44%) of non‐sworn indicated “don’t know/not applicable.”
Responses to the statement, “Fire prevention staffing is the right size to meet community needs,” reflected concerns on the part of all respondents. Of sworn respondents, 37% agreed or strongly agreed with the statement, 51% disagreed or strongly disagreed, while 23% indicated “don’t know/not applicable.” Of non‐sworn respondents, only 26% indicated that they agreed or strongly agreed, 41% disagreed or strongly disagreed with the statement, and 33% indicated “don’t know/not applicable.”
Responses to the statement, “Alarm Room staffing is the right size to meet community needs,” reflected similar concerns with the negative outweighing positive responses. Of sworn respondents, 32% agreed or strongly agreed, 38% disagreed or strongly disagreed and 30% indicated “don’t know/not applicable.” Of non‐sworn respondents, 21% agreed or strongly agreed, 42% disagreed or strongly disagreed and 37% indicated “don’t know/not applicable.”
Sworn respondents indicated that recruitment and retention were being done well and there are sufficient promotional opportunities. However, responses to the statement, “Our department does a good job recruiting civilian members,” showed a difference in opinions between sworn and non‐sworn personnel as 68% of sworn agreed or strongly agreed while 52% of non‐sworn respondents disagreed or strongly disagreed.
The next two statements on the survey showed a similar disparity. Of those responding to the statement, “Our department has sufficient promotional opportunities,” 69% of sworn agreed or strongly agreed while 55% of non‐sworn disagreed or strongly disagreed. The pattern continued with responses to the question, “Our department recognizes employees appropriately.” Again, a majority (74%) of sworn expressed

Fire Department Innovation and Efficiency Study Project Approach Management Partners
19
agreement while a majority of non‐sworn (55%) expressed disagreement. The statement, “Morale in the department is good,” showed similar differences. Four out of five sworn respondents (81%) agreed or strongly agreed while 54% of non‐sworn staff expressed the opposite sentiment.
Interestingly, the majority of all respondents feel their work is valued by their colleagues, as indicated by 93% of sworn and 72% of non‐sworn. A much greater percentage of sworn employees (94%) indicated their work was valued by their supervisors than did non‐sworn employees (67%). However, both groups indicated their work is valued by their customer (93% and 90%, respectively).
Employee Safety, Skills and Training
Responses to statements about equipment and safety indicated general satisfaction. Similarly, responses to statements about employee skills and training showed general satisfaction among sworn personnel. However, several of the statements relating to non‐sworn personnel received negative reactions by respondents. Of the non‐sworn employees responding to the statement, “Frequency of civilian member training is sufficient,” 38% disagreed and 21% strongly disagreed. Similarly, of the non‐sworn employees responding to the statement, “Frequency of civilian supervisory training is sufficient,” 29% of respondents disagreed and 26% strongly disagreed. Half of the respondents disagreed or strongly disagreed with the statement, “Quality of civilian member training is sufficient,” while 43% agreed or strongly agreed.
Technology, Facilities and Equipment
The overwhelming majority (92%) of sworn respondents expressed general agreement with the statement, “The PFD has up‐to‐date technology for fighting fires and providing EMS and rescue,” while only 55% of non‐sworn respondents so indicated. The majority of sworn respondents indicated general agreements with other statements regarding technology, facilities and equipment. Many non‐sworn respondents answered “Don’t Know/Not Applicable” to the statements in this section, with two exceptions. The first was the statement, “The PFD has up‐to‐date administrative technology,” to which 64% agreed or strongly agreed. The second was the statement, “The condition of our administrative and support facilities is adequate,” to which 82% agreed or strongly agreed.

Fire Department Innovation and Efficiency Study Project Approach Management Partners
20
Organization, Support Services and Technical Response
The majority of respondents agreed or strongly agreed with the statement, “Teamwork within the Fire Department is good,” as indicated by 95% of sworn respondents and 63% of non‐sworn respondents. Sworn respondents answered similarly to all of the other statements in this section. However, over three‐fourths of non‐sworn respondents (78%) disagreed or strongly disagreed with the statement, “Communication from management to civilian staff is good.”
Customer Service and Community Involvement
Overwhelmingly, respondents indicated that customer service in the department is good, as indicated by 97% of sworn and 85% of non‐sworn respondents. Many respondents answered, ““Don’t Know/Not Applicable” to the statements in this section, indicating less familiarity with the services being queried.
Survey results are included as Attachment C.
Benchmarking
Benchmarking is used to identify where an agency stands in comparison with similar organizations. It is used to determine whether an agency is at the polar ends of a scale or somewhere in the middle and is particularly useful in identifying the reasons other agencies may be more efficient in performing the same operation. Peer agency benchmarking typically provides a general comparison of key indicators.
Seven cities were originally identified for benchmarking purposes: Dallas, Denver, Los Angeles, Orange County Fire Authority (OCFA), San Antonio, San Diego and Seattle. Criteria used to select peer agencies included population; size of operations and staffing; services provided; and socio‐economic demographics such as household income, percentage of home ownership and unemployment. Los Angeles and San Antonio declined to participate. Each peer jurisdiction verified their data before this report was finalized.
Table 3 displays some of the basic comparative data from Phoenix and its peers. Phoenix and the Orange County Fire Authority are closest in population served as well as square miles covered, although Phoenix has significantly less density than do the other peers. OCFA has significantly fewer employees (both sworn and civilian). The data in this table were

Fire Department Innovation and Efficiency Study Project Approach Management Partners
21
obtained from publicly available sources as well as the fire departments in each of the participating jurisdictions.
Table 3. Peer Data
Jurisdiction 2010
Population*
Percent of Individuals below Poverty Level
Relative to US
Average**
Median Family Income*
Number of
Stations
Full‐time Equivalent
Employees (FTE)
Area Covered in Square Miles DensityDollars
Percent of US
average ($50,221) Sworn
Non‐Sworn
Phoenix 1,445,632 4.7% $55,482 110% 57 1,604 355 520 2,780
Dallas 1,197,816 8.3% $44,083 88% 56 1,788 80 385 3,111
Denver 619,264 4.3% $56,909 113% 34 908 27 153 3,872
OCFA 1,400,000 ‐3.9% $83,338 166% 61 806 252 550 3,815
San Diego 1,307,402 ‐0.4% $75,492 150% 47 916 257 331 3,222
Seattle 608,660 ‐1.3% $85,432 170% 33 1,073 82 143 4,271 *Source: US Census Bureau ** Percent above or below relative to US average of 13.5% individual poverty
As Figure 9 shows, Phoenix has the largest number of personnel (1,959) followed closely by Dallas (1,868). Dallas has the largest number of sworn FTE (1,788) but a low ratio of sworn to non‐sworn (4%). Denver has the fewest employees of the peers (935) and of those, only 3% are non‐sworn. Of the peers with high ratios of non‐sworn to sworn personnel, 24% of OCFA’s personnel are non‐sworn, compared with 22% in San Diego and 18% in Phoenix.

Fire Department Innovation and Efficiency Study Project Approach Management Partners
22
Figure 9. Comparison of Sworn and Non‐Sworn Personnel
One important factor in comparing these peer agencies is that only Phoenix, OCFA and San Diego are part of automatic aid systems; the others do not share this advantage. The Phoenix Fire Department describes their system as “much more fully integrated than in San Diego and Orange County” and Management Partners supports this description. The concept of automatic aid means that participating jurisdictions utilize all resources available to respond to calls for service, which avoids duplication of equipment and allows more judicious placement of new stations. This helps to ensure that participating jurisdictions benefit from efficiencies of both stations and personnel. More information about automatic aid is provided in the section of this report on best practices.
Phoenix provides depth of services in many areas that benchmarking jurisdictions do not. Two examples are the health center and the community assistance program (see section on best practices for more information).
Not all of the fire departments reporting provide fire‐based ambulance transport, as does Phoenix. All else being equal, a fire department that provides for transport, such as Phoenix, will have higher staffing and

Fire Department Innovation and Efficiency Study Project Approach Management Partners
23
expenditures as well as significant revenues associated with the transport function.
Figure 10 shows a comparison of emergency calls per 1,000 population. With 185 calls for service, Phoenix has the highest volume among its peers. San Diego (with 175 calls per 1,000 population) has the next highest volume, followed by OCFA at 169.
Figure 10. Calls for Service per 1,000 population
Figure 11 shows the number of sworn staff per station. As illustrated in the graph, Seattle and Dallas both have higher numbers of sworn staff per station (32.52 and 31.93, respectively), while Phoenix has 27.19. As indicated previously, Phoenix’s participation in the automatic aid system may explain these results.

Fire Department Innovation and Efficiency Study Project Approach Management Partners
24
Figure 11. Number of Sworn Staff per Station
Table 4 compares operating budgets per 10,000 population. Seattle has the highest budget, followed by Phoenix. The other peers are all below the average. As mentioned previously, it is important to note that Phoenix provides ambulance transport which contributes to both expenditures and revenues. Phoenix has an unusually high rate of cost recovery for ambulance services.

Fire Department Innovation and Efficiency Study Project Approach Management Partners
25
Table 4. Operating Budget Comparisons for FY 2009/10
Peer Operating Budget per 10,000 population
Phoenix $1,942,030
Dallas $1,680,158
Denver $1,656,417
OCFA $1,680,324
San Diego $1,461,621
Seattle $2,694,885
Average $1,852,573
Table 5 shows the average number of square miles per station in the peer jurisdictions as well as the number of stations per 100,000 population. Phoenix has the largest average size for the first response area and a below average number of stations per 100,000 population. All else being equal, the data suggest that Phoenix would have longer response times and busier engine companies.
Table 5. Square Miles per Station and Number of Stations per 100,000 Population
Peer Square Miles per
Station Number of Stations per 100,000 Population
Phoenix 9.12 3.94
Dallas 6.88 4.68
Denver 4.50 5.49
OCFA 9.02 4.36
San Diego 7.04 3.59
Seattle 4.33 5.42
Average 6.81 4.58
Our analysis confirmed that fire station crews in Phoenix are relatively active. The average engine company in Phoenix does approximately 2,400 runs per year (about 7 runs per 24 hour period on average), and several engines are above 3,650 runs per year which is considered quite active in looking at national data. Table 6 shows that even when compared against jurisdictions with more stations per square mile and more stations per capita, response time statistics for Phoenix compare remarkably well. The reasons appear to be the automatic aid system and the dynamic

Fire Department Innovation and Efficiency Study Project Approach Management Partners
26
response system that utilizes the nearest available unit based on actual location and not station location.
Table 6. Average Response Time for Fire and EMS Calls
Peer
Average Time (minutes) for Fire Calls
Average Time (minutes) for EMS Calls
Phoenix 4:36 4:48
Dallas 4:15 5:31
Denver* 4:42 8:30
OCFA* 4:06 3:53
San Diego* 4:54 5:38
Seattle** 3:21 2:48
Average 4:19 5:19 *Utilize private transport **Utilize private transport for Basic Life Support (BLS) only
As Figure 12 shows, 63% of the time Phoenix’s response is within the industry standard; lower than Seattle, Dallas and Denver (85%, 81%, and 75%, respectively). Phoenix’s coverage of 520 square miles compared with the peers’ lower square mileage may have some bearing on this.
Figure 12. Percent of Responses within Industry Standard*
*Industry standard is 4 minutes road time plus 1 minute to depart from the station.
0%
10%
20%
30%
40%
50%
60%
70%
80%
90%
Phoenix Dallas Denver OCFA San Diego Seattle

Fire Department Innovation and Efficiency Study Project Approach Management Partners
27
Management Partners takes great care in conducting benchmarking surveys; however, benchmark data is most effective when it is used in conjunction with the other detailed analysis provided in this report. Additional results of the peer analysis are discussed in subsequent sections of this report.
This high level benchmarking analysis shows that Phoenix has:
• Comparable cost and staffing levels relative to other reasonably similar jurisdictions.
• A high call volume handled well. • Excellent response times given the average territory each station is
expected to serve and the relatively low number of stations per capita.

Fire Department Innovation and Efficiency Study Best Practices in the Phoenix Fire Department Management Partners
28
Best Practices in the Phoenix Fire Department
The Phoenix Fire Department is widely respected among fire departments in this country and internationally. Over the years the department has been a leader in many areas including customer service, firefighter training and safety, arson investigation, incident command systems, automatic aid across jurisdictional boundaries, regional dispatch, and public information, among others. As we focused on innovation and efficiency, Management Partners identified many best practices already in use by the PFD including the automatic aid system, the regional dispatch system, labor/management collaboration, the community assistance program, billing and collections for emergency medical transport and the standardized training among auto aid departments. These best practices are briefly discussed below.
Automatic Aid and the Regional Dispatch Center
The automatic aid system utilized by the City of Phoenix and approximately 20 surrounding jurisdictions covers 2,000 square miles. The system provides a unique response capability for participating agencies because the unit closest to the call is dispatched, regardless of jurisdiction. It essentially means that jurisdictional boundaries are erased and ensures that responses to calls for service are swift. This provides a myriad of benefits including ensuring that persons in need receive an appropriate level of care and allowing efficient use of resources for all participating agencies.
The principle behind the automatic aid system is that each participating agency “agrees to adhere to standard operating policies and procedures which allow multiple agencies to work side‐by‐side at an incident under one incident command. This seamless cooperative effort ensures that the closest most appropriate resources are dispatched without a time or distance delay.”
The Regional Dispatch Center contributes to the seamless provision of service by dispatching to Phoenix and regional jurisdictions. An automatic vehicle location (AVL) feature of the computer aided dispatch

Fire Department Innovation and Efficiency Study Best Practices in the Phoenix Fire Department Management Partners
29
(CAD) system allows the closest, most appropriate unit to be dispatched. It also allows the incident call taker to tell the caller how soon help will arrive. Table 7 below shows the number and variety of calls involving automatic aid for a one‐year period from April 2010 through March 2011.
Table 7. Automatic Aid Incidents from April 1, 2010 through March 31, 2011
Category Phoenix Responds into Automatic Aid
Automatic Aid Responds into Phoenix
ALS 2,722 4,728
BLS 1,625 2,594
Fire 1,293 1,977
Miscellaneous Service 45 33
None 317 135
Other 520 470
Special Operations 219 234
Total 6,424 10,036 Note: Unit responses included from Avondale, Chandler, Daisy Mountain, El Mirage, Glendale, Guadalupe, Peoria, Phoenix, Scottsdale, Sun City, Youngtown, Sun City West, Sun Lakes, Surprise, Tempe and Tolleson.
Clearly, mutual benefits accrue to all jurisdictions involved. Although Phoenix receives automatic aid more often than it provides it, Phoenix’s resources (e.g., special equipment like HazMat, utilities trucks and other expensive technical tools) mean that others avoid this expense. In addition, Phoenix provides dispatch services for an extremely reasonable cost to participating jurisdictions. Many of the partner jurisdictions, (especially those small in size) would be forced to pay much more if the regional dispatch system were not operational. Training opportunities available through the Phoenix Fire Department, such as the Command Training Center, also provide advantages for the automatic aid jurisdictions.
Labor/Management Collaboration
The United Phoenix Fire Fighters Association Local 493 International Association of Fire Fighters (IAFF) has worked with PFD management since the mid‐1980s using a collaborative process to work through issues that impact employees and the department. According to the PFD’s Professional Standards Document, the relationships by objectives (RBO) process, “allows everyone a seat at the table in creating or changing
Fire Department Innovation and Efficiency Study Best Practices in the Phoenix Fire Department Management Partners
30
policies and/or procedures that might directly improve the quality of our services internally.1”
The collaboration is based on labor/management committees working together on issues affecting the PFD. The process is based on the following:
… those who are the closest to the actual services we provide should be allowed equitable input into the system. The RBO process solidifies the relationship between labor and management. The emphasis of this partnership is tackling issues and seeking equitable solutions without damaging relationships. The RBO process allows room for differing opinions without inviting disrespect or unhealthy politics. The end result is the Phoenix Fire Department is a fair, effective organization with “buy in” from all members, no matter what rank or position. The RBO process works because both sides respect each other as being credible participants who have value to offer, and because both sides remain open to another point of view. 2
One result of this collaboration is that there have been a handful of grievances filed during the last several years by IAFF members. This is truly remarkable in a large city unionized environment. The RBO process includes five committees (Deployment, Medical Services, Physical Resources, Human Resources, Urban Services) and Administration. Together, they include 31 ongoing/standing subcommittees. These provide the forum for issues to be solved rather than grieved through the traditional labor/management process. Although committee and subcommittee meetings require time (which is recognized as having costs) to vet issues and collaborate to reach solutions, the benefits that accrue from avoiding contentious and expensive grievance processes and assuring support of developmental plans more than outweigh the costs.
Although this model is a best practice, it is not used uniformly throughout the Fire Department. Members of the other three labor associations (ASPTEA, AFSCME Local 2960 and AFSCME Local 2384) do not share similarly beneficial relationships with Fire Department management, nor do they use RBO. Past attempts at instituting a collaborative process have not been successful. Investing the time to build
1 Phoenix Fire Department, Professional Standards, p. 4
2 Ibid., page 10.

Fire Department Innovation and Efficiency Study Best Practices in the Phoenix Fire Department Management Partners
31
a process with these represented groups would signal innovation and is most likely to result in efficiencies.
Community Assistance Program
The community assistance program operates with a small staff of three non‐sworn employees who are supplemented by a large group of trained volunteers that provide on‐scene crisis intervention and victim services. The program works in conjunction with fire and police personnel as well as various public and private social service organizations throughout the greater Phoenix area.
The community assistance program teams include volunteer emergency medical technicians (EMTs), behavioral health specialists (BHS) as well as interns from local colleges and universities. Their presence allows sworn personnel to return to service more quickly as the volunteers are able to stay on the scene to help victims and others after an event.
Emergency Medical Transportation and Billing for Services
The design and operation of a fire department‐based emergency medical service system enables rapid response to calls for emergency medical help over a very large geographic area while meeting state‐mandated response times. This is accomplished through the use of Advanced Life Support (ALS) engine companies already in service and fire department transport ambulances. The structured billing system provides overall total cost recovery and is tailored to focus initially on transport payments readily available from both federal and private medical insurance sources. Immediately following that billing phase, civilian PFD staff members help persons in need to obtain available state‐aid monies which financially subsidize the relatively small percentage of hardship cases. As a result, Phoenix’s collection rate is extremely high (84%) and represents an industry best practice.
Standardized Capability and Training of Auto Aid Departments
The Phoenix Fire Department has provided long‐term leadership to standardize staffing, equipment, basic training, operational emergency incident tactics, and incident command protocols among the fire department partners of the automatic aid system. This has included the cooperative formulation of a training manual, various response agreements, and the conduct of the Incident Command Training Program housed at a PFD facility. Without the formation of this “seamless” fire

Fire Department Innovation and Efficiency Study Best Practices in the Phoenix Fire Department Management Partners
32
and EMS protection system, costs to the City and partner communities for local protection would be significantly higher and the level of protection much less adequate.

Fire Department Innovation and Efficiency Study Standards of Cover Analysis of Emergency Response Operations Management Partners
33
Standards of Cover Analysis of Emergency Response Operations
The vast majority of Phoenix Fire Department operations and expenditures relates to the core functions of responding to emergency calls on a 24/7, 365 days per year basis. As Table 7 showed, most emergency calls are for medical reasons which may or may not relate to an accident. A minority, but still significant number of calls concern structure fires, technical rescue incidents and hazardous materials calls.
As mentioned previously, the evaluation of proper operations and staffing with respect to basic fire operations is called a Standards of Cover analysis. Our major findings from the SOC analysis with respect to basic emergency operations are detailed below. As mentioned earlier, the full Standards of Cover analysis prepared for this innovation and efficiency study is included as Attachment B.
An SOC functions as a framework for evaluating key aspects of emergency response and appears in the national fire department accreditation process. SOC, as used in this study, has the following three components:
1. Fire department “capability,” which assesses the scope and depth of emergency services provided, plus the ability to respond quickly and with sufficient strength to conduct an effective and safe initial fire attack or rescue action followed by a sustained attack. This capability is typically judged against national standards.
2. Fire department “availability,” which considers how frequent and lengthy the time periods are by which various emergency response units are able to immediately respond to a call for assistance; and
3. Fire department “capacity,” which refers to the ability of a department to handle its typical call workload, simultaneous calls, and multiple alarms, using its own resources plus outside pre‐arranged resources such as automatic instant responders and multi‐department response agreements.

Fire Department Innovation and Efficiency Study Standards of Cover Analysis of Emergency Response Operations Management Partners
34
Primary Applicable National Standards
Fire Fighting
The Occupational Safety and Health Administration (OSHA) calls for the following operational safety measures in Arizona, which has an OSHA‐approved state plan:
• Once fire fighters begin the interior attack on an interior structural fire, the atmosphere is assumed to be IDLH (immediately dangerous to life and health), and paragraph 29 CFR 1910.134(g)(4) (two‐in/two‐out) applies.
• All engaged in interior structural firefighting must wear self‐contained breathing apparatus (SCBAs), work in teams of two or more, and maintain voice or visual contact (not radio). 29CFR 1910.134
• At an interior structural fire, four individuals are required (minimum), two as an interior team and two outside for rapid assistance or rescue. (29 CFD 910.134(g)(4)) The exception is a known life‐hazard situation requiring immediate action.
The National Fire Protection Association (NFPA) issues relevant standards, including:
• NFPA Standard 1500 (“Fire Department Safety and Health Program”) Chapter 8, Emergency Operations, specifies the above OSHA requirements plus additional measures applicable to Rapid Intervention Rescue Crews.
• NFPA Standard 1710 (“Standard for the Organization and Deployment of Fire Suppression Operations, Emergency Medical Operations, and Special Operations to the Public by Career Fire Departments,” 2010 Edition) contains several sections directly applicable to the Phoenix Fire Department and its Standards of Cover.
• Although NFPA standards are legally binding only in those communities which formally adopt them, they do represent national/industry standards and are used in expert testimony to describe a “Reasonable Person Standard” and a scientifically derived “Standard of Care when a Standard of Duty exists,” with a breach of civil duty claimed (tort). For example, the lack of knowledge of the NFPA standard on live fire training was disallowed in an actual civil and a criminal defense against

Fire Department Innovation and Efficiency Study Standards of Cover Analysis of Emergency Response Operations Management Partners
35
charges successfully brought against a fire training officer and a fire chief. NFPA Standard 1710 provisions for fire suppression directly relevant to the Phoenix/Valley Automatic Aid System “Standards of Cover” analysis are:
“… shall be permitted to use established automatic aid … to comply” (5.2.1.2)
“The number of (firefighters) shall be sufficient … given the expected fire‐fighting conditions.” (5.2.2)
“On‐duty personnel … shall be organized into company units …” (5.2.2.2)
“Supervisory chief officers shall be dispatched to all full alarm assignments.” (5.2.2.2.3)
“These companies shall be staffed with a minimum of four on‐duty personnel.” (engines and ladders) (5.2.3.1.1)
“In (special areas) … companies shall be staffed with a minimum of five or six members.” (5.2.3.1.2)
“… Provide for the arrival of an engine company within a 240 second travel time to 90 percent of incidents.” (5.2.4.1.1)
“… Deploy an initial full alarm assignment within a 480‐second travel time to 90 percent of the incidents.” (5.2.4.2.1)
“The initial full alarm assignment to a structure fire in a (2000 sq. ft., two story) single family dwelling with no basement or exposures shall provide for … (Incident Commander plus 14 personnel, with duties outlined in 8 sub‐sections) (5.2.4.2.2)
“… (response) to occupancies with hazards greater (than above) shall deploy additional resources on the initial alarm” (5.2.4.2.3)
“… (escalating) beyond an initial full alarm assignment … upgrade to a full four person or larger Rapid Intervention Crew”, plus a Safety Officer” (5.2.4.3.3. & 4.)
Emergency Medical Service
The Phoenix Fire Department staffs each engine company with two ALS paramedic firefighters so emergency medical service can be provided at the ALS level of service upon arrival. Rescue units (ambulances), which

Fire Department Innovation and Efficiency Study Standards of Cover Analysis of Emergency Response Operations Management Partners
36
can provide both on‐scene service and transport, operate ALS level. Additional units are placed in service daily during the peak load times.
• NFPA Standard 1710 calls for emergency medical assistance, including automatic external defibrillator application when needed, to begin within 240 seconds travel time and, if not at the ALS level, ALS service must arrive within 480 seconds. The Phoenix Fire Department strives to reach those response times most often through their ALS engine companies with transportation at the required level provided by its rescue ambulances.
• The Arizona Division of Public Health Services “Certificate of Need” calls for the PFD to operate “ground ALS and BLS ambulance services” with Code 3 response times (use of emergency warning devices) for 911 generated dispatches as follows:
1. Ten minutes on 90% of all Code 3 ambulance transports 2. Fifteen minutes on 95% of all Code 3 ambulance transports 3. Twenty minutes on 99% of all Code 3 transports
During fiscal year 2009/10, 59% of ALS medical calls were responded to by ALS paramedic units within five minutes. Total EMS calls for 2009/10 are reported as 126,100.
Phoenix, like most major fire departments, uses these emergency medical service response standards to design and operate their response function. As such, its response function consists of staffing and expenditures which are designed to meet these standards most of the time. A major part of the SOC analysis is to evaluate the level of compliance with the applicable standards.
Mapping
A total of 79 computer maps were generated for the Phoenix SOC analysis. Further analysis reduced the number of maps to 18 which are included with the attached SOC document and which form the basis for this section of the report. The maps are divided into three general categories:
• Geographic area studied (3) • Service demand‐PFD workload (5) • PFD response capabilities (10)
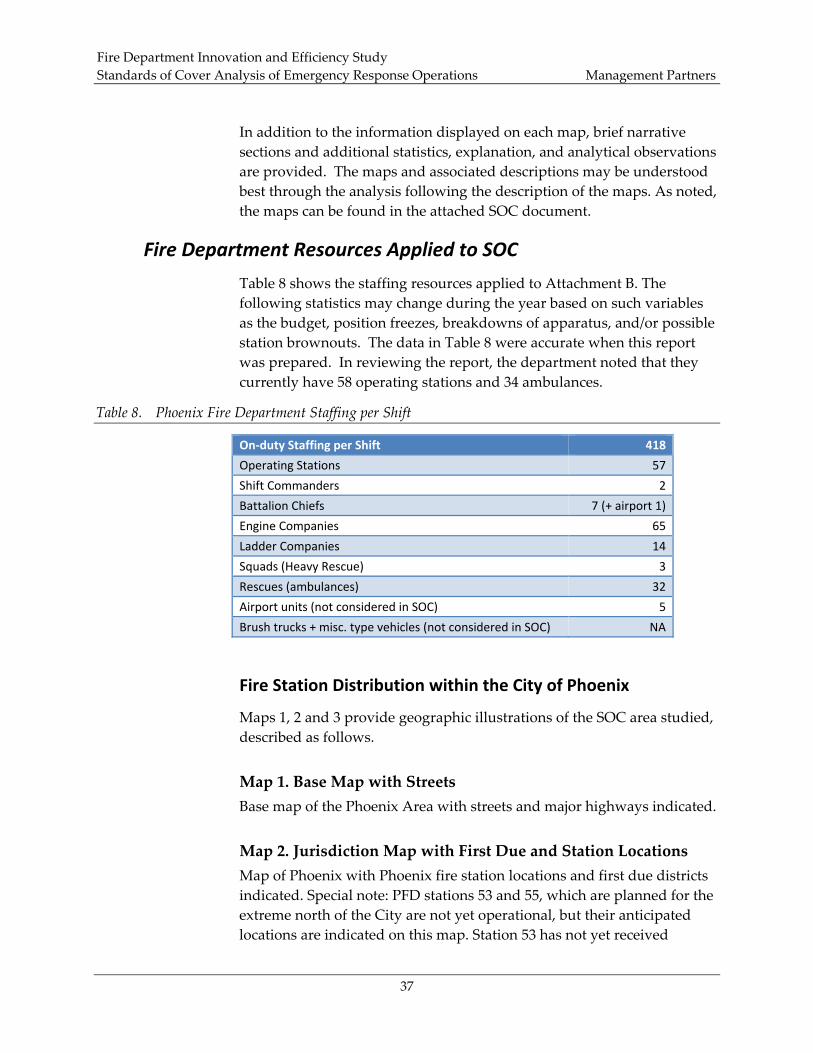
Fire Department Innovation and Efficiency Study Standards of Cover Analysis of Emergency Response Operations Management Partners
37
In addition to the information displayed on each map, brief narrative sections and additional statistics, explanation, and analytical observations are provided. The maps and associated descriptions may be understood best through the analysis following the description of the maps. As noted, the maps can be found in the attached SOC document.
Fire Department Resources Applied to SOC
Table 8 shows the staffing resources applied to Attachment B. The following statistics may change during the year based on such variables as the budget, position freezes, breakdowns of apparatus, and/or possible station brownouts. The data in Table 8 were accurate when this report was prepared. In reviewing the report, the department noted that they currently have 58 operating stations and 34 ambulances.
Table 8. Phoenix Fire Department Staffing per Shift
On‐duty Staffing per Shift 418
Operating Stations 57
Shift Commanders 2
Battalion Chiefs 7 (+ airport 1)
Engine Companies 65
Ladder Companies 14
Squads (Heavy Rescue) 3
Rescues (ambulances) 32
Airport units (not considered in SOC) 5
Brush trucks + misc. type vehicles (not considered in SOC) NA
Fire Station Distribution within the City of Phoenix
Maps 1, 2 and 3 provide geographic illustrations of the SOC area studied, described as follows.
Map 1. Base Map with Streets Base map of the Phoenix Area with streets and major highways indicated.
Map 2. Jurisdiction Map with First Due and Station Locations Map of Phoenix with Phoenix fire station locations and first due districts indicated. Special note: PFD stations 53 and 55, which are planned for the extreme north of the City are not yet operational, but their anticipated locations are indicated on this map. Station 53 has not yet received

Fire Department Innovation and Efficiency Study Standards of Cover Analysis of Emergency Response Operations Management Partners
38
funding approval. Station 55 was included in the most recent Capital Improvement Plan, but those funds are frozen.
Map 3. Jurisdiction Map with Automatic Aid Station Locations Jurisdiction map of Phoenix and outside communities, with automatic aid and Phoenix fire stations located, excluding PFD non‐operational stations 53 and 55.
The location of fire stations in the City of Phoenix, with current staffing levels, generally provides satisfactory response times and sufficient apparatus and crew numbers for the downtown high‐rise area and for the built‐up areas along most major roads and streets. Both the area south of South Mountain and the northernmost City areas have very light station coverage, however, with resultant longer response times. The northern area, especially, has minimal structural build‐up at this time, but high development is anticipated.
Both the eastern and western boundaries of the City receive important partial protection from automatic aid stations, several of which were deliberately located to provide joint coverage, as were several Phoenix stations, in the interest of cost efficiency.
From April 1, 2010 to March 31, 2011, Phoenix Fire Department units responded to 6,424 incidents in 16 automatic aid jurisdictions, with 8,757 PFD unit responses. Automatic aid partners responded into Phoenix for 10,036 incidents, with 12,729 unit responses.
Six Phoenix stations each house two engine companies.
• Station 1 provides necessary coverage for a “high hazard” high‐rise area.
• Station 5 provides coverage for a high workload demand area which typically generates simultaneous incidents and multiple alarms for large incidents.
• Station 25 provides coverage for a high workload demand area. • Station 30 provides coverage for a high workload demand area. • Station 35 provides an often available move‐up engine to cover
empty responding stations elsewhere, especially to the north. • Station 60 provides coverage for a high demand area.
Note: High hazard areas, as classified by the National Fire Protection Association, include places of public assembly, schools, hospitals, nursing homes, high‐rise buildings, places with high life hazard, hazardous content areas, and refineries.

Fire Department Innovation and Efficiency Study Standards of Cover Analysis of Emergency Response Operations Management Partners
39
Companies in each of the six double engine stations may be dispatched to provide move‐up coverage for a variety of reasons including empty stations dispatched to other alarms, companies called for training, maintenance of another apparatus, browned‐out areas, as well as the primary responsibility for simultaneous and multiple alarms in high demand and high‐rise areas.
The SOC process includes a review of existing station locations. That process is also useful in helping to determine the best location for new stations or the consolidation of two or more older stations. Due to projected growth, Phoenix might well anticipate additional stations in the north or in possible annexation areas. Note that Stations 1, 3, 4 and 8 are relatively close to each other but house apparatus and crews necessary for adequate downtown area protection. Although combining some of those four into a large single facility might seem advantageous, it would not be cost‐effective.
Service Demand
To understand the SOC, it is also important to understand service demand. Therefore, Table 9 shows the incidents reported during calendar 2010. In most categories, the calendar 2010 incident statistics exceed the 2009 numbers and 2011incident statistics exceed all previous years.
Table 9. Incidents in 2010
Type of Incident Number
Total emergency medical calls 130,101
Rescue transports (356 per 24 hour avg.) 65,085
Structure fires (5.5 per 24 hour avg.) 1,626
Hazardous Materials Incidents 471
Technical Rescue Incidents 186
GIS Computer Generated Maps
As discussed previously, maps 1 through 3 present a geographic overview of the City of Phoenix and the Automatic Aid Valley area.
Maps 4 through 8 illustrate 2010 workload incidents by category, using call density per square mile as the indicator. Maps 4 through 18 are described below (and all maps are contained in Attachment B).

Fire Department Innovation and Efficiency Study Standards of Cover Analysis of Emergency Response Operations Management Partners
40
Map 4. Structure Fire Incident Density 2010 This map illustrates density per square mile of all 2010 structure fire incidents across Phoenix and the automatic aid area.
Map 5. EMS Incident Density 2010 Map 5 shows density per square mile of all 2010 EMS incidents across Phoenix and the automatic aid area. The EMS incident category exceeds the total of ALS and BLS incidents. All EMS incidents include all the ALS and BLS incidents plus Nature Codes MED1A (97 incidents), MED2‐1 (564 incidents), and MED3‐1 (97 incidents). These codes refer to specially staffed rescues.
Map 6. Transport Density ALS 2010 This map illustrates density per square mile of all 2010 ALS transports by units across Phoenix and the automatic aid area.
Map 7. HazMat Incident Density 2010 Map 7 shows the density per square mile of all 2010 hazardous material incidents across Phoenix and the automatic aid area. Hazmat vehicle stations are also indicated.
Map 8. Technical Rescue Incident Density 2010 This map shows density per square mile of all 2010 technical rescue incidents across Phoenix and the automatic aid area. Technical rescue squad vehicle stations are also indicated.
Maps 9 through 16 illustrate the response capabilities of the various major types of PFD units, detailed by each map key. Airport units are not considered as “outside airport” responders per Federal Aviation Administration (FAA) requirements for maintaining available airport protection. Brush and other special‐call units activated and staffed for specific incidents are not included. When needed, these vehicles are generally cross‐staffed by personnel assigned to the stations where they are located.
Map 9. Existing Engine Company 4‐Minute Response Capabilities This map represents the four minute travel time response capabilities of all the non‐airport engine companies from the Phoenix and automatic aid

Fire Department Innovation and Efficiency Study Standards of Cover Analysis of Emergency Response Operations Management Partners
41
fire stations. The “number of engines” symbolization identifies the number of overlapping responding engine companies which, if “in‐quarters” at the time of dispatch, should be able to reach the area within 240 seconds travel time.
Map 10. Existing Ladder Company 4‐Minute Response Capabilities
This map represents the four minute travel time response capabilities of all the non‐airport ladder companies from the Phoenix and automatic aid fire stations. The “number of ladders” symbolization identifies the number of overlapping responding ladder companies, as specified above (in the Map 9 explanation) for engines.
Station officers may elect to respond with either an aerial apparatus or a ladder tender truck.
Map 11. Existing Rescue Company (Ambulance) 24‐Hours 4‐Minute Response Capabilities This map represents the four‐minute travel time response capabilities of the rescue companies staffed 24 hours a day from Phoenix fire stations. The “number of rescues” symbolization identifies the number of overlapping responding rescue companies, as specified above for engines and ladders.
Map 12. Existing Rescue Company (Ambulance) 24 Hours 8‐Minute Response Capabilities This map represents the eight minute travel time response capabilities of the rescue companies staffed 24 hours a day from the Phoenix fire stations. The “number of rescues” symbolization identifies the number of overlapping responding rescue companies, assuming in‐quarters status at time of dispatch.
Map 13. Existing Battalion Command 8‐Minute Response Capabilities This map represents the eight minute travel time response capabilities of the non‐airport battalion chiefs from the Phoenix fire stations, as listed on the map for nine stations. The “number of battalions” symbolization identifies the number of overlapping responding battalion chiefs, assuming in‐quarters status at time of dispatch. However, note that the number of battalion chiefs on duty per shift is not nine, but typically six
Fire Department Innovation and Efficiency Study Standards of Cover Analysis of Emergency Response Operations Management Partners
42
or seven, typically deployed at stations 9, 12, 18, 22, 25, 41 and 52. Thus, the response times for battalion chief command throughout the City at working incidents often appear to be excessive. This issue, which is eased by shift commander response from stations 1 and 30, along with the fact that aerial ladder and heavy technical rescue response capability are significantly behind engine response capability, are probably the largest response issues impacting the City as a whole.
Map 14. Existing Squad Company 8‐Minute Response Capabilities
This map represents the eight minute travel time response capabilities of the non‐airport squad companies from the Phoenix and automatic aid fire stations. The “number of squads” symbolization identifies the number of overlapping responding squad companies. Some “squad type” equipment is carried on PFD Ladder Tender trucks to augment Squad capabilities.
Map 15. Existing NFPA 1710 Initial Full Alarm 8‐Minute Response Capabilities with 15 Fire Fighters
This map represents the eight‐minute travel time response capabilities for a residential structure full alarm dispatch from the Phoenix and automatic aid fire stations. The residential structure fire alarm response capability is comprised of the intersection of all eight‐minute response capabilities of the appropriate apparatus in‐quarters for a residential structure fire response.
The apparatus comprising a typical residential structure working fire incident are three engine companies, one ladder company and two command vehicles, providing a minimum of 15 firefighters, a Rapid Intervention Team, a Safety Officer and a Commander. One or more ambulances also would be dispatched.
Map 16. Existing NFPA 1710 Initial Attack for High Hazards, 8‐Minute Response Capabilities with 26 Fire Fighters This map represents the eight‐minute travel time response capabilities for an NFPA 1710 initial attack, High Hazards Alarm, from Phoenix and automatic aid fire stations. The NFPA 1710 Initial Attack Alarm for a high hazard/commercial/high‐rise incident consists of the assembly of 26 fire fighters, multiple engine and ladder companies, a heavy squad, multiple command staff, a full Rapid Intervention Team, safety officers,

Fire Department Innovation and Efficiency Study Standards of Cover Analysis of Emergency Response Operations Management Partners
43
and special‐call units plus ambulances, depending on the structure and location.
A formal NFPA Standard 1710 section covering minimum resources to be dispatched to a “working” high‐rise fire will be prepared and issued in 2012. Currently, PFD dispatches the following resources: five engine companies, two ladder companies, three command vehicles, one command van, two Phoenix shift commanders, three utility trucks, and two ambulances.
Map 17. Responses Requiring in Excess of 10 minutes in 2010 Map 17 shows responses occurring in 2010 where it took more than 10 minutes but less than 15 minutes to arrive on scene. The data indicate that 8.6% of responses took more than 10 minutes. This is an important metric because the Arizona Division of Public Health Services “Certificate of Necessity” calls for the PFD to operate “ground ALS and BLS ambulance services” with Code 3 response times (use of emergency warning devices) for 911 generated dispatches as follows:
1. Ten minutes on 90% of all Code 3 ambulance transports 2. Fifteen minutes on 95% of all Code 3 ambulance transports.
The responses requiring more than 10 minutes are somewhat clustered in the north and south areas of the City. As previously explained, this is due to the development patterns in the City.
Map 18. Responses Requiring in Excess of 15 minutes in 2010
This map is the same as Map 17 but shows the responses that are greater than 15 minutes. Such responses account for approximately 1.6% of total runs. This is well within the state standard.
SOC Analysis and Observations
Based on the SOC analysis the following are the pertinent observations and findings with respect to basic emergency call response outcomes in Phoenix:
• The PFD is meeting the OSHA requirements concerning interior crew safety and training, and is fully aware of the National Institute for Occupational Safety and Health (NIOSH) advisories concerning fire ground tactics and incident safety. The PFD has conducted the nationally recognized operational research on firefighter rescue team operations and search‐time requirements.
Fire Department Innovation and Efficiency Study Standards of Cover Analysis of Emergency Response Operations Management Partners
44
• NFPA Standard 1500 provisions for fire ground safety, appropriate response levels, interior attack crew size and operations, plus safety officer response requirements are being met. Incident command “time to arrive” can be excessive, due to long response distances in some sections of the City.
• NFPA Standard 1710 provisions for response crew size and company supervision are being met through the current deployment of personnel, including company captains.
• PFD provisions for increased size of the response to high hazard/ high‐rise incidents appear sufficient; although, as noted, an NFPA standard regarding high‐rise and high hazard areas will be forthcoming in 2012.
• Certain areas of the City, as indicated on the capability maps, are unable to be covered in the timeframes called for in NFPA Standard 1710, due to the longer response distances from more remote stations in the northern area of the City and, to a lesser extent, in the far south. Automatic aid units are important in both areas. It should be noted that the percentage of City streets covered under the four‐ and eight‐minute time requirements of NFPA Standard 1710 are indicated on the various four and eight minute maps (maps 9 through 16).
Standard 1710 specifies that no less than 90% of annual incidents meet the travel time requirements. The percentage of streets covered in Phoenix for each category appear to indicate that the 1710 travel time requirements likely could not be met for 90% of annual calls.
• Equity of service delivery throughout the City will need increasing attention, especially as development resurges in the north. Were it not for the automatic aid provisions, the PFD would need immediate additional station and response resources to provide adequate protection under current development conditions.
Conclusion
Phoenix Standards of Cover currently are adequate for almost all sections of the City, but are noticeably dependent, as planned, on automatic aid for some east‐west border areas, in the area south of South Mountain (especially for EMS) and in the northern area, where only one operational Phoenix station exists. Should automatic aid response in the north become an issue, a significant protection problem quickly would emerge.

Fire Department Innovation and Efficiency Study Standards of Cover Analysis of Emergency Response Operations Management Partners
45
A contingency plan and a mid‐ to long‐term plan for additional PFD stations in the north would be useful
The City and the Fire Department are experiencing a quite common, but potentially troublesome, phenomenon in the Standards of Cover as they apply to the length of time required for response by rescue units (ambulances) to incidents. The Arizona State stipulation for Code 3 ALS responses, as noted earlier, calls for 90% of annual responses not to exceed ten minutes. PFD rescue response times in 2010 of runs taking more than 10 and 15 minutes have been noted. Thus, while PFD is within the stipulated response time requirements, continuing evaluations and service provision adjustments are necessary to meet the goals with a cost‐effective deployment of ambulances and crews. The distribution of these longer responses, while indicating some clustering, is fairly widespread and also appears indicative of heavy unit workload.
Regarding “first due” emergency response zones and the designated “first due” units in 56 surveyed zones, only 3 units from the 56 stations arrived first in their own zones at least 90% of the time during a surveyed time period. Ten units arrived as a “designated first due” less than 75% of the time. These statistics illustrate high unit workload, which reduces significantly the percentage of time that units are “in quarters” waiting for a call.
This SOC analysis, along with the benchmarking work described above, confirms that when it comes to the core job of responding to emergency calls, the Phoenix Fire Department generally meets accepted industry standards with respect to emergency response and performance. Aspects of NFPA 1710 and the certificate of need for ambulance service are not always being met. Management Partners did not find evidence from the SOC analysis that the department has significant excess capacity or surplus when it comes to meeting basic response standards. While units vary considerably with respect to individual workload, on balance, the system is handling a relatively heavy workload and the relevant performance metrics used to evaluate modern fire department performance are reasonable.
Although the department is frequently able to meet performance standards, some areas need to be watched carefully since the performance attained is just at, or in some cases slightly below, the applicable guidelines. This would be true for meeting state EMS response guidelines (the 10 minute rule) and with respect to the NFPA 1710 response time track record. While these are areas of concern, it also should be noted that providing for response coverage is quite expensive and most large

Fire Department Innovation and Efficiency Study Standards of Cover Analysis of Emergency Response Operations Management Partners
46
departments do not have the resources to meet every criteria. There is always a balance between maintaining adequate response and controlling expenditures. In the area of direct response the benchmarking and SOC analysis show that Phoenix has a good system that is doing a commendable job of reaching this balance.
It is critically important to recognize that the system’s current performance, which is in many ways outstanding, is directly linked to and dependent on the automatic aid response system which is so unique to the Phoenix metropolitan area. If this system were diluted, Phoenix as well as other surrounding cities would have to expend more resources to obtain the same level of system performance.

Fire Department Innovation and Efficiency Study Innovations and Efficiencies Management Partners
47
Innovations and Efficiencies
The purpose of this study is to identify innovations and efficiencies that, when implemented, would benefit the Fire Department. Management Partners examined operations throughout the department and the results are provided in the sections below. They include
• Organizational Structure and Management Level Staffing, • Human Resources, • Financial and Business Practices, • Training, • Fire Prevention, • Technology, and • Fleet and Facilities.
Organizational Structure and Management Level Staffing
The fire service has evolved to a standard organizational structure that has stood the test of time in terms of fire suppression, emergency medical services, and the incident command structure during emergencies. This structure has been studied extensively by fire and emergency management professionals and is based on many years of experience by first responders and fire service personnel. As a result, Management Partners did not conduct an in‐depth review of the specific PFD organizational structures associated with these functions, as the structures appear consistent with standard fire service delivery practices.
Rather, Management Partners looked at the overall management hierarchy of the department within the context of best practices, innovation and efficiency to:
• Ensure the levels and number of management positions support effective lines of communication and encourage efficiency and effectiveness.
• Identify opportunities where management positions could effectively be occupied by non‐sworn personnel to reduce costs, increase expertise, and encourage consistency and continuity, particularly in administrative functions.

Fire Department Innovation and Efficiency Study Innovations and Efficiencies Management Partners
48
Organizational structure can be the cause of workplace issues and be an obstacle to performance and results. Equally important, it can also inhibit opportunity for innovation and efficiency which can result from too many layers of management and occasional span of control issues. In addition, problems from organizational structure can result from organizing to accommodate employees instead of outcomes or functional alignment. As pointed out in an article in Business Horizons entitled “Structure Is Not Organization . . .” “. . . solutions to today’s thorny organizing problems that invoke only structure—or even strategy and structure— are seldom adequate.”3
Organizational structure should not be considered the only determinant of performance. According to an article in the Harvard Business Review,
…there is a profound misunderstanding about the link between structure and performance. Contrary to popular belief, performance is not determined solely by the nature, scale and disposition of resources, important though they may be… If you can align your organization’s structure with its decisions, then the structure will work better, and your company’s performance will improve.4
Based on our experience with local governments across the country reviewing organizational structures and our knowledge of fire safety functions, Management Partners was guided by the following principles in reviewing the overall management structure of the Phoenix Fire Department. Organizational structures should:
• Be designed around desired outcomes, not specialties. • Centralize or cluster functions to maximize economies of scale,
eliminate duplication and align functions with common core missions.
• Be based on a clear statement of outcomes of the organization and how the team is expected to work together to achieve them (create norms).
• Be clear about the chain of command, but expect horizontal teamwork to achieve desired outcomes.
3 Structure is Not Organization, by Robert H. Waterman, Jr., Thomas J. Peters, and Julien R. Phillips, Business Horizons.
4 The Decision‐Driven Organization by Marcia W. Blenko, Michael C. Mankins and Paul Rogers, Harvard Business Review, June 2010

Fire Department Innovation and Efficiency Study Innovations and Efficiencies Management Partners
49
• Create boundary‐crossing partnerships that do not tolerate silo thinking.
• Have a small executive team whose members are expected to work collaboratively to achieve results.
• Support the reengineering of work processes to design optimal ways of achieving results, across department, division or section lines.
In addition to these guiding principles, we considered the following throughout our analysis of the Phoenix Fire Department management structure:
1. The Fire Department’s interest in sustaining a department able to recruit and retain a high performing work force that can continue to deliver excellent service to the Phoenix community.
2. A reasonable span of control for the Fire Chief and other managers to effectively manage the department, focus on priority projects and issues, and exercise long‐term planning for a sustainable and fiscally viable organization able to foster innovation.
3. Peer agency information regarding fire service management hierarchies.
4. Effective management practices and span of control considerations.
5. The importance of administrative units where decisions can be made at the lowest possible level (flattening the organization).
Span of Control
There is no consensus among management experts or theorists about either the appropriate number of management layers or span of control standards. Span of control varies considerably, depending on the size of the organization, functions and complexities of the jobs involved, and between the public and private sectors.
A 1995 Wall Street Journal study found corporate controls ranged from 1:11 for service companies to 1:9 for all businesses.5 A 1996 Office of City Auditor Study in Seattle, Washington found Seattle’s overall average ratio of staff to managers was 5.9, which was the lowest of those found in
5 Wall Street Journal, “Critical Slot: Restructuring Alters Middle‐Manager Role but Leaves it Robust.” September 25, 1995. Pg. A‐1

Fire Department Innovation and Efficiency Study Innovations and Efficiencies Management Partners
50
comparable agencies in the region.6 In an update to the 1996 study in 2005, the City Auditor found that Seattle’s overage average ratio increased to 6.8 in 2005.7 A California Research Bureau, California State Library study points out there is no ideal ratio of line employees to managers and the following factors will affect the optimum ratio:
• Mission of the organization • Type of service or product produced • Complexity and sensitivity of the work • Management style of the top executive(s) • Proximity of employees to each other and to their manager • Legal requirements • Consequence of error
The study goes on to state that:
Performance tends to suffer when an organization has too many management layers or too narrow a span of control. Communi‐cation slows down as work moves through chains of command or across organizational lines. On the other hand, insufficient supervision can lead to morale problems, burnout, costly errors and scandals. Increasing the span of control without eliminating management layers can actually decrease efficiency. 8
There is agreement, though, that span of control is directly influenced by the number of layers in an organization. As stated in a South Florida Management District Interim Study of Span of Control:
Span of control has a direct bearing on the number of layers in an organization, which is a measure of the length of an organization’s lines of communications. These two measures are indicators of the efficiency and effectiveness of an agency. 9
6 Office of City Auditor, Seattle, WA “Ratio of Staff to Managers in City Government.” January 25, 1996. Pg. i 7 Office of City Auditor, Seattle, WA “Span of Control in City Government Increases Overall.” September 19, 2005. Pg. 3
8 California Research Bureau, California State Library, “Flattening Organizations: Practices and Standards.” September 1997. Pg. 9
9 Office of the Inspector General, South Florida Water Management District, “Interim Study of Span of Control – Report 99‐28, December 21, 1998, Pg. 4

Fire Department Innovation and Efficiency Study Innovations and Efficiencies Management Partners
51
Tom Peters, author of several management books including Thriving on Chaos, suggests that most organizations need only three layers: “first line supervisors, division heads and unit managers (plant, operations or distribution manager).”10
Each organization has its own unique circumstances influencing span of control ratios to make it most effective. And, as previously observed, the fire service has considerable information and experience regarding span of control for operational functions. Management Partners believes that the existing Phoenix Fire Department executive level organization structure and operational units represent reasonable spans of control.
Levels of Management
As part of this study, Management Partners gathered benchmarking data from several fire service agencies of a similar size to examine their management hierarchies with respect to the following.
• Number of executive level managers within the fire department. • Number of management level positions, defined as deputy chief,
assistant chief, division chief (Denver only) or above. • The levels of management in the finance and human resource
functions as well as whether these positions were filled by sworn or non‐sworn personnel.
As previously discussed, benchmarking partners included:
• City of Dallas Fire Department • City of Denver Fire Department • Orange County Fire Authority • City of San Diego Fire Department • City of Seattle Fire Department
Attachment D shows an organization chart of the existing Phoenix Fire Department. Management Partners also obtained applicable organization charts from peer agencies, which are included as Attachment E. The peer research indicates the agencies vary considerably in how they organize their management structures outside of the basic fire suppression and emergency response functions. Also, titles vary between agencies so that
10Tom Peters, Thriving on Chaos: Handbook for a Management Revolution (Alfred A. Knopf, Inc., New York, 1987), Pg. 359

Fire Department Innovation and Efficiency Study Innovations and Efficiencies Management Partners
52
a deputy chief in one agency may be comparable to an assistant chief in another. Table 10 provides a summary of the executive level staff and associated basic functional assignments in a management hierarchy or tiered format for each of the benchmarking agencies. Management Partners verified executives included in this table with each peer jurisdiction.
Table 10. Fire Department Executive Management Hierarchy Peer Comparison
Peer
Number of Executive Level
Positions Executive Level Hierarchy
Phoenix 8 Fire Chief Executive Assistant Chief (1) Assistant Chief (3) North Operations South Operations Special Operations Assistant Chief (3) Administration and Finance Fire Marshal* Human Resources
Dallas 7 Fire Chief Assistant Chief (6) Emergency Response Bureau Homeland Security Bureau Life Safety & Professional Standards Bureau Planning & Development Bureau Training & Support Services Bureau Assistant Director (1) Financial Services Bureau
Denver 8 Fire Chief Deputy Chief (1) Division Chief (6) Special Operations/EMS Fire Prevention Technical Services Administration and Investigations Safety and Training Airport Structural and Aircraft Rescue Firefighting (ARFF)
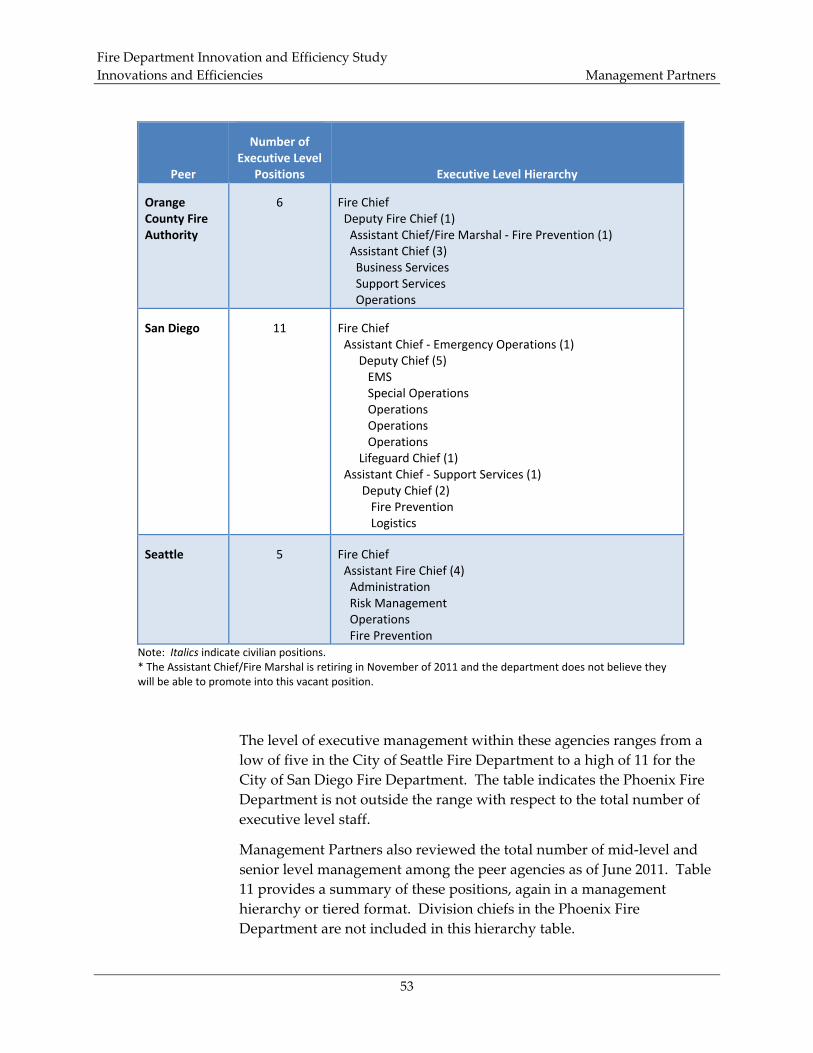
Fire Department Innovation and Efficiency Study Innovations and Efficiencies Management Partners
53
Peer
Number of Executive Level
Positions Executive Level Hierarchy
Orange County Fire Authority
6 Fire Chief Deputy Fire Chief (1) Assistant Chief/Fire Marshal ‐ Fire Prevention (1) Assistant Chief (3) Business Services Support Services Operations
San Diego 11 Fire Chief Assistant Chief ‐ Emergency Operations (1) Deputy Chief (5) EMS Special Operations Operations Operations Operations Lifeguard Chief (1) Assistant Chief ‐ Support Services (1) Deputy Chief (2) Fire Prevention Logistics
Seattle 5 Fire Chief Assistant Fire Chief (4) Administration Risk Management Operations Fire Prevention
Note: Italics indicate civilian positions. * The Assistant Chief/Fire Marshal is retiring in November of 2011 and the department does not believe they will be able to promote into this vacant position.
The level of executive management within these agencies ranges from a low of five in the City of Seattle Fire Department to a high of 11 for the City of San Diego Fire Department. The table indicates the Phoenix Fire Department is not outside the range with respect to the total number of executive level staff.
Management Partners also reviewed the total number of mid‐level and senior level management among the peer agencies as of June 2011. Table 11 provides a summary of these positions, again in a management hierarchy or tiered format. Division chiefs in the Phoenix Fire Department are not included in this hierarchy table.

Fire Department Innovation and Efficiency Study Innovations and Efficiencies Management Partners
54
We recognize that each department has unique characteristics and that an “apples to apples” comparison is impossible. Management Partners spoke with each of the peer agencies to identify the number of mid‐level and senior management positions in each organization. We believe this is a useful illustration to compare the hierarchy/levels of management in each peer agency. Some agencies utilize sworn members in management positions while others utilize non‐sworn personnel. In addition, there is variation in the way support services are provided among the peer agencies. For example, the Phoenix Fire Department noted that their department provides some services (e.g., information technology and human resources) that are provided by city departments in other jurisdictions.
Table 11. Fire Department Management Hierarchy Peer Comparison
Peer
Number of Management
Level Positions* Management Hierarchy
Phoenix 28 Fire Chief Executive Assistant Chief (1) Assistant Chief (3) North Operations Deputy Chief (4) South Operations Deputy Chief (4) Special Operations Deputy Chief (4) Assistant Chief (3) Administration and Finance Deputy Chief (2) Fire Marshal Deputy Chief (2) Human Resources Deputy Chief (3) Emergency Management (City Manager’s Office) Deputy Chief (1)

Fire Department Innovation and Efficiency Study Innovations and Efficiencies Management Partners
55
Peer
Number of Management
Level Positions* Management Hierarchy
Dallas 16 Fire Chief Assistant Chief (6) Internal Affairs Emergency Response Bureau Deputy Chief (4) Fire‐Response Division I Division II EMS Response Homeland Security Bureau Deputy Chief (2) Special Operations Arson Investigations/Bomb Squad Life Safety & Professional Standards Bureau Deputy Chief (1) Inspection & Life Safety Education Planning & Development Bureau Training & Support Services Bureau Deputy Chief (1) Training/Safety Assistant Director (1) Financial Services Bureau
Denver 16 Fire Chief Deputy Chief (1) Division Chief (6) Operations Assistant Chief (2) Fire Prevention Assistant Chief (1) Technical Services Assistant Chief (1) Administration and Investigations Assistant Chief (1) Safety and Training Assistant Chief (1) Airport Structural and ARFF Assistant Chiefs (2)
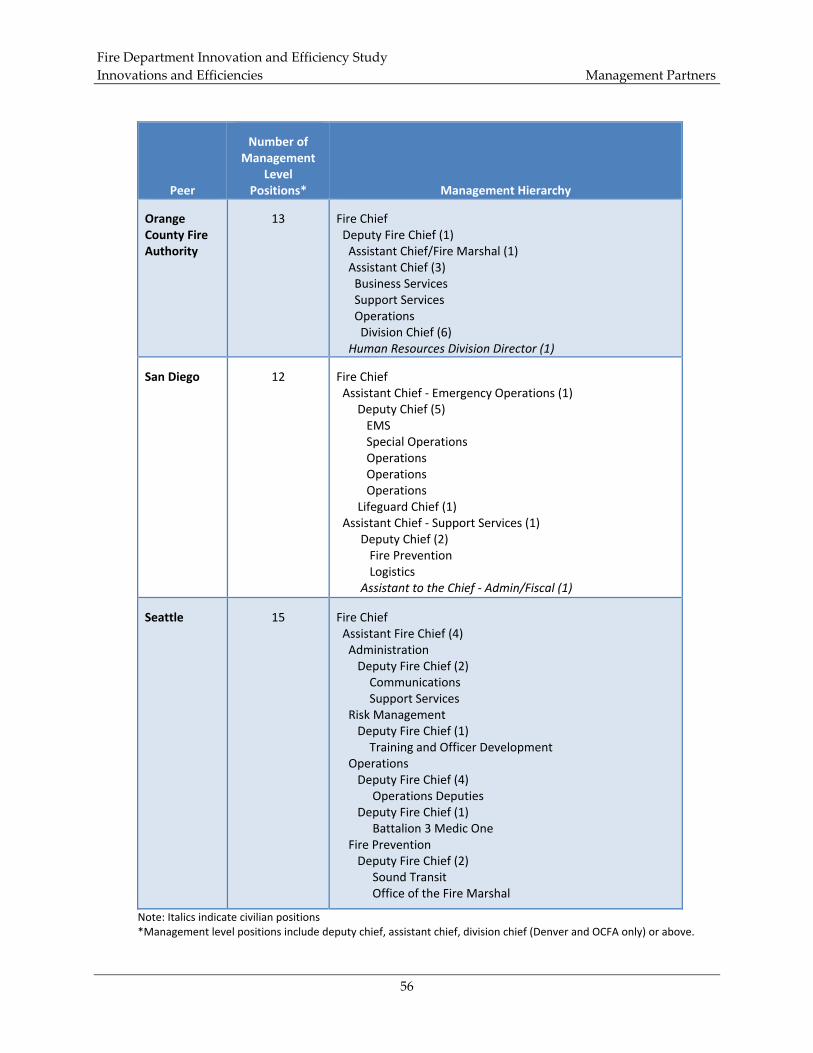
Fire Department Innovation and Efficiency Study Innovations and Efficiencies Management Partners
56
Peer
Number of Management
Level Positions* Management Hierarchy
Orange County Fire Authority
13 Fire Chief Deputy Fire Chief (1) Assistant Chief/Fire Marshal (1) Assistant Chief (3) Business Services Support Services Operations Division Chief (6) Human Resources Division Director (1)
San Diego 12 Fire Chief Assistant Chief ‐ Emergency Operations (1) Deputy Chief (5) EMS Special Operations Operations Operations Operations Lifeguard Chief (1) Assistant Chief ‐ Support Services (1) Deputy Chief (2) Fire Prevention Logistics Assistant to the Chief ‐ Admin/Fiscal (1)
Seattle 15 Fire Chief Assistant Fire Chief (4) Administration Deputy Fire Chief (2) Communications Support Services Risk Management Deputy Fire Chief (1) Training and Officer Development Operations Deputy Fire Chief (4) Operations Deputies Deputy Fire Chief (1) Battalion 3 Medic One Fire Prevention Deputy Fire Chief (2) Sound Transit Office of the Fire Marshal
Note: Italics indicate civilian positions *Management level positions include deputy chief, assistant chief, division chief (Denver and OCFA only) or above.

Fire Department Innovation and Efficiency Study Innovations and Efficiencies Management Partners
57
Table 11 indicates that the number of mid‐level sworn management positions and the number of levels in the mid‐management (sworn) structure in the Phoenix Fire Department exceed those in the peer agencies.
While functional responsibilities and the number of trucks/engines vary among the departments and can be the basis for some of the difference, the management hierarchy is inconsistent with the most efficient operations and management structure principles articulated earlier.
Eliminating 8 to 10 of these positions by reallocating them to operational sworn ranks as vacancies occur or converting those deemed critical to non‐sworn positions through attrition could result in savings to the department. Estimating conservatively, if only five of the positions were eliminated through attrition, the department would realize annual savings of over $850,000.
Management Partners did not conduct an in‐depth review of the duties and responsibilities of each position. In fact, it is likely that some or all of the work may not be able to be eliminated. However, each one‐on‐one report position should be reviewed to assess whether the work must be done by a sworn, mid‐level management position.
Recommendation 1. Perform a comprehensive review of each mid‐level management position when a vacancy occurs to determine the need for the position and whether operational fire expertise is required. An evaluation tool and checklist would be valuable for assessing the need for fire expertise. If it is determined the position is not necessary, the vacant position should be reallocated to the operational functions of the department. In the event that the position is necessary, but could be filled by a non‐sworn individual, the department could pursue position reclassification.
Allocation of Sworn/Non‐Sworn Mid‐Management Positions
In addition to the number and levels of executive and mid‐management level hierarchies, Management Partners also believes it is important to review the management approach and functional alignment of administrative, business and system functions. Through interviews and focus groups, comments were received that some mid‐level sworn managers have been placed in positions managing functions for which they may not have the expertise or training. Also, as a result of the rotation practices within the department which are meant to enhance

Fire Department Innovation and Efficiency Study Innovations and Efficiencies Management Partners
58
professional development, some of these mid‐managers rotate out of their function just when expertise is beginning to be obtained. Many of these areas could more efficiently be managed by non‐sworn personnel with expertise in administrative, business or system functions. As vacancies occur, each sworn management position should be evaluated to assure that fire operations expertise is critical to the work being performed. Currently a hiring freeze is in effect which prevents the department from filling non‐sworn management positions. Nevertheless, this is a best practice and the hiring freeze should not be a deterrent to substituting non‐sworn positions for sworn positions in the future.
Recommendation 2. Utilize sworn personnel in mid‐ and senior‐level positions to manage functions requiring fire expertise and experience.
Management Partners also specifically reviewed the management hierarchy among peer agencies with respect to human resources and financial management. We wanted to understand how many sworn management levels exist over these functions as well as whether the human resources manager or office was a sworn or non‐sworn position. Table 12 provides a summary of the levels of sworn management positions over each of these functions. We have included the next level below management (indicated by the words “not management”) to provide context.
Table 12. Peer Comparison of Human Resources and Finance Management Hierarchy
Peer
Number of Management
Level Positions* Management Hierarchy
Phoenix Finance: 2 Assistant Chief ‐ Administration and Finance (1) Deputy Chief (1) Department Budget Supervisor (not management)
Human Resources: 3
Assistant Chief ‐ Human Resources (1) Deputy Chief (2) Personnel Officer (not management)
Dallas Finance: 1 Assistant Director (1)
Financial Services Bureau (not management)
Human Resources
Not housed in the Fire Department
Denver Finance: 1 Deputy Chief (1) Finance and Budget Manager ( not management)

Fire Department Innovation and Efficiency Study Innovations and Efficiencies Management Partners
59
Peer
Number of Management
Level Positions* Management Hierarchy
Human Resources
Not housed in the Fire Department (in Manager of Safety's office)
Orange County Fire Authority
Finance: 2 Deputy Fire Chief (1) Assistant Chief ‐ Business Services (1) Finance Division Manager (not management)
Human Resources: 1
Deputy Fire Chief (1) Human Resources Division Director (not management)
San Diego Finance: 1 Assistant Chief (1) Assistant to the Chief ‐ Admin/Fiscal (not management)
Human Resources: 1
Assistant Chief (1) Human Resources Manager (not management)
Seattle Finance: 1 Assistant Fire Chief ‐ Administration (1) Finance Manager (not management)
Human Resources: 1
Assistant Fire Chief ‐ Administration (1) Human Resources Manager (not management)
Note: Italics indicate civilian positions. *Management level positions include deputy chief, assistant chief, division chief (Denver only) or above.
The PFD has one sworn executive level and one sworn management position over the finance function, while one of the peers (OCFA) also has two and the remaining three only one. Similarly, the PFD has one sworn executive level and two senior management positions over the human resources function as compared with one for the peer agencies.
In reviewing the report, it should be noted that the Phoenix Fire Department asserted that one of the reasons they have very few grievances or labor issues is the presence of sworn middle managers in personnel. Management Partners cannot be sure that there is a causal relationship. In the interest of efficiency, we believe that it should be noted that other departments operate using non‐sworn individuals in their personnel and administrative functions.
In the peer agencies surveyed, each of the finance and human resource management positions reports directly to an executive level sworn position without an intermediate senior or mid‐management sworn position. While Management Partners certainly appreciates the department’s focus on professional development within the sworn ranks,

Fire Department Innovation and Efficiency Study Innovations and Efficiencies Management Partners
60
in the current economic environment it constitutes a potentially costly level of management and oversight. While recognizing the historical practice of executive level oversight of administrative functions by sworn personnel in the field of public safety, the peer agencies also appear to support a direct reporting relationship with non‐sworn managers in these areas.
Recommendation 3. Reallocate the deputy chief in finance to an operational or other position within the department and provide the non‐sworn managers with a direct reporting relationship to executive level management. If necessary and through attrition, upgrade the non‐sworn management positions in this function to levels commensurate with senior level management responsibilities. Based on the differential between sworn and non‐sworn salaries and benefits reallocating a sworn position to a non‐sworn position will save approximately $25,000 annually. It will also provide a framework to place non‐sworn positions in business and administrative positions where operational expertise is not required.
In most, but not all of the peer agencies, the human resources and finance functions are grouped under the same senior level executive. Key administrative functions such as finance and human resources, while separately managed at a senior management level, benefit from an alignment and shared vision. Both of these functions have a common mission to provide critical business and administrative services to the entire department, ensuring consistency in business practices and systems support across operations.
In the PFD, these functions report to separate assistant chiefs. Management Partners believes the department can benefit from reorganizing these administrative functions under one executive level position. This may also provide an opportunity to eliminate one executive level or senior management position following the retirement of incumbents, which would save approximately $215,000 annually.
Recommendation 4. Reorganize administrative and business functions under one executive level manager. This can be accomplished upon retirement of executive and/or senior management sworn positions.

Fire Department Innovation and Efficiency Study Innovations and Efficiencies Management Partners
61
Human Resources
Personnel/Payroll Section
The Personnel/Payroll Section of the Fire Department is located within the Human Resources Division which is headed by an assistant fire chief. Two deputy fire chiefs are assigned to the Personnel/Payroll Section. A total of 14 full‐time positions are shown on the organization chart for the section; the human resources officer position has been held vacant for the last several months. Although it was vacant at the time of the study, the position has recently been filled.
This section is responsible for payroll and related tasks, recruitment and testing processes, public records and criminal subpoena requests, internal affairs investigations, bilingual certification program, retirement issues, overtime, and various other reporting requirements related to personnel and payroll. The Personnel/Payroll Section also processes volunteers for the department. Currently, there are 272 volunteers within three department programs (91 with the Community Assistance Program, 113 with Community Emergency Response Teams, and 68 cadets).
Having two deputy fire chiefs in charge of this operation seems inconsistent with the most efficient possible operations, especially given the total staffing of 14 positions. It is expensive to have sworn personnel heading this operation and having two sworn individuals is particularly costly. The department could return both deputies to the field in positions requiring sworn expertise and add a civilian manager with human resources expertise.
Given state and federal laws, best human resources practices, city requirements, and department expectations regarding human resources administration, supervision of this function requires substantial training and expertise. Just as the fire profession requires years of experience and training, knowledge and capability in the field of human resources requires significant training, education and experience as well.
One of the deputy fire chiefs has been in his assignment since May 2009; the other since April 2010. Rotating sworn officers to head the personnel/payroll function is not an effective method of providing expertise in this critical management area. At the time of the study, the Fire Department had a vacant human resources officer position.
If the department believes strongly that a sworn individual must head the Personnel/Payroll Section, another option would be to eliminate one of

Fire Department Innovation and Efficiency Study Innovations and Efficiencies Management Partners
62
the deputy positions and place the remaining deputy in Personnel/Payroll for a five‐year assignment. Eliminating one position would make the span of control appropriate and save $175,000. Requiring a five‐year assignment would provide the deputy sufficient time to learn the job before leaving for another assignment. Training for the deputy in professional human resources practices and legal requirements is essential for effective management.
Recommendation 5. Return one or both deputies in the Personnel/Payroll Section to the field in positions requiring sworn expertise and add a civilian manager with human resources expertise. If the PFD has a strong belief that a sworn individual must head the Personnel/ Payroll Section, reassign one of the deputy positions to the field and assign only one deputy to the function for at least a five‐year period.
Rotational Assignments
Management Partners heard a number of concerns during interviews about the short tenure of deputy fire chiefs in many assignments. While we believe rotational assignments are a positive management practice, concern was expressed that short assignments do not allow for the training time necessary to become proficient in an area. In addition, during an assignment changes are often introduced that are then revised once a new deputy chief rotates into the position.
Current deputy chiefs of the PFD were asked in a survey to provide the title of their last three assignments and the length of time they served in each assignment. The data in Table 13 show the length of time spent by current deputy chiefs in a single position varies significantly with some assignments lasting as little as two months while others last as long as 132 months (11 years).
Table 13. Deputy Chief Assignment Tenure for Previous Three Assignments
Assignment Tenure (months)
Minimum 2.0
Maximum 132.0
Average 20.2
Minimum Average 8.3
Maximum Average 81.0
The average length of time current deputy chiefs spent in one assignment (over the span of the last three assignments for each deputy chief) was
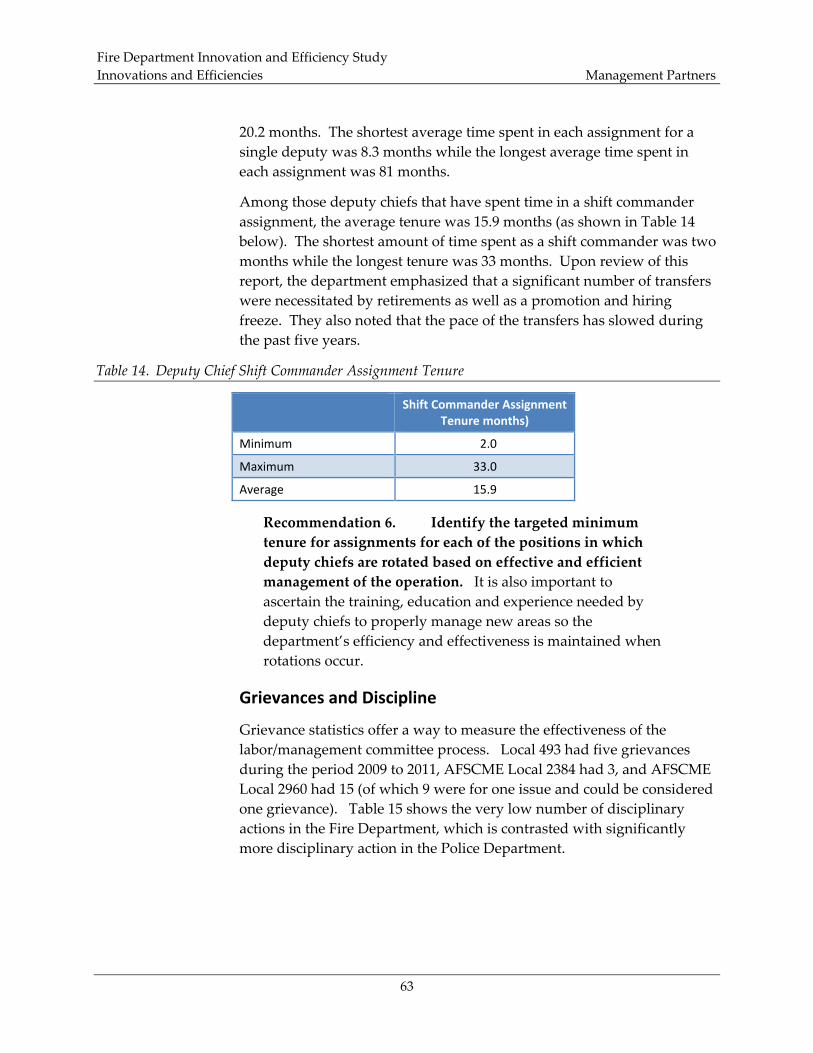
Fire Department Innovation and Efficiency Study Innovations and Efficiencies Management Partners
63
20.2 months. The shortest average time spent in each assignment for a single deputy was 8.3 months while the longest average time spent in each assignment was 81 months.
Among those deputy chiefs that have spent time in a shift commander assignment, the average tenure was 15.9 months (as shown in Table 14 below). The shortest amount of time spent as a shift commander was two months while the longest tenure was 33 months. Upon review of this report, the department emphasized that a significant number of transfers were necessitated by retirements as well as a promotion and hiring freeze. They also noted that the pace of the transfers has slowed during the past five years.
Table 14. Deputy Chief Shift Commander Assignment Tenure
Shift Commander Assignment Tenure months)
Minimum 2.0
Maximum 33.0
Average 15.9
Recommendation 6. Identify the targeted minimum tenure for assignments for each of the positions in which deputy chiefs are rotated based on effective and efficient management of the operation. It is also important to ascertain the training, education and experience needed by deputy chiefs to properly manage new areas so the department’s efficiency and effectiveness is maintained when rotations occur.
Grievances and Discipline
Grievance statistics offer a way to measure the effectiveness of the labor/management committee process. Local 493 had five grievances during the period 2009 to 2011, AFSCME Local 2384 had 3, and AFSCME Local 2960 had 15 (of which 9 were for one issue and could be considered one grievance). Table 15 shows the very low number of disciplinary actions in the Fire Department, which is contrasted with significantly more disciplinary action in the Police Department.

Fire Department Innovation and Efficiency Study Innovations and Efficiencies Management Partners
64
Table 15. Disciplinary Statistics for 2009 and 2010
Action Fire Department Police Department
Written reprimands 7 93
Suspensions 25 80
Dismissals 1 10
As the purpose of the labor/management committees is to deal with problems as well as to address policy, practice and management issues, given the relatively low number of grievances, the committees appear to be serving an important problem‐solving function. This is an innovative program that should be maintained and expanded to other bargaining groups within the department.
Succession Planning
The department currently does not have a written personnel succession plan. With the Deferred Retirement Option Program (DROP), the department is able to project retirements five years in advance. Table 16 provides information about pending retirements through this program and shows that over the next three years the Phoenix Fire Department is projected to lose 86 employees to DROP retirements alone, not including attrition through other means. Over half of these retirements will occur in the next year. Given the importance of ensuring that knowledge about fire department operations, policies and practices remains strong within the organization, succession planning is needed.
Table 16. Projected Retirements Resulting from the Deferred Retirement Option Program (DROP)
Calendar Year
Number of Projected DROP Retirements
2011 45
2012 12
2013 29
Total 86
The goal of a succession planning program is to ensure continuity of leadership and the provision of quality services as people retire or exit the organization for other reasons. This requires understanding turnover and expected vacancies, identifying positions for which preparation will be critical for success, establishing training and development opportunities that develop needed skills and competencies required for higher level positions, identifying talent and providing support, mentoring and

Fire Department Innovation and Efficiency Study Innovations and Efficiencies Management Partners
65
training for their development, and supporting knowledge transfer as the organization changes.
The best practice approach is to engage employees in the process of planning for their succession several years before their expected retirement. This allows time to cultivate competencies within the existing workforce and can prevent a significant loss of institutional knowledge as larger numbers of people leave in a short period of time. Organizations are also documenting institutional knowledge where possible, providing for overlap from the incumbent to the new person in a position, and mentoring candidates in advance so they will be ready to take on higher‐level responsibilities. Doing so minimizes the uncertainty experienced by staff and helps achieve the goal of seamless delivery of quality services.
Recommendation 7. Create a succession planning program to ensure continuity of leadership as retirements occur. Include supervisory and management training as part of succession planning.
Certifications/Special Pays
The department has seven types of special pays, as shown in Table 17. Fire fighters are limited to receiving only two special pays in addition to paramedic pay and linguistic skill pay.
Table 17. Special Pay for Certifications
Certifications/Special Pays
Number of Staff with
Certification/ Special Pay1
2010 Certification/ Special Pay
Cost2
Amount of Extra Pay for Certification/ Special Pay (per month)
Number of Staff with
Certification/ Special Pay
Needed per Shift3
Annual Recertification Requirement?
Airport Rescue Fire Fighting (ARFF) 129 $405,530 $261.97
24 (plus one assigned to staff) Yes
Hazardous Materials Technician (Hazmat) 183 $575,286 $261.97 17 Yes
Technical Rescue Technician (TRT) 231 $726,181 $261.97
20 (plus one assigned to staff) Yes
Emergency Paramedic (Medic) 619 $3,744,083 $504.05 158 (plus three assigned to staff) Yes
Urban Search and Rescue Canine Search Technician (Canine) 3 $9,431 $261.97
Yes
Linguistic Skill Qualification 338 $304,200 $75.00 No

Fire Department Innovation and Efficiency Study Innovations and Efficiencies Management Partners
66
Certifications/Special Pays
Number of Staff with
Certification/ Special Pay1
2010 Certification/ Special Pay
Cost2
Amount of Extra Pay for Certification/ Special Pay (per month)
Number of Staff with
Certification/ Special Pay
Needed per Shift3
Annual Recertification Requirement?
Linguistic Skill Qualification Coordinator 12 $54,000 $375.00
No
1 Staff with multiple certifications: 2 certifications ‐ 276; 3 certifications ‐ 100; 4 certifications ‐ 18; 5 certifications ‐ 0 2 Best yearly cost estimate with available data. Fire fighters are limited to receiving only two special pays plus paramedic and linguistic skill, if applicable. The total cost may be overstated slightly. 3 An additional 17 individuals with Hazmat/TRT dual certifications are needed per shift. Additional trained staff are also needed to cover for vacancies.
Of the several types of special pay, five require annual recertification. Two (linguistic skills qualification and the linguistic skill qualification coordinator) do not. Over $350,000 is paid by the City for these two special pays as part of the PFD’s goal of having 50% of the Fire Department proficient in a second language. During interview and focus groups, Management Partners was told that some of the individuals receiving linguistic pay are not currently proficient. Based on an assumption that 20% are not, the Fire Department will save approximately $60,000 annually. To ensure the individuals receiving the special pay actually are using the skills on a regular basis and are proficient in the language for which they are receiving compensation, having a regular recertification process would be advisable.
Recommendation 8. Establish an annual recertification process for individuals receiving linguistic pay to ensure proficiency in the language for which compensation is being received.
Bilingual Capability
As indicated above, the Phoenix Fire Department has 338 employees receiving special pay for being bilingual. This represents 16% of the department’s total employees. The Spanish‐speaking population of the community is estimated to be 32.8% or approximately 457,927 people. In 2002 the PFD established a goal of having 50% of its employees be bilingual. The annual RBO process has included this goal and has maintained a focus on training people to become bilingual. However, given the number of people receiving bilingual pay relative to the department’s goal there may be other avenues for making greater progress.

Fire Department Innovation and Efficiency Study Innovations and Efficiencies Management Partners
67
For example, the City of Santa Ana has a total population of 336,988 of which 222,137 (73.3%) are Spanish‐speaking. In 1986 the City began to focus on recruitment of bilingual employees and has recruited only bilingual employees for many years. As a result, the Santa Ana Fire Department is now 51% bilingual.
Recommendation 9. Provide added points for bilingual capability during recruitments and/or establish bilingual only recruitments to move toward the department’s goal of 50% bilingual employees.
Workers’ Compensation Usage
The number of the City’s total workers’ compensation cases has decreased over the last three years while the Fire Department’s cases have not. Table 18 lists the departments with the largest number of cases and summarizes all other departments in one category.
Table 18. Total Workers’ Compensation Cases by Year
Total Cases 2008 2009 2010
Aviation 65 65 47
Fire 623 623 647
Parks and Recreation 199 169 163
Police 676 534 502
Public Works 124 134 116
Street Transportation 81 89 69
Water Services 177 165 158
Other Departments 187 183 183
Total 2,132 1,962 1,885
Figure 13 further summarizes the number of annual total workers’ compensation cases. It graphically demonstrates the Police Department and All Other Department categories have experienced decreases in annual total cases while the Fire Department has had a slight increase. These data include only accepted cases and do not include denied claims.

Fire Department Innovation and Efficiency Study Innovations and Efficiencies Management Partners
68
Figure 13. Annual Total Workers’ Compensation Cases for Fire, Police, and All Other Departments
Table 19 shows the number of cases in 2010 as a percentage of department FTEs (FY 2010/11). This is not a ratio of the number of employees with workers’ compensation cases to the number of employees for two reasons: the number of cases includes employees with multiple cases; and FTE numbers are lower than the number of employees due to the number of part time employees in departments. Although there are some variables in the percentages (due to the use of FTEs and not accounting for multiple cases per employee), the Fire Department has a significant percentage of the cases in the City. The Fire Department has been working on strategies to reduce injuries.
Table 19. Cases as a Percentage of Department FTEs for 2010/11
Department Total Cases
2010 2010/11 FTEs
Cases as Percent of FTEs
Fire 647 2,066.2 31.3%
Police 502 4,825.7 10.4%
Water Services 158 1,524.1 10.4%
Street Transportation 69 719.0 9.6%
Public Works 10 112.0 8.9%
All Other Departments 452 5,519.8 8.2%
Aviation 47 869.7 5.4%
Total 1,885 15,636.5 12.1%
623 623 647
676
534 502
833 805
736
500
600
700
800
900
2008 2009 2010
Fire

Fire Department Innovation and Efficiency Study Innovations and Efficiencies Management Partners
69
Annual Open Workers’ Compensation Cases
The City has experienced a significant increase in the number of open workers’ compensation cases during the three‐year period as shown in Figure 14. This indicates a need for a review of the workers’ compensation program for the City.
Figure 14. Summary of Open Cases by Department
Recommendation 10. Analyze the causes of the significant increase in workers’ compensation cases and take actions to reduce the number of injuries.
Efficiencies from Reducing Injuries in the Fire Department
A review of injury data in Table 20 shows that, after work related injuries, basketball and weightlifting are the two largest causes of claims. After reviewing this report, the PFD stated that half of the exercise injuries do not result in lost time. However, data to analyze severity or lost time were not available.
40
84
153
27
64
142
30 32
134
‐
50
100
150
200
2008 2009 2010

Fire Department Innovation and Efficiency Study Innovations and Efficiencies Management Partners
70
Table 20. Fire Department Work Injuries Compared with Exercise Injuries
Total Cases 2008 2009 2010
Work/non‐sports 423 413 439
Basketball 107 78 64
Weight Lifting 54 93 81
Other Recreation/Sports 39 39 63
Total 623 623 647
Figure 15 graphically shows that exercise injuries account for about 33% of the 2010 cases.
Figure 15. Percentage of 2010 Cases for Work Injuries Compared with Exercise Injuries
Of all injury cases in 2010, basketball and weightlifting account for 10% and 13%, respectively. Further analysis might identify ways to prevent such injuries including deficient facilities or specific training needs.
As noted above, Phoenix has reduced workers’ compensation claims in all departments except the Fire Department in the last three years.
Work/non‐sports, 68%
Basketball, 10%
Weight Lifting, 13%
Other Recreation/Sports, 10%

Fire Department Innovation and Efficiency Study Innovations and Efficiencies Management Partners
71
Substantial savings and work efficiencies would be generated if the Fire Department could match the performance demonstrated in other City departments.
Specifically, The Police Department reduced its workers’ compensation claims by approximately 25% from 2008 to 2010 while the overall City average was reduced 13%. Based on the data in Table 22 below, the cost of an average case is $4,000. Using the more conservative city‐wide decrease, if the Fire Department was able to reduce its cases by 13%, (reducing the number of cases from 647 to 563; a difference of 84 cases) savings would total an estimated $364,000. If the department could achieve a 25% reduction like the Police Department, savings of approximately $647,000 could be realized.
Recommendation 11. Implement injury prevention and workers’ compensation management systems to achieve claims reductions equivalent to what the City as a whole achieved over the 2008 to 2010 period. In particular, analyze the types and locations of basketball and weight lifting injuries to identify necessary improvements or appropriate training to reduce these types of injuries.
Multiple Cases
Over the three‐year period from 2008 through 2010, 218 Fire Department employees had more than one workers’ compensation case each. Table 21 lists the number of claims, the number of employees, and the costs of those claims.
Table 21. Number of Employees with Multiple Claims from 2008 through 2010
Number of Claims per Employee
Number of Employees with Cases Total Cases
Cost of Cases
7 1 7 $ 27,721
6 4 24 $ 73,378
5 6 30 $101,274
4 22 88 $161,367
3 23 69 $119,081
2 162 324 $1,684,900
Total 218 542 $2,167,721

Fire Department Innovation and Efficiency Study Innovations and Efficiencies Management Partners
72
Further analysis is needed to review individual cases by employee to determine if confidential follow‐up is appropriate.
Recommendation 12. Review the cases for employees with three or more injuries in the last three years and provide appropriate training and physical therapy to avoid future injuries.
Return to Work and Light Duty
While we have no recommendations in this area it should be noted that the City does have a “light duty” program. This is a best practice as experience has shown that firefighters return to normal duty much faster if a light duty program is available. In Phoenix, light duty is tracked using a daily roll call that is reviewed by the Fire Department Health Center and fire personnel managers to watch the progress of each case. Firefighters on light duty are required to complete regularly scheduled rechecks at the Health Center. Depending on the type of injury and the status of the case, the checks may be weekly or monthly. There are a limited number of light duty positions. However, there have been few times when there were more employees on light duty than light duty assignments.
Financial and Business Practices
Management Partners identified several areas where innovations and efficiencies may be beneficial with respect to the Fire Department’s financial and business practices. Potential changes to purchasing and inventory services, the Fire Department’s Health Center, and revenue opportunities are each discussed below.
Purchasing and Inventory Services
The Fire Department has developed a strong working relationship with the City Finance Department’s Purchasing Division. The Fire Department coordinates through the Resource Management function within the Support Services Division, which by all accounts works well for both the City and the Fire Department. City Purchasing Division staff members cite this centralized approach as providing a vital coordinating role for fire operations while providing necessary support to meet City procurement requirements. This approach focusing on centralized management should continue.

Fire Department Innovation and Efficiency Study Innovations and Efficiencies Management Partners
73
While maintaining a centralized approach to procurement planning and management, the City can benefit by transitioning away from centralized purchase order fulfillment and distribution to a model involving direct vendor shipments. Many organizations are applying alternative approaches to reduce inventory carrying costs and inventory management costs. Direct shipments can provide the following benefits:
• Knowledgeable vendor representatives making frequent contact with an organization can lead to lower incidence of out‐of‐stock situations, reducing downtime and special order costs.
• Communication between the vendor and the organization via synchronized data minimizes data input errors and time for resolution.
• Labor expense for reordering and stocking inventory is reduced since this is handled by the vendor, resulting in labor savings of up to 10%.
• Based on industry estimates, bypassing the central warehouse through direct shipments will reduce between 3% and 4% of inventory from total inventory assets. We understand that the PFD must stock a number of specialized items and therefore cannot eliminate the warehouse entirely. The department has expressed concern about direct deliveries to fire stations because when a unit is on a call, the station may not be able to verify the shipment details. Appropriate management mechanisms can be utilized to assure shipments are not left without signatures.
• Significant and continuing labor savings in the warehouse operation as inventory is sent directly to the user.
Recommendation 13. Pursue direct vendor shipments, as appropriate, to yield continuing operating savings. The Fire Department should continue to pursue direct shipments (as it currently is in limited use). The PFD should also continue its central coordination with the City’s purchasing operations as is currently the practice.
Pursuing an alternative service delivery approach will support greater efficiencies, transfer effort to vendors, and allow for the attrition of selected positions supporting inventory management.
The value of inventory currently carried by the Fire Department per month has decreased over the last two years by approximately 9%. This has contributed in bringing the value of excess stock by month consistently below the City’s target of 15%. The Fire Department used approximately $3.9 million from inventory during a recent 12‐month

Fire Department Innovation and Efficiency Study Innovations and Efficiencies Management Partners
74
period. Applying a conservative 1% inventory savings through direct shipment would yield savings of a minimum of $39,000 per year.
A greater source of efficiency and savings for the Fire Department and City will come from reduced staffing resources supporting the central warehouse function. Five stock clerks currently report to the warehouse manager. Deliveries are made primarily by “red shirts” (prospective fire department candidates) with minimal associated costs. The department and City could yield continuing savings through the attrition of a minimum of two stock clerks. The estimated annual salary savings for two supplies clerk I positions ($119,000) would be supplemented by continuing savings in associated operating costs. The Fire Department believes this estimate is aggressive but Management Partners believes it is realistic.
Recommendation 14. Analyze the warehouse contents to determine which items are necessary to continue to stock and which may be dealt with on a just‐in‐time basis.
Recommendation 15. Eliminate two supplies clerk I positions once direct vendor shipments have been fully implemented.
Health Center Capacity
The Fire Department operates a modern, state‐of‐the‐art Health Center located in the Fire Department Administrative Headquarters Building. The approximately 20,000 square foot facility is fully equipped with the necessary medical equipment to do health related tasks such as physical exams, x‐rays, infectious disease control, and immunizations. The medical services provided at the Center are primarily provided through a contract with a private company. This allows staffing levels to be more easily adjusted without the necessity of having to add or lay off city staff.
Currently, three of the staff associated with the Health Center are City employees. For rehabilitative care for job‐related injuries covered by the City’s workers’ compensation insurance program, the center is reimbursed for its costs. The Health Center also provides workers’ compensation services to several other smaller cities in the area.
After two visits following an injury, the Center becomes the “physician of record” for the workers’ compensation program. The Center sees the injured staff members within 48 hours of the injury and staff are pre‐authorized for six therapy visits initially. They require the injured fire
Fire Department Innovation and Efficiency Study Innovations and Efficiencies Management Partners
75
fighters to return at least every seven days and, if on light duty, every 30 days to prevent the staff on workers’ compensation leave from “hiding.”
All job‐related injuries covered by the City’s workers’ compensation program are seen at the Health Center for initial and follow up evaluations to determine work status and progress. All visits are reimbursed according to standard medical codes. As a result, the department realizes an estimated $150,000 per year in revenue from workers’ compensation claims management. All revenue generated by the Health Center is returned to the City’s General Fund. According to Fire Department management, annual revenues from contracts with outside cities and work injury management have historically averaged $1 million per year.)
The Health Center currently provides the required annual physical exams for all Phoenix firefighters (approximately 1,740) and provides rehabilitation services to a majority (but not all) injured PFD firefighters. It also provides physicals and various other services under contract for 15 smaller fire departments in the greater Phoenix vicinity.
The Center has also provided physical exams for staff from other City departments, specifically the Water Department, certain staff in the Public Works Department, and a small number of staff in the Police Department who require specific medical certifications that the PFD Health Center is authorized to provide. In the past, the PFD did not charge the other departments for these services. However, Fire Department management indicated that future exams and certifications will be billed to the departments and are expected to generate over $90,000 in the current fiscal year.
Due to the facility size and amount and quality of equipment, and as a result of the recent loss of approximately 900 annual physical examinations the PFD had been providing for the City of Glendale (which recently established its own facility), there is a significant level of additional capacity that could be used to either increase revenues or reduce costs to other departments in the City. (Since this study was undertaken, the department reports adding approximately 600 physicals.)
The deputy chief in charge of the Health Center does not see any significant logistical impediments to preparing the facility to provide additional services to outside cities or departments. Additional staffing could be available through the current contracting arrangement. The deputy chief also believes it would be necessary to add a staff therapist if additional therapy services are added. He indicated the Health Center
Fire Department Innovation and Efficiency Study Innovations and Efficiencies Management Partners
76
could accommodate the approximately 900 annual physicals examinations lost when Glendale left and 8 to 10 additional physical therapy patients daily, five days per week.
As a result of this additional capacity, Management Partners sees an excellent opportunity to generate revenues and cut costs through a more efficient use of the facility. As one example, there are over 3,600 police officers in the Phoenix Police Department, many of whom receive periodic physical examinations. The Police Department currently contracts with a private company (Concentra), for this service, spending $180 per Level A physical exam. The exams provided to police officers are much less extensive than those provided to firefighters, resembling more of a screening than a full exam.
Switching a portion of these physical examinations to the PFD’s Health Center would save dollars currently being spent from the Police Department General Fund budget. According to the Fire Department, the Health Center can modify the elements of a physical exam to the specifications desired by the Police Department. If 900 Police Department physical exams currently being contracted at a cost of $180 per exam were provided in‐house by the PFD, approximately $162,000 in gross annual savings could be realized.
Recommendation 16. Develop an agreement between the PFD, the Phoenix Police Department and any other City departments utilizing physical exam or physical therapy services from outside contractors to have a portion of those services provided by the Phoenix Fire Department Health Center. As an alternative, commence an effort to sell the additional PFD physical exam capacity to area fire departments or police departments currently contracting their physical exams and physical therapy services. Potential additional revenue if all 300 available exam appointments could be performed at the prevailing $718 per exam rate is $215,400.
Recommendation 17. Verify that the rates being charged by the PFD for firefighter physical exams and immunization services provided to outside fire departments are at market and adjust them upward if warranted.
Fire Department Innovation and Efficiency Study Innovations and Efficiencies Management Partners
77
New Revenue Sources
The Phoenix Fire Department and the Phoenix Budget Office have explored the development of new revenue sources over the last several years. However, the ideas have not been implemented for a variety of reasons. As an example, one fee implemented in a number of California cities and looked at by Phoenix is a crash or accident response fee. This fee is designed to recover the costs of Fire Department personnel when they are dispatched to the scene of an accident. According to conversations with City of Tempe staff, the establishment of this fee in Tempe had recently been under serious consideration. Their efforts were stymied at the last minute though, when insurance industry lobbyists convinced the Arizona State Legislature to pass a bill prohibiting the establishment of such fees.
This is not a particularly radical concept. Insurance customarily pays for many private sector responses to accidents (such as are associated with water damage, property protection and vehicle towing). Public sector services provided by fire departments have traditionally been supplied at no cost to the recipient due to the fact that such services are supported by taxes. With tax revenues becoming inadequate to maintain such responses, local governments across the country have explored cost recovery.
Although new revenue sources will always be met with opposition by certain sectors of the community, it is clear the severity of the budget situation facing Phoenix and almost all other governmental agencies nationwide cannot be solved solely by cost cutting without a corresponding reduction in the quality and quantity of vital public service programs. It is therefore important that new revenue ideas be seriously examined as an alternative to service reductions when deciding how to balance budgets in this economic environment.
Management Partners recommends that the City consider three new revenue sources to help offset the costs to the General Fund for Fire Department services. Each is described below.
Emergency Response (911) Fee
An emergency response fee is intended to recover costs to either the Fire and Police Departments (or both) for emergency dispatch services. This revenue source, sometimes termed a “911 fee” has been set up as either a cost recovery fee or a tax in several California cities and counties. The City and County of San Francisco and the County of Santa Cruz charge a

Fire Department Innovation and Efficiency Study Innovations and Efficiencies Management Partners
78
fee per phone line (both land and cellular) to recover the costs of the emergency dispatch program. In these programs the revenue collected cannot exceed the cost of the program.
The City of San Jose implemented an emergency response fee approximately 10 years ago. Due to concerns about legal challenges to this being a tax rather than a fee (under California law any new tax must be placed on the ballot and approved by either a majority or two‐thirds vote depending on the type of tax), two years ago the City placed a measure on the ballot. The measure received voter approval to assess the per line cost as a tax, so it is no longer calculated or based on a cost recovery fee calculation. These programs all use an assessment per phone line (or in the case of businesses, per “trunk line”) to help defray the cost of emergency dispatch services.
Estimating the amount of revenue that could be received from a 911 fee and what the exact cost would be per phone line for the City of Phoenix would require significant additional analysis. It would be necessary to know how many phone lines exist in the City that would be eligible for this fee and what types of exemptions would be granted. Typical exemptions include other government agencies, schools, low‐income individuals, and public phones. These exemptions for the programs we have examined can total as much as 45% of the existing phone lines. Whether such a fee program would recover both police and fire emergency dispatch costs would also obviously greatly impact the revenue and costs.
The programs mentioned above all recover the costs of both police and fire dispatch. We have not done a detailed estimate of police dispatch services in Phoenix as the scope of our engagement is limited to the Fire Department. A rough estimate of the potential revenue that might be achieved can be extrapolated by using per capita costs from an existing program (in this case, the City of San Jose) and applying them to Phoenix’s population. San Jose (population 946,000) collects approximately $20.7 million from its tax which is intended to offset costs of both police and fire emergency dispatch services. This currently results in a charge of $1.57 per month per non‐exempt phone line for each land and cell phone number in the city limits of San Jose. This equals about $21.90 per capita in annual revenue.
The legal and other hurdles necessary to implement such a fee are significant. However, if Phoenix (with a population of 1,590,488) were to achieve the same per capita revenue as described above, it would realize approximately $34.8 million.

Fire Department Innovation and Efficiency Study Innovations and Efficiencies Management Partners
79
Recommendation 18. Explore the feasibility of establishing an Emergency Response (911) Fee.
Ambulance Subscription Program
A second revenue source worth considering is a subscription program for ambulance services. In most cities, including Phoenix, ambulance transport services are funded from user fees. Even though the majority of costs for many users are at least partially covered by health insurance, most users incur some out of pocket costs and for many this can be a burdensome amount of money. Nationally, many cities have established ambulance subscription programs. With a subscription program, a household pays an annual fee to the city. In many cities with such programs the annual fees range from $40 to $60 per year. The subscription guarantees that should a transport be necessary for any resident of the household, the household will not be billed.
By becoming a subscriber, residents authorize the city or fire department to bill their private health insurance carriers and/or Medicare or Medicaid. The membership fee covers the remaining insurance balance. First response medical assistance is still provided to everyone in need, regardless of participation in a subscription program. Those households participating in the subscription program are, in effect, buying insurance so their costs will be covered.
The revenues from subscription programs are dependent on the participation rates. Generally, the more marketing that is done the higher the level of participation. Based on our experience with a number of California cities (a recent survey of seven such cities was conducted for another study undertaken by Management Partners), a subscriber rate of approximately 6% is achievable if the program is well publicized. As a rough example, with an annual fee of $40 per household, and based on a participation rate of only 6% (the average of the survey cities), the City of Phoenix could expect to achieve revenue of $3.8 million with the establishment of this program.
Recommendation 19. Explore the feasibility of establishing a subscription program for ambulance transport services.
Assisted Living/Nursing Home Response Fee
The assisted living/nursing home response fee is a targeted response fee that would be assessed to facilities where calls are frequent, do not use

Fire Department Innovation and Efficiency Study Innovations and Efficiencies Management Partners
80
Fire Department resources appropriately, and are potentially avoidable. A fee of this type would generate some revenue but would also serve as a demand management tool.
The fee would be targeted at facilities that are essentially utilizing EMS personnel as supplemental facility staff by calling for assistance on incidents or transports that should more appropriately be handled by the facility staff themselves.
Some communities assess a fee to nursing homes or assisted living facilities for responses over a certain number or type. For example, the City of Santa Monica (population 88,000) established a $490 per call fee for responding to calls that should have been handled by the facility staff themselves (e.g., returning a patient to their bed). The fee generates around $70,000 per year (approximately 12 calls per month).
Given the population difference between Phoenix and Santa Monica, and therefore the proportionately greater number of facilities, if we make the reasonable assumption the number of calls is increased by a factor of five, an annual revenue estimate of $350,000 would be conservative. This fee would both compensate the City and discourage the frequency of unnecessary calls and responses. Discretion would of course be necessary to assure that appropriate calls for service were responded to with a waiver of the fee in order to not discourage the appropriate use of public EMS services for true emergencies.
Recommendation 20. Explore the feasibility of establishing a fee for excessive “lift/assist calls” by assisted living and nursing homes in the City of Phoenix.
Training
Training is a major cost driver in the Fire Department because it is a key element in successful service delivery and the time commitment for ongoing training as well as special unit training is significant. In fact, fire department training often takes as much time or even more time than direct service delivery. Training on how to safely approach and handle a wide variety of events makes this a core operational activity.
To better understand how Fire Department employees receive training, Management Partners provided a short survey to the following organizational units: Aviation, Dispatch and Deployment, EMS, Fire Investigations, Fire Prevention, Fire Technical Services, Special
Fire Department Innovation and Efficiency Study Innovations and Efficiencies Management Partners
81
Operations, Training Academy, Battalions and Command Training Center (CTC). The survey addressed several areas including:
• What type of operations training is provided • What type of administrative training is provided • Whether or not the unit conducts a training needs assessment • What portion of the budget, if any, is allocated to training • What training is provided to new unit members • How record keeping is handled • How technology is utilized
Training in the Phoenix Fire Department is decentralized with each organizational unit providing specific training to employees. This led to varying answers to each of the questions posed.
Operations Training
Each unit administers operations training to current and new members. Most operations training is attended on‐duty although some training is off‐duty. The Training Academy provides or supports training for the following:
• Recruit firefighter training (candidates who wish to become uniformed members of a sponsoring fire department). Automatic aid partners can send their recruits through the department’s recruit training program.
• Probationary firefighter training (recruit firefighters who have graduated from the Training Academy). This training is an extension of the recruit training program and is supported by field captains who have a probationary firefighter assigned to their crew.
• Battalion/Company training (operations firefighters/crews). The Training Academy provides support for various training functions by hosting the training and/or providing consumables. This can also include firefighters from automatic aid partners.
• Driver training (engineers; promotional candidates; firefighters who move‐up in classification to drive; members involved in vehicle accidents; crews who require training on specialized apparatus). Driver training supports a wide array of programs designed to improve driver/operator skill sets.
• Maricopa Community Colleges Programs (college students; PFD members). The Training Academy supports the community college fire science programs by providing classroom space and

Fire Department Innovation and Efficiency Study Innovations and Efficiencies Management Partners
82
use of the grinder during each semester. To a lesser extent, the Training Academy also supports three high school fire science programs. (The department noted that the community college system contributed over $1 million for the Training Academy facility.)
• Regional training (public safety personnel; PFD members; stakeholder groups). The training academy hosts several National Incident Management System‐related (NIMS) courses throughout the year.
Aviation Unit Training
The Aviation Unit administers the Aircraft Rescue Fire Fighting Training (ARFF), which is mandated by the Federal Aviation Administration. This includes an 80‐hour basic course with 8‐hours of live fire training and 12 hours annually of driver training for all ARFF engineers. All ARFF personnel receive 50 hours of training annually consisting of 8 hours of live fire training, 24 hours of web‐based training and 18 hours of hands‐on training.
Command Center Training
Training occurs annually at the Command Training Center for company officers and three engines, one ladder and rescue. This training consists of timely subjects selected by the shift commanders, strategic, tactical and task level expectations at the company officer level, fire simulation, and workshops.
Fire Technical Services Training
Fire Technical Services provides just‐in‐time training to new and existing employees on technical systems, including telephone, computer hardware/software, network, radio, computer aided dispatch (CAD), station alerting, mobile CAD computing, automatic vehicle location, records management, email, and workplace environment.
Fire Prevention Unit Training
The Fire Prevention unit uses several training methods designed to meet the specific needs of its various sections. Initial training and continuing education is provided to all members assigned using didactic, supervised

Fire Department Innovation and Efficiency Study Innovations and Efficiencies Management Partners
83
field experience using preceptors and close supervision during probationary periods.
Fire Investigations Unit Training
The Fire Investigations Unit conducts training that covers fire investigations, police procedures, officer safety, and crime scene investigations.
EMS Unit Training
The EMS section provides:
• Paramedic training for up to 28 members at a time selected to enter this program
• Paramedic recertification training for all PFD paramedics • Continuing education training for all PFD paramedics • EMT refresher training for all PFD EMTs • EMS battalion training for all PFD members • Tox Medic training for paramedics who work on HazMat units as
well as outside medics • Tox Medic continued education training for Tox medics
Special Operations Unit
The Special Operations Unit provides both initial and continuing education training for hazardous materials, technical rescue and Federal Emergency Management Agency (FEMA) Urban Search and Rescue (USAR) position‐specific training for members of the Arizona‐TF1 USAR team. This training is provided when staffing levels decrease and funding is available.
Administrative Training
Administrative training varies among units; with two units, EMS and Fire Prevention reporting there is no administrative training for their members. Although a number of other units (Special Operations, Training Academy, Fire Technical Services, Battalions, Fire Prevention and Aviation) do not provide administrative training within the unit, they reported their unit members receive administrative training provided by the City of Phoenix. Administrative training is provided within the Dispatch and Deployment Unit informally at management

Fire Department Innovation and Efficiency Study Innovations and Efficiencies Management Partners
84
team meetings that occur about every month. CTC is the only unit that reports providing administrative training within the unit.
Training Needs Assessment
A formal needs assessment is conducted in five of the organizational units: Dispatch and Deployment, Fire Investigations, Special Operations, Training Academy and Fire prevention. However, only Dispatch and Deployment was able to provide a copy of their needs assessment. Aviation, EMS, Battalions, CTC and Fire Technical Services do not conduct needs assessments.
Training Budgets
Management Partners requested training budgets for each type of training utilized in the department. Unfortunately, accurate data were not available.
Phoenix firefighters receive training at various levels in the department’s two primary training sections, Emergency Medical Services and the Training Academy. Firefighters and fire officers receive training on numerous subjects including driver training, emergency medical services, federally required hazardous materials/ blood borne pathogen training, firefighting, and a number of other subject areas. Firefighters certified as paramedics, hazardous materials responders, and technical rescue specialists receive additional initial and on‐going training.
Fire Department civilian employees receive initial and on‐going training specific to their job functions such as dispatcher training and fire prevention inspector training.
At the current time, the Fire Department does not have an effective system to gather and summarize data on all of the training received by personnel. A number of fragmented systems to track training exist but no system provides a comprehensive picture. As recommended elsewhere in this report, the Fire Department could benefit from a comprehensive system to document training that is received by its members.
The most significant cost is likely to be staffing on an overtime or regular time basis. The Fire Department should include all personnel costs in its training budgets to ascertain the true cost of training.

Fire Department Innovation and Efficiency Study Innovations and Efficiencies Management Partners
85
Recommendation 21. Identify the full costs of training in the budget, including personnel and overtime costs, to understand the true cost of PFD training.
New Unit Member Training
New members rotating into each organizational unit generally receive training, though depending on the unit, it is either formal or informal training. Formal training is defined as having to fulfill a requirement of hours for training or receiving training in a classroom setting. Informal training is simply on the job peer‐to‐peer training.
Aviation, Fire Investigations, Battalions, Special Operations and Fire Prevention all provide formal training to new members rotating into the unit. Dispatch and Deployment provides formal training to battalion chiefs entering the unit (in addition to all new dispatchers). EMS, Training Academy and Fire Technical Services each provide informal, peer‐to‐peer training. CTC has not had a new member rotate in since 2008 and thus did not specify how/if new members receive training.
Recordkeeping
Each organization unit was asked whether they keep formal records documenting the training received and if those records were tied into training records of the other organizational units. Every organizational unit surveyed keeps formal training records and all but Battalions, CTC and Fire Investigations utilize eChris to store some of their records.
Aviation, Dispatch and Deployment, EMS, Fire Investigations, Special Operations and Fire Prevention all keep hard copies of training records in the respective units.
The lack of centralized training records has consequences in many areas of the department. For example, when there is a disciplinary action, human resources must gather information from many sources in the department about training the person received. Centralizing training recordkeeping is a best practice. More information about a records management system for the Fire Department is included below in the Technology Section of this report.
Recommendation 22. Centralize and automate the training records for all department employees.

Fire Department Innovation and Efficiency Study Innovations and Efficiencies Management Partners
86
Use of Technology for Training Purposes
Table 22 shows the types of technology utilized by each organizational unit for training purposes. Fire Technical Services and Fire Prevention both utilize the largest variety of technology options while other organizational units rely solely on PowerPoint presentations, audio/visual tools such as compact discs and DVDs or computer‐based simulations. Four units use web‐based online training tools.
Table 22. Technology Use by Organizational Unit
Organizational Unit Phoenix Fire Network TV Web‐based PowerPoint
Audio/ Visual
Computer Simulations
Aviation X X
Dispatch and Deployment X
EMS X
Fire Investigations X
Special Operations X
Training Academy X X
CTC X
Fire Technical Services X X X X
Fire Prevention X X X X
Each unit was also asked to provide recommendations about what types of technology might make training more effective. There was overwhelming support to implement more web‐based training to “facilitate distance learning, reduce out of service time and reduce apparatus maintenance costs,” as suggested by the Training Academy. The use of teleconferencing was also mentioned several times as a means to enhance training within the organizational units.
One suggestion by a survey respondent was to divide training into topic areas “such as information‐only topics, mandated topics, and hands‐on high risk/low frequency topics and then create a department‐wide training plan that includes collaborative communication and information sharing.”
More information about the savings that might be accrued from utilizing web‐based training throughout the department is included below in the Technology section of this report.
Fire Department Innovation and Efficiency Study Innovations and Efficiencies Management Partners
87
Public Affairs
The Public Affairs Section of the Fire Department has three units: Public Information, Fire Training Support, and Community Involvement. Staff not specifically assigned to one of the three units are involved with internal communications and putting together the Buckslip, the weekly Phoenix Fire Department newsletter. The Buckslip delivers current news to internal audiences, both electronically and in paper format, which ensures all members are informed about important topics within the department.
A total of 18 employees are assigned to the Public Affairs Section of which 10 are sworn and 8 are non‐sworn. One of the 10 sworn individuals is on light duty and one of the non‐sworn is an intern. Without these two positions, the Public Affairs Section has a total of 16 full‐time employees. Each of the units within Public Affairs is described below.
Public Information
The Public Information Unit includes three fire captains who work 24 hours on/48 hours off. This schedule mirrors fire companies in the field. These officers respond to high‐profile incidents and media inquiries to provide timely and accurate information to the community. The unit also implements numerous public information programs, including stories about the Fire Department, information distributed through email blasts and social media, press releases and press conferences, Fire Department website, City Manager’s report items, regular radio shows, employee and department award programs, and other special events and activities. On a monthly basis, the three captains receive from 350 to 660 pages, 150 to 274 phone calls, and 40 to 90 dispatches. There is also a public information specialist within the Fire Department who works with this unit.
Fire Training Support
This Fire Training Support Unit has three non‐sworn staff members. This unit performs a variety of technical, creative and administrative duties involved in the planning, design, coordination and production of audio‐visual and printed media to support the Fire Department’s training, communication, marketing and public information needs.

Fire Department Innovation and Efficiency Study Innovations and Efficiencies Management Partners
88
Staff provides technical and creative support for the online training websites and the Public Safety Cable Television Channel. In addition, they participate in all phases of training development with the assistance of content specialists. Duties include video production involving pre‐planning, script writing, videography, video editing, duplication, and distribution of finished products; digital still photography; PowerPoint presentations; and all audio/visual support for training symposiums and press conferences.
Examples of projects they assist with include incident critiques, extrication demonstrations, USAR mobilization exercise, storm water compliance training, North Dispatch Center overview, drivers’ training, Training Academy instructional series, educational videos for police and fire, and providing various audio visual/photography support at events.
Community Involvement
This unit has six sworn community education specialists (CES) working in public affairs, one full‐time non‐sworn employee and an intern. As indicated previously, one of the six sworn personnel is on light duty. This light duty assignment is a productive way to obtain capacity in the Public Affairs Section.
Four of the five assigned full‐time sworn personnel are captains and one is a firefighter. They support Fire Department programs, teach students in the classroom about fire and life safety, and promote and foster the reputation of the department throughout the city. Examples of programs and activities are the Urban Survival Program, Fire Fit program, Wills for Heroes program, various community education activities, drowning awareness events, Firefighter‐for‐a‐Day program, smoke alarm program, car seat program, and lesson plans for various PFD committees.
These programs are undoubtedly valuable to the community. However, deploying sworn personnel for these activities is expensive in tight economic times.
Examples of better resource utilization include training retired personnel (who might provide such services on a volunteer or hourly basis) or contracting with local non‐profit organizations to deliver the programs. If an alternative service delivery method was implemented and four captains and one firefighter were redeployed in operations, the estimated personnel cost savings (based on the average captain salary of $131,750 and the average firefighter salary of $101,400) would be about $628,000. If we estimate that one sworn captain can provide training and

Fire Department Innovation and Efficiency Study Innovations and Efficiencies Management Partners
89
coordination of hourly employees (or manage a contract with another service provider), and assume that $125,000 would be allocated to compensate hourly workers, it is conservatively estimated that up to $500,000 could be saved by utilizing a different service delivery model.
Recommendation 23. Develop lower cost alternatives for providing the programs in the Public Affairs Community Involvement Unit.
Fire Prevention
Aside from fire suppression and medical life safety services, one of the most basic missions of any fire department is to save lives and property through the prevention of conditions, systems, or practices that may result in a fire or medical emergency. As the City of Phoenix Fire Prevention website states:
“Fire Prevention is the key to saving lives and property…Fire Prevention is the true ‘first responder.’”
Fire prevention divisions promote life safety through a range of educational and regulatory functions which generally include the enforcement of the fire code through a comprehensive program of inspections and the issuance of fire permits for existing businesses, new construction and special events, special fire investigations, and an array of public education programs. To accomplish this mission the Fire Prevention Division has organized itself into three primary areas:
• Fire Prevention (including new construction plan review and inspection and general Fire Code inspections for existing businesses)
• Fire Investigations • Special Hazards
In analyzing the efficiency and effectiveness of the Fire Prevention Division with the goal of identifying opportunities for innovation or delivering services more efficiently, our interviews, research, and a document review resulted in three areas of focus:
• General Fire Code inspection performance and documentation • Hazardous materials work program and documentation • New construction fire code inspections services
Before discussing each of these areas it is important to discuss the overall context in which the Fire Prevision Division has been operating.
Fire Department Innovation and Efficiency Study Innovations and Efficiencies Management Partners
90
Management Partners was unable to find substantive performance documentation or metrics within the Fire Prevention General Fire Code Inspection section which would allow an adequate evaluation of the division’s efficiency and effectiveness. Division staff members stated that Fire Prevention is undergoing an organizational transition and a work plan has been developed to document and strengthen the City’s general fire code and hazardous materials programs. As this transition moves forward, accountability for results should become a norm of the function. From an efficiency standpoint, better performance measurement in this area is essential.
The division currently lacks the tools and mechanisms to adequately assess productivity, performance and efficiency, although efforts to develop them are underway. Fire Prevention Division managers are taking steps to organize available data in order to support a workable program, document performance, and set goals.
Until mechanisms and metrics are in place to document and monitor operating costs and deployment of personnel, opportunities for innovation and efficiency (e.g., using operational personnel to conduct certain fire code inspections) are difficult to objectively measure and assess. If the division cannot sufficiently measure what it does, it will not know whether it is accomplishing its goals, providing service in a cost effective manner, or what service alternatives might exist.
Recommendation 24. Develop specific fire prevention goals and objectives that can be measured and assessed annually. This will encourage better management of resources and a basis for measuring and assessing the work program required to support the core missions of the division.
General Fire Code and Hazardous Material Inspections
General fire code inspections are intended to ensure commercial occupancies, specially licensed facilities (such as nursing homes, day care facilities or hospitals), or special events are in compliance with the applicable fire codes. This is typically accomplished through a program of planned inspections either annually or every two to three years depending on the type of occupancy or level of risk associated with the use of the facility or business as well as available resources.
Planned inspection schedules and personnel to conduct them vary across fire departments. Some inspections are carried out by fire inspectors dedicated specifically to that function while other departments utilize on‐

Fire Department Innovation and Efficiency Study Innovations and Efficiencies Management Partners
91
duty operational personnel for some inspections. Familiarization of properties by fire fighters and preparation of incident pre‐plans are considered industry best practices. In addition to planned inspections, fire prevention personnel also respond to complaints that come in on an ongoing basis.
As part of the benchmarking research, Table 23 shows data about general fire code inspection personnel (not including new construction) and the number of inspections carried out in FY 2009/10.
Table 23. General Fire Code Inspections
Peer Agency
FTE Assigned to Fire Inspections Number of Fire Code Inspections Sworn Civilian
Phoenix 0 22 3,767
Dallas 60.5 4 63,950*
Denver
All uniformed Fire Prevention personnel are required to perform fire safety property inspections.
N/A
Orange County Fire Authority 6 41 12, 482**
San Diego 2 3 7,757
Seattle 25 7.84 4,582 * Inspection count includes individual tenant in commercial buildings, each single family/duplex residence, at least 10% percent of the individual apartments or suites in multi‐family residential buildings and hotel/motel facilities as well as fire watches and the inspections conducted for special events and tradeshows such as tents, food vending trucks and carts, fireworks/ pyrotechnics, gasoline powered vehicles displayed inside buildings, and temporary display booths. **A total of 10,693 inspections were performed by operations personnel and 1,789 inspections were conducted by fire prevention personnel.
Table 24 shows similar information with respect to personnel assigned to inspect hazardous material occupancies and the number of inspections carried out in FY 2009/10.
Table 24. Hazardous Materials Inspections
Peer Agency
FTE Assigned to Hazardous Material Inspections
Number of Hazardous Materials
Inspections Sworn Civilian
Phoenix 8 2 308
Dallas 9 0 723
Denver 5 0 473
OCFA 17 2 2,363
San Diego 5 3 2,082
Seattle 9 1 2,657

Fire Department Innovation and Efficiency Study Innovations and Efficiencies Management Partners
92
Aside from reporting the number of general fire code inspections conducted by the peer departments, Management Partners did not obtain more specific information regarding the types of inspections or the department’s inspection goals or schedules.
The Phoenix Fire Prevention website states, “some types of businesses and occupancies require fire inspections on a set schedule while others occur when requested or when violations are reported.” The Orange County Fire Authority and City of Denver both state that fire and life safety inspections are carried out once every year or every three years depending on the business type. The number of general fire inspections carried out by the Phoenix Fire Department in FY 2009/10 was about 18% less than the next highest number of inspections conducted by the peer departments. In addition, Phoenix had more staff members assigned to this function per inspection reported than any of the other peers. Phoenix Fire Prevention reports that the number of inspections has increased considerably in the last fiscal year, primarily as a result of a more focused analysis of the data base, assignments and tracking performance.
It would also appear from the data that the Fire Prevention Division did not inspect hazardous materials occupancies much beyond those required in response to permit applications. This compares to a significantly higher number in at least three of the peer agencies.
The Fire Prevention Division is currently coordinating and obtaining the additional data (Water Department, Business Licensing and State Licensing) needed to implement a regularly scheduled general inspection program. According to Fire Prevention staff, the City of Phoenix has 66,578 businesses currently paying sales tax, not including wholesalers. According to Fire Department records, there could be as many as 3,427 businesses that store, use or handle hazardous materials. At this time, the Fire Prevention Division tracks and permits only 1,610 of these hazardous materials occupancies. It was unclear when the database is expected to be completed. In any event, an ongoing database management and maintenance program should be implemented concurrently. Workload data and performance goals for general fire code and the hazardous materials inspections are currently insufficient to evaluate the effectiveness of the fire prevention program.
Discussions with Fire Prevention personnel indicated a goal of 15 to 20 general fire code inspections per inspector for the month of June 2011, with the intent of increasing that to about 25 to 30 per month in the first quarter of the new fiscal year. As the database of occupancies is refined and inspection assignments are grouped geographically, Fire Prevention

Fire Department Innovation and Efficiency Study Innovations and Efficiencies Management Partners
93
staff stated they expect to realize 50 to 60 inspections per month per inspector. If this is achieved, and a staff of 16 Fire Prevention inspectors is sustained, the result would be upward of 10,000 inspections per year if all inspectors worked five days per week, 12 months per year. With vacations and variable work weeks, the number of actual inspections may range from 50% to 75% of this number.
Some Fire Prevention inspectors are now being trained to assist in hazardous materials occupancy permitting and inspections and may be diverted to that effort in whole or in part on an ongoing basis. Management Partners agrees that such cross‐training would be beneficial and would provide additional capacity to the fire captains.
Finally, Fire Prevention has submitted a grant request to acquire mobile work stations for the inspection staff which would significantly improve productivity by reducing the need to return to the office to conduct research and report results. Phoenix encompasses such a large geographic area that a great deal of time is lost driving to the office from assigned inspection areas. With mobile work stations supervisors and management would also be able to track performance and schedule assignments more efficiently.
Historically, fire captains have been responsible for hazardous materials occupancy inspections including those required for both new hazardous materials occupancy permits and annual or periodic inspections. In recognition that the database documenting hazardous materials occupancies is still under development, Fire Prevention staff stated they have an interim goal of processing 20 to 25 permits or inspections per quarter per captain. This would certainly increase the number of potential inspections (depending on permitting activity), but it is not sufficient to accomplish the annual program necessary to support an adequate hazardous occupancy inspection program. Management Partners believes the number of inspections per captain is low and should be reevaluated.
Recommendation 25. Document the annual inspection work program for both general fire code and hazardous materials programs and establish annual inspection goals by program and by staff.
Implementation of this recommendation will result in a significant increase in efficiency. A productivity increase of 50% would not be inconsistent with performance similar to that observed in the peer jurisdictions. This would have the

Fire Department Innovation and Efficiency Study Innovations and Efficiencies Management Partners
94
effect of providing 5.5 additional FTE or an efficiency savings of about $500,000.
Recommendation 26. Determine the best interface with the City’s business licensing system, as well as planning and development, to capture hazardous materials occupancies not in the system. This will improve public safety and increase revenue to support these inspections.
Inspection Program Fees and Charges
The Fire Department will be challenged to develop an annual inspection program and allocate the necessary resources if it has to rely entirely on the General Fund and the existing General Inspection and Hazardous Material fee schedule to do so. Increased productivity will result from improving the Fire Prevention Division’s database and establishing higher performance standards with respect to inspections. In addition, fee charges to offset the critical mission of fire prevention among municipalities are now a best practice to finance the cost of delivering an annual general fire inspection program.
One of the peer organizations used in this analysis, the City of Denver, imposes an annual fire inspection fee to offset their annual fire inspection programs. In January 2002 they implemented a fee‐based Fire Safety Inspection Program. According to the Denver Fire Department’s website, “The City of Denver enjoys an extremely low fire loss rating for a city of its size, with the additional benefit of lower overall property insurance rates compared to other cities.” The city attributes this in part to its annual fire inspection program. Denver’s fees are based on a property’s square footage, number of floors and type of occupancy.
As of May 2011, the Phoenix Fire Prevention reports they had collected about $665,774 in general inspection fee revenue, as against $1.7 million in personnel costs, not including indirect costs. Phoenix has no annual inspection fee for general fire code inspections; this revenue is primarily a result of permits required following a general inspection. The hazardous materials program is primarily supported by permit fees resulting from new applications as the number of these types of occupancies is likely significantly understated. In contrast, Table 25 shows the annual revenues from the City of Denver inspection fees.

Fire Department Innovation and Efficiency Study Innovations and Efficiencies Management Partners
95
Table 25. Denver Inspection Fee Revenues
Year General Inspection
Fee Revenue Hazardous Materials
Inspection Fee Revenue Total Inspection Fee
Revenue
2009 $1,699,640 $172,044 $1,871,684
2010 $1,720,315 $255,056 $1,975,371
Annual general fire code inspections have a long standing tradition of being considered a basic function of the fire service. However, as is the case with many local government services, services that have been traditionally supported by the General Fund are being impacted by a different economic environment, one which will not be changing in the near term nor be able to support service levels expected by the community.
For this reason, Phoenix may wish to consider an innovative approach to offset fire prevention costs such as is utilized by Denver. The City of Denver collects inspection fee revenues of approximately $3.19 per capita. This compares with only about $0.48 per capita in Phoenix. If Phoenix were to increase fee revenues to $1.21 per capita, it would cover all personnel costs associated with existing fire prevention activities, increase revenue generation by approximately $1.03 million per year, and still be well below Denver in cost per capita. It should be noted that actual fee revenues will be based on the number and types of businesses inspected, and Phoenix may have some differences with Denver in this regard. Revenues per capita are used only as a rough tool to gauge an “order of magnitude” revenue estimate.
An annual fire inspection fee program may, in fact, be viewed as a worthwhile investment by the business community to ensure the safety of their property, employees and visitors.
Recommendation 27. Conduct a fee study to determine the administrative costs and revenues of an annual fire inspection fee program, including hazardous materials occupancies. The study should engage the business community to inform them about the costs and benefits of such a program.
Fire Department Innovation and Efficiency Study Innovations and Efficiencies Management Partners
96
Recommendation 28. Review the current hazardous materials permit fee schedule and revenue against costs for plan review, permit issuance and inspection to ensure full cost recovery.
Fire Code Development Services
Plan check and review of fire permits for new construction in the City of Phoenix went through some transitions in FY 2010/11 and again in the current fiscal year. Before that time, all fire code plan review and inspection was performed within the Fire Department. While all development applications (except hazardous materials) were filed in the City’s Development Services Center, plan check and review as well as permit issuance and inspection was coordinated and performed from the Fire Department. Many have relocated to reside in the City’s Development Services Center to improve coordination and customer service, although they remain employees of the Fire Department.
The first transition occurred when the fire code inspectors associated with the City’s Annual Facilities Program (AFP) were relocated to the Planning and Development Department. The AFP inspectors report to a Fire Protection Engineer in the Fire Department, but reside at the Development Services Center and serve as members of the AFP team. The AFP allows development applicants who regularly obtain building permits for ongoing building changes or renovations to work with the same plan check and inspection team on an annual basis. These inspectors now are assigned from the Development Services/Inspections Division although their responsibility is still to enforce the fire code in accordance with approved plans.
The second transition occurred during the current fiscal year when a fire protection engineer and five fire protection inspectors, effectively the fire plan check function, were also relocated from the Fire Department to reside in the Development Services/Plan Check Division. Both of these actions represent a significant contribution to providing the development services customer a seamless and well‐coordinated permit application and issuance experience. The only function still located in the Fire Prevention section of the Fire Department is the general fire inspection for new construction. This means that once a fire permit has been issued, the customer must coordinate with the Fire Department for all ensuing inspections. As of the drafting of this report, the City was giving consideration to also relocating this inspection staff to Planning and Development.

Fire Department Innovation and Efficiency Study Innovations and Efficiencies Management Partners
97
Table 26 describes where responsibility for fire code permit issuance and inspections for new construction reside with the peer agencies.
Table 26. Service Providers for Fire Code Plan Check and New Construction Inspection*
Peer Agency Permit Application Fire Plan Check Fire Permit Inspection
Phoenix Planning and Development Department
Planning and Development Department
Fire Department except for Annual Facilities Program (AFP)
Dallas Sustainable Development and Construction Department
Sustainable Development and Construction Department
Sustainable Development and Construction Department
Denver Fire Department/ Fire Prevention
Fire Department/ Fire Prevention
Fire Department/ Fire Prevention
OCFA** OCFA OCFA OCFA
San Diego Development Services Department/Fire New Construction
Development Services Department/Fire New Construction
Development Services Department/Fire New Construction
Seattle Fire Department/Fire Marshal's Office
Fire Department/Fire Marshal's Office
Fire Department/Fire Marshal's Office
*Does not include hazardous material inspections **OCFA is a special district that encompasses 22 cities and all unincorporated areas and would be unable to delegate this function to each jurisdiction.
Among the peer agencies reviewed, two out of the four have assigned fire code development services function to one‐stop shop development services function in whole or in part. Management Partners’ extensive experience in development services indicates that many jurisdictions have migrated to this consolidated model to provide a seamless operation for the customer and a better coordinated development services function.
There is no reason to believe that the Planning and Development Department/Inspection Services Division would be unable to manage and coordinate the new construction Fire Protection inspection staff as they do with the staff associated with the AFP program. Fire plan check and inspection staff would effectively have a matrix reporting relationship since the Fire Marshal would remain responsible for final determinations regarding enforcement of the fire code within new construction. Planning and Development would then have the entire responsibility and accountability to the customer for ensuring a well‐coordinated development services application, plan review and inspection process.
Management Partners recognizes the Fire Department currently receives an allocation of development services revenue ($212,554 in FY 2010/11) in support of the indirect costs associated with the administration and update of the fire code. This Fire Department responsibility will not go away under the proposed development services fire code plan check and

Fire Department Innovation and Efficiency Study Innovations and Efficiencies Management Partners
98
inspection organization model. However, if implemented, an assessment of future revenue sharing will need to be agreed upon.
Recommendation 29. Transfer new construction fire inspection staff to the Planning and Development Department/Inspection Services Division to allow better coordination of the entire spectrum of building permit processes and improve customer service, performance and accountability. As part of this process, plan check turnaround and fire inspection standards for new development should be reviewed. The PFD currently receives indirect costs for these positions so this issue must be resolved if the recommendation is to be implemented.
Management Staffing Levels
Based on a March 31, 2011 Position Schedule issued by the Fire Department, Fire Prevention Services was staffed with 63 positions (22 sworn and 41 non‐sworn employees). This includes an assistant chief and two deputy chiefs. Figure 16 shows the management hierarchy used to administer the program.
Figure 16. Fire Prevention Management Hierarchy
FIRE PREVENTION MANAGEMENT HIERARCHY
Assistant Chief/Fire Marshal Deputy Chief (Special Hazards/General Inspection) Captain(s) (sworn) Fire Protection Engineer/General Investigations Supervisor (non‐sworn) Deputy Chief (Fire Prevention/New Construction) Fire Protection Engineer/New Construction/AFP Supervisor (non‐sworn)
Management Partners understands that at least one sworn mid‐management position has been transferred to another department since the position schedule was provided to Management Partners (in March 2011). There may also have been some additional changes in the total number of staff as a result of vacancies and other rotational assignments. As described above, fiscal years 2009/10 and 2011/12 also saw a transition of fire prevention staff associated with new construction plan check and inspections services.
As discussed previously in the Organizational Structure section of this report, Management Partners believes the number of senior and mid‐

Fire Department Innovation and Efficiency Study Innovations and Efficiencies Management Partners
99
level management sworn positions in the Fire Department exceeds what is necessary to provide appropriate oversight and adequate management of the department. Fire Prevention is another division where we believe two deputy chiefs are not required to effectively manage the function. The span of control under one deputy chief would be reasonable regardless of disposition of the development services staff. If one of the deputy chief positions was eliminated, the department would save $175,000.
Recommendation 30. Transfer one Fire Prevention deputy chief to another area of the department or reduce this position through attrition to increase efficiency within the division and eliminate a layer of management.
Technology
Information Technology (IT) has been of increasing importance in the delivery of public safety services for over 25 years. Public safety agencies generally use two forms of computer software in support of their mission: tactical support software and business support software. Each is discussed below.
Systems
Tactical support software is used in the management of field operations. Generally, this is the computer assisted dispatch (CAD) system and related components such as mobile computers in operational vehicles, automated vehicle location (AVL) system, and message switches for routing communications to related organizations such as other law enforcement agencies or private ambulance service providers. CAD systems track calls for service and any activity generated in the field while field units are actively engaged in servicing those calls. They also track calls waiting to be dispatched. A history of calls for service is maintained for at least a few weeks.
Business support software is used to collect and preserve historical information on calls for service, information resources, support operation management (such as fire inspection and inventory records), and to provide management information to allow agency managers to monitor performance and support service improvement. The general software application used for this purpose is called a records management system (RMS). Many RMS applications are designed to provide modules to address most of the information management needs of an organization. As a practical matter, independent software packages supporting narrow

Fire Department Innovation and Efficiency Study Innovations and Efficiencies Management Partners
100
business functions such as scheduling, training, records management, and other business functions may be required.
The mission of providing EMS has become the largest role of most urban and suburban fire departments. With the advancement of the emergency medical profession and medical services in general, it has become critical to provide detailed medical information for use beyond the location where first responders provide aid. Information must travel with a patient to the hospital for use in subsequent care.
The same information should also be used within the EMS agency to provide information about the effectiveness of any treatments provided as well as the quality of training and skills of the EMS personnel involved. Such information had traditionally been tracked on paper forms at the scene of a call for service with a copy of the paper form sent with the patient to the hospital. Data entry into records management systems was often done afterward to provide management information. In recent years a new class of software, the electronic patient care tracking (ePCR) system, has been developed to improve the collection of medical information. This will eventually feed standardized medical record systems that are expected to be ubiquitous in coming years.
The Phoenix Fire Department is equipped with an RMS but is not currently equipped with an ePCR system. The department uses an older CAD system that is highly customized to its needs although the age and customized nature of that software may become challenging in the future. The CAD system runs on hardware and software that were very popular in the past but those systems are not in common use today and the long‐term viability is questionable. The department has begun to investigate alternatives.
Management Partners’ team members attempted to assess ePCR systems that would be suitable for Phoenix. However, the complexities and variables of different ePCR systems and their practical implementation in each agency make it impossible to estimate the cost or return on investment within the scope of this study. Such a system will undoubtedly benefit the department by improving efficiency and productivity of paramedics’ time on scene, supporting the transmission of patient condition information to secondary care providers, providing data to staff and procedural effectiveness, as well as simplifying billing processes. With the increasing automation of medical devices, the data provided through ePCR and equipment integrated into ePCR systems will be richer and more valuable in improving the care of patients both at the emergency scene and in hospital. It should be pursued.

Fire Department Innovation and Efficiency Study Innovations and Efficiencies Management Partners
101
Recommendation 31. Analyze the costs and return on investment of an electronic patient care tracking system. A regional approach to implementation of an ePCR may serve to also improve the effectiveness of emergency treatment in the region’s secondary care providers by handing off more complete medical information than is currently possible using paper forms.
Management Partners recommends a realistic assessment of the remaining lifespan of the CAD system be performed and a replacement fund be established.
Recommendation 32. Identify a reasonable remaining lifespan for the current CAD system and develop a replacement funding strategy. This will minimize the fiscal and organizational impact should a sudden need for replacement of the system be required.
IT Program Management
The acquisition of a computer system alone is not enough to gain the full operational and cost‐effectiveness benefits touted by computer system manufacturers. Such systems must be managed by a strong IT support organization to provide effective services for departmental operations. Such support has typically been provided by city technical staff. In recent years a large variety of outsourced service options have become available although many technical challenges face public safety agencies in outsourcing such services due to the risk of failure in case of a disaster. However, solutions are being developed and outsourced services may ultimately offer acceptable or even superior service to public safety agencies.
PFD’s technical support is provided by the Technical Services Division. The division is currently staffed by five sworn fire personnel and 38 civilian technical staff members. Division personnel also serve the automatic aid communities as necessary. One of the section head positions was occupied by a fire division chief at the time of this study although this is normally a civilian position. Figure 17 shows the organization chart for the division.
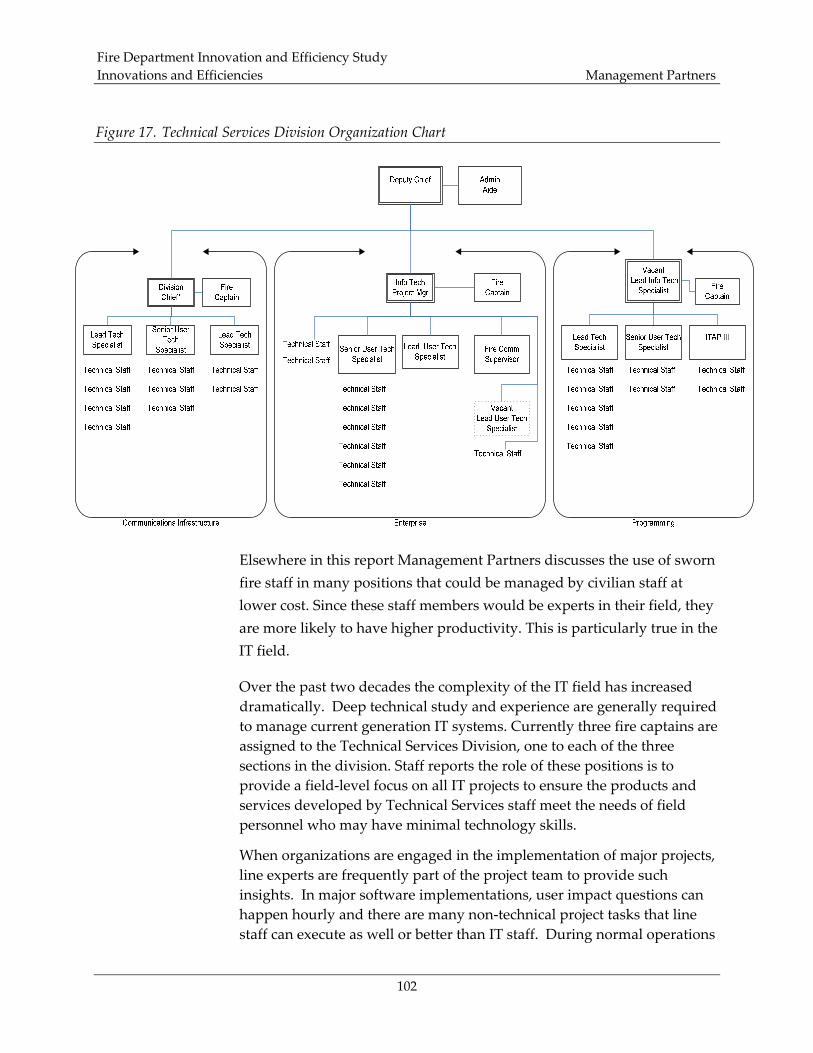
Fire Department Innovation and Efficiency Study Innovations and Efficiencies Management Partners
102
Figure 17. Technical Services Division Organization Chart
Elsewhere in this report Management Partners discusses the use of sworn fire staff in many positions that could be managed by civilian staff at lower cost. Since these staff members would be experts in their field, they are more likely to have higher productivity. This is particularly true in the IT field.
Over the past two decades the complexity of the IT field has increased dramatically. Deep technical study and experience are generally required to manage current generation IT systems. Currently three fire captains are assigned to the Technical Services Division, one to each of the three sections in the division. Staff reports the role of these positions is to provide a field‐level focus on all IT projects to ensure the products and services developed by Technical Services staff meet the needs of field personnel who may have minimal technology skills.
When organizations are engaged in the implementation of major projects, line experts are frequently part of the project team to provide such insights. In major software implementations, user impact questions can happen hourly and there are many non‐technical project tasks that line staff can execute as well or better than IT staff. During normal operations

Fire Department Innovation and Efficiency Study Innovations and Efficiencies Management Partners
103
the need to answer such questions is much less frequent and an IT professional with experience in supporting the fire service can generally make good judgments about the needs of line staff, with greater cost‐effectiveness.
Ensuring a high degree of usability for Fire Department systems can be accomplished through effective project management techniques where a number of field personnel are asked to provide input in a needs assessment, participate in testing programs, complete surveys, and participate in focus groups and follow‐up studies that do not remove them from their normal line duties.
Management Partners recommends that once the new CAD system is in place, the three captains assigned to the Technical Services Division be transferred back to line service. A trained IT project manager can reduce the impact of the loss of such positions. Until then, two captains can be returned to operations positions, for a savings of approximately $260,000.
Recommendation 33. Retain one captain position in the Technical Services Division until a new CAD system is implemented and return the other two captains to operations positions. At least one of the two captains should be replaced with a trained IT project manager who can facilitate the development of IT needs. This would ensure the interest of field effectiveness is met while allowing a more efficient use of personnel costs and improved management of the IT program.
Online Training Systems
Online training takes many forms but can be summarized as any form of training where the instructor is not present when the training is delivered. This includes computer‐based training, web‐based training, distance learning, e‐learning, and even simple audio or video lectures or demonstrations. Using technology, training can be more cost‐effective where specialized equipment or close supervision of the trainees is not required.
There are a number of distinct advantages to online training for the fire service. Such courses have the ability to provide training to a large number of people who are on different shifts, separated by distance, and whose training may be interrupted by the need to respond to critical calls. Courses can be delivered to people in different locations without the expense of travel and with less interruption of work schedules. In
Fire Department Innovation and Efficiency Study Innovations and Efficiencies Management Partners
104
addition, online training courses offer the flexibility of being available when individuals are able to utilize the training.
Although the City of Phoenix has an ideal training center, travel to the center for the large number of field personnel is not cost effective. Online training cannot replace the training center entirely because of the excellent simulation capabilities housed there. However, topics that do not require hands‐on or instructor supervision can all lend themselves to online training.
For many people, an online training course supplies the training material in a more useful manner than instructor‐led courses. This method is self‐paced and may include supporting tutorials, questionnaires, case studies, self‐assessment, and other features that support alternate learning styles. Despite this flexibility both in scheduling and available resources, online training must be structured to ensure training is delivered completely to the target audience. Subject matter quizzes and tests are often included to validate training effectiveness. The ability to start and stop training, use of alternative materials to fill in gaps in understanding, and the variety of different approaches to learning available online can be effective at delivering a deeper understanding of the topics to a larger number of employees.
PFD has conducted an informal evaluation of several online training services. One of these was offered by a major manufacturer of internet‐ based software. The products and services proposed were well regarded in the field and would provide an effective technology platform for the department’s use in an online training program.
Two options were provided for serving up to 150 concurrent users of the system. One proposal included web‐conferencing capability for just under $100,000 per year; the alternate proposal provided the same online training services but without web conferencing for just under $75,000. Web conferencing would allow interaction between the trainees and instructors based at the training center or elsewhere. The web conferencing capability can be valuable in many circumstances because of ability of the trainees to resolve questions quickly. However, this is of less value in the fire service where trainees can be taking their courses at any time of the day and day of the week.
Full‐time instructors are typically 40 hour per week employees and line duty instructors may rarely be on duty when two‐thirds of the line staff are in training. Developing an alternative channel for resolving questions and taking the less expensive service option appears to be the better

Fire Department Innovation and Efficiency Study Innovations and Efficiencies Management Partners
105
alternative between these two choices. Although these proposals are from a major company that is well‐regarded in the industry, it should be noted that a significant weakness is they both require the department to create its own training materials to a large degree. Production expenses and practical challenges can easily eclipse the cost of providing the online training technologies.
PFD also obtained a proposal for an online training service from a company that provides general employee training and also offers a large library of fire‐ and EMS‐specific training. In cases where training material does not yet exist or department‐specific training is preferred, in‐house productions can be developed. The cost of this service is roughly $120,000 per year for sworn personnel and $17,000 per year for civilian employees.
A conservative cost/benefit analysis performed for Mesa, Arizona’s Fire Department by that service provider predicted the department would realize a 51% reduction in current training costs ($152,000) from the replacement of at least half the in‐service classroom training at the training center with online training (in all cases where online training is appropriate). The savings resulted mainly from the fuel required to bring trainees to the training center and a slight reduction in employee costs associated with the production of training content.
The Phoenix Fire Department has 57 stations while the Mesa Fire Department has 18 stations. Even a modest reduction in travel to the training center equal to Mesa’s predicted reduction would result in a reduction in fuel costs of $150,000 per year. (Subtracting the $120,000 cost of the system, the department could expect a net savings of $30,000 savings in the first year alone.) As more training is available online to replace classroom work, a comparable trip reduction in Phoenix based on the rate predicted in Mesa could result in a fuel savings of as much as $300,000 per year.
Recommendation 34. Implement an online training system that enables the number of trips to the training center to be reduced by at least 20% per year while providing the same level of training. Work to expand online offerings over the next several years to realize further savings.

Fire Department Innovation and Efficiency Study Innovations and Efficiencies Management Partners
106
Fleet and Facilities
Equipment Management Division Organization and Staffing
The Equipment Management Division (EMD), a division of the City’s Public Works Department, is responsible for the management and maintenance of the City’s fleet of approximately 7,500 vehicles and pieces of equipment. EMD operates 14 maintenance locations throughout the City and serves 30 departments. Figure 18 shows the organization chart for the EMD.
Figure 18. Equipment Management Division Organization

Fire Department Innovation and Efficiency Study Innovations and Efficiencies Management Partners
107
One of EMD’s maintenance facilities is located at the 19th Avenue Fire Operations Service Center where all fire apparatus and support units are maintained. When data were supplied by the Fire Department in June 2011, the fleet consisted of 592 pieces of rolling stock including 88 engines (pumpers), 20 ladder trucks, 47 rescue trucks (ambulances), 16 brush trucks and 421 support units (i.e., sedans, SUVs, vans and trucks). In addition, EMD services 45 standby generators.
EMD’s Fire Fleet Operations Service Center is comprised of one equipment maintenance supervisor who reports to the fleet maintenance superintendent (not shown in Figure 19). The supervisor oversees three equipment service foremen, fifteen heavy equipment mechanics, nine auto mechanics, four service workers and one equipment service aide. There are currently four vacancies. These positions work during one of three round‐the‐clock eight‐hour shifts, as shown in Figure 19 below. Not shown are three auto parts clerks that support the fire fleet, one of which was vacant when the study was undertaken.

Fire Department Innovation and Efficiency Study Innovations and Efficiencies Management Partners
108
Figure 19. Equipment Management Division Positions
Fire Fleet Management Division Organization and Staffing
The Fleet Management Division of the Fire Department is responsible for coordinating with EMD for the maintenance and repair of the entire fire fleet. The division is comprised of the personnel shown in Figure 20 below.

Fire Department Innovation and Efficiency Study Innovations and Efficiencies Management Partners
109
Figure 20. Fleet Management Organization Chart
The division is located at the Fire Operations Service Center and as Figure 23 shows, includes the following units: RM14, Light Duty Fleet, Apparatus Shop, RM50, Rehab 1 and Rehab 2.
RM14 is staffed with three sworn fire engineers (apparatus drivers) who work a 24‐hour shift which coincides with the Fire Department’s A, B, and C shifts. They act as the liaison between Fire Operations and EMD and among other duties (i.e., emergency scene rehab unit response, apparatus change‐out, hook lift and pod responses) are primarily responsible for supplying fire apparatus and rescue vehicles to the EMD shop as needed for preventive maintenance and repair work and inspecting the work prior to returning the units to service.
In addition to the three engineers, one non‐sworn individual manages the Fire Department’s light equipment (i.e., sedans and pickups). This position is responsible for scheduling preventive maintenance, managing vehicle assignments and coordinating loaner cars.
Apparatus Shop ERSs
3 filled positions 2 vacant positions
Fleet Captain (40 hour)
Division Chief
South Operations Assistant Chief
Secretary II
RM143 positions (A, B, C)
Rehab 2Alt. Duty / CS
Light Duty Fleet1 position
RM50 Captains3 positions (A, B, C)
Rehab 13 vacant positions
(A, B, C)

Fire Department Innovation and Efficiency Study Innovations and Efficiencies Management Partners
110
The Apparatus Shop consists of five authorized equipment repair specialists. Three positions are currently filled and there are two vacancies. They are located in the shop area of the Service Center and are responsible for modifying apparatus, preparing new vehicles and apparatus for service, maintaining specialized systems such as foam systems and mobile breathing air compressors and refitting apparatus to extend the life of the vehicles and vehicle components.
RM50 is responsible for emergency scene logistics and is staffed with three captains, one on each shift, who also have staff responsibilities. Rehab 1 and 2 are staffed by fire personnel that are occasionally placed on light duty and the units are used to respond to certain emergency incidents calls with the fire Rehab truck. This truck is outfitted with refrigeration, an awning, mister and ice to support fire personnel that need to be in the field for extended periods of time.
Maintaining the Fire Fleet
Our review indicates that the Equipment Management Division is not providing an adequate level of service to maintain the Fire Department’s fleet and the overall costs are excessive. The redundancies in management and oversight of the fleet between Fire and EMD have evolved due to the need to address the service provision deficiencies that impact the Fire Department. This represents a significant inefficiency.
In addition, the City’s reluctance to replace fire apparatus on a timely basis due to budget constraints has meant that units are being kept beyond their economic life cycle. This places an added burden on EMD’s shop workload and contributes to more costly repairs and downtime.
Fleet Costs
During the 12 months from April 2010 to April 2011 EMD spent over $6.74 million to maintain and repair the Fire Department’s fleet according to records supplied by EMD. This includes $653,557 of work sent to private commercial vendors. Accident costs, which amounted to $80,416 and fuel costs were not included in the total cost.
The maintenance and management of the Fire Department fleet is a complex and multi‐faceted enterprise. An in‐depth analysis of these issues is beyond the scope of this review. Given the scope of the Phoenix Fire Department fleet and the cost of vehicle maintenance, there are significant efficiencies and savings that can be realized by any improvement in fleet operations.

Fire Department Innovation and Efficiency Study Innovations and Efficiencies Management Partners
111
Recommendation 35. Establish a cross‐functional working group to identify specific improvements related to Fire Department fleet management issues. The involvement of representatives from Fire, Equipment Management, Budget and Research, Finance, and the City Manager’s Office would assure that the proper personnel are at the table for these important deliberations.
In any case, regardless of the organizational approach, the City must make a commitment to address a number of existing operational issues. The exact solution will be influenced by the overall organizational structure the City concludes is best. Nevertheless, these issues need to be addressed to assure the City of efficient fire and fleet operations. These issues include:
• Lack of Funding for Fleet Replacements, • Quality Control Duplication, • Separate Fire Apparatus Shop, • Lack of Staffing/Training, • Lack of a Service Level Agreement, • Preventive Maintenance Program, and • Size of Fleet, Replacement and Reserve Issues.
Each of these areas is discussed below.
Lack of Funding for Fleet Replacements
The City does not have a reserve or sinking fund established to finance fleet replacements. Instead, decisions are made on a yearly basis. Although the department has general age and mileage standards for replacing emergency apparatus, it is behind in the replacement schedule. Currently, 161 fire units are overdue for replacement. This represents about 25% of PFD’s total fleet of 637 units. During the past three years (FY 2008/09 to FY2010/11) only 30 units were replaced at a cost of $6.47 million. An additional 12 units are scheduled for replacement in FY 2011/12 at a cost of $1.44 million.
The City’s decision to delay the purchase of fire apparatus has placed a burden on EMD’s ability to keep units on‐line. The best practice in fleet management is life‐cycle costing and advance funding of depreciation (replacement) as the equipment is being used. The PFD has kept more reserve units on hand because first‐line apparatus are unavailable due to repair work that takes a long time to accomplish. When units are kept

Fire Department Innovation and Efficiency Study Innovations and Efficiencies Management Partners
112
beyond their economic life cycle EMD’s shop workload is impacted and repair costs increase.
Recommendation 36. Establish an equipment replacement fund for fire vehicles and equipment.
Quality Control Duplication The Equipment Management Division appears to be providing a minimal quality assurance review prior to turning fire apparatus back into service. They rely on Fire RM14 personnel to perform a more thorough review. As noted above, this approach is inefficient. Management Partners was told that RM14 personnel continually find problems during their quality control review that require the apparatus to be returned to the EMD shop for correction. This may be due in part because shop technicians are not completing all the tasks on their PM checklists and repair orders. Nor are shop foreman consistently inspecting or reviewing technician’s work. Another reason may lie in the fact that RM14 engineers use a more comprehensive (albeit less detailed) checklist than that used by EMD technicians when conducting the quality review. It is unusual to see this type of arrangement where responsibility for performing quality control lies with the fleet customer rather than fleet management. This is not a best fleet management practice and is clearly redundant. The need for a fire division chief and fire captain to oversee the RM14 section, among their other responsibilities, only adds to the redundancy and cost of this function.
EMD should formalize its quality assurance program with the goal of assuming complete control of this function. Doing so requires that EMD reexamine its preventive maintenance program and establish maintenance and repair performance standards for its technicians. Once the program is in place, technicians can be held accountable for the work they perform and foreman can be held accountable for releasing units only after being thoroughly test driven and inspected.
As a result the need for PFD’s RM14 personnel to conduct quality control inspections would be eliminated. Their remaining duties could then be evaluated and a determination made as to the most appropriate personnel to assume those duties.

Fire Department Innovation and Efficiency Study Innovations and Efficiencies Management Partners
113
Recommendation 37. Formalize EMD’s quality assurance program.
Recommendation 38. Reassess the need for RM14 to remain intact to save costs and/or improve efficiencies. Once EMD’s quality control improves, the need for some, but not all of the work currently completed by RM14’s sections will be eliminated. Eliminating only one of the three positions would result in savings of $128,000.
Management Partners also noted another unusual arrangement with respect to the Fire Department’s responsibility for overseeing the Fire Apparatus Shop function. Three full‐time equipment repair specialists are currently responsible for preparing new apparatus for service and performing modifications to existing apparatus.
EMD already has a Make Ready Shop managed by a fleet control manager and supervised by a fabrication foreman. This may be a more appropriate location to place the make ready and modification functions that the Apparatus Shop performs in a revised EMD or successor entity.
Recommendation 39. Assess the workload of the three equipment repair specialists in the Fire Apparatus Shop and consider transferring them to EMD’s Make Ready Shop. While the current functions of EMD’s Make Ready Shop are very different than the PFD’s Fire Apparatus Shop, EMD should be able to handle this function.
Lack of Staffing/Training Management Partners also conducted a Vehicle Equivalent Unit Analysis to determine if EMD’s staffing is sufficient. Our calculations indicate that EMD may be understaffed by 1.2 FTE heavy equipment technicians based on the size, makeup and condition of the fire fleet. Rather than hire additional technicians, EMD may want to consider contracting certain repair work until preventive maintenance work is current.
Lack of training for heavy equipment mechanics may be a contributing factor to the repeat repairs and excessive repair turnaround time issues raised by fire personnel. Of the 32 EMD technicians assigned to work on fire apparatus only four have Automotive Service Excellence (ASE) certifications. None of the technicians have Emergency Vehicle Technician (EVT) certification.
Fire Department Innovation and Efficiency Study Innovations and Efficiencies Management Partners
114
These certifications are desirable because they confirm that technicians have attained knowledge about diagnosing and repairing various automobile and truck systems (ASE certifications) and emergency apparatus, including ambulances (EVT certifications).
During FY2011/12, only $40,000 is budgeted for training for all 225 EMD technicians. That amounts to about $175 per year per mechanic, far less than the industry standard of between 1% and 2% of a mechanic’s yearly compensation.
Recommendation 40. Increase the training budget for EMD technicians and establish incentives for technicians to acquire ASE and EVT certifications. Strive for the industry standard of 1% of salary. Consider sending some technicians to the California Fire Mechanic Academy (cafiremech.com) for training.
Lack of a Service Level Agreement
One of the key elements missing from the City’s fleet program is written service level agreements. No matter how the function is organized, a specific agreement as to service levels between the organization responsibility to provide fleet maintenance service and the owner/user organization receiving the service would be beneficial. These formal agreements are used to define fleet services, charges, and responsibilities of the parties and level of services, including priorities, policies and standards. Attachment F contains a sample of a customer service agreement.
Recommendation 41. Develop a service level agreement between the fleet maintenance organization and the Fire Department.
Preventive Maintenance Program
In May 2011, 149 units were overdue for preventive maintenance, averaging 109 days overdue for servicing. The percent of time EMD devotes to scheduled repair work is 17% while the industry standard is between 50% and 65%. The percent of time devoted to unscheduled repair work is 83% with the industry standard being between 35% and 50%. These ratios, based on the last 12 months of work history, indicate a lack of planned maintenance leading to lengthy and costly repairs.

Fire Department Innovation and Efficiency Study Innovations and Efficiencies Management Partners
115
Recommendation 42. Adjust the shop workload by giving priority to units that are overdue for preventive maintenance and contract excessive repair work until all fire units are in preventive maintenance compliance. EMD should require that all work be performed by qualified contractors.
EMD uses a one‐level preventive maintenance (PM) inspection form for all fire apparatus units instead of multiple echelons of progressive services. Tasks particular to a specific type of PM should be included in each subsequent PM. For example, PM A tasks such as oil and filter changes should be incorporated into PM B service that might include a tune‐up. Then, PM B tasks would be incorporated into PM C tasks.
Recommendation 43. Reengineer the preventive maintenance program to include formal, progressive, multi‐level servicing unique to each vehicle and equipment class.
EMD’s preventive maintenance interval for pumpers is set at 6,000 miles or once per year, whichever comes first. Pumpers typically receive preventive maintenance on a more frequent basis. Moreover, the criteria for servicing should also take into consideration unique circumstances in which fire apparatus is used extensively in the field.
Recommendation 44. Review and modify preventive maintenance intervals to conform to manufacturer‐suggested servicing and industry standards. This review should also incorporate service criteria to accommodate situations where the apparatus is used extensively.
Size of Fleet, Replacement and Reserve Issues
Replacement Criteria
The age criteria established for replacing fire apparatus such as pumpers, aerial ladder trucks and brush trucks is somewhat aggressive when compared with the criteria used by the peer benchmarking agencies. This is well illustrated in Table 27 where agencies have replacement parameters for pumpers averaging 17 years compared with Phoenix’s 12 years. Phoenix’s replacement criteria calls for aerial ladder trucks to be replaced at 15 years compared to the average of 18 years for the other agencies. Similarly, Phoenix’s criteria for replacing brush trucks is 12 years compared with the average of 16 years from the three peers reporting such criteria. Given the costly apparatus required by the PFD

Fire Department Innovation and Efficiency Study Innovations and Efficiencies Management Partners
116
(e.g., an average of $450,000 per engine and close to $1 million for an aerial ladder truck), it is easy to see how a premature replacement schedule can result in significantly increased costs.
Table 27. Fire Apparatus Replacement Criteria Comparison
Jurisdiction
Apparatus Type
Pumpers (Engines)
Aerial Ladder Trucks
Rescue (Ambulances)
Brush Trucks
Phoenix Miles 150,000 150,000 150,000 200,000
Years 12 15 8 12
Dallas Miles N/A N/A N/A N/A
Years 12 15 3 12
Denver Miles 150,000 150,000 N/A N/A
Years 20 20 N/A N/A
OCFA Miles 120,000 120,000 120,000 120,000
Years 15 17 4 20
San Diego Miles 250,000 250,000 N/A 250,000
Years 20 20 N/A 15
Seattle Miles N/A N/A N/A N/A
Years 18 18 6 N/A
Average Miles N/A N/A N/A N/A
(excluding Phoenix) Years 17 18 4 16
Recommendation 45. Reevaluate fire apparatus replacement criteria and develop new age and mileage criteria based on reasonable replacement guidelines utilized by other large cities. For example, by extending the replacement intervals to those average cycles used by the peer agencies, the City could save about $1 million per year by deferring purchase of pumpers, ladder trucks and brush trucks.
Reserve Units
Our review of the number of reserve or spare units for rescue, ladder and pumper units indicates the number may be excessive when compared with the peer benchmarking agencies. As illustrated in Table 28, peer agencies average 1 reserve pumper for every 3.31 front line pumpers

Fire Department Innovation and Efficiency Study Innovations and Efficiencies Management Partners
117
compared with Phoenix’s 1 reserve pumper for every 2.95 front line pumpers. Phoenix’s ratio of reserve aerial ladder trucks is 1:2.31 compared to the average of 1:3.31 units for the other agencies. Similarly, Phoenix’s ratio of ambulance reserves is 1:2.36 compared with the average of 1:3.13 from the two peers reporting such criteria. Phoenix does not have any reserve units for its brush trucks while the peer groups reported reserve ratios ranging from 0 to 10.0 reserve units for every front line unit. Although the Insurance Services Office (ISO) recommends one reserve for every seven first‐line apparatus, most fire departments do not maintain this ratio.
Table 28. Fire Apparatus Ratios of Reserve Units to Front Line Units
Pumpers (Engine) Aerial Ladder Trucks Rescue (Ambulances) Brush Trucks
Agency
Reserves
Front Line
Ratio
Reserves
Front Line
Ratio
Reserves
Front Line
Ratio
Reserves
Front Line
Ratio
Phoenix 22 65 2.95 6 14 2.33 14 33 2.36 0 16 0
Dallas 14 75 5.36 6 29 4.83 12 57 4.75 1 10 10.00
Denver 10 40 4.00 7 22 3.14 0 0 n/a 0 0 n/a
OCFA 37 55 1.49 6 13 2.17 2 3 1.50 2 10 5.00
San Diego 28 47 1.68 5 12 2.40 0 0 n/a 0 11 0
Seattle 11 44 4.00 4 16 4.00 0 0 n/a 8 19 2.38
The need for additional reserve units may be a result of fire apparatus not being replaced on a timely basis and EMD’s backlog of maintenance and repair work. Both of these issues have been discussed previously in this section.
At the time of this study EMD records showed that 31 units exceeded the City’s age or mileage criteria but were retained and were in reserve “D” status. (”D” status indicates a unit has been replaced but has not been declared as surplus and remains on active status.)
During calendar year 2010 EMD spent $529,000 in labor and parts to maintain these units. Sixteen of these units are utilized as reserves for first‐line apparatus. Given the fact that the units have been kept beyond their economic life, there is a question whether they are fully capable of performing in an emergency situation. A better solution is to move apparatus into a reserve status for three to five years prior to the end of its replacement cycle rather than waiting until the unit has reached or exceeded its optimal economic threshold. By eliminating 15 of the 31

Fire Department Innovation and Efficiency Study Innovations and Efficiencies Management Partners
118
units the City could generate an estimated $220,000 in one‐time revenue and save approximately $255,000 per year in on‐going operational costs.
Recommendation 46. Determine the number of units required to provide adequate reserves for first‐line fire apparatus. This should be accomplished once the backlog of maintenance and repair work has been resolved. The number of reserve units required should then be re‐evaluated every five years or as necessary.
Recommendation 47. Dispose of excess apparatus. This will generate one‐time revenues as well as operational cost savings.
Surplus Fire Vehicles
A cursory look at mileage reports indicates that during the last 12 months nearly 30% of 85 sedans the Fire Department operates traveled less than 2,000 miles per year. Of these, 11 sedans accumulated less than 1,000 miles per year. Average for all sedans was 4,542 miles per year.
The Fire Department operates 114 light duty trucks. Of these, 24 traveled less than 2,000 miles per year and 8 traveled less than 1,000 miles per year. A total of 66 trucks fell below the average yearly mileage of 7,423 miles for all light duty trucks. A fleet utilization review would show that not all of the sedans and light duty trucks are necessary. If the vehicles that traveled less than 1,000 miles were eliminated, the City would realize about $30,000 from one-time surplus sales and $38,000 per year in ongoing maintenance and operational costs.
Recommendation 48. Conduct a fleet utilization review to evaluate the need for each assigned vehicle and piece of equipment in the Fire Department. This will result in one‐time monetary savings as well as on‐going efficiencies. During the review of this report, the Fire Department commented that a fleet utilization study is underway.
Facilities Management
In our review of the Fire Facilities Management Division, Management Partners found that operations were efficient and working well. The department relies on Metro Facilities, a division of the Public Works Department for mechanical and electrical maintenance and energy conservation services for City of Phoenix facilities, including Fire Department buildings and grounds.

Fire Department Innovation and Efficiency Study Innovations and Efficiencies Management Partners
119
Generally speaking, the Fire Department was pleased with Metro Facilities support. The Fire Department staff did indicate they would prefer to see a more comprehensive maintenance program and a better explanation of work performed and related costs. This could easily be accomplished by expanding the work order detail and showing the costs associated with each element.
One of the primary responsibilities of the division is to screen all maintenance requests prior to contacting Metro Facilities. In this manner some requests can be averted and many times performed “in‐house” without the need to involve Metro.
Focus groups and survey respondents recommended retrofitting Fire Department stations and other facilities with energy‐reducing technology to save costs. This is the one area that may yield cost savings.
Recommendation 49. Analyze the costs and benefits of retrofitting Fire Department facilities with energy saving technology.
Performance Management
Prior to the widespread use of automated data systems, it was difficult for organizations to effectively assess performance in delivering services or the efficiency and effectiveness of underlying business support processes. As a result of this lack of information, decisions had to rely on expensive and potentially inaccurate sampling approaches to data collection. Most often decisions were made for entirely subjective reasons.
Automated systems now offer the ability for organizations to collect performance measurement data and present this information in a manner that can be used to improve services. David Ammons, a professor and advocate for public sector measurement explains the value of measurement.
Performance measures are… core diagnostic and evaluative tools for performance improvement. Ideally, a good set of performance measures can answer four key questions: How many; How efficiently; of what quality; And, to what effect? Armed with such information, local officials can identify operational

Fire Department Innovation and Efficiency Study Innovations and Efficiencies Management Partners
120
strengths and weaknesses and can assess the effectiveness of steps taken to correct deficiencies.11
Performance measurement is the practice of regular and continuous data collection and reporting on important aspects of an organization’s services, programs or processes. Performance measures are numeric indicators representing specific process or service delivery activities. By collecting performance data linked to specific activities, the quality, impact or outcome of service delivery efforts can be measured.
The use of performance measures enables an organization to evaluate the effectiveness and efficiency of its services and programs by documenting how well they are accomplishing the goals they and their customers set. Performance measurement provides a means to identify where service outcomes are meeting objectives and where they are not. Thus, it indicates where improvement efforts should be focused and what alternatives may be available.
Performance measures should not be the sole source of information for management decisions nor should they be used in a punitive manner. They can, though, serve as sound reference points for management and customers, track progress against organizational goals and standards, and serve as early warning signs when baseline staffing is unable to meet service demands. Measuring the elements of performance, and then analyzing the data and making improvement where indicated, will lead to higher quality services and increased customer satisfaction. In short, performance measurement gets results.
Because delivering programs and services is a complex process, it is necessary to analyze performance from different perspectives. Therefore, developing a family of measures for each specific program allows managers to get a complete picture, both qualitatively and quantitatively, of how well that program is performing. For example, if an agency only measures how many general fire code inspections are made each month per inspector, but never asks how much it costs, how many resources are expended or whether the number supports specific life safety goals for the community, the agency’s managers will not know if and where improvements should be made. If an agency only measures how many times it met an inspection goal within a certain period, managers will not
11 David N. Ammons, Accountability for Performance: Measurement and Monitoring in Local Government, 1995.
Fire Department Innovation and Efficiency Study Innovations and Efficiencies Management Partners
121
know if the established standard meets the interests or needs of the development customer.
Once performance measures are identified, it is critical the data be collected and analyzed on a continuous cycle. This allows a local government to make changes to service delivery when necessary. In some cases, this review and improvement cycle also can mitigate future potential problems by providing early warning signs if program performance is declining.
There are many uses for performance measurement data, both internal and external to the local government organization. As a management tool, performance measurement should be used within an organization to assist with day‐to‐day management decisions, including budgeting. Measures also can help with program planning and aligning it with customer needs and identifying areas for improvement and alternative service delivery options.
For the public, performance measurement is a tool that can be used to communicate how well services are being delivered, whether standards are being met, and how efficiently and effectively fees for service are being utilized.
In the past decade, both private and public sector IT departments have begun developing and improving software tools to assist in performance measurement. These are typically called business intelligence (BI) tools. BI tools vary widely in their level of sophistication and uses. Some use complex mathematical modeling techniques to correlate the impact of a number of environmental conditions on the success of business processes. Others offer simple “dashboards” that serve as a manager’s web browser “home page,” providing a combination of graphic and textual displays of the organization’s current state in terms of meeting productivity or service goals, efficient use of budgets, and many industry specific metrics. Figure 21 provides an example of a dashboard data display.

Fire Department Innovation and Efficiency Study Innovations and Efficiencies Management Partners
122
Figure 21. Example of a Performance ʺDashboardʺ Data Display
Source: http://examples2.idashboards.com/idashboards/?guestuser=wphea&dashID=159
Management Partners recommends the PFD develop reporting tools that support the development of programs that not only answer questions such as, “Is the department making our response time goals?” but also address such questions as “Is the department improving the survival rates of EMS patients? Is the department reducing fire losses? Is the department reducing its cost to provide core services?” The answers to such questions are the foundation for improving organizational effectiveness.
Recommendation 50. Develop a set of key performance measures that demonstrate efficiency and effectiveness of the department. Once measures have been developed, the department should develop computerized reports to monitor departmental performance.

Fire Department Innovation and Efficiency Study Savings from Efficiencies and Innovations Management Partners
123
Savings from Efficiencies and Innovations
This report contains 50 recommendations representing either efficiencies or innovations which, when implemented, will improve service, save money, or both. Each of the recommendations is listed below in Table 29.
When it is possible to estimate a dollar impact, Management Partners has done so. When there has been a range, we have used the more conservative number. While there are several one‐time revenue opportunities (and each is noted), all potential savings will be annual.
In some cases, where it is difficult or unduly speculative to quantify the economic impact, no dollar value has been assigned. This does not mean there will not be a gain in efficiency or innovation, only that it is difficult to estimate such without study and analysis beyond the scope of this assignment. For example, developing and implementing a succession planning program (Recommendation 10) is a best practice in efficient and innovative organizations and it will result in savings by minimizing the costs associated with organizational turnover. However, it would be speculative to make the variety of assumptions necessary to estimate savings.
Table 29 also provides a priority for implementation. Priority 1 indicates that implementation could be accomplished in the short‐term (calendar year 2012). Priority 2 indicates implementation in two to three years (2013 or 2014). Priority 3 indicates a longer horizon for implementation (2015 and beyond).
If all recommendations relating to new revenue sources were implemented, Management Partners estimates that the City would gain over $39 million (of which $250,000 is one‐time revenue). The Fire Department would save over $5.1 million if all recommendations were fully implemented.

Fire Department Innovation and Efficiency Study Savings from Efficiencies and Innovations Management Partners
124
Table 29. Potential Savings from Recommendations and Implementation Priorities
Recommendation
Potential Savings
Revenues Savings Implementation
Priority
1. Perform a comprehensive review of each mid‐level management position when a vacancy occurs to determine the need for the position and whether operational fire expertise is required.
$850,000 3
2. Utilize sworn personnel in mid‐ and senior‐level positions to manage functions requiring fire expertise and experience.
1
3. Reallocate the deputy chief in finance to an operational or other position within the department and provide the non‐sworn managers with a direct reporting relationship to executive level management.
$175,000 1
4. Reorganize administrative and business functions under one executive level manager.
$215,000 1
5. Return one or both deputies in the Personnel/ Payroll Section to the field in positions requiring sworn expertise and add a civilian manager with human resources expertise.
$175,000 1
6. Identify the targeted minimum tenure for assignments for each of the positions in which deputy chiefs are rotated based on effective and efficient management of the operation.
1
7. Create a succession planning program to ensure continuity of leadership as retirements occur.
2
8. Establish an annual recertification process for individuals receiving linguistic pay to ensure proficiency in the language for which pay is being received.
$60,000 1
9. Provide added points for bilingual capability and/or establish bilingual only recruitments to move toward the department’s goal of 50% bilingual employees.
2
10. Analyze the causes of the significant increase in workers’ compensation cases and take actions to reduce the number of injuries.
2
11. Implement injury prevention and workers’ compensation management systems to achieve claims reductions equivalent to what the City as a whole achieved over the 2008 to 2010 period.
$364,000 2
12. Review the cases for employees with three or more injuries in the last three years and provide appropriate training and physical therapy to avoid future injuries.
2

Fire Department Innovation and Efficiency Study Savings from Efficiencies and Innovations Management Partners
125
Recommendation
Potential Savings
Revenues Savings Implementation
Priority
13. Pursue direct vendor shipments, as applicable, to yield continuing operating savings.
$39,000 2
14. Analyze the warehouse contents to determine which items are necessary to continue to stock and which may be dealt with on a just‐in‐time basis.
2
15. Eliminate two supplies clerk I positions once direct vendor shipments have been fully implemented.
$119,000 2
16. Develop an agreement between the PFD, the Phoenix Police Department and any other City departments buying physical exam or physical therapy services from outside contractors to have a portion of those services provided by the Phoenix Fire Department Medical Center.
$162,000 2
17. Verify that the rates being charged by the PFD for firefighter physical exams and immunization services provided to outside fire departments are at market and adjust them upward if warranted.
2
18. Explore the feasibility of establishing an Emergency Response Fee (911) Fee.
$34,800,000 3
19. Explore the feasibility of establishing a subscription program for ambulance transport services.
$3,800,000 3
20. Explore the feasibility of establishing a fee for excessive “lift/assist calls” by assisted living and nursing homes in the City of Phoenix.
$350,000 3
21. Identify the full costs of training in the budget, including personnel and overtime, to understand the true cost of PFD training.
3
22. Centralize and automate the training records for all department employees.
2
23. Implement lower cost alternatives for providing the programs in Public Affairs’ Community Involvement Unit.
$500,000 1
24. Develop specific fire prevention goals and objectives that can be measured and assessed annually.
1
25. Document the annual inspection work program for both general fire code and hazardous materials programs and establish annual inspection goals by program and by staff.
$500,000 1
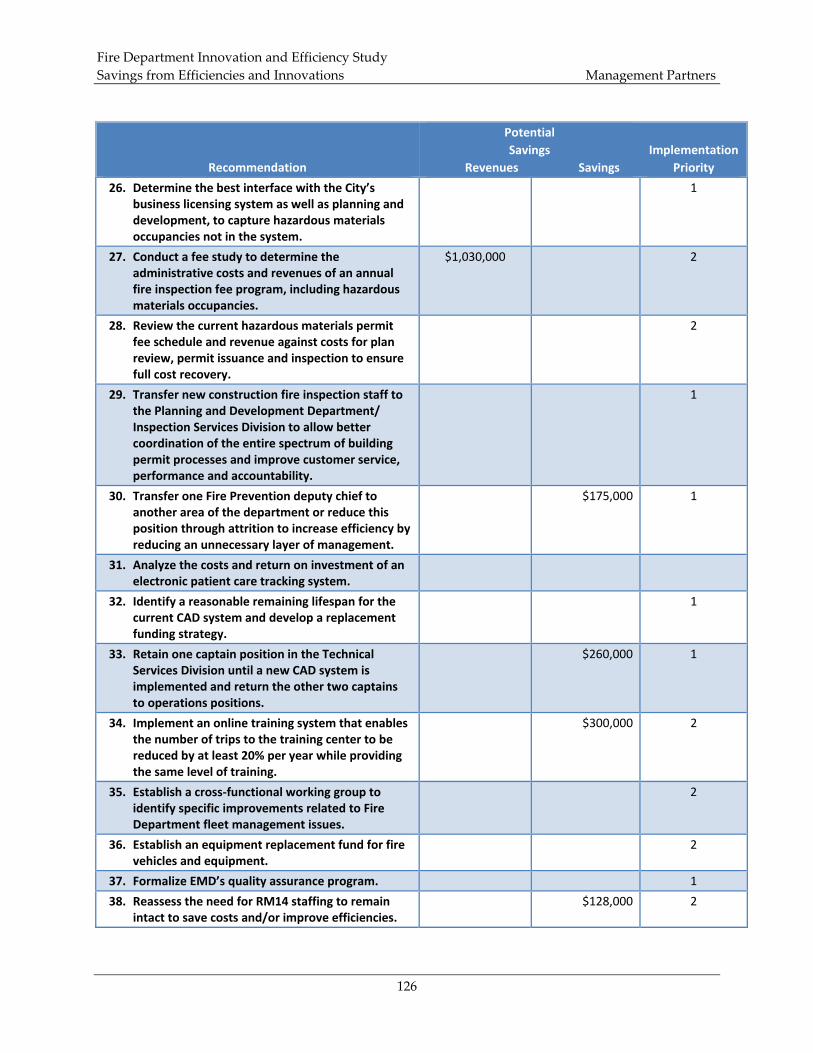
Fire Department Innovation and Efficiency Study Savings from Efficiencies and Innovations Management Partners
126
Recommendation
Potential Savings
Revenues Savings Implementation
Priority
26. Determine the best interface with the City’s business licensing system as well as planning and development, to capture hazardous materials occupancies not in the system.
1
27. Conduct a fee study to determine the administrative costs and revenues of an annual fire inspection fee program, including hazardous materials occupancies.
$1,030,000 2
28. Review the current hazardous materials permit fee schedule and revenue against costs for plan review, permit issuance and inspection to ensure full cost recovery.
2
29. Transfer new construction fire inspection staff to the Planning and Development Department/ Inspection Services Division to allow better coordination of the entire spectrum of building permit processes and improve customer service, performance and accountability.
1
30. Transfer one Fire Prevention deputy chief to another area of the department or reduce this position through attrition to increase efficiency by reducing an unnecessary layer of management.
$175,000 1
31. Analyze the costs and return on investment of an electronic patient care tracking system.
32. Identify a reasonable remaining lifespan for the current CAD system and develop a replacement funding strategy.
1
33. Retain one captain position in the Technical Services Division until a new CAD system is implemented and return the other two captains to operations positions.
$260,000 1
34. Implement an online training system that enables the number of trips to the training center to be reduced by at least 20% per year while providing the same level of training.
$300,000 2
35. Establish a cross‐functional working group to identify specific improvements related to Fire Department fleet management issues.
2
36. Establish an equipment replacement fund for fire vehicles and equipment.
2
37. Formalize EMD’s quality assurance program. 1
38. Reassess the need for RM14 staffing to remain intact to save costs and/or improve efficiencies.
$128,000 2

Fire Department Innovation and Efficiency Study Savings from Efficiencies and Innovations Management Partners
127
Recommendation
Potential Savings
Revenues Savings Implementation
Priority
39. Assess the workload of the three equipment repair specialists in the Fire Apparatus Shop and consider transferring them to EMD’s Make Ready Shop.
1
40. Increase the training budget for EMD technicians and establish incentives for technicians to acquire ASE and EVT certifications.
1
41. Develop a service level agreement between EMD and the Fire Department.
1
42. Adjust the shop workload by giving priority to units that are overdue for preventive maintenance and contract excessive repair work until all fire units are in preventive maintenance compliance.
1
43. Reengineer the preventive maintenance program to include formal, progressive, multi‐level servicing unique to each vehicle and equipment class.
1
44. Review and modify preventive maintenance intervals to conform to manufacturer‐suggested servicing and industry standards.
1
45. Reevaluate fire apparatus replacement criteria and develop new age and mileage criteria based on reasonable replacement guidelines utilized by other large cities.
$1,000,000 2
46. Determine the number of units required to provide adequate reserves for first‐line fire apparatus.
1
47. Dispose of excess apparatus. $220,000 (one‐time revenue)
$255,000 2
48. Conduct a fleet utilization review to evaluate the need for each assigned vehicle and piece of equipment in the Fire Department.
$30,000 (one‐ time revenue)
$38,000 1
49. Analyze the costs and benefits of retrofitting Fire Department facilities with energy saving technology.
2
50. Develop a set of key performance measures that demonstrate efficiency and effectiveness of the department.
2
Total Potential Savings $39,980,000 (includes
$250,000 in one‐time revenue)
$5,140,000

Fire Department Innovation and Efficiency Study Attachment A – List of Recommendations Management Partners
128
Attachment A – List of Recommendations Recommendation 1. Perform a comprehensive review of each mid‐level management position when a vacancy occurs to determine the need for the position and whether operational fire expertise is required. Recommendation 2. Utilize sworn personnel in mid‐ and senior‐level positions to manage functions requiring fire expertise and experience. Recommendation 3. Reallocate the deputy chief in finance to an operational or other position within the department and provide the non‐sworn managers with a direct reporting relationship to executive level management. Recommendation 4. Reorganize administrative and business functions under one executive level manager. Recommendation 5. Return one or both deputies in the Personnel/Payroll Section to the field in positions requiring sworn expertise and add a civilian manager with human resources expertise. Recommendation 6. Identify the targeted minimum tenure for assignments for each of the positions in which deputy chiefs are rotated based on effective and efficient management of the operation. Recommendation 7. Create a succession planning program to ensure continuity of leadership as retirements occur. Recommendation 8. Establish an annual recertification process for individuals receiving linguistic pay to ensure proficiency in the language for which compensation is being received. Recommendation 9. Provide added points for bilingual capability during recruitments and/or establish bilingual only recruitments to move toward the department’s goal of 50% bilingual employees. Recommendation 10. Analyze the causes of the significant increase in workers’ compensation cases and take actions to reduce the number of injuries. Recommendation 11. Implement injury prevention and workers’ compensation management systems to achieve claims reductions equivalent to what the City as a whole achieved over the 2008 to 2010 period. Recommendation 12. Review the cases for employees with three or more injuries in the last three years and provide appropriate training and physical therapy to avoid future injuries. Recommendation 13. Pursue direct vendor shipments, as appropriate, to yield continuing operating savings. Recommendation 14. Analyze the warehouse contents to determine which items are necessary to continue to stock and which may be dealt with on a just‐in‐time basis. Recommendation 15. Eliminate two supplies clerk I positions once direct vendor shipments have been fully implemented. Recommendation 16. Develop an agreement between the PFD, the Phoenix Police Department and any other City departments utilizing physical exam or physical therapy services from
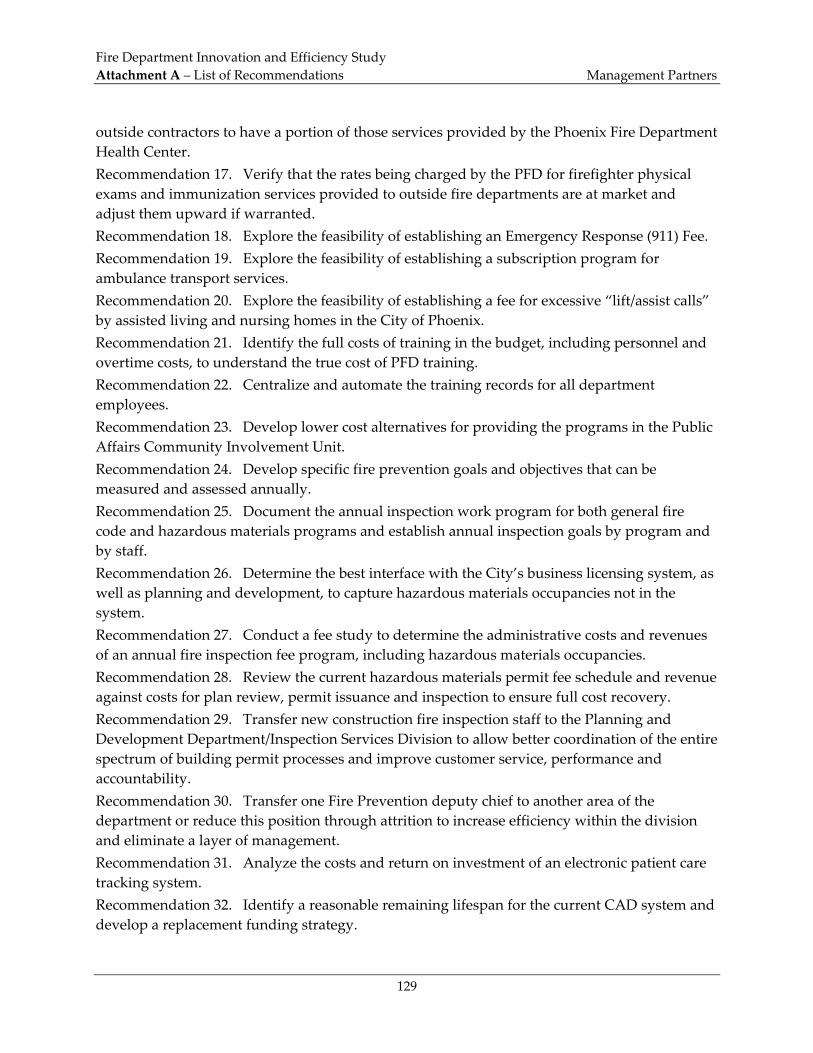
Fire Department Innovation and Efficiency Study Attachment A – List of Recommendations Management Partners
129
outside contractors to have a portion of those services provided by the Phoenix Fire Department Health Center. Recommendation 17. Verify that the rates being charged by the PFD for firefighter physical exams and immunization services provided to outside fire departments are at market and adjust them upward if warranted. Recommendation 18. Explore the feasibility of establishing an Emergency Response (911) Fee. Recommendation 19. Explore the feasibility of establishing a subscription program for ambulance transport services. Recommendation 20. Explore the feasibility of establishing a fee for excessive “lift/assist calls” by assisted living and nursing homes in the City of Phoenix. Recommendation 21. Identify the full costs of training in the budget, including personnel and overtime costs, to understand the true cost of PFD training. Recommendation 22. Centralize and automate the training records for all department employees. Recommendation 23. Develop lower cost alternatives for providing the programs in the Public Affairs Community Involvement Unit. Recommendation 24. Develop specific fire prevention goals and objectives that can be measured and assessed annually. Recommendation 25. Document the annual inspection work program for both general fire code and hazardous materials programs and establish annual inspection goals by program and by staff. Recommendation 26. Determine the best interface with the City’s business licensing system, as well as planning and development, to capture hazardous materials occupancies not in the system. Recommendation 27. Conduct a fee study to determine the administrative costs and revenues of an annual fire inspection fee program, including hazardous materials occupancies. Recommendation 28. Review the current hazardous materials permit fee schedule and revenue against costs for plan review, permit issuance and inspection to ensure full cost recovery. Recommendation 29. Transfer new construction fire inspection staff to the Planning and Development Department/Inspection Services Division to allow better coordination of the entire spectrum of building permit processes and improve customer service, performance and accountability. Recommendation 30. Transfer one Fire Prevention deputy chief to another area of the department or reduce this position through attrition to increase efficiency within the division and eliminate a layer of management. Recommendation 31. Analyze the costs and return on investment of an electronic patient care tracking system. Recommendation 32. Identify a reasonable remaining lifespan for the current CAD system and develop a replacement funding strategy.

Fire Department Innovation and Efficiency Study Attachment A – List of Recommendations Management Partners
130
Recommendation 33. Retain one captain position in the Technical Services Division until a new CAD system is implemented and return the other two captains to operations positions. Recommendation 34. Implement an online training system that enables the number of trips to the training center to be reduced by at least 20% per year while providing the same level of training. Recommendation 35. Establish a cross‐functional working group to identify specific improvements related to Fire Department fleet management issues. Recommendation 36. Establish an equipment replacement fund for fire vehicles and equipment. Recommendation 37. Formalize EMD’s quality assurance program. Recommendation 38. Reassess the need for RM14 to remain intact to save costs and/or improve efficiencies. Recommendation 39. Assess the workload of the three equipment repair specialists in the Fire Apparatus Shop and consider transferring them to EMD’s Make Ready Shop. Recommendation 40. Increase the training budget for EMD technicians and establish incentives for technicians to acquire ASE and EVT certifications. Recommendation 41. Develop a service level agreement between the fleet maintenance organization and the Fire Department. Recommendation 42. Adjust the shop workload by giving priority to units that are overdue for preventive maintenance and contract excessive repair work until all fire units are in preventive maintenance compliance. Recommendation 43. Reengineer the preventive maintenance program to include formal, progressive, multi‐level servicing unique to each vehicle and equipment class. Recommendation 44. Review and modify preventive maintenance intervals to conform to manufacturer‐suggested servicing and industry standards. Recommendation 45. Reevaluate fire apparatus replacement criteria and develop new age and mileage criteria based on reasonable replacement guidelines utilized by other large cities. Recommendation 46. Determine the number of units required to provide adequate reserves for first‐line fire apparatus. Recommendation 47. Dispose of excess apparatus. Recommendation 48. Conduct a fleet utilization review to evaluate the need for each assigned vehicle and piece of equipment in the Fire Department. Recommendation 49. Analyze the costs and benefits of retrofitting Fire Department facilities with energy saving technology. Recommendation 50. Develop a set of key performance measures that demonstrate efficiency and effectiveness of the department.

Fire Department Innovation and Efficiency Study Attachment B – Standards of Cover Management Partners
131
Attachment B – Standards of Cover


September 2011
Phoenix Fire Department
Standards of Cover


Standards of Cover Table of Contents Management Partners
i
Table of Contents
Introduction and Background ................................................................................................................ 1 Standards of Cover ................................................................................................................................... 2 Glossary of Related Terms ...................................................................................................................... 3
System Terms .................................................................................................................................... 3 Requirements and Standards ......................................................................................................... 3 Emergency Response Units and Personnel .................................................................................. 4 SOC Mapping Terms ....................................................................................................................... 5
Primary Applicable National Standards .............................................................................................. 6 Fire Fighting ...................................................................................................................................... 6 Emergency Medical Service ............................................................................................................ 8
Analysis ...................................................................................................................................................... 9 Fire Department Resources Applied to SOC ................................................................................ 9 Fire Station Distribution within the City of Phoenix ................................................................ 10
Map 1. Base Map with Streets .................................................................................................. 10 Map 2. Jurisdiction Map with First Due and Station Locations .............................................. 10 Map 3. Jurisdiction Map with Automatic Aid Station Locations ............................................ 10
Service Demand .............................................................................................................................. 11 GIS Computer Generated Maps ................................................................................................... 12
Map 4. Structure Fire Incident Density 2010 ......................................................................... 12 Map 5. EMS Incident Density 2010 ....................................................................................... 12 Map 6. Transport Density ALS 2010 ...................................................................................... 12 Map 7. HazMat Incident Density 2010 .................................................................................. 12 Map 8. Technical Rescue Incident Density 2010 .................................................................... 13 Map 9. Existing Engine Company 4‐Minute Response Capabilities ..................................... 13 Map 10. Existing Ladder Company 4‐Minute Response Capabilities .................................... 13 Map 11. Existing Rescue Company (Ambulance) 24‐Hours 4‐Minute Response Capabilities ............................................................................................................................... 13 Map 12. Existing Rescue Company (Ambulance) 24 Hours 8‐Minute Response Capabilities ................................................................................................................................ 14

Standards of Cover Table of Contents Management Partners
ii
Map 13. Existing Battalion Command 8‐Minute Response Capabilities ................................ 14 Map 14. Existing Squad Company 8‐Minute Response Capabilities ...................................... 14 Map 15. Existing NFPA 1710 Initial Full Alarm 8‐Minute Response Capabilities with 15 Fire Fighters................................................................................................................. 14 Map 16. Existing NFPA 1710 Initial Attack for High Hazards, 8‐Minute Response Capabilities with 26 Fire Fighters ............................................................................................. 15 Map 17. Responses Requiring in Excess of 10 minutes in 2010 ............................................. 15 Map 18. Responses Requiring in Excess of 15 minutes in 2010 ............................................. 15
SOC Analysis and Observations .......................................................................................................... 17 Maps .......................................................................................................................................................... 20

Standards of Cover Table of Contents Management Partners
iii
Tables
Table 1. Phoenix Fire Department Resources ................................................................................. 9 Table 2. Incidents in 2010 .................................................................................................................. 11


Standards of Cover Introduction and Background Management Partners
1
Introduction and Background
As part of Management Partners’ Innovation and Efficiency Study of the Phoenix Fire Department (PFD), City officials requested a Standards of Cover (SOC) analysis regarding the deployment of fire‐rescue stations, apparatus and emergency responders. This document reports that analysis.
Due to the unique and effective automatic aid system utilized by PFD and the more than 20 other fire‐rescue departments in the valley area around Phoenix, both the computer generated GIS maps used as a basis for the analysis and the analysis itself necessarily include the larger automatic aid area and the “nearest station/nearest vehicle response” dispatch provisions.
This SOC section includes definitions, a glossary of related technical terms, a summary of applicable regulations and standards, descriptions and analyses of the included key GIS maps, and resultant observations.
The maps in this document were produced by EF Geographic, LLC with data provided by the Phoenix Fire Department.

Standards of Cover Standards of Cover Management Partners
2
Standards of Cover
The term “standards of cover” originated in the British fire service during World War II and has been adapted and expanded as a useful concept by the U.S. fire service. It functions as a framework for evaluating key aspects of emergency response and appears in the national fire department accreditation process. SOC, as used in this study, has the following three components.
1. Fire department “capability,” which assesses the scope and depth of emergency services provided, plus the ability to respond quickly enough and with sufficient strength to conduct an effective and safe initial fire attack or rescue action followed by sustained attack, typically judged against national standards.
2. Fire department “availability,” which considers how frequent and how lengthy are the time periods when the various emergency response units of a department are unable to service a call for help immediately; and
3. Fire department “capacity,” which refers to the ability of a department to handle its typical call workload, simultaneous calls, and multiple alarms using its own resources plus outside pre‐arranged resources such as automatic instant responders and multi‐department response agreements.

Standards of Cover Glossary of Related Terms Management Partners
3
Glossary of Related Terms
System Terms • Mutual Aid: Outside department assistance summoned to the
incident after the home department has arrived and determined aid is needed.
• Automatic Mutual Aid: Outside department units dispatched by pre‐arrangement, simultaneously with the home department.
• Nearest Station Response: Dispatching units from whichever station is closest to the incident and has units “in quarters” at that time.
• Nearest Vehicle Response: Dispatching units which are available for immediate dispatch and closest to the incident, even if driving in the area. This requires a satellite based automatic vehicle locator system (which is used by the PFD).
• CAD: Computer aided dispatch; typically utilizing specialized hardware, software, and a radio communication system, located at a specialized facility staffed by trained dispatchers.
• PSAP: Public safety answering point; the area facility into which 9‐1‐1 telephone calls for help are received by call takers and assigned to dispatchers.
• Medical dispatch: Dispatcher’s guidance to 9‐1‐1 callers for emergency medical assistance; typically follows a medically approved question‐answer‐guidance telephone format.
Requirements and Standards • OSHA Requirements: Mandatory obligations applied by federal
and state OSHA. • NIOSH: National Institute for Occupational Safety and Health;
conducts relevant fire department incident analyses, and issues advisories.
• NFPA: National Fire Protection Association issues consensus based standards which, although not legal requirements, may be judged in legal proceedings to have the weight of law. Those related directly to Phoenix SOC include:

Standards of Cover Glossary of Related Terms Management Partners
4
NFPA 1500 “Standard on Fire Department Occupational Safety and Health Program”
NFPA 1710 “Standard for the Organization and Deployment of Fire Suppression Operations, Emergency Medical Operations, and Special Operations to the Public by Career Fire Departments”
Emergency Response Units and Personnel • Engine Company: Pumper apparatus and full crew • Ladder Company: Aerial ladder apparatus and full crew • Ladder Tender: Specialized equipment vehicle (no ladders) • Rescue: In Phoenix, a transport ambulance at basic or advanced
life support level • Squad: Large specialized vehicle carrying equipment used at
technical rescue incidents such as confined space, trench collapse, high‐angle, machinery, vehicle crash, building collapse, mountain rescue, etc. incidents
• Cover or Fill‐in Company: Appropriate apparatus and crew moved to a critical but emptied station in order to cover new alarms
• EMT: Emergency medical technician trained and certified as a pre‐hospital provider
First Responder (initial aid provider, defibrillator trained) EMT‐Basic (trained at a basic level, not using invasive
procedures) EMT‐Intermediate (certified for some advanced
procedures) EMT‐Paramedic (certified for advanced life support
protocols and some invasive procedures) • Paramedic Vehicle (Engine, rescue ambulance): ALS equipped
and staffed to include one or two paramedics • Technical Rescue: Appropriate equipment and crew trained to
perform technical rescues at confined space, high angle, industrial equipment, mountain incidents, vehicle crashes, etc.
• Rapid Intervention Team: Crew standing‐by solely to rescue endangered firefighters
• Incident Command: Refers to the officer responsible for all incident activities, plus various command functions and protocols

Standards of Cover Glossary of Related Terms Management Partners
5
SOC Mapping Terms • Total Alarm Handling Time: Time required to receive and
process the alarm. Should be added to travel time, ideally about 90 seconds.
• Turnout Time: The elapsed time between when a response unit receives its dispatch and that unit leaves the station; typically about 60 seconds and must be added to the travel time.
• Travel Time: The elapsed time between a unit leaving the station and arriving at the incident; indicated on the computerized map by distance travelled from the station toward the incident. Map distance travelled is a surrogate for elapsed time.
• Action Initiation Time: Time required on‐scene to begin controlling actions. Varies, and may be added to travel time.
• Total Response Time: The sum of alarm handling, turnout of station, and travel time. Action initiation time is additional.
Note: Software considers safe speeds, one‐way streets, turns, etc.

Standards of Cover Primary Applicable National Standards Management Partners
6
Primary Applicable National Standards
Fire Fighting
OSHA calls for the following operational safety measures in Arizona, which has an OSHA‐approved state plan:
• “Once fire fighters begin the interior attack on an interior structural fire, the atmosphere is assumed to be IDLH (immediately dangerous to life and health), and paragraph 29 CFR 1910.134(g)(4) (two‐in/two‐out) applies.”
• All engaged in interior structural firefighting must wear SCBAs, work in teams of two or more, and maintain voice or visual contact (not radio). 29CFR 1910.134
• At an interior structural fire, four individuals are required (minimum), two as an interior team and two outside for rapid assistance or rescue. (29 CFD 910.134(g)(4)) (Exception is a known life‐hazard situation requiring immediate action.)
The National Fire Protection Association issues relevant standards.
• NFPA Standard 1500 (“Fire Department Safety and Health Program”) Chapter 8, Emergency Operations, specifies the above OSHA requirements plus additional measures applicable to Rapid Intervention Rescue Crews.
• NFPA Standard 1710 (“Standard for the Organization and Deployment of Fire Suppression Operations, Emergency Medical Operations, and Special Operations to the Public by Career Fire Departments,” 2010 Edition) contains several sections directly applicable to the Phoenix Fire Department and its Standards of Cover.
• Although NFPA standards are legally binding only in those communities which formally adopt them, they do represent national/industry standards and are used in expert testimony to describe a “Reasonable Person Standard” and a scientifically derived “Standard of Care when a Standard of Duty exists,” with a breach of civil duty claimed (tort). For example, the lack of

Standards of Cover Primary Applicable National Standards Management Partners
7
knowledge of the NFPA standard on live fire training was disallowed in an actual civil and a criminal defense against charges successfully brought against a fire training officer and a fire chief. NFPA Standard 1710 provisions for fire suppression directly relevant to the Phoenix/Valley Automatic Aid System “Standards of Cover” analysis are:
o “… shall be permitted to use established automatic aid … to comply” (5.2.1.2)
o “The number of (firefighters) shall be sufficient … given the expected fire‐fighting conditions.” (5.2.2)
o “On‐duty personnel … shall be organized into company units …” (5.2.2.2)
o “Supervisory chief officers shall be dispatched to all full alarm assignments.” (5.2.2.2.3)
o “These companies shall be staffed with a minimum of four on‐duty personnel.” (engines and ladders) (5.2.3.1.1)
o “In (special areas) … companies shall be staffed with a minimum of five or six members.” (5.2.3.1.2)
o “… Provide for the arrival of an engine company within a 240 second travel time to 90 percent of incidents.” (5.2.4.1.1)
o “… Deploy an initial full alarm assignment within a 480‐second travel time to 90 percent of the incidents.” (5.2.4.2.1)
o “The initial full alarm assignment to a structure fire in a (2000 sq. ft., two story) single family dwelling with no basement or exposures shall provide for … (Incident Commander plus 14 personnel, with duties outlined in 8 sub‐sections) (5.2.4.2.2)
o “… (response) to occupancies with hazards greater (than above) shall deploy additional resources on the initial alarm” (5.2.4.2.3)
o “… (escalating) beyond an initial full alarm assignment … upgrade to a full four person or larger Rapid Intervention Crew”, plus a Safety Officer” (5.2.4.3.3. & 4.)

Standards of Cover Primary Applicable National Standards Management Partners
8
Emergency Medical Service
The Phoenix Fire Department staffs each engine company with two ALS paramedic firefighters so emergency medical service can be provided at the ALS level of service upon arrival. Rescue units (ambulances), which can provide both on‐scene service and transport, operate ALS level. Additional units are placed in service daily during the peak load times.
• NFPA Standard 1710 calls for emergency medical assistance, including automatic external defibrillator application when needed, to begin within 240 seconds travel time, and, if not at the ALS level, ALS service must arrive within 480 seconds. The Phoenix Fire Department strives to reach those response times most often through their ALS engine companies, with transportation at the required level provided by its rescue ambulances.
• The Arizona Division of Public Health Services “Certificate of Necessity” calls for the PFD to operate “ground ALS and BLS ambulance services” with Code 3 response times (use of emergency warning devices) for 9‐1‐1 generated dispatches as follows:
1. Ten (10) minutes on 90% of all Code 3 ambulance transports 2. Fifteen (15) minutes on 95% of all Code 3 ambulance transports 3. Twenty (20) minutes on 99% of all Code 3 transports
During fiscal year 2009‐10, 59% of ALS medical calls were responded to by ALS paramedic units within five minutes. Total EMS calls for 2009‐10 are reported as 126,100.

Standards of Cover Analysis Management Partners
9
Analysis
A total of 79 computer maps were generated for this SOC analysis, 16 of which form the basis for this report. The maps are divided into three general categories:
• Geographic area studied (3) • Service demand‐PFD workload (5) • PFD response capabilities (10)
Two additional maps (Map 17 and Map 18) are being generated from PFD data, denoting geographic areas of Phoenix where ambulance responses have exceeded state response time requirements. (Please note that they are not attached at this time.)
In addition to the information displayed on each map, brief narrative sections and additional statistics, explanation, and analytical observations are provided. The maps and associated descriptions may be understood best through the narrative topics preceding this section.
Fire Department Resources Applied to SOC
Table 1 shows the resources applied to this SOC document. The following statistics may vary during the year, based on budget variations, position freezes, breakdowns of apparatus, possible station brownouts, etc.
Table 1. Phoenix Fire Department Resources
On‐duty Staffing per Shift 418
Operating Stations 57
Shift Commanders 2
Battalion Chiefs 7 (+ airport 1)
Engine Companies 65
Ladder Companies 14
Squads (Heavy Rescue) 3
Rescues (ambulances) 32
Airport units (not considered in SOC) 5
Brush trucks + misc. type vehicles (not considered in SOC) NA

Standards of Cover Analysis Management Partners
10
Fire Station Distribution within the City of Phoenix
Maps 1, 2 and 3 provide geographic illustrations of the SOC area studied, as described by the following.
Map 1. Base Map with Streets Base map of the Phoenix Area with streets and major highways indicated.
Map 2. Jurisdiction Map with First Due and Station Locations Map of Phoenix with Phoenix fire station locations and first due districts indicated. Special note: PFD stations 53 and 55, which are planned for the extreme north of the City are not yet operational, but their anticipated locations are indicated on this map. Station 53 has not yet received funding approval. Station 55 was included in the most recent Capital Improvement Plan, but those funds are frozen.
Map 3. Jurisdiction Map with Automatic Aid Station Locations Jurisdiction map of Phoenix and outside communities, with automatic aid and Phoenix fire stations located, excluding PFD non‐operational stations 53 and 55.
The location of fire stations in the City of Phoenix, with current staffing levels, generally provides satisfactory response times and sufficient apparatus and crew numbers for the downtown high‐rise area and for the built‐up areas along most major roads and streets. Both the area south of South Mountain and the northernmost City areas have very light station coverage, however, with resultant longer response times. The northern area, especially, has minimal structural build‐up at this time, but high development is anticipated.
Both the eastern and western boundaries of the City receive important partial protection from automatic aid stations, several of which were deliberately located to provide joint coverage, as were several Phoenix stations, in the interest of cost efficiency.
From April 1, 2010 to March 31, 2011, Phoenix Fire Department units responded to 6,424 incidents in 16 automatic aid jurisdictions, with 8,757 PFD unit responses. Automatic aid partners responded into Phoenix for 10,036 incidents, with 12,729 unit responses.
Six Phoenix stations each house two engine companies.
• Station 1 provides necessary coverage for a “high hazard” high rise area.

Standards of Cover Analysis Management Partners
11
• Station 5 provides coverage for a high workload demand area, which typically generate simultaneous incidents and multiple alarms for large incidents.
• Station 25 provides coverage for a high workload demand area. • Station 30 provides coverage for a high workload demand area. • Station 35 provides an often available move‐up engine to cover
empty responding stations elsewhere, especially to the north. • Station 60 provides coverage for a high demand area.
Note: High hazard areas, as classified by the National Fire Protection Association, include places of public assembly, schools, hospitals, nursing homes, high‐rise buildings, places with high life hazard, hazardous content areas, refineries, etc.
Each of the six double engine stations may be dispatched to provide move‐up cover for empty stations dispatched to other alarms, for companies called for training, for maintenance of another apparatus, for browned‐out areas, etc., as well as the primary responsibility for simultaneous and multiple alarms in high demand and high rise areas.
The SOC process includes a review of existing station locations. That process is most useful, also, in helping to determine the best location for new stations or the consolidation of two or more older stations. Phoenix might well anticipate additional stations in the north or in possible annexation areas. Note that Stations 1, 3, 4 and 8 are relatively close to each other, but house apparatus and crews necessary for adequate downtown area protection. Combining some of those four into a large single facility might appear advantageous in some respects, but would not appear to be cost‐effective.
Service Demand
Table 2 shows the incidents reported during calendar 2010. In most categories, the calendar 2010 incident statistics exceed the 2009 numbers and 2011incident statistics exceed all previous years.

Standards of Cover Analysis Management Partners
12
Table 2. Incidents in 2010
Type of Incident Number
Total emergency medical calls 130,101
Rescue transports (356 per 24 hour avg.) 65,085
Structure fires (5.5 per 24 hour avg.) 1,626
Hazardous Materials Incidents 471
Technical Rescue Incidents 186
GIS Computer Generated Maps
As discussed previously, maps 1 through 3 present a geographic overview of the City of Phoenix and the Automatic Aid Valley area.
Maps 4 through 8 illustrate 2010 workload incidents by category, using call density per square mile as the indicator. Maps 4 through 18 are described below.
Map 4. Structure Fire Incident Density 2010 This map illustrates density per square mile of all 2010 structure fire incidents across Phoenix and the automatic aid area.
Map 5. EMS Incident Density 2010 Map 5 shows density per square mile of all 2010 EMS incidents across Phoenix and the automatic aid area. The EMS incident category exceeds the total of ALS and BLS incidents. All EMS incidents include all the ALS and BLS incidents plus Nature Codes MED1A (97 incidents), MED2‐1 (564 incidents), and MED3‐1 (97 incidents). These codes refer to specially staffed rescues.
Map 6. Transport Density ALS 2010 This map illustrates density per square mile of all 2010 ALS transports by units across Phoenix and the automatic aid area.
Map 7. HazMat Incident Density 2010 Map 7 shows the density per square mile of all 2010 hazardous material incidents across Phoenix and the automatic aid area. Hazmat vehicle stations indicated.

Standards of Cover Analysis Management Partners
13
Map 8. Technical Rescue Incident Density 2010 This map shows density per square mile of all 2010 technical rescue incidents across Phoenix and the automatic aid area. Technical rescue squad vehicle stations are indicated.
Maps 9 through 16 illustrate the response capabilities of the various major types of PFD units, detailed by each map key. Airport units are not considered as “outside airport” responders per Federal Aviation Administration (FAA) requirements for maintaining available airport protection. Brush and other special‐call units activated and staffed for specific incidents are not included. When needed, these vehicles are generally cross‐staffed by personnel assigned to the stations where they are located.
Map 9. Existing Engine Company 4‐Minute Response Capabilities This map represents the four minute travel time response capabilities of all the non‐airport engine companies from the Phoenix and automatic aid fire stations. The “number of engines” symbolization identifies the number of overlapping responding engine companies which, if “in‐quarters” at the time of dispatch, should be able to reach the area within 240 seconds travel time.
Map 10. Existing Ladder Company 4‐Minute Response Capabilities
This map represents the four minute travel time response capabilities of all the non‐airport ladder companies from the Phoenix and automatic aid fire stations. The “number of ladders” symbolization identifies the number of overlapping responding ladder companies, as specified above for engines.
Station officers may select to respond with either an aerial apparatus or a ladder tender truck.
Map 11. Existing Rescue Company (Ambulance) 24‐Hours 4‐Minute Response Capabilities This map represents the four‐minute travel time response capabilities of the rescue companies staffed 24 hours a day from Phoenix fire stations. The “number of rescues” symbolization identifies the number of overlapping responding rescue companies, as specified above for engines and ladders.

Standards of Cover Analysis Management Partners
14
Map 12. Existing Rescue Company (Ambulance) 24 Hours 8‐Minute Response Capabilities This map represents the eight minute travel time response capabilities of the rescue companies staffed 24 hours a day from the Phoenix fire stations. The “number of rescues” symbolization identifies the number of overlapping responding rescue companies, assuming in‐quarters status at time of dispatch.
Map 13. Existing Battalion Command 8‐Minute Response Capabilities This map represents the eight minute travel time response capabilities of the non‐airport battalion chiefs from the Phoenix fire stations, as listed on the map for nine stations. The “number of battalions” symbolization identifies the number of overlapping responding battalion chiefs, assuming in‐quarters status at time of dispatch. However, note that the number of battalion chiefs on duty per shift is not nine, but typically six or seven, typically deployed at stations 9, 12, 18, 22, 25, 41 and 52. Thus, the response times for battalion chief command throughout the City at working incidents often appear to be excessive. This issue, which is eased by shift commander response from stations 1 and 30, along with the fact that aerial ladder and heavy technical rescue response capability are significantly behind engine response capability, are probably the largest response issues impacting the City as a whole.
Map 14. Existing Squad Company 8‐Minute Response Capabilities
This map represents the eight minute travel time response capabilities of the non‐airport squad companies from the Phoenix and automatic aid fire stations. The “number of squads” symbolization identifies the number of overlapping responding squad companies. Some “squad type” equipment is carried on PFD Ladder Tender trucks to augment Squad capabilities.
Map 15. Existing NFPA 1710 Initial Full Alarm 8‐Minute Response Capabilities with 15 Fire Fighters
This map represents the eight‐minute travel time response capabilities for a residential structure full alarm dispatch from the Phoenix and automatic aid fire stations. The residential structure fire alarm response capability is comprised of the intersection of all eight‐minute response
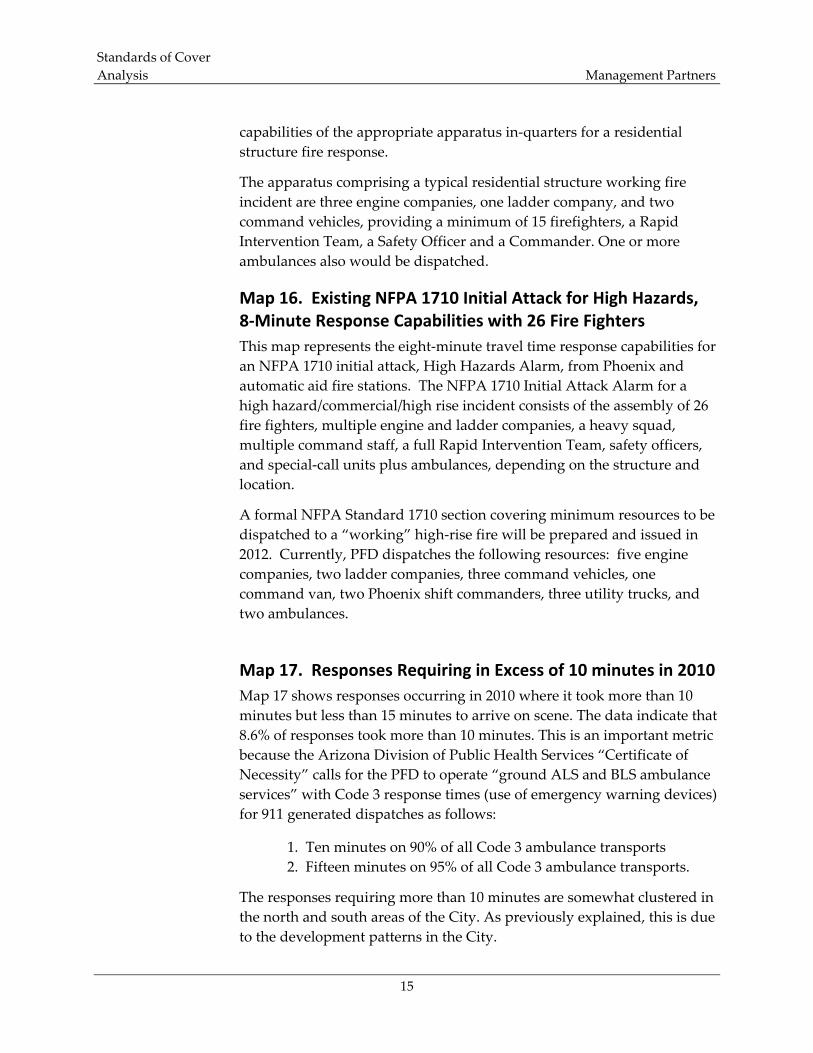
Standards of Cover Analysis Management Partners
15
capabilities of the appropriate apparatus in‐quarters for a residential structure fire response.
The apparatus comprising a typical residential structure working fire incident are three engine companies, one ladder company, and two command vehicles, providing a minimum of 15 firefighters, a Rapid Intervention Team, a Safety Officer and a Commander. One or more ambulances also would be dispatched.
Map 16. Existing NFPA 1710 Initial Attack for High Hazards, 8‐Minute Response Capabilities with 26 Fire Fighters This map represents the eight‐minute travel time response capabilities for an NFPA 1710 initial attack, High Hazards Alarm, from Phoenix and automatic aid fire stations. The NFPA 1710 Initial Attack Alarm for a high hazard/commercial/high rise incident consists of the assembly of 26 fire fighters, multiple engine and ladder companies, a heavy squad, multiple command staff, a full Rapid Intervention Team, safety officers, and special‐call units plus ambulances, depending on the structure and location.
A formal NFPA Standard 1710 section covering minimum resources to be dispatched to a “working” high‐rise fire will be prepared and issued in 2012. Currently, PFD dispatches the following resources: five engine companies, two ladder companies, three command vehicles, one command van, two Phoenix shift commanders, three utility trucks, and two ambulances.
Map 17. Responses Requiring in Excess of 10 minutes in 2010 Map 17 shows responses occurring in 2010 where it took more than 10 minutes but less than 15 minutes to arrive on scene. The data indicate that 8.6% of responses took more than 10 minutes. This is an important metric because the Arizona Division of Public Health Services “Certificate of Necessity” calls for the PFD to operate “ground ALS and BLS ambulance services” with Code 3 response times (use of emergency warning devices) for 911 generated dispatches as follows:
1. Ten minutes on 90% of all Code 3 ambulance transports 2. Fifteen minutes on 95% of all Code 3 ambulance transports.
The responses requiring more than 10 minutes are somewhat clustered in the north and south areas of the City. As previously explained, this is due to the development patterns in the City.

Standards of Cover Analysis Management Partners
16
Map 18. Responses Requiring in Excess of 15 minutes in 2010
This map is the same as Map 17 but shows the responses that are greater than 15 minutes. Such responses account for approximately 1.6% of total runs. This is well within the state standard.
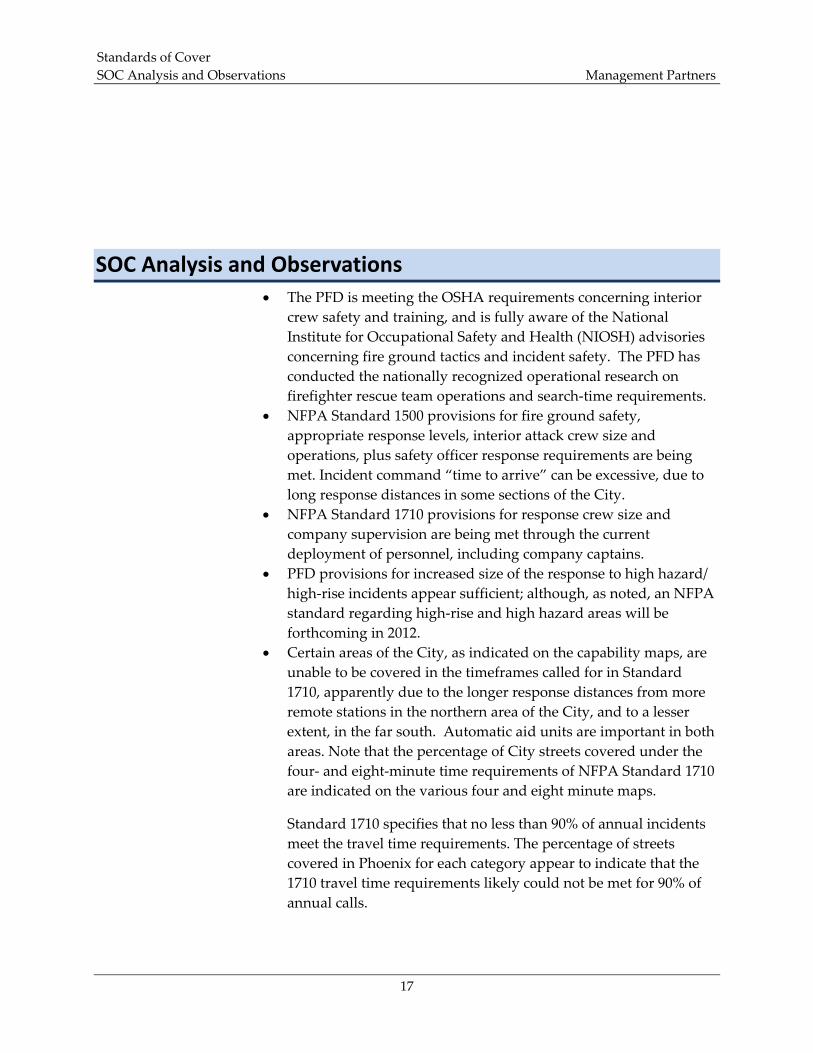
Standards of Cover SOC Analysis and Observations Management Partners
17
SOC Analysis and Observations • The PFD is meeting the OSHA requirements concerning interior
crew safety and training, and is fully aware of the National Institute for Occupational Safety and Health (NIOSH) advisories concerning fire ground tactics and incident safety. The PFD has conducted the nationally recognized operational research on firefighter rescue team operations and search‐time requirements.
• NFPA Standard 1500 provisions for fire ground safety, appropriate response levels, interior attack crew size and operations, plus safety officer response requirements are being met. Incident command “time to arrive” can be excessive, due to long response distances in some sections of the City.
• NFPA Standard 1710 provisions for response crew size and company supervision are being met through the current deployment of personnel, including company captains.
• PFD provisions for increased size of the response to high hazard/ high‐rise incidents appear sufficient; although, as noted, an NFPA standard regarding high‐rise and high hazard areas will be forthcoming in 2012.
• Certain areas of the City, as indicated on the capability maps, are unable to be covered in the timeframes called for in Standard 1710, apparently due to the longer response distances from more remote stations in the northern area of the City, and to a lesser extent, in the far south. Automatic aid units are important in both areas. Note that the percentage of City streets covered under the four‐ and eight‐minute time requirements of NFPA Standard 1710 are indicated on the various four and eight minute maps.
Standard 1710 specifies that no less than 90% of annual incidents meet the travel time requirements. The percentage of streets covered in Phoenix for each category appear to indicate that the 1710 travel time requirements likely could not be met for 90% of annual calls.

Standards of Cover SOC Analysis and Observations Management Partners
18
• Equity of service delivery throughout the City will need increasing attention, especially as development resurges in the north. Were it not for the automatic aid provisions, the PFD would need immediate additional station and response resources to provide adequate protection even now, with current development.
• Phoenix Standards of Cover currently are adequate for almost all sections of the City, but are noticeably dependent, as planned, on automatic aid for some east‐west border areas, in the area south of South Mountain (especially for EMS) and in the northern area, where only one operational Phoenix station exists. Should automatic aid response in the north become an issue, a significant protection problem quickly would emerge. A contingency plan and a mid‐ to long‐term plan for additional PFD stations in the north would be useful
• The City and the Fire Department are experiencing a quite common, but potentially troublesome, phenomenon in the Standards of Cover as they apply to the length of time required for response by rescue units (ambulances) to incidents. The Arizona State stipulation for Code 3 ALS responses, as noted earlier, calls for 90% of annual responses not to exceed ten minutes. PFD rescue response times in 2010 of runs taking more than 10 and 15 minutes have been noted. Thus, while PFD is within the stipulated response time requirements, continuing evaluations and service provision adjustments are necessary to meet the goals with a cost‐effective deployment of ambulances and crews. The distribution of these longer responses, while indicating some clustering, is fairly widespread and also appears indicative of heavy unit workload.
• Maps 17 and 18 will display the “over 10 minute” and “over 15 minute” response incident areas for a recent 12 month period, where 22,574 rescue responses were tabulated. The distribution of these longer responses, while indicating some clustering, is fairly widespread and appears indicative of heavy unit workload.
• Regarding “first due” emergency response zones and the designated “first due” units in 56 surveyed zones, only 3 units from the 56 stations arrived first in their own zones at least 90% of the time during a surveyed time period. Ten units arrived as a “designated first due” less than 75% of the time. These statistics illustrate high unit workload, which reduces significantly the percentage of time that units are “in quarters” waiting for a call.

Standards of Cover SOC Analysis and Observations Management Partners
19
• This SOC analysis, along with the benchmarking work described above, confirms that when it comes to the core job of responding to emergency calls, the Phoenix Fire Department generally meets accepted industry standards with respect to emergency response and performance. Aspects of NFPA 1710 and the certificate of need for ambulance service are not always being met. Management Partners did not find evidence from the SOC analysis that the department has significant excess capacity or surplus when it comes to meeting basic response standards. While units vary considerably with respect to individual workload, on balance, the system is handling a relatively heavy workload and the relevant performance metrics used to evaluate modern fire department performance are reasonable.


Standards of Cover Maps Management Partners
20
Maps


o
o
MARICOPA COUNTY
PHOENIX
MESA
GOODYEAR
BUCKEYE
PEORIA
GILA RIVER INDIAN COMM
SCOTTSDALESURPRISE
GILBERT
CHANDLER
TEMPE
DAISY MOUNTAIN
GLENDALE
MARICOPA
SALT RIVER INDIAN COMM
WITTMANN
CAVE CREEKCIRCLE CITY
AVONDALE
SUN CITY FOUNTAIN HILLSN
SCOT
TSDA
LE R
D
E CAREFREE HWY
N 99
TH AV
E
E BASELINE RD
CENT
RAL A
VE
WASHINGTON ST
§̈¦17
§̈¦10
UV101
UV202
UV51
£¤89
£¤60
UV303
UV143
UV74
UV87UV85
Management Partners 20110 7.5 153.75
Miles
¯
Phoenix ArizonaBasemap with Streets
Map 1


!!
!
!
!
!
!
!
!
!
!
!
!
!
!
!
!
!
!
!
!
!
!
!
!
!
!
!!
!!
!
!
!
!
!
!
!
!
!
!
!
!
!
!
!
!
!
!
!
!
!
!
!!
!
!
!
PHOENIX
MESA
GOODYEAR
BUCKEYE
PEORIA
GILA RIVER INDIAN COMM
SCOTTSDALESURPRISE
GILBERT
CASA GRANDE
CHANDLER
TEMPE
DAISY MOUNTAIN
GLENDALE
MARICOPA
SALT RIVER INDIAN COMM
WITTMANN
CAVE CREEKCIRCLE CITY
AVONDALE
SUN CITY FOUNTAIN HILLS
6
3
7
5
9
84
38
20
17
11
31
58
56
25
32
13
18
45
42
36
43
10
15
60
28
33
30
53
19
40
26
55
2223
21
37
57
49
35
2959
72
12
48
41
50
24
54
46
39
27
52
4414 1
16
61
§̈¦10
§̈¦17
£¤60
§̈¦10
UV101
UV202
UV51
£¤89
UV303
UV143
UV74
UV87
UV85
CENT
RAL A
VE
W WASHINGTON ST
E BASELINE RD
N SC
OTTS
DALE
RD
E CAREFREE HWY
UV202
UV347
£¤60
99 AV
E
Management Partners 20110 7.5 153.75
Miles
¯
InterstatesState HighwaysMajor RoadsPhoenix First Due Areas
Phoenix Fire StationStatus
! Current! Not in Service
Map 2
Phoenix Fire DepartmentFirst Due
&Station Locations

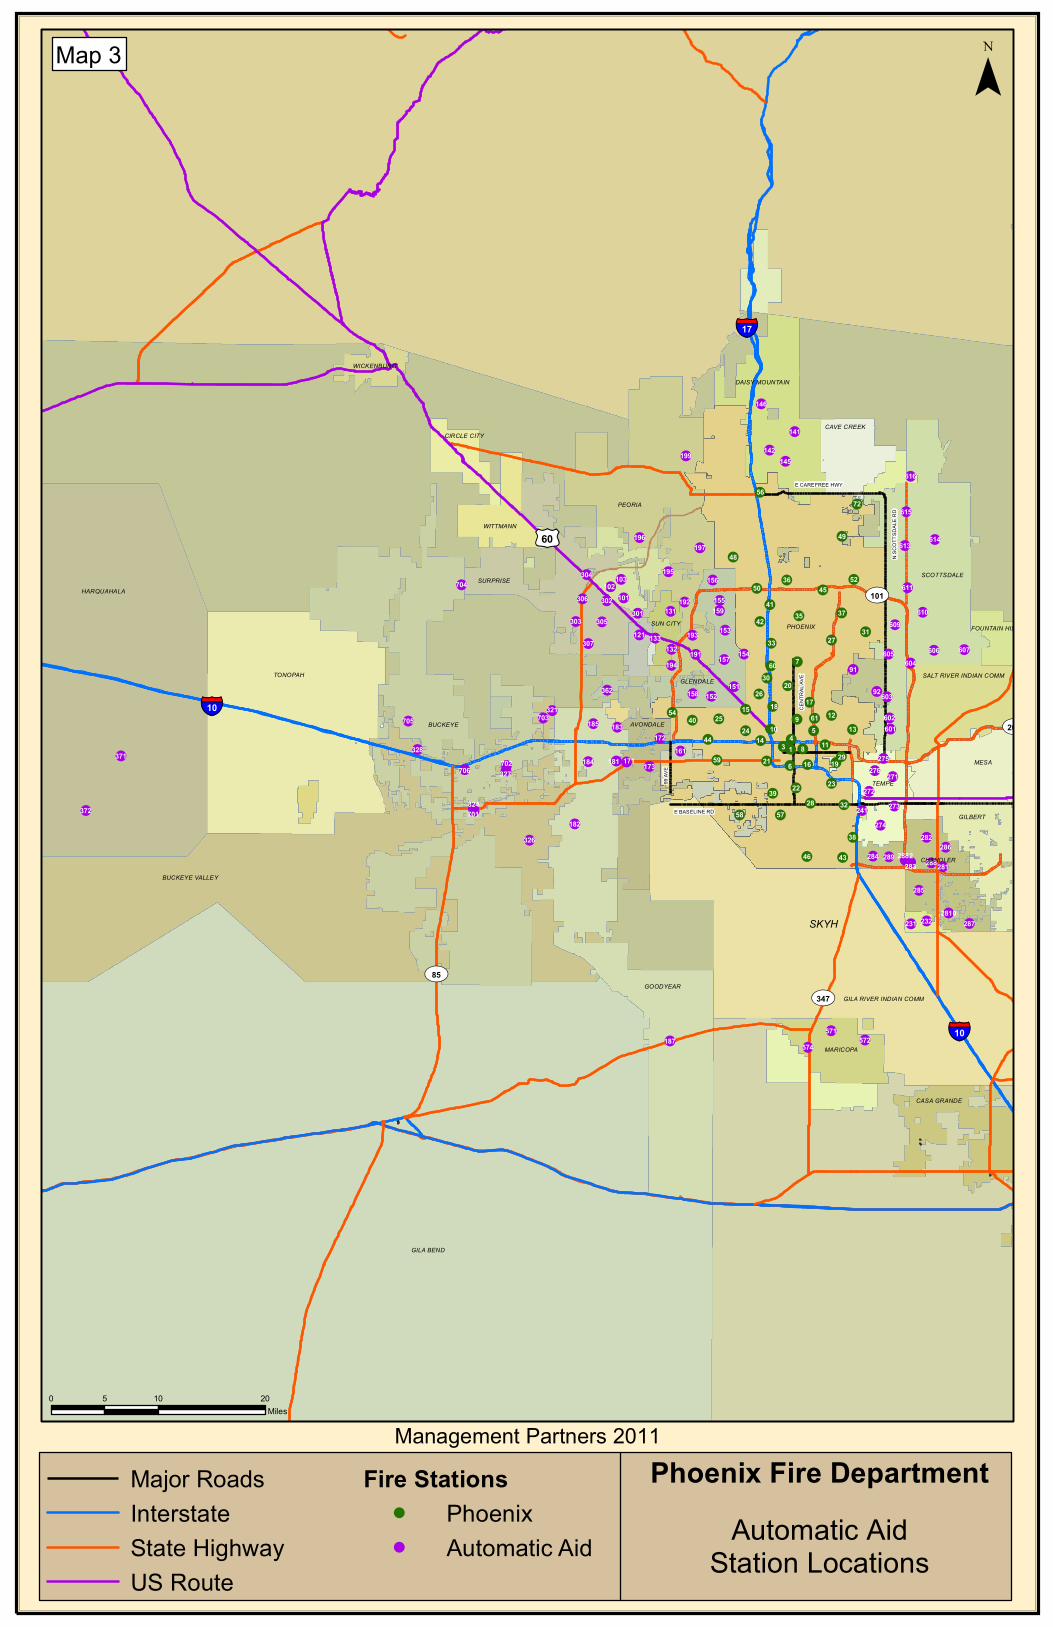
!
!
!!
!
!
!
!
!
!
!
!
!
!!
!
!
!
!
!
!
!
!
!
!
!
!
!
!
!
!
!
!
!!
!!
!
!
!
!
!
!!
!
!
!
!
!
!
!
!
!
!
!
!
!
!
!
!
!
!
!
!
!
!
!
!!
!!
!
!!
!
!!
!!
!
!
!!
!
!
!
!
!
!
!!
!
!
!
! !
!
!
!
!
!
!
!
!
!
!
!
!
!
!
!!
!
!
!
!
!
!
!
!
!
!
!
!
!
!
!
!
!
!
!
!
!
!
! !
!
!
!
!
!
!
!
! !
!
!
! !
!
!
!
!
!
1
6
3
7
59
84
38
2017
11
31
58
56
25
32
92
13
18
45
42
36
43
10
15
60
28
33
9130
19
40
26
22 23
21
37
16
61
57
49
35
2959
72
12
48
4150
24
54
46
39
27
52
44 14
103
604
146
195304
282
704
605
271
232231
182
172
171
326
571
133
613
191
141
287
703
131 159303
158
153
156
276
142
241
284
702
616
607606
615
306
121
328
609
603
601
610
275161
362
706
132193
285
327
288281
155
154
372
321
307
305
197
705
101
199
194
371
324
286
302
273272
192
152
602
187 574
145
196
183
181
157
185
572
184
102
301
173
611
614
289283
274
151
2810
701
2882
GILA BEND
PHOENIX
HARQUAHALA
TONOPAH
MESA
BUCKEYE VALLEY
GOODYEAR
BUCKEYE
PEORIA
GILA RIVER INDIAN COMM
SCOTTSDALESURPRISE
GILBERT
CASA GRANDE
CHANDLER
TEMPE
DAISY MOUNTAIN
GLENDALE
MARICOPA
SALT RIVER INDIAN COMM
WITTMANN
CAVE CREEKCIRCLE CITY
AVONDALE
SUN CITY
WICKENBURG
FOUNTAIN HILLS
£¤60
UV85
UV347
UV101
UV202
SKYH
CENT
RAL A
VEE BASELINE RD
N SC
OTTS
DALE
RD
E CAREFREE HWY
99 AV
E
§̈¦17
§̈¦10
§̈¦10
Management Partners 20110 10 205
Miles
¯
Major RoadsInterstateState HighwayUS Route
Fire Stations! Phoenix! Automatic Aid
Phoenix Fire DepartmentAutomatic Aid
Station Locations
Map 3


GILA BEND
PHOENIX
HARQUAHALA
TONOPAH
MESA
BUCKEYE VALLEY
GOODYEAR
BUCKEYE
PEORIA
GILA RIVER INDIAN COMM
SCOTTSDALESURPRISE
GILBERT
CASA GRANDE
CHANDLER
TEMPE
DAISY MOUNTAIN
GLENDALE
MARICOPA
SALT RIVER INDIAN COMM
WITTMANN
CAVE CREEKCIRCLE CITY
AVONDALE
SUN CITY
WICKENBURG
FOUNTAIN HILLS
Fire Stations! Phoenix! Automatic Aid
2010 Structure FiresLess Than 55 - 1010 - 1515 - 20Over 20
¯
0 10 205Miles
Management Partners 2011
2010 Structure Fire Incident DensityPer Square Mile
Phoenix Fire Department
Map 4


GILA BEND
PHOENIX
HARQUAHALA
TONOPAH
MESA
BUCKEYE VALLEY
GOODYEAR
BUCKEYE
PEORIA
GILA RIVER INDIAN COMM
SCOTTSDALESURPRISE
GILBERT
CASA GRANDE
CHANDLER
TEMPE
DAISY MOUNTAIN
GLENDALE
MARICOPA
SALT RIVER INDIAN COMM
WITTMANN
CAVE CREEKCIRCLE CITY
AVONDALE
SUN CITY
WICKENBURG
FOUNTAIN HILLS
Fire Stations! Phoenix! Automatic Aid
2010 EMS IncidentsLess Than 100100 - 250 250 - 500500 - 1,000Over 1,000
¯
0 10 205Miles
Management Partners 2011
2010 EMS Incident DensityPer Square Mile
Phoenix Fire Department
Map 5

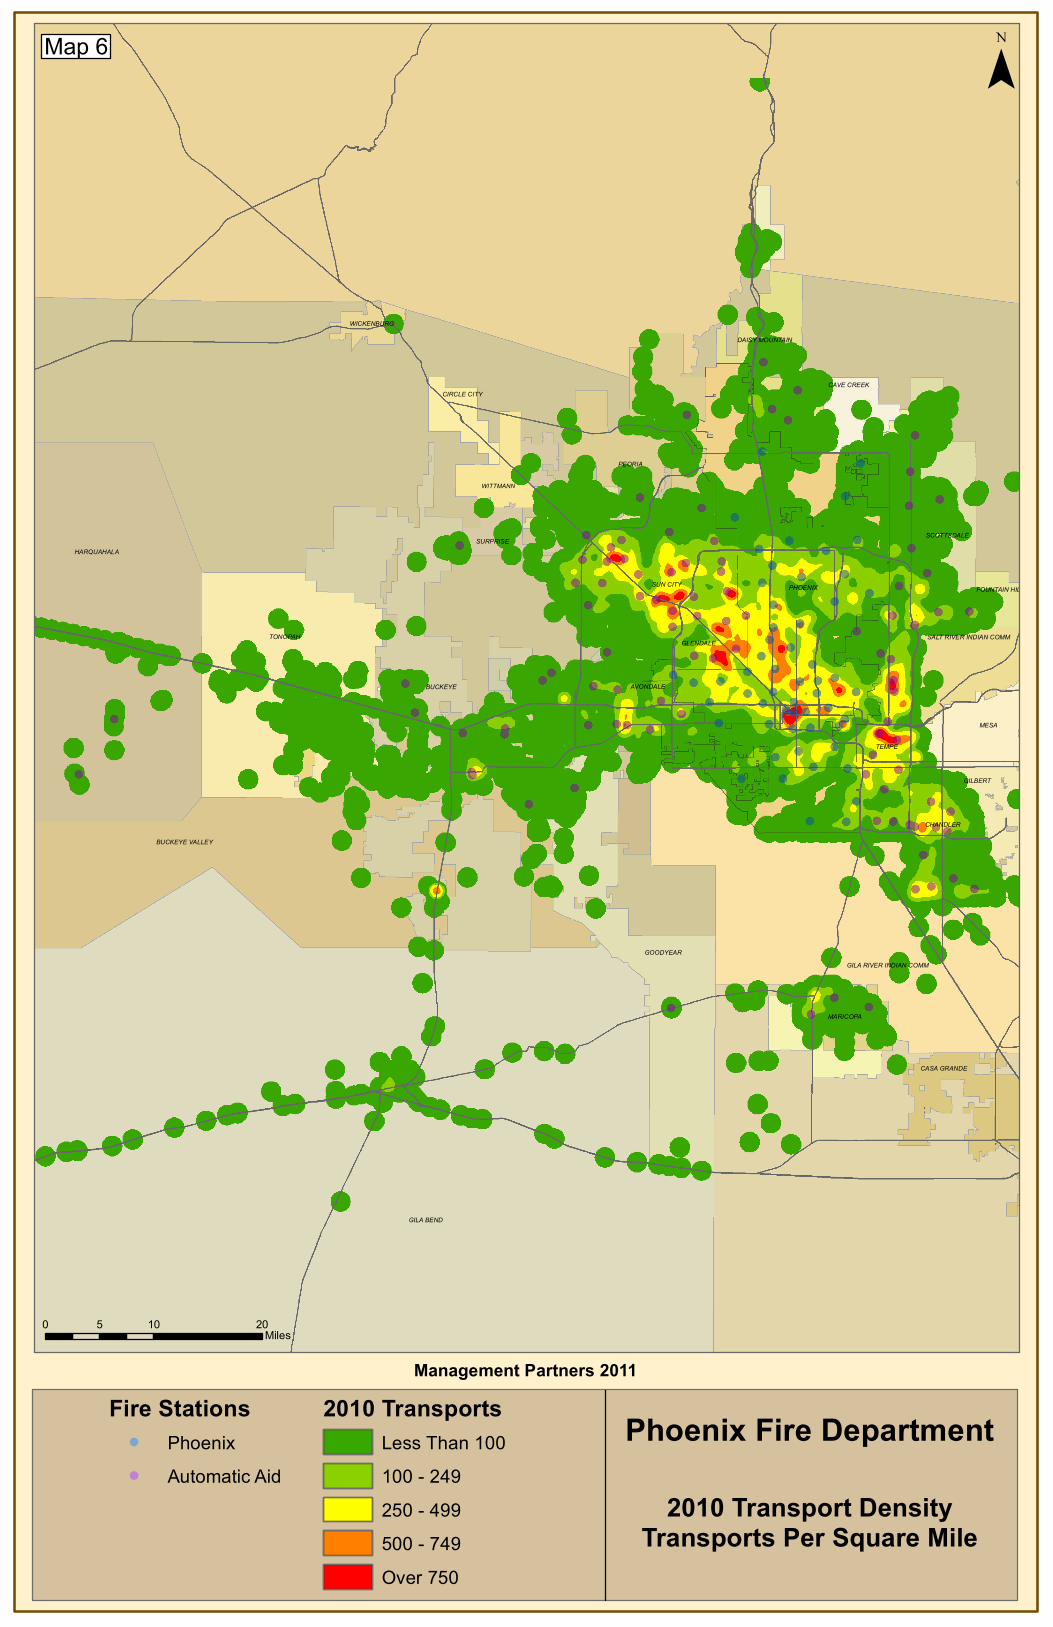
GILA BEND
PHOENIX
HARQUAHALA
TONOPAH
MESA
BUCKEYE VALLEY
GOODYEAR
BUCKEYE
PEORIA
GILA RIVER INDIAN COMM
SCOTTSDALESURPRISE
GILBERT
CASA GRANDE
CHANDLER
TEMPE
DAISY MOUNTAIN
GLENDALE
MARICOPA
SALT RIVER INDIAN COMM
WITTMANN
CAVE CREEKCIRCLE CITY
AVONDALE
SUN CITY
WICKENBURG
FOUNTAIN HILLS
Fire Stations! Phoenix! Automatic Aid
2010 TransportsLess Than 100100 - 249 250 - 499 500 - 749 Over 750
¯
0 10 205Miles
Management Partners 2011
2010 Transport DensityTransports Per Square Mile
Phoenix Fire Department
Map 6


GILA BEND
PHOENIX
HARQUAHALA
TONOPAH
MESA
BUCKEYE VALLEY
GOODYEAR
BUCKEYE
PEORIA
GILA RIVER INDIAN COMM
SCOTTSDALESURPRISE
GILBERT
CASA GRANDE
CHANDLER
TEMPE
DAISY MOUNTAIN
GLENDALE
MARICOPA
SALT RIVER INDIAN COMM
WITTMANN
CAVE CREEKCIRCLE CITY
AVONDALE
SUN CITY
WICKENBURG
FOUNTAIN HILLS
Fire Stations! Phoenix! Automatic Aid
2010 HazMat IncidentsLess Than 22 - 44 - 66 - 8Over 8
¯
0 10 205Miles
Management Partners 2011
2010 HazMat Incident DensityPer Square Mile
Phoenix Fire Department
HazMat CompaniesDeploy From:Phoenix:Station 4Station 8Station 25Station 38Station 41Station 72
Automatic Aid:Station 141Station 157Station 159Station 183Station 184Station 193Station 271Station 272Station 283Station 305Station 605
Map 7


GILA BEND
PHOENIX
HARQUAHALA
TONOPAH
MESA
BUCKEYE VALLEY
GOODYEAR
BUCKEYE
PEORIA
GILA RIVER INDIAN COMM
SCOTTSDALESURPRISE
GILBERT
CASA GRANDE
CHANDLER
TEMPE
DAISY MOUNTAIN
GLENDALE
MARICOPA
SALT RIVER INDIAN COMM
WITTMANN
CAVE CREEKCIRCLE CITY
AVONDALE
SUN CITY
WICKENBURG
FOUNTAIN HILLS
Fire Stations! Phoenix! Automatic Aid
2010 Tech Rescue IncidentsLess Than 1010 - 2020 - 30 30 - 40Over 40
¯
0 10 205Miles
Management Partners 2011
2010 Tech Rescue Incident DensityPer Square Mile
Phoenix Fire Department
Technical Rescue CompaniesDeploying From:Phoenix:Station 8Station 12Station 25Station 28Station 45Station 72
Automatic Aid:Station 159Station 172Station 191Station 197Station 271Station 276Station 283Station 606Station 703
Map 8


GILA BEND
PHOENIX
HARQUAHALA
TONOPAH
MESA
BUCKEYE VALLEY
GOODYEAR
BUCKEYE
PEORIA
GILA RIVER INDIAN COMM
SCOTTSDALESURPRISE
GILBERT
CASA GRANDE
CHANDLER
TEMPE
DAISY MOUNTAIN
GLENDALE
MARICOPA
SALT RIVER INDIAN COMM
WITTMANN
CAVE CREEKCIRCLE CITY
AVONDALE
SUN CITY
WICKENBURG
FOUNTAIN HILLS
Fire Stations! Phoenix! Automatic Aid
Number of Engines1234 or More
¯
0 10 205Miles
Management Partners 2011
Existing Engine Company4-Minute Response Capabilities
Phoenix Fire Department
81.53% of Phoenix Streets Covered By 4 Minute Engine Response
Map 9

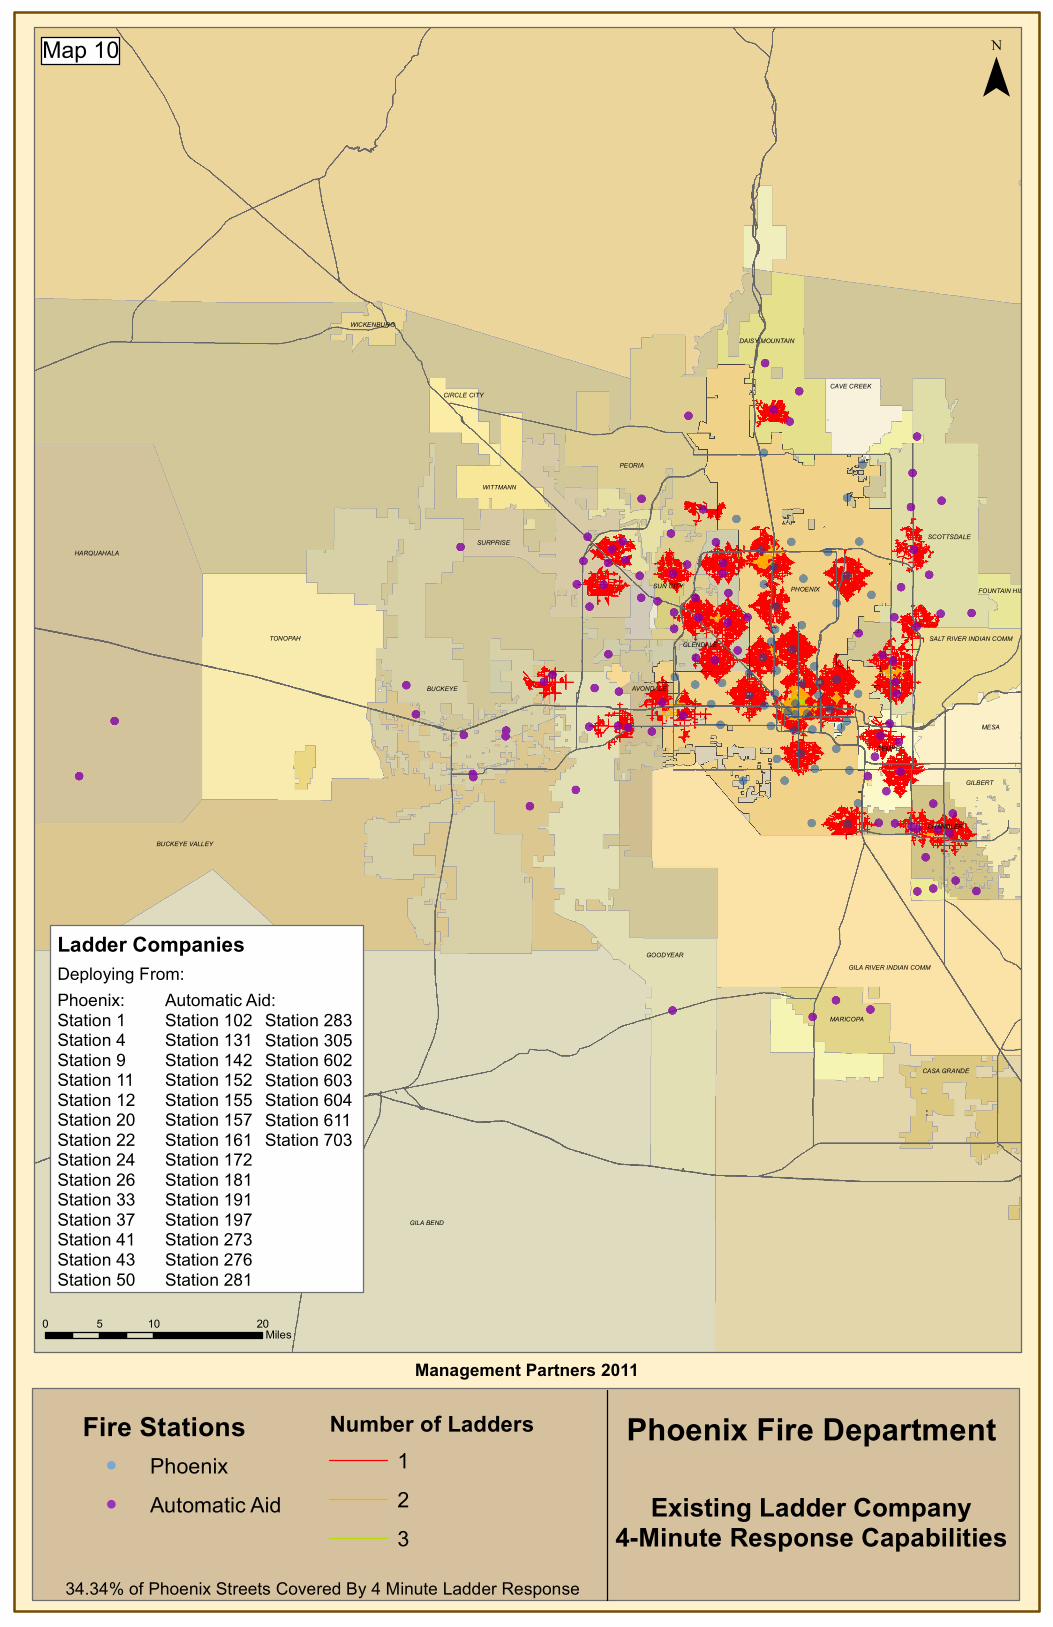
GILA BEND
PHOENIX
HARQUAHALA
TONOPAH
MESA
BUCKEYE VALLEY
GOODYEAR
BUCKEYE
PEORIA
GILA RIVER INDIAN COMM
SCOTTSDALESURPRISE
GILBERT
CASA GRANDE
CHANDLER
TEMPE
DAISY MOUNTAIN
GLENDALE
MARICOPA
SALT RIVER INDIAN COMM
WITTMANN
CAVE CREEKCIRCLE CITY
AVONDALE
SUN CITY
WICKENBURG
FOUNTAIN HILLS
Fire Stations! Phoenix! Automatic Aid
Number of Ladders123
¯
0 10 205Miles
Management Partners 2011
Existing Ladder Company4-Minute Response Capabilities
Phoenix Fire Department
34.34% of Phoenix Streets Covered By 4 Minute Ladder Response
Ladder CompaniesDeploying From:Phoenix:Station 1Station 4Station 9Station 11Station 12Station 20Station 22Station 24Station 26Station 33Station 37Station 41Station 43Station 50
Automatic Aid:Station 102Station 131Station 142Station 152Station 155Station 157Station 161Station 172Station 181Station 191Station 197Station 273Station 276Station 281
Station 283Station 305Station 602Station 603Station 604Station 611Station 703
Map 10


GILA BEND
PHOENIX
HARQUAHALA
TONOPAH
MESA
BUCKEYE VALLEY
GOODYEAR
BUCKEYE
PEORIA
GILA RIVER INDIAN COMM
SCOTTSDALESURPRISE
GILBERT
CASA GRANDE
CHANDLER
TEMPE
DAISY MOUNTAIN
GLENDALE
MARICOPA
SALT RIVER INDIAN COMM
WITTMANN
CAVE CREEKCIRCLE CITY
AVONDALE
SUN CITY
WICKENBURG
FOUNTAIN HILLS
Fire Stations! Phoenix! Automatic Aid
Number of Rescues123
¯
0 10 205Miles
Management Partners 2011
Existing Rescue Company(Ambulance)
24 Hours4-Minute Response Capabilities
Phoenix Fire Department
44.15% of Phoenix Streets Covered By 4 Minute Rescue Response
Rescue CompaniesDeploying From:Phoenix:Station 3Station 5Station 7Station 9Station 11Station 12Station 13Station 15Station 17Station 18Station 21Station 22Station 25Station 26Station 27Station 28
Station 29Station 30Station 31Station 32Station 33Station 35Station 36Station 40Station 42Station 43Station 45Station 50Station 57Station 59Station 60
Map 11


GILA BEND
PHOENIX
HARQUAHALA
TONOPAH
MESA
BUCKEYE VALLEY
GOODYEAR
BUCKEYE
PEORIA
GILA RIVER INDIAN COMM
SCOTTSDALESURPRISE
GILBERT
CASA GRANDE
CHANDLER
TEMPE
DAISY MOUNTAIN
GLENDALE
MARICOPA
SALT RIVER INDIAN COMM
WITTMANN
CAVE CREEKCIRCLE CITY
AVONDALE
SUN CITY
WICKENBURG
FOUNTAIN HILLS
Fire Stations! Phoenix! Automatic Aid
Number of Rescues1234 or More
¯
0 10 205Miles
Management Partners 2011
83.44% of Phoenix Streets Covered By 8 Minute Rescue Response
Rescue CompaniesDeploying From:Phoenix:Station 3Station 5Station 7Station 9Station 11Station 12Station 13Station 15Station 17Station 18Station 21Station 22Station 25Station 26Station 27Station 28
Station 29Station 30Station 31Station 32Station 33Station 35Station 36Station 40Station 42Station 43Station 45Station 50Station 57Station 59Station 60
Existing Rescue Company(Ambulance)
24 Hours8-Minute Response Capabilities
Phoenix Fire Department
Map 12


GILA BEND
PHOENIX
HARQUAHALA
TONOPAH
MESA
BUCKEYE VALLEY
GOODYEAR
BUCKEYE
PEORIA
GILA RIVER INDIAN COMM
SCOTTSDALESURPRISE
GILBERT
CASA GRANDE
CHANDLER
TEMPE
DAISY MOUNTAIN
GLENDALE
MARICOPA
SALT RIVER INDIAN COMM
WITTMANN
CAVE CREEKCIRCLE CITY
AVONDALE
SUN CITY
WICKENBURG
FOUNTAIN HILLS
Fire Stations! Phoenix! Automatic Aid
Number of Battalions1234 or More
¯
0 10 205Miles
Management Partners 2011
Existing Battalion Command8-Minute Response Capabilities
Phoenix Fire Department
65.37% of Phoenix Streets Covered By 8 Minute Battalion Response
Battalion CommandsPhoenix:Station 9Station 12Station 18Station 19Station 22Station 25Station 30Station 41Station 52
Deploying from:
Map 13

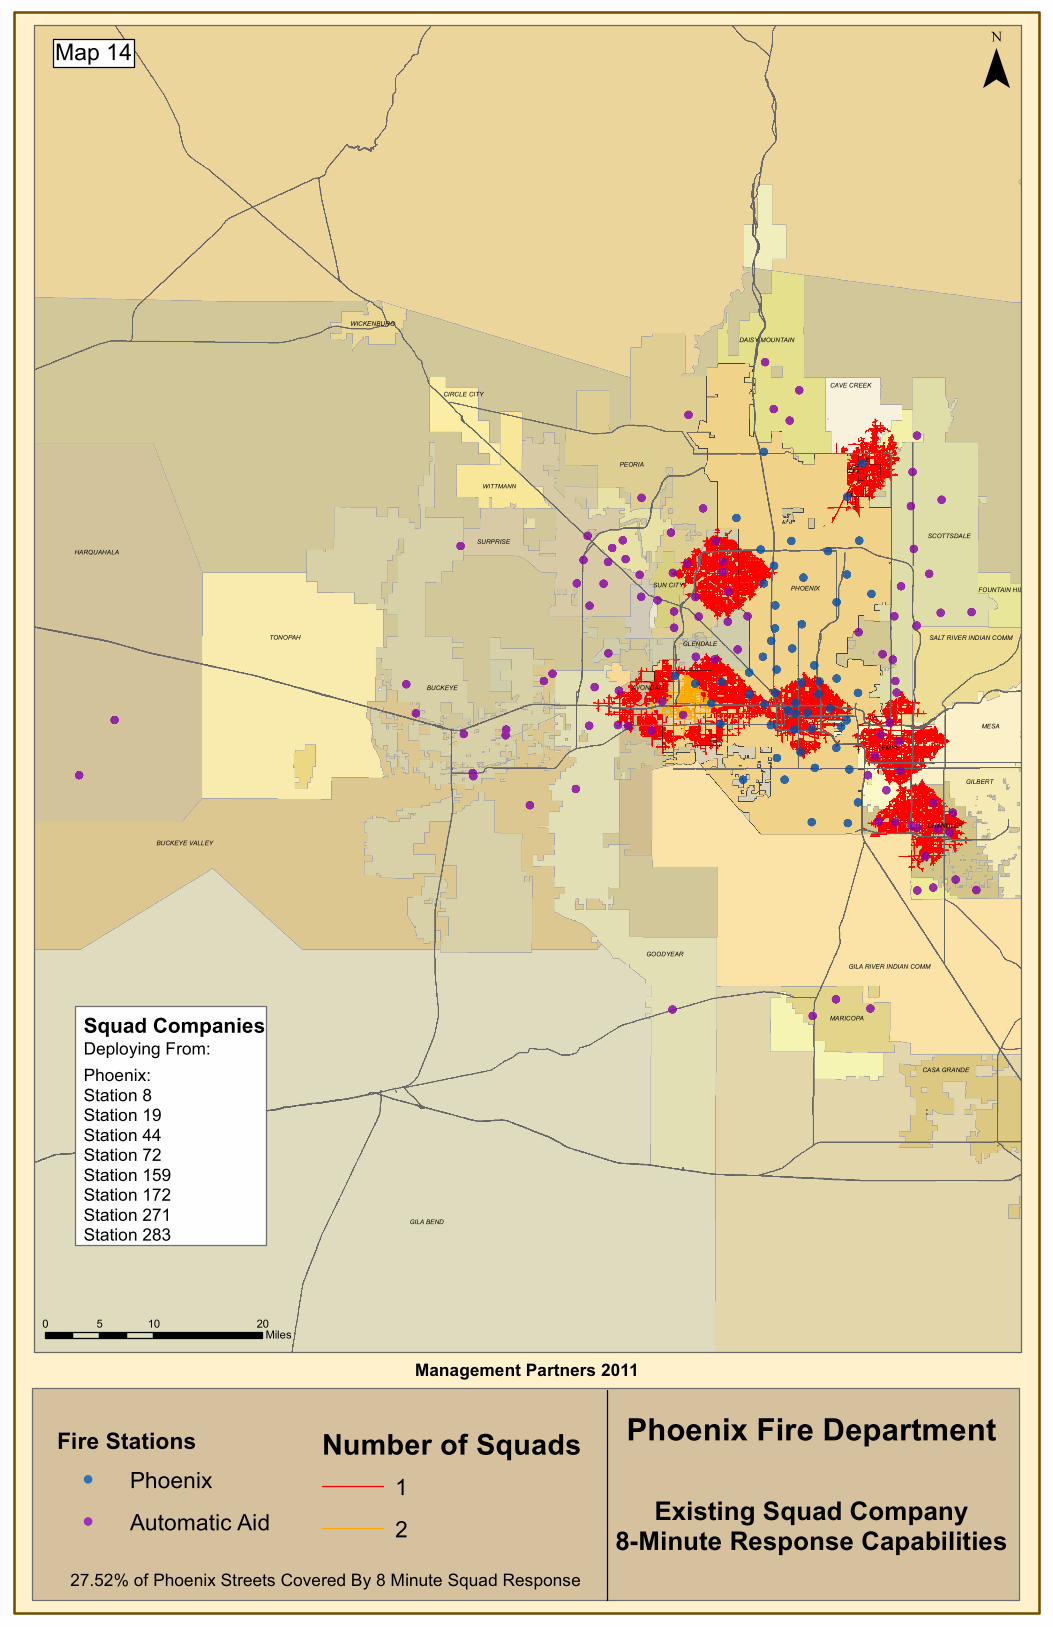
GILA BEND
PHOENIX
HARQUAHALA
TONOPAH
MESA
BUCKEYE VALLEY
GOODYEAR
BUCKEYE
PEORIA
GILA RIVER INDIAN COMM
SCOTTSDALESURPRISE
GILBERT
CASA GRANDE
CHANDLER
TEMPE
DAISY MOUNTAIN
GLENDALE
MARICOPA
SALT RIVER INDIAN COMM
WITTMANN
CAVE CREEKCIRCLE CITY
AVONDALE
SUN CITY
WICKENBURG
FOUNTAIN HILLS
¯
0 10 205Miles
Management Partners 2011
Existing Squad Company8-Minute Response Capabilities
Phoenix Fire DepartmentFire Stations! Phoenix! Automatic Aid
Number of Squads12
27.52% of Phoenix Streets Covered By 8 Minute Squad Response
Squad CompaniesPhoenix:Station 8Station 19Station 44Station 72Station 159Station 172Station 271Station 283
Deploying From:
Map 14


GILA BEND
PHOENIX
HARQUAHALA
TONOPAH
MESA
BUCKEYE VALLEY
GOODYEAR
BUCKEYE
PEORIA
GILA RIVER INDIAN COMM
SCOTTSDALESURPRISE
GILBERT
CASA GRANDE
CHANDLER
TEMPE
DAISY MOUNTAIN
GLENDALE
MARICOPA
SALT RIVER INDIAN COMM
WITTMANN
CAVE CREEKCIRCLE CITY
AVONDALE
SUN CITY
WICKENBURG
FOUNTAIN HILLS
Fire Stations! Phoenix! Automatic Aid
Initial Full Alarm
¯
0 10 205Miles
Management Partners 2011
Existing NFPA 1710 Initial Full Alarm8-Minute Response Capabilities
15 Fire Fighters
Phoenix Fire Department
83.87% of Phoenix Streets Covered By Initial Full Alarm
Apparatus Deployed
Ladder Tender 161
Engine 1Engine 10Engine 101Engine 102Engine 103Engine 11Engine 12Engine 121Engine 122Engine 13Engine 131Engine 132Engine 133Engine 14Engine 141Engine 142Engine 145Engine 146Engine 15Engine 150Engine 151Engine 152Engine 153Engine 154Engine 155Engine 156Engine 157Engine 158Engine 159Engine 16Engine 161Engine 161Engine 17Engine 171Engine 18
Ladder 1Ladder 11Ladder 12Ladder 131Ladder 142Ladder 152Ladder 155Ladder 157Ladder 172Ladder 173Ladder 181Ladder 191Ladder 197Ladder 20Ladder 22Ladder 24Ladder 26
HazMat 141HazMat 157HazMat 183HazMat 184HazMat 193HazMat 272HazMat 283HazMat 305HazMat 4HazMat 605
Utility 10Utility 153Utility 172Utility 274Utility 288Utility 29Utility 50Utility 606
Engine 182Engine 183Engine 184Engine 185Engine 191Engine 192Engine 193Engine 194Engine 195Engine 196Engine 197Engine 199Engine 2Engine 20Engine 21Engine 22Engine 2282Engine 23Engine 231Engine 232Engine 24Engine 241Engine 25Engine 26Engine 27Engine 271Engine 272Engine 273Engine 274Engine 275Engine 276Engine 277Engine 278Engine 28Engine 2810
Engine 282Engine 283Engine 284Engine 285Engine 286Engine 287Engine 288Engine 289Engine 29Engine 3Engine 30Engine 301Engine 302Engine 303Engine 304Engine 306Engine 307Engine 31Engine 32Engine 321Engine 326Engine 328Engine 33Engine 35Engine 36Engine 37Engine 371Engine 38Engine 39Engine 4Engine 40Engine 41Engine 42Engine 43Engine 44
Engine 45Engine 46Engine 48Engine 49Engine 5Engine 50Engine 52Engine 54Engine 56Engine 57Engine 571Engine 572Engine 574Engine 575Engine 58Engine 59Engine 6Engine 601Engine 6012Engine 602Engine 605Engine 606Engine 607Engine 608Engine 609Engine 61Engine 610Engine 613Engine 614Engine 615Engine 616Engine 7Engine 701Engine 705Engine 706
Engine 8Engine 9Engine 905Engine 91Engine 910Engine 918Engine 92Engine 925Engine 929Engine 930Engine 935Engine 960HAR 1SC01SC02
Engines:
Ladders: HazMat: Utility:Ladder 273Ladder 276Ladder 281Ladder 283Ladder 305Ladder 33Ladder 37Ladder 4Ladder 41Ladder 43Ladder 50Ladder 602Ladder 603Ladder 604Ladder 611Ladder 703Ladder 9
Battalions:Battalion 1 Ballation 2 Battalion 8 Batallion 19 Batallion 5 Battalion 3 NDC Battalion 4 Battalion 6 Battalion 101 Battalion 102Battalion 121 Battalion 131 Battalion 146 Battalion 151 WDC Battalion 152 Battalion 161 Battalion 171 Battalion 181 Battalion 192 Battalion 231 Battalion 271 Battalion 281 Battalion 282 Battalion 301 Battalion 321 Battalion 371 Battalion 571 Battalion 601 Battalion 602 Battalion 701
Map 15


GILA BEND
PHOENIX
HARQUAHALA
TONOPAH
MESA
BUCKEYE VALLEY
GOODYEAR
BUCKEYE
PEORIA
GILA RIVER INDIAN COMM
SCOTTSDALESURPRISE
GILBERT
CASA GRANDE
CHANDLER
TEMPE
DAISY MOUNTAIN
GLENDALE
MARICOPA
SALT RIVER INDIAN COMM
WITTMANN
CAVE CREEKCIRCLE CITY
AVONDALE
SUN CITY
WICKENBURG
FOUNTAIN HILLS
Fire Stations! Phoenix! Automatic Aid
Initial Attack
¯
0 10 205Miles
Management Partners 2011
Existing NFPA 1710 Initial AttackHigh Hazards
8-Minute Response Capabilities26 Fire Fighters
Phoenix Fire Department
65.46% of Phoenix Streets Covered By Initial Attack
Apparatus Deployed
Ladder Tender 161
Engine 1Engine 10Engine 101Engine 102Engine 103Engine 11Engine 12Engine 121Engine 122Engine 13Engine 131Engine 132Engine 133Engine 14Engine 141Engine 142Engine 145Engine 146Engine 15Engine 150Engine 151Engine 152Engine 153Engine 154Engine 155Engine 156Engine 157Engine 158Engine 159Engine 16Engine 161Engine 161Engine 17Engine 171Engine 18
Ladder 1Ladder 11Ladder 12Ladder 131Ladder 142Ladder 152Ladder 155Ladder 157Ladder 172Ladder 173Ladder 181Ladder 191Ladder 197Ladder 20Ladder 22Ladder 24Ladder 26
HazMat 141HazMat 157HazMat 183HazMat 184HazMat 193HazMat 272HazMat 283HazMat 305HazMat 4HazMat 605
Utility 10Utility 153Utility 172Utility 274Utility 288Utility 29Utility 50Utility 606
Engine 182Engine 183Engine 184Engine 185Engine 191Engine 192Engine 193Engine 194Engine 195Engine 196Engine 197Engine 199Engine 2Engine 20Engine 21Engine 22Engine 2282Engine 23Engine 231Engine 232Engine 24Engine 241Engine 25Engine 26Engine 27Engine 271Engine 272Engine 273Engine 274Engine 275Engine 276Engine 277Engine 278Engine 28Engine 2810
Engine 282Engine 283Engine 284Engine 285Engine 286Engine 287Engine 288Engine 289Engine 29Engine 3Engine 30Engine 301Engine 302Engine 303Engine 304Engine 306Engine 307Engine 31Engine 32Engine 321Engine 326Engine 328Engine 33Engine 35Engine 36Engine 37Engine 371Engine 38Engine 39Engine 4Engine 40Engine 41Engine 42Engine 43Engine 44
Engine 45Engine 46Engine 48Engine 49Engine 5Engine 50Engine 52Engine 54Engine 56Engine 57Engine 571Engine 572Engine 574Engine 575Engine 58Engine 59Engine 6Engine 601Engine 6012Engine 602Engine 605Engine 606Engine 607Engine 608Engine 609Engine 61Engine 610Engine 613Engine 614Engine 615Engine 616Engine 7Engine 701Engine 705Engine 706
Engine 8Engine 9Engine 905Engine 91Engine 910Engine 918Engine 92Engine 925Engine 929Engine 930Engine 935Engine 960HAR 1SC01SC02
Engines:
Ladders: HazMat: Utility:Ladder 273Ladder 276Ladder 281Ladder 283Ladder 305Ladder 33Ladder 37Ladder 4Ladder 41Ladder 43Ladder 50Ladder 602Ladder 603Ladder 604Ladder 611Ladder 703Ladder 9
Battalions:Battalion 1 Ballation 2 Battalion 8 Batallion 19 Batallion 5 Battalion 3 NDC Battalion 4 Battalion 6 Battalion 101 Battalion 102Battalion 121 Battalion 131 Battalion 146 Battalion 151 WDC Battalion 152 Battalion 161 Battalion 171 Battalion 181 Battalion 192 Battalion 231 Battalion 271 Battalion 281 Battalion 282 Battalion 301 Battalion 321 Battalion 371 Battalion 571 Battalion 601 Battalion 602 Battalion 701
Map 16


GILA BEND
PHOENIX
HARQUAHALA
TONOPAH
MESA
BUCKEYE VALLEY
GOODYEAR
BUCKEYE
PEORIA
GILA RIVER INDIAN COMM
SCOTTSDALESURPRISE
GILBERT
CASA GRANDE
CHANDLER
TEMPE
DAISY MOUNTAIN
GLENDALE
MARICOPA
SALT RIVER INDIAN COMM
WITTMANN
CAVE CREEKCIRCLE CITY
AVONDALE
SUN CITY
WICKENBURG
FOUNTAIN HILLS
Fire Stations! Phoenix! Automatic Aid
Rescue Incidents
¯
0 10 205Miles
Management Partners 2011
Rescue Calls Over 10 MinutesDisptach to On Scene - Code 3
July 1, 2010 - June 30, 2011
Phoenix Fire Department
2,067 Incidents
Map 17


GILA BEND
PHOENIX
HARQUAHALA
TONOPAH
MESA
BUCKEYE VALLEY
GOODYEAR
BUCKEYE
PEORIA
GILA RIVER INDIAN COMM
SCOTTSDALESURPRISE
GILBERT
CASA GRANDE
CHANDLER
TEMPE
DAISY MOUNTAIN
GLENDALE
MARICOPA
SALT RIVER INDIAN COMM
WITTMANN
CAVE CREEKCIRCLE CITY
AVONDALE
SUN CITY
WICKENBURG
FOUNTAIN HILLS
Fire Stations! Phoenix! Automatic Aid
Rescue Incidents
¯
0 10 205Miles
Management Partners 2011
Rescue Calls Over 15 MinutesDisptach to On Scene - Code 3
July 1, 2010 - June 30, 2011
Phoenix Fire Department
Map 18
394 Incidents


Fire Department Innovation and Efficiency Study Attachment C – Employee Survey Results Management Partners
132
Attachment C – Employee Survey Results


1
Summary of Survey Results
Management Partners prepared a survey to solicit input from all PFD employees. Chief Khan sent an initial email to all employees inviting participation and a reminder email as well. Of the 776 surveys completed, 651 (84%) were from sworn personnel and 125 (16%) were from non‐sworn personnel. The survey results were tallied by sworn and non‐sworn responses because some questions apply more directly to one area compared with another (e.g., frequency of firefighter training is sufficient). Highlights The highlights are reported in the following sections:
• Staffing • Employee Safety, Skills and Training • Technology, Facilities and Equipment • Organization, Support Services and Technical Response • Customer Service and Community Involvement • Respondent Demographics
We have not commented on every question, rather we have highlighted those questions where answers may signal differences of opinion between sworn and non‐sworn employees or where the majority indicate changes may be needed.
Staffing A majority of sworn respondents agreed or strongly agreed that EMS staffing levels, paramedic staffing and fire apparatus staffing are the right size to meet community needs (56%, 59% and 55%, respectively). For each of these three questions, half or close to half of the non‐sworn respondents indicated “don’t know/not applicable.” When asked to agree or disagree with the statement, “Ambulance staffing is the right size to meet community needs,” 77% of sworn staff indicated that they disagreed or strongly disagreed. Again, a sizeable majority (44%) of non‐sworn indicated “don’t know/not applicable.” Responses to the statement, “Fire prevention staffing is the right size to meet community needs,” reflected concerns on the part of all respondents. Of sworn respondents, 37% agreed or strongly agreed with the statement, 41% disagreed or strongly disagreed, while 23% indicated “don’t know/not applicable.” Of non‐sworn respondents, only 26% indicated that they agreed or strongly agreed, 41% disagreed or strongly disagreed with the statement, and 33% indicated “don’t know/not applicable.” Responses to the statement, “Alarm Room staffing is the right size to meet community needs,” reflected similar concerns, with the negative outweighing positive responses. Of sworn respondents, 32% agreed or strongly agreed, 38% disagreed or strongly disagreed and 30% indicated “don’t know/not applicable.” Of non‐sworn respondents, 21% agreed or strongly agreed, 42% disagreed or strongly disagreed and 37% indicated “don’t know/not applicable.”
2
Overwhelmingly, sworn respondents indicated that recruitment and retention were being done well and that there are sufficient promotional opportunities. However, the responses to the statement, “Our department does a good job recruiting civilian members,” showed a difference in opinions, as 63% of sworn agreed or strongly agreed while less than half (47%) of non‐sworn respondents agreed or strongly agreed. The next two statements on the survey showed a similar disparity. Of those responding to the statement, “Our department has sufficient promotional opportunities,” 69% of sworn agreed or strongly agreed while 55% of non‐sworn disagreed or strongly disagreed. The pattern continued with responses to the questions, “Our department recognizes employees appropriately.” Again, a majority (74%) of sworn expressed agreement while a majority of non‐sworn (56%) expressed disagreement. The statement, “Morale in the department is good,” showed similar differences. Four out of five sworn respondents (81%) agreed or strongly agreed while 54% of the non‐sworn respondents expressed the opposite sentiment. Interestingly, the majority of all respondents feel their work is valued by their colleagues, as indicated by 93% of sworn and 72% of non‐sworn. A much greater percentage of sworn employees (94%) indicated their work was valued by their supervisors than did non‐sworn employees (67%). However, both groups indicated their work is valued by their customer (93% and 90%, respectively). Employee Safety, Skills and Training Responses to statements about equipment and safety indicated a general satisfaction. Similarly, responses to statements about employee skills and training showed general satisfaction among sworn personnel. However, several of the statements relating to non‐sworn personnel received negative reactions by respondents. Of the non‐sworn employees responding to the statement, “Frequency of civilian member training is sufficient,” 38% disagreed and 21% strongly disagreed. Similarly, of the non‐sworn employees responding to the statement, “Frequency of civilian supervisory training is sufficient,” 29% of respondents disagreed and 26% strongly disagreed. Half of the respondents disagreed or strongly disagreed with the statement, “Quality of civilian member training is sufficient,” while 43% agreed or strongly agreed. Technology, Facilities and Equipment The overwhelming majority (92%) of sworn respondents expressed general agreement with the statement, “The PFD has up‐to‐date technology for fighting fires and providing EMS and rescue.” The majority of sworn respondents indicated general agreement with the other statements regarding technology, facilities and equipment. Many non‐sworn respondents answered “don’t know/not applicable” to the statements in this section, with two exceptions. The first was the statement, “The PFD has up‐to‐date administrative technology,” to which 54% agreed or strongly agreed. The second was the statement, “The condition of our administrative and support facilities is adequate,” to which 74% of non‐sworn respondents agreed or strongly agreed. Organization, Support Services and Technical Response The majority of respondents throughout the department agreed or strongly agreed with the statement, “Teamwork within the Fire Department is good,” as indicated by 95% of sworn respondents and 63% of non‐sworn respondents. Sworn respondents answered similarly to all of the other statements in this section. However, nearly two‐thirds of non‐sworn respondents (62%) disagreed or strongly disagreed with the statement, “Communication from management to civilian staff is good.”

3
Customer Service and Community Involvement Overwhelmingly, respondents indicated that customer service in the department is good, as indicated by 97% of sworn and 87% of non‐sworn respondents. Many respondents answered, “don’t know/not applicable” to the statements in this section, indicating less familiarity with the services being queried. Respondent Demographics The tables below show respondents, by position as well as by years of service with the PFD. Position Sworn Non‐SwornFirefighter 279 (36%)Engineer 143 (18.4%)Captain 204 (26.3%Battalion or Division Chief 28 (3.6%)Any other Chief level title 25 (3.2%)Civilian staff member 94 (75.2%)Civilian manager or supervisor 37 (4.8%)Other 4 (0.6%) 1 (0.8%)Total 651 125
Position Sworn Non‐SwornLess than 1 year 13 (2%) 0 (0%)1 to 5 years 108 (17%) 32 (26%)6 to 10 years 123 (19%) 31 (25%)11 to 15 years 111 (17%) 21 (17%)16 to 20 years 92 (14%) 20 (16%)21 to 25 years 90 (14%) 10 (8%)26 to 30 years 79 (12%) 10 (8%)Over 30 years 32 (5%) 1 (1%)

Sworn Non-Sworn Response Count
80 (12%) 4 (3%) 84 (11%)284 (44%) 35 (28%) 319 (41%)182 (28%) 16 (13%) 198 (26%)77 (12%) 6 (5%) 83 (11%)27 (4%) 64 (51%) 91 (12%)
650 125 775
94 (14%) 7 (6%) 101 (13%)293 (45%) 35 (28%) 328 (42%)190 (29%) 17 (14%) 207 (27%)
50 (8%) 4 (3%) 54 (7%)23 (4%) 61 (49%) 84 (11%)
650 124 774
86 (13%) 10 (8%) 96 (12%)273 (42%) 30 (25%) 303 (39%)190 (29%) 22 (18%) 212 (27%)83 (13%) 4 (3%) 87 (11%)17 (3%) 56 (46%) 73 (9%)
649 122 771
37 (6%) 8 (6%) 45 (6%)100 (15%) 24 (19%) 124 (16%)265 (41%) 22 (18%) 287 (37%)235 (36%) 16 (13%) 251 (32%)
12 (2%) 54 (44%) 66 (9%)649 124 773
39 (6%) 5 (4%) 44 (6%)198 (31%) 27 (22%) 225 (29%)181 (28%) 29 (24%) 210 (27%)81 (13%) 21 (17%) 102 (13%)
149 (23%) 41 (33%) 190 (25%)648 123 771
31 (5%) 6 (5%) 37 (5%)175 (27%) 20 (16%) 195 (25%)164 (25%) 26 (21%) 190 (25%)81 (13%) 26 (21%) 107 (14%)
197 (30%) 46 (37%) 243 (31%)648 124 772
78 (12%) 10 (8%) 88 (11%)331 (51%) 44 (35%) 375 (49%)115 (18%) 21 (17%) 136 (18%)
54 (8%) 21 (17%) 75 (10%)71 (11%) 28 (23%) 99 (13%)
649 124 773
1. EMS staffing is the right size to meet community needs.
Strongly Agree
Don’t Know/ Not Applicable
Disagree
Strongly Agree
Agree
Disagree
Agree
Don’t Know/ Not Applicable
Q1. Staffing
Agree
2. Paramedic staffing is the right size to meet community needs.
Strongly Agree
Disagree
Phoenix Fire Employee Survey
Strongly Disagree
Strongly Agree
Disagree
6. Alarm Room staffing is the right size to meet community needs.
Agree
Disagree
Disagree
Strongly Agree
Strongly Disagree
4. Ambulance staffing is the right size to meet community needs.
Strongly Disagree
Strongly Disagree
Disagree
Strongly Agree
Don’t Know/ Not Applicable
Don’t Know/ Not Applicable
Answer Options
7. Supervisory staffing is the right size to meet department needs.
Strongly Disagree
Agree
3. Fire apparatus staffing is the right size to meet community needs.
Don’t Know/ Not Applicable
Don’t Know/ Not Applicable
Agree
Agree
Don’t Know/ Not Applicable
Strongly Disagree
Strongly Agree
5. Fire prevention staffing is the right size to meet community needs.
Strongly Disagree
Phoenix Fire Employee Survey
Management Partners
4
Walls
MP Logo

Phoenix Fire Employee Survey
Sworn Non-Sworn Response Count
144 (22%) 12 (10%) 156 (20%)434 (67%) 46 (37%) 480 (62%)
35 (5%) 5 (4%) 40 (5%)20 (3%) 0 (0%) 20 (3%)16 (2%) 60 (48%) 76 (10%)
649 123 772
184 (28%) 27 (22%) 211 (27%)375 (58%) 66 (53%) 441 (57%)
55 (8%) 4 (3%) 59 (8%)13 (2%) 5 (4%) 18 (2%)23 (4%) 21 (17%) 44 (6%)
650 123 773
108 (17%) 11 (9%) 119 (15%)296 (46%) 47 (38%) 343 (44%)
44 (7%) 29 (23%) 73 (9%)8 (1%) 25 (20%) 33 (4%)
190 (29%) 11 (9%) 201 (26%)646 123 769
359 (55%) 43 (35%) 402 (52%)269 (42%) 58 (47%) 327 (42%)
10 (2%) 0 (0%) 10 (1%)6 (1%) 2 (2%) 8 (1%)
3 (0.5%) 22 (18%) 25 (3%)647 125 772
167 (26%) 14 (11%) 181 (23%)275 (42%) 51 (41%) 326 (42%)
22 (3%) 29 (23%) 51 (7%)5 (1%) 23 (19%) 28 (4%)
180 (28%) 6 (5%) 186 (24%)649 123 772
88 (14%) 4 (3%) 92 (12%)354 (55%) 39 (31%) 393 (51%)133 (21%) 33 (27%) 166 (22%)63 (10%) 35 (28%) 98 (13%)
8 (1%) 12 (10%) 20 (3%)646 123 769
94 (15%) 5 (4%) 99 (13%)381 (59%) 43 (35%) 424 (55%)127 (20%) 42 (34%) 169 (22%)
33 (5%) 27 (22%) 60 (8%)11 (2%) 5 (4%) 16 (2%)
646 122 768
Agree
Strongly Disagree
12. Our department does a good job retaining civilian members.
Disagree
Disagree
14. Our department recognizes employees appropriately.
Agree
Strongly Disagree
Don’t Know/ Not Applicable
Disagree
Don’t Know/ Not Applicable
Agree
Strongly Disagree
Strongly Agree
Strongly Disagree
Strongly Agree
Don’t Know/ Not Applicable
Don’t Know/ Not Applicable
Disagree
8. On-scene incident management staffing is the right size to manage most incidents.
Strongly Agree
10. Our department does a good job recruiting civilian members.
Agree
11. Our department does a good job retaining firefighters.
Strongly Agree
Strongly Agree
Don’t Know/ Not Applicable
Agree
Disagree
Disagree
Strongly Disagree
Strongly Disagree
Disagree
13. Our department has sufficient promotional opportunities.
9. Our department does a good job recruiting firefighters.
Don’t Know/ Not Applicable
Agree
Agree
Strongly Agree
Don’t Know/ Not Applicable
Strongly Disagree
Strongly Agree
Q1. StaffingAnswer Options
Phoenix Fire Employee Survey
Management Partners
5
Walls
MP Logo

Phoenix Fire Employee Survey
Sworn Non-Sworn Response Count
108 (17%) 6 (5%) 114 (15%)414 (64%) 50 (40%) 464 (60%)93 (14%) 43 (35%) 136 (18%)31 (5%) 23 (19%) 54 (7%)4 (1%) 3 (2%) 7 (1%)
650 125 775
107 (16%) 16 (13%) 123 (16%)443 (68%) 75 (60%) 518 (67%)73 (11%) 18 (15%) 91 (12%)21 (3%) 12 (10%) 33 (4%)6 (1%) 2 (2%) 8 (1%)
650 123 773
51 (8%) 7 (6%) 58 (8%)337 (52%) 28 (23%) 365 (47%)89 (14%) 28 (23%) 117 (15%)23 (4%) 13 (10%) 36 (5%)
145 (22%) 47 (38%) 192 (25%)645 123 768
178 (27%) 31 (25%) 209 (27%)429 (66%) 58 (47%) 487 (63%)
24 (4%) 20 (16%) 44 (6%)11 (2%) 14 (11%) 25 (3%)7 (1%) 2 (2%) 9 (1%)
649 125 774
207 (32%) 34 (27%) 241 (31%)401 (62%) 50 (40%) 451 (58%)
26 (4%) 25 (20%) 51 (7%)9 (1%) 13 (10%) 22 (3%)6 (1%) 2 (2%) 8 (1%)
649 124 773
224 (35%) 49 (40%) 273 (35%)375 (58%) 62 (50%) 437 (57%)
33 (5%) 5 (4%) 38 (5%)9 (1%) 3 (2%) 12 (2%)8 (1%) 5 (4%) 13 (2%)
649 124 773
Disagree
16. Employee performance is evaluated regularly.
Strongly Agree
Strongly Agree
Don’t Know/ Not Applicable
Disagree
19. My work is valued by my supervisor.
Agree
Agree
Strongly Disagree
Strongly Agree
Strongly Disagree
Agree
Don’t Know/ Not ApplicableStrongly Disagree
Strongly Agree
Disagree
Disagree
Strongly Disagree
Strongly Agree
15. Employee morale in the department is good.
17. Succession planning meets the needs of our department.
Disagree
20. My work is valued by my customer.
Agree
Agree
Strongly Disagree
18. My work is valued by my colleagues.
Don’t Know/ Not Applicable
Strongly Disagree
Disagree
Strongly Agree
Don’t Know/ Not Applicable
Don’t Know/ Not Applicable
Agree
Don’t Know/ Not Applicable
Q1. StaffingAnswer Options
Phoenix Fire Employee Survey
Management Partners
6
Walls
MP Logo

Phoenix Fire Employee Survey
Sworn Non-Sworn Response Count
259 (40%) 13 (10%) 272 (35%)374 (58%) 79 (63%) 453 (59%)
14 (2%) 10 (8%) 24 (3%)2 (0.3%) 2 (2%) 4 (1%)0 (0%) 21 (17%) 21 (3%)
649 125 774
271 (42%) 17 (14%) 288 (37%)350 (54%) 71 (57%) 421 (54%)
26 (4%) 5 (4%) 31 (4%)2 (0.3%) 0 (0%) 2 (0.3%)1 (0.2%) 32 (26%) 33 (4%)
650 125 775
202 (31%) 12 (10%) 214 (28%)417 (64%) 66 (53%) 483 (62%)
28 (4%) 10 (8%) 38 (5%)2 (0.3%) 1 (1%) 3 (0.4%)0 (0%) 35 (28%) 35 (5%)
649 124 773
185 (29%) 10 (8%) 195 (25%)376 (58%) 55 (44%) 431 (56%)
41 (6%) 4 (3%) 45 (6%)4 (1%) 0 (0%) 4 (1%)
42 (6%) 55 (44%) 97 (13%)648 124 772
182 (28%) 8 (6%) 190 (25%)385 (59%) 42 (34%) 427 (55%)
34 (5%) 10 (8%) 44 (6%)3 (0.5%) 0 (0%) 3 (0.4%)44 (7%) 64 (51%) 108 (14%)
648 124 772
190 (29%) 7 (6%) 197 (25%)404 (62%) 66 (53%) 470 (61%)
46 (7%) 18 (14%) 64 (8%)6 (1%) 4 (3%) 10 (1%)4 (1%) 30 (24%) 34 (4%)
650 125 775
Q2. Employee SafetyAnswer Options1. Our safety procedures and practices are satisfactory.Strongly AgreeAgreeDisagreeStrongly DisagreeDon’t Know/ Not Applicable
2. There is sufficient personal safety equipment available.Strongly AgreeAgreeDisagreeStrongly DisagreeDon’t Know/ Not Applicable
3. Personal safety equipment is used appropriately.Strongly AgreeAgreeDisagreeStrongly DisagreeDon’t Know/ Not Applicable
4. There is sufficient advanced operational safety equipment available.Strongly AgreeAgreeDisagreeStrongly DisagreeDon’t Know/ Not Applicable
5. Advanced operational safety equipment is used appropriately.Strongly AgreeAgreeDisagreeStrongly DisagreeDon’t Know/ Not Applicable
6. Safety training for employees is sufficient.Strongly AgreeAgreeDisagreeStrongly DisagreeDon’t Know/ Not Applicable
Phoenix Fire Employee Survey
Management Partners
7
Walls
MP Logo

Phoenix Fire Employee Survey
Sworn Non-Sworn Response Count
115 (18%) 10 (8%) 125 (16%)431 (66%) 59 (47%) 490 (63%)95 (15%) 27 (22%) 122 (16%)
8 (1%) 8 (6%) 16 (2%)2 (0.3%) 21 (17%) 23 (3%)
651 125 776
149 (23%) 14 (11%) 163 (21%)470 (72%) 82 (66%) 552 (71%)
30 (5%) 16 (13%) 46 (6%)0 (0%) 2 (2%) 2 (0.3%)
1 (0.2%) 10 (8%) 11 (1%)650 124 774
116 (18%) 11 (9%) 127 (16%)424 (65%) 55 (44%) 479 (62%)91 (14%) 36 (29%) 127 (16%)13 (2%) 16 (13%) 29 (4%)6 (1%) 7 (6%) 13 (2%)
650 125 775
209 (32%) 13 (10%) 222 (29%)411 (63%) 31 (25%) 442 (57%)
21 (3%) 7 (6%) 28 (4%)7 (1%) 3 (2%) 10 (1%)
3 (0.5%) 71 (57%) 74 (10%)651 125 776
106 (16%) 9 (7%) 115 (15%)384 (59%) 36 (29%) 420 (54%)143 (22%) 8 (6%) 151 (19%)
13 (2%) 1 (1%) 14 (2%)3 (0.5%) 71 (57%) 74 (10%)
649 125 774
44 (7%) 5 (4%) 49 (6%)150 (23%) 39 (31%) 189 (24%)
35 (5%) 47 (38%) 82 (11%)11 (2%) 26 (21%) 37 (5%)
409 (63%) 8 (6%) 417 (54%)649 125 774
78 (12%) 9 (7%) 87 (11%)312 (48%) 28 (22%) 340 (44%)116 (18%) 12 (10%) 128 (16%)
26 (4%) 6 (5%) 32 (4%)115 (18%) 70 (56%) 185 (24%)
647 125 772
Q3. Employee Skills and TrainingAnswer Options1. PFD training requirements are sufficient.Strongly AgreeAgreeDisagreeStrongly DisagreeDon’t Know/ Not Applicable
2. Employees have the technical skills to do their job.Strongly AgreeAgreeDisagreeStrongly DisagreeDon’t Know/ Not Applicable
3. Supervision of employee performance is sufficient.Strongly AgreeAgreeDisagreeStrongly DisagreeDon’t Know/ Not Applicable
4. Availability of EMS recertification classes is sufficient.Strongly AgreeAgreeDisagreeStrongly DisagreeDon’t Know/ Not Applicable
5. Frequency of firefighter training is sufficient.Strongly AgreeAgreeDisagreeStrongly DisagreeDon’t Know/ Not Applicable
6. Frequency of civilian member training is sufficient.Strongly AgreeAgreeDisagreeStrongly DisagreeDon’t Know/ Not Applicable
7. Frequency of sworn supervisory training is sufficient.Strongly AgreeAgreeDisagreeStrongly DisagreeDon’t Know/ Not Applicable
Phoenix Fire Employee Survey
Management Partners
8
Walls
MP Logo

Phoenix Fire Employee Survey
Sworn Non-Sworn Response Count
42 (6%) 4 (3%) 46 (6%)143 (22%) 35 (28%) 178 (23%)
45 (7%) 36 (29%) 81 (10%)8 (1%) 32 (26%) 40 (5%)
407 (63%) 18 (14%) 425 (55%)645 125 770
132 (20%) 11 (9%) 143 (18%)428 (66%) 40 (32%) 468 (60%)79 (12%) 5 (4%) 84 (11%)
8 (1%) 0 (0%) 8 (1%)1 (0.2%) 67 (54%) 68 (9%)
648 123 771
43 (7%) 7 (6%) 50 (6%)156 (24%) 46 (37%) 202 (26%)
24 (4%) 38 (30%) 62 (8%)5 (1%) 25 (20%) 30 (4%)
417 (64%) 8 (6%) 425 (55%)645 124 769
65 (10%) 11 (9%) 76 (10%)390 (60%) 34 (27%) 424 (55%)65 (10%) 8 (6%) 73 (9%)17 (3%) 0 (0%) 17 (2%)
112 (17%) 72 (58%) 184 (24%)649 125 774
73 (11%) 12 (10%) 85 (11%)398 (61%) 34 (27%) 432 (56%)83 (13%) 5 (4%) 88 (11%)17 (3%) 0 (0%) 17 (2%)
77 (12%) 73 (58%) 150 (19%)648 124 772
8. Frequency of civilian supervisory training is sufficient.Strongly AgreeAgreeDisagreeStrongly DisagreeDon’t Know/ Not Applicable
9. Quality of firefighter training is sufficient.Strongly AgreeAgreeDisagreeStrongly DisagreeDon’t Know/ Not Applicable
10. Quality of civilian member training is sufficient.Strongly AgreeAgreeDisagreeStrongly DisagreeDon’t Know/ Not Applicable
11. Automatic aid responders are trained appropriately.Strongly AgreeAgreeDisagreeStrongly DisagreeDon’t Know/ Not Applicable
12. Automatic aid responders are proficient at emergencies.Strongly AgreeAgreeDisagreeStrongly DisagreeDon’t Know/ Not Applicable
Q3. Employee Skills and TrainingAnswer Options
Phoenix Fire Employee Survey
Management Partners
9
Walls
MP Logo

Phoenix Fire Employee Survey
Sworn Non-Sworn Response Count
227 (35%) 19 (15%) 246 (32%)374 (57%) 50 (40%) 424 (55%)
37 (6%) 1 (1%) 38 (5%)9 (1%) 0 (0%) 9 (1%)4 (1%) 54 (44%) 58 (7%)
651 124 775
113 (17%) 15 (12%) 128 (17%)293 (45%) 52 (42%) 345 (45%)86 (13%) 25 (20%) 111 (14%)18 (3%) 7 (6%) 25 (3%)
141 (22%) 26 (21%) 167 (22%)651 125 776
141 (22%) 16 (13%) 157 (20%)356 (55%) 49 (40%) 405 (52%)67 (10%) 12 (10%) 79 (10%)18 (3%) 3 (2%) 21 (3%)
65 (10%) 45 (36%) 110 (14%)647 125 772
78 (12%) 17 (14%) 95 (12%)376 (58%) 49 (40%) 425 (55%)152 (23%) 10 (8%) 162 (21%)
42 (6%) 3 (2%) 45 (6%)3 (0.5%) 46 (37%) 49 (6%)
651 125 776
99 (15%) 16 (13%) 115 (15%)424 (65%) 76 (61%) 500 (65%)
38 (6%) 13 (10%) 51 (7%)8 (1%) 7 (6%) 15 (2%)
82 (13%) 13 (10%) 95 (12%)651 125 776
52 (8%) 17 (14%) 69 (9%)370 (57%) 40 (32%) 410 (53%)174 (27%) 12 (10%) 186 (24%)
51 (8%) 1 (1%) 52 (7%)4 (1%) 55 (44%) 59 (8%)
651 125 776
90 (14%) 17 (14%) 107 (14%)426 (65%) 45 (36%) 471 (61%)106 (16%) 7 (6%) 113 (15%)
22 (3%) 1 (1%) 23 (3%)6 (1%) 53 (43%) 59 (8%)
650 123 773
97 (15%) 17 (14%) 114 (15%)458 (70%) 48 (39%) 506 (65%)83 (13%) 3 (2%) 86 (11%)11 (2%) 1 (1%) 12 (2%)2 (0.3%) 56 (45%) 58 (7%)
651 125 776
Q4. Technology, Facilities and EquipmentAnswer Options1. The PFD has up-to-date technology for fighting fires and providing EMS and rescue.Strongly AgreeAgreeDisagreeStrongly DisagreeDon’t Know/ Not Applicable
2. The PFD has up-to-date administrative technology.Strongly AgreeAgreeDisagreeStrongly DisagreeDon’t Know/ Not Applicable
3. The dispatch system meets the needs of the departments and communities it serves.Strongly AgreeAgreeDisagreeStrongly DisagreeDon’t Know/ Not Applicable
4. The condition of our stations is adequate.Strongly AgreeAgreeDisagreeStrongly DisagreeDon’t Know/ Not Applicable
5. The condition of our administrative and support facilities is adequate.Strongly AgreeAgreeDisagreeStrongly DisagreeDon’t Know/ Not Applicable
6. Stations are adequately sized for equipment and staff.Strongly AgreeAgreeDisagreeStrongly DisagreeDon’t Know/ Not Applicable
7. Apparatus and vehicles are available when needed.Strongly AgreeAgreeDisagreeStrongly DisagreeDon’t Know/ Not Applicable
8. The condition of apparatus and vehicles is satisfactory.Strongly AgreeAgreeDisagreeStrongly DisagreeDon’t Know/ Not Applicable
Phoenix Fire Employee Survey
Management Partners
10
Walls
MP Logo

Phoenix Fire Employee Survey
Sworn Non-Sworn Response Count
189 (29%) 12 (10%) 201 (26%)434 (67%) 66 (53%) 500 (64%)
23 (4%) 31 (25%) 54 (7%)4 (1%) 13 (10%) 17 (2%)
1 (0.2%) 3 (2%) 4 (1%)651 125 776
114 (18%) 9 (7%) 123 (16%)416 (64%) 52 (42%) 468 (60%)100 (15%) 45 (36%) 145 (19%)
15 (2%) 16 (13%) 31 (4%)5 (1%) 3 (2%) 8 (1%)
650 125 775
168 (26%) 13 (10%) 181 (23%)426 (65%) 64 (51%) 490 (63%)
47 (7%) 34 (27%) 81 (10%)8 (1%) 10 (8%) 18 (2%)
1 (0.2%) 3 (2%) 4 (1%)650 124 774
102 (16%) 11 (9%) 113 (15%)439 (67%) 34 (27%) 473 (61%)85 (13%) 10 (8%) 95 (12%)15 (2%) 5 (4%) 20 (3%)10 (2%) 65 (52%) 75 (10%)
651 125 776
60 (9%) 5 (4%) 65 (8%)194 (30%) 38 (30%) 232 (30%)
21 (3%) 49 (39%) 70 (9%)3 (0.5%) 29 (23%) 32 (4%)
371 (57%) 3 (2%) 374 (48%)649 124 773
107 (16%) 8 (6%) 115 (15%)437 (67%) 43 (34%) 480 (62%)88 (14%) 8 (6%) 96 (12%)14 (2%) 1 (1%) 15 (2%)5 (1%) 65 (52%) 70 (9%)
651 125 776
151 (23%) 16 (13%) 167 (22%)449 (69%) 46 (37%) 495 (64%)
24 (4%) 0 (0%) 24 (3%)1 (0.2%) 0 (0%) 1 (0.1%)25 (4%) 63 (50%) 88 (11%)
650 125 775
Q5. Organization, Support Services and Technical ResponseAnswer Options1. Teamwork within the Fire Department is good.Strongly AgreeAgreeDisagreeStrongly DisagreeDon’t Know/ Not Applicable
2. Department-wide communications are good.Strongly AgreeAgreeDisagreeStrongly DisagreeDon’t Know/ Not Applicable
3. Employees are empowered to make decisions.Strongly AgreeAgreeDisagreeStrongly DisagreeDon’t Know/ Not Applicable
4. Communication from management to sworn staff is good.Strongly AgreeAgreeDisagreeStrongly DisagreeDon’t Know/ Not Applicable
5. Communication from management to civilian staff is good.Strongly AgreeAgreeDisagreeStrongly DisagreeDon’t Know/ Not Applicable
6. Radio communication on scene works well.Strongly AgreeAgreeDisagreeStrongly DisagreeDon’t Know/ Not Applicable
7. Automatic aid response works well.Strongly AgreeAgreeDisagreeStrongly DisagreeDon’t Know/ Not Applicable
Phoenix Fire Employee Survey
Management Partners
11
Walls
MP Logo

Phoenix Fire Employee Survey
Sworn Non-Sworn Response Count
114 (18%) 13 (10%) 127 (16%)422 (65%) 81 (65%) 503 (65%)98 (15%) 13 (10%) 111 (14%)12 (2%) 3 (2%) 15 (2%)5 (1%) 15 (12%) 20 (3%)
651 125 776
79 (12%) 7 (6%) 86 (11%)373 (57%) 53 (42%) 426 (55%)114 (18%) 13 (10%) 127 (16%)
19 (3%) 9 (7%) 28 (4%)66 (10%) 42 (34%) 108 (14%)
651 124 775
156 (24%) 13 (10%) 169 (22%)445 (68%) 81 (65%) 526 (68%)
41 (6%) 18 (14%) 59 (8%)6 (1%) 8 (6%) 14 (2%)
1 (0.2%) 5 (4%) 6 (1%)649 125 774
114 (18%) 11 (9%) 125 (16%)373 (57%) 73 (58%) 446 (57%)
27 (4%) 8 (6%) 35 (5%)2 (0.3%) 11 (9%) 13 (2%)
129 (20%) 22 (18%) 151 (19%)645 125 770
8. Supplies are available as needed.Answer Options
Strongly AgreeAgreeDisagreeStrongly DisagreeDon’t Know/ Not Applicable
9. The inventory control process is adequate.Strongly AgreeAgreeDisagreeStrongly DisagreeDon’t Know/ Not Applicable
10. Department policies and procedures are clear.Strongly AgreeAgreeDisagreeStrongly DisagreeDon’t Know/ Not Applicable
11. New employee orientation is adequate.Strongly AgreeAgreeDisagreeStrongly DisagreeDon’t Know/ Not Applicable
Q5. Organization, Support Services and Technical Response
Phoenix Fire Employee Survey
Management Partners
12
Walls
MP Logo

Phoenix Fire Employee Survey
Sworn Non-Sworn Response Count
166 (25%) 17 (14%) 183 (24%)351 (54%) 57 (46%) 408 (53%)
8 (1%) 6 (5%) 14 (2%)1 (0.2%) 3 (2%) 4 (1%)
125 (19%) 42 (34%) 167 (22%)651 125 776
304 (47%) 35 (28%) 339 (44%)326 (50%) 74 (59%) 400 (52%)
12 (2%) 10 (8%) 22 (3%)0 (0%) 3 (2%) 3 (0%)8 (1%) 3 (2%) 11 (1%)
650 125 775
170 (26%) 15 (12%) 185 (24%)398 (61%) 56 (45%) 454 (59%)
58 (9%) 3 (2%) 61 (8%)5 (1%) 4 (3%) 9 (1%)
16 (2%) 47 (38%) 63 (8%)647 125 772
92 (14%) 15 (12%) 107 (14%)291 (45%) 38 (30%) 329 (42%)67 (10%) 11 (9%) 78 (10%)
5 (1%) 6 (5%) 11 (1%)194 (30%) 55 (44%) 249 (32%)
649 125 774
35 (5%) 14 (11%) 49 (6%)121 (19%) 26 (21%) 147 (19%)
42 (6%) 1 (1%) 43 (6%)5 (1%) 3 (2%) 8 (1%)
445 (68%) 81 (65%) 526 (68%)648 125 773
35 (5%) 8 (6%) 43 (6%)126 (19%) 27 (22%) 153 (20%)
34 (5%) 9 (7%) 43 (6%)9 (1%) 4 (3%) 13 (2%)
443 (68%) 76 (61%) 519 (67%)647 124 771
Q6. Customer Service and Community InvolvementAnswer Options1. Response to complaints from the public is prompt.Strongly AgreeAgreeDisagreeStrongly DisagreeDon’t Know/ Not Applicable
2. Overall customer service is good.Strongly AgreeAgreeDisagreeStrongly DisagreeDon’t Know/ Not Applicable
3. Pre-planning for emergency response is good.Strongly AgreeAgreeDisagreeStrongly DisagreeDon’t Know/ Not Applicable
4. We have a comprehensive fire prevention program.Strongly AgreeAgreeDisagreeStrongly DisagreeDon’t Know/ Not Applicable
5. New construction inspections are timely.Strongly AgreeAgreeDisagreeStrongly DisagreeDon’t Know/ Not Applicable
6. Quality of plans review is adequate.Strongly AgreeAgreeDisagreeStrongly DisagreeDon’t Know/ Not Applicable
Phoenix Fire Employee Survey
Management Partners
13
Walls
MP Logo

Phoenix Fire Employee Survey
Sworn Non-Sworn Response Count13 (2%) 0 (0%) 13 (2%)
108 (17%) 32 (26%) 140 (18%)123 (19%) 31 (25%) 154 (20%)111 (17%) 21 (17%) 132 (17%)92 (14%) 20 (16%) 112 (14%)90 (14%) 10 (8%) 100 (13%)79 (12%) 10 (8%) 89 (12%)32 (5%) 1 (1%) 33 (4%)
How long have you been employed by the Phoenix Fire Department?Answer OptionsLess than 1 year1 to 5 years6 to 10 years11 to 15 years16 to 20 years21 to 25 years26 to 30 yearsOver 30 years
Phoenix Fire Employee Survey
Management Partners
14
Walls
MP Logo

Fire Department Innovation and Efficiency Study Attachment D – Phoenix Fire Department Organization Chart Management Partners
133
Attachment D – Phoenix Fire Department Organization Chart


Fire Chief
Assistant to theFire Chief*
Deputy Chief(EmergencyManagement)
ExecutiveAssistantChief
Assistant Chief(Administration
and Finance)
Assistant Chief(Fire Marshal)
Assistant Chief(HumanResources)
Deputy Chief (Budget/Fiscal)
Deputy Chief (Health Center)
Fire Investigations Manager* (Fire Investigations)
Deputy Chief (Fire Prevention)
Deputy Chief (Special Hazards)
Deputy Chief (Public Affairs)
Deputy Chief (Personnel)
Deputy Chief (Personnel)
Assistant Chief(NorthOperations)
Assistant Chief(SouthOperations)
Assistant Chief(SpecialOperations)
Deputy Chief (3) Battalion Chief (12) (North Shift Command)
Deputy Chief (Command Training Center)
Deputy Chief (Training Academy)
Division Chief (Driver Training)
Deputy Chief (EMS)
Deputy Chief (3) Battalion Chief (9) (South Shift Command)
Division Chief (Resource Management)
Division Chief (Facilities)
Deputy Chief (Emergency Response Staffing Officer)
Deputy Chief (Aviation)
Battalion Chief (3) (Battalion 19)
Deputy Chief (Safety)
Deputy Chief (Homeland Defense)
Division Chief (Homeland Defense)
Deputy Chief (Special Operations)
Deputy Chief (Technical Services)
Deputy Chief (Dispatch)
Division Chief (Technical Serivces)
Division Chief
911 Administrator* (Regional 911)
Division Chief (3) (Alarm Room)
City of PhoenixFire Department – DRAFT Organizational Chart
*Non-sworn position


Fire Department Innovation and Efficiency Study Attachment E – Peer Organization Charts Management Partners
134
Attachment E – Peer Organization Charts


1
* All vacancies dependent on funding 1
EDDIE BURNS, SR FIRE CHIEF
ORGANIZATIONAL CHART April 21, 2011
DALLAS FIRE-RESCUE
2
Fire Chief Eddie Burns, Sr.
Executive Assistant Kim Gary
Medical Director Internal Affairs Division
Assistant Chief Debra Mullins
Emergency Response Bureau
Assistant Chief Tod Gillam
Financial Services Bureau
Assistant Director Kurt Steward
Homeland Security Bureau
Assistant Chief Eugene Campbell, Jr.
Life Safety & Professional Standards Bureau
Assistant Chief Debra Carlin
Planning & Development Bureau Assistant Chief
Joseph L. Vasquez
Training & Support Services Bureau Assistant Chief
Louie W. Bright, III
Revised 04/21/11
Sherry Durant EEOC Inquires/Complaint only
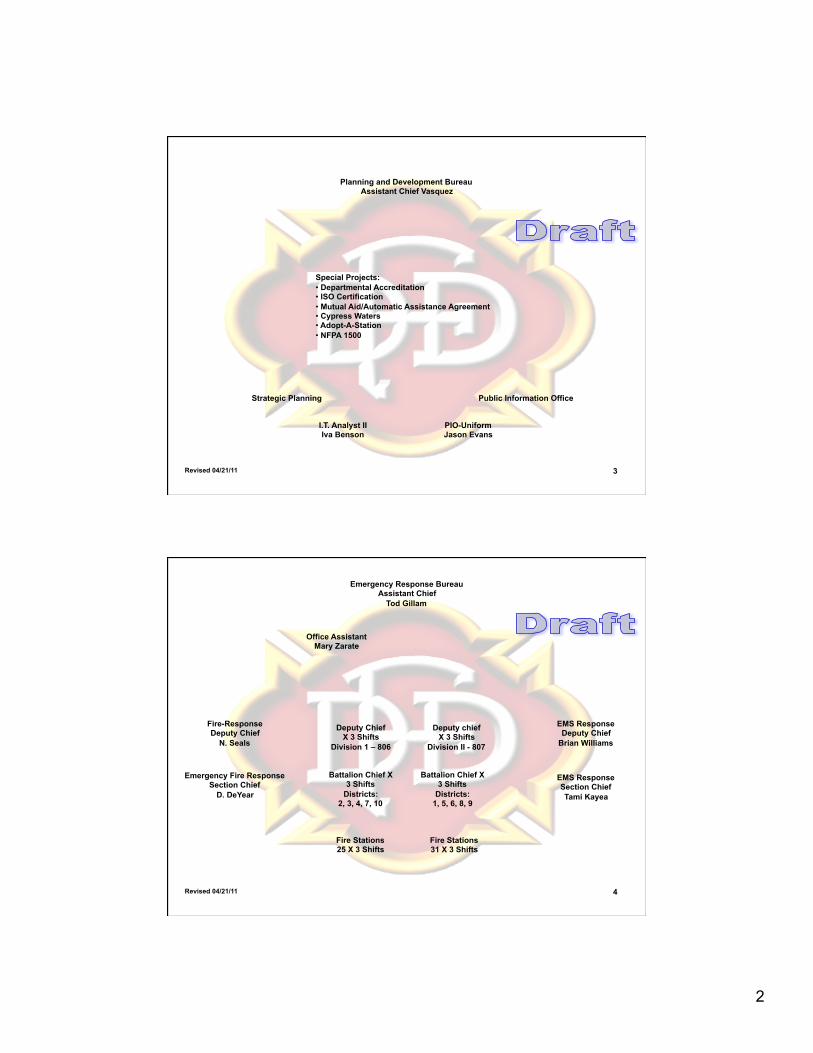
2
3
Planning and Development Bureau Assistant Chief Vasquez
Special Projects: • Departmental Accreditation • ISO Certification • Mutual Aid/Automatic Assistance Agreement • Cypress Waters • Adopt-A-Station • NFPA 1500
Strategic Planning Public Information Office
I.T. Analyst II Iva Benson
PIO-Uniform Jason Evans
Revised 04/21/11
4
Emergency Response Bureau Assistant Chief
Tod Gillam
Fire-Response Deputy Chief
N. Seals
Office Assistant Mary Zarate
Deputy Chief X 3 Shifts
Division 1 – 806
Emergency Fire Response Section Chief
D. DeYear
Battalion Chief X 3 Shifts
Districts: 2, 3, 4, 7, 10
Fire Stations 31 X 3 Shifts
Deputy chief X 3 Shifts
Division II - 807
EMS Response Deputy Chief
Brian Williams
Fire Stations 25 X 3 Shifts
Battalion Chief X 3 Shifts
Districts: 1, 5, 6, 8, 9
Revised 04/21/11
EMS Response Section Chief Tami Kayea

3
5
Office Assistant Mary Zarate
Section Chief Tami Kayea
EPCR Captain George Gamaz
Office Assistant Liz Moore
EMS Response Deputy Chief B. Williams
QI Captain D.T. Tyler
Administrative Captain Robert Holloway
781 A. Thomas K. Rufus J. Barr
Budget & Resources Lt. Gilbert Pena
Revised 04/21/11
Special Events Lt. M. Cook
783 J. Smithey
T. Hamessley G. Henderson
784 J. Walker N. Sasso G. Evans
782 J. Blythe J. Aleem S. Friar
780 G. Courson
D. Miller J. Steindorf
785 R. Clower R. Tocci
D. Williams
6
Homeland Security Bureau Assistant Chief E. Campbell
Special Operation Deputy Chief L. P. Jones
Arson Investigation/Bomb Squad Deputy Chief
Joe Pierce
Office Assistant Regina Long
Communication & Technology Section Chief
Isaac McClellan
Revised 04/21/11

4
7
Special Operations Deputy Chief L. P. Jones
Aviation Section Chief Max Kirk
Special Operations Section Chief J. Ostroski
(Acting)
Communications & Technology Section Chief McClellan
GIS LT. N. Rossy
Special Projects Joel Lavender
Fire Dispatch Captain X 4 Shifts
2 Lieutenants X 4 Shifts 9 Dispatchers X 4 Shifts
Quality Assurance Captain Martin
IDS Team Captain Coffman
CAD G. R. Lee
Telecom Analyst D. DeGroat
Coordinator II S. Hinderson
ARFF Station 21, 42 & 49
Water Rescue Captain C. Smith
Station 34
USAR Captain Ostroski Station 15 & 19
Haz/Mat Steve Harris (Acting) Stations 3, 40 & 16**
Wildland Urban Interface TBD*
Stations 1, 4, 7, 9, 30, 52 & 54
Communication Specialist
Revised 04/21/11
8
Fire Investigation and Explosive Ordinance Disposal
Deputy Chief J. Pierce
Office Assistant Celia Salazar
Section Chief J. Adams
BATF Arson Task Force
Liaison D. J. Palmer
Capt. Team A L. Osborn
Capt. Team A P. Martinez
LT. Team C L. Salazar
Capt. Team A T. Berry
LT. Team A D. Cherry
Capt. Team C M. Stephenson
Capt. Team C R. Hester, II
Capt. Team C C. Nichols
Arson Awareness & Juvenile Firesetter
Intervention
Lieutenant M. Forbes-Scott
SFPO D. Smith
SFPO P. Martinez++
R. Molina
North Texas Auto Theft Task Force Liaison
Section Chief C. Martinez
Capt. Team D R. Ham
Capt. Team D C. Bustillos
Capt. Team D F. Drahos
Capt. Team B E. Hauptmann
Capt. Team B J. Brown
Capt. Team B T. Clark
Capt. Team D D. Hickman
Capt. Team B R. Sanders
EOS Sgt. Dennis Wilson
Revised 04/21/11

5
9
Life Safety & Professional Standards Bureau Assistant Chief
D. Carlin (Fire Marshal)
Office Assistant Delia Castillo
Inspection & Life Safety Education Division
Deputy Chief K. Sipes
Professional Standards Division
Revised 04/21/11
10
Inspection & Life Safety Education Division Deputy Chief K. Sipes
Section Chief C. Michaels
Section Chief S. Marsh
Office Assistant Delia Castillo
2 SFPO Smoke Det./Data Analysis
Code Development/Training C. Roper/J. Gilmore
Office Assistant M. Burks Office Assistant
S. Shulte
Revised 04/21/11

6
11
SFPO S. Westbrook
Office Assistant Mary Lee Burks
Section Chief S. Marsh
Inspection & Life Safety Education Division
Deputy Chief K. Sipes
LT. NC 2 E. Beal
SFPO M. Parkerson
SFPO B. Record
SFPO L. Clayton
SFPO W. Madison
SFPO J. Kimball
SFPO D. Freeman
SFPO B. Badejogbin
SFPO S. Urteaga
SFPO C. Burns
SFPO B. Aguayo
Captain Lt. Baughn
(Acting)
LT. Admin/CT P. Martinez
Office Assistant B. Simpson
LT. High Rise J. Kumar
LT. HazMat M. Adams
Office Assistant R. Gonzales
SFPO A. Ponce
SFPO S. Braddick
SFPO S. Boyd
SFPO J. White
SFPO J. Sepuvedo
SFPO F. Johnson
SFPO E. Campa
SFPO D. Kaiser
SFPO T. Spencer
SFPO D. Seals
SFPO A. Jimenez
Sr. Office Asst. M. Robinson
Revised 04/21/11
SFPO B. Moody
SFPO B. Record
12
Inspection & Life Safety Education Division
Deputy Chief K. Sipes
Section Chief C. Michaels
Office Assistant Mary Lee Burk
FPO D. Castaneda
SFPO C. Lee
LT. Public Assembly/Safe
A. Shaffner
SFPO A. Jacobs
SFPO N. Reese
SFPO F. Hill
LT. Education S. Hoops
FPO ND E. Maddox
SFPO ND D. James
FPO A. Wilson
SFPO BH A. Yarberry
SFPO TS/SE M. Turner
SFPO TS/SE S. Moore
Captain R. Mathews
Lieutenant SW/SC N. Price
Lieutenant C/SE/NE
B. Johnson
Lieutenant NW/NC
K. O‘Brian
FPO K. Gallegos
FPO A. Lowe
FPO R. Torres
FPO C. Johnson
SFPO J. Webb
SFPO M. Bradley
FPO T. McDonald
FPO C. Gober
FPO G. Padilla
FPO M. Contreras
FPO M. Whalen
FPO A. Marshall
FPO (*Vacant)
FPO R. Johnson
FPO K. Richter
FPO T. Quan
FPO (*Vacant)
FPO J. Jones
FPO S. Brown
FPO/Safe E. Hernandez
Revised 04/21/11 * All vacancies dependent on funding

7
13
Employee Service Section
Captain K. Foreman
Recruitment & Retention Section Internal Affairs Section
Professional Standards Division
H.R. Liaison M. High
Health & Benefits Liaison Ms. Elliott
Chaplains D. Smith
R. Winters
Worker’s Compensation Manager/J. Lewis
Coordinator/R. Jackson Coordinator/M. Robbins
Captain G. Florance
LT. D. Salinas DE - B. Ingram FRO - J. Cantu
Office Assistant V. Langley
Section Chief D. Mullins EEOC Officer
S. Durant
Captain R. Batchelor
Office Assistant V. Varker
Revised 04/21/11
14
Training & Support Services Bureau Assistant Chief
L. Bright
Office Assistant Monique Sasser
Training/Safety Deputy Chief D. Salazar
Environmental Compliance Captain L. Pitman
Maintenance J.D. Travis, Manager
Facility Coordinator LT. B. Wilson
Revised 04/21/11

8
* All vacancies dependent on funding 15
Training Deputy Chief D. Salazar
Office Assistant Monique Sasser
Academy Commander Captain B. Pipkins
Safety Officer Section Chief F. Gray
Office Assistant C. McGruder
Safety/Wellness (*Vacant)
Physical Fitness Coordinator W. Reynolds
Communicable Disease Nurse M. Allison Green
In-Service LT. J. Almaguer
LT. V. Killingsworth
EMS Training Coordinator
Capt. L. Cardenas
LS&PS Training Liaison
LT. F. Acuna
LT. (*Vacant)
LT. Z. Rendahl
LT. M. Combs
LT. (*Vacant)
LT. (*Vacant)
Revised 04/21/11
EMS Liaison D. Diaz
Respiratory Protection Coordinator
Lt. J. Hunter
16
Maintenance J.D. Travis, Manager
Office Assistant Julie Munoz
Warranty Coordinator Rhonda Carden
Clerk E. Russell
Mechanic Leadworker Engine
Tim Wooten
Fleet Services Manager (*Vacant)
Small/Engine/Hose Mechanic R. Coker
Coordinator Patrick Juricek
Revised 04/21/11
Mechanic Leadworker Truck
Williams Rhyne
Mechanic Leadworker Field Service
Jackie Don Phelps
Mechanic Leadworker MICU
L. Pitts
Mechanics N. DeMorato G. Hughes
S. Mann R. Felarca O. Avalos R. McFail
C. Thomas
Mechanics J. Besherse
G. Eudy B. Jenkins J. Molina M. Meza
Mechanics M. Garafola D. Kennedy M. Monroe K. Roberts G. Sullivan
Vacant
Mechanics O. Avalos J. Barnhill R. Carter R. Fugua T. Milligan A. White
D. Phillips R. Woodruff
Office Assistant P. Escobedo
* All vacancies dependent on funding

9
17
Maintenance J.D. Travis, Manager
Office Assistant Julie Munoz
Warranty Coordinator Cherry Carden
Materials Management (*Vacant)
Office Assistant Magdalena Chavarria
Sr. Storekeeper K. Parker
Carpenters M. Sheets
S. Freeman
Electricians G. Jones P. Massie
Sr. Storekeeper P. Mitchell
Supervisor S. Gonzales
Supervisor G. Casas
Sr. Storekeepers R. Sombrerero
J. Falkquay S. Freeman M. Sheets
Parts Workers M. Canyon
B. Esquivel J. Jimenez
S. Nicholson R. Pate, M. Harris
C. Sosa EMS Supply Storekeepers
K. Brock K. Mieure Revised 04/21/11
Office Assistant P. Escobedo
Storekeepers D. Leigh Manuell
S. Turner T. Larkin
V. Hernandez R. Olivarez
* All vacancies dependent on funding
18
Financial Services Bureau Assistant Director
K. Steward
Financial Reporting & Accounting
Grant, Trust & Bond Program Management
(Section)
Budget & Financial Oversight (Section) J. Camper
Procurement (Section) S. Harris, J. Camper
D. Tyler
Financial Oversight of Bond Program Project
Development and Funding
Annual Budget Development
Internal and External Audit Response
Financial Target Analysis Advantage Financial and Pay 1
Civilian & Uniform Hiring (General Oversight)
PCA Updates & Payroll Review
Internal Control Review & Assessment
Council Agenda & Administrative Actions
Travel and Mileage Approval, Processing P-Card, Travel
Card & Petty Cash
Requisitions, Delivery Orders, Accounts Payable
Contract Review, Monitoring & Development
Revised 04/21/11

Denver Fire Department – General Organization Chart (2011 Budget) (revised 1/2011) The Denver Fire Department serves the needs of Denver’s community and its citizens through emergency medical and fire services. It also conducts a variety of prevention efforts and public education programs to promote fire safety and emergency preparedness throughout the community. The Department is organized into six Divisions: Operations (Division 1), Fire Prevention (Division 2), Technical Services (Division 3), Administration & Investigations (Division 4), Safety and Training (Division 5), Airport Fire and Rescue (Division 6). Thirty-four (34) fire stations are operated by the Department, which includes an Intergovernmental Fire Service Agreement with the City of Glendale, Skyline Fire Protection District and the City of Sheridan. The Department has an authorized strength of 931 uniform and 27 civilian personnel. See specific charts for each Fire Department Division.
FIRE CHIEF
Deputy Chief
Division Chief Operations
Special Ops/EMS
Division 1
Division Chief Fire Prevention
Division 2
Division Chief Safety & Training
Division 5
Division Chief Airport
Structural & ARFF
Division 6
Division Chief Administration &
Investigations
Division 4
Division Chief Technical Services (Facilities, Fleet & Communications)
Division 3

Chief of the Department This executive level management team of Denver Fire Department falls below the Mayor and Manager of Safety. This level consists of the decision-making and strategic planning operations of the Department. Administration is organized into various organization-wide staff functions which includes Emergency/Disaster Management Liaison activities (OEM), Finance and Budget, and Public Information. Staffing levels are as follows: Chief of the Department (1), Deputy Chief (1), Captain (1), Lieutenant (1), Executive Assistants (2), Manager 1 (1), Senior Accountant (1), Staff Accountant (1), and Staff Assistant (1). Total: Uniform = 4; Civilian = 6
FIRE CHIEF
Deputy Chief
Finance & Budget Manager 1
Executive Assistant
Executive Assistant
P2P Program Coordinator (P-Card/Purchasing/Payables/ Receiving)/Travel/Official Functions/Petty Cash
Staff Assistant
Financial Mgt – Acctg/Budget/Rev/Grants/ Contracts/Billings/Accts Receivables
Senior Accountant Staff Accountant
Public Information Lieutenant
Technician (vacant)
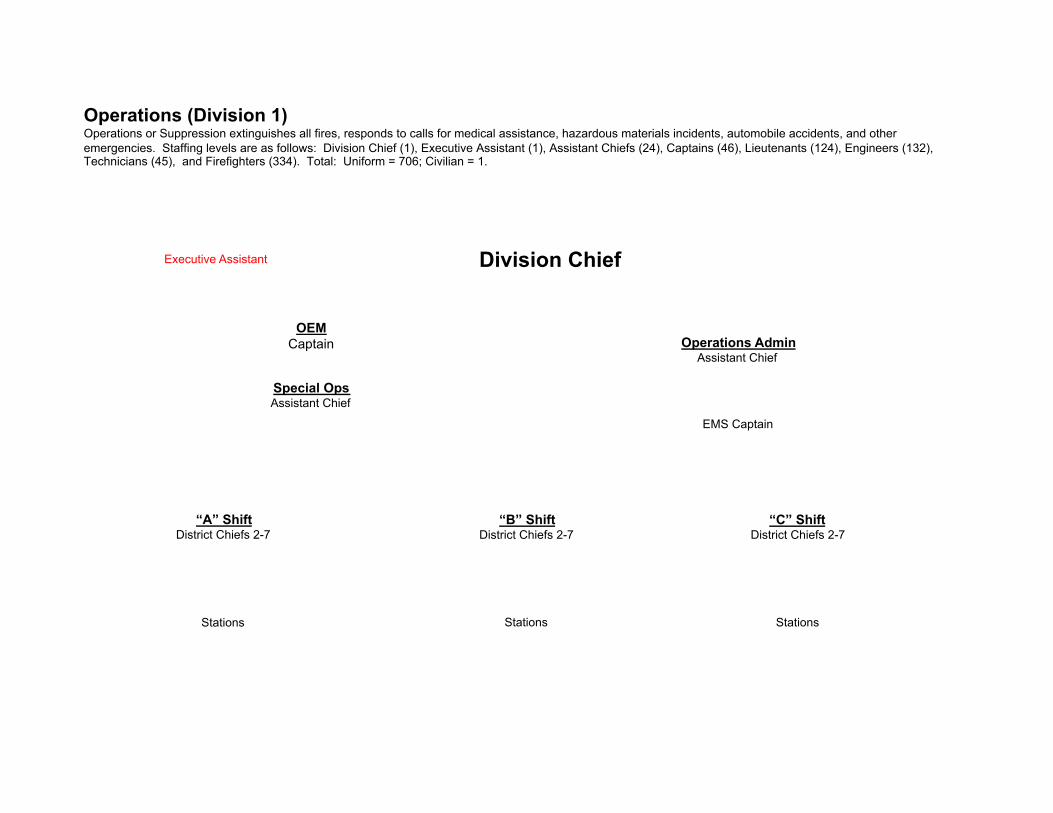
Division Chief
Operations Admin Assistant Chief
Executive Assistant
EMS Captain
Special Ops Assistant Chief
“A” Shift District Chiefs 2-7
“B” Shift District Chiefs 2-7
“C” Shift District Chiefs 2-7
Stations Stations Stations
OEM Captain
Operations (Division 1) Operations or Suppression extinguishes all fires, responds to calls for medical assistance, hazardous materials incidents, automobile accidents, and other emergencies. Staffing levels are as follows: Division Chief (1), Executive Assistant (1), Assistant Chiefs (24), Captains (46), Lieutenants (124), Engineers (132), Technicians (45), and Firefighters (334). Total: Uniform = 706; Civilian = 1.

Fire Prevention (Division 2) Fire Prevention and Investigation protects the public from fire or explosion caused by dangerous and hazardous materials. The Division ensures the construction of safe buildings and structures through plan reviews, enforcement, and the issuance of occupancy permits. It also issues permits for pyrotechnic displays and fire protection systems. The Hazardous Materials section responds to and provides abatement for hazardous materials. Staffing levels are as follows: Division Chief (1), Assistant Chief (1), Captains (2), Lieutenants (8), Technicians (20), Operational Supervisor I (1), Adm Supt Assist IVs (4), Agency Support Tech (1), Senior Accountant (1), Program Coordinator (1), Fire Protection Supervisor (1), Fire Protection Engineers (5). Total: Uniform = 32; Civilian = 14.
Division Chief
Administrative Section Assistant Chief
HazMat Section Captain
HiRise/Institutions Section Captain
Engineering Section Fire Protection Engineer Supervisor
Fire Protection Engineers
High Rises Lieutenant/Technicians
Institutions Lieutenant/Technicians
Emergency Procedures Training
Lieutenant
Assistant to Chief Operational Supervisor I
Accounting Senior Accountant
Inspections/Permits/Fire Safety Licenses Admin Supt Asst IVs; Agency Sup Tech
Special Detail/Public Assembly Permits
Lieutenant/Technicians Program Coordinator
Licenses/COs/TCOs Lieutenant/Technicians
Hazardous Materials/ Warehouses
Lieutenant/Technicians
Flammables Lieutenant/Technicians
Sprinkler Systems/Fire Alarm/Testing
Lieutenant/Technicians

Technical Services (Division 3) Technical Services includes Fire Station and Facility Maintenance, Fleet Management/Warehouse Operations, the Communications Center, and Line Shop. The Line Shop maintains and services all the Department’s communications equipment including radios and handles installation of any electrical service needs. Fleet Management purchases and maintains all motorized equipment, miscellaneous tools and all breathing apparatus. The Communication Center provides for all the communication activity including dispatching and electronic records keeping. Facility maintenance is responsible for the maintenance of all Fire Department facilities. Staffing levels are as follows: Division Chief (1), Executive Assistant (1), Assistant Chief (1), Supt of Fire Alarm (1), Asst Supt of Fire Alarm (1), Captains (2), Lieutenants (6), Technicians (15), FSTS (15), Master Mechanic (1), Asst Master Mechanic (1), Mechanics (14), Administrative Support Assistant III (1), Stockkeeper (1), Stock Clerks (2). Total: Uniform = 58; Civilian = 5
Division Chief
Dispatch Assistant Chief
Fleet Maintenance Master Mechanic
Asst Master Mechanic Adm Supt Asst III
Communications/Line Shop Supt of Fire Alarm
Asst Supt of Fire Alarm
DATA/NFIRS Lieutenant
Executive Assistant
Captain
Facility Maintenance Lieutenant
Technician (vacant)
Dispatchers Captain, Lts, Techs
Fire Systems Technical Specialists Fleet Operations
Mechanics Stockkeeper
Warehouse Stock Clerks

Administration & Investigations (Division 4) Administration provides oversight of the Department’s staff scheduling functions (TeleStaff), recruitment activities, and administers position management. The Fire Investigation section identifies the origin and cause of all fires, collects evidence, interviews witnesses and suspects, and aids in criminal prosecution. This Division also reviews and follows up on injuries (line-of-duty, non line-of-duty, modified duty assignments) and investigation of internal matters involving discipline, grievances and liaison with the City Attorney. Staffing levels are as follows: Division Chief (1), Assistant Chief (1), Captain (2), Lieutenants (3), Technician (14). Total: Uniform = 21; Civilian = 0
Division Chief
Assistant Chief
Investigations/Staffing Mgt Captain
Internal Investigations Lieutenant
Fire Investigations Lieutenant Technicians
Tech (Juvenile Firesetters)
Staffing (TeleStaff) Lieutenant Technician
Recruiting Captain
Technician (vacant)

Safety & Training (Division 5) Safety & Training provides training to all new firefighters and continuing education to all tenured firefighters. The Division administers curriculums, video training, annual physicals, in-service training, and a safety program. Staffing levels are as follows: Division Chief (1), Assistant Chief (1), Captains (2), Lieutenants (4), Engineer (1) and Technician (2), Staff Assistant (1). Total: Uniform = 11; Civilian = 1
Division Chief
Assistant Chief
Technicians Driving Coordinator Engineer
Drill Master Captain
Staff Assistant
Lieutenants
Research and Development Captain

Airport Structural and Fire and Rescue (Division 6) Airport Structural and Fire and Rescue provides emergency services at the airport and surrounding five-mile area. These duties include, but are not limited to the following: Aircraft Accident Mitigation – Evacuation, rescue, fire suppression, EMS and operations level hazardous materials response; Airport Structures – Fire Suppression, fire prevention, fire inspections, EMS and operations level hazardous materials response training; and Federal Aviation Administration regulations Part 139 requirements. Staffing levels are as follows: Division Chief (1), Assistant Chiefs (4), Captains (8), Lieutenants (10), Engineers (33), Technicians (17), Firefighters (26). Total: Uniform = 99; Civilian = 0
Division Chief
ARFF Training Asst Chief
Assistant Chief C Shift
Assistant Chief B Shift
Assistant Chief A Shift
Executive Assistant (DIA Personnel)
Technician
Technician/Fuel Inspector
Technician/ Bldg Inspector
ARFF 1 Capt
Truck 31 Capt
Eng 32 Capt
ARFF 3 Capt
ARFF 4 Capt
Roving Capt
ARFF 1 Lt
Truck 31 Lt
Eng 32 Lt
ARFF 3 Lt
ARFF 4 Lt
Roving Capt
ARFF 1 Lt
Truck 31 Lt
Eng 32 Lt
ARFF 3 Lt
ARFF 4 Lt
Roving Capt
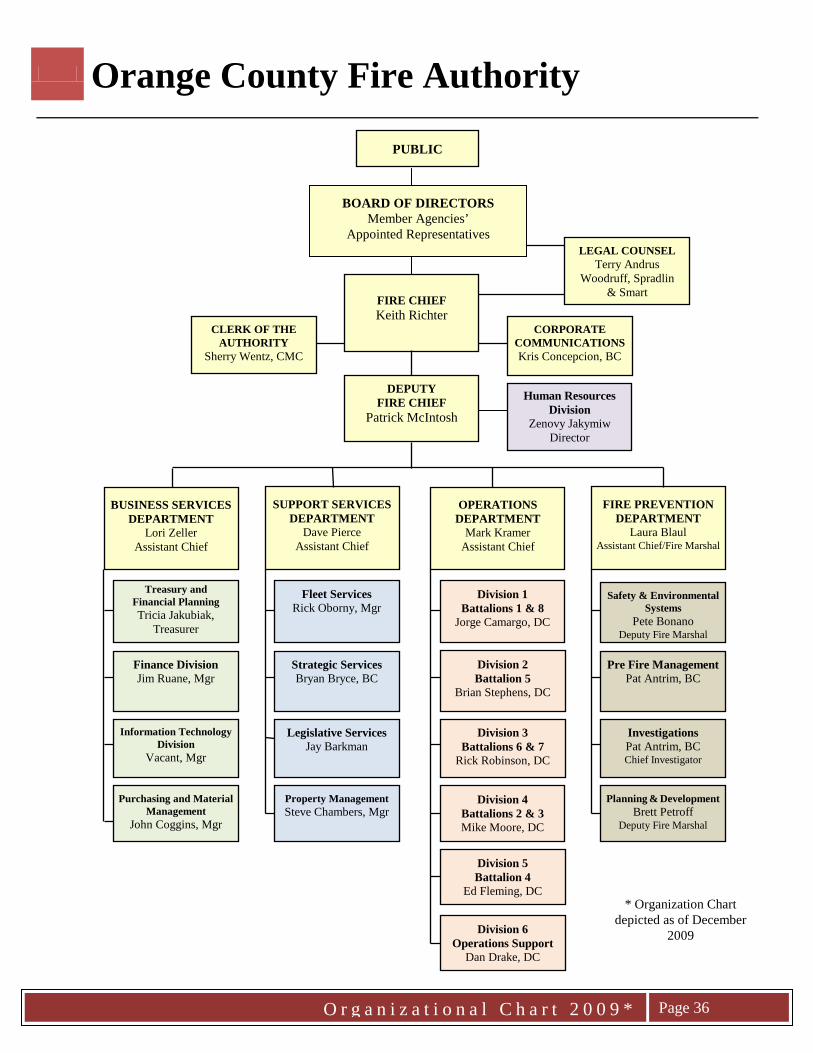
Orange County Fire Authority
O r g a n i z a t i o n a l C h a r t 2 0 0 9 *
Page 36
FIRE CHIEF
Keith Richter
CLERK OF THE AUTHORITY
Sherry Wentz, CMC
DEPUTY FIRE CHIEF
Patrick McIntosh
CORPORATE COMMUNICATIONS Kris Concepcion, BC
BUSINESS SERVICES DEPARTMENT
Lori Zeller Assistant Chief
SUPPORT SERVICES DEPARTMENT
Dave Pierce Assistant Chief
OPERATIONS DEPARTMENT
Mark Kramer Assistant Chief
FIRE PREVENTION DEPARTMENT
Laura Blaul Assistant Chief/Fire Marshal
Human Resources Division
Zenovy Jakymiw Director
Treasury and Financial Planning Tricia Jakubiak,
Treasurer
Finance Division Jim Ruane, Mgr
Information Technology Division
Vacant, Mgr
Division 1 Battalions 1 & 8
Jorge Camargo, DC
Division 2 Battalion 5
Brian Stephens, DC
Division 3 Battalions 6 & 7
Rick Robinson, DC
Division 4 Battalions 2 & 3 Mike Moore, DC
Fleet Services Rick Oborny, Mgr
Legislative Services Jay Barkman
Property Management Steve Chambers, Mgr
Purchasing and Material Management
John Coggins, Mgr
Safety & Environmental Systems
Pete Bonano Deputy Fire Marshal
Pre Fire Management Pat Antrim, BC
Investigations Pat Antrim, BC Chief Investigator
Division 5 Battalion 4
Ed Fleming, DC
Planning & Development Brett Petroff
Deputy Fire Marshal
BOARD OF DIRECTORS Member Agencies’
Appointed Representatives
Strategic Services Bryan Bryce, BC
LEGAL COUNSEL Terry Andrus
Woodruff, Spradlin & Smart
Division 6 Operations Support
Dan Drake, DC
* Organization Chart depicted as of December
2009
PUBLIC

S A N D I E G O F I R E – R E S C U E D E P A R T M E N TMARCH 2011
FIRE CHIEFJavier Mainar
LIFEGUARDSERVICESRick WurtsLifeguard Chief
SPECIALOPERATIONSDoug NakamaDeputy Chief
SUPPORT SERVICESBrian FennessyAssistant Chief
EmergencyManagement
San DiegoMedicalServices
WellnessCenter
MAST,HAZMAT,
EDTAdministration
Ocean FrontOperations
PREPARED BYHUMAN RESOURCES
EMS/SDMSCriss BrainardDeputy Chief
Revised: 03/21/2011
US&R TaskForce
EMERGENCY OPERATIONSJeff Carle
Assistant Chief
COMMUNICATIONSSusan InfantinoProgram Manager
InformationSystems
Fire Dispatch
FIREPREVENTIONDoug PerryDeputy Chief
High Rise
F.C.I.P.
FISCAL/ADMINDianne ModeloAsst to the Chief
FiscalServices
Admin Svcs
LOGISTICSLorraineHutchinsonDeputy Chief
Facilities
Fleet
MEDIA SERVICESMaurice LuqueProgram Manager
EXECUTIVE SECRETARYSally Zumalt
EXECUTIVE SECRETARYSally Zumalt
Payroll
BrushManagement
NewConstruction
CEDMAT
BoatingSafety Unit
EmergencyMedicalServices
OPERATIONSRon Hicks
Ken MalbroughPerry PeakeDeputy Chiefs
Battalion 1
Battalion 2
Battalion 3
Battalion 4
Battalion 5
Battalion 7
Battalion 6
PROFESSIONALSTANDARDSJohn StrockBattalion Chief
OFFICE OF HOMELAND SECURITYDonna FallerProgram Manager
Grants &Technology
SpecialEvents
TRAINING/EDUCATIONKen BarnesBattalion Chief
HUMANRESOURCESKathi YoungA/HR Manager
AirOperations
CERTProgram

Seattle Fire Department 2010 Adopted

Seattle Fire Department 2010 Adopted ADMINISTRATION
2010 Adopted FTE: 87.30

Seattle Fire Department 2010 Adopted RISK MANAGEMENT
2010 Adopted FTE: 18
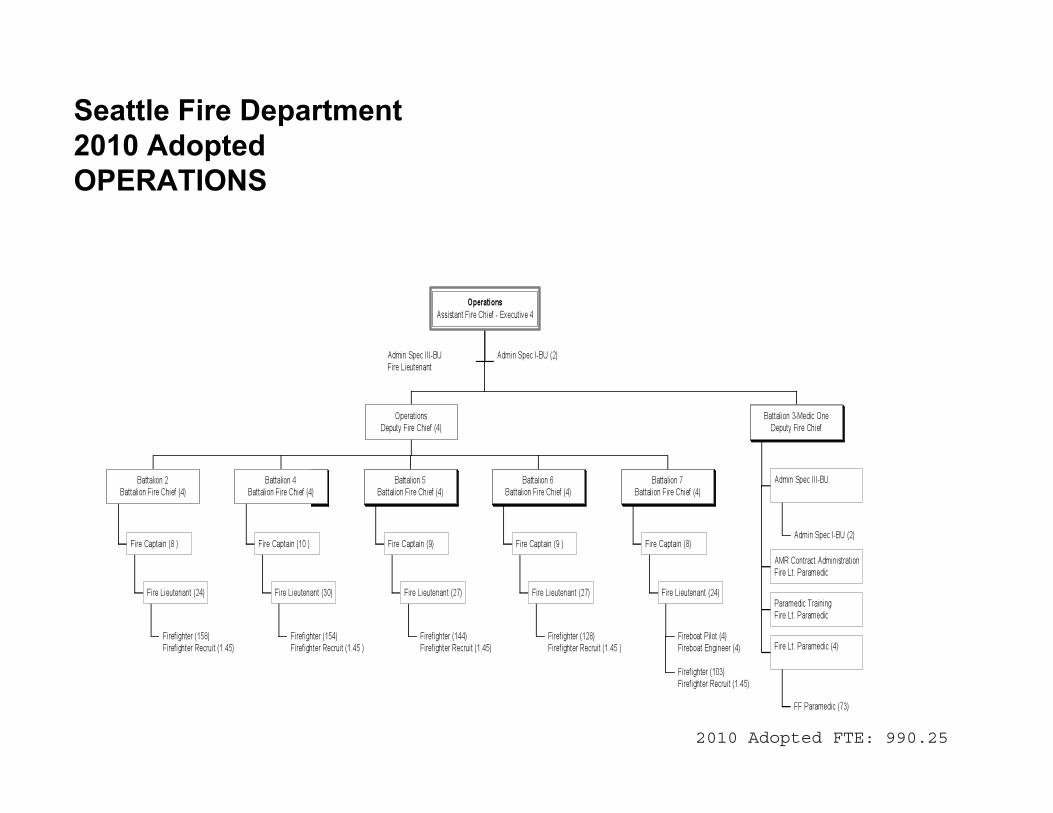
Seattle Fire Department 2010 Adopted OPERATIONS
2010 Adopted FTE: 990.25

Seattle Fire Department 2010 Adopted FIRE PREVENTION
2010 Adopted FTE: 60.00

Fire Department Innovation and Efficiency Study Attachment F – Sample Service Level Agreement Management Partners
135
Attachment F – Sample Service Level Agreement


1
CUSTOMER SERVICE AGREEMENT SAMPLE
Customer Service Agreement City Fleet Policy ...................................................................................................................................... 2 1) Services to be provided by Fleet ................................................................................................... 2
Management and Asset Management: .......................................................................................... 2 Maintenance and Repair Services: ................................................................................................ 2
2) Preventative Maintenance (PM) Services and Inspections ......................................................... 2 3) Communications ............................................................................................................................. 3 4) Fleet Responsibilities ..................................................................................................................... 3 5) Repair Authorization ....................................................................................................................... 3 6) Customer Responsibilities ............................................................................................................. 4 7) Commercial Services ...................................................................................................................... 5 8) On-Call Services: ............................................................................................................................ 5 9) Miscellaneous Services (non-fleet equipment) ............................................................................ 5 10) Billing ............................................................................................................................................... 5 11) Motor Pool “Car Share” Services .................................................................................................. 5 12) Fleet Purchasing Cycle, ................................................................................................................. 7 13) 2011 Replacement Process and Replacement Criteria ............................................................... 7 14) Requirements .................................................................................................................................. 8 15) Preventative Maintenance Schedules ........................................................................................... 8 16) Levels of Inspection - Generators ................................................................................................. 9 17) Schedule of Fleet Rates and Markups .......................................................................................... 9 18) Fleet Administration Location ..................................................................................................... 10 19) Fleet Management Maintenance, Repair and Fuel locations .................................................... 10 20) Zonar Systems GPS Rules ........................................................................................................... 11 21) 2011 Replacement List (Report) .................................................................................................. 11 22) Fleet Inventory (Report) ............................................................................................................... 11 23) Unit Utilization Opportunity Review (Report) ............................................................................. 11 24) Fleet Management Equipment Review (Report) ......................................................................... 12 25) Customer Requested Special Services and Reports, Other Requirements ............................ 12 26) Addendum ..................................................................................................................................... 13
This agreement is between the Fire Department (Customer) and Fleet Management Division (Fleet). The signatures below indicate understanding of Fleet policy and operations and agreement to abide by the terms and conditions of this document. Approved: Customer Date XXXXXXXXX, Fire Chief Fleet Date Date XXXXXXXX, Fleet Manager XXXXXXXXXXXX, Director of Gen. Svcs

2
City Fleet Policy The customer and Fleet agree to abide by the policies governing City fleet procedures and practices, Fleet Purchasing and Budgeting Policy and the City Employee’s Transportation Policy and Procedures. The current Customer Service Agreement will stay in effect until the next agreement is signed. Fees and rates at mid-year and/or the end of the fiscal year may change due to budget changes. Fleet will notify the customers when rates or fees change. 1) Services to be provided by Fleet
Management and Asset Management: Fleet policy development Fleet asset management Replacement planning Fleet budget recommendations in February Fleet information systems and system management Fleet information reports and reporting Vehicle and equipment specification preparation Vehicle and equipment selection and purchase coordination Fuel and fueling infrastructure management and services Vehicle and equipment motor pool services Surplus vehicle disposal Regulatory compliance for vehicles and equipment, fuel systems and infrastructure, hazardous material generation, storage and disposal Compliance with all City Fleet related policies
Maintenance and Repair Services:
Preventative maintenance and inspection services Comprehensive vehicle and equipment maintenance and repair services Contracting and coordination of vendor repair services Vehicle towing, road services and recovery services Collision damage estimating and repair services Condition assessments
2) Preventative Maintenance (PM) Services and Inspections Fleet will maintain all units in accordance with the recommended maintenance schedule. The customer must provide units for service at the scheduled increments. Fleet will place a service due sticker in the upper left corner of the windshield and side loaders in the right corner, indicating the mileage and date when the next service is due. A maintenance schedule is attached to this agreement. Fleet Management will provide the following levels of services: PM includes all levels of preventative maintenance inspections, emissions testing and certification (diesel and gasoline engines), crane and aerial testing and certification. Not all units are required to have all levels of preventative maintenance or inspections.

3
The preventative maintenance program is instrumental in minimizing premature equipment failure by maintaining an ongoing awareness of the condition of the equipment and to identify, repair or correct defects before they become serious problems. An effective PM program will minimize unscheduled repairs and may reduce operating costs 3) Communications The Fleet Manager and assigned Operations General Supervisor will meet with department representatives (please see addendum for list) twice a year. At this meeting, the Fleet Manager will present a summary of performance in regard to the customer’s fleet over the preceding quarter. In addition, the participants will discuss any issues or concerns regarding performance and the Fleet Manager will follow-up with a written memo within 14 days of the meeting date, describing how these issues will be addressed. An Operations General Supervisor (please see addendum) will be assigned to oversee the customer’s organizations fleet. 4) Fleet Responsibilities
a) Establish acceptable levels of services provided by Fleet that are measurable. These measures may include percentage of time units are available for service or dispatch, service turnaround times, etc. Fleet shall provide reports prior to the beginning of the fiscal year that are based on the prior fiscal year performance of the average of the three previously completed quarters.
b) Fleet shall provide high quality, timely and cost effective services. Fleet will develop service goals and will enter into discussions with customers as to the consequences for not meeting stated goals.
c) Fleet shall provide annual budget estimates for each City organization based on their historical usage and costs incurred for operations and maintenance including fuel during the previous fiscal year or last full 12 months of operations.
d) Fleet shall provide periodic performance and billing reports through “Business Objects” to each City organization that show the actual costs of operations, maintenance, fuel and charges billed by individual unit and by the organization as a whole. If you don’t have access to the Business Objects reports and would like access, please contact Eric Choi at extension 6930.i
e) Fleet shall provide and maintain fueling facilities, car/truck washes and vacuum cleaners. (All features not available at all locations.)
f) Provide schedules and customer notification for PM services, emission and other inspections due.
g) Notify customer of non-urgent repairs needed when found on PM services or while performing other work and create work requests for future scheduling.
h) Fleet shall provide notification to the customer for units sent off site for repairs, will provide a minimum of weekly updates, and will include the vendor’s expected completion date.
5) Repair Authorization The customer department representative will be contacted for authorization before remedial repairs are initiated, in which the estimated cost of repairs may exceed $2,000.00. Customer agrees to respond to either authorize or deny commencement of the repairs within 24 hours (one business day).

4
A list of customer representative(s) who may authorize repairs equal to or exceeding the estimated limit will be provided to Fleet. Please see addendum for current list. 6) Customer Responsibilities
a) Customers are expected to perform all pre-trip/post trip, daily checks, inspections and maintenance as required by federal, state, and XXXXX regulations or policies and verify carb. compliance stickers are installed in every vehicle.
b) Customers will be expected to fuel vehicles and equipment and maintain lubricating oils (engine oils) at proper levels. Except for LNG Fueled Trucks.
c) Customers will be expected to operate all City vehicles and equipment in accordance with the law and all policies and procedures pertaining to the operation of City vehicles and equipment.
d) Customers will be expected to operate vehicles and equipment safely, with care, and to keep them clean on the inside and outside and litter free.
e) Customers will be expected to pay for all costs associated with the operation of fleet units including damage from improper operation, abuse or misuse of vehicles and equipment.
f) Customers will be expected to pay for all costs associated with crash, accidental and/or incidental damage to equipment and facilities including fueling facilities, car/truck washes and vacuum cleaners. (Example: Damage to a fuel nozzle and hose caused by driving away from a fuel dispenser with the nozzle left in the fuel tank.)
g) Customers shall confirm organizational assignment and verification of parking location including authorized home retention addressii for all units assigned to their organizations.
h) Customers will be expected to support City Council goals, mandates, and directives such as improving overall fleet fuel economy, improving air quality, and vehicle/equipment standardization. They will be expected to participate in these projects even though, in some cases, it may mean increased capital and operating costs.
i) Customers will be expected to deliver Fleet units to Fleet repair facilities for services and repairs and to make units available for preventative maintenance and inspections based on the agreed upon schedule.
j) Customer shall review all their low-mileage equipment by October 10th of each year (including those designated as mission critical specialty units) to evaluate opportunities to consolidate use of equipment and improve overall utilization.iii
k) Customer departments are encouraged to voluntarily turn in non-mission critical or specialty equipment that is not anticipated to travel 6,000 miles per year.iv
l) Customer shall schedule and make units available for additional repairs noted at the time of PM services.
m) If vehicle is not turned in to fleet shop for a (Preventive Maintenance) PM or BIT inspection within 15 days or 500 miles of when due, fleet has the right to turn off fuel access.
n) Customers shall bring units to repair facilities for repairs as soon as the problems are noticed or identified by operator.
o) Customers shall not operate units that are unsafe or in need of repairs. p) Customers shall report all crash, accidental, and incidental damage to Risk Management and
Fleet in accordance with City policy. q) Customers shall authorize crash damage repair, replacement or removal from the fleet as soon
as possible. Customers shall not allow continued use of vehicles and equipment with body damage.
r) Customers will not perform maintenance, make repairs or modifications for City fleet vehicles and equipment unless authorized in advance by the Fleet Manager.
s) Customers must maintain the security of vehicles and equipment by properly managing unit keys.

5
t) Customers will provide a list of all take home vehicles, by October 15th of each year, with the names and positions of the employees taking the Fleet vehicles home.
u) Customers shall make every effort to replace vehicles based on their current replacement cycle. 7) Commercial Services Fleet will coordinate and contract for commercial repair services from vendors providing fleet services. The decision to use an outside vendor will be based on shop workload, services that require special tools, equipment or expertise, or have demonstrated cost or other savings.
8) On-Call Services Fleet will maintain two levels of on-call services: one for the general fleet and one for fire apparatus. Fleet staff will be available for emergency repairs 24 hours a day, seven days a week. Call out of Fleet staff will result in a minimum of a two-hour charge billed to the unit (or department for non-unit related services,) at the current labor rate. There will be a charge for all call outs unless cancelled prior to response by the on-call staff. 9) Miscellaneous Services (non-fleet equipment)
Maintenance, repair of, or fuel rotation for non-fleet generators; all costs will be directly billed to the customer. Utilities will do the A and B Services to their portable generators keeping in mind the Environmental Compliance issues and the reporting to the Air District of maintenance that has been performed on the generators.1
Car and truck wash facilities including maintenance and repair of the systems will be provided
by Fleet.
Emergency management, participation in the City-County Emergency Operations Center, after hours staffing during events, etc. will be provided as needed to support City and/or other agency or area needs.
10) Billing
1. Fleet is responsible for providing accurate billing information for repairs and services on all vehicles.
2. Customers will be directly billed for fleet services based on Fleet Policy and the services and supplies that they consume.
3. Customers are responsible for reviewing bills in a timely manner and notifying Fleet of errors or omissions. Fleet’s billing will be available for review by the 15th of every month.v
4. Corrections to billings may not be made after two (2) billing periods based on the date of posting. Any corrections or adjustments will be recorded in the period the correction is made.
11) Motor Pool “Car Share” Servicesvi
1. Fleet will provide motor pool “car share”vii services for occasional needs or use. The INVERS system allows City employees 24/7 access to Motor Pool Vehicle reservations from any City networked computer quickly and efficiently. The system can be accessed from the City’ intranet site by typing XXXXXXXXX in the web browser on a city computer. Employees must be set-up on the INVERS system in order to use it. All employees must complete a Security

6
Access Request Form in order to have access to the key manager system. There are a total of four key managers currently available. One of the motor pool key managers is located at the City Hall basement parking garage outside the elevators. City Hall motor pool users will pick up their keys from the basement garage and retrieve the vehicles from either the parking lot in City Hall or the parking garage adjacent to City Hall located at the 9th and H Street Garage between the 3rd and 4th parking level. The second key manager is located at the 24th Street Corp Yard at the exterior of the 24th Street Corporation Yard’s Motor Pool Operations office in Building One. A third key manager is located at Sutter’s Landing and the fourth location is at 300 Richards Blvd.
a. Daily Rentals: fuel will be provided up to the first 100 miles. b. For rentals over one day fuel will not be provided. Fleet will charge a flat rate to fill tank
based on current fuel pricing and staff time to fill vehicle. c. Time will be based on 2 hours minimum charge for under one day. d. Any rental needed over 2 weeks might be a rental car that is from an outside rental
company depending on availability. If under 2 weeks and a pool vehicle is available for rental it will be provided. Motor Pool rentals over 3 months will need approval from the Division Manager.
e. Any damage by the user will be charge to the using department and also the motor pool ticket will stay open until repairs are completed.
f. No specialized department-specific equipment will be assigned to the poolviii
2. Customers must provide Fleet a list of staff authorized to check out motor pool unit(s) from the City’s Motor Pools.
3. 2011 Rates of most common City vehicles available for employee use:ix
2 Hour (Quick Trip Rate) Half Day Day Week
Month
Carx $10.00 $18.50 $37.00 $187.00 $839.00Pick‐up n/a $39.50 $79.00 $372.00 $1200.00Mini Van n/a $36.50 $73.00 $328.00 $1,313.00Large Passenger Van n/a $49.50 $99.00 $595.00 $2,379.00Cargo Van n/a $37.50 $75.00 $350.00 $1,346.00

Fire Department – FY 2011
7
12) Fleet Purchasing Cyclexi,xii
Fleet SCRUBS / DevelopsReplacement List
Nov-Dec
Fleet Management Replacement List
Submitted January
Budget Office Review of Replacement List
February
Replacement Budgets Established March-April
Meetings to Establish a Department Replacement
Plan May-June
Council Adopts Fleet Budgets
June
Replacement Purchasing
New Fiscal YearJuly
Fleet Procurement Plan (Second Priority)
October
Fleet Procurement Plan (First Priority)
End of July
NEW Vehicle and Equipment Upgrade
Request Forms Due February
ID Underutilized Equpment for Turn-in or Exception
ApprovalOctober /November
13) 2011 Replacement Process and Replacement Criteriaxiii Fleet replacements for all funds at this point must be evaluated on a case-by-case basis. A vehicle having hit the time and mileage criteria for replacement is necessary but not by itself
sufficient to authorize moving forward with purchase. No replacement funds were budgeted from the General Fund for Fiscal Year 2011. For FY2011/12, the Fleet division will recommend to the Enterprise funded departments a
vehicle replacement list based on the process described above which reflects a citywide policy

Fire Department – FY 2011
8
approach to vehicle replacement. Fleet Management will work with individual Enterprise funded departments if there is a desire to modify those lists to reflect specific rate and/or operational needs.
An ACM may make an exception to these guidelines for replacement purchases (for example
for timing purposes if grant funds are available or at risk). 14) Requirements
Fleet Purchasing and Budgeting Policy, API No. 52 City Employees Transportation Policy and Procedures, API No. 29
15) Preventative Maintenance Schedules The following schedules are representative only, certain vehicles and equipment may have special requirements established by the manufacturers that require more frequent service intervals. Sedans, light pickups
PM B - 6 months, 6,000 miles PM C - 30,000 miles Emission Inspection - Annual
Police patrol sedans
PM B - 4 months, 3,000 miles PM C - 30,000 miles Speedometer Check – 6 months Emission Inspection - Annual
Medium and heavy duty trucks
PM B – 6 months, 3,000 miles PM C – 30,000 miles Smoke Check – Annual BIT Inspection – 90 days
Refuse trucks
PM B – 3,000 miles PM C – Annual or 6,000 miles Smoke Check – Annual BIT Inspection – 90 days
Fire Apparatus (Heavy)
PM B – 6 months, 3,000 miles PM C – 30,000 miles Smoke Check – Annual BIT Inspection – 90 days
Trailers, light duty
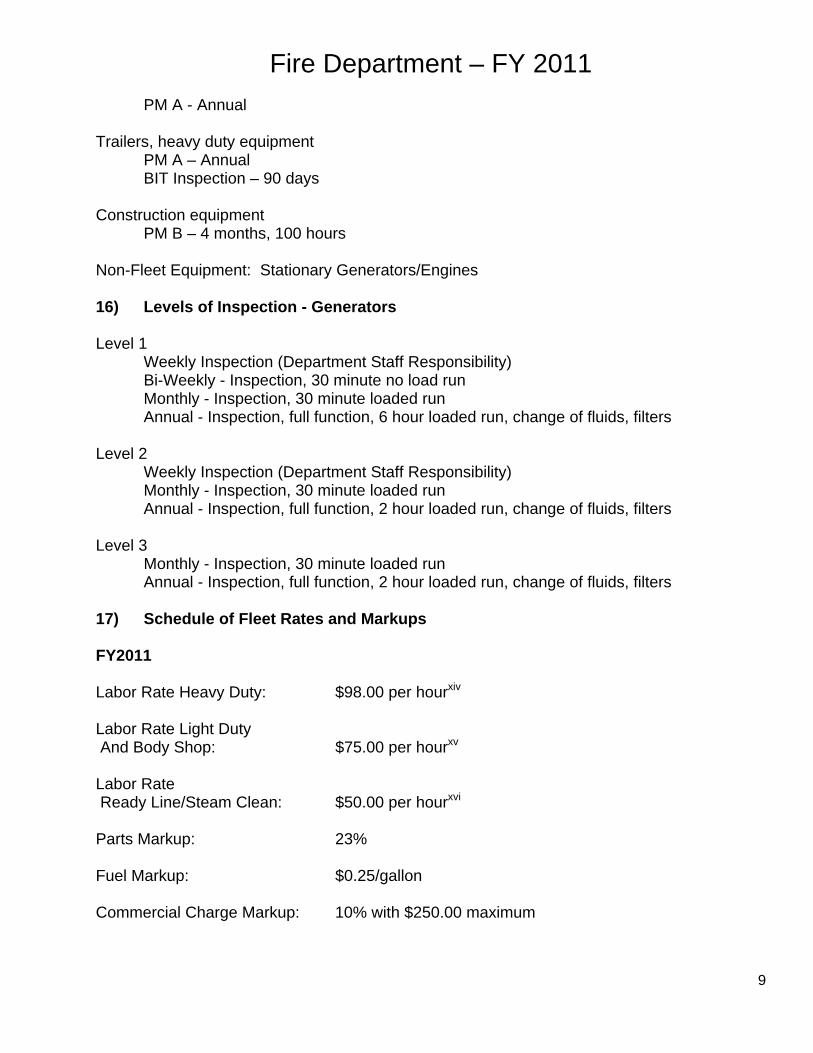
Fire Department – FY 2011
9
PM A - Annual Trailers, heavy duty equipment
PM A – Annual BIT Inspection – 90 days
Construction equipment
PM B – 4 months, 100 hours Non-Fleet Equipment: Stationary Generators/Engines 16) Levels of Inspection - Generators Level 1
Weekly Inspection (Department Staff Responsibility) Bi-Weekly - Inspection, 30 minute no load run Monthly - Inspection, 30 minute loaded run Annual - Inspection, full function, 6 hour loaded run, change of fluids, filters
Level 2
Weekly Inspection (Department Staff Responsibility) Monthly - Inspection, 30 minute loaded run Annual - Inspection, full function, 2 hour loaded run, change of fluids, filters
Level 3
Monthly - Inspection, 30 minute loaded run Annual - Inspection, full function, 2 hour loaded run, change of fluids, filters
17) Schedule of Fleet Rates and Markups FY2011 Labor Rate Heavy Duty: $98.00 per hourxiv Labor Rate Light Duty And Body Shop: $75.00 per hourxv Labor Rate Ready Line/Steam Clean: $50.00 per hourxvi
Parts Markup: 23% Fuel Markup: $0.25/gallon Commercial Charge Markup: 10% with $250.00 maximum

Fire Department – FY 2011
10
Hazardous Material Charge: 10% with $15.00 maximum per work orderxvii Administrative Fee: $40.00/unit per month Administrative Fee: Zonar Light Duty $67.99/unit per month Heavy Duty $70.99/unit per monthxviii 18) Fleet Administration Location Fleet Management Administration 5730 24th Street, Building 1 XXX-XXXX 19) Fleet Management Maintenance, Repair and Fuel Locations 5730 24th Street Main Shop: Building 5 808-6341 6:00 am – 11:30 pm M-F Service Shop: Building 6 808-6234 6:00 am – 11:30 pm M-F Body Shop: Building 16 808-6231 6:00 am – 4:30 pm M-F Fuel Availability: Gasoline, Diesel, Propane (LP) - 24 hour access 2812 Meadowview Road 4 a.m. shift (on call), weekend, and holidays (schedule attached). Fleet Shop: Building 3 808-4870 24 hours a day Sunday 10:00 pm to Friday 10:30 pmxix Fuel Availability: Gasoline, Diesel, Propane (LP) – 24 hour access Liquefied Natural Gas (LNG) 3550 Marysville Blvd. Kinney Police Garage 566-6477 5:30 am – 10:30 pm 7 days Fuel Availability: Gasoline, Diesel - 24 hour (access only with CardKey after 5:00 pm– 7:00 am, weekends and holidays.) 5303 Franklin Blvd. Rooney Police Garage 277-6010 5:30 am – 10:30 pm 7 days Fuel Availability: Gasoline - 24 hour (access only with Cardkey 5:00 pm – 7:00 am, weekends and holidays.)

Fire Department – FY 2011
11
28th Street and A Street Sutter’s Landing 264-5214 7:00 am – 4:30 pm M-F Fuel Availability: Gasoline, Diesel - 24 hour access 918 Del Paso Road NACY Fleet Shop: 808-6232 6:00 am – 12:00 pm M-T 6:00 am – 1:00 am W-F 8:00 am – 6:30 pm Saturday Fuel Availability: Gasoline, Diesel - 24 hour access 300 Richards Blvd.xx Fuel Availability: Gasoline, E85 - 24 hour (access only with Cardkey 5:00 pm – 7:00 am, weekends and holidays.) 20) Zonar Systems GPS Rules Fleet Management will be implementing the Zonar Systems GPS and vehicle inspection system. These systems are capable of providing real time, as well as historical information about each vehicle including, but not limited to:
• Vehicle Speed • Engine Idle time • Mileage • Vehicle location and paths traveled
For commercial vehicles requiring pre/post trip inspections per federal DOT and City policy, this device may also provide an electronic daily vehicle inspection reporting system. Fleet will provide for initial and ongoing training for the use of this system, administration of access rights for fleet customers, and quarterly status reports and updates. Fleet customers will be responsible for all costs associated with the installation. Additionally, they will be responsible for informing their respective employees of the installation and capabilities of this system, and monitoring/reviewing information provided by this system. 21) 2011 Replacement List (Report)
See Attached 22) Fleet Inventory (Report)
See Attached 23) Unit Utilization Opportunity Review (Report)

Fire Department – FY 2011
12
See Attached
24) Fleet Management Equipment Review (Report)
See Attached 25) Customer Requested Special Services and Reports, Other Requirements
Training Apparatus Agreement Fire Department and Fleet Operations
Intent: The intent of this agreement is to describe the terms and conditions of fire apparatus to be used exclusively for the training of cadet fire fighters. Understanding: The Fire Department supports retention of these apparatus knowing full well that these units exceed the retention guidelines recommended by the Fire Department and representing Union to City Council (retaining apparatus that is beyond its scheduled life of 15 years.) Maintained Condition: Fleet Management will maintain the apparatus in safe operable condition. Replacement: These units will not be replaced at Fleet expense, they have already been replaced. At the end of the term of retention, the units will be disposed of using the procedures as set forth in the City Code. Proceeds from the sale of surplus apparatus will be deposited in the Fleet Fund. Costs of Operation: All costs of retention including scheduled maintenance, repairs, fuel and inspections will be paid by the Fire Department. Fleet will bill using the normal fleet hourly charge out rate, parts, and fuel markups. Transportation of the units to and from Fleet maintenance facilities is the responsibility of the Fire Department. Any towing or on-site repairs will be charged to the Fire Department. High Cost Repairs: Any needed repairs for the apparatus that will exceed $2,000.00 will be discussed with the Fire Department for their approval prior to commencement of the repairs. Approval may only be made by the Fire Chief or the designated Deputy Fire Chief. Training Use Only: The training apparatus will be used exclusively for training. The training apparatus shall not be utilized as either front line or reserve apparatus under any circumstances. Identification: Training apparatus will be visibly marked “TRAINING USE ONLY”. Priority for Repair: Priority for repair of apparatus is as follows: First: Front line apparatus (engines, trucks and medics), Second: Reserve apparatus (engines, trucks and medics), Third: Other Fire Apparatus, Fourth: Training Apparatus. The priority can be changed or modified at the direction of the Chief with the full understanding that higher priority units will not be repaired in a timely manner. Term: The term of the agreement is one year from the date of the agreement with the ability to renew for a second year with the agreement of both the Fire Department and Public Works, Maintenance Services Division (Fleet Operations.)

Fire Department – FY 2011
13
Parking Location: The training apparatus will be parked at the City training facility located at McClellan Business Park. Units: City Equip. #4212, 1977 Seagrave Ladder Truck City Equip. #6172, 1988 Seagrave Pumper/Engine City Equip. #4564, 1980 Seagrave Pumper/Engine This agreement supersedes previous agreement MS03119 26) Addendum
As referenced in Item 3, the Fleet Manager and assigned Operations General Supervisor will meet with department representatives, as listed below, twice a year.
XXXXXXXX (phone XXX-XXXX) has been assigned your department id(s) 12001001 - 120099991. As referenced in Item 5, customer representative(s) who may authorize repairs equal to or exceeding the estimated limit are:
1. XXXXXXXX Phone XXX-XXXX 2. XXXXXXXX Phone XXX-XXXX 3. XXXXXXXX Phone XXX-XXXX 4. XXXXXXXX Phone XXX-XXXX i Changed information from City info to Business Objects (8/2009) ii Added per request (7/2/07) iii Added (9/2010) iv Added (9/2010) v Added that the reports can be run on Fleet Billing after the 15th of the month (7/2009) vi Added information about INVERS (7/2009) / “Car Sharing” Added (10/2010) vii Added “Car Sharing” (10/2010) viii Added for Fiscal year 2008 based on new billing structure in Motor Pool (5/25/07) ix Requested Addition 2/2009 x Added Quick Trip Rate (9/20/10) xi Added (6/27/07) xii Changed (9/2010) xiii Changed (9/2010) xiv Changed Labor Rate (7/2010) xv Changed Labor Rate (7/2009) xvi Added (9/2010) xvii Changed Maximum per Work Order Rate (7/2010) xviii Added Zonar Rates (7/2009) xix 24 hour operation anticipated to start September 2008 xx Fuel tank anticipated to be in operation 8/2008


Fire Department Innovation and Efficiency Study Attachment G – Implementation Action Plan Management Partners
136
Attachment G – Draft Implementation Action Plan


Phoenix Fire Department
Draft Implementation Action Plan
January 2012


Making the Most of the Draft Implementation Action Plan
Management Partners has developed this high‐level draft Implementation Action Plan to assist the Phoenix Fire Department with the implementation of 50 recommendations. The work involved in implementing the recommendations must be integrated into the other work of the Fire Department, with appropriate assignments of responsibility for implementation and with the identification of specific planned completion dates. The draft Action Plan includes a recommended priority assignment (1, 2 or 3, based on criteria described in the document) and includes a blank field to identify target completion dates (milestones). To convert this draft to a final Action Plan, the Fire Chief, executive management team and appropriate managers will need to identify specific target dates, integrating the work described in this draft Action Plan with the other work of the assigned managers. In doing so, you may want to modify the described activities for implementing an individual recommendation based on your knowledge of what will be required for completion, or to adjust the assignment of responsibility based on workload or other considerations. Management Partners remains available to consult with you in this process in whatever way we can be helpful. Please do not hesitate to contact Amy Paul at 513‐861‐5400 if we can be of assistance. Amy can be reached by email at [email protected]. The discipline of successful project planning is basic to successful execution of the work ahead. We hope that you find the draft Action Plan useful in that regard.


Phoenix Fire Department Draft Implementation Action Plan Management Partners
Management Partners, Inc. 1
Rec No. Recommendation
ImplementationSteps Priority1
Target Date
Person Responsible2 Comments
1 Perform a comprehensive review of each mid‐level management position when a vacancy occurs to determine the need for the position and whether operational fire expertise is required.
• Develop criteria to assess mid‐level management positions to determine need and whether operational fire expertise is required
• Assess mid‐level management position vacancies as they occur using criteria
Priority 3 Assistant Chief Human Resources
2 Utilize sworn personnel in mid‐ and senior‐level positions to manage functions requiring fire expertise and experience.
• Evaluate mid‐ and senior‐ level positions to determine if fire expertise and experience is required
• Reassign personnel accordingly
Priority 1 Assistant Chief Human Resources
3 Reallocate the deputy chief in finance to an operational or other position within the department and provide the non‐sworn managers with a direct reporting relationship to executive level management.
• Reorganize the division to provide non‐sworn managers with direct reporting relationship to executive level management
Priority 1 Assistant Chief Administration and Finance
The Assistant Chief for Human Resources will need to play a major role in implementing this recommendation
4 Reorganize administrative and business functions under one executive level manager.
• Develop a reorganization plan • Implement the plan
Priority 1 Assistant Chief Administration and Finance
The Assistant Chief for Human Resources will need to play a major role in implementing this recommendation
5 Return one or both deputies in the Personnel/Payroll Section to the field in positions requiring sworn expertise and add a civilian manager with human resources expertise.
• Develop a job description • Recruit a civilian manager with human
resources expertise
Priority 1 Assistant Chief Human Resources
1 Priority 1: Important to accomplish without delay and/or easy to accomplish. Priority 2: Second tier of importance to accomplish and/or may involve some complexity or time to complete Priority 3: Least urgent to complete and/or may take longer to set‐up or to execute 2 To establish clear accountability there should be a single responsible manager assigned responsibility for completing implementation of each recommendation. Where more than one manager is identified in this column, clarification of responsibility should occur when preparing the Final Action Plan.

Phoenix Fire Department Draft Implementation Action Plan Management Partners
Management Partners, Inc. 2
Rec No. Recommendation
ImplementationSteps Priority1
Target Date
Person Responsible2 Comments
6 Identify the targeted minimum tenure for assignments for each of the positions in which deputy chiefs are rotated based on effective and efficient management of the operation.
• Based on best practices, determine the targeted minimum tenure for each rotational assignment.
Priority 1 Assistant Chief Human Resources
The management team should be part of the decision making process
7 Create a succession planning program to ensure continuity of leadership as retirements occur.
• Develop succession planning tools to assist each key manager (especially those in the DROP program) in documenting important job‐related information to retain institutional knowledge
• For executives in the DROP program, assure that the tools are utilized and that institutional knowledge is transferred to appropriate individuals
Priority 2 Assistant Chief Human Resources
8 Establish an annual recertification process for individuals receiving linguistic pay to ensure proficiency in the language for which compensation is being received.
• Administer linguistic test annually to determine proficiency
• Compensate accordingly based on results of the linguistic test
Priority 1 Assistant Chief Human Resources
9 Provide added points for bilingual capability and/or establish bilingual only recruitments to move toward the department’s goal of 50% bilingual employees.
• Research legality of holding special recruitments
• Once legal determination is made, develop bilingual standards for recruitment process
• Implement recruitment • Evaluate success
Priority 2 Assistant Chief Human Resources
In conjunction with the City’s Human Resources Director

Phoenix Fire Department Draft Implementation Action Plan Management Partners
Management Partners, Inc. 3
Rec No. Recommendation
ImplementationSteps Priority1
Target Date
Person Responsible2 Comments
10 Analyze the causes of the significant increase in workers’ compensation cases and take actions to reduce the number of injuries.
• Assess employee injury claims to determine reasons for the increase in workers’ compensation cases
• Develop a plan to address factors • Implement the plan • Assess results
Priority 2 Assistant Chief Human Resources
To be done in conjunction with Health Center
11 Implement injury prevention and workers’ compensation management systems to achieve claims reductions equivalent to what the City as a whole achieved over the 2008 to 2010 period.
• To be achieved in conjunction with Recommendation 10
Priority 2 Assistant Chief Human Resources
12 Review the cases for employees with three or more injuries in the last three years and provide appropriate training and physical therapy to avoid future injuries.
• Obtain files for employees with three or more injuries in the last three years
• Analyze reasons for injuries • Provide appropriate training and physical
therapy to those employees • Evaluate results
Priority 2 Assistant Chief Human Resources
In conjunction with Health Center
13 Pursue direct vendor shipments, as applicable, to yield continuing operating savings.
• Evaluate purchases to identify those that must be warehoused and those that can be provided on a “just in time” basis
• Obtain price quotes for direct shipments and assess where savings can be gained
• Implement direct vendor shipments as appropriate
Priority 2 Assistant Chief Administration and Finance
In conjunction with Division Chief for Resource Management

Phoenix Fire Department Draft Implementation Action Plan Management Partners
Management Partners, Inc. 4
Rec No. Recommendation
ImplementationSteps Priority1
Target Date
Person Responsible2 Comments
14 Analyze the warehouse contents to determine which items are necessary to continue to stock and which may be dealt with on a just‐in‐time basis.
• Develop criteria to determine which current warehouse items must be stocked and which can be provided on a “just in time” basis
• Assess current warehouse stock utilizing criteria
• Revise ordering criteria in conjunction with Recommendation 13
• Implement protocol
Priority 2 Division Chief for Resource Management
Division Chief for Resource Management
15 Eliminate two supplies clerk I positions once direct vendor shipments have been fully implemented.
• Assess results of Recommendation 13 to confirm that two supplies clerk I positions are no longer needed
• Eliminate positions after direct vendor shipments have been fully implemented
Priority 2 Assistant Chief Human Resources
Division Chief for Resource Management
16 Develop an agreement between the PFD, the Phoenix Police Department and any other City departments utilizing physical exam or physical therapy services from outside contractors to have a portion of those services provided by the Phoenix Fire Department Health Center.
• Communicate with other City departments about benefits of utilizing the PFD Health Center
• Establish a working agreement to provide physical exam or physical therapy services to other City departments
• Implement agreement
Priority 2 Assistant Chief Administration and Finance
In conjunction with City’s Human Resource Director and Deputy Chief of the Health Center
17 Verify that the rates being charged by the PFD for firefighter physical exams and immunization services provided to outside fire departments are at market and adjust them upward if warranted.
• Research market rates for firefighter physical exam and immunization services
• Assess current rates based on research of market rates and adjust if necessary
Priority 2 Deputy Chief Budget/Fiscal
In conjunction with Deputy Chief for Health Center

Phoenix Fire Department Draft Implementation Action Plan Management Partners
Management Partners, Inc. 5
Rec No. Recommendation
ImplementationSteps Priority1
Target Date
Person Responsible2 Comments
18 Explore the feasibility of establishing an Emergency Response (911) Fee.
• Research legality of establishing an Emergency Response Fee in Arizona
• If legally feasible, assess political will • If both are affirmative, develop
implementation plan
Priority 3 Assistant Chief Administration and Finance
In conjunction with City Attorney’s Office
19 Explore the feasibility of establishing a subscription program for ambulance transport services.
• Research legality of establishing a subscription program for ambulance transport in Arizona
• If legally feasible, assess political will • If both are affirmative, develop
implementation plan
Priority 3 Assistant Chief Administration and Finance
In conjunction with City Attorney’s Office
20 Explore the feasibility of establishing a fee for excessive “lift/assist calls” by assisted living and nursing homes in the City of Phoenix.
• Research best practices of establishing fee for excessive “lift/assist calls”
• Explore concept with most active assisted living and nursing homes served by PFD
• Assess whether implementation of a fee for excessive “lift/assist calls” is feasible
Priority 3 Assistant Chief Administration and Finance
21 Identify the full costs of training in the budget, including personnel and overtime, to understand the true cost of PFD training.
• Develop mechanism to track direct and indirect costs of training (especially the cost of personnel time)
• Implement protocols to track training costs
Priority 3 Deputy Chief Budget/Fiscal
In conjunction with Assistant Chiefs Note: Once Recommendation 34 is implemented, this may be easier to accomplish
22 Centralize and automate the training records for all department employees.
• Implement in conjunction with Recommendation 34
Priority 2 Assistant Chief Human Resources
In conjunction with Deputy Chief for Technical Services

Phoenix Fire Department Draft Implementation Action Plan Management Partners
Management Partners, Inc. 6
Rec No. Recommendation
ImplementationSteps Priority1
Target Date
Person Responsible2 Comments
23 Implement lower cost alternatives for providing the programs in the Public Affairs’ Community Involvement Unit.
• Survey retired personnel to evaluate feasibility of utilizing them for Community Involvement Unit activities
• Explore contracting opportunities with non‐profit agencies that share a similar mission
• Implement lower cost alternatives
Priority 1 Assistant Chief Human Resources
24 Develop specific fire prevention goals and objectives that can be measured and assessed annually.
• Draft goals and objectives • Establish performance expectations • Implement a process to assess goals and
objectives based on expectations regularly
Priority 1 Fire Marshal
25 Document the annual inspection work program for both general fire code and hazardous materials programs and establish annual inspection goals by program and by staff.
• Establish a method to document annual inspection work
• Draft monthly inspection goals • Implement a process to assess results
monthly
Priority 1 Fire Marshal
26 Determine the best interface with the City’s business licensing system, as well as planning and development, to capture hazardous materials occupancies not in the system.
• Research which interface is best to fit with the City’s business licensing system
• Determine which hazardous material occupancies are not in the system
• Implement new interface and include missing hazardous material occupancies
Priority 1 Deputy Chief Technical Services
In conjunction with City’s Information Technology Department and appropriate PFD executive management
27 Conduct a fee study to determine the administrative costs and revenues of an annual fire inspection fee program, including hazardous materials occupancies.
• Collect all fee and revenue data related to fire inspections
• Determine administrative costs • Adjust fees as necessary
Priority 2 Deputy ChiefBudget/Fiscal
In conjunction with Fire Marshal

Phoenix Fire Department Draft Implementation Action Plan Management Partners
Management Partners, Inc. 7
Rec No. Recommendation
ImplementationSteps Priority1
Target Date
Person Responsible2 Comments
28 Review the current hazardous materials permit fee schedule and revenue against costs for plan review, permit issuance and inspection to ensure full cost recovery.
• Collect all fee and revenue data related to fire inspections
• Determine administrative costs • Adjust fees as necessary to ensure full
cost recovery
Priority 2 Deputy ChiefBudget/Fiscal
In conjunction with Fire Marshal
29 Transfer new construction fire inspection staff to the Planning and Development Department/Inspection Services Division to allow better coordination of the entire spectrum of building permit processes and improve customer service, performance and accountability.
• Resolve indirect cost issue to avoid a negative impact on the PFD
• Transfer new construction fire inspection staff to the Planning and Development Department
Priority 1 Assistant Chief Administration and Finance
In conjunction with appropriate City officials
30 Transfer one Fire Prevention deputy chief to another area of the department or reduce this position through attrition to increase efficiency by reducing an unnecessary layer of management.
• Identify vacancy or need in another area of PFD
• Transfer Deputy Chief for Fire Prevention to needed position
Priority 1 Fire Marshal The Assistant Chief for Human Resources will need to play a major role in implementing this recommendation
31 Analyze the costs and return on investment of an electronic patient care tracking system.
• Research costs of electronic patient care tracking systems
• Determine return on investment from an electronic patient care tracking system
• If three‐year return on investment is demonstrated, implement.
Priority 1 Assistant Chief Administration and Finance
In conjunction with City officials
32 Identify a reasonable remaining lifespan for the current CAD system and develop a replacement funding strategy.
• Research available systems and costs of a new CAD system
• Develop a replacement funding strategy based on costs for a new CAD system
Priority 1 Deputy Chief Technical Services
Research on available systems is already underway in the PFD

Phoenix Fire Department Draft Implementation Action Plan Management Partners
Management Partners, Inc. 8
Rec No. Recommendation
ImplementationSteps Priority1
Target Date
Person Responsible2 Comments
33 Retain one captain position in the Technical Services Division until a new CAD system is implemented and return the other two captains to operations positions.
• Determine vacancies where captains are needed
• Reassign two captains to operations positions
Priority 1 Assistant ChiefHuman Resources
In conjunction with Executive Team
34 Implement an online training system that enables the number of trips to the training center to be reduced by at least 20% per year while providing the same level of training.
• Research online training systems • Develop and Install online training system • Communicate to employees the need to
utilize online training systems
Priority 2 Assistant ChiefHuman Resources
In conjunction with Assistant Chiefs in North and South Operations
35 Establish a cross‐functional working group to identify specific improvements related to Fire Department fleet management issues.
• Determine members of cross‐functional working group
• Assign working group to identify improvements to flee management
• Implement improvements
Priority 2 Assistant ChiefSouth Operations
36 Establish an equipment replacement fund for fire vehicles and equipment.
• Determine necessary funds needed for replacement of fire vehicles and equipment
• Create an equipment replacement fund
Priority 2 Assistant Chief Administration and Finance
37 Formalize EMD’s quality assurance program.
• Develop quality assurance protocols that meet PFD needs
• Test protocols • Adjust as necessary and implement
Priority 1 Assistant ChiefSouth Operations
In conjunction with Public Works’ Fleet Manager
38 Reassess the need for RM14 staffing to remain intact to save costs and/or improve efficiencies.
• Establish criteria to determine the necessity of RM14 staffing
• Analyze data • Implement changes, if warranted
Priority 2 Assistant ChiefSouth Operations

Phoenix Fire Department Draft Implementation Action Plan Management Partners
Management Partners, Inc. 9
Rec No. Recommendation
ImplementationSteps Priority1
Target Date
Person Responsible2 Comments
39 Assess the workload of the three equipment repair specialists in the Fire Apparatus Shop and consider transferring them to EMD’s Make Ready Shop.
• Establish criteria to determine workload • Analyze data • Transfer positions, if warranted, to EMD’s
Make Ready Shop
Priority 1 Assistant ChiefSouth Operations
40 Increase the training budget for EMD technicians and establish incentives for technicians to acquire ASE and EVT certifications.
• Determine costs needed to afford incentives for certifications
• Increase budget based on cost estimates • Implement incentives for certification
Priority 1 City’s Fleet Manager
PFD is not responsible for implementation, but could be supportive of need for better training specifically for fire apparatus
41 Develop a service level agreement between the EMD and the Fire Department.
• Obtain model agreements • Modify language as needed • Implement
Priority 1 Assistant ChiefSouth Operations
In conjunction with City’s Fleet Manager
42 Adjust the shop workload by giving priority to units that are overdue for preventive maintenance and contract excessive repair work until all fire units are in preventive maintenance compliance.
• Determine which units are overdue for preventative maintenance
• Prioritize workload based off of determination
• Contract excessive repair work
Priority 1 City’s Fleet Manager
In conjunction with PFD Division Chief for Fleet
43 Reengineer the preventive maintenance program to include formal, progressive, multi‐level servicing unique to each vehicle and equipment class.
• Analyze each unique piece of equipment to determine best practice preventative maintenance
• Implement best practice for preventative maintenance for each unique piece of equipment
Priority 1 City’s Fleet Manager
In conjunction with PFD Division Chief for Fleet
44 Review and modify preventive maintenance intervals to conform to manufacturer‐suggested servicing and industry standards.
• Research manufacturer‐suggested servicing and industry standards for preventative maintenance intervals
• Adjust current intervals as needed
Priority 1 City’s Fleet Manager
In conjunction with PFD Division Chief for Fleet

Phoenix Fire Department Draft Implementation Action Plan Management Partners
Management Partners, Inc. 10
Rec No. Recommendation
ImplementationSteps Priority1
Target Date
Person Responsible2 Comments
45 Reevaluate fire apparatus replacement criteria and develop new age and mileage criteria based on reasonable replacement guidelines utilized by other large cities.
• Analyze peer apparatus replacement criteria
• Develop new age and mileage criteria as needed
Priority 2 Assistant ChiefSouth Operations
In conjunction with PFD Division Chief for Fleet and City’s Fleet Manager
46 Determine the number of units required to provide adequate reserves for first‐line fire apparatus.
• Research best practice for number of reserve first‐line fire units
• Adjust number of reserve units accordingly
Priority 1 Assistant ChiefSouth Operations
In conjunction with PFD Division Chief for Fleet
47 Dispose of excess apparatus. • Sell/auction excess apparatus Priority 2 Assistant ChiefSouth Operations
In conjunction with Assistant Chief Administration and Finance
48 Conduct a fleet utilization review to evaluate the need for each assigned vehicle and piece of equipment in the Fire Department.
• Develop request for proposals for fleet utilization study
• Choose experienced fleet consultant • Undertake review
Priority 1 Assistant ChiefSouth Operations
In conjunction with PFD Division Chief for Fleet
49 Analyze the costs and benefits of retrofitting Fire Department facilities with energy saving technology.
• Research retrofit equipment and costs • Determine benefits of each • Implement retrofits that will save costs
Priority 2 Division Chief Facilities
50 Develop a set of key performance measures that demonstrate efficiency and effectiveness of the department.
• Identify appropriate measures focused on efficiency and effectiveness
• Pilot test data collection procedures • Examine data quarterly
Priority 2 Assistant Chief Administration and Finance
In conjunction with all Executive team members