Towards defining a unified concept for the acceptability of Intelligent Transport Systems (ITS): A...
36
biblio.ugent.be The UGent Institutional Repository is the electronic archiving and dissemination platform for all UGent research publications. Ghent University has implemented a mandate stipulating that all academic publications of UGent researchers should be deposited and archived in this repository. Except for items where current copyright restrictions apply, these papers are available in Open Access. This item is the archived peer-reviewed author-version of: Towards defining a unified concept for the acceptability of Intelligent Transport Systems (ITS): A conceptual analysis based on the case of Intelligent Speed Adaptation (ISA) Vlassenroot, S., Brookhuis, K., Marchau, V., Witlox, F. In: Transportation Research Part F, 13 (3), 164-178, 2010. doi: 10.1016/j.trf2010.02.001 To refer to or to cite this work, please use the citation to the published version: Vlassenroot, S., Brookhuis, K., Marchau, V., Witlox, F. (2010). Towards defining a unified concept for the acceptability of Intelligent Transport Systems (ITS): A conceptual analysis based on the case of Intelligent Speed Adaptation (ISA). Transportation Research Part F 13(3), 164-178. doi 10.1016/j.trf2010.02.001.
Transcript of Towards defining a unified concept for the acceptability of Intelligent Transport Systems (ITS): A...
biblio.ugent.be
The UGent Institutional Repository is the electronic archiving and dissemination platform for all
UGent research publications. Ghent University has implemented a mandate stipulating that all
academic publications of UGent researchers should be deposited and archived in this repository.
Except for items where current copyright restrictions apply, these papers are available in Open
Access.
This item is the archived peer-reviewed author-version of:
Towards defining a unified concept for the acceptability of Intelligent Transport Systems
(ITS): A conceptual analysis based on the case of Intelligent Speed Adaptation (ISA)
Vlassenroot, S., Brookhuis, K., Marchau, V., Witlox, F.
In: Transportation Research Part F, 13 (3), 164-178, 2010.
doi: 10.1016/j.trf2010.02.001
To refer to or to cite this work, please use the citation to the published version:
Vlassenroot, S., Brookhuis, K., Marchau, V., Witlox, F. (2010). Towards defining a unified
concept for the acceptability of Intelligent Transport Systems (ITS): A conceptual analysis
based on the case of Intelligent Speed Adaptation (ISA). Transportation Research Part F
13(3), 164-178. doi 10.1016/j.trf2010.02.001.
1
Towards defining a unified concept for the acceptability of Intelligent T ransport
Systems (I TS): A conceptual analysis based on the case of Intelligent Speed
Adaptation (ISA)
Sven Vlassenroota,b*, Karel Brookhuisa,c, Vincent Marchaua, Frank Witloxd
a Transport Policy and Logistics Organisation, Delft University of
Technology, PO Box 5015, 2600 GA Delft, The Netherlands, tel. +31 15 27 87 135,
fax. +31 15 27 82 719, e-mail: [email protected],
[email protected], [email protected]. b Institute for Sustainable Mobility (IDM), Ghent University, Vrijdagmarkt
10/301, 9000 Gent, Belgium. c Department of Psychology, University of Groningen, Grote Kruisstraat 2/1,
9712 TS Groningen, The Netherlands, [email protected]. d Department of Geography, Ghent University, Krijgslaan 281, 9000 Gent,
Belgium, e-mail: [email protected].
* Author for correspondence
*ManuscriptClick here to view linked References
2
Abstract
A key success factor in the future implementation of new in-vehicle
technologies is in understanding how users will experience and respond to these
devices. Although it is recognized that acceptance, acceptability and/or support is
important, consistency in the definition of acceptability, and how it can be measured,
is absent. In this paper we conceptualize acceptance as the attitudes towards a new
device after its introduction and acceptability as the attitudes to it before its
introduction. It is our goal to describe and conceptualize the most common and
relevant socio-psychological factors that can influence acceptance and acceptability of
Intelligent Speed Adaptation (ISA). By analysing the different theories and methods
used in ISA trials we arrived at the 14 most potential indicators that could influence
the definition of acceptability and acceptance. A test survey was conducted to
determine if these indicators are relevant and if they affect acceptability. The use of a
factor analysis helped to single out those questions that were deemed relevant in
doing our conceptual acceptability analysis, and to allocate correlations between the
different items. We conclude that we have found a concept with some main possible
indicators that directly influence the acceptability of ISA.
K eywords
Acceptance, Acceptability, Driver attitudes, Intelligent Speed Adaptation, Support
3
1. Introduction
In their
the European Commission stated that the main challenges for sustainable mobility
include a reduction of congestion, an increase in traffic safety (a 50% reduction in
fatalities in 2010 compared with 2000), an increase in energy efficiency, and a
reduction of dependence on fossil fuels (European Commission, 2001). The use of
different transport technologies (also known as Intelligent Transport Systems or ITS)
may play a significant role in achieving these policy goals. Many ITS applications in
the field of traffic management and travel information that are already on the market
have proved their effectiveness. These systems support transport system users, traffic
managers, and fleet operators with traffic and travel information. However, to achieve
the stated EC transport policy goals, the implementation of more advanced ITS
applications is required, with active intervention in vehicle driving tasks. This
category of ITS device is also known as the Advanced Driving Assistance Systems
(ADAS) that partially take over driving tasks such as distance keeping, lane keeping,
overtaking, and so on. Many research initiatives on different ADAS technologies are
being conducted at international, national, and regional level. While most studies
focus on the technological feasibility of ADAS and its intended impacts, an important
question as to whether these new technologies will be accepted and used remains
unanswered.
ADAS vary from relatively simple systems that provide drivers with basic
information to relativel
understand how users experience and respond or not to the support of ADAS is
important for determining how driver
view has been roughly noted as acceptance or acceptability. Although several studies
have examined acceptance and/or acceptability of ADAS there is little consistency on
what is understood by acceptance or acceptability and, equally important, how these
factors can be measured (cf. Molin & Brookhuis, 2007). The present paper aims to
define acceptance and acceptability, and to determine which indicators should be
considered relevant for their measurement. Our application involves Intelligent Speed
4
Adaptation (ISA). ISA is a traffic safety device that warns the driver about speeding,
discourages the driver from speeding, or prevents the driver from exceeding the speed
limit (Brookhuis & De Waard, 1999), and hence, can be considered an ADAS
application.
The aim of this paper is first to define acceptance and acceptability, i.e. to
develop a theoretical framework that concurs with our conceptualization. We
introduce our definitions of acceptance and acceptability, and give a brief overview of
current theories and methods used in ISA trials. Based on these theories and methods
we then define similarities between the items or determinants that lead to the selected
indicators. In section 3 we outline a conceptual framework. This framework forms the
basis for constructing a test survey to discover which indicators can be considered
relevant, and if they are, what correlations exist between the described indicators. In
section 4 we describe the research method used for the test survey. In section 5 we
summarize the results of our test survey based on factor analysis. In the final section
we set out our conclusions and propose avenues for future research.
2. Defining acceptance and acceptability in I TS and ISA research
2.1 What is acceptance and acceptability?
Acceptance, acceptability, social acceptance, public support, social support,
etc. are all terms frequently used to describe a similar phenomenon, how potential
users will react and act if a certain measure or device is implemented. The interest in
defining acceptance or acceptability lies in the precondition that the effectiveness and
success of a measure will increase if there is public/social support for it. Under
favourable conditions a positive assessment leads to an increased willingness to
accept a measure and even to support it actively (Nelissen & Bartels, 1998;
Goldenbeld, 2002). Although it is recognized that acceptance, acceptability, and
support are important, a clear definition of what acceptance and acceptability are and
precisely how they should be measured is still absent (Adell, 2008a; Regan et al.,
2006; Vlassenroot, 2006).
5
To a certain extent the terms acceptance and support are strongly related.
Goldenbeld (2002), however, introduces an important nuance between both concepts.
The basic idea is that even if acceptance exists, it would not necessarily lead to the
support of a measure.
In the field of ITS, Ausserer and Risser (2005) define acceptance as a
phenomenon that reflects to what extent potential users are willing to use a certain
system. Hence, acceptance is linked closely to usage, and acceptance will depend on
how user needs are integrated into the development of the system. Nielsen (cited in
Young et al., 2003) described acceptability as related to the question of whether the
system is good enough to satisfy all the needs and requirements of the users and other
3) diffusion of innovations,
acceptability research is defined as the investigation of perceived attributes of an ideal
innovation in order to guide research and development to create such an innovation.
Van der Laan et al. (1997) distinguished between user acceptance and social
acceptance. User acceptance is directed more towards evaluation of the ergonomics of
the system while social acceptance is a more indirect evaluation of consequences of
the system.
In another distinction between acceptance and acceptability, Schade and
behavioural responses, after the introduction of a measure, and acceptability as the
prospective judgement before such future introduction. In this case, the respondents
will not have experienced any of the measures or devices in practice, which makes
acceptability a construction of attitude. In our research, we are more interested in
defining the social aspects that could lead to public acceptability. Our research target
group will not have experienced driving with ISA. Therefore, the term acceptability
should be preferred, whereas in the literature this difference is not always found.
The lack of a theory and definition regarding acceptance has resulted in a large
number of different attempts to measure ITS acceptance, often with quite different
results (Adell, 2008a). Some existing theories were used to measure these within the
acceptance and acceptability research of ITS. In the next sections we describe some of
6
2.1 User acceptance models and theories
One of the most frequently used frameworks to define acceptance is the
Theory of Planned Behaviour (TPB). Based on the Theory of Reasoned Action
(Fischbein & Ajzen, 1975), the TPB assumes that behavioural intentions, and
therefore behaviour, may be predicted by three components (Van Acker et al., 2007,
2010): attitudes towards the behaviour of
performing a particular behaviour; subjective norms, which describe the perception of
perception of their own capability.
TPB has been used successfully to predict behaviour in a wide variety of
applied research settings within different domains, including several studies dealing
with driving behaviour and traffic safety, such as the effects of drinking and driving
(Aberg, 1993; Parker et al., 1992a), driving violations (Parker et al., 1992b), and
speeding and speed behaviour (Elliot et al., 2005; Haglund et al., 2000). Warner and
Aberg (2006) specifically used the TPB related to the use of ISA. Comparing self-
reported speeding of test drivers within an ISA trial with logged data explained 28%
of the variance in logged speeding. In their study, Warner and Aberg (2006) noted
that perceived behavioural control did not add significantly to the prediction of
Another successful model is the Technology Acceptance Model (TAM)
(Davis et al., 1989). TAM was designed to predict information technology acceptance
and usage on the job. TAM assumes that perceived usefulness and perceived ease of
the intention to use
serving as a mediator of actual system use. TAM has been used in the field of ITS
in the prediction of electronic toll collection (Chen et al., 2007).
Van der Laan et al. (1996) published a simple method to define acceptance.
Acceptance is measured by direct attitudes towards a system and provides a system
evaluation in two dimensions. The technique consists of nine rating-scale items.
These items are mapped on two scales, the one denoting the usefulness of the system,
and the other satisfaction.
7
Venkatesh et al. (2003) noted that there are several theories and models of user
acceptance of information technology, which presents researchers with difficulties in
choosing the proper model. Venkatesh et al. (2003) found different underlying basic
concepts in acceptance models by means of a detailed description and analysis of
different models such as TPB, the motivational model, TAM, innovation diffusion
theory, and combined models. Based on these theories, they constructed a unified
model they named the Unified Theory of Acceptance and Use of Technology
(UTAUT). In the UTAUT, four constructs play a significant role as direct
determinants of user acceptance: (i) performance expectancy the degree to which an
individual believes that using the system would help him or her to attain gains in job
performance; (ii) effort expectancy the degree of convenience with the use of the
system; (iii) social influence
individual uses the system; and (iv) facilitating conditions how an individual
believes that an organizational and technical infrastructure exists to support use of the
system. The supposed key moderators within this framework are gender, age,
voluntariness of use, and experience. Although in sev
determinants of intention, these are not mentioned in the UTAUT. Venkatesh et al.
(2003) presumed that attitudes towards using the technology would not have a
significant influence.
Stern (2000) developed the value belief norm (VBN) theory to examine
which factors are related to acceptability of energy policies. Stern and colleagues
proposed the VBN theory of environmentalism to explain environmental behaviour,
including the acceptability of public policies. They proposed that environmental
behaviour results from personal norms, that is, a feeling of moral obligation to act
pro-environmentally. These personal norms are activated by beliefs that
environmental conditions threaten the individual values (awareness of consequences)
and beliefs that the individual can adopt to reduce this threat (ascription of
responsibility). VBN theory (Steg et al., 2005) proposes that these beliefs are
dependent on general beliefs on human environment relations and on relatively stable
value orientations. VBN theory was successful in explaining various environmental
behaviours, among which consumer behaviour, environmental citizenship, willingness
8
to sacrifice, and willingness to reduce car use (Stern et al., 1999; Nordlund & Garvill,
2003).
Schlag and Teubel (1997) defined the following essential issues determining
acceptability about traffic measures: problem perception, important aims, mobility-
related social norms, knowledge about options, perceived effectiveness and efficiency
of the proposed measures, equity (personal outcome expectation), attribution of
responsibility, and socio-economic factors.
2.2 Acceptance measurements in ISA trials
In our approach we want to describe the most common and relevant socio-
psychological factors that influence acceptance and acceptability of ITS and actively
interact with vehicle driving tasks. We will focus on ISA. ISA can be categorized
within different types, depending upon how interventionist (or permissive) they are
(Morsink et al., 2006).
[Insert Table 1. Overview of different types of ISA (Morsink et al., 2006)]
In most ISA studies, acceptance and acceptability refer to the opinions,
attitudes, and values of the users relative to the experience they had when driving with
the system (Brookhuis & De Waard, 1999; Comte et al., 2000; Vlassenroot et al.,
2007; Young & Regan, 2007). In these studies, acceptance is measured by comparing
behavioural changes when driving without ISA before using the device and driving
with ISA and finally driving without ISA after the test period (Adell et al., 2008;
Biding & Lind, 2002; Hjalmdahl & Varhelyi, 2004; Katteler, 2005). Brookhuis and
De Waard (1999) defined these behavioural changes as the level of adaptation instead
of acceptance. Adaptations are those behaviours that may occur following the
introduction of changes to the road-vehicle user (Dragutinovic et al., 2005).
Therefore, adaptation will better describe the behavioural outcomes (and changes)
when drivers have experienced the device, while acceptance will be more related to
9
the attitudes, norms, and beliefs that may influence adaptation. Goldenbeld (2002) has
noted that opinion and attitude studies are the most widely adopted research methods
for measuring acceptability and acceptance of road safety measures.
Based on recent ISA field trials in different countries, certain directions for
defining acceptance can be found. Although the main research set-ups and methods
used were different in most trials, some common ground is evident.
In a large-scale ISA trial in Sweden, different types of ISA were tested
voluntarily by 10,000 drivers between 1999 and 2002 (Biding & Lind, 2002). In these
trials, acceptance was measured by relating attitudes to traffic safety and speed with
experience of the tested ISA, willingness to pay, performance when using ISA, and
the Van der Laan scale.
In the Dutch ISA trial (Ministerie van Verkeer en Waterstaat: Adviesdienst
Verkeer en Vervoer, 2001) a mandatory (closed) system was tested, implying that the
drivers could not violate the speed limit. The acceptance aspect focused primarily on
limited areas), technical functions of ISA, and ergonomic issues.
In the Australian trial (Regan et al., 2006), the acceptance study was based on
the model of Davis and Nielsen (cited in Young et al., 2007). The five main constructs
were usefulness (users perceive the system to serve a purpose), effectiveness (users
believe that the system does what it is designed to achieve), usability (the ease of use
of the system), affordability (willingness to pay), and social acceptability (broader
scale that users may take into account in assessing whether ISA is acceptable). The
scope of research in the Australian trial involved other ITS devices such distance-
keeping warning.
In 2001, a new trial started in the UK, called ISA-UK (Carsten et al., 2008). In
four field trials conducted in different parts of the UK, 80 private and professional test
drivers drove 20 vehicles that had a system installed over a period of six months
(during the first and last month the system was not activated). The system made it
impossible for the test drivers to exceed the speed limits without using kick-down or
was assessed by using TPB related to speeding in three scenarios: speeding on a
10
motorway, urban 40 mph road, and residential 30 mph road. The impact of ISA on
acceptance was rated using dimensions of usefulness and satisfaction.
In 2004 an ISA experiment with 20 vehicles was conducted near Versailles,
acceptance of the system and to define both their attitudes and social representations
of speed and ISA. This means that the behaviour of individuals and groups is directly
determined by the responses they show for an objective or to the situation in which
they find themselves. Social representations guide relationships, communications, and
social practices.
In a Belgian trial (Vlassenroot et al., 2007), drivers drove with an active
accelerator pedal, implying that the drivers received feedback through a push-back of
the accelerator if they sped. The concept of acceptance was based on a framework
designed to define public opinions on speed measures and ISA. This framework
denotes how people view mobility and transportation in relation to road safety,
especially with respect to speed, speeding, and speeding restrictions. Based on this
framework, basic attitudes to road safety, speed, and speeding, and recognition of
speed as a problem in society and attitudes about road safety and policy could be
measured, distinguishing between different socio-demographic backgrounds of
transport users. Further aspects were the voluntary use of the system outside the test
area, willingness to pay, and the scaling of the use of ISA on satisfaction and
usefulness (Van der Laan et al., 1997).
A Danish trial (Harms et al., 2007) used an open ISA system, based only on
information about speeding, in combination with other incentives when driving safely
(e.g. lower insurance premiums). This trial focused on the influence of background
factors such as age and driving experience, questions related to driving style, attitudes
to safe driving, driving speed and speed limits, and to risky traffic behaviour. The
respondents were also asked to judge a number of frequently used ISA features, and
to anticipate effects of driving with ISA.
main variables that would influence ISA acceptability. De Mol et al. (2001) based
11
ISA acceptability measurement on the attitudes and opinions given by individuals,
which stand for the general public. Within this concept several layers with mutual
relations were defined, with the socio-demographic issues and the individual
attitudes denote how people perceive mobility and transportation, in particular the
perception of speed in relation to motorized vehicles. Public support is also
indication that a problem about the relationship between road safety, speed, and
speeding is perceived, there will be no change in future acceptance. Some of the
abstract norms and values are made concrete in issues concerning how people think
about road-
should occur. Within the SARTRE (Social Attitudes to Road Traffic Risk in Europe)
project (Drevet, 2004) some questions related to how people noticed speed and
speeding, and were brought into relation with willingness to use a speed-limiting
device. Some of the aspects used in acceptance research and in acceptability research
are mutual.
As a reminder, we will define acceptance as the reaction (beliefs and attitudes)
of individuals, based on their behavioural reactions after the introduction of a
measure or device. Acceptability describes the prospective judgement of measures to
be introduced in the future. In our further research we will focus on acceptability
instead of acceptance.
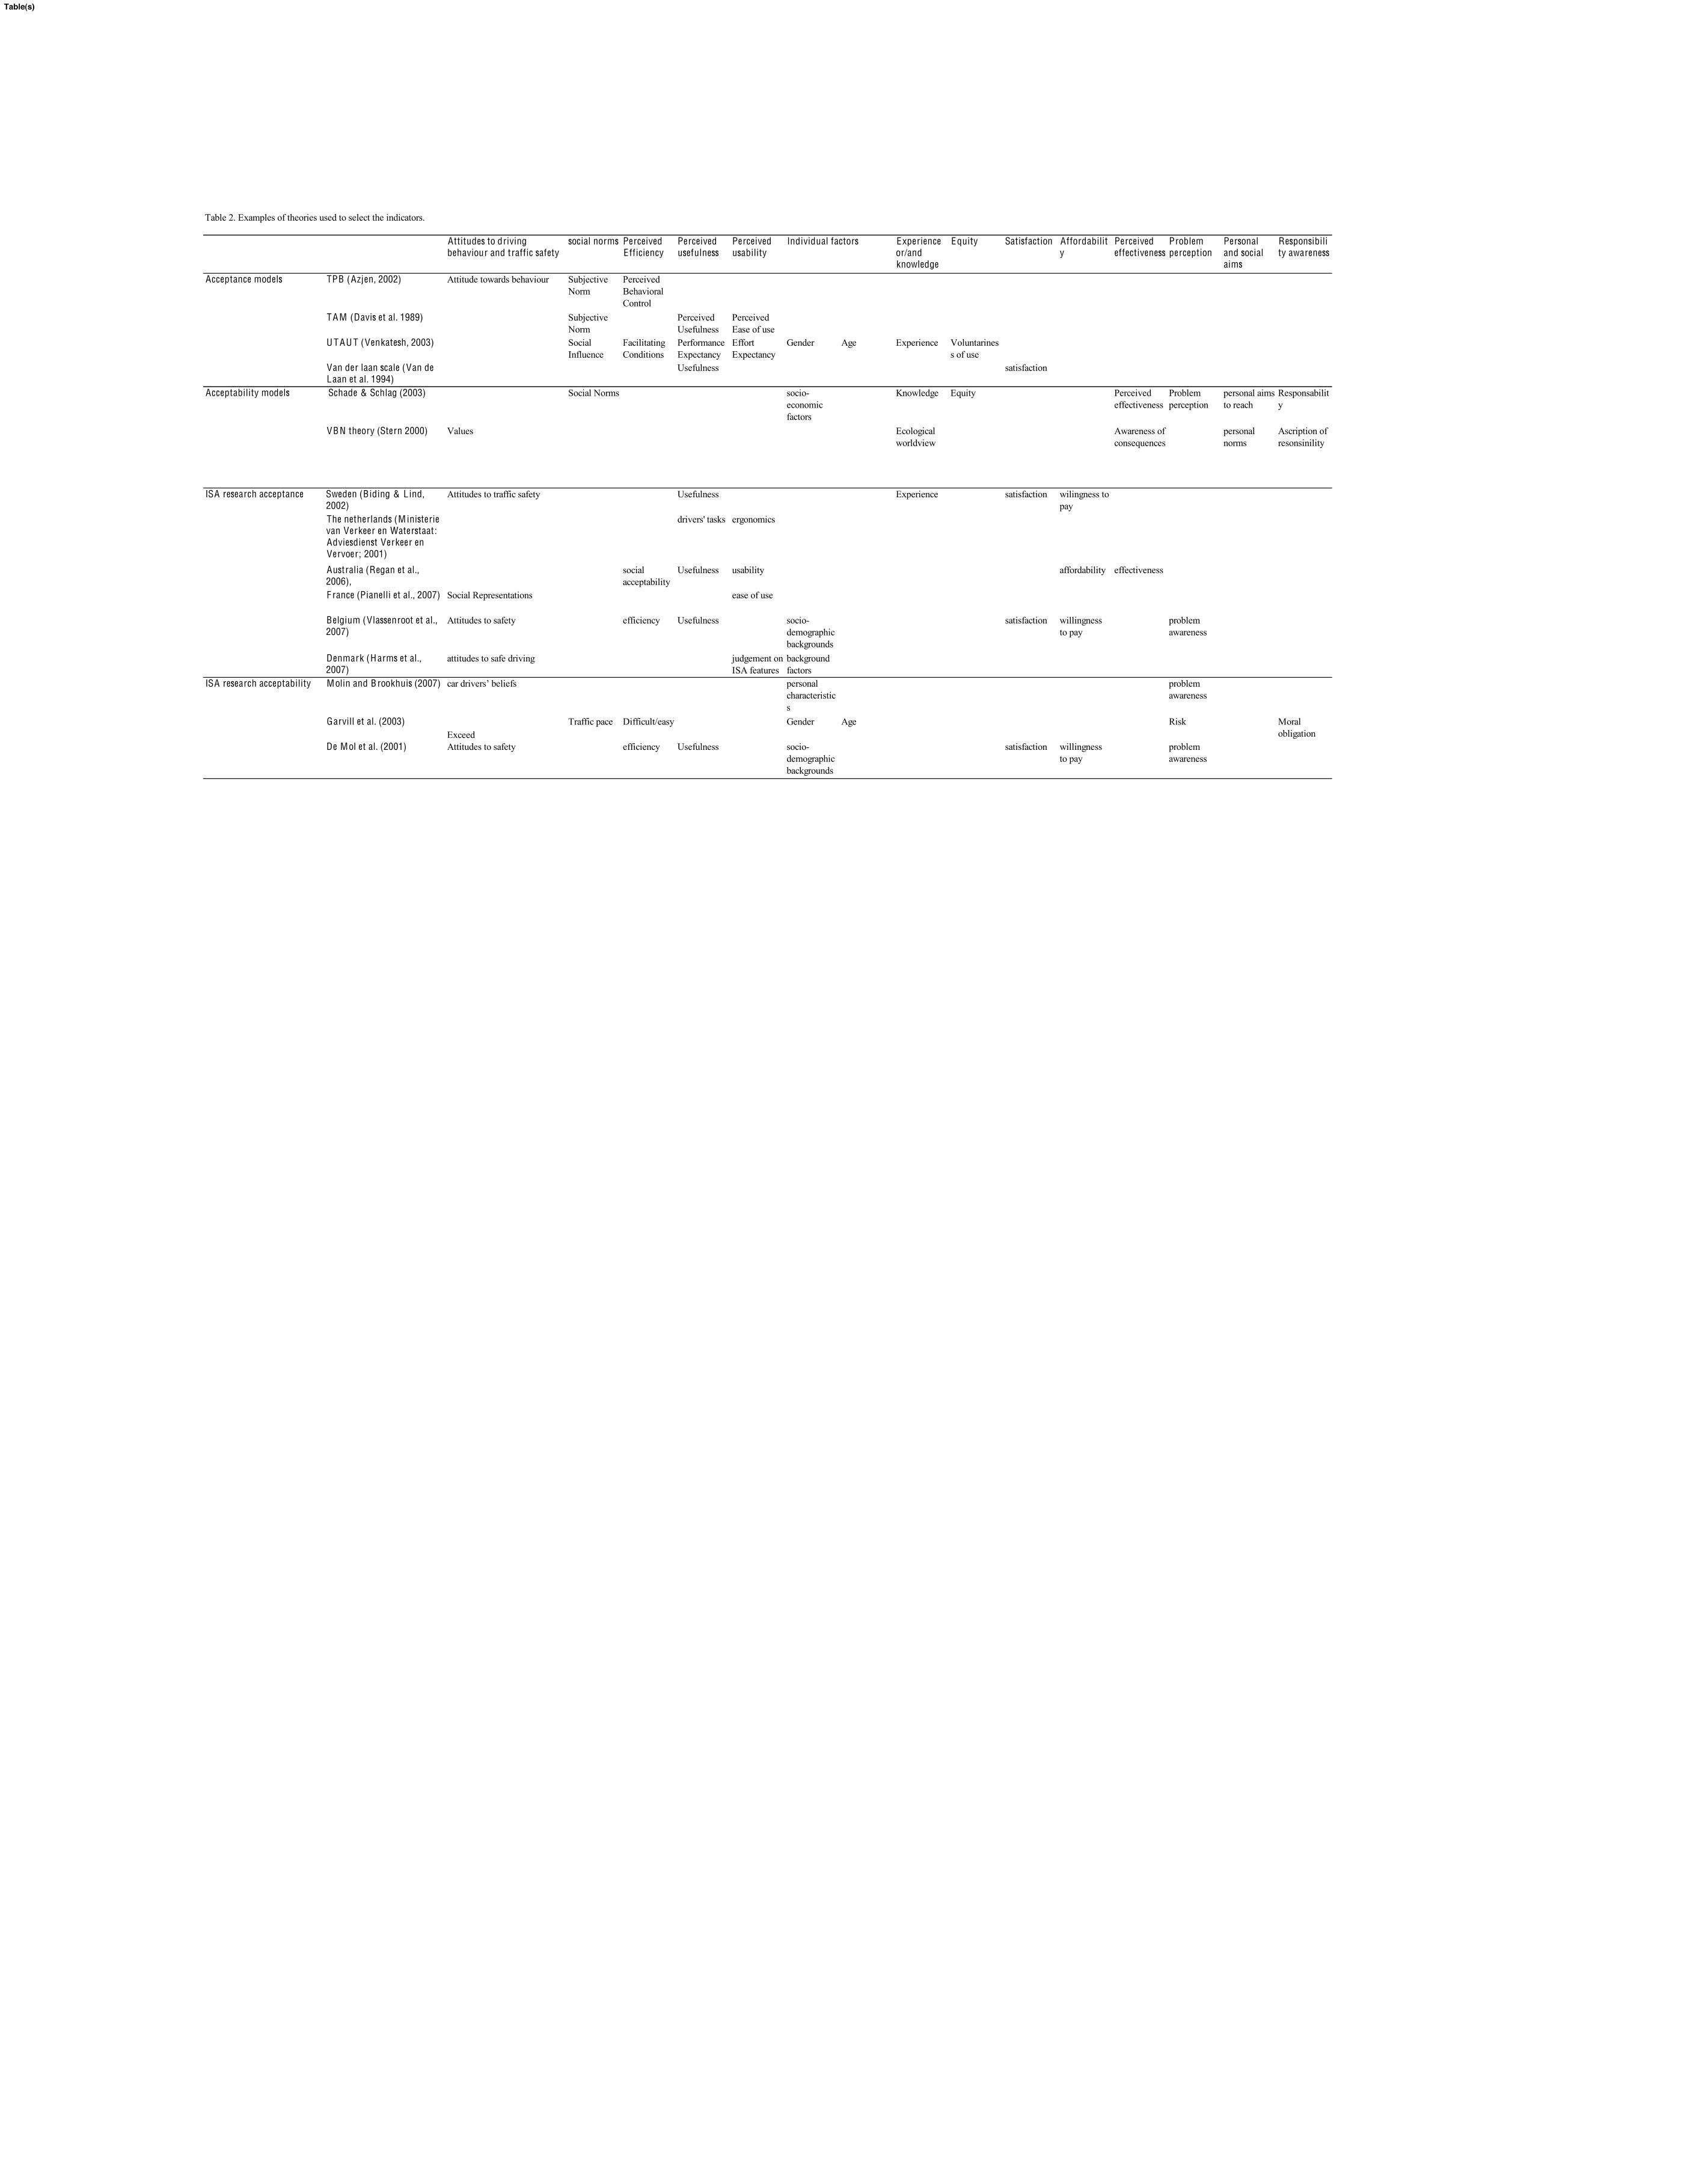
3. Conceptualization of the model
The previous sections described how methods and theories are used to distil
the most relevant determinants that could influence acceptance and acceptability. In
these theories and methods we tried to find which items were related to each other.
Venkatesh et al. (2003) did a similar exercise to build their UTAUT model. Table 2
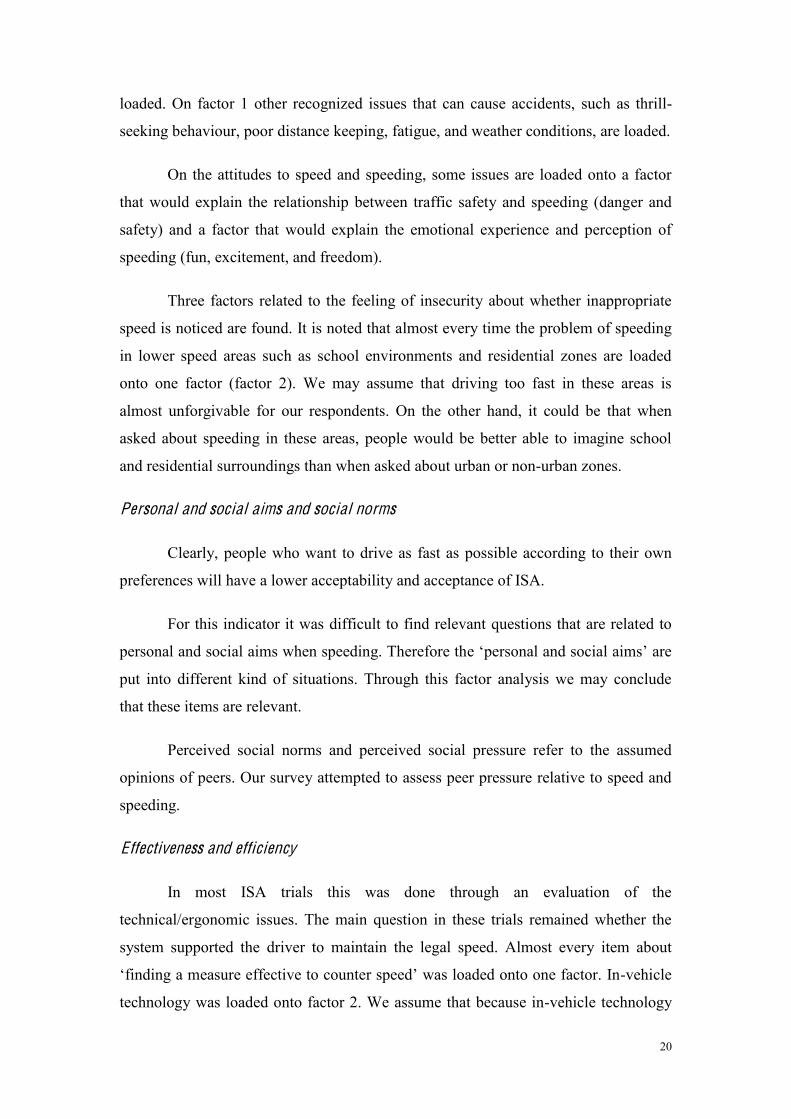
gives an overview of some of the theories used to select the indicators.
[Insert Table 2. Examples of theories used to select the indicators]
12
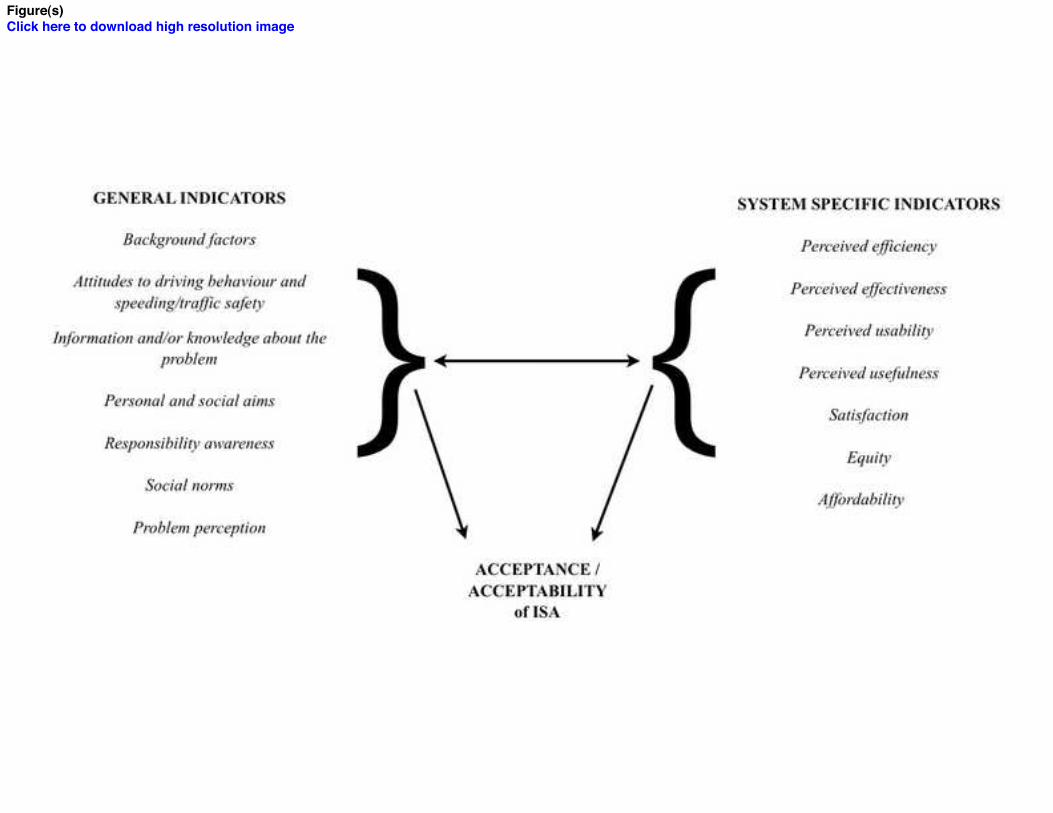
In Figure 1 a distinction is made between general indicators (related to the
context awareness of the system) and system-specific indicators (directly related to
the characteristics of the device). The 14 indicators are considered to be the most
relevant that can or will influence acceptance/acceptability. These general and
specific indications will influence each other and the level of acceptance and
acceptability. We give a brief description of every indicator.
[Insert Figure 1. General and system specific indicators that can influence acceptance
or acceptability]
3.1 General indicators
Individual factors
Gender, age, level of education, and (income) employment are considered to
influence how people think about speed and speeding and therefore on the use of ISA.
Gender and age are considered as relevant determinants within the performance of
speeding behaviour. Speed is more associated with young drivers (Ingram et al., 2001;
Parker et al., 1992a; Stradling et al., 2000), and more specifically, with young male
drivers (Stradling et al., 2003). Although male drivers are more likely to speed, some
studies noted that a difference between sexes could not be found. Shinar et al. (2001)
analysed the proportion of licensed drivers that reported that they drive within the
speed limits. They noted that age, education, income, and gender are relevant factors
in speeding behaviour. Shinar et al. (2001) observed that drivers who were more
educated and had a higher income (related to employment) were more likely to report
that they sped than the less educated and poorer respondents.
Attitudes to driving behaviour and speeding/traffic safety
Travel behaviour, driving style and the choice of vehicle are also related to
speeding behaviour. Silcock et al. (2000) noted that people admitted to driving faster
in more powerful and comfortable cars. Moreover, Steg et al. (2001) conducted a
study to clarify the importance of symbolic-affective as opposed to instrumental-
13
reasoned motives for car use. These motives for car use can have an impact on why
individuals drive too fast, or whether they would or would not accept ISA. Stradling
et al. (2003) examined the demographic and driving characteristics of speeding,
violating, and thrill-seeking drivers. They concluded that in England drivers who
speed, who violate other rules of the road, and who seek excitement when driving,
pose greater risks to themselves and to other road users. Stradling et al. (2003) also
found two population groups whose driving behaviour put themselves and other road
users at risk. The first group was young and mostly, but not exclusively, male drivers.
The second group was drivers from high-income households, living out of town,
driving larger-engine cars for high annual mileage as part of their work. Crash
involvement has been noted as a possible influence on speed and speeding behaviour.
In relation to defining the acceptance and acceptability of ISA, the influence of travel
behaviour, car use, vehicle choice, and driving style should be considered relevant
indicators.
Personal and social aims
Schade and Schlag (2003) describe personal and social aims as the dilemma
between social or personal aims and benefits. They assume that a higher valuation of
common social aims will be positively related to acceptability. Clearly, people who
want to drive as fast as possible will have a lower acceptability and acceptance of
ISA. Another issue is the effect of speeding measures on individual freedom. Policies
or devices that seriously affect individual freedom will be less acceptable (De Groot
& Steg, 2006).
Social norms
Perceived social norms and perceived social pressure refer to the (assumed)
opinions of their peers multiplied by th
whether peers would think that he or she should accept the device (Ajzen, 2002;
Schade & Schlag, 2003). It is assumed that peers, e.g. co-workers or specific other
road users, will influence the attitudes and behaviour of individuals
14
Problem perception
The extent to which speeding is perceived as a problem is a necessary
indication in defining acceptance and acceptability. There is common agreement that
high problem awareness will lead to increased willingness to accept solutions for the
perceived problems (Schade & Schlag, 2003; Steg et al., 1995; Eriksson et al. 2006;
Goldenbeld, 2002; Molin & Brookhuis, 2007; De Mol et al., 2001).
Responsibility awareness
This concept is based on the norm activation theory (Schwartz, 1977) and
environmental travel demand management studies (Eriksson, 2006; Steg & De Groot,
2006; Stern, 2000). Responsibility awareness explains how an individual stands in
respect to the issue of whether it is the government (others/extrinsic) or the individual
(own/intrinsic) that is deemed to be responsible. It is assumed that environment-
preserving behaviour becomes more likely if individuals perceive the damaging
consequences of their own actions on the environment and others, and at the same
time ascribe the responsibility for the consequences to themselves (Schade & Schlag,
2003).
Information and knowledge about the problem
The level of acceptability can depend on how well-informed the respondents
are about the problem and about any new device that is to be introduced to solve the
problem (Schlag & Schade, 2003; Steg et al., 1995). The hypothesis may be that the
more that people are informed, the higher the acceptance/acceptability will be.
However, better knowledge about a problem can also lead to less
acceptance/acceptability for a specific solution caused by, for instance, awareness of
alternatives to solve the problem.
3.2 Device-specific indicators
Device-specific beliefs are directly related to the characteristics of the system.
Seven indicators could have the potential to define acceptance or acceptability and
how user needs are integrated into the system. As noted, ISA acceptance is related to
15
titudes and behaviour about speed and speeding. Therefore, the previously
noted concepts of general beliefs must be taken into consideration and will influence
specific beliefs for defining acceptability of ISA.
Perceived efficiency
Perceived efficiency indicates the possible benefits users expect of a concrete
measure (or device) as compared with other measures.
Perceived effectiveness
specifications, or in the manner it was intended to function (Young et al., 2003). In
most ISA trials, this was found through an evaluation of the technical/ergonomic
issues. The main question in these trials remained whether the system assisted the
driver to maintain the proper speed. The level of effectiveness can depend on how
interventionist a system is or was. For instance, an advisory system can be considered
as less effective than a system that prevents the driver from exceeding the speed limit.
Perceived usability
Perceived usability is the ability to use the system successfully and with
minimal effort. Usability is also an indication for how users understand how the
system works. User friendliness can be associated with usability: the users will expect
a service that does not distract or overload them with information and (difficult) tasks
(Landwehr et al., 2005).
Perceived usefulness
and driving behaviour. Usefulness is, in a certain way, different from effectiveness. A
potential user can find ISA effective in general but not for his own driving behaviour.
Young et al. (2003) define usefulness as the degree to which a person believes that
using a particular system will enhance his or her performance.
16
Satisfaction
Satisfaction is one of two factors derived form the items within the ITS
acceptance scale that Van der Laan et al. (1997) developed to study user acceptance.
Equity
In general, equity refers to the distribution of costs and benefits among
affected parties. However, from a psychological viewpoint, perceived justice,
integrity, privacy, etc., are basic requirements for acceptability. This may differ from
the objective costs and benefits, but equity is an important indicator influencing
personal perceptions (Schade & Schlag, 2003). The integrity of driver information,
privacy, and loss of certain freedom in driving can be an issue for willingness to use
ISA.
Affordability
It may be assumed that socio-economic status will affect acceptance and
acceptability, as users
public/private funding. It is to be expected that low-income groups will be more
opposed to ISA. In many trials acceptance was defined by willingness to pay for ISA
(Vlassenroot et al., 2007; Biding & Lind, 2002; Hjalmdahl, 2004). The willingness to
pay will depend on income, but in many trials it is assumed that the more people are
willing to pay, the higher the acceptance and acceptability will be. Incentives such as
lower road taxes and lower insurance fees can stimulate the acceptance or
acceptability of ISA (Lahrmann et al., 2007; Schuitema & Steg, 2008).
17
4. Research methodology
In the previous section we described the most relevant indicators that could
influence acceptance and acceptability based on previous research and methods. In
this section we want to develop our conceptual framework operational. To this end,
we developed and tested a first survey.
4.1 Survey set-up
Based on the literature about acceptance and acceptability theories and
models, different factors and some 250 possible questions from past surveys some
questions had multiple sub-questions were found. These questions were categorized
into questions about (i) personality characteristics, (ii) problem recognition related to
speed and speeding, (iii) the use and integration of the actual methods to counter
speeding, and (iv) the use of the new technology (ISA) to counter speed and speeding.
These clusters made it possible to identify similar questions and to redefine some
questions. The above-mentioned 14 indicators were also positioned in these clusters.
In the second phase only questions relevant to defining the indicators were
withheld: about 60 questions were deemed relevant. A first survey was made, based
on these questions. Some of the questions were redefined and only the most relevant
questions were taken into account. The number of main questions was reduced to 36,
most of which consisted of different items (sub-questions) that had to be rated
(besides some identification questions) on a 5-point Likert-scale. To reduce the
number of items that the respondents had to fill in, in questions relating to car choice
and responsibility awareness, respondents were asked to rank the items from most
important to least important.
and sent first to colleagues for testing. Using their comments, especially about user
friendliness, a pilot test survey was made and circulated by mail and the popular
networking site Facebook. The goal was to reach 150 respondents. Based on the
answers of these respondents some modifications were made to improve the survey
18
and some of the early responses were processed to find out if the questions would
cover the described indicators (main variables).
Finally the definitive Web survey was published online. The goal was to have
at least 1000 respondents in Belgium (Dutch-speaking part) and 1000 respondents in
The Netherlands. The Web address of the survey was distributed by the Flemish and
Dutch motoring organizations. In Flanders a motoring organization sent an email
newsletter to their members, in the Netherlands, the link to the survey was announced
on website.
The same survey will be given to certain stakeholders involved in transport
policy and ITS deployment, who will be asked to estimate how people would answer
the questions.
4.2 Data analysis
While we used factor analysis in our analysis of the pilot test-survey data, we
are aware that this approach has some limitations. For instance, the analysis depends
etation of results. However, the goal of this analysis
is to find some first indications and relationships to define our concept of
acceptability. Second, factor scores provide a means to summarize information on a
large number of variables in a manageable and meaningful form.
5. Primary results from the pilot test survey
In total 217 individuals responded to the questionnaire, but only 148
respondents completed the survey. The answers of these 148 respondents were
analysed. Factor analysis was used to investigate if the questions and sub-questions
(see Table 3) covered the pre-defined indicators and if some other (internal) relations
could be found. Some of the indicators consisted of different items, which covered a
series of sub-questions (e.g. the indicator of problem perception consisted of items
such as accident influence, attitudes about speeding, etc). These sub-questions will be
reduced to factors that cover the items within the indicator or main variable.
19
asked as the respondents had not experienced the system and it was difficult to predict
how the Human Machine Interface (HMI) would be developed in the future. The
processed in the factor analysis because of a wrong question set-up in the survey. In
the future survey this indicator will be asked differently (on a Likert-scale instead of
ranking).
5.1 Factor analysis
In general our questions covered every indicator that we intended to ask in the
large survey (see Table 3). Factor analysis is made per indicator or item. Most of the
indicators or items within the indicators loaded onto one factor. Some of the most
relevant ones are described below.
[Insert Table 3. Factor loadings for the pre-defined indicators and (sub)-items]
Problem perception
The extent to which speeding was perceived as a problem is a necessary
indicator for defining acceptance and acceptability. Four items were considered
relevant in defining perception of this problem: (i) what will cause accidents, (ii)
attitudes to speed and speeding, (iii) insecurity feelings when speeding, and (iv)
opinions about posted speed limits.
Noteworthy is that 58.2% of the variance is explained by three factors
regarding causes of accidents. Speeding and driving under the influence of alcohol
and drugs are loaded onto the same factor. Speeding, alcohol, and drugs are
such as no experience as a driver, infrastructure, and inexperienced other drivers, are
20
loaded. On factor 1 other recognized issues that can cause accidents, such as thrill-
seeking behaviour, poor distance keeping, fatigue, and weather conditions, are loaded.
On the attitudes to speed and speeding, some issues are loaded onto a factor
that would explain the relationship between traffic safety and speeding (danger and
safety) and a factor that would explain the emotional experience and perception of
speeding (fun, excitement, and freedom).
Three factors related to the feeling of insecurity about whether inappropriate
speed is noticed are found. It is noted that almost every time the problem of speeding
in lower speed areas such as school environments and residential zones are loaded
onto one factor (factor 2). We may assume that driving too fast in these areas is
almost unforgivable for our respondents. On the other hand, it could be that when
asked about speeding in these areas, people would be better able to imagine school
and residential surroundings than when asked about urban or non-urban zones.
Personal and social aims and social norms
Clearly, people who want to drive as fast as possible according to their own
preferences will have a lower acceptability and acceptance of ISA.
For this indicator it was difficult to find relevant questions that are related to
personal and social aims when speeding. Therefore th
put into different kind of situations. Through this factor analysis we may conclude
that these items are relevant.
Perceived social norms and perceived social pressure refer to the assumed
opinions of peers. Our survey attempted to assess peer pressure relative to speed and
speeding.
E ffectiveness and efficiency
In most ISA trials this was done through an evaluation of the
technical/ergonomic issues. The main question in these trials remained whether the
system supported the driver to maintain the legal speed. Almost every item about
-vehicle
technology was loaded onto factor 2. We assume that because in-vehicle technology
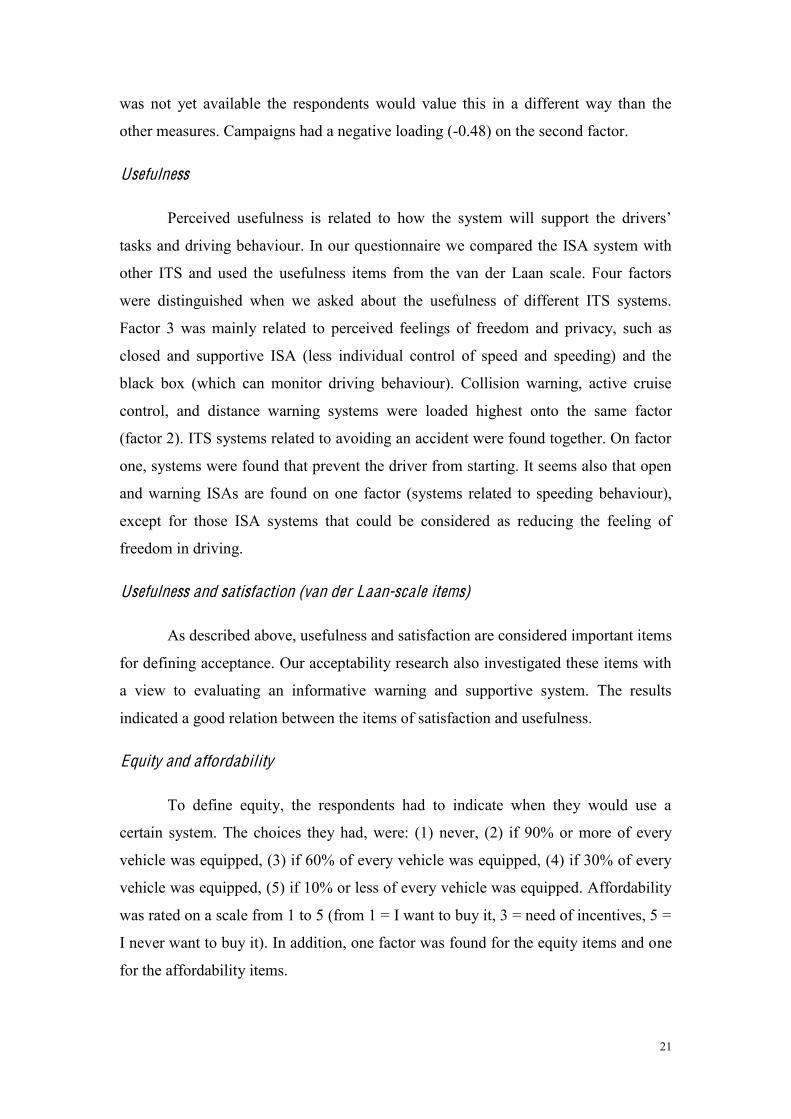
21
was not yet available the respondents would value this in a different way than the
other measures. Campaigns had a negative loading (-0.48) on the second factor.
Usefulness
tasks and driving behaviour. In our questionnaire we compared the ISA system with
other ITS and used the usefulness items from the van der Laan scale. Four factors
were distinguished when we asked about the usefulness of different ITS systems.
Factor 3 was mainly related to perceived feelings of freedom and privacy, such as
closed and supportive ISA (less individual control of speed and speeding) and the
black box (which can monitor driving behaviour). Collision warning, active cruise
control, and distance warning systems were loaded highest onto the same factor
(factor 2). ITS systems related to avoiding an accident were found together. On factor
one, systems were found that prevent the driver from starting. It seems also that open
and warning ISAs are found on one factor (systems related to speeding behaviour),
except for those ISA systems that could be considered as reducing the feeling of
freedom in driving.
Usefulness and satisfaction (van der Laan-scale items)
As described above, usefulness and satisfaction are considered important items
for defining acceptance. Our acceptability research also investigated these items with
a view to evaluating an informative warning and supportive system. The results
indicated a good relation between the items of satisfaction and usefulness.
Equity and affordability
To define equity, the respondents had to indicate when they would use a
certain system. The choices they had, were: (1) never, (2) if 90% or more of every
vehicle was equipped, (3) if 60% of every vehicle was equipped, (4) if 30% of every
vehicle was equipped, (5) if 10% or less of every vehicle was equipped. Affordability
was rated on a scale from 1 to 5 (from 1 = I want to buy it, 3 = need of incentives, 5 =
I never want to buy it). In addition, one factor was found for the equity items and one
for the affordability items.
22
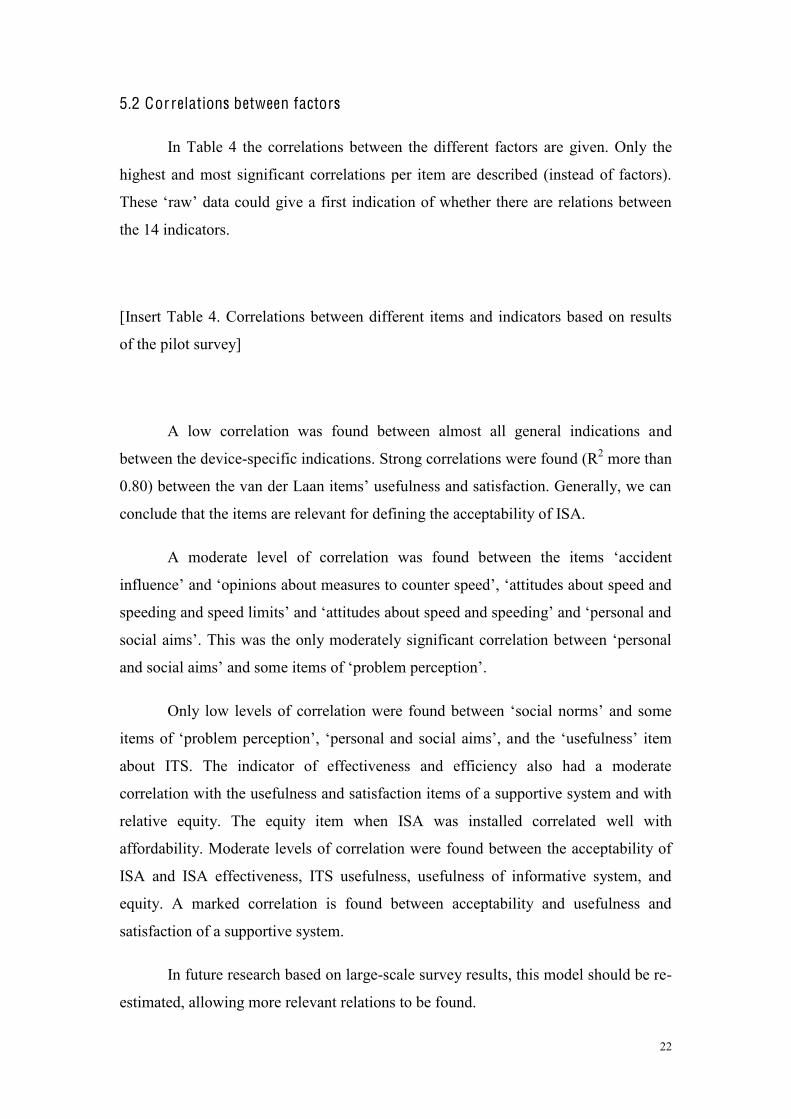
5.2 Correlations between factors
In Table 4 the correlations between the different factors are given. Only the
highest and most significant correlations per item are described (instead of factors).
e a first indication of whether there are relations between
the 14 indicators.
[Insert Table 4. Correlations between different items and indicators based on results
of the pilot survey]
A low correlation was found between almost all general indications and
between the device-specific indications. Strong correlations were found (R2 more than
conclude that the items are relevant for defining the acceptability of ISA.
A moderate level of correlation was found between the items
about ITS. The indicator of effectiveness and efficiency also had a moderate
correlation with the usefulness and satisfaction items of a supportive system and with
relative equity. The equity item when ISA was installed correlated well with
affordability. Moderate levels of correlation were found between the acceptability of
ISA and ISA effectiveness, ITS usefulness, usefulness of informative system, and
equity. A marked correlation is found between acceptability and usefulness and
satisfaction of a supportive system.
In future research based on large-scale survey results, this model should be re-
estimated, allowing more relevant relations to be found.
23
6. Conclusions
It is recognized that knowledge concerning the level of acceptance or
acceptability of a measure is important for future implementation of in-vehicle
technologies. Ironically, a clear definition of what acceptance and acceptability are or
how they should be measured is still lacking. In this paper we aimed to improve on
this lack of knowledge. We made a distinction between acceptance and acceptability
based on time and experience of the individual, whereby acceptance entails beliefs
and attitudes, based on their behavioural reactions after the introduction of a measure.
Acceptability describes the prospective judgement, based on attitudes and beliefs
about a measure, without experience, to be introduced in the future.
New vehicle technologies such as ISA are difficult to implement. Therefore
there is a need to understand wh
acceptability or acceptance. Based on different socio-psychological theories and
methods used in ISA trials we found 14 relevant indicators that we divided into
psyches, social values and norms at that time,
and so on) and device-specific indications (factors that are directly related to the
device itself). These 14 indicators were presented to randomly selected respondents
(through new Internet media) in a test survey. The main goal of this survey was to
find if the distilled indications and the questions were relevant, and if some relations
could be found between the indicators . Through the use of factor analysis we found
out that our questions were relevant for every item and some correlations were found
between the items. It is also noted that some indicators would directly influence the
acceptability of ISA while some would influence others more indirectly. This first
step in our research enabled us to conduct a relevant large-scale survey among the
general public in The Netherlands and Belgium on the acceptability of ISA.
In the second phase of our research analysis, following the large-scale survey,
the data will be processed to define how indicators relate to each other and how they
fit the model. This model will be used to define how far implementation strategies
should be taken to encourage higher acceptability and future acceptance of ISA. Some
cross-cultural research will also be done and the answers related to answers given by
different stakeholders.
24
One of the key issues is how the public will react if ITS is implemented. The
understanding of the defined indications that will influence acceptability and
acceptance may support decision-makers in developing an appropriate
implementation strategy. Through the construction of this framework, we want to
provide decision-makers with methods and procedures that are easy to use and
understand, based on well-accepted socio-psychological models.
Acknowledgement
This PhD research project is a co-operation between Delft University of Technology,
The Netherlands and Ghent University, Belgium.
25
References
Aberg, L. (1993). Drinking and driving: intentions, attitudes, and social norms
of swedish male drivers. Accident Analysis and Prevention, 25, 289 296.
Adell, E. (2008a). The concept of acceptance. Paper presented at the ICTCT-
workshop.
Adell, E., and Varhelyi, A. (2008b). Driver comprehension and acceptance of
the active accelerator pedal after long-term use. Transportation Research Part F:
Traffic Psychology and Behaviour, 11(1), 37-51.
Ajzen, I. (2002). Attitudes, personality and behaviour (2 ed.). Buckingham:
Open University Press.
Ausserer, K., and Risser, R. (2005). Intelligent transport systems and services
- chances and risks. Paper presented at the ICTCT-workshop.
Biding, T., and Lind, G. (2002). Intelligent Speed Adaptation (ISA), Results
of Large-scale Trials in Borlange, Lidkoping, Lund and Umea during the periode
1999-2002. Borlange: Vägverket.
Brookhuis, K.A., and De Waard, D. (1999). Limiting speed, towards an
intelligent speed adapter (ISA). Transportation Research Part F: Traffic Psychology
and Behaviour, 2(2), 81-90.
Brookhuis, K.A., and De Waard, D., 2005. on
behaviour: the consequences of automation? In: G. Underwood (Ed.), Traffic and
Transport Psychology. Theory and Application. Amsterdam: Elsevier, 73-278.
Carsten, O. M. J. European research on ISA: Where are we now and what
remains to be done. Paper presented at the ICTCT workshop Nagoya.
Carsten, O. M. J., and Tate, F. N. (2005). Intelligent speed adaptation:
accident savings and cost-benefit analysis. Accident Analysis and Prevention, 37(3),
407-416.
Carsten, O., Fowkes, M., Lai, F., Chorlton, K., Jamson, S., Tate, F., Simpkin,
B. (2008). ISA-UK. Executive Summary of Project Results. Leeds: University of
Leeds and MIRA Ltd.
Chen, C., Fan, Y., Farn, C. (2007). Prediction electronic toll collection service
adoption: an integration of the technology acceptance model and the theory of
planned behavior. Transportation Research Part C, 15 (5) 300-311.
26
Comte, S., Wardman, M., and Whelan, G. (2000). Drivers' acceptance of
automatic speed limiters: implications for policy and implementation. Transport
Policy, 7(4), 259-267.
Corbett, C. (2001). Explanations for "understating" in self-reported speeding
behaviour. Transportation Research Part F: Traffic Psychology and Behaviour, 4(2),
133-150.
Davis, F., Bagozzi, R., and Warshaw, P. (1989). User acceptance of computer
technology: A comparison of two theoretical models. Management Science, 35, 982-
1003.
De Groot, J., and Steg, L. (2006). Impact of transport pricing on quality of life,
acceptability, and intentions to reduce car use: An exploratory study in five European
countries. Journal of Transport Geography, 14(6), 463-470.
De Mol, J., Broeckaert, M., Van Hoorebeeck, B., Toebat, W., and Pelckmans,
J. (2001). Naar een draagvlak voor een voertuigtechnische snelheidsbeheersing
binnen een intrinsiek veilige verkeersomgeving Ghent, Belgium.: Centre for
sustainable development/Ghent University BIVV.
De Pelsmacker, P., and Janssens, W. (2007). The effect of norms, attitudes and
habits on speeding behavior: Scale development and model building and estimation.
Accident Analysis and Prevention, 39(1), 6-15.
Dragutinovic, N., Brookhuis, K.A., Hagenzieker, M., and Marchau, V. (2005).
Behavioural effects of Advanced Cruise Control Use a meta-analytic approach.
European Journal of Transport and Infrastructure Research, 5(4), 267-280.
Drevet, M. (2004). Social Attitudes to Road Traffic Risk in Europe -
SARTRE: Resultaten voor België. Brussel: Belgisch Instituut voor de
Verkeersveiligheid.
Elliot, M., Armitage, J., Baughan, C. (2005). Exploring the beliefs
ntentions to comply with speed limits. Transportation Research
Part F: Traffic Psychology and Behaviour, 8 (6), 459 479.
Elliott, M. A., and Baughan, C. J. (2004). Developing a self-report method for
investigating adolescent road user behaviour. Transportation Research Part F: Traffic
Psychology and Behaviour, 7(6), 373-393.
Eriksson, L., Garvill, J., and Nordlund, A. M. (2006). Acceptability of travel
demand management measures: The importance of problem awareness, personal
norm, freedom, and fairness. Journal of Environmental Psychology, 26(1), 15-26.
27
European Commission, White paper "European Transport Policies for 2010: Time to
Decide", in COM(2001) 370 final. 2001: (ISBN: 92-894-0341-1) Italy.
Garvill, J., Marell, A., Westin, K. (2003). Factors influencing drivers'
decision to install an electronic speed checker in the car. Transportation Research Part
F: Traffic Psychology and Behaviour. 6(1), 37-43.
Goldenbeld, C. (2002). Publiek draagvlak voor verkeersveiligheid en
veiligheidsmaatregelen. Overzicht van bevindingen en mogelijkheden voor
onderzoek. Leidschendam: Stichting Wetenschappelijk Onderzoek Verkeersveiligheid
SWOV.
Haglund, M., Aberg, L. (2000) Speed choice in relation to speed limit and
influences from other drivers. Transportation Research Part F vol. 3. 39-51.
Haglund, M., and Aberg, L. (2000). Speed choice in relation to speed limit and
influences from other drivers. Transportation Research Part F: Traffic Psychology and
Behaviour, 3(1), 39-51.
Harms, L., Klarborg, B., Lahrmann, H., Agerholm, N., Jensen, E., and
Tradisauskas, N. (2007). Effects of isa on the driving speed of young volunteers: a
controlled study of the impact information and incentives on speed. Paper presented at
the 6th European Congress on Intelligent Transport Systems and Services.
Hedge, J. W., and Teachout, M. S. (2000). Exploring the Concept of
Acceptability as a Criterion for Evaluating Performance Measures. Group
Organization Management, 25(1), 22-44.
Hjalmdahl, M., and Varhelyi, A. (2004). Speed regulation by in-car active
accelerator pedal: Effects on driver behaviour. Transportation Research Part F: Traffic
Psychology and Behaviour, 7(2), 77-94.
Ingram, D., Lancaster, B., and Hope, S. (2001). Precreational Drugs and
Driving: Prevalence Survey: Central Research Unit, Scottish Executive.
Katteler, H. (2005). Driver acceptance of mandatory intelligent speed
adaptation. European Journal on Traffic and Infrastructure Research 5(4), 317-336.
Lahrmann, H., Agerholm, N., Tradisauskas, N., Juhl, J., Harms, L., et al.
(2007). Spar paa farten. an intelligent speed adaptation project in denmark based on
pay as you drive principles Paper presented at the 6th European Congress on
Intelligent Transport Systems and Services.
28
Molin, E. J. E., and Brookhuis, K.A. (2007). Modelling acceptability of the
intelligent speed adapter. Transportation Research Part F: Traffic Psychology and
Behaviour, 10(2), 99-108.
Morsink, P., Goldenbeld, C., Dragutinovic, N., Marchau, V., Walta, L., and
Brookhuis, K.A. (2006). Speed support through the intelligent vehicle: perspective,
estimated effects and implementation aspects. Leidschendam: SWOV Institute for
Road Safety Research.
Nelissen, W. J. A., and Bartels, G. C. (1998). De transactionele overheid. In G.
Bartels, Nelissen, W. and Ruelle, H. (Ed.), De transactionele overheid. Communicatie
Paris, H., and Van den Broucke, S. (2008). Measuring cognitive determinants of
speeding: An application of the theory of planned behaviour. Transportation Research
Part F: Traffic Psychology and Behaviour, 11(3), 168-180.
Parker D, Manstead A, Stradling S and Reason J (1992a), Determinants of
intention to commit driving violations, Accident Analysis and Prevention, 24 (2),
117 131.
Parker, D., and Stradling, S. (2001). Influencing driver attitudes and
behaviour. London: Department for Transport.
Parker, D., Manstead, A. S. R., Stradling, S. G., Reason, J. T., and Baxter, J.
S. (1992b). Intention to Commit Driving Violations: An Application of the Theory of
Planned Behavior. Journal of Applied Psychology, 77(1), 94-101.
Pianelli, C., Saad, F., Abric, J. (2007). Social representations and acceptability
of LAVIA (French ISA system). Paper presented at 14th world congress of Intelligent
Transport Systems.
Regan, M. A., Triggs, T. J., Young, K. L., Tomasevic, N., Mitsopoulos, E.,
Stephan, K., Tingvall, C. (2006). On-Road Evaluation of Intelligent Speed
Adaptation, Following Distance Warning and Seatbelt Reminder Systems: Final
Results of the TAC SafeCar Project Victoria: Monash University Accident Research
Centre
Rogers, E.M., Diffusion of Innovations. 5 ed. 2003, New-York: The Free
Press.
Schade, J., and Schlag, B. (2003). Acceptability of urban transport pricing
strategies. Transportation Research Part F: Traffic Psychology and Behaviour, 6(1),
45-61.
29
Schuitema, G., and Steg, L. (2008). The role of revenue use in the
acceptability of transport pricing policies. Transportation Research Part F: Traffic
Psychology and Behaviour, 11(3), 221-231.
Schwartz, S. (1977). Normative influence on altruism. Advances in
Experimental Social Psychology, 10(1977), 221 279.
Shinar, D. (2007). Traffic Saefty and Human Behavior. Oxford: Elsevier.
Silcock, D., Smith, K., Knox, D., and Beuret, K. (2000). What Limits Speed?
Factors That Affect How Fast We Drive, Final Report.: AA Foundation for Road
Safety Research.
Steg, L. and Vlek, C. (1997), The role of problem awareness in willingness-to-
change car use and in evaluating relevant policy measures. In: J.A. Rothengatter and
E. Carbonell Vaya, Editors, Traffic and Transport Psychology. Theory and
Application, Pergamon, Oxford, 465 475.
Steg, L., Dreijerink, L., and Abrahamse, W. (2005). Factors influencing the
acceptability of energy policies: A test of VBN theory. Journal of Environmental
Psychology, 25(4), 415-425.
Steg, L., Vlek, C., and Slotegraaf, G. (2001). Instrumental-reasoned and
symbolic-affective motives for using a motor car. Transportation Research Part F:
Traffic Psychology and Behaviour, 4(3), 151-169.
Stern, P. (2000), Toward a coherent theory of environmentally significant
behavior, Journal of Social Issues, 56, 407 424.
Stradling, S., Campbell, M., Allan, I., Gorell, R., Hill, J., and Winter, M.
(2003). The speeding driver: who, how and why? Edinburgh: Scottish Executive
Social Research.
Stradling, S., Meadows, M., and Beatty, S. (2000). Helping drivers out of their
cars Integrating transport policy and social psychology for sustainable change.
Transport Policy, 7(3), 207-215.
Van Acker V., Witlox F., van Wee B. (2007). The effects of the land use
system on travel behaviour: towards a new research approach. Transportation
Planning and Technology, 30(4), 331-353.
Van Acker, V., B. Van Wee & F. Witlox (2010) When transport geography
meets social psychology: toward a conceptual model of travel behaviour. Transport
Reviews. Accepted for publication.
30
Van der Laan, J. D., Heino, A., and De Waard, D. (1997). A simple procedure
for the assessment of acceptance of advanced transport telematics. Transportation
Research Part C: Emerging Technologies, 5(1), 1-10.
Venkatesh, V., Morris, M., Davis, G. B., and Davis, F. D. (2003). User
acceptance of information technology: toward a unified view. mis quarterly, 27(3),
425-478.
Vlassenroot, S., Brijs, T., De Mol, J., Wets, G. (2006). Defining the carrying
capacity: What can determine acceptance of road safety measures by a general public?
Paper presented at The European Transport Conference.
Vlassenroot, S., Broekx, S., Mol, J. D., Panis, L. I., Brijs, T., and Wets, G.
(2007). Driving with intelligent speed adaptation: Final results of the Belgian ISA-
trial. Transportation Research Part A: Policy and Practice, 41(3), 267-279.
Vlassenroot, S., De Mol, J., (2005). Intelligente snelheidsaanpassing ISA-
project Gent. Centrum voor Duurzame Ontwikkeling. Universiteit Gent, Belgium.
the theory of planned behaviour. Transportation research Part F. 9 (6), 427-433.
Young, K. L., and Regan, M. A. (2007). Use of manual speed alerting and
cruise control devices by car drivers. Safety Science, 45(4), 473-485.
Young, K. L., Regan, M. A., Misopoulos, E., and Haworth, N. (2003).
Acceptability of In-vehicle Intelligent transport systems to Young Novice Drivers in
New South Wales. Victoria: Monash University.
Figure(s)Click here to download high resolution image
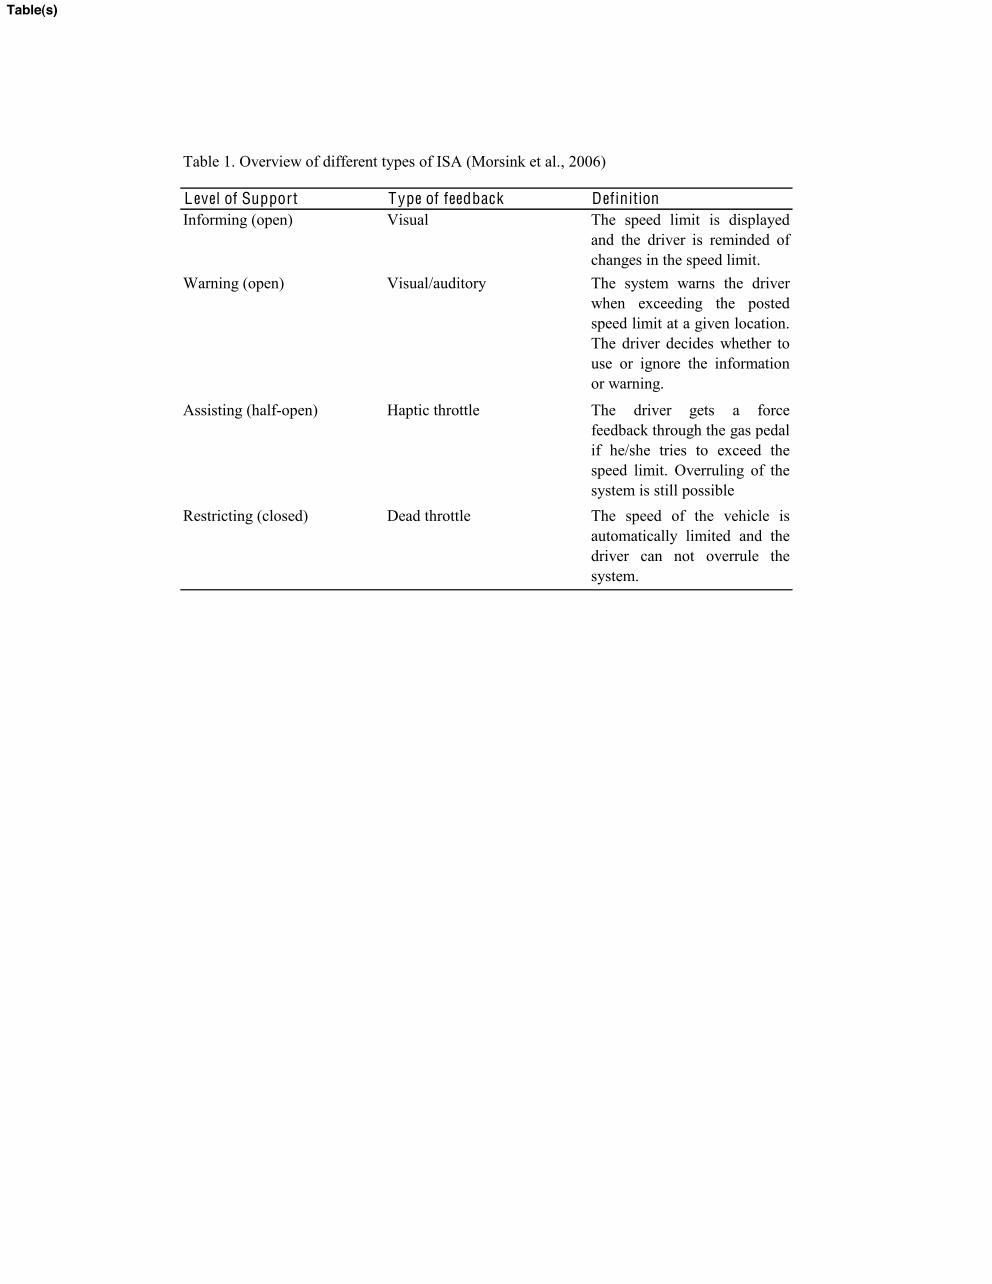
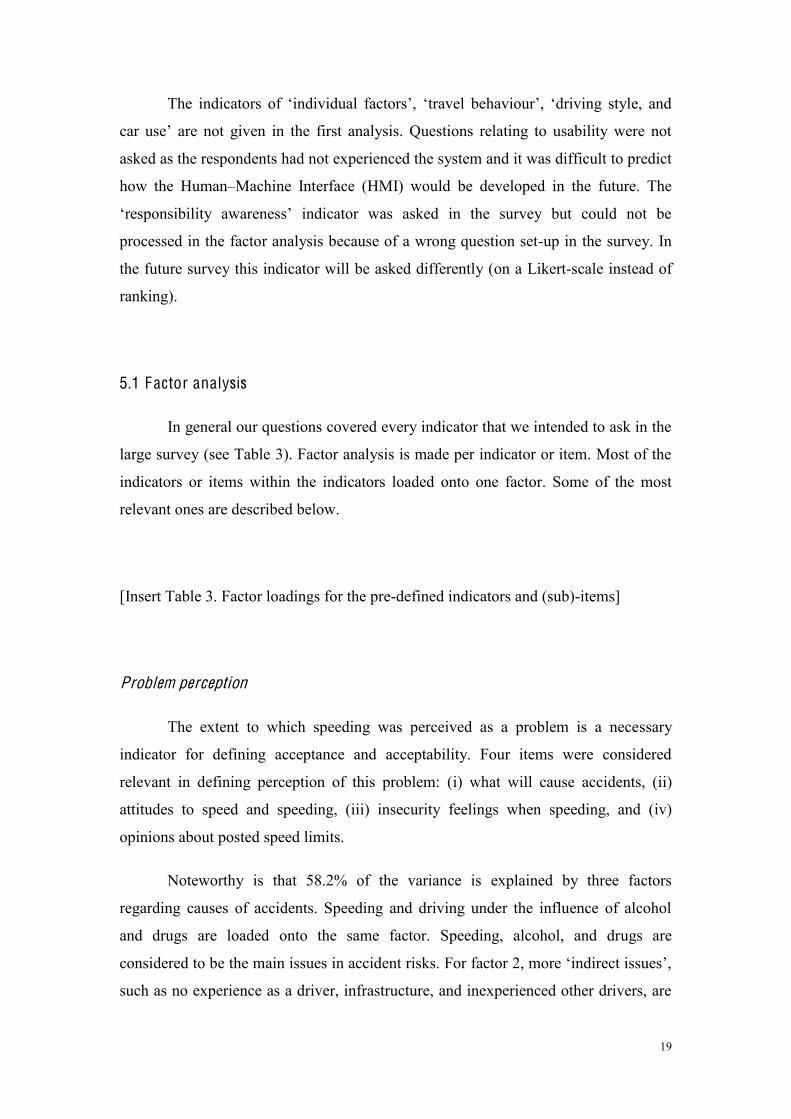
Table 1. Overview of different types of ISA (Morsink et al., 2006)
L evel of Support Type of feedback DefinitionInforming (open) Visual The speed limit is displayed
and the driver is reminded ofchanges in the speed limit.
Warning (open) Visual/auditory The system warns the driverwhen exceeding the postedspeed limit at a given location.The driver decides whether touse or ignore the informationor warning.
Assisting (half-open) Haptic throttle The driver gets a forcefeedback through the gas pedalif he/she tries to exceed thespeed limit. Overruling of thesystem is still possible
Restricting (closed) Dead throttle The speed of the vehicle isautomatically limited and thedriver can not overrule thesystem.
Table(s)
Attitudes to driving behaviour and traffic safety
social norms Perceived Efficiency
Perceived usefulness
Perceived usability
Experience or/and knowledge
Equity Satisfaction Affordability
Perceived effectiveness
Problem perception
Personal and social aims
Responsibility awareness
Acceptance models TPB (Azjen, 2002) Attitude towards behaviour Subjective Norm
Perceived Behavioral Control
TA M (Davis et al. 1989) Subjective Norm
Perceived Usefulness
Perceived Ease of use
U TAU T (Venkatesh, 2003) Social Influence
Facilitating Conditions
Performance Expectancy
Effort Expectancy
Gender Age Experience Voluntariness of use
Van der laan scale (Van de Laan et al. 1994)
Usefulness satisfaction
Acceptability models Schade & Schlag (2003) Social Norms socio-economic factors
Knowledge Equity Perceived effectiveness
Problem perception
personal aims to reach
Responsability
VB N theory (Stern 2000) Values Ecological worldview
Awareness of consequences
personal norms
Ascription of resonsinility
ISA research acceptance Sweden (B iding & L ind, 2002)
Attitudes to traffic safety Usefulness Experience satisfaction wilingness to pay
The netherlands (M inisterie van Verkeer en Waterstaat: Adviesdienst Verkeer en Vervoer; 2001)
drivers' tasks ergonomics
Aust ralia (Regan et al., 2006),
social acceptability
Usefulness usability affordability effectiveness
F rance (Pianelli et al., 2007) Social Representations ease of use
Belgium (Vlassenroot et al., 2007)
Attitudes to safety efficiency Usefulness socio-demographic backgrounds
satisfaction willingness to pay
problem awareness
Denmark (H arms et al., 2007)
attitudes to safe driving judgement on ISA features
background factors
ISA research acceptability Molin and B rookhuis (2007) personal characteristics
problem awareness
Garvill et al. (2003)Exceed
Traffic pace Difficult/easy Gender Age Risk Moral obligation
De Mol et al. (2001) Attitudes to safety efficiency Usefulness socio-demographic backgrounds
satisfaction willingness to pay
problem awareness
Table 2. Examples of theories used to select the indicators.
Individual factors
Table(s)
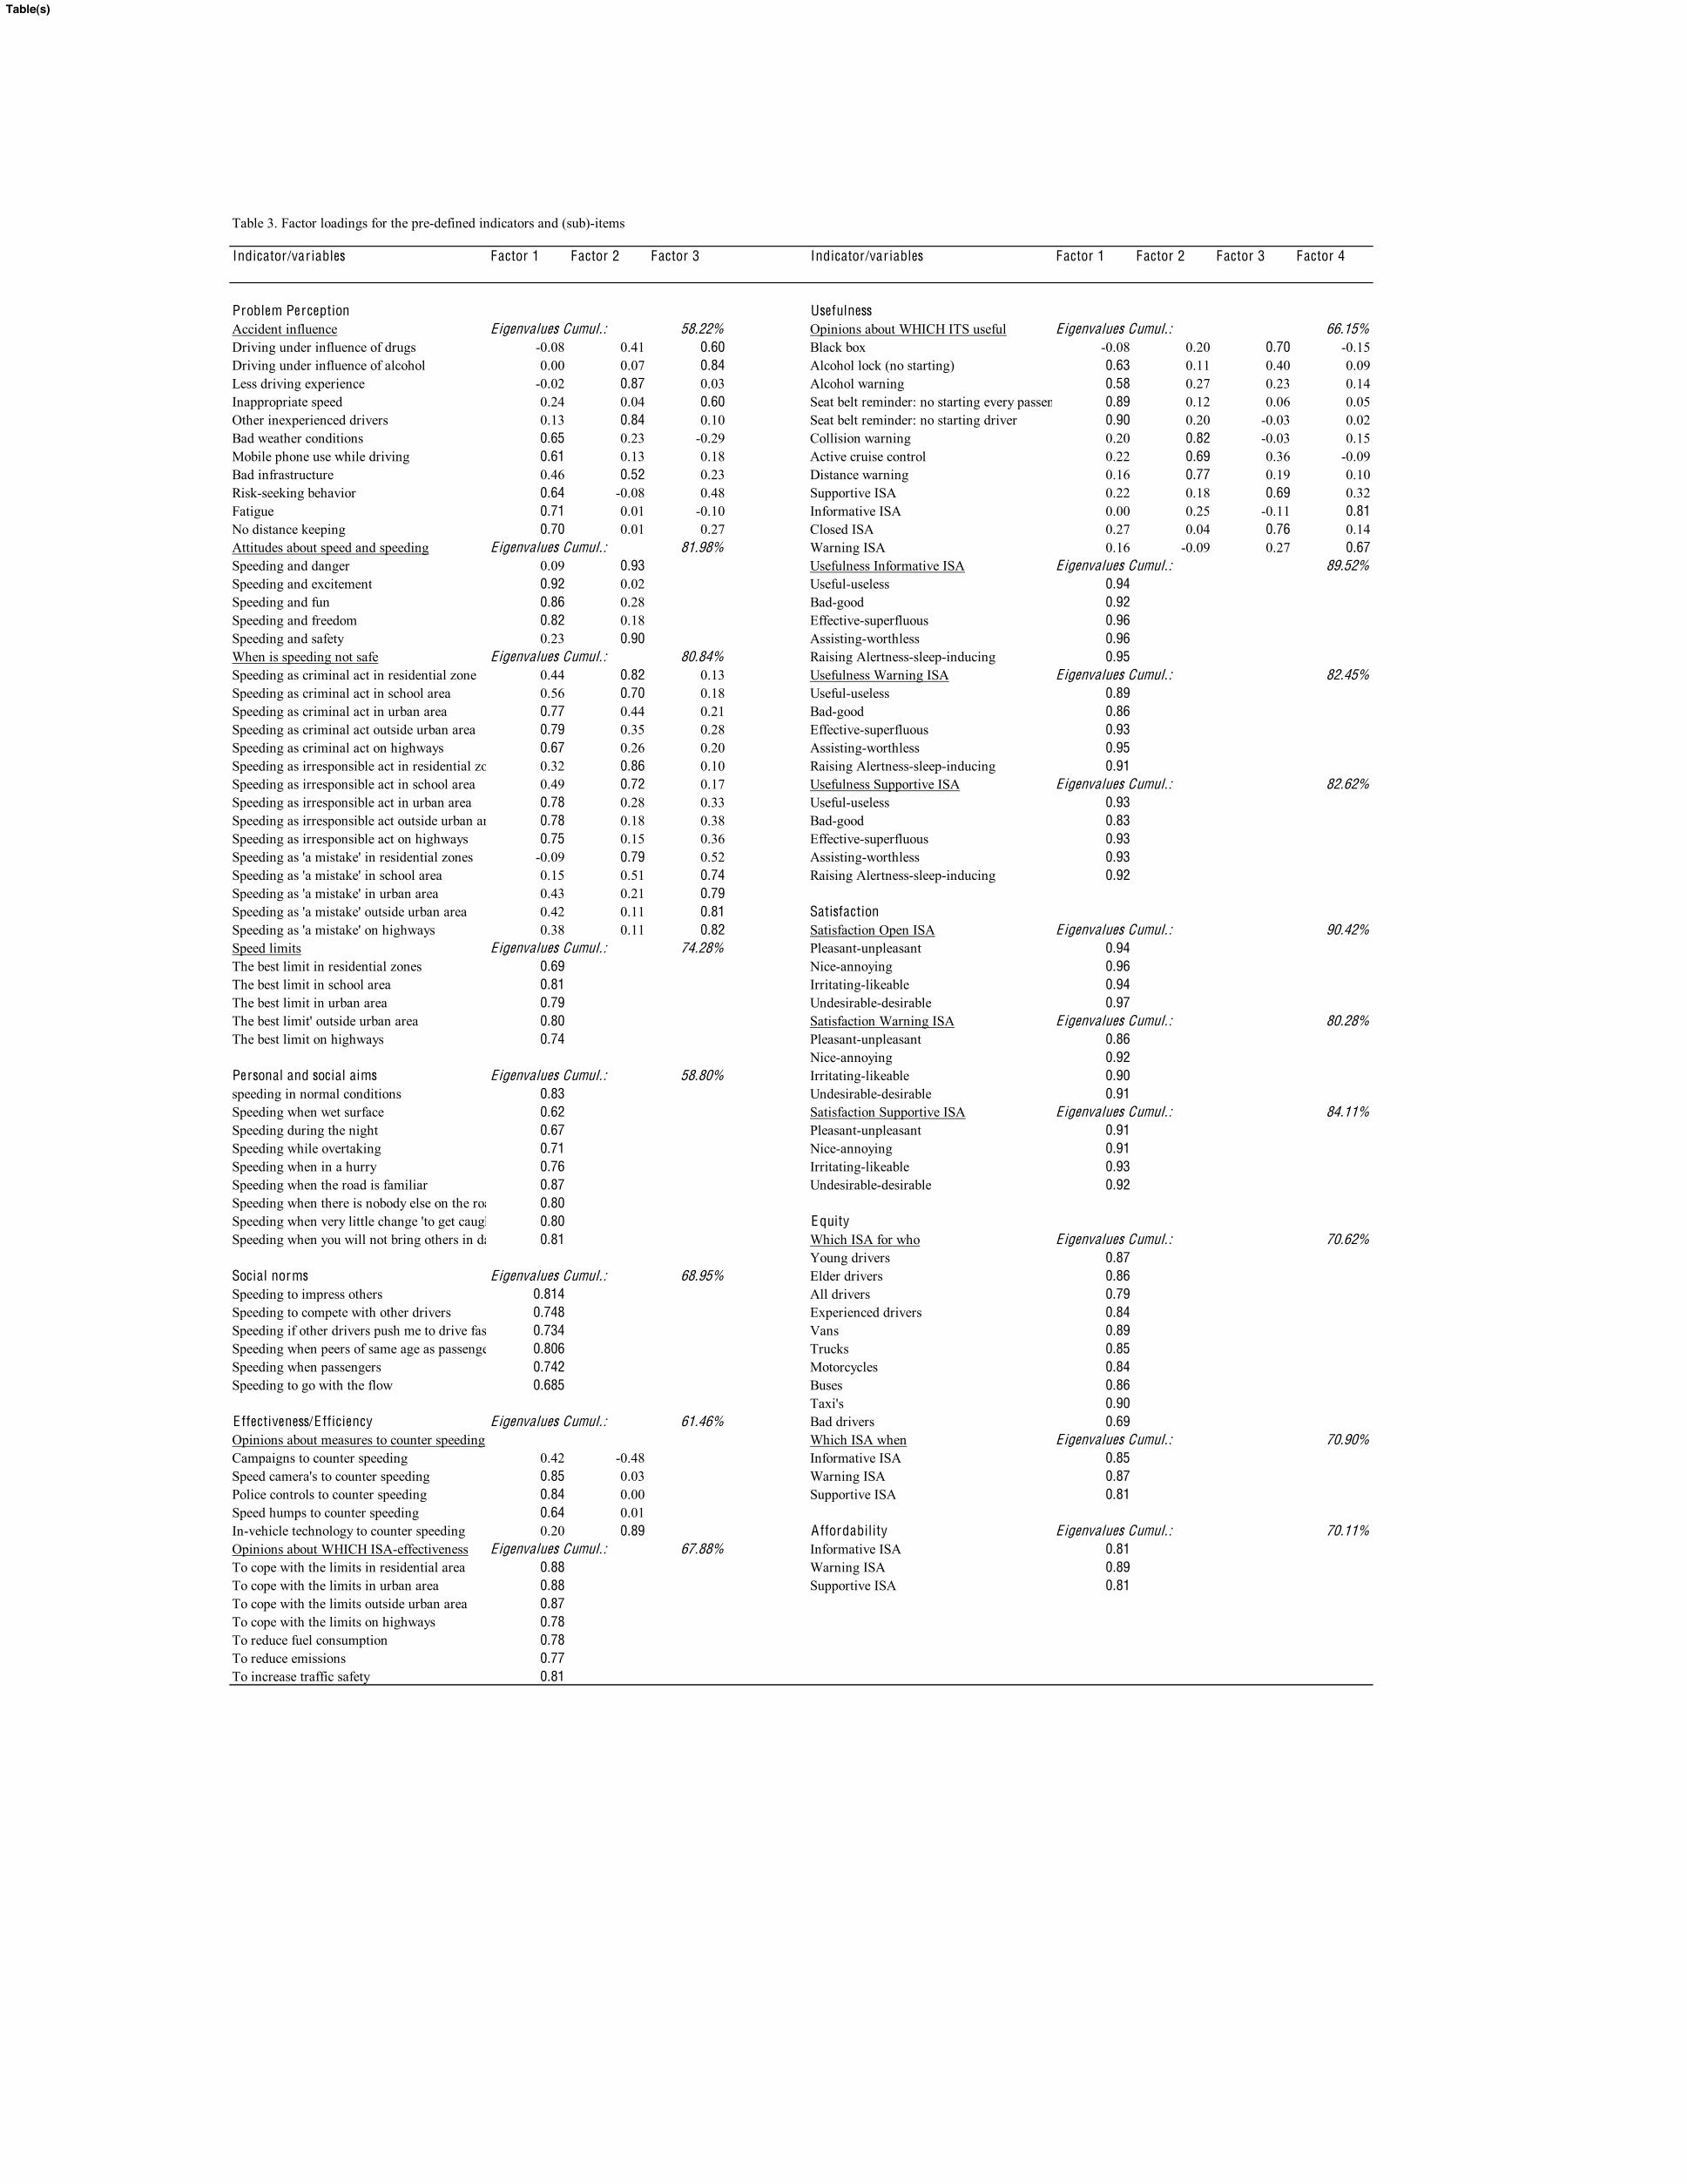
Table 3. Factor loadings for the pre-defined indicators and (sub)-items
Indicator/variables Factor 1 Factor 2 Factor 3 Indicator/variables Factor 1 Factor 2 Factor 3 Factor 4
Problem Perception UsefulnessAccident influence Eigenvalues Cumul.: 58.22% Opinions about WHICH ITS useful Eigenvalues Cumul.: 66.15%Driving under influence of drugs -0.08 0.41 0.60 Black box -0.08 0.20 0.70 -0.15Driving under influence of alcohol 0.00 0.07 0.84 Alcohol lock (no starting) 0.63 0.11 0.40 0.09Less driving experience -0.02 0.87 0.03 Alcohol warning 0.58 0.27 0.23 0.14Inappropriate speed 0.24 0.04 0.60 Seat belt reminder: no starting every passenger 0.89 0.12 0.06 0.05Other inexperienced drivers 0.13 0.84 0.10 Seat belt reminder: no starting driver 0.90 0.20 -0.03 0.02Bad weather conditions 0.65 0.23 -0.29 Collision warning 0.20 0.82 -0.03 0.15Mobile phone use while driving 0.61 0.13 0.18 Active cruise control 0.22 0.69 0.36 -0.09Bad infrastructure 0.46 0.52 0.23 Distance warning 0.16 0.77 0.19 0.10Risk-seeking behavior 0.64 -0.08 0.48 Supportive ISA 0.22 0.18 0.69 0.32Fatigue 0.71 0.01 -0.10 Informative ISA 0.00 0.25 -0.11 0.81No distance keeping 0.70 0.01 0.27 Closed ISA 0.27 0.04 0.76 0.14Attitudes about speed and speeding Eigenvalues Cumul.: 81.98% Warning ISA 0.16 -0.09 0.27 0.67Speeding and danger 0.09 0.93 Usefulness Informative ISA Eigenvalues Cumul.: 89.52%Speeding and excitement 0.92 0.02 Useful-useless 0.94Speeding and fun 0.86 0.28 Bad-good 0.92Speeding and freedom 0.82 0.18 Effective-superfluous 0.96Speeding and safety 0.23 0.90 Assisting-worthless 0.96When is speeding not safe Eigenvalues Cumul.: 80.84% Raising Alertness-sleep-inducing 0.95Speeding as criminal act in residential zone 0.44 0.82 0.13 Usefulness Warning ISA Eigenvalues Cumul.: 82.45%Speeding as criminal act in school area 0.56 0.70 0.18 Useful-useless 0.89Speeding as criminal act in urban area 0.77 0.44 0.21 Bad-good 0.86Speeding as criminal act outside urban area 0.79 0.35 0.28 Effective-superfluous 0.93Speeding as criminal act on highways 0.67 0.26 0.20 Assisting-worthless 0.95Speeding as irresponsible act in residential zones 0.32 0.86 0.10 Raising Alertness-sleep-inducing 0.91Speeding as irresponsible act in school area 0.49 0.72 0.17 Usefulness Supportive ISA Eigenvalues Cumul.: 82.62%Speeding as irresponsible act in urban area 0.78 0.28 0.33 Useful-useless 0.93Speeding as irresponsible act outside urban area 0.78 0.18 0.38 Bad-good 0.83Speeding as irresponsible act on highways 0.75 0.15 0.36 Effective-superfluous 0.93Speeding as 'a mistake' in residential zones -0.09 0.79 0.52 Assisting-worthless 0.93Speeding as 'a mistake' in school area 0.15 0.51 0.74 Raising Alertness-sleep-inducing 0.92Speeding as 'a mistake' in urban area 0.43 0.21 0.79Speeding as 'a mistake' outside urban area 0.42 0.11 0.81 SatisfactionSpeeding as 'a mistake' on highways 0.38 0.11 0.82 Satisfaction Open ISA Eigenvalues Cumul.: 90.42%Speed limits Eigenvalues Cumul.: 74.28% Pleasant-unpleasant 0.94The best limit in residential zones 0.69 Nice-annoying 0.96The best limit in school area 0.81 Irritating-likeable 0.94The best limit in urban area 0.79 Undesirable-desirable 0.97The best limit' outside urban area 0.80 Satisfaction Warning ISA Eigenvalues Cumul.: 80.28%The best limit on highways 0.74 Pleasant-unpleasant 0.86
Nice-annoying 0.92Personal and social aims Eigenvalues Cumul.: 58.80% Irritating-likeable 0.90speeding in normal conditions 0.83 Undesirable-desirable 0.91Speeding when wet surface 0.62 Satisfaction Supportive ISA Eigenvalues Cumul.: 84.11%Speeding during the night 0.67 Pleasant-unpleasant 0.91Speeding while overtaking 0.71 Nice-annoying 0.91Speeding when in a hurry 0.76 Irritating-likeable 0.93Speeding when the road is familiar 0.87 Undesirable-desirable 0.92Speeding when there is nobody else on the road 0.80Speeding when very little change 'to get caught' 0.80 Equity Speeding when you will not bring others in danger 0.81 Which ISA for who Eigenvalues Cumul.: 70.62%
Young drivers 0.87Social norms Eigenvalues Cumul.: 68.95% Elder drivers 0.86Speeding to impress others 0.814 All drivers 0.79Speeding to compete with other drivers 0.748 Experienced drivers 0.84Speeding if other drivers push me to drive faster 0.734 Vans 0.89Speeding when peers of same age as passenger 0.806 Trucks 0.85Speeding when passengers 0.742 Motorcycles 0.84Speeding to go with the flow 0.685 Buses 0.86
Taxi's 0.90Effectiveness/Efficiency Eigenvalues Cumul.: 61.46% Bad drivers 0.69Opinions about measures to counter speeding Which ISA when Eigenvalues Cumul.: 70.90%Campaigns to counter speeding 0.42 -0.48 Informative ISA 0.85Speed camera's to counter speeding 0.85 0.03 Warning ISA 0.87Police controls to counter speeding 0.84 0.00 Supportive ISA 0.81Speed humps to counter speeding 0.64 0.01In-vehicle technology to counter speeding 0.20 0.89 Affordability Eigenvalues Cumul.: 70.11%Opinions about WHICH ISA-effectiveness Eigenvalues Cumul.: 67.88% Informative ISA 0.81To cope with the limits in residential area 0.88 Warning ISA 0.89To cope with the limits in urban area 0.88 Supportive ISA 0.81To cope with the limits outside urban area 0.87To cope with the limits on highways 0.78To reduce fuel consumption 0.78To reduce emissions 0.77To increase traffic safety 0.81
Table(s)
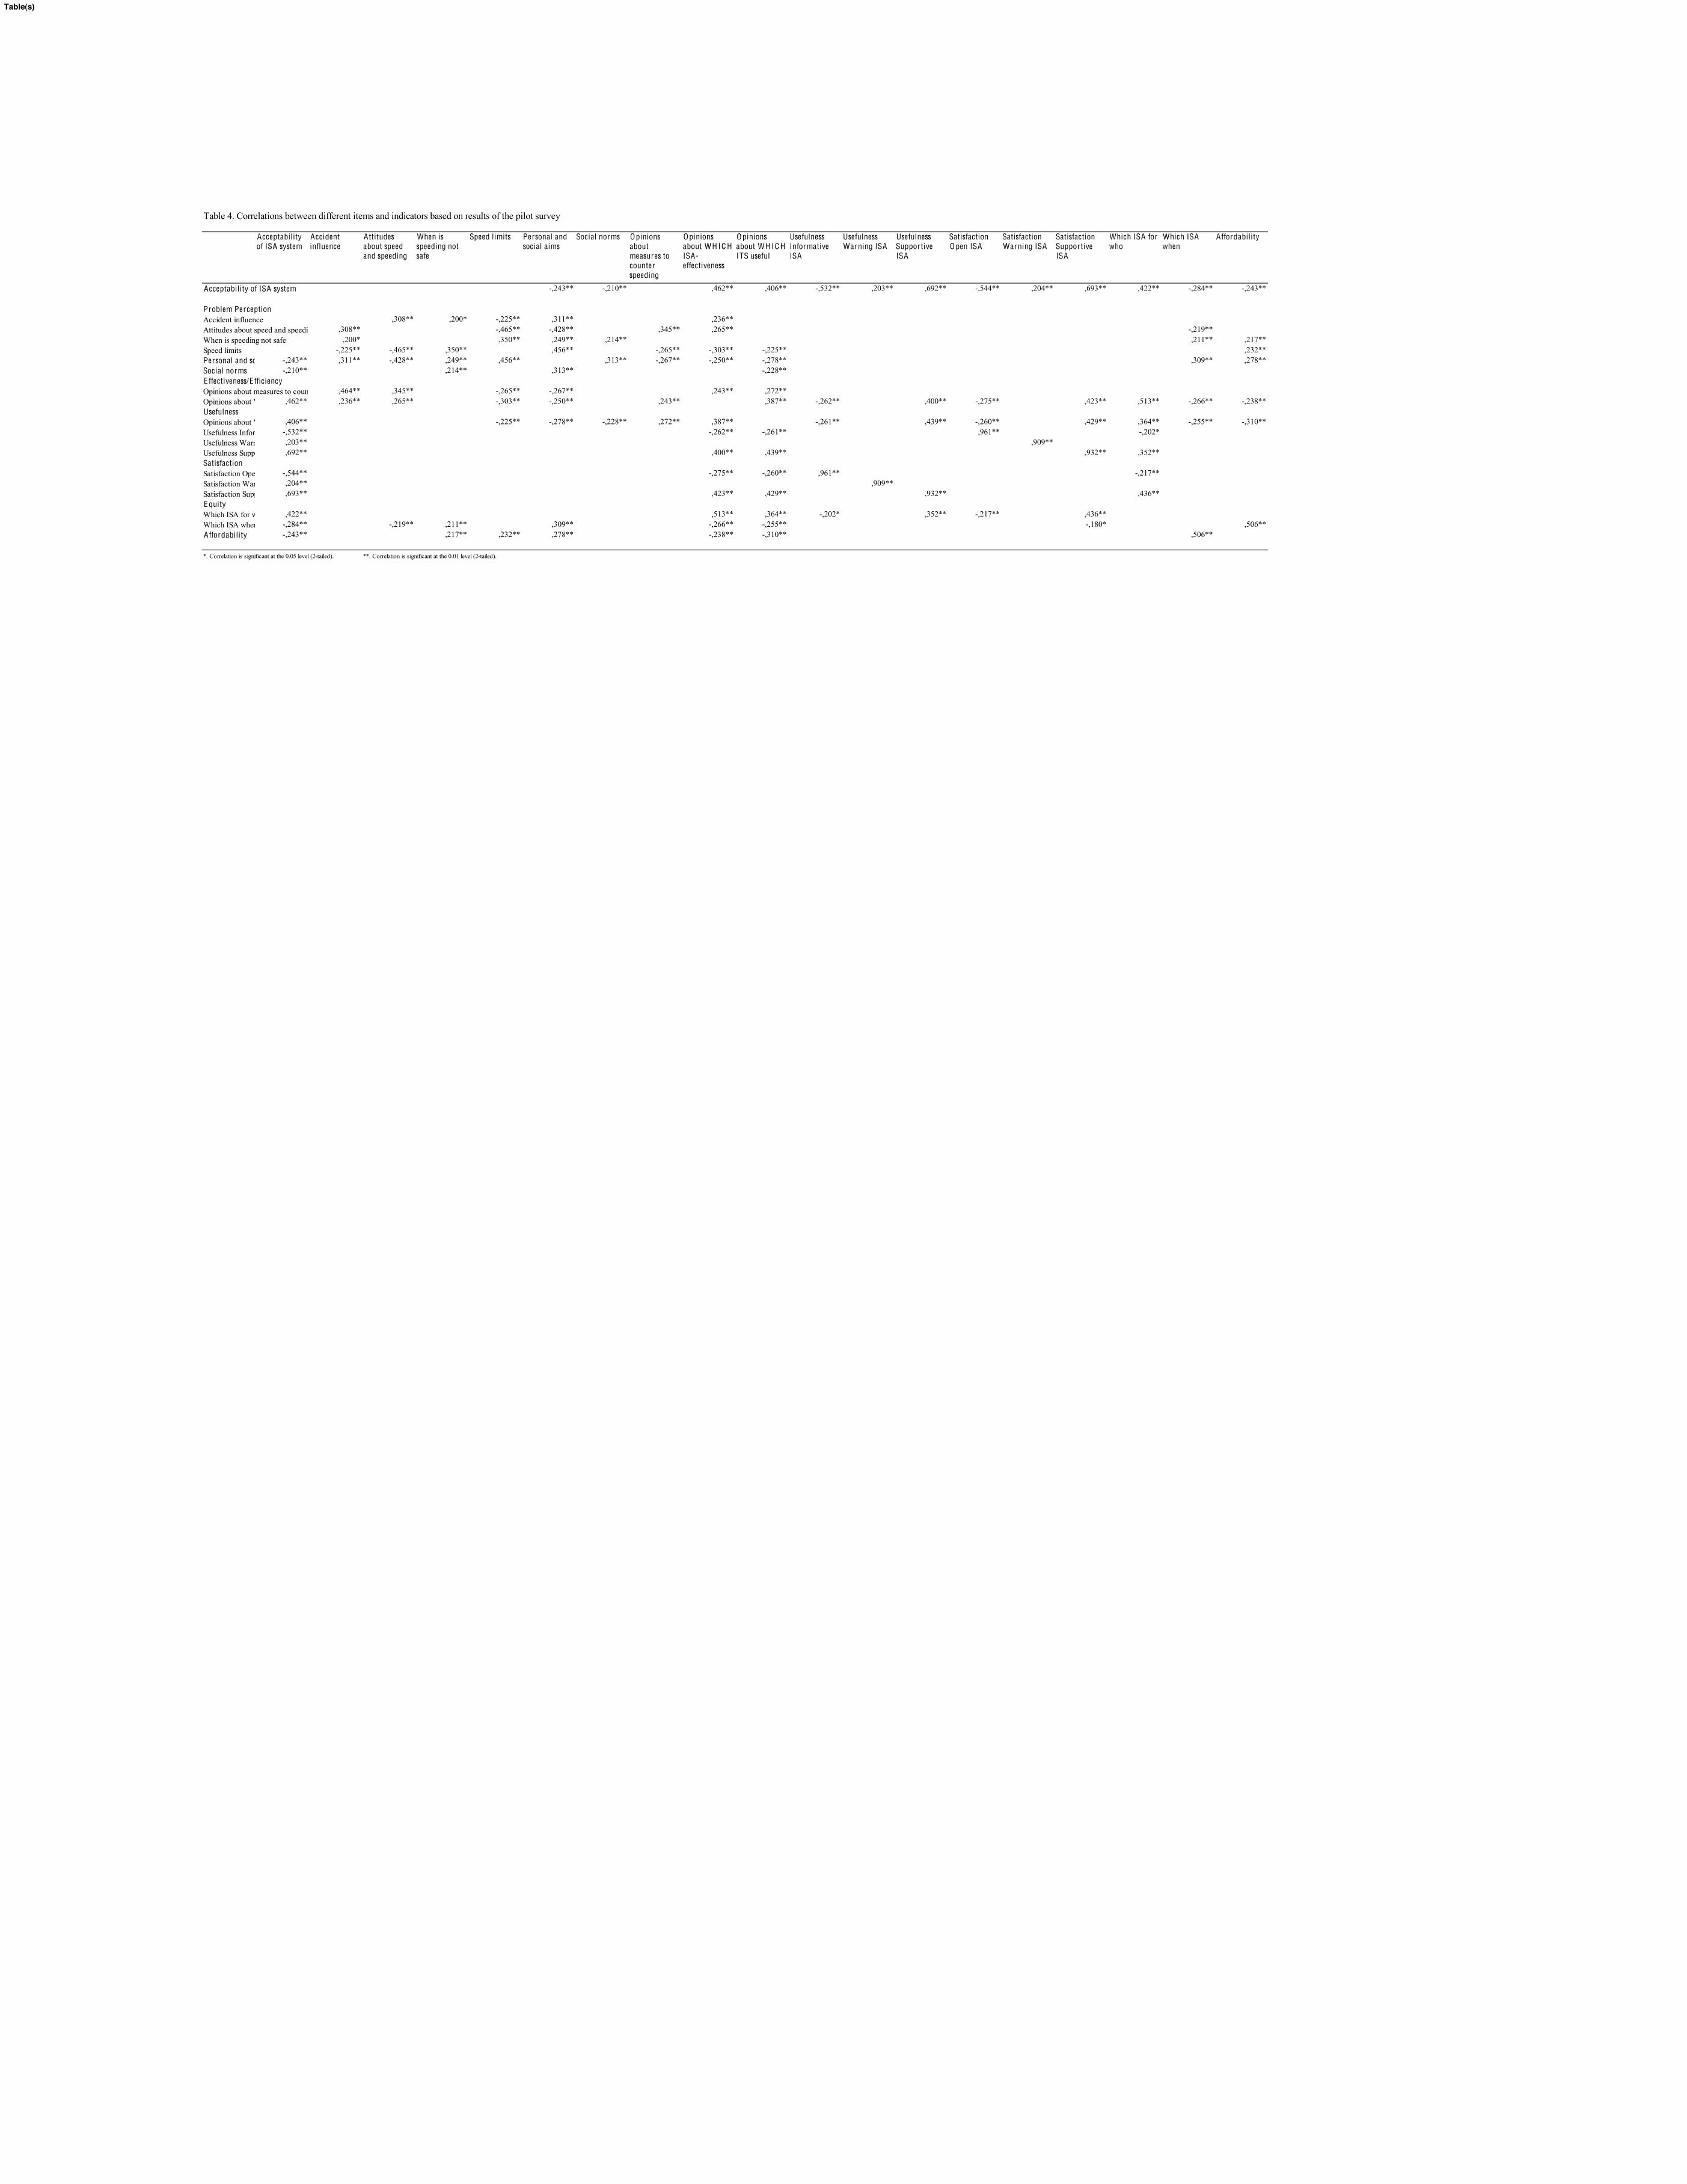
Table 4. Correlations between different items and indicators based on results of the pilot survey
Acceptability of ISA system
Accident influence
Attitudes about speed and speeding
When is speeding not safe
Speed limits Personal and social aims
Social norms Opinions about measures to counter speeding
Opinions about W H IC H ISA-effectiveness
Opinions about W H IC H ITS useful
Usefulness Informative ISA
Usefulness Warning ISA
Usefulness Supportive ISA
Satisfaction Open ISA
Satisfaction Warning ISA
Satisfaction Supportive ISA
Which ISA for who
Which ISA when
Affordability
Acceptability of ISA system -,243** -,210** ,462** ,406** -,532** ,203** ,692** -,544** ,204** ,693** ,422** -,284** -,243**
Problem PerceptionAccident influence ,308** ,200* -,225** ,311** ,236**Attitudes about speed and speeding ,308** -,465** -,428** ,345** ,265** -,219**When is speeding not safe ,200* ,350** ,249** ,214** ,211** ,217**Speed limits -,225** -,465** ,350** ,456** -,265** -,303** -,225** ,232**Personal and social aims-,243** ,311** -,428** ,249** ,456** ,313** -,267** -,250** -,278** ,309** ,278**Social norms -,210** ,214** ,313** -,228**Effectiveness/EfficiencyOpinions about measures to counter speeding,464** ,345** -,265** -,267** ,243** ,272**Opinions about WHICH ISA-effectiveness,462** ,236** ,265** -,303** -,250** ,243** ,387** -,262** ,400** -,275** ,423** ,513** -,266** -,238**UsefulnessOpinions about WHICH ITS useful,406** -,225** -,278** -,228** ,272** ,387** -,261** ,439** -,260** ,429** ,364** -,255** -,310**Usefulness Informative ISA-,532** -,262** -,261** ,961** -,202*Usefulness Warning ISA ,203** ,909**Usefulness Supportive ISA,692** ,400** ,439** ,932** ,352**SatisfactionSatisfaction Open ISA -,544** -,275** -,260** ,961** -,217**Satisfaction Warning ISA ,204** ,909**Satisfaction Supportive ISA,693** ,423** ,429** ,932** ,436**EquityWhich ISA for who ,422** ,513** ,364** -,202* ,352** -,217** ,436**Which ISA when -,284** -,219** ,211** ,309** -,266** -,255** -,180* ,506**Affordability -,243** ,217** ,232** ,278** -,238** -,310** ,506**
*. Correlation is significant at the 0.05 level (2-tailed). **. Correlation is significant at the 0.01 level (2-tailed).
Table(s)