
Toward a functional accounting system - Massachusetts ...
80
-
Upload
khangminh22 -
Category
Documents
-
view
4 -
download
0
Transcript of Toward a functional accounting system - Massachusetts ...


LIBRARY
OF THE
MASSACHUSETTS INSTITUTE
OF TECHNOLOGY


Toward a Functional Accounting System ;
Accounting Variances andStatistical Variance Analysis
Zenon S. Zannetos
#172-66
March 1966


Toward a Functional Accounting System; Accounting Variances and
Statistical Variance Analysis
by
*Zenon S. Zannetos
The functions of accounting and statistics are in most respects similar,
These fields are both tools, concerned with the processes of measurement,
collection of data, analysis and decision making. In performing their func-
tions both accounting and statistics rely heavily on signals generated by
variations from expected performance.
Even in their manifested differences these two fields are at worst
complementary. For example, accounting is concerned with the design of
the total system which will provide the relevant information on a con-
tinuous basis, while statistics focuses more on ad hoc micro analyses
such as design and analysis of experiments for eliminating hypotheses,
which are aimed at determining "relevance". In view of all the similari-
ties and complementarities, one wonders why statistical analyses have not
become an integral part of the accounting systems.
The purpose of this paper is to point out some ways by means of which
statistical techniques can be introduced into the accounting system to
The author is Associate Professor of Industrial Management at the MIT
Sloan School of Management. The research on which this paper is based was
done during 1964-65 when the author was a Ford Foundation Faculty Research
Fellow. In addition to acknowledging the help of the Ford Foundation, the
author wishes to thank Kenan Sahin a research assistant at MIT for his
comments
.


make its output more meaningful and provide flexibility for measuring the
potential outcome of alternative courses of action. To do this, I will:
(a) Provide some background material on my previous efforts inthis direction and also elaborate a little more on what moti-vated me in the first place, (b) show that the output of stan-dard accounting systems can be used for statistical analysesof variance, and (c) carry out some of the consequences ofstatistical analyses and of testing hypotheses for what I callfunctional managerial accounting systems.
In an appendix, I will apply such statistical techniques to determine the
statistical significance of variations in the performance of subentities within
the firm, using as inputs the variances generated by the accounting system.
Hopefully the arguments to be presented in this paper and the illustration
will encourage the designers of managerial information systems to make such
analyses an integral part of the accounting systems.
I. Background and Motivation
On another occasion I sketched the general characteristics of an inte-
grated accounting system of the future. The criteria that I set before me
in developing such a system were twofold. 1 wanted first of all to provide
management with routine quantitative information, useful in analyzing the
efficacy of existing organizational configurations, and second I felt that
such information should be a part of a comprehensive managerial accounting
system. It was an attempt, in other words, to integrate all the major
requirements for information that is necessary for managerial decision mak-
ing, present such information on a routine rather than ajd hoc basis, and so
Zenon S. Zannetos, "Measuring the Efficiency of Organization Structures:Some Implications for the Control System of the Firm" Working Paper 117-65,
Alfred P. Sloan School of Management, MIT, 1965, pp. 19-21.


-3-
help management encompass in its decisions more of the global aspects of the
firm's activities. And this because I strongly believe that as far as manage-
ment is concerned:
1. The efficiency of allocation of resources given the obiectives , can-
not be divorced from the process of defining the objectives themselves, and,
2. An operationally meaningful definition of objectives and the design
of the organizational structure of the firm are virtually two sides of the
same coin.
Present-day managerial accounting systems are mostly concerned with the
short-run process of resource allocation but even this in a rather restrictive
sense. The standard cost system in industrial operations is the only branch
of routine accounting which attempts to provide through variances, informa-
tion on how efficiently resources are utilized. But as I have previously
pointed out, "Unlike statistical variance analysis which attaches prob-
abilistic interpretation to the results obtained, accounting variances do
2not indicate vhat is important and what is not." Furthermore, one has no
way of obtaining routine cause and effect relationships, or information on
the process of defining and translating objectives, which process is inter-
2Zenon S. Zannetos, "On the Hnthematics of Variance Analysis",
The Accounting Review , Volume XXXVIII, No. 3, July 1963, p. 530;
For a possible solution to this problem see,,"Standard
Costs as a First Step to Probabilistic Control: A Theoretical Justl'
fication, an Extension and Implications", The Accounting Review ,
Vol. XXXIX, No. 2, April 1964, pp. 296-304.


-4-
3woven with the issues of centralization and decentralization. Unless we
make some progress in these directions, we cannot very well help manage-
ment with our measurements.
In an effort to provide answers to some of the problems that plague ac-
counting, and also make the information generated more useful for managerial
decisions, I suggested: (a) A method of covariance analysis for assessing
the efficiency of existing organization structures, and (b) statistical
analysis of variance (the components of covariances) for developing ele-
mentary cause and effect relationships to be incorporated in the informa-
4tion system of the firm. Now I wish to illustrate how one can use the
data generated by the traditional "standard cost" system as inputs to a
managerial accounting system, where the latter is based on cause and
effect relationships derived from statistical variance analysis. These
relationships are necessary to get a functional accounting system started
and then change it sequentially as the evidence dictates.
II. Accounting Variances and Statistical Variance Analysis; TheoreticalFormulations
Let us now start with a brief statement of the mathematical basis of sta-
tsitical variance analysis--using as an example a single-factor completely
3For the factors affecting the organizational structure of the firm and the
role pl-^yed by the definition of objectives in this process see: Zenon S.
Zannetos, "On the Theory of Divisional Structures: Some Aspects of Centrali-
zation and Decentralization of Control and Decision Making", Management
Science . December 1965, Vol. 12, No. 4, Series B, pp. 49-69. Also see
Herbert A. Simon, "On the Concept of Organizational Goal", Administrative
Science Quarterly , Vol. 9, No. 1, June 1964, pp. 1-22.
"Measuring the Efficiency of Organization Structures ...etc.," Op. Cit.


-5-
randomized experiment with random treatment levels—and prove that accounting
variances out of "standard" systems can serve as input data. Those familiar
with the subject at hand, will readily recognize that the proof is very
simple, and that it falls out iiranediately upon making two critical equivalence
substitutions, (a) and (b) as stated below, in the test statistic.
Let: G = the budgeted goal or the control standard
X . . = observation i of subsample j
X, .-G = the accounting variance V generated by observation
1 of subsample j
v., = the total accounting variance generated within sub-^ sample j (subsidiary account)
v.. = the grand total accounting variance (summary account)
generated by all observations for all j
X.. = the oberall average performance as observed
n = the number of observations or entries in subsample j
N = the grand total number of observations
Clearly, if we deal with accounting variances rather than observations
the test statistics remains unchanged . Ana this because the transformation
results in the subtraction of a constant, that is to say G , from each and
every observation. Consequently we substitute in the F statistic:
(a) X.. = V../N
(b) X.J .. V.j/„j
and the proof is complete.


-6-
For those now who are not well versed in the mathematics of statistical
analysis of variance more explanation is in order. So we go back to the
"fundamental equation of one-way analysis of variance":
k"j _ k __ k"j(1) E S (X..-X..)^= S n. (X..-X..)^+ T. S (X..-X..)^
j=l i=l ^J j=l ^J j=l i=l 'J J
The above relationship tells us that the total sum of squared deviations
around the grand mean is equal to the sum of the squares of the deviations
between treatment means and the grand mean, plus the sum of the squares of
the error or the sum of squared deviations within treatments.
If we divide the terms on the right-hand side of expression (1) by their
respective degrees of freedom, then we obtain two independent estimates of
2the variance cr when H is true, that is to say when the only difference
between the observations within the treatments (subsamples) is an estimate
2of the error variance a . These estimates are chi-square distributed
e
and their ratio is F distributed with k-1 and N-k degrees of freedom.
So the test statistic is:
^ - 2E n. (X..-X..) /k-1
1 = 1 -' -'
(2) F = -^—^^ ^
k-1, N-k
k J _ 2E E (X .-X. ) /N-kj=l i=l ^J J


-6a-
Note now that in the numerator we have:
^ --2'^ -2 ^ -- -2(3) Z n. (X..-X..) = E n.X .. - 2 E n, X..X., + NX .
.
j=l J J j-1 J Jj = l
J J
We proceed with substitutions (a) and (b) to obtain:
k k
(4) = E n.V^.Jn^ .- 2 En, (V../n.) (V../N) +NV^../N^
(5) = E V^../n. - 2 V^../N + V^../N
(6) = E V^../n. - V^../N with k-1 df
Therefore, all the necessary data for the numerator of the F ratio wherever
the latter is applicable, can thus be obtained from the output of the regular
accounting process .
In a similar fashion, the sum of squares of the denominator can be also
expressed in terms of accounting variances as follows:


k


-8-
means (standards) and variances do exist. Our efforts here are aimed at
developing the techniques which will bridge the gap between the statistics
and accounting and thus speed up the process of assimilation of the former
Into the latter.
The illustration, which is included in the appendix, proceeds in a step
by step fashion to apply aspects of such statistical analysis techniques to
the output of the accounting process. The appendix is not aimed at the
expert in statistics nor at the manager who possesses no statistical know-
ledge at all, but at the vast majority of people in between, who are
interested and wish to acquire working knowledge in the general area of
information for managerial planning and control. The main body of the paper,
however, was structured to stand on its own without any study of the appendix.
III. Cause and Effect Relationships as Inputs to Managerial Accounting Systems
The analysis suggested in this paper indicates that the variances generated
by the accounting system should be: (a) automatically tested for probabilistic
significance for focusing attention on "exceptions" that require managerial
action, and (b) used as inputs to experimental designs for statistical
Although for certain statistical tests for determining the probabilisticsignificance of accounting variances the standard must be set at the mean,small errors in estimation are not incapacitating especially if the standards
are tested £ posteriori in a Bayesian framework. For a brief description of
the latter method see: Zenon S. Zannetos, "Mathematics as a Tool of AccountingInstruction and Research", The Accounting Review , Vol. XXXVIII, No. 2,
April 1963, pp. 326-335 and "Standard Costs as a First Step to ProbabilisticControl", op. cit. The possibility of using biased standards for purposes
of motivation does not interfere with this analysis, in fact it makes it more
necessary as well as revealing.


variance analysis. The latter will provide certain cause and effect relation-
ships that are presently not part of the managerial accounting systems. The
value of these relationships cannot be overemphasized, and runs in several
directions:
1. Performance Evaluation
The evaluation of performance is not only a multi-dimensional but also
a multi-varied process itself. It may be aimed at (a) measuring the results
of experimentation and discerning changes in technology where Issues of
motivation are, or are assumed to be absent, (b) encouraging learning
through experimentation in Identifying cause and effect in cases where
proper motivation is assumed to exist, and (c) motivating efficient behavior
by challenging the purpose of individual actions through the feedback-control
mechanism of the management information system.
(a) Discerning changes in Technology: In order to be able to as-
sess the impact of technological change on the results from
operations, one must first separate the impact of random varia-
tions surrounding a given state of technology from the consequences
of purposive action by operating units. Since operations take
place within a probabilistic setting, a certain amount of random
variation is to be expected. As knowledge is gained, however,
and specialized information is generated about a particular
technological stage, this type of random variation is reduced.
An efficient managerial information system should, therefore,
separate the random from non-random variations in the performance
of otherwise homogeneous units within standardized operations. If
the differences between the average performance of operating
subentities (departments, etc.) are great, then some type of
technological change must be taking place, on which management
should capitalize. Present accounting systems tend to aim at


•10-
"deterministic conformity" and thus suppress the informational
content of meaningful signals that emanate from suboperations
.
Our previous suggestions and the system proposed in this paper
tend to remedy these deficiencies.
(b) Encouraging Learning through Experimentation: Performance
evaluation, of course, is not an end in itself nor is it primarily
aimed at rewarding efficiencyj although the latter is one of the
legitimate objectives of any evaluation process. If nothing else,
people look at reward as a signal which reinforces certain modes
of behavior. It is in effect part of the individual information
system of associating cause and effect. Another important aspect
of an efficient system of performance evaluation^ however, is that
it encourages experimentation. If the tools for measurement and
the establishment of cause and effect relationships exist, then
managers will be more inclined to experiment for learning 5 because
they will not be moving in the dark. Furthermore 3 with such a
system, information will flow in "continuously" to allow sequential
learning and adaptation, and thus minimize the probability of
disastrous results. For if experimentation has to be carried
out inflexibly to its completion before any evaluation is per-
formed and information on cause and effect obtainedj disasters
will occur often, and will thus discourage long-run and sub-
stantial experiments.
(c) Motivating Efficient Behavior; An Information system which
is based on functional relationships can be geared to carry out
the consequences of projected actions (on the basis of postulated
cause and effect relationships) and provide managers with bases
for choosing among alternatives. The separation of the various
components of variance, and the closer identification of the
direct impact of managerial decisions on global objectives, will
It is for these reasons that a standard system can encourage Innovationif used properly;) because It provides a substability or a base for experimenta-tion at the margin without endangering the total objective.


-11-
help direct management attention in areas consistent with the over-
all objectives of the firm. This is especially important at
middle management levels where the operational objectives are
means to an "obscure" end, and often appear to be in conflict
with the personal goals of the decision maker. Signals will be
generated to warn of impending changes, and point out the neces-
sity for future action because of variations that originated in
other units within the firm or for that matter outside the firm.
On the basis of these signals both position and performance
budgets will be revised automatically to incorporate in them the
latest information.
2. System Efficiency
As operations increase in size and complexity, the requirements imposed
upon the information system of the firm Increase exponentially. I have
previously shown, In conjunction with centralization and decentralization,
that the channels of communication needed for linking the members of
2structures organized for mutual Interaction, increase by more than c ,
where c stands for the Increase in the size of the group. In terms of
information storage requirements the situation is even worse. If we take
as an example the data inputs to our present budgetary planning and
control systems, the total number of possible combinations of data for
extraction of information and hence the total number of possible pieces of
data generated for storage at various levels in the hierarchy is 2 , where
See "On the Theory of Divisional Structures ... etc.," op. clt.


-12-
o
n is the size of the raw data pool. Of course, not under all circumstances
will we have to take all possible combinations, but with the present practices
of aggregation and storage of semi-processed information (pooled data), the
data stored will not be much less. Furthermore, the present combinations of
raw data do not usually result in real information useful for managerial
decisions, because the transformation functions (the functional relation-
ships for cause and effect) are not given. Consequently, memoranda or
information storage devices outside the regular accounting system are neces-
sary for control and decision making thus further adding to the requirements
for storage. One example of this is the information necessary for planning
which is mostly carried on a memorandum basis.
My suggestions for a functional accounting system, which as I have
9previously sketched operates on a raw data base and functional forms,
will alleviate this situation because it will obviate the need for trans-
mitting as well as storing so much redundancy.
The efficiency of an information system undoubtedly depends on both the
quantity of useful raw data upon which it draws, and the intelligence or
manipulative capability of the system. Given a certain capacity in a system,
the more of it we use for storage purposes the less capacity we have for
QWe can readily see that the total N is:
n nN = E B(x,n) = E B(x,n)(l)''(l)""'^ = (1+1)
x=0 x=0
where B(x,n) stands for binomial coefficient of n items combined x
at a time
.
9See "Measuring the Efficiency of Organization Structures .. .etc .,"
op. clt.


-13-
trans format Ions . Furthermore, the probability of chaos, cluttering, and con-
fusion increases with the amount of data stored. As a result it appears that
the greater the sophistication of the information system the more emphasis
should be placed on its manipulative capabilities. This we also observe in
human beings. There are people who have stored in their brain an extraordinary
amount of data which they can readily retrieve. However, the data are usually
disjoint and rather useless for the owner (with the possible exception of
Impressing others at social gatherings), because the frame of reference is
missing. Intelligence depends extensively on manipulative capability. A
person who has to depend on memory must store the information in practically
all the various semi-processed forms he will need to use later, while the
one who depends on his intelligence stores only primitive data and methods
of analysis (cause and effect relationships), leaving the particular need,
whenever manifested, to dictate the transformation which will result in the
best possible information for the particular use. The former system may be
faster but inflexible and limited, the latter a bit slower but more articu-
late, fundamental and useful. The majority of existing accounting systems
are of the former type, unsophisticated and useful mostly for storage of
disjoint classifications of data. Our suggestions for eliminating serai-
processed information and storing functional forms is aimed at providing
"intelligence" to the management information system.
3. Advance Warning of Changes in Interrelated Operations
One of the greatest attributes of an information system is its prognostic
capacity. The longer the time span between the prediction of the consequences
of certain events and the point of occurrence of such, if no adjusting actions
are undertaken, the greater the value of the information. An information


-14-
system based on cause and effect relationships can progressively advance from
the most obvious or immediate relationships to the most fundamental, thus in-
creasing continuously the lead time available for action.
Many of the operations of business firms are vitally interrelated and can
be easily expressed in terms of cause and effect relationships. Such an ar-
rangement will not only aid in performance valuation, but will also provide
better premises for operating decisions. The cause and effect relations will
guide the information system as well as the managers, in selecting the type
of information that must be transmitted and how often it must be made avail-
able. Today, managers are only guided by the most superficial cause and
effect relationships in collecting data for decisions, and are often neglecting
the global aspects of the firm's operations since the organizational structure
shields them from the interrelationships between their limited goals and the
overall objectives of the firm. A functional information system will not
only provide the necessary data upon request, but will also bring them to
the attention of management without the latter's initiation, if significant
changes in other operations necessitate action by a certain unit. It will
allow "decentralized" operations to function independently more effectively,
and at the same time permit overall management to use the generated sub-
stabilities for higher level solutions. In effect the use of the organiza-
tion structure of the firm as a management tool will be exploited fully and
be brought to fruition, while subunits realize their full potential under
the greatest possible decentralization. And this because such arrangements


-15-
will provide operating units with advance signals of the necessity of impend-
ing actions, and thus allow them to plan and implement changes with a minimum
of delay and wastage of resources.
4. Development of a Total Modular Model of Operations
Clearly, a functional accounting system is based on a model of the firm's
operations. The budgetary system is itself one such model. In recent years
increasingly more and more efforts have been devoted to the development of
different types of total models. Some of the latter are based on simulated
relationships of existing or assumed systems, and others on simulation of
observed or postulated decision-making processes. Because of the complexity
of the firm's total operations, analytical and normative approaches are
effectively limited to only parts of the total system.
Most of the models that have been thus far proposed are either ad hoc ,
or independent of the system which will generate the necessary data for
their continued application. In my estimation the models cannot be divorced
from the information system of the firm. If such empirical independence is
observed it implies that either the model is addressed toward inconsequential
objectives, or else the information system is misguided in collecting useless
information.
My efforts, as reflected in this as well as previous papers, are aimed
toward remedying the existing deficiencies in managerial accounting systems.
For some such efforts as related to the total information systems of the
firm see: Jay W. Forrester, Industrial Dynamics , The MIT Press, Cambridge,Massachusetts, 1961; Charles P. Bonini, Simulation of Information and DecisionSystems in the Firm , Prentice-Hall, Inc., Englewood Cliffs^ New Jersey, 1963;
James C. Emery, "The Planning Process and Its Formalization in ComputerModels", Sloan School of Management, MITs, Working Paper No. 108-65, 1965.


-16-
The models that I suggest we introduce in the information systems derive both
from theoretical functional relations--the experimental design--and also
directly from the operations in that the results from operations are used in
testing alternative hypotheses. Thus normative as well as behavioral notions
may be both brought to bear on the design of the information system of an
organization. The cause and effect relationships that are developed are used
locally for purposes of learning and efficient resource allocation, but at
the same time they serve as modules in an Integrated information system.
Thus, the planner and the operating manager, in the presence of such a
system, can test the consequences of proposed actions and be able to encompass
more of the global criteria in their decisions. Finally, we have in the
proposed system- -through covariance and variance analysis--a means for
system validation on a continuous basis, because the validation is part of
the system itself. One of the most severe criticisms of simulated models of
the firm and of simulation Information systems, has been the absence of
statistical validation and the necessity for accepting or rejecting them
mostly on faith alone. A system based on the suggestions presented in this
paper will satisfy at least partly a lot of the necessary requirements for
a successful statistical validation of the models.
5. Eventual Development of an Associative Information System
In a functional accounting system there is one-to-one correspondence be-
tween inputs (the variables) and the functional forms into which these enter.
This implies that with the exception of the subjective prior distributions
attached to the levels of the various functional relationships j, the model is
monolithic. In other words it does not allow for different configurations
or qualitative differences in the postulated functional relationships ^ and


-17-
therefore cannot automatically generate and show the Implications of many al-
ternative plans for the utilization of given inputs. These deficiencies we
cannot today remedy by introducing the desirable attributes into our informa-
tion systems, because we have not made enough progress in understanding the
process by means of which objectives are translated into operations. It
is imperative, however, that we solve this problem, because only then we
will be able to introduce meaningful economic opportunity costs into our
information and control systems.
The successor to the functional accounting system will be probably an
associative information system, which associates inputs with functional
forms in a one-many relationship. It will draw data from the same data base
as used by a functional accounting system. A reference file of variables both
dependent and independent will provide a multi -dimensional cross reference
of the variables and the various forms into which these enter as inputs, as
well as the conditional patterns which determine the applicability of the
forms. Depending on the availability-scarcity of complementary resources,
the system will then associate the input with a configuration of functional
relationships, suggest a plan of utilization (based on the current op-
portunity costs of resources), and compare it with the budgeted dominant
solution . The manager will thus be able to choose the best feasible plan
of action of else query the system for further information before a decision
is made.
This topic I will attempt to analyze In a forthcoming paper entitled,
"Objectives and Transformations: Toward a Theory of Dominance".


-18-
The functional accounting system is feasible with present day ancillary
technology and knowledge. The associative information system, however, is
still out in the future in that there are a lot of problems, both conceptual
and technical, that need be resolved before the system becomes a reality.
On purely theoretical grounds, however, the signs are very encouraging,
so it may not be too long before a breakthrough in this area is achieved.
Until then, our life will not be dull because we will find an abundance of
challenges in trying to implement a functional managerial accounting system.
IV. Brief Summary
I have suggested in this paper (and shown in the appendix) that accounting
data, especially of the managerial type, are not as inflexible or useless as
many claim. Most of the present criticism is applicable to, and therefore
should be directed at, the faulty use of information, and not at the validity
of the basic data, pointing out that the greatest payoff lies in the improve-
ment of the managerial decision-making processes. Refinements of data--if
such refinements are addressed to the end uses—are helpful, but the fact
still remains that we have not as yet utilized or capitalized on the informa-
tion content of existing data. In particular I have shown previously and
here, that data generated by existing standard accounting systems can be
extremely useful for managerial purposes. If extended, serving as inputs to
probabilistic control systems, design and analysis of experiments, and
accounting systems based on cause and effect relationships. The Implica-
tions of all these potential uses are in our estimation enormous. They can


-19-
bring to bear on managerial decisions, both the normative and behavioral
aspects of operations, modeling and statistical validation, and the full
extent of utilization of all the available tools and ancillary technologies,
The end result will be an accounting system which is really managerial.


APPENDIX
The Use of Accounting Variances for Statistical Variance Analysts;
An Illustration
1« The Analysis of Variance
Let us assume that we have a company which produces a standard line of
products. Each product is manufactured by many divisions (or departments,
groups, machines, etc. within a division), under standard batch-order
12conditions. The material (or labor) usage variances for the division are
very small, indicating that "operations are under control" since the
13standards are set by this company at the expected value or mean. We want
to find out, however, whether there are differences between the performance
of the various departments, operators, machines, weeks, etc.
In the example that we use here for a one-way analysis of variance, we
shall test at the departmental level, by picking at random four departments
and using the last five batches completed by each as the basis for testing
14efficiency in terms of materials usage. Then we shall compare Department 1
versus Department 3, Department 2 versus Department 4 and the average
performance of Departments 1 and 3 versus that of Departments 2 and 4. And
12Although I will be talking about batch-order manufacturing operations,
the arguments and system are equally applicable to any standardizable opera-tions. Also, a lot of the assumptions made here are not limiting in anyfundamental sense but are introduced to describe the situation I ure for
illustrative purposes.
13That is to say the company applies initially a test to assess the prob-
abilistic significance of total deviations similar to the one described in
"Standard Costs as a First Step to Probabilistic Control" op. cit.
14The analysis of variance can be applied as a matter of routine to all
the results of each accounting period, rather than on a sampling basis. Such
a practice, however, will be wasteful.


-21-
this because we wish to discern possible particularities in technology, etc.,
that create heterogeneities in otherwise standard operations, and which
heterogeneities are of such magnitude as to imply the possible existence of
subpopulations . Such analysis is necessary for learning purposes and for
incorporating innovations in standard operation procedures.
In our example we assume that the estimated material content (standard)
for each homogeneous batch is 1,000 units, and that the observations which
we pick out of the "credit side" of the Work-in-Process departmental accounts
are as shown in Table 1.
Batches

11'


-23-
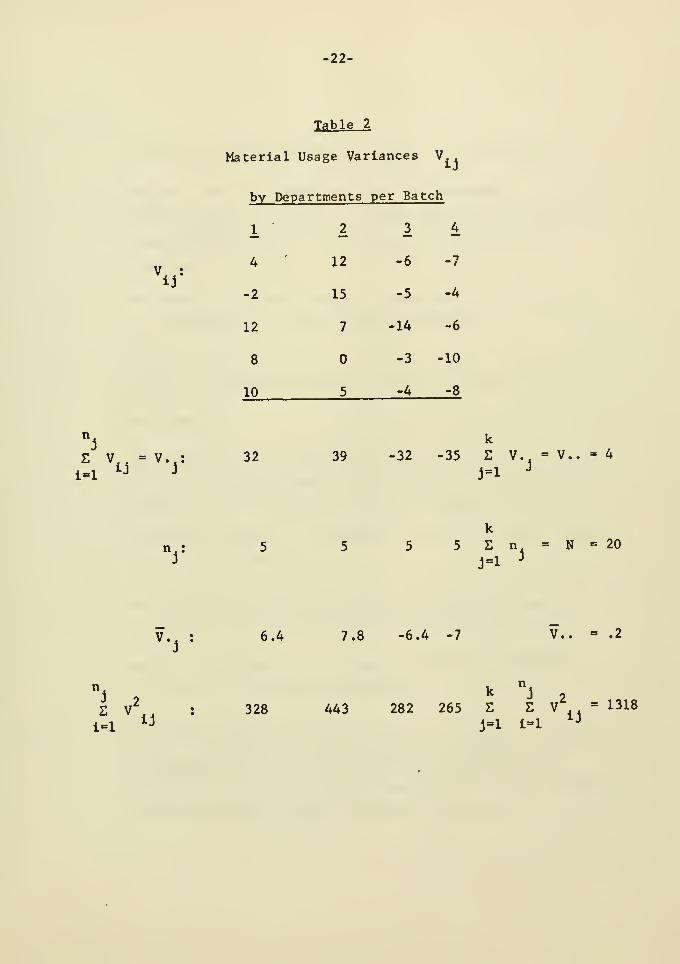
In Table 2:
V = the material usage variance of batch i for department j
v.. " the total material usage variance for department j for the
batches used in the sample. If the check is done randomly on
a monthly basis then V., represents the monthly total
departmental variance.
n = the number of batches taken for department j . Note that
n. need not be the same for each department.
kN = E n. or the total number of batches included in the
j=l J
experiment.
v.. = the total material usage variance for the division based on
the observations included in the sample. If the firm is
committed to 100 per cent sampling--a practice that we find
unnecessary- -then V.. represents the total variance summary
or control account.
v.. = the average observed variance per batch for department j
The combined sum of V. and the standard output, can
serve as an estimate of the mean departmental performance
to be used in a Bayesian framework.
V,, = the overall average observed variance per batch. The com-
bined total of v.. and the standard can serve as an
estimate of the empirical grand mean output for the division.
Again here this is useful for Bayesian analysis.


24-
As shown in the text in part II, we can test the hypothesis that the
2departaental variances a are equal to zero, by comparing the observed F
value at k-1 and N-k degrees of freedom (df) with the critical region
of the F distribution.
This empirical F value is:
E V^. /n - V^../NJ/k-1
^k-l,N-k
L E V - E V . /n]/N-k
^ j=i i=i ^J j=i ^ y
where in the numerator we have, in our case, the estimate of the variance
between departments, and in the denominator the estimate of the variance
within departments or the random error C. . • The amounts in the paren-
theses are the sum of squares (SS) and the total of the numerator and
denominator is, of course, the sum of squares of the decomposed variance,
SS = E 2 V - V ../N^ j=l i=l ^
The critical region is usually the upper tail of the F distribution,
and thr- test consists of rejecting the hypothesis H if the observed F
ratio value is greater or equal to the value of F, ^ where O^ is the
confidence level at which we wish to test.


-25-
The values of the above terms as derived from the data presented in
Table 2 are for our illustration as follows:
1. Total sum of Squares (N-1 df.) = £ Z V - V . . /N
j=l i=l
= 1318 -If
ij
1317.2
2. Sum of Squares between Departments
SS (k-1 df.) = E V^../n. - V^../N°
j=l J J
1024 + 1521 + 1024 + 1225 16
5 "20
= 958
3. Sum of Squares of Error = 1317.2 - 958 = 359.2
Now we summarize in Table 3 our results as preparatory to testing the
2null hypothesis H that the variance ff around the performance of the
various departments is zero.


-26-
Table 3
Degrees Sum of Mean ExpectedSource of Variation of Freedom Squares Square Mean Square
2 2Between Departments (k-1) = 3 958 319.3 u + 5cr
e D
Within Departments or2
Error E, ,(N-k) = 16 359.2 22.45 a
ij e
Total 19 1317.2
The test statistic for the above (the F-ratio for 3 degrees of freedom
for the numerator and 16 for the denominator) is:
F , ,, = 319.3/22.45 = 14.22J , lb
which is highly significant (the critical F „ ,. value for CX = .01 beingJ, 16
25.29) indicating that the hypothesis that a = must be rejected. So we
can safely infer that the difference between the performance (material
utilization) of the various departments contains something more than the
estimate of the population variance. Probably there is a real difference
in the performance of the various departments and further probing is
required. A manager would naturally be interested in finding out among
other things:
(a) What percentage of the total variation in material utiliza-
tion among departments is due to random causes (stochastic error)
and what due to the efficiency of departments or possible
qualitative differences in the raw material used.


•27-
(b) Which of the average performances are significantly different?
For example is Department 1 statistically more efficient than
say No. 3? Is Department 2 better than 4? How does the average
performance of Departments 1 and 3 compare with that of
Departments 2 and 4?
(c) Can we utilize the information generated by statistical analysis
for developing cause and effect information useful for budgeting
purposes, performance evaluation, and more efficient utilization
of resources in the case of interdependent operations?
2. The Components of Variance
The random model that we have been testing was
where X. . is the standard material content of the actual output of each
input batch, yH = 1000 material units (the standard material content of
the standard output) and ^. . the random error. In terms of the material^ ij
usage variance, the model was changed to:
(x^. -/^) = i/<..-y^) + (X.. -/H..) or
v.. ^ v.. + (V.^ - V. )
Setting now the observed variances equal to their expected values, we
can solve for the best estimates of the components of the variance from
standard, and so separate that which is due to stochastic error from the
part which can be safely attributed to the average performance of depart-
ments. Thus the variance due to the latter is equal to:


-28-
9 9 ?
= D <= V^j ^ e>'"
2 2where S „ is the observed variance for batches, and S the error
V eij
variance
.
From Table 3 we obtain:
2S = 319.3 , and
ij
S^ = 22.45e
Hence: 5 S^j^ = 319.3 - 22.45
2The estimate of the total variance from operations S is therefore
T
2 2 2
^T = %-^^e
= 79.82
showing that approximately 72 per cent of the total variance can be attributed
to differences between the mean performance of the departments, and 28 per cent
to a random variation around the means.
If now we use the above estimate of the standard deviation S = 8.9 for
assessing the probabilistic significance of variances within the division, we
can set up a system as previously suggested, by means of which only variances
beyond the control limits will be brought to the attention of management. Also
"Standard Costs as a First Step to Probabilistic Control" op. cit.

29-
this estimated standard deviation can be used for deriving the discrete prob-
abilities applicable to (a) the various alternative standards and (b) the
occurrences of various variances given the standards, under the a priori
assumption that the standard deviation is invariant with respect to the
different standards. These features of experimental design must be incorporated
into the information system if we are to have selective "signal generation"
and sequential testing of standards. The separation of random variations
from variations due to operating efficiency and variations arising from
technological change is not only desirable but it is also requisite for
efficient decision making.
Looking over the entries in Table 2, we notice that the variations around
the standard (mean) fall within + 2S , consequently none would have been
brought to the attention of divisional management under such control limits.
If alternatively the limits were set at one standard deviation (that is to
say identifying as exceptional any variance which occurs due to purely
stochastic reasons with probability p < .32^ then the performance of
Departments 1 and 2 would have been analyzed twice and that of Departments 3
and 4 only once during the period it took to run the specified five batches.
3. Comparisons Between Departmental Performance
To the extent that every statistical universe contains subpopulations
which Lay have their own distinct characteristics but which characteristics
become buried in averages, we must test the means of the various departments
to find out which differ. We have already determined that differences do
exist but we do not know exactly which means are statistically different.
This contrast of means is normally used in fixed rather than random


-30-
experimental designs. That is to say, it is used under controlled experimental
conditions to test whether there are any significant differences in performance
because of the introduction of different methods of operation (treatment).
For example one may wish to test for differences in the fastness of the color
of a cloth as the temperature or the amount of time of the dyeing process is -varied,
Under such conditions the levels of treatment of the experiment are exhaustive.
In our case the levels are not exhaustive but are a random sample out of
many. We wish, however, to contrast means in order to obtain signals on the
possible existence of differences, in order that we further investigate
(possibly through fixed experimental designs) and establish cause and effect
relationships. Since we have decided prior to the experiment on what compari-
sons we wanted to make (Department 1 versus Department 3; Department 2 versus
Department 4; and Departments 1 and 3 together versus Departments 2 and 4
together), we can use the method of orthogonal contrasts. Again the
necessary inputs for this test are obtained from the accounting records,
which in our case are the Material Usage Variance accounts of the depart-
ments as shown in Table 2.
The test statistic for orthogonal contrasts is again the F distribution,
where for each hypothesis, in the numerator we have the sum of squares of the
contrast and in the denominator the sum of squares of the error, each
(numerator and denominator) divided by its own degrees of freedom.
If the decision on comparisons is made after the data are observed,
then the method of orthogonal contrasts is not appropriate but other
methods are available.


31-
A contrast C is defined asm
kC = Z C v..
where C. stands for the coefficient for department j in contrast Cjm '^
-^ m
kand where E n.C. =0
J=l J J™
For orthogonality the sum of the product of the coefficients of each
pair of contrasts C, and C. must also be zero, so thatjm jq
kS n,C, C =0j=i J J'" jq
Finally the sum of squares of a contrast C ism
m
SS =c" k
2T. n.C.
j=l J J'"
Our three contrasts are consequently the three rows of the resulting
matrix upon multiplication of the matrix of coefficients C, with thejm
column vector of material usage variances V. . That is to say:


32-
C = / +1m
C = 32 + - (-32) +
C2 = + 39 + - (-35)
C = 32 - 39 - 32 - (-35)
-1
+1 -1 +1
= 64
= 74
= -4
And the sum of squares is therefore:
2
(a) SS^ = -^1^ = 409.6
(b) SS, = -^7^ = 547.
(
'C2 5(2)
(^> '\ -^- •«
The total sum of squares, that is to say the sum of (a) through (c) , is
958.0 (as before: see Table 3).
test:
Using the above results, each of which has one degree of freedom, we
18
18The denominator of the F-ratio is the variance of the random error.


-33-
"l • ^'1 ' ^'3 'l,16 " 22.45= 18.3
"2 ' ^'2 ^'4= 547.6
'l,16 22.45= 24.5
H- : v., + v.- = v.. + v.,3 13 2 4 1,16 22.45
= 0.036
At the 1 per cent significance level the value of F^ ^, = 8.53; conse-
quently H and H. are rejected but H is not. We conclude, therefore,
that there are significant differences between the performances of Department 1
and Department 3, also between Department 2 and Department 4, but not between
the combined totals of Departments 1 and 3 and Departments 2 and 4. These
results raise the possibility that Departments 1 and 2 may belong to a dif-
ferent statistical population than that of Departments 3 and 4. The neces-
sity for an inquiry in the method of operation or in the quality of raw
material inputs of these pairs of departments is, therefore, strongly sug-
gested. Fixed experiments, not necessarily limited to a one-way analysis of
variance, may now be run if necessary so as to isolate cause and effect.
In essence a second round of analyses of variances within the standardized
operations must be undertaken to isolate the real causes of variation in
performance, for the purpose of learning and adopting new methods of opera-
tion. Any new method of operation being a deviation from existing standard
procedures will at first serve as a challenger, become eventually the
standard procedure if successful, serve as a basis (or substability) to a
higher level solution, and eventually be challenged itself, ad^ infinitum .


References
1. Boulni, Charles P., Simulation o-l Information and Decision Systems in
the Firm , Prentice-Hall, Inc., Englewood Cliffs, New Jersey, 1963.
2. Davies, Oven L., Statistical Methods in Research and Production ,
Oliver and Boyd, London, 1949 (2nd Edition).
3. , Design and Analysis of Industrial Experiments , HafnerPublishing Company, New York, 1954.
4. Emery, James C, "The Planning Process and Its Formalization in ComputerModels", Sloan School of Management, Massachusetts Institute of Technology,
Working Paper No. 108-65, January 1965.
5. Forrester, Jay W., Industrial Dynamics , The MIT Press, Cambridge,Massachusetts, 1961,
6. Hicks, Charles R., Fundamental Concepts in the Design of Experiments ,
Holt, Rinehart and Winston, New York, 1964.
7. Simon, Herbert A., "On the Concept of Organizational Goal", AdministrativeScience Quarterly , Vol. 9, No. 1, June 1964, pp. 1-22.
8. Zannetos, Zenon S., "Mathematics as a Tool of Accounting Instruction and
Research", The Accounting Review, Vol. XXXVIII, No. 2, April 1963,
pp. 326-335.
9. , "On the Mathematics of Variance Analysis", The AccountingReview . Vol. XXXVIIl, No. 3, July 1963, pp. 528-533.
10. , "Standard Costs as a First Step to Probabilistic Control:
A Theoretical Justification, an Extension and Implications", The Accounting
Review , Vol. XXXIX, No. 2, April 1964, pp. 296-304.
11. , "Some Thoughts on Internal Control Systems of the Firm",
The Accounting Review , Vol. XXXIX, No. 4, October 1964, pp. 860-868.
12. , "On the Theory of Divisional Structures: Some Aspects of
Centralization and Decentralization of Control and Decision Making",
Management Science , December 1965, Vol. 12, No. 4, Series B, pp. 49-69.
13. , "Measuring the Efficiency of Organization Structures: Some
Implications for the Control System of the Firm", Sloan School of
Management, Massachusetts Institute of Technology, Working Paper No. 117-65,
May, 1965.

'%
/


Date Due
Lib-26-67

i3 IDfiO 003 flbfl fl3
3 TDflD
wn uetARUb
3 a fl flb3
Ipill ill
Mr LIBRARIES
3 TOfiD 003 ST'^ as D /G^-^6
iiilitiiii
3 TOaO 003 all an6^-66
MIT LiBRARIfS
3 TOfl
3 Toao
'linuln.'liiilliiliiliiiiiliiiiliilllmil! ini Ml II III! mil nil III mill 11 Hill II ,-7-, / ,
003 a^T fl^3 '^^~^t>
03 aiT T34
MH LIBRARIES
3 Toao 003 aba tei
.1,"'. Alfred P. Sloan•^r»hnoT of Management
i.np Veve'".