Toothpicks and Transformations
21
The High School Math Project —Focus on Algebra http://www.pbs.org/mathline Page 1 Toothpicks and Transformations (Quadratic Functions) Objective Students will investigate quadratic functions using geometric toothpick designs. Overview of the Lesson The lesson begins with a review of transformations of quadratic functions—vertical and horizontal shifts, and stretches and shrinks. First, students match the symbolic form of the function to the appropriate graph, then given the graphs, students analyze the various transformations and determine the equation for the functions. This review is followed by an activity where students explore a mathematical pattern that emerges as they build a geometric design with toothpicks. The pattern is quadratic, and the students determine the mathematical model in several different forms. Students examine the recursive nature of the relationship. An explicit model for the relation is developed, and a third model is developed by examining the scatterplot and determining the equation from the transformations. Finally, the class uses the graphing calculators to develop another model and to verify that all of the models—factored form, vertex form, and general form—are equivalent. Materials • graphing calculator overhead unit • overhead projector For each group of four: • small paper cup containing about 100 toothpicks (Note: Flat toothpicks will be easier to work with than round ones.) • bright-colored construction paper mats (optional) • graphing calculators
-
Upload
khangminh22 -
Category
Documents
-
view
0 -
download
0
Transcript of Toothpicks and Transformations

The High School Math Project —Focus on Algebra
http://www.pbs.org/mathline Page 1
Toothpicks and Transformations(Quadratic Functions)
Objective
Students will investigate quadratic functions using geometric toothpick designs.
Overview of the Lesson
The lesson begins with a review of transformations of quadratic functions—verticaland horizontal shifts, and stretches and shrinks. First, students match the symbolicform of the function to the appropriate graph, then given the graphs, studentsanalyze the various transformations and determine the equation for the functions.This review is followed by an activity where students explore a mathematical patternthat emerges as they build a geometric design with toothpicks. The pattern isquadratic, and the students determine the mathematical model in several differentforms. Students examine the recursive nature of the relationship. An explicit modelfor the relation is developed, and a third model is developed by examining thescatterplot and determining the equation from the transformations. Finally, the classuses the graphing calculators to develop another model and to verify that all of themodels—factored form, vertex form, and general form—are equivalent.
Materials
• graphing calculator overhead unit• overhead projector
For each group of four:• small paper cup containing about 100 toothpicks (Note: Flat toothpicks will be
easier to work with than round ones.)• bright-colored construction paper mats (optional)• graphing calculators
PBS MATHLINE®
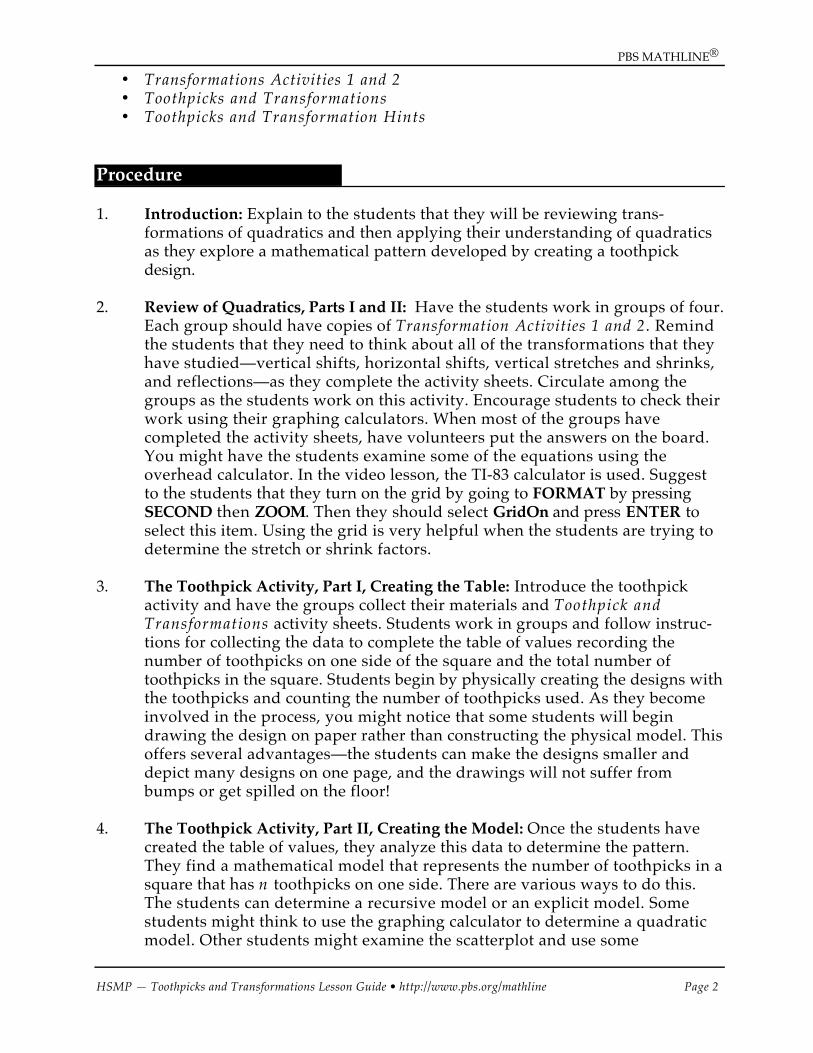
HSMP — Toothpicks and Transformations Lesson Guide • http://www.pbs.org/mathline Page 2
• Transformations Activities 1 and 2• Toothpicks and Transformations• Toothpicks and Transformation Hints
Procedure
1. Introduction: Explain to the students that they will be reviewing trans-formations of quadratics and then applying their understanding of quadraticsas they explore a mathematical pattern developed by creating a toothpickdesign.
2. Review of Quadratics, Parts I and II: Have the students work in groups of four.Each group should have copies of Transformation Activities 1 and 2. Remindthe students that they need to think about all of the transformations that theyhave studied—vertical shifts, horizontal shifts, vertical stretches and shrinks,and reflections—as they complete the activity sheets. Circulate among thegroups as the students work on this activity. Encourage students to check theirwork using their graphing calculators. When most of the groups havecompleted the activity sheets, have volunteers put the answers on the board.You might have the students examine some of the equations using theoverhead calculator. In the video lesson, the TI-83 calculator is used. Suggestto the students that they turn on the grid by going to FORMAT by pressingSECOND then ZOOM. Then they should select GridOn and press ENTER toselect this item. Using the grid is very helpful when the students are trying todetermine the stretch or shrink factors.
3. The Toothpick Activity, Part I, Creating the Table: Introduce the toothpickactivity and have the groups collect their materials and Toothpick andTransformations activity sheets. Students work in groups and follow instruc-tions for collecting the data to complete the table of values recording thenumber of toothpicks on one side of the square and the total number oftoothpicks in the square. Students begin by physically creating the designs withthe toothpicks and counting the number of toothpicks used. As they becomeinvolved in the process, you might notice that some students will begindrawing the design on paper rather than constructing the physical model. Thisoffers several advantages—the students can make the designs smaller anddepict many designs on one page, and the drawings will not suffer frombumps or get spilled on the floor!
4. The Toothpick Activity, Part II, Creating the Model: Once the students havecreated the table of values, they analyze this data to determine the pattern.They find a mathematical model that represents the number of toothpicks in asquare that has n toothpicks on one side. There are various ways to do this.The students can determine a recursive model or an explicit model. Somestudents might think to use the graphing calculator to determine a quadraticmodel. Other students might examine the scatterplot and use some
PBS MATHLINE®
HSMP — Toothpicks and Transformations Lesson Guide • http://www.pbs.org/mathline Page 3
combination of these models in connection with what they know abouttransformations to determine the equation of the parabola in vertex form.
How much guidance do the students need? This varies from class to class, andtherefore the hint sheets are designed to be a guide for students who needthem. You may wish to let students try to determine a model without anyguidance and then pass out the various hint sheets as you think particulargroups need them. Challenge the groups to determine the model in as manyways as they can.
5. Putting it all Together: Give each group a chance to report on the ideas theyhad and how they arrived at their solutions. Summarize these ideas on theblackboard. As groups are presenting, encourage all of the students in the classto listen intently to make sure they understand the ideas the group ispresenting, and to raise questions if there is anything that is not clear. Havinga good summary activity is critically important when students do groupinvestigations.
Assessment
Assessment for the purpose of guiding instruction is an ongoing process in theclassroom. For this lesson, there are many ways and times that you will observe howwell your students understand transformations of quadratic functions and thedevelopment of a quadratic model for a particular set of data. As you circulate amongthe groups, you will hear conversations that give insight into their level ofunderstanding. However, it is impossible for you to monitor every group all of thetime. You may have a very good idea of where the groups are, but you don’tnecessarily have all the details of the thinking that has transpired. For these reasons,it is particularly important to have an entire class discussion of the ideas that eachgroup came up with as they worked on the problem.
Students and groups have opportunities for self-assessment as they report theirfindings and listen to the ideas of others. For example, what were their ideas; andwhat did others come up with that they did not have? As groups continue to workand report back, the idea of synergy is one that students should begin to appreciate.Together, as a class, they can learn more and do more than any one person or onegroup could do alone.
For assessment purposes you could collect the activity sheets that the studentscomplete on transformations; or you could ask students to write up the toothpickinvestigation, stating the problem, giving the table of values for the data, andexplaining the mathematical models that could be used to represent that data. Asalways, be sure to give students specific information about what you are grading, andhow you are grading it. Students need to know the grading criteria in advance.

PBS MATHLINE®
HSMP — Toothpicks and Transformations Lesson Guide • http://www.pbs.org/mathline Page 4
Extensions & Adaptations
• Students can develop models for other toothpick patterns. You could start with atriangle which takes three toothpicks; the next triangle would have a base of twoand take nine toothpicks; and so on. Challenge the students to come up withpatterns and mathematical models that represent the number of toothpicksrequired to make any particular stage of the pattern.
• Parts of this lesson could be used with any class studying quadratic functions.Having students understand the connections among the graphs, the tables, andthe symbolic forms is very important for all students.
Mathematically Speaking
The transformations that are dealt with in this lesson are the basic transformationsthat will be applied to other functions as students continue their study ofmathematics. The method used by the teacher in this lesson models a way todetermine a quadratic equation in vertex form by using the graph and analyzing thetransformations. The students consider the parent function, f(x) = x2 as they examinethe graph to determine the values of a(the stretch or shrink factor), h (the horizontalshift), and k (the vertical shift), where f(x) = a(x - h)2 + k. Identifying the vertex is a keytask in writing the equation for a graph in vertex form. Once the students haveidentified the vertex, they know the values for h and k because the vertex has beenmoved h units horizontally and k units vertically putting the vertex at (h, k). To findthe value for a, the students simply move one unit to the right of the vertex andmove to find the corresponding value of the function. If they had to move up 3units, then a is 3; if they had to move down 3 units, then a is -3. The students areactually just evaluating the stretch or shrink factor because they are simply lookingfor the relative change. If they were looking at f(x) = x2, then they would go over 1and up 1 to be on the parabola and a would be 1, but when the relative change isdifferent, you have a different value for a. Be sure that the students understand thatthis stretch or shrink has nothing to do with positive or negative. If the parabola ischanging or growing faster than f(x) = x2, then you know that a is greater than 1 andyou say that a is the stretch factor. If the parabola is changing or growing slower thanf(x) = x2, then you know that a is less than 1 and you say that a is the shrink factor.The sign of a simply tells the students whether the parabola opens up or down.

PBS MATHLINE®
HSMP — Toothpicks and Transformations Lesson Guide • http://www.pbs.org/mathline Page 5
Tips From Ellen
A Constructivist Approach to Learning
It has been said that we have a written curriculum, a taught curriculum, and alearned curriculum. The distinction between the first two is obvious; the distinctionbetween the last two has to do in part with what we know about how students learn.This lesson demonstrates the importance of a constructivist approach to learningand the importance of learning styles.
Constructivism, based on brain research, holds that people’s understanding of anyconcept depends entirely on their experience in deriving that concept for them-selves. Teachers can guide the process, but students must develop their ownunderstandings. People remember an experience based on what their pre-existingknowledge and cognitive structures allow them to absorb—regardless of a teacher’sintentions or the quality of an explanation. This lesson illustrates how a teacher canscaffold a learning experience, building from a very concrete activity in whichtoothpicks are manipulated, to visual drawings of the same, to representations viatables, to abstract models. Students can build their understanding and movebackwards from any point that their thinking becomes uncertain to a less abstractform of reasoning. The teacher is available to move the learning forward throughinterventions and guided discussion at appropriate times. The brain likes to createconnections and patterns; it is essential that the desired connections are found!
At the same time, it is very apparent that individual students are responding to theinstruction differently. These students are very articulate about their learningpreferences and styles, e.g.,
— “I’m not too good with the visual aspect.”— “I tend to work intuitively, so to have to verbalize—it helps me to crystallize
my thinking.”— “When I’m doing something I don’t know, I have to learn it by hand to
understand it.”Learning styles address individuals’ preferences or strengths in processinginformation. There are many processing models in the literature including thefamiliar visual, auditory, or tactile/kinesthetic; field sensitive versus fielddependent; and more recently Howard Gardner’s seven intelligences, to name a few.
Some implications and ideas:* Organize instruction around a few powerful ideas. A constructivist approach
is more time-consuming, but the learning is deeper and persists longer.* Move from concrete to abstract reasoning.* Remember that “hands on” is not always “minds on.” Students can follow
directions as mindlessly when using objects as they can completing a activitysheets. Design activities that require complex reasoning.
PBS MATHLINE®
HSMP — Toothpicks and Transformations Lesson Guide • http://www.pbs.org/mathline Page 6
* Remember that there is a role for other kinds of learning, such as rotememorization.
* Develop an awareness of students’ learning preferences and styles for yourselfand among your students. Learning style inventories are fun and informative.
* Teach to a variety of styles within each lesson. This may take the form oftapping into the various strengths of students at different times (e.g. usingmanipulatives, writing a description, drawing a picture). It can also take theform of offering students choices in how to complete a task.
* Encourage students to make their own adaptations to suit their styles.* Encourage students to formulate their learning in a variety of ways.
Resources
National Council of Teachers of Mathematics. Curriculum and EvaluationStandards for School Mathematics Addenda Series, Grades 9 - 12 :Connecting Mathematics. Reston, Virginia: National Council of Teachersof Mathematics, 1991.
Mamchur, Carolyn, A Teacher’s Guide to Cognitive Type Theory and LearningStyle. Alexandria, Virginia: Association for Supervision andCurriculum Development, 1996.
Keirsey, D. and M. Bates. Please Understand Me. Del Mar: PrometheusNemesis Books, 1978.
Lawrence, G. People Types and Tiger Stripes. Gainsville: Center forApplications of Psychological Type, 1979.
Myers, I. The Myers-Briggs Type Indicator. Princeton: Educational TestingService, 1962.
Internet location:http://viihills,nw-georgia.resak12.ga.us/InternetResources/Conselor.htmlThis address takes you to The Counselor’s Closet which has topics such ascolleges and universities, financial aid, academic testing, financial aid andcareers in addition to personality testing. Direct your students to the KeirseyTemperament Sorter.
Internet location:http://www.dc.peachnet.edu/~shale/humanities/composition/assignments/Keirsey.html This location describes the Keirsey Temperament Sorter, allowsyou to take the test, and gives you an analysis of the results.
Internet location: http//www.esu10.k12.ne.us/~loupcity/academic/cassette.htmlThe lesson uses a quadratic function to model sales of a popular cassette.Collecting data, analyzing graphs, and examining local maxima andminimum values are also covered.cussio
PBS MATHLINE®
HSMP — Toothpicks and Transformations Lesson Guide • http://www.pbs.org/mathline Page 8
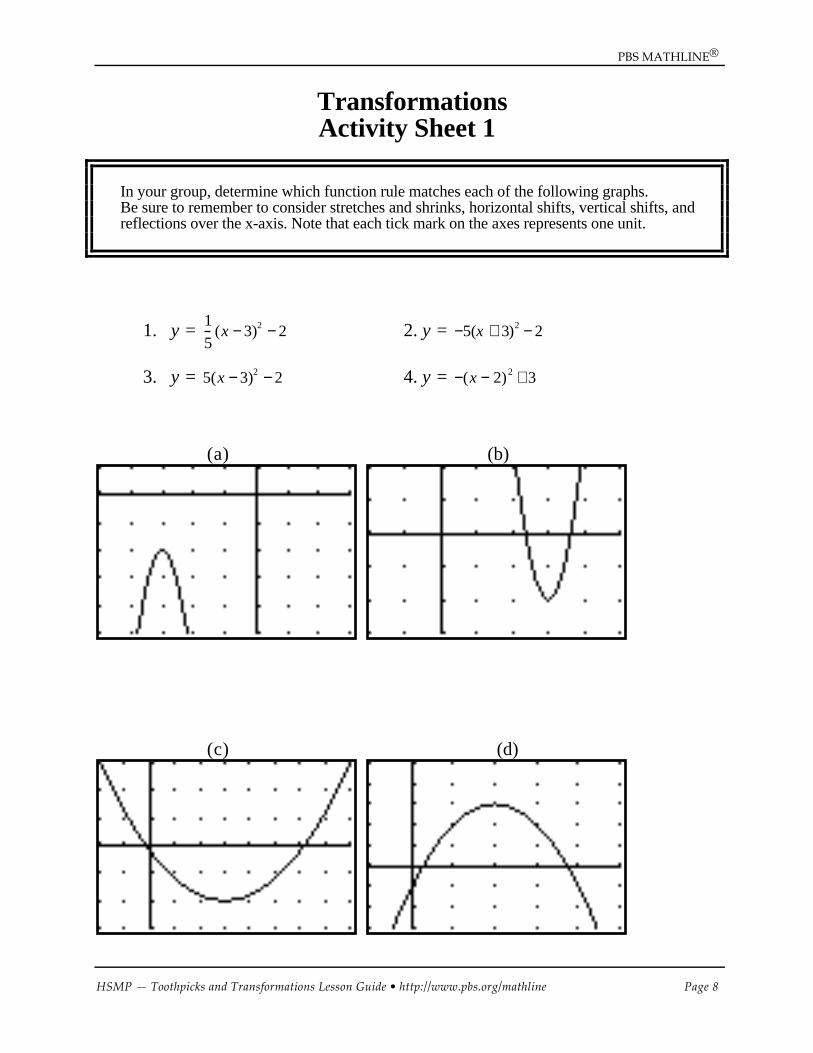
TransformationsActivity Sheet 1
In your group, determine which function rule matches each of the following graphs.Be sure to remember to consider stretches and shrinks, horizontal shifts, vertical shifts, andreflections over the x-axis. Note that each tick mark on the axes represents one unit.
1. y = 1
5(x − 3)2 − 2 2. y = −5(x + 3)2 − 2
3. y = 5(x − 3)2 − 2 4. y = −(x − 2)2 + 3
(a) (b)
(c) (d)

PBS MATHLINE®
HSMP — Toothpicks and Transformations Lesson Guide • http://www.pbs.org/mathline Page 9
TransformationsActivity Sheet 2
In your group, determine the function rules for each of the following graphs. Write thefunction in vertex form, y = a(x - h)2 + k. Be sure to remember to consider stretches andshrinks, horizontal shifts, vertical shifts, and reflections over the x-axis.Note that each tick mark on the axes represents one unit.
1. y = _______________ 2. y = _______________
3. y = _______________ 4. y = _______________
PBS MATHLINE®
HSMP — Toothpicks and Transformations Lesson Guide • http://www.pbs.org/mathline Page 10
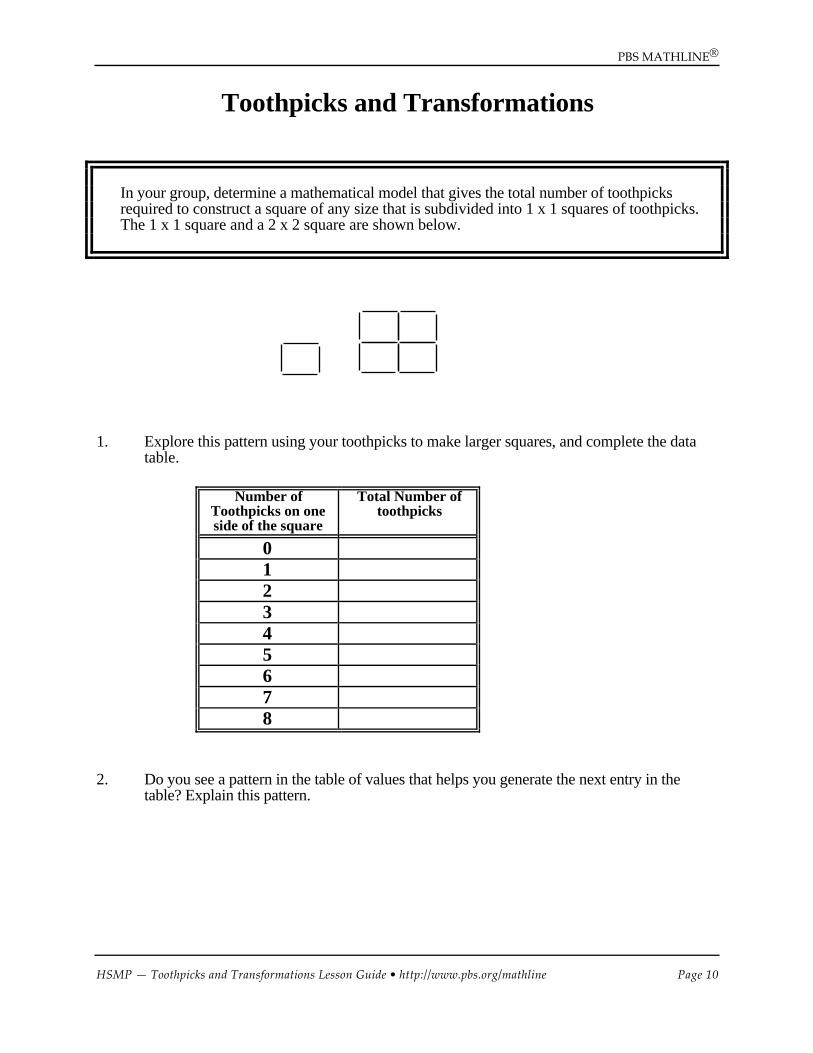
Toothpicks and Transformations
In your group, determine a mathematical model that gives the total number of toothpicksrequired to construct a square of any size that is subdivided into 1 x 1 squares of toothpicks.The 1 x 1 square and a 2 x 2 square are shown below.
1. Explore this pattern using your toothpicks to make larger squares, and complete the datatable.
Number ofToothpicks on oneside of the square
Total Number oftoothpicks
012345678
2. Do you see a pattern in the table of values that helps you generate the next entry in thetable? Explain this pattern.
PBS MATHLINE®
HSMP — Toothpicks and Transformations Lesson Guide • http://www.pbs.org/mathline Page 11
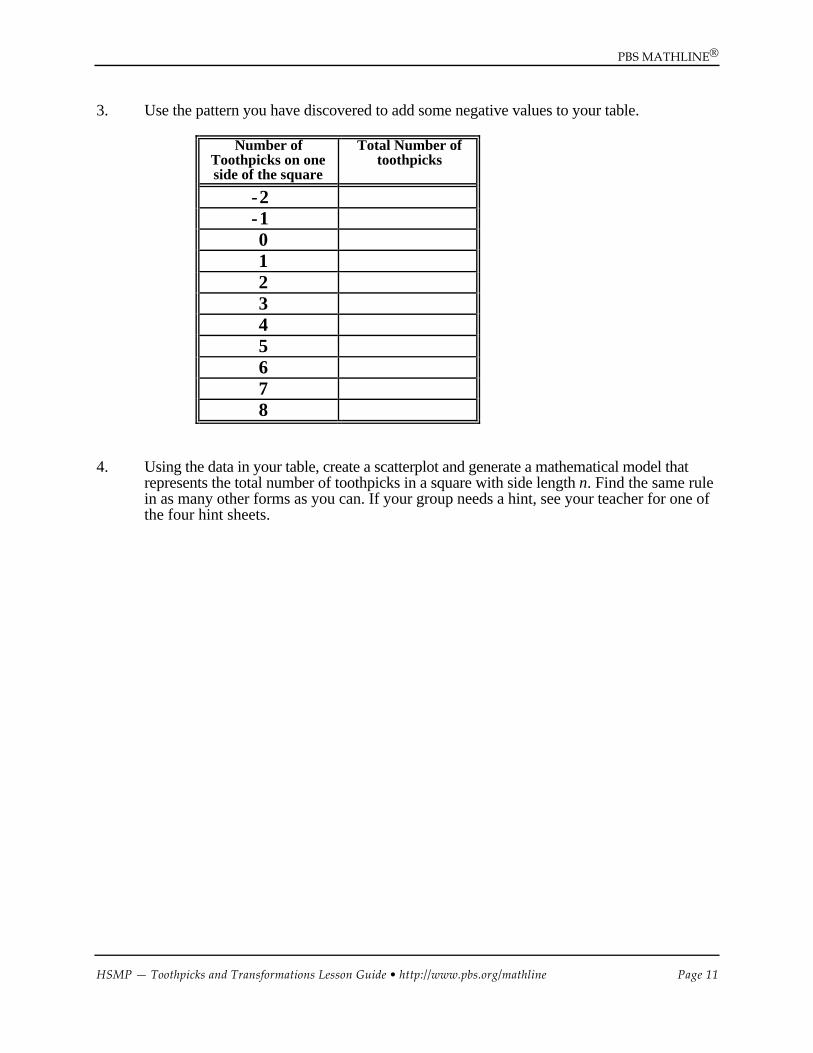
3. Use the pattern you have discovered to add some negative values to your table.
Number ofToothpicks on oneside of the square
Total Number oftoothpicks
-2 -1
012345678
4. Using the data in your table, create a scatterplot and generate a mathematical model thatrepresents the total number of toothpicks in a square with side length n. Find the same rulein as many other forms as you can. If your group needs a hint, see your teacher for one ofthe four hint sheets.

PBS MATHLINE®
HSMP — Toothpicks and Transformations Lesson Guide • http://www.pbs.org/mathline Page 12
Toothpicks and TransformationsHint # 1
In your group, determine a mathematical model that gives the total number of toothpicksrequired to construct a square of any size that is subdivided into 1 x 1 squares of toothpicks.The 1 x 1 square and a 2 x 2 square are shown below.
1. Our goal for this model is to determine the number of toothpicks that need to be added eachtime. How many toothpicks do you add to the first diagram in order to form the seconddiagram? How many do you add to the second figure, to make a third?
t1 = 4
t2 = 4 + _______
t3 = t2 + _______
2. You need to generalize this now so that you will be able to write tn = tn - 1 + _______ .Each time you increase the size of your square, you are adding four groups of toothpicks:horizontal outside ( ), horizontal inside ( ), vertical outside ( ), and vertical inside( ). Study this pattern.
n = 2 n = 3
To increase to a 3 x 3 square, how many toothpicks had to be added? How manytoothpicks were added in each of the four categories: horizontal outside, horizontal inside,vertical outside and vertical inside?
PBS MATHLINE®
HSMP — Toothpicks and Transformations Lesson Guide • http://www.pbs.org/mathline Page 13
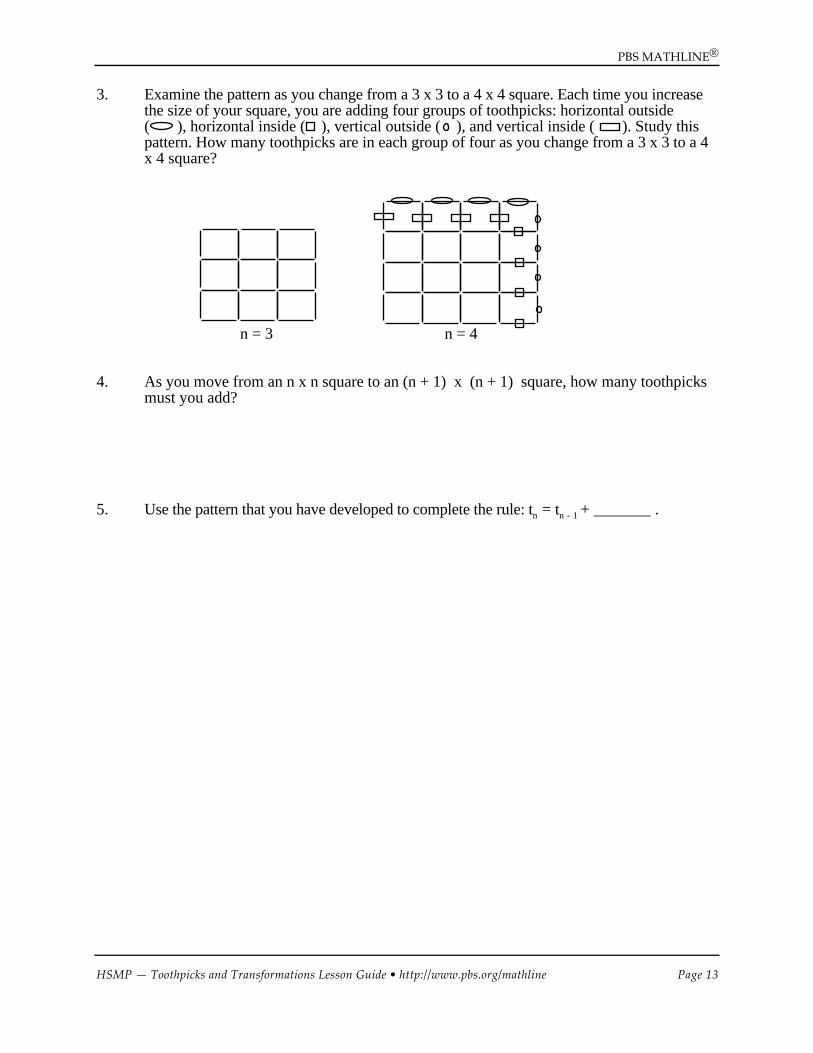
3. Examine the pattern as you change from a 3 x 3 to a 4 x 4 square. Each time you increasethe size of your square, you are adding four groups of toothpicks: horizontal outside( ), horizontal inside ( ), vertical outside ( ), and vertical inside ( ). Study thispattern. How many toothpicks are in each group of four as you change from a 3 x 3 to a 4x 4 square?
n = 3 n = 4
4. As you move from an n x n square to an (n + 1) x (n + 1) square, how many toothpicksmust you add?
5. Use the pattern that you have developed to complete the rule: tn = tn - 1 + _______ .

PBS MATHLINE®
HSMP — Toothpicks and Transformations Lesson Guide • http://www.pbs.org/mathline Page 14
Toothpicks and TransformationsHint # 2
In your group, determine a mathematical model that gives the total number of toothpicksrequired to construct a square of any size that is subdivided into 1 x 1 squares of toothpicks.
On the grid below make a scatterplot using the data points from your table of values fromToothpicks and Transformations problem # 3. Sketch a curve and determine the equation for thatcurve using what you have studied in this lesson.

PBS MATHLINE®
HSMP — Toothpicks and Transformations Lesson Guide • http://www.pbs.org/mathline Page 15
Toothpicks and TransformationsHint # 3
In your group, determine a mathematical model that gives the total number of toothpicksrequired to construct a square of any size that is subdivided into 1 x 1 squares of toothpicks.
For this model, you will examine the pattern and determine the number of toothpicks required foran n x n square in terms of n. Study the patterns below.
n = 3
1. How many columns of vertical toothpicks are in the figure?2. How many rows of horizontal toothpicks are in the figure?3. How many toothpicks are in each row?4. Combine this information to give the total number of toothpicks.
n = 4
5. How many columns of vertical toothpicks are in the figure?6. How many rows of horizontal toothpicks are in the figure?7. How many toothpicks are in each row?8. Combine this information to give the total number of toothpicks.
Generalize this pattern to answer these same four questions for an n x n square.
9. How many columns of vertical toothpicks would you have for an n x n square?10. How many rows of horizontal toothpicks would you have for an n x n square?11. How many toothpicks are in each row?12. Combine this information to give the total number of toothpicks.13. State the mathematical model that gives the total number of toothpicks for an n x n square.
PBS MATHLINE®
HSMP — Toothpicks and Transformations Lesson Guide • http://www.pbs.org/mathline Page 16
Toothpicks and TransformationsHint # 4
In your group, determine a mathematical model that gives the total number of toothpicksrequired to construct a square of any size that is subdivided into 1 x 1 squares of toothpicks.
Use your graphing calculator to help you determine a mathematical model for this relationship.
1. Enter the data from “Toothpicks and Transformations” problem # 3 into your calculator.
2. Use your calculator to create a scatterplot.
3. Identify the type of function you think this scatterplot represents, and then use thecalculator to determine the best model for your data. What type of function do you have?Give the equation you determined using your calculator.
4. Plot this model on your scatterplot to see how well it fits your data.
PBS MATHLINE®
HSMP — Toothpicks and Transformations Lesson Guide • http://www.pbs.org/mathline Page 17
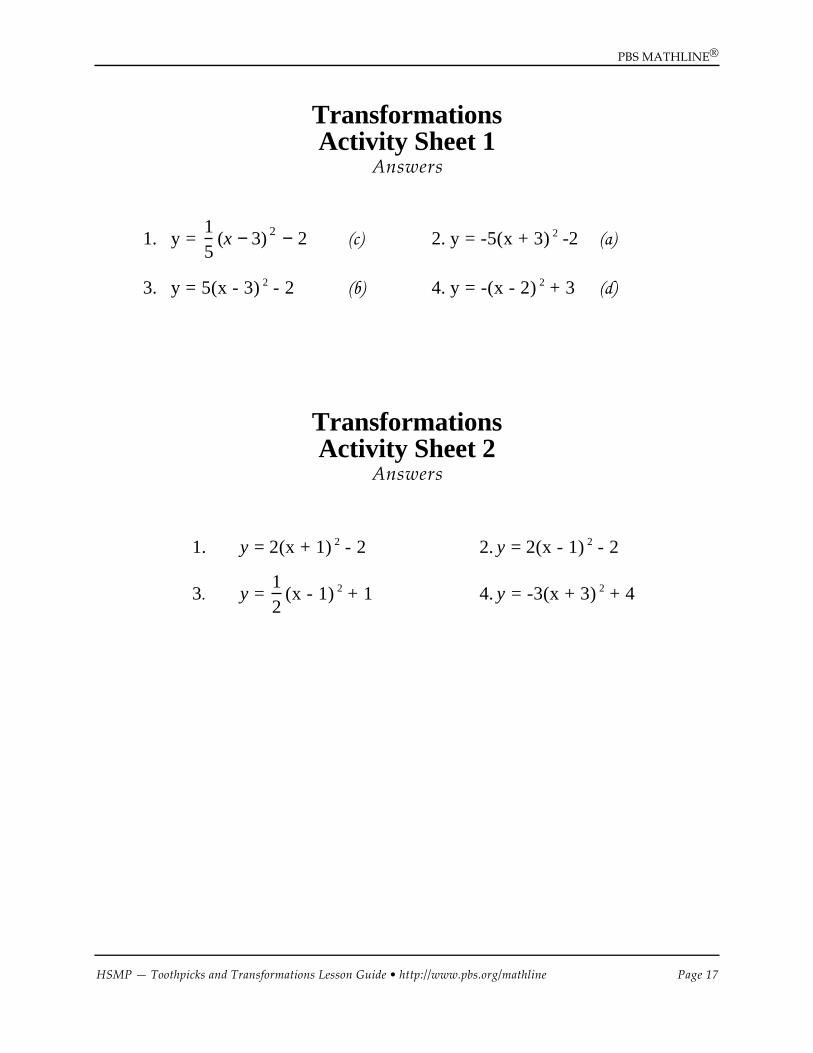
TransformationsActivity Sheet 1
Answers
1. y = 15
(x − 3) 2 − 2 (c) 2. y = -5(x + 3) 2 -2 (a)
3. y = 5(x - 3) 2 - 2 (b) 4. y = -(x - 2) 2 + 3 (d)
TransformationsActivity Sheet 2
Answers
1. y = 2(x + 1) 2 - 2 2. y = 2(x - 1) 2 - 2
3. y = 12
(x - 1) 2 + 1 4. y = -3(x + 3) 2 + 4
PBS MATHLINE®
HSMP — Toothpicks and Transformations Lesson Guide • http://www.pbs.org/mathline Page 18
Toothpicks and TransformationsSelected Answers
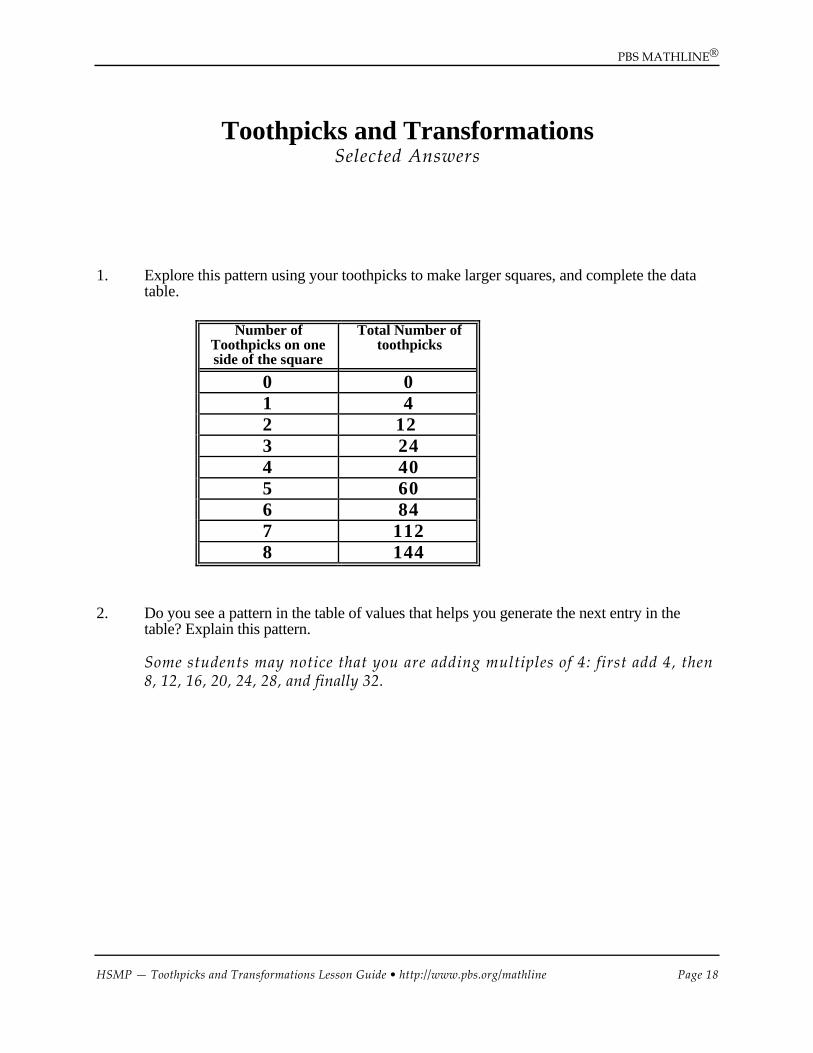
1. Explore this pattern using your toothpicks to make larger squares, and complete the datatable.
Number ofToothpicks on oneside of the square
Total Number oftoothpicks
0 01 42 123 244 405 606 847 1128 144
2. Do you see a pattern in the table of values that helps you generate the next entry in thetable? Explain this pattern.
Some students may notice that you are adding multiples of 4: first add 4, then8, 12, 16, 20, 24, 28, and finally 32.

PBS MATHLINE®
HSMP — Toothpicks and Transformations Lesson Guide • http://www.pbs.org/mathline Page 19
3. Use the pattern you have discovered to add some negative values to your table.
Number ofToothpicks on oneside of the square
Total Number oftoothpicks
-2 4 -1 0
0 01 42 123 244 405 606 847 1128 144
4. Using the data in your table, create a scatterplot and generate a mathematical model thatrepresents the total number of toothpicks in a square with side length n. Find the same rulein as many other forms as you can. If your group needs a hint, see your teacher for one ofthe four hint sheets.

PBS MATHLINE®
HSMP — Toothpicks and Transformations Lesson Guide • http://www.pbs.org/mathline Page 20
Toothpicks and TransformationsHint # 1
Answers
1. Our goal for this model is to determine the number of toothpicks that need to be added eachtime. How many toothpicks do you add to the first diagram in order to form the seconddiagram? 8 How many do you add to the second figure, to make a third? 12
t1 = 4
t2 = 4 + 8
t3 = t2 + 12
2. You need to generalize this now so that you will be able to write tn = tn - 1 + _______ .Each time you increase the size of your square, you are adding four groups of toothpicks:horizontal outside ( ), horizontal inside ( ), vertical outside ( ), and vertical inside( ). Study this pattern.
n = 2 n = 3
To increase to a 3 x 3 square, how many toothpicks had to be added? 12 How manytoothpicks were added in each of the four categories: horizontal outside, horizontal inside,vertical outside and vertical inside? 4 in each group
3. Examine the pattern as you change from a 3 x 3 to a 4 x 4 square. Each time you increasethe size of your square, you are adding four groups of toothpicks: horizontal outside( ), horizontal inside ( ), vertical outside ( ), and vertical inside ( ). Study thispattern. How many toothpicks are in each group of four as you change from a 3 x 3 to a 4x 4 square? 4 toothpicks are in each group of 4
4. As you move from an n x n square to an (n + 1) x (n + 1) square, how many toothpicksmust you add? 4(n + 1)
5. Use the pattern that you have developed to complete the rule: tn = tn - 1 + 4n .

PBS MATHLINE®
HSMP — Toothpicks and Transformations Lesson Guide • http://www.pbs.org/mathline Page 21
Toothpicks and TransformationsHint # 2
Answers
The vertex is (- 0.5, - 0.5). If you move over one unit from the vertex, you go up2 units to hit the graph. This information gives the model: y = 2(x + 0.5)2– 0.5.

PBS MATHLINE®
HSMP — Toothpicks and Transformations Lesson Guide • http://www.pbs.org/mathline Page 22
Toothpicks and TransformationsHint # 3
Answers
For n = 31. How many columns of vertical toothpicks are in the figure? 42. How many rows of horizontal toothpicks are in the figure? 43. How many toothpicks are in each row? 34. Combine this information to give the total number of toothpicks. 24
For n = 45. How many columns of vertical toothpicks are in the figure? 56. How many rows of horizontal toothpicks are in the figure? 57. How many toothpicks are in each row? 48. Combine this information to give the total number of toothpicks. 40
For an n x n square9. How many columns of vertical toothpicks would you have for an n x n square? n + 1
10. How many rows of horizontal toothpicks would you have for an n x n square? n + 111. How many toothpicks are in each row? n12. Combine this information to give the total number of toothpicks. 2n(n + 1)13. State the mathematical model that gives the total number of toothpicks for an n x n square.
y = 2n(n + 1)
Toothpicks and TransformationsHint # 4
Selected Answers
3. Students will probably identify this general shape as a parabola. Using the calculator to findthe quadratic model, students will determine the model y = 2x2 + 2x
4. Plot this model on your scatterplot to see how well it fits your data.