Tookany/Tacony-Creek Integrated Watershed Management Plan
355
Tookany/Tacony-Creek Integrated Watershed Management Plan Tookany/Tacony-Frankford Watershed Partnership Mission Statement The Tookany/Tacony-Frankford Watershed Partnership is a consortium of proactive environmental groups, community groups, government agencies, businesses, residents and other stakeholders who have an interest in improving the Tookany/Tacony-Frankford Watershed. The goals of the initiative are to protect, enhance, and restore the beneficial uses of the Tookany/Tacony-Frankford waterways and riparian areas. Watershed management seeks to mitigate the adverse physical, biological, and chemical impacts of land uses as surface and ground waters are transported throughout the watershed to the waterways. The partnership seeks to achieve higher levels of environmental improvement by sharing information and resources. Simply stated, the mission of the Partnership is: * To increase public understanding of the importance of a clean and healthy watershed * To instill a sense of appreciation and stewardship among residents for the natural environment * To improve and enhance our parks, streams, and surrounding communities in the Tookany/Tacony-Frankford Watershed. May 2005
-
Upload
khangminh22 -
Category
Documents
-
view
0 -
download
0
Transcript of Tookany/Tacony-Creek Integrated Watershed Management Plan

Tookany/Tacony-Creek Integrated Watershed Management Plan
Tookany/Tacony-Frankford Watershed Partnership Mission Statement The Tookany/Tacony-Frankford Watershed Partnership is a consortium of proactive environmental groups, community groups, government agencies, businesses, residents and other stakeholders who have an interest in improving the Tookany/Tacony-Frankford Watershed.
The goals of the initiative are to protect, enhance, and restore the beneficial uses of the Tookany/Tacony-Frankford waterways and riparian areas. Watershed management seeks to mitigate the adverse physical, biological, and chemical impacts of land uses as surface and ground waters are transported throughout the watershed to the waterways. The partnership seeks to achieve higher levels of environmental improvement by sharing information and resources.
Simply stated, the mission of the Partnership is:
* To increase public understanding of the importance of a clean and healthy watershed
* To instill a sense of appreciation and stewardship among residents for the natural environment
* To improve and enhance our parks, streams, and surrounding communities in the Tookany/Tacony-Frankford Watershed.
May 2005
Executive Summary
Foreword This plan presents a logical and affordable pathway to restore and protect the beneficial and designated uses of the waters of the Tookany/Tacony-Frankford Creek basin. Based on extensive physical, chemical and biological assessments, the plan explores the nature, causes, severity and opportunities for control of water quality impairments in the Tookany/Tacony-Frankford Creek watershed. The primary intent of the planning process, as articulated by the stakeholders, is to improve the environmental health and safe enjoyment of the Tookany/Tacony-Frankford watershed by sharing resources and through cooperation among residents and other stakeholders in the watershed. The goals of the initiative are to protect, enhance, and restore the beneficial uses of the Tookany/Tacony-Frankford waterways and its riparian areas. The plan recommends appropriate remedial measures for the Tookany/Tacony-Frankford Creek basin, provides a financial commitment to initiate the implementation of the plan, and seeks to provide the impetus for stakeholders of the Tookany/Tacony-Frankford basin to follow suit.
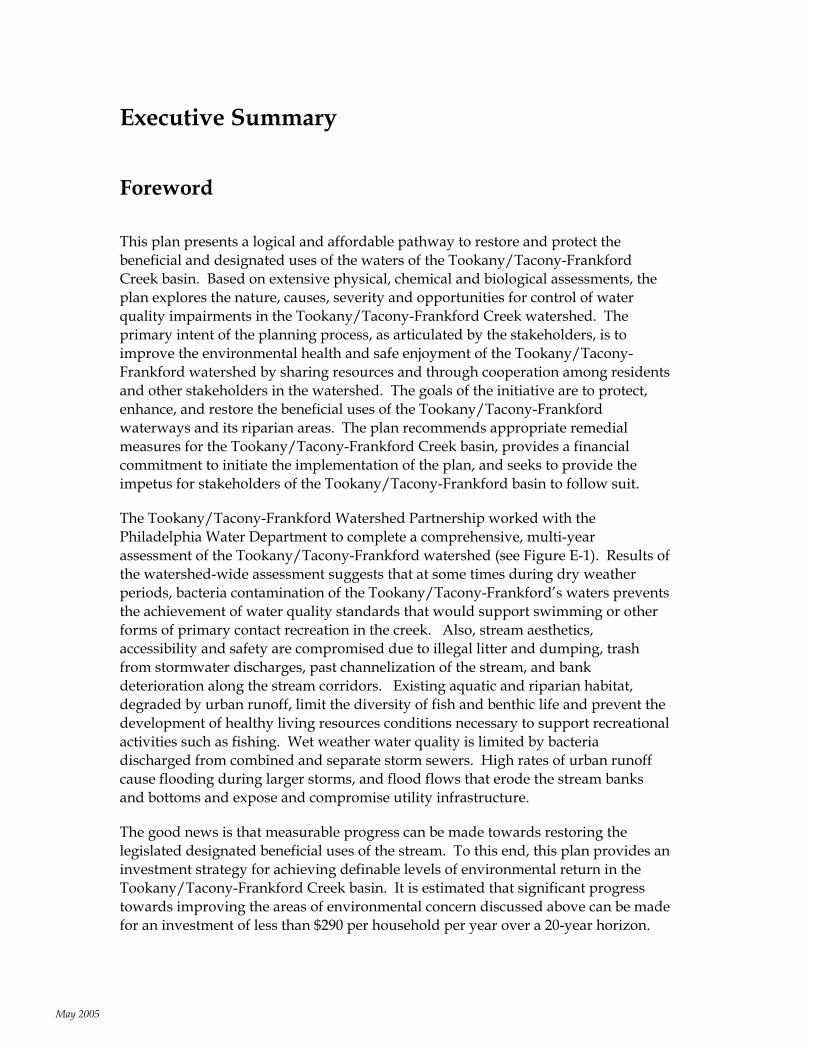
The Tookany/Tacony-Frankford Watershed Partnership worked with the Philadelphia Water Department to complete a comprehensive, multi-year assessment of the Tookany/Tacony-Frankford watershed (see Figure E-1). Results of the watershed-wide assessment suggests that at some times during dry weather periods, bacteria contamination of the Tookany/Tacony-Frankford’s waters prevents the achievement of water quality standards that would support swimming or other forms of primary contact recreation in the creek. Also, stream aesthetics, accessibility and safety are compromised due to illegal litter and dumping, trash from stormwater discharges, past channelization of the stream, and bank deterioration along the stream corridors. Existing aquatic and riparian habitat, degraded by urban runoff, limit the diversity of fish and benthic life and prevent the development of healthy living resources conditions necessary to support recreational activities such as fishing. Wet weather water quality is limited by bacteria discharged from combined and separate storm sewers. High rates of urban runoff cause flooding during larger storms, and flood flows that erode the stream banks and bottoms and expose and compromise utility infrastructure.
The good news is that measurable progress can be made towards restoring the legislated designated beneficial uses of the stream. To this end, this plan provides an investment strategy for achieving definable levels of environmental return in the Tookany/Tacony-Frankford Creek basin. It is estimated that significant progress towards improving the areas of environmental concern discussed above can be made for an investment of less than $290 per household per year over a 20-year horizon.
May 2005
The plan proposes that the other municipalities in the Tookany/Tacony-Frankford basin make similar financial commitments to implementation that will ensure the restoration and preservation of the waters that flow from and through their communities, shaping their quality of life along the way. A significant portion of this funding is directed towards work that reflects the widely recognized national need to renew our water resources infrastructure. These efforts reflect many efforts that should be done anyway. It is proposed that a combination of Federal, state, local government, and private funding be brought to bear to implement this plan. The Philadelphia Water Department has expended over $1 million in the development of the plan, and will commit an additional $2 - 3 million per year or more towards implementing its recommendations over the next 20 years. The plan proposes that the other municipalities in the Tookany/Tacony-Frankford basin make similar financial commitments to implementation that will ensure the restoration and preservation of the waters that flow from and through their communities.
Figure E-1: Tookany/Tacony-Frankford Watershed. This plan summarizes the results of watershed assessment activities in the Tookany/Tacony-Frankford basin. Detailed monitoring, analysis, planning, and implementation guidelines are provided for the Tookany/Tacony-Frankford basin. The plan recommends appropriate measures to restore habitat and water quality, and seeks to provide an example for stakeholders in the Tookany/Tacony-Frankford watershed to follow.
May 2005
Introduction Stewardship of a river must be built around the needs of the community. It will grow by making visible the critical way the health of the watershed is integral to basic quality of life issues. Once the seeds of stewardship have been planted, members of the community can be recruited to take action in protecting their watershed. In 2000, The Philadelphia Water Department (PWD) acted as the municipal sponsor of the Tookany/Tacony-Frankford Watershed Partnership, an exciting and groundbreaking effort to connect residents, businesses and government as neighbors and stewards of the watershed. Since then, the Partnership has been active in developing a vision for the watershed and guiding and supporting subsequent planning activities within the Tookany/Tacony-Frankford watershed.
PWD, with the support of the Tookany/Tacony-Frankford Watershed Partnership, has just completed a multi-year watershed planning effort to restore the Tookany/Tacony-Frankford Creek Watershed to one that can boast fishable, swimmable and enjoyable streams. The planning process and implementation recommendations are contained in the recently completed Tookany/Tacony-Frankford Creek Integrated Watershed Management Plan (TTFIWMP). This executive summary presents the major findings of the TTFIWMP.
Background In 2000, PWD acted as the municipal sponsor of the Tookany/Tacony-Frankford Watershed Partnership, an exciting and groundbreaking effort to connect residents, businesses and government as neighbors and stewards of the watershed. PWD hired the Pennsylvania Environmental Council (PEC), a well-respected, non-profit institution with a reputation for supporting watershed-based, holistic planning in the form of smart growth planning. PEC pulled together a diverse representation of the watershed – municipalities, “friends” groups, educators, citizens, agencies, and watershed organizations – for the first partnership meeting.
The Tookany/Tacony-Frankford Watershed Partnership first worked with PWD to complete a comprehensive, multi-year watershed assessment covering the Tookany/Tacony-Frankford drainage basin (see Figure E-1). The assessment provides a snapshot of current conditions in the watershed, and lays the groundwork for the development of more detailed plans to improve conditions in the Tookany/Tacony-Frankford. With portions of the Tookany/Tacony-Frankford Creek watershed served by combined sewers, and with significant interest from the Partnership in improving water quality and riparian habitat conditions, PWD then took the next step by leading the development of the TTFIWMP.
With this plan, the watershed communities now have a blueprint for restoring this urban stream into a community asset, while making significant progress toward improving water quality during both dry and wet weather.
May 2005

The primary intent of the plan, as articulated by the stakeholders, is to mitigate wet weather impacts caused by urban stormwater runoff and combined sewer overflow (CSO), identify ways to improve water quality, aesthetics, and recreational opportunities in dry weather; and restore living resources in the stream and along the stream corridor. PWD placed a high priority on the development of the TTFIWMP because it represents one of the three major components of the City of Philadelphia’s CSO Long Term Control Plan (LTCP) strategy. This component entails a substantial commitment by the City to watershed planning to identify long term improvements throughout its watersheds, including any additional CSO controls that will result in an improvement to water quality and, ultimately, the attainment of water quality standards.
PWD was not alone in this planning effort. Significant support from other agencies has helped to fund various components of the plan in order to better integrate this effort with other regulatory programs. The USEPA provided funding under its Wetland Program Grant to help assess existing wetlands within Tookany/Tacony-Frankford Creek and provide basic data for developing wetland restoration projects. Through the Act 167 Stormwater Management Program, PADEP is also providing funding to PWD for modeling and analysis to support stormwater planning, as well as to initiate the creation of an Act 167 Plan for this watershed. Finally, initial planning efforts and the development of planning goals were embodied in two Rivers Conservation Plans funded by PA-DCNR.
At the outset, there was insufficient physical, chemical, and biological information on the nature and causes of water quality impairments, sources of pollution, and appropriate remedial measures for the Tookany/Tacony-Frankford Creek. The lack of information made it impossible to determine what needed to be done for additional CSO control or control of other wet weather sources throughout the watershed. Lack of sufficient information is not unique to Tookany/Tacony-Frankford Creek. In fact recognition of this deficiency, especially with respect to the effects of wet weather discharges and receiving water dynamics, has increased nationwide and led to a broader recognition of the need for watershed-based planning and management to properly define water quality standards and goals.
The USEPA Long Term Control Planning Guidance suggests that the sources of watershed pollution and impairment, in addition to CSOs, are varied and include other point source discharges; discharges from storm drains; overland runoff; habitat destruction; land use activities, such as agriculture and construction; erosion; and septic systems and landfills. The Guidance notes that the major advantage in using a watershed-based approach to develop a LTCP is that it allows the site-specific determination of the relative impacts of CSOs and non-CSO sources of pollution on water quality.
May 2005
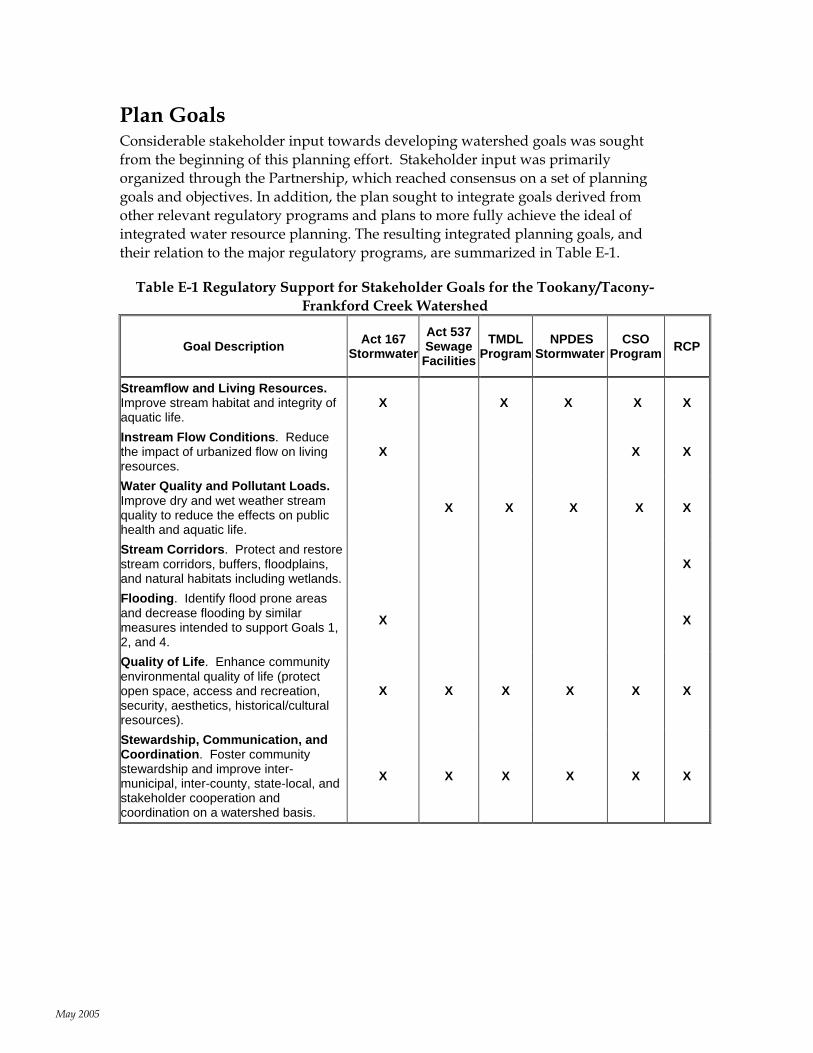
Plan Goals Considerable stakeholder input towards developing watershed goals was sought from the beginning of this planning effort. Stakeholder input was primarily organized through the Partnership, which reached consensus on a set of planning goals and objectives. In addition, the plan sought to integrate goals derived from other relevant regulatory programs and plans to more fully achieve the ideal of integrated water resource planning. The resulting integrated planning goals, and their relation to the major regulatory programs, are summarized in Table E-1.
Table E-1 Regulatory Support for Stakeholder Goals for the Tookany/Tacony-Frankford Creek Watershed
Goal Description Act 167 Stormwater
Act 537 Sewage Facilities
TMDL Program
NPDES Stormwater
CSO Program RCP
Streamflow and Living Resources. Improve stream habitat and integrity of aquatic life.
X X X X X
Instream Flow Conditions. Reduce the impact of urbanized flow on living resources.
X X X
Water Quality and Pollutant Loads. Improve dry and wet weather stream quality to reduce the effects on public health and aquatic life.
X X X X X
Stream Corridors. Protect and restore stream corridors, buffers, floodplains, and natural habitats including wetlands.
X
Flooding. Identify flood prone areas and decrease flooding by similar measures intended to support Goals 1, 2, and 4.
X X
Quality of Life. Enhance community environmental quality of life (protect open space, access and recreation, security, aesthetics, historical/cultural resources).
X X X X X X
Stewardship, Communication, and Coordination. Foster community stewardship and improve inter-municipal, inter-county, state-local, and stakeholder cooperation and coordination on a watershed basis.
X X X X X X
May 2005
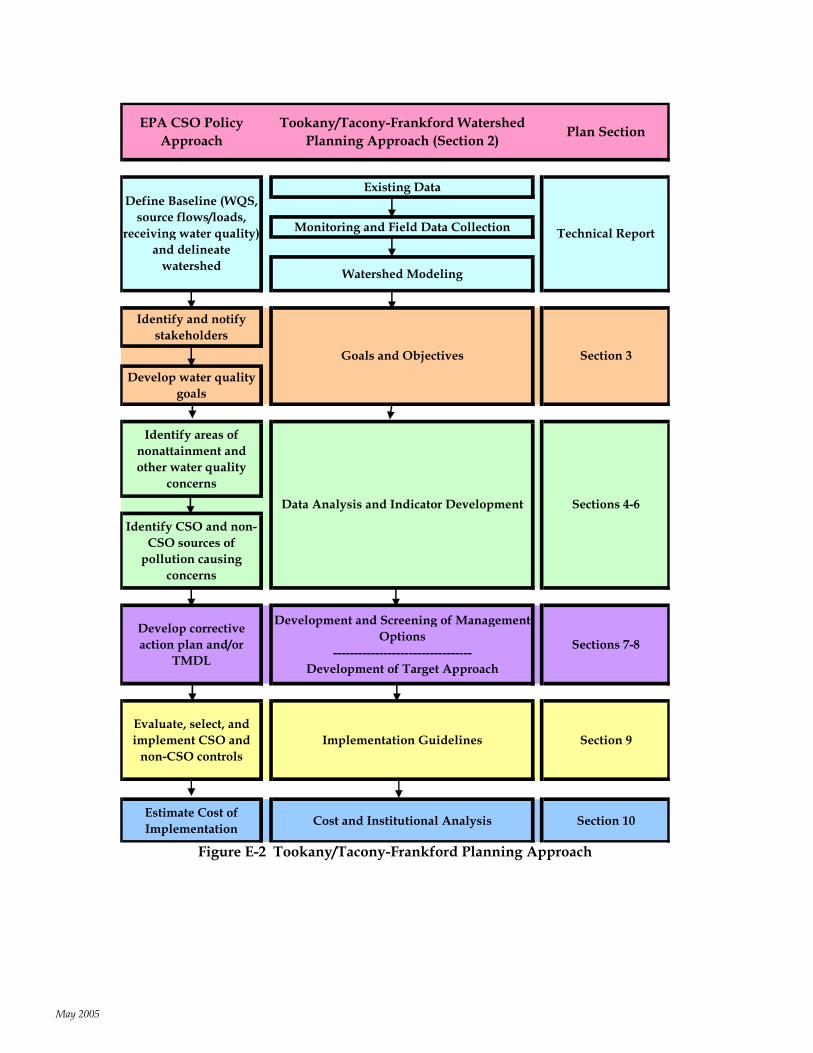
Planning Approach Once the Partnership had established the goals and objectives for the TTFIWMP, a planning approach was designed to achieve the desired results through a cooperative effort between Philadelphia and the other watershed municipalities. The approach has four major elements:
Data collection, organization and analysis
Systems description
Problem identification and development of plan objectives
Strategies, policies and approaches
Figure E-2 summarizes the primary steps of the planning process. The right column shows the sections of the plan relevant to each step in the planning process.
May 2005
EPA CSO Policy Approach
Tookany/Tacony-Frankford Watershed Planning Approach (Section 2) Plan Section
Existing Data
Monitoring and Field Data Collection
Watershed Modeling
Identify and notify stakeholders
Develop water quality goals
Identify areas of nonattainment and other water quality
concerns
Identify CSO and non-CSO sources of
pollution causing concerns
Develop corrective action plan and/or
TMDL
Development and Screening of Management Options
--------------------------------- Development of Target Approach
Sections 7-8
Evaluate, select, and implement CSO and
non-CSO controlsImplementation Guidelines Section 9
Estimate Cost of Implementation Cost and Institutional Analysis Section 10
Data Analysis and Indicator Development Sections 4-6
Define Baseline (WQS, source flows/loads,
receiving water quality)and delineate
watershed
Technical Report
Goals and Objectives Section 3
Figure E-2 Tookany/Tacony-Frankford Planning Approach
May 2005
Watershed Status and Problem Identification An important aspect of the watershed management plan is a basic description of existing conditions within the watershed and streams. To accomplish this, a series of indicators were developed to represent the results of the data collection efforts and the data analysis and modeling. An indicator is a measurable quantity that characterizes the current state of at least one aspect of watershed health. The indicators were selected for their potential use both in assessing current conditions and assessing future progress in improving conditions.
Through the extensive field studies, modeling, and data analysis, the highest priority problems in the Tookany/Tacony-Frankford Creek were identified, and the means for addressing the problems were developed. Given that the Tookany/Tacony-Frankford Creek watershed is a highly urbanized watershed with both CSOs and significant stormwater flows, some of the highest priority problems included:
Dry Weather Water Quality and Aesthetics Water quality concerns including high fecal coliform during dry weather
Dry weather sewage flows in separate sewered areas
Trash-filled, unsightly streams that discourage residential use.
Safety concerns along streams and stream corridors
Healthy Living Resources
Degraded aquatic and riparian habitats
Loss of wetlands
Channelized stream sections
Limited diversity of fish and benthic life
Periodic, localized occurrences of low dissolved oxygen in downstream areas of the watershed
Wide diurnal swings in dissolved oxygen
Utility infrastructure threatened by bank and streambed erosion
Limited public awareness and sense of stewardship for Tookany/Tacony-Frankford Creek
Wet Weather Water Quality and Quantity
Water quality concerns including high fecal coliform during wet weather, and nutrients and metals during wet weather flows
CSO impacts on water quality and stream channels
Little volume control and treatment of stormwater flows in separate sewered areas
May 2005
Development and Screening of Management Options Lists of management measures, called options, were developed to address the identified problems and to meet each of the goals and objectives established for the Tookany/Tacony-Frankford Creek watershed. Only those options deemed feasible and practical for Tookany/Tacony-Frankford Creek were considered in the final list of management options. Options were developed and evaluated in three steps:
Development of a Comprehensive
Options List
Detailed Evaluation of Structural Options
Initial Screening
Since the plan cannot prescribe actions to be undertaken by all the participants in the planning process, recommendations and guidelines for implementation were developed. Modeling and other analyses were used to help recommend an approach for municipalities to develop an implementation plan to achieve the goals and objectives laid out in this plan.
Implementation Approach In developing watershed management alternatives and discussing goals and objectives with stakeholders, it became clear that implementation could best be achieved by defining three distinct targets to meet the overall plan objectives. Two of the targets (A and B) were defined so that they could be fully met with a limited set of options that are fully implemented. For the third target (C), it was agreed to set interim objectives, recommend measures to achieve the interim objectives, implement those controls, and monitor and reassess the effectiveness of the plan in meeting the objectives.
TARGET A: Dry Weather Water Quality and Aesthetics The first target is to meet water quality standards in the stream during dry weather flows. Target A was defined for Tookany/Tacony-Frankford Creek with a focus on trash removal and litter prevention, and the elimination of sources of sewage discharge during dry weather.
TARGET B: Healthy Living Resources Improvements to the number, health, and diversity of the benthic invertebrate and fish species in the Tookany/Tacony-Frankford Creek will require investment in habitat improvement and measures to provide the opportunity for organisms to avoid high velocities during storms. Improving the ability of an urban stream to support viable habitat and fish populations must focus primarily on the elimination or remediation of the more obvious impacts of urbanization on the stream. These include loss of riparian habitat, eroding and undercut banks, scoured streambed or excessive silt deposits, channelized and armored stream sections, trash buildup, and invasive species.
May 2005
TARGET C: Wet Weather Water Quality and Quantity The third target is to restore water quality to meet fishable and swimmable criteria during wet weather and address flooding issues. Improving water quality and flow conditions during and immediately following storms is the most difficult target to meet in the urban environment. The only rational approach to achieve this target must include stepped implementation with interim targets for reducing wet weather pollutant loads and stormwater flows, along with monitoring for the efficacy of control measures.
Initial load reduction targets for parameters such as stormwater flow, metals, total suspended solids, and bacteria were set in conjunction with the stakeholders. Based on preliminary work by PWD, 20% reductions are a challenging but achievable interim target.
Implementation Guidelines All measures or options were thoroughly screened and evaluated using a variety of approaches, including modeling and cost-effectiveness screening. This resulted in the selection of only those options appropriate and deemed effective for the particular conditions found in the Tookany/Tacony-Frankford Creek watershed. The implementation guidelines seek to present the options in such a way that each major stakeholder or responsible party understands what is expected. The guidelines are designed such that, if implementation follows the recommendations, all plan objectives associated with Targets A and B will be fully met, and the interim objectives for Target C will be met or exceeded.
In the plan, options are fully described, and a recommended level of implementation is provided. Where possible, the locations where implementation is expected are also indicated. Implementation guidelines are presented in this executive summary in a series of tables. First, options are grouped by the party responsible for implementation. Second, options are grouped according to their applicability to the implementation targets. Finally, tables of planning level costs are provided.
Recommendations by Responsible Party These summary tables present the recommended actions grouped according to the agency or organization primarily responsible for implementation. Tables E-2 through E-4 present the recommended actions for Philadelphia and Montgomery County, and PADEP.
May 2005
Table E-2 Philadelphia Actions Table
Action Where When
Pet Waste, Litter, and Dumping Ordinances Watershed-wide Short-term Public Education Watershed-wide Short-term School-Based Education All schools Short-term Public Participation and Volunteer Programs Watershed-wide Short-term Inspection and Cleaning of Combined Sewers Watershed-wide Short-term Combined Sewer Rehabilitation Combined-Sewered Areas Medium-term
Stream Cleanup and Maintenance Tookany/Tacony-Frankford Creek within or along City boundary Short-term
Enhancing Stream Corridor Recreational and Cultural Resources Along the stream corridor Medium-term
Bed Stabilization and Habitat Restoration Tookany/Tacony-Frankford Creek high priority areas Short-term
Bank Stabilization and Habitat Restoration Tookany/Tacony-Frankford Creek high priority areas Short-term
Channel Realignment and Relocation Tookany/Tacony-Frankford Creek, high priority areas Short-term
Plunge Pool Removal CSO and stormwater outfalls Short-term Improvement of Fish Passage Medium-term Wetland Creation Riparian corridor Short-term Invasive Species Management Riparian corridor Short-term Reforestation Riparian corridor Short-term Stormwater and Floodplain Management Watershed-wide Short-term Post-Construction Stormwater Runoff Management
Municipalities required to do Phase II permit Short-term
Sanitary Sewer Overflow Detection Separate-Sewered Areas Short-term Sanitary Sewer Overflow Elimination: Structural Measures Separate-Sewered Areas Medium-term
CSO Control Program Philadelphia combined sewer system Short-term
Catch Basin and Storm Inlet Maintenance All inlets Short-term Street Sweeping (Philadelphia Streets Department) Streets and Parking Lots Short-term Responsible Landscaping on Public lands Green space Short-term Responsible Bridge and Roadway Maintenance Roadways and bridges Short-term Increasing Urban Tree Canopy Watershed-wide Medium-term
Green Rooftops Appropriate public buildings chosen by PWD Medium-term
Capturing Roof Runoff in Rain Barrels or Cisterns
Homes where dry wells are not feasible Medium-term
Maintaining/Retrofitting Existing Stormwater Structures Watershed-wide Short-term Retrofitting Existing Sewer Inlets with Dry Wells Inlets in combined-sewered areas Long-term Residential Dry Wells, Seepage Trenches, and Water Gardens
Homes and schools watershed-wide Long-term
Bioretention Basins and Porous Media Filtration Watershed-wide Long-term Treatment Wetlands: Onsite and Regional Riparian corridor Medium-term Monitoring, Reporting, and Further Study Watershed-wide Ongoing
May 2005
E-3 Montgomery County Municipality Actions
Action Where When On-Lot Disposal (Septic System) Management All areas with septic systems Short-term Pet Waste, Litter, and Dumping Ordinances Watershed-wide Short-term
Public Education All Tookany/Tacony-Frankford Creek municipalities Short-term
School-Based Education All schools Short-term
Public Participation and Volunteer Programs All Tookany/Tacony-Frankford Creek municipalities Short-term
Capacity Management Operation and Maintenance Separate-Sewered Areas Short-term Inspection and Cleaning of Sanitary Sewers Separate and Combined Sewered Areas Short-term Sanitary Sewer Rehabilitation Separate-Sewered Areas Medium-term Illicit Discharge, Detection, and Elimination (IDD&E)
All areas with a storm or combined sewer. Short-term
Stream Cleanup and Maintenance Tookany/Tacony-Frankford Creek within or along City boundary Short-term
Enhancing Stream Corridor Recreational and Cultural Resources Along the stream corridor Medium-term
Bed Stabilization and Habitat Restoration Tookany/Tacony-Frankford Creek high priority areas Short-term
Bank Stabilization and Habitat Restoration Tookany/Tacony-Frankford Creek high priority areas Short-term
Channel Realignment and Relocation Tookany/Tacony-Frankford Creek Short-term Plunge Pool Removal CSO and stormwater outfalls Short-term Improvement of Fish Passage Medium-term Wetland Creation Riparian corridor Short-term Invasive Species Management Riparian corridor Short-term Biofiltration Reforestation Riparian corridor Short-term Requiring Better Site Design in Redevelopment Watershed-wide Short-term Stormwater and Floodplain Management Watershed-wide Short-term Post-Construction Stormwater Runoff Management
Municipalities required to do Phase II permit Short-term
Sanitary Sewer Overflow Detection All areas with separate sewers Ongoing program
Reduction of Stormwater Inflow and Infiltration to Sanitary Sewers Separate-Sewered Areas Medium-term
Catch Basin and Storm Inlet Maintenance All inlets Ongoing program
Street Sweeping Streets and Parking Lots Short-term Responsible Landscaping on Public lands Green space Short-term Responsible Bridge and Roadway Maintenance Roadways and bridges Short-term Increasing Urban Tree Canopy Watershed-wide Medium-term Porous Pavement and Subsurface Storage Parking lots watershed-wide Long-term Capturing Roof Runoff in Rain Barrels or Cisterns Homes where dry wells are not feasible Medium-term Maintaining/Retrofitting Existing Stormwater Structures Watershed-wide Short-term Residential Dry Wells, Seepage Trenches, and Water Gardens Homes and schools watershed-wide Long-term Bioretention Basins and Porous Media Filtration Watershed-wide Long-term Treatment Wetlands: Onsite and Regional Riparian corridor Medium-term Monitoring, Reporting, and Further Study Watershed-wide Ongoing
May 2005
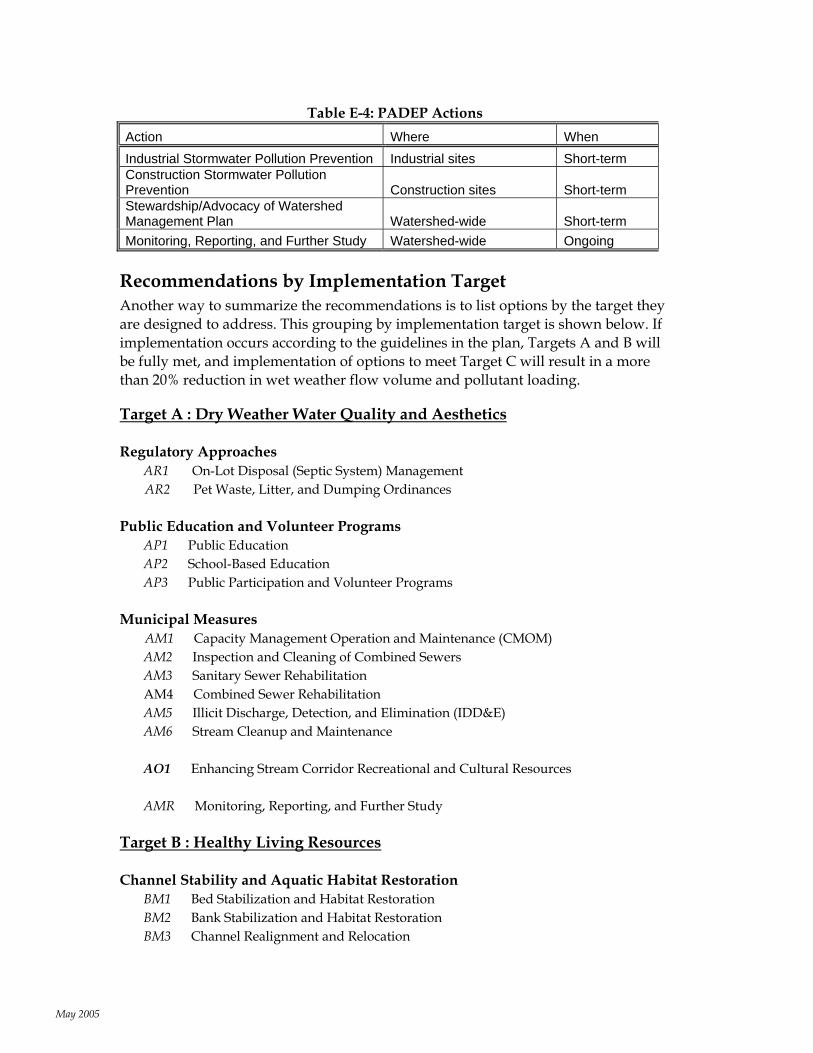
Table E-4: PADEP Actions
Action Where When Industrial Stormwater Pollution Prevention Industrial sites Short-term Construction Stormwater Pollution Prevention Construction sites Short-term Stewardship/Advocacy of Watershed Management Plan Watershed-wide Short-term Monitoring, Reporting, and Further Study Watershed-wide Ongoing
Recommendations by Implementation Target Another way to summarize the recommendations is to list options by the target they are designed to address. This grouping by implementation target is shown below. If implementation occurs according to the guidelines in the plan, Targets A and B will be fully met, and implementation of options to meet Target C will result in a more than 20% reduction in wet weather flow volume and pollutant loading.
Target A : Dry Weather Water Quality and Aesthetics
Regulatory Approaches AR1 On-Lot Disposal (Septic System) Management
AR2 Pet Waste, Litter, and Dumping Ordinances
Public Education and Volunteer Programs AP1 Public Education AP2 School-Based Education AP3 Public Participation and Volunteer Programs
Municipal Measures AM1 Capacity Management Operation and Maintenance (CMOM)
AM2 Inspection and Cleaning of Combined Sewers AM3 Sanitary Sewer Rehabilitation AM4 Combined Sewer Rehabilitation AM5 Illicit Discharge, Detection, and Elimination (IDD&E) AM6 Stream Cleanup and Maintenance AO1 Enhancing Stream Corridor Recreational and Cultural Resources AMR Monitoring, Reporting, and Further Study
Target B : Healthy Living Resources Channel Stability and Aquatic Habitat Restoration
BM1 Bed Stabilization and Habitat Restoration BM2 Bank Stabilization and Habitat Restoration BM3 Channel Realignment and Relocation
May 2005
BM4 Plunge Pool Removal BM5 Improvement of Fish Passage
Lowland Restoration and Enhancement
BM6 Wetland Creation BM7 Invasive Species Management
Upland Restoration and Enhancement
BM8 Biofiltration BM9 Reforestation BMR Monitoring, Reporting and Further Study
Target C : Wet Weather Water Quality and Quantity Regulatory Approaches
Zoning and Land Use Control CR2 Requiring Better Site Design in Redevelopment CR3 Stormwater and Floodplain Management CR4 Industrial Stormwater Pollution Prevention CR5 Construction Stormwater Pollution Prevention CR6 Post-construction Stormwater Runoff Management CR7 Pollution Trading CR8 Use Review and Attainability Analysis CR9 Watershed-Based Permitting
Municipal Measures CM1 Sanitary Sewer Overflow Detection CM2 Sanitary Sewer Overflow Elimination: Structural Measures CM3 Reduction of Stormwater Inflow and Infiltration to Sanitary Sewers CM4 Combined Sewer Overflow (CSO) Control Program
▪ Nine Minimum Controls ▪ Long Term CSO Control Plan ▪ Watershed-Based Planning
CM5 Catch Basin and Storm Inlet Maintenance CM6 Street Sweeping CM7 Responsible Landscaping Practices on Public Lands CM9 Responsible Bridge and Roadway Maintenance
Stormwater Management Source Control Measures
CS2 Increasing Urban Tree Canopy CS3 Porous Pavement and Subsurface Storage CS4 Green Rooftops CS5 Capturing Roof Runoff in Rain Barrels or Cisterns
May 2005

Onsite and Regional Stormwater Control Facilities CS6 Maintaining/Retrofitting Existing Stormwater Structures CS8 Retrofit of Existing Sewer Inlets with Dry Wells CS9 Residential Dry Wells, Seepage Trenches, and Water Gardens CS12 Bioretention Basins and Porous Media Filtration CS13 Treatment Wetlands: Onsite and Regional
CMR Monitoring, Reporting, and Further Study
Planning Level Cost Tables Planning-level costs have been developed for the majority of the options being recommended. Because costs are highly dependent on site specific conditions as well as the extent that implementation occurs, costs are only approximate. These costs are useful, however, in providing order of magnitude funding needs, and also, as a comparison to potential costs associated with more traditional approaches to CSO control, such as large scale storage tanks designed to reach the 85% capture goal.
Planning level costs are provided for each of the options discussed under the three Targets. In many cases, the cost is left blank. This means that costs are not applicable because they are relatively small, or the option would be implemented by existing municipal staff and do not represent an additional cost.
The mix of structural BMPs and implementation percentages in this section are suggested as a feasible plan that will equal or exceed the 20% discharge reduction target. The exact mix of BMPs implemented in each area of the watershed will be determined by local municipalities or by a government or institutional body to be chosen at a later time.
Tables E-5 and E-6 provide costs for implementation to meet Targets A and B. Table E-7 provides costs for measures aimed at meeting Target C. PWD costs are separated from outside agency costs (primarily municipalities) by apportioning costs based on ownership of facilities or simply by the relative areas of the watershed within and outside of Philadelphia City limits. Cost ranges are provided based on the costs associated with the various assumptions used regarding programs and mixes of alternatives. Actual costs are expected to fall within the range, and will depend on the exact mix of options ultimately implemented. “Cost per acre” values are provided in Table E-8 as a simple measure of the way costs are apportioned in the table.
The affordability of the costs associated with this plan was also analyzed. The results of this analysis are presented in Table E-9 for Philadelphia and for the combined suburban communities comprising the remainder of the watershed. For Philadelphia, the affordability calculation indicates that the incremental cost of the
May 2005

May 2005
Tookany/Tacony-Frankford improvements would be approximately $10 per household per year, representing 0.03% of median household income. For the combined suburban communities the cost would be $157 per household per year, representing 0.26% of the weighted median household income for those areas. Both of these values are well within USEPA affordability guidelines, and represent relatively limited increases in the current rates being paid for water, sewer, and stormwater in Philadelphia. These calculations represent incremental costs. The overall impact on affordability would need to be evaluated in the context of all the programs comprising water quality improvement within a given community. For example, residents of Philadelphia will ultimately help pay for management programs in five or more watersheds. Residents of Cheltenham, for example, will only pay for this one program. Because residents of Philadelphia will ultimately pay for improvements in a number of watersheds, the total cost per household in Philadelphia likely will be similar to the cost for households in the suburban communities.
Tables E-10 and E-11 provide data to assist communities outside Philadelphia in placing projected TTFIWMP costs in a local context. Table E-10 expresses estimated costs for communities per acre and per household inside the watershed boundaries; Table E-11 presents costs within the boundaries of all municipalities that intersect the watershed. These cost tables are but one illustration of a possible cost distribution, and are provided to aid municipalities in deciding what funding and institutional mechanisms may be most appropriate given local conditions.
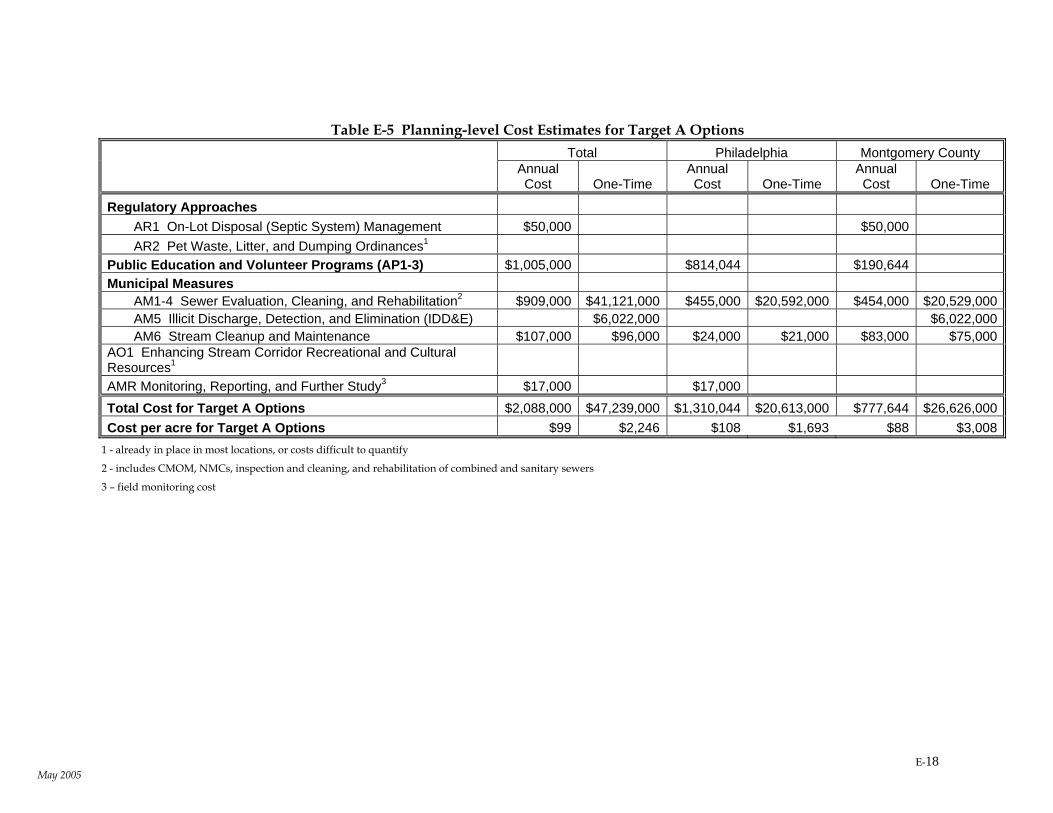
Table E-5 Planning-level Cost Estimates for Target A Options Total Philadelphia Montgomery County
Annual Cost One-Time
Annual Cost One-Time
Annual Cost One-Time
Regulatory Approaches AR1 On-Lot Disposal (Septic System) Management $50,000 $50,000 AR2 Pet Waste, Litter, and Dumping Ordinances1
Public Education and Volunteer Programs (AP1-3) $1,005,000 $814,044 $190,644Municipal Measures
AM1-4 Sewer Evaluation, Cleaning, and Rehabilitation2 $909,000 $41,121,000 $455,000 $20,592,000 $454,000 $20,529,000 AM5 Illicit Discharge, Detection, and Elimination (IDD&E) $6,022,000 $6,022,000 AM6 Stream Cleanup and Maintenance $107,000 $96,000 $24,000 $21,000 $83,000 $75,000
AO1 Enhancing Stream Corridor Recreational and Cultural Resources1 AMR Monitoring, Reporting, and Further Study3 $17,000 $17,000Total Cost for Target A Options $2,088,000 $47,239,000 $1,310,044 $20,613,000 $777,644 $26,626,000 Cost per acre for Target A Options $99 $2,246 $108 $1,693 $88 $3,008
1 - already in place in most locations, or costs difficult to quantify
2 - includes CMOM, NMCs, inspection and cleaning, and rehabilitation of combined and sanitary sewers
3 – field monitoring cost
E-18 May 2005
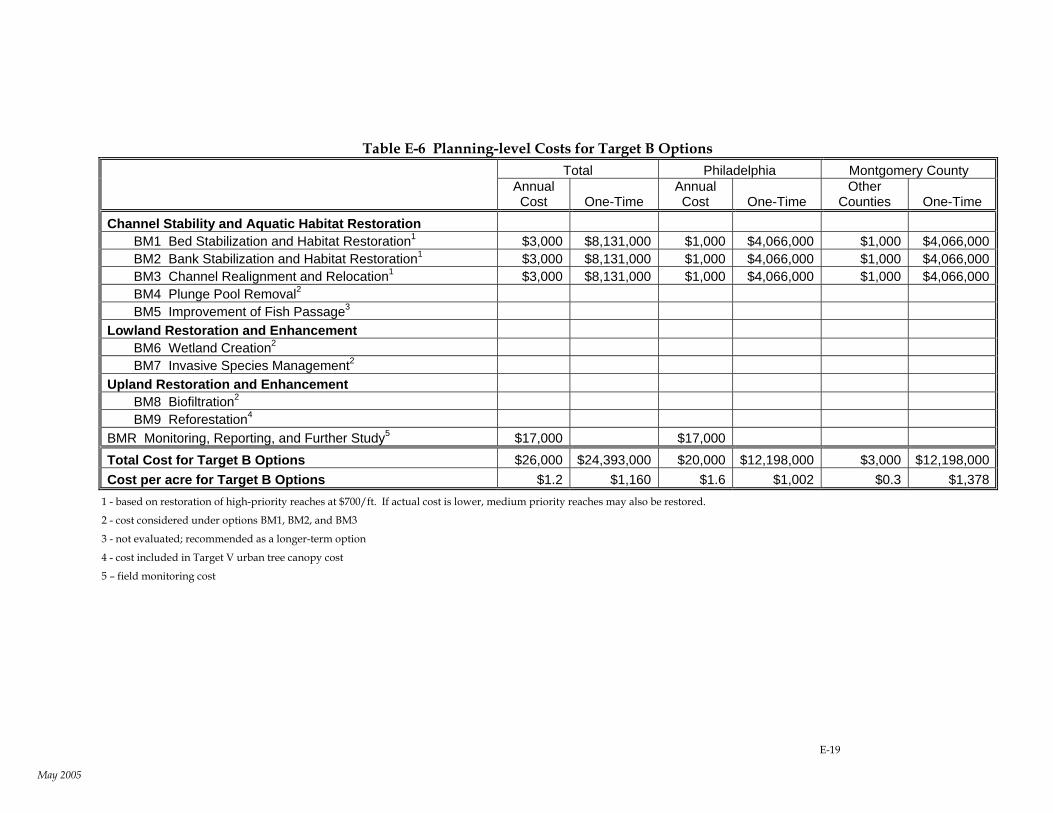
Table E-6 Planning-level Costs for Target B Options
Total Philadelphia Montgomery County
Annual Cost One-Time
Annual Cost One-Time
Other Counties One-Time
Channel Stability and Aquatic Habitat Restoration BM1 Bed Stabilization and Habitat Restoration1 $3,000 $8,131,000 $1,000 $4,066,000 $1,000 $4,066,000 BM2 Bank Stabilization and Habitat Restoration1 $3,000 $8,131,000 $1,000 $4,066,000 $1,000 $4,066,000 BM3 Channel Realignment and Relocation1 $3,000 $8,131,000 $1,000 $4,066,000 $1,000 $4,066,000 BM4 Plunge Pool Removal2 BM5 Improvement of Fish Passage3
Lowland Restoration and Enhancement BM6 Wetland Creation2 BM7 Invasive Species Management2
Upland Restoration and Enhancement BM8 Biofiltration2 BM9 Reforestation4
BMR Monitoring, Reporting, and Further Study5 $17,000 $17,000 Total Cost for Target B Options $26,000 $24,393,000 $20,000 $12,198,000 $3,000 $12,198,000 Cost per acre for Target B Options $1.2 $1,160 $1.6 $1,002 $0.3 $1,378
1 - based on restoration of high-priority reaches at $700/ft. If actual cost is lower, medium priority reaches may also be restored.
2 - cost considered under options BM1, BM2, and BM3
3 - not evaluated; recommended as a longer-term option
4 - cost included in Target V urban tree canopy cost
5 – field monitoring cost
E-19
May 2005
E-20
May 2005
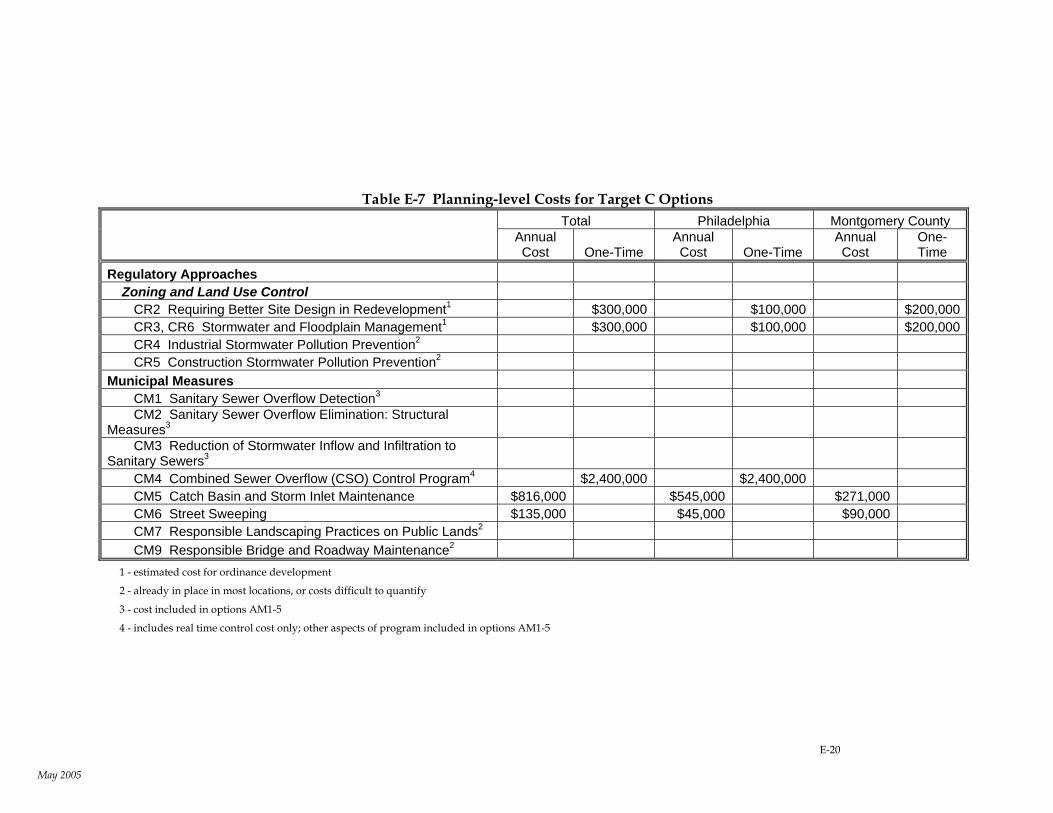
Table E-7 Planning-level Costs for Target C Options Total Philadelphia Montgomery County
Annual Cost One-Time
Annual Cost One-Time
Annual Cost
One-Time
Regulatory Approaches Zoning and Land Use Control
CR2 Requiring Better Site Design in Redevelopment1 $300,000 $100,000 $200,000CR3, CR6 Stormwater and Floodplain Management1 $300,000 $100,000 $200,000CR4 Industrial Stormwater Pollution Prevention2 CR5 Construction Stormwater Pollution Prevention2
Municipal Measures CM1 Sanitary Sewer Overflow Detection3 CM2 Sanitary Sewer Overflow Elimination: Structural
Measures3 CM3 Reduction of Stormwater Inflow and Infiltration to
Sanitary Sewers3 CM4 Combined Sewer Overflow (CSO) Control Program4 $2,400,000 $2,400,000CM5 Catch Basin and Storm Inlet Maintenance $816,000 $545,000 $271,000 CM6 Street Sweeping $135,000 $45,000 $90,000 CM7 Responsible Landscaping Practices on Public Lands2 CM9 Responsible Bridge and Roadway Maintenance2
1 - estimated cost for ordinance development
2 - already in place in most locations, or costs difficult to quantify
3 - cost included in options AM1-5
4 - includes real time control cost only; other aspects of program included in options AM1-5
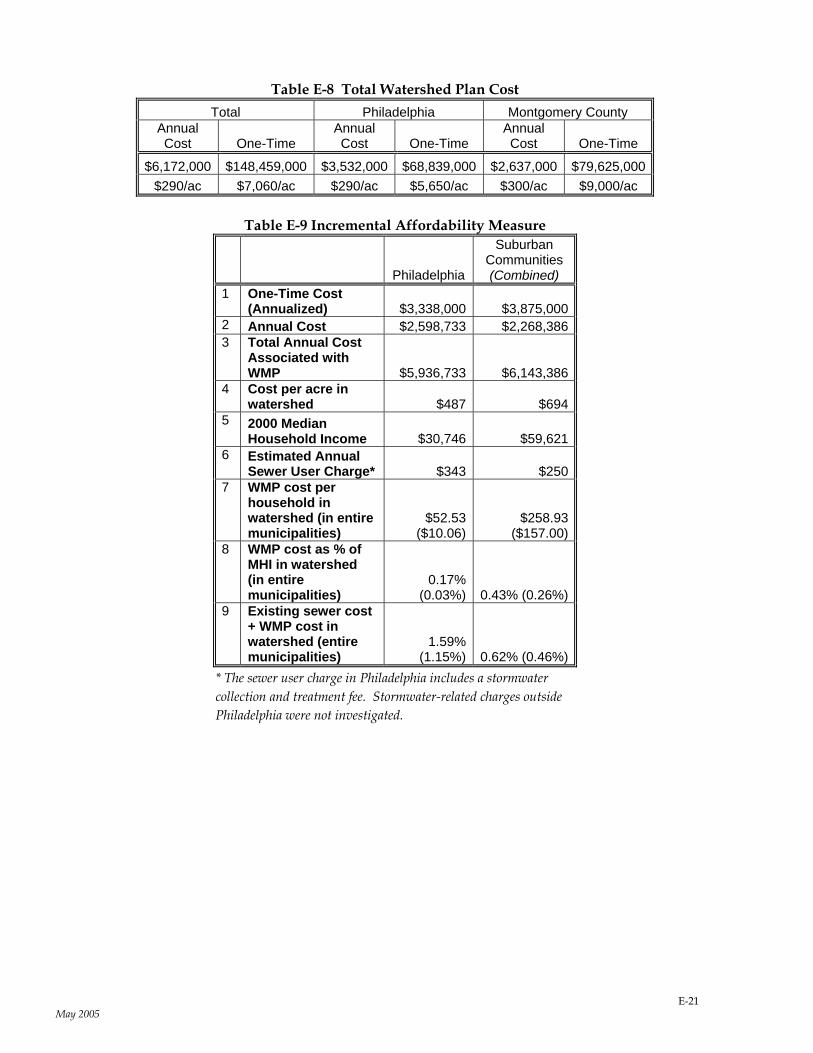
Table E-8 Total Watershed Plan Cost Total Philadelphia Montgomery County
Annual Cost One-Time
Annual Cost One-Time
Annual Cost One-Time
$6,172,000 $148,459,000 $3,532,000 $68,839,000 $2,637,000 $79,625,000 $290/ac $7,060/ac $290/ac $5,650/ac $300/ac $9,000/ac
Table E-9 Incremental Affordability Measure
Philadelphia
Suburban Communities (Combined)
1 One-Time Cost (Annualized) $3,338,000 $3,875,000
2 Annual Cost $2,598,733 $2,268,3863 Total Annual Cost
Associated with WMP $5,936,733 $6,143,386
4 Cost per acre in watershed $487 $694
5 2000 Median Household Income $30,746 $59,621
6 Estimated Annual Sewer User Charge* $343 $250
7 WMP cost per household in watershed (in entire municipalities)
$52.53 ($10.06)
$258.93 ($157.00)
8 WMP cost as % of MHI in watershed (in entire municipalities)
0.17% (0.03%) 0.43% (0.26%)
9 Existing sewer cost + WMP cost in watershed (entire municipalities)
1.59% (1.15%) 0.62% (0.46%)
* The sewer user charge in Philadelphia includes a stormwater collection and treatment fee. Stormwater-related charges outside Philadelphia were not investigated.
E-21 May 2005
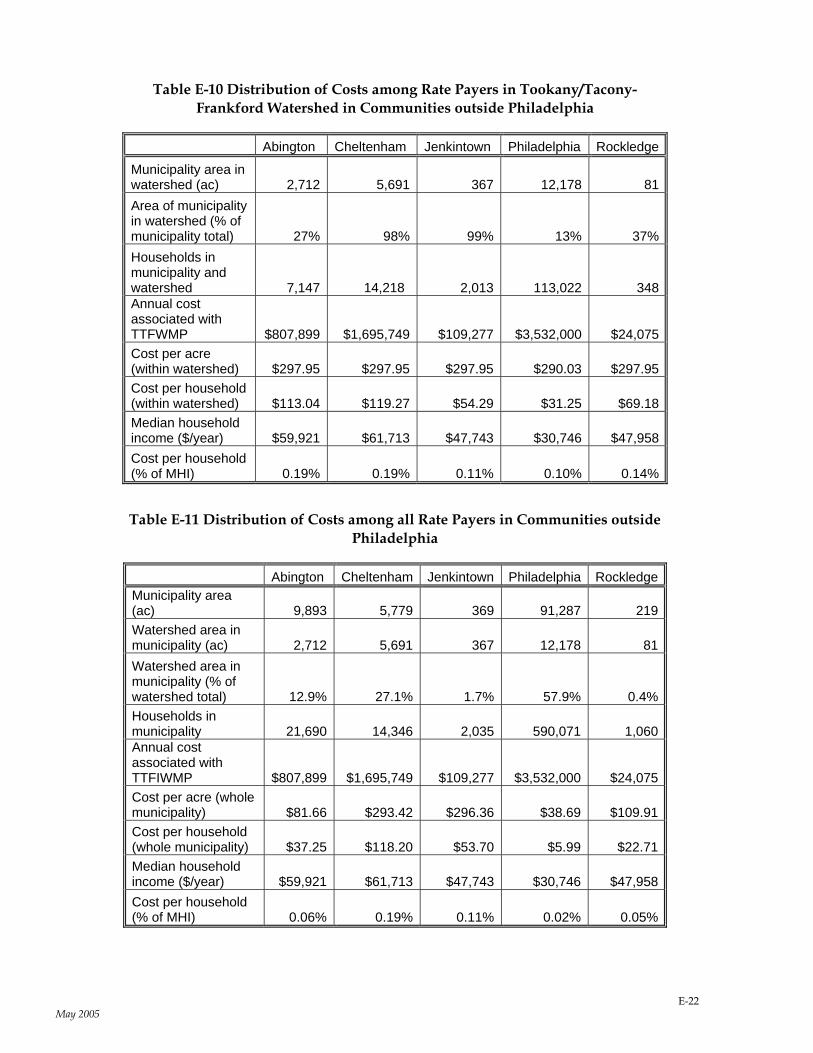
Table E-10 Distribution of Costs among Rate Payers in Tookany/Tacony-Frankford Watershed in Communities outside Philadelphia
Abington Cheltenham Jenkintown Philadelphia Rockledge
Municipality area in watershed (ac) 2,712 5,691 367 12,178 81Area of municipality in watershed (% of municipality total) 27% 98% 99% 13% 37%Households in municipality and watershed
7,147 14,218
2,013
113,022
348
Annual cost associated with TTFWMP $807,899 $1,695,749 $109,277 $3,532,000 $24,075 Cost per acre (within watershed) $297.95 $297.95 $297.95 $290.03 $297.95Cost per household (within watershed) $113.04 $119.27 $54.29 $31.25 $69.18Median household income ($/year) $59,921 $61,713 $47,743 $30,746 $47,958Cost per household (% of MHI) 0.19% 0.19% 0.11% 0.10% 0.14%
Table E-11 Distribution of Costs among all Rate Payers in Communities outside
Philadelphia
Abington Cheltenham Jenkintown Philadelphia RockledgeMunicipality area (ac) 9,893 5,779 369 91,287 219Watershed area in municipality (ac)
2,712 5,691
367
12,178
81
Watershed area in municipality (% of watershed total) 12.9% 27.1% 1.7% 57.9% 0.4%Households in municipality 21,690 14,346 2,035 590,071 1,060Annual cost associated with TTFIWMP $807,899 $1,695,749 $109,277 $3,532,000 $24,075 Cost per acre (whole municipality) $81.66 $293.42 $296.36 $38.69 $109.91Cost per household (whole municipality) $37.25 $118.20 $53.70 $5.99 $22.71Median household income ($/year) $59,921 $61,713 $47,743 $30,746 $47,958Cost per household (% of MHI) 0.06% 0.19% 0.11% 0.02% 0.05%
E-22 May 2005

Tookany/Tacony-Frankford Integrated Watershed Management Plan
Section 1 Background This integrated watershed management plan (IWMP) for the Tookany/Tacony-Frankford watershed is based on a carefully developed approach to meet the challenges of watershed management in an urban setting. It is designed to meet the goals and objectives of numerous, water resources related regulations and programs, and utilizes adaptive management approaches to implement recommendations. Its focus is on attaining priority environmental goals in a phased approach, making use of the consolidated goals of the numerous existing programs that directly or indirectly require watershed planning.
1.1 What is a Watershed and Why a Plan? A watershed is a natural formation including land and communities connected by the drainage area of a water body (Figure 1-1). Simply said, the health of a stream depends on the quality of the land surrounding it, which in turn relies on the people charged with the care for that land. How do we care for an urban watershed? By addressing practices of the past, including paving the land and piping the stormwater, which took place as the area was urbanized. These practices were deemed an important step in development at the time, but they have had a devastating impact on the natural environment. As scientific knowledge and values have changed over time, we have realized that we can have both a vibrant community and healthy natural resources, and that the two can reinforce one another.
Figure 1-1 Tookany/Tacony-Frankford Watershed
May 2005 1-1
Tookany/Tacony-Frankford Integrated Watershed Management Plan
An integrated watershed management plan is a long-term road map designed to achieve these twin goals of a healthy community and healthy natural resources. An integrated plan embraces the laws designed to save our streams, preserves the streams’ ecology, and enhances the parkland and riparian buffers that shelter these streams. The plan also reaches out to include the best of municipal and conservation planning that strives to ensure that growth within the watershed occurs with particular care to the environment. Most importantly, the plan incorporates a diversity of people who live, work, and dream in all areas of the watershed. People provide the catalyst for change, the energy to create the plan, and the vigilance to sustain the plan. These people, the stakeholders, become the watershed’s guardians – the keepers of the integrated plan.
The Tookany/Tacony-Frankford Partnership provides a forum for stakeholders to work together to develop strategies that embrace our dual focus of improving stream water quality as well as the quality of life in our communities. Stakeholders care with their minds, hearts, and hands. Stakeholders include government agencies: regulatory agencies, whose jobs empower them to guard the quality of our rivers and streams; counties and municipalities, separate political entities bound together by nature. Stakeholders include all those groups – nonprofit groups, neighborhood groups, religious groups, and schools - who define themselves as environmental advocates. Finally, stakeholders include concerned citizens who care about the state of their natural environment and their own quality of life.
Stakeholders have come together to discuss visions for the watershed. They shared thoughts of what they would like to see in our streams, parks, and neighborhoods. They are passionate about the possibilities – of revived aquatic and plant life, of streams that flow naturally, of parks that appear lush and inviting, of wetlands, and of meadows and woods that abound with wildlife. Together, we decide that our visions must become a reality.
We discussed our priorities and the actions necessary to make us successful. These actions become our strategy, and they address our desire to improve our water and land environment through a number of avenues. The plan is built upon the foundation of environmental regulations, already in place and providing the impetus for stakeholders to work together to meet watershed goals. The plan’s framework includes a number of elements - innovative land use controls and best management practices, improvements to piping and other conveyance systems, restoration of damaged stream corridors, and education and public awareness. These components, like good building materials, can result in a solid, sustainable structure, a plan that will result in a healthier and greener environment.
Stakeholders are committed to implementing the plan while canvassing for funds to nurture and sustain it, looking to our governments and to stakeholders to contribute the dollars, expertise, and people. We will review our plan on a regular basis to ensure that it remains vital and to measure incremental successes that place us on the path of achieving our long-term goals. We share our plan with the residents of the watershed, show them and teach them how it works, and show how each of them plays a part in its success. We empower them to share our vision of a vital, dynamic watershed.
We look for solutions on the land where rainfall drains to our waterways, in the underground infrastructure that carries rainwater and wastewater away, and in and along our streams where
May 2005 1-2
Tookany/Tacony-Frankford Integrated Watershed Management Plan
natural ecosystems should thrive. As champions of our water resources, we believe this approach benefits not only our water environment, but also the region’s physical, social, and economic environment.
1.2 Brief History of the Tookany/Tacony Frankford Creek Watershed As part of its Rivers Conservation Planning (RCP) program, the Tookany/Tacony-Frankford Watershed Partnership has compiled a brief history of the watershed, including Tookany Creek. Portions of this history are reproduced here exactly as they appear in the RCPs.
Prior to the European settlement in the early 1600s, the area that is now Philadelphia was inhabited by the Lenape Indian tribe. The Lenape people, referred to as Delaware Indians by European Settlers, considered themselves the “original people”. Lee Sultzman, in his History of Delaware, indicates that there was a widespread belief among native peoples that the Lenape were the original tribe of Algonquin speaking peoples to inhabit the area.
The Unami bank of Lenapes, occupied the territory of Pennsylvania and New Jersey from Staten island to just south of Philadelphia. The Unamis were not a politically cohesive group but shared common language and cultural characteristics.
The Lenape people lived in villages and depended on agricultural crops such as squash and corn as their primary source of sustenance. Men of the tribe supplemented the tribe’s diet through hunting and fishing. Tribal government consisted of three sachems or captains that represented the three matrilenal clans that comprised Lenape society. The head chief was always from the Turtle clan, although the position was elected and not strictly hereditary. The other two clans were the Wolf and Turkey clans.
First contact between the Lenape and Europeans (primarily Dutch explorers) occurred in the early 1600s. The Tacony-Frankford Watershed was colonized in the mid seventeenth century by different groups of immigrants. Swedes and Finns traveling up the Delaware River were the first European inhabitants of the Tacony Creek Valley, while Germans fleeing religious persecution settled in the western portion of the watershed in what is now Germantown. In 1664, the land that is southeastern Pennsylvania was surrendered to the English by the Dutch. In 1681, King Charles II of England granted William Penn 40,000 acres of land in the Delaware Valley as repayment for a debt owed to Penn’s father. The entire Tookany/Tacony-Frankford Watershed lies within the area of this land grant. With the establishment of Penn’s colony, English settlers flocked to the region, establishing homesteads, plantations and towns.
The Tacony Creek and surrounding valley was primarily developed as an area of agriculture and milling operations. The Tacony Creek was dammed several times for mills and become a center for industrial operations during the late eighteenth and early nineteenth centuries. Expansion of the city in the late 1800s converted farmland into residential neighborhoods. Active agriculture persisted in the upper watershed until the early 1900s (FPC Vol.2). Land for the Tacony Creek Park was purchased by the city in 1915, while land was being consumed for the need for new housing. The park was added to in 1939, and now occupies 302 acres (FPC Vol.2). High-density housing characterizes the development of the area after the 1940s.
May 2005 1-3

Tookany/Tacony-Frankford Integrated Watershed Management Plan
1.3 Comprehensive Planning and the Regulatory Framework Water Resource Management in Urban Streams In many states, numerous federal and state regulations and programs are aimed at improving the water quality and flow patterns in urban streams, while at the same time reducing flooding. Pennsylvania is no exception; the USEPA and the Pennsylvania Department of Environmental Protection (PADEP) have a complex regulatory framework for managing water resources with frequently overlapping demands and requirements. There are five major regulatory programs that contain significant elements related to watershed management in the Tookany/Tacony-Frankford watershed. These are:
the TMDL process to improve water quality on impaired streams and water bodies;
the Phase I and Phase II stormwater regulations to control pollution due to stormwater discharges from municipal stormwater systems;
PA Act 537 sewage facilities planning to protect and prevent contamination of groundwater and surface water by developing proper sewage disposal plans;
the stormwater management PA Act 167 to address management of stormwater runoff quantity particularly in developing areas; and
EPA’s Combined Sewer Overflow (CSO) Control Policy to minimize mixed sewage and stormwater overflowing directly into streams.
Each of these programs provides guidelines that are transformed into a series of planning objectives within the watershed management planning process, and lead directly to the selection of watershed management options to address those objectives.
Impairment Designations and the TMDL Process Section 303(d) of the Clean Water Act and the USEPA’s Water Quality Planning and Management Regulations (40 CFR Part 130) provide a framework for watershed planning based on Total Maximum Daily Loads. TMDLs are the sum of individual waste load allocations (point sources) and load allocations (non-point sources) plus a margin of safety. They establish a link between water quality standards and water quality based controls. The objective of TMDLs is to allocate allowable loads among different pollutant sources so that the appropriate control actions can be taken and water quality standards achieved.
The basic steps in the water quality based approach to TMDLs include:
Identification of the water quality-limited waters and the quality parameters of concern
Prioritizing the locations by ranking and targeting
Establishing the TMDL
Implementing the control actions
Assessment of the control actions
Pennsylvania has listed water quality-limited waters according to point and non-point sources for toxic, conventional (BOD, TSS, fecal coliform, oil and grease), and non-conventional (ammonia, chlorine, and iron) pollutants. Streams that are listed under Section 303(d) of the
May 2005 1-4
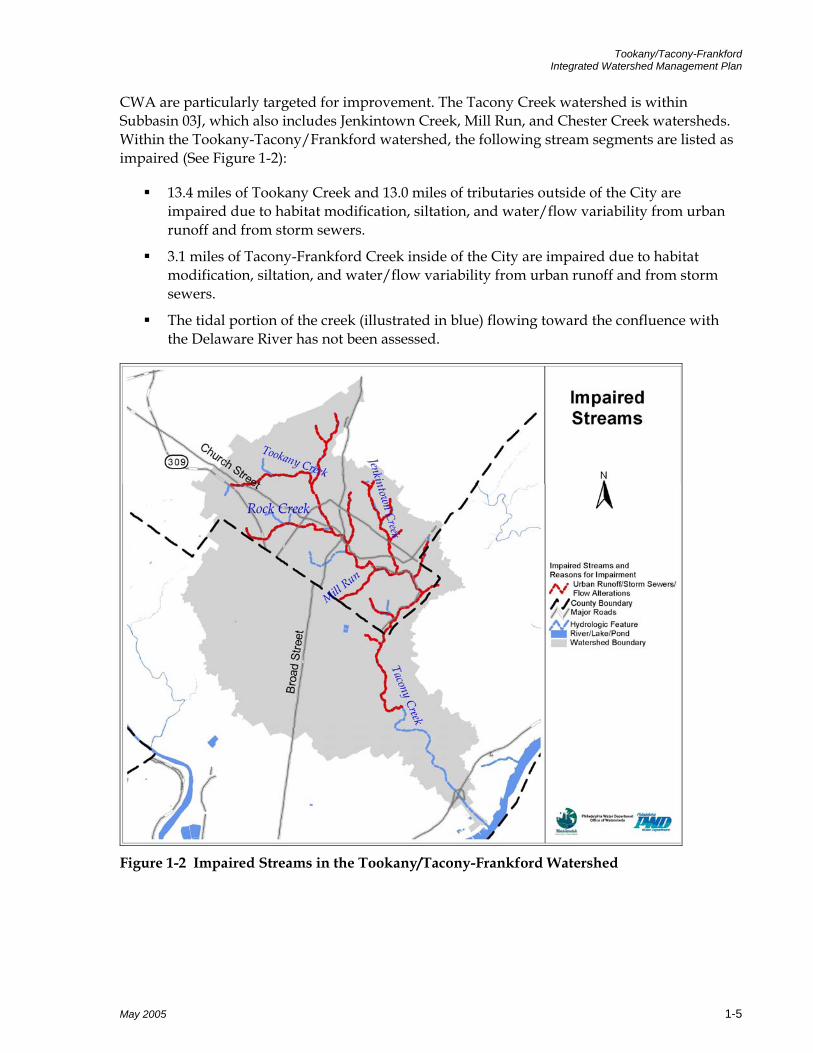
Tookany/Tacony-Frankford Integrated Watershed Management Plan
CWA are particularly targeted for improvement. The Tacony Creek watershed is within Subbasin 03J, which also includes Jenkintown Creek, Mill Run, and Chester Creek watersheds. Within the Tookany-Tacony/Frankford watershed, the following stream segments are listed as impaired (See Figure 1-2):
13.4 miles of Tookany Creek and 13.0 miles of tributaries outside of the City are impaired due to habitat modification, siltation, and water/flow variability from urban runoff and from storm sewers.
3.1 miles of Tacony-Frankford Creek inside of the City are impaired due to habitat modification, siltation, and water/flow variability from urban runoff and from storm sewers.
The tidal portion of the creek (illustrated in blue) flowing toward the confluence with the Delaware River has not been assessed.
Figure 1-2 Impaired Streams in the Tookany/Tacony-Frankford Watershed
May 2005 1-5

Tookany/Tacony-Frankford Integrated Watershed Management Plan
The next step in the statewide TMDL process includes prioritization of the list and the development of TMDLs for high-priority water bodies. It is this phase of the TMDL process that is of interest to the integrated watershed planning process.
Prioritization must take into account the severity of the pollution and the designated uses of the water body. It should consider the following:
Risks pertaining to human health and aquatic life
Degree of public interest and support
Recreational, economic, and aesthetic importance
Vulnerability or fragility of the aquatic habitat
New permit applications for discharges or revisions to existing permits
Court orders and decisions
National policies and priorities
TMDL development requires the quantification of pollutant sources and the allocation of maximum discharge loads to contributing point and non-point sources in order to attain water quality standards. TMDLs are best developed on a watershed basis in order to efficiently and effectively manage the quality of the water. The TMDL process may be developed using a phased approach that includes monitoring requirements and it generally includes the following five activities:
Selection of the pollutants
Evaluation of the water body’s assimilative capacity
Assessment of the pollutants discharged from all sources
Predictive analysis of the water body’s response to pollution and determination of the total allowable pollutant load
Allocation (with a margin of safety) of the allowable pollutant load among the different sources
The National Pollutant Discharge Elimination System’s (NPDES) permitting process is used to implement control measures to limit effluent from point sources. In the case of non-point sources, state and local laws can be used to implement best management practices (BMPs), as well as Section 319 state management programs. These programs must be coordinated in order to effectively achieve the required non-point source reductions.
NPDES Stormwater Rules In response to the 1987 Amendments to the Clean Water Act (CWA), the Environmental Protection Agency (EPA) developed Phase I of the NPDES Stormwater Program in 1990. Phase I required NPDES permits for all stormwater discharging from storm sewers (MS4s) of medium and large urban areas with populations of 100,000 or more. It also required permits from eleven categories of industrial activity, including construction activities that disturb five or more acres of land. Permit coverage can be either under an individually tailored NPDES permit (used by
May 2005 1-6

Tookany/Tacony-Frankford Integrated Watershed Management Plan
MS4s and some industrial facilities) or a general NPDES permit (used by most industrial facilities and construction sites).
Phase II of the NPDES Stormwater Program was published in November 1999. The Phase II Regulation requires NPDES permit coverage - mostly under general permits - for stormwater discharges from most small-urbanized areas (small MS4s) and construction activities that disturb from 1 to 5 acres of land. A list of affected communities has been published in the Federal Register.
There are a minimum of six control measures that communities must implement as part of a municipal stormwater management program whose goal is Phase II compliance. These are:
1. Public Education and Outreach
Distributing educational materials and performing outreach to inform citizens about the impacts polluted stormwater runoff discharges can have on water quality.
2. Public Participation and Involvement
Providing opportunities for citizens to participate in program development and implementation, including effectively publicizing public hearings and/or encouraging citizen representatives to be part of a stormwater management panel.
3. Illicit Discharge Detection and Elimination
Developing and implementing a plan to detect and eliminate illicit discharges to the storm sewer system. Includes the developing of a system map as well as informing the community about hazards associated with illegal discharges and improper waste disposal.
4. Construction Site Runoff Control
Developing, implementing, and enforcing an erosion and sediment control program for construction activities that disturb one or more acres of land (controls could include for example, silt fences and temporary stormwater detention ponds).
5. Post Construction Runoff Control
Developing, implementing, and enforcing a program to address discharges of post-construction stormwater runoff from new development and redevelopment areas. Applicable controls could include preventative actions such as protecting sensitive areas (e.g. wetlands) or the use of structural BMPs such as grassed swales or porous pavement.
6. Pollution Prevention/Good Housekeeping
Developing and implementing a program with the goal of preventing or reducing pollutant runoff from municipal operations. The program must include municipal staff training on pollution prevention measures and techniques (e.g., regular street sweeping, reduction in the use of pesticides or street salt, or frequent catch-basin cleaning).
May 2005 1-7
Tookany/Tacony-Frankford Integrated Watershed Management Plan
The EPA has listed the following municipalities within the Tookany/Tacony-Frankford watershed for inclusion in the Phase II program: Cheltenham Township, Jenkintown Borough, and Rockledge Borough. The permit cycle for these permits started in 2003. Act 167 Stormwater Management Act of 1978 (32 PS § 680.3.) The Stormwater Management Act 167 is administered by PADEP and is designed to address the inadequate management of accelerated stormwater runoff resulting from development. The plan must address a wide range of hydrologic impacts due to development on a watershed basis, and include such considerations as tributary timing, flow volume reduction, base flow augmentation, water quality control, and ecological protection. Watershed runoff modeling is usually a critical component of the study, with modeled hydrologic responses to 2, 5, 10, 25, 50, and 100-year storms.
The primary purposes of the act are to:
Encourage planning and management of stormwater runoff
Authorize a comprehensive program of stormwater management designed to preserve and restore the flood carrying capacity of Commonwealth streams;
Preserve natural stormwater runoff regimes
Protect and conserve groundwater
The act requires that each county--in consultation with affected municipalities --prepare and adopt a stormwater management plan for each watershed that falls wholly or partially within the county. The act focuses on reduction of stormwater runoff quantities, rather than on water quality. Each stormwater plan will include, but is not limited to:
A survey of existing runoff characteristics in small as well as large storms, including the impact of soils, slopes, vegetation and existing development;
A survey of existing significant obstructions and their capacities;
An assessment of projected and alternative land development patterns in the watershed, and the potential impact of runoff quantity, velocity, and quality;
An analysis of present and projected development in flood hazard areas, and its sensitivity to damages from future flooding or increased runoff;
A survey of existing drainage problems and proposed solutions;
A review of existing and proposed stormwater collection systems and their impacts;
An assessment of alternative runoff control techniques and their efficiency in the particular watershed;
An identification of existing and proposed state, federal, and local flood control projects located in the watershed and their design capacities;
May 2005 1-8

Tookany/Tacony-Frankford Integrated Watershed Management Plan
A designation of those areas to be served by stormwater collection and control facilities within a ten-year period;
An estimate of the design capacity and costs of such facilities;
A schedule and proposed methods for financing the development, construction and operation of the facilities;
An identification of the existing or proposed institutional arrangements to implement and operate the facilities;
An identification of floodplains within the watershed;
Standards for the control of stormwater runoff from existing and new development which are necessary to minimize dangers to property and life;
Priorities for implementation of action within each plan; and
Provisions for periodically reviewing, revising and updating the plan.
After adoption and approval of a stormwater plan, the location, design, and construction within the watershed of stormwater management systems, flood control projects, subdivisions and major land developments, highways, and transportation facilities must all be conducted in a manner consistent with the approved plan.
An Act 167 Plan is presently under preparation for the Tookany/Tacony-Frankford Creek watershed by Cheltenham Township with assistance from Philadelphia and Montgomery Counties.
Act 537 Sewage Facilities Planning Act 537, enacted by the Pennsylvania Legislature in 1966, requires that every municipality in the state develops and maintains an up-to-date sewage facilities plan. The act requires proper planning of all types of sewage facilities, permitting of individual and community on-lot disposal systems, and uniform standards of design.
The main purpose of a municipality’s sewage facilities plan is to correct existing sewage disposal problems including malfunctioning on-lot septic systems, overloaded treatment plants or sewer lines, and improper sewer connections. The program is also designed to prevent future sewer problems and to protect the groundwater and surface water of the locality. To meet these objectives, PADEP uses the Official Sewage Planning requirements of Act 537 that prevent and eliminate pollution of the waters of the Commonwealth by coordinating planning for the sanitary disposal of sewage with a comprehensive program of water quality management.
Official plans contain comprehensive information, including:
Planning objectives and needs
Physical description of planning area
Evaluation of existing wastewater treatment and conveyance systems
Evaluation of wastewater treatment needs
May 2005 1-9

Tookany/Tacony-Frankford Integrated Watershed Management Plan
Presently, all of the municipalities in the watershed have an Act 537 Plan, a plan that provides for the resolution of existing sewage disposal problems, future sewage disposal needs of new land development and future sewage disposal needs of the municipality. Abington Township’s Act 537 Plan is less than 5 years old and Philadelphia’s is between 5-10 years old. However, some plans are older than 20 years: Cheltenham, Rockledge, and Jenkintown boroughs. Also, the Act 537 plans vary in the levels of detail. Combined Sewer Overflow (CSO) Control Policy EPA's CSO Control Policy, published in 1994, provides the national framework for regulation of CSOs under NPDES. The policy guides municipalities and state and federal permitting agencies in meeting the pollution control goals of the CWA in as flexible and cost-effective a manner as possible. As part of the program, communities serviced by combined sewer systems are required to develop long-term CSO control plans (LTCPs) that will result in full compliance with the CWA, including attainment of water quality standards.
As the first step under the CSO policy, nine minimum technology-based controls are required; these are measures that can reduce the prevalence and impacts of CSOs and that are not expected to require significant engineering studies or major construction.
Proper operation and regular maintenance programs for the sewer system and the CSOs;
Maximum use of the collection system for storage;
Review and modification of pretreatment requirements to assure CSO impacts are minimized;
Maximization of flow to the publicly owned treatment works for treatment;
Prohibition of CSOs during dry weather;
Control of solid and floatable materials in CSOs;
Pollution prevention;
Public notification to ensure that the public receives adequate notification of CSO occurrences and CSO impacts; and
Monitoring to effectively characterize CSO impacts and the efficacy of CSO controls.
In the longer term, the CSO policy includes four requirements to ensure that the CSO systems meet the pollution control goals and local environmental objectives in a cost-effective manner:
Clear levels of control to meet health and environmental objectives;
Flexibility to consider the site-specific nature of CSOs and find the most cost-effective way to control them;
Phased implementation of CSO controls to accommodate a community's financial capability; and
Review and revision of water quality standards during the development of CSO control plans to reflect the site-specific wet weather impacts of CSOs.
May 2005 1-10

Tookany/Tacony-Frankford Integrated Watershed Management Plan
One of the three major components of the City of Philadelphia’s CSO Long Term Control Plan (LTCP) strategy involves a substantial commitment by the City to watershed planning to identify long term improvements throughout its watersheds, including any necessary additional CSO controls, which will result in further improvements in water quality and, ultimately, the attainment of water quality standards. The need for this watershed initiative is rooted in the fact that insufficient physical, chemical and biological information currently exist on the nature and causes of water quality impairments, sources of pollution, and appropriate remedial measures. Because of this deficiency, at the time the CSO LTCP was developed, it was impossible to determine what needed to be done for additional CSO control or control of other wet weather sources throughout the watershed. This deficiency, especially with respect to the effects of wet weather discharges and receiving water dynamics, was increasingly recognized nationwide and led to a broader recognition of the need for watershed-based planning and management to properly define water quality standards and goals. The PWD suggested in its LTCP that the National CSO Policy, state and federal permitting and water quality management authorities, cities, environmental groups, and industry, recognized that effective long-term water quality management could be accomplished only through watershed-based planning.
The CSO Control Policy acknowledges the importance of watershed planning in the long term control of CSOs by encouraging the permit writer “... to evaluate water pollution control needs on a watershed management basis and coordinate CSO control efforts with other point and nonpoint source control activities” (1.B). The watershed approach is also discussed in the section of the CSO Control Policy addressing the demonstration approach to CSO control (II.B.4.b; and Chapter 3 of the USEPA Guidance for Long Term Control Planning), which, in recommending that NPDES permitting authorities allow a demonstration of attainment of WQS, provides for consideration of natural background conditions and pollution sources other than CSOs.
The EPA Long Term Control Planning Guidance suggests that EPA is committed to supporting the implementation of a comprehensive watershed management approach. EPA has convened a Watershed Management Policy Committee, consisting of senior managers, to oversee the reorientation of all EPA water programs to support watershed approaches.
Of particular importance to CSO control planning and management is the NPDES Watershed Strategy. This strategy outlines national objectives and implementation activities to integrate the NPDES program into the broader watershed protection approach. The Strategy also supports the development of basin management as part of an overall watershed management approach
The Long Term Control Planning Guidance suggests that the sources of watershed pollution and impairment, in addition to CSOs, are varied and include other point source discharges; discharges from storm drains; overland runoff; habitat destruction; land use activities, such as agriculture and construction; erosion; and septic systems and landfills. The benefits to implementing a watershed approach are significant and include:
Consideration of all important sources of pollution or impairment
Closer ties to receiving water benefits
May 2005 1-11
Tookany/Tacony-Frankford Integrated Watershed Management Plan
Greater flexibility
Greater cost effectiveness (through coordination of monitoring programs, for example)
Fostering of prevention as well as control
Fairer allocation of resources and responsibilities.
The Guidance notes that the major advantage in using a watershed-based approach to develop an LTCP is that it allows the site-specific determination of the relative impacts of CSOs and non-CSO sources of pollution on water quality. For some receiving water reaches within a watershed, CSOs could well be less significant contributors to nonattainment than stormwater or upstream sources. In such cases, a large expenditure on CSO control could result in negligible improvement in water quality.
The EPA LTCP Guidance outlines a conceptual framework for conducting CSO planning in a watershed context (Figure 1-3). The approach is intended to identify CSO controls for each receiving water segment based on the concepts of watershed management and use attainability. The Tookany/Tacony-Frankford watershed planning approach outlined in this document is conceptually identical. It moved from data collection through analysis and modeling to arrive at a set of recommended measures or options designed to meet the goals and objectives agreed upon through the stakeholder process. Figure 1-3 also identifies the section of the Watershed Management Plan that documents each step in the process.
May 2005 1-12
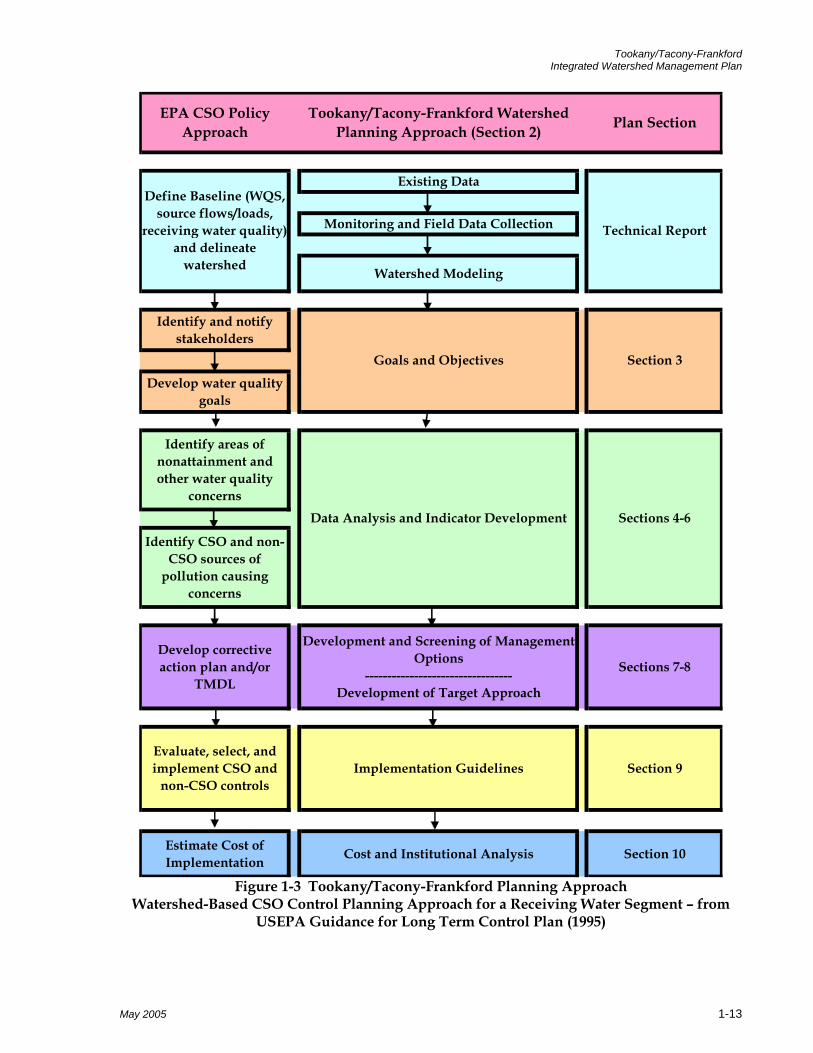
Tookany/Tacony-Frankford Integrated Watershed Management Plan
EPA CSO Policy Approach
Tookany/Tacony-Frankford Watershed Planning Approach (Section 2) Plan Section
Existing Data
Monitoring and Field Data Collection
Watershed Modeling
Identify and notify stakeholders
Develop water quality goals
Identify areas of nonattainment and other water quality
concerns
Identify CSO and non-CSO sources of
pollution causing concerns
Develop corrective action plan and/or
TMDL
Development and Screening of Management Options
--------------------------------- Development of Target Approach
Sections 7-8
Evaluate, select, and implement CSO and
non-CSO controlsImplementation Guidelines Section 9
Estimate Cost of Implementation Cost and Institutional Analysis Section 10
Data Analysis and Indicator Development Sections 4-6
Define Baseline (WQS, source flows/loads,
receiving water quality)and delineate
watershed
Technical Report
Goals and Objectives Section 3
Figure 1-3 Tookany/Tacony-Frankford Planning Approach
Watershed-Based CSO Control Planning Approach for a Receiving Water Segment – from USEPA Guidance for Long Term Control Plan (1995)
May 2005 1-13
Tookany/Tacony-Frankford Integrated Watershed Management Plan
1.4 Overlapping Aspects of Regulatory Programs Integrated watershed planning includes various tasks, ranging from monitoring and resource assessment to technology evaluation and public participation. The scope and importance of each task varies for each watershed, depending on the site-specific factors such as the environmental features of the watershed, regulatory factors such as the need to revise permits or complete TMDLs, available funding, extent of previous work, land use, and the size and degree of urbanization of watershed.
There are numerous activities required under each of the five programs mentioned above. Table 1-1 gives an overview of the types of activities required under each program, and Table 1-2 gives an overview of the types of data needed for each activity. Both tables highlight the fact that the task completed or the data collected under one program is often identical or very similar to the work done under other programs. It is clear that significant savings can be achieved through coordination of the programs and the development of one comprehensive plan for a watershed that meets all five program needs.
May 2005 1-14

Tookany/Tacony-Frankford Integrated Watershed Management Plan
Table 1-1 Overview of Planning Tasks Required by Watershed Programs
Planning Tasks Act 167 Stormwater
Act 537 Sewage Facilities
TMDL Program
NPDES Stormwater
CSO Program RCP
Preliminary Reconnaissance Survey Existing data collection and assessment X X X X X X Preliminary water quality assessment X X X X Present/Future Land use and resource mapping X X X X X Inventory of point and non-point sources X X X X Definition of regulatory issues and requirements X X Preliminary biological habitat assessment X X X Preliminary problem assessment X X X X X Public Involvement X X X X X X Individual Watershed Plan Survey of runoff characteristics for storm events X X X Survey of drainage problems, flood plains, drainage structures X X X Mapping of point sources, sewer system X X X X Monitoring, sampling, and bioassessment X X QA/QC and data evaluation X X X X X X Sewer system modeling X X Watershed Modeling X X X Water body Modeling X X Problem Definition and goal setting X X X X X X Identification and evaluation of runoff, flood control measures X X Identification of Combined Sewer Overflow X X Identification and evaluation of pollution control measures X X X X Economic assessment and funding requirements X X X X X X Public Involvement X X X X X X Development of a Watershed Management Plan X X X X X X* *Note: An RCP includes some but not all elements of a comprehensive watershed management plan.
May 2005 1-15

Tookany/Tacony-Frankford Integrated Watershed Management Plan
Table 1-2 Overview of Data Collection Required by Watershed Programs
Data collection Act 167 Stormwater
Act 537 Sewage Facilities
TMDL Program
NPDES Stormwater
CSO Program RCP
Geographic Data (Political, Transportation, Topographic, Hydrographic, Land Use, etc.)
X X X X X X
Economic and Demographic X X X X Meteorological X X X X X Hydrologic Characteristics X X X X X X Designated uses and impaired water bodies X X X X
Water Quality X X X X X Biological and Habitat assessment X X X X Floodplains and flooding issues X X Point Sources /Potential sources X X X X X Non-point sources of pollution X X X Sewer system performance and CSO X X X X X Storm drainage system X X X Historical and cultural resources X X
Watershed-based planning is now the preferred approach on both the federal and state level. General water quality and water quantity goals have been established at a state level, and the next step is to develop specific goals for each watershed. Table 1-3 shows the watershed planning goals for Tookany/Tacony-Frankford Creeks and how they correspond to many of the overlapping goals of the five major regulatory programs.
May 2005 1-16
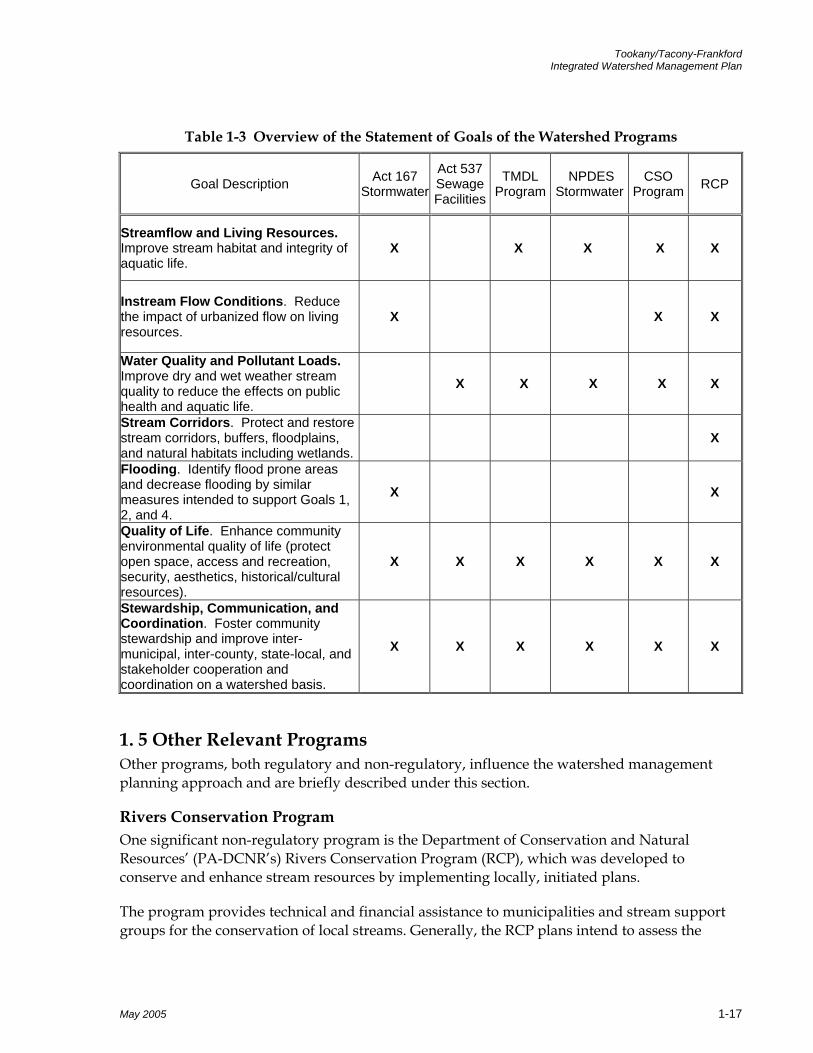
Tookany/Tacony-Frankford Integrated Watershed Management Plan
Table 1-3 Overview of the Statement of Goals of the Watershed Programs
Goal Description Act 167 Stormwater
Act 537 Sewage Facilities
TMDL Program
NPDES Stormwater
CSO Program RCP
Streamflow and Living Resources. Improve stream habitat and integrity of aquatic life.
X X X X X
Instream Flow Conditions. Reduce the impact of urbanized flow on living resources.
X X X
Water Quality and Pollutant Loads. Improve dry and wet weather stream quality to reduce the effects on public health and aquatic life.
X X X X X
Stream Corridors. Protect and restore stream corridors, buffers, floodplains, and natural habitats including wetlands.
X
Flooding. Identify flood prone areas and decrease flooding by similar measures intended to support Goals 1, 2, and 4.
X X
Quality of Life. Enhance community environmental quality of life (protect open space, access and recreation, security, aesthetics, historical/cultural resources).
X X X X X X
Stewardship, Communication, and Coordination. Foster community stewardship and improve inter-municipal, inter-county, state-local, and stakeholder cooperation and coordination on a watershed basis.
X X X X X X
1. 5 Other Relevant Programs Other programs, both regulatory and non-regulatory, influence the watershed management planning approach and are briefly described under this section.
Rivers Conservation Program One significant non-regulatory program is the Department of Conservation and Natural Resources’ (PA-DCNR’s) Rivers Conservation Program (RCP), which was developed to conserve and enhance stream resources by implementing locally, initiated plans.
The program provides technical and financial assistance to municipalities and stream support groups for the conservation of local streams. Generally, the RCP plans intend to assess the
May 2005 1-17

Tookany/Tacony-Frankford Integrated Watershed Management Plan
river’s resources, identify potential threats, and recommend restoration/maintenance options. It involves the statement of goals to be accomplished and the listing of recommendations for the development and implementation of the plan.
The goals and recommendations from an RCP can be an important building block for a comprehensive watershed management plan (WMP). The programs are similar in structure and approach; they have the same geographic scope, require overlapping data collection, and involve the statement of goals and listing of recommendations. However, the RCP is narrower in scope than the WMP and focuses more on quality of life along the stream corridor rather than on regulatory compliance. The RCP for the Tookany Watershed was completed October 2003 by Abington Township, Cheltenham Township, Jenkintown Borough, and Rockledge Borough. The Tookany/Tacony-Frankford Watershed Partnership completed the Tacony-Frankford RCP in February 2004. The goals and objectives from the RCPs are incorporated into this integrated watershed plan.
Summary of Other Programs Other relevant programs that have been incorporated or that may affect the watershed management program are listed on Table 1-4.
Table 1-4 Other Programs that may Influence the Watershed Implementation Plan Sanitary Sewer Overflow (SSO) Policy Requires revisions to the NPDES permit regulations to improve the operation of municipal sanitary sewer collection systems, eliminate the occurrence of sewer overflows, and provide more effective public notification when overflows do occur. PADEP On-Lot Sewage Disposal Regulations Require local agencies to administer a permitting program for the installation of on-lot sewage disposal systems. PENNVEST State Revolving Fund Program Provides funding for sewer, stormwater, and water projects throughout the Commonwealth. Delaware River Basin Commission (DRBC) Programs Regulate both groundwater and surface water use for withdrawals greater than 100,000 gpd based on average 30-day use in a large portion of the study area, which drains to the Delaware River Delaware Valley Regional Planning Commission (DVRPC) Programs Address transportation, land use, and environmental protection issues in addition to economic development. Also provide services in planning analysis, data collection, and mapping. PADEP Greenways Program An Action Plan for Creating Connections is designed to provide a coordinated and strategic approach to creating connections through the establishment of greenways in the State. CWA Section 104(b)(3) Program Promotes the coordination and acceleration of research, investigations, experiments, training, demonstrations, surveys, and studies relating to the causes, effects, extent, prevention, reduction and elimination of pollution. CWA Section 208 Wastewater Planning Intended to encourage and facilitate the development and implementation of area-wide waste treatment management plans. CWA Section 319(b) Non-point Source Management Program Designed to address mine drainage, agricultural runoff, construction/urban runoff, hydrologic and habitat modifications, on-lot wastewater systems, and silviculture.
May 2005 1-18
Tookany/Tacony-Frankford Integrated Watershed Management Plan
1. 6 Regulatory Agency and Stakeholder Partnerships In 2000, PWD acted as the municipal sponsor of the Tookany/Tacony-Frankford Watershed Partnership, an exciting and groundbreaking effort to connect residents, businesses and government as neighbors and stewards of the watershed. PWD hired the Pennsylvania Environmental Council (PEC), a well-respected, non-profit institution with a reputation for supporting watershed-based, holistic planning in the form of smart growth planning. PEC pulled together a diverse representation of the watershed – municipalities, “friends” groups, educators, citizens, agencies, and watershed organizations – for the first partnership meeting.
Meetings during the first year were devoted to general education about watershed concepts, about soliciting the visions and concerns of participants as they related to their communities’ environmental health and to the creation of three subcommittees to assist in managing the groundwork required for foundation of a watershed management plan.
A steering committee was recruited, representing municipalities that already had some form of watershed planning under way, to develop the road map and timeline for the tackling of a watershed management plan. The steering committee assisted with the selection of topics to be covered, reviewed the technical data and suggested public education/outreach tasks, and helped select the plan’s goals and objectives.
The technical committee was open to all members of the partnership; ultimately, participants consisted mainly of local, state, and federal government agencies. This committee reviewed the technical documents produced by PWD, including a watershed reconnaissance of past and existing water quality studies, a current water quality sampling and modeling report, a sediment pollutant loading report, and a bioassessment summary. This technical data is essential for justifying and prioritizing the goals and objectives of the watershed management plan.
The public participation committee, also open to all partnership members, largely consists of watershed organizations, educators, residents, and educational non-profits. The committee established a number of projects to raise general awareness about watershed issues and to recruit further partnership membership. Projects included: a watershed wide survey, press conferences, a state of the watershed report, teacher training workshops, and the development of a watershed video.
The partnership selected and prioritized the goals and objectives of the watershed management plan. Their role will continue as the recommendations of the plan are implemented in the coming years.
May 2005 1-19
Tookany/Tacony-Frankford Integrated Watershed Management Plan
Section 3 Goals and Objectives Developing a focused and prioritized list of goals (general) and objectives (specific, measurable) is critical to a successful planning process. Goals and objectives need to be:
initially developed by stakeholders and regulatory agencies,
analyzed and informed by the watershed data collection, analysis, and modeling carried out by the project team
finalized by the project team and stakeholders
prioritized by the stakeholders
3.1 Stakeholder Goal Setting Process Considerable stakeholder input towards developing watershed goals was sought from the beginning of this planning effort. Responses were summarized, and additional stakeholder input organized through further contacts with the stakeholders. The mission statement for the Tookany/Tacony-Frankford planning effort, as well as related goals from other programs was developed by the stakeholders and is listed here.
Tookany/Tacony-Frankford Partnership Mission Statement To improve the environmental health and safe enjoyment of the Tookany/Tacony Frankford watershed by sharing resources through cooperation of the residents and other stakeholders in the watershed. The goals of the initiative are to protect, enhance, and restore the beneficial uses of the Tookany/Tacony-Frankford waterways and riparian areas. Watershed management seeks to mitigate the adverse physical, biological, and chemical impacts of land uses as surface and groundwater are transported throughout the watershed to the waterways. The partnership seeks to achieve higher levels of environmental improvement by sharing information and resources.
Goals of Related Studies and Programs Other studies already have provided a list of goals. Generally the goals in this section are those identified through the river conservation planning process, supplemented by those goals that are required as a result of various environmental regulatory requirements. Additional goals identified in the Tookany/Tacony-Frankford stakeholder meetings also were included once consensus was established. Existing goals included:
Aquatic life designated use attainment goal (warm water fishery)
Public health: contact recreation (bacteria, noxious plants)
Aesthetics: visual and olfactory conditions (noxious plants, bank erosion, litter, odor, etc.)
Riparian corridors
May 2005 3-1

Tookany/Tacony-Frankford Integrated Watershed Management Plan
Wetlands, woodlands & meadows
Wildlife
Act 167 plan goals
Act 537 goals
TMDL-related goals
NPDES program goals (including stormwater management and CSO control)
Environmental Futures Program goals
River Conservation Plan goals
3.2 Consolidated Watershed Planning Goals and Objectives The large list of goals from the existing stakeholder process needed to be organized. This was accomplished by consolidating goals from various sources into a coherent set for the integrated plan. Other considerations included stakeholders’ desire to restore the living resources, and the steering committee preference for achieving goals through innovative, land-based, low-impact, and cost-effective management options. Consensus was reached eventually around the following seven goals. Under each goal, more specific objectives are listed.
1. Stream Habitat and Living Resources. Improve stream habitat and integrity of aquatic life. 1.1. Improve quantitative measures of fishery health. 1.2. Improve quantitative measures of benthic invertebrate quality. 1.3. Adapt or develop quantitative measures of attached algae to assess current stream conditions. 1.4. Improve migratory fish passage. 1.5. Increase miles of stable stream banks and stream channels by reducing deposition & scour.
2. Instream Flow Conditions. Reduce the impact of urbanized flow on living resources.
2.1. Increase baseflow as a percentage of total flow. 2.2. Increase groundwater recharge. 2.3. Prevent increases in the stormwater flow peaks in future development/redevelopment areas. 2.4. Reduce directly connected impervious cover in developed and new development areas. 2.5. Revise municipal codes to encourage new development and redevelopment using responsible stormwater management techniques. 2.6. Reduce the frequency of occurrence of bankfull flow.
3. Water Quality and Pollutant Loads. Improve dry and wet weather stream quality to reduce the effects on public health and aquatic life.
3.1. Develop a phased approach to meeting appropriate water quality criteria in dry weather and wet weather.
May 2005 3-2
Tookany/Tacony-Frankford Integrated Watershed Management Plan
3.2. Work with regulatory agencies to re-evaluate designated uses. 3.3. Prevent fish consumption advisories. 3.4. Decrease loads of targeted water quality parameters from stormwater. 3.5. Identify and eliminate SSOs and storm sewer cross-connections. 3.6. Minimize CSO volume and frequency. 3.7. Decrease inputs of floatables, debris, and litter from all sources. 3.8. Increase I/I studies, sewer cleanings and inspections. 3.9. Eliminate septic tank failures
4. Stream Corridors. Protect and restore stream corridors, buffers, floodplains, and natural habitats including wetlands.
4.1. Maximize open space and habitat by responsibly managing new development and redevelopment of existing, vacant, and abandoned lands. 4.2. Inventory and protect existing wetlands. 4.3. Identify and pursue opportunities for wetland enhancement and wetland creation for stormwater treatment. 4.4. Improve floodplain conditions through restoration or improvement of the connections between streams and their floodplains. 4.5. Protect and restore riparian and upland habitats along stream corridors with native species.
5. Flooding. Identify flood prone areas and decrease flooding by similar measures intended to support Goals 1, 2, and 4.
5.1. Reduce the effects and frequency of out-of-bank flooding through management of stormwater. 5.2. Remediate stream-related flooding in known problem areas without increasing the problem in other areas. 5.3. Increase regular storm drain maintenance and cleaning programs throughout the watershed. 5.4. Incorporate sound floodplain management principles in flood planning. 5.5. Minimize the effects of structural floodway and stream encroachments with regard to sediment load and natural streamflow.
6. Quality of Life. Enhance community environmental quality of life.
6.1. Increase community green and open space. 6.2. Increase community access and recreational activities in city parks and streams (e.g., by increasing miles of greenways and trails along stream corridors). 6.3. Increase the public sense of security along stream corridors (e.g., by increased police presence, lighting, signage, park maintenance). 6.4. Improve and protect aesthetics along stream corridors (e.g., by litter/graffiti removal, enforcement against illegal practices such as dumping, controls on ATV use). 6.5. Identify and protect historical and cultural resources along stream corridors.
7. Stewardship, Communication, and Coordination. Foster community stewardship and improve inter-municipal, inter-county, state-local, and stakeholder cooperation and coordination on a watershed basis.
7.1. Increase public awareness of the value of streams to the community.
May 2005 3-3
Tookany/Tacony-Frankford Integrated Watershed Management Plan
7.2. Improve public, business, and institutional awareness of and accountability for activities that affect water quality. 7.3. Encourage and support establishment of watershed organizations, EACs, etc. to bear the watershed banner. 7.4. Engage local officials and planners. 7.5. Increase volunteer participation in implementing management options. 7.6. Increase school-based education.
3.3 Goals Prioritization The goals and objectives represent the collective idea of the stakeholders on what the watershed management plan should achieve. Not all goals, however, are of equal importance. It is important to elicit from the stakeholders a collective opinion on the relative importance of each goal for the Tookany/Tacony-Frankford Creeks. Because the achievement of goals is an important yardstick for measuring the effectiveness of the management plan, some numerical representation of the importance of each goal is useful.
To develop a set of numerical weights that represent the importance of each goal relative to the other goals, a workshop was held on May 21st, 2003, with members of the partnership participating. The goal of the workshop was to work towards a consensus on a numerical set of weights that best represent the collective opinion on the importance of each goal. Each participant filled in a worksheet that described, as a percent, the individual contribution of each goal to the overall goal of watershed management. These sheets provided a variety of opinions on how the goals should be weighted, and served as a guide to a discussion on the relative importance of each goal. Through the group discussion, a consensus set of goal weights was developed that best represents the importance of each goal as defined by the stakeholders. Table 3-1 shows the weights assigned to each goal. The weights represent a percentage of the overall importance of each goal relative to all goals.
May 2005 3-4

Tookany/Tacony-Frankford Integrated Watershed Management Plan
Table 3-1 Stakeholder Priorities as Weights for Goals
Streamflow and Living Resources. Improve stream habitat and integrity of aquatic life. 15
Instream Flow Conditions. Reduce the impact of urbanized flow on living resources. 15
Water Quality and Pollutant Loads. Improve dry and wet weather stream quality to reduce the effects on public health and aquatic life.
20
Stream Corridors. Protect and restore stream corridors, buffers, floodplains, and natural habitats including wetlands.
15
Flooding. Identify flood prone areas and decrease flooding by similar measures intended to support Goals 1, 2, and 4.
5
Quality of Life. Enhance community environmental quality of life (protect open space, access and recreation, security, aesthetics, historical/cultural resources).
10
Stewardship, Communication, and Coordination. Foster community stewardship and improve inter-municipal, inter-county, state-local, and stakeholder cooperation and coordination on a watershed basis.
20
In addition to the weights assigned to each goal, the workshop participants also provided some insight into the relative importance of each of the objectives within the goals. These were provided as an opinion on whether a particular objective had a high, medium, or low priority as part of the goal. No consensus building process was attempted for all of the objectives, since these play a lesser role in the overall evaluation. The project team assigned a value of 1 point for a low designation, 2 points for a medium designation, and 3 points for a high designation. The point totals on all the sheets were tallied, and average scores were computed to distribute the overall consensus weight for each goal over its sub-objectives.
The weights assigned to each goal were important in screening and evaluating the many possible alternative water management approaches to arrive at the recommended alternative.
May 2005 3-5

Tookany/Tacony-Frankford Integrated Watershed Management Plan
Section 2 Integrated Watershed Management for the Tookany/Tacony-Frankford Watershed Section 2.1 describes the general approach to watershed planning that serves as the framework for the Tookany/Tacony-Frankford Integrated Watershed Management Plan (TTFIWMP). The approach contains many of the activities included in Philadelphia’s Long Term Combined Sewer Overflow Control Plan. Section 2.2 describes the specific activities carried out to complete the plan.
2.1 General Planning Approach The approach followed for the TTFIWMP coordinates each of the five programs discussed in Section 1.3. It has four major elements, each with multiple tasks specific to the planning efforts within the sub-basin of the Tookany/Tacony-Frankford watershed.
Data collection, organization and analysis
Systems description
Problem identification and development of plan objectives
Strategies, policies and approaches
Tookany/Tacony-FrankfordWatershed Management
Plan
Strategies,Policies, andApproaches
Data Collection,Organization,and Analysis
SystemsDescriptions
Problem Identificationand Development of
Plan Objectives
Tookany/Tacony-FrankfordWatershed Management
Plan
Strategies,Policies, andApproaches
Data Collection,Organization,and Analysis
SystemsDescriptions
Problem Identificationand Development of
Plan Objectives
May 2005 2-1
Tookany/Tacony-Frankford Integrated Watershed Management Plan
Data Collection, Organization and Analysis The initial step in the planning process is the collection and organization of existing data on surface water hydrology and quality, wastewater collection and treatment, combined sewer overflows, stormwater control, land use, stream habitat and biological conditions, and historic and cultural resources. In addition, existing rules, regulations, and guidelines pertaining to watershed management at federal, state, basin commission, county, and municipal levels also are examined for coherence and completeness in facilitating the achievement of watershed planning goals.
Data are collected by many agencies and organizations in various forms, ranging from reports to databases and Geographic Information System (GIS) files. Field data collection efforts were undertaken prior to the study, and expanded once data gaps were identified.
Systems Description The planning approach for an urban stream must focus on the relationship between the natural watershed systems (both groundwater and surface water) and the constructed systems related to land use that influence the hydrologic cycle, such as water supply, wastewater collection and treatment, and stormwater collection. A critical step in the planning process is to examine this relationship in all its complexity and to explore the adequacy of the existing regulatory structure at the federal, state, county, and municipal level to properly manage these natural and anthropogenic systems. In urban watersheds, the natural systems are, by definition, influenced by the altered environment, and existing conditions reflect these influences. It is not, however, always obvious which constructed systems are having the most influence, and what that influence is. Analyzing and understanding the water resources and water supply/wastewater/stormwater facilities and their interrelationship provides a sound basis for subsequent planning, leading to the development of a realistic set of planning objectives. Concise descriptions of each of the constructed systems are presented, and a series of indicators that adequately describe the watershed and stream characteristics are identified and measured.
Problem Identification and Development of Plan Objectives Existing problems and issues of water quality, stream habitat, and streamflow related to the urbanization of the watershed can be identified through analyses of:
Prior studies and assessments
Existing data
New field data
Stakeholder input Problems and issues identified through data analysis must be compared with problems and issues brought forward by stakeholders. An initial list of problems and issues then are transformed into a preliminary set of goals and objectives. These goals and objectives may reveal data gaps and may require additional data collection and analysis. Ultimately, with stakeholder collaboration, a final list of goals and objectives is established that truly reflects the conditions of the watershed. These goals and objectives are prioritized by the stakeholders based on the results of the data analysis.
May 2005 2-2

Tookany/Tacony-Frankford Integrated Watershed Management Plan
The priority of objectives becomes the basis for developing planning alternatives. Potential constraints on implementation require that the objectives be broken down into phased targets, in which alternatives are developed to meet interim objectives. In this way, the effectiveness of implementation can be monitored, and targets adjusted, as more is learned about the watershed, its physical characteristics, and evolving water quality regulations.
Strategies, Policies and Approaches Once end targets and interim targets are established, with a clear list of associated planning objectives based on sound scientific analysis and consensus among stakeholders, effective sets of implementable management alternatives are developed to meet the agreed upon targets and objectives. These alternatives are a combination of options that may include suggested municipal actions, recommendations on water supply and wastewater collection system improvements, potential measures to protect water quality from point sources, best management practices for stormwater control, measures to control sanitary and combined sewer overflows, changes to land use and zoning, stream channel and streambank restoration measures, etc. Guidelines are provided on how best to combine the many options in a coherent fashion within the context of the watershed-wide management objectives. The plan is designed to provide an implementation process and guidelines to achieve the stated objectives over a specified period of time.
The Tookany/Tacony-Frankford
Planning Approach
2.2.1 Existing Data
2.2.2Monitoring and
Field Data Collection
2.2.3Watershed Modeling
2.2.4 Goals andObjectives
2.2.5 Data Analysisand IndicatorDevelopment
2.2.6 Development and
Screening ofManagement Options2.2.7
Development ofTarget Approachfor Meeting Goals
and Objectives
2.2.8Development and
Evaluation ofTarget C Management
Alternatives
2.2.9 Implementation
Plan
May 2005 2-3
Tookany/Tacony-Frankford Integrated Watershed Management Plan
2.2 The Tookany/Tacony-Frankford Planning Approach The approach and specific tasks for the TTFIWMP are intended to meet the criteria of the five major programs discussed in Section 1.3.
In order to establish environmental goals and identify the indicators that measure progress toward these goals, the Tookany/Tacony-Frankford planning strategy utilizes the “plan-do-check-review” methodology often called the “adaptive management approach”. To satisfy the five elements included in this procedure, the Tookany/Tacony-Frankford planning process moved from data collection and analysis to plan development in an organized manner, with constant interaction with the established stakeholder groups. The primary data collection, analysis, and technical planning activities of the TTFIWMP are outlined below, and the stakeholder process is discussed in Section 3.
2.2.1 Existing Data PWD assembled relevant existing data and information collected in the past by other agencies and by prior studies. Several types of geographic and physical data were collected.
Geographic and Demographic Data The base map for the project study area was prepared from U.S. Census Bureaus TIGER (Topologically Integrated Geographic Encoding and Referencing) database. These files contain local and state political boundaries, rivers and waterways, roads and railroads, and census block and block group boundaries for demographic analysis.
Meteorological Data In addition to U.S. Census data, meteorological data was gathered to analyze streamflow responses to seasonal changes, climate variation, and storms, and to model stormwater flows. Long-term rainfall data were obtained from the National Oceanic and Atmospheric Administration’s rainfall gauge at the Philadelphia International Airport. This gauge has over 100 years of hourly precipitation data, from January 3, 1902 through the present. In addition to this long-term rainfall gauge, the PWD CSO Program has over 10 years of 15-minute rainfall data from 24 City rain gauges. Ten of these gauges are in the vicinity of the Tookany/Tacony-Frankford watershed. The available rainfall data for each gauge is summarized in Table 2-1, and Figure 2-1 shows their locations. Data from each gauge were analyzed for accuracy and completeness, and the data were subjected to statistical analyses to check for changes in the gauge location or physical layout, as well as, to explore correlations among gauges to identify potential over-or under-catch trends.
Rain Gauge Data. The Philadelphia Water Department maintains a database of 15-minute accumulated precipitation depths collected from its county-wide 24 tipping bucket rain gauge network for the period 1990 to the present. The uncorrected, 2.5-minute accumulated, 0.01 inch tip count, rain gauge data is subjected to preliminary quality assurance and quality control procedures. Identification and flagging of bad or missing data is performed for each rainfall event on a monthly basis by visual inspection comparing 15-minute accumulated measurements at nearby gauges and looking for patterns of obvious gauge failures, including plugged gauges and erratic tipping. Next, a bias adjustment procedure is performed to normalize systematic rain gauge biases across the network. Finally, all data flagged as bad or
May 2005 2-4

Tookany/Tacony-Frankford Integrated Watershed Management Plan
missing is filled with data from up to five nearby gauges using inverse-distance-squared weighting. A continuous rainfall record at each gauge location is thereby produced for use in continuous hydrologic model simulations.
Table 2-1 Rainfall Data Available for the Tookany/Tacony-Frankford Watershed Gauges
Gauge Name Available Data RG-03 1991 – 2003 RG-07 1991 – 2003 RG-08 1991 – 2001, 2003 RG-10 1991 - 2001 RG-11 1991 – 2000, 2002-2003 RG-13 1991 - 1998, 2001 – 2003RG-14 1991 - 1998, 2001 RG-17 1991, 1993-2003 RG-18 1992-2003 RG-19 1991-2003
Figure 2-1 City Rain Gauges in or near the Watershed
2-5 May 2005
Tookany/Tacony-Frankford Integrated Watershed Management Plan
Radar Rainfall Data. Gauge calibrated radar rainfall estimates have been obtained from Vieux and Associates for seven wet weather events sampled during 2003. The spatial resolution of this data is approximately 1km x 1km grid covering the extended watershed area. The 15-minute accumulated rainfall depths are derived from the National Weather Service’s Mount Holly, NJ, level 2 radar reflectivity data that has been calibrated to the Philadelphia Water Departments rain gauge network data using mean field bias adjustment. Mean field bias adjustment preserves the average rainfall depth measured at the rain gauges along with the spatial distribution represented by the radar reflectivity data.
Representative Wet Weather Year. A representative year of rainfall data was constructed to more easily evaluate the effectiveness of stormwater management alternatives. This was done by comparing the 100-year hourly rainfall record from the NOAA Philadelphia International Airport rain gauge station to individual quarterly records for the years 1991 through 2002. Each quarter year was evaluated against the long term record by comparing total quarterly rainfall along with the cumulative distributions of rainfall intensities and storm total depths. The resulting representative year was constructed using data from quarter 1 of 1997, quarter 2 of 1998, quarter 3 of 1996, and quarter 4 of 1997.
Land Use Land use information for the Tookany/Tacony-Frankford watershed was obtained from the Delaware Valley Regional Planning Commission (DVRPC) for Montgomery and Philadelphia counties. The DVRPC land use maps are based on aerial photography from March through May of 1995. The residential areas were updated based on the 2000 Census populations. A useful representation of the existing land use information for hydrologic analyses was developed as shown in Figure 2-2.
May 2005 2-6
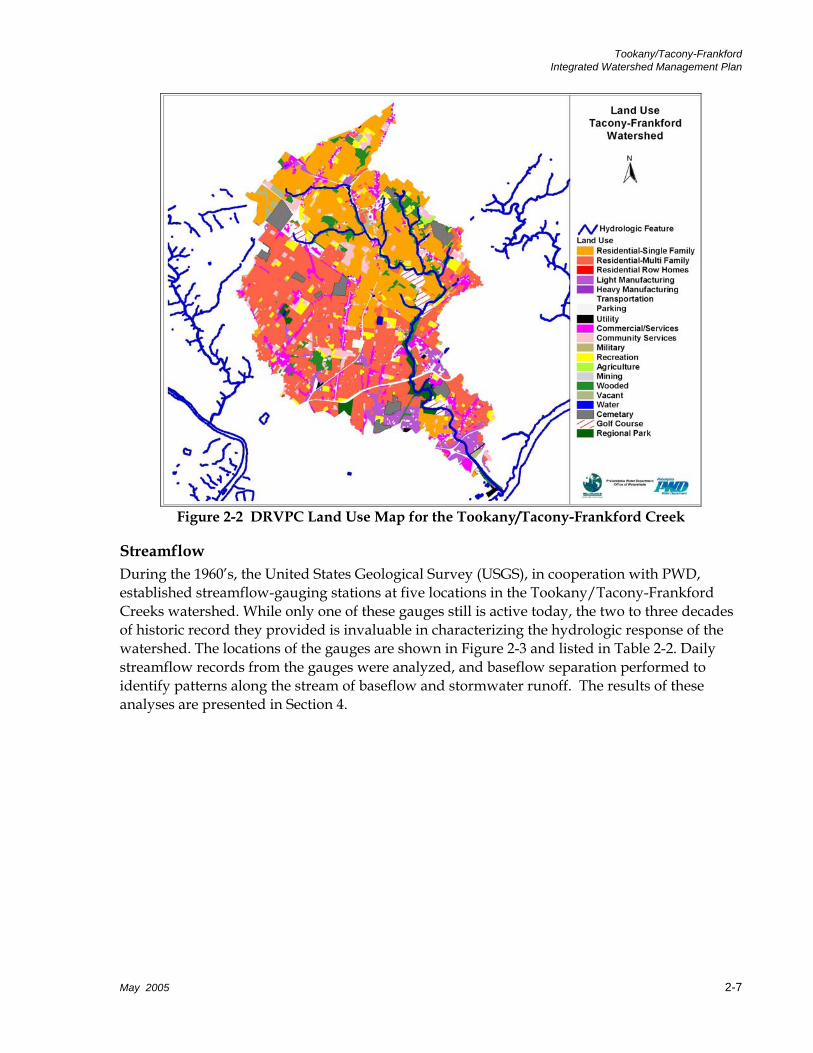
Tookany/Tacony-Frankford Integrated Watershed Management Plan
Figure 2-2 DRVPC Land Use Map for the Tookany/Tacony-Frankford Creek
Streamflow During the 1960’s, the United States Geological Survey (USGS), in cooperation with PWD, established streamflow-gauging stations at five locations in the Tookany/Tacony-Frankford Creeks watershed. While only one of these gauges still is active today, the two to three decades of historic record they provided is invaluable in characterizing the hydrologic response of the watershed. The locations of the gauges are shown in Figure 2-3 and listed in Table 2-2. Daily streamflow records from the gauges were analyzed, and baseflow separation performed to identify patterns along the stream of baseflow and stormwater runoff. The results of these analyses are presented in Section 4.
May 2005 2-7
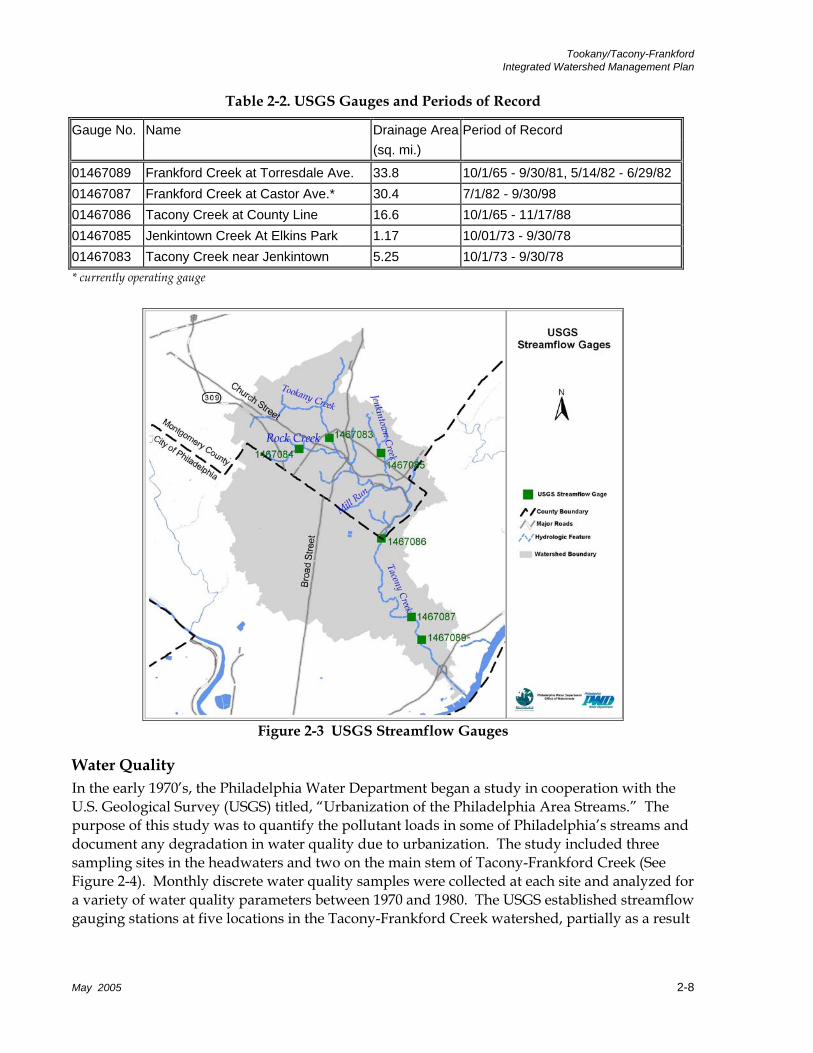
Tookany/Tacony-Frankford Integrated Watershed Management Plan
Table 2-2. USGS Gauges and Periods of Record
Gauge No. Name Drainage Area Period of Record (sq. mi.)
01467089 Frankford Creek at Torresdale Ave. 33.8 10/1/65 - 9/30/81, 5/14/82 - 6/29/82 01467087 Frankford Creek at Castor Ave.* 30.4 7/1/82 - 9/30/98 01467086 Tacony Creek at County Line 16.6 10/1/65 - 11/17/88 01467085 Jenkintown Creek At Elkins Park 1.17 10/01/73 - 9/30/78 01467083 Tacony Creek near Jenkintown 5.25 10/1/73 - 9/30/78 * currently operating gauge
Figure 2-3 USGS Streamflow Gauges
Water Quality In the early 1970’s, the Philadelphia Water Department began a study in cooperation with the U.S. Geological Survey (USGS) titled, “Urbanization of the Philadelphia Area Streams.” The purpose of this study was to quantify the pollutant loads in some of Philadelphia’s streams and document any degradation in water quality due to urbanization. The study included three sampling sites in the headwaters and two on the main stem of Tacony-Frankford Creek (See Figure 2-4). Monthly discrete water quality samples were collected at each site and analyzed for a variety of water quality parameters between 1970 and 1980. The USGS established streamflow gauging stations at five locations in the Tacony-Frankford Creek watershed, partially as a result
May 2005 2-8
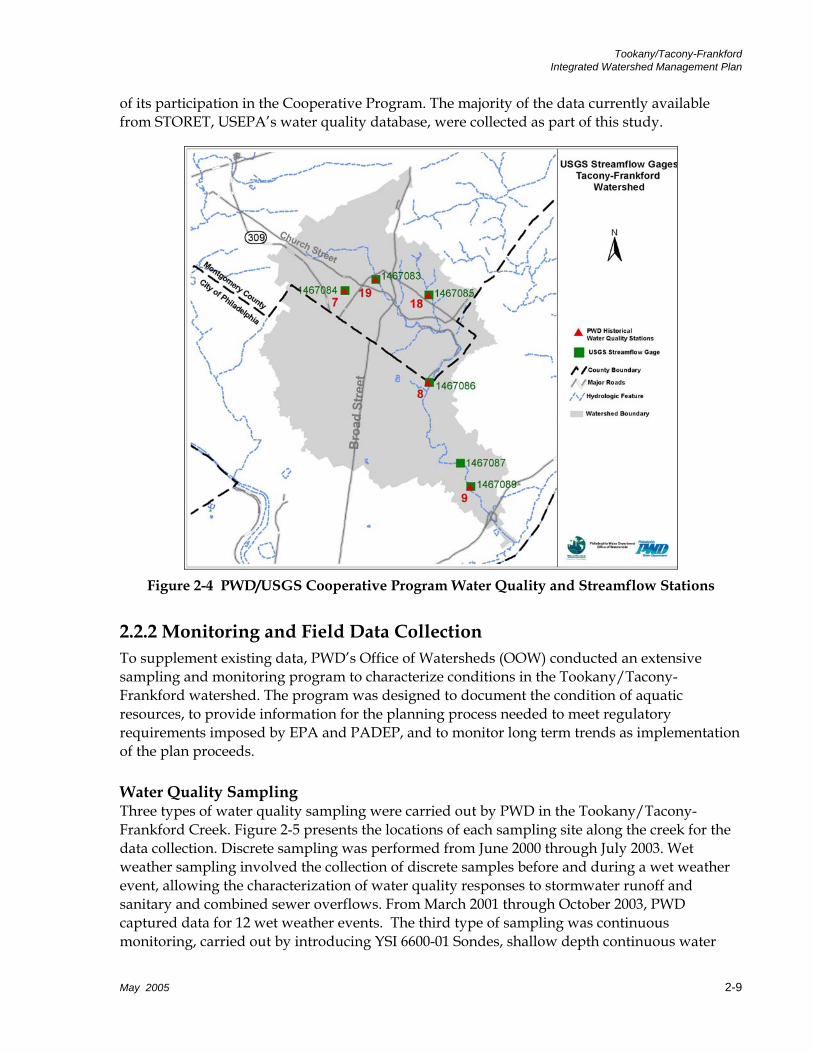
Tookany/Tacony-Frankford Integrated Watershed Management Plan
of its participation in the Cooperative Program. The majority of the data currently available from STORET, USEPA’s water quality database, were collected as part of this study.
Figure 2-4 PWD/USGS Cooperative Program Water Quality and Streamflow Stations
2.2.2 Monitoring and Field Data Collection To supplement existing data, PWD’s Office of Watersheds (OOW) conducted an extensive sampling and monitoring program to characterize conditions in the Tookany/Tacony-Frankford watershed. The program was designed to document the condition of aquatic resources, to provide information for the planning process needed to meet regulatory requirements imposed by EPA and PADEP, and to monitor long term trends as implementation of the plan proceeds. Water Quality Sampling Three types of water quality sampling were carried out by PWD in the Tookany/Tacony-Frankford Creek. Figure 2-5 presents the locations of each sampling site along the creek for the data collection. Discrete sampling was performed from June 2000 through July 2003. Wet weather sampling involved the collection of discrete samples before and during a wet weather event, allowing the characterization of water quality responses to stormwater runoff and sanitary and combined sewer overflows. From March 2001 through October 2003, PWD captured data for 12 wet weather events. The third type of sampling was continuous monitoring, carried out by introducing YSI 6600-01 Sondes, shallow depth continuous water
May 2005 2-9
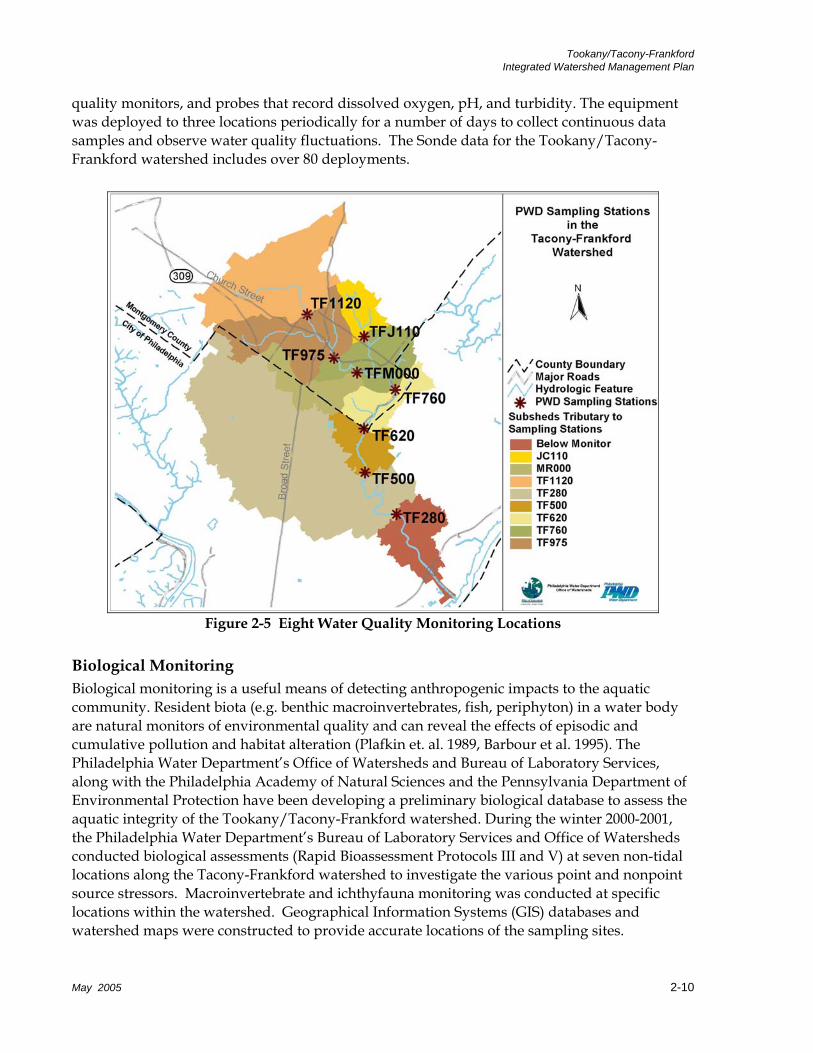
Tookany/Tacony-Frankford Integrated Watershed Management Plan
quality monitors, and probes that record dissolved oxygen, pH, and turbidity. The equipment was deployed to three locations periodically for a number of days to collect continuous data samples and observe water quality fluctuations. The Sonde data for the Tookany/Tacony-Frankford watershed includes over 80 deployments.
Figure 2-5 Eight Water Quality Monitoring Locations
Biological Monitoring Biological monitoring is a useful means of detecting anthropogenic impacts to the aquatic community. Resident biota (e.g. benthic macroinvertebrates, fish, periphyton) in a water body are natural monitors of environmental quality and can reveal the effects of episodic and cumulative pollution and habitat alteration (Plafkin et. al. 1989, Barbour et al. 1995). The Philadelphia Water Department’s Office of Watersheds and Bureau of Laboratory Services, along with the Philadelphia Academy of Natural Sciences and the Pennsylvania Department of Environmental Protection have been developing a preliminary biological database to assess the aquatic integrity of the Tookany/Tacony-Frankford watershed. During the winter 2000-2001, the Philadelphia Water Department’s Bureau of Laboratory Services and Office of Watersheds conducted biological assessments (Rapid Bioassessment Protocols III and V) at seven non-tidal locations along the Tacony-Frankford watershed to investigate the various point and nonpoint source stressors. Macroinvertebrate and ichthyfauna monitoring was conducted at specific locations within the watershed. Geographical Information Systems (GIS) databases and watershed maps were constructed to provide accurate locations of the sampling sites.
May 2005 2-10
Tookany/Tacony-Frankford Integrated Watershed Management Plan
An ichthyfauna (fish) assessment occurred at four sampling stations on the mainstem of the Tookany/Tacony-Frankford Creeks. Six metrics were used to assess the quality of the fish assemblages in the study stream.
1. Species richness
2. Species diversity
3. Trophic composition relationships
4. Pollution tolerance levels
5. Disease and parasite abundance/severity
6. Introduced (exotic) species
In addition to the fish assessment, the results of a PADEP Rapid Bioassessment Protocol (RBP) assessment of seven sites in the Tookany/Tacony-Frankford watershed were also compiled. PADEP biologists used a combination of habitat and biological assessments to evaluate the Tookany/Tacony-Frankford under the Unassessed Waters Program. Biological surveys included kick screen sampling of benthic macroinvertebrates, which were identified by family and by their tolerance to pollution. Benthic macroinvertebrates mainly are aquatic insect larvae that live on the stream bottom. Since they are short-lived and relatively immobile, they reflect the chemical and physical characteristics of a stream and chronic sources of pollution. The biological integrity and benthic community composition was determined using USEPA guidelines for RBP III.
Upon completion of the total biological scoring criteria, each site was compared to a reference site according to its drainage area and geomorphological attributes. The reference site chosen was French Creek, located at Coventry Road Bridge, South Coventry Township, Chester County. The comparison of the biological assessment of each site with the reference site was designed to create a baseline for monitoring trends in benthic community structure that might be attributable to improvement or worsening of conditions over time. Several Biological Condition Categories were developed:
Non-impaired
Slightly impaired
Moderately impaired
Severely impaired
Habitat Assessment Habitat assessments evaluate how deeply the stream substrate is embedded, the degree of streambank erosion, the condition of riparian vegetation, and the amount of sedimentation. Data from the PADEP surveys were available for the Tookany/Tacony-Frankford Creeks. Habitat assessments at seven non-tidal sites were completed based on the Stream Classification Guidelines for Wisconsin (Ball, 1982) and Methods of Evaluating Stream, Riparian, and Biotic Conditions (Platts et al., 1983). Reference conditions were used to normalize the assessment to
May 2005 2-11

Tookany/Tacony-Frankford Integrated Watershed Management Plan
the Tookany/Tacony-Frankford (mainstream) “best attainable” situation. Habitat parameters were separated into three principal categories to characterize the site:
Primary or microscale habitat
Secondary or macroscale habitat (stream channel)
Tertiary or riparian and bank structure
Resource based Habitat Suitability Indices (HSI) were developed to add aquatic life-based habitat and flow requirement criteria to the watershed assessment. HSIs integrate the expected effects of a variety of physicochemical and hydrological variables on a target species of environmental or economic concern. Data are used to construct sets of suitability index curves, each of which relates a habitat parameter to its suitability for the species of interest. Curves rate habitat variables on a scale of 0 to 1.0, and were developed to measure food and cover, water quality, and reproduction (e.g. substrate type, percent pools, percent cover, depth of pools, pH, DO, turbidity, temperature).
Fluvial Geomorphological Assessment For the Tacony Creek Watershed, members of the Philadelphia Water Department performed a fluvial geomorphological (FGM) assessment which included baseline determination of stream stability and habitat parameters. The measurement of geomorphic parameters and physical and hydraulic relationships were performed at both Level I and Level II using the Rosgen classification methodology (D.L. Rosgen Applied River Morphology 1996).
Level I: Desktop survey included desktop delineation of the stream using generalized major stream types based on available topographic information, geological maps, soils maps, and aerial photographs. The purpose of the inventory was to provide an initial framework for organizing and targeting subsequent field assessments of important reaches where problems are known to occur or are anticipated to occur. Available topographic information, geological maps, soils maps, and aerial photographs were reviewed.
Level II: Reach stream survey was performed for approximately 30 miles of stream including the Main Stem Tookany/Tacony Creek and 14 tributaries within the Watershed. A field team consisting of engineers and biologists walked the designated lengths of each stream and tributary and estimated several parameters related to channel morphology:
Bankfull Elevations/Widths Floodprone Elevations/Widths Bankfull/Floodprone Discharges Entrenchment Ratios Width/Depth Ratios Sinuosity Channel/Water Surface Slopes Channel Materials (pebble count) – D50's Meander Pattern
May 2005 2-12
Tookany/Tacony-Frankford Integrated Watershed Management Plan
Rosgen Stream Types Velocities
Shear Stresses
Wetland Study Method Wetlands play a significant role in ecosystem health and water quality in a watershed. For this reason, two wetland field investigations were conducted to characterize the presence and condition of wetlands in the Tookany/Tacony-Frankford Watershed. Potential wetlands within Philadelphia were evaluated in July of 2001, and potential wetlands in Montgomery County were evaluated in August 2003. The wetland field investigation was designed to survey existing wetlands, evaluate potential wetland enhancement actions, and identify potential wetland creation sites.
The field investigation plan was developed based on orthophoto basemaps, and indicator information such as National Wetlands Inventory (NWI) mapping, hydric soil information, Natural Lands Restoration and Environmental Education Program (NLREEP) mapping, and Delaware Valley Regional Planning Commission (DVRPC) existing open space mapping.
The wetland field investigation evaluated the hydrology, vegetation, soils, general location, estimated acreage, and landscape position of the wetlands in the riparian corridors. Although wetlands were not delineated, all identified wetlands within the watershed met the criteria for jurisdictional wetlands as described in the 1987 U.S. Army Corps of Engineers (USACE) Wetlands Delineation Manual (Environmental Laboratory 1987). Where possible, significant and representative points were mapped using global positioning systems (GPS).
Existing wetlands located during the field survey were also evaluated for existing wetland functions using the Oregon Assessment Method. The Oregon Freshwater Wetland Assessment Methodology (Roth, et al. 1996) and the Human Disturbance Gradient (Gernes and Helgen, 2002) were applied to each wetland location. The Oregon Assessment Method values were calculated for Wildlife Habitat, Fish Habitat, Water Quality, Hydrologic Control, and Sensitivity to Future Impact. An additional function, termed Wetland Improvement, was evaluated using relevant questions from other areas of the Oregon Assessment Method. The Wetland Improvement Function was intended to reflect field observations that the potential for wetland enhancement may exist without a significant buffer, so long as there was sufficient access to create the enhancement.
Water quality is a factor of both the Oregon Assessment Method and the Human Disturbance Gradient (HDG). A combination of field observations, including the location of the wetland and waterway within the watershed or sub-watershed, as well as the PADEP’s 2002 Section 303(d) List of Impaired Waterbodies (PADEP 2002) was used as a measure of water quality. Four PWD monitoring stations within the Tookany/Tacony-Frankford watershed that assess chemical, macroinvertebrate, and fish habitat data also contributed data to the Oregon and HDG analyses.
Where applicable, the redirection of outlets was considered in determining sites for streambank restoration and/or wetland restoration. Existing undeveloped areas were considered as potential wetland creation sites; factors included proximity to a waterway, the presence of stormwater outlets, the presence of existing wetlands nearby, whether these wetlands would be
May 2005 2-13
Tookany/Tacony-Frankford Integrated Watershed Management Plan
negatively impacted by the creation of additional wetland, and construction access and physical limitations of the site.
2.2.3 Watershed Modeling An important tool for developing the watershed plan is a hydrologic and hydraulic model of the stream and stormwater system. In most streams in the eastern US, stormwater flows can range from less than 30% of total annual streamflow in less-developed watersheds to over 70% in highly urbanized settings. Modeling of stormwater flows is, therefore, a critical component of a watershed management plan. The model should, at a minimum, be built to provide storm-by-storm flows to the streams as well as estimates of pollutant loads carried by the stormwater reaching the streams.
A Stormwater Management Model (SWMM) was built for the entire Tookany/Tacony-Frankford watershed. SWMM is a comprehensive set of mathematical models originally developed for the simulation of urban runoff quantity and quality in storm, sanitary, and combined sewer systems. The model subdivides the watershed into approximately 300 subwatersheds and estimates flow and pollutant loading from each land use type within each of the subwatersheds. It simulates the hydraulics of combined sewers, the open channel of the creek itself, and the floodplain. Thus, the model is useful for simulation of stormwater runoff quantity and quality, combined sewer overflow, and streamflow. The model was calibrated by comparing stormwater runoff to estimated runoff, calculated through hydrograph separation at the USGS gauges in the watershed. Model simulations included:
Existing conditions using a long-term rainfall record from Philadelphia Airport
Annual average pollutant loads for key pollutants found in stormwater. The list of pollutants includes parameters such as nitrate, phosphorus, total suspended solids, heavy metals, BOD, and DO
Numerous simulations to test the effectiveness of various BMPs within the Tookany/Tacony-Frankford watershed. Effectiveness was judged based on reductions in stormwater discharges, CSOs, and reduced pollutant loading during wet weather
The model results helped identify areas where stormwater runoff or pollutant loads are particularly high and in need of control. Model flow results, in combination with the results of the fluvial geomorphic assessment, provided excellent tools for identifying areas of the watershed that are undergoing stormwater-related stress and an efficient way of developing alternative integrated watershed management approaches, particularly with regard to the Wet Weather Target C objective.
2.2.4 Goals and Objectives Early in the planning process, project goals and objectives were developed in conjunction with the stakeholders. In general, goals represent consensus on a series of “wishes” for the watershed. Eight project goals were established that represent the full spectrum of goals from all the programs relevant to the watershed (e.g. River Conservation Plan, TMDL programs, Act 167 Stormwater Plans, etc.) A significant effort was made to consolidate the various goals into a single, coherent set that avoids overlap and is organized into clear categories.
May 2005 2-14
Tookany/Tacony-Frankford Integrated Watershed Management Plan
Once the preliminary set of goals was developed, a series of associated objectives was developed. Objectives translate the “wishes” into measurable quantities; indicators are the means of measuring progress toward those objectives. This relationship is the link between the more general project goals and the indicators developed to assess the watershed and to track future improvement.
The preliminary planning goals and objectives were presented to stakeholders for initial review. However, the final, prioritized goals and objectives were subjected to final review and approval when the data analysis and modeling work were completed.
2.2.5 Data Analysis and Indicator Development An important aspect of a watershed management plan is a basic description of existing conditions within the watershed and streams. To accomplish this, a series of indicators were developed to represent the results of the data collection efforts and the data analysis and modeling. An indicator is a measurable quantity that characterizes the current state of at least one aspect of watershed health. Every indicator is directly linked to one or more project objectives. Thus, they serve to describe the current conditions, and provide a clear method of monitoring progress, and achievement of objectives as management alternatives are implemented over time.
The indicators selected for their potential use both in assessing current conditions, as well as assessing future progress in improving conditions, are shown below.
May 2005 2-15
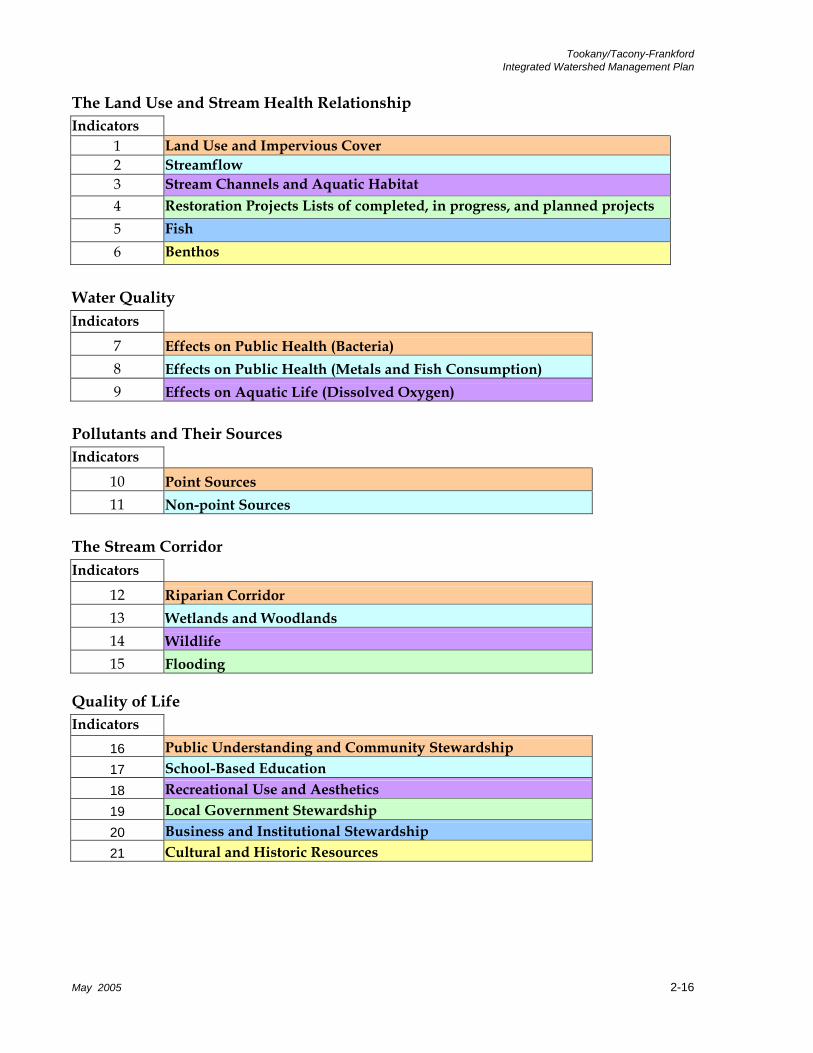
Tookany/Tacony-Frankford Integrated Watershed Management Plan
The Land Use and Stream Health Relationship Indicators
1 Land Use and Impervious Cover 2 Streamflow 3 Stream Channels and Aquatic Habitat 4 Restoration Projects Lists of completed, in progress, and planned projects 5 Fish 6 Benthos
Water Quality Indicators
7 Effects on Public Health (Bacteria) 8 Effects on Public Health (Metals and Fish Consumption) 9 Effects on Aquatic Life (Dissolved Oxygen)
Pollutants and Their Sources Indicators
10 Point Sources 11 Non-point Sources
The Stream Corridor Indicators
12 Riparian Corridor 13 Wetlands and Woodlands 14 Wildlife 15 Flooding
Quality of Life Indicators
16 Public Understanding and Community Stewardship 17 School-Based Education 18 Recreational Use and Aesthetics 19 Local Government Stewardship 20 Business and Institutional Stewardship 21 Cultural and Historic Resources
May 2005 2-16
Tookany/Tacony-Frankford Integrated Watershed Management Plan
2.2.6 Development and Screening of Management Options Clear, measurable objectives provided the guidance for developing options designed to meet the project goals. A management option is a technique, measure, or structural control that addresses one or more objectives (e.g., a detention basin that gets built, an ordinance that gets passed, an educational program that gets implemented).
The following example clarifies the difference among a goal, an objective, and a management option.
Goal: improve water quality
Objective: maintain dissolved oxygen levels above 5 mg/L
Management Option: eliminate deep, poorly mixed plunge pools where low DO is detected
Lists of management options were developed to meet each of the goals and objectives established for the Tookany/Tacony-Frankford Creek watershed. Only those options deemed feasible and practical were considered in the final list of management options. Options were developed and evaluated in three steps:
1. Development of a Comprehensive Options List. Virtually all options applicable in the urban environment were collected. These options were identified from a variety of sources, including other watershed plans, demonstration programs, regulatory programs, literature, and professional experience.
2. Initial Screening. Some options could be eliminated as impractical for reasons of cost, space required, or other considerations. Options that already were implemented, were mandated by one of the programs, or were agreed to be vital, were identified for definite implementation. The remaining options were screened for applicability to Tacony-Frankford Creek and for their relative cost and the degree to which they met the project objectives. Only the most cost-effective options were considered further.
3. Detailed Evaluation of Structural Options. Structural best management practices for stormwater and combined sewage were subjected to a modeling analysis. Effects on runoff volume, overflow volume, peak stream velocity, and pollutant loads were evaluated at various levels of coverage.
Detailed evaluation of structural options (step 3) used the SWMM model to assess the effectiveness of each option and used planning-level cost estimates of each option. All options that had an effect on CSOs or stormwater-related pollutant loads were modeled at several degrees of implementation using the SWMM model. Graphs of effectiveness versus degree of implementation were developed, and the results then were combined with more careful cost estimates to provide guidance on selecting effective options or combinations of options.
May 2005 2-17
Tookany/Tacony-Frankford Integrated Watershed Management Plan
2.2.7 Development of Target Approach for Meeting Goals and Objectives In developing watershed management alternatives and discussing goals and objectives with stakeholders, it became clear that implementation could best be achieved by defining three distinct targets to meet the overall plan objectives. Two of the targets were defined so that they could be fully met with a limited set of options that are fully implemented. The third target fit better with an adaptive management approach. In other words, it was agreed to set interim objectives, recommend measures to achieve the interim objectives, implement those controls, and reassess the capability to meet the objectives or agree to raise the bar to more complete achievement of the final objectives.
Targets are defined here as groups of objectives that each focus on a different problem related to the urban stream system. They can be thought of as different parts of the overall goal of fishable and swimmable waters through improved water quality, more natural flow patterns, and restored aquatic and riparian habitat. Targets are specifically designed to help focus plan implementation.
By defining these targets, and designing the alternatives and implementation plan to address the targets simultaneously, the plan will have a greater likelihood of success. It also will result in realizing some of the objectives within a relatively short time frame, providing positive incentive to the communities and agencies involved in the restoration, and more immediate benefits to the people living in the watershed.
The targets for the Tookany/Tacony-Frankford watershed management plan are defined as follows:
TARGET A: Dry Weather Water Quality and Aesthetics Target A was defined for Tookany/Tacony-Frankford Creeks with a focus on trash removal and litter prevention, and the elimination of sources of sewage discharge during dry weather. Streams should be aesthetically appealing (look and smell good), be accessible to the public, and be an amenity to the community. Access and interaction with the stream during dry weather has the highest priority, because dry weather flows occur about 60-65 % of the time during the course of a year on the Tookany/Tacony-Frankford Creeks. These are also the times when the public is most likely to be near or in contact with the streams. The water quality of the stream in dry weather, particularly with respect to bacteria, should be similar to background concentrations in groundwater.
In many urban streams, monitoring indicates that the water quality rarely meets the water quality standard for bacteria, and exhibit occasional DO problems, even during baseflow or dry weather conditions. Thus, the first target focuses on dry weather water quality, coupled with the visual aesthetics of the stream, primarily the removal of trash and the elimination of illegal dumping so often associated with degraded, urban waterways. The first target also includes a range of regulatory and nonstructural options that address both water quality and quantity concerns. Because the options under consideration are aimed at the total elimination of dry weather sources of trash and sewage, all options related to this target were included in the implementation plan.
May 2005 2-18

Tookany/Tacony-Frankford Integrated Watershed Management Plan
TARGET B: Healthy Living Resources Based on the results of the water quality monitoring, habitat assessment, and biological monitoring, water quality was not identified as the primary cause of the low diversity and impaired nature of the fish population in the stream. Improvements to the number, health, and diversity of the benthic invertebrate and fish species in the Tookany/Tacony-Frankford Creeks need to focus on habitat improvement and the opportunity for organisms to avoid high velocities during storms. Fluvial geomorphological studies, wetland and streambank restoration/creation projects, and stream modeling should be combined with continued biological monitoring to ensure that correct procedures are implemented to increase habitat heterogeneity within the aquatic ecosystem.
Improving the ability of an urban stream to support viable habitat and fish populations focuses primarily on the elimination or remediation of the more obvious impacts of urbanization on the stream. These include loss of riparian habitat, eroding and undercut banks, scoured streambed or excessive silt deposits, channelized and armored stream sections, trash buildup, and invasive species. The primary tool to accomplish this target is stream restoration. Restoration focuses on improving channel stability, improving in-stream and riparian habitat, providing refuges for fish from high velocity conditions during storms, and managing land within the stream corridor. Restoration strategies include:
Bank stabilization, including boulder structures, bioengineering, root wads, plantings, and log and woody structures
Bed stabilization, including rock/log vanes with grade control, rock/log cross vanes, and using naturally occurring boulders and bedrock
Realignment & relocation, used only on severely degraded stream sections Dam and debris removal Reforestation, with priority to floodplains, steep slopes, and wetlands Invasive species management to increase biodiversity Wetland creation, often used in conjunction with stream realignment to improve
floodplain areas subject to annual flooding Forest preservation Fish holding areas, with low to no current zones created to provide fish with places to
hold position during high flows Stream restoration measures to meet this target were identified, and all options required to meet the target are planned for implementation.
TARGET C: Wet Weather Water Quality and Quantity The third target is to restore water quality to meet fishable and swimmable criteria during wet weather. Improving water quality and flow conditions during and after storms is the most difficult target to meet in the urban environment. Because wet weather conditions on Tookany/Tacony-Frankford Creeks occur to some degree about 35-40% of the time during the year, measures to improve wet weather quality have a somewhat lower priority than measures designed to address dry weather water quality. During wet weather, extreme increases in streamflow are common, accompanied by short-term changes in water quality. Stormwater
May 2005 2-19
Tookany/Tacony-Frankford Integrated Watershed Management Plan
generally does not cause immediate DO problems, but sampling data indicate that concentrations of some metals (such as copper, lead, and zinc) and bacteria do not meet water quality standards during wet weather. These pollutants are introduced by both stormwater and wet weather sewage overflows (CSOs and SSOs).
A comprehensive watershed management approach must also address flooding issues. Where water quality and quantity problems exist, options may be identified that address both. Any BMP that increases infiltration or detains flow will help decrease the frequency of damaging floods; however, the size of such structures may need to be increased in areas where flooding is a major concern. Reductions in the frequency of erosive flows and velocities also will help protect the investment in stream restoration made as part of the second target (B).
Target C must be approached somewhat differently from Targets A and B. Full achievement of this target means meeting all water quality standards during wet weather, as well as eliminating all flooding. Meeting these goals will be difficult. It will be expensive and will require a long-term effort. The only rational approach to achieve this target must include stepped implementation with interim targets for reducing wet weather pollutant loads and stormwater flows, along with monitoring for the efficacy of control measures.
Initial load reduction targets for parameters such as metals, total suspended solids (TSS), and bacteria were set in conjunction with the stakeholders. Based on preliminary work by PWD, a 20% reduction is a challenging but achievable initial interim target.
It is expected that changes to the approach, and even to the desired results, will occur as measures are implemented and results are monitored. This process of continually monitoring progress and adjusting the approach is known as adaptive management. The NPDES permit programs for stormwater and CSO outfalls can lead to a cycle of monitoring, planning, and implementation that helps define a time frame to this process.
2.2.8 Implementation Plan Implementation plan guidelines were developed to provide Philadelphia and the upstream municipalities as a blueprint for improving water quality and habitat conditions. The guidelines include;
Specific recommendations and a schedule for meeting Target A objectives Specific recommendations and a schedule for meeting Target B objectives Guidance on which BMPs or mixes of BMPs were most effective in Tookany/Tacony-
Frankford s Creek for meeting Target C objectives. Guidance on the needed degree of implementation to achieve Target C objectives Guidance on areas of the watershed where BMPs would be most effective Recommendations on Target C options for the CSO areas and separate storm sewer
areas Planning level cost estimates for implementation.
May 2005 2-20
Tookany/Tacony-Frankford Integrated Watershed Management Plan
Section 4 Tookany/Tacony-Frankford Study Results
This section summarizes the results of the numerous studies that have already been carried out within the watershed. When available, results are included for the Tookany, Tacony and Frankford portions of the watershed. However, several studies have provided more detailed information in the City of Philadelphia’s portion of the watershed.
4.1 Watershed Description and Demographics The Tookany/Tacony-Frankford watershed is defined as the land area that drains to the Delaware River, first via the Tookany, then the Tacony, and finally through the Frankford Creek. The Tookany/Tacony-Frankford study area includes parts of Montgomery County and a portion of Philadelphia County and covers a total of approximately 29 square miles, or about 20,000 acres. Figure 4-1 includes the watershed boundaries, hydrologic features, and political boundaries. The creek is referred to as the Tookany Creek until it enters Philadelphia at Cheltenham Avenue. The Creek is referred to as the Tacony Creek from the Montgomery County border until the confluence with the historical Wingohocking Creek in Juniata Park. The section of stream from Juniata Park to the Delaware River is referred to as the Frankford Creek, and is underlain by a concrete channel.
The streams in the western portion of the watershed are contained in pipes and combined sewer infrastructure. Historic streams, including the Wingohocking Creek, Rock Run, and Little Tacony Creek, were encapsulated in combined sewers to facilitate the development of this watershed in the early twentieth century. Combined sewers convey sanitary waste, as well as stormwater to the city’s wastewater treatment facilities. The total number of stream miles in this study is 14.4 miles in the mainstem creek and approximately 31.9 miles of encapsulated tributaries.
The drainage area is highly urbanized both in the lower reaches, which are primarily located in Philadelphia County, and in the upper reaches, however, this upper portion, included mainly in Montgomery County, is characterized by a more varying mixture of land uses. The population of the entire drainage area, based on 2000 census data, is approximately 331,400 people. This yields an average population density of approximately 16 -17 persons/acre.
In addition to CSO discharges to Frankford Creek from the City of Philadelphia, the drainage area receives a significant amount of point and nonpoint source discharges that impact water quality. According to the USGS data for the study area, the breakdown by sewer type is as follows: combined sewer areas make up 9,800 acres, or 47% of the drainage area; separate sewers, including areas outside of the City of Philadelphia, account for 9,200 acres or 44% of the drainage area; and non-contributing sewers make up 1,900 acres or 9% of the drainage area.
May 2005 4-1
The waters in the drainage area receive point source discharges including CSO’s and other urban and suburban stormwater, sanitary sewer overflows, and industrial storm, process, and cooling waters. Nonpoint sources in the basin include atmospheric deposition, overland runoff

Tookany/Tacony-Frankford Integrated Watershed Management Plan
from urban and suburban areas, and potentially some remaining individual on-lot domestic sewage systems discharging through shallow groundwater.
Figure 4-1 Tookany/Tacony-Frankford Study Area
May 2005 4-2
In a relatively undisturbed watershed, the watershed boundaries follow topographic high points or contours. The U.S. Geological Survey (USGS) has further subdivided the Tookany/Tacony-Frankford watershed based on topography, as shown in Figure 4-2. These USGS subwatersheds are determined from the land area draining to a particular point of interest, such as a stream confluence or gauging site. These boundaries allow initial determinations of drainage areas and modeling elements. However, it is important in the urban environment to include the effects of man-made changes to natural drainage patterns. In the Philadelphia portion of the watershed, drainage areas were adjusted to account for the combined sewer system drainage boundaries.

Tookany/Tacony-Frankford Integrated Watershed Management Plan
Figure 4-2 USGS Topographic Subwatersheds
Geology and Soils Geology and soils play a role in the hydrology, water quality, and ecology of a watershed. The middle and upper reaches of the study area are in the Northern Piedmont Ecoregion (EPA Enviromapper). The Piedmont is characterized by ridges, hills, and deep narrow valleys. Elevation can vary from 40 feet at the fall line to 400 feet at the ridge tops. The topography of the study area is level except for steep slopes along the banks of the Tacony Creek. This section of the watershed is generally underlain by metamorphic and igneous geologic formations, predominately the Wissahickon Formation with small areas of gneiss and hornblende. These formations are exposed where the Tacony Creek has eroded overlying sediments to the bedrock (PADEP 2001).
The lower portion of the watershed lies within the Middle Atlantic Coastal Plain Ecoregion. This is an area of low relief. Historically, the coastal plain in the city of Philadelphia was tidal marsh. These marshes were filled and paved over for urban development (PADEP 2001). The topography of the coastal plain is gently sloping with elevations from 0 to 40 feet above sea level. The coastal plain is mainly comprised of unconsolidated sand and clay. These sands and clays are represented by the Pennsauken Formation, which was deposited in the Cretaceous period, and unconsolidated sand and clay (Trenton Gravel) deposited during the current quarternary geologic period.
May 2005 4-3
Figure 4-3 displays a map of the geologic formations within the study area. The following are generalized descriptions of the geologic formations:
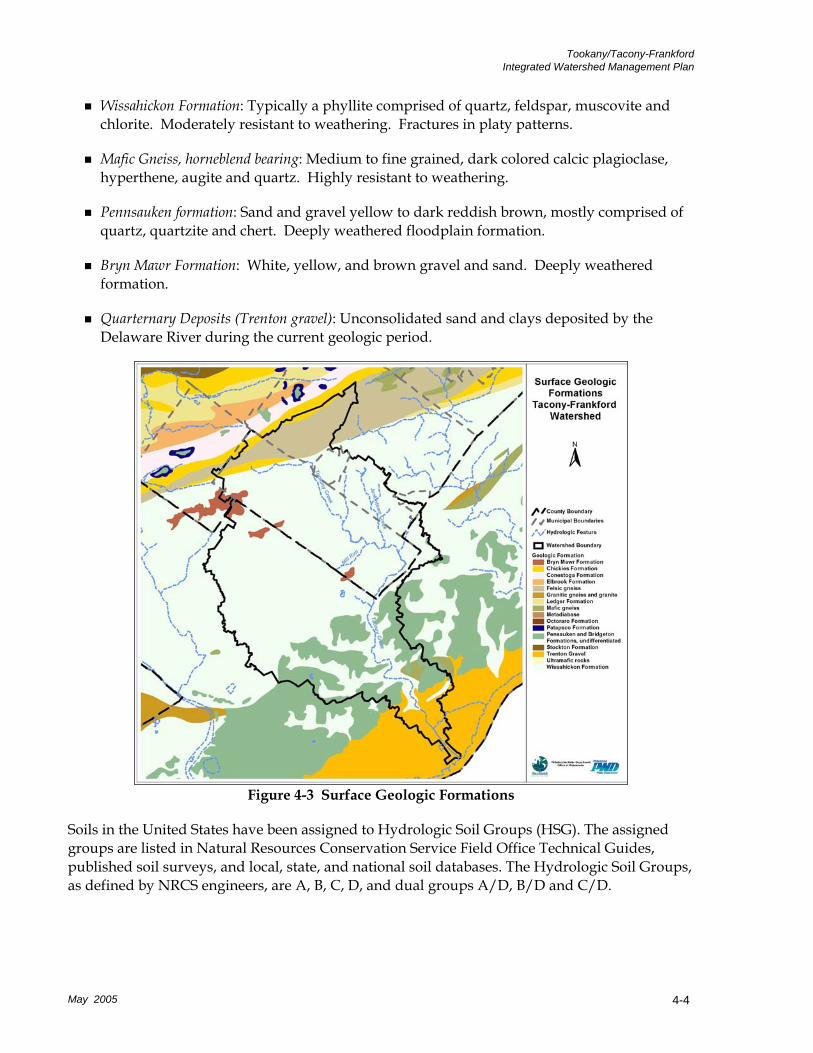
Tookany/Tacony-Frankford Integrated Watershed Management Plan
Wissahickon Formation: Typically a phyllite comprised of quartz, feldspar, muscovite and chlorite. Moderately resistant to weathering. Fractures in platy patterns.
Mafic Gneiss, horneblend bearing: Medium to fine grained, dark colored calcic plagioclase, hyperthene, augite and quartz. Highly resistant to weathering.
Pennsauken formation: Sand and gravel yellow to dark reddish brown, mostly comprised of quartz, quartzite and chert. Deeply weathered floodplain formation.
Bryn Mawr Formation: White, yellow, and brown gravel and sand. Deeply weathered formation.
Quarternary Deposits (Trenton gravel): Unconsolidated sand and clays deposited by the Delaware River during the current geologic period.
Figure 4-3 Surface Geologic Formations
May 2005 4-4
Soils in the United States have been assigned to Hydrologic Soil Groups (HSG). The assigned groups are listed in Natural Resources Conservation Service Field Office Technical Guides, published soil surveys, and local, state, and national soil databases. The Hydrologic Soil Groups, as defined by NRCS engineers, are A, B, C, D, and dual groups A/D, B/D and C/D.
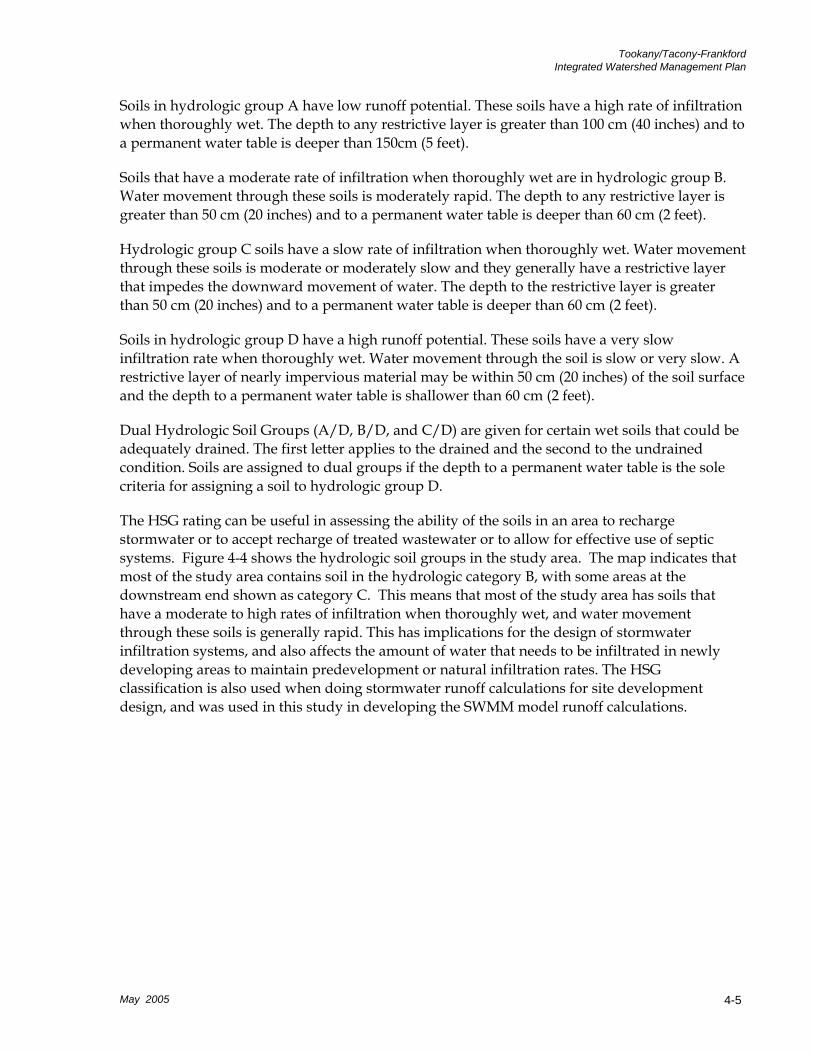
Tookany/Tacony-Frankford Integrated Watershed Management Plan
Soils in hydrologic group A have low runoff potential. These soils have a high rate of infiltration when thoroughly wet. The depth to any restrictive layer is greater than 100 cm (40 inches) and to a permanent water table is deeper than 150cm (5 feet).
Soils that have a moderate rate of infiltration when thoroughly wet are in hydrologic group B. Water movement through these soils is moderately rapid. The depth to any restrictive layer is greater than 50 cm (20 inches) and to a permanent water table is deeper than 60 cm (2 feet).
Hydrologic group C soils have a slow rate of infiltration when thoroughly wet. Water movement through these soils is moderate or moderately slow and they generally have a restrictive layer that impedes the downward movement of water. The depth to the restrictive layer is greater than 50 cm (20 inches) and to a permanent water table is deeper than 60 cm (2 feet).
Soils in hydrologic group D have a high runoff potential. These soils have a very slow infiltration rate when thoroughly wet. Water movement through the soil is slow or very slow. A restrictive layer of nearly impervious material may be within 50 cm (20 inches) of the soil surface and the depth to a permanent water table is shallower than 60 cm (2 feet).
Dual Hydrologic Soil Groups (A/D, B/D, and C/D) are given for certain wet soils that could be adequately drained. The first letter applies to the drained and the second to the undrained condition. Soils are assigned to dual groups if the depth to a permanent water table is the sole criteria for assigning a soil to hydrologic group D.
May 2005 4-5
The HSG rating can be useful in assessing the ability of the soils in an area to recharge stormwater or to accept recharge of treated wastewater or to allow for effective use of septic systems. Figure 4-4 shows the hydrologic soil groups in the study area. The map indicates that most of the study area contains soil in the hydrologic category B, with some areas at the downstream end shown as category C. This means that most of the study area has soils that have a moderate to high rates of infiltration when thoroughly wet, and water movement through these soils is generally rapid. This has implications for the design of stormwater infiltration systems, and also affects the amount of water that needs to be infiltrated in newly developing areas to maintain predevelopment or natural infiltration rates. The HSG classification is also used when doing stormwater runoff calculations for site development design, and was used in this study in developing the SWMM model runoff calculations.
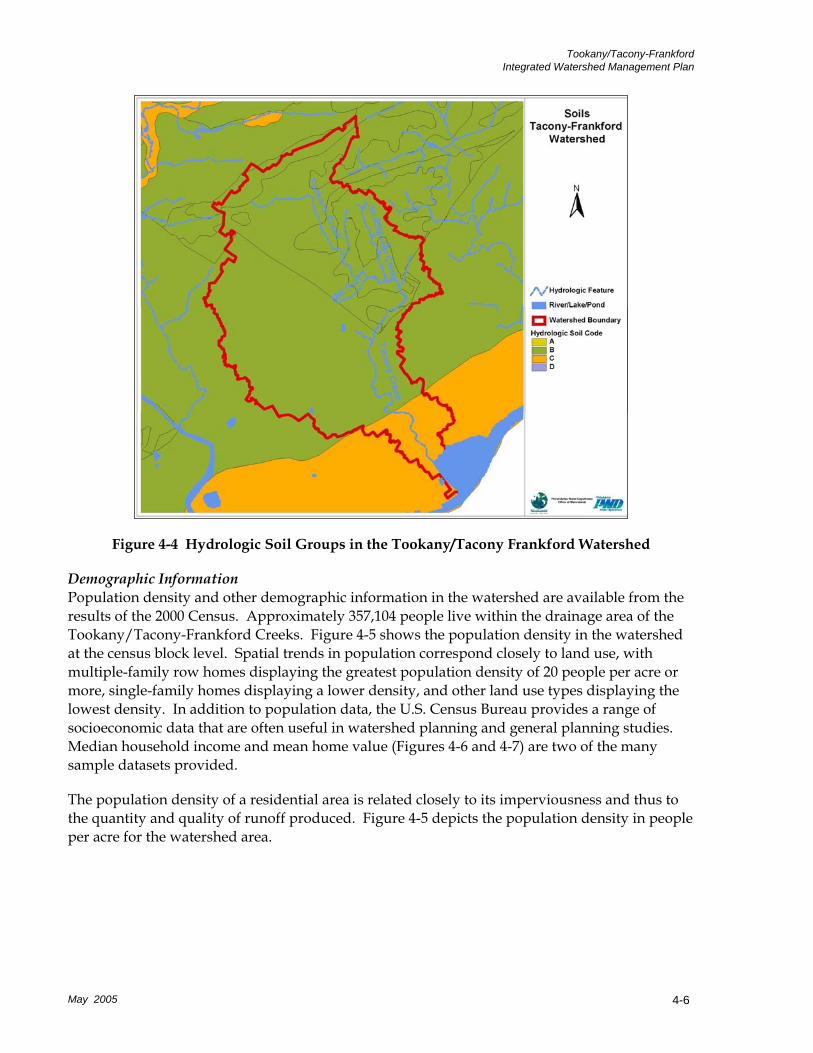
Tookany/Tacony-Frankford Integrated Watershed Management Plan
Figure 4-4 Hydrologic Soil Groups in the Tookany/Tacony Frankford Watershed
Demographic Information Population density and other demographic information in the watershed are available from the results of the 2000 Census. Approximately 357,104 people live within the drainage area of the Tookany/Tacony-Frankford Creeks. Figure 4-5 shows the population density in the watershed at the census block level. Spatial trends in population correspond closely to land use, with multiple-family row homes displaying the greatest population density of 20 people per acre or more, single-family homes displaying a lower density, and other land use types displaying the lowest density. In addition to population data, the U.S. Census Bureau provides a range of socioeconomic data that are often useful in watershed planning and general planning studies. Median household income and mean home value (Figures 4-6 and 4-7) are two of the many sample datasets provided.
May 2005 4-6
The population density of a residential area is related closely to its imperviousness and thus to the quantity and quality of runoff produced. Figure 4-5 depicts the population density in people per acre for the watershed area.
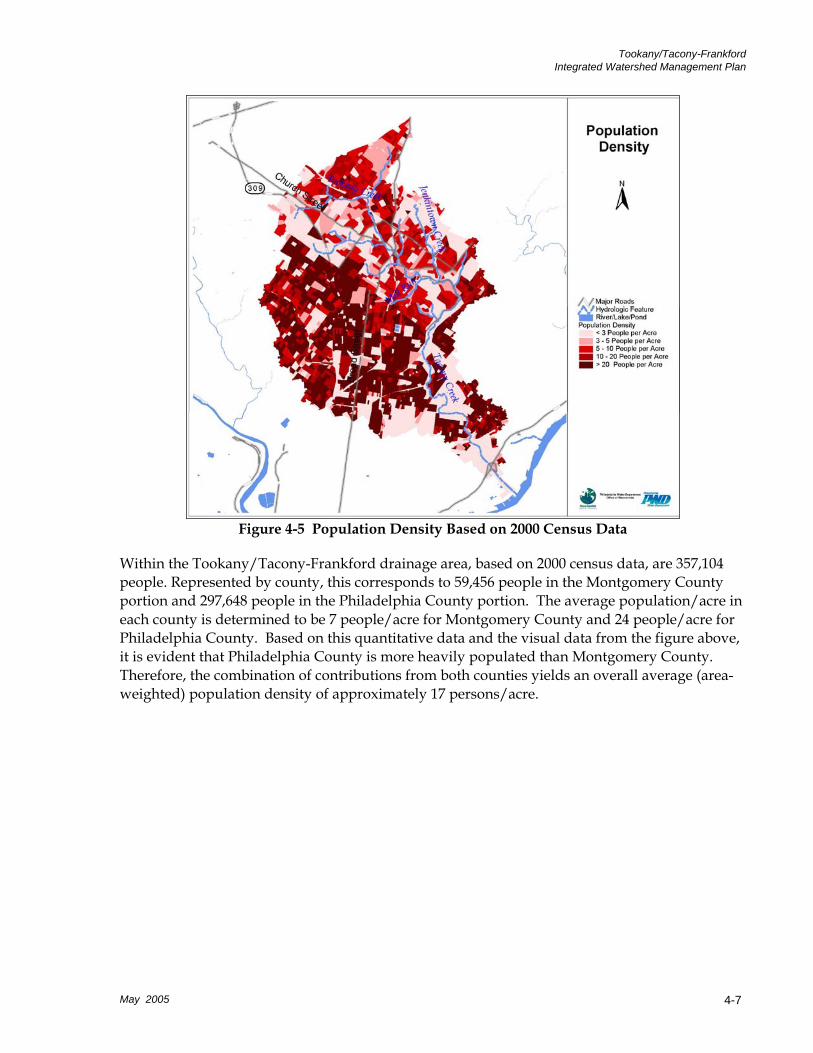
Tookany/Tacony-Frankford Integrated Watershed Management Plan
Figure 4-5 Population Density Based on 2000 Census Data
May 2005 4-7
Within the Tookany/Tacony-Frankford drainage area, based on 2000 census data, are 357,104 people. Represented by county, this corresponds to 59,456 people in the Montgomery County portion and 297,648 people in the Philadelphia County portion. The average population/acre in each county is determined to be 7 people/acre for Montgomery County and 24 people/acre for Philadelphia County. Based on this quantitative data and the visual data from the figure above, it is evident that Philadelphia County is more heavily populated than Montgomery County. Therefore, the combination of contributions from both counties yields an overall average (area-weighted) population density of approximately 17 persons/acre.
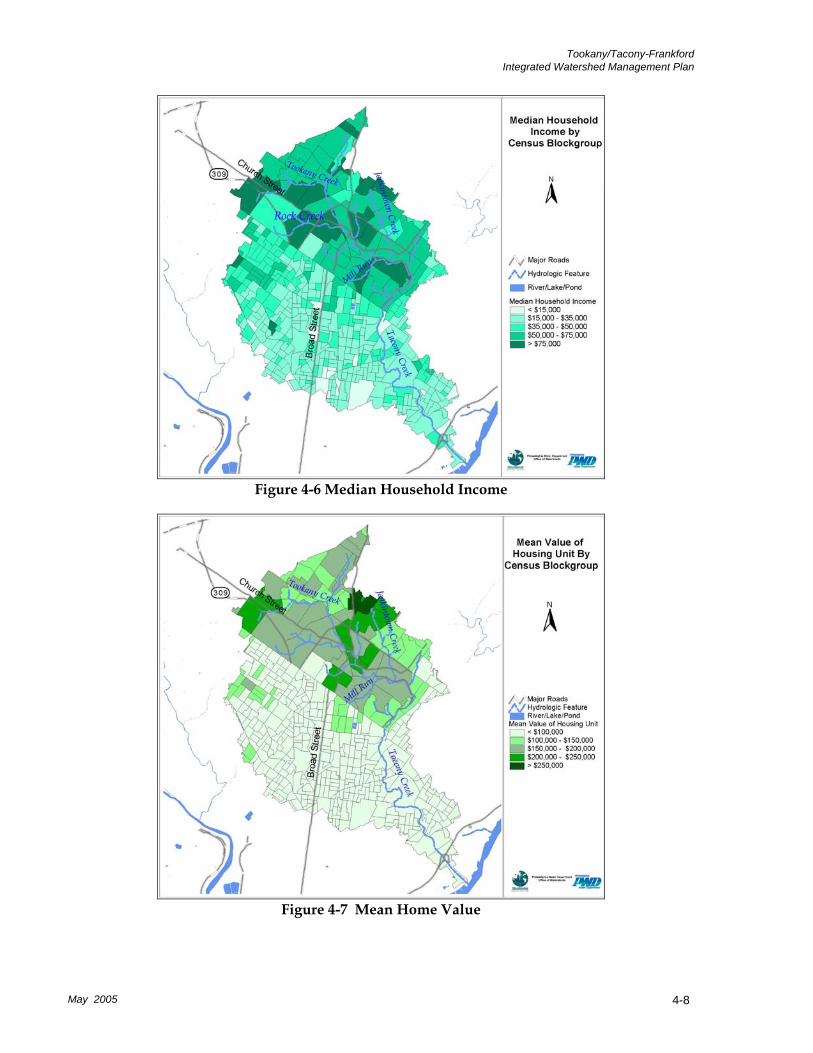
Tookany/Tacony-Frankford Integrated Watershed Management Plan
Figure 4-6 Median Household Income
May 2005 4-8
Figure 4-7 Mean Home Value
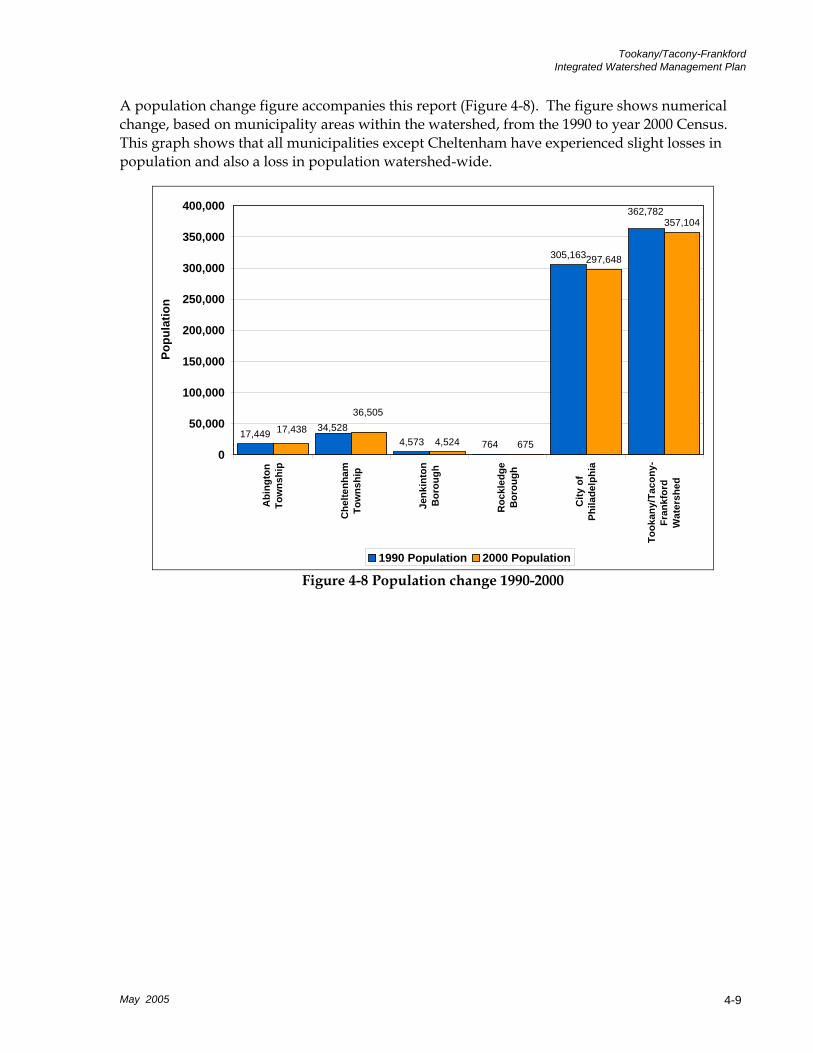
Tookany/Tacony-Frankford Integrated Watershed Management Plan
A population change figure accompanies this report (Figure 4-8). The figure shows numerical change, based on municipality areas within the watershed, from the 1990 to year 2000 Census. This graph shows that all municipalities except Cheltenham have experienced slight losses in population and also a loss in population watershed-wide.
17,4494,573 764
305,163
4,524 675
297,648
357,104362,782
34,52817,438
36,505
0
50,000
100,000
150,000
200,000
250,000
300,000
350,000
400,000
Abi
ngto
nTo
wns
hip
Che
ltenh
amTo
wns
hip
Jenk
into
nB
orou
gh
Roc
kled
geB
orou
gh
City
of
Phila
delp
hia
Took
any/
Taco
ny-
Fran
kfor
dW
ater
shed
Popu
latio
n
1990 Population 2000 Population
May 2005 4-9
Figure 4-8 Population change 1990-2000

Tookany/Tacony-Frankford Integrated Watershed Management Plan
4.2 Watershed Status and Trends
This section was developed to serve as a basis for understanding the state of the Tookany/Tacony-Frankford watershed, its relative environmental quality, and trends with respect to the management of factors that influence its quality. The report details the history and current conditions of the watershed and attempts to establish trends associated with a host of progress indicators. The results presented in this report were derived from past studies on the watershed and from recent data collection efforts conducted by the Philadelphia Water Department. 21 indicators were identified:
The Land Use and Stream Health Relationship Indicator 1: Land Use and Impervious Cover Flow Conditions and Living Resources Indicator 2: Streamflow Indicator 3: Stream Channels and Aquatic Habitat Indicator 4: Restoration Projects Indicator 5: Fish Indicator 6: Benthos Water Quality Indicator 7: Effects on Public Health (Bacteria) Indicator 8: Effects on Public Health (Metals and Fish Consumption) Indicator 9: Effects on Aquatic Life (Dissolved Oxygen) Pollutants and Their Sources Indicator 10: Point Sources Indicator 11: Non-point Sources The Stream Corridor Indicator 12: Riparian Corridor Indicator 13: Wetlands and Woodlands Indicator 14: Wildlife Quality of Life Indicator 15: Flooding Indicator 16: Public Understanding and Community Stewardship Indicator 17: School-Based Education Indicator 18: Recreational Use and Aesthetics Indicator 19: Local Government Stewardship Indicator 20: Business and Institutional Stewardship Indicator 21: Cultural and Historic Resources
May 2005 4-10

Tookany/Tacony-Frankford Integrated Watershed Management Plan
The Land Use and Stream Health Relationship Indicator 1: Land Use and Impervious Cover Urbanization of natural lands affects watershed hydrology, water quality, stream stability, and ecology. One of the primary indicators of watershed health is the percent of impervious cover in the watershed. Based on numerous research efforts, studies, and observations, a general categorization of watersheds has been widely applied to watershed management based on percent impervious cover (Schueler 1995). Table 4-1 summarizes several of the impacts of traditional development on streams and watersheds, most of which are created by the addition of impervious cover across the portions of the land surface.
Table 4-1 Impervious Cover as an Indicator of Stream Health (Schueler 1995) Characteristic Sensitive Degrading Non-Supporting Percent Impervious Cover
0% to 10% 11% to 25% 26% to 100%
Channel Stability Stable Unstable Highly Unstable Water Quality Good to Excellent Fair to Good Fair to Poor Stream Biodiversity Good to Excellent Fair to Good Poor Pollutants of Concern Sediment and
temperature only Also nutrients and metals
Also bacteria
This indicator measures:
GIS-estimated impervious cover of each municipality (% of total area) Model-estimated Directly Connected Impervious Area (DCIA) of each subwatershed (% of
total area) Open space in each municipality (% of total area) Publicly-owned land in each municipality (% of total area) Vacant Land
Where We Were: By 1820, the majority of the woodland in the watershed had been cut down for use as fuel and for construction. After this time, the land use of the watershed began to change drastically. During the 1890’s there were transportation improvements which brought to the watershed new industries that were seeking to take advantage of the growing riverfront industrial community. Streets were laid and roads, houses, churches, and stores were built. During the 19th and early 20th centuries, the Tookany/Tacony-Frankford Watershed became an industry center for textile production. Many mills and factories were built in the flood plains of the stream and the tributaries. In the early 20th century, in order to protect the creek from further pollution, the City of Philadelphia set aside hundreds of acres of parkland along the creek, called the Fairmount Park System, which included Juniata Park and Tacony Creek Park in the Tacony-Frankford Watershed.
Since World War II, half a million people have left Philadelphia, which has increased the amount of vacant land. Incentives for the construction of single-homes in the suburbs along with many other factors created a flight of people out of the city and into the suburbs, leaving many building and lots vacant and untended. Vacant land is unwanted because abandoned properties decrease the value of homes within the neighborhood and is a drain on city resources.
May 2005 4-11
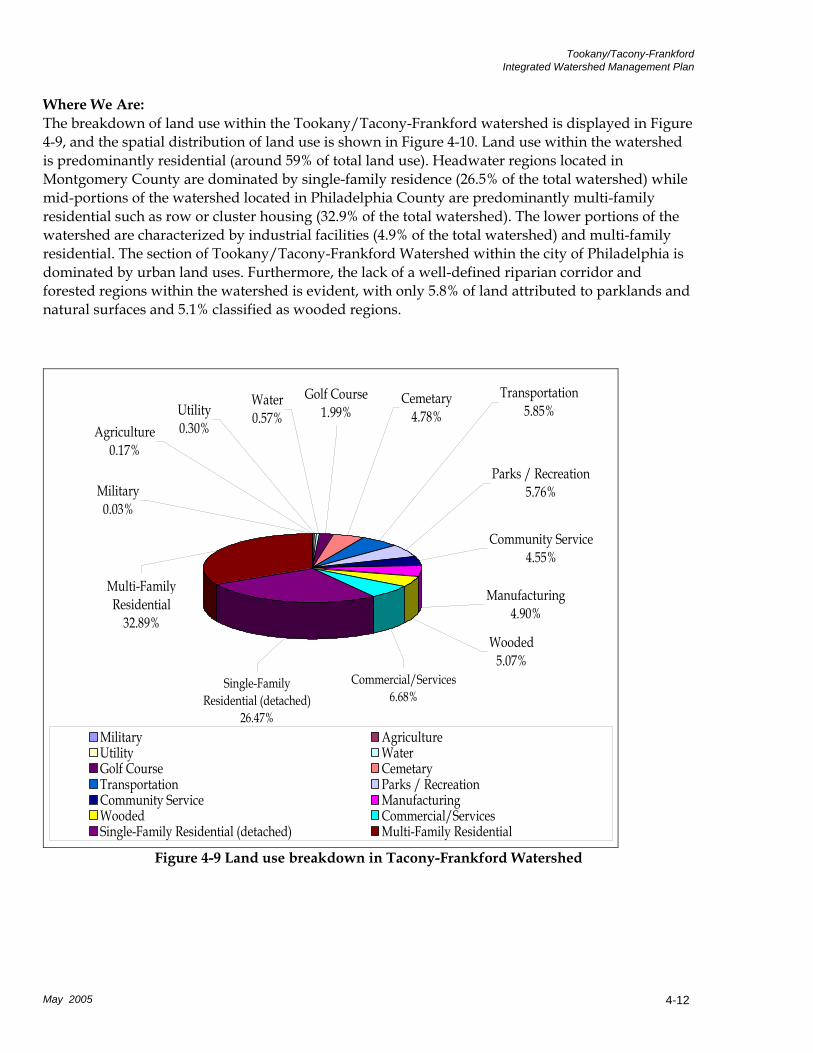
Tookany/Tacony-Frankford Integrated Watershed Management Plan
Where We Are: The breakdown of land use within the Tookany/Tacony-Frankford watershed is displayed in Figure 4-9, and the spatial distribution of land use is shown in Figure 4-10. Land use within the watershed is predominantly residential (around 59% of total land use). Headwater regions located in Montgomery County are dominated by single-family residence (26.5% of the total watershed) while mid-portions of the watershed located in Philadelphia County are predominantly multi-family residential such as row or cluster housing (32.9% of the total watershed). The lower portions of the watershed are characterized by industrial facilities (4.9% of the total watershed) and multi-family residential. The section of Tookany/Tacony-Frankford Watershed within the city of Philadelphia is dominated by urban land uses. Furthermore, the lack of a well-defined riparian corridor and forested regions within the watershed is evident, with only 5.8% of land attributed to parklands and natural surfaces and 5.1% classified as wooded regions.
Manufacturing4.90%
Commercial/Services6.68%
Single-Family Residential (detached)
26.47%
Wooded5.07%
Community Service4.55%
Parks / Recreation5.76%
Transportation5.85%
Cemetary4.78%
Water0.57%
Golf Course1.99%
Military0.03%
Utility0.30%Agriculture
0.17%
Multi-Family Residential
32.89%
Military AgricultureUtility WaterGolf Course CemetaryTransportation Parks / RecreationCommunity Service ManufacturingWooded Commercial/ServicesSingle-Family Residential (detached) Multi-Family Residential
Figure 4-9 Land use breakdown in Tacony-Frankford Watershed
May 2005 4-12
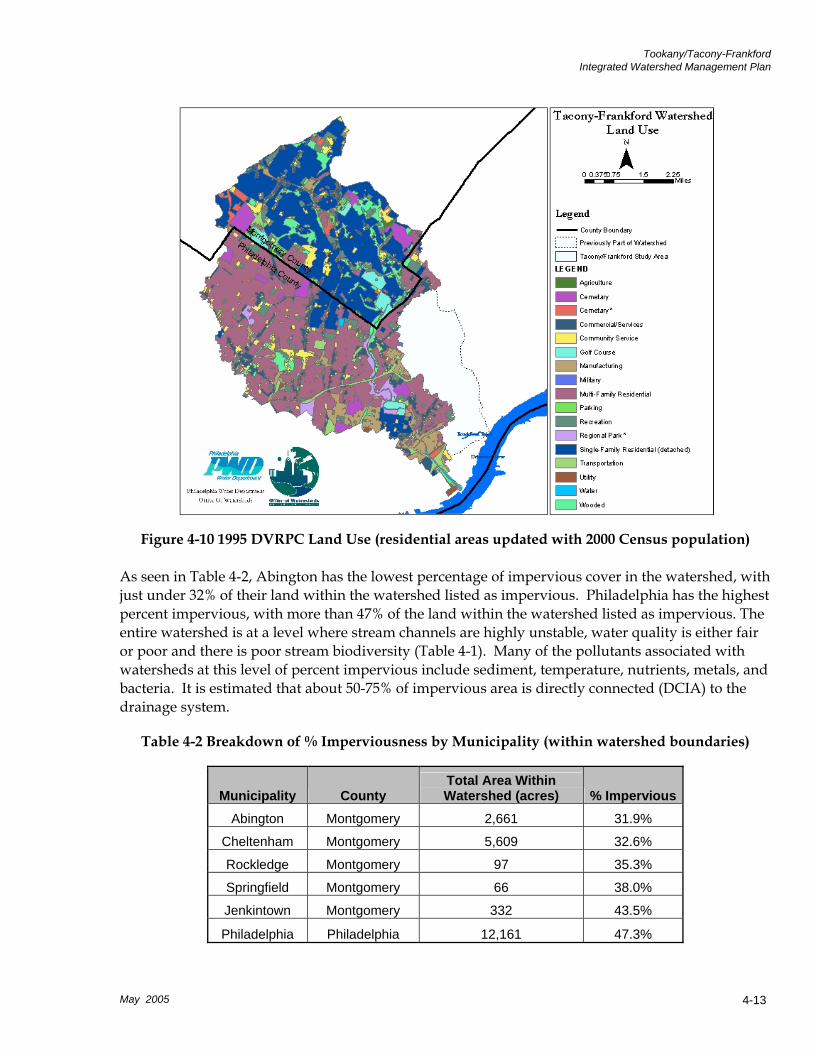
Tookany/Tacony-Frankford Integrated Watershed Management Plan
Figure 4-10 1995 DVRPC Land Use (residential areas updated with 2000 Census population)
As seen in Table 4-2, Abington has the lowest percentage of impervious cover in the watershed, with just under 32% of their land within the watershed listed as impervious. Philadelphia has the highest percent impervious, with more than 47% of the land within the watershed listed as impervious. The entire watershed is at a level where stream channels are highly unstable, water quality is either fair or poor and there is poor stream biodiversity (Table 4-1). Many of the pollutants associated with watersheds at this level of percent impervious include sediment, temperature, nutrients, metals, and bacteria. It is estimated that about 50-75% of impervious area is directly connected (DCIA) to the drainage system.
Table 4-2 Breakdown of % Imperviousness by Municipality (within watershed boundaries)
Municipality County Total Area Within Watershed (acres) % Impervious
Abington Montgomery 2,661 31.9%
Cheltenham Montgomery 5,609 32.6%
Rockledge Montgomery 97 35.3%
Springfield Montgomery 66 38.0%
Jenkintown Montgomery 332 43.5%
Philadelphia Philadelphia 12,161 47.3%
May 2005 4-13
Tookany/Tacony-Frankford Integrated Watershed Management Plan
From the land use data, the part of each municipality that lies within the watershed was analyzed to determine the amount of open space and the amount of publicly owned land. The watershed on a whole averages about 17% open space and 19% publicly owned land. As seen in Table 4-3, the amount of open space varies by municipality within the watersheds, with Jenkintown with as little as 3.5% open space and with Rockledge with as much as 30% of their land within the watershed as open space. Open space includes categories such as agriculture, cemeteries, golf courses, regional parks, urban recreation areas, water, wetlands and wooded areas. Publicly owned land varied greatly, depending on municipality, with the small portion of Springfield that lies within the watershed having only 8% publicly owned land, and Rockledge with the most publicly owned land, with almost 28%. Publicly owned land included cemeteries, commercial, transportation, regional parks, urban recreation areas, water, and wetlands.
Table 4-3 Estimated Open Space and Publicly Owned Land
Municipality County Total Area Within Watershed (acres)
Publicly Owned (% of total)
Open Space (% of total)
Abington Montgomery 2,661 17.2% 27.0%
Cheltenham Montgomery 5,609 15.0% 23.6%
Rockledge Montgomery 97 27.9% 30.6%
Springfield Montgomery 66 8.1% 5.9%
Jenkintown Montgomery 332 20.5% 3.5%
Philadelphia Philadelphia 12,161 25.9% 14.4% The City of Philadelphia began a program in June 2001, named Neighborhood Transformation Initiative (NTI) that aims at revitalizing Philadelphia neighborhoods. NTI includes a vacant lot program that cleans and maintains vacant lots throughout the City to free them of debris and transform some of them into green space. Through the NTI program, the City’s 31,000 vacant lots were cleaned at least once and 33,950 tons of debris was removed. As of June 2003, the City had greened 470 vacant parcels of land (over 13 acres). Figure 4-11 displays the vacant lands in the City. Another aspect of NTI is demolishing dangerous vacant buildings. From 2000-2003, more that 4100 vacant buildings were demolished in Philadelphia.
May 2005 4-14
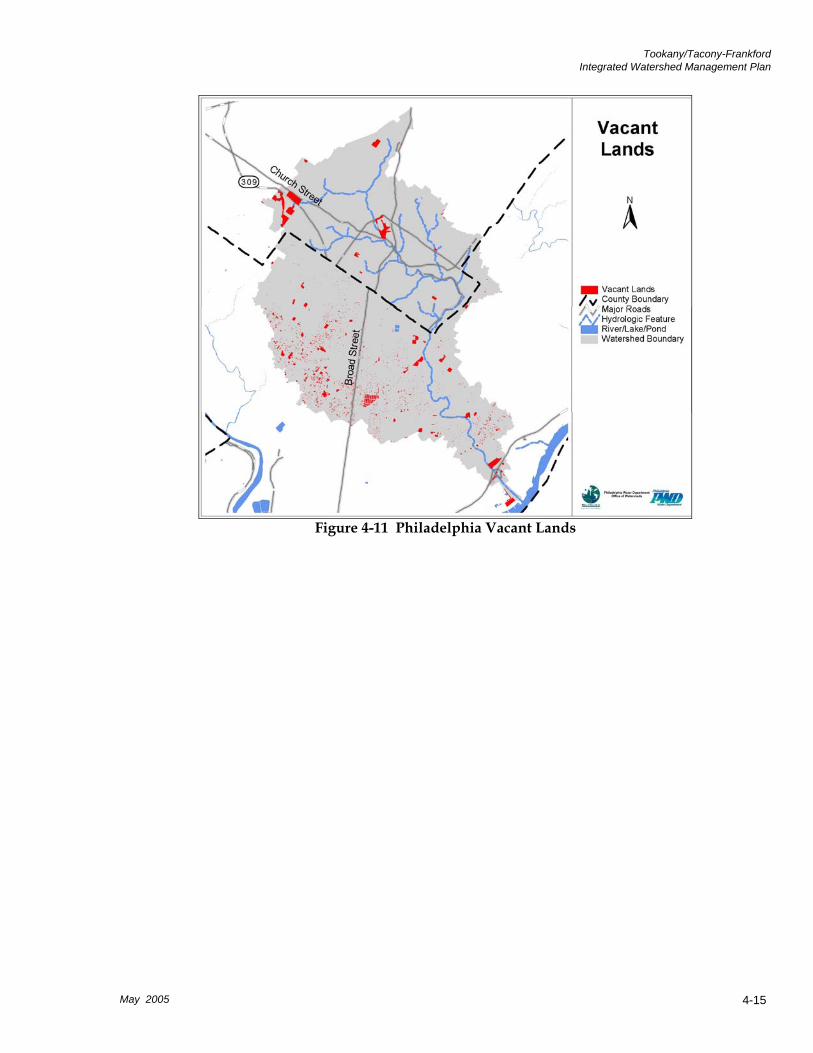
Tookany/Tacony-Frankford Integrated Watershed Management Plan
Figure 4-11 Philadelphia Vacant Lands
May 2005 4-15
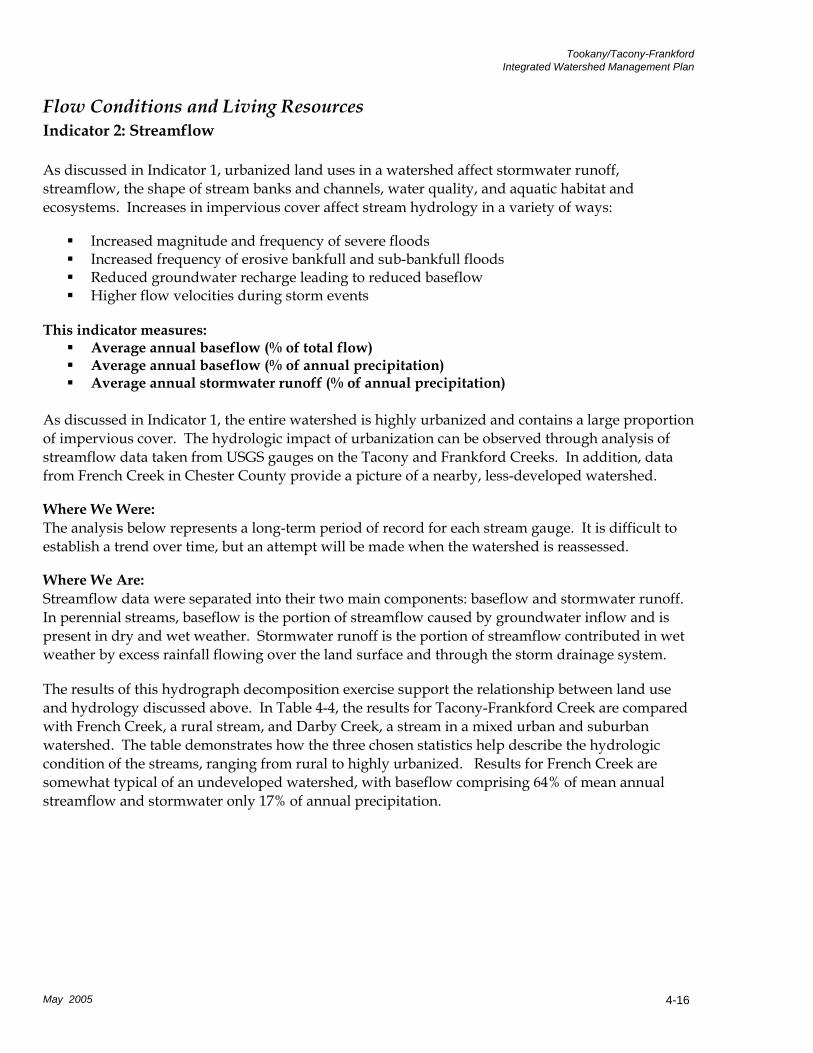
Tookany/Tacony-Frankford Integrated Watershed Management Plan
Flow Conditions and Living Resources Indicator 2: Streamflow As discussed in Indicator 1, urbanized land uses in a watershed affect stormwater runoff, streamflow, the shape of stream banks and channels, water quality, and aquatic habitat and ecosystems. Increases in impervious cover affect stream hydrology in a variety of ways:
Increased magnitude and frequency of severe floods Increased frequency of erosive bankfull and sub-bankfull floods Reduced groundwater recharge leading to reduced baseflow Higher flow velocities during storm events
This indicator measures:
Average annual baseflow (% of total flow) Average annual baseflow (% of annual precipitation) Average annual stormwater runoff (% of annual precipitation)
As discussed in Indicator 1, the entire watershed is highly urbanized and contains a large proportion of impervious cover. The hydrologic impact of urbanization can be observed through analysis of streamflow data taken from USGS gauges on the Tacony and Frankford Creeks. In addition, data from French Creek in Chester County provide a picture of a nearby, less-developed watershed.
Where We Were: The analysis below represents a long-term period of record for each stream gauge. It is difficult to establish a trend over time, but an attempt will be made when the watershed is reassessed.
Where We Are: Streamflow data were separated into their two main components: baseflow and stormwater runoff. In perennial streams, baseflow is the portion of streamflow caused by groundwater inflow and is present in dry and wet weather. Stormwater runoff is the portion of streamflow contributed in wet weather by excess rainfall flowing over the land surface and through the storm drainage system.
The results of this hydrograph decomposition exercise support the relationship between land use and hydrology discussed above. In Table 4-4, the results for Tacony-Frankford Creek are compared with French Creek, a rural stream, and Darby Creek, a stream in a mixed urban and suburban watershed. The table demonstrates how the three chosen statistics help describe the hydrologic condition of the streams, ranging from rural to highly urbanized. Results for French Creek are somewhat typical of an undeveloped watershed, with baseflow comprising 64% of mean annual streamflow and stormwater only 17% of annual precipitation.
May 2005 4-16
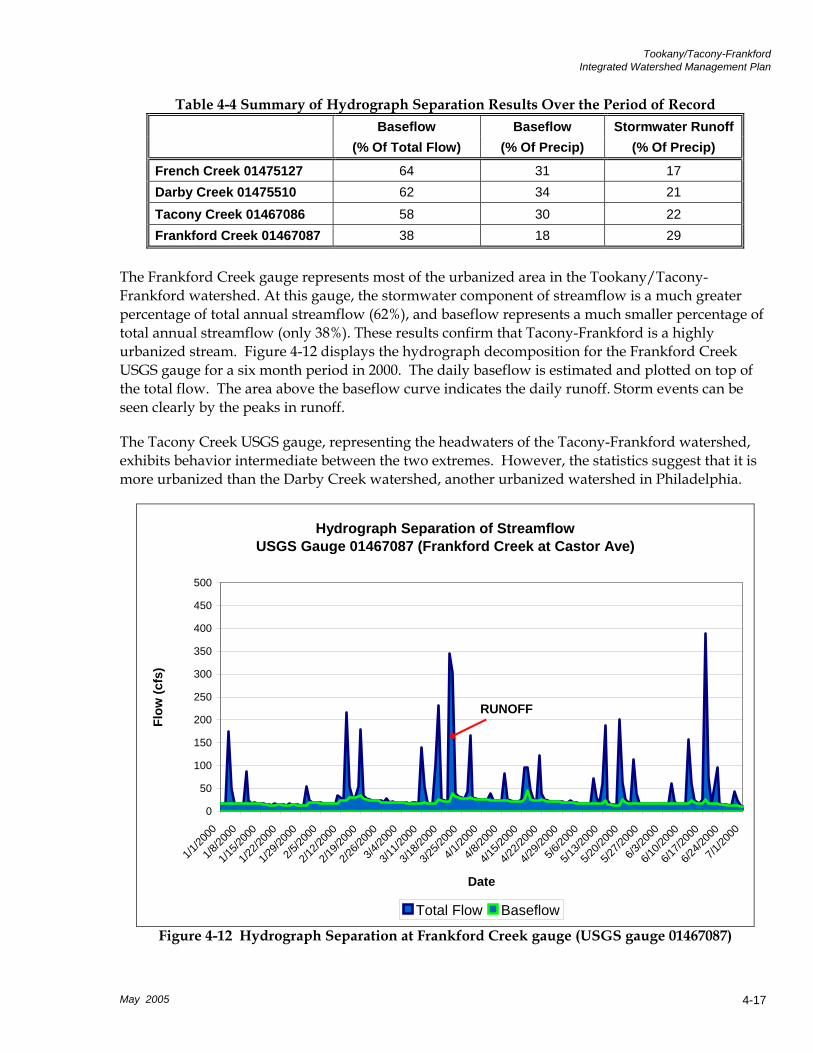
Tookany/Tacony-Frankford Integrated Watershed Management Plan
Table 4-4 Summary of Hydrograph Separation Results Over the Period of Record Baseflow Baseflow Stormwater Runoff (% Of Total Flow) (% Of Precip) (% Of Precip)
French Creek 01475127 64 31 17 Darby Creek 01475510 62 34 21
Tacony Creek 01467086 58 30 22 Frankford Creek 01467087 38 18 29
The Frankford Creek gauge represents most of the urbanized area in the Tookany/Tacony-Frankford watershed. At this gauge, the stormwater component of streamflow is a much greater percentage of total annual streamflow (62%), and baseflow represents a much smaller percentage of total annual streamflow (only 38%). These results confirm that Tacony-Frankford is a highly urbanized stream. Figure 4-12 displays the hydrograph decomposition for the Frankford Creek USGS gauge for a six month period in 2000. The daily baseflow is estimated and plotted on top of the total flow. The area above the baseflow curve indicates the daily runoff. Storm events can be seen clearly by the peaks in runoff.
The Tacony Creek USGS gauge, representing the headwaters of the Tacony-Frankford watershed, exhibits behavior intermediate between the two extremes. However, the statistics suggest that it is more urbanized than the Darby Creek watershed, another urbanized watershed in Philadelphia.
Hydrograph Separation of StreamflowUSGS Gauge 01467087 (Frankford Creek at Castor Ave)
0
50
100
150
200
250
300
350
400
450
500
1/1/20
00
1/8/20
00
1/15/2
000
1/22/2
000
1/29/2
000
2/5/20
00
2/12/2
000
2/19/2
000
2/26/2
000
3/4/20
00
3/11/2
000
3/18/2
000
3/25/2
000
4/1/20
00
4/8/20
00
4/15/2
000
4/22/2
000
4/29/2
000
5/6/20
00
5/13/2
000
5/20/2
000
5/27/2
000
6/3/20
00
6/10/2
000
6/17/2
000
6/24/2
000
7/1/20
00
Date
Flow
(cfs
)
Total Flow Baseflow
RUNOFF
Figure 4-12 Hydrograph Separation at Frankford Creek gauge (USGS gauge 01467087)
May 2005 4-17
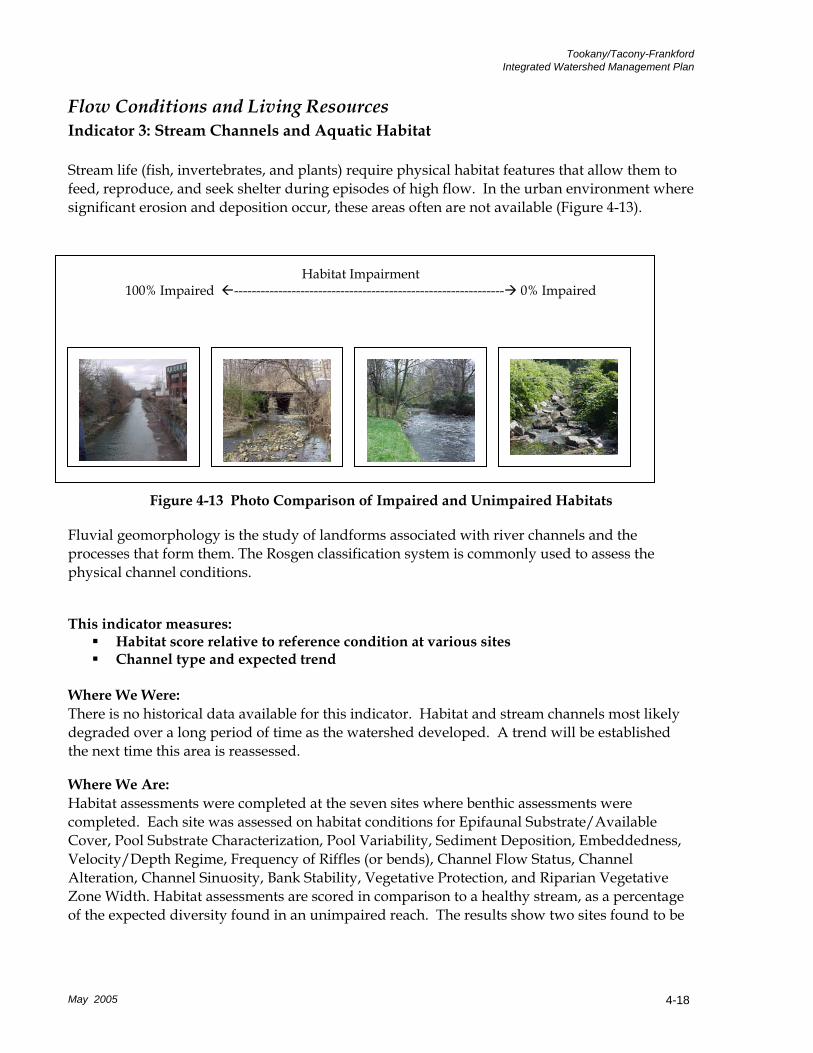
Tookany/Tacony-Frankford Integrated Watershed Management Plan
Flow Conditions and Living Resources Indicator 3: Stream Channels and Aquatic Habitat Stream life (fish, invertebrates, and plants) require physical habitat features that allow them to feed, reproduce, and seek shelter during episodes of high flow. In the urban environment where significant erosion and deposition occur, these areas often are not available (Figure 4-13).
Habitat Impairment 100% Impaired ------------------------------------------------------------- 0% Impaired
Figure 4-13 Photo Comparison of Impaired and Unimpaired Habitats
Fluvial geomorphology is the study of landforms associated with river channels and the processes that form them. The Rosgen classification system is commonly used to assess the physical channel conditions.
This indicator measures:
Habitat score relative to reference condition at various sites Channel type and expected trend
Where We Were: There is no historical data available for this indicator. Habitat and stream channels most likely degraded over a long period of time as the watershed developed. A trend will be established the next time this area is reassessed.
Where We Are:
May 2005 4-18
Habitat assessments were completed at the seven sites where benthic assessments were completed. Each site was assessed on habitat conditions for Epifaunal Substrate/Available Cover, Pool Substrate Characterization, Pool Variability, Sediment Deposition, Embeddedness, Velocity/Depth Regime, Frequency of Riffles (or bends), Channel Flow Status, Channel Alteration, Channel Sinuosity, Bank Stability, Vegetative Protection, and Riparian Vegetative Zone Width. Habitat assessments are scored in comparison to a healthy stream, as a percentage of the expected diversity found in an unimpaired reach. The results show two sites found to be
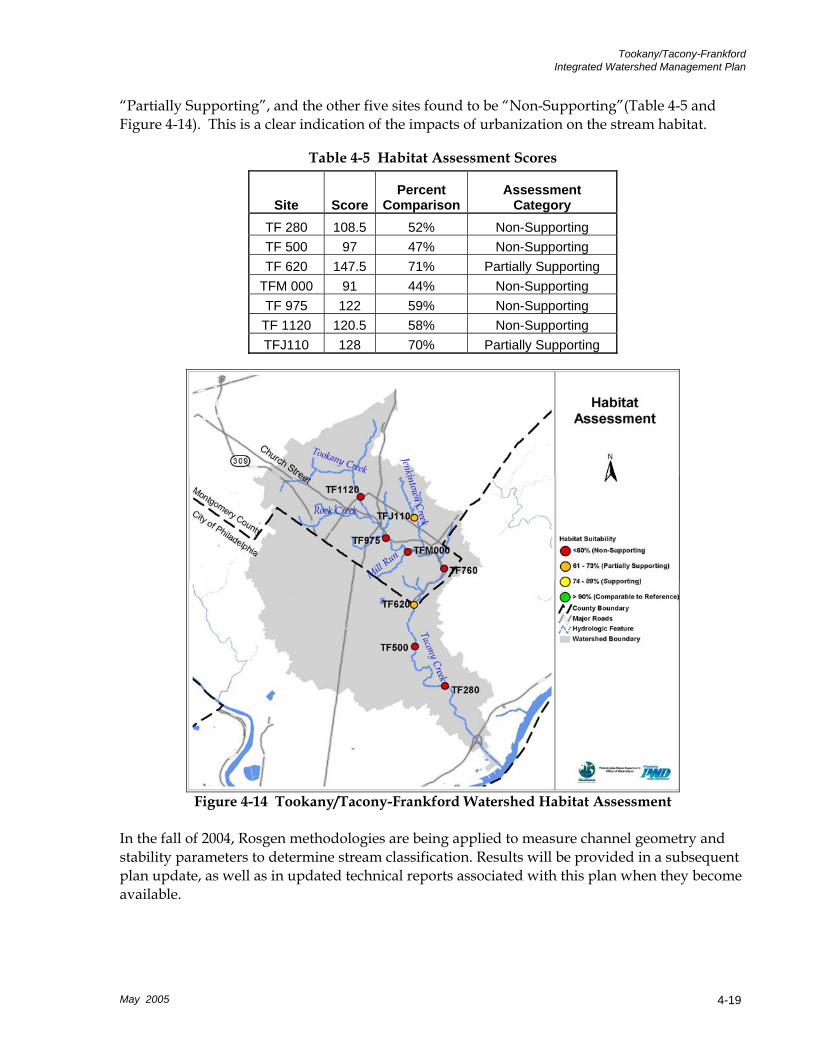
Tookany/Tacony-Frankford Integrated Watershed Management Plan
“Partially Supporting”, and the other five sites found to be “Non-Supporting”(Table 4-5 and Figure 4-14). This is a clear indication of the impacts of urbanization on the stream habitat.
Table 4-5 Habitat Assessment Scores
Site ScorePercent
ComparisonAssessment
Category TF 280 108.5 52% Non-Supporting TF 500 97 47% Non-Supporting TF 620 147.5 71% Partially Supporting
TFM 000 91 44% Non-Supporting TF 975 122 59% Non-Supporting
TF 1120 120.5 58% Non-Supporting TFJ110 128 70% Partially Supporting
Figure 4-14 Tookany/Tacony-Frankford Watershed Habitat Assessment
May 2005 4-19
In the fall of 2004, Rosgen methodologies are being applied to measure channel geometry and stability parameters to determine stream classification. Results will be provided in a subsequent plan update, as well as in updated technical reports associated with this plan when they become available.
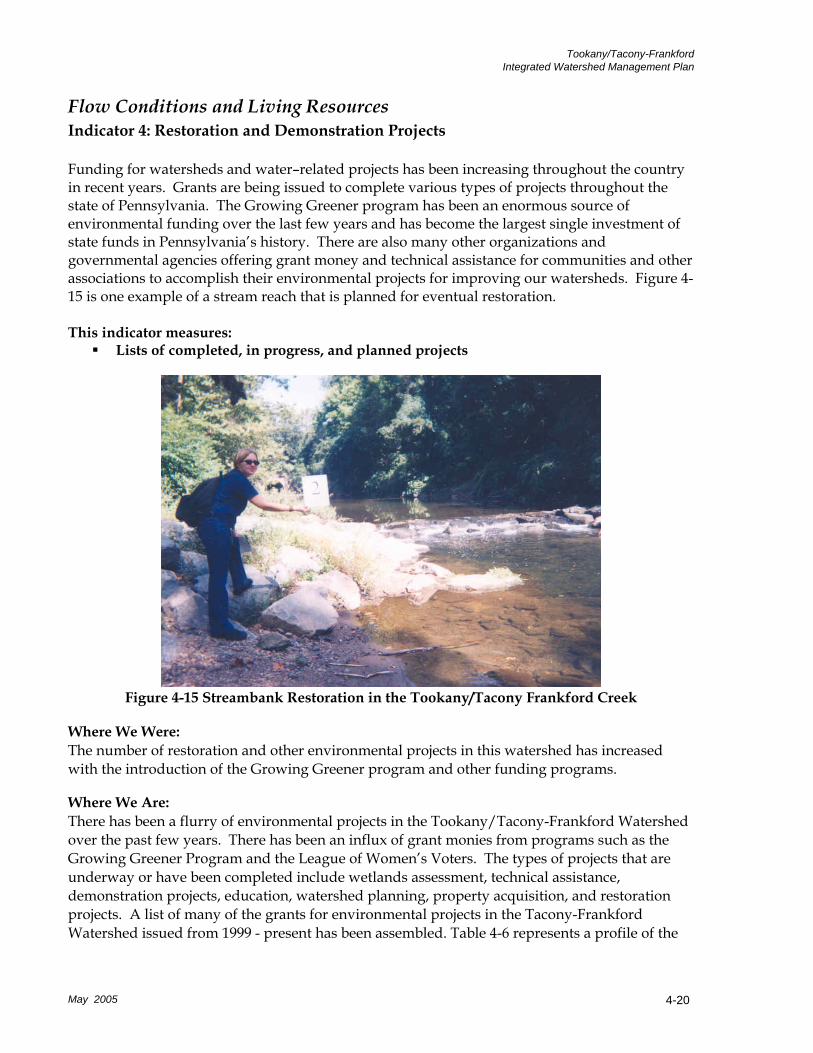
Tookany/Tacony-Frankford Integrated Watershed Management Plan
Flow Conditions and Living Resources Indicator 4: Restoration and Demonstration Projects Funding for watersheds and water–related projects has been increasing throughout the country in recent years. Grants are being issued to complete various types of projects throughout the state of Pennsylvania. The Growing Greener program has been an enormous source of environmental funding over the last few years and has become the largest single investment of state funds in Pennsylvania’s history. There are also many other organizations and governmental agencies offering grant money and technical assistance for communities and other associations to accomplish their environmental projects for improving our watersheds. Figure 4-15 is one example of a stream reach that is planned for eventual restoration.
This indicator measures:
Lists of completed, in progress, and planned projects
Figure 4-15 Streambank Restoration in the Tookany/Tacony Frankford Creek
Where We Were: The number of restoration and other environmental projects in this watershed has increased with the introduction of the Growing Greener program and other funding programs.
Where We Are:
May 2005 4-20
There has been a flurry of environmental projects in the Tookany/Tacony-Frankford Watershed over the past few years. There has been an influx of grant monies from programs such as the Growing Greener Program and the League of Women’s Voters. The types of projects that are underway or have been completed include wetlands assessment, technical assistance, demonstration projects, education, watershed planning, property acquisition, and restoration projects. A list of many of the grants for environmental projects in the Tacony-Frankford Watershed issued from 1999 - present has been assembled. Table 4-6 represents a profile of the
Tookany/Tacony-Frankford Integrated Watershed Management Plan
grants received and the projects being performed. The list is composed of 20 projects with a total amount of received funding totaling over $1.7 million for grants received for projects either completely or partially in the watershed.
One example project just completed in the Tookany/Tacony-Frankford Watershed that was conducted by the Watershed Partnership is the Rain Barrel Implementation Project. This project demonstrated the use of rain barrels as a method to reduce stormwater runoff. The rain barrel project enlisted members of the communities in and around Philadelphia, as well as several environmental organizations to install a rain barrel(s) on their personal property or on the property of their organization. This project included an educational component that consisted of instruction on the assembly and maintenance of the rain barrel, as well as the uses and benefits. The primary goal of this project was to implement a property-level Best Management Practice (BMP) to aid in the reduction of the volume of stormwater reaching the receiving stream or to increase the length of time it takes the stormwater to reach the receiving stream.
May 2005 4-21
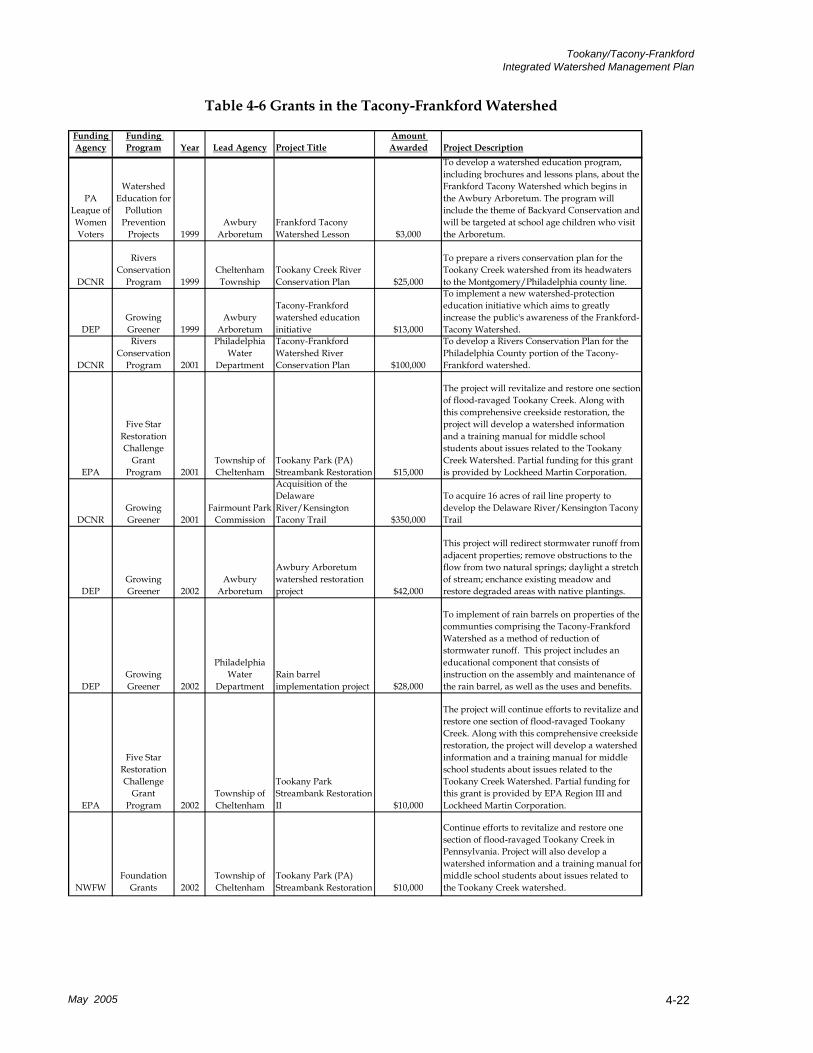
Tookany/Tacony-Frankford Integrated Watershed Management Plan
Table 4-6 Grants in the Tacony-Frankford Watershed
Funding Agency
Funding Program Year Lead Agency Project Title
Amount Awarded Project Description
PA League of Women Voters
Watershed Education for
Pollution Prevention
Projects 1999Awbury
ArboretumFrankford Tacony Watershed Lesson $3,000
To develop a watershed education program, including brochures and lessons plans, about the Frankford Tacony Watershed which begins in the Awbury Arboretum. The program will include the theme of Backyard Conservation and will be targeted at school age children who visit the Arboretum.
DCNR
Rivers Conservation
Program 1999Cheltenham Township
Tookany Creek River Conservation Plan $25,000
To prepare a rivers conservation plan for the Tookany Creek watershed from its headwaters to the Montgomery/Philadelphia county line.
DEPGrowing Greener 1999
Awbury Arboretum
Tacony-Frankford watershed education initiative $13,000
To implement a new watershed-protection education initiative which aims to greatly increase the public's awareness of the Frankford-Tacony Watershed.
DCNR
Rivers Conservation
Program 2001
Philadelphia Water
Department
Tacony-Frankford Watershed River Conservation Plan $100,000
To develop a Rivers Conservation Plan for the Philadelphia County portion of the Tacony-Frankford watershed.
EPA
Five Star Restoration Challenge
Grant Program 2001
Township of Cheltenham
Tookany Park (PA) Streambank Restoration $15,000
The project will revitalize and restore one section of flood-ravaged Tookany Creek. Along with this comprehensive creekside restoration, the project will develop a watershed information and a training manual for middle school students about issues related to the Tookany Creek Watershed. Partial funding for this grant is provided by Lockheed Martin Corporation.
DCNRGrowing Greener 2001
Fairmount Park Commission
Acquisition of the Delaware River/Kensington Tacony Trail $350,000
To acquire 16 acres of rail line property to develop the Delaware River/Kensington Tacony Trail
DEPGrowing Greener 2002
Awbury Arboretum
Awbury Arboretum watershed restoration project $42,000
This project will redirect stormwater runoff from adjacent properties; remove obstructions to the flow from two natural springs; daylight a stretch of stream; enchance existing meadow and restore degraded areas with native plantings.
DEPGrowing Greener 2002
Philadelphia Water
DepartmentRain barrel implementation project $28,000
To implement of rain barrels on properties of the communties comprising the Tacony-Frankford Watershed as a method of reduction of stormwater runoff. This project includes an educational component that consists of instruction on the assembly and maintenance of the rain barrel, as well as the uses and benefits.
EPA
Five Star Restoration Challenge
Grant Program 2002
Township of Cheltenham
Tookany Park Streambank Restoration II $10,000
The project will continue efforts to revitalize and restore one section of flood-ravaged Tookany Creek. Along with this comprehensive creekside restoration, the project will develop a watershed information and a training manual for middle school students about issues related to the Tookany Creek Watershed. Partial funding for this grant is provided by EPA Region III and Lockheed Martin Corporation.
NWFWFoundation
Grants 2002Township of Cheltenham
Tookany Park (PA) Streambank Restoration $10,000
Continue efforts to revitalize and restore one section of flood-ravaged Tookany Creek in Pennsylvania. Project will also develop a watershed information and a training manual formiddle school students about issues related to the Tookany Creek watershed.
May 2005 4-22
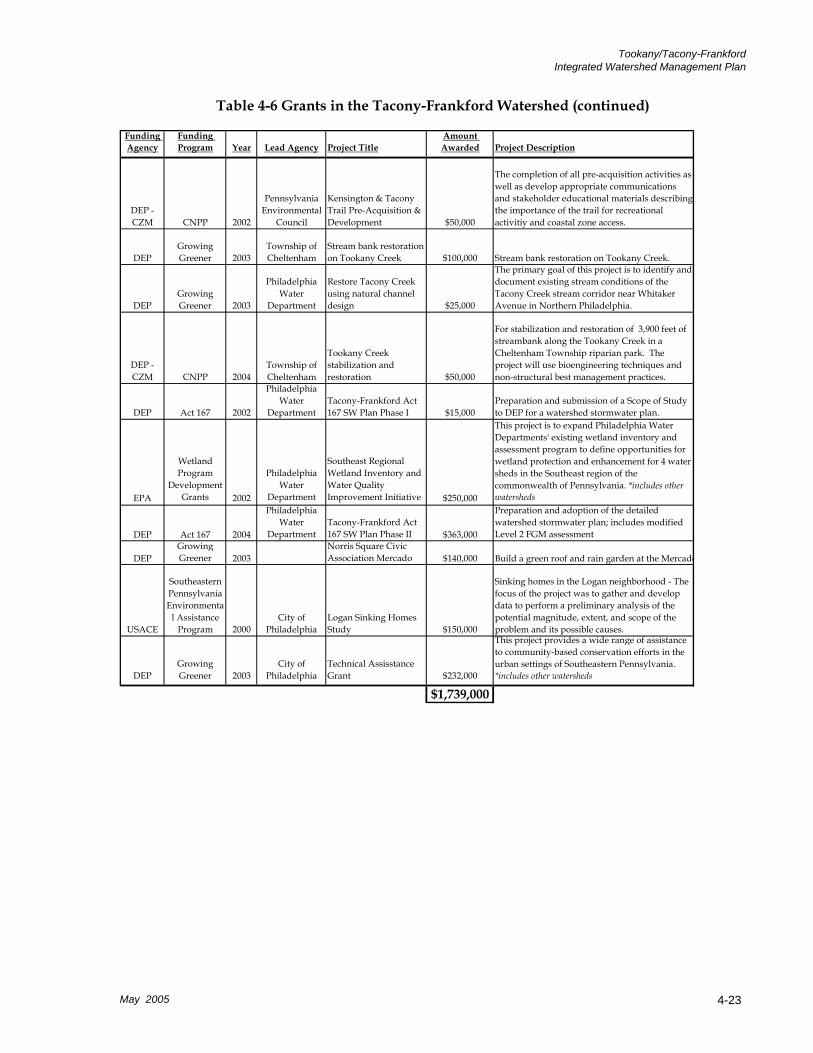
Tookany/Tacony-Frankford Integrated Watershed Management Plan
Table 4-6 Grants in the Tacony-Frankford Watershed (continued)
Funding Agency
Funding Program Year Lead Agency Project Title
Amount Awarded Project Description
DEP - CZM CNPP 2002
Pennsylvania Environmental
Council
Kensington & Tacony Trail Pre-Acquisition & Development $50,000
The completion of all pre-acquisition activities as well as develop appropriate communications and stakeholder educational materials describingthe importance of the trail for recreational activitiy and coastal zone access.
DEPGrowing Greener 2003
Township of Cheltenham
Stream bank restoration on Tookany Creek $100,000 Stream bank restoration on Tookany Creek.
DEPGrowing Greener 2003
Philadelphia Water
Department
Restore Tacony Creek using natural channel design $25,000
The primary goal of this project is to identify and document existing stream conditions of the Tacony Creek stream corridor near Whitaker Avenue in Northern Philadelphia.
DEP - CZM CNPP 2004
Township of Cheltenham
Tookany Creek stabilization and restoration $50,000
For stabilization and restoration of 3,900 feet of streambank along the Tookany Creek in a Cheltenham Township riparian park. The project will use bioengineering techniques and non-structural best management practices.
DEP Act 167 2002
Philadelphia Water
DepartmentTacony-Frankford Act 167 SW Plan Phase I $15,000
Preparation and submission of a Scope of Study to DEP for a watershed stormwater plan.
EPA
Wetland Program
Development Grants 2002
Philadelphia Water
Department
Southeast Regional Wetland Inventory and Water Quality Improvement Initiative $250,000
This project is to expand Philadelphia Water Departments' existing wetland inventory and assessment program to define opportunities for wetland protection and enhancement for 4 water sheds in the Southeast region of the commonwealth of Pennsylvania. *includes other watersheds
DEP Act 167 2004
Philadelphia Water
DepartmentTacony-Frankford Act 167 SW Plan Phase II $363,000
Preparation and adoption of the detailed watershed stormwater plan; includes modified Level 2 FGM assessment
DEPGrowing Greener 2003
Norris Square Civic Association Mercado $140,000 Build a green roof and rain garden at the Mercado
USACE
Southeastern Pennsylvania Environmenta
l Assistance Program 2000
City of Philadelphia
Logan Sinking Homes Study $150,000
Sinking homes in the Logan neighborhood - The focus of the project was to gather and develop data to perform a preliminary analysis of the potential magnitude, extent, and scope of the problem and its possible causes.
DEPGrowing Greener 2003
City of Philadelphia
Technical Assisstance Grant $232,000
This project provides a wide range of assistance to community-based conservation efforts in the urban settings of Southeastern Pennsylvania. *includes other watersheds
$1,739,000
May 2005 4-23
Tookany/Tacony-Frankford Integrated Watershed Management Plan
Flow Conditions and Living Resources Indicator 5: Fish Fish are good indicators of stream health because their presence requires favorable environmental conditions within a certain range of stream flow, water temperature, water quality, and channel habitat. Abundance and diversity of fish are great indicators of water quality. Other indicators are the amount of pollution tolerant fish and the amount of fish with abnormalities. A large percentage of the fish population made up of pollution tolerant species is undesirable because this indicates habitat deterioration and water quality degradation.
This indicator measures: Abundance and pollution tolerance of species found at various sites Fish community integrity relative to reference condition at various sites Whether stream meets criteria for trout-stocking
Where We Were: There is no historical data available for this indicator. A trend will be established the next time this area is reassessed.
Where We Are: A biological assessment of the Tookany/Tacony-Frankford Watershed was completed in 2000-2001 by the Philadelphia Water Department, with fish assessments at four locations on the main stem creek. The biological assessment locations are named according to river mile, and the four locations with fish assessments completed are TF 280, TF 620, TF 975, and TF 1120. The fish assessments looked at a variety of quantitative and qualitative analyses including species richness, species diversity, trophic composition relationships, pollution tolerance levels, Modified Index of Well-Being (MIWB), biomass per unit area, and species descriptions.
May 2005 4-24
The pollution tolerance metric identifies the abundance of tolerant, moderately tolerant and pollution intolerant individuals at the study site. Figure 4-16 shows the percentage of the total number of fish at each site, by their tolerance level. Both pollution tolerant and moderately tolerant species were found at each site, with pollution tolerant species being the predominant at every site. No pollution intolerant species were found during the fish assessment.
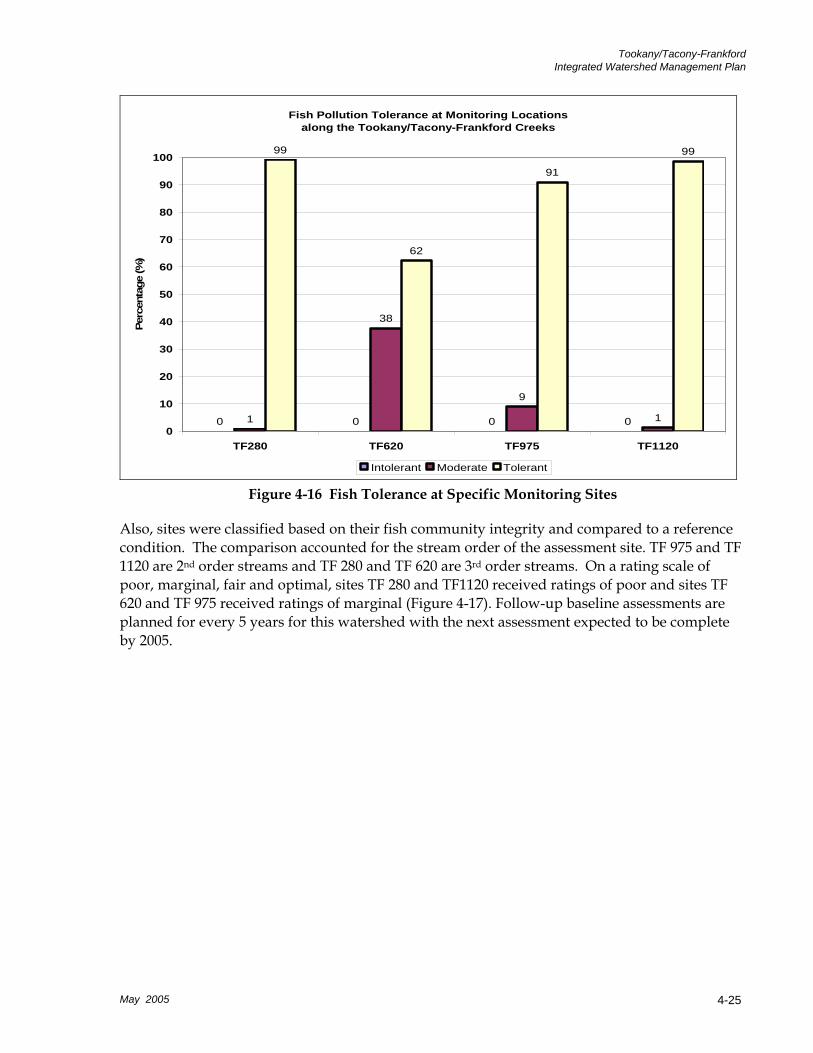
Tookany/Tacony-Frankford Integrated Watershed Management Plan
Fish Pollution Tolerance at Monitoring Locations along the Tookany/Tacony-Frankford Creeks
0 0 0 01
38
9
1
99
62
91
99
0
10
20
30
40
50
60
70
80
90
100
TF280 TF620 TF975 TF1120
Perc
enta
ge (%
)
Intolerant Moderate Tolerant
Figure 4-16 Fish Tolerance at Specific Monitoring Sites
May 2005 4-25
Also, sites were classified based on their fish community integrity and compared to a reference condition. The comparison accounted for the stream order of the assessment site. TF 975 and TF 1120 are 2nd order streams and TF 280 and TF 620 are 3rd order streams. On a rating scale of poor, marginal, fair and optimal, sites TF 280 and TF1120 received ratings of poor and sites TF 620 and TF 975 received ratings of marginal (Figure 4-17). Follow-up baseline assessments are planned for every 5 years for this watershed with the next assessment expected to be complete by 2005.
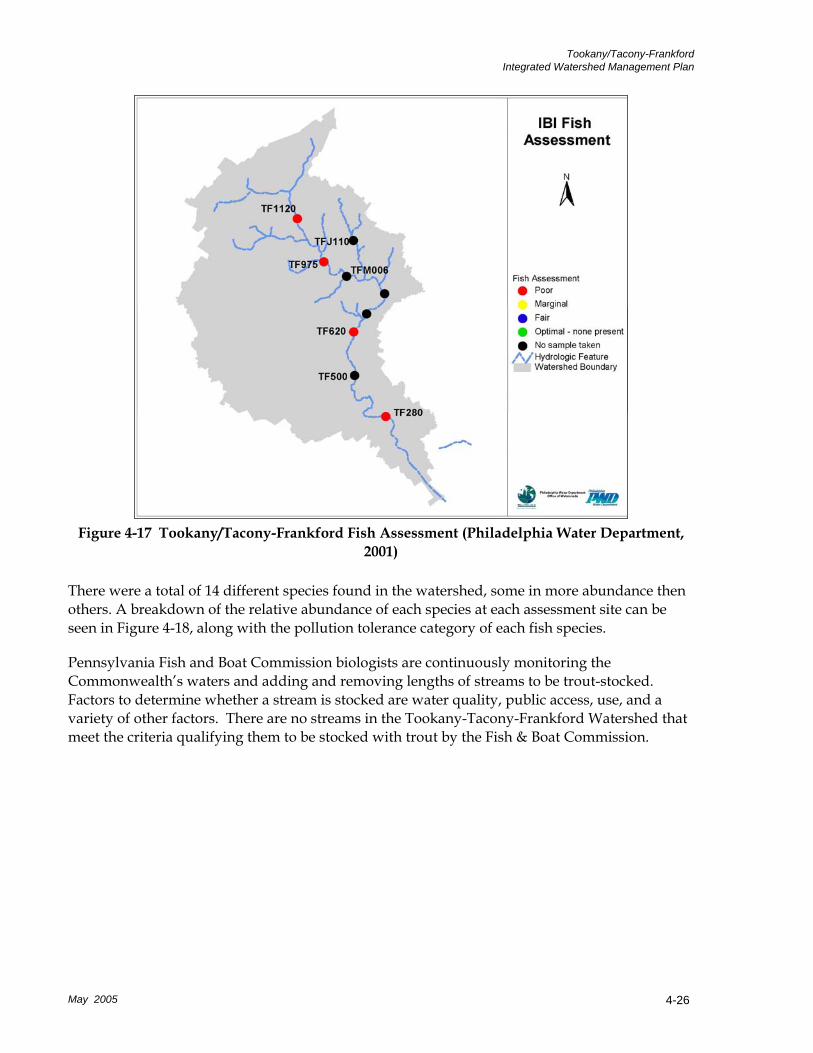
Tookany/Tacony-Frankford Integrated Watershed Management Plan
Figure 4-17 Tookany/Tacony-Frankford Fish Assessment (Philadelphia Water Department,
2001) There were a total of 14 different species found in the watershed, some in more abundance then others. A breakdown of the relative abundance of each species at each assessment site can be seen in Figure 4-18, along with the pollution tolerance category of each fish species.
Pennsylvania Fish and Boat Commission biologists are continuously monitoring the Commonwealth’s waters and adding and removing lengths of streams to be trout-stocked. Factors to determine whether a stream is stocked are water quality, public access, use, and a variety of other factors. There are no streams in the Tookany-Tacony-Frankford Watershed that meet the criteria qualifying them to be stocked with trout by the Fish & Boat Commission.
May 2005 4-26
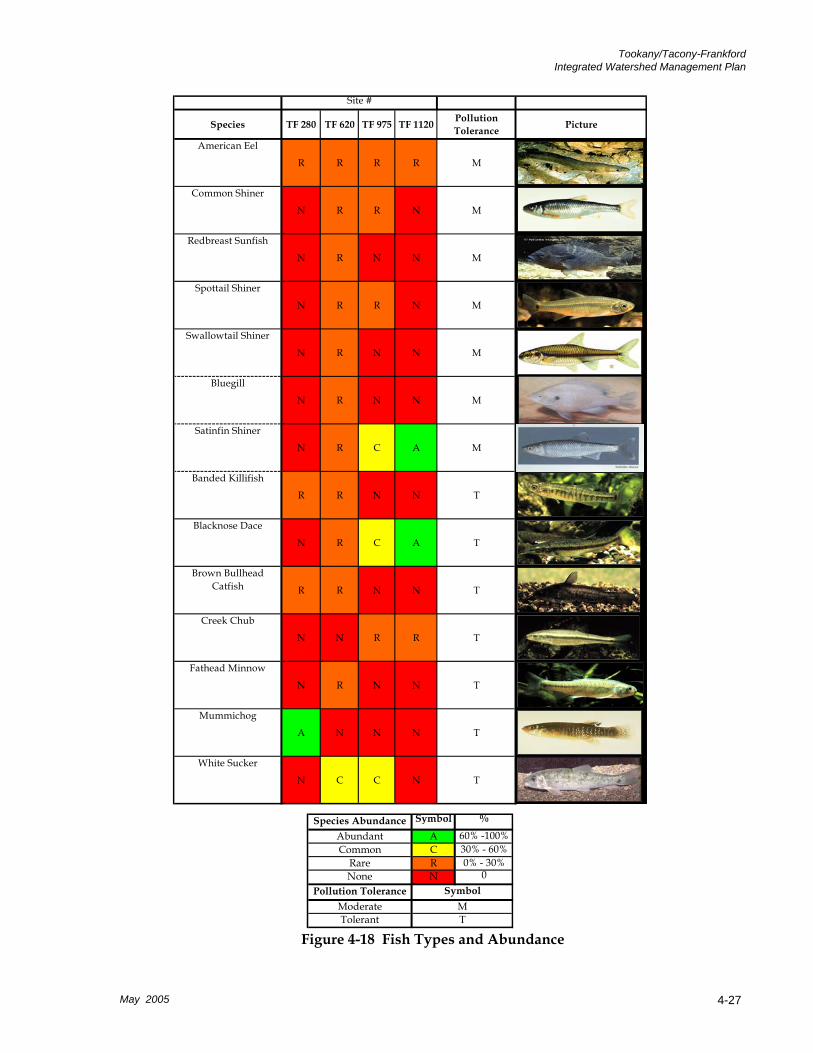
Tookany/Tacony-Frankford Integrated Watershed Management Plan
Species TF 280 TF 620 TF 975 TF 1120 Pollution Tolerance Picture
American Eel
R R R R M
Common Shiner
N R R N M
Redbreast Sunfish
N R N N M
Spottail Shiner
N R R N M
Swallowtail Shiner
N R N N M
Bluegill
N R N N M
Satinfin Shiner
N R C A M
Banded Killifish
R R N N T
Blacknose Dace
N R C A T
Brown Bullhead Catfish R R N N T
Creek Chub
N N R R T
Fathead Minnow
N R N N T
Mummichog
A N N N T
White Sucker
N C C N T
Site #
Species Abundance Symbol %
Abundant A 60% -100%Common C 30% - 60%
Rare R 0% - 30%None N 0
Pollution ToleranceModerateTolerant
SymbolMT
May 2005 4-27
Figure 4-18 Fish Types and Abundance


Tookany/Tacony-Frankford Integrated Watershed Management Plan
Flow Conditions and Living Resources Indicator 6: Benthos The community of organisms on the bottom of water bodies is a good indicator of long-term water quality and the overall health of an aquatic system. Benthic organisms play roles in the aquatic ecosystem similar to the ones terrestrial small plant and animal species play in land-based communities. Benthic communities respond to changes in the aquatic environment and often provide an indication of concerns or evidence of successful restoration projects. Figure 4-19 is an example of a benthic macroinvertebrate.
This indicator measures: State designation of attained and unattained reaches Benthic community integrity relative to reference condition at various sites
Figure 4-19 Life Cycle of a Mayfly
Where We Were: There is no historical data available for this indicator. A trend will be established when this area is reassessed.
Where We Are:
May 2005 4-29
The Pennsylvania DEP assesses the water quality of the waters of Pennsylvania and categorizes them according to their water quality status attainment. The assessments are found in the Pennsylvania Integrated Water Quality Monitoring and Assessment Report. Water bodies that do not meet water quality standards are designated as “impaired” and those that meet the designated water quality standards are designated as “attained”.
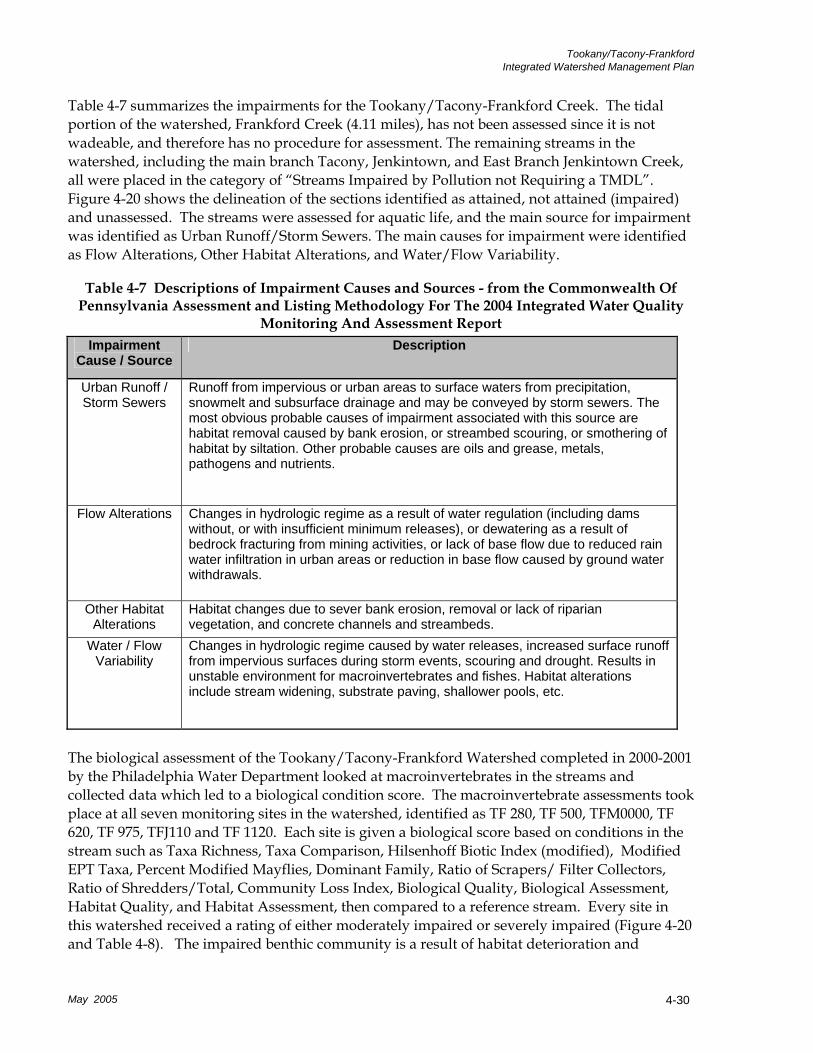
Tookany/Tacony-Frankford Integrated Watershed Management Plan
Table 4-7 summarizes the impairments for the Tookany/Tacony-Frankford Creek. The tidal portion of the watershed, Frankford Creek (4.11 miles), has not been assessed since it is not wadeable, and therefore has no procedure for assessment. The remaining streams in the watershed, including the main branch Tacony, Jenkintown, and East Branch Jenkintown Creek, all were placed in the category of “Streams Impaired by Pollution not Requiring a TMDL”. Figure 4-20 shows the delineation of the sections identified as attained, not attained (impaired) and unassessed. The streams were assessed for aquatic life, and the main source for impairment was identified as Urban Runoff/Storm Sewers. The main causes for impairment were identified as Flow Alterations, Other Habitat Alterations, and Water/Flow Variability.
Table 4-7 Descriptions of Impairment Causes and Sources - from the Commonwealth Of Pennsylvania Assessment and Listing Methodology For The 2004 Integrated Water Quality
Monitoring And Assessment Report Impairment
Cause / Source Description
Urban Runoff / Storm Sewers
Runoff from impervious or urban areas to surface waters from precipitation, snowmelt and subsurface drainage and may be conveyed by storm sewers. The most obvious probable causes of impairment associated with this source are habitat removal caused by bank erosion, or streambed scouring, or smothering of habitat by siltation. Other probable causes are oils and grease, metals, pathogens and nutrients.
Flow Alterations Changes in hydrologic regime as a result of water regulation (including dams without, or with insufficient minimum releases), or dewatering as a result of bedrock fracturing from mining activities, or lack of base flow due to reduced rain water infiltration in urban areas or reduction in base flow caused by ground water withdrawals.
Other Habitat Alterations
Habitat changes due to sever bank erosion, removal or lack of riparian vegetation, and concrete channels and streambeds.
Water / Flow Variability
Changes in hydrologic regime caused by water releases, increased surface runoff from impervious surfaces during storm events, scouring and drought. Results in unstable environment for macroinvertebrates and fishes. Habitat alterations include stream widening, substrate paving, shallower pools, etc.
May 2005 4-30
The biological assessment of the Tookany/Tacony-Frankford Watershed completed in 2000-2001 by the Philadelphia Water Department looked at macroinvertebrates in the streams and collected data which led to a biological condition score. The macroinvertebrate assessments took place at all seven monitoring sites in the watershed, identified as TF 280, TF 500, TFM0000, TF 620, TF 975, TFJ110 and TF 1120. Each site is given a biological score based on conditions in the stream such as Taxa Richness, Taxa Comparison, Hilsenhoff Biotic Index (modified), Modified EPT Taxa, Percent Modified Mayflies, Dominant Family, Ratio of Scrapers/ Filter Collectors, Ratio of Shredders/Total, Community Loss Index, Biological Quality, Biological Assessment, Habitat Quality, and Habitat Assessment, then compared to a reference stream. Every site in this watershed received a rating of either moderately impaired or severely impaired (Figure 4-20 and Table 4-8). The impaired benthic community is a result of habitat deterioration and
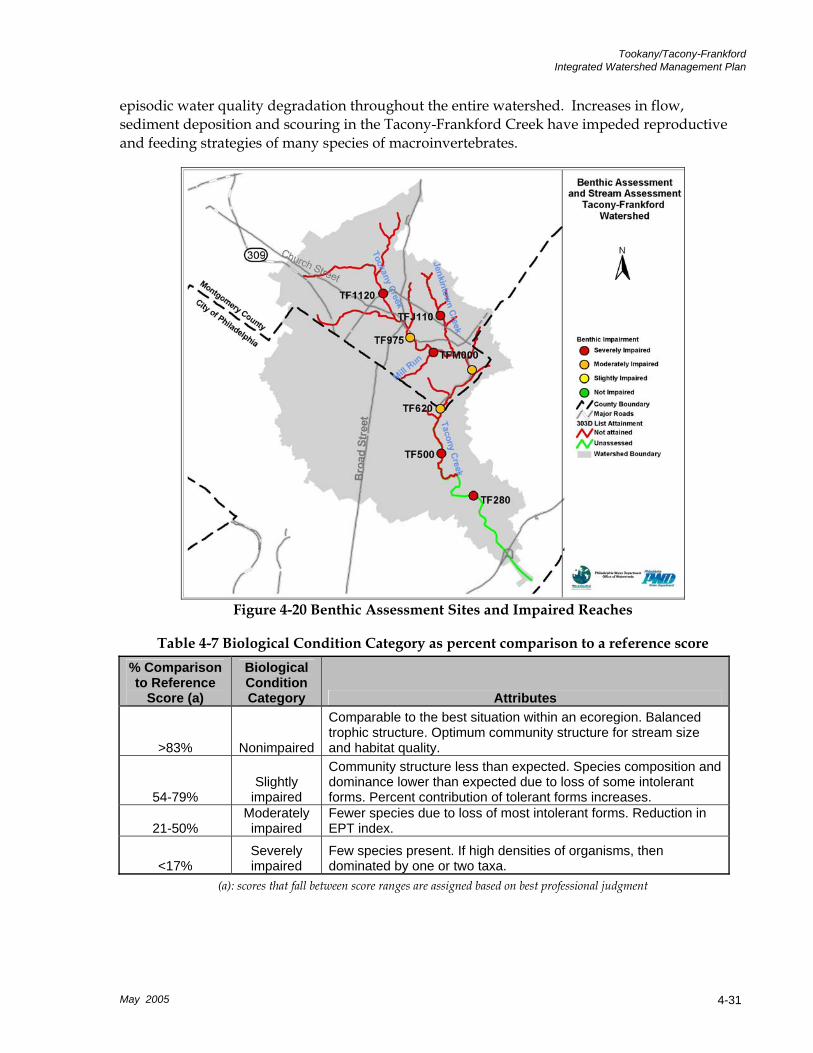
Tookany/Tacony-Frankford Integrated Watershed Management Plan
episodic water quality degradation throughout the entire watershed. Increases in flow, sediment deposition and scouring in the Tacony-Frankford Creek have impeded reproductive and feeding strategies of many species of macroinvertebrates.
Figure 4-20 Benthic Assessment Sites and Impaired Reaches
Table 4-7 Biological Condition Category as percent comparison to a reference score
% Comparison to Reference
Score (a)
Biological Condition Category Attributes
>83% Nonimpaired
Comparable to the best situation within an ecoregion. Balanced trophic structure. Optimum community structure for stream size and habitat quality.
54-79% Slightly
impaired
Community structure less than expected. Species composition and dominance lower than expected due to loss of some intolerant forms. Percent contribution of tolerant forms increases.
21-50% Moderately impaired
Fewer species due to loss of most intolerant forms. Reduction in EPT index.
<17% Severely impaired
Few species present. If high densities of organisms, then dominated by one or two taxa.
May 2005 4-31
(a): scores that fall between score ranges are assigned based on best professional judgment
Tookany/Tacony-Frankford Integrated Watershed Management Plan
Water Quality Indicator 7: Effects on Public Health (Bacteria) Fecal contamination of natural waters may originate from both human and animal sources and poses a threat to human health. Surface runoff transports waste material from pets, livestock, and other animals to surface waters. Wet weather sewer overflows (both SSOs and CSOs) introduce domestic wastewater constituents to surface water. Illegal or accidental connection of sanitary sewers to storm sewers may also result in discharges of raw wastewater. Municipal wastewater treatment plants and septic systems release some bacteria to surface waters, but these inputs are generally small.
Fecal coliform bacteria are a group of bacteria that are abundant in the intestines of warm blooded animals, including humans. Fecal coliform is a fairly accurate indicator of the presence of harmful bacteria in natural water, drinking water, and wastewater. Measures taken to reduce the input of fecal coliform to natural waters are likely to reduce the input of other microorganisms found in sewage and surface runoff.
The water quality standard for fecal coliform is as follows: during the swimming season (May 1 through September 30), the maximum fecal coliform level shall be a geometric mean of 200 per 100 mL based on five consecutive samples, each sample collected on different days; for the remainder of the year, the maximum fecal coliform level shall be a geometric mean of 2000 per 100 mL based on five consecutive samples collected on different days.
This indicator measures: Percent of fecal coliform samples meeting state standards at various sites
Where We Were: Approximately 100 samples of fecal coliform were taken between 1970 and 1980 at five different sites. For samples taken in the headwaters in Tacony and Jenkintown Creeks, approximately one-half to two-thirds met the current standard. For samples taken in Rock Creek and on the main stem at the Philadelphia-Montgomery county line, only a quarter of the samples met the standard. At the most downstream site at Castor Avenue, less than 15% of samples taken met the standard. Conditions under wet weather are not significantly worse than dry weather, suggesting that dry weather inputs were the main source of bacteria in the stream.
Where We Are: Samples were collected between June 2000 and October 2003 at seven sites in the watershed. Table 4-9 summarizes the results of the data collection and comparison to water quality standards. At each of three of the seven sites in the watershed, less than 67% of dry weather samples taken met the water quality standard. At each of the remaining four sites, less than 33% of dry weather samples taken met the water quality standard. Less than 10% of all wet weather samples at each of the seven sampling sites met the water quality standard.
May 2005 4-32
The two sites on the lower main stem were sampled in both the historical and 2000 – 2003 periods and can be directly compared. Over time, the percent of samples meeting the standard in dry weather improved slightly at both the main stem county-line site and the Castor Avenue
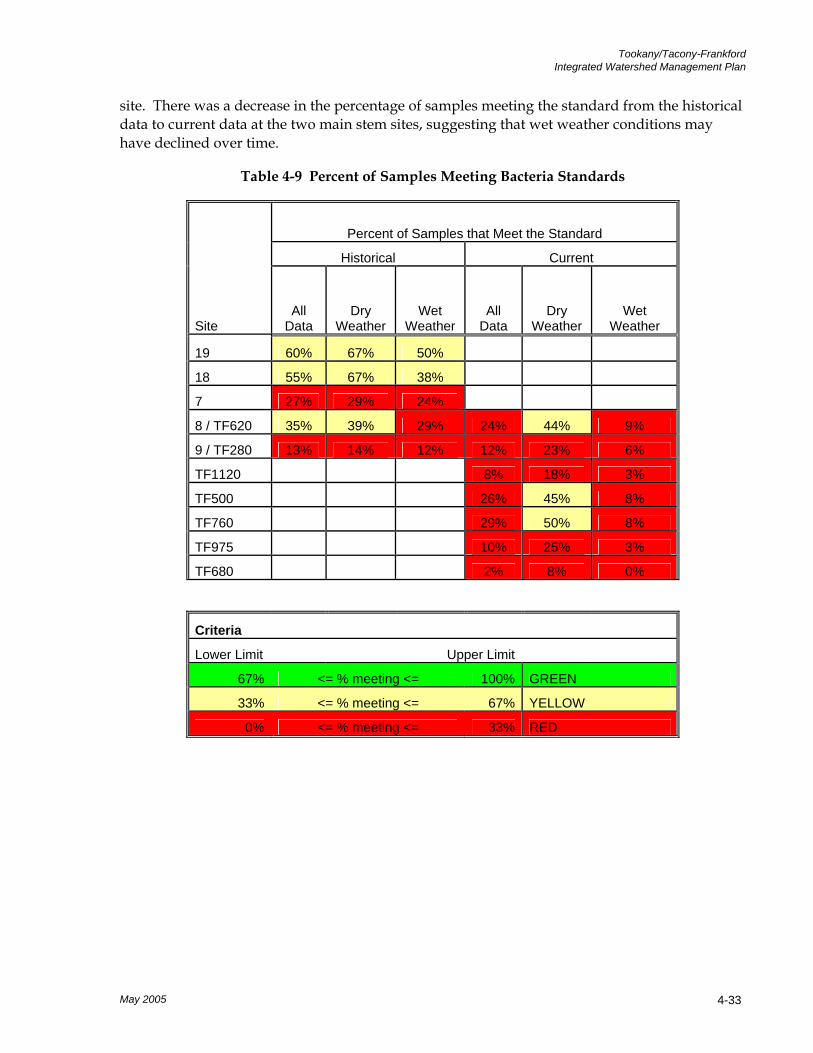
Tookany/Tacony-Frankford Integrated Watershed Management Plan
site. There was a decrease in the percentage of samples meeting the standard from the historical data to current data at the two main stem sites, suggesting that wet weather conditions may have declined over time.
Table 4-9 Percent of Samples Meeting Bacteria Standards
Percent of Samples that Meet the Standard
Historical Current
Site All
Data Dry
Weather Wet
Weather All
Data Dry
Weather Wet
Weather
19 60% 67% 50%
18 55% 67% 38%
7 27% 29% 24%
8 / TF620 35% 39% 29% 24% 44% 9%
9 / TF280 13% 14% 12% 12% 23% 6%
TF1120 8% 18% 3%
TF500 26% 45% 8%
TF760 29% 50% 8%
TF975 10% 25% 3%
TF680 2% 8% 0%
Criteria
Lower Limit Upper Limit
67% <= % meeting <= 100% GREEN
33% <= % meeting <= 67% YELLOW
0% <= % meeting <= 33% RED
May 2005 4-33
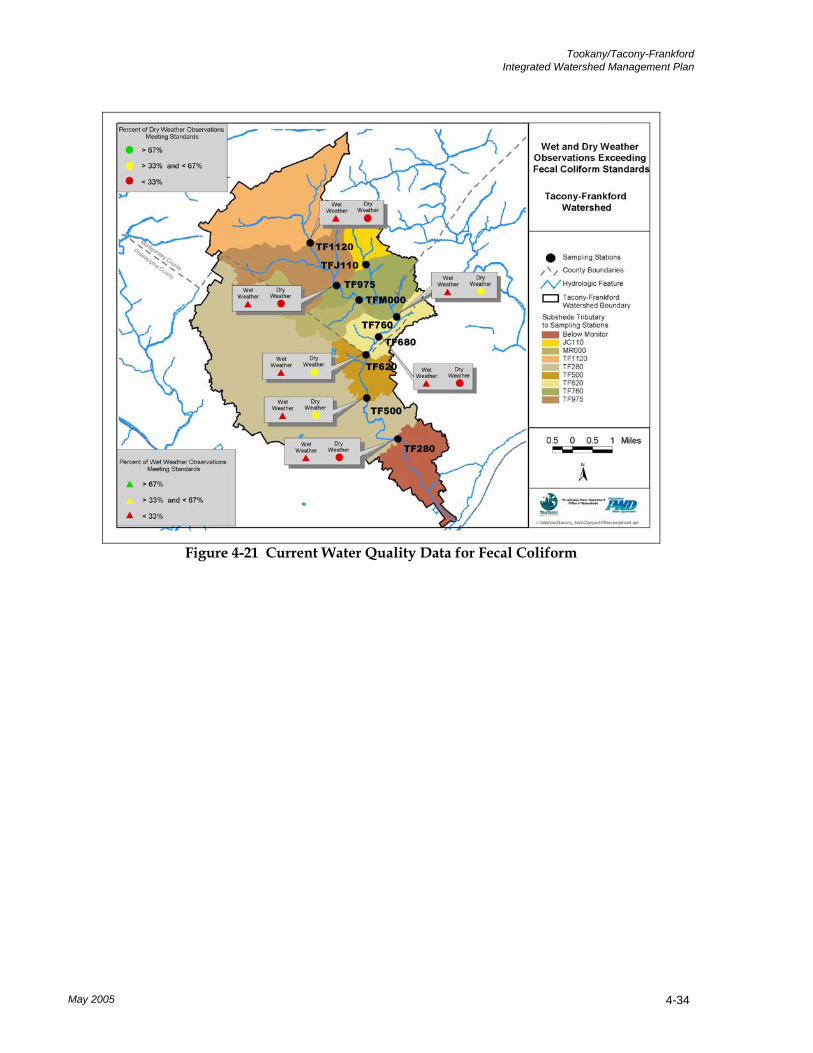
Tookany/Tacony-Frankford Integrated Watershed Management Plan
Figure 4-21 Current Water Quality Data for Fecal Coliform
May 2005 4-34
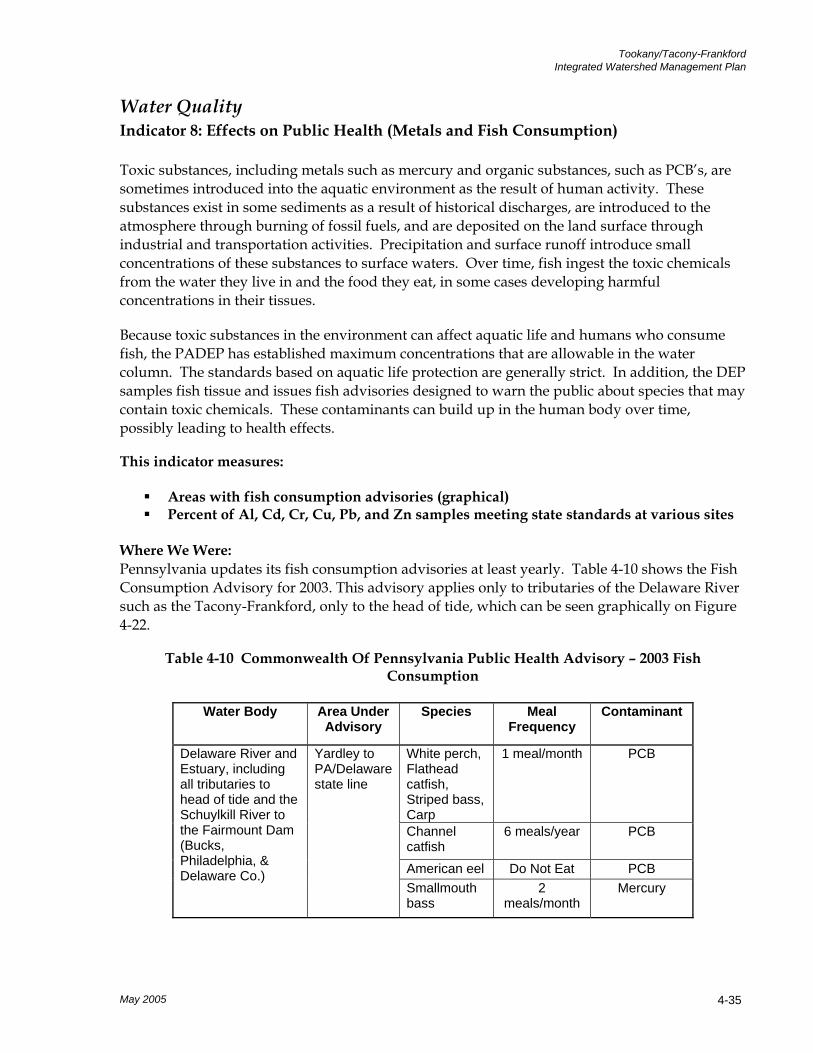
Tookany/Tacony-Frankford Integrated Watershed Management Plan
Water Quality Indicator 8: Effects on Public Health (Metals and Fish Consumption) Toxic substances, including metals such as mercury and organic substances, such as PCB’s, are sometimes introduced into the aquatic environment as the result of human activity. These substances exist in some sediments as a result of historical discharges, are introduced to the atmosphere through burning of fossil fuels, and are deposited on the land surface through industrial and transportation activities. Precipitation and surface runoff introduce small concentrations of these substances to surface waters. Over time, fish ingest the toxic chemicals from the water they live in and the food they eat, in some cases developing harmful concentrations in their tissues.
Because toxic substances in the environment can affect aquatic life and humans who consume fish, the PADEP has established maximum concentrations that are allowable in the water column. The standards based on aquatic life protection are generally strict. In addition, the DEP samples fish tissue and issues fish advisories designed to warn the public about species that may contain toxic chemicals. These contaminants can build up in the human body over time, possibly leading to health effects.
This indicator measures:
Areas with fish consumption advisories (graphical) Percent of Al, Cd, Cr, Cu, Pb, and Zn samples meeting state standards at various sites
Where We Were: Pennsylvania updates its fish consumption advisories at least yearly. Table 4-10 shows the Fish Consumption Advisory for 2003. This advisory applies only to tributaries of the Delaware River such as the Tacony-Frankford, only to the head of tide, which can be seen graphically on Figure 4-22.
Table 4-10 Commonwealth Of Pennsylvania Public Health Advisory – 2003 Fish Consumption
Water Body Area Under
Advisory Species Meal
Frequency Contaminant
White perch, Flathead catfish, Striped bass, Carp
1 meal/month PCB
Channel catfish
6 meals/year PCB
American eel Do Not Eat PCB
Delaware River and Estuary, including all tributaries to head of tide and the Schuylkill River to the Fairmount Dam (Bucks, Philadelphia, & Delaware Co.)
Yardley to PA/Delaware state line
Smallmouth bass
2 meals/month
Mercury
May 2005 4-35
Tookany/Tacony-Frankford Integrated Watershed Management Plan
Historical information on concentrations of toxins in fish tissue is not readily available. Information on concentrations of some metals was collected in the 1970’s, and this can be compared to current water quality standards. Approximately 60 samples were collected at each of three sites between 1970 and 1980 for cadmium, lead, chromium, copper, and zinc together. Metals concentrations frequently exceeded standards at the observation sites, in both dry and wet weather. With the exception of Site 7 during wet weather, all three sites during both dry and wet weather fell below the level of 75% of the samples meeting the standard to protect aquatic life. The approximate levels reached by the sites were to meet the standard between 50 – 60% of the time, depending on the site and wet or dry weather (Table 4-12).
Where We Are: The 2004 Fish Consumption Advisory recommends limiting consumption of white perch, flathead catfish, striped bass, carp, channel catfish, and American eel due to PCB contamination in an area that includes the Tacony-Frankford Creek, up to the head of tide (Table 4-11). The only change seen from the previous year’s advisory is that an advisory for mercury in smallmouth bass has been lifted.
Table 4-11 Commonwealth of Pennsylvania Public Health Advisory – 2004 Fish Consumption
Waterway Area Under
Advisory Species Meal
Frequency Contaminant White perch, flathead catfish, striped bass, carp
1 meal/month
Channel catfish
6 meals/year
Delaware River and Estuary, including the tidal portion of all PA tributaries and the Schuylkill River to the Fairmount Dam (Bucks, Philadelphia, & Delaware Co.)
Yardley to PA/Delaware
state line
American eel Do Not Eat
PCB
Samples for metals testing were collected between June 2000 and October 2003 at seven sites in the watershed. Samples were tested for Aluminum, Cadmium, Chromium, Copper, Lead, and Zinc. At each site, 90% of the samples taken in dry weather for each metals parameter met the standard, with the exception of Copper at two sites. 100% of the Lead and Cadmium dry weather samples met the standard at every site. At two upstream sites, every parameter met the standard 100% of the time. Actual results for wet weather differed from site to site and depended on the individual metals parameter, but most often the samples were meeting the standard less than 90% of the time.
May 2005 4-36
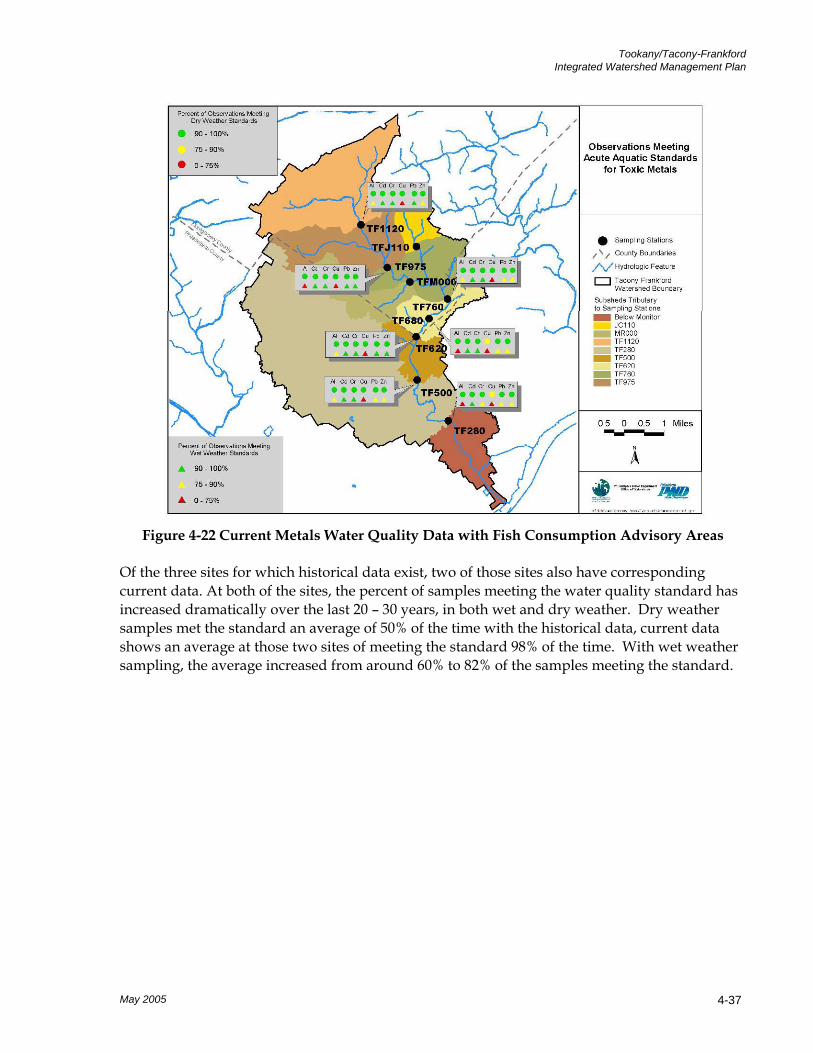
Tookany/Tacony-Frankford Integrated Watershed Management Plan
Figure 4-22 Current Metals Water Quality Data with Fish Consumption Advisory Areas
May 2005 4-37
Of the three sites for which historical data exist, two of those sites also have corresponding current data. At both of the sites, the percent of samples meeting the water quality standard has increased dramatically over the last 20 – 30 years, in both wet and dry weather. Dry weather samples met the standard an average of 50% of the time with the historical data, current data shows an average at those two sites of meeting the standard 98% of the time. With wet weather sampling, the average increased from around 60% to 82% of the samples meeting the standard.

Tookany/Tacony-Frankford Integrated Watershed Management Plan
Table 4-12 Percent of Samples Meeting Toxic Metals Standards
Percent of Samples that Meet the Standard
Historical Current
Site All Data Dry
Weather Wet
Weather All Data Dry
Weather Wet
Weather
19
18
7 58% 48% 82%
8 / TF620 55% 52% 61% 93% 99% 88%
9 / TF280 50% 47% 59% 84% 97% 76%
TF1120 90% 100% 84%
TF500 87% 99% 75%
TF760 91% 100% 82%
TF975 89% 98% 83%
TF680 86% 97% 80%
Criteria
Lower Limit Upper Limit
90% <= % meeting <= 100% GREEN
75% <= % meeting <= 90% YELLOW
0% <= % meeting <= 75% RED
May 2005 4-38
Tookany/Tacony-Frankford Integrated Watershed Management Plan
Water Quality Indicator 9: Effects on Aquatic Life (Dissolved Oxygen) Just as humans require oxygen gas for respiration, most aquatic organisms require dissolved oxygen (DO). Oxygen dissolves in water through air-water interaction at the surface of the flow and through photosynthesis of plants and algae. At the same time, DO is depleted through the respiration of microorganisms, animals, plants, and algae. In a healthy system, the balance between oxygen-depleting and oxygen-providing processes maintains DO at a level that allows aquatic organisms to survive and flourish. In a less healthy system, dissolved oxygen may be depleted below levels needed by aquatic organisms. The minimum dissolved oxygen concentration required by many common fish species found in rivers and streams is approximately 5 mg/L. The PADEP has set a water quality standard, or minimum allowable concentration, of 5 mg/L as a daily average and 4 mg/L as an instantaneous value for the Tookany/Tacony-Frankford Watershed creeks.
This indicator measures: Percent of DO samples meeting state standards at various sites
Where We Were: Discrete samples of DO were taken at five sites in the watershed in the 1970s and 1980s. At all five sites, 100% of the wet weather samples met the average minimum standard. Dry weather samples met the standard 100% of the time at three of the sites, and met the standard 95% and 98% of the time at the remaining two sites.
Where We Are:
May 2005 4-39
Both discrete and continuous samples were collected between 2000 and 2003. Discrete samples produce a single DO value at the time the sample is taken; continuous monitoring measures DO over the entire photic period, including the night when DO is lowest due to algal respiration. Both the discrete and continuous samples suggest that dissolved oxygen is rarely below the standard under dry or wet conditions. At each of the seven sites where discrete samples were taken, 100% of the discrete samples taken in both wet weather and dry weather met both the average minimum standard and the instantaneous minimum standard, with the exception of one site downstream, TF280. At this site, 4 out of 19 samples were below the average minimum standard in dry weather and 2 out of 19 samples were below the instantaneous minimum standard in dry weather. No discrete samples at any of the sites were below the standard in wet weather.
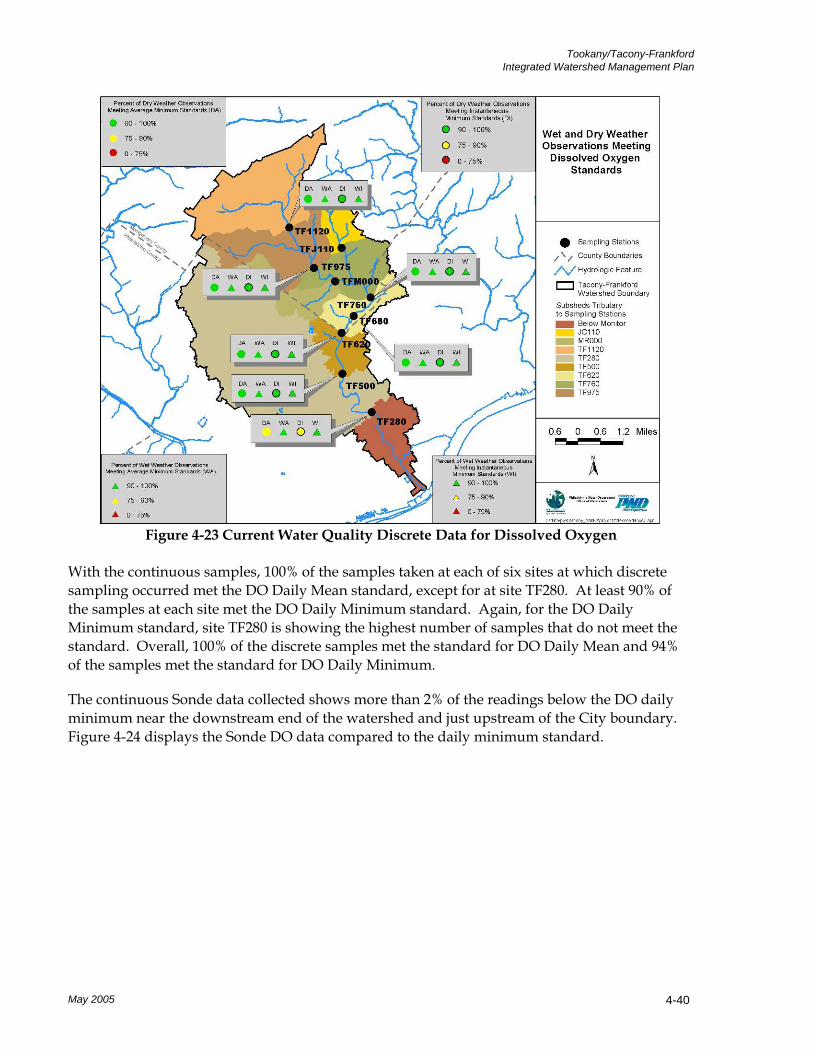
Tookany/Tacony-Frankford Integrated Watershed Management Plan
Figure 4-23 Current Water Quality Discrete Data for Dissolved Oxygen
With the continuous samples, 100% of the samples taken at each of six sites at which discrete sampling occurred met the DO Daily Mean standard, except for at site TF280. At least 90% of the samples at each site met the DO Daily Minimum standard. Again, for the DO Daily Minimum standard, site TF280 is showing the highest number of samples that do not meet the standard. Overall, 100% of the discrete samples met the standard for DO Daily Mean and 94% of the samples met the standard for DO Daily Minimum.
May 2005 4-40
The continuous Sonde data collected shows more than 2% of the readings below the DO daily minimum near the downstream end of the watershed and just upstream of the City boundary. Figure 4-24 displays the Sonde DO data compared to the daily minimum standard.
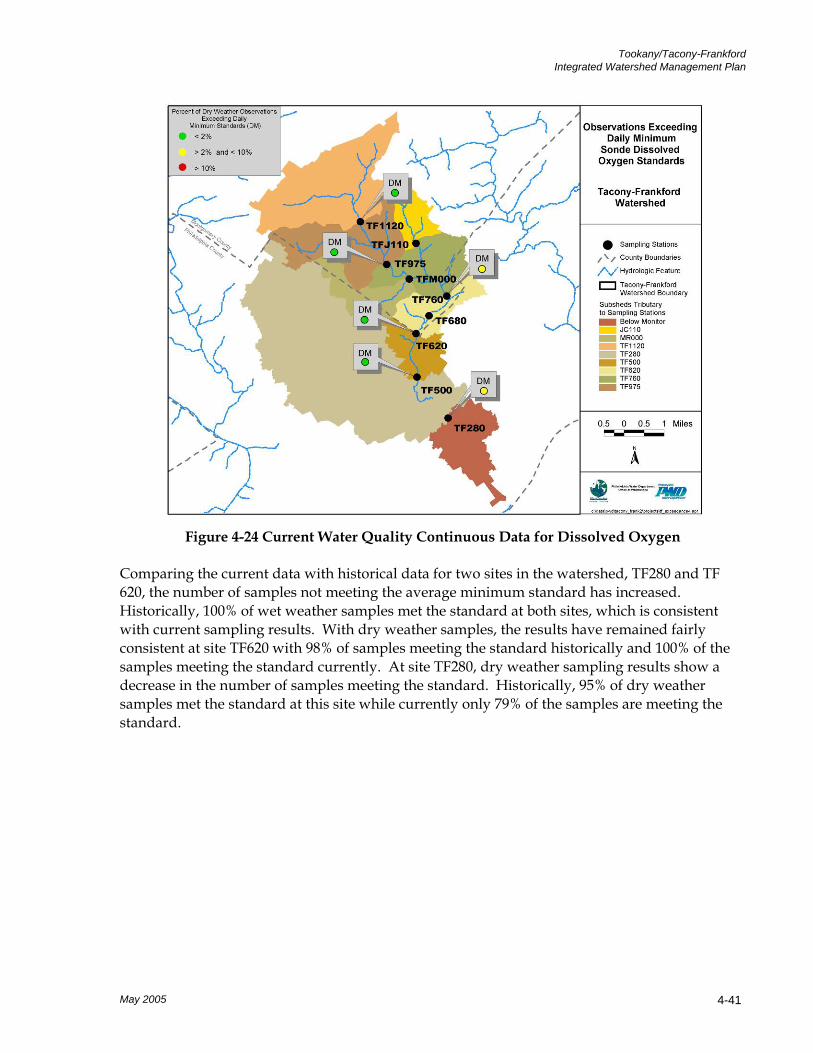
Tookany/Tacony-Frankford Integrated Watershed Management Plan
Figure 4-24 Current Water Quality Continuous Data for Dissolved Oxygen
Comparing the current data with historical data for two sites in the watershed, TF280 and TF 620, the number of samples not meeting the average minimum standard has increased. Historically, 100% of wet weather samples met the standard at both sites, which is consistent with current sampling results. With dry weather samples, the results have remained fairly consistent at site TF620 with 98% of samples meeting the standard historically and 100% of the samples meeting the standard currently. At site TF280, dry weather sampling results show a decrease in the number of samples meeting the standard. Historically, 95% of dry weather samples met the standard at this site while currently only 79% of the samples are meeting the standard.
May 2005 4-41
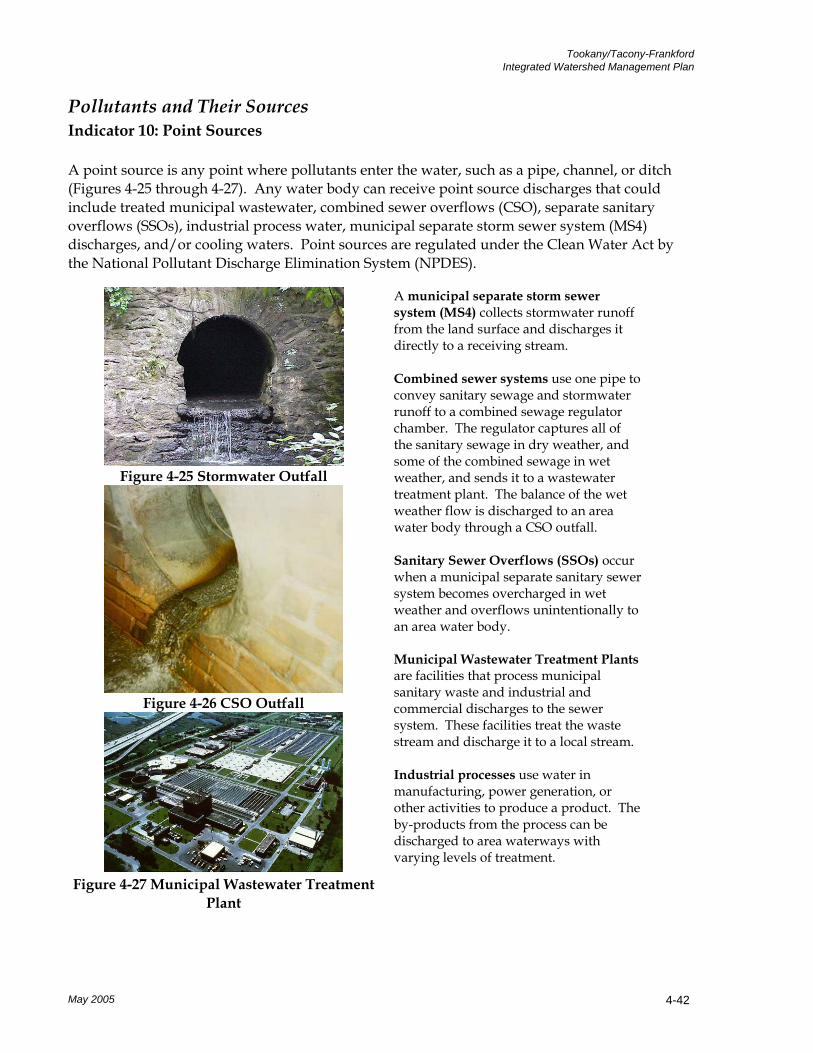
Tookany/Tacony-Frankford Integrated Watershed Management Plan
Pollutants and Their Sources Indicator 10: Point Sources A point source is any point where pollutants enter the water, such as a pipe, channel, or ditch (Figures 4-25 through 4-27). Any water body can receive point source discharges that could include treated municipal wastewater, combined sewer overflows (CSO), separate sanitary overflows (SSOs), industrial process water, municipal separate storm sewer system (MS4) discharges, and/or cooling waters. Point sources are regulated under the Clean Water Act by the National Pollutant Discharge Elimination System (NPDES).
Figure 4-25 Stormwater Outfall
Figure 4-26 CSO Outfall
Figure 4-27 Municipal Wastewater Treatment
Plant
A municipal separate storm sewer system (MS4) collects stormwater runoff from the land surface and discharges it directly to a receiving stream. Combined sewer systems use one pipe to convey sanitary sewage and stormwater runoff to a combined sewage regulator chamber. The regulator captures all of the sanitary sewage in dry weather, and some of the combined sewage in wet weather, and sends it to a wastewater treatment plant. The balance of the wet weather flow is discharged to an area water body through a CSO outfall. Sanitary Sewer Overflows (SSOs) occur when a municipal separate sanitary sewer system becomes overcharged in wet weather and overflows unintentionally to an area water body. Municipal Wastewater Treatment Plants are facilities that process municipal sanitary waste and industrial and commercial discharges to the sewer system. These facilities treat the waste stream and discharge it to a local stream. Industrial processes use water in manufacturing, power generation, or other activities to produce a product. The by-products from the process can be discharged to area waterways with varying levels of treatment.
May 2005 4-42
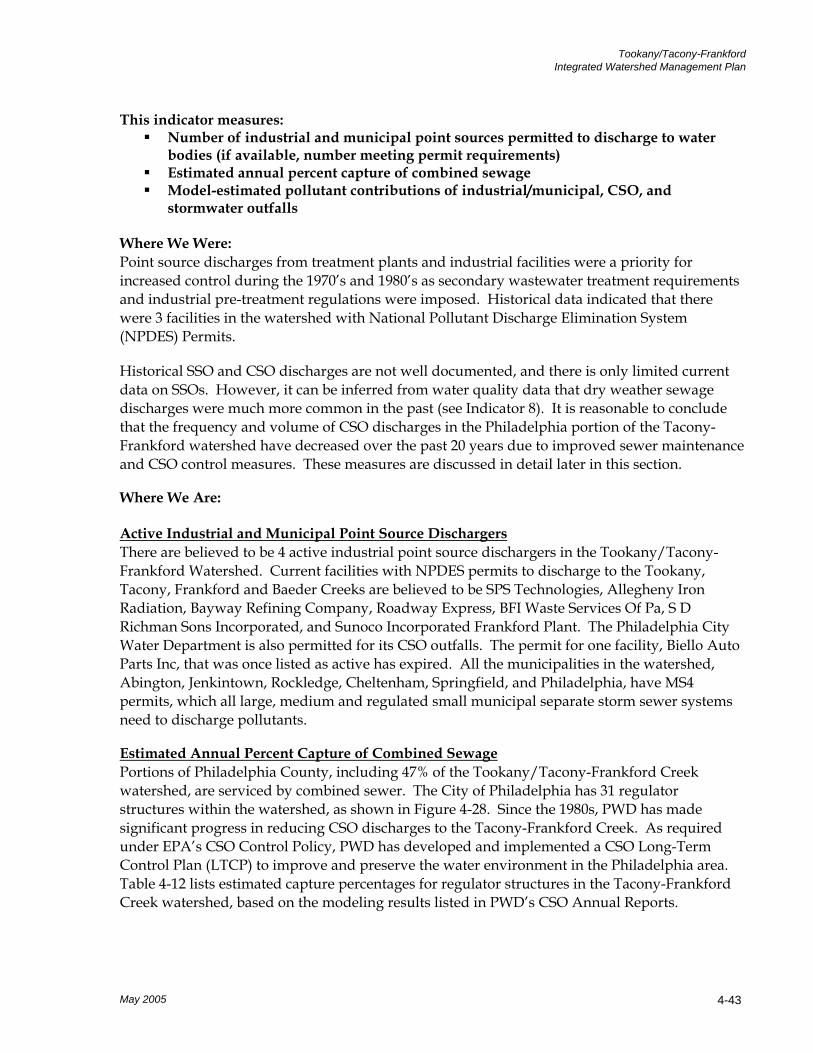
Tookany/Tacony-Frankford Integrated Watershed Management Plan
This indicator measures:
Number of industrial and municipal point sources permitted to discharge to water bodies (if available, number meeting permit requirements)
Estimated annual percent capture of combined sewage Model-estimated pollutant contributions of industrial/municipal, CSO, and
stormwater outfalls Where We Were: Point source discharges from treatment plants and industrial facilities were a priority for increased control during the 1970’s and 1980’s as secondary wastewater treatment requirements and industrial pre-treatment regulations were imposed. Historical data indicated that there were 3 facilities in the watershed with National Pollutant Discharge Elimination System (NPDES) Permits.
Historical SSO and CSO discharges are not well documented, and there is only limited current data on SSOs. However, it can be inferred from water quality data that dry weather sewage discharges were much more common in the past (see Indicator 8). It is reasonable to conclude that the frequency and volume of CSO discharges in the Philadelphia portion of the Tacony-Frankford watershed have decreased over the past 20 years due to improved sewer maintenance and CSO control measures. These measures are discussed in detail later in this section.
Where We Are: Active Industrial and Municipal Point Source DischargersThere are believed to be 4 active industrial point source dischargers in the Tookany/Tacony-Frankford Watershed. Current facilities with NPDES permits to discharge to the Tookany, Tacony, Frankford and Baeder Creeks are believed to be SPS Technologies, Allegheny Iron Radiation, Bayway Refining Company, Roadway Express, BFI Waste Services Of Pa, S D Richman Sons Incorporated, and Sunoco Incorporated Frankford Plant. The Philadelphia City Water Department is also permitted for its CSO outfalls. The permit for one facility, Biello Auto Parts Inc, that was once listed as active has expired. All the municipalities in the watershed, Abington, Jenkintown, Rockledge, Cheltenham, Springfield, and Philadelphia, have MS4 permits, which all large, medium and regulated small municipal separate storm sewer systems need to discharge pollutants.
Estimated Annual Percent Capture of Combined Sewage
May 2005 4-43
Portions of Philadelphia County, including 47% of the Tookany/Tacony-Frankford Creek watershed, are serviced by combined sewer. The City of Philadelphia has 31 regulator structures within the watershed, as shown in Figure 4-28. Since the 1980s, PWD has made significant progress in reducing CSO discharges to the Tacony-Frankford Creek. As required under EPA’s CSO Control Policy, PWD has developed and implemented a CSO Long-Term Control Plan (LTCP) to improve and preserve the water environment in the Philadelphia area. Table 4-12 lists estimated capture percentages for regulator structures in the Tacony-Frankford Creek watershed, based on the modeling results listed in PWD’s CSO Annual Reports.
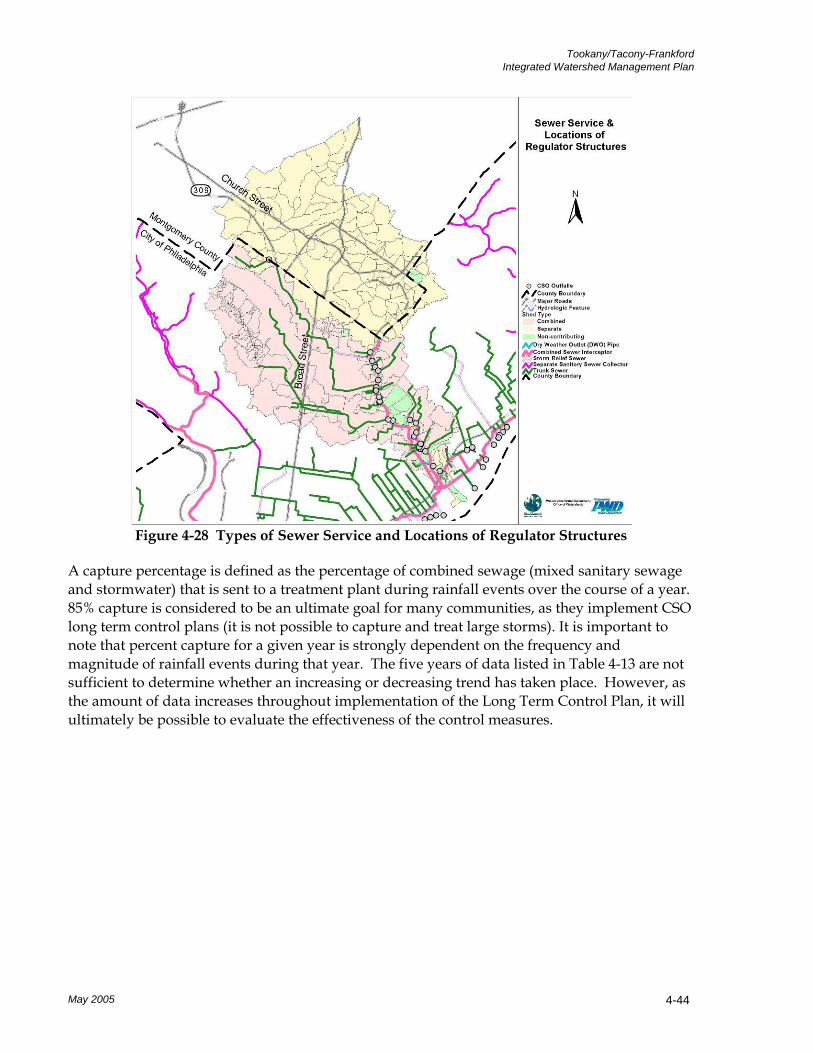
Tookany/Tacony-Frankford Integrated Watershed Management Plan
Figure 4-28 Types of Sewer Service and Locations of Regulator Structures
A capture percentage is defined as the percentage of combined sewage (mixed sanitary sewage and stormwater) that is sent to a treatment plant during rainfall events over the course of a year. 85% capture is considered to be an ultimate goal for many communities, as they implement CSO long term control plans (it is not possible to capture and treat large storms). It is important to note that percent capture for a given year is strongly dependent on the frequency and magnitude of rainfall events during that year. The five years of data listed in Table 4-13 are not sufficient to determine whether an increasing or decreasing trend has taken place. However, as the amount of data increases throughout implementation of the Long Term Control Plan, it will ultimately be possible to evaluate the effectiveness of the control measures.
May 2005 4-44
Tookany/Tacony-Frankford Integrated Watershed Management Plan
Table 4-13 Estimated Annual Combined Sewage Capture Percentages
Year Precipitation Capture (%) – Lowest and Highest Structure (in) Tacony Upper Frankford Low Level 2003 46.72 43 - 45 64 - 65 2002 34.11 59 - 64 76 - 79 2001 30.62 51 - 53 70 - 72 2000 43.26 40 - 42 58 - 60 1999 48.6 39 - 40 57 - 59
Model-Estimated Pollutant Contributions of Different Sources Estimated annual pollutant contributions for the Tookany/Tacony-Frankford watersheds are shown in Figure 4-29. CSO is the largest source of pollutants associated with urban and suburban runoff, including nutrients such as phosphorus and metals such as lead. For the Tookany/Tacony-Frankford Creek watershed, stormwater outfalls are a smaller but significant source of these constituents. CSO discharges are the dominant source of fecal coliform in the watershed. Permitted industrial and municipal point source discharges make up less than 1% of annual streamflow in both systems. SSOs are thought to occur in both watersheds but have not been well documented to date.
May 2005 4-45
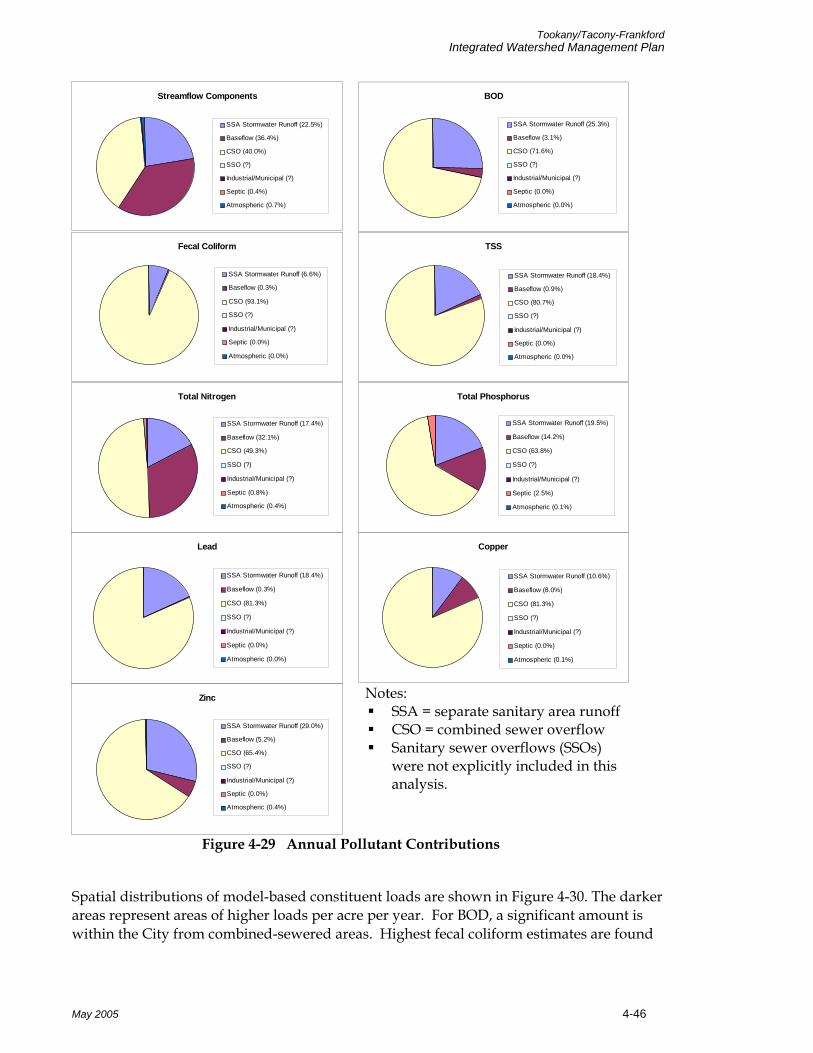
Tookany/Tacony-Frankford Integrated Watershed Management Plan
Streamflow Components
SSA Stormwater Runoff (22.5%)
Baseflow (36.4%)
CSO (40.0%)
SSO (?)
Industrial/Municipal (?)
Septic (0.4%)
Atmospheric (0.7%)
BOD
SSA Stormwater Runoff (25.3%)
Baseflow (3.1%)
CSO (71.6%)
SSO (?)
Industrial/Municipal (?)
Septic (0.0%)
Atmospheric (0.0%)
Fecal Coliform
SSA Stormwater Runoff (6.6%)
Baseflow (0.3%)
CSO (93.1%)
SSO (?)
Industrial/Municipal (?)
Septic (0.0%)
Atmospheric (0.0%)
TSS
SSA Stormwater Runoff (18.4%)
Baseflow (0.9%)
CSO (80.7%)
SSO (?)
Industrial/Municipal (?)
Septic (0.0%)
Atmospheric (0.0%)
Total Nitrogen
SSA Stormwater Runoff (17.4%)
Baseflow (32.1%)
CSO (49.3%)
SSO (?)
Industrial/Municipal (?)
Septic (0.8%)
Atmospheric (0.4%)
Total Phosphorus
SSA Stormwater Runoff (19.5%)
Baseflow (14.2%)
CSO (63.8%)
SSO (?)
Industrial/Municipal (?)
Septic (2.5%)
Atmospheric (0.1%)
Lead
SSA Stormwater Runoff (18.4%)
Baseflow (0.3%)
CSO (81.3%)
SSO (?)
Industrial/Municipal (?)
Septic (0.0%)
Atmospheric (0.0%)
Copper
SSA Stormwater Runoff (10.6%)
Baseflow (8.0%)
CSO (81.3%)
SSO (?)
Industrial/Municipal (?)
Septic (0.0%)
Atmospheric (0.1%)
Zinc
SSA Stormwater Runoff (29.0%)
Baseflow (5.2%)
CSO (65.4%)
SSO (?)
Industrial/Municipal (?)
Septic (0.0%)
Atmospheric (0.4%)
Notes: SSA = separate sanitary area runoff CSO = combined sewer overflow Sanitary sewer overflows (SSOs)
were not explicitly included in this analysis.
Figure 4-29 Annual Pollutant Contributions
Spatial distributions of model-based constituent loads are shown in Figure 4-30. The darker areas represent areas of higher loads per acre per year. For BOD, a significant amount is within the City from combined-sewered areas. Highest fecal coliform estimates are found
May 2005 4-46

Tookany/Tacony-Frankford Integrated Watershed Management Plan
May 2005 4-47
in the City portion of the watershed. Metals (lead and zinc) are generally higher in the more urbanized areas of the watershed. Total suspended solids loads follow a similar trend to metals. Nutrients (phosphorus and nitrogen) have significant contributions throughout the watershed, with the highest near the Philadelphia County line.
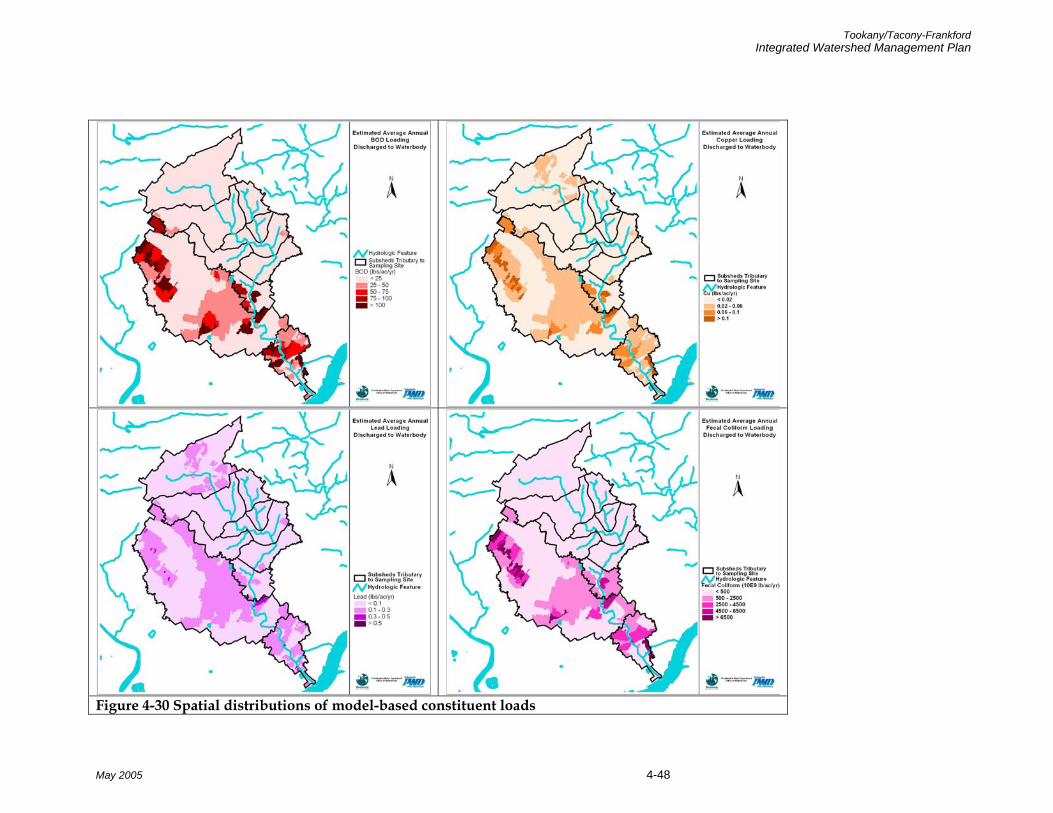
Tookany/Tacony-Frankford Integrated Watershed Management Plan
Figure 4-30 Spatial distributions of model-based constituent loads
May 2005 4-48
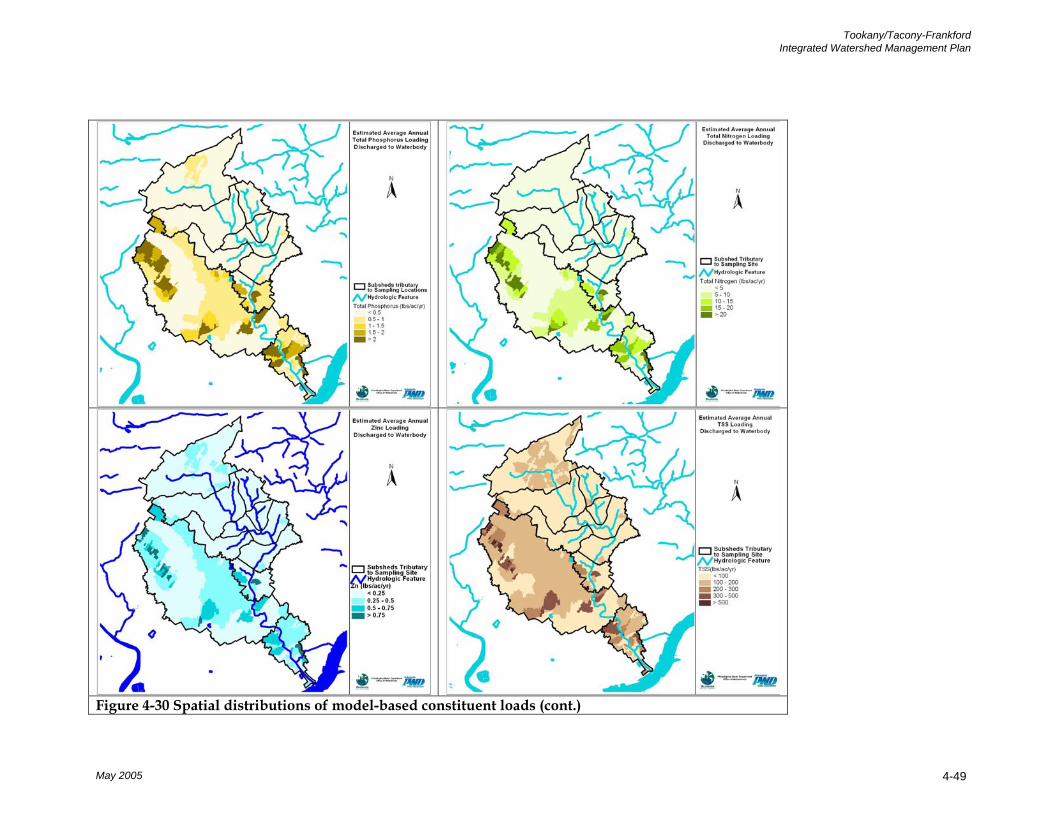
Tookany/Tacony-Frankford Integrated Watershed Management Plan
Figure 4-30 Spatial distributions of model-based constituent loads (cont.)
May 2005 4-49

Tookany/Tacony-Frankford Integrated Watershed Management Plan
Section 5 Problem Definition and Analysis
The watershed indicators are used to characterize the current state of the Tookany/Tacony-Frankford watershed. This section continues by identifying the potential problems in the watershed and the analysis tools used to define the problems and locations. Many of the problems have been identified by the assessments carried out by the project team and others. Other problems were identified through stakeholder participation. Water quality problems were identified by taking samples and comparing results to water quality criteria. Several criteria were relevant to the analysis, many of which provided specific numeric standards with which to comply. Others were less specific, but nonetheless relevant. These are often referred to as narrative standards.
National water quality criteria include aesthetic qualities that protect the quality of streams. The criteria states:
“All waters free from substances attributable to wastewater or other discharges that:
(1) settle to form objectionable deposits;
(2) float as debris, scum, oil, or other matter to form a nuisance;
(3) produce objectionable color, odor, taste, or turbidity;
(4) injure or are toxic or produce adverse physiological responses in humans, animals or plants: and;
(5) produce undesirable or nuisance aquatic life.” (EPA, Goldbook, 1986).
Also, PADEP’s general water quality criteria states:
“(a) Water may not contain substances attributable to point or nonpoint source discharges in concentration or amounts sufficient to be inimical or harmful to the water uses to be protected or to human, animal, plant or aquatic life.
(b) In addition to other substances listed within or addressed by this chapter, specific substances to be controlled include, but are not limited to, floating materials, oil, grease, scum and substances which produce color, tastes, odors, turbidity or settle to form deposits.” (PADEP Chapter 93 § 93.6.).
Some standards were related to the uses of the creek. The Tookany/Tacony-Frankford Creeks’ protected uses as designated by PADEP are:
5-1
May 2005

Tookany/Tacony-Frankford Integrated Watershed Management Plan
Aquatic Life – Warm Water Fishes
Water Supply – Potable Water Supply
Recreation and Fish Consumption - Boating, Fishing, Water Contact Sports, and Esthetics
The results of the problem analysis are presented below.
5.1 Visual Stream Assessment (Aesthetics and Narrative Criteria) The Tookany/Tacony-Frankford Partnership steering committee conducted a visual assessment along the major tributaries and mainstem streams. This assessment provided a baseline inventory of the existing conditions along the stream corridor. The method utilized a modified version of the USDA’s Visual Streambank Assessment Protocol. Members of the steering committee and volunteers conducted the visual stream assessments.
The visual assessments assisted in identification of problems and problem locations in the Tookany/Tacony-Frankford watershed. Generally, the issues found in the watershed included:
Erosion of creek banks (undercutting, exposed roots)
Appearance of invasive species – Disturbed areas throughout the watershed are susceptible to invasion by non-native exotic vegetation. Japanese knotweed, Kudzu, Purple loosestrife and multiflora rose were identified as issues within the watershed.
Trash and debris – Along the creeks, there was an abundance of trash and debris.
Illegal dumping – Dumping of trash, cars and other appliances are an issue for Tacony Creek Park and vacant land. Secluded open areas are especially susceptible to dumping. Sites of abandoned cars often become targets for fire. Illegal dumping ranges from trucks dumping construction materials and appliances to residents throwing trash directly into the creek.
Illegal recreational activities (e.g. ATVs, swimming) – ATV use is illegal in Tacony Creek Park and has had a very detrimental effect on the health of the park. Illegal trails disturb native vegetation and open habitat for invasives while contributing to erosion on slopes of the creek banks.
Sewage and odors
Lack of riparian buffer – The lack of riparian buffer was observed on both private property and municipal land. Native vegetation that is found in the
5-2 May 2005
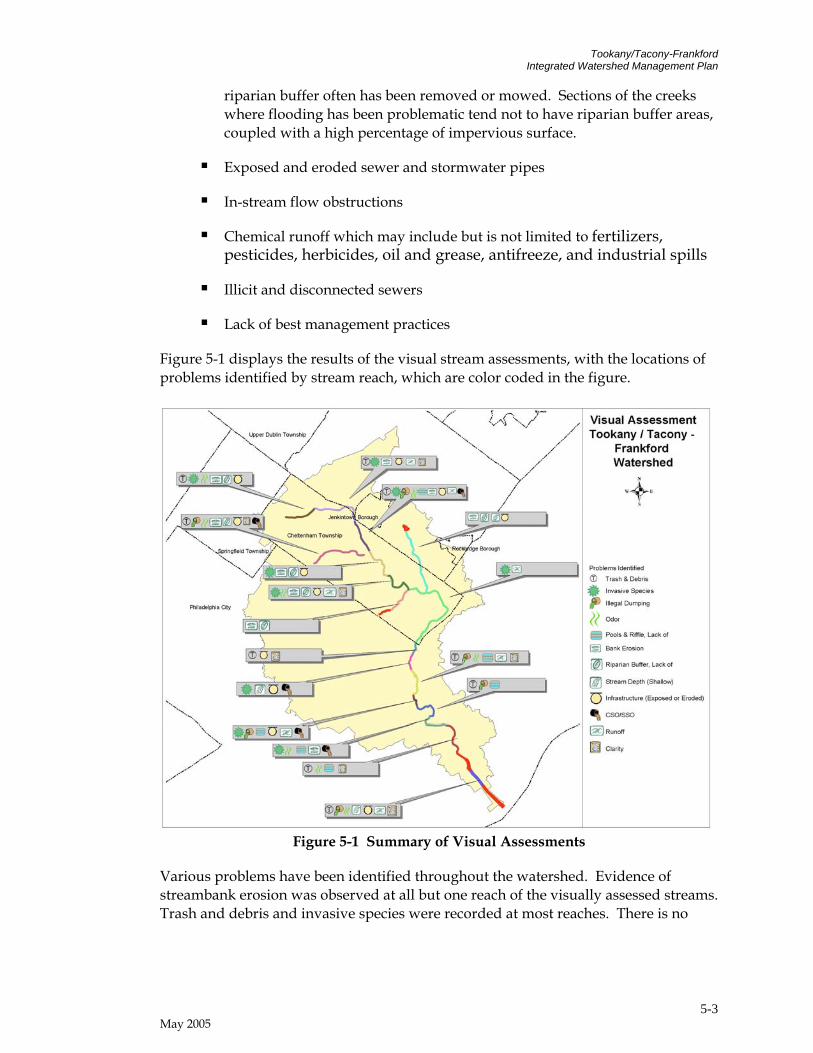
Tookany/Tacony-Frankford Integrated Watershed Management Plan
riparian buffer often has been removed or mowed. Sections of the creeks where flooding has been problematic tend not to have riparian buffer areas, coupled with a high percentage of impervious surface.
Exposed and eroded sewer and stormwater pipes
In-stream flow obstructions
Chemical runoff which may include but is not limited to fertilizers, pesticides, herbicides, oil and grease, antifreeze, and industrial spills
Illicit and disconnected sewers
Lack of best management practices
Figure 5-1 displays the results of the visual stream assessments, with the locations of problems identified by stream reach, which are color coded in the figure.
Figure 5-1 Summary of Visual Assessments
Various problems have been identified throughout the watershed. Evidence of streambank erosion was observed at all but one reach of the visually assessed streams. Trash and debris and invasive species were recorded at most reaches. There is no
5-3 May 2005
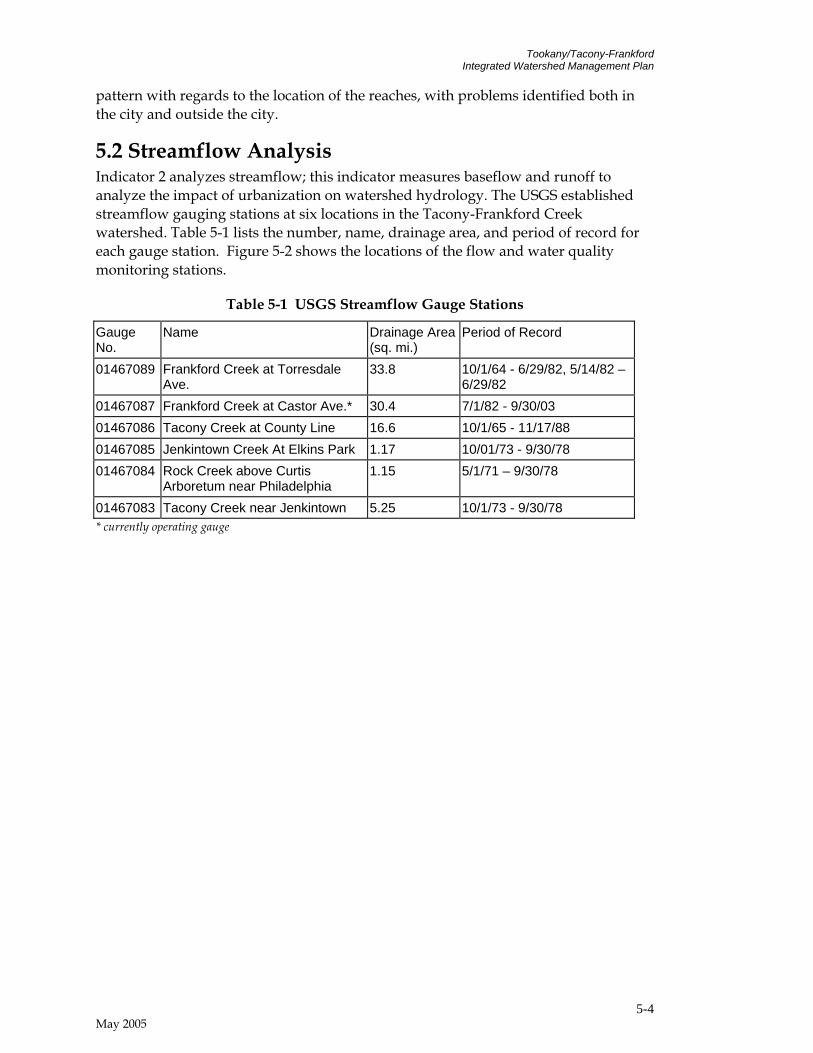
Tookany/Tacony-Frankford Integrated Watershed Management Plan
pattern with regards to the location of the reaches, with problems identified both in the city and outside the city.
5.2 Streamflow Analysis Indicator 2 analyzes streamflow; this indicator measures baseflow and runoff to analyze the impact of urbanization on watershed hydrology. The USGS established streamflow gauging stations at six locations in the Tacony-Frankford Creek watershed. Table 5-1 lists the number, name, drainage area, and period of record for each gauge station. Figure 5-2 shows the locations of the flow and water quality monitoring stations.
Table 5-1 USGS Streamflow Gauge Stations
Gauge No.
Name Drainage Area (sq. mi.)
Period of Record
01467089 Frankford Creek at Torresdale Ave.
33.8 10/1/64 - 6/29/82, 5/14/82 – 6/29/82
01467087 Frankford Creek at Castor Ave.* 30.4 7/1/82 - 9/30/03 01467086 Tacony Creek at County Line 16.6 10/1/65 - 11/17/88 01467085 Jenkintown Creek At Elkins Park 1.17 10/01/73 - 9/30/78 01467084 Rock Creek above Curtis
Arboretum near Philadelphia 1.15 5/1/71 – 9/30/78
01467083 Tacony Creek near Jenkintown 5.25 10/1/73 - 9/30/78 * currently operating gauge
5-4 May 2005

Tookany/Tacony-Frankford Integrated Watershed Management Plan
Figure 5-2 USGS Streamflow Stations
Similar to the streamflow indicator analysis, the flow records at each of the USGS gauges in the Tookany/Tacony-Frankford watershed were separated into runoff and baseflow components. In Table 5-2, the results for Tacony-Frankford Creek are compared with French Creek, a rural stream, and Darby Creek, a stream in a mixed urban and suburban watershed. Results for French Creek are somewhat typical of an undeveloped watershed, with baseflow comprising 64% of mean annual streamflow and stormwater only 17% of annual precipitation. At the Frankford Creek gauge, representing most of the urbanized Tacony-Frankford watershed, the stormwater component of streamflow is a much greater percentage of total annual streamflow (65%), and baseflow represents a much smaller percentage of total annual streamflow (only 35%). These results are indicative of a highly urbanized stream. The Tacony Creek USGS gauge, representing the headwaters of the Tacony-Frankford watershed, exhibits a relationship between stormflow and baseflow that is between the two extremes.
5-5 May 2005
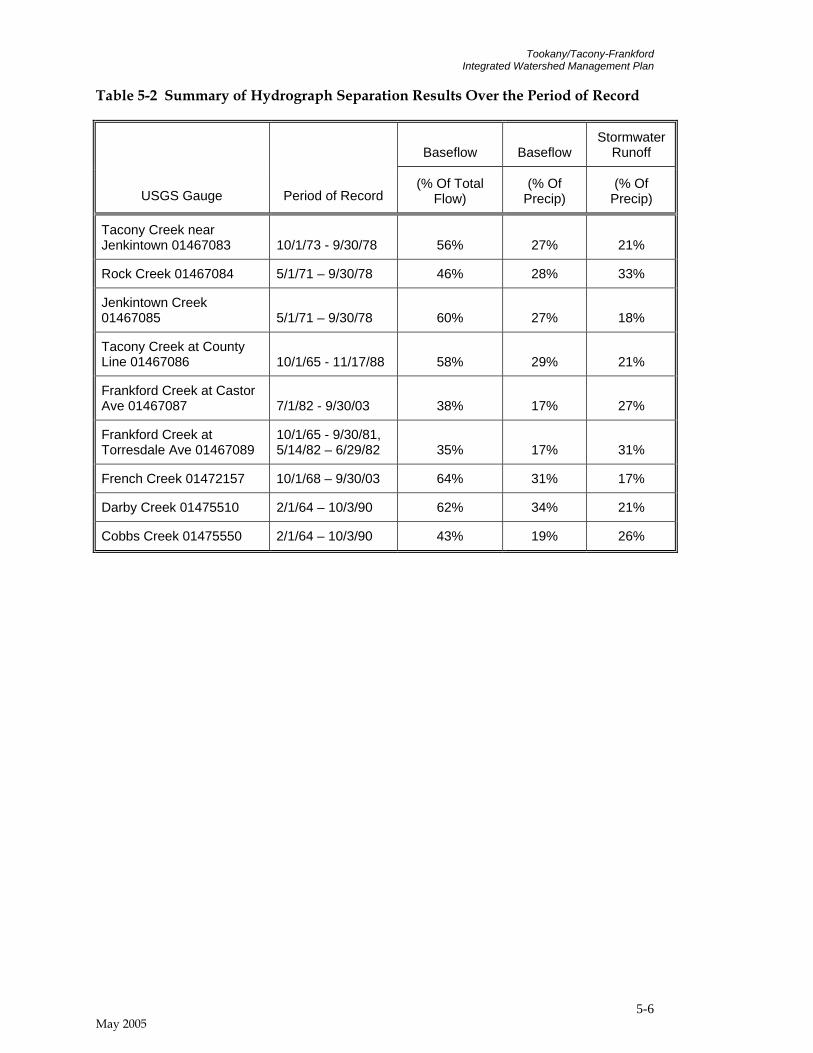
Tookany/Tacony-Frankford Integrated Watershed Management Plan
Table 5-2 Summary of Hydrograph Separation Results Over the Period of Record
Baseflow Baseflow Stormwater
Runoff
USGS Gauge Period of Record (% Of Total
Flow) (% Of
Precip) (% Of
Precip)
Tacony Creek near Jenkintown 01467083 10/1/73 - 9/30/78 56% 27% 21%
Rock Creek 01467084 5/1/71 – 9/30/78 46% 28% 33%
Jenkintown Creek 01467085 5/1/71 – 9/30/78 60% 27% 18%
Tacony Creek at County Line 01467086 10/1/65 - 11/17/88 58% 29% 21%
Frankford Creek at Castor Ave 01467087 7/1/82 - 9/30/03 38% 17% 27%
Frankford Creek at Torresdale Ave 01467089
10/1/65 - 9/30/81, 5/14/82 – 6/29/82 35% 17% 31%
French Creek 01472157 10/1/68 – 9/30/03 64% 31% 17%
Darby Creek 01475510 2/1/64 – 10/3/90 62% 34% 21%
Cobbs Creek 01475550 2/1/64 – 10/3/90 43% 19% 26%
5-6 May 2005
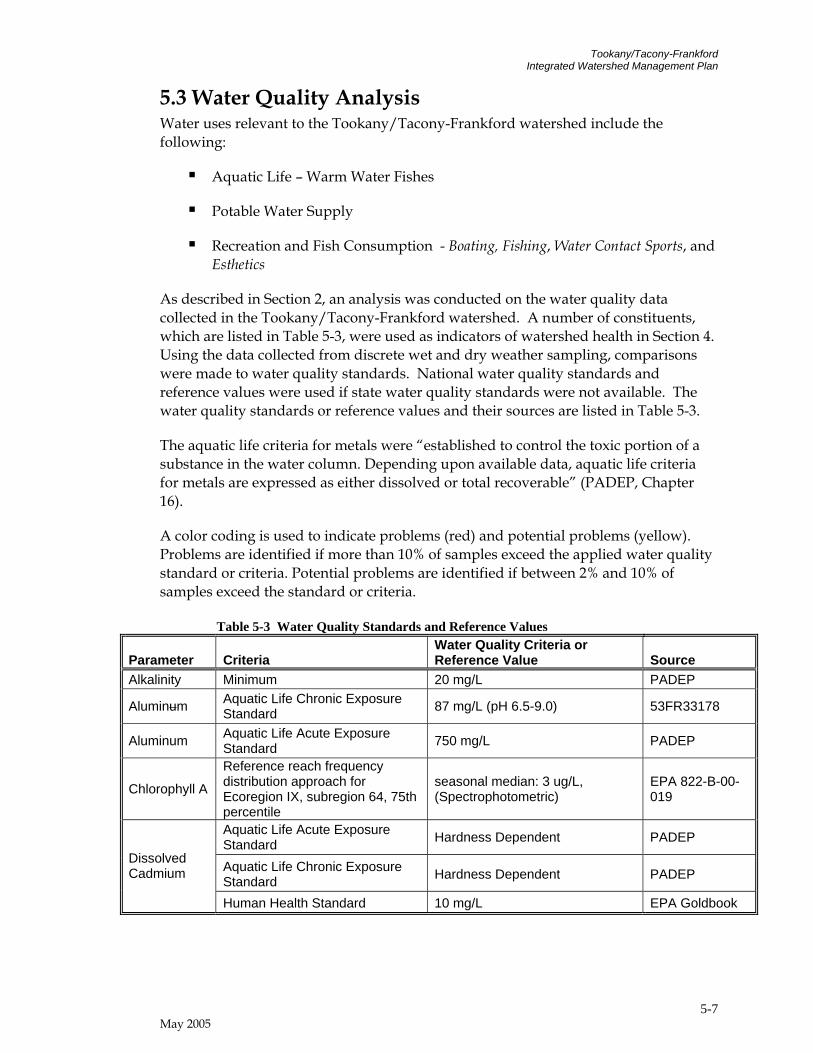
Tookany/Tacony-Frankford Integrated Watershed Management Plan
5.3 Water Quality Analysis Water uses relevant to the Tookany/Tacony-Frankford watershed include the following:
Aquatic Life – Warm Water Fishes
Potable Water Supply
Recreation and Fish Consumption - Boating, Fishing, Water Contact Sports, and Esthetics
As described in Section 2, an analysis was conducted on the water quality data collected in the Tookany/Tacony-Frankford watershed. A number of constituents, which are listed in Table 5-3, were used as indicators of watershed health in Section 4. Using the data collected from discrete wet and dry weather sampling, comparisons were made to water quality standards. National water quality standards and reference values were used if state water quality standards were not available. The water quality standards or reference values and their sources are listed in Table 5-3.
The aquatic life criteria for metals were “established to control the toxic portion of a substance in the water column. Depending upon available data, aquatic life criteria for metals are expressed as either dissolved or total recoverable” (PADEP, Chapter 16).
A color coding is used to indicate problems (red) and potential problems (yellow). Problems are identified if more than 10% of samples exceed the applied water quality standard or criteria. Potential problems are identified if between 2% and 10% of samples exceed the standard or criteria.
Table 5-3 Water Quality Standards and Reference Values
Parameter Criteria Water Quality Criteria or Reference Value Source
Alkalinity Minimum 20 mg/L PADEP
Aluminum Aquatic Life Chronic Exposure Standard 87 mg/L (pH 6.5-9.0) 53FR33178
Aluminum Aquatic Life Acute Exposure Standard 750 mg/L PADEP
Chlorophyll A
Reference reach frequency distribution approach for Ecoregion IX, subregion 64, 75th percentile
seasonal median: 3 ug/L, (Spectrophotometric)
EPA 822-B-00-019
Aquatic Life Acute Exposure Standard Hardness Dependent PADEP
Aquatic Life Chronic Exposure Standard Hardness Dependent PADEP
Dissolved Cadmium
Human Health Standard 10 mg/L EPA Goldbook
5-7 May 2005

Tookany/Tacony-Frankford Integrated Watershed Management Plan
Table 5-3 Water Quality Standards and Reference Values (continued)
Parameter Criteria Water Quality Criteria or Reference Value Source
Aquatic Life Acute Exposure Standard 16 mg/L PADEP Dissolved
Chromium Aquatic Life Chronic Exposure Standard 10 mg/L PADEP
Aquatic Life Acute Exposure Standard Hardness Dependent PADEP
Aquatic Life Chronic Exposure Standard Hardness Dependent PADEP
Dissolved Copper
Human Health Standard 1000 mg/L EPA Goldbook Dissolved Iron Maximum 0.3 mg/L PADEP
Aquatic Life Acute Exposure Standard Hardness Dependent PADEP
Aquatic Life Chronic Exposure Standard Hardness Dependent PADEP
Dissolved Lead
Human Health Standard 50 mg/L EPA Goldbook Aquatic Life Acute Exposure Standard Hardness Dependent PADEP
Aquatic Life Chronic Exposure Standard Hardness Dependent PADEP
Dissolved Zinc
Human Health Standard 5000 mg/L EPA Goldbook Instantaneous Minimum 4 mg/L PADEP DO Average Minimum 5 mg/L PADEP
Fecal coliform Maximum
Geometric Mean of 5 consecutive samples on different days within a 30 day period may not exceed 200/100mL (Summer) or 2000/100mL (Winter)
PADEP
Fluoride Maximum 2.0 mg/L PADEP Iron Maximum 1.5 mg/L PADEP Manganese Maximum 1.0 mg/L PADEP NH3-N Maximum pH dependent PADEP
NO2+NO3 Nitrates – Human Health Consumption for water + organisms
10 mg/L PADEP
NO23-N Maximum 10 mg/L PADEP Periphyton Chlorophyll A Ecoregion IX – 20.35 mg/m2 Gold book
pH Range 6.0 mg/L - 9.0 mg/L PADEP Phenolics Maximum 0.005 mg/L PADEP TDS Maximum 750 mg/L PADEP
Temperature
Varies w/ season.Additionally, waters may not result in a change by more than 2°F during a 1-hour period.
PADEP
TKN Maximum Ecoregion IX, subregion 64 seasonal median: 0.675 mg/L
EPA 822-B-00-019
5-8 May 2005

Tookany/Tacony-Frankford Integrated Watershed Management Plan
TN Maximum Ecoregion IX, subregion 64 seasonal median: 4.91 mg/L
EPA 822-B-00-019
TP Maximum Ecoregion IX, subregion 64 seasonal median: 140 ug/L
EPA 822-B-00-019
TSS Maximum 25 mg/L Other US states
Turbidity Maximum Ecoregion IX, subregion 64 seasonal median: 8.05 NTU
EPA 822-B-00-019
Based on a comparison of water quality sampling data with standards, criteria, or reference values, the problem and potential problem parameters have been identified and are discussed in this section. The issues have also been identified during wet and dry weather, if applicable.
5.3.1 Water Supply The state’s potable water supply criteria were applied to the Tookany/Tacony-Frankford watershed. The criteria are listed in Table 5-3 above. Comparisons between the water quality data and the criteria for water supply are listed in Table 5-4 below. Table 5-4 displays the overall watershed exceedances during dry and wet weather.
Table 5-4 Summary of Water Supply Criteria Exceedances
Dry Wet
Parameter Criteria No.
Obs. No.
Exceed %
Exceed No. Obs
No. Exceed
% Exceed
Dissolved Fe Maximum 64 3 4.69 123 5 4.07 F Maximum 61 1 1.64 438 0 0.00
Mn Maximum 90 0 0.00 461 9 1.95 Ammonia Maximum 41 0 0.00 144 0 0.00 NO23-N Maximum 62 0 0.00 464 0 0.00
TDS Maximum 36 0 0.00 144 2 1.39 Green – Parameter is not a problem Yellow – Potential problem parameter Red – Problem parameter
The results indicate dissolve iron, manganese, and total dissolved solids (TDS) as potential problem parameters. Figures 5-3 through 5-5 show the criteria comparison by monitoring location in the Tookany/Tacony-Frankford watershed. Dissolved iron, prevalent in clay soils, has been identified to exceed the criteria more than 2% of the time in both dry and wet weather. Manganese appears to be a potential wet weather problem, and TDS a potential dry weather problem.
5-9 May 2005

Tookany/Tacony-Frankford Integrated Watershed Management Plan
Figure 5-3 Water Supply Criteria for Dissolved Iron
Figure 5-4 Water Supply Criteria for Manganese
5-10 May 2005
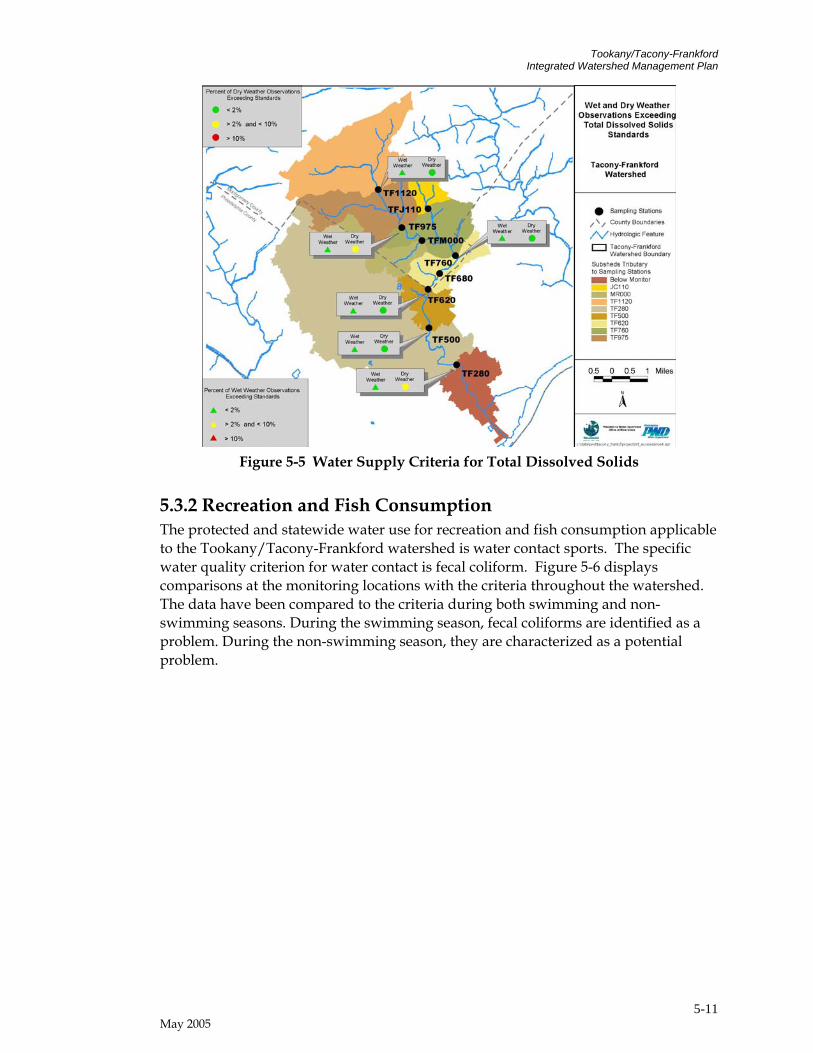
Tookany/Tacony-Frankford Integrated Watershed Management Plan
Figure 5-5 Water Supply Criteria for Total Dissolved Solids
5.3.2 Recreation and Fish Consumption The protected and statewide water use for recreation and fish consumption applicable to the Tookany/Tacony-Frankford watershed is water contact sports. The specific water quality criterion for water contact is fecal coliform. Figure 5-6 displays comparisons at the monitoring locations with the criteria throughout the watershed. The data have been compared to the criteria during both swimming and non-swimming seasons. During the swimming season, fecal coliforms are identified as a problem. During the non-swimming season, they are characterized as a potential problem.
5-11 May 2005

Tookany/Tacony-Frankford Integrated Watershed Management Plan
Figure 5-6 Water Contact Criteria for Fecal Coliform
Table 5-5 Summary of Recreation Criteria Exceedances
Season Site No.
Obs. No.
Exceed Percent
Exc. TF500 1 1 100.00 TF620 7 6 85.71 TF760 1 0 0.00
Nonswimming
TF975 3 3 100.00 TF1120 8 8 100.00 TF280 7 7 100.00 Swimming TF975 8 8 100.00
5.3.3 Human Health The relevant human health criteria developed by EPA and PADEP include exposure to toxic metals from drinking water and fish consumption.
Table 5-6 Summary of Human Health Criteria Exceedances
Dry Wet
Parameter Criteria No.
Obs. No.
Exceed %
Exceed No. Obs
No. Exceed
% Exceed
Dissolved Cd Human Health
Maximum 37 0 0.00 118 0 0.00 Dissolved Cu Human Health 28 0 0.00 5 0 0.00
5-12 May 2005
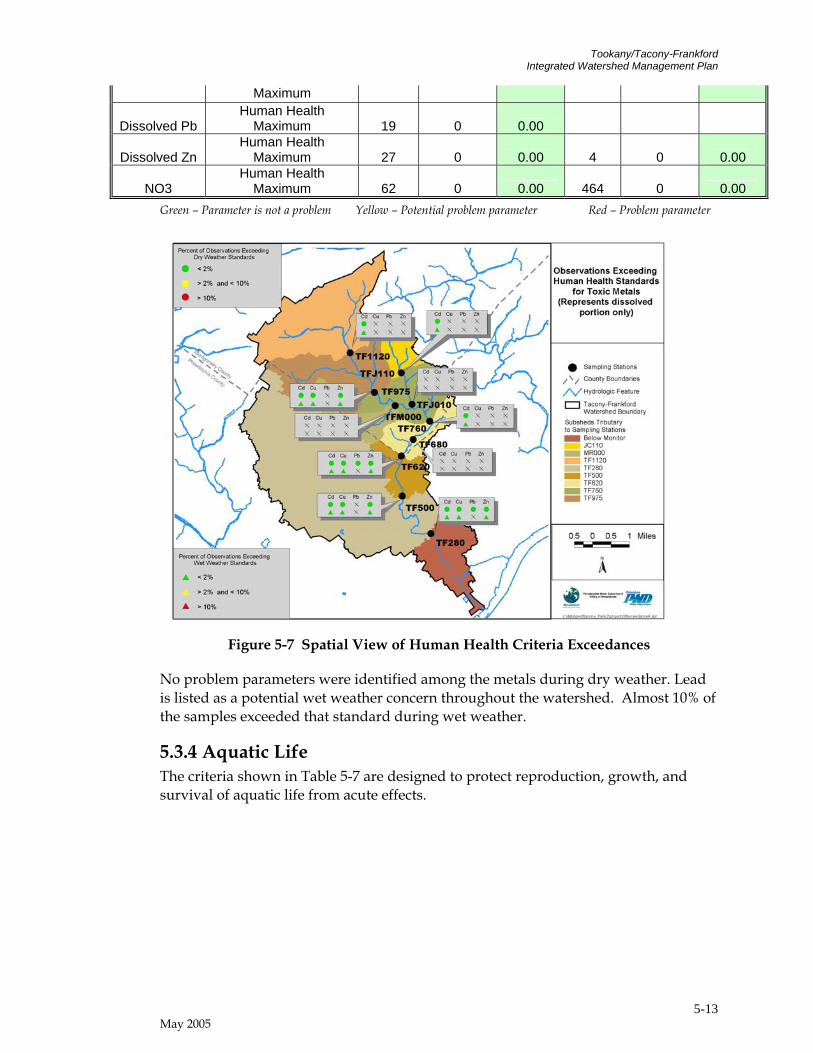
Tookany/Tacony-Frankford Integrated Watershed Management Plan
Maximum
Dissolved Pb Human Health
Maximum 19 0 0.00
Dissolved Zn Human Health
Maximum 27 0 0.00 4 0 0.00
NO3 Human Health
Maximum 62 0 0.00 464 0 0.00 Green – Parameter is not a problem Yellow – Potential problem parameter Red – Problem parameter
Figure 5-7 Spatial View of Human Health Criteria Exceedances
No problem parameters were identified among the metals during dry weather. Lead is listed as a potential wet weather concern throughout the watershed. Almost 10% of the samples exceeded that standard during wet weather.
5.3.4 Aquatic Life The criteria shown in Table 5-7 are designed to protect reproduction, growth, and survival of aquatic life from acute effects.
5-13 May 2005
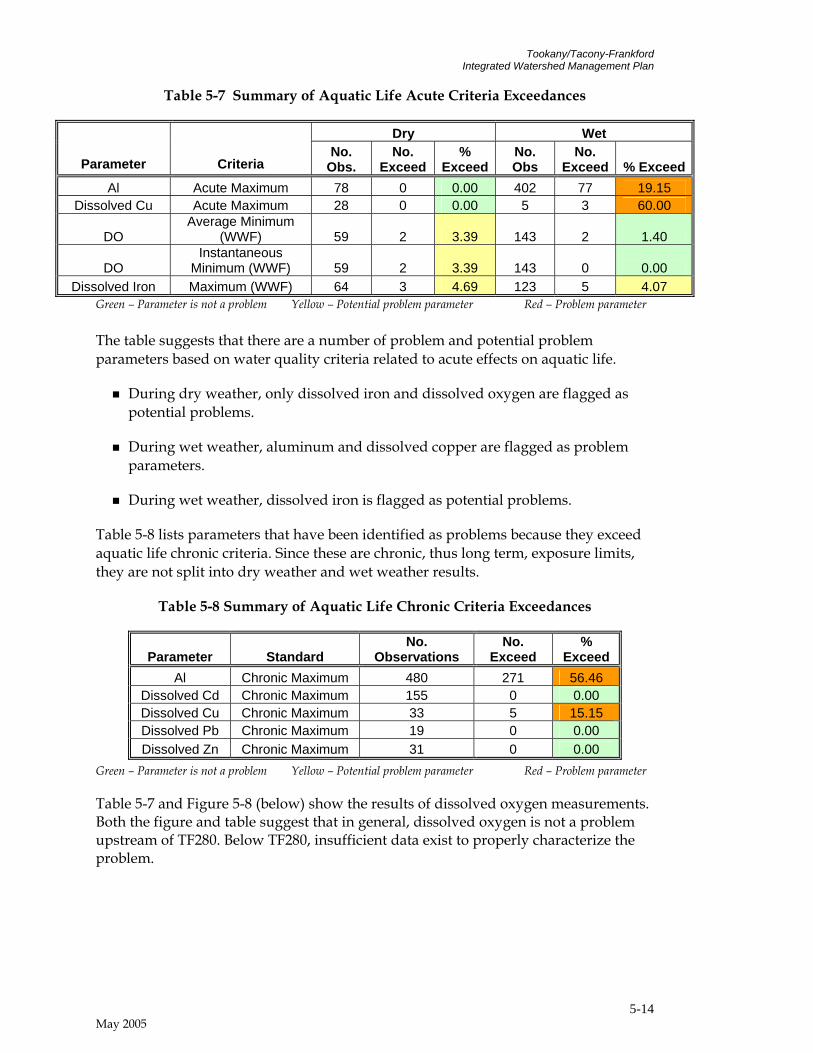
Tookany/Tacony-Frankford Integrated Watershed Management Plan
Table 5-7 Summary of Aquatic Life Acute Criteria Exceedances
Dry Wet
Parameter Criteria No.
Obs. No.
Exceed %
ExceedNo. Obs
No. Exceed % Exceed
Al Acute Maximum 78 0 0.00 402 77 19.15 Dissolved Cu Acute Maximum 28 0 0.00 5 3 60.00
DO Average Minimum
(WWF) 59 2 3.39 143 2 1.40
DO Instantaneous
Minimum (WWF) 59 2 3.39 143 0 0.00 Dissolved Iron Maximum (WWF) 64 3 4.69 123 5 4.07
Green – Parameter is not a problem Yellow – Potential problem parameter Red – Problem parameter The table suggests that there are a number of problem and potential problem parameters based on water quality criteria related to acute effects on aquatic life.
During dry weather, only dissolved iron and dissolved oxygen are flagged as potential problems.
During wet weather, aluminum and dissolved copper are flagged as problem parameters.
During wet weather, dissolved iron is flagged as potential problems.
Table 5-8 lists parameters that have been identified as problems because they exceed aquatic life chronic criteria. Since these are chronic, thus long term, exposure limits, they are not split into dry weather and wet weather results.
Table 5-8 Summary of Aquatic Life Chronic Criteria Exceedances
Parameter Standard No.
Observations No.
Exceed %
Exceed Al Chronic Maximum 480 271 56.46
Dissolved Cd Chronic Maximum 155 0 0.00 Dissolved Cu Chronic Maximum 33 5 15.15 Dissolved Pb Chronic Maximum 19 0 0.00 Dissolved Zn Chronic Maximum 31 0 0.00
Green – Parameter is not a problem Yellow – Potential problem parameter Red – Problem parameter
Table 5-7 and Figure 5-8 (below) show the results of dissolved oxygen measurements. Both the figure and table suggest that in general, dissolved oxygen is not a problem upstream of TF280. Below TF280, insufficient data exist to properly characterize the problem.
5-14 May 2005
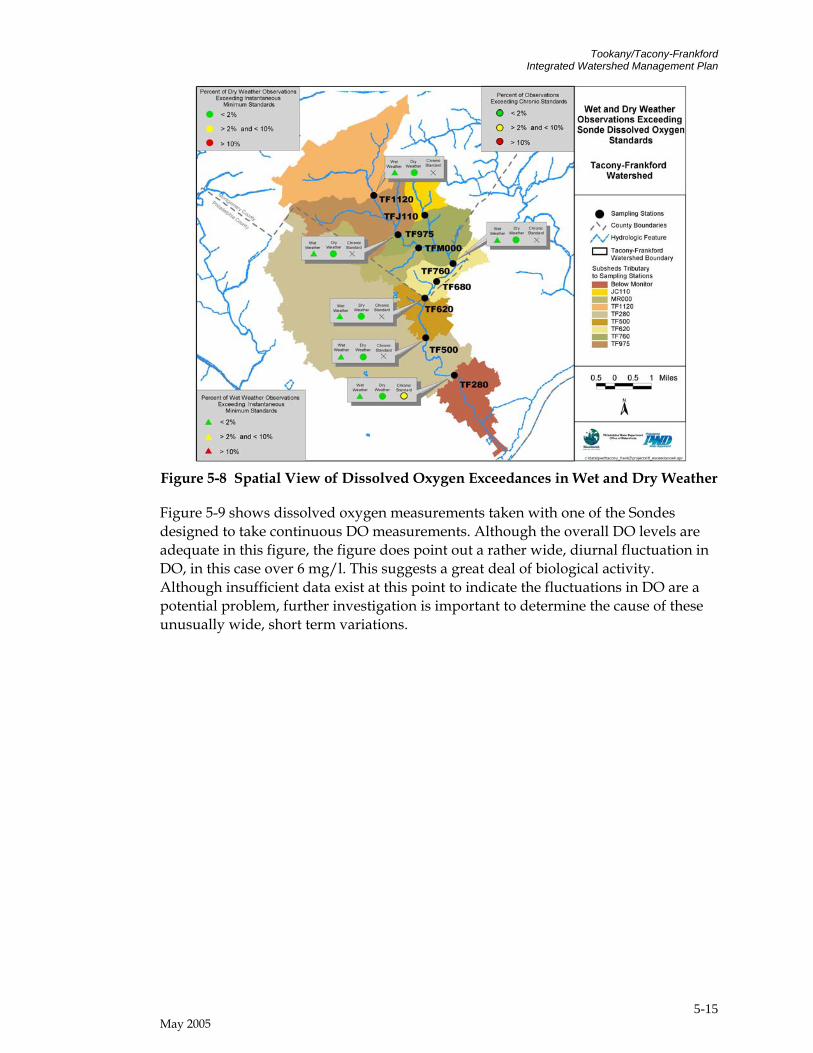
Tookany/Tacony-Frankford Integrated Watershed Management Plan
Figure 5-8 Spatial View of Dissolved Oxygen Exceedances in Wet and Dry Weather
Figure 5-9 shows dissolved oxygen measurements taken with one of the Sondes designed to take continuous DO measurements. Although the overall DO levels are adequate in this figure, the figure does point out a rather wide, diurnal fluctuation in DO, in this case over 6 mg/l. This suggests a great deal of biological activity. Although insufficient data exist at this point to indicate the fluctuations in DO are a potential problem, further investigation is important to determine the cause of these unusually wide, short term variations.
5-15 May 2005
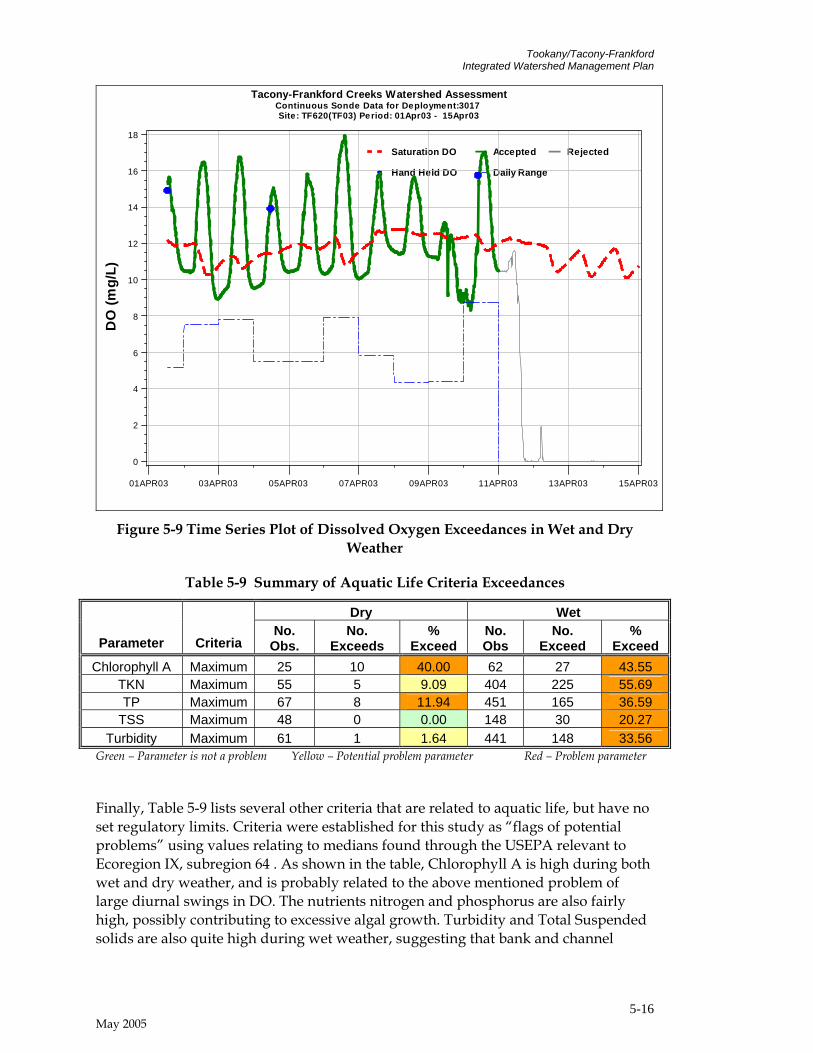
Tookany/Tacony-Frankford Integrated Watershed Management Plan
Saturation DO Accepted Rejected
Hand Held DO Daily Range
Tacony-Frankford Creeks Watershed AssessmentContinuous Sonde Data for Deployment:3017 Site: TF620(TF03) Period: 01Apr03 - 15Apr03
DO
(mg/
L)
0
2
4
6
8
10
12
14
16
18
01APR03 03APR03 05APR03 07APR03 09APR03 11APR03 13APR03 15APR03
Figure 5-9 Time Series Plot of Dissolved Oxygen Exceedances in Wet and Dry
Weather
Table 5-9 Summary of Aquatic Life Criteria Exceedances
Dry Wet
Parameter Criteria No.
Obs. No.
Exceeds %
Exceed No. Obs
No. Exceed
% Exceed
Chlorophyll A Maximum 25 10 40.00 62 27 43.55 TKN Maximum 55 5 9.09 404 225 55.69 TP Maximum 67 8 11.94 451 165 36.59
TSS Maximum 48 0 0.00 148 30 20.27 Turbidity Maximum 61 1 1.64 441 148 33.56
Green – Parameter is not a problem Yellow – Potential problem parameter Red – Problem parameter
Finally, Table 5-9 lists several other criteria that are related to aquatic life, but have no set regulatory limits. Criteria were established for this study as “flags of potential problems” using values relating to medians found through the USEPA relevant to Ecoregion IX, subregion 64 . As shown in the table, Chlorophyll A is high during both wet and dry weather, and is probably related to the above mentioned problem of large diurnal swings in DO. The nutrients nitrogen and phosphorus are also fairly high, possibly contributing to excessive algal growth. Turbidity and Total Suspended solids are also quite high during wet weather, suggesting that bank and channel
5-16 May 2005

Tookany/Tacony-Frankford Integrated Watershed Management Plan
erosion may be occurring, as well as high wash loads of sediments in stormwater during rain events.
5.4 Potential Problem Parameter Summary Based on the analysis, the problem and potential problem parameters are summarized in this section. The problem parameters are those constituents for which more than 10% of the samples exceed the standard watershed-wide. Parameters where the standards (or reference values) were exceeded over 2% of the time for all samples throughout the Tookany/Tacony-Frankford watershed are listed as potential problems. Also, at the least, over 10% of parameter samples at one sampling location must exceed the standard to be considered a problem parameter.
In Table 5-10, the problem and potential problem parameters are listed by category. They are also broken down as either wet or dry weather problems, if applicable. For the metals, the listing is further broken down for chronic vs. acute criteria.
Table 5-10 Summary of Problem and Potential Problem Parameters
Parameter Standard Dry Wet Chronic Acute
Al Acute Maximum Dissolved Cu Acute Maximum
Chronic
Al Chronic
Maximum
Dissolved Cu Chronic
Maximum
Water Supply Dissolved Fe Maximum
Other Parameters based on reference values Chla Maximum Fe Maximum
Phenolics Maximum TKN Maximum TP Maximum
TSS Maximum Temp C Maximum
Total Nitrogen Maximum Turbidity Maximum
DO Minimum
DO Minimum Average
Green – Parameter is not a problem Yellow – Potential problem parameter Red – Problem parameter
5-17 May 2005

Tookany/Tacony-Frankford Integrated Watershed Management Plan
5.5 Stream Ecology The biological community of the Tookany/Tacony-Frankford Watershed is heavily impacted by its urban surroundings. The impaired state of the creek is a result of habitat deterioration and water quality degradation. High levels of urbanization and development, poor stream bank stability and flood control deeply influence the Tookany/Tacony-Frankford creeks and watershed. These factors have resulted in a channelization of the creeks, further inducing erosion and sedimentation problems. The natural water flows have been redirected to storm sewers and replaced by block after block of impervious surfaces. Due to the changes in the hydrologic profile of the stream and watershed, storm events result in more concentrated runoff and cause more damage than they once did. Instead of percolating into the ground, stormwater is collected and rushed into an already unstable creek where it scours banks, fills pools, and covers riffles. The rushing water strips soil from the banks and deposits some of it over the embedded cobbles and takes the rest to the Delaware River, all the while holding on to the chemicals and pathogens it collected on the city streets and in the sewers.
Figure 5-10 displays the results of the biological and habitat assessments of the Tookany/Tacony-Frankford Creeks. Biological monitoring indicates that the whole Tacony-Frankford Watershed suffers from impaired aquatic habitat and does not meet its designated use as a warm water fishery. As a result, the whole length of the Tacony-Frankford Creek and its tributaries were listed in PA DEP’s 303d list of impaired waters in 1999. This impairment is due to severe water flow fluctuations, habitat alteration, point and non-point source (NPS) pollution from urban development, hydro-modification, and combined sewer overflows (CSO)(PA DEP 2001). The tidal portion of the Frankford Creek remains unassessed because the biological assessment protocol is not applicable to tidal stream segments.
5-18
May 2005
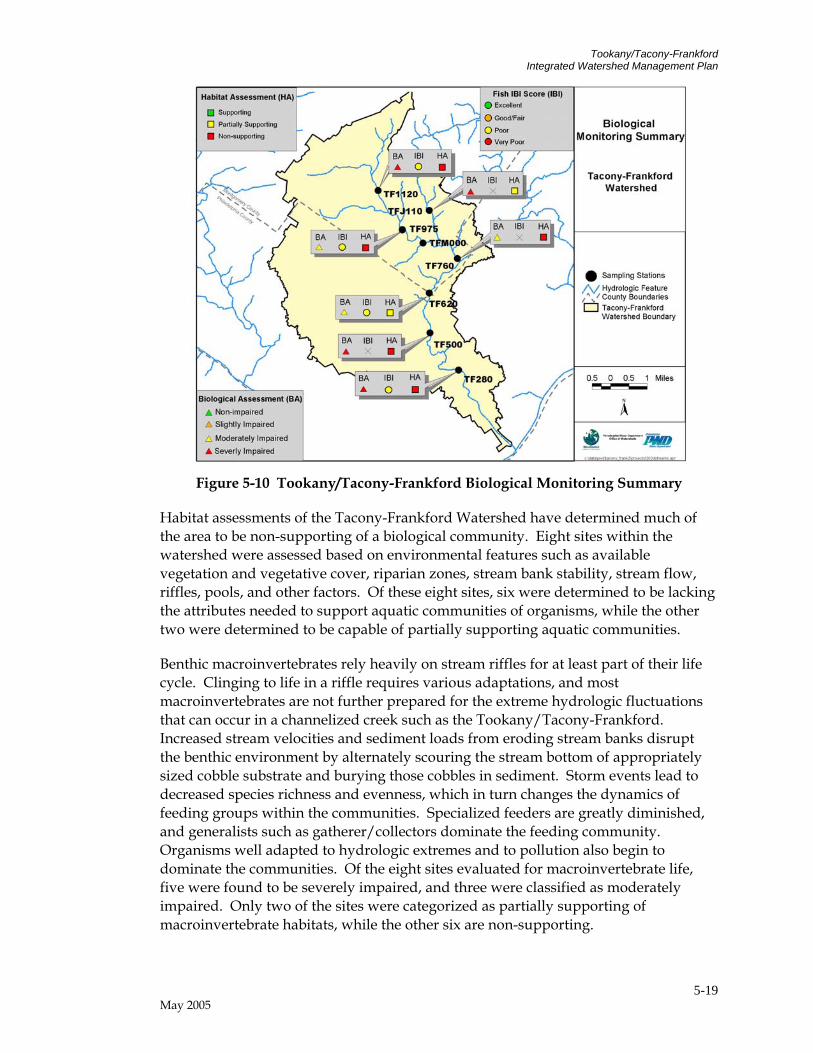
Tookany/Tacony-Frankford Integrated Watershed Management Plan
Figure 5-10 Tookany/Tacony-Frankford Biological Monitoring Summary
Habitat assessments of the Tacony-Frankford Watershed have determined much of the area to be non-supporting of a biological community. Eight sites within the watershed were assessed based on environmental features such as available vegetation and vegetative cover, riparian zones, stream bank stability, stream flow, riffles, pools, and other factors. Of these eight sites, six were determined to be lacking the attributes needed to support aquatic communities of organisms, while the other two were determined to be capable of partially supporting aquatic communities.
Benthic macroinvertebrates rely heavily on stream riffles for at least part of their life cycle. Clinging to life in a riffle requires various adaptations, and most macroinvertebrates are not further prepared for the extreme hydrologic fluctuations that can occur in a channelized creek such as the Tookany/Tacony-Frankford. Increased stream velocities and sediment loads from eroding stream banks disrupt the benthic environment by alternately scouring the stream bottom of appropriately sized cobble substrate and burying those cobbles in sediment. Storm events lead to decreased species richness and evenness, which in turn changes the dynamics of feeding groups within the communities. Specialized feeders are greatly diminished, and generalists such as gatherer/collectors dominate the feeding community. Organisms well adapted to hydrologic extremes and to pollution also begin to dominate the communities. Of the eight sites evaluated for macroinvertebrate life, five were found to be severely impaired, and three were classified as moderately impaired. Only two of the sites were categorized as partially supporting of macroinvertebrate habitats, while the other six are non-supporting.
5-19 May 2005

Tookany/Tacony-Frankford Integrated Watershed Management Plan
Like the benthic invertebrate community, fish communities rely heavily on various habitats within a stream reach. An altered hydrologic profile in the stream leads to fewer offspring and decreased diversity in the fish community. The extreme flow conditions disrupt nesting habitats and routines for many species. Fish are also unable to rely on the presence of the calm pools and runs they often inhabit. A fish assessment of the Tookany/Tacony-Frankford stream collected a total of 14 taxa, all of which being at least moderately tolerant of pollution. One of the sites evaluated only had three species of fish present. The low diversity and species richness is indicative of poor habitat and stream health.
5.6 Wetlands Assessment The Philadelphia Water Department conducted an extensive wetlands assessment along the riparian corridor of the Tookany/Tacony-Frankford Watershed. Wetland indicators were used to identify possible wetland locations (e.g., soils, hydrology). Over 100 potential wetland locations were field evaluated, and 24 existing wetlands were identified. These wetlands were characterized using the Oregon Freshwater Wetland Assessment method, which evaluates how effectively a wetland performs the following functions: Wildlife Habitat, Fish Habitat, Water Quality, Hydrologic Control.
The existing wetlands ranged in size from 0.01 to 2.5 acres, and comprise a total of about 15 acres in the watershed (which excludes open water). Only 15 acres of wetland remain within the 685 acres that constitute the undeveloped riparian corridor of the Tookany/Tacony-Frankford Watershed, and most of those wetlands exhibit degraded wetland functions as a result of hydrologic disconnection from the waterways, encroachment, and invasive vegetation.
The most significant issues affecting wetlands are:
Many wetlands have been lost to development
Remaining wetlands are not sufficiently inundated because stormwater is piped directly to streams
Wetlands are no longer hydrologically connected to the primary waterway
Wetlands have suffered encroachment and disturbance from urbanization
Wetland vegetative and wildlife diversity has been compromised by disturbance
Remaining wetlands are extensively compromised in terms of their water quality improvement function
The extent of disturbance to the remaining wetlands is indicated by the degree to which the wetland functions have been degraded and the degree of human disturbance. The wetland field investigation produced ratings of the degree to which
5-20 May 2005
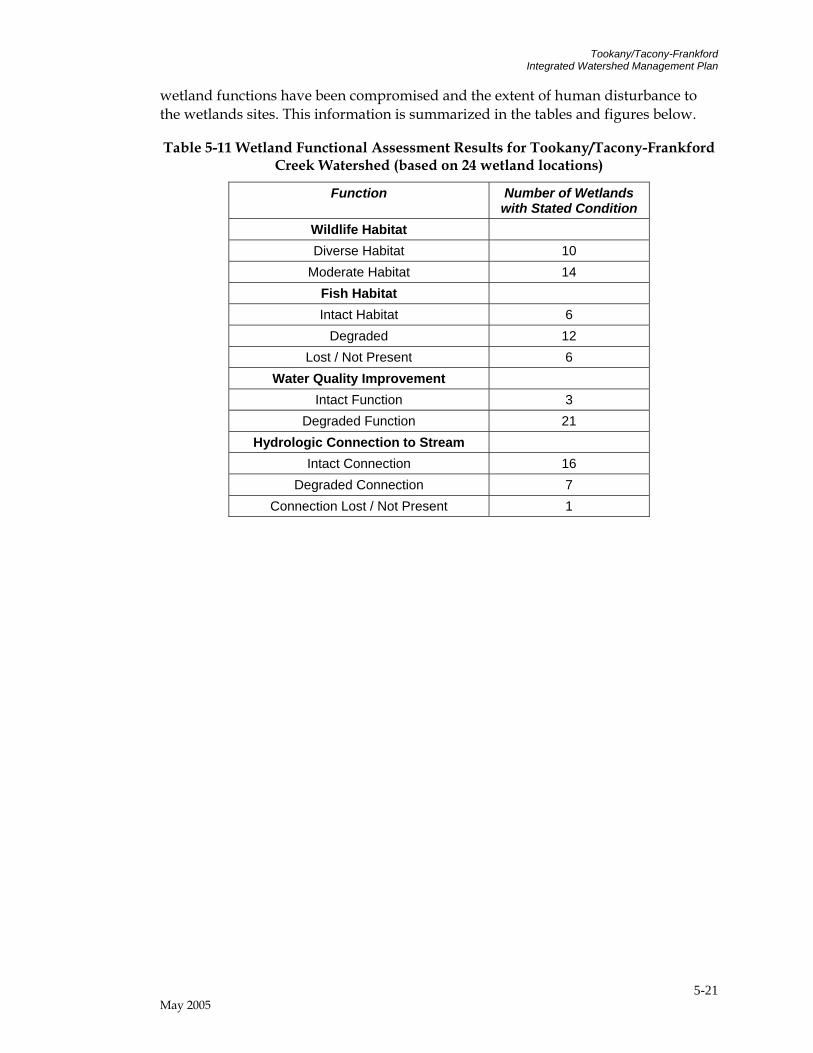
Tookany/Tacony-Frankford Integrated Watershed Management Plan
wetland functions have been compromised and the extent of human disturbance to the wetlands sites. This information is summarized in the tables and figures below.
Table 5-11 Wetland Functional Assessment Results for Tookany/Tacony-Frankford Creek Watershed (based on 24 wetland locations)
Function Number of Wetlands with Stated Condition
Wildlife Habitat Diverse Habitat 10
Moderate Habitat 14 Fish Habitat Intact Habitat 6
Degraded 12 Lost / Not Present 6
Water Quality Improvement Intact Function 3
Degraded Function 21 Hydrologic Connection to Stream
Intact Connection 16 Degraded Connection 7
Connection Lost / Not Present 1
5-21 May 2005
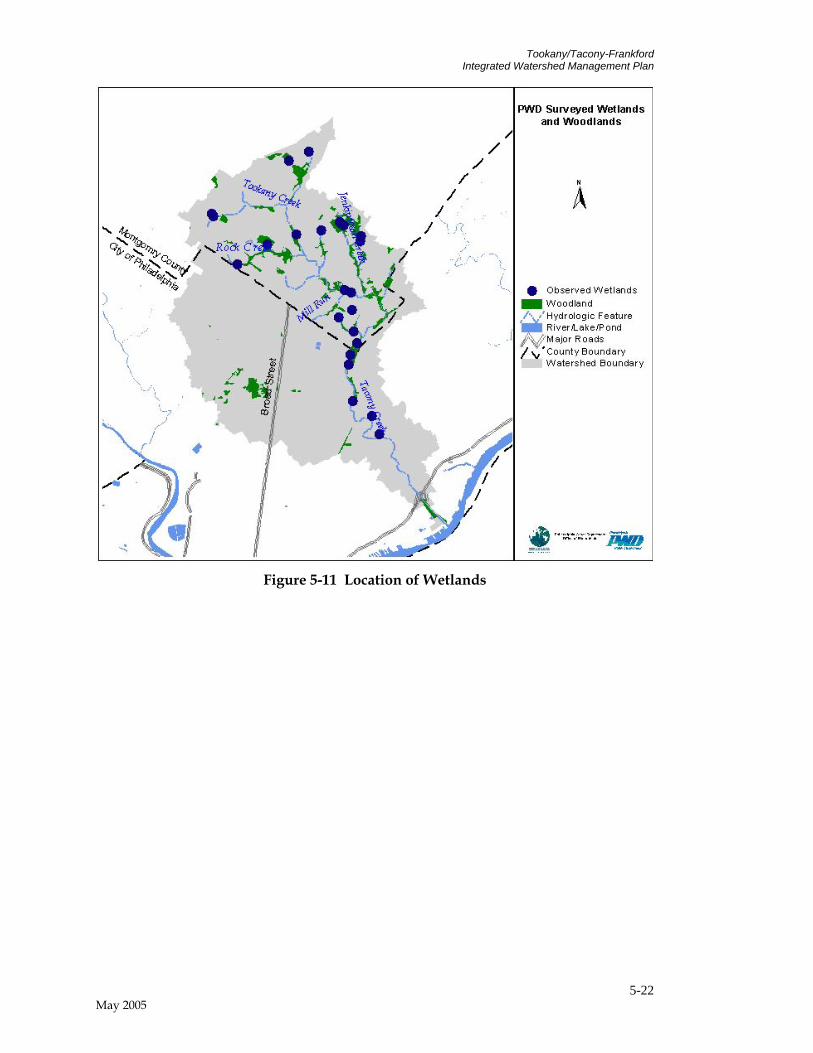
Tookany/Tacony-Frankford Integrated Watershed Management Plan
Figure 5-11 Location of Wetlands
5-22 May 2005
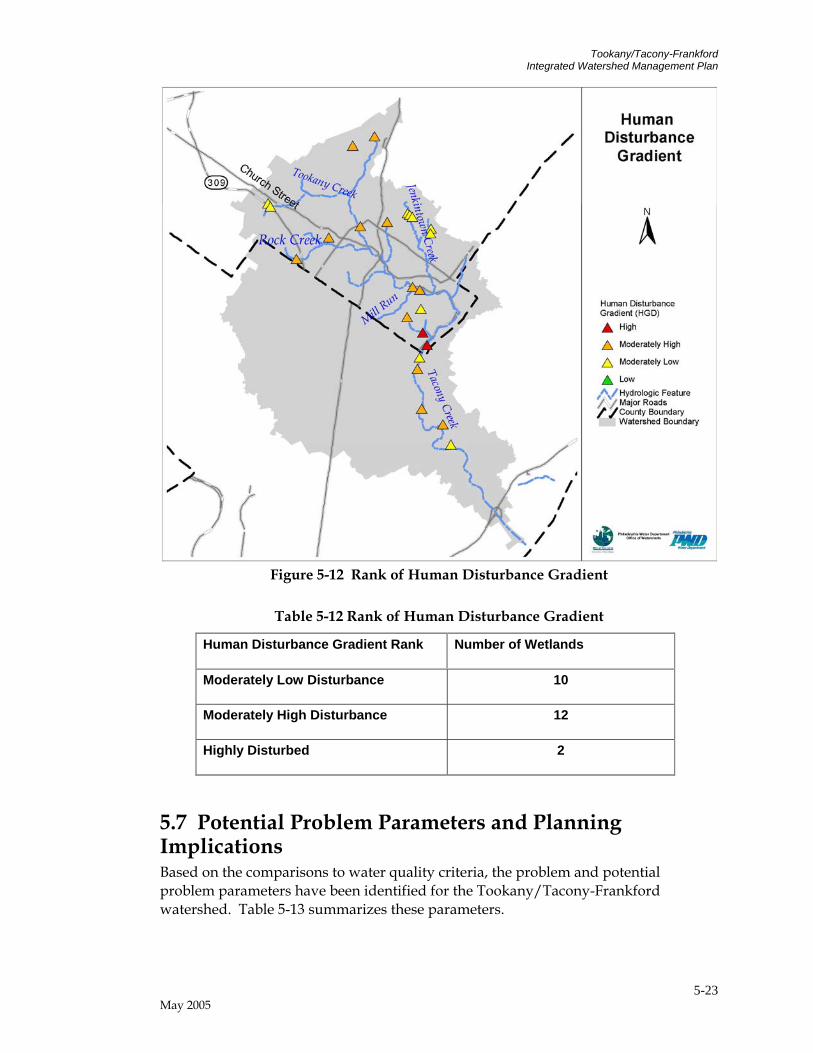
Tookany/Tacony-Frankford Integrated Watershed Management Plan
Figure 5-12 Rank of Human Disturbance Gradient
Table 5-12 Rank of Human Disturbance Gradient
Human Disturbance Gradient Rank Number of Wetlands
Moderately Low Disturbance 10
Moderately High Disturbance 12
Highly Disturbed 2
5.7 Potential Problem Parameters and Planning Implications Based on the comparisons to water quality criteria, the problem and potential problem parameters have been identified for the Tookany/Tacony-Frankford watershed. Table 5-13 summarizes these parameters.
5-23 May 2005
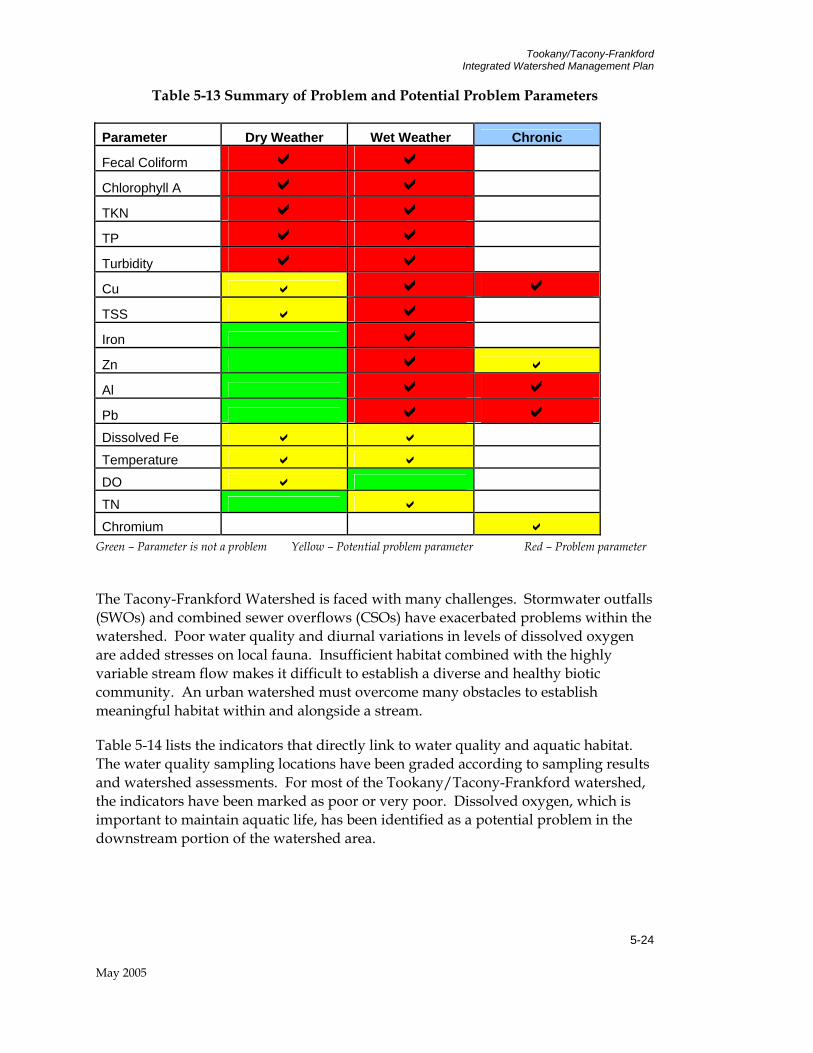
Tookany/Tacony-Frankford Integrated Watershed Management Plan
Table 5-13 Summary of Problem and Potential Problem Parameters Parameter Dry Weather Wet Weather Chronic
Fecal Coliform
Chlorophyll A
TKN
TP
Turbidity
Cu TSS
Iron
Zn
Al Pb Dissolved Fe
Temperature
DO
TN
Chromium Green – Parameter is not a problem Yellow – Potential problem parameter Red – Problem parameter
The Tacony-Frankford Watershed is faced with many challenges. Stormwater outfalls (SWOs) and combined sewer overflows (CSOs) have exacerbated problems within the watershed. Poor water quality and diurnal variations in levels of dissolved oxygen are added stresses on local fauna. Insufficient habitat combined with the highly variable stream flow makes it difficult to establish a diverse and healthy biotic community. An urban watershed must overcome many obstacles to establish meaningful habitat within and alongside a stream.
Table 5-14 lists the indicators that directly link to water quality and aquatic habitat. The water quality sampling locations have been graded according to sampling results and watershed assessments. For most of the Tookany/Tacony-Frankford watershed, the indicators have been marked as poor or very poor. Dissolved oxygen, which is important to maintain aquatic life, has been identified as a potential problem in the downstream portion of the watershed area.
5-24
May 2005
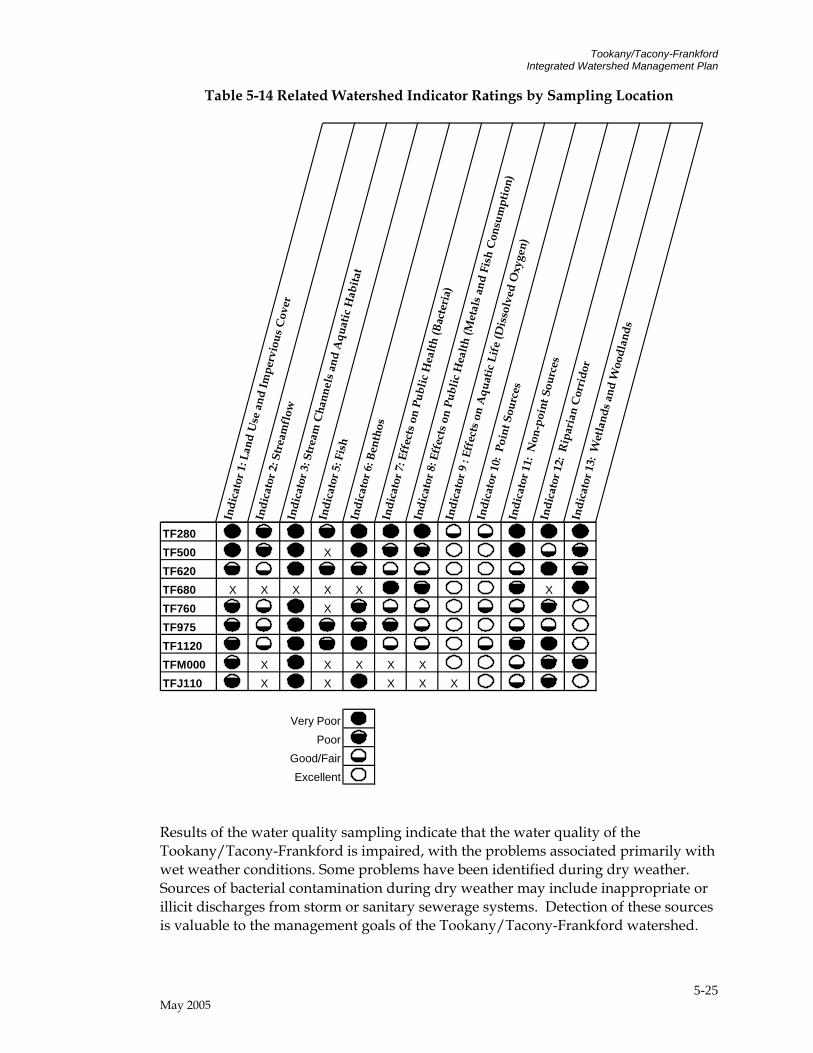
Tookany/Tacony-Frankford Integrated Watershed Management Plan
Table 5-14 Related Watershed Indicator Ratings by Sampling Location
Indi
cato
r 1: L
and
Use
and
Impe
rvio
us C
over
Indi
cato
r 2: S
trea
mfl
owIn
dica
tor 3
: Str
eam
Cha
nnel
s and
Aqu
atic
Hab
itat
Indi
cato
r 5: F
ish
Indi
cato
r 6: B
enth
osIn
dica
tor 7
: Eff
ects
on
Publ
ic H
ealth
(Bac
teri
a)
Indi
cato
r 8: E
ffec
ts o
n Pu
blic
Hea
lth (M
etal
s and
Fis
h C
onsu
mpt
ion)
Indi
cato
r 9 :
Effe
cts o
n A
quat
ic L
ife
(Dis
solv
ed O
xyge
n)
Indi
cato
r 10:
Poi
nt S
ourc
esIn
dica
tor 1
1: N
on-p
oint
Sou
rces
Indi
cato
r 12:
Rip
aria
n C
orri
dor
Indi
cato
r 13:
Wet
land
s and
Woo
dlan
ds
TF280TF500 XTF620TF680 X X X X X XTF760 XTF975TF1120TFM000 X X X X XTFJ110 X X X X X
Very PoorPoor
Good/FairExcellent
Results of the water quality sampling indicate that the water quality of the Tookany/Tacony-Frankford is impaired, with the problems associated primarily with wet weather conditions. Some problems have been identified during dry weather. Sources of bacterial contamination during dry weather may include inappropriate or illicit discharges from storm or sanitary sewerage systems. Detection of these sources is valuable to the management goals of the Tookany/Tacony-Frankford watershed.
5-25 May 2005

Tookany/Tacony-Frankford Integrated Watershed Management Plan
Dry weather concentrations of nutrients may be attributed to treated wastewater effluent, over-watering of lawns and gardens, pet-waste, and failing septic tanks.
In wet weather, the model-estimated pollutant loadings have identified contributions from different sources. Estimated annual pollutant contributions for the Tookany/Tacony-Frankford watersheds are discussed in Section 4. Permitted industrial and municipal point source discharges make up less than 1% of annual streamflow in both systems. SSOs are thought to occur in both watersheds but have not been well documented to date.
5-26 May 2005

Tookany/Tacony-Frankford Integrated Watershed Management Plan
Pollutants and Their Sources Indicator 11: Nonpoint Sources Nonpoint source pollution is any source of water contamination not associated with a distinct discharge point. This type of pollution is a leading cause of water quality degradation in the United States. Nonpoint sources include atmospheric deposition, stormwater runoff from pasture and crop land, and individual on-lot domestic sewage systems discharging through shallow groundwater. Stormwater from urban and suburban areas is considered a point source for regulatory purposes because it is collected in a pipe system and discharged at a single point.
Figure 4.30 Pasture Land
Figure 4.31 Septic System
Source: Ohio State University Extension
Agricultural activity is a major source of nonpoint source pollution in many areas. Animal manure and fertilizers applied to crops may lead to pollutant inputs to surface water and groundwater. A properly sited and maintained septic system should not result in inputs of nutrients to groundwater. However, failing septic systems are common and can result in nutrient inputs to shallow groundwater and ultimately to stream baseflow. Background concentrations of some water quality constituents are present in groundwater and may be transferred to stream baseflow. Some constituents may be introduced through agricultural activity or failing septic systems, while others may be present as a result of local geology.
This indicator measures:
Model-estimated percent of total pollutant loads contributed by septic tanks Evidence that sanitary sewers are leaking during dry weather, or are in direct contact
with the stream Where We Were: Since most point sources were addressed in the 1970s and 1980s, regulatory agencies have been turning attention towards controlling nonpoint sources of pollution. Many of these sources began to be addressed only during the 1990s.
May 2005 4-49
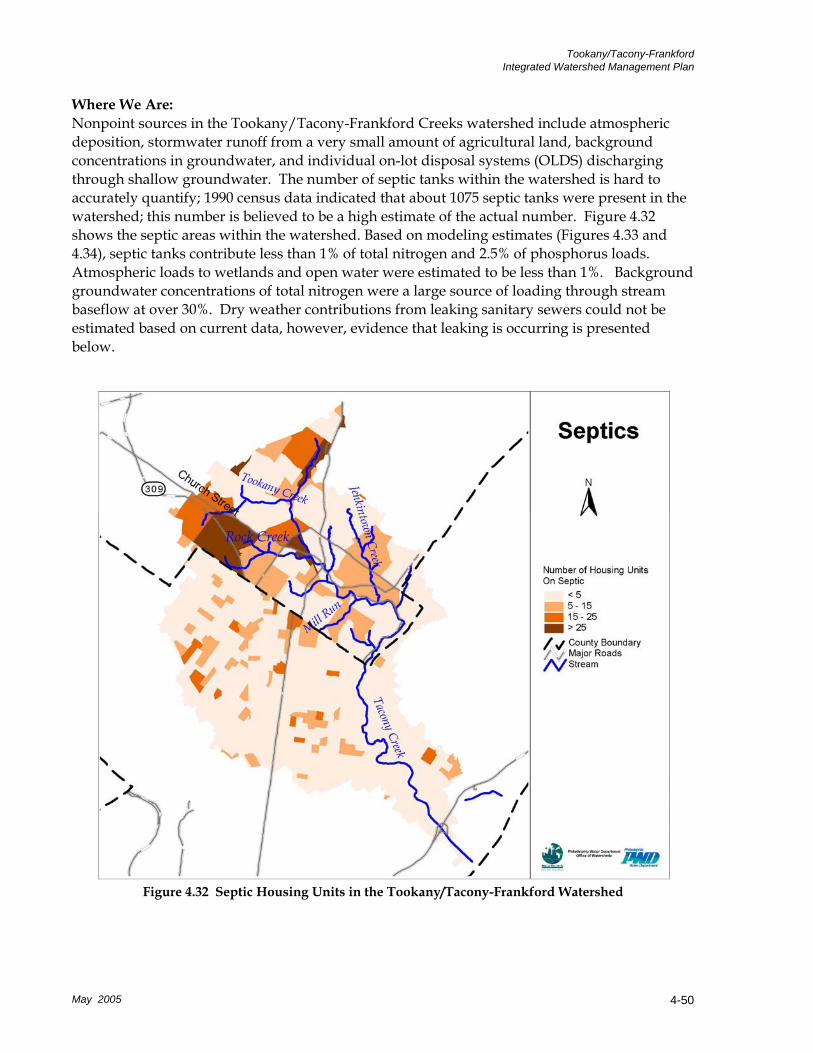
Tookany/Tacony-Frankford Integrated Watershed Management Plan
Where We Are: Nonpoint sources in the Tookany/Tacony-Frankford Creeks watershed include atmospheric deposition, stormwater runoff from a very small amount of agricultural land, background concentrations in groundwater, and individual on-lot disposal systems (OLDS) discharging through shallow groundwater. The number of septic tanks within the watershed is hard to accurately quantify; 1990 census data indicated that about 1075 septic tanks were present in the watershed; this number is believed to be a high estimate of the actual number. Figure 4.32 shows the septic areas within the watershed. Based on modeling estimates (Figures 4.33 and 4.34), septic tanks contribute less than 1% of total nitrogen and 2.5% of phosphorus loads. Atmospheric loads to wetlands and open water were estimated to be less than 1%. Background groundwater concentrations of total nitrogen were a large source of loading through stream baseflow at over 30%. Dry weather contributions from leaking sanitary sewers could not be estimated based on current data, however, evidence that leaking is occurring is presented below.
Figure 4.32 Septic Housing Units in the Tookany/Tacony-Frankford Watershed
May 2005 4-50
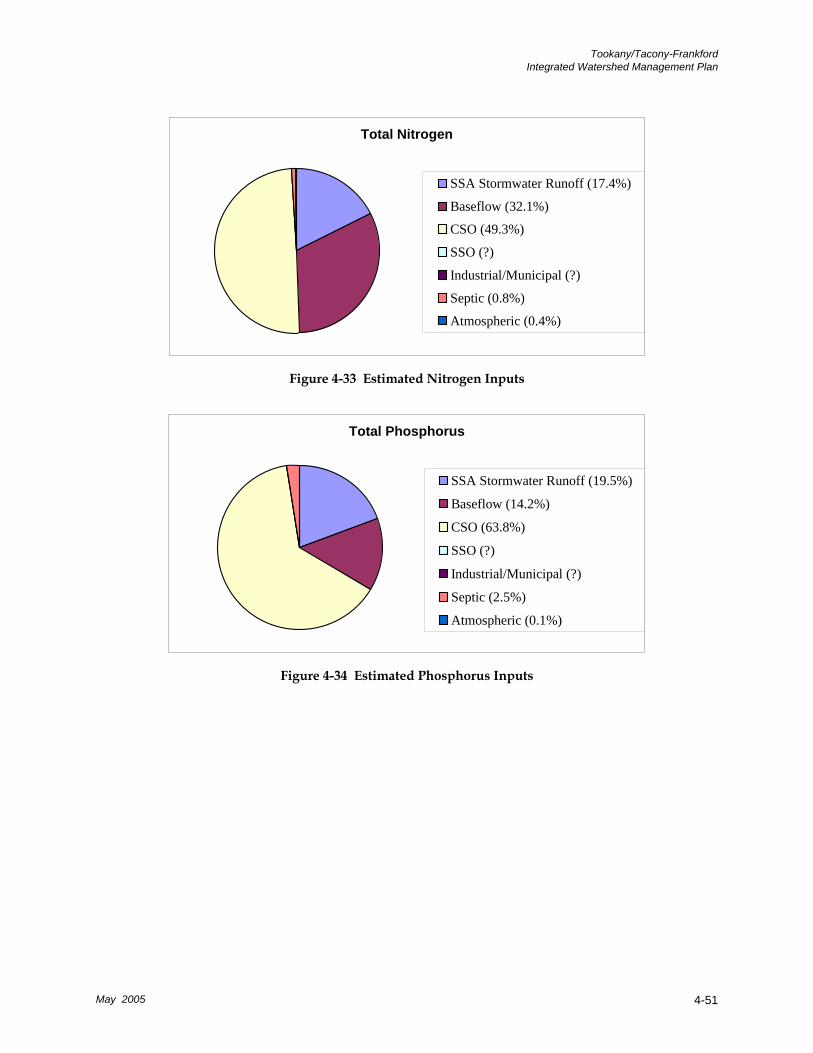
Tookany/Tacony-Frankford Integrated Watershed Management Plan
Total Nitrogen
SSA Stormwater Runoff (17.4%)
Baseflow (32.1%)
CSO (49.3%)
SSO (?)
Industrial/Municipal (?)
Septic (0.8%)
Atmospheric (0.4%)
Figure 4-33 Estimated Nitrogen Inputs
Total Phosphorus
SSA Stormwater Runoff (19.5%)
Baseflow (14.2%)
CSO (63.8%)
SSO (?)
Industrial/Municipal (?)
Septic (2.5%)
Atmospheric (0.1%)
May 2005 4-51
Figure 4-34 Estimated Phosphorus Inputs
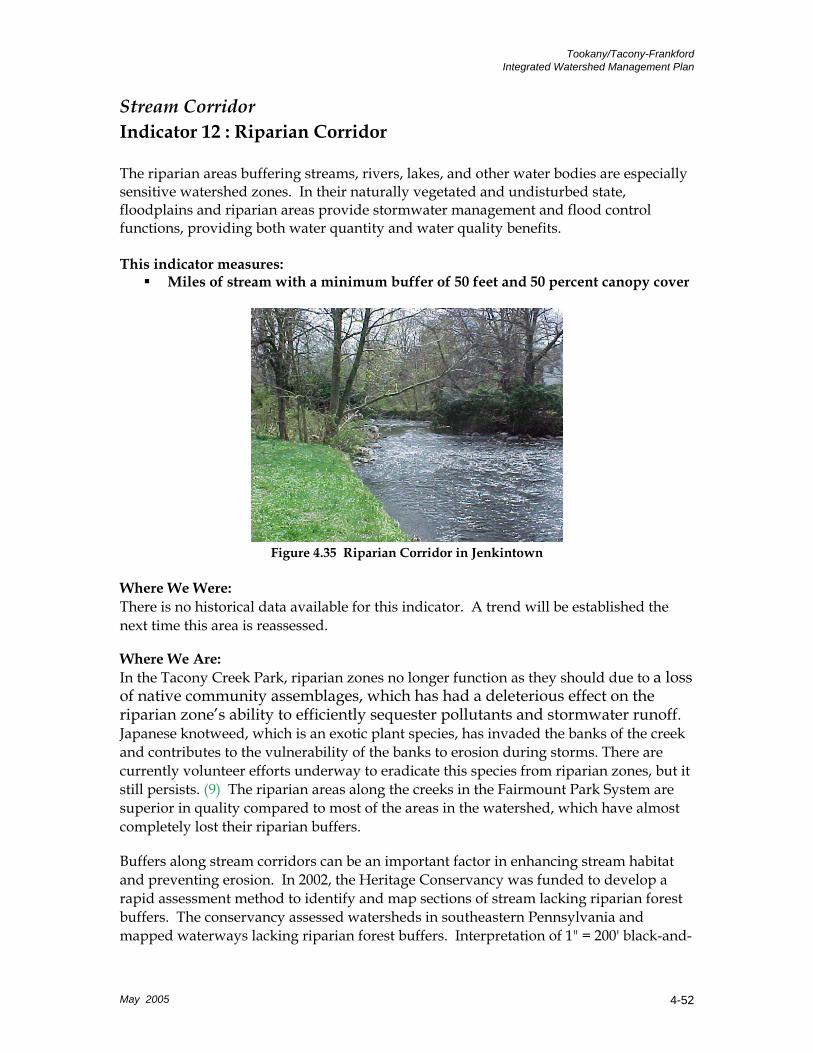
Tookany/Tacony-Frankford Integrated Watershed Management Plan
Stream Corridor Indicator 12 : Riparian Corridor The riparian areas buffering streams, rivers, lakes, and other water bodies are especially sensitive watershed zones. In their naturally vegetated and undisturbed state, floodplains and riparian areas provide stormwater management and flood control functions, providing both water quantity and water quality benefits. This indicator measures:
Miles of stream with a minimum buffer of 50 feet and 50 percent canopy cover
Figure 4.35 Riparian Corridor in Jenkintown
Where We Were: There is no historical data available for this indicator. A trend will be established the next time this area is reassessed.
Where We Are: In the Tacony Creek Park, riparian zones no longer function as they should due to a loss of native community assemblages, which has had a deleterious effect on the riparian zone’s ability to efficiently sequester pollutants and stormwater runoff. Japanese knotweed, which is an exotic plant species, has invaded the banks of the creek and contributes to the vulnerability of the banks to erosion during storms. There are currently volunteer efforts underway to eradicate this species from riparian zones, but it still persists. (9) The riparian areas along the creeks in the Fairmount Park System are superior in quality compared to most of the areas in the watershed, which have almost completely lost their riparian buffers.
Buffers along stream corridors can be an important factor in enhancing stream habitat and preventing erosion. In 2002, the Heritage Conservancy was funded to develop a rapid assessment method to identify and map sections of stream lacking riparian forest buffers. The conservancy assessed watersheds in southeastern Pennsylvania and mapped waterways lacking riparian forest buffers. Interpretation of 1" = 200' black-and-
May 2005 4-52
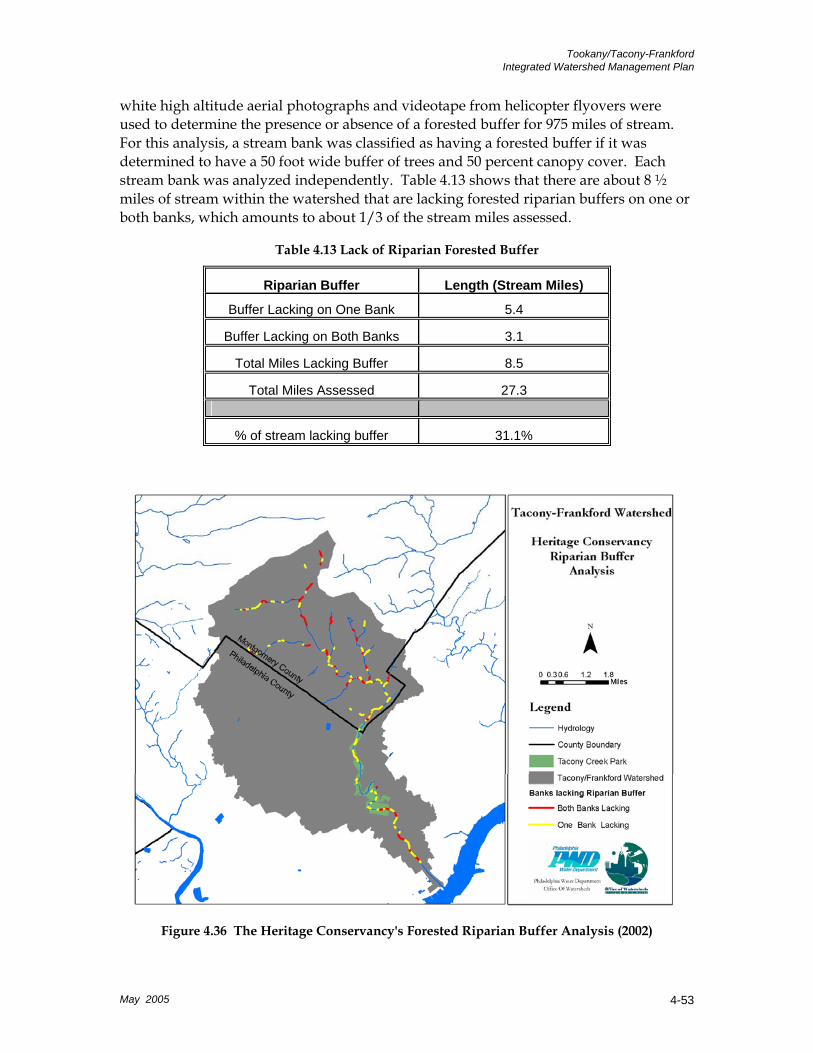
Tookany/Tacony-Frankford Integrated Watershed Management Plan
white high altitude aerial photographs and videotape from helicopter flyovers were used to determine the presence or absence of a forested buffer for 975 miles of stream. For this analysis, a stream bank was classified as having a forested buffer if it was determined to have a 50 foot wide buffer of trees and 50 percent canopy cover. Each stream bank was analyzed independently. Table 4.13 shows that there are about 8 ½ miles of stream within the watershed that are lacking forested riparian buffers on one or both banks, which amounts to about 1/3 of the stream miles assessed.
Table 4.13 Lack of Riparian Forested Buffer
Riparian Buffer Length (Stream Miles)
Buffer Lacking on One Bank 5.4
Buffer Lacking on Both Banks 3.1
Total Miles Lacking Buffer 8.5
Total Miles Assessed 27.3
% of stream lacking buffer 31.1%
Figure 4.36 The Heritage Conservancy's Forested Riparian Buffer Analysis (2002)
May 2005 4-53
Tookany/Tacony-Frankford Integrated Watershed Management Plan
Stream Corridor Indicator 13: Wetlands and Riparian Woodlands Wetlands and riparian woodlands are important natural filters for pollutants in stormwater. Wetlands and woodlands increase vegetation diversity, providing feeding and nesting habitat for birds and animals. They are important in preventing slope erosion and mitigating flood peaks by slowing runoff, and they promote natural infiltration of rainfall and groundwater recharge.
The most significant functions that wetlands perform are:
Wildlife Habitat Fish Habitat Water Quality Improvement (nutrient and toxicant reduction) Hydrologic (flood flow) modification Groundwater recharge
The location and size of a wetland influence the functions it can perform. For example, the geographic location may determine its habitat functions, and the location of a wetland within a watershed can influence its hydrologic and water-quality functions. Many factors determine how well a wetland will perform these functions; such as the size and type of wetland, the quantity and quality of water entering the wetland, and the disturbances or alteration within the wetland or in the surrounding ecosystem.
Wetlands of the Tookany/Tacony-Frankford watershed were evaluated for the first four of the functions listed above, and were further studied to understand the degree to which they have experienced disturbance and their potential for enhancement and improvement, where they have experienced disturbance. Figure 4.37 shows a typical wetland in the watershed.
This indicator measures:
Approximate area of wetland in the watershed Area of riparian buffer along waterways The quality of (and disturbance to) the wetlands The ability of the wetland and woodlands to improve water quality
May 2005 4-54
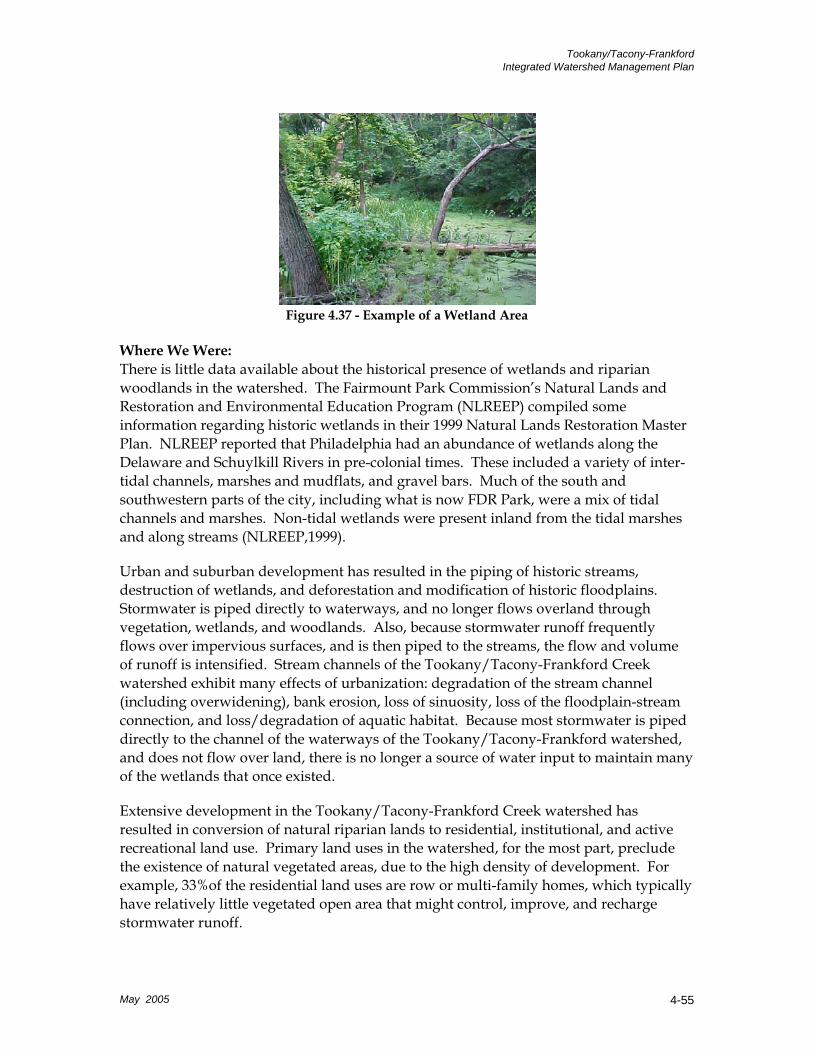
Tookany/Tacony-Frankford Integrated Watershed Management Plan
Figure 4.37 - Example of a Wetland Area
Where We Were: There is little data available about the historical presence of wetlands and riparian woodlands in the watershed. The Fairmount Park Commission’s Natural Lands and Restoration and Environmental Education Program (NLREEP) compiled some information regarding historic wetlands in their 1999 Natural Lands Restoration Master Plan. NLREEP reported that Philadelphia had an abundance of wetlands along the Delaware and Schuylkill Rivers in pre-colonial times. These included a variety of inter-tidal channels, marshes and mudflats, and gravel bars. Much of the south and southwestern parts of the city, including what is now FDR Park, were a mix of tidal channels and marshes. Non-tidal wetlands were present inland from the tidal marshes and along streams (NLREEP,1999).
Urban and suburban development has resulted in the piping of historic streams, destruction of wetlands, and deforestation and modification of historic floodplains. Stormwater is piped directly to waterways, and no longer flows overland through vegetation, wetlands, and woodlands. Also, because stormwater runoff frequently flows over impervious surfaces, and is then piped to the streams, the flow and volume of runoff is intensified. Stream channels of the Tookany/Tacony-Frankford Creek watershed exhibit many effects of urbanization: degradation of the stream channel (including overwidening), bank erosion, loss of sinuosity, loss of the floodplain-stream connection, and loss/degradation of aquatic habitat. Because most stormwater is piped directly to the channel of the waterways of the Tookany/Tacony-Frankford watershed, and does not flow over land, there is no longer a source of water input to maintain many of the wetlands that once existed.
Extensive development in the Tookany/Tacony-Frankford Creek watershed has resulted in conversion of natural riparian lands to residential, institutional, and active recreational land use. Primary land uses in the watershed, for the most part, preclude the existence of natural vegetated areas, due to the high density of development. For example, 33%of the residential land uses are row or multi-family homes, which typically have relatively little vegetated open area that might control, improve, and recharge stormwater runoff.
May 2005 4-55

Tookany/Tacony-Frankford Integrated Watershed Management Plan
In summary, the number and area of wetlands and riparian woodlands in the Tookany/Tacony-Frankford Creek watershed have declined significantly over time as a result of development close to the stream edges, changes to the floodplain from concentrated stormwater flows, and routing of nearly all stormwater flow into pipes.
Where We Are: The Tookany/Tacony-Frankford Creek watershed is 21,000 acres in size, or about 31 square miles. The watershed is nearly totally developed - 87% (18,200 acres) of the watershed now hosts residences, businesses, industries, and utilities.
Land use data indicates that only 13% of the Tookany/Tacony-Frankford watershed land area is non-urbanized (i.e., agriculture, cemetery, recreation, woodland), and only 5% of the watershed land area remains as woodland (1,060 acres). The undeveloped riparian corridor, which comprises the undeveloped land directly adjacent to the Tookany/Tacony-Frankford waterways, totals about 3.3% (685 acres) of the watershed land area. The undeveloped riparian corridor is illustrated in Figure 4-38. About one-third of the total woodland is located within the Tookany/Tacony-Frankford undeveloped riparian corridor. (Also see Indicator 1: Land Use and Impervious Cover)
Figure 4-38 Undeveloped Lands in the Riparian Corridor
May 2005 4-56
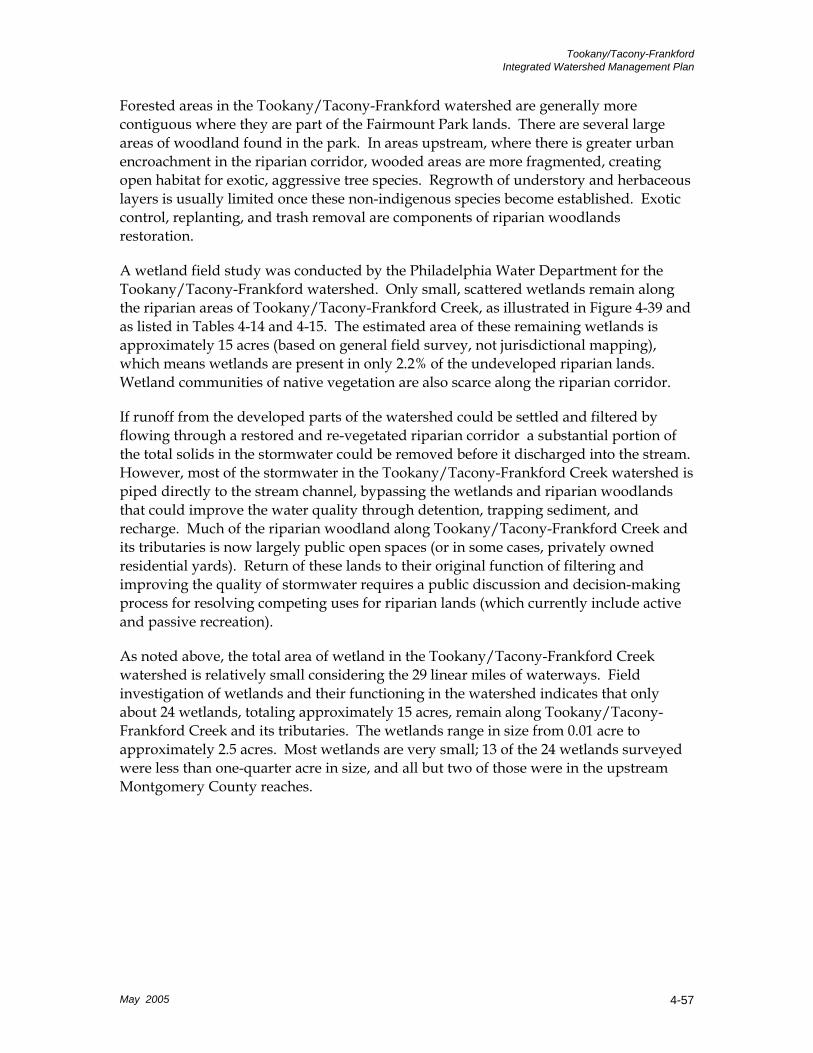
Tookany/Tacony-Frankford Integrated Watershed Management Plan
Forested areas in the Tookany/Tacony-Frankford watershed are generally more contiguous where they are part of the Fairmount Park lands. There are several large areas of woodland found in the park. In areas upstream, where there is greater urban encroachment in the riparian corridor, wooded areas are more fragmented, creating open habitat for exotic, aggressive tree species. Regrowth of understory and herbaceous layers is usually limited once these non-indigenous species become established. Exotic control, replanting, and trash removal are components of riparian woodlands restoration.
A wetland field study was conducted by the Philadelphia Water Department for the Tookany/Tacony-Frankford watershed. Only small, scattered wetlands remain along the riparian areas of Tookany/Tacony-Frankford Creek, as illustrated in Figure 4-39 and as listed in Tables 4-14 and 4-15. The estimated area of these remaining wetlands is approximately 15 acres (based on general field survey, not jurisdictional mapping), which means wetlands are present in only 2.2% of the undeveloped riparian lands. Wetland communities of native vegetation are also scarce along the riparian corridor.
If runoff from the developed parts of the watershed could be settled and filtered by flowing through a restored and re-vegetated riparian corridor a substantial portion of the total solids in the stormwater could be removed before it discharged into the stream. However, most of the stormwater in the Tookany/Tacony-Frankford Creek watershed is piped directly to the stream channel, bypassing the wetlands and riparian woodlands that could improve the water quality through detention, trapping sediment, and recharge. Much of the riparian woodland along Tookany/Tacony-Frankford Creek and its tributaries is now largely public open spaces (or in some cases, privately owned residential yards). Return of these lands to their original function of filtering and improving the quality of stormwater requires a public discussion and decision-making process for resolving competing uses for riparian lands (which currently include active and passive recreation).
As noted above, the total area of wetland in the Tookany/Tacony-Frankford Creek watershed is relatively small considering the 29 linear miles of waterways. Field investigation of wetlands and their functioning in the watershed indicates that only about 24 wetlands, totaling approximately 15 acres, remain along Tookany/Tacony-Frankford Creek and its tributaries. The wetlands range in size from 0.01 acre to approximately 2.5 acres. Most wetlands are very small; 13 of the 24 wetlands surveyed were less than one-quarter acre in size, and all but two of those were in the upstream Montgomery County reaches.
May 2005 4-57
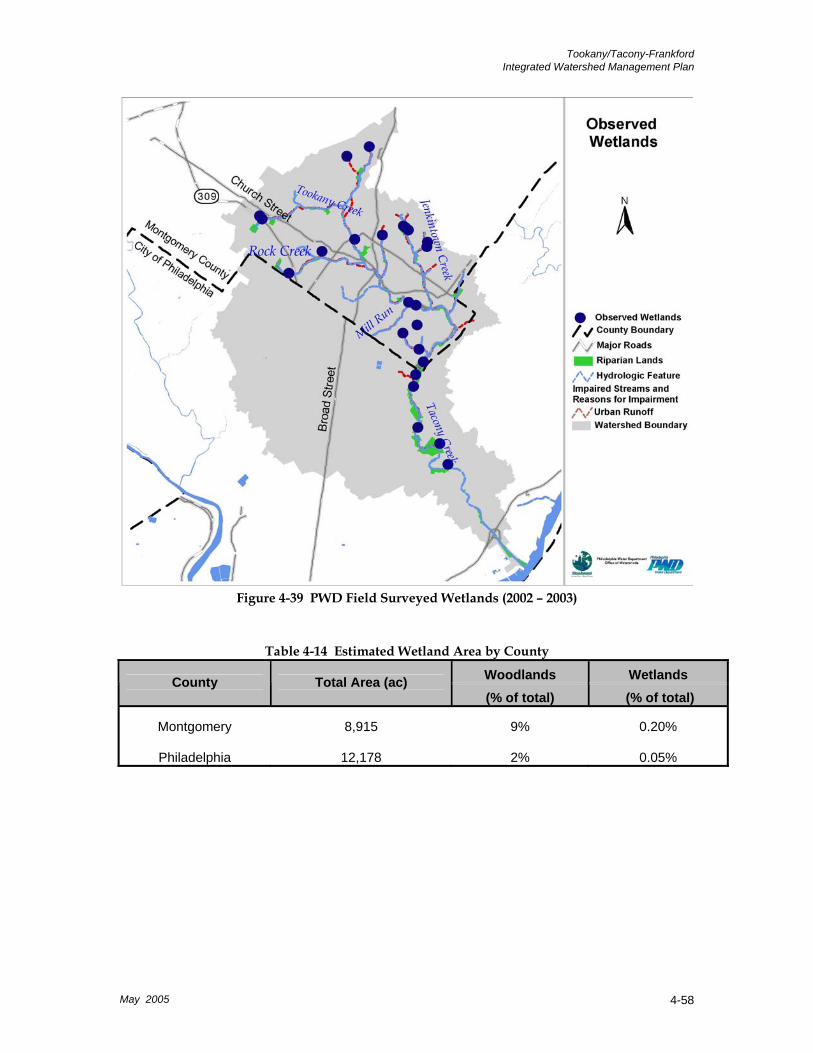
Tookany/Tacony-Frankford Integrated Watershed Management Plan
Figure 4-39 PWD Field Surveyed Wetlands (2002 – 2003)
Table 4-14 Estimated Wetland Area by County
Woodlands Wetlands County Total Area (ac) (% of total) (% of total)
Montgomery 8,915 9% 0.20%
Philadelphia 12,178 2% 0.05%
May 2005 4-58
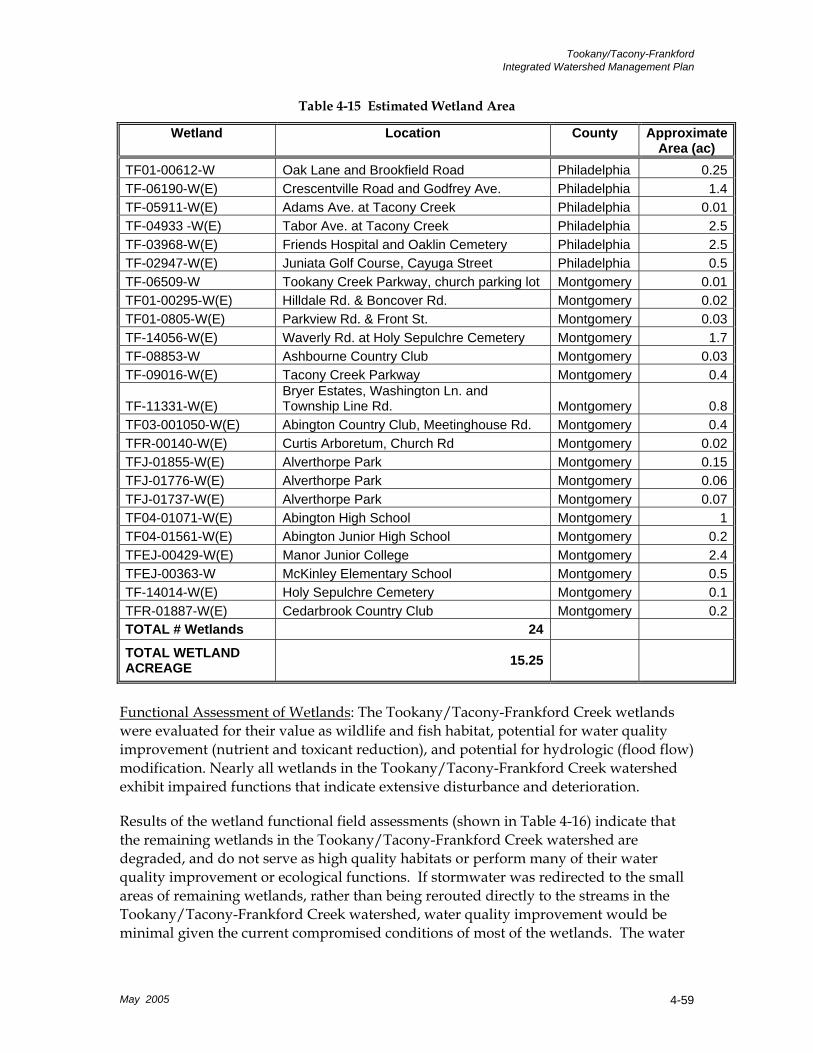
Tookany/Tacony-Frankford Integrated Watershed Management Plan
Table 4-15 Estimated Wetland Area
Wetland Location County Approximate Area (ac)
TF01-00612-W Oak Lane and Brookfield Road Philadelphia 0.25TF-06190-W(E) Crescentville Road and Godfrey Ave. Philadelphia 1.4TF-05911-W(E) Adams Ave. at Tacony Creek Philadelphia 0.01TF-04933 -W(E) Tabor Ave. at Tacony Creek Philadelphia 2.5TF-03968-W(E) Friends Hospital and Oaklin Cemetery Philadelphia 2.5TF-02947-W(E) Juniata Golf Course, Cayuga Street Philadelphia 0.5TF-06509-W Tookany Creek Parkway, church parking lot Montgomery 0.01TF01-00295-W(E) Hilldale Rd. & Boncover Rd. Montgomery 0.02TF01-0805-W(E) Parkview Rd. & Front St. Montgomery 0.03TF-14056-W(E) Waverly Rd. at Holy Sepulchre Cemetery Montgomery 1.7TF-08853-W Ashbourne Country Club Montgomery 0.03TF-09016-W(E) Tacony Creek Parkway Montgomery 0.4
TF-11331-W(E) Bryer Estates, Washington Ln. and Township Line Rd. Montgomery 0.8
TF03-001050-W(E) Abington Country Club, Meetinghouse Rd. Montgomery 0.4TFR-00140-W(E) Curtis Arboretum, Church Rd Montgomery 0.02TFJ-01855-W(E) Alverthorpe Park Montgomery 0.15TFJ-01776-W(E) Alverthorpe Park Montgomery 0.06TFJ-01737-W(E) Alverthorpe Park Montgomery 0.07TF04-01071-W(E) Abington High School Montgomery 1TF04-01561-W(E) Abington Junior High School Montgomery 0.2TFEJ-00429-W(E) Manor Junior College Montgomery 2.4TFEJ-00363-W McKinley Elementary School Montgomery 0.5TF-14014-W(E) Holy Sepulchre Cemetery Montgomery 0.1TFR-01887-W(E) Cedarbrook Country Club Montgomery 0.2TOTAL # Wetlands 24
TOTAL WETLAND ACREAGE 15.25
Functional Assessment of Wetlands: The Tookany/Tacony-Frankford Creek wetlands were evaluated for their value as wildlife and fish habitat, potential for water quality improvement (nutrient and toxicant reduction), and potential for hydrologic (flood flow) modification. Nearly all wetlands in the Tookany/Tacony-Frankford Creek watershed exhibit impaired functions that indicate extensive disturbance and deterioration.
Results of the wetland functional field assessments (shown in Table 4-16) indicate that the remaining wetlands in the Tookany/Tacony-Frankford Creek watershed are degraded, and do not serve as high quality habitats or perform many of their water quality improvement or ecological functions. If stormwater was redirected to the small areas of remaining wetlands, rather than being rerouted directly to the streams in the Tookany/Tacony-Frankford Creek watershed, water quality improvement would be minimal given the current compromised conditions of most of the wetlands. The water
May 2005 4-59

Tookany/Tacony-Frankford Integrated Watershed Management Plan
quality improvement function for surveyed wetlands is mapped in Figure 4-40, and illustrates the extensively compromised ability of wetlands to perform their natural water quality improvement functions.
Table 4-16 Wetland Functional Assessment Results (based on 24 wetland locations) Function Number of Wetlands with Stated Condition
Wildlife Habitat Diverse Habitat 10
Moderate 14 Fish Habitat Intact Habitat 6
Degraded 12 Lost / Not Present 6
Water Quality Improvement Intact Function 3
Degraded 21 Hydrologic Connection to Stream
Intact Connection 16 Degraded 7
Lost / Not Present 1
Figure 4-40 Results of Tookany/Tacony-Frankford Creek Functional Assessments for the
Water Quality Improvement Function (2002 – 2003)
May 2005 4-60
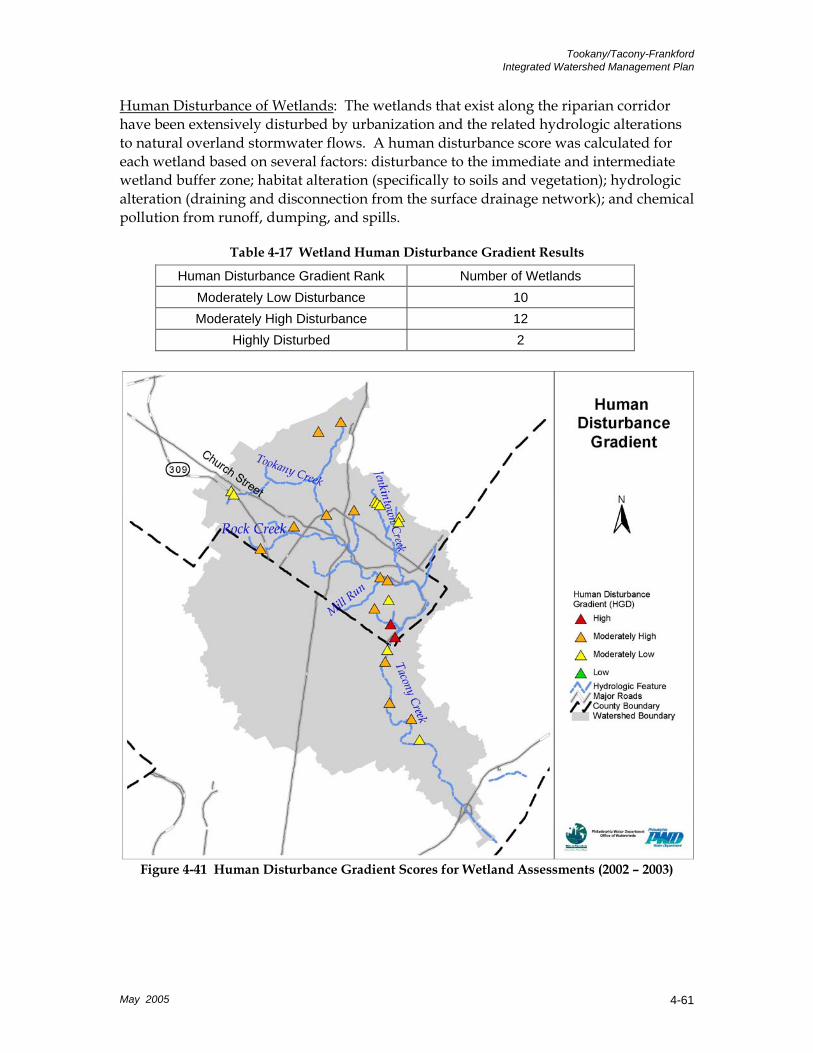
Tookany/Tacony-Frankford Integrated Watershed Management Plan
Human Disturbance of Wetlands: The wetlands that exist along the riparian corridor have been extensively disturbed by urbanization and the related hydrologic alterations to natural overland stormwater flows. A human disturbance score was calculated for each wetland based on several factors: disturbance to the immediate and intermediate wetland buffer zone; habitat alteration (specifically to soils and vegetation); hydrologic alteration (draining and disconnection from the surface drainage network); and chemical pollution from runoff, dumping, and spills.
Table 4-17 Wetland Human Disturbance Gradient Results Human Disturbance Gradient Rank Number of Wetlands
Moderately Low Disturbance 10 Moderately High Disturbance 12
Highly Disturbed 2
Figure 4-41 Human Disturbance Gradient Scores for Wetland Assessments (2002 – 2003)
May 2005 4-61
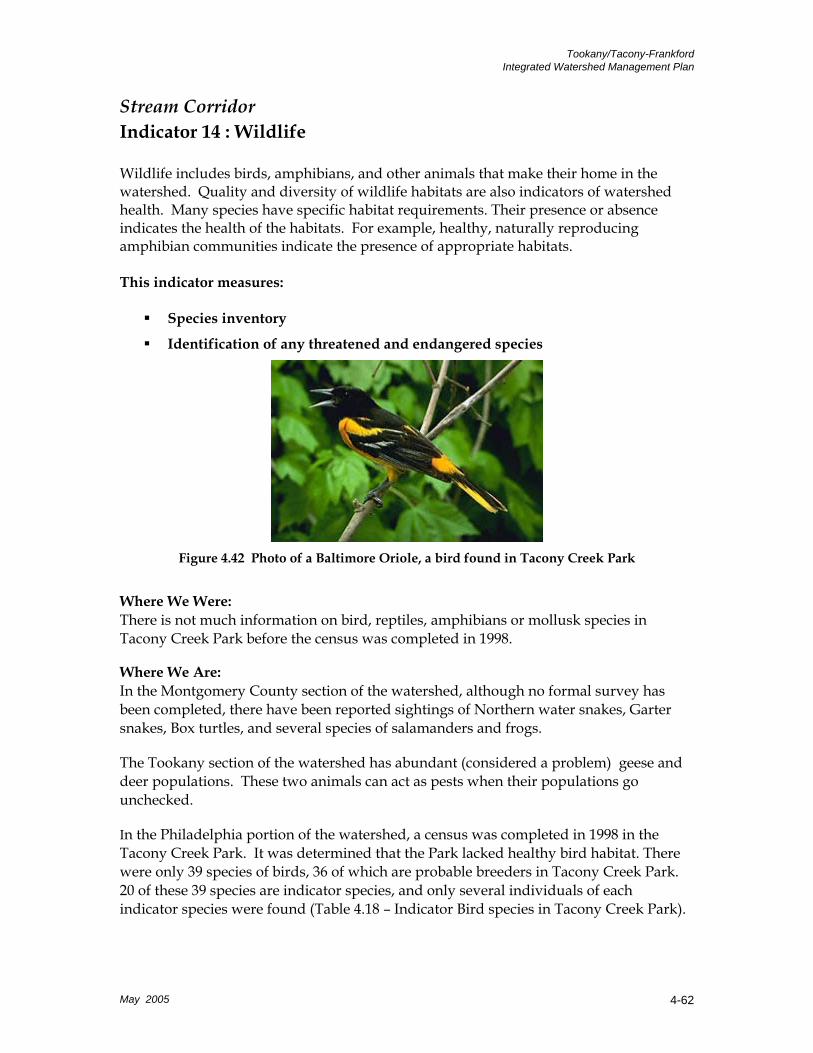
Tookany/Tacony-Frankford Integrated Watershed Management Plan
Stream Corridor Indicator 14 : Wildlife Wildlife includes birds, amphibians, and other animals that make their home in the watershed. Quality and diversity of wildlife habitats are also indicators of watershed health. Many species have specific habitat requirements. Their presence or absence indicates the health of the habitats. For example, healthy, naturally reproducing amphibian communities indicate the presence of appropriate habitats. This indicator measures:
Species inventory
Identification of any threatened and endangered species
Figure 4.42 Photo of a Baltimore Oriole, a bird found in Tacony Creek Park
Where We Were: There is not much information on bird, reptiles, amphibians or mollusk species in Tacony Creek Park before the census was completed in 1998.
Where We Are: In the Montgomery County section of the watershed, although no formal survey has been completed, there have been reported sightings of Northern water snakes, Garter snakes, Box turtles, and several species of salamanders and frogs.
The Tookany section of the watershed has abundant (considered a problem) geese and deer populations. These two animals can act as pests when their populations go unchecked.
In the Philadelphia portion of the watershed, a census was completed in 1998 in the Tacony Creek Park. It was determined that the Park lacked healthy bird habitat. There were only 39 species of birds, 36 of which are probable breeders in Tacony Creek Park. 20 of these 39 species are indicator species, and only several individuals of each indicator species were found (Table 4.18 – Indicator Bird species in Tacony Creek Park).
May 2005 4-62
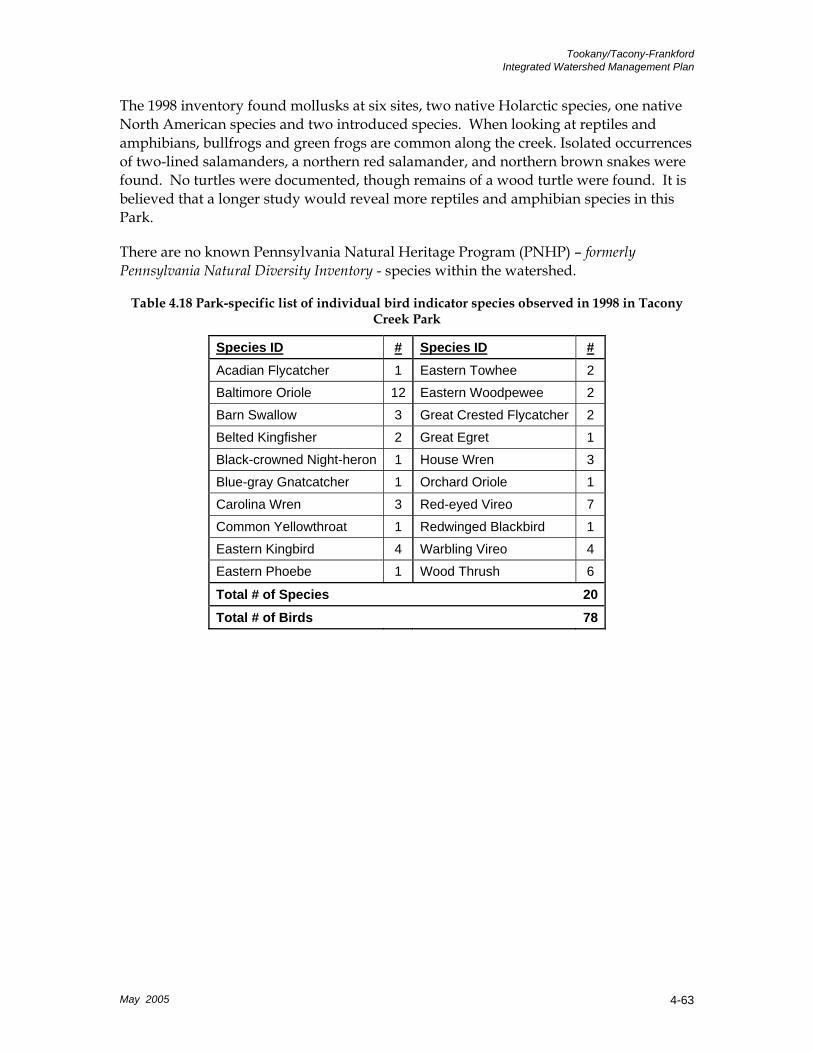
Tookany/Tacony-Frankford Integrated Watershed Management Plan
The 1998 inventory found mollusks at six sites, two native Holarctic species, one native North American species and two introduced species. When looking at reptiles and amphibians, bullfrogs and green frogs are common along the creek. Isolated occurrences of two-lined salamanders, a northern red salamander, and northern brown snakes were found. No turtles were documented, though remains of a wood turtle were found. It is believed that a longer study would reveal more reptiles and amphibian species in this Park.
There are no known Pennsylvania Natural Heritage Program (PNHP) – formerly Pennsylvania Natural Diversity Inventory - species within the watershed.
Table 4.18 Park-specific list of individual bird indicator species observed in 1998 in Tacony Creek Park
Species ID # Species ID #Acadian Flycatcher 1 Eastern Towhee 2
Baltimore Oriole 12 Eastern Woodpewee 2
Barn Swallow 3 Great Crested Flycatcher 2
Belted Kingfisher 2 Great Egret 1
Black-crowned Night-heron 1 House Wren 3
Blue-gray Gnatcatcher 1 Orchard Oriole 1
Carolina Wren 3 Red-eyed Vireo 7
Common Yellowthroat 1 Redwinged Blackbird 1
Eastern Kingbird 4 Warbling Vireo 4
Eastern Phoebe 1 Wood Thrush 6
Total # of Species 20 Total # of Birds 78
May 2005 4-63
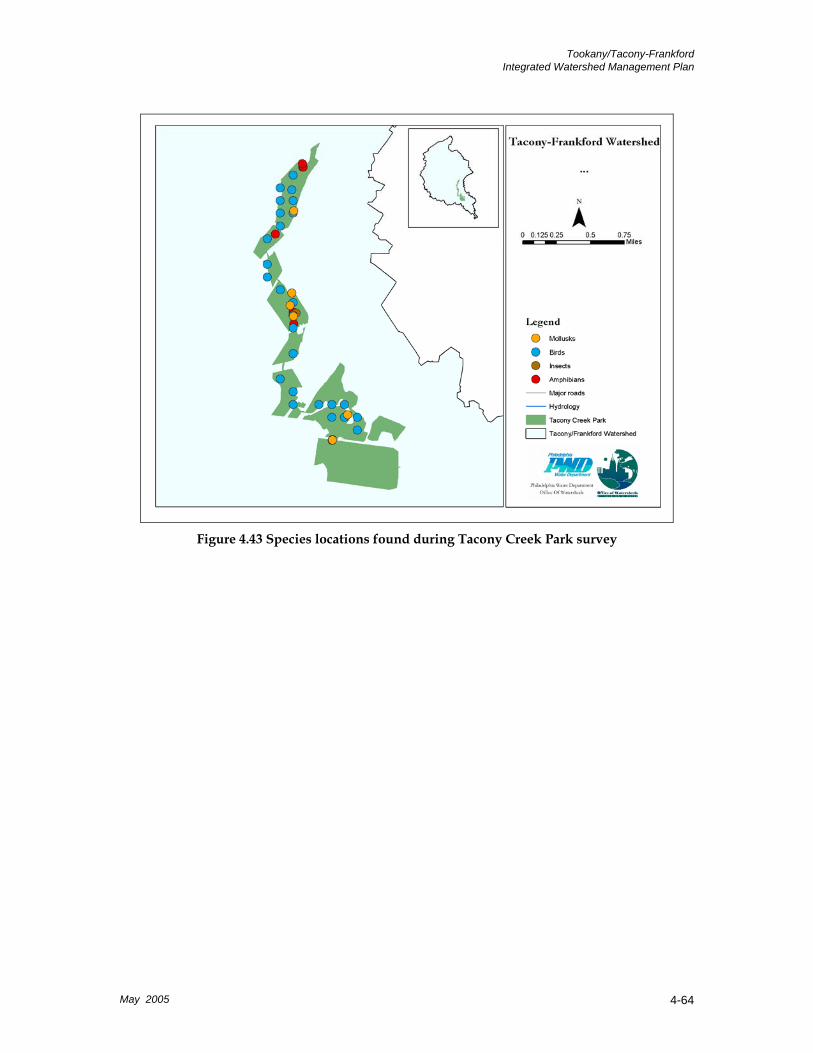
Tookany/Tacony-Frankford Integrated Watershed Management Plan
Figure 4.43 Species locations found during Tacony Creek Park survey
May 2005 4-64
Tookany/Tacony-Frankford Integrated Watershed Management Plan
Quality of Life Indicator 15 : Flooding This indicator measures:
Areas susceptible to flooding along Tookany/Tacony-Frankford Creek
Impervious cover and improperly sized or maintained drainage systems in urban watersheds occasionally lead to flooding. Act 167, the Storm Water Management Act of 1978, requires each county in Pennsylvania to prepare and adopt a stormwater management plan for each designated watershed in the county. An official plan provides a mechanism for municipalities to plan for and manage increased runoff associated with possible future development and land use change.
Where We Were: Frequent, serious flooding has not been a major concern in the Tookany/Tacony-Frankford watershed for many years since the stream was channelized. Floodplain mapping studies were conducted by FEMA to establish flood insurance rates for Montgomery County and for Philadelphia County in 1996. These studies include anecdotal evidence of major flooding during tropical storms.
Where We Are: FEMA studies include stream cross-sections at major road crossings. Figure 4-44 identifies several road crossings where bridge decks are in the 100-year floodplain. As an example, several pictures were taken from the storm on August 1, 2004. The locations of the photos are along the Tacony Creek near Adams Avenue. Figures 4-45 through 4-47 indicate that extensive flooding occurred near the bridge, almost overtopping the bridge. Considerable debris was trapped at the culverts, shown in the photos after the stormflows had subsided.
May 2005 4-65
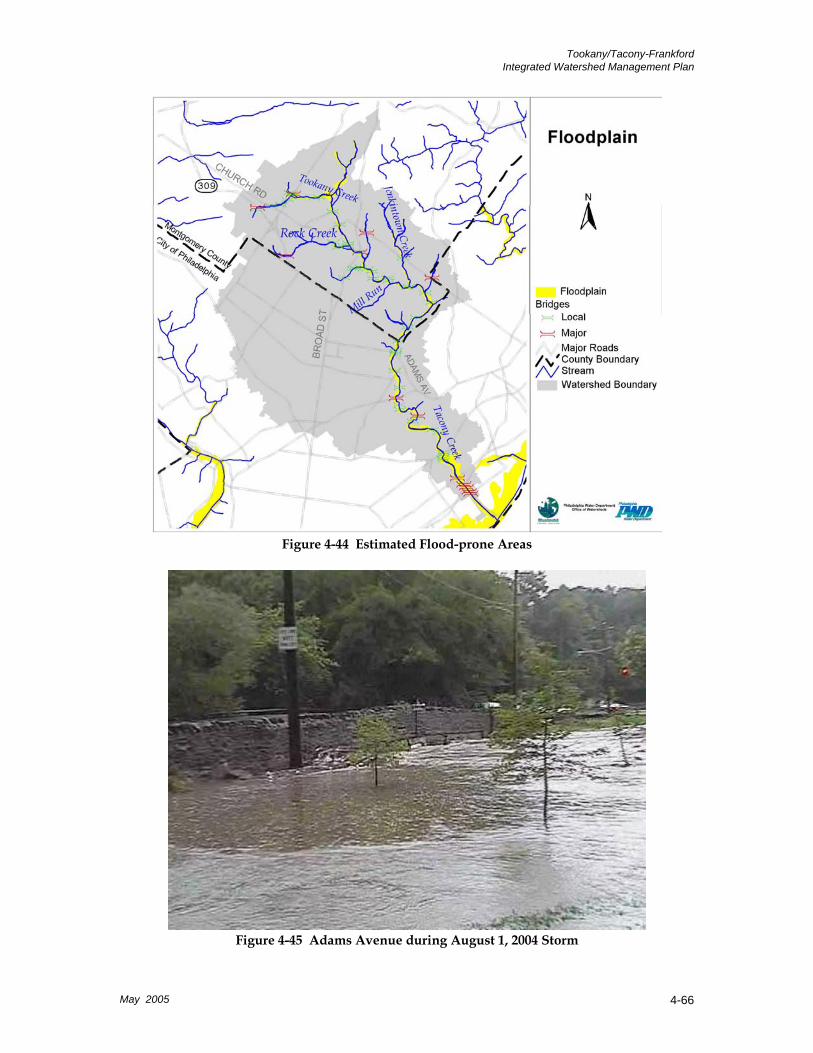
Tookany/Tacony-Frankford Integrated Watershed Management Plan
Figure 4-44 Estimated Flood-prone Areas
Figure 4-45 Adams Avenue during August 1, 2004 Storm
May 2005 4-66
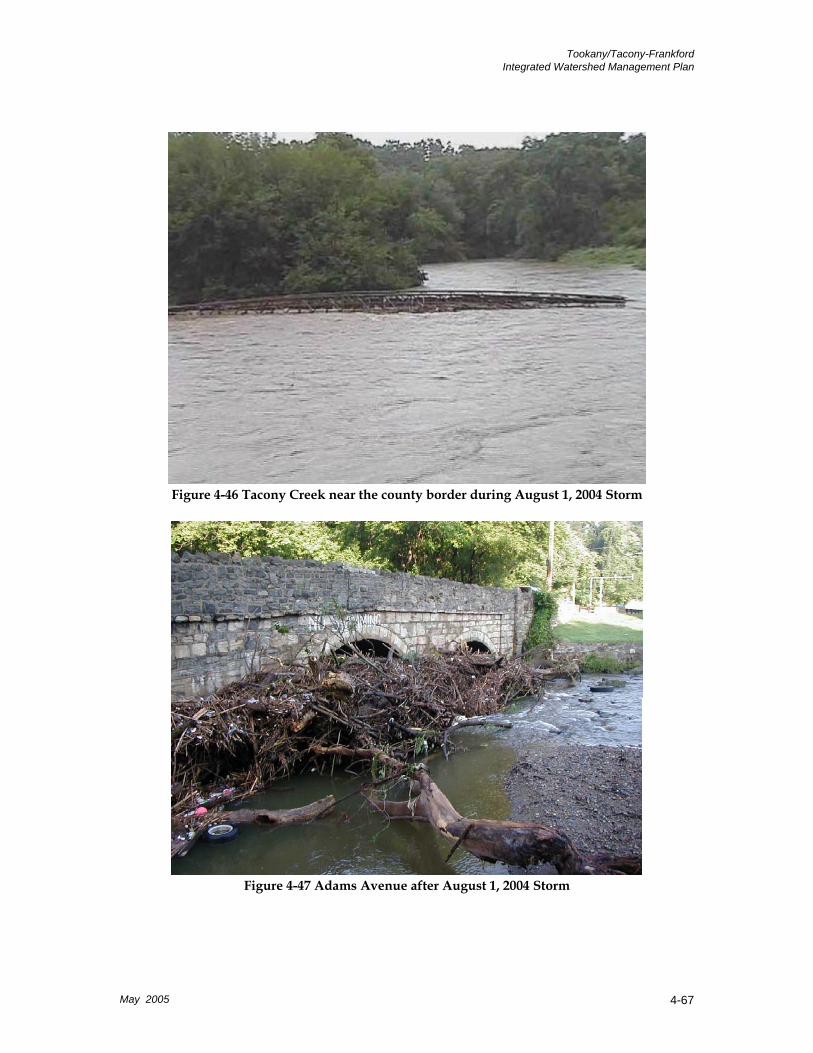
Tookany/Tacony-Frankford Integrated Watershed Management Plan
Figure 4-46 Tacony Creek near the county border during August 1, 2004 Storm
Figure 4-47 Adams Avenue after August 1, 2004 Storm
May 2005 4-67
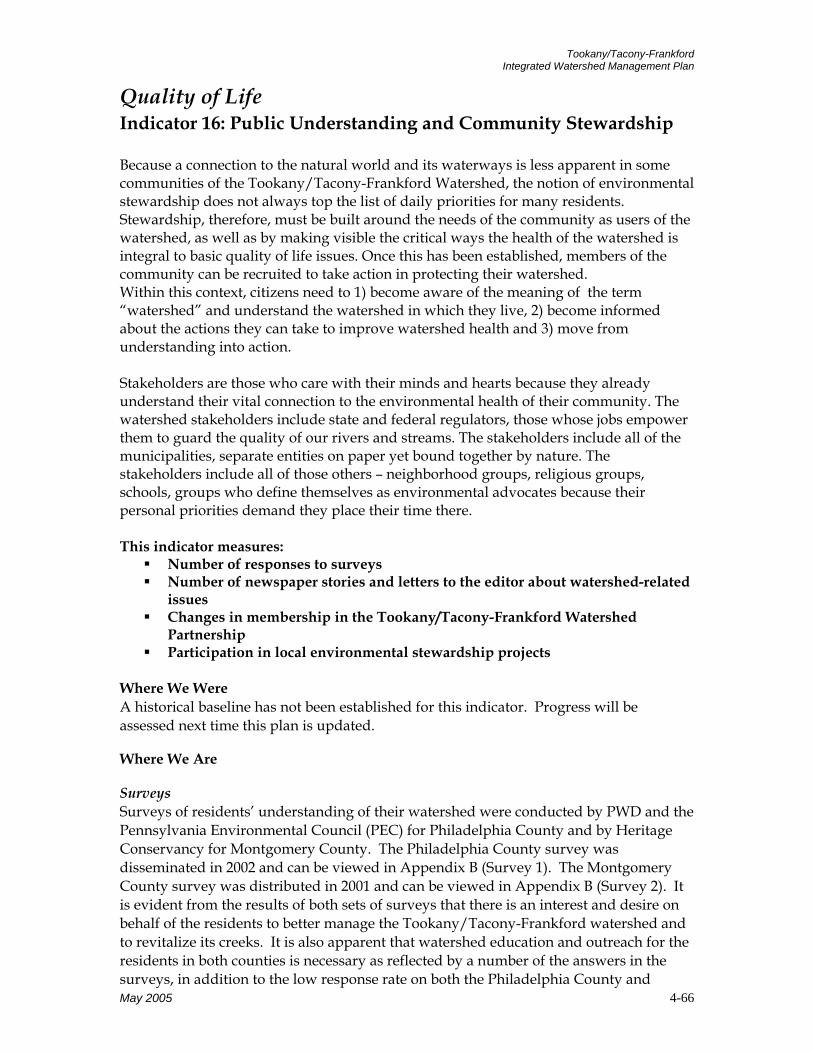
Tookany/Tacony-Frankford Integrated Watershed Management Plan
May 2005 4-66
Quality of Life Indicator 16: Public Understanding and Community Stewardship Because a connection to the natural world and its waterways is less apparent in some communities of the Tookany/Tacony-Frankford Watershed, the notion of environmental stewardship does not always top the list of daily priorities for many residents. Stewardship, therefore, must be built around the needs of the community as users of the watershed, as well as by making visible the critical ways the health of the watershed is integral to basic quality of life issues. Once this has been established, members of the community can be recruited to take action in protecting their watershed. Within this context, citizens need to 1) become aware of the meaning of the term “watershed” and understand the watershed in which they live, 2) become informed about the actions they can take to improve watershed health and 3) move from understanding into action. Stakeholders are those who care with their minds and hearts because they already understand their vital connection to the environmental health of their community. The watershed stakeholders include state and federal regulators, those whose jobs empower them to guard the quality of our rivers and streams. The stakeholders include all of the municipalities, separate entities on paper yet bound together by nature. The stakeholders include all of those others – neighborhood groups, religious groups, schools, groups who define themselves as environmental advocates because their personal priorities demand they place their time there. This indicator measures:
Number of responses to surveys Number of newspaper stories and letters to the editor about watershed-related
issues Changes in membership in the Tookany/Tacony-Frankford Watershed
Partnership Participation in local environmental stewardship projects
Where We Were A historical baseline has not been established for this indicator. Progress will be assessed next time this plan is updated.
Where We Are Surveys Surveys of residents’ understanding of their watershed were conducted by PWD and the Pennsylvania Environmental Council (PEC) for Philadelphia County and by Heritage Conservancy for Montgomery County. The Philadelphia County survey was disseminated in 2002 and can be viewed in Appendix B (Survey 1). The Montgomery County survey was distributed in 2001 and can be viewed in Appendix B (Survey 2). It is evident from the results of both sets of surveys that there is an interest and desire on behalf of the residents to better manage the Tookany/Tacony-Frankford watershed and to revitalize its creeks. It is also apparent that watershed education and outreach for the residents in both counties is necessary as reflected by a number of the answers in the surveys, in addition to the low response rate on both the Philadelphia County and
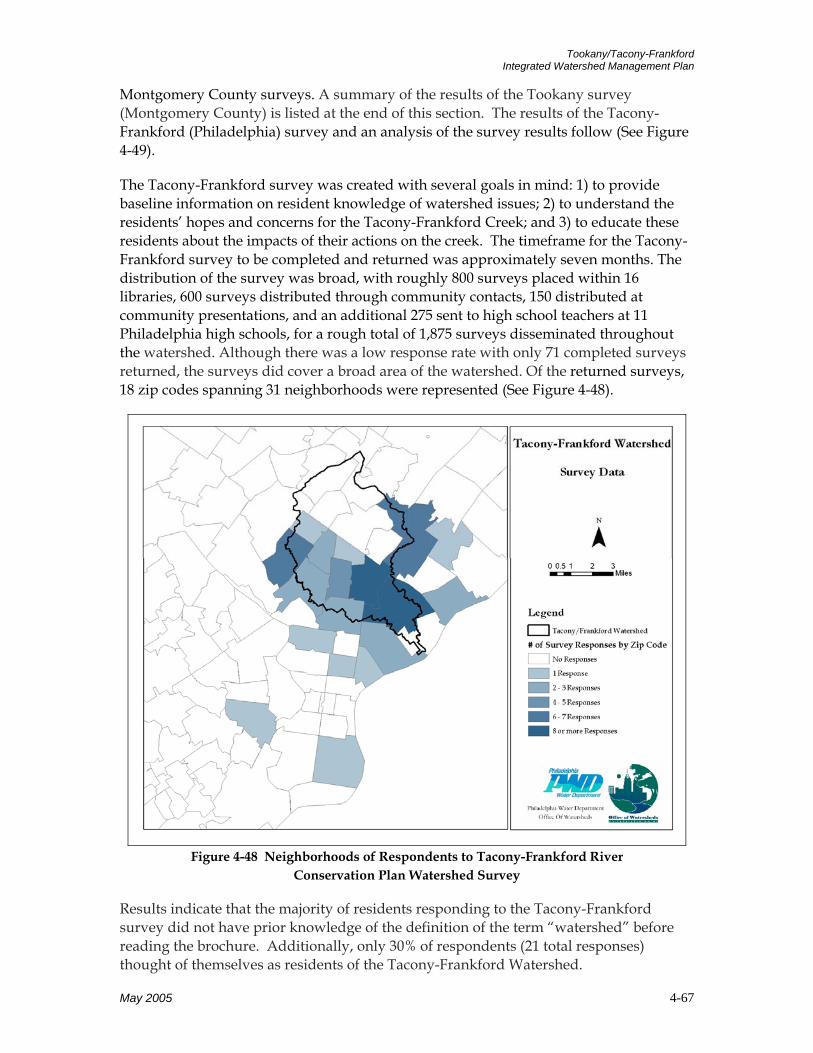
Tookany/Tacony-Frankford Integrated Watershed Management Plan
May 2005 4-67
Montgomery County surveys. A summary of the results of the Tookany survey (Montgomery County) is listed at the end of this section. The results of the Tacony-Frankford (Philadelphia) survey and an analysis of the survey results follow (See Figure 4-49).
The Tacony-Frankford survey was created with several goals in mind: 1) to provide baseline information on resident knowledge of watershed issues; 2) to understand the residents’ hopes and concerns for the Tacony-Frankford Creek; and 3) to educate these residents about the impacts of their actions on the creek. The timeframe for the Tacony-Frankford survey to be completed and returned was approximately seven months. The distribution of the survey was broad, with roughly 800 surveys placed within 16 libraries, 600 surveys distributed through community contacts, 150 distributed at community presentations, and an additional 275 sent to high school teachers at 11 Philadelphia high schools, for a rough total of 1,875 surveys disseminated throughout the watershed. Although there was a low response rate with only 71 completed surveys returned, the surveys did cover a broad area of the watershed. Of the returned surveys, 18 zip codes spanning 31 neighborhoods were represented (See Figure 4-48).
Figure 4-48 Neighborhoods of Respondents to Tacony-Frankford River
Conservation Plan Watershed Survey Results indicate that the majority of residents responding to the Tacony-Frankford survey did not have prior knowledge of the definition of the term “watershed” before reading the brochure. Additionally, only 30% of respondents (21 total responses) thought of themselves as residents of the Tacony-Frankford Watershed.

Tookany/Tacony-Frankford Integrated Watershed Management Plan
May 2005 4-68
Sixty four percent (64%) of the Tacony-Frankford survey responses (43 respondents) indicate that these residents rarely, if ever, spend recreational time along the creek. Also, more than half of the respondents perceive the water quality of the Tacony-Frankford Creek as poor. The surveyed residents have identified trash and litter in the streams as the most significant source of pollution to the watershed. Sedimentation was ranked as the second most significant source of pollution and illegal dumping ranked third. When asked where money should be directed for the purpose of enhancing the greater community, the answer most frequently rated as most important was the “cleaning of the water in the creek.” The removal of trash from the creek area ranked second, and increased safety and security in parks ranked third.
Once the Tacony-Frankford survey results were broken down into two age groups, respondents 18 years and over, and respondents under the age of 18, additional interesting results emerged. Of the 48 individuals surveyed that were 18 years and over, 35 % responded that they knew what a watershed was, and 23% had at least heard of the term before. In contrast, only 6% of the 17 respondents in the category of “under the age of 18 years” knew what a watershed was, although 35% of them claimed to have at least heard the term before.
When asked about the amount of recreational time spent along the Tacony-Frankford creek, of those under the age of 18, only 12% (2 of the respondents) claimed to spend any time at all along the creek, and of those few that do it is only a few times a year. It seems that residents in the “18 years and over” category have been more likely to make use of the areas along the creek; 39% (19) of them having visited the area at least a few times a year. Of the 45 respondents that do spend time in the parks, 53% of them go there to walk, as it has become the most frequent recreational activity in the area.
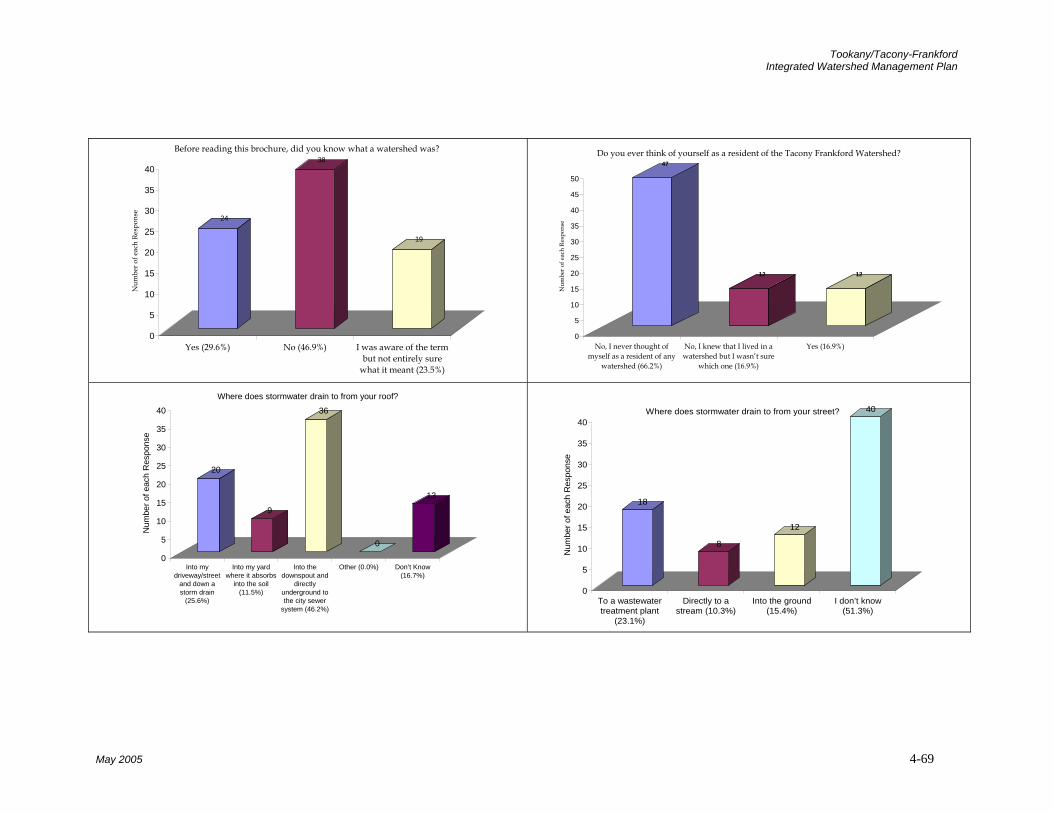
Tookany/Tacony-Frankford Integrated Watershed Management Plan
24
38
19
0
5
10
15
20
25
30
35
40
Num
ber o
f eac
h Re
spon
se
Yes (29.6%) No (46.9%) I was aware of the termbut not entirely sure
what it meant (23.5%)
Before reading this brochure, did you know what a watershed was?
47
12 12
0
5
10
15
20
25
30
35
40
45
50
Num
ber o
f eac
h Re
spon
se
No, I never thought ofmyself as a resident of any
watershed (66.2%)
No, I knew that I lived in awatershed but I wasn’t sure
which one (16.9%)
Yes (16.9%)
Do you ever think of yourself as a resident of the Tacony Frankford Watershed?
20
9
36
0
13
0
5
10
15
20
25
30
35
40
Num
ber o
f eac
h R
espo
nse
Into mydriveway/street
and down astorm drain
(25.6%)
Into my yardwhere it absorbs
into the soil(11.5%)
Into thedownspout and
directlyunderground tothe city sewer
system (46.2%)
Other (0.0%) Don’t Know(16.7%)
Where does stormwater drain to from your roof?
18
8
12
40
0
5
10
15
20
25
30
35
40
Num
ber o
f eac
h R
espo
nse
To a wastewatertreatment plant
(23.1%)
Directly to astream (10.3%)
Into the ground(15.4%)
I don’t know(51.3%)
Where does stormwater drain to from your street?
May 2005 4-69
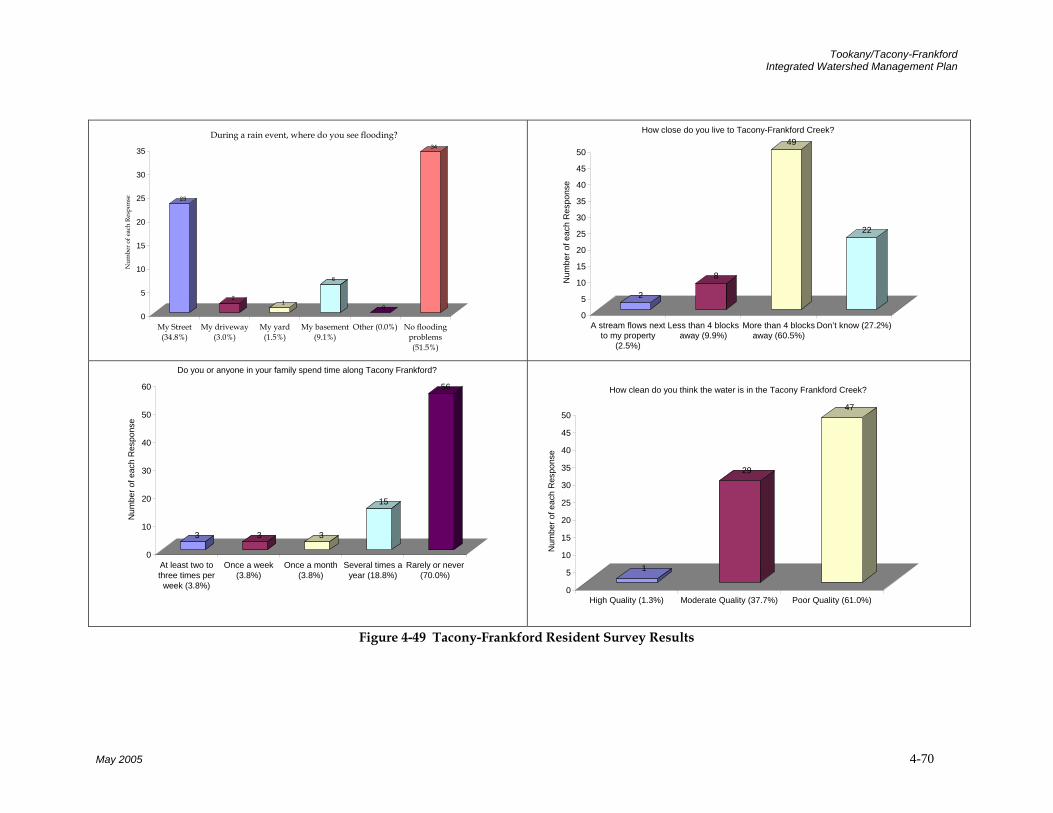
Tookany/Tacony-Frankford Integrated Watershed Management Plan
May 2005 4-70
23
21
6
0
34
0
5
10
15
20
25
30
35
Num
ber o
f eac
h Re
spon
se
My Street(34.8%)
My driveway(3.0%)
My yard(1.5%)
My basement(9.1%)
Other (0.0%) No floodingproblems(51.5%)
During a rain event, where do you see flooding?
2
8
49
22
0
5
10
15
20
25
30
35
40
45
50
Num
ber o
f eac
h R
espo
nse
A stream flows nextto my property
(2.5%)
Less than 4 blocksaway (9.9%)
More than 4 blocksaway (60.5%)
Don’t know (27.2%)
How close do you live to Tacony-Frankford Creek?
3 3 3
15
56
0
10
20
30
40
50
60
Num
ber o
f eac
h R
espo
nse
At least two tothree times per
week (3.8%)
Once a week(3.8%)
Once a month(3.8%)
Several times ayear (18.8%)
Rarely or never(70.0%)
Do you or anyone in your family spend time along Tacony Frankford?
1
29
47
0
5
10
15
20
25
30
35
40
45
50
Num
ber o
f eac
h R
espo
nse
High Quality (1.3%) Moderate Quality (37.7%) Poor Quality (61.0%)
How clean do you think the water is in the Tacony Frankford Creek?
Figure 4-49 Tacony-Frankford Resident Survey Results
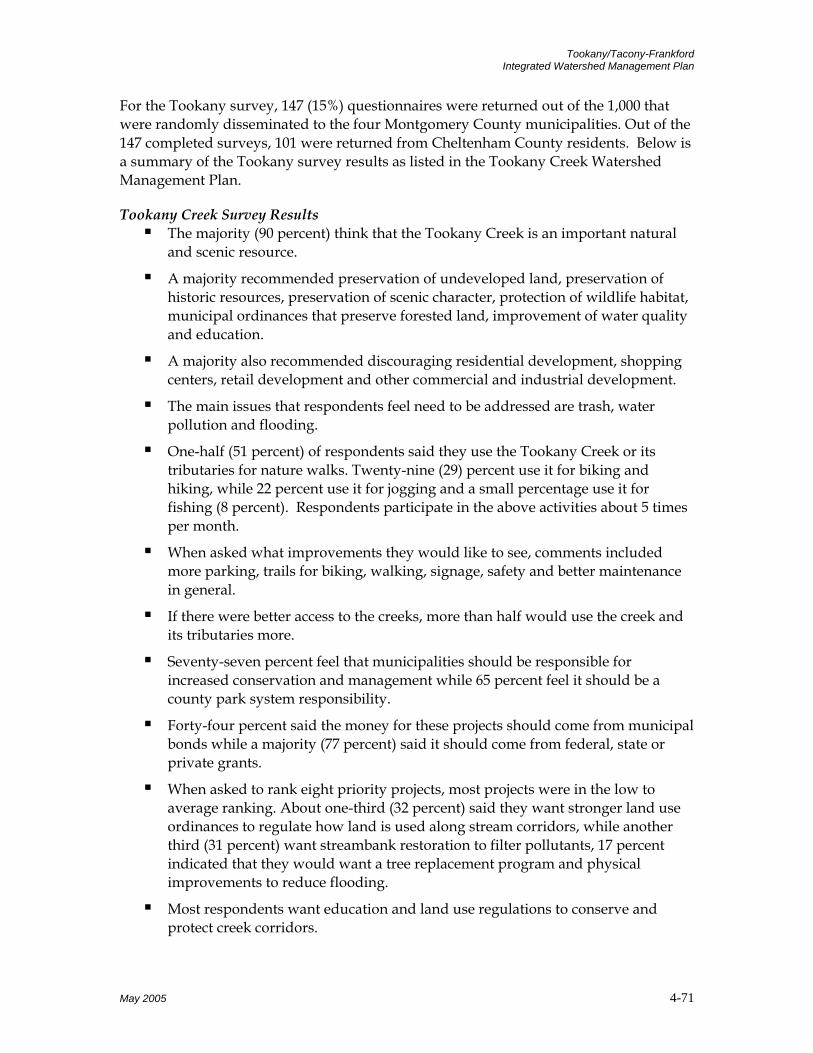
Tookany/Tacony-Frankford Integrated Watershed Management Plan
For the Tookany survey, 147 (15%) questionnaires were returned out of the 1,000 that were randomly disseminated to the four Montgomery County municipalities. Out of the 147 completed surveys, 101 were returned from Cheltenham County residents. Below is a summary of the Tookany survey results as listed in the Tookany Creek Watershed Management Plan.
Tookany Creek Survey Results The majority (90 percent) think that the Tookany Creek is an important natural
and scenic resource.
A majority recommended preservation of undeveloped land, preservation of historic resources, preservation of scenic character, protection of wildlife habitat, municipal ordinances that preserve forested land, improvement of water quality and education.
A majority also recommended discouraging residential development, shopping centers, retail development and other commercial and industrial development.
The main issues that respondents feel need to be addressed are trash, water pollution and flooding.
One-half (51 percent) of respondents said they use the Tookany Creek or its tributaries for nature walks. Twenty-nine (29) percent use it for biking and hiking, while 22 percent use it for jogging and a small percentage use it for fishing (8 percent). Respondents participate in the above activities about 5 times per month.
When asked what improvements they would like to see, comments included more parking, trails for biking, walking, signage, safety and better maintenance in general.
If there were better access to the creeks, more than half would use the creek and its tributaries more.
Seventy-seven percent feel that municipalities should be responsible for increased conservation and management while 65 percent feel it should be a county park system responsibility.
Forty-four percent said the money for these projects should come from municipal bonds while a majority (77 percent) said it should come from federal, state or private grants.
When asked to rank eight priority projects, most projects were in the low to average ranking. About one-third (32 percent) said they want stronger land use ordinances to regulate how land is used along stream corridors, while another third (31 percent) want streambank restoration to filter pollutants, 17 percent indicated that they would want a tree replacement program and physical improvements to reduce flooding.
Most respondents want education and land use regulations to conserve and protect creek corridors.
May 2005 4-71
Tookany/Tacony-Frankford Integrated Watershed Management Plan
Prior to this survey, 65 percent of people had not heard about any conservation efforts along the Tookany Creek, and those that did, (20 percent) read it in the newspaper.
More than one-half of the respondents (55 percent) would like to receive written updates on the progress of the TCWMP.
Only 3 percent of respondents own creek front property.
Half of the respondents said they do not want to serve on a volunteer coalition or volunteer to participate in a streambank restoration.
Articles The media greatly influences community perception and may indicate, via public reaction, which events and issues are important to the community. Through an examination of newspaper clipping articles and “letters to the editor” in local weekly and daily papers that serve the Tookany/Tacony-Frankford watershed fifteen articles specific to the watershed or the partnership have been identified since 2000.
Membership Attendance at meetings held by watershed-related groups is another way to gauge interest among citizens. Approximately thirty-two stakeholders (See Table 4-19) have attended or participated in meetings sponsored by the Tookany/Tacony-Frankford Partnership and other watershed-related forums.
May 2005 4-72
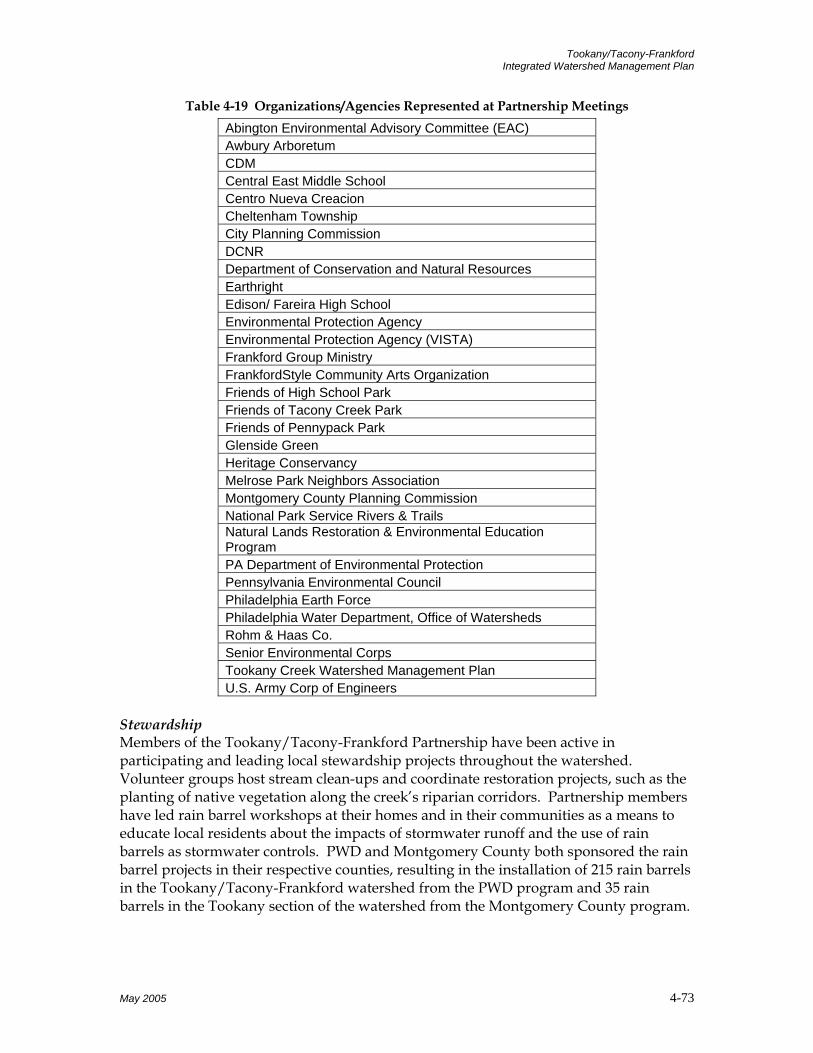
Tookany/Tacony-Frankford Integrated Watershed Management Plan
Table 4-19 Organizations/Agencies Represented at Partnership Meetings Abington Environmental Advisory Committee (EAC) Awbury Arboretum CDM Central East Middle School Centro Nueva Creacion Cheltenham Township City Planning Commission DCNR Department of Conservation and Natural Resources Earthright Edison/ Fareira High School Environmental Protection Agency Environmental Protection Agency (VISTA) Frankford Group Ministry FrankfordStyle Community Arts Organization Friends of High School Park Friends of Tacony Creek Park Friends of Pennypack Park Glenside Green Heritage Conservancy Melrose Park Neighbors Association Montgomery County Planning Commission National Park Service Rivers & Trails Natural Lands Restoration & Environmental Education Program PA Department of Environmental Protection Pennsylvania Environmental Council Philadelphia Earth Force Philadelphia Water Department, Office of Watersheds Rohm & Haas Co. Senior Environmental Corps Tookany Creek Watershed Management Plan U.S. Army Corp of Engineers
Stewardship Members of the Tookany/Tacony-Frankford Partnership have been active in participating and leading local stewardship projects throughout the watershed. Volunteer groups host stream clean-ups and coordinate restoration projects, such as the planting of native vegetation along the creek’s riparian corridors. Partnership members have led rain barrel workshops at their homes and in their communities as a means to educate local residents about the impacts of stormwater runoff and the use of rain barrels as stormwater controls. PWD and Montgomery County both sponsored the rain barrel projects in their respective counties, resulting in the installation of 215 rain barrels in the Tookany/Tacony-Frankford watershed from the PWD program and 35 rain barrels in the Tookany section of the watershed from the Montgomery County program.
May 2005 4-73
Tookany/Tacony-Frankford Integrated Watershed Management Plan
In order to broaden community support and involvement throughout the watershed, partnership members also coordinated various public events. Self-Guided Watershed Tours and Visual Stream Assessments took place. The “Wingohocking Mystery Tour”, which follows the route of the now sewered Wingohocking stream, the largest tributary to the Tacony-Frankford creek, has now been held annually for three years in a row. Great Blue Heron Day was organized in spring of 2003 to celebrate and bring attention to the natural resources of the watershed. An “Invasive Plants Workshop” was hosted in 2004 in the Tacony Creek Park and an Urban Streams Restoration Program was held in January of 2004, featuring an urban streams restoration expert was organized at The Franklin Institute. This well received program was such a success that it inspired a more detailed follow-up program; the “Urban Watersheds Revitalization Conference” was held in January of 2005 at the Franklin Institute.
May 2005 4-74

Tookany/Tacony-Frankford Integrated Watershed Management Plan
Quality of Life Indicator 17 : School-Based Education School aged children of today are the watershed stewards of the future. As such, school based education is an integral component of the long-term health of the watershed. School based education takes many forms, from lesson plans within the classroom to hands-on activities outside of the classroom such as field trips to the Tookany/Tacony- Frankford creek and direct involvement in actual restoration projects.
Figure 4-50 Students collecting insects in the TTF watershed.
Being engaged in actual restoration projects, either through service learning, after school clubs, or as part of lesson plans translates lessons into action. There are several ways to measure the success of school based education programs and each depends on the other. This indicator measures:
Survey of schools on whether they have environmental or watershed management curriculum
Schools participating in local environmental stewardship projects Where We Were A historical baseline has not been established for this indicator. Progress will be assessed next time this plan is updated. Where We Are To date, there are various schools in the watershed that have incorporated environmental or watershed management into the curricula. Furthermore, there are schools that have led local stewardship projects that involve, for example, the creation of a wetland on-campus, participation in a streambank restoration project, and the installation of rain barrels on-campus. Students throughout the watershed have also submitted twenty-four logo entries into the Tookany/Tacony-Frankford Partnership Logo Contest. The winning schools’ logo has, in fact, become the Partnerships’ emblem. In Montgomery County, there are a minimum of seven schools that incorporate environmental and watershed lesson plans into their curricula. These schools include, Cheltenham Elementary, Myers Elementary, Wyncote Elementary, Glenside Elementary, Elkins Park Middle School, Cedarbrook Middle School and Cheltenham High School. In
May 2005 4-75
Tookany/Tacony-Frankford Integrated Watershed Management Plan
Philadelphia, there are a minimum of ten schools integrating watershed and environmental education into their curricula. Five of the schools listed below participate in watershed and environmental education programs offered at nearby Awbury Arboretum, while other schools develop their own stewardship projects in their local neighborhoods. Schools in Philadelphia that have incorporated watershed and environmental education into their curricula include, Edison Fareira High School, Frankford High School, Grover Washington Junior High School, Hill-Freedman Middle School, Ada Lewis Middle School, Henry R. Edmunds Middle School, Germantown Settlement Charter School, Fulton Elementary School, Hopkinson Elementary and Holy Innocents Parish Elementary. The Academic Standards for Science and Technology and Environment and Ecology became a core requirement of the public school curriculum in January 2002 and testing on these topics commenced for the first time in spring 2003 as part of the Pennsylvania System of School Assessment (PSSA). The standards establish the basic elements of what students should know and be able to accomplish at the end of grades four, seven, ten and twelve. Section 4.1 of these standards is dedicated to watersheds and wetlands. The goals for this topic area are for students to gain knowledge about water cycles, the role of watersheds, physical factors, characteristics and functions of wetlands and the impacts of watersheds and wetlands. A scope and sequence has been predetermined for each of the aforementioned grades.
May 2005 4-76

Tookany/Tacony-Frankford Integrated Watershed Management Plan
Quality of Life Indicator 18: Recreational Use and Aesthetics People seem to be innately drawn to water and areas of natural beauty. Not surprisingly then, park and recreational areas are often centered on scenic water features, such as lakes or rivers. Indeed, many acres of parkland are already developed along the Tookany/Tacony-Frankford Creek (See Figure 4-52). However, many miles of the creek are not accessible to the public. If the public has no way to get to a particular stream, it is less likely to be enjoyed. Parks, and the waterways that flow through them, serve many functions, some obvious and others unseen. For instance, parks and waterways are areas of active and passive recreation. Active recreation includes football, baseball, and canoeing, while passive recreation implies that areas are intended for quiet contemplation or conversation, an essential respite from the concrete and asphalt of the urban world. Natural amenities, when protected and preserved, elevate the quality of life for residents by providing a myriad of recreational, educational and other activities, in addition to enhancing the market value of homes and institutions. This indicator measures:
Stream accessibility for the Tookany/Tacony-Frankford Creek and its tributaries
Tons of trash removed from the creek and buffer areas Miles of Trails
Where We Were A historical baseline has not been established for this indicator. Progress will be assessed next time this plan is updated. Where We Are Stream Accessibility An accessibility indicator was developed to determine the degree to which a community is able to reach their waterways (Table 4.20 and Figure 4.51). Accessibility was determined on a scale from 0 through 5, with zero representing a particular segment of a stream that is inaccessible and 5 representing a completely accessible stream segment. The greater the availability of parking, trails, and public recreational land adjacent to the stream, the higher the accessibility rating given to that reach of stream. A segment of a stream running through a private, industrial, or commercial site was given a rating of 0. A segment of a stream running through a public park that has parking and trails leading to the stream was given an accessibility rating of 5. The number of stream miles and the percentage of the total stream miles with each particular accessibility rating were calculated. Fifteen percent of the waterways within the Tacony-Frankford Watershed were given a “Completely Accessible” rating. An additional 20% of the stream miles were rated as “Highly” or “Somewhat Accessible.”
May 2005 4-77
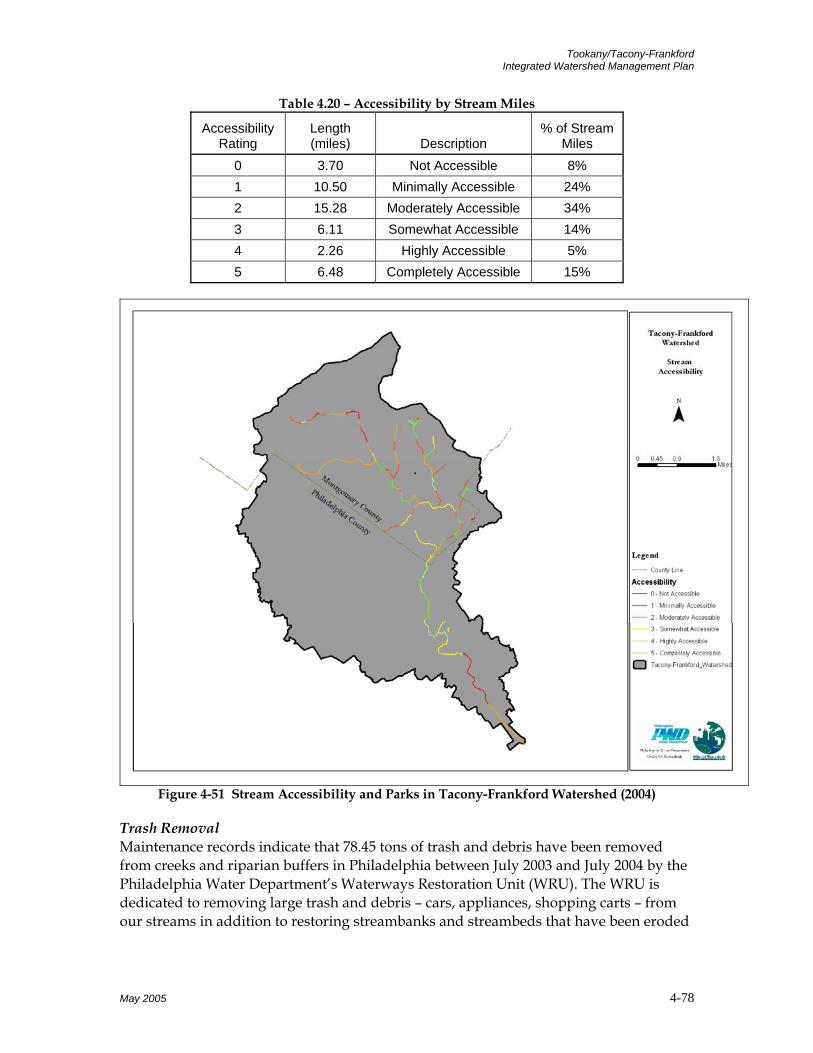
Tookany/Tacony-Frankford Integrated Watershed Management Plan
Table 4.20 – Accessibility by Stream Miles
Accessibility Rating
Length (miles) Description
% of Stream Miles
0 3.70 Not Accessible 8% 1 10.50 Minimally Accessible 24% 2 15.28 Moderately Accessible 34% 3 6.11 Somewhat Accessible 14% 4 2.26 Highly Accessible 5% 5 6.48 Completely Accessible 15%
Figure 4-51 Stream Accessibility and Parks in Tacony-Frankford Watershed (2004)
Trash Removal Maintenance records indicate that 78.45 tons of trash and debris have been removed from creeks and riparian buffers in Philadelphia between July 2003 and July 2004 by the Philadelphia Water Department’s Waterways Restoration Unit (WRU). The WRU is dedicated to removing large trash and debris – cars, appliances, shopping carts – from our streams in addition to restoring streambanks and streambeds that have been eroded
May 2005 4-78
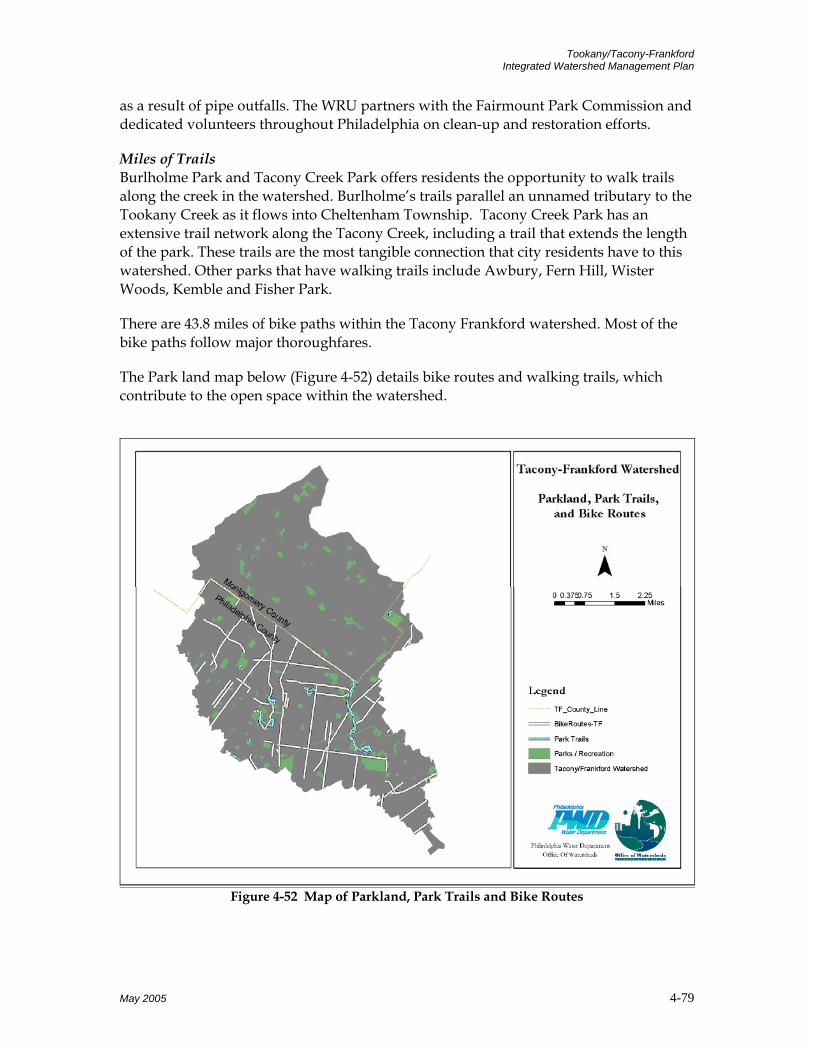
Tookany/Tacony-Frankford Integrated Watershed Management Plan
as a result of pipe outfalls. The WRU partners with the Fairmount Park Commission and dedicated volunteers throughout Philadelphia on clean-up and restoration efforts.
Miles of Trails Burlholme Park and Tacony Creek Park offers residents the opportunity to walk trails along the creek in the watershed. Burlholme’s trails parallel an unnamed tributary to the Tookany Creek as it flows into Cheltenham Township. Tacony Creek Park has an extensive trail network along the Tacony Creek, including a trail that extends the length of the park. These trails are the most tangible connection that city residents have to this watershed. Other parks that have walking trails include Awbury, Fern Hill, Wister Woods, Kemble and Fisher Park.
There are 43.8 miles of bike paths within the Tacony Frankford watershed. Most of the bike paths follow major thoroughfares.
The Park land map below (Figure 4-52) details bike routes and walking trails, which contribute to the open space within the watershed.
Figure 4-52 Map of Parkland, Park Trails and Bike Routes
May 2005 4-79

Tookany/Tacony-Frankford Integrated Watershed Management Plan
Quality of Life Indicator 19 : Local Government Stewardship Local government leadership is essential to ensuring that improvements made under watershed restoration planning are sustainable. Local governments must also support, encourage and complement the stewardship efforts of individuals, environmental groups, and businesses. A major goal is for local governments to work within their regulatory and statutory obligations while actively supporting the stewardship efforts within the watershed. It is also important that local governments implement voluntary actions to restore the watershed. Most importantly, to ensure the success of the watershed management plan, each local government within the watershed must embrace the goals and implementation strategies of the plan. A formal adoption of this plan would multiply its chance for success tremendously. This indicator measures:
Municipalities participating in Act 167 planning, the Partnership, River Conservation Plans (RCPs), and Structure Committee
Age of sewage facilities (Act 537) plans Where We Were A historical baseline has not been established for this indicator. Progress will be assessed next time this plan is updated.
Where We Are Figure 4-53 illustrates the municipalities in the Tookany/Tacony-Frankford watershed. To date, the Philadelphia Water Department and Cheltenham Township have received state grants to develop Act 167 Plans in the Tookany/Tacony-Frankford watershed. Act 167 Plans require counties to prepare and adopt stormwater management plans for each designated watershed in a county. Consequently, PWD and Montgomery County’s four townships have committed to participating in these plans. Montgomery County townships include, Abington Township, Cheltenham Township, and the boroughs of Jenkintown and Rockledge. See below map (Figure 4-53). Cheltenham Township is also leading an effort to explore the possibility of creating a watershed-wide Environmental Advisory Committee (EAC) in collaboration with the other three municipalities in Montgomery County. An EAC is comprised of a number of local experts that are community members and appointed by municipal councils to provide them with environmental and conservation advice. A resolution or by-law of the municipal council is required to enact an EAC. A resolution is currently being drafted for the Cheltenham Township watershed-wide EAC effort. In 2000, PWD created the Tookany/Tacony-Frankford Watershed Partnership with its partners. The partnership represents a consortium of proactive environmental groups, municipal officials, community groups, government agencies, businesses, residents and other stakeholders who have a vested interest in improving the Tookany/Tacony-
May 2005 4-80
Tookany/Tacony-Frankford Integrated Watershed Management Plan
Frankford watershed. The partnership is made up of multiple committees and meets on a regular basis. Soon after the partnership was born, a Rivers Conservation Plan (RCP) for the Tacony Frankford watershed was developed by PWD and its partnership members. The RCP Team was comprised of representatives from: PWD, Frankford Group Ministry, Fairmount Park Commission, Heritage Conservancy and the Pennsylvania Environmental Council. The RCP Steering Committee members also helped guide the Plan. Members from this committee which are not represented in the RCP Team include representatives from: LaSalle University, City Planning Commission, Frankford Community Development Corporation, Cheltenham Township, Department of Conservation and Natural Resources, Awbury Arboretum, National Park Service and Trails, Riverkeeper, Friends of Tacony Creek Park, 35th Police District and the US Army Corps of Engineers. The Tookany RCP (referred to as the Tookany Creek Watershed Management Plan), led by Heritage Conservancy, was also developed by a diverse team of representatives. The Steering Committee members were made up of officials from each municipality, in addition to representatives from Montgomery County Conservation District and Planning Commission, PECO Energy Company, PWD and the Old York Road Historical Society. Today, the Tacony Frankford River Conservation Plan is complete and is currently undergoing an approval process in order to be placed on the Rivers Registry. The Tookany RCP is also complete and has been approved by the four Montgomery County municipalities. It is currently registered with the state on its Rivers Registry. Over the past year, a diverse group of Tookany/Tacony-Frankford Partnership members developed a Structure Committee in order to determine how to effectively guide the future progress of the partnership. The committee expanded the goals of the partnership and established that the transformation of the partnership into an organization, such as a 501(c)(3), would enable the partnership to focus on the on-the-ground implementation of the recommendations in the RCP and broaden community and political support for the revitalization of the watershed. Garnering political support from all municipal officials is an especially important priority for the partnership as the need for enforcement is critical in the watershed. Members of the Structure Committee include representatives from the Fairmount Park Commission, Awbury Arboretum, Cheltenham Township, Abington Environmental Advisory Committee, Frankford Group Ministry, Friends of High School Park, Friends of Tacony Creek Park, Heritage Conservancy, Melrose Park Neighbors Association, Delaware Riverkeepers, Montgomery County Planning Commission, PA Department of Environmental Protection, PA Department of Conservation and Natural Resources and the U.S. Army Corps of Engineers. Presently, all of the municipalities in the watershed have an Act 537 Plan, a plan that provides for the resolution of existing sewage disposal problems, future sewage disposal
May 2005 4-81
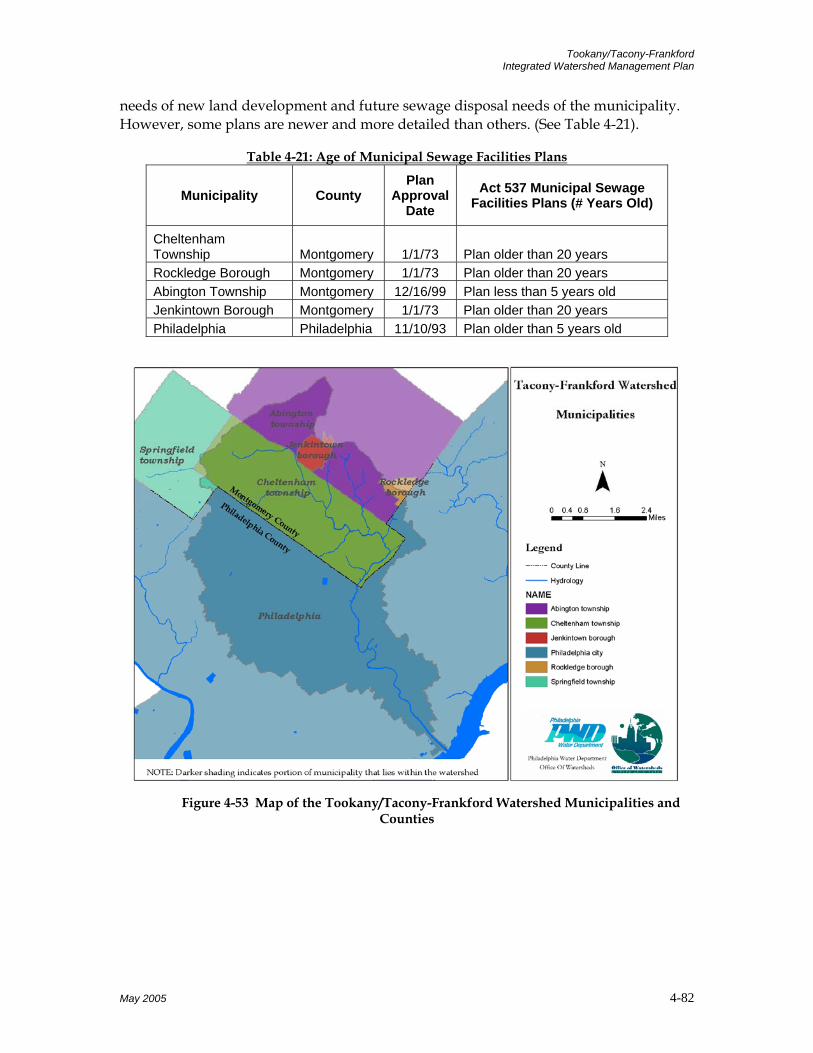
Tookany/Tacony-Frankford Integrated Watershed Management Plan
needs of new land development and future sewage disposal needs of the municipality. However, some plans are newer and more detailed than others. (See Table 4-21).
Table 4-21: Age of Municipal Sewage Facilities Plans
Municipality County Plan
Approval Date
Act 537 Municipal Sewage Facilities Plans (# Years Old)
Cheltenham Township Montgomery 1/1/73 Plan older than 20 years Rockledge Borough Montgomery 1/1/73 Plan older than 20 years Abington Township Montgomery 12/16/99 Plan less than 5 years old Jenkintown Borough Montgomery 1/1/73 Plan older than 20 years Philadelphia Philadelphia 11/10/93 Plan older than 5 years old
Figure 4-53 Map of the Tookany/Tacony-Frankford Watershed Municipalities and
Counties
May 2005 4-82
Tookany/Tacony-Frankford Integrated Watershed Management Plan
Quality of Life Indicator 20 : Business and Institutional Stewardship Awareness of the role of businesses and institutions in watershed degradation and restoration is growing. Success of the watershed management plan will require stewardship on the part of stakeholders who represent the diversity of land uses in the watershed, including conservation groups, commercial, industrial, institutional and residential users. The goal of the Partnership is to have a proportional representation of these groups.
This indicator measures: Breakdown of Partnership Committee Participation by organizational type
Where We Were A historical baseline has not been established for this indicator. Progress will be assessed next time this plan is updated.
Where We Are Figure 4-54 illustrates the number of representatives of each type of group that are part of the Partnership’s Technical, Public Participation and RCP Steering Committees. To date, three business representatives have participated in Partnership meetings and events, as illustrated in the below charts. These business representatives include Rohm & Haas Co., Hankin Management and Cardone Industries. These industries are all located near the creek. Recently, PWD has developed a partnership with Shop Rite Supermarkets and the Pennsylvania Food Merchants Association (PFMA) to address the removal of shopping carts from local streams. Shop Rite has committed to sponsoring stream side clean-up events with students throughout the watershed.
May 2005 4-83
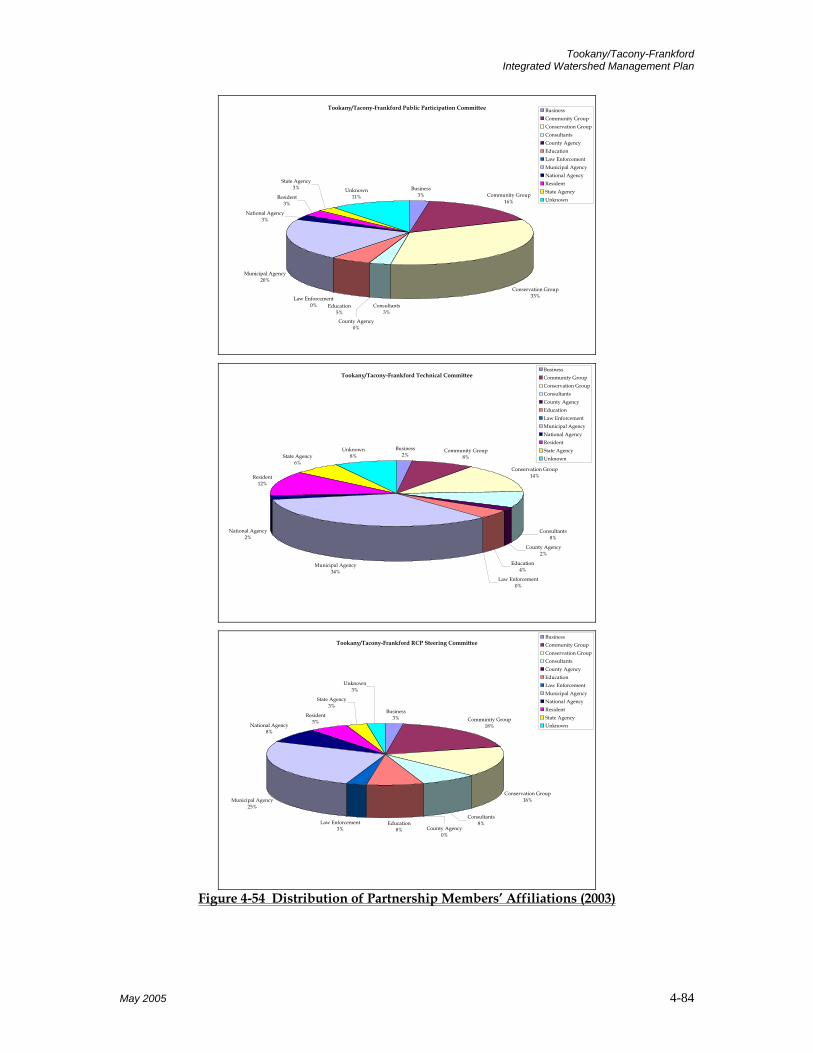
Tookany/Tacony-Frankford Integrated Watershed Management Plan
Tookany/Tacony-Frankford Public Participation Committee
Business3% Community Group
16%
Conservation Group33%
Municipal Agency20%
National Agency3%
Resident3%
State Agency3% Unknown
11%
Education5%
Consultants3%
County Agency0%
Law Enforcement0%
BusinessCommunity GroupConservation GroupConsultantsCounty AgencyEducationLaw EnforcementMunicipal AgencyNational AgencyResidentState AgencyUnknown
Tookany/Tacony-Frankford Technical Committee
Business2%
Community Group8%
Conservation Group14%
Consultants8%
County Agency2%
Education4%
Law Enforcement0%
Municipal Agency34%
National Agency2%
Resident12%
State Agency6%
Unknown8%
BusinessCommunity GroupConservation GroupConsultantsCounty AgencyEducationLaw EnforcementMunicipal AgencyNational AgencyResidentState AgencyUnknown
Tookany/Tacony-Frankford RCP Steering Committee
Business3% Community Group
18%
Conservation Group16%
Education8%
Law Enforcement3%
Municipal Agency25%
National Agency8%
Resident5%
State Agency3%
Unknown3%
County Agency0%
Consultants8%
BusinessCommunity GroupConservation GroupConsultantsCounty AgencyEducationLaw EnforcementMunicipal AgencyNational AgencyResidentState AgencyUnknown
Figure 4-54 Distribution of Partnership Members’ Affiliations (2003)
May 2005 4-84

Tookany/Tacony-Frankford Integrated Watershed Management Plan
Quality of Life Indicator 21: Cultural and Historic Resources Waterways have always been cradles of civilization, providing, among many things, a means of travel and rich floodplain soils in which to cultivate crops. Much later, waterways provided power for mills and fueled the beginnings of the industrial revolution. Consequently, historical and cultural resources are often concentrated in and along waterways. These resources enable us to better understand and appreciate different cultures and traditions, to recognize the struggles endured by our ancestors, and to comprehend the technologies of past generations. These cultural and historical resources can also be an invaluable tool to inform our understanding of our present conditions.
This indicator measures: • National Register of Historic Places inventory • National Register of Historic Districts inventory • Number of nonprofit historical/cultural organizations Where We Were A historical baseline has not been established for this indicator. Progress will be assessed next time this plan is updated.
Where We Are Although it is hard to pinpoint the actual number of historic properties located in the watershed, there are approximately 11 historic properties located in the municipalities in the Tookany section of the watershed and approximately 46 historic properties in the Philadelphia section of the watershed. Fairmount Park has identified 8 historic resources just located in Tacony Creek Park. Additionally, six districts are identified as National Register Districts. The four National Register Historic Districts in Philadelphia include, Awbury, Germantown, Friends Hospital and Tulpehocken. The two Districts that exist in Montgomery County include, La Mott Historic District with 40 resources and Wyncote Historic District with 232 resources. The watershed is rich with numerous other historical, cultural and social amenities throughout both counties, many of which are deemed eligible for listing on the National Registry by the Pennsylvania Historical and Museum Commission. The National Register was authorized by an Act of Congress in 1966 and serves as the nation’s official list of cultural resources worthy of protection. The National Register is administered by the National Park Service of the U.S. Department of the Interior. Furthermore, five nonprofit historical societies or cultural organizations exist to preserve the history and culture of the rich communities of the Tookany/Tacony-Frankford watershed: Germantown Historical Society, Historical Society of Frankford, Old York Road Historical Society, Ryerss Victorian Mansion and the Settlement Music School. Philadelphia also has the distinction of being an important destination for fugitive slaves seeking freedom in the North. There are numerous important Underground Railroad
May 2005 4-85

Tookany/Tacony-Frankford Integrated Watershed Management Plan
sites within the watershed. Two sites that are listed in Charles Blockson’s Hippocrene Guide to the Underground Railroad are the John Johnson House in Germantown and the Campbell AME Church in Frankford.
May 2005 4-86
Tookany/Tacony-Frankford Integrated Watershed Management Plan
Section 6 Causes of Impairment This section discusses the causes of the problems identified through field study, stakeholders input, modeling, and data analysis. It forms the link between the problem analysis found in section 5, and the identification of alternative solutions or options found in section 7. The primary problems, in no particular order, to be addressed include:
Trash/Dumping
Sewer Odors
Lack of Healthy Riparian Habitat
Impaired Wetlands
Erosion, Sediment Accumulation and Flow Variability
Poor Instream Habitat and Biological Impairment
Water Quality Concerns (metals, TSS, Fecal Coliform, DO)
In most cases, field studies and data analysis have identified one or more causes for the problem or impairment. In some cases, particularly regarding dissolved oxygen, further studies will be required before a full understanding of the problem is achieved. The high priority problems and their probable causes are discussed below, with recommendations for additional study where appropriate.
6.1 Litter and Trash Cause The source of litter and dumped material is not hard to establish. Litter reaches the stream through careless behavior resulting in trash and litter accumulation in the streets. If litter is not controlled, it can wash into the storm sewers or combined sewers and eventually discharge into the streams. Once in the stream, it can get trapped along banks, or build up near flow obstructions such as bridge supports. In general, littering is not an intentional activity, but results from carelessness or lack of concern for its effect on the environment. Dumping, however, is a more deliberate act, and occurs when people gain access to the stream and dump waste material from the home or business directly into the stream. Dumping is generally done to avoid the costs associated with proper disposal. In either case, the cause of the buildup of litter and trash in the stream is clear, and can only be addressed through education and enforcement that eventually modifies the behavior of people living and working in the watershed.
May 2005 6-1
Tookany/Tacony-Frankford Integrated Watershed Management Plan
Further Studies Some further study will be required to identify points along the stream that are most easily accessible by vehicle, and where illegal dumping has been a common practice in the past.
6.2 Erosion, Sediment Accumulation, and Flow Variability Cause Erosion of the channel bed and along the streambanks has been identified as a problem in many areas of the watershed. High levels of urbanization and development and poor stream bank stability deeply influence the Tookany/Tacony-Frankford Creek. These factors have resulted in a channelization of the creeks, further inducing erosion and sedimentation problems. The natural water flows have been redirected to storm sewers and replaced by block after block of impervious surfaces. Due to the changes in the hydrologic profile of the stream and watershed, storm events result in greater amounts of runoff and cause more damage than they once did. Instead of percolating into the ground, stormwater is collected and rushed into an already unstable creek where it scours banks, fills pools, and covers riffles. The rushing water strips soil from the banks and deposits some of it over the embedded cobbles and takes the rest to the Delaware River, all the while holding on to the chemicals and pathogens it collected on the city streets and in the sewers.
The cause of erosion can be traced primarily to the above mentioned flow variability, particularly to bankfull flow conditions that occur more frequently than in more natural watersheds due to the urbanized nature of the Tookany/Tacony-Frankford watershed. Sediment buildup can be caused either by streambed and streambank erosion, or by sediment washing into the creek from stormwater discharges. Note that flow variability has been identified as both a problem in itself, and as the cause of erosion and poor instream habitat (see below).
Further Studies The flow variability is well established and understood, and does not require additional studies. The erosion problem has been generally identified through stream assessments. Further studies will be required, however, to prioritize areas undergoing erosion, and to more exactly identify the cause of erosion or sediment buildup for each reach of the river where erosion or deposition is occurring. These studies will be carried out during conceptual design of stream restoration measures.
6.3 Instream Sewer Odors Cause Sewer odors occur during dry weather when sewer lines leak into the stream, or when waste lines from homes or businesses are cross-connected to storm sewers in areas where the sanitary and storm sewer systems are separate. Odors also occur during wet weather, with the cause identified as combined sewer overflows, or in areas of separate storm and sanitary sewers, through sanitary sewer overflows.
May 2005 6-2
Tookany/Tacony-Frankford Integrated Watershed Management Plan
Further Studies Although the causes are well known, further studies will be required to pinpoint the location and cause of all dry weather sewer discharges in separate sewered areas, and to identify SSOs and opportunities for reduced CSOs during wet weather.
6.4 Lack of Healthy Riparian Habitat Cause The entire length of the Tookany/Tacony-Frankford Creek has been assessed, and the existence or absence of riparian buffers noted. The cause is usually obvious. Either development has encroached on the riparian buffer, leaving little or no room for a vegetated buffer, or the riparian area is open but poorly managed.
Further Studies Additional studies will be required in developing a riparian buffer improvement program. These studies will primarily involve the identification of land ownership of riparian areas.
6.5 Poor Instream Habitat and Biological Impairment Cause Poor instream habitat has been identified as both a problem itself, as well as the cause of the biological impairment found throughout the watershed. Stream channels in the Tookany/Tacony-Frankford watershed exhibit many effects of urbanization, including over-widening, erosion, loss of sinuosity, loss of the floodplain, loss of stream connection, channel modification, and loss/degradation of aquatic habitat. Biological monitoring indicates that the whole Tookany/Tacony-Frankford Watershed suffers from impaired aquatic habitat and does not meet its designated use as a warm water fishery. As a result, the whole length of the non-tidal Tookany/Tacony-Frankford Creek and its tributaries were listed in PA DEP’s 303d list of impaired waters in 1999. This impairment is due to severe water flow fluctuations, habitat alteration, point and non-point source (NPS) pollution from urban development, hydromodification, and combined sewer overflows (CSO) (PA DEP 2001). The tidal portion of the Frankford Creek remains unassessed because the biological assessment protocol is not applicable to tidal stream segments.
The biological community of the Tookany/Tacony-Frankford Watershed is heavily impacted by its urban surroundings. The impaired state of the creek is a result of habitat deterioration due to urbanized stormwater flow patterns and/or water quality degradation.
Benthic macroinvertebrates rely heavily on stream riffles for at least part of their life cycle. Clinging to life in a riffle requires various adaptations, and most macroinvertebrates are not prepared for the extreme hydrologic fluctuations that can occur in a channelized creek such as the Tookany/Tacony-Frankford. Increased stream velocities and sediment loads from eroding stream banks are disrupting the benthic environment by alternately scouring the stream bottom of appropriately sized cobble substrate. The cobble substrate has limited interstitial space, often filled by
May 2005 6-3
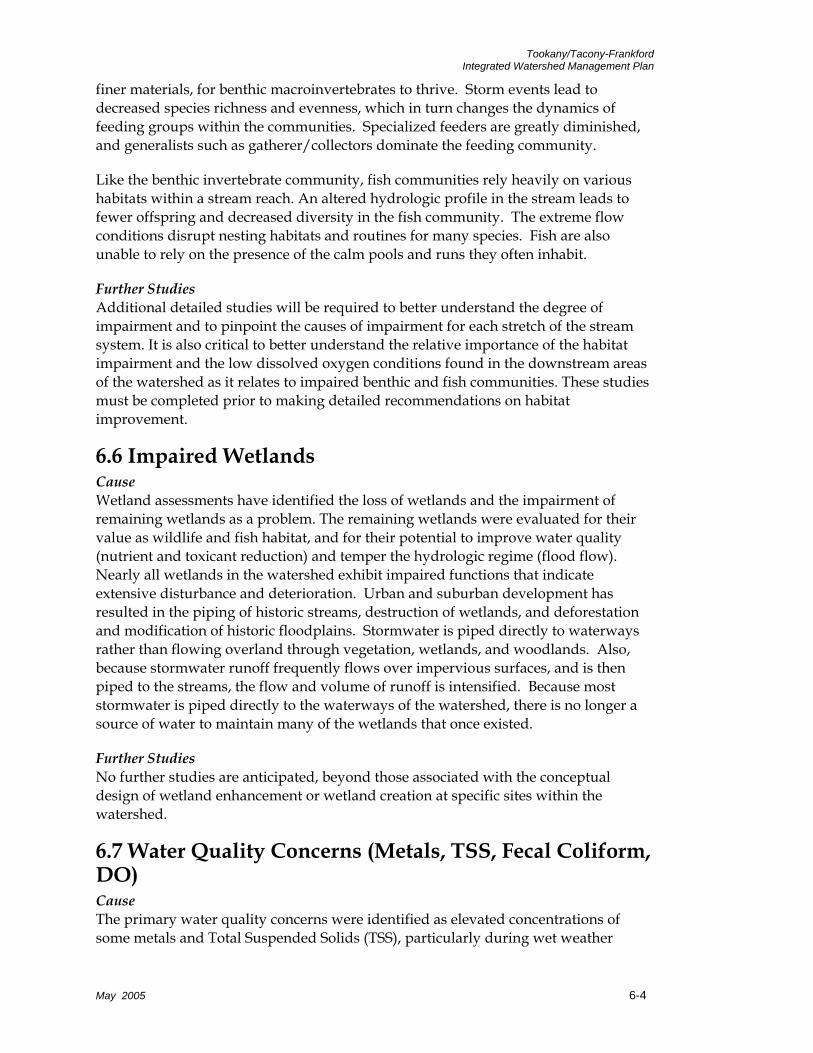
Tookany/Tacony-Frankford Integrated Watershed Management Plan
finer materials, for benthic macroinvertebrates to thrive. Storm events lead to decreased species richness and evenness, which in turn changes the dynamics of feeding groups within the communities. Specialized feeders are greatly diminished, and generalists such as gatherer/collectors dominate the feeding community.
Like the benthic invertebrate community, fish communities rely heavily on various habitats within a stream reach. An altered hydrologic profile in the stream leads to fewer offspring and decreased diversity in the fish community. The extreme flow conditions disrupt nesting habitats and routines for many species. Fish are also unable to rely on the presence of the calm pools and runs they often inhabit.
Further Studies Additional detailed studies will be required to better understand the degree of impairment and to pinpoint the causes of impairment for each stretch of the stream system. It is also critical to better understand the relative importance of the habitat impairment and the low dissolved oxygen conditions found in the downstream areas of the watershed as it relates to impaired benthic and fish communities. These studies must be completed prior to making detailed recommendations on habitat improvement.
6.6 Impaired Wetlands Cause Wetland assessments have identified the loss of wetlands and the impairment of remaining wetlands as a problem. The remaining wetlands were evaluated for their value as wildlife and fish habitat, and for their potential to improve water quality (nutrient and toxicant reduction) and temper the hydrologic regime (flood flow). Nearly all wetlands in the watershed exhibit impaired functions that indicate extensive disturbance and deterioration. Urban and suburban development has resulted in the piping of historic streams, destruction of wetlands, and deforestation and modification of historic floodplains. Stormwater is piped directly to waterways rather than flowing overland through vegetation, wetlands, and woodlands. Also, because stormwater runoff frequently flows over impervious surfaces, and is then piped to the streams, the flow and volume of runoff is intensified. Because most stormwater is piped directly to the waterways of the watershed, there is no longer a source of water to maintain many of the wetlands that once existed.
Further Studies No further studies are anticipated, beyond those associated with the conceptual design of wetland enhancement or wetland creation at specific sites within the watershed.
6.7 Water Quality Concerns (Metals, TSS, Fecal Coliform, DO) Cause The primary water quality concerns were identified as elevated concentrations of some metals and Total Suspended Solids (TSS), particularly during wet weather
May 2005 6-4
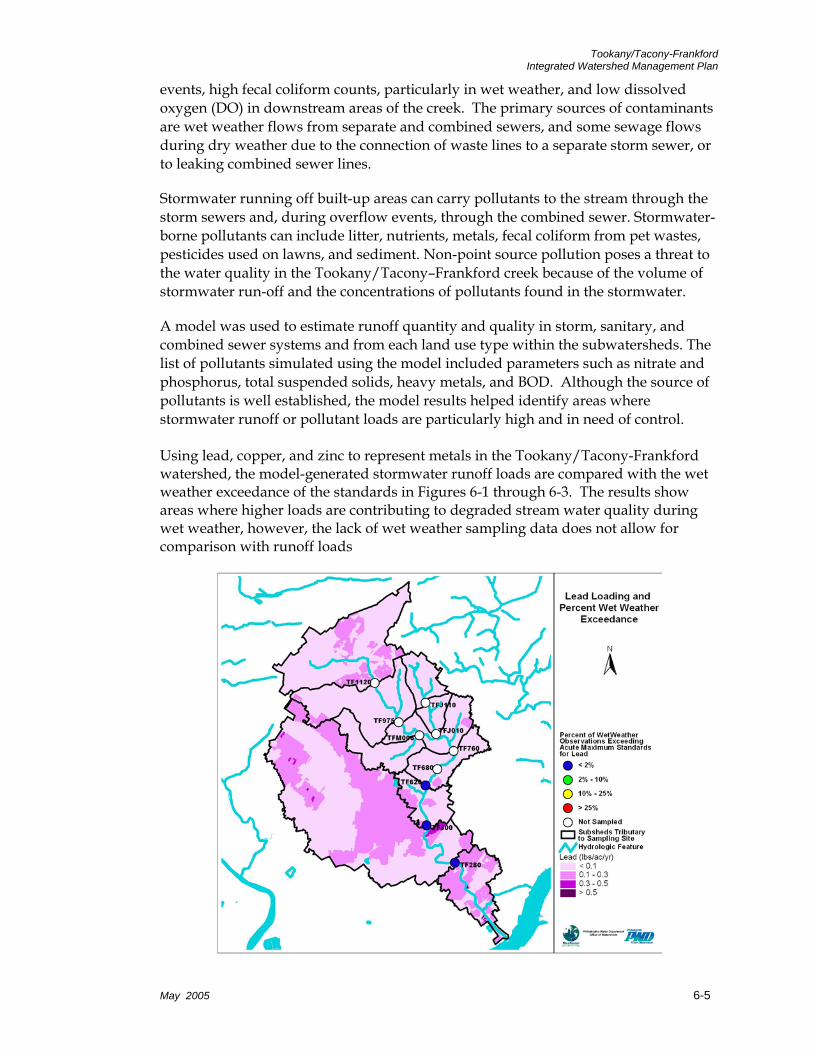
Tookany/Tacony-Frankford Integrated Watershed Management Plan
events, high fecal coliform counts, particularly in wet weather, and low dissolved oxygen (DO) in downstream areas of the creek. The primary sources of contaminants are wet weather flows from separate and combined sewers, and some sewage flows during dry weather due to the connection of waste lines to a separate storm sewer, or to leaking combined sewer lines.
Stormwater running off built-up areas can carry pollutants to the stream through the storm sewers and, during overflow events, through the combined sewer. Stormwater-borne pollutants can include litter, nutrients, metals, fecal coliform from pet wastes, pesticides used on lawns, and sediment. Non-point source pollution poses a threat to the water quality in the Tookany/Tacony–Frankford creek because of the volume of stormwater run-off and the concentrations of pollutants found in the stormwater.
A model was used to estimate runoff quantity and quality in storm, sanitary, and combined sewer systems and from each land use type within the subwatersheds. The list of pollutants simulated using the model included parameters such as nitrate and phosphorus, total suspended solids, heavy metals, and BOD. Although the source of pollutants is well established, the model results helped identify areas where stormwater runoff or pollutant loads are particularly high and in need of control. Using lead, copper, and zinc to represent metals in the Tookany/Tacony-Frankford watershed, the model-generated stormwater runoff loads are compared with the wet weather exceedance of the standards in Figures 6-1 through 6-3. The results show areas where higher loads are contributing to degraded stream water quality during wet weather, however, the lack of wet weather sampling data does not allow for comparison with runoff loads
May 2005 6-5

Tookany/Tacony-Frankford Integrated Watershed Management Plan
Figure 6-1 Lead Loading
Figure 6-2 Copper Loading
May 2005 6-6
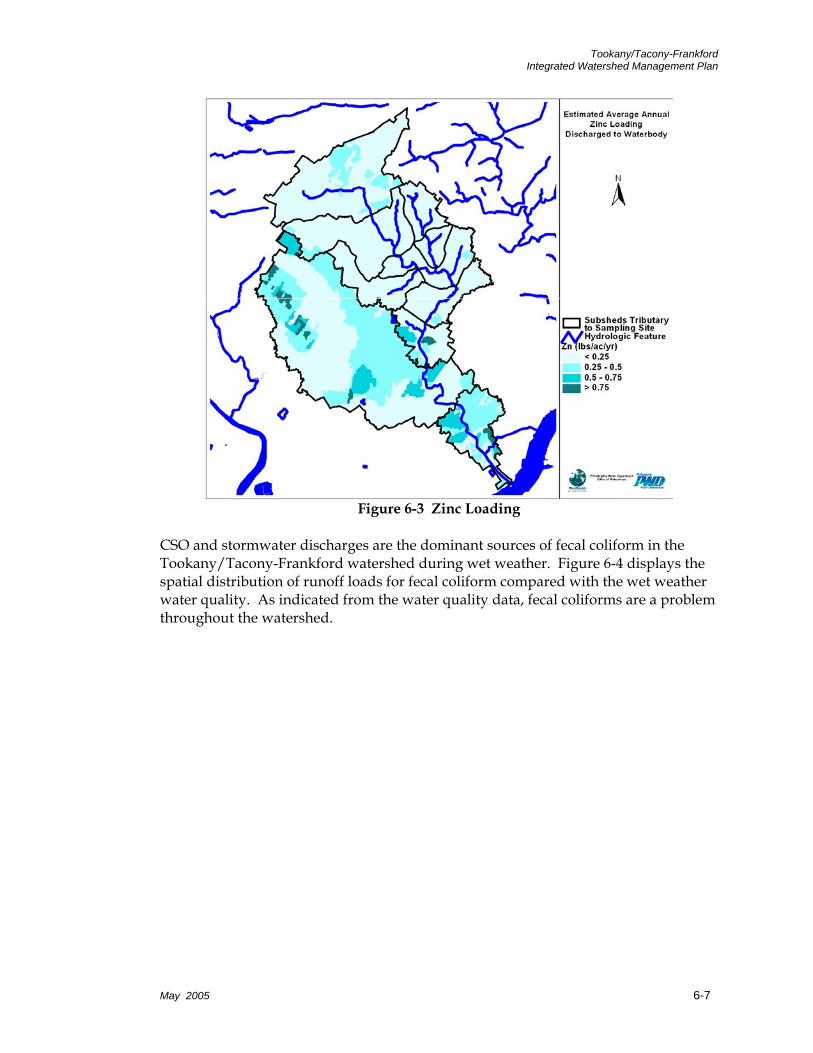
Tookany/Tacony-Frankford Integrated Watershed Management Plan
Figure 6-3 Zinc Loading
CSO and stormwater discharges are the dominant sources of fecal coliform in the Tookany/Tacony-Frankford watershed during wet weather. Figure 6-4 displays the spatial distribution of runoff loads for fecal coliform compared with the wet weather water quality. As indicated from the water quality data, fecal coliforms are a problem throughout the watershed.
May 2005 6-7

Tookany/Tacony-Frankford Integrated Watershed Management Plan
Figure 6-4 Fecal Coliform Loading
Figure 6-5 shows the model estimated TSS loading and the wet weather sampling results. The pattern of sample results and model estimated loads is a little less clear for TSS than for some of the other pollutants, with exceedances occurring both upstream and downstream, and loading more heavily weighted toward the urbanized, downstream portion of the watershed. This may indicate that stormwater runoff is not the only source of sediment, and that instream channel and bank erosion may also be a significant source. Additional studies are would be necessary to further pinpoint the sources.
May 2005 6-8
Tookany/Tacony-Frankford Integrated Watershed Management Plan
Figure 6-5 Total Suspended Solids Loading
CSOs are the largest source of pollutants associated with urban and suburban runoff, including nutrients such as phosphorus and metals such as lead, copper, and zinc. For the Tookany/Tacony-Frankford Creek watershed, stormwater outfalls are a smaller but significant source of these constituents. Figure 6-6 shows the model estimated contributions for metals and fecal coliforms as percentages of the total estimated load.
Low dissolved oxygen has been identified as a potential problem in the downstream section of Tookany/Tacony Frankford Creek. In addition, unusually high diurnal fluctuations in DO have also been observed in the downstream sections. There are several potential causes of low DO. These include:
high BOD loading during dry and wet weather,
the existence of scour pools or pools upstream of dams that do not flush frequently enough, allowing anoxic conditions to occur,
excessive growth of attached algae that alternately produce and consume oxygen resulting in large diurnal fluctuations in DO, and
the buildup of organic material in the sediment that exerts high oxygen demand
May 2005 6-9
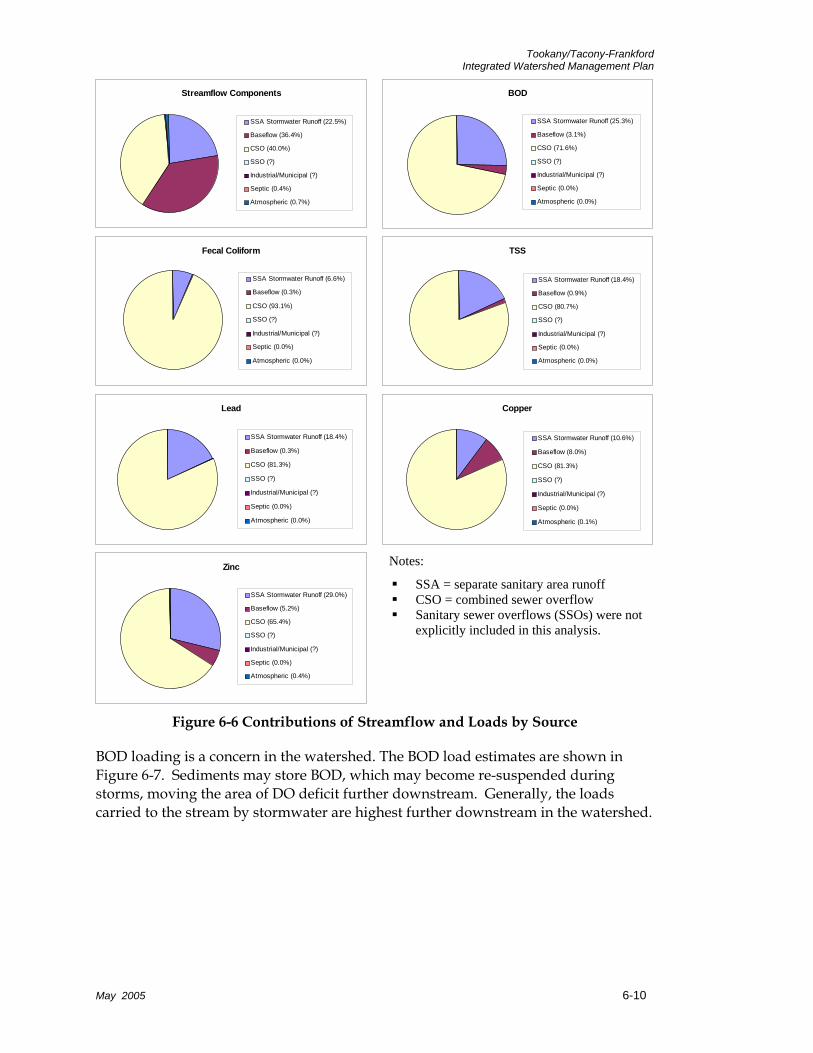
Tookany/Tacony-Frankford Integrated Watershed Management Plan
Streamflow Components
SSA Stormwater Runoff (22.5%)
Baseflow (36.4%)
CSO (40.0%)
SSO (?)
Industrial/Municipal (?)
Septic (0.4%)
Atmospheric (0.7%)
BOD
SSA Stormwater Runoff (25.3%)
Baseflow (3.1%)
CSO (71.6%)
SSO (?)
Industrial/Municipal (?)
Septic (0.0%)
Atmospheric (0.0%)
Fecal Coliform
SSA Stormwater Runoff (6.6%)
Baseflow (0.3%)
CSO (93.1%)
SSO (?)
Industrial/Municipal (?)
Septic (0.0%)
Atmospheric (0.0%)
TSS
SSA Stormwater Runoff (18.4%)
Baseflow (0.9%)
CSO (80.7%)
SSO (?)
Industrial/Municipal (?)
Septic (0.0%)
Atmospheric (0.0%)
Lead
SSA Stormwater Runoff (18.4%)
Baseflow (0.3%)
CSO (81.3%)
SSO (?)
Industrial/Municipal (?)
Septic (0.0%)
Atmospheric (0.0%)
Copper
SSA Stormwater Runoff (10.6%)
Baseflow (8.0%)
CSO (81.3%)
SSO (?)
Industrial/Municipal (?)
Septic (0.0%)
Atmospheric (0.1%)
Zinc
SSA Stormwater Runoff (29.0%)
Baseflow (5.2%)
CSO (65.4%)
SSO (?)
Industrial/Municipal (?)
Septic (0.0%)
Atmospheric (0.4%)
Notes:
SSA = separate sanitary area runoff CSO = combined sewer overflow Sanitary sewer overflows (SSOs) were not
explicitly included in this analysis.
Figure 6-6 Contributions of Streamflow and Loads by Source
BOD loading is a concern in the watershed. The BOD load estimates are shown in Figure 6-7. Sediments may store BOD, which may become re-suspended during storms, moving the area of DO deficit further downstream. Generally, the loads carried to the stream by stormwater are highest further downstream in the watershed.
May 2005 6-10
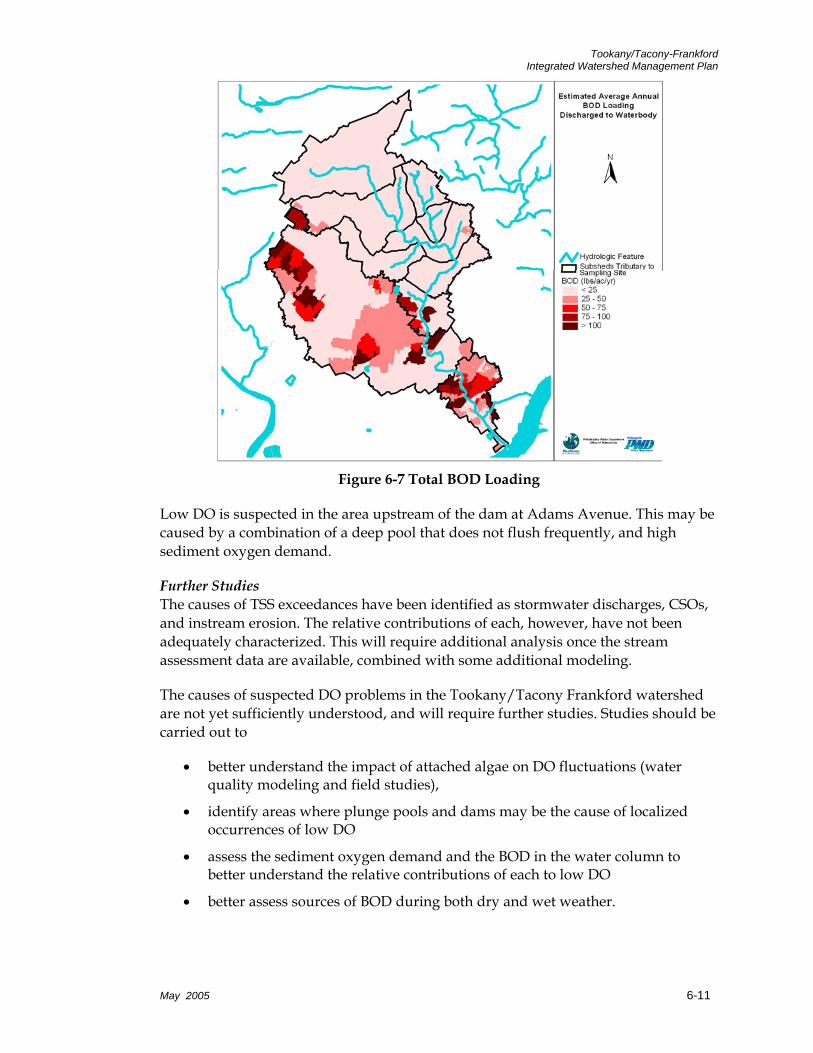
Tookany/Tacony-Frankford Integrated Watershed Management Plan
Figure 6-7 Total BOD Loading
Low DO is suspected in the area upstream of the dam at Adams Avenue. This may be caused by a combination of a deep pool that does not flush frequently, and high sediment oxygen demand.
Further Studies The causes of TSS exceedances have been identified as stormwater discharges, CSOs, and instream erosion. The relative contributions of each, however, have not been adequately characterized. This will require additional analysis once the stream assessment data are available, combined with some additional modeling.
The causes of suspected DO problems in the Tookany/Tacony Frankford watershed are not yet sufficiently understood, and will require further studies. Studies should be carried out to
• better understand the impact of attached algae on DO fluctuations (water quality modeling and field studies),
• identify areas where plunge pools and dams may be the cause of localized occurrences of low DO
• assess the sediment oxygen demand and the BOD in the water column to better understand the relative contributions of each to low DO
• better assess sources of BOD during both dry and wet weather.
May 2005 6-11
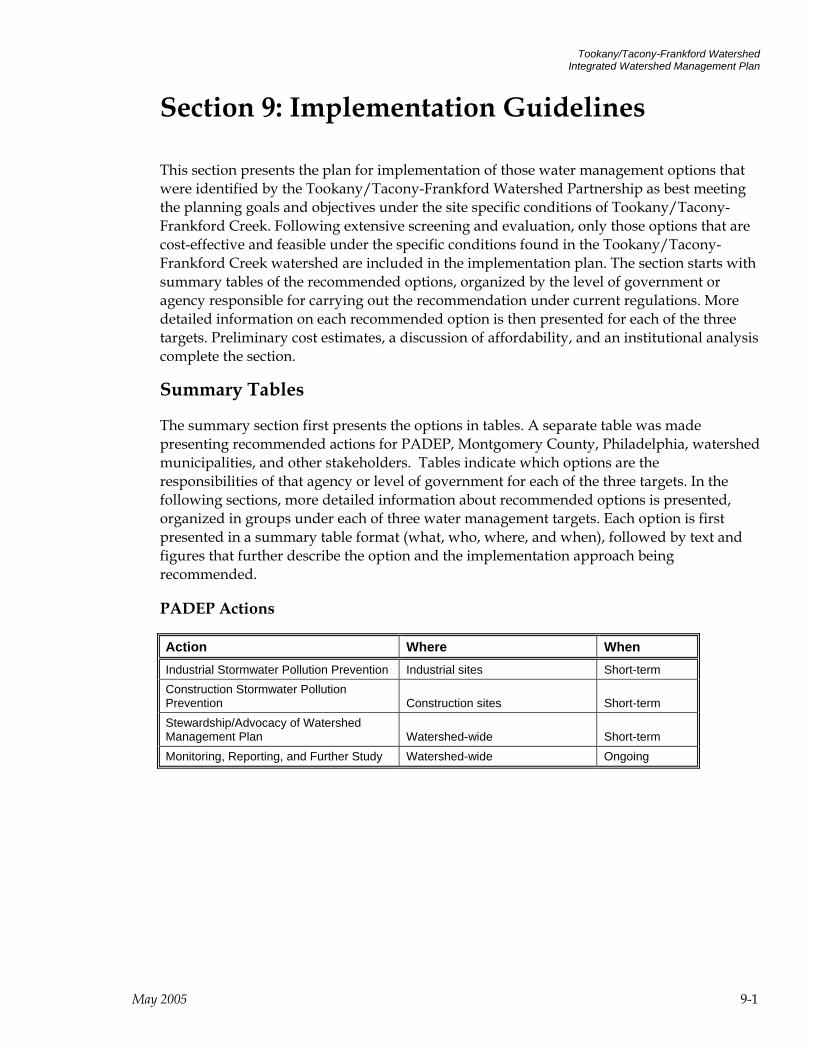
Tookany/Tacony-Frankford Watershed Integrated Watershed Management Plan
Section 9: Implementation Guidelines
This section presents the plan for implementation of those water management options that were identified by the Tookany/Tacony-Frankford Watershed Partnership as best meeting the planning goals and objectives under the site specific conditions of Tookany/Tacony-Frankford Creek. Following extensive screening and evaluation, only those options that are cost-effective and feasible under the specific conditions found in the Tookany/Tacony-Frankford Creek watershed are included in the implementation plan. The section starts with summary tables of the recommended options, organized by the level of government or agency responsible for carrying out the recommendation under current regulations. More detailed information on each recommended option is then presented for each of the three targets. Preliminary cost estimates, a discussion of affordability, and an institutional analysis complete the section.
Summary Tables
The summary section first presents the options in tables. A separate table was made presenting recommended actions for PADEP, Montgomery County, Philadelphia, watershed municipalities, and other stakeholders. Tables indicate which options are the responsibilities of that agency or level of government for each of the three targets. In the following sections, more detailed information about recommended options is presented, organized in groups under each of three water management targets. Each option is first presented in a summary table format (what, who, where, and when), followed by text and figures that further describe the option and the implementation approach being recommended.
PADEP Actions
Action Where When Industrial Stormwater Pollution Prevention Industrial sites Short-term Construction Stormwater Pollution Prevention Construction sites Short-term Stewardship/Advocacy of Watershed Management Plan Watershed-wide Short-term Monitoring, Reporting, and Further Study Watershed-wide Ongoing
May 2005 9-1
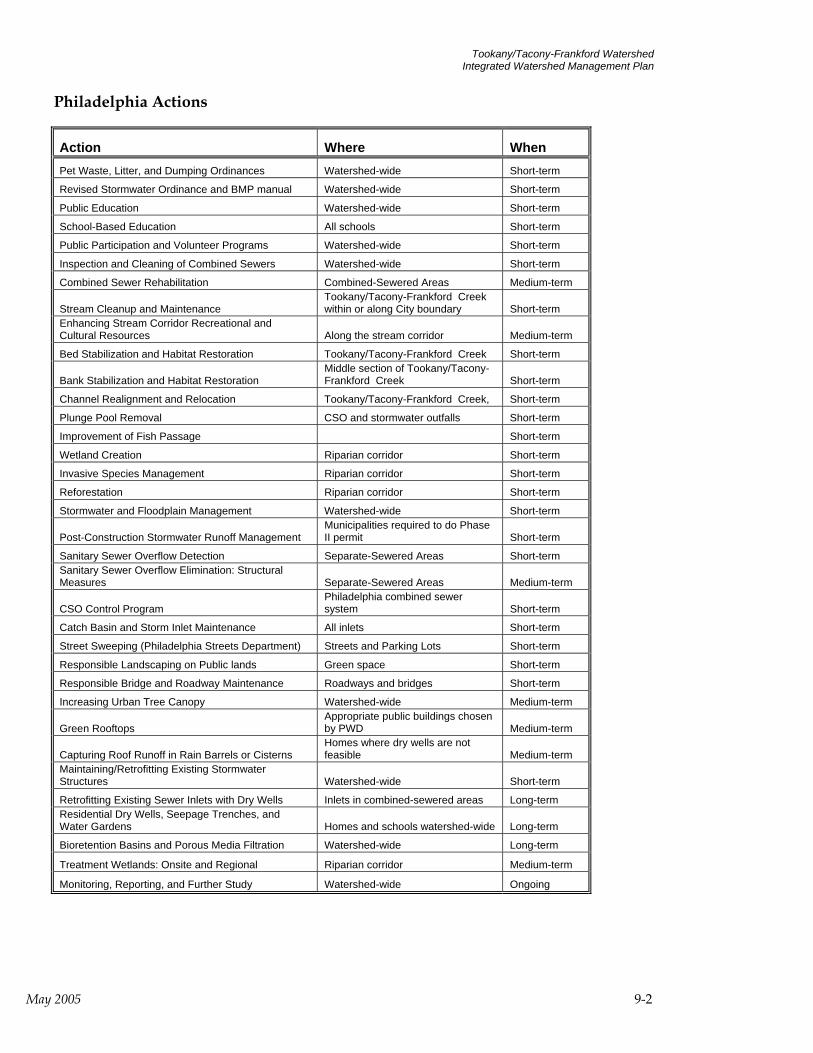
Tookany/Tacony-Frankford Watershed Integrated Watershed Management Plan
Philadelphia Actions
Action Where When Pet Waste, Litter, and Dumping Ordinances Watershed-wide Short-term
Revised Stormwater Ordinance and BMP manual Watershed-wide Short-term
Public Education Watershed-wide Short-term
School-Based Education All schools Short-term
Public Participation and Volunteer Programs Watershed-wide Short-term
Inspection and Cleaning of Combined Sewers Watershed-wide Short-term
Combined Sewer Rehabilitation Combined-Sewered Areas Medium-term
Stream Cleanup and Maintenance Tookany/Tacony-Frankford Creek within or along City boundary Short-term
Enhancing Stream Corridor Recreational and Cultural Resources Along the stream corridor Medium-term
Bed Stabilization and Habitat Restoration Tookany/Tacony-Frankford Creek Short-term
Bank Stabilization and Habitat Restoration Middle section of Tookany/Tacony-Frankford Creek Short-term
Channel Realignment and Relocation Tookany/Tacony-Frankford Creek, Short-term
Plunge Pool Removal CSO and stormwater outfalls Short-term
Improvement of Fish Passage Short-term
Wetland Creation Riparian corridor Short-term
Invasive Species Management Riparian corridor Short-term
Reforestation Riparian corridor Short-term
Stormwater and Floodplain Management Watershed-wide Short-term
Post-Construction Stormwater Runoff Management Municipalities required to do Phase II permit Short-term
Sanitary Sewer Overflow Detection Separate-Sewered Areas Short-term Sanitary Sewer Overflow Elimination: Structural Measures Separate-Sewered Areas Medium-term
CSO Control Program Philadelphia combined sewer system Short-term
Catch Basin and Storm Inlet Maintenance All inlets Short-term
Street Sweeping (Philadelphia Streets Department) Streets and Parking Lots Short-term
Responsible Landscaping on Public lands Green space Short-term
Responsible Bridge and Roadway Maintenance Roadways and bridges Short-term
Increasing Urban Tree Canopy Watershed-wide Medium-term
Green Rooftops Appropriate public buildings chosen by PWD Medium-term
Capturing Roof Runoff in Rain Barrels or Cisterns Homes where dry wells are not feasible Medium-term
Maintaining/Retrofitting Existing Stormwater Structures Watershed-wide Short-term
Retrofitting Existing Sewer Inlets with Dry Wells Inlets in combined-sewered areas Long-term Residential Dry Wells, Seepage Trenches, and Water Gardens Homes and schools watershed-wide Long-term
Bioretention Basins and Porous Media Filtration Watershed-wide Long-term
Treatment Wetlands: Onsite and Regional Riparian corridor Medium-term
Monitoring, Reporting, and Further Study Watershed-wide Ongoing
May 2005 9-2
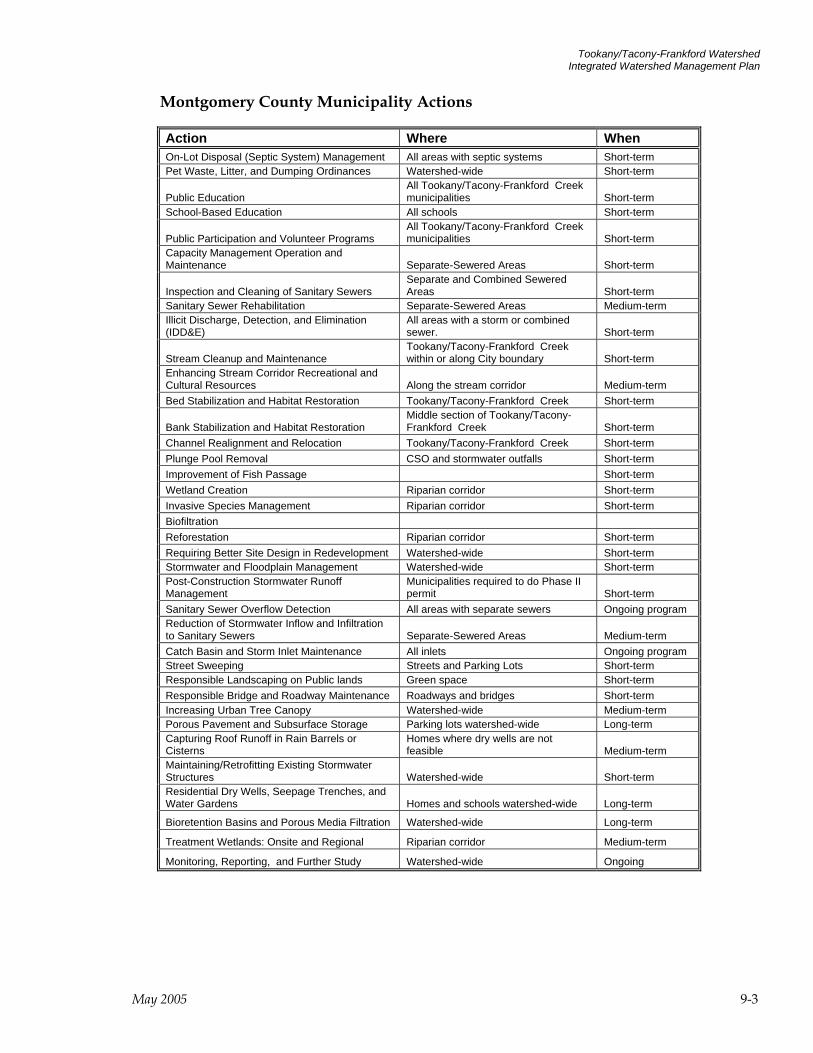
Tookany/Tacony-Frankford Watershed Integrated Watershed Management Plan
Montgomery County Municipality Actions
Action Where When On-Lot Disposal (Septic System) Management All areas with septic systems Short-term Pet Waste, Litter, and Dumping Ordinances Watershed-wide Short-term
Public Education All Tookany/Tacony-Frankford Creek municipalities Short-term
School-Based Education All schools Short-term
Public Participation and Volunteer Programs All Tookany/Tacony-Frankford Creek municipalities Short-term
Capacity Management Operation and Maintenance Separate-Sewered Areas Short-term
Inspection and Cleaning of Sanitary Sewers Separate and Combined Sewered Areas Short-term
Sanitary Sewer Rehabilitation Separate-Sewered Areas Medium-term Illicit Discharge, Detection, and Elimination (IDD&E)
All areas with a storm or combined sewer. Short-term
Stream Cleanup and Maintenance Tookany/Tacony-Frankford Creek within or along City boundary Short-term
Enhancing Stream Corridor Recreational and Cultural Resources Along the stream corridor Medium-term Bed Stabilization and Habitat Restoration Tookany/Tacony-Frankford Creek Short-term
Bank Stabilization and Habitat Restoration Middle section of Tookany/Tacony-Frankford Creek Short-term
Channel Realignment and Relocation Tookany/Tacony-Frankford Creek Short-term Plunge Pool Removal CSO and stormwater outfalls Short-term Improvement of Fish Passage Short-term Wetland Creation Riparian corridor Short-term Invasive Species Management Riparian corridor Short-term Biofiltration Reforestation Riparian corridor Short-term Requiring Better Site Design in Redevelopment Watershed-wide Short-term Stormwater and Floodplain Management Watershed-wide Short-term Post-Construction Stormwater Runoff Management
Municipalities required to do Phase II permit Short-term
Sanitary Sewer Overflow Detection All areas with separate sewers Ongoing program Reduction of Stormwater Inflow and Infiltration to Sanitary Sewers Separate-Sewered Areas Medium-term Catch Basin and Storm Inlet Maintenance All inlets Ongoing program Street Sweeping Streets and Parking Lots Short-term Responsible Landscaping on Public lands Green space Short-term Responsible Bridge and Roadway Maintenance Roadways and bridges Short-term Increasing Urban Tree Canopy Watershed-wide Medium-term Porous Pavement and Subsurface Storage Parking lots watershed-wide Long-term Capturing Roof Runoff in Rain Barrels or Cisterns
Homes where dry wells are not feasible Medium-term
Maintaining/Retrofitting Existing Stormwater Structures Watershed-wide Short-term Residential Dry Wells, Seepage Trenches, and Water Gardens Homes and schools watershed-wide Long-term
Bioretention Basins and Porous Media Filtration Watershed-wide Long-term
Treatment Wetlands: Onsite and Regional Riparian corridor Medium-term
Monitoring, Reporting, and Further Study Watershed-wide Ongoing
May 2005 9-3

Tookany/Tacony-Frankford Watershed Integrated Watershed Management Plan
9.1 Target A: Dry Weather Water Quality and Aesthetics Regulatory Approaches
AR1 On-Lot Disposal (Septic System) Management AR2 Pet Waste, Litter, and Dumping Ordinances
Public Education and Volunteer Programs
AP1 Public Education AP2 School-Based Education AP3 Public Participation and Volunteer Programs
Municipal Measures AM1 Capacity Management Operation and Maintenance (CMOM)
AM2 Inspection and Cleaning of Combined Sewers AM3 Sanitary Sewer Rehabilitation AM4 Combined Sewer Rehabilitation AM5 Illicit Discharge, Detection, and Elimination (IDD&E) AM6 Stream Cleanup and Maintenance AO1 Enhancing Stream Corridor Recreational and Cultural Resources AMR Monitoring, Reporting, and Further Study
9.1.1 Regulatory Approaches
On-Lot Disposal (Septic System) Management (AR1) Related goals: 3
Related Indicators: 7, 11, 19, 20 What Who Where When
Septic tank management program required as part of the municipality’s Official Act 537 Sewage Facilities Plan
Municipalities through state certified Sewage Enforcement Officers (SEO)
• All Act 537 plans are outdated and should be updated with exception of Abington Township
All areas with septic systems; See Table 9-1
Within next 5 years
Septic tank management programs are presently required of all Pennsylvania municipalities as part of their Official Act 537 Sewage Facilities Plans. Keeping these plans up to date, including provisions related to operation and maintenance of on-lot sewage disposal systems (OLDS) is an important means of controlling the release of pathogens and nutrients within the watershed.
May 2005 9-4
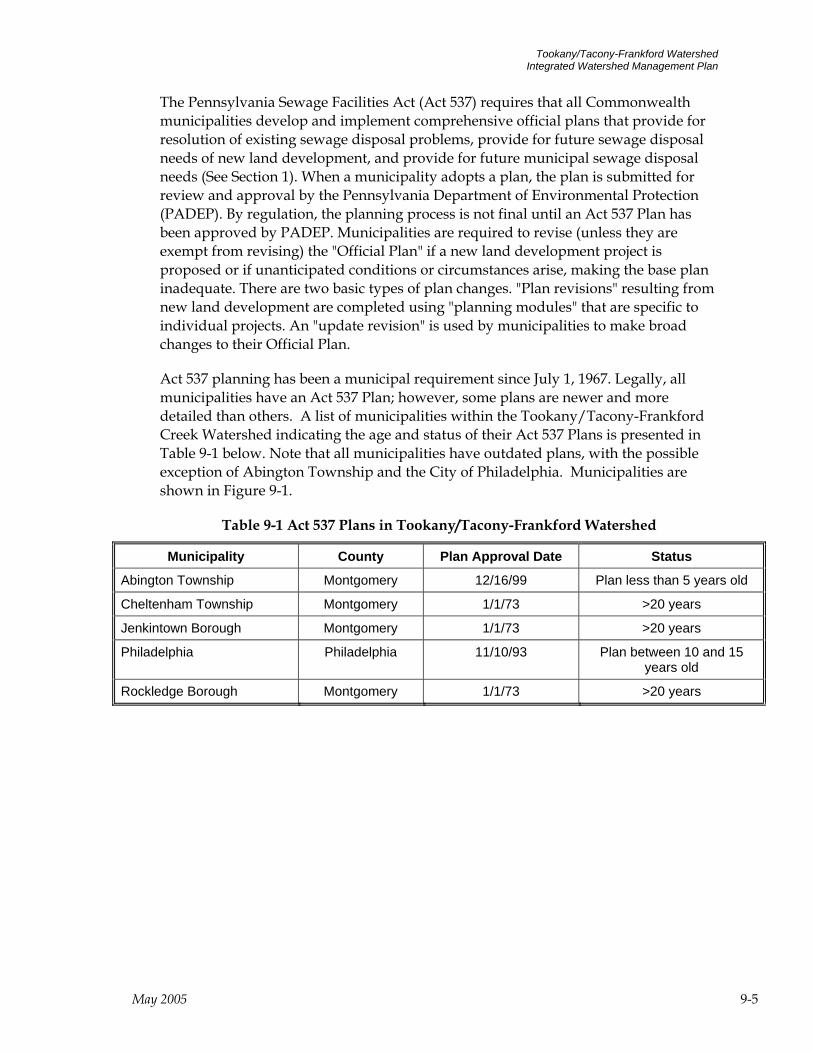
Tookany/Tacony-Frankford Watershed Integrated Watershed Management Plan
The Pennsylvania Sewage Facilities Act (Act 537) requires that all Commonwealth municipalities develop and implement comprehensive official plans that provide for resolution of existing sewage disposal problems, provide for future sewage disposal needs of new land development, and provide for future municipal sewage disposal needs (See Section 1). When a municipality adopts a plan, the plan is submitted for review and approval by the Pennsylvania Department of Environmental Protection (PADEP). By regulation, the planning process is not final until an Act 537 Plan has been approved by PADEP. Municipalities are required to revise (unless they are exempt from revising) the "Official Plan" if a new land development project is proposed or if unanticipated conditions or circumstances arise, making the base plan inadequate. There are two basic types of plan changes. "Plan revisions" resulting from new land development are completed using "planning modules" that are specific to individual projects. An "update revision" is used by municipalities to make broad changes to their Official Plan.
Act 537 planning has been a municipal requirement since July 1, 1967. Legally, all municipalities have an Act 537 Plan; however, some plans are newer and more detailed than others. A list of municipalities within the Tookany/Tacony-Frankford Creek Watershed indicating the age and status of their Act 537 Plans is presented in Table 9-1 below. Note that all municipalities have outdated plans, with the possible exception of Abington Township and the City of Philadelphia. Municipalities are shown in Figure 9-1.
Table 9-1 Act 537 Plans in Tookany/Tacony-Frankford Watershed
Municipality County Plan Approval Date Status
Abington Township Montgomery 12/16/99 Plan less than 5 years old
Cheltenham Township Montgomery 1/1/73 >20 years
Jenkintown Borough Montgomery 1/1/73 >20 years
Philadelphia Philadelphia 11/10/93 Plan between 10 and 15 years old
Rockledge Borough Montgomery 1/1/73 >20 years
May 2005 9-5
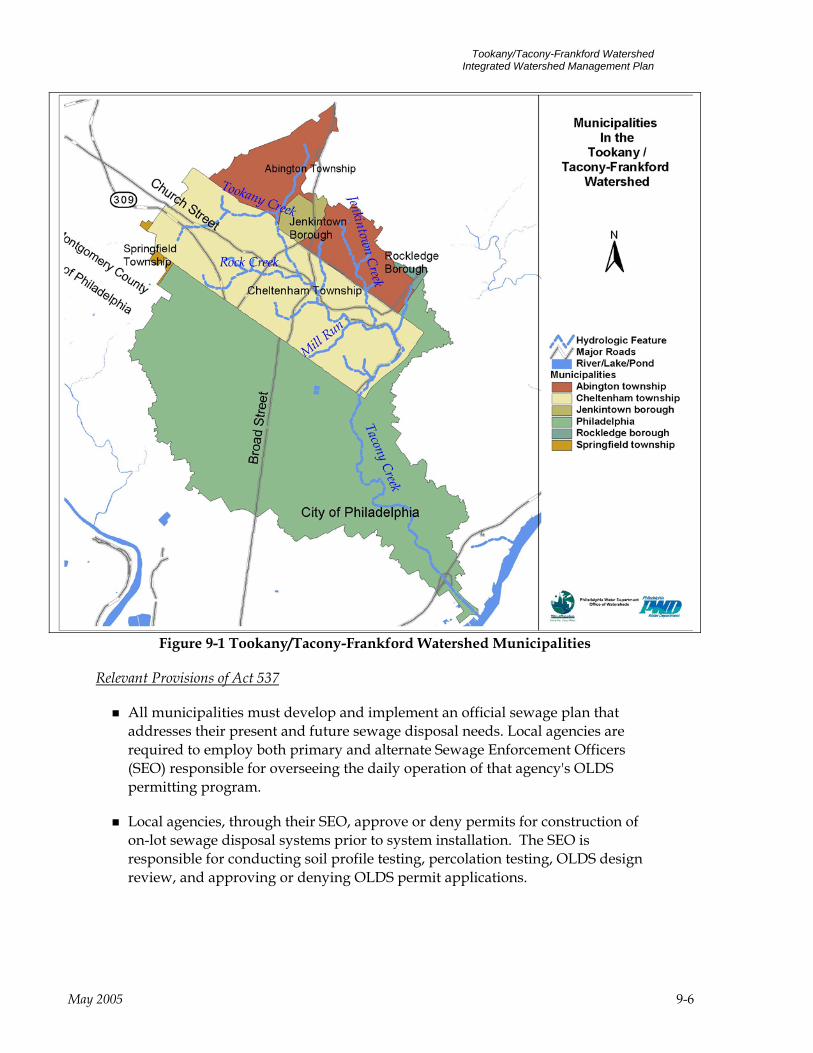
Tookany/Tacony-Frankford Watershed Integrated Watershed Management Plan
Figure 9-1 Tookany/Tacony-Frankford Watershed Municipalities
Relevant Provisions of Act 537
All municipalities must develop and implement an official sewage plan that addresses their present and future sewage disposal needs. Local agencies are required to employ both primary and alternate Sewage Enforcement Officers (SEO) responsible for overseeing the daily operation of that agency's OLDS permitting program.
Local agencies, through their SEO, approve or deny permits for construction of on-lot sewage disposal systems prior to system installation. The SEO is responsible for conducting soil profile testing, percolation testing, OLDS design review, and approving or denying OLDS permit applications.
May 2005 9-6
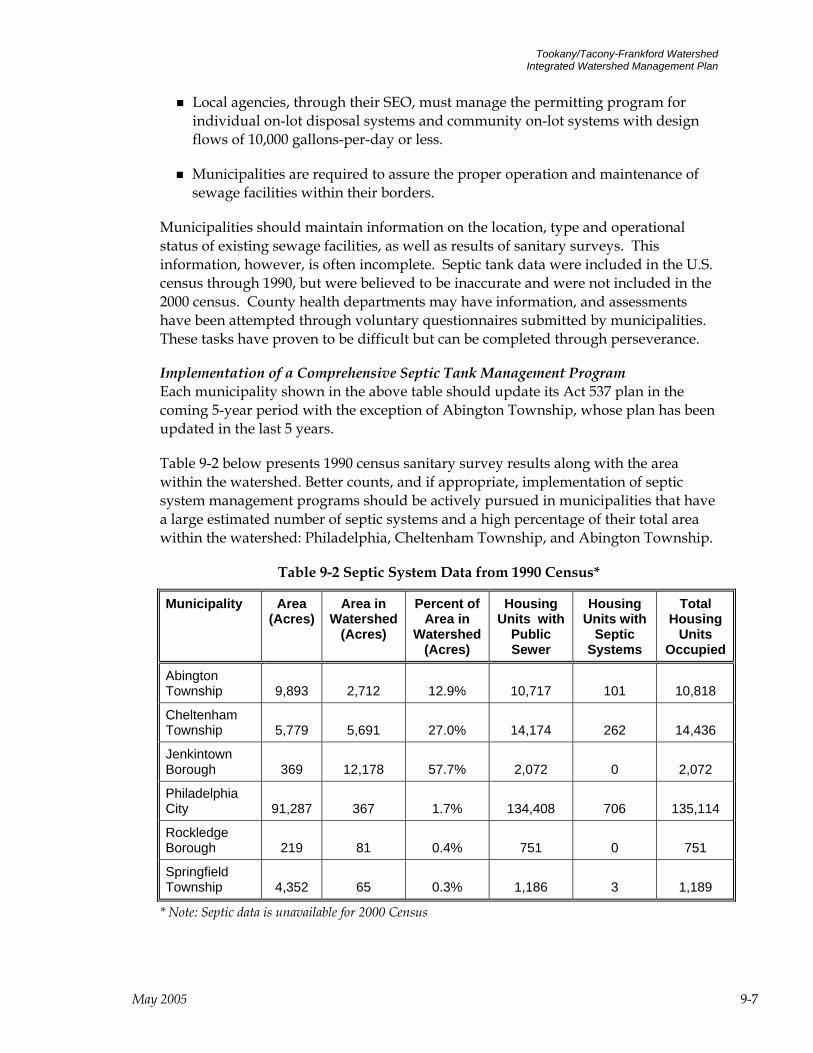
Tookany/Tacony-Frankford Watershed Integrated Watershed Management Plan
Local agencies, through their SEO, must manage the permitting program for individual on-lot disposal systems and community on-lot systems with design flows of 10,000 gallons-per-day or less.
Municipalities are required to assure the proper operation and maintenance of sewage facilities within their borders.
Municipalities should maintain information on the location, type and operational status of existing sewage facilities, as well as results of sanitary surveys. This information, however, is often incomplete. Septic tank data were included in the U.S. census through 1990, but were believed to be inaccurate and were not included in the 2000 census. County health departments may have information, and assessments have been attempted through voluntary questionnaires submitted by municipalities. These tasks have proven to be difficult but can be completed through perseverance.
Implementation of a Comprehensive Septic Tank Management Program Each municipality shown in the above table should update its Act 537 plan in the coming 5-year period with the exception of Abington Township, whose plan has been updated in the last 5 years.
Table 9-2 below presents 1990 census sanitary survey results along with the area within the watershed. Better counts, and if appropriate, implementation of septic system management programs should be actively pursued in municipalities that have a large estimated number of septic systems and a high percentage of their total area within the watershed: Philadelphia, Cheltenham Township, and Abington Township.
Table 9-2 Septic System Data from 1990 Census*
Municipality Area (Acres)
Area in Watershed
(Acres)
Percent of Area in
Watershed (Acres)
Housing Units with
Public Sewer
Housing Units with
Septic Systems
Total Housing
Units Occupied
Abington Township 9,893 2,712 12.9% 10,717 101 10,818
Cheltenham Township 5,779 5,691 27.0% 14,174 262 14,436
Jenkintown Borough 369 12,178 57.7% 2,072 0 2,072
Philadelphia City 91,287 367 1.7% 134,408 706 135,114
Rockledge Borough 219 81 0.4% 751 0 751
Springfield Township 4,352 65 0.3% 1,186 3 1,189
* Note: Septic data is unavailable for 2000 Census
May 2005 9-7
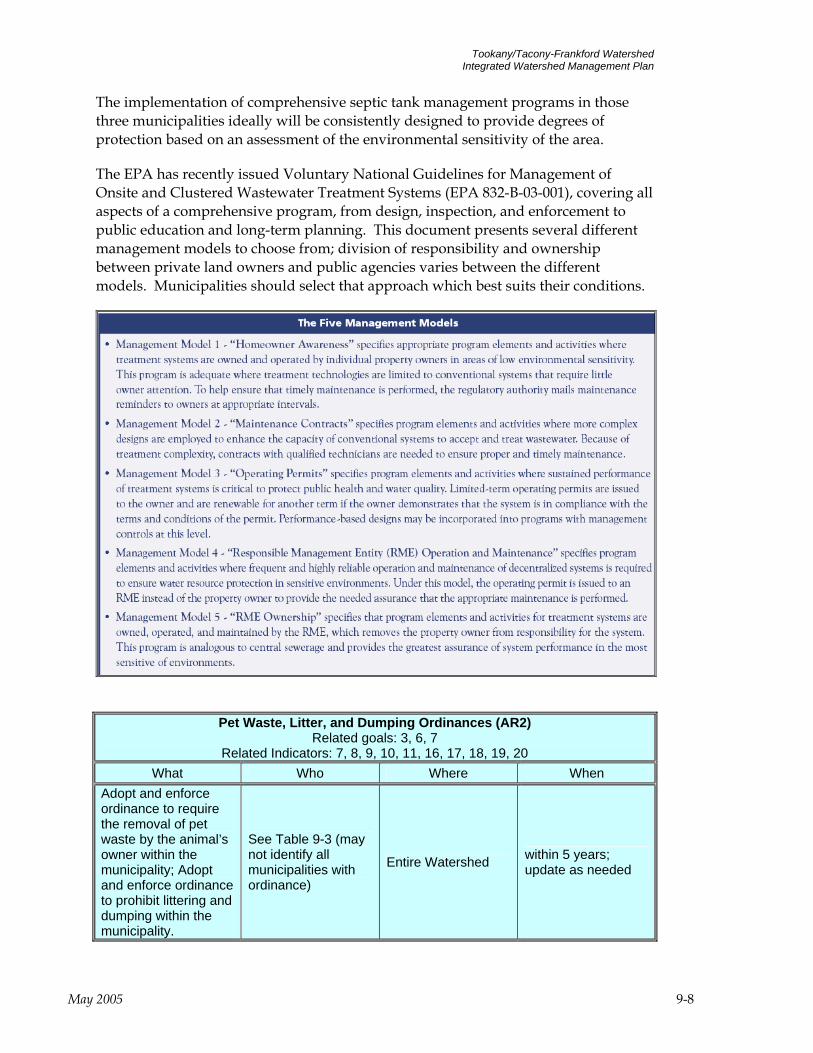
Tookany/Tacony-Frankford Watershed Integrated Watershed Management Plan
The implementation of comprehensive septic tank management programs in those three municipalities ideally will be consistently designed to provide degrees of protection based on an assessment of the environmental sensitivity of the area.
The EPA has recently issued Voluntary National Guidelines for Management of Onsite and Clustered Wastewater Treatment Systems (EPA 832-B-03-001), covering all aspects of a comprehensive program, from design, inspection, and enforcement to public education and long-term planning. This document presents several different management models to choose from; division of responsibility and ownership between private land owners and public agencies varies between the different models. Municipalities should select that approach which best suits their conditions.
Pet Waste, Litter, and Dumping Ordinances (AR2) Related goals: 3, 6, 7
Related Indicators: 7, 8, 9, 10, 11, 16, 17, 18, 19, 20 What Who Where When
Adopt and enforce ordinance to require the removal of pet waste by the animal’s owner within the municipality; Adopt and enforce ordinance to prohibit littering and dumping within the municipality.
See Table 9-3 (may not identify all municipalities with ordinance)
Entire Watershed within 5 years; update as needed
May 2005 9-8
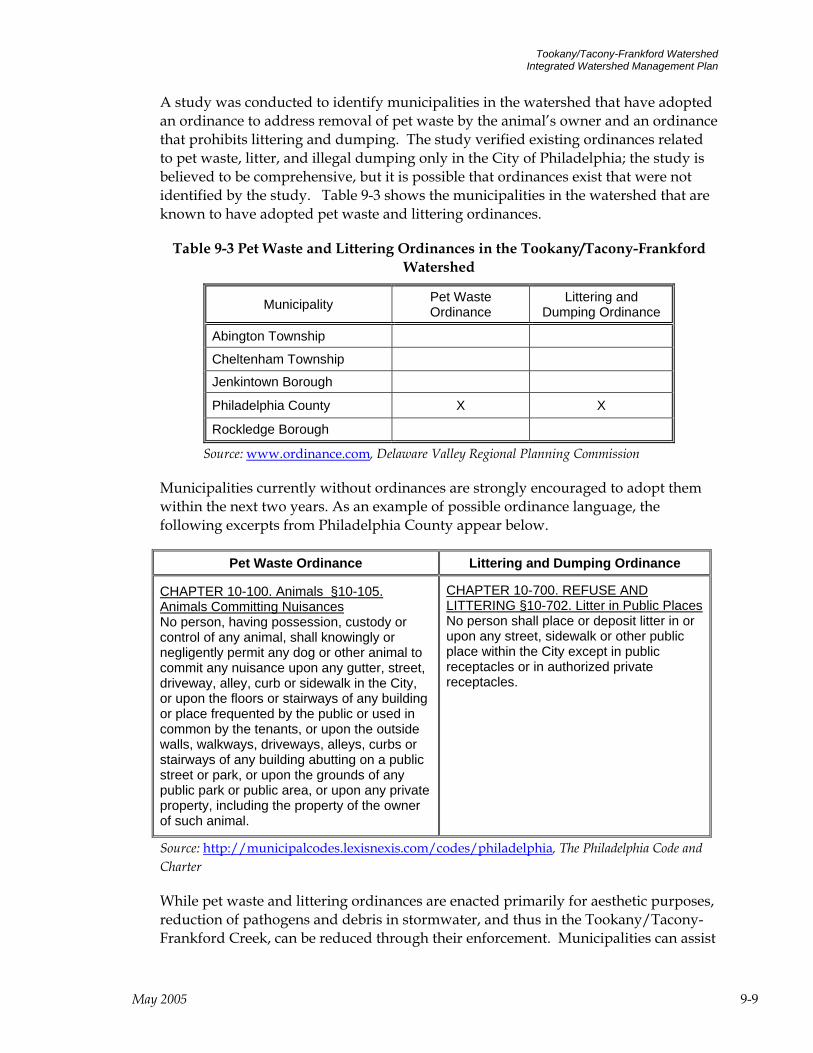
Tookany/Tacony-Frankford Watershed Integrated Watershed Management Plan
A study was conducted to identify municipalities in the watershed that have adopted an ordinance to address removal of pet waste by the animal’s owner and an ordinance that prohibits littering and dumping. The study verified existing ordinances related to pet waste, litter, and illegal dumping only in the City of Philadelphia; the study is believed to be comprehensive, but it is possible that ordinances exist that were not identified by the study. Table 9-3 shows the municipalities in the watershed that are known to have adopted pet waste and littering ordinances.
Table 9-3 Pet Waste and Littering Ordinances in the Tookany/Tacony-Frankford Watershed
Municipality Pet Waste Ordinance
Littering and Dumping Ordinance
Abington Township
Cheltenham Township
Jenkintown Borough
Philadelphia County X X
Rockledge Borough
Source: www.ordinance.com, Delaware Valley Regional Planning Commission
Municipalities currently without ordinances are strongly encouraged to adopt them within the next two years. As an example of possible ordinance language, the following excerpts from Philadelphia County appear below.
Pet Waste Ordinance Littering and Dumping Ordinance
CHAPTER 10-100. Animals §10-105. Animals Committing NuisancesNo person, having possession, custody or control of any animal, shall knowingly or negligently permit any dog or other animal to commit any nuisance upon any gutter, street, driveway, alley, curb or sidewalk in the City, or upon the floors or stairways of any building or place frequented by the public or used in common by the tenants, or upon the outside walls, walkways, driveways, alleys, curbs or stairways of any building abutting on a public street or park, or upon the grounds of any public park or public area, or upon any private property, including the property of the owner of such animal.
CHAPTER 10-700. REFUSE AND LITTERING §10-702. Litter in Public PlacesNo person shall place or deposit litter in or upon any street, sidewalk or other public place within the City except in public receptacles or in authorized private receptacles.
Source: http://municipalcodes.lexisnexis.com/codes/philadelphia, The Philadelphia Code and Charter
While pet waste and littering ordinances are enacted primarily for aesthetic purposes, reduction of pathogens and debris in stormwater, and thus in the Tookany/Tacony-Frankford Creek, can be reduced through their enforcement. Municipalities can assist
May 2005 9-9

Tookany/Tacony-Frankford Watershed Integrated Watershed Management Plan
residents in abiding by ordinances by placing trash cans in areas with higher pedestrian traffic. Plastic bags should be provided with trash cans in areas heavily used by dog owners. Homeowners’ associations should also be asked to notify residents of these ordinances and to provide trash cans and plastic bags in those neighborhoods as well.
9.1.2 Public Education and Volunteer Programs Public Education (AP1)
Related Goals: 4, 6, 7 Related Indicators: 16, 17, 18, 19, 20, 21
What Who Where When Public Education Plan Educational Program Implementation
Municipalities on the Phase II List (see Table 9-4)
All municipalities in the Tookany/Tacony-Frankford Watershed
Short-term: first 5 years coinciding with the stormwater permit (See Table 9-5)
Public education about watershed management is an integral part of the watershed implementation plan. It is designed to educate citizens on the importance of the watershed to the community, and on ways that individual behavior can impact water quality and the riparian and aquatic environment associated with Tookany/Tacony-Frankford Creek. In accordance with the Tookany/Tacony-Frankford Creek Plan’s stated purpose of integrating various existing programs, and to avoid duplication of effort, the recommended implementation plan follows the Stormwater Management Program Protocol (“Protocol”) to meet the six Minimum Control Measures required of municipal permittees under Phase II NPDES Stormwater Regulations (found at 40 CFR § 122.26 – 123.35). In this way, implementation of these public education measures by municipalities will satisfy federal NPDES permit requirements for municipal separate storm sewer systems (“MS4s”), described in detail at 40 CFR §122.34.
Table 9-4 lists the municipalities that should work together with the City of Philadelphia on Public Education about watershed management issues. Assuming that a single, watershed-wide public education campaign focusing on all three targets (A, B, and C) can be implemented, PWD should work with Cheltenham Township, Jenkintown Borough, Abington Township, and Rockledge Borough.
May 2005 9-10
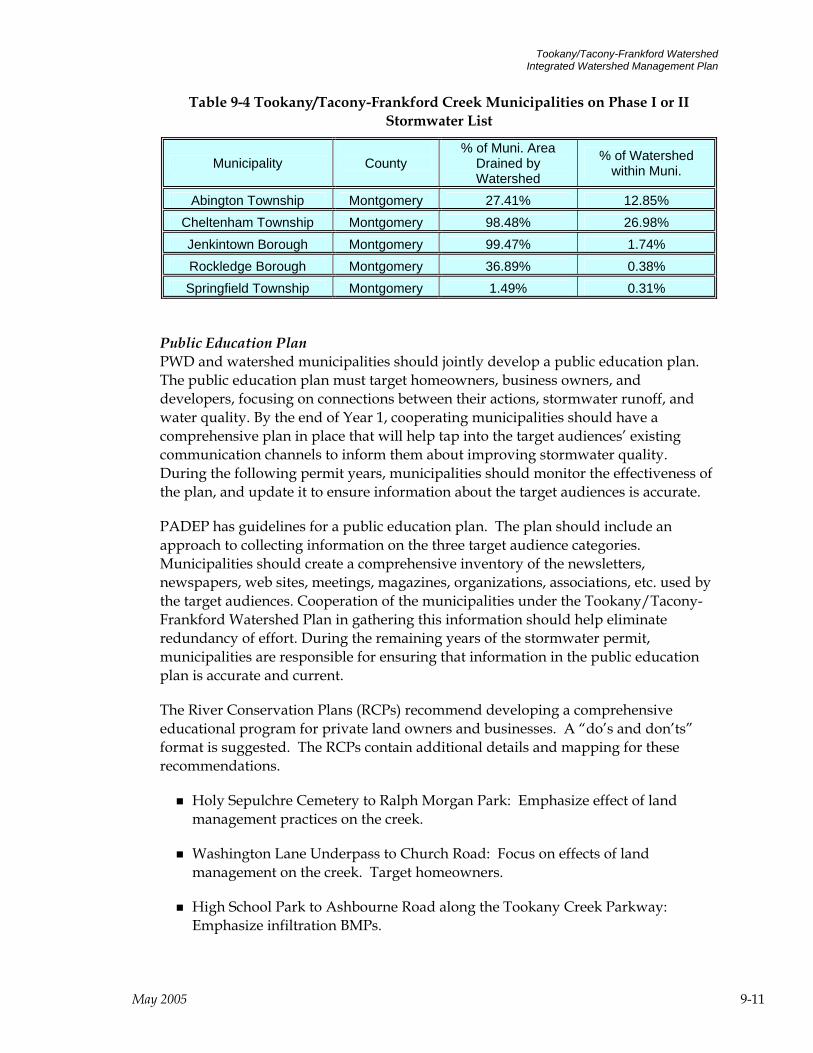
Tookany/Tacony-Frankford Watershed Integrated Watershed Management Plan
Table 9-4 Tookany/Tacony-Frankford Creek Municipalities on Phase I or II Stormwater List
Municipality
County % of Muni. Area
Drained by Watershed
% of Watershed within Muni.
Abington Township Montgomery 27.41% 12.85% Cheltenham Township Montgomery 98.48% 26.98% Jenkintown Borough Montgomery 99.47% 1.74% Rockledge Borough Montgomery 36.89% 0.38% Springfield Township Montgomery 1.49% 0.31%
Public Education Plan PWD and watershed municipalities should jointly develop a public education plan. The public education plan must target homeowners, business owners, and developers, focusing on connections between their actions, stormwater runoff, and water quality. By the end of Year 1, cooperating municipalities should have a comprehensive plan in place that will help tap into the target audiences’ existing communication channels to inform them about improving stormwater quality. During the following permit years, municipalities should monitor the effectiveness of the plan, and update it to ensure information about the target audiences is accurate.
PADEP has guidelines for a public education plan. The plan should include an approach to collecting information on the three target audience categories. Municipalities should create a comprehensive inventory of the newsletters, newspapers, web sites, meetings, magazines, organizations, associations, etc. used by the target audiences. Cooperation of the municipalities under the Tookany/Tacony-Frankford Watershed Plan in gathering this information should help eliminate redundancy of effort. During the remaining years of the stormwater permit, municipalities are responsible for ensuring that information in the public education plan is accurate and current.
The River Conservation Plans (RCPs) recommend developing a comprehensive educational program for private land owners and businesses. A “do’s and don’ts” format is suggested. The RCPs contain additional details and mapping for these recommendations.
Holy Sepulchre Cemetery to Ralph Morgan Park: Emphasize effect of land management practices on the creek.
Washington Lane Underpass to Church Road: Focus on effects of land management on the creek. Target homeowners.
High School Park to Ashbourne Road along the Tookany Creek Parkway: Emphasize infiltration BMPs.
May 2005 9-11
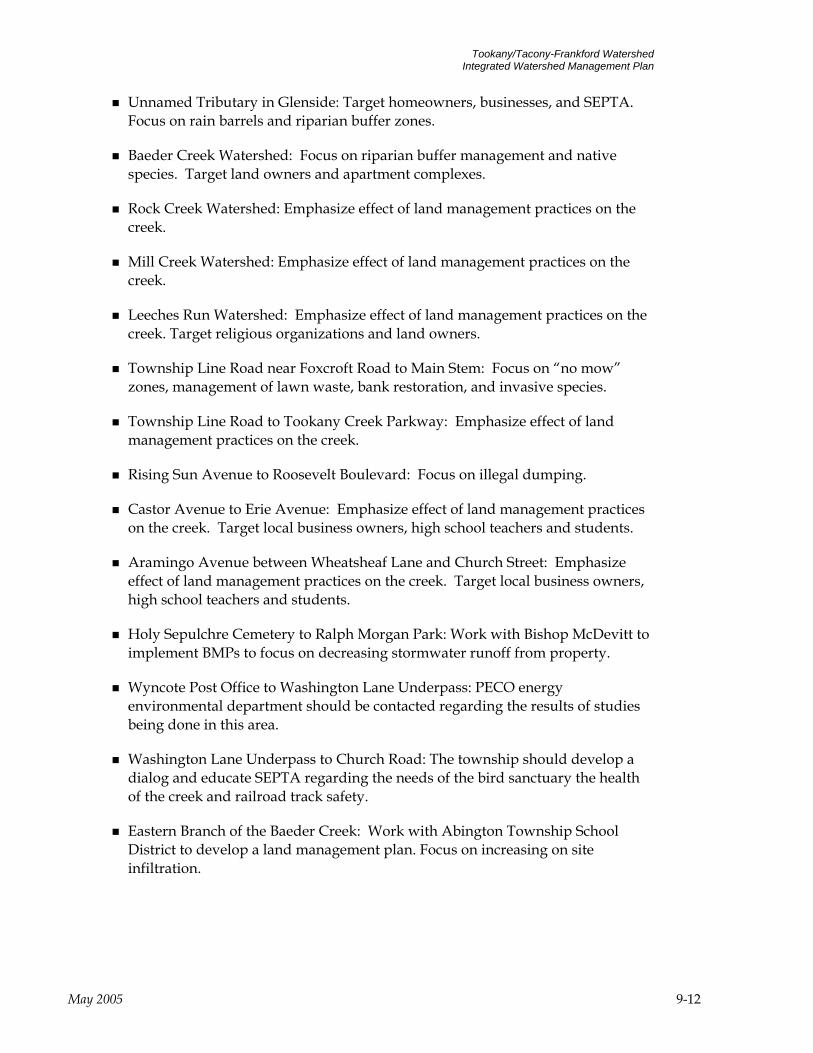
Tookany/Tacony-Frankford Watershed Integrated Watershed Management Plan
Unnamed Tributary in Glenside: Target homeowners, businesses, and SEPTA. Focus on rain barrels and riparian buffer zones.
Baeder Creek Watershed: Focus on riparian buffer management and native species. Target land owners and apartment complexes.
Rock Creek Watershed: Emphasize effect of land management practices on the creek.
Mill Creek Watershed: Emphasize effect of land management practices on the creek.
Leeches Run Watershed: Emphasize effect of land management practices on the creek. Target religious organizations and land owners.
Township Line Road near Foxcroft Road to Main Stem: Focus on “no mow” zones, management of lawn waste, bank restoration, and invasive species.
Township Line Road to Tookany Creek Parkway: Emphasize effect of land management practices on the creek.
Rising Sun Avenue to Roosevelt Boulevard: Focus on illegal dumping.
Castor Avenue to Erie Avenue: Emphasize effect of land management practices on the creek. Target local business owners, high school teachers and students.
Aramingo Avenue between Wheatsheaf Lane and Church Street: Emphasize effect of land management practices on the creek. Target local business owners, high school teachers and students.
Holy Sepulchre Cemetery to Ralph Morgan Park: Work with Bishop McDevitt to implement BMPs to focus on decreasing stormwater runoff from property.
Wyncote Post Office to Washington Lane Underpass: PECO energy environmental department should be contacted regarding the results of studies being done in this area.
Washington Lane Underpass to Church Road: The township should develop a dialog and educate SEPTA regarding the needs of the bird sanctuary the health of the creek and railroad track safety.
Eastern Branch of the Baeder Creek: Work with Abington Township School District to develop a land management plan. Focus on increasing on site infiltration.
May 2005 9-12

Tookany/Tacony-Frankford Watershed Integrated Watershed Management Plan
In addition, other information relevant to watershed management should be included on topics such as:
Improper Disposal to Storm Drains
Automobile Maintenance
Car Washing
Animal Waste Collection
Restorative Redevelopment: Public Education Aspects
Public Education Implementation Once the public education plan is developed, it must be implemented. This means distributing educational materials provided by PADEP or others that contain messages related to watershed (and stormwater) management. Municipalities can find educational materials needed to implement the educational program on the PADEP website, http://www.dep.state.pa.us/dep/deputate/watermgt/wc/NPDSMS4/MS4CD/.
To fulfill NPDES stormwater permit requirements, municipalities should implement two phases of educational outreach. During the first stage, the focus is on raising the awareness of target audiences. In the second stage, municipalities should aim to educate the target audiences about the problems and potential solutions. PADEP presents requirements in the stormwater permit for the “what” and “when” of this minimum measure component, but it does not specify the “how.” Municipalities should use their Public Education Plan to determine the most effective means of getting educational materials into the hands of target audiences. Any additional educational activities should show compliance with this Minimum Control Measure. This includes educational activities by watershed groups, and certainly should make use of the existing Tookany/Tacony-Frankford Creek Partnership activities.
In Year 1, municipalities are required to start raising target audience awareness. Raising awareness can be accomplished by use of PADEP materials. PADEP has made available copies of the pamphlet entitled, “When It Rains, It Drains” (available on the PADEP website, http://www.dep.state.pa.us/dep/deputate/watermgt/wc/NPDSMS4/MS4CD/ ).
This document addresses the issue of pollution related to stormwater runoff and activities that citizens can use to improve stormwater quality. It also provides an overview of a typical stormwater management program. Using the information on distribution channels in the Public Education Plan, municipalities should disseminate these pamphlets to all the target audience categories in the community.
In Year 2, municipalities should begin to educate all the target audiences. This includes distributing fact sheets to developers about their responsibilities under the
May 2005 9-13
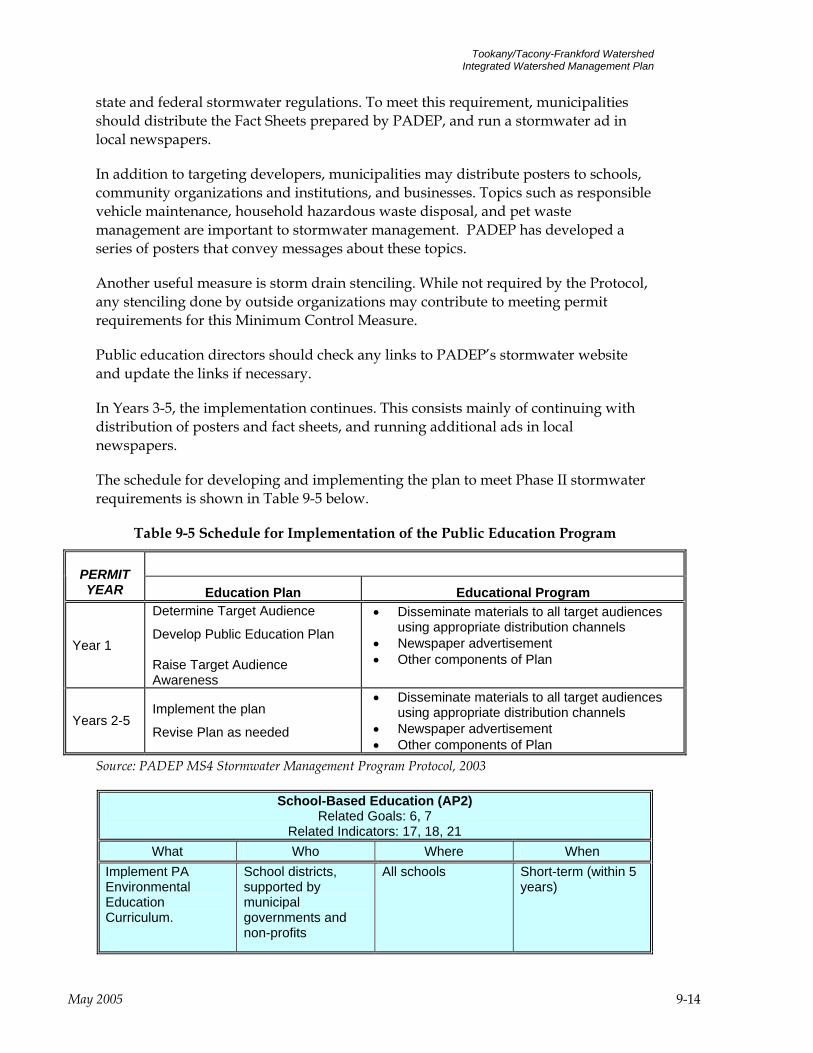
Tookany/Tacony-Frankford Watershed Integrated Watershed Management Plan
state and federal stormwater regulations. To meet this requirement, municipalities should distribute the Fact Sheets prepared by PADEP, and run a stormwater ad in local newspapers.
In addition to targeting developers, municipalities may distribute posters to schools, community organizations and institutions, and businesses. Topics such as responsible vehicle maintenance, household hazardous waste disposal, and pet waste management are important to stormwater management. PADEP has developed a series of posters that convey messages about these topics.
Another useful measure is storm drain stenciling. While not required by the Protocol, any stenciling done by outside organizations may contribute to meeting permit requirements for this Minimum Control Measure.
Public education directors should check any links to PADEP’s stormwater website and update the links if necessary.
In Years 3-5, the implementation continues. This consists mainly of continuing with distribution of posters and fact sheets, and running additional ads in local newspapers.
The schedule for developing and implementing the plan to meet Phase II stormwater requirements is shown in Table 9-5 below.
Table 9-5 Schedule for Implementation of the Public Education Program
PERMIT YEAR Education Plan Educational Program
Year 1
Determine Target Audience
Develop Public Education Plan Raise Target Audience Awareness
• Disseminate materials to all target audiences using appropriate distribution channels
• Newspaper advertisement • Other components of Plan
Years 2-5 Implement the plan
Revise Plan as needed
• Disseminate materials to all target audiences using appropriate distribution channels
• Newspaper advertisement • Other components of Plan
Source: PADEP MS4 Stormwater Management Program Protocol, 2003
School-Based Education (AP2) Related Goals: 6, 7
Related Indicators: 17, 18, 21 What Who Where When
Implement PA Environmental Education Curriculum.
School districts, supported by municipal governments and non-profits
All schools Short-term (within 5 years)
May 2005 9-14
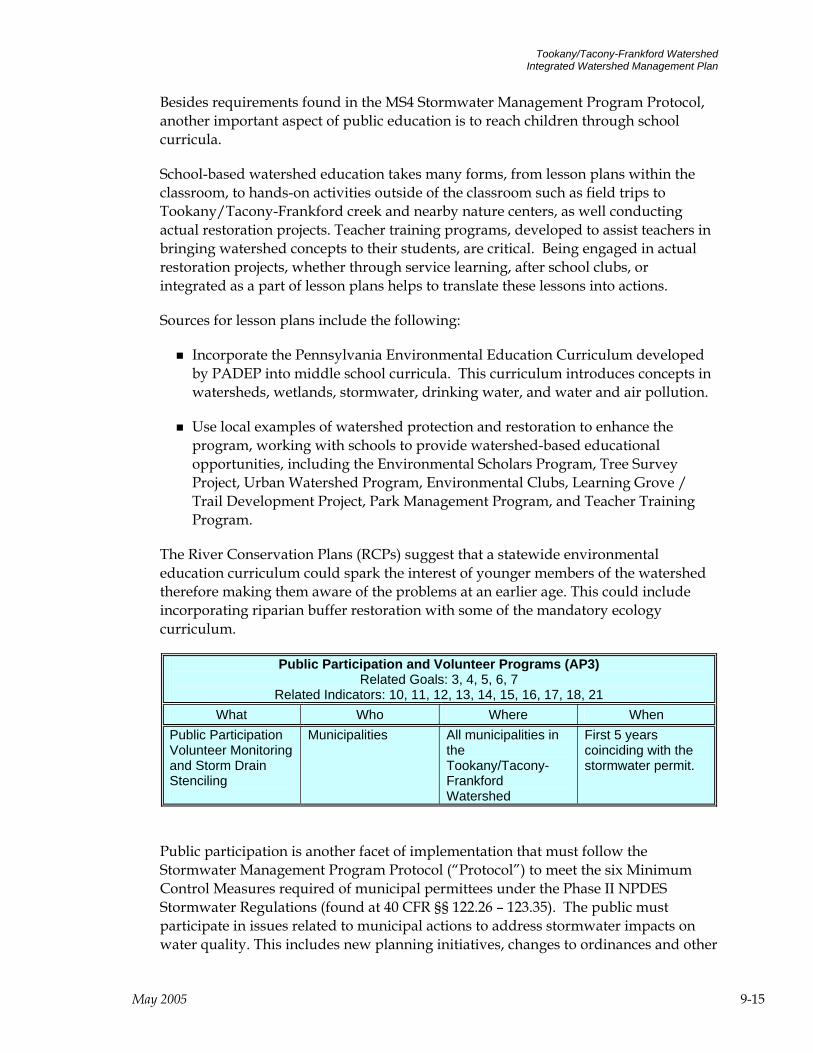
Tookany/Tacony-Frankford Watershed Integrated Watershed Management Plan
Besides requirements found in the MS4 Stormwater Management Program Protocol, another important aspect of public education is to reach children through school curricula.
School-based watershed education takes many forms, from lesson plans within the classroom, to hands-on activities outside of the classroom such as field trips to Tookany/Tacony-Frankford creek and nearby nature centers, as well conducting actual restoration projects. Teacher training programs, developed to assist teachers in bringing watershed concepts to their students, are critical. Being engaged in actual restoration projects, whether through service learning, after school clubs, or integrated as a part of lesson plans helps to translate these lessons into actions.
Sources for lesson plans include the following:
Incorporate the Pennsylvania Environmental Education Curriculum developed by PADEP into middle school curricula. This curriculum introduces concepts in watersheds, wetlands, stormwater, drinking water, and water and air pollution.
Use local examples of watershed protection and restoration to enhance the program, working with schools to provide watershed-based educational opportunities, including the Environmental Scholars Program, Tree Survey Project, Urban Watershed Program, Environmental Clubs, Learning Grove / Trail Development Project, Park Management Program, and Teacher Training Program.
The River Conservation Plans (RCPs) suggest that a statewide environmental education curriculum could spark the interest of younger members of the watershed therefore making them aware of the problems at an earlier age. This could include incorporating riparian buffer restoration with some of the mandatory ecology curriculum.
Public Participation and Volunteer Programs (AP3) Related Goals: 3, 4, 5, 6, 7
Related Indicators: 10, 11, 12, 13, 14, 15, 16, 17, 18, 21 What Who Where When
Public Participation Volunteer Monitoring and Storm Drain Stenciling
Municipalities All municipalities in the Tookany/Tacony-Frankford Watershed
First 5 years coinciding with the stormwater permit.
Public participation is another facet of implementation that must follow the Stormwater Management Program Protocol (“Protocol”) to meet the six Minimum Control Measures required of municipal permittees under the Phase II NPDES Stormwater Regulations (found at 40 CFR §§ 122.26 – 123.35). The public must participate in issues related to municipal actions to address stormwater impacts on water quality. This includes new planning initiatives, changes to ordinances and other
May 2005 9-15
Tookany/Tacony-Frankford Watershed Integrated Watershed Management Plan
local regulations. This requirement overlaps the public participation aspects of the watershed management plan, and suggests that a unified and coordinated approach between municipalities would be efficient. All municipalities in the watershed (listed in Table 9-4) are required to have a public participation program.
Prior to adoption of any ordinance required under the PADEP Stormwater Protocol, municipalities must provide adequate public notice and opportunities for public review and input, and hold hearings to obtain public feedback. This can be done in conjunction with normal public sessions of the municipal governing body. The notice must be published in a local newspaper of general circulation. Involving citizen groups, watershed organizations and businesses as much as possible will obtain broad support for stormwater management efforts. The current Steering Committee for the Tookany/Tacony-Frankford Creek Watershed Plan is an obvious example of such inclusion, and can help municipalities to meet this requirement.
Although the actual public participation requirements can be met by following guidelines for Act 167 planning, it is recommended that municipalities do more than the minimum. Some options for additional public participation are listed below.
Develop a Public Involvement and Participation Plan: by the end of Year 1, a municipality may want to have a comprehensive plan in place that will guide your efforts to recruit volunteers and obtain participation at public meetings. This could be part of the Public Education Plan discussed above.
Produce strategies for recruiting participation from six categories of stakeholders: municipal employees, homeowners, businesses, schools, watershed associations and other volunteer groups and developers.
Develop a comprehensive stakeholder mailing list.
Conduct Public Meetings: PADEP suggests using a general stormwater public meeting to kick-off public education and participation efforts. This has already been done for the Tookany/Tacony-Frankford Partnership and Steering Committee, and municipalities are encouraged to make use of this. Invite representatives from all six stakeholder categories. It is important that all stakeholder interests have the opportunity to participate. Meeting agendas should include, but not be limited to, the overview presentation on the watershed management and stormwater program and time for questions from the audience.
An important aspect of public participation is the establishment of volunteer programs. There are many types of volunteer programs that can help manage stormwater and improve a community’s water quality. The goal of the volunteer program is to obtain and sustain volunteer support that will aid watershed management efforts. To reach this goal, it is important to develop a program that reflects stakeholders’ concerns and interests. Examples of volunteer programs are:
May 2005 9-16

Tookany/Tacony-Frankford Watershed Integrated Watershed Management Plan
Volunteer Monitoring Program Municipalities should determine which type of assessment the program will undertake and develop a study design using the manual entitled Designing Your Monitoring Program: A Technical Handbook for Community-Based Monitoring in Pennsylvania as the basis for planning and implementing your monitoring program (PADEP, 2001).
Storm Drain Stenciling Program Municipalities should establish procedures for storm drain stenciling and organize volunteers to carry out the program. PADEP has provided resource materials in a References and Resources CD-ROM on developing and implementing a storm drain stenciling program.
Stream Cleanup and Restoration Activities Citizen participation in stream cleanups is a good way to get the community involved in keeping the streams free of trash and debris. In Philadelphia, stream cleanups can be coordinated with PWD’s Waterways Restoration Unit. Other participatory activities can include support of riparian plantings during stream restoration activities.
The River Conservation Plans (RCPs) suggest that increased volunteer work will increase the general awareness regarding what citizen can do to keep the watershed free of problems. For example, at the Washington Lane Underpass to Church Road, a group could be organized to adopt the bird sanctuary area.
9.1.3 Municipal Measures Capacity Management Operation and Maintenance (CMOM) (AM1)
Related Goals: 1, 2, 3 Related Indicators: 7, 9, 11
What Who Where When
Program to manage and maintain sewer systems; plans in place to track SSOs and overflow response plan.
Separate Sewered Municipalities
Separate Sanitary Sewer Areas
Medium term: 5+ years
CMOM programs are recommended for all areas with separate sanitary sewer systems and are an important component of Target A because they help prevent dry weather discharges. Recommendations in this section cover both the dry and wet weather aspects of the program; recommendations that are specific to SSO abatement are included here for completeness and are referred to under Target C. The recommendations in this section are adapted from the “Consensus Recommendation of the SSO Federal Advisory Subcommittee” published in October 1999.
May 2005 9-17
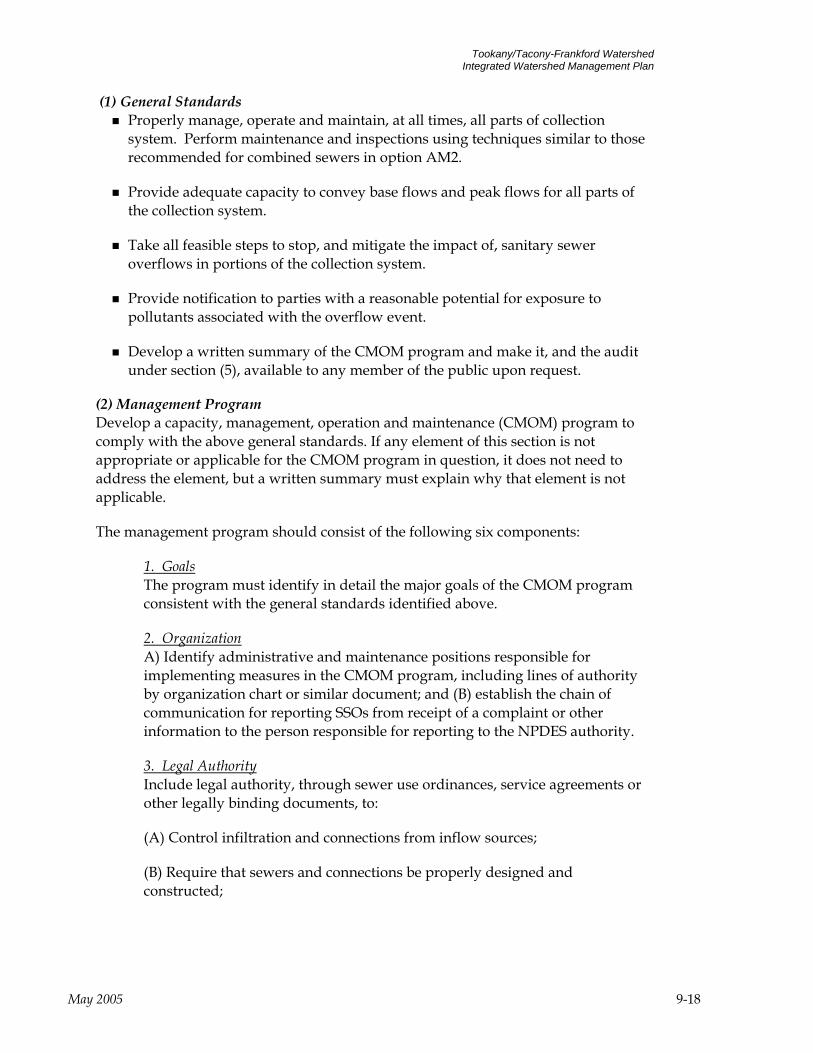
Tookany/Tacony-Frankford Watershed Integrated Watershed Management Plan
(1) General Standards Properly manage, operate and maintain, at all times, all parts of collection
system. Perform maintenance and inspections using techniques similar to those recommended for combined sewers in option AM2.
Provide adequate capacity to convey base flows and peak flows for all parts of the collection system.
Take all feasible steps to stop, and mitigate the impact of, sanitary sewer overflows in portions of the collection system.
Provide notification to parties with a reasonable potential for exposure to pollutants associated with the overflow event.
Develop a written summary of the CMOM program and make it, and the audit under section (5), available to any member of the public upon request.
(2) Management Program Develop a capacity, management, operation and maintenance (CMOM) program to comply with the above general standards. If any element of this section is not appropriate or applicable for the CMOM program in question, it does not need to address the element, but a written summary must explain why that element is not applicable.
The management program should consist of the following six components:
1. Goals The program must identify in detail the major goals of the CMOM program consistent with the general standards identified above.
2. Organization A) Identify administrative and maintenance positions responsible for implementing measures in the CMOM program, including lines of authority by organization chart or similar document; and (B) establish the chain of communication for reporting SSOs from receipt of a complaint or other information to the person responsible for reporting to the NPDES authority.
3. Legal Authority Include legal authority, through sewer use ordinances, service agreements or other legally binding documents, to:
(A) Control infiltration and connections from inflow sources;
(B) Require that sewers and connections be properly designed and constructed;
May 2005 9-18

Tookany/Tacony-Frankford Watershed Integrated Watershed Management Plan
(C) Ensure proper installation, testing, and inspection of new and rehabilitated sewers (such as new or rehabilitated collector sewers and new or rehabilitated service laterals);
(D) Address flows from satellite municipal collection systems; and
(E) Implement the general and specific prohibitions of the national pretreatment program that you are subject to under 40 CFR 403.5.
4. Measures and Activities The CMOM program must address the elements listed below that are appropriate and applicable to the sewer system and identify the person or position in the organization responsible for each element.
(A) Maintenance of facilities
(B) Maintenance of a map of the collection system
(C) Management of information and use of timely, relevant information to establish and prioritize appropriate CMOM activities, and to identify and illustrate trends in overflows.
(D) Routine preventive operation and maintenance activities
(E) Assessment of the current capacity of the collection system and treatment facilities
(F) Identification and prioritization of structural deficiencies and identification and implementation of short-term and long term rehabilitation actions to address each deficiency
(G) Appropriate training on a regular basis.
(H) Equipment and replacement parts inventories including identification of critical replacement parts.
5. Design and Performance Provisions (A) Requirements and standards for the installation of new sewers, pumps and other appurtenances; and rehabilitation and repair projects.
(B) Procedures and specifications for inspecting and testing the installation of new sewers, pumps, and other appurtenances and for rehabilitation and repair projects.
6. Monitoring, Measurement and Program Modifications Monitor the implementation and, where appropriate, measure the effectiveness of each element of the CMOM program. Program elements must be updated as appropriate based on monitoring or performance evaluations.
May 2005 9-19
Tookany/Tacony-Frankford Watershed Integrated Watershed Management Plan
The summary of the CMOM program should be modified as appropriate to keep it updated and accurate.
(3) Overflow Response Plan: An overflow response plan should be developed and implemented that identifies measures to protect public health and the environment including, but not limited to, mechanisms to:
(i) ensure that all overflows are made aware of (to the greatest extent possible);
(ii) ensure that overflows are appropriately responded to, including ensuring that reports of overflows are immediately dispatched to appropriate personnel for investigation and appropriate response;
(iii) ensure appropriate reporting pursuant to 40 CFR 122.42(e).
(iv) ensure appropriate notification to the public, health agencies, and other impacted entities (e.g. water suppliers) pursuant to 40 CFR 122.42(h). The CMOM plan should identify the public health and other officials who will receive immediate notification.
(v) ensure that appropriate personnel are aware of and follow the plan and are appropriately trained; and
(vi) provide emergency operations.
(4) System Evaluation and Capacity assurance plan: A plan should be prepared and implemented for system evaluation and capacity assurance if peak flow conditions are contributing to an SSO discharge unless either (1) already taken steps to correct the hydraulic deficiency or (2) the discharge meets the criteria of 122.42(g)(2). At a minimum the plan must include:
(i) Evaluation: Steps to evaluate those portions of the collection system which are experiencing or contributing to an SSO discharge caused by hydraulic deficiency or to noncompliance at a treatment plant. The evaluation should provide estimates of peak flows (including flows from SSOs that escape from the system) associated with conditions similar to those causing overflow events, provide estimates of the capacity of key system components, identify hydraulic deficiencies, including components of the system with limiting capacity and identify the major sources that contribute to the peak flows associated with overflow events.
(ii) Capacity Enhancement Measures: Establish short and long term actions to address each hydraulic deficiency including prioritization, alternative analysis, and a schedule.
(iii) Plan updates: The plan should be updated to describe any significant change in proposed actions and/or implementation schedule. The plan should
May 2005 9-20
Tookany/Tacony-Frankford Watershed Integrated Watershed Management Plan
also be updated to reflect available information on the performance of measures that have been implemented.
(5) CMOM Program Audits As part of the NPDES permit application, an audit should be conducted, appropriate to the size of the system and the number of overflows, and a report submitted of such audit, evaluating the CMOM program and its compliance with this subsection, including its deficiencies and steps to respond to them.
(6) Communications The permittee should communicate on a regular basis with various interested parties on the implementation and performance of its CMOM program. The communication system should allow interested parties to provide input to the permittee as the CMOM program is developed and implemented.
Inspection and Cleaning of Combined Sewers (AM2) Related Goals: 3, 4, 7
Related Indicators: 11, 19 What Who Where When
inspection activities routine maintenance, monitoring activities
PWD
Combined Sewered Areas (see Figure 9-2)
First 5 years coinciding with the stormwater permit.
Maintenance of sewers includes activities required to keep the system functioning as it was originally designed and constructed. Any reinvestment in the system, including routine maintenance, capital improvements for repair or rehabilitation, inspection activities, and monitoring activities are generally classified as maintenance.
An inspection program is vital to proper maintenance of a wastewater collection system. Without inspections, a maintenance program is difficult to design, since problems cannot be solved if they are not identified. Sewer inspections identify problems such as blocked, broken, or cracked pipes; tree roots growing into the sewer; sections of pipe that settle or shift so that pipe joints no longer match; and sediment and other material building up and causing pipes to break or collapse. The elements of an inspection program include flow monitoring, manhole inspections, smoke/dye testing, closed circuit television inspection, and private sector inspections. Private sector building inspection activities include inspection of area drains, downspouts, cleanouts, sump discharges and other private sector inflow sources into the system.
In addition to inspection, routine maintenance must also include sewer cleaning, root removal/treatment, cleaning of mainline stoppages, cleaning of house service stoppages, and inspections and servicing of pump stations.
PWD is responsible for implementation of this option in the combined sewer areas of
May 2005 9-21

Tookany/Tacony-Frankford Watershed Integrated Watershed Management Plan
the Tookany/Tacony-Frankford Watershed, but municipalities with separate sewers should have similar permanent and active sewer maintenance programs in place under CMOM (see AM1). Figure 9-2 shows the areas where sanitary sewers and combined sewers exist. All municipalities in the watershed are responsible for sewer maintenance.
Figure 9-2 Separate Sewer and Combined Sewer Areas in Tookany/Tacony-Frankford Creek
PWD has combined sewer maintenance responsibilities in the Tookany/Tacony-Frankford Watershed. CSO regulations (including the Nine Minimum Controls discussed in Section 1) have required that PWD carry out improved sewer maintenance. Some of the activities PWD is carrying out include the review and improvement of on-going operation and maintenance programs, and comprehensive inspection and monitoring programs to characterize and report overflows and other conditions in the combined sewer system.
May 2005 9-22
Tookany/Tacony-Frankford Watershed Integrated Watershed Management Plan
Sanitary Sewer Rehabilitation (AM3) Related Goals: 3
Related Indicators:7, 11 What Who Where When
Perform major repairs or replacement on sections of sewer determined to be in poor condition.
All municipalities with separate sanitary sewer systems
All municipalities with separate sanitary sewer systems
Medium Term
The CMOM and sewer inspection programs discussed in previous sections may identify sections of sewer that are in poor condition and in need of major repair or replacement. This section is adapted from fact sheets provided on the EPA web site: http://www.epa.gov/owm/mtb/rehabl.pdf. Under the traditional method of sewer relief, a replacement or additional parallel sewer line is constructed by digging along the entire length of the existing pipeline. While these traditional methods of sewer rehabilitation require unearthing and replacing the deficient pipe (the dig-and-replace method), trenchless methods of rehabilitation use the existing pipe as a host for a new pipe or liner. Trenchless sewer rehabilitation techniques offer a method of correcting pipe deficiencies that requires less restoration and causes less disturbance and environmental degradation than the traditional dig and-replace method. Trenchless Sewer Rehabilitation Methods:
Pipe Bursting, or In-Line Expansion Sliplining Cured-In-Place Pipe Modified Cross Section Liner
These alternative techniques must be fully understood before they are applied. These four sewer rehabilitation methods are described further in the following sections. Pipe Bursting or In-Line Expansion: Pipe bursting, or in-line expansion, is a method by which the existing pipe is forced outward and opened by a bursting tool. The Pipebursting™ method, patented by the British Gas Company in 1980, was successfully applied by the gas pipelines industry before its applicability was identified by other underground utility agencies. Over the last two decades, other methods of in-line expansion have been patented as well.
During in-line expansion, the existing pipe is used as a guide for inserting the expansion head (part of the bursting tool). The expansion head, typically pulled by a cable rod and winch, increases the area available for the new pipe by pushing the existing pipe radially outward until it cracks. The bursting device pulls the new pipeline behind itself.
May 2005 9-23
Tookany/Tacony-Frankford Watershed Integrated Watershed Management Plan
Sliplining: Sliplining is a well-established method of trenchless rehabilitation. During the sliplining process, a new liner of smaller diameter is placed inside the existing pipe. The annular space, or area between the existing pipe and the new pipe, is typically grouted to prevent leaks and to provide structural integrity.
Cured-In-Place Pipe: During the cured-in-place pipe (CIPP) renewal process, a flexible fabric liner, coated with a thermosetting resin, is inserted into the existing pipeline and cured to form a new liner. The liner is typically inserted into the existing pipe through an existing manhole. The fabric tube holds the resin in place until the tube is inserted in the pipe and ready to be cured. Commonly manufactured resins include unsaturated polyester, vinyl ester.
Modified Cross Section Lining: The modified cross section lining methods include deformed and reformed methods, sewagelining™, and rolldown. These methods either modify the pipe’s cross sectional profile or reduce its cross sectional area so that the liner can be extruded through the existing pipe. The liner is subsequently expanded to conform to the existing pipe’s size. Another method of obtaining a close fit between the new lining and existing pipe is to temporarily compress the new liner before it is drawn through the existing pipeline. The sewagelining™ and rolldown processes use chemical and mechanical means, respectively, to reduce the cross-sectional area of the new liner.
External Sewer Rehabilitation Methods (adapted from EPA/600/R-01/034) External rehabilitation methods are performed from the above ground surface by excavating adjacent to the pipe, or the external region of the pipe is treated from inside the pipe through the wall. Some of the methods used include:
External Point Repairs Chemical Grouting (Acrylamide Base Gel, Acrylic Base Gel) Cement Grouting (Cement, Microfine Cement, Compaction) Internal Sewer Rehabilitation Methods The basic internal sewer rehabilitation methods include: Chemical Grouting: Internal grouting is the most commonly used method for sealing leaking joints in structurally sound sewer pipes. Chemical grouts do not stop leaks by filling cracks; they are forced through cracks and joints, and gel with surrounding soil, forming a waterproof collar around leaking pipes. This method is accomplished by sealing off an area with a “packer,” air testing the segment, and pressure injecting a chemical grout for all segments which fail the air test. The three major types of chemical grout are: Acrylic, Acrylate, and Urethane.
Continuous Pipe: Insertion of a continuous pipe through the existing pipe (Polyethylene and Polypropylene)
Segmental: Short segments of new pipe are assembled to form a continuous line, and forced into the host pipe. Generally, this method is used on larger sized pipe and
May 2005 9-24
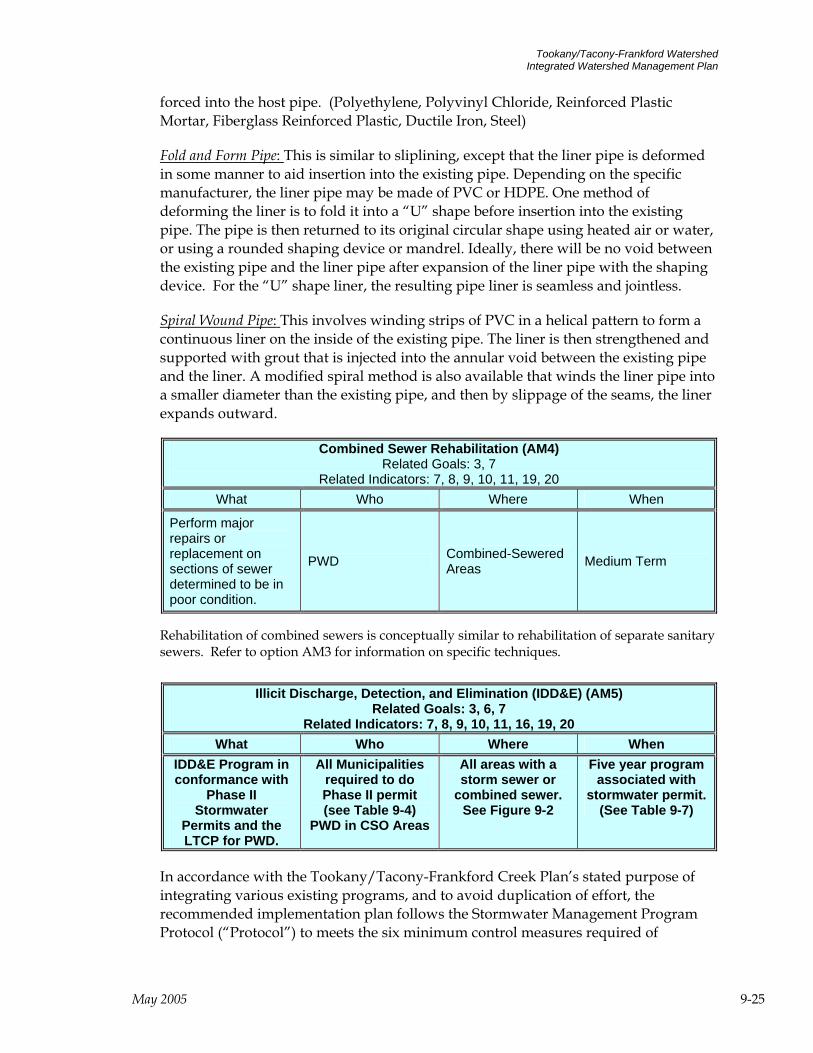
Tookany/Tacony-Frankford Watershed Integrated Watershed Management Plan
forced into the host pipe. (Polyethylene, Polyvinyl Chloride, Reinforced Plastic Mortar, Fiberglass Reinforced Plastic, Ductile Iron, Steel)
Fold and Form Pipe: This is similar to sliplining, except that the liner pipe is deformed in some manner to aid insertion into the existing pipe. Depending on the specific manufacturer, the liner pipe may be made of PVC or HDPE. One method of deforming the liner is to fold it into a “U” shape before insertion into the existing pipe. The pipe is then returned to its original circular shape using heated air or water, or using a rounded shaping device or mandrel. Ideally, there will be no void between the existing pipe and the liner pipe after expansion of the liner pipe with the shaping device. For the “U” shape liner, the resulting pipe liner is seamless and jointless.
Spiral Wound Pipe: This involves winding strips of PVC in a helical pattern to form a continuous liner on the inside of the existing pipe. The liner is then strengthened and supported with grout that is injected into the annular void between the existing pipe and the liner. A modified spiral method is also available that winds the liner pipe into a smaller diameter than the existing pipe, and then by slippage of the seams, the liner expands outward.
Combined Sewer Rehabilitation (AM4) Related Goals: 3, 7
Related Indicators: 7, 8, 9, 10, 11, 19, 20 What Who Where When
Perform major repairs or replacement on sections of sewer determined to be in poor condition.
PWD Combined-Sewered Areas Medium Term
Rehabilitation of combined sewers is conceptually similar to rehabilitation of separate sanitary sewers. Refer to option AM3 for information on specific techniques.
Illicit Discharge, Detection, and Elimination (IDD&E) (AM5) Related Goals: 3, 6, 7
Related Indicators: 7, 8, 9, 10, 11, 16, 19, 20 What Who Where When
IDD&E Program in conformance with
Phase II Stormwater
Permits and the LTCP for PWD.
All Municipalities required to do Phase II permit (see Table 9-4)
PWD in CSO Areas
All areas with a storm sewer or
combined sewer. See Figure 9-2
Five year program associated with
stormwater permit. (See Table 9-7)
In accordance with the Tookany/Tacony-Frankford Creek Plan’s stated purpose of integrating various existing programs, and to avoid duplication of effort, the recommended implementation plan follows the Stormwater Management Program Protocol (“Protocol”) to meets the six minimum control measures required of
May 2005 9-25
Tookany/Tacony-Frankford Watershed Integrated Watershed Management Plan
municipal permittees under the Phase II NPDES Stormwater Regulations (found at 40 CFR §§ 122.26 – 123.35). One of the six minimum controls is an IDD&E program. The IDD&E program can be summarized as consisting of the following steps:
Develop map of municipal separate storm sewer system outfalls and receiving water bodies
Prohibit illicit discharges via PADEP-approved ordinance
Implement an IDD&E Program that includes 1) field screening program and procedures and 2) elimination of illicit discharges
Conduct public awareness and reporting program (see under Public Education above)
A similar approach to controlling dry weather flows is being followed by PWD under the Long Term Control Plan (LTCP) for CSOs.
Each step is explained in more detail below.
Develop an Outfall Map The federal regulations define an outfall as “a point source as defined by 40 CFR 122.2 at the point where a municipal separate storm sewer discharges to waters of the United States”. A “point source” is defined as “any discernable, confined and discrete conveyance, including but not limited to any pipe, ditch, channel, tunnel, conduit, well, discrete fissure, container, rolling stock, concentrated animal feeding operation, vessel, or other floating craft from which pollutants are or may be discharged.”
Many of the outfalls along Tookany/Tacony-Frankford Creek have already been located under the studies performed for the Tookany/Tacony-Frankford Creek RCP. Municipalities should work with PWD to develop a consistent set of outfall maps that meet the specific requirements of the Phase II program.
Illicit Discharge Ordinance A Model Ordinance is available from PADEP and should be used as is. PADEP discourages changes to the model ordinance, because it has been prepared to meet the MS4 permit requirements. However, some municipalities already have good stormwater ordinances. Municipalities who do not wish to enact the model ordinance in its entirety must get approval from PADEP to ensure that the MS4 permit requirements are met.
The model ordinance must be enacted in the first year of the permit term, except where a municipality commits to a multi-municipal, watershed-based program following this Protocol, in which case the schedule is delayed one year. Subsequent to completion of the Act 167 Plan (or Plan Update), the ordinance must be modified to reflect Plan requirements. Regardless of the timing of the Act 167 Plan (or Plan Update) an ordinance must be enacted within the first two years of the permit term
May 2005 9-26
Tookany/Tacony-Frankford Watershed Integrated Watershed Management Plan
for all municipalities in Tookany/Tacony-Frankford Creek.
IDD&E Program Following PADEP protocol, the IDD&E Program must consist of the following three elements, which must be implemented according to the schedule shown below.
Conduct Field Screening
Identify Source of Illicit Discharges
Develop and Implement a Strategy to Remove or Correct Illicit Discharges.
Field Screening: Field screening is necessary to identify source(s) of actual illicit discharges. Field screening must start in Year 2 of the permit. PADEP provides a checklist that must be used when conducting field screening. Every outfall in priority areas must be screened two times a year. This activity can be accomplished concurrently with other existing field activities, such as regularly scheduled fire hydrant inspections, road repairs, landscaping activities, other field work conducted during county preparation of the Act 167 stormwater plan, etc.
Using a PADEP supplied Checklist, the staff designated to conduct field screening collect visual data. The screening should be conducted at least 72 hours since the last precipitation event, and at least 48 hours should pass between the first screening at a particular outfall and the second screening at that outfall. If someone conducting the field screening discovers a dry-weather flow, they (or another designated individual with the proper training) must collect a sample of that flow for analysis. Such a discovery triggers the requirements under the other two program elements:
Identify Source of Illicit Discharges
Remove or Correct Illicit Discharges
Identify the Source of Illicit Discharges: The following IDD&E Program elements only apply if a dry-weather flow is identified during field screening activities in Years 2, 3, 4, and/or 5. For each illicit discharge that is identified during field screening, the following program elements must be carried out.
Collect and analyze samples of the dry-weather flow.
If field inspectors identify a dry-weather flow at an outfall during field screening, they should take two grab samples of the flow and analyze the samples for the characteristics and pollutants listed in the Table 9-6 below.
May 2005 9-27
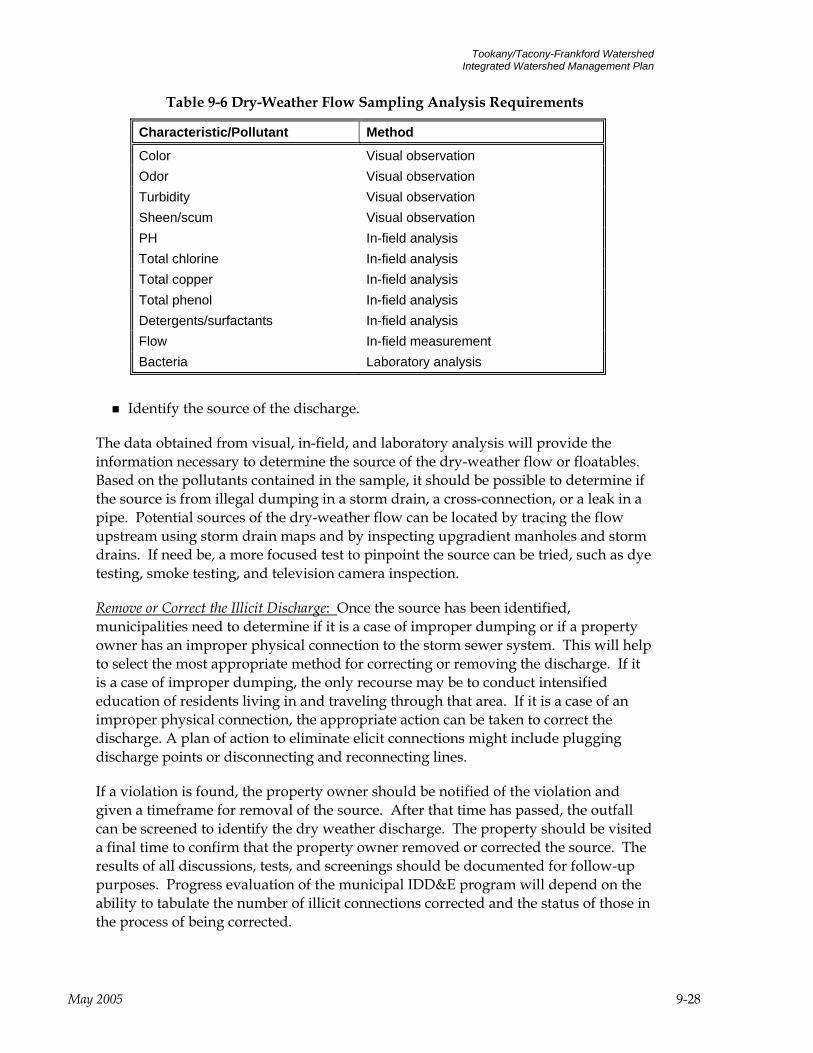
Tookany/Tacony-Frankford Watershed Integrated Watershed Management Plan
Table 9-6 Dry-Weather Flow Sampling Analysis Requirements
Characteristic/Pollutant Method
Color Visual observation Odor Visual observation Turbidity Visual observation Sheen/scum Visual observation PH In-field analysis Total chlorine In-field analysis Total copper In-field analysis Total phenol In-field analysis Detergents/surfactants In-field analysis Flow In-field measurement Bacteria Laboratory analysis
Identify the source of the discharge.
The data obtained from visual, in-field, and laboratory analysis will provide the information necessary to determine the source of the dry-weather flow or floatables. Based on the pollutants contained in the sample, it should be possible to determine if the source is from illegal dumping in a storm drain, a cross-connection, or a leak in a pipe. Potential sources of the dry-weather flow can be located by tracing the flow upstream using storm drain maps and by inspecting upgradient manholes and storm drains. If need be, a more focused test to pinpoint the source can be tried, such as dye testing, smoke testing, and television camera inspection.
Remove or Correct the Illicit Discharge: Once the source has been identified, municipalities need to determine if it is a case of improper dumping or if a property owner has an improper physical connection to the storm sewer system. This will help to select the most appropriate method for correcting or removing the discharge. If it is a case of improper dumping, the only recourse may be to conduct intensified education of residents living in and traveling through that area. If it is a case of an improper physical connection, the appropriate action can be taken to correct the discharge. A plan of action to eliminate elicit connections might include plugging discharge points or disconnecting and reconnecting lines.
If a violation is found, the property owner should be notified of the violation and given a timeframe for removal of the source. After that time has passed, the outfall can be screened to identify the dry weather discharge. The property should be visited a final time to confirm that the property owner removed or corrected the source. The results of all discussions, tests, and screenings should be documented for follow-up purposes. Progress evaluation of the municipal IDD&E program will depend on the ability to tabulate the number of illicit connections corrected and the status of those in the process of being corrected.
May 2005 9-28
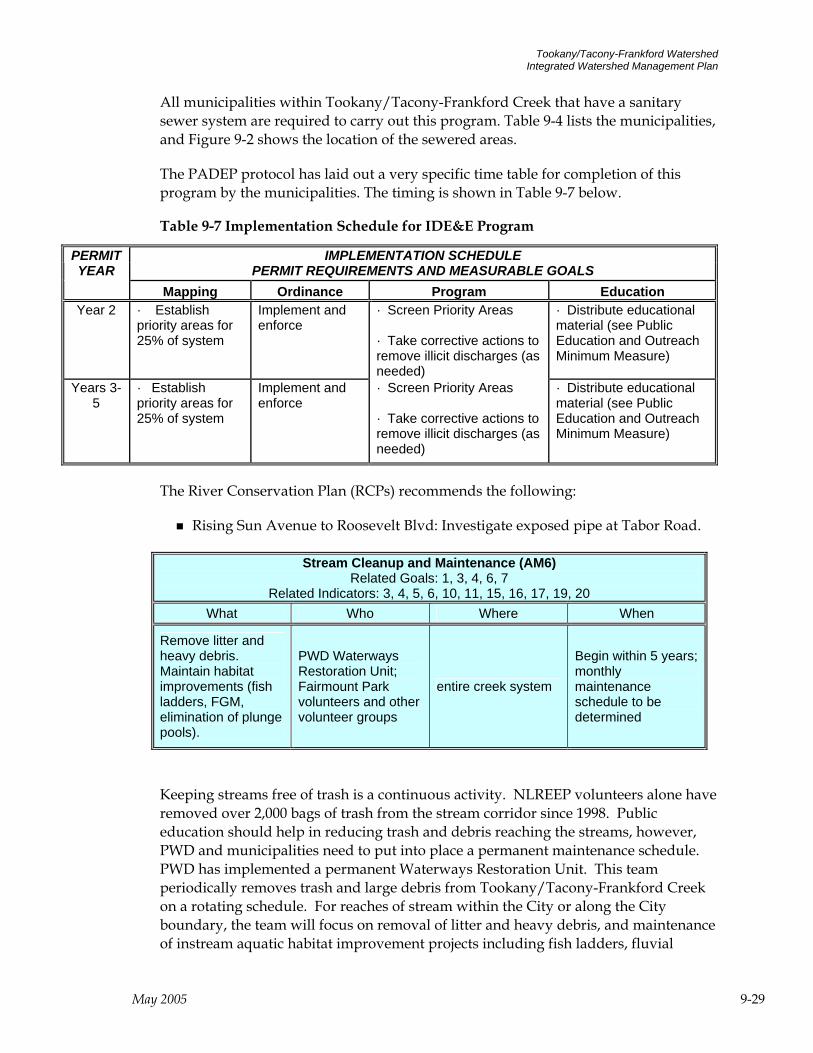
Tookany/Tacony-Frankford Watershed Integrated Watershed Management Plan
All municipalities within Tookany/Tacony-Frankford Creek that have a sanitary sewer system are required to carry out this program. Table 9-4 lists the municipalities, and Figure 9-2 shows the location of the sewered areas.
The PADEP protocol has laid out a very specific time table for completion of this program by the municipalities. The timing is shown in Table 9-7 below.
Table 9-7 Implementation Schedule for IDE&E Program
The River Conservation Plan (RCPs) recommends the following:
Rising Sun Avenue to Roosevelt Blvd: Investigate exposed pipe at Tabor Road.
IMPLEMENTATION SCHEDULE PERMIT YEAR PERMIT REQUIREMENTS AND MEASURABLE GOALS
Mapping Ordinance Program Education Year 2 · Establish
priority areas for 25% of system
Implement and enforce
· Screen Priority Areas · Take corrective actions to remove illicit discharges (as needed)
· Distribute educational material (see Public Education and Outreach Minimum Measure)
Years 3-5
· Establish priority areas for 25% of system
Implement and enforce
· Screen Priority Areas · Take corrective actions to remove illicit discharges (as needed)
· Distribute educational material (see Public Education and Outreach Minimum Measure)
Stream Cleanup and Maintenance (AM6) Related Goals: 1, 3, 4, 6, 7
Related Indicators: 3, 4, 5, 6, 10, 11, 15, 16, 17, 19, 20 What Who Where When
Remove litter and heavy debris. Maintain habitat improvements (fish ladders, FGM, elimination of plunge pools).
PWD Waterways Restoration Unit; Fairmount Park volunteers and other volunteer groups
entire creek system
Begin within 5 years; monthly maintenance schedule to be determined
Keeping streams free of trash is a continuous activity. NLREEP volunteers alone have removed over 2,000 bags of trash from the stream corridor since 1998. Public education should help in reducing trash and debris reaching the streams, however, PWD and municipalities need to put into place a permanent maintenance schedule. PWD has implemented a permanent Waterways Restoration Unit. This team periodically removes trash and large debris from Tookany/Tacony-Frankford Creek on a rotating schedule. For reaches of stream within the City or along the City boundary, the team will focus on removal of litter and heavy debris, and maintenance of instream aquatic habitat improvement projects including fish ladders, fluvial
May 2005 9-29
Tookany/Tacony-Frankford Watershed Integrated Watershed Management Plan
geomorphologic restoration projects, and elimination of outfall plunge pools. For reaches of stream outside the City, municipalities should organize periodic stream cleanups using volunteer groups.
The River Conservation Plans (RCPs) recommend a general clean-up routine be established to conserve both the biological and aesthetical quality of the rivers. Any plans that reduce the amount of trash or illegal dumping would be considered essential. Local township volunteers can be of great assistance in this particular BMP.
Wyncote Post Office to Washington Lane Underpass: Investigate dumping of construction material.
Rock Creek Watershed: Monitor commercial areas for illegal dumping.
Rising Sun Avenue to Roosevelt Boulevard: Erect a barricade to deter illegal dumping.
Roosevelt Boulevard to Whitaker Avenue: Install a barrier to stop dumping at Whitaker Ave. Bridge.
Whitaker Avenue to Wyoming Avenue: Erect a barricade to deter illegal dumping.
Aramingo Avenue between Wheatsheaf Lane and Church Street: Install fence barrier at Aramingo Ave. overpass to stop illegal dumping.
Holy Sepulchre Cemetery to Ralph Morgan Park: Conduct regular trash removal.
Ralph Morgan Park to Greenwood Avenue: Clear debris blocking stormwater outlets and ask staff not to dump leaves in the creek.
Greenwood Avenue to Wyncote Post Office: Routinely clear creek of trash and debris after storms.
Wyncote Post Office to Washington Lane Underpass: Major cleanup required. SEPTA should be contacted to clean railroad debris.
Washington Lane Underpass to Church Road: Remove trash, storm debris and graffiti.
High School Park to Ashbourne Road along the Tookany Creek Parkway: Conduct regular trash removal.
Unnamed Tributary in Glenside: Clean up trash and storm debris along Tyson Ave. SEPTA should monitor culverts for blockage.
Rock Creek Watershed: Continue to improve infrastructure that has a negative impact on water quality. Conduct regular trash removal.
May 2005 9-30
Tookany/Tacony-Frankford Watershed Integrated Watershed Management Plan
Abington Country Club to Township Line Road: Clean and maintain channelized portion of the creek on a regular basis.
Township Line Road near Foxcroft Road to Main Stem (unnamed tributary): Clear entire reach of storm debris.
Abington Friends School to Township Line Road: Regularly remove trash in the creek area.
Township Line Road to Tookany Creek Parkway: Conduct regular trash/debris removal.
Cheltenham Avenue to Adams Avenue: Clear creek of debris. Concentrate on woody debris at bridge. Evaluate trash pick-up schedule with Fairmount Park.
Crescentville and Adams Avenues to Rising Sun Avenue: Conduct regular trash removal.
Rising Sun Avenue to Roosevelt Boulevard: Conduct a massive trash removal, concentrating at the F Street site. Clear overgrown vegetation.
Roosevelt Boulevard to Whitaker Avenue: Conduct massive trash removal of the whole segment.
Wyoming Avenue to Castor Avenue: Conduct a trash cleanup. Contact Ferko Playground regarding trashcans and regular trash removal.
Castor Avenue to Erie Avenue: Remove graffiti from walls and secure access areas.
Aramingo Avenue between Wheatsheaf Lane and Church Street: Clear creek of all debris.
Rohm & Haas, 5000 Richmond Street: Conduct trash removal at mouth of embankment.
Intersection of Adams and Newtown Avenue: Investigate illegal dumpsite and install fencing.
Driveway connecting Adams Ave to Godfrey Ave: Investigate illegal dumpsite and install fencing.
Castor Avenue near Wyoming Avenue: Investigate illegal dumpsite and install fencing.
I and Ramona: Investigate illegal dumpsite and install fencing.
Awbury Arboretum: Investigate illegal dumpsite and install fencing.
May 2005 9-31
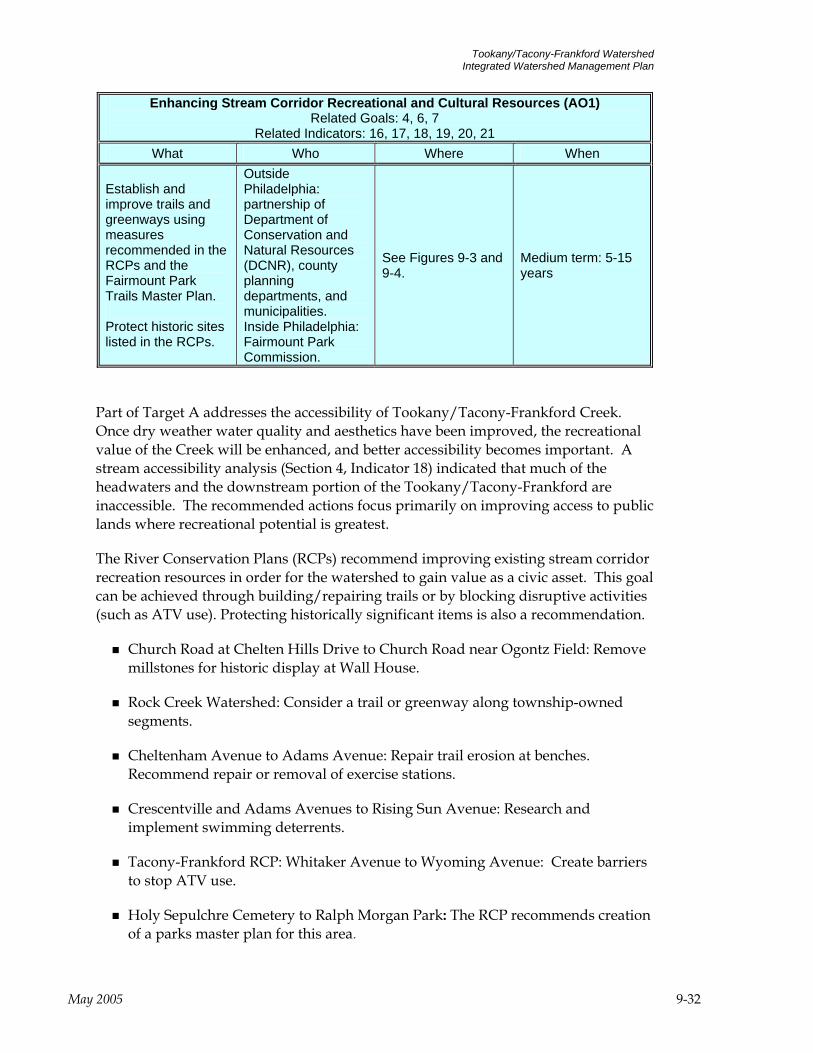
Tookany/Tacony-Frankford Watershed Integrated Watershed Management Plan
Enhancing Stream Corridor Recreational and Cultural Resources (AO1) Related Goals: 4, 6, 7
Related Indicators: 16, 17, 18, 19, 20, 21 What Who Where When
Establish and improve trails and greenways using measures recommended in the RCPs and the Fairmount Park Trails Master Plan. Protect historic sites listed in the RCPs.
Outside Philadelphia: partnership of Department of Conservation and Natural Resources (DCNR), county planning departments, and municipalities. Inside Philadelphia: Fairmount Park Commission.
See Figures 9-3 and 9-4.
Medium term: 5-15 years
Part of Target A addresses the accessibility of Tookany/Tacony-Frankford Creek. Once dry weather water quality and aesthetics have been improved, the recreational value of the Creek will be enhanced, and better accessibility becomes important. A stream accessibility analysis (Section 4, Indicator 18) indicated that much of the headwaters and the downstream portion of the Tookany/Tacony-Frankford are inaccessible. The recommended actions focus primarily on improving access to public lands where recreational potential is greatest.
The River Conservation Plans (RCPs) recommend improving existing stream corridor recreation resources in order for the watershed to gain value as a civic asset. This goal can be achieved through building/repairing trails or by blocking disruptive activities (such as ATV use). Protecting historically significant items is also a recommendation.
Church Road at Chelten Hills Drive to Church Road near Ogontz Field: Remove millstones for historic display at Wall House.
Rock Creek Watershed: Consider a trail or greenway along township-owned segments.
Cheltenham Avenue to Adams Avenue: Repair trail erosion at benches. Recommend repair or removal of exercise stations.
Crescentville and Adams Avenues to Rising Sun Avenue: Research and implement swimming deterrents.
Tacony-Frankford RCP: Whitaker Avenue to Wyoming Avenue: Create barriers to stop ATV use.
Holy Sepulchre Cemetery to Ralph Morgan Park: The RCP recommends creation of a parks master plan for this area.
May 2005 9-32
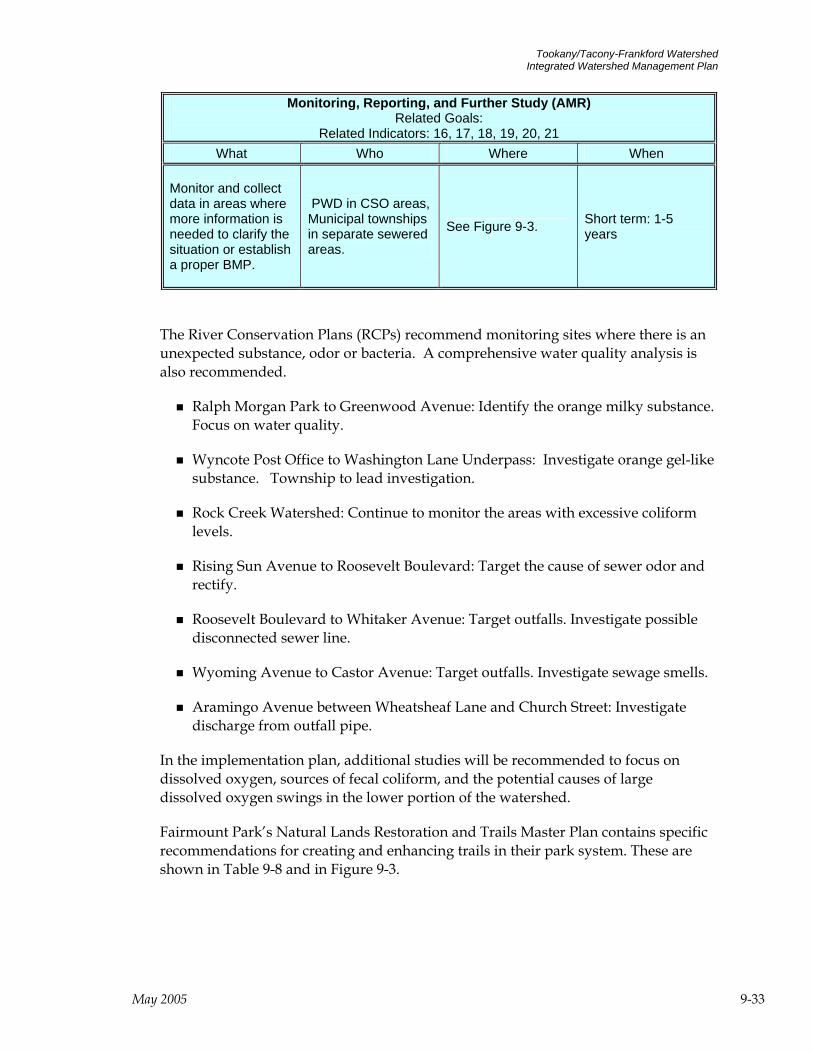
Tookany/Tacony-Frankford Watershed Integrated Watershed Management Plan
Monitoring, Reporting, and Further Study (AMR) Related Goals:
Related Indicators: 16, 17, 18, 19, 20, 21 What Who Where When
Monitor and collect data in areas where more information is needed to clarify the situation or establish a proper BMP.
PWD in CSO areas, Municipal townships in separate sewered areas.
See Figure 9-3. Short term: 1-5 years
The River Conservation Plans (RCPs) recommend monitoring sites where there is an unexpected substance, odor or bacteria. A comprehensive water quality analysis is also recommended.
Ralph Morgan Park to Greenwood Avenue: Identify the orange milky substance. Focus on water quality.
Wyncote Post Office to Washington Lane Underpass: Investigate orange gel-like substance. Township to lead investigation.
Rock Creek Watershed: Continue to monitor the areas with excessive coliform levels.
Rising Sun Avenue to Roosevelt Boulevard: Target the cause of sewer odor and rectify.
Roosevelt Boulevard to Whitaker Avenue: Target outfalls. Investigate possible disconnected sewer line.
Wyoming Avenue to Castor Avenue: Target outfalls. Investigate sewage smells.
Aramingo Avenue between Wheatsheaf Lane and Church Street: Investigate discharge from outfall pipe.
In the implementation plan, additional studies will be recommended to focus on dissolved oxygen, sources of fecal coliform, and the potential causes of large dissolved oxygen swings in the lower portion of the watershed.
Fairmount Park’s Natural Lands Restoration and Trails Master Plan contains specific recommendations for creating and enhancing trails in their park system. These are shown in Table 9-8 and in Figure 9-3.
May 2005 9-33
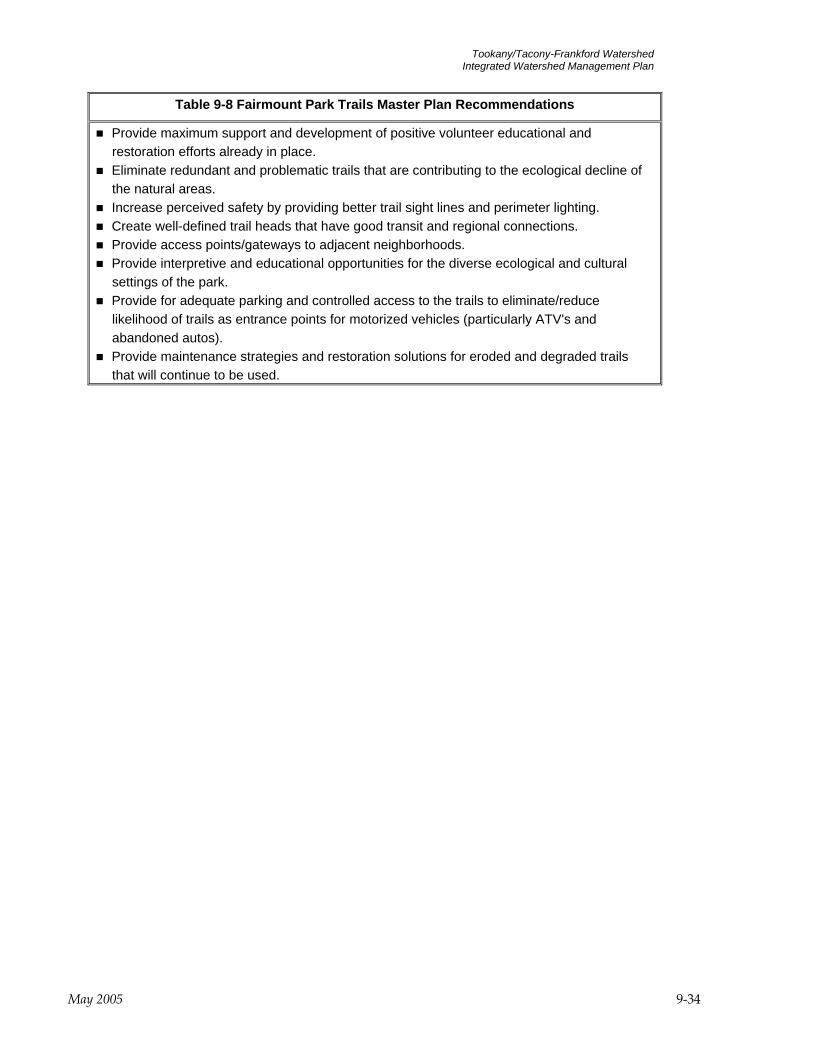
Tookany/Tacony-Frankford Watershed Integrated Watershed Management Plan
Table 9-8 Fairmount Park Trails Master Plan Recommendations
Provide maximum support and development of positive volunteer educational and restoration efforts already in place.
Eliminate redundant and problematic trails that are contributing to the ecological decline of the natural areas.
Increase perceived safety by providing better trail sight lines and perimeter lighting. Create well-defined trail heads that have good transit and regional connections. Provide access points/gateways to adjacent neighborhoods. Provide interpretive and educational opportunities for the diverse ecological and cultural
settings of the park. Provide for adequate parking and controlled access to the trails to eliminate/reduce
likelihood of trails as entrance points for motorized vehicles (particularly ATV's and abandoned autos).
Provide maintenance strategies and restoration solutions for eroded and degraded trails that will continue to be used.
May 2005 9-34

Tookany/Tacony-Frankford Watershed Integrated Watershed Management Plan
Figure 9-3 Tookany/Tacony-Frankford Creek Proposed Trails Plan (from
www.nlreep.org)
May 2005 9-35
Tookany/Tacony-Frankford Watershed Integrated Watershed Management Plan
9.2 Target B: Healthy Living Resources
9.2.1 Stream and Riparian Corridor Improvement The Tookany/Tacony-Frankford Watershed Management Plan proposes a comprehensive stream and riparian corridor restoration strategy. Given the historic degradation of the water quality and ecology of Tookany/Tacony-Frankford Creek and its tributaries from urbanization, an interdependent set of corridor improvement actions are recommended. The actions - ranging from conservation of existing open spaces, to stream stabilization actions, to creation of new wetlands and biofiltration areas – together constitute a fully integrated riparian corridor improvement strategy that provides new habitat and water quality improvement. In the Philadelphia portion of the riparian corridor, this approach is intended to complement and expand the Fairmount Park Commission’s Natural Lands Restoration and Environmental Education Program (NLREEP).
These riparian corridor improvement actions, when implemented simultaneously, will result in improvements that span the waterway and riparian corridor, from the developed properties along one bank to the developed properties along the opposing bank. Thus, riparian corridor actions improve the ecology of the Tookany/Tacony-Frankford Creek landscape and optimize the ways in which the limited remaining open space can help improve water quality. The long-term benefits of an integrated riparian strategy significantly outweigh the short-term construction disturbances that are needed to implement the Tookany/Tacony-Frankford Creek riparian corridor improvements.
The riparian corridor is defined here as the land area that borders a stream and which directly affects and is affected by the water quality. The riparian corridor typically includes floodplains, shorelines, wetlands, and riparian forest. For the purposes of the Tookany/Tacony-Frankford Creek riparian corridor improvement strategy, the riparian area also includes the stream channel. Thus, the full undeveloped land and waterway area between the existing land development that surrounds the corridor will be considered for ecological improvement and for biofiltration functions that will improve water quality. Listed below are the options recommended for implementation across the corridor, from the lowest point in the landscape (the stream channel) to the highest (upland forest).
Channel Stability and Aquatic Habitat Restoration BM1 Bed Stabilization and Habitat Restoration BM2 Bank Stabilization and Habitat Restoration BM3 Channel Realignment and Relocation BM4 Plunge Pool Removal BM5 Improvement of Fish Passage
May 2005 9-36
Tookany/Tacony-Frankford Watershed Integrated Watershed Management Plan
Lowland Restoration and Enhancement BM6 Wetland Creation BM7 Invasive Species Management
Upland Restoration and Enhancement
BM8 Biofiltration BM9 Reforestation BMR Monitoring, Reporting and Further Study
The most effective approach to riparian corridor improvement is to perform all the proposed streambed, streambank, wetland, and riparian upland improvements simultaneously along a reach, or stream section, to realize the synergy of the full set of landscape improvements. When one stream segment is completed, work would shift to the next priority location, section by section, for the length of the Tookany/Tacony-Frankford Creek corridor.
Implementing one set of corridor actions, for example, bed stabilization, without complementary actions, such as bank stabilization, will result in only limited success, because the aquatic and streamside land environments must function interactively to provide optimal stability. For this reason, the riparian corridor improvement strategy is both a short-term and long-term plan. Restoration activities in sections of the watershed that are in greatest need of improvement should be implemented early (targeting stream sections that are causing or contributing to water quality or ecological impairment first). For the Tookany/Tacony-Frankford Creek corridor, it is anticipated that significant improvements in water quality and ecology can be realized by addressing high priority locations that are principally upstream during the first 5 years, with sections downstream of Castor Ave. that require further evaluation of water quality issues receiving riparian corridor improvement during a second 10 year period (Figure 9-4 and Table 9-9). It is important to note that the next step in implementing the riparian corridor improvement strategy is to develop a corridor improvement facilities plan, under which integrated designs are prepared for the full range of corridor improvements (e.g., bed and bank stabilization, and wetland creation and enhancement).
PWD is currently in the process of performing stream assessments along the entire Tookany/Tacony-Frankford Creek corridor. This study, scheduled for completion in the spring of 2005, will provide more specific guidance on priority stream sections and recommended improvements.
At this time, only the River Conservation Plan (RCPs) recommendations are available for restoring buffer zones and undercut creek banks in an effort to control both stream contamination and flooding.
Holy Sepulchre Cemetery to Ralph Morgan Park: Initiate plan to study geomorphology and sinuosity. Restore and enforce riparian buffer regulations. Conduct streambank stabilization.
May 2005 9-37
Tookany/Tacony-Frankford Watershed Integrated Watershed Management Plan
Ralph Morgan Park to Greenwood Avenue: Restore banks where there is severe undercutting. Plant creek banks to prevent washed out areas. Create “no-mow” zones. Remove a retaining wall, regrade and plant the bank to facilitate a natural retaining basin. Relocate and replace the macadam walking path with natural material.
Church Road at Chelten Hills Drive to Church Road near Ogontz Field: Possible relocation of playground equip. away from stream bank to promote healthier buffer zone. Check stability of rip-rap and stacked cement retaining wall. Restore and/or stabilize some of the undercut bank and root exposed trees.
High School Park to Ashbourne Road along the Tookany Creek Parkway: Initiate plan to study local geomorphology and sinuosity. Conduct streambank stabilization.
Unnamed Tributary in Glenside: Redesign, regrade and plant banks along Grove Park. Create “no-mow” zone. Create riparian buffer zone, restore streambank along Waverly Rd. Formally name all unnamed tributaries.
Baeder Creek Watershed: Consider removal of vertical gabion baskets and concrete wall in place of natural bank slopes. Conduct a hydrological assessment to correct serious flooding and bank instability; much of the creek’s geometry has been altered. Conduct biotechnical streambank stabilization in most severe areas.
Rock Creek Watershed: Restore the riparian buffer.
Mill Run Watershed: Restore the riparian buffer. Enforce regulations.
Abington Country Club to Township Line Road: Re-establish riparian buffer, possibly a 20-ft “no-mow” zone.
Township Line Road near Foxcroft Road to Main Stem (unnamed tributary): Restore and stabilize some of the undercut and eroded banks.
Abington Friends School to Township Line Road: Consider restoration of natural riparian buffer and channel along residential areas. Repair eroded areas using naturalized approaches such as native plantings.
Township Line Road to Tookany Creek Parkway: Replant riparian areas and restore riparian buffer. Enforce regulations. Conduct biotechnical streambank stabilization.
Cheltenham Avenue to Adams Avenue: Restore creek banks where there is severe undercutting.
Crescentville and Adams Avenues to Rising Sun Avenue: Restore creek banks where there are exposed roots.
Rising Sun Avenue to Roosevelt Boulevard: Repair undercut streambanks.
May 2005 9-38

Tookany/Tacony-Frankford Watershed Integrated Watershed Management Plan
Roosevelt Boulevard to Whitaker Avenue: Restore creek banks where there is severe erosion.
Whitaker Avenue to Wyoming Avenue: Restore creek banks and repair restoration site.
Wyoming Avenue to Castor Avenue: Repair undercut and exposed streambank. Repair manmade restoration project.
Aramingo Avenue between Wheatsheaf Lane and Church Street: Restore creek banks.
Holy Sepulchre Cemetery to Ralph Morgan Park: Remove fencing crossing stream; it appears to impede normal flow.
Plunge Pool Removal (BM4)
Related Goals: 5, 7 Related Indicators: 3, 15, 19, 20
What Who Where When
Remove plunge pools below stormwater and CSO outfalls.
PWD Municipalities bordering streams recommended for restoration.
Outfalls shown in Figure 9-7
Begin within 5 years; monthly maintenance schedule to be determined
When stormwater and combined sewer outfalls discharge directly to the stream channel, they may create deep, poorly mixed pools. Both types of outfalls discharge along the length of the Tookany/Tacony-Frankford and its tributaries (Figure 9-4). Because these pools are typically near the bank and not in the main flow, they can become poorly mixed during low flow. These pools often have increased odors and reduce the aesthetic quality of the stream. DO Biological activity in the sediment and water column can reduce dissolved oxygen to low levels, and this low-DO water can be flushed out and affect downstream areas during wet weather. The depression of DO is a function of both pollutant loads from the outfalls and in stream baseflow, and the physical condition of the channel. When DO is in an acceptable range in the well-mixed portion of the channel but not in nearby plunge pools, elimination of the plunge pools can eliminate a water quality condition that might affect the aquatic ecosystem.
When possible, outfalls can discharge further up the bank into a wetland or biofiltration area; these areas provide detention, evaporation, cooling, and treatment of pollutant loads in addition to protecting the integrity of the stream channel. Opportunities for creation of these areas will be discussed later in this section. Where the only place for an outfall to discharge is directly into the stream channel, the area may be protected using appropriate bed and bank stabilization features as discussed in previous sections.
May 2005 9-39
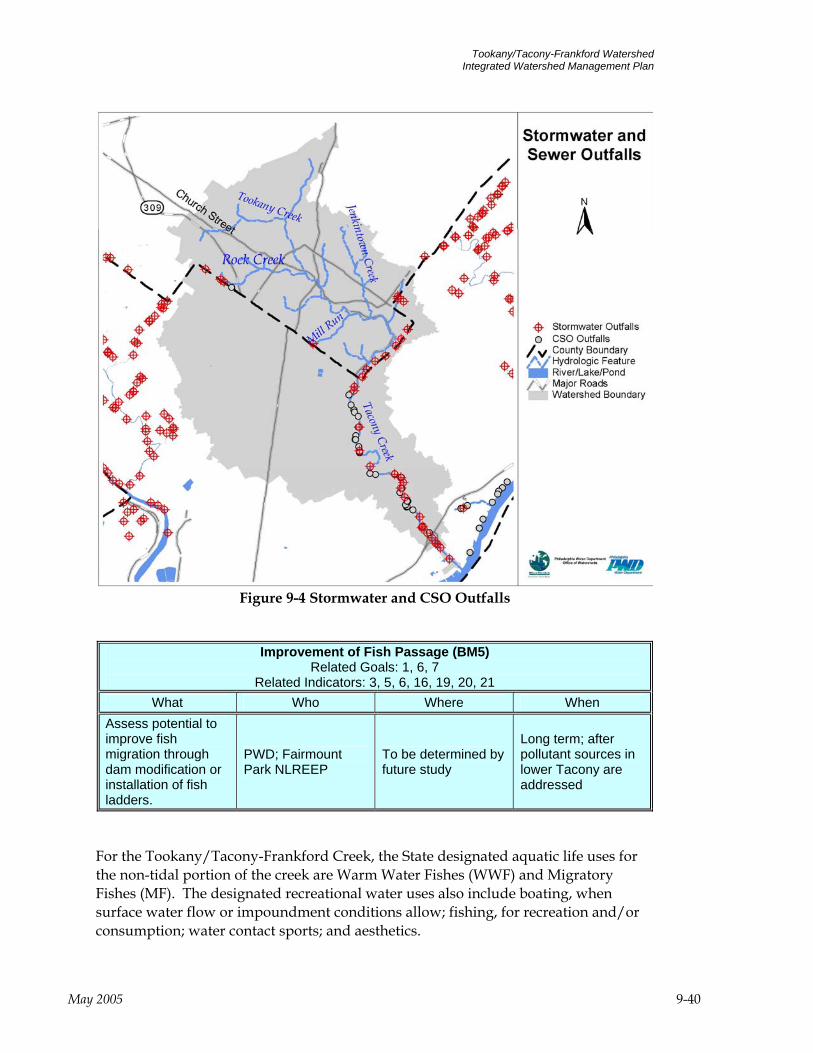
Tookany/Tacony-Frankford Watershed Integrated Watershed Management Plan
Figure 9-4 Stormwater and CSO Outfalls
Improvement of Fish Passage (BM5) Related Goals: 1, 6, 7
Related Indicators: 3, 5, 6, 16, 19, 20, 21 What Who Where When
Assess potential to improve fish migration through dam modification or installation of fish ladders.
PWD; Fairmount Park NLREEP
To be determined by future study
Long term; after pollutant sources in lower Tacony are addressed
For the Tookany/Tacony-Frankford Creek, the State designated aquatic life uses for the non-tidal portion of the creek are Warm Water Fishes (WWF) and Migratory Fishes (MF). The designated recreational water uses also include boating, when surface water flow or impoundment conditions allow; fishing, for recreation and/or consumption; water contact sports; and aesthetics.
May 2005 9-40
Tookany/Tacony-Frankford Watershed Integrated Watershed Management Plan
Investigation and restoration of fish migration is recommended as a long-term goal. However, areas of low DO have been identified south of Castor Avenue. Further investigation and remediation of this problem is recommended as a short-term goal; efforts to remove barriers to fish migration will not succeed in restoring populations until water quality conditions are sufficient to support fish.
The River Conservation Plan (RCPs) recommends the following:
Township Line Road to Tookany Creek Parkway: Work with landowner to remove wooden plank to allow fish to pass through.
9.2.2 Lowland Restoration and Enhancement One high-priority riparian corridor improvement action, from both an ecological and water quality improvement perspective, is creation and enhancement of wetlands along Tookany/Tacony-Frankford Creek. NLREEP has proposed four vegetation restoration sites along the Tookany/Tacony-Frankford Creek, two of which are wetland sites. The Tookany/Tacony-Frankford Creek subwatersheds were field surveyed in 2002/2003 to assess wetland improvement opportunities for existing wetlands, and wetland creation opportunities for new locations. Existing wetlands were evaluated for their ability to perform important wetland functions (e.g., flood flow alteration, water quality improvement, and habitat), where degraded actions were evaluated to improve compromised functions. Existing wetlands were then assessed to determine if they might be effectively expanded. Finally, locations where new wetlands could be created were identified. New wetland creation opportunities were classified into two groups:
Wetlands immediately adjacent to the waterway and which would receive flood flows frequently during the year (< one year storm), and,
Pocket wetlands that can be created using checkdams that are higher in the landscape and that would receive stormwater flows from adjacent subwatershed areas, but would receive flood flows only from major storm events.
Wetlands Enhancement The wetland field investigations for the Tookany/Tacony-Frankford watershed rated the opportunity to improve and expand existing wetlands, by evaluating opportunities to reconnect the wetland to the waterway, to receive additional overland flows, to remove sources of encroachment, and to expand the areal extent of the wetlands. Nearly all the 24 existing wetlands exhibited potential for functional improvement through hydrologic improvements, re-vegetation, or reducing historic disturbance. The field analysis indicates significant opportunity for wetland improvement, as shown in Table 9-9.
May 2005 9-41
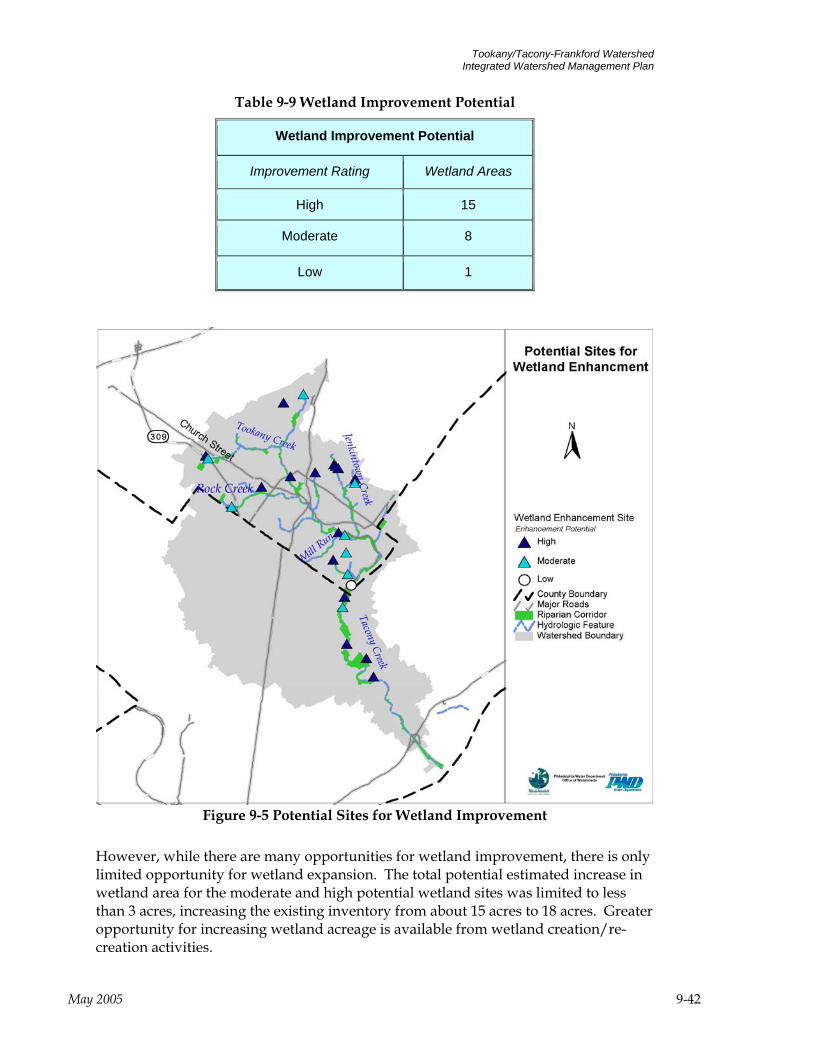
Tookany/Tacony-Frankford Watershed Integrated Watershed Management Plan
Table 9-9 Wetland Improvement Potential
Wetland Improvement Potential
Improvement Rating Wetland Areas
High 15
Moderate 8
Low 1
Figure 9-5 Potential Sites for Wetland Improvement
However, while there are many opportunities for wetland improvement, there is only limited opportunity for wetland expansion. The total potential estimated increase in wetland area for the moderate and high potential wetland sites was limited to less than 3 acres, increasing the existing inventory from about 15 acres to 18 acres. Greater opportunity for increasing wetland acreage is available from wetland creation/re-creation activities.
May 2005 9-42
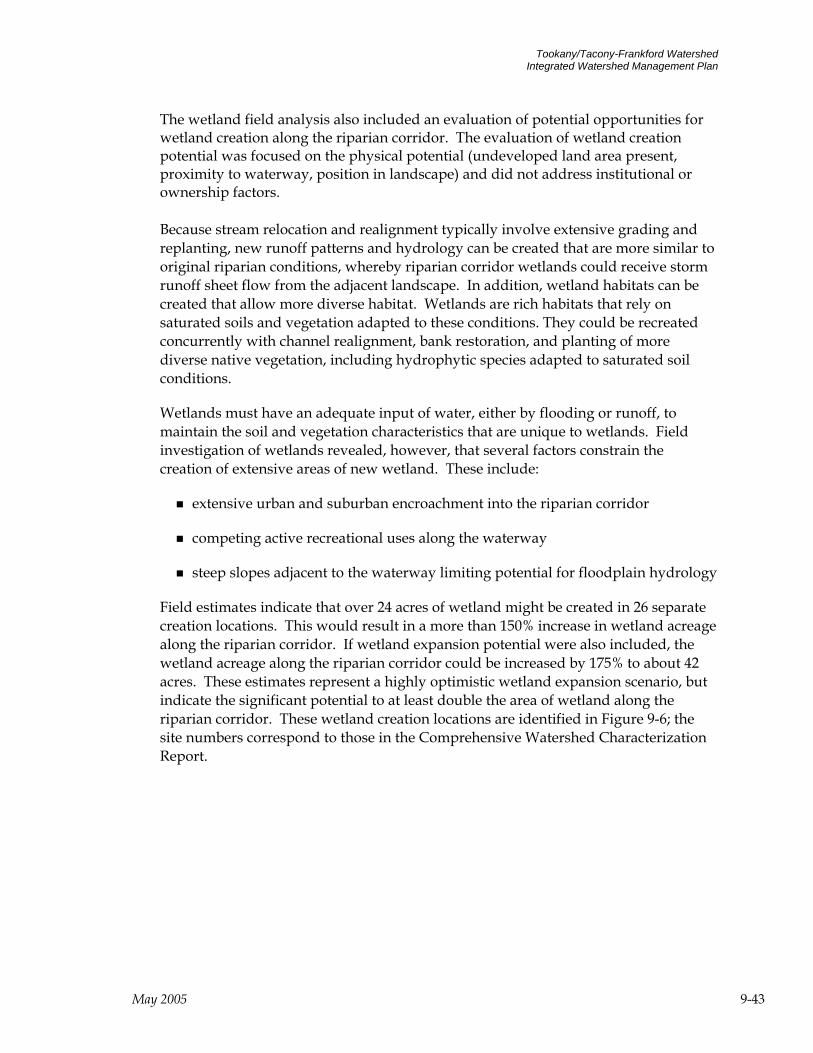
Tookany/Tacony-Frankford Watershed Integrated Watershed Management Plan
The wetland field analysis also included an evaluation of potential opportunities for wetland creation along the riparian corridor. The evaluation of wetland creation potential was focused on the physical potential (undeveloped land area present, proximity to waterway, position in landscape) and did not address institutional or ownership factors. Because stream relocation and realignment typically involve extensive grading and replanting, new runoff patterns and hydrology can be created that are more similar to original riparian conditions, whereby riparian corridor wetlands could receive storm runoff sheet flow from the adjacent landscape. In addition, wetland habitats can be created that allow more diverse habitat. Wetlands are rich habitats that rely on saturated soils and vegetation adapted to these conditions. They could be recreated concurrently with channel realignment, bank restoration, and planting of more diverse native vegetation, including hydrophytic species adapted to saturated soil conditions.
Wetlands must have an adequate input of water, either by flooding or runoff, to maintain the soil and vegetation characteristics that are unique to wetlands. Field investigation of wetlands revealed, however, that several factors constrain the creation of extensive areas of new wetland. These include:
extensive urban and suburban encroachment into the riparian corridor
competing active recreational uses along the waterway
steep slopes adjacent to the waterway limiting potential for floodplain hydrology
Field estimates indicate that over 24 acres of wetland might be created in 26 separate creation locations. This would result in a more than 150% increase in wetland acreage along the riparian corridor. If wetland expansion potential were also included, the wetland acreage along the riparian corridor could be increased by 175% to about 42 acres. These estimates represent a highly optimistic wetland expansion scenario, but indicate the significant potential to at least double the area of wetland along the riparian corridor. These wetland creation locations are identified in Figure 9-6; the site numbers correspond to those in the Comprehensive Watershed Characterization Report.
May 2005 9-43
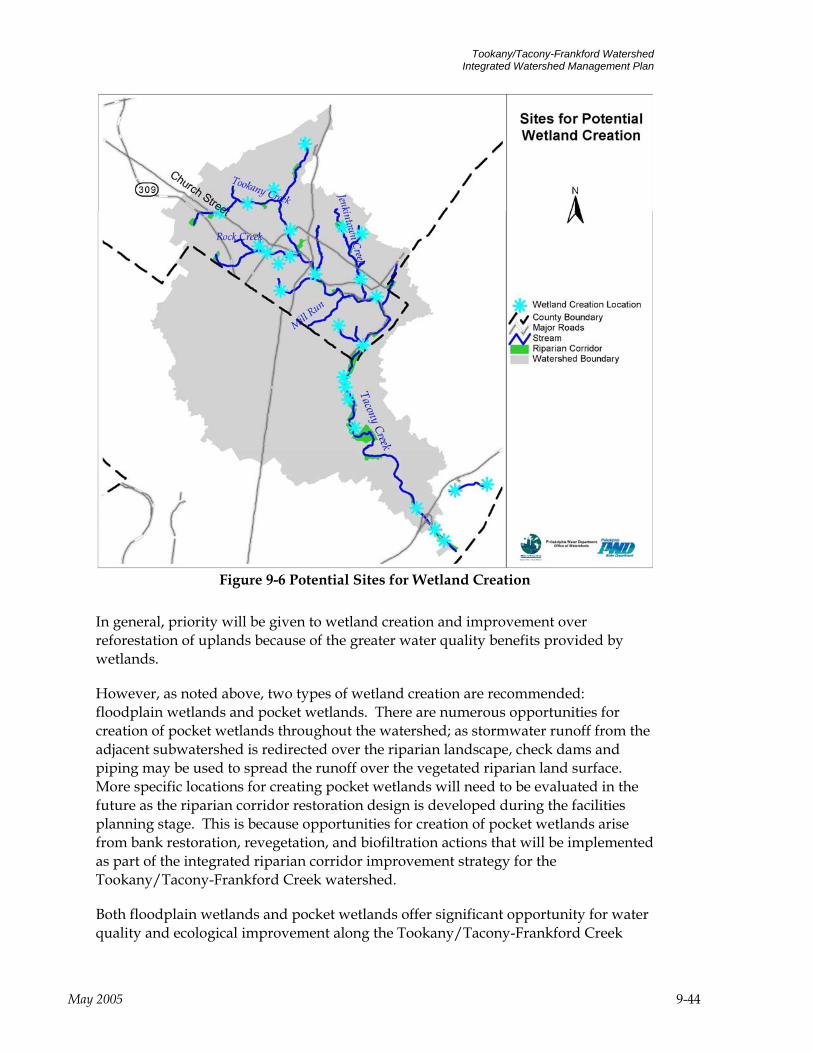
Tookany/Tacony-Frankford Watershed Integrated Watershed Management Plan
Figure 9-6 Potential Sites for Wetland Creation
In general, priority will be given to wetland creation and improvement over reforestation of uplands because of the greater water quality benefits provided by wetlands.
However, as noted above, two types of wetland creation are recommended: floodplain wetlands and pocket wetlands. There are numerous opportunities for creation of pocket wetlands throughout the watershed; as stormwater runoff from the adjacent subwatershed is redirected over the riparian landscape, check dams and piping may be used to spread the runoff over the vegetated riparian land surface. More specific locations for creating pocket wetlands will need to be evaluated in the future as the riparian corridor restoration design is developed during the facilities planning stage. This is because opportunities for creation of pocket wetlands arise from bank restoration, revegetation, and biofiltration actions that will be implemented as part of the integrated riparian corridor improvement strategy for the Tookany/Tacony-Frankford Creek watershed.
Both floodplain wetlands and pocket wetlands offer significant opportunity for water quality and ecological improvement along the Tookany/Tacony-Frankford Creek
May 2005 9-44
Tookany/Tacony-Frankford Watershed Integrated Watershed Management Plan
riparian corridor, and will play a central role as the design of the riparian corridor improvements is developed.
Assuring long term success for wetland creation projects will involve future monitoring to measure integration of the wetland into the riparian landscape and to correct defective conditions, where possible. However, proper design of the wetland to assure adequate input of water (via flooding or runoff), protection from erosion, and maintenance of the diverse planted vegetation is essential to long-term success. Wetland creation projects typically involve monitoring and maintaining the created wetland’s hydrology, vegetation (including invasive species), and erosion characteristics for a period of 3 years following creation.
Wetland Creation (BM6) Related Goals: 1, 2, 3, 4, 5, 7
Related Indicators: 1, 2, 3, 4, 7, 8, 9, 15, 19 What Who Where When
Wetland creation and enhancement for flood flow alteration, groundwater recharge, increased habitat, increased plant and animal diversity, and improved water quality.
PWD; Fairmount Park NLREEP Municipalities bordering streams recommended for restoration.
Recommended locations for floodplain wetland creation; areas for pocket wetland creation need to be field determined, based on where they are adjacent to lands proposed for stream realignment and bank restoration. (See Figure 9-10)
Prototype design and evaluation phase, followed by upstream creation/enhancement in years 1-5; downstream implementation over two 10 year phases.
Further investigation of all potential wetland enhancement and creation opportunities should include the following: identification of landowners, rainfall data collection and evaluation, runoff calculations, soils investigation, water budget, native species investigation, and groundwater/soil saturation monitoring.
Invasive Species Management (BM7)
Related Goals: 4 Related Indicators: 12, 13, 14, 19
What Who Where When
Implement an Invasive Species Management Plan (already in effect in Fairmount Park)
PWD; Fairmount Park NLREEP
Lowland and upland habitat restoration sites
Within 5 years
A plan to control invasive plant species is necessary when restoring or enhancing wetlands and riparian forests. Invasive species provide little value to native animals
May 2005 9-45
Tookany/Tacony-Frankford Watershed Integrated Watershed Management Plan
that depend on native species for habitat and food. Japanese knotweed (Polygonum cuspidatum) is the one prevalent invasive species that was observed during the field reconnaissance. In many areas, knotweed, due to its aggressive nature, has already out-competed native vegetation. Maintaining a healthy riparian plant community along Tookany/Tacony-Frankford Creek will retain biodiversity and support a healthy stream ecosystem.
NLREEP has implemented an invasive species control program in the Fairmount Park portion of the stream corridor. It is recommended that invasive species control be expanded to the remaining natural areas of the corridor. Implementation of an invasive species management plan would assist natural succession within the riparian buffer and decrease further impacts of invasive species.
Planting plans for all restoration efforts should complement the invasive species management plan by recommending appropriate native planting to supplement areas where invasives have been eliminated. Although invasive species management priority areas are considered those that contain 80% or greater invasive species, the most practical approach is to recommend invasive species management be implemented for all riparian restoration sites. Recommended areas where restoration will occur are shown in Figure 9-9 above. An invasive species management plan will require, at a minimum, a three-year commitment to ensure success.
The River Conservation Plans (RCPs) recommend most to remove invasives and replant native vegetation. The most common invasive was Japanese knotweed.
Holy Sepulchre Cemetery to Ralph Morgan Park: Control invasive plants and replant with natives.
Ralph Morgan Park to Greenwood Avenue: Remove Japanese Knotweed and replant with natives. Remove invasive vines from trees.
Greenwood Avenue to Wyncote Post Office: Remove invasive plants from banks and replant with natives.
Washington Lane Underpass to Church Road: Remove invasive vines from trees and knotweed. Replant native shrubs and ground cover.
Church Road at Chelten Hills Drive to Church Road near Ogontz Field: Remove knotweed and other invasives. Replant a native buffer zone.
High School Park to Ashbourne Road along the Tookany Creek Parkway: Eradicate invasive plants and replant with natives.
Unnamed Tributary in Glenside: Clear Knotweed.
Baeder Creek Watershed: Eradicate invasives and replant natives.
May 2005 9-46
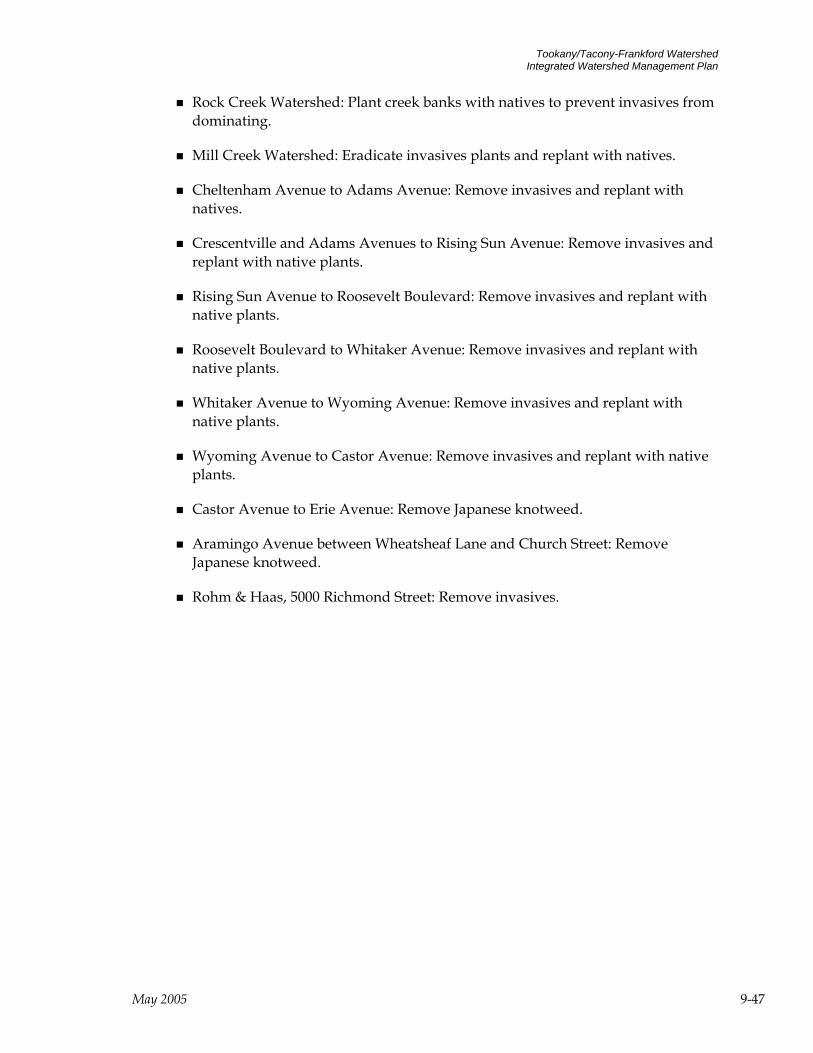
Tookany/Tacony-Frankford Watershed Integrated Watershed Management Plan
Rock Creek Watershed: Plant creek banks with natives to prevent invasives from dominating.
Mill Creek Watershed: Eradicate invasives plants and replant with natives.
Cheltenham Avenue to Adams Avenue: Remove invasives and replant with natives.
Crescentville and Adams Avenues to Rising Sun Avenue: Remove invasives and replant with native plants.
Rising Sun Avenue to Roosevelt Boulevard: Remove invasives and replant with native plants.
Roosevelt Boulevard to Whitaker Avenue: Remove invasives and replant with native plants.
Whitaker Avenue to Wyoming Avenue: Remove invasives and replant with native plants.
Wyoming Avenue to Castor Avenue: Remove invasives and replant with native plants.
Castor Avenue to Erie Avenue: Remove Japanese knotweed.
Aramingo Avenue between Wheatsheaf Lane and Church Street: Remove Japanese knotweed.
Rohm & Haas, 5000 Richmond Street: Remove invasives.
May 2005 9-47

Tookany/Tacony-Frankford Watershed Integrated Watershed Management Plan
9.2.3 Upland Restoration and Enhancement
Biofiltration (BM8) Related Goals: 1, 2, 3, 5, 7
Related Indicators: 1, 2, 3, 4, 15, 19, 20 What Who Where When
Biofiltration involves creating sheet flow over the vegetated landscape to slow the rate of runoff, facilitate groundwater recharge, and remove sediment, nutrients, and toxicants from the runoff.
PWD; Fairmount Park NLREEP
Throughout Tookany/Tacony-Frankford, riparian corridors; focus on vegetated landscape
2 10-year implementation phases (high and medium priority)
The goal of the Tookany/Tacony-Frankford Creek riparian corridor improvement strategy is to identify all opportunities along the riparian corridor for natural landscape designs that achieve water quality improvement. For higher landscape positions at the outer edges of the riparian corridor there are extensive opportunities to implement biofiltration to improve runoff. Biofiltration involves creating sheet flow over the vegetated landscape to slow the rate of runoff, facilitate groundwater recharge, and remove sediment, nutrients, and toxicants from the runoff. Typical biofiltration approaches include installation of stormwater swales and checkdams along natural drainageways that spread runoff, creation of bioretention plantings and hydrology, and hydrologic features that allow sheet flow to spread over grassed and shrub/scrub fields to achieve water quality improvement. The advantage of biofiltration is that it is compatible with recreational use of the riparian corridor, because flows are very shallow and are usually only present during rainfall events.
Analysis of the existing stormwater management in the Tookany/Tacony-Frankford Creek watershed shows that most stormwater outfalls discharge directly to the waterway. However, if the stormwater was redirected over the vegetated landscape higher in the stream valley, it would follow the natural slope and land contour as it traveled down to the stream. There are over 685 acres of undeveloped land along the Tookany/Tacony-Frankford Creek riparian corridor, but almost none of that land carries runoff sheet flow because the stormwater piping system conveys all flows, from storms large and small, directly to the stream. In order to achieve water quality improvement goals it is important to optimize the ability of this vegetated riparian land to receive overland runoff, rather than piping the runoff directly into the stream.
Biofiltration has an effectiveness range of about 25-60% in removing suspended solids from runoff, and the concept of directing runoff to sheet flow over the vegetated riparian landscape matches fully with the way that such lands function naturally in an undeveloped watershed. Thus, the goal of biofiltration is to restore sheet flow of
May 2005 9-48
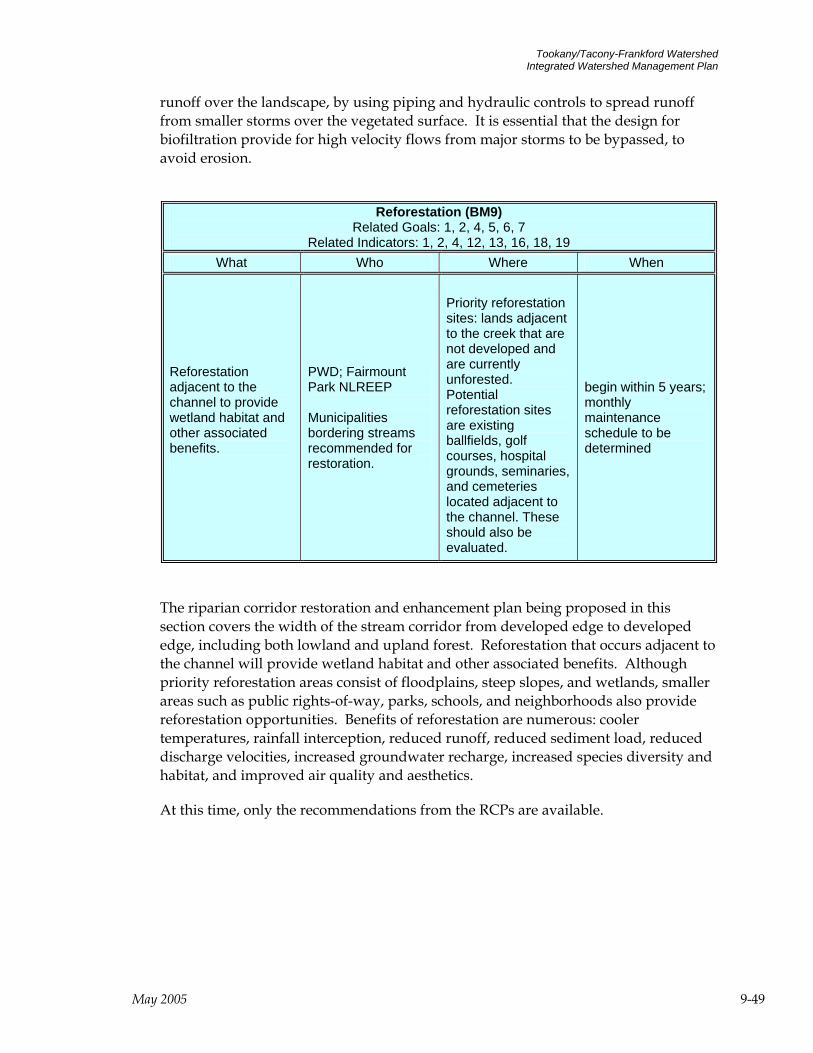
Tookany/Tacony-Frankford Watershed Integrated Watershed Management Plan
runoff over the landscape, by using piping and hydraulic controls to spread runoff from smaller storms over the vegetated surface. It is essential that the design for biofiltration provide for high velocity flows from major storms to be bypassed, to avoid erosion.
Reforestation (BM9) Related Goals: 1, 2, 4, 5, 6, 7
Related Indicators: 1, 2, 4, 12, 13, 16, 18, 19 What Who Where When
Reforestation adjacent to the channel to provide wetland habitat and other associated benefits.
PWD; Fairmount Park NLREEP Municipalities bordering streams recommended for restoration.
Priority reforestation sites: lands adjacent to the creek that are not developed and are currently unforested. Potential reforestation sites are existing ballfields, golf courses, hospital grounds, seminaries, and cemeteries located adjacent to the channel. These should also be evaluated.
begin within 5 years; monthly maintenance schedule to be determined
The riparian corridor restoration and enhancement plan being proposed in this section covers the width of the stream corridor from developed edge to developed edge, including both lowland and upland forest. Reforestation that occurs adjacent to the channel will provide wetland habitat and other associated benefits. Although priority reforestation areas consist of floodplains, steep slopes, and wetlands, smaller areas such as public rights-of-way, parks, schools, and neighborhoods also provide reforestation opportunities. Benefits of reforestation are numerous: cooler temperatures, rainfall interception, reduced runoff, reduced sediment load, reduced discharge velocities, increased groundwater recharge, increased species diversity and habitat, and improved air quality and aesthetics.
At this time, only the recommendations from the RCPs are available.
May 2005 9-49
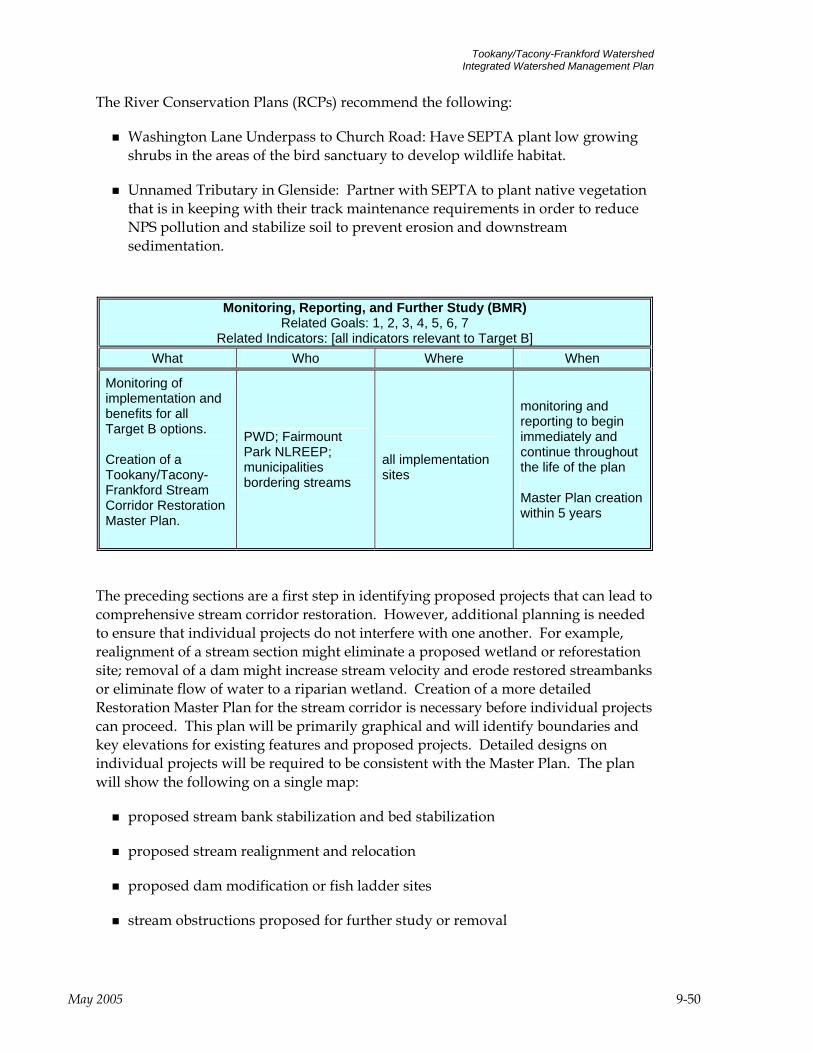
Tookany/Tacony-Frankford Watershed Integrated Watershed Management Plan
The River Conservation Plans (RCPs) recommend the following:
Washington Lane Underpass to Church Road: Have SEPTA plant low growing shrubs in the areas of the bird sanctuary to develop wildlife habitat.
Unnamed Tributary in Glenside: Partner with SEPTA to plant native vegetation that is in keeping with their track maintenance requirements in order to reduce NPS pollution and stabilize soil to prevent erosion and downstream sedimentation.
Monitoring, Reporting, and Further Study (BMR) Related Goals: 1, 2, 3, 4, 5, 6, 7
Related Indicators: [all indicators relevant to Target B] What Who Where When
Monitoring of implementation and benefits for all Target B options. Creation of a Tookany/Tacony-Frankford Stream Corridor Restoration Master Plan.
PWD; Fairmount Park NLREEP; municipalities bordering streams
all implementation sites
monitoring and reporting to begin immediately and continue throughout the life of the plan Master Plan creation within 5 years
The preceding sections are a first step in identifying proposed projects that can lead to comprehensive stream corridor restoration. However, additional planning is needed to ensure that individual projects do not interfere with one another. For example, realignment of a stream section might eliminate a proposed wetland or reforestation site; removal of a dam might increase stream velocity and erode restored streambanks or eliminate flow of water to a riparian wetland. Creation of a more detailed Restoration Master Plan for the stream corridor is necessary before individual projects can proceed. This plan will be primarily graphical and will identify boundaries and key elevations for existing features and proposed projects. Detailed designs on individual projects will be required to be consistent with the Master Plan. The plan will show the following on a single map:
proposed stream bank stabilization and bed stabilization
proposed stream realignment and relocation
proposed dam modification or fish ladder sites
stream obstructions proposed for further study or removal
May 2005 9-50
Tookany/Tacony-Frankford Watershed Integrated Watershed Management Plan
existing wetlands; proposed wetland creation and enhancement
existing habitat not to be disturbed, including threatened or endangered species
proposed reforestation and habitat creation areas
existing and proposed upland BMPs (biofiltration)
key recreation and access facilities (trails, parking lots)
Before habitat restoration is recommended, however, water quality problems that might now be the cause of poor fish species diversity must be better investigated, and eventually solved.
9.3 Target C: Wet Weather Water Quality and Quantity Target C must be approached somewhat differently from the first two targets. Full achievement of this target means meeting all water quality standards during wet weather, as well as eliminating all flooding. Full achievement of these goals will be difficult, particularly with regard to wet weather water quality. It would certainly be extremely expensive, and would require a long term effort. The only rational approach to full achievement of Target C goals is through stepped implementation with interim targets for reducing wet weather pollutant loads and stormwater flows. During implementation, monitoring must continue to continuously assess the effectiveness of the program. Based on the extensive modeling analysis carried out for Tookany/Tacony-Frankford Creek to date, an initial goal of a 20-25% reduction in stormwater flows and stormwater/CSO related pollutant loads is challenging but achievable. The stakeholders have identified Mill Creek (also called Mill Run) as a priority area for stormwater control.
It is expected that changes to the approach required to meet Target C, and even to the desired results, will occur as measures are implemented and results are monitored. With permits of 5-year duration for most discharge permits, discharge targets and reduction targets must be set and implementation designed in the first 5 years. Implementation for meeting Target C should occur over the next 5 years, with monitoring for effectiveness taking place for 5 years subsequent to implementation. During the last 5-year period, PWD should also work with the regulatory agencies to review water quality standards and determine whether any adjustments to them may be appropriate based on the results of monitoring.
Regulatory Approaches Zoning and Land Use Control CR2 Requiring Better Site Design in Redevelopment CR3 Stormwater and Floodplain Management CR4 Industrial Stormwater Pollution Prevention CR5 Construction Stormwater Pollution Prevention CR6 Post-construction Stormwater Runoff Management CR7 Pollution Trading
May 2005 9-51

Tookany/Tacony-Frankford Watershed Integrated Watershed Management Plan
CR8 Use Review and Attainability Analysis CR9 Watershed-Based Permitting
Municipal Measures CM1 Sanitary Sewer Overflow Detection CM2 Sanitary Sewer Overflow Elimination: Structural Measures CM3 Reduction of Stormwater Inflow and Infiltration to Sanitary Sewers CM4 Combined Sewer Overflow (CSO) Control Program
▪ Nine Minimum Controls ▪ Long Term CSO Control Plan ▪ Watershed-Based Planning
CM5 Catch Basin and Storm Inlet Maintenance CM6 Street Sweeping CM7 Responsible Landscaping Practices on Public Lands CM9 Responsible Bridge and Roadway Maintenance
Stormwater Management Source Control Measures CS2 Increasing Urban Tree Canopy CS3 Porous Pavement and Subsurface Storage CS4 Green Rooftops CS5 Capturing Roof Runoff in Rain Barrels or Cisterns
Onsite and Regional Stormwater Control Facilities CS6 Maintaining/Retrofitting Existing Stormwater Structures CS8 Retrofit of Existing Sewer Inlets with Dry Wells CS9 Residential Dry Wells, Seepage Trenches, and Water Gardens CS12 Bioretention Basins and Porous Media Filtration CS13 Treatment Wetlands: Onsite and Regional CMR Monitoring, Reporting, and Further Study
May 2005 9-52
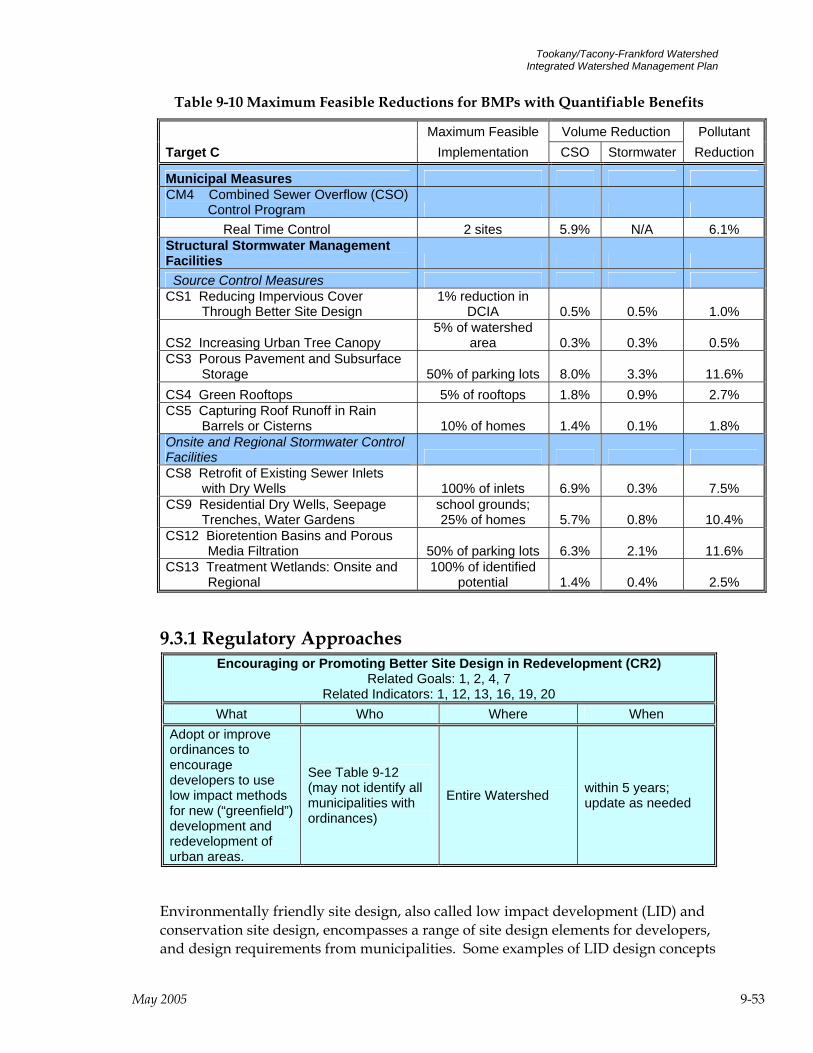
Tookany/Tacony-Frankford Watershed Integrated Watershed Management Plan
Table 9-10 Maximum Feasible Reductions for BMPs with Quantifiable Benefits
Maximum Feasible Volume Reduction Pollutant Target C Implementation CSO Stormwater Reduction
Municipal Measures CM4 Combined Sewer Overflow (CSO)
Control Program Real Time Control 2 sites 5.9% N/A 6.1%
Structural Stormwater Management Facilities Source Control Measures CS1 Reducing Impervious Cover
Through Better Site Design 1% reduction in
DCIA 0.5% 0.5% 1.0%
CS2 Increasing Urban Tree Canopy 5% of watershed
area 0.3% 0.3% 0.5% CS3 Porous Pavement and Subsurface
Storage 50% of parking lots 8.0% 3.3% 11.6% CS4 Green Rooftops 5% of rooftops 1.8% 0.9% 2.7% CS5 Capturing Roof Runoff in Rain
Barrels or Cisterns 10% of homes 1.4% 0.1% 1.8% Onsite and Regional Stormwater Control Facilities CS8 Retrofit of Existing Sewer Inlets
with Dry Wells 100% of inlets 6.9% 0.3% 7.5% CS9 Residential Dry Wells, Seepage
Trenches, Water Gardens school grounds; 25% of homes 5.7% 0.8% 10.4%
CS12 Bioretention Basins and Porous Media Filtration 50% of parking lots 6.3% 2.1% 11.6%
CS13 Treatment Wetlands: Onsite and Regional
100% of identified potential 1.4% 0.4% 2.5%
9.3.1 Regulatory Approaches Encouraging or Promoting Better Site Design in Redevelopment (CR2)
Related Goals: 1, 2, 4, 7 Related Indicators: 1, 12, 13, 16, 19, 20
What Who Where When Adopt or improve ordinances to encourage developers to use low impact methods for new (“greenfield”) development and redevelopment of urban areas.
See Table 9-12 (may not identify all municipalities with ordinances)
Entire Watershed within 5 years; update as needed
Environmentally friendly site design, also called low impact development (LID) and conservation site design, encompasses a range of site design elements for developers, and design requirements from municipalities. Some examples of LID design concepts
May 2005 9-53
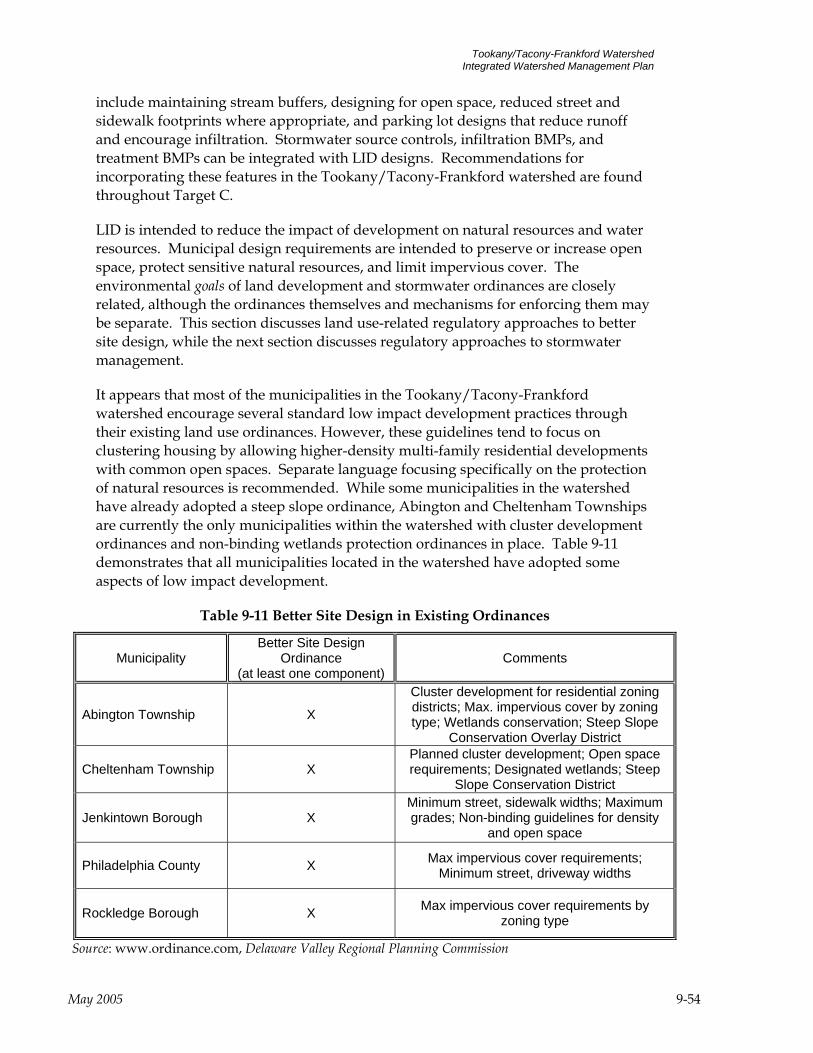
Tookany/Tacony-Frankford Watershed Integrated Watershed Management Plan
include maintaining stream buffers, designing for open space, reduced street and sidewalk footprints where appropriate, and parking lot designs that reduce runoff and encourage infiltration. Stormwater source controls, infiltration BMPs, and treatment BMPs can be integrated with LID designs. Recommendations for incorporating these features in the Tookany/Tacony-Frankford watershed are found throughout Target C.
LID is intended to reduce the impact of development on natural resources and water resources. Municipal design requirements are intended to preserve or increase open space, protect sensitive natural resources, and limit impervious cover. The environmental goals of land development and stormwater ordinances are closely related, although the ordinances themselves and mechanisms for enforcing them may be separate. This section discusses land use-related regulatory approaches to better site design, while the next section discusses regulatory approaches to stormwater management.
It appears that most of the municipalities in the Tookany/Tacony-Frankford watershed encourage several standard low impact development practices through their existing land use ordinances. However, these guidelines tend to focus on clustering housing by allowing higher-density multi-family residential developments with common open spaces. Separate language focusing specifically on the protection of natural resources is recommended. While some municipalities in the watershed have already adopted a steep slope ordinance, Abington and Cheltenham Townships are currently the only municipalities within the watershed with cluster development ordinances and non-binding wetlands protection ordinances in place. Table 9-11 demonstrates that all municipalities located in the watershed have adopted some aspects of low impact development.
Table 9-11 Better Site Design in Existing Ordinances
Municipality Better Site Design
Ordinance (at least one component)
Comments
Abington Township X
Cluster development for residential zoning districts; Max. impervious cover by zoning type; Wetlands conservation; Steep Slope
Conservation Overlay District
Cheltenham Township X Planned cluster development; Open space requirements; Designated wetlands; Steep
Slope Conservation District
Jenkintown Borough X Minimum street, sidewalk widths; Maximum grades; Non-binding guidelines for density
and open space
Philadelphia County X Max impervious cover requirements; Minimum street, driveway widths
Rockledge Borough X Max impervious cover requirements by zoning type
Source: www.ordinance.com, Delaware Valley Regional Planning Commission
May 2005 9-54
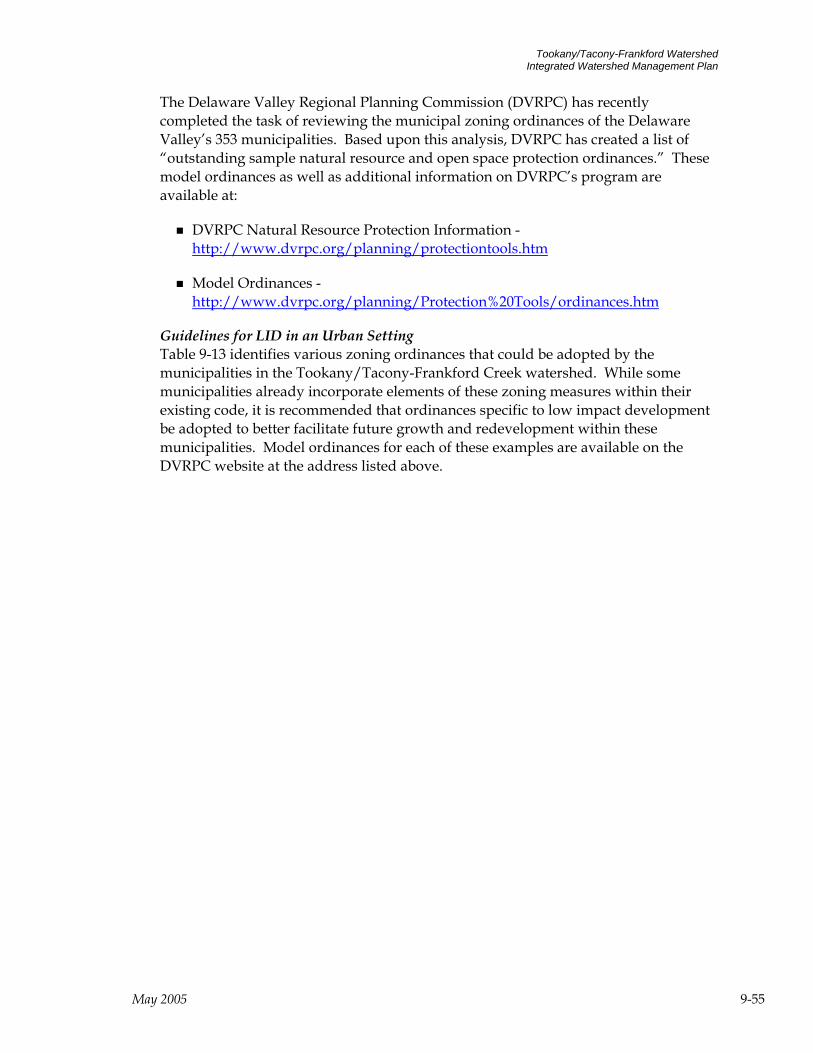
Tookany/Tacony-Frankford Watershed Integrated Watershed Management Plan
The Delaware Valley Regional Planning Commission (DVRPC) has recently completed the task of reviewing the municipal zoning ordinances of the Delaware Valley’s 353 municipalities. Based upon this analysis, DVRPC has created a list of “outstanding sample natural resource and open space protection ordinances.” These model ordinances as well as additional information on DVRPC’s program are available at:
DVRPC Natural Resource Protection Information - http://www.dvrpc.org/planning/protectiontools.htm
Model Ordinances - http://www.dvrpc.org/planning/Protection%20Tools/ordinances.htm
Guidelines for LID in an Urban Setting Table 9-13 identifies various zoning ordinances that could be adopted by the municipalities in the Tookany/Tacony-Frankford Creek watershed. While some municipalities already incorporate elements of these zoning measures within their existing code, it is recommended that ordinances specific to low impact development be adopted to better facilitate future growth and redevelopment within these municipalities. Model ordinances for each of these examples are available on the DVRPC website at the address listed above.
May 2005 9-55
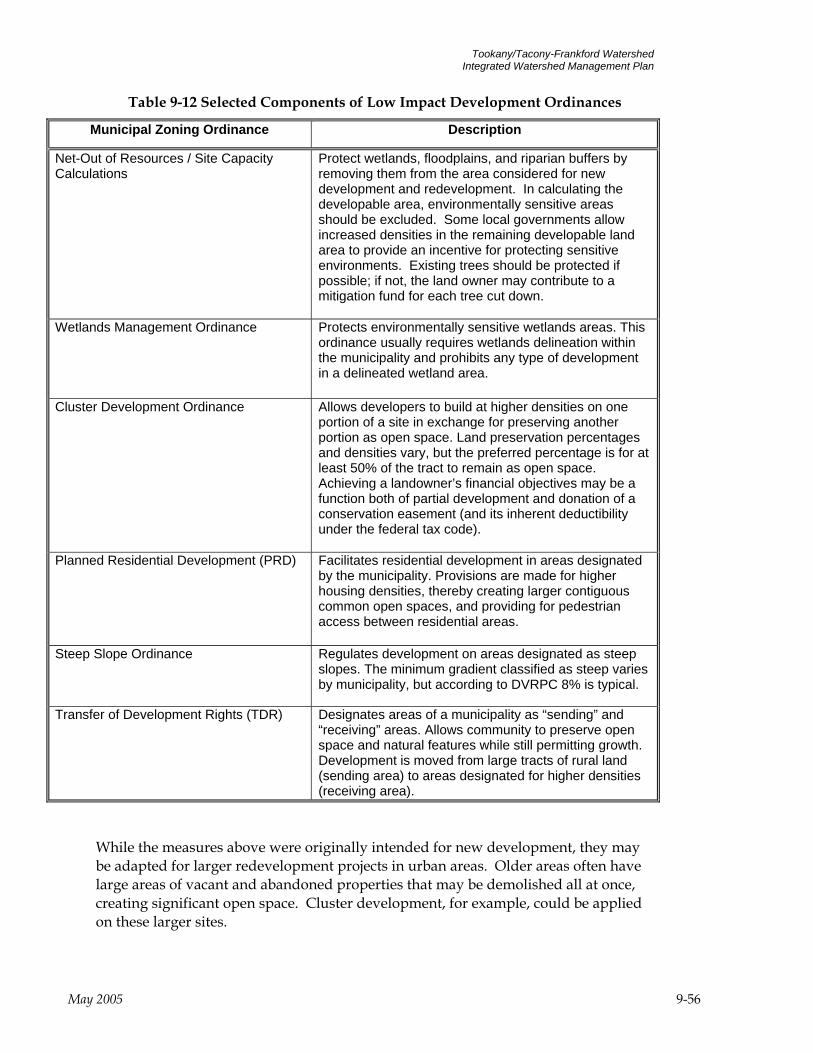
Tookany/Tacony-Frankford Watershed Integrated Watershed Management Plan
Table 9-12 Selected Components of Low Impact Development Ordinances
Municipal Zoning Ordinance Description
Net-Out of Resources / Site Capacity Calculations
Protect wetlands, floodplains, and riparian buffers by removing them from the area considered for new development and redevelopment. In calculating the developable area, environmentally sensitive areas should be excluded. Some local governments allow increased densities in the remaining developable land area to provide an incentive for protecting sensitive environments. Existing trees should be protected if possible; if not, the land owner may contribute to a mitigation fund for each tree cut down.
Wetlands Management Ordinance Protects environmentally sensitive wetlands areas. This ordinance usually requires wetlands delineation within the municipality and prohibits any type of development in a delineated wetland area.
Cluster Development Ordinance Allows developers to build at higher densities on one portion of a site in exchange for preserving another portion as open space. Land preservation percentages and densities vary, but the preferred percentage is for at least 50% of the tract to remain as open space. Achieving a landowner’s financial objectives may be a function both of partial development and donation of a conservation easement (and its inherent deductibility under the federal tax code).
Planned Residential Development (PRD) Facilitates residential development in areas designated by the municipality. Provisions are made for higher housing densities, thereby creating larger contiguous common open spaces, and providing for pedestrian access between residential areas.
Steep Slope Ordinance Regulates development on areas designated as steep slopes. The minimum gradient classified as steep varies by municipality, but according to DVRPC 8% is typical.
Transfer of Development Rights (TDR) Designates areas of a municipality as “sending” and “receiving” areas. Allows community to preserve open space and natural features while still permitting growth. Development is moved from large tracts of rural land (sending area) to areas designated for higher densities (receiving area).
While the measures above were originally intended for new development, they may be adapted for larger redevelopment projects in urban areas. Older areas often have large areas of vacant and abandoned properties that may be demolished all at once, creating significant open space. Cluster development, for example, could be applied on these larger sites.
May 2005 9-56

Tookany/Tacony-Frankford Watershed Integrated Watershed Management Plan
In addition to the specific ordinances above, municipalities should require, or provide strong incentives for, innovative site design when urbanized areas are redeveloped. Effective conservation design techniques to consider include the following:
Review municipal codes for any minimum size requirements for impervious surfaces, such as road and sidewalk widths. Review any stipulation of a minimum size lot that development and stormwater ordinances apply to. In the City of Philadelphia, the ordinance requiring all downspouts to be connected directly to the sewer system is not appropriate in all cases; wherever feasible, infiltration (e.g., using dry wells) should be encouraged over disposal of stormwater to combined or separate storm sewers.
Depending on the zoning classification, specify a maximum effective impervious cover allowed after construction. Many publications recommend that impervious cover connected directly to the drainage system be limited (see “Reducing Effective Impervious Cover through Conservation Site Design” for specific recommendations). Developers are then free to choose a combination of methods to meet the requirement: an absolute reduction in impervious cover, directing runoff onto depressed landscaped areas, tree credits, and structural BMPs. Consider incentives in the stormwater control calculations to reduce directly connected impervious surfaces.
For areas experiencing redevelopment, structural stormwater controls may be tied to the impervious area calculations discussed above. Developers have an incentive to reduce impervious area because it may be more cost effective than installing structural stormwater BMPs. Specific recommendations for stormwater ordinances are discussed under option CR3.
Promote discussions early in the development review process at the sketch plan/conceptual plan level (before developers have spent large sums of money on design and engineering). A number of municipalities around the U.S. have concluded that sketch/conceptual plans are more important in the planning process than preliminary plans because early intervention and change allows greater opportunity to include innovative low impact development designs. Some municipalities have opted to eliminate the final plan and accept the preliminary plan as the final plan as an incentive to developers to participate.
After the final plan is submitted, require a pre-construction meeting and a site visit to discuss construction issues and pollution prevention.
Consider incentives in addition to regulations; for small sites, incentives alone may be sufficient. For example, award density or stormwater control bonuses for reducing impervious cover. Streamline project reviews and waive permit fees when conservation design objectives are met. Tie stormwater fees and/or property taxes to impervious cover and stormwater management practices.
May 2005 9-57

Tookany/Tacony-Frankford Watershed Integrated Watershed Management Plan
The River Conservation Plans (RCPs) recommend the following:
Church Road at Chelten Hills Drive to Church Road near Ogontz Field- For areas that are redeveloped, have landscape architects design a more natural buffer zone.
Stormwater and Floodplain Management (CR3) Related Goals: 1, 2, 3, 4, 5, 7
Related Indicators: 1, 2, 12, 13, 15, 19, 20 What Who Where When
Participate in finalization of the watershed-wide Act 167 plan and model ordinance being developed in the watershed. Adopt and enforce the model ordinance.
Counties to adopt plan and ordinance first, followed by all municipalities (See Table 9-14)
Entire Watershed begin within 5 years; update as needed
Table 9-13 identifies the municipalities in the Tookany/Tacony-Frankford Creek watershed that currently have a floodplain protection or stormwater ordinance in place.
Table 9-13 Floodplain and Stormwater Ordinances in the Tookany/Tacony-Frankford Creek Watershed
Municipality Floodplain Ordinance
Stormwater Ordinance
Erosion and Sedimentation
Control Comments
Abington Township X X X
Stormwater design requirements; Floodplain Conservation District;
Erosion and Sedimentation Control Plan
Cheltenham Township X X X
Storm drainage requirements; Floodplain Conservation District; Soil Erosion and Sediment Control (DEP
Manual compliance)
Jenkintown Borough X X X
Storm drainage design requirements; Floodplain Conservation District;
Erosion and sedimentation control measures required (no description)
Philadelphia County X X
Stormwater management controls; Erosion and sedimentation control
measures –engineer required
Rockledge Borough
No stormwater/floodplain ordinances; All development served by public
sewer and public water
Source: www.ordinance.com, Delaware Valley Regional Planning Commission
May 2005 9-58
Tookany/Tacony-Frankford Watershed Integrated Watershed Management Plan
The majority of municipalities in the watershed have adopted ordinances limiting development in the floodplain or designating a floodplain conservation district. The protection offered varies by municipality, but an effective ordinance should place controls on land development within the 100-year floodplain as well as limit development within riparian corridors.
EPA provides a model for a floodplain preservation ordinance at the following website link:
EPA Model Ordinances (http://www.epa.gov/owow/nps/ordinance/osm1.htm)
Philadelphia and Montgomery Counties are cooperating to develop an official Act 167 Stormwater Management Plan and model ordinance. The model ordinance will specify measures that must be undertaken to promote infiltration, improve water quality, reduce streambank erosion rates, and protect against flooding. These requirements will apply to both new (also called “greenfield”) development and redevelopment (including brownfields or former industrial sites), and to both separate-sewered and combined-sewered areas. As of late 2004, the plan and model ordinance were still under development; all counties and municipalities will be invited to provide input before the plan is finalized.
Adoption and implementation of the model ordinance is a critical step that will allow municipalities to begin implementing many of the wet weather management measures mentioned later under Target C. For example, the ordinance may require a specific storage volume to be created on a developed site and may indicate that it must be a BMP capable of water quality treatment. The developer will then consult a state or local stormwater manual designated by the municipality to determine an appropriate BMP and appropriate design criteria.
While many of the state manuals provide excellent guidance for new development, PWD plans to develop a manual with guidance for redevelopment projects given local conditions. Some preliminary ideas for this BMP manual are listed below.
Commercial/Industrial Land Uses 1. Encourage better site design techniques, impervious cover disconnection, and tree
credits to decrease impervious cover directly connected to the drainage system.
2. Directly-Connected Parking Lots
Encourage a bioretention system if sufficient space is available to meet parking needs.
In highly urban areas where adding landscaping is not possible, encourage porous pavement (or other drainage mechanism) and subsurface storage if feasible.
May 2005 9-59

Tookany/Tacony-Frankford Watershed Integrated Watershed Management Plan
3. Directly-Connected Rooftops
If parking lot storage is installed, recommend routing rooftop drainage to the storage.
If parking lot storage is not feasible, route rooftop drainage to dry wells. If dry wells are not feasible, route rooftop drainage to rain barrels or tanks.
Other approaches may be proposed and considered on a case-by-case basis.
Residential Land Uses 1. Encourage better site design techniques, impervious cover disconnection, and tree
credits to decrease impervious cover directly connected to the drainage system.
2. Route roof runoff to dry wells if feasible. If dry wells are not feasible, route rooftop drainage to rain barrels or tanks.
3. Other approaches may be proposed and considered on a case-by-case basis.
The River Conservations Plans (RCPs) recommend the following:
Holy Sepulchre Cemetery to Ralph Morgan Park: Purchase properties in floodplain to convert land to open space.
Mill Creek Watershed: Relocate or purchase then demolish structures in the floodplain.
Church Road at Chelten Hills Drive to Church Road near Ogontz Field: Assess upstream issues to see why Shoemaker Road area floods more.
Industrial Stormwater Pollution Prevention (CR4) Related Goals: 1, 2, 3, 7
Related Indicators: 1, 2, 3, 4, 7, 8, 9, 10, 19, 20 What Who Where When
Enforcement of NPDES requirements for Industrial Stormwater Management Dissemination of information on spill prevention and pollution prevention plans.
The PADEP is the Designated Authority responsible for issuing, administering, and enforcing NPDES permits Municipalities are responsible for information dissemination.
All sites contributing storm water discharges associated with industrial activity within the watershed
Within 5 years
Industrial stormwater pollution prevention measures can contribute significantly to achieving the watershed plan’s wet weather implementation targets. These measures
May 2005 9-60

Tookany/Tacony-Frankford Watershed Integrated Watershed Management Plan
include monitoring and enforcing existing industrial stormwater permit requirements under Phase I of the NPDES program, as well as, Official Industrial Pollution Prevention Plans and Spill Response Actions required by the state. Full implementation of these measures should be monitored and enforced throughout the watershed.
NPDES Industrial Stormwater Permits All sites contributing storm water discharges associated with industrial activity, defined in federal regulations (40 CFR §§ 122.26(b)(14)(i)-(xi)), are required to be covered under Phase I of the NPDES stormwater program. This includes discharges from any conveyance that is used for collecting and conveying storm water and that is directly related to manufacturing, processing or raw materials storage areas at an industrial plant. This includes, but is not limited to, storm water discharges from industrial plant yards; immediate access roads and rail lines used or traveled by carriers of raw materials, manufactured products, waste material, or by-products used or created by the facility; material handling sites; refuse sites; sites used for the application or disposal of process waste waters; sites used for the storage and maintenance of material handling equipment; sites used for residual treatment, storage, or disposal; shipping and receiving areas; manufacturing buildings; storage areas (including tank farms) for raw materials, and intermediate and final products; and areas where industrial activity has taken place in the past and significant materials remain and are exposed to storm water. The term material handling activities includes storage, loading and unloading, transportation, or conveyance of any raw material, intermediate product, final product, by-product or waste product.
The PADEP is the Designated NPDES Authority responsible for issuing, administering, and enforcing NPDES stormwater permits under the EPA’s regulatory provisions set forth in 40 CFR.
Storm water discharges from most industrial facilities are covered under General Permits when they discharge into municipal separate sanitary sewers. General NPDES permits have a fixed term not to exceed 5 years. An operator of a storm water discharge associated with industrial activity which discharges through a large or medium municipal separate storm sewer system shall submit, to the operator of the municipal separate storm sewer system receiving the discharge the following information: the name of the facility; a contact person and phone number; the location of the discharge; a description, including Standard Industrial Classification, which best reflects the principal products or services provided by each facility; and any existing NPDES permit number.
In addition, the operator of a storm water discharge associated with industrial activity covered under a general, group, or individual permit, shall provide the following minimum information (40 CFR § 122.26 (c)(i)):
A site map showing topography, drainage features, buildings, and areas where materials or activities may contribute pollutants to storm water.
May 2005 9-61
Tookany/Tacony-Frankford Watershed Integrated Watershed Management Plan
An estimate of the area of impervious surfaces (including paved areas and building roofs) and the total area drained by each outfall (within a mile radius of the facility) and a narrative description of materials handled or stored as well as measures taken to control pollutants in the runoff.
A certification that all outfalls that should contain storm water discharges associated with industrial activity have been tested or evaluated for the presence of non-storm water discharges which are not covered by a NPDES permit; tests for such non-storm water discharges may include smoke tests, fluorometric dye tests, analysis of accurate schematics, as well as other appropriate tests. The certification shall include a description of the method used, the date of any testing, and the on-site drainage points that were directly observed during a test;
Existing information regarding significant leaks or spills of toxic or hazardous pollutants at the facility that have taken place within the three years prior to the submittal of this application;
Quantitative data based on samples collected during storm events from all outfalls containing a storm water discharge associated with industrial activity for a number of water quality parameters. Industrial Pretreatment Requirements Industrial pretreatment requirements are another area where enforcement can result in lower pollutant concentrations in storm water. Under PA Code Title 25 § 94.15, the operator of the sewerage facilities in cases where pollutants contributed by industrial users result in interference or pass through, and the violation is likely to recur, must develop and implement specific local limits for industrial users and other users, as appropriate, that together with appropriate sewerage facility or operational changes, are necessary to ensure renewed or continued compliance with the plant’s NPDES permit or sludge use or disposal practices.
Additional Measures Information on existing pollution prevention plans and spill response requirements should be provided to relevant industries in the watershed as part of the Phase II public education measures.
Industrial Pollution Prevention Plans are one means to prevent spills and accidental releases. Under PA Code Title 25 § 91.34 (Activities Utilizing Pollutants):
Persons engaged in an activity which includes the impoundment, production, processing, transportation, storage, use, application or disposal of pollutants shall take necessary measures to prevent the substances from directly or indirectly reaching waters of this Commonwealth, through accident, carelessness, maliciousness, hazards of weather or from another cause.
PADEP may require a person to submit a report or plan setting forth the nature of the activity and the nature of the preventative measures taken. The
May 2005 9-62
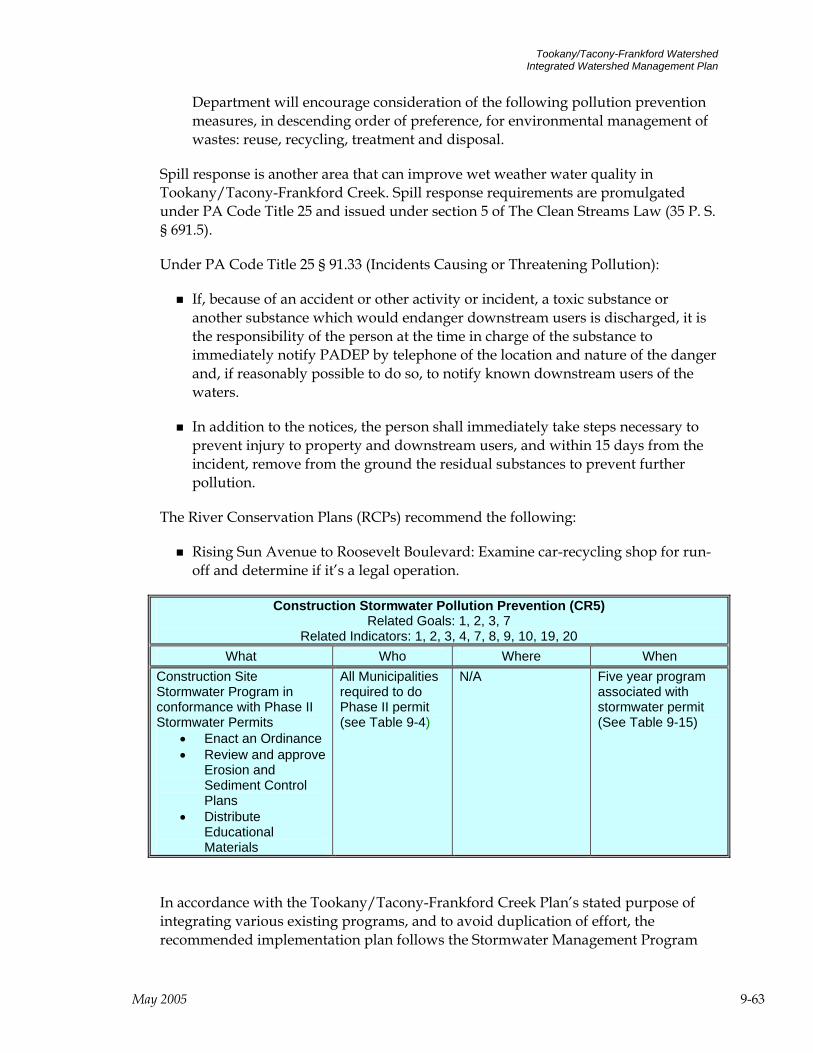
Tookany/Tacony-Frankford Watershed Integrated Watershed Management Plan
Department will encourage consideration of the following pollution prevention measures, in descending order of preference, for environmental management of wastes: reuse, recycling, treatment and disposal.
Spill response is another area that can improve wet weather water quality in Tookany/Tacony-Frankford Creek. Spill response requirements are promulgated under PA Code Title 25 and issued under section 5 of The Clean Streams Law (35 P. S. § 691.5).
Under PA Code Title 25 § 91.33 (Incidents Causing or Threatening Pollution):
If, because of an accident or other activity or incident, a toxic substance or another substance which would endanger downstream users is discharged, it is the responsibility of the person at the time in charge of the substance to immediately notify PADEP by telephone of the location and nature of the danger and, if reasonably possible to do so, to notify known downstream users of the waters.
In addition to the notices, the person shall immediately take steps necessary to prevent injury to property and downstream users, and within 15 days from the incident, remove from the ground the residual substances to prevent further pollution.
The River Conservation Plans (RCPs) recommend the following:
Rising Sun Avenue to Roosevelt Boulevard: Examine car-recycling shop for run-off and determine if it’s a legal operation.
Construction Stormwater Pollution Prevention (CR5) Related Goals: 1, 2, 3, 7
Related Indicators: 1, 2, 3, 4, 7, 8, 9, 10, 19, 20 What Who Where When
Construction Site Stormwater Program in conformance with Phase II Stormwater Permits
• Enact an Ordinance • Review and approve
Erosion and Sediment Control Plans
• Distribute Educational Materials
All Municipalities required to do Phase II permit (see Table 9-4)
N/A Five year program associated with stormwater permit (See Table 9-15)
In accordance with the Tookany/Tacony-Frankford Creek Plan’s stated purpose of integrating various existing programs, and to avoid duplication of effort, the recommended implementation plan follows the Stormwater Management Program
May 2005 9-63
Tookany/Tacony-Frankford Watershed Integrated Watershed Management Plan
Protocol (“Protocol”) to meet the six minimum control measures required of municipal permittees under the Phase II NPDES Stormwater Regulations (found at 40 CFR §§ 122.26 – 123.35). One of the six minimum controls is a Construction Site Stormwater (CSS) Program.
In Pennsylvania, two programs currently exist that address stormwater runoff from construction activities: 1) the Erosion and Sediment Control Program under 25 Pa. Code Chapter 102, and 2) the NPDES Stormwater Construction Permit Program.
The Erosion and Sediment Control Plan submitted by the developer must contain BMPs appropriate to the site and the surrounding area that might be impacted by the construction activities, as well as for post-construction runoff. Construction activity-related BMPs are available to developers and others through the Erosion and Sediment Pollution Control Program Manual, (PADEP ID: 363-2134-008) on PADEP’s website, www.dep.state.pa.us, directLINK “stormwater,” and available at the County Conservation District (CCD).
The CSS program can be summarized as consisting of the following steps:
Enact, implement and enforce a stormwater control ordinance using PADEP model language (a model PADEP is available),
Coordinate the review and approval of Erosion and Sediment Control Plans with the County Conservation District(s) (CCD) or PADEP for any earth disturbance of one acre or more causing runoff or any earth disturbance five acres or more. Make approval of the Erosion and Sediment Control Plan a prerequisite for the formal approval of land development and redevelopment plans or the issuance of building permits, and
Distribute educational materials to land developers with the applications for building permits and other land development/redevelopment.
Municipalities must have an agreement with their local CCD that addresses these reviews and permitting requirements. This agreement ensures the close coordination between the municipality and the CCD on these important issues affecting water quality. Note that a NPDES Stormwater Construction Permit is required for earth disturbance activities where the construction disturbs five acres or more, or there is a discharge from a site to the MS4 where earth disturbance is one acre or more.
In most cases, the County Conservation District implements these two programs, and PADEP is responsible for implementing and enforcing these programs in cases where the County does not have this responsibility. By requiring review and approval of Erosion and Sediment Control Plans by the CCD or PADEP (and proof of NPDES Stormwater Construction Permits where required), and by coordinating building permit and other land development permits or approvals with the CCD (or PADEP in some cases), municipalities will meet MS4 permit requirements for this component of the Construction Stormwater Runoff Management Minimum Control Measure.
May 2005 9-64
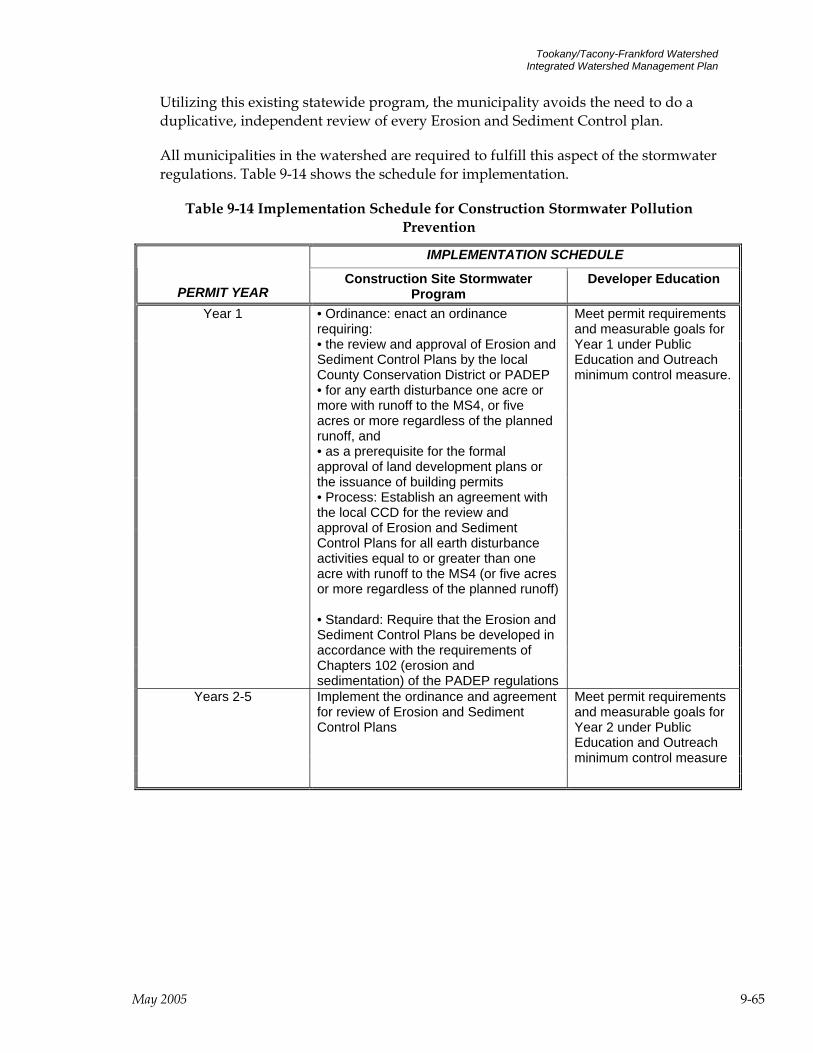
Tookany/Tacony-Frankford Watershed Integrated Watershed Management Plan
Utilizing this existing statewide program, the municipality avoids the need to do a duplicative, independent review of every Erosion and Sediment Control plan.
All municipalities in the watershed are required to fulfill this aspect of the stormwater regulations. Table 9-14 shows the schedule for implementation.
Table 9-14 Implementation Schedule for Construction Stormwater Pollution Prevention
IMPLEMENTATION SCHEDULE
PERMIT YEAR Construction Site Stormwater
Program Developer Education
Year 1 • Ordinance: enact an ordinance requiring: • the review and approval of Erosion and Sediment Control Plans by the local County Conservation District or PADEP • for any earth disturbance one acre or more with runoff to the MS4, or five acres or more regardless of the planned runoff, and • as a prerequisite for the formal approval of land development plans or the issuance of building permits • Process: Establish an agreement with the local CCD for the review and approval of Erosion and Sediment Control Plans for all earth disturbance activities equal to or greater than one acre with runoff to the MS4 (or five acres or more regardless of the planned runoff) • Standard: Require that the Erosion and Sediment Control Plans be developed in accordance with the requirements of Chapters 102 (erosion and sedimentation) of the PADEP regulations
Meet permit requirements and measurable goals for Year 1 under Public Education and Outreach minimum control measure.
Years 2-5 Implement the ordinance and agreement for review of Erosion and Sediment Control Plans
Meet permit requirements and measurable goals for Year 2 under Public Education and Outreach minimum control measure
May 2005 9-65

Tookany/Tacony-Frankford Watershed Integrated Watershed Management Plan
Post-Construction Stormwater Runoff Management (CR6) Related Goals: 1, 2, 3, 7
Related Indicators: 1, 2, 3, 4, 7, 8, 9, 10, 19, 20 What Who Where When
Post-Construction Stormwater Runoff Management in conformance with Phase II Stormwater Permits
• Enact Ordinance • Coordinate Review
and Approval of Plans
• Ensure BMP Maintenance
All Municipalities required to do Phase II permit (see Table 9-4)
N/A Five year program associated with stormwater permit. (See Table 9-16)
In accordance with the Tookany/Tacony-Frankford Creek Plan’s stated purpose of integrating various existing programs, and to avoid duplication of effort, the recommended implementation plan follows the Stormwater Management Program Protocol (“Protocol”) to meets the six minimum control measures required of municipal permittees under the Phase II NPDES Stormwater Regulations (found at 40 CFR §§ 122.26 – 123.35). One of the six minimum controls is a Post-Construction Stormwater Runoff Management Program. The program can be summarized as consisting of the following steps:
Enact, implement and enforce a stormwater control ordinance using PADEP model language,
Coordinate the review and approval of post-construction BMPs simultaneously with the review and approval for construction Erosion and Sediment Control Plans as described in the Construction Minimum Control Measure, and
Ensure long-term operation and maintenance of the BMPs
PADEP links management of post-construction run-off with the Construction Minimum Control Measure component discussed above. Approvals for construction activities will be dependent on how post-construction issues are addressed. For example, if an applicant’s plan for a land development or redevelopment project adequately addresses stormwater issues during construction but does not do so for post-construction impacts, then it must not be approved until the post-construction issues are addressed.
Ordinance Municipalities must enact, implement and enforce a stormwater control ordinance using PADEP model language. The ordinance must address the proper standard for BMPs and operations and maintenance requirements for the BMPs. The ordinance will apply a statewide post-construction requirement until the water quality-based Act 167 Plan is adopted by the County and implemented by the municipality, at
May 2005 9-66
Tookany/Tacony-Frankford Watershed Integrated Watershed Management Plan
which time the municipality will need to amend it to include those requirements.
The ordinance should require that all development and redevelopment activities with earth disturbance one acre or more with runoff to the MS4 (or five acres or more regardless of the planned runoff), be conducted in accordance with the ordinance. No formal approval of land development plans or issuance of building permits should occur without municipal approval of post-construction stormwater controls. A Model Ordinance is available from PADEP.
Implement Program The municipalities must commit municipal resources or establish an agreement with the local CCD or other service provider (e.g., municipality’s consulting engineer) for coordination of post-construction BMP approvals. There must be a process to review the post-construction controls in conjunction with the review process for construction approval.
Ensure that the post-construction controls will meet state water quality requirements. The requirements for post-construction controls depend upon the status of the Act 167 Stormwater Management planning in the watershed. Where a water-quality-based Act 167 plan has been completed (or updated), those local watershed requirements apply. Otherwise, statewide requirements must be implemented.
It is the municipalities’ responsibility to ensure that the BMPs meet the water quality requirements. However, PADEP will be reviewing post-construction plans for Individual permits, and some County Conservation Districts have the expertise to conduct the reviews under an agreement with the municipality similar to that for the Construction Minimum Control Measure.
Operation and Maintenance of Post-Construction BMPs
It is the municipalities’ responsibility to ensure that the post-construction BMPs required and approved pursuant to the program are constructed, operated and maintained. Many BMPs may be “non-structural”; they will require no operation or maintenance. Examples are use of open space and vegetated buffers in development design, minimization of soil disturbance and compaction during construction, and minimization of directly-connected impervious areas. Other BMPs - “structural BMPs” - will require proper operation and maintenance. Examples include wet ponds, grassed swales, infiltration basins and bioretention areas.
Municipalities will need to have a monitoring program that ensures that the post-construction BMPs are constructed, operated and maintained, within the first permit term of 5-years.
May 2005 9-67
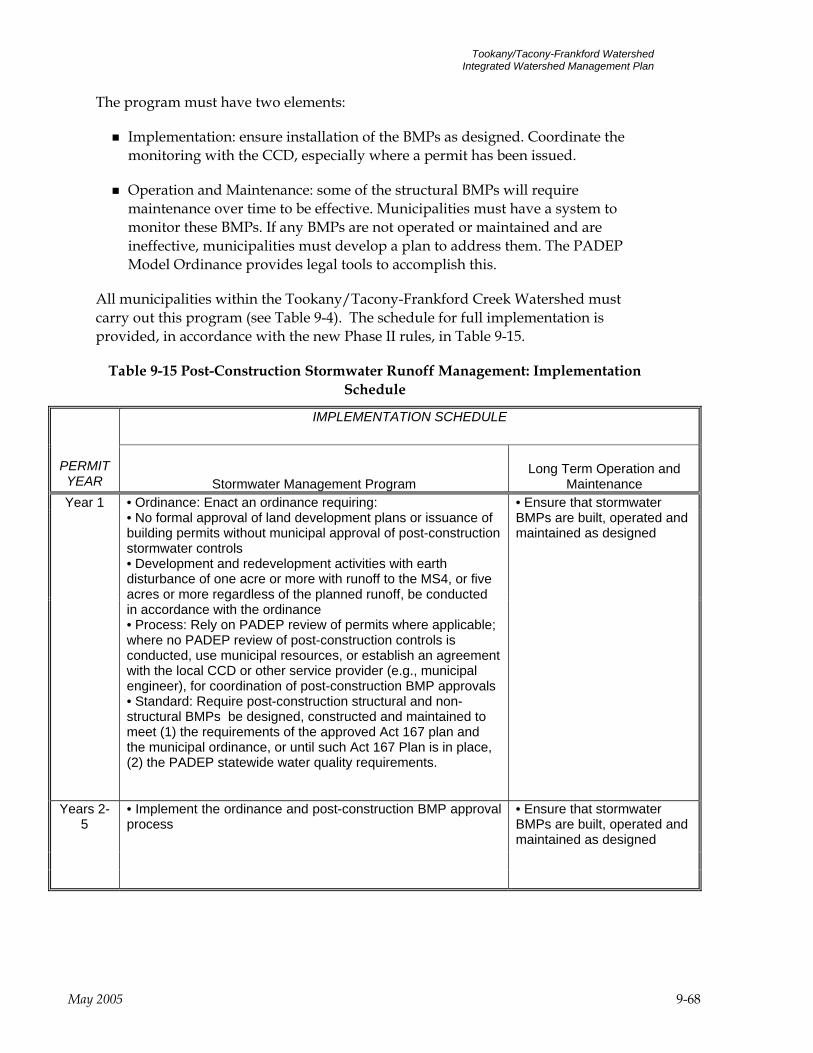
Tookany/Tacony-Frankford Watershed Integrated Watershed Management Plan
The program must have two elements:
Implementation: ensure installation of the BMPs as designed. Coordinate the monitoring with the CCD, especially where a permit has been issued.
Operation and Maintenance: some of the structural BMPs will require maintenance over time to be effective. Municipalities must have a system to monitor these BMPs. If any BMPs are not operated or maintained and are ineffective, municipalities must develop a plan to address them. The PADEP Model Ordinance provides legal tools to accomplish this.
All municipalities within the Tookany/Tacony-Frankford Creek Watershed must carry out this program (see Table 9-4). The schedule for full implementation is provided, in accordance with the new Phase II rules, in Table 9-15.
Table 9-15 Post-Construction Stormwater Runoff Management: Implementation Schedule
IMPLEMENTATION SCHEDULE
PERMIT YEAR Stormwater Management Program
Long Term Operation and Maintenance
Year 1 • Ordinance: Enact an ordinance requiring: • No formal approval of land development plans or issuance of building permits without municipal approval of post-construction stormwater controls • Development and redevelopment activities with earth disturbance of one acre or more with runoff to the MS4, or five acres or more regardless of the planned runoff, be conducted in accordance with the ordinance • Process: Rely on PADEP review of permits where applicable; where no PADEP review of post-construction controls is conducted, use municipal resources, or establish an agreement with the local CCD or other service provider (e.g., municipal engineer), for coordination of post-construction BMP approvals • Standard: Require post-construction structural and non-structural BMPs be designed, constructed and maintained to meet (1) the requirements of the approved Act 167 plan and the municipal ordinance, or until such Act 167 Plan is in place, (2) the PADEP statewide water quality requirements.
• Ensure that stormwater BMPs are built, operated and maintained as designed
Years 2-5
• Implement the ordinance and post-construction BMP approval process
• Ensure that stormwater BMPs are built, operated and maintained as designed
May 2005 9-68
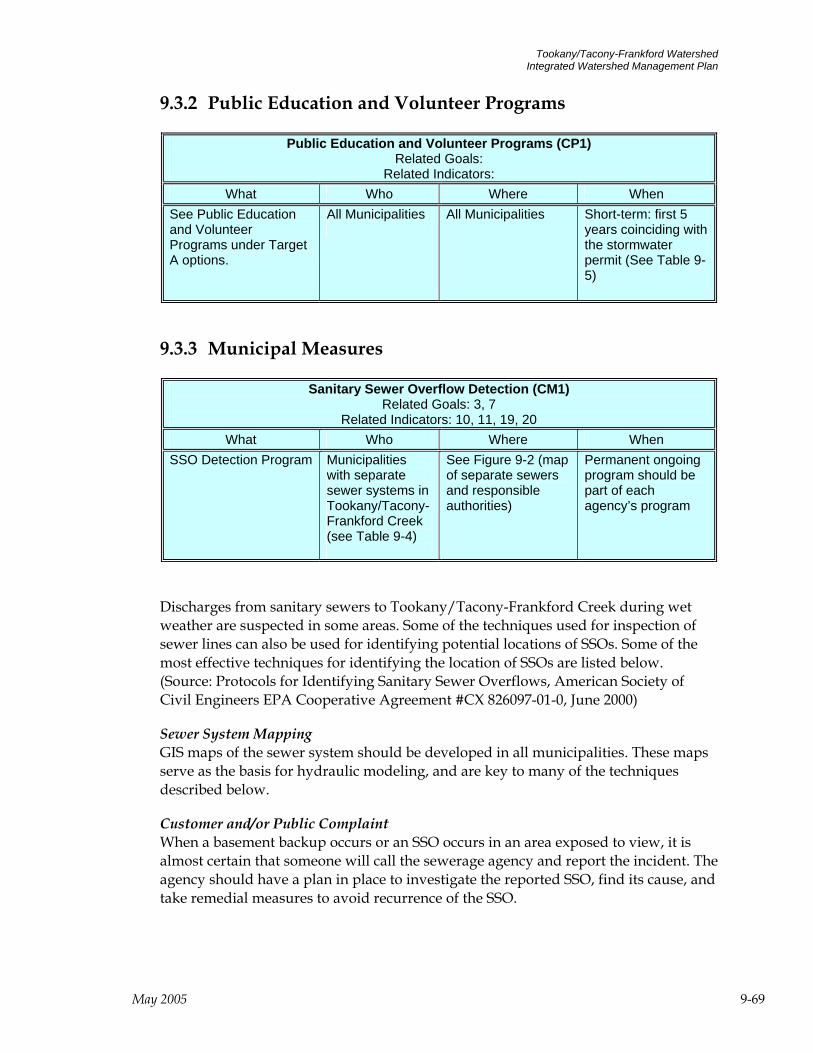
Tookany/Tacony-Frankford Watershed Integrated Watershed Management Plan
9.3.2 Public Education and Volunteer Programs
Public Education and Volunteer Programs (CP1) Related Goals:
Related Indicators: What Who Where When
See Public Education and Volunteer Programs under Target A options.
All Municipalities
All Municipalities Short-term: first 5 years coinciding with the stormwater permit (See Table 9-5)
9.3.3 Municipal Measures
Sanitary Sewer Overflow Detection (CM1) Related Goals: 3, 7
Related Indicators: 10, 11, 19, 20 What Who Where When
SSO Detection Program Municipalities with separate sewer systems in Tookany/Tacony-Frankford Creek (see Table 9-4)
See Figure 9-2 (map of separate sewers and responsible authorities)
Permanent ongoing program should be part of each agency’s program
Discharges from sanitary sewers to Tookany/Tacony-Frankford Creek during wet weather are suspected in some areas. Some of the techniques used for inspection of sewer lines can also be used for identifying potential locations of SSOs. Some of the most effective techniques for identifying the location of SSOs are listed below. (Source: Protocols for Identifying Sanitary Sewer Overflows, American Society of Civil Engineers EPA Cooperative Agreement #CX 826097-01-0, June 2000)
Sewer System Mapping GIS maps of the sewer system should be developed in all municipalities. These maps serve as the basis for hydraulic modeling, and are key to many of the techniques described below.
Customer and/or Public Complaint When a basement backup occurs or an SSO occurs in an area exposed to view, it is almost certain that someone will call the sewerage agency and report the incident. The agency should have a plan in place to investigate the reported SSO, find its cause, and take remedial measures to avoid recurrence of the SSO.
May 2005 9-69
Tookany/Tacony-Frankford Watershed Integrated Watershed Management Plan
Visual Inspections after Overflows Visual inspections can be used to confirm the occurrence of SSOs at suspected locations. The agency should develop a list of such locations and update it periodically. Immediately following a major storm, an inspection team should be sent to investigate these locations. A visual inspection program can be enhanced by encouraging participation of the public through providing opportunities for the public to become part of the solution.
Scheduled Maintenance Inspection Municipal sewerage agencies should be performing routine maintenance inspections of their system. While the maintenance crew is performing the inspection, it can also look for signs of SSO. SSOs are most likely to occur pumping stations, manholes, stream crossings, and cleanouts.
GIS-Based Analysis of Past SSOs GIS analysis can answer questions related to location, condition, trends, patterns, and modeling. Listed below are some typical questions that GIS can answer:
What exists at a given location?
Where is the location of an object or outcome with a number of specific characteristics?
What has changed over a given period?
What is the spatial distribution of areas with a certain attribute?
Sanitary Sewer Management Systems A Sanitary Sewer Management System (SSMS) can be used to store, organize and analyze large quantities of data associated with sewer system operation, maintenance, inspection, modeling and rehabilitation. The SSMS may include the following modules:
Inventory Module
Flow Module
Modeling Module
Inspection Module
Maintenance Module
Rehabilitation (CIP) Module
Mapping Module
Analysis of the data in the SSMS can reveal many problem areas, trends, and patterns.
May 2005 9-70
Tookany/Tacony-Frankford Watershed Integrated Watershed Management Plan
For example, the database can be searched to develop a list of lines with flat slopes or areas where frequent maintenance is needed. Another application of the SSMS is analysis of historical data.
Flow Monitoring Flow monitoring at strategic locations may be used to identify potential locations of SSOs. Flow monitors can be installed in open channels and pumping stations to obtain the data necessary for proper system evaluation. In conjunction with flow monitoring, rain gauges should also be installed. Many open channel temporary flowmeters have both velocity and depth measuring sensors. Municipalities are encouraged to make use of the existing rain gauge network in the Tookany/Tacony-Frankford Creek watershed.
Flow data can be used to determine the average daily flow, the infiltration rate, and the inflow rate. The rain gauge data can be used to determine the recurrence interval or severity of the storm event (for example, 5-year) that caused the inflow. The flow data will also indicate whether a surcharge occurred during the flow monitoring period.
Monitoring of Receiving Stream for Sewage Indicators This technique may be used for identifying the locations of dry weather SSOs. Samples from a nearby stream are taken at regular intervals along the stream and tested for fecal coliforms. Significant presence of these bacteria could be an indication of sewage leaking from the sewer line into the stream.
Closed Circuit Television (CCTV) Inspection CCTV inspection has been widely used for inspection of sewer line interiors. The final product of a CCTV inspection is videotape and a field log prepared and narrated by an operator. The videotape provides a visual and audio record of problem areas in the sewer line. Evaluation of the CCTV records help identify structural problems; locate leaking joints and non-structural cracks, blockages, and dropped joints; and identify areas of root intrusion.
Sewer Scanner and Evaluation Technology Surveys (SSET) The SSET is a new pipeline inspection technology developed in Japan. The equipment consists of a scanner, a CCTV, and a three-axis mechanical gyroscope. The mechanics of placing the SSET in the sewer line are similar to those of CCTV inspection. The images produced by SSET are of higher quality than CCTV images. Interpretation of the results is done in the office by an engineer rather than in the field by a technician. This increases the speed of field operations and reduces the cost.
Surcharge Level Alarms/Remote Monitoring These devices can be placed at strategic locations in the manholes and pumping stations. Once the flow reaches a certain elevation, the alarm goes off and sends a signal to a control center via a telephone line or SCADA system. The sewerage agency should have a plan in place to respond immediately to such alarms. In addition, the responding agency should also record the event in a database.
May 2005 9-71
Tookany/Tacony-Frankford Watershed Integrated Watershed Management Plan
Dye Tracing Dyed water testing consists of dye tracing or flooding, and is done to locate possible sources of inflow such as area drains or catch basins suspected of being connected to the sewer line, or sources of rainfall-induced infiltration/inflow which indirectly contribute to the flow in the sewer line through the soil and pipe cracks. Dye testing is normally used to complement smoke testing of suspect areas. The downstream manhole is monitored to see if the dye water injected into an outside source such as a downspout has found its way into the sewer system. Color CCTV may also be used for locating problem areas after the dye enters the pipeline through the surrounding soil. Figure 5-4 is a sample form for recording the results of dye water inspection.
Smoke Testing The purpose of smoke testing is to locate rainfall-dependent I/I sources which could lead to SSOs during a storm events. Public notification is an important and critical element of any smoke testing program. Specific I/I sources detected by smoke testing includes roof, yard, and area drain connections; catch basins; and broken service lines. The testing procedure consists of pumping non-toxic smoke through a manhole into the sewer pipe for distances up to 600 ft. The smoke will surface through open breaks in the pipe connections. All such sources are photographed and documented.
Aerial Monitoring Aerial monitoring by helicopter may be used to gain a general understanding of conditions along a sewer line which may lead to an SSO. For example, washout may expose a section of pipe, which would then be at risk of damage and subsequent SSO. Examples of features which may be observed during such monitoring include manholes with broken or missing covers and sewer lines exposed by erosion.
Monitoring of Grease Buildup A significant cause of SSOs during dry weather is sewer stoppages resulting from grease buildup. Such stoppages occur most frequently in downtown areas where restaurants are major sources of flow in the sewer system. A list of locations of grease buildup should be developed and these locations should be regularly inspected. Grease buildup can be prevented by enforcing grease ordinances, by effective pretreatment programs, and by promoting public education. The grease accumulations can be removed using the many available cleaning techniques, such as bucket machines with brushes, power rodders, and high velocity jet cleaners. Bioaugmentation, which involves the addition of bacteria cultures to sewers to speed up the breakdown of grease deposits, can also be effective.
Pump Station Inspection Pump station failures can lead to significant SSO problems. Such failures can be avoided by regular inspections. The frequency of inspections may vary from once a day to once a month, depending on the size and criticality of the station, and reliance on monitoring by means such as the SCADA system.
Manhole Inspection Manhole interiors are inspected for physical soundness for evidence surcharging such
May 2005 9-72
Tookany/Tacony-Frankford Watershed Integrated Watershed Management Plan
as high water marks on manhole walls. The observed defects should be compiled into a database that will be used to estimate the I/I attributable to each manhole and to establish manhole maintenance and rehabilitation program.
Line Lamping Line lamping is done in conjunction with manhole inspection by inspecting the interior of the sewer lines connected to the manhole using an artificial light and a mirror. Lamping helps identify pipe defects and provides a basis for selecting sewers for television inspection.
Building Inspection Building inspections are conducted to investigate extraneous flow from connections to sump pumps, foundation drains, downspouts, or leaking laterals. Building inspections should include investigation of the causes of basement backups.
Ground Penetrating Radar Ground penetrating radar uses the transmission and reflection properties of an electromagnetic wave passing through the soil to determine soil properties and the depth and extent of subsurface objects. The speed and amplitude of the electromagnetic wave are dependent on the moisture content of the soil. This principle can be used to detect leaking joints in the line and voids around the pipe, which may be caused by soils being washed out. In such locations, the signal will be delayed because the speed of the wave will be reduced, and the amplitude of the wave will be attenuated.
Soil Moisture and Temperature Monitoring When the ground is relatively dry, a larger portion of the rainfall will penetrate the soil, which will result in a decrease of groundwater to sanitary sewers. However, as the soil moisture increases, the amount of infiltration to sewers increases. For this reason, the impact of subsequent storm will be more severe: while the system did not overflow during the first storm, it will do so during the second storm, although the second storm of smaller intensity than the first. By monitoring the soil moisture and temperature, it may be possible to develop a measure for assessing the occurrence of SSOs.
Inspections of Stream Crossings and Parallel Lines Pipes running alongside or crossing streams are often vulnerable to SSOs. If the sewer is buried under the stream bed, the scouring action of the stream bed will eventually expose it, causing the pipe to lose its soil support. The pipe segments may move under the water pressure and joints may open, or the pipe may become exposed as a result of bank erosion. Any such openings admit significant amounts of flow, which may exceed the capacity of the sewer pipe. Stream crossings that include inverted siphons often become clogged with accumulations of silt and debris, which may cause an overflow upstream. The foundations of aerial stream crossing piers are also subject to scouring and may lead to foundation failure of the sewer line.
Sewer pipes that cross or parallel streams should be inspected to ensure that they are
May 2005 9-73
Tookany/Tacony-Frankford Watershed Integrated Watershed Management Plan
not broken or cracked. The manholes on each side of the stream should be checked for excess flow, which would indicate a leaking sewer under the stream. Since these sewers are usually in remote areas, they are vulnerable to vandalism and can overflow undetected for long periods.
All municipalities in the Tookany/Tacony-Frankford Watershed should have a routine and effective SSO detection program. Once SSOs are found and the cause determined, proper measures to eliminate the SSO should be taken.
Figure 9-2 shows the areas where separate sanitary sewers exist. All municipalities with separate sanitary sewers are responsible for developing an effective SSO detection program.
The River Conservation Plans (RCPs) recommend the following:
Greenwood Avenue to Wyncote Post Office: Inspect and repair manhole covers as needed.
Wyncote Post Office to Washington Lane Underpass: Inspect and repair all manhole covers and cement encasements.
Sanitary Sewer Overflow (SSO) Elimination: Structural Measures (CM2) Related Goals: 3, 7
Related Indicators: 10, 11, 19, 20 What Who Where When
Implement a CMOM program (option AM1). Update and implement official Act 537 Sewage Facilities Plans.
Municipalities with separate sewer systems in Tookany/Tacony-Frankford Creek (see Table 9-4)
See Figure 9-2 (map of separate sewers and responsible authorities)
Short-term (within 5 years of SSO detection)
Discharges to waters of the United States from municipal sanitary sewer collection systems are prohibited, unless authorized by an NPDES permit. Permits authorizing discharges from such systems must contain technology-based effluent limitations, based upon secondary treatment and applicable water quality standards. NPDES permits for municipal wastewater treatment plants should require record-keeping and reporting of overflows that result in a discharge. Permits should also contain requirements for operation and maintenance of the sanitary sewer collection system.
The EPA and PADEP are continuing to address SSO problems with compliance assistance and enforcement in accordance with the Compliance and Enforcement Strategy Addressing Combined Sewer Overflows and Sanitary Sewer Overflows, issued April 27, 2000. In addition to the national policy, Act 537, enacted by the Pennsylvania Legislature in 1966, requires that every municipality in the state develops and maintains an up-to-date sewage facilities plan. The main purpose of a municipality’s sewage facilities plan is to ensure that the sewage collection and
May 2005 9-74
Tookany/Tacony-Frankford Watershed Integrated Watershed Management Plan
treatment systems have adequate capacity to convey present and future to sewage flows to a wastewater treatment facility. Official plans contain comprehensive information, including:
The location of treatment plants, main intercepting lines, pumping stations and force mains, including their size, capacity, point of discharge and drainage basin served (preferably in a GIS format).
Descriptions of problems with existing sewerage facilities and operation and maintenance requirements
Planning objectives and needs
Physical description of planning area
Evaluation of existing wastewater treatment and conveyance systems
Evaluation of wastewater conveyance and treatment needs
EPA has developed a comprehensive management framework called Capacity, Management, Operations, and Maintenance (CMOM) to assist municipalities in developing more comprehensive sanitary sewer system management programs. A CMOM program, as described in option AM1, helps to prevent SSOs. Once a recurring SSO is detected using the methods recommended under option CM1, measures must be taken to eliminate the discharge.
Reduction of Stormwater Inflow and Infiltration (RDII) to Sanitary Sewers (CM3) Related Goals: 3, 7
Related Indicators: 10, 11, 19, 20 What Who Where When
RDII Reduction Program
Municipalities with separate sewer systems in Tookany/Tacony-Frankford Creek (see Table 9-4)
See Figure 9-2 (map of separate sewers and responsible authorities)
Short-term
Where significant RDII is detected, measures can be taken to seal the sanitary sewer system to reduce inflow of stormwater and groundwater. These measures are discussed in detail under option AM3, sanitary sewer rehabilitation.
May 2005 9-75
Tookany/Tacony-Frankford Watershed Integrated Watershed Management Plan
Combined Sewer Overflow (CSO) Control Program (CM4) Related Goals: 3, 7
Related Indicators: 7, 8, 9, 10, 11, 19, 20 What Who Where When
Nine Minimum Controls Long Term Control Plan (LTCP) Capital Projects, including real time control Watershed Plan Development
Philadelphia Water Department (PWD)
Philadelphia combined sewer system (Figure 9-11)
NMCs complete and ongoing RTC short-term (within 5 years)
The fundamental goal of the Philadelphia Water Department’s (PWD) combined sewer overflow (CSO) program is to improve and preserve the water environment in the Philadelphia area and to fulfill PWD’s obligations under the Clean Water Act and the Pennsylvania Clean Streams Law by implementing technically viable, cost-effective improvements and operational changes.
The PWD’s strategy to attain these goals has three primary phases: aggressive implementation of a comprehensive program for Nine Minimum Controls; planning, design and construction of capital projects that further enhance system performance and reduce CSO volume and frequency; and comprehensive watershed-based planning and analyses that will identify additional, priority actions to further improve water quality in Philadelphia area water bodies.
May 2005 9-76
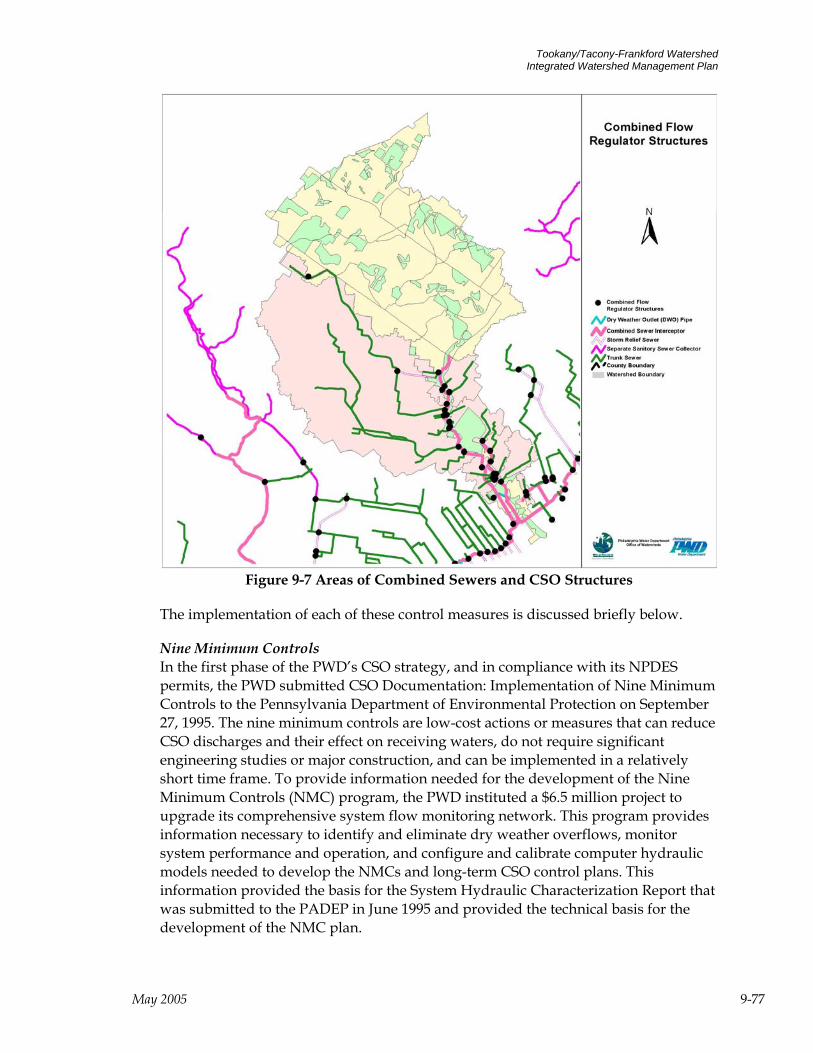
Tookany/Tacony-Frankford Watershed Integrated Watershed Management Plan
Figure 9-7 Areas of Combined Sewers and CSO Structures
The implementation of each of these control measures is discussed briefly below.
Nine Minimum Controls In the first phase of the PWD’s CSO strategy, and in compliance with its NPDES permits, the PWD submitted CSO Documentation: Implementation of Nine Minimum Controls to the Pennsylvania Department of Environmental Protection on September 27, 1995. The nine minimum controls are low-cost actions or measures that can reduce CSO discharges and their effect on receiving waters, do not require significant engineering studies or major construction, and can be implemented in a relatively short time frame. To provide information needed for the development of the Nine Minimum Controls (NMC) program, the PWD instituted a $6.5 million project to upgrade its comprehensive system flow monitoring network. This program provides information necessary to identify and eliminate dry weather overflows, monitor system performance and operation, and configure and calibrate computer hydraulic models needed to develop the NMCs and long-term CSO control plans. This information provided the basis for the System Hydraulic Characterization Report that was submitted to the PADEP in June 1995 and provided the technical basis for the development of the NMC plan.
May 2005 9-77
Tookany/Tacony-Frankford Watershed Integrated Watershed Management Plan
Extensive data from the PWD’s Geographic Information System (GIS), flow monitoring system, the U.S. Army Corps of Engineer’s Storage, Treatment, Overflow, Runoff Model (STORM), and the EXTRAN and RUNOFF blocks of the EPA Stormwater Management Model (SWMM) were used to support each phase of the CSO program. These tools were developed to support concept engineering through implementation and post-construction monitoring. The monitoring system, models, and GIS will serve as the basis for planning improvements and enhancing operation of the sewerage system over the long-term.
Using the above tools, the PWD’s NMC program includes comprehensive, aggressive measures to maximize water quality improvements through the following measures:
1. Review and improvement of on-going operation and maintenance programs
CSO Regulator Inspection & Maintenance Program
PWD has committed to demonstrating an improved follow-up response to sites experiencing a dry weather overflow. PWD has instituted a policy of next day follow-up inspection at sites that experience an overflow. PWD will conduct an evaluation of the effectiveness of twice-weekly inspections.
A database has been developed to document the maintenance performed on each CSO site. This system will ensure that proper regulator settings are maintained and system changes are documented. This database can also store scanned plan view and profile view drawings of CSO regulator and hydraulic control point chambers for inclusion in the filed inspection report forms.
Additional components of the O&M program include:
Pumping Station Maintenance Sewer Cleaning Contracts Inflow Prevention Program Tide Gate Inspection and Maintenance Program Emergency Overflow Weir Modification
2. Measures to maximize the use of the collection system for storage
Use of the collection system for storage has long been recognized as a potentially cost-effective means to mitigate the occurrence and impacts of CSOs. PWD has been implementing in-system storage in Philadelphia’s combined sewer system for nearly twenty years, using a variety of technologies.
Reducing tidal inflows at regulators can reduce CSO overflows to Tookany/Tacony-Frankford Creek by increasing available treatment capacity at the POTW.
May 2005 9-78
Tookany/Tacony-Frankford Watershed Integrated Watershed Management Plan
A program to install tide gates or other backflow prevention structures at Tookany/Tacony-Frankford Creek regulators to protect these regulators from potential inundation.
Another approach that can be implemented to gain additional in-system storage is to raise the overflow elevation by physically modifying the overflow structure (e.g. raising an overflow weir). However, this approach must be implemented cautiously, since raising the overflow elevation also raises the hydraulic grade line in the combined trunk sewer during storm flows, and therefore increases the risk of basement and other structural flooding within the upstream sewer system due to backup or surcharge problems.
3. Review and modification of PWD’s industrial pretreatment program
(also see the section from Regulatory Approaches: Industrial Pollution Prevention)
Over the years, PWD has implemented a rigorous industrial pretreatment program. The effectiveness of this program has allowed the City to develop one of the largest and most successful biosolids beneficial reuse programs in the nation. As part of the nine minimum controls effort, the Department is committed to taking actions to encourage industries to better manage their process water discharges to the sewer collection system during wet weather periods.
4. Measures to maximize flow to the wastewater treatment facilities
As a minimum control, maximizing flow to the publicly owned treatment works (POTW) means making simple modifications to the sewer system and treatment plant to enable as much wet weather flow as possible to reach the treatment plant and receive treatment. The secondary capacity of the treatment plant should be maximized, and all flows exceeding the capacity of secondary treatment should receive a minimum of primary treatment (and disinfection, when necessary). The most effective way to determine the ability of the POTW to operate acceptably at incremental increases in wet weather flow, and to estimate the effect of the POTW’s compliance with its permit requirement, is to perform stress testing to determine optimum flows, loads, and operations of the plant’s unit processes.
5. Measures to detect and eliminate dry weather overflows
Relevant measures are discussed under the municipal measures of Target A.
6. Control of the discharge of solid and floatable materials
Solids are waterborne waste material and debris consisting of sand, gravel, silts, clay, and organic matter. Significant concentrations of solids are not only a visual nuisance, but can affect turbidity, dissolved oxygen, and carry pathogens in the receiving water. In addition, excessive amounts of solids can affect the combined
May 2005 9-79

Tookany/Tacony-Frankford Watershed Integrated Watershed Management Plan
sewer system by decreasing hydraulic capacity, thus increasing the frequency of overflows. Solids can enter the system through domestic and industrial wastewater, and debris washed from streets.
Floatables are waterborne waste material and debris (e.g., plastics, polystyrene, and paper) that float at or below the water surface. Floatables seen in significant quantities are aesthetically undesirable and can cause beach closings, interfere with navigation by fouling propellers and water intake systems, and impact wildlife through entanglement and ingestion.
Floatables and solids control measures consist of non structural and structural technologies.
Non structural technologies include combined sewer system maintenance procedures such as sewer flushing, street sweeping, and catch basin cleaning. Public education, land use planning and zoning, and ordinances are also considered non-structural technologies implemented to reduce solids and floatables entering the combined sewer system. These technologies are discussed under separate subsections and therefore will not be discussed further here.
Structural controls typically consist of abatement devices that would be constructed near the point of discharge. Technologies used for removing solids and floatables from CSOs include: Baffles, Booms, Catch Basin Modifications, Netting Systems, Swirl Concentrators, Screens, and Trash Racks. Modification of storm and combined sewer inlets for solids control, as well as catch basin and storm inlet maintenance are discussed under separate subsections. Solids and floatables discharged from CSOs may represent a potentially significant impact to Tookany/Tacony-Frankford Creek. PWD currently expends considerable effort to minimize the potential discharge of solids and floatables.
PWD performs over 50,000 inlet cleanings each year preventing many tons of street surface-related materials from discharging to waterways through CSOs. The significant pipe cleaning and grit removal activities conducted by the department also remove a great deal of material that otherwise might discharge through CSO outlets during wet weather.
The continued practice of regularly cleaning and maintaining grit pockets at critical locations in the trunk and interceptor system is an important part of the CSO control strategy. Grit buildup reduces the hydraulic capacity of the interceptor both by constricting its cross sectional area, and by increasing its frictional resistance. For example, quarterly cleaning of the 100-foot deep siphon grit pocket located at the Central Schuylkill wastewater pumping station is a major undertaking requiring specialized equipment and the commitment of significant labor resources. This practice has been shown to reduce the hydraulic grade surface at the siphon, increasing the wet weather flow capacity to the SWWPCP. Prior to the institution of this cleaning
May 2005 9-80
Tookany/Tacony-Frankford Watershed Integrated Watershed Management Plan
practice, the grit pit at this location had not been cleaned regularly in over 40 years.
Operation condition inspections of regulator chamber and backflow prevention devices are conducted for each structure approximately weekly, resulting in more than 10,000 inspections conducted each year. Additionally, comprehensive structural and preventative maintenance inspections are performed annually.
A pilot, in-line, floatables netting chamber was constructed as part of a sewer reconstruction project at CSO T-4 Rising Sun Ave. E. of Tacony Creek. The construction of the chamber was completed in March of 1997 and the netting system continues to operate. The quantity of material collected is weighed with each net change. On an area weighted basis the inlet cleaning program data suggests that street surface litter dominates the volume of material that can enter the sewer system. The pilot in-line netting system installed at T_4 has been shown to capture debris on the same order as the WPCP influent screens indicating that effective floatables control needs to target street surface litter in order to effectively reduce the quantity of debris likely to cause aesthetic concerns in receiving streams.
Debris grills are maintained regularly at sites where the tide introduces large floating debris into the outfall conduit. This debris can then become lodged in a tide gate thus causing inflow to occur. Additionally, these debris grills provide entry restriction, and some degree of floatables control. Repair, Rehabilitation, and /or expansion of debris grills was performed at outfall F05 during calendar year 2002.
7. Implementation of programs to prevent generation and discharge of pollutants at the source
Most of the city ordinances related to this minimum control are housekeeping practices that help to prohibit litter and debris from actually being deposited on the streets and within the watershed area. These options are discussed under Target A, including litter ordinances and illegal dumping policies and enforcement. If these pollutants eventually accumulate within the watershed, practices such as street sweeping and regular maintenance of catch basins can help to reduce the amount of pollutants entering the combined system and ultimately, the receiving water.
8. Measures to ensure that the public is informed about the occurrence, location and impacts of CSOs
The Water Department has developed and will continue to develop a series of informational brochures and other materials about its CSO discharges and the potential affect on the receiving waters, in addition to information regarding dry weather flows from its stormwater outfalls. The brochures provide phone contacts for additional information. Also, the opportunity to recruit citizen volunteers to check or adopt CSO outfalls in their watersheds (i.e., notifying the PWD of dry weather
May 2005 9-81
Tookany/Tacony-Frankford Watershed Integrated Watershed Management Plan
overflows, etc.) will be explored through the watershed partnership framework. Brochures and other educational materials discuss the detrimental affects of these overflows and request that the public report these incidences to the department. In addition, the Water Department has enlisted watershed organizations to assist it with this endeavor. The department continued with this focus in 2002 to raise the level of awareness in its citizens about the function of combined and stormwater outfalls through a variety of educational mediums. The watershed partnerships are important for this kind of public/private effort to protect stream water quality. Lastly, the department's Waterways Restoration Unit will investigate the feasibility of installing signs that can withstand nature and vandals at the department's outfalls
9. Comprehensive inspection and monitoring programs to characterize and report overflows and other conditions in the combined sewer system.
Monitoring and characterization of CSO impacts from a combined wastewater collection and treatment system are necessary to document existing conditions and to identify water quality benefits achievable by CSO mitigation measures. Tables are compiled annually to represent average annual CSO overflow statistics as required in the NPDES Permit.
Long Term Control Plan Capital Projects The second phase of the PWD’s CSO strategy is focused on technology-based capital improvements to the City’s sewerage system that will further increase its ability to store and treat combined sewer flow, reduce inflow to the system, eliminate flooding due to system surcharging, decrease CSO volumes and improve receiving water quality. The recommended capital improvement program is the result of a detailed analysis of a broad range of technology-based control alternatives.
Real Time Control
A real time control (RTC) center is being established at PWD’s Fox Street facility. The ultimate goal for this center is to house a centralized RTC system that will allow telemetered commands to be sent to site-specific, automated controls located throughout the collection and treatment facilities. These signals may be transmitted based upon an optimized response to rainfall patterns and are intended to further enhance capture of CSO volume. Establishing a RTC center will enable PWD to provide 24-hr monitoring and eventually, control of key collection system facilities including automated CSO regulators, pump stations, and inter-district diversions.
Two real time control projects are currently being designed for regulators that discharge to Tacony Creek. The trunk sewer discharging to regulator structure T-14 near Juniata Park and Tacony Creek Park contains excess storage capacity that can be utilized by increasing the overflow elevation during smaller rain events. A dynamic gate is ideal because the original overflow capacity is still needed to provide adequate drainage during very large storms. The project will reduce discharge volume associated pollutants such as bacteria, organic matter, solids, and litter from both untreated stormwater and wastewater.
May 2005 9-82
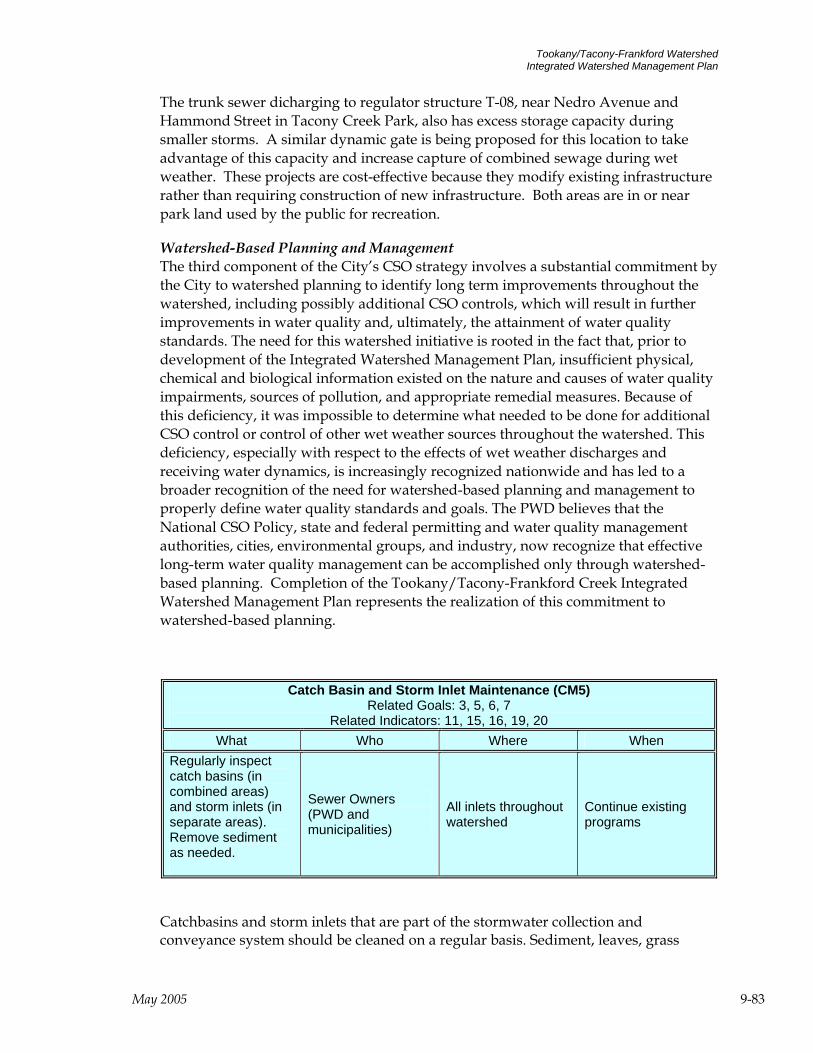
Tookany/Tacony-Frankford Watershed Integrated Watershed Management Plan
The trunk sewer dicharging to regulator structure T-08, near Nedro Avenue and Hammond Street in Tacony Creek Park, also has excess storage capacity during smaller storms. A similar dynamic gate is being proposed for this location to take advantage of this capacity and increase capture of combined sewage during wet weather. These projects are cost-effective because they modify existing infrastructure rather than requiring construction of new infrastructure. Both areas are in or near park land used by the public for recreation.
Watershed-Based Planning and Management The third component of the City’s CSO strategy involves a substantial commitment by the City to watershed planning to identify long term improvements throughout the watershed, including possibly additional CSO controls, which will result in further improvements in water quality and, ultimately, the attainment of water quality standards. The need for this watershed initiative is rooted in the fact that, prior to development of the Integrated Watershed Management Plan, insufficient physical, chemical and biological information existed on the nature and causes of water quality impairments, sources of pollution, and appropriate remedial measures. Because of this deficiency, it was impossible to determine what needed to be done for additional CSO control or control of other wet weather sources throughout the watershed. This deficiency, especially with respect to the effects of wet weather discharges and receiving water dynamics, is increasingly recognized nationwide and has led to a broader recognition of the need for watershed-based planning and management to properly define water quality standards and goals. The PWD believes that the National CSO Policy, state and federal permitting and water quality management authorities, cities, environmental groups, and industry, now recognize that effective long-term water quality management can be accomplished only through watershed-based planning. Completion of the Tookany/Tacony-Frankford Creek Integrated Watershed Management Plan represents the realization of this commitment to watershed-based planning.
Catch Basin and Storm Inlet Maintenance (CM5) Related Goals: 3, 5, 6, 7
Related Indicators: 11, 15, 16, 19, 20 What Who Where When
Regularly inspect catch basins (in combined areas) and storm inlets (in separate areas). Remove sediment as needed.
Sewer Owners (PWD and municipalities)
All inlets throughout watershed
Continue existing programs
Catchbasins and storm inlets that are part of the stormwater collection and conveyance system should be cleaned on a regular basis. Sediment, leaves, grass
May 2005 9-83
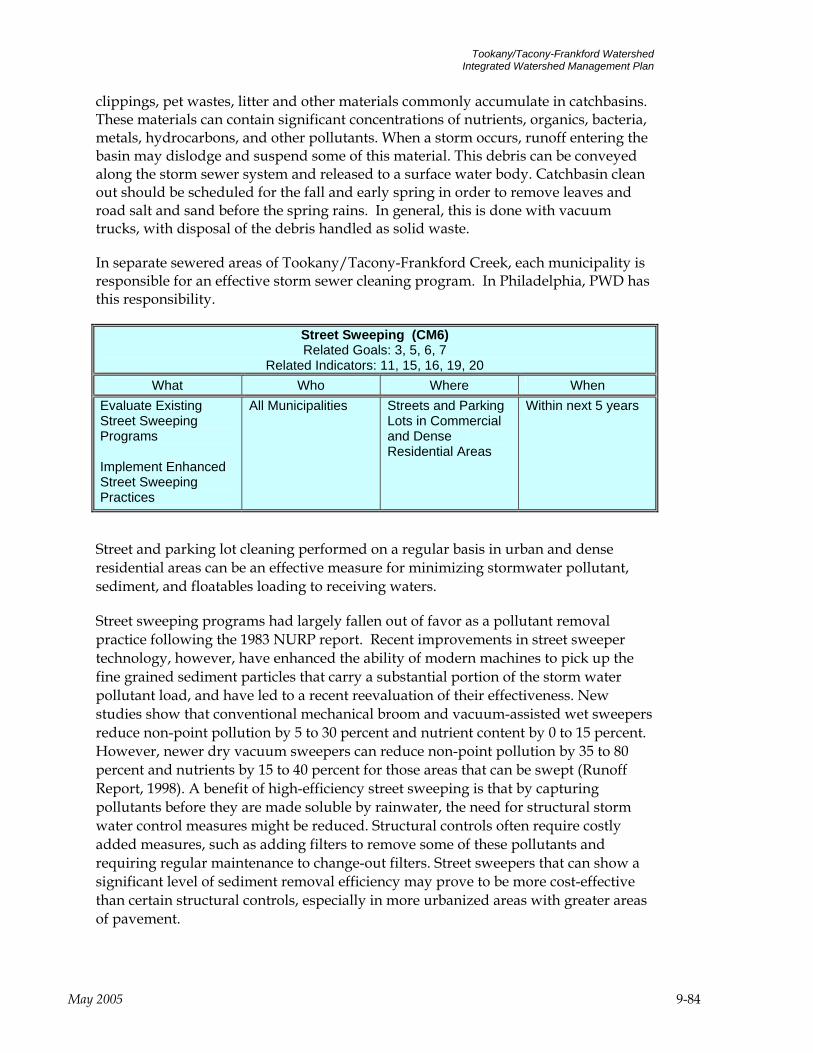
Tookany/Tacony-Frankford Watershed Integrated Watershed Management Plan
clippings, pet wastes, litter and other materials commonly accumulate in catchbasins. These materials can contain significant concentrations of nutrients, organics, bacteria, metals, hydrocarbons, and other pollutants. When a storm occurs, runoff entering the basin may dislodge and suspend some of this material. This debris can be conveyed along the storm sewer system and released to a surface water body. Catchbasin clean out should be scheduled for the fall and early spring in order to remove leaves and road salt and sand before the spring rains. In general, this is done with vacuum trucks, with disposal of the debris handled as solid waste.
In separate sewered areas of Tookany/Tacony-Frankford Creek, each municipality is responsible for an effective storm sewer cleaning program. In Philadelphia, PWD has this responsibility.
Street Sweeping (CM6) Related Goals: 3, 5, 6, 7
Related Indicators: 11, 15, 16, 19, 20 What Who Where When
Evaluate Existing Street Sweeping Programs Implement Enhanced Street Sweeping Practices
All Municipalities
Streets and Parking Lots in Commercial and Dense Residential Areas
Within next 5 years
Street and parking lot cleaning performed on a regular basis in urban and dense residential areas can be an effective measure for minimizing stormwater pollutant, sediment, and floatables loading to receiving waters.
Street sweeping programs had largely fallen out of favor as a pollutant removal practice following the 1983 NURP report. Recent improvements in street sweeper technology, however, have enhanced the ability of modern machines to pick up the fine grained sediment particles that carry a substantial portion of the storm water pollutant load, and have led to a recent reevaluation of their effectiveness. New studies show that conventional mechanical broom and vacuum-assisted wet sweepers reduce non-point pollution by 5 to 30 percent and nutrient content by 0 to 15 percent. However, newer dry vacuum sweepers can reduce non-point pollution by 35 to 80 percent and nutrients by 15 to 40 percent for those areas that can be swept (Runoff Report, 1998). A benefit of high-efficiency street sweeping is that by capturing pollutants before they are made soluble by rainwater, the need for structural storm water control measures might be reduced. Structural controls often require costly added measures, such as adding filters to remove some of these pollutants and requiring regular maintenance to change-out filters. Street sweepers that can show a significant level of sediment removal efficiency may prove to be more cost-effective than certain structural controls, especially in more urbanized areas with greater areas of pavement.
May 2005 9-84
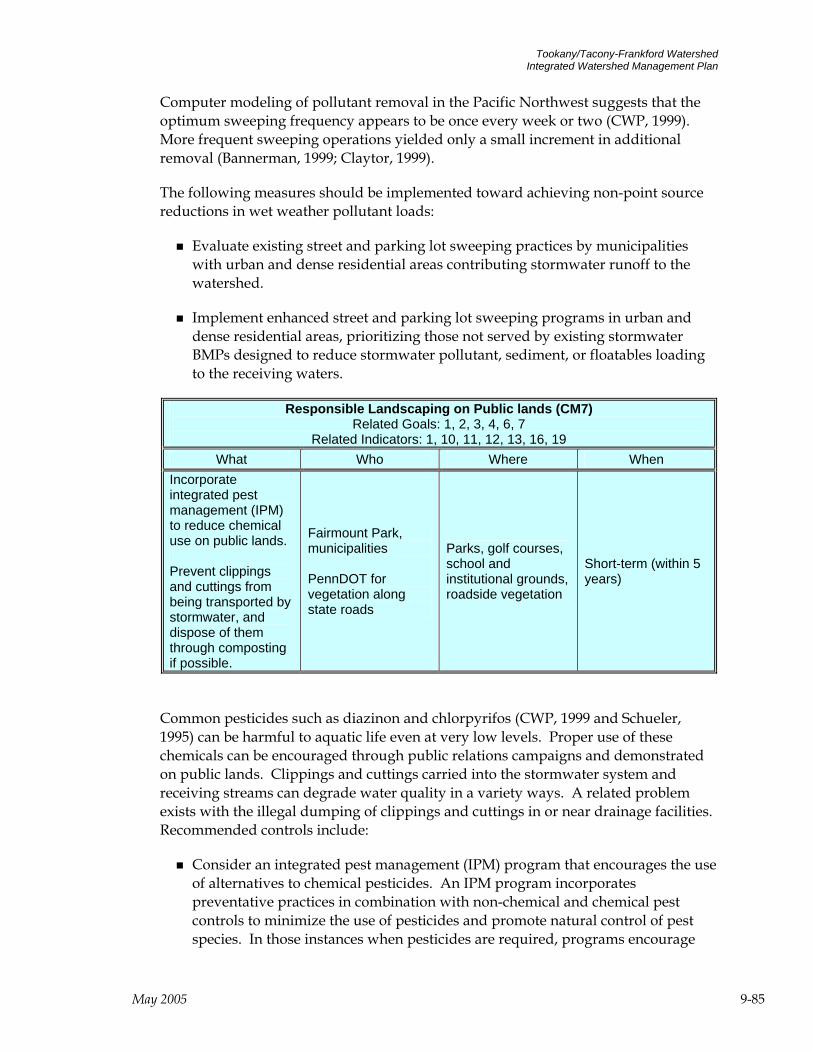
Tookany/Tacony-Frankford Watershed Integrated Watershed Management Plan
Computer modeling of pollutant removal in the Pacific Northwest suggests that the optimum sweeping frequency appears to be once every week or two (CWP, 1999). More frequent sweeping operations yielded only a small increment in additional removal (Bannerman, 1999; Claytor, 1999).
The following measures should be implemented toward achieving non-point source reductions in wet weather pollutant loads:
Evaluate existing street and parking lot sweeping practices by municipalities with urban and dense residential areas contributing stormwater runoff to the watershed.
Implement enhanced street and parking lot sweeping programs in urban and dense residential areas, prioritizing those not served by existing stormwater BMPs designed to reduce stormwater pollutant, sediment, or floatables loading to the receiving waters.
Responsible Landscaping on Public lands (CM7) Related Goals: 1, 2, 3, 4, 6, 7
Related Indicators: 1, 10, 11, 12, 13, 16, 19 What Who Where When
Incorporate integrated pest management (IPM) to reduce chemical use on public lands. Prevent clippings and cuttings from being transported by stormwater, and dispose of them through composting if possible.
Fairmount Park, municipalities PennDOT for vegetation along state roads
Parks, golf courses, school and institutional grounds, roadside vegetation
Short-term (within 5 years)
Common pesticides such as diazinon and chlorpyrifos (CWP, 1999 and Schueler, 1995) can be harmful to aquatic life even at very low levels. Proper use of these chemicals can be encouraged through public relations campaigns and demonstrated on public lands. Clippings and cuttings carried into the stormwater system and receiving streams can degrade water quality in a variety ways. A related problem exists with the illegal dumping of clippings and cuttings in or near drainage facilities. Recommended controls include:
Consider an integrated pest management (IPM) program that encourages the use of alternatives to chemical pesticides. An IPM program incorporates preventative practices in combination with non-chemical and chemical pest controls to minimize the use of pesticides and promote natural control of pest species. In those instances when pesticides are required, programs encourage
May 2005 9-85
Tookany/Tacony-Frankford Watershed Integrated Watershed Management Plan
the use of less toxic products such as insecticidal soaps. The development of higher tolerance levels for certain weed species is a central concept of IPM programs for reducing herbicide use. This approach should be balanced with the invasive species control methods discussed under Target B.
Collect clippings and cuttings on slopes and the bottom of stormwater control facilities and near stormwater inlets. Avoid mowing when significant rain events are predicted. Dispose of material through composting when possible.
The River Conservation Plans (RCPs) recommend the following:
High School Park to Ashbourne Road along the Tookany Creek Parkway: Educate Cheltenham Township Public Works in ecological maintenance practices. Encourage the 2 golf course to evaluate fertilizing, mowing regime. Consider Audubon Golf Certification Program.
Baeder Creek Watershed: Work with Abington Jr. High School to restore riparian buffer. Establish “no-mow” zone 30 feet from creek and plant native plants.
Rock Creek Watershed: The mowed township-owned park would benefit from a change to a wooded area for both habitat enhancement and increased infiltration.
Abington Country Club to Township Line Road: The Club greens should be maintained in a way to protect water quality.
Abington Friends School to Township Line Road: Alter land management practices in the park to the restored pond shoreline including BMP’s for the chip and putt course.
Wyoming Avenue to Castor Avenue: Meet with Juniata golf course to discuss creating a “no mow” zone.
May 2005 9-86

Tookany/Tacony-Frankford Watershed Integrated Watershed Management Plan
Responsible Bridge and Roadway Maintenance (CM9) Related Goals: 1, 2, 4, 7 Related Indicators: 1, 19
What Who Where When Incorporate BMPs into regular maintenance and repairs: Road and bridge resurfacing practices Deicing chemicals and practices Existing bridge drains
Bridge and roadway owners (municipalities and PennDOT)
Roadways and bridges (Figure 9-12)
Short-term (within 5 years)
Figure 9-8 Major Roads and Bridges
Sediment and pollutants are generated during daily roadway and bridge use and scheduled repair operations, and these pollutants can impact local water quality by
May 2005 9-87
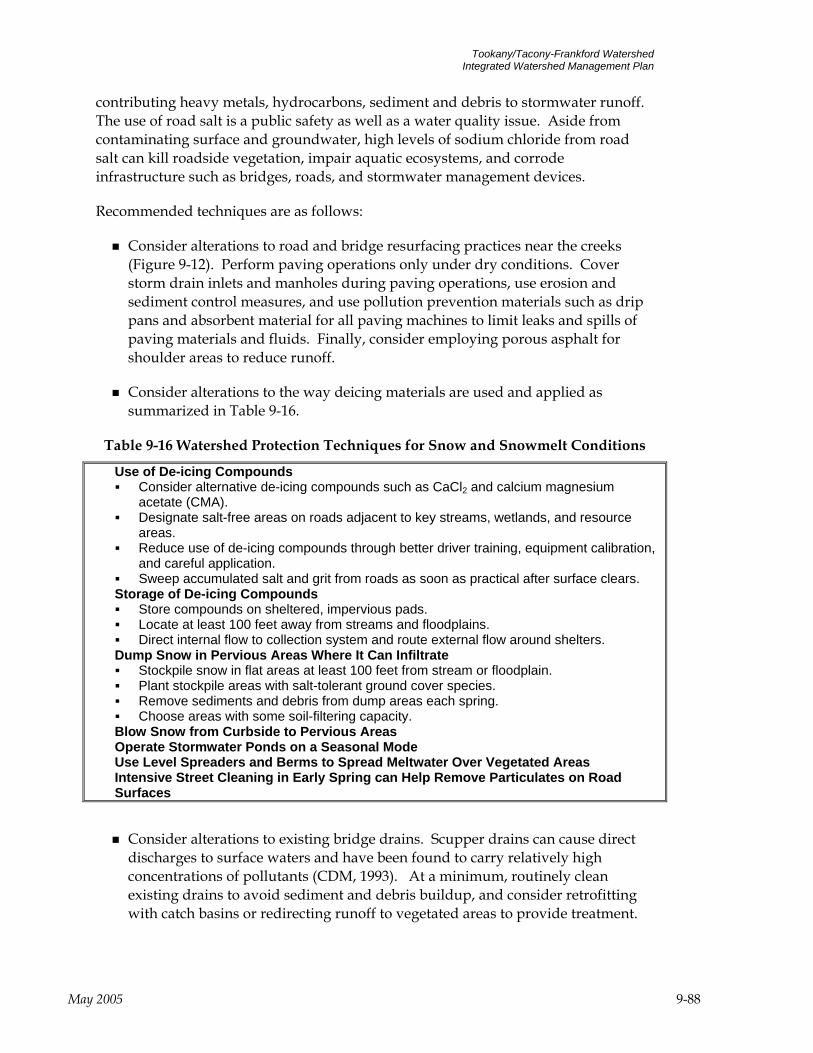
Tookany/Tacony-Frankford Watershed Integrated Watershed Management Plan
contributing heavy metals, hydrocarbons, sediment and debris to stormwater runoff. The use of road salt is a public safety as well as a water quality issue. Aside from contaminating surface and groundwater, high levels of sodium chloride from road salt can kill roadside vegetation, impair aquatic ecosystems, and corrode infrastructure such as bridges, roads, and stormwater management devices.
Recommended techniques are as follows:
Consider alterations to road and bridge resurfacing practices near the creeks (Figure 9-12). Perform paving operations only under dry conditions. Cover storm drain inlets and manholes during paving operations, use erosion and sediment control measures, and use pollution prevention materials such as drip pans and absorbent material for all paving machines to limit leaks and spills of paving materials and fluids. Finally, consider employing porous asphalt for shoulder areas to reduce runoff.
Consider alterations to the way deicing materials are used and applied as summarized in Table 9-16.
Table 9-16 Watershed Protection Techniques for Snow and Snowmelt Conditions
Use of De-icing Compounds Consider alternative de-icing compounds such as CaCl2 and calcium magnesium
acetate (CMA). Designate salt-free areas on roads adjacent to key streams, wetlands, and resource
areas. Reduce use of de-icing compounds through better driver training, equipment calibration,
and careful application. Sweep accumulated salt and grit from roads as soon as practical after surface clears.
Storage of De-icing Compounds Store compounds on sheltered, impervious pads. Locate at least 100 feet away from streams and floodplains. Direct internal flow to collection system and route external flow around shelters.
Dump Snow in Pervious Areas Where It Can Infiltrate Stockpile snow in flat areas at least 100 feet from stream or floodplain. Plant stockpile areas with salt-tolerant ground cover species. Remove sediments and debris from dump areas each spring. Choose areas with some soil-filtering capacity.
Blow Snow from Curbside to Pervious Areas Operate Stormwater Ponds on a Seasonal Mode Use Level Spreaders and Berms to Spread Meltwater Over Vegetated Areas Intensive Street Cleaning in Early Spring can Help Remove Particulates on Road Surfaces
Consider alterations to existing bridge drains. Scupper drains can cause direct discharges to surface waters and have been found to carry relatively high concentrations of pollutants (CDM, 1993). At a minimum, routinely clean existing drains to avoid sediment and debris buildup, and consider retrofitting with catch basins or redirecting runoff to vegetated areas to provide treatment.
May 2005 9-88

Tookany/Tacony-Frankford Watershed Integrated Watershed Management Plan
Runoff from bridges and roadways can become a serious hazard to water quality when the toxic pollutants from vehicles are taken into consideration. The River Conservation Plan (RCPs) recommend the following:
Ralph Morgan Park to Greenwood Avenue: Communicate with SEPTA regarding their maintenance practices of the parking lot.
Cheltenham Avenue to Adams Avenue: Check railroad area for possible chemical run-off.
9.3.4 Stormwater Management Source Control Measures
Increasing Urban Tree Canopy (CS2) Related Goals: 1, 2, 4, 6, 7
Related Indicators: 1, 4, 13, 16, 17, 18, 19, 20 What Who Where When
Increase tree canopy in the watershed from 27% to 32%.
Municipalities (through ordinances, education, and incentive programs affecting land owners)
Private property, Parking lots, Streets, Parks (riparian corridors under Target B)
Medium-term (5-15 years)
Tree planting and urban reforestation programs provide hydrologic benefits in addition to quality of life improvements. Leaf surfaces intercept some rainfall that might otherwise fall on impervious surfaces. The rainfall then either evaporates or is conveyed more slowly to the ground along plant stems and trunks. American Forests has assessed tree canopy in the Tookany/Tacony-Frankford watershed at 27% (report “Urban Ecosystem Analysis, Delaware Valley Region” available at www.americanforests.org). American Forests recommends the following levels of tree canopy coverage for urban watersheds:
40% overall 50% in suburban residential zones 25% in urban residential zones 15% in central business districts
A goal of increasing tree canopy by 5% of the watershed over the medium term was selected as a feasible implementation level. Several regulatory and incentive-based strategies to achieve these goals include:
Requirements to protect existing trees on private property, or creation of “tree banks” to offset loss (see regulatory/incentive approaches).
May 2005 9-89
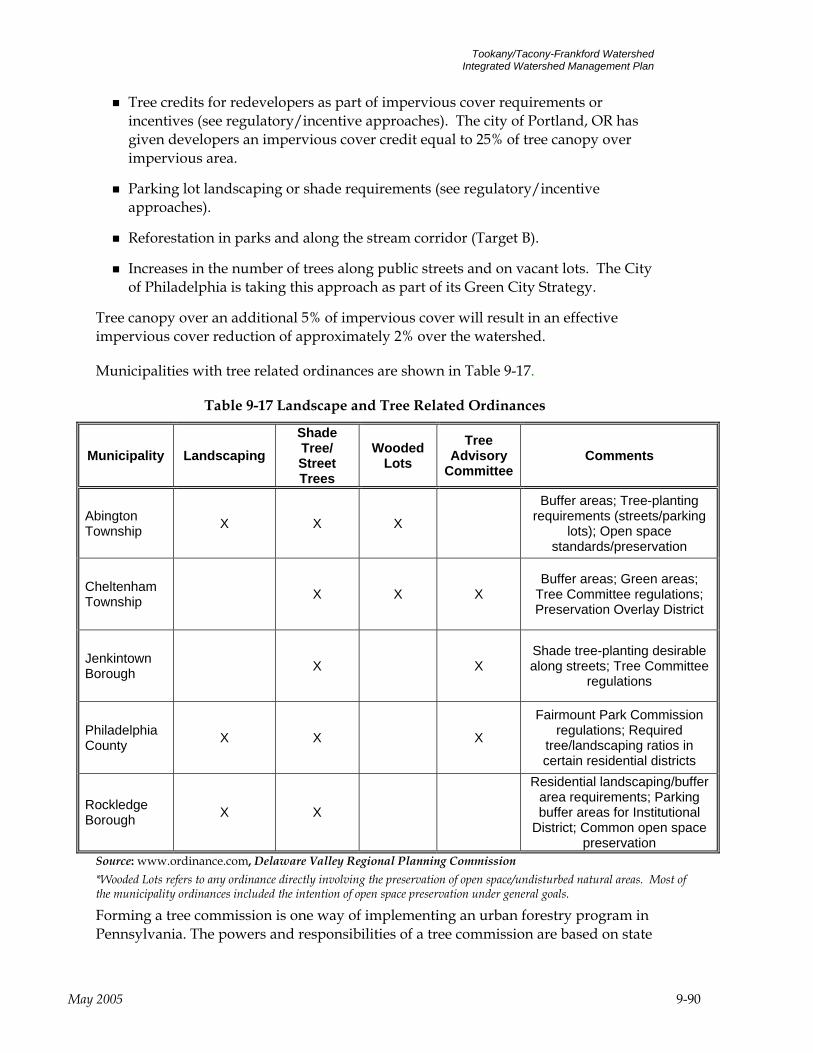
Tookany/Tacony-Frankford Watershed Integrated Watershed Management Plan
Tree credits for redevelopers as part of impervious cover requirements or incentives (see regulatory/incentive approaches). The city of Portland, OR has given developers an impervious cover credit equal to 25% of tree canopy over impervious area.
Parking lot landscaping or shade requirements (see regulatory/incentive approaches).
Reforestation in parks and along the stream corridor (Target B).
Increases in the number of trees along public streets and on vacant lots. The City of Philadelphia is taking this approach as part of its Green City Strategy.
Tree canopy over an additional 5% of impervious cover will result in an effective impervious cover reduction of approximately 2% over the watershed.
Municipalities with tree related ordinances are shown in Table 9-17.
Table 9-17 Landscape and Tree Related Ordinances
Municipality Landscaping Shade Tree/ Street Trees
Wooded Lots
Tree Advisory
CommitteeComments
Abington Township X X X
Buffer areas; Tree-planting requirements (streets/parking
lots); Open space standards/preservation
Cheltenham Township X X X
Buffer areas; Green areas; Tree Committee regulations; Preservation Overlay District
Jenkintown Borough X X
Shade tree-planting desirable along streets; Tree Committee
regulations
Philadelphia County X X X
Fairmount Park Commission regulations; Required
tree/landscaping ratios in certain residential districts
Rockledge Borough X X
Residential landscaping/buffer area requirements; Parking buffer areas for Institutional
District; Common open space preservation
Source: www.ordinance.com, Delaware Valley Regional Planning Commission *Wooded Lots refers to any ordinance directly involving the preservation of open space/undisturbed natural areas. Most of the municipality ordinances included the intention of open space preservation under general goals.
Forming a tree commission is one way of implementing an urban forestry program in Pennsylvania. The powers and responsibilities of a tree commission are based on state
May 2005 9-90

Tookany/Tacony-Frankford Watershed Integrated Watershed Management Plan
statute and are assumed by local government. By forming and empowering a tree commission, a community can empower and motivate volunteers to run an effective urban forestry program. Tree commissions are either advisory or administrative and may have various responsibilities.
Advise community leaders and staff on administering the community forest Stimulate and organize tree planting and maintenance Develop and implement urban forest inventories, management plans, and
ordinances Lessen liability by arranging to remove hazardous trees and repair damage
caused by trees In Pennsylvania, a tree commission created by municipal ordinance as a decision-making body has exclusive control over a community’s shade trees. No tree can be planted or removed within the public right-of-way except under the auspices of the tree commission. This includes public trees that may be planted or removed in conjunction with subdivisions or approved development plans. Tree commissions can be given additional power within a municipality by a council, including:
Control over all public trees such as trees within community parks Review and approval of landscaping proposed in development plans
The formation and empowerment of a tree commission can be a crucial element in developing broad-based support for community trees and ensuring long-term success and continuance of a community forestry program. (For more information, contact the Extension Urban Forestry Program, School of Forest Resources. The Pennsylvania State University, 108 Ferguson, University Park, PA 16802; (814) 863-7941
Porous Pavement and Subsurface Storage (CS3) Related Goals: 1, 2, 3, 4, 6, 7
Related Indicators: 1, 10, 11, 16, 19, 20 What Who Where When
Install porous pavement and subsurface storage in 10-50% of parking lots; coverage to be chosen by municipality to meet a share of watershed-wide reduction targets. Route runoff from nearby impervious cover to storage when possible.
Public and private parking lot owners. See Figure 9-13. Long-term: 15+
years
As discussed in Section 7, subsurface storage under parking lots is one of the most feasible and effective ways to create storage and promote infiltration in the highly
May 2005 9-91
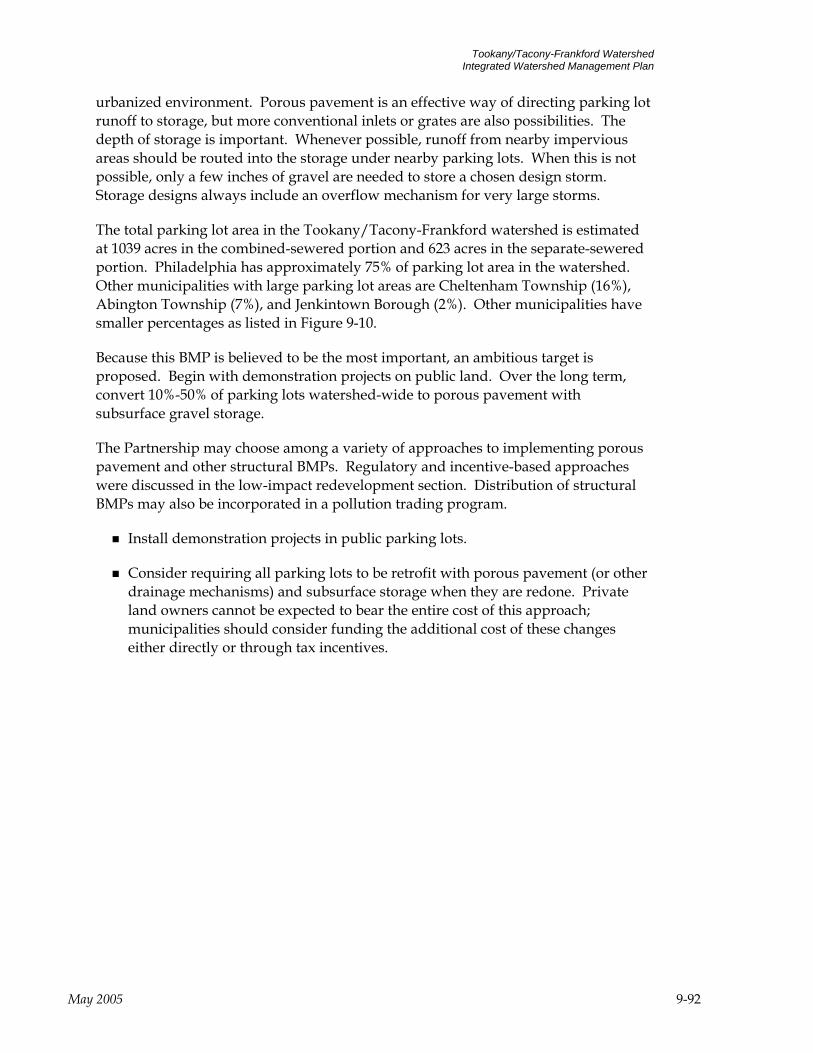
Tookany/Tacony-Frankford Watershed Integrated Watershed Management Plan
urbanized environment. Porous pavement is an effective way of directing parking lot runoff to storage, but more conventional inlets or grates are also possibilities. The depth of storage is important. Whenever possible, runoff from nearby impervious areas should be routed into the storage under nearby parking lots. When this is not possible, only a few inches of gravel are needed to store a chosen design storm. Storage designs always include an overflow mechanism for very large storms.
The total parking lot area in the Tookany/Tacony-Frankford watershed is estimated at 1039 acres in the combined-sewered portion and 623 acres in the separate-sewered portion. Philadelphia has approximately 75% of parking lot area in the watershed. Other municipalities with large parking lot areas are Cheltenham Township (16%), Abington Township (7%), and Jenkintown Borough (2%). Other municipalities have smaller percentages as listed in Figure 9-10.
Because this BMP is believed to be the most important, an ambitious target is proposed. Begin with demonstration projects on public land. Over the long term, convert 10%-50% of parking lots watershed-wide to porous pavement with subsurface gravel storage.
The Partnership may choose among a variety of approaches to implementing porous pavement and other structural BMPs. Regulatory and incentive-based approaches were discussed in the low-impact redevelopment section. Distribution of structural BMPs may also be incorporated in a pollution trading program.
Install demonstration projects in public parking lots.
Consider requiring all parking lots to be retrofit with porous pavement (or other drainage mechanisms) and subsurface storage when they are redone. Private land owners cannot be expected to bear the entire cost of this approach; municipalities should consider funding the additional cost of these changes either directly or through tax incentives.
May 2005 9-92

Tookany/Tacony-Frankford Watershed Integrated Watershed Management Plan
Figure 9-9 Parking Areas in Tookany/Tacony-Frankford Creek Watershed
Abington Township(7.48%)Cheltenham Township(15.5%)
Jenkintown Borough(1.69%)Philadelphia City(74.9%)Rockledge Borough(0.19%)
Springfield Township(0.23%)
Figure 9-10 Percent of Total Parking Area by Municipality
May 2005 9-93

Tookany/Tacony-Frankford Watershed Integrated Watershed Management Plan
The River Conservation Plans (RCPs) recommend the following:
Greenwood Avenue to Wyncote Post Office: If parking lots are renovated, use pervious material to reduce pollutants from washing into creek.
Green Rooftops (CS4) Related Goals: 1, 2, 4, 6, 7
Related Indicators: 1, 16, 18, 19, 20 What Who Where When
Green rooftop demonstrations Targeted public information campaign on advantages of green roofs. Feasibility study and green roof implementation plan.
PWD Appropriate public buildings chosen by PWD
Medium term: 5-15 years
The analyses in Sections 5 and 6 indicate that green rooftops, while highly effective at detaining and evaporating stormwater, are not currently a cost-effective option for the Tookany/Tacony-Frankford. However, there is a potential for them to become more cost-effective in the future. As more successful demonstration projects are implemented in the United States, the materials and construction techniques will become more common and the economies of scale will improve. To facilitate this long-term change locally, this plan recommends that Philadelphia take the lead and implement one or more projects on public buildings in the City. Along with this project, we recommend a feasibility study of the potential for a larger-scale green roof program throughout the watershed. The feasibility study will form the basis for future recommendations when this plan is revised. In addition, we recommend a public relations campaign to change the perceptions of citizens, public officials, and contractors.
May 2005 9-94
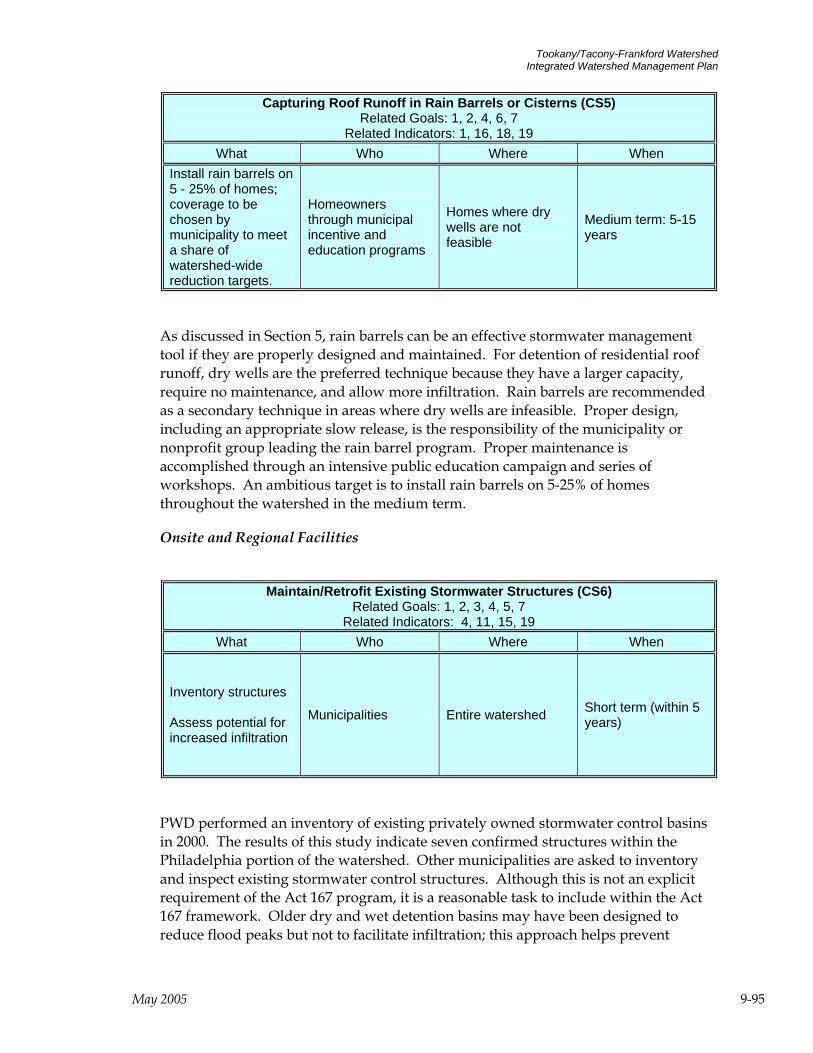
Tookany/Tacony-Frankford Watershed Integrated Watershed Management Plan
Capturing Roof Runoff in Rain Barrels or Cisterns (CS5) Related Goals: 1, 2, 4, 6, 7
Related Indicators: 1, 16, 18, 19 What Who Where When
Install rain barrels on 5 - 25% of homes; coverage to be chosen by municipality to meet a share of watershed-wide reduction targets.
Homeowners through municipal incentive and education programs
Homes where dry wells are not feasible
Medium term: 5-15 years
As discussed in Section 5, rain barrels can be an effective stormwater management tool if they are properly designed and maintained. For detention of residential roof runoff, dry wells are the preferred technique because they have a larger capacity, require no maintenance, and allow more infiltration. Rain barrels are recommended as a secondary technique in areas where dry wells are infeasible. Proper design, including an appropriate slow release, is the responsibility of the municipality or nonprofit group leading the rain barrel program. Proper maintenance is accomplished through an intensive public education campaign and series of workshops. An ambitious target is to install rain barrels on 5-25% of homes throughout the watershed in the medium term.
Onsite and Regional Facilities
Maintain/Retrofit Existing Stormwater Structures (CS6) Related Goals: 1, 2, 3, 4, 5, 7
Related Indicators: 4, 11, 15, 19 What Who Where When
Inventory structures Assess potential for increased infiltration
Municipalities Entire watershed Short term (within 5 years)
PWD performed an inventory of existing privately owned stormwater control basins in 2000. The results of this study indicate seven confirmed structures within the Philadelphia portion of the watershed. Other municipalities are asked to inventory and inspect existing stormwater control structures. Although this is not an explicit requirement of the Act 167 program, it is a reasonable task to include within the Act 167 framework. Older dry and wet detention basins may have been designed to reduce flood peaks but not to facilitate infiltration; this approach helps prevent
May 2005 9-95
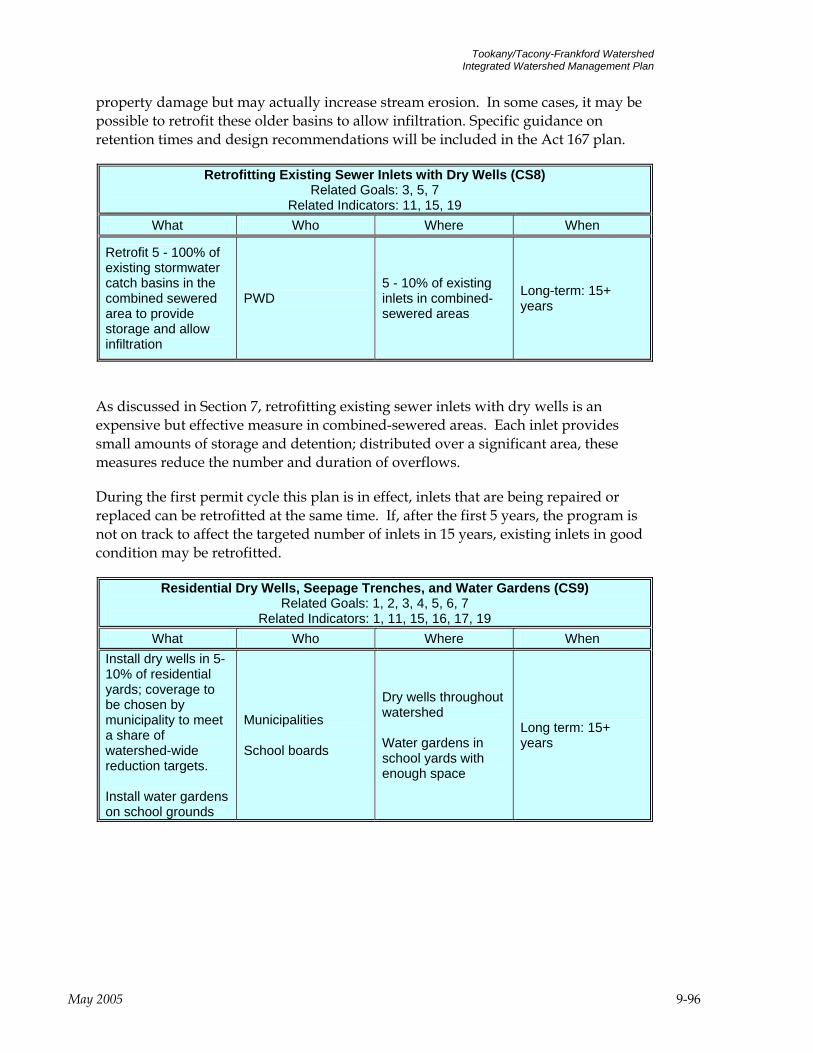
Tookany/Tacony-Frankford Watershed Integrated Watershed Management Plan
property damage but may actually increase stream erosion. In some cases, it may be possible to retrofit these older basins to allow infiltration. Specific guidance on retention times and design recommendations will be included in the Act 167 plan.
Retrofitting Existing Sewer Inlets with Dry Wells (CS8) Related Goals: 3, 5, 7
Related Indicators: 11, 15, 19 What Who Where When
Retrofit 5 - 100% of existing stormwater catch basins in the combined sewered area to provide storage and allow infiltration
PWD 5 - 10% of existing inlets in combined-sewered areas
Long-term: 15+ years
As discussed in Section 7, retrofitting existing sewer inlets with dry wells is an expensive but effective measure in combined-sewered areas. Each inlet provides small amounts of storage and detention; distributed over a significant area, these measures reduce the number and duration of overflows.
During the first permit cycle this plan is in effect, inlets that are being repaired or replaced can be retrofitted at the same time. If, after the first 5 years, the program is not on track to affect the targeted number of inlets in 15 years, existing inlets in good condition may be retrofitted.
Residential Dry Wells, Seepage Trenches, and Water Gardens (CS9) Related Goals: 1, 2, 3, 4, 5, 6, 7
Related Indicators: 1, 11, 15, 16, 17, 19 What Who Where When
Install dry wells in 5-10% of residential yards; coverage to be chosen by municipality to meet a share of watershed-wide reduction targets. Install water gardens on school grounds
Municipalities School boards
Dry wells throughout watershed Water gardens in school yards with enough space
Long term: 15+ years
May 2005 9-96
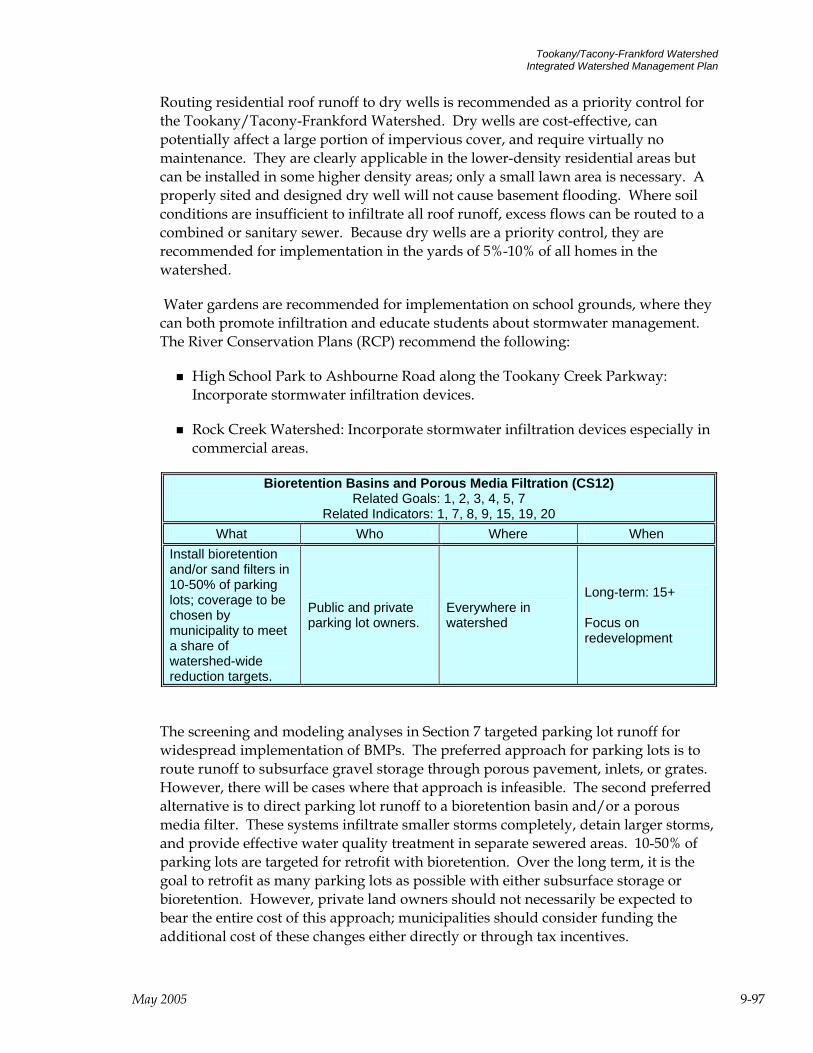
Tookany/Tacony-Frankford Watershed Integrated Watershed Management Plan
Routing residential roof runoff to dry wells is recommended as a priority control for the Tookany/Tacony-Frankford Watershed. Dry wells are cost-effective, can potentially affect a large portion of impervious cover, and require virtually no maintenance. They are clearly applicable in the lower-density residential areas but can be installed in some higher density areas; only a small lawn area is necessary. A properly sited and designed dry well will not cause basement flooding. Where soil conditions are insufficient to infiltrate all roof runoff, excess flows can be routed to a combined or sanitary sewer. Because dry wells are a priority control, they are recommended for implementation in the yards of 5%-10% of all homes in the watershed.
Water gardens are recommended for implementation on school grounds, where they can both promote infiltration and educate students about stormwater management. The River Conservation Plans (RCP) recommend the following:
High School Park to Ashbourne Road along the Tookany Creek Parkway: Incorporate stormwater infiltration devices.
Rock Creek Watershed: Incorporate stormwater infiltration devices especially in commercial areas.
Bioretention Basins and Porous Media Filtration (CS12) Related Goals: 1, 2, 3, 4, 5, 7
Related Indicators: 1, 7, 8, 9, 15, 19, 20 What Who Where When
Install bioretention and/or sand filters in 10-50% of parking lots; coverage to be chosen by municipality to meet a share of watershed-wide reduction targets.
Public and private parking lot owners.
Everywhere in watershed
Long-term: 15+ Focus on redevelopment
The screening and modeling analyses in Section 7 targeted parking lot runoff for widespread implementation of BMPs. The preferred approach for parking lots is to route runoff to subsurface gravel storage through porous pavement, inlets, or grates. However, there will be cases where that approach is infeasible. The second preferred alternative is to direct parking lot runoff to a bioretention basin and/or a porous media filter. These systems infiltrate smaller storms completely, detain larger storms, and provide effective water quality treatment in separate sewered areas. 10-50% of parking lots are targeted for retrofit with bioretention. Over the long term, it is the goal to retrofit as many parking lots as possible with either subsurface storage or bioretention. However, private land owners should not necessarily be expected to bear the entire cost of this approach; municipalities should consider funding the additional cost of these changes either directly or through tax incentives.
May 2005 9-97
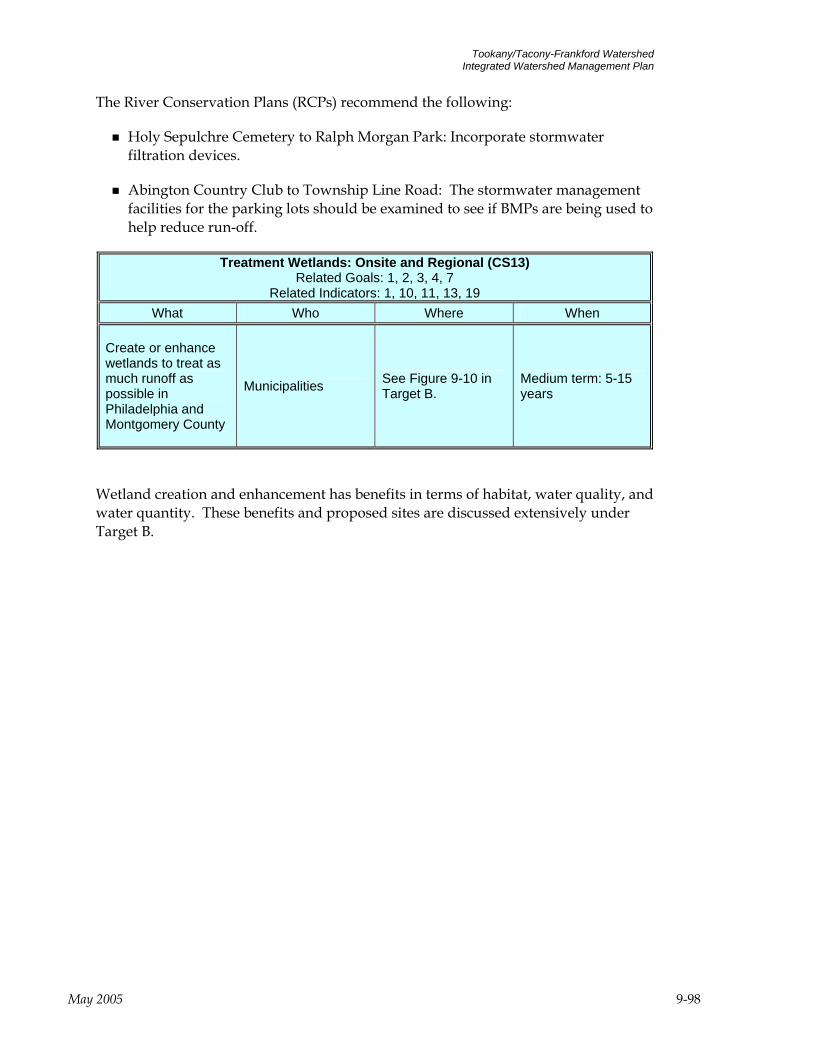
Tookany/Tacony-Frankford Watershed Integrated Watershed Management Plan
The River Conservation Plans (RCPs) recommend the following:
Holy Sepulchre Cemetery to Ralph Morgan Park: Incorporate stormwater filtration devices.
Abington Country Club to Township Line Road: The stormwater management facilities for the parking lots should be examined to see if BMPs are being used to help reduce run-off.
Treatment Wetlands: Onsite and Regional (CS13) Related Goals: 1, 2, 3, 4, 7
Related Indicators: 1, 10, 11, 13, 19 What Who Where When
Create or enhance wetlands to treat as much runoff as possible in Philadelphia and Montgomery County
Municipalities See Figure 9-10 in Target B.
Medium term: 5-15 years
Wetland creation and enhancement has benefits in terms of habitat, water quality, and water quantity. These benefits and proposed sites are discussed extensively under Target B.
May 2005 9-98
Tookany/Tacony-Frankford Watershed Integrated Watershed Management Plan
Section 7: Development and Screening of Management Options 7.1 Menu of Options This section summarizes a comprehensive list of stormwater and watershed management options that the Tookany/Tacony-Frankford Watershed Partnership thinks may be applicable in their watershed. This list serves as the starting point for the screening and evaluation (Section 7.2) steps that lead to the recommendations contained in the implementation guidance in Section 9. A large amount of detailed information on these options is available from existing sources. Rather than reproducing this information, this section provides references and links to these sources. The options are grouped under the three targets introduced in Section 2:
Target A: Dry Weather Water Quality and Aesthetics Regulatory Approaches Public Education and Volunteer Programs Municipal Measures Enhancing Stream Corridor Recreational and Cultural Resources Monitoring and Reporting
Target B: Healthy Living Resources
Channel Stability and Aquatic Habitat Restoration Lowland Restoration and Enhancement Upland Restoration and Enhancement Monitoring and Reporting
Target C: Wet Weather Water Quality and Quantity
Regulatory Approaches Public Education and Volunteer Programs Municipal Measures Stormwater Management Monitoring and Reporting
Target A Target A is defined for Tookany/Tacony-Frankford Creek as focusing on trash removal and litter prevention, and the elimination of sources of sewage during dry weather. Streams should be aesthetically appealing (look and smell good), accessible to the public, and be an amenity to the community. Sewer odors occurring from dry weather sewer discharges in both combined and separate sewered areas should be remedied.
Regulatory Approaches AR1 On-Lot Disposal (Septic System) Management AR2 Pet Waste, Litter, and Dumping Ordinances
May 2005 7-1

Tookany/Tacony-Frankford Watershed Integrated Watershed Management Plan
These typical pollution reduction and aesthetic ordinances are already in effect in most locations, and can be effective at controlling diffuse sources of pollutants. They are particularly important in urban watersheds; however, they must be consistently enforced to be effective. Public Education and Volunteer Programs
AP1 Public Education AP2 School-Based Education AP3 Public Participation and Volunteer Programs
Municipal Measures
AM1 Capacity Management Operation and Maintenance (CMOM) AM2 Inspection and Cleaning of Combined Sewers AM3 Sanitary Sewer Rehabilitation AM4 Combined Sewer Rehabilitation AM5 Illicit Discharge, Detection, and Elimination (IDD&E) AM6 Stream Cleanup and Maintenance AM7 Household Hazardous Waste Collection AO1 Enhancing Stream Corridor Recreational and Cultural Resources AMR Monitoring, Reporting, and Further Study
AO1 - Enhancing Stream Corridor Recreational and Cultural Resources Preservation and enhancement of recreational and cultural resources may be integrated into comprehensive watershed management. These resources are part of the link between the human population and natural resources in a watershed. Strategies to provide access to water resources for recreational purposes encourage appreciation for and stewardship of these areas. Strategies to protect water-based historic structures should be implemented to insure that flooding and other impacts are avoided. AMR – Monitoring, Reporting, and Further Study Monitoring and reporting under Target A include monitoring of progress toward achievement of objectives (as measured by indicators) and monitoring of implementation of recommended management measures. For example, indicator 18 measures the tons of trash removed from streams and riparian areas (a measure of option implementation) and derives a stream accessibility score for reaches of the creeks (a measure of progress toward an objective).
Target B Improving the ability of an urban stream to support viable habitat and fish populations focuses primarily on remediating the more obvious impacts of urbanization on the stream. These impacts include loss of healthy riparian habitat, eroding and undercut banks, scoured streambed or excessive sediment deposits, channelized and armored stream sections, and invasive species. Encroaching development on the riparian buffer can leave little or no room for a vegetated buffer, while other open riparian areas have been left poorly managed.
May 2005 7-2
Tookany/Tacony-Frankford Watershed Integrated Watershed Management Plan
Biological monitoring indicates that the whole Tookany/Tacony-Frankford Watershed suffers from impaired aquatic habitat and does not meet its designated use as a warm water fishery. This impairment is due to severe water flow fluctuations, habitat alteration, point and non-point source pollution from urban development, hydromodification, and combined sewer overflows (PA DEP 2001).
The primary tool to address these problems is stream restoration. Restoration addresses poor in-stream habitat and biological impairment, focusing on improving channel stability, improving in-stream and riparian habitat, providing refuge that allows fish to avoid high velocity conditions during storms, and managing land within the stream corridor. Lowland restoration and enhancement addresses the problem of wetland loss and impairment. Nearly all wetlands in the watershed exhibit impaired functions that indicate extensive disturbance and deterioration.
The wet weather strategy includes both restoration of physical stream habitat and reduction of discharges from stormwater and combined sewage. These measures are complementary; stream restoration provides areas of lower flow where aquatic life can avoid higher flows, and discharge reduction helps limit velocities and protects the long-term investment in the restored stream. Targets B and C are intended to accomplish the restoration of physical stream habitat through control measures involving erosion, sediment accumulation, and flow variability.
Channel Stability and Aquatic Habitat Restoration BM1 Bed Stabilization and Habitat Restoration BM2 Bank Stabilization and Habitat Restoration BM3 Channel Realignment and Relocation BM4 Plunge Pool Removal BM5 Improvement of Fish Passage
Lowland Restoration and Enhancement BM6 Wetland Improvement BM7 Invasive Species Management
Upland Restoration and Enhancement BM8 Biofiltration BM9 Reforestation BMR Monitoring, Reporting, and Further Study
Many of the stresses faced by aquatic life in urban streams are the result of alternating extremes of high and low flow, and sediment scour and deposition. While stormwater BMPs that promote infiltration do help to reduce these extremes, a recent modeling analysis conducted by PWD indicates that impervious cover would have to be reduced by half or more to have a significant effect. This result indicates that stream restoration measures may be a more feasible means of improving the aquatic habitat in the short term. Modern design techniques may create areas of reduced velocity where aquatic life is protected during high
May 2005 7-3
Tookany/Tacony-Frankford Watershed Integrated Watershed Management Plan
flow. Techniques appropriate to our area are summarized in “Guidelines for Natural Stream Channel Design for Pennsylvania Waterways”, by the Alliance for the Chesapeake Bay in March 2003. This publication is available online at http://www.acb-online.org/toolkits.cfm. BMR – Monitoring, Reporting, and Further Study Monitoring and reporting under Target B includes monitoring of progress toward achievement of objectives (as measured by indicators) and monitoring of implementation of recommended management measures. For example, Indicator 3 measures the channel condition and trend for each reach of the stream. This indicator is both a measure of implementation and a measure of progress toward the goal of reducing streambank and stream channel deposition and scour to protect and restore the natural functions of aquatic habitat and ecosystems, streambanks, and stream channels.
Target C The third target is to restore water quality to meet fishable and swimmable criteria during wet weather. A comprehensive watershed management approach also must address flooding issues. The wet weather strategy includes both restoration of physical stream habitat and reduction of discharges from stormwater and combined sewage. These measures are complementary; stream restoration provides areas of lower flow where aquatic life can avoid higher flows, and discharge reduction helps limit velocities and protects the long-term investment in the restored stream. Targets B and C are intended to attend to restoration of physical stream habitat through control measures involving erosion, sediment accumulation, and flow variability.
Regulatory Approaches Zoning and Land Use Control
CR1 Requiring Better Site Design in New Development ▪ Open Space Preservation Plan ▪ Stream Buffer/Corridor Protection Ordinance ▪ Wetlands Protection Ordinance ▪ Steep Slope Ordinance ▪ Cluster Development Ordinance ▪ Transfer of Development Rights Ordinance
CR2 Requiring Better Site Design in Redevelopment (may include options in CR1) CR3 Stormwater and Floodplain Management CR4 Industrial Stormwater Pollution Prevention CR5 Construction Stormwater Pollution Prevention CR6 Post-construction Stormwater Runoff Management CR7 Pollution Trading CR8 Use Review and Attainability Analysis CR9 Watershed-Based Permitting
The regulatory authority for controlling land use is vested in the municipalities through their ability to develop ordinances that regulate zoning and development practices. In areas that are undergoing development pressures, these ordinances are some of the most effective tools for watershed protection. In fully developed, urban watersheds such as the Tookany/Tacony-
May 2005 7-4

Tookany/Tacony-Frankford Watershed Integrated Watershed Management Plan
Frankford Creek watershed, they are less effective, and are needed primarily to help improve conditions in areas that are re-developing.
A variety of approaches to environmentally responsible land use controls have been developed in recent years, and some are being implemented in the areas adjacent to Philadelphia that are undergoing rapid development. The Delaware Valley Regional Planning Commission (DVRPC) has collected information on these practices and local applications on their web site at http://www.dvrpc.org/planning/community/protectiontools.htm.
CR3 - Stormwater and Floodplain Management Ordinances that are important in both developing and developed areas deal directly with the way that stormwater is handled and floodplains are developed or re-developed. Municipal ordinances for stormwater and floodplain management should be consistent with the “Comprehensive Stormwater Management Policy” (Document 392-0300-002) released by PADEP in September 2002. This policy is intended “to more fully integrate post-construction stormwater planning requirements, emphasizing the use of ground water infiltration and volume and rate control best management practices (BMPs), into the existing NPDES permitting programs and the Stormwater Management Act (‘Act 167’) Planning Program.” The comprehensive policy is available on PADEP’s web site at http://www.dep.state.pa.us/dep/deputate/watermgt/wc/Subjects/StormwaterManagement/GeneralInformation/default.htm.
As of late 2004 Tookany/Tacony Frankford watershed is starting on the process of developing an Act 167 plan. This will include developing and adopting a model ordinance intended to satisfy the requirements of both the Act 167 and NPDES Phase II programs. This model ordinance may be based on a recently completed model ordinance developed for the Darby-Cobbs watershed, adapted to meet the needs of the Tookany/Tacony-Frankford watershed.
CR4 - Industrial Stormwater Pollution Prevention
Industrial stormwater pollution prevention includes attention to the following measures:
Good Housekeeping Preventive Maintenance Visual Inspections Spill Prevention and Response Employee Training Record Keeping and Reporting Fueling Maintaining Vehicles and Equipment Painting Vehicles and Equipment Washing Vehicles and Equipment Loading and Unloading Materials Liquid Storage in Above-Ground Tanks Industrial Waste Management and Outside Manufacturing Outside Storage of Raw Materials, By-Products, or Finished Products Salt Storage
May 2005 7-5
Tookany/Tacony-Frankford Watershed Integrated Watershed Management Plan
Flow Diversion Exposure Minimization Structures (dikes, drains, etc.) Erosion Prevention and Sediment Control Infiltration Practices
Detailed guidance on these industrial measures is available in EPA publication 832-R-92-006, “Storm Water Management for Industrial Activities: Developing Pollution Prevention Plans and Best Management Practices”, released in September 1992. Municipalities may choose to adopt more stringent controls at the local level, or may work with state authorities to enforce the existing requirements. These measures are also appropriate for commercial and government operations involved in similar activities. The publication mentioned above is available online at http://www.epa.gov/clariton/clhtml/pubtitleOW.html.
CR5 - Construction Stormwater Pollution Prevention Stormwater pollution prevention during construction activities includes attention to the following measures:
Sediment and Erosion Control Practices Good Housekeeping Waste Disposal Minimizing Offsite Vehicle Tracking of Sediments Sanitary/Septic Disposal Material Management Spill Response Control of Allowable Non-Stormwater Discharges Maintenance and Inspection Stormwater Management
Detailed guidance on these measures is available in PADEP publication 363-2134-008, “Erosion and Sediment Pollution Control Program Manual”, released in April 2000. Municipalities may choose to adopt more stringent controls at the local level, or may work with state authorities to enforce the existing requirements. These measures are also appropriate for commercial and government operations involved in similar activities. The publication mentioned above is available online at http://www.dep.state.pa.us/dep/deputate/watermgt/wc/Subjects/StormwaterManagement/GeneralInformation/default.htm. CR6 - Post-construction Stormwater Runoff Management Post-construction Stormwater Runoff Management is part of the NPDES Phase 2 stormwater management plan. Options CR3 and CR6 have substantial overlap.
CR7 - Pollution Trading USEPA is exploring market-based measures as a way of reaching targeted overall pollutant load reductions in a watershed. EPA’s “Final Water Quality Trading Policy” was released on January 13, 2003, and may be accessed at http://www.epa.gov/owow/watershed/trading/tradingpolicy.html. As this policy is adopted by
May 2005 7-6

Tookany/Tacony-Frankford Watershed Integrated Watershed Management Plan
the states and incorporated in regulations, it may increase incentives for cooperation and coordination between the municipalities and counties that share a watershed.
CR8 - Use Review and Attainability Analysis USEPA provides procedures for reviewing the applicability and attainability of designated uses. This process may be appropriate for urban watersheds like the Tookany/Tacony-Frankford. EPA document 833-R-01-002, “Coordinating CSO Long-Term Planning with Water Quality Standards Reviews”, provides a framework for the process in areas served by combined sewers. This document is available on the EPA web site at http://cfpub.epa.gov/npdes/cso/guidedocs.cfm.
CR9 - Watershed-Based Permitting A holistic watershed management approach provides a framework for addressing all stressors within a hydrologically defined drainage basin instead of viewing individual sources in isolation. Within a broader watershed management system, the watershed-based permitting approach is a tool that can assist with implementation activities. The utility of this tool relies heavily on a detailed, integrated and inclusive watershed planning process. Watershed planning includes monitoring and assessment activities that generate the data necessary for clear watershed goals to be established and permits to be designed to specifically address the goals. The policy statement and implementation guidance (Watershed-Based National Pollutant Discharge Elimination System (NPDES) Permitting Implementation Guidance, finalized in 2004) are available on the EPA’s web site at http://cfpub.epa.gov/npdes/wqbasedpermitting/wspermitting.cfm.
Public Education CP1 Public Education and Volunteer Programs
Municipal Measures
CM1 Sanitary Sewer Overflow Detection CM2 Sanitary Sewer Overflow Elimination: Structural Measures CM3 Reduction of Stormwater Inflow and Infiltration to Sanitary Sewers CM4 Combined Sewer Overflow (CSO) Control Program
▪ Nine Minimum Controls ▪ Long Term CSO Control Plan ▪ Watershed-Based Planning
CM5 Catch Basin and Storm Inlet Maintenance CM6 Street Sweeping CM7 Responsible Landscaping Practices on Public Lands CM8 Household Hazardous Waste Collection CM9 Responsible Bridge and Roadway Maintenance
The first three measures above apply primarily to municipalities with separate sanitary sewer systems. The second, reduction of sanitary sewer overflow, is believed to be of critical importance in the Tookany/Tacony-Frankford watershed. Inspection, cleaning, and when necessary, rehabilitation of aging sanitary sewers may be the single most important pollution reduction measure, and should be implemented immediately in this watershed. Reduction of
May 2005 7-7

Tookany/Tacony-Frankford Watershed Integrated Watershed Management Plan
pollutant loads due to stormwater may be of secondary importance if significant loads are being introduced by sanitary sewage. Structural Stormwater Management Facilities Detailed information on structural BMPs for stormwater management is available in existing BMP manuals and is not reproduced here. Links to many of these manuals are available in Appendix A of the PADEP’s Comprehensive Stormwater Management Policy (see link provided earlier in this document), and three are reproduced below: City of Philadelphia Stormwater BMP Manual (currently in development, available August 2005) Center for Watershed Protection Stormwater Manager’s Resource Center http://www.stormwatercenter.net/ Maryland Stormwater Design Manual http://www.mde.state.md.us/Programs/WaterPrograms/SedimentandStormwater/stormwater_design/index.asp New Jersey: Best Management Practices for Control of Nonpoint Source Pollution http://www.state.nj.us/dep/watershedmgt/bmpmanual.htm Stormwater Management
Source Control Measures CS1 Reducing Effective Impervious Cover Through Better Site Design CS2 Increasing Urban Tree Canopy CS3 Porous Pavement and Subsurface Storage CS4 Green Rooftops CS5 Capturing Roof Runoff in Rain Barrels or Cisterns
The first measure, reducing effective impervious cover, refers to a variety of measures, including encouraging homeowners to reduce the size of paved areas on their properties. Use of porous pavement is an alternative to reduction of paved areas. Rooftops represent a large proportion of the impervious area in highly urbanized watersheds such as the Tookany/Tacony-Frankford; constructing rooftop gardens over public and private buildings can be an effective structural measure to reduce urban runoff. This technology is catching on slowly in the United States, but there are some examples in our area.
The Tookany/Tacony-Frankford Partnership has begun to implement a rain barrel pilot program. Rain barrels are inexpensive but need to be implemented throughout a watershed and drained between storms to be effective as a runoff reduction measure. It is also important that their owners are properly trained and committed to operate and maintain them. Cisterns are similar to rain barrels in function; they also must be drained on a regular basis to provide effective stormwater control.
Tree planting and urban reforestation programs provide hydrologic benefits in addition to
May 2005 7-8

Tookany/Tacony-Frankford Watershed Integrated Watershed Management Plan
quality of life improvements. Leaf surfaces intercept some rainfall that might otherwise fall on impervious surfaces. The rainfall then either evaporates or is conveyed more slowly to the ground along plant stems and trunks. Trees located over or near impervious cover provide the greatest stormwater control benefits.
Municipalities have the opportunity to provide incentives for private landowners to implement these innovative measures through ordinances, tax incentives, or a stormwater fee linked to impervious cover.
Onsite and Regional Stormwater Control Facilities CS6 Maintaining/Retrofitting Existing Stormwater Structures CS7 Modifying Catch Basins to Delay Stormwater Inflow CS8 Retrofit of Existing Sewer Inlets with Dry Wells CS9 Residential Dry Wells, Seepage Trenches, and Rain Gardens CS10 Infiltration Basins CS11 Vegetated Swales and Open Channels CS12 Bioretention Basins and Porous Media Filtration CS13 Treatment Wetlands: Onsite and Regional CS14 Dry Detention Basins CS15 Wet Retention Basins CS16 BMPs for Highway Runoff (may include various structural options in this list)
The options above are documented in the state manuals. Most of them may be implemented on the small scale of an individual property. Residential dry wells are an inexpensive way to infiltrate residential roof runoff and provide a benefit distributed over the watershed. Infiltration basins are similar but typically used on a larger scale requiring more land. Porous media filters and bioretention basins are most often used to detain, treat, and infiltrate parking lot runoff. Water gardens are similar to bioretention and can be implemented in backyards or public land such as school grounds. Proper design and maintenance, along with an effective public relations campaign, can alleviate typical concerns about mosquito control and basement flooding.
Retrofit of existing sewer inlets with dry wells is an innovative option that, while expensive, may be attractive in a completely urbanized area with very little land available for traditional BMPs. Using this technology, existing catch basins are retrofitted to provide some measure of storage and infiltration. With full implementation and favorable soil conditions, the resulting outflows may resemble the pre-development condition. The City of Portland, Oregon has implemented this approach and has provided some documentation in its Stormwater Management Manual (http://www.cleanrivers-pdx.org/tech_resources/2002_swmm.htm).
Dry detention and wet retention basins are traditional BMPs that typically provide detention and treatment functions but only limited infiltration. Their design is extensively documented in the state manuals. Constructed wetlands, either on-site or regional, provide even greater detention and treatment functions; in addition, they may provide a cooling function and removal of some stormwater through evapotranspiration.
May 2005 7-9
Tookany/Tacony-Frankford Watershed Integrated Watershed Management Plan
CMR – Monitoring, Reporting, and Further Study Monitoring and reporting under Target C includes monitoring of progress toward achievement of objectives (as measured by indicators) and monitoring of implementation of recommended management measures. For example, indicator 7 measures the percent of water quality samples where the state fecal coliform standard is met. This indicator is a measure of progress toward the goal of improved water quality in wet weather. Water Quality Concerns such as metals, TSS, fecal coliform, and DO require further study to pinpoint sources. However, the problem can still be addressed (as most of the Target C options intend to do).
7.2 Screening of Options The extensive lists of management options described in the previous section were developed to meet each of the goals and objectives established for the Tookany/Tacony-Frankford Creek watershed. Only those options deemed feasible and practical, however, were considered in the final list of management options. Options were evaluated in three steps:
Identification of Clearly Applicable Options. Some options were already being implemented or were mandated by a regulatory program. For some options, the planning team reached an early consensus that they were needed. These options did not require further evaluation.
Screening Based on Watershed Characterization. The extensive data analyses undertaken to characterize the watershed are summarized in Sections 4 (watershed status and trends), 5 (problem analysis), and 6 (sources). The results of these analyses were used to evaluate the remaining options.
Detailed Evaluation of Structural Options. Structural best management practices for stormwater and combined sewage were subjected to a more rigorous modeling analysis. Effects on runoff volume, overflow volume, and pollutant loads were evaluated at various levels of coverage. This analysis is described in section 7.3.
Table 7-1 lists the options chosen for each evaluation step.
May 2005 7-10
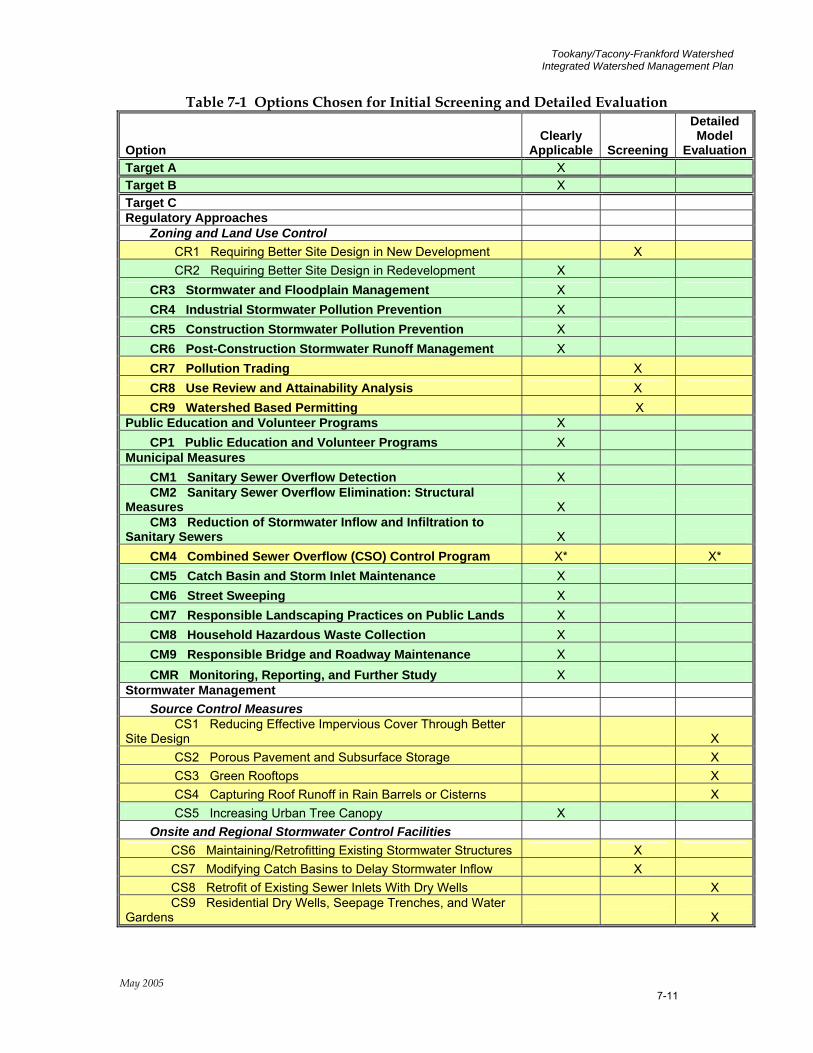
Tookany/Tacony-Frankford Watershed Integrated Watershed Management Plan
Table 7-1 Options Chosen for Initial Screening and Detailed Evaluation
Option Clearly
Applicable Screening
Detailed Model
EvaluationTarget A X Target B X Target C Regulatory Approaches Zoning and Land Use Control CR1 Requiring Better Site Design in New Development X CR2 Requiring Better Site Design in Redevelopment X CR3 Stormwater and Floodplain Management X CR4 Industrial Stormwater Pollution Prevention X CR5 Construction Stormwater Pollution Prevention X CR6 Post-Construction Stormwater Runoff Management X CR7 Pollution Trading X CR8 Use Review and Attainability Analysis X CR9 Watershed Based Permitting X Public Education and Volunteer Programs X CP1 Public Education and Volunteer Programs X Municipal Measures CM1 Sanitary Sewer Overflow Detection X CM2 Sanitary Sewer Overflow Elimination: Structural Measures X CM3 Reduction of Stormwater Inflow and Infiltration to Sanitary Sewers X CM4 Combined Sewer Overflow (CSO) Control Program X* X* CM5 Catch Basin and Storm Inlet Maintenance X CM6 Street Sweeping X CM7 Responsible Landscaping Practices on Public Lands X CM8 Household Hazardous Waste Collection X CM9 Responsible Bridge and Roadway Maintenance X CMR Monitoring, Reporting, and Further Study X Stormwater Management Source Control Measures CS1 Reducing Effective Impervious Cover Through Better Site Design X CS2 Porous Pavement and Subsurface Storage X CS3 Green Rooftops X CS4 Capturing Roof Runoff in Rain Barrels or Cisterns X CS5 Increasing Urban Tree Canopy X Onsite and Regional Stormwater Control Facilities CS6 Maintaining/Retrofitting Existing Stormwater Structures X CS7 Modifying Catch Basins to Delay Stormwater Inflow X CS8 Retrofit of Existing Sewer Inlets With Dry Wells X CS9 Residential Dry Wells, Seepage Trenches, and Water Gardens X
May 2005 7-11
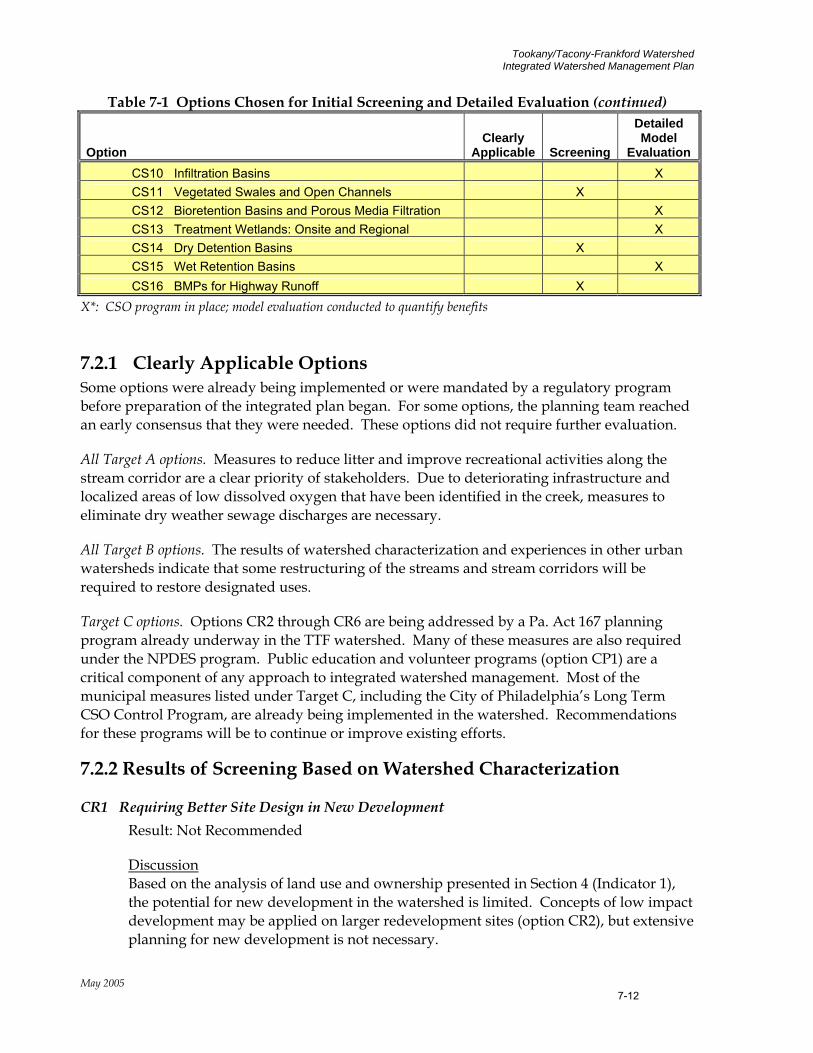
Tookany/Tacony-Frankford Watershed Integrated Watershed Management Plan
Table 7-1 Options Chosen for Initial Screening and Detailed Evaluation (continued)
Option Clearly
Applicable Screening
Detailed Model
Evaluation CS10 Infiltration Basins X CS11 Vegetated Swales and Open Channels X CS12 Bioretention Basins and Porous Media Filtration X CS13 Treatment Wetlands: Onsite and Regional X CS14 Dry Detention Basins X CS15 Wet Retention Basins X CS16 BMPs for Highway Runoff X
X*: CSO program in place; model evaluation conducted to quantify benefits 7.2.1 Clearly Applicable Options Some options were already being implemented or were mandated by a regulatory program before preparation of the integrated plan began. For some options, the planning team reached an early consensus that they were needed. These options did not require further evaluation.
All Target A options. Measures to reduce litter and improve recreational activities along the stream corridor are a clear priority of stakeholders. Due to deteriorating infrastructure and localized areas of low dissolved oxygen that have been identified in the creek, measures to eliminate dry weather sewage discharges are necessary.
All Target B options. The results of watershed characterization and experiences in other urban watersheds indicate that some restructuring of the streams and stream corridors will be required to restore designated uses.
Target C options. Options CR2 through CR6 are being addressed by a Pa. Act 167 planning program already underway in the TTF watershed. Many of these measures are also required under the NPDES program. Public education and volunteer programs (option CP1) are a critical component of any approach to integrated watershed management. Most of the municipal measures listed under Target C, including the City of Philadelphia’s Long Term CSO Control Program, are already being implemented in the watershed. Recommendations for these programs will be to continue or improve existing efforts.
7.2.2 Results of Screening Based on Watershed Characterization
CR1 Requiring Better Site Design in New Development Result: Not Recommended
Discussion Based on the analysis of land use and ownership presented in Section 4 (Indicator 1), the potential for new development in the watershed is limited. Concepts of low impact development may be applied on larger redevelopment sites (option CR2), but extensive planning for new development is not necessary.
May 2005 7-12
Tookany/Tacony-Frankford Watershed Integrated Watershed Management Plan
CR7 Pollution Trading
CR8 Use Review and Attainability Analysis
CR9 Watershed Based Permitting Result: Recommended for Further Study
Discussion The United States Environmental Protection Agency has endorsed these innovative options for improving the water resources environment in practical, sustainable, and cost-effective ways. Taken together, these three options represent a powerful opportunity for regulatory change in the watershed.
CS6 Maintaining/Retrofitting Existing Stormwater Structures
Result: Recommended
Discussion PWD performed an inventory of existing privately owned stormwater control basins in 2000. The results of this study indicate seven confirmed structures within the Philadelphia portion of the watershed. Retrofit of existing basins, including maintenance and modification of outlet structures, can often increase the benefits from an older structure at minimal cost. This option is recommended and will be discussed in more detail in the implementation section.
CS7 Modifying Catch Basins to Delay Stormwater Inflow
Result: Not Recommended
Discussion This option delays entry of stormwater runoff into street inlets and catch basins, providing some level of detention while temporarily storing water on roadways. Based on discussions with stakeholders and local officials, this option is unpopular due to public perception. Other forms of detention are preferred.
CS11 Vegetated Swales and Open Channels
Result: Not Recommended
Discussion Vegetated swales and open channels are an attractive option as an alternative to traditional infrastructure in areas with new development. They are generally not applicable on smaller sites or on redevelopment sites. This option is not recommended except in very limited cases to be determined on a site-by-site basis.
CS14 Dry Detention Basins
Result: Not Recommended
May 2005 7-13
Tookany/Tacony-Frankford Watershed Integrated Watershed Management Plan
Discussion Wet retention and infiltration basins are generally recommended over dry detention basins. Wet retention provides more effective water quality treatment in most cases. Dry extended detention ponds have only moderate pollutant removal when compared to other structural stormwater practices, and are ineffective at removing soluble pollutants. If a standing pool is not desired, designing for infiltration is recommended. This option is not recommended except in limited cases to be determined on a site-by-site basis.
CS16 BMPs for Highway Runoff Result: Not Recommended
Discussion Transportation infrastructure in the watershed is dominated by city streets rather than highways. In most cases, there is not sufficient space available on roadway shoulders for significant storage to be created. In some cases, medians and islands in intersections may be appropriate for infiltration. These cases will be discussed under option CS12, Bioretention Basins and Porous Media Filtration.
7.2.3 Detailed Evaluation of Structural Options Structural best management practices for stormwater and combined sewage were subjected to a rigorous modeling analysis. Effects on runoff volume, overflow volume, and pollutant loads were evaluated at various levels of coverage. In this way, the BMPs could be assessed for their cost-effectiveness when implemented in TTF. BMPs (or options) that appear to cost-effectively decrease stormwater flows or combined sewer overflows, or significantly reduce pollutant loading during wet weather were subjected to a series of model runs. BMPs were simulated at various levels of implementation within the watershed, and the results graphed. For the assumed level of implementation, the results in terms of pollutant reduction and amount of stormwater treated were then combined with planning level cost estimates, and the options were ranked according to their cost effectiveness.
Figure 7-1 compares the effectiveness of the BMPs at volume removal (through evapotranspiration and/or infiltration) at their maximum feasible implementation levels. Two measures are capable of reducing total discharge to the receiving water (the sum of stormwater runoff and CSO) by more than 12%. Porous pavement with subsurface storage removes the volume primarily through infiltration, while real time control reduces combined sewer overflow.
May 2005 7-14

Tookany/Tacony-Frankford Watershed Integrated Watershed Management Plan
0.0
2.0
4.0
6.0
8.0
10.0
12.0
Porous
Pav
ement
Inlet
Dry Wells
Res. Dry
Wells
Infiltr
ation
Bas
ins
Rain Barr
els
Wet Rete
ntion
Biorete
ntion
Green R
oofto
ps
Wetlands RTCIn
filtra
tion+
ET
(% o
f sto
rmw
ater
)
Figure 7-1 Potential Stormwater Volume Removal at Maximum Feasible Coverage
Figure 7-1 represents a range of impervious area draining to BMPs, from existing conditions (46% DCIA) to the maximum feasible coverage (varies by BMP). Levels of feasible coverage are chosen to be ambitious but realistic. For example, dry wells may not be technically feasible for all residences due to available space and other site constraints; for planning purposes, the maximum feasible level of coverage for the long term was assumed to be 25% for the TTF watershed. Table 7-2 ranks the relative ability of each of the BMPs to store stormwater, treat stormwater, or remove TSS, based on simulations of the maximum feasible level implementation of each of the BMPs. The rankings represent total volume and mass on a watershed basis over the one-year continuous simulation; they are a function of both technical effectiveness and feasible level of coverage. This ranking is independent of cost considerations.
Table 7-2 BMP Performance at Maximum Feasible Coverage
BMP Ranking Potential Storage Volume Removed Load Reduction Highest Porous Pavement Porous Pavement Porous Pavement
Wet Retention Inlet Dry Wells Res. Dry Wells Infiltration Basins Bioretention Bioretention Bioretention Res. Dry Wells Inlet Dry Wells Inlet Dry Wells Real Time Control Real Time Control Res. Dry Wells Green Rooftops Wet Retention Green Rooftops Wet Retention Infiltration Basins Wetlands Infiltration Basins Green Rooftops Rain Barrels Wetlands Wetlands
Lowest Rain Barrels Rain Barrels
May 2005 7-15
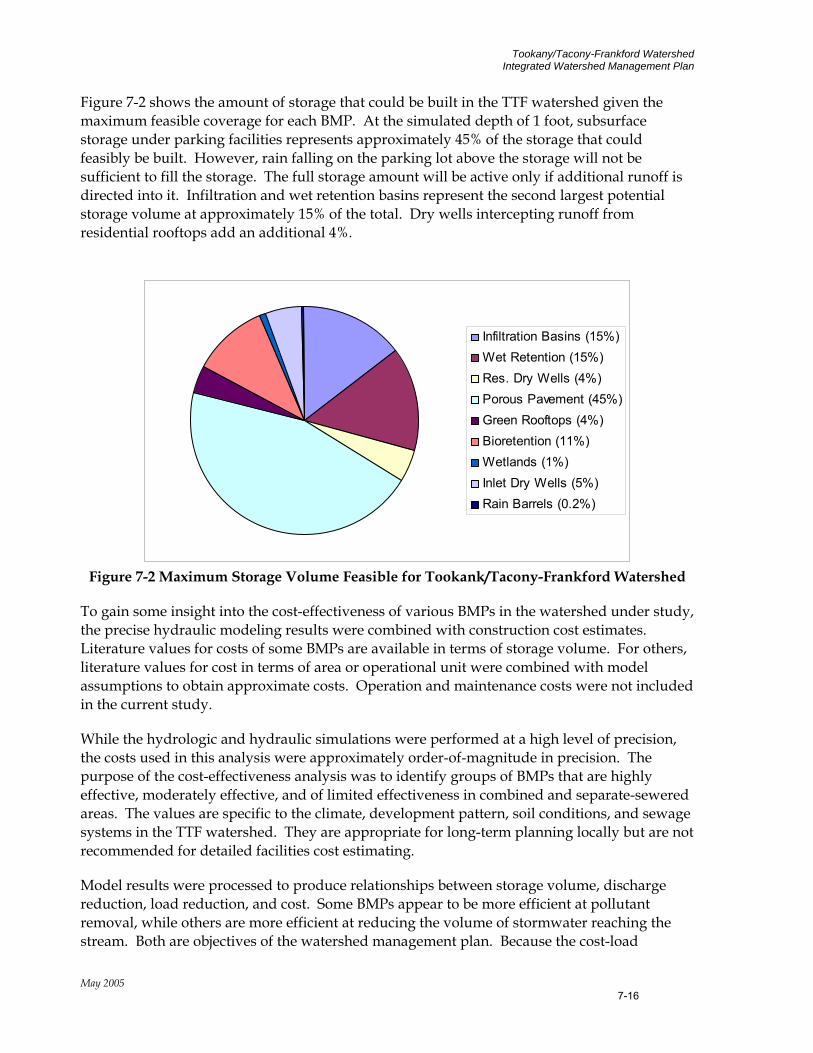
Tookany/Tacony-Frankford Watershed Integrated Watershed Management Plan
Figure 7-2 shows the amount of storage that could be built in the TTF watershed given the maximum feasible coverage for each BMP. At the simulated depth of 1 foot, subsurface storage under parking facilities represents approximately 45% of the storage that could feasibly be built. However, rain falling on the parking lot above the storage will not be sufficient to fill the storage. The full storage amount will be active only if additional runoff is directed into it. Infiltration and wet retention basins represent the second largest potential storage volume at approximately 15% of the total. Dry wells intercepting runoff from residential rooftops add an additional 4%.
Infiltration Basins (15%)Wet Retention (15%)Res. Dry Wells (4%)Porous Pavement (45%)Green Rooftops (4%)Bioretention (11%)Wetlands (1%)Inlet Dry Wells (5%)Rain Barrels (0.2%)
Figure 7-2 Maximum Storage Volume Feasible for Tookank/Tacony-Frankford Watershed
To gain some insight into the cost-effectiveness of various BMPs in the watershed under study, the precise hydraulic modeling results were combined with construction cost estimates. Literature values for costs of some BMPs are available in terms of storage volume. For others, literature values for cost in terms of area or operational unit were combined with model assumptions to obtain approximate costs. Operation and maintenance costs were not included in the current study.
While the hydrologic and hydraulic simulations were performed at a high level of precision, the costs used in this analysis were approximately order-of-magnitude in precision. The purpose of the cost-effectiveness analysis was to identify groups of BMPs that are highly effective, moderately effective, and of limited effectiveness in combined and separate-sewered areas. The values are specific to the climate, development pattern, soil conditions, and sewage systems in the TTF watershed. They are appropriate for long-term planning locally but are not recommended for detailed facilities cost estimating.
Model results were processed to produce relationships between storage volume, discharge reduction, load reduction, and cost. Some BMPs appear to be more efficient at pollutant removal, while others are more efficient at reducing the volume of stormwater reaching the stream. Both are objectives of the watershed management plan. Because the cost-load
May 2005 7-16
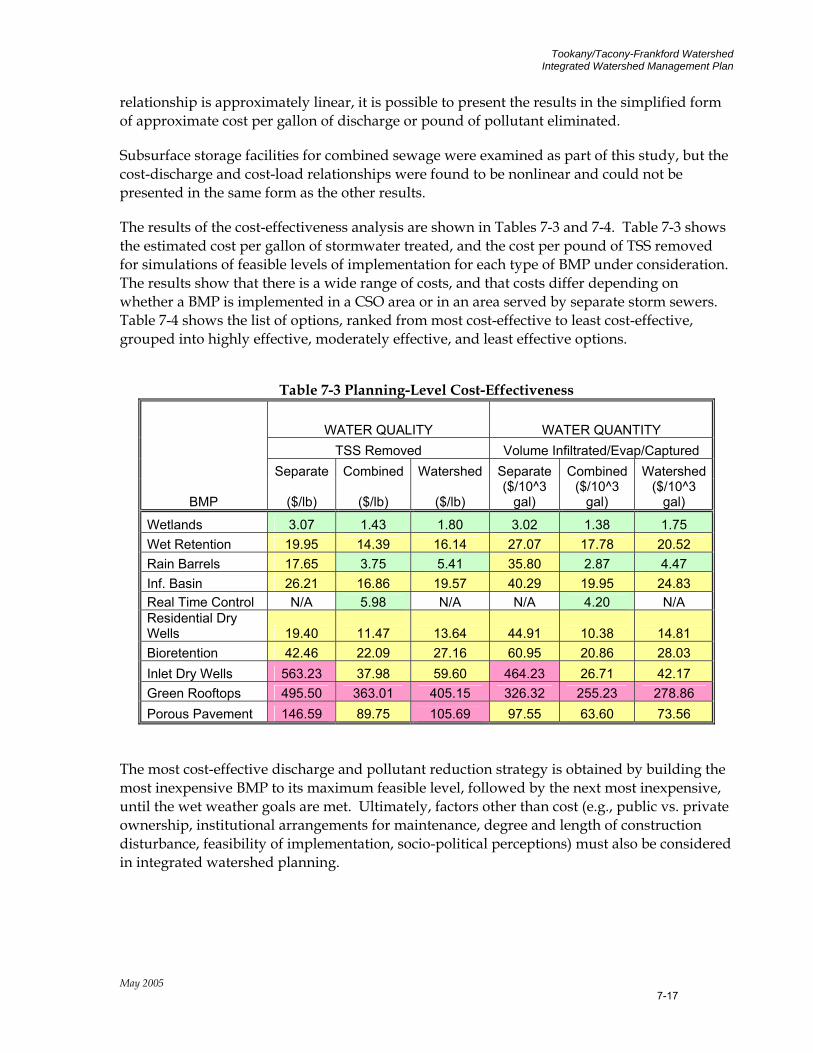
Tookany/Tacony-Frankford Watershed Integrated Watershed Management Plan
relationship is approximately linear, it is possible to present the results in the simplified form of approximate cost per gallon of discharge or pound of pollutant eliminated.
Subsurface storage facilities for combined sewage were examined as part of this study, but the cost-discharge and cost-load relationships were found to be nonlinear and could not be presented in the same form as the other results.
The results of the cost-effectiveness analysis are shown in Tables 7-3 and 7-4. Table 7-3 shows the estimated cost per gallon of stormwater treated, and the cost per pound of TSS removed for simulations of feasible levels of implementation for each type of BMP under consideration. The results show that there is a wide range of costs, and that costs differ depending on whether a BMP is implemented in a CSO area or in an area served by separate storm sewers. Table 7-4 shows the list of options, ranked from most cost-effective to least cost-effective, grouped into highly effective, moderately effective, and least effective options.
Table 7-3 Planning-Level Cost-Effectiveness
WATER QUALITY WATER QUANTITY TSS Removed Volume Infiltrated/Evap/Captured Separate Combined Watershed Separate Combined Watershed
BMP ($/lb) ($/lb) ($/lb) ($/10^3
gal) ($/10^3
gal) ($/10^3
gal)
Wetlands 3.07 1.43 1.80 3.02 1.38 1.75 Wet Retention 19.95 14.39 16.14 27.07 17.78 20.52 Rain Barrels 17.65 3.75 5.41 35.80 2.87 4.47 Inf. Basin 26.21 16.86 19.57 40.29 19.95 24.83 Real Time Control N/A 5.98 N/A N/A 4.20 N/A Residential Dry Wells 19.40 11.47 13.64 44.91 10.38 14.81 Bioretention 42.46 22.09 27.16 60.95 20.86 28.03 Inlet Dry Wells 563.23 37.98 59.60 464.23 26.71 42.17 Green Rooftops 495.50 363.01 405.15 326.32 255.23 278.86 Porous Pavement 146.59 89.75 105.69 97.55 63.60 73.56
The most cost-effective discharge and pollutant reduction strategy is obtained by building the most inexpensive BMP to its maximum feasible level, followed by the next most inexpensive, until the wet weather goals are met. Ultimately, factors other than cost (e.g., public vs. private ownership, institutional arrangements for maintenance, degree and length of construction disturbance, feasibility of implementation, socio-political perceptions) must also be considered in integrated watershed planning.
May 2005 7-17
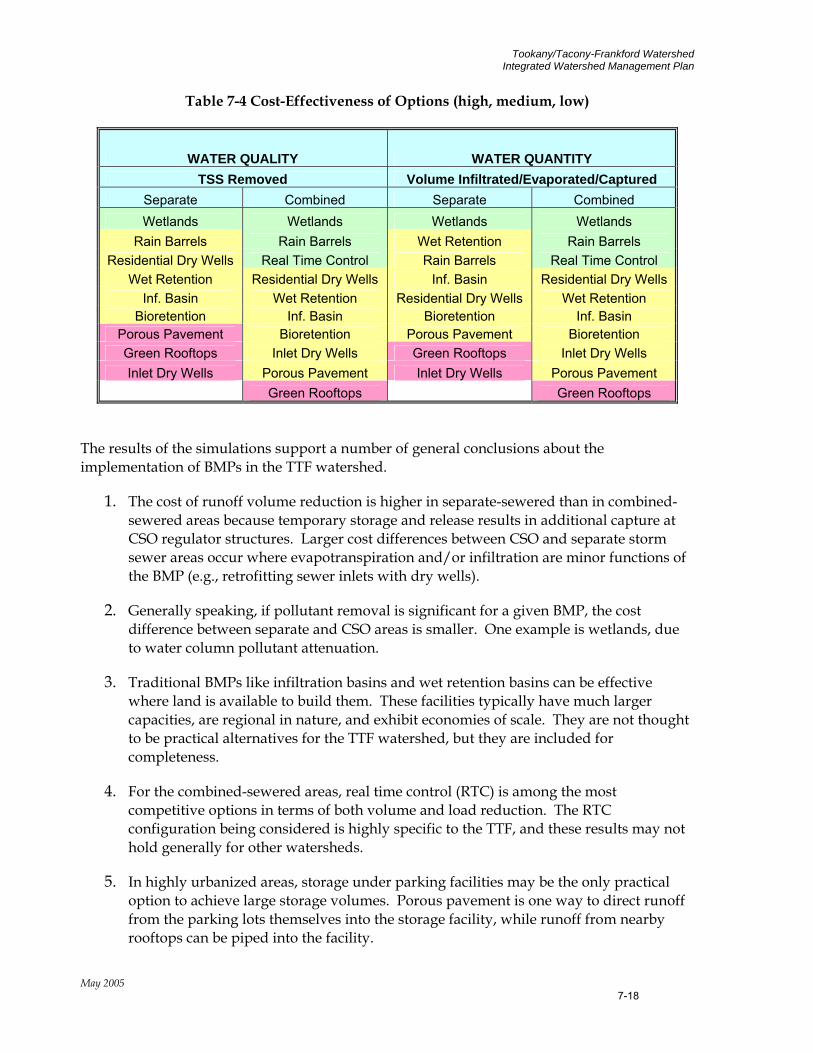
Tookany/Tacony-Frankford Watershed Integrated Watershed Management Plan
Table 7-4 Cost-Effectiveness of Options (high, medium, low)
WATER QUALITY WATER QUANTITY TSS Removed Volume Infiltrated/Evaporated/Captured
Separate Combined Separate Combined Wetlands Wetlands Wetlands Wetlands
Rain Barrels Rain Barrels Wet Retention Rain Barrels Residential Dry Wells Real Time Control Rain Barrels Real Time Control
Wet Retention Residential Dry Wells Inf. Basin Residential Dry Wells Inf. Basin Wet Retention Residential Dry Wells Wet Retention
Bioretention Inf. Basin Bioretention Inf. Basin Porous Pavement Bioretention Porous Pavement Bioretention Green Rooftops Inlet Dry Wells Green Rooftops Inlet Dry Wells Inlet Dry Wells Porous Pavement Inlet Dry Wells Porous Pavement
Green Rooftops Green Rooftops
The results of the simulations support a number of general conclusions about the implementation of BMPs in the TTF watershed.
1. The cost of runoff volume reduction is higher in separate-sewered than in combined-sewered areas because temporary storage and release results in additional capture at CSO regulator structures. Larger cost differences between CSO and separate storm sewer areas occur where evapotranspiration and/or infiltration are minor functions of the BMP (e.g., retrofitting sewer inlets with dry wells).
2. Generally speaking, if pollutant removal is significant for a given BMP, the cost difference between separate and CSO areas is smaller. One example is wetlands, due to water column pollutant attenuation.
3. Traditional BMPs like infiltration basins and wet retention basins can be effective where land is available to build them. These facilities typically have much larger capacities, are regional in nature, and exhibit economies of scale. They are not thought to be practical alternatives for the TTF watershed, but they are included for completeness.
4. For the combined-sewered areas, real time control (RTC) is among the most competitive options in terms of both volume and load reduction. The RTC configuration being considered is highly specific to the TTF, and these results may not hold generally for other watersheds.
5. In highly urbanized areas, storage under parking facilities may be the only practical option to achieve large storage volumes. Porous pavement is one way to direct runoff from the parking lots themselves into the storage facility, while runoff from nearby rooftops can be piped into the facility.
May 2005 7-18
Tookany/Tacony-Frankford Watershed Integrated Watershed Management Plan
The cost analysis of alternatives in areas of separate storm sewers shows:
6. Wetlands and rain barrels are the most cost effective options for TSS removal on a cost per pound basis. Wetlands and wet retention are the most cost effective on a cost per gallon stormwater removed basis.
7. Dry wells in sewer inlets and green rooftops are particularly expensive for both TSS and discharge reduction. Porous pavement is expensive for TSS removal, but is more cost effective as a volume control measure.
The cost analysis of alternatives in areas of combined sewers shows:
8. Wetlands, rain barrels and real time control are all relatively cost-effective options on the basis of cost per pound TSS removed and on the basis of cost per gallon of stormwater removed.
9. Green rooftops are the more expensive choice either on the basis of TSS removal or on the basis of dollars per gallon stormwater treated. Dry wells in sewer inlets is only moderately expensive in combined sewer areas (in contrast with separate sewer areas).
10. It is clear that the most expensive options in combined-sewered areas cost less than the most expensive options in separate-sewered areas. Because hydraulic detention is the most important mechanism in combined-sewered areas, there is less difference in cost-effectiveness between the different types of BMPs.
11. In combined areas, the regulator structures represent an investment already made in pollution reduction. Thus money spent on stormwater best management practices results in greater load and volume reductions per additional dollar spent than in separate areas where no stormwater controls are in place. To meet an overall load reduction target in watersheds served by both combined and separate areas, it may be more efficient to focus management measures on the combined areas.
Table 7-5 lists ten measures, a feasible implementation level for each, and discharge and pollutant load reductions that are possible with each. These results may be used as a guide for individual municipalities or a watershed organization to select suitable BMPs. Use of this table is discussed further in Sections 8 and 9.
May 2005 7-19
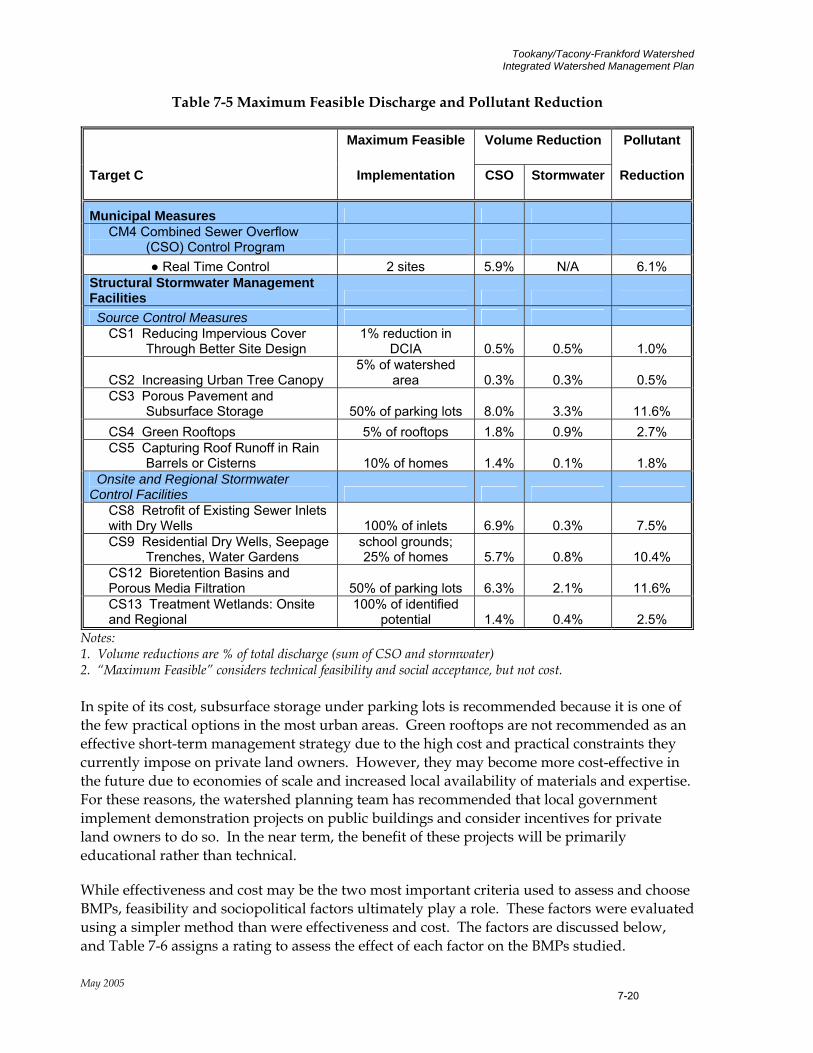
Tookany/Tacony-Frankford Watershed Integrated Watershed Management Plan
Table 7-5 Maximum Feasible Discharge and Pollutant Reduction
Maximum Feasible Volume Reduction Pollutant
Target C Implementation CSO Stormwater Reduction
Municipal Measures CM4 Combined Sewer Overflow
(CSO) Control Program ● Real Time Control 2 sites 5.9% N/A 6.1%
Structural Stormwater Management Facilities Source Control Measures
CS1 Reducing Impervious Cover Through Better Site Design
1% reduction in DCIA 0.5% 0.5% 1.0%
CS2 Increasing Urban Tree Canopy 5% of watershed
area 0.3% 0.3% 0.5% CS3 Porous Pavement and
Subsurface Storage 50% of parking lots 8.0% 3.3% 11.6% CS4 Green Rooftops 5% of rooftops 1.8% 0.9% 2.7% CS5 Capturing Roof Runoff in Rain
Barrels or Cisterns 10% of homes 1.4% 0.1% 1.8% Onsite and Regional Stormwater Control Facilities
CS8 Retrofit of Existing Sewer Inlets with Dry Wells 100% of inlets 6.9% 0.3% 7.5% CS9 Residential Dry Wells, Seepage
Trenches, Water Gardens school grounds; 25% of homes 5.7% 0.8% 10.4%
CS12 Bioretention Basins and Porous Media Filtration 50% of parking lots 6.3% 2.1% 11.6% CS13 Treatment Wetlands: Onsite and Regional
100% of identified potential 1.4% 0.4% 2.5%
Notes: 1. Volume reductions are % of total discharge (sum of CSO and stormwater) 2. “Maximum Feasible” considers technical feasibility and social acceptance, but not cost. In spite of its cost, subsurface storage under parking lots is recommended because it is one of the few practical options in the most urban areas. Green rooftops are not recommended as an effective short-term management strategy due to the high cost and practical constraints they currently impose on private land owners. However, they may become more cost-effective in the future due to economies of scale and increased local availability of materials and expertise. For these reasons, the watershed planning team has recommended that local government implement demonstration projects on public buildings and consider incentives for private land owners to do so. In the near term, the benefit of these projects will be primarily educational rather than technical.
While effectiveness and cost may be the two most important criteria used to assess and choose BMPs, feasibility and sociopolitical factors ultimately play a role. These factors were evaluated using a simpler method than were effectiveness and cost. The factors are discussed below, and Table 7-6 assigns a rating to assess the effect of each factor on the BMPs studied.
May 2005 7-20
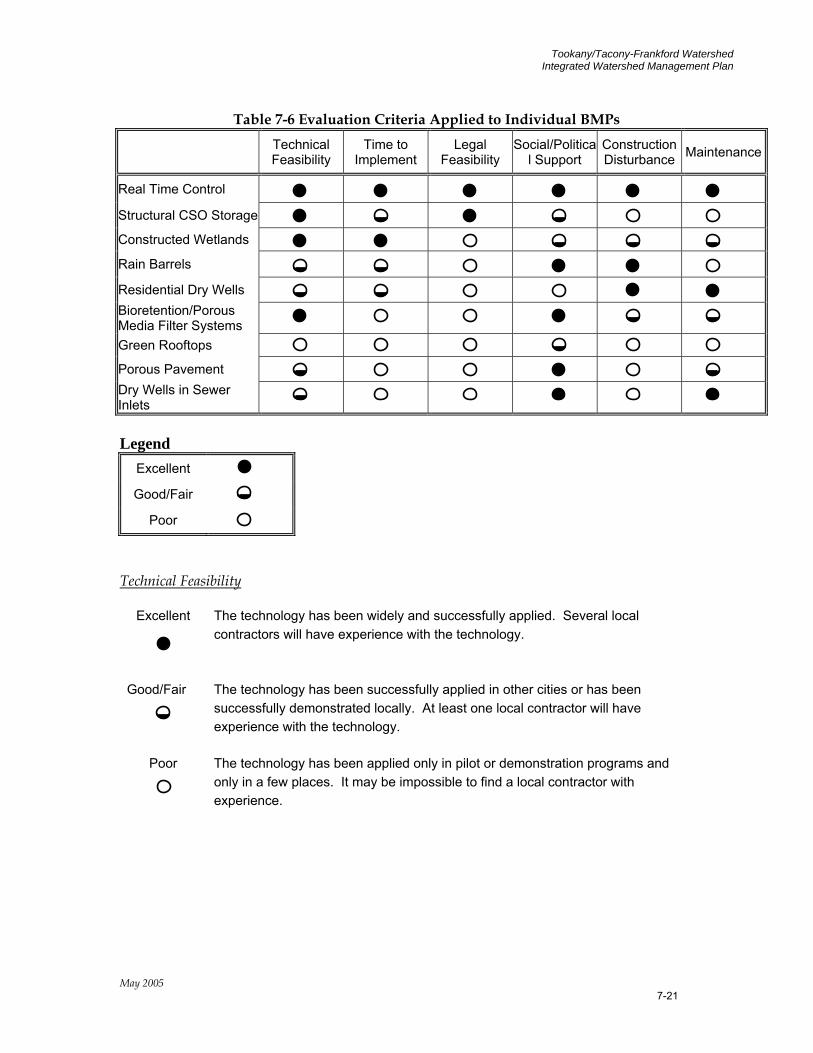
Tookany/Tacony-Frankford Watershed Integrated Watershed Management Plan
Table 7-6 Evaluation Criteria Applied to Individual BMPs
Technical Feasibility
Time to Implement
Legal Feasibility
Social/Political Support
Construction Disturbance Maintenance
Real Time Control
Structural CSO Storage
Constructed Wetlands
Rain Barrels
Residential Dry Wells
Bioretention/Porous Media Filter Systems
Green Rooftops
Porous Pavement
Dry Wells in Sewer Inlets
Legend
Excellent
Good/Fair
Poor
Technical Feasibility
Excellent The technology has been widely and successfully applied. Several local contractors will have experience with the technology.
Good/Fair The technology has been successfully applied in other cities or has been successfully demonstrated locally. At least one local contractor will have experience with the technology.
Poor The technology has been applied only in pilot or demonstration programs and only in a few places. It may be impossible to find a local contractor with experience.
May 2005 7-21

Tookany/Tacony-Frankford Watershed Integrated Watershed Management Plan
Length of Time to Implement
Excellent The technology can be implemented in 2 years or less.
Good/Fair The technology can be implemented in 2 to 5 years.
Poor The technology takes more than 5 years to implement.
Feasibility within the Legal Structure
Excellent Existing laws require or provide an incentive for implementation. For example, measures proposed may overlap with the “six minimum controls” required by NPDES Phase II regulations.
Poor Existing laws do not affect or do provide disincentives for different aspects of the plan. For example, a local ordinance may discourage infiltration.
Social/Political Support
Excellent Overall, the measure proposed will be seen as positive by a majority of stakeholders (citizens, local governments, and non-profits).
Good/Fair The measure has both positive and negative aspects.
Poor Overall, the measure proposed will be seen as negative by a majority of stakeholders (citizens, local governments, and non-profits).
Construction Disturbance
Excellent Pavement removal is not required or is minimal. Effects on parking, traffic patterns, and noise are minimal. Rain barrels are one example.
Good/Fair Some pavement removal is required. Effects on parking, traffic patterns, and noise are moderate.
Poor Construction will require removal of large amounts of pavement (streets, parking lots) and/or significantly affect parking, movement of people and vehicles, and the noise level. Examples include porous pavement and installation of dry wells in sewer inlets.
May 2005 7-22

Tookany/Tacony-Frankford Watershed Integrated Watershed Management Plan
Maintenance – Cost and Institutional Considerations
Excellent Maintenance can be performed through existing programs and existing funding. For example, maintenance of retrofit sewer inlets can be integrated into current sewer maintenance.
Good/Fair Private land owners will be responsible for minor maintenance chores (e.g., minor landscape maintenance for a bioretention basin that would have been a parking island anyway). Public agencies can handle maintenance with existing staff and budget, and/or will dedicate staff time to outreach, workshops, etc.
Poor Existing public programs, staff, and funding will not cover maintenance, or maintenance will be a large burden on private land owners. Or, frequent maintenance is absolutely critical to BMP effectiveness, as with rain barrels.
7.3 Recommended Options Table 7-7 summarizes options recommended for full implementation, options recommended for conditional implementation, and options that are not recommended. Options recommended for conditional implementation include most of the structural stormwater and combined sewage management measures. Each conditional recommendation is accompanied by a superscript relating to one of the conclusions presented in the previous section.
TARGET A: Options for Dry Weather Water Quality and Aesthetics For the Tookany/Tacony-Frankford Creek, the focus of Target A is trash removal, litter prevention, and elimination of sources of sewage during dry weather. Because the options under consideration are aimed at the total elimination of trash and dry weather sources of sewage, no complex analysis was required to help define the program or assess its potential benefits. All options related to this target are recommended for implementation.
Streams should be aesthetically appealing (e.g., look and smell good), accessible to the public, and be an amenity to the community. Access to and interaction with the stream during dry weather have the highest priority, because dry weather flows occur about 60-65% of the time during the course of a year, and are also the times when the public is most likely to be near or in contact with the streams. The water quality of the stream in dry weather, particularly with respect to bacteria, should be similar to background concentrations in groundwater. Many urban streams rarely meet water quality standards for bacteria, and urban streams often have significant BOD problems, even during baseflow or dry weather conditions.
TARGET B: Options for Healthy Living Resources Improving the ability of an urban stream to support viable habitat and fish populations focuses primarily on the elimination of the more obvious impacts of urbanization on the stream. These include loss of riparian habitat, eroding and undercut banks, scoured streambed or excessive silt deposits, channelized and armored stream sections, trash buildup, and invasive species. The primary tool to accomplish this is stream and stream corridor
May 2005 7-23
Tookany/Tacony-Frankford Watershed Integrated Watershed Management Plan
restoration. Restoration focuses on improving channel stability, improving in-stream and riparian habitat, providing refuges for fish from high velocity conditions during storms, and managing land within the stream corridor. Because designated uses in the stream cannot be restored without these options, all options grouped under Target B are recommended for implementation.
TARGET C: Options for Wet Weather Water Quality and Quantity Improving water quality and flow conditions during and after storms is the most difficult target to meet in the urban environment. During wet weather, extreme increases in streamflow are common, accompanied by short term changes in water quality. Stormwater generally does not have DO problems, but sampling data indicate that concentrations of metals (such as copper, lead, and zinc) and bacteria do not meet water quality standards during wet weather. These pollutants are introduced by both stormwater and wet weather sewer overflows (CSOs and SSOs).
Target C options also must address flooding issues. Where water quality and quantity problems both exist, options must be identified that address both. Any BMP that increases infiltration or detains flow will help decrease the frequency of damaging floods; however, the size of such structures may need to be increased in areas where flooding is a major concern. Reductions in the frequency of erosive flows and velocities will also help protect the investment in stream restoration made as part of the implementation of Target B options.
Options related to Target C are divided into two groups. The first group, listed in the following outline, includes options recommended for full implementation regardless of what alternative is ultimately chosen. These options include a range of ordinances and regulatory measures and public education measures related to existing municipal infrastructure, selected source controls, and possibilities for pollution trading and use review. The municipal measures focus on the elimination of sanitary sewer overflows and the causes of overflows such as blockages and excessive infiltration.
The second group of Target C options includes structural measures designed to achieve specific, measurable discharge and pollutant load reductions. These options are recommended on a conditional basis, based on conclusions of screening and modeling studies. Each of the conditional recommendations is linked to one of the conclusions drawn.
May 2005 7-24

Tookany/Tacony-Frankford Watershed Integrated Watershed Management Plan
Table 7-7 Summary of Recommended Options
Option RecommendedNot
Recommended Conditional* Target A X
Target B X
Target C Regulatory Approaches
Zoning and Land Use Control CR1 Requiring Better Site Design in New
Development X CR2 Requiring Better Site Design in
Redevelopment X CR3 Stormwater and Floodplain
Management X CR4 Industrial Stormwater Pollution
Prevention X CR5 Construction Stormwater Pollution
Prevention X CR6 Post-Construction Stormwater Runoff
Management X CR7 Pollution Trading X CR8 Use Review and Attainability Analysis X CR9 Watershed Based Permitting X
Public Education and Volunteer Programs CP1 Public Education and Volunteer
Programs X Municipal Measures
CM1 Sanitary Sewer Overflow Detection X CM2 Sanitary Sewer Overflow Elimination:
Structural Measures X CM3 Reduction of Stormwater Inflow /
Infiltration to Sanitary Sewers X CM4 Combined Sewer Overflow (CSO)
Control Program X CM5 Catch Basin and Storm Inlet
Maintenance X CM6 Street Sweeping X CM7 Responsible Landscaping Practices on
Public Lands X CM8 Household Hazardous Waste Collection X CM9 Responsible Bridge and Roadway
Maintenance X CMR Monitoring, Reporting, and Further
Study X
May 2005 7-25
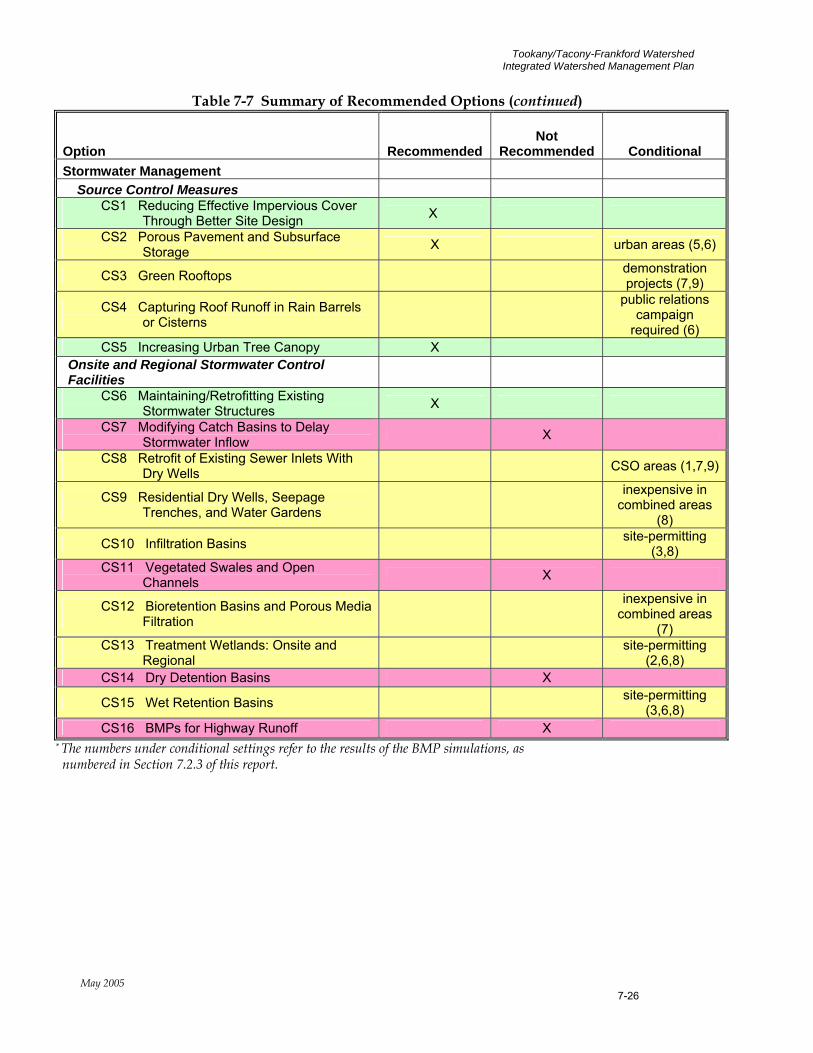
Tookany/Tacony-Frankford Watershed Integrated Watershed Management Plan
Table 7-7 Summary of Recommended Options (continued)
Option Recommended Not
Recommended Conditional Stormwater Management
Source Control Measures CS1 Reducing Effective Impervious Cover
Through Better Site Design X
CS2 Porous Pavement and Subsurface Storage X urban areas (5,6)
CS3 Green Rooftops demonstration projects (7,9)
CS4 Capturing Roof Runoff in Rain Barrels or Cisterns
public relations campaign
required (6) CS5 Increasing Urban Tree Canopy X
Onsite and Regional Stormwater Control Facilities
CS6 Maintaining/Retrofitting Existing Stormwater Structures X
CS7 Modifying Catch Basins to Delay Stormwater Inflow X
CS8 Retrofit of Existing Sewer Inlets With Dry Wells CSO areas (1,7,9)
CS9 Residential Dry Wells, Seepage Trenches, and Water Gardens
inexpensive in combined areas
(8)
CS10 Infiltration Basins site-permitting (3,8)
CS11 Vegetated Swales and Open Channels X
CS12 Bioretention Basins and Porous Media Filtration
inexpensive in combined areas
(7) CS13 Treatment Wetlands: Onsite and
Regional site-permitting (2,6,8)
CS14 Dry Detention Basins X
CS15 Wet Retention Basins site-permitting (3,6,8)
CS16 BMPs for Highway Runoff X * The numbers under conditional settings refer to the results of the BMP simulations, as numbered in Section 7.2.3 of this report.
May 2005 7-26
Tookany/Tacony-Frankford Integrated Watershed Management Plan
Section 8: Development and Evaluation of Management Alternatives
May 2005 8-1
BMPs, stream restoration measures, stormwater and CSO management technologies, and public education measures must be combined into coherent, integrated management plan alternatives that address the multiple objectives of the Tookany/Tacony-Frankford Watershed Partnership. In highly urbanized watersheds, however, it is very difficult to develop appropriate water quality, quantity, and habitat objectives. For Tookany/Tacony-Frankford Creek, PWD’s approach is to define three separate sets of objectives or targets, and recommend BMPs and programs to achieve each of the targets. Targets are defined here as groups of objectives that each focus on a different problem related to the urban stream system. They can be thought of as different parts of the overall goal of fishable and swimmable waters through improved water quality, more natural flow patterns, and restored aquatic and riparian habitat.
The three targets of watershed restoration for Tookany/Tacony-Frankford Creek are:
TARGET A: Dry Weather Water Quality and Aesthetics
TARGET B: Healthy Living Resources
TARGET C: Wet Weather Water Quality and Quantity
By defining clear and achievable targets, and designing the alternatives and implementation plan to address the targets simultaneously, the plan will have a much higher likelihood of success. It will also result in realizing some of the objectives within a relatively short time frame, providing positive incentive to the communities and agencies involved in the program to continue and expand their efforts. This approach will also result in more immediate benefits to people living in the watershed than would an approach that attempts to meet all objectives completely in one implementation plan.
Discharge and Load Reduction Target Target A and Target B have specific measures that must be implemented, and full achievement of the targets is envisioned. For Target C, no single option or BMP is sufficient, and none are clearly superior to all others. This indicates that flexibility, “seeing what works where, and adjusting”, is probably the best approach to implementation. A mixed approach (not having a plan to implement certain BMPs as a primary approach), however, appears to lead to only moderately successful alternatives.
Target C must be approached somewhat differently from the first two targets. Full achievement of this target means meeting all water quality standards during wet weather, as well as eliminating all flooding. Full achievement of these goals will be

Tookany/Tacony-Frankford Integrated Watershed Management Plan
expensive and will require a long term effort. A rational approach to full achievement of Target C goals is through stepped implementation with interim targets for reducing wet weather pollutant loads and discharges to the creek. During implementation, monitoring must continue to continuously assess the effectiveness of the program. Based on the extensive modeling analysis carried out for TTF to date, an initial goal of a 20-25% reduction in total discharge (the sum of stormwater and CSO flows) and pollutant loads is challenging but achievable.
It is expected that changes to the approach, and even to the desired results, will occur as measures are implemented and results are monitored. With permits of 5-year duration for most discharge permits, discharge targets and reduction targets must be set and implementation designed in the first 5 years. Implementation for meeting Target C should occur over the next 5 years, with monitoring for effectiveness taking place for 5 years subsequent to implementation. During the last 5-year period, PWD will also work with the regulatory agencies to review water quality standards and determine whether any adjustments to them may be appropriate based on the results of monitoring.
The 20-25% reduction in total discharge is a goal to be achieved on a watershed basis. The specific measures chosen within individual municipalities or geographical areas will depend on several factors and local preferences.
Steps to Assembly of a Management Alternative The following steps may be followed by a county, municipality, or watershed group responsible for implementation in a defined geographic area.
Step 1: Include all options listed as “Recommended” in Table 7-7. All Target A options
All Target B options
Selected Target C options, including ordinances and regulatory measures, public education, measures related to existing municipal infrastructure, selected source controls, and possibilities for pollution trading and use review
Example Municipality A implements all recommended options. Some options are regulatory changes, such as adopting a model ordinance to encourage low impact development techniques in redevelopment. Other options involve evaluating the effectiveness of existing programs, such as street sweeping and inlet cleaning. Some of these programs need minor adjustments to bring them in line with the recommendations of the plan.
May 2005 8-2
Tookany/Tacony-Frankford Integrated Watershed Management Plan
Step 2: Identify “Conditional” options that are effective. Table 7-7 and the conclusions in Section 7 identify “Conditional” options that are appropriate for the type of sewer system in the area. For example, option CS8, Retrofit of Existing Sewer Inlets With Dry Wells, is recommended only in areas with combined sewers. Eliminate BMP types that are not appropriate.
Example Municipality A is a small municipality in an area with separate storm and sanitary sewers. It will participate in the TTFIWMP by reducing stormwater discharges to the creek by 20%. Options CS1 (Reducing Effective Impervious Cover Through Better Site Design) and CS5 (Increasing Urban Tree Canopy) are recommended without condition and will contribute to the total. The municipality identifies the following conditional options as effective:
CS2 Porous Pavement and Subsurface Storage CS3 Green Rooftops CS4 Capturing Roof Runoff in Rain Barrels or Cisterns CS6 Maintaining/Retrofitting Existing Stormwater Structures CS9 Residential Dry Wells, Seepage Trenches, and Water Gardens CS10 Infiltration Basins CS12 Bioretention Basins and Porous Media Filtration CS13 Treatment Wetlands: Onsite and Regional CS15 Wet Retention Basins
Step 3: Identify areas for BMP implementation. Within the geographic area where BMPs will be implemented, measure areas of parking lots, roofs, parks, and riparian land. Eliminate BMP types that have no land available to implement them.
Example Municipality A has a number of shopping centers and office buildings with large parking lots. It has one municipal park but it is not along the stream corridor. It has no existing detention basins. Based on these conditions, all options from step 2 are feasible with the exception of retrofitting existing stormwater structures and regional treatment wetlands (small wetlands on individual sites may be technically feasible).
Step 4: Rank remaining BMPs by cost-effectiveness. Table 7-4 ranks BMPs from most to least cost-effective based on sewer type. This ranking provides a first approximation of the priorities that BMPs may be given in the area.
Example Municipality A ranks its options from most to least cost-effective based on quantity reduction in separate-sewered areas:
May 2005 8-3
Tookany/Tacony-Frankford Integrated Watershed Management Plan
CS13 Treatment Wetlands: Onsite CS4 Capturing Roof Runoff in Rain Barrels or Cisterns CS2 Porous Pavement and Subsurface Storage CS15 Wet Retention Basins CS10 Infiltration Basins CS9 Residential Dry Wells, Seepage Trenches, and Water Gardens CS12 Bioretention Basins and Porous Media Filtration CS3 Green Rooftops
Step 5: Adjust ranking based on qualitative factors. Table 7-6 provides guidance on evaluating qualitative factors, such as amount of construction disturbance and institutional arrangements for maintenance. Based on local preferences, the priority order identified in step 4 may be adjusted.
Example Municipality A prefers to avoid options that have not been tested locally; it is willing to consider a porous pavement test site but prefers not to include green roofs in its strategy. Based on these requirements, the ranking is adjusted as follows:
CS13 Treatment Wetlands: Onsite CS4 Capturing Roof Runoff in Rain Barrels or Cisterns CS15 Wet Retention Basins CS10 Infiltration Basins CS9 Residential Dry Wells, Seepage Trenches, and Water Gardens CS2 Porous Pavement and Subsurface Storage CS12 Bioretention Basins and Porous Media Filtration
Step 6: Adjust ranking based on local siting preferences. Local governments or stakeholders may have preferences for BMP siting that will further affect the ranking. Some of these preferences are discussed below.
Effect on Existing Land Use
In the urban environment where space is at a premium, stormwater controls that affect the existing function of a property may not be acceptable. For example, building a detention basin where a parking lot currently exists may not be acceptable because it changes the function of the property and will affect its value. Adding a small bioretention basin to the parking lot while still meeting the needed parking capacity may be acceptable. Porous pavement and parking lot options are extremely effective at meeting Target C objectives for infiltration.
Infrastructure-Based vs. Land-Based
A given municipality may prefer management measures that involve retrofitting existing sewer infrastructure (e.g., dry wells in sewer inlets) rather than measures that alter the land surface (e.g., building a landscaped infiltration basin in a park). The infrastructure-related option, while more expensive, may provide the same
May 2005 8-4
Tookany/Tacony-Frankford Integrated Watershed Management Plan
benefit, be easier to maintain, and be more acceptable to the public. This local preference may not be true in another municipality.
Public Land vs. Private Land
A given municipality may prefer a strategy that emphasizes BMPs on public land (funded through taxes or utility fees) rather than BMPs on private land (constructed and funded by developers or landowners). Alternatives that rely on the use of public property provide more ability to control implementation than those that rely on private property. Private property BMPs (rain barrels, residential dry wells) can be effective and low cost, if reasonable levels of implementation and regular maintenance can be achieved.
On-Site, Riparian, and Regional Sites
Many BMPs are suitable for managing stormwater on an individual site before it leaves that site. Others are suitable for intercepting and treating stormwater or combined sewage along the stream corridor before it reaches the stream. Some BMPs are suitable for implementation on a large-scale, regional basis. BMPs may also be implemented at multiple scales, creating “BMPs in series” or a “treatment train” effect. The choice between these options is ultimately a matter of local conditions and preferences.
Example
Parking is limited in municipality A and the public will not accept options that reduce it further. However, some parking lots can be reconfigured to include a bioretention basin without reducing the total number of stalls. Park land in the municipality is heavily used for recreation; construction of wet retention, infiltration basins, or wetlands in the park is not an attractive option. Local government is willing to implement some options on public land (e.g., municipal parking lots) and work with private property owners to implement others.
Municipality A chooses the following options for implementation:
CS12 Bioretention Basins and Porous Media Filtration CS2 Porous Pavement and Subsurface Storage CS9 Residential Dry Wells, Seepage Trenches, and Water Gardens CS4 Capturing Roof Runoff in Rain Barrels or Cisterns
Step 7: Evaluate the total reduction possible and compare to the target. Identify the maximum feasible implementation of the first BMP in the final ranking. Using Table 7-2, determine the maximum reduction that can be achieved when this BMP is implemented at its maximum level. If the reduction is less than the target, continue with the second BMP in the ranking. Continue until the target is met.
May 2005 8-5
Tookany/Tacony-Frankford Integrated Watershed Management Plan
Examples
Municipality A implements better site design techniques as part of all landscaping and redevelopment projects on public land. It adopts a new stormwater ordinance providing incentives for better site design in private redevelopment. It participates in a regional urban reforestation program. Most of its public and private parking lots are retrofit with either porous pavement or bioretention. It works with the watershed Partnership to implement dry wells and rain barrels on private residential properties. Over a period of twenty years, it exceeds the discharge reduction target at a reasonable cost and without affecting local quality of life.
Municipalities B and C choose to take part in an experimental trading program for discharge reduction credits. Municipality C is able to achieve a larger discharge reduction per dollar spent due to infrastructure-related options and riparian land suitable for wetlands. Municipality B, with limited space suitable for BMPs, pays municipality C to achieve its share of the discharge reduction target. This arrangement achieves an identical benefit to the stream at lower cost.
May 2005 8-6
Tookany/Tacony-Frankford Integrated Watershed Management Plan
Section 10: Cost and Institutional Analysis 10.1 Estimated Cost of Implementation Planning-level costs have been developed for many of the options being recommended. Because costs are highly dependent on site specific conditions as well as the extent to which implementation occurs, costs are only approximate. These costs are useful, however, in providing order of magnitude funding needs, and also, as a comparison to potential costs associated with more traditional approaches to CSO control, such as large scale storage tanks designed to reach the 85% capture goal. Planning level costs are provided for each of the options discussed under the three Targets.
The combination of structural BMPs and implementation percentages in this section are suggested as a feasible plan that will equal or exceed the 20% discharge reduction target. The exact combination of BMPs implemented in each area of the watershed will be determined by local municipalities or by a government or institutional body to be chosen at a later time.
Order-of-magnitude, planning-level cost estimates are shown in Tables 10-1 through 10-4. For structural stormwater best management practices, cost estimates are based on an assumed implementation percentage taken from Section 9, Implementation Guidelines.
May 2005 10-1
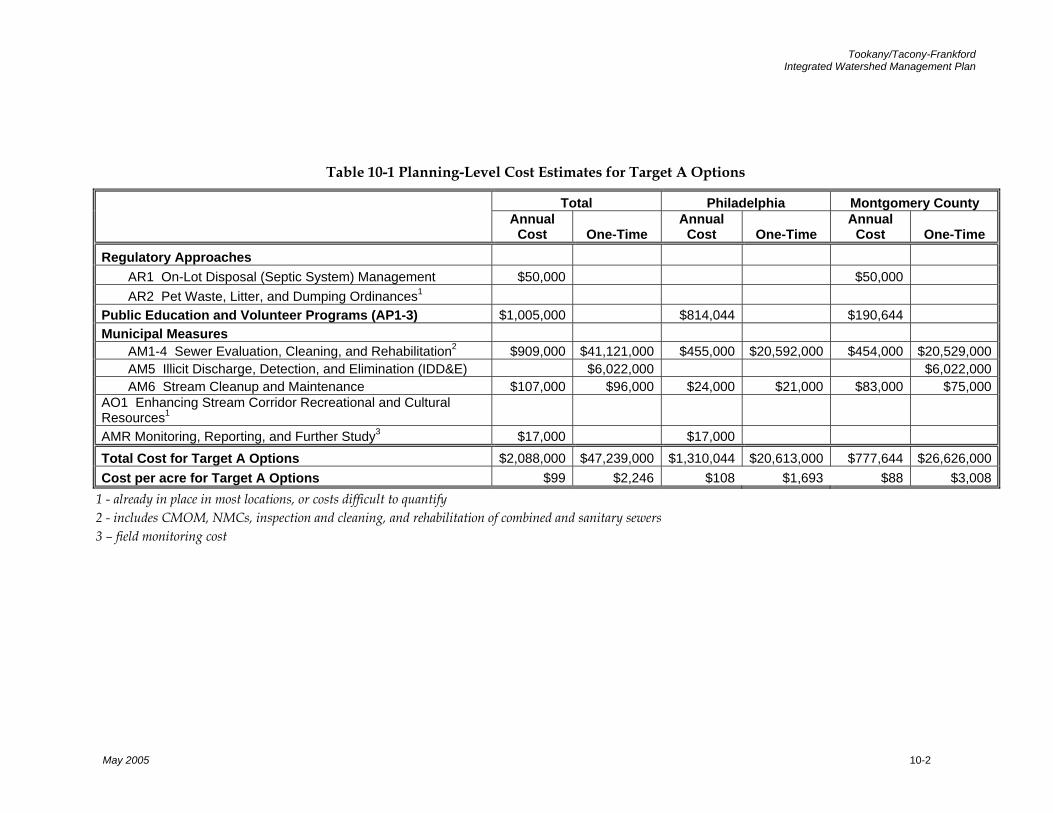
Tookany/Tacony-Frankford Integrated Watershed Management Plan
Table 10-1 Planning-Level Cost Estimates for Target A Options
Total Philadelphia Montgomery County
Annual
Cost One-Time Annual
Cost One-Time Annual
Cost One-Time Regulatory Approaches
AR1 On-Lot Disposal (Septic System) Management $50,000 $50,000 AR2 Pet Waste, Litter, and Dumping Ordinances1
Public Education and Volunteer Programs (AP1-3) $1,005,000 $814,044 $190,644Municipal Measures
AM1-4 Sewer Evaluation, Cleaning, and Rehabilitation2 $909,000 $41,121,000 $455,000 $20,592,000 $454,000 $20,529,000 AM5 Illicit Discharge, Detection, and Elimination (IDD&E) $6,022,000 $6,022,000 AM6 Stream Cleanup and Maintenance $107,000 $96,000 $24,000 $21,000 $83,000 $75,000
AO1 Enhancing Stream Corridor Recreational and Cultural Resources1 AMR Monitoring, Reporting, and Further Study3 $17,000 $17,000Total Cost for Target A Options $2,088,000 $47,239,000 $1,310,044 $20,613,000 $777,644 $26,626,000 Cost per acre for Target A Options $99 $2,246 $108 $1,693 $88 $3,008
1 - already in place in most locations, or costs difficult to quantify 2 - includes CMOM, NMCs, inspection and cleaning, and rehabilitation of combined and sanitary sewers 3 – field monitoring cost
May 2005 10-2

Tookany/Tacony-Frankford Integrated Watershed Management Plan
Table 10-2 Planning-level Costs for Target B Options
Total Philadelphia Montgomery County
Annual
Cost One-TimeAnnual
Cost One-TimeOther
Counties One-TimeChannel Stability and Aquatic Habitat Restoration
BM1 Bed Stabilization and Habitat Restoration1 $3,000 $8,131,000 $1,000 $4,066,000 $1,000 $4,066,000 BM2 Bank Stabilization and Habitat Restoration1 $3,000 $8,131,000 $1,000 $4,066,000 $1,000 $4,066,000 BM3 Channel Realignment and Relocation1 $3,000 $8,131,000 $1,000 $4,066,000 $1,000 $4,066,000 BM4 Plunge Pool Removal2 BM5 Improvement of Fish Passage3
Lowland Restoration and Enhancement BM6 Wetland Creation2 BM7 Invasive Species Management2
Upland Restoration and Enhancement BM8 Biofiltration2 BM9 Reforestation4
BMR Monitoring, Reporting, and Further Study5 $17,000 $17,000 Total Cost for Target B Options $26,000 $24,393,000 $20,000 $12,198,000 $3,000 $12,198,000 Cost per acre for Target B Options $1.2 $1,160 $1.6 $1,002 $0.3 $1,378
1 - based on restoration of high-priority reaches at $700/ft. If actual cost is lower, medium priority reaches may also be restored. 2 - cost considered under options BM1, BM2, and BM3 3 - not evaluated; recommended as a longer-term option 4 - cost included in Target V urban tree canopy cost 5 – field monitoring cost
May 2005 10-3
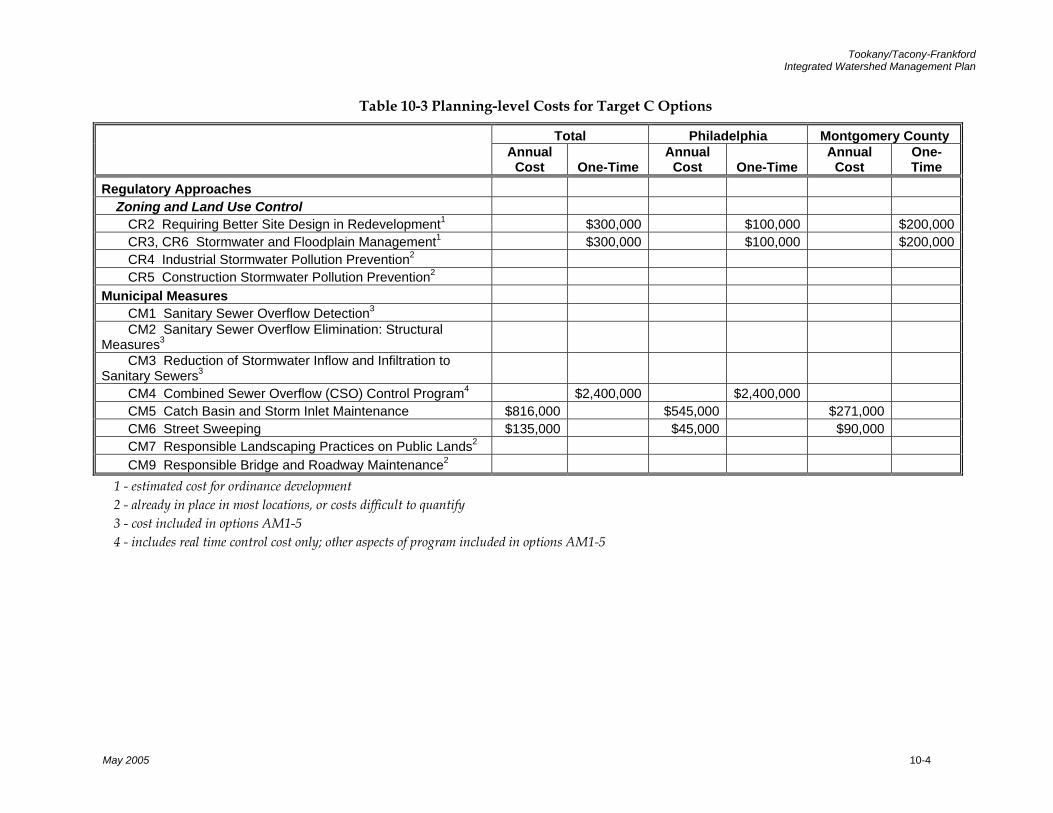
Tookany/Tacony-Frankford Integrated Watershed Management Plan
Table 10-3 Planning-level Costs for Target C Options
Total Philadelphia Montgomery County
Annual
Cost One-Time Annual
Cost One-Time Annual
Cost One-Time
Regulatory Approaches Zoning and Land Use Control
CR2 Requiring Better Site Design in Redevelopment1 $300,000 $100,000 $200,000CR3, CR6 Stormwater and Floodplain Management1 $300,000 $100,000 $200,000CR4 Industrial Stormwater Pollution Prevention2 CR5 Construction Stormwater Pollution Prevention2
Municipal Measures CM1 Sanitary Sewer Overflow Detection3 CM2 Sanitary Sewer Overflow Elimination: Structural
Measures3 CM3 Reduction of Stormwater Inflow and Infiltration to
Sanitary Sewers3 CM4 Combined Sewer Overflow (CSO) Control Program4 $2,400,000 $2,400,000CM5 Catch Basin and Storm Inlet Maintenance $816,000 $545,000 $271,000 CM6 Street Sweeping $135,000 $45,000 $90,000 CM7 Responsible Landscaping Practices on Public Lands2 CM9 Responsible Bridge and Roadway Maintenance2
1 - estimated cost for ordinance development 2 - already in place in most locations, or costs difficult to quantify 3 - cost included in options AM1-5 4 - includes real time control cost only; other aspects of program included in options AM1-5
May 2005 10-4
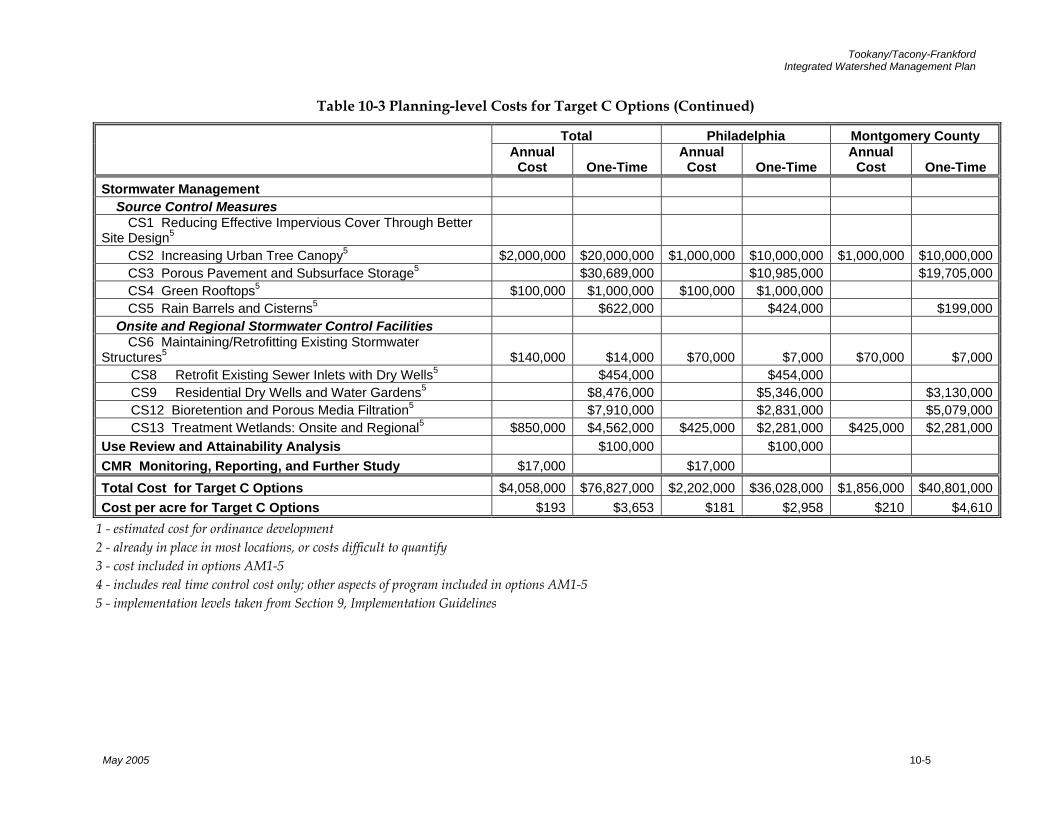
Tookany/Tacony-Frankford Integrated Watershed Management Plan
May 2005 10-5
Table 10-3 Planning-level Costs for Target C Options (Continued)
Total Philadelphia Montgomery County
Annual
Cost One-Time Annual
Cost One-Time Annual
Cost One-Time Stormwater Management Source Control Measures
CS1 Reducing Effective Impervious Cover Through Better Site Design5
CS2 Increasing Urban Tree Canopy5 $2,000,000 $20,000,000 $1,000,000 $10,000,000 $1,000,000 $10,000,000 CS3 Porous Pavement and Subsurface Storage5 $30,689,000 $10,985,000 $19,705,000CS4 Green Rooftops5 $100,000 $1,000,000 $100,000 $1,000,000 CS5 Rain Barrels and Cisterns5 $622,000 $424,000 $199,000
Onsite and Regional Stormwater Control Facilities CS6 Maintaining/Retrofitting Existing Stormwater
Structures5 $140,000 $14,000 $70,000 $7,000 $70,000 $7,000 CS8 Retrofit Existing Sewer Inlets with Dry Wells5 $454,000 $454,000 CS9 Residential Dry Wells and Water Gardens5 $8,476,000 $5,346,000 $3,130,000 CS12 Bioretention and Porous Media Filtration5 $7,910,000 $2,831,000 $5,079,000 CS13 Treatment Wetlands: Onsite and Regional5 $850,000 $4,562,000 $425,000 $2,281,000 $425,000 $2,281,000 Use Review and Attainability Analysis $100,000 $100,000CMR Monitoring, Reporting, and Further Study $17,000 $17,000Total Cost for Target C Options $4,058,000 $76,827,000 $2,202,000 $36,028,000 $1,856,000 $40,801,000 Cost per acre for Target C Options $193 $3,653 $181 $2,958 $210 $4,610
1 - estimated cost for ordinance development 2 - already in place in most locations, or costs difficult to quantify 3 - cost included in options AM1-5 4 - includes real time control cost only; other aspects of program included in options AM1-5 5 - implementation levels taken from Section 9, Implementation Guidelines
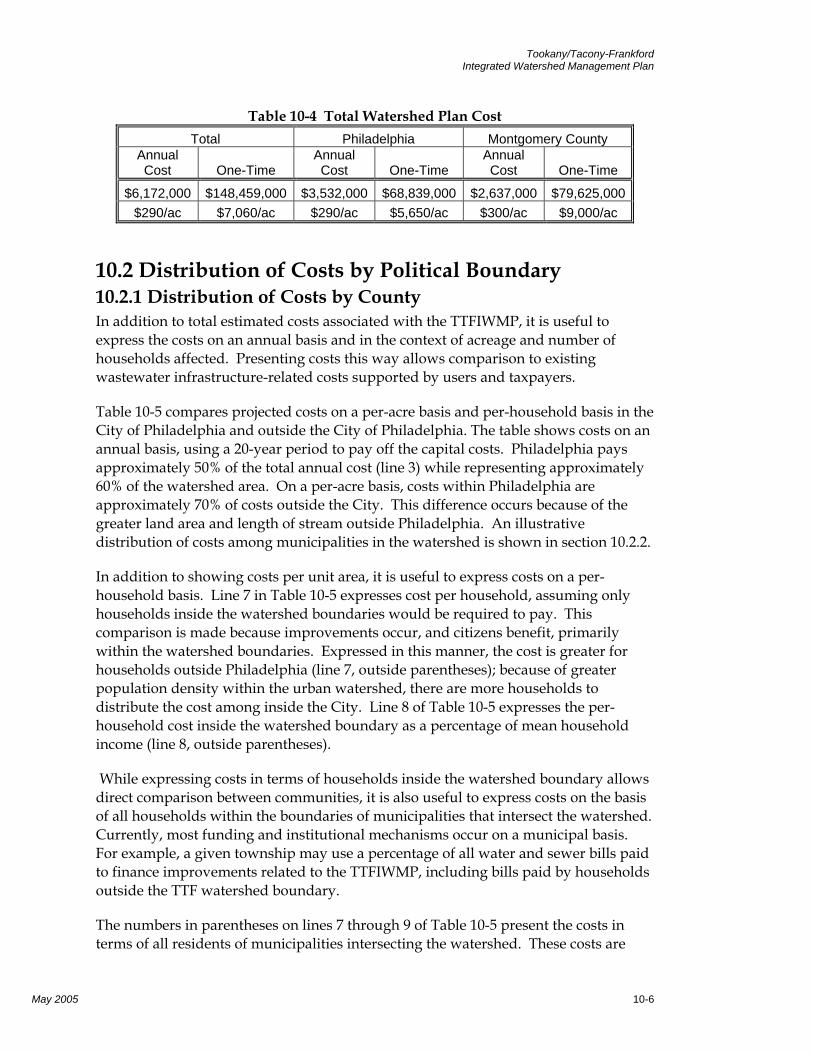
Tookany/Tacony-Frankford Integrated Watershed Management Plan
Table 10-4 Total Watershed Plan Cost Total Philadelphia Montgomery County
Annual Cost One-Time
Annual Cost One-Time
Annual Cost One-Time
$6,172,000 $148,459,000 $3,532,000 $68,839,000 $2,637,000 $79,625,000 $290/ac $7,060/ac $290/ac $5,650/ac $300/ac $9,000/ac
10.2 Distribution of Costs by Political Boundary 10.2.1 Distribution of Costs by County In addition to total estimated costs associated with the TTFIWMP, it is useful to express the costs on an annual basis and in the context of acreage and number of households affected. Presenting costs this way allows comparison to existing wastewater infrastructure-related costs supported by users and taxpayers.
Table 10-5 compares projected costs on a per-acre basis and per-household basis in the City of Philadelphia and outside the City of Philadelphia. The table shows costs on an annual basis, using a 20-year period to pay off the capital costs. Philadelphia pays approximately 50% of the total annual cost (line 3) while representing approximately 60% of the watershed area. On a per-acre basis, costs within Philadelphia are approximately 70% of costs outside the City. This difference occurs because of the greater land area and length of stream outside Philadelphia. An illustrative distribution of costs among municipalities in the watershed is shown in section 10.2.2.
In addition to showing costs per unit area, it is useful to express costs on a per-household basis. Line 7 in Table 10-5 expresses cost per household, assuming only households inside the watershed boundaries would be required to pay. This comparison is made because improvements occur, and citizens benefit, primarily within the watershed boundaries. Expressed in this manner, the cost is greater for households outside Philadelphia (line 7, outside parentheses); because of greater population density within the urban watershed, there are more households to distribute the cost among inside the City. Line 8 of Table 10-5 expresses the per-household cost inside the watershed boundary as a percentage of mean household income (line 8, outside parentheses).
While expressing costs in terms of households inside the watershed boundary allows direct comparison between communities, it is also useful to express costs on the basis of all households within the boundaries of municipalities that intersect the watershed. Currently, most funding and institutional mechanisms occur on a municipal basis. For example, a given township may use a percentage of all water and sewer bills paid to finance improvements related to the TTFIWMP, including bills paid by households outside the TTF watershed boundary.
The numbers in parentheses on lines 7 through 9 of Table 10-5 present the costs in terms of all residents of municipalities intersecting the watershed. These costs are
May 2005 10-6
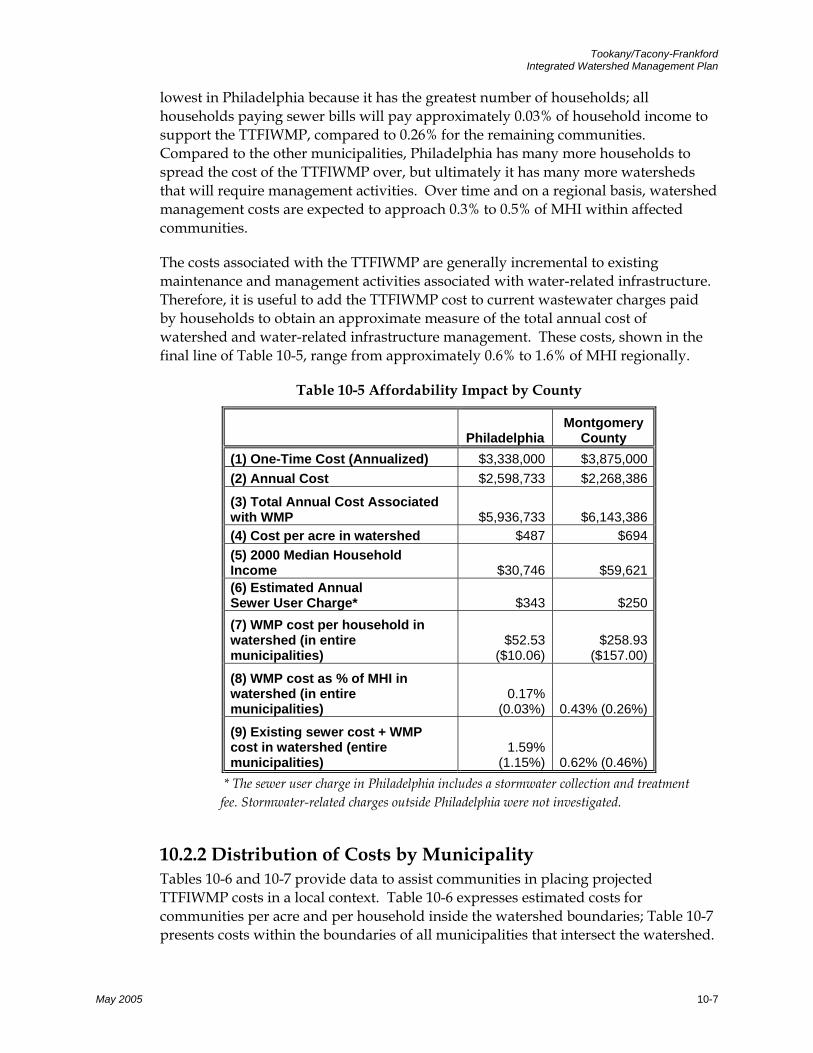
Tookany/Tacony-Frankford Integrated Watershed Management Plan
lowest in Philadelphia because it has the greatest number of households; all households paying sewer bills will pay approximately 0.03% of household income to support the TTFIWMP, compared to 0.26% for the remaining communities. Compared to the other municipalities, Philadelphia has many more households to spread the cost of the TTFIWMP over, but ultimately it has many more watersheds that will require management activities. Over time and on a regional basis, watershed management costs are expected to approach 0.3% to 0.5% of MHI within affected communities.
The costs associated with the TTFIWMP are generally incremental to existing maintenance and management activities associated with water-related infrastructure. Therefore, it is useful to add the TTFIWMP cost to current wastewater charges paid by households to obtain an approximate measure of the total annual cost of watershed and water-related infrastructure management. These costs, shown in the final line of Table 10-5, range from approximately 0.6% to 1.6% of MHI regionally.
Table 10-5 Affordability Impact by County
Philadelphia Montgomery
County (1) One-Time Cost (Annualized) $3,338,000 $3,875,000 (2) Annual Cost $2,598,733 $2,268,386
(3) Total Annual Cost Associated with WMP $5,936,733 $6,143,386 (4) Cost per acre in watershed $487 $694 (5) 2000 Median Household Income $30,746 $59,621 (6) Estimated Annual Sewer User Charge* $343 $250 (7) WMP cost per household in watershed (in entire municipalities)
$52.53 ($10.06)
$258.93 ($157.00)
(8) WMP cost as % of MHI in watershed (in entire municipalities)
0.17% (0.03%) 0.43% (0.26%)
(9) Existing sewer cost + WMP cost in watershed (entire municipalities)
1.59% (1.15%) 0.62% (0.46%)
* The sewer user charge in Philadelphia includes a stormwater collection and treatment fee. Stormwater-related charges outside Philadelphia were not investigated.
10.2.2 Distribution of Costs by Municipality Tables 10-6 and 10-7 provide data to assist communities in placing projected TTFIWMP costs in a local context. Table 10-6 expresses estimated costs for communities per acre and per household inside the watershed boundaries; Table 10-7 presents costs within the boundaries of all municipalities that intersect the watershed.
May 2005 10-7
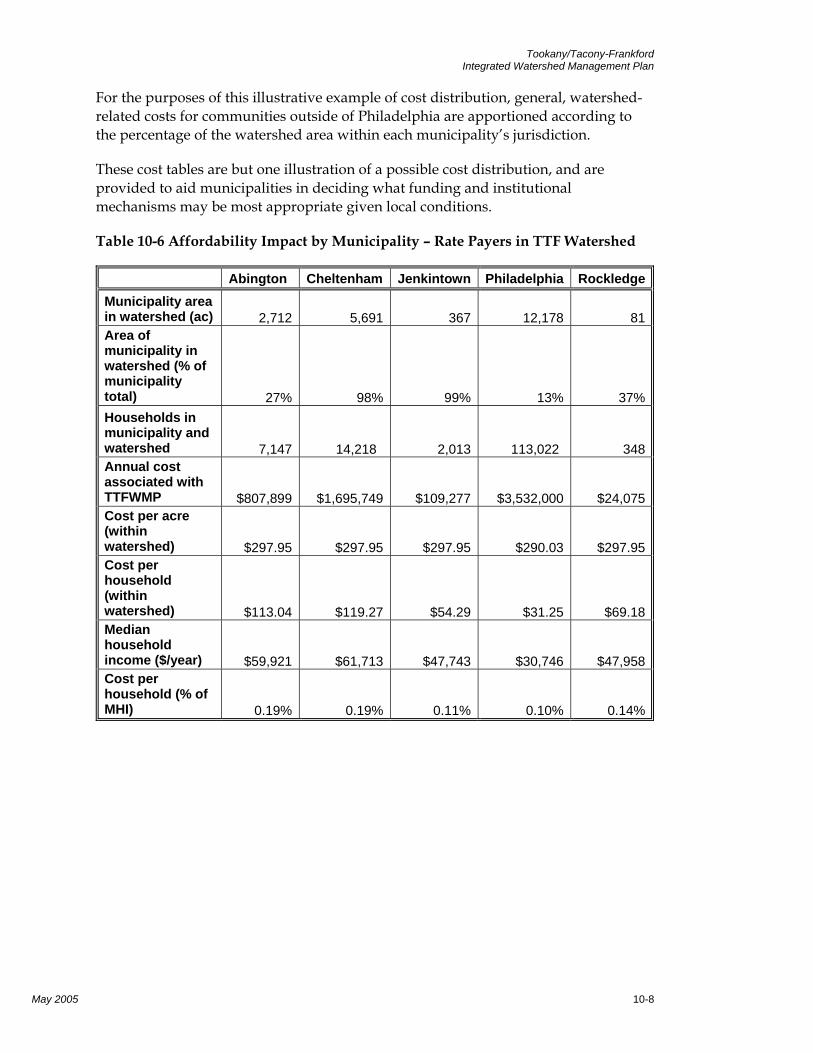
Tookany/Tacony-Frankford Integrated Watershed Management Plan
For the purposes of this illustrative example of cost distribution, general, watershed-related costs for communities outside of Philadelphia are apportioned according to the percentage of the watershed area within each municipality’s jurisdiction.
These cost tables are but one illustration of a possible cost distribution, and are provided to aid municipalities in deciding what funding and institutional mechanisms may be most appropriate given local conditions.
Table 10-6 Affordability Impact by Municipality – Rate Payers in TTF Watershed
Abington Cheltenham Jenkintown Philadelphia Rockledge Municipality area in watershed (ac) 2,712 5,691 367 12,178 81 Area of municipality in watershed (% of municipality total) 27% 98% 99% 13% 37% Households in municipality and watershed
7,147 14,218
2,013 113,022
348
Annual cost associated with TTFWMP $807,899 $1,695,749 $109,277 $3,532,000 $24,075 Cost per acre (within watershed) $297.95 $297.95 $297.95 $290.03 $297.95 Cost per household (within watershed) $113.04 $119.27 $54.29 $31.25 $69.18 Median household income ($/year) $59,921 $61,713 $47,743 $30,746 $47,958 Cost per household (% of MHI) 0.19% 0.19% 0.11% 0.10% 0.14%
May 2005 10-8
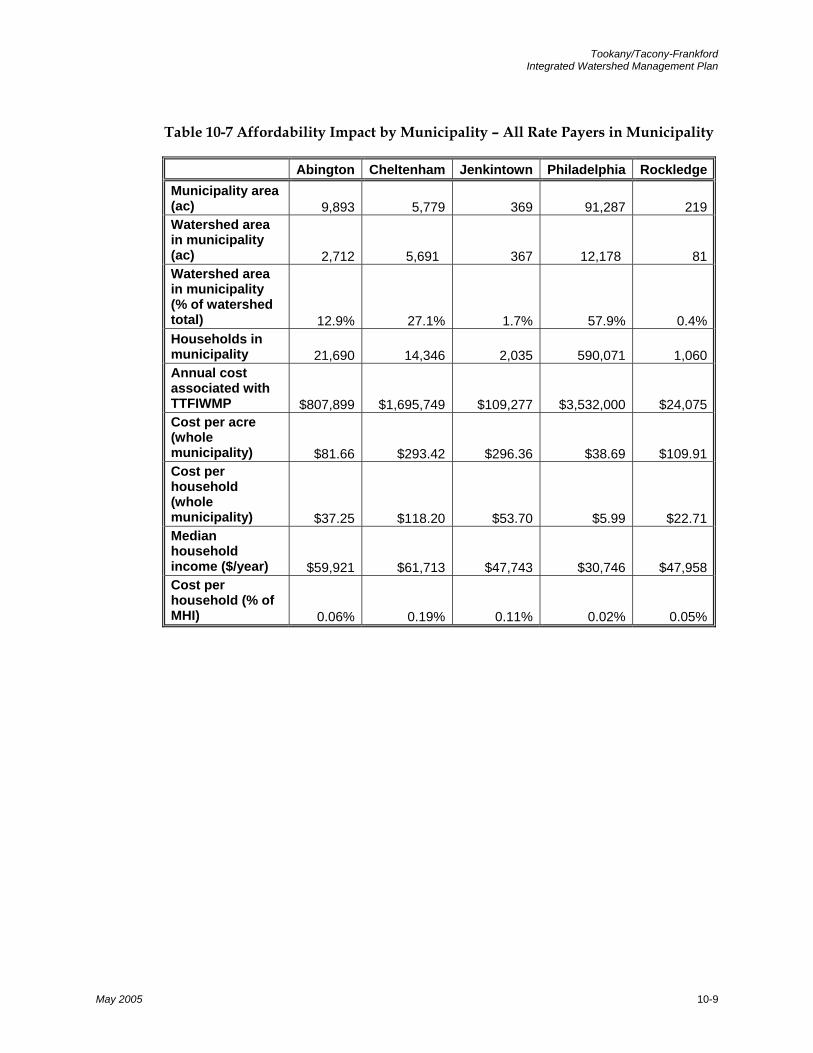
Tookany/Tacony-Frankford Integrated Watershed Management Plan
Table 10-7 Affordability Impact by Municipality – All Rate Payers in Municipality
Abington Cheltenham Jenkintown Philadelphia RockledgeMunicipality area (ac) 9,893 5,779 369 91,287 219Watershed area in municipality (ac)
2,712 5,691
367 12,178
81
Watershed area in municipality (% of watershed total) 12.9% 27.1% 1.7% 57.9% 0.4%Households in municipality 21,690 14,346 2,035 590,071 1,060Annual cost associated with TTFIWMP $807,899 $1,695,749 $109,277 $3,532,000 $24,075 Cost per acre (whole municipality) $81.66 $293.42 $296.36 $38.69 $109.91Cost per household (whole municipality) $37.25 $118.20 $53.70 $5.99 $22.71Median household income ($/year) $59,921 $61,713 $47,743 $30,746 $47,958Cost per household (% of MHI) 0.06% 0.19% 0.11% 0.02% 0.05%
May 2005 10-9
Tookany/Tacony-Frankford Integrated Watershed Management Plan
10.3 Institutional Analysis The primary purpose of Section 9 of this plan is to provide recommendations and guidance to stakeholders - primarily state, county and other government agencies, municipalities, non-government organizations, land owners, and individuals - on ways to better manage the water resources of Tookany/Tacony-Frankford Creek. Everyone in the watershed communities can contribute in numerous ways to the protection of water resources. Roles of primary stakeholders and participants in the plan are briefly described below, followed by the recommendation that a watershed-wide management organization be created to facilitate implementation.
10.3.1 Description of Roles Both government and non-government organizations will play a role in the successful implementation of the Tookany/Tacony-Frankford Creek Watershed Management Plan. The primary roles are outlined below.
PADEP Role Two agencies of the Commonwealth of Pennsylvania are directly and indirectly involved in watershed planning in Tookany/Tacony-Frankford Creek: the Pennsylvania Department of Environmental Protection (PADEP) and PA Department of Conservation and Natural Resources (PADCNR). Achievement of Watershed Plan goals and objectives through local implementation will require continued support through funding and integration of the various existing state level stormwater management and runoff related programs. Particular attention should be paid to the following programs:
Act 167 Plans
Phase II Stormwater permits
Act 537 / CMOM Plans
Construction Stormwater Pollution Prevention
Industrial Stormwater Pollution Prevention
Watershed monitoring and performance reporting
Exploring Watershed Permitting Opportunities
A critical PADEP role will be activities required under Section 303(d) of the Clean Water Act and the EPA’s Water Quality Planning and Management Regulations (40 CFR Part 130). PADEP will need to actively administer the water quality standards process for portions of Tookany/Tacony-Frankford Creek in the near future. TMDLs should be integrated with the findings of this watershed plan, and the approaches recommended by this plan should be designed to meet the TMDL requirements as they arise. PADEP should also be active in encouraging municipalities to carry out the
May 2005 10-10
Tookany/Tacony-Frankford Integrated Watershed Management Plan
requirements of Phase II stormwater permits and Act 167 requirements. This plan provides the blueprint for effectively integrating both programs, and addressing water quantity and quality goals. Most of the regulatory approaches will need to define guidelines and limits, including TMDL’s in order to create possibilities for pollution trading. PADEP would also need to support the review and revision of water quality standards and Use Attainability Analysis.
PWD Role PWD, as the primary author of this plan, plays a central role in its implementation, as well as in continued monitoring to chart improvements to water quality and to provide the scientific foundation for eventual TMDL’s and for a Use Review and Attainability Analysis. PWD will take a lead role in implementing a variety of the recommendations, including;
Stream Restoration
Improvement of Fish Passage
CSO Control
Green Rooftop Demonstrations
Stormwater BMP installation
Organization of Stakeholder Participation
Monitoring
Municipal Role Municipalities can play a key role in the implementation of recommendations through the incorporation of water resources strategies into their land use planning and governance functions. Because of the authorities contained in the Pennsylvania Municipalities Planning Code (MPC), municipalities are one of the two main foci of implementation efforts (PWD being the other). Enabled by the MPC, municipalities are the focal point to address runoff from redeveloped and existing developed lands, to address problems associated with sanitary sewer collection systems, to enhance recreational opportunities, and to protect natural resources from the effects of land disturbance.
The most fundamental role recommended for municipalities is to consider undertaking a comprehensive review of their existing land use regulations, policies and requirements to identify where they may be unnecessarily causing impacts to water resources; and to undertake the necessary actions needed to eliminate SSOs and sanitary sewer leaks.
The primary actions recommended for municipalities include: encouraging connection of roof leaders to storm sewers, reduction of expansive paved
May 2005 10-11
Tookany/Tacony-Frankford Integrated Watershed Management Plan
(impervious) parking lot requirements and replacement of asphalt with porous paving surfaces or the installation of bioretention structures to handle parking lot stormwater runoff, repair and maintenance of leaking sanitary sewers, and the elimination of SSOs. Municipalities also might consider creating an Environmental Advisory Council (EAC), which is possible under Pennsylvania General Assembly enabling legislation - Act 148 of 1973. The EAC could then participate in the implementation of the plan, and help to coordinate the approach among all the municipalities within the watershed.
County Role An important role of Montgomery County is to conduct the necessary comprehensive stormwater management studies to:
Complete an Act 167 stormwater plan that is consistent with and furthers the achievement of the goals and objectives of this plan.
Work with municipalities to update Act 537 plans
In addition, the Montgomery County Conservation District has several important responsibilities within the watershed, including:
Chapter 102 Erosion Control: Administers the State's program to control sediment pollution from earth disturbance activities.
National Pollution Discharge Elimination System (NPDES): Processes applications and seeks compliance towards stormwater discharge permits for Construction Activities.
Chapter 105 Waterways and Wetlands General Permitting: Assists applicants with permit information. Processes general permits for work within wetlands and streams.
These are important elements in coordinating Act 167 planning requirements with Phase II of the NPDES Stormwater Program.
Non-Government Organization Role The Tookany/Tacony-Frankford Partnership is an important, organization within the watershed, and the partnership should continue to work with PWD through the implementation phase. A Tree Commission could be created within the watershed to manage the urban forest program recommendations. In Pennsylvania, a tree commission is created by municipal ordinance as a decision-making body, and once empowered, can have exclusive control over a community’s shade trees.
Land Owners’ Role Voluntary watershed stewardship by all land owners can contribute significantly toward the protection and restoration of the Tookany/Tacony-Frankford watershed
May 2005 10-12
Tookany/Tacony-Frankford Integrated Watershed Management Plan
while simultaneously minimizing the need for additional regulatory controls. Recommended roles for land owners include:
Implementing “watershed stewardship” practices in their landscape and outdoor housekeeping practices.
Disconnecting roof leaders and installing rain barrels or dry wells
Considering pervious solutions for driveways
Joining and supporting the activities of the watershed partnership.
10.3.2 Possible Organizational Structures The above outlined roles can be, and often are, carried out within the existing regulatory structure without any real coordination or formal agreement to join and work through a watershed organization. In the absence of a central watershed organization, PWD would commit to implementation of recommended projects and programs within the City, and each of the major municipalities would respond to various regulatory requirements individually. Collectively, these activities would improve water quality and habitat in the watershed; however, there would be significant overlap, duplication of effort, and potential gaps in the implementation. This is far from ideal.
As an alternative, it is preferred that a Tookany/Tacony-Frankford Watershed Organization be created to coordinate activities. A Watershed Organization could be set up with a County or the City of Philadelphia as the primary organization running the program, with other organizations participating through stakeholder meetings. In this case, PWD could assume this role.
Alternatively, a separate, non-profit organization with member organizations bound by formal agreement could be established (perhaps as an expansion of the current Partnership). The Organization could be allowed to start modestly, and to grow as the need arises. Thus, the ultimate structure of the Organization and its responsibilities would evolve over time, but participants in the Organization would work together by formally adopting this plan, and providing funds for the completion of the major recommendations. Potential sources of funding could include member assessments, grants, in-kind and cash matches from implementing organizations, and in-kind services from member organizations.
An example of just such an organization was formed for the Rouge River in Michigan. Using the Rouge River Assembly as a guide, the Tookany/Tacony-Frankford watershed organization could have some or all of the following characteristics.
May 2005 10-13
Tookany/Tacony-Frankford Integrated Watershed Management Plan
Membership could be open to PWD, all the municipalities, and the two
counties in the watershed. All members would either have a permit to discharge storm water into the creek, or are responsible for CSO into the creek.
Membership could be expanded to include PADEP and EPA in an advisory capacity.
For each municipality, voting shares and costs could be apportioned based upon land and population in watershed.
A General Assembly of participants could be set up to meet twice per year to focus on priorities, budget, and assessments.
An Executive Committee with a representative from each major participating body could be set up to meet 6 times per year to provide management oversight.
Standing Committees (e.g. Finance, Technical, and Public Involvement) could be established to provide day to day guidance and advice, with members drawn from the member organizations.
An Organization Committee could be established to consider long term changes for the permanent organization to best meet needs.
Some of the primary functions of the newly formed organization could include:
Seeking implementation plan approval. This approval includes obtaining signatures from municipalities followed by a letter of support from PADEP. The Organization would encourage PADEP to adopt the Plan as a governing document for the watershed. The existing Watershed Restoration Action Strategy (WRAS) program could provide a framework for implementation of the Plan.
Instituting a program to hire watershed plan implementation specialists, similar to existing county conservation district specialists. A county would have several specialists, and each specialist would be assigned to several municipalities. The specialists would represent their assigned communities in Organization meetings and other regional meetings. The watershed Organization would apply to the Growing Greener program as a source of funding for these specialists.
Overseeing the continued implementation of basic, essential services required of all municipalities by stormwater permits (e.g., sewer system maintenance).
Overseeing continued monitoring, sampling, data analysis, and reporting on both the water quality and biology of the system using the established indicators.
May 2005 10-14
Tookany/Tacony-Frankford Integrated Watershed Management Plan
Providing public participation and public education.
Exploring innovative solutions to long-term operation and maintenance of stormwater management facilities.
Requiring that projects applying for state funding (Growing Greener, DCNR) must be reviewed and shown to be consistent with the Plan. The specialists, directed by the Organization, would review all submitted projects and apply a rating scale for consistency with the plan.
Encouraging the idea of applying for federal funding for regional projects (e.g., stream restoration, regional wetlands); however, most smaller-scale projects would be funded locally. Public funding for major infrastructure projects on private land could be explored.
Another role for the new organization would be created if the State sets up a watershed-based permitting experiment in the watershed. The organization could then function as a Watershed Compliance Association (WCA). A WCA is a Commonwealth-created nonprofit entity comprised of public and private entities that hold individual NPDES permits or General Permits to discharge to the creeks. A WCA is specifically created to implement watershed based permitting. The WCA would constitute a point of contact between PADEP and its co-permittee members on issues related to the group permit for the parameter(s) of concern, once a TMDL is established in the watershed. If the WCA exceeds its parameter limit (load) for the year, the Association would be out of compliance, and any co-permittee member that exceeds its individual load limit would also be out of compliance and subject to enforcement action. Through the group approach, however, pollution trading can be easily implemented.
May 2005 10-15
Tookany/Tacony-Frankford Integrated Watershed Management Plan
List of Figures
1-1 Tookany/Tacony-Frankford Watershed.....................................................................1-1 1-2 Impaired Streams in the Tookany/Tacony-Frankford Watershed .........................1-5 1-3 Tookany/Tacony-Frankford Watershed Planning Watershed .............................1-13 2-1 City Rain Gauges in or Near the Watershed ..............................................................2-6 2-2 DVRPC Land Use Map for the Tookany/Tacony-Frankford Creek .......................2-7 2-3 USGS Streamflow Gauges .............................................................................................2-8 2-4 PWD/USGS Cooperative Program Water Quality and Streamflow Stations .......2-9 2-5 Eight Water Quality Monitoring Locations ..............................................................2-10 4-1 Tookany/Tacony-Frankford Study Area ....................................................................4-2 4-2 USGS Topographic Subwatersheds .............................................................................4-3 4-3 Surface Geologic Formations ........................................................................................4-5 4-4 Hydrologic Soil Groups in the Tookany/Tacony Frankford Watershed ...............4-7 4-5 Population Density Based on 2000 Census Data .......................................................4-8 4-6 Median Household Income ...........................................................................................4-9 4-7 Mean Home Value .........................................................................................................4-9 4-8 Population change 1999-2000…………………………………………………….…..4-10 4-9 Land use breakdown in Tacony-Frankford Watershed...........................................4-13 4-10 DVRPC Land use (residential areas updated with 2000 Census Population .....4-14 4-11 Philadelphia Vacant Lands ........................................................................................4-16 4-12 Hydrograph Separation at Frankford Creek gauge (USGS gauge 01467087).....4-18 4-13 Photo Comparison of Impaired and Unimpaired Habitats ..................................4-19 4-14 Tookany/Tacony-Frankford Watershed Habitat Assessment..............................4-20 4-15 Streambank Restoration in the Tookany/Tacony-Frankford Creek....................4-21 4-16 Fish Tolerance at Specific Monitoring Sites .............................................................4-26 4-17 Tookany/Tacony-Frankford Fish Assessment (Philadelphia Water Department, 2001)..............................................................4-27 4-18 Fish Types and Abundance .......................................................................................4-28 4-19 Life Cycle of a Mayfly.................................................................................................4-29 4-20 Benthic Assessment Sites and Impaired Reaches ...................................................4-31 4-21 Current Water Quality Data for Fecal Coliform .....................................................4-34 4-22 Current Metals Water Quality Data with Fish Consumption Advisory Areas .......................................................................................................4-37 4-23 Current Water Quality Discrete Data for Dissolved Oxygen ...............................4-40 4-24 Current Water Quality Continuous Data for Dissolved Oxygen .........................4-41 4-25 Stormwater Outfall .....................................................................................................4-42 4-26 CSO Outfall ..................................................................................................................4-42 4-27 Municipal Wastewater Treatment Plant ..................................................................4-42 4-28 Types of Sewer Service and Locations of Regulator Structures ...........................4-44 4-29 Annual Pollutant Contributions................................................................................4-46 4-30 Spatial Distribution of Loads……………………………………………………….4-48 4-31 Pasture Land ................................................................................................................4-49 4-32 Septic System ...............................................................................................................4-49 4-33 Septic Housing Units in the Tookany/Tacony-Frankford Watershed ................4-50
May 2005 iii

Tookany/Tacony-Frankford Integrated Watershed Management Plan
4-34 Estimated Nitrogen Inputs.........................................................................................4-50 4-35 Estimated Phosphorus Inputs ...................................................................................4-51 4-36 Riparian Corridor in Jenkintown ..............................................................................4-52 4-37 The Heritage Conservancy’s Forested Riparian Buffer Analysis .........................4-53 4-38 Example of a Wetland Area .......................................................................................4-55 4-39 Undeveloped Lands in the Riparian Corridor ........................................................4-56 4-40 PWD Field Surveyed Wetlands (2002 – 2003) .........................................................4-58 4-41 Results of Tookany/Tacony-Frankford Creek Functional Assessments for the Water Quality Improvement Function ................................................................4-60 4-42 Human Disturbance Gradient Scores for Wetland Assessments (2002-2003) ....4-61 4-43 Photo of a Baltimore Oriole, a bird found in Tacony Creek Park.........................4-62 4-44 Species locations found during Tacony Creek Park Survey .................................4-64 4-45 Estimated Flood-prone areas .....................................................................................4-66 4-46 Adams Avenue during August 1, 2004 Storm ........................................................4-66 4-47 Tacony Creek near the county border during August 1, 2004 Storm ..................4-67 4-48 Adams Avenue after August 1, 2004........................................................................4-67 4-49 Neighborhoods of Respondents to Tacony-Frankford River Conservation Plan Watershed Survey ..................................................................................................4-70 4-50 Tacony-Frankford Resident Survey Results ............................................................4-72 4-51 Students collecting insects in the TTF watershed...................................................4-78 4-52 Stream, Accessibility and Parks in Tacony-Frankford Watershed (2004) ...........4-81 4-53 Map of Parkland, Park Trails and Bike Routes .......................................................4-82 4-54 Map of the Tookany/Tacony-Frankford Watershed Municipalities and Counties ................................................................................4-85 4-55 Distribution of Partnership Members’ Affiliations (2003).....................................4-87 5-1 Summary of Visual Assessments ..................................................................................5-3 5-2 USGS Streamflow Stations .............................................................................................5-5 5-3 Water Supply Criteria for Dissolved Iron..................................................................5-10 5-4 Water Supply Criteria for Manganese........................................................................5-10 5-5 Water Supply Criteria for Total Dissolved Solids ....................................................5-11 5-6 Water Contact Criteria for Fecal Coliform.................................................................5-12 5-7 Spatial View of Human Health Criteria Exceedances..............................................5-13 5-8 Spatial View of Dissolved Oxygen Exceedances in Wet and Dry Weather ..........5-15 5-9 Time Series Plot of Dissolved Oxygen Exceedances in Wet and Dry Weather ....5-16 5-10 Tookany/Tacony-Frankford Biological Monitoring Summary............................5-20 5-11 Location of Wetlands ..................................................................................................5-23 5-12 Rank of Human Disturbance Gradient ....................................................................5-24 6-1 Lead Loading ...................................................................................................................6-6 6-2 Copper Loading...............................................................................................................6-6 6-3 Zinc Loading ....................................................................................................................6-7 6-4 Fecal Coliform Loading ..................................................................................................6-8 6-5 Total Suspended Solids Loading...................................................................................6-9 6-6 Contributions of Streamflow and Loads by Source .................................................6-10 6-7 Total BOD Loading .......................................................................................................6-11 7-1 Potential Stormwater Volume Removal at Maximum Feasible Coverage............7-15 7-2 Maximum Storage Volume Feasible for Tookany/Tacony-Frankford Creek Watershed.............................................................................................................................7-16
May 2005 iv
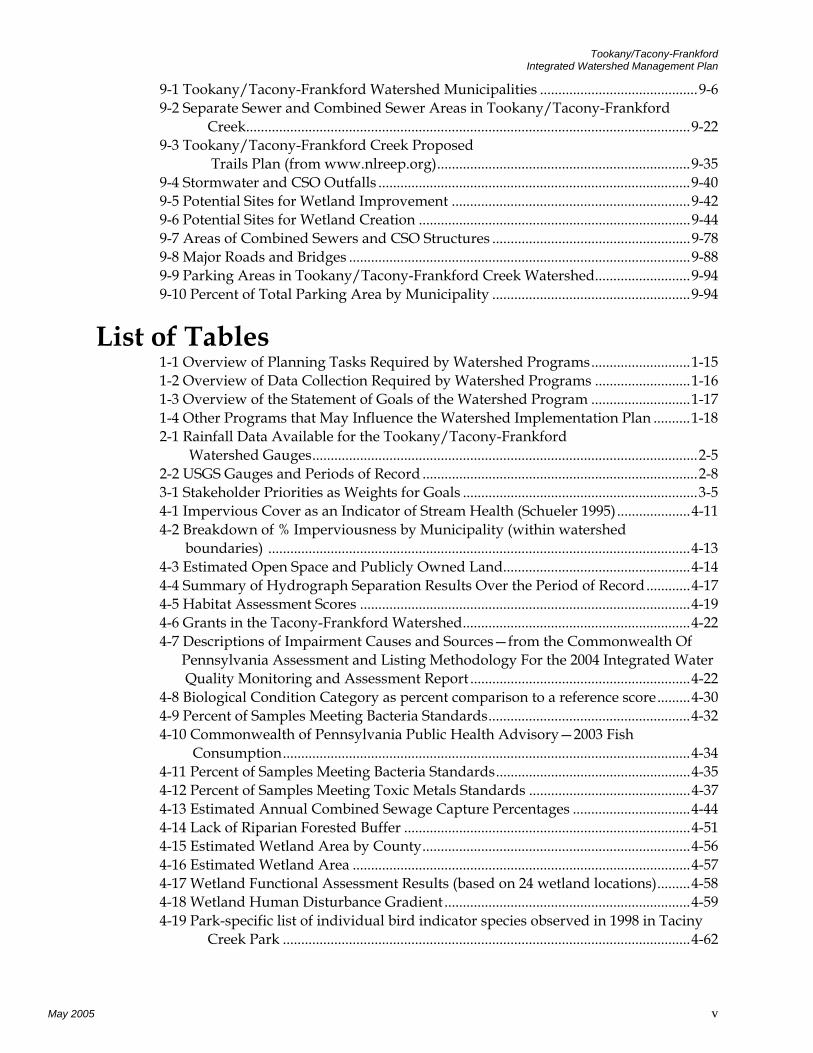
Tookany/Tacony-Frankford Integrated Watershed Management Plan
9-1 Tookany/Tacony-Frankford Watershed Municipalities ...........................................9-6 9-2 Separate Sewer and Combined Sewer Areas in Tookany/Tacony-Frankford Creek.........................................................................................................................9-22 9-3 Tookany/Tacony-Frankford Creek Proposed Trails Plan (from www.nlreep.org).....................................................................9-35 9-4 Stormwater and CSO Outfalls .....................................................................................9-40 9-5 Potential Sites for Wetland Improvement .................................................................9-42 9-6 Potential Sites for Wetland Creation ..........................................................................9-44 9-7 Areas of Combined Sewers and CSO Structures ......................................................9-78 9-8 Major Roads and Bridges .............................................................................................9-88 9-9 Parking Areas in Tookany/Tacony-Frankford Creek Watershed..........................9-94 9-10 Percent of Total Parking Area by Municipality ......................................................9-94
List of Tables 1-1 Overview of Planning Tasks Required by Watershed Programs...........................1-15 1-2 Overview of Data Collection Required by Watershed Programs ..........................1-16 1-3 Overview of the Statement of Goals of the Watershed Program ...........................1-17 1-4 Other Programs that May Influence the Watershed Implementation Plan ..........1-18 2-1 Rainfall Data Available for the Tookany/Tacony-Frankford Watershed Gauges.........................................................................................................2-5 2-2 USGS Gauges and Periods of Record ...........................................................................2-8 3-1 Stakeholder Priorities as Weights for Goals ................................................................3-5 4-1 Impervious Cover as an Indicator of Stream Health (Schueler 1995)....................4-11 4-2 Breakdown of % Imperviousness by Municipality (within watershed boundaries) ...................................................................................................................4-13 4-3 Estimated Open Space and Publicly Owned Land...................................................4-14 4-4 Summary of Hydrograph Separation Results Over the Period of Record............4-17 4-5 Habitat Assessment Scores ..........................................................................................4-19 4-6 Grants in the Tacony-Frankford Watershed..............................................................4-22 4-7 Descriptions of Impairment Causes and Sources—from the Commonwealth Of Pennsylvania Assessment and Listing Methodology For the 2004 Integrated Water Quality Monitoring and Assessment Report ............................................................4-22 4-8 Biological Condition Category as percent comparison to a reference score.........4-30 4-9 Percent of Samples Meeting Bacteria Standards.......................................................4-32 4-10 Commonwealth of Pennsylvania Public Health Advisory—2003 Fish Consumption...............................................................................................................4-34 4-11 Percent of Samples Meeting Bacteria Standards.....................................................4-35 4-12 Percent of Samples Meeting Toxic Metals Standards ............................................4-37 4-13 Estimated Annual Combined Sewage Capture Percentages ................................4-44 4-14 Lack of Riparian Forested Buffer ..............................................................................4-51 4-15 Estimated Wetland Area by County.........................................................................4-56 4-16 Estimated Wetland Area ............................................................................................4-57 4-17 Wetland Functional Assessment Results (based on 24 wetland locations).........4-58 4-18 Wetland Human Disturbance Gradient ...................................................................4-59 4-19 Park-specific list of individual bird indicator species observed in 1998 in Taciny Creek Park ...............................................................................................................4-62
May 2005 v
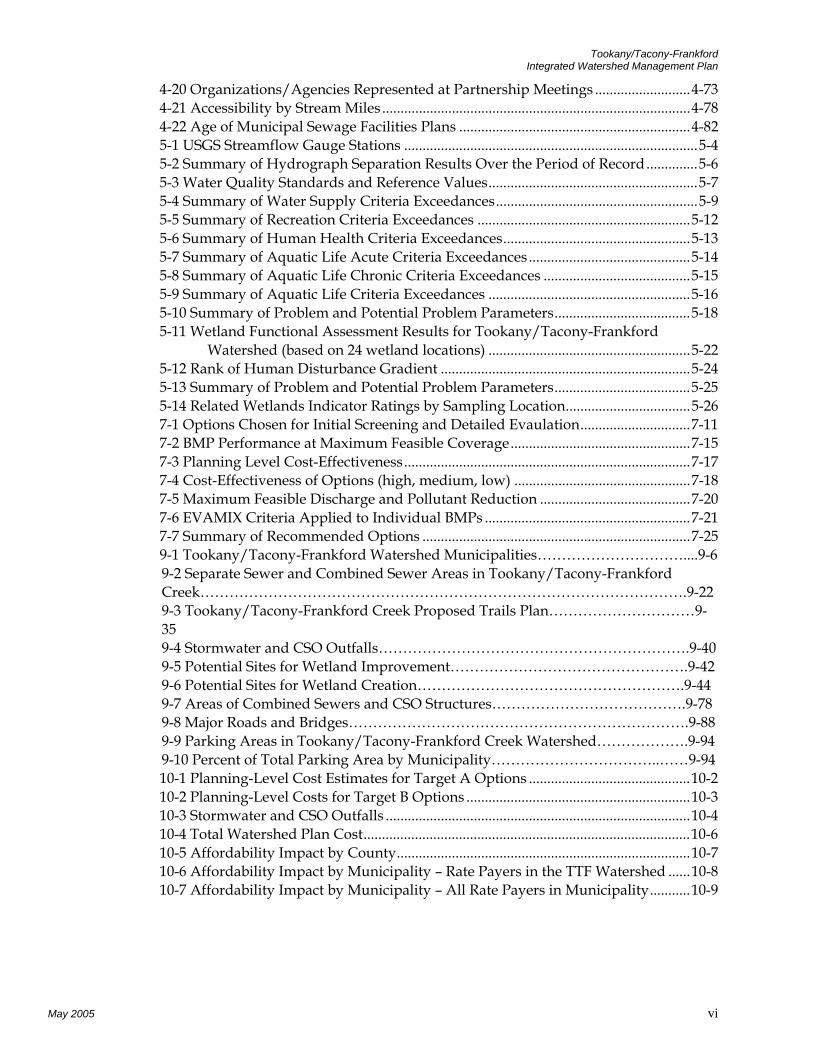
Tookany/Tacony-Frankford Integrated Watershed Management Plan
4-20 Organizations/Agencies Represented at Partnership Meetings ..........................4-73 4-21 Accessibility by Stream Miles ....................................................................................4-78 4-22 Age of Municipal Sewage Facilities Plans ...............................................................4-82 5-1 USGS Streamflow Gauge Stations ................................................................................5-4 5-2 Summary of Hydrograph Separation Results Over the Period of Record..............5-6 5-3 Water Quality Standards and Reference Values.........................................................5-7 5-4 Summary of Water Supply Criteria Exceedances.......................................................5-9 5-5 Summary of Recreation Criteria Exceedances ..........................................................5-12 5-6 Summary of Human Health Criteria Exceedances...................................................5-13 5-7 Summary of Aquatic Life Acute Criteria Exceedances ............................................5-14 5-8 Summary of Aquatic Life Chronic Criteria Exceedances ........................................5-15 5-9 Summary of Aquatic Life Criteria Exceedances .......................................................5-16 5-10 Summary of Problem and Potential Problem Parameters.....................................5-18 5-11 Wetland Functional Assessment Results for Tookany/Tacony-Frankford Watershed (based on 24 wetland locations) .......................................................5-22 5-12 Rank of Human Disturbance Gradient ....................................................................5-24 5-13 Summary of Problem and Potential Problem Parameters.....................................5-25 5-14 Related Wetlands Indicator Ratings by Sampling Location..................................5-26 7-1 Options Chosen for Initial Screening and Detailed Evaulation..............................7-11 7-2 BMP Performance at Maximum Feasible Coverage.................................................7-15 7-3 Planning Level Cost-Effectiveness..............................................................................7-17 7-4 Cost-Effectiveness of Options (high, medium, low) ................................................7-18 7-5 Maximum Feasible Discharge and Pollutant Reduction .........................................7-20 7-6 EVAMIX Criteria Applied to Individual BMPs ........................................................7-21 7-7 Summary of Recommended Options .........................................................................7-25 9-1 Tookany/Tacony-Frankford Watershed Municipalities…………………………....9-6 9-2 Separate Sewer and Combined Sewer Areas in Tookany/Tacony-Frankford Creek……………………………………………………………………………………….9-22 9-3 Tookany/Tacony-Frankford Creek Proposed Trails Plan…………………………9-35 9-4 Stormwater and CSO Outfalls……………………………………………………….9-40 9-5 Potential Sites for Wetland Improvement………………………………………….9-42 9-6 Potential Sites for Wetland Creation……………………………………………….9-44 9-7 Areas of Combined Sewers and CSO Structures………………………………….9-78 9-8 Major Roads and Bridges…………………………………………………………….9-88 9-9 Parking Areas in Tookany/Tacony-Frankford Creek Watershed……………….9-94 9-10 Percent of Total Parking Area by Municipality……………………………..……9-94 10-1 Planning-Level Cost Estimates for Target A Options ............................................10-2 10-2 Planning-Level Costs for Target B Options .............................................................10-3 10-3 Stormwater and CSO Outfalls ...................................................................................10-4 10-4 Total Watershed Plan Cost.........................................................................................10-6 10-5 Affordability Impact by County................................................................................10-7 10-6 Affordability Impact by Municipality – Rate Payers in the TTF Watershed ......10-8 10-7 Affordability Impact by Municipality – All Rate Payers in Municipality...........10-9
May 2005 vi
Tookany/Tacony-Frankford Integrated Watershed Management Plan
Appendix A: Glossary of Terms
Adaptive management Process of continually monitoring progress and adjusting the approach
Bankfull flow The high flow stage of a fluvial system distinguished by the highest stage elevation a stream can reach before spilling over.
Baseflow The portion of streamflow contributed by groundwater.
Benthic Used to describe aquatic organisms living at the bottom of a body of water
Benthic macroinvertebrates
Are mainly aquatic insect larvae that live on the stream bottom. Since they are short-lived and relatively immobile, they reflect the chemical and physical characteristics of a stream and chronic sources of pollution.
BMP - Best Management Practice – Also called a “management option,” BMP is a technique, measure, or structural control that addresses one or more objectives (e.g., a detention basin that gets built, an ordinance that gets passed, an educational program that gets implemented).
BOD Biochemical Oxygen Demand
CCD County Conservation District(s)
CCHL Cobbs Creek High-Level Combined Sewer System
CCLL Cobbs Creek Low-Level Combined Sewer System
CCTV Closed Circuit Television
Clean Streams Law
CSO Combined Sewer Overflow
CSS Combined Sewer System
A-1 December 2004
Tookany/Tacony-Frankford Integrated Watershed Management Plan
CWA Clean Water Act – The Federal Amendment that authorizes the EPA to implement pollution control programs and to set water quality standards for all contaminants in surface waters. “The Act made it unlawful for any person to discharge any pollutant from a point source into navigable waters, unless a permit was obtained under its provisions. It also funded the construction of sewage treatment plants under the construction grants program and recognized the need for planning to address the critical problems posed by nonpoint source pollution.” (EPA website)
CWA Section 104(b)(3) Program
Promotes the coordination and acceleration of research, investigations, experiments, training, demonstrations, surveys, and studies relating to the causes, effects, extent, prevention, reduction and elimination of pollution.
CWA Section 208 Wastewater Planning
Intended to encourage and facilitate the development and implementation of area-wide waste treatment management plans.
CWA Section 319(b) Non-point Source Management Program
Designed to address mine drainage, agricultural runoff, construction/urban runoff, hydrologic and habitat modifications, on-lot wastewater systems, and silviculture.
DCIA Directly Connected Impervious Area
DCVA Darby Creek Valley Association
DO Dissolved Oxygen
DRBC Delaware River Basin Commission
DVRPC Delaware Valley Regional Planning Commission
DWO Dry-Weather Outlet - connector pipe between a CSO regulator and interceptor sewer.
A-2 December 2004
Tookany/Tacony-Frankford Integrated Watershed Management Plan
IDD&E Illicit Discharge, Detection, and Elimination – one of the six minimum control measures required of permittees under the Phase II NPDES Stormwater Regulations. Program steps include developing maps of municipal separate storm sewer system outfalls and receiving waterbodies; prohibiting illicit discharges via PADEP-approved ordinance; implementing an IDD&E Program that includes a field screening program and procedures, and elimination of illicit discharges; conducting public awareness and reporting program. A similar program is being followed by PWD in the Long Term Control Plan (LTCP) for CSOs.
EACs Environmental Action Committees
Floatables Waterborne waste material and debris (e.g., plastics, polystyrene, paper) that float at or below the water surface.
ET Evapotranspiration – the sum of water vapor evaporation from the earth’s surface and transpiration from plants.
EVAMIX A multi-criteria evaluation program to help choose objectively between various alternatives
GIS Geographic Information Systems
Handheld DO Dissolved oxygen readings taken with a handheld meter.
HIS Habitat Suitability Indices
IPM Integrated Pest Management
LID Low-Impact Development (similar to “better site design” and “conservation site design”)
LTCP Long-Term CSO Control Plan – part of the EPA’s CSO Control Policy for regulation of CSOs under NPDES that guides municipalities, state, and federal permitting agencies in reaching full compliance with the CWA.
Macro invertebrates Macroinvertebrates are invertebrate animals that are can be seen without the aid of a microscope.
MPC Municipalities Planning Code
A-3 December 2004

Tookany/Tacony-Frankford Integrated Watershed Management Plan
MS4 Municipal Separate Storm Sewer System
NLREEP Natural Lands and Restoration and Environmental Education Program (a unit of Philadelphia’s Fairmount Park Commission)
NOAA National Oceanic and Atmospheric Administration
Non-point source pollution
Pollution that comes from a diffuse source such as atmospheric deposition, stormwater runoff from pasture and crop land, and individual on-lot domestic sewage systems discharging through shallow groundwater.
Non-structural BMPs These BMPs will require no operation or maintenance. Examples are use of open space and vegetated buffers in development design, minimization of soil disturbance and compaction during construction, and minimization of directly-connected impervious areas.
NPDES National Pollutant Discharge Elimination System
NPDES Phase I The stormwater management component of the NPDES program, instituted in 1990, which addressed the storm runoff sources most threatening to water quality. Under this phase, sites with larger communities, industrial activity, and construction sites are required to obtain permits for the storm water leaving the site.
NPDES Phase II Additional stormwater management regulations enacted in 1999, applying to smaller communities and construction sites.
OLDS On-Lot sewage Disposal Systems
O&M Operations and Maintenance
OOW PWD’s Office of Watersheds
PA Act 167 Stormwater Management Act
PA Act 537 Sewage Facilities Planning Act
PADCNR Pennsylvania Department of Conservation and Natural Resources
PADEP Pennsylvania Department of Environmental Protection
A-4 December 2004
Tookany/Tacony-Frankford Integrated Watershed Management Plan
PADEP Greenways Program
An Action Plan for Creating Connections is designed to provide a coordinated and strategic approach to creating connections through the establishment of greenways in the State.
PEC Pennsylvania Environmental Council
PENNVEST Pennsylvania State Revolving Fund Program - Provides funding for sewer, stormwater, and water projects throughout the Commonwealth.
Point source Pollution discharged from a single point, defined in the CWA as “any discernable, confined and discrete conveyance, including but not limited to any pipe, ditch, channel, tunnel, conduit, well, discrete fissure, container, rolling stock, concentrated animal feeding operation, vessel, or other floating craft from which pollutants are or may be discharged.” (pg20 Section 7)
POTW Publicly Owned Treatment Works
PRD Planned Residential Development
PWD Philadelphia Water Department
QA/QC Quality Assurance/Quality Control
RBP Rapid Bioassessment Protocol (developed by the EPA) a standard method to assess aquatic health through fish and macroinvertebrate diversity (EPA Website).
RBP III Section of the RBP dealing benthic macroinvertebrates.
RCP PADCNR’s Rivers Conservation Program
Riparian corridor The area of land along the bank or shoreline of a body of water (EPA website).
Riparian woodlands Woodlands that grow within the riparian corridor.
RTC Real Time Control - a dynamic system of hydraulic controls to provide additional storage and reduce overflows from a combined sewer system
SEO Sewage Enforcement Officers (designated by PADEP)
Solids Waterborne waste material and debris consisting of sand,
A-5 December 2004
Tookany/Tacony-Frankford Integrated Watershed Management Plan
gravel, silts, clay, and organic matter.
Sonde Shallow depth continuous water quality monitor manufactured by YSI Inc.
SSA Separate-Sewered Area stormwater runoff
SSET Sewer Scanner and Evaluation Technology
SSMS Sanitary Sewer Management System
SSO Sanitary Sewer Overflow
STORET USEPA’s water quality database (STOrage and RETrieval)
Stormwater Management Program Protocol (“Protocol”)
PADEP guidance for implementing the requirements of the NPDES Phase II stormwater regulations
Structural BMPs These BMPS will require proper operation and maintenance. Examples include wet ponds, grassed swales, infiltration basins and bioretention areas.
SWMM Storm Water Management Model
TDR Transfer of Development Rights
TIGER Topologically Integrated Geographic Encoding and Referencing (U.S. Census database)
TMDL program Total Maximum Daily Load program - EPA/PADEP program for limiting and allocating discharges of a pollutant within a watershed.
Transpiration The process by which water vapor passes through the membrane or pores of plants to the atmosphere.
TSS Total Suspended Solids
UA Urban Areas
UAA Use Attainability Analysis
USGS United States Geological Survey
A-6 December 2004
Tookany/Tacony-Frankford Integrated Watershed Management Plan
Watershed The area of land draining to a stream, river, or water body. Watershed boundaries are established where any precipitation falling inside the boundary will drain to that particular watershed water body. Precipitation falling outside the boundary will drain to a different watershed. Watershed boundaries are typically formed on high elevation ridges. The water bodies formed from the watershed drainage are usually at the lowest elevation in the watershed. Watersheds can also be called drainage basins.
WMP Watershed Management Plan
WQS Water Quality Standards
WRAS PADEP’s Watershed Restoration Action Strategy
A-7 December 2004
Tookany/Tacony-Frankford Creek Integrated Watershed Management Plan
References Association of Metropolitan Sewerage Agencies (2002), Preparation of integrated water quality monitoring and assessment reports: recommendations for Clean Water Act § 303(d) and §305(b) methodologies and reporting. Available from http://www.amsa-cleanwater.org/advocacy/wqmar/finallisting.pdf, pp.16-38. Angermeier, Paul L. and Isaac J. Schlosser (1989), Species-area relationships for stream fishes, Ecology, 70 (5), pp. 1450-1462. Proceedings of the Water Environment Federation 71st Annual Conference and Exposition, Vol. 2, Angell, (1998), J.L., Clement, M. and Smullen, J.T., Innovative GIS techniques to improve hydrologic modeling for CSO permit compliance, Part 2, pp. 655- 666. Ball, J. (1982), Stream classification guidelines for Wisconsin, Wisconsin Department of Natural Resources Technical Bulletin, Wisconsin Department of Natural Resources. Madison, Wisconsin. Baltimore County Department of Environmental Protection and Resource Management (1999), Hydrologic, hydraulic and geomorphological assessment of streams in the Piedmont region of Maryland. Bannerman, R. (1999), Sweeping Water Clean, American Sweeper Magazine, Huntsville, AL. Vol. 7, Number 1. Barbour, M. T., J. Gerritsen, B. D. Snyder and J. B. Stribling (1999), Rapid bioassessment protocols for use in streams and wadeable rivers: periphyton, benthic macroinvertebrates, and fish. US Environmental Protection Agency, Office of Water, EPA/841/B-99-002, Washington, DC. Barbour, M. T., J. B. Stribling, and J. R. Carr (1995), The multimetric approach for establishing biocriteria and measuring biological condition, Biological assessment and criteria: tools for water resource planning and decision making, ed. W. S. Davis and T. P. Simon, Lewis Publishers, Boca Raton, FL. pp. 63-80. Barnes, H.H. Jr. (1967), Roughness characteristics of natural channels, U.S. Geological Survey Water-Supply Paper, U.S. Geological Survey, 1849. Brigham Young University, Environmental Research Laboratory (2000), “Surface water modeling system version 7.0 tutorials.” EMS-I, Provo, UT. Brower, J., J. Zar and C. VanEnde (1990), Field and laboratory methods for general ecology. 3rd
Ed. WM C. Brown, Dubuque, Iowa.
May 2005 R-1
Tookany/Tacony-Frankford Creek Integrated Watershed Management Plan
Camp, Dresser and McKee (CDM) (1992), “Watershed Management Model user’s manual, version 2.0”, Prepared for the Florida Department of Environmental Regulation, Tallahassee, FL. Camp, Dresser and McKee (CDM), (1998), “Users manual: Watershed Management Model, version 4.1”, Prepared for USEPA Region 5, Rouge River National Wet Weather Demonstration Project. Carpenter, D.H. (1983), Characteristics of streamflow in Maryland Department of Natural Resources, Maryland Geological Survey. Center for Watershed Protection, “An eight-step approach to stormwater retrofitting: how to get them implemented”, Retrieved June 6, 2002 from http://www.lib.duke.edu/libguide/bib_webpage.htm. Center for Watershed Protection, “Site planning model development principles”, Retrieved June 6, 2002 from http://www.cwp.org/22_principles.htm. Center for Watershed Protection, “Elements of a smart watershed program”, Retrieved June 6, 2002 from http://www.cwp.org/SMART_WATERSHED_PROGRAM.htm. Center for Watershed Protection (1996), “Urban watershed management – a workshop for innovative urban watershed restoration and protection”. Charbeneau, R.J. and Barrett, M.E. (1998), Evaluation of methods for estimating stormwater pollutant loads, Water Environment Research, 70, No. 7, pp 1295-1302. Chow, V.T. (1959), Open-channel hydraulics, McGraw-Hill, Inc., New York, p. 680. Claytor, R. (1999), Center for Watershed Protection, New Developments in Street Sweeper Technology, Watershed Protection Techniques, Vol. 3, Number 1. Ellicott City, MD. Collier, Michael and Robert H. Webb, and John C. Schmidt (2000), Dams and rivers, a primer on the downstream effects of dams, U.S. Geological Survey, Circular 1126. Dillon, P.J. (1975), The phosphorous budget of Cameron Lake, Ontario: The importance of flushing rate to the degree of eutrophy in lakes, Limnol. Oceanogr, 19 pp. 28-39. Dillow, Jonathan J.A. (1996), Technique for estimating magnitude and frequency of peak flows in Maryland, U.S. Geological Survey. Donigian, A. S. and Huber, W. C. (1990), USEPA Office of Research and Development, Modeling of Nonpoint Source Water Quality in Urban and Non-Urban Areas, Contract No. 68-03-3513, WA No. 29, 115. Dunster, J. and Dunster, K. (1996), Dictionary of Natural Resource Management: Stream Corridor Restoration: Principles, Processes and Practices, University of British Columbia.
May 2005 R-2
Tookany/Tacony-Frankford Creek Integrated Watershed Management Plan
Edwards, E.A., G. Gebhart, and O.E. Maughan (1983), U.S. Department of the Interior, Fish and Wildlife Service, Habitat suitability information: Smallmouth bass, FWS/OBS- 82/10.36. 47 pp. Fairmount Park Commission (1999), Tacony Creek Park master plan, Natural Land restoration master plan, Vol. 2, Park-specific master plans. Gloucester County Planning Department (1994), Still Run watershed stormwater management plan. Halliwell, D. B., R. W. Langdon, R. A., J. P. Kurtenbach, and R. A. Jacobson (1999), Classification of freshwater fish species of the northeastern United States for use in the development of IBIs: Assessing the sustainability and biological integrity of water resources using fish communities, ed. T. P. Simon, CRC Press, Boca Raton, FL, pp. 301-337. The Heritage Conservancy (2000), Tookany creek watershed management plan. Hilsenhoff, V.L. (1987), An improved index of organic stream pollution, The Great Lakes Entomologist, 10(1): 31-39. Hudson, J. (1986), U.S. Environmental Protection Agency, Forecasting onsite soil adsorption system failure rates, EPA/600/2-86/060, Cincinnati, OH. Jaworski, N. A. (1997), Section VIII – Multiple lakes and special topics limnological characteristics of the Potomac Estuary, North American Project – A Study of U.S. Water Bodies, EPA-600/3-77-086, ed. L. Seyb and K. Randolph, U.S. EPA-Corvallis. Karr, E. A., K. D. Fausch, P. L. Angermeier, P. R. Yant, and I. J. Schlosser (1986), “Assessing biological integrity in running waters: A method and its rationale”, Special publication 5. Illinois Natural History Survey. King, I. et al (1997), U.S. Army Corps of Engineers, Waterways Experiment Station Hydraulics Laboratory, Users guide to RMA WES- version 4.3. Lane, Emory W. (1955), Design of stable channels, Transactions, American Society of Civil Engineers, Vol. 120, Paper No. 2776. Larsen, D.P. and Mercier, H.T. (1976), Phosphorous retention capacity of lakes, Jour. Fish. Res. Bd. Canada, 33, pp. 1742-1750. Lee, G.F. and Jones, A.R. (1981), Application of the OECD eutrophication modeling approach to estuaries: Estuaries and Nutrient, ed. Neilson and Cronin, Humana Press, Clifton, NJ, 549-568. Leopold, L.B., Wolman, M.G., and J.P. Miller (1964), Fluvial processes in geomorphology. W.H. Freeman and Company, San Francisco, CA. Limerinos, J.T. (1970), Determination of the Manning coefficient from measured bed roughness in natural channels, U.S. Geological Survey Water-Supply Paper, U.S. Geological Survey, 1898-B.
May 2005 R-3
Tookany/Tacony-Frankford Creek Integrated Watershed Management Plan
Manning, M.J., Farrow, D.R.G., and Arnold, F.D. (1977), National pollutant discharge inventory, publicly owned treatment works in coastal areas of the US, National Oceanic and Atmospheric Administration (NOAA), Rockville, MD. Mays, Larry W. (1999), Hydraulic design handbook, McGraw-Hill, New York. McCuen, R.H. (1989), Hydrologic analysis and design, Prentice-Hall Inc., 15: 724-730. Merritt, R.W., and K.W. Cummins (1996), An introduction to the aquatic insects of North America. Third Edition. Kendall/Hunt Publishing Co., Dubuque, Iowa. National Oceanic and Atmospheric Administration (NOAA), Technical paper no. 40 rainfall frequency atlas of the eastern United States for duration from 30 minutes to 24 hours and return periods from 1 to 100 years, available from http://www.erh.noaa.gov/hq/Tp40s.htm. Nizeyimana, E., Evans, B.M., Anderson, M.C., Petersen, G.W., DeWalle, D., Sharpe, W., Swistock, B. (1997), Quantification of NPS pollution loads within Pennsylvania watershed, prepared for PA DEP by Environmental Resources Research Institute of the Pennsylvania State University. Ohio Environmental Protection Agency (1987), Biological criteria for the protection of aquatic life: Vol. 1-4, Ohio EPA, Division of Water Quality Monitoring and Assessment, Surface Water Section, Columbus, Ohio. Overton, D. E. and M. R. Meadows (1976), Stormwater modeling. Academic Press, New York. PADEP (2001), Designing Your Monitoring Program, A Technical Handbook for Community-Based Monitoring in Pennsylvania, available from http://www.dep.state.pa.us/dep/deputate/watermgt/wc/subjects/cvmp/initiatives/ cvmp_HdBook.htm. PADEP (2004), 2004 Integrated List of All Waters, a list of impaired streams and lakes as required by 303(d), available from http://www.dep.state.pa.us/dep/deputate/watermgt/wqp/wqstandards/303dreport. htm#List. Peckarsky, B. L., P. R. Fraissinet, M. A. Penton, and D. J. Conklin, Jr. (1990), Freshwater macroinvertebrates of northeastern North America, Comstock Publishing Assoc, Ithaca, NY. P. 442. Philadelphia Water Department (2000), Tacony-frankford preliminary characterization report from http://www.phillywater.org/Tacony- Frankford/TechnologyCenter/Documents/Reports/reports.htm. Plafkin, J. L., M. T. Barbour, K. D. Porter, S. K. Gross, and R. M. Hughes (1989), Rapid bioassessment protocols for use in streams and rivers Benthic macroinvertebrates and fish, EPA/440/4-89-001, Office of Water, US Environmental Protection Agency, Washington, DC.
May 2005 R-4
Tookany/Tacony-Frankford Creek Integrated Watershed Management Plan
Platts, W. S., W. F. Megahan, and G. W. Minshall (1983), Methods for evaluating Stream, riparian, and biotic conditions, General Report INT-138, U. S. Department of Agriculture, U. S. Forest Service, Ogden, Utah. Rast, W. and Lee, G.F. (1978), Summary analysis of the North American (US portion) OECD eutrophication project, Nutrient loading – lake response relationships and trophic state indices, EPA-600/3-78-008, USEPA, Office of Research and Development, 454 pages. Rabeni, Charles F., and Robert B. Jacobson (1993), The importance of fluvial hydraulics to fish-habitat restoration in low-gradient alluvial streams, Freshwater Biology, 29: 211- 220. Rosgen, D. L. (1994), A classification of natural rivers, Catena, 22:169-199. Rosgen, D.L. (2001), A practical method of computing streambank erosion rate. Federal Interagency Sedimentation Conference 2001. Rosgen, D.L. (1996), Applied river morphology. Wildland Hydrology, Pagosa Springs, CO. A Clean Sweep Now Possible, Runoff Report, The Terrene Institute, Alexandria, VA. Vol. 6 No. 4, July/August 1998. Sawyer, C.N. (1947), Fertilization of lakes by agricultural and urban drainage, Journal of New England Water Works Association. 61:109-127. Schueler, T. (1995), Environmental land planning series, Site planning for urban stream protection, for Metropolitan Washington Council of Governments, Washington D.C., December. Pub. No. 95708. Schueler, T. (1987), Controlling urban runoff - a practical manual for planning and designing urban best management practices, Metropolitan Washington Council of Government, DC, pp 202. Schueler, T.R. (1995), The architecture of urban stream buffers, Watershed Protection Techniques, 1:4. Proceedings of Engineering Hydrology Symposium, ASCE, San Fransico, July 1993, edited by Schueler T.R., Perfomance of stormwater ponds and wetland systems, pp. 747. Smith, V.H. (1976), Storm-derived losses of phosphorus and their significance to annual phosphorus export from two New Jersey watersheds, Masters Thesis, 115 pages, Rutgers University, New Brunswick, NJ. Smullen, J.T., Shallcross, A.L. and Cave, K.A. (1999), Updating the U.S. nationwide urban runoff quality database, Water Science and Technology, 39, No. 12, pp. 9-16. Stankowski, S.J. (1974), Magnitude and frequency of floods in New Jersey with effects of urbanization, Special report 38, U.S. Geological Survey, Trenton, New Jersey. Tookany/Tacony-Frankford Creek Watershed Partnership (2004), Final report Tacony-
May 2005 R-5
Tookany/Tacony-Frankford Creek Integrated Watershed Management Plan
Frankford creek river conservation plan from http://www.phillywater.org/Tacony- Frankford/River%20Conservation%20Plan/RCP.htm. Thurston H.W., Goddard H.C., Szlag D., and Lemberg B., Controlling Storm-Water Runoff with Tradable Allowances for Impervious Surfaces, Journal of Water Resources Planning and Management; ASCE (September/October 2003), pp 409 – 418. Tuffey, T.J. and Baker, H. (1975), The plight of the urban reservoir: A case study, Water Resources Bulletin, 11, No. 3, pp.575-583. Proceeding No. 20, American Water Resources Association (1975) edited by Tuffey, T.J. and Trama, F.B. , Temporal variations in tributary phosphorus loads, in urbanization and water quality control, pp.140-152. U.S. Army Corps of Engineers, Hydrologic Engineering Center (1998), HEC-5, simulation of flood control and conservation systems, Appendix on water quality analysis, Davis, CA. U.S. Army Corps of Engineers, Hydrologic Engineering Center (March 1995), HECDSS, Data storage system, User’s guide and utility program manuals, Davis, CA. U.S. Department of Agriculture (1986), Urban hydrology for Small Watersheds TR-55, Natural Resources Conservation Service, Technical Release 55. USEPA’s Draft framework for watershed-based trading (1996), EPA 800-R096-001, Office of Water, Washington D.C. USEPA (U.S. Environmental Protection Agency) (1997), Monitoring Consortiums: A Cost-Effective Means to Enhancing Watershed Data Collection and Analysis. U.S. Environmental Protection Agency, Washington, DC. U.S. Environmental Protection Agency and the Delaware Department of Natural Resources and Environmental Council (January 1999), Christina River Watershed Stream Restoration Study, NPS Project 98-8. U.S. Environmental Protection Agency (2002), Exfiltration in sewer systems (EPA/600/R-01/034), available from http://www.epa.gov/ORD/NRMRL/Pubs/600R01034/600R01034.htm. U.S. Environmental Protection Agency (2003), Watershed-Based National Pollutant Discharge Elimination System (NPDES) Permitting Implementation Guidance (EPA 833- B-03-004), available from http://cfpub.epa.gov/npdes/wqbasedpermitting/wspermitting.cfm. U.S. Environmental Protection Agency, SWMM RUNOFF for hydrology and loading, available from http://www.ccee.orst.edu/swmm/, http://www.epa.gov/ceampubl/swmm.htm. U.S. Environmental Protection Agency, EXTRAN for stream hydrodynamics loading, available from http://www.ccee.orst.edu/swmm/, http://www.epa.gov/ceampubl/swmm.htm.
May 2005 R-6
Tookany/Tacony-Frankford Creek Integrated Watershed Management Plan
U.S. Environmental Protection Agency, WASP for instream and reservoir water quality modeling, available from (http://www.epa.gov/ceampubl/wasp.htm). U.S. Water Resources Council (1982), Guidelines for determining flood flow frequency, Revised Bulletin 17B. Upper Perkiomen Watershed Coalition, Upper Perkiomen Watershed Coalition conservation plan, Retrieved September 5, 2002 available from http://www.phillywater.org/Schuylkill/Watershed/watershed_history.htm. Vollenweider, R.A. and Dillon, P.J. (1974), The application of the phosphorus loading concept to eutrophication research, National Research Council Canada., NRC Associate Committee on Scientific Criteria for Environmental Quality, NRCC No. 13690. Warwick, John J. (2002), Impacts of urban land use on macro invertebrate communities in southeastern Wisconsin streams, Journal of the American Water Resources Association. Allen Press, Inc. Lawrence, Kansas. 38(4): 1041-1051. Winer, R. (2000), “National Pollutant Removal Performance Database for Stormwater Treatment Practices: 2nd Edition”, Center for Watershed Protection. Ellicott City, MD. Wolman, M.G. (1954), A method of sampling coarse river-bed material, Transactions of American Geophysical Union, 35: 951-956. Wolman, M.G. & W.P. Miller (1960), Magnitude and frequency of forces in geomorphic processes, Journal of Geology, 68: 54-74.
May 2005 R-7