Tolerance and cross tolerance to the accuracy- and rate-decreasing effects of μ opioids in rats...
12
Drug and Alcohol Dependence 46 (1997) 19–30 Tolerance and cross tolerance to the accuracy- and rate-decreasing effects of m opioids in rats responding under a fixed-consecutive-number schedule Mark A. Smith *, Raymond C. Pitts, Mitchell J. Picker Department of Psychology, Uni6ersity of North Carolina at Wilmington, Wilmington, NC 28403 -3297, USA Received 4 October 1996; accepted 26 February 1997 Abstract The purpose of the present investigation was to examine the development of tolerance to the effects of morphine and other m opioids in rats responding under a fixed-consecutive-number (FCN) schedule of food presentation. To this end, five rats were trained under an FCN schedule and subsequently tested with a variety of m opioids both before and during chronic exposure to a 0.4 mg/ml morphine drinking solution. Morphine, fentanyl, buprenorphine, butorphanol and nalbuphine produced dose-depen- dent decreases in both accuracy and response rate when tested prior to the chronic regimen. In most instances, doses of these drugs that decreased accuracy also decreased response rate. During chronic treatment, tolerance developed to the effects of morphine and cross-tolerance was conferred to the effects of fentanyl, buprenorphine and butorphanol. A greater degree of tolerance was conferred to the effects of butorphanol than to the other opioids examined, and the degree of tolerance conferred to butorphanol’s rate-decreasing effects was greater than the degree of tolerance conferred to its accuracy-decreasing effects. Doses of naloxone that had no effect prior to morphine treatment produced large decreases in accuracy and response rate when tested during the chronic regimen. In contrast to the other opioids examined, the potency of nalbuphine was not altered by chronic morphine administration. These data emphasize the importance of both pharmacological and procedural variables in the development of tolerance and cross tolerance to the behavioral effects of opioids. © 1997 Elsevier Science Ireland Ltd. Keywords: Cross tolerance; Fixed-consecutive-number schedule; Morphine; Opioid; Rat; Tolerance 1. Introduction Previous studies indicate that tolerance develops to the physiological and behavioral effects of morphine and other m opioids at different rates and to different degrees (Fernandes et al., 1977, 1982; Ling et al., 1989). For example, Solomon et al. (1987) reported that fol- lowing weekly administration of morphine for 10 weeks little or no tolerance developed to morphine’s effects on schedule-controlled responding, but complete tolerance developed to its antinociceptive effects. Similarly, Young et al. (1991) reported that in the drug discrimi- nation procedure a greater degree of tolerance was conferred to the discriminative-stimulus effects of mor- phine, etorphine, methadone and buprenorphine than to their rate-decreasing effects. One purpose of the present investigation was to extend the findings mentioned above by comparing the rate and extent to which tolerance develops to the effects of morphine in a complex discrimination task. In complex discrimination tasks, food reinforcement is contingent upon the completion of a predetermined response, or series of responses, and both accuracy and rate of responding are measured. Although there is a lack of studies examining the development of tolerance to the effects of opioids in these tasks, evidence indi- cates that tolerance develops to both the accuracy- and * Corresponding author. Tel.: +1 919 9627201; fax: +1 919 9626090. 0376-8716/97/$17.00 © 1997 Elsevier Science Ireland Ltd. All rights reserved. PII S03 6-8716(97)00039-2
-
Upload
independent -
Category
Documents
-
view
1 -
download
0
Transcript of Tolerance and cross tolerance to the accuracy- and rate-decreasing effects of μ opioids in rats...
Drug and Alcohol Dependence 46 (1997) 19–30
Tolerance and cross tolerance to the accuracy- and rate-decreasingeffects of m opioids in rats responding under a
fixed-consecutive-number schedule
Mark A. Smith *, Raymond C. Pitts, Mitchell J. Picker
Department of Psychology, Uni6ersity of North Carolina at Wilmington, Wilmington, NC 28403-3297, USA
Received 4 October 1996; accepted 26 February 1997
Abstract
The purpose of the present investigation was to examine the development of tolerance to the effects of morphine and other m
opioids in rats responding under a fixed-consecutive-number (FCN) schedule of food presentation. To this end, five rats weretrained under an FCN schedule and subsequently tested with a variety of m opioids both before and during chronic exposure toa 0.4 mg/ml morphine drinking solution. Morphine, fentanyl, buprenorphine, butorphanol and nalbuphine produced dose-depen-dent decreases in both accuracy and response rate when tested prior to the chronic regimen. In most instances, doses of thesedrugs that decreased accuracy also decreased response rate. During chronic treatment, tolerance developed to the effects ofmorphine and cross-tolerance was conferred to the effects of fentanyl, buprenorphine and butorphanol. A greater degree oftolerance was conferred to the effects of butorphanol than to the other opioids examined, and the degree of tolerance conferredto butorphanol’s rate-decreasing effects was greater than the degree of tolerance conferred to its accuracy-decreasing effects. Dosesof naloxone that had no effect prior to morphine treatment produced large decreases in accuracy and response rate when testedduring the chronic regimen. In contrast to the other opioids examined, the potency of nalbuphine was not altered by chronicmorphine administration. These data emphasize the importance of both pharmacological and procedural variables in thedevelopment of tolerance and cross tolerance to the behavioral effects of opioids. © 1997 Elsevier Science Ireland Ltd.
Keywords: Cross tolerance; Fixed-consecutive-number schedule; Morphine; Opioid; Rat; Tolerance
1. Introduction
Previous studies indicate that tolerance develops tothe physiological and behavioral effects of morphineand other m opioids at different rates and to differentdegrees (Fernandes et al., 1977, 1982; Ling et al., 1989).For example, Solomon et al. (1987) reported that fol-lowing weekly administration of morphine for 10 weekslittle or no tolerance developed to morphine’s effects onschedule-controlled responding, but complete tolerancedeveloped to its antinociceptive effects. Similarly,Young et al. (1991) reported that in the drug discrimi-
nation procedure a greater degree of tolerance wasconferred to the discriminative-stimulus effects of mor-phine, etorphine, methadone and buprenorphine thanto their rate-decreasing effects.
One purpose of the present investigation was toextend the findings mentioned above by comparing therate and extent to which tolerance develops to theeffects of morphine in a complex discrimination task. Incomplex discrimination tasks, food reinforcement iscontingent upon the completion of a predeterminedresponse, or series of responses, and both accuracy andrate of responding are measured. Although there is alack of studies examining the development of toleranceto the effects of opioids in these tasks, evidence indi-cates that tolerance develops to both the accuracy- and
* Corresponding author. Tel.: +1 919 9627201; fax: +1 9199626090.
0376-8716/97/$17.00 © 1997 Elsevier Science Ireland Ltd. All rights reserved.PII S 0 3 6 -8716 (97 )00039 -2
M.A. Smith et al. / Drug and Alcohol Dependence 46 (1997) 19–3020
rate-decreasing effects of a variety of drugs, includingcocaine (Clark and Poling, 1990), diazepam (McMillan,1982) and D9-tetrahydrocannabinol (Ferraro andGrilly, 1974), and that tolerance often develops to theseeffects at different rates and to different degrees (seeBranch et al., 1980; Branch and Dearing, 1982).
A second purpose of this investigation was to deter-mine the extent to which morphine confers cross-toler-ance to the accuracy- and rate-decreasing effects ofother m opioids. Studies extending across species andassays suggest that the magnitude to which cross toler-ance is conferred between m opioids is inversely relatedto the compound’s intrinsic efficacy, with greater de-grees of tolerance conferred to opioids possessing lowintrinsic efficacy than to opioids possessing high intrin-sic efficacy (Brase, 1986; Stevens and Yaksh, 1989;Craft and Dykstra, 1990; Sosnowski and Yaksh, 1990;Paronis and Holtzman, 1994). For example, in mor-phine-treated rats, greater degrees of cross tolerance areconferred to the discriminative-stimulus and antinoci-ceptive effects of the low-efficacy opioids buprenor-phine and nalbuphine than to the effects of thehigh-efficacy opioids methadone and etorphine (Younget al., 1991; Paronis and Holtzman, 1992).
In the present investigation, the development of tol-erance to the accuracy- and rate-decreasing effects ofmorphine and other m opioids were examined in ratsresponding under a fixed-consecutive-number (FCN)schedule of food presentation. The FCN procedure is acomplex discrimination task in which food presentationis dependent upon responding a fixed number of timeson one lever and then responding once on a secondlever. If the animal responds on the second lever beforecompleting the fixed number of responses on the origi-nal lever, no food is delivered and the response require-ment is reset to its original value. In this type ofschedule, accuracy of responding is measured as thepercentage of response runs in which the animal emitsthe minimum number of responses on the first leverbefore a single response is emitted on the second lever.Drugs from a variety of pharmacological classes havebeen shown to disrupt accuracy of responding in thisprocedure, including psychomotor stimulants (Mechnerand Latranyi, 1963; Laties et al., 1981; Rees et al.,1985), benzodiazepines (Picker et al., 1986), can-nabinoids (Doty et al., 1992) and opioids (Picker et al.,1987; Bronson and Moerschbaecher, 1987; Picker andDykstra, 1988).
2. Methods
2.1. Animals and apparatus
Five male Long-Evans hooded rats were maintainedat approximately 80% of their free-feeding body
weights (295–365 g) by restricting their daily intake ofPurina Rat Chow. The rats were approximately 4months old at the start of the experiment and werehoused individually in a colony room on a 12 h light/dark cycle. Drinking water was available ad libitum inthe home cage.
Five rat operant-conditioning chambers (Gerbrandsmodel G7322) were enclosed in ventilated, sound-atten-uating cubicles. Each chamber was equipped with tworesponse levers, located 9.0 cm above the floor and 13.0cm apart. Two stimulus lights were mounted 7.0 cmabove each lever, and a food receptacle into which 45mg Noyes pellets (Noyes, Lancaster, NH) were dis-pensed was centered 6.0 cm below the levers. Twohouselights were located on the ceiling above the rearwall. White noise was present continuously within eachchamber and throughout the room. Experimentalevents were programmed and data were collectedthrough the use of a microcomputer, using softwareand interfacing supplied by Med Associates, (St. Al-bans, VT).
2.2. Beha6ioral procedure
Rats initially were trained to lever press under afixed-ratio 1 (FR 1) schedule of food presentation inwhich each press on either lever produced a food pellet.After responding on the FR 1 schedule was established,the FCN schedule was introduced. During the initialtraining sessions, the stimulus lights above the left leverwere illuminated and a single press on this lever turnedoff the lights and illuminated the stimulus lights abovethe right lever. A subsequent press on the right leverproduced a pellet, turned off the lights above the rightlever, and illuminated the lights above the left lever.Over the next several sessions, the number of consecu-tive responses on the left lever required before a re-sponse on the right lever produced a pellet wasincreased to 20. Under this condition, a press on theright lever produced a pellet only if it was preceded byat least 20 consecutive presses on the left lever. If apress on the right lever occurred prior to 20 consecutivepresses on the left lever, the requirement was reset to20, but the stimulus lights did not change. Inclusion ofstimulus lights during these initial training sessionsserved to facilitate the production of long response runsbefore switching to the right lever.
When responding on this schedule was established,the contingencies were changed such that the number ofconsecutive responses required on the left lever wasdecreased to 12 and the corresponding changes in thestimulus lights were eliminated. Under these conditions,the lights above the left and right levers were illumi-nated continuously throughout the experimental ses-sion. Each sequence at least 12 consecutive responseson the left lever that was followed by a press on the
M.A. Smith et al. / Drug and Alcohol Dependence 46 (1997) 19–30 21
right lever produced a food pellet (FCN 12), but a presson the right lever occurring prior to 12 consecutiveresponses on the left lever reset the response require-ment. Sessions were conducted Monday through Fridayand ended after the delivery of 100 food pellets or 20min, whichever occurred first.
2.3. Pharmacological procedure
Once the daily percentage of response runs thatresulted in food presentation under the FCN 12 sched-ule showed no apparent increasing or decreasing trendsover a 2 week period, dose-effect curves for morphine,butorphanol, fentanyl, buprenorphine, nalbuphine andnaloxone were determined in that order. Doses of eachdrug were administered ip, 30 min prior to the experi-mental session. Doses for each compound were admin-istered in an irregular order that varied across rats. Testcompounds were administered on Tuesdays and Fri-days, whereas vehicle control injections were adminis-tered on Thursdays. Non-injection training sessionswere continued on Mondays and Wednesdays.
Following determination of dose-effect curves for allthe drugs, which required approximately 6 months, achronic regimen of morphine administration was ini-tiated by adding morphine to the home-cage drinkingwater. Initially, morphine was dissolved in the drinkingwater at a concentration of 0.1 mg/ml. After 8–10 daysunder this regimen, the concentration of morphine wasincreased gradually by 0.1 mg/ml over a period of 3weeks until a final concentration of 0.4 mg/ml wasreached. Under these conditions, the rats had unlimitedaccess to the morphine solution, and it was the onlysource of drinking water available. This method ofmorphine administration has been used previously toestablish tolerance to morphine’s effects on schedule-controlled responding (Negus et al., 1989; Picker et al.,1992).
Once the final concentration of 0.4 mg/ml morphinewas reached, the development of tolerance to 5.6 mg/kgmorphine and 1.0 mg/kg butorphanol were tested atweekly intervals for 1 month. These doses were selectedbecause they decreased accuracy and response rate toless than 25% of saline control values when tested priorto morphine treatment. During this 1 month period,morphine was administered on Tuesdays, saline onThursdays, and butorphanol on Fridays, with Mondaysand Wednesdays serving as non-injection training days.After 1 month exposure to the final concentration of0.4 mg/ml morphine, dose-effect curves for morphine,butorphanol, fentanyl, buprenorphine, nalbuphine andnaloxone were redetermined as described above. Fol-lowing redetermination of these curves, which tookapproximately 5 months, the morphine solution wasremoved from the home cages and replaced with regu-lar tap water. Daily training sessions were continued
for the next month, but no drugs were administeredduring this time. At the end of this 1 month period,dose-effect curves for morphine and butorphanol wereredetermined using the same procedure describedabove.
2.4. Data analysis
Accuracy of responding on the FCN 12 schedule forall rats was measured as the percentage of runs thatproduced food reinforcement, and was obtained bydividing the number of runs that produced food rein-forcement by the total number of runs. In computingaccuracy values for individual rats, consecutive presseson the right lever were not included in the analysis.Also, accuracy of responding for an individual rat wasnot included in the group mean during sessions inwhich that rat completed less than ten runs during the20 min session. Rates of responding (responses/min) foreach rat were calculated by dividing the total number ofpresses on both levers by the total session time. Foreach test session, relative frequency distributions werecalculated by dividing the number of runs observed ateach run length by the total number of runs emittedduring the entire test session. Frequency distributionswere obtained in all rats for relevant doses of the testdrugs before and during morphine treatment.
Group dose-effect curves for accuracy and responserate were derived by converting the data obtainedduring test sessions to percent saline control and aver-aging across individual rats. For each dose-effect curve,ED50 values (95% confidence limits), or the estimate ofthe dose that decreased accuracy and response rates to50% of control values, were computed mathematically(least squares method) by log-linear interpolation usingat least three points on the descending portion of thecurve. Differences between the ED50 values for pre-chronic versus chronic and pre-chronic versus post-chronic curves were considered statistically significantwhen the 95% confidence limits did not overlap.
2.5. Drugs
Morphine sulfate, buprenorphine hydrochloride(both supplied by National Institute on Drug Abuse,Rockville, MD), fentanyl citrate (generously suppliedby McNeil Laboratories Inc., Fort Washington, PA),butorphanol tartrate (generously supplied by Bristol-Myers, Wallingford, CT), nalbuphine hydrochloride(Research Biochemical Int., Natick, MA) and naloxonehydrochloride (Sigma Chemical Co., St. Louis, MO)were dissolved in saline and injected ip in a volume of1.0 ml/kg of body weight. For chronic administration,morphine was dissolved in tap water.
M.A. Smith et al. / Drug and Alcohol Dependence 46 (1997) 19–3022
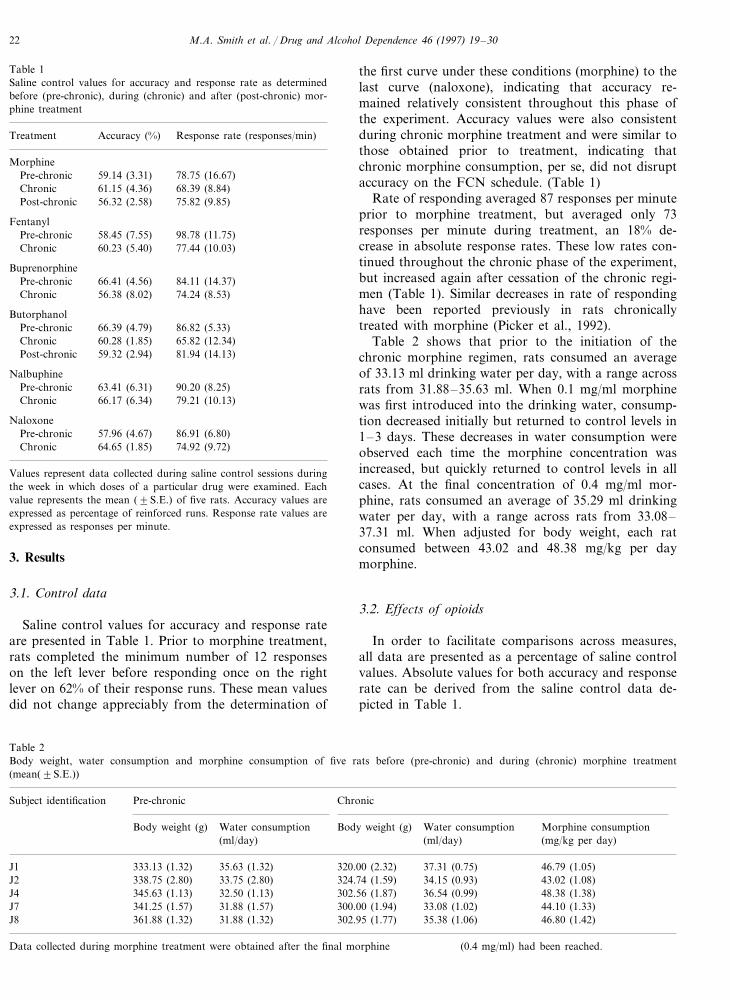
Table 1Saline control values for accuracy and response rate as determinedbefore (pre-chronic), during (chronic) and after (post-chronic) mor-phine treatment
Response rate (responses/min)Accuracy (%)Treatment
Morphine78.75 (16.67)59.14 (3.31)Pre-chronic
Chronic 61.15 (4.36) 68.39 (8.84)75.82 (9.85)56.32 (2.58)Post-chronic
Fentanyl98.78 (11.75)58.45 (7.55)Pre-chronic
Chronic 77.44 (10.03)60.23 (5.40)
Buprenorphine66.41 (4.56) 84.11 (14.37)Pre-chronic
74.24 (8.53)Chronic 56.38 (8.02)
ButorphanolPre-chronic 66.39 (4.79) 86.82 (5.33)
65.82 (12.34)60.28 (1.85)Chronic81.94 (14.13)Post-chronic 59.32 (2.94)
Nalbuphine63.41 (6.31) 90.20 (8.25)Pre-chronic66.17 (6.34) 79.21 (10.13)Chronic
Naloxone57.96 (4.67) 86.91 (6.80)Pre-chronic
74.92 (9.72)64.65 (1.85)Chronic
Values represent data collected during saline control sessions duringthe week in which doses of a particular drug were examined. Eachvalue represents the mean (9S.E.) of five rats. Accuracy values areexpressed as percentage of reinforced runs. Response rate values areexpressed as responses per minute.
the first curve under these conditions (morphine) to thelast curve (naloxone), indicating that accuracy re-mained relatively consistent throughout this phase ofthe experiment. Accuracy values were also consistentduring chronic morphine treatment and were similar tothose obtained prior to treatment, indicating thatchronic morphine consumption, per se, did not disruptaccuracy on the FCN schedule. (Table 1)
Rate of responding averaged 87 responses per minuteprior to morphine treatment, but averaged only 73responses per minute during treatment, an 18% de-crease in absolute response rates. These low rates con-tinued throughout the chronic phase of the experiment,but increased again after cessation of the chronic regi-men (Table 1). Similar decreases in rate of respondinghave been reported previously in rats chronicallytreated with morphine (Picker et al., 1992).
Table 2 shows that prior to the initiation of thechronic morphine regimen, rats consumed an averageof 33.13 ml drinking water per day, with a range acrossrats from 31.88–35.63 ml. When 0.1 mg/ml morphinewas first introduced into the drinking water, consump-tion decreased initially but returned to control levels in1–3 days. These decreases in water consumption wereobserved each time the morphine concentration wasincreased, but quickly returned to control levels in allcases. At the final concentration of 0.4 mg/ml mor-phine, rats consumed an average of 35.29 ml drinkingwater per day, with a range across rats from 33.08–37.31 ml. When adjusted for body weight, each ratconsumed between 43.02 and 48.38 mg/kg per daymorphine.
3.2. Effects of opioids
In order to facilitate comparisons across measures,all data are presented as a percentage of saline controlvalues. Absolute values for both accuracy and responserate can be derived from the saline control data de-picted in Table 1.
3. Results
3.1. Control data
Saline control values for accuracy and response rateare presented in Table 1. Prior to morphine treatment,rats completed the minimum number of 12 responseson the left lever before responding once on the rightlever on 62% of their response runs. These mean valuesdid not change appreciably from the determination of
Table 2Body weight, water consumption and morphine consumption of five rats before (pre-chronic) and during (chronic) morphine treatment(mean(9S.E.))
Pre-chronicSubject identification Chronic
Body weight (g) Morphine consumptionWater consumption Body weight (g) Water consumption(ml/day)(ml/day) (mg/kg per day)
35.63 (1.32)333.13 (1.32)J1 46.79 (1.05)37.31 (0.75)320.00 (2.32)338.75 (2.80)J2 43.02 (1.08)33.75 (2.80) 34.15 (0.93)324.74 (1.59)
J4 48.38 (1.38)36.54 (0.99)302.56 (1.87)32.50 (1.13)345.63 (1.13)341.25 (1.57) 31.88 (1.57) 300.00 (1.94) 33.08 (1.02) 44.10 (1.33)J7361.88 (1.32)J8 46.80 (1.42)35.38 (1.06)302.95 (1.77)31.88 (1.32)
Data collected during morphine treatment were obtained after the final morphine (0.4 mg/ml) had been reached.
M.A. Smith et al. / Drug and Alcohol Dependence 46 (1997) 19–30 23
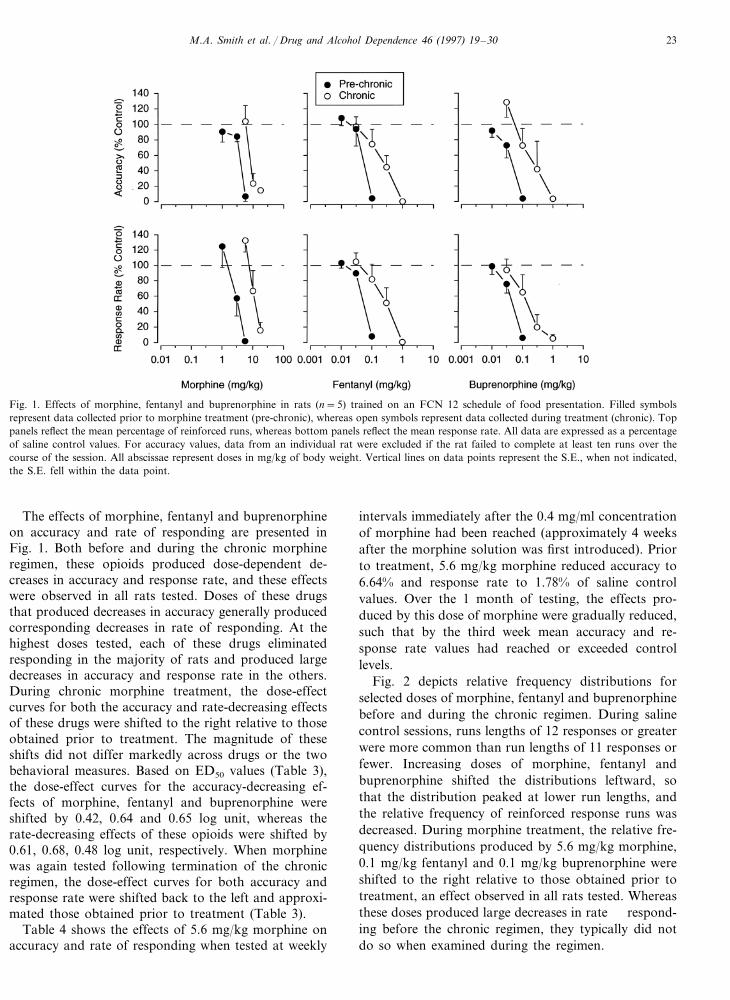
Fig. 1. Effects of morphine, fentanyl and buprenorphine in rats (n=5) trained on an FCN 12 schedule of food presentation. Filled symbolsrepresent data collected prior to morphine treatment (pre-chronic), whereas open symbols represent data collected during treatment (chronic). Toppanels reflect the mean percentage of reinforced runs, whereas bottom panels reflect the mean response rate. All data are expressed as a percentageof saline control values. For accuracy values, data from an individual rat were excluded if the rat failed to complete at least ten runs over thecourse of the session. All abscissae represent doses in mg/kg of body weight. Vertical lines on data points represent the S.E., when not indicated,the S.E. fell within the data point.
The effects of morphine, fentanyl and buprenorphineon accuracy and rate of responding are presented inFig. 1. Both before and during the chronic morphineregimen, these opioids produced dose-dependent de-creases in accuracy and response rate, and these effectswere observed in all rats tested. Doses of these drugsthat produced decreases in accuracy generally producedcorresponding decreases in rate of responding. At thehighest doses tested, each of these drugs eliminatedresponding in the majority of rats and produced largedecreases in accuracy and response rate in the others.During chronic morphine treatment, the dose-effectcurves for both the accuracy and rate-decreasing effectsof these drugs were shifted to the right relative to thoseobtained prior to treatment. The magnitude of theseshifts did not differ markedly across drugs or the twobehavioral measures. Based on ED50 values (Table 3),the dose-effect curves for the accuracy-decreasing ef-fects of morphine, fentanyl and buprenorphine wereshifted by 0.42, 0.64 and 0.65 log unit, whereas therate-decreasing effects of these opioids were shifted by0.61, 0.68, 0.48 log unit, respectively. When morphinewas again tested following termination of the chronicregimen, the dose-effect curves for both accuracy andresponse rate were shifted back to the left and approxi-mated those obtained prior to treatment (Table 3).
Table 4 shows the effects of 5.6 mg/kg morphine onaccuracy and rate of responding when tested at weekly
intervals immediately after the 0.4 mg/ml concentrationof morphine had been reached (approximately 4 weeksafter the morphine solution was first introduced). Priorto treatment, 5.6 mg/kg morphine reduced accuracy to6.64% and response rate to 1.78% of saline controlvalues. Over the 1 month of testing, the effects pro-duced by this dose of morphine were gradually reduced,such that by the third week mean accuracy and re-sponse rate values had reached or exceeded controllevels.
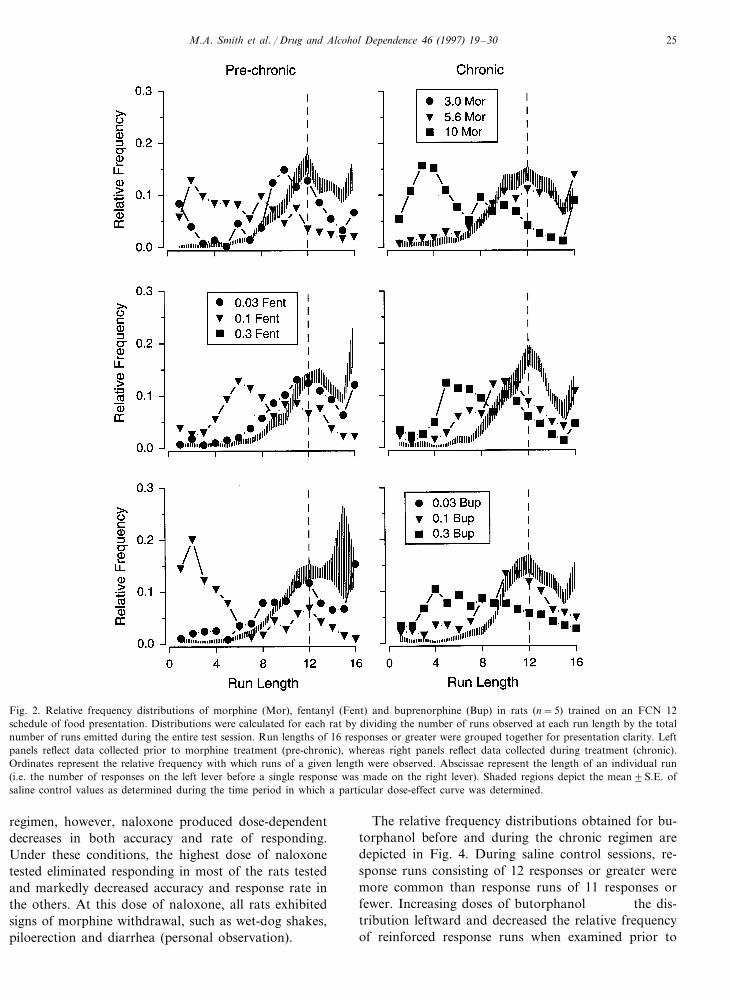
Fig. 2 depicts relative frequency distributions forselected doses of morphine, fentanyl and buprenorphinebefore and during the chronic regimen. During salinecontrol sessions, runs lengths of 12 responses or greaterwere more common than run lengths of 11 responses orfewer. Increasing doses of morphine, fentanyl andbuprenorphine shifted the distributions leftward, sothat the distribution peaked at lower run lengths, andthe relative frequency of reinforced response runs wasdecreased. During morphine treatment, the relative fre-quency distributions produced by 5.6 mg/kg morphine,0.1 mg/kg fentanyl and 0.1 mg/kg buprenorphine wereshifted to the right relative to those obtained prior totreatment, an effect observed in all rats tested. Whereasthese doses produced large decreases in rate respond-ing before the chronic regimen, they typically did notdo so when examined during the regimen.
M.A. Smith et al. / Drug and Alcohol Dependence 46 (1997) 19–3024
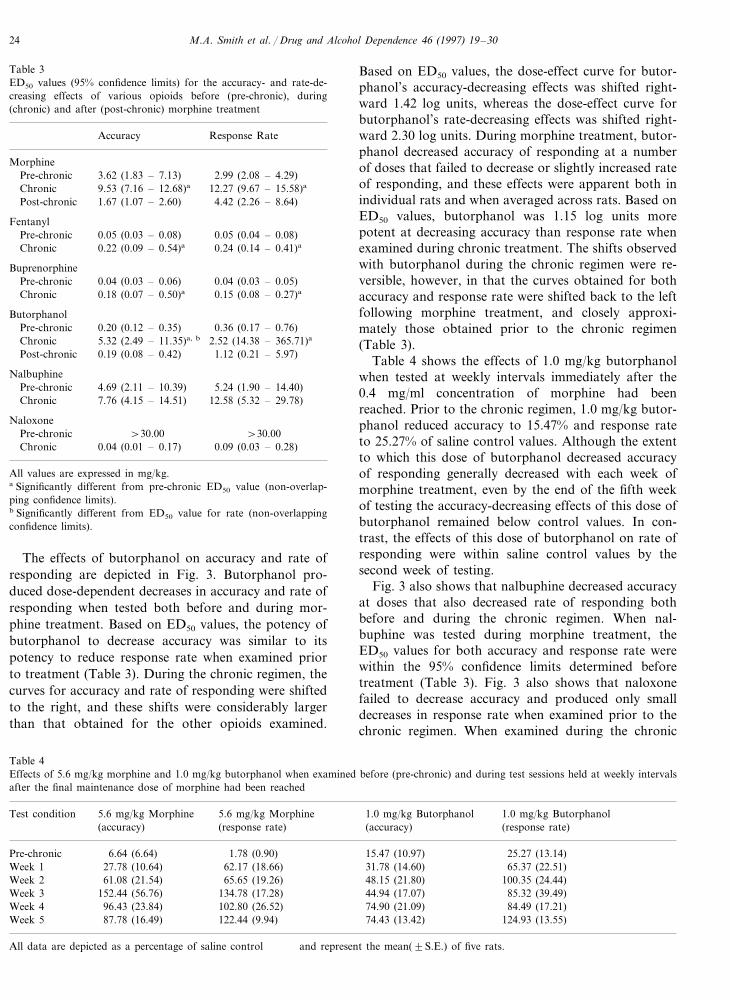
Table 3ED50 values (95% confidence limits) for the accuracy- and rate-de-creasing effects of various opioids before (pre-chronic), during(chronic) and after (post-chronic) morphine treatment
Accuracy Response Rate
Morphine3.62 (1.83 – 7.13) 2.99 (2.08 – 4.29)Pre-chronic
12.27 (9.67 – 15.58)a9.53 (7.16 – 12.68)aChronicPost-chronic 4.42 (2.26 – 8.64)1.67 (1.07 – 2.60)
Fentanyl0.05 (0.04 – 0.08)0.05 (0.03 – 0.08)Pre-chronic0.24 (0.14 – 0.41)a0.22 (0.09 – 0.54)aChronic
Buprenorphine0.04 (0.03 – 0.06)Pre-chronic 0.04 (0.03 – 0.05)0.18 (0.07 – 0.50)a 0.15 (0.08 – 0.27)aChronic
ButorphanolPre-chronic 0.36 (0.17 – 0.76)0.20 (0.12 – 0.35)Chronic 5.32 (2.49 – 11.35)a, b 2.52 (14.38 – 365.71)a
1.12 (0.21 – 5.97)0.19 (0.08 – 0.42)Post-chronic
NalbuphinePre-chronic 5.24 (1.90 – 14.40)4.69 (2.11 – 10.39)Chronic 7.76 (4.15 – 14.51) 12.58 (5.32 – 29.78)
NaloxonePre-chronic \30.00\30.00Chronic 0.04 (0.01 – 0.17) 0.09 (0.03 – 0.28)
All values are expressed in mg/kg.a Significantly different from pre-chronic ED50 value (non-overlap-ping confidence limits).b Significantly different from ED50 value for rate (non-overlappingconfidence limits).
Based on ED50 values, the dose-effect curve for butor-phanol’s accuracy-decreasing effects was shifted right-ward 1.42 log units, whereas the dose-effect curve forbutorphanol’s rate-decreasing effects was shifted right-ward 2.30 log units. During morphine treatment, butor-phanol decreased accuracy of responding at a numberof doses that failed to decrease or slightly increased rateof responding, and these effects were apparent both inindividual rats and when averaged across rats. Based onED50 values, butorphanol was 1.15 log units morepotent at decreasing accuracy than response rate whenexamined during chronic treatment. The shifts observedwith butorphanol during the chronic regimen were re-versible, however, in that the curves obtained for bothaccuracy and response rate were shifted back to the leftfollowing morphine treatment, and closely approxi-mately those obtained prior to the chronic regimen(Table 3).
Table 4 shows the effects of 1.0 mg/kg butorphanolwhen tested at weekly intervals immediately after the0.4 mg/ml concentration of morphine had beenreached. Prior to the chronic regimen, 1.0 mg/kg butor-phanol reduced accuracy to 15.47% and response rateto 25.27% of saline control values. Although the extentto which this dose of butorphanol decreased accuracyof responding generally decreased with each week ofmorphine treatment, even by the end of the fifth weekof testing the accuracy-decreasing effects of this dose ofbutorphanol remained below control values. In con-trast, the effects of this dose of butorphanol on rate ofresponding were within saline control values by thesecond week of testing.
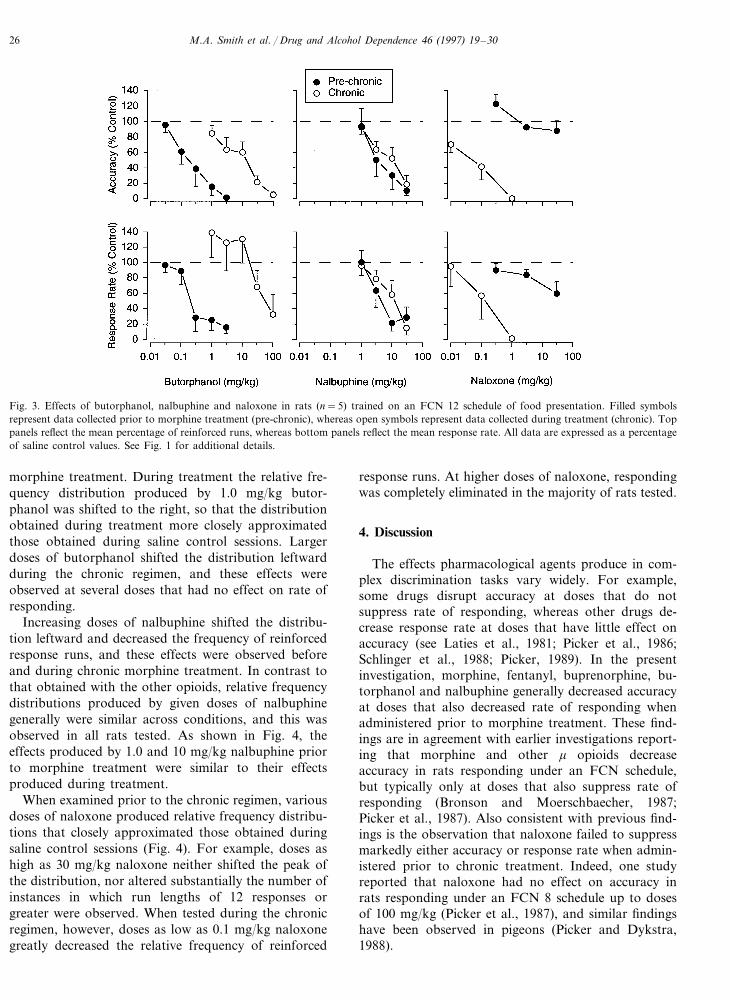
Fig. 3 also shows that nalbuphine decreased accuracyat doses that also decreased rate of responding bothbefore and during the chronic regimen. When nal-buphine was tested during morphine treatment, theED50 values for both accuracy and response rate werewithin the 95% confidence limits determined beforetreatment (Table 3). Fig. 3 also shows that naloxonefailed to decrease accuracy and produced only smalldecreases in response rate when examined prior to thechronic regimen. When examined during the chronic
The effects of butorphanol on accuracy and rate ofresponding are depicted in Fig. 3. Butorphanol pro-duced dose-dependent decreases in accuracy and rate ofresponding when tested both before and during mor-phine treatment. Based on ED50 values, the potency ofbutorphanol to decrease accuracy was similar to itspotency to reduce response rate when examined priorto treatment (Table 3). During the chronic regimen, thecurves for accuracy and rate of responding were shiftedto the right, and these shifts were considerably largerthan that obtained for the other opioids examined.
Table 4Effects of 5.6 mg/kg morphine and 1.0 mg/kg butorphanol when examined before (pre-chronic) and during test sessions held at weekly intervalsafter the final maintenance dose of morphine had been reached
1.0 mg/kg Butorphanol5.6 mg/kg MorphineTest condition 1.0 mg/kg Butorphanol5.6 mg/kg Morphine(response rate)(accuracy) (accuracy) (response rate)
6.64 (6.64) 1.78 (0.90)Pre-chronic 15.47 (10.97) 25.27 (13.14)27.78 (10.64) 62.17 (18.66)Week 1 31.78 (14.60) 65.37 (22.51)
65.65 (19.26)61.08 (21.54)Week 2 100.35 (24.44)48.15 (21.80)152.44 (56.76)Week 3 134.78 (17.28) 44.94 (17.07) 85.32 (39.49)
Week 4 96.43 (23.84) 102.80 (26.52) 74.90 (21.09) 84.49 (17.21)87.78 (16.49) 122.44 (9.94)Week 5 74.43 (13.42) 124.93 (13.55)
All data are depicted as a percentage of saline control and represent the mean(9S.E.) of five rats.
M.A. Smith et al. / Drug and Alcohol Dependence 46 (1997) 19–30 25
Fig. 2. Relative frequency distributions of morphine (Mor), fentanyl (Fent) and buprenorphine (Bup) in rats (n=5) trained on an FCN 12schedule of food presentation. Distributions were calculated for each rat by dividing the number of runs observed at each run length by the totalnumber of runs emitted during the entire test session. Run lengths of 16 responses or greater were grouped together for presentation clarity. Leftpanels reflect data collected prior to morphine treatment (pre-chronic), whereas right panels reflect data collected during treatment (chronic).Ordinates represent the relative frequency with which runs of a given length were observed. Abscissae represent the length of an individual run(i.e. the number of responses on the left lever before a single response was made on the right lever). Shaded regions depict the mean9S.E. ofsaline control values as determined during the time period in which a particular dose-effect curve was determined.
regimen, however, naloxone produced dose-dependentdecreases in both accuracy and rate of responding.Under these conditions, the highest dose of naloxonetested eliminated responding in most of the rats testedand markedly decreased accuracy and response rate inthe others. At this dose of naloxone, all rats exhibitedsigns of morphine withdrawal, such as wet-dog shakes,piloerection and diarrhea (personal observation).
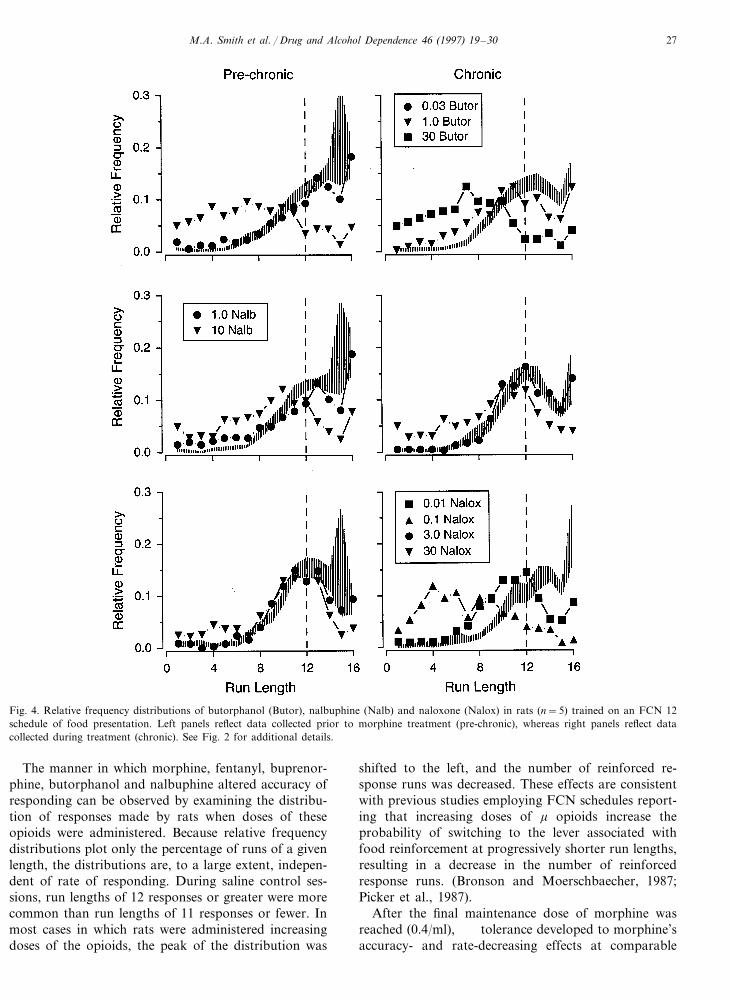
The relative frequency distributions obtained for bu-torphanol before and during the chronic regimen aredepicted in Fig. 4. During saline control sessions, re-sponse runs consisting of 12 responses or greater weremore common than response runs of 11 responses orfewer. Increasing doses of butorphanol the dis-tribution leftward and decreased the relative frequencyof reinforced response runs when examined prior to
M.A. Smith et al. / Drug and Alcohol Dependence 46 (1997) 19–3026
Fig. 3. Effects of butorphanol, nalbuphine and naloxone in rats (n=5) trained on an FCN 12 schedule of food presentation. Filled symbolsrepresent data collected prior to morphine treatment (pre-chronic), whereas open symbols represent data collected during treatment (chronic). Toppanels reflect the mean percentage of reinforced runs, whereas bottom panels reflect the mean response rate. All data are expressed as a percentageof saline control values. See Fig. 1 for additional details.
morphine treatment. During treatment the relative fre-quency distribution produced by 1.0 mg/kg butor-phanol was shifted to the right, so that the distributionobtained during treatment more closely approximatedthose obtained during saline control sessions. Largerdoses of butorphanol shifted the distribution leftwardduring the chronic regimen, and these effects wereobserved at several doses that had no effect on rate ofresponding.
Increasing doses of nalbuphine shifted the distribu-tion leftward and decreased the frequency of reinforcedresponse runs, and these effects were observed beforeand during chronic morphine treatment. In contrast tothat obtained with the other opioids, relative frequencydistributions produced by given doses of nalbuphinegenerally were similar across conditions, and this wasobserved in all rats tested. As shown in Fig. 4, theeffects produced by 1.0 and 10 mg/kg nalbuphine priorto morphine treatment were similar to their effectsproduced during treatment.
When examined prior to the chronic regimen, variousdoses of naloxone produced relative frequency distribu-tions that closely approximated those obtained duringsaline control sessions (Fig. 4). For example, doses ashigh as 30 mg/kg naloxone neither shifted the peak ofthe distribution, nor altered substantially the number ofinstances in which run lengths of 12 responses orgreater were observed. When tested during the chronicregimen, however, doses as low as 0.1 mg/kg naloxonegreatly decreased the relative frequency of reinforced
response runs. At higher doses of naloxone, respondingwas completely eliminated in the majority of rats tested.
4. Discussion
The effects pharmacological agents produce in com-plex discrimination tasks vary widely. For example,some drugs disrupt accuracy at doses that do notsuppress rate of responding, whereas other drugs de-crease response rate at doses that have little effect onaccuracy (see Laties et al., 1981; Picker et al., 1986;Schlinger et al., 1988; Picker, 1989). In the presentinvestigation, morphine, fentanyl, buprenorphine, bu-torphanol and nalbuphine generally decreased accuracyat doses that also decreased rate of responding whenadministered prior to morphine treatment. These find-ings are in agreement with earlier investigations report-ing that morphine and other m opioids decreaseaccuracy in rats responding under an FCN schedule,but typically only at doses that also suppress rate ofresponding (Bronson and Moerschbaecher, 1987;Picker et al., 1987). Also consistent with previous find-ings is the observation that naloxone failed to suppressmarkedly either accuracy or response rate when admin-istered prior to chronic treatment. Indeed, one studyreported that naloxone had no effect on accuracy inrats responding under an FCN 8 schedule up to dosesof 100 mg/kg (Picker et al., 1987), and similar findingshave been observed in pigeons (Picker and Dykstra,1988).
M.A. Smith et al. / Drug and Alcohol Dependence 46 (1997) 19–30 27
Fig. 4. Relative frequency distributions of butorphanol (Butor), nalbuphine (Nalb) and naloxone (Nalox) in rats (n=5) trained on an FCN 12schedule of food presentation. Left panels reflect data collected prior to morphine treatment (pre-chronic), whereas right panels reflect datacollected during treatment (chronic). See Fig. 2 for additional details.
The manner in which morphine, fentanyl, buprenor-phine, butorphanol and nalbuphine altered accuracy ofresponding can be observed by examining the distribu-tion of responses made by rats when doses of theseopioids were administered. Because relative frequencydistributions plot only the percentage of runs of a givenlength, the distributions are, to a large extent, indepen-dent of rate of responding. During saline control ses-sions, run lengths of 12 responses or greater were morecommon than run lengths of 11 responses or fewer. Inmost cases in which rats were administered increasingdoses of the opioids, the peak of the distribution was
shifted to the left, and the number of reinforced re-sponse runs was decreased. These effects are consistentwith previous studies employing FCN schedules report-ing that increasing doses of m opioids increase theprobability of switching to the lever associated withfood reinforcement at progressively shorter run lengths,resulting in a decrease in the number of reinforcedresponse runs. (Bronson and Moerschbaecher, 1987;Picker et al., 1987).
After the final maintenance dose of morphine wasreached (0.4/ml), tolerance developed to morphine’saccuracy- and rate-decreasing effects at comparable
M.A. Smith et al. / Drug and Alcohol Dependence 46 (1997) 19–3028
rates and to similar degrees. Morphine also conferredcross tolerance to the accuracy- and rate-decreasingeffects of fentanyl and buprenorphine, and the magni-tude of this tolerance was similar to that observedwith morphine. In previous investigations where toler-ance developed to the effects of morphine, tolerance ofsimilar or lesser magnitude has been conferred to theeffects of fentanyl (Brase, 1986; Emmett-Oglesby et al.,1988; Picker et al., 1991; Paronis and Holtzman, 1992,1994). These findings are in contrast to previous re-ports regarding buprenorphine, which have indicatedthat substantially greater degrees of tolerance are con-ferred to the effects of buprenorphine than to mor-phine itself (Negus et al., 1989; Paronis and Holtzman,1992, 1994). Buprenorphine possesses less intrinsic effi-cacy at the m receptor than either morphine or fen-tanyl (Hayes et al., 1987; Picker et al., 1993; Walker etal., 1995), and it was predicted that greater degrees oftolerance would be conferred to its accuracy- and rate-decreasing effects. The reasons that greater amounts oftolerance were not conferred to buprenorphine are notknown, but these findings suggest that pharmacologi-cal variables may play only a limited role in the devel-opment of tolerance. Indeed, it is becomingincreasingly apparent that the development of toler-ance to the effects of opioids are mediated, in part, byprocedural variables, and these factors must be takeninto account when measuring tolerance to their behav-ioral effects (see Hughes et al., 1996).
Greater degrees of tolerance were conferred to theaccuracy- and rate-decreasing effects of butorphanolthan to the other opioids examined. Of particular in-terest was the finding that tolerance developed to theseeffects at different rates and to different degrees.Weekly probe tests with 1.0 mg/kg butorphanol re-vealed that tolerance was conferred more rapidly tothe effects of butorphanol on rate of responding thanto its effects on accuracy. Furthermore, analysis ofED50 values obtained during the chronic regimen re-vealed that substantially greater degrees of tolerancewere conferred to butorphanol’s rate-decreasing thanaccuracy-decreasing effects. The reasons morphineconferred differential degrees of cross tolerance to theeffects of butorphanol are unclear, but it is consistentwith previous reports indicating that tolerance devel-ops at different rates and to different degrees to manyphysiological and behavioral endpoints that can bemodulated by administration of m opioids (Colpaert etal., 1976; Miksic and Lal, 1977; Fernandes et al., 1977,1982; Solomon et al., 1987; Ling et al., 1989). In thepresent investigation, only butorphanol showed a dis-association of tolerance development, suggesting thatthe mechanisms mediating butorphanol’s accuracy-and rate-decreasing effects may be different from theother opioids examined. In addition to its activity atthe m receptor, butorphanol also possesses activity at k
and d opioid receptors (Horan and Ho, 1989; Jaw etal., 1993; Leander, 1983; Smith and Picker, 1995). It ispossible that chronic morphine treatment allowed bu-torphanol’s activity at one of these other receptor sitesto be unmasked, thus producing the differential toler-ance observed between butorphanol’s accuracy- andrate-decreasing effects. Such a conclusion would beconsistent with previously reports that activity at non-m receptors may be unmasked during chronic mor-phine treatment (Negus et al., 1989; Picker et al.,1990).
In contrast to the effects of morphine, fentanyl,buprenorphine and butorphanol, the effects of nal-buphine were not significantly altered during thechronic morphine regimen, indicating that cross toler-ance was not conferred to either nalbuphine’s accu-racy- or rate-decreasing effects. In individual rats, therelative frequency distributions produced by nal-buphine during morphine treatment were similar tothose produced prior to treatment. This observationrules out the possibility that the lack of change notedin nalbuphine’s dose-effect curves was an artifact ofaveraging across rats, with some rats showing en-hanced sensitivity and others showing tolerance. Aprevious study reported that profound degrees of crosstolerance were conferred to the discriminative-stimuluseffects of nalbuphine under conditions in which toler-ance developed to the effects of morphine (Young etal., 1991). Other studies examining schedule-controlledbehavior, however, have reported either no change, orenhanced sensitivity to the rate-decreasing effects ofnalbuphine under conditions in which tolerance devel-oped to the effects of morphine (Oliveto et al., 1991;Picker and Yarbrough, 1991). The possibility existsthat the effects of nalbuphine observed in the presentinvestigation are not mediated by its activity at the m
receptor. Previous studies have reported that the ef-fects of nalbuphine in complex discrimination tasksdiffer from those of more selective m opioids such asmorphine and methadone (Moerschbaecher et al.,1987), and this has been taken as evidence that nal-buphine’s effects in these tasks are not mediated by itsactivity at the m receptor. Although this possibility isinviting, a recent study reporting that opioid antago-nists yield pA2 values for nalbuphine similar to that ofother m opioids on schedule-controlled behavior doesnot support this notion (Pitts et al., 1996). Evidently,the mechanisms mediating tolerance and sensitivity tothe effects of nalbuphine have yet to be identified, butboth pharmacological and procedural variables appearto be involved.
Whereas naloxone did not markedly suppress eitheraccuracy or response rate when administered prior tomorphine treatment, naloxone produceddent decreases in both measures when examined dur-ing the chronic regimen. These data extend a large
M.A. Smith et al. / Drug and Alcohol Dependence 46 (1997) 19–30 29
body of literature indicating that opioid antagonistsdisrupt operant behavior when administered to mor-phine-tolerant animals (e.g., Leander et al., 1975;Brady and Holtzman, 1980; Adams and Holtzman,1990; Picker and Yarbrough, 1991; Picker et al.,1992). The effects observed with naloxone duringtreatment were likely due to its ability to precipitatewithdrawal. Indeed, when administered a dose of 1.0mg/kg naloxone, all rats exhibited pronounced with-drawal symptoms of varying degrees of severity, in-cluding diarrhea, piloerection and wet-dog shakes.These results suggest that the oral administration ofmorphine was sufficient to produce opioid dependenceunder the parameters employed in the present investi-gation.
In summary, morphine, fentanyl, buprenorphine,butorphanol and nalbuphine decreased accuracy andrate of responding when administered to rats re-sponding under an FCN 12 schedule of food presen-tation. During chronic morphine treatment, tolerancedeveloped to both the accuracy- and rate-decreasingeffects of morphine and cross tolerance was conferredto the effects of fentanyl, buprenorphine and butor-phanol. A greater degree of tolerance was conferredto the effects of butorphanol than to the other opi-oids examined, and the degree of tolerance conferredto butorphanol’s rate-decreasing effects was greaterthan the degree of tolerance conferred to its accuracy-decreasing effects. Doses of naloxone that had no ef-fect prior to morphine treatment decreased bothaccuracy and response rate when tested during thechronic regimen, an effect that was likely due tonaloxone’s ability to precipitate withdrawal. The po-tency of nalbuphine was not altered during chronicmorphine treatment. These data suggest that bothpharmacological and procedural variables contributeto the development of tolerance and cross toleranceto the behavioral effects of opioids.
Acknowledgements
This study was supported by US Public ServiceGrants DA02749, DA07327 and DA10277 from theNational Institute on Drug Abuse. M.A.S. was sup-ported by Training Grant DA07244 and PredoctoralFellowship DA05713 from the National Institute onDrug Abuse. Animals used in this study were main-tained in accordance with the guidelines of the Insti-tutional Animal Care and Use Committee of theUniversity of North Carolina, and the ‘Guide for theCare and Use of Laboratory Animals’ (Institute ofLaboratory Animal Resources, National AcademyPress, 1996). The authors would especially like tothank William Prizer for expert technical assistance.
References
Adams, J.U., Holtzman, S.G., 1990. Tolerance and dependence aftercontinuous morphine infusion from osmotic pumps measured byoperant responding in rats. Psychopharmacology 100, 451–458.
Brady, L.S., Holtzman, S.G., 1980. Schedule-controlled behavior inthe morphine-dependent and post-dependent rat. Psychopharma-cology 70, 11–18.
Branch, M.N., Dearing, M.E., 1982. Effects of acute and dailycocaine administration on performance under a delayed-match-ing-to-sample procedure. Pharmacol. Biochem. Behav. 16, 713–718.
Branch, M.N., Dearing, M.E., Lee, D.M., 1980. Acute and chroniceffects of D9-tetrahydrocannabinol on complex behavior of squir-rel monkeys. Psychopharmacology 71, 247–256.
Brase, D.A., 1986. Unequal opiate cross tolerance to morphine in thelocomotor activation model in the mouse. Neuropharmacology14, 297–304.
Bronson, M.E., Moerschbaecher, J.M., 1987. Effect of m, k and s
opioids on fixed consecutive number responding in rats. Pharma-col. Biochem. Behav. 27, 733–743.
Clark, R.D., Poling, A., 1990. Effects of cocaine administration andwithdrawal on the performance of pigeons under a fixed-consecu-tive-number schedule with and without an external discriminativestimulus. Behav. Pharmacol. 1, 491–496.
Colpaert, F.C., Kuyps, J.J.M.D., Niemegeers, C.J.E., Janssen, P.A.J.,1976. Discriminative stimulus properties of fentanyl and mor-phine: Tolerance and dependence. Pharmacol. Biochem. Behav. 5,401–408.
Craft, R.M., Dykstra, L.A., 1990. Differential cross tolerance toopioids in squirrel monkeys responding under a shock titrationschedule. J. Pharmacol. Exp. Ther. 252, 945–952.
Doty, P., Dykstra, L.A., Picker, M.J., 1992. D9-Tetrahydrocan-nabinol interactions with phencyclidine and ethanol: Effects onaccuracy and rate of responding. Pharmacol. Biochem. Behav. 43,61–70.
Emmett-Oglesby, M.W., Shippenberg, T.S., Herz, A., 1988. Toler-ance and cross tolerance to the discriminative stimulus propertiesof fentanyl and morphine. J. Pharmacol. Exp. Ther. 245, 17–23.
Fernandes, M., Kluwe, S., Coper, H., 1977. Quantitative assessmentof tolerance to and dependence on morphine in mice. Naunyn-Schmiedebergs Arch. Pharmacol. 297, 53–60.
Fernandes, M., Kluwe, S., Coper, H., 1982. Development and loss oftolerance to morphine in the rat. Psychopharmacology 78, 234–238.
Ferraro, D.P., Grilly, D.M., 1974. Effects of chronic exposure toD9-tetrahydrocannabinol on delayed matching-to-sample in chim-panzees. Psychopharmacology 37, 127–138.
Hayes, A.G., Sheehan, M.J., Tyers, M.B., 1987. Differential sensitiv-ity of models of antinociception in the rat, mouse, and guinea pigto m and k opioid receptor agonists. Br. J. Pharmacol. 91,823–832.
Horan, P., Ho, I.K., 1989. Butorphanol precipitates abstinence inmorphine dependent rats. Eur. J. Pharmacol. 170, 265–268.
Hughes, C.E., Dykstra, L.A., Picker, M.J., 1996. Behavioral toleranceand cross-tolerance to the response rat-decreasing effects of m
opioids in rats. Behav. Pharmacol. 7, 228–236.Jaw, S.P., Hoskins, B., Ho, I.K., 1993. Involvement of d-opioid
receptors in physical dependence on butorphanol. Eur. J. Pharma-col. 240, 67–72.
Laties, V.G., Ronald, R.W., Rees, D.C., 1981. Stimulus control andthe effects of d-amphetamine in the rat. Psychopharmacology 75,277–282.
Leander, J.D., 1983. Evidence that nalorphine, butorphanol andoxilorphan are partial at a k opioid receptor. Eur. J.Pharmacol. 86, 467–470.
M.A. Smith et al. / Drug and Alcohol Dependence 46 (1997) 19–3030
Leander, J.D., McMillan, D.E., Harris, L.S., 1975. Effects of narcoticagonist and antagonists on schedule-induced water and morphineingestion. J. Pharmacol. Exp. Ther. 195, 271–278.
Ling, G.S.F., Paul, D., Simantov, R., Pasternak, G.W., 1989. Differ-ential development of acute tolerance to analgesia, respiratorydepression, gastrointestinal transit and hormone release in a mor-phine infusion model. Life Sci. 45, 1627–1636.
McMillan, D.E., 1982. Effects of chemicals on delayed matchingbehavior in pigeons II: Tolerance to the effects of diazepam andcross tolerance to phencyclidine. Neurotoxicology 3, 138–141.
Mechner, F., Latranyi, M., 1963. Behavioral effects of caffeine,methamphetamine and methylphenidate in the rat. J. Exp. Anal.Behav. 6, 331–342.
Miksic, S., Lal, H., 1977. Tolerance to morphine-produced discrimina-tive stimuli and analgesia. Psychopharmacology 54, 217–221.
Moerschbaecher, J.M., Devia, C., Brocklehurst, C., 1987. Effects ofmixed agonist-antagonist opioids on the acquisition of conditionaldiscriminations in monkeys. J. Pharmacol. Exp. Ther. 240, 74–81.
Negus, S.S., Picker, M.J., Dykstra, L.A., 1989. K antagonist propertiesof buprenorphine in non-tolerant and morphine-tolerant rats.Psychopharmacology 98, 141–143.
Oliveto, A.H., Picker, M.J., Dykstra, L.A., 1991. Acute and chronicmorphine administration: Effects of mixed action opioids in ratsand squirrel monkeys responding under a schedule of food presen-tation. J. Pharmacol. Exp. Ther. 257, 8–18.
Paronis, C.A., Holtzman, S.G., 1992. Development of tolerance to theanalgesic activity of m agonists after continuous infusion of mor-phine, meperidine or fentanyl in rats. J. Pharmacol. Exp. Ther. 262,1–9.
Paronis, C.A., Holtzman, S.G., 1994. Sensitization and tolerance to thediscriminative stimulus effects of m-opioid agonists. Psychopharma-cology 114, 601–610.
Picker, M.J., 1989. Neuroleptics and conditional discrimination tasks:cholinergic mediation of the accuracy- and response rate-alteringeffects of chlorpromazine and clozapine but not haloperidol. Behav.Pharmacol. 1, 141–152.
Picker, M.J., Craft, R.M., Negus, S.S., Powell, K.R., Mattox, S.R.,Jones, S.R., Hargrove, B.K., Dykstra, L.A., 1992. Intermediateefficacy m opioids: Examination of their morphine-like stimuluseffects and response rate-decreasing effects in morphine-tolerantrats. J. Pharmacol. Exp. Ther. 263, 668–681.
Picker, M.J., Dykstra, L.A., 1988. Differential effects of opioid andnonopioid analgesics on conditional discriminations in pigeons.Psychopharmacology 94, 405–411.
Picker, M.J., Heise, J.W., Dykstra, L.A., 1987. Evaluation of the effectsof opioid agonists and antagonists under a fixed-consecutive-num-ber schedule in rats. Pharmacol. Biochem. and Behav. 27, 73–80.
Picker, M.J., Leibold, L., Endsley, B., Poling, A., 1986. Effects ofclonazepam and ethosuximide on the responding of pigeons undera fixed-consecutive-number schedule with and without an externaldiscriminative stimulus. Psychopharmacology 88, 325–330.
Picker, M.J., Negus, S.S., Craft, R.M., 1990. Butorphanol’s efficacy atm and k opioid receptors: Inferences based on the schedule-con-trolled behavior of nontolerant and morphine-tolerant rats and onthe responding of rats under a drug discrimination procedure.Pharmacol. Biochem. Behav. 36, 563–568.
Picker, M.J., Negus, S.S., Powell, K.R., 1991. Differential cross-toler-ance to m and k opioid agonists in morphine-tolerant rats respond-ing under a schedule of food presentation. Psychopharmacology103, 129–135.
Picker, M.J., Yarbrough, J., 1991. Cross tolerance and enhancedsensitivity to the response rate-decreasing effects of opioids withvarying degrees of efficacy at the m receptor. Psychopharmacology105, 459–466.
Picker, M.J., Yarbrough, J., Hughes, C.E., Smith, M.A., Morgan, D.,Dykstra, L.A., 1993. Agonist and antagonist effects of mixed actionopioids in the pigeon drug discrimination procedure: Influence oftraining dose, intrinsic efficacy and inter-animal differences. J.Pharmacol. Exp. Ther. 266, 756–767.
Pitts, R.C., West, J.P., Morgan, D., Dykstra, L.A., Picker, M.J.,1996. Opioids and rate of positively reinforced behavior: Dif-ferential antagonism by naltrexone. Behav. Pharmacol. 7, 205–215.
Rees, D.C., Wood, R.W., Laties, V.G., 1985. The roles of stimuluscontrol and reinforcement frequency in modulating the behavioraleffects of D-amphetamine in the rat. J. Exp. Anal. Behav. 43,243–255.
Smith, M.A., Picker, M.J., 1995. Examination of the k agonist andantagonist properties of opioids in the rat drug discriminationprocedure: Influence of training dose and intrinsic efficacy. Behav.Pharmacol. 6, 703–717.
Schlinger, H., Wilkenfield, J., Poling, A., 1988. Effects of methsuximideand mephenytoin on the responding of pigeons under a fixed-con-secutive-number schedule with and without an external discrimina-tive stimulus. Psychopharmacology 95, 216–221.
Solomon, R.E., Wasserman, E.A., Gebhart, G.F., 1987. Tolerance tothe antinociceptive effects of morphine without tolerance to itseffects on schedule-controlled behavior. Psychopharmacology 92,327–333.
Sosnowski, M., Yaksh, T.L., 1990. Differential cross tolerance betweenintrathecal morphine and sufentanil in the rat. Anesthesiology 73,1141–1147.
Stevens, C.W., Yaksh, T.L., 1989. Potency of infused spinal antinoci-ceptive agents is inversely related to magnitude of tolerance aftercontinuous infusion. J. Pharmacol. Exp. Ther. 250, 1–8.
Walker, E.A., Zernig, G., Woods, J.H., 1995. Buprenorphine antago-nism of m opioids in the rhesus monkey tail-withdrawal procedure.J. Pharmacol. Exp. Ther. 273, 1345–1352.
Young, A.M., Kapitsopoulos, G., Makhay, M.M., 1991. Tolerance tomorphine-like stimulus effects of m opioid agonists. J. Pharmacol.Exp. Ther. 257, 795–805.
.