Tokio Marine Group - Business Strategy
45
Copyright (c) 2021 Tokio Marine Holdings, Inc. May 27, 2021 Tokio Marine Group Business Strategy 2013 2014 2015 2016 2017 2018 2019 Achieved carbon-neutral for seven consecutive years CO2 Emission CO2 Absorption/Fixation/Reduction 133 111 (Thousand ton)
-
Upload
khangminh22 -
Category
Documents
-
view
1 -
download
0
Transcript of Tokio Marine Group - Business Strategy

Copyright (c) 2021 Tokio Marine Holdings, Inc.
May 27, 2021
Tokio Marine Group
Business Strategy
2013 2014 2015 2016 2017 2018 2019
Achieved carbon-neutral for seven consecutive years
CO2 Emission CO2 Absorption/Fixation/Reduction
133111
(Thousand ton)

Copyright (c) 2021 Tokio Marine Holdings, Inc. 1
Table of Contents
I. Review of Previous Mid-Term Business Plan..... P. 2
II. Strategy and Current Positioning ...................... P. 6
III. Management and Sustainability ....................... P. 16
IV. New Mid-Term Business Plan ............................ P. 22
Reference .................................................................... P. 44
◆Abbreviations used in this material
TMNF : Tokio Marine & Nichido Fire Insurance Co., Ltd.
NF : Nisshin Fire & Marine Insurance Co., Ltd.
TMNL : Tokio Marine & Nichido Life Insurance Co., Ltd.
PHLY: Philadelphia
DFG: Delphi
TMHCC: Tokio Marine HCC
TMK: Tokio Marine Kiln

Copyright (c) 2021 Tokio Marine Holdings, Inc. 2
Review of Previous Mid-Term Business Plan
I

Copyright (c) 2021 Tokio Marine Holdings, Inc.
QualitativeQuantitativeI.Review of Previous MTP
Sustainable profit growth Enhance capital efficiency Enhance shareholder return
2017
341.4336.1
2020
Adjusted net income: 3-7% CAGR
2017
8.6%
9.7%
2020
Previous MTP
Adjusted ROE: 10% or higher
2017 2020(Plans)
(billions of JPY) (billions of JPY)
Total dividends/payout ratio*2
: Normalized basis*1
• Sustainably increase dividends along with profit growth
• Gradually increase the payout ratio towards future vision of the Group
+5.0%+21.5
431.1
12.0%
139.1
: Actual basis
*1: Excluding the impact of COVID-19, natural catastrophes over annual average, and adjusted the market condition (FX and stock price) to the same level as at the end of Mar. 2018.
9.4%
Review of Previous MTP (Quantitative)
Achieved the plan despite facing various issues including natural catastrophes and COVID-19 through steadily boosting our capabilities
36%
42%
*2: Payout ratio to 5-year average adjusted net income
Adjusted ROE Adjusted net income
3
Previous MTP
Previous MTP
372.0117.6

Copyright (c) 2021 Tokio Marine Holdings, Inc.
QualitativeQuantitativeI.Review of Previous MTP
4
Review of Previous MTP (Enhancement of Global Management Team)
Management team overcame various issues and further enhanced global management capabilities
Measures implementedGlobal insurance company management team
COVID-19
Natural catastro
phes
Low interest
rates
Social Inflation
Issues
Increased reserves based on detailed review by the Reserves Committee
Forward-looking rate increase and limit reduction
Post-COVID strategy established by Post-COVID Task Force
Retention / reinsurance strategy by GRSC
Global joint purchase of reinsurance programs
Investment synergies through GISC
Even
stron
ger m
an
ag
em
en
t te
am
Even
stron
ger m
an
ag
em
en
t te
am
Group CEO / CCO Culture
CWOWellness
CLCOLegal and Compliance
CITOInformation Technology
CISOInformation Security
CSUOSustainability
CDIODiversity & Inclusion
Donald Sherman
Co-CIO
Overseas top management
Christopher Williams
Co-CRSOCo-Head of International Business
CFOFinancial
CSSOStrategy and Synergy
CRORisk
CDODigital
CRSORetention Strategy
CIOInvestment
CHROHuman Resources
C-Suite includes overseas top management
ERM Committee
Global Information Technology Committee
International Executive Committee (IEC)
Global Investment Strategy Committee (GISC)
Global Retention Strategy Committee (GRSC)
Digital Round Table
Utilization of Global Committee, etc.
(Transferred from TMHCC) (Transferred from TMHCC to TMAsia)
Philippe VezioBrad Irick
SpecialtyTMK CEO
Caryn Angelson(Additional posts: TMNAS and TMHD)
Legal / HR
Daniel Thomas
Daljitt Barn
Barry Cook
ReservingReinsurance
Cyber Insurance
Appropriate application of expertise on global basis
Sustainability Committee
CWOWellness
CLCOLegal and Compliance
CITOInformation Technology
CISOInformation Security
CSUOSustainability
CDIODiversity & Inclusion

Copyright (c) 2021 Tokio Marine Holdings, Inc.
QualitativeQuantitativeI.Review of Previous MTP
May 2020
5
Review of Previous MTP (Optimization of Insurance Portfolio)
Insurance portfolio performance management is our core strength Conduct forward-looking reviews and invest in growth areas to optimize our diversified portfolio
Portfolio optimization initiatives
Acquisition
Divestment
Aug. 2018
Dec. 2018
Jan. 2020announcement
Feb. 2020
2018 2020
Sept. 2020
Tokio Marine Egypt Family Takaful
From Jan. 2019
Europe Non-Japanese business*1
*1: UK non-Japanese business and some unprofitable non-Japanese businesses in other European regions(continue Lloyd’s business)
*2: Business unit profit basis.*3: TMK, PHLY, DFG, TMHCC, Pure. Cumulative profit on business unit profit basis from time of acquisition up to FY2020.*4: Ratio of net incurred losses for COVID-19 in FY2020 to net premiums earned in FY2019.
TMHD’s figure is on non-compulsory insurance basis. Net incurred loss excludes domestic auto insurance result which had a large loss ratio improvement effect from COVID-19.Peers are Allianz, AXA, Chubb, and Zurich. (Source) D&P research
2019
Dec. 2020
Staffing insurance business
(Reference) Results of past portfolio management
International Insurance: Cumulative profit*2
(billions of JPY)
Acquisition pricecirca ¥42.8bn
Investment amountcirca ¥40.0bn
Investment amountcirca ¥39.5bn
Acquisition pricecirca ¥325.5bn
Acquisition priceBelow ¥10bn
Acquisition priceBelow ¥10bn
Impact of COVID-19 related losses on premium*4
Results of five major acquisitions since 2008*3
Total acquisition cost: ¥2.1 trillion
Cumulative profit: ¥1.1 trillion
2.5% 2.9%4.7%
3.2%
6.7%
TMHD Peer 1 Peer 2 Peer 3 Peer 4Mar. 2019
Transaction amountcirca ¥168.5bn
0
500
1,000
1,500
2002 2008 2014 2020

Copyright (c) 2021 Tokio Marine Holdings, Inc. 6
Strategy and Current Positioning
II

Copyright (c) 2021 Tokio Marine Holdings, Inc.
StrategyII. Strategy and Position Positioning
ESG for sustainable growth
7
Milestones and Strategy
With the fast and planned implementation of management strategy, achievement of the medium-to long-term target (milestone) is within view
Capital generation
Capital adjustment
Strategic capital release
Appropriate risk control
Disciplined and strategic M&A
Disciplined risk taking
Business investment
Dividend increase
Flexible capital level adjustment
Shareholder return
Sustained stable profit base in Japan
Enhanced on specialty in developed countries
Capture growth potential in emerging countries
+
Organicgrowth
Portfolio review
Milestone
Adjusted net income: Over ¥500bn
Adjusted ROE: About 12%
Payout Ratio: Global Peer Level*
Further growth
*: Payout ratio of global peers is currently circa 50%.

Copyright (c) 2021 Tokio Marine Holdings, Inc.
StrategyII. Strategy and Position Positioning
8
Strong Group franchise
Established top-class businesses in Japan and overseas through portfolio optimization together with internal growth
Emerging markets
Developed markets
Japan
Region
Above-market top-line growth (+0.6pt)*1
Below-market expense ratio (-2.5pt )*2
Continue generating stable
income as a No.1company in both top-line and bottom-line results
World-class status
centered on specialty areas and achieved a high level of
stable profitability
Strong position in
high growth potential markets to capture growth
Position Strength
Overseas
US: Stable C/R that outperforms peers (-7.0pt)*3
UK: C/R that outperforms peers (-5.2pt)*4
Top-line growth (+2.2pt) that exceeds fast growing markets*5
See pages 9-10 for details
*1: 2010-2019 CAGR
*2: 2019
*3: 2015-2020 average
*4: 2015-2020 average
*5: 2015-2019 average

Copyright (c) 2021 Tokio Marine Holdings, Inc.
StrategyII. Strategy and Position Positioning
97.3% 97.5% 97.5%94.4%
91.4% 90.8% 90.0% 91.6% 92.2% 92.8%90.4%
2010 2011 2012 2013 2014 2015 2016 2017 2018 2019 2020
TMNFSJMSADOther
2010 2011 2012 2013 2014 2015 2016 2017 2018 2019
9
(Reference) Positioning of Domestic Non-life Insurance
Continue generating stable income as a No.1 company in both top-line and bottom-line results
No.1 in top-line and bottom-line
Superior business efficiency
<Expense Ratio (all lines)> TMNF
Market*5
*5: Total of the members of The General Insurance Association of Japan (excluding TMNF). Source: Website of the General Insurance Association of Japan
35.0%
33.5%
30.8%
33.3%
Reduce workloads on a long-term basis
By 20-30%
2010 2019
Stable profitability for more than a decade
*4: Natural catastrophes normalized to an average annual level
1.5%
-0.8%
1.1%
-1.7%-2.0%
-1.0%
0.0%
1.0%
2.0%
<vs FY2010(Market share)*1,2>
<Combined Ratio*4>
*1: Direct net premiums written *2: Total of the members of The General Insurance Association of Japan. Source: Website of the General Insurance Association of Japan, company websites *3: Total of the members of The General Insurance Association of Japan. Source: Website of the General Insurance Association of Japan, Insurance Statistics (Sompo Toukeigo)
Top-line growth outperforming the market
(billions of JPY)<Top-line*1>
1,851.42,486.2
CAGR + 2.7%
CAGR + 3.3%
■ TMNF
■ Market*3
<Bottom-line (underwriting profit)*2>
FY2010-2020Average: 92.9%
-2.5pt
<Top-line*1,2>
25.8%
25.6%
18%
15%
16% 2%4%25%
32%
38%
Average FY2017-2019 (market share of each company)
FY2016-2020Average: 91.4%

Copyright (c) 2021 Tokio Marine Holdings, Inc.
StrategyII. Strategy and Position Positioning
Developed markets Emerging markets
10
(Reference) Positioning of International Insurance
Developed markets: World-class status centered on specialty areas and achieved a high level of stable profitability
Emerging markets: Strong position in high growth potential markets to capture growth
Average
Sta
nd
ard
Devia
tion
Peer
US P&C
90%100%110%
0%
5%
10%
Market
Combined Ratio2015-2020*2
Combined Ratio2015-2020
Emerging markets total
Top line*6
2015-2019 CAGR
+9.8%
(vs Market +2.2 pt)
Brazil Thailand
US Commercial*1
*1: US Commercial P&C direct premiums written in FY2020 (Source) S&P Global*2: Tokio Marine’s C/R is total C/R of North America. Bottom line is after-tax profit of PHLY, DFG, TMHCC, and Pure on a local financial accounting basis.
C/R and bottom-line of the below are those of their US P&C business.Market: All US non-life insurersPeer: Median of Allianz, AXA, Chubb, and ZurichUS P&C: Median of non-insurers selected by Tokio Marine whose main business is US Commercial and market capitalization at or above ¥4 trillion (Chubb, Travelers, and AIG) (Source) S&P Global
Market Share*7
(2019)
Bottom line(2020)
No. 4 (8%)
¥4.5 bn(YoY +1%*8)
Market size*6
(2019)
¥1.0 trillion(Largest in
Southeast Asia)
No. 6 (5%)
¥11.0 bn(YoY +40%*8)
¥3.6 trillion(Largest in Central & South America)+1.7%
+0.6%
-7.9%-6.8%
Bottom line2015- 2020 CAGR *2
Peer
USP&C
Market
Top 10Leading Player
in Specialty Market
UK Lloyd’s
Leading Player
80%
100%
120%
2015 2016 2017 2018 2019 2020
TMK(Syndicate510)
All Lloyd's *4
*3
*5
*3: Local management accounting basis*4: (Source) Lloyd’s Annual Report*5. Excluding the impact of COVID-19*6: Non-life premiums: NWP for TMHD and GWP for Market (Source) Swiss Re*7: Source: Brazil: SUSEP; Thailand: local insurance rating organization*8: On a local currency basis
Average 100.9%
Average 95.7%

Copyright (c) 2021 Tokio Marine Holdings, Inc.
StrategyII. Strategy and Position Positioning
11
Group Synergy
The strong global franchise enables Tokio Marine Group to create various synergies by leveraging on each Group company’s network and expertise
Investment
Leverage Delphi’sasset management
capabilities
Revenue
Leverage our globalnetwork
Cost
Leverage group resources and
economies of scale
Capital
Optimize retention / reinsurance on a group basis
Group synergiesImpact on profits from Group synergies
(cumulative)
Group synergies
Annual results:
USD 295mn
(Dec.31, 2020)
(USD mn)
170
1,303
0
500
1,000
1,500
2016 2017 2018 2019 2020

Copyright (c) 2021 Tokio Marine Holdings, Inc.
StrategyII. Strategy and Position Positioning
Disciplined
control
29%
26%12%
22%
12%
2014 2015 2016 2017 2018 2019 2020
12
Risk Diversification and Growth
21%
33%21%
14%
10%
Risk diversification Trends of premiums and risks*
Net premiums written + Life insurance premiums
Risk Volume
¥3.3trillion
¥2.8trillion
¥4.5 trillion
¥2.9 trillion
Sustainablegrowth
*: ESR risk (99.95% VaR, after tax basis)
FY2020 Diversification effects 50%
FY2014 Diversification effects 44%
Before¥5.0 trillion
Risk after diversification
¥2.8 trillion
Risk after diversification
¥2.9 trillion
■ Domestic non-life
(underwriting)
Control of nat-cat risk
■ International insurance
Diversification improvements with business expansion
■ Domestic non-life
(investment)
Reduction of business-related equities risk
■ Domestic life
Control of interest rate risks
Shift to protection-type products
Before¥5.7 trillion
■ Others: Financial and General businesses, FX risk derived from net capital investments, etc.
Diversify risks and sustainably expand business

Copyright (c) 2021 Tokio Marine Holdings, Inc.
StrategyII. Strategy and Position Positioning
13
Stable ROE Improvement
By enhancing profitability and risk diversification, ROE has stably increased to peer level
ROE: Financial accounting basis.
Figures for other companies are 2014-2020 averages. (2017 of AXA is excluded).
Peer: Allianz, AXA, Chubb, Zurich Source: Bloomberg
5% 9% 11%
0.0%
1.5%
3.0%
ROE
Standard
Deviation
Average ROE
Peer 1
Low
High
Peer 3
Peer 2Peer 4
HighLow
Vo
lati
lity
3%
TMHD(2007-2013)
Japanese P&C 1
Japanese P&C 2
7%
(Cost of capital)
Capital efficiency
TMHD(2014-2020)

Copyright (c) 2021 Tokio Marine Holdings, Inc.
StrategyII. Strategy and Position Positioning
0
100
200
300
400
14
Strong Track Record
Resulted in TSR and EPS above-market and our peers
Source: Bloomberg*1: Total Shareholder Return (TSR): Capital return after reinvesting dividends.
Stock price indexed at 100 as of April 1, 2002.
*2: Allianz, AXA, Chubb, Zurich * 3. Financial accounting basis
Peer*2
325
TOPIX (Insurance)261
MSCI World Insurance
274
TOPIX263
396
As of end of Mar. 2021
TSR*1 EPS*3CAGR (2010-2020)
Median Maximum Minimum
Peer*2
+9.6%
+1.5%
+3.9%
-1.6%
Performance(Before Mar. 2021)
5Y 10Y
Tokio Marine 175 327
Peer*2 185 296
MSCI World Insurance 172 252
TOPIX (Insurance) 165 252
TOPIX 168 282
Copyright (c) 2021 Tokio Marine Holdings, Inc. 15
(Blank Page)

Copyright (c) 2021 Tokio Marine Holdings, Inc. 16
Management and
Sustainability ⅢⅢⅢⅢ
Copyright (c) 2021 Tokio Marine Holdings, Inc.
III. Sustainability
17
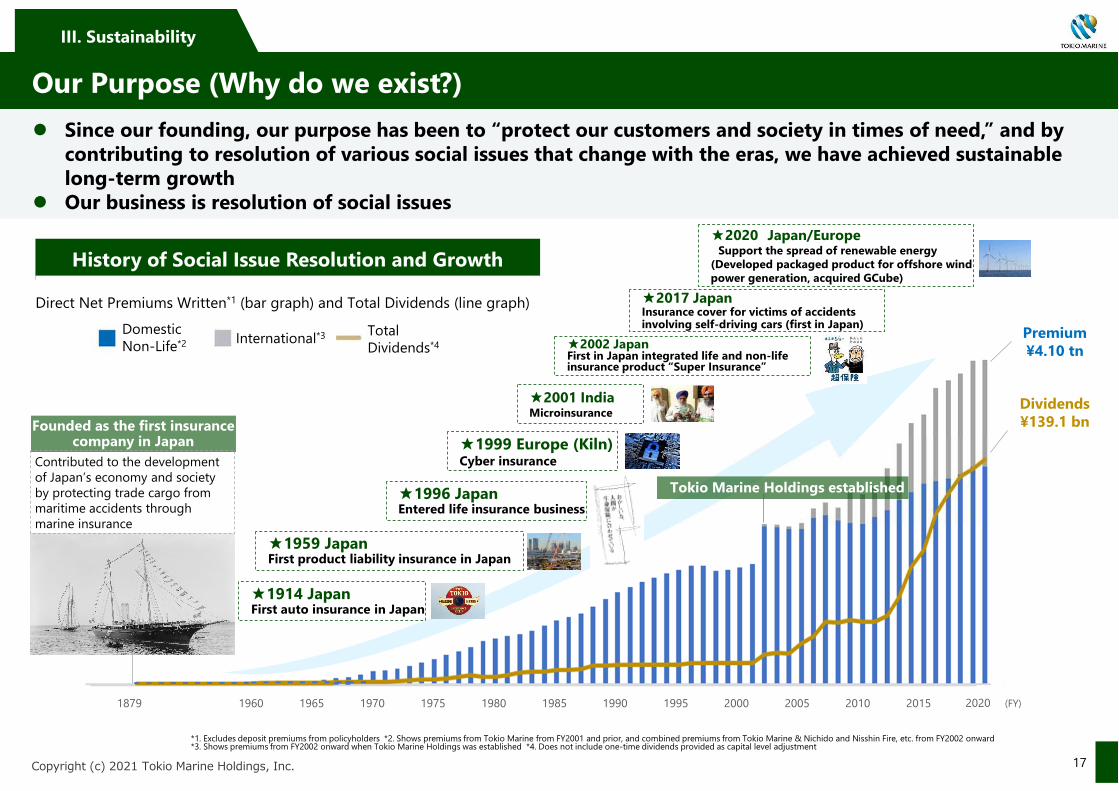
Our Purpose (Why do we exist?)
Since our founding, our purpose has been to “protect our customers and society in times of need,” and by contributing to resolution of various social issues that change with the eras, we have achieved sustainable long-term growth
Our business is resolution of social issues
1879 1960 1965 1970 1975 1980 1985 1990 1995 2000 2005 2010 2015
Founded as the first insurance company in Japan
Tokio Marine Holdings established
Premium¥4.10 tn
Dividends¥139.1 bn
2020 (FY)
★1914 JapanFirst auto insurance in Japan
★1959 JapanFirst product liability insurance in Japan
★1999 Europe (Kiln)Cyber insurance
★2001 IndiaMicroinsurance
★2020 Japan/EuropeSupport the spread of renewable energy
(Developed packaged product for offshore wind power generation, acquired GCube)
★1996 JapanEntered life insurance business
History of Social Issue Resolution and Growth
Contributed to the development of Japan’s economy and society by protecting trade cargo from maritime accidents throughmarine insurance
★2002 JapanFirst in Japan integrated life and non-life insurance product “Super Insurance”
*1. Excludes deposit premiums from policyholders *2. Shows premiums from Tokio Marine from FY2001 and prior, and combined premiums from Tokio Marine & Nichido and Nisshin Fire, etc. from FY2002 onward*3. Shows premiums from FY2002 onward when Tokio Marine Holdings was established *4. Does not include one-time dividends provided as capital level adjustment
★2017 JapanInsurance cover for victims of accidents involving self-driving cars (first in Japan)
Direct Net Premiums Written*1 (bar graph) and Total Dividends (line graph)
Domestic Non-Life*2 International*3 Total
Dividends*4

Copyright (c) 2021 Tokio Marine Holdings, Inc.
III. Sustainability
18
Our Purpose (What are we aiming for?)
Contribute to the realization of sustainable society and simultaneously enhance our social value and economic value (profit growth) by circulating business-oriented social issue resolution initiatives
Established Group Sustainability Officer and Sustainability Committee (consisting of CEO and C-suite) in April 2021 to accelerate our initiatives
Values provided to the stakeholders and Materiality
• Promote climate actions
• Support people’s healthy lives
• Enhance disaster resilience
• Support and create digital-oriented innovations, etc.
• Contributing to the realization of healthy and enriched lives of our customers by delivering safety and security and by supporting them in challenges that lead to the future
• Contributing to creating a sustainable society where can live in safety and security, and take on any challenges
• Promote and penetrate D&I• Contributing to employees’ high performance by
providing opportunities to work brightly and vibrantly and through engagement
• Promote climate actions
• Educate and raise awareness of children, etc.
• Passing on a sustainable environment to the future generations
• Disclosures in a timely, appropriate and transparent manner
• Sustainable growth of shareholder returns• Working to gain the trust of shareholders /
investors and improve corporate value through appropriate disclosure and constructive dialogue
MaterialityOur Vision
For Customers
For Society
For Employees
For Future Generations
For Shareholders / Investors

Copyright (c) 2021 Tokio Marine Holdings, Inc.
III. Sustainability
19
Our Purpose (How will we do it?)
Derivation of 4 medium- to long-term core themes from materiality Create value through steady implementation
Stakeholders
Promote climate actions(★)
Support and createdigital-oriented
innovations
Materiality (★Core themes)
• Initiatives related to renewable energy, etc.:
see page 27
• Products and services using digital technology, protection against cyber risks, and initiatives to support SMEs, etc.:
see pages 27, 40
Values Created
Support people’s healthy lives(★)
• Response to demands for health care services, asset formulation and savings, etc.: see pages 27, 31, 40, 57
• Disseminate / promote health management supporting service further
• Develop / provide new healthcare service and support asset formation / saving needs to cope with longevity risk (products / services)
Enhance disaster resilience(★)
• Contribution to disaster prevention / reduction and early recovery, and building sustainable fire insurance system, etc.: see pages 28, 40
• Products and services that support disaster prevention / reduction and early recovery• Invest in business that works on
establishing resilient environment• Support formulation of Business
Continuity Plan (BCP) in collaboration with local governments and companies• Build a sustainable fire insurance
system
• New products and services using digital technology, etc.
• Protection for increasing cyber risks (products / services)
• Products and services for development of corporations such as SME support
• Provide and develop insurance & service that promotes use of renewable energy (Established Group-wide “Green Transformation Task Force” to accelerate the initiative)
Core Initiatives
Economic value Social value Economic value Social value Economic value Social value
: Main elements improved with the initiativesEconomic value Social value
Economic value Social value
For CustomersFor Society

Copyright (c) 2021 Tokio Marine Holdings, Inc.
III. Sustainability
20
Our Purpose (How will we do it?)
※See page 75 for the list of climate change related initiatives; page 82 for international initiatives; page 83 for external evaluation; and page 84 for ESG X SDGs
Promote climate actions(★)Educate and raise
awareness of childrenMateriality
(★Core themes)
• 100% total participation ratio for social contribution activities
• Green lessons
• Disaster prevention lessons
• Lessons on managing risks and the future
Values Created
Core Initiatives
• Realize carbon neutral through engagement with investees / customers, etc.
• Reduce CO2 emission in Group operation (RE100 certification, etc.)
• Mangrove planting / forest preservation activities
• Reduction of our greenhouse gas (CO2/GHG) emissions: FY2030 -60% reduction (Compared to FY2015)
• Ratio of renewable energy usage to total electricity consumption: FY2030 100% to renewable energy at major buildings/facilities
• Continue to achieve carbon-neutral* (achieved for seven consecutive years)
• Cumulative economic value of mangrove planting by FY2038 is expected to exceed ¥300bn
*: Related to our business activities (Scope 1+2+3 (Category 1,3,5,6))
For Future GenerationsStakeholders
Social value Social value
: Main elements improved with the initiatives
For Shareholders / Investors
Disclosures in a timely, appropriate and transparent
manner
• Promote appropriate disclosure practices by enhancing intelligence including TCFD-related matters
• Enhance disclosures aligned with the TCFD recommendation and implement appropriate measures based on NGFS
• Sustainable growth of shareholder returns[Medium- to long-term target]
Adjusted Net Income: Over ¥500bn
Adjusted ROE: About 12% Primary means of shareholder
return is dividends, which will be sustainably increased along with profit growth
Economic value Social value
Promote and penetrateD&I(★)
• Annual culture & value survey
• Female managers:FY2030 30% of managers in TMNF are female
• D&I promotion: see page 21
• Promote diversity / disseminate D&I culture
• Share best practice across the Group
• Make efforts to improve operations though human rights due diligence, etc.
For Employees
Social value
Green lessons:• About 870 lessons• About 57,000 participants
(Total as of end of Mar. 2021)
Disaster prevention lessons:• About 810 lessons• About 55,000 participants
(Total as of end of Mar. 2021)
Economic value Social value

Copyright (c) 2021 Tokio Marine Holdings, Inc.
III. Sustainability
21
People and Culture as the Foundation
In an era of uncertainty, promotion of diversity is critical to resolve increasingly complex social issues Unite diverse talents with shared corporate culture
Excellent talent who join the Group through overseas M&A, are appointed to positions such as Group Co-Heads and global committee leaders
Tokio Marine Group Women’s Career
College was established in to assist
female Group employees in voluntary
career planning, and to ensure that
women are active in their workplaces
An in-house venture program to support employees including young talent who are eager to innovate, relaxation of side job rules
Turnover ratio*1: 2.0% (TMNF, FY2020)
Promotion of Diversity & Inclusion
Established Group Diversity & Inclusion Officer (CDIO) and Diversity Council chaired by the CEO in April 2021
CDIO Nabeshima
Spreading the core identity
CEO held a remote world tour during the pandemic
By penetrating the corporate culture, engrave our corporate purpose in all acts from individual action to management decision making (essence of governance)
Remote world tour by CEO Komiya (CEO Meeting)
Culture & value survey*2 (84% response ratio)
4.3 points out of 5
(Group Attachment)
Creation of Exciting and Rewarding Work Environment
Nationality
Gender
Generation
Female sub-leader ratio: 54.9% (TMNF, as of April 1, 2021)
Female corporate officer ratio: 11.5% (TMNF, as of April 1, 2021)
*1: Calculated based on voluntary resignation, excluding resignation for mandatory age, etc. *2: FY2020 survey result (total for domestic and overseas Group companies and HD)

Copyright (c) 2021 Tokio Marine Holdings, Inc. 22
ⅣⅣⅣⅣNew Mid-Term Business Plan

Copyright (c) 2021 Tokio Marine Holdings, Inc.
Capital PolicyActionsKPIⅣⅣⅣⅣ.New MTP
Peer1
TMHD
Peer 2
Peer 3
Peer 4
Domestic
Non-Life 1Domestic
Non-Life 2
R² = 0.7206
0
1,000
2,000
3,000
4,000
5,000
6,000
7,000
8,000
9,000
-100 0 100 200 300 400 500 600
23
New MTP (Target KPIs)
Steadily implement strategy to achieve medium- to long-term target
*1: Based on new definition (natural disasters normalized to an average annual level, excluding impact of COVID-19 and FX) to be applied to new MTP.Based on the previous definition applied to previous MTP, adjusted net income is ¥431.1bn (+5.0% CAGR) and adjusted ROE is 13.1%.
*2: Payout ratio is on the five-year average adjusted net income. Based on original projections.*3: Payout ratio of global peers is currently circa 50%.*4: Set maximum amount (threshold) for small- to medium-sized business investment and capital level adjustment (FY2021 budget is ¥100.0bn)
Market Cap(billions of JPY)
*5: Plotted top 30 companies in terms of market cap mainly engaged in non-life insurance business*6: FX and market cap as of April 20, 2021*7: 2018-2020 average. Adjusted net income based on company disclosure for domestic non-life including TMHD.
Others are based on financial accounting (IFRS, USGAAP, etc.)
<Global Non-Life Insurance Companies*5 Market Cap and Profit>*6,7
(Reference) Positioning of the Milestone “adjusted net income of over ¥500bn”
Profit*7 (billions of JPY)
1,000
12,000
FY2020 Previous MTP Target
Adjusted ROE
Adjusted net income
11.5%*1
¥446bn*1
10% or higher
CAGR: 3-7%(circa ¥400-450bn)
Shareholder return
Payout ratio*2
Capital level
adjustment
FY2023 Projection
CAGR: 3-7%
around 12%
Flexible execution
40% or higher
40%
¥50bn
35% or higher
Flexible execution
around 12%
Over ¥500bn
On par with Global Peers*3
Flexible execution
Medium- to long-term
target

Copyright (c) 2021 Tokio Marine Holdings, Inc.
Capital PolicyActionsKPIⅣⅣⅣⅣ.New MTP
24
New MTP (Profit Growth)
[Adjusted Net income/Adjusted ROE (normalized basis)*1]
*1: Natural catastrophes are normalized to an average annual level, and the impact of reinstatement premiums is excluded for 2018 and 2019.*2. FY2020 is based on new definition (see page 88) adjusted basis excluding the impact of COVID-19 and FX.
Under the previous definition adjusted basis, adjusted net income is ¥423.0bn and adjusted ROE is 11.2%
(billions of JPY)
100.0
200.0
300.0
400.0
500.0
2011 2012 2013 2014 2015 2016 2017 2018 2019 2020 2023(Plan)
Medium- to long-term target
(Milestones)
Over ¥500bn (adjusted net income)
Around 12% (adjusted ROE)
CAGR: 3-7%
Allocating capital for M&A will enable further growth in shorter time frame
M&A
Medium- to long-term target can be achieved with organic growth
Hardening overseas market Growth potential of Pure and
Caixa Profitability improvement of
fire insurance and expansion of specialty insurance
Organic growth
Fu
rth
er
gro
wth
Shorter time frame
446.0
11. 5%
*2
Copyright (c) 2021 Tokio Marine Holdings, Inc.
Capital PolicyActionsKPIⅣⅣⅣⅣ.New MTP
25
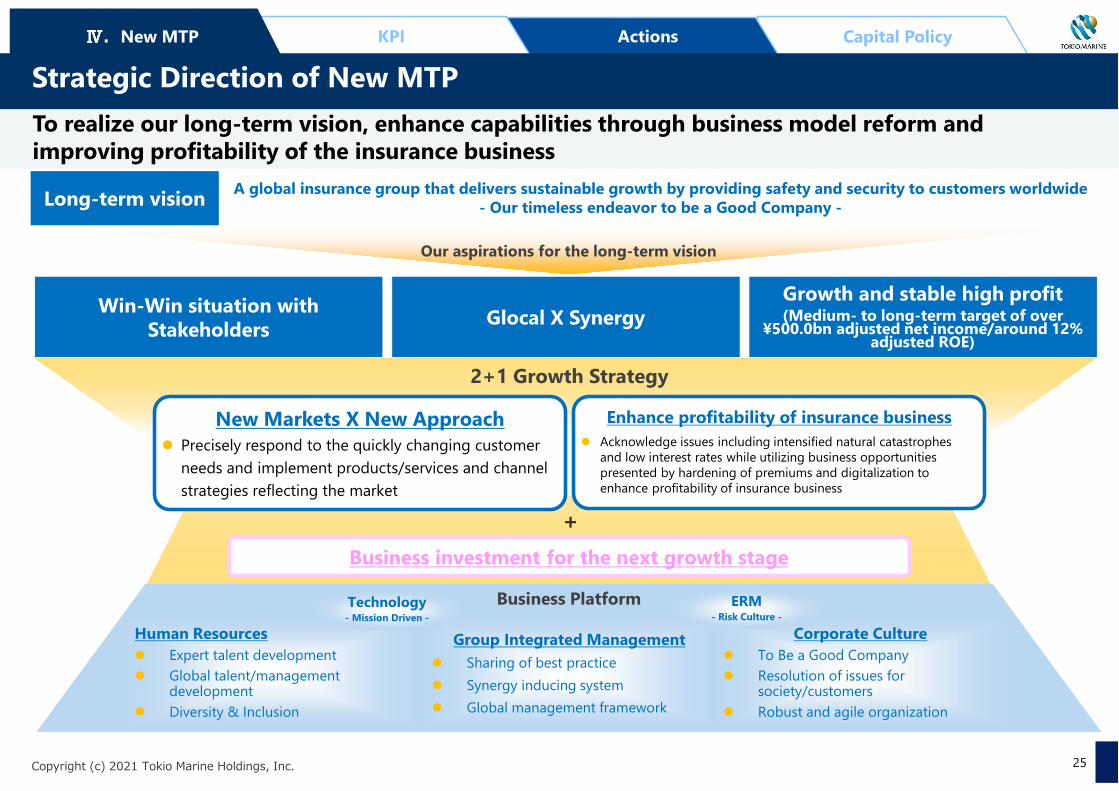
Strategic Direction of New MTP
Business Platform
Glocal X Synergy
Business investment for the next growth stage
New Markets X New Approach Enhance profitability of insurance business
2+1 Growth Strategy
+
A global insurance group that delivers sustainable growth by providing safety and security to customers worldwide- Our timeless endeavor to be a Good Company -Long-term vision
To realize our long-term vision, enhance capabilities through business model reform and improving profitability of the insurance business
Precisely respond to the quickly changing customer
needs and implement products/services and channel
strategies reflecting the market
Acknowledge issues including intensified natural catastrophes and low interest rates while utilizing business opportunities presented by hardening of premiums and digitalization to enhance profitability of insurance business
Our aspirations for the long-term vision
Human Resources
Expert talent development
Global talent/management development
Diversity & Inclusion
Group Integrated Management
Sharing of best practice
Synergy inducing system
Global management framework
Corporate Culture
To Be a Good Company
Resolution of issues for society/customers
Robust and agile organization
Technology- Mission Driven -
ERM- Risk Culture -
Growth and stable high profit(Medium- to long-term target of over
¥500.0bn adjusted net income/around 12% adjusted ROE)
Win-Win situation with Stakeholders

Copyright (c) 2021 Tokio Marine Holdings, Inc.
Asset ManagementⅣⅣⅣⅣ.New MTP - ActionsDomestic Non-Life InternationalDomestic Life
2010 2011 2012 2013 2014 2015 2016 2017 2018 2019 2020 2021
103.2%
102.9%
100.2%
95.7%
91.6%
91.4%
91.0%
91.8%
93.1%91.6%
84.2%
92.4%
2010 2011 2012 2013 2014 2015 2016 2017 2018 2019 2020 2021
26
Presence in Auto Insurance Market (Strengthening competitiveness in existing market)
Steady growth of market share
*1: Net premiums written*2: Direct net premiums written Source: Insurance Statistics (Sonpo Toukeigo) Vol.4864*3: Drive Agent Personal (DAP). A product using original driving recorder with communications function that
provides accident prevention and collision response services. *4: C/R = E/I loss ratio + W/P expense ratio
Generate sustainable stable income
Top line*1 (billions of JPY)
850.8
1,105.2CAGR+2.7%
24.3%
25.6%
Market Share*2
No.1 in premiums on managerial accounting basis for FY2020, achieving growth despite the pandemic
Combined Ratio*4 (Private insurance E/I basis)
Continue to generate stable income
Generate sustainable stable income by flexibly adjusting premium rates based on loss cost, etc.
Continue to increase market competitivenessIncrease market competitiveness by increasing coverage (such as new DAP*3), implementation of early contacting, and enhancement of digital customer contact points
Generate stable income by steadily increasing market share with increased coverage that meets the needs of our customers
TMNF SJ MS AD
Premiums (managerial accounting basis, billions of JPY)
1,115.4 1,098.5 690.5 704.6
YoY Change (%) 102.6 100.4 102.2 103.2
Temporary decrease in accidents due to COVID-19
TMNF SJ MS AD
2010-2019 Growth Rate (%) 126.7 113.6 120.2 111.8

Copyright (c) 2021 Tokio Marine Holdings, Inc.
Asset ManagementⅣⅣⅣⅣ.New MTP - ActionsDomestic Non-Life InternationalDomestic Life
2010 2011 2012 2013 2014 2015 2016 2017 2018 2019 2020 2023
29%
71%
25%
75%
27
Specialty Insurance Growth (Creation of New Markets)
• Respond to higher health awareness and the need for balancing treatment (nursing care) and work
• Increase revenue for wide area public sector/corporate workplace with new sales model and digital application procedures
Realize over ¥100bn revenue increase in 3 years by resolving social issues and strongly drive the growth of domestic non-life
*1: Direct net premiums written, including P.A. *2: Temporary rise in C/R due to specific contract *3: Net premiums written, including P.A. for specialty*4: Net premiums written during 3 year new MTP period *5: Estimated from public data and actual sales of our packaged products for SMEs*6: Our packaged product for SMEs *7: Green Transformation
Creation of new marketsSpecialty insurance growth potential
635.4
448.7
CAGR+3.5%
Top line*1 (billions of JPY): Growth driven by SME and health care
Health care
+¥20-30bn*4
SME
+¥15-25bn*4
• Current market size of about ¥400bn*5
• Premiums*6 increased more than fourfold in 10 years• Increase revenue by strengthening alliance with
commerce and industry associations and improving product appeal
Offshore Wind
Around +¥5bn*4
• Global market size in 2030: ¥200bn• Establish “GX*7 Office” in June 2021• Increase revenue by enhance Group-based
initiatives including utilization of the abundant expertise of GCube
Cyber insurance
Around +¥5bn*4
• Current market size of about ¥180bn (according to research firm)
• Double digit increase in our premiums each fiscal year• Increase revenue by capturing stronger risk awareness
and revised Personal Information Protection Law (2022)
OtherNew risks, etc.
+¥20-30bn*4
• Increase revenue with coverage for various new risks including M&A, local government related area, etc.
• Create new market by leveraging on the strength of core data company Tokio Marine dR to be launched in July 2021
Private insurance
total: ¥2,021.9bn*3
Private insurance
total: ¥2,167.7bn*3
Transform business line portfolio with growth of specialty insurance
Realize high growth with speedy implementation of measures and PDCA
C/R 97% 90% 91% 96% 91% 92% 90% 91% 89% 95%*2 91.4%
(FY2010-2020 average: 92.2%, FY2016-2020 average: 91.4%)
26%
74%
Private insurance
total: ¥1,517.5bn*3
■Specialty ■Other
2010 2020 2023

Copyright (c) 2021 Tokio Marine Holdings, Inc.
Asset ManagementⅣⅣⅣⅣ.New MTP - ActionsDomestic Non-Life InternationalDomestic Life
Implement comprehensive measures to secure profitability matching the capital cost
Increase in natural catastrophes and water leak damage in aging buildings
28
Profitability Improvement of Fire Insurance (Enhance Profitability of Insurance Business)
In addition to fire insurance rate revision, contribute to building a society resilient to catastrophes through product review; enhancement of underwriting; and initiatives on disaster prevention and reduction, and secure profitability matching the capital cost (3-year profitability improvement of over ¥26.0bn)
Profitability improvement of fire insurance
★Oct. 2019 (¥16bn profit improvement)
Reinsurance arrangement
Preparation for once-in-centuries capital events
However, perpetually cedants will lose the amount of reinsurer’s margin; mainly focus on risk diversification, with earnings coverage determined based on economic rationale
★Jan. 2021 (¥20bn profit improvement)
TBD
TBD
★Jan. 2021(Breaking down water damage rate for corporate fire insurance)
TBD
Appropriate reinsurance arrangement
FY2024-2026FY2021-2023Up to
FY2020
Our action
Issues
Product revision
Other
Rate revision
FY2027 onwards
From Payer to Partner
[Disaster prevention/reduction] Flooding risk projection systemVisualize at-risk area with real time flooding area projection to support local government decision making at time of heavy rains. Minimize damage to local residents to reduce loss ratio
Donate part of the expenses saved with online contracts/policies. Donations will be used for disaster prevention/reduction activities and recovery support in the customers’ community, leading to reduction of loss ratio
[Early restoration] Restoration by BELFORUtilize advanced cleaning technology of a disaster recovery specialist. Support early business reopening to reduce loss ratio
[Disaster prevention/reduction] Total assist fire insurance x Red Feather Disaster prevention/reduction program
Disaster prevention/reduction
Speedy insurance payout
Early recovery from disaster
After restorationBefore restoration
TBD
Further enhancement of underwriting
Enhancement of disaster prevention/reduction and early recovery initiatives
Secu
re p
rofitab
ility match
ing
th
e cap
ital cost
Copyright (c) 2021 Tokio Marine Holdings, Inc.
Asset ManagementⅣⅣⅣⅣ.New MTP - ActionsDomestic Non-Life InternationalDomestic Life
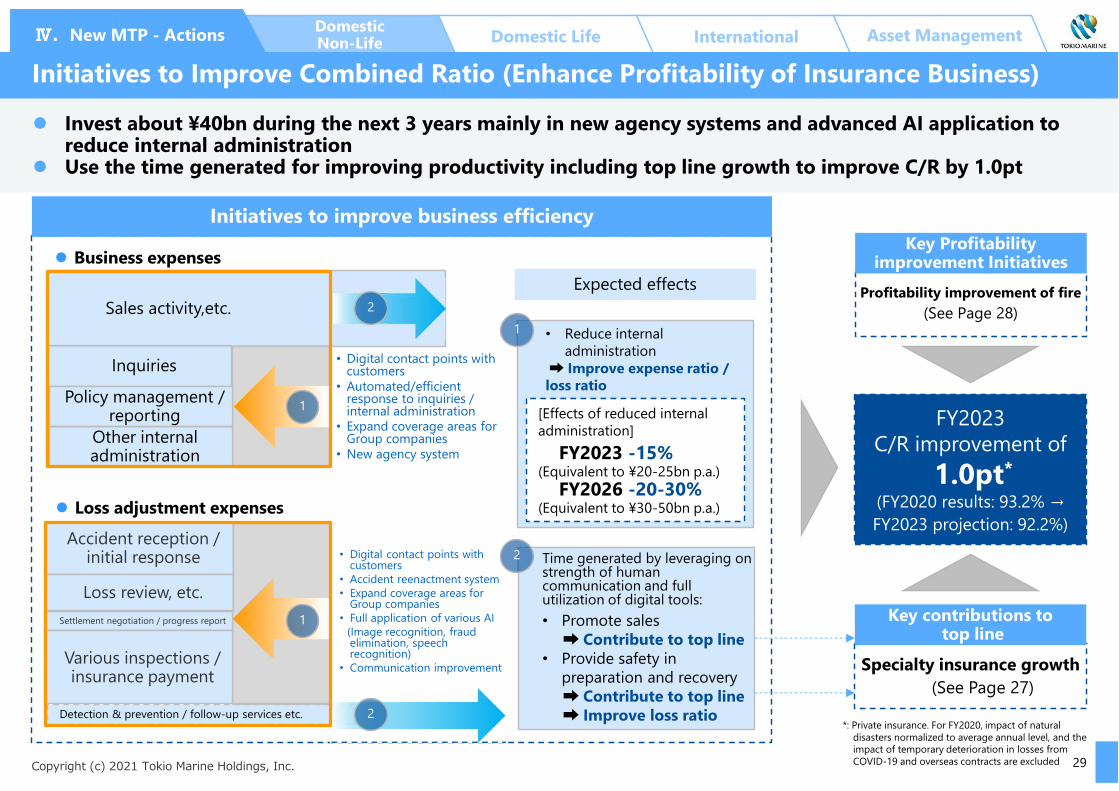
Invest about ¥40bn during the next 3 years mainly in new agency systems and advanced AI application to reduce internal administration
Use the time generated for improving productivity including top line growth to improve C/R by 1.0pt
29
Initiatives to Improve Combined Ratio (Enhance Profitability of Insurance Business)
Detection & prevention / follow-up services etc.
Sales activity,etc.
Inquiries
Policy management / reporting
• Digital contact points with customers
• Automated/efficient response to inquiries / internal administration
• Expand coverage areas for Group companies
• New agency system
Accident reception / initial response
Loss review, etc.
Settlement negotiation / progress report
Other internal administration
Various inspections / insurance payment
• Digital contact points with customers
• Accident reenactment system• Expand coverage areas for
Group companies• Full application of various AI
(Image recognition, fraud elimination, speech recognition)
• Communication improvement
Business expenses
Loss adjustment expenses
1
1
2
2
Time generated by leveraging on strength of human communication and full utilization of digital tools:
• Promote sales➡ Contribute to top line
• Provide safety in preparation and recovery➡ Contribute to top line➡ Improve loss ratio
• Reduce internal administration
➡ Improve expense ratio / loss ratio
FY2023C/R improvement of
1.0pt*
(FY2020 results: 93.2% →
FY2023 projection: 92.2%)
1
2
[Effects of reduced internal administration]
FY2023 -15%(Equivalent to ¥20-25bn p.a.)
FY2026 -20-30%(Equivalent to ¥30-50bn p.a.)
Specialty insurance growth
(See Page 27)
Initiatives to improve business efficiency
Expected effectsProfitability improvement of fire
(See Page 28)
Key Profitability improvement Initiatives
Key contributions totop line
*: Private insurance. For FY2020, impact of natural disasters normalized to average annual level, and the impact of temporary deterioration in losses from COVID-19 and overseas contracts are excluded

Copyright (c) 2021 Tokio Marine Holdings, Inc.
ⅣⅣⅣⅣ.New MTP - ActionsDomestic Non-Life InternationalDomestic Life Asset Management
Improve profitability
Early profit contribution
②(See Page 31)
30
Risk Diversification and Long-Term Growth Drivers
Continue to grow by “facing the social issues in the 100-year life era and protecting the customers’ lives” Long-term profit level exceeds ¥100bn to contribute to our long-term growth and risk diversification
TMNL profit growth curve*1 (image)
Top line projection of around +5% CAGR*2
Bottom line to stably secure ¥50bn level
*1: Assuming top line growth of about +5% CAGR to 2024-2029. Flatten from FY2030.*2: New policies ANP basis
① Expand sales scale (See Page 31)
Negative effect for current year due to conservative J-GAAP accounting but positive contribution to future profits
New MTP
0
50
100
Business Unit Profit(billions of JPY)
FiscalYear
2021 2023 20502030 2040

Copyright (c) 2021 Tokio Marine Holdings, Inc.
ⅣⅣⅣⅣ.New MTP - ActionsDomestic Non-Life InternationalDomestic Life Asset Management
31
Strategies to be Incorporated in the New MTP Period
② Improve profitability and accelerate profit contribution
Mainly introduce products with high profitability that makes early profit contribution
Unique and competitive new product in nursing care area to be launched in August 2021
0
15
30
0% 8% 16%
Short-term
Long-term
HighLow IRR (Internal Rate of Return for full insurance period)*2
Tim
e r
eq
uir
ed
fo
r cu
mu
lati
ve
pro
fita
bil
ity
*3 (y
ear)
Shift to protection-type products
Improve profitability while generating early profit
January 2013Medical Kit R etc.
① August 2017: Variable insurance
② August 2020: Medical Kit R
③ January 2021: Disability insurance*4
④ August 2021: New nursing care insurance
October 1998long-term savings-
type products
Suspended sale
*1: 35% or higher for TNP / TQ agents*2: IRR indicates profitability as expected returns on expenses for the entire insurance period on
financial accounting basis (FY2016 for long-term savings-type products, FY2020 for others)*3: Time required for cumulative profits on financial accounting basis to turn positive
Size of the bubble indicates new policies ANP for the product (FY2020, FY2021 projection for (4))*4: Includes household income protection with death benefit
(1)(3) (2)(4)
① Expand sales scale
2023Target
30%+*1
26.5%
2020
Results
2020Target
25%
<Super Insurance: Ratio of the number of policies with either life or third sector>
• Deep cultivation of TMNF senior customers with significant room for development
• Big data analysis achieved improved product appeal and ease of sales
Relaxed underwriting standard for seniors with preexisting conditions or concerns over health and simplify sales administration
Industry top level price competitiveness for seniors and strong coverage / services
• In the 8 months from launch, secured industry leading sales scale at about 50,000 policies (second only to the mega hit product “Medical Kit R”)
Focus on growth areas of seniors, healthcare, and asset formulation
Further promote cross-sell with integrated business model for life and non-life using Super Insurance to TMNF customer base to improve ratio of the number of policies with either life or third sector to 30% or higher
21.0%
2017Results
[Sample of improving ratio of the number of policies with either life or third sector]
Medical Kit Yell (Medical insurance with relaxed underwriting criteria, August 2020)
+5.5pt
By offering innovative products with integrated business model for life and non-life, contribute to resolution of social issues such as extension of healthy life expectancy and asset life, and accelerate our profit growth

Copyright (c) 2021 Tokio Marine Holdings, Inc.
ⅣⅣⅣⅣ.New MTP - ActionsDomestic Non-Life InternationalDomestic Life Asset Management
CAGR circa 9%
32
International Insurance Strategy
Achieve +9% CAGR through growth strategies in developed and emerging markets
Business Unit Profits*1
*1: 2020 and 2023 profits are calculated using FX rate as of Mar 31, 2021.For 2010, profit is calculated before adjustment relating to natural catastrophes in 1Q 2011.For 2020, natural catastrophes are normalized to an average annual level and the impact of COVID-19 is excluded.
• Well-balanced business portfolio / strong specialty franchise• Well-disciplined underwriting / adequate risk control• Strong governance / integrated Group management / Group synergy
Strengths
Developed markets• New risk taking• Maintain underwriting
discipline• Rates increase• Efficient operation• Growth of Pure• Continue bolt-on M&A
Emerging markets• Capture market growth• Growth of Caixa, etc.2002
¥3.5bn
2010
¥52.7bn
■Philadelphia
■Delphi
■TMHCC
■Pure
■Europe
■Central & South America
■Asia
■Reinsurance
■Life
2020
¥180.1bn
2023
Emerging markets
Developed markets
Emerging markets
Developed markets
Achieve further profit increase with controlled
volatility

Copyright (c) 2021 Tokio Marine Holdings, Inc.
ⅣⅣⅣⅣ.New MTP - ActionsDomestic Non-Life InternationalDomestic Life Asset Management
33
Developed Markets Strategy (Further Increase Underwriting Profits)
Implement three strategies to achieve profit growth of around 6% CAGR
(1) Increase Underwriting Profits
Leverage strengths of each group company and achieve rate increase exceeding loss cost
Improved the quality of portfolio during the previous MTP period through rigorous efforts to reduce unprofitable business lines
Constant effort to maintain a healthy underwriting portfolio by closely monitoring profitability and other market trends including social inflation
Premium rates increases
New risk-taking
Maintain strict underwriting discipline
Opportunistic new risk taking (e.g., lines with the improved profitability due to market hardening)
<FY2020 results>
*1: See page 61 for rate increases of main lines*2: Excluding A&H, Surety and Credit
Promote administrative process improvement in each group company
Improve operational efficiency
PHLY*1: +circa 11%, TMHCC *1,2: +circa 15%, TMK: +circa 10%
98.9%
Circa 93%
CAGR: around +5%
C/R*3
Top line*4
Increase underwriting profits by improving combined ratio and top-line growth
*3: North America + Europe segments. Include policies with high C/R such as DFG’s excess workers’ compensation and life insurance. 2020 is actual figure. Adjusted base normalizing natural catastrophes and excluding the impact of COVID-19 is 93.3%.
*4: Total NPW of North America and Europe segments. FX rate is as of Mar. 31, 2021.
¥1,314.8bn
2020 2023
Contribution image
✔ ✔ ✔

Copyright (c) 2021 Tokio Marine Holdings, Inc.
ⅣⅣⅣⅣ.New MTP - ActionsDomestic Non-Life InternationalDomestic Life Asset Management
490 640 781 963 1,153 1,337
2015 2016 2017 2018 2019 2020
34
Developed Markets Strategy (Growth Area Investment)
Become a leading company in the U.S. staffing insurance business
Establish overwhelming competitiveness in highly profitable markets
(2) Pure’s growth (3) Bolt-on M&AContribution
image
✔ ✔ ✔Contribution
image
✔ + α(Case-by-case)
Achieve over 20% profit growth through rating upgrade and further expansion of synergies in addition to the existing strong growth capability
More than 60 successful bolt-on M&As, and will continue our successful track record
Improve the quality of bolt-on M&A through TMHD’s proactive governance
Further expansion of synergies
New business relation with PHLY’s leading agents
Introduce RSL’s blue-chip company clients to PURE
Joint marketing to agents in Hawaii by Pure and FICOH in Hawaii
Joint development of cyber insurance products with TMHCC for individual clients
Growth acceleration with AM Best rating upgrade (Apr. 2021: A→A+)
(millions of USD)
CAGR
+22% Further growth
Premiums under management company
Paid Family Leave insurance market is expected to grow nationwide in US in the future
Top 3 in NY market (our estimate), and after-tax profit is expected to be ¥1.5 to ¥2bn. Cross-selling synergy with DFG is expected
Acquired by DFG in Apr. 2021(Acquisition price: circa ¥19.8bn)
Acquired by PHLY in Dec. 2020(Acquisition price: below ¥10.0bn)
New premium per year grew from around $160mn to $200mn following the rating upgrade in August 2018 (A-→A), and similar effect is expected for the current upgrade

Copyright (c) 2021 Tokio Marine Holdings, Inc.
ⅣⅣⅣⅣ.New MTP - ActionsDomestic Non-Life InternationalDomestic Life Asset Management
35
Emerging Markets Strategy
Implement growth strategies to capture strong growth potentials and to further diversify risks, thereby aiming to achieve a CAGR of 10% or more and developing pillars for future growth
Brazil Home Insurance Market*1
TMSR has increased profitability for the mainstay auto insurance, achieving profit growth of over 30% CAGR
2020Home insurance market premium
$1.5bn
2015-2020Home insurance
market CAGR +7.5%
*1: Source: Brazilian insurance regulator SUSEP*2: Exchange rate at time of publication*3: Exchange rate as of end of Mar. 2021
Establish JV with Caixa Bank and accelerate growth
Further utilize IFFCO’s network and Group know-how
Indian market*4
2020Non-life insurance market premium
$27.2bn
2015-2020Non-life insurance
market CAGR
+15.6%
*4: Source: General Insurance Council、IRDAI
Contribution Image
✔Contribution
image
✔
(millions of BRL)
TMSRafter-tax profit
323 400
560
2018 2019 2020
(JPY basis*3) ¥6.3bn ¥7.8bn ¥10.9bn
2025
JV Contribution
Utilize IFFCO’s nationwide 36,000 branch network for sales of auto, medical, and agricultural insurance
Utilize IFFCO’s branch network to expand sales in rural areas where the number of middle-income earners is expected to grow, and promote utilizing Tokio Marine Group’s know-how (U/W and digital)
In FY2023, aim to double the profit after tax compared to FY2020 to about ¥4.5bn (based on our 49% stake)
CAGR
+32%
Started operation of insurance JV with Caixa Bank for portfolio diversification and further growth in Feb. 2021
Aim circa ¥6.5bn in after-tax profit*2 in FY2025 (based on our 25% stake)
(Reference)Further expansion of mortgage market in Brazil
Circa 25 million of housing demand is expected based on new housing demand of 16.9 million by 2040 as well as current housing gap

Copyright (c) 2021 Tokio Marine Holdings, Inc.
Asset ManagementⅣⅣⅣⅣ.New MTP - ActionsDomestic Non-Life InternationalDomestic Life
36
Asset Management Strategy in the Low Interest Rate Environment
<Track record vs. index>
■ DFG ■ Barclays Aggregate*3
Given the anticipated lengthening of the low interest rate environment, increase investment income utilizing the ability to spot good investment targets in the credit market
Steadily increase AUM through DFG’s own growth and increase in assets entrusted by other GCs
7.26% 6.63%
4.44% 4.50%
5-year average(2016-2020)
2007-2020average
¥6.0 trillion
Overseas AUM Income yield Income gain
4.6% ¥274.9bn
New MTP outlook (overseas investment*1)
Despite the current uptick in interest rates, interest rates are expected to remain historically low levels
While closely monitoring the risk of rewidening of credit spread, control low income yield and increase investment income, by utilizing DFG investment team’s ability to spot good investment opportunities
(Reference) Strength of DFG investment team
Flexibly rebalance investment portfolio in accordance with economic condition by leveraging DFG’s excellent research and robust analysis by utilizing broad network - e.g., at the timing of fire-sale during the COVID-19 crisis, a valuable investment opportunity was brought in by DFG’s network, analyzed and made decision in overnight, etc.
Team has produced stable returns compared to index
[FY2020 Results]
[FY2023 plan]
¥6.8 trillion
Overseas AUM
Income yield Income gain
4.1% ¥279.2bn 3.63% 3.66%3.13% 3.22%
5-year average(2016-2020)
2007-2020average
Investment return Volatility
1.60 1.46
0.95 1.00
5-year average(2016-2020)
2007-2020average
Sharp ratio*2
*1: Assets of U.S. 5 major GCs (DFG, PHLY, FICOH, TMAIC, TMHCC) + Assets entrusted by domestic 3 GCs.*2: Measures excess return per unit of risk. Calculated as “(Investment return – risk-free rate) / Volatility”.
Risk free rate: LIBOR3M*3: Bloomberg Barclays US Aggregate Bond Index

Copyright (c) 2021 Tokio Marine Holdings, Inc.
Capital PolicyActionsKPIⅣⅣⅣⅣ.New MTP
Strict acquisition criteria to maintain discipline
37
Pursue Optimal Portfolio
Capture further growth and pursue business diversification through various strategic options including entry to new businesses
Make portfolio review and decision in a disciplined manner
M&A including bolt-on M&A
Developed markets
M&A
Partnership(Bancassurance, etc.)
Emerging markets
Cultural fit
High profitability
Solid business model
Target
Cost of capital (7%)
+ Risk premium
+ Country interest rate spread
Hurdle rate
Additional risk taking
Establish new offices
Developed / emerging markets
M&A
JV / New Establishment, etc.
Worldwide including Japan
New BusinessInsurance Business
Apr. 2021 LaunchedStrategic Initiatives DivisionInternal Market Intelligence function

Copyright (c) 2021 Tokio Marine Holdings, Inc.
Capital PolicyActionsKPIⅣⅣⅣⅣ.New MTP
38
Post COVID-19 Strategy
A task force including overseas top executives has identified changes and challenges post COVID-19, and reviewed strategies
The review results are incorporated into respective Group companies’ strategies to capture next growth opportunities
Changes and challenges post COVID-19
Existing business models worked well during the
pandemic
Further advancement
post COVID-19⑦ Accumulation control of pandemic risk
② Continuation of operations during an emergency
③ Priority placed on the safety of the lives and health of individuals
④ Agents mainly offering insurance products face to face will find it harder to capture clients
⑤ Accelerated use of data / digitalization to offer high-quality, non-face-to-face customer experience
⑥ Increasing needs to improve cost efficiency in response to growing cost awareness from clients
① Growing needs for non-face-to-face channels for product purchases, etc.
Existing initiatives will be further
accelerated
Our understanding
① New system to allow contract binding and claim payment via smartphones(implemented)(Pursue the best mix of face-to-face and virtual
channels based on changes in customer preferences)
⑦ Further upgrade risk management ofpandemic (e.g., risk measurement method)
② Teleworking of all employees during an emergency
③ Offer high value-added products / services for prevention and other healthcare needs
④ Support for digitalization of agents
⑤ Measures to address skills gap (e.g., recruiting digitalization personnel)
⑥ Further improve operation efficiencythrough high-level use of AI
Measures
Remote
Digital
Resilient
Remote
Digital
Digital
Resilient
Refer to page 76 for the values we have offered to our stakeholdersduring the COVID-19 pandemic

Copyright (c) 2021 Tokio Marine Holdings, Inc.
Capital PolicyActionsKPIⅣⅣⅣⅣ.New MTP
Digitalization Strategy (Productivity Improvement)
① Radically reduce internal administration through effective use of technology, data, operation process reforms and workstyles
Japan Overseas
<Marketing>
▶ Automation / streamlining of inquiry response and internal administration
<Claims>
▶ Voice mining using AI
▶ Reenactment of accidents
<Workstyle reform>
▶ Further promote paperless operation
<Marketing>
▶ Client inquiry response and product recommendation by chatbot
<Claims>
▶ AI fraud detection
<Workstyle reform>
▶ Establish “RPA library” each GC can utilize to share RPA know-how
Use technology and data to radically improve productivity
Internalization of core insurance function led to the internal accumulation of core technology know-how and reduction of internal administration
39
Internal development of AI to analyze
and propose telephone conversation tips
• In April 2021, we developed proprietary AI that
analyze telephone conversation contents using voice
mining technology for our claims service. Currently
applying for a patent.
• A trial run began in March 2021 for auto accidents.
A rollout to all branches is scheduled by the end of
FY2021.
• It significantly reduces the time spent on
inputting the contents of telephone conversations
that has been done after each call.
Rollout of accident reenactment system
• Currently rolling out a system for AI to reenact auto
accidents using videos obtained from drive recorders,
etc. and automatically calculate liabilities between
parties based on the circumstance of accidents and
damage to vehicles
• Quicker settlement improves client satisfaction
and reduces our workload
• Won the Nikkei Superior Products and Services
Award by Nikkei Inc. in January 2021
Case Study
② Use the hours saved to promote sales and to offer peace of mind pre and post incident, allowing top line growth and loss ratio improvement
③ Achieve productivity improvement (improve C/R) as a result
Step toward productivity improvement
TMNF: Reduce internal
administration by 20-30%by the end of FY2026
(equivalent to ¥30-50bn cost reduction a year)
Asia: Aim to reduce internal
administration by 8-10%
over the medium- to long-term(equivalent to ¥2bn cost reduction a year)

Copyright (c) 2021 Tokio Marine Holdings, Inc.
Capital PolicyActionsKPIⅣⅣⅣⅣ.New MTP
Digital Strategy (Creation of New Value)
By utilizing data to enable various risk-taking and risk solutions, promote realization of growth in the new stage for each Group company. At the same time, pursue business investment opportunities
40
Growth in new areas
Apply sophisticated data analysis, etc. to increasingly diverse and complex set of risks to develop and implement products and risk solutions that undertake new risks and create new markets
E.g., enhance initiatives in areas of safety in preparation and recovery in the areas of health care, cyber risks, and disaster prevention / reduction
Realize growth in the new stage by evolving to a ready partner that always supports the customers in times of need
Provide risk solutions beyond insurance
Pro
vid
e n
ew
insu
ran
ce p
rod
ucts
New areas
Existing area
Pursue permanent and real-time
Risk visualization / early detection
Transform behavior on prevention, etc.
New market creation
Sophisticated pricing
Underwriting of new risks, etc.
etc.Insurance
Risk consulting
Launch of core data company Tokio Marine dR
Data strategy is positioned as the pillar of new growth strategy, and the Group’s core data company Tokio Marine dR is to launch in July 2021
By strengthening Group data analysis and solution development capacities, accelerate new data driven product and risk solution development by each Group company
2021 Around 2026
Tens of billion
yen
20XX
<Image of growth>
*: Group total premiums and fees
Copyright (c) 2021 Tokio Marine Holdings, Inc.
Capital PolicyActionsKPIⅣⅣⅣⅣ.New MTP
Sep. 30, 2020 Mar. 31, 2021
Implementation of;
Business investment, and/or
Additional risk-taking, and/or
Shareholder return
Strategic consideration of;
Business investment, and/or
Additional risk-taking, and/or
Shareholder return
Aim to recover capital level through accumulation of profits
Control risk level by reducing risk-taking activities
De-risking
Consideration of capital increase
Review of shareholder return policy
ESR*2
41
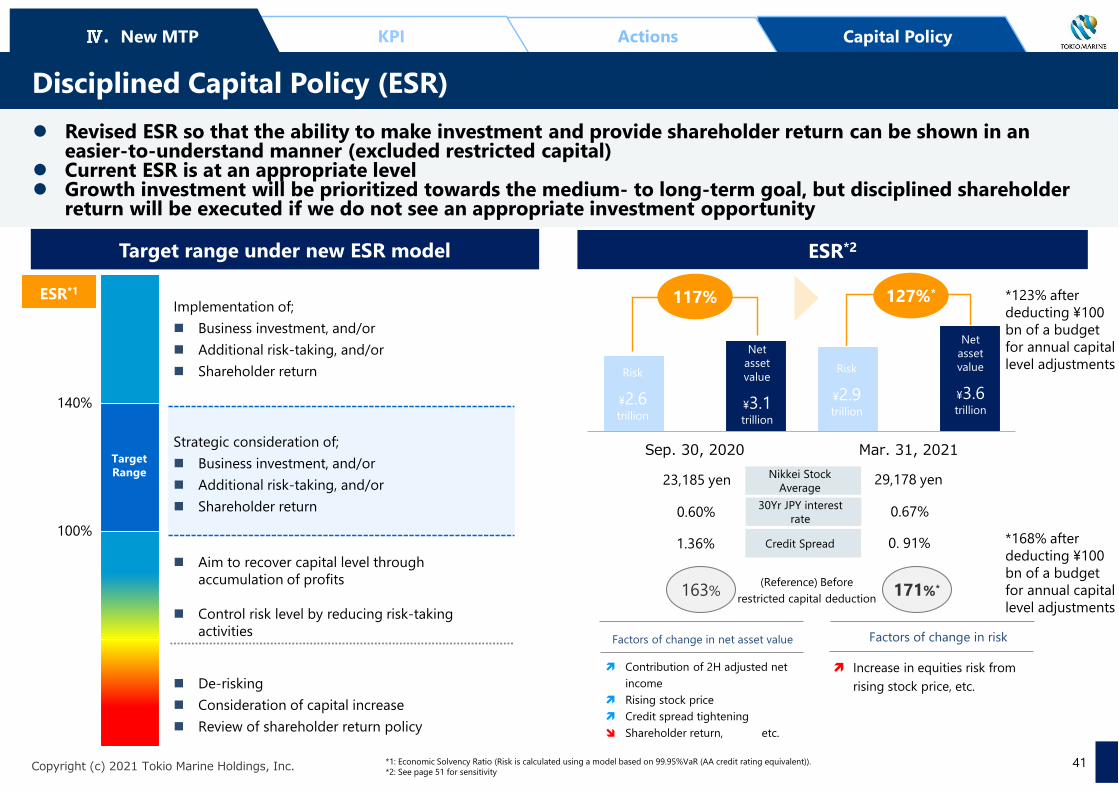
Disciplined Capital Policy (ESR)
Target range under new ESR model
117%
140%
100%
ESR*1
Target Range
*1: Economic Solvency Ratio (Risk is calculated using a model based on 99.95%VaR (AA credit rating equivalent)).*2: See page 51 for sensitivity
23,185 yen 29,178 yenNikkei Stock Average
0.60% 0.67%30Yr JPY interest rate
127%*
1.36% 0. 91%Credit Spread
Revised ESR so that the ability to make investment and provide shareholder return can be shown in an easier-to-understand manner (excluded restricted capital)
Current ESR is at an appropriate level Growth investment will be prioritized towards the medium- to long-term goal, but disciplined shareholder
return will be executed if we do not see an appropriate investment opportunity
Risk
¥2.6trillion
Net asset value
¥3.1trillion
Risk
¥2.9trillion
Net asset value
¥3.6trillion
(Reference) Before
restricted capital deduction163% 171%*
Factors of change in net asset value Factors of change in risk
Contribution of 2H adjusted net
income
Rising stock price
Credit spread tightening
Shareholder return, etc.
Increase in equities risk from
rising stock price, etc.
*123% after deducting ¥100 bn of a budget for annual capital level adjustments
*168% after deducting ¥100 bn of a budget for annual capital level adjustments

Copyright (c) 2021 Tokio Marine Holdings, Inc.
Capital PolicyActionsKPIⅣⅣⅣⅣ.New MTP
42
Disciplined Capital Policy (Shareholder Return)
Primary means of shareholder return is dividends, which will be sustainably increased along with profit growth
A budget for annual capital level adjustment is set at ¥100bn (FY2021) to ensure greater transparency
DPS (JPY)
Mid-term goal*4
(Milestone)
High level shareholder return
*1: 5-year average of adjusted net income.*2: Payout ratio based on the original projection basis.*3: Payout ratio of global peers is currently circa 50%.*4: Adjusted net income of over ¥500.0bn, around 12% adjusted ROE*5: The figure for 2021 (projection) is before reflecting share buybacks.*6: Total amount approved by the announcement date of financial results of each fiscal year.
The figure for 2018 includes one-time dividends of circa 50.0bn yen and those for 2019 and 2020 include of circa 25.0bn yen, respectively.
*7: FY2021 (projection) is the total amount of small- to medium-sized business investment and capital level adjustment (guideline)
Primary means of shareholder return is dividends, which will be sustainably increased along with profit growth
Payout ratio is at or above 40% of average adjusted net income*1, and upon achievement of the mid-term goal, the ratio*2 shall be increased to levels on par with global peers*3
Global Peer Level*3
Dividends
Payout ratio*2
Tenth consecutive year of higher dividends projected
2023
(MTP)
A budget for annual capital level adjustment is set to ensure greater transparency
The budget is set at ¥100bn for FY2021. As our policy is to prioritize growth investment, the amount will be aggregated with the amount of small- and medium-size growth investment (large M&A shall be executed separately, including recycling of existing investments)
Capital level adjustment
140160
180 190 200215
2016 2017 2018 2019 2020(予定)
2021(予想)
35% 35%36%
38%40%
43%
Total dividends(billions of JPY)
105.3 117.6 128.0
Capital level adjustment*6
(share buybacks, etc.) (billions of JPY)50.0 150.0 125.0
133.0
50.0
139.1
50.0
149.0*5
100.0*7
2021
(Projection)
2020
(Plan)

Copyright (c) 2021 Tokio Marine Holdings, Inc. 43
(Blank Page)

Copyright (c) 2021 Tokio Marine Holdings, Inc.
Disclaimer
These presentation materials include business projections and forecasts relating to expected financial and operating results of Tokio Marine Holdings and certain of its affiliates in current and future periods. All such forward looking information is based on information and assumptions available to Tokio Marine Holdings when the materials were prepared and is subject to a range of inherent risks and uncertainties. Actual results may vary materially from those estimated, anticipated, expected or projected in the accompanying materials and no assurances can be given that any such forward looking information will prove to have been accurate. Investors are cautioned not to place undue reliance on forward looking statements in these materials. Tokio Marine Holdings undertakes no obligation to update or revise any of this forward looking information, whether as a result of new information, recent or future developments, or otherwise.
These presentation materials do not constitute an offering of securities in any jurisdiction. To the extent distribution of these presentation materials or the information included herein is restricted by law, persons receiving these materials must inform themselves of and observe any such restrictions.
For further information...
Investor Relations Group, Corporate Planning Dept.Tokio Marine Holdings, Inc.
URL : www.tokiomarinehd.com/en/inquiry/TEL : +81-3-3285-0350