public-disclosure-march-2022.pdf - IFFCO-Tokio
131
S.No. Form No Description 1 NL-1-B-RA Revenue Account 2 NL-2-B-PL Profit and Loss Account 3 NL-3-B-BS Balance Sheet 4 NL-4-PREMIUM SCHEDULE Premium 5 NL-5-CLAIMS SCHEDULE Claims Incurred 6 NL-6-COMMISSION SCHEDULE Commission 7 NL-7-OPERATING EXPENSES SCHEDULE Operating Expenses 8 NL-8-SHARE CAPITAL SCHEDULE Share Capital NL-9-PATTERN OF SHAREHOLDING SCHEDULE Pattern of Shareholding NL-9A-SHAREHOLDING PATTERN SCHEDULE Pattern of Shareholding-Annexure A 10 NL-10-RESERVE AND SURPLUS SCHEDULE Reserves and Surplus 11 NL-11-BORROWING SCHEDULE Borrowings NL-12- INVESTMENT SCHEDULE (SHAREHOLDERS) NL-12A-INVESTMENT SCHEDULE (POLICYHOLDERS) AGGREGATE VALUE OF INVESTMENTS OTHER THAN EQUITY SHARES AND MUTUAL FUND 13 NL-13-LOANS SCHEDULE Loans 14 NL-14-FIXED ASSETS SCHEDULE Fixed Assets 15 NL-15-CASH AND BANK BALANCE SCHEDULE Cash and Bank Balance 16 NL-16-ADVANCES AND OTHER ASSETS SCHEDULE Advances & Other Assets 17 NL-17-CURRENT LIABILITIES SCHEDULE Current Liabilities 18 NL-18-PROVISIONS SCHEDULE Provisions 19 NL-19-MISC EXPENDITURE SCHEDULE Misc Expenditure 20 NL-20-ANALYTICAL RATIOS SCHEDULE Analytical Ratios 21 NL-21-RELATED PARTY TRANSACTIONS SCHEDULE Related Party Transactions 22 NL-22-RECEIPTS AND PAYMENT SCHEDULE Receipts & Payment Statement 23 NL-23 - SOLVENCY MARGIN - GI-TA Statement of Admissible Assets 24 NL-24 - SOLVENCY MARGIN - GI-TR Statement of Liabilities 25 NL-25 - SOLVENCY MARGIN - GI-SM-TABLE IA Required Solvency Margin 26 NL-26 - SOLVENCY MARGIN - GI-SM-TABLE IB Solvency Margin 27 NL-27-PRODUCT INFORMATION Product Information 28 NL-28-STATEMENT OF INVESTMENT ASSETS AND STATEMENT OF ACCRETION OF ASSETS Investment assets and Accretion of Assets 29 NL-29-DEBT SECURITIES Debt Securities 30 NL-30-NON PERFORMING ASSETS Non performing assets 31 NL-31-STATEMENT OF INVESTMENT AND INCOME ON INVESTMENT Investment and Investment Income 32 NL-32-STATEMENT OF DOWN GRADED INVESTMENTS Down graded investment, Investment Rating and Infra investment rating 33 NL-33-REINSURANCE/RETROCESSION RISK CONCENTRATION Reinsurance Risk Concentration 34 NL-34-GEOGRAPHICAL DISTN OF BSNS Geographical Distribution of Business 35 NL-35-BSNS RETURNS ACROSS LOB Quarterly Business Returns for different line of business (Premium amount and number of policies) 36 NL-36-CHANNEL WISE PREMIUM Business channels 37 NL-37-CLAIMS DATA Claims Data 38 NL-38-DEVELOPMENT OF LOSSES (ANNUAL SUBMISSION) Movement of Claims 39 NL-39-AGEING OF CLAIMS Ageing of Claims 40 NL-41-OFFICE INFORMATION Office Information 41 NL-42-KEY MANAGEMENT PERSONS Board of Directors & Management Person 42 NL-43-RURAL AND SOCIAL SECTOR OBLIGATIONS Rural & Social Sector Obligations 43 NL-44 MOTOR THIRD PARTY OBLIGATION Motor Third Party Obligation 44 NL-45-GRIEVANCE DISPOSAL Grievance Disposal 45 NL-46-VOTING ACTIVITY DISCLOSURE UNDER STEWARDSHIP CODE Voting Activity disclosure under Stewardship Code 46 NL-47- PROFILE & PERFORMANCE OF HEALTH INSURANCE, PERSONAL ACCIDENT AND TRAVEL INSURANCE PRODUCTS (ANNUAL SUBMISSION) Profile & Performance of Health Insurance, Personal Accident and Travel Insurance Products 47 NL-48 - DISCLOSURES ON QUANTITATIVE AND QUALITATIVE PARAMETERS OF HEALTH SERVICES RENDERED (ANNUAL DISCLOSURE) Quantitative and Qualitative parameters of Health services rendered Disclosures - IFFCO TOKIO General Insurance Co. Ltd. for the period 1st April, 2021 - 31st March, 2022 9 12 Investment
-
Upload
khangminh22 -
Category
Documents
-
view
0 -
download
0
Transcript of public-disclosure-march-2022.pdf - IFFCO-Tokio
S.No. Form No Description
1 NL-1-B-RA Revenue Account
2 NL-2-B-PL Profit and Loss Account
3 NL-3-B-BS Balance Sheet
4 NL-4-PREMIUM SCHEDULE Premium
5 NL-5-CLAIMS SCHEDULE Claims Incurred
6 NL-6-COMMISSION SCHEDULE Commission
7 NL-7-OPERATING EXPENSES SCHEDULE Operating Expenses
8 NL-8-SHARE CAPITAL SCHEDULE Share Capital
NL-9-PATTERN OF SHAREHOLDING SCHEDULE Pattern of Shareholding
NL-9A-SHAREHOLDING PATTERN SCHEDULE Pattern of Shareholding-Annexure A
10 NL-10-RESERVE AND SURPLUS SCHEDULE Reserves and Surplus
11 NL-11-BORROWING SCHEDULE Borrowings
NL-12- INVESTMENT SCHEDULE (SHAREHOLDERS)
NL-12A-INVESTMENT SCHEDULE (POLICYHOLDERS)
AGGREGATE VALUE OF INVESTMENTS OTHER THAN EQUITY SHARES
AND MUTUAL FUND
13 NL-13-LOANS SCHEDULE Loans
14 NL-14-FIXED ASSETS SCHEDULE Fixed Assets
15 NL-15-CASH AND BANK BALANCE SCHEDULE Cash and Bank Balance
16 NL-16-ADVANCES AND OTHER ASSETS SCHEDULE Advances & Other Assets
17 NL-17-CURRENT LIABILITIES SCHEDULE Current Liabilities
18 NL-18-PROVISIONS SCHEDULE Provisions
19 NL-19-MISC EXPENDITURE SCHEDULE Misc Expenditure
20 NL-20-ANALYTICAL RATIOS SCHEDULE Analytical Ratios
21 NL-21-RELATED PARTY TRANSACTIONS SCHEDULE Related Party Transactions
22 NL-22-RECEIPTS AND PAYMENT SCHEDULE Receipts & Payment Statement
23 NL-23 - SOLVENCY MARGIN - GI-TA Statement of Admissible Assets
24 NL-24 - SOLVENCY MARGIN - GI-TR Statement of Liabilities
25 NL-25 - SOLVENCY MARGIN - GI-SM-TABLE IA Required Solvency Margin
26 NL-26 - SOLVENCY MARGIN - GI-SM-TABLE IB Solvency Margin
27 NL-27-PRODUCT INFORMATION Product Information
28 NL-28-STATEMENT OF INVESTMENT ASSETS AND STATEMENT OF
ACCRETION OF ASSETS Investment assets and Accretion of Assets
29 NL-29-DEBT SECURITIES Debt Securities
30 NL-30-NON PERFORMING ASSETS Non performing assets
31 NL-31-STATEMENT OF INVESTMENT AND INCOME ON INVESTMENT Investment and Investment Income
32
NL-32-STATEMENT OF DOWN GRADED INVESTMENTS
Down graded investment, Investment Rating and
Infra investment rating
33 NL-33-REINSURANCE/RETROCESSION RISK CONCENTRATION Reinsurance Risk Concentration
34 NL-34-GEOGRAPHICAL DISTN OF BSNS Geographical Distribution of Business
35
NL-35-BSNS RETURNS ACROSS LOB
Quarterly Business Returns for different line of
business (Premium amount and number of policies)
36 NL-36-CHANNEL WISE PREMIUM Business channels
37 NL-37-CLAIMS DATA Claims Data
38 NL-38-DEVELOPMENT OF LOSSES (ANNUAL SUBMISSION) Movement of Claims
39 NL-39-AGEING OF CLAIMS Ageing of Claims
40 NL-41-OFFICE INFORMATION Office Information
41 NL-42-KEY MANAGEMENT PERSONS Board of Directors & Management Person
42 NL-43-RURAL AND SOCIAL SECTOR OBLIGATIONS
Rural & Social Sector Obligations
43 NL-44 MOTOR THIRD PARTY OBLIGATION Motor Third Party Obligation
44 NL-45-GRIEVANCE DISPOSAL Grievance Disposal
45
NL-46-VOTING ACTIVITY DISCLOSURE UNDER STEWARDSHIP CODE Voting Activity disclosure under Stewardship Code
46
NL-47- PROFILE & PERFORMANCE OF HEALTH INSURANCE, PERSONAL
ACCIDENT AND TRAVEL INSURANCE PRODUCTS (ANNUAL SUBMISSION)
Profile & Performance of Health Insurance,
Personal Accident and Travel Insurance Products
47 NL-48 - DISCLOSURES ON QUANTITATIVE AND QUALITATIVE
PARAMETERS OF HEALTH SERVICES RENDERED (ANNUAL
DISCLOSURE)
Quantitative and Qualitative parameters of Health
services rendered
Disclosures - IFFCO TOKIO General Insurance Co. Ltd. for the period 1st April, 2021 - 31st March, 2022
9
12
Investment
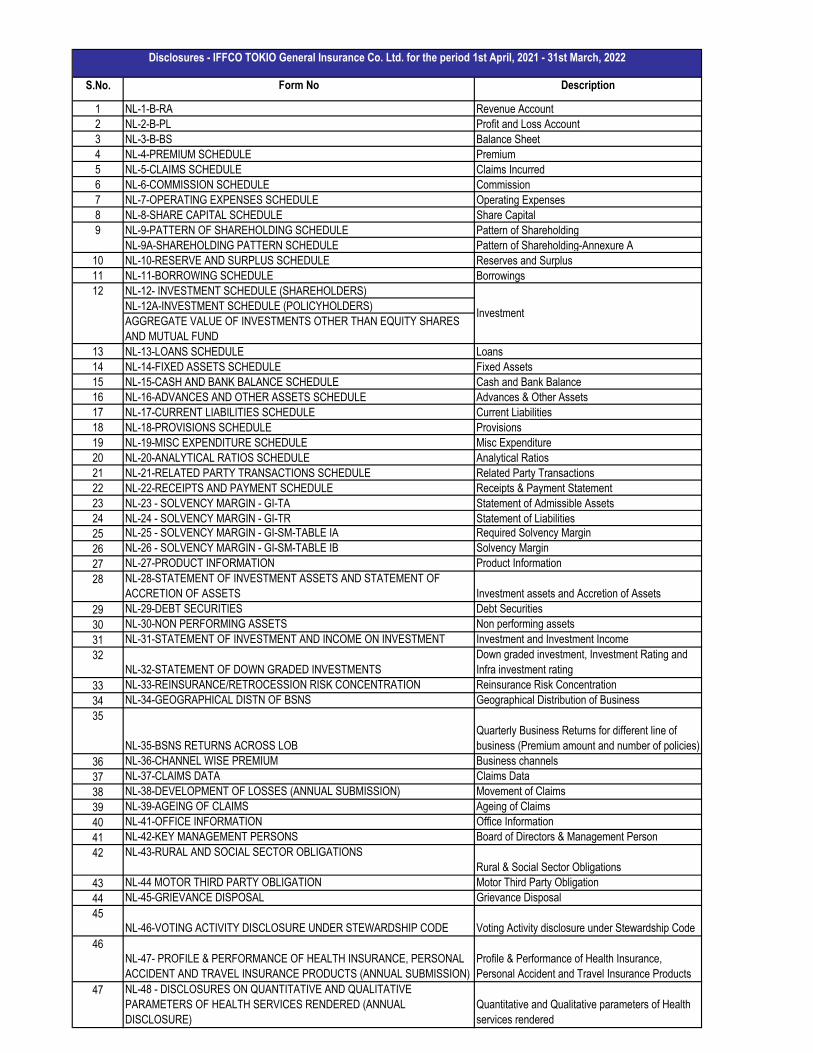
Name of the Insurer: IFFCO TOKIO GENERAL INSURANCE CO. LTD.
Registration No. 106 dated 4.12.2000
FIRE INSURANCE REVENUE ACCOUNT FOR THE PERIOD ENDED 31ST MARCH 2022
(₹ In Lakhs)
Particulars ScheduleQUARTER ENDED
31ST MARCH 2022
PERIOD ENDED
31ST MARCH 2022
QUARTER ENDED
31ST MARCH 2021
PERIOD ENDED
31ST MARCH 2021
1 Premiums earned (Net) NL-4-Premium Schedule 4,556 12,471 2,393 8,317
2Profit/ (Loss) on sale/redemption
of Investments 61 359 3 76
3 Interest, Dividend & Rent – Gross * 341 1,265 236 1,037
4 a) Other Income:
i) Transfer & Duplicate Fee - - - -
ii) Exchange Gain / (Loss) - - - (3)
iii) Handling Charges (71) (200) (50) (131)
b) Contribution from the Shareholders'
Account:
i) Towards Excess Expenses of
Management - - - -
ii) Others - - - -
TOTAL (A) 4,887 13,895 2,581 9,296
1 Claims Incurred (Net) NL-5-Claims Schedule 2,412 7,932 627 5,187
2 CommissionNL-6-Commission
Schedule (1,463) (6,551) 1,574 (3,728)
3Operating Expenses related to
Insurance Business
NL-7-Operating Expenses
Schedule 756 2,886 272 1,093
4 Premium Deficiency - - - -
TOTAL (B) 1,705 4,267 2,472 2,552
Operating Profit/(Loss) from Fire
Business C= (A - B) 3,182 9,628 109 6,744
APPROPRIATIONS
Transfer to Shareholders’ Account 3,182 9,628 109 6,744
Transfer to Catastrophe Reserve - - - -
Transfer to Other Reserve - - - -
TOTAL (C) 3,182 9,628 109 6,744
* Note 1 (₹ In Lakhs)
QUARTER ENDED
31ST MARCH 2022
PERIOD ENDED
31ST MARCH 2022
QUARTER ENDED
31ST MARCH 2021
PERIOD ENDED
31ST MARCH 2021
332 1,255 244 1,078
- - - -
(1) (13) (14) (65)
- - - -
- - - -
- - - -
10 23 5 23
341 1,265 236 1,037
PERIODIC DISCLOSURES
FORM NL-1-B-RA
Pertaining to Policyholder’s funds
Interest, Dividend & Rent
Add/Less:-
Investment Expenses
Amortisation of Premium/ Discount on Investments
Amount written off in respect of depreciated investments
Provision for Bad and Doubtful Debts
Provision for diminution in the value of other than actively traded
Investment income from Pool
Interest, Dividend & Rent – Gross
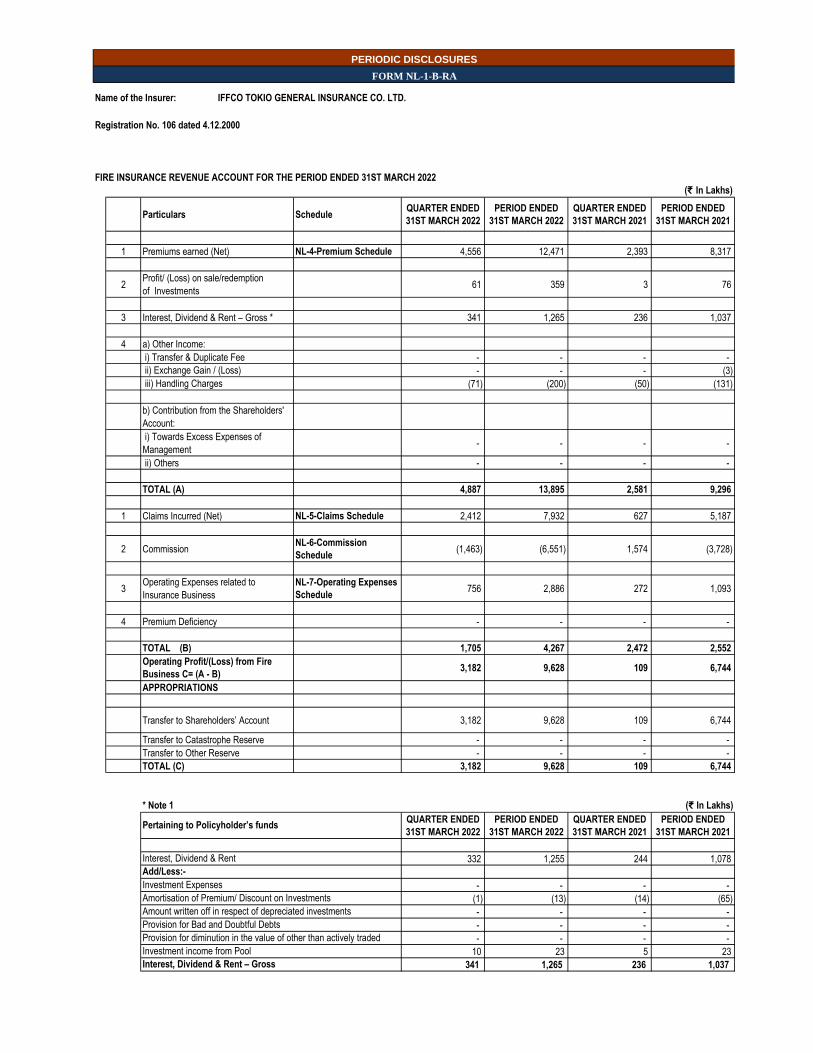
MARINE INSURANCE REVENUE ACCOUNT FOR THE PERIOD ENDED 31ST MARCH 2022
(₹ In Lakhs)
Particulars ScheduleQUARTER ENDED
31ST MARCH 2022
PERIOD ENDED
31ST MARCH 2022
QUARTER ENDED
31ST MARCH 2021
PERIOD ENDED
31ST MARCH 2021
1 Premiums earned (Net) NL-4-Premium Schedule 4,017 11,496 2,182 7,554
2Profit/ (Loss) on sale/redemption
of Investments 31 188 1 43
3 Interest, Dividend & Rent – Gross * 178 663 126 582
4 a) Other Income:
i) Transfer & Duplicate Fee - - - -
ii) Exchange Gain / (Loss) - - - (0)
iii) Handling Charges (7) (11) (2) (10)
b) Contribution from the Shareholders'
Account:
i) Towards Excess Expenses of
Management - - - -
ii) Others - - - -
TOTAL (A) 4,219 12,336 2,307 8,169
1 Claims Incurred (Net) NL-5-Claims Schedule 3,593 12,027 1,435 5,145
2 CommissionNL-6-Commission
Schedule 101 748 219 609
3Operating Expenses related to
Insurance Business
NL-7-Operating Expenses
Schedule 519 1,970 326 1,163
4 Premium Deficiency - - - -
TOTAL (B) 4,213 14,745 1,979 6,917
Operating Profit/(Loss) from Marine
Business C= (A - B) 6 (2,409) 328 1,251
APPROPRIATIONS
Transfer to Shareholders’ Account 6 (2,409) 328 1,251
Transfer to Catastrophe Reserve - - - -
Transfer to Other Reserve - - - -
TOTAL (C) 6 (2,409) 328 1,251
* Note 1 (₹ In Lakhs)
QUARTER ENDED
31ST MARCH 2022
PERIOD ENDED
31ST MARCH 2022
QUARTER ENDED
31ST MARCH 2021
PERIOD ENDED
31ST MARCH 2021
174 658 130 605
- - - -
(1) (7) (7) (36)
- - - -
- - - -
- - - -
5 12 3 13
178 663 126 582 Interest, Dividend & Rent – Gross
Amortisation of Premium/ Discount on Investments
Amount written off in respect of depreciated investments
Provision for Bad and Doubtful Debts
Provision for diminution in the value of other than actively traded
Investment income from Pool
Pertaining to Policyholder’s funds
Interest, Dividend & Rent
Add/Less:-
Investment Expenses
FORM NL-1-B-RA
PERIODIC DISCLOSURES
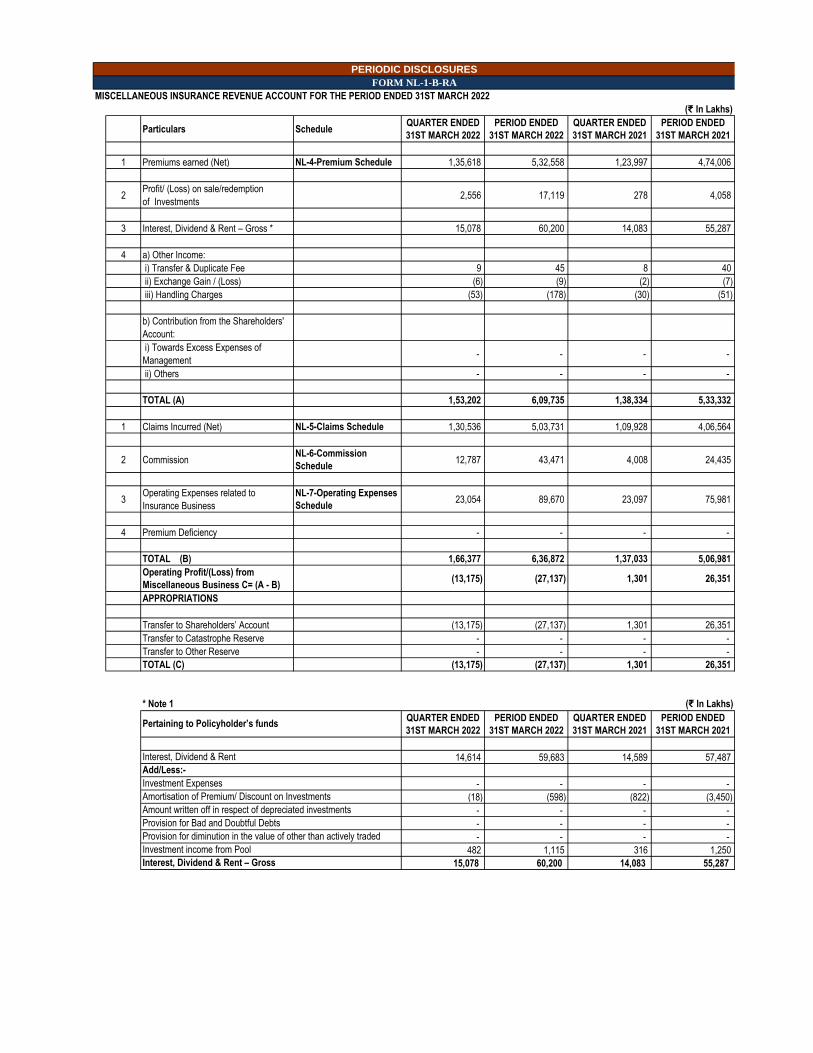
MISCELLANEOUS INSURANCE REVENUE ACCOUNT FOR THE PERIOD ENDED 31ST MARCH 2022
(₹ In Lakhs)
Particulars ScheduleQUARTER ENDED
31ST MARCH 2022
PERIOD ENDED
31ST MARCH 2022
QUARTER ENDED
31ST MARCH 2021
PERIOD ENDED
31ST MARCH 2021
1 Premiums earned (Net) NL-4-Premium Schedule 1,35,618 5,32,558 1,23,997 4,74,006
2Profit/ (Loss) on sale/redemption
of Investments 2,556 17,119 278 4,058
3 Interest, Dividend & Rent – Gross * 15,078 60,200 14,083 55,287
4 a) Other Income:
i) Transfer & Duplicate Fee 9 45 8 40
ii) Exchange Gain / (Loss) (6) (9) (2) (7)
iii) Handling Charges (53) (178) (30) (51)
b) Contribution from the Shareholders'
Account:
i) Towards Excess Expenses of
Management - - - -
ii) Others - - - -
TOTAL (A) 1,53,202 6,09,735 1,38,334 5,33,332
1 Claims Incurred (Net) NL-5-Claims Schedule 1,30,536 5,03,731 1,09,928 4,06,564
2 CommissionNL-6-Commission
Schedule 12,787 43,471 4,008 24,435
3Operating Expenses related to
Insurance Business
NL-7-Operating Expenses
Schedule 23,054 89,670 23,097 75,981
4 Premium Deficiency - - - -
TOTAL (B) 1,66,377 6,36,872 1,37,033 5,06,981
Operating Profit/(Loss) from
Miscellaneous Business C= (A - B) (13,175) (27,137) 1,301 26,351
APPROPRIATIONS
Transfer to Shareholders’ Account (13,175) (27,137) 1,301 26,351
Transfer to Catastrophe Reserve - - - -
Transfer to Other Reserve - - - -
TOTAL (C) (13,175) (27,137) 1,301 26,351
* Note 1 (₹ In Lakhs)
QUARTER ENDED
31ST MARCH 2022
PERIOD ENDED
31ST MARCH 2022
QUARTER ENDED
31ST MARCH 2021
PERIOD ENDED
31ST MARCH 2021
14,614 59,683 14,589 57,487
- - - -
(18) (598) (822) (3,450)
- - - -
- - - -
- - - -
482 1,115 316 1,250
15,078 60,200 14,083 55,287
Provision for diminution in the value of other than actively traded
Investment income from Pool
Interest, Dividend & Rent – Gross
Add/Less:-
Investment Expenses
Amortisation of Premium/ Discount on Investments
Amount written off in respect of depreciated investments
Provision for Bad and Doubtful Debts
Pertaining to Policyholder’s funds
Interest, Dividend & Rent
FORM NL-1-B-RA
PERIODIC DISCLOSURES
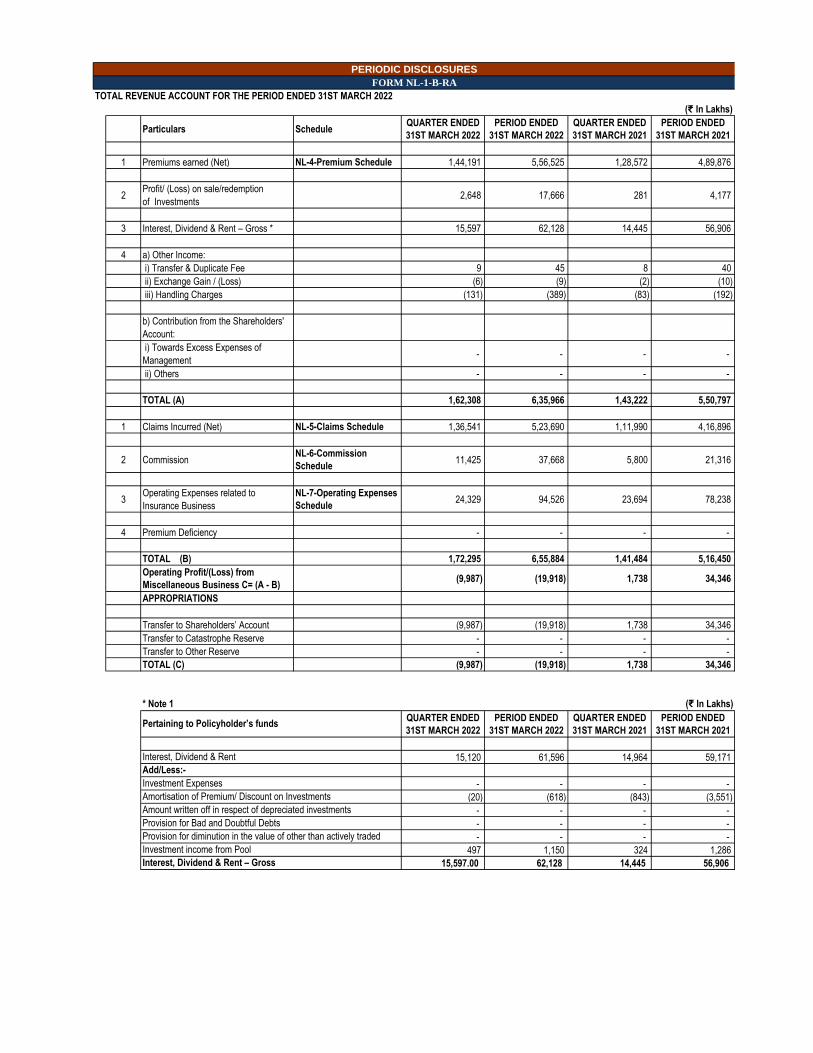
TOTAL REVENUE ACCOUNT FOR THE PERIOD ENDED 31ST MARCH 2022
(₹ In Lakhs)
Particulars ScheduleQUARTER ENDED
31ST MARCH 2022
PERIOD ENDED
31ST MARCH 2022
QUARTER ENDED
31ST MARCH 2021
PERIOD ENDED
31ST MARCH 2021
1 Premiums earned (Net) NL-4-Premium Schedule 1,44,191 5,56,525 1,28,572 4,89,876
2Profit/ (Loss) on sale/redemption
of Investments 2,648 17,666 281 4,177
3 Interest, Dividend & Rent – Gross * 15,597 62,128 14,445 56,906
4 a) Other Income:
i) Transfer & Duplicate Fee 9 45 8 40
ii) Exchange Gain / (Loss) (6) (9) (2) (10)
iii) Handling Charges (131) (389) (83) (192)
b) Contribution from the Shareholders'
Account:
i) Towards Excess Expenses of
Management - - - -
ii) Others - - - -
TOTAL (A) 1,62,308 6,35,966 1,43,222 5,50,797
1 Claims Incurred (Net) NL-5-Claims Schedule 1,36,541 5,23,690 1,11,990 4,16,896
2 CommissionNL-6-Commission
Schedule 11,425 37,668 5,800 21,316
3Operating Expenses related to
Insurance Business
NL-7-Operating Expenses
Schedule 24,329 94,526 23,694 78,238
4 Premium Deficiency - - - -
TOTAL (B) 1,72,295 6,55,884 1,41,484 5,16,450
Operating Profit/(Loss) from
Miscellaneous Business C= (A - B) (9,987) (19,918) 1,738 34,346
APPROPRIATIONS
Transfer to Shareholders’ Account (9,987) (19,918) 1,738 34,346
Transfer to Catastrophe Reserve - - - -
Transfer to Other Reserve - - - -
TOTAL (C) (9,987) (19,918) 1,738 34,346
* Note 1 (₹ In Lakhs)
QUARTER ENDED
31ST MARCH 2022
PERIOD ENDED
31ST MARCH 2022
QUARTER ENDED
31ST MARCH 2021
PERIOD ENDED
31ST MARCH 2021
15,120 61,596 14,964 59,171
- - - -
(20) (618) (843) (3,551)
- - - -
- - - -
- - - -
497 1,150 324 1,286
15,597.00 62,128 14,445 56,906 Interest, Dividend & Rent – Gross
Amortisation of Premium/ Discount on Investments
Amount written off in respect of depreciated investments
Provision for Bad and Doubtful Debts
Provision for diminution in the value of other than actively traded
Investment income from Pool
Pertaining to Policyholder’s funds
Interest, Dividend & Rent
Add/Less:-
Investment Expenses
PERIODIC DISCLOSURES
FORM NL-1-B-RA
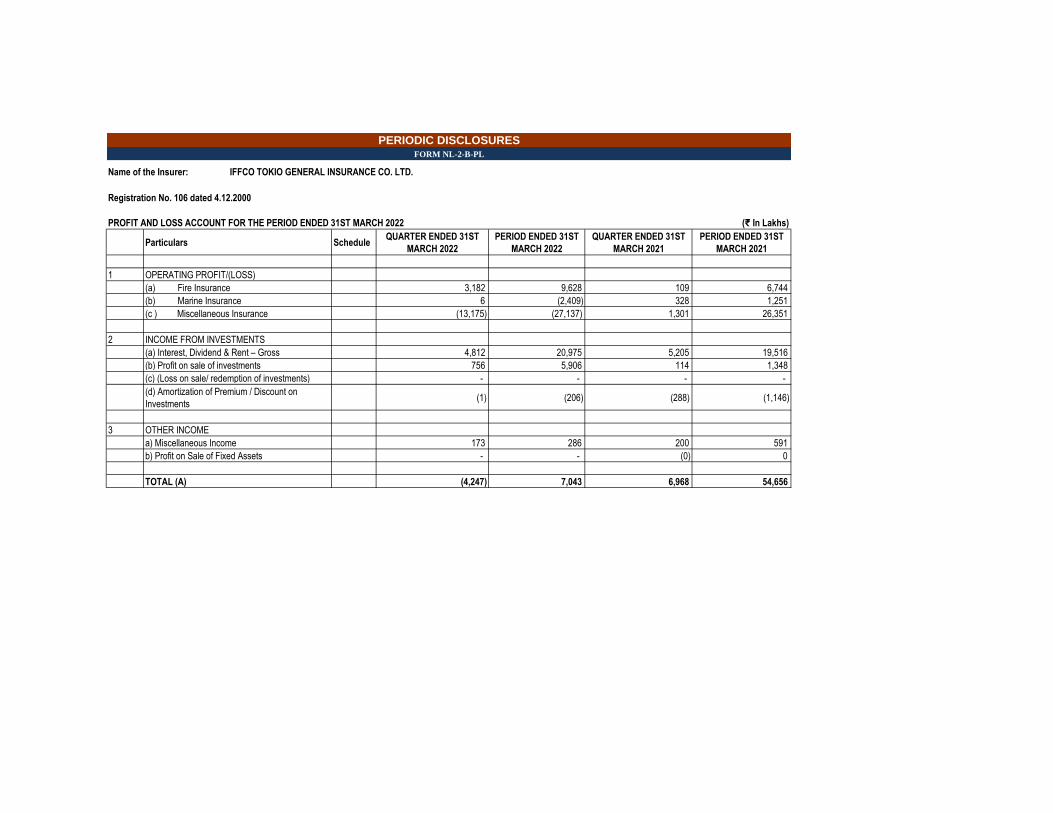
Name of the Insurer: IFFCO TOKIO GENERAL INSURANCE CO. LTD.
Registration No. 106 dated 4.12.2000
PROFIT AND LOSS ACCOUNT FOR THE PERIOD ENDED 31ST MARCH 2022 (₹ In Lakhs)
Particulars ScheduleQUARTER ENDED 31ST
MARCH 2022
PERIOD ENDED 31ST
MARCH 2022
QUARTER ENDED 31ST
MARCH 2021
PERIOD ENDED 31ST
MARCH 2021
1 OPERATING PROFIT/(LOSS)
(a) Fire Insurance 3,182 9,628 109 6,744
(b) Marine Insurance 6 (2,409) 328 1,251
(c ) Miscellaneous Insurance (13,175) (27,137) 1,301 26,351
2 INCOME FROM INVESTMENTS
(a) Interest, Dividend & Rent – Gross 4,812 20,975 5,205 19,516
(b) Profit on sale of investments 756 5,906 114 1,348
(c) (Loss on sale/ redemption of investments) - - - -
(d) Amortization of Premium / Discount on
Investments (1) (206) (288) (1,146)
3 OTHER INCOME
a) Miscellaneous Income 173 286 200 591
b) Profit on Sale of Fixed Assets - - (0) 0
TOTAL (A) (4,247) 7,043 6,968 54,656
PERIODIC DISCLOSURESFORM NL-2-B-PL
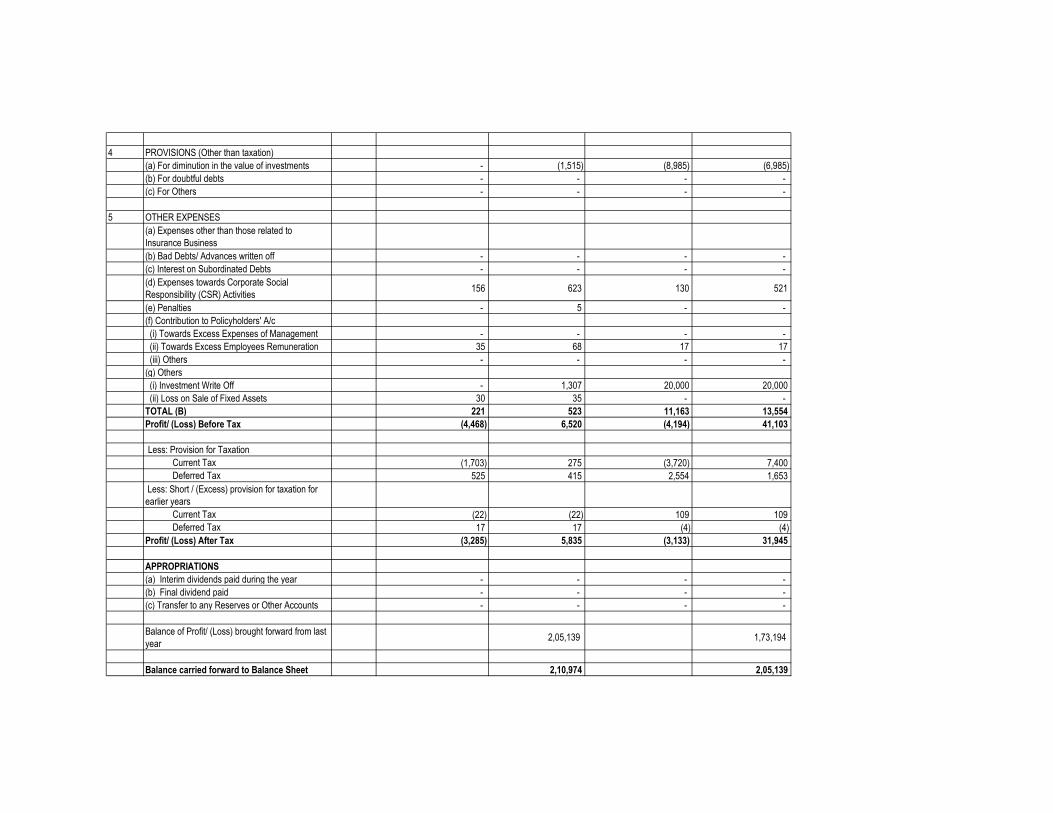
4 PROVISIONS (Other than taxation)
(a) For diminution in the value of investments - (1,515) (8,985) (6,985)
(b) For doubtful debts - - - -
(c) For Others - - - -
5 OTHER EXPENSES
(a) Expenses other than those related to
Insurance Business
(b) Bad Debts/ Advances written off - - - -
(c) Interest on Subordinated Debts - - - -
(d) Expenses towards Corporate Social
Responsibility (CSR) Activities 156 623 130 521
(e) Penalties - 5 - -
(f) Contribution to Policyholders' A/c
(i) Towards Excess Expenses of Management - - - -
(ii) Towards Excess Employees Remuneration 35 68 17 17
(iii) Others - - - -
(g) Others
(i) Investment Write Off - 1,307 20,000 20,000
(ii) Loss on Sale of Fixed Assets 30 35 - -
TOTAL (B) 221 523 11,163 13,554
Profit/ (Loss) Before Tax (4,468) 6,520 (4,194) 41,103
Less: Provision for Taxation
Current Tax (1,703) 275 (3,720) 7,400
Deferred Tax 525 415 2,554 1,653
Less: Short / (Excess) provision for taxation for
earlier years
Current Tax (22) (22) 109 109
Deferred Tax 17 17 (4) (4)
Profit/ (Loss) After Tax (3,285) 5,835 (3,133) 31,945
APPROPRIATIONS
(a) Interim dividends paid during the year - - - -
(b) Final dividend paid - - - -
(c) Transfer to any Reserves or Other Accounts - - - -
Balance of Profit/ (Loss) brought forward from last
year2,05,139 1,73,194
Balance carried forward to Balance Sheet 2,10,974 2,05,139
Name of the Insurer: IFFCO TOKIO GENERAL INSURANCE CO. LTD.
Registration No. 106 dated 4.12.2000
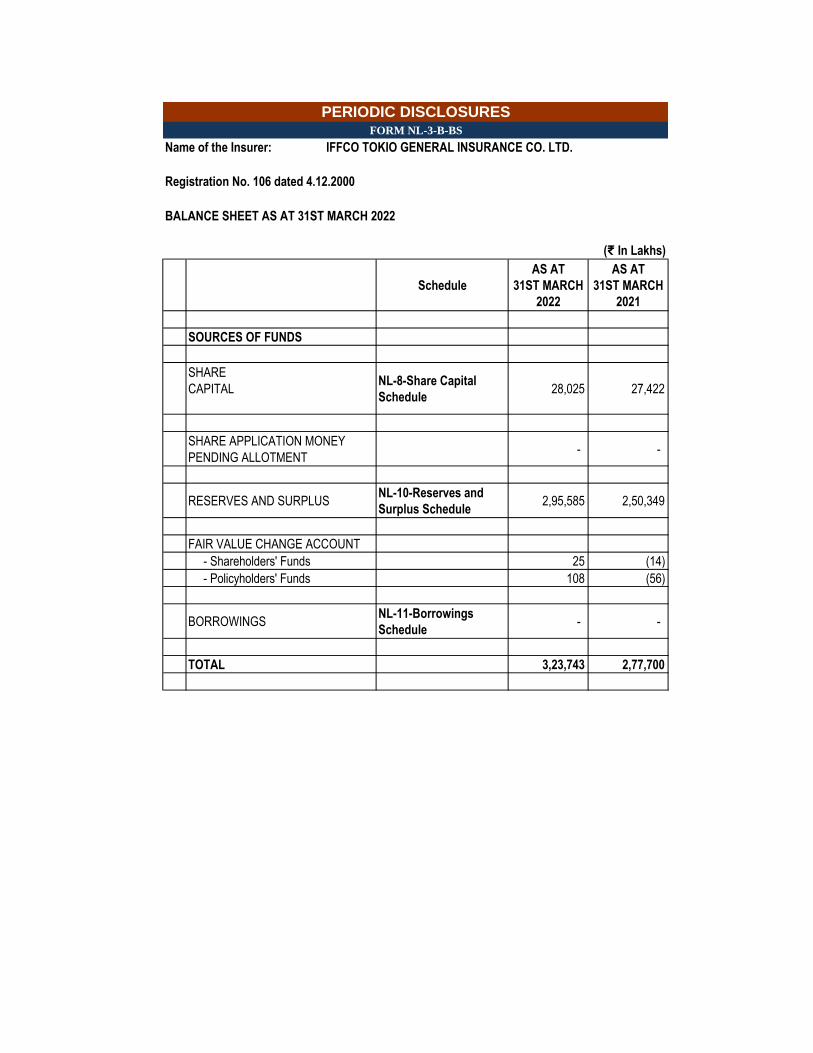
BALANCE SHEET AS AT 31ST MARCH 2022
(₹ In Lakhs)
Schedule
AS AT
31ST MARCH
2022
AS AT
31ST MARCH
2021
SOURCES OF FUNDS
SHARE
CAPITAL
NL-8-Share Capital
Schedule 28,025 27,422
SHARE APPLICATION MONEY
PENDING ALLOTMENT - -
RESERVES AND SURPLUSNL-10-Reserves and
Surplus Schedule 2,95,585 2,50,349
FAIR VALUE CHANGE ACCOUNT
- Shareholders' Funds 25 (14)
- Policyholders' Funds 108 (56)
BORROWINGSNL-11-Borrowings
Schedule - -
TOTAL 3,23,743 2,77,700
PERIODIC DISCLOSURESFORM NL-3-B-BS
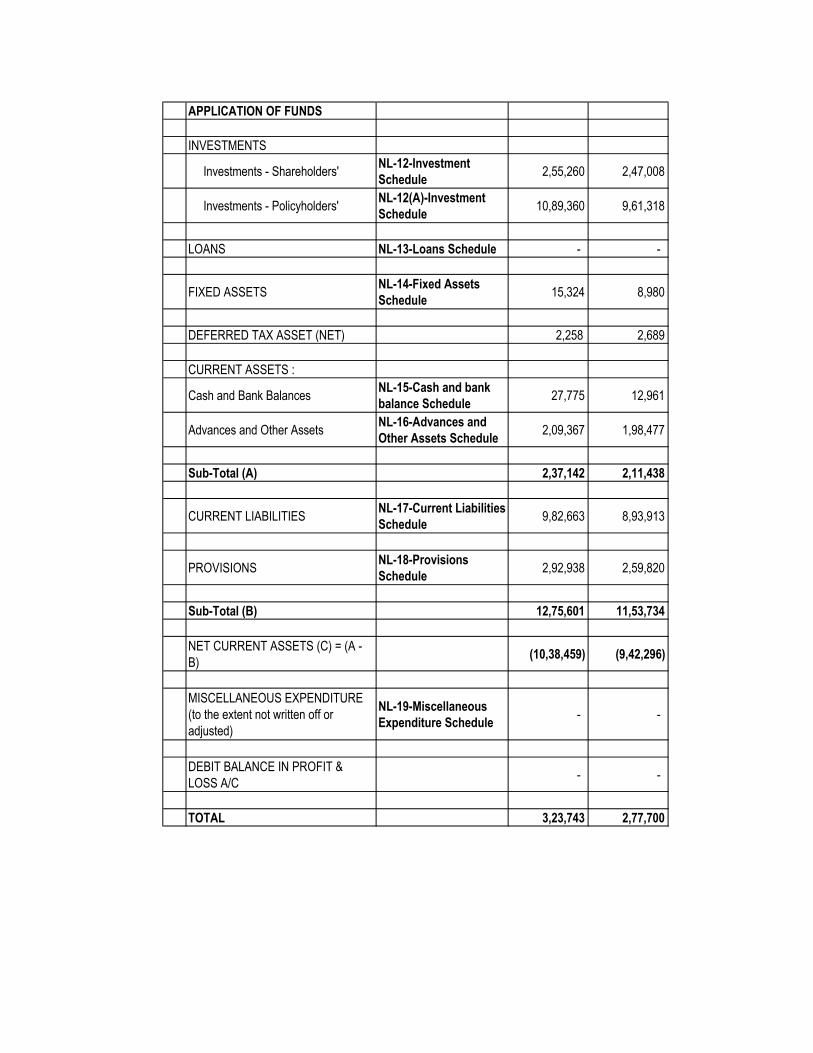
APPLICATION OF FUNDS
INVESTMENTS
Investments - Shareholders'NL-12-Investment
Schedule 2,55,260 2,47,008
Investments - Policyholders'NL-12(A)-Investment
Schedule 10,89,360 9,61,318
LOANS NL-13-Loans Schedule - -
FIXED ASSETSNL-14-Fixed Assets
Schedule 15,324 8,980
DEFERRED TAX ASSET (NET) 2,258 2,689
CURRENT ASSETS :
Cash and Bank BalancesNL-15-Cash and bank
balance Schedule 27,775 12,961
Advances and Other AssetsNL-16-Advances and
Other Assets Schedule 2,09,367 1,98,477
Sub-Total (A) 2,37,142 2,11,438
CURRENT LIABILITIESNL-17-Current Liabilities
Schedule 9,82,663 8,93,913
PROVISIONSNL-18-Provisions
Schedule 2,92,938 2,59,820
Sub-Total (B) 12,75,601 11,53,734
NET CURRENT ASSETS (C) = (A -
B) (10,38,459) (9,42,296)
MISCELLANEOUS EXPENDITURE
(to the extent not written off or
adjusted)
NL-19-Miscellaneous
Expenditure Schedule - -
DEBIT BALANCE IN PROFIT &
LOSS A/C - -
TOTAL 3,23,743 2,77,700
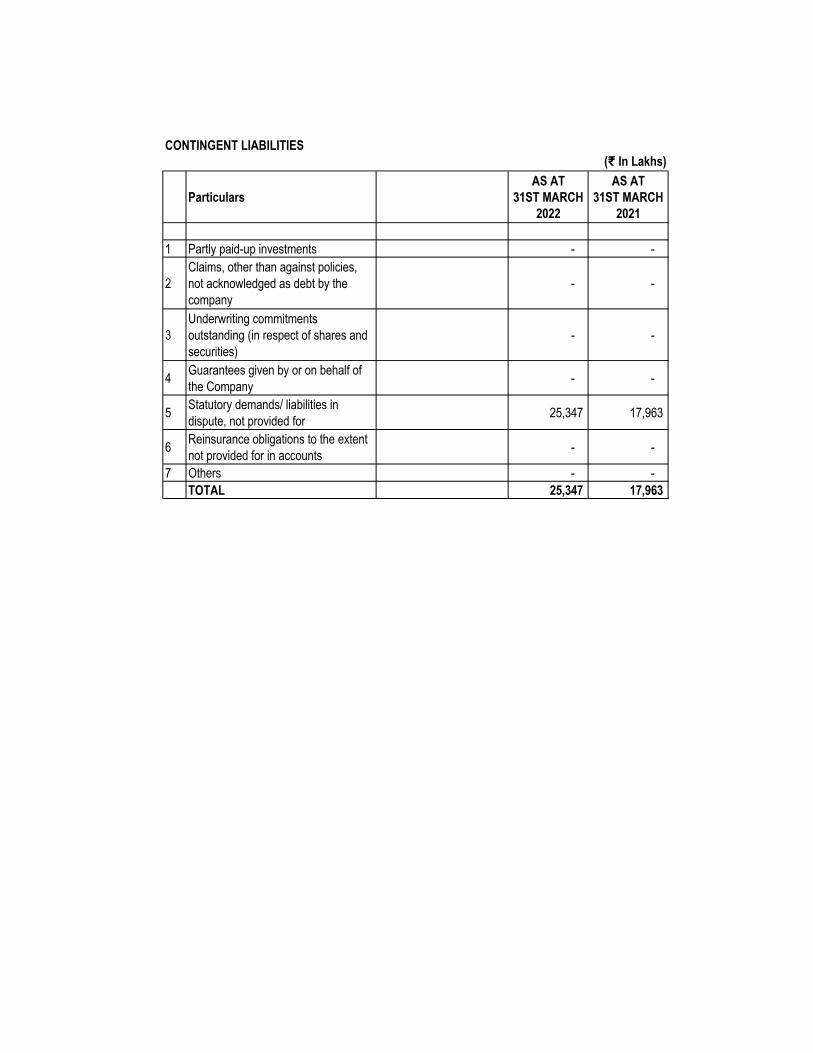
CONTINGENT LIABILITIES
(₹ In Lakhs)
Particulars
AS AT
31ST MARCH
2022
AS AT
31ST MARCH
2021
1 Partly paid-up investments - -
2
Claims, other than against policies,
not acknowledged as debt by the
company
- -
3
Underwriting commitments
outstanding (in respect of shares and
securities)
- -
4Guarantees given by or on behalf of
the Company - -
5Statutory demands/ liabilities in
dispute, not provided for 25,347 17,963
6Reinsurance obligations to the extent
not provided for in accounts - -
7 Others - -
TOTAL 25,347 17,963
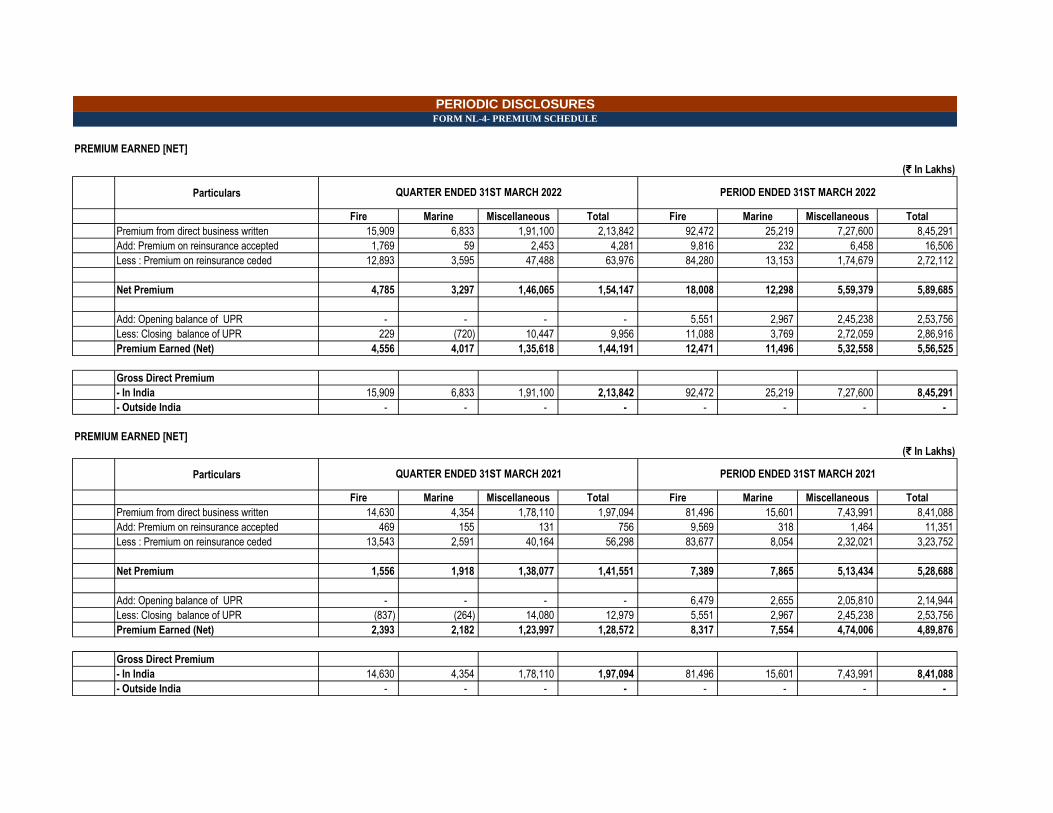
PREMIUM EARNED [NET]
(₹ In Lakhs)
Particulars
Fire Marine Miscellaneous Total Fire Marine Miscellaneous Total
Premium from direct business written 15,909 6,833 1,91,100 2,13,842 92,472 25,219 7,27,600 8,45,291
Add: Premium on reinsurance accepted 1,769 59 2,453 4,281 9,816 232 6,458 16,506
Less : Premium on reinsurance ceded 12,893 3,595 47,488 63,976 84,280 13,153 1,74,679 2,72,112
Net Premium 4,785 3,297 1,46,065 1,54,147 18,008 12,298 5,59,379 5,89,685
Add: Opening balance of UPR - - - - 5,551 2,967 2,45,238 2,53,756
Less: Closing balance of UPR 229 (720) 10,447 9,956 11,088 3,769 2,72,059 2,86,916
Premium Earned (Net) 4,556 4,017 1,35,618 1,44,191 12,471 11,496 5,32,558 5,56,525
Gross Direct Premium
- In India 15,909 6,833 1,91,100 2,13,842 92,472 25,219 7,27,600 8,45,291
- Outside India - - - - - - - -
PREMIUM EARNED [NET]
(₹ In Lakhs)
Particulars
Fire Marine Miscellaneous Total Fire Marine Miscellaneous Total
Premium from direct business written 14,630 4,354 1,78,110 1,97,094 81,496 15,601 7,43,991 8,41,088
Add: Premium on reinsurance accepted 469 155 131 756 9,569 318 1,464 11,351
Less : Premium on reinsurance ceded 13,543 2,591 40,164 56,298 83,677 8,054 2,32,021 3,23,752
Net Premium 1,556 1,918 1,38,077 1,41,551 7,389 7,865 5,13,434 5,28,688
Add: Opening balance of UPR - - - - 6,479 2,655 2,05,810 2,14,944
Less: Closing balance of UPR (837) (264) 14,080 12,979 5,551 2,967 2,45,238 2,53,756
Premium Earned (Net) 2,393 2,182 1,23,997 1,28,572 8,317 7,554 4,74,006 4,89,876
Gross Direct Premium
- In India 14,630 4,354 1,78,110 1,97,094 81,496 15,601 7,43,991 8,41,088
- Outside India - - - - - - - -
PERIODIC DISCLOSURESFORM NL-4- PREMIUM SCHEDULE
QUARTER ENDED 31ST MARCH 2021 PERIOD ENDED 31ST MARCH 2021
QUARTER ENDED 31ST MARCH 2022 PERIOD ENDED 31ST MARCH 2022
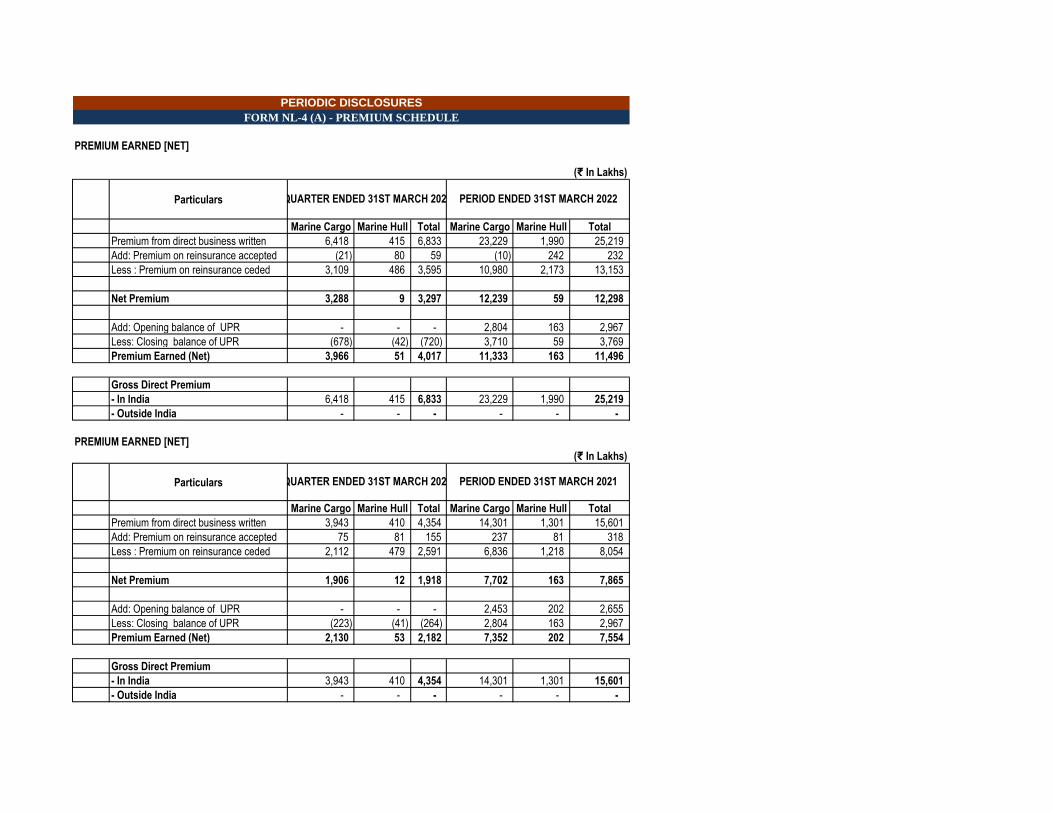
PREMIUM EARNED [NET]
(₹ In Lakhs)
Particulars
Marine Cargo Marine Hull Total Marine Cargo Marine Hull Total
Premium from direct business written 6,418 415 6,833 23,229 1,990 25,219
Add: Premium on reinsurance accepted (21) 80 59 (10) 242 232
Less : Premium on reinsurance ceded 3,109 486 3,595 10,980 2,173 13,153
Net Premium 3,288 9 3,297 12,239 59 12,298
Add: Opening balance of UPR - - - 2,804 163 2,967
Less: Closing balance of UPR (678) (42) (720) 3,710 59 3,769
Premium Earned (Net) 3,966 51 4,017 11,333 163 11,496
Gross Direct Premium
- In India 6,418 415 6,833 23,229 1,990 25,219
- Outside India - - - - - -
PREMIUM EARNED [NET]
(₹ In Lakhs)
Particulars
Marine Cargo Marine Hull Total Marine Cargo Marine Hull Total
Premium from direct business written 3,943 410 4,354 14,301 1,301 15,601
Add: Premium on reinsurance accepted 75 81 155 237 81 318
Less : Premium on reinsurance ceded 2,112 479 2,591 6,836 1,218 8,054
Net Premium 1,906 12 1,918 7,702 163 7,865
Add: Opening balance of UPR - - - 2,453 202 2,655
Less: Closing balance of UPR (223) (41) (264) 2,804 163 2,967
Premium Earned (Net) 2,130 53 2,182 7,352 202 7,554
Gross Direct Premium
- In India 3,943 410 4,354 14,301 1,301 15,601
- Outside India - - - - - -
QUARTER ENDED 31ST MARCH 2021 PERIOD ENDED 31ST MARCH 2021
PERIODIC DISCLOSURES
FORM NL-4 (A) - PREMIUM SCHEDULE
QUARTER ENDED 31ST MARCH 2022 PERIOD ENDED 31ST MARCH 2022
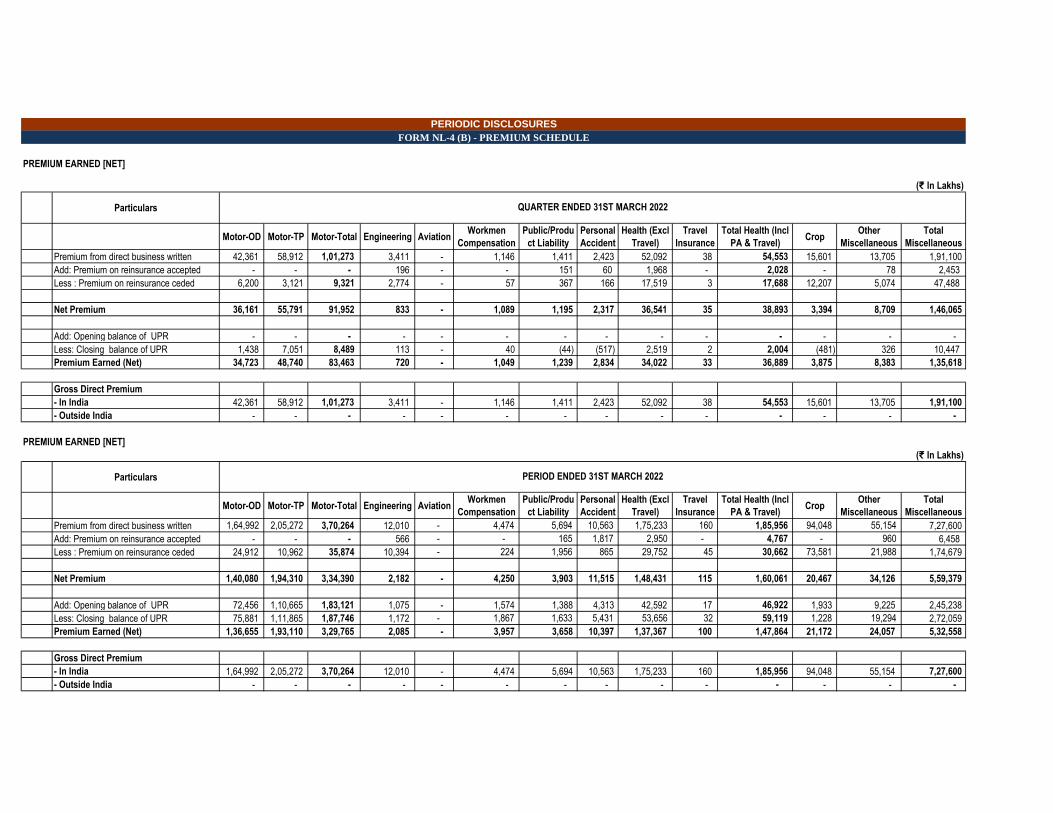
PREMIUM EARNED [NET]
(₹ In Lakhs)
Particulars
Motor-OD Motor-TP Motor-Total Engineering Aviation Workmen
Compensation
Public/Produ
ct Liability
Personal
Accident
Health (Excl
Travel)
Travel
Insurance
Total Health (Incl
PA & Travel)Crop
Other
Miscellaneous
Total
Miscellaneous
Premium from direct business written 42,361 58,912 1,01,273 3,411 - 1,146 1,411 2,423 52,092 38 54,553 15,601 13,705 1,91,100
Add: Premium on reinsurance accepted - - - 196 - - 151 60 1,968 - 2,028 - 78 2,453
Less : Premium on reinsurance ceded 6,200 3,121 9,321 2,774 - 57 367 166 17,519 3 17,688 12,207 5,074 47,488
Net Premium 36,161 55,791 91,952 833 - 1,089 1,195 2,317 36,541 35 38,893 3,394 8,709 1,46,065
Add: Opening balance of UPR - - - - - - - - - - - - - -
Less: Closing balance of UPR 1,438 7,051 8,489 113 - 40 (44) (517) 2,519 2 2,004 (481) 326 10,447
Premium Earned (Net) 34,723 48,740 83,463 720 - 1,049 1,239 2,834 34,022 33 36,889 3,875 8,383 1,35,618
Gross Direct Premium
- In India 42,361 58,912 1,01,273 3,411 - 1,146 1,411 2,423 52,092 38 54,553 15,601 13,705 1,91,100
- Outside India - - - - - - - - - - - - - -
PREMIUM EARNED [NET]
(₹ In Lakhs)
Particulars
Motor-OD Motor-TP Motor-Total Engineering Aviation Workmen
Compensation
Public/Produ
ct Liability
Personal
Accident
Health (Excl
Travel)
Travel
Insurance
Total Health (Incl
PA & Travel)Crop
Other
Miscellaneous
Total
Miscellaneous
Premium from direct business written 1,64,992 2,05,272 3,70,264 12,010 - 4,474 5,694 10,563 1,75,233 160 1,85,956 94,048 55,154 7,27,600
Add: Premium on reinsurance accepted - - - 566 - - 165 1,817 2,950 - 4,767 - 960 6,458
Less : Premium on reinsurance ceded 24,912 10,962 35,874 10,394 - 224 1,956 865 29,752 45 30,662 73,581 21,988 1,74,679
Net Premium 1,40,080 1,94,310 3,34,390 2,182 - 4,250 3,903 11,515 1,48,431 115 1,60,061 20,467 34,126 5,59,379
Add: Opening balance of UPR 72,456 1,10,665 1,83,121 1,075 - 1,574 1,388 4,313 42,592 17 46,922 1,933 9,225 2,45,238
Less: Closing balance of UPR 75,881 1,11,865 1,87,746 1,172 - 1,867 1,633 5,431 53,656 32 59,119 1,228 19,294 2,72,059
Premium Earned (Net) 1,36,655 1,93,110 3,29,765 2,085 - 3,957 3,658 10,397 1,37,367 100 1,47,864 21,172 24,057 5,32,558
Gross Direct Premium
- In India 1,64,992 2,05,272 3,70,264 12,010 - 4,474 5,694 10,563 1,75,233 160 1,85,956 94,048 55,154 7,27,600
- Outside India - - - - - - - - - - - - - -
PERIODIC DISCLOSURES
FORM NL-4 (B) - PREMIUM SCHEDULE
QUARTER ENDED 31ST MARCH 2022
PERIOD ENDED 31ST MARCH 2022
PREMIUM EARNED [NET]
(₹ In Lakhs)
Particulars
Motor-OD Motor-TP Motor-Total Engineering Aviation Workmen
Compensation
Public/Produ
ct Liability
Personal
Accident
Health (Excl
Travel)
Travel
Insurance
Total Health (Incl
PA & Travel)Crop
Other
Miscellaneous
Total
Miscellaneous
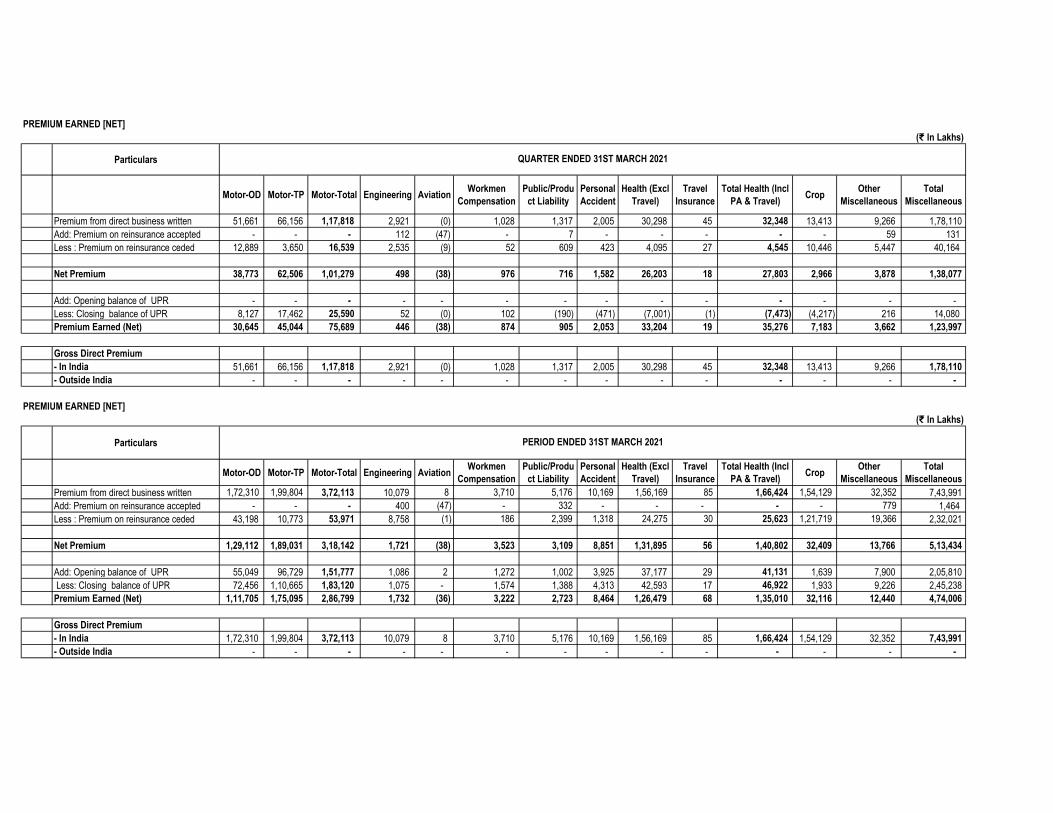
Premium from direct business written 51,661 66,156 1,17,818 2,921 (0) 1,028 1,317 2,005 30,298 45 32,348 13,413 9,266 1,78,110
Add: Premium on reinsurance accepted - - - 112 (47) - 7 - - - - - 59 131
Less : Premium on reinsurance ceded 12,889 3,650 16,539 2,535 (9) 52 609 423 4,095 27 4,545 10,446 5,447 40,164
Net Premium 38,773 62,506 1,01,279 498 (38) 976 716 1,582 26,203 18 27,803 2,966 3,878 1,38,077
Add: Opening balance of UPR - - - - - - - - - - - - - -
Less: Closing balance of UPR 8,127 17,462 25,590 52 (0) 102 (190) (471) (7,001) (1) (7,473) (4,217) 216 14,080
Premium Earned (Net) 30,645 45,044 75,689 446 (38) 874 905 2,053 33,204 19 35,276 7,183 3,662 1,23,997
Gross Direct Premium
- In India 51,661 66,156 1,17,818 2,921 (0) 1,028 1,317 2,005 30,298 45 32,348 13,413 9,266 1,78,110
- Outside India - - - - - - - - - - - - - -
PREMIUM EARNED [NET]
(₹ In Lakhs)
Particulars
Motor-OD Motor-TP Motor-Total Engineering Aviation Workmen
Compensation
Public/Produ
ct Liability
Personal
Accident
Health (Excl
Travel)
Travel
Insurance
Total Health (Incl
PA & Travel)Crop
Other
Miscellaneous
Total
Miscellaneous
Premium from direct business written 1,72,310 1,99,804 3,72,113 10,079 8 3,710 5,176 10,169 1,56,169 85 1,66,424 1,54,129 32,352 7,43,991
Add: Premium on reinsurance accepted - - - 400 (47) - 332 - - - - - 779 1,464
Less : Premium on reinsurance ceded 43,198 10,773 53,971 8,758 (1) 186 2,399 1,318 24,275 30 25,623 1,21,719 19,366 2,32,021
Net Premium 1,29,112 1,89,031 3,18,142 1,721 (38) 3,523 3,109 8,851 1,31,895 56 1,40,802 32,409 13,766 5,13,434
Add: Opening balance of UPR 55,049 96,729 1,51,777 1,086 2 1,272 1,002 3,925 37,177 29 41,131 1,639 7,900 2,05,810
Less: Closing balance of UPR 72,456 1,10,665 1,83,120 1,075 - 1,574 1,388 4,313 42,593 17 46,922 1,933 9,226 2,45,238
Premium Earned (Net) 1,11,705 1,75,095 2,86,799 1,732 (36) 3,222 2,723 8,464 1,26,479 68 1,35,010 32,116 12,440 4,74,006
Gross Direct Premium
- In India 1,72,310 1,99,804 3,72,113 10,079 8 3,710 5,176 10,169 1,56,169 85 1,66,424 1,54,129 32,352 7,43,991
- Outside India - - - - - - - - - - - - - -
QUARTER ENDED 31ST MARCH 2021
PERIOD ENDED 31ST MARCH 2021
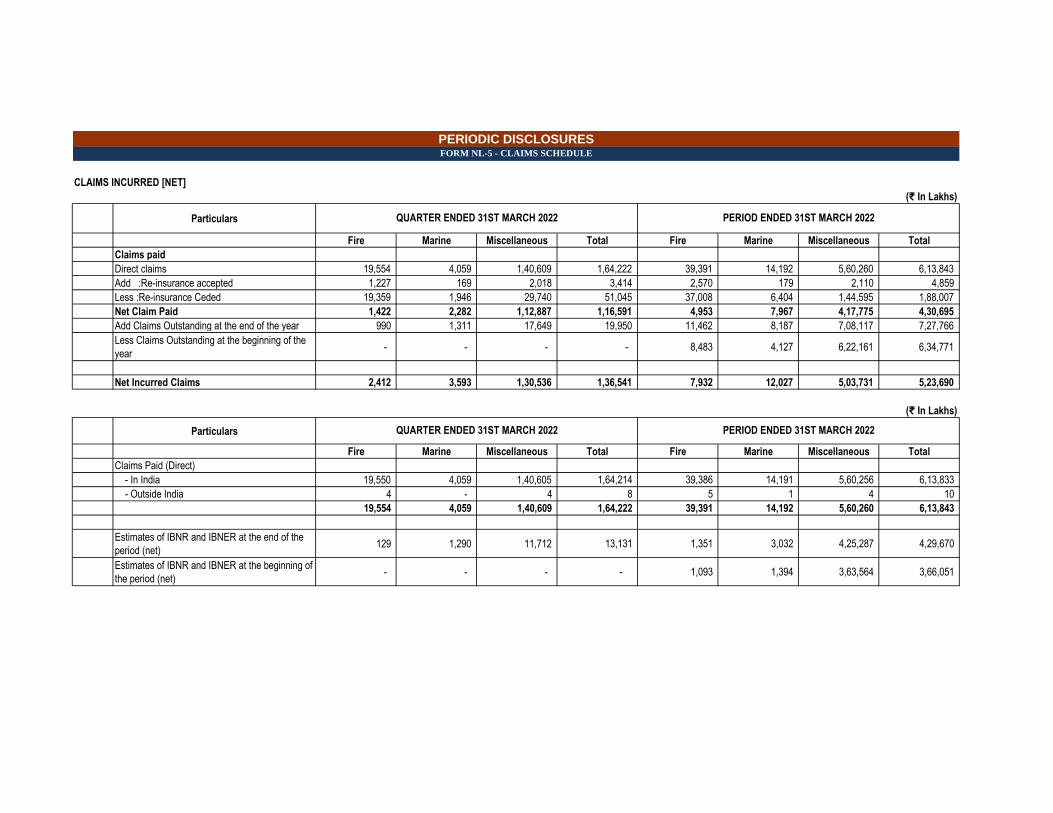
CLAIMS INCURRED [NET]
(₹ In Lakhs)
Particulars
Fire Marine Miscellaneous Total Fire Marine Miscellaneous Total
Claims paid
Direct claims 19,554 4,059 1,40,609 1,64,222 39,391 14,192 5,60,260 6,13,843
Add :Re-insurance accepted 1,227 169 2,018 3,414 2,570 179 2,110 4,859
Less :Re-insurance Ceded 19,359 1,946 29,740 51,045 37,008 6,404 1,44,595 1,88,007
Net Claim Paid 1,422 2,282 1,12,887 1,16,591 4,953 7,967 4,17,775 4,30,695
Add Claims Outstanding at the end of the year 990 1,311 17,649 19,950 11,462 8,187 7,08,117 7,27,766
Less Claims Outstanding at the beginning of the
year - - - - 8,483 4,127 6,22,161 6,34,771
Net Incurred Claims 2,412 3,593 1,30,536 1,36,541 7,932 12,027 5,03,731 5,23,690
(₹ In Lakhs)
Particulars
Fire Marine Miscellaneous Total Fire Marine Miscellaneous Total
Claims Paid (Direct)
- In India 19,550 4,059 1,40,605 1,64,214 39,386 14,191 5,60,256 6,13,833
- Outside India 4 - 4 8 5 1 4 10
19,554 4,059 1,40,609 1,64,222 39,391 14,192 5,60,260 6,13,843
Estimates of IBNR and IBNER at the end of the
period (net) 129 1,290 11,712 13,131 1,351 3,032 4,25,287 4,29,670
Estimates of IBNR and IBNER at the beginning of
the period (net) - - - - 1,093 1,394 3,63,564 3,66,051
PERIODIC DISCLOSURESFORM NL-5 - CLAIMS SCHEDULE
QUARTER ENDED 31ST MARCH 2022 PERIOD ENDED 31ST MARCH 2022
QUARTER ENDED 31ST MARCH 2022 PERIOD ENDED 31ST MARCH 2022
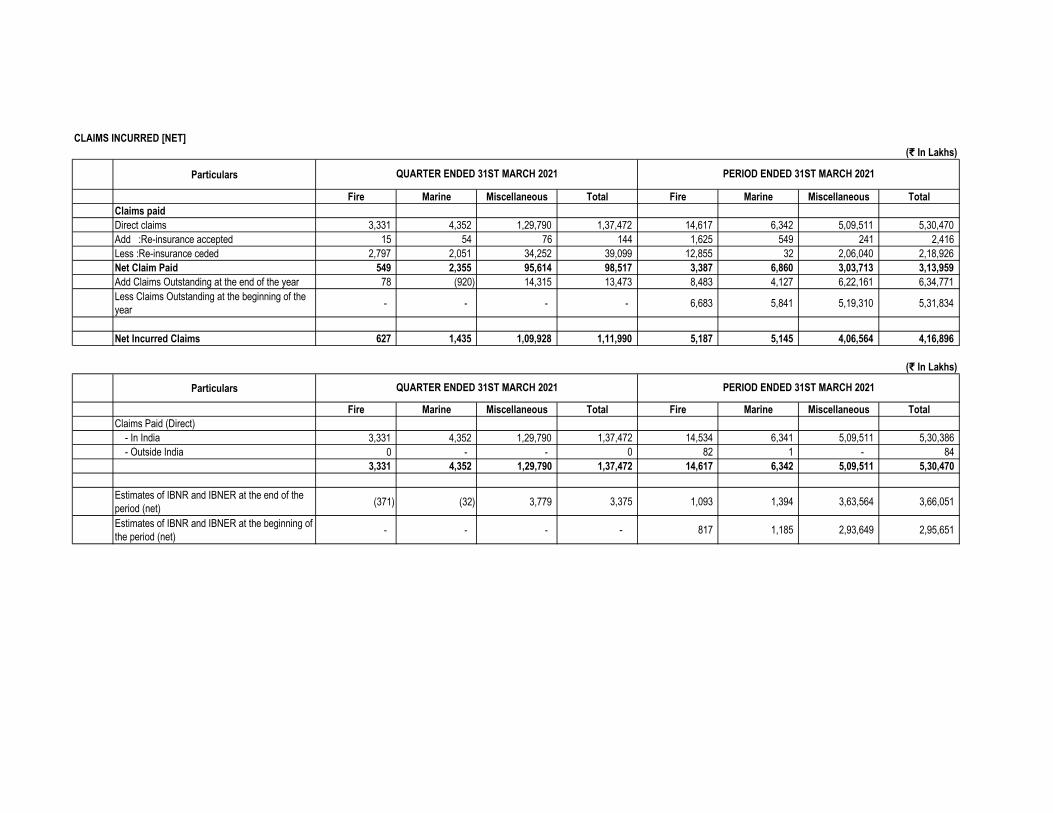
CLAIMS INCURRED [NET]
(₹ In Lakhs)
Particulars
Fire Marine Miscellaneous Total Fire Marine Miscellaneous Total
Claims paid
Direct claims 3,331 4,352 1,29,790 1,37,472 14,617 6,342 5,09,511 5,30,470
Add :Re-insurance accepted 15 54 76 144 1,625 549 241 2,416
Less :Re-insurance ceded 2,797 2,051 34,252 39,099 12,855 32 2,06,040 2,18,926
Net Claim Paid 549 2,355 95,614 98,517 3,387 6,860 3,03,713 3,13,959
Add Claims Outstanding at the end of the year 78 (920) 14,315 13,473 8,483 4,127 6,22,161 6,34,771
Less Claims Outstanding at the beginning of the
year - - - - 6,683 5,841 5,19,310 5,31,834
Net Incurred Claims 627 1,435 1,09,928 1,11,990 5,187 5,145 4,06,564 4,16,896
(₹ In Lakhs)
Particulars
Fire Marine Miscellaneous Total Fire Marine Miscellaneous Total
Claims Paid (Direct)
- In India 3,331 4,352 1,29,790 1,37,472 14,534 6,341 5,09,511 5,30,386
- Outside India 0 - - 0 82 1 - 84
3,331 4,352 1,29,790 1,37,472 14,617 6,342 5,09,511 5,30,470
Estimates of IBNR and IBNER at the end of the
period (net) (371) (32) 3,779 3,375 1,093 1,394 3,63,564 3,66,051
Estimates of IBNR and IBNER at the beginning of
the period (net) - - - - 817 1,185 2,93,649 2,95,651
QUARTER ENDED 31ST MARCH 2021 PERIOD ENDED 31ST MARCH 2021
QUARTER ENDED 31ST MARCH 2021 PERIOD ENDED 31ST MARCH 2021
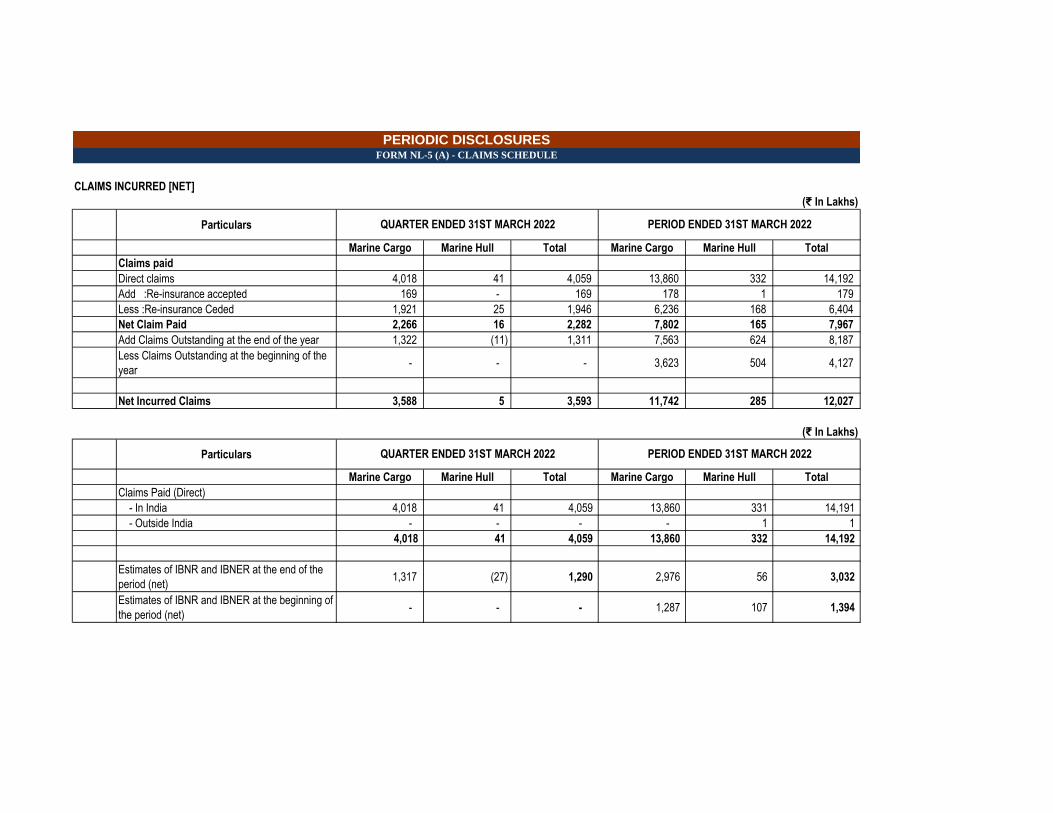
CLAIMS INCURRED [NET]
(₹ In Lakhs)
Particulars
Marine Cargo Marine Hull Total Marine Cargo Marine Hull Total
Claims paid
Direct claims 4,018 41 4,059 13,860 332 14,192
Add :Re-insurance accepted 169 - 169 178 1 179
Less :Re-insurance Ceded 1,921 25 1,946 6,236 168 6,404
Net Claim Paid 2,266 16 2,282 7,802 165 7,967
Add Claims Outstanding at the end of the year 1,322 (11) 1,311 7,563 624 8,187
Less Claims Outstanding at the beginning of the
year - - - 3,623 504 4,127
Net Incurred Claims 3,588 5 3,593 11,742 285 12,027
(₹ In Lakhs)
Particulars
Marine Cargo Marine Hull Total Marine Cargo Marine Hull Total
Claims Paid (Direct)
- In India 4,018 41 4,059 13,860 331 14,191
- Outside India - - - - 1 1
4,018 41 4,059 13,860 332 14,192
Estimates of IBNR and IBNER at the end of the
period (net) 1,317 (27) 1,290 2,976 56 3,032
Estimates of IBNR and IBNER at the beginning of
the period (net) - - - 1,287 107 1,394
PERIODIC DISCLOSURESFORM NL-5 (A) - CLAIMS SCHEDULE
QUARTER ENDED 31ST MARCH 2022 PERIOD ENDED 31ST MARCH 2022
QUARTER ENDED 31ST MARCH 2022 PERIOD ENDED 31ST MARCH 2022
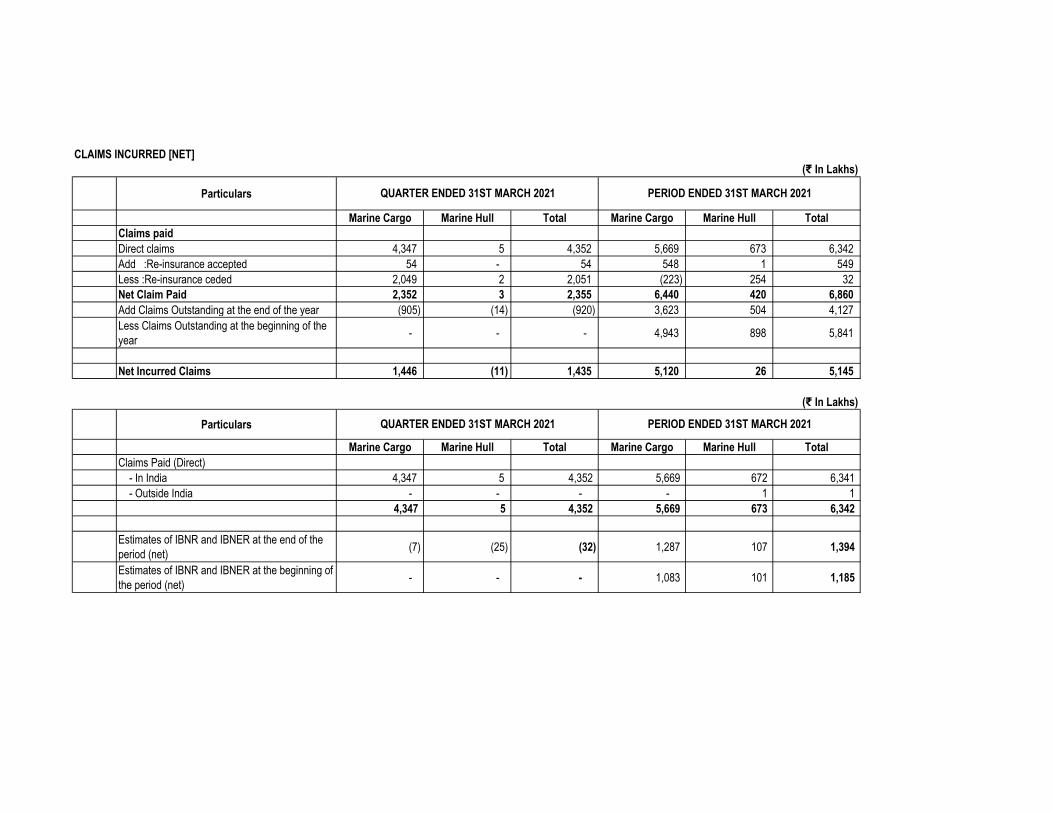
CLAIMS INCURRED [NET]
(₹ In Lakhs)
Particulars
Marine Cargo Marine Hull Total Marine Cargo Marine Hull Total
Claims paid
Direct claims 4,347 5 4,352 5,669 673 6,342
Add :Re-insurance accepted 54 - 54 548 1 549
Less :Re-insurance ceded 2,049 2 2,051 (223) 254 32
Net Claim Paid 2,352 3 2,355 6,440 420 6,860
Add Claims Outstanding at the end of the year (905) (14) (920) 3,623 504 4,127
Less Claims Outstanding at the beginning of the
year - - - 4,943 898 5,841
Net Incurred Claims 1,446 (11) 1,435 5,120 26 5,145
(₹ In Lakhs)
Particulars
Marine Cargo Marine Hull Total Marine Cargo Marine Hull Total
Claims Paid (Direct)
- In India 4,347 5 4,352 5,669 672 6,341
- Outside India - - - - 1 1
4,347 5 4,352 5,669 673 6,342
Estimates of IBNR and IBNER at the end of the
period (net) (7) (25) (32) 1,287 107 1,394
Estimates of IBNR and IBNER at the beginning of
the period (net) - - - 1,083 101 1,185
QUARTER ENDED 31ST MARCH 2021 PERIOD ENDED 31ST MARCH 2021
QUARTER ENDED 31ST MARCH 2021 PERIOD ENDED 31ST MARCH 2021
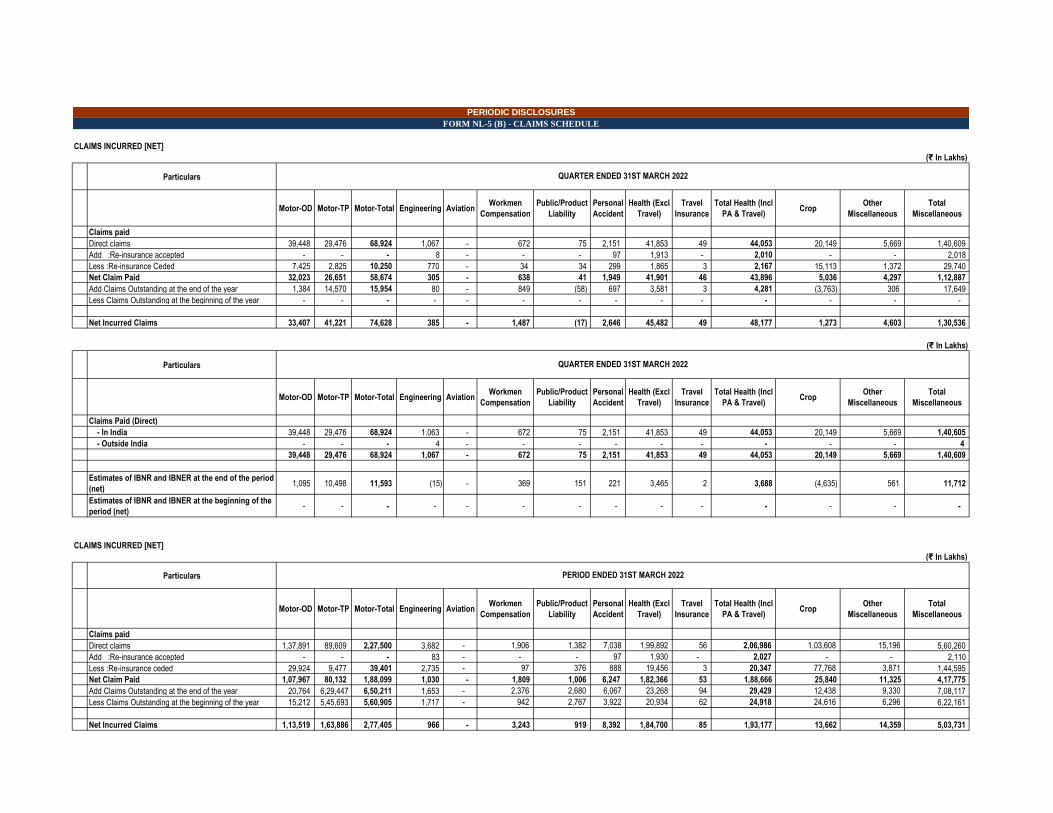
CLAIMS INCURRED [NET]
(₹ In Lakhs)
Particulars
Motor-OD Motor-TP Motor-Total Engineering Aviation Workmen
Compensation
Public/Product
Liability
Personal
Accident
Health (Excl
Travel)
Travel
Insurance
Total Health (Incl
PA & Travel)Crop
Other
Miscellaneous
Total
Miscellaneous
Claims paid
Direct claims 39,448 29,476 68,924 1,067 - 672 75 2,151 41,853 49 44,053 20,149 5,669 1,40,609
Add :Re-insurance accepted - - - 8 - - - 97 1,913 - 2,010 - - 2,018
Less :Re-insurance Ceded 7,425 2,825 10,250 770 - 34 34 299 1,865 3 2,167 15,113 1,372 29,740
Net Claim Paid 32,023 26,651 58,674 305 - 638 41 1,949 41,901 46 43,896 5,036 4,297 1,12,887
Add Claims Outstanding at the end of the year 1,384 14,570 15,954 80 - 849 (58) 697 3,581 3 4,281 (3,763) 306 17,649
Less Claims Outstanding at the beginning of the year - - - - - - - - - - - - - -
Net Incurred Claims 33,407 41,221 74,628 385 - 1,487 (17) 2,646 45,482 49 48,177 1,273 4,603 1,30,536
(₹ In Lakhs)
Particulars
Motor-OD Motor-TP Motor-Total Engineering Aviation Workmen
Compensation
Public/Product
Liability
Personal
Accident
Health (Excl
Travel)
Travel
Insurance
Total Health (Incl
PA & Travel)Crop
Other
Miscellaneous
Total
Miscellaneous
Claims Paid (Direct)
- In India 39,448 29,476 68,924 1,063 - 672 75 2,151 41,853 49 44,053 20,149 5,669 1,40,605
- Outside India - - - 4 - - - - - - - - - 4
39,448 29,476 68,924 1,067 - 672 75 2,151 41,853 49 44,053 20,149 5,669 1,40,609
Estimates of IBNR and IBNER at the end of the period
(net) 1,095 10,498 11,593 (15) - 369 151 221 3,465 2 3,688 (4,635) 561 11,712
Estimates of IBNR and IBNER at the beginning of the
period (net) - - - - - - - - - - - - - -
CLAIMS INCURRED [NET]
(₹ In Lakhs)
Particulars
Motor-OD Motor-TP Motor-Total Engineering Aviation Workmen
Compensation
Public/Product
Liability
Personal
Accident
Health (Excl
Travel)
Travel
Insurance
Total Health (Incl
PA & Travel)Crop
Other
Miscellaneous
Total
Miscellaneous
Claims paid
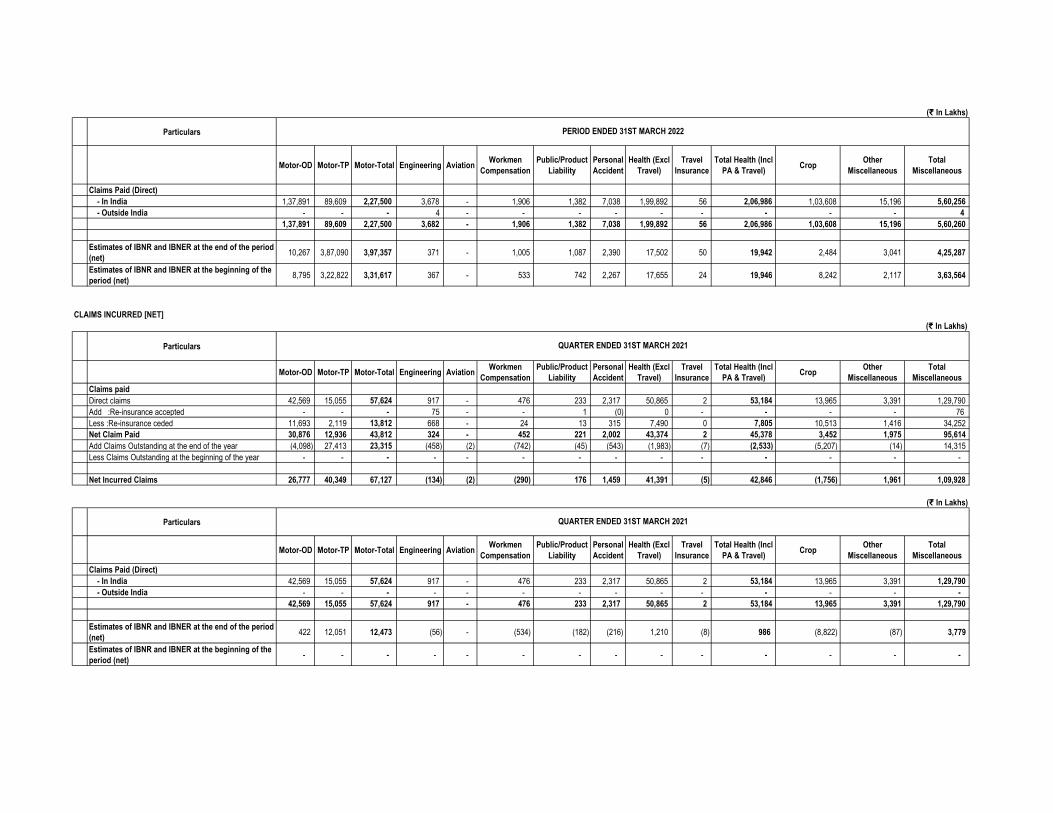
Direct claims 1,37,891 89,609 2,27,500 3,682 - 1,906 1,382 7,038 1,99,892 56 2,06,986 1,03,608 15,196 5,60,260
Add :Re-insurance accepted - - - 83 - - - 97 1,930 - 2,027 - - 2,110
Less :Re-insurance ceded 29,924 9,477 39,401 2,735 - 97 376 888 19,456 3 20,347 77,768 3,871 1,44,595
Net Claim Paid 1,07,967 80,132 1,88,099 1,030 - 1,809 1,006 6,247 1,82,366 53 1,88,666 25,840 11,325 4,17,775
Add Claims Outstanding at the end of the year 20,764 6,29,447 6,50,211 1,653 - 2,376 2,680 6,067 23,268 94 29,429 12,438 9,330 7,08,117
Less Claims Outstanding at the beginning of the year 15,212 5,45,693 5,60,905 1,717 - 942 2,767 3,922 20,934 62 24,918 24,616 6,296 6,22,161
Net Incurred Claims 1,13,519 1,63,886 2,77,405 966 - 3,243 919 8,392 1,84,700 85 1,93,177 13,662 14,359 5,03,731
QUARTER ENDED 31ST MARCH 2022
PERIODIC DISCLOSURES
FORM NL-5 (B) - CLAIMS SCHEDULE
QUARTER ENDED 31ST MARCH 2022
PERIOD ENDED 31ST MARCH 2022
(₹ In Lakhs)
Particulars
Motor-OD Motor-TP Motor-Total Engineering Aviation Workmen
Compensation
Public/Product
Liability
Personal
Accident
Health (Excl
Travel)
Travel
Insurance
Total Health (Incl
PA & Travel)Crop
Other
Miscellaneous
Total
Miscellaneous
Claims Paid (Direct)
- In India 1,37,891 89,609 2,27,500 3,678 - 1,906 1,382 7,038 1,99,892 56 2,06,986 1,03,608 15,196 5,60,256
- Outside India - - - 4 - - - - - - - - - 4
1,37,891 89,609 2,27,500 3,682 - 1,906 1,382 7,038 1,99,892 56 2,06,986 1,03,608 15,196 5,60,260
Estimates of IBNR and IBNER at the end of the period
(net) 10,267 3,87,090 3,97,357 371 - 1,005 1,087 2,390 17,502 50 19,942 2,484 3,041 4,25,287
Estimates of IBNR and IBNER at the beginning of the
period (net) 8,795 3,22,822 3,31,617 367 - 533 742 2,267 17,655 24 19,946 8,242 2,117 3,63,564
CLAIMS INCURRED [NET]
(₹ In Lakhs)
Particulars
Motor-OD Motor-TP Motor-Total Engineering Aviation Workmen
Compensation
Public/Product
Liability
Personal
Accident
Health (Excl
Travel)
Travel
Insurance
Total Health (Incl
PA & Travel)Crop
Other
Miscellaneous
Total
Miscellaneous
Claims paid
Direct claims 42,569 15,055 57,624 917 - 476 233 2,317 50,865 2 53,184 13,965 3,391 1,29,790
Add :Re-insurance accepted - - - 75 - - 1 (0) 0 - - - - 76
Less :Re-insurance ceded 11,693 2,119 13,812 668 - 24 13 315 7,490 0 7,805 10,513 1,416 34,252
Net Claim Paid 30,876 12,936 43,812 324 - 452 221 2,002 43,374 2 45,378 3,452 1,975 95,614
Add Claims Outstanding at the end of the year (4,098) 27,413 23,315 (458) (2) (742) (45) (543) (1,983) (7) (2,533) (5,207) (14) 14,315
Less Claims Outstanding at the beginning of the year - - - - - - - - - - - - - -
Net Incurred Claims 26,777 40,349 67,127 (134) (2) (290) 176 1,459 41,391 (5) 42,846 (1,756) 1,961 1,09,928
(₹ In Lakhs)
Particulars
Motor-OD Motor-TP Motor-Total Engineering Aviation Workmen
Compensation
Public/Product
Liability
Personal
Accident
Health (Excl
Travel)
Travel
Insurance
Total Health (Incl
PA & Travel)Crop
Other
Miscellaneous
Total
Miscellaneous
Claims Paid (Direct)
- In India 42,569 15,055 57,624 917 - 476 233 2,317 50,865 2 53,184 13,965 3,391 1,29,790
- Outside India - - - - - - - - - - - - - -
42,569 15,055 57,624 917 - 476 233 2,317 50,865 2 53,184 13,965 3,391 1,29,790
Estimates of IBNR and IBNER at the end of the period
(net) 422 12,051 12,473 (56) - (534) (182) (216) 1,210 (8) 986 (8,822) (87) 3,779
Estimates of IBNR and IBNER at the beginning of the
period (net) - - - - - - - - - - - - - -
QUARTER ENDED 31ST MARCH 2021
PERIOD ENDED 31ST MARCH 2022
QUARTER ENDED 31ST MARCH 2021
CLAIMS INCURRED [NET]
(₹ In Lakhs)
Particulars
Motor-OD Motor-TP Motor-Total Engineering Aviation Workmen
Compensation
Public/Product
Liability
Personal
Accident
Health (Excl
Travel)
Travel
Insurance
Total Health (Incl
PA & Travel)Crop
Other
Miscellaneous
Total
Miscellaneous
Claims paid
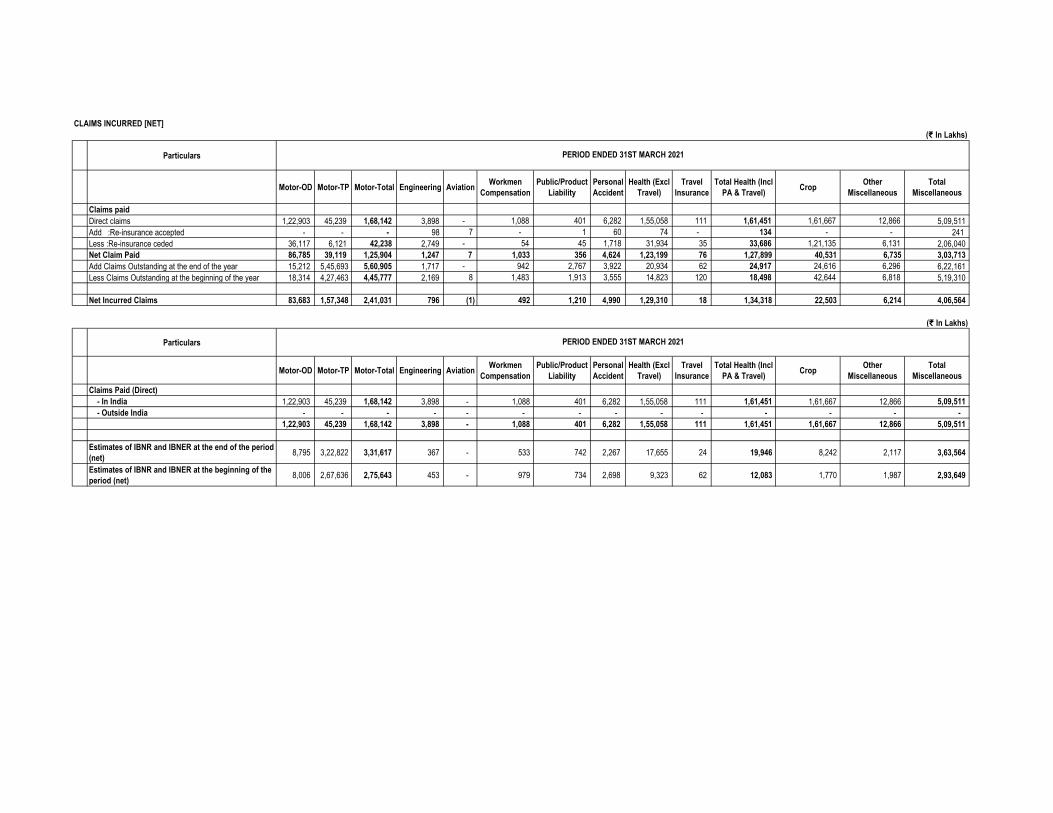
Direct claims 1,22,903 45,239 1,68,142 3,898 - 1,088 401 6,282 1,55,058 111 1,61,451 1,61,667 12,866 5,09,511
Add :Re-insurance accepted - - - 98 7 - 1 60 74 - 134 - - 241
Less :Re-insurance ceded 36,117 6,121 42,238 2,749 - 54 45 1,718 31,934 35 33,686 1,21,135 6,131 2,06,040
Net Claim Paid 86,785 39,119 1,25,904 1,247 7 1,033 356 4,624 1,23,199 76 1,27,899 40,531 6,735 3,03,713
Add Claims Outstanding at the end of the year 15,212 5,45,693 5,60,905 1,717 - 942 2,767 3,922 20,934 62 24,917 24,616 6,296 6,22,161
Less Claims Outstanding at the beginning of the year 18,314 4,27,463 4,45,777 2,169 8 1,483 1,913 3,555 14,823 120 18,498 42,644 6,818 5,19,310
Net Incurred Claims 83,683 1,57,348 2,41,031 796 (1) 492 1,210 4,990 1,29,310 18 1,34,318 22,503 6,214 4,06,564
(₹ In Lakhs)
Particulars
Motor-OD Motor-TP Motor-Total Engineering Aviation Workmen
Compensation
Public/Product
Liability
Personal
Accident
Health (Excl
Travel)
Travel
Insurance
Total Health (Incl
PA & Travel)Crop
Other
Miscellaneous
Total
Miscellaneous
Claims Paid (Direct)
- In India 1,22,903 45,239 1,68,142 3,898 - 1,088 401 6,282 1,55,058 111 1,61,451 1,61,667 12,866 5,09,511
- Outside India - - - - - - - - - - - - - -
1,22,903 45,239 1,68,142 3,898 - 1,088 401 6,282 1,55,058 111 1,61,451 1,61,667 12,866 5,09,511
Estimates of IBNR and IBNER at the end of the period
(net) 8,795 3,22,822 3,31,617 367 - 533 742 2,267 17,655 24 19,946 8,242 2,117 3,63,564
Estimates of IBNR and IBNER at the beginning of the
period (net) 8,006 2,67,636 2,75,643 453 - 979 734 2,698 9,323 62 12,083 1,770 1,987 2,93,649
PERIOD ENDED 31ST MARCH 2021
PERIOD ENDED 31ST MARCH 2021
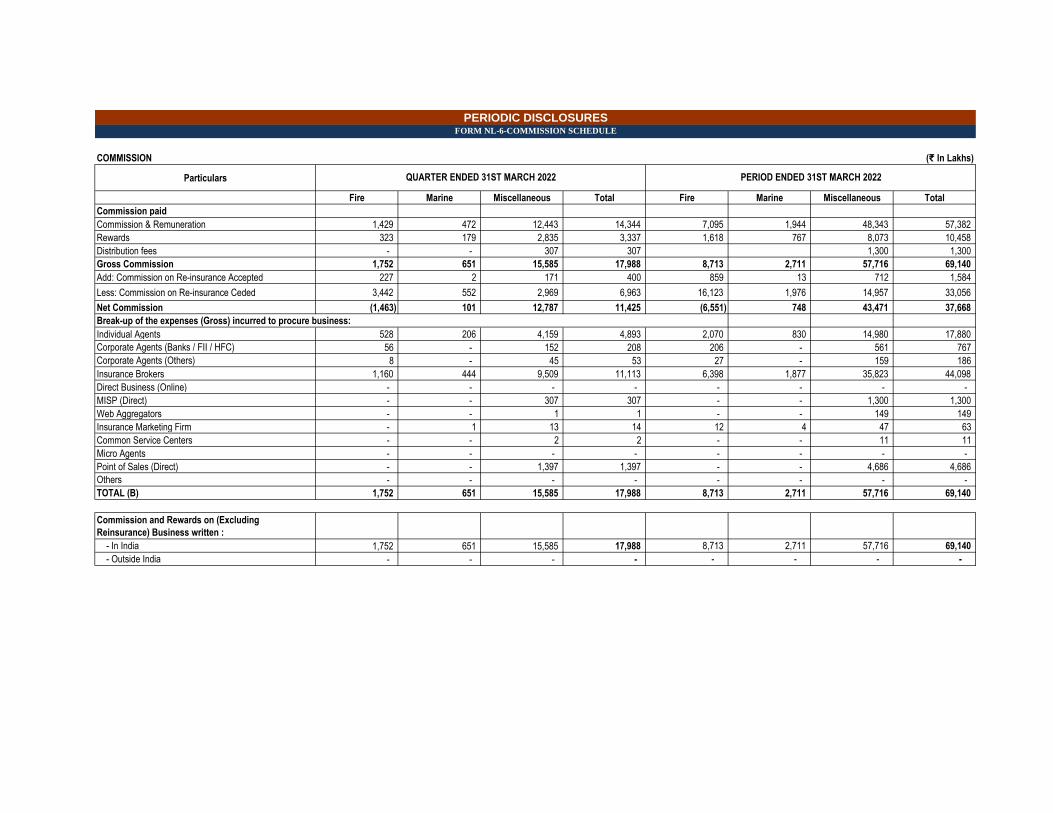
COMMISSION (₹ In Lakhs)
Particulars
Fire Marine Miscellaneous Total Fire Marine Miscellaneous Total
Commission paid
Commission & Remuneration 1,429 472 12,443 14,344 7,095 1,944 48,343 57,382
Rewards 323 179 2,835 3,337 1,618 767 8,073 10,458
Distribution fees - - 307 307 1,300 1,300
Gross Commission 1,752 651 15,585 17,988 8,713 2,711 57,716 69,140
Add: Commission on Re-insurance Accepted 227 2 171 400 859 13 712 1,584
Less: Commission on Re-insurance Ceded 3,442 552 2,969 6,963 16,123 1,976 14,957 33,056
Net Commission (1,463) 101 12,787 11,425 (6,551) 748 43,471 37,668
Break-up of the expenses (Gross) incurred to procure business:
Individual Agents 528 206 4,159 4,893 2,070 830 14,980 17,880
Corporate Agents (Banks / FII / HFC) 56 - 152 208 206 - 561 767
Corporate Agents (Others) 8 - 45 53 27 - 159 186
Insurance Brokers 1,160 444 9,509 11,113 6,398 1,877 35,823 44,098
Direct Business (Online) - - - - - - - -
MISP (Direct) - - 307 307 - - 1,300 1,300
Web Aggregators - - 1 1 - - 149 149
Insurance Marketing Firm - 1 13 14 12 4 47 63
Common Service Centers - - 2 2 - - 11 11
Micro Agents - - - - - - - -
Point of Sales (Direct) - - 1,397 1,397 - - 4,686 4,686
Others - - - - - - - -
TOTAL (B) 1,752 651 15,585 17,988 8,713 2,711 57,716 69,140
Commission and Rewards on (Excluding
Reinsurance) Business written :
- In India 1,752 651 15,585 17,988 8,713 2,711 57,716 69,140
- Outside India - - - - - - - -
PERIODIC DISCLOSURESFORM NL-6-COMMISSION SCHEDULE
QUARTER ENDED 31ST MARCH 2022 PERIOD ENDED 31ST MARCH 2022
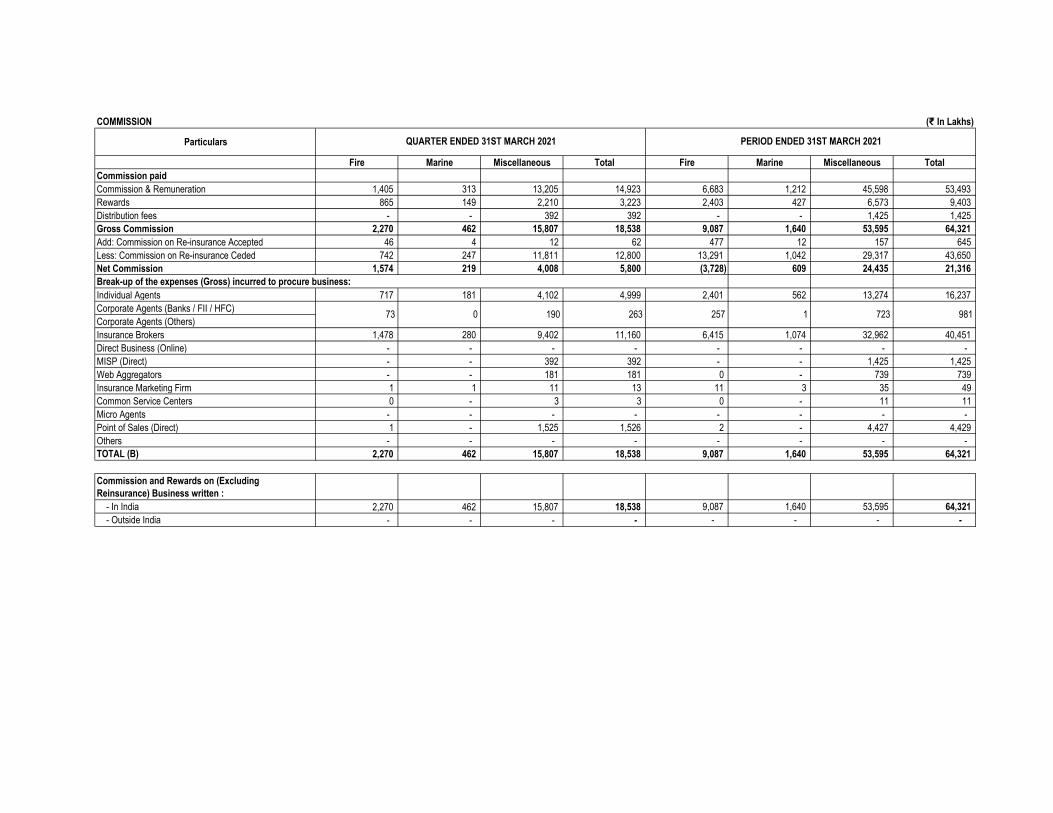
COMMISSION (₹ In Lakhs)
Particulars
Fire Marine Miscellaneous Total Fire Marine Miscellaneous Total
Commission paid
Commission & Remuneration 1,405 313 13,205 14,923 6,683 1,212 45,598 53,493
Rewards 865 149 2,210 3,223 2,403 427 6,573 9,403
Distribution fees - - 392 392 - - 1,425 1,425
Gross Commission 2,270 462 15,807 18,538 9,087 1,640 53,595 64,321
Add: Commission on Re-insurance Accepted 46 4 12 62 477 12 157 645
Less: Commission on Re-insurance Ceded 742 247 11,811 12,800 13,291 1,042 29,317 43,650
Net Commission 1,574 219 4,008 5,800 (3,728) 609 24,435 21,316
Break-up of the expenses (Gross) incurred to procure business:
Individual Agents 717 181 4,102 4,999 2,401 562 13,274 16,237
Corporate Agents (Banks / FII / HFC)
Corporate Agents (Others)
Insurance Brokers 1,478 280 9,402 11,160 6,415 1,074 32,962 40,451
Direct Business (Online) - - - - - - - -
MISP (Direct) - - 392 392 - - 1,425 1,425
Web Aggregators - - 181 181 0 - 739 739
Insurance Marketing Firm 1 1 11 13 11 3 35 49
Common Service Centers 0 - 3 3 0 - 11 11
Micro Agents - - - - - - - -
Point of Sales (Direct) 1 - 1,525 1,526 2 - 4,427 4,429
Others - - - - - - - -
TOTAL (B) 2,270 462 15,807 18,538 9,087 1,640 53,595 64,321
Commission and Rewards on (Excluding
Reinsurance) Business written :
- In India 2,270 462 15,807 18,538 9,087 1,640 53,595 64,321
- Outside India - - - - - - - -
263 257 73 0 190 1 723 981
QUARTER ENDED 31ST MARCH 2021 PERIOD ENDED 31ST MARCH 2021
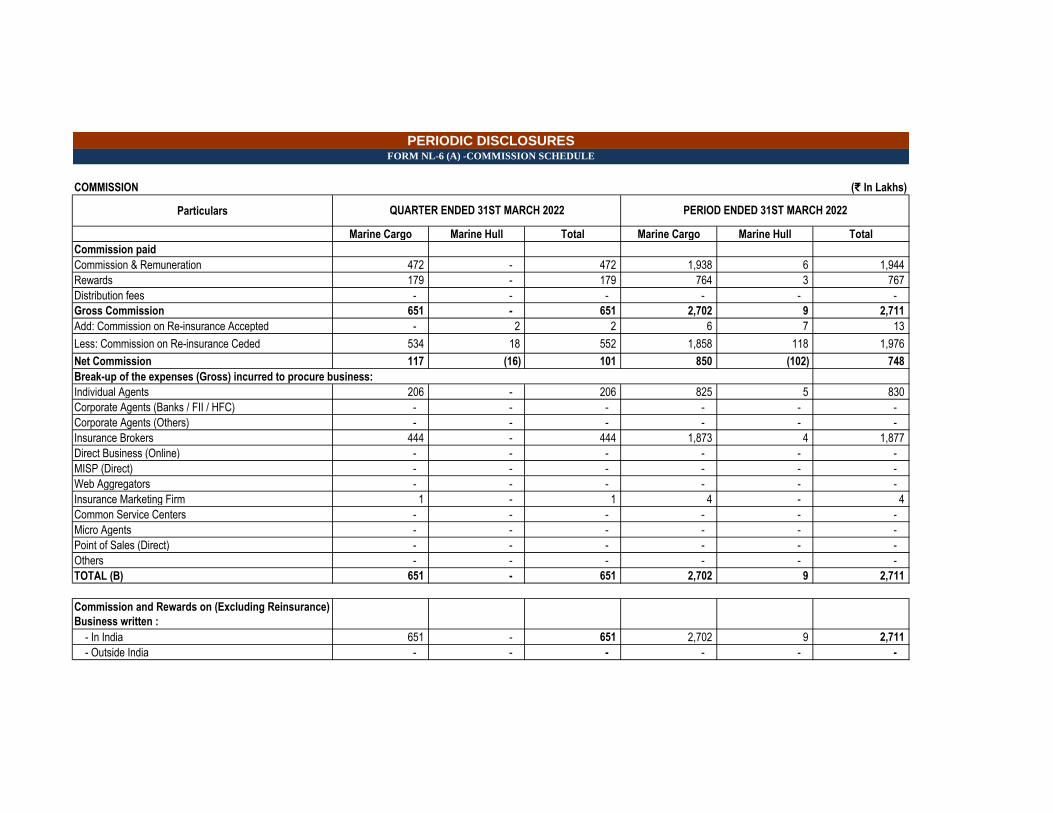
COMMISSION (₹ In Lakhs)
Particulars
Marine Cargo Marine Hull Total Marine Cargo Marine Hull Total
Commission paid
Commission & Remuneration 472 - 472 1,938 6 1,944
Rewards 179 - 179 764 3 767
Distribution fees - - - - - -
Gross Commission 651 - 651 2,702 9 2,711
Add: Commission on Re-insurance Accepted - 2 2 6 7 13
Less: Commission on Re-insurance Ceded 534 18 552 1,858 118 1,976
Net Commission 117 (16) 101 850 (102) 748
Break-up of the expenses (Gross) incurred to procure business:
Individual Agents 206 - 206 825 5 830
Corporate Agents (Banks / FII / HFC) - - - - - -
Corporate Agents (Others) - - - - - -
Insurance Brokers 444 - 444 1,873 4 1,877
Direct Business (Online) - - - - - -
MISP (Direct) - - - - - -
Web Aggregators - - - - - -
Insurance Marketing Firm 1 - 1 4 - 4
Common Service Centers - - - - - -
Micro Agents - - - - - -
Point of Sales (Direct) - - - - - -
Others - - - - - -
TOTAL (B) 651 - 651 2,702 9 2,711
Commission and Rewards on (Excluding Reinsurance)
Business written :
- In India 651 - 651 2,702 9 2,711
- Outside India - - - - - -
PERIODIC DISCLOSURESFORM NL-6 (A) -COMMISSION SCHEDULE
QUARTER ENDED 31ST MARCH 2022 PERIOD ENDED 31ST MARCH 2022
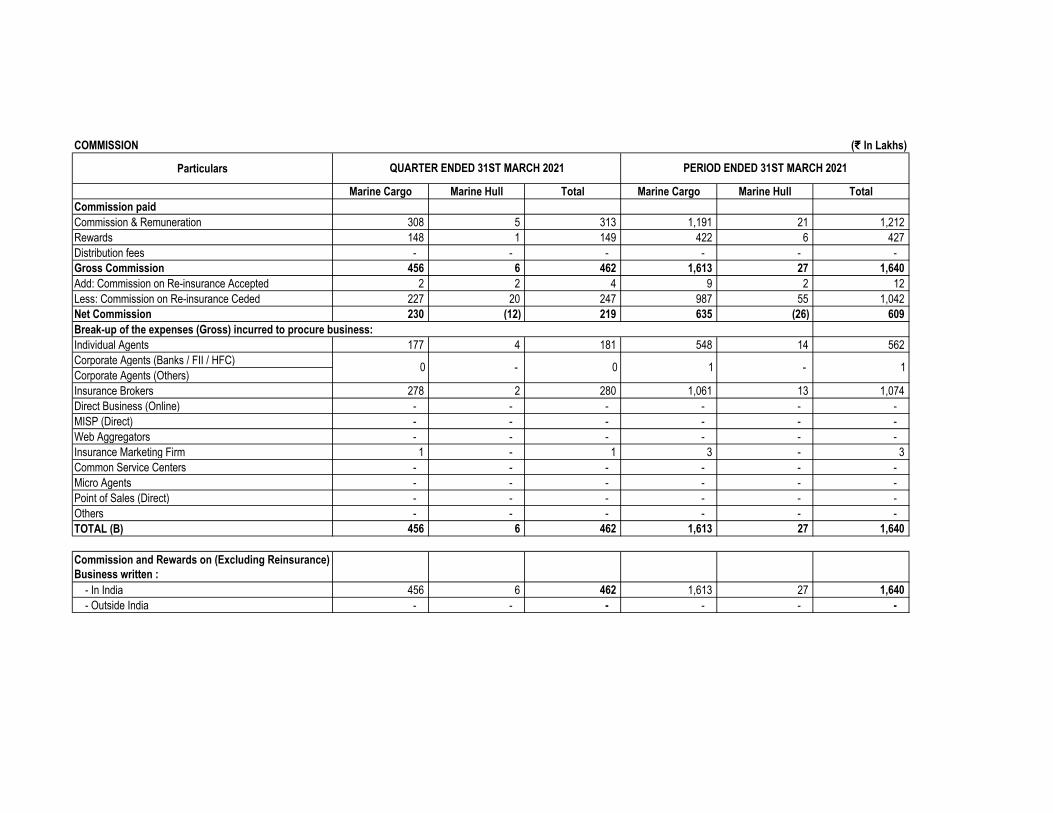
COMMISSION (₹ In Lakhs)
Particulars
Marine Cargo Marine Hull Total Marine Cargo Marine Hull Total
Commission paid
Commission & Remuneration 308 5 313 1,191 21 1,212
Rewards 148 1 149 422 6 427
Distribution fees - - - - - -
Gross Commission 456 6 462 1,613 27 1,640
Add: Commission on Re-insurance Accepted 2 2 4 9 2 12
Less: Commission on Re-insurance Ceded 227 20 247 987 55 1,042
Net Commission 230 (12) 219 635 (26) 609
Break-up of the expenses (Gross) incurred to procure business:
Individual Agents 177 4 181 548 14 562
Corporate Agents (Banks / FII / HFC)
Corporate Agents (Others)
Insurance Brokers 278 2 280 1,061 13 1,074
Direct Business (Online) - - - - - -
MISP (Direct) - - - - - -
Web Aggregators - - - - - -
Insurance Marketing Firm 1 - 1 3 - 3
Common Service Centers - - - - - -
Micro Agents - - - - - -
Point of Sales (Direct) - - - - - -
Others - - - - - -
TOTAL (B) 456 6 462 1,613 27 1,640
Commission and Rewards on (Excluding Reinsurance)
Business written :
- In India 456 6 462 1,613 27 1,640
- Outside India - - - - - -
1 0 - 0 1 -
QUARTER ENDED 31ST MARCH 2021 PERIOD ENDED 31ST MARCH 2021
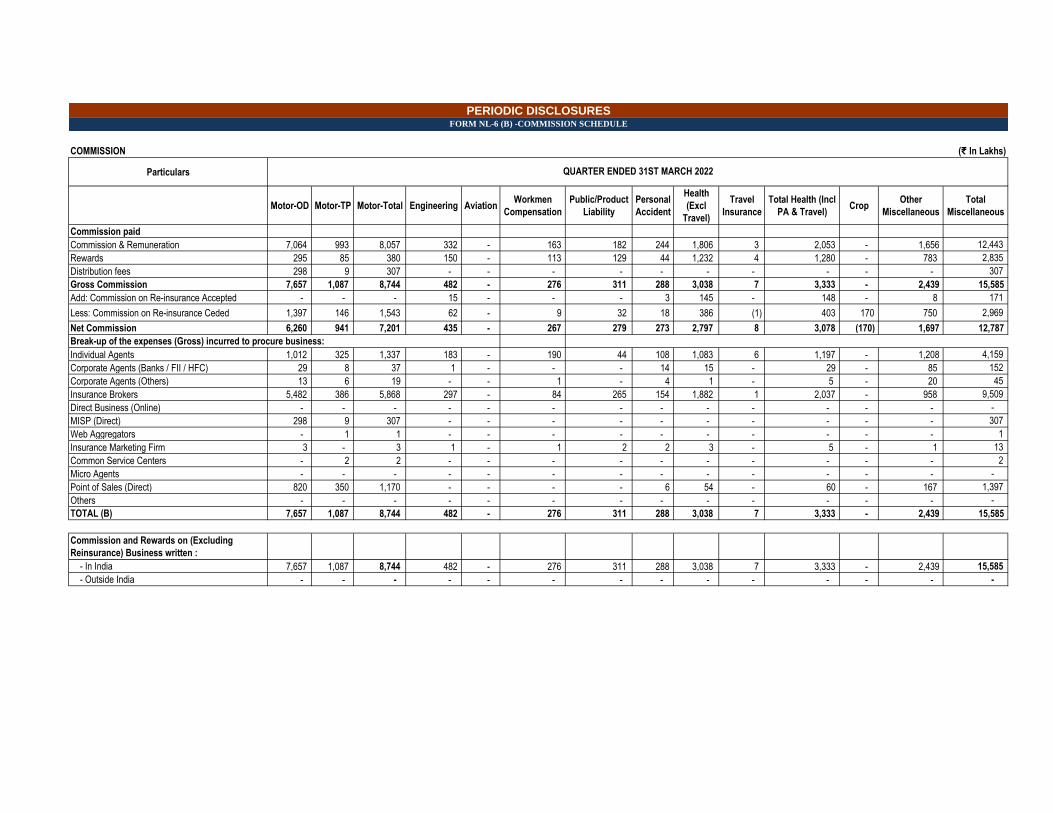
COMMISSION (₹ In Lakhs)
Particulars
Motor-OD Motor-TP Motor-Total Engineering Aviation Workmen
Compensation
Public/Product
Liability
Personal
Accident
Health
(Excl
Travel)
Travel
Insurance
Total Health (Incl
PA & Travel)Crop
Other
Miscellaneous
Total
Miscellaneous
Commission paid
Commission & Remuneration 7,064 993 8,057 332 - 163 182 244 1,806 3 2,053 - 1,656 12,443
Rewards 295 85 380 150 - 113 129 44 1,232 4 1,280 - 783 2,835
Distribution fees 298 9 307 - - - - - - - - - - 307
Gross Commission 7,657 1,087 8,744 482 - 276 311 288 3,038 7 3,333 - 2,439 15,585
Add: Commission on Re-insurance Accepted - - - 15 - - - 3 145 - 148 - 8 171
Less: Commission on Re-insurance Ceded 1,397 146 1,543 62 - 9 32 18 386 (1) 403 170 750 2,969
Net Commission 6,260 941 7,201 435 - 267 279 273 2,797 8 3,078 (170) 1,697 12,787
Break-up of the expenses (Gross) incurred to procure business:
Individual Agents 1,012 325 1,337 183 - 190 44 108 1,083 6 1,197 - 1,208 4,159
Corporate Agents (Banks / FII / HFC) 29 8 37 1 - - - 14 15 - 29 - 85 152
Corporate Agents (Others) 13 6 19 - - 1 - 4 1 - 5 - 20 45
Insurance Brokers 5,482 386 5,868 297 - 84 265 154 1,882 1 2,037 - 958 9,509
Direct Business (Online) - - - - - - - - - - - - - -
MISP (Direct) 298 9 307 - - - - - - - - - - 307
Web Aggregators - 1 1 - - - - - - - - - - 1
Insurance Marketing Firm 3 - 3 1 - 1 2 2 3 - 5 - 1 13
Common Service Centers - 2 2 - - - - - - - - - - 2
Micro Agents - - - - - - - - - - - - - -
Point of Sales (Direct) 820 350 1,170 - - - - 6 54 - 60 - 167 1,397
Others - - - - - - - - - - - - - -
TOTAL (B) 7,657 1,087 8,744 482 - 276 311 288 3,038 7 3,333 - 2,439 15,585
Commission and Rewards on (Excluding
Reinsurance) Business written :
- In India 7,657 1,087 8,744 482 - 276 311 288 3,038 7 3,333 - 2,439 15,585
- Outside India - - - - - - - - - - - - - -
PERIODIC DISCLOSURESFORM NL-6 (B) -COMMISSION SCHEDULE
QUARTER ENDED 31ST MARCH 2022
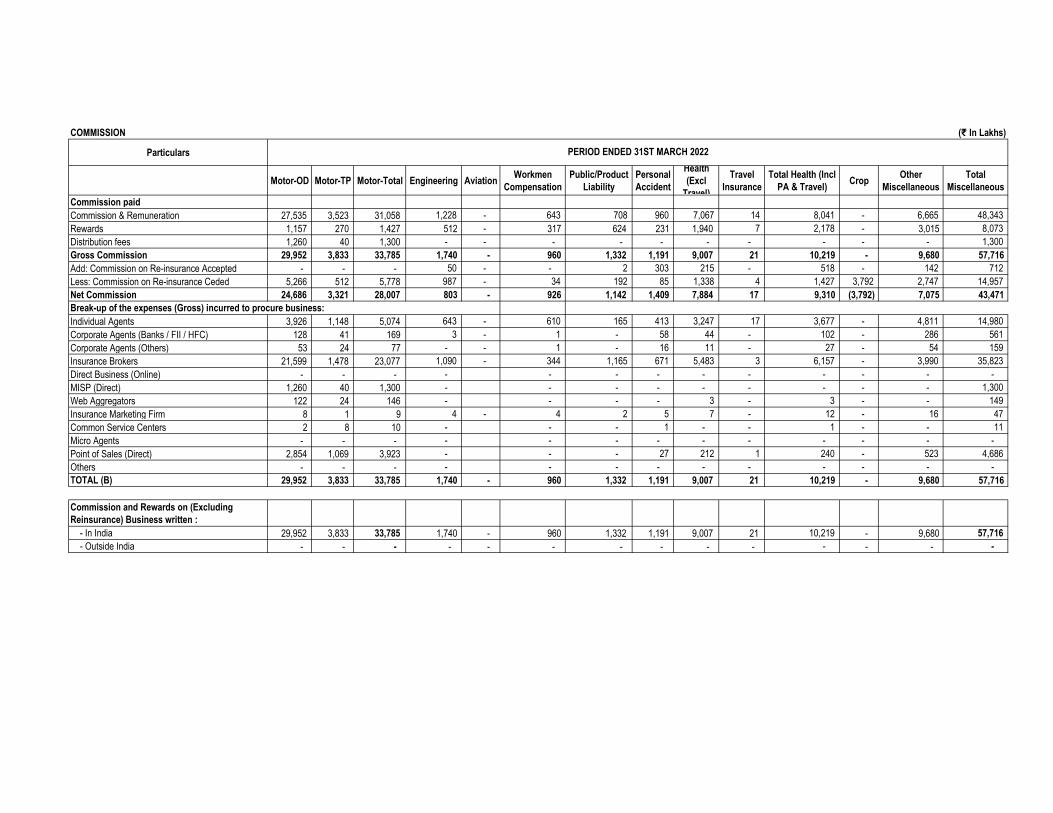
COMMISSION (₹ In Lakhs)
Particulars
Motor-OD Motor-TP Motor-Total Engineering Aviation Workmen
Compensation
Public/Product
Liability
Personal
Accident
Health
(Excl
Travel)
Travel
Insurance
Total Health (Incl
PA & Travel)Crop
Other
Miscellaneous
Total
Miscellaneous
Commission paid
Commission & Remuneration 27,535 3,523 31,058 1,228 - 643 708 960 7,067 14 8,041 - 6,665 48,343
Rewards 1,157 270 1,427 512 - 317 624 231 1,940 7 2,178 - 3,015 8,073
Distribution fees 1,260 40 1,300 - - - - - - - - - - 1,300
Gross Commission 29,952 3,833 33,785 1,740 - 960 1,332 1,191 9,007 21 10,219 - 9,680 57,716
Add: Commission on Re-insurance Accepted - - - 50 - - 2 303 215 - 518 - 142 712
Less: Commission on Re-insurance Ceded 5,266 512 5,778 987 - 34 192 85 1,338 4 1,427 3,792 2,747 14,957
Net Commission 24,686 3,321 28,007 803 - 926 1,142 1,409 7,884 17 9,310 (3,792) 7,075 43,471
Break-up of the expenses (Gross) incurred to procure business:
Individual Agents 3,926 1,148 5,074 643 - 610 165 413 3,247 17 3,677 - 4,811 14,980
Corporate Agents (Banks / FII / HFC) 128 41 169 3 - 1 - 58 44 - 102 - 286 561
Corporate Agents (Others) 53 24 77 - - 1 - 16 11 - 27 - 54 159
Insurance Brokers 21,599 1,478 23,077 1,090 - 344 1,165 671 5,483 3 6,157 - 3,990 35,823
Direct Business (Online) - - - - - - - - - - - - -
MISP (Direct) 1,260 40 1,300 - - - - - - - - - 1,300
Web Aggregators 122 24 146 - - - - 3 - 3 - - 149
Insurance Marketing Firm 8 1 9 4 - 4 2 5 7 - 12 - 16 47
Common Service Centers 2 8 10 - - - 1 - - 1 - - 11
Micro Agents - - - - - - - - - - - - -
Point of Sales (Direct) 2,854 1,069 3,923 - - - 27 212 1 240 - 523 4,686
Others - - - - - - - - - - - - -
TOTAL (B) 29,952 3,833 33,785 1,740 - 960 1,332 1,191 9,007 21 10,219 - 9,680 57,716
Commission and Rewards on (Excluding
Reinsurance) Business written :
- In India 29,952 3,833 33,785 1,740 - 960 1,332 1,191 9,007 21 10,219 - 9,680 57,716
- Outside India - - - - - - - - - - - - - -
PERIOD ENDED 31ST MARCH 2022
COMMISSION (₹ In Lakhs)
Particulars
Motor-OD Motor-TP Motor-Total Engineering Aviation Workmen
Compensation
Public/Product
Liability
Personal
Accident
Health
(Excl
Travel)
Travel
Insurance
Total Health (Incl
PA & Travel)Crop
Other
Miscellaneous
Total
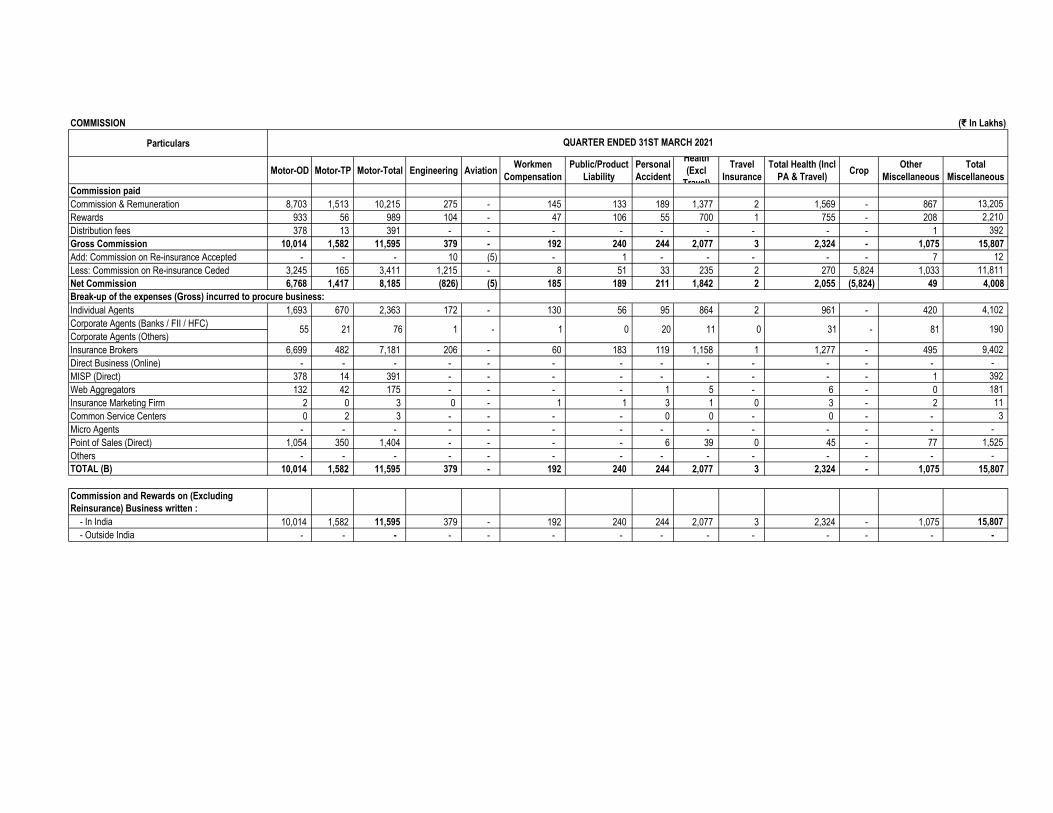
Miscellaneous
Commission paid
Commission & Remuneration 8,703 1,513 10,215 275 - 145 133 189 1,377 2 1,569 - 867 13,205
Rewards 933 56 989 104 - 47 106 55 700 1 755 - 208 2,210
Distribution fees 378 13 391 - - - - - - - - - 1 392
Gross Commission 10,014 1,582 11,595 379 - 192 240 244 2,077 3 2,324 - 1,075 15,807
Add: Commission on Re-insurance Accepted - - - 10 (5) - 1 - - - - - 7 12
Less: Commission on Re-insurance Ceded 3,245 165 3,411 1,215 - 8 51 33 235 2 270 5,824 1,033 11,811
Net Commission 6,768 1,417 8,185 (826) (5) 185 189 211 1,842 2 2,055 (5,824) 49 4,008
Break-up of the expenses (Gross) incurred to procure business:
Individual Agents 1,693 670 2,363 172 - 130 56 95 864 2 961 - 420 4,102
Corporate Agents (Banks / FII / HFC)
Corporate Agents (Others)
Insurance Brokers 6,699 482 7,181 206 - 60 183 119 1,158 1 1,277 - 495 9,402
Direct Business (Online) - - - - - - - - - - - - - -
MISP (Direct) 378 14 391 - - - - - - - - - 1 392
Web Aggregators 132 42 175 - - - - 1 5 - 6 - 0 181
Insurance Marketing Firm 2 0 3 0 - 1 1 3 1 0 3 - 2 11
Common Service Centers 0 2 3 - - - - 0 0 - 0 - - 3
Micro Agents - - - - - - - - - - - - - -
Point of Sales (Direct) 1,054 350 1,404 - - - - 6 39 0 45 - 77 1,525
Others - - - - - - - - - - - - - -
TOTAL (B) 10,014 1,582 11,595 379 - 192 240 244 2,077 3 2,324 - 1,075 15,807
Commission and Rewards on (Excluding
Reinsurance) Business written :
- In India 10,014 1,582 11,595 379 - 192 240 244 2,077 3 2,324 - 1,075 15,807
- Outside India - - - - - - - - - - - - - -
55 21 76 1 - 1 0 20
QUARTER ENDED 31ST MARCH 2021
31 - 81 0 190 11
COMMISSION (₹ In Lakhs)
Particulars
Motor-OD Motor-TP Motor-Total Engineering Aviation Workmen
Compensation
Public/Product
Liability
Personal
Accident
Health
(Excl
Travel)
Travel
Insurance
Total Health (Incl
PA & Travel)Crop
Other
Miscellaneous
Total
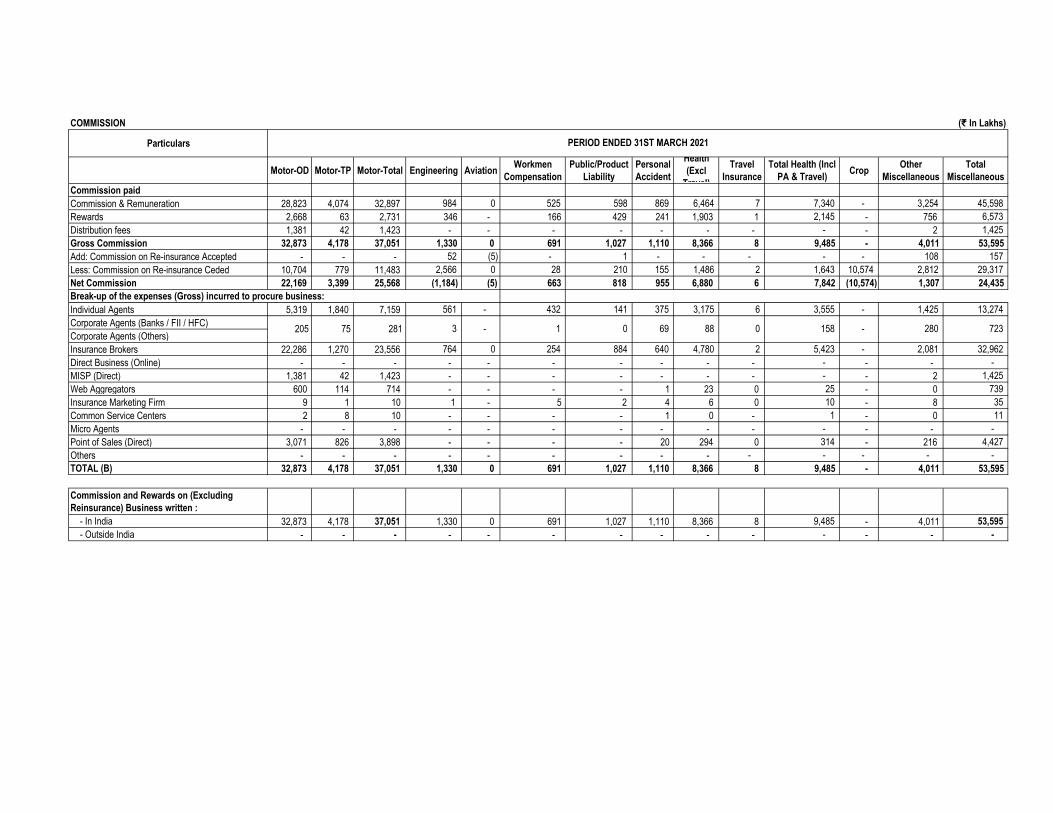
Miscellaneous
Commission paid
Commission & Remuneration 28,823 4,074 32,897 984 0 525 598 869 6,464 7 7,340 - 3,254 45,598
Rewards 2,668 63 2,731 346 - 166 429 241 1,903 1 2,145 - 756 6,573
Distribution fees 1,381 42 1,423 - - - - - - - - - 2 1,425
Gross Commission 32,873 4,178 37,051 1,330 0 691 1,027 1,110 8,366 8 9,485 - 4,011 53,595
Add: Commission on Re-insurance Accepted - - - 52 (5) - 1 - - - - - 108 157
Less: Commission on Re-insurance Ceded 10,704 779 11,483 2,566 0 28 210 155 1,486 2 1,643 10,574 2,812 29,317
Net Commission 22,169 3,399 25,568 (1,184) (5) 663 818 955 6,880 6 7,842 (10,574) 1,307 24,435
Break-up of the expenses (Gross) incurred to procure business:
Individual Agents 5,319 1,840 7,159 561 - 432 141 375 3,175 6 3,555 - 1,425 13,274
Corporate Agents (Banks / FII / HFC)
Corporate Agents (Others)
Insurance Brokers 22,286 1,270 23,556 764 0 254 884 640 4,780 2 5,423 - 2,081 32,962
Direct Business (Online) - - - - - - - - - - - - - -
MISP (Direct) 1,381 42 1,423 - - - - - - - - - 2 1,425
Web Aggregators 600 114 714 - - - - 1 23 0 25 - 0 739
Insurance Marketing Firm 9 1 10 1 - 5 2 4 6 0 10 - 8 35
Common Service Centers 2 8 10 - - - - 1 0 - 1 - 0 11
Micro Agents - - - - - - - - - - - - - -
Point of Sales (Direct) 3,071 826 3,898 - - - - 20 294 0 314 - 216 4,427
Others - - - - - - - - - - - - - -
TOTAL (B) 32,873 4,178 37,051 1,330 0 691 1,027 1,110 8,366 8 9,485 - 4,011 53,595
Commission and Rewards on (Excluding
Reinsurance) Business written :
- In India 32,873 4,178 37,051 1,330 0 691 1,027 1,110 8,366 8 9,485 - 4,011 53,595
- Outside India - - - - - - - - - - - - - -
158 -
PERIOD ENDED 31ST MARCH 2021
280 723 205 75 281 3 - 1 0 69 88 0
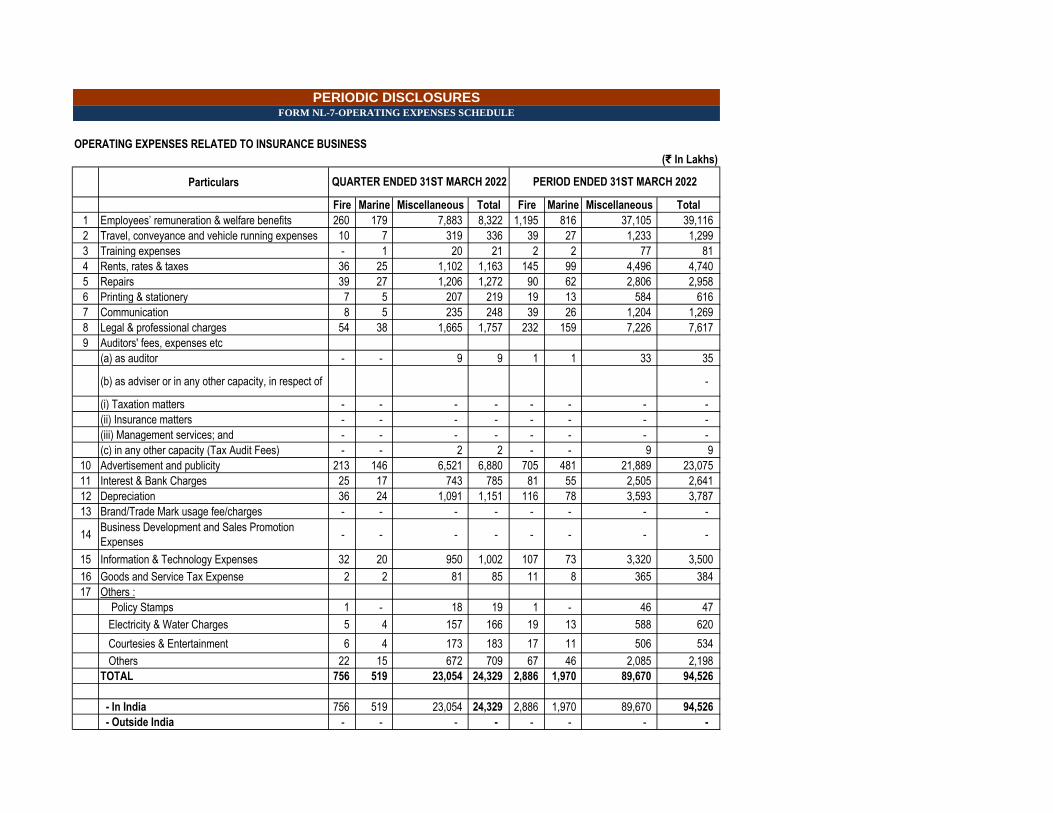
OPERATING EXPENSES RELATED TO INSURANCE BUSINESS
(₹ In Lakhs)
Particulars
Fire Marine Miscellaneous Total Fire Marine Miscellaneous Total
1 Employees’ remuneration & welfare benefits 260 179 7,883 8,322 1,195 816 37,105 39,116
2 Travel, conveyance and vehicle running expenses 10 7 319 336 39 27 1,233 1,299
3 Training expenses - 1 20 21 2 2 77 81
4 Rents, rates & taxes 36 25 1,102 1,163 145 99 4,496 4,740
5 Repairs 39 27 1,206 1,272 90 62 2,806 2,958
6 Printing & stationery 7 5 207 219 19 13 584 616
7 Communication 8 5 235 248 39 26 1,204 1,269
8 Legal & professional charges 54 38 1,665 1,757 232 159 7,226 7,617
9 Auditors' fees, expenses etc
(a) as auditor - - 9 9 1 1 33 35
(b) as adviser or in any other capacity, in respect of -
(i) Taxation matters - - - - - - - -
(ii) Insurance matters - - - - - - - -
(iii) Management services; and - - - - - - - -
(c) in any other capacity (Tax Audit Fees) - - 2 2 - - 9 9
10 Advertisement and publicity 213 146 6,521 6,880 705 481 21,889 23,075
11 Interest & Bank Charges 25 17 743 785 81 55 2,505 2,641
12 Depreciation 36 24 1,091 1,151 116 78 3,593 3,787
13 Brand/Trade Mark usage fee/charges - - - - - - - -
14Business Development and Sales Promotion
Expenses - - - - - - - -
15 Information & Technology Expenses 32 20 950 1,002 107 73 3,320 3,500
16 Goods and Service Tax Expense 2 2 81 85 11 8 365 384
17 Others :
Policy Stamps 1 - 18 19 1 - 46 47
Electricity & Water Charges 5 4 157 166 19 13 588 620
Courtesies & Entertainment 6 4 173 183 17 11 506 534
Others 22 15 672 709 67 46 2,085 2,198
TOTAL 756 519 23,054 24,329 2,886 1,970 89,670 94,526
- In India 756 519 23,054 24,329 2,886 1,970 89,670 94,526
- Outside India - - - - - - - -
PERIODIC DISCLOSURESFORM NL-7-OPERATING EXPENSES SCHEDULE
QUARTER ENDED 31ST MARCH 2022 PERIOD ENDED 31ST MARCH 2022
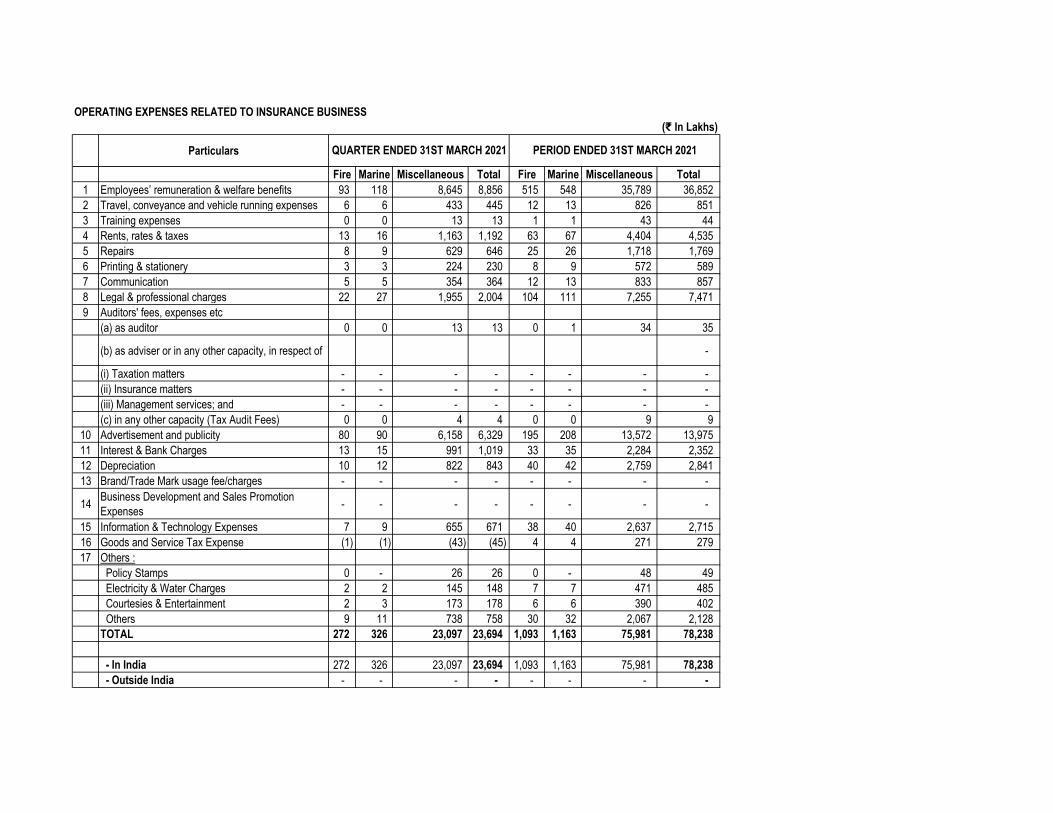
OPERATING EXPENSES RELATED TO INSURANCE BUSINESS
(₹ In Lakhs)
Particulars
Fire Marine Miscellaneous Total Fire Marine Miscellaneous Total
1 Employees’ remuneration & welfare benefits 93 118 8,645 8,856 515 548 35,789 36,852
2 Travel, conveyance and vehicle running expenses 6 6 433 445 12 13 826 851
3 Training expenses 0 0 13 13 1 1 43 44
4 Rents, rates & taxes 13 16 1,163 1,192 63 67 4,404 4,535
5 Repairs 8 9 629 646 25 26 1,718 1,769
6 Printing & stationery 3 3 224 230 8 9 572 589
7 Communication 5 5 354 364 12 13 833 857
8 Legal & professional charges 22 27 1,955 2,004 104 111 7,255 7,471
9 Auditors' fees, expenses etc
(a) as auditor 0 0 13 13 0 1 34 35
(b) as adviser or in any other capacity, in respect of -
(i) Taxation matters - - - - - - - -
(ii) Insurance matters - - - - - - - -
(iii) Management services; and - - - - - - - -
(c) in any other capacity (Tax Audit Fees) 0 0 4 4 0 0 9 9
10 Advertisement and publicity 80 90 6,158 6,329 195 208 13,572 13,975
11 Interest & Bank Charges 13 15 991 1,019 33 35 2,284 2,352
12 Depreciation 10 12 822 843 40 42 2,759 2,841
13 Brand/Trade Mark usage fee/charges - - - - - - - -
14Business Development and Sales Promotion
Expenses - - - - - - - -
15 Information & Technology Expenses 7 9 655 671 38 40 2,637 2,715
16 Goods and Service Tax Expense (1) (1) (43) (45) 4 4 271 279
17 Others :
Policy Stamps 0 - 26 26 0 - 48 49
Electricity & Water Charges 2 2 145 148 7 7 471 485
Courtesies & Entertainment 2 3 173 178 6 6 390 402
Others 9 11 738 758 30 32 2,067 2,128
TOTAL 272 326 23,097 23,694 1,093 1,163 75,981 78,238
- In India 272 326 23,097 23,694 1,093 1,163 75,981 78,238
- Outside India - - - - - - - -
QUARTER ENDED 31ST MARCH 2021 PERIOD ENDED 31ST MARCH 2021
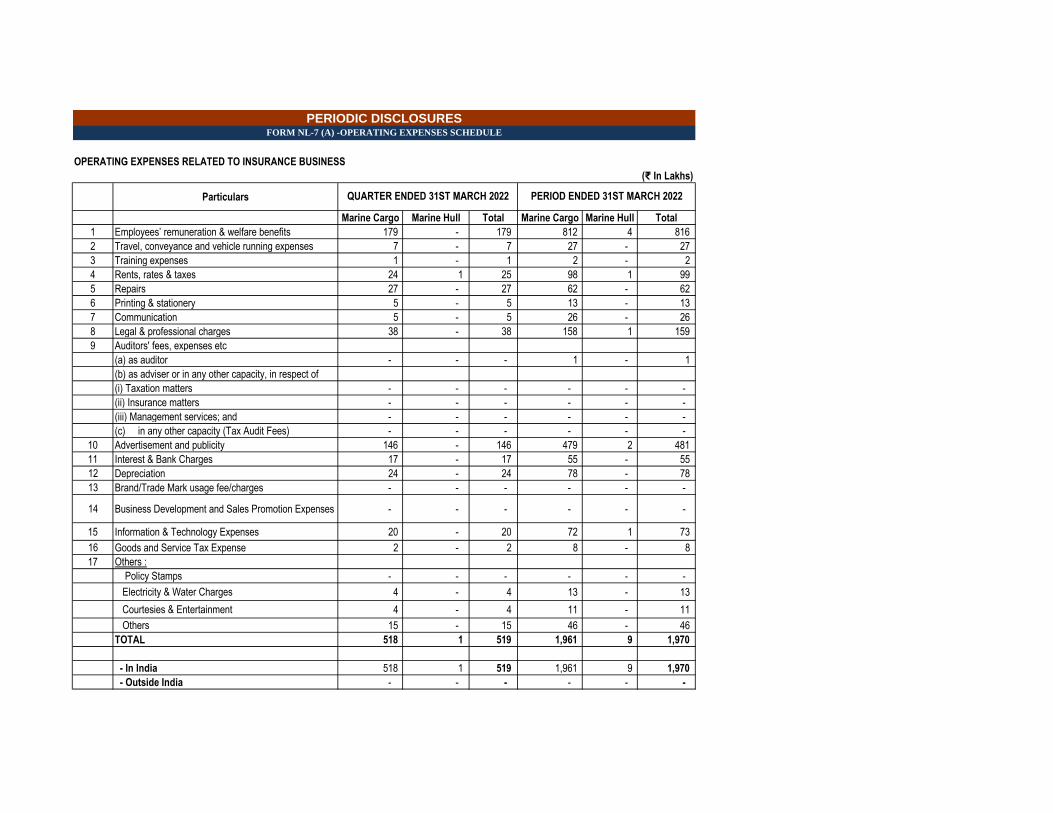
OPERATING EXPENSES RELATED TO INSURANCE BUSINESS
(₹ In Lakhs)
Particulars
Marine Cargo Marine Hull Total Marine Cargo Marine Hull Total
1 Employees’ remuneration & welfare benefits 179 - 179 812 4 816
2 Travel, conveyance and vehicle running expenses 7 - 7 27 - 27
3 Training expenses 1 - 1 2 - 2
4 Rents, rates & taxes 24 1 25 98 1 99
5 Repairs 27 - 27 62 - 62
6 Printing & stationery 5 - 5 13 - 13
7 Communication 5 - 5 26 - 26
8 Legal & professional charges 38 - 38 158 1 159
9 Auditors' fees, expenses etc
(a) as auditor - - - 1 - 1
(b) as adviser or in any other capacity, in respect of
(i) Taxation matters - - - - - -
(ii) Insurance matters - - - - - -
(iii) Management services; and - - - - - -
(c) in any other capacity (Tax Audit Fees) - - - - - -
10 Advertisement and publicity 146 - 146 479 2 481
11 Interest & Bank Charges 17 - 17 55 - 55
12 Depreciation 24 - 24 78 - 78
13 Brand/Trade Mark usage fee/charges - - - - - -
14 Business Development and Sales Promotion Expenses - - - - - -
15 Information & Technology Expenses 20 - 20 72 1 73
16 Goods and Service Tax Expense 2 - 2 8 - 8
17 Others :
Policy Stamps - - - - - -
Electricity & Water Charges 4 - 4 13 - 13
Courtesies & Entertainment 4 - 4 11 - 11
Others 15 - 15 46 - 46
TOTAL 518 1 519 1,961 9 1,970
- In India 518 1 519 1,961 9 1,970
- Outside India - - - - - -
PERIODIC DISCLOSURESFORM NL-7 (A) -OPERATING EXPENSES SCHEDULE
QUARTER ENDED 31ST MARCH 2022 PERIOD ENDED 31ST MARCH 2022
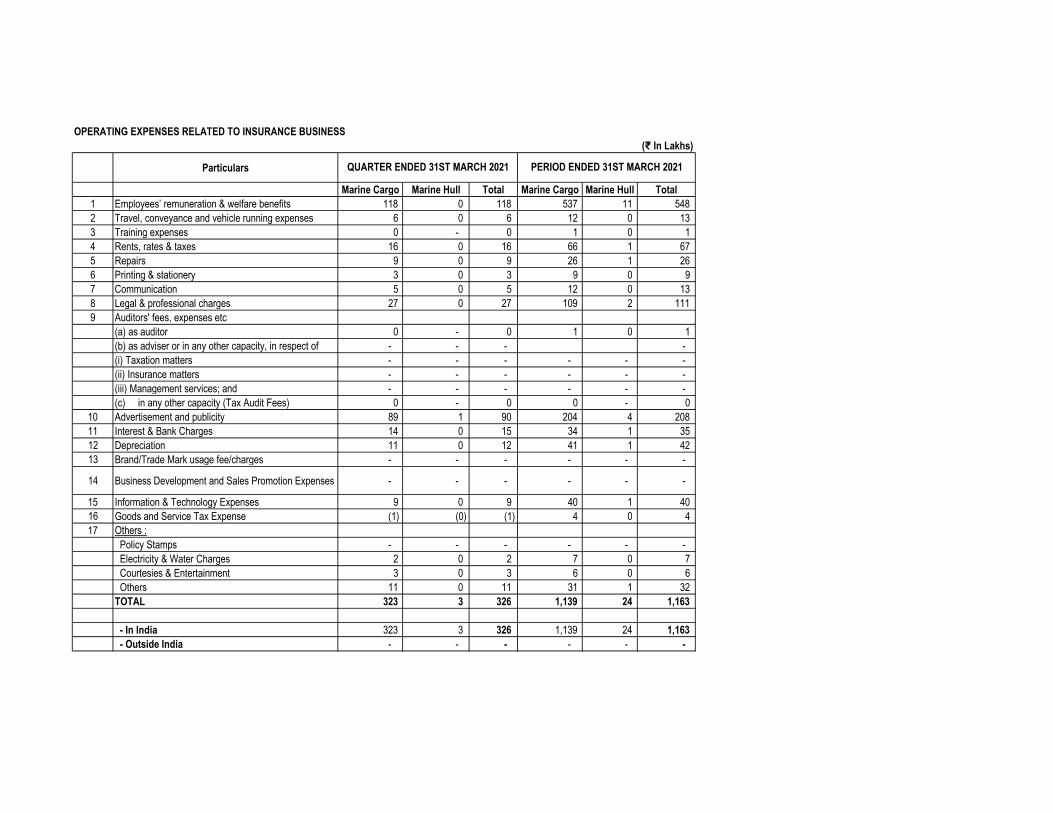
OPERATING EXPENSES RELATED TO INSURANCE BUSINESS
(₹ In Lakhs)
Particulars
Marine Cargo Marine Hull Total Marine Cargo Marine Hull Total
1 Employees’ remuneration & welfare benefits 118 0 118 537 11 548
2 Travel, conveyance and vehicle running expenses 6 0 6 12 0 13
3 Training expenses 0 - 0 1 0 1
4 Rents, rates & taxes 16 0 16 66 1 67
5 Repairs 9 0 9 26 1 26
6 Printing & stationery 3 0 3 9 0 9
7 Communication 5 0 5 12 0 13
8 Legal & professional charges 27 0 27 109 2 111
9 Auditors' fees, expenses etc
(a) as auditor 0 - 0 1 0 1
(b) as adviser or in any other capacity, in respect of - - - -
(i) Taxation matters - - - - - -
(ii) Insurance matters - - - - - -
(iii) Management services; and - - - - - -
(c) in any other capacity (Tax Audit Fees) 0 - 0 0 - 0
10 Advertisement and publicity 89 1 90 204 4 208
11 Interest & Bank Charges 14 0 15 34 1 35
12 Depreciation 11 0 12 41 1 42
13 Brand/Trade Mark usage fee/charges - - - - - -
14 Business Development and Sales Promotion Expenses - - - - - -
15 Information & Technology Expenses 9 0 9 40 1 40
16 Goods and Service Tax Expense (1) (0) (1) 4 0 4
17 Others :
Policy Stamps - - - - - -
Electricity & Water Charges 2 0 2 7 0 7
Courtesies & Entertainment 3 0 3 6 0 6
Others 11 0 11 31 1 32
TOTAL 323 3 326 1,139 24 1,163
- In India 323 3 326 1,139 24 1,163
- Outside India - - - - - -
QUARTER ENDED 31ST MARCH 2021 PERIOD ENDED 31ST MARCH 2021
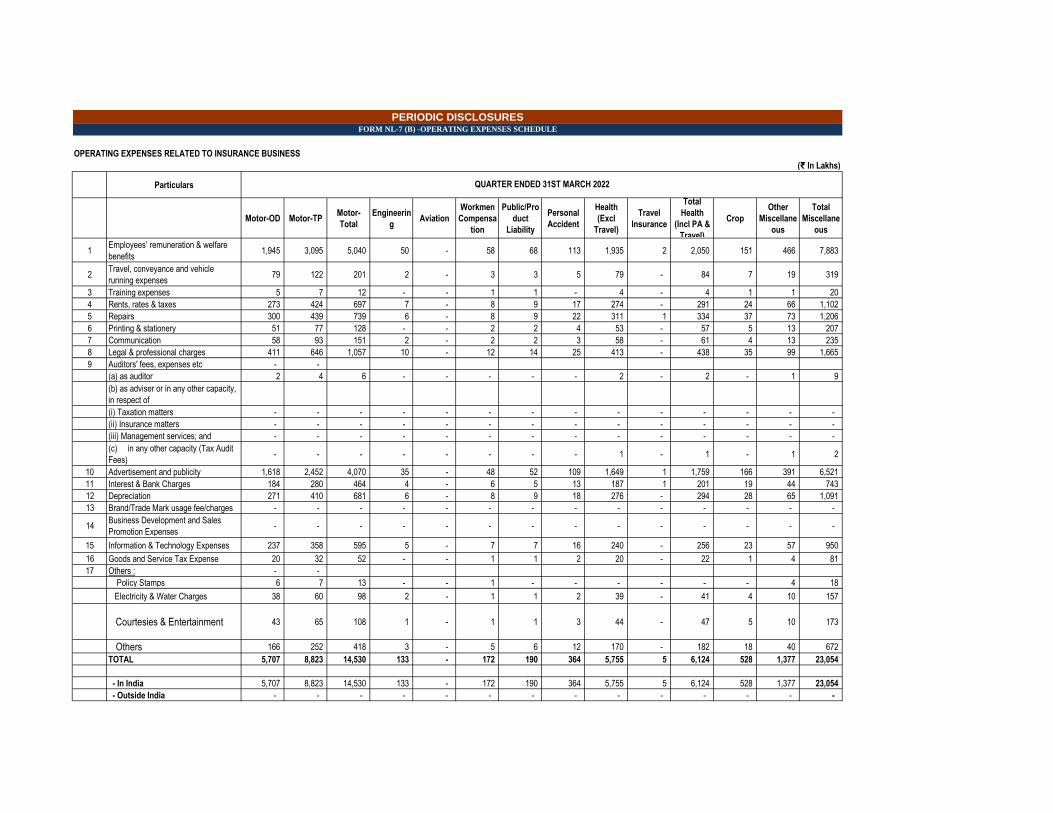
OPERATING EXPENSES RELATED TO INSURANCE BUSINESS
(₹ In Lakhs)
Particulars
Motor-OD Motor-TPMotor-
Total
Engineerin
gAviation
Workmen
Compensa
tion
Public/Pro
duct
Liability
Personal
Accident
Health
(Excl
Travel)
Travel
Insurance
Total
Health
(Incl PA &
Travel)
Crop
Other
Miscellane
ous
Total
Miscellane
ous
1Employees’ remuneration & welfare
benefits 1,945 3,095 5,040 50 - 58 68 113 1,935 2 2,050 151 466 7,883
2Travel, conveyance and vehicle
running expenses 79 122 201 2 - 3 3 5 79 - 84 7 19 319
3 Training expenses 5 7 12 - - 1 1 - 4 - 4 1 1 20
4 Rents, rates & taxes 273 424 697 7 - 8 9 17 274 - 291 24 66 1,102
5 Repairs 300 439 739 6 - 8 9 22 311 1 334 37 73 1,206
6 Printing & stationery 51 77 128 - - 2 2 4 53 - 57 5 13 207
7 Communication 58 93 151 2 - 2 2 3 58 - 61 4 13 235
8 Legal & professional charges 411 646 1,057 10 - 12 14 25 413 - 438 35 99 1,665
9 Auditors' fees, expenses etc - -
(a) as auditor 2 4 6 - - - - - 2 - 2 - 1 9
(b) as adviser or in any other capacity,
in respect of
(i) Taxation matters - - - - - - - - - - - - - -
(ii) Insurance matters - - - - - - - - - - - - - -
(iii) Management services; and - - - - - - - - - - - - - -
(c) in any other capacity (Tax Audit
Fees) - - - - - - - - 1 - 1 - 1 2
10 Advertisement and publicity 1,618 2,452 4,070 35 - 48 52 109 1,649 1 1,759 166 391 6,521
11 Interest & Bank Charges 184 280 464 4 - 6 5 13 187 1 201 19 44 743
12 Depreciation 271 410 681 6 - 8 9 18 276 - 294 28 65 1,091
13 Brand/Trade Mark usage fee/charges - - - - - - - - - - - - - -
14Business Development and Sales
Promotion Expenses - - - - - - - - - - - - - -
15 Information & Technology Expenses 237 358 595 5 - 7 7 16 240 - 256 23 57 950
16 Goods and Service Tax Expense 20 32 52 - - 1 1 2 20 - 22 1 4 81
17 Others : - -
Policy Stamps 6 7 13 - - 1 - - - - - - 4 18
Electricity & Water Charges 38 60 98 2 - 1 1 2 39 - 41 4 10 157
Courtesies & Entertainment 43 65 108 1 - 1 1 3 44 - 47 5 10 173
Others 166 252 418 3 - 5 6 12 170 - 182 18 40 672
TOTAL 5,707 8,823 14,530 133 - 172 190 364 5,755 5 6,124 528 1,377 23,054
- In India 5,707 8,823 14,530 133 - 172 190 364 5,755 5 6,124 528 1,377 23,054
- Outside India - - - - - - - - - - - - - -
PERIODIC DISCLOSURESFORM NL-7 (B) -OPERATING EXPENSES SCHEDULE
QUARTER ENDED 31ST MARCH 2022
OPERATING EXPENSES RELATED TO INSURANCE BUSINESS
(₹ In Lakhs)
Particulars
Motor-OD Motor-TPMotor-
Total
Engineerin
gAviation
Workmen
Compensa
tion
Public/Pro
duct
Liability
Personal
Accident
Health
(Excl
Travel)
Travel
Insurance
Total
Health
(Incl PA &
Crop
Other
Miscellane
ous
Total
Miscellane
ous
1Employees’ remuneration & welfare
benefits 9,292 12,889 22,181 145 - 282 259 763 9,846 8 10,617 1,358 2,263 37,105
2Travel, conveyance and vehicle
running expenses 309 428 737 5 - 10 9 25 327 - 352 45 75 1,233
3 Training expenses 19 27 46 - - 1 1 1 20 - 21 3 5 77
4 Rents, rates & taxes 1,126 1,562 2,688 18 - 34 31 93 1,193 1 1,287 164 274 4,496
5 Repairs 702 975 1,677 11 - 21 20 58 744 1 803 103 171 2,806
6 Printing & stationery 146 203 349 2 - 5 4 12 155 - 167 21 36 584
7 Communication 302 418 720 5 - 9 8 25 320 - 345 44 73 1,204
8 Legal & professional charges 1,809 2,510 4,319 28 - 55 50 149 1,918 1 2,068 265 441 7,226
9 Auditors' fees, expenses etc
(a) as auditor 8 12 20 - - - - 1 9 - 10 1 2 33
(b) as adviser or in any other capacity,
in respect of- -
(i) Taxation matters - - - - - - - - - - - - - -
(ii) Insurance matters - - - - - - - - - - - - - -
(iii) Management services; and - - - - - - - - - - - - - -
(c) in any other capacity (Tax Audit
Fees) 2 3 5 - - - - - 3 - 3 - 1 9
10 Advertisement and publicity 5,482 7,603 13,085 85 - 166 153 451 5,809 4 6,264 801 1,335 21,889
11 Interest & Bank Charges 627 870 1,497 10 - 19 17 52 664 1 717 92 153 2,505
12 Depreciation 900 1,248 2,148 14 - 27 25 74 953 1 1,028 131 220 3,593
13 Brand/Trade Mark usage fee/charges - - - - - - - - - - - - - -
14Business Development and Sales
Promotion Expenses - - - - - - - - - - - - - -
15 Information & Technology Expenses 832 1,153 1,985 13 - 25 23 68 881 1 950 121 203 3,320
16 Goods and Service Tax Expense 91 127 218 1 - 3 3 8 97 - 105 13 22 365
17 Others :
Policy Stamps 16 21 37 - - 2 - 1 - - 1 - 6 46
Electricity & Water Charges 147 204 351 3 - 4 4 12 156 - 168 22 36 588
Courtesies & Entertainment 127 176 303 2 - 4 3 10 134 - 144 19 31 506
Others 522 725 1,247 8 - 16 15 43 553 - 596 76 127 2,085
TOTAL 22,459 31,154 53,613 350 - 683 625 1,846 23,782 18 25,646 3,279 5,474 89,670
- In India 22,459 31,154 53,613 350 - 683 625 1,846 23,782 18 25,646 3,279 5,474 89,670
- Outside India - - - - - - - - - - - - - -
PERIOD ENDED 31ST MARCH 2022
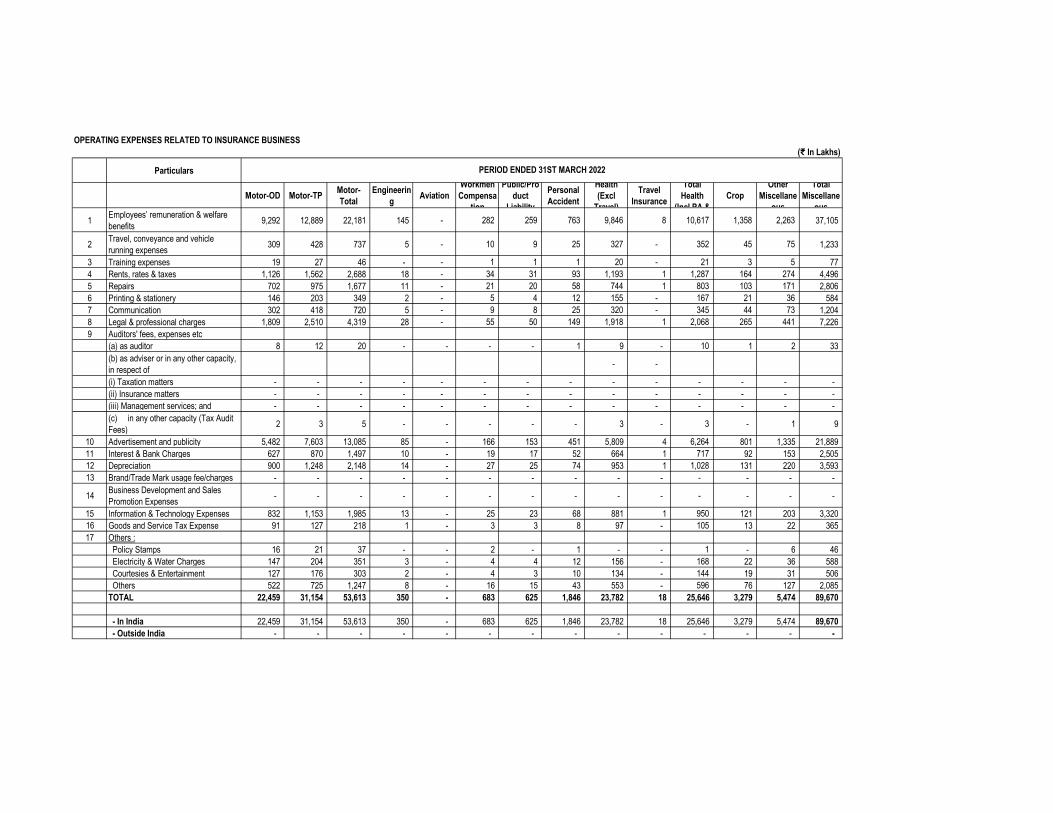
OPERATING EXPENSES RELATED TO INSURANCE BUSINESS
(₹ In Lakhs)
Particulars
Motor-OD Motor-TPMotor-
Total
Engineerin
gAviation
Workmen
Compensa
tion
Public/Pro
duct
Liability
Personal
Accident
Health
(Excl
Travel)
Travel
Insurance
Total
Health
(Incl PA &
Crop
Other
Miscellane
ous
Total
Miscellane
ous
1Employees’ remuneration & welfare
benefits 2,467 4,027 6,493 32 - 61 44 91 1,551 1 1,643 130 242 8,645
2Travel, conveyance and vehicle
running expenses 113 172 285 1 - 3 2 7 102 0 108 21 12 433
3 Training expenses 4 6 9 0 - 0 0 0 3 - 3 0 0 13
4 Rents, rates & taxes 327 529 856 4 - 8 6 13 219 0 232 24 32 1,163
5 Repairs 170 266 436 2 - 4 3 9 135 0 143 23 17 629
6 Printing & stationery 60 93 153 1 - 2 1 3 49 0 52 9 6 224
7 Communication 94 145 239 1 - 2 2 5 79 0 84 15 10 354
8 Legal & professional charges 549 884 1,433 7 - 14 10 22 371 0 394 42 54 1,955
9 Auditors' fees, expenses etc
(a) as auditor 3 5 9 0 - 0 0 0 3 - 3 1 0 13
(b) as adviser or in any other capacity,
in respect of - - - - - - - - - - - - -
(i) Taxation matters - - - - - - - - - - - - - -
(ii) Insurance matters - - - - - - - - - - - - - -
(iii) Management services; and - - - - - - - - - - - - - -
(c) in any other capacity (Tax Audit
Fees) 1 2 2 0 - 0 0 0 1 - 1 0 0 4
10 Advertisement and publicity 1,629 2,498 4,126 21 - 43 35 90 1,399 1 1,490 275 168 6,158
11 Interest & Bank Charges 263 405 668 3 - 7 6 14 223 0 237 43 27 991
12 Depreciation 228 363 590 3 - 6 4 10 163 0 173 22 23 822
13 Brand/Trade Mark usage fee/charges - - - - - - - - - - - - - -
14Business Development and Sales
Promotion Expenses - - - - - - - - - - - - - -
15 Information & Technology Expenses 186 303 489 2 - 5 3 7 119 (0) 126 11 18 655
16 Goods and Service Tax Expense (7) (6) (14) (0) - (0) (0) (1) (19) - (20) (8) (1) (43)
17 Others :
Policy Stamps 8 12 20 0 - 1 - 0 0 0 0 - 4 26
Electricity & Water Charges 40 63 103 1 - 1 1 2 29 0 31 4 4 145
Courtesies & Entertainment 46 70 116 1 - 1 1 3 39 0 42 8 5 173
Others 200 313 513 3 - 5 4 10 157 (0) 167 26 20 738
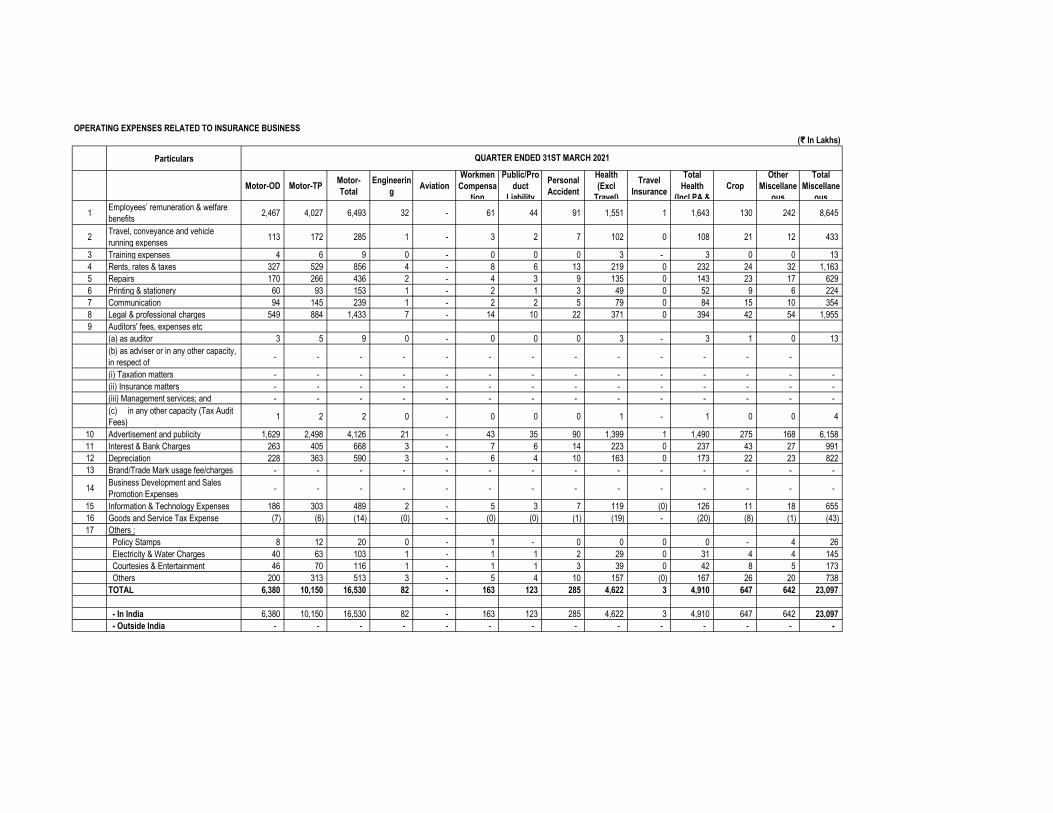
TOTAL 6,380 10,150 16,530 82 - 163 123 285 4,622 3 4,910 647 642 23,097
- In India 6,380 10,150 16,530 82 - 163 123 285 4,622 3 4,910 647 642 23,097
- Outside India - - - - - - - - - - - - - -
QUARTER ENDED 31ST MARCH 2021

OPERATING EXPENSES RELATED TO INSURANCE BUSINESS
(₹ In Lakhs)
Particulars
Motor-OD Motor-TPMotor-
Total
Engineerin
gAviation
Workmen
Compensa
tion
Public/Pro
duct
Liability
Personal
Accident
Health
(Excl
Travel)
Travel
Insurance
Total
Health
(Incl PA &
Crop
Other
Miscellane
ous
Total
Miscellane
ous
1Employees’ remuneration & welfare
benefits 9,000 13,176 22,176 120 - 246 217 617 9,194 4 9,815 2,259 957 35,789
2Travel, conveyance and vehicle
running expenses 208 304 512 3 - 6 5 14 212 0 227 52 22 826
3 Training expenses 11 16 27 0 - 0 0 1 11 - 12 3 1 43
4 Rents, rates & taxes 1,107 1,621 2,729 15 - 30 27 76 1,131 0 1,208 278 118 4,404
5 Repairs 432 632 1,064 6 - 12 10 30 441 0 471 108 46 1,718
6 Printing & stationery 144 211 355 2 - 4 3 10 147 0 157 36 15 572
7 Communication 209 307 516 3 - 6 5 14 214 0 228 53 22 833
8 Legal & professional charges 1,824 2,671 4,496 24 - 50 44 125 1,864 1 1,990 458 194 7,255
9 Auditors' fees, expenses etc
(a) as auditor 9 13 21 0 - 0 0 1 9 - 9 2 1 34
(b) as adviser or in any other capacity,
in respect of - - - - - - - - - - -
(i) Taxation matters - - - - - - - - - - - - - -
(ii) Insurance matters - - - - - - - - - - - - - -
(iii) Management services; and - - - - - - - - - - - - - -
(c) in any other capacity (Tax Audit
Fees) 2 3 5 0 - 0 0 0 2 - 2 1 0 9
10 Advertisement and publicity 3,413 4,997 8,409 45 - 93 82 234 3,486 1 3,722 857 363 13,572
11 Interest & Bank Charges 574 841 1,415 8 - 16 14 39 587 0 626 144 61 2,284
12 Depreciation 694 1,016 1,709 9 - 19 17 48 709 0 757 174 74 2,759
13 Brand/Trade Mark usage fee/charges - - - - - - - - - - - - - -
14Business Development and Sales
Promotion Expenses - - - - - - - - - - - - - -
15 Information & Technology Expenses 663 971 1,634 9 - 18 16 45 678 0 723 166 71 2,637
16 Goods and Service Tax Expense 68 100 168 1 - 2 2 5 70 0 74 17 7 271
17 Others :
Policy Stamps 15 22 37 0 - 2 0 0 1 0 1 - 8 48
Electricity & Water Charges 118 173 292 2 - 3 3 8 121 0 129 30 13 471
Courtesies & Entertainment 98 144 242 1 - 3 2 7 100 0 107 25 10 390
Others 520 761 1,281 7 - 14 13 36 531 - 567 130 55 2,067
TOTAL 19,110 27,978 47,088 255 - 523 460 1,309 19,507 8 20,825 4,793 2,038 75,981
- In India 19,110 27,978 47,088 255 - 523 460 1,309 19,507 8 20,825 4,793 2,038 75,981
- Outside India - - - - - - - - - - - - - -
PERIOD ENDED 31ST MARCH 2021
(₹ In Lakhs)
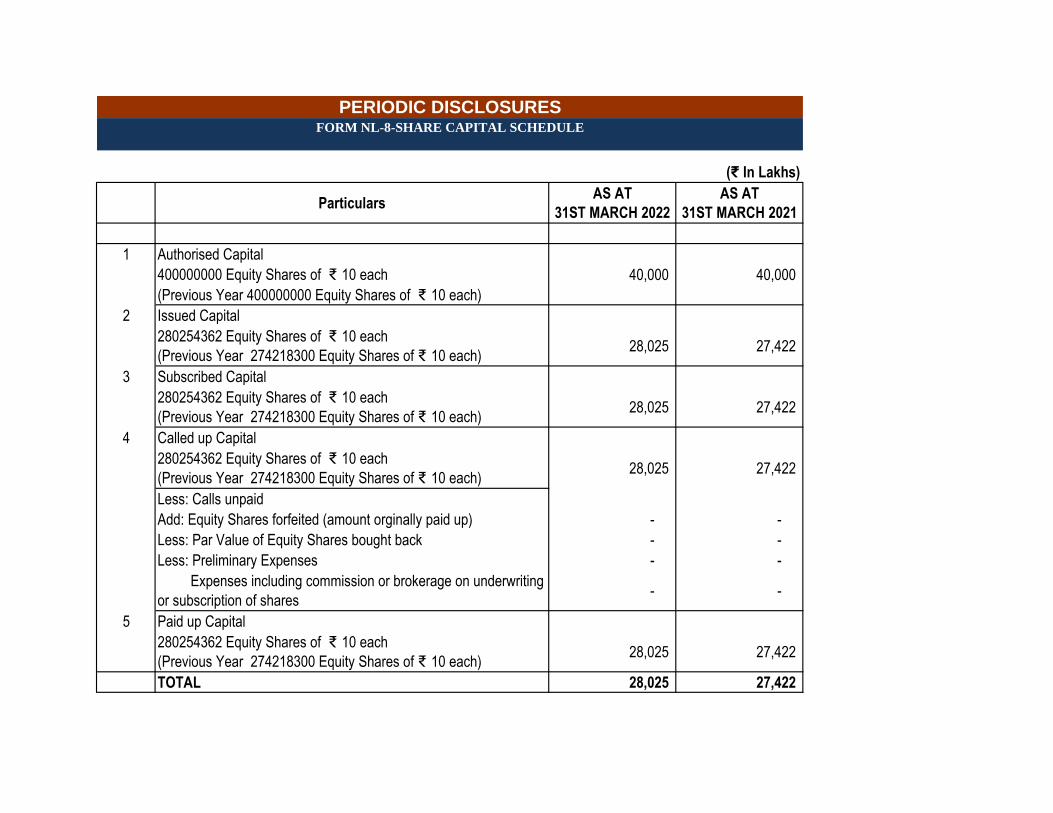
ParticularsAS AT
31ST MARCH 2022
AS AT
31ST MARCH 2021
1 Authorised Capital
400000000 Equity Shares of ₹ 10 each 40,000 40,000
(Previous Year 400000000 Equity Shares of ₹ 10 each)
2 Issued Capital
280254362 Equity Shares of ₹ 10 each
(Previous Year 274218300 Equity Shares of ₹ 10 each)28,025 27,422
3 Subscribed Capital
280254362 Equity Shares of ₹ 10 each
(Previous Year 274218300 Equity Shares of ₹ 10 each)28,025 27,422
4 Called up Capital
280254362 Equity Shares of ₹ 10 each
(Previous Year 274218300 Equity Shares of ₹ 10 each)28,025 27,422
Less: Calls unpaid
Add: Equity Shares forfeited (amount orginally paid up) - -
Less: Par Value of Equity Shares bought back - -
Less: Preliminary Expenses - -
Expenses including commission or brokerage on underwriting
or subscription of shares- -
5 Paid up Capital
280254362 Equity Shares of ₹ 10 each
(Previous Year 274218300 Equity Shares of ₹ 10 each)28,025 27,422
TOTAL 28,025 27,422
PERIODIC DISCLOSURESFORM NL-8-SHARE CAPITAL SCHEDULE
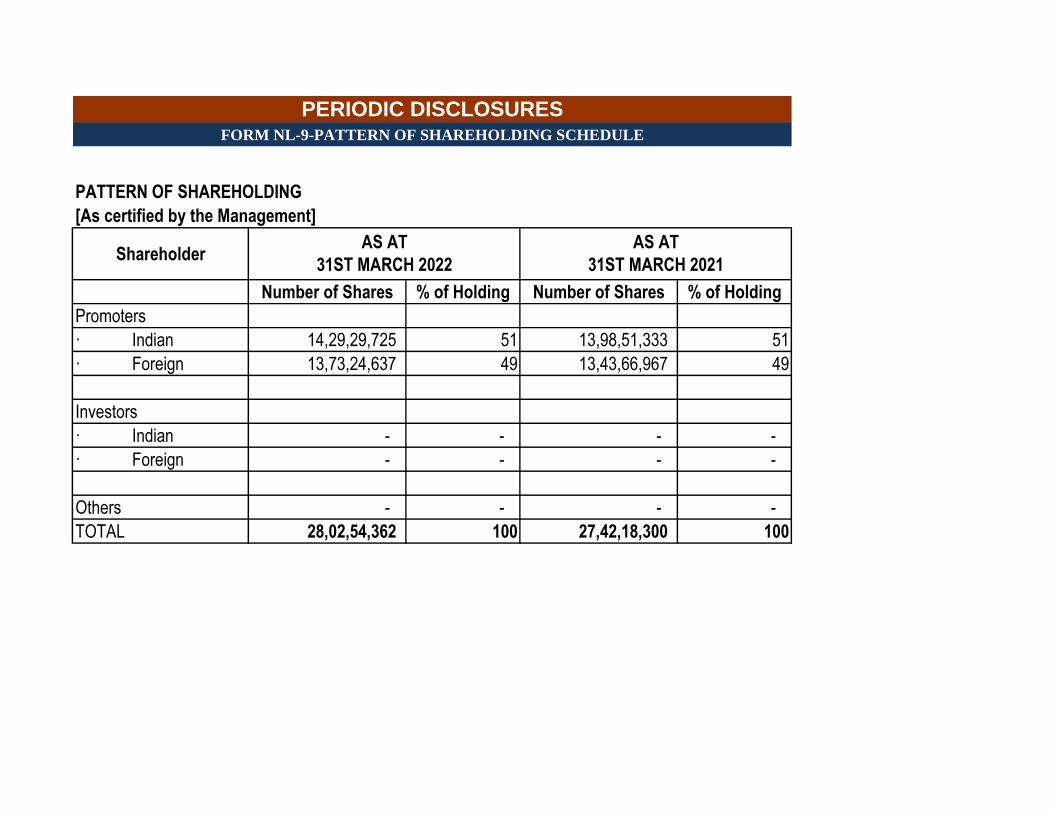
PATTERN OF SHAREHOLDING
[As certified by the Management]
Shareholder
Number of Shares % of Holding Number of Shares % of Holding
Promoters
· Indian 14,29,29,725 51 13,98,51,333 51
· Foreign 13,73,24,637 49 13,43,66,967 49
Investors
· Indian - - - -
· Foreign - - - -
Others - - - -
TOTAL 28,02,54,362 100 27,42,18,300 100
PERIODIC DISCLOSURESFORM NL-9-PATTERN OF SHAREHOLDING SCHEDULE
AS AT
31ST MARCH 2022
AS AT
31ST MARCH 2021
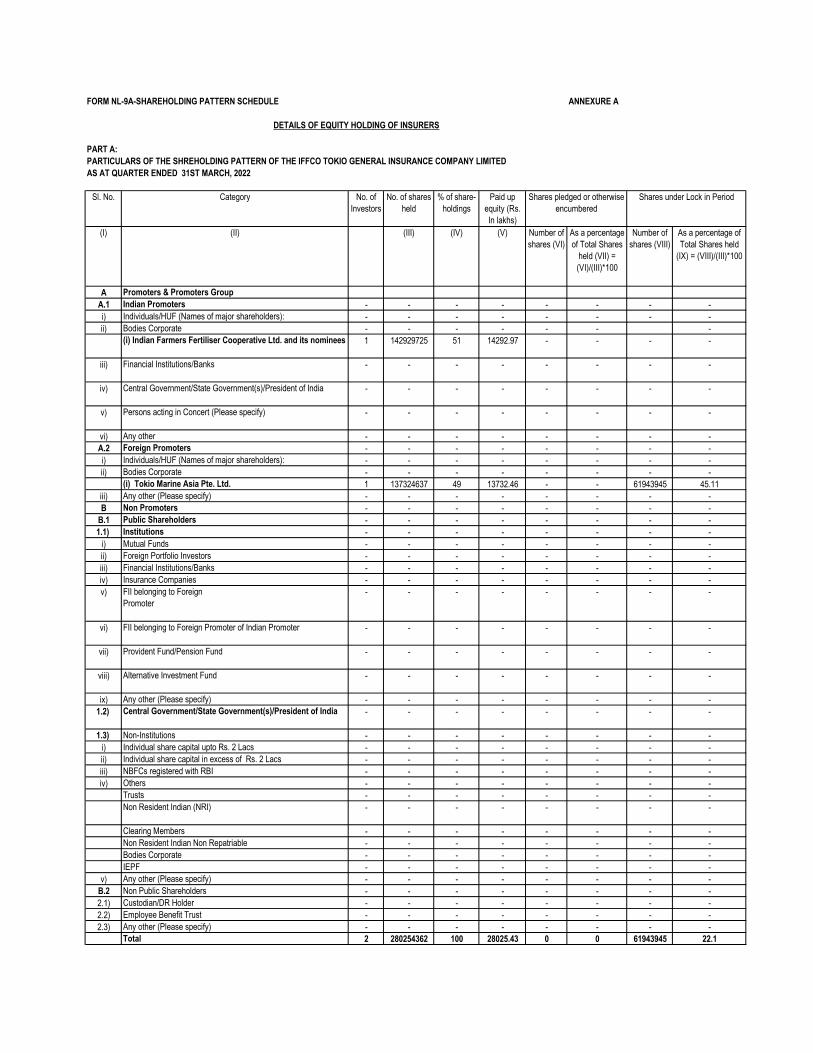
FORM NL-9A-SHAREHOLDING PATTERN SCHEDULE ANNEXURE A
PART A:
PARTICULARS OF THE SHREHOLDING PATTERN OF THE IFFCO TOKIO GENERAL INSURANCE COMPANY LIMITED
AS AT QUARTER ENDED 31ST MARCH, 2022
Sl. No. Category No. of
Investors
No. of shares
held
% of share-
holdings
Paid up
equity (Rs.
In lakhs)
(I) (II) (III) (IV) (V) Number of
shares (VI)
As a percentage
of Total Shares
held (VII) =
(VI)/(III)*100
Number of
shares (VIII)
As a percentage of
Total Shares held
(IX) = (VIII)/(III)*100
A Promoters & Promoters Group
A.1 Indian Promoters - - - - - - - -
i) Individuals/HUF (Names of major shareholders): - - - - - - - -
ii) Bodies Corporate - - - - - - -
(i) Indian Farmers Fertiliser Cooperative Ltd. and its nominees 1 142929725 51 14292.97 - - - -
iii) Financial Institutions/Banks - - - - - - - -
iv) Central Government/State Government(s)/President of India - - - - - - - -
v) Persons acting in Concert (Please specify) - - - - - - - -
vi) Any other - - - - - - - -
A.2 Foreign Promoters - - - - - - - -
i) Individuals/HUF (Names of major shareholders): - - - - - - - -
ii) Bodies Corporate - - - - - - - -
(i) Tokio Marine Asia Pte. Ltd. 1 137324637 49 13732.46 - - 61943945 45.11
iii) Any other (Please specify) - - - - - - - -
B Non Promoters - - - - - - - -
B.1 Public Shareholders - - - - - - - -
1.1) Institutions - - - - - - - -
i) Mutual Funds - - - - - - - -
ii) Foreign Portfolio Investors - - - - - - - -
iii) Financial Institutions/Banks - - - - - - - -
iv) Insurance Companies - - - - - - - -
v) FII belonging to Foreign
Promoter
- - - - - - - -
vi) FII belonging to Foreign Promoter of Indian Promoter - - - - - - - -
vii) Provident Fund/Pension Fund - - - - - - - -
viii) Alternative Investment Fund - - - - - - - -
ix) Any other (Please specify) - - - - - - - -
1.2) Central Government/State Government(s)/President of India - - - - - - - -
1.3) Non-Institutions - - - - - - - -
i) Individual share capital upto Rs. 2 Lacs - - - - - - - -
ii) Individual share capital in excess of Rs. 2 Lacs - - - - - - - -
iii) NBFCs registered with RBI - - - - - - - -
iv) Others - - - - - - - -
Trusts - - - - - - - -
Non Resident Indian (NRI) - - - - - - - -
Clearing Members - - - - - - - -
Non Resident Indian Non Repatriable - - - - - - - -
Bodies Corporate - - - - - - - -
IEPF - - - - - - - -
v) Any other (Please specify) - - - - - - - -
B.2 Non Public Shareholders - - - - - - - -
2.1) Custodian/DR Holder - - - - - - - -
2.2) Employee Benefit Trust - - - - - - - -
2.3) Any other (Please specify) - - - - - - - -
Total 2 280254362 100 28025.43 0 0 61943945 22.1
DETAILS OF EQUITY HOLDING OF INSURERS
Shares pledged or otherwise
encumbered
Shares under Lock in Period
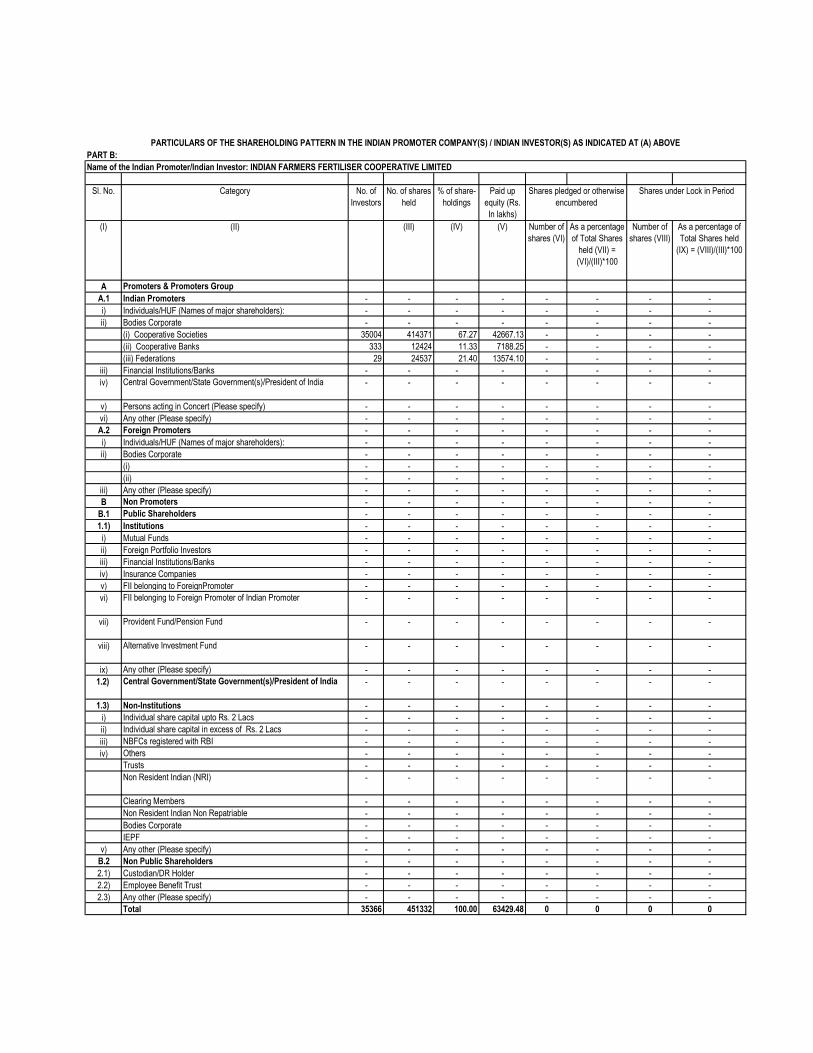
PART B:
Sl. No. Category No. of
Investors
No. of shares
held
% of share-
holdings
Paid up
equity (Rs.
In lakhs)
(I) (II) (III) (IV) (V) Number of
shares (VI)
As a percentage
of Total Shares
held (VII) =
(VI)/(III)*100
Number of
shares (VIII)
As a percentage of
Total Shares held
(IX) = (VIII)/(III)*100
A Promoters & Promoters Group
A.1 Indian Promoters - - - - - - - -
i) Individuals/HUF (Names of major shareholders): - - - - - - - -
ii) Bodies Corporate - - - - - - - -
(i) Cooperative Societies 35004 414371 67.27 42667.13 - - - -
(ii) Cooperative Banks 333 12424 11.33 7188.25 - - - -
(iii) Federations 29 24537 21.40 13574.10 - - - -
iii) Financial Institutions/Banks - - - - - - - -
iv) Central Government/State Government(s)/President of India - - - - - - - -
v) Persons acting in Concert (Please specify) - - - - - - - -
vi) Any other (Please specify) - - - - - - - -
A.2 Foreign Promoters - - - - - - - -
i) Individuals/HUF (Names of major shareholders): - - - - - - - -
ii) Bodies Corporate - - - - - - - -
(i) - - - - - - - -
(ii) - - - - - - - -
iii) Any other (Please specify) - - - - - - - -
B Non Promoters - - - - - - - -
B.1 Public Shareholders - - - - - - - -
1.1) Institutions - - - - - - - -
i) Mutual Funds - - - - - - - -
ii) Foreign Portfolio Investors - - - - - - - -
iii) Financial Institutions/Banks - - - - - - - -
iv) Insurance Companies - - - - - - - -
v) FII belonging to Foreign Promoter - - - - - - - -
vi) FII belonging to Foreign Promoter of Indian Promoter - - - - - - - -
vii) Provident Fund/Pension Fund - - - - - - - -
viii) Alternative Investment Fund - - - - - - - -
ix) Any other (Please specify) - - - - - - - -
1.2) Central Government/State Government(s)/President of India - - - - - - - -
1.3) Non-Institutions - - - - - - - -
i) Individual share capital upto Rs. 2 Lacs - - - - - - - -
ii) Individual share capital in excess of Rs. 2 Lacs - - - - - - - -
iii) NBFCs registered with RBI - - - - - - - -
iv) Others - - - - - - - -
Trusts - - - - - - - -
Non Resident Indian (NRI) - - - - - - - -
Clearing Members - - - - - - - -
Non Resident Indian Non Repatriable - - - - - - - -
Bodies Corporate - - - - - - - -
IEPF - - - - - - - -
v) Any other (Please specify) - - - - - - - -
B.2 Non Public Shareholders - - - - - - - -
2.1) Custodian/DR Holder - - - - - - - -
2.2) Employee Benefit Trust - - - - - - - -
2.3) Any other (Please specify) - - - - - - - -
Total 35366 451332 100.00 63429.48 0 0 0 0
Shares pledged or otherwise
encumbered
Shares under Lock in Period
PARTICULARS OF THE SHAREHOLDING PATTERN IN THE INDIAN PROMOTER COMPANY(S) / INDIAN INVESTOR(S) AS INDICATED AT (A) ABOVE
Name of the Indian Promoter/lndian Investor: INDIAN FARMERS FERTILISER COOPERATIVE LIMITED
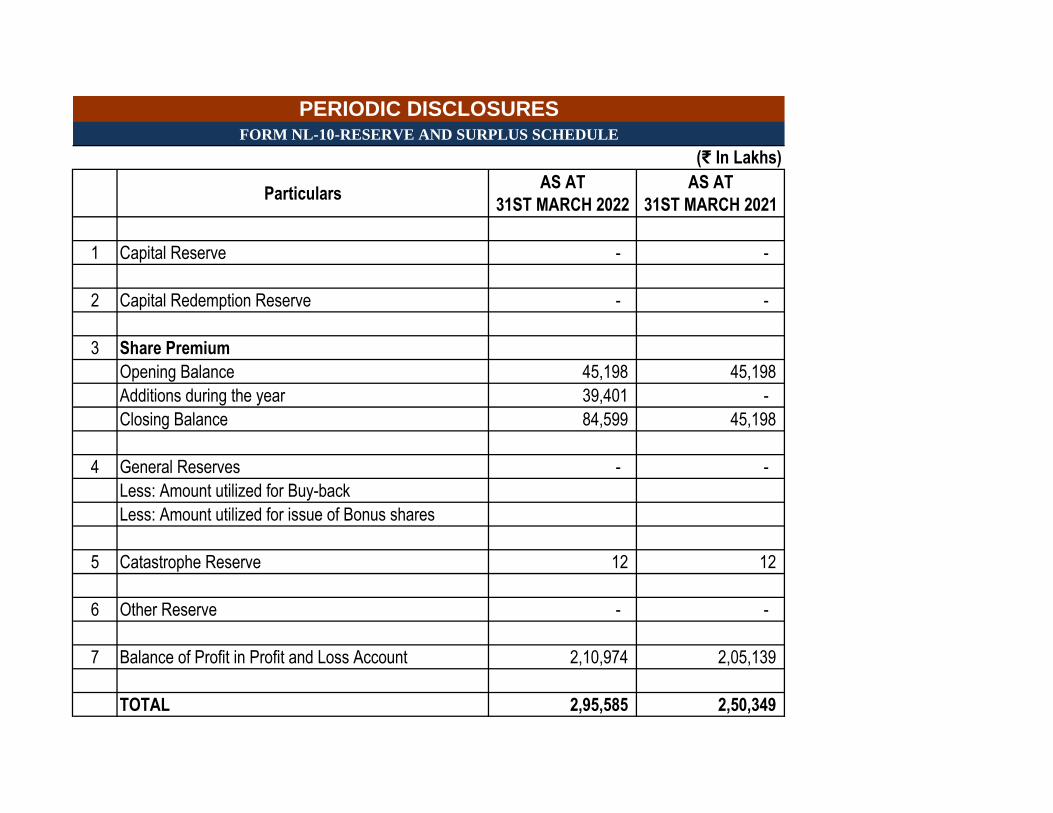
(₹ In Lakhs)
ParticularsAS AT
31ST MARCH 2022
AS AT
31ST MARCH 2021
1 Capital Reserve - -
2 Capital Redemption Reserve - -
3 Share Premium
Opening Balance 45,198 45,198
Additions during the year 39,401 -
Closing Balance 84,599 45,198
4 General Reserves - -
Less: Amount utilized for Buy-back
Less: Amount utilized for issue of Bonus shares
5 Catastrophe Reserve 12 12
6 Other Reserve - -
7 Balance of Profit in Profit and Loss Account 2,10,974 2,05,139
TOTAL 2,95,585 2,50,349
PERIODIC DISCLOSURESFORM NL-10-RESERVE AND SURPLUS SCHEDULE
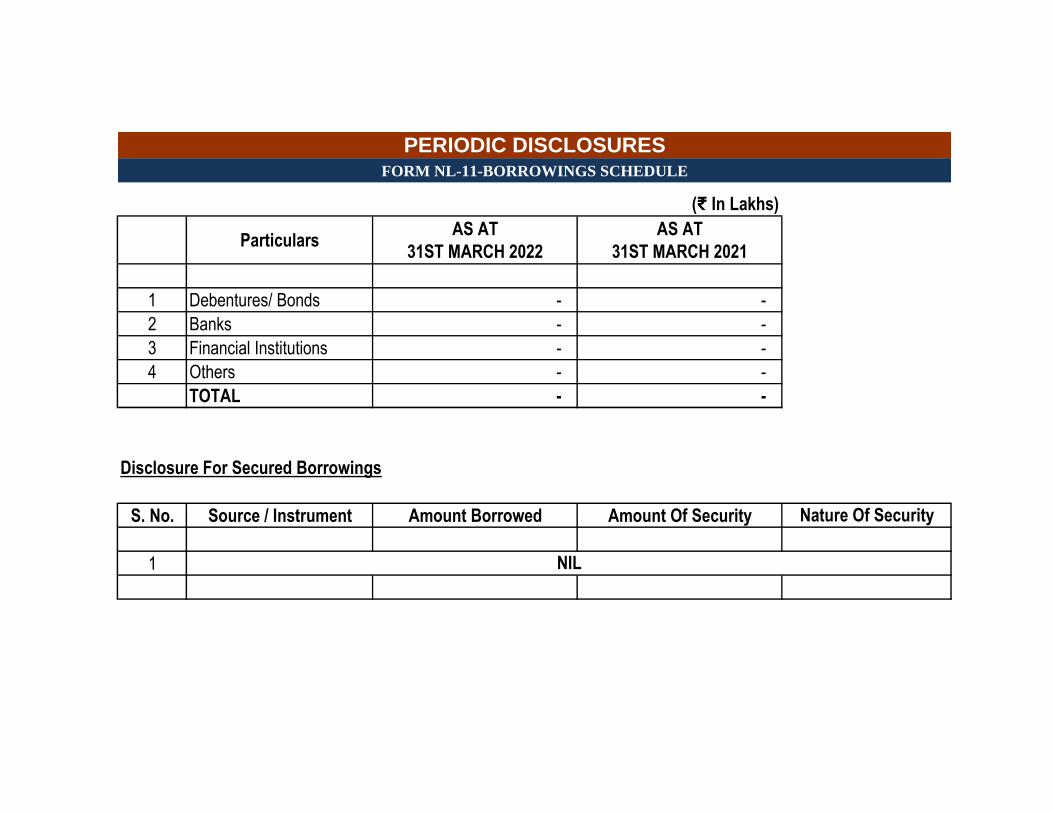
(₹ In Lakhs)
ParticularsAS AT
31ST MARCH 2022
AS AT
31ST MARCH 2021
1 Debentures/ Bonds - -
2 Banks - -
3 Financial Institutions - -
4 Others - -
TOTAL - -
Disclosure For Secured Borrowings
S. No. Source / Instrument Amount Borrowed Amount Of Security Nature Of Security
1 NIL
PERIODIC DISCLOSURESFORM NL-11-BORROWINGS SCHEDULE
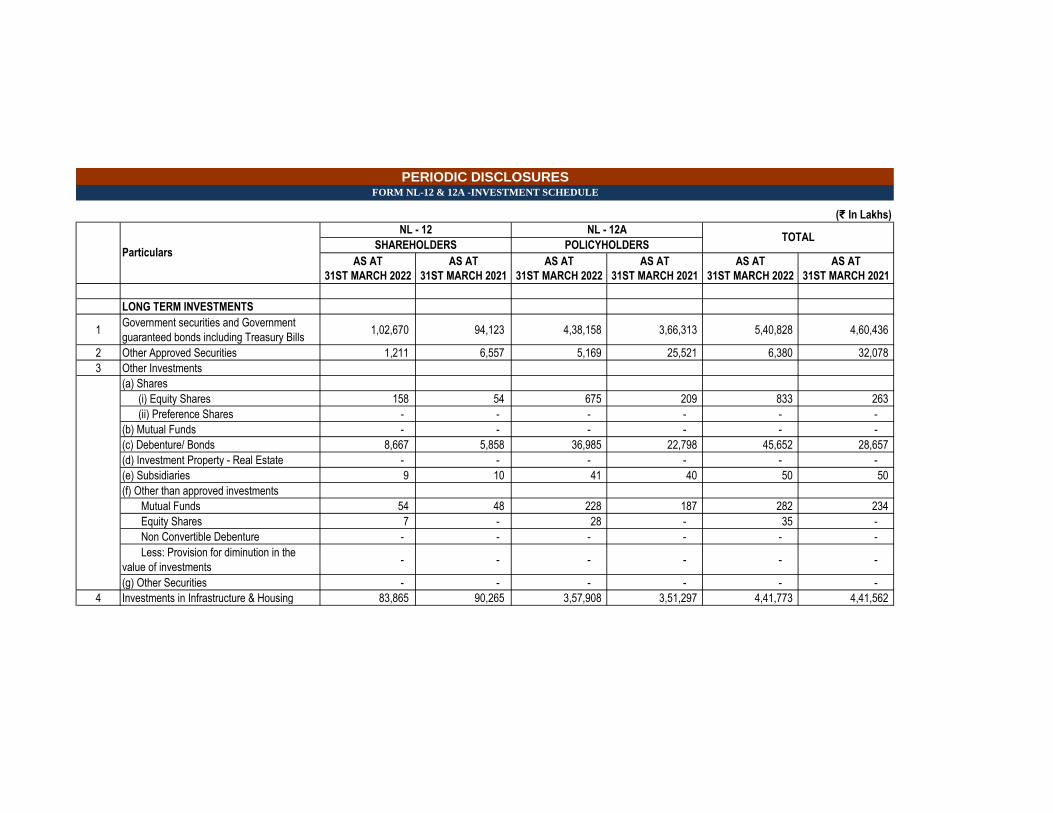
(₹ In Lakhs)
AS AT
31ST MARCH 2022
AS AT
31ST MARCH 2021
AS AT
31ST MARCH 2022
AS AT
31ST MARCH 2021
AS AT
31ST MARCH 2022
AS AT
31ST MARCH 2021
LONG TERM INVESTMENTS
1Government securities and Government
guaranteed bonds including Treasury Bills 1,02,670 94,123 4,38,158 3,66,313 5,40,828 4,60,436
2 Other Approved Securities 1,211 6,557 5,169 25,521 6,380 32,078
3 Other Investments
(a) Shares
(i) Equity Shares 158 54 675 209 833 263
(ii) Preference Shares - - - - - -
(b) Mutual Funds - - - - - -
(c) Debenture/ Bonds 8,667 5,858 36,985 22,798 45,652 28,657
(d) Investment Property - Real Estate - - - - - -
(e) Subsidiaries 9 10 41 40 50 50
(f) Other than approved investments
Mutual Funds 54 48 228 187 282 234
Equity Shares 7 - 28 - 35 -
Non Convertible Debenture - - - - - -
Less: Provision for diminution in the
value of investments - - - - - -
(g) Other Securities - - - - - -
4 Investments in Infrastructure & Housing 83,865 90,265 3,57,908 3,51,297 4,41,773 4,41,562
SHAREHOLDERS
PERIODIC DISCLOSURESFORM NL-12 & 12A -INVESTMENT SCHEDULE
Particulars
TOTALPOLICYHOLDERS
NL - 12ANL - 12
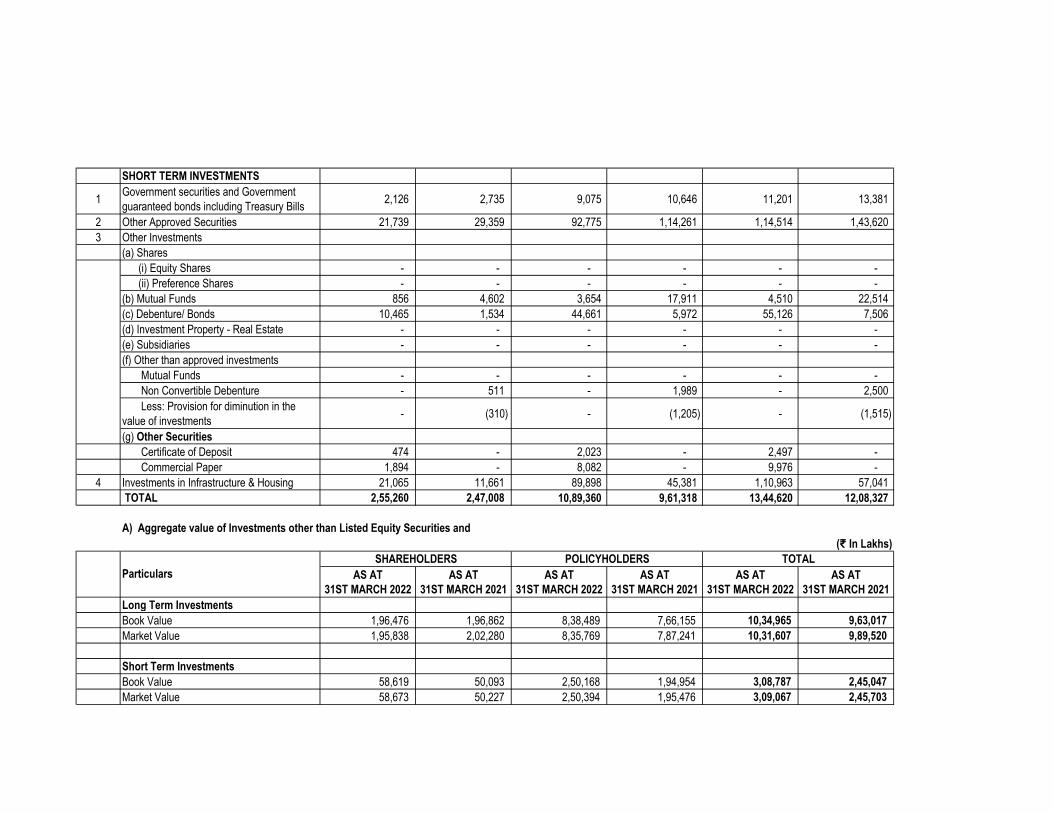
SHORT TERM INVESTMENTS
1Government securities and Government
guaranteed bonds including Treasury Bills 2,126 2,735 9,075 10,646 11,201 13,381
2 Other Approved Securities 21,739 29,359 92,775 1,14,261 1,14,514 1,43,620
3 Other Investments
(a) Shares
(i) Equity Shares - - - - - -
(ii) Preference Shares - - - - - -
(b) Mutual Funds 856 4,602 3,654 17,911 4,510 22,514
(c) Debenture/ Bonds 10,465 1,534 44,661 5,972 55,126 7,506
(d) Investment Property - Real Estate - - - - - -
(e) Subsidiaries - - - - - -
(f) Other than approved investments
Mutual Funds - - - - - -
Non Convertible Debenture - 511 - 1,989 - 2,500
Less: Provision for diminution in the
value of investments - (310) - (1,205) - (1,515)
(g) Other Securities
Certificate of Deposit 474 - 2,023 - 2,497 -
Commercial Paper 1,894 - 8,082 - 9,976 -
4 Investments in Infrastructure & Housing 21,065 11,661 89,898 45,381 1,10,963 57,041
TOTAL 2,55,260 2,47,008 10,89,360 9,61,318 13,44,620 12,08,327
(₹ In Lakhs)
AS AT
31ST MARCH 2022
AS AT
31ST MARCH 2021
AS AT
31ST MARCH 2022
AS AT
31ST MARCH 2021
AS AT
31ST MARCH 2022
AS AT
31ST MARCH 2021
Long Term Investments
Book Value 1,96,476 1,96,862 8,38,489 7,66,155 10,34,965 9,63,017
Market Value 1,95,838 2,02,280 8,35,769 7,87,241 10,31,607 9,89,520
Short Term Investments
Book Value 58,619 50,093 2,50,168 1,94,954 3,08,787 2,45,047
Market Value 58,673 50,227 2,50,394 1,95,476 3,09,067 2,45,703
A) Aggregate value of Investments other than Listed Equity Securities and
SHAREHOLDERS
Particulars
POLICYHOLDERS TOTAL
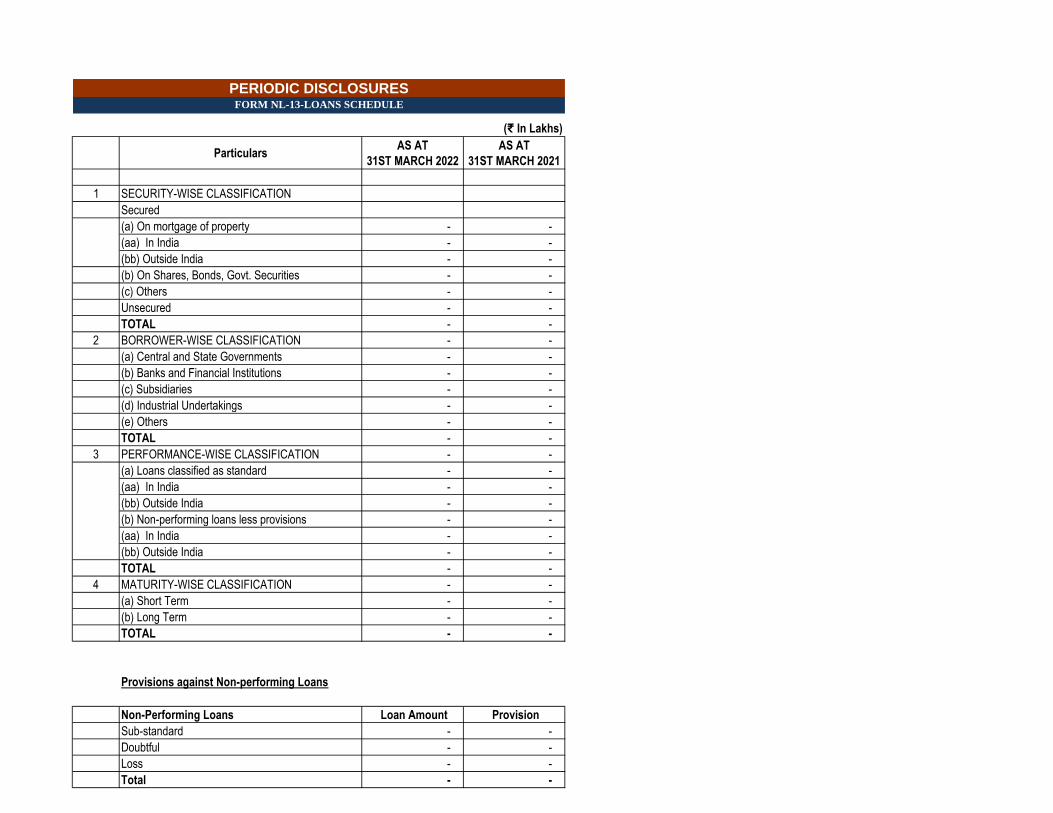
(₹ In Lakhs)
ParticularsAS AT
31ST MARCH 2022
AS AT
31ST MARCH 2021
1 SECURITY-WISE CLASSIFICATION
Secured
(a) On mortgage of property - -
(aa) In India - -
(bb) Outside India - -
(b) On Shares, Bonds, Govt. Securities - -
(c) Others - -
Unsecured - -
TOTAL - -
2 BORROWER-WISE CLASSIFICATION - -
(a) Central and State Governments - -
(b) Banks and Financial Institutions - -
(c) Subsidiaries - -
(d) Industrial Undertakings - -
(e) Others - -
TOTAL - -
3 PERFORMANCE-WISE CLASSIFICATION - -
(a) Loans classified as standard - -
(aa) In India - -
(bb) Outside India - -
(b) Non-performing loans less provisions - -
(aa) In India - -
(bb) Outside India - -
TOTAL - -
4 MATURITY-WISE CLASSIFICATION - -
(a) Short Term - -
(b) Long Term - -
TOTAL - -
Provisions against Non-performing Loans
Non-Performing Loans Loan Amount Provision
Sub-standard - -
Doubtful - -
Loss - -
Total - -
PERIODIC DISCLOSURESFORM NL-13-LOANS SCHEDULE
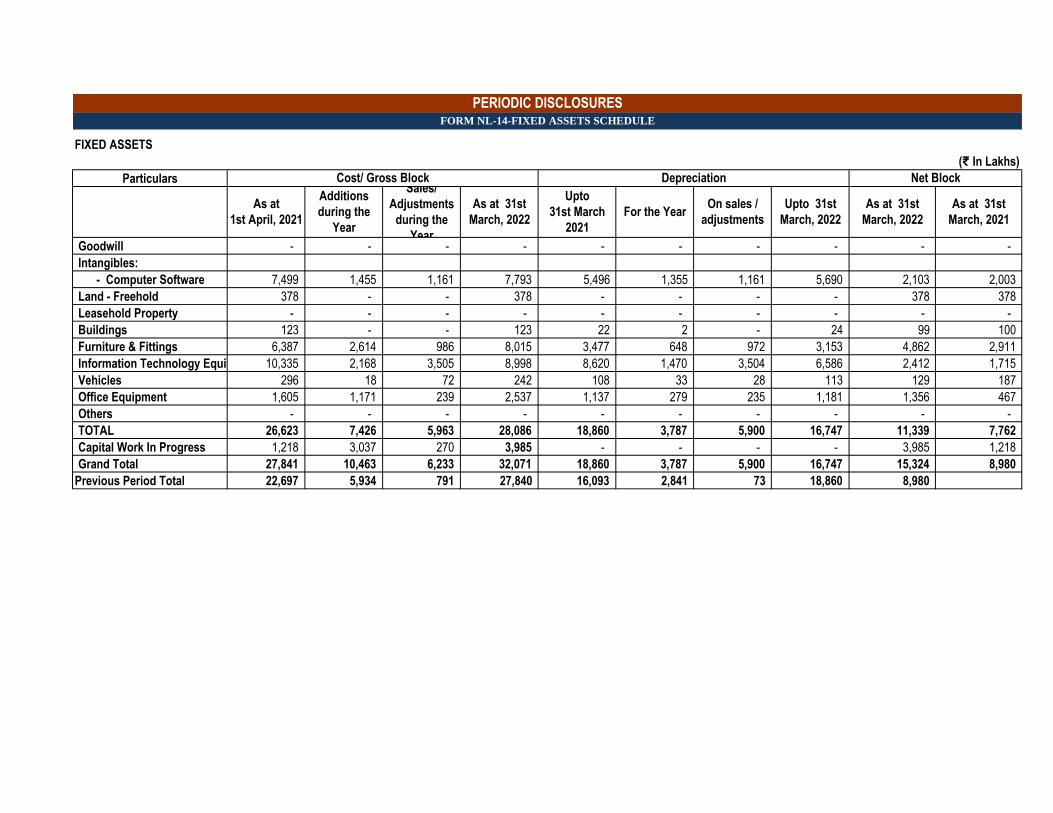
FIXED ASSETS
(₹ In Lakhs)
Particulars
Goodwill - - - - - - - - - -
Intangibles:
- Computer Software 7,499 1,455 1,161 7,793 5,496 1,355 1,161 5,690 2,103 2,003
Land - Freehold 378 - - 378 - - - - 378 378
Leasehold Property - - - - - - - - - -
Buildings 123 - - 123 22 2 - 24 99 100
Furniture & Fittings 6,387 2,614 986 8,015 3,477 648 972 3,153 4,862 2,911
Information Technology Equipment 10,335 2,168 3,505 8,998 8,620 1,470 3,504 6,586 2,412 1,715
Vehicles 296 18 72 242 108 33 28 113 129 187
Office Equipment 1,605 1,171 239 2,537 1,137 279 235 1,181 1,356 467
Others - - - - - - - - - -
TOTAL 26,623 7,426 5,963 28,086 18,860 3,787 5,900 16,747 11,339 7,762
Capital Work In Progress 1,218 3,037 270 3,985 - - - - 3,985 1,218
Grand Total 27,841 10,463 6,233 32,071 18,860 3,787 5,900 16,747 15,324 8,980
Previous Period Total 22,697 5,934 791 27,840 16,093 2,841 73 18,860 8,980
Upto
31st March
2021
For the YearUpto 31st
March, 2022
As at 31st
March, 2022
As at 31st
March, 2021
On sales /
adjustments
PERIODIC DISCLOSURESFORM NL-14-FIXED ASSETS SCHEDULE
Cost/ Gross Block Depreciation Net Block
As at
1st April, 2021
Additions
during the
Year
Sales/
Adjustments
during the
Year
As at 31st
March, 2022
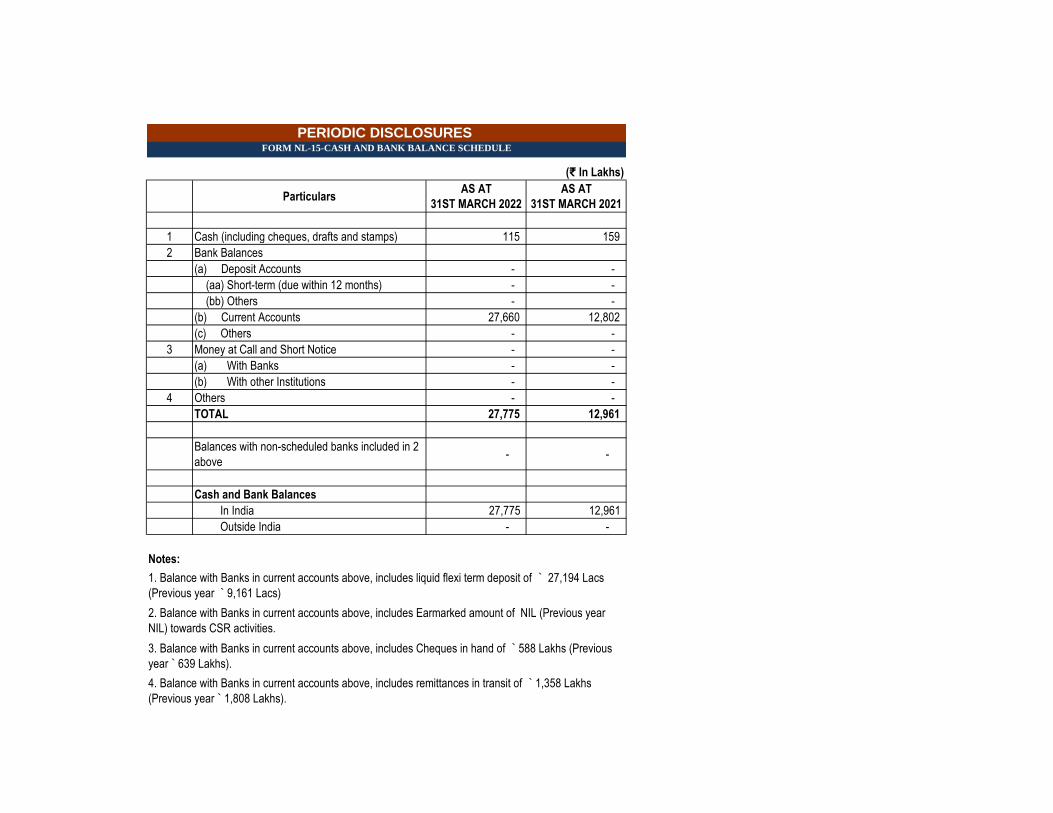
(₹ In Lakhs)
ParticularsAS AT
31ST MARCH 2022
AS AT
31ST MARCH 2021
1 Cash (including cheques, drafts and stamps) 115 159
2 Bank Balances
(a) Deposit Accounts - -
(aa) Short-term (due within 12 months) - -
(bb) Others - -
(b) Current Accounts 27,660 12,802
(c) Others - -
3 Money at Call and Short Notice - -
(a) With Banks - -
(b) With other Institutions - -
4 Others - -
TOTAL 27,775 12,961
Balances with non-scheduled banks included in 2
above- -
Cash and Bank Balances
In India 27,775 12,961
Outside India - -
Notes:
PERIODIC DISCLOSURES FORM NL-15-CASH AND BANK BALANCE SCHEDULE
4. Balance with Banks in current accounts above, includes remittances in transit of ` 1,358 Lakhs
(Previous year ` 1,808 Lakhs).
2. Balance with Banks in current accounts above, includes Earmarked amount of NIL (Previous year
NIL) towards CSR activities.
3. Balance with Banks in current accounts above, includes Cheques in hand of ` 588 Lakhs (Previous
year ` 639 Lakhs).
1. Balance with Banks in current accounts above, includes liquid flexi term deposit of ` 27,194 Lacs
(Previous year ` 9,161 Lacs)
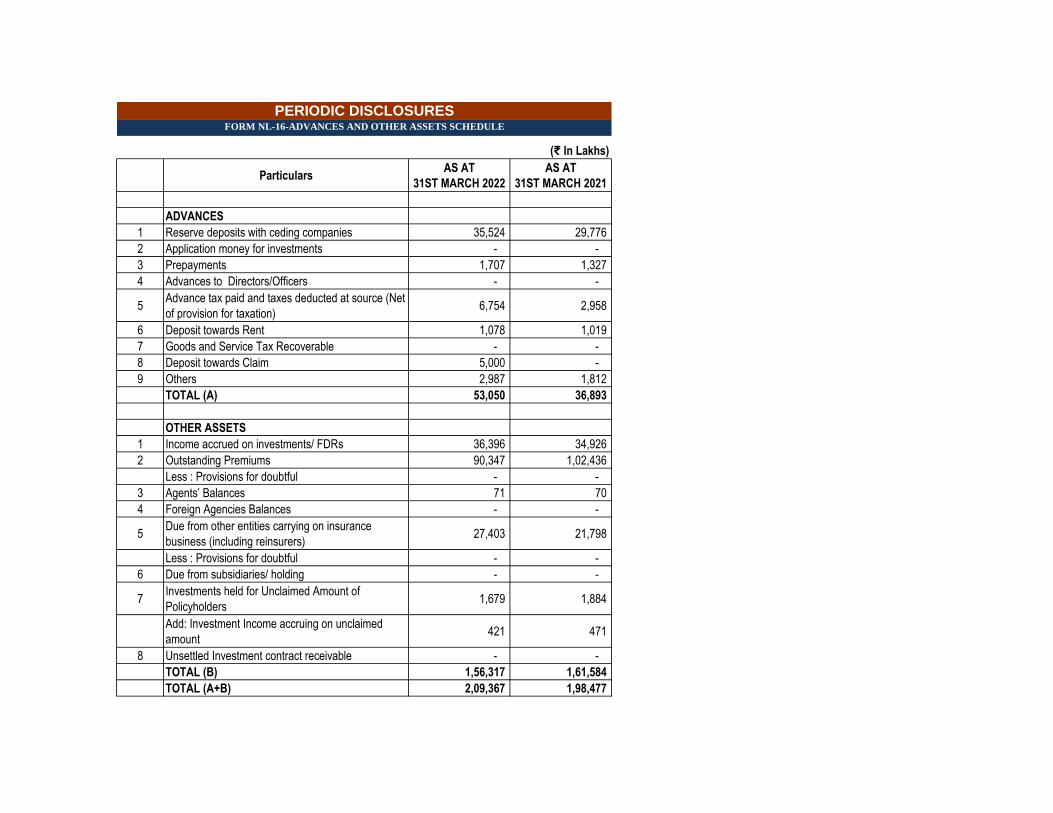
(₹ In Lakhs)
ParticularsAS AT
31ST MARCH 2022
AS AT
31ST MARCH 2021
ADVANCES
1 Reserve deposits with ceding companies 35,524 29,776
2 Application money for investments - -
3 Prepayments 1,707 1,327
4 Advances to Directors/Officers - -
5Advance tax paid and taxes deducted at source (Net
of provision for taxation) 6,754 2,958
6 Deposit towards Rent 1,078 1,019
7 Goods and Service Tax Recoverable - -
8 Deposit towards Claim 5,000 -
9 Others 2,987 1,812
TOTAL (A) 53,050 36,893
OTHER ASSETS
1 Income accrued on investments/ FDRs 36,396 34,926
2 Outstanding Premiums 90,347 1,02,436
Less : Provisions for doubtful - -
3 Agents’ Balances 71 70
4 Foreign Agencies Balances - -
5Due from other entities carrying on insurance
business (including reinsurers) 27,403 21,798
Less : Provisions for doubtful - -
6 Due from subsidiaries/ holding - -
7Investments held for Unclaimed Amount of
Policyholders 1,679 1,884
Add: Investment Income accruing on unclaimed
amount 421 471
8 Unsettled Investment contract receivable - -
TOTAL (B) 1,56,317 1,61,584
TOTAL (A+B) 2,09,367 1,98,477
PERIODIC DISCLOSURES FORM NL-16-ADVANCES AND OTHER ASSETS SCHEDULE
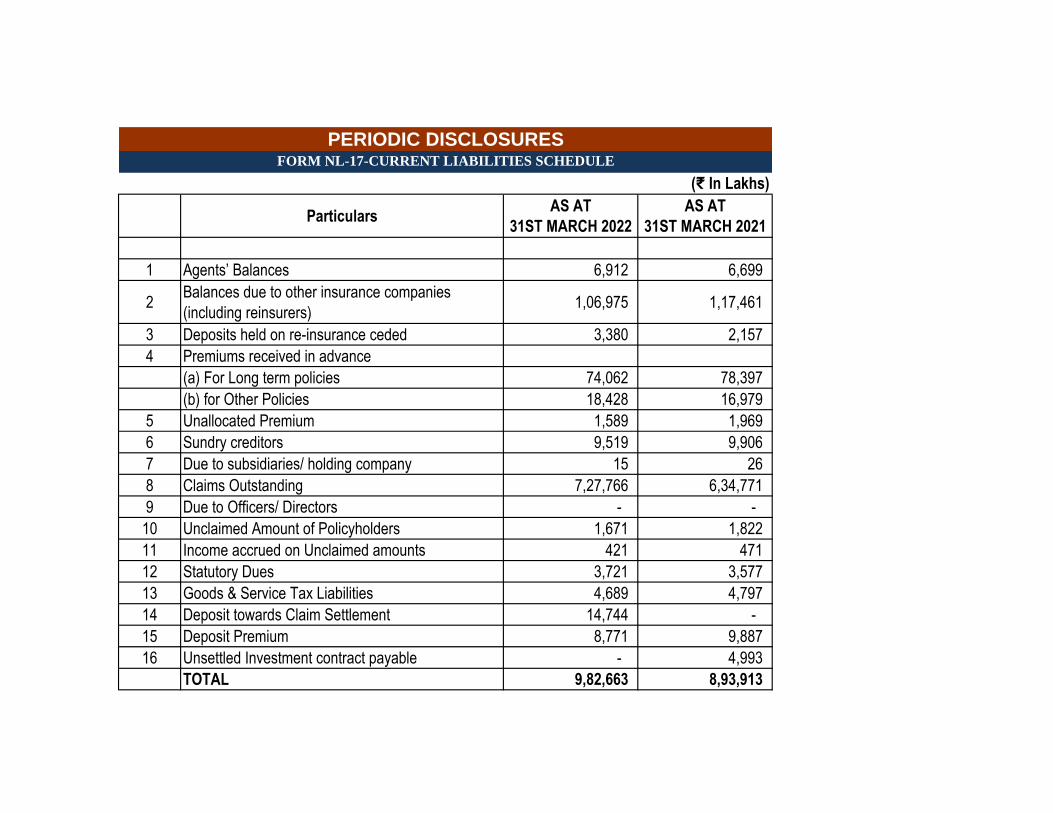
(₹ In Lakhs)
ParticularsAS AT
31ST MARCH 2022
AS AT
31ST MARCH 2021
1 Agents’ Balances 6,912 6,699
2Balances due to other insurance companies
(including reinsurers) 1,06,975 1,17,461
3 Deposits held on re-insurance ceded 3,380 2,157
4 Premiums received in advance
(a) For Long term policies 74,062 78,397
(b) for Other Policies 18,428 16,979
5 Unallocated Premium 1,589 1,969
6 Sundry creditors 9,519 9,906
7 Due to subsidiaries/ holding company 15 26
8 Claims Outstanding 7,27,766 6,34,771
9 Due to Officers/ Directors - -
10 Unclaimed Amount of Policyholders 1,671 1,822
11 Income accrued on Unclaimed amounts 421 471
12 Statutory Dues 3,721 3,577
13 Goods & Service Tax Liabilities 4,689 4,797
14 Deposit towards Claim Settlement 14,744 -
15 Deposit Premium 8,771 9,887
16 Unsettled Investment contract payable - 4,993
TOTAL 9,82,663 8,93,913
PERIODIC DISCLOSURESFORM NL-17-CURRENT LIABILITIES SCHEDULE
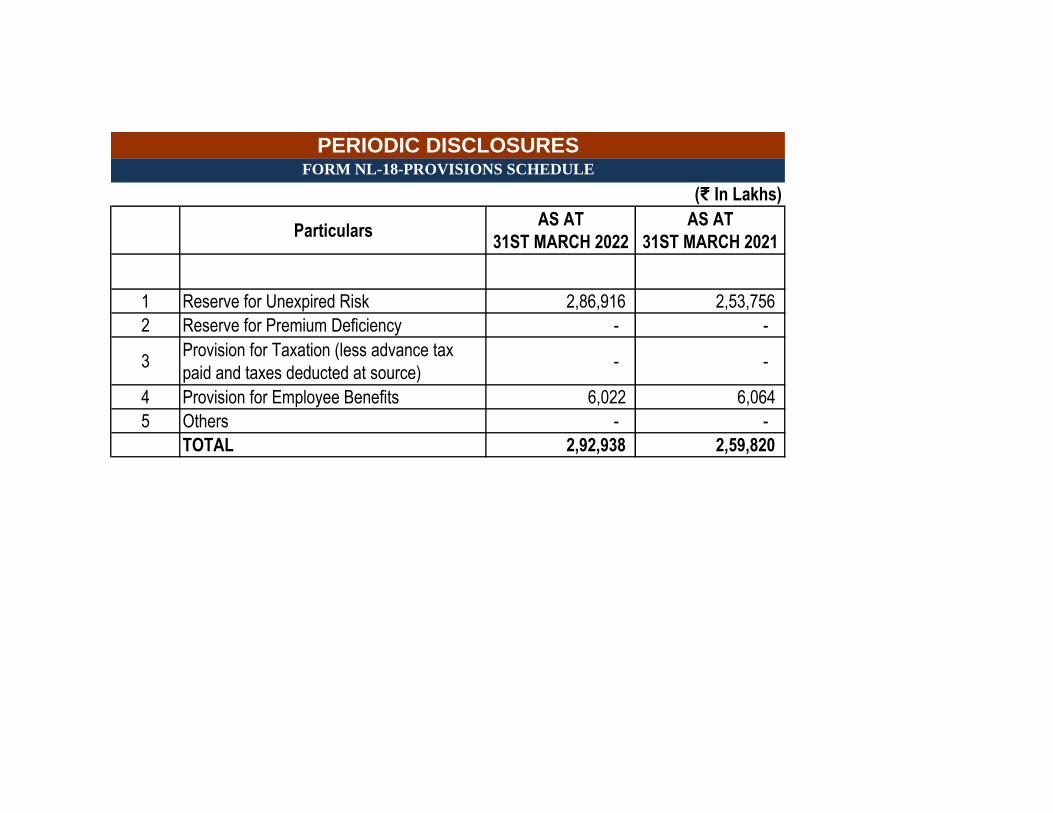
(₹ In Lakhs)
ParticularsAS AT
31ST MARCH 2022
AS AT
31ST MARCH 2021
1 Reserve for Unexpired Risk 2,86,916 2,53,756
2 Reserve for Premium Deficiency - -
3Provision for Taxation (less advance tax
paid and taxes deducted at source) - -
4 Provision for Employee Benefits 6,022 6,064
5 Others - -
TOTAL 2,92,938 2,59,820
PERIODIC DISCLOSURESFORM NL-18-PROVISIONS SCHEDULE
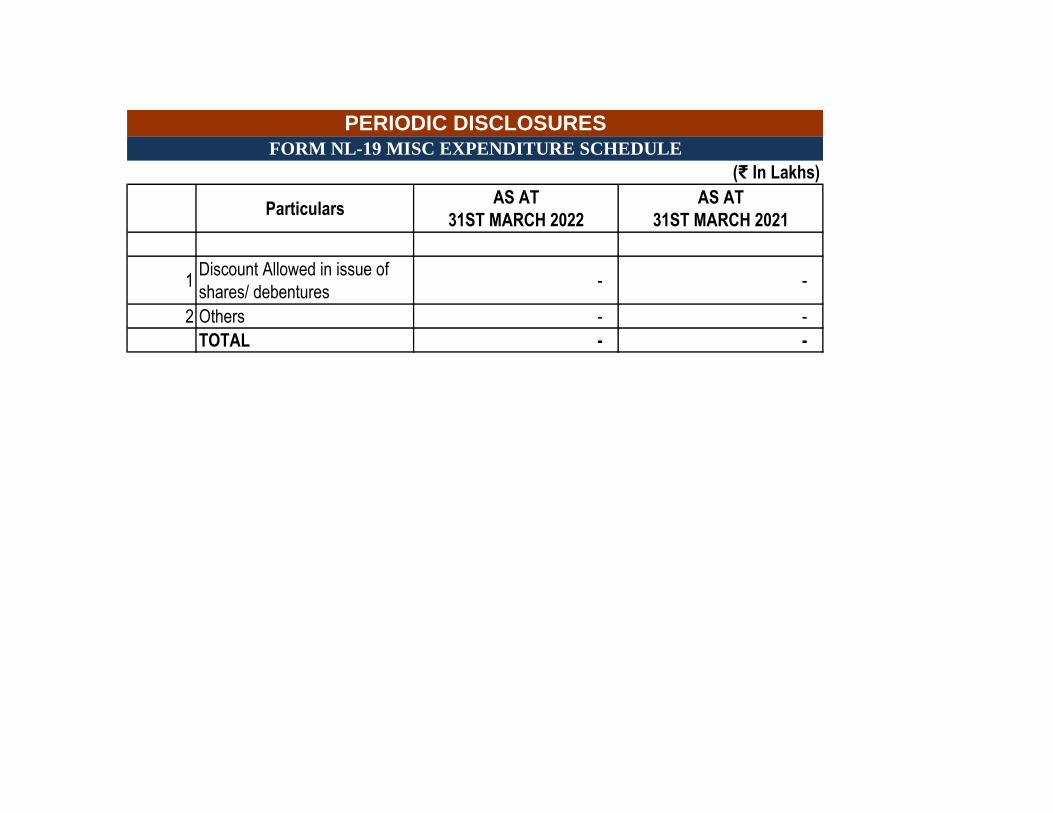
(₹ In Lakhs)
ParticularsAS AT
31ST MARCH 2022
AS AT
31ST MARCH 2021
1Discount Allowed in issue of
shares/ debentures - -
2 Others - -
TOTAL - -
PERIODIC DISCLOSURESFORM NL-19 MISC EXPENDITURE SCHEDULE
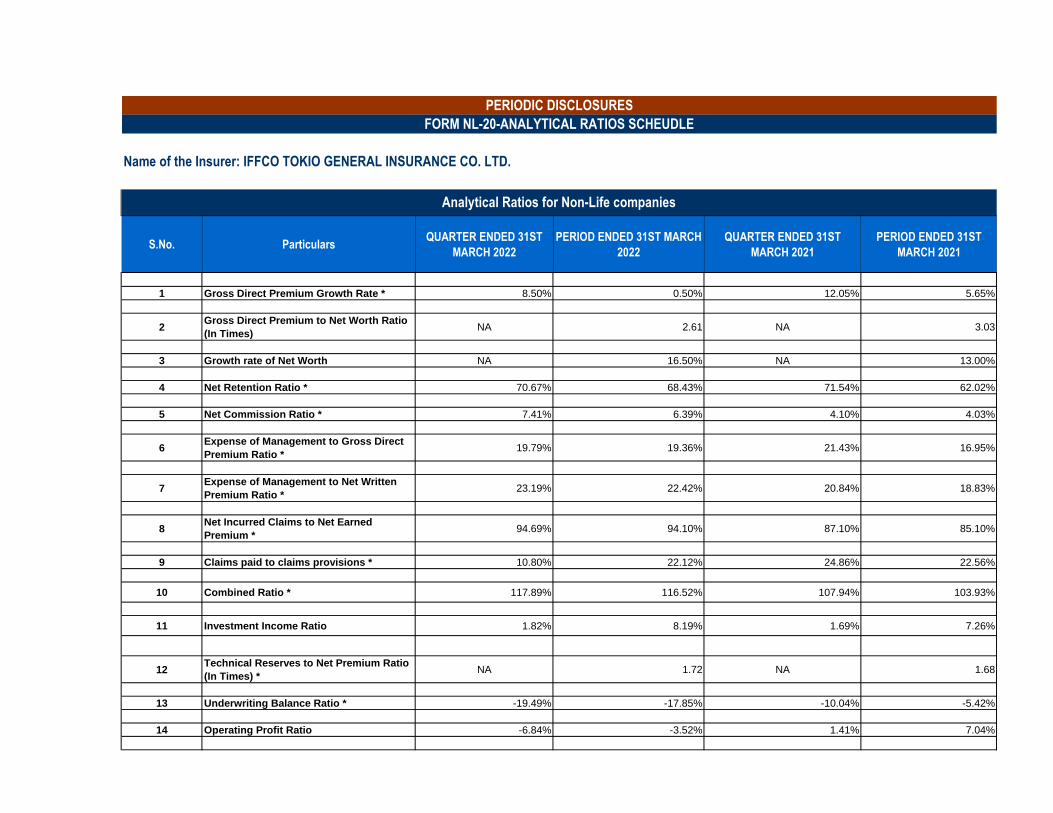
m
Name of the Insurer: IFFCO TOKIO GENERAL INSURANCE CO. LTD.
S.No. ParticularsQUARTER ENDED 31ST
MARCH 2022
PERIOD ENDED 31ST MARCH
2022
QUARTER ENDED 31ST
MARCH 2021
PERIOD ENDED 31ST
MARCH 2021
1 Gross Direct Premium Growth Rate * 8.50% 0.50% 12.05% 5.65%
2Gross Direct Premium to Net Worth Ratio
(In Times)NA 2.61 NA 3.03
3 Growth rate of Net Worth NA 16.50% NA 13.00%
4 Net Retention Ratio * 70.67% 68.43% 71.54% 62.02%
5 Net Commission Ratio * 7.41% 6.39% 4.10% 4.03%
6Expense of Management to Gross Direct
Premium Ratio *19.79% 19.36% 21.43% 16.95%
7Expense of Management to Net Written
Premium Ratio *23.19% 22.42% 20.84% 18.83%
8Net Incurred Claims to Net Earned
Premium *94.69% 94.10% 87.10% 85.10%
9 Claims paid to claims provisions * 10.80% 22.12% 24.86% 22.56%
10 Combined Ratio * 117.89% 116.52% 107.94% 103.93%
11 Investment Income Ratio 1.82% 8.19% 1.69% 7.26%
12Technical Reserves to Net Premium Ratio
(In Times) *NA 1.72 NA 1.68
13 Underwriting Balance Ratio * -19.49% -17.85% -10.04% -5.42%
14 Operating Profit Ratio -6.84% -3.52% 1.41% 7.04%
PERIODIC DISCLOSURES
Analytical Ratios for Non-Life companies
FORM NL-20-ANALYTICAL RATIOS SCHEUDLE
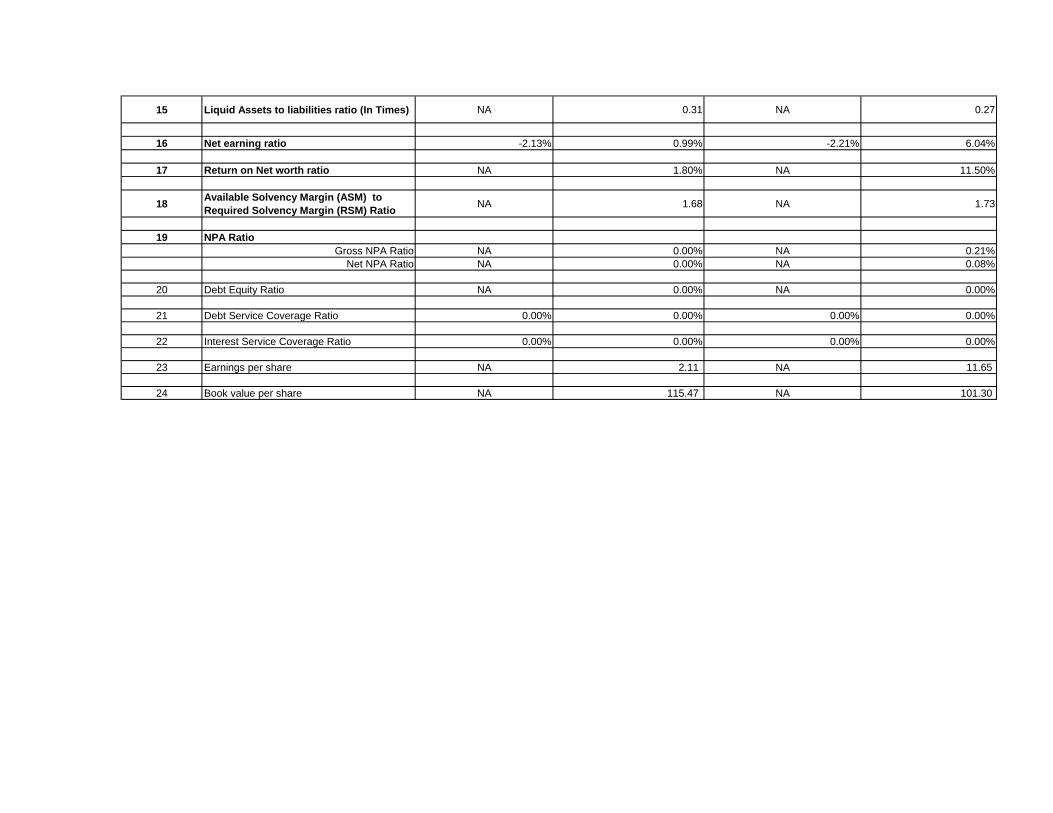
15 Liquid Assets to liabilities ratio (In Times) NA 0.31 NA 0.27
16 Net earning ratio -2.13% 0.99% -2.21% 6.04%
17 Return on Net worth ratio NA 1.80% NA 11.50%
18Available Solvency Margin (ASM) to
Required Solvency Margin (RSM) RatioNA 1.68 NA 1.73
19 NPA Ratio
Gross NPA Ratio NA 0.00% NA 0.21%
Net NPA Ratio NA 0.00% NA 0.08%
20 Debt Equity Ratio NA 0.00% NA 0.00%
21 Debt Service Coverage Ratio 0.00% 0.00% 0.00% 0.00%
22 Interest Service Coverage Ratio 0.00% 0.00% 0.00% 0.00%
23 Earnings per share NA 2.11 NA 11.65
24 Book value per share NA 115.47 NA 101.30
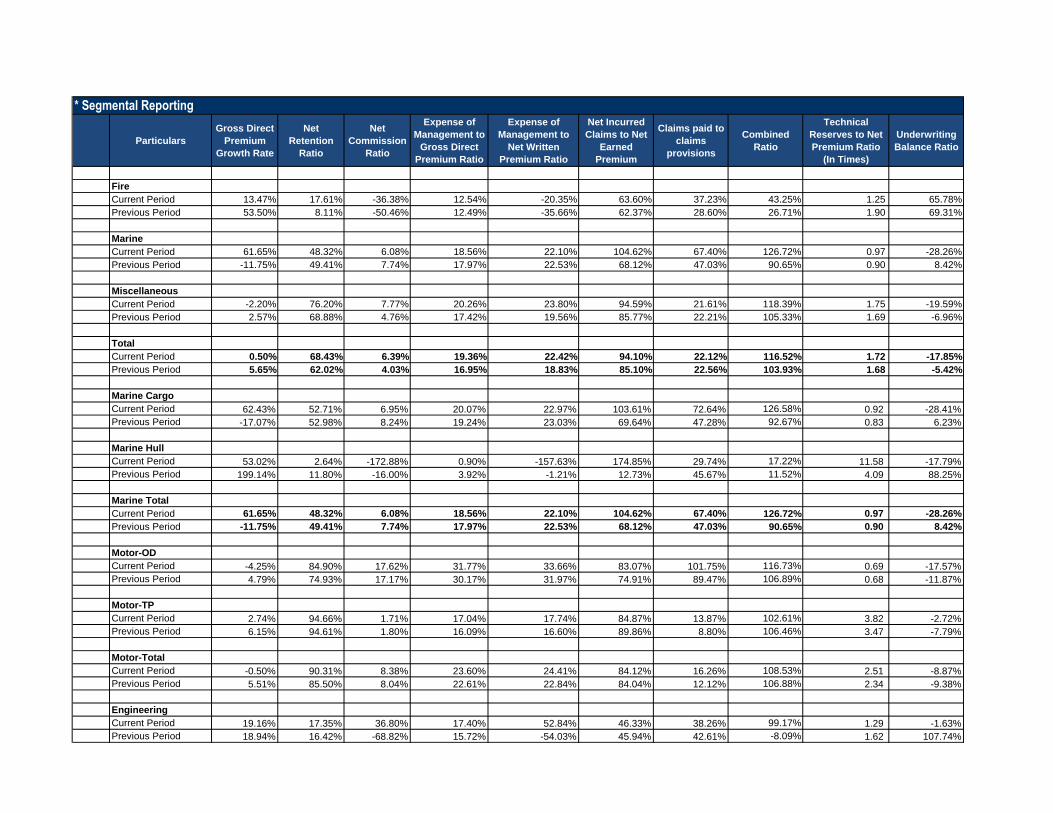
Particulars
Gross Direct
Premium
Growth Rate
Net
Retention
Ratio
Net
Commission
Ratio
Expense of
Management to
Gross Direct
Premium Ratio
Expense of
Management to
Net Written
Premium Ratio
Net Incurred
Claims to Net
Earned
Premium
Claims paid to
claims
provisions
Combined
Ratio
Technical
Reserves to Net
Premium Ratio
(In Times)
Underwriting
Balance Ratio
Fire
Current Period 13.47% 17.61% -36.38% 12.54% -20.35% 63.60% 37.23% 43.25% 1.25 65.78%
Previous Period 53.50% 8.11% -50.46% 12.49% -35.66% 62.37% 28.60% 26.71% 1.90 69.31%
Marine
Current Period 61.65% 48.32% 6.08% 18.56% 22.10% 104.62% 67.40% 126.72% 0.97 -28.26%
Previous Period -11.75% 49.41% 7.74% 17.97% 22.53% 68.12% 47.03% 90.65% 0.90 8.42%
Miscellaneous
Current Period -2.20% 76.20% 7.77% 20.26% 23.80% 94.59% 21.61% 118.39% 1.75 -19.59%
Previous Period 2.57% 68.88% 4.76% 17.42% 19.56% 85.77% 22.21% 105.33% 1.69 -6.96%
Total
Current Period 0.50% 68.43% 6.39% 19.36% 22.42% 94.10% 22.12% 116.52% 1.72 -17.85%
Previous Period 5.65% 62.02% 4.03% 16.95% 18.83% 85.10% 22.56% 103.93% 1.68 -5.42%
Marine Cargo
Current Period 62.43% 52.71% 6.95% 20.07% 22.97% 103.61% 72.64% 126.58% 0.92 -28.41%
Previous Period -17.07% 52.98% 8.24% 19.24% 23.03% 69.64% 47.28% 92.67% 0.83 6.23%
Marine Hull
Current Period 53.02% 2.64% -172.88% 0.90% -157.63% 174.85% 29.74% 17.22% 11.58 -17.79%
Previous Period 199.14% 11.80% -16.00% 3.92% -1.21% 12.73% 45.67% 11.52% 4.09 88.25%
Marine Total
Current Period 61.65% 48.32% 6.08% 18.56% 22.10% 104.62% 67.40% 126.72% 0.97 -28.26%
Previous Period -11.75% 49.41% 7.74% 17.97% 22.53% 68.12% 47.03% 90.65% 0.90 8.42%
Motor-OD
Current Period -4.25% 84.90% 17.62% 31.77% 33.66% 83.07% 101.75% 116.73% 0.69 -17.57%
Previous Period 4.79% 74.93% 17.17% 30.17% 31.97% 74.91% 89.47% 106.89% 0.68 -11.87%
Motor-TP
Current Period 2.74% 94.66% 1.71% 17.04% 17.74% 84.87% 13.87% 102.61% 3.82 -2.72%
Previous Period 6.15% 94.61% 1.80% 16.09% 16.60% 89.86% 8.80% 106.46% 3.47 -7.79%
Motor-Total
Current Period -0.50% 90.31% 8.38% 23.60% 24.41% 84.12% 16.26% 108.53% 2.51 -8.87%
Previous Period 5.51% 85.50% 8.04% 22.61% 22.84% 84.04% 12.12% 106.88% 2.34 -9.38%
Engineering
Current Period 19.16% 17.35% 36.80% 17.40% 52.84% 46.33% 38.26% 99.17% 1.29 -1.63%
Previous Period 18.94% 16.42% -68.82% 15.72% -54.03% 45.94% 42.61% -8.09% 1.62 107.74%
* Segmental Reporting
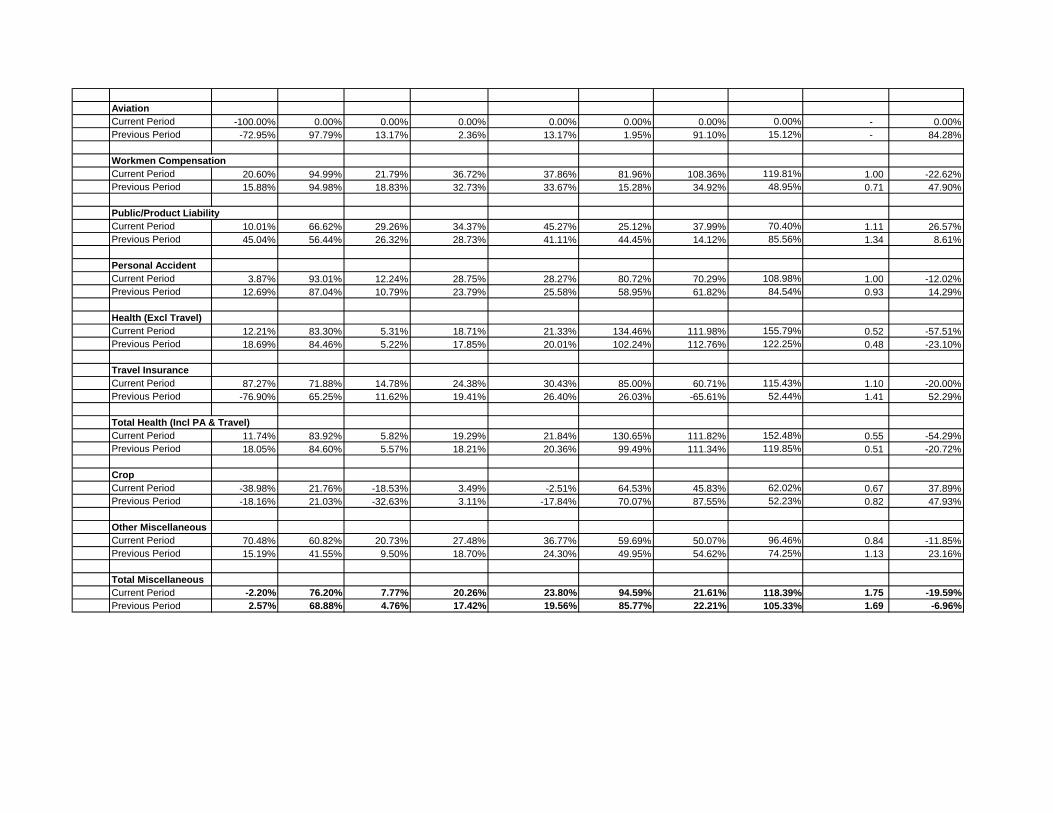
Aviation
Current Period -100.00% 0.00% 0.00% 0.00% 0.00% 0.00% 0.00% 0.00% - 0.00%
Previous Period -72.95% 97.79% 13.17% 2.36% 13.17% 1.95% 91.10% 15.12% - 84.28%
Workmen Compensation
Current Period 20.60% 94.99% 21.79% 36.72% 37.86% 81.96% 108.36% 119.81% 1.00 -22.62%
Previous Period 15.88% 94.98% 18.83% 32.73% 33.67% 15.28% 34.92% 48.95% 0.71 47.90%
Public/Product Liability
Current Period 10.01% 66.62% 29.26% 34.37% 45.27% 25.12% 37.99% 70.40% 1.11 26.57%
Previous Period 45.04% 56.44% 26.32% 28.73% 41.11% 44.45% 14.12% 85.56% 1.34 8.61%
Personal Accident
Current Period 3.87% 93.01% 12.24% 28.75% 28.27% 80.72% 70.29% 108.98% 1.00 -12.02%
Previous Period 12.69% 87.04% 10.79% 23.79% 25.58% 58.95% 61.82% 84.54% 0.93 14.29%
Health (Excl Travel)
Current Period 12.21% 83.30% 5.31% 18.71% 21.33% 134.46% 111.98% 155.79% 0.52 -57.51%
Previous Period 18.69% 84.46% 5.22% 17.85% 20.01% 102.24% 112.76% 122.25% 0.48 -23.10%
Travel Insurance
Current Period 87.27% 71.88% 14.78% 24.38% 30.43% 85.00% 60.71% 115.43% 1.10 -20.00%
Previous Period -76.90% 65.25% 11.62% 19.41% 26.40% 26.03% -65.61% 52.44% 1.41 52.29%
Total Health (Incl PA & Travel)
Current Period 11.74% 83.92% 5.82% 19.29% 21.84% 130.65% 111.82% 152.48% 0.55 -54.29%
Previous Period 18.05% 84.60% 5.57% 18.21% 20.36% 99.49% 111.34% 119.85% 0.51 -20.72%
Crop
Current Period -38.98% 21.76% -18.53% 3.49% -2.51% 64.53% 45.83% 62.02% 0.67 37.89%
Previous Period -18.16% 21.03% -32.63% 3.11% -17.84% 70.07% 87.55% 52.23% 0.82 47.93%
Other Miscellaneous
Current Period 70.48% 60.82% 20.73% 27.48% 36.77% 59.69% 50.07% 96.46% 0.84 -11.85%
Previous Period 15.19% 41.55% 9.50% 18.70% 24.30% 49.95% 54.62% 74.25% 1.13 23.16%
Total Miscellaneous
Current Period -2.20% 76.20% 7.77% 20.26% 23.80% 94.59% 21.61% 118.39% 1.75 -19.59%
Previous Period 2.57% 68.88% 4.76% 17.42% 19.56% 85.77% 22.21% 105.33% 1.69 -6.96%
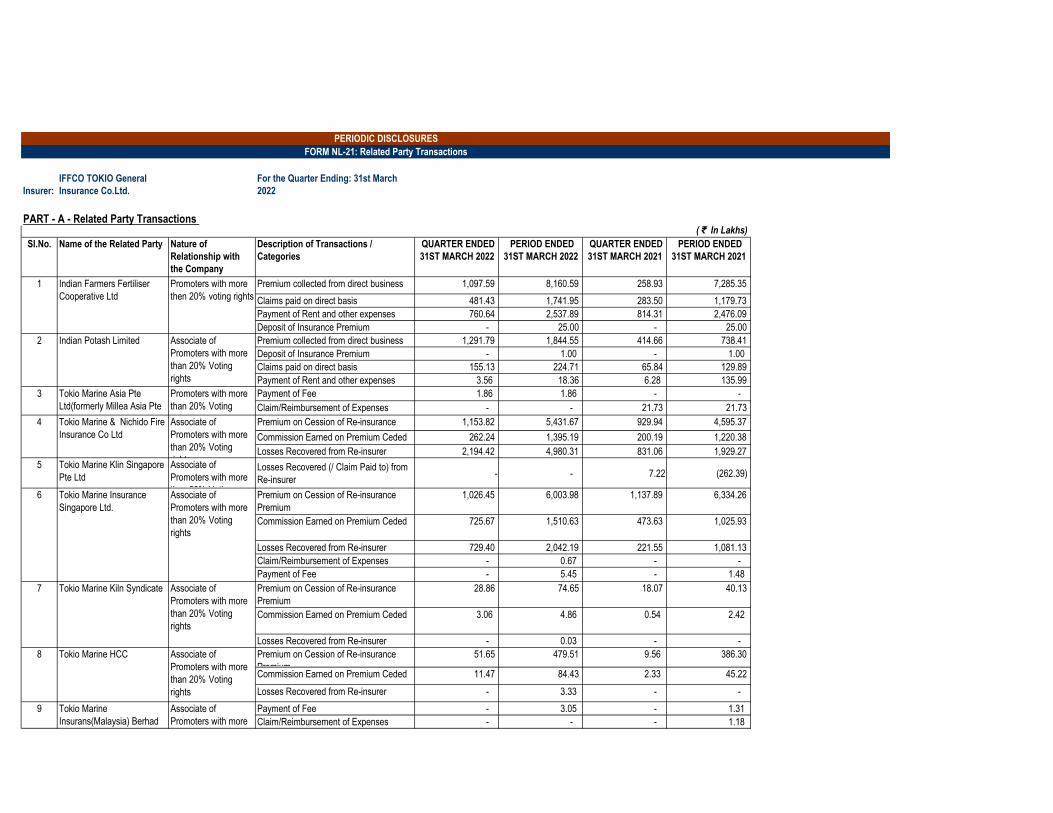
Insurer:
IFFCO TOKIO General
Insurance Co.Ltd.
For the Quarter Ending: 31st March
2022
Related ( ₹ In Lakhs)
Sl.No. Name of the Related Party Nature of
Relationship with
the Company
Description of Transactions /
Categories
QUARTER ENDED
31ST MARCH 2022
PERIOD ENDED
31ST MARCH 2022
QUARTER ENDED
31ST MARCH 2021
PERIOD ENDED
31ST MARCH 2021
Premium collected from direct business 1,097.59 8,160.59 258.93 7,285.35
Claims paid on direct basis 481.43 1,741.95 283.50 1,179.73
Payment of Rent and other expenses 760.64 2,537.89 814.31 2,476.09
Deposit of Insurance Premium - 25.00 - 25.00
Premium collected from direct business 1,291.79 1,844.55 414.66 738.41
Deposit of Insurance Premium - 1.00 - 1.00
Claims paid on direct basis 155.13 224.71 65.84 129.89
Payment of Rent and other expenses 3.56 18.36 6.28 135.99
Payment of Fee 1.86 1.86 - -
Claim/Reimbursement of Expenses - - 21.73 21.73
Premium on Cession of Re-insurance
Premium
1,153.82 5,431.67 929.94 4,595.37
Commission Earned on Premium Ceded 262.24 1,395.19 200.19 1,220.38
Losses Recovered from Re-insurer 2,194.42 4,980.31 831.06 1,929.27
5 Tokio Marine Klin Singapore
Pte Ltd
Associate of
Promoters with more
than 20% Voting
Losses Recovered (/ Claim Paid to) from
Re-insurer - - 7.22 (262.39)
Premium on Cession of Re-insurance
Premium
1,026.45 6,003.98 1,137.89 6,334.26
Commission Earned on Premium Ceded 725.67 1,510.63 473.63 1,025.93
Losses Recovered from Re-insurer 729.40 2,042.19 221.55 1,081.13
Claim/Reimbursement of Expenses - 0.67 - -
Payment of Fee - 5.45 - 1.48
Premium on Cession of Re-insurance
Premium
28.86 74.65 18.07 40.13
Commission Earned on Premium Ceded 3.06 4.86 0.54 2.42
Losses Recovered from Re-insurer - 0.03 - -
Premium on Cession of Re-insurance
Premium
51.65 479.51 9.56 386.30
Commission Earned on Premium Ceded 11.47 84.43 2.33 45.22
Losses Recovered from Re-insurer - 3.33 - -
Payment of Fee - 3.05 - 1.31
Claim/Reimbursement of Expenses - - - 1.18
3 Tokio Marine Asia Pte
Ltd(formerly Millea Asia Pte
Ltd)
Promoters with more
than 20% Voting
rights4 Tokio Marine & Nichido Fire
Insurance Co Ltd
Associate of
Promoters with more
than 20% Voting
rights
7 Tokio Marine Kiln Syndicate Associate of
Promoters with more
than 20% Voting
rights
6 Tokio Marine Insurance
Singapore Ltd.
Associate of
Promoters with more
than 20% Voting
rights
PERIODIC DISCLOSURES
Promoters with more
then 20% voting rights
FORM NL-21: Related Party Transactions
1 Indian Farmers Fertiliser
Cooperative Ltd
PART - A - Related Party Transactions
2 Indian Potash Limited Associate of
Promoters with more
than 20% Voting
rights
8 Tokio Marine HCC Associate of
Promoters with more
than 20% Voting
rights
9 Tokio Marine
Insurans(Malaysia) Berhad
Associate of
Promoters with more
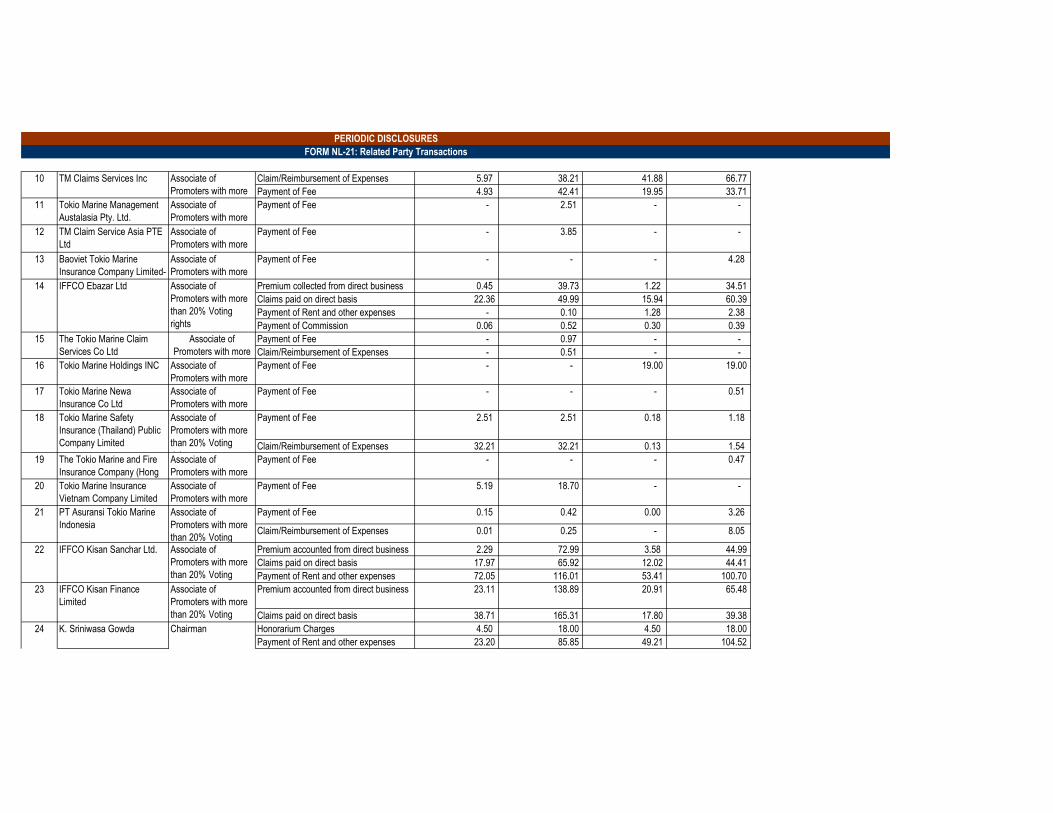
PERIODIC DISCLOSURES
FORM NL-21: Related Party Transactions
Claim/Reimbursement of Expenses 5.97 38.21 41.88 66.77
Payment of Fee 4.93 42.41 19.95 33.71
Payment of Fee - 2.51 - -
Payment of Fee - 3.85 - -
Payment of Fee - - - 4.28
Premium collected from direct business 0.45 39.73 1.22 34.51
Claims paid on direct basis 22.36 49.99 15.94 60.39
Payment of Rent and other expenses - 0.10 1.28 2.38
Payment of Commission 0.06 0.52 0.30 0.39
Payment of Fee - 0.97 - -
Claim/Reimbursement of Expenses - 0.51 - -
16 Tokio Marine Holdings INC Associate of
Promoters with more
than 20% Voting
Payment of Fee - - 19.00 19.00
17 Tokio Marine Newa
Insurance Co Ltd
Associate of
Promoters with more
than 20% Voting
Payment of Fee - - - 0.51
Payment of Fee 2.51 2.51 0.18 1.18
Claim/Reimbursement of Expenses 32.21 32.21 0.13 1.54
19 The Tokio Marine and Fire
Insurance Company (Hong
Kong) Limited
Associate of
Promoters with more
than 20% Voting
Payment of Fee - - - 0.47
20 Tokio Marine Insurance
Vietnam Company Limited
Associate of
Promoters with more
than 20% Voting
Payment of Fee 5.19 18.70 - -
Payment of Fee 0.15 0.42 0.00 3.26
Claim/Reimbursement of Expenses 0.01 0.25 - 8.05
Premium accounted from direct business 2.29 72.99 3.58 44.99
Claims paid on direct basis 17.97 65.92 12.02 44.41
Payment of Rent and other expenses 72.05 116.01 53.41 100.70
Premium accounted from direct business 23.11 138.89 20.91 65.48
Claims paid on direct basis 38.71 165.31 17.80 39.38
Honorarium Charges 4.50 18.00 4.50 18.00
Payment of Rent and other expenses 23.20 85.85 49.21 104.52
24 K. Sriniwasa Gowda Chairman
PT Asuransi Tokio Marine
Indonesia
Associate of
Promoters with more
than 20% Voting
21
Associate of
Promoters with more
than 20% Voting
rights
IFFCO Kisan Sanchar Ltd. Associate of
Promoters with more
than 20% Voting
rights
Tokio Marine Safety
Insurance (Thailand) Public
Company Limited
14 IFFCO Ebazar Ltd Associate of
Promoters with more
than 20% Voting
rights
15 The Tokio Marine Claim
Services Co Ltd
Associate of
Promoters with more
22
10
11 Tokio Marine Management
Austalasia Pty. Ltd.
Associate of
Promoters with more
than 20% Voting
23 IFFCO Kisan Finance
Limited
Associate of
Promoters with more
than 20% Voting
rights
13 Baoviet Tokio Marine
Insurance Company Limited-
Ho Chi Minh Branch
Associate of
Promoters with more
than 20% Voting
12 TM Claim Service Asia PTE
Ltd
Associate of
Promoters with more
than 20% Voting
18
TM Claims Services Inc Associate of
Promoters with more
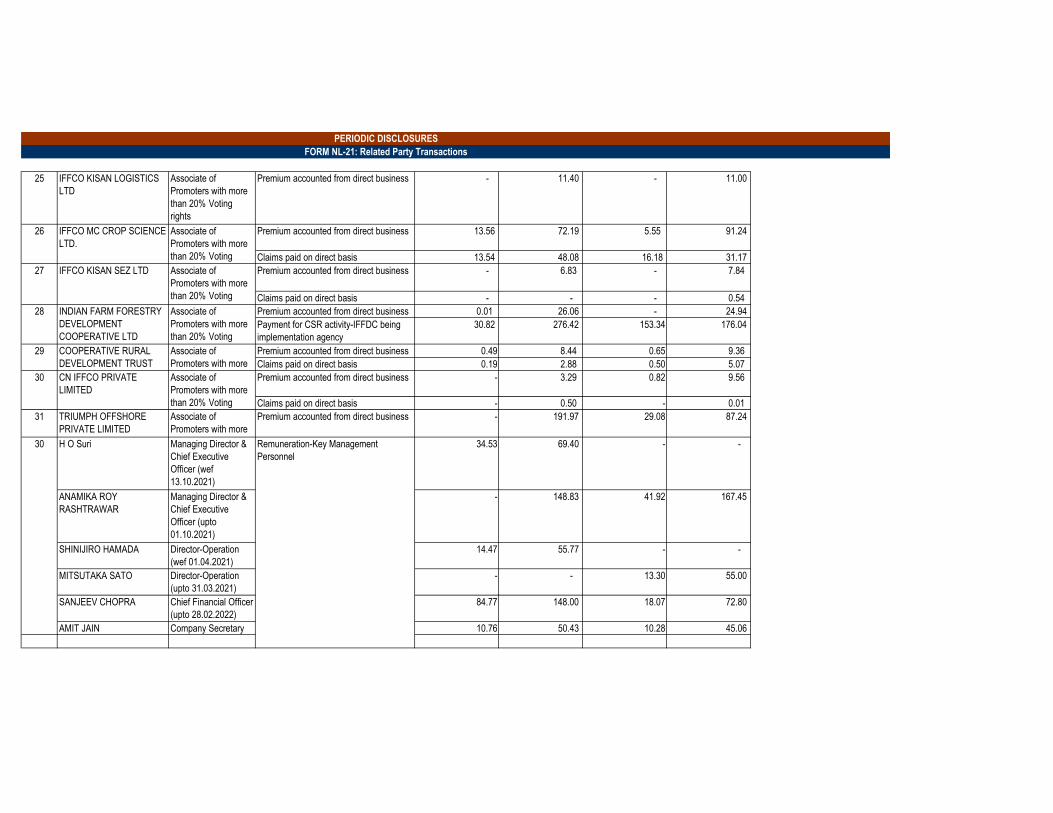
PERIODIC DISCLOSURES
FORM NL-21: Related Party Transactions
25 IFFCO KISAN LOGISTICS
LTD
Associate of
Promoters with more
than 20% Voting
rights
Premium accounted from direct business - 11.40 - 11.00
Premium accounted from direct business 13.56 72.19 5.55 91.24
Claims paid on direct basis 13.54 48.08 16.18 31.17
Premium accounted from direct business - 6.83 - 7.84
Claims paid on direct basis - - - 0.54
Premium accounted from direct business 0.01 26.06 - 24.94
Payment for CSR activity-IFFDC being
implementation agency
30.82 276.42 153.34 176.04
Premium accounted from direct business 0.49 8.44 0.65 9.36
Claims paid on direct basis 0.19 2.88 0.50 5.07
Premium accounted from direct business - 3.29 0.82 9.56
Claims paid on direct basis - 0.50 - 0.01
31 TRIUMPH OFFSHORE
PRIVATE LIMITED
Associate of
Promoters with more
than 20% Voting
Premium accounted from direct business - 191.97 29.08 87.24
H O Suri Managing Director &
Chief Executive
Officer (wef
13.10.2021)
34.53 69.40 - -
ANAMIKA ROY
RASHTRAWAR
Managing Director &
Chief Executive
Officer (upto
01.10.2021)
- 148.83 41.92 167.45
SHINIJIRO HAMADA Director-Operation
(wef 01.04.2021)
14.47 55.77 - -
MITSUTAKA SATO Director-Operation
(upto 31.03.2021)
- - 13.30 55.00
SANJEEV CHOPRA Chief Financial Officer
(upto 28.02.2022)
84.77 148.00 18.07 72.80
AMIT JAIN Company Secretary 10.76 50.43 10.28 45.06
30 CN IFFCO PRIVATE
LIMITED
Associate of
Promoters with more
than 20% Voting
26 IFFCO MC CROP SCIENCE
LTD.
Associate of
Promoters with more
than 20% Voting
rights27 IFFCO KISAN SEZ LTD Associate of
Promoters with more
than 20% Voting
rights
29 COOPERATIVE RURAL
DEVELOPMENT TRUST
Associate of
Promoters with more
30 Remuneration-Key Management
Personnel
28 INDIAN FARM FORESTRY
DEVELOPMENT
COOPERATIVE LTD
Associate of
Promoters with more
than 20% Voting
rights
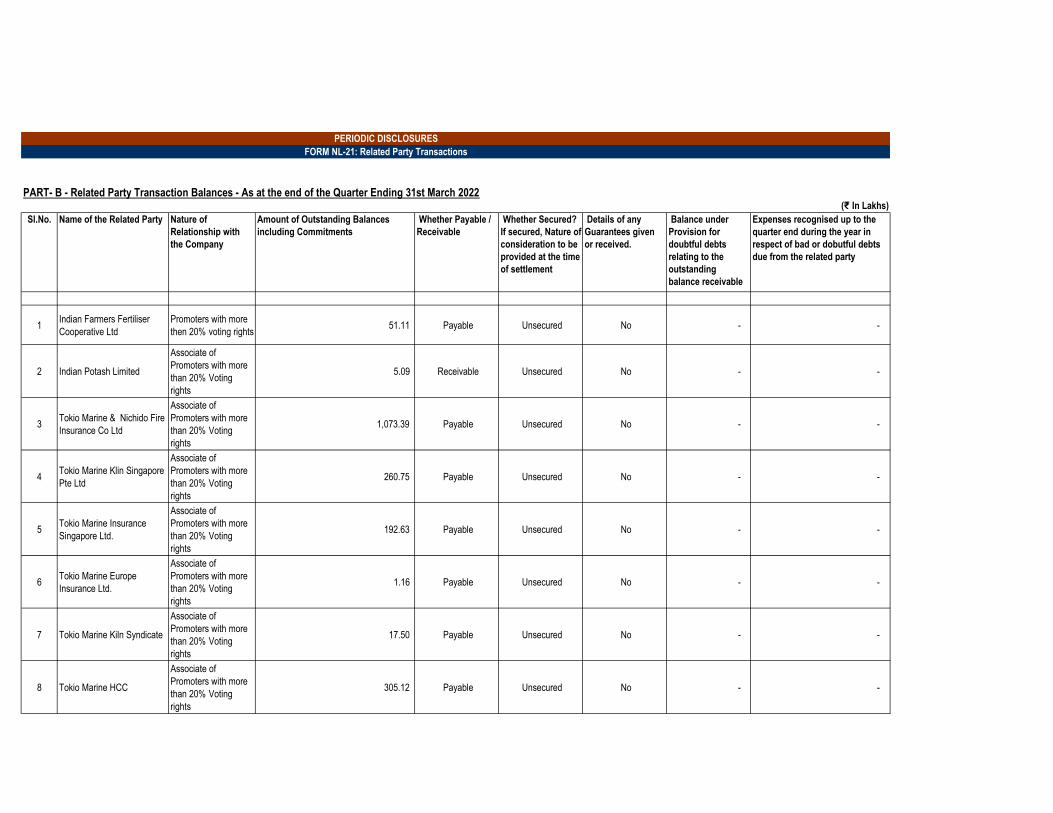
PERIODIC DISCLOSURES
FORM NL-21: Related Party Transactions
(₹ In Lakhs)
Sl.No. Name of the Related Party Nature of
Relationship with
the Company
Amount of Outstanding Balances
including Commitments
Whether Payable /
Receivable
Whether Secured?
If secured, Nature of
consideration to be
provided at the time
of settlement
Details of any
Guarantees given
or received.
Balance under
Provision for
doubtful debts
relating to the
outstanding
balance receivable
Expenses recognised up to the
quarter end during the year in
respect of bad or dobutful debts
due from the related party
1Indian Farmers Fertiliser
Cooperative Ltd
Promoters with more
then 20% voting rights 51.11 Payable Unsecured No - -
2 Indian Potash Limited
Associate of
Promoters with more
than 20% Voting
rights
5.09 Receivable Unsecured No - -
3Tokio Marine & Nichido Fire
Insurance Co Ltd
Associate of
Promoters with more
than 20% Voting
rights
1,073.39 Payable Unsecured No - -
4Tokio Marine Klin Singapore
Pte Ltd
Associate of
Promoters with more
than 20% Voting
rights
260.75 Payable Unsecured No - -
5Tokio Marine Insurance
Singapore Ltd.
Associate of
Promoters with more
than 20% Voting
rights
192.63 Payable Unsecured No - -
6Tokio Marine Europe
Insurance Ltd.
Associate of
Promoters with more
than 20% Voting
rights
1.16 Payable Unsecured No - -
7 Tokio Marine Kiln Syndicate
Associate of
Promoters with more
than 20% Voting
rights
17.50 Payable Unsecured No - -
8 Tokio Marine HCC
Associate of
Promoters with more
than 20% Voting
rights
305.12 Payable Unsecured No - -
PART- B - Related Party Transaction Balances - As at the end of the Quarter Ending 31st March 2022
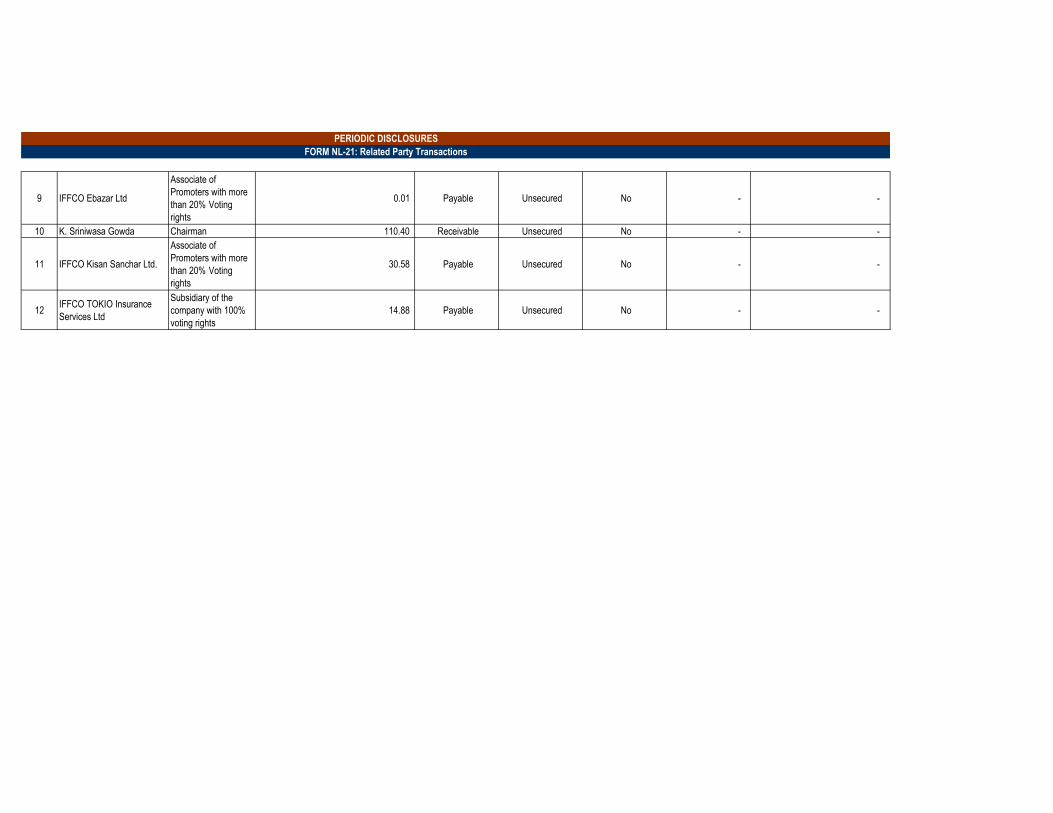
PERIODIC DISCLOSURES
FORM NL-21: Related Party Transactions
9 IFFCO Ebazar Ltd
Associate of
Promoters with more
than 20% Voting
rights
0.01 Payable Unsecured No - -
10 K. Sriniwasa Gowda Chairman 110.40 Receivable Unsecured No - -
11 IFFCO Kisan Sanchar Ltd.
Associate of
Promoters with more
than 20% Voting
rights
30.58 Payable Unsecured No - -
12IFFCO TOKIO Insurance
Services Ltd
Subsidiary of the
company with 100%
voting rights
14.88 Payable Unsecured No - -
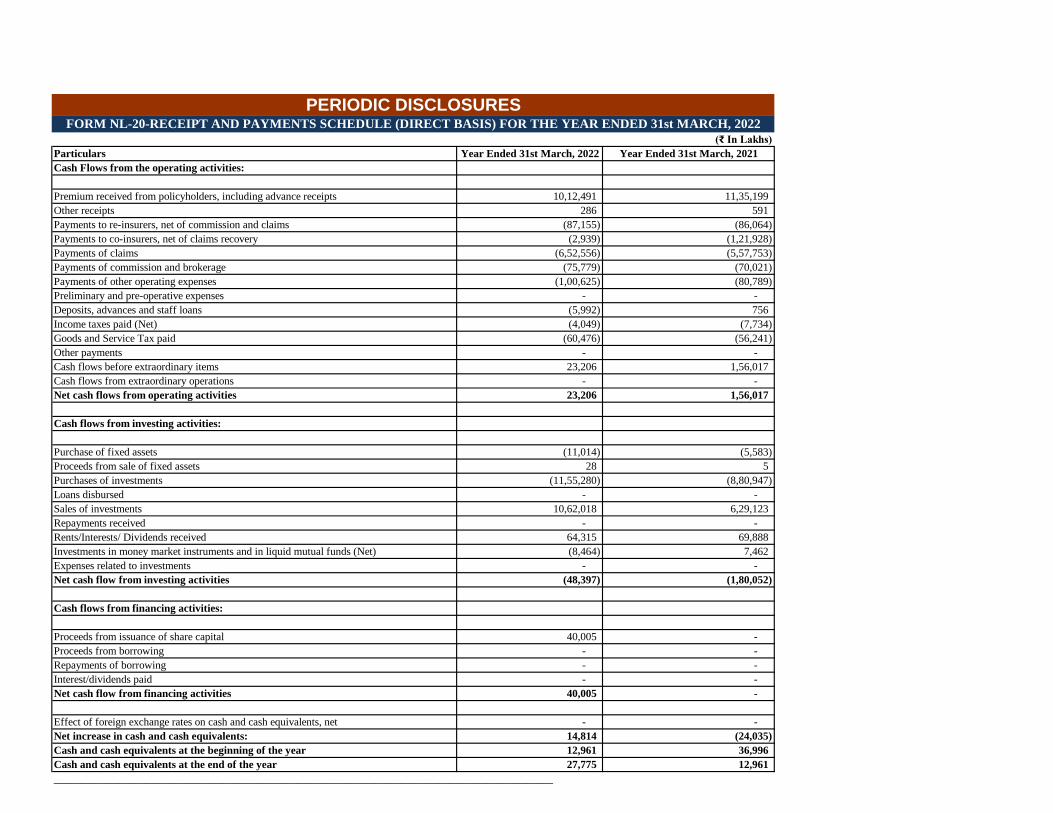
(₹ In Lakhs)
Particulars Year Ended 31st March, 2022 Year Ended 31st March, 2021
Cash Flows from the operating activities:
Premium received from policyholders, including advance receipts 10,12,491 11,35,199
Other receipts 286 591
Payments to re-insurers, net of commission and claims (87,155) (86,064)
Payments to co-insurers, net of claims recovery (2,939) (1,21,928)
Payments of claims (6,52,556) (5,57,753)
Payments of commission and brokerage (75,779) (70,021)
Payments of other operating expenses (1,00,625) (80,789)
Preliminary and pre-operative expenses - -
Deposits, advances and staff loans (5,992) 756
Income taxes paid (Net) (4,049) (7,734)
Goods and Service Tax paid (60,476) (56,241)
Other payments - -
Cash flows before extraordinary items 23,206 1,56,017
Cash flows from extraordinary operations - -
Net cash flows from operating activities 23,206 1,56,017
Cash flows from investing activities:
Purchase of fixed assets (11,014) (5,583)
Proceeds from sale of fixed assets 28 5
Purchases of investments (11,55,280) (8,80,947)
Loans disbursed - -
Sales of investments 10,62,018 6,29,123
Repayments received - -
Rents/Interests/ Dividends received 64,315 69,888
Investments in money market instruments and in liquid mutual funds (Net) (8,464) 7,462
Expenses related to investments - -
Net cash flow from investing activities (48,397) (1,80,052)
Cash flows from financing activities:
Proceeds from issuance of share capital 40,005 -
Proceeds from borrowing - -
Repayments of borrowing - -
Interest/dividends paid - -
Net cash flow from financing activities 40,005 -
Effect of foreign exchange rates on cash and cash equivalents, net - -
Net increase in cash and cash equivalents: 14,814 (24,035)
Cash and cash equivalents at the beginning of the year 12,961 36,996
Cash and cash equivalents at the end of the year 27,775 12,961
____________________________________________________________________________________________
PERIODIC DISCLOSURESFORM NL-20-RECEIPT AND PAYMENTS SCHEDULE (DIRECT BASIS) FOR THE YEAR ENDED 31st MARCH, 2022
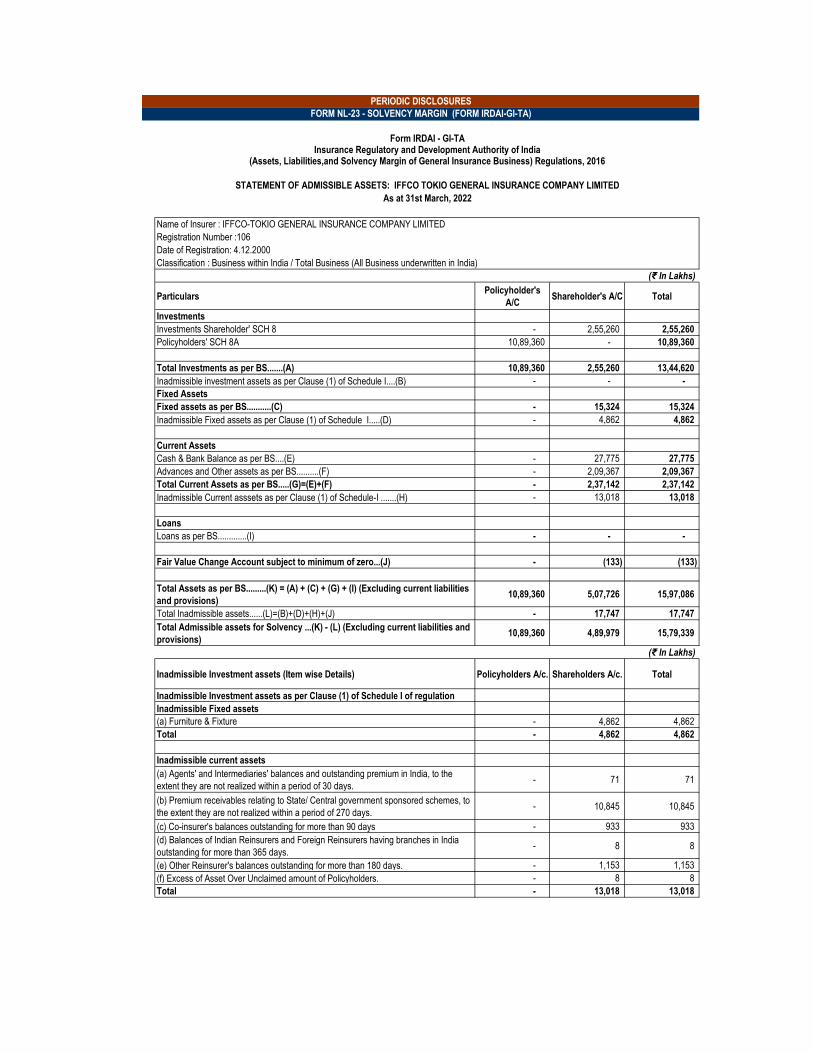
(₹ In Lakhs)
ParticularsPolicyholder's
A/CShareholder's A/C Total
Investments
Investments Shareholder' SCH 8 - 2,55,260 2,55,260
Policyholders' SCH 8A 10,89,360 - 10,89,360
Total Investments as per BS.......(A) 10,89,360 2,55,260 13,44,620
Inadmissible investment assets as per Clause (1) of Schedule I....(B) - - -
Fixed Assets
Fixed assets as per BS...........(C) - 15,324 15,324
Inadmissible Fixed assets as per Clause (1) of Schedule I.....(D) - 4,862 4,862
Current Assets
Cash & Bank Balance as per BS....(E) - 27,775 27,775
Advances and Other assets as per BS..........(F) - 2,09,367 2,09,367
Total Current Assets as per BS.....(G)=(E)+(F) - 2,37,142 2,37,142
Inadmissible Current asssets as per Clause (1) of Schedule-I .......(H) - 13,018 13,018
Loans
Loans as per BS.............(I) - - -
Fair Value Change Account subject to minimum of zero...(J) - (133) (133)
Total Assets as per BS.........(K) = (A) + (C) + (G) + (I) (Excluding current liabilities
and provisions)10,89,360 5,07,726 15,97,086
Total Inadmissible assets......(L)=(B)+(D)+(H)+(J) - 17,747 17,747
Total Admissible assets for Solvency ...(K) - (L) (Excluding current liabilities and
provisions)10,89,360 4,89,979 15,79,339
(₹ In Lakhs)
Inadmissible Investment assets (Item wise Details) Policyholders A/c. Shareholders A/c. Total
Inadmissible Investment assets as per Clause (1) of Schedule I of regulation
Inadmissible Fixed assets
(a) Furniture & Fixture - 4,862 4,862
Total - 4,862 4,862
Inadmissible current assets
(a) Agents' and Intermediaries' balances and outstanding premium in India, to the
extent they are not realized within a period of 30 days.- 71 71
(b) Premium receivables relating to State/ Central government sponsored schemes, to
the extent they are not realized within a period of 270 days.- 10,845 10,845
(c) Co-insurer's balances outstanding for more than 90 days - 933 933
(d) Balances of Indian Reinsurers and Foreign Reinsurers having branches in India
outstanding for more than 365 days.- 8 8
(e) Other Reinsurer's balances outstanding for more than 180 days. - 1,153 1,153
(f) Excess of Asset Over Unclaimed amount of Policyholders. - 8 8
Total - 13,018 13,018
PERIODIC DISCLOSURES
FORM NL-23 - SOLVENCY MARGIN (FORM IRDAI-GI-TA)
Name of Insurer : IFFCO-TOKIO GENERAL INSURANCE COMPANY LIMITED
Registration Number :106
Date of Registration: 4.12.2000
Classification : Business within India / Total Business (All Business underwritten in India)
Form IRDAI - GI-TAInsurance Regulatory and Development Authority of India
(Assets, Liabilities,and Solvency Margin of General Insurance Business) Regulations, 2016
STATEMENT OF ADMISSIBLE ASSETS: IFFCO TOKIO GENERAL INSURANCE COMPANY LIMITED
As at 31st March, 2022
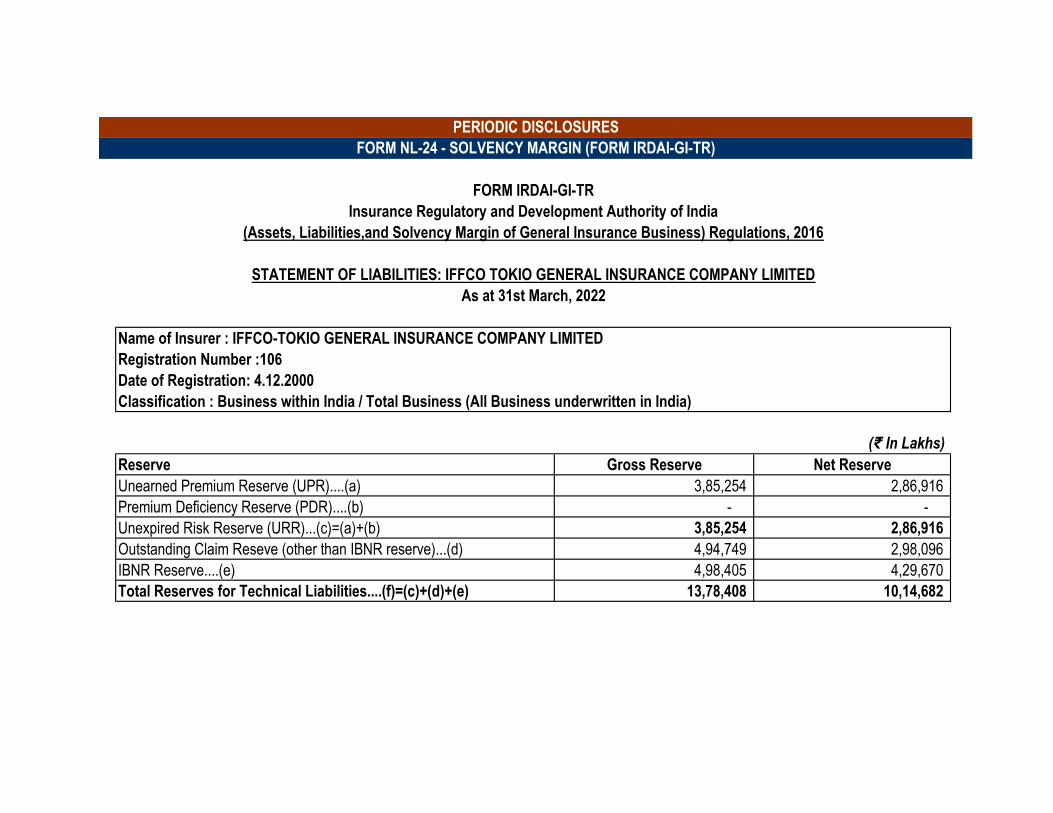
Name of Insurer : IFFCO-TOKIO GENERAL INSURANCE COMPANY LIMITED
Registration Number :106
Date of Registration: 4.12.2000
Classification : Business within India / Total Business (All Business underwritten in India)
(₹ In Lakhs)
Reserve Gross Reserve Net Reserve
Unearned Premium Reserve (UPR)....(a) 3,85,254 2,86,916
Premium Deficiency Reserve (PDR)....(b) - -
Unexpired Risk Reserve (URR)...(c)=(a)+(b) 3,85,254 2,86,916
Outstanding Claim Reseve (other than IBNR reserve)...(d) 4,94,749 2,98,096
IBNR Reserve....(e) 4,98,405 4,29,670
Total Reserves for Technical Liabilities....(f)=(c)+(d)+(e) 13,78,408 10,14,682
STATEMENT OF LIABILITIES: IFFCO TOKIO GENERAL INSURANCE COMPANY LIMITED
As at 31st March, 2022
PERIODIC DISCLOSURES
FORM NL-24 - SOLVENCY MARGIN (FORM IRDAI-GI-TR)
FORM IRDAI-GI-TR
Insurance Regulatory and Development Authority of India
(Assets, Liabilities,and Solvency Margin of General Insurance Business) Regulations, 2016
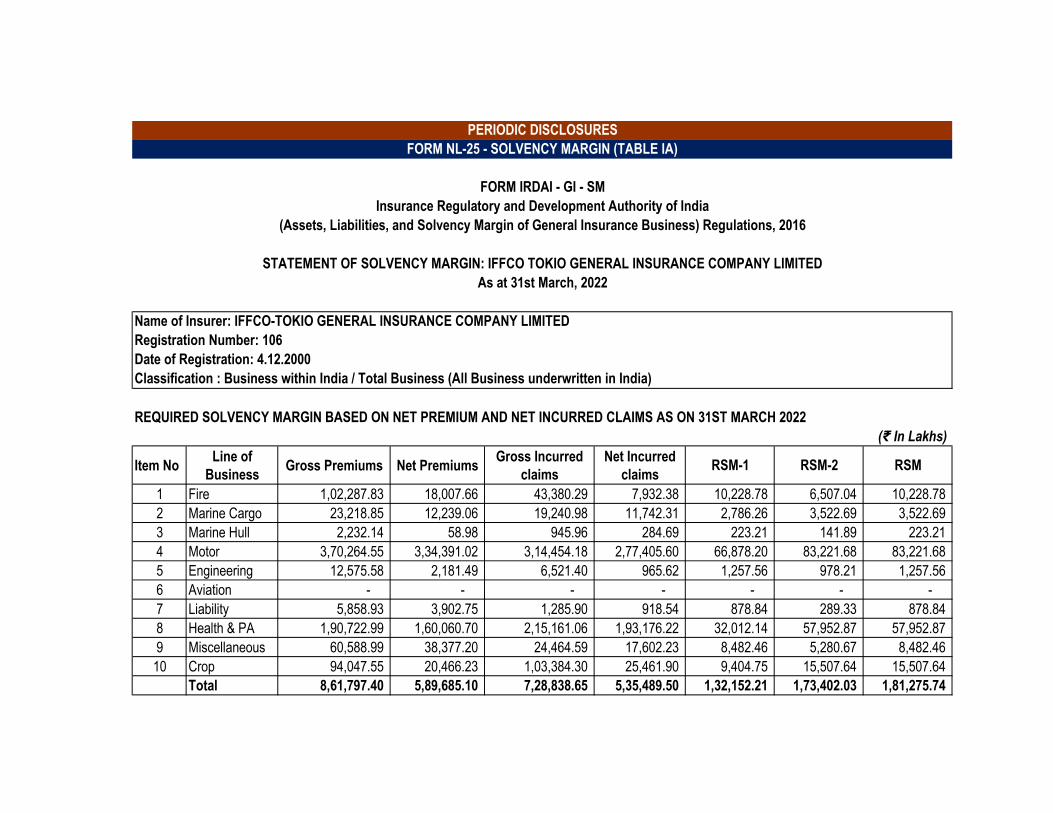
REQUIRED SOLVENCY MARGIN BASED ON NET PREMIUM AND NET INCURRED CLAIMS AS ON 31ST MARCH 2022
(₹ In Lakhs)
Item NoLine of
BusinessGross Premiums Net Premiums
Gross Incurred
claims
Net Incurred
claimsRSM-1 RSM-2 RSM
1 Fire 1,02,287.83 18,007.66 43,380.29 7,932.38 10,228.78 6,507.04 10,228.78
2 Marine Cargo 23,218.85 12,239.06 19,240.98 11,742.31 2,786.26 3,522.69 3,522.69
3 Marine Hull 2,232.14 58.98 945.96 284.69 223.21 141.89 223.21
4 Motor 3,70,264.55 3,34,391.02 3,14,454.18 2,77,405.60 66,878.20 83,221.68 83,221.68
5 Engineering 12,575.58 2,181.49 6,521.40 965.62 1,257.56 978.21 1,257.56
6 Aviation - - - - - - -
7 Liability 5,858.93 3,902.75 1,285.90 918.54 878.84 289.33 878.84
8 Health & PA 1,90,722.99 1,60,060.70 2,15,161.06 1,93,176.22 32,012.14 57,952.87 57,952.87
9 Miscellaneous 60,588.99 38,377.20 24,464.59 17,602.23 8,482.46 5,280.67 8,482.46
10 Crop 94,047.55 20,466.23 1,03,384.30 25,461.90 9,404.75 15,507.64 15,507.64
Total 8,61,797.40 5,89,685.10 7,28,838.65 5,35,489.50 1,32,152.21 1,73,402.03 1,81,275.74
PERIODIC DISCLOSURES
FORM NL-25 - SOLVENCY MARGIN (TABLE IA)
FORM IRDAI - GI - SM
Insurance Regulatory and Development Authority of India
(Assets, Liabilities, and Solvency Margin of General Insurance Business) Regulations, 2016
Classification : Business within India / Total Business (All Business underwritten in India)
STATEMENT OF SOLVENCY MARGIN: IFFCO TOKIO GENERAL INSURANCE COMPANY LIMITED
As at 31st March, 2022
Name of Insurer: IFFCO-TOKIO GENERAL INSURANCE COMPANY LIMITED
Registration Number: 106
Date of Registration: 4.12.2000

(₹ In Lakhs)
Item Description Amount
(A) Policyholder's FUNDS
Available assets 10,89,360
Deduct :
(B) Current Liabilities as per BS 7,27,766
(C) Provisions as per BS 2,86,916
(D) Other Liabilities 74,678
(E) Excess in Policyholder's funds (A)-(B)-(C)-(D) -
Shareholder's FUNDS
(F) Available Assets 4,89,979
Deduct :
(G) Other Liabilities 1,86,241
(H) Excess in Shareholder's funds (F-G) 3,03,738
(I) Total ASM ( E+H ) 3,03,738
(J) Total RSM 1,81,276
(K) SOLVENCY RATIO ( Total ASM/ Total RSM) 1.68
Date of Registration: 4.12.2000
Classification : Business within India / Total Business (All Business underwritten in India)
PERIODIC DISCLOSURES
FORM NL-26 - SOLVENCY MARGIN (TABLE IB)
TABLE IB : AVAILABLE SOLVENCY MARGIN AND SOLVENCY RATIO
Name of Insurer: IFFCO-TOKIO GENERAL INSURANCE COMPANY LIMITED
Registration Number: 106
As at 31st March, 2022
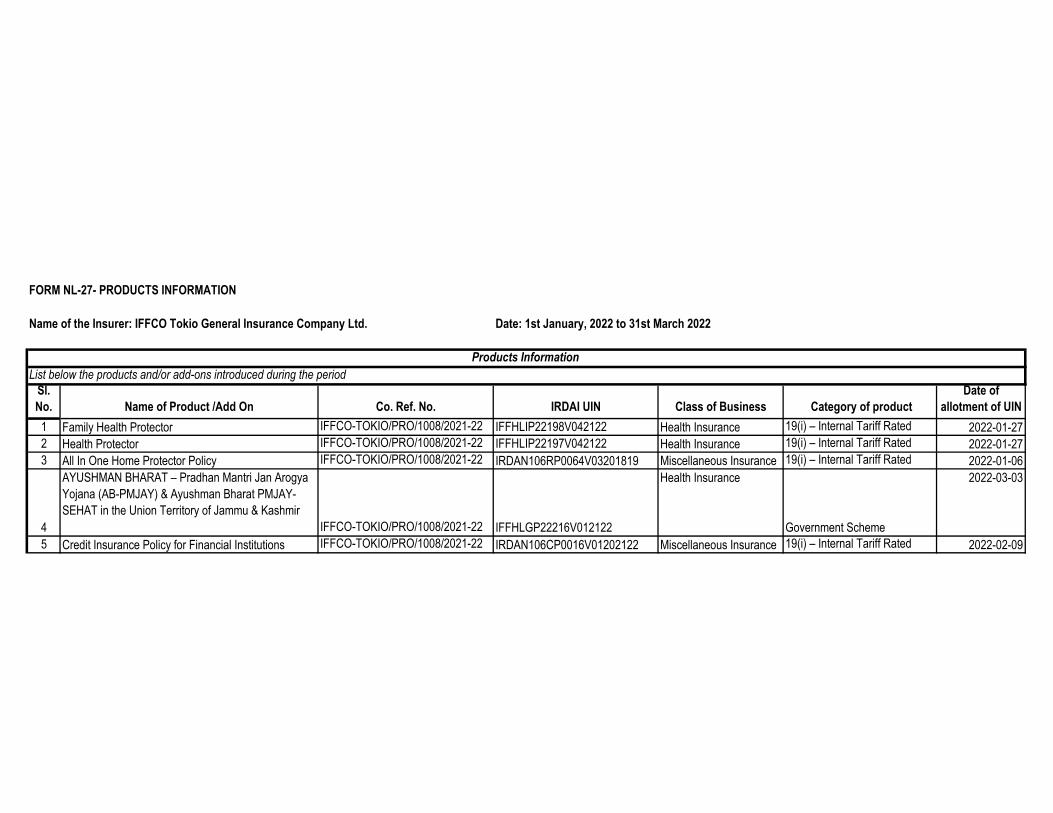
FORM NL-27- PRODUCTS INFORMATION
Name of the Insurer: IFFCO Tokio General Insurance Company Ltd. Date: 1st January, 2022 to 31st March 2022
List below the products and/or add-ons introduced during the period
Sl.
No. Name of Product /Add On Co. Ref. No. IRDAI UIN Class of Business Category of product
Date of
allotment of UIN
1 Family Health Protector IFFCO-TOKIO/PRO/1008/2021-22 IFFHLIP22198V042122 Health Insurance 19(i) – Internal Tariff Rated 2022-01-27
2 Health Protector IFFCO-TOKIO/PRO/1008/2021-22 IFFHLIP22197V042122 Health Insurance 19(i) – Internal Tariff Rated 2022-01-27
3 All In One Home Protector Policy IFFCO-TOKIO/PRO/1008/2021-22 IRDAN106RP0064V03201819 Miscellaneous Insurance 19(i) – Internal Tariff Rated 2022-01-06
4
AYUSHMAN BHARAT – Pradhan Mantri Jan Arogya
Yojana (AB-PMJAY) & Ayushman Bharat PMJAY-
SEHAT in the Union Territory of Jammu & Kashmir
IFFCO-TOKIO/PRO/1008/2021-22 IFFHLGP22216V012122
Health Insurance
Government Scheme
2022-03-03
5 Credit Insurance Policy for Financial Institutions IFFCO-TOKIO/PRO/1008/2021-22 IRDAN106CP0016V01202122 Miscellaneous Insurance 19(i) – Internal Tariff Rated 2022-02-09
Products Information
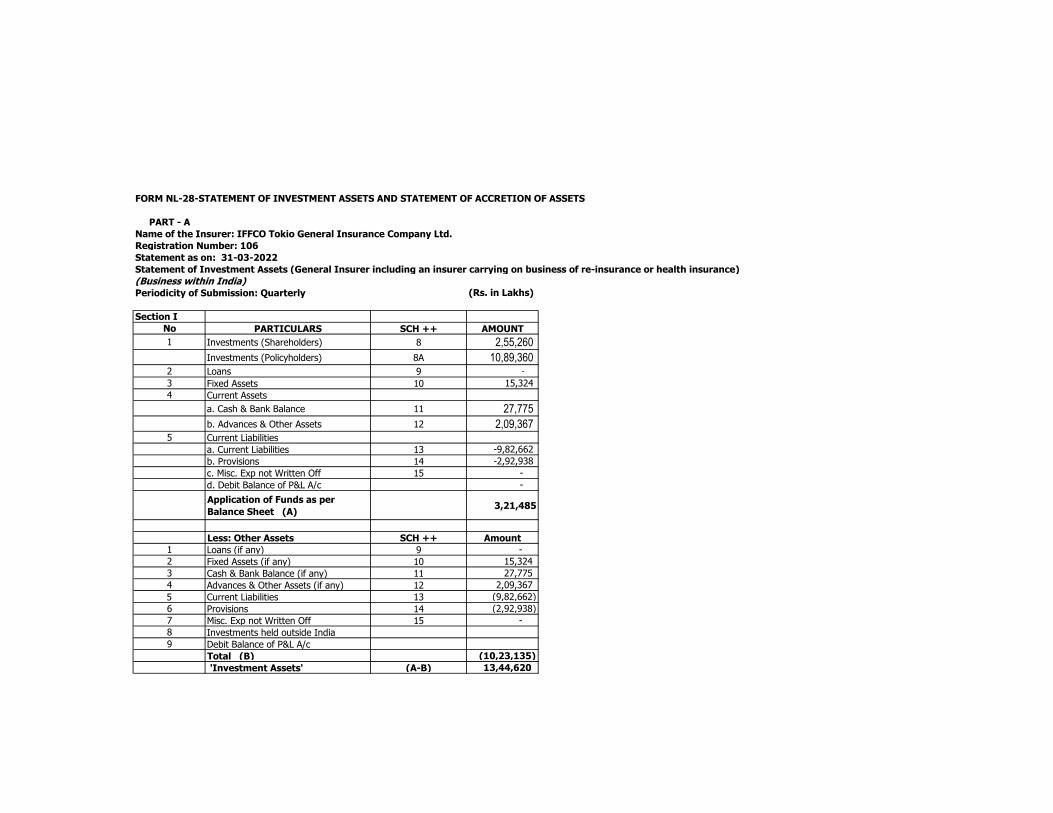
FORM NL-28-STATEMENT OF INVESTMENT ASSETS AND STATEMENT OF ACCRETION OF ASSETS
PART - A
Name of the Insurer: IFFCO Tokio General Insurance Company Ltd.
Registration Number: 106
Statement as on: 31-03-2022
Statement of Investment Assets (General Insurer including an insurer carrying on business of re-insurance or health insurance)
(Business within India)Periodicity of Submission: Quarterly (Rs. in Lakhs)
Section I
No PARTICULARS SCH ++ AMOUNT
1 Investments (Shareholders) 8 2,55,260
Investments (Policyholders) 8A 10,89,360 2 Loans 9 -
3 Fixed Assets 10 15,324
4 Current Assets
a. Cash & Bank Balance 11 27,775
b. Advances & Other Assets 12 2,09,367 5 Current Liabilities
a. Current Liabilities 13 -9,82,662
b. Provisions 14 -2,92,938
c. Misc. Exp not Written Off 15 -
d. Debit Balance of P&L A/c -
Application of Funds as per
Balance Sheet (A) 3,21,485
Less: Other Assets SCH ++ Amount
1 Loans (if any) 9 -
2 Fixed Assets (if any) 10 15,324
3 Cash & Bank Balance (if any) 11 27,775
4 Advances & Other Assets (if any) 12 2,09,367
5 Current Liabilities 13 (9,82,662)
6 Provisions 14 (2,92,938)
7 Misc. Exp not Written Off 15 -
8 Investments held outside India
9 Debit Balance of P&L A/c
Total (B) (10,23,135)
'Investment Assets' (A-B) 13,44,620
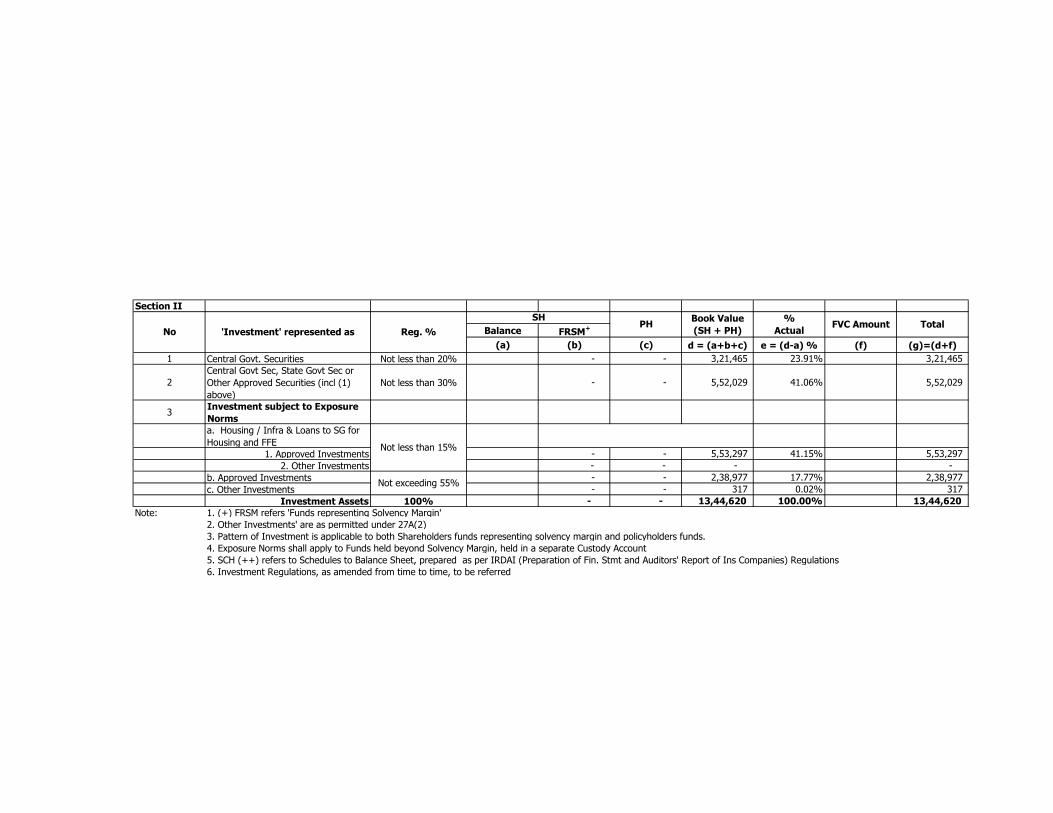
Section II
Balance FRSM+
(a) (b) (c) d = (a+b+c) e = (d-a) % (f) (g)=(d+f)
1 Central Govt. Securities Not less than 20% - - 3,21,465 23.91% 3,21,465
2
Central Govt Sec, State Govt Sec or
Other Approved Securities (incl (1)
above)
Not less than 30% - - 5,52,029 41.06% 5,52,029
3Investment subject to Exposure
Norms
a. Housing / Infra & Loans to SG for
Housing and FFE
1. Approved Investments - - 5,53,297 41.15% 5,53,297
2. Other Investments - - - -
b. Approved Investments - - 2,38,977 17.77% 2,38,977
c. Other Investments - - 317 0.02% 317
Investment Assets 100% - - 13,44,620 100.00% 13,44,620
Note: 1. (+) FRSM refers 'Funds representing Solvency Margin'
2. Other Investments' are as permitted under 27A(2)
3. Pattern of Investment is applicable to both Shareholders funds representing solvency margin and policyholders funds.
4. Exposure Norms shall apply to Funds held beyond Solvency Margin, held in a separate Custody Account
5. SCH (++) refers to Schedules to Balance Sheet, prepared as per IRDAI (Preparation of Fin. Stmt and Auditors' Report of Ins Companies) Regulations
6. Investment Regulations, as amended from time to time, to be referred
No 'Investment' represented as Reg. %
SHPH
Book Value
(SH + PH)
%
ActualFVC Amount Total
Not less than 15%
Not exceeding 55%
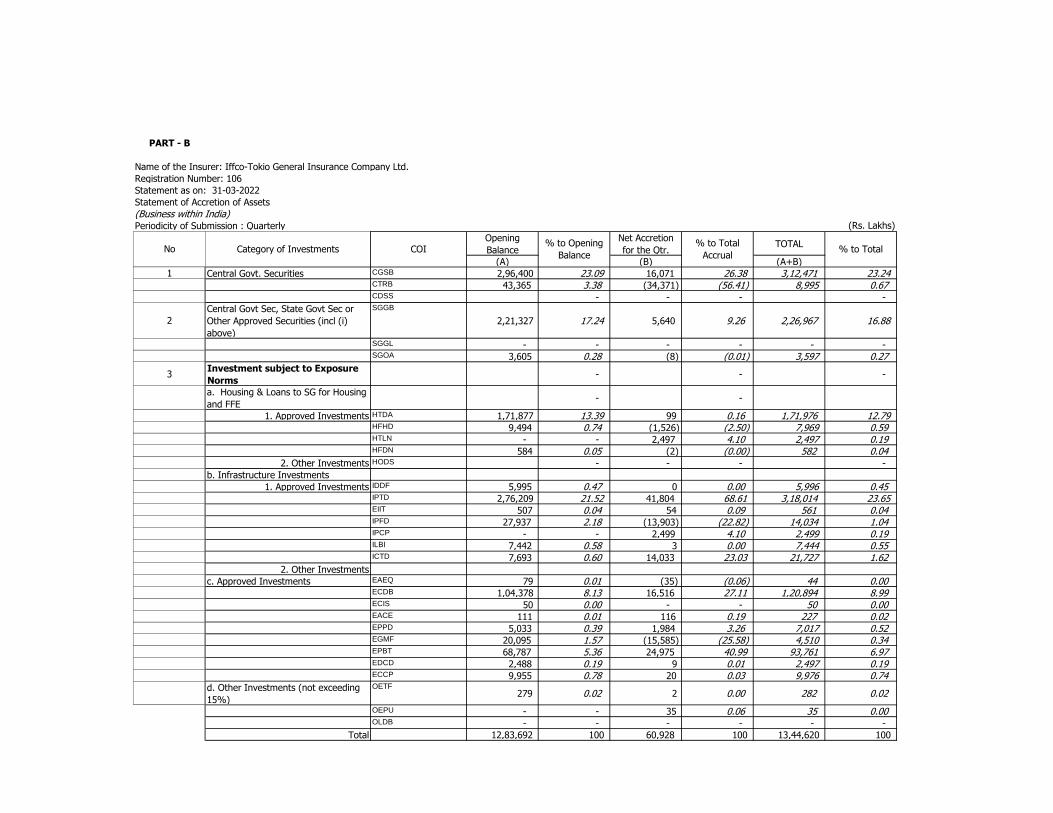
PART - B
Name of the Insurer: Iffco-Tokio General Insurance Company Ltd.
Registration Number: 106
Statement as on: 31-03-2022
Statement of Accretion of Assets
(Business within India)Periodicity of Submission : Quarterly
Opening
Balance
Net Accretion
for the Qtr.TOTAL
(A) (B) (A+B)
1 Central Govt. Securities CGSB 2,96,400 23.09 16,071 26.38 3,12,471 23.24 CTRB 43,365 3.38 (34,371) (56.41) 8,995 0.67 CDSS - - - -
2
Central Govt Sec, State Govt Sec or
Other Approved Securities (incl (i)
above)
SGGB
2,21,327 17.24 5,640 9.26 2,26,967 16.88
SGGL - - - - - - SGOA 3,605 0.28 (8) (0.01) 3,597 0.27
3Investment subject to Exposure
Norms - - -
a. Housing & Loans to SG for Housing
and FFE - -
1. Approved Investments HTDA 1,71,877 13.39 99 0.16 1,71,976 12.79 HFHD 9,494 0.74 (1,526) (2.50) 7,969 0.59 HTLN - - 2,497 4.10 2,497 0.19 HFDN 584 0.05 (2) (0.00) 582 0.04
2. Other Investments HODS - - - - b. Infrastructure Investments
1. Approved Investments IDDF 5,995 0.47 0 0.00 5,996 0.45 IPTD 2,76,209 21.52 41,804 68.61 3,18,014 23.65 EIIT 507 0.04 54 0.09 561 0.04 IPFD 27,937 2.18 (13,903) (22.82) 14,034 1.04 IPCP - - 2,499 4.10 2,499 0.19 ILBI 7,442 0.58 3 0.00 7,444 0.55 ICTD 7,693 0.60 14,033 23.03 21,727 1.62
2. Other Investments
c. Approved Investments EAEQ 79 0.01 (35) (0.06) 44 0.00 ECDB 1,04,378 8.13 16,516 27.11 1,20,894 8.99 ECIS 50 0.00 - - 50 0.00 EACE 111 0.01 116 0.19 227 0.02 EPPD 5,033 0.39 1,984 3.26 7,017 0.52 EGMF 20,095 1.57 (15,585) (25.58) 4,510 0.34 EPBT 68,787 5.36 24,975 40.99 93,761 6.97 EDCD 2,488 0.19 9 0.01 2,497 0.19 ECCP 9,955 0.78 20 0.03 9,976 0.74
d. Other Investments (not exceeding
15%)
OETF 279 0.02 2 0.00 282 0.02
OEPU - - 35 0.06 35 0.00 OLDB - - - - - -
Total 12,83,692 100 60,928 100 13,44,620 100
(Rs. Lakhs)
No Category of Investments COI% to Opening
Balance
% to Total
Accrual% to Total
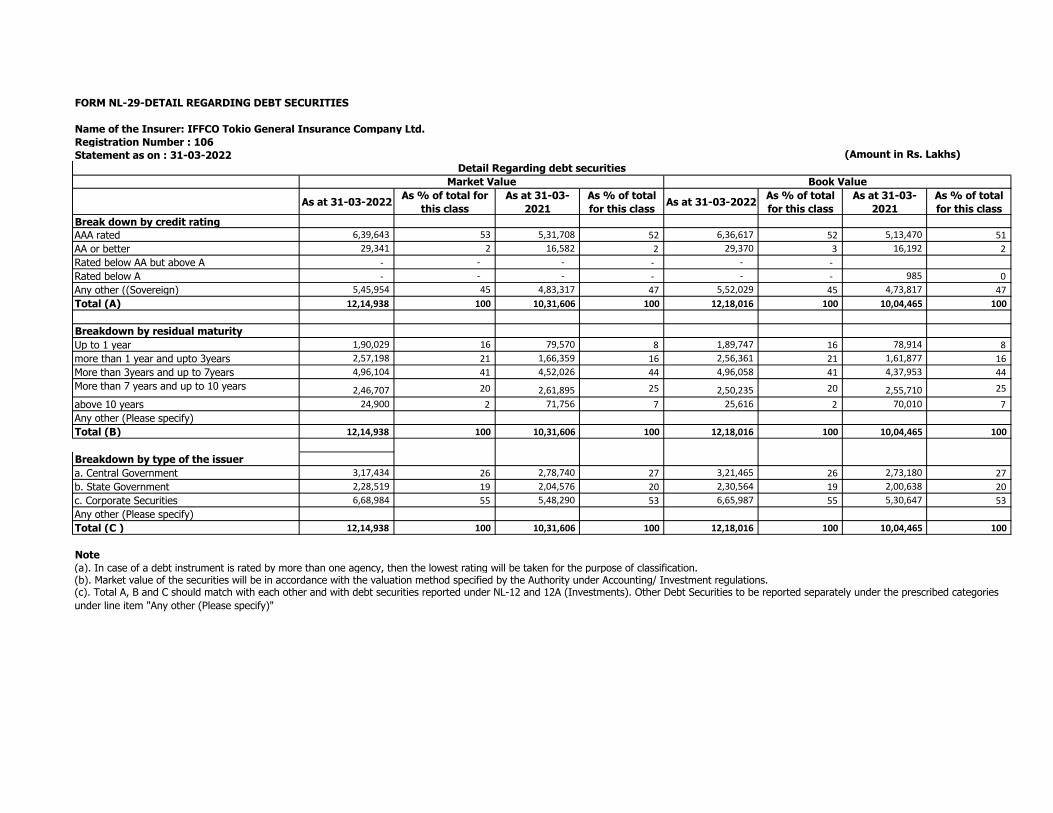
FORM NL-29-DETAIL REGARDING DEBT SECURITIES
Name of the Insurer: IFFCO Tokio General Insurance Company Ltd.
Registration Number : 106
Statement as on : 31-03-2022 (Amount in Rs. Lakhs)
As at 31-03-2022As % of total for
this class
As at 31-03-
2021
As % of total
for this classAs at 31-03-2022
As % of total
for this class
As at 31-03-
2021
As % of total
for this class
Break down by credit rating
AAA rated 6,39,643 53 5,31,708 52 6,36,617 52 5,13,470 51
AA or better 29,341 2 16,582 2 29,370 3 16,192 2
Rated below AA but above A - - - - - -
Rated below A - - - - - - 985 0
Any other ((Sovereign) 5,45,954 45 4,83,317 47 5,52,029 45 4,73,817 47
Total (A) 12,14,938 100 10,31,606 100 12,18,016 100 10,04,465 100
Breakdown by residual maturity
Up to 1 year 1,90,029 16 79,570 8 1,89,747 16 78,914 8
more than 1 year and upto 3years 2,57,198 21 1,66,359 16 2,56,361 21 1,61,877 16
More than 3years and up to 7years 4,96,104 41 4,52,026 44 4,96,058 41 4,37,953 44
More than 7 years and up to 10 years 2,46,707 20 2,61,895 25 2,50,235 20 2,55,710 25
above 10 years 24,900 2 71,756 7 25,616 2 70,010 7
Any other (Please specify)
Total (B) 12,14,938 100 10,31,606 100 12,18,016 100 10,04,465 100
Breakdown by type of the issuer
a. Central Government 3,17,434 26 2,78,740 27 3,21,465 26 2,73,180 27
b. State Government 2,28,519 19 2,04,576 20 2,30,564 19 2,00,638 20
c. Corporate Securities 6,68,984 55 5,48,290 53 6,65,987 55 5,30,647 53
Any other (Please specify)
Total (C ) 12,14,938 100 10,31,606 100 12,18,016 100 10,04,465 100
Note
(a). In case of a debt instrument is rated by more than one agency, then the lowest rating will be taken for the purpose of classification.
Detail Regarding debt securities
Market Value Book Value
(b). Market value of the securities will be in accordance with the valuation method specified by the Authority under Accounting/ Investment regulations.(c). Total A, B and C should match with each other and with debt securities reported under NL-12 and 12A (Investments). Other Debt Securities to be reported separately under the prescribed categories
under line item "Any other (Please specify)"
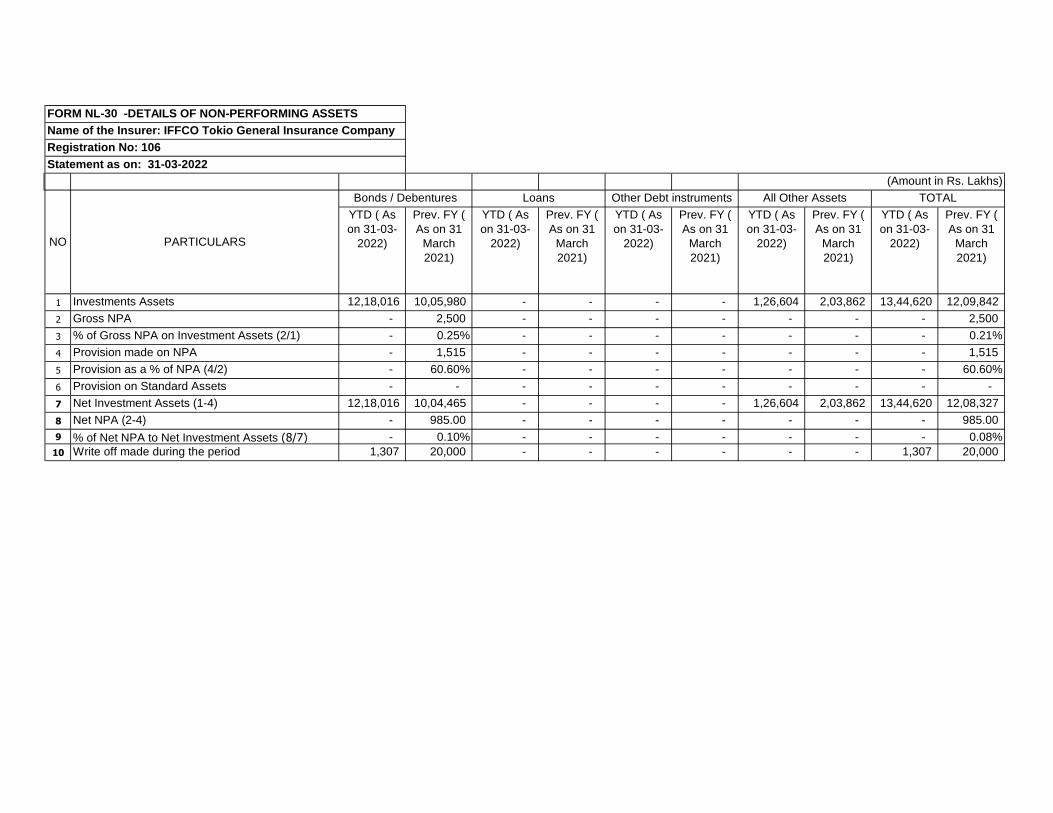
YTD ( As
on 31-03-
2022)
Prev. FY (
As on 31
March
2021)
YTD ( As
on 31-03-
2022)
Prev. FY (
As on 31
March
2021)
YTD ( As
on 31-03-
2022)
Prev. FY (
As on 31
March
2021)
YTD ( As
on 31-03-
2022)
Prev. FY (
As on 31
March
2021)
YTD ( As
on 31-03-
2022)
Prev. FY (
As on 31
March
2021)
1 Investments Assets 12,18,016 10,05,980 - - - - 1,26,604 2,03,862 13,44,620 12,09,842
2 Gross NPA - 2,500 - - - - - - - 2,500
3 % of Gross NPA on Investment Assets (2/1) - 0.25% - - - - - - - 0.21%
4 Provision made on NPA - 1,515 - - - - - - - 1,515
5 Provision as a % of NPA (4/2) - 60.60% - - - - - - - 60.60%
6 Provision on Standard Assets - - - - - - - - - -
7 Net Investment Assets (1-4) 12,18,016 10,04,465 - - - - 1,26,604 2,03,862 13,44,620 12,08,327
8 Net NPA (2-4) - 985.00 - - - - - - - 985.00
9 % of Net NPA to Net Investment Assets (8/7) - 0.10% - - - - - - - 0.08%
10 Write off made during the period 1,307 20,000 - - - - - - 1,307 20,000
(Amount in Rs. Lakhs)
FORM NL-30 -DETAILS OF NON-PERFORMING ASSETS
Name of the Insurer: IFFCO Tokio General Insurance Company
Ltd.Registration No: 106
Statement as on: 31-03-2022
NO PARTICULARS
Bonds / Debentures Loans Other Debt instruments TOTALAll Other Assets
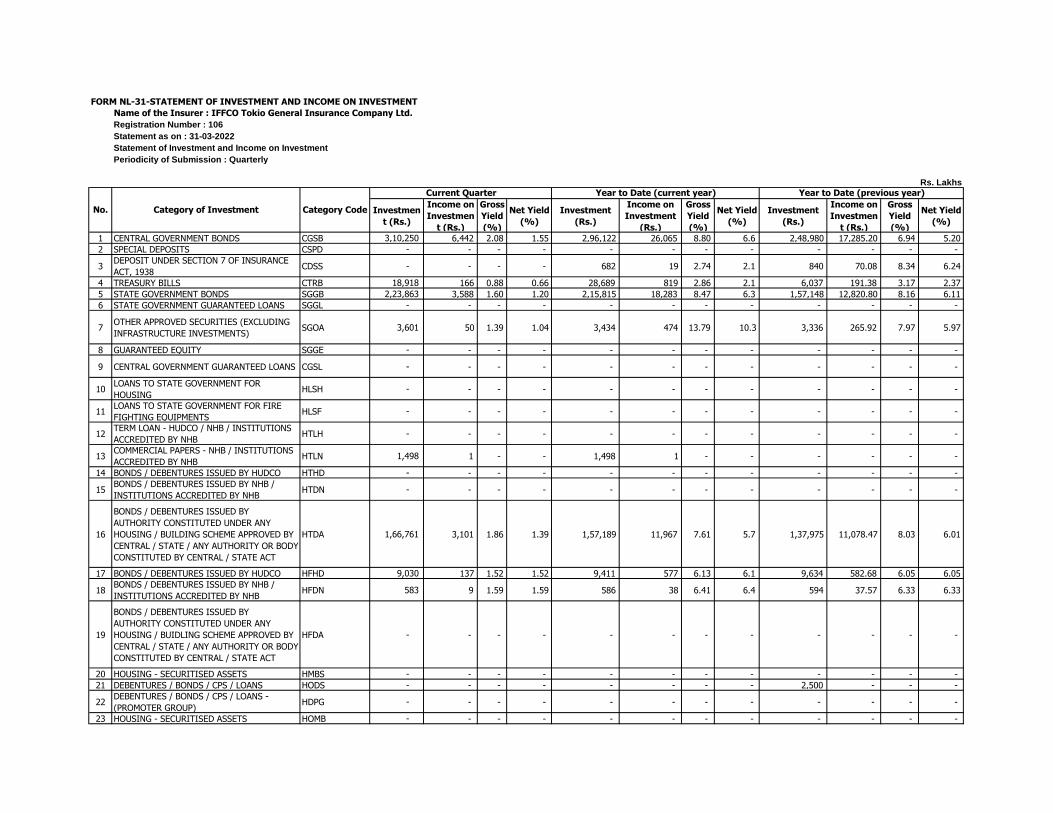
FORM NL-31-STATEMENT OF INVESTMENT AND INCOME ON INVESTMENT
Name of the Insurer : IFFCO Tokio General Insurance Company Ltd.
Registration Number : 106
Statement as on : 31-03-2022
Statement of Investment and Income on Investment
Periodicity of Submission : Quarterly
Investmen
t (Rs.)
Income on
Investmen
t (Rs.)
Gross
Yield
(%)
Net Yield
(%)
Investment
(Rs.)
Income on
Investment
(Rs.)
Gross
Yield
(%)
Net Yield
(%)
Investment
(Rs.)
Income on
Investmen
t (Rs.)
Gross
Yield
(%)
Net Yield
(%)
1 CENTRAL GOVERNMENT BONDS CGSB 3,10,250 6,442 2.08 1.55 2,96,122 26,065 8.80 6.6 2,48,980 17,285.20 6.94 5.20
2 SPECIAL DEPOSITS CSPD - - - - - - - - - - - -
3DEPOSIT UNDER SECTION 7 OF INSURANCE
ACT, 1938CDSS - - - - 682 19 2.74 2.1 840 70.08 8.34 6.24
4 TREASURY BILLS CTRB 18,918 166 0.88 0.66 28,689 819 2.86 2.1 6,037 191.38 3.17 2.37
5 STATE GOVERNMENT BONDS SGGB 2,23,863 3,588 1.60 1.20 2,15,815 18,283 8.47 6.3 1,57,148 12,820.80 8.16 6.11
6 STATE GOVERNMENT GUARANTEED LOANS SGGL - - - - - - - - - - - -
7OTHER APPROVED SECURITIES (EXCLUDING
INFRASTRUCTURE INVESTMENTS)SGOA 3,601 50 1.39 1.04 3,434 474 13.79 10.3 3,336 265.92 7.97 5.97
8 GUARANTEED EQUITY SGGE - - - - - - - - - - - -
9 CENTRAL GOVERNMENT GUARANTEED LOANS CGSL - - - - - - - - - - - -
10LOANS TO STATE GOVERNMENT FOR
HOUSINGHLSH - - - - - - - - - - - -
11LOANS TO STATE GOVERNMENT FOR FIRE
FIGHTING EQUIPMENTSHLSF - - - - - - - - - - - -
12TERM LOAN - HUDCO / NHB / INSTITUTIONS
ACCREDITED BY NHBHTLH - - - - - - - - - - - -
13COMMERCIAL PAPERS - NHB / INSTITUTIONS
ACCREDITED BY NHBHTLN 1,498 1 - - 1,498 1 - - - - - -
14 BONDS / DEBENTURES ISSUED BY HUDCO HTHD - - - - - - - - - - - -
15BONDS / DEBENTURES ISSUED BY NHB /
INSTITUTIONS ACCREDITED BY NHBHTDN - - - - - - - - - - - -
16
BONDS / DEBENTURES ISSUED BY
AUTHORITY CONSTITUTED UNDER ANY
HOUSING / BUILDING SCHEME APPROVED BY
CENTRAL / STATE / ANY AUTHORITY OR BODY
CONSTITUTED BY CENTRAL / STATE ACT
HTDA 1,66,761 3,101 1.86 1.39 1,57,189 11,967 7.61 5.7 1,37,975 11,078.47 8.03 6.01
17 BONDS / DEBENTURES ISSUED BY HUDCO HFHD 9,030 137 1.52 1.52 9,411 577 6.13 6.1 9,634 582.68 6.05 6.05
18BONDS / DEBENTURES ISSUED BY NHB /
INSTITUTIONS ACCREDITED BY NHBHFDN 583 9 1.59 1.59 586 38 6.41 6.4 594 37.57 6.33 6.33
19
BONDS / DEBENTURES ISSUED BY
AUTHORITY CONSTITUTED UNDER ANY
HOUSING / BUIDLING SCHEME APPROVED BY
CENTRAL / STATE / ANY AUTHORITY OR BODY
CONSTITUTED BY CENTRAL / STATE ACT
HFDA - - - - - - - - - - - -
20 HOUSING - SECURITISED ASSETS HMBS - - - - - - - - - - - -
21 DEBENTURES / BONDS / CPS / LOANS HODS - - - - - - - - 2,500 - - -
22DEBENTURES / BONDS / CPS / LOANS -
(PROMOTER GROUP)HDPG - - - - - - - - - - - -
23 HOUSING - SECURITISED ASSETS HOMB - - - - - - - - - - - -
Rs. Lakhs
No. Category of Investment Category Code
Current Quarter Year to Date (current year) Year to Date (previous year)
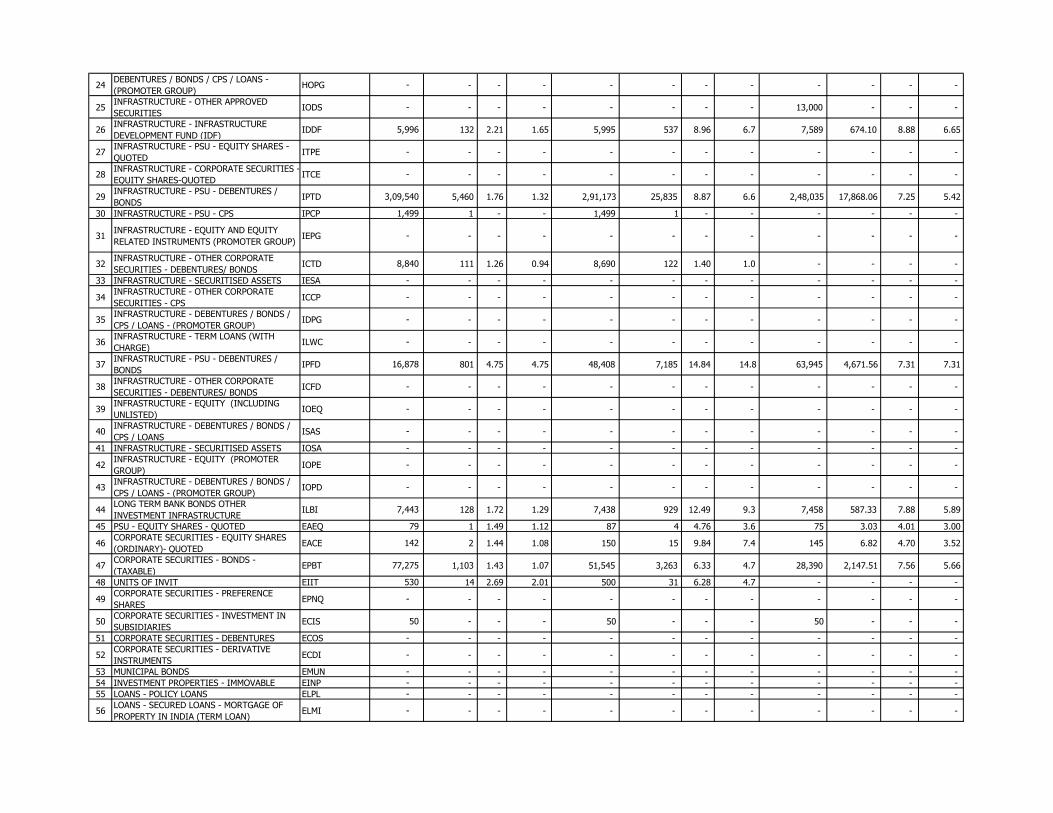
24DEBENTURES / BONDS / CPS / LOANS -
(PROMOTER GROUP)HOPG - - - - - - - - - - - -
25INFRASTRUCTURE - OTHER APPROVED
SECURITIESIODS - - - - - - - - 13,000 - - -
26INFRASTRUCTURE - INFRASTRUCTURE
DEVELOPMENT FUND (IDF)IDDF 5,996 132 2.21 1.65 5,995 537 8.96 6.7 7,589 674.10 8.88 6.65
27INFRASTRUCTURE - PSU - EQUITY SHARES -
QUOTEDITPE - - - - - - - - - - - -
28INFRASTRUCTURE - CORPORATE SECURITIES -
EQUITY SHARES-QUOTEDITCE - - - - - - - - - - - -
29INFRASTRUCTURE - PSU - DEBENTURES /
BONDSIPTD 3,09,540 5,460 1.76 1.32 2,91,173 25,835 8.87 6.6 2,48,035 17,868.06 7.25 5.42
30 INFRASTRUCTURE - PSU - CPS IPCP 1,499 1 - - 1,499 1 - - - - - -
31INFRASTRUCTURE - EQUITY AND EQUITY
RELATED INSTRUMENTS (PROMOTER GROUP)IEPG - - - - - - - - - - - -
32INFRASTRUCTURE - OTHER CORPORATE
SECURITIES - DEBENTURES/ BONDSICTD 8,840 111 1.26 0.94 8,690 122 1.40 1.0 - - - -
33 INFRASTRUCTURE - SECURITISED ASSETS IESA - - - - - - - - - - - -
34INFRASTRUCTURE - OTHER CORPORATE
SECURITIES - CPSICCP - - - - - - - - - - - -
35INFRASTRUCTURE - DEBENTURES / BONDS /
CPS / LOANS - (PROMOTER GROUP)IDPG - - - - - - - - - - - -
36INFRASTRUCTURE - TERM LOANS (WITH
CHARGE)ILWC - - - - - - - - - - - -
37INFRASTRUCTURE - PSU - DEBENTURES /
BONDSIPFD 16,878 801 4.75 4.75 48,408 7,185 14.84 14.8 63,945 4,671.56 7.31 7.31
38INFRASTRUCTURE - OTHER CORPORATE
SECURITIES - DEBENTURES/ BONDSICFD - - - - - - - - - - - -
39INFRASTRUCTURE - EQUITY (INCLUDING
UNLISTED)IOEQ - - - - - - - - - - - -
40INFRASTRUCTURE - DEBENTURES / BONDS /
CPS / LOANSISAS - - - - - - - - - - - -
41 INFRASTRUCTURE - SECURITISED ASSETS IOSA - - - - - - - - - - - -
42INFRASTRUCTURE - EQUITY (PROMOTER
GROUP)IOPE - - - - - - - - - - - -
43INFRASTRUCTURE - DEBENTURES / BONDS /
CPS / LOANS - (PROMOTER GROUP)IOPD - - - - - - - - - - - -
44LONG TERM BANK BONDS OTHER
INVESTMENT INFRASTRUCTUREILBI 7,443 128 1.72 1.29 7,438 929 12.49 9.3 7,458 587.33 7.88 5.89
45 PSU - EQUITY SHARES - QUOTED EAEQ 79 1 1.49 1.12 87 4 4.76 3.6 75 3.03 4.01 3.00
46CORPORATE SECURITIES - EQUITY SHARES
(ORDINARY)- QUOTEDEACE 142 2 1.44 1.08 150 15 9.84 7.4 145 6.82 4.70 3.52
47CORPORATE SECURITIES - BONDS -
(TAXABLE)EPBT 77,275 1,103 1.43 1.07 51,545 3,263 6.33 4.7 28,390 2,147.51 7.56 5.66
48 UNITS OF INVIT EIIT 530 14 2.69 2.01 500 31 6.28 4.7 - - - -
49CORPORATE SECURITIES - PREFERENCE
SHARESEPNQ - - - - - - - - - - - -
50CORPORATE SECURITIES - INVESTMENT IN
SUBSIDIARIESECIS 50 - - - 50 - - - 50 - - -
51 CORPORATE SECURITIES - DEBENTURES ECOS - - - - - - - - - - - -
52CORPORATE SECURITIES - DERIVATIVE
INSTRUMENTSECDI - - - - - - - - - - - -
53 MUNICIPAL BONDS EMUN - - - - - - - - - - - -
54 INVESTMENT PROPERTIES - IMMOVABLE EINP - - - - - - - - - - - -
55 LOANS - POLICY LOANS ELPL - - - - - - - - - - - -
56LOANS - SECURED LOANS - MORTGAGE OF
PROPERTY IN INDIA (TERM LOAN)ELMI - - - - - - - - - - - -
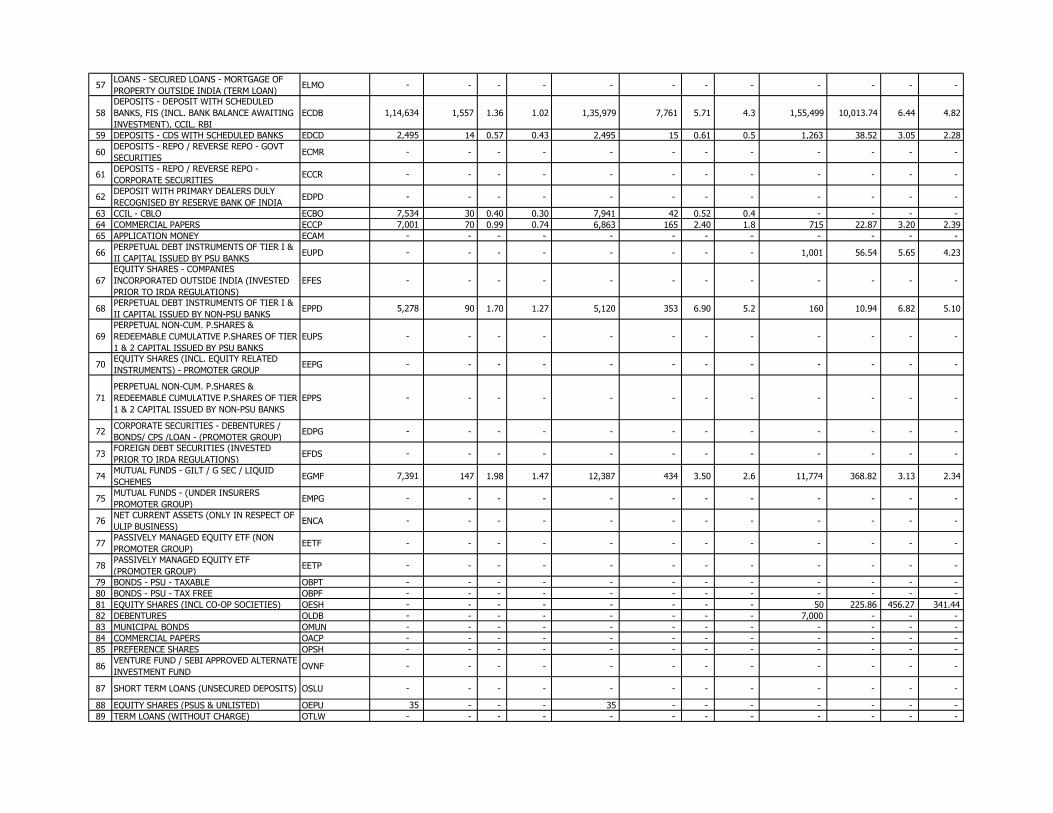
57LOANS - SECURED LOANS - MORTGAGE OF
PROPERTY OUTSIDE INDIA (TERM LOAN)ELMO - - - - - - - - - - - -
58
DEPOSITS - DEPOSIT WITH SCHEDULED
BANKS, FIS (INCL. BANK BALANCE AWAITING
INVESTMENT), CCIL, RBI
ECDB 1,14,634 1,557 1.36 1.02 1,35,979 7,761 5.71 4.3 1,55,499 10,013.74 6.44 4.82
59 DEPOSITS - CDS WITH SCHEDULED BANKS EDCD 2,495 14 0.57 0.43 2,495 15 0.61 0.5 1,263 38.52 3.05 2.28
60DEPOSITS - REPO / REVERSE REPO - GOVT
SECURITIESECMR - - - - - - - - - - - -
61DEPOSITS - REPO / REVERSE REPO -
CORPORATE SECURITIESECCR - - - - - - - - - - - -
62DEPOSIT WITH PRIMARY DEALERS DULY
RECOGNISED BY RESERVE BANK OF INDIAEDPD - - - - - - - - - - - -
63 CCIL - CBLO ECBO 7,534 30 0.40 0.30 7,941 42 0.52 0.4 - - - -
64 COMMERCIAL PAPERS ECCP 7,001 70 0.99 0.74 6,863 165 2.40 1.8 715 22.87 3.20 2.39
65 APPLICATION MONEY ECAM - - - - - - - - - - - -
66PERPETUAL DEBT INSTRUMENTS OF TIER I &
II CAPITAL ISSUED BY PSU BANKSEUPD - - - - - - - - 1,001 56.54 5.65 4.23
67
EQUITY SHARES - COMPANIES
INCORPORATED OUTSIDE INDIA (INVESTED
PRIOR TO IRDA REGULATIONS)
EFES - - - - - - - - - - - -
68PERPETUAL DEBT INSTRUMENTS OF TIER I &
II CAPITAL ISSUED BY NON-PSU BANKSEPPD 5,278 90 1.70 1.27 5,120 353 6.90 5.2 160 10.94 6.82 5.10
69
PERPETUAL NON-CUM. P.SHARES &
REDEEMABLE CUMULATIVE P.SHARES OF TIER
1 & 2 CAPITAL ISSUED BY PSU BANKS
EUPS - - - - - - - - - - - -
70EQUITY SHARES (INCL. EQUITY RELATED
INSTRUMENTS) - PROMOTER GROUPEEPG - - - - - - - - - - - -
71
PERPETUAL NON-CUM. P.SHARES &
REDEEMABLE CUMULATIVE P.SHARES OF TIER
1 & 2 CAPITAL ISSUED BY NON-PSU BANKS
EPPS - - - - - - - - - - - -
72CORPORATE SECURITIES - DEBENTURES /
BONDS/ CPS /LOAN - (PROMOTER GROUP)EDPG - - - - - - - - - - - -
73FOREIGN DEBT SECURITIES (INVESTED
PRIOR TO IRDA REGULATIONS)EFDS - - - - - - - - - - - -
74MUTUAL FUNDS - GILT / G SEC / LIQUID
SCHEMESEGMF 7,391 147 1.98 1.47 12,387 434 3.50 2.6 11,774 368.82 3.13 2.34
75MUTUAL FUNDS - (UNDER INSURERS
PROMOTER GROUP)EMPG - - - - - - - - - - - -
76NET CURRENT ASSETS (ONLY IN RESPECT OF
ULIP BUSINESS)ENCA - - - - - - - - - - - -
77PASSIVELY MANAGED EQUITY ETF (NON
PROMOTER GROUP)EETF - - - - - - - - - - - -
78PASSIVELY MANAGED EQUITY ETF
(PROMOTER GROUP)EETP - - - - - - - - - - - -
79 BONDS - PSU - TAXABLE OBPT - - - - - - - - - - - -
80 BONDS - PSU - TAX FREE OBPF - - - - - - - - - - - -
81 EQUITY SHARES (INCL CO-OP SOCIETIES) OESH - - - - - - - - 50 225.86 456.27 341.44
82 DEBENTURES OLDB - - - - - - - - 7,000 - - -
83 MUNICIPAL BONDS OMUN - - - - - - - - - - - -
84 COMMERCIAL PAPERS OACP - - - - - - - - - - - -
85 PREFERENCE SHARES OPSH - - - - - - - - - - - -
86VENTURE FUND / SEBI APPROVED ALTERNATE
INVESTMENT FUNDOVNF - - - - - - - - - - - -
87 SHORT TERM LOANS (UNSECURED DEPOSITS) OSLU - - - - - - - - - - - -
88 EQUITY SHARES (PSUS & UNLISTED) OEPU 35 - - - 35 - - - - - - -
89 TERM LOANS (WITHOUT CHARGE) OTLW - - - - - - - - - - - -
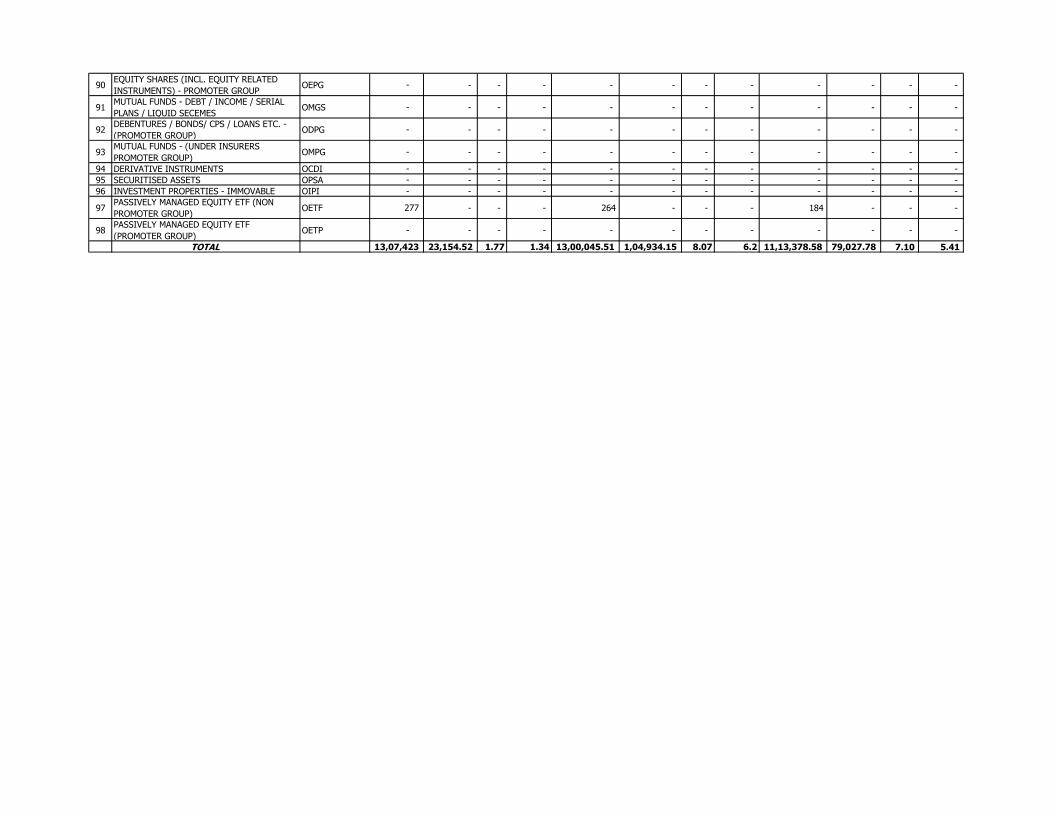
90EQUITY SHARES (INCL. EQUITY RELATED
INSTRUMENTS) - PROMOTER GROUPOEPG - - - - - - - - - - - -
91MUTUAL FUNDS - DEBT / INCOME / SERIAL
PLANS / LIQUID SECEMESOMGS - - - - - - - - - - - -
92DEBENTURES / BONDS/ CPS / LOANS ETC. -
(PROMOTER GROUP)ODPG - - - - - - - - - - - -
93MUTUAL FUNDS - (UNDER INSURERS
PROMOTER GROUP)OMPG - - - - - - - - - - - -
94 DERIVATIVE INSTRUMENTS OCDI - - - - - - - - - - - -
95 SECURITISED ASSETS OPSA - - - - - - - - - - - -
96 INVESTMENT PROPERTIES - IMMOVABLE OIPI - - - - - - - - - - - -
97PASSIVELY MANAGED EQUITY ETF (NON
PROMOTER GROUP)OETF 277 - - - 264 - - - 184 - - -
98PASSIVELY MANAGED EQUITY ETF
(PROMOTER GROUP)OETP - - - - - - - - - - - -
TOTAL 13,07,423 23,154.52 1.77 1.34 13,00,045.51 1,04,934.15 8.07 6.2 11,13,378.58 79,027.78 7.10 5.41
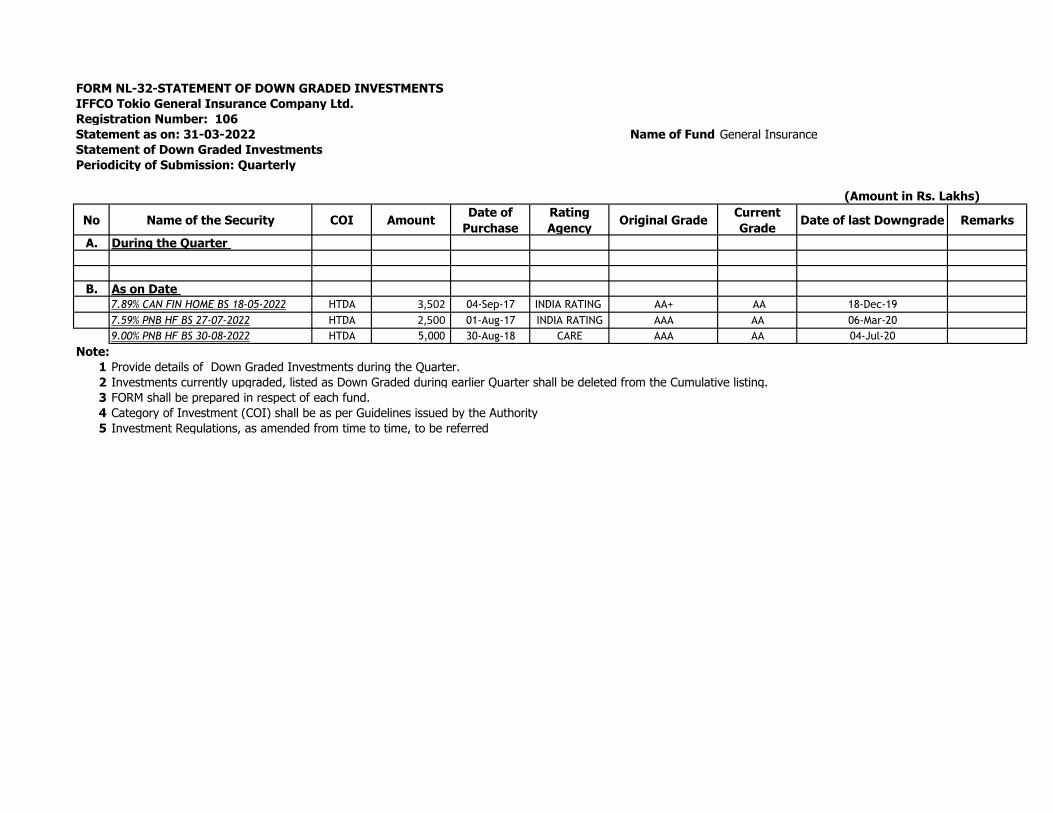
FORM NL-32-STATEMENT OF DOWN GRADED INVESTMENTS
IFFCO Tokio General Insurance Company Ltd.
Registration Number: 106
Statement as on: 31-03-2022 Name of Fund General Insurance
Statement of Down Graded Investments
Periodicity of Submission: Quarterly
No Name of the Security COI AmountDate of
Purchase
Rating
AgencyOriginal Grade
Current
GradeDate of last Downgrade Remarks
A. During the Quarter
B. As on Date 7.89% CAN FIN HOME BS 18-05-2022 HTDA 3,502 04-Sep-17 INDIA RATING AA+ AA 18-Dec-19
7.59% PNB HF BS 27-07-2022 HTDA 2,500 01-Aug-17 INDIA RATING AAA AA 06-Mar-20
9.00% PNB HF BS 30-08-2022 HTDA 5,000 30-Aug-18 CARE AAA AA 04-Jul-20
Note:
1 Provide details of Down Graded Investments during the Quarter.
2 Investments currently upgraded, listed as Down Graded during earlier Quarter shall be deleted from the Cumulative listing.
3 FORM shall be prepared in respect of each fund.
4 Category of Investment (COI) shall be as per Guidelines issued by the Authority
5 Investment Regulations, as amended from time to time, to be referred
(Amount in Rs. Lakhs)
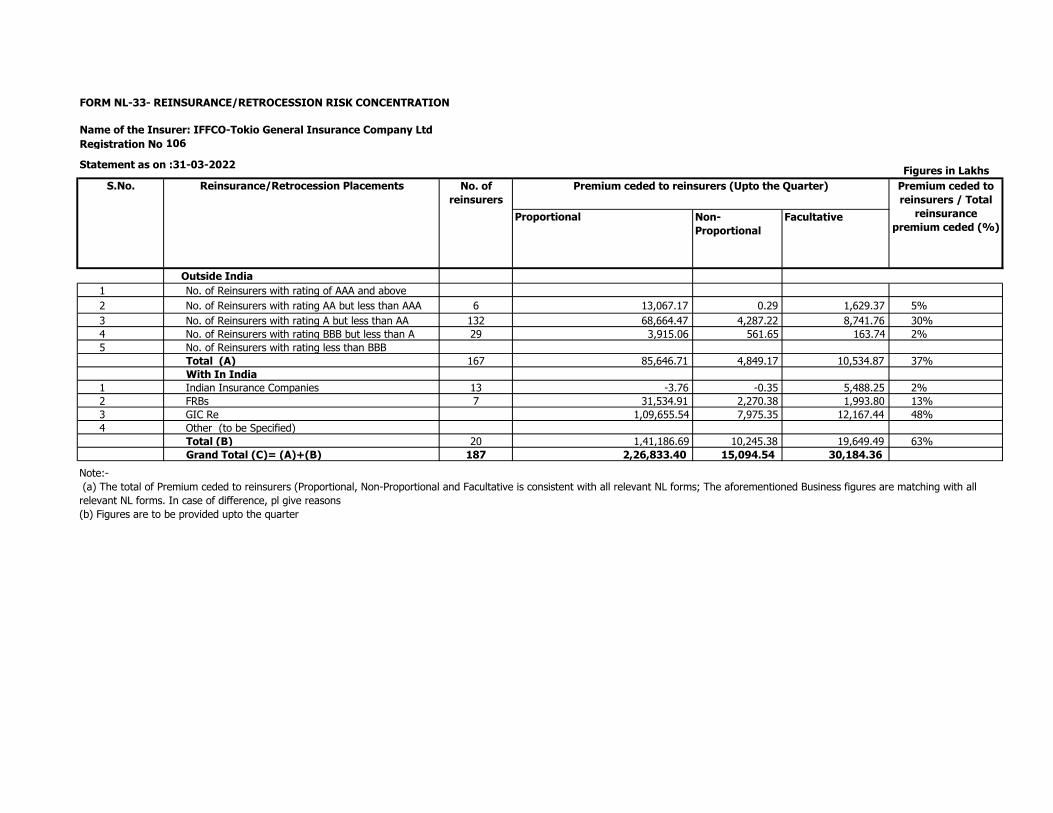
FORM NL-33- REINSURANCE/RETROCESSION RISK CONCENTRATION
Name of the Insurer: IFFCO-Tokio General Insurance Company Ltd
Registration No:106
Statement as on :31-03-2022Figures in Lakhs
Proportional Non-
Proportional
Facultative
Outside India
1 No. of Reinsurers with rating of AAA and above
2 No. of Reinsurers with rating AA but less than AAA 6 13,067.17 0.29 1,629.37 5%
3 No. of Reinsurers with rating A but less than AA 132 68,664.47 4,287.22 8,741.76 30%
4 No. of Reinsurers with rating BBB but less than A 29 3,915.06 561.65 163.74 2%
5 No. of Reinsurers with rating less than BBB
Total (A) 167 85,646.71 4,849.17 10,534.87 37%
With In India
1 Indian Insurance Companies 13 -3.76 -0.35 5,488.25 2%
2 FRBs 7 31,534.91 2,270.38 1,993.80 13%
3 GIC Re 1,09,655.54 7,975.35 12,167.44 48%
4 Other (to be Specified)
Total (B) 20 1,41,186.69 10,245.38 19,649.49 63%
Grand Total (C)= (A)+(B) 187 2,26,833.40 15,094.54 30,184.36
Note:-
(a) The total of Premium ceded to reinsurers (Proportional, Non-Proportional and Facultative is consistent with all relevant NL forms; The aforementioned Business figures are matching with all
relevant NL forms. In case of difference, pl give reasons
(b) Figures are to be provided upto the quarter
S.No. Reinsurance/Retrocession Placements No. of
reinsurers
Premium ceded to reinsurers (Upto the Quarter) Premium ceded to
reinsurers / Total
reinsurance
premium ceded (%)
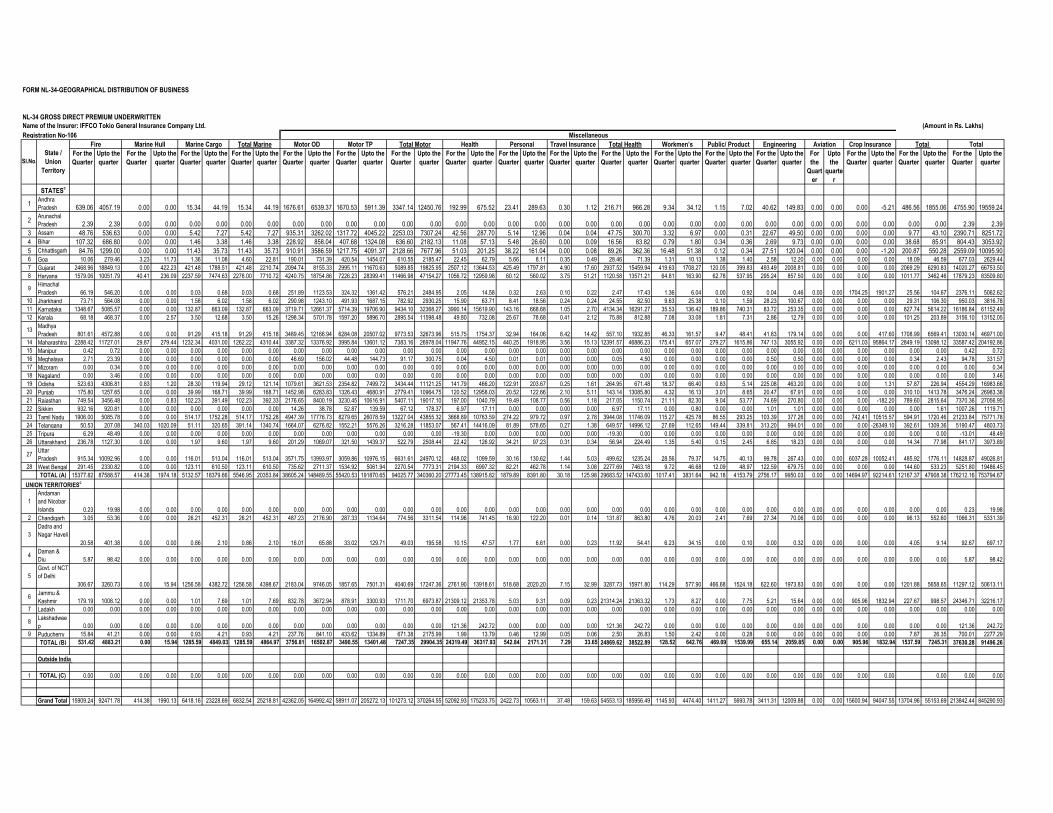
FORM NL-34-GEOGRAPHICAL DISTRIBUTION OF BUSINESS
NL-34 GROSS DIRECT PREMIUM UNDERWRITTEN
Name of the Insurer: IFFCO Tokio General Insurance Company Ltd. (Amount in Rs. Lakhs)
Registration No-106
For the
Quarter
Upto the
quarter
For the
Quarter
Upto the
quarter
For the
Quarter
Upto the
quarter
For the
Quarter
Upto the
quarter
For the
Quarter
Upto the
quarter
For the
Quarter
Upto the
quarter
For the
Quarter
Upto the
quarter
For the
Quarter
Upto the
quarter
For the
Quarter
Upto the
quarter
For the
Quarter
Upto the
quarter
For the
Quarter
Upto the
quarter
For the
Quarter
Upto the
quarter
For the
Quarter
Upto the
quarter
For the
Quarter
Upto the
quarter
For
the
Quart
er
Upto
the
quarte
r
For the
Quarter
Upto the
quarter
For the
Quarter
Upto the
quarter
For the
Quarter
Upto the
quarter
STATESc
1Andhra
Pradesh 639.06 4057.19 0.00 0.00 15.34 44.19 15.34 44.19 1676.61 6539.37 1670.53 5911.39 3347.14 12450.76 192.99 675.52 23.41 289.63 0.30 1.12 216.71 966.28 9.34 34.12 1.15 7.02 40.62 149.83 0.00 0.00 0.00 -5.21 486.56 1855.06 4755.90 19559.24
2Arunachal
Pradesh 2.39 2.39 0.00 0.00 0.00 0.00 0.00 0.00 0.00 0.00 0.00 0.00 0.00 0.00 0.00 0.00 0.00 0.00 0.00 0.00 0.00 0.00 0.00 0.00 0.00 0.00 0.00 0.00 0.00 0.00 0.00 0.00 0.00 0.00 2.39 2.39
3 Assam 48.76 536.63 0.00 0.00 5.42 7.27 5.42 7.27 935.31 3262.02 1317.72 4045.22 2253.03 7307.24 42.56 287.70 5.14 12.96 0.04 0.04 47.75 300.70 3.32 6.97 0.00 0.31 22.67 49.50 0.00 0.00 0.00 0.00 9.77 43.10 2390.71 8251.72
4 Bihar 107.32 686.80 0.00 0.00 1.46 3.38 1.46 3.38 228.92 858.04 407.68 1324.08 636.60 2182.13 11.08 57.13 5.48 26.60 0.00 0.09 16.56 83.82 0.79 1.80 0.34 0.36 2.69 9.73 0.00 0.00 0.00 0.00 38.68 85.91 804.43 3053.92
5 Chhattisgarh 84.76 1299.00 0.00 0.00 11.43 35.73 11.43 35.73 910.91 3586.59 1217.75 4091.37 2128.66 7677.96 51.03 201.25 38.22 161.04 0.00 0.08 89.26 362.36 16.48 51.38 0.12 0.34 27.51 120.04 0.00 0.00 0.00 -1.20 200.87 550.28 2559.09 10095.906 Goa 10.06 279.46 3.23 11.73 1.36 11.08 4.60 22.81 190.01 731.39 420.54 1454.07 610.55 2185.47 22.45 62.79 5.66 8.11 0.35 0.49 28.46 71.39 1.31 10.13 1.38 1.40 2.58 12.20 0.00 0.00 0.00 0.00 18.09 46.59 677.03 2629.44
7 Gujarat 2468.96 18849.13 0.00 422.23 421.48 1788.51 421.48 2210.74 2094.74 8155.33 2995.11 11670.63 5089.85 19825.95 2507.12 13644.53 425.49 1797.81 4.90 17.60 2937.52 15459.94 419.63 1708.27 120.05 399.83 493.49 2008.81 0.00 0.00 0.00 0.00 2069.29 6290.83 14020.27 66753.50
8 Haryana 1579.06 10051.79 40.41 236.09 2237.59 7474.63 2278.00 7710.72 4240.75 18754.86 7226.23 28399.41 11466.98 47154.27 1056.72 12959.98 60.12 560.02 3.75 51.21 1120.58 13571.21 64.81 163.90 62.78 537.95 295.24 857.50 0.00 0.00 0.00 0.00 1011.77 3462.46 17879.23 83509.80
9Himachal
Pradesh 66.19 546.20 0.00 0.00 0.03 0.68 0.03 0.68 251.89 1123.53 324.32 1361.42 576.21 2484.95 2.05 14.58 0.32 2.63 0.10 0.22 2.47 17.43 1.36 6.04 0.00 0.92 0.04 0.46 0.00 0.00 1704.25 1901.27 25.56 104.67 2376.11 5062.62
10 Jharkhand 73.71 564.08 0.00 0.00 1.58 6.02 1.58 6.02 290.98 1243.10 491.93 1687.15 782.92 2930.25 15.90 63.71 8.41 18.56 0.24 0.24 24.55 82.50 9.63 25.38 0.10 1.59 28.23 100.67 0.00 0.00 0.00 0.00 29.31 106.30 950.03 3816.78
11 Karnataka 1348.67 5085.57 0.00 0.00 132.87 663.09 132.87 663.09 3719.71 12661.37 5714.39 19706.90 9434.10 32368.27 3990.14 15619.90 143.16 668.68 1.05 2.70 4134.34 16291.27 35.53 136.42 189.86 740.31 83.72 253.35 0.00 0.00 0.00 0.00 827.74 5614.22 16186.84 61152.49
12 Kerala 68.18 468.37 0.00 2.57 3.50 12.68 3.50 15.26 1298.34 5701.78 1597.20 5896.70 2895.54 11598.48 49.80 732.08 25.67 78.68 0.41 2.12 75.88 812.88 7.08 33.08 1.81 7.31 2.86 12.79 0.00 0.00 0.00 0.00 101.25 203.89 3156.10 13152.05
13Madhya
Pradesh 801.61 4572.88 0.00 0.00 91.29 415.18 91.29 415.18 3489.45 12166.94 6284.08 20507.02 9773.53 32673.96 515.75 1754.37 32.94 164.06 8.42 14.42 557.10 1932.85 46.33 161.57 9.47 48.41 41.83 179.14 0.00 0.00 0.00 417.60 1708.99 6569.41 13030.14 46971.00
14 Maharashtra 2288.42 11727.01 29.87 279.44 1232.34 4031.00 1262.22 4310.44 3387.32 13376.92 3995.84 13601.12 7383.16 26978.04 11947.76 44952.15 440.25 1918.95 3.56 15.13 12391.57 46886.23 175.41 657.07 279.27 1615.86 747.13 3055.92 0.00 0.00 6211.03 95864.17 2849.19 13098.12 33587.42 204192.86
15 Manipur 0.42 0.72 0.00 0.00 0.00 0.00 0.00 0.00 0.00 0.00 0.00 0.00 0.00 0.00 0.00 0.00 0.00 0.00 0.00 0.00 0.00 0.00 0.00 0.00 0.00 0.00 0.00 0.00 0.00 0.00 0.00 0.00 0.00 0.00 0.42 0.72
16 Meghalaya 2.71 23.39 0.00 0.00 0.00 0.00 0.00 0.00 46.69 156.02 44.48 144.73 91.17 300.75 0.04 4.50 0.01 0.01 0.00 0.00 0.05 4.50 0.00 0.00 0.00 0.00 0.50 0.50 0.00 0.00 0.00 0.00 0.34 2.43 94.78 331.57
17 Mizoram 0.00 0.34 0.00 0.00 0.00 0.00 0.00 0.00 0.00 0.00 0.00 0.00 0.00 0.00 0.00 0.00 0.00 0.00 0.00 0.00 0.00 0.00 0.00 0.00 0.00 0.00 0.00 0.00 0.00 0.00 0.00 0.00 0.00 0.00 0.00 0.34
18 Nagaland 0.00 3.46 0.00 0.00 0.00 0.00 0.00 0.00 0.00 0.00 0.00 0.00 0.00 0.00 0.00 0.00 0.00 0.00 0.00 0.00 0.00 0.00 0.00 0.00 0.00 0.00 0.00 0.00 0.00 0.00 0.00 0.00 0.00 0.00 0.00 3.46
19 Odisha 523.63 4306.81 0.83 1.20 28.30 119.94 29.12 121.14 1079.61 3621.53 2354.82 7499.72 3434.44 11121.25 141.79 466.20 122.91 203.67 0.25 1.61 264.95 671.48 18.37 66.40 0.83 5.14 225.08 463.20 0.00 0.00 0.00 1.31 57.87 226.94 4554.29 16983.66
20 Punjab 175.80 1257.65 0.00 0.00 39.99 168.71 39.99 168.71 1452.98 6283.83 1326.43 4680.91 2779.41 10964.75 120.52 12958.03 20.52 122.66 2.10 5.11 143.14 13085.80 4.32 16.13 3.01 8.65 20.47 67.91 0.00 0.00 0.00 0.00 310.10 1413.78 3476.24 26983.38
21 Rajasthan 749.54 3456.48 0.00 0.83 102.23 391.49 102.23 392.33 2176.65 8400.19 3230.45 10616.91 5407.11 19017.10 197.00 1040.79 19.49 108.77 0.56 1.18 217.05 1150.74 21.11 82.30 9.04 53.77 74.69 270.80 0.00 0.00 0.00 -182.20 789.60 2815.64 7370.36 27056.95
22 Sikkim 932.16 920.81 0.00 0.00 0.00 0.00 0.00 0.00 14.26 38.78 52.87 139.59 67.12 178.37 6.97 17.11 0.00 0.00 0.00 0.00 6.97 17.11 0.00 0.80 0.00 0.00 1.01 1.01 0.00 0.00 0.00 0.00 0.00 1.61 1007.26 1119.71
23 Tamil Nadu 1906.00 5085.78 0.00 0.00 514.17 1752.28 514.17 1752.28 4947.39 17776.73 8279.65 26078.59 13227.04 43855.32 3668.89 10763.59 274.22 979.72 0.97 2.78 3944.08 11746.09 115.27 425.78 86.55 293.25 103.39 377.26 0.00 0.00 742.41 10515.57 594.91 1720.46 21233.84 75771.78
24 Telangana 50.53 207.08 340.03 1020.09 51.11 320.65 391.14 1340.74 1664.07 6276.82 1552.21 5576.26 3216.28 11853.07 567.41 14416.09 81.89 578.65 0.27 1.38 649.57 14996.12 27.69 112.65 149.44 339.81 313.20 994.01 0.00 0.00 0.00 -26349.10 392.61 1309.36 5190.47 4803.73
25 Tripura 6.29 48.49 0.00 0.00 0.00 0.00 0.00 0.00 0.00 0.00 0.00 0.00 0.00 0.00 -19.30 0.00 0.00 0.00 0.00 0.00 -19.30 0.00 0.00 0.00 0.00 0.00 0.00 0.00 0.00 0.00 0.00 0.00 0.00 0.00 -13.01 48.49
26 Uttarakhand 236.78 1127.30 0.00 0.00 1.97 9.60 1.97 9.60 201.29 1069.07 321.50 1439.37 522.79 2508.44 22.42 126.92 34.21 97.23 0.31 0.34 56.94 224.49 1.35 5.40 0.15 2.45 6.85 18.23 0.00 0.00 0.00 0.00 14.34 77.98 841.17 3973.89
27Uttar
Pradesh 915.34 10092.96 0.00 0.00 116.01 513.04 116.01 513.04 3571.75 13993.97 3059.86 10976.15 6631.61 24970.12 468.02 1099.59 30.16 130.62 1.44 5.03 499.62 1235.24 28.56 79.37 14.75 40.13 99.78 267.43 0.00 0.00 6037.28 10052.41 485.92 1776.11 14828.87 49026.81
28 West Bengal 291.45 2330.82 0.00 0.00 123.11 610.50 123.11 610.50 735.62 2711.37 1534.92 5061.94 2270.54 7773.31 2194.33 6997.32 82.21 462.78 1.14 3.08 2277.69 7463.18 9.72 46.68 12.09 48.97 122.59 679.75 0.00 0.00 0.00 0.00 144.60 533.23 5251.80 19486.45
TOTAL (A) 15377.82 87588.57 414.38 1974.18 5132.57 18379.66 5546.95 20353.84 38605.24 148489.55 55420.53 191870.65 94025.77 340360.20 27773.45 138915.82 1879.89 8391.80 30.18 125.98 29683.52 147433.60 1017.41 3831.64 942.18 4153.79 2756.17 9950.03 0.00 0.00 14694.97 92214.61 12167.37 47908.38 176212.16 753794.67
UNION TERRITORIESc
1
Andaman
and Nicobar
Islands 0.23 19.98 0.00 0.00 0.00 0.00 0.00 0.00 0.00 0.00 0.00 0.00 0.00 0.00 0.00 0.00 0.00 0.00 0.00 0.00 0.00 0.00 0.00 0.00 0.00 0.00 0.00 0.00 0.00 0.00 0.00 0.00 0.00 0.00 0.23 19.98
2 Chandigarh 3.05 53.36 0.00 0.00 26.21 452.31 26.21 452.31 487.23 2176.90 287.33 1134.64 774.56 3311.54 114.96 741.45 16.90 122.20 0.01 0.14 131.87 863.80 4.76 20.03 2.41 7.69 27.34 70.06 0.00 0.00 0.00 0.00 96.13 552.60 1066.31 5331.39
3
Dadra and
Nagar Haveli
20.58 401.38 0.00 0.00 0.86 2.10 0.86 2.10 16.01 65.88 33.02 129.71 49.03 195.58 10.15 47.57 1.77 6.61 0.00 0.23 11.92 54.41 6.23 34.15 0.00 0.10 0.00 0.32 0.00 0.00 0.00 0.00 4.05 9.14 92.67 697.17
4Daman &
Diu 5.87 98.42 0.00 0.00 0.00 0.00 0.00 0.00 0.00 0.00 0.00 0.00 0.00 0.00 0.00 0.00 0.00 0.00 0.00 0.00 0.00 0.00 0.00 0.00 0.00 0.00 0.00 0.00 0.00 0.00 0.00 0.00 0.00 0.00 5.87 98.42
5
Govt. of NCT
of Delhi
306.67 3260.73 0.00 15.94 1256.58 4382.72 1256.58 4398.67 2183.04 9746.05 1857.65 7501.31 4040.69 17247.36 2761.90 13918.61 518.68 2020.20 7.15 32.99 3287.73 15971.80 114.29 577.90 466.68 1524.18 622.60 1973.83 0.00 0.00 0.00 0.00 1201.88 5658.65 11297.12 50613.11
6Jammu &
Kashmir 179.19 1008.12 0.00 0.00 1.01 7.69 1.01 7.69 832.78 3672.94 878.91 3300.93 1711.70 6973.87 21309.12 21353.78 5.03 9.31 0.09 0.23 21314.24 21363.32 1.73 8.27 0.00 7.75 5.21 15.64 0.00 0.00 905.96 1832.94 227.67 998.57 24346.71 32216.17
7 Ladakh 0.00 0.00 0.00 0.00 0.00 0.00 0.00 0.00 0.00 0.00 0.00 0.00 0.00 0.00 0.00 0.00 0.00 0.00 0.00 0.00 0.00 0.00 0.00 0.00 0.00 0.00 0.00 0.00 0.00 0.00 0.00 0.00 0.00 0.00 0.00 0.00
8Lakshadwee
p 0.00 0.00 0.00 0.00 0.00 0.00 0.00 0.00 0.00 0.00 0.00 0.00 0.00 0.00 121.36 242.72 0.00 0.00 0.00 0.00 121.36 242.72 0.00 0.00 0.00 0.00 0.00 0.00 0.00 0.00 0.00 0.00 0.00 0.00 121.36 242.72
9 Puducherry 15.84 41.21 0.00 0.00 0.93 4.21 0.93 4.21 237.76 841.10 433.62 1334.89 671.38 2175.99 1.99 13.79 0.46 12.99 0.05 0.06 2.50 26.83 1.50 2.42 0.00 0.28 0.00 0.00 0.00 0.00 0.00 0.00 7.87 26.35 700.01 2277.29
TOTAL (B) 531.42 4883.21 0.00 15.94 1285.59 4849.03 1285.59 4864.97 3756.81 16502.87 3490.55 13401.48 7247.35 29904.35 24319.49 36317.93 542.84 2171.31 7.29 33.65 24869.62 38522.89 128.52 642.76 469.09 1539.99 655.14 2059.85 0.00 0.00 905.96 1832.94 1537.59 7245.31 37630.28 91496.26
Outside India
1 TOTAL (C) 0.00 0.00 0.00 0.00 0.00 0.00 0.00 0.00 0.00 0.00 0.00 0.00 0.00 0.00 0.00 0.00 0.00 0.00 0.00 0.00 0.00 0.00 0.00 0.00 0.00 0.00 0.00 0.00 0.00 0.00 0.00 0.00 0.00 0.00 0.00
Grand Total (A)+(B)+(C) 15909.24 92471.78 414.38 1990.13 6418.16 23228.69 6832.54 25218.81 42362.05 164992.42 58911.07 205272.13 101273.12 370264.55 52092.93 175233.75 2422.73 10563.11 37.48 159.63 54553.13 185956.49 1145.93 4474.40 1411.27 5693.78 3411.31 12009.88 0.00 0.00 15600.94 94047.55 13704.96 55153.69 213842.44 845290.93
Engineering Aviation Crop Insurance Total TotalHealth Personal Travel Insurance Total Health Workmen’s Public/ Product
Miscellaneous
Sl.No.
State /
Union
Territory
Fire Marine Hull Marine Cargo Total Marine Motor OD Motor TP Total Motor
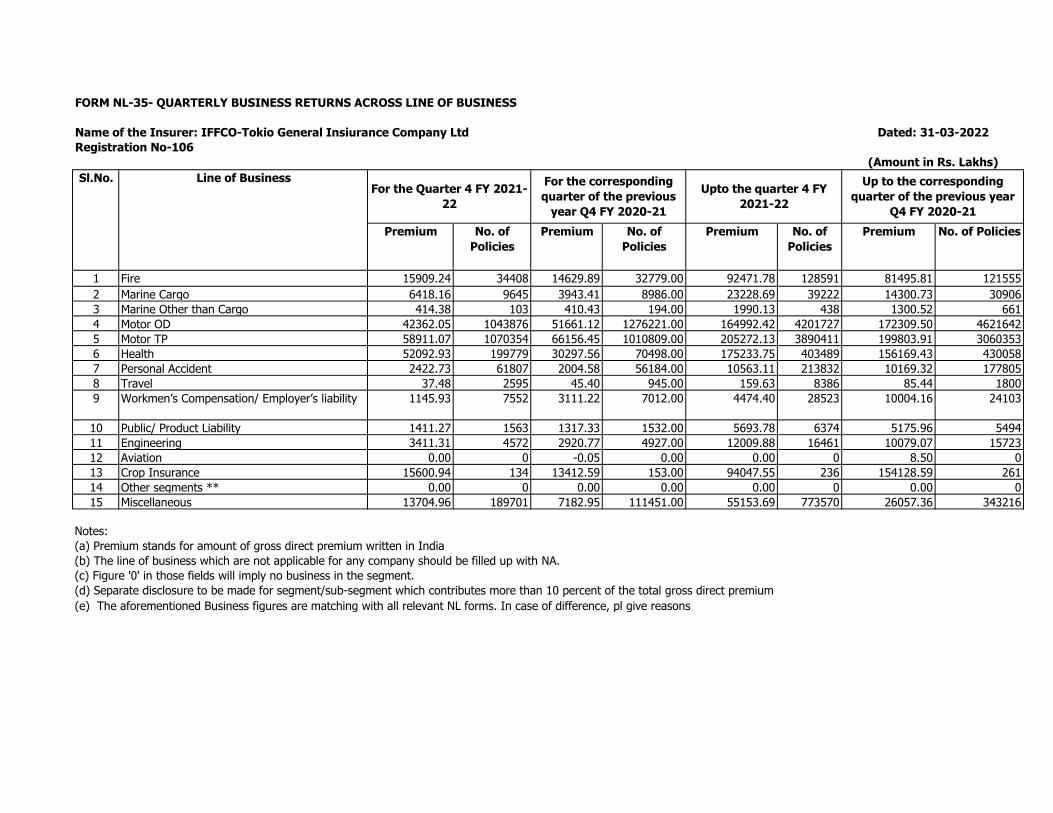
FORM NL-35- QUARTERLY BUSINESS RETURNS ACROSS LINE OF BUSINESS
Name of the Insurer: IFFCO-Tokio General Insiurance Company Ltd
Registration No-106
Premium No. of
Policies
Premium No. of
Policies
Premium No. of
Policies
Premium No. of Policies
1 Fire 15909.24 34408 14629.89 32779.00 92471.78 128591 81495.81 121555
2 Marine Cargo 6418.16 9645 3943.41 8986.00 23228.69 39222 14300.73 30906
3 Marine Other than Cargo 414.38 103 410.43 194.00 1990.13 438 1300.52 661
4 Motor OD 42362.05 1043876 51661.12 1276221.00 164992.42 4201727 172309.50 4621642
5 Motor TP 58911.07 1070354 66156.45 1010809.00 205272.13 3890411 199803.91 3060353
6 Health 52092.93 199779 30297.56 70498.00 175233.75 403489 156169.43 430058
7 Personal Accident 2422.73 61807 2004.58 56184.00 10563.11 213832 10169.32 177805
8 Travel 37.48 2595 45.40 945.00 159.63 8386 85.44 1800
9 Workmen’s Compensation/ Employer’s liability 1145.93 7552 3111.22 7012.00 4474.40 28523 10004.16 24103
10 Public/ Product Liability 1411.27 1563 1317.33 1532.00 5693.78 6374 5175.96 5494
11 Engineering 3411.31 4572 2920.77 4927.00 12009.88 16461 10079.07 15723
12 Aviation 0.00 0 -0.05 0.00 0.00 0 8.50 0
13 Crop Insurance 15600.94 134 13412.59 153.00 94047.55 236 154128.59 261
14 Other segments ** 0.00 0 0.00 0.00 0.00 0 0.00 0
15 Miscellaneous 13704.96 189701 7182.95 111451.00 55153.69 773570 26057.36 343216
Notes:
(a) Premium stands for amount of gross direct premium written in India
(b) The line of business which are not applicable for any company should be filled up with NA.
(c) Figure '0' in those fields will imply no business in the segment.
(d) Separate disclosure to be made for segment/sub-segment which contributes more than 10 percent of the total gross direct premium
(e) The aforementioned Business figures are matching with all relevant NL forms. In case of difference, pl give reasons
Dated: 31-03-2022
(Amount in Rs. Lakhs)
Sl.No. Line of BusinessFor the Quarter 4 FY 2021-
22
For the corresponding
quarter of the previous
year Q4 FY 2020-21
Upto the quarter 4 FY
2021-22
Up to the corresponding
quarter of the previous year
Q4 FY 2020-21
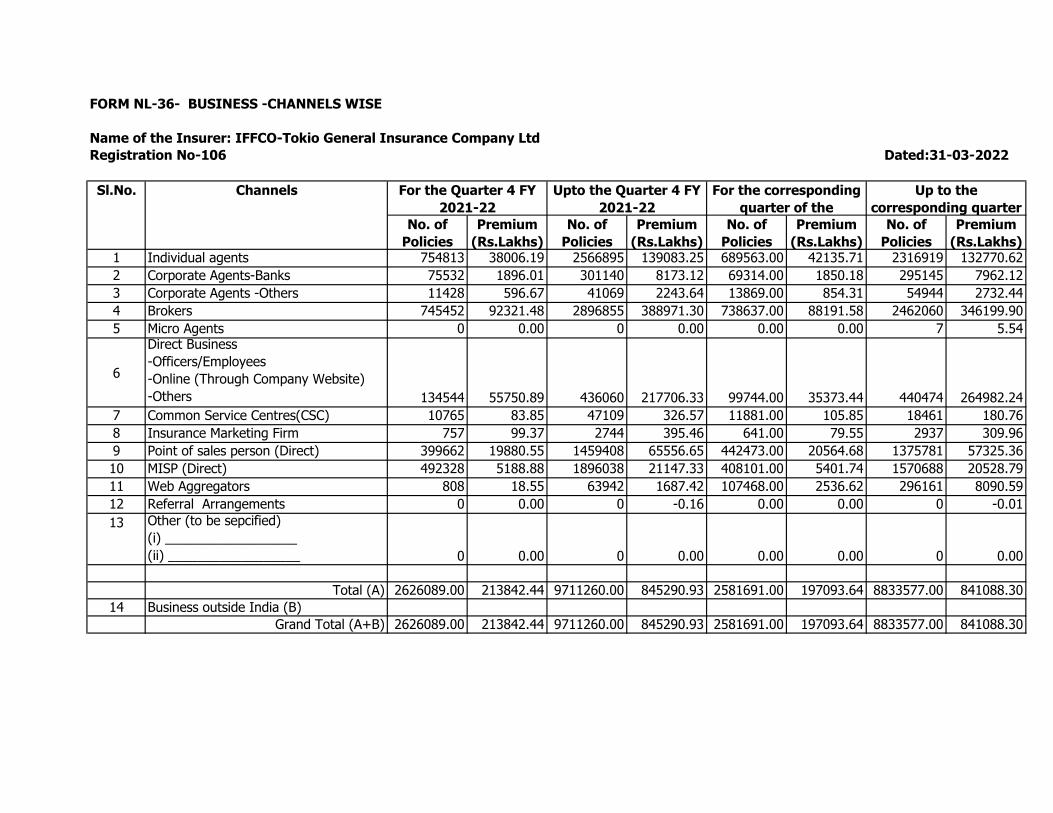
FORM NL-36- BUSINESS -CHANNELS WISE
Name of the Insurer: IFFCO-Tokio General Insurance Company Ltd
Registration No-106
1 Individual agents 754813 38006.19 2566895 139083.25 689563.00 42135.71 2316919 132770.62
2 Corporate Agents-Banks 75532 1896.01 301140 8173.12 69314.00 1850.18 295145 7962.12
3 Corporate Agents -Others 11428 596.67 41069 2243.64 13869.00 854.31 54944 2732.44
4 Brokers 745452 92321.48 2896855 388971.30 738637.00 88191.58 2462060 346199.90
5 Micro Agents 0 0.00 0 0.00 0.00 0.00 7 5.54
6
Direct Business
-Officers/Employees
-Online (Through Company Website)
-Others 134544 55750.89 436060 217706.33 99744.00 35373.44 440474 264982.24
7 Common Service Centres(CSC) 10765 83.85 47109 326.57 11881.00 105.85 18461 180.76
8 Insurance Marketing Firm 757 99.37 2744 395.46 641.00 79.55 2937 309.96
9 Point of sales person (Direct) 399662 19880.55 1459408 65556.65 442473.00 20564.68 1375781 57325.36
10 MISP (Direct) 492328 5188.88 1896038 21147.33 408101.00 5401.74 1570688 20528.79
11 Web Aggregators 808 18.55 63942 1687.42 107468.00 2536.62 296161 8090.59
12 Referral Arrangements 0 0.00 0 -0.16 0.00 0.00 0 -0.01
13 Other (to be sepcified)
(i) __________________
(ii) __________________ 0 0.00 0 0.00 0.00 0.00 0 0.00
Total (A) 2626089.00 213842.44 9711260.00 845290.93 2581691.00 197093.64 8833577.00 841088.30
14 Business outside India (B)
Grand Total (A+B) 2626089.00 213842.44 9711260.00 845290.93 2581691.00 197093.64 8833577.00 841088.30
No. of
Policies
Premium
(Rs.Lakhs)
No. of
Policies
Premium
(Rs.Lakhs)
No. of
Policies
Premium
(Rs.Lakhs)
No. of
Policies
Premium
(Rs.Lakhs)
Dated:31-03-2022
Sl.No. Channels For the Quarter 4 FY
2021-22
Upto the Quarter 4 FY
2021-22
For the corresponding
quarter of the
Up to the
corresponding quarter
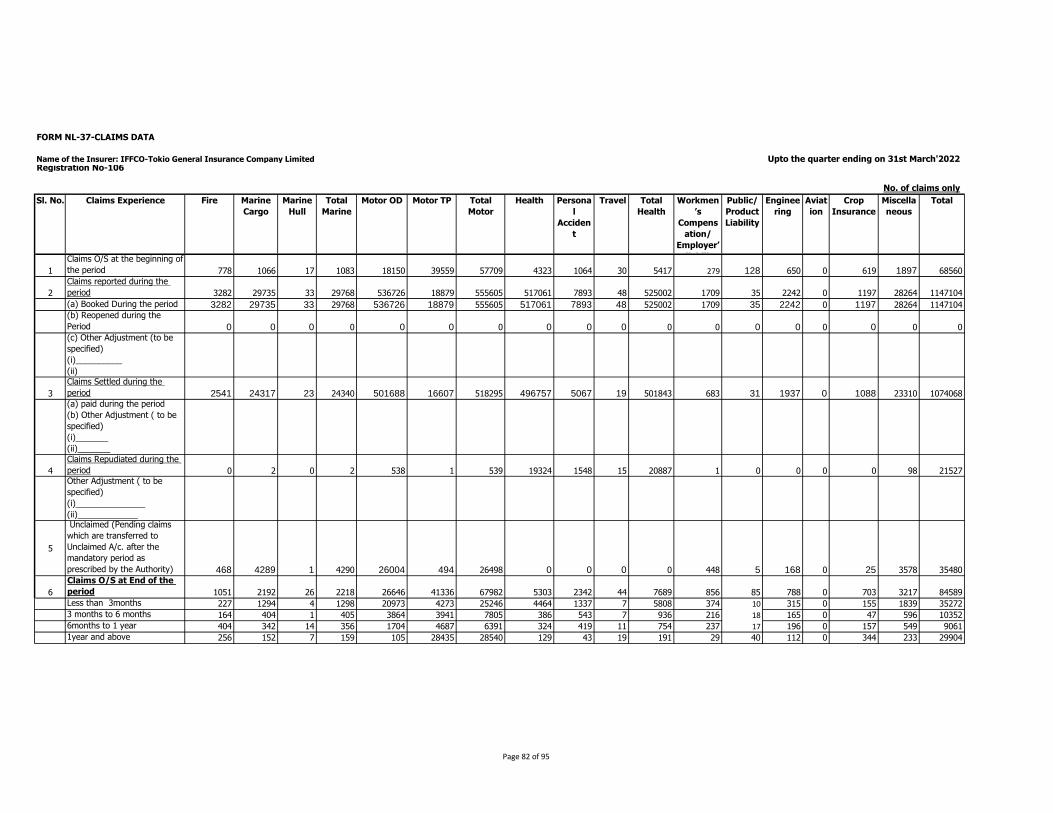
FORM NL-37-CLAIMS DATA
Name of the Insurer: IFFCO-Tokio General Insurance Company LimitedRegistration No-106
Sl. No. Claims Experience Fire Marine
Cargo
Marine
Hull
Total
Marine
Motor OD Motor TP Total
Motor
Health Persona
l
Acciden
t
Travel Total
Health
Workmen
’s
Compens
ation/
Employer’
s liability
Public/
Product
Liability
Enginee
ring
Aviat
ion
Crop
Insurance
Miscella
neous
Total
1
Claims O/S at the beginning of
the period 778 1066 17 1083 18150 39559 57709 4323 1064 30 5417 279 128 650 0 619 1897 68560
2
Claims reported during the
period 3282 29735 33 29768 536726 18879 555605 517061 7893 48 525002 1709 35 2242 0 1197 28264 1147104
(a) Booked During the period 3282 29735 33 29768 536726 18879 555605 517061 7893 48 525002 1709 35 2242 0 1197 28264 1147104(b) Reopened during the
Period 0 0 0 0 0 0 0 0 0 0 0 0 0 0 0 0 0 0(c) Other Adjustment (to be
specified)
(i)__________
(ii)
3
Claims Settled during the
period 2541 24317 23 24340 501688 16607 518295 496757 5067 19 501843 683 31 1937 0 1088 23310 1074068(a) paid during the period
(b) Other Adjustment ( to be
specified)
(i)_______
(ii)_______
4
Claims Repudiated during the
period 0 2 0 2 538 1 539 19324 1548 15 20887 1 0 0 0 0 98 21527Other Adjustment ( to be
specified)
(i)_______________
(ii)_____________
5
Unclaimed (Pending claims
which are transferred to
Unclaimed A/c. after the
mandatory period as
prescribed by the Authority) 468 4289 1 4290 26004 494 26498 0 0 0 0 448 5 168 0 25 3578 35480
6
Claims O/S at End of the
period 1051 2192 26 2218 26646 41336 67982 5303 2342 44 7689 856 85 788 0 703 3217 84589
Less than 3months 227 1294 4 1298 20973 4273 25246 4464 1337 7 5808 374 10 315 0 155 1839 35272
3 months to 6 months 164 404 1 405 3864 3941 7805 386 543 7 936 216 18 165 0 47 596 10352
6months to 1 year 404 342 14 356 1704 4687 6391 324 419 11 754 237 17 196 0 157 549 9061
1year and above 256 152 7 159 105 28435 28540 129 43 19 191 29 40 112 0 344 233 29904
Upto the quarter ending on 31st March'2022
No. of claims only
Page 82 of 95
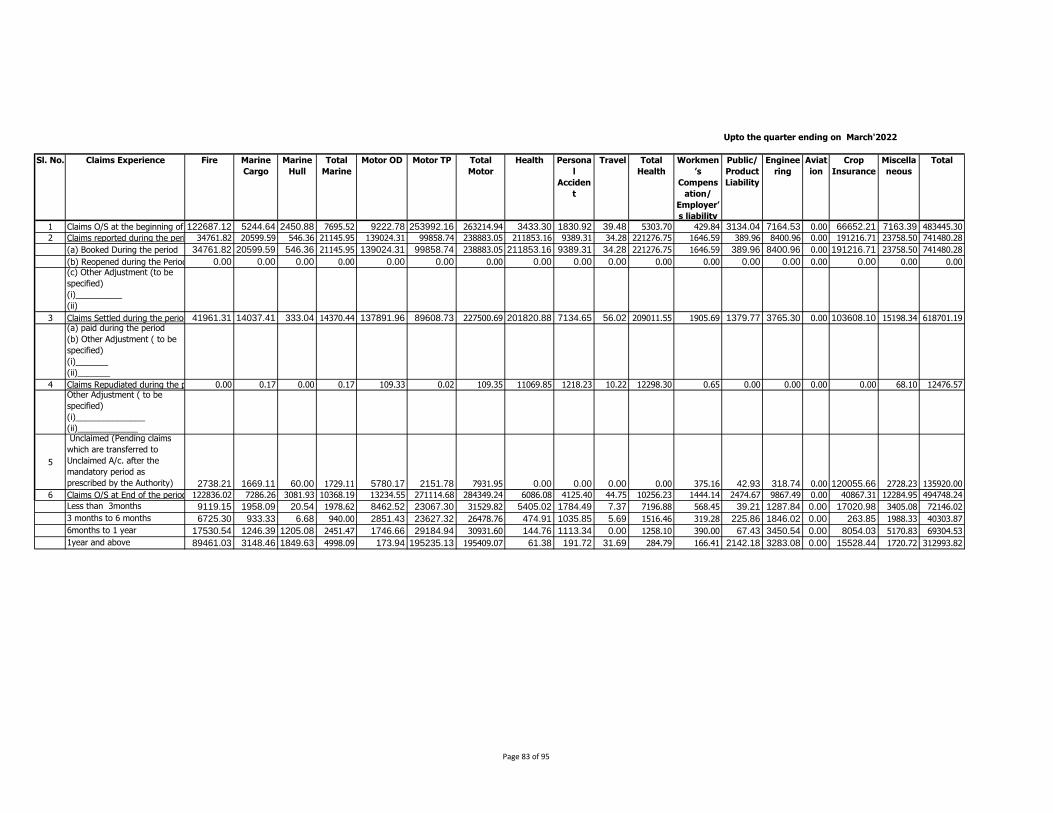
Upto the quarter ending on March'2022
Sl. No. Claims Experience Fire Marine
Cargo
Marine
Hull
Total
Marine
Motor OD Motor TP Total
Motor
Health Persona
l
Acciden
t
Travel Total
Health
Workmen
’s
Compens
ation/
Employer’
s liability
Public/
Product
Liability
Enginee
ring
Aviat
ion
Crop
Insurance
Miscella
neous
Total
1 Claims O/S at the beginning of the period122687.12 5244.64 2450.88 7695.52 9222.78 253992.16 263214.94 3433.30 1830.92 39.48 5303.70 429.84 3134.04 7164.53 0.00 66652.21 7163.39 483445.30
2 Claims reported during the period 34761.82 20599.59 546.36 21145.95 139024.31 99858.74 238883.05 211853.16 9389.31 34.28 221276.75 1646.59 389.96 8400.96 0.00 191216.71 23758.50 741480.28
(a) Booked During the period 34761.82 20599.59 546.36 21145.95 139024.31 99858.74 238883.05 211853.16 9389.31 34.28 221276.75 1646.59 389.96 8400.96 0.00 191216.71 23758.50 741480.28
(b) Reopened during the Period 0.00 0.00 0.00 0.00 0.00 0.00 0.00 0.00 0.00 0.00 0.00 0.00 0.00 0.00 0.00 0.00 0.00 0.00(c) Other Adjustment (to be
specified)
(i)__________
(ii)
3 Claims Settled during the period 41961.31 14037.41 333.04 14370.44 137891.96 89608.73 227500.69 201820.88 7134.65 56.02 209011.55 1905.69 1379.77 3765.30 0.00 103608.10 15198.34 618701.19(a) paid during the period
(b) Other Adjustment ( to be
specified)
(i)_______
(ii)_______
4 Claims Repudiated during the period 0.00 0.17 0.00 0.17 109.33 0.02 109.35 11069.85 1218.23 10.22 12298.30 0.65 0.00 0.00 0.00 0.00 68.10 12476.57Other Adjustment ( to be
specified)
(i)_______________
(ii)_____________
5
Unclaimed (Pending claims
which are transferred to
Unclaimed A/c. after the
mandatory period as
prescribed by the Authority) 2738.21 1669.11 60.00 1729.11 5780.17 2151.78 7931.95 0.00 0.00 0.00 0.00 375.16 42.93 318.74 0.00 120055.66 2728.23 135920.00
6 Claims O/S at End of the period 122836.02 7286.26 3081.93 10368.19 13234.55 271114.68 284349.24 6086.08 4125.40 44.75 10256.23 1444.14 2474.67 9867.49 0.00 40867.31 12284.95 494748.24
Less than 3months 9119.15 1958.09 20.54 1978.62 8462.52 23067.30 31529.82 5405.02 1784.49 7.37 7196.88 568.45 39.21 1287.84 0.00 17020.98 3405.08 72146.02
3 months to 6 months 6725.30 933.33 6.68 940.00 2851.43 23627.32 26478.76 474.91 1035.85 5.69 1516.46 319.28 225.86 1846.02 0.00 263.85 1988.33 40303.87
6months to 1 year 17530.54 1246.39 1205.08 2451.47 1746.66 29184.94 30931.60 144.76 1113.34 0.00 1258.10 390.00 67.43 3450.54 0.00 8054.03 5170.83 69304.53
1year and above 89461.03 3148.46 1849.63 4998.09 173.94 195235.13 195409.07 61.38 191.72 31.69 284.79 166.41 2142.18 3283.08 0.00 15528.44 1720.72 312993.82
Page 83 of 95
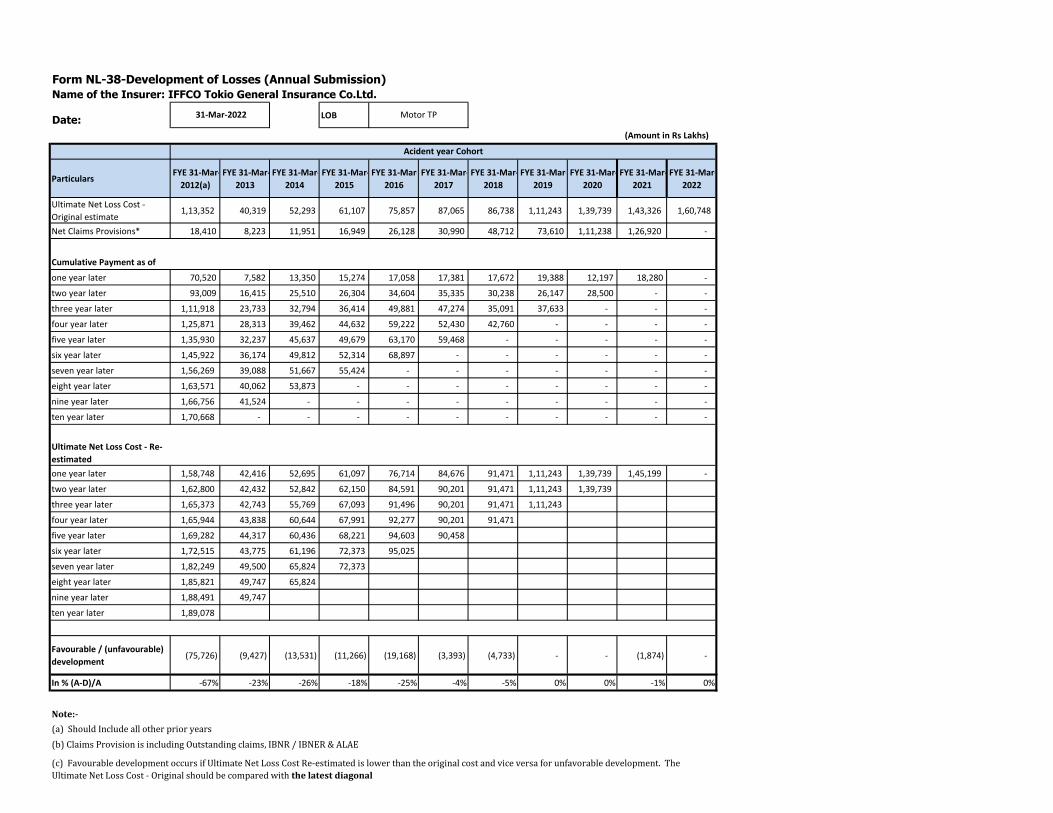
Name of the Insurer: IFFCO Tokio General Insurance Co.Ltd.
Date:LOB
ParticularsFYE 31-Mar-
2012(a)
FYE 31-Mar-
2013
FYE 31-Mar-
2014
FYE 31-Mar-
2015
FYE 31-Mar-
2016
FYE 31-Mar-
2017
FYE 31-Mar-
2018
FYE 31-Mar-
2019
FYE 31-Mar-
2020
FYE 31-Mar-
2021
FYE 31-Mar-
2022
Ultimate Net Loss Cost -
Original estimate 1,13,352 40,319 52,293 61,107 75,857 87,065 86,738 1,11,243 1,39,739 1,43,326 1,60,748
Net Claims Provisions* 18,410 8,223 11,951 16,949 26,128 30,990 48,712 73,610 1,11,238 1,26,920 -
Cumulative Payment as of
one year later 70,520 7,582 13,350 15,274 17,058 17,381 17,672 19,388 12,197 18,280 -
two year later 93,009 16,415 25,510 26,304 34,604 35,335 30,238 26,147 28,500 - -
three year later 1,11,918 23,733 32,794 36,414 49,881 47,274 35,091 37,633 - - -
four year later 1,25,871 28,313 39,462 44,632 59,222 52,430 42,760 - - - -
five year later 1,35,930 32,237 45,637 49,679 63,170 59,468 - - - - -
six year later 1,45,922 36,174 49,812 52,314 68,897 - - - - - -
seven year later 1,56,269 39,088 51,667 55,424 - - - - - - -
eight year later 1,63,571 40,062 53,873 - - - - - - - -
nine year later 1,66,756 41,524 - - - - - - - - -
ten year later 1,70,668 - - - - - - - - - -
Ultimate Net Loss Cost - Re-
estimated
one year later 1,58,748 42,416 52,695 61,097 76,714 84,676 91,471 1,11,243 1,39,739 1,45,199 -
two year later 1,62,800 42,432 52,842 62,150 84,591 90,201 91,471 1,11,243 1,39,739
three year later 1,65,373 42,743 55,769 67,093 91,496 90,201 91,471 1,11,243
four year later 1,65,944 43,838 60,644 67,991 92,277 90,201 91,471
five year later 1,69,282 44,317 60,436 68,221 94,603 90,458
six year later 1,72,515 43,775 61,196 72,373 95,025
seven year later 1,82,249 49,500 65,824 72,373
eight year later 1,85,821 49,747 65,824
nine year later 1,88,491 49,747
ten year later 1,89,078
Favourable / (unfavourable)
development (75,726) (9,427) (13,531) (11,266) (19,168) (3,393) (4,733) - - (1,874) -
In % (A-D)/A -67% -23% -26% -18% -25% -4% -5% 0% 0% -1% 0%
Note:-
(a) Should Include all other prior years
(b) Claims Provision is including Outstanding claims, IBNR / IBNER & ALAE
(c) Favourable development occurs if Ultimate Net Loss Cost Re-estimated is lower than the original cost and vice versa for unfavorable development. The
Ultimate Net Loss Cost - Original should be compared with the latest diagonal
Form NL-38-Development of Losses (Annual Submission)
31-Mar-2022 Motor TP
(Amount in Rs Lakhs)
Acident year Cohort
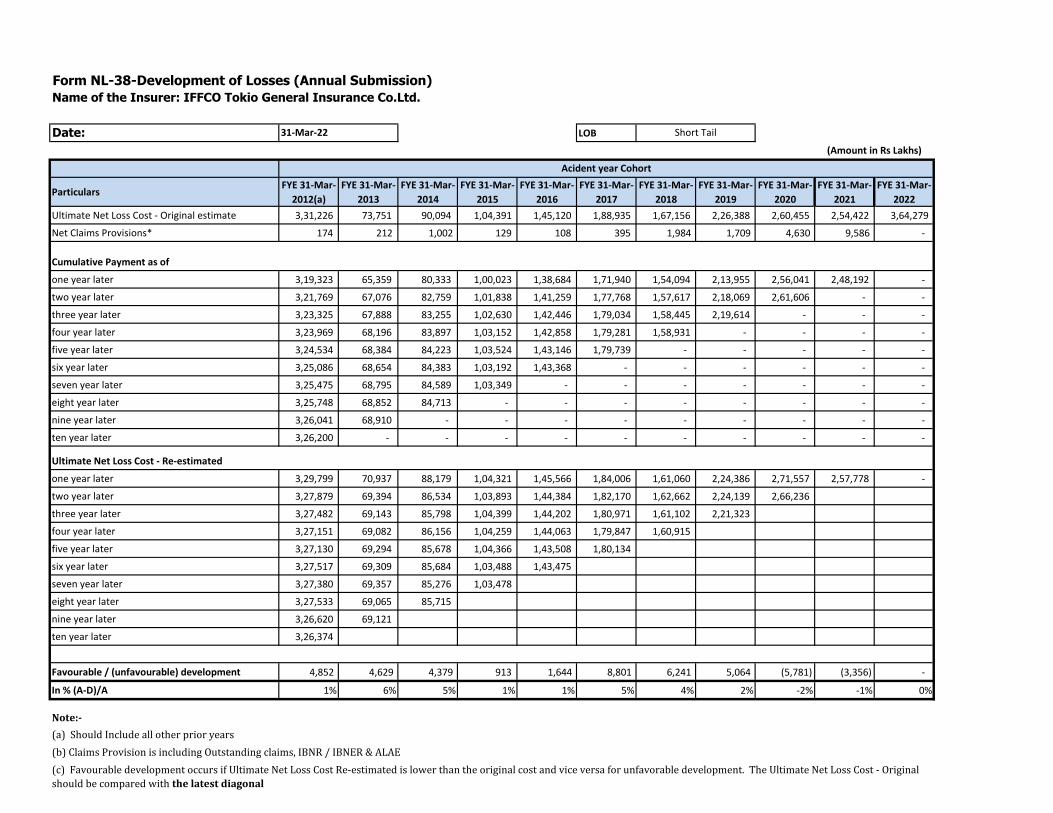
Name of the Insurer: IFFCO Tokio General Insurance Co.Ltd.
Date: LOB
ParticularsFYE 31-Mar-
2012(a)
FYE 31-Mar-
2013
FYE 31-Mar-
2014
FYE 31-Mar-
2015
FYE 31-Mar-
2016
FYE 31-Mar-
2017
FYE 31-Mar-
2018
FYE 31-Mar-
2019
FYE 31-Mar-
2020
FYE 31-Mar-
2021
FYE 31-Mar-
2022
Ultimate Net Loss Cost - Original estimate 3,31,226 73,751 90,094 1,04,391 1,45,120 1,88,935 1,67,156 2,26,388 2,60,455 2,54,422 3,64,279
Net Claims Provisions* 174 212 1,002 129 108 395 1,984 1,709 4,630 9,586 -
Cumulative Payment as of
one year later 3,19,323 65,359 80,333 1,00,023 1,38,684 1,71,940 1,54,094 2,13,955 2,56,041 2,48,192 -
two year later 3,21,769 67,076 82,759 1,01,838 1,41,259 1,77,768 1,57,617 2,18,069 2,61,606 - -
three year later 3,23,325 67,888 83,255 1,02,630 1,42,446 1,79,034 1,58,445 2,19,614 - - -
four year later 3,23,969 68,196 83,897 1,03,152 1,42,858 1,79,281 1,58,931 - - - -
five year later 3,24,534 68,384 84,223 1,03,524 1,43,146 1,79,739 - - - - -
six year later 3,25,086 68,654 84,383 1,03,192 1,43,368 - - - - - -
seven year later 3,25,475 68,795 84,589 1,03,349 - - - - - - -
eight year later 3,25,748 68,852 84,713 - - - - - - - -
nine year later 3,26,041 68,910 - - - - - - - - -
ten year later 3,26,200 - - - - - - - - - -
Ultimate Net Loss Cost - Re-estimated
one year later 3,29,799 70,937 88,179 1,04,321 1,45,566 1,84,006 1,61,060 2,24,386 2,71,557 2,57,778 -
two year later 3,27,879 69,394 86,534 1,03,893 1,44,384 1,82,170 1,62,662 2,24,139 2,66,236
three year later 3,27,482 69,143 85,798 1,04,399 1,44,202 1,80,971 1,61,102 2,21,323
four year later 3,27,151 69,082 86,156 1,04,259 1,44,063 1,79,847 1,60,915
five year later 3,27,130 69,294 85,678 1,04,366 1,43,508 1,80,134
six year later 3,27,517 69,309 85,684 1,03,488 1,43,475
seven year later 3,27,380 69,357 85,276 1,03,478
eight year later 3,27,533 69,065 85,715
nine year later 3,26,620 69,121
ten year later 3,26,374
Favourable / (unfavourable) development 4,852 4,629 4,379 913 1,644 8,801 6,241 5,064 (5,781) (3,356) -
In % (A-D)/A 1% 6% 5% 1% 1% 5% 4% 2% -2% -1% 0%
Note:-
(a) Should Include all other prior years
(b) Claims Provision is including Outstanding claims, IBNR / IBNER & ALAE
(c) Favourable development occurs if Ultimate Net Loss Cost Re-estimated is lower than the original cost and vice versa for unfavorable development. The Ultimate Net Loss Cost - Original
should be compared with the latest diagonal
Form NL-38-Development of Losses (Annual Submission)
31-Mar-22
(Amount in Rs Lakhs)
Short Tail
Acident year Cohort
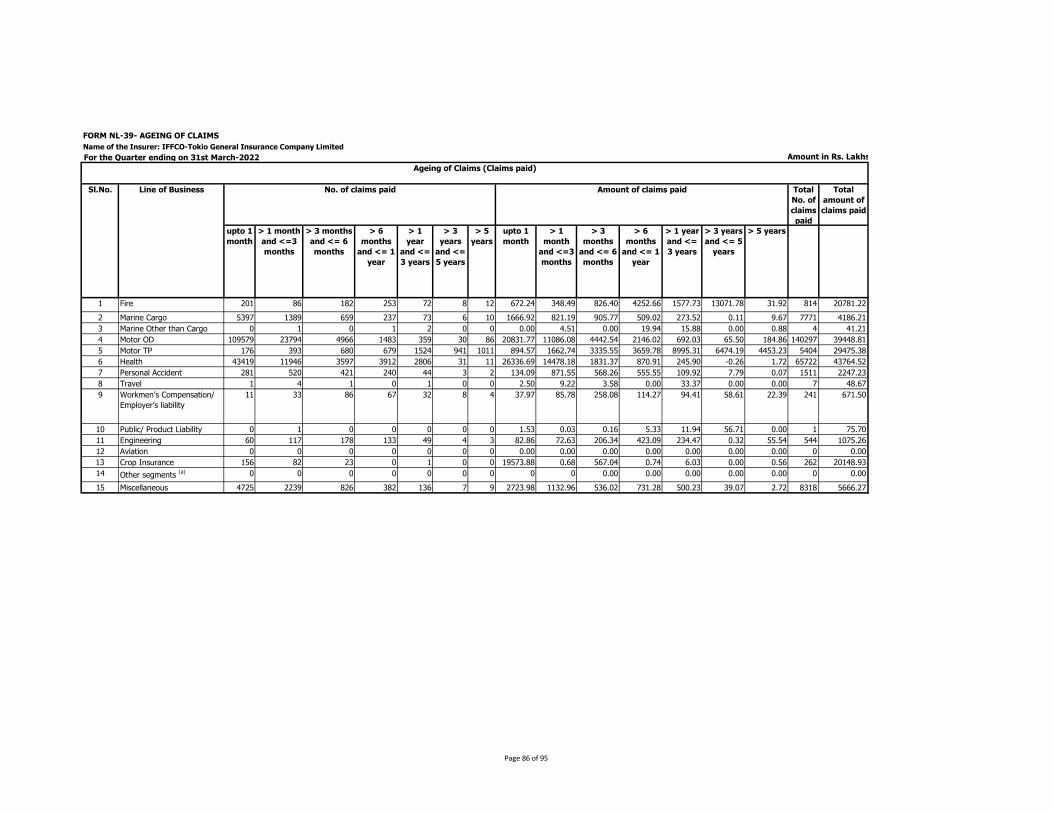
FORM NL-39- AGEING OF CLAIMS
Name of the Insurer: IFFCO-Tokio General Insurance Company Limited
For the Quarter ending on 31st March-2022
Total
No. of
claims
paid
Total
amount of
claims paid
upto 1
month
> 1 month
and <=3
months
> 3 months
and <= 6
months
> 6
months
and <= 1
year
> 1
year
and <=
3 years
> 3
years
and <=
5 years
> 5
years
upto 1
month
> 1
month
and <=3
months
> 3
months
and <= 6
months
> 6
months
and <= 1
year
> 1 year
and <=
3 years
> 3 years
and <= 5
years
> 5 years
1 Fire 201 86 182 253 72 8 12 672.24 348.49 826.40 4252.66 1577.73 13071.78 31.92 814 20781.22
2 Marine Cargo 5397 1389 659 237 73 6 10 1666.92 821.19 905.77 509.02 273.52 0.11 9.67 7771 4186.21
3 Marine Other than Cargo 0 1 0 1 2 0 0 0.00 4.51 0.00 19.94 15.88 0.00 0.88 4 41.21
4 Motor OD 109579 23794 4966 1483 359 30 86 20831.77 11086.08 4442.54 2146.02 692.03 65.50 184.86 140297 39448.81
5 Motor TP 176 393 680 679 1524 941 1011 894.57 1662.74 3335.55 3659.78 8995.31 6474.19 4453.23 5404 29475.38
6 Health 43419 11946 3597 3912 2806 31 11 26336.69 14478.18 1831.37 870.91 245.90 -0.26 1.72 65722 43764.52
7 Personal Accident 281 520 421 240 44 3 2 134.09 871.55 568.26 555.55 109.92 7.79 0.07 1511 2247.23
8 Travel 1 4 1 0 1 0 0 2.50 9.22 3.58 0.00 33.37 0.00 0.00 7 48.67
9 Workmen’s Compensation/
Employer’s liability
11 33 86 67 32 8 4 37.97 85.78 258.08 114.27 94.41 58.61 22.39 241 671.50
10 Public/ Product Liability 0 1 0 0 0 0 0 1.53 0.03 0.16 5.33 11.94 56.71 0.00 1 75.70
11 Engineering 60 117 178 133 49 4 3 82.86 72.63 206.34 423.09 234.47 0.32 55.54 544 1075.26
12 Aviation 0 0 0 0 0 0 0 0.00 0.00 0.00 0.00 0.00 0.00 0.00 0 0.00
13 Crop Insurance 156 82 23 0 1 0 0 19573.88 0.68 567.04 0.74 6.03 0.00 0.56 262 20148.93
14 Other segments (a) 0 0 0 0 0 0 0 0 0 0.00 0.00 0.00 0.00 0.00 0 0.00
15 Miscellaneous 4725 2239 826 382 136 7 9 2723.98 1132.96 536.02 731.28 500.23 39.07 2.72 8318 5666.27
(Amount in Rs. Lakhs)
Ageing of Claims (Claims paid)
Sl.No. Line of Business No. of claims paid Amount of claims paid
Page 86 of 95
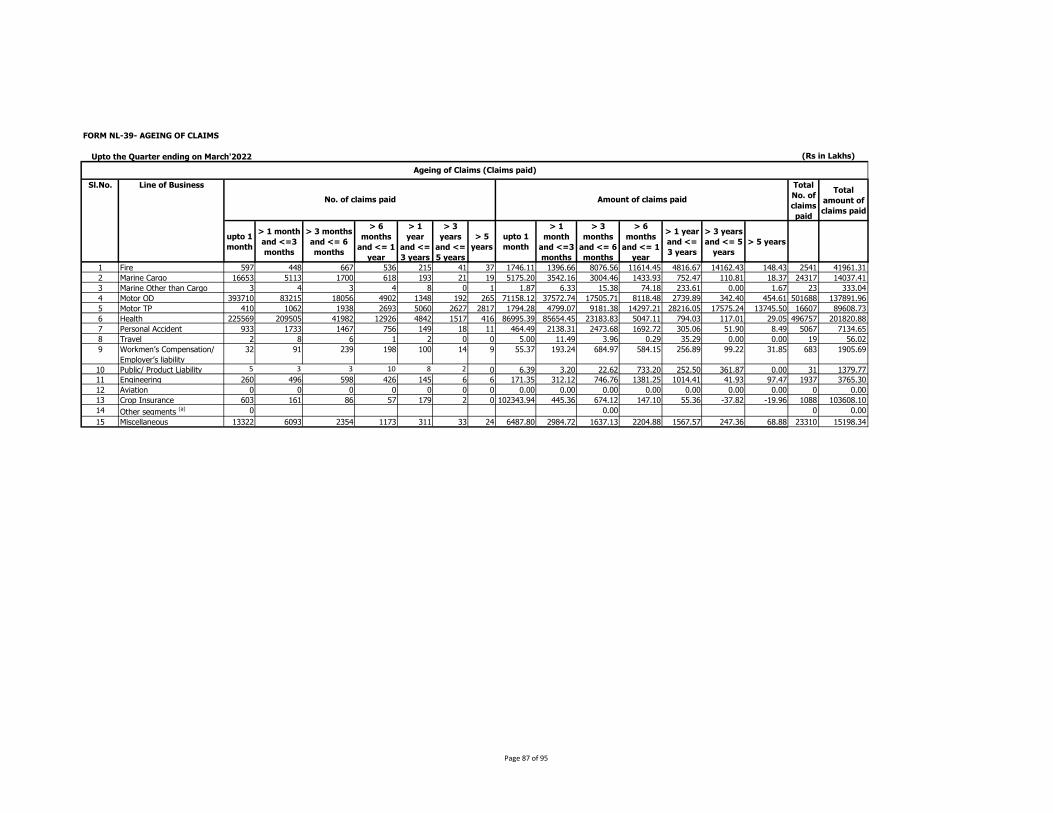
FORM NL-39- AGEING OF CLAIMS
Upto the Quarter ending on March'2022
Total
No. of
claims
paid
Total
amount of
claims paid
upto 1
month
> 1 month
and <=3
months
> 3 months
and <= 6
months
> 6
months
and <= 1
year
> 1
year
and <=
3 years
> 3
years
and <=
5 years
> 5
years
upto 1
month
> 1
month
and <=3
months
> 3
months
and <= 6
months
> 6
months
and <= 1
year
> 1 year
and <=
3 years
> 3 years
and <= 5
years
> 5 years
1 Fire 597 448 667 536 215 41 37 1746.11 1396.66 8076.56 11614.45 4816.67 14162.43 148.43 2541 41961.31
2 Marine Cargo 16653 5113 1700 618 193 21 19 5175.20 3542.16 3004.46 1433.93 752.47 110.81 18.37 24317 14037.41
3 Marine Other than Cargo 3 4 3 4 8 0 1 1.87 6.33 15.38 74.18 233.61 0.00 1.67 23 333.04
4 Motor OD 393710 83215 18056 4902 1348 192 265 71158.12 37572.74 17505.71 8118.48 2739.89 342.40 454.61 501688 137891.96
5 Motor TP 410 1062 1938 2693 5060 2627 2817 1794.28 4799.07 9181.38 14297.21 28216.05 17575.24 13745.50 16607 89608.73
6 Health 225569 209505 41982 12926 4842 1517 416 86995.39 85654.45 23183.83 5047.11 794.03 117.01 29.05 496757 201820.88
7 Personal Accident 933 1733 1467 756 149 18 11 464.49 2138.31 2473.68 1692.72 305.06 51.90 8.49 5067 7134.65
8 Travel 2 8 6 1 2 0 0 5.00 11.49 3.96 0.29 35.29 0.00 0.00 19 56.02
9 Workmen’s Compensation/
Employer’s liability
32 91 239 198 100 14 9 55.37 193.24 684.97 584.15 256.89 99.22 31.85 683 1905.69
10 Public/ Product Liability 5 3 3 10 8 2 0 6.39 3.20 22.62 733.20 252.50 361.87 0.00 31 1379.77
11 Engineering 260 496 598 426 145 6 6 171.35 312.12 746.76 1381.25 1014.41 41.93 97.47 1937 3765.30
12 Aviation 0 0 0 0 0 0 0 0.00 0.00 0.00 0.00 0.00 0.00 0.00 0 0.00
13 Crop Insurance 603 161 86 57 179 2 0 102343.94 445.36 674.12 147.10 55.36 -37.82 -19.96 1088 103608.10
14 Other segments (a) 0 0.00 0 0.00
15 Miscellaneous 13322 6093 2354 1173 311 33 24 6487.80 2984.72 1637.13 2204.88 1567.57 247.36 68.88 23310 15198.34
(Rs in Lakhs)
Ageing of Claims (Claims paid)
Sl.No. Line of Business
No. of claims paid Amount of claims paid
Page 87 of 95
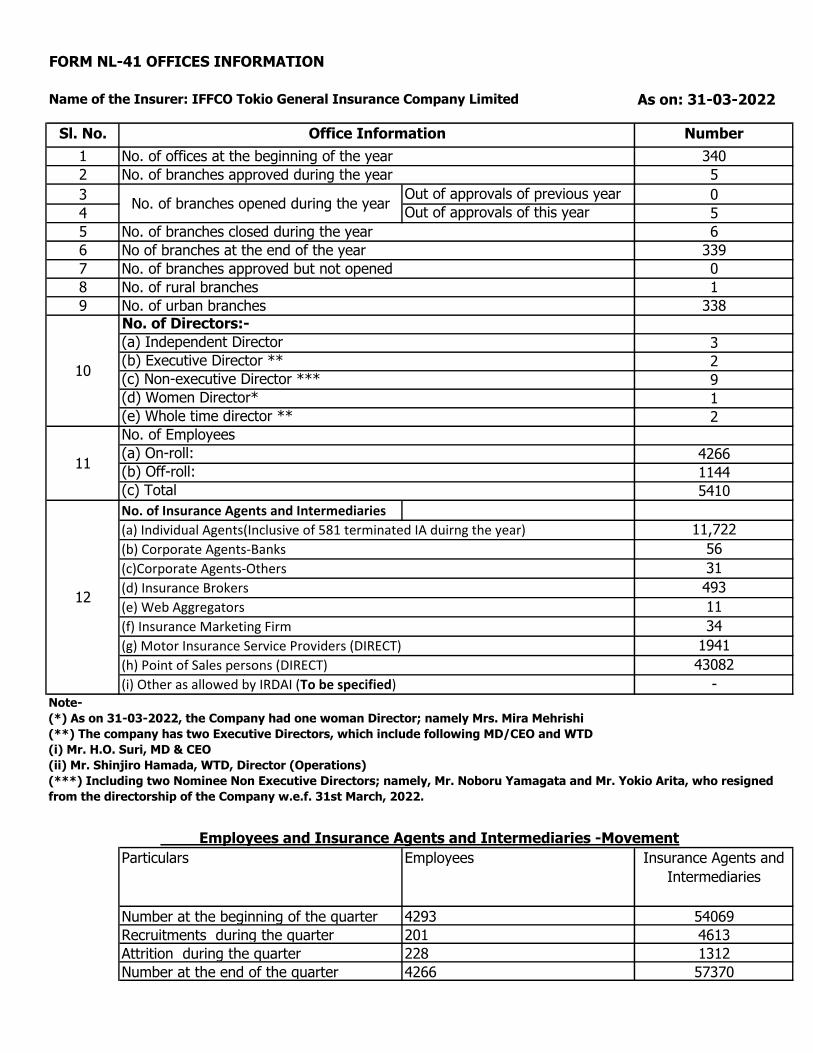
FORM NL-41 OFFICES INFORMATION
Name of the Insurer: IFFCO Tokio General Insurance Company Limited As on: 31-03-2022
Sl. No. Number
1 340
2 5
3 Out of approvals of previous year 0
4 Out of approvals of this year 5
5 6
6 339
7 0
8 1
9 338No. of Directors:-
(a) Independent Director 3(b) Executive Director ** 2(c) Non-executive Director *** 9(d) Women Director* 1(e) Whole time director ** 2No. of Employees
(a) On-roll: 4266(b) Off-roll: 1144(c) Total 5410
No. of Insurance Agents and Intermediaries
11,722
56
31
493
11
34
1941
43082
-
Particulars Employees Insurance Agents and
Intermediaries
Number at the beginning of the quarter 4293 54069
Recruitments during the quarter 201 4613
Attrition during the quarter 228 1312
Number at the end of the quarter 4266 57370
No of branches at the end of the year
Office Information
No. of offices at the beginning of the year
No. of branches approved during the year
No. of branches opened during the year
No. of branches closed during the year
No. of branches approved but not opened
No. of rural branches
No. of urban branches
10
11
Employees and Insurance Agents and Intermediaries -Movement
(e) Web Aggregators
(f) Insurance Marketing Firm
(g) Motor Insurance Service Providers (DIRECT)
(h) Point of Sales persons (DIRECT)
(i) Other as allowed by IRDAI (To be specified)Note-
(*) As on 31-03-2022, the Company had one woman Director; namely Mrs. Mira Mehrishi
(**) The company has two Executive Directors, which include following MD/CEO and WTD
(i) Mr. H.O. Suri, MD & CEO
(ii) Mr. Shinjiro Hamada, WTD, Director (Operations)
(***) Including two Nominee Non Executive Directors; namely, Mr. Noboru Yamagata and Mr. Yokio Arita, who resigned
from the directorship of the Company w.e.f. 31st March, 2022.
12
(a) Individual Agents(Inclusive of 581 terminated IA duirng the year)
(b) Corporate Agents-Banks
(c)Corporate Agents-Others
(d) Insurance Brokers
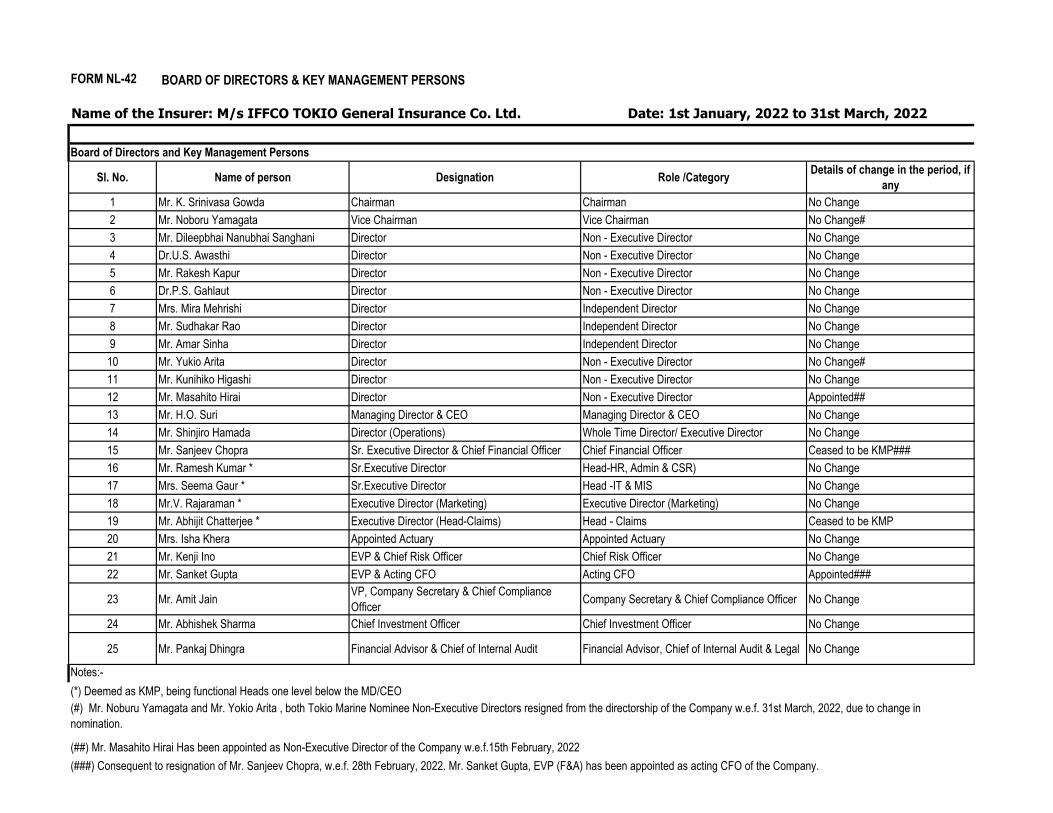
FORM NL-42
Sl. No. Name of person Designation Role /CategoryDetails of change in the period, if
any
1 Mr. K. Srinivasa Gowda Chairman Chairman No Change
2 Mr. Noboru Yamagata Vice Chairman Vice Chairman No Change#
3 Mr. Dileepbhai Nanubhai Sanghani Director Non - Executive Director No Change
4 Dr.U.S. Awasthi Director Non - Executive Director No Change
5 Mr. Rakesh Kapur Director Non - Executive Director No Change
6 Dr.P.S. Gahlaut Director Non - Executive Director No Change
7 Mrs. Mira Mehrishi Director Independent Director No Change
8 Mr. Sudhakar Rao Director Independent Director No Change
9 Mr. Amar Sinha Director Independent Director No Change
10 Mr. Yukio Arita Director Non - Executive Director No Change#
11 Mr. Kunihiko Higashi Director Non - Executive Director No Change
12 Mr. Masahito Hirai Director Non - Executive Director Appointed##
13 Mr. H.O. Suri Managing Director & CEO Managing Director & CEO No Change
14 Mr. Shinjiro Hamada Director (Operations) Whole Time Director/ Executive Director No Change
15 Mr. Sanjeev Chopra Sr. Executive Director & Chief Financial Officer Chief Financial Officer Ceased to be KMP###
16 Mr. Ramesh Kumar * Sr.Executive Director Head-HR, Admin & CSR) No Change
17 Mrs. Seema Gaur * Sr.Executive Director Head -IT & MIS No Change
18 Mr.V. Rajaraman * Executive Director (Marketing) Executive Director (Marketing) No Change
19 Mr. Abhijit Chatterjee * Executive Director (Head-Claims) Head - Claims Ceased to be KMP
20 Mrs. Isha Khera Appointed Actuary Appointed Actuary No Change
21 Mr. Kenji Ino EVP & Chief Risk Officer Chief Risk Officer No Change
22 Mr. Sanket Gupta EVP & Acting CFO Acting CFO Appointed###
23 Mr. Amit Jain VP, Company Secretary & Chief Compliance
Officer Company Secretary & Chief Compliance Officer No Change
24 Mr. Abhishek Sharma Chief Investment Officer Chief Investment Officer No Change
25 Mr. Pankaj Dhingra Financial Advisor & Chief of Internal Audit Financial Advisor, Chief of Internal Audit & Legal No Change
Notes:-
(###) Consequent to resignation of Mr. Sanjeev Chopra, w.e.f. 28th February, 2022. Mr. Sanket Gupta, EVP (F&A) has been appointed as acting CFO of the Company.
BOARD OF DIRECTORS & KEY MANAGEMENT PERSONS
Name of the Insurer: M/s IFFCO TOKIO General Insurance Co. Ltd. Date: 1st January, 2022 to 31st March, 2022
Board of Directors and Key Management Persons
(*) Deemed as KMP, being functional Heads one level below the MD/CEO
(#) Mr. Noburu Yamagata and Mr. Yokio Arita , both Tokio Marine Nominee Non-Executive Directors resigned from the directorship of the Company w.e.f. 31st March, 2022, due to change in
nomination.
(##) Mr. Masahito Hirai Has been appointed as Non-Executive Director of the Company w.e.f.15th February, 2022
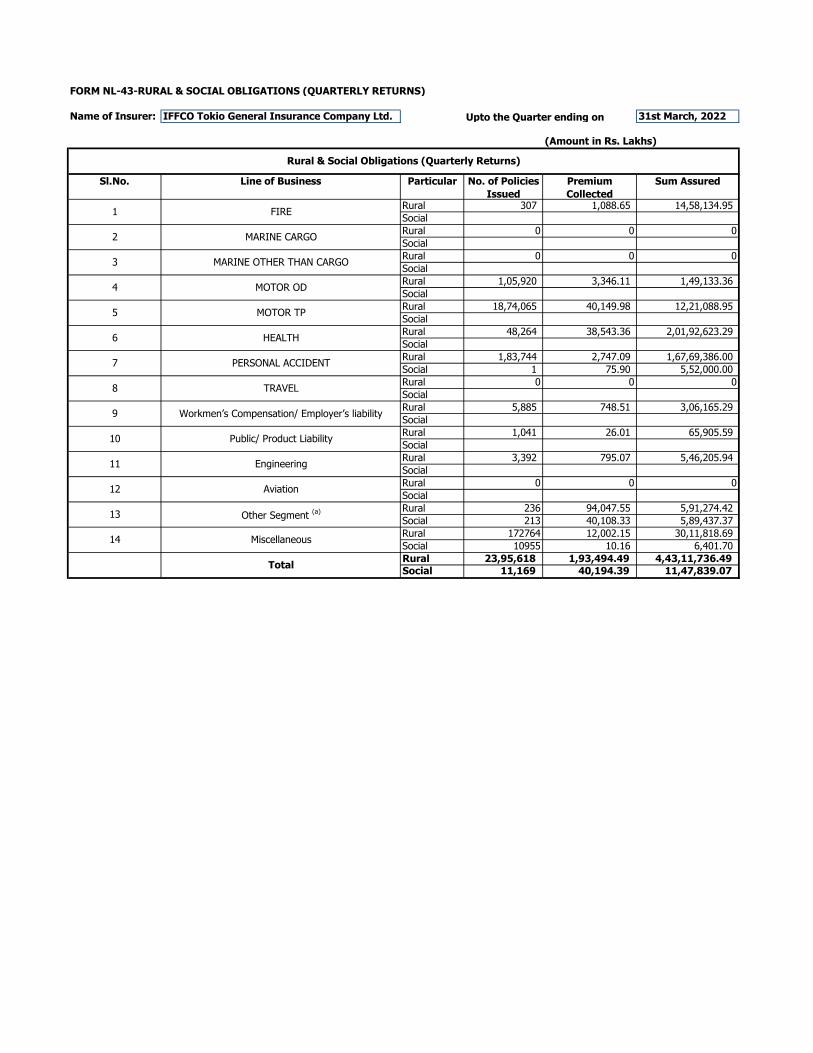
FORM NL-43-RURAL & SOCIAL OBLIGATIONS (QUARTERLY RETURNS)
Name of Insurer: IFFCO Tokio General Insurance Company Ltd. Upto the Quarter ending on 31st March, 2022
(Amount in Rs. Lakhs)
Sl.No. Line of Business Particular No. of Policies
Issued
Premium
Collected
Sum Assured
Rural 307 1,088.65 14,58,134.95
Social
Rural 0 0 0
Social
Rural 0 0 0
Social
Rural 1,05,920 3,346.11 1,49,133.36
Social
Rural 18,74,065 40,149.98 12,21,088.95
Social
Rural 48,264 38,543.36 2,01,92,623.29
Social
Rural 1,83,744 2,747.09 1,67,69,386.00
Social 1 75.90 5,52,000.00
Rural 0 0 0
Social
Rural 5,885 748.51 3,06,165.29
Social
Rural 1,041 26.01 65,905.59
Social
Rural 3,392 795.07 5,46,205.94
Social
Rural 0 0 0
Social
Rural 236 94,047.55 5,91,274.42
Social 213 40,108.33 5,89,437.37
Rural 172764 12,002.15 30,11,818.69
Social 10955 10.16 6,401.70
Rural 23,95,618 1,93,494.49 4,43,11,736.49
Social 11,169 40,194.39 11,47,839.07
3 MARINE OTHER THAN CARGO
Rural & Social Obligations (Quarterly Returns)
1 FIRE
2 MARINE CARGO
4 MOTOR OD
5 MOTOR TP
6 HEALTH
7 PERSONAL ACCIDENT
8 TRAVEL
9 Workmen’s Compensation/ Employer’s liability
10 Public/ Product Liability
11 Engineering
12 Aviation
13 Other Segment (a)
14 Miscellaneous
Total
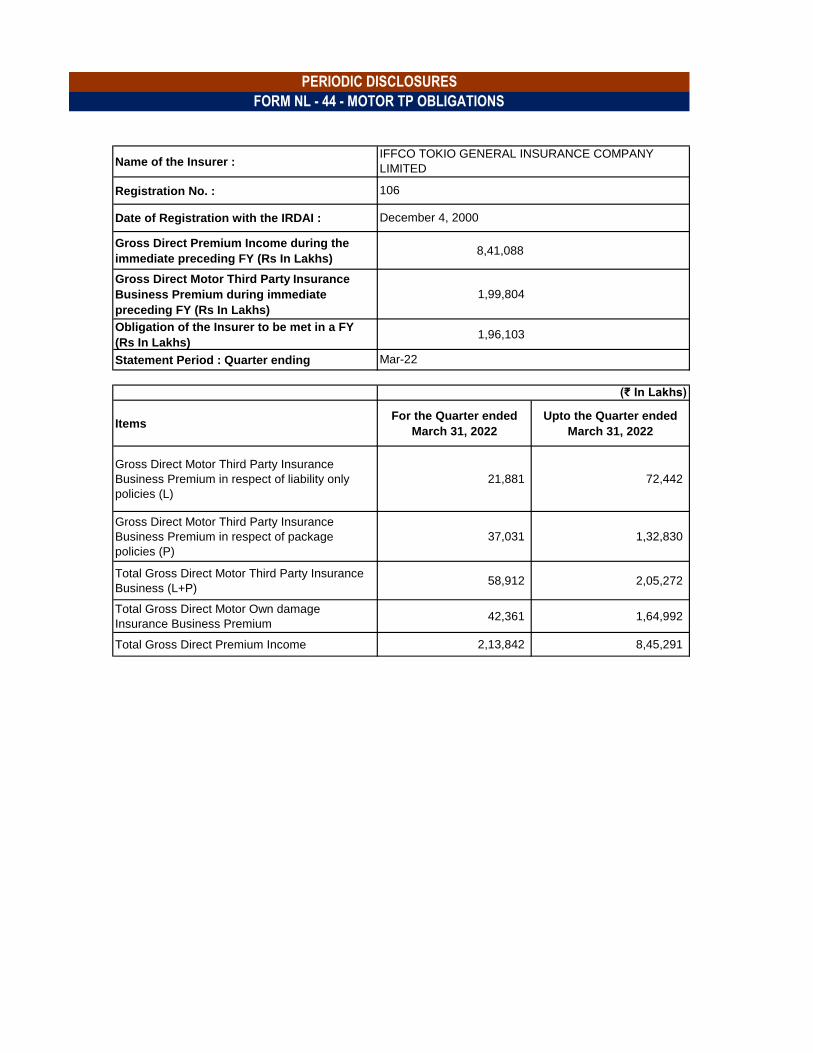
Name of the Insurer :
Registration No. :
Date of Registration with the IRDAI :
Gross Direct Premium Income during the
immediate preceding FY (Rs In Lakhs) 8,41,088
Gross Direct Motor Third Party Insurance
Business Premium during immediate
preceding FY (Rs In Lakhs)
1,99,804
Obligation of the Insurer to be met in a FY
(Rs In Lakhs)1,96,103
Statement Period : Quarter ending
ItemsFor the Quarter ended
March 31, 2022
Upto the Quarter ended
March 31, 2022
Gross Direct Motor Third Party Insurance
Business Premium in respect of liability only
policies (L)
21,881 72,442
Gross Direct Motor Third Party Insurance
Business Premium in respect of package
policies (P)
37,031 1,32,830
Total Gross Direct Motor Third Party Insurance
Business (L+P)58,912 2,05,272
Total Gross Direct Motor Own damage
Insurance Business Premium42,361 1,64,992
Total Gross Direct Premium Income 2,13,842 8,45,291
(₹ In Lakhs)
PERIODIC DISCLOSURES
FORM NL - 44 - MOTOR TP OBLIGATIONS
IFFCO TOKIO GENERAL INSURANCE COMPANY
LIMITED
106
December 4, 2000
Mar-22
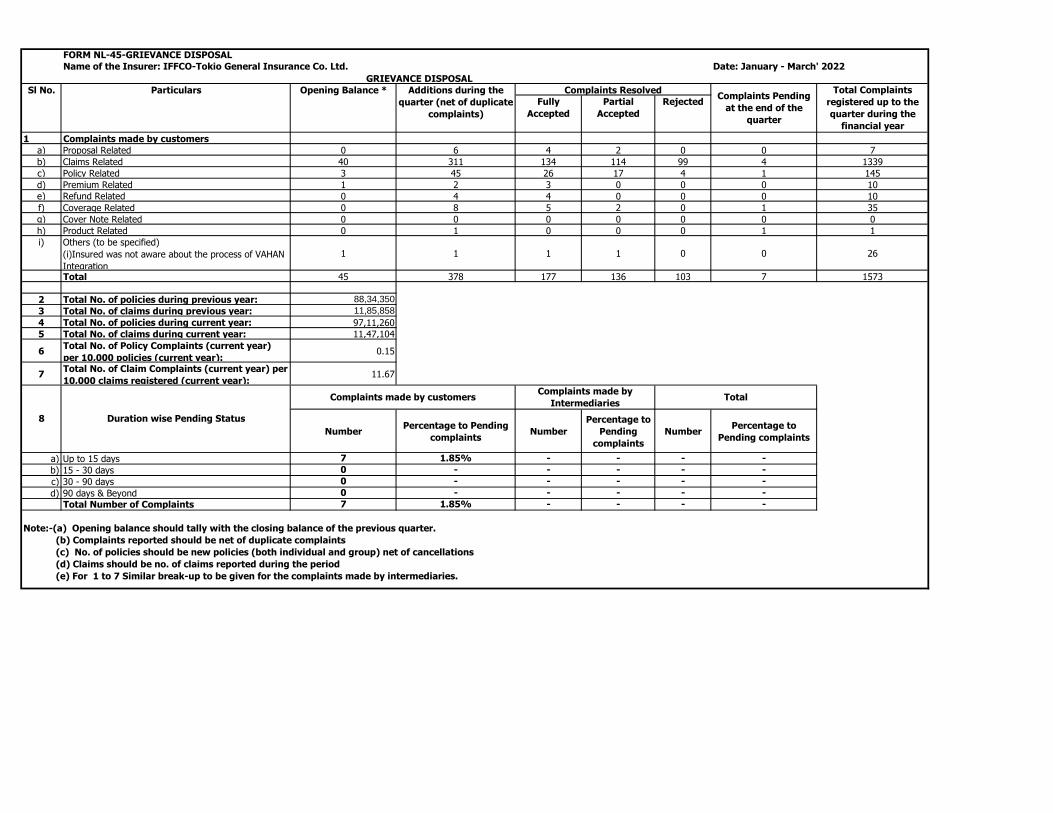
FORM NL-45-GRIEVANCE DISPOSAL
Fully
Accepted
Partial
Accepted
Rejected
1 Complaints made by customers
a) Proposal Related 0 6 4 2 0 0 7
b) Claims Related 40 311 134 114 99 4 1339
c) Policy Related 3 45 26 17 4 1 145
d) Premium Related 1 2 3 0 0 0 10
e) Refund Related 0 4 4 0 0 0 10
f) Coverage Related 0 8 5 2 0 1 35
g) Cover Note Related 0 0 0 0 0 0 0
h) Product Related 0 1 0 0 0 1 1
i) Others (to be specified)
(i)Insured was not aware about the process of VAHAN
Integration
1 1 1 1 0 0 26
Total 45 378 177 136 103 7 1573
2 Total No. of policies during previous year: 88,34,350
3 Total No. of claims during previous year: 11,85,858
4 Total No. of policies during current year: 97,11,260
5 Total No. of claims during current year: 11,47,104
6Total No. of Policy Complaints (current year)
per 10,000 policies (current year):0.15
7Total No. of Claim Complaints (current year) per
10,000 claims registered (current year):11.67
NumberPercentage to Pending
complaintsNumber
Percentage to
Pending
complaints
NumberPercentage to
Pending complaints
a) Up to 15 days 7 1.85% - - - -
b) 15 - 30 days 0 - - - - -
c) 30 - 90 days 0 - - - - -
d) 90 days & Beyond 0 - - - - -
Total Number of Complaints 7 1.85% - - - -
Note:-(a) Opening balance should tally with the closing balance of the previous quarter.
(b) Complaints reported should be net of duplicate complaints
(c) No. of policies should be new policies (both individual and group) net of cancellations
(d) Claims should be no. of claims reported during the period
(e) For 1 to 7 Similar break-up to be given for the complaints made by intermediaries.
Name of the Insurer: IFFCO-Tokio General Insurance Co. Ltd. Date: January - March' 2022
GRIEVANCE DISPOSAL
Sl No. Particulars Opening Balance * Additions during the
quarter (net of duplicate
complaints)
Complaints ResolvedComplaints Pending
at the end of the
quarter
Total Complaints
registered up to the
quarter during the
financial year
8 Duration wise Pending Status
Complaints made by customersComplaints made by
IntermediariesTotal
Form NL-46-VOTING ACTIVITY DISCLOSURE UNDER STEWARDSHIP CODE
Name of the Insurer: IFFCO Tokio General Insurance Company Ltd. For the Quarter ending: 31-03-2022
Vote
(For /
Against/
Abstain)
Reason
supporting the
vote decision
Nil
Meeting
Date
Investee
Company
Name
Type of
Meeting (AGM
/ EGM)
Proposal of
Management /
Shareholders
Description of
the proposal
Management
Recommendation
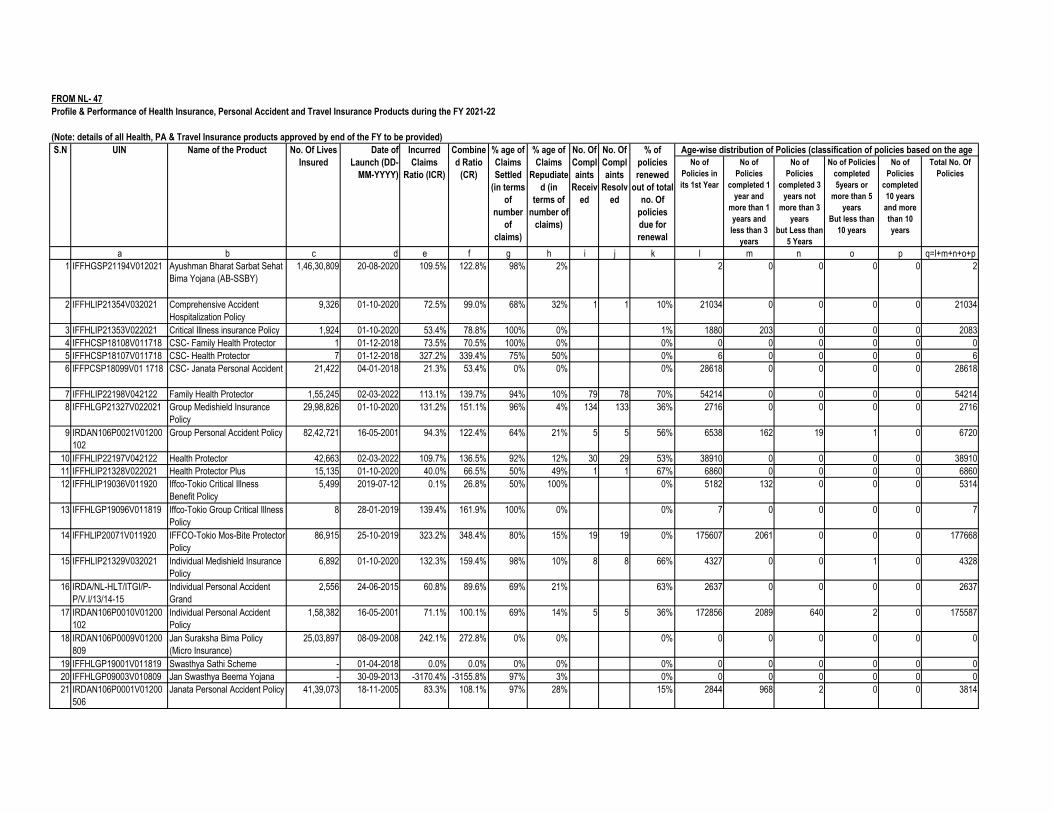
FROM NL- 47
Profile & Performance of Health Insurance, Personal Accident and Travel Insurance Products during the FY 2021-22
(Note: details of all Health, PA & Travel Insurance products approved by end of the FY to be provided)
No of
Policies in
its 1st Year
No of
Policies
completed 1
year and
more than 1
years and
less than 3
years
No of
Policies
completed 3
years not
more than 3
years
but Less than
5 Years
No of Policies
completed
5years or
more than 5
years
But less than
10 years
No of
Policies
completed
10 years
and more
than 10
years
Total No. Of
Policies
a b c d e f g h i j k l m n o p q=l+m+n+o+p
1 IFFHGSP21194V012021 Ayushman Bharat Sarbat Sehat
Bima Yojana (AB-SSBY)
1,46,30,809 20-08-2020 109.5% 122.8% 98% 2% 2 0 0 0 0 2
2 IFFHLIP21354V032021 Comprehensive Accident
Hospitalization Policy
9,326 01-10-2020 72.5% 99.0% 68% 32% 1 1 10% 21034 0 0 0 0 21034
3 IFFHLIP21353V022021 Critical Illness insurance Policy 1,924 01-10-2020 53.4% 78.8% 100% 0% 1% 1880 203 0 0 0 2083
4 IFFHCSP18108V011718 CSC- Family Health Protector 1 01-12-2018 73.5% 70.5% 100% 0% 0% 0 0 0 0 0 0
5 IFFHCSP18107V011718 CSC- Health Protector 7 01-12-2018 327.2% 339.4% 75% 50% 0% 6 0 0 0 0 6
6 lFFPCSP18099V01 1718 CSC- Janata Personal Accident 21,422 04-01-2018 21.3% 53.4% 0% 0% 0% 28618 0 0 0 0 28618
7 IFFHLIP22198V042122 Family Health Protector 1,55,245 02-03-2022 113.1% 139.7% 94% 10% 79 78 70% 54214 0 0 0 0 54214
8 IFFHLGP21327V022021 Group Medishield Insurance
Policy
29,98,826 01-10-2020 131.2% 151.1% 96% 4% 134 133 36% 2716 0 0 0 0 2716
9 IRDAN106P0021V01200
102
Group Personal Accident Policy 82,42,721 16-05-2001 94.3% 122.4% 64% 21% 5 5 56% 6538 162 19 1 0 6720
10 IFFHLIP22197V042122 Health Protector 42,663 02-03-2022 109.7% 136.5% 92% 12% 30 29 53% 38910 0 0 0 0 38910
11 IFFHLIP21328V022021 Health Protector Plus 15,135 01-10-2020 40.0% 66.5% 50% 49% 1 1 67% 6860 0 0 0 0 6860
12 IFFHLIP19036V011920 Iffco-Tokio Critical Illness
Benefit Policy
5,499 2019-07-12 0.1% 26.8% 50% 100% 0% 5182 132 0 0 0 5314
13 IFFHLGP19096V011819 Iffco-Tokio Group Critical Illness
Policy
8 28-01-2019 139.4% 161.9% 100% 0% 0% 7 0 0 0 0 7
14 lFFHLlP20071V011920 IFFCO-Tokio Mos-Bite Protector
Policy
86,915 25-10-2019 323.2% 348.4% 80% 15% 19 19 0% 175607 2061 0 0 0 177668
15 IFFHLIP21329V032021 Individual Medishield Insurance
Policy
6,892 01-10-2020 132.3% 159.4% 98% 10% 8 8 66% 4327 0 0 1 0 4328
16 IRDA/NL-HLT/ITGI/P-
P/V.I/13/14-15
Individual Personal Accident
Grand
2,556 24-06-2015 60.8% 89.6% 69% 21% 63% 2637 0 0 0 0 2637
17 IRDAN106P0010V01200
102
Individual Personal Accident
Policy
1,58,382 16-05-2001 71.1% 100.1% 69% 14% 5 5 36% 172856 2089 640 2 0 175587
18 IRDAN106P0009V01200
809
Jan Suraksha Bima Policy
(Micro Insurance)
25,03,897 08-09-2008 242.1% 272.8% 0% 0% 0% 0 0 0 0 0 0
19 IFFHLGP19001V011819 Swasthya Sathi Scheme - 01-04-2018 0.0% 0.0% 0% 0% 0% 0 0 0 0 0 0
20 IFFHLGP09003V010809 Jan Swasthya Beema Yojana - 30-09-2013 -3170.4% -3155.8% 97% 3% 0% 0 0 0 0 0 0
21 IRDAN106P0001V01200
506
Janata Personal Accident Policy 41,39,073 18-11-2005 83.3% 108.1% 97% 28% 15% 2844 968 2 0 0 3814
Incurred
Claims
Ratio (ICR)
S.N UIN Name of the Product No. Of Lives
Insured
Date of
Launch (DD-
MM-YYYY)
Age-wise distribution of Policies (classification of policies based on the age Combine
d Ratio
(CR)
% age of
Claims
Settled
(in terms
of
number
of
claims)
% age of
Claims
Repudiate
d (in
terms of
number of
claims)
No. Of
Compl
aints
Receiv
ed
No. Of
Compl
aints
Resolv
ed
% of
policies
renewed
out of total
no. Of
policies
due for
renewal
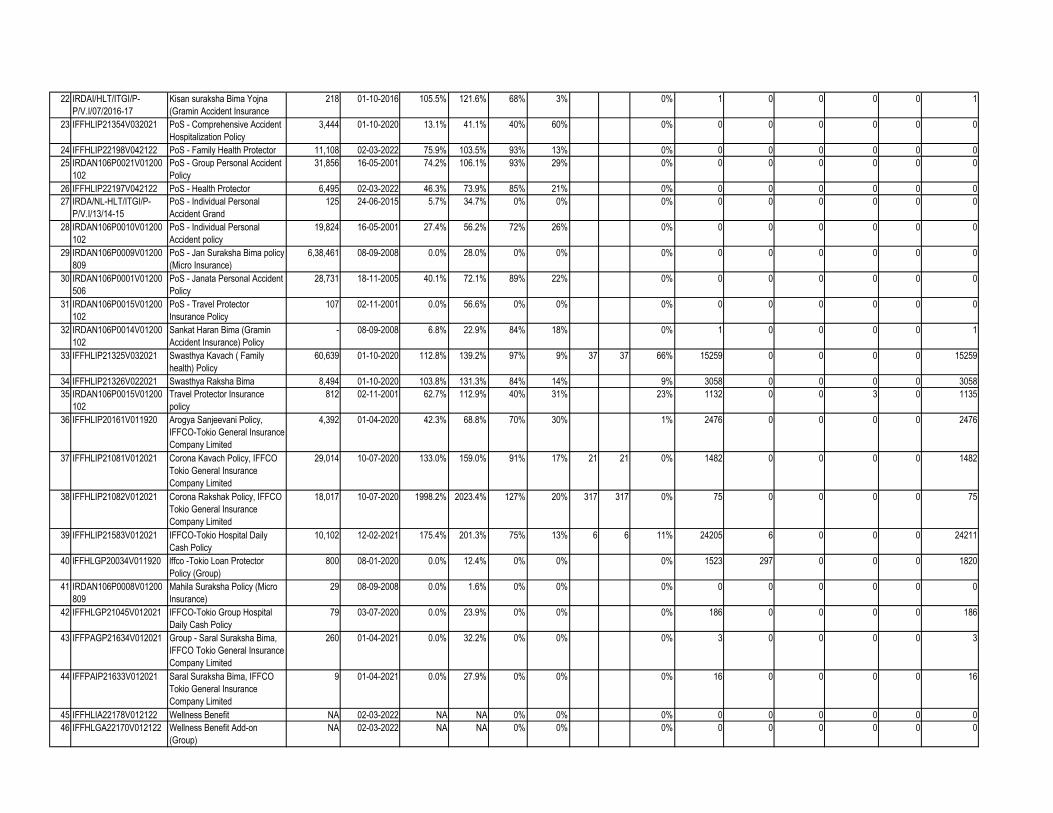
22 IRDAI/HLT/ITGI/P-
P/V.I/07/2016-17
Kisan suraksha Bima Yojna
(Gramin Accident Insurance
218 01-10-2016 105.5% 121.6% 68% 3% 0% 1 0 0 0 0 1
23 IFFHLIP21354V032021 PoS - Comprehensive Accident
Hospitalization Policy
3,444 01-10-2020 13.1% 41.1% 40% 60% 0% 0 0 0 0 0 0
24 IFFHLIP22198V042122 PoS - Family Health Protector 11,108 02-03-2022 75.9% 103.5% 93% 13% 0% 0 0 0 0 0 0
25 IRDAN106P0021V01200
102
PoS - Group Personal Accident
Policy
31,856 16-05-2001 74.2% 106.1% 93% 29% 0% 0 0 0 0 0 0
26 IFFHLIP22197V042122 PoS - Health Protector 6,495 02-03-2022 46.3% 73.9% 85% 21% 0% 0 0 0 0 0 0
27 IRDA/NL-HLT/ITGI/P-
P/V.I/13/14-15
PoS - Individual Personal
Accident Grand
125 24-06-2015 5.7% 34.7% 0% 0% 0% 0 0 0 0 0 0
28 IRDAN106P0010V01200
102
PoS - Individual Personal
Accident policy
19,824 16-05-2001 27.4% 56.2% 72% 26% 0% 0 0 0 0 0 0
29 IRDAN106P0009V01200
809
PoS - Jan Suraksha Bima policy
(Micro Insurance)
6,38,461 08-09-2008 0.0% 28.0% 0% 0% 0% 0 0 0 0 0 0
30 IRDAN106P0001V01200
506
PoS - Janata Personal Accident
Policy
28,731 18-11-2005 40.1% 72.1% 89% 22% 0% 0 0 0 0 0 0
31 IRDAN106P0015V01200
102
PoS - Travel Protector
Insurance Policy
107 02-11-2001 0.0% 56.6% 0% 0% 0% 0 0 0 0 0 0
32 IRDAN106P0014V01200
102
Sankat Haran Bima (Gramin
Accident Insurance) Policy
- 08-09-2008 6.8% 22.9% 84% 18% 0% 1 0 0 0 0 1
33 IFFHLIP21325V032021 Swasthya Kavach ( Family
health) Policy
60,639 01-10-2020 112.8% 139.2% 97% 9% 37 37 66% 15259 0 0 0 0 15259
34 IFFHLIP21326V022021 Swasthya Raksha Bima 8,494 01-10-2020 103.8% 131.3% 84% 14% 9% 3058 0 0 0 0 3058
35 IRDAN106P0015V01200
102
Travel Protector Insurance
policy
812 02-11-2001 62.7% 112.9% 40% 31% 23% 1132 0 0 3 0 1135
36 IFFHLIP20161V011920 Arogya Sanjeevani Policy,
IFFCO-Tokio General Insurance
Company Limited
4,392 01-04-2020 42.3% 68.8% 70% 30% 1% 2476 0 0 0 0 2476
37 IFFHLIP21081V012021 Corona Kavach Policy, IFFCO
Tokio General Insurance
Company Limited
29,014 10-07-2020 133.0% 159.0% 91% 17% 21 21 0% 1482 0 0 0 0 1482
38 IFFHLIP21082V012021 Corona Rakshak Policy, IFFCO
Tokio General Insurance
Company Limited
18,017 10-07-2020 1998.2% 2023.4% 127% 20% 317 317 0% 75 0 0 0 0 75
39 IFFHLIP21583V012021 IFFCO-Tokio Hospital Daily
Cash Policy
10,102 12-02-2021 175.4% 201.3% 75% 13% 6 6 11% 24205 6 0 0 0 24211
40 lFFHLGP20034V011920 lffco -Tokio Loan Protector
Policy (Group)
800 08-01-2020 0.0% 12.4% 0% 0% 0% 1523 297 0 0 0 1820
41 IRDAN106P0008V01200
809
Mahila Suraksha Policy (Micro
Insurance)
29 08-09-2008 0.0% 1.6% 0% 0% 0% 0 0 0 0 0 0
42 IFFHLGP21045V012021 IFFCO-Tokio Group Hospital
Daily Cash Policy
79 03-07-2020 0.0% 23.9% 0% 0% 0% 186 0 0 0 0 186
43 IFFPAGP21634V012021 Group - Saral Suraksha Bima,
IFFCO Tokio General Insurance
Company Limited
260 01-04-2021 0.0% 32.2% 0% 0% 0% 3 0 0 0 0 3
44 IFFPAIP21633V012021 Saral Suraksha Bima, IFFCO
Tokio General Insurance
Company Limited
9 01-04-2021 0.0% 27.9% 0% 0% 0% 16 0 0 0 0 16
45 IFFHLIA22178V012122 Wellness Benefit NA 02-03-2022 NA NA 0% 0% 0% 0 0 0 0 0 0
46 IFFHLGA22170V012122 Wellness Benefit Add-on
(Group)
NA 02-03-2022 NA NA 0% 0% 0% 0 0 0 0 0 0
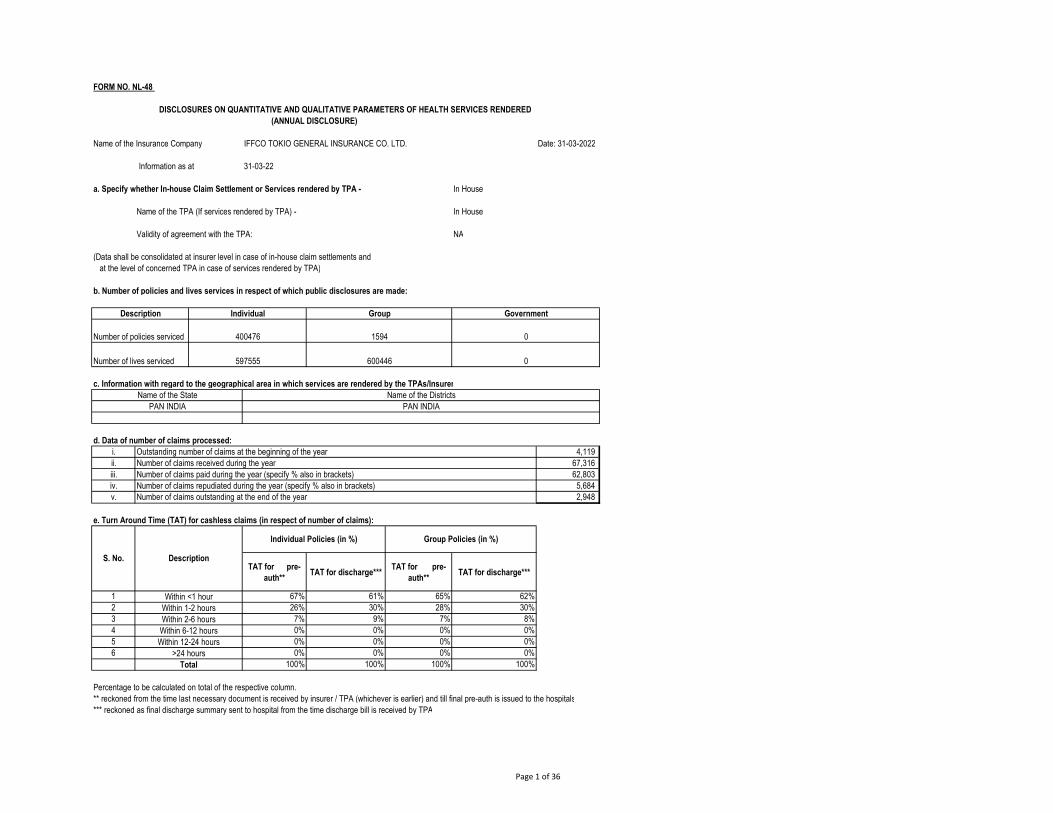
FORM NO. NL-48
Date: 31-03-2022
In House
In House
NA
(Data shall be consolidated at insurer level in case of in-house claim settlements and at the level of concerned TPA in case of services rendered by TPA)
b. Number of policies and lives services in respect of which public disclosures are made:
c. Information with regard to the geographical area in which services are rendered by the TPAs/Insurer
d. Data of number of claims processed:i. 4,119 ii. 67,316 iii. 62,803 iv. 5,684 v. 2,948
e. Turn Around Time (TAT) for cashless claims (in respect of number of claims):
TAT for pre-auth**
TAT for discharge***TAT for pre-
auth**TAT for discharge***
1 67% 61% 65% 62%2 26% 30% 28% 30%3 7% 9% 7% 8%4 0% 0% 0% 0%5 0% 0% 0% 0%6 0% 0% 0% 0%
100% 100% 100% 100%
Percentage to be calculated on total of the respective column.** reckoned from the time last necessary document is received by insurer / TPA (whichever is earlier) and till final pre-auth is issued to the hospitals*** reckoned as final discharge summary sent to hospital from the time discharge bill is received by TPA
Within <1 hourWithin 1-2 hoursWithin 2-6 hours
Within 6-12 hoursWithin 12-24 hours
>24 hoursTotal
Number of claims repudiated during the year (specify % also in brackets)Number of claims outstanding at the end of the year
S. No. Description
Individual Policies (in %) Group Policies (in %)
Outstanding number of claims at the beginning of the yearNumber of claims received during the yearNumber of claims paid during the year (specify % also in brackets)
Name of the State Name of the DistrictsPAN INDIA PAN INDIA
Number of lives serviced 597555 600446 0
a. Specify whether In-house Claim Settlement or Services rendered by TPA -
Name of the TPA (If services rendered by TPA) -
Validity of agreement with the TPA:
Description Individual Group Government
Number of policies serviced 400476 1594 0
DISCLOSURES ON QUANTITATIVE AND QUALITATIVE PARAMETERS OF HEALTH SERVICES RENDERED (ANNUAL DISCLOSURE)
Name of the Insurance Company IFFCO TOKIO GENERAL INSURANCE CO. LTD.
Information as at 31-03-22
Page 1 of 36
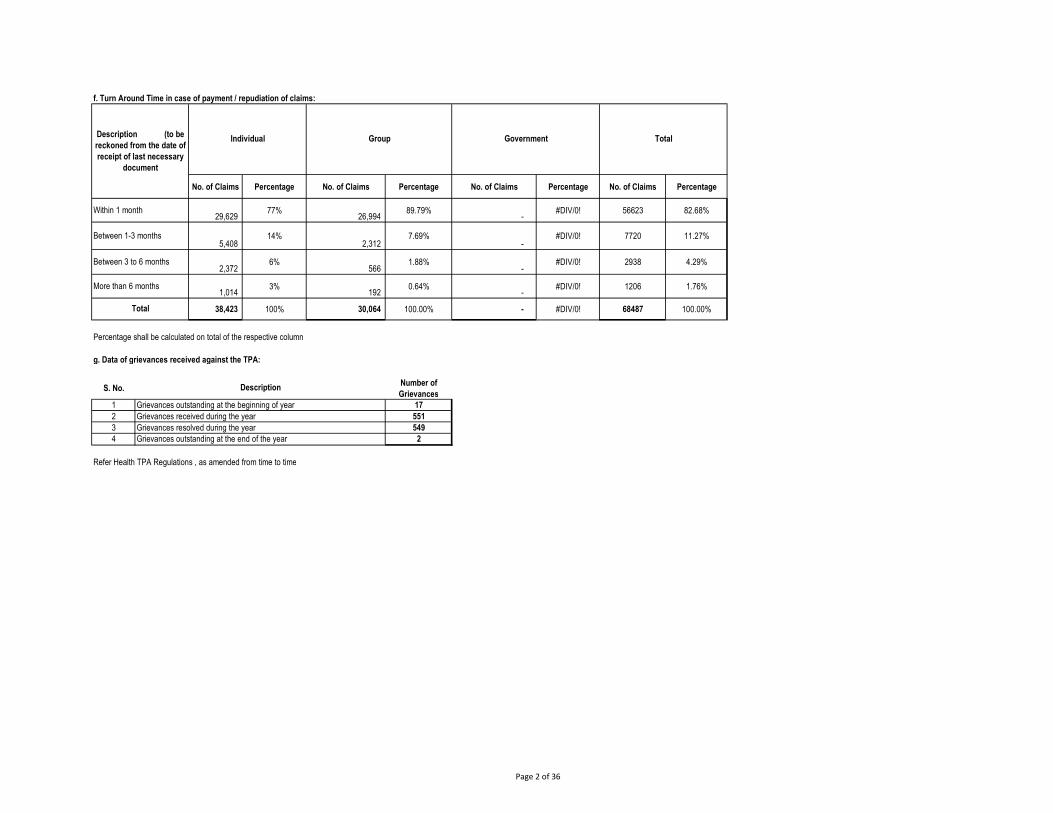
f. Turn Around Time in case of payment / repudiation of claims:
No. of Claims Percentage No. of Claims Percentage No. of Claims Percentage No. of Claims Percentage
29,629 77%
26,994 89.79%
- #DIV/0! 56623 82.68%
5,408 14%
2,312 7.69%
- #DIV/0! 7720 11.27%
2,372 6%
566 1.88%
- #DIV/0! 2938 4.29%
1,014 3%
192 0.64%
- #DIV/0! 1206 1.76%
38,423 100% 30,064 100.00% - #DIV/0! 68487 100.00%
Percentage shall be calculated on total of the respective column
g. Data of grievances received against the TPA:
S. No.Number of Grievances
1 172 5513 5494 2
Refer Health TPA Regulations , as amended from time to time
Grievances outstanding at the beginning of yearGrievances received during the yearGrievances resolved during the yearGrievances outstanding at the end of the year
Within 1 month
Between 1-3 months
Between 3 to 6 months
More than 6 months
Total
Description
TotalDescription (to be reckoned from the date of receipt of last necessary
document
Individual Group Government
Page 2 of 36
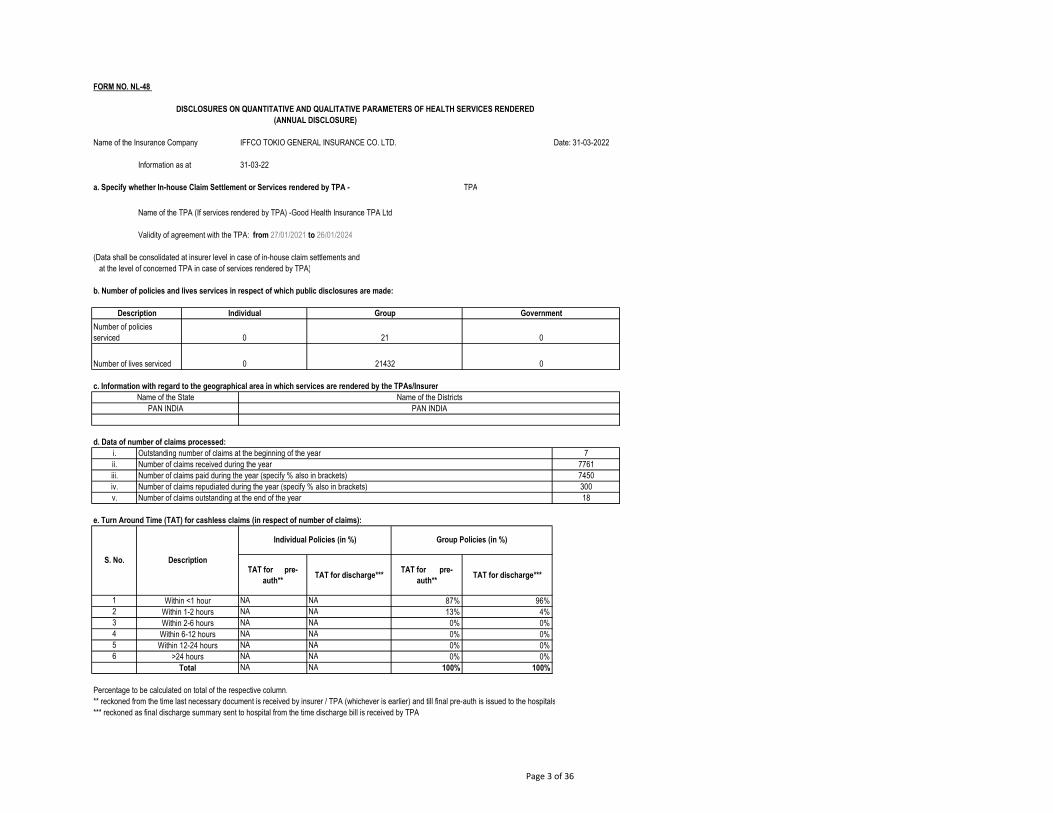
FORM NO. NL-48
Date: 31-03-2022
TPA
(Data shall be consolidated at insurer level in case of in-house claim settlements and at the level of concerned TPA in case of services rendered by TPA)
b. Number of policies and lives services in respect of which public disclosures are made:
c. Information with regard to the geographical area in which services are rendered by the TPAs/Insurer
d. Data of number of claims processed:i. 7ii. 7761iii. 7450iv. 300v. 18
e. Turn Around Time (TAT) for cashless claims (in respect of number of claims):
TAT for pre-auth**
TAT for discharge***TAT for pre-
auth**TAT for discharge***
1 NA NA 87% 96%2 NA NA 13% 4%3 NA NA 0% 0%4 NA NA 0% 0%5 NA NA 0% 0%6 NA NA 0% 0%
NA NA 100% 100%
Percentage to be calculated on total of the respective column.** reckoned from the time last necessary document is received by insurer / TPA (whichever is earlier) and till final pre-auth is issued to the hospitals*** reckoned as final discharge summary sent to hospital from the time discharge bill is received by TPA
IFFCO TOKIO GENERAL INSURANCE CO. LTD.
31-03-22
a. Specify whether In-house Claim Settlement or Services rendered by TPA -
Name of the TPA (If services rendered by TPA) -Good Health Insurance TPA Ltd
Validity of agreement with the TPA: from 27/01/2021 to 26/01/2024
Outstanding number of claims at the beginning of the year
Description Individual Group Government
Number of policies serviced
(ANNUAL DISCLOSURE)DISCLOSURES ON QUANTITATIVE AND QUALITATIVE PARAMETERS OF HEALTH SERVICES RENDERED
Name of the Insurance Company
Information as at
Total
Number of claims outstanding at the end of the year
Number of claims received during the year
PAN INDIA PAN INDIA
Within <1 hourWithin 1-2 hoursWithin 2-6 hours
Within 6-12 hoursWithin 12-24 hours
>24 hours
S. No. Description
Individual Policies (in %) Group Policies (in %)
Number of claims paid during the year (specify % also in brackets)Number of claims repudiated during the year (specify % also in brackets)
0 21 0
Number of lives serviced 0 21432 0
Name of the State Name of the Districts
Page 3 of 36
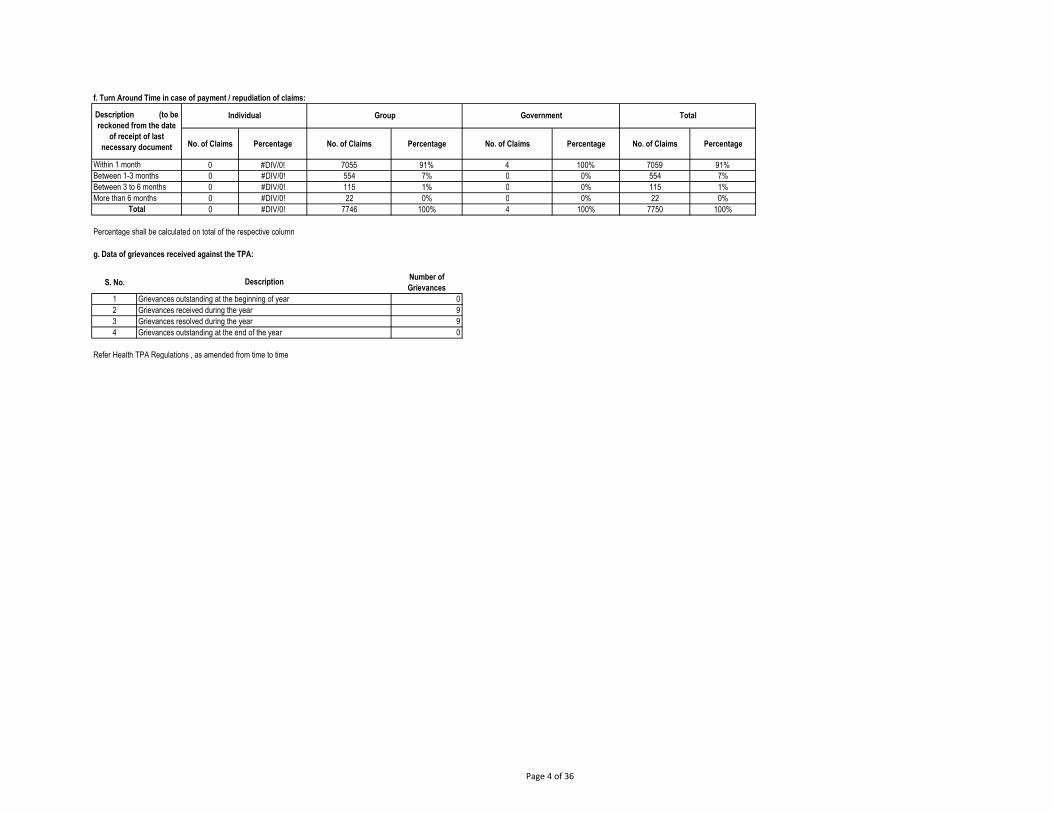
f. Turn Around Time in case of payment / repudiation of claims:
No. of Claims Percentage No. of Claims Percentage No. of Claims Percentage No. of Claims Percentage
0 #DIV/0! 7055 91% 4 100% 7059 91%0 #DIV/0! 554 7% 0 0% 554 7%0 #DIV/0! 115 1% 0 0% 115 1%0 #DIV/0! 22 0% 0 0% 22 0%0 #DIV/0! 7746 100% 4 100% 7750 100%
Percentage shall be calculated on total of the respective column
g. Data of grievances received against the TPA:
S. No.Number of Grievances
1 02 93 94 0
Refer Health TPA Regulations , as amended from time to time
Grievances outstanding at the beginning of yearGrievances received during the yearGrievances resolved during the yearGrievances outstanding at the end of the year
Between 1-3 monthsBetween 3 to 6 monthsMore than 6 months
Total
Description
Within 1 month
Description (to be reckoned from the date
of receipt of last necessary document
Individual Group Government Total
Page 4 of 36
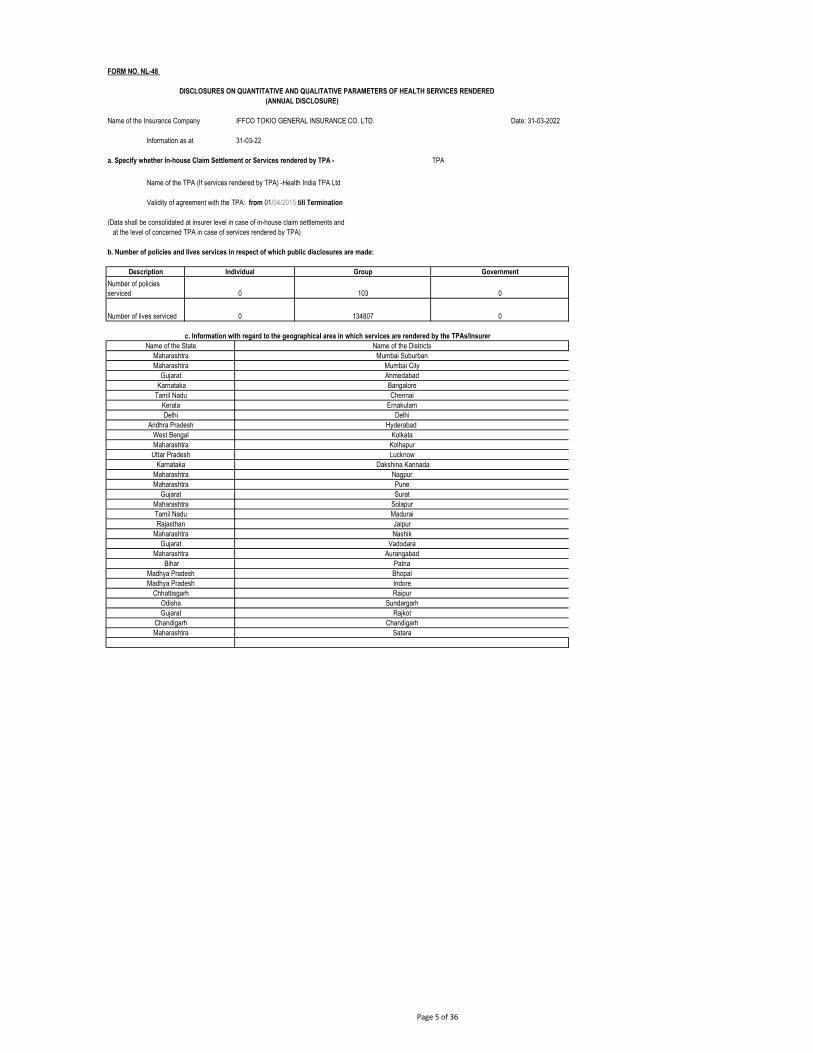
FORM NO. NL-48
Date: 31-03-2022
TPA
(Data shall be consolidated at insurer level in case of in-house claim settlements and at the level of concerned TPA in case of services rendered by TPA)
b. Number of policies and lives services in respect of which public disclosures are made:
ChandigarhSatara
c. Information with regard to the geographical area in which services are rendered by the TPAs/Insurer
PatnaBhopalIndoreRaipur
SundargarhRajkot
SolapurMaduraiJaipurNashik
VadodaraAurangabad
KolhapurLucknow
Dakshina KannadaNagpurPuneSurat
Maharashtra
Mumbai Suburban
BangaloreChennai
ErnakulamDelhi
Hyderabad Kolkata
Madhya Pradesh
Uttar PradeshKarnataka
MaharashtraMaharashtra
GujaratMaharashtra
MaharashtraMaharashtra
Gujarat KarnatakaTamil Nadu
Kerala
Madhya PradeshChhattisgarh
Name of the State Name of the Districts
DelhiAndhra Pradesh
West BengalMaharashtra
OdishaGujarat
Chandigarh
Tamil NaduRajasthan
MaharashtraGujarat
Maharashtra Bihar
Mumbai CityAhmedabad
Number of lives serviced 0 134807 0
a. Specify whether In-house Claim Settlement or Services rendered by TPA -
Name of the TPA (If services rendered by TPA) -Health India TPA Ltd
Validity of agreement with the TPA: from 01/04/2015 till Termination
Description Individual Group Government
DISCLOSURES ON QUANTITATIVE AND QUALITATIVE PARAMETERS OF HEALTH SERVICES RENDERED (ANNUAL DISCLOSURE)
Name of the Insurance Company IFFCO TOKIO GENERAL INSURANCE CO. LTD.
Information as at 31-03-22
Number of policies serviced 0 103 0
Page 5 of 36
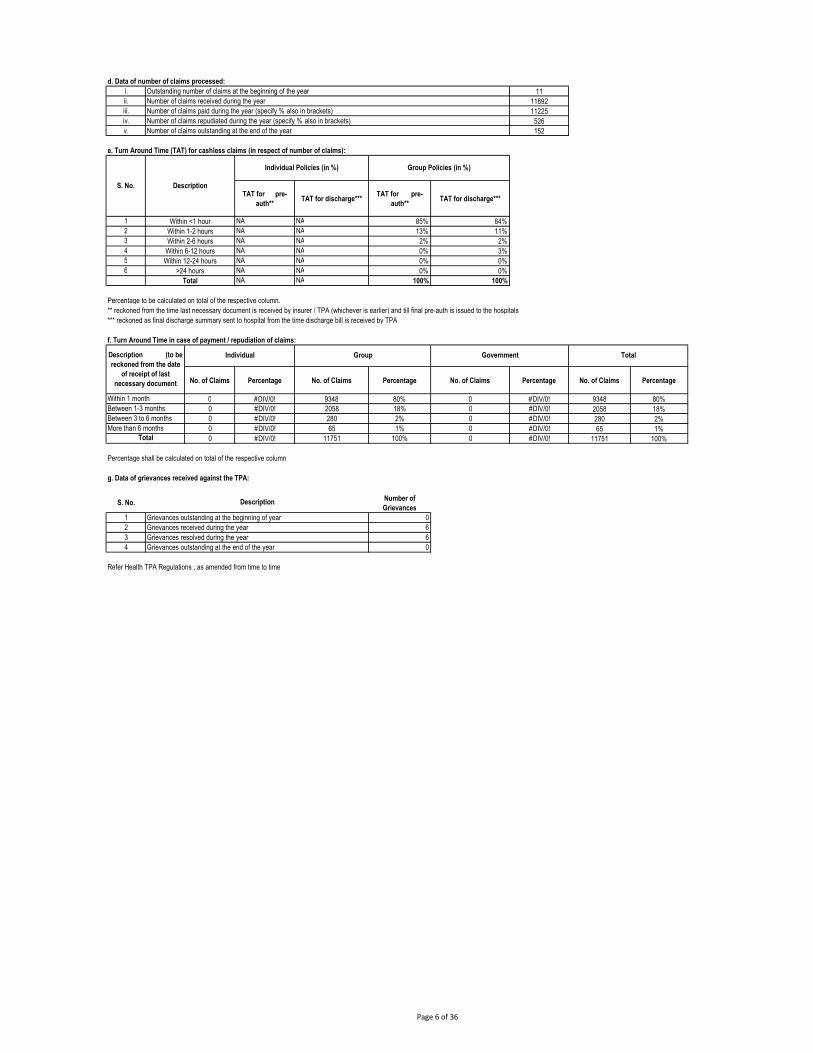
i. 11ii. 11892iii. 11225iv. 526v. 152
e. Turn Around Time (TAT) for cashless claims (in respect of number of claims):
TAT for pre-auth**
TAT for discharge***TAT for pre-
auth**TAT for discharge***
1 NA NA 85% 84%2 NA NA 13% 11%3 NA NA 2% 2%4 NA NA 0% 3%5 NA NA 0% 0%6 NA NA 0% 0%
NA NA 100% 100%
Percentage to be calculated on total of the respective column.** reckoned from the time last necessary document is received by insurer / TPA (whichever is earlier) and till final pre-auth is issued to the hospitals*** reckoned as final discharge summary sent to hospital from the time discharge bill is received by TPA
f. Turn Around Time in case of payment / repudiation of claims:
No. of Claims Percentage No. of Claims Percentage No. of Claims Percentage No. of Claims Percentage
0 #DIV/0! 9348 80% 0 #DIV/0! 9348 80%0 #DIV/0! 2058 18% 0 #DIV/0! 2058 18%0 #DIV/0! 280 2% 0 #DIV/0! 280 2%0 #DIV/0! 65 1% 0 #DIV/0! 65 1%0 #DIV/0! 11751 100% 0 #DIV/0! 11751 100%
Percentage shall be calculated on total of the respective column
g. Data of grievances received against the TPA:
S. No. Number of Grievances
1 02 63 64 0
Refer Health TPA Regulations , as amended from time to time
d. Data of number of claims processed:
Grievances outstanding at the beginning of yearGrievances received during the yearGrievances resolved during the yearGrievances outstanding at the end of the year
Within 1 monthBetween 1-3 monthsBetween 3 to 6 monthsMore than 6 months
Total
Description
Total
Description (to be reckoned from the date
of receipt of last necessary document
Individual Group
S. No.
Outstanding number of claims at the beginning of the year
Government Total
Within <1 hourWithin 1-2 hoursWithin 2-6 hours
Within 6-12 hoursWithin 12-24 hours
>24 hours
Number of claims repudiated during the year (specify % also in brackets)Number of claims outstanding at the end of the year
Description
Individual Policies (in %) Group Policies (in %)
Number of claims received during the yearNumber of claims paid during the year (specify % also in brackets)
Page 6 of 36
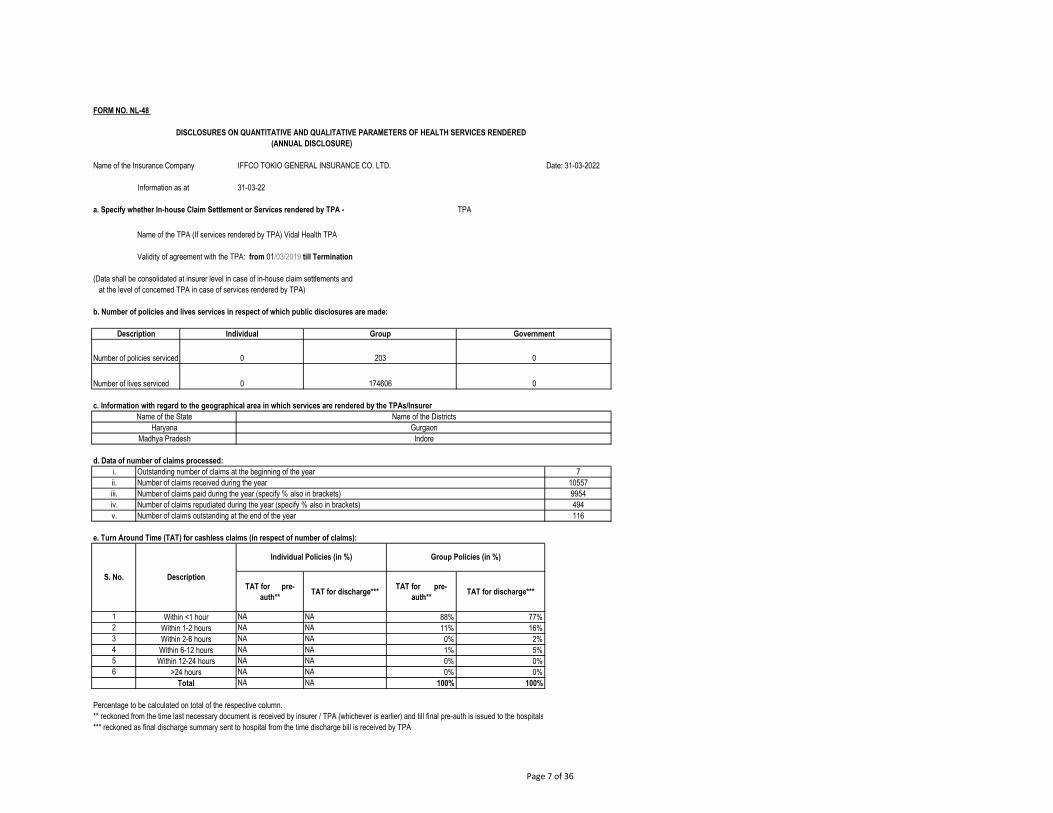
FORM NO. NL-48
Date: 31-03-2022
TPA
(Data shall be consolidated at insurer level in case of in-house claim settlements and at the level of concerned TPA in case of services rendered by TPA)
b. Number of policies and lives services in respect of which public disclosures are made:
c. Information with regard to the geographical area in which services are rendered by the TPAs/Insurer
d. Data of number of claims processed:i. 7ii. 10557iii. 9954iv. 494v. 116
e. Turn Around Time (TAT) for cashless claims (in respect of number of claims):
TAT for pre-auth**
TAT for discharge***TAT for pre-
auth**TAT for discharge***
1 NA NA 88% 77%2 NA NA 11% 16%3 NA NA 0% 2%4 NA NA 1% 5%5 NA NA 0% 0%6 NA NA 0% 0%
NA NA 100% 100%
Percentage to be calculated on total of the respective column.** reckoned from the time last necessary document is received by insurer / TPA (whichever is earlier) and till final pre-auth is issued to the hospitals*** reckoned as final discharge summary sent to hospital from the time discharge bill is received by TPA
Within <1 hourWithin 1-2 hoursWithin 2-6 hoursWithin 6-12 hoursWithin 12-24 hours
>24 hoursTotal
Number of claims repudiated during the year (specify % also in brackets)Number of claims outstanding at the end of the year
S. No. Description
Individual Policies (in %) Group Policies (in %)
Outstanding number of claims at the beginning of the yearNumber of claims received during the yearNumber of claims paid during the year (specify % also in brackets)
Name of the State Name of the DistrictsHaryana Gurgaon
Madhya Pradesh Indore
Number of policies serviced 0 203 0
Number of lives serviced 0 174606 0
a. Specify whether In-house Claim Settlement or Services rendered by TPA -
Name of the TPA (If services rendered by TPA) Vidal Health TPA
Validity of agreement with the TPA: from 01/03/2019 till Termination
Description Individual Group Government
DISCLOSURES ON QUANTITATIVE AND QUALITATIVE PARAMETERS OF HEALTH SERVICES RENDERED (ANNUAL DISCLOSURE)
Name of the Insurance Company IFFCO TOKIO GENERAL INSURANCE CO. LTD.
Information as at 31-03-22
Page 7 of 36
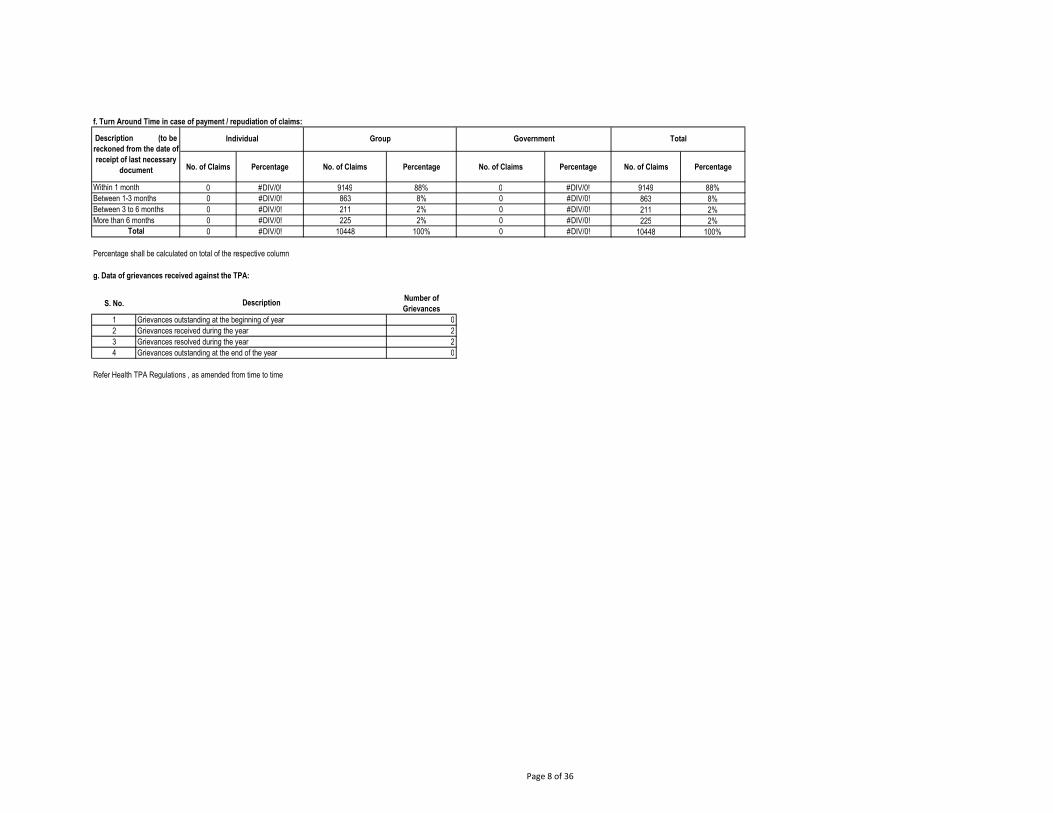
f. Turn Around Time in case of payment / repudiation of claims:
No. of Claims Percentage No. of Claims Percentage No. of Claims Percentage No. of Claims Percentage
0 #DIV/0! 9149 88% 0 #DIV/0! 9149 88%0 #DIV/0! 863 8% 0 #DIV/0! 863 8%0 #DIV/0! 211 2% 0 #DIV/0! 211 2%0 #DIV/0! 225 2% 0 #DIV/0! 225 2%0 #DIV/0! 10448 100% 0 #DIV/0! 10448 100%
Percentage shall be calculated on total of the respective column
g. Data of grievances received against the TPA:
S. No.Number of Grievances
1 02 23 24 0
Refer Health TPA Regulations , as amended from time to time
Grievances outstanding at the beginning of yearGrievances received during the yearGrievances resolved during the yearGrievances outstanding at the end of the year
Within 1 monthBetween 1-3 monthsBetween 3 to 6 monthsMore than 6 months
Total
Description
TotalDescription (to be reckoned from the date of receipt of last necessary
document
Individual Group Government
Page 8 of 36

FORM NO. NL-48
Date: 31-03-2022
TPA
(Data shall be consolidated at insurer level in case of in-house claim settlements and at the level of concerned TPA in case of services rendered by TPA)
b. Number of policies and lives services in respect of which public disclosures are made:
c. Information with regard to the geographical area in which services are rendered by the TPAs/Insurer
d. Data of number of claims processed:i. 36ii. 109417iii. 106262iv. 2567v. 624
e. Turn Around Time (TAT) for cashless claims (in respect of number of claims):
TAT for pre-auth**
TAT for discharge***TAT for pre-
auth**TAT for discharge***
1 NA NA 92% 77%2 NA NA 7% 19%3 NA NA 1% 3%4 NA NA 0% 0%5 NA NA 0% 0%6 NA NA 0% 0%
NA NA 100% 100%
Percentage to be calculated on total of the respective column.** reckoned from the time last necessary document is received by insurer / TPA (whichever is earlier) and till final pre-auth is issued to the hospitals*** reckoned as final discharge summary sent to hospital from the time discharge bill is received by TPA
Within <1 hourWithin 1-2 hoursWithin 2-6 hoursWithin 6-12 hoursWithin 12-24 hours
>24 hoursTotal
Number of claims repudiated during the year (specify % also in brackets)Number of claims outstanding at the end of the year
S. No. Description
Individual Policies (in %) Group Policies (in %)
Outstanding number of claims at the beginning of the yearNumber of claims received during the yearNumber of claims paid during the year (specify % also in brackets)
Name of the State Name of the DistrictsPAN India PAN India
Number of policies serviced 0 255 1
Number of lives serviced 0 868408 61600
a. Specify whether In-house Claim Settlement or Services rendered by TPA -
Name of the TPA (If services rendered by TPA): MediAssist Insurance TPA
Validity of agreement with the TPA: from 01/04/2014 till Termination
Description Individual Group Government
DISCLOSURES ON QUANTITATIVE AND QUALITATIVE PARAMETERS OF HEALTH SERVICES RENDERED (ANNUAL DISCLOSURE)
Name of the Insurance Company IFFCO TOKIO GENERAL INSURANCE CO. LTD.
Information as at 31-03-22
Page 9 of 36

f. Turn Around Time in case of payment / repudiation of claims:
No. of Claims Percentage No. of Claims Percentage No. of Claims Percentage No. of Claims Percentage
0 #DIV/0! 42980 75% 27027 53% 70007 64%0 #DIV/0! 12084 21% 21284 41% 33368 31%0 #DIV/0! 1593 3% 1690 3% 3283 3%0 #DIV/0! 855 1% 1316 3% 2171 2%0 #DIV/0! 57512 100% 51317 100% 108829 100%
Percentage shall be calculated on total of the respective column
g. Data of grievances received against the TPA:
S. No.Number of Grievances
1 02 233 224 1
Refer Health TPA Regulations , as amended from time to time
Grievances outstanding at the beginning of yearGrievances received during the yearGrievances resolved during the yearGrievances outstanding at the end of the year
Within 1 monthBetween 1-3 monthsBetween 3 to 6 monthsMore than 6 months
Total
Description
TotalDescription (to be reckoned from the date of receipt of last necessary
document
Individual Group Government
Page 10 of 36

FORM NO. NL-48
Date: 31-03-2022
TPA
(Data shall be consolidated at insurer level in case of in-house claim settlements and at the level of concerned TPA in case of services rendered by TPA)
b. Number of policies and lives services in respect of which public disclosures are made:
c. Information with regard to the geographical area in which services are rendered by the TPAs/Insurer
d. Data of number of claims processed:i. 1ii. 589iii. 588iv. 0v. 2
e. Turn Around Time (TAT) for cashless claims (in respect of number of claims):
TAT for pre-auth**
TAT for discharge***TAT for pre-
auth**TAT for discharge***
1 NA NA NA NA2 NA NA NA NA3 NA NA NA NA4 NA NA NA NA5 NA NA NA NA6 NA NA NA NA
NA NA NA NA
Percentage to be calculated on total of the respective column.** reckoned from the time last necessary document is received by insurer / TPA (whichever is earlier) and till final pre-auth is issued to the hospitals*** reckoned as final discharge summary sent to hospital from the time discharge bill is received by TPA
Within <1 hourWithin 1-2 hoursWithin 2-6 hoursWithin 6-12 hoursWithin 12-24 hours
>24 hoursTotal
Number of claims outstanding at the end of the year
S. No. Description
Individual Policies (in %) Group Policies (in %)
Number of claims received during the yearNumber of claims paid during the year (specify % also in brackets)Number of claims repudiated during the year (specify % also in brackets)
Number of policies serviced 0 3 0
Number of lives serviced 0 2591 0
Name of the State Name of the DistrictsPAN India PAN India
Outstanding number of claims at the beginning of the year
a. Specify whether In-house Claim Settlement or Services rendered by TPA -
Name of the TPA (If services rendered by TPA) : Park TPA
Validity of agreement with the TPA: from 19/06/2018 till 18/06/2024
Description Individual Group Government
DISCLOSURES ON QUANTITATIVE AND QUALITATIVE PARAMETERS OF HEALTH SERVICES RENDERED (ANNUAL DISCLOSURE)
Name of the Insurance Company IFFCO TOKIO GENERAL INSURANCE CO. LTD.
Information as at 31-03-22
Page 11 of 36
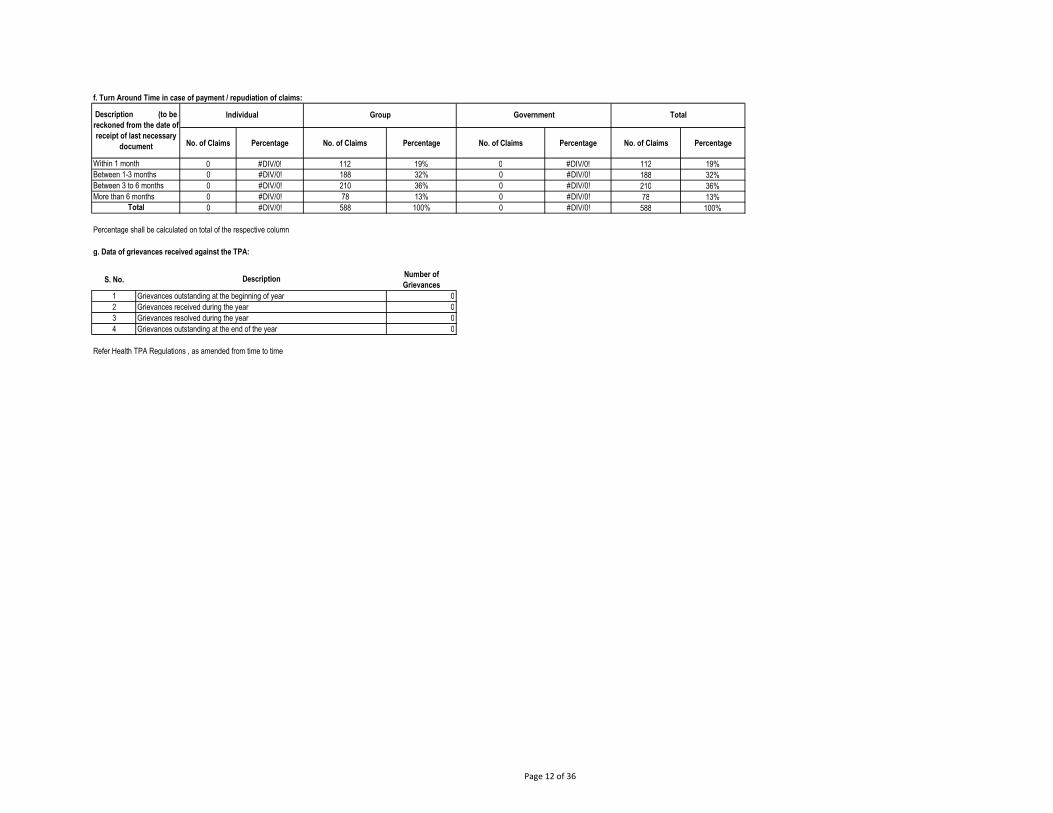
f. Turn Around Time in case of payment / repudiation of claims:
No. of Claims Percentage No. of Claims Percentage No. of Claims Percentage No. of Claims Percentage
0 #DIV/0! 112 19% 0 #DIV/0! 112 19%0 #DIV/0! 188 32% 0 #DIV/0! 188 32%0 #DIV/0! 210 36% 0 #DIV/0! 210 36%0 #DIV/0! 78 13% 0 #DIV/0! 78 13%0 #DIV/0! 588 100% 0 #DIV/0! 588 100%
Percentage shall be calculated on total of the respective column
g. Data of grievances received against the TPA:
S. No.Number of Grievances
1 02 03 04 0
Refer Health TPA Regulations , as amended from time to time
Grievances outstanding at the beginning of yearGrievances received during the yearGrievances resolved during the yearGrievances outstanding at the end of the year
Within 1 monthBetween 1-3 monthsBetween 3 to 6 monthsMore than 6 months
Total
Description
TotalDescription (to be reckoned from the date of receipt of last necessary
document
Individual Group Government
Page 12 of 36
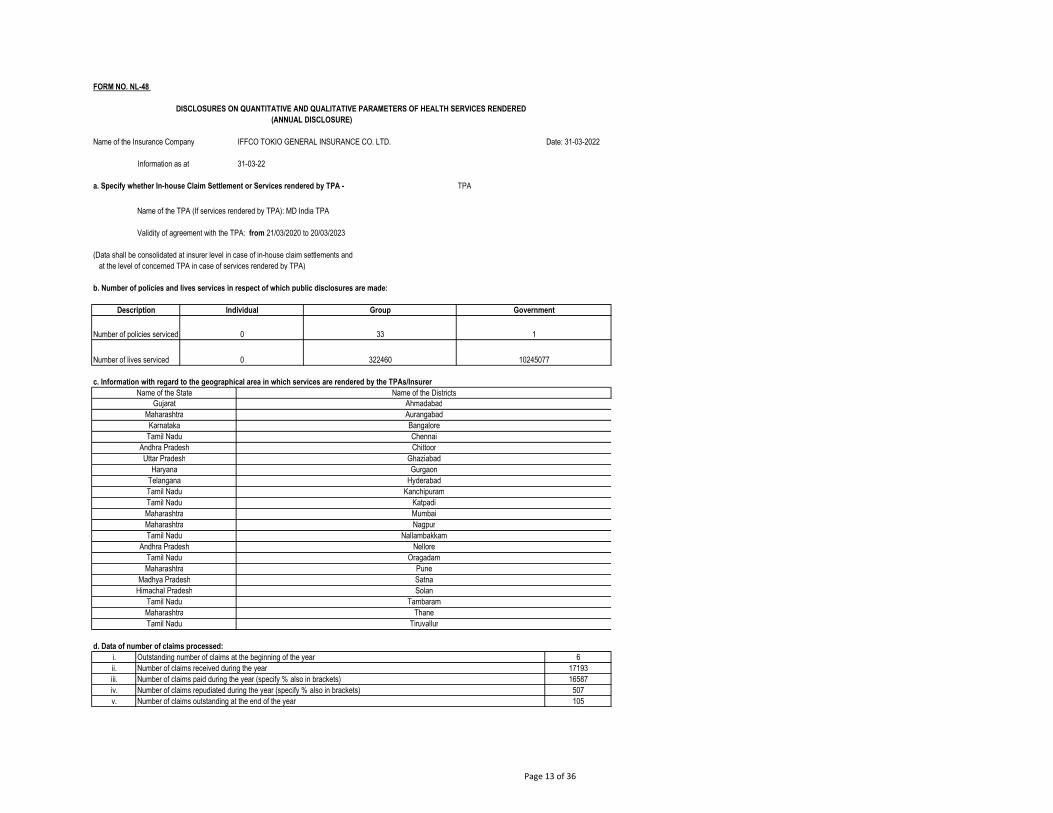
FORM NO. NL-48
Date: 31-03-2022
TPA
(Data shall be consolidated at insurer level in case of in-house claim settlements and at the level of concerned TPA in case of services rendered by TPA)
b. Number of policies and lives services in respect of which public disclosures are made:
c. Information with regard to the geographical area in which services are rendered by the TPAs/Insurer
d. Data of number of claims processed:i. 6ii. 17193iii. 16587iv. 507v. 105
Maharashtra NagpurTamil Nadu Nallambakkam
Andhra Pradesh Nellore
Tamil Nadu Tiruvallur
Himachal Pradesh SolanTamil Nadu TambaramMaharashtra Thane
Tamil Nadu OragadamMaharashtra Pune
Madhya Pradesh Satna
Gujarat AhmadabadMaharashtra AurangabadKarnataka Bangalore
Number of claims received during the year
Uttar Pradesh GhaziabadHaryana Gurgaon
Number of claims outstanding at the end of the year
Number of claims paid during the year (specify % also in brackets)Number of claims repudiated during the year (specify % also in brackets)
Name of the State Name of the Districts
Outstanding number of claims at the beginning of the year
Tamil Nadu ChennaiAndhra Pradesh Chittoor
Telangana HyderabadTamil Nadu KanchipuramTamil Nadu KatpadiMaharashtra Mumbai
Number of lives serviced 0 322460 10245077
a. Specify whether In-house Claim Settlement or Services rendered by TPA -
Name of the TPA (If services rendered by TPA): MD India TPA
Validity of agreement with the TPA: from 21/03/2020 to 20/03/2023
Description Individual Group Government
DISCLOSURES ON QUANTITATIVE AND QUALITATIVE PARAMETERS OF HEALTH SERVICES RENDERED (ANNUAL DISCLOSURE)
Name of the Insurance Company IFFCO TOKIO GENERAL INSURANCE CO. LTD.
Information as at 31-03-22
Number of policies serviced 0 33 1
Page 13 of 36
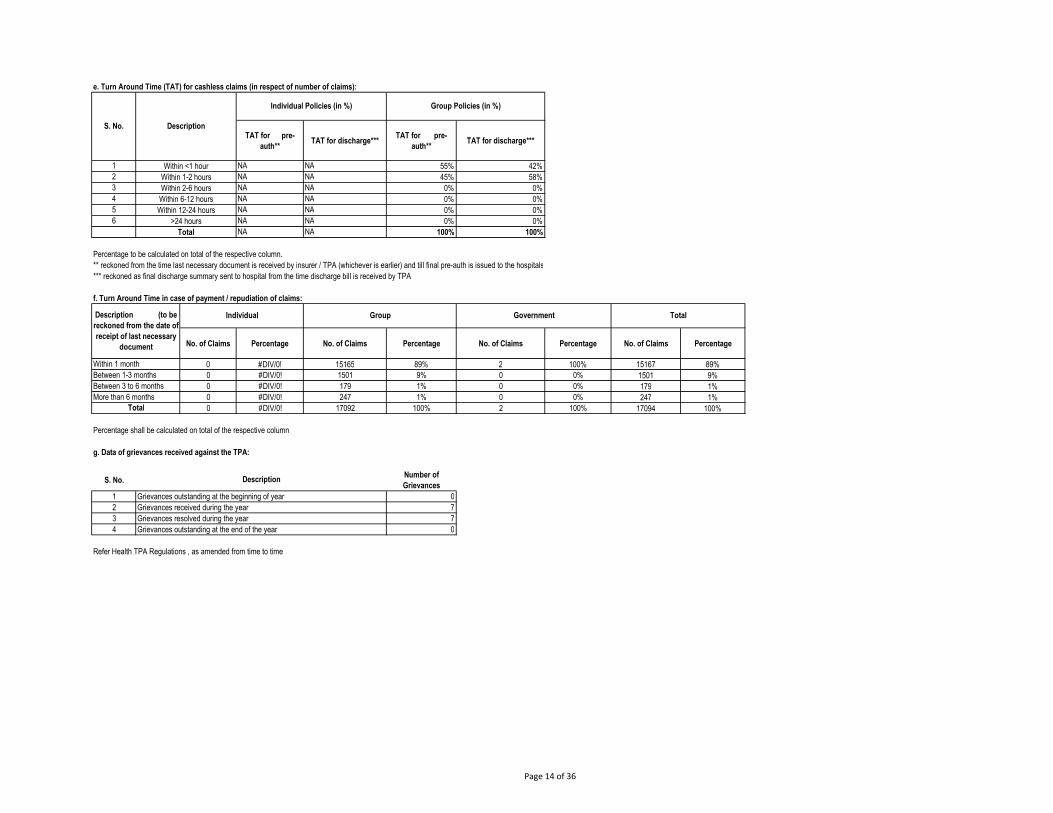
e. Turn Around Time (TAT) for cashless claims (in respect of number of claims):
TAT for pre-auth**
TAT for discharge***TAT for pre-
auth**TAT for discharge***
1 NA NA 55% 42%2 NA NA 45% 58%3 NA NA 0% 0%4 NA NA 0% 0%5 NA NA 0% 0%6 NA NA 0% 0%
NA NA 100% 100%
Percentage to be calculated on total of the respective column.** reckoned from the time last necessary document is received by insurer / TPA (whichever is earlier) and till final pre-auth is issued to the hospitals*** reckoned as final discharge summary sent to hospital from the time discharge bill is received by TPA
f. Turn Around Time in case of payment / repudiation of claims:
No. of Claims Percentage No. of Claims Percentage No. of Claims Percentage No. of Claims Percentage
0 #DIV/0! 15165 89% 2 100% 15167 89%0 #DIV/0! 1501 9% 0 0% 1501 9%0 #DIV/0! 179 1% 0 0% 179 1%0 #DIV/0! 247 1% 0 0% 247 1%0 #DIV/0! 17092 100% 2 100% 17094 100%
Percentage shall be calculated on total of the respective column
g. Data of grievances received against the TPA:
S. No.Number of Grievances
1 02 73 74 0
Refer Health TPA Regulations , as amended from time to time
Grievances outstanding at the beginning of yearGrievances received during the yearGrievances resolved during the yearGrievances outstanding at the end of the year
Within 1 monthBetween 1-3 monthsBetween 3 to 6 monthsMore than 6 months
Total
Description
Total
Description (to be reckoned from the date of receipt of last necessary
document
Individual Group Government
S. No.
Total
Within <1 hourWithin 1-2 hoursWithin 2-6 hoursWithin 6-12 hoursWithin 12-24 hours
>24 hours
Description
Individual Policies (in %) Group Policies (in %)
Page 14 of 36
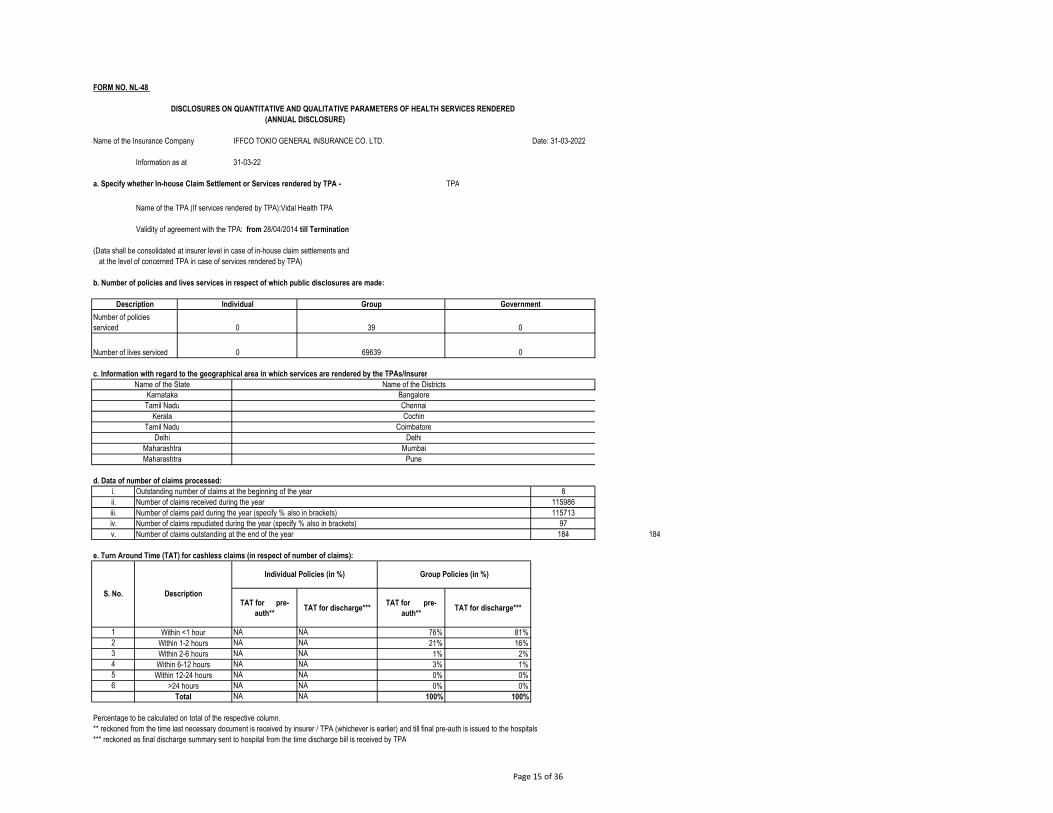
FORM NO. NL-48
Date: 31-03-2022
TPA
(Data shall be consolidated at insurer level in case of in-house claim settlements and at the level of concerned TPA in case of services rendered by TPA)
b. Number of policies and lives services in respect of which public disclosures are made:
c. Information with regard to the geographical area in which services are rendered by the TPAs/Insurer
d. Data of number of claims processed:i. 8ii. 115986iii. 115713iv. 97v. 184 184
e. Turn Around Time (TAT) for cashless claims (in respect of number of claims):
TAT for pre-auth**
TAT for discharge***TAT for pre-
auth**TAT for discharge***
1 NA NA 76% 81%2 NA NA 21% 16%3 NA NA 1% 2%4 NA NA 3% 1%5 NA NA 0% 0%6 NA NA 0% 0%
NA NA 100% 100%
Percentage to be calculated on total of the respective column.** reckoned from the time last necessary document is received by insurer / TPA (whichever is earlier) and till final pre-auth is issued to the hospitals*** reckoned as final discharge summary sent to hospital from the time discharge bill is received by TPA
Within 2-6 hoursWithin 6-12 hours
Within 12-24 hours>24 hours
Total
S. No. Description
Individual Policies (in %) Group Policies (in %)
Within <1 hourWithin 1-2 hours
Number of claims paid during the year (specify % also in brackets)Number of claims repudiated during the year (specify % also in brackets)Number of claims outstanding at the end of the year
Outstanding number of claims at the beginning of the yearNumber of claims received during the year
Maharashtra Pune
Tamil Nadu CoimbatoreDelhi Delhi
Maharashtra Mumbai
Karnataka BangaloreTamil Nadu Chennai
Kerala Cochin
Name of the State Name of the Districts
Number of policies serviced 0 39 0
Number of lives serviced 0 69639 0
a. Specify whether In-house Claim Settlement or Services rendered by TPA -
Name of the TPA (If services rendered by TPA):Vidal Health TPA
Validity of agreement with the TPA: from 28/04/2014 till Termination
Description Individual Group Government
DISCLOSURES ON QUANTITATIVE AND QUALITATIVE PARAMETERS OF HEALTH SERVICES RENDERED (ANNUAL DISCLOSURE)
Name of the Insurance Company IFFCO TOKIO GENERAL INSURANCE CO. LTD.
Information as at 31-03-22
Page 15 of 36
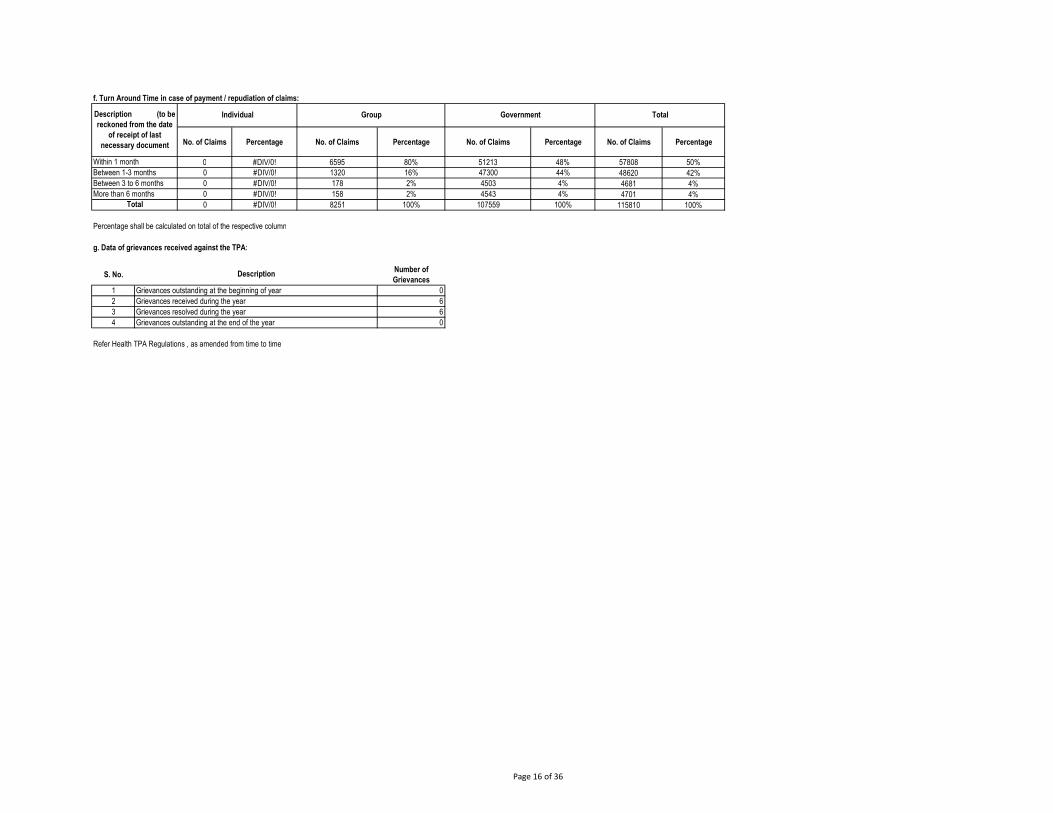
f. Turn Around Time in case of payment / repudiation of claims:
No. of Claims Percentage No. of Claims Percentage No. of Claims Percentage No. of Claims Percentage
0 #DIV/0! 6595 80% 51213 48% 57808 50%0 #DIV/0! 1320 16% 47300 44% 48620 42%0 #DIV/0! 178 2% 4503 4% 4681 4%0 #DIV/0! 158 2% 4543 4% 4701 4%0 #DIV/0! 8251 100% 107559 100% 115810 100%
Percentage shall be calculated on total of the respective column
g. Data of grievances received against the TPA:
S. No.Number of Grievances
1 02 63 64 0
Refer Health TPA Regulations , as amended from time to time
Grievances outstanding at the end of the year
More than 6 monthsTotal
Description
Grievances outstanding at the beginning of yearGrievances received during the yearGrievances resolved during the year
Group Government Total
Within 1 monthBetween 1-3 monthsBetween 3 to 6 months
Description (to be reckoned from the date
of receipt of last necessary document
Individual
Page 16 of 36
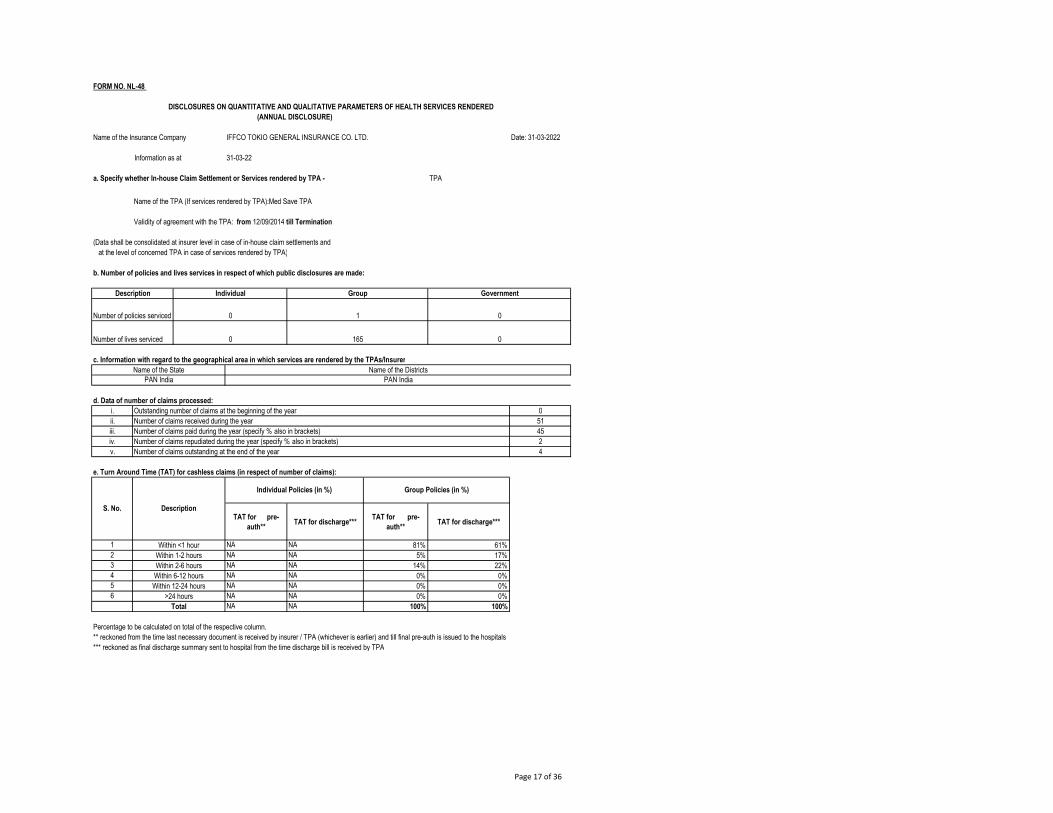
FORM NO. NL-48
Date: 31-03-2022
TPA
(Data shall be consolidated at insurer level in case of in-house claim settlements and at the level of concerned TPA in case of services rendered by TPA)
b. Number of policies and lives services in respect of which public disclosures are made:
c. Information with regard to the geographical area in which services are rendered by the TPAs/Insurer
d. Data of number of claims processed:i. 0ii. 51iii. 45iv. 2v. 4
e. Turn Around Time (TAT) for cashless claims (in respect of number of claims):
TAT for pre-auth**
TAT for discharge***TAT for pre-
auth**TAT for discharge***
1 NA NA 81% 61%2 NA NA 5% 17%3 NA NA 14% 22%4 NA NA 0% 0%5 NA NA 0% 0%6 NA NA 0% 0%
NA NA 100% 100%
Percentage to be calculated on total of the respective column.** reckoned from the time last necessary document is received by insurer / TPA (whichever is earlier) and till final pre-auth is issued to the hospitals*** reckoned as final discharge summary sent to hospital from the time discharge bill is received by TPA
Within <1 hourWithin 1-2 hoursWithin 2-6 hoursWithin 6-12 hoursWithin 12-24 hours
>24 hoursTotal
Number of claims repudiated during the year (specify % also in brackets)Number of claims outstanding at the end of the year
S. No. Description
Individual Policies (in %) Group Policies (in %)
Outstanding number of claims at the beginning of the yearNumber of claims received during the yearNumber of claims paid during the year (specify % also in brackets)
Name of the State Name of the DistrictsPAN India PAN India
Number of policies serviced 0 1 0
Number of lives serviced 0 165 0
a. Specify whether In-house Claim Settlement or Services rendered by TPA -
Name of the TPA (If services rendered by TPA):Med Save TPA
Validity of agreement with the TPA: from 12/09/2014 till Termination
Description Individual Group Government
DISCLOSURES ON QUANTITATIVE AND QUALITATIVE PARAMETERS OF HEALTH SERVICES RENDERED (ANNUAL DISCLOSURE)
Name of the Insurance Company IFFCO TOKIO GENERAL INSURANCE CO. LTD.
Information as at 31-03-22
Page 17 of 36
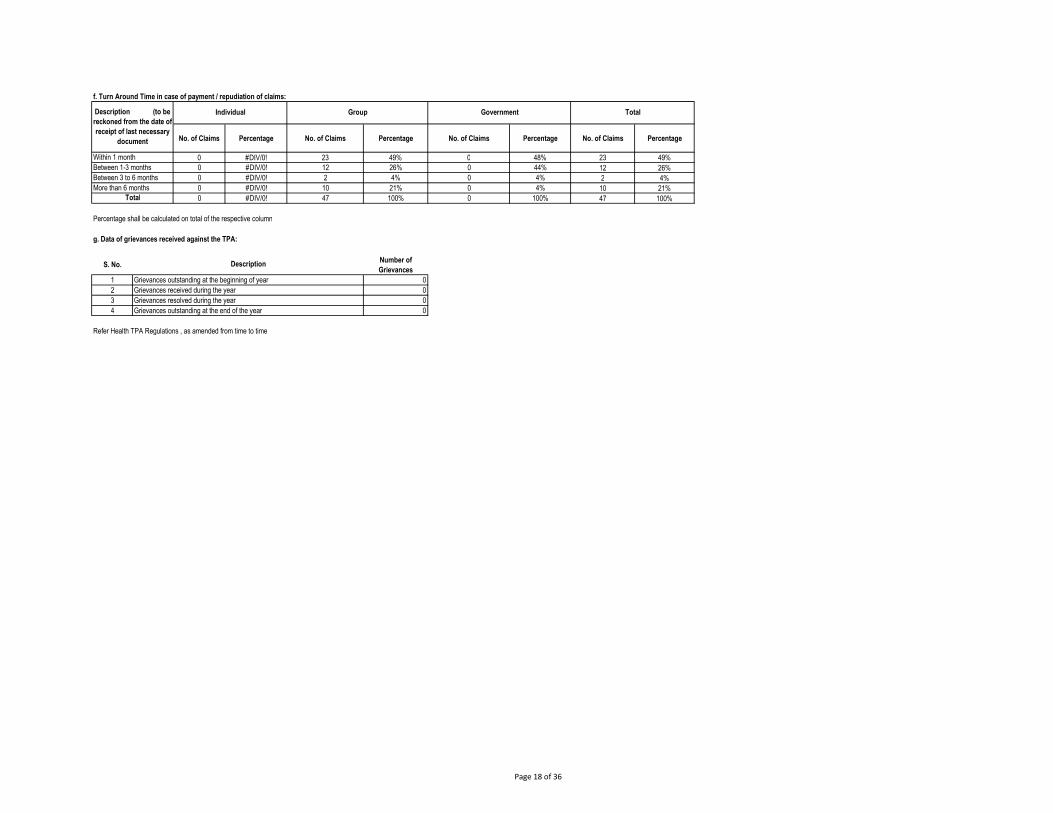
f. Turn Around Time in case of payment / repudiation of claims:
No. of Claims Percentage No. of Claims Percentage No. of Claims Percentage No. of Claims Percentage
0 #DIV/0! 23 49% 0 48% 23 49%0 #DIV/0! 12 26% 0 44% 12 26%0 #DIV/0! 2 4% 0 4% 2 4%0 #DIV/0! 10 21% 0 4% 10 21%0 #DIV/0! 47 100% 0 100% 47 100%
Percentage shall be calculated on total of the respective column
g. Data of grievances received against the TPA:
S. No.Number of Grievances
1 02 03 04 0
Refer Health TPA Regulations , as amended from time to time
Grievances outstanding at the beginning of yearGrievances received during the yearGrievances resolved during the yearGrievances outstanding at the end of the year
Within 1 monthBetween 1-3 monthsBetween 3 to 6 monthsMore than 6 months
Total
Description
TotalDescription (to be reckoned from the date of receipt of last necessary
document
Individual Group Government
Page 18 of 36
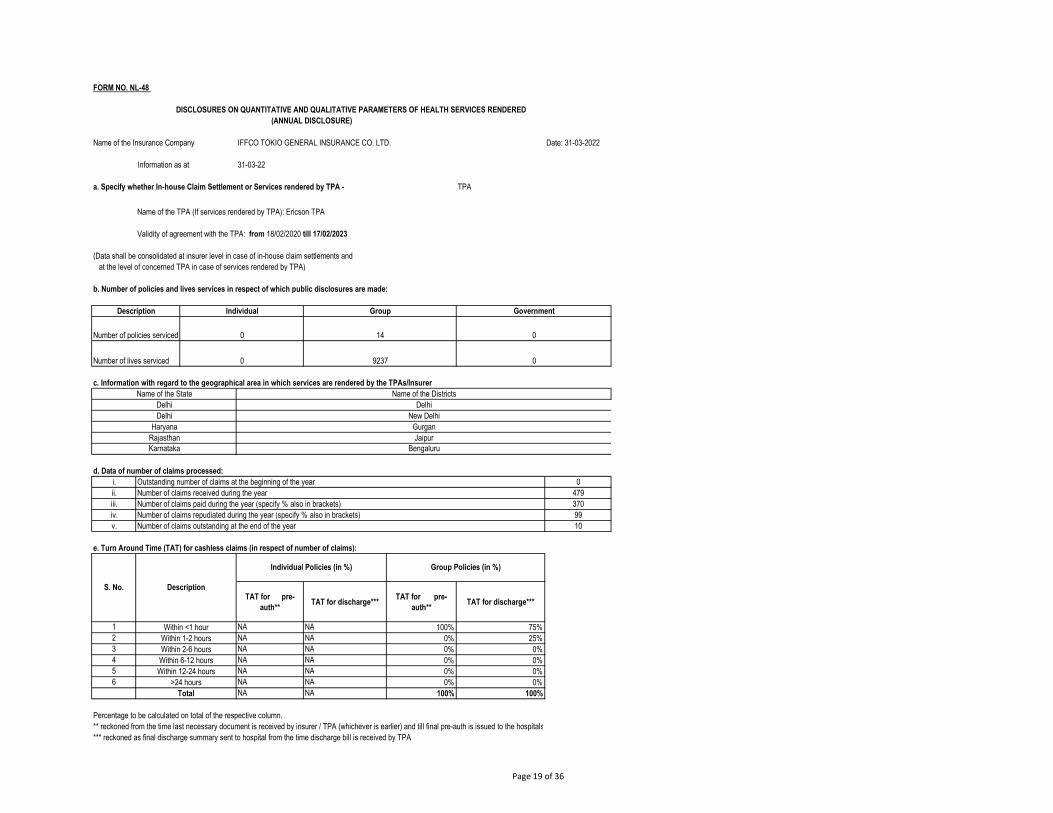
FORM NO. NL-48
Date: 31-03-2022
TPA
(Data shall be consolidated at insurer level in case of in-house claim settlements and at the level of concerned TPA in case of services rendered by TPA)
b. Number of policies and lives services in respect of which public disclosures are made:
c. Information with regard to the geographical area in which services are rendered by the TPAs/Insurer
d. Data of number of claims processed:i. 0ii. 479iii. 370iv. 99v. 10
e. Turn Around Time (TAT) for cashless claims (in respect of number of claims):
TAT for pre-auth**
TAT for discharge***TAT for pre-
auth**TAT for discharge***
1 NA NA 100% 75%2 NA NA 0% 25%3 NA NA 0% 0%4 NA NA 0% 0%5 NA NA 0% 0%6 NA NA 0% 0%
NA NA 100% 100%
Percentage to be calculated on total of the respective column.** reckoned from the time last necessary document is received by insurer / TPA (whichever is earlier) and till final pre-auth is issued to the hospitals*** reckoned as final discharge summary sent to hospital from the time discharge bill is received by TPA
DelhiDelhi
HaryanaRajasthan
DelhiNew Delhi
Within <1 hourWithin 1-2 hoursWithin 2-6 hoursWithin 6-12 hoursWithin 12-24 hours
>24 hoursTotal
Number of claims outstanding at the end of the year
S. No. Description
Individual Policies (in %) Group Policies (in %)
Number of claims received during the yearNumber of claims paid during the year (specify % also in brackets)Number of claims repudiated during the year (specify % also in brackets)
GurganJaipur
Number of policies serviced 0 14 0
Number of lives serviced 0 9237 0
Name of the State Name of the Districts
Karnataka Bengaluru
Outstanding number of claims at the beginning of the year
a. Specify whether In-house Claim Settlement or Services rendered by TPA -
Name of the TPA (If services rendered by TPA): Ericson TPA
Validity of agreement with the TPA: from 18/02/2020 till 17/02/2023
Description Individual Group Government
DISCLOSURES ON QUANTITATIVE AND QUALITATIVE PARAMETERS OF HEALTH SERVICES RENDERED (ANNUAL DISCLOSURE)
Name of the Insurance Company IFFCO TOKIO GENERAL INSURANCE CO. LTD.
Information as at 31-03-22
Page 19 of 36

f. Turn Around Time in case of payment / repudiation of claims:
No. of Claims Percentage No. of Claims Percentage No. of Claims Percentage No. of Claims Percentage
0 #DIV/0! 269 57% 0 #DIV/0! 269 57%0 #DIV/0! 89 19% 0 #DIV/0! 89 19%0 #DIV/0! 49 10% 0 #DIV/0! 49 10%0 #DIV/0! 62 13% 0 #DIV/0! 62 13%0 #DIV/0! 469 100% 0 #DIV/0! 469 100%
Percentage shall be calculated on total of the respective column
g. Data of grievances received against the TPA:
S. No.Number of Grievances
1 02 13 14 0
Refer Health TPA Regulations , as amended from time to time
Grievances outstanding at the beginning of yearGrievances received during the yearGrievances resolved during the yearGrievances outstanding at the end of the year
Within 1 monthBetween 1-3 monthsBetween 3 to 6 monthsMore than 6 months
Total
Description
TotalDescription (to be reckoned from the date of receipt of last necessary
document
Individual Group Government
Page 20 of 36
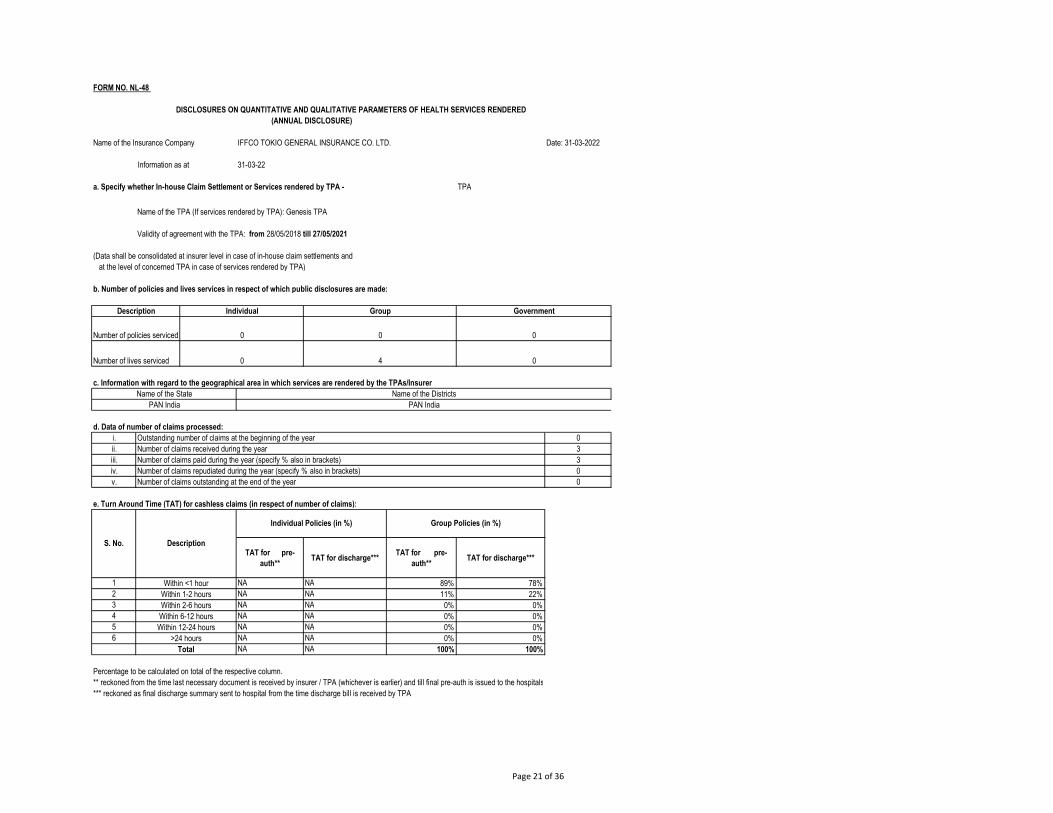
FORM NO. NL-48
Date: 31-03-2022
TPA
(Data shall be consolidated at insurer level in case of in-house claim settlements and at the level of concerned TPA in case of services rendered by TPA)
b. Number of policies and lives services in respect of which public disclosures are made:
c. Information with regard to the geographical area in which services are rendered by the TPAs/Insurer
d. Data of number of claims processed:i. 0ii. 3iii. 3iv. 0v. 0
e. Turn Around Time (TAT) for cashless claims (in respect of number of claims):
TAT for pre-auth**
TAT for discharge***TAT for pre-
auth**TAT for discharge***
1 NA NA 89% 78%2 NA NA 11% 22%3 NA NA 0% 0%4 NA NA 0% 0%5 NA NA 0% 0%6 NA NA 0% 0%
NA NA 100% 100%
Percentage to be calculated on total of the respective column.** reckoned from the time last necessary document is received by insurer / TPA (whichever is earlier) and till final pre-auth is issued to the hospitals*** reckoned as final discharge summary sent to hospital from the time discharge bill is received by TPA
Within <1 hourWithin 1-2 hoursWithin 2-6 hoursWithin 6-12 hoursWithin 12-24 hours
>24 hoursTotal
Number of claims repudiated during the year (specify % also in brackets)Number of claims outstanding at the end of the year
S. No. Description
Individual Policies (in %) Group Policies (in %)
Outstanding number of claims at the beginning of the yearNumber of claims received during the yearNumber of claims paid during the year (specify % also in brackets)
Name of the State Name of the DistrictsPAN India PAN India
Number of policies serviced 0 0 0
Number of lives serviced 0 4 0
a. Specify whether In-house Claim Settlement or Services rendered by TPA -
Name of the TPA (If services rendered by TPA): Genesis TPA
Validity of agreement with the TPA: from 28/05/2018 till 27/05/2021
Description Individual Group Government
DISCLOSURES ON QUANTITATIVE AND QUALITATIVE PARAMETERS OF HEALTH SERVICES RENDERED (ANNUAL DISCLOSURE)
Name of the Insurance Company IFFCO TOKIO GENERAL INSURANCE CO. LTD.
Information as at 31-03-22
Page 21 of 36

f. Turn Around Time in case of payment / repudiation of claims:
No. of Claims Percentage No. of Claims Percentage No. of Claims Percentage No. of Claims Percentage
0 #DIV/0! 2 91% 0 #DIV/0! 2 67%0 #DIV/0! 0 0% 0 #DIV/0! 0 0%0 #DIV/0! 0 0% 0 #DIV/0! 0 0%0 #DIV/0! 1 9% 0 #DIV/0! 1 33%0 #DIV/0! 3 100% 0 #DIV/0! 3 100%
Percentage shall be calculated on total of the respective column
g. Data of grievances received against the TPA:
S. No.Number of Grievances
1 02 03 04 0
Refer Health TPA Regulations , as amended from time to time
Grievances outstanding at the beginning of yearGrievances received during the yearGrievances resolved during the yearGrievances outstanding at the end of the year
Within 1 monthBetween 1-3 monthsBetween 3 to 6 monthsMore than 6 months
Total
Description
TotalDescription (to be reckoned from the date of receipt of last necessary
document
Individual Group Government
Page 22 of 36

FORM NO. NL-48
Date: 31-03-2022
TPA
(Data shall be consolidated at insurer level in case of in-house claim settlements and at the level of concerned TPA in case of services rendered by TPA)
b. Number of policies and lives services in respect of which public disclosures are made:
c. Information with regard to the geographical area in which services are rendered by the TPAs/Insurer
d. Data of number of claims processed:i. 0ii. 109iii. 106iv. 3v. 0
e. Turn Around Time (TAT) for cashless claims (in respect of number of claims):
TAT for pre-auth**
TAT for discharge***TAT for pre-
auth**TAT for discharge***
1 NA NA 50% 0%2 NA NA 50% 50%3 NA NA 0% 50%4 NA NA 0% 0%5 NA NA 0% 0%6 NA NA 0% 0%
NA NA 100% 100%
Percentage to be calculated on total of the respective column.** reckoned from the time last necessary document is received by insurer / TPA (whichever is earlier) and till final pre-auth is issued to the hospitals*** reckoned as final discharge summary sent to hospital from the time discharge bill is received by TPA
Within <1 hourWithin 1-2 hoursWithin 2-6 hoursWithin 6-12 hoursWithin 12-24 hours
>24 hoursTotal
Number of claims outstanding at the end of the year
S. No. Description
Individual Policies (in %) Group Policies (in %)
Number of claims received during the yearNumber of claims paid during the year (specify % also in brackets)Number of claims repudiated during the year (specify % also in brackets)
Number of policies serviced 0 1 0
Number of lives serviced 0 1889 0
Name of the State Name of the DistrictsPAN India PAN India
Outstanding number of claims at the beginning of the year
a. Specify whether In-house Claim Settlement or Services rendered by TPA -
Name of the TPA (If services rendered by TPA): Anmol Medicare Insurance (TPA) Ltd.
Validity of agreement with the TPA: from 01/04/2021 till 31/03/2022
Description Individual Group Government
DISCLOSURES ON QUANTITATIVE AND QUALITATIVE PARAMETERS OF HEALTH SERVICES RENDERED (ANNUAL DISCLOSURE)
Name of the Insurance Company IFFCO TOKIO GENERAL INSURANCE CO. LTD.
Information as at 31-03-22
Page 23 of 36

f. Turn Around Time in case of payment / repudiation of claims:
No. of Claims Percentage No. of Claims Percentage No. of Claims Percentage No. of Claims Percentage
0 #DIV/0! 84 77% 0 #DIV/0! 84 77%0 #DIV/0! 24 22% 0 #DIV/0! 24 22%0 #DIV/0! 1 1% 0 #DIV/0! 1 1%0 #DIV/0! 0 0% 0 #DIV/0! 0 0%0 #DIV/0! 109 100% 0 #DIV/0! 109 100%
Percentage shall be calculated on total of the respective column
g. Data of grievances received against the TPA:
S. No.Number of Grievances
1 02 03 04 0
Refer Health TPA Regulations , as amended from time to time
Grievances outstanding at the beginning of yearGrievances received during the yearGrievances resolved during the yearGrievances outstanding at the end of the year
Within 1 monthBetween 1-3 monthsBetween 3 to 6 monthsMore than 6 months
Total
Description
TotalDescription (to be reckoned from the date of receipt of last necessary
document
Individual Group Government
Page 24 of 36

FORM NO. NL-48
Date: 31-03-2022
TPA
(Data shall be consolidated at insurer level in case of in-house claim settlements and at the level of concerned TPA in case of services rendered by TPA)
b. Number of policies and lives services in respect of which public disclosures are made:
c. Information with regard to the geographical area in which services are rendered by the TPAs/Insurer
d. Data of number of claims processed:i. 0ii. 19iii. 18iv. 0v. 1
e. Turn Around Time (TAT) for cashless claims (in respect of number of claims):
TAT for pre-auth**
TAT for discharge***TAT for pre-
auth**TAT for discharge***
1 NA NA 100% 100%2 NA NA 0% 0%3 NA NA 0% 0%4 NA NA 0% 0%5 NA NA 0% 0%6 NA NA 0% 0%
NA NA 100% 100%
Percentage to be calculated on total of the respective column.** reckoned from the time last necessary document is received by insurer / TPA (whichever is earlier) and till final pre-auth is issued to the hospitals*** reckoned as final discharge summary sent to hospital from the time discharge bill is received by TPA
Within <1 hourWithin 1-2 hoursWithin 2-6 hoursWithin 6-12 hoursWithin 12-24 hours
>24 hoursTotal
Number of claims outstanding at the end of the year
S. No. Description
Individual Policies (in %) Group Policies (in %)
Number of claims received during the yearNumber of claims paid during the year (specify % also in brackets)Number of claims repudiated during the year (specify % also in brackets)
Number of policies serviced 0 4 0
Number of lives serviced 0 920 0
Name of the State Name of the DistrictsPAN India PAN India
Outstanding number of claims at the beginning of the year
a. Specify whether In-house Claim Settlement or Services rendered by TPA -
Name of the TPA (If services rendered by TPA): Safeway Insurance (TPA) Ltd.
Validity of agreement with the TPA: from 25/02/2020 till 24/02/2023
Description Individual Group Government
DISCLOSURES ON QUANTITATIVE AND QUALITATIVE PARAMETERS OF HEALTH SERVICES RENDERED (ANNUAL DISCLOSURE)
Name of the Insurance Company IFFCO TOKIO GENERAL INSURANCE CO. LTD.
Information as at 31-03-22
Page 25 of 36

f. Turn Around Time in case of payment / repudiation of claims:
No. of Claims Percentage No. of Claims Percentage No. of Claims Percentage No. of Claims Percentage
0 #DIV/0! 18 100% 0 #DIV/0! 18 #DIV/0!0 #DIV/0! 0 0% 0 #DIV/0! 0 #DIV/0!0 #DIV/0! 0 0% 0 #DIV/0! 0 #DIV/0!0 #DIV/0! 0 0% 0 #DIV/0! 0 #DIV/0!0 #DIV/0! 0 100% 0 #DIV/0! 0 #DIV/0!
Percentage shall be calculated on total of the respective column
g. Data of grievances received against the TPA:
S. No.Number of Grievances
1 02 03 04 0
Refer Health TPA Regulations , as amended from time to time
Grievances outstanding at the beginning of yearGrievances received during the yearGrievances resolved during the yearGrievances outstanding at the end of the year
Within 1 monthBetween 1-3 monthsBetween 3 to 6 monthsMore than 6 months
Total
Description
TotalDescription (to be reckoned from the date of receipt of last necessary
document
Individual Group Government
Page 26 of 36

FORM NO. NL-48
Date: 31-03-2022
TPA
(Data shall be consolidated at insurer level in case of in-house claim settlements and at the level of concerned TPA in case of services rendered by TPA)
b. Number of policies and lives services in respect of which public disclosures are made:
c. Information with regard to the geographical area in which services are rendered by the TPAs/Insurer
d. Data of number of claims processed:i. 0ii. 45iii. 45iv. 0v. 0
e. Turn Around Time (TAT) for cashless claims (in respect of number of claims):
TAT for pre-auth**
TAT for discharge***TAT for pre-
auth**TAT for discharge***
1 NA NA 83% 92%2 NA NA 17% 8%3 NA NA 0% 0%4 NA NA 0% 0%5 NA NA 0% 0%6 NA NA 0% 0%
NA NA 100% 100%
Percentage to be calculated on total of the respective column.** reckoned from the time last necessary document is received by insurer / TPA (whichever is earlier) and till final pre-auth is issued to the hospitals*** reckoned as final discharge summary sent to hospital from the time discharge bill is received by TPA
Within <1 hourWithin 1-2 hoursWithin 2-6 hoursWithin 6-12 hoursWithin 12-24 hours
>24 hoursTotal
Number of claims outstanding at the end of the year
S. No. Description
Individual Policies (in %) Group Policies (in %)
Number of claims received during the yearNumber of claims paid during the year (specify % also in brackets)Number of claims repudiated during the year (specify % also in brackets)
Number of policies serviced 0 0 0
Number of lives serviced 0 561 0
Name of the State Name of the DistrictsPAN India PAN India
Outstanding number of claims at the beginning of the year
a. Specify whether In-house Claim Settlement or Services rendered by TPA -
Name of the TPA (If services rendered by TPA): Heritage Health Insurance
Validity of agreement with the TPA: from 25/02/2018 till 19/09/2021
Description Individual Group Government
DISCLOSURES ON QUANTITATIVE AND QUALITATIVE PARAMETERS OF HEALTH SERVICES RENDERED (ANNUAL DISCLOSURE)
Name of the Insurance Company IFFCO TOKIO GENERAL INSURANCE CO. LTD.
Information as at 31-03-22
Page 27 of 36

f. Turn Around Time in case of payment / repudiation of claims:
No. of Claims Percentage No. of Claims Percentage No. of Claims Percentage No. of Claims Percentage
0 #DIV/0! 21 47% 0 #DIV/0! 21 47%0 #DIV/0! 12 27% 0 #DIV/0! 12 27%0 #DIV/0! 4 9% 0 #DIV/0! 4 9%0 #DIV/0! 8 18% 0 #DIV/0! 8 18%0 #DIV/0! 45 100% 0 #DIV/0! 45 100%
Percentage shall be calculated on total of the respective column
g. Data of grievances received against the TPA:
S. No.Number of Grievances
1 02 03 04 0
Refer Health TPA Regulations , as amended from time to time
Grievances outstanding at the beginning of yearGrievances received during the yearGrievances resolved during the yearGrievances outstanding at the end of the year
Within 1 monthBetween 1-3 monthsBetween 3 to 6 monthsMore than 6 months
Total
Description
TotalDescription (to be reckoned from the date of receipt of last necessary
document
Individual Group Government
Page 28 of 36
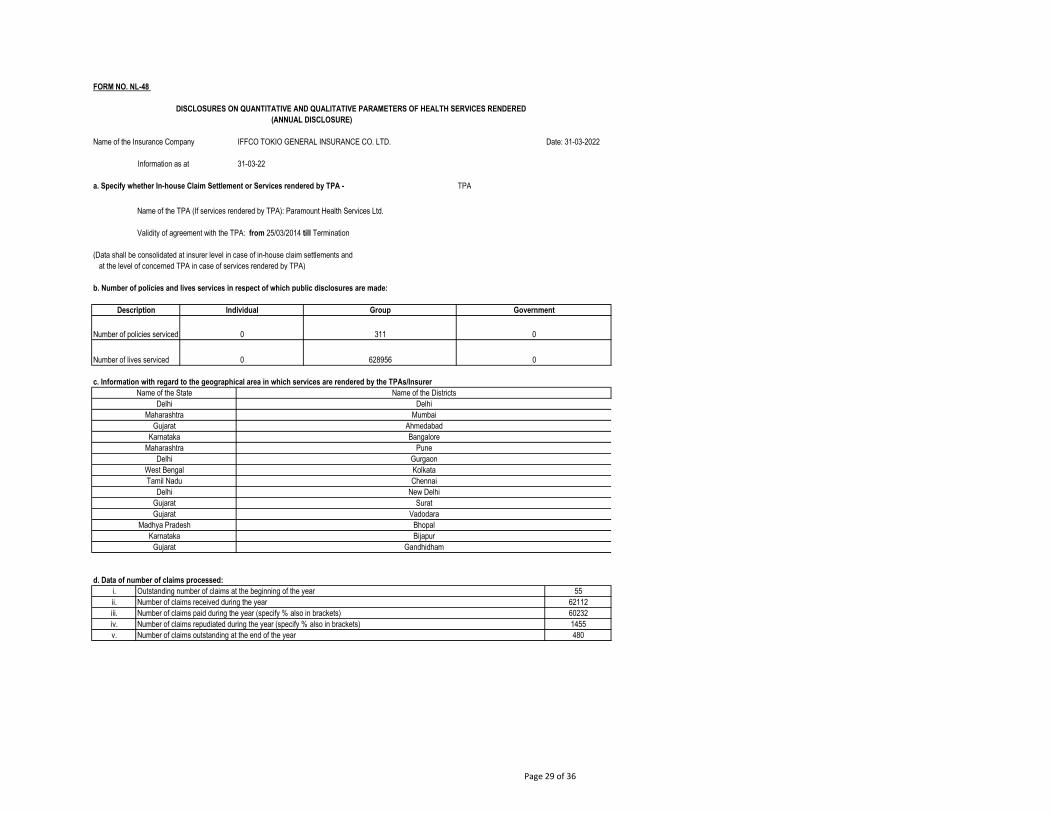
FORM NO. NL-48
Date: 31-03-2022
TPA
(Data shall be consolidated at insurer level in case of in-house claim settlements and at the level of concerned TPA in case of services rendered by TPA)
b. Number of policies and lives services in respect of which public disclosures are made:
c. Information with regard to the geographical area in which services are rendered by the TPAs/Insurer
d. Data of number of claims processed:i. 55ii. 62112iii. 60232iv. 1455v. 480
Delhi DelhiMaharashtra Mumbai
Gujarat Ahmedabad
Number of claims outstanding at the end of the year
Number of claims received during the yearNumber of claims paid during the year (specify % also in brackets)Number of claims repudiated during the year (specify % also in brackets)
Name of the State Name of the Districts
Gujarat Gandhidham
Outstanding number of claims at the beginning of the year
Delhi GurgaonWest Bengal KolkataTamil Nadu Chennai
Madhya Pradesh BhopalKarnataka Bijapur
Delhi
Karnataka BangaloreMaharashtra Pune
New DelhiGujarat SuratGujarat Vadodara
Number of policies serviced 0 311 0
Number of lives serviced 0 628956 0
a. Specify whether In-house Claim Settlement or Services rendered by TPA -
Name of the TPA (If services rendered by TPA): Paramount Health Services Ltd.
Validity of agreement with the TPA: from 25/03/2014 till Termination
Description Individual Group Government
DISCLOSURES ON QUANTITATIVE AND QUALITATIVE PARAMETERS OF HEALTH SERVICES RENDERED (ANNUAL DISCLOSURE)
Name of the Insurance Company IFFCO TOKIO GENERAL INSURANCE CO. LTD.
Information as at 31-03-22
Page 29 of 36

e. Turn Around Time (TAT) for cashless claims (in respect of number of claims):
TAT for pre-auth**
TAT for discharge***TAT for pre-
auth**TAT for discharge***
1 NA NA 73% 61%2 NA NA 21% 29%3 NA NA 5% 9%4 NA NA 0% 0%5 NA NA 0% 0%6 NA NA 0% 0%
NA NA 100% 100%
Percentage to be calculated on total of the respective column.** reckoned from the time last necessary document is received by insurer / TPA (whichever is earlier) and till final pre-auth is issued to the hospitals*** reckoned as final discharge summary sent to hospital from the time discharge bill is received by TPA
f. Turn Around Time in case of payment / repudiation of claims:
No. of Claims Percentage No. of Claims Percentage No. of Claims Percentage No. of Claims Percentage
0 #DIV/0! 52299 88% 1 0% 52300 85%0 #DIV/0! 5144 9% 0 0% 5144 8%0 #DIV/0! 749 1% 0 0% 749 1%0 #DIV/0! 1406 2% 2088 100% 3494 6%0 #DIV/0! 59598 100% 2089 100% 61687 100%
Percentage shall be calculated on total of the respective column
g. Data of grievances received against the TPA:
S. No.Number of Grievances
1 02 273 274 0
Refer Health TPA Regulations , as amended from time to time
Grievances outstanding at the beginning of yearGrievances received during the yearGrievances resolved during the yearGrievances outstanding at the end of the year
Within 1 monthBetween 1-3 monthsBetween 3 to 6 monthsMore than 6 months
Total
Description
Total
Within <1 hourWithin 1-2 hoursWithin 2-6 hoursWithin 6-12 hoursWithin 12-24 hours
>24 hoursTotal
Description (to be reckoned from the date of receipt of last necessary
document
Individual Group Government
S. No. Description
Individual Policies (in %) Group Policies (in %)
Page 30 of 36
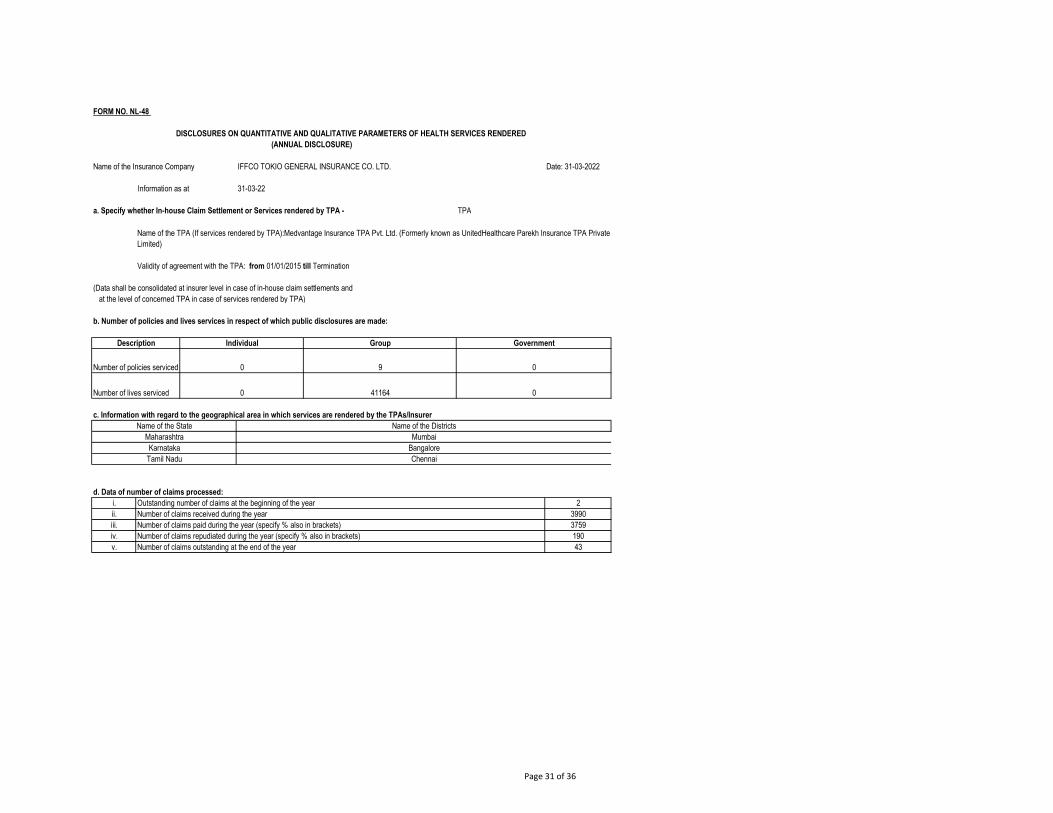
FORM NO. NL-48
Date: 31-03-2022
TPA
(Data shall be consolidated at insurer level in case of in-house claim settlements and at the level of concerned TPA in case of services rendered by TPA)
b. Number of policies and lives services in respect of which public disclosures are made:
c. Information with regard to the geographical area in which services are rendered by the TPAs/Insurer
d. Data of number of claims processed:i. 2ii. 3990iii. 3759iv. 190v. 43
Name of the TPA (If services rendered by TPA):Medvantage Insurance TPA Pvt. Ltd. (Formerly known as UnitedHealthcare Parekh Insurance TPA Private Limited)
Number of claims repudiated during the year (specify % also in brackets)Number of claims outstanding at the end of the year
Outstanding number of claims at the beginning of the yearNumber of claims received during the yearNumber of claims paid during the year (specify % also in brackets)
Tamil Nadu ChennaiKarnataka Bangalore
Name of the State Name of the DistrictsMaharashtra Mumbai
Number of policies serviced 0 9 0
Number of lives serviced 0 41164 0
Government
DISCLOSURES ON QUANTITATIVE AND QUALITATIVE PARAMETERS OF HEALTH SERVICES RENDERED (ANNUAL DISCLOSURE)
Name of the Insurance Company IFFCO TOKIO GENERAL INSURANCE CO. LTD.
Information as at 31-03-22
a. Specify whether In-house Claim Settlement or Services rendered by TPA -
Validity of agreement with the TPA: from 01/01/2015 till Termination
Description Individual Group
Page 31 of 36
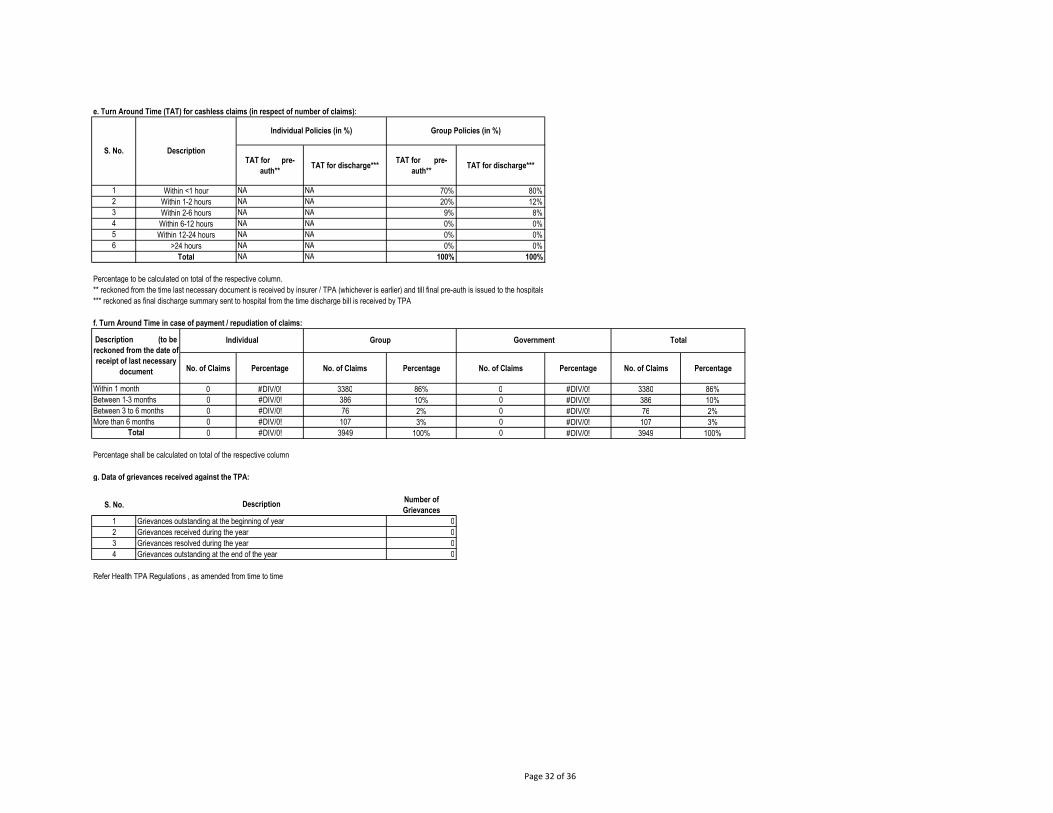
e. Turn Around Time (TAT) for cashless claims (in respect of number of claims):
TAT for pre-auth**
TAT for discharge***TAT for pre-
auth**TAT for discharge***
1 NA NA 70% 80%2 NA NA 20% 12%3 NA NA 9% 8%4 NA NA 0% 0%5 NA NA 0% 0%6 NA NA 0% 0%
NA NA 100% 100%
Percentage to be calculated on total of the respective column.** reckoned from the time last necessary document is received by insurer / TPA (whichever is earlier) and till final pre-auth is issued to the hospitals*** reckoned as final discharge summary sent to hospital from the time discharge bill is received by TPA
f. Turn Around Time in case of payment / repudiation of claims:
No. of Claims Percentage No. of Claims Percentage No. of Claims Percentage No. of Claims Percentage
0 #DIV/0! 3380 86% 0 #DIV/0! 3380 86%0 #DIV/0! 386 10% 0 #DIV/0! 386 10%0 #DIV/0! 76 2% 0 #DIV/0! 76 2%0 #DIV/0! 107 3% 0 #DIV/0! 107 3%0 #DIV/0! 3949 100% 0 #DIV/0! 3949 100%
Percentage shall be calculated on total of the respective column
g. Data of grievances received against the TPA:
S. No.Number of Grievances
1 02 03 04 0
Refer Health TPA Regulations , as amended from time to time
Grievances outstanding at the beginning of yearGrievances received during the yearGrievances resolved during the yearGrievances outstanding at the end of the year
Within 1 monthBetween 1-3 monthsBetween 3 to 6 monthsMore than 6 months
Total
Description
Total
Description (to be reckoned from the date of receipt of last necessary
document
Individual Group Government Total
Within <1 hourWithin 1-2 hoursWithin 2-6 hoursWithin 6-12 hoursWithin 12-24 hours
>24 hours
S. No. Description
Individual Policies (in %) Group Policies (in %)
Page 32 of 36
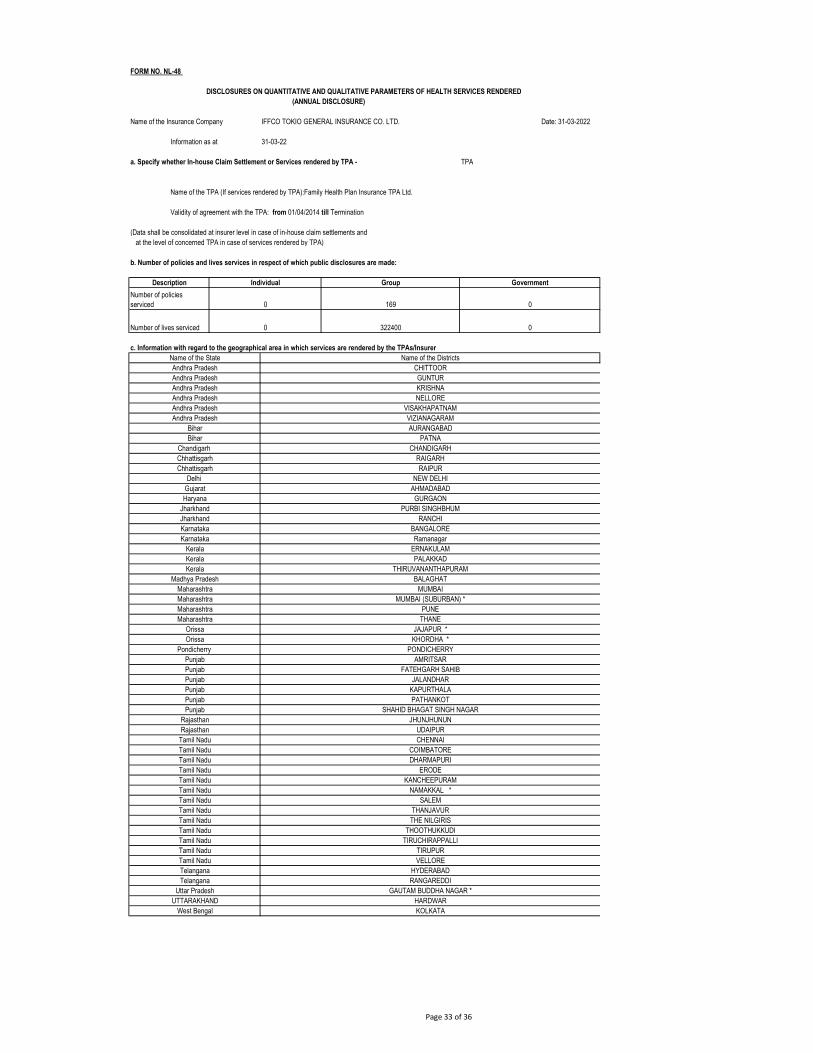
FORM NO. NL-48
Date: 31-03-2022
TPA
(Data shall be consolidated at insurer level in case of in-house claim settlements and at the level of concerned TPA in case of services rendered by TPA)
b. Number of policies and lives services in respect of which public disclosures are made:
c. Information with regard to the geographical area in which services are rendered by the TPAs/Insurer
Uttar Pradesh GAUTAM BUDDHA NAGAR *UTTARAKHAND HARDWAR
West Bengal KOLKATA
Tamil Nadu VELLORETelangana HYDERABADTelangana RANGAREDDI
Tamil Nadu THOOTHUKKUDITamil Nadu TIRUCHIRAPPALLITamil Nadu TIRUPUR
Tamil Nadu SALEMTamil Nadu THANJAVURTamil Nadu THE NILGIRIS
Tamil Nadu ERODETamil Nadu KANCHEEPURAMTamil Nadu NAMAKKAL *
Tamil Nadu CHENNAITamil Nadu COIMBATORETamil Nadu DHARMAPURI
Punjab SHAHID BHAGAT SINGH NAGARRajasthan JHUNJHUNUNRajasthan UDAIPUR
Punjab JALANDHARPunjab KAPURTHALAPunjab PATHANKOT
Pondicherry PONDICHERRYPunjab AMRITSARPunjab FATEHGARH SAHIB
Maharashtra THANEOrissa JAJAPUR *Orissa KHORDHA *
Maharashtra MUMBAIMaharashtra MUMBAI (SUBURBAN) *Maharashtra PUNE
Kerala PALAKKADKerala THIRUVANANTHAPURAM
Madhya Pradesh BALAGHAT
Karnataka RamanagarKerala ERNAKULAM
Haryana GURGAONJharkhand PURBI SINGHBHUMJharkhand RANCHI
Andhra Pradesh KRISHNA
Andhra Pradesh VISAKHAPATNAMAndhra Pradesh VIZIANAGARAM
Bihar AURANGABAD
Chhattisgarh
Andhra Pradesh NELLORE
RAIPURDelhi NEW DELHI
Gujarat AHMADABAD
Bihar PATNAChandigarh CHANDIGARHChhattisgarh RAIGARH
Karnataka BANGALORE
Name of the State Name of the DistrictsAndhra Pradesh CHITTOORAndhra Pradesh GUNTUR
Number of policies serviced 0 169 0
Number of lives serviced 0 322400 0
a. Specify whether In-house Claim Settlement or Services rendered by TPA -
Name of the TPA (If services rendered by TPA):Family Health Plan Insurance TPA Ltd.
Validity of agreement with the TPA: from 01/04/2014 till Termination
Description Individual Group Government
DISCLOSURES ON QUANTITATIVE AND QUALITATIVE PARAMETERS OF HEALTH SERVICES RENDERED (ANNUAL DISCLOSURE)
Name of the Insurance Company IFFCO TOKIO GENERAL INSURANCE CO. LTD.
Information as at 31-03-22
Page 33 of 36
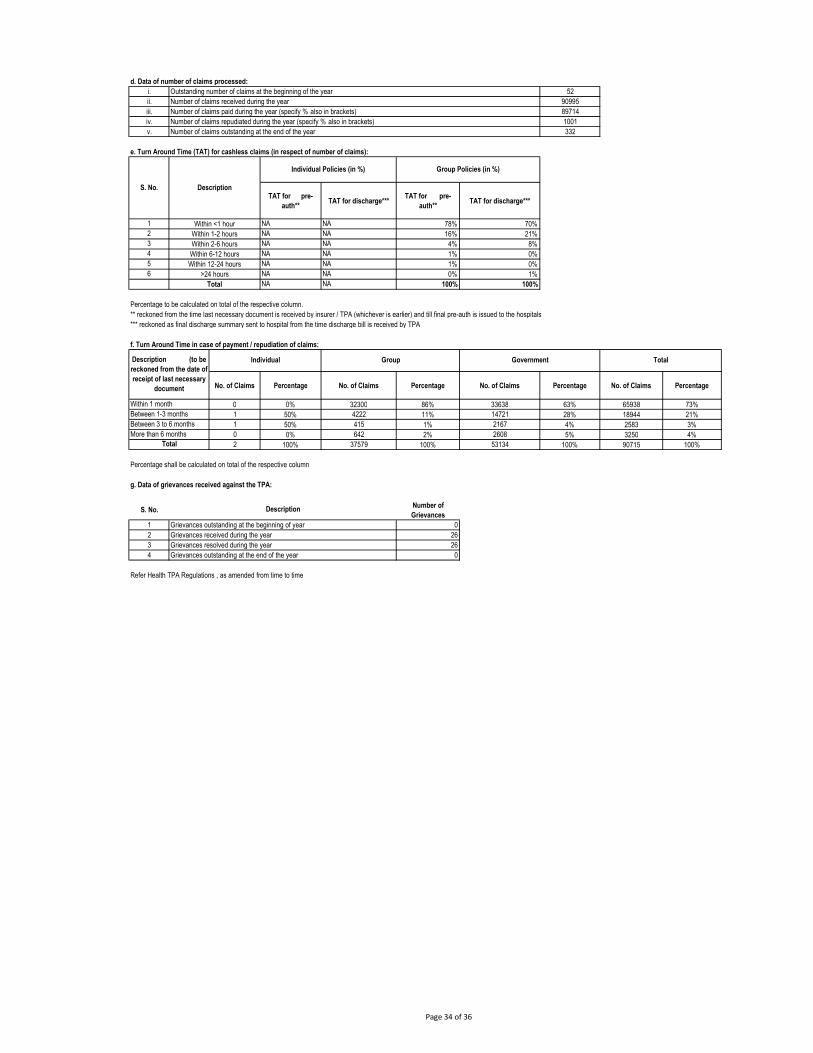
d. Data of number of claims processed:i. 52ii. 90995iii. 89714iv. 1001v. 332
e. Turn Around Time (TAT) for cashless claims (in respect of number of claims):
TAT for pre-auth**
TAT for discharge***TAT for pre-
auth**TAT for discharge***
1 NA NA 78% 70%2 NA NA 16% 21%3 NA NA 4% 8%4 NA NA 1% 0%5 NA NA 1% 0%6 NA NA 0% 1%
NA NA 100% 100%
Percentage to be calculated on total of the respective column.** reckoned from the time last necessary document is received by insurer / TPA (whichever is earlier) and till final pre-auth is issued to the hospitals*** reckoned as final discharge summary sent to hospital from the time discharge bill is received by TPA
f. Turn Around Time in case of payment / repudiation of claims:
No. of Claims Percentage No. of Claims Percentage No. of Claims Percentage No. of Claims Percentage
0 0% 32300 86% 33638 63% 65938 73%1 50% 4222 11% 14721 28% 18944 21%1 50% 415 1% 2167 4% 2583 3%0 0% 642 2% 2608 5% 3250 4%2 100% 37579 100% 53134 100% 90715 100%
Percentage shall be calculated on total of the respective column
g. Data of grievances received against the TPA:
S. No.Number of Grievances
1 02 263 264 0
Refer Health TPA Regulations , as amended from time to time
Grievances received during the yearGrievances outstanding at the beginning of year
Description
Within 2-6 hoursWithin 6-12 hours
Within 12-24 hours>24 hours
Total
S. No. Description
Individual Policies (in %) Group Policies (in %)
Within <1 hourWithin 1-2 hours
Number of claims paid during the year (specify % also in brackets)
Grievances outstanding at the end of the yearGrievances resolved during the year
More than 6 monthsTotal
Group Government Total
Within 1 monthBetween 1-3 monthsBetween 3 to 6 months
Description (to be reckoned from the date of receipt of last necessary
document
Individual
Number of claims repudiated during the year (specify % also in brackets)Number of claims outstanding at the end of the year
Outstanding number of claims at the beginning of the yearNumber of claims received during the year
Page 34 of 36
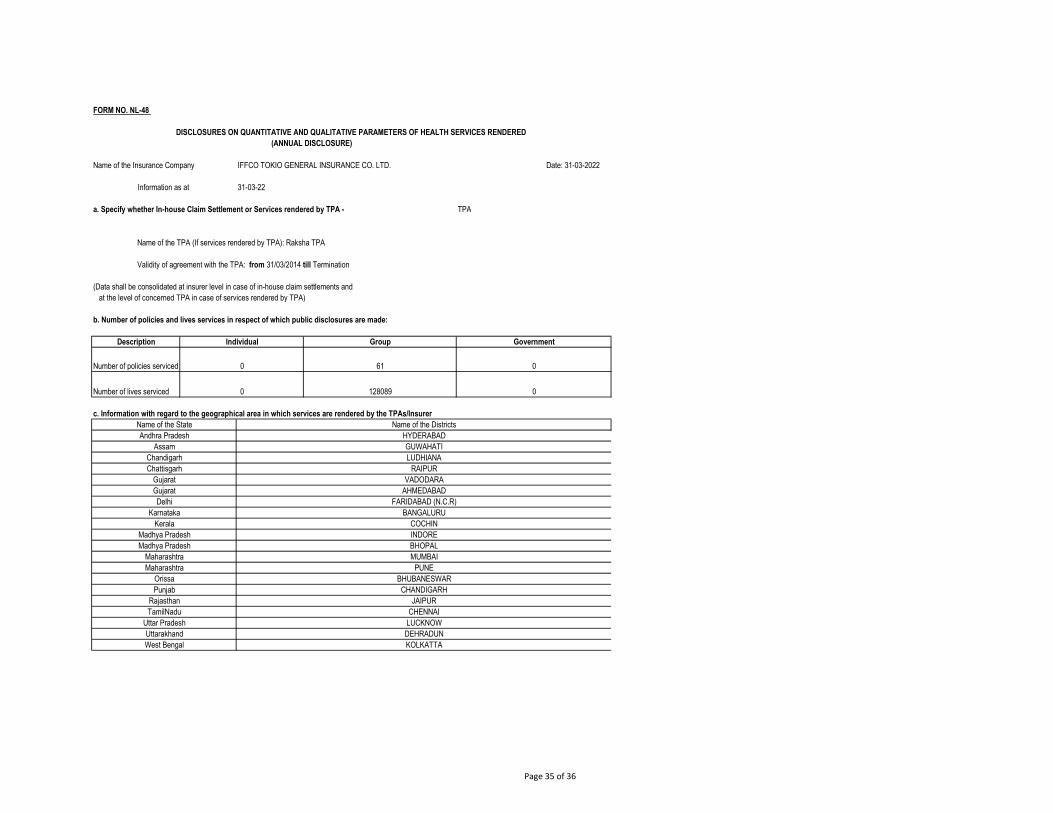
FORM NO. NL-48
Date: 31-03-2022
TPA
(Data shall be consolidated at insurer level in case of in-house claim settlements and at the level of concerned TPA in case of services rendered by TPA)
b. Number of policies and lives services in respect of which public disclosures are made:
c. Information with regard to the geographical area in which services are rendered by the TPAs/Insurer
Uttar Pradesh LUCKNOWUttarakhand DEHRADUNWest Bengal KOLKATTA
Punjab CHANDIGARHRajasthan JAIPURTamilNadu CHENNAI
Maharashtra MUMBAIMaharashtra PUNE
Orissa BHUBANESWAR
Kerala COCHINMadhya Pradesh INDOREMadhya Pradesh BHOPAL
Gujarat AHMEDABADDelhi FARIDABAD (N.C.R)
Karnataka BANGALURU
Chandigarh LUDHIANAChattisgarh RAIPUR
Gujarat VADODARA
Name of the State Name of the DistrictsAndhra Pradesh HYDERABAD
Assam GUWAHATI
Number of policies serviced 0 61 0
Number of lives serviced 0 128089 0
a. Specify whether In-house Claim Settlement or Services rendered by TPA -
Name of the TPA (If services rendered by TPA): Raksha TPA
Validity of agreement with the TPA: from 31/03/2014 till Termination
Description Individual Group Government
DISCLOSURES ON QUANTITATIVE AND QUALITATIVE PARAMETERS OF HEALTH SERVICES RENDERED (ANNUAL DISCLOSURE)
Name of the Insurance Company IFFCO TOKIO GENERAL INSURANCE CO. LTD.
Information as at 31-03-22
Page 35 of 36
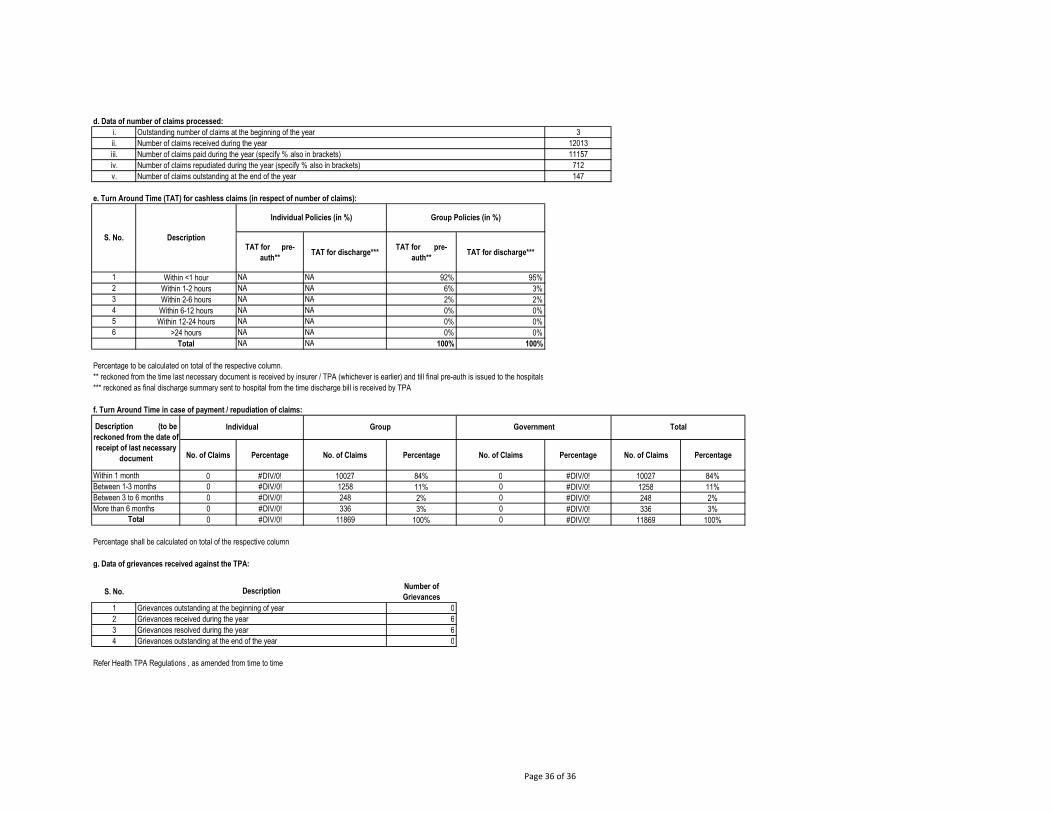
d. Data of number of claims processed:i. 3ii. 12013iii. 11157iv. 712v. 147
e. Turn Around Time (TAT) for cashless claims (in respect of number of claims):
TAT for pre-auth**
TAT for discharge***TAT for pre-
auth**TAT for discharge***
1 NA NA 92% 95%2 NA NA 6% 3%3 NA NA 2% 2%4 NA NA 0% 0%5 NA NA 0% 0%6 NA NA 0% 0%
NA NA 100% 100%
Percentage to be calculated on total of the respective column.** reckoned from the time last necessary document is received by insurer / TPA (whichever is earlier) and till final pre-auth is issued to the hospitals*** reckoned as final discharge summary sent to hospital from the time discharge bill is received by TPA
f. Turn Around Time in case of payment / repudiation of claims:
No. of Claims Percentage No. of Claims Percentage No. of Claims Percentage No. of Claims Percentage
0 #DIV/0! 10027 84% 0 #DIV/0! 10027 84%0 #DIV/0! 1258 11% 0 #DIV/0! 1258 11%0 #DIV/0! 248 2% 0 #DIV/0! 248 2%0 #DIV/0! 336 3% 0 #DIV/0! 336 3%0 #DIV/0! 11869 100% 0 #DIV/0! 11869 100%
Percentage shall be calculated on total of the respective column
g. Data of grievances received against the TPA:
S. No.Number of Grievances
1 02 63 64 0
Refer Health TPA Regulations , as amended from time to time
Grievances outstanding at the beginning of yearGrievances received during the yearGrievances resolved during the yearGrievances outstanding at the end of the year
Within 1 monthBetween 1-3 monthsBetween 3 to 6 monthsMore than 6 months
Total
Description
Total
Within <1 hourWithin 1-2 hoursWithin 2-6 hoursWithin 6-12 hoursWithin 12-24 hours
>24 hoursTotal
Description (to be reckoned from the date of receipt of last necessary
document
Individual Group Government
Number of claims outstanding at the end of the year
S. No. Description
Individual Policies (in %) Group Policies (in %)
Number of claims received during the yearNumber of claims paid during the year (specify % also in brackets)Number of claims repudiated during the year (specify % also in brackets)
Outstanding number of claims at the beginning of the year
Page 36 of 36