The maintenance costs of marine natural capital: A case study from the initial assessment of the...
11
The maintenance costs of marine natural capital: A case study from the initial assessment of the Marine Strategy Framework Directive in France Harold Levrel a,n , Céline Jacob a , Denis Bailly b , Mahe Charles d , Olivier Guyader a , Schéhérazade Aoubid e , Adeline Bas b , Alexia Cujus e , Marjolaine Frésard c , Sophie Girard a , Julien Hay c , Yann Laurans f , Jérôme Paillet d , José A. Pérez Agúndez a , Rémi Mongruel a a IFREMER, UMR AMURE, Marine Economics Unit, Centre de Brest, ZI Pointe du Diable, 29280 Plouzané, France b Université de Brest, UMR AMURE, IFREMER, Centre de Brest, ZI Pointe du Diable, 29280 Plouzané, France c Université de Brest, UMR AMURE, 29334 Quimper Cedex, France d Marine Protected Area Agency, 16 Quai de la Douane CS 42932, 29229 Brest Cedex 2, 29200 Brest, France e ECOWHAT, 99 Rue Duhesme, F-75018 Paris, France f Institut du Développement Durable et des Relations Internationales, 41, rue du Four 75006 Paris, France article info Article history: Received 5 August 2013 Received in revised form 18 March 2014 Accepted 19 March 2014 Keywords: Maintenance cost Marine ecosystems Marine Strategy Framework Directive Economic analysis abstract There are two ways of assessing the costs of environmental degradation: as the costs associated with the loss of benefits resulting from the degradation of natural capital, and as the maintenance costs required to compensate for the actual or potential degradation of natural capital. The first of these methods is based on the Total Economic Value (TEV) of benefits forgone because of the depletion of ecosystem services delivered by marine biodiversity. The second method is based on the costs required to maintain a good state of marine biodiversity, one which makes it possible to deliver ecosystem services. This paper gives an illustration of this second approach. It details how these maintenance costs have been calculated in the initial assessment of the Marine Strategy Framework Directive (MSFD) in France. It addresses nine problem areas – corresponding to nine sources of environmental degradation – from non-native invasive species to oil spills. It gives a total figure for these degradation costs (around 2 billion Euros). The results are compared with those of other Member States who have taken similar approaches in the context of the MSFD. One key conclusion is that it is not really possible to make meaningful comparisons at this stage, since the methods of data collection and the nature of the costs are very different. The need to develop such assessments in a standardised way is noted. & 2014 Elsevier Ltd. All rights reserved. 1. Introduction This paper discusses the assessment of the cost of environ- mental degradation, in the policy context of the Marine Strategy Framework Directive (MSFD). The MSFD represents the environ- mental component of the European integrated marine approach (2008/56/EC) and establishes a legislative framework for commu- nity action in the area of marine environmental policy. The ultimate aim is to design a programme of environmental measures to achieve a good environmental status (GES) by 2020. The MSFD is founded on an initial assessment of the current environmental status of national marine waters and a socio-economic analysis of human activities in these waters (carried out in 2012). The initial socio-economic assessment includes an analysis of the costs of degradation of the marine environment. There are two ways of assessing the costs of environmental degradation [1]: as the costs associated with the loss of benefits resulting from the degradation of natural capital [2,3], and as the maintenance costs required to compensate for the actual or potential degradation of natural capital [4,5]. The first method for assessing the costs of environmental degradation is based on the Total Economic Value (TEV) of benefits forgone because of the depletion of ecosystem services delivered by marine biodiversity. The second method is based on the costs required to maintain a good state of marine biodiversity which makes it possible to deliver ecosystem services. The expert group of economists charged with assessing the cost of degradation of the marine environment in France recognised the limits and difficulties of capturing the TEV of the environmental Contents lists available at ScienceDirect journal homepage: www.elsevier.com/locate/marpol Marine Policy http://dx.doi.org/10.1016/j.marpol.2014.03.028 0308-597X/& 2014 Elsevier Ltd. All rights reserved. n Corresponding author. E-mail address: [email protected] (H. Levrel). Marine Policy 49 (2014) 37–47
-
Upload
independent -
Category
Documents
-
view
11 -
download
0
Transcript of The maintenance costs of marine natural capital: A case study from the initial assessment of the...

The maintenance costs of marine natural capital: A case study from theinitial assessment of the Marine Strategy Framework Directivein France
Harold Levrel a,n, Céline Jacob a, Denis Bailly b, Mahe Charles d, Olivier Guyader a,Schéhérazade Aoubid e, Adeline Bas b, Alexia Cujus e, Marjolaine Frésard c, Sophie Girard a,Julien Hay c, Yann Laurans f, Jérôme Paillet d, José A. Pérez Agúndez a, Rémi Mongruel a
a IFREMER, UMR AMURE, Marine Economics Unit, Centre de Brest, ZI Pointe du Diable, 29280 Plouzané, Franceb Université de Brest, UMR AMURE, IFREMER, Centre de Brest, ZI Pointe du Diable, 29280 Plouzané, Francec Université de Brest, UMR AMURE, 29334 Quimper Cedex, Franced Marine Protected Area Agency, 16 Quai de la Douane CS 42932, 29229 Brest Cedex 2, 29200 Brest, Francee ECOWHAT, 99 Rue Duhesme, F-75018 Paris, Francef Institut du Développement Durable et des Relations Internationales, 41, rue du Four 75006 Paris, France
a r t i c l e i n f o
Article history:Received 5 August 2013Received in revised form18 March 2014Accepted 19 March 2014
Keywords:Maintenance costMarine ecosystemsMarine Strategy Framework DirectiveEconomic analysis
a b s t r a c t
There are two ways of assessing the costs of environmental degradation: as the costs associated with theloss of benefits resulting from the degradation of natural capital, and as the maintenance costs requiredto compensate for the actual or potential degradation of natural capital. The first of these methods isbased on the Total Economic Value (TEV) of benefits forgone because of the depletion of ecosystemservices delivered by marine biodiversity. The second method is based on the costs required to maintaina good state of marine biodiversity, one which makes it possible to deliver ecosystem services.
This paper gives an illustration of this second approach. It details how these maintenance costs havebeen calculated in the initial assessment of the Marine Strategy Framework Directive (MSFD) in France.It addresses nine problem areas – corresponding to nine sources of environmental degradation – fromnon-native invasive species to oil spills. It gives a total figure for these degradation costs (around2 billion Euros). The results are compared with those of other Member States who have taken similarapproaches in the context of the MSFD. One key conclusion is that it is not really possible to makemeaningful comparisons at this stage, since the methods of data collection and the nature of the costsare very different. The need to develop such assessments in a standardised way is noted.
& 2014 Elsevier Ltd. All rights reserved.
1. Introduction
This paper discusses the assessment of the cost of environ-mental degradation, in the policy context of the Marine StrategyFramework Directive (MSFD). The MSFD represents the environ-mental component of the European integrated marine approach(2008/56/EC) and establishes a legislative framework for commu-nity action in the area of marine environmental policy. Theultimate aim is to design a programme of environmental measuresto achieve a good environmental status (GES) by 2020. The MSFDis founded on an initial assessment of the current environmentalstatus of national marine waters and a socio-economic analysis ofhuman activities in these waters (carried out in 2012). The initial
socio-economic assessment includes an analysis of the costs ofdegradation of the marine environment.
There are two ways of assessing the costs of environmentaldegradation [1]: as the costs associated with the loss of benefitsresulting from the degradation of natural capital [2,3], and as themaintenance costs required to compensate for the actual orpotential degradation of natural capital [4,5]. The first methodfor assessing the costs of environmental degradation is based onthe Total Economic Value (TEV) of benefits forgone because of thedepletion of ecosystem services delivered by marine biodiversity.The second method is based on the costs required to maintain agood state of marine biodiversity which makes it possible todeliver ecosystem services.
The expert group of economists charged with assessing the costof degradation of the marine environment in France recognised thelimits and difficulties of capturing the TEV of the environmental
Contents lists available at ScienceDirect
journal homepage: www.elsevier.com/locate/marpol
Marine Policy
http://dx.doi.org/10.1016/j.marpol.2014.03.0280308-597X/& 2014 Elsevier Ltd. All rights reserved.
n Corresponding author.E-mail address: [email protected] (H. Levrel).
Marine Policy 49 (2014) 37–47

benefits discussed in the literature (see Section 2), and decided touse the maintenance costs method.
This paper presents the results of this assessment, and attempts todescribe the challenges, strengths and limits of the maintenance costassessment method.
The paper is organised as follows: the method and the dataused to assess the costs of degradation in the French case study aredescribed and discussed; next, the results of the assessment aredetailed; finally, the results are discussed and compared withthose of other Member States who have taken similar approachesin the context of the MFSD. In conclusion, the strengths, limits andprospects of these types of assessment are discussed.
2. Materials and method
2.1. Context
In France, the economic analysis of the costs of degradation hasbeen assigned to an expert group of economists, specialists in marineeconomics who belong to the Centre for the Law and Economics of theSea (UMR AMURE1), working closely with the Ministry of Ecology,Sustainable Development and Energy2 and with the Marine ProtectedArea Agency.3 To carry out the work two full-time agents wererecruited, and three part-time external consultants were involved inthe assessment process.4 It was decided, in accordance with the MSFD,that this analysis had to be based on available data and carried out ona sub-regional scale. The analysis took four marine sub-regions intoaccount: the Occidental Mediterranean Sea (OMS), the Channel-NorthSea (CNS), the Bay of Biscay (BOB) and the Celtic Sea (CS) (Fig. 1).Contributions for the Celtic Sea have sometimes been included inChannel-North Sea, or not included if data were not available. Thisanalysis did not take French Overseas Territories into account.
2.2. Economic assessment methods
As mentioned in the Introduction, there are two ways to assessthe cost of environmental degradation: through the loss ofbenefits or through the cost of compensating for this degradation.
From the point of view of standard economic theory the firstapproach is more robust, since it is in accordance with the welfareoptimisation analysis [6]. However, there are at least six majorpractical issues which have to be addressed when consideringmonetary valuation of non-use values, indirect use values, and evensimple non-market use values such as recreational activities [2,7–9]:the lack of data on interactions between biological entities, ecologicalfunctions, ecosystem services production, and changes in well-being[10–13]; the high level of uncertainty regarding some of the valuesbased on support services or cultural services [14,15]; the controver-sies around the benefit-transfer method for extrapolating local valuesto a regional or national scale [16,17], [1]; the controversies around thestated preferences analysis for capturing non-use, indirect use, andnon-market use values [18–20]; ethical issues regarding the commen-surability andmonetisation of nature [21,22]; and the limits of the TEVas a source of relevant information when the analysis is used in apolicy framework in which certain strong sustainability goals are fixed[23,24].
Recognising these limits, Pearce [8] has proposed paying attentionto the real costs borne by society to provision and maintain ecosystemservices – that is, the costs of conservation policies. Bartelmus [4] also
suggests paying attention to the maintenance costs of a givenenvironmental state.5
The maintenance cost assessment has, until now, mainly been usedin specific environmental policies for the calculation of the environ-mental restoration costs associated with environmental damagefollowing a pollution event [25–27]. In this context, the assessmentis carried out to determine how much the polluters have to pay torestore what they have damaged and to reach a “no net loss” goal ofecosystem services, acting in accordance with a strong sustainabilityprinciple [26,28]. Concretely, in the MSFD the maintenance costs canbe understood as the real expenditures that a socio-economic systemneeds in order to maintain the level of natural capital required todeliver a certain level of ecosystem services.
This method does not take the economic welfare theory intoaccount but draws on a basic accountability theory. Maintenancecosts can therefore be disproportionate with respect to themeasurable benefits resulting from the expenditures required tomaintain the level of natural capital [3] (Table 1). This is clearlyone of the main limits of this method; but it is also one of thestrengths of the maintenance cost approach.
Thus, the maintenance costs assessment makes sense onlywithin a policy framework in which some environmental stan-dards have been adopted, reflecting the level of natural capital thata society agrees to maintain through a specific level of investment.This policy framework is a product of compromise over theformulation of the environmental problem, the norms and ruleswhich are necessary to tackle this issue, and the effort (measuredin terms of changes in use and/or restoration programmes)required to achieve them. The MSFD includes a clear environ-mental normative reference (the GES), reflecting a strong sustain-ability goal, which will be the product of a number of negotiationprocesses and political trade-offs.
In this context, it is inappropriate to provide a TEV resultingfrom individual aggregated preferences,6 since that would bebased on a different normative principle from the GES, namelythe maximum of welfare. But it might seem meaningful to knowthe current maintenance costs devoted to marine environmentalecosystem management, considering the gap between the presentsituation and the GES goal. Indeed, to achieve the GES will requireimproving and complementing existing marine environmentalmanagement measures, which will generate additional costs. Fromthis perspective, the maintenance cost approach will also providethe basis for a future cost-effectiveness analysis of the complexmanagement system which will result from the Programme ofMeasures recommended by the MSFD. It is for these reasons, inaddition to those mentioned in the introduction, that the team ofexperts believed that this approach was the best to use forassessing the costs of environmental degradation.
The costs of environmental degradation discussed in this paper arethe real expenditures devoted to conservation of the marine environ-ment in 2010.7 However, even though the problems have been definedon the basis of the GES descriptors, it has not been possible to use the
1 http://www.umr-amure.fr/index2.php.2 http://www.developpement-durable.gouv.fr/.3 http://www.aires-marines.com/.4 The experts, consultants, and agents recruited for this task are listed as co-
authors.
5 “Maintenance cost is applied to environmental degradation. The SEEAreviews maintenance costing critically as the hypothetical cost of avoiding pollu-tion or restoring the polluted environment ([5], chap. 10D). Maintenance cost canbe seen, however, as the weights for actual environmental impacts “according tosociety's obligation and capacity for dealing with environmental concerns” ([4],p. 145); “Such costing is indeed more practical than the assessment of elusivedamage effects from environmental impacts” ([4], p. 1851).
6 Assuming that it is impossible to set an aggregation rule that would make itpossible to sum individual preferences within a TEV in a way that would be inaccordance with the norms that society as a whole agrees to be essential, as notedlong ago by Kenneth Arrow (1950), the maintenance cost assessment seems to bemore suited to the MSFD in which some normative environmental goals havealready been adopted.
7 This was the last year of available data at the time the study was carried out.
H. Levrel et al. / Marine Policy 49 (2014) 37–4738

GES
standardsto
calculateinitialm
aintenancecosts.In
addition,sincethe
GES
standardsare
notsupposed
tobe
complied
with
before2020,
thesestandards
arenot
suitedto
calculatingmaintenance
costsin
2010.Theteam
ofFrench
economists
thusadopted
thecurrent
legalnorm
s,specific
toeach
degradationproblem
area,as
thebest
substitute(Table
2).Th
emain
tenan
cecosts
were
then
divid
edinto
three
categories(Fig.2).
–Costs
ofmon
itoring
and
inform
ation:aim
edat
improvin
ginform
ationan
dcoord
ination
levelsrelative
tocon
servationof
themarin
een
vironmen
t.–
Costs
ofpreven
tingenviron
mentald
egradation:costs
ofspecifi
cinvestm
entin
preven
tingand
avoiding
environmental
impact.
–Costs
ofen
vironmen
talrestoration
and
remed
iation:costs
ofen
vironmen
talrestorationan
drem
ediation
afterdestru
ctionor
anecological
acciden
t.
2.3.Data
Data
ontheen
vironmen
talcosts
was
collectedin
2011,with
2010as
theyear
ofreferen
cefor
ourassessm
ent.
Cost
assessmen
thas
beenbroken
outinto
nine“d
egradation
problem
areas”:marin
elitter;
chem
icalcom
pou
nds;
microbial
path
ogens;
oilsp
illsan
dillegal
disch
arges;eu
trophication
;non
-native
invasive
species;
biologicaldegrad
ationofn
aturalresou
rcesexp
loited;loss
ofbiod
iversity,trophic
chan
ges,lossof
integrity
ofmarin
esu
bstrates;an
dintrod
uction
ofen
ergyinto
theen
viron-
men
tan
dch
anges
inwater
regime.
Thelist
ofdegrad
ationareas
was
derived
fromtheMSFD
listof
GES
descriptors,an
dalso
fromthelist
of“p
ressures
andim
pacts”
intheinitial
assessmen
t.Th
eecological
standard
sused
tocarry
outthe
analysis
come
fromdifferen
texistin
glegal
framew
orks(Table
2).For
eachof
the
nine
degrad
ationproblem
areas,the
same
meth
odology
was
followed
:
–Interview
swith
specialists
intheninedegrad
ationproblem
sfrom
differen
tpublic
and
private
organisation
s,in
order
tocom
plete
thecost
structu
repreviou
slydefined
bytheteam
sof
expert
econom
ists.–
Aliteratu
rean
drep
ortreview
,problem
byproblem
.–
Fig.1.Map
ofthefou
rmarin
esu
b-regions.
Table 1Differences between the two ways of assessing the costs of environmental degradation.
Cost of maintaining the flow of ecosystem services delivered by marine biodiversity Total economic value of benefits forgone because of the depletion of marine biodiversity
Rationale Investment required for restoring or maintaining natural capital Monetary value associated with loss of well-being resulting from thedepletion of ecosystem services
Field of application Law regarding environmental responsibility and environmentalimpact assessment
Financial analysis for project management
Cost assessment Accounting costs Economic costsTarget Natural capital primarily, and indirectly the well-being of the human
population benefiting from itWell-being of the population, including positive and negative externalities
Economic scale Macro-economic (the socio-ecosystem) Micro-economic (individual values)Main limit of the method This method does not take economic welfare theory into account.
Maintenance costs can be disproportionate relative to the benefit provided by theinvestment in natural capital (EPA, 2009).
Cost-benefit analysis does not say anything about ecological sustainability.The internalisation of the externalities can lead to major loss ofbiodiversity and threaten social-ecological resilience (Bithas, 2011)
Unit of equivalency Biophysical units (habitat, species, ecosystem services) Value units (utility, price, well-being)Capital theory Critical natural capital (Ekins, 2003) Genuine saving (Atkinson and Pearce [29])Large-scale assessment method Costs transfer Benefits transfer (Brouwer [30])Level of sustainability Strong to medium: the natural capital loss cannot be compensated for
(replaced) by anything but natural capital. However, the level of compensation stronglydepends on the indicator of biophysical equivalency used (habitat, species, etc.)
Weak to medium: the natural capital loss can be compensated for(replaced by) human or manufactured capital. However, it ispossible to take into account some thresholds which limit the degree of substitutability
H.Levrel
etal./
Marine
Policy49
(2014)37
–4739

Phone and email surveys to collect data from private and publicorganisations presumed to possess information on the costslisted in Tables 3 and 4; more than 150 organisations werecontacted during this phase. The number of organisations to becontacted for each of the nine areas was varied and highlyproblem-specific. The organisations contacted are listed percategory of environmental problem in Table 3 and per categoryof costs in Table 4.
The survey was conducted using the following questions:
– Is your organisation involved in one of the following types ofactivity: activities related to monitoring or information; mea-sures for sustainable management, control, and enforcement;compensatory measures or restoration? (This question wasmodified depending on the remit of the organisation).
– Can you give some examples of activities? (This question wasmodified depending on the remit of the organisation).
– Can you give details of the budget allocated to each activity andthe full-time staff equivalent devoted to each one?
– Do you have a financial statement which breaks out thedifferent activities pursued?
– Does the budget allocated to each activity change from one yearto the next?
Unfortunately, data about the costs associated with some of theproblem areas are not available on a large scale, or have turned outto be incomplete or of very poor quality. This is why the costsrelated to two of the problem areas, invasive species and marinelitter, are not detailed in this paper. However, the lack of accuratedata does not mean that the costs associated with these twoproblems are insignificant.
When data for 2010 were not available or when using datafrom only one year did not make sense (due to high variability ofthe costs from one year to the next, such as in the case of oil spills),an inter-annual average was calculated.
3. Results
3.1. Results broken out by problem area
The total expenditure devoted to maintaining the currentecological status of marine waters for France was more than2054 million euros a year in 2010 (Table 5). A significant propor-tion of these costs (1247 million euros) was related to preventingenvironmental degradation by microbial pathogens, and took theform of enforcement of water quality standards (99% of the costwas expended onwastewater treatment). These expenditures haveas their primary purpose the protection of the health of humanpopulations, and the benefits for the natural environment areindirect. This is the reason why the costs are the highest. Theperception of the risks associated with water pollution is greaterwhen human health may be impacted than when only biodiversityis affected. The second highest was the chemical compoundscategory, with costs associated with prevention of chemicalpollution amounting to 347 million euros (81% of the cost wasexpended on industrial wastewater treatment). Here again, thegoal is protection of human health, which explains the size of thisexpenditure. Next come the costs associated with loss of biodi-versity and decrease of fish stocks, 148 and 133 million eurosrespectively. The high costs associated with fishing are due to theincreasing erosion of fish stocks and the need for more sustainable
Table 2Problem areas, links with MSFD, and current legal standards used to assess maintenance costs.
Problem areas GES descriptors, pressures, and impacts in theMSFD included in the analysis
Current legal framework
Marine litter Descriptor 10 “marine litter” OSPAR and Barcelona Conventions, Waste water treatment regulation,Water Framework Directive
Chemical compounds Descriptors 8 “contaminants and pollution,ecological effects” and 9 “contaminants in food”
REACH Directive, Waste water treatment regulation, WaterFramework Directive, Bathing water regulation
Microbial pathogens Pressure-impact “introduction of microbialpathogens”
Waste water treatment regulation, Water Framework Directive,Bathing water regulation, Regulation on animal products for humanconsumption (Food law)
Oil spills and illegal discharges Descriptors 8 “contaminants and pollution,ecological effects” and 9 “contaminants in food”
MARPOL, FIPOL, OSPAR and Barcelona Conventions
Eutrophication Descriptor 5 “eutrophication” Nitrate DirectiveNon-native invasive species Descriptor 2 “non-native species” Ramsar, CITES, Berne, Bonn, Biodiversity, Barcelona, OMI ConventionsBiological degradation of natural resourcesexploited (split into 2 sub-problems,aquaculture and fisheries)
Descriptor 3 “status of species exploited” European common fisheries policy
Loss of biodiversity, trophic changes, loss ofintegrity of marine substrates
Descriptors 6 and 1 regarding “biodiversity andintegrity of the marine substrates” anddescriptor 4 “webs”
Convention on biodiversity, European Strategy on Biodiversity, FrenchStrategy on Biodiversity
Introduction of energy into the environmentand changes in water regime
Descriptors 11 “energy” and 7 “hydrography” Environmental Impact Assessment Directive
Fig. 2. The different types of cost of degradation of the marine environment.
H. Levrel et al. / Marine Policy 49 (2014) 37–4740

management of these stocks (67% of costs). The costs linked tobiodiversity loss are mainly related to monitoring and reporting(52% of costs), which indicate substantial interest in these issuesand a serious lack of scientific data. Finally there are threeproblems for which the costs of environmental degradation aremuch lower: eutrophication (47.4 million euros), oil pollution (47.3million euros), and degradation of exploited resources related toaquaculture (30 million euros). The costs of preventing environ-mental degradation caused by oil spills and illegal discharges comelast, due to the fact that anticipating and preventing damageassociated with accidental marine pollution is difficult, and alsothat political action to prevent such damage still seemsinadequate.
3.2. Costs broken out by type and marine sub-region
The costs of preventing environmental degradation are by farthe highest, at 1.7 billion euros (Table 5). This is mainly due towastewater treatment for microbial pathogens and chemicalcompounds (accounting for 89% of these costs). Of the other fiveproblem areas, three (biodiversity loss, oil spills and illegaldischarges, and erosion of exploited resources for aquaculture)involve costs of monitoring and information which are higher thanthe costs of preventing environmental degradation. The costs ofenvironmental restoration and remediation are always the lowest,except for two problem areas (oil spills and illegal discharges,eutrophication) in which they come second; the costs associatedwith these two areas are related to clean-up of oil spills and greenalgae. Another point brought out by the analysis is that the erosionof biodiversity and oil pollution and illegal discharges are the two
main contributors to the costs of environmental restoration andremediation.
The relative weight of the different types of cost is variableacross the marine sub-regions. The distribution of the costs ofmonitoring and information is more or less the same in all themarine sub-regions (Fig. 3), except for aquaculture, because thisactivity is mainly conducted in the Bay of Biscay where most of theshellfish farming businesses are located.
The distribution of the costs of preventing environmentaldegradation is highly variable (Fig. 4), chiefly because the Occi-dental Mediterranean Sea benefits from a higher level of expen-diture for the prevention of marine environmental degradationthan the other two sub-regions. The high demographic density(sources of pollution and urbanisation), with 47% of the coastalpopulation of France located in the Mediterranean sub-region,explains why costs associated with wastewater treatment formicrobial pathogens and with land acquisition for biodiversityprotection are higher. Moreover, the cultural-symbolic significanceof the Mediterranean ecosystem and the level of pressure exertedon it create greater political interest in biodiversity protection inthis region.
Among other differences, the cost of prevention related tomanaging chemical compounds is significantly higher in theChannel-North Sea, where there is a long history of industrialactivity. The cost of eutrophication is zero in the OccidentalMediterranean Sea because the principal cause of eutrophicationin France is organic nitrates, mainly resulting from intensivelivestock breeding located mostly in Brittany (2/3 of this in theBay of Biscay sub-region and 1/3 in the Channel-North Sea sub-region); the only areas affected by eutrophication in the
Table 3Organisations contacted.
Problem area Type of organisation contacted Number oforganisationscontacted
Responserate
Marine litter Ministry of the environment, research organisations, Navy, naval prefecture, regionalcentres of surveillance and rescue, environmental NGOs, maritime ports, environmentalconsultancy firms, shellfish and fisheries associations, turtle care centres
15 67%
Chemical compounds Ministry of the environment, research organisations, Centre for marine and fluvial technicalstudies, maritime ports, French public body in charge of water management, environmentalconsultancy firm
25 85%
Microbial pathogens Ministry of health, Sanitary Surveillance Institute, Ministry of the environment, Ministry ofagriculture and fisheries, research organisations, NGO, French public body in charge ofwater management
7 100%
Oil spills and illegal discharges of oil Ministry of the environment, research organisations, Navy, environmental NGOs, Centre formarine and fluvial technical studies, maritime ports, naval prefecture, local authorities,regional fisheries committees, professional organisation of the French companies oftransport and maritime services, regional centres of surveillance and rescue, NavalHydrographic and Oceanographic Service, International Oil Pollution Compensation Funds,regional tourism committee, environmental consultancy firms, national shellfishcommittees
25 65%
Eutrophication Research organisations, French public body in charge of water management, national andregional administration, decentralised services of the agriculture Ministry, decentralisedservices of the health Ministry, shellfish committees, tourism organisations, maritime port,NGOs, organisations concerned with seaweed management
50 60%
Non-native invasive species Ministry of the environment, regional and local authorities, research organisations, Frenchpublic body in charge of water management, regional shellfish committees, diving clubs,marine protected areas, NGOs, French Marine Protected Areas Agency
25 45%
Biological degradation of naturalresources exploited: aquaculture
Ministry of agriculture and fisheries, national and regional shellfish committees, shellfishtechnical centres, research organisations
15 100%
Biological degradation of naturalresources exploited: fisheries
Ministry of agriculture and fisheries, research institute, national and regional fisheriescommittees, national NGOs
7 50%
Loss of biodiversity, trophic changes,loss of integrity of marine substrates
Ministry of the environment, public organisations in charge of environment protection,marine protected areas, environmental consultancy firms, research institutes, Centre formarine and fluvial technical studies, operator of the French electricity transmission system,French committee of granulate producers, fisheries observers, national and local NGOs,environment observatories, maritime ports
130 80%
Introduction of energy French electricity supplier, research organisations, regional administration, NavalHydrographic and Oceanographic Service
5 80%
H. Levrel et al. / Marine Policy 49 (2014) 37–47 41

Table 4Detailed environmental measures whose costs have been estimated in this paper (in grey when the information is missing; when the data collected are incomplete, this is noted in parentheses).
Problem area Costs of monitoring and information Costs of preventing environmental degradation Costs of environmental restoration and remediation
Marine litter Participation in international convention Marine programmes of litter reduction of the Ministryof the environment
Collection of litter on beaches (incomplete data)
Research programmes Awareness-raising campaign Collection of litter around nuclear power plants (incompletedata)
Ministry of the environment (Marine programme) Certification of litter management in ports(incomplete data)
Collection of litter on the water surface
Information from Environmental NGOs about litter issues Improvement of litter management on beaches Collection of litter on the seabedCollection of litter in ports
Chemical compounds Monitoring of pollution on the coast and in ports Industrial sewage treatmenta NoneMonitoring of dragged sediments (incomplete data) Collection and treatment of storm waterImplementation of REACH Directive Management of sewage sludgeWater Framework Directive coordination for marine water Action in the agricultural domain to reduce the use
of phytosanitary productsMonitoring of sewage sludgeResearch programmes
Microbial pathogens Monitoring of pollution on the coast and in bathing waters Domestic sewage water treatment (bacteria)b Purification of shellfish located in a B classified zoneResearch on microbial pathogens Collection and treatment of storm water
Measures linked to use of fertiliser in agricultureOil spills and illegal discharges of oil Research and data collection programmes (incomplete data) Litter collection in ports (incomplete data) Mitigation costs of oil spill impacts
Functioning of monitoring and rescue centres (incompletedata)
Marine pollution prevention system (POLMAR)(incomplete data)
Valuation of voluntary work to mitigate oil spill impacts
Functioning of a centre dedicated to prevention andreduction of marine pollution (CEDRE)
Eutrophication Coastal monitoring Management of watersheds, water agencies (incompletedata)
Collection of green algae
Research programmes Information on the national programme on green algae(incomplete data)
Treatment of green algae
Management of watersheds, water agencies (studies,monitoring)
Regional action programmes (incomplete data) Construction of green algae treatment plants
National programme on green algae Measures to improve agricultural practices (incompletedata)
OSPAR implementation Domestic sewage water treatment (phosphate andnitrate)
Non-native invasive species Scientific studies (incomplete data) None Reduction of population size (Crepidula fornicata, Crassostreagigas, Caulerpa taxifolia)Impact assessment programmes (incomplete data)
Biological degradation of naturalresources exploited: fisheries
Coordination of fisheries management of the fisheriesMinistry and decentralised administrations (incomplete data)
Management measures(decommissioning schemes, etc.)
Temporary cessation measures
Functioning of professional organisations Control of fisheries (incomplete data)Recreational fishing NGOFisheries programmes of Environmental NGOScientific research and monitoring
Biological degradation of naturalresources exploited: aquaculture
Coordination of fisheries management of the Fisheriesministry and decentralised administration
Functioning of regional shellfish committees (exceptcommunication, shoreline management)
Cleaning and reorganisation of shoreline
Functioning of professional organisations Spat seedingShellfish observatories (monitoring networks)Research programmes (incomplete data)
Loss of biodiversity, trophic changes,loss of integrity of marine substrates
Coordination of biodiversity conservation programmesof the Ministry of the environment and public structures
Preservation measures of public authorities (land buying,awareness campaigns, and Natura 2000 contracts)
Restoration and planning programmes of public authorities
Impact studies of granulate extraction and maritimeport works (incomplete data)
International and national environmental NGOprogrammes
Restoration activity conducted in Marine Protected Areas
Observations on “bycatch” (incomplete data) Management of Marine Protected Areas Snorkelling areas managementProfessional observatories (incomplete data) Attenuation and compensation measures linked to granulate
extraction and maritime port works (incomplete data)Voluntary observatoriesLocal NGOs programmes (incomplete data)Research programmes (incomplete data)
H.Levrel
etal./
Marine
Policy49
(2014)37
–4742

Mediterranean are lagoons, which are not taken into account inthe MSDF. The greater cost of preventing environmental degrada-tion relative to aquaculture in the Bay of Biscay is in line with theimportance of aquaculture in the area.
The costs of environmental restoration and remediation aresignificantly lower than the two other types of cost, and mainlyaffect the Channel-North Sea sub-region (Fig. 5). Three factors arerelevant here. Compensation for biodiversity losses comes fromharbour infrastructure development, granulate extraction, andcompensation for environmental damage from recent oil spills inthis area. It is necessary to collect and treat green algae on beacheswhere eutrophication is a source of green tides. Oil spills have alsooccurred in the Bay of Biscay.
Compensation costs for biodiversity loss are legally mandated(see Table 5). These costs are very substantial in the Channel-North Sea and in the Bay of Biscay, since there has been someproject development (especially new harbours). In the OccidentalMediterranean Sea, the costs of restoration are mainly due tovoluntary efforts conducted in marine protected areas to restoredegraded ecosystems.
4. Discussion
The main question discussed in this paper, as noted in theIntroduction, is the feasibility and robustness of the maintenancecost assessment method for evaluating environmental degradationcosts. The literature on the maintenance costs of marine ecosys-tems seems limited to the costs of establishing and managingmarine protected areas [31–33]. In the present study, we haveattempted to produce an integrated assessment of maintenancecosts for all the environmental components of French marineecosystems. In order to take the interpretation of the resultsfarther, they have to be compared with the assessments andstudies carried out by other Member States; however, the limitsof such a comparison also need to be recognised.
4.1. Comparisons with other national studies
First, it is interesting to compare our results with those of otherMember States who have taken similar approaches in the contextof the MFSD, especially the Netherlands and Spain. In the Nether-lands, total expenditure devoted to the maintenance of desirableenvironmental conditions amounts to 1.58 billion euros a year[34]. Our estimated figures are fairly close to this, but the Frenchcoastline is seven times as long as that of the Netherlands. InSpain, total expenditure for the maintenance of marine naturalcapital was around 1.53 billion euros in 2010, divided into sevenproblem areas [35]. Even if the problem areas are more or lesssimilar to the French ones, there are many differences in the waythe Member States have broken out the expenditures to be takeninto account to calculate the cost of degradation. The differencesbetween these results are difficult to interpret at this stage, sincethe methods were not harmonised before the data were collected.
However, despite the heterogeneous calculation methods,these results can be compared in some ways. For instance, thecost of water treatment in the river catchments represents thelion's share of expenditures in each case (73% in France, 90% in theNetherlands, 38% in Spain). As noted above, this may be due to thefact that it is necessary to protect human health.
4.2. Comparisons of cost and effectiveness
This assessment should serve to define environmental goals,taking social and economic considerations into account. This in turn
Introductionofen
ergy
Resea
rchon
impacts
ofacou
stic
dev
ices,m
ilitary
sonar,
shipbu
ilding(inco
mplete
data)
Subm
arinepulsenoise
sources
forseismic
andsonar
operators
Non
eforacou
stic
perturbations
Mon
itoringof
thermal
discardsfrom
electric
plants
Installation
sprovidingforgo
odthermal
dispersion
insea
water
atpow
erplantex
its(inco
mplete
data)
Shoreprotectionprogram
mes
inthesouth
ofFran
ceHyd
rologicparam
eter
mon
itoring
Hyd
rologicmod
ification
mon
itoringlin
kedto
civil
enginee
ringon
shore(inco
mplete
data)
Mon
itoringof
Rhôn
ealluvial
inputs
(inco
mplete
data)
aInve
stmen
tco
stsof
industrial
sewag
eplants
over
thewholeof
Fran
ce(this
correspo
ndsto
thezo
neof
sensitivity
toch
emical
contaminationas
iden
tified
byex
perts).
bInve
stmen
tan
dfunctioningco
stsof
sewag
eplants
ina5km
coastalstrip(this
correspon
dsto
thezo
neof
sensitivity
tomicrobial
contaminationas
iden
tified
byex
perts).
H. Levrel et al. / Marine Policy 49 (2014) 37–47 43

Table 5Annual costs required to maintain current level of ecological status, detailed by problem areas and types of cost (in millions of Euros; “na” when the data is not available).
Problem areas Loss ofbiodiversity
% Chemicalcompounds
% Microbialpathogens
% Decreasein fishstocks
% Biologicaldegradation ofnatural resourcesexploited:aquaculture
% Eutrophication % Oil spillsand illegaldischargesof oil
% Introductionof energy
% Total %
Cost types
Costs ofmonitoringandinformation
Organisation in charge ofcoordination
8.914 € 18 0.665 € 1 na – 13.000 € 26 7.300 € 15 na – 19.334 € 40 na – 49.213 € 100
Observation, monitoring,studies, expert analysis, impactassessment
23.071 18 65.166 € 51 5.828 € 5 23.700 € 18% 5.216 € 5 2.909 € 3 na – 2.600 € 2 128.489 € 100%
Research 45.525 84 0.117 € 0 2.302 € 5 na – 3.455 € 6 0.189 € 0 1.801 € 4 0.527 € 1 53.915 € 100SUB-TOTAL 77.510 € 65.948 € 8.129 € 36.700 € 15.971 € 3.098 € 21.135 € 3.127 € 231.618 €
% 52 19 1 28 53 7 45 6 11Costs ofpreventingenvironmen-taldegradation
Measures for sustainablemanagement (MPA, contracts,pollution treatment), controland enforcement
41.669 € 2 281.770 € 16 1232.666€
71 90.200 € 6 11.506 € 1 35.507 € 2 7.602 € 0 38.600 € 2 1739.521€
100
SUB-TOTAL% 28 81 98 67 38 74 16 73 85Costs ofenvironmen-talrestorationandremediation
Compensatory measures (legalobligation)
11.181 € 46 0 € 0 6.260 € 26 6.800 € 28 0 € 0 8.840 € 0 18.571 € 11.000 € 24.242 € 100
Restoration and compensation(voluntary)
18.131 € 88 0 € 0 0 € 0 na – 2.574 € 12 0 € 0 0 € 0 0 € 0 20.705 € 100
SUB-TOTAL 29.312 € 0 € 6.260 € 6.800 € 2.574 € 8.840 € 18.571 € 11.000 € 83.358 €
% 20 0 1 5 9 19 39 21 4Total 148.491 € 7 347.718 € 17 1247.056 € 61 133.700 € 7 30.051 € 1 47.445 € 2 47.308 € 2 52.727 € 3 2054.496
€
100
% 100 100 100 100 100 100 100 100
H.Levrel
etal./
Marine
Policy49
(2014)37
–4744
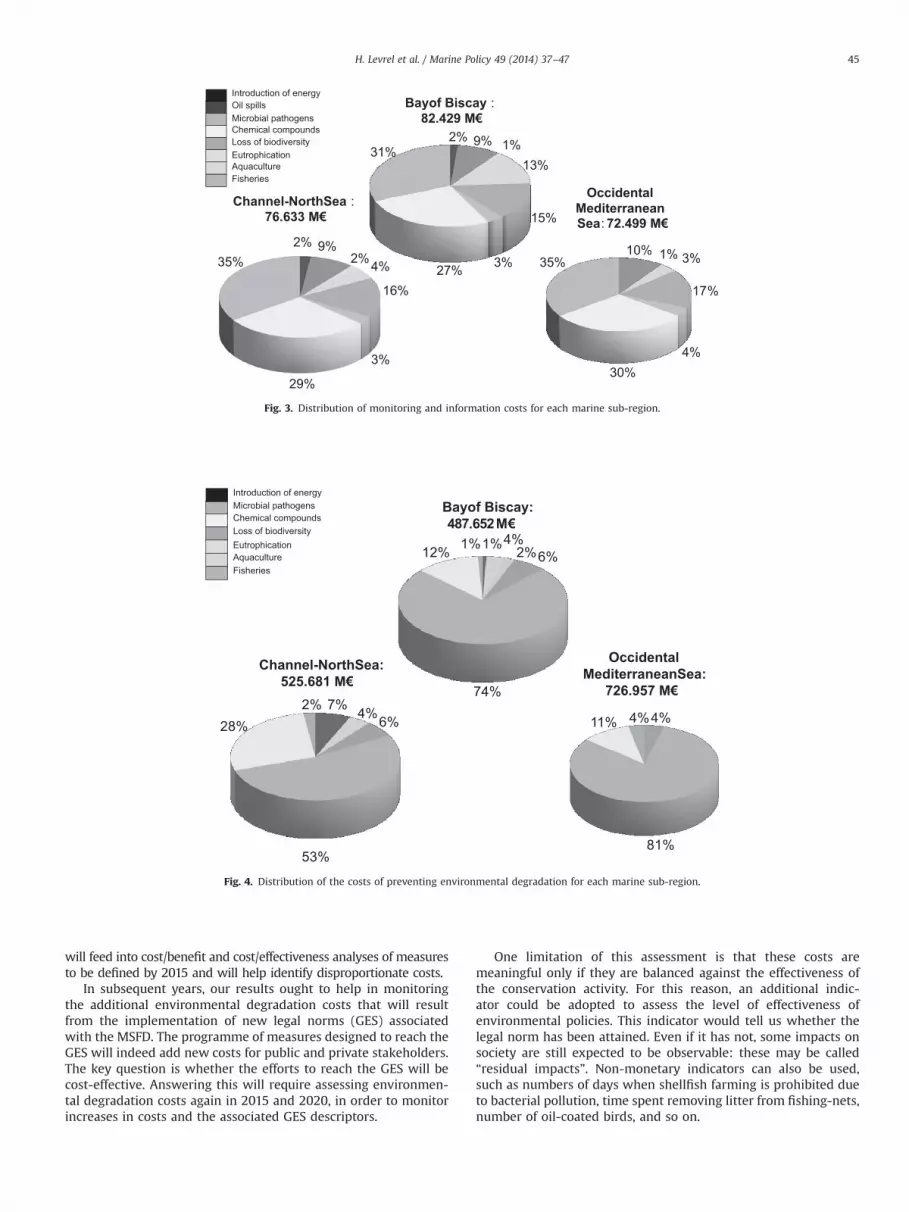
will feed into cost/benefit and cost/effectiveness analyses of measuresto be defined by 2015 and will help identify disproportionate costs.
In subsequent years, our results ought to help in monitoringthe additional environmental degradation costs that will resultfrom the implementation of new legal norms (GES) associatedwith the MSFD. The programme of measures designed to reach theGES will indeed add new costs for public and private stakeholders.The key question is whether the efforts to reach the GES will becost-effective. Answering this will require assessing environmen-tal degradation costs again in 2015 and 2020, in order to monitorincreases in costs and the associated GES descriptors.
One limitation of this assessment is that these costs aremeaningful only if they are balanced against the effectiveness ofthe conservation activity. For this reason, an additional indic-ator could be adopted to assess the level of effectiveness ofenvironmental policies. This indicator would tell us whether thelegal norm has been attained. Even if it has not, some impacts onsociety are still expected to be observable: these may be called“residual impacts”. Non-monetary indicators can also be used,such as numbers of days when shellfish farming is prohibited dueto bacterial pollution, time spent removing litter from fishing-nets,number of oil-coated birds, and so on.
Bayof Biscay :82.429 M€
Occidental MediterraneanSea: 72.499 M€
Channel-NorthSea :76.633 M€
29%
35%
3%
4%2%9%
16%
31%
27% 3%
15%
13%
9%2%
35%
4%
17%
3%1%10%
30%
Loss of biodiversityChemical compoundsMicrobial pathogens
EutrophicationAquacultureFisheries
Oil spills
2%
1%
Introduction of energy
Fig. 3. Distribution of monitoring and information costs for each marine sub-region.
Bayof Biscay: 487.652 M€
Occidental MediterraneanSea:
726.957 M€
Channel-NorthSea: 525.681 M€
4%2%6%
74%
12%
2% 7% 4%28%
53%
1%
81%
4%4%11%
Loss of biodiversityChemical compoundsMicrobial pathogens
EutrophicationAquacultureFisheries
6%
1%
Introduction of energy
Fig. 4. Distribution of the costs of preventing environmental degradation for each marine sub-region.
H. Levrel et al. / Marine Policy 49 (2014) 37–47 45

4.3. Limits of the maintenance cost method and recommendations
All these comparisons highlight the lack of standardisation andhomogenisation of maintenance cost assessment methods, incontrast to conventional monetary economic valuations whichhave been discussed for a long time in the literature and are moreclearly defined.
At this stage, there is no point in making any comparisons,given the lack of common methods for collecting data. In addition,it seems that the reported level of these costs is deeply influencedby the sampling efforts: the more actively you look for expendi-tures, the more the costs of maintenance are increased.
It is also important to note that this method is really time-consuming. The data collection took almost one year and requiredone full-time person plus one available expert for each of the“problem areas”, in order to be sure that the costs about whichinformation was collected are clearly related to the maintenance ofthe natural capital being assessed.
To improve the level of the quality of such assessments, it iscrucial to develop some standards regarding
– A data collection framework or guidelines which would make itpossible to: (1) define some categories of cost, as proposed inthis paper; (2) target the organisations where collecting infor-mation on these costs is necessary; and (3) spell out how theinterviews with the organisation representatives must beconducted, what sampling frame and extrapolation variablescan be used if it is not possible to gather exhaustive data, andwhat types of cost are eligible (or not) for the assessment.
– An accounting system framework which would make it possi-ble to: (1) link up with the national accountability system andcompanies' accountability systems; (2) organise the data col-lection; and (3) make comparisons using macro-economic andmicro-economic indicators as well as ecological indicators fromwhich effectiveness analysis could be carried out.
The only source of such standards is the United Nationssystems of economic and environmental accounting [4]. It seemsimportant to make the link between these accounting systems andthis type of evaluation more explicit. It would also be usefulto standardise the typology of management interventions (obser-vation, prevention, and maintenance or restoration) that Member
States will implement in their MSFD Programme of Measuresin order to facilitate ex-ante and ex-post assessments of theseProgrammes, as well as comparisons across Member States.
Acknowledgements
We would like to thank Mateo Cordier and the anonymousreviewers for all the comments and corrections on this paper,which have helped greatly to improve it. We also wish to thank allthe people who were interviewed for our work.
Appendix A. Supporting information
Supplementary data associated with this article can be found in theonline version at http://dx.doi.org/10.1016/j.marpol.2014.03.028.
References
[1] The economics of ecosystems and biodiversity. Mainstreaming the economicsof nature: a synthesis of the approach, conclusions and recommendations ofTEEB. Final Report. European Commission; 2010 ⟨http://www.teebweb.org/Portals/25/TEEB%20Synthesis/TEEB_SynthReport_09_2010_online.pdf⟩.
[2] Barbier EB, Baumgärtner S, Chopra K, Costello C, Duraiappah A, Hassan R, et al.The valuation of ecosystem services. In: Naeem S, Bunker DE, Hector A, LoreauM, Perrings C, editors. Biodiversity, Ecosystem Functioning, and Human WellBeing. Oxford and New York: Oxford University Press; 2009. p. 248–62.
[3] Environmental Protection Agency. Valuing the protection of ecological sys-tems and services. Report of the EPA Science Advisory Board. Washington DC;2009.
[4] Bartelmus P. The cost of natural capital consumption: accounting for asustainable world economy. Ecol Econ 2009;68:1850–7.
[5] United Nations, European Commission, International Monetary Fund, Organi-sation of Economic Cooperation and Development, World Bank. Integratedenvironmental and economic accounting 2003. New York: United Nations;2003 ⟨http://unstats.un.org/unsd/envAccounting/seea.htm⟩, p. 572.
[6] Mäler KG, Aniyar S, Jansson Å. Accounting for ecosystem services as a way tounderstand the requirements for sustainable development. Proc Natl Acad Sci2008;105:9501–6.
[7] Heal G. Nature and the marketplace: capturing the value of ecosystemservices. Washington DC: Island Press; 2000.
[8] Pearce D. Do we really care about biodiversity. Environ Resour Econ2007;37:313–33.
[9] Wallace K. Ecosystem services: multiple classifications or confusion. BiolConserv 2008;141:353–4.
[10] Costanza R, Fisher B, Mulder K, Liu S, Christopher T. Biodiversity andecosystem services: a multi-scale empirical study of the relationship betweenspecies richness and net primary production. Ecol Econ 2007;61:478–91.
Channel-NorthSea: 39.952 M€
40%
6%
26%
3%5%
12%10% 7%
21%
Bayof Biscay:
22.172 M€
33% 36%
2%
52%11%
29%
8%
Occidental MediterraneanSea:
21.147 M€
1%
Loss of biodiversityMicrobial pathogensOil spills
EutrophicationAquacultureFisheries
Introduction of energy
Fig. 5. Distribution of the costs of environmental restoration and remediation for each marine sub-region.
H. Levrel et al. / Marine Policy 49 (2014) 37–4746

[11] Naeem S. Biodiversity, ecosystem functioning, and human wellbeing: anecological and economic perspective. Oxford and New York: Oxford UniversityPress; 2009.
[12] Carpenter SR, DeFries R, Dietz T, Mooney HA, Polasky S, Reid W, et al.Millennium ecosystem assessment: research needs. Science 2006;314:257–8.
[13] Carpenter SR, Mooney HA, Agard J, Capistrano D, DeFries R, Díaz S, et al.Science for managing ecosystem services. Beyond the Millennium EcosystemAssessment. Proc Natl Acad Sci 2009;106(5):1305–12.
[14] Ludwig D. Limitations of economic valuation of ecosystems. Ecosystems2000;3:31–5.
[15] Toman M. Why not to calculate the value of the world's ecosystem servicesand natural capital. Ecol Econ 1998;25:57–60.
[16] Spash CL, Vatn A. Transferring environmental value estimates: issues andalternatives. Ecol Econ 2006;60:379–88.
[17] Braat L, ten Brink P. The cost of policy inaction (COPI) – the case of not meetingthe 2010 biodiversity target. Final Report. European Commission; 2008.
[18] Kahneman D, Knetsch JL, Thaler RH. Experimental tests of the endowmenteffect and the Coase theorem. J Politic Econ 1990;98:1325–48.
[19] Kahneman D, Ritov I. Determinants of stated willingness to pay for publicgoods: a study in the headline method. J Risk Uncertain 1994;9:5–37.
[20] Horowitz J, McConnell KE. Willingness to accept, willingness to pay, and theincome effect. J Econ Behav Org 2002;51(4):537–45.
[21] Espeland WN, Stevens ML. Commensuration as a social process. Annu RevSociol 1998;24:13–343.
[22] Rutherford MB, Knetsch JL, Brown TC. Assessing environmental losses:judgments of importance and damage schedules. Harv Environ Law Rev1998;22:51–101.
[23] Ekins P, Simon S, Deutsch L, Folke C, De Groot R. A framework for the practicalapplication of the concepts of critical natural capital and strong sustainability.Ecol Econ 2003;44:165–85.
[24] Bithas K. Sustainability and externalities: is the internalisation of externalitiesa sufficient condition for sustainability. Ecol Econ 2011;70:1703–6.
[25] Dunford RW, Ginn TC, Desvousges WH. The use of habitat equivalency analysisin natural resource damage assessments. Ecol Econ 2004;48(1):49–70.
[26] Roach B, Wade WW. Policy evaluation of natural resource injuries usinghabitat equivalency analysis. Ecol Econ 2006;58:421–33.
[27] Zafonte M, Hampton S. Exploring welfare implications of resource equivalencyanalysis in natural resource damage assessments. Ecol Econ 2007;61:134–45.
[28] Vaissière AC, Levrel H, Hily C, Le Guyader D. Selecting ecological indicators tocompare maintenance costs related to the compensation of damaged ecosys-tem services. Ecol Indic 2013;29:255–69.
[29] Atkinson G, Pearce DW. Capital theory and the measurement of sustainabledevelopment: an indicator of weak sustainability. Ecol Econ 1993;8:103–8.
[30] Brouwer R. Environmental value transfer: state of the art and future prospects.Ecol Econ 2000;32:137–52.
[31] Balmford A, Gravestock P, Hockley N, McClean CJ, Roberts CM. The worldwidecosts of marine protected areas. Proc Natl Acad Sci USA 2004;101(26):9694–7.
[32] Cullis-Suzuki S, Pauly D. Marine protected area costs as “beneficial” fisheriessubsidies: a global evaluation. Coast Manag 2010;38(2):113–21.
[33] McCrea-Strub A, Zeller D, Sumaila UR, Nelson J, Balmford A, Pauly D. Under-standing the cost of establishing marine protected areas. Mar Policy 2011;35(1):1–9.
[34] Walker AN, Strietman WJ. Oostenbrugge JAE. The current cost of avoidingdegradation of the Dutch North Sea environment. LEI Memorandum 11-009;2011.
[35] Ministerio de medio ambiente y medio rural y marino. Marine StrategyFramework Directive economic and social analysis. Communication at theSubregional Coordination Meeting: Bay of Biscay and Iberian Coast (PT/SP/FR);23 March 2012.
H. Levrel et al. / Marine Policy 49 (2014) 37–47 47