Trade Liberalization, Financial development and Economic growth in Nigeria.
Upload
independentCategory
view
2download
0
Emerging Markets Review 13 (2012) 78–99
Contents lists available at SciVerse ScienceDirect
Emerging Markets Review
j ourna l homepage: www.e lsev ie r .com/ locate /emr
To liberalize or not to liberalize: Political and economicdeterminants of financial liberalization☆
Ilker Kaya a, Konstantin Lyubimov b, Mihail Miletkov c,⁎a School of Business and Management, American University in Sharjah, Sharjah, United Arab Emiratesb Terry College of Business, University of Georgia, Athens, GA 30602, USAc Whittemore School of Business and Economics, University of New Hampshire, Durham, NH 03824, USA
a r t i c l e i n f o
☆ We are grateful to Jeffry Netter, Annette Poulsenful comments.⁎ Corresponding author. Tel.: +1 603 862 3331; fa
E-mail addresses: [email protected] (I. Kaya), konstl
1566-0141/$ – see front matter © 2011 Elsevier B.V.doi:10.1016/j.ememar.2011.10.002
a b s t r a c t
Article history:Received 19 May 2011Received in revised form 18 October 2011Accepted 21 October 2011Available online 30 October 2011
Using a sample of 70 emerging market and developing countries, weexamine the political and economic factors which affect the govern-ment's decision to liberalize the domestic equity markets. We docu-ment that the levels of industrialization and financial development,the quality of investor protection, and the level of the government'sinvolvement in the economy are closely associated with the stockmarket liberalization decision. Furthermore, we find a positive andsignificant relation between the amount of foreign financial aid re-ceived by the governments in emerging market countries and theprobability of stock market liberalization.
© 2011 Elsevier B.V. All rights reserved.
JEL classification:F30F35G15G18
Keywords:Equity market liberalizationForeign investorsGovernment policy and regulationForeign financial aid
1. Introduction
Over the past two decades a great number of emerging market and developing countries have openedtheir equity markets to foreign investors in a process known as stock market liberalization. Numerous aca-demic studies document that stock market liberalizations improve risk sharing and substantially reduce thecost of capital (Bekaert and Harvey, 2000; Bekaert et al., 2006; Blair Henry, 2000a; Blair Henry, 2003; Chariand Blair Henry, 2004), increase aggregate investment (Blair Henry, 2000b), and promote economic growth(Bekaert et al., 2005; Moshirian, 2008). Recent studies further document that stock market liberalizations
, Harold Mulherin, Babajide Wintoki, and an anonymous referee for many help-
x: +1 603 862 [email protected] (K. Lyubimov), [email protected] (M. Miletkov).
All rights reserved.
79I. Kaya et al. / Emerging Markets Review 13 (2012) 78–99
reduce agency costs and aggregate stock-return volatility in emergingmarkets (Cuñado et al., 2006; Ghosh etal., 2008; Umutlu et al., 2010). Peter Blair Henry summarizes the empirical evidence on the effects of equitymarket liberalizations in a 2003 Congressional Testimony1: “…all the evidence we have indicates that coun-tries derive substantial economic benefits from opening their stockmarkets to foreign investors…”Given theabundance of studies examining the effects of stockmarket liberalizations on firmperformance and economicgrowth, it is surprising that there is a lack of research on the potential determinants of the stock marketliberalization decision.2 Specifically, if the equity market liberalizations lead to the positive welfare ef-fects documented in the literature, why would governments choose either to delay or to completely re-sist the liberalization of their stock markets?
In this paper we use an extensive list of countries for which we can identify whether a stock marketliberalization occurred and the date of such events, and employ a probit model and a duration model toanalyze the factors which affect the liberalization decision. Our results suggest that both political and eco-nomic factors influence the government's decision to liberalize the national stock markets. Among the eco-nomic factors, the level of financial development, the structure of the economy, the quality of investorprotection, and the level of the government's involvement in the economyare significantly related to the like-lihood of stockmarket liberalization. The significant political factors include the government's political orien-tation and the influence of foreign governments and agencies through the allocation of foreign financial aid.
Our finding that the amount of foreign financial aid received by the governments in the emerging marketand developing countries is significantly and positively related to the probability of a stockmarket liberaliza-tion contributes to the long-standing debate about the effectiveness of foreign aid. Specifically, economistshave long sought to demonstrate that foreign financial aid promotes economic growth.Many of the empiricalstudies, however, fail to identify a robust positive effect of foreign financial aid on economic growth (Easterly,2003; Easterly et al., 2004; Rajan and Subramanian, 2008). Easterly et al. (2004) state the need for further re-search which “…will continue to explore pressing macroeconomic and microeconomic questions surround-ing foreign aid, such as whether aid can foment reforms in policies and institutions that in turn fostereconomic growth…”(p.780). Our paper provides some evidence in this direction. We find that foreign finan-cial aid is positively related to the likelihood of a stock market liberalization, which in turn can promote eco-nomic growth. This does not, however, imply that the overall effect of aid on growthwill be positive since anybeneficial effects of foreign financial aid can still be offset by adverse spillover effects.3
Our paper also has important implications for the literature on the effects of stock market liberaliza-tions. Most prior studies assume (often implicitly) that equity market liberalizations occur randomly,and therefore, are treated as exogenous events. Our work demonstrates that this assumption is not correct,since many of the factors that influence the stock market liberalization decision are also associated witheconomic development. Future research should account for the determinants of the liberalization decisionin order to address this endogeneity issue.
The remainder of the paper proceeds as follows. Section 2 presents the data and identifies the politicaland economic factors that can potentially influence the likelihood of a stock market liberalization. Section 3describes themethodology employed in the analysis of the stockmarket liberalization decision. Section 4 pre-sents the empirical findings. Section 5 tests the robustness of the empirical findings. Section 6 concludes.
2. Data
2.1. Dating the stock market liberalizations
The objective of the paper is to examine the political and economic factors which affect the govern-ment's decision to liberalize the domestic equity markets. We use the official stock market liberalization
1 Capital Account Liberalization: Lessons For the Chile Singapore Trade Agreements. Prepared statement of Peter Blair Henry be-fore the Committee on Financial Services, United States House of Representatives.
2 For example, Martell and Stulz, (2003) state that: “The literature on equity-market liberalizations has mostly ignored the issue ofwhy some countries liberalize their equity markets and others do not.”
3 For example, prior studies document that foreign financial aid may hinder economic development by encouraging rent-seekingand corruption, weakening government accountability, and undermining the overall quality of governance (Knack, (2001); Rajanand Subramanian, (2007)).
80 I. Kaya et al. / Emerging Markets Review 13 (2012) 78–99
dates provided by Bekaert et al. (2005).4 These dates correspond to the dates of formal regulatory changeafter which foreign investors officially have the opportunity to invest in domestic equity securities. Bekaertet al. (2005) examine 95 countries of which 17 liberalized their equitymarkets before 1980.5 Another 6 coun-tries, out of the remaining 78 nations, are considered economically developed (Greece, Iceland, Japan, NewZealand, Portugal, and Spain), which leaves 72 emergingmarket and developing countries.We are able to col-lect data on the majority of the explanatory variables used in the subsequent analysis for 70 out of the 72countries. Therefore, our final sample consists of 70 emerging market and developing countries out ofwhich 36 liberalized their stock markets in the period from 1980 to 2000. Our indicator variable for thestock market liberalization takes the value of one on and after the year of the official stock market liberaliza-tion, and zero otherwise.
There are alternative methods to date the equity market liberalizations.6 In some countries foreignersare able to indirectly invest in domestic equity securities prior to the official liberalization reforms viacountry funds or American Depository Receipts (ADRs). Additionally, countries often open their stockmarkets gradually to foreign investors, and the intensity of liberalization can be measured by the fractionof all domestic equity securities that are available to foreign investors (investability measure) or by the ac-tual flows of foreign portfolio investment. Bekaert et al. (2003) investigate the different liberalizationmethods and demonstrate that the official liberalization dates are generally associated with the first bigjumps in both the investability measure and the actual foreign holdings of domestic equity securities,and therefore, are good indicators of a country's integration into the world capital markets. Given theample empirical evidence on the positive welfare effects associated with the official stock market liberaliza-tions, our aim in this paper is to investigate the factors that led to these reforms.
2.2. Factors affecting the likelihood of a stock market liberalization
In this section, we present and discuss the economic and political factors which can potentially influencethe government's decision to liberalize the domestic equity markets. The majority of the data is from theWorld BankDatabases and from the OECD's website. Table 1 presents a list of variable definitions and sourcesof the data.
2.2.1. Economic factors
2.2.1.1. Economic development. The success of the equitymarket liberalizations largely depends on the foreigninvestors' demand for shares of companies in the liberalizing countries. Therefore, the countries with higherlevels of economic development may be more likely to liberalize their equity markets, since they are alsomore likely to attract foreign investors. Alternatively, poorer countries which dependmore on foreign capitalmay be less opposed to foreign ownership and, therefore, more likely to liberalize their equity markets. Weuse gross national income per capital (GNI per capita) as proxy for the level of economic development.
2.2.1.2. Financial development. The countries that have better developed financial markets are more likelyto have the institutions necessary to support a market economy, and are more likely to attract foreign in-vestors following the liberalization of their stock markets. We proxy for the development of the bankingsector with PRIVATE CREDIT, which equals the financial intermediary credits to the private sector dividedby gross domestic product. We follow Boehmer et al. (2005), Megginson et al. (2004), and Demirguc-Kuntand Maksimovic (1999) and measure stock market development with TURNOVER, which equals the ratioof annual equity value-traded to market capitalization.
4 Most of the dates are based on Bekaert and Harvey (2002) chronology of important financial, economic and political events inemerging markets.
5 These 17 countries are primarily developed nations and include Australia, Austria, Belgium, Canada, Denmark, Finland, France,Germany, Ireland, Italy, Netherlands, Norway, Singapore, Sweden, Switzerland, United Kingdom, and the United States.
6 The following discussion is largely based on Bekaert et al. (2003) who provide an excellent overview of the different equity mar-ket liberalization methods.

Table 1Variable definitions.
Variable Description
Official liberalizationdate
Corresponds to the date of formal regulatory change after which foreign investors officially have theopportunity to invest in domestic equity securities. Official liberalization dates are based on Bekaert andHarvey (2002) ‘A Chronology of Important Financial, Economic and Political Events in Emerging Markets’,http://www.duke.edu/ charvey/chronology.htm.
GNI per capita Gross national income per capita based on purchasing power parity (PPP), constant 2005 USD Source:World Bank Development Indicators 2005. CD-ROM
Population Average annual population figure (in millions) based on the de facto definition of population, whichcounts all residents regardless of legal status or citizenship—except for refugees not permanently settledin the country of asylum, who are generally considered part of the population of the country of origin.Source: World Bank Development Indicators 2005. CD-ROM
Private credit Private credit divided by gross domestic product. Credit to private sector refers tofinancial resources provided totheprivate sector, such as through loans, purchases of non-equity securities, and trade credits andother accountsreceivable, that establish a claim for repayment. Source: World Bank Development Indicators 2005. CD-ROM
Market turnover Ratio of annual equity value-traded to market capitalization. Source: World Bank Development Indicators2005. CD-ROM
Agriculture Annual share of value added in agriculture as a percentage of gross domestic product. Value added is thenet output of a sector after adding up all outputs and subtracting intermediate inputs. It is calculatedwithout making deductions for depreciation of fabricated assets or depletion and degradation of naturalresources. Agriculture corresponds to International Standard Industrial Classification (ISIC) divisions 1–5.Source: World Bank Development Indicators 2005. CD-ROM
Industry Annual share of value added in industry as a percentage of gross domestic product. Industry correspondsto International Standard Industrial Classification (ISIC) divisions 10–45. Source: World BankDevelopment Indicators 2005. CD-ROM
Common Law Binary variable equal to one if the country's legal system is based on common law, and zero otherwise.Source: (Djankov et al., 2008)
Trade openness The sum of exports and imports of goods and services divided by gross domestic product. Source: WorldBank Development Indicators 2005. CD-ROM
Foreign directinvestment
Average annual foreign direct investment isnet inflows of investment to acquire a lastingmanagement interest(10 percent ormore of voting stock) in an enterprise operating in an economyother than that of the investor. Itis the sumof equity capital, reinvestment of earnings, other long-term capital, and short-term capital as shownin the balance of payments (% of GDP). Source: World Bank Development Indicators 2005. CD-ROM
Governmentconsumption
General government final consumption as a fraction of GDP: includes all government currentexpenditures for purchases of goods and services (including compensation of employees). It also includesmost expenditures on national defense and security, but excludes government military expenditures thatare part of government capital formation. Source: World Bank Development Indicators 2005. CD-ROM
BlackMktPrem An index indicating the premium one must pay to exchange the domestic currency for dollars in the blackmarket relative to the official exchange rate. The index ranges from −10 to 0 with smaller values of theindex indicating smaller differences between the official exchange rate and the black market exchangerate. The index is calculated at five-year intervals during the period from 1980 to 2000. Source: Gwartney,James and Robert Lawson (2006). Economic Freedom of the World: 2006 Annual Report. Vancouver: TheFraser Institute. Data retrieved from www.freetheworld.com.
First privatization Binary variable which takes the value of one on and after the year of the first privatization of a stateowned enterprise (SOE), and zero otherwise. Source: (Boehmer et al., 2005) and Securities DataCorporation's Mergers and Acquisitions database.
First SIP Binary variable which takes the value of one on and after the year of the country's first share issueprivatization (SIP), and zero otherwise. Source: Securities Data Corporation's Global New Issues database.
Nationalist Binary variable equal to one if the party of the executive is classified as a nationalist party, and zerootherwise. Source: World Bank's Database of Political Institutions.
All donors Aid disbursements from all donors, including the 22 member countries of the OECD's DevelopmentAssistance Committee (DAC), the European Commission, and other international organizations. Thestatistics are compiled according to internationally agreed definitions and classifications. The data coversDAC donors' bilateral aid flows to developing countries and countries in transition (including projectsexecuted by non-governmental organizations and multilateral institutions on behalf of the donor), andprojects by the World Bank, the regional development banks and some UN agencies. It excludes privategrants and aid from non-DAC bilateral donors. Amounts are expressed in millions of constant (2005) USDollars. Source: www.stats.oecd.org
DAC bilateral Aid disbursements from the countries members of the OECD's Development Assistance Committee(DAC). Amounts are expressed in millions of constant (2005) US Dollars. Source: www.stats.oecd.org
Multilateral Aid disbursements from non-governmental organizations and multilateral institutions including projectsby the World Bank, the regional development banks and UN agencies. Amounts are expressed in millionsof constant (2005) US Dollars. Source: www.stats.oecd.org
81I. Kaya et al. / Emerging Markets Review 13 (2012) 78–99

82 I. Kaya et al. / Emerging Markets Review 13 (2012) 78–99
2.2.1.3. Structure of the economy. We expect that the likelihood of stock market liberalization will be lowerin the countries where agriculture constitutes the majority of economic activity and higher in the more in-dustrialized countries, which have larger capital needs. Our proxies for the structure of the economy areAGRICULTURE and INDUSTRY. AGRICULTURE equals the share of economic value added in forestry, hunting,fishing, and cultivation of crops and livestock production as a percentage of gross domestic product. INDUS-TRY equals the share of economic value added inmining, manufacturing, construction, electricity generation,and water and gas production as a percentage of gross domestic product.
2.2.1.4. Business environment. The level of investor protection affects the willingness of foreign investors topurchase domestic equity securities. We expect that the countries that have institutions protecting therights of the minority shareholders are more likely to benefit from the stock market liberalizations, andtherefore, are more likely to liberalize their equity markets. Our proxy for the level of investor protectionand, more broadly, for the presence of institutions supporting financial development is the common-law/civil-law indicator variable proposed by La Porta et al. (1998). These authors document that the countrieswith common law legal origin have stronger legal protection of investor rights than the countries withcivil law legal origin.7
Countries that are more integrated into the global economy, by being open to trade and capital flows,might be more likely to liberalize their equity markets. The 2002World Development Report, published bythe World Bank, states that: “Openness to trade and the exchange of ideas within countries and betweencountries has served as a catalyst for institutional change throughout history”(p.9). Additionally, Rajanand Zingales (2003) argue that openness to trade and capital flows may mitigate the incentives and theability of incumbent firms to oppose financial reforms, which lower the cost of capital and spur competi-tion.8 Our proxy for openness to trade is TRADE OPENNESS, which equals the sum of exports and importsof goods and services divided by gross domestic product. The proxy for openness to foreign capital is FDI,which equals net foreign direct investment divided by gross domestic product.
2.2.1.5. Government in the economy. Governments which are less market oriented and instead rely on thepolitical process to allocate resources and goods and services are less likely to support financial develop-ment in general, and may oppose the liberalization of the domestic equity markets. Additionally, govern-ment officials may be reluctant to remove the barriers to foreign equity ownership in order to preserve therents that they extract from the government's involvement in the economy. This argument is supported byDjankov et al. (2002) who suggest that government regulation of economic activity benefits politiciansand bureaucrats. Following La Porta et al. (1999) and La Porta et al. (2002) we proxy for the level of thegovernment's involvement in the economy with GOVERNMENT CONSUMPTION, which equals all govern-ment current expenditures for purchases of goods and services divided by gross domestic product, and theBLACKMARKET PREMIUM index, which reflects the premium one must pay to exchange the domestic cur-rency for dollars in the black market relative to the official exchange rate.9
A government can signal its commitment to market oriented reforms and can foster the developmentof the domestic equity markets by privatizing its state owned enterprises (Megginson et al., (2004)). Suchgovernments may liberalize their stock markets in order to expand the market for subsequent share issueprivatizations (Martell and Stulz, 2003). We hypothesize that the governments which have launched a pri-vatization program are more likely to liberalize their equity markets. Our indicators for whether the govern-ment has launched a privatization program are FIRST PRIVATIZATION and FIRST SIP. The FIRSTPRIVATIZATION indicator takes the value of one on and after the year of the country's first privatization,and zero otherwise. We obtain the first privatization date from Boehmer et al. (2005) and the SecuritiesData Corporation's Mergers and Acquisitions database. The FIRST SIP indicator takes the value of one on
7 Beck et al., (2003) find that legal origin matters for financial development because the legal traditions differ in their ability toadapt efficiently to evolving economic conditions.
8 See Rajan and Zingales, (2003) for a thorough discussion of this topic.9 The original version of the BLACK MARKET PREMIUM index ranges from 0 to 10 with higher values of the index indicating smal-
ler differences between the official exchange rate and the black market exchange rate. We multiply the original values of the indexby −1 in order to interpret the higher values of the index as indicating higher levels of government interference in the economy.
83I. Kaya et al. / Emerging Markets Review 13 (2012) 78–99
and after the year of the country's first share issue privatization, and zero otherwise. The data is from the Se-curities Data Corporation's Global New Issues database.
2.2.2. Political factors
2.2.2.1. Internal. The political orientation of the government can influence the stock market liberalizationdecision. For example, a nationalist government is more likely to oppose foreign ownership of domesticassets and therefore, should be less likely to liberalize the domestic equity markets. Our proxy for the po-litical orientation of the government is the NATIONALIST indicator variable, which equals one in all theyears when the party of the executive is defined as nationalist, and zero otherwise. We obtain the datafrom the World Bank's Database of Political Institutions (DPI).10
2.2.2.2. External. Foreign governments and international financial institutions can exert influence on thepolicies of the domestic governments through the allocation of foreign financial aid (Alesina and Dollar,2000; Kuziemko and Werker, 2006; Bourguignon and Sundberg, 2007). Bourguignon and Sundberg(2007) state that: “…donor views of the ‘right development policies' have been promoted through aidconditionality with little reference to country context. Public enterprise privatization and finance liberaliza-tion at times have been treated as necessarily good…” (p.318).
The majority of the studies on the effects of foreign financial aid on institutional development and govern-ment policy find either a negative relationship or an insignificant relationship. There is no evidence that foreignfinancial aid promotes democracy or market-oriented economic reforms (Knack, 2004; Easterly, 2007; andHeckelman and Knack, 2008), while there is evidence indicating that foreign financial aidworsens the qualityof governance (Knack, 2001; Rajan and Subramanian, 2007).
To the best of our knowledge, we are the first to directly examine the relationship between foreign fi-nancial aid and the liberalization of the equity markets. If aid flows alleviate the need to reform inefficientgovernment policies and institutions, we would expect a negative relationship between foreign financialaid and the likelihood of stock market liberalization. Conversely, if the recipient governments use theaid funds to compensate the politically powerful constituencies that may be adversely affected by theliberalization reforms, or if the “donors” use the foreignfinancial aid to “purchase” the support of the govern-ment officials for the liberalization reforms,wewould expect a positive relationship between foreignfinancialaid and the likelihood of stock market liberalization. Wemeasure foreign financial aid with “official develop-ment assistance” (ODA), which is available from the OECD's Development Assistance Committee website.11
Finally, we control for country size in all of our estimations. It is correlated with many of the covariatesand can potentially affect the stock market liberalization decision, since the costs of structural reformsmay be higher in the larger countries. We use population size as proxy for country size.
3. Methodology
The objective of the paper is to shed light on the factors that affect the government's decision to liberalizethe national stock markets. We begin the analysis with a cross-sectional probit model which allows us to es-timate the partial effect of each factor on the likelihood of a stock market liberalization. The dependentvariable in the model equals one if the country liberalized its national stock market in the period from1980 to 2000, and zero otherwise. In order to alleviate the potential endogeneity in the relationship betweenour explanatory variables and the stock market liberalization indicator we only use data prior to the officialequity market liberalization dates. For the countries that did not liberalize their equity markets, we averagethe explanatory variables over the five years preceding the official liberalization year of their closest
10 In robustness tests we use additional proxies for the government's political orientation including a dummy variable for the presenceof a left-wing government (also from DPI) and a measure of the degree of democracy based on Glaeser et al. (2004). There are no clearhypotheses about the effect of these political institution variables on the likelihood of observing a stock market liberalization. The priorliterature fails to document a significant relationship between the various political institution indicators and the likelihood of eithermarket-oriented economic reforms or economic growth (Glaeser et al., (2004); Heckelman and Knack, (2008)). In our empirical analysisnone of these variables attain statistical significance; these results are not reported, but are available upon request.11 ODA aid includes grants and loans with at least 25% grant element from multilateral as well as bilateral aid agencies.
84 I. Kaya et al. / Emerging Markets Review 13 (2012) 78–99
geographic neighbor.12 For the countries that liberalized their stockmarkets, we average the explanatoryvariables over the five years preceding the year of their official equity market liberalization.13
In the second part of the analysis, we estimate a duration model which explores the panel nature of ourdata. The duration model allows us to investigate the timing of the stock market liberalization decision,and explicitly accounts for the censoring in the data. This latter feature is especially important, becausethe countries that did not liberalize their equity markets by the end of our sample period may still liberalizeafterwards.
Following Cox (1972), we estimate the semiparametric model h tð Þ ¼ h0 tð ÞeX tð Þβ , where X(t) is a set ofobservable (possibly time-varying) covariates, β is a vector of unknown parameters associated with thesecovariates, and h0(t) is the baseline hazard function, which is left unspecified and corresponds to the hazardrate when all the covariates are set to zero. The data for the Cox proportional hazard model is split into seventhree-year sub-periods covering the period from 1980 to 2000.14 The stock market liberalization indicatorvariable takes the value of one in the three-year period of the stockmarket liberalization, and zero otherwise.We use lagged values of the independent variables to reduce the potential endogeneity due to the fact that theequity market liberalizations can affect the majority of our explanatory variables.
4. Results
4.1. Descriptive statistics and univariate analysis
Tables 2 and 3 summarize the timing of the stock market liberalizations and privatizations for the sub-samples of liberalized and non-liberalized countries, and present each country's legal origin. The data sup-port our prediction that the common law countries are more likely to liberalize their equity markets.Specifically, 17 out of the 36 countries that liberalized their equity markets have a common law legal originwhile only 9 out of the 34 countries that did not liberalize have a common law legal origin. With respect toour privatization hypothesis, there is some evidence that the privatizing governments are more likelyto liberalize their equity markets. During our sample period 35 out of the 36 countries that liberalizedtheir stock markets privatized at least one state owned enterprise and 27 completed a share issue privatiza-tion. For the non-liberalized countries, 31 out of the 34 countries privatized at least one state owned enter-prise and only 6 completed a share issue privatization.
Table 4 presents the results of univariate tests for differences in characteristics between the liberalizedand non-liberalized countries. The data suggest that the liberalized countries are, on average, larger in sizeand havemore productive economies. The results support the hypothesis that themore financially developedcountries aremore likely to liberalize their stockmarkets. Specifically, themeasure for the development of thebanking sector (PRIVATE CREDIT) is approximately two times larger for the liberalized countries than for thenon-liberalized countries (39.51% versus 21.56%), and the proxy for the development of the stock market(MARKET TURNOVER) is approximately 16 times larger for the liberalized countries than for the non-liberalized countries (15.85% versus 0.92%). The univariate tests also support our hypotheses regarding thestructure of the economy. The liberalized countries are more industrialized relative to the non-liberalizedcountries, and have a smaller proportion of economic value added in agriculture. Our hypothesis about thegovernment's role in the economy suggests that the more interventionist governments are less likely to re-move the barriers to foreign equity ownership. The univariate tests show that GOVERNMENT CONSUMPTIONis almost identical in the liberalized and non-liberalized countries, but the BLACKMARKET PREMIUM index ishigher in the non-liberalized countries. Therefore, the size of the government is roughly the same in the twogroups, but the governments in the non-liberalized countries tend to favor more interventionist policies.
The political factors that can potentially influence the government's decision to liberalize the domesticstock markets include the government's political orientation and the influence of foreign governments andinternational financial institutions through the allocation of foreign financial aid. The evidence in Table 4suggests that the countries which liberalize their stock markets are less likely to have a nationalist
12 This approach is used in an earlier version of Bekaert et al. (2005).13 We obtain similar results using three-year averages of the data.14 We average the annual data to account for the high level of persistence in the data and for the effects of business cycles.

Table 2Timing of the stock market liberalizations and the privatizations for the subsample of liberalized countries.
Country Off. lib. First SOE priv. First SIP Legal origin
Argentina 1989 1990 1991 FrenchBangladesh 1991 1994 EnglishBotswana 1990 EnglishBrazil 1991 1988 1995 FrenchChile 1992 1988 1998 FrenchColombia 1991 1991 1998 FrenchCote d'Ivoire 1995 1995 1998 FrenchEcuador 1994 1993 1995 FrenchEgypt, Arab Rep. 1992 1993 1993 FrenchGhana 1993 1994 1994 EnglishIndia 1992 1991 1993 EnglishIndonesia 1989 1994 1991 FrenchIsrael 1993 1986 1987 EnglishJamaica 1991 1986 EnglishJordan 1995 1995 2002 FrenchKenya 1995 1986 1986 EnglishKorea, Rep. 1992 1989 1989 GermanMalaysia 1988 1985 1985 EnglishMalta 1992 1998 EnglishMauritius 1994 2000 FrenchMexico 1989 1988 1991 FrenchMorocco 1988 1993 1993 FrenchNigeria 1995 1989 1989 EnglishOman 1999 1992 2004 FrenchPakistan 1991 1990 1992 EnglishPeru 1992 1991 1994 FrenchPhilippines 1991 1989 1991 FrenchSaudi Arabia 1999 1994 2002 EnglishSouth Africa 1996 1988 1988 EnglishSri Lanka 1991 1989 1991 EnglishThailand 1987 1988 1989 EnglishTrinidad and Tobago 1997 1993 EnglishTunisia 1995 1995 1995 FrenchTurkey 1989 1988 1993 FrenchVenezuela, RB 1990 1990 1996 FrenchZimbabwe 1993 1994 1997 English
The table presents the official equity market liberalization dates for all the countries that liberalized their stock markets in the periodfrom 1980 to 2000 as well as the dates for the first privatization of a state owned enterprise (SOE), and for the first Share IssuePrivatization (SIP). The last column presents each country's legal origin.
85I. Kaya et al. / Emerging Markets Review 13 (2012) 78–99
government (the difference, however, is not statistically significant), and receive significantly more foreignfinancial aid than the countries which do not liberalize their stock markets.
The univariate analysis provides an insightful description of the data, but does not allow us to disentan-gle the relative importance of each factor. As Table 6 illustrates, some of our regressors are highly correlated.For example, the correlations between AGRICULTURE and GNI per capita and between AGRICULTURE and IN-DUSTRY are both approximately−0.69.15 This is not surprising since countries where agriculture constitutesthemajority of economic activity are often poorer and less industrialized. In order to identify the partial effectof each regressor on the likelihood of a stock market liberalization we turn to multivariate analysis and esti-mate a cross-sectional probit model.16
15 All other correlation coefficients are smaller than 0.5 in absolute value, except the correlation between GNI per capita and PRI-VATE CREDIT which equals 0.55.16 It is important to note that the high degrees of correlation among the independent variables work to increase the variances of theestimated coefficients, and thus, make it harder to find statistically significant results. Unfortunately, dropping variables that poten-tially belong in the model is not a viable solution since it can lead to bias.

Table 3Timing of the privatizations for the subsample of non-liberalized countries.
Country Neighbor's off. lib. First SOE priv. First SIP Legal origin
Algeria 1988 1998 FrenchBarbados 1997 1992 EnglishBenin 1995 1994 FrenchBurkina Faso 1993 1994 FrenchCameroon 1995 1996 FrenchCentral African Republic 1995 FrenchChad 1995 1999 FrenchCongo, Rep. 1995 1996 FrenchCosta Rica 1991 1994 FrenchDominican Republic 1991 1999 FrenchEl Salvador 1989 1998 FrenchFiji 1987 1990 EnglishGabon 1995 1998 1998 FrenchGuatemala 1989 1997 FrenchGuyana 1990 1991 EnglishHaiti 1991 1992 FrenchHonduras 1989 1994 1999 FrenchIran, Islamic Rep. 1999 1995 FrenchKuwait 1999 1994 1995 FrenchLesotho 1996 1999 EnglishMadagascar 1996 1999 FrenchMalawi 1993 1996 EnglishMali 1995 1996 FrenchNepal 1992 1992 EnglishNicaragua 1991 1994 FrenchParaguay 1989 1994 FrenchRwanda 1995 1997 FrenchSenegal 1995 1997 1997 FrenchSierra Leone 1995 1997 EnglishSwaziland 1996 EnglishSyrian Arab Republic 1995 FrenchTogo 1993 1997 FrenchUruguay 1989 1990 1993 FrenchZambia 1993 1993 1995 English
The table presents the official equity market liberalization dates for the closest neighbors of the countries that did not liberalize theirstock markets in the period from 1980 to 2000 as well as the dates for the first privatization of a state owned enterprise (SOE), andfor the first Share Issue Privatization (SIP). The last column presents each country's legal origin.
86 I. Kaya et al. / Emerging Markets Review 13 (2012) 78–99
4.2. Cross-sectional probit model
Table 7 presents the results from the following cross-sectional probit model:
P Liberalization ¼ 1ð jx Þ ¼ Gðβ0 þ β1GNI per capitaþ β2populationþ β3common lawþβ4trade opennessþ β5FDIþ β6black market premium indexþβ7government consumptionþ β8agricultureþ β9private creditþβ10market turnoverþ β11all donors financial aidÞ
:
The results support some of our predictions about the effects of the economic variables on the likeli-hood of a stock market liberalization. The level of financial development, as measured by the equity turn-over ratio, is positively and significantly related to the probability of a stock market liberalization.Regarding the structure of the economy, the negative and significant coefficient on AGRICULTURE suggeststhat the likelihood of a stock market liberalization is lower in the countries where agriculture constitutesthe majority of economic activity. The parameter estimates for the coefficients of the proxies for the levelof investor protection and for the openness to foreign capital are also positive and significant. Our hypothesisabout the effect of government involvement in the economypredicts that the bigger andmore interventionist

Table 4Summary statistics for the subsamples of liberalized and non-liberalized countries.
Variable N obs. Mean Std. dev. Min Max
Subsample of countries that did not liberalize in the period from 1980 to 2000 (34 countries)GNI PER CAPITA 709 2684.34a 2823.51 300 20,050POPULATION 711 7.58a 9.60 0.2491 63.66TRADE OPENNESS 714 69.75b 39.02 8.96 282.40FOREIGN DIRECT INVESTMENT 712 1.52 3.76 −28.62 39.81BLACK MARKET PREMIUM INDEX 155 −6.99c 3.99 −10 0GOVERNMENT CONSUMPTION 712 14.39 6.41 2.9 76.22AGRICULTURE 693 25.37a 12.80 0.18 61.77INDUSTRY 693 27.05a 11.59 8.91 74.86PRIVATE CREDIT 712 21.56a 15.37 1.95 112.63MARKET TURNOVER 714 0.92a 8.13 0 144.9ALL DONORS FINANCIAL AID 688 326.56a 317.42 −9.68 3512.54DAC BILATERAL FINANCIAL AID 688 195.75a 160.58 −34.12 900.92MULTILATERAL FINANCIAL AID 688 102.73a 110.71 −8.13 1718.01YEARS WITH NATIONALIST GVMNT. 714 3.26 6.44 0 21
Subsample of countries that liberalized in the period from 1980 to 2000 (36 countries)GNI PER CAPITA 756 4395.89a 3417.37 450 19,490POPULATION 756 60.19a 141.35 0.34 1015.92TRADE OPENNESS 755 66.28b 38.07 6.32 228.88FOREIGN DIRECT INVESTMENT 714 1.51 2.00 −6.90 17.42BLACK MARKET PREMIUM INDEX 175 −7.72c 3.22 −10 0GOVERNMENT CONSUMPTION 749 14.90 6.74 2.98 41.48AGRICULTURE 705 15.83a 10.64 0.99 59.73INDUSTRY 705 34.04a 9.79 6.25 71.60PRIVATE CREDIT 739 39.51a 27.49 1.54 165.72MARKET TURNOVER 756 15.85a 38.63 0 475.46ALL DONORS FINANCIAL AID 738 697.18a 881.71 −404.62 7289.92DAC BILATERAL FINANCIAL AID 738 477.26a 631.46 −402.88 5377.96MULTILATERAL FINANCIAL AID 735 175.18a 338.97 −30.89 3163.02YEARS WITH NATIONALIST GVMNT. 756 2.75 5.768 0 21
The table presents summary statistics for the period from 1980 to 2000, and the results from a two-sample mean comparison test forthe countries that liberalized their stock markets and those that did not. The variables Trade openness, Foreign direct investment,Government consumption, Agriculture, Industry, and Private credit are all expressed as fractions of gross domestic product. Marketturnover is expressed as a fraction of total market capitalization. GNI per capita is measured in constant US dollars. Population ismeasured in millions, and All donors financial aid, DAC bilateral financial aid, and Multilateral financial aid are expressed in millionsof constant US dollars.
a —statistically significant at 1% level,b —statistically significant at 5% level,c —statistically significant at 10% level.
87I. Kaya et al. / Emerging Markets Review 13 (2012) 78–99
governments are less likely to remove the barriers to foreign equity ownership. Consistentwith this hypothesis,we find that GOVERNMENT CONSUMPTION and the BLACKMARKET PREMIUM index are both negatively re-lated to the probability of a stock market liberalization. Finally, the coefficient on TRADE OPENNESS is posi-tive, but insignificant. While we expected a positive effect of trade openness on the likelihood of a stockmarket liberalization, the relationshipmay bemore complex. For example, Rajan and Zingales (2003) suggestthat incumbentfirmswhich face foreign competition and needmore externalfinancingmay demand govern-ment subsidies instead of supporting reforms that foster financial development. Additionally, trade opennessmay increase the likelihood of liberalization reforms in the banking sector, but not in the stock market.
Regarding the political variables, the results in Table 7 indicate that the countries which receive moreforeign financial aid are more likely to liberalize their equity markets. This is consistent with the view thatforeign governments and international financial institutions use the allocation of foreign financial aid toinfluence the policies of the recipient governments. This finding has important implications for thelong-standing debate about the effectiveness of foreign financial aid. The World Bank asserts that the pri-mary goal of foreign financial aid is to fight poverty and to promote economic development. The majorityof the empirical studies, however, fail to identify a robust positive effect of foreign financial aid on eco-nomic growth (Easterly, 2003; Easterly et al., 2004; Easterly, 2007; Rajan and Subramanian, 2008). Most

Table 5Summary statistics for the combined sample.
Variable All countries in the sample (70 countries)
N obs. Mean Std. dev. Min Max
GNI PER CAPITA 1465 3567.57 3257.33 300 20,050POPULATION 1467 34.69 105.01 0.25 1015.92TRADE OPENNESS 1469 67.97 38.56 6.32 282.40FOREIGN DIRECT INVESTMENT 1426 1.51 3.01 −28.62 39.81BLACK MARKET PREMIUM INDEX 330 −7.37 3.62 −10 0GOVERNMENT CONSUMPTION 1461 14.65 6.59 2.9 76.22AGRICULTURE 1398 20.56 12.69 0.18 61.77INDUSTRY 1398 30.58 11.27 6.25 74.86PRIVATE CREDIT 1451 30.70 24.11 1.54 165.72MARKET TURNOVER 1470 8.60 29.24 0 475.46ALL DONORS FINANCIAL AID 1426 518.37 696.40 −404.62 7289.92DAC BILATERAL FINANCIAL AID 1426 341.44 488.32 −402.88 5377.96MULTILATERAL FINANCIAL AID 1423 140.15 257.95 −30.89 3163.02YEARS WITH NATIONALIST GVMNT. 1470 3 6.06 0 21
The table presents summary statistics for all the countries in our sample for the period from 1980 to 2000. The variables Tradeopenness, Foreign direct investment, Government consumption, Agriculture, Industry, and Private credit are all expressed asfractions of gross domestic product. Market turnover is expressed as a fraction of total market capitalization. GNI per capita ismeasured in constant US dollars. Population is measured in millions, and All donors financial aid, DAC bilateral financial aid, andMultilateral financial aid are expressed in millions of constant US dollars.
88 I. Kaya et al. / Emerging Markets Review 13 (2012) 78–99
academic studies attempt to document a direct link between foreign financial aid and economic growth.Our findings, however, may reveal an indirect link between foreign financial aid and economic growth.Specifically, foreign financial aid is positively related to the likelihood of a stock market liberalization,which in turn fosters economic growth.17
Foreign financial aid is often measured in the prior literature as a percentage of gross national incomeor on a per capita basis. This approach is warranted when evaluating the effect of foreign financial aid oneconomic growth. We, however, use a measure of foreign financial aid that equals the total official devel-opment assistance received by the national governments in the recipient countries, and include gross na-tional income per capita (GNI per capita) and population size as separate regressors. This measure is moreappropriate for our analysis, since we are investigating the factors that can potentially influence thegovernment's decision to liberalize the domestic equity markets. The actual dollar amount of the foreign fi-nancial aid is a better indicator of the influence of the donors on the policies of the domestic governments(potentially a small group of government officials), because as Boone (1996) demonstrates foreign financialaid mostly benefits local political elites.18 It is also possible that a larger absolute amount of foreign aid is as-sociated with a more extensive relationship between the donor countries or institutions and the recipientgovernments, which is likely to increase the flow of ideas and the opportunities for donor staff to offer policyadvice to government officials (Heckelman and Knack, 2008). Furthermore, Kuziemko and Werker (2006)use a similar measure of foreign financial aid to show that foreign aid is used to bribe the rotating memberson the U.N. Security Council.
The probitmodel in Table 7 is estimated in a static setting, which allows us to investigate the differences inthe characteristics between the countries that liberalized their stock markets and those that did not. Thismodel alleviates the reverse causality issues since we average the explanatory variables over the five years
17 The overall effect of aid on growth, however, remains ambiguous since any beneficial effects of foreign financial aid can be offsetby the adverse effect of aid on governance (Knack, (2001); Rajan and Subramanian, (2007)).18 For example, consider two hypothetical countries A and B where country A has 1 million inhabitants and receives $100 million inforeign financial aid, and country B has 2 million inhabitants and receives $200 million in foreign financial aid. When measured on aper capita basis both countries receive the same amount of foreign financial aid. However, since most of the foreign aid is not equallydistributed among the countries' citizens, but instead mainly benefits the political elites, we expect the effect of foreign financial aidto be stronger in country B (where the government officials receive $200 million) than in country A (where the government officialsreceive $100 million). A similar argument can be made when aid is measured as a percentage of gross national income.
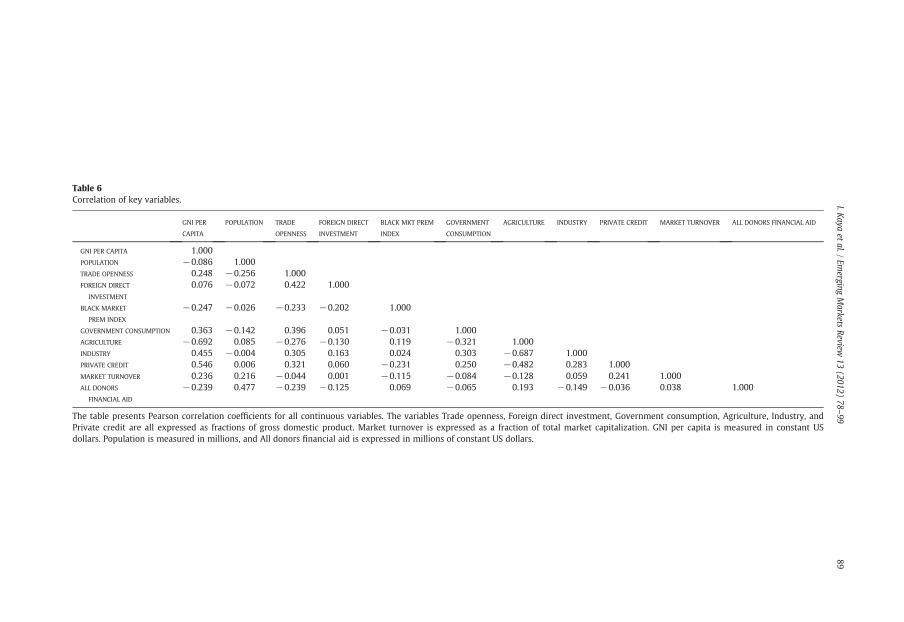
Table 6Correlation of key variables.
GNI PER
CAPITA
POPULATION TRADE
OPENNESS
FOREIGN DIRECT
INVESTMENT
BLACK MKT PREM
INDEX
GOVERNMENT
CONSUMPTION
AGRICULTURE INDUSTRY PRIVATE CREDIT MARKET TURNOVER ALL DONORS FINANCIAL AID
GNI PER CAPITA 1.000POPULATION −0.086 1.000TRADE OPENNESS 0.248 −0.256 1.000FOREIGN DIRECT
INVESTMENT
0.076 −0.072 0.422 1.000
BLACK MARKET
PREM INDEX
−0.247 −0.026 −0.233 −0.202 1.000
GOVERNMENT CONSUMPTION 0.363 −0.142 0.396 0.051 −0.031 1.000AGRICULTURE −0.692 0.085 −0.276 −0.130 0.119 −0.321 1.000INDUSTRY 0.455 −0.004 0.305 0.163 0.024 0.303 −0.687 1.000PRIVATE CREDIT 0.546 0.006 0.321 0.060 −0.231 0.250 −0.482 0.283 1.000MARKET TURNOVER 0.236 0.216 −0.044 0.001 −0.115 −0.084 −0.128 0.059 0.241 1.000ALL DONORS
FINANCIAL AID
−0.239 0.477 −0.239 −0.125 0.069 −0.065 0.193 −0.149 −0.036 0.038 1.000
The table presents Pearson correlation coefficients for all continuous variables. The variables Trade openness, Foreign direct investment, Government consumption, Agriculture, Industry, andPrivate credit are all expressed as fractions of gross domestic product. Market turnover is expressed as a fraction of total market capitalization. GNI per capita is measured in constant USdollars. Population is measured in millions, and All donors financial aid is expressed in millions of constant US dollars.
89I.K
ayaet
al./Em
ergingMarkets
Review13
(2012)78
–99

Table 7Cross-sectional probit estimates.
Hypoth. sign Coefficient Part. effect
GNI PER CAPITA, LOG +/− 0.3886 0.0044(0.6443)
POPULATION +/− 0.0912a 0.0010(0.0285)
COMMON LAW + 2.4576b 0.0352(1.0325)
TRADE OPENNESS + 0.0173 0.0002(0.0156)
FOREIGN DIRECT INVESTMENT + 0.6856b 0.0078(0.3222)
BLACK MARKET PREMIUM INDEX − −0.3811a −0.0043(0.1331)
GOVERNMENT CONSUMPTION − −0.3243a −0.0037(0.0983)
AGRICULTURE − −0.1587a −0.0018(0.0466)
PRIVATE CREDIT + 0.0201 0.0002(0.0184)
MARKET TURNOVER + 0.0284c 0.0003(0.0171)
ALL DONORS FINANCIAL AID +/− 0.0056a 0.00006(0.0015)
N of observations 60Log likelihood −10.6
The dependent variable in the probit model takes the value of one if the country liberalized its national stock market in the periodfrom 1980 to 2000, and zero otherwise. For the countries that liberalized their national stock markets, the explanatory variables areaveraged over the five years preceding the liberalization year. For the countries that did not liberalize their equity markets, theexplanatory variables are averaged over the five years preceding the liberalization year of their closest geographic neighbor. Thetable reports the coefficients and Quasi-Maximum Likelihood adjusted standard errors (in parenthesis), and the associated partialeffects.
a Statistically significant at 1% level.b Statistically significant at 5% level.c Statistically significant at 10% level.
90 I. Kaya et al. / Emerging Markets Review 13 (2012) 78–99
preceding the official liberalization year, but is sensitive to the choice of dates for the non-liberalizing coun-tries and does not explore the panel nature of our data.19
4.3. Cox proportional hazard model
In this section, we model the duration of the time period until a country's stock market liberalization,given the observable covariates. The model treats all the countries that did not liberalize their equity mar-kets during our sample period as right censored. Tables 8 and 9 present the results from five differentspecifications of the Cox proportional hazard model. For ease of interpretation we report hazard ratios in-stead of coefficients. These ratios measure how much the hazard of liberalization (i.e. the instantaneousrisk of liberalization) increases for a unit change in the respective covariate. A hazard ratio greater thanone indicates that the covariate, ceteris paribus, increases the probability of a stock market liberalization,while a hazard ratio lower than one indicates that the covariate decreases the probability of a stock marketliberalization.
19 Another limitation of the cross-sectional probit model is that we cannot test the effects of FIRST PRIVATIZATION, FIRST SIP, andNATIONALIST on the likelihood of a stock market liberalization. The size of our sample renders the estimation of such a highly pa-rameterized model infeasible. We return to the analysis of these variables in the Cox regressions.

Table 8Cox proportional hazard estimates (Models 1–2).
Hypoth. effect Model 1 Model 2
GNI PER CAPITA +/− 0.9996c 0.9996c
(0.0002) (0.0002)POPULATION +/− 0.9930a 0.9921a
(0.0024) (0.0025)COMMON LAW + 6.7822a 8.7993a
(3.5456) (4.9624)TRADE OPENNESS + 1.0015 0.9965
(0.0102) (0.0107)FOREIGN DIR. INV. + 0.9366 0.9624
(0.1297) (0.1385)BLACKMKTPREM − 0.7492a 0.7350a
(0.0607) (0.0626)GOV. CONSUMPT. − 0.7965a 0.8077a
(0.0542) (0.0577)AGRICULTURE − 0.9293c 0.9278b
(0.0361) (0.0348)INDUSTRY + 1.0922a 1.0944a
(0.0199) (0.0328)PRIVATE CREDIT + 1.0199c 1.0262b
(0.0120) (0.0124)MARKET TURNOVER + 1.0658a 1.0686a
(0.0223) (0.0225)ALL DONORS +/− 1.0010a 1.0010a
(0.0002) (0.0002)NATIONALIST − — 0.3147
— (0.2340)N of groups/events 62/30 62/30N of observations 312 312Log likelihood −86.80 −85.41
The table presents the results from the duration model estimated using the data from seven three-year sub-periods covering the pe-riod from 1980 to 2000. We model the duration between a country's entry in our sample and its official equity market liberalization.The official equity market liberalization indicator variable takes the value of one in and after the three-year period of the stock mar-ket liberalization, and zero otherwise. The countries that did not liberalize their equity markets in the period from 1980 to 2000 aretreated as right-censored. The explanatory variables are lagged three-year averages of the data. The table reports hazard ratios andthe associated standard errors (in parenthesis).
a Statistically significant at 1% level.b Statistically significant at 5% level.c Statistically significant at 10% level.
91I. Kaya et al. / Emerging Markets Review 13 (2012) 78–99
Model 1 in Table 8 is almost identical to the specification in the cross-sectional probit model. The onlynew covariate is INDUSTRY, which measures the country's level of industrialization. The majority of theresults corroborate the findings from the static probit model. The level of financial development, as mea-sured by the development of the banking sector (PRIVATE CREDIT) and of the stock market (MARKETTURNOVER), is positively related to the hazard of liberalization. The liberalization of the stock marketsis also more likely in the more industrialized countries, and less likely in the countries where agricultureconstitutes the majority of economic activity. Regarding the nature of the government's economic policy,the more interventionist governments are less likely to liberalize their equity markets. Finally, the coun-tries which receive more foreign financial aid and have a common law legal tradition are more likely toliberalize their stock markets.
There are, however, a number of differences between the results from the probit model and the hazardmodel. The level of economic development and the size of the country are negatively and significantly re-lated to the hazard of liberalization, and the openness to foreign capital is no longer significant. The negativeeffect of GNI per capita on the hazard of liberalization supports the view that the poorer countries, which lackinvestment capital, are less opposed to foreign equity ownership and therefore, are more likely to liberalize
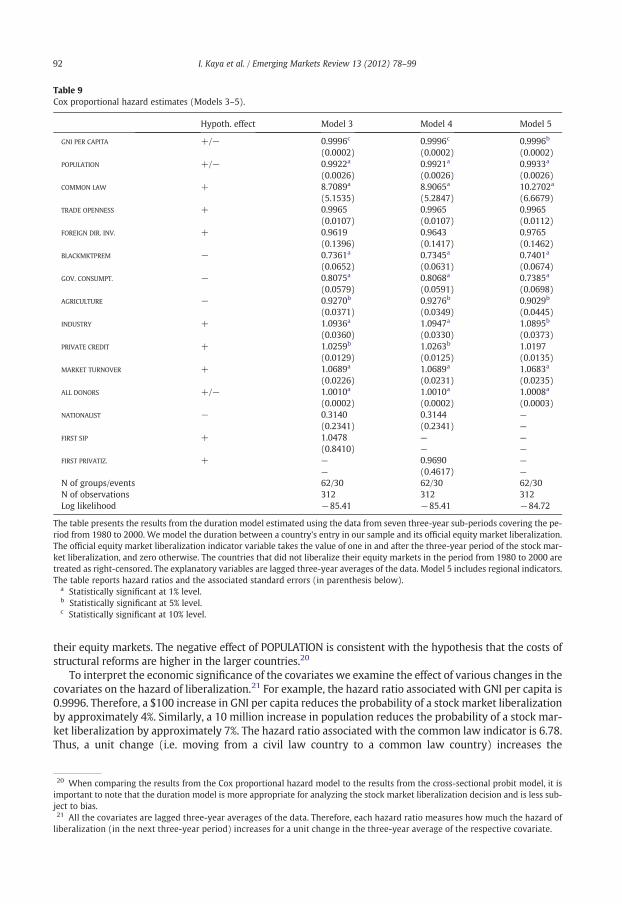
Table 9Cox proportional hazard estimates (Models 3–5).
Hypoth. effect Model 3 Model 4 Model 5
GNI PER CAPITA +/− 0.9996c 0.9996c 0.9996b
(0.0002) (0.0002) (0.0002)POPULATION +/− 0.9922a 0.9921a 0.9933a
(0.0026) (0.0026) (0.0026)COMMON LAW + 8.7089a 8.9065a 10.2702a
(5.1535) (5.2847) (6.6679)TRADE OPENNESS + 0.9965 0.9965 0.9965
(0.0107) (0.0107) (0.0112)FOREIGN DIR. INV. + 0.9619 0.9643 0.9765
(0.1396) (0.1417) (0.1462)BLACKMKTPREM − 0.7361a 0.7345a 0.7401a
(0.0652) (0.0631) (0.0674)GOV. CONSUMPT. − 0.8075a 0.8068a 0.7385a
(0.0579) (0.0591) (0.0698)AGRICULTURE − 0.9270b 0.9276b 0.9029b
(0.0371) (0.0349) (0.0445)INDUSTRY + 1.0936a 1.0947a 1.0895b
(0.0360) (0.0330) (0.0373)PRIVATE CREDIT + 1.0259b 1.0263b 1.0197
(0.0129) (0.0125) (0.0135)MARKET TURNOVER + 1.0689a 1.0689a 1.0683a
(0.0226) (0.0231) (0.0235)ALL DONORS +/− 1.0010a 1.0010a 1.0008a
(0.0002) (0.0002) (0.0003)NATIONALIST − 0.3140 0.3144 —
(0.2341) (0.2341) —
FIRST SIP + 1.0478 — —
(0.8410) — —
FIRST PRIVATIZ. + — 0.9690 —
— (0.4617) —
N of groups/events 62/30 62/30 62/30N of observations 312 312 312Log likelihood −85.41 −85.41 −84.72
The table presents the results from the duration model estimated using the data from seven three-year sub-periods covering the pe-riod from 1980 to 2000. We model the duration between a country's entry in our sample and its official equity market liberalization.The official equity market liberalization indicator variable takes the value of one in and after the three-year period of the stock mar-ket liberalization, and zero otherwise. The countries that did not liberalize their equity markets in the period from 1980 to 2000 aretreated as right-censored. The explanatory variables are lagged three-year averages of the data. Model 5 includes regional indicators.The table reports hazard ratios and the associated standard errors (in parenthesis below).
a Statistically significant at 1% level.b Statistically significant at 5% level.c Statistically significant at 10% level.
92 I. Kaya et al. / Emerging Markets Review 13 (2012) 78–99
their equity markets. The negative effect of POPULATION is consistent with the hypothesis that the costs ofstructural reforms are higher in the larger countries.20
To interpret the economic significance of the covariates we examine the effect of various changes in thecovariates on the hazard of liberalization.21 For example, the hazard ratio associated with GNI per capita is0.9996. Therefore, a $100 increase in GNI per capita reduces the probability of a stock market liberalizationby approximately 4%. Similarly, a 10 million increase in population reduces the probability of a stock mar-ket liberalization by approximately 7%. The hazard ratio associated with the common law indicator is 6.78.Thus, a unit change (i.e. moving from a civil law country to a common law country) increases the
20 When comparing the results from the Cox proportional hazard model to the results from the cross-sectional probit model, it isimportant to note that the duration model is more appropriate for analyzing the stock market liberalization decision and is less sub-ject to bias.21 All the covariates are lagged three-year averages of the data. Therefore, each hazard ratio measures how much the hazard ofliberalization (in the next three-year period) increases for a unit change in the three-year average of the respective covariate.

93I. Kaya et al. / Emerging Markets Review 13 (2012) 78–99
probability of equity market liberalization almost sevenfold. Regarding the BLACK MARKET PREMIUMindex, a unit increase in the index translates into a 25% reduction in the hazard of liberalization. Similarly,a one percent increase in GOVERNMENT CONSUMPTION decreases the hazard of liberalization by approx-imately 20%. The hazard ratios associated with the variables which proxy for the structure of the economyAGRICULTURE and INDUSTRY are 0.9293 and 1.0922 respectively. This implies that a one percent increasein AGRICULTURE (INDUSTRY) decreases (increases) the probability of a stock market liberalization by 7(9) percent. Regarding the proxies for the level of financial development, a 10% increase in PRIVATE CREDIT(MARKET TURNOVER) increases the hazard of equity market liberalization by approximately 22% (89%). Fi-nally, the hazard ratio associated with our measure of foreign financial aid is 1.001. Therefore, a$100 million increase in foreign financial aid increases the probability of a stock market liberalization by ap-proximately 10%.
Model 2 in Table 8 tests the effect of the government's political orientation on the likelihood of a stockmarket liberalization. The NATIONALIST indicator variable is negatively related to the probability of a stockmarket liberalization (i.e. its hazard ratio is lower than one), which is consistent with our hypothesis that anationalist government ismore likely to oppose the liberalization of thedomestic equitymarkets. The variable,however, is only marginally significant (p-value of 0.12).
Table 9 examines the effect of privatization on the probability of a stock market liberalization and therobustness of the results. Models 3 and 4 show that the FIRST PRIVATIZATION and FIRST SIP dummy variablesdo not significantly affect the hazard of liberalization. Specification 5 tests the robustness of the results frommodel 1 in Table 8 to including regional dummies.22 The results remain qualitatively the same.
Tables 10 and 11 further investigate the effect of foreign financial aid on the probability of a stock mar-ket liberalization by splitting the foreign aid into two categories: bilateral versus multilateral aid. Prior litera-ture suggests that bilateral aid has a large positive effect on government consumption while multilateral aiddoes not (Burnside and Dollar, 2000).23 In the less transparent environments of the emerging market coun-tries the increases in government consumption associated with the increases in foreign financial aid can po-tentially be used by the governments to compensate the politically-powerful groups, which might beadversely affected by the equity market liberalization reforms. Additionally, the increases in government con-sumption, financed with the foreign financial aid, might be correlated with increases in the private consump-tion of the government officials (i.e., foreign financial aid can be used to “purchase” the support of thegovernment officials for the liberalization reforms). Both of these arguments suggest that we should find astronger relationship between bilateral aid and the likelihood of stock market liberalization than betweenmultilateral aid and the likelihood of liberalization. The evidence from model 1 in Table 10 supports this hy-pothesis. The effect of bilateral aid on the hazard of liberalization is positive and significant, while the effectof multilateral aid on the hazard of liberalization is not statistically significant. Therefore, the bilateral aidflows appear to drive the relationship between foreign financial aid and the probability of stock marketliberalization.24
Model 2 in Table 10 tests the effect of the government's political orientation on the likelihood of a stockmarket liberalization. The results indicate that nationalist governments are significantly less likely toliberalize their equitymarkets (hazard ratio of 0.2968). Regarding the effect of privatization on the likelihoodof stock market liberalization, models 3 and 4 in Table 11 document no significant relationship between ourproxies for privatization (FIRST SIP and FIRST PRIVATIZATION) and the hazard of liberalization. Finally, inspecification 5 we demonstrate that our findings are robust to the inclusion of the same regional dummiesas in model 5 of Table 9.25
22 We include regional indicators for countries located in the Middle East and North Africa, Sub-Saharan Africa, Asia excluding theMiddle East, and Latin America (the excluded category in the model). The hazard ratios for the regional dummies are not reported inthe table for brevity.23 This can be attributed to the fact that multilateral aid tends to be more project-oriented.24 An important characteristic of foreign financial aid is “aid conditionality”. International financial institutions often condition therelease of foreign financial aid on the implementation of structural reforms by the recipient governments. This approach of aid allo-cation suggests that foreign financial aid increases after the implementation of the reforms. Therefore, “aid conditionality” does notexplain the results in our study, since we document a positive and significant relationship between foreign financial aid and the sub-sequent probability of a stock market liberalization. Furthermore, “aid conditionality” is primarily associated with multilateral aid,while our results are mainly driven by the bilateral aid flows.25 The hazard ratios for the regional dummies are not reported in the table for brevity.

Table 10Cox proportional hazard estimates with different types of foreign financial aid (Models 1–2).
Hypoth. effect Model 1 Model 2
GNI PER CAPITA +/− 0.9997c 0.9997c
(0.0002) (0.0002)POPULATION +/− 0.9922a 0.9910a
(0.0029) (0.0030)COMMON LAW + 5.9130a 7.6695a
(3.2201) (4.4864)TRADE OPENNESS + 1.0029 0.9981
(0.0103) (0.0107)FOREIGN DIR. INV. + 0.9424 0.9717
(0.1292) (0.1407)BLACKMKTPREM − 0.7581a 0.7408a
(0.0594) (0.0614)GOV. CONSUMPT. − 0.7990a 0.8070a
(0.0539) (0.0577)AGRICULTURE − 0.9284c 0.9270b
(0.0352) (0.0355)INDUSTRY + 1.0952a 1.1008a
(0.0352) (0.0355)PRIVATE CREDIT + 1.0203c 1.0271b
(0.0119) (0.0124)MARKET TURNOVER + 1.0655a 1.0693a
(0.0222) (0.0227)DAC BILATERAL +/− 1.0012a 1.0012a
(0.0003) (0.0003)MULTILATERAL +/− 1.0015 1.0017
(0.0013) (0.0013)NATIONALIST − — 0.2968c
— (0.2212)N of groups/events 62/30 62/30N of observations 312 312Log likelihood −86.77 −85.24
The table presents the results from the duration model estimated using the data from seven three-year sub-periods covering the pe-riod from 1980 to 2000. We model the duration between a country's entry in our sample and its official equity market liberalization.The official equity market liberalization indicator variable takes the value of one in and after the three-year period of the stock mar-ket liberalization, and zero otherwise. The countries that did not liberalize their equity markets in the period from 1980 to 2000 aretreated as right-censored. The explanatory variables are lagged three-year averages of the data. The table reports hazard ratios andthe associated standard errors (in parenthesis).
a Statistically significant at 1% level.b Statistically significant at 5% level.c Statistically significant at 10% level.
94 I. Kaya et al. / Emerging Markets Review 13 (2012) 78–99
5. Robustness
In this section, we perform a number of tests to confirm the robustness of our main findings. The de-scriptive statistics in Table 5 show that there are several potential outliers in the data. The maximumvalue for population, for example, is 1015 million people. This value corresponds to the population ofIndia, which is in the sample of liberalized countries. After dropping India from the sample, the coefficienton population loses significance in the Cox proportional hazard model, but the other findings remain qual-itatively the same. Another source of potential outliers is GOVERNMENT CONSUMPTION, which has ex-tremely high values for Kuwait (76.22%). All of our results, including the results on GOVERNMENTCONSUMPTION, are robust to exclude Kuwait from the sample.26
In this paper we examine the factors that affect the government's decision to liberalize the domesticequity markets. However, we have not yet discussed the fact that the likelihood of a stock market liberal-ization can be influenced by global factors such as world stock market returns.27 Omitting such relevant
26 These results are not reported, but are available upon request.27 We thank the referee for pointing this out.

Table 11Cox proportional hazard estimates with different types of foreign financial aid (Models 3–5).
Hypoth. effect Model 3 Model 4 Model 5
GNI PER CAPITA +/− 0.9997c 0.9997c 0.9996b
(0.0002) (0.0002) (0.0002)POPULATION +/− 0.9911a 0.9910a 0.9910a
(0.0030) (0.0030) (0.0032)COMMON LAW + 7.3935a 7.3997a 13.1193a
(4.5824) (4.6035) (9.3278)TRADE OPENNESS + 0.9983 0.9983 0.9959
(0.0107) (0.0107) (0.0115)FOREIGN DIR. INV. + 0.9710 0.9673 1.0071
(0.1422) (0.1430) (0.1454)BLACKMKTPREM − 0.7435a 0.7416a 0.7141a
(0.0635) (0.0618) (0.0720)GOV. CONSUMPT. − 0.8066a 0.8088a 0.7337a
(0.0579) (0.0587) (0.0720)AGRICULTURE − 0.9246c 0.9274b 0.9000b
(0.0377) (0.0356) (0.0394)INDUSTRY + 1.0983a 1.1007a 1.1021a
(0.0377) (0.0356) (0.0394)PRIVATE CREDIT + 1.0264b 1.0268b 1.0292b
(0.0129) (0.0125) (0.0144)MARKET TURNOVER + 1.0690a 1.0687a 1.0752a
(0.0227) (0.0230) (0.0246)DAC BILATERAL +/− 1.0012a 1.0012a 1.0009b
(0.0003) (0.0003) (0.0004)MULTILATERAL +/− 1.0017 1.0017 1.0017
(0.0013) (0.0014) (0.0014)NATIONALIST − 0.2940c 0.2961c 0.2725c
(0.2204) (0.2203) (0.2175)FIRST SIP + 1.1611 — —
(0.9324) — —
FIRST PRIVATIZ. + — 1.0861 —
— (0.5358) —
N of groups/events 62/30 62/30 62/30N of observations 312 312 312Log likelihood −85.23 −85.23 −83.06
The table presents the results from the duration model estimated using the data from seven three-year sub-periods covering the pe-riod from 1980 to 2000. We model the duration between a country's entry in our sample and its official equity market liberalization.The countries that did not liberalize their equity markets in the period from 1980 to 2000 are treated as right-censored. The explanatoryvariables are lagged three-year averages of the data. Model 5 includes regional indicators. The table reports hazard ratios and the asso-ciated standard errors (in parenthesis).
a Statistically significant at 1% level.b Statistically significant at 5% level.c Statistically significant at 10% level.
95I. Kaya et al. / Emerging Markets Review 13 (2012) 78–99
global factors from the regression analysis would introduce an omitted variable bias. Instead of attemptingto identify all relevant global factors (many of which could be latent variables) we recognize that all coun-tries are exposed to the same global factors (i.e. there is no cross-sectional variation in the global factors),and therefore, controlling for the global factors is analogous to controlling for a time trend. The Cox pro-portional hazardmodel implicitly accounts for the presence of a time trend since the effect of all the covariatesthat do not vary cross-sectionally is subsumed in the baseline hazard. As an additional robustness test, how-ever, we estimate a panel probit model which explicitly accounts for the temporal trend in the pace of stockmarket liberalization reforms by including time fixed effects.28 The results from the panel probit estimationare largely consistent with the results from the Cox model, which further attests to the robustness of ourmain findings.
28 These results are not reported, but are available upon request.

96 I. Kaya et al. / Emerging Markets Review 13 (2012) 78–99
Table 4 illustrates that there are important differences between the countries that liberalized their equitymarkets during our sample period and those that did not. Some observersmay argue that these two groups ofcountries are so fundamentally different that they should not be combined together.We address this concernby reestimating the duration models from Table 8 using only the subset of countries that liberalized theirequity markets in the period from 1980 to 2000. The results presented in Table 12 support themajority ofour previous findings. Specifically, the more industrialized countries which provide better investor protec-tion, have less interventionist and less nationalistic governments, and receive more foreign financial aid arelikely to liberalize their equity markets earlier than other countries.29
One of the most interesting results in the paper is the positive relationship between foreign financialaid and the likelihood of stock market liberalization. The most significant criticism against this findingarises from the potential endogeneity of foreign financial aid. We address this issue by using an instru-mental variables approach within the cross-sectional probit model. A valid instrumental variable wouldbe correlated with the endogenous explanatory variable, but uncorrelated with the error term (ε). There-fore, we need to identify a variable which can indirectly affect the government's decision to liberalize thedomestic equity markets through the foreign financial aid channel (and the other determinants of theliberalization decision), but cannot have an independent effect on the regressand. One variable that potential-ly fits this description is the country's colonial past. Alesina andDollar (2000) document that: “Factors such ascolonial past and voting patterns in the United Nations explain more of the distribution of [foreign financial]aid than the political institutions or economic policy of the recipients” (p.55). Colonial past is potentially avalid instrumental variable, because it can affect the stock market liberalization decision through the foreignfinancial aid channel (and through someof the other explanatory variables in themodel, such as the country'slegal origin), but does not have an independent effect on the dependant variable.
Table 13 illustrates the results from a cross-sectional instrumental variable (IV) probit estimationwhere the instrumented variable is “All donors financial aid” and the instruments are dummy variablesfor British, French, Spanish, and Portuguese colonial past. The coefficient on the instrumented foreign fi-nancial aid variable is similar in magnitude to the one that we obtain in the probit model in Table 7,and is significant at the one percent level. This result alleviates the endogeneity concerns and reinforcesour finding that foreign financial aid is an important determinant of the government's decision to liberalizethe domestic equity markets.30
Economic policy changes are often implemented as a response to financial crises. To address this issuewe use the banking crises indicator variable from Beck et al. (2006) which equals to one if the country isexperiencing a banking crises and zero otherwise. The banking crises dummy variable is not significantlyrelated to the likelihood of a stock market liberalization in any of our regressions and including it does notaffect our main findings.31
Finally, our main results remain qualitatively unchanged when we drop the microstates (countrieswith less than 1 million inhabitants) and when we control for membership in OPEC (Organization of thePetroleum Exporting Countries).32
6. Conclusion
In this paper we analyze some of the factors that can potentially influence the government's decision toallow foreign investors to purchase domestic equity securities. We document that both political and eco-nomic factors affect the stock market liberalization decision. Specifically, the more industrialized coun-tries, which have higher levels of financial development, provide better legal protection of minorityshareholder rights and have less interventionist governments are more likely to liberalize their equitymarkets. Regarding the political factors, nationalist governments are less likely to allow foreign investors
29 The proxy for the development of the stock market “MARKET TURNOVER” is only marginally significant in both specifications(p-values of 0.12 and 0.11 respectively).30 The results are also robust to winsorizing the foreign financial aid variable at the five percent level (which lessen the effect ofoutliers), and dropping Israel and Egypt from the sample (because they are the largest recipients of aid from the United States, whichis also the largest donor of foreign financial aid).31 These results are not reported, but are available upon request.32 Controlling for OPEC membership addresses the concern that the availability of a valuable natural resource can alleviate thepressure on the government to pursue market oriented reforms. These results are not reported, but are available upon request.

Table 12Cox proportional hazard estimates for the subsample of liberalized countries (Models 1–2).
Hypoth. effect Model 1 Model 2
GNI PER CAPITA +/− 0.9999 0.9999(0.0002) (0.0002)
POPULATION +/− 0.9958c 0.9948b
(0.0024) (0.0025)COMMON LAW + 2.9068b 4.04663b
(1.5749) (2.3329)TRADE OPENNESS + 1.0049 0.9985
(0.0102) (0.0105)FOREIGN DIR. INV. + 0.8409 0.8444
(0.15137) (0.1504)BLACKMKTPREM − 0.8101b 0.7836a
(0.0717) (0.0718)GOV. CONSUMPT. − 0.8365b 0.8505c
(0.0658) (0.0714)AGRICULTURE − 0.9680 0.9655
(0.0399) (0.0353)INDUSTRY + 1.0677c 1.0676c
(0.0373) (0.03638)PRIVATE CREDIT + 1.0002 1.0079
(0.0142) (0.0147)MARKET TURNOVER + 1.0316 1.0332
(0.0211) (0.0215)ALL DONORS +/− 1.0006b 1.0006b
(0.0003) (0.0003)NATIONALIST − — 0.2495c
— (0.2014)N of groups/events 30/30 30/30N of observations 102 102Log likelihood −74.97 −73.19
The table presents the results from the duration model estimated using the data from seven three-year sub-periods covering the pe-riod from 1980 to 2000. We model the duration between a country's entry in our sample and its official equity market liberalization.The official equity market liberalization indicator variable takes the value of one in and after the three-year period of the stock mar-ket liberalization, and zero otherwise. The explanatory variables are lagged three-year averages of the data. The table reports hazardratios and the associated standard errors (in parenthesis).
a Statistically significant at 1% level.b Statistically significant at 5% level.c Statistically significant at 10% level.
97I. Kaya et al. / Emerging Markets Review 13 (2012) 78–99
to purchase domestic equity securities, whereas governments that receive more foreign financial aid, es-pecially bilateral aid, are more likely to liberalize their equity markets.33
The positive relationship between foreignfinancial aid and the likelihood of a stockmarket liberalization isa promising area for future research. The exact channels through which foreign financial aid influences thedomestic government's decision to liberalize the national stockmarkets are unclear. One possible interpreta-tion is that the recipient governments use the foreign financial aid to compensate the politically powerfulgroups that would otherwise oppose the liberalization of the stock markets, or that the “donors” usethe foreign financial aid to “purchase” the support of the government officials for the liberalization reforms.This research has important policy implications since foreign aid has long been considered ineffective at pro-moting economic growth. Our findings may indicate the presence of an indirect link between aid and growthwhere foreign financial aid increases the likelihood of a stock market liberalization, which in turn promoteseconomic growth.
33 As with the majority of empirical work on the causes and effects of economic reforms, our results should be interpreted withcaution. While we have tried to address the issue of causality with a series of robustness tests including various econometric tech-niques it is important to acknowledge that the endogeneity issues are only alleviated and not fully resolved.

Table 13Cross-sectional instrumental variable estimates.
Hypoth. sign IV probit estimate
ALL DONORS FINANCIAL AID +/− 0.0058a
(0.0018)GNI PER CAPITA, LOG +/− 0.9667
(0.6784)POPULATION +/− 0.0623
(0.0432)COMMON LAW + 1.8095c
(1.0901)TRADE OPENNESS + 0.0039
(0.0132)FOREIGN DIRECT INVESTMENT + 0.7365b
(0.3839)BLACK MARKET PREMIUM INDEX − −0.3437b
(0.1716)GOVERNMENT CONSUMPTION − −0.1828
(0.1217)AGRICULTURE − −0.0928
(0.0661)PRIVATE CREDIT + 0.0175
(0.0230)MARKET TURNOVER + 0.0154
(0.0215)N of observations 60Log likelihood −464.5
The dependent variable takes the value of one if the country liberalized its national stock market in the period from 1980 to 2000,and zero otherwise. The instrumented variable is “ALL DONORS FINANCIAL AID” and the instruments are dummy variables for British,French, Spanish, and Portuguese colonial past. For the countries that liberalized their national stock markets, the explanatoryvariables are averaged over the five years preceding the liberalization year. For the countries that did not liberalize their equitymarkets, the explanatory variables are averaged over the five years preceding the liberalization year of their closest geographicneighbor. The table reports the coefficients and standard errors (in parentheses).
a Statistically significant at 1% level.b Statistically significant at 5% level.c Statistically significant at 10% level.
98 I. Kaya et al. / Emerging Markets Review 13 (2012) 78–99
References
Alesina, A., Dollar, D., 2000. Who gives foreign aid to whom and why? Journal of Economic Growth 5, 33–63.Beck, T., Demirgüç-Kunt, A., Levine, R., 2003. Law and finance: why does legal origin matter? Journal of Comparative Economics 31,
653–675.Beck, T., Demirgüç-Kunt, A., Levine, R., 2006. Bank concentration, competition, and crises: first results. Journal of Banking and Finance
30, 1581–1603.Bekaert, G., Harvey, C.R., 2000. Foreign speculators and emerging equity markets. Journal of Finance 55, 565–613.Bekaert, G., Harvey, C.R., 2002. Chronology of important financial, economic and political events in emerging markets. http://www.
duke.edu/~charvey/chronology.htm.Bekaert, G., Harvey, C.R., Lundblad, C., 2003. Equity market liberalization in emerging markets. Journal of Financial Research 26,
275–299.Bekaert, G., Harvey, C.R., Lundblad, C., 2005. Does financial liberalization spur growth? Journal of Financial Economics 77, 3–55.Bekaert, G., Harvey, C.R., Lundblad, C., 2006. Growth volatility and financial liberalization. Journal of International Money and Finance
25, 370–403.Blair Henry, P., 2000a. Stock market liberalization, economic reform and emerging market equity prices. Journal of Finance 55,
529–564.Blair Henry, P., 2000b. Do stock market liberalizations cause investment booms? Journal of Financial Economics 58, 301–334.Blair Henry, P., 2003. Capital-account liberalization, the cost of capital and economic growth. American Economic Review 93, 91–96.Boehmer, E., Nash, R.C., Netter, J.M., 2005. Bank privatization in developing and developed countries: cross-sectional evidence on the
impact of economic and political factors. Journal of Banking and Finance 29, 1981–2013.Boone, P., 1996. Politics and effectiveness of foreign aid. European Economic Review 40, 289–329.Bourguignon, F., Sundberg, M., 2007. Aid effectiveness — opening the black box. American Economic Review 97, 316–321.Burnside, C., Dollar, D., 2000. Aid, policies and growth. American Economic Review 90, 847–868.Chari, A., Blair Henry, P., 2004. Risk sharing and asset prices: evidence from a natural experiment. Journal of Finance 59, 1295–1324.Cox, D., 1972. Regression models and life-tables. Journal of the Royal Statistical Society 34, 187–220.

99I. Kaya et al. / Emerging Markets Review 13 (2012) 78–99
Cuñado, J., Gómez Biscarri, J., Pérez de Gracia, F., 2006. Changes in the dynamic behavior of emerging market volatility: revisiting theeffects of financial liberalization. Emerging Markets Review 7, 261–278.
Demirguc-Kunt, A., Maksimovic, V., 1999. Institutions, financial markets, and firm debt maturity. Journal of Financial Economics 54,295–336.
Djankov, S., La Porta, R., Lopez-de-Silanes, F., Shleifer, A., 2002. The regulation of entry. Quarterly Journal of Economics 107, 1–37.Djankov, S., La Porta, R., Lopez-de-Silanes, F., Shleifer, A., 2008. The law and economics of self-dealing. Journal of Financial Economics
88, 430–465.Easterly, W., 2003. Can foreign aid buy growth? Journal of Economic Perspectives 17, 23–48.Easterly, W., 2007. Was development assistance a mistake? American Economic Review 97, 328–332.Easterly, W., Levine, R., Roodman, D., 2004. Aid, policies and growth: comment. American Economic Review 94, 774–780.Ghosh, C., Harding, J., Phani, B., 2008. Does liberalization reduce agency costs? Evidence from the Indian banking sector. Journal of
Banking and Finance 32, 405–419.Glaeser, E., La Porta, R., Lopez-de-Silanes, F., Shleifer, A., 2004. Do institutions cause growth? Journal of Economic Growth 9, 271–303.Gwartney, J., Lawson, R., 2006. Economic Freedom of the World: 2006 Annual Report. The Fraser Institute, Vancouver. http://www.
freetheworld.com.Heckelman, J., Knack, S., 2008. Foreign aid and market-liberalizing reform. Economica 75, 524–548.Knack, S., 2001. Aid dependence and the quality of governance: cross-country empirical tests. Southern Economic Journal 68,
310–329.Knack, S., 2004. Does foreign aid promote democracy? International Studies Quarterly 48, 251–266.Kuziemko, I., Werker, E.D., 2006. How much is a seat on the security council worth? Foreign aid and bribery at the united nations.
Journal of Political Economy 114, 905–930.La Porta, R., Lopez-de-Silanes, F., Shleifer, A., Vishny, R.W., 1998. Law and finance. Journal of Political Economy 106, 1113–1155.La Porta, R., Lopez-de-Silanes, F., Shleifer, A., Vishny, R.W., 1999. The quality of government. Journal of Law, Economics, and Organi-
zation 15, 222–270.La Porta, R., Lopez-de-Silanes, F., Shleifer, A., 2002. Government ownership of banks. Journal of Finance 57, 265–301.Martell, R., Stulz, R.M., 2003. Equity market liberalizations as country IPO's. American Economic Review 93, 97–101.Megginson, W.L., Nash, R.C., Netter, J.M., Poulsen, A.B., 2004. The choice of private versus public capital markets: evidence from pri-
vatizations. Journal of Finance 59, 2835–2870.Moshirian, F., 2008. Globalisation, growth and institutions. Journal of Banking and Finance 32, 472–479.Rajan, R.G., Subramanian, A., 2007. Does aid affect governance? American Economic Review 97, 322–327.Rajan, R.G., Subramanian, A., 2008. Aid and growth: what does the cross-country evidence really show? Review of Economic Studies
90, 643–665.Rajan, R.G., Zingales, L., 2003. The great reversals: the politics of financial development in the twentieth century. Journal of Financial
Economics 69, 5–50.Umutlu, M., Akdeniz, L., Altay-Salih, A., 2010. The degree of financial liberalization and aggregated stock-return volatility in emerging
markets. Journal of Banking and Finance 34, 509–521.
Copyright © 2022 FDOKUMEN