![DTY``]d UVdVceVU Rd GR]]Vj VUXj - Daily Pioneer](https://static.fdokumen.com/doc/165x107/633bb4a374fc2f28f3012c1b/dtyd-uvdvcevu-rd-grvj-vuxj-daily-pioneer.jpg)
tJrn tk VJ-iJml ~e/J/i, &zdd June 30, 2005 - Greensboro-nc.gov
269
,_,,,,_,,,, • Reptni tJrn tk VJ-iJml &zdd June 30, 2005
-
Upload
khangminh22 -
Category
Documents
-
view
2 -
download
0
Transcript of tJrn tk VJ-iJml ~e/J/i, &zdd June 30, 2005 - Greensboro-nc.gov

~.,,,,,,J/ ,_,,,,_,,,, • IJ~ ~ Reptni tJrn tk VJ-iJml ~e/J/i, &zdd June 30, 2005

e4 af, q~, JYMik e~a e001f'~ II~~ l<epa/d tflcn the tfltdod fjecU ~ /une 30, 2005
Prepared by the
City of Greensboro
Finance Department
Richard L. Lusk Finance Director
Sherry E. Carson Administrative Assistant
Marlene F. Druga Financial Reporting Manager
Jeffrey L. Roberts
Investment Manager
Bonnie G. Harvell Senior Financial Analyst
Roberta K. Johnson Senior Financial Analyst
Pattie G. Elwood Senior Accountant
Susan C. Wuchae Accounting Manager
Anita B. Wilson Assistant Accounting Manager
Christina N. Smith Senior Accountant
James R. HoKield Senior Accountant
Gregory L. Jenkins, II Senior Accountant

1k 2005 eC9##f~ II~ q~ RepMi u ckdioate.d b
1~ e4 A1~ rf uw.a-u1, J:dohut
This year's Comprehensive Annual Financial Report is dedicated to former City Manager Ed Kitchen, who retired in August 2005 after 30 years of public service with the City of Greensboro. This dedication is particularly appropriate given Ed's strong interest in and commitment to stewardship of public resources.
During his nine-year tenure as City Manager, Ed managed the City's budget and finances in a conservative manner which maintained our AAA bond rating and consequently the lowest possible interest rate on bond issues. This conservatism stood us in good stead during times of unpredictable financial crisis, such as when the state unexpectedly withheld City revenues to balance its budget.
Ed also guided economic development efforts in Greensboro. These included the merger of multiple local economic development groups into one and the creation of a special Assistant City Manager for Economic Development. He particularly supported downtown revitalization in projects such as the creation of Center City Park and the attraction of Elon University's law school to Greensboro's central business district.
Ed's leadership in ensuring our future water supply resulted in adequate water for the next thirty-five plus years and sewer capacity to service growth for the next fifteen years. This was achieved in a city with no natural water source, at the top of the water basin, and which at the time of Ed's becoming manager was extremely vulnerable to drought and facing growth restriction.
Capital improvements and technology initiatives flourished under Ed as well -the new downtown library, the Parks and Recreation master plan, a Public Safety Training Center, Police District Stations, and a new multi-purpose community operations center named for him. Our Parks & Recreation and Housing programs have won national awards, Police and Fire achieved national accreditation and the Fire Department received an ASO I rating. The historic Greensboro Depot was also renovated into a state of the art transportation facility linking rail and bus services. The City underwent significant computer system upgrades and implemented a centralized citizen Contact Center to improve service delivery.
Finally, the City gratefully acknowledges Ed's leadership of our internal strategic planning efforts and the first true Comprehensive Plan for City growth.
Thank you, Ed, for your valued service to the community and City government.

CITY OF GREENSBORO Comprehensive Annual Financial Report For the Fiscal Year Ended June 30, 2005
Table of Contents Exhibit Page Number Number Introductory Section Letter of Transmittal .......................................................................................................................................................................I Certificate of Achievement for Excellence in Financial Reporting .............................................................................................. XI Organizational Chart ................................................................................................................................................................... XII City Officials ............................................................................................................................................................................... XIII Financial Section Independent Auditor’s Report Management’s Discussion and Analysis ......................................................................................................................................1 Basic Financial Statements: I. Government-Wide Financial Statements: Statement of Net Assets ............................................................................................ A-1 ..................................................2 Statement of Activities ............................................................................................... A-2 ..................................................4 II. Fund Financial Statements: Balance Sheet-Governmental Funds ......................................................................... A-3 ..................................................6 Reconciliation of the Balance Sheet of Governmental Funds to the Statement of Net Assets ................................................................... A-4 ..................................................7 Statement of Revenues, Expenditures, and Changes in Fund Balances-Governmental Funds .................................................................... A-5 ..................................................8 Reconciliation of the Statement of Revenues, Expenditures, and Changes in Fund Balances of Governmental Funds to the Statement of Activities ........................................................................................... A-6 ..................................................9 Statement of Revenues, Expenditures, and Changes in Fund Balances-Budget to Actual-General Fund .................................................... A-7 ................................................10 Statement of Revenues, Expenditures, and Changes in Fund Balances-Budget to Actual– Housing Partnership Revolving Fund ...................................................................................................... A-8 ................................................11 Statement of Net Assets-Proprietary Funds .............................................................. A-9 ................................................12 Reconciliation of the Statement of Net Assets of Proprietary Funds to the Statement of Net Assets ……………………………. ………………... A-10………………………………….16

Exhibit/ Schedule Page Number Number Statement of Revenues, Expenses, and Changes in Fund Net Assets-Proprietary Funds .................................................................... A-11 ................................................17 Reconciliation of the Statement of Revenues, Expenses, and Changes in Fund Net Assets of Proprietary Funds to the Statement of Activities ......................................................................................... A-12 ................................................19 Statement of Cash Flows-Proprietary Funds .......................................................... A-13 ................................................20 Police Special Separation Allowance Fund: Statement of Fiduciary Net Assets-Fiduciary Fund ............................................. A-14 ................................................25 Statement of Changes in Fiduciary Net Assets-Fiduciary Fund .......................... A-15 ................................................26 Statement of Net Assets-Component Units ............................................................ A-16 ................................................27 Statement of Activities-Component Units ............................................................... A-17 ................................................28 III. Notes to the Financial Statements……………………………………………………………………... .....................................30 Required Supplementary Information: Schedule of Funding Progress ........................................................................................ 1 ................................................31 Schedule of Employer Contributions ............................................................................... 2 ................................................32 Combining and Individual Fund Statements and Schedules: Combining Balance Sheet-Nonmajor Funds: Governmental Funds ................................................................................................. 3 ................................................33 Special Revenue Funds ............................................................................................. 4 ................................................34 Capital Projects Funds ............................................................................................... 5 ................................................36 Combining Statement of Revenues, Expenditures, and Changes in Fund Balances-Nonmajor Funds: Governmental Funds ................................................................................................. 6 ................................................40 Special Revenue Funds ............................................................................................. 7 ................................................41 Capital Projects Funds ............................................................................................... 8 ................................................43 Schedule of Changes in Long-Tem Debt-Enterprise Funds ......................................... 9 ................................................47 Statement of Revenues, Expenses, and Changes in Fund Net Assets-Component Unit ........................................................................... 10 ................................................48 Statement of Cash Flows-Component Unit ................................................................ 11 ................................................49 Schedules of Revenues, Expenses, and Changes in Fund Balance-Budget and Actual-Component Unit: Greensboro Transit Authority ................................................................................... 12 ................................................51 Greensboro Transit Planning and Grant Project Fund ............................................ 13 ................................................53 Greensboro Transit Authority Multi Modal Transportation Center ........................... 14 ................................................54 Schedules of Revenues, Expenditures, and Changes in Fund Balance-Budget and Actual: General Fund: ............................................................................................................. 15 ................................................56

Schedule Page Number Number Special Revenue Funds: Street and Sidewalk ................................................................................................ 16 ................................................66 State Highway Allocation ........................................................................................ 17 ................................................67 Cemetery ................................................................................................................ 18 ................................................68 Hotel/Motel Occupancy Tax .................................................................................... 19 ................................................69 Special Tax Disctricts ............................................................................................. 20 ................................................70 Housing Partnership Revolving .............................................................................. 21 ................................................71 Community Development ....................................................................................... 22 ................................................72 Home Program ....................................................................................................... 23 ................................................74 Hope VI Program .................................................................................................... 24 ................................................75 Workforce Investment Act ....................................................................................... 25 ................................................76 Job Training Consortium ......................................................................................... 26 ................................................77 South Elm Street Redevelopment .......................................................................... 27 ................................................78 State and Federal Grants ....................................................................................... 28 ................................................79 Guilford Metro 911 .................................................................................................. 29 ................................................81 Debt Service Fund ...................................................................................................... 30 ................................................83 Capital Projects Funds: Street and Sidewalk ................................................................................................ 31 ................................................85 State Highway Allocation ........................................................................................ 32 ................................................86 General Capital Improvements ............................................................................... 33 ................................................87 Public Improvement Bond—Series 1990, 1992, 1994 and 1998 ............................ 34 ................................................88 Redevelopment Bond—Series 1994 ...................................................................... 35 ................................................89 Public Improvement Bond—Series 1998A ............................................................. 36 ................................................90 Public Improvement Bond—Series 1998B ............................................................. 37 ................................................91 Housing/Redevelopment Bond—Series 1998 ........................................................ 38 ................................................92 Street Improvement Bond —Series 2003 ............................................................... 39 ................................................93 Parks and Recreation Bond —Series 2003 and 2005A .......................................... 40 ................................................94 Fire Station Bond —Series 2003 and 2005A .......................................................... 41 ................................................95 Public Transportation Bond —Series 2003 and 2005A .......................................... 42 ................................................96 Natural Science Center Bond —Series 2005A ....................................................... 43 ................................................97 Law Enforcement Bond -Series 2003 ..................................................................... 44 ................................................98 Library Facilities Bond -Series 2003 and 2005A ..................................................... 45 ................................................99 Neighborhood Redevelopment Bond -Series 2005 ................................................ 46 ..............................................100 Perpetual Care Fund ..................................................................................................... ..............................................101

Schedule Page Number Number Enterprise Funds: Schedules of Revenues, Expenses, and Changes in Fund Balance-Budget and Actual: Water Resources ...................................................................................................... 47 ..............................................104 Water Resources Bond—Series 2001 ...................................................................... 48 ..............................................106 Water Resources Bond—Series 2003 ...................................................................... 49 ..............................................107 Water Resources Bond—Series 2005 ...................................................................... 50 ..............................................108 Guilford County Construction Project ...................................................................... 51 ..............................................109 Water Resources Capital Improvement ................................................................... 52 ..............................................110 Stormwater Management ........................................................................................ 53 ..............................................111 Stormwater Capital Improvement ............................................................................. 54 ..............................................113 War Memorial Coliseum ........................................................................................... 55 ..............................................114 War Memorial Coliseum Improvement ..................................................................... 56 ..............................................116 Parking Facilities ....................................................................................................... 57 ..............................................117 Solid Waste Management ......................................................................................... 58 ..............................................119 Solid Waste Capital Improvement ............................................................................ 59 ..............................................121 Solid Waste Bond—Series 2005 .............................................................................. 60 ..............................................122 Internal Service Funds: Combining Statement of Net Assets ............................................................................. 61 ..............................................124 Combining Statement of Revenues, Expenses and Changes in Fund Net Assets ...... 62 ..............................................126 Combining Statement of Cash Flows ........................................................................... 63 ..............................................128 Schedule of Changes in Long-Term Debt .................................................................... 64 ..............................................130 Schedules of Revenues, Expenses, and Changes in Fund Balance-Budget and Actual: Equipment Services .................................................................................................. 65 ..............................................132 Technical Services Fund .......................................................................................... 66 ..............................................134 City/County Telecommunications ............................................................................ 67 ..............................................136 Graphic Services ...................................................................................................... 68 ..............................................138 Employee Insurance ................................................................................................ 69 ..............................................140 General Insurance .................................................................................................... 70 ..............................................142 Capital Leasing ......................................................................................................... 71 ..............................................144 General Capital Assets: Schedule of General Capital Assets by Source ........................................................ 72 ..............................................146 Schedule of General Capital Assets by Function and Activity .................................. 73 ..............................................147 Schedule of Changes in General Capital Assets by Function and Activity ............... 74 ..............................................149 Schedule of Changes in General Long-Term Debt: ........................................................ 75 ..............................................151

Schedule/Table Page Number Number Statistical Section (unaudited) I. Fund Information: General Governmental Expenditures by Function ................................................................ I ..............................................154 General Governmental Revenues by Source ...................................................................... II ..............................................156 General Governmental Tax Revenues by Source .............................................................. III ..............................................158 Assessed Value of All Taxable Property .............................................................................IV ..............................................159 Property Tax Levies and Collections ...................................................................................V ..............................................160 Analysis of Current Tax Levy ..............................................................................................VI ..............................................162 Property Tax Rates—Direct and Overlapping Governments .............................................VII ..............................................163 Principal Taxpayers ..........................................................................................................VIII ..............................................165 Assessments Receivable and Collections ..........................................................................IX ..............................................166 Computation of Legal Debt Margin ......................................................................................X ..............................................167 Ratio of Annual Debt Service Expenditures for General Obligation Bonded Debt to Total General Governmental Expenditures ............................................XI ..............................................168 Ratio of Net General Obligation Bonded Debt to Assessed Value and Net General Obligation Debt per Capita ..........................................................................XII ..............................................169 Computation of Direct and Overlapping Bonded Debt—General Obligation Bonds .........XIII ..............................................171 Revenue and Special Obligation Bond Coverage ........................................................... XIV ..............................................172 II. Other Information: Demographic Statistics ..................................................................................................... XV ..............................................173 Miscellaneous Statistics ................................................................................................... XVI ..............................................174 Construction, Bank Deposits and Property Value ........................................................... XVII ..............................................175 Single Audit Section Independent Auditor’s Report on Internal Control Over Financial Reporting and on Compliance and Other Matters Based on an Audit of Financial Statements Performed in Accordance with Government Auditing Standards Independent Auditor’s Report on Compliance with Requirements Applicable to Each Major Federal Program and Internal Control over Compliance in Accordance with OMB Circular A—133 and the State Single Audit Implementation Act Independent Auditor’s Report on Compliance with Requirements Applicable to Each Major State Program and Internal Control over Compliance in Accordance with Applicable Sections of OMB Circular A—133 and the State Single Audit Implementation Act Schedule of Findings and Questioned Costs Schedule of Expenditures of Federal Awards ...............................................................................................................................178 Schedule of Expenditures of State Awards ..................................................................................................................................184 Schedule of Expenditures by Program and Cost Category—Job Training Partnership Act .........................................................186 Notes to the Schedule of Expenditures of Federal and State Awards ..........................................................................................187

640
October 7, 2005
The Honorable Mayor
City of Greensboro North Carolina
And Members of the City Council Greensboro, North Carolina
The Comprehensive Annual Financial Report of the City of Greensboro, North Carolina for the fiscal year ended June 30, 2005, is submitted for your review. This report was prepared by the City's Finance Department and it is the comprehensive publication of the City's financial position and results of operations for the fiscal year ended June 30, 2005, for all funds and component units of the City. Responsibility for both the accuracy of the presented data and the completeness and fairness of the presentation, including all disclosures, rests with City management. To provide a reasonable basis for making these representations, we have established a comprehensive internal control framework that is designed both to protect the government's assets from loss, theft, or misuse and to compile sufficient reliable information for the preparation of the City of Greensboro's financial statements in conformity with generally accepted accounting principles (GAAP). Because the cost of internal controls should not outweigh their benefits, the City's comprehensive framework of internal controls has been designed to provide reasonable rather than absolute assurance that the financial statements will be free from material misstatement. As management, we believe the data, as presented, is accurate in all material respects and is reported in a manner designed to present fairly the financial position and results of operations of the various funds and component units of the City. All disclosures necessary to enable the reader to gain an understanding of the City's financial activities have been included.
The City is required by state law to have an annual independent financial audit. A compliance audit on federal and state financial assistance programs is also required under the Federal Single Audit Act of 1984 and the State Single Audit Implementation Act. The independent auditors' report on the Basic Financial Statements is included in the Financial Section of this report. The independent auditor concluded, based upon the audit. that the financial statements of the City of Greensboro present fairly in conformity with GAAP, in all material respects, the financial position of the City of Greensboro, North Carolina, as of June 30, 2005. In addition, the auditors' reports, required as part of a single audit , are found in the Single Audit Section of this report. This report focuses not only on the fair presentation of the financial statements, but also on the City's internal controls and compliance with legal requirements involving the administration of state and federal awards.
The Comprehensive Annual Financial Report is presented in four sections: ( I) Introductory Section; (2) Financial Section; (3) Statistical Section; and (4) Single Audit Section.
The Introductory Section includes this transmittal letter, the Certificate of Achievement for Excellence in Financial Reporting for the fiscal year ended June 30, 2004, the City's organization chart and a listing of the City's principal officials.
The Financial Section includes the independent auditors' report, the management's discussion and analysis (MD&A), the Basic Financial Statements composed of government-wide and fund financial statements, with supporting statements included, and notes to the financial statements deemed necessary to present fairly the financial position of the City. GMP require that management provide a narrative introduction, overview, and analysis to accompany the Basic Financial Statements in the form of the MD&A. This letter of transmittal is designed to complement MD&A and should be read in conjunction with it. The City of Greensboro's MD&A can be found immediately following the report of the independent auditors.
P 0 . Box 3136 • Greensboro, NC 27402-3136 · www.greensboro-nc.gov · (336) 373-2065 • TTY # 333-6930

II
In addition, Supplementary Information is presented in this section displaying all individual funds by classification of the City. Although these statements are not considered necessary for a fair presentation of the financial position or results of operations and cash flows, they are presented for supplementary analysis purposes and have been subjected to auditing procedures applied by the independent auditors in the audit of the Basic Financial Statements. Required Supplementary Information pertaining to contributions and funding progress of the City’s Law Enforcement Officers’ Special Separation Allowance is also included in this section. The Statistical Section includes selected financial data trends of the City and its operations and local demographic and economic information. The Single Audit Section presents information in conformity with provisions of the Federal and State Single Audit Acts, which establish audit requirements for state and local governments that receive federal and state financial assistance. It includes detail grant schedules and independent auditors' reports on the internal control structure and compliance with applicable laws and regulations. In conformity with the standards of the Governmental Accounting Standards Board, this report includes all funds of the City, as well as all of its component units. Component units (blended or discrete) are legally separate entities, for which the City is financially accountable. Blended component units are, in substance, part of the City’s operations. The City’s one blended component unit, the Greensboro Center City Corporation, is reported in the Proprietary Funds. Discretely presented component units are not considered to be part of the City’s primary operations and, therefore, are reported in total as a separate column to differentiate their financial position, results of operations and cash flows from those of the City. The Greensboro Housing Development Partnership, Inc., the Greensboro Transit Authority and the Greensboro ABC Board are presented as discrete component units. Additional information on all three of these legally separate entities can be found in Note I. A. PROFILE OF THE GOVERNMENT The City of Greensboro is located in central piedmont North Carolina, midway between Washington, D.C. and Atlanta. The Town was incorporated in 1808 and is the county seat of Guilford County. Greensboro has a population of 238,440 and presently covers a land area of approximately 121.5 square miles. The City is empowered to levy a property tax on the appraised value of all real and certain categories of tangible personal property located in the City. The County is the only other unit levying such taxes within the City's corporate limits. The City is also empowered by state statute to extend its corporate limits by annexation, which occurs periodically when deemed appropriate by the governing council. The City operates as a Council-Manager form of government. The Council is the policy-making and legislative body of City government and includes a Mayor and eight Council members who serve two-year concurrent terms. The Mayor and three Council members are elected at-large and the remaining five Council members are elected from districts within the City. The Mayor is a voting member and the presiding officer of the Council. A Mayor Pro Tempore is selected by the Council from its members. The City Manager is appointed by the Council as Chief Executive Officer and is responsible for carrying out the policies and ordinances of the Council and administering the daily operations and programs of the City through appointed department directors and staff members. The City provides services to its citizens in the following areas: police, fire, transportation, environmental services, water resources, parks and recreation, libraries, housing and community development, public improvements and general administration. The City also operates an arena, auditorium and exhibition building complex, golf course facilities, downtown parking facilities and government access cable television.

III
The annual budget serves as the foundation for the City’s financial planning and control. The North Carolina General Statutes require all governmental units to adopt a balanced budget by July 1 of each year for all funds for which a budget is required. Activities of the General Fund, Special Revenue Funds (except for Grant Project Funds), Debt Service Fund, and Proprietary Funds are included in the annual appropriated budget. Project-length financial plans are adopted for Grant and Capital Projects Funds. Budgetary control is facilitated by the use of a personnel/payroll data system that requires every position, including applicable fringe benefits, be budgeted. Also, the North Carolina General Statutes require an encumbrance system and a finance officer's “pre-audit” certification that funds are available prior to the placement of all purchase orders and contracts. Outstanding purchase orders and contracts are reported as a reservation of fund balance at June 30, 2005. The appropriated budget is prepared by fund, function (e.g. public safety), and department (e.g. police). The City Manager then presents the proposed budget to Council for review as well as the citizens of Greensboro for questions and/or concerns. The City Manager may make transfers of appropriations within funds and department heads may make transfers of appropriations within a department. Transfers of appropriations between funds, however, require the special approval of the governing council. Budget-to-actual comparisons are provided in this report for each individual governmental fund for which an appropriated annual budget has been adopted. Budgetary comparisons for the General Fund and Housing Partnership Revolving Fund (Special Revenue Fund) are presented on pages 10 and 11 as part of the Basic Financial Statements. Detailed budget to actual comparisons for other funds with annual and project-length budgets are presented in the supplementary information subsection of this report, which starts on page 33.
COUNCIL BUDGET PRIORITIES
• Maintain a Stable Property Tax Rate • Continue Basic City Services and Programs • Develop New Revenue Sources for New Services and Programs • Enhance Financial Condition and Continue Fund Balance Policies • Maintain Enterprise Funds with User Fees • Continue Productivity Improvements • Provide Adequate Employee Compensation
Within these priorities, six strategic issues were the primary focus for FY 2004-05 funding:
• Economic Development, particularly in the downtown area • Public Safety • Protection of Natural Resources and Growth Management • Maintenance of Existing Facilities and Assets • Community Relations • Fiscal Management
FACTORS AFFECTING FINANCIAL CONDITION A. Local Economy
Greensboro's diverse economy is attributed to its unique blend of trade, manufacturing and service businesses. Local industry is characterized by the production of a wide range of products, including textiles, apparel, tobacco, machinery and electronics equipment, with increased emphasis on the service industry. Citi Cards, the largest provider of credit card products in North America, recently completed a state-of-the-art facility that will add 1,000 new jobs to it’s Greensboro-based operation. This area experiences an excellent market location which has access to all major domestic and international markets from Interstate Highways 40 and 85, and the Piedmont Triad International Airport. Plans are in progress for a new interstate system (I-73) that will span North Carolina, joining Detroit and Charleston, including Greensboro en route. In northern Greensboro, U.S. 29, between Danville and Greensboro, has also been designated as Interstate 785. In addition, the Urban Loop, a 40 mile beltway around Greensboro is under construction, at a cost of $900 million. The target date for overall completion of the Eastern, Southern and

IV
Western Loops is after 2010, however portions of the Southern section are open for travel. The Greensboro area is not only progressive in traditional connectivity, the City is a significant partner in a fiber optic network that facilitates data and telecommunications.
% Employment Distribution (Guilford County) Agrigulture & Mining 2,349 .87 Construction 13,229 4.89 Manufacturing 50,297 18.61 Transportation, Communications & Utilities
18,179
6.73
Wholesale Trade 19,025 7.04 Retail Trade 49,110 18.17 Finance, Insurance & Real Estate 15,925 5.89 Services 72,226 26.72 Government 29,944 11.08 270,284 100% Source: Greensboro Economic Development Partnership, 12/2004
Located in the vicinity of Piedmont Triad International Airport (“Airport”) are various major industrial and business parks covering about 700 acres. Existing office and industrial facilities located within 2½ miles of the airport exit off Interstate Highway 40 include more than three million square feet of office, office/showroom, warehouse/distribution, light industrial and hotel space. The Airport has recently been rated as the fastest growing airport facility in the nation by Aviation System Research, Inc., largely due to expansion and preparations for the $500 million Federal Express Mid-Atlantic Hub site, which is scheduled to be completed and operational in 2009. Also within the past year, Dell Inc., one of the world’s largest personal computer manufacturers made the decision to locate a plant in western Forsyth County, within 20 miles of the Airport. In October 2005, the Dell facility began operations, which has already increased the demand for ancilliary goods and services within the region. This move has set a precedence for the Piedmont Triad to change its textile and tobacco image to a hub for high-tech companies of all types. Greensboro is also home to many companies in the biotech and life science industry. North Carolina is ranked the nation’s third largest state in biotechnology (Ernst and Young-Global Biotechnology Report, 2004).
Revitalization of downtown has been energized with a variety of activities including new housing development, business location loans, business facade improvement programs, landscaping programs and public safety. A new $20 million minor league baseball stadium with a 6,000 seat capacity, opened in April 2005. The six-acre tract surrounding the new stadium is also planned to include new residential and commercial development. Amtrak train service also recently began operations in The Depot, downtown Greensboro’s newly renovated transportation hub. Beginning in late FY 2003-04, a Business Improvement Disctrict was established for downtown Greensboro with a separate tax rate of $.09 for properties within the district boundaries. Area businesses have experienced moderate growth and development overall in the past year, and the economic slowdown of recent years in the Piedmont Triad region is improving, as evidenced in the following statistics.
V
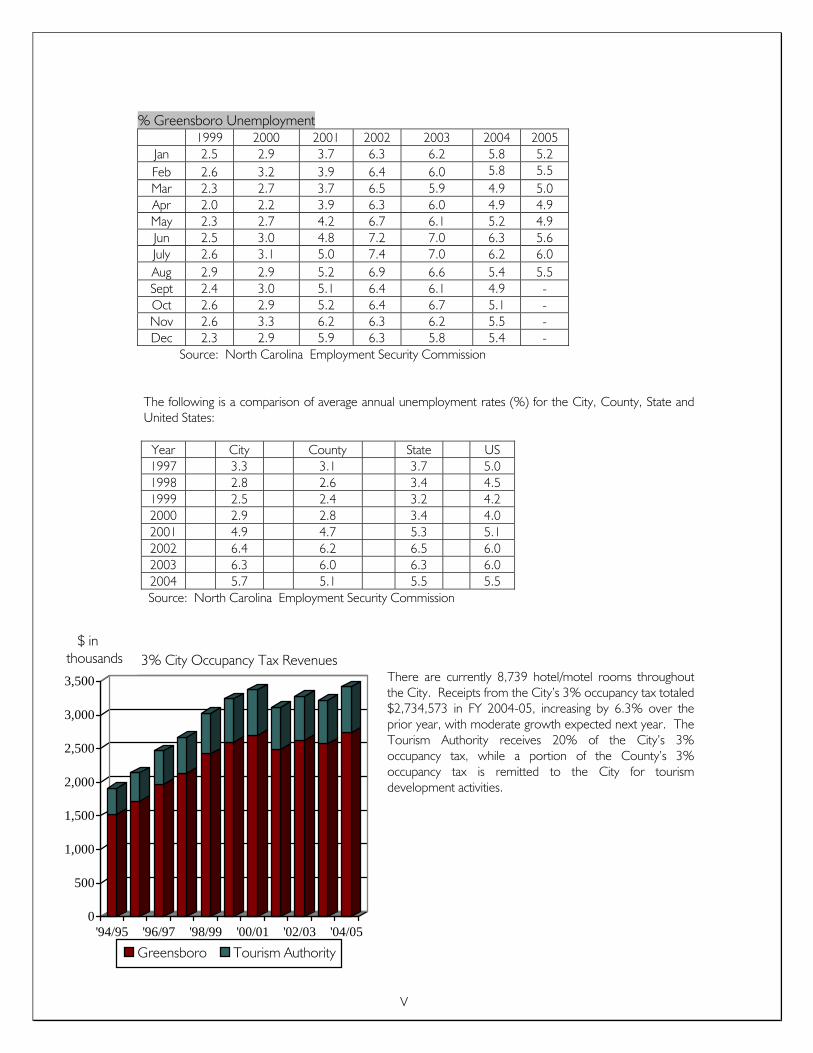
% Greensboro Unemployment
1999 2000 2001 2002 2003 2004 2005 Jan 2.5 2.9 3.7 6.3 6.2 5.8 5.2 Feb 2.6 3.2 3.9 6.4 6.0 5.8 5.5 Mar 2.3 2.7 3.7 6.5 5.9 4.9 5.0 Apr 2.0 2.2 3.9 6.3 6.0 4.9 4.9 May 2.3 2.7 4.2 6.7 6.1 5.2 4.9 Jun 2.5 3.0 4.8 7.2 7.0 6.3 5.6 July 2.6 3.1 5.0 7.4 7.0 6.2 6.0 Aug 2.9 2.9 5.2 6.9 6.6 5.4 5.5 Sept 2.4 3.0 5.1 6.4 6.1 4.9 - Oct 2.6 2.9 5.2 6.4 6.7 5.1 - Nov 2.6 3.3 6.2 6.3 6.2 5.5 - Dec 2.3 2.9 5.9 6.3 5.8 5.4 -
Source: North Carolina Employment Security Commission
The following is a comparison of average annual unemployment rates (%) for the City, County, State and United States: Year City County State US 1997 3.3 3.1 3.7 5.0 1998 2.8 2.6 3.4 4.5 1999 2.5 2.4 3.2 4.2 2000 2.9 2.8 3.4 4.0 2001 4.9 4.7 5.3 5.1 2002 6.4 6.2 6.5 6.0 2003 6.3 6.0 6.3 6.0 2004 5.7 5.1 5.5 5.5 Source: North Carolina Employment Security Commission
There are currently 8,739 hotel/motel rooms throughout the City. Receipts from the City’s 3% occupancy tax totaled $2,734,573 in FY 2004-05, increasing by 6.3% over the prior year, with moderate growth expected next year. The Tourism Authority receives 20% of the City’s 3% occupancy tax, while a portion of the County’s 3% occupancy tax is remitted to the City for tourism development activities.
0
500
1,000
1,500
2,000
2,500
3,000
3,500
'94/95 '96/97 '98/99 '00/01 '02/03 '04/05
3% City Occupancy Tax Revenues
Greensboro Tourism Authority
$ in thousands

VI
Greensboro Area Largest Employers Company
Product / Service
Approximate Number of Full-Time Employees
Guilford County Public Schools Education 7,900 Moses H.Cone Health System & Affiliates
Health Care
7,000
U.S. Postal Service Postal Service 3,367 Guilford County Government 3,000 City of Greensboro Government 2,995 American Express, Inc. Credit Card Services 2,100 United Parcel Service Shipping 2,066 Lorillard Tobacco Company Cigarettes 1,950 The University of North Carolina at Greensboro Education 1,940 Bank of America, N.A. Banking Services 1,900 VF (Vanity Fair) Corporation Apparel 1,500 Gilbarco Veeder-Root Service Station Equipment 1,500 TIMCO Aviation Services, Inc. Aircraft Maintenance 1,500 International Textile Group Textile 1,500 RF Micro Devices Semiconductors 1,500 Volvo Trucks North America Truck Production 1,475 Tyco Electronics Corporation Electronics 995 Procter & Gamble Corporation Consumer Products 900 Source: Greensboro Chamber of Commerce, June 2005
Growth in Assessed Valuation
13,500,00014,000,00014,500,00015,000,00015,500,00016,000,00016,500,00017,000,00017,500,00018,000,00018,500,00019,000,00019,500,00020,000,00020,500,00021,000,00021,500,000
1999 2000 2001 2002 2003 2004* 2005
5.0%
4.7%
5.2%3.4%
.5%3.1%
24.3%
($ 000’s)
*2004 Revaluation Year

VII
Population Characteristics
Median
Age
Median Household
Income
% Households Earning
>$20,000 Greensboro 33.0 $34,656 77.2 Guilford County 35.6 37,805 79.3 North Carolina 35.7 35,356 76.4 United States 36.0 38,201 NA Source: Sales and Marketing Management Magazine, 2004 Book of County Demographics, 2004 U.S.Census, 2000
Business Investment FY2005 Summary
New Jobs Investment
Expanding Firms 1,010 $ 4,500,000 New Firms 2,063 163,800,000 Total 3,073 $ 168,300,000
Source: Greensboro Chamber of Commerce
Retail Sales Data Fiscal Year
Retail Sales
% Increase Over Previous Year
1992 $3,897,081,800 3.4 1993 4,172,198,401 7.1 1994 4,684,753,591 12.3 1995 5,280,097,083 12.7 1996 5,344,766,815 1.2 1997 5,624,445,628 5.2 1998 6,080,301,316 8.1 1999 6,450,317,470 6.1 2000 6,365,659,377 (1.3) 2001 6,573,713,784 3.3 2002 5,929,164,086 (9.8) 2003 5,780,945,375 (2.5) 2004 5,947,188,265 2.9 2005 6,582,550,668 10.7
Source: North Carolina Department of Revenue

VIII
B. Long-Term Financial Planning
The City currently has $71,320,000 in authorized (2000) and unissued general obligation bonds in the following functional areas to fund various governmental projects. We anticipate to phase the issuance of these bonds over the next several years in accordance with Greensboro’s capital improvement program and Council’s strategic priorities:
Street Improvements $54,420,000 Public Transportation 1,000,000 Neighborhood Redevelopment 2,800,000 Parks and Recreational Facilities 13,100,000
In accordance with these plans, the City intends to issue another $27 million in fixed and variable rate general obligation bonds by January 2006. In November 2005, the City will issue $8.6 million in special obligation bonds to fund a solid waste transfer station located in the western region of the City. The City has begun construction of the estimated $9.2 million facility as an alternative to the White Street Landfill. The project cost to date is $1.6 million, which includes land and right of way purchases, design and construction start-up. Debt service for the special obligation bonds will be backed by a pledge of a portion of the City’s local option sales tax receipts.
Bond-financed and other major capital projects completed, or in progress at year-end include significant street and bridge projects, additional fire stations, water and sewer system upgrades, and parks and recreation improvements. The Kitchen Operating Center, a new facility which houses water resource and public safety services, is nearing full operations this year.
The proposed six-year Capital Improvement Plan (CIP) includes approximately $450 million for projects that will be undertaken during FY 2005-2011 and will be funded primarily with the proceeds of authorized or proposed bond sales, state and federal grants and enterprise fund revenues. This is approximately 5.1% less than the capital plan adopted last year. A substantial portion of the CIP relates to environmental related projects such as water resources projects, funded from Enterprise Fund net revenues and proceeds of Combined Enterprise System Revenue Bonds.
Proposed projects, which form the basis for potential bond referenda in 2006 and later years, include further implementation of the Parks and Recreation Master Plan, new and renovated fire stations, branch library improvements and the renovation of the War Memorial Auditorium.
The City has also begun planning for implementation of GASB Statement No. 45, Accounting and Financial Reporting by Employers for Postemployment Benefits Other Than Pensions, which is scheduled for adoption in the City’s financial records in Fiscal Year 2008. As part of a strategy to manage funding of this liability, the City is developing a plan that initially includes an actuarial study to determine estimated future costs, and is also analyzing the level of benefits it provides to employees.
C. Cash Management Policies and Practices
The City's investment policy is to minimize credit and market risks while maintaining a competitive yield on its portfolio. Accordingly, deposits were either insured by federal depository insurance or collateralized. All collateral on deposits was held either by the City or its agent. All investments held by the City during the year and at June 30, 2005 are classified in the category of lowest credit risk as defined by the Governmental Accounting Standards Board. The City's cash management program provided the City with interest earnings totaling $9,559,522 for the fiscal year ended June 30, 2005 as compared to $6,128,911 in the prior year. Cash balances are analyzed daily to forecast the amount of funds required and amounts available for investment. The average amount of funds invested per month totaled $252,640,398 during the year. The City's average yield on investments for the year was 3.8%. Interest earnings showed an increase over the prior year largely due to the market

IX
conditions. Interest earned on bond proceeds was used to offset the cost of debt service. Interest earnings were the equivalent of nearly 4.6 cents on the tax rate for FY 2004-05. In addition, during FY 2005, the City entered into Master Standby Purchase Agreements for certain of it’s Combined Enterprise System Revenue Bonds and Certificates of Participation to streamline the bond issuance process and to take advantage of cost savings.
D. Risk Management
The City has a risk management program where resources are being accumulated to meet potential losses due to employee injuries, damage to assets, and natural disasters to name a few. In addition, various internal control techniques, including employee accident prevention sessions, have been implemented to minimize accident-related losses and to safeguard assets.
Additional information on the City’s risk management activity can be found in Note V. A of the notes to the financial statements.
E. Pension and Other Postemployment Benefits
The City provides pension benefits for all permanent, full-time employees through the statewide Local Governmental Employees’ Retirement System, (System) a multiple-employer, cost-sharing, defined benefit pension plan, administered by the State of North Carolina. Covered employees are required by State statute to contribute 6% of their salary to the System. The City is required by State statute to contribute the remaining amounts necessary to pay benefits when due, based on an actuarially determined contribution requirement. The City of Greensboro has no obligation in connection with employee benefits offered through this plan beyond its annual contractual payment to the State.
The General Statutes of North Carolina require the City to provide a special separation allowance for law enforcement officers. Each year, an independent actuary engaged by the pension plan calculates the amount of the annual contribution that the City must make to the pension plan to ensure that the plan will be able to fully meet its obligations to retired employees on a timely basis. The actuarial present value of the total accrued actuarial liabilities as of December 31, 2004, the date of the last actuarial valuation, amounted to $18,772,248 of which 23.8% was funded. The valuation projects that an annual contribution of 6.77% of law enforcement payroll or $1,727,950 is required in FY 2006 to provide sufficient funding for this liability. Increased hiring of police officers due to Council service priorities and higher levels of federal funding have raised City contributions to $1,670,838 in FY 2004-05, which represents 165% of the required amount. This amount was funded in the current year. All law enforcement officers employed by the City participate in the State of North Carolina Supplemental Retirement Income Plan, a 401(k) defined contribution pension plan, administered by the State of North Carolina. The City is required to contribute 5% of each officer’s salary, as well as the law enforcement officers may make voluntary contributions to the plan. The City of Greensboro also provides postretirement health benefits for retirees until age 65. As of the end of the current fiscal year, there were 445 retirees receiving these benefits, which are financed on a pay-as-you-go basis. GAAP do not require governments to report a liability in the financial statements in connection with an employer’s obligation to provide these benefits. Additional information on the City of Greensboro’s pension arrangements and postemployment benefits can be found in Notes V. G and I in the notes to the financial statements.

X
AWARDS AND ACKNOWLEDGMENTS The City has participated in the Government Finance Officers Association of the United States and Canada (GFOA) Certificate of Achievement Program since 1975. GFOA recognizes governmental units that issue their comprehensive annual financial reports substantially in conformity with the standards of the Governmental Accounting Standards Board. The City has received favorable recognition for its comprehensive annual financial report for thirty consecutive years, (1975 through 2004). Valid for a period of one year, we believe our current report continues to conform to Certificate of Achievement Program requirements, as an easily readable and efficiently organized CAFR, and we are submitting it to GFOA to determine its eligibility for another certificate.
To conclude, a review of the financial statements of the City will indicate a sound financial position and responsible actions in response to statewide slowing of the economy and decreased state-shared revenues. The financial outlook for FY 2005-06 is strong, with moderate growth in revenue categories forecasted. Present management efforts in long-range strategic and comprehensive planning should enable the City to generate adequate resources to meet future services demand levels, afford a stable financial position, protect the City's credit ratings, and maintain realistic tax burdens on the public. City staff are preparing to meet the challenges of the twenty-first century to exceed the expectations of citizens for service delivery.
The preparation of this report on a timely basis could not be accomplished without the efficient and dedicated services of the Financial Reporting and Accounting Divisions of the Finance Department and the Internal Audit staff. We would like to express our appreciation to all personnel who assisted and contributed to the preparation of this report. We would also like to thank the members of the City Council for their interest and support in planning and conducting the financial operations of the City in a responsible and progressive manner.
Respectfully submitted,
Mitchell E. Johnson City Manager
Richard L. Lusk Finance Director
Certificate of Achievement for Excellence
in Financial Reporting
Presented to
City of Greensboro, North Carolina
For its Comprehensive Annual
Financial Report
for the Fiscal Year Ended
June 30, 2004
A Certificate of Achievement for Excellence in Financial Reporting is presented by the Government Finance Officers
Association of the United States and Canada to government units and public employee retirement systems whose comprehensive annual financial
reports ( CAFRs) achieve the highest standards in government accounting
and financial reporting.
President
Executive Director


Oty Manager
Mitchell £Johnson
Greensboro Oty Coundl
l<Eith A Hdiday, Mayor
Yvonne J. Johnson, Mayor Pro Tem
Thomas M. Phillips, At Large
D::mald R. Vaughan , At Large
T. Dianne Bellamy-Small, Distnct I
Claudette Burroughs-White, District 2
Robert V. Perkins, District 3
Florence F. Gatten, District 4
Sandra G. Carmany, District 5
Finance Director
Ridiard L W.Sk
(Jiil;o./q~ XIII

CHERRY BEKAEITT&. HOLLAND CFJl'rll-lf.O Pl'BL.J(' ACcotJNTANTS & CONSl...'L?AXTS
To the Honorable Mayor
Independent Auditor's Report
and Members of the City Council Greensboro, North Carolina
We have audited the accompanying financial statements of the governmental activities, the business-type activities, the Greensboro Housing Development Partnership and the Greensboro Transit Authority, which are discretely presented component units, each major fund, and the aggregate remaining fund information of the City of Greensboro, North Carolina, as of and for the year ended June 30, 2005, which collectively comprise the City's basic financial statements as listed In the table of contents. These financial statements are the responsibility of ltie City of Greensboro's management. Our responsibility is to express opinions on these basic financial statements based on our audit. We did not audit the financial statements of the Greensboro ABC Board. Those financial statements were audited by other auditors whose reports thereon have been furnished to us, and our opinion. Insofar as it relates to the amounts Included for the Greensboro ABC Board, is based solely on the reports of the other auditors.
We conducted our audit in accordance with auditing standards generally accepted in the United States of America and the standards applicable to financial audits contained in Government Auditing Standards. Issued by the Comptroller General of the United States. Those standards require that we plan and perform the audit to obtain reasonable assurance about whether the financial statements are free of material misstatement. An audit includes examining, on a test basis, evidence supporting the amounts and disclosures in the financial statements. An audit also Includes asse.ssing the accounting principles used and significant estimates made by management, as well as evaluating the overall financial statement presentation. We believe that our audit and the report of the other auditors provide a reasonable basis for our opinions.
In our opinion, based on our audit and the report of the other auditors, the financial statements referred to above present fairly, In all material respects, the respective financial position of the governmental activities, the business-type activities, the Greensboro Housing Development Partnership and the Greensboro Transit Authority, which are discretely presented component units, each major fund, and the agg regale remaining fund information of the City of Greensboro, North Carolina as of June 30, 2005, and the respective changes in financial position and cash nows, where appropriate, thereof and the respective budgetary comparison for the General Fund and the Housing Partnership Revolving Special Revenue Fund for the year then ended in conformity with accounting principles generally accepted in the United States of America.
Jn accordance with Government Auditing Standards, we have also issued our report dated October 7, 2005 on our consideration of City of Greensboro's internal control over

financial reporting and our tests of its compliance with certain prov1s1ons of laws, regulations, contracts and grant agreements and other matters. The purpose of that report is to describe the scope of our testing of internal control over financial reporting and compliance and the results of that testing, and not to provide an opinion on the internal control over financial reporting or on compliance. That report is an integral part of an audit performed in accordance with Government Auditing Standards and should be considered in assessing the results of our audit.
Management's Discussion and Analysis and the Law Enforcement Officers' Special Separation Allowance Schedule of Funding Progress and Schedule of Employer Contributions are not a required part of the basic financial statements but are supplementary information required by the Governmental Accounting Standards Board. We and the other auditors have applied certain limited procedures, which consisted principally of inquiries of management regarding the methods of measurement and presentation of the required supplementary information. However, we did not audit the information and express no opinion on it.
Our audit was performed for the purpose of forming opinions on the financial statements that collectively comprise the City of Greensboro's basic financial statements. The letter of transmittal, combining and individual nonmajor fund financial statements and schedules, as well as the accompanying schedule of expenditures of federal and state awards as required by U.S. Office of Management and Budget Circular A-133, Audits of States, Local Governments, and Non-Profit Organizations, and the State Single Audit Implementation Act, and the statistical information are presented for purposes of additional analysis and are not a required part of the basic financial statements. The combining and individual nonmajor fund financial statements and schedules, as well as the schedule of expenditures of federal and state awards have been subjected to the auditing procedures applied in the audit of the basic financial statements and, in our opinion, are fairly stated, in all material respects, in relation to the basic financial statements taken as a whole. The letter of transmittal and statistical information have not been subjected to the auditing procedures applied in the audit of the basic financial statements and, accordingly, we express no opinion on them.
Greensboro, North Carolina October 7, 2005

MANAGEMENT’S DISCUSSION AND ANALYSIS As management of the City of Greensboro, we offer readers of our financial statements this narrative overview and analysis of the financial activities of the City of Greensboro for the fiscal year ended June 30, 2005. The Management Discussion and Analysis (MD&A) section is designed to assist the reader in focusing on significant financial issues, provide an overview of the City’s financial activity, identify changes in the City’s financial condition, identify material deviations from the financial budget, and identify individual fund issues or concerns. Since the MD&A is structured to focus on the current years activities, resulting changes and currently known facts, we encourage readers to consider the information presented here in conjunction with the transmittal letter, which can be found beginning on page I of this report, and the City’s financial statements, which follow this section. FINANCIAL HIGHLIGHTS
The assets of the City of Greensboro exceeded its liabilities at the close of the fiscal year by $736 million (net assets).
The City’s net assets increased by $20.8 million (2.9%) compared to FY 2004. The governmental net assets increased slightly by $1.6 million (.4%) due to higher than anticipated sales tax receipts, additional interest earnings and approximately 4% less expenditures compared to budget. The business-type net assets increased by $19.2 million (5.4%) primarily due to self-sustaining Water Resources operations and a non-recurring receipt for purchase of certain of Greensboro’s future water rights in the Randleman Dam project.
The governmental activities program revenue decreased by $5.2 million, down 8% from last year, largely due to
a change in accounting treatment for Stormwater Management services which are recorded in an Enterprise Fund in FY 2005 compared to a Special Revenue Fund in FY2004. General revenues for property taxes increased by more than $15 million as a result of an increase in the tax rate to fund public safety, solid waste and other initiatives. Investment earnings were the equivalent of 4.6 cents on the property tax rate compared to 3.6 cents last year. In the City’s business-type activities, program revenues increased by $17.4 million or 19.1% to $108.3 million. The change in business-type activities is largely due to increased capital contributions from developers for donated water and sewer lines, higher utility rates adopted January 1, 2005, and a one-time contribution of $5.2 million from Randolph County relating to purchase of water rights. City-wide, charges for services increased $7.8 million or 6.3%.
During the year, the City’s governmental expenses were $222.7 million, an increase of $10.8 million or 5.1%
from last year primarily to support higher staffing levels and new positions for public safety and also considers reclassification of approximately $6 million of expenses for Stormwater services to business-type activities in FY 2005. In all, expenses increased 11.6% in the City’s business-type activities due to the Stormwater reclassification and increased debt service for ongoing significant capital improvements.
Of the City’s various business-type service areas, water and sewer operations and stormwater management
generated sufficient revenues in their programs to cover expenses. No significant new funding sources were noted in FY 2005, however, a property sale agreement generated $2.1 million in revenue, and is recorded in the Economic Opportunity function.
The total cost of all City programs increased by $21.7 million or 7.1% compared to FY 2004.
As of the close of the current fiscal year, the City’s governmental funds reported combined ending fund balances
of $123.8 million, a decrease of approximately $13 million in comparison with the prior year largely due to spending related to capital projects. Approximately 57.6% of this total amount, or $75.5 million is unreserved, less amounts appropriated for next year’s budget.
1

At the end of the current fiscal year, the total unreserved fund balance for the General Fund specifically was $28.0 million, or 13.8% of total general fund expenditures and transfers for the fiscal year. Of this balance, $7.2 million is designated for appropriation next year. It is also the City’s policy to hold aside 9% of the subsequent year’s General Fund budget as “undesignated” to remain available for appropriation. This amounted to $19.3 million as of June 30, 2005.
Charges for services for the City’s largest enterprise activity, the Water Resources Fund, comprising water and
sewer operations increased 15.4% in FY 2005, excluding a $5 million payment from Randolph County for purchase of water rights. The City purchased a water supply from four neighboring municipalities in the current year for approximately $2 million. Payments of $4,455,000 were also made to the PTRWA for reservoir and surrounding infrastructure improvements associated with the construction of the Randleman Dam, which should be operational by 2007. This project is being funded by a group of local government units and will supplement Greensboro’s water supply needs for the long term. The City’s total equity interest in the Randleman Dam project is approximately $47.4 million as of June 30, 2005.
Deficit fund balances of were reported in the Community Development Block Grant Fund ($92,034) Hope VI
Program ($46,110), Workforce Investment Act Fund ($133,742), South Elm Street Redevelopment Fund ($131,068) and the Neighborhood Redevelopment Series 2005 Bond Fund, respectively, as of the end of the fiscal year. These deficits will be funded with grant and other reimbursements from governmental agencies and from the future sale of general obligation bonds in FY2006.
The General Fund budget for the fiscal year ended June 30, 2005 was adopted with a $.5500 per $100 assessed
valuation property tax rate, and is $.0425 higher than the revenue neutral tax rate relating to revalution. Major cost increases included addition of 32 police patrol positions ($.01), health insurance costs ($.01) and adjustment for elimination of the regressive residential solid waste fee ($.015). An additional levy of $.0175 per $100 assessed valuation was used to improve and expand the public transit system compared to $.0200 in the prior year.
As of June 30, 2005, the City had collected approximately $204.7 million or 103% of its amended budgeted
General Fund revenues and had incurred $203.9 million or 96% of its budgeted expenditures. The net effect on General Fund fund balance was an increase of approximately $805,000 this year.
Overall General Fund budget appropriations were increased by approximately $3.6 million for various small
enhancements to several functions during FY 2005.
Key Ratios _____ 2005 2004 2003 2002 $ Bonded Debt Per Capita $645 $648 $693 $576 % Debt Service to General Governmental
Expenditures 8.5 7.9 8.1 8.1 % Property Tax Collections 97.97 98.53 98.83 98.74 % Increase in Assessed Property Valuation 24.3 .8 .5 3.1
Revaluation of assessed property occurred in 2004 and was last adjusted in 1996.
The City’s total bonded debt increased by $34 million due to issuances of both general obligation and revenue bonds during FY2005, in addition to normal debt service retirements. Interest rates on the City’s variable rate debt were 2.3% and 3.25% respectively for tax-exempt and taxable general obligations at June 30, 2005.
1a

The City of Greensboro maintained its AAA, Aa1, and AAA general obligation (GO) credit rating from Standard and Poor’s, Moody’s Investors Service and Fitch IBCA this year. The Combined Enterprise System Revenue Bonds were reaffirmed by the three rating services as follows:
Standard and Poor’s (S&P) General Obligation Bonds Currently AAA Target AAA Certificates of Participation Currently AA+ Target AA+ Enterprise System Revenue Bonds Currently AA+ Target AA+
Moody’s Investors Service (Moody’s)
General Obligation Bonds Currently Aa1 Target Aaa Certificates of Participation Currently Aa2 Target Aa1 Enterprise System Revenue Bonds Currently Aa3 Target Aa1
Fitch IBCA (Fitch)
General Obligation Bonds Currently AAA Target AAA Certificates of Participation Currently AA+ Target AA+ Enterprise System Revenue Bonds Currently AA+ Target AA+
OVERVIEW OF THE FINANCIAL STATEMENTS This discussion and analysis are intended to serve as an introduction to the City of Greensboro’s basic financial statements. The financial statements include two kinds of statements that present different views of the City: 1) Government-Wide Financial Statements and 2) Fund Financial Statements. Both perspectives, however, are essential and complementary components that allow the user to address relevant questions, broaden a basis for comparison, and enhance the City’s accountability. Another element of the basic financial statements is the notes to the financial statements. In addition to the basic financial statements, this report contains other supplemental information that will enhance the reader’s understanding of the financial condition of the City of Greensboro. (See Figure 1)
Required Components of Annual Financial Report
Figure 1
Summary Detail
Management’s Discussion and
Analysis
Basic Financial
Statements
Government-wide
Financial Statements
Fund
Financial Statements
Notes to the
Financial Statements
1b

A. Government-Wide Financial Statements The government-wide statements report both short-term and long-term information about the financial condition of the City as a whole, focusing on the government’s operational accountability. The accounting methods of these statements reflect that of private sector companies in that all governmental and business-type activities are consolidated into columns that add to a total for the primary government. The statement of net assets reports the City’s net assets and includes all, both current and non-current, assets and liabilities of the government. The difference between the two is reported as net assets. Over time, increases or decreases in the City’s net assets are one indicator of whether its financial health is improving or deteriorating. You will also need to consider other non-financial factors, such as changes in the City’s property tax base, local economy and service levels, to assess the overall health of the City. On the other hand, the statement of activities reports how net assets have changed and includes all of the current year’s revenues and expenses regardless of when cash is received or paid.
The government-wide financial statements of the City are divided into three categories:
Governmental Activities- Most of the City’s basic services are included here, such as police, fire, transportation, environmental services, libraries, housing and community development, public improvements, parks and recreation and general administration. Property taxes and state and federal grants finance most of these activities.
Business-Type Activities- The City charges fees to customers to help it cover the costs of certain services it provides. The City’s water and sewer system and other water resources, parking facilities, solid waste facilities and coliseum are included here.
Component Units- The City includes three other discretely presented component entities in its report—Greensboro Housing Development Partnership, Inc., the Alcoholic Beverage Control Board (ABC) and the Greensboro Transit Authority. The activities of Greensboro Center City Corporation are also blended with those of the City. Although legally separate, these “component units” are important because of certain financial transactions that exist between the entities and the City and from extensive board member appointments by City officials. The government-wide financial statements can be found on pages 2-5 of this report.
B. Fund Financial Statements
The fund financial statements provide more detailed information about the City’s major funds while focusing on the fiscal accountability. Funds are accounting devices that the City uses to keep track of specific sources of funding and spending for particular purposes, as required by state law and bond covenants,. City Council establishes many funds to assure control as well as good management and to exhibit proper usage of certain taxes and grants. The City of Greensboro, like all other governmental entities in North Carolina, also uses fund accounting to ensure and reflect compliance (or non-compliance) with finance-related legal requirements, such as the General Statutes or City ordinances. The City has three types of funds:
Governmental Funds- Most of the City’s basic services are included in governmental funds, which focus on 1) how cash and other financial assets can readily be converted to cash flow in and out (that is, their liquidity) and 2) the balances left at year-end that are available for spending. This is the manner in which the financial budget is typically developed. Because this information provides a short-term view that helps determine whether there are more or fewer financial resources that can be spent in the near future to finance the City’s programs, as opposed to the government-wide statements which provides both a short and a long-term focus, a reconciliation is provided on the page following the fund statements that explains the relationship or differences between the two views. The governmental fund financial statements can be found on pages 6-11 of this report. 1c

Proprietary Funds- Services for which the City charges customers a fee are generally reported in proprietary funds. Accounted for like the government-wide statements, proprietary funds provide both long and short-term financial information and in addition include the statement of cash flows. A reconciliation statement is once more provided following these funds to explain the differences between them. The Internal Service Funds are an accounting device used to accumulate and allocate costs internally among the City’s various functions. Because these services predominantly benefit governmental rather than business-type functions, they have been included within governmental activities in the government-wide statements. Individual fund data for the internal service funds is provided in the form of combining statements located on pages 123-145. The proprietary fund financial statements can be found on pages 12-23 of this report. Fiduciary Funds- The City is the trustee, or fiduciary, for its Police Special Separation Allowance Pension Trust. The City is responsible for ensuring that the assets reported in this fund are used only for their intended purposes. All of the City’s fiduciary activities are reported in a separate statement of fiduciary net assets and a statement of changes in fiduciary net assets. We exclude these activities from the government-wide financial statements because the City cannot use these assets to finance its operations. The basic fiduciary fund financial statements can be found on pages 25-26 of this report.
C. Notes to the Financial Statements
The notes provide additional information that is essential to a full understanding of the data provided in the government-wide and fund financial statements. The notes to the financial statements can be found starting on page 30 of this report.
D. Required Supplementary Information In addition to the basic financial statements and accompanying notes, this report also presents certain required supplementary information concerning the City of Greensboro’s progress in funding its obligation to provide pension benefits to certain of its employees. Required supplementary information can be found on pages 31-32 of this report.
E. Other Supplementary Information The combining statements referred to earlier in connection with nonmajor governmental funds and internal service funds are presented immediately following the required supplementary information on pensions. Combining and individual fund statements and schedules can be found on pages starting on page 33 of this report.
GOVERNMENT-WIDE FINANCIAL ANALYSIS The government-wide financial statements for the fiscal year ended June 30, 2005 are becoming more familiar to readers of City of Greensboro reports. In previous years, the City maintained its governmental and proprietary fund groups as two separate and very distinct types of accounting, without any type of consolidated statement that accurately reflected the operations and net assets of the government as a whole. There was a total column that appeared on the financial statements, but it was a memorandum total only. No attempt was made to adjust the statements in such a way that the total column would represent the overall financial condition of the City. These statements were basically the equivalent of the fund financial statements that appear in this report with fiduciary funds and two former account groups, the long-term debt and the general fixed assets, added in. The changes in the financial statement reporting model were mandated by the Governmental Accounting Standards Board (GASB). GASB Statement No. 34 dictated the changes you see in the City of Greensboro’s financial reports as well as those of many other units of government. While the City of Greensboro was required to implement these changes in 2002, many other units were not required to implement until 2004. 1d

Comparative numbers, when available, have been included in this report. Future years’ reports will have more comparative data that will allow more opportunities for comparative analysis, particularly in the Statistical Section. Net assets may serve over time as a useful indicator of a government’s financial position. In the case of the City of Greensboro, assets exceeded liabilities by $735,980,448 at the close of June 30, 2005 compared to $715,210,951 in the previous year. The net assets for the City as a whole increased 2.9% at June 30, 2005. This increase of $20.8 million represents a combination of increased collections for sales and other taxes and enterprise user fees along with increased interest earnings compared to previous years. The largest portion of the City of Greensboro’s net assets $477,536,126 (65%) represents its investment in capital assets (e.g. land, building, machinery, and equipment), less any related debt used to acquire those assets that is still outstanding. The resources needed to repay the debt must be provided from sources other than capital assets, since they cannot be used to liquidate the liabilities. An additional portion of the City of Greensboro’s net assets $55,414,626 (8%), represents resources that are subject to external restrictions on how they may be used. Unrestricted net assets, the residual amount of assets that can be used without constraints established by debt covenants, enabling legislation, or other legal requirements changed from $200,242,052 at June 30, 2004 to $203,029,696 (27%) at the end of this year. However, it should be noted that of this total reported “unrestricted” amount, only approximately $25 million is available and unobligated to finance additional day-to-day governmental activities or unforeseen circumstances in the future. Table A-1
City of Greensboro’s Net Assets (In thousands of dollars)
*For more detailed information, see the Statement of Net Assets on page 2.
%2004 2005 2004 2005 2004 2005 Change
Current and Other Assets 234,114$ 231,167$ 134,213$ 175,522$ 368,327$ 406,689$ 10.4%Capital Assets, Net 366,040 318,574 445,307 518,205 811,347 836,779 3.1% Total Assets 600,154 549,741 579,520 693,727 1,179,674 1,243,468 5.4%
Long-Term Debt Outstanding 208,982 212,482 197,894 230,768 406,876 443,250 8.9%Other Liabilities 30,410 36,189 27,177 28,048 57,587 64,237 11.5% Total Liabilities 239,392 248,671 225,071 258,816 464,463 507,487 9.3%
Net Assets $360,762 $301,070 $354,449 $434,911 $715,211 $735,981 2.9%Invested in Capital Assets,Net of Related Debt $193,892 $152,734 $276,298 $324,802 $470,190 $477,536 1.6%
Restricted 37,034 31,259 7,745 24,156 44,779 55,415 23.8%Unrestricted 129,836 117,077 70,406 85,953 200,242 203,030 1.4%
Total Net Assets 360,762$ 301,070$ 354,449$ 434,911$ 715,211$ 735,981$ 2.9%
TotalGovernmental
ActivitiesBusiness-Type
Activities
1e

Table A-2 City of Greensboro’s Changes in Net Assets
(In thousands of dollars)
2004 2005 2004 2005 2004 2005Revenues:Program Revenues: Charges for Services $ 41,055 $ 35,109 $ 83,430 $ 97,191 $ 124,485 $ 132,300 Operating Grants and Contributions 18,290 19,046 18,290 19,046 Capital Grants and Contributions 5,049 5,074 7,458 11,083 12,507 16,157 General Revenues: Property Taxes 100,305 115,806 100,305 115,806 Other Taxes 51,599 55,450 51,599 55,450 Investment Income 1,597 4,945 402 1,759 1,999 6,704 Other 3,252 999 2,406 1,366 5,658 2,365
Total Revenues 221,147 236,429 93,696 111,399 314,843 347,828
Expenses: General Government 33,663 21,767 33,663 21,767 Public Safety 80,125 92,938 80,125 92,938 Transportation 26,158 22,356 26,158 22,356 Engineering and Inspection 15,609 25,469 15,609 25,469 Environmental Services 1,110 662 1,110 662 Culture and Recreation 30,831 37,178 30,831 37,178 Community Development
and Housing 9,414 9,828 9,414 9,828 Economic Opportunity 2,733 3,102 2,733 3,102 Water Resources 2,306 2,306 Intergovernmental 1,204 1,326 1,204 1,326 Interest, Fees on Long Term Debt 8,665 8,029 8,665 8,029 Water Resources 52,062 59,700 52,062 59,700 Stormwater Management 8,564 8,564 War Memorial Coliseum 17,562 11,669 17,562 11,669 Solid Waste Management 21,699 22,425 21,699 22,425 Parking Facilities 2,192 2,045 2,192 2,045
Total Expenses 211,818 222,655 93,515 104,403 305,333 327,058Net Increase (Decrease) in Net Assets Before Transfers 9,329 13,774 181 6,996 9,510 20,770
Governmental Business-TypeActivities Activities Total
1f

(Continued) 2004 2005 2004 2005 2004 2005
Transfers (7,635) (12,190) 7,635 12,190 Increase Net Assets 1,694 1,584 7,816 19,186 9,510 20,770
Beg.Net Assets Restated 359,068 299,486 346,633 415,725 705,701 715,211
Ending Net $ 360,762 $ 301,070 $ 354,449 $ 434,911 $ 715,211 $ 735,981
TotalGovernmental Business-Type
Activities Activities
Table A-3 Summary of Financing/Interest Earnings - Governmental Activities
(In thousands of dollars)
FY2004 FY2005 $ Change % ChangeInterest Revenue $1,597 $4,945 $3,348 209.6%Interest Expense 8,665 8,029 (636) -7.3%
Net ($7,068) ($3,084) $3,984 -56.4%
Summary of Financing/Interest Earnings - Business Activities (In thousands of dollars)
FY2004 FY2005 $ Change % Change
Interest Revenue $ 402 $ 1,759 $1,357 337.6%Interest Expense 7,007 8,027 1,020 14.6%
Net ($6,605) ($6,268) $337 -5.1%
A. Governmental Activities
Governmental activities increased the City’s net assets by approximately $1.6 million. Key elements of this increase are as follows: Expenditure levels for significant service areas such as public safety and culture and recreation increased in FY 2005 with offsetting increases in property and other tax revenue as well as investment income. Expenditures of approximately $8.5 million for support services were also reclassified from “General Government” to “Engineering and Inspections” in FY2005 following departmental reorganizations. Stormwater operations expenditures of approximately $5.9 million, previously included in the “Transportation” and “Water Resources” categories, were reclassified to an enterprise fund.
1g

FIGURE 2
Expenses and Program Revenues – Governmental (In thousands of dollars)
$0
$15,000
$30,000
$45,000
$60,000
$75,000
$90,000
Genera
l Gov
ernmen
t
Public
Safety
Transp
ortati
on
Engine
ering
and I
nspe
ction
s
Enviro
nmen
tal S
ervice
s
Culture
and R
ecrea
tion
Commun
ity D
evelo
pmen
t and
Hou
sing
Econo
mic Opp
ortun
ity
Interg
overn
mental
Expenses
ProgramRevenues
1h

Table A-4 Net Cost – Governmental Activities
(In thousands of dollars)
% %Change Change
2004 2005 2004 2005General Government $33,663 $21,768 -35.3% ($16,596) ($6,205) 62.6%Public Safety 80,125 92,938 16.0% (72,625) (86,270) -18.8%Transportation 26,158 22,356 -14.5% (15,445) (11,467) 25.8%Engineering and Inspections 15,609 25,469 63.2% (10,195) (17,832) -74.9%Environmental Services 1,110 662 -40.4% 8,140 199 -97.6%Culture and Recreation 30,831 37,178 20.6% (26,277) (31,865) -21.3%Community Development and Housing 9,414 9,828 4.4% (2,245) (2,343) -4.4%Economic Opportunity 2,733 3,102 13.5% (27) 1,713 6444.4%Water Resources 2,306 -100.0% (2,285) 100.0%Intergovernmental 1,204 1,326 10.1% (1,204) (1,326) -10.1% Total $203,153 $214,627 5.6% ($138,759) ($155,396) -12.0%
Total Cost Net Costof Services Of Services
B. Business-Type Activities
Business-type activities increased the City of Greensboro’s net assets by $19.2 million, largely attributable to higher charges for services impacted by several user rate increases, a one time payment from Randolph County to purchase water rights and a reduction in net expenses of approximately $2 million in the Coliseum Fund. In FY 2004-05, the City also eliminated the regressive residential solid waste collection fee and imposed additional property taxes of $.015 to transfer to the operations.
1) Enterprise Funds
There are five separate and distinct operations accounted for in the Enterprise Funds: the Water Resources Utility Operations, Stormwater Management Services, War Memorial Coliseum Complex, Parking Facilities and Solid Waste Management. Effective, July 1, 2004, those stormwater activities, previously accounted for in the General Fund in the Transportation and Water Resources expenditure categories were reclassified to an enterprise fund, using the full accrual method of accounting. Stormwater fees of approximately $8 million were reclassified, as well.
Depreciation is computed on all depreciable plant and equipment and is reflected as an operating expense. The following schedule reflects the change in net assets before and after depreciation for each of the enterprises compared to the preceding year.
1i

Table B-1 Change in Net Assets– Business-Type Activities
(in thousands of dollars)
Enterprise Activities 2004 2005 2004 2005Water Resources $20,535 $30,912 $10,210 $19,699 Stormwater Management** 2,064 409 War Memorial Coliseum (298) 1,158 (2,376) (918)Parking Facilities 1,478 1,631 948 1,088 Solid Waste Management (679) 360 (1,491) (629) Total $21,036 $36,125 $7,291 $19,649
Before Depreciation After Depreciation*
*Excludes the effect of Internal Service Fund chargebacks. ** Operations included in governmental activities in FY2004 Major activities and/or changes in the Enterprise Fund operations are presented in the following comments.
2) Water Resources Fund
Charges for current services totaled $61,309,316 as compared to $53,341,275 for the preceding year, an increase of 15%. Operating expenses increased by 10% and totaled $50,794,157 as compared to $46,213,469 for the preceding year. An approximate 15% increase in water and sewer rates was effective January 2005 to help offset debt service associated with a variety of ongoing capital improvements and to meet environmental regulations. The City has established a capital reserve account to provide for future water and sewer system needs. An account balance of $8,392,655 is available in the restricted assets total of the Water Resources Fund. This reserve will be used primarily to fund future contributions to the PTRWA for the reservoir and surrounding infrastructure improvements associated with the Randleman Dam, Lake and Water Plant Project. PTRWA initiated construction of the Dam in 2002 and spent more than $9.8 million on the project in the current year. The City continues to make a significant investment in water resource needs to replace and expand existing infrastructure and to meet new environmental regulations. In 2005, we issued $40,860,000 in Combined Enterprise System Revenue Bonds to fund these needs.
3) Stormwater Management Fund
Charges for current services totaled $8,369,025 as compared to $7,542,489 for the preceding year, an increase of 11%. Operating expenses (excluding depreciation) increased by 17% and totaled $6,909,135 as compared to $5,895,947 for the preceding year. The stormwater program monitors and manages the quality and quantity of stormwater runoff and helps protect limited water resources throughout the City. Residential stormwater fees, ranging from $1.50 to $3.90 per square foot of impervious property area owned, help fund operations of this program as well as related capital improvement projects.
4) War Memorial Coliseum Fund
Charges for current services totaled $7,621,544 as compared to $11,833,848 for the preceding year, a decrease of 36%. The total number of events in FY 2004-05 decreased from 751 to 748 with attendance at approximately 1 million compared to about 1.3 million last year. In the prior year, the Greensboro Coliseum hosted the Mens’ ACC Basketball tournament, with week-long attendance of approximately 100,000. This tournament is scheduled to return to Greensboro in March 2006 along with the Men’s NCAA Division I championship games. Operating expenses totaled $11,892,154 as compared to $17,462,976 for the preceding year, a decrease of 32%. The General Fund contributed $1,800,000 toward Coliseum operating activities this year. In addition, revenues from the privatized concessions operations (FY04) help offset capital improvements such as state-of-the-art LED signage in the arena to continue this venue’s competitive edge.
1j

The War Memorial Coliseum Fund is not charged with the retirement of its general long-term debt. City residents have voted to tax themselves for the cost of major bond-financed improvements. Proceeds of the Hotel/Motel Room Occupancy Tax will retire the debt on improvements financed with certificates of participation, except for catering kitchen improvements to be funded from catering revenues.
3) Parking Facilities Fund Charges for current services totaled $1,878,684 as compared to $1,931,440 in the preceding year, a decrease of 2.7%. Operating expenses totaled $1,464,264 as compared to $1,504,506 for the preceding year, also a decrease of 2.7%. This fund incurs interest payments on outstanding debt for parking facilities certificates of participation. General Fund support in FY 2004-05 totaled $1,226,395.
4) Solid Waste Management Fund Charges for current services totaled $10,316,091 as compared to $14,422,659 for the preceding year, a decrease of 28.5%. In FY 2005, the City eliminated the $5.00 per month residential solid waste collection fee and raised property taxes by $.015 to offset this change. General Fund contributions totaled $10.4 million compared to $5 million in the prior year, to finance the cost of solid waste collection and disposal. Operating expenses totaled $21,517,314 as compared to $20,942,578 for the preceding year, an increase of 2.7%. The City has commenced construction of a transfer station for municipal solid waste as an alternative to the White Street Landfill, at an estimated cost of $9.2 million. In order to fund the additional costs for land, operations, and haul & disposal associated with the transfer station, which is scheduled to open in July 2006, the FY 2007 budget includes additional General Fund transfers of $4.4 million to support these added costs. The City plans to issue $8.6 million in special obligation bonds in November 2005 associated with the new facility.
1k

FIGURE 3 Expenses and Program Revenues – Business-Type
(In thousands of dollars)
$0
$10,000
$20,000
$30,000
$40,000
$50,000
Wate
r
Sewer
Storm
water M
anage
ment
War
Memor
ial Coli
seum
Solid
Wast
e Man
agemen
t
Parki
ng Fa
cilitie
s
Expenses
Revenues
1l

Figure 4 Revenues by Sources – Business-Type Activities
Capital Grants and Contributions
Charges for Current Services
Investment Income
Miscellaneous
87.3%
9.9%
1.6%1.2%
FINANCIAL ANALYSIS OF THE CITY’S FUNDS A. Governmental Funds
As noted earlier, the City uses fund accounting to ensure and demonstrate compliance with finance-related legal requirements. As of June 30, 2005, governmental funds reported a combined fund balance of $123,813,466 a decrease of approximately $13 million in comparison with June 2004, due to significant expenditures for bond-financed capital projects. $37,110,056 or 30% of the total amount has been reserved to indicate that it is not available for new spending due to commitments to (1) liquidate contracts and purchase orders of the previous year, 2) adhere to State statutes that limit the amount that may be appropriated by the governing board, 3) segregate funds for the 911 wireless emergency system and future capital projects or 4) for other restricted purposes. The remainder of fund balance represents unrestricted funds, known as unreserved fund balance.
The General Fund is the chief operating fund of the City. At the end of the current fiscal year, unreserved fund balance of the General Fund, $28,042,697, exemplifies 48% of the total General Fund fund balance. Of this amount, $7,171,221 is designated for appropriation in next year’s budget, $1,609,585 is designated for hazardous waste material collection, and $19,261,891 or 9% of the subsequent years’ budget is undesignated and retained for working capital purposes as well as unforeseen emergencies.
The Debt Service Fund has a total fund balance of $13,030,506 compared to $13,917,614 in the prior year. Amounts are designated for debt service in FY 2006 ($12,801,938) and succeeding years.
Revenues for general governmental functions (General, Special Revenue and Debt Service Funds) amounted to $231,209,894 for the fiscal year ended June 30, 2005 and are comprised of various sources as shown in the following graph:
1m

Figure 5 Revenues by Sources – Governmental Activities
Taxes
Intergovernmental
Licenses and Permits
Fines and Forfeitures
Charges for Current Services
Investment Income
Miscellaneous
66.6%
1.5%
1.7%9.3%
3.8%16.7%
.4%
Property tax collections, including delinquent amounts, were $120,350,318. The current year rate of collections decreased .56% as compared to the previous year, from 98.53% to 97.97%. The property tax rate decreased in FY 2004-05, due to property revaluation in 2004, however it is $.042 above the revenue neutral rate of $.508. Tax rates for the current and three preceding fiscal years were adopted, as follows:
2005 2004 2003 2002 General Fund $.5500 $.5975 $.5975 $.5625 Transit Authority .0175 .0200 .0200 .0200 Total Tax Rate $.5675 $.6175 $.6175 $.5825
The local option sales tax collection amounted to $35,542,429 as compared to the previous year's collection of $34,121,791 an increase of $1,420,638 or 4.2% from last year. The State of North Carolina grants local governments the authority to levy a local sales tax of up to 2.5% (previously 2% prior to January 1, 2003), with the state sales tax currently at 4.5%. Increased collections represent a general improvement over the weakened economic conditions noted in the Triad region during the past several years. Guilford County also changed its method of sales tax distribution for all municipalities within the county in FY 2003-04 to the “ad valorem” (property tax) method and as a result, sales tax receipts for Greensboro may fluctuate from year to year, depending on the property tax policies of each of the municipalities within the County, compared to the total collected. The distribution currently requires that 1% be distributed back to the County point of sale. This, and the remaining 1% is distributed within the county based upon either the “per capita” or “ad valorem” method. Local option sales taxes represent 15.3% of overall general government revenues in FY 05.
Intergovernmental Revenues amounted to $38,553,374 as compared to previous year revenues of $39,184,108 a decrease of 1.6% from last year. State-shared and grant revenues are a major source of funding for municipal operations and services, with intergovernmental revenues comprising 16.7% of total general governmental revenues, as compared to 17.9% in the previous year. The decrease is attributable to decreased funding for state and federal grants. Licenses and permits amounted to $8,926,893 compared to previous year revenues of $8,481,016 an increase of 5% due to higher collections of cable TV access licenses and building permits. 1n

Fines and forfeitures amounted to $979,352 as compared to the previous year's collection of $823,071 an increase of 19% over last year. The increase is primarily due to increased collections for parking violations and library fines. Charges for current services amounted to $21,437,475 as compared to the previous year's revenue of $28,324,184. The decline is primarily due to reclassifying approximately $7.5 million in stormwater services fees from a special revenue fund to an enterprise fund in FY 2005.
B. Proprietary Funds
Proprietary Funds provide the same type of information found in the government-wide financial statements but in more detail. Other factors concerning the finances of the proprietary funds have already been addressed in the discussion of the City of Greensboro’s business-type activities.
General Fund Budgetary Highlights
The General Fund budget for FY 2004-05 was adopted at $208,812,646 and represents an increase of 4.6% over the adopted FY 2003-04 budget. Significant variances from the original and final amended budget follow:
• $502,866 in increases allocated to culture and recreation projects • $340,400 in increases allocated to organizational development and communication • $109,392 in increases allocated to management information systems • $309,552 in increases allocated to transportation projects • $170,828 in increases allocated to environmental services projects
In addition, $3,011,125 in funding of 911 communications systems was transferred from the police department to a new special revenue fund, in preparation for consolidation of services with Guilford County.
The net increases were funded from the available beginning fund balance. During the year, revenues exceeded budgetary estimates and expenditures were less than budgetary estimates, thus eliminating the need to draw upon existing fund balance. As of June 2005, the City had collected approximately $204.7 million or 103% of its budgeted General Fund revenues and had incurred $ 203.9 million or 96% of its budgeted expenditures. Significant differences between actual results and the amended budget are highlighted below:
• $2,569,000 in increases for local option sales tax receipts as well as approximately $800,000 more in property tax revenues
• $2,469,000 in decreases for general government expenditures, across all “staff” departments and less
contributions to outside agencies and other staff supported functions by $460,000 • $1,000,000 in decreases for building maintenance • $2,000,000 in decreases for culture and recreation activities associated with Parks and Recreation ($1.1
million) and Libraries ($.9 million) Capital Asset and Debt Administration A. Capital Assets
The City’s investment in capital assets for both its governmental and business-type activities as of June 30, 2005, amounts to $836,779,797 (net of accumulated depreciation). These assets include buildings, roads and bridges, land, machinery and equipment, park facilities and vehicles among other types of assets. This investment represents an increase of $25,432,362 or 3.1% over the prior year.
1o

Table C-1 Capital Assets
(Net of Depreciation-in thousands of dollars)
2005 2004 2005 2004 2005 2004Land $ 52,096 $ 51,415 $ 36,649 $ 33,695 $ 88,745 $ 85,110 Construction in Progress 32,756 32,896 84,188 75,877 116,944 108,773Buildings 83,903 74,044 140,847 137,876 224,750 211,920Improvements Other Than Buildings 4,574 5,092 11,498 8,841 16,072 13,933 Furniture, Fixtures, Machinery and Equipment 39,215 40,747 9,565 7,430 48,780 48,177Infrastructure 106,030 161,846 235,458 181,588 341,488 343,434 Total Capital Assets $ 318,574 $ 366,040 $ 518,205 $ 445,307 $ 836,779 $ 811,347
Total
Governmental Business-Type
Activities Activities
This year’s major capital asset additions included:
• Over $12 million was spent on governmental buildings for police, parks and recreation, libraries and the new
operations center located in the southern district of the City • Construction in progress for the business activities increased by over $9 million for sewer pumping station
projects
• Two new fire stations are under construction at a cost of approximately $5 million. Both are scheduled for completion by June 2006 and are in response to growing service needs and by City initiated annexations
Construction in progress for governmental-type and business-type capital assets totaled $32,755,651 and $84,188,051, respectively as of June 30, 2005. No major demolitions were recorded this year. The City adopted the FY 2005-2011 Capital Improvements Program (CIP) totaling $449,868,982 or a 5.1% decrease from the prior year plan amounts. Funding for major improvements is allocated as follows:
Table C-2
CIP Expenditures – 5 Year Plan
CIP Expenditure Category by Service Area % of Total CIP Environmental Protection 43% Transportation 20% Culture and Recreation 22% Public Safety 8% Economic and Community Development 6% General Government 1% 100%
1p

Table C-3 CIP Funding Sources – 5 Year Plan
CIP Funding Source % of Total CIP
Revenue Bonds 30% Authorized Bonds 18% Grants/Other 5% Enterprise Funds 14% Unauthorized Bonds 24% Miscellaneous Sources 8% General Fund/Capital Reserve 1 % 100% Additional information on the City’s capital assets can be found in Note I.D.5 and IV.C of this report. B. Long-Term Debt As of June 30, 2005, the City had total bonded debt outstanding of $380,105,000, with $169,080,000 backed by the full faith, credit and taxing power of the City.
Table D-1 General Obligation, Special Obligation and Revenue Bonds – Outstanding Debt
(in thousands of dollars)
2005 2004 2005 2004 2005 2004General Obligation Bonds $166,550 $166,106 $ 2,530 $ 3,679 $169,080 $169,785 Special Obligation Bonds 10,415 11,455 10,415 11,455 Revenue Bonds 200,610 164,470 200,610 164,470
Total $166,550 $166,106 $213,555 $179,604 $380,105 $345,710
Governmental Business-TypeActivities Activities Total
The City’s total outstanding long-term liabilities increased by approximately $38 million during the current fiscal year from the issuance of new revenue and general obligation bonds. The issuance of these bonds supports continued enhancements of the capital projects program, including improvements to the City’s water and sewer system and other public facilities such as fire stations, libraries and park and recreation sites. To accommodate these and future business-activity projects, utility rates were increased by approximately 10% effective January 1, 2005 with future rate increases of 10% also anticipated in FY 06 and FY07.
The City of Greensboro has a general obligation bond rating of Aa1 from Moody’s Investors Service and an AAA rating from Standard and Poor’s Corporation and Fitch ICBA. These bond ratings are a clear indication of the sound financial condition of the City of Greensboro. Greensboro’s credit worthiness is a major factor in securing a bond rating. This credit worthiness, according to recent rating reports, is the result of a strong and diverse economy, a stable and consistent growth in the taxpayer base, the conservative fiscal policies for reserve and debt management and the operating performance, as well as financial flexibility. Other factors considered and affecting the high-grade credit position is the history of budgeting, the moderate debt position and the oversight provided by the North Carolina Local Government Commission.
North Carolina general statutes limit the amount of general obligation debt that a unit of government can issue to 8 percent
of the total assessed value of taxable property located within that government’s boundaries. The legal debt margin for the City of Greensboro is $1,466,465,173. The City has $71,320,000 in authorized, but unissued bonds at June 30, 2005.
More detailed information about the City’s long-term liabilities is presented in Note IV.F. 1q

Economic Factors and Next Year’s Budgets and Rates The level of Greensboro unemployment has decreased in the past year to 5.6%, down from 6.3% in June 2004. The relatively high unemployment levels are largely due to the regional textile and furniture industry which have reported successive employment declines in recent years due to increased manufacturing overseas. The average City's unemployment rate is compared to a statewide and national rate of 5.5%. Over the past twelve months, the number of goods-producing jobs in the Piedmont Triad has risen .9%, while goods-producing employment nationally has risen 1.0%. However, during the same period, the number of jobs in business, education, health and leisure services has grown locally 1.9%. This employment category accounts for 40.5% of all Triad jobs. In addition, since August 2004, real spending at the retail level has risen 8.3%. (Triad Business Index, August 2005). Durable spending in construction dollars, according to new residential building permit activity, increased by approximately $47 million in FY 2005, while commercial new construction increased by approximately $26 million. Revenue generated from construction permits within the City increased 13% during the year. The property tax base increased by 24% to $21 billion in the fiscal year ended June 30, 2005, due to octennial property revaluation, performed in 2004. Collection of sales tax receipts increased by 4.2% over the prior year, primarily due to improving economic conditions in the region. The City also experienced a 6.3% increase in hotel/motel occupancy tax receipts for the fiscal year ended June 30, 2005. The FY 2005 property tax rate was adopted at 56.75 cents per $100 assessed value and includes 1.75 cents and .85 cents to fund transit and housing initiatives. The adopted tax rate is lower than the previous rate by 5 cents, however, it is higher than a revenue neutral rate by 4.25 cents. The revenue neutral rate is that rate which would generate revenue growth equal to the average annual growth experienced since the last property revaluation in 1996. Significant City service enhancements planned for the fiscal year ending June 30, 2006 includes increased support for public safety, particularly for fire enhancements along with water resource and environmental issues. The FY 2006 budget includes a total net gain of 60 full time equivalent positions, primarily for fire personnel. Considering the above indicators when adopting the operating budget for the next fiscal year, the City’s adopted FY 2005-06 budget increased 1.4% or $4.96 million to $349,840,088. The FY 2006 adopted property tax rate remained the same at 56.76 cents per $100 value. City management has reaffirmed its intention to continue to maintain the undesignated General Fund balance at 9% of the 2006 fiscal year budget. Budget Highlights for the Fiscal Year Ending June 30, 2006 Governmental Activities: Limited enhancements were included in the FY 2006 budget and are for operating costs associated with new fire stations and continued anticipated increases in health insurance costs for employees. In addition, a transfer of ¼ cent of the property tax from the General Fund to the GTA Fund is used to offset projected losses in federal operating subsidies for fixed route bus service. Thirty new employee positions relate to increased fire operations. Business-Type Activities: Water Resources activities, with a budget of $69 million in FY 2006, compared to $62 million in the prior year, has increases of approximately $3 million in the construction and maintenance division where maintenance and repairs to the City’s water and sewer pipes, sewage pump stations and metering system and installations of all new customer connections takes place. This is in response to the significant improvements that have been undertaken in the City’s utility infrastructure in the past ten years. Accordingly, budgeted debt service expense has also increased. Requests for Information This financial report is designed to provide a general overview of the City of Greensboro’s finances and to demonstrate the City’s accountability for the money it receives. Questions concerning any information provided in this report or requests for additional information should be addressed to City of Greensboro Finance Department, P.O. Box 3136, Greensboro, North Carolina 27402-3136 or by calling (336) 373-2077.
1r
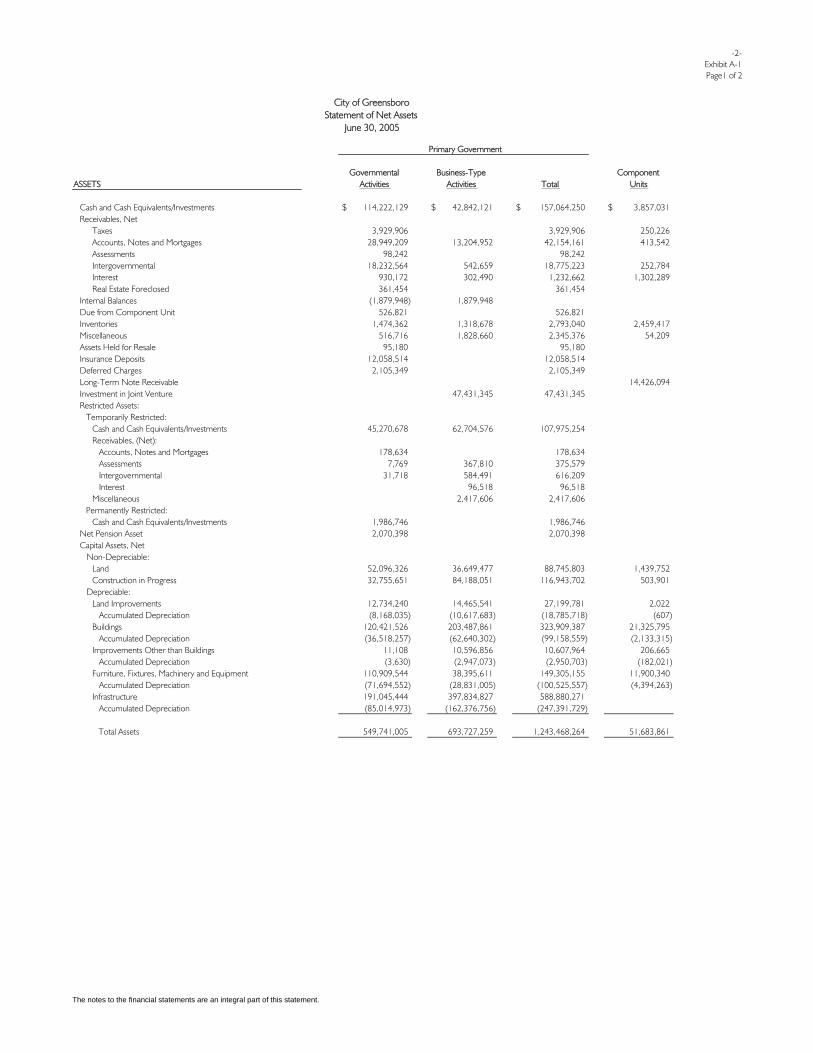
-2-Exhibit A-1Page1 of 2
Primary Government
Governmental Business-Type ComponentASSETS Activities Activities Total Units
Cash and Cash Equivalents/Investments 114,222,129$ 42,842,121$ 157,064,250$ 3,857,031$ Receivables, Net
Taxes 3,929,906 3,929,906 250,226 Accounts, Notes and Mortgages 28,949,209 13,204,952 42,154,161 413,542 Assessments 98,242 98,242 Intergovernmental 18,232,564 542,659 18,775,223 252,784 Interest 930,172 302,490 1,232,662 1,302,289 Real Estate Foreclosed 361,454 361,454
Internal Balances (1,879,948) 1,879,948 Due from Component Unit 526,821 526,821 Inventories 1,474,362 1,318,678 2,793,040 2,459,417 Miscellaneous 516,716 1,828,660 2,345,376 54,209 Assets Held for Resale 95,180 95,180 Insurance Deposits 12,058,514 12,058,514 Deferred Charges 2,105,349 2,105,349 Long-Term Note Receivable 14,426,094 Investment in Joint Venture 47,431,345 47,431,345 Restricted Assets:
Temporarily Restricted:Cash and Cash Equivalents/Investments 45,270,678 62,704,576 107,975,254 Receivables, (Net): Accounts, Notes and Mortgages 178,634 178,634 Assessments 7,769 367,810 375,579 Intergovernmental 31,718 584,491 616,209 Interest 96,518 96,518 Miscellaneous 2,417,606 2,417,606
Permanently Restricted:Cash and Cash Equivalents/Investments 1,986,746 1,986,746
Net Pension Asset 2,070,398 2,070,398 Capital Assets, Net Non-Depreciable:
Land 52,096,326 36,649,477 88,745,803 1,439,752 Construction in Progress 32,755,651 84,188,051 116,943,702 503,901
Depreciable:Land Improvements 12,734,240 14,465,541 27,199,781 2,022 Accumulated Depreciation (8,168,035) (10,617,683) (18,785,718) (607) Buildings 120,421,526 203,487,861 323,909,387 21,325,795 Accumulated Depreciation (36,518,257) (62,640,302) (99,158,559) (2,133,315) Improvements Other than Buildings 11,108 10,596,856 10,607,964 206,665 Accumulated Depreciation (3,630) (2,947,073) (2,950,703) (182,021) Furniture, Fixtures, Machinery and Equipment 110,909,544 38,395,611 149,305,155 11,900,340 Accumulated Depreciation (71,694,552) (28,831,005) (100,525,557) (4,394,263) Infrastructure 191,045,444 397,834,827 588,880,271 Accumulated Depreciation (85,014,973) (162,376,756) (247,391,729)
Total Assets 549,741,005 693,727,259 1,243,468,264 51,683,861
City of GreensboroStatement of Net Assets
June 30, 2005
The notes to the financial statements are an integral part of this statement.

-3-Exhibit A-1Page 2 of 2
Primary Government
Governmental Business-Type ComponentLIABILITIES Activities Activities Total Units
Accounts Payable 11,446,520$ 4,416,045$ 15,862,565$ 1,770,917$ Contracts/Retainage Payable 1,534,701 1,416,358 2,951,059 1,735,157 Intergovernmental Payable 1,505,487 712,769 2,218,256 Customer Deposits Payable 31,612 1,922,226 1,953,838 Accrued Interest Payable 2,442,165 1,063,263 3,505,428 Due to Primary Government 526,821 Miscellaneous 114,399 114,399 46,466 Accrued Landfill Liability 500,000 500,000 Unearned Revenues 5,570,579 5,570,579 443,290 Liabilities Payable from Restricted Assets:
Contracts/Retainage Payable 3,599,311 3,599,311 Miscellaneous 706,911 706,911
Noncurrent Liabilities:Due Within One Year: General Obligation Bonds 13,262,831 1,087,168 14,349,999 Lease Purchase and Other Financing Agreements Payable 719,975 418,717 1,138,692 Revenue Bonds Payable 5,030,000 5,030,000 Special Obligation Bonds Payable 1,090,000 1,090,000 Certificates of Participation Payable 5,673,640 2,091,360 7,765,000 Federal Loan Obligation 254,403 254,403 Note Payable 127,494 Compensated Absences 5,520,449 1,303,737 6,824,186 13,302 Miscellaneous 481 481 Due in More Than One Year: Payable from Restricted Assets: Accounts Payable 72,003 72,003 Contracts/Retainage Payable 5,217,266 5,217,266 Intergovernmental Payable 10,599 10,599 General Obligation Bonds 153,287,166 1,442,835 154,730,001 Lease Purchase and Other Financing Agreements Payable 4,058,262 1,983,479 6,041,741 Revenue Bonds Payable 195,580,000 195,580,000 Special Obligation Bonds Payable 9,325,000 9,325,000 Certificates of Participation Payable 32,060,720 6,824,280 38,885,000 Premium (Discount) on Debt 3,419,158 3,097,283 6,516,441 Federal Loan Obligation 2,544,034 2,544,034 Note Payable 266,425 Compensated Absences 3,717,303 608,988 4,326,291 19,630 Deposits Returnable 175 Accrued Landfill Liability 10,652,768 10,652,768 Unearned Revenues 151,565 151,565
Total Liabilities 248,671,189 258,816,627 507,487,816 4,949,677
NET ASSETS
Invested in Capital Assets, Net of Related Debt 152,734,241 324,801,885 477,536,126 28,569,174 Restricted for:
Highway Improvements 3,879,051 3,879,051 Transportation 417,408 417,408 Culture and Recreation 365,693 365,693 Capital Projects 8,018,147 24,155,414 32,173,561 Community Development 2,114,889 2,114,889 29,167 Public Safety 151,843 151,843 Environmental Services 3,902 3,902 Engineering and Inspections 192,621 192,621 Pension Benefits 2,070,398 2,070,398 Insurance Deposits 12,058,514 12,058,514 Perpetual Care:
Nonexpendable 1,986,746 1,986,746 Unrestricted 117,076,363 85,953,333 203,029,696 18,135,843
Total Net Assets 301,069,816$ 434,910,632$ 735,980,448$ 46,734,184$

-4-Exhibit A-2Page 1 of 2City of Greensboro
Statement of ActivitiesFor the Fiscal Year Ended June 30, 2005
Program RevenuesOperating Capital
Charges for Grants and Grants andExpenses Services Contributions Contributions
Functions/ProgramsPrimary Government: Governmental Activities: General Government 21,767,584$ 15,562,235$ $ $ Public Safety 92,937,600 4,005,541 1,974,792 687,563 Transportation 22,356,011 3,282,749 7,596,063 9,837 Engineering and Inspections 25,468,682 5,768,440 1,868,367 Environmental Services 662,457 573,946 68,336 218,872 Culture and Recreation 37,177,821 3,933,363 1,379,313 Community Development & Housing 9,827,924 1,987,527 5,308,366 189,004 Economic Opportunity 3,101,682 (4,470) 2,719,399 2,100,000 Intergovernmental 1,325,930 Interest, Fees on Long-Term Debt 8,029,110
Total Governmental Activities 222,654,801 35,109,331 19,046,269 5,073,643
Business-Type Activities: Water Operations 26,562,064 36,229,488 4,537,861 Sewer Operations 33,138,469 32,775,950 4,537,861 Stormwater Management 8,563,728 8,369,025 507,642 War Memorial Coliseum 11,669,181 7,621,544 1,500,000 Solid Waste Management 22,424,921 10,316,091 Parking Facilities 2,045,382 1,878,684
Total Business-Type Activities 104,403,745 97,190,782 11,083,364
Total Primary Government 327,058,546$ 132,300,113$ 19,046,269$ 16,157,007$
Component Units: Greensboro Housing Dev. Partnership 127,947$ 70,741$ $ $ Greensboro Transit Authority 12,328,852 2,360,781 6,910,346 Greensboro ABC Board 20,793,884 20,776,345
Total Component Units 33,250,683$ 23,207,867$ $ 6,910,346$
General Revenues:Property TaxLocal Option Sales TaxVehicle Gross Receipts TaxHotel/Motel Occupancy TaxUtility Franchise TaxPiped Natural Gas TaxTelecommunications Sales TaxSales Tax Hold HarmlessBeer and Wine TaxABC Profit DistributionIntergovernmental - undesignatedInvestment IncomeMiscellaneous
Transfers In (Out)
Total General Revenues and Transfers
Change in Net Assets
Net Assets - July 1
Cumulative Effect of Change in Accounting Principle for Fund AccountingNet Assets - July 1, (restated)
Net Assets - June 30
The notes to the financial statements are an integral part of this statement.

-5-Exhibit A-2Page 2 of 2
Net (Expenses) Revenue andChanges in Net Assets
Primary GovernmentGovernmental Business-Type Component
Activities Activities Total Units
(6,205,349)$ $ (6,205,349)$ $ (86,269,704) (86,269,704) (11,467,362) (11,467,362) (17,831,875) (17,831,875)
198,697 198,697 (31,865,145) (31,865,145)
(2,343,027) (2,343,027) 1,713,247 1,713,247
(1,325,930) (1,325,930) (8,029,110) (8,029,110)
(163,425,558) (163,425,558)
14,205,285 14,205,285 4,175,342 4,175,342
312,939 312,939 (2,547,637) (2,547,637)
(12,108,830) (12,108,830) (166,698) (166,698)
3,870,401 3,870,401
(163,425,558) 3,870,401 (159,555,157)
(57,206) (3,057,725)
(17,539)
(3,132,470)
115,805,629 115,805,629 3,658,772 35,542,429 35,542,429
322,227 322,227 2,734,573 2,734,573 6,764,970 6,764,970 1,968,825 1,968,825 3,612,340 3,612,340 1,012,047 1,012,047 1,024,673 1,024,673 2,468,216 2,468,216
149,050 149,050 4,944,761 1,758,810 6,703,571 1,349,190
849,817 1,366,287 2,216,104 228,181 (12,189,950) 12,189,950
165,009,607 15,315,047 180,324,654 5,236,143
1,584,049 19,185,448 20,769,497 2,103,673
360,762,038 354,448,913 715,210,951 44,630,511
(61,276,271) 61,276,271 299,485,767 415,725,184 715,210,951 44,630,511
301,069,816$ 434,910,632$ 735,980,448$ 46,734,184$

-6-Exhibit A-3
BALANCE SHEETGovernmental Funds June 30, 2005
(1)
HOUSING OTHER TOTAL PARTNERSHIP DEBT. GOVERNMENTAL GOVERNMENTAL
GENERAL REVOLVING SERVICE FUNDS FUNDS
Cash and Cash Equivalents/Investments 48,484,241$ 1,764,189$ 12,979,890$ 10,004,746$ 73,233,066$ Receivables:
Taxes 3,927,043 2,863 3,929,906 Accounts, Notes and Mortgages 3,430,600 14,373,145 11,145,464 28,949,209 Assessments 98,242 98,242 Intergovernmental 16,036,590 28,263 228,568 1,543,627 17,837,048 Real Estate Foreclosed 361,454 361,454
Internal Receivables 485,000 175,000 660,000 Due from Component Unit 526,821 526,821 Inventories 793,686 793,686 Miscellaneous 328,114 328,114 Assets Held for Resale 95,180 95,180 Restricted Assets:
Cash and Cash Equivalents/Investments 45,708,800 45,708,800 Receivables:
Accounts, Notes and Mortgages 178,634 178,634 Assessments 7,769 7,769 Intergovernmental 31,718 31,718
Total Assets 73,888,549$ 16,650,597$ 13,208,458$ 68,992,043$ 172,739,647$
Liabilities: Accounts Payable 2,843,783$ $ 177,952$ 682,199$ 3,703,934$ Contracts/Retainage Payable 388,757 38,262 1,107,682 1,534,701 Intergovernmental Payable 1,468,541 1,468,541 Internal Payable 435,000 435,000 Miscellaneous 56,650 57,749 114,399 Deferred Revenues 9,565,208 14,360,505 13,212,671 37,138,384 Liabilities Payable From Restricted Assets:
Contracts/Retainage Payable 3,599,311 3,599,311 Internal Payable 225,000 225,000 Miscellaneous 705,955 956 706,911
Total Liabilities 14,972,244 14,455,417 177,952 19,320,568 48,926,181
Fund Balances:Reserved by State Statute 17,958,568 525,903 228,568 2,581,389 21,294,428 Reserved for Encumbrances 2,897,108 192,073 626,589 3,715,770 Reserved for Inventories 793,686 793,686 Reserved for 911 Wireless 978,430 978,430 Reserved for Assets Held for Resale 95,180 95,180 Reserved for Capital Projects 8,245,816 8,245,816 Reserved for Perpetual Care 1,986,746 1,986,746
Total Reserved Fund Balance 30,873,608 717,976 228,568 5,289,904 37,110,056
Unreserved, Reported In:Designated for Subsequent Year's Expenditures: General Fund 7,171,221 7,171,221 Special Revenue Funds 174,951 444,924 619,875 Debt Service Fund 3,418,785 3,418,785
Total Unreserved-Subsequent Year's Expenditures 7,171,221 174,951 3,418,785 444,924 11,209,881
Designated for Debt Service: Special Revenue Funds 138,920 138,920 Debt Service Fund 9,383,153 9,383,153
Total Designated for Debt Service 9,383,153 138,920 9,522,073
Designated for Specific Purposes: General Fund 1,609,585 1,609,585 Special Revenue Funds 1,230,006 1,230,006 Capital Projects Funds 38,113,572 38,113,572
Total Unreserved-Specific Purposes 1,609,585 39,343,578 40,953,163
Undesignated: General Fund 19,261,891 19,261,891 Special Revenue Funds 1,302,253 4,454,149 5,756,402
Total Unreserved-Undesignated 19,261,891 1,302,253 4,454,149 25,018,293
Total Fund Balances 58,916,305 2,195,180 13,030,506 49,671,475 123,813,466
Total Liabilities and Fund Balances 73,888,549$ 16,650,597$ 13,208,458$ 68,992,043$ 172,739,647$
(1) After internal receivables and payables have been eliminated.
ASSETS
LIABILITIES AND FUND BALANCES
The notes to the financial statements are an integral part of this statement.

-7-Exhibit A-4
Total fund balances - governmental funds 123,813,466$
Amounts reported for governmental activities in the statement of net assets are different because:
Capital assets used in governmental activities are not financial resources and, therefore, are not reported in the funds. 280,394,844
Other long-term assets are not available to pay for current-periodexpenditures and, therefore, are deferred in the funds. 31,566,285
Internal service funds are used by management to charge the costs offleet management, equipment services, technical services, city/countytelecommunications, graphic services, employee insurance, generalinsurance and capital leasing to individual funds. The assets and liabilities of the internal service funds are included in governmental activities in the statement of net assets. 64,600,888
Long-term liabilities including bonds payable, are not due and payable in the current period and therefore are not reported in the funds. (202,091,820)
Miscellaneous adjustments to net assets include investment income receivable and pension assets not reported in the governmental funds. 2,786,153
Net assets of governmental activities 301,069,816$
City of GreensboroReconciliation of the Balance Sheet of Governmental Funds
To the Statement of Net AssetsJune 30, 2005
The notes to the financial statements are an integral part of this statement.

-8-Exhibit A-5
STATEMENT OF REVENUES, EXPENDITURES AND CHANGES IN FUND BALANCESGovernmental FundsFor the Fiscal Year Ended June 30, 2005
HOUSING OTHER TOTALPARTNERSHIP DEBT GOVERNMENTAL GOVERNMENTAL
GENERAL REVOLVING SERVICE FUNDS FUNDS
Revenues:Taxes 150,682,146$ $ $ 3,258,407$ 153,940,553$ Assessments 135,315 135,315 Intergovernmental 19,500,196 107,291 19,804,902 39,412,389 Licenses and Permits 8,926,893 8,926,893 Fines and Forfeitures 979,352 979,352 Charges for Current Services 18,830,820 991,611 1,615,044 21,437,475 Investment Income 7,545 114,085 2,810,798 1,056,662 3,989,090 Miscellaneous 2,048,520 336,498 1,722,481 4,107,499
Total Revenues 200,975,472 1,105,696 3,254,587 27,592,811 232,928,566
Expenditures:Current:
General Government 21,857,796 94,999 21,952,795 Public Safety 83,893,658 9,268,266 93,161,924 Transportation 15,549,873 15,785,073 31,334,946 Engineering and Inspections 16,159,327 8,153,732 24,313,059 Environmental Services 655,149 655,149 Culture and Recreation 29,863,658 4,972,853 34,836,511 Community Development and Housing 2,270,827 7,856,094 10,126,921 Economic Opportunity 2,992,840 2,992,840
Intergovernmental 1,325,930 1,325,930 Debt Service:
Principal Retirement 12,758,770 2,014,000 14,772,770 Interest, Fees on Long-Term Debt 5,965,324 983,220 6,948,544
Total Expenditures 169,305,391 2,270,827 18,724,094 52,121,077 242,421,389
Excess of Revenues Over (Under) Expenditures 31,670,081 (1,165,131) (15,469,507) (24,528,266) (9,492,823)
Other Financing Sources (Uses):Debt Issuances:
General Obligation Bonds Issued 14,580,000 14,580,000 Federal Loan Program 477,000 477,000 Refunding Bonds Issued 30,572,711 30,572,711 Premium, (Discount) on Debt 2,641,815 (180,498) 2,461,317
Transfers In 3,721,500 1,782,332 14,426,541 11,715,334 31,645,707 Transfers Out (34,586,695) (9,896,558) (44,483,253) Payment to Escrow Agent for Refunded Debt (33,058,668) (33,058,668)
Total Other Financing Sources (Uses) (30,865,195) 1,782,332 14,582,399 16,695,278 2,194,814
Net Change in Fund Balances 804,886 617,201 (887,108) (7,832,988) (7,298,009)
Fund Balances - July 1 58,111,419 1,577,979 13,917,614 62,848,886 136,455,898
Cumulative Effect of Change in Accounting Principle for Fund Accounting (5,344,423) (5,344,423)
Fund Balances - July 1, restated 58,111,419 1,577,979 13,917,614 57,504,463 131,111,475
Fund Balances - June 30 58,916,305$ 2,195,180$ 13,030,506$ 49,671,475$ 123,813,466$
The notes to the financial statements are an integral part of this statement.

-9-Exhibit A-6
Amounts reported for governmental activities in the statement of activities are different because:
Net change in fund balances----total governmental funds. (7,298,009)$
Governmental funds report capital outlays as expenditures. However,in the statement of activities the cost of those assets is allocated over their estimated useful lives and reported as depreciation expense.This is the amount by which capital outlays exceeded depreciation in the current period, including amounts for disposals. 8,070,391
Revenues in the statement of activities that do not provide currentfinancial resources are not reported as revenues in the funds. 4,857,894
The issuance of long-term debt (e.g., bonds, leases) provides currentfinancial resources to governmental funds, while the repayment of theprincipal of long-term debt consumes the current financial resources of governmental funds. Neither transaction, however, has any effecton net assets. Also, governmental funds report the effect of issuance costs, premiums, discounts, and similar items when debt is first issued,whereas these amounts are deferred and amortized in the statementof activities. This amount represents principal repayments in the current year. (1,527,252)
Internal service funds are used by management to charge the costs of equipment services, technical services, city/county telecommunications, graphic services, employee insurance, general insurance, and capital leasing to individual funds. The net revenue of certain activities of internal service funds is reported with governmental activities. 761,332
This amount represents the change in pension asset for funds contributed to the special separation allowance for law enforcement officers inexcess of the actuarially determined annual pension cost. 236,596
Revenues earned in prior year that first became available in the currentyear in the government funds have been reclassed to beginning netassets in the statement of activities. (3,516,903)
Change in net assets of governmental activities 1,584,049$
For the Fiscal Year Ended June 30, 2005
Expenditures, and Changes in Fund Balances of Governmental Funds
City of GreensboroReconciliation of the Statement of Revenues,
To the Statement of Activities
The notes to the financial statements are an integral part of this statement.

-10-Exhibit A-7
CITY OF GREENSBOROGeneral Fund
Statement Of Revenues, Expenditures And Changes In Fund Balances - Budget And ActualFor the Fiscal Year Ended June 30, 2005
Variance with Budgeted Amounts Final Budget-
Actual PositiveOriginal Final Amounts (Negative)
Revenues: Taxes 147,044,606$ 147,044,606$ 150,682,146$ 3,637,540$ Intergovernmental 19,013,501 19,165,653 19,500,196 334,543 Licenses and Permits 8,773,675 8,773,675 8,926,893 153,218 Fines and Forfeitures 860,520 860,520 979,352 118,832 Charges for Current Services 17,867,163 17,867,163 18,830,820 963,657 Investment Income 5,000 5,000 7,545 2,545 Miscellaneous 1,599,605 1,864,605 2,048,520 183,915
Appropriated Fund Balance 10,132,076 13,073,970 (13,073,970)
Total Revenues 205,296,146 208,655,192 200,975,472 (7,679,720)
Expenditures: Current: General Government: 23,868,531 24,327,283 21,857,796 2,469,487 Public Safety 88,477,406 85,430,703 83,893,658 1,537,045 Transportation 15,377,175 15,686,727 15,549,873 136,854 Engineering and Inspections 17,528,887 18,069,664 16,159,327 1,910,337 Environmental Services 755,135 925,963 655,149 270,814 Culture and Recreation 31,394,820 31,897,676 29,863,658 2,034,018 Intergovernmental 1,361,855 1,359,578 1,325,930 33,648
Total Expenditures 178,763,809 177,697,594 169,305,391 8,392,203
Excess of Revenues Over Expenditures 26,532,337 30,957,598 31,670,081 712,483
Other Financing Sources (Uses): Transfers In 3,516,500 3,721,500 3,721,500 Transfers Out (30,048,837) (34,679,098) (34,586,695) 92,403
Total Other Financing Sources (Uses) (26,532,337) (30,957,598) (30,865,195) 92,403
Net Change in Fund Balances 804,886 804,886
Fund Balances - July 1 58,111,419 58,111,419
Fund Balances - June 30 $ $ 58,916,305$ 58,916,305$
The notes to the financial statements are an integral part of this statement.

-11-Exhibit A-8
CITY OF GREENSBOROHousing Partnership Revolving
Statement Of Revenues, Expenditures And Changes In Fund Balances - Budget And ActualFor the Fiscal Year Ended June 30, 2005
Variance with Budgeted Amounts Final Budget-
Actual PositiveOriginal Final Amounts (Negative)
Revenues: Charges for Current Services 350,000$ 350,000$ 991,611$ 641,611$ Investment Income 50,000 50,000 114,085 64,085
Appropriated Fund Balance 515,349 515,349 (515,349)
Total Revenues 915,349 915,349 1,105,696 190,347
Expenditures: Current: Community Development and Housing 2,697,681 2,697,681 2,270,827 (426,854)
Excess of Revenues Under Expenditures (1,782,332) (1,782,332) (1,165,131) 617,201
Other Financing Sources: Transfers In 1,782,332 1,782,332 1,782,332
Net Change in Fund Balances 617,201 617,201
Fund Balances - July 1 1,577,979 1,577,979
Fund Balances - June 30 $ $ 2,195,180$ 2,195,180$
The notes to the financial statements are an integral part of this statement.

-12-Exhibit A-9Page 1 of 4
Statement of Net AssetsProprietary FundsJune 30, 2005
Solid Water Stormwater War Memorial Waste
Resources Management Coliseum ManagementASSETS Current Assets: Cash and Cash Equivalents/Investments 28,165,029$ 2,658,524$ 3,459,387$ 8,202,064$ Receivables (Net): Accounts, Notes and Mortgages 12,225,978 177,194 235,951 553,094 Intergovernmental 397,932 18,251 42,108 61,116 Interest 198,271 27,486 11,920 62,497 Inventories 1,201,921 28,951 87,806 Miscellaneous 1,584,644 1,311 53,153 Total Current Assets 43,773,775 2,881,455 3,779,628 9,019,730Noncurrent Assets: Restricted: Cash and Cash Equivalents/Investments 52,779,851 3,390,339 1,115,133 5,419,177 Receivables (Net): Assessments 367,810 Intergovernmental 584,488 3 Interest 61,803 5,044 29,671 Miscellaneous 2,417,606 Self-Funded Retention Deposits Investment in Joint Venture 47,431,345 Capital Assets: Non-Depreciable: Land 25,553,136 751,637 1,416,153 4,955,164 Construction in Progress 77,301,619 2,377,728 3,538,404 Depreciable: Land Improvements 1,753,057 3,080 74,831 12,577,633 Buildings 118,420,368 1,734 64,032,303 1,763,363 Improvements Other than Buildings 10,119,992 275,756 35,887 Furniture, Fixtures, Machinery and Equipment 28,701,148 238,120 8,567,243 586,222 Infrastructure 298,896,425 98,938,402 Less Accumulated Depreciation (177,448,004) (46,524,423) (25,598,780) (10,182,809) Total Noncurrent Assets 486,940,644 59,181,664 49,882,639 18,722,712 Total Assets 530,714,419 62,063,119 53,662,267 27,742,442
(1) After internal receivables and payables have been eliminated.
Enterprise FundsBusiness-Type Activities -
The notes to the financial statements are an integral part of this statement.
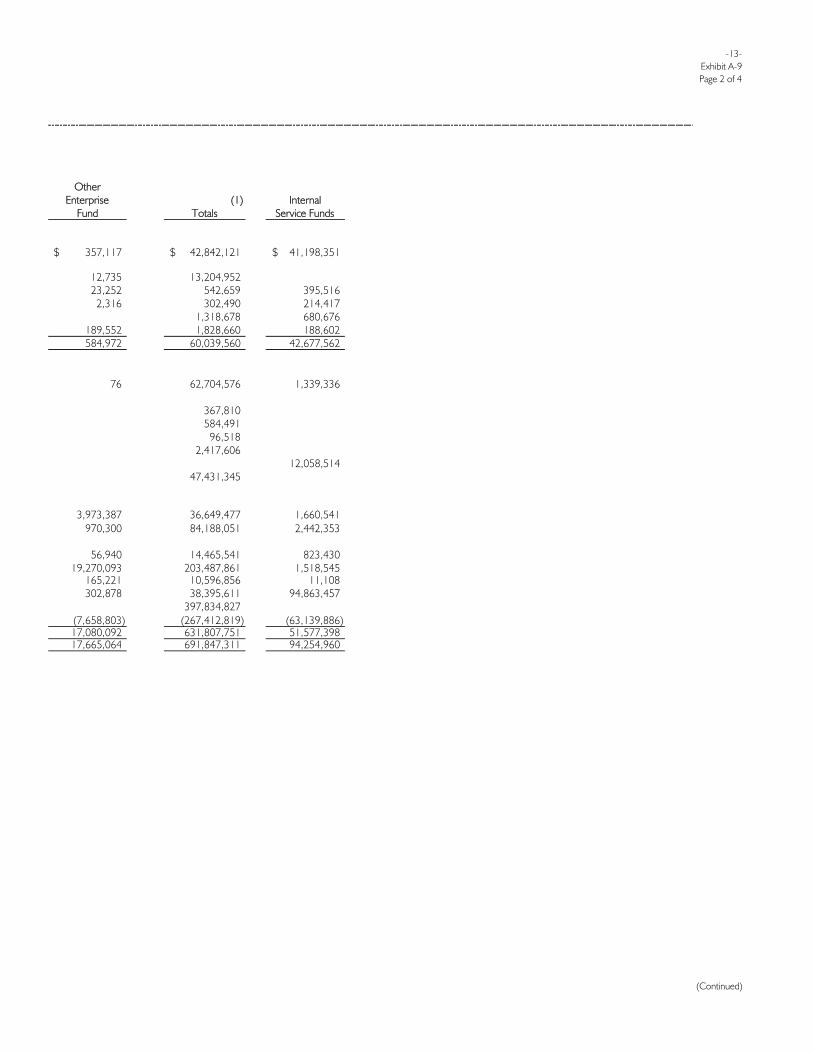
-13-Exhibit A-9Page 2 of 4
OtherEnterprise (1) Internal
Fund Totals Service Funds
357,117$ 42,842,121$ 41,198,351$
12,735 13,204,952 23,252 542,659 395,5162,316 302,490 214,417
1,318,678 680,676189,552 1,828,660 188,602584,972 60,039,560 42,677,562
76 62,704,576 1,339,336
367,810 584,491
96,518 2,417,606
12,058,514 47,431,345
3,973,387 36,649,477 1,660,541970,300 84,188,051 2,442,353
56,940 14,465,541 823,43019,270,093 203,487,861 1,518,545
165,221 10,596,856 11,108302,878 38,395,611 94,863,457
397,834,827 (7,658,803) (267,412,819) (63,139,886)17,080,092 631,807,751 51,577,39817,665,064 691,847,311 94,254,960
(Continued)

-14-Exhibit A-9Page 3 of 4
Statement of Net Assets (continued)Proprietary FundsJune 30, 2005
Solid Water Stormwater War Memorial Waste
Resources Management Coliseum ManagementLIABILITIES Current Liabilities: Accounts Payable 1,310,664$ 228$ 3,084,414$ 20,739$ Contracts/Retainage Payable 42,850 23,628 1,349,880 Intergovernmental Payable 680,463 32,306 Internal Payables General Obligation Bonds Payable 1,087,168 Revenue Bonds Payable 5,030,000 Special Obligation Bonds Payable 1,090,000 Lease-Purchase and Other Financing Agreements Payable 418,717 Certificates of Participation Payable 110,000 Federal Loan Obligation 254,403 Accrued Landfill Liability 500,000 Interest Payable 971,619 1,662 44,080 Customer Deposits Payable 1,795,289 85,124 600 Compensated Absences Payable 773,906 104,999 108,471 299,415 Miscellaneous 277 204 Total Current Liabilities 12,365,356 128,855 3,422,181 3,304,714 Noncurrent Liabilities: Payable from Restricted Assets: Accounts Payable 72,003 Contracts/Retainage Payable 5,063,654 113,612 40,000 Intergovernmental Payable 10,599 General Obligation Bonds Payable 1,442,835 Revenue Bonds Payable 195,580,000 Premium-Revenue Bonds Payable 3,089,642 Special Obligation Bonds Payable 9,325,000 Discount-Special Obligation Bonds Payable (31,112) Lease-Purchase and Other Financing Agreements Payable 1,983,479 Certificates of Participation Payable 540,000 Premium (Discount)-Certificates of Participation (2,969) Federal Loan Obligation 2,544,034 Accrued Landfill Liability 10,652,768 Compensated Absences Payable 252,742 135,447 131,834 72,227 Unearned Revenues 151,565 Total Noncurrent Liabilities 210,038,988 249,059 820,430 20,058,883 Total Liabilities 222,404,344 377,914 4,242,611 23,363,597NET ASSETSInvested in Capital Assets, Net of Related Debt 208,989,797 55,786,278 48,120,475 2,943,129Restricted 15,464,792 3,281,774 5,408,848Unrestricted 83,855,486 2,617,153 1,299,181 (3,973,132) Total Net Assets 308,310,075$ 61,685,205$ 49,419,656$ 4,378,845$
Enterprise Funds

-15-Exhibit A-9Page 4 of 4
OtherEnterprise (1) Internal
Fund Totals Service Funds
$ 4,416,045$ 7,742,586$ 1,416,358 712,769 1,087,168 244,622 5,030,000
1,090,000
418,717 521,975 1,981,360 2,091,360 3,500,000
254,403 500,000
45,902 1,063,263 41,213 1,922,226 31,612 16,946 1,303,737 207,499
481 2,085,421 21,306,527 12,248,294
72,003 5,217,266
10,599 1,442,835 4,812,391
195,580,000 3,089,642 9,325,000
(31,112)
1,983,479 93,262 6,284,280 6,824,280 10,500,000
41,722 38,753 2,544,034 10,652,768
16,738 608,988 120,177 151,565
6,342,740 237,510,100 15,525,830 8,428,161 258,816,627 27,774,124
8,962,206 324,801,885 19,846,634 24,155,414 12,058,514
274,697 84,073,385 34,575,688 9,236,903$ 433,030,684$ 66,480,836$

-16-Exhibit A-10
Net assets - proprietary funds 433,030,684$
Amounts reported for business-type activities in the statement of net assets are different because:
Internal service funds 1,879,948
Net assets of business-type activities 434,910,632$
City of GreensboroReconciliation of the Statement of Net Assets-Proprietary Funds
To the Statement of Net AssetsJune 30, 2005
The notes to the financial statements are an integral part of this statement.

-17-Exhibit A-11Page 1 of 2
Statement of Revenues, Expenses, and Changes in Fund Net AssetsProprietary FundsFor the Fiscal Year Ended June 30, 2005
Solid Water Stormwater War Memorial Waste
Resources Management Coliseum ManagementRevenues: Charges for Current Services 61,309,316$ 8,369,025$ 7,621,544$ 10,316,091$ Miscellaneous 2,278,726 19,460 1,726,675 1,109,501 Total Operating Revenues 63,588,042 8,388,485 9,348,219 11,425,592
Operating Expenses: Personal Services 11,540,473 2,442,637 3,292,986 5,319,421 Fringe Benefits 3,844,081 862,500 841,762 1,888,225 Maintenance and Operations 24,196,182 3,603,998 5,681,282 13,320,915 Insurance Claims and Expenses Depreciation 11,213,421 1,654,593 2,076,124 988,753 Total Operating Expenses 50,794,157 8,563,728 11,892,154 21,517,314
Operating Income (Loss) 12,793,885 (175,243) (2,543,935) (10,091,722)
Nonoperating Revenues (Expenses): Investment Income 1,085,883 174,035 58,705 424,118 Net Income from Joint Venture 832,030 Miscellaneous Nonoperating Revenue 7,633,340 8,950 1,121 Interest Expense (6,904,737) (17,227) (588,403) Loss on Disposal of Capital Assets (14,465) Amortization of Underwriters' Expense (188,860) (23,374) Miscellaneous Nonoperating Expense (1,380,036) (19,242) (2,580) Total Nonoperating Revenues (Expenses) 1,063,155 174,035 31,186 (189,118)
Income (Loss) Before Contributions and Transfers 13,857,040 (1,208) (2,512,749) (10,280,840)
Capital Contributions 6,027,748 507,642
Transfers In 1,800,000 10,373,045Transfers Out (185,815) (97,500) (205,000) (721,175) Change in Net Assets 19,698,973 408,934 (917,749) (628,970)
Net Assets - July 1 288,611,102 50,337,405 5,007,815
Cumulative Effect of Change in AccountingPrinciple for Fund Accounting 61,276,271
Net Assets - July 1, restated 288,611,102 61,276,271 50,337,405 5,007,815
Net Assets - June 30 308,310,075$ 61,685,205$ 49,419,656$ 4,378,845$
Business-Type Activities -Enterprise Funds
The notes to the financial statements are an integral part of this statement.

-18-Exhibit A-11Page 2 of 2
Other Enterprise Internal
Fund Totals Service Funds
1,878,684$ 89,494,660$ 49,648,039$ 580 5,134,942 1,524,841
1,879,264 94,629,602 51,172,880
335,371 22,930,888 3,413,427 109,160 7,545,728 1,059,393 477,069 47,279,446 11,755,937
24,881,949 542,664 16,475,555 9,830,465
1,464,264 94,231,617 50,941,171
415,000 397,985 231,709
16,069 1,758,810 1,295,405 832,030
7,643,411 37,792 (516,853) (8,027,220) (461,561)
(14,465) (1,252,315) (21,657) (233,891) (2,953) (31,066) (1,432,924) (197,969)
(553,507) 525,751 (581,601)
(138,507) 923,736 (349,892)
6,535,390
1,226,395 13,399,440 1,577,920 (1,209,490) (930,324)
1,087,888 19,649,076 297,704
8,149,015 352,105,337 66,183,132
61,276,271
8,149,015 413,381,608 66,183,132
9,236,903$ 433,030,684$ 66,480,836$

-19-Exhibit A-12
Amounts reported for business-type activities in the statement of activities are different because:
Net change in fund balances----total proprietary funds. 19,649,076$
Internal service funds are used by management to charge the costs offleet management and management information systems to individualfunds. The net revenue (loss) of certain activities of internal service funds is reported with business-type activities. (463,628)
Change in net assets of business-type activities 19,185,448$
For the Fiscal Year Ended June 30, 2005
Expenses, and Changes in Fund Net Assets-Proprietary Funds
City of GreensboroReconciliation of the Statement of Revenues,
To the Statement of Activities
The notes to the financial statements are an integral part of this statement.

-20-Exhibit A-13Page 1 of 4
Statement of Cash FlowsProprietary FundsFor the Fiscal Year Ended June 30, 2005
Solid Water Stormwater War Memorial Waste
Resources Management Coliseum ManagementCash Flows from Operating Activities:Receipts from Customers 58,900,508$ 8,261,825$ 10,038,987$ 10,526,496$ Payments to Suppliers (30,953,724) (3,622,079) (5,709,662) (12,654,518)Payments to Employees (14,441,290) (3,296,253) (4,143,078) (7,178,407)Other Receipts 7,696,346 19,460 1,726,675 1,110,622 Net Cash Provided by (Used for) Operating Activities 21,201,840 1,362,953 1,912,922 (8,195,807)
Cash Flows from Noncapital Financing Activities:Subsidies and Transfers In 1,595,000 10,373,045Subsidies and Transfers Out (185,815) (97,500) (721,175) Net Cash Provided by (Used for) Noncapital Financing Activities (185,815) (97,500) 1,595,000 9,651,870
Cash Flows from Capital and Related Financing Activities:Capital Debt Issued 75,057,424Acquisition and Construction of Capital Assets (27,263,851) (632,582) (8,207) 889,662Proceeds from Sale of Capital Assets 2Payment to Escrow Agent for Refunding of Debt (32,428,140)Principal Paid on Capital Debt (6,519,860) (90,000) (1,040,000)Interest and Fiscal Charges Paid on Capital Debt (6,999,448) (19,717) (581,462) Net Cash Provided By (Used) for Capital and Related Financing Activities 1,846,127 (632,582) (117,924) (731,800)
Cash Flows from Investing Activities:Interest 1,016,059 141,505 53,322 436,669
Net Increase (Decrease) in Cash and Cash Equivalents 23,878,211 774,376 3,443,320 1,160,932
Balances - July 1 57,066,669 5,274,487 1,131,200 12,460,309Balances - June 30 80,944,880$ 6,048,863$ 4,574,520$ 13,621,241$
Reconciliation of Cash and Cash Equivalents/Investments: Cash and Cash Equivalents/Investments - Current 28,165,029$ 2,658,524$ 3,459,387$ 8,202,064$ Cash and Cash Equivalents/Investments - Restricted 52,779,851 3,390,339 1,115,133 5,419,177 Total Cash and Cash Equivalents/Investments - June 30 80,944,880$ 6,048,863$ 4,574,520$ 13,621,241$
Business-Type Activities -Enterprise Funds
The notes to the financial statements are an integral part of this statement.

-21-Exhibit A-13Page 2 of 4
Other Enterprise Internal
Fund Totals Service Funds
1,871,780$ 89,599,596$ 49,544,373$ (487,325) (53,427,308) (33,627,456)(439,383) (29,498,411) (4,577,877)
580 10,553,683 1,348,234945,652 17,227,560 12,687,274
1,226,395 13,194,440 1,577,920 (1,004,490) (930,324)
1,226,395 12,189,950 647,596
75,057,424 7,000,000(1,812,357) (28,827,335) (11,646,851)
2 569(32,428,140)
(1,941,000) (9,590,860) (4,680,016)(380,075) (7,980,702) (595,446)
(4,133,432) (3,769,611) (9,921,744)
17,930 1,665,485 1,270,360
(1,943,455) 27,313,384 4,683,486
2,300,648 78,233,313 37,854,201357,193$ 105,546,697$ 42,537,687$
357,117$ 42,842,121$ 41,198,351$ 76 62,704,576 1,339,336
357,193$ 105,546,697$ 42,537,687$
(Continued)

-22-Exhibit A-13Page 3 of 4
Statement of Cash FlowsProprietary FundsFor the Fiscal Year Ended June 30, 2005
Solid Water Stormwater War Memorial Waste
(continued) Resources Management Coliseum Management
Reconciliation of Operating Income (Loss) to Net Cash Provided by (Used for) Operating Activities: Operating Income (Loss) 12,793,885$ (175,243)$ (2,543,935)$ (10,091,722)$ Adjustments to Reconcile Operating Income (Loss) to Net Cash Provided by (Used for) Operating Activities: Depreciation 11,213,421 1,654,593 2,076,124 988,753 Change in Assets and Liabilities: (Increase) Decrease in Receivables (2,408,808) (107,200) 177,939 210,405 Decrease in Inventories (218,970) (4,207) (2,520) Increase (Decrease) in Intergovernmental Receivables (254,267) (10,130) (42,108) 8,919 (Increase) Decrease in Miscellaneous Assets (1,008,460) 404 Increase in Investment in Joint Venture (4,455,000) Increase (Decrease) in Accounts Payable (820,845) (7,951) 17,531 10,846 Increase in Landfill Liability 649,152 Increase (Decrease) in Compensated Absences Payable 133,570 8,884 (13,771) 30,139 Increase in Intergovernmental Payable 685,726 5,441 Increase in Customer Deposits Payable Increase (Decrease) in Miscellaneous Payable 123,968 2,239,504 (900) Increase in Other Receipts 5,417,620 1,121 Total Adjustments 8,407,955 1,538,196 4,456,857 1,895,915
Net Cash Provided by (Used for) Operating Activities 21,201,840$ 1,362,953$ 1,912,922$ (8,195,807)$
Noncash Investing, Capital and Financing Activities: Lease-Purchase and Other Capital Financing Agreements 26,509$ $ $ $ Donated Assets 6,027,748 507,642 Equity Interest in Joint Venture 832,030 Total Noncash Investing, Capital and Financing Activities 6,886,287$ 507,642$ $ $
Business-Type Activities -Enterprise Funds

-23-Exhibit A-13-
Page 4 of 4
Other Enterprise Internal
Fund Totals Service Funds
415,000$ 397,985$ 231,709$
542,664 16,475,555 9,830,465
(6,904) (2,134,568) (225,697) (158,592)
(3,645) (301,231) (114,447) (1,008,056) (265,118) (4,455,000) 3,242,003
(6,611) (807,030) 649,152 24,643
3,625 162,447 (129,701) 691,167
16,612 2,362,572
1,523 5,420,264 9,700 530,652 16,829,575 12,455,565
945,652$ 17,227,560$ 12,687,274$
$ 26,509$ 43,216$ 6,535,390
832,030 $ 7,393,929$ 43,216$

-24-
Police Special Separation Allowance Fund
Police Special Separation Allowance Fund
This fund was established to account for special separation (pension) benefits, payable monthly, to qualified law enforcement officers. The City is required to provide such benefits until each qualified law enforcement officer attains age 62. The City’s contributions to this fund have been actuarially determined and will be funded by fringe benefit charges based on active police officers’ salaries.

-25-Exhibit A-14
PensionBenefitTrust
ASSETSCash and Cash Equivalents/Investments,
Restricted for: Pension Benefits-Police Special
Separation AllowanceCash and Cash Equivalents 118,917$ US Government Agencies 3,965,494 US Treasuries 167,413 Commercial Paper 104,274 Money Market Mutual Funds 228,321
Interest Receivable 25,530 Total Assets Held in Trust for Pension Benefits 4,609,949$
City of GreensboroStatement of Fiduciary Net Assets
Fiduciary FundJune 30, 2005
The notes to the financial statements are an integral part of this statement.

-26-Exhibit A-15
City of GreensboroStatement of Changes in Fiduciary Net Assets
Fiduciary FundFor the Fiscal Year Ended June 30, 2005
Pension BenefitTrust
ADDITIONSEmployer Contribution 1,670,838$ Investment Income 114,361
Total Additions 1,785,199
DEDUCTIONSBenefits Paid-Police Special Separation Allowance 1,622,459Administrative Expenses 1,240
Total Deductions 1,623,699
Change in Net Assets 161,500
Net Assets - Beginning of the Year 4,448,449Net Assets - End of the Year 4,609,949$
The notes to the financial statements are an integral part of this statement.

-27-Exhibit A-16
Statement of Net AssetsComponent UnitsJune 30, 2005
Greensboro Greensboro Greensboro TotalHousing Dev. Transit ABC Component
ASSETS Partnership Authority Board Units
Cash and Cash Equivalents/Investments 153,195$ 2,877,342$ 826,494$ 3,857,031$ Receivables, Net
Taxes 250,226 250,226 Accounts, Notes and Mortgages 404,125 9,417 413,542 Intergovernmental 159,508 93,276 252,784 Interest 1,302,289 1,302,289
Inventories 130,159 2,329,258 2,459,417 Miscellaneous 54,209 54,209 Long-Term Note Receivable 14,426,094 14,426,094 Capital Assets: Non-Depreciable:
Land 1,099,897 339,855 1,439,752 Construction in Progress 55,000 448,901 503,901
Depreciable:Land Improvements 2,022 2,022 Accumulated Depreciation (607) (607) Buildings 121,287 19,557,104 1,647,404 21,325,795 Accumulated Depreciation (77,282) (1,384,181) (671,852) (2,133,315) Improvements Other than Buildings 3,807 202,858 206,665 Accumulated Depreciation (666) (181,355) (182,021) Furniture, Fixtures, Machinery and Equipment 135 10,663,225 1,236,980 11,900,340 Accumulated Depreciation (45) (3,530,501) (863,717) (4,394,263)
Total Assets 411,798 46,342,512 4,929,551 51,683,861
LIABILITIES
Accounts Payable 27,406 37,247 1,706,264 1,770,917 Contracts/Retainage Payable 1,735,157 1,735,157 Due to Primary Government 526,821 526,821 Miscellaneous 46,466 46,466 Unearned Revenues 443,290 443,290 Noncurrent Liabilities:
Due Within One Year: Note Payable 127,494 127,494 Compenstated Absences 13,302 13,302 Due in More Than One Year: Note Payable 266,425 266,425 Compensated Absences 19,630 19,630 Deposits Returnable 175 175
Total Liabilities 421,325 2,248,801 2,279,551 4,949,677
NET ASSETS
Invested in Capital Assets, Net of Related Debt 26,859,001 1,710,173 28,569,174 Restricted for:
Community Development 29,167 29,167 Unrestricted (38,694) 17,234,710 939,827 18,135,843
Total Net Assets (9,527)$ 44,093,711$ 2,650,000$ 46,734,184$
The notes to the financial statements are an integral part of this statement.

-28-Exhibit A-17Page 1 of 2
Statement of ActivitiesComponent Units
For the Fiscal Year Ended June 30, 2005
Program RevenuesOperating Capital
Charges for Grants and Grants andExpenses Services Contributions Contributions
Greensboro Housing Dev. PartnershipGovernmental Activities:
Community Development & Housing 127,947$ 70,741$ $ $
Total Greensboro Housing Dev. Partnership 127,947 70,741
Greensboro Transit AuthorityBusiness Type Activities:
Transit Operations 12,328,852 2,360,781 6,910,346
Total Greensboro Transit Authority 12,328,852 2,360,781 6,910,346
Greensboro ABC Board Business Type Activities:
ABC Board Operations 20,793,884 20,776,345
Total Greensboro ABC Board 20,793,884 20,776,345
Total 33,250,683$ 23,207,867$ $ 6,910,346$
General Revenues:Taxes:
Property TaxInvestment IncomeMiscellaneous
Total General Revenues
Change in Net AssetsNet Assets - July 1Net Assets - July 30
The notes to the financial statements are an integral part of this statement.

-29-Exhibit A-17Page 2 of 2
Net (Expenses) Revenue andChanges in Net Assets
Greensboro Greensboro GreensboroHousing Dev. Transit ABC
Partnership Authority Board Totals
(57,206)$ $ $ (57,206)$
(57,206) (57,206)
(3,057,725) (3,057,725)
(3,057,725) (3,057,725)
(17,539) (17,539)
(17,539) (17,539)
(57,206) (3,057,725) (17,539) (3,132,470)
3,658,772 3,658,772 1,331,651 17,539 1,349,190
228,181 228,181
5,218,604 17,539 5,236,143
(57,206) 2,160,879 2,103,673 47,679 41,932,832 2,650,000 44,630,511 (9,527)$ 44,093,711$ 2,650,000$ 46,734,184$

NOTES TO THE FINANCIAL STATEMENTS CITY OF GREENSBORO, NORTH CAROLINA
JUNE 30, 2005
I. Summary of Significant Accounting Policies
The accounting policies of the City of Greensboro (City) and its component units conform to accounting principles generally accepted in the United States of America (GAAP) as applicable to governmental units. The Governmental Accounting Standards Board (GASB) is the accepted standard-setting body for establishing governmental accounting and financial reporting principles. The following is a summary of the more significant accounting policies of the City:
A. The Financial Reporting Entity
The City is a municipal corporation governed by an elected Mayor and eight-member Council. As required by generally accepted accounting principles, these financial statements present the City (the primary government) and its component units, entities for which the City is considered to be financially accountable. Criteria used to establish financial accountability include appointment of a voting majority of the component unit’s governing board and imposition of will or a financial benefit/burden relationship, fiscal dependency or other significant operational and financial relationships.
1. Blended Component Unit
Blended component units, although legally separate entities, are, in substance, part of the City’s operations. Financial amounts from this unit are combined with amounts of the primary government. The Greensboro Center City Corporation (GCCC) assists the City in financing, acquiring and constructing public facilities and in purchasing equipment. The sole purpose of the GCCC is to provide a funding source for City assets, lease the assets to the City and to use the lease payments to repay the debt. The corporation has no other operations. The GCCC’s twelve member governing board is appointed by the City Mayor. A financial burden exists, as the City is required to transfer funds to the GCCC in an amount sufficient to pay the scheduled debt service on GCCC certificates of participation. The GCCC’s cash and debt is combined with assets and liabilities of the Parking facilities and the Capital Leasing Funds for financial statement purposes.
2. Discretely Presented Component Units
The component unit column in the basic financial statements includes the financial data of the City’s other component units. The units are reported in a separate column to emphasize that they are legally separate from the City. Greensboro Housing Development Partnership, Inc. (GHDP) provides first-time home buyers, with low to moderate income, affordable financing. GHDP also serves as a conduit to sell surplus land to builders to develop affordable housing for City citizens. The voting majority of the Board not only rests with the City, but also the financial burden, as the City guarantees support for any deficits of certain programs and loan obligations. The City also influences the operations of the GHDP by providing loan initiatives and rehabilitation of properties. Related transactions of this partnership are reflected in the City records. The Greensboro Transit Authority (GTA) is responsible for operating the mass transit system in the municipal area. The members of GTA’s governing board are appointed by City Council. City Council approves GTA’s budget, transit rates and maintains substantive approval over significant operating decisions. Transit taxes are levied under the taxing authority of the City and are included as part of the City’s total tax levy. The GTA is presented as an Enterprise Fund. Greensboro ABC Board operates alcoholic beverage stores, regulates the sale of such beverages and enforces alcoholic beverage laws in the City. Members of the governing body are appointed by City Council. Financial benefit is provided to the City as a portion of the Greensboro ABC Board’s profits are distributed to the City, quarterly. Each of the blended and discretely presented component units has a June 30 year-end. Complete financial statements for the individual component units may be obtained at their respective administrative offices. Financial transactions of the
30

GTA are reported and audited during the City’s annual audit. No separate financial statements are prepared for this entity.
ADMINISTRATIVE OFFICES
Greensboro Center City Corporation Greensboro Housing Development Attention: Richard Lusk Partnership, Inc.
P. O. Box 3136 Attention: Linda Jones Greensboro, North Carolina 27402-3136 P.O. Box 3136 Greensboro, North Carolina 27402-3136
Greensboro ABC Board Attention: Fred McCormick P.O. Box 16905 Greensboro, North Carolina 27416-0905
B. Governmental-Wide and Fund Financial Statements
The basic financial statements include both government-wide (based on the City as a whole) and fund financial statements. While the previous model emphasized fund types (the total of all funds of a particular type), in the new reporting model the focus is on either the City as a whole or major individual funds (within the fund financial statements).
The government-wide financial statements (i.e., the statement of net assets and the statement of changes in net assets) report information on all of the non-fiduciary activities of the primary government and its component units. For the most part, the effect of interfund activity has been removed from these financial statements. Governmental activities, which normally are supported by taxes and intergovernmental revenues, are reported separately from business-type activities, which rely to a significant extent on fees and charges for support. Likewise, the primary government is reported separately from certain legally separate component units for which the primary government is financially accountable.
The statement of activities demonstrates the degree to which the direct expenses of a given function or segment are offset by program revenues. Direct expenses are those that are clearly identifiable with a specific function or segment. Program revenues include 1) charges to customers or applicants who purchase, use, or directly benefit from goods, services, or privileges provided by a given function or segment and 2) grants and contributions that are restricted to meeting the operational or capital requirements of a particular function or segment. Taxes and other items not properly included among program revenues are reported instead as general revenues. The previous reporting model did not summarize or present net cost by function or activity. Separate financial statements are provided for governmental funds, proprietary funds, and fiduciary funds, even though the latter are excluded from the government-wide financial statements. The focus of the governmental and proprietary fund financial statements is on major funds. The City’s determination of reporting major funds considered the criteria prescribed by GASB and consistency of presentation from year to year. Major individual governmental funds and major individual enterprise funds are reported as separate columns in the fund financial statements. Non-major funds are summarized into a single column. Internal Service funds, funds that provide goods and services to other City departments and certain outside agencies on a cost-reimbursement basis, have also been eliminated to prevent “double reporting” of their transactions.
The government-wide financial statements and the fund financial statements report the City’s operational and fiscal accountability. Operational accountability refers to the reporting of efficiency and effectiveness of achieved operating objectives using all resources available for that purpose, and whether additional objectives can be met in the foreseeable future. Fiscal accountability is demonstrated through additional fund information detailing compliance with finance-related legal and contractual provisions.
30a

C. Measurement Focus, Basis of Accounting, and Financial Statement Presentation
The government-wide financial statements are reported using the economic resources measurement focus and the accrual basis of accounting, as are the proprietary fund and fiduciary fund financial statements. Revenues are recorded when earned and expenses are recorded when a liability is incurred, regardless of the timing of related cash flows. Property taxes are recognized as revenues in the year for which they are levied. Grants and similar items are recognized as revenue as soon as all eligibility requirements imposed by the provider have been met. All assets and liabilities (whether current or non-current) associated with these activities are included in the government-wide financial statements, resulting in net assets.
Governmental fund financial statements are reported using the current financial resources measurement focus and the modified accrual basis of accounting. Revenues are recognized when they are measurable and available, or when susceptible to accrual. “Measurable” means the amount of the transaction can be determined, and “available” means collectible within the current period or soon enough thereafter to pay liabilities of the current period. The City considers ad valorem taxes, sales taxes, state-shared revenues and reimbursements, and profit distributions from the ABC Board to be available if they are collected within 90 days after year end. Certain intergovernmental revenues, licenses and permits, fines and forfeitures, and charges for current services are recognized when cash is received, unless they are subject to deferral to a future period.
As of January 1, 1993, state law changed the procedures for the assessment and collection of property taxes on registered motor vehicles in North Carolina. For those motor vehicles registered under the staggered system, property taxes are due the first day of the fourth month after the vehicles are registered. The billed taxes are applicable to the Fiscal Year in which they become due. Therefore, taxes for vehicles registered from March 2004 through February 2005 apply to the Fiscal Year ended June 30, 2005.
Uncollected taxes that were billed during this period are shown as a receivable on the financial statements. Those taxes for vehicles registered from March 1 through the Fiscal Year end apply to the Fiscal Year 2005-2006 and are not shown as receivables at June 30, 2005. For those motor vehicles registered under the annual system, taxes are due on May 1 of each year. Taxes for vehicles registered annually that have already been collected as of year end are reflected as deferred revenues at June 30, 2005 because they will be used to fund City operations during the 2005-2006 Fiscal Year.
Expenditures are generally recognized under the modified accrual basis of accounting when the related fund liability is incurred. Exceptions to this general rule include accumulated unpaid sick pay which is not accrued and debt service on general long-term debt and claims and judgments which are recognized when the liability is normally expected to be liquidated with available financial resources. Only current assets and current liabilities are generally included on the balance sheets of the governmental funds. Operating statements present increases (revenues and other financing sources) and decreases (expenditures and other financing uses) in net current assets. Accordingly, the reported fund balance presents a summary of sources and uses of “available spendable resources” during a period. Since the governmental fund statements are presented on a different measurement focus and basis of accounting than the governmental column in the government-wide statements, a reconciliation is presented on the page following each statement, which briefly explains the adjustment necessary to transform the fund-based financial statements into the governmental column of the government-wide presentation.
Proprietary funds distinguish operating revenues and expenses from non-operating items. It is the City’s policy that operating revenues and expenses generally result from providing services and producing and delivering goods in connection with a proprietary fund’s principal ongoing operations. The principal operating revenues of the Enterprise Funds and of the government’s Internal Service Funds are charges to customers for sales and services. Operating expenses for Enterprise Funds and Internal Service Funds include the cost of sales and services, administrative expenses, claims payments, and depreciation on capital assets. All revenues and expenses not meeting this definition are reported as non-operating revenues and expenses.
As permitted by accounting principles generally accepted in the United States of America, the City has elected to apply only applicable FASB Statements and Interpretations issued before November 30, 1989 in its accounting and reporting practices in the government-wide financial statements as well as for its proprietary operations and Pension Trust Fund.
The government reports the following major governmental funds:
General Fund - The General Fund is the primary operating fund of the City. It is used to account for all financial resources of the general government, except those required to be accounted for in another fund.
30b

Debt Service Fund - The Debt Service Fund is used to account for the accumulation of resources for, and the payment of, general long-term debt principal, interest and related costs. The Housing Partnership Revolving Fund - The Housing Partnership Revolving Fund is used to provide resources for low and moderate income housing initiatives, approved by City Council, including grant/loan programs, construction/renovation projects, and cooperative efforts with private and not-for-profit organizations. General Fund support to this fund is .85 cents of the property tax rate.
The government reports the following major proprietary funds:
Enterprise Funds - Enterprise Funds account for operations that are financed and operated in a manner similar to private business enterprises where the intent of the governing body is that the costs of providing goods or services to the general public on a continuing basis be financed or recovered primarily through user charges; or where the governing body has decided that periodic determination of revenues earned, expenses incurred, and net income is appropriate for capital maintenance, public policy, management control, accountability or other purposes. The Stormwater Management Fund was established to account for the federally mandated program of stormwater system management, which is supported by a city-wide stormwater fee.
The Water Resources Fund provides services to over 95,000 customers and is designed to be self-supporting. This fund also provides for principal and interest on all water and sewer debt. Combined Enterprise System Revenue bonds as well as General Obligation bonds outstanding are recorded in this fund. The War Memorial Coliseum Fund administers operation of the complex that brings top artists in entertainment, education and sports to the City. The Solid Waste Management Fund accounts for waste collection, disposal and recycling operations of the City, as well as solid waste landfill improvements. The City’s parking operations are included in “Other Enterprise Fund”, a non-major fund.
Additionally, the government reports the following fund types:
Internal Service Funds - Internal Service Funds account for the financing of goods or services provided by one department or agency to other departments or agencies of the City, or to other governments, on a cost-reimbursement basis. The City also accounts for its self-insurance transactions and major equipment purchases financed with lease-purchase agreements or certificates of participation in the Internal Service Funds. Internal Service Funds of the City government (which traditionally provide services primarily to other funds of the government) are presented in summary form as part of the proprietary fund financial statements. Since the principal users of the Internal Service Funds are associated with the City’s governmental activities, financial statements of Internal Service Funds are consolidated into the governmental column when presented at the government-wide level. To the extent possible, the costs of these services are reflected in the appropriate functional activity. Pension Trust Fund – The Pension Trust Fund accounts for assets held by the City in a trustee capacity and accumulates funds to provide pension benefit payments to qualified law enforcement officers. This fund uses the accrual basis of accounting and has a capital maintenance measurement focus. It is accounted for in essentially the same manner as Proprietary Funds.
The City’s fiduciary funds (which have been redefined and narrowed in scope) are presented in the fund financial statements by type (Pension Benefit Trust). Since by definition these assets are being held for the benefit of a third party (pension participants) and cannot be used to address activities or obligations of the government, these funds are not incorporated into the government-wide statements. As a general rule the effect of interfund activity has been eliminated from the government-wide financial statements. Exceptions to the rule are payments between the water resources function and the General Fund. Elimination of these charges would distort the direct costs and program revenues reported for the various functions concerned. When both restricted and
30c

unrestricted resources are available for use, it is the City’s policy to use restricted resources first, then unrestricted resources as they are needed.
D. Assets, Liabilities and Net Assets or Equity
1. Cash and Cash Equivalents/Investments
The City maintains a cash and investment pool that is used by all funds except the following, which maintain separate deposits and investments: Capital Project Bond funds and Water Resources Bond Funds. The City is directly responsible for managing cash and cash equivalents/ investments of all funds except for certain cash and cash equivalents/ investments of the Capital Leasing Fund managed by a third party trustee for the Greensboro Center City Corporation. Each fund type’s equity in cash and cash equivalents/ investments is displayed separately on the combined balance sheet. Interest earned is distributed to the various funds on the basis of equity in the cash and cash equivalents/ investments pool and individual fund investments. For purposes of the statement of cash flows, investments (including restricted assets) are considered to be cash equivalents, since they represent highly liquid deposits of the cash and investment pool. 2. Receivables and Payables
Activity between funds that are representative of lending/borrowing arrangements outstanding at the end of the Fiscal Year are referred to as “internal receivables/internal payable” (i.e., the current portion of interfund loans) and are reported “net”. Residual balances outstanding between the governmental activities and business-type activities are reported in the government-wide financial statements as “internal balances”.
City ad valorem taxes are billed by the Guilford County Tax Collector after July 1, the beginning of the Fiscal Year, and are due on September 1. No penalties or interest are assessed until the following January 6. The taxes levied are based on the assessed values as of January 1, which is the statutory lien date on real property. Liens against personal property are coincident with action taken to levy or garnish. Collections of City taxes are made by the County and remitted to the City as collected. Property taxes on certain registered motor vehicles are assessed and collected throughout the year. The taxes receivable amount for the General Fund is reduced by an allowance for uncollectibles of $133,580. The net receivable of $3,927,043 is shown as a deferred revenue on the Balance Sheet.
3. Inventories
Inventories consist primarily of materials and supplies held for consumption. They are stated at cost, determined principally by a moving average method. The costs of governmental fund-type inventories are recorded as expenditures when consumed rather than when purchased. Inventories of the Greensboro ABC Board are valued at the lower of cost (FIFO) or market.
4. Restricted Assets Certain proceeds of the City’s revenue bonds and certificates of participation, as well as certain grant and tax receipts, are classified as restricted assets on the balance sheet because they are maintained in separate bank accounts and/or their use is limited by applicable bond covenants, grantor or enabling legislative restrictions.
5. Capital Assets
Capital assets, which include property, plant, equipment, infrastructure assets (e.g., roads, bridges, sidewalks, and similar items) and intangible assets, are reported in the applicable governmental or business-type activities columns in the government-wide financial statements. Capital assets are defined by the government as assets with an initial, individual cost of more than $5,000. General infrastructure assets that were acquired or received substantial improvements subsequent to July 1, 1980 are reported at estimated historical cost using deflated replacement values.
All purchased capital assets of the City and GTA are valued at historical cost or estimated historical cost if actual historical cost is not available. Donated capital assets are valued at their estimated fair market value on the date donated.
The costs of normal maintenance and repairs that do not add value to the asset or materially extend assets lives are not capitalized.
30d

General capital assets and the related accumulated depreciation are reported for the City and GTA using the straight-line method over the following estimated useful lives: Buildings, 40 years; Improvements, 20 years; Equipment, 5-20 years and Infrastructure as follows: Streets, 50 years; Sidewalks, 40 years; Bridges 50 years; Water/Sewer, 40 years and Stormwater Improvements, 30-75 years. Depreciation of all exhaustible capital assets used by Proprietary Funds is charged as an expense against their operations.
Property and equipment of the Greensboro ABC Board are stated at cost and are depreciated over their useful lives on a straight-line basis as follows: Buildings, 50 years; Equipment, 3-5 years. Leasehold improvements of the Greensboro ABC Board are depreciated over the term of the lease agreement.
Property, furniture and equipment of the GHDP are stated at cost and are depreciated over their useful lives on a straight-line basis as follows: Buildings, 27 years; Furniture and Equipment, 3-5 years.
6. Deferred/Unearned Revenues
The City reports deferred revenue on its government-wide and fund financial statements. Deferred revenues arise when a potential revenue does not meet both the “measurable” and “available” criteria for recognition in the current period (fund financial statements). Deferred revenues also arise when resources are unearned by the City and received before it has a legal claim to them, as when grant monies are received prior to the incurrence of qualifying expenditures (fund financial statements and government-wide financial statements). In subsequent periods, when both revenue recognition criteria are met, or when the City has a legal claim to the resources, the liability for deferred/unearned revenue is removed from the applicable financial statement and revenue is recognized.
Deferred/unearned revenues in the fund and basic financial statements at June 30, 2005 are composed of the following:
Other Housing Non-Major
General Partnership Special RevenueFund Fund Funds
Deferred Revenue:Taxes Receivable 3,927,043$ $ 2,863$ Prepaid Taxes Not Yet Earned 1,249,840 1,953 Prepaid Assessments Not Yet Earned 620 97,147 Prepaid Privilege Licenses Revenues 1,357,966 Other Prepaid Deferred Revenues 304,729 2,295,920 Notes and Mortgages Receivable 2,530,058 14,360,505 10,708,777 Other Deferred Revenues 194,952 106,011
9,565,208$ 14,360,505$ 13,212,671$
Fund Financial Statements
Governmental Business-TypeActivities Activities
Unearned Revenue:Prepaid Taxes Not Yet Earned 1,251,793$ $ Prepaid Assessments Not Yet Earned 97,767 Prepaid Privilege Licenses Not Yet Earned 1,357,966 Other Prepaid Deferred Revenues 2,600,649 151,565 Other Deferred Revenues 262,404
5,570,579$ 151,565$
Basic Financial Statements
30e

7. Long-Term Liabilities
In the government-wide financial statements, and proprietary fund-types in the fund financial statements, long-term debt and other long-term obligations are reported as liabilities in the applicable governmental activities, business-type activities, or proprietary fund-type statement of net assets. Bond premiums and discounts, as well as issuance costs, and losses on extinguishment of debt are deferred and amortized over the life of the bonds using the effective interest method. Bonds payable are reported at par, with a separate line shown for the applicable bond premium or discount.
In the fund financial statements, governmental fund-types recognize bond premiums and discounts, as well as bond issuance costs, during the current period. The face amount of debt issued is reported as an Other Financing Source. Premiums received on debt issuances are reported as Other Financing Sources while discounts on debt issuances are reported as Other Financing Uses. Issuance costs, whether or not withheld from the actual debt proceeds received, are reported as debt service expenditures.
8. Fund Equity
In the fund financial statements, governmental funds report reservations of fund balance for amounts that are not available for appropriation or are legally restricted by outside parties for use for a specific purpose. Designations of fund balance represent tentative management plans that are subject to change. Fund balances are segregated into the following classifications:
a. Reserved by State Statute - This represents the amount of fund balance, which cannot be appropriated by the governing board. North Carolina General Statutes limit the amount that each local government may commit for purposes of future expenditures to the sum of cash and cash investments, less the sum of liabilities, encumbrances and deferred revenues arising from cash receipts as those amounts stand at the close of the Fiscal Year.
b. Reserved for Encumbrances - This represents commitments outstanding at June 30, 2005 related to purchase orders and unperformed contracts.
c. Reserved for Inventories - This represents that portion of fund balance segregated for inventories of supplies; these are current assets which do not represent available spendable resources.
d. Reserved for 911 Wireless - This represents a portion of fund balance to be used for 911 communications.
e. Reserved for Assets Held for Resale - This represents a portion of fund balance segregated for an inventory of properties that will be resold and does not represent spendable resources.
f. Reserved for Capital Projects - This represents the proceeds of bond sales used to finance major capital improvements not yet completed and funds accumulated for future capital projects.
g. Reserved for Perpetual Care - This represents a portion of fund balance segregated for maintenance of the City’s cemeteries.
h. Reserved for Specific Purpose - This represents a portion of fund balance which has been reserved by the City for use in future periods.
i. Designated for Subsequent Year’s Expenditures - This represents the amount of fund balance appropriated by the City Council to the budget for the year ending June 30, 2006.
j. Designated for Specific Purposes - This represents that portion of fund balance which has been specifically set aside by the City for use in future periods.
k. Designated for Debt Service - This represents amounts held for the future payment of general long-term debt principal and interest.
l. Undesignated - This represents the amount of fund balance which is available for future appropriations.
30f

9. Net Assets
The government-wide and business-type fund financial statements utilize a net asset presentation. Net assets are categorized as investment in capital assets (net of related debt), restricted and unrestricted.
Investment in Capital Assets (net of related debt) is intended to reflect the portion of net assets which are associated with non-liquid, capital assets less outstanding capital asset related debt. The net related debt is reduced by any associated unamortized deferred costs.
Restricted Net Assets are liquid assets (typically generated from certain revenues and bond proceeds) which have third-party (statutory, bond covenant or granting agency) limitations on their use. Restrictions may also be imposed by law through constitutional provisions or enabling legislation.
Unrestricted Net Assets represent net assets that do not meet the definitions of “restricted” or “invested in capital assets net of related debt”. Unrestricted net assets may be designated for management’s specific internal purposes.
10. Accounting Changes and Reclassifications
Effective, July 1, 2004, the City adopted GASB Statement No. 40, “Deposit and Investment Risk Disclosures” and made conforming changes to the notes to the financial statements for deposits and investments. In addition, the City changed the basis of accounting and measurement focus for stormwater operations from the previous treatment in special revenue and capital project funds to enterprise funds as of July 1, 2004. Accordingly, the Stormwater Management Fund and Stormwater Capital Improvement Fund beginning net assets were increased by $57,526,753 and $3,749,518, respectively. All of the stormwater capital assets totaling $56,163,410 as of July 1, 2004 were transferred from the “Governmental” activities to the “Business-Type” activities in the Statement of Net Assets at the government-wide level of reporting. In addition, beginning compensated absence liability balances of $231,562 were reclassified between categories.
II. Reconciliation of Government-Wide and Fund Financial Statements
A. Explanation of certain differences between the governmental fund balance sheet and the government-wide statement of net assets.
The governmental fund balance sheet includes a reconciliation between fund balance – total governmental funds and net assets – governmental activities as reported in the governmental-wide statement of net assets. One element of that reconciliation explains that “long-term liabilities, including bonds payable, are not due and payable in the current period and therefore are not reported in the funds.” The details of this $202,091,820 difference are as follows:
Bonds and Notes Payable (including Premium of $3,419,158 and including Deferred Issuance Costs of $2,106,869) 162,805,273$ Intergovernmental Payable 36,946 Accrued Interest Payable 2,442,165 Certificate of Participation Payable 23,734,360 Compensated Absences 8,910,076 Lease Purchase & Other Financing Payable 4,163,000 Combined Adjustment 202,091,820$
B. Explanation of certain differences between the governmental fund statement of revenues, expenditures, and changes in fund balances and the government-wide statement of activities.
The governmental fund statement of revenues, expenditures, and changes in fund balances includes a reconciliation between net changes in fund balances – total governmental funds and changes in net assets of governmental activities as reported in the government-wide statement of activities. One element of that reconciliation explains that “Governmental funds report capital
30g

outlays as expenditures. However, in the statement of activities the cost of those assets is allocated over their estimated useful lives and reported as depreciation expense”.
The details of this $8,070,391 difference are as follows:
Capital Outlay 17,826,084$ Disposals (1,038,269) Depreciation Expense (8,717,424) Combined Adjustment 8,070,391$
Another element of that reconciliation states that “the issuance of long-term debt (e.g., bonds, leases) provides current financial resources to governmental funds, while the repayment of the principal of long-term debt consumes the current financial resources of governmental funds. Neither transaction, however, has any effect on net assets. Also, governmental funds report the effect of issuance costs, premiums, discounts, and similar items when debt is first issued, whereas these amounts are deferred and amortized in the statement of activities.” The details of this $1,527,252 difference are as follows:
Issuance of Debt (15,212,858)$ Principal Expenditure 15,078,770 Interest Expenditure (619,005) Salary Expense (741,646) Miscellaneous Expense (32,513) Combined Adjustment (1,527,252)$
III. Stewardship, Compliance and Accountability A. Budgetary Information
In accordance with the General Statutes of the State of North Carolina, the City prepares and adopts its budgets on the modified accrual basis. The General Statutes also require balanced budgets for all funds for which a budget is required. The City adopts annual budgets for all funds except Capital Projects Funds, Grant Project Funds and a Trust Fund. Capital and Grant Project budgets are adopted for the duration of the project which may encompass several years. Appropriations for funds that adopt annual budgets lapse at the end of the budget year. Capital and Grant Project budget appropriations do not lapse until the completion of the project.
Budgets are adopted at the fund level and are amended as necessary during the Fiscal Year in one of two ways. First, the City Manager, as delegated by City Council, may make line-item transfers within individual fund budgets with subsequent monthly notice to City Council. Such transfers can neither increase nor decrease the overall budget at the fund level. Secondly, the budget may be increased or decreased at the fund level as changing circumstances dictate, subject to City Council approval. The legal level of budgetary control (the level at which expenditures may not legally exceed appropriations) is the fund level.
The City Council officially adopts the annual budget ordinance and all project ordinances in June and amends such ordinances as necessary to recognize changes in resources or reallocations of budgets. As required by North Carolina General Statutes, appropriations in Governmental Funds are encumbered upon issuance of purchase orders, contracts or other forms of legal commitments. Even though goods and services have not been received, the transactions are accounted for as a reservation of fund balance in the year that the commitment is made. While appropriations lapse at the end of the Fiscal Year, the succeeding year’s budget ordinance specifically provides for the reappropriation of year-end encumbrances. Supplemental budgetary amendments increased the General Fund appropriations by $3,564,046, primarily for establishment of the Guilford Metro 911 program and various other governmental enhancements. No expenditures exceeded appropriations at the legal level of control during Fiscal Year 2004-2005.
30h

B. Deficit Fund Equity
The following funds reported deficit fund balances as of June 30, 2005:
Community Development Block Grant Fund $ (92,034) Hope VI Program Fund (46,110) Workforce Investment Act Fund (133,742) South Elm Street Redevelopment Fund (131,068) Neighborhood Redevelopment Series 2005 Bond Fund (220,812)
These deficits will be eliminated with future reimbursements of federal grants and issuance of general obligation bonds.
IV. Detailed Notes on all Funds A. Deposits and Investments
1. Deposits
All deposits of the City of Greensboro are either insured or collateralized by using one of the two methods. Under the Dedicated Method, all deposits that exceed the federal depository insurance coverage level are collateralized with securities held by the City’s agents in the City’s name. Under the Pooling Method, which is a collateral pool, all uninsured deposits are collateralized with securities held by the State Treasurer’s agent in the name of the State Treasurer. Since the State Treasurer is acting in a fiduciary capacity for the City, the deposits are considered to be held by the City’s agent in the City’s name. The amount of the pledged collateral is based on an approved averaging method for non-interest bearing deposits and the actual current balance for interest-bearing deposits. Depositories using the Pooling Method report to the State Treasurer the adequacy of their pooled collateral covering uninsured deposits. The State Treasurer does not confirm this information with the City or the escrow agent. Because of the inability to measure the exact amount of collateral pledged for the City under the Pooling Method, the potential exists for under-collateralization, and the risk may increase in periods of high cash flows. However, the State Treasurer of North Carolina enforces strict standards of financial stability for each depository that collateralizes public deposits under the Pooling Method. The City does not have a formal investment policy regarding custodial credit risk for deposits.
At June 30, 2005, the City’s deposits had a carrying amount of $678,563 and a bank balance of $5,002,856. Of the bank balance, $100,000 was covered by federal depository insurance and the remainder was covered by the collateral held under the Pooling Method.
The Greensbosro ABC Board, a discretely presented component unit, held deposits in Pooling Method banks only. At June 30, 2005, the carrying amount of deposits was $799,194 and the bank balance was $1,086,776. All of the bank balances were covered by federal depository insurance, as well.
2. Investments
North Carolina General Statute 159-30 (c) authorizes the City to invest in obligations of the U. S. Treasury and obligations of certain federal agencies; prime quality commercial paper and bankers’ acceptances bearing the highest rating of a nationally recognized statistical rating service (NRSRS); repurchase agreements with respect to either direct obligations of the United States or obligations of which the principal and interest are guaranteed by the United States; and SEC-registered mutual funds certified by the N. C. Local Government Commission. The City holds investments to maturity in order to realize full book value and interest earnings. As required for periods beginning after June 15, 1997 by GASB Statement No. 31, Accounting and Financial Reporting for Certain Investments and for External Investment Pools, the City’s investments with a maturity of more than one year at acquisition and non-money market investments are carried at fair value determined annually by quoted market prices, using the specific identification method. The North Carolina Capital Management Trust (NCCMT) Cash Portfolio’s securities are valued at fair value, which is the NCCMT’s share price. Money market instruments that have a remaining maturity at time of purchase of one year or less are reported at amortized cost. Interest income earned in the Capital Projects Funds, amounting to $904,667 was assigned to the Debt Service Fund.
30i

The GTA owns a percentage of the City’s total investment pool. Accordingly, investment balances for the GTA are included in the following table:
Weighted AverageInvestment Type Reported/Fair Value Maturity (Year)U.S. Government Securities 8,005,937$ 0.419U.S Government Agencies 189,393,921 2.153North Carolina Capital Management Trust (NCCMT) 71,423,048 0.003Commercial Paper 4,986,542 0.079Total Fair Value 273,809,448$ Portfolio Weighted Average Maturity 1.710
Interest Rate Risk
In accordance with the formally approved City of Greensboro’s Charter, Article III, Section 4.71, the Investment Manager (Assistant Treasurer) prepares a memo describing investment transactions in detail as they are purchased. This memo is sent to the Mayor, the City Manager and the Finance Director (Treasurer) for signature approval and then returned to the Investment Manager. Although the investment policy has not been formally approved by the City Council, the City has an investment policy guideline, an internally approved Finance Department document, that follows the North Carolina General Statute 159-30. As a means of limiting the City’s exposure to declines in fair market values from rising interest rates, the City limits the weighted average maturity of its investments to less than 2 years. Also, the City purchases securities in a structured ladder with stated maturity dates to limit interest rate risk.
Credit Risk
North Carolina General Statute 159-30 limits investments in U.S. Governmental Agencies and commercial paper to those with top ratings issued by NRSRS. The City has no formal investment policy regarding credit risk, however in practice, we follow the 159-30 statute, and in effect the City limits its investment types to those with top ratings issued by NRSRS. As of June 30, 2005, the City had investments in the NCCMT Cash Portfolio which is rated AAA by Standard and Poor’s. The City also invests in U. S. Government Agencies, all of which are AAA rated by Standard and Poor’s. Investments in commerical paper by the City are rated either A1/P1 by Standard and Poor’s or Moody’s Investors Service.
Concentration of Credit Risk
The City does not limit the amount of investment in any one issuer. As of June 30, 2005 the City owned the following investments, which exceed 5% of the City’s total investments, along with the percentage noted of each compared to the total portfolio:
Federal National Mortgage Association 28.55%
Federal Home Loan Bank 26.00% Federal Farm Credit Bank 12.17%
Federal Home Loan Mortgage Corporation 11.92%
a. Interest Rate Swap
Objective of the Interest Rate Swap
As a means to convert variable rate obligations to synthetic fixed rate obligations to reduce the overall variable rate exposure of the City, the City entered into three interest rate swap agreements with Bank of America, N.A. in October 2002, in connection with its $13,600,000 Series 1994B Variable Rate General Obligation Bonds (Swap 1) and $5,700,000 Series 1998 Variable Rate General Obligation Bonds (Swap 2) and in March 2005, in connection with a portion ($31,070,000) of its $41,070,000 Series 2005B Combined Enterprise System Revenue Bonds (Swap 3). The intention of the swaps was to effectively change the City’s interest rate on the bonds (or portion thereof with regard to the Series
30j

2005B Combined Enterprise System Revenue Bonds) to a synthetic fixed rate of 2.92% (Swap 1), 3.46% (Swap 2) and 4.99% (Swap 3), respectively.
Swap Terms
Swap 1 and Swap 2. The bonds and the related swap agreements mature on April 1, 2014 (Swap 1) and April 1, 2020 (Swap 2) and the combined swaps’ notional amount of $19,300,000 matches the $19,300,000 variable- rate bonds outstanding. Starting in Fiscal Year 2007 (Swap 1) and Fiscal Year 2019 (Swap 2) the notional value of the swaps and the principal amount of the associated debt decline. Under the swaps, the City pays the counterparty a fixed payment of 2.92% (Swap 1) and 3.46% (Swap 2) and receives a variable payment computed as 67% of 1 Month London Interbank Offered Rate (LIBOR). The bonds’ variable rate coupons are closely associated with the Bond Market Association Municipal Swap Index (BMA).
Swap 3. The swapped portion ($31,070,000) of the Series 2005B Combined Enterprise System Revenue Bonds (that portion representing mandatory sinking fund redemptions from June 1, 2006 to June 1, 2019) and the related swap agreement mature on June 1, 2019, and the swap’s notional amount of $31,070,000 matches the $31,070,000 of Series 2005B Combined Enterprise System Revenue Bonds subject to mandatory sinking fund redemption from June 1, 2006 to June 1, 2019. Starting in Fiscal Year 2006, the notional value of Swap 3 and the principal amount of the associated debt decline. Under Swap 3, the City pays the counterparty a fixed payment of 4.99% and receives a variable payment computed as 72% of 1 Month LIBOR. The bond’s variable rate coupons are closely associated with the BMA.
Fair Value
Because interest rates were higher on June 30, 2005 than at the date of the execution of the swaps, the swaps had estimated fair values of ($117,779) (Swap 1), ($317,778) (Swap 2) and (Swap 3) ($4,105,294) as of June 30, 2005. The mark-to-market valuations were established by market quotations from the counterparty representing estimates of the amounts that would be paid for replacement transactions.
Credit Risk
As of June 30, 2005, the City is exposed to credit risk in the amount of the derivatives’ fair values. The swaps’ counterparty was rated Aa1 by Moody’s Investors Service (Moody’s), AA by Standard and Poor’s (S&P) and AA- by Fitch Ratings (Fitch).
Basis Risk
As noted above, Swap 1 and Swap 2 expose the City to basis risk should the relationship between 67% of 1 Month LIBOR and BMA diverge, changing the synthetic rate on the bonds. The effect of this difference in basis is indicated by the difference between the intended synthetic rates of 2.92% (Swap 1) and 3.46% (Swap 2) and the synthetic rates as of June 30, 2005 of 2.98% (Swap 1) and 3.52% (Swap 2). As of June 30, 2005, the rate on the City’s bonds was 2.30%, whereas 67% of 1 Month LIBOR was 2.24%.
As also noted above, Swap 3 exposes the City to basis risk should the relationship between 72% of 1 Month LIBOR and BMA diverge, changing the synthetic rate on the bonds. The effect of this difference in basis is indicated by the difference between the intended synthetic rate of 4.99% and the synthetic rate as of June 30, 2005 of 4.89%. As of June 30, 2005, the rate on the City’s bonds was 2.30%, whereas 72% of 1 Month LIBOR was 2.40%.
Termination Risk
The derivative contract uses the International Swap Dealers Association Master Agreement, which includes standard termination events, such as failure to pay and bankruptcy. The City will have the right to terminate the swaps at any time over the life of the swaps at the current market value on short-term notice. The respective Schedule to the respective Master Agreement includes an “additional termination event.” That is, in the case of Swap 1 and Swap 2, the swap may be terminated by the counterparty if the outstanding debt of the City, secured by its faith, credit and taxing power, ceases to be rated at least A3 by Moody’s or any successor thereto, A- by S&P or any successor thereto, or A- by Fitch, or any successor thereto or shall fail to be rated by at least one of Moody’s, S&P, and Fitch. In the case of Swap 3, the swap may be terminated by the counterparty if the outstanding Combined Enterprise System Revenue Bond debt of the City ceases
30k

to be rated at least A3 by Moody’s or any successor thereto, A- by S&P or any successor thereto, or A- by Fitch or any successor thereto or shall fail to be rated by at least one of Moody’s, S & P, and Fitch. The City or the counterparty may terminate the swaps if the other party fails to perform under the terms of the contract. If the swaps are terminated, the variable-rate bonds would no longer carry a synthetic interest rate. Termination will result in the City either making or receiving a termination payment based upon the market value on the date of termination.
Market Access Risk/Roll Over Risk The City’s swaps are for the term (maturity) of the bonds (or in the case of Swap 3, are for the term (maturity) of the portion of the Series 2005B Combined Enterprise System Revenue Bonds that are related to Swap 3) and therefore there is no market-access risk or rollover risk.
B. Long-Term Notes Receivable
The GTA entered into an agreement with Duke Power Company, effective July 1, 1991, which authorized the discontinuance of transit services provided by Duke Transit in Greensboro, pursuant to a franchise agreement scheduled to expire on July 1, 2028. In exchange, GTA is to receive $55,500,000 in 37 equal annual installments of $1,500,000 from Duke Power Company with the first installment on July 1, 1991 and the final installment on July 1, 2027. The annual payment is secured by a First and Refunding Mortgage Bond issued by Duke Power Company to GTA. The present value of the note receivable as of June 30, 2005 is $14,426,094. Interest income of $18,782,771 will be recognized by the effective yield method over the remaining 22-year term of the note, based on an imputed interest rate of 8.95%.
In January, 2005, the City sold a downtown facility, previously associated with its library services, to Elon University School of Law. In exchange, the City will receive annual interest payments of $57,750 until 2015 when the principal payment of $2,100,000 is due. Accordingly, a note receivable and corresponding deferred revenue amount of $2,100,000 is recorded in the General Fund as of June 30, 2005.
C. Capital Assets
Capital asset activity for the year ended June 30, 2005 was as follows:
30l
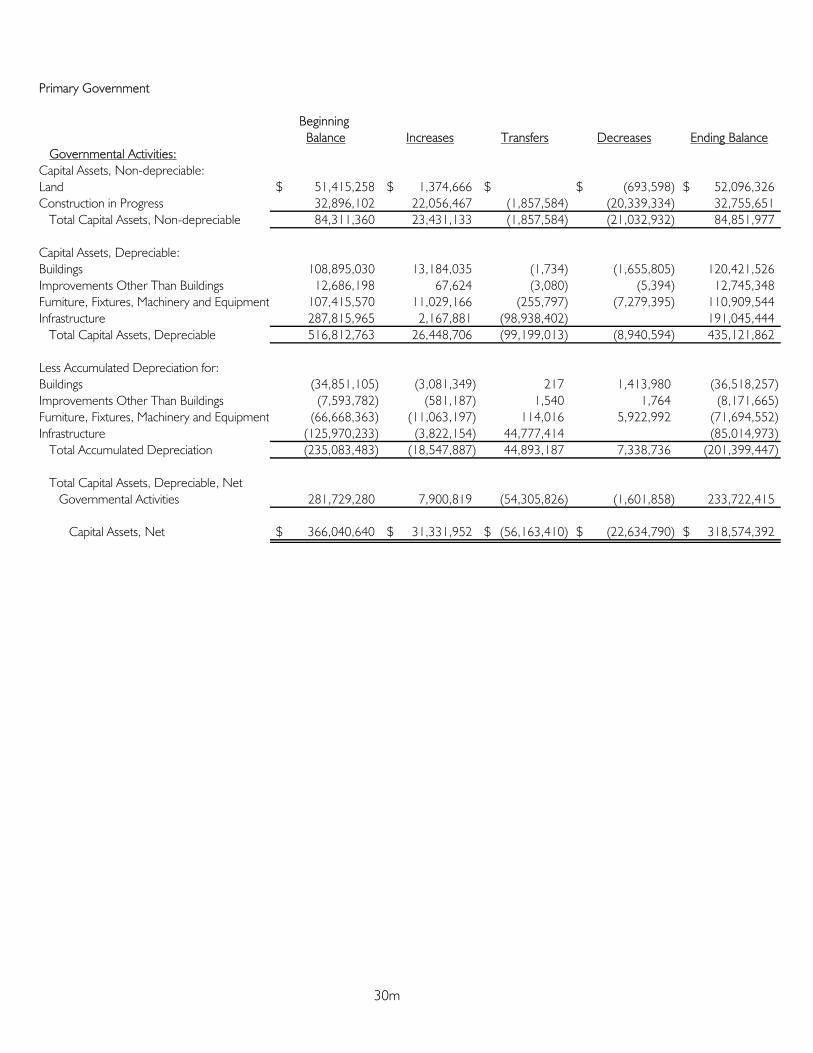
Primary Government
Beginning Balance Increases Transfers Decreases Ending Balance
Governmental Activities:Capital Assets, Non-depreciable:Land 51,415,258$ 1,374,666$ $ (693,598)$ 52,096,326$ Construction in Progress 32,896,102 22,056,467 (1,857,584) (20,339,334) 32,755,651 Total Capital Assets, Non-depreciable 84,311,360 23,431,133 (1,857,584) (21,032,932) 84,851,977
Capital Assets, Depreciable:Buildings 108,895,030 13,184,035 (1,734) (1,655,805) 120,421,526 Improvements Other Than Buildings 12,686,198 67,624 (3,080) (5,394) 12,745,348 Furniture, Fixtures, Machinery and Equipment 107,415,570 11,029,166 (255,797) (7,279,395) 110,909,544 Infrastructure 287,815,965 2,167,881 (98,938,402) 191,045,444 Total Capital Assets, Depreciable 516,812,763 26,448,706 (99,199,013) (8,940,594) 435,121,862
Less Accumulated Depreciation for:Buildings (34,851,105) (3,081,349) 217 1,413,980 (36,518,257) Improvements Other Than Buildings (7,593,782) (581,187) 1,540 1,764 (8,171,665) Furniture, Fixtures, Machinery and Equipment (66,668,363) (11,063,197) 114,016 5,922,992 (71,694,552) Infrastructure (125,970,233) (3,822,154) 44,777,414 (85,014,973) Total Accumulated Depreciation (235,083,483) (18,547,887) 44,893,187 7,338,736 (201,399,447)
Total Capital Assets, Depreciable, Net Governmental Activities 281,729,280 7,900,819 (54,305,826) (1,601,858) 233,722,415
Capital Assets, Net 366,040,640$ 31,331,952$ (56,163,410)$ (22,634,790)$ 318,574,392$
30m

Beginning Balance Increases Transfers Decreases Ending Balance
Business-Type Activities:Capital Assets, Non-depreciable:Land 33,694,791$ 2,954,686$ $ $ 36,649,477$ Construction in Progress 75,877,247 26,396,873 1,857,584 (19,943,653) 84,188,051 Total Capital Assets, Non-depreciable 109,572,038 29,351,559 1,857,584 (19,943,653) 120,837,528
Capital Assets, Depreciable:Buildings 195,343,486 8,142,641 1,734 203,487,861 Improvements Other Than Buildings 21,224,785 3,834,532 3,080 25,062,397 Furniture, Fixtures, Machinery and Equipment 34,704,752 3,596,625 255,797 (161,563) 38,395,611 Infrastructure 290,642,258 8,254,167 98,938,402 397,834,827 Total Capital Assets, Depreciable 541,915,281 23,827,965 99,199,013 (161,563) 664,780,696
Less Accumulated Depreciation for:Buildings (57,468,061) (5,172,024) (217) (62,640,302) Improvements Other Than Buildings (12,383,436) (1,179,780) (1,540) (13,564,756) Furniture, Fixtures, Machinery and Equipment (27,275,011) (1,578,425) (114,016) 136,447 (28,831,005) Infrastructure (109,054,016) (8,545,326) (44,777,414) (162,376,756) Total Accumulated Depreciation (206,180,524) (16,475,555) (44,893,187) 136,447 (267,412,819)
Total Capital Assets, Depreciable, Net Business Activities 335,734,757 7,352,410 54,305,826 (25,116) 397,367,877
Capital Assets, Net 445,306,795$ 36,703,969$ 56,163,410$ (19,968,769)$ 518,205,405$
Depreciation expense was charged to functions/programs of the primary government as follows:
Governmental Activities:
General Government 579,473$ Public Safety 1,220,398 Transportation, including depreciation of general infrastructure assets 3,984,004 Engineering and Inspections 645,389 Culture and Recreation 2,288,158 Capital assets held by the government's internal service funds are
charged to the various functions based on their usage of the assets 9,830,465 Total depreciation expense - Governmental Activities 18,547,887$
Business-Type Activities:Water Resources Fund, including depreciation of infrastructure assets 11,213,421$ Stormwater Management Fund 1,654,593 War Memorial Coliseum Fund 2,076,124 Parking Facilities Fund 988,753 Solid Waste Management Fund 542,664
Total depreciation expense - Business-Type Activities 16,475,555$
30n

Construction Commitments The City has construction contract commitments on capital projects at June 30, 2005 as follows:
Governmental Funds: Special Revenue 357,676$ Capital Projects 17,122,117 Total Governmental Funds 17,479,793
Enterprise Funds: Water Resources 8,957,581 Solid Waste Management 7,003 Total Enterprise Funds 8,964,584
26,444,377$
Discretely Presented Component Units:
Activity for GHDP for the year ended June 30, 2005, was as follows:
Beginning Balance Increases Decreases Ending Balance
Capital Assets, Non-depreciable:Construction in Progress 439,975$ $ (272,498)$ 167,477$
Capital Assets, Depreciable, Amortized:Buildings 121,287 121,287 Software 135 135 Total Capital Assets Depreciable, Amortized 121,287 135 121,422
Less Accumulated Depreciation Amortization for:Buildings (69,863) (7,419) (77,282) Software (45) (45) Total Accumulated Depreciation, Amortization (69,863) (7,464) (77,327)
Total Capital Assets, Depreciable, Amortized-Net 51,424 (7,329) 44,095 GHDP Capital Assets, Net 491,399$ (7,329)$ (272,498)$ 211,572$
30o

Activity for GTA for the year ended June 30, 2005, was as follows:
Beginning Balance Increases Decreases Ending Balance
Capital Assets, Non-depreciable:Land 1,099,897$ $ $ 1,099,897$ Construction in Progress 315,551 133,350 448,901 Total Capital Assets, Non-depreciable 1,415,448 133,350 1,548,798
Capital Assets, Depreciable:Buildings 19,557,104 19,557,104 Improvements Other Than Buildings 5,829 5,829 Furniture, Fixtures, Machinery and Equipment 8,716,373 2,683,110 (736,258) 10,663,225 Total Capital Assets, Depreciable 28,279,306 2,683,110 (736,258) 30,226,158
Less Accumulated Depreciation for:Buildings (895,253) (488,928) (1,384,181) Improvements Other Than Buildings (1,077) (196) (1,273) Furniture, Fixtures, Machinery and Equipment (3,412,237) (838,595) 720,331 (3,530,501) Total Accumulated Depreciation (4,308,567) (1,327,719) 720,331 (4,915,955)
Total Capital Assets, Depreciable-Net 23,970,739 1,355,391 (15,927) 25,310,203
GTA Capital Assets, Net 25,386,187$ 1,488,741$ (15,927)$ 26,859,001$
Activity for ABC Board for the year ended June 30, 2005, was as follows:
Beginning Balance Increases Decreases Ending Balance
Capital Assets, Non-depreciable:Land 339,855$ $ $ 339,855$
Capital Assets, Depreciable:Buildings 1,647,404 1,647,404 Improvements Other Than Buildings 196,772 6,086 202,858 Furniture, Fixtures, Machinery and Equipment 1,047,133 189,847 1,236,980 Total Capital Assets, Depreciable 2,891,309 195,933 3,087,242
Less Accumulated Depreciation for:Buildings (639,558) (32,294) (671,852) Improvements Other Than Buildings (174,778) (6,577) (181,355) Furniture, Fixtures, Machinery and Equipment (729,422) (134,295) (863,717) Total Accumulated Depreciation (1,543,758) (173,166) (1,716,924)
Total Capital Assets, Depreciable-Net 1,347,551 22,767 1,370,318
ABC Capital Assets, Net 1,687,406$ 22,767$ $ 1,710,173$
30p

D. Closure and Postclosure Care Costs - White Street Landfill
The City owns and operates a regional landfill site located in the northeast portion of the City. State and federal laws require the City to place a final cover on its White Street landfill site and to perform certain maintenance and monitoring functions at the site for thirty years after closure. The City reports a portion of these closure and post closure care costs as an operating expense in each period based on landfill capacity used as of each June 30. The $11,152,768 reported as landfill closure and post closure care liability at June 30, 2005 is based on the use 100% of the estimated capacity of Phase II and Phase III, Cells 1 and 2. Phase III, Cell 3 is estimated at 3.6% filled. These amounts are based on what it would cost to perform all closure and post closure care in the current year. Actual cost may be higher due to inflation, changes in technology, or changes in regulations. At June 30, 2005, the City had expended $3,876,035 to complete closure for the White Street facility, Phase II. The balance of closure costs, estimated at $8,195,001 for Phase III will be funded over the remaining life of the landfill.
E. Interfund Receivables, Payables and Transfers
The following is a schedule of interfund receivables and payables and due to/from primary government and component unit at June 30, 2005:
1. Internal Receivables/Payables:
Housing Non-Major Partnership Governmental
Revolving Fund Funds Total
Current Payable From:
Non-Major Governmental Funds 485,000$ 175,000$ 660,000$
Receivable By:
2. Due To/From Primary Government and Component Unit: Receivable By: General Fund Payable From: Component Unit – ABC Board $ 526,821
Internal receivables and payable were recorded due to timing lags in receipt of funds from outside parties. Current internal balances for the Housing Partnership Fund represent amounts advanced to the Community Development Fund ($162,000) and the Neighborhood Redevelopment-Series 2005 Bond Fund pending issuance of bonds and reimbursement receipts from grantor agencies in the next fiscal year. Receivable by other Non-Major Governmental Funds will be paid back to the respective funds following future grant reimbursements.
30q
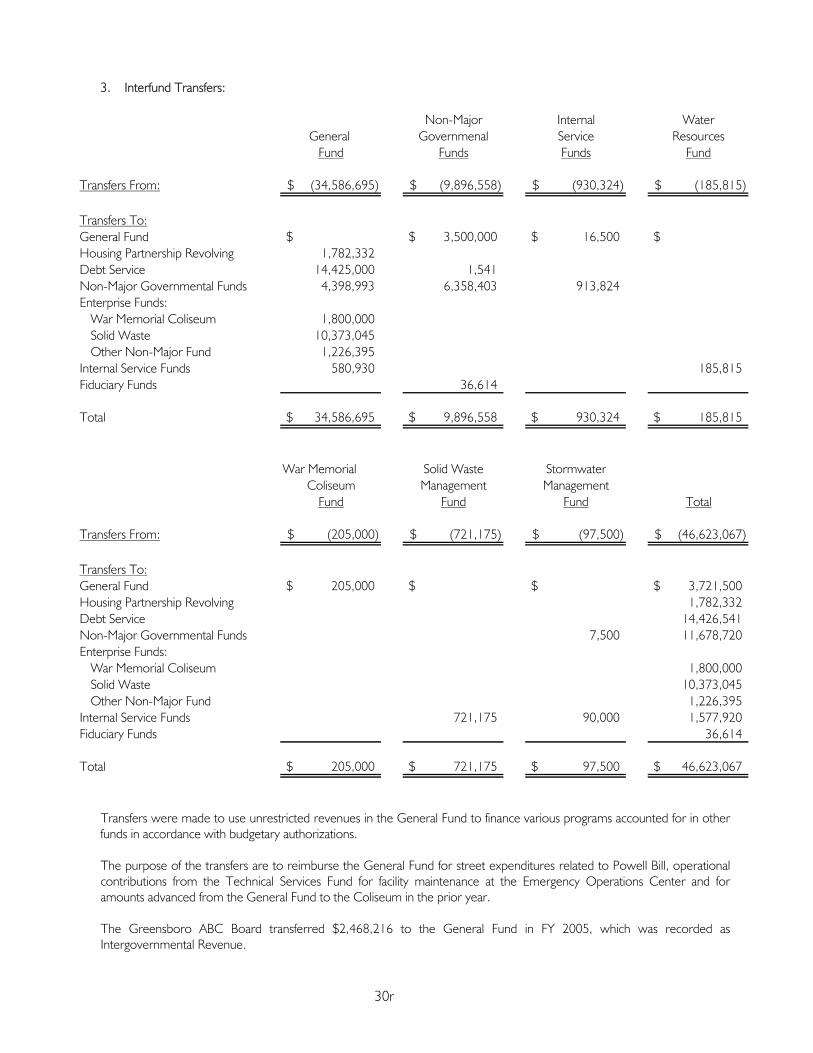
3. Interfund Transfers:
Non-Major Internal WaterGeneral Governmenal Service Resources
Fund Funds Funds Fund
Transfers From: (34,586,695)$ (9,896,558)$ (930,324)$ (185,815)$
Transfers To:General Fund $ 3,500,000$ 16,500$ $Housing Partnership Revolving 1,782,332 Debt Service 14,425,000 1,541 Non-Major Governmental Funds 4,398,993 6,358,403 913,824 Enterprise Funds:
War Memorial Coliseum 1,800,000 Solid Waste 10,373,045 Other Non-Major Fund 1,226,395
Internal Service Funds 580,930 185,815 Fiduciary Funds 36,614
Total 34,586,695$ 9,896,558$ 930,324$ 185,815$
War Memorial Solid Waste StormwaterColiseum Management Management
Fund Fund Fund Total
Transfers From: (205,000)$ (721,175)$ (97,500)$ (46,623,067)$
Transfers To:General Fund 205,000$ $ $ 3,721,500$ Housing Partnership Revolving 1,782,332 Debt Service 14,426,541 Non-Major Governmental Funds 7,500 11,678,720 Enterprise Funds:
War Memorial Coliseum 1,800,000 Solid Waste 10,373,045 Other Non-Major Fund 1,226,395
Internal Service Funds 721,175 90,000 1,577,920 Fiduciary Funds 36,614
Total 205,000$ 721,175$ 97,500$ 46,623,067$
Transfers were made to use unrestricted revenues in the General Fund to finance various programs accounted for in other funds in accordance with budgetary authorizations. The purpose of the transfers are to reimburse the General Fund for street expenditures related to Powell Bill, operational contributions from the Technical Services Fund for facility maintenance at the Emergency Operations Center and for amounts advanced from the General Fund to the Coliseum in the prior year. The Greensboro ABC Board transferred $2,468,216 to the General Fund in FY 2005, which was recorded as Intergovernmental Revenue.
30r

F. Long-Term Debt
Long-Term Bonded Debt of the City consists of General Obligation Bonds, which are collateralized by the full faith, credit and taxing power of the City and are issued for both general governmental improvements and for Proprietary Fund purposes. The City’s Legal Debt Margin as of June 30, 2005 is $1,466,465,173. Long-Term Bonded Debt consists of the following:
1. General Governmental Improvement General Obligation Bonds
These outstanding tax-exempt and taxable bonds bear interest, payable monthly, at variable rates along with interest payable semi-annually at fixed rates from 2.25% to 6.0%. The outstanding tax-exempt and taxable variable rate bonds are reported at 2.3% and 3.25%, respectively as of June 30, 2005. Principal is payable annually in varying amounts through 2023. Principal and interest requirements will be provided by an appropriation in the year in which they become due.
$161,492,984 2. Internal Service Improvement General Obligation Bonds
This obligation, issued in 1998, relates to a public safety communications system and is recorded in the Technical Services Fund. Debt service will be covered by fees charged to other internal departments.
5,057,013 3. Enterprise Improvement General Obligation Bonds
These General Obligation Bonds were issued for water and sewer improvements. It is expected that the revenues produced by this enterprise will meet the debt service required for bond retirement. Outstanding tax-exempt bonds bear interest, payable semi-annually, at rates varying from 2.25% to 5.5%. Principal is payable annually in varying amounts through 2030. Principal and interest requirements will be provided by an appropriation in the year in which they become due.
2,530,003 $169,080,000
4. Defeased Bonds
In prior years, the City defeased General Obligation Bonds by placing the proceeds of new bonds in an irrevocable trust to provide for all future debt service payments on the old debt. Accordingly, the trust account assets and the liability for the defeased bonds are not included in the City’s financial statements. At June 30, 2005, $76,060,000 of General Obligation Bonds outstanding are considered defeased. On February 1, 2005, the City issued $14,580,000 General Obligation Public Improvement Bonds Series 2005A payable semiannually at a fixed rate ranging from 3.0% to 4.13% on February 1 and August 1, with a final maturity in 2023. The original issue premium amounted to $106,475. The proceeds of these bonds will be used for improvements to the City’s facilities for parks and recreation, libraries and fire stations along with the public transportation system. On December 1, 2004, the City issued $31,290,000 in Refunding General Obligation Bonds to defease $32,465,000 Series 1996 Public Improvement Refunding General Obligation Bonds. The net proceeds of $33,795,408 (net of $39,834 in underwriting fees, accrued interest and other issuance costs) were placed in escrow in an irrevocable trust to provide for all future debt service payments on the old bonds. As a result, the liability for the 1996 Refunding General Obligation Bonds has been removed from the City’s financial statements. Aggregate debt service payments over the next seven years was decreased by an estimated $1,992,587, resulting in an economic savings of $1,797,665.
30s

5. General Obligation Bonds Debt Service Requirements to Maturity are:
Fiscal Year Principal Interest Principal Interest Total2005-06 13,262,831$ 6,239,662$ 1,087,168$ 131,755$ 20,721,416$ 2006-07 13,758,573 5,789,292 591,428 71,567 20,210,860 2007-08 13,756,718 5,286,135 578,282 46,430 19,667,565 2008-09 13,813,944 4,825,658 191,056 13,540 18,844,198 2009-10 14,232,931 4,260,621 82,069 4,017 18,579,638 2010-15 48,945,000 13,664,331 62,609,331 2015-20 30,910,000 6,157,270 37,067,270 2020-25 17,870,000 926,986 18,796,986
166,549,997$ 47,149,955$ 2,530,003$ 267,309$ 216,497,264$
Governmental Activities Business-Type ActivitiesAnnual Requirements Annual Requirements
6. Special Obligation Bonds
In 1997, the City issued $16,000,000 in tax-exempt Special Obligation Bonds. Outstanding bonds bear interest payable semi-annually at fixed rates from 4.8% to 5.2%. Principal is payable annually in varying amounts from the years 2000 through 2013. These bonds were issued to finance construction of Phase III of the existing solid waste landfill and to purchase adjacent land for the project. A portion of the Local Options Sales Tax is pledged for payment of debt service on the Bonds. Certain financial covenants are contained in the bond order, among the most restrictive of which provide that the City maintain a long-term debt service coverage ratio, as defined, of not less than 2.0. The coverage ratio at June 30, 2005 is 6.8. The City demonstrated compliance with bond covenants during Fiscal Year 2004-05.
Special Obligation Bonds Debt Service Requirements to Maturity are:
Fiscal Year Principal Interest Total2005-06 1,090,000$ 528,961$ 1,618,961$ 2006-07 1,145,000 475,551 1,620,551 2007-08 1,200,000 419,446 1,619,446 2008-09 1,260,000 359,446 1,619,446 2009-10 1,325,000 296,446 1,621,446 2010-13 4,395,000 464,880 4,859,880
10,415,000$ 2,544,730$ 12,959,730$
Business-Type ActivitiesAnnual Requirements
7. Combined Enterprise System Revenue Bonds
On May 10, 2005, the City issued $30,860,000 2005A Combined Enterprise System Revenue Bonds payable semiannually at a fixed rate ranging from 3.0% to 5.0% on June 1 and December 1, with a final maturity in 2027. The City also issued $10,000,000 in 2005B variable-rate Combined Enterprise System Revenue Bonds with interest payable monthly through 2030. The original issue premium amounted to $1,729,860. The proceeds of these bonds will be used for improvements to the City’s water system and sanitary sewer system. In 2005, the City issued $31,070,000 in 2005B Refunding Combined Enterprise System Revenue Bonds to defease $31,070,000 Series 1995 Combined Enterprise System Revenue Bonds. The net proceeds of $31,691,400 (after payment of $1,011,699 in underwriting fees, accrued interest, call premium and other issuance costs) were placed in escrow in an irrevocable trust to provide for all future debt service payments on the old certificates. As a result, the liability for the 1995 Series Revenue Bonds has been removed from the Proprietary Fund. The proceeds of these bonds, along
30t

with $923,340 received from the origination of the swaption agreement in connection with the variable-rate bond portion of the issue, will be used for improvements to the City’s water system and sanitary sewer system and other issue costs. The City has $32,345,000 in 2003A Combined Enterprise System Revenue Bonds payable semiannually at a fixed rate ranging from 2.00% to 5.25% on June 1 and December 1, with final maturity in 2025. The City also issued $10,000,000 in 2003B variable-rate Combined Enterprise System Revenue Bonds with interest payable monthly through 2028. The original issue premium amounted to $1,164,513. The proceeds of these bonds, along with $2,904,000 received from the origination of a swaption agreement in connection with the variable-rate bond portion of the issue, will be used for improvements to the City’s water system and sanitary sewer system.
The City has $32,445,000 fixed rate 2001A bearing interest rates from 4.25% to 5.50% and $20,190,000 variable rate 2001B Series tax-exempt Combined Enterprise System Revenue Bonds. A portion of the 2001B bonds was issued to defease $10,000,000 Variable Rate 1995B tax-exempt bonds. Series 2001 Revenue Bonds mature in 2026.
The City has $23,700,000 in outstanding tax-exempt 1998A Revenue Bonds bearing interest payable semi-annually at fixed rates from 4.3% to 5.5%. In addition, $10,000,000 in tax-exempt variable rate 1998B Revenue Bonds are outstanding. Principal is payable annually in varying amounts through 2024. The Combined Enterprise System is currently comprised of the City’s water and sanitary sewer system. Net receipts of the Combined Enterprise System are pledged to the payment of and as security for the Revenue Bonds. Principal and interest requirements will be provided by an appropriation in the year in which they become due. The outstanding tax-exempt variable rate bonds are reported at 2.3% as of June 30, 2005.
Certain financial covenants are contained in the revenue bond order, among the most restrictive of which provide that the City maintain a long-term debt service coverage ratio, as defined, of not less than 1.20. The coverage ratio at June 30, 2005 is 2.3. The City was in compliance with all such covenants during Fiscal Year 2004-05.
Revenue Bonds Debt Service Requirements to maturity are:
Fiscal Year Principal Interest Total2005-06 5,030,000$ 6,952,784$ 11,982,784$ 2006-07 6,325,000 7,535,352 13,860,352 2007-08 6,620,000 7,964,486 14,584,486 2008-09 6,870,000 7,676,159 14,546,159 2009-10 7,295,000 7,376,604 14,671,604 2010-15 41,485,000 31,383,389 72,868,389 2015-20 52,405,000 20,153,858 72,558,858 2020-25 50,315,000 8,408,294 58,723,294 2025-30 24,265,000 1,554,478 25,819,478
200,610,000$ 99,005,404$ 299,615,404$
Business-Type ActivitiesAnnual Requirements
8. Certificates of Participation
In June 2005, the Center City Corporation (GCCC) issued $7,000,000 in tax-exempt Certificates of Participation to finance equipment purchases of the City. The certificates bear interest, payable quarterly, at a variable rate. Principal and interest is payable annually in varying amounts through 2009.
Certificates of Participation of the GCCC have been issued in prior years for parking facilities, expansion and improvements to the War Memorial Coliseum Complex, and equipment purchases. Outstanding certificates bear interest payable quarterly at variable rates and payable semi-annually at fixed a rate on tax-exempt issues from 3% to 5% and on taxable issues from 3.5% to 8%. The outstanding tax-exempt and taxable variable rate bonds are reported at 3.25% as of the end of June 30, 2005. Principal is payable annually in varying amounts through 2030. Pursuant to installment purchase agreements, the City will make installment payments sufficient to pay the scheduled debt service on all certificates. Principal and interest requirements will be provided by appropriation in the year in which they become due. These payments will be appropriated in the Parking Facilities Enterprise Fund for the debt service attributable to parking facilities;
30u
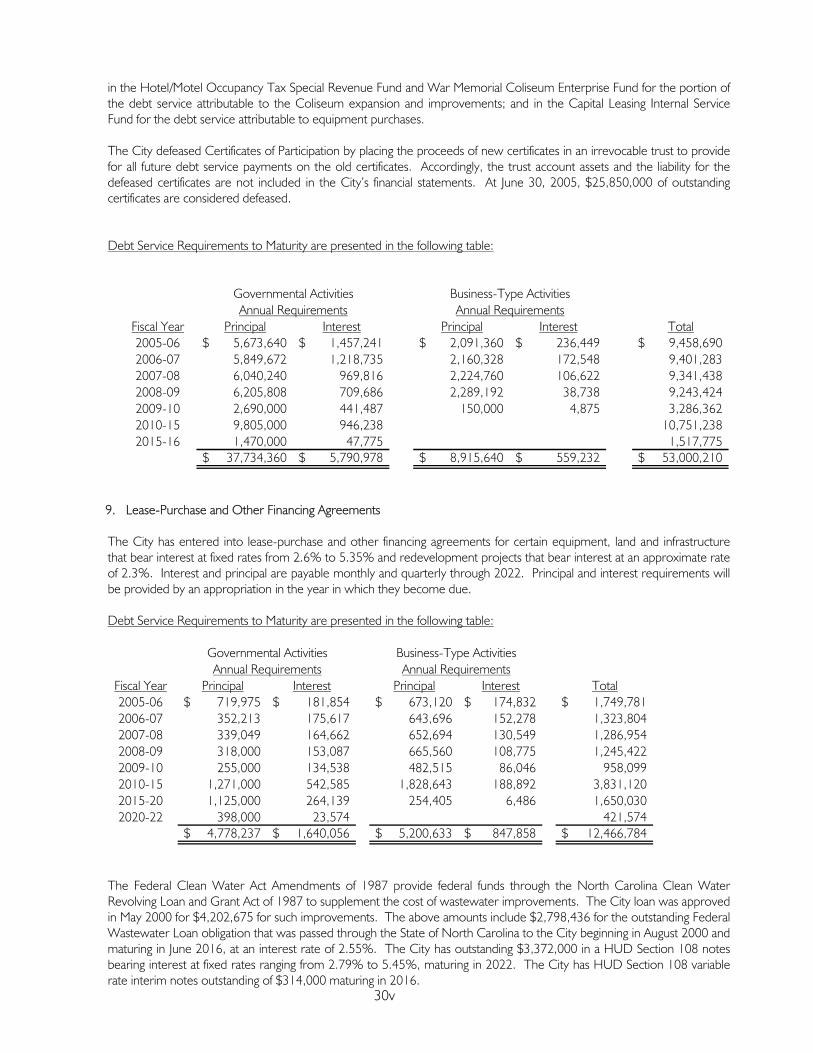
in the Hotel/Motel Occupancy Tax Special Revenue Fund and War Memorial Coliseum Enterprise Fund for the portion of the debt service attributable to the Coliseum expansion and improvements; and in the Capital Leasing Internal Service Fund for the debt service attributable to equipment purchases.
The City defeased Certificates of Participation by placing the proceeds of new certificates in an irrevocable trust to provide for all future debt service payments on the old certificates. Accordingly, the trust account assets and the liability for the defeased certificates are not included in the City’s financial statements. At June 30, 2005, $25,850,000 of outstanding certificates are considered defeased.
Debt Service Requirements to Maturity are presented in the following table:
Fiscal Year Principal Interest Principal Interest Total2005-06 5,673,640$ 1,457,241$ 2,091,360$ 236,449$ 9,458,690$ 2006-07 5,849,672 1,218,735 2,160,328 172,548 9,401,283 2007-08 6,040,240 969,816 2,224,760 106,622 9,341,438 2008-09 6,205,808 709,686 2,289,192 38,738 9,243,424 2009-10 2,690,000 441,487 150,000 4,875 3,286,362 2010-15 9,805,000 946,238 10,751,238 2015-16 1,470,000 47,775 1,517,775
37,734,360$ 5,790,978$ 8,915,640$ 559,232$ 53,000,210$
Annual RequirementsGovernmental Activities Business-Type Activities
Annual Requirements
9. Lease-Purchase and Other Financing Agreements
The City has entered into lease-purchase and other financing agreements for certain equipment, land and infrastructure that bear interest at fixed rates from 2.6% to 5.35% and redevelopment projects that bear interest at an approximate rate of 2.3%. Interest and principal are payable monthly and quarterly through 2022. Principal and interest requirements will be provided by an appropriation in the year in which they become due.
Debt Service Requirements to Maturity are presented in the following table:
Fiscal Year Principal Interest Principal Interest Total2005-06 719,975$ 181,854$ 673,120$ 174,832$ 1,749,781$ 2006-07 352,213 175,617 643,696 152,278 1,323,804 2007-08 339,049 164,662 652,694 130,549 1,286,954 2008-09 318,000 153,087 665,560 108,775 1,245,422 2009-10 255,000 134,538 482,515 86,046 958,099 2010-15 1,271,000 542,585 1,828,643 188,892 3,831,120 2015-20 1,125,000 264,139 254,405 6,486 1,650,030 2020-22 398,000 23,574 421,574
4,778,237$ 1,640,056$ 5,200,633$ 847,858$ 12,466,784$
Governmental Activities Business-Type ActivitiesAnnual Requirements Annual Requirements
The Federal Clean Water Act Amendments of 1987 provide federal funds through the North Carolina Clean Water Revolving Loan and Grant Act of 1987 to supplement the cost of wastewater improvements. The City loan was approved in May 2000 for $4,202,675 for such improvements. The above amounts include $2,798,436 for the outstanding Federal Wastewater Loan obligation that was passed through the State of North Carolina to the City beginning in August 2000 and maturing in June 2016, at an interest rate of 2.55%. The City has outstanding $3,372,000 in a HUD Section 108 notes bearing interest at fixed rates ranging from 2.79% to 5.45%, maturing in 2022. The City has HUD Section 108 variable rate interim notes outstanding of $314,000 maturing in 2016.
30v

In addition, the City received $477,000 in HUD Section 108 variable rate notes in 2004-05 maturing in 2016. Interim and current year additional notes bear interest at a rate of 3 Month LIBOR plus 20 basis points which approximated 3.68% at June 30, 2005. Total notes outstanding for HUD funding is $4,163,000 with a total commitment of $7,461,000.
10. Changes in Long-Term Debt are as follows:
Long-term liability activity for the year ended June 30, 2005, was as follows:
Beginning Ending Due WithinBalance Additions Transfers Reductions Balance One Year
Governmental Activities:Bonds and Notes Payable:
General Obligation Bonds 166,105,780$ 45,152,711$ $ (44,708,494)$ 166,549,997$ 13,262,831$ Certificates of Participation 36,248,360 7,000,000 (5,514,000) 37,734,360 5,673,640 Section 108 HUD Loan 3,992,000 477,000 (306,000) 4,163,000 198,000
Deferred Amounts:For Issuance Premium 863,714 2,641,815 (86,371) 3,419,158 (86,371)
Total Debt Payable 207,209,854 55,271,526 (50,614,865) 211,866,515 19,048,100 Other Liabilities
Capital Leases 1,771,705 43,216 (1,199,684) 615,237 521,975 Compensated Absences 8,701,503 6,622,552 (231,562) (5,854,741) 9,237,752 5,520,449
Governmental ActivityLong-Term Liability 217,683,062$ 61,937,294$ (231,562)$ (57,669,290)$ 221,719,504$ 25,090,524$
Beginning Ending Due WithinBalance Additions Transfers Reductions Balance One Year
Business-Type Activities:Bonds and Notes Payable:
General Obligation Bonds 3,679,219$ 717,289$ $ (1,866,505)$ 2,530,003$ 1,087,168$ Special Oblilgation Bonds 11,455,000 (1,040,000) 10,415,000 1,090,000 Revenue Bonds 164,470,000 71,930,000 (35,790,000) 200,610,000 5,030,000 Certificates of Participation 10,946,640 (2,031,000) 8,915,640 2,091,360 State Water Revolving Loan 3,081,746 (28,906) (254,403) 2,798,437 254,403 Watershed 2,804,637 26,509 (428,950) 2,402,196 418,717
Deferred Amounts:For Issuance Discounts (44,793) 13,681 (31,112) 13,681 For Issuance Premiums 1,502,038 1,788,734 (162,377) 3,128,395 (303,952)
Total Debt Payable 197,894,487 74,462,532 (28,906) (41,559,554) 230,768,559 9,681,377 Other Liabilities
Accrued Landfill Liability 10,503,616 649,152 11,152,768 500,000 Compensated Absences 1,518,716 1,700,361 231,562 (1,537,914) 1,912,725 1,303,737
Business-Type ActivityLong-Term Liability 209,916,819$ 76,812,045$ 202,656$ (43,097,468)$ 243,834,052$ 11,485,114$
30w

Internal Service Funds predominately serve the governmental funds. Accordingly, the related long term liabilities are included as part of the above totals for governmental activities. Additions fo $43,216 were recorded for Internal Service Fund capital leases.
Ending Balance
Internal Service Funds:Bonds and Notes Payable:
General Obligation Bonds 5,057,013$ Certificate of Participation Payable 14,000,000
Total Debt Payable 19,057,013 Other Liabilities:
Capital Leases 615,237 Compensated Absences 327,676 Internal Service Fund
Long-Term Liability 19,999,926$
Swap Payments and Associated Debt
Using rates as of June 30, 2005, debt service requirements of the variable-rate debt and net swap payments assuming current interest rates remain the same for their term, were as follows. As rates vary, variable-rate bond interest payments and net swap payments will vary. For further description of the transactions, see Derivative disclosure in Note IV. A, Deposits and Investments.
FY Ending Rate Swaps,June 30 Principal Interest(1) Net(2) Total2005 $ 503,451$ 229,380$ 732,831$ 2006 1,470,000 1,158,510 965,666 3,594,176 2007 3,025,000 1,124,700 1,893,330 6,043,030 2008 3,200,000 1,055,125 1,841,770 6,096,895 2009 3,350,000 981,525 1,786,637 6,118,162 2010 3,670,000 904,475 1,729,529 6,304,004 2011 3,755,000 820,065 1,666,052 6,241,117 2012 3,960,000 733,700 1,602,280 6,295,980 2013 4,175,000 642,620 1,535,112 6,352,732 2014 4,345,000 546,595 1,464,288 6,355,883 2015 2,470,000 446,660 1,390,021 4,306,681 2016 2,600,000 389,850 1,326,167 4,316,017 2017 2,735,000 330,050 1,258,951 4,324,001 2018 2,880,000 267,145 1,188,246 4,335,391 2019 5,775,000 200,905 1,113,792 7,089,697 2020 2,960,000 68,080 1,001,843 4,029,923
50,370,000$ 10,173,456$ 21,993,064$ 82,536,520$
Variable Rate Bonds
(1) Computed at 2.30% at June 30, 2005
(2) Computed at (2.92% less 67% of 1 Month LIBOR at June 30, 2005-Swap 1) and (3.46% less 67% of 1 Month LIBOR at June 30, 2005-Swap 2) and (4.99% less 72% of 1 Month LIBOR at June 30, 2005-Swap 3)
30x

G. Annual Leave and Sick Leave
The City’s policy permits employees to accumulate up to 30 days of earned but unused annual leave, which would be paid to employees upon separation from the City. Accumulated annual leave at June 30, 2005 amounted to $11,150,477 of which $9,237,752 relates to Governmental Activities and $1,912,725 relates to Business-Type Activities.
Changes in accumulated annual leave are as follows:
Balance Balance Due WithinFund Type 7/1/04 Increase Transfers Decrease 6/30/05 One Year
Governmental Activities 8,701,503$ 6,622,552$ (231,562)$ (5,854,741)$ 9,237,752$ 5,520,449$ Business-Type Activities 1,518,716 1,931,923 (1,537,914) 1,912,725 1,303,737
10,220,219$ 8,554,475$ (231,562)$ (7,392,655)$ 11,150,477$ 6,824,186$
Current Year
Greensboro ABC Board employees may accumulate up to 20 days earned leave. The balance of the accumulated leave liability is not considered to be material. Operations of the GHDP are performed by employees of the City. Accordingly, there is no recorded liability for employee leave amounts for GHDP at June 30, 2005. GTA leave liability is $32,932. City employees had accumulated sick leave benefits of $40,147,490 at June 30, 2005, based on compensation rates in effect on that date. Sick leave does not vest, but any unused sick leave accumulated at the time of retirement may be used in the determination of length of service for retirement benefit. Since the City has no obligation for the accumulated sick leave until it is actually taken, no accrual has been made for sick leave. The same policy is followed by the Greensboro ABC Board.
V. Other Information
A. Risk Management
The City is exposed to various risks of loss related to torts; theft of, damage to, and destruction of assets; errors and omissions; injuries to employees; and natural disasters. The City protects itself from potential loss through a combination of risk-sharing participation, purchase of commercial insurance for primary and/or excess liability coverage and self-funded risk retention. Self-funded risks are primarily for health, employee workers’ compensation, general, professional, law enforcement, vehicle and underground storage tank liabilities. All operating funds of the City participate in the risk management program and make payments to the Employee Insurance Fund and the General Insurance Fund based on the insured funds’ historical claims experience. Payments are for prior and current year claims and to establish a reserve for catastrophic losses. Claims liabilities are reported when it is probable that a loss has occurred and the amount of the loss can be reasonably estimated. Liabilities include an amount for claims that have been incurred but are not reported (IBNRs), based on actuarial computations. Settled claims have not exceeded self-retained or purchased insurance coverage in any of the past three fiscal years.
1. Employee Insurance
The City provides for health, dental, life and workers’ compensation benefits in its Employee Insurance Fund. The City’s health plan currently offers two plan options through a self funded program, as well as administers a dental plan for employees and their covered dependents, supplemented by employee contributions. Term life insurance for employees is provided by the City for the term of employment, at no cost to the employee. The amount of coverage is based on salary. For those dependents covered by health insurance, the City also provides a reduced coverage term life insurance policy at no cost to the employee. For the life plan, the City pays its contribution and the employees’ portion of insurance premiums directly to the insurer.
30y

The City is self-funded for workers compensation for claims up to $600,000 per occurrence. Claims in excess of the retention are covered through a combination of purchased insurance and self-funding participation. The City’s contributions toward employee costs are accounted for as expenditures when the funds are contributed to the Employee Insurance Fund.
2. General Insurance
The City’s General Insurance Fund covers the first $100,000 in liability claims. A purchased insurance policy pays claims in excess of $3,000,000 per occurrence, a limit of $5,000,000 per occurrence thereafter, with an aggregate of $5,000,000 for public official liability claims. The City currently participates in four separate funds in the Excess Liability Fund, Inc. (ELF) to self-fund certain types of liability claims in conjunction with the purchased excess policy. Up until December 31, 1999, the ELF was structured to provide varying tiers of funding, with pre-determined contribution rates, limits of coverage, repayment schedules and certain levels of transfer of risk from the five local governments and school members represented by the ELF. Annual contributions by members are actuarially determined and periodically reviewed by the Board of Directors and the Executive Director of the ELF. Effective January 1, 2000, the ELF was reorganized and the resulting structure provides for no transfer of risk from any of the member units to the ELF Corporation. Fund balances are segregated by member and in the event of loss, those amounts are available for claims payment by the respective member, on either a loan or withdrawal basis. The new structure of the ELF is considered to be similar to a claims-servicing arrangement. The Revolving Fund – Primary Liability Coverage pays amounts in excess of $100,000 up to $3,600,000 per occurrence, with an aggregate available for the City of $8,105,308 as of June 30, 2005. Additional amounts of $2,662,377 are recorded in the Excess Liability Fund – Tier I for payment of City claims. Accordingly, a total of $10,767,685 is included in the City’s General Insurance Fund as insurance deposits. A portion of the Excess Liability Fund – Tier I, $943,030, is also available to be used as a “run-off” account for any unsettled claims which occurred as of December 31, 1999 and were reported by January 7, 2000. This amount will be handled under the old fund structure and will be shared by members in accordance with the original bylaws. In addition, the City recorded $990,829 in insurance deposits in the Employee Insurance Fund to reflect amounts held by the ELF to pay employer’s liability and workers’ compensation claims. Amounts paid by the Revolving Fund – Employer’s Liability/Worker’s Compensation Fund are to be repaid in subsequent years by the member incurring the loss. The City is also a member of the Local Government Property Insurance Deductible Fund, Inc. This Fund provides excess property insurance coverage through a purchased insurance policy. Property losses up to $100,000 per occurrence are paid by the Fund after application of a $10,000 deductible requirement for each member agency. These claims are shared jointly by all members of the Fund. Property insurance coverage above the annual retention provides for up to 100% replacement cost, limited to $250,000,000 per occurrence. As of June 30, 2005, the City did not contribute to the Property Deductible Fund. At June 30, 2005, the total retained earnings of the Local Government Property Insurance Deductible Fund, Inc. is $0, following distribution to individual accounts for respective members. The City has the right to withdraw its contributions in the Revolving Fund - Primary Liability Coverage, the Excess Liability Fund - Tier I, and the Revolving Fund – Employers’ Liability/Workers’ Compensation of the Local Government Excess Liability Fund, Inc. and the Local Government Property Insurance Deductible Fund, Inc. when all claims against the Funds have been settled and all legal obligations have been paid for each claim year.
30z

3. Reconciliation of Claims Liability
Changes in the City’s claims liability balance during Fiscal Years 2005 and 2004 are as follows:
Employee General Total Total Insurance Insurance 2004-05 2003-04
Balance - July 1 2,860,381$ 1,226,738$ 4,087,119$ 3,833,466$ Add: Incurred Claims (including)
IBNR's and Changes in Estimates 25,210,818 597,605 25,808,423 17,758,572 Deduct: Claims Payments (21,858,646) (579,597) (22,438,243) (17,504,919)
Balance - June 30 6,212,553$ 1,244,746$ 7,457,299$ 4,087,119$
B. Subsequent Events
The City intends to issue $27 million in fixed and variable rate general obligation bonds to fund street improvements and neighborhood redevelopment by the end of the calendar year. On November 17, 2005, $8.6 million in special obligation bonds will be issued to finance a solid waste transfer station. In addition, on July 1, 2005, the City merged fire operations with Rural Fire District #14 located in eastern Guilford County, and assumed an outstanding obligation of $422,898 which is collateralized by the District’s real property. The City is obligated to make annual debt service payments of $44,796 through August, 2018.
C. Commitments and Contingencies
1. Legalities
The City is party to a number of civil lawsuits and other legal actions. In the opinion of the City’s attorney and management, the ultimate outcome of these suits is not expected to have a significant impact upon the City’s financial position. In prior years, the City had a judgment by a jury for $1.5 million in a personal injury suit. The trial judge reversed the jury award and ordered a new trial. The North Carolina Court of Appeals dismissed the case completely and the plaintiffs have appealed to the North Carolina Supreme Court. Our insurance fund has sufficient reserves to cover this judgment.
2. Authorized capital projects at June 30, 2005 are comprised of the following:
Project Expended Through UnexpendedAuthorization June 30, 2005 Authorization
Governmental Funds:Special Revenue 18,529,519$ 14,482,972$ 4,046,547$ Capital Projects 333,530,650 219,790,125 113,740,525
352,060,169$ 234,273,097$ 117,787,072$
Enterprise Funds:Water Resources 235,208,216$ 178,269,008$ 56,939,208$ Coliseum 1,493,600 1,407,723 85,877 Parking Facilities 7,685,497 4,422,523 3,262,974 Solid Waste Management 10,468,825 1,758,491 8,710,334
254,856,138$ 185,857,745$ 68,998,393$
30aa

3. Financial Assistance Programs
The City participates in a number of Federal and State financial assistance programs. For the Fiscal Year ended June 30, 2005, these programs were subject to audit in accordance with the Single Audit Act Amendments of 1996, the provisions of OMB Circular A-133, and the State Single Audit Implementation Act. The amount, if any, of expenditures which may be disallowed by the granting agencies resulting from this and other audits cannot be determined at this time, although the City expects such amounts, if any, to be immaterial.
4. Operating Lease Agreement - ABC Board
The Greensboro ABC Board has operating lease agreements for various store and office properties. Rental expense for the year ended June 30, 2005 totaled $279,505. Future lease payments less payments under sublease agreement are as follows:
Lease Fiscal Year Payments2005-06 261,928$ 2006-07 238,346 2007-08 174,512 2008-09 111,598 2009-10 15,512
801,896$
5. Operating Lease Payments
The City has operating lease payments for computers, printers, software/licenses, maintenance and workstations. Lease payments for the year ended June 30, 2005 totaled $1,745,672. Future lease payments are as follows:
Lease Fiscal Year Payments2005-06 1,823,740$ 2006-07 1,329,169 2007-08 690,652 2008-09 128,822
3,972,383$
6. Contingencies
During 1996, the City entered into a line of credit loan guarantee agreement with a financial institution to guarantee obligations up to $150,000 for GHDP for housing rehabilitation in the Asheboro Target Area. In August 1999 the amount was increased to $300,000 for additional rehab work. Subsequently, the agreement was re-negotiated and increased to $650,000 in 2001 to allow for new construction in the Bingham Street neighborhood. In 2002, the City Council authorized an additional loan guarantee in the amount of $215,000 in conjunction with the development of the Southside neighborhood. During fiscal year 2005, all of the $215,000 loan guarantee was repaid by GHDP, with a pledge of 25% of the proceeds from the sale of each newly constructed home unit. The $650,000 line of credit has an outstanding balance of $127,494 as of June 30, 2005.
30ab

D. Joint Venture
Piedmont Triad Regional Water Authority (Authority)
The City, in conjunction with five other governmental entities, formed the Authority in September 1987 to develop a regional water supply. The Authority’s board is composed of ten members, three of which are appointed by City Council. The joint venture agreement provides that each participant will annually contribute funds to acquire land, a reservoir and to construct the Randleman Dam. The City’s funding share was originally 59.4%, or $33,858,000, based on a percentage of raw water allocation. City contributions, funded from the Water and Sewer Capital Reserve Fund, total $34,063,761, including $205,761 for staff administration and equipment fees paid from City operations as of June 30, 2005. In December 2004, the City received a payment of $5,244,257 from Randolph County to acquire a portion of the City’s future raw water allocation which effectively reduced the City’s share to 53.1% as of June 30, 2005.
The Authority began construction of the Dam in August 2001 and will also construct a Water Treatment Plant to be financed from revenue bonds, expected to be issued by the Authority in FY 2005-2006. The City has contributed an additional $14,850,000 as of June 2005 for reservoir and infrastructure improvements. Each participant has the right to purchase future treated water in agreed upon allotments, according to a uniform rate structure set by the Authority. The City’s net investment and its share of the operating results of the Authority are reported in the Water Resources Enterprise Fund. At June 30, 2005, the City’s equity interest in the Authority was $47,431,345. Complete financial statements for the Authority may be obtained from the Authority’s administrative office at 2216 West Meadowview Road, Greensboro, North Carolina.
E. Jointly Governed Organization
Greensboro/Guilford County Tourism Development Authority (Authority)
The City, in conjunction with Guilford County, established the Authority to promote regional tourism. The City appoints five members of the Authority’s thirteen member board. The Authority receives room occupancy taxes which are levied on gross receipts from rental accommodations within Guilford County.
The tax is levied at 6% for establishments within the city limits of Greensboro, of which 3% is levied by the City and 3% is levied by Guilford County. During 2004-05, the City levied $3,418,216 in room occupancy taxes, of which $683,643 was remitted to the Authority for travel and tourism promotion.
F. Related Organization
Greensboro Housing Authority (Authority)
The Authority was created to provide affordable housing for citizens with limited income. Although all of the members of the governing body of the Authority are appointed by the City Mayor, the City has no decision in selecting the management of the Authority. Financial transactions between the City and the Authority reflect contractual agreements between the parties for the provision of services by the City. The City is not responsible for any deficits nor is it entitled to any surpluses of the Authority. The City does not significantly influence the operations of the Authority, and the Authority is not accountable to the City for its fiscal matters. In 1998, the City issued $1.5 million in General Obligation Bonds on behalf of the Authority to fund certain housing projects. The amount is being repaid by the Authority with payments in lieu of taxes, as principal and interest payments become due.
G. Post-employment Benefits
In addition to the pension benefits described in Note I, the City Council has authorized the City to provide health care benefits to retirees until age 65. As of June 30, 2005, 445 retirees are participating in one or more health, dental and life insurance programs. The City’s contribution is determined by the number of years of service prior to retirement. For retirees with 30 or more years of service, the City funds the benefit at the active employees’ benefit rate. Retirees with 25 years and 20 years of service are funded at 75 percent and 50 percent of the active employees’ benefit rate, respectively. The City does not fund any portion of the cost for retirees with less than 20 years of service. Retirees are required to pay a portion of the premium for health and all of the premium for dental coverage and dependent health coverage. Those retirees who were employed at least 20 years receive reduced term life insurance coverage until age 65.
30ac

Post employment health care benefits are accounted for in the City’s Employee Insurance Fund and payments are made on a pay-as-you-go basis. The City’s portion of retiree benefits (net of retiree contributions) totaled $1,856,854 for the Fiscal Year ended June 30, 2005.
H. Deferred Compensation
The City offers all of its employees a Deferred Compensation Plan (Plan) in accordance with Internal Revenue Code Section 457. The Plan, available to permanent City employees, permits them to defer a portion of their salary until future years. The deferred compensation is not available to employees until termination, retirement, death or unforeseeable emergency.
The City has complied with changes in the laws which govern the City’s Plan, requiring all assets of the Plan to be held in trust, custodial accounts or in annuity contracts for the exclusive benefit of participants and their beneficiaries. Effective January 1, 1999, the City entered in a trust arrangement and is also holding annuity contracts in compliance with GASB Statement 32, Accounting and Financial Reporting for Internal Revenue Code Section 457 Deferred Compensation Plans. All transactions are administered by third party administrators and accordingly, Plan assets are not included in the City’s financial statements.
The City contributes 2% of salary, less FICA, if applicable, to the Plan for participating full time employees. The City contributes an additional 3% of salary, less FICA, if applicable, for those engaged in firefighting, if firefighters choose to defer at least 3% of their salary, as well. Those employees engaged in law enforcement may participate in the Plan, however, no City contributions are made on their behalf, but instead are contributed to the 401(k) Defined Contribution Pension Plan. All employees may defer amounts up to the maximum allowed by the Internal Revenue Service each year. The employee receives credit for his contribution as well as the City’s, and benefits are based on the total assets owned in the employee’s individual accounts. The fair market value of the deferred compensation accounts of employees through the year ended June 30, 2005 was $57,430,741.
I. Pension Plan Obligations
1. Local Governmental Employees’ Retirement System
a. Plan Description
All permanent full-time City of Greensboro employees participate in the statewide Local Governmental Employees’ Retirement System (System), a multiple-employer, cost-sharing, defined benefit pension plan, administered by the State of North Carolina. The City’s payroll for employees covered by the System for the Fiscal Year ended June 30, 2005 was $119,092,873 and the City’s total payroll was $127,200,466. All employees may retire with unreduced retirement benefits after 30 years of creditable service, at age 60 with 25 years of creditable service, or at age 65 with 5 years of creditable service. Law enforcement officers may retire at age 55 with 5 years of creditable service. Employees retiring under one of the above conditions are entitled to annual retirement benefits, payable monthly for life, equal to 1.85% of average final compensation times years of creditable service. Average final compensation is defined as the average of an employee’s salary during the employee’s four consecutive highest-paid years. Benefits fully vest on reaching 5 years of service. The retirement system also provides death and disability benefits. Employees qualify for a vested deferred benefit after one year (death) and five years (disability) of creditable service. Article 3 of G. S. Chapter 128 assigns the authority to establish and amend benefit provisions to the North Carolina General Assembly. Employees may retire with reduced benefits under the following conditions: law enforcement officers who have reached age 50 with 15 years of creditable service as an officer, or firefighters who have reached age 55 with 5 years of creditable service, or employees not engaged in public safety who have reached age 50 with 20 years of creditable service or age 60 with 5 years of creditable service.
30ad

b. Funding Policy
Covered employees are required by State statute to contribute 6% of their salary to the System. The City is required by State statute to contribute the remaining amounts necessary to pay benefits when due. The actuarially determined contribution requirements of the City for the years ended June 30, 2005, 2004, and 2003 were $4,535,174, $4,351,154, and $4,226,384, respectively. The contributions made by the City equaled 100% of the required contributions in each year. The City’s current required contributions for employees not engaged in law enforcement and for law enforcement officers represented 4.91% and 4.79% of covered payroll, respectively.
The System is included in the Comprehensive Annual Financial Report (CAFR) for the State of North Carolina. The State’s CAFR includes financial statements and required supplementary information for the System. That report may be obtained by writing to the Office of the State Controller, 3512 Bush Street, Raleigh, North Carolina 27609. The System also provides retirement benefits to permanent Greensboro ABC Board employees. The employee members contribute 6% of their individual salaries. Effective July 1, 2002, the Board’s mandatory contribution was 4.96%. The employer contributions to the System for the years ended June 30, 2005, 2004 and 2003 were $339,124, $333,114, and $313,413, respectively. There is no unfunded accrued pension liability as of June 30, 2005. The contribution requirements of members and of the City and the ABC Board employers are established and may be amended by the North Carolina General Assembly.
2. Law Enforcement Officers Special Separation Allowance
a. Plan Description
The City is the administrator of a single-employer, defined benefit, retirement system (System) established by the City to provide special separation benefits to its law enforcement officers. The payroll for employees covered by the System for the Fiscal Year ended June 30, 2005 was $26,727,001. The City’s total payroll was $127,200,466. All full-time City law enforcement officers are covered by the System. At December 31, 2004, the date of the latest actuarial valuation, the System’s membership consisted of:
Retirees currently receiving benefits 117 Active plan members 542
Total 659
The System provides separation benefits to all full-time City law enforcement officers who meet the following requirements:
(1) Have (i) completed 30 or more years of creditable service or, (ii) attained 55 years of age and completed 5 or more years of creditable service; and (2) Have not attained 62 years of age; and (3) Have completed at least 5 years of continuous service as a law enforcement officer immediately preceding a service retirement.
The qualified law enforcement officers are entitled to an annual retirement benefit of .85% of the annual equivalent of the base rate of compensation most recently applicable to the covered employee for each year of creditable service. The retirement benefits are paid monthly in equal installments. Payments to retired officers cease at their death or on the last day of the month in which the officer attains 62 years of age or upon the first day of reemployment by any State department, agency, or institution. Article 12D of G. S. Chapter 143 assigns the authority to establish and amend benefit provisions to the North Carolina General Assembly.
30ae

b. Summary of Significant Accounting Policies
Basis of Accounting - Financial transactions for the System are recorded using the accrual basis of accounting and are reflected as a Pension Trust Fund in the City’s financial statements. The System is not included in the report of another entity and a stand-alone financial statement is not issued. Employer contributions to the plan are recognized when due and when the City has made a formal commitment to provide the contributions. Benefits are recognized when due and payable in accordance with the terms of the plan. Method Used to Value Investments - Investments are reported at fair value. Short-term obligations with a maturity of less than one year at acquisition are reported at amortized cost. Certain longer term United States Government and United States Agency securities are valued at the last reported sales price. Investment balances are concentrated in federal agencies and securities as follows:
Agency % of Plan Net AssetsFederal Home Loan Bank 29.88Federal National Mortgage Association 32.81United States Treasury Notes 3.77Federal Home Loan Mortgage Corporation 13.69Federal Farm Credit Bank 13.99
c. Contributions
The City is required by Article 12D of G. S. Chapter 143 to provide these retirement benefits and has chosen to fund the amounts necessary to cover the benefits earned by making contributions based on actuarial valuations. For the current year, the City contributed $1,670,838 or 6.3% of annual covered payroll. Current contributions equaled 165% of the actuarially required amounts in Fiscal Year 2004-05. There were no contributions made by employees. The City’s obligation to contribute to this plan is established and may be amended by the North Carolina General Assembly. Administration costs of the System are financed through investment earnings. The annual required contribution for the current year was determined as part of the December 31, 2003 actuarial valuation using the projected unit credit actuarial cost method. The actuarial assumptions included (a) 6.0% investment rate of return and (b) projected salary increases of 4.0%. Both (a) and (b) included an inflation component of 3.75%. The assumptions did not include postretirement benefit increases. The actuarial value of assets was determined using the market value of investments. The unfunded actuarial accrued liability is being amortized as a level dollar amount on a closed basis. The remaining amortization period at December 31, 2003 was 27 years.
Annual Pension Percentage of Net PensionCost (APC) APC Contributed Obligation
1,257,899$ 121.70% (1,336,248)$ 1,075,432 143.10% (1,833,802) 1,434,242 164.96% (2,070,398)
30af

The City’s annual pension cost and net pension obligation to the System for the current year were as follows:
Annual Required Contributiion 1,343,829$ Interest on Net Pension Obligation (110,028) Adjustment to Annual Required Contribution 200,441 Annual Pension Cost 1,434,242 Contributions Made (1,670,838) Decrease in Net Pension Obligation (236,596) Net Pension Obligation-Beginning of Year (1,833,802) Net Pension Obligation-End of Year (2,070,398)$
3. Supplemental Retirement Income Plan For Law Enforcement Officers
All law enforcement officers employed by the City participate in the State of North Carolina Supplemental Retirement Income Plan, a 401(k) defined contribution pension plan, administered by the Department of State Treasurer and a Board of Trustees. Participation begins on the first day of the quarter upon reaching sworn status. In a defined contribution plan, benefits depend solely on amounts contributed to the plan plus investment earnings. Article 5 of G. S. Chapter 135 assigns the authority to establish and amend benefit provisions to the North Carolina General Assembly. Article 12E of G. S. Chapter 143 requires that the City contribute each month an amount equal to 5% of each officer’s salary, and all amounts contributed are vested immediately. Also, the law enforcement officers may make voluntary contributions to the plan. The City’s contributions for the year ended June 30, 2005 were calculated using a covered payroll (base salary) in the amount of $22,803,031. The City’s total payroll was $127,200,466. Total contributions were $2,271,945, which consisted of $1,140,152 from the City and $1,131,793 from the law enforcement officers. The City’s required contributions and the officer’s voluntary contributions represented 5.0% and 4.96% of the covered payroll amount, respectively.
30ag

Schedule 1
Schedule of Funding ProgressLaw Enforcement Officers' Special Separation AllowanceRequired Supplementary InformationYears Ended December 31, 1995 - 2004
Actuarial Valuation Date
Actuarial Value of Assets
(a)
Actuarial Accrued Liability -
Projected Unit Credit
(b)
Funded Ratio
(a) / (b)
Unfunded Actuarial Accrued Liability (b) - (a)
Covered Payroll (c)
Unfunded Actuarial Accrued
Liability as a Percentage of
Covered Payroll
((b - a) / c)
12/31/1995 2,406,842$ 7,657,871$ 31.4% 5,251,029$ 17,210,802$ 30.5%
12/31/1996 2,407,134 8,329,669 28.9% 5,922,535 18,085,582 32.7%
12/31/1997 2,530,925 9,511,422 26.6% 6,980,497 19,065,240 36.6%
12/31/1998 2,617,828 10,512,393 24.9% 7,894,565 19,370,384 40.8%
12/31/1999 2,700,772 11,397,369 23.7% 8,696,597 20,497,436 42.4%
12/31/2000 * 3,244,197 14,006,640 23.2% 10,762,443 21,823,165 49.3%
12/31/2001 3,980,402 14,890,819 26.7% 10,910,417 22,633,569 48.2%
12/31/2002 4,428,099 15,831,856 28.0% 11,403,757 23,199,431 49.2%
12/31/2003 4,411,127 16,260,001 27.1% 11,848,874 24,027,245 49.3%
12/31/2004 4,465,487 18,772,248 23.8% 14,306,761 25,053,871 57.1%
* Reflects changes in actuarial assumptions.
of annual covered payroll approximately adjusts for the effects of inflation and aids analysis of PERS progress made in accumulating sufficient assets to pay benefits when due. Generally,the smaller this percentage, the stronger the PERS.
becoming financially stronger or weaker. Generally, the greater this percentage, the strongerthe PERS. Trends in the unfunded actuarial accrued liability and annual covered payroll are both affected by inflation. Expressing the unfunded actuarial accrued liability as a percentage
Analysis of the dollar amounts of plan net assets, actuarial accrued liability, and unfundedactuarial accrued liability in isolation can be misleading. Expressing plan net assets as apercentage of the actuarial accrued liability provides one indication of PERS funding status isa going-concern basis. Analysis of this percentage over time indicates whether the system is
-31-

Schedule 2
Schedule of Employer ContributionsLaw Enforcement Officers' Special Separation AllowanceRequired Supplementary InformationFiscal Years Ended June 30, 1996 - 2005
Year AnnualEnded Required Percentage6/30 Contribution Contributed
1996 (2) 592,512$ 92.7 %1997 722,853 100.0 1998 791,389 100.0 1999 876,382 100.0 2000 976,812 100.0 2001 1,069,146 146.2 2002 1,233,895 122.5 2003 1,257,899 121.8 2004 1,075,432 146.3 2005 1,434,242 164.9
Notes to the Required Schedules:
The information presented in the required supplementary schedules was determined as part of the actuarial valuations at the dates indicated. Additional information as of the latest actuarial valuation follows:
Valuation Date 12/31/2004Actuarial Cost Method Projected Unit CreditAmortization Method Level Dollar ClosedRemaining Amortization Period 26 YearsAsset Valuation Method Market ValueActuarial Assumptions: Investment Rate of Return (1) 6.0% Projected Salary Increases (1) 4.0%
(1) Includes inflation at 3.75%Cost of Living Adjustments None
(2) The active service and mortality tables and assumed rates of salary were revised to reflect the results of the most recent study of the experience under the program.
-32-

Schedule 3
COMBINING BALANCE SHEETNonmajor Governmental FundsJune 30, 2005
PERMANENT TOTAL
SPECIAL CAPITAL FUND NONMAJORREVENUE PROJECTS PERPETUAL GOVERNMENTALFUNDS FUNDS CARE FUNDS
Cash and Cash Equivalents/Investments 5,475,500$ 4,529,246$ $ 10,004,746$ Receivables:
Taxes 2,863 2,863 Accounts, Notes and Mortgages 11,145,464 11,145,464 Assessments 98,242 98,242 Intergovernmental 1,543,627 1,543,627
Internal Receivables 175,000 175,000 Assets Held for Resale 95,180 95,180 Restricted Assets:
Cash and Cash Equivalents/Investments 5,752,320 37,969,734 1,986,746 45,708,800 Receivables:
Accounts, Notes and Mortgages 177,534 1,100 178,634 Assessments 7,769 7,769 Intergovernmental 31,718 31,718
Total Assets 24,505,217$ 42,500,080$ 1,986,746$ 68,992,043$
Liabilities:Accounts Payable 682,199$ $ $ 682,199$ Contracts/Retainage Payable 546,441 561,241 1,107,682 Internal Payable 435,000 435,000 Miscellaneous 57,749 57,749 Deferred Revenues 13,212,671 13,212,671 Liabilities Payable From Restricted Assets:
Accounts Payable Contracts/Retainage Payable 3,599,311 3,599,311 Interfund Payable 225,000 225,000 Miscellaneous 956 956
Total Liabilities 14,934,060 4,386,508 19,320,568
Fund Balances:Reserved by State Statute 2,581,389 2,581,389 Reserved for Encumbrances 626,589 626,589 Reserved for Assets Held for Resale 95,180 95,180 Reserved for Perpetual Care 1,986,746 1,986,746
Total Reserved Fund Balance 3,303,158 1,986,746 5,289,904
Unreserved, Reported In: Designated for Subsequent Year's Expenditures:
Special Revenue Funds 444,924 444,924
Designated for Debt Service: Special Revenue Funds 138,920 138,920
Designated for Specific Purposes: Special Revenue Funds 1,230,006 1,230,006 Capital Projects Funds 38,113,572 38,113,572 Total Unreserved-Specific Purposes 1,230,006 38,113,572 39,343,578
Undesignated: Special Revenue Funds 4,454,149 4,454,149 Capital Projects Funds Total Unreserved-Undesignated 4,454,149 4,454,149
Total Fund Balances 9,571,157 38,113,572 1,986,746 49,671,475
Total Liabilities and Fund Balances 24,505,217$ 42,500,080$ 1,986,746$ 68,992,043$
ASSETS
LIABILITIES AND FUND BALANCES
-33-

Schedule 4Page 1 of 2
COMBINING BALANCE SHEETNonmajor Special Revenue FundsJune 30, 2005
STREET STATE HOTEL/MOTEL SPECIALAND SIDEWALK HIGHWAY OCCUPANCY TAX COMMUNITY
REVOLVING ALLOCATION CEMETERY TAX DISTRICTS DEVELOPMENT
Cash and Cash Equivalents/Investments 3,712,783$ $ 9,957$ 138,920$ 871,257$ 3,223$ Receivables:
Taxes 2,863Accounts, Notes and Mortgages 34,933 5,427,891 Assessments 98,242Intergovernmental 11,649 1,737 207,414 527 158,374
Internal ReceivablesAssets Held for Resale 95,180Restricted Assets:
Cash and Cash Equivalents/Investments 3,544,048 Receivables:
Accounts, Notes and MortgagesAssessments 7,769Intergovernmental 31,718
Total Assets 3,917,854$ 3,583,535$ 46,627$ 346,334$ 874,647$ 5,589,488$
Liabilities: Accounts Payable $ $ $ $ $ 4,220$ Contracts/Retainage Payable 36,148Internal Payable 162,000Miscellaneous 1,868 55,881Deferred Revenues 195,389 7,769 34,933 4,816 5,423,273
Total Liabilities 197,257 7,769 34,933 4,816 5,681,522
Fund Balances:Reserved by State Statute 106,829 31,718 1,737 207,414 527 162,992Reserved for Encumbrances 428,933 114,110 2,201 30,943Reserved for Assets Held for Resale 95,180Unreserved Fund Balance: Designated for Subsequent Year's Expenditures 444,924 Designated for Debt Service 138,920 Designated for Specific Purposes 1,109,360 Undesignated 1,535,371 3,429,938 7,756 838,361 (255,026)
Total Fund Balances 3,720,597 3,575,766 11,694 346,334 869,831 (92,034)
Total Liabilities and Fund Balances 3,917,854$ 3,583,535$ 46,627$ 346,334$ 874,647$ 5,589,488$
ASSETS
LIABILITIES AND FUND BALANCES
-34-

Schedule 4Page 2 of 2
TOTALWORKFORCE JOB SOUTH ELM STATE NONMAJOR
HOME INVESTMENT TRAINING STREET AND FEDERAL GUILFORD SPECIAL REVENUEPROGRAM HOPE VI ACT CONSORTIUM REDEVELOPMENT GRANTS METRO 911 FUNDS
5,929$ 1,309$ 1,847$ 3,685$ 984$ $ 725,606$ 5,475,500$
2,863 5,073,037 609,603 11,145,464
98,242 743,281 7 20,560 3,546 387,537 8,995 1,543,627
21,000 154,000 175,000 95,180
2,208,272 5,752,320
177,534 177,534 7,769
31,718
5,843,247$ 1,316$ 22,407$ 3,685$ 4,530$ 3,536,946$ 734,601$ 24,505,217$
645,323$ 426$ 2,149$ $ $ 30,081$ $ 682,199$ 58,570 63,598 388,125 546,441
47,000 154,000 72,000 435,000 57,749
5,073,037 2,473,454 13,212,671
5,776,930 47,426 156,149 135,598 2,891,660 14,934,060
764,281 7 20,560 1 3,546 1,272,781 8,996 2,581,38950,402 626,589
95,180
444,924 138,920
120,646 1,230,006 (697,964) (46,117) (154,302) 3,684 (134,614) (627,495) 554,557 4,454,149
66,317 (46,110) (133,742) 3,685 (131,068) 645,286 734,601 9,571,157
5,843,247$ 1,316$ 22,407$ 3,685$ 4,530$ 3,536,946$ 734,601$ 24,505,217$
-35-

Schedule 5Page 1 of 4
COMBINING BALANCE SHEETNonmajor Capital Projects FundsJune 30, 2005
STATE GENERALSTREET HIGHWAY CAPITAL
AND SIDEWALK ALLOCATION IMPROVEMENTS
Cash and Cash Equivalents/Investments 3,048,616$ $ 1,480,630$ Restricted Assets:
Cash and Cash Equivalents/Investments 11,842,314Receivables:
Accounts, Notes and Mortgages
Total Assets 3,048,616$ 11,842,314$ 1,480,630$
Liabilities:Contracts/Retainage Payable 556,345$ $ 4,896$ Liabilities Payable From Restricted Assets:
Contracts/Retainage Payable 1,828,225Internal PayableMiscellaneous
Total Liabilities Payable From Restricted Assets 1,828,225
Total Liabilities 556,345 1,828,225 4,896
Fund Balances: Unreserved Fund Balance: Designated for Capital Projects 2,492,271 10,014,089 1,475,734
Total Liabilities and Fund Balances 3,048,616$ 11,842,314$ 1,480,630$
ASSETS
LIABILITIES AND FUND BALANCES
-36-

Schedule 5Page 2 of 4
PUBLICIMPROVEMENTS PUBLIC PUBLIC HOUSING/SERIES 1990, 1992 REDEVELOPMENT IMPROVEMENT IMPROVEMENT REDEVELOPMENT
1994 and 1998 SERIES 1994 SERIES 1998A SERIES 1998B SERIES 1998
$ $ $ $ $
1,704,746 336,331 3,514,501 2,558 137,576
1,100
1,704,746$ 337,431$ 3,514,501$ 2,558$ 137,576$
$ $ $ $ $
99,848 5,909
956
99,848 6,865
99,848 6,865
1,704,746 337,431 3,414,653 2,558 130,711
1,704,746$ 337,431$ 3,514,501$ 2,558$ 137,576$
(continued)-37-

Schedule 5Page 3 of 4
COMBINING BALANCE SHEET(continued)Nonmajor Capital Projects FundsJune 30, 2005
PARKS & FIRE
STREET RECREATION STATIONIMPROVEMENT SERIES 2003 SERIES 2003
SERIES 2003 and 2005A and 2005A
Cash and Cash Equivalents/Investments $ $ $ Restricted Assets:
Cash and Cash Equivalents/Investments 5,396,958 5,795,926 4,761,293Receivables:
Accounts, Notes and Mortgages
Total Assets 5,396,958$ 5,795,926$ 4,761,293$
Liabilities:Contracts/Retainage Payable $ $ $ Liabilities Payable From Restricted Assets:
Contracts/Retainage Payable 1,205,486 14,234 344,467Internal PayableMiscellaneous
Total Liabilities Payable From Restricted Assets 1,205,486 14,234 344,467
Total Liabilities 1,205,486 14,234 344,467
Fund Balances: Unreserved Fund Balance: Designated for Capital Projects 4,191,472 5,781,692 4,416,826
Total Liabilities and Fund Balances 5,396,958$ 5,795,926$ 4,761,293$
ASSETS
LIABILITIES AND FUND BALANCES
-38-

Schedule 5Page 4 of 4
TOTALPUBLIC NATURAL LIBRARY NONMAJOR
TRANSPORTATION SCIENCE LAW FACILITIES NEIGHBORHOOD CAPITALSERIES 2003 CENTER ENFORCEMENT SERIES 2003 REDEVELOPMENT PROJECTSand 2005A SERIES 2005A SERIES 2003 and 2005A SERIES 2005 FUNDS
$ $ $ $ $ 4,529,246$
508,323 3,485,114 474,183 5,723 4,188 37,969,734
1,100
508,323$ 3,485,114$ 474,183$ 5,723$ 4,188$ 42,500,080$
$ $ $ $ $ 561,241$
3,046 92,693 5,403 3,599,311 225,000 225,000
956
3,046 92,693 5,403 225,000 3,825,267
3,046 92,693 5,403 225,000 4,386,508
505,277 3,485,114 381,490 320 (220,812) 38,113,572
508,323$ 3,485,114$ 474,183$ 5,723$ 4,188$ 42,500,080$
-39-

Schedule 6
COMBINING STATEMENT OF REVENUES, EXPENDITURES AND CHANGES IN FUND BALANCESNonmajor Governmental FundsFor the Fiscal Year Ended June 30, 2005
PERMANENT TOTAL SPECIAL CAPITAL FUND NONMAJOR
REVENUE PROJECTS PERPETUAL GOVERNMENTALFUNDS FUNDS CARE FUNDS
Revenues:Taxes 3,258,407$ $ $ 3,258,407$ Assessments 135,315 135,315 Intergovernmental 18,945,887 859,015 19,804,902 Charges for Current Services 1,615,044 1,615,044 Investment Income 1,056,662 1,056,662 Miscellaneous 862,824 859,657 1,722,481
Total Revenues 25,874,139 1,718,672 27,592,811
Expenditures:Current:
General Government 94,699 300 94,999 Public Safety 5,000,759 4,267,507 9,268,266 Transportation 6,221,875 9,563,198 15,785,073 Engineering and Inspections 746,313 7,407,419 8,153,732 Culture and Recreation 823,603 4,149,250 4,972,853 Community Development and Housing 6,982,381 873,713 7,856,094 Economic Opportunity 2,992,840 2,992,840
Debt Service: Principal Retirement 2,014,000 2,014,000 Interest 952,877 952,877 Fees and Other 30,343 30,343
Total Expenditures 25,859,690 26,261,387 52,121,077
Excess of Revenues Over (Under) Expenditures 14,449 (24,542,715) (24,528,266)
Other Financing Sources (Uses):Debt Issuances:
General Obligation Bonds Issued 14,580,000 14,580,000 Premium on Debt (180,498) (180,498) Federal Loan Program 477,000 477,000
Transfers In 4,305,475 7,373,245 36,614 11,715,334 Transfers Out (9,895,017) (1,541) (9,896,558)
Total Other Financing Sources (Uses) (5,112,542) 21,771,206 36,614 16,695,278
Net Change in Fund Balances (5,098,093) (2,771,509) 36,614 (7,832,988)
Fund Balances - July 1 18,306,435 42,592,319 1,950,132 62,848,886
Cumulative Effect of Change in Accounting Principle for Fund Accounting (3,637,185) (1,707,238) (5,344,423)
Fund Balances - July 1, restated 14,669,250 40,885,081 1,950,132 57,504,463
Fund Balances - June 30 9,571,157$ 38,113,572$ 1,986,746$ 49,671,475$
-40-

Schedule 7Page 1 of 2
COMBINING STATEMENT OF REVENUES, EXPENDITURES AND CHANGES IN FUND BALANCESNonmajor Special Revenue FundsFor the Fiscal Year Ended June 30, 2005
STREET AND STATE HOTEL/MOTEL SPECIALSIDEWALK HIGHWAY OCCUPANCY TAX COMMUNITY
REVOLVING ALLOCATION CEMETERY TAX DISTRICTS DEVELOPMENT
Revenues:Taxes $ $ $ 2,734,573$ 523,834$ $ Assessments 131,002 4,313 Intergovernmental 6,590,139 1,796,034 Charges for Current Services 859,371 359,468 396,205 Investment Income 182,047 619,982 53,609 4,139 16,527 109,941 Miscellaneous 10,430 19,531 5,070 10,093 19,987
Total Revenues 1,182,850 7,233,965 418,147 2,748,805 560,348 2,302,180
Expenditures:Current:
General Government Public Safety Transportation 869,757 2,123,748 Engineering and Inspections Culture and Recreation 655,475 19,000 Community Development and Housing 219,656 2,530,311 Economic Opportunity
Debt Service: Principal Retirement 2,014,000 Interest 952,877 Fees and Other 30,343
Total Expenditures 869,757 2,123,748 655,475 3,016,220 219,656 2,530,311
Excess of Revenues Over (Under) Expenditures 313,093 5,110,217 (237,328) (267,415) 340,692 (228,131)
Other Financing Sources (Uses):Transfers In 127,665 Transfers Out (1,141,158) (8,717,245) (36,614) Debt Issuances:
Federal Loan Program
Total Other Financing Sources (Uses) (1,141,158) (8,717,245) 91,051
Net Change in Fund Balances (828,065) (3,607,028) (146,277) (267,415) 340,692 (228,131)
Fund Balances - July 1 4,548,662 7,182,794 157,971 613,749 529,139 136,097
Fund Balances - June 30 3,720,597$ 3,575,766$ 11,694$ 346,334$ 869,831$ (92,034)$
-41-

Schedule 7Page 2 of 2
TOTALWORKFORCE JOB SOUTH ELM STATE AND NONMAJOR
HOME INVESTMENT TRAINING STREET FEDERAL GUILFORD SPECIAL REVENUEPROGRAM HOPE VI ACT CONSORTIUM REDEVELOPMENT GRANTS METRO 911 FUNDS
$ $ $ $ $ $ $ 3,258,407$ 135,315
2,236,016 2,719,399 12,174 5,592,125 18,945,887 1,615,044
18,343 23,147 (4,747) 989 7,216 25,469 1,056,662 46,913 127,661 215 62 228,565 394,297 862,824
2,301,272 150,808 2,714,867 62 13,163 5,827,906 419,766 25,874,139
94,699 94,699 1,357,633 3,643,126 5,000,759 3,228,370 6,221,875
746,313 746,313 149,128 823,603
2,421,118 486,771 1,324,525 6,982,381 2,848,609 144,231 2,992,840
2,014,000
952,877 30,343
2,421,118 486,771 2,848,609 144,231 6,900,668 3,643,126 25,859,690
(119,846) (335,963) (133,742) 62 (131,068) (1,072,762) (3,223,360) 14,449
219,849 3,957,961 4,305,475 (9,895,017)
477,000 477,000
477,000 219,849 3,957,961 (5,112,542)
(119,846) 141,037 (133,742) 62 (131,068) (852,913) 734,601 (5,098,093)
186,163 (187,147) 3,623 1,498,199 14,669,250
66,317$ (46,110)$ (133,742)$ 3,685$ (131,068)$ 645,286$ 734,601$ 9,571,157$
-42-

Schedule 8Page 1 of 4
COMBINING STATEMENT OF REVENUES, EXPENDITURES AND CHANGES IN FUND BALANCESNonmajor Capital Projects FundsFor the Fiscal Year Ended June 30, 2005
STATE GENERALSTREET AND HIGHWAY CAPITAL
SIDEWALK ALLOCATION IMPROVEMENTS
Revenues:Intergovernmental 859,015$ $ $ Miscellaneous 360,000
Total Revenues 859,015 360,000
Expenditures:Current:
General Government 300 Public Safety 155,212 Transportation 1,266,929 8,208,378 Engineering and Inspections 293,106 Culture and Recreation 381,988 Community Development and Housing 110,930
Total Expenditures 1,560,035 8,319,308 537,500
Excess of Revenues UnderExpenditures (701,020) (8,319,308) (177,500)
Other Financing Sources (Uses):Debt Issuances:
General Obligation Bonds IssuedPremium on Debt
Transfers In 950,000 5,217,245 200,000 Transfers Out
Total Other Financing Sources (Uses) 950,000 5,217,245 200,000
Net Change in Fund Balances 248,980 (3,102,063) 22,500
Fund Balances - July 1 2,243,291 13,116,152 1,453,234
Fund Balances - June 30 2,492,271$ 10,014,089$ 1,475,734$
-43-

Schedule 8Page 2 of 4
PUBLIC
IMPROVEMENT PUBLIC PUBLIC HOUSINGSERIES 1990, 1992 REDEVELOPMENT IMPROVEMENT IMPROVEMENT REDEVELOPMENT
1994 and 1998 SERIES 1994 SERIES 1998A SERIES 1998B SERIES 1998
$ $ $ $ $ 132,049 102,254
132,049 102,254
1,076,177
6,522
226,668 4,760 310,543
6,522 226,668 1,076,177 4,760 310,543
(6,522) (94,619) (1,076,177) (4,760) (208,289)
786,000 (1,541)
784,459
(6,522) (94,619) (291,718) (4,760) (208,289)
1,711,268 432,050 3,706,371 7,318 339,000
1,704,746$ 337,431$ 3,414,653$ 2,558$ 130,711$
(continued)-44-

Schedule 8Page 3 of 4
COMBINING STATEMENT OF REVENUES, EXPENDITURES AND CHANGES IN FUND BALANCES (continued)Nonmajor Capital Projects FundsFor the Fiscal Year Ended June 30, 2005
PARKS & FIRE STREET RECREATION STATION
IMPROVEMENTS SERIES 2003 SERIES 2003SERIES 2003 and 2005A and 2005A
Revenues:Intergovernmental $ $ $ Miscellaneous 84,000
Total Revenues 84,000
Expenditures:Current:
General GovernmentPublic Safety 1,486,002 TransportationEngineering and Inspections 7,107,791 Culture and Recreation 2,126,148 Community Development and Housing
Total Expenditures 7,107,791 2,126,148 1,486,002
Excess of Revenues UnderExpenditures (7,023,791) (2,126,148) (1,486,002)
Other Financing Sources:Debt Issuances:
General Obligation Bonds Issued 4,500,000 4,380,000 Premium on Debt (65,914) (53,914) (26,421)
Transfers InTransfers Out
Total Other Financing Sources (Uses) (65,914) 4,446,086 4,353,579
Net Change in Fund Balances (7,089,705) 2,319,938 2,867,577
Fund Balances - July 1 11,281,177 3,461,754 1,549,249
Fund Balances - June 30 4,191,472$ 5,781,692$ 4,416,826$
-45-

Schedule 8Page 4 of 4
PUBLIC NATURAL LIBRARY TOTALTRANSPORTATION SCIENCE LAW FACILITIES NEIGHBORHOOD NONMAJOR
SERIES 2003 CENTER ENFORCEMENT SERIES 2003 REDEVELOPMENT CAPITAL PROJECTSand 2005A SERIES 2005 SERIES 2003 and 2005A SERIES 2005 FUNDS
$ $ $ $ $ 859,015$ 181,354 859,657
181,354 1,718,672
300 1,550,116 4,267,507
87,891 9,563,198 7,407,419
14,886 1,626,228 4,149,250 220,812 873,713
87,891 14,886 1,550,116 1,626,228 220,812 26,261,387
(87,891) (14,886) (1,550,116) (1,444,874) (220,812) (24,542,715)
500,000 3,500,000 1,700,000 14,580,000 (1,624) (32,625) (180,498)
220,000 7,373,245 (1,541)
498,376 3,500,000 (32,625) 1,920,000 21,771,206
410,485 3,485,114 (1,582,741) 475,126 (220,812) (2,771,509)
94,792 1,964,231 (474,806) 40,885,081
505,277$ 3,485,114$ 381,490$ 320$ (220,812)$ 38,113,572$
-46-

Schedule 9
Enterprise FundsSchedule of Changes in Long-Term DebtFor the Fiscal Year Ended June 30, 2005
Debt DebtOutstanding OutstandingJuly 1, 2004 Additions Retirements Adjustments June 30, 2005
Water Resources: General Obligation Bonds 3,679,219$ 717,289$ 1,866,505$ $ 2,530,003$ Revenue Bonds 164,470,000 71,930,000 35,790,000 200,610,000 Federal Loan Obligation 3,081,746 254,403 (28,906) 2,798,437 Other Financing Agreements 2,804,637 26,509 428,950 2,402,196 Compensated Absences 893,078 987,043 853,473 1,026,648
Total Water Resources 174,928,680 73,660,841 39,193,331 (28,906) 209,367,284
War Memorial Coliseum: Certificates of Participation 740,000 90,000 650,000 Compensated Absences 254,076 148,812 162,583 240,305
Total War Memorial Coliseum 994,076 148,812 252,583 890,305
Parking Facilities: Certificates of Participation 10,206,640 1,941,000 8,265,640 Compensated Absences 30,059 25,444 21,819 33,684
Total Parking Facilities 10,236,699 25,444 1,962,819 8,299,324
Solid Waste Management: Special Obligation Bonds 11,455,000 1,040,000 10,415,000 Accrued Landfill Liability 10,503,616 649,152 11,152,768 Compensated Absences 341,503 327,352 297,213 371,642
Total Solid Waste Management 22,300,119 976,504 1,337,213 21,939,410
Stormwater Management: Compensated Absences 231,562 211,710 202,826 240,446
Total Stormwater Management 231,562 211,710 202,826 240,446
Total Enterprise Funds 208,691,136$ 75,023,311$ 42,948,772$ (28,906)$ 240,736,769$
-47-

Schedule 10
Statement of Revenues, Expenses, and Changes in Fund Net AssetsComponent UnitFor the Fiscal Year Ended June 30, 2005
GREENSBOROTRANSIT
AUTHORITYRevenues: Charges for Current Services 2,360,781$ Miscellaneous 27,286 Total Operating Revenues 2,388,067
Operating Expenses: Personal Services 432,526 Fringe Benefits 99,931 Maintenance and Operations 10,452,749 Depreciation 1,327,720 Total Operating Expenses 12,312,926
Operating Loss (9,924,859)
Nonoperating Revenues (Expenses): Investment Income 1,331,651 Property Taxes 3,658,772 Grants 6,910,346 Miscellaneous Nonoperating Revenue 200,895 Loss on Disposal of Capital Assets (15,926) Total Nonoperating Revenues (Expenses) 12,085,738
Change in Net Assets 2,160,879
Net Assets - July 1 41,932,832Net Assets - June 30 44,093,711$
-48-

Schedule 11Page 1 of 2
Statement of Cash FlowsComponent UnitFor the Fiscal Year Ended June 30, 2005
GREENSBOROTRANSIT
AUTHORITYCash Flows from Operating Activities:Receipts from Customers (446,741)$ Payments to Suppliers (6,219,138) Payments to Employees (524,295) Other Receipts 10,797,299 Net Cash Provided by Operating Activities 3,607,125
Cash Flows from Capital and Related Financing Activities:Acquisition and Construction of Capital Assets (2,838,017)
Cash Flows from Investing Activities:Interest 1,330,644
Net Increase in Cash and Cash Equivalents 2,099,752
Cash and Cash Equivalents/ Investments - July 1 777,590 Cash and Cash Equivalents/ Investments - June 30 2,877,342$
Reconciliation of Cash and Cash Equivalents/ Investments: Cash and Cash Equivalents/ Investments - Current 2,877,342$ Cash and Cash Equivalents/ Investments - Restricted Total Cash and Cash Equivalents/Investments - June 30 2,877,342$
-49-

Schedule 11Page 2 of 2
Statement of Cash FlowsComponent UnitFor the Fiscal Year Ended June 30, 2005
GREENSBOROTRANSIT
(continued) AUTHORITY
Reconciliation of Operating Loss to Net Cash Used for Operating Activities: Operating Loss (9,924,859)$ Adjustments to Reconcile Operating Loss to Net Cash Provided by Operating Activities: Depreciation 1,327,720 Change in Assets and Liabilities: Increase in Receivables (264,845) Increase in Inventories (22,865) Decrease in Intergovernmental Receivables 3,578,734 Increase in Accounts Payable 648,647 Increase in Annual Leave Accrual 7,987 Decrease in Miscellaneous Payable (2,513,407) Other Receipts 10,770,013 Total Adjustments 13,531,984
Net Cash Provided by Operating Activities 3,607,125$
Noncash Investing, Capital and Financing Activities: Lease-Purchase and Other Capital Financing Agreements $
-50-

Schedule 12Page 1 of 2
Greensboro Transit AuthoritySchedule of Revenues and Expenses - Budget and Actual (Non-GAAP)For the Fiscal Year Ended June 30, 2005
VariancePositive
Budget Actual (Negative)Operating Revenues: Charges for Current Services 2,205,000$ 2,360,781$ 155,781$ Other Operating Revenues 3,000 27,286 24,286 Total Operating Revenues 2,208,000 2,388,067 180,067
Operating Expenses: Personal Services 384,096 432,526 48,430 Fringe Benefits 100,072 99,931 (141) Maintenance and Operations 10,488,922 10,411,062 (77,860) Capital Outlay 14,261 5,967 (8,294) Total Operating Expenses 10,987,351 10,949,486 (37,865)
Operating Loss (8,779,351) (8,561,419) 217,932
Nonoperating Revenues: Investment Income 1,500,495 1,331,651 (168,844) Property Tax Collections 3,576,104 3,658,772 82,668 State and Federal Grants 3,339,945 3,213,664 (126,281) Mortgage Note Principal Payment 148,240 191,707 43,467 Miscellaneous Nonoperating Revenue 194,000 200,895 6,895 Total Nonoperating Revenues 8,758,784 8,596,689 (162,095)
Excess of Revenues Over (Under) Expenses Before Other Financing Uses (20,567) 35,270 55,837
Other Financing Uses: Transfers Out (332,750) (309,750) 23,000
Excess of Revenues Under Expenses and Other Financing Uses (353,317) (274,480) 78,837
Appropriated Fund Balance 353,317 (353,317)
Excess of Revenues Under Expenses and Other Financing Uses $ (274,480)$ (274,480)$
-51-

Schedule 12Page 2 of 2
Greensboro Transit AuthoritySchedule of Revenues and Expenses - Budget and Actual (Non-GAAP)For the Fiscal Year Ended June 30, 2005
Reconciliation of Modified Accrual Basis to Full Accrual Basis: Total Revenues 10,984,756$ Total Expenses 10,949,486
Excess of Revenues Over Expenses Before Other Financing Uses 35,270
Adjustment to Full Accrual Basis: Depreciation (1,327,720) Capital Outlay 5,967 Mortgage Note Principal Payment (191,707) Transit Grant Project Funds Revenues and Expenses 3,654,995 Loss on Disposal of Capital Assets (15,926)
Income Before Transfers 2,160,879$
-52-

Schedule 13
Greensboro Transit Planning and Grant Project FundSchedule of Revenues and Expenses - Budget and Actual (Non-GAAP)From Project Inception and For the Year Ended June 30, 2005
ActualProject Prior Current Total
Authorization Years Year To DateRevenues: Federal Grants 8,429,167$ 3,218,058$ 2,177,216$ 5,395,274$ State Grants 1,053,644 331,846 2,706 334,552 Total Revenues 9,482,811 3,549,904 2,179,922 5,729,826
Expenses: Capital Improvements: Section 5307 Capital Program 6,829,609 1,080,140 2,701,330 3,781,470 Section 5309 Capital Program 1,839,554 1,285,619 1,285,619 Multi Modal Transportation Center 1,200,000 1,200,000 (48,539) 1,151,461 Planning and Capital Assistance 667,296 505,353 20,190 525,543 Total Expenses 10,536,459 4,071,112 2,672,981 6,744,093
Excess of Revenues Under Expenses Before Other Financing Sources (1,053,648) (521,208) (493,059) (1,014,267)
Other Financing Sources: Transfers In 1,053,648 735,362 309,750 1,045,112
Excess of Revenues and Other Financing Sources Over (Under) Expenses $ 214,154$ (183,309)$ 30,845$
-53-

Schedule 14
Greensboro Transit Authority Multi Modal Transportation CenterSchedule of Revenues and Expenses - Budget and Actual (Non-GAAP)From Project Inception and For the Year Ended June 30, 2005
ActualProject Prior Current Total
Authorization Years Year To DateRevenues: Federal Grants 14,946,338$ 14,134,563$ 783,486$ 14,918,049$ State Grants 1,868,291 1,008,740 736,376 1,745,116 Local Grants/ In Kind Services 1,449,998 1,299,998 (3,101) 1,296,897 Investment Income (21,560) (21,560) Total Revenues 18,264,627 16,421,741 1,516,761 17,938,502
Expenses: Capital Improvements: Multi Modal Transportation Center 18,682,922 18,516,900 130,661 18,647,561 Total Capital Improvements 18,682,922 18,516,900 130,661 18,647,561
Excess of Revenues Over (Under) Expenses Before Other Financing Sources (418,295) (2,095,159) 1,386,100 (709,059)
Other Financing Sources: Transfers In 418,295 568,295 (568,295)
Excess of Revenues and Other Financing Sources Over (Under) Expenses $ (1,526,864)$ 817,805$ (709,059)$
-54-

General Fund
The General Fund is the principal fund of the City from which the major portion of the City's operations are financed. This fund finances the regular operation of all departments except Enterprise Fund and Internal ServiceFund departments.
A summary of revenues and other financing sources and expenditures and other financing uses for the fiscalyear ended June 30, 2005 is presented below:
AmountPercent of
TotalRevenues and Other Financing Sources
Taxes 150,682,146$ 73.6%Intergovernmental 19,500,196 9.5%Licenses and Permits 8,926,893 4.4%Fines and Forfeitures 979,352 0.5%Charges for Current Services 18,830,820 9.2%Miscellaneous 2,056,065 1.0%Other Financing Sources 3,721,500 1.8%Total Revenues and Other Financing Sources 204,696,972$ 100.0%
Expenditures and Other Financing Uses
General Government 21,857,796$ 10.7%Public Safety 83,893,658 41.2%Transportation 15,549,873 7.6%Engineering and Inspections 16,159,327 7.9%Environmental Services 655,149 0.3%Culture and Recreation 29,863,658 14.6%Intergovernmental 1,325,930 0.7%Other Financing Uses 34,586,695 17.0%Total Expenditures and Other Financing Uses 203,892,086$ 100.0%
-55-

Schedule 15Page 1 of 8
General FundSchedule of Revenues, Expenditures and Changes in Fund Balance - Budget and ActualFor the Fiscal Year Ended June 30, 2005
Variance
Final PositiveBudget Actual (Negative)
Revenues:Taxes: Ad Valorem Taxes-Current Year 112,600,000$ 113,421,524$ 821,524$ Ad Valorem Taxes-Prior Year 701,000 954,573 253,573 Penalties and Interest 413,000 441,393 28,393 Local Option Sales Tax 32,973,606 35,542,429 2,568,823 Vehicle Gross Receipts Tax 357,000 322,227 (34,773) Total Taxes 147,044,606 150,682,146 3,637,540
Intergovernmental: State Grants: Libraries 305,985 322,008 16,023 State-Shared: Utility Taxes: Utility Franchise Tax 6,826,049 6,764,970 (61,079) Piped Natural Gas Excise Tax 1,994,056 1,968,825 (25,231) Telecommunications Sales Tax 3,554,601 3,612,340 57,739 Beer and Wine Tax 1,014,815 1,024,673 9,858 State Reimbursements/Other: Sales Tax Hold Harmless Payment 1,012,050 1,012,047 (3) Court Fees 103,700 149,050 45,350 Payment In Lieu of Taxes 225,650 225,848 198 Local Grants: Parks and Recreation 5,150 (5,150) Libraries 933,300 938,800 5,500 School Safety Programs 885,297 936,617 51,320 Environmental Programs 75,000 76,802 1,802 ABC Board Profit Distribution 2,230,000 2,468,216 238,216 Total Intergovernmental 19,165,653 19,500,196 334,543
Licenses and Permits: Privilege Licenses: Privilege Licenses-Current Year 3,125,975 3,032,498 (93,477) Penalties on Privilege Licenses 40,000 55,920 15,920 Privilege Licenses-Prior Years 50,000 24,024 (25,976) Penalties on Prior Years' Licenses 10,000 5,811 (4,189) Motor Vehicle Licenses 850,000 879,431 29,431 Cable TV Access Licenses 2,296,000 2,333,150 37,150 Other Licenses and Permits 583,700 613,609 29,909 Construction Permits: Building Permits 820,000 956,934 136,934 Electrical Permits 426,000 406,397 (19,603) Plumbing Permits 277,000 293,885 16,885 Heating Permits 295,000 325,234 30,234 Total Licenses and Permits 8,773,675 8,926,893 153,218
-56-

Schedule 15Page 2 of 8
General FundSchedule of Revenues, Expenditures and Changes in Fund Balance - Budget and ActualFor the Fiscal Year Ended June 30, 2005
Variance
Final PositiveBudget Actual (Negative)
Fines and Forfeitures: Parking Violations 475,000$ 604,926$ 129,926$ Library Fines 135,120 147,238 12,118 City Code Violations 33,000 43,590 10,590 False Burglar Alarm Fines 217,400 183,598 (33,802) Total Fines and Forfeitures 860,520 979,352 118,832
Charges for Current Services: Planning: Preliminary Plan Reviews 105,000 98,881 (6,119) Final Plats/Declarations 12,500 8,110 (4,390) Rezoning Applications 50,000 50,550 550 Other Planning Fees 20,000 13,320 (6,680) Police Department: Police Department Services 19,700 13,836 (5,864) Tow-In Services 23,380 33,007 9,627 Off-Duty Employment 1,850,000 1,575,602 (274,398) Contracted Services 410,845 520,689 109,844 Communications Reimbursement 50,000 (50,000) 911 Wireless Telephone 250,000 (250,000) Fire Department: Hazardous Material Fees 20,000 21,468 1,468 Fire Department Plan Reviews 59,400 48,552 (10,848) Fire Code Reinspections 20,800 27,200 6,400 Disaster Recovery 362,637 362,637 Miscellaneous Permits 35,400 38,830 3,430 Transportation: State Highway System: Signals, Signs and Lights 569,205 856,848 287,643 Maintenance to Highways 267,620 329,090 61,470 Ridesharing Revenue 90,000 106,492 16,492 Van Pool Revenue 5,000 5,028 28 Monthly Parking Fees 11,250 9,916 (1,334) Engineering and Inspections: Plan Review/Water and Sewer/Roadways 180,000 234,134 54,134 Vacant Lot Cleaning Fees 87,130 172,511 85,381 Junked Auto Fees 150,000 60,921 (89,079) Boarding Vacant Houses 8,795 8,795 Environmental Services: Hazardous Waste Disposal Fees 377,702 394,548 16,846 Parks and Recreation: Maintenance Service-Local Agencies 99,380 73,744 (25,636) Admissions and Charges 1,871,150 2,040,313 169,163 Rental and Lease 770,001 843,060 73,059 Catering Services 45,750 33,316 (12,434)
-57-

Schedule 15Page 3 of 8
General FundSchedule of Revenues, Expenditures and Changes in Fund Balance - Budget and ActualFor the Fiscal Year Ended June 30, 2005
VarianceFinal Positive
Budget Actual (Negative)Charges for Current Services (Continued): Concessions 135,300$ 184,337$ 49,037$ Concessions-Alcoholic Beverages 10,550 11,352 802 Bur-Mil Reimbursement 384,780 334,120 (50,660) Mowing Services-State Highways 88,000 80,910 (7,090) Fishing, Hunting and Boating Fees 36,555 29,323 (7,232) Other Parks and Recreation Revenue 131,850 153,806 21,956 Library Fees 15,445 10,160 (5,285) Interdepartmental Charges: Information Systems Services 4,243,850 4,682,848 438,998 Administrative Charges 3,501,000 3,554,434 53,434 Engineering Services 1,370,000 1,370,000 Rents 498,620 438,132 (60,488) Total Charges for Current Services 17,867,163 18,830,820 963,657
Miscellaneous: Sale of Assets 373,425 533,055 159,630 Miscellaneous Receivables Revenue 29,000 12,981 (16,019) Donations and Private Contributions 155,500 89,101 (66,399) Contracted Construction Projects 892,000 917,804 25,804 Service Charges 5,400 5,790 390 Other Revenue 414,280 497,334 83,054 Total Miscellaneous 1,869,605 2,056,065 186,460
Appropriated Fund Balance 13,073,970 (13,073,970)
Total Revenues 208,655,192 200,975,472 (7,679,720)
-58-

Schedule 15Page 4 of 8
General FundSchedule of Revenues, Expenditures and Changes in Fund Balance - Budget and ActualFor the Fiscal Year Ended June 30, 2005
Variance
Final PositiveBudget Actual (Negative)
Expenditures:General Government: Legislative: Governing Body 227,251$ 188,534$ (38,717)$ Clerk of Governing Body 292,828 275,534 (17,294) Elections 90,000 (90,000) Total Legislative 610,079 464,068 (146,011)
Executive: City Manager 1,198,398 1,119,361 (79,037) Enterprise Resource Planning 234,572 195,088 (39,484) Economic Development 453,765 289,145 (164,620) Internal Audit 311,354 300,380 (10,974) Minority and Women's Business Enterprises 281,009 280,664 (345) Total Executive 2,479,098 2,184,638 (294,460)
Organizational Development and Communications 2,587,809 2,275,428 (312,381)
Human Relations 558,905 533,203 (25,702)
Human Resources: Administration 444,376 326,408 (117,968) Compensation and Employment 585,947 579,913 (6,034) HRIS and Benefits 481,838 514,466 32,628 Employee Safety and Health 514,810 467,066 (47,744) Total Human Resources 2,026,971 1,887,853 (139,118)
Budget and Evaluation 667,421 666,895 (526)
Planning 1,881,567 1,584,282 (297,285)
Finance: Administration 813,823 731,773 (82,050) Accounting 850,213 783,696 (66,517) Purchasing and Supply 567,061 494,610 (72,451) Collections 1,491,626 1,330,214 (161,412) Total Finance 3,722,723 3,340,293 (382,430)
Legal 991,839 933,628 (58,211)
Management Information Systems: Administration 406,094 395,398 (10,696) Desktop Services 3,866,517 3,660,600 (205,917) Geographic Information Services 610,343 602,490 (7,853) Application Services 2,170,772 2,041,117 (129,655) Total Management Information Systems 7,053,726 6,699,605 (354,121)
-59-

Schedule 15Page 5 of 8
General FundSchedule of Revenues, Expenditures and Changes in Fund Balance - Budget and ActualFor the Fiscal Year Ended June 30, 2005
Variance
Final PositiveBudget Actual (Negative)
Other General Government: Chamber of Commerce 200,000$ 150,000$ (50,000)$ Piedmont Triad Partnership 37,200 37,200 Greensboro Housing Coalition 4,682 (4,682) Downtown Greensboro, Inc. 255,000 255,000 East Market Street Development Corporation 40,000 40,000 Architectural Salvage 22,000 22,000 Downtown Development 215,000 (215,000) NC Metropolitan Coalition 12,000 12,000 Productivity Improvement Program 8,000 424 (7,576) FEMA Response 10,118 10,118 Nondepartmental 953,263 761,161 (192,102) Total Other General Government 1,747,145 1,287,903 (459,242)
Total General Government 24,327,283 21,857,796 (2,469,487)
Public Safety: Police: Administration 2,431,264 2,366,504 (64,760) Resource Management 9,182,876 7,624,148 (1,558,728) Field Operations 22,178,801 21,113,155 (1,065,646) Criminal Investigations 3,317,772 3,342,881 25,109 Special Operations 1,758,599 2,036,552 277,953 Investigative Support 4,536,441 4,047,066 (489,375) Vice/Narcotics 1,451,472 1,492,705 41,233 Professional Standards 967,144 1,238,935 271,791 Organizational Development 1,310,172 3,621,582 2,311,410 Communications 1,566,282 1,300,020 (266,262) 911 Program 21,725 (21,725) Information and Technology 4,227,307 3,944,540 (282,767) Total Police 52,949,855 52,128,088 (821,767)
Fire: Administration 2,299,723 2,201,292 (98,431) Training 1,175,441 1,168,859 (6,582) Fire Prevention 1,269,725 1,311,262 41,537 Emergency Services 23,159,313 22,748,525 (410,788) Regulatory/Fleet Repair Service 3,225,956 3,036,508 (189,448) Stations and Buildings 1,350,690 1,299,124 (51,566) Total Fire 32,480,848 31,765,570 (715,278)
Total Public Safety 85,430,703 83,893,658 (1,537,045)
Transportation: Administration 1,934,901 1,958,844 23,943 Street Cleaning 498,670 527,989 29,319 Traffic Operations 3,170,441 3,109,292 (61,149) Storm Sewer Construction 1,873,215 1,873,669 454 Street Administration 4,881,908 4,680,415 (201,493) Traffic Engineering 3,046,857 3,080,508 33,651 Transportation Planning 280,735 319,156 38,421 Total Transportation 15,686,727 15,549,873 (136,854)
-60-

Schedule 15Page 6 of 8
General FundSchedule of Revenues, Expenditures and Changes in Fund Balance - Budget and ActualFor the Fiscal Year Ended June 30, 2005
Variance
Final PositiveBudget Actual (Negative)
Engineering and Inspections: Administration 770,265$ 604,404$ (165,861)$ Engineering 4,477,055 4,191,536 (285,519) Facilities Engineering 702,140 526,641 (175,499) Central City Maintenance 3,807,562 3,526,844 (280,718) Building Maintenance 3,464,830 2,745,071 (719,759) Franchise Administration 156,114 110,583 (45,531) Service Center Maintenance 530,129 490,426 (39,703) Building Inspections 2,865,571 2,827,850 (37,721) Local Ordinance Enforcement 1,295,998 1,135,972 (160,026) Total Engineering and Inspections 18,069,664 16,159,327 (1,910,337)
Environmental Services 925,963 655,149 (270,814) Culture and Recreation: Parks and Recreation: Administration 1,898,389 1,857,322 (41,067) Bryan Park at Guilford County 5,300 (5,300) Bryan Enrichment Center 290,221 237,223 (52,998) Bryan Park Operations 616,152 513,393 (102,759) Gillespie Golf Course 534,745 526,835 (7,910) Greensboro Sportsplex 879,539 803,910 (75,629) City Arts 915,326 820,823 (94,503) Program and Community Services 988,021 972,030 (15,991) Neighborhood Playgrounds and Centers 2,492,190 2,341,827 (150,363) Swimming Pools 462,708 495,083 32,375 Memorial Stadium 325,354 235,201 (90,153) Hagan Stone Park 493,804 456,190 (37,614) Hester Park 339,093 324,539 (14,554) Country Park 362,632 363,355 723 Jaycee Park 96,435 117,446 21,011 Athletics 863,694 803,567 (60,127) Regional Parks 19,445 17,623 (1,822) Bur-Mil Club 836,094 829,090 (7,004) Lake Wardens 835,070 811,265 (23,805) Barber Park 428,065 384,815 (43,250) Equipment Maintenance 270,018 268,138 (1,880) Development and Maintenance 5,110,616 4,988,927 (121,689) Landscape and Beautification 2,335,720 2,187,639 (148,081) Tannenbaum Park 268,661 255,437 (13,224) Carolyn Allen Park 299,724 219,994 (79,730) Price Park 2,004 323 (1,681) Total Parks and Recreation 21,969,020 20,831,995 (1,137,025)
-61-

Schedule 15Page 7 of 8
General FundSchedule of Revenues, Expenditures and Changes in Fund Balance - Budget and ActualFor the Fiscal Year Ended June 30, 2005
Variance
Final PositiveBudget Actual (Negative)
Library: Administration 2,716,549$ 2,270,102$ (446,447)$ Main Library 1,646,318 1,588,708 (57,610) Extension Services 122,865 129,590 6,725 Collection Inventory 892,357 691,514 (200,843) Benjamin Branch Library 341,767 337,708 (4,059) Northeast Branch Library 5,990 2,289 (3,701) Vance H. Chavis Branch Library 367,478 365,624 (1,854) Southwest Branch Library 488,673 470,795 (17,878) Glenwood Branch Library 383,419 324,864 (58,555) Kathleen Clay Edwards Branch Library 499,571 444,325 (55,246) McGirt-Horton Branch Library 382,686 355,156 (27,530) Historical Museum 821,983 790,744 (31,239) Total Library 8,669,656 7,771,419 (898,237)
Other Culture and Recreation: Historic Preservation Commission 3,000 3,000 Natural Science Center of Greensboro 1,085,000 1,085,000 Greensboro Sports Commission 100,000 100,000 Eastern Music Festival 10,000 10,000 Fun Fourth - Grassroots 10,000 7,500 (2,500) Downtown Banners/Grassroots 11,000 14,744 3,744 Blandwood Mansion 10,000 10,000 Greensboro Jaycees 20,000 20,000 Festival of Lights 10,000 10,000 Total Other Culture and Recreation 1,259,000 1,260,244 1,244
Total Culture and Recreation 31,897,676 29,863,658 (2,034,018)
Intergovernmental: Guilford County: Animal Shelter and Animal Control 936,379 919,487 (16,892) Tax Collections 355,515 355,512 (3) Environmental Health Control 7,500 (7,500) National Guard Armory 3,000 3,000 Human Service Agencies: Program Administration 344 94 (250) PCC Community Nursing 9,000 (9,000) Piedmont Council of Governments 47,840 47,837 (3) Total Intergovernmental 1,359,578 1,325,930 (33,648)
Total Expenditures 177,697,594 169,305,391 (8,392,203)
Excess of Revenues Over Expenditures 30,957,598 31,670,081 712,483
-62-

Schedule 15Page 8 of 8
General FundSchedule of Revenues, Expenditures and Changes in Fund Balance - Budget and ActualFor the Fiscal Year Ended June 30, 2005
Variance
Final PositiveBudget Actual (Negative)
Other Financing Sources (Uses): Transfers In: State Highway Allocation Fund 3,500,000$ 3,500,000$ $ Coliseum Fund 205,000 205,000 Technical Services Fund 16,500 16,500 Total Transfers In 3,721,500 3,721,500
Transfers Out: Cemetery Operating Fund 127,665 127,665 Housing Partnership Revolving Fund 1,782,332 1,782,332 State and Federal Grants Fund 113,594 21,191 (92,403) Guilford Metro 911 3,830,137 3,830,137 General Capital Improvements Fund 200,000 200,000 Debt Service Fund 14,425,000 14,425,000 Libraries Bond Fund 220,000 220,000 War Memorial Coliseum Fund 1,800,000 1,800,000 Parking Facilities Fund 1,226,395 1,226,395 Solid Waste Management Fund 10,373,045 10,373,045 Equipment Services Fund 566,530 566,530 Employee Health Insurance Fund 14,400 14,400 Total Transfers Out 34,679,098 34,586,695 (92,403)
Total Other Financing Sources (Uses) (30,957,598) (30,865,195) 92,403
Excess of Revenues and Other Financing Sources Over Expenditures and Other Financing Uses $ 804,886 804,886
Fund Balance - July 1 58,111,419 58,111,419
Fund Balance - June 30 58,916,305$ 58,916,305$
-63-

-64-
Special Revenue Funds
Street and Sidewalk Revolving Fund
The primary purpose of this fund is to finance the repair and or construction of streets and sidewalks. Revenues are derived primarily from a motor vehicle license tax and payment of street and sidewalk assessments levied on abutting property.
State Highway Allocation Fund
This fund was established to account for Powell Bill Funds which are derived from a one and three-fourths cents per gallon motor fuel tax. The State of North Carolina collects these monies and returns a proportionate share to local governments based on local street mileage and population. Expenditures from this fund are restricted to specific highway construction and maintenance costs.
Cemetery Fund
The Cemetery Fund is responsible for the operation and maintenance of three cemeteries. The cemeteries are perpetually endowed by the Perpetual Care Fund which receives one-fourth of all cemetery lot sales. All interest earned by the Perpetual Care Fund is restricted for operations of the Cemetery Fund.
Hotel/Motel Occupancy Tax Fund
This fund was established to account for a 3% room occupancy tax levied on hotels and motels located within the city limits. This tax revenue is dedicated for debt service on certificates of participation issued by the Greensboro Center City Corporation to finance improvements at the Greensboro War Memorial Coliseum Complex.
Special Tax Districts Fund
This fund was established to account for a special tax on property in the College Hill and Charles B. Aycock Historic Districts, as authorized by voter referendum.
Housing Partnership Revolving Fund
In FY 2001-02, City Council increased its General Fund support to the Housing Partnership Revolving Fund from one cent to one and one-third cent of the property tax rate. This revenue provides resources to fund low and moderate income housing initiatives approved by City Council, including grant/loan programs, construction/renovation projects, and cooperative efforts with private and not-for-profit organizations.
Community Development Fund
The purpose of the Community Development Fund is to account for projects financed primarily with Community Development Block Grant funds which are used for revitalization of low and moderate income areas.

-65-
HOME Program Fund
The purpose of the HOME Program Fund is to account for projects financed with Housing and Urban Development funds which are used for revitalization of low and moderate income areas.
HOPE VI Fund The purpose of the HOPE VI Fund is to account for projects financed primarily with the proceeds of Greensboro’s Community Development Block Grant Section 108 Loan which are used for revitalization of low and moderate income housing areas.
Workforce Investment Act
The purpose of the Workforce Investment Act is to account for Department of Labor grant funds used to establish programs for employment and classroom training activities. The Workforce Investment Act became effective January 2000 and will replace many of the Job Training Consortium Fund activities.
Job Training Consortium Fund
The purpose of the Job Training Consortium Fund is to account for Job Training Partnership Act grant funds used to establish programs for public service employment jobs, on-the-job-training programs and classroom training.
South Elm Street Redevelopment Fund
The purpose of the South Elm Street Redevelopment Fund is to account for funds used to assess and remedy environmental contamination in order to implement planned redevelopment of properties in the South Elm Street area.
State and Federal Grants Fund
The purpose of the State and Federal Grants Fund is to account for various projects financed primarily with State or Federal aid.
Guilford Metro 911 Fund
This fund oversees Guilford Metro 911 Communications Department. Guilford Metro 911 became a separate City of Greensboro department on July 1, 2004. The Guilford Metro 911 fund has three divisions: Guilford Metro 911 Administration, Emergency Communications and Greensboro Emergency Management. The fund is supported by General Revenue and 911 Wired and Wireless surcharge fees.

Schedule 16
Street and Sidewalk Revolving FundSchedule of Revenues, Expenditures and Changes in Fund Balance - Budget and ActualFor the Fiscal Year Ended June 30, 2005
VarianceFinal Positive
Budget Actual (Negative)Revenues:
Assessments 211,800$ 131,002$ (80,798)$
Charges for Current Services:Red Light Camera Violations 1,087,500 859,371 (228,129)
Investment Income 180,000 182,047 2,047
Miscellaneous:Sales and Use Tax Refund 10,430 10,430
Appropriated Fund Balance 1,594,646 (1,594,646)
Total Revenues 3,073,946 1,182,850 (1,891,096)
Expenditures:Transportation:
Street Construction 1,907,788 869,757 (1,038,031)Bridge Construction and Maintenance 25,000 (25,000)
Total Expenditures 1,932,788 869,757 (1,063,031)
Excess of Revenues Over Expenditures 1,141,158 313,093 (828,065)
Other Financing Uses:Transfers Out (1,141,158) (1,141,158)
Excess of Revenues Under Expenditures and Other Financing Uses $ (828,065) (828,065)
Fund Balance - July 1 4,548,662 4,548,662
Fund Balance - June 30 3,720,597$ 3,720,597$
-66-

Schedule 17
State Highway Allocation FundSchedule of Revenues, Expenditures and Changes in Fund Balance - Budget and ActualFor the Fiscal Year Ended June 30, 2005
VarianceFinal Positive
Budget Actual (Negative)Revenues:
Intergovernmental:State Powell Bill 5,935,760$ 6,590,139$ 654,379$
Assessments 47,700 4,313 (43,387)
Investment Income 700,000 619,982 (80,018)
Miscellaneous:Sales and Use Tax Refund 78,000 19,531 (58,469)
Appropriated Fund Balance 4,193,342 (4,193,342)
Total Revenues 10,954,802 7,233,965 (3,720,837)
Expenditures: Transportation:
Transportation Improvements 7,500 (7,500)Streets and Structures 2,230,057 2,123,748 (106,309)
Total Expenditures 2,237,557 2,123,748 (113,809)
Excess of Revenues Over Expenditures 8,717,245 5,110,217 (3,607,028)
Other Financing Uses:Transfers Out (8,717,245) (8,717,245)
Excess of Revenues Under Expenditures and Other Financing Uses $ (3,607,028) (3,607,028)
Fund Balance - July 1 7,182,794 7,182,794
Fund Balance - June 30 3,575,766$ 3,575,766$
-67-

Schedule 18
Cemetery FundSchedule of Revenues, Expenditures and Changes in Fund Balance - Budget and ActualFor the Fiscal Year Ended June 30, 2005
VarianceFinal Positive
Budget Actual (Negative)Revenues:
Charges for Current Services:Forest Lawn Cemetery 320,850$ 292,975$ (27,875)$ Maplewood Cemetery 38,800 27,740 (11,060)Greenhill Cemetery 45,810 38,753 (7,057)
Total Charges for Current Services 405,460 359,468 (45,992)
Investment Income 93,165 53,609 (39,556)
Miscellaneous:Donations and Contributions 100 4,940 4,840Other Miscellaneous Revenue 130 130
100 5,070 4,970
Appropriated Fund Balance 125,962 (125,962)
Total Revenues 624,687 418,147 (206,540)
Expenditures: Culture and Recreation:
Cemeteries:Administration 272,198 264,545 (7,653)Forest Lawn Cemetery 178,416 168,422 (9,994)Maplewood Cemetery 101,875 86,763 (15,112)Greenhill Cemetery 160,848 135,745 (25,103)
Total Expenditures 713,337 655,475 (57,862)
Excess of Revenues Under Expenditures (88,650) (237,328) (148,678)
Other Financing Sources (Uses):Transfers In 127,665 127,665 Transfers Out (39,015) (36,614) 2,401
Total Other Financing Sources (Uses) 88,650 91,051 2,401
Excess of Revenues and Other Financing Sources Under Expenditures andOther Financing Uses $ (146,277) (146,277)
Fund Balance - July 1 157,971 157,971
Fund Balance - June 30 11,694$ 11,694$
-68-
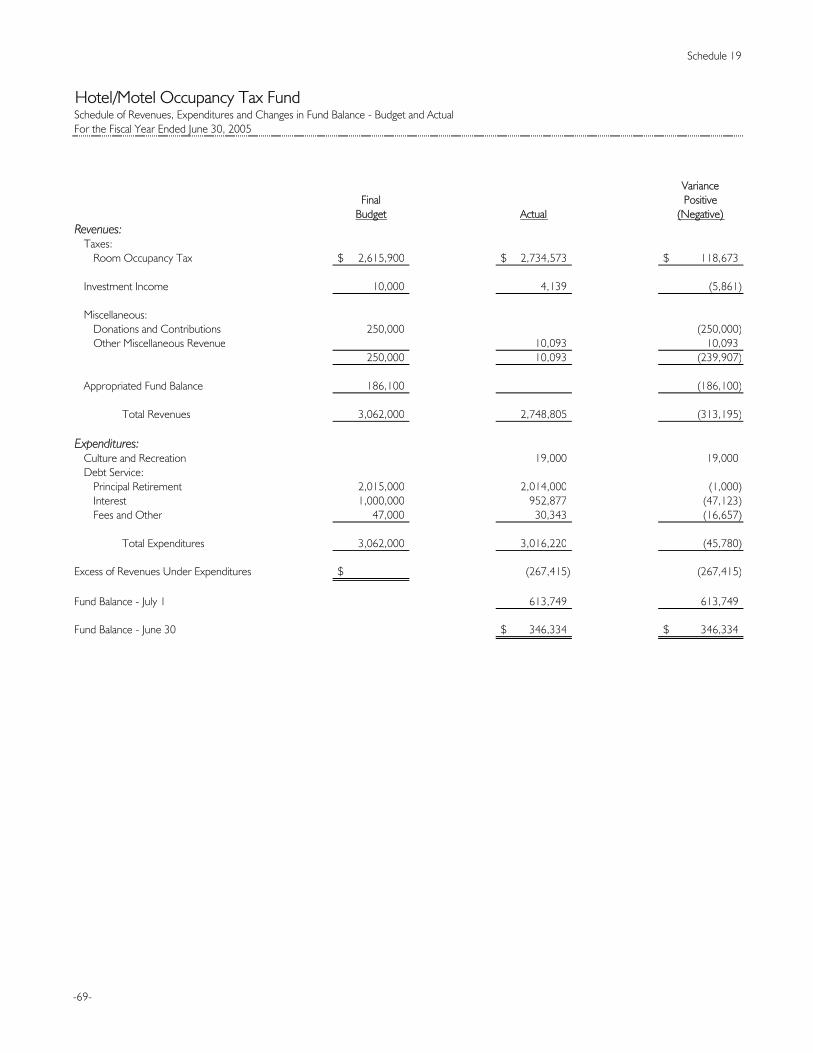
Schedule 19
Hotel/Motel Occupancy Tax FundSchedule of Revenues, Expenditures and Changes in Fund Balance - Budget and ActualFor the Fiscal Year Ended June 30, 2005
VarianceFinal Positive
Budget Actual (Negative)Revenues:
Taxes:Room Occupancy Tax 2,615,900$ 2,734,573$ 118,673$
Investment Income 10,000 4,139 (5,861)
Miscellaneous:Donations and Contributions 250,000 (250,000) Other Miscellaneous Revenue 10,093 10,093
250,000 10,093 (239,907)
Appropriated Fund Balance 186,100 (186,100)
Total Revenues 3,062,000 2,748,805 (313,195)
Expenditures:Culture and Recreation 19,000 19,000Debt Service:
Principal Retirement 2,015,000 2,014,000 (1,000)Interest 1,000,000 952,877 (47,123)Fees and Other 47,000 30,343 (16,657)
Total Expenditures 3,062,000 3,016,220 (45,780)
Excess of Revenues Under Expenditures $ (267,415) (267,415)
Fund Balance - July 1 613,749 613,749
Fund Balance - June 30 346,334$ 346,334$
-69-

Schedule 20
Special Tax Districts FundSchedule of Revenues, Expenditures and Changes in Fund Balance - Budget and ActualFor the Fiscal Year Ended June 30, 2005
VarianceFinal Positive
Budget Actual (Negative)Revenues:
Taxes: Ad Valorem Taxes 403,000$ 523,834$ 120,834$
Investment Income 16,527 16,527
Miscellaneous:Sales and Use Tax Refund 19,987 19,987
Appropriated Fund Balance 170,610 (170,610)
Total Revenues 573,610 560,348 (13,262)
Expenditures: Community Development:
Aycock Historic District 79,610 6,713 (72,897)College Hill Historic District 144,000 37,943 (106,057)Business Improvement District 350,000 175,000 (175,000)
Total Expenditures 573,610 219,656 (353,954)
Excess of Revenues Over Expenditures $ 340,692 340,692
Fund Balance - July 1 529,139 529,139
Fund Balance - June 30 869,831$ 869,831$
-70-

Schedule 21
Housing Partnership Revolving FundSchedule of Revenues, Expenditures and Changes in Fund Balance - Budget and ActualFor the Fiscal Year Ended June 30, 2005
VarianceFinal Positive
Budget Actual (Negative)Revenues:
Charges for Current Services:Mortgage Collections 350,000$ 471,643$ 121,643$ Rents 22,390 22,390Sale of Materials 8 8Sale of Real Estate 11,295 11,295Other Revenue 486,275 486,275
Total Charges for Current Services 350,000 991,611 641,611
Investment Income 50,000 114,085 64,085
Appropriated Fund Balance 515,349 (515,349)
Total Revenues 915,349 1,105,696 190,347
Expenditures: Housing:
Administration 1,355,128 1,220,988 (134,140)Housing Programs 1,342,553 1,049,839 (292,714)
Total Expenditures 2,697,681 2,270,827 (426,854)
Excess of Revenues Under Expenditures (1,782,332) (1,165,131) (617,201)
Other Financing Sources:Transfers In 1,782,332 1,782,332
Excess of Revenues and Other FinancingSources Over Expenditures $ 617,201 617,201
Fund Balance - July 1 1,577,979 1,577,979
Fund Balance - June 30 2,195,180$ 2,195,180$
-71-

Schedule 22Page 1 of 2
Community Development FundSchedule of Revenues, Expenditures and Changes in Fund Balance - Budget and ActualFrom Project Inception and For the Fiscal Year Ended June 30, 2005
ActualProject Prior Current Total
Authorization Years Year To DateRevenues:
Intergovernmental:Federal Grants 29,978,694$ 24,879,105$ 1,796,034$ 26,675,139$ Local Grants 85,637 85,637 85,637
Total Intergovernmental 30,064,331 24,964,742 1,796,034 26,760,776
Investment Income 1,058,316 1,080,388 109,941 1,190,329
Charges for Current Services:Program Income 209,239Rent 241,423 178,218 20,375 198,593Mortgage Collections 3,911,622 4,024,585 299,832 4,324,417Sale of Real Estate 163,048 182,832 59,398 242,230Other Revenue 32,611 34,627 16,600 51,227
Total Charges for Current Services 4,557,943 4,420,262 396,205 4,816,467
Total Revenues 35,680,590 30,465,392 2,302,180 32,767,572
Expenditures: Community Development:
Block Grant:Administration 2,796,949 2,268,711 401,680 2,670,391Community Planning 626,855 660,230 49,976 710,206Fair Housing 157,500 135,473 17,469 152,942Rental Rehabilitation 1,040,626 554,077 257,846 811,923Citywide Housing Repair 3,207,531 3,180,975 9,054 3,190,029Target Area Personnel 569,778 467,775 5,000 472,775Targeted Loan Pool Program 890,000 7,200 250,990 258,190MWBE Training Program 35,000 33,600 33,600Emergency Shelter Assistance 43,350 43,350 43,350Neighborhood Economic Development 160,000 160,000 160,000Gate City CDV'D Partners 130,000 130,000 130,000Greensboro Women's Club 62,000 62,000 62,000Asheboro 2,761,082 1,767,484 169,756 1,937,240Asheboro Resource Center 50,000 50,000 50,000Arlington Park 1,234,898 862,453 35,876 898,329Rosewood 966,313 733,428 12,780 746,208Section 108 Loan Principal Retirement 2,768,815 2,130,904 306,000 2,436,904Section 108 Loan Interest 153,110 178,423 331,533Section 108 Fees 300 300Eastside Park 1,836,464 1,601,379 216,028 1,817,407Best Street 328,597 328,594 6 328,600Gorrell Street 55,039 32,930 2,893 35,823Gideon's Army 12,500 12,500 12,500Willow Oaks 444,417 436,172 6,463 442,635Housing Coalition 72,500 42,500 30,000 72,500Women's Resource Center 25,000 25,000 25,000Greensboro Children's Museum 25,000 25,000 25,000Hope VI Revitalization 30,020 30,020 30,020Magnolia House Motel 110,601 78,241 15,596 93,837Project Deadbolt 4,195 4,194 4,194Project Homestead Construction Training 20,000 20,000 20,000Episcopal Servant Center 53,662 33,630 20,032 53,662Youth Focus 15,310 8,310 7,000 15,310Warnersville Recreation Center 4,314 4,313 4,313
-72-

Schedule 22Page 2 of 2
Community Development FundSchedule of Revenues, Expenditures and Changes in Fund Balance - Budget and ActualFrom Project Inception and For the Fiscal Year Ended June 30, 2005
ActualProject Prior Current Total
Authorization Years Year To DateExpenditures (Continued):
Lot Acquisition 232,846$ 232,845$ $ 232,845$ Homeowner Rehab 275,483 180,612 180,612Family and Children's Services 34,713 34,712 34,712Salvation Army 233,750 153,000 80,750 233,750Jericho House 62,000 62,000 62,000Southeast Economic Development 214,209 214,209 214,209Central Carolina Legal Service 28,502 28,502 28,502Compass International 12,500 12,500 12,500S/F Homeownership Opportunity 444,667 444,667 444,667Habitat - Holt's Chapel 65 65 65Habitat for Humanity 15,000M/F Rental Housing Technical Assistance 9,521 9,521 9,521Homeless Prevention Services & Shelter 148,720 148,720 148,720Christian Counseling/Wellness 152,500 125,000 125,000East Market Street Development Corporation 70,000 70,000 70,000Interfaith Hospitality Network 15,000 15,000 15,000Malachi House 56,000 56,000 56,000Mary's House 26,000 26,000 26,000Room at the Inn of the Triad 125,000 125,000 125,000Prince of Peace Shelter 55,000 55,000 55,000Guilford Native American Association 25,000 25,000 25,000Elderly Housing 21,760 21,760 21,760Contingency 60,218Public Service Funding 63,750 63,750 63,750Greensboro Urban Ministry 145,600 119,600 26,000 145,600Self Help Credit Union 21,609 21,609 21,609Advocacy - Persons W/Disability 3,500 3,499 3,499Section 108 Project 1,640,000 1,639,998 1,639,998
Other Community Development:Kids, Inc. Day Care 162,120 98,425 39,409 137,834Camel Street Apartments 04 178,000 24,634 153,366 178,000Home Grants 92 987,000 987,000 987,000Home Grants 93 651,870 651,870 651,870Home Grants 94 756,955 756,954 1 756,955Home Grants 95 2,013,117 2,000,267 2,000,267Home Grants 96 1,814,611 1,814,610 1 1,814,611Home Grants 97 1,470,598 1,470,598 1,470,598Home Grants 98 1,620,475 1,554,225 9,547 1,563,772HOPWA 1,228,000 1,112,587 47,457 1,160,044Federal Emergency Shelter Grant 82,000 82,000 82,000
Total Expenditures 35,695,975 30,344,680 2,530,311 32,874,991
Excess of Revenues Over (Under) Expenditures (15,385) 120,712 (228,131) (107,419)
Other Financing Sources:Transfers In 15,385 15,385 15,385
Excess of Revenues and Other FinancingSources Over (Under) Expenditures $ 136,097 (228,131) (92,034)
Fund Balance - July 1 136,097
Fund Balance - June 30 136,097$ (92,034)$ (92,034)$
-73-

Schedule 23
HOME Program FundSchedule of Revenues, Expenditures and Changes in Fund Balance - Budget and ActualFrom Project Inception and For the Fiscal Year Ended June 30, 2005
ActualProject Prior Current Total
Authorization Years Year To DateRevenues:
Intergovernmental:Federal Grants:
Greensboro Home Program 7,430,841$ 4,550,497$ 775,227$ 5,325,724$ Greensboro Affordable Home Loans - ADDI 169,444Guilford County Home Program 798,999 9,600 134,946 144,546High Point Home Program 2,440,524 871,026 829,534 1,700,560Burlington Home Program 1,200,253 894,701 349,568 1,244,269Alamance County Home Program 553,982 344,575 146,741 491,316
Local Grants 38,595Total Intergovernmental 12,632,638 6,670,399 2,236,016 8,906,415
Investment Income 46,514 46,643 18,343 64,986
Miscellaneous:Mortgage Collections 195,917 193,383 43,413 236,796Program Income - Prior Years 1,100 1,100 1,100Other 10,839 10,840 2,400 13,240
Total Miscellaneous 207,856 204,223 46,913 251,136
Total Revenues 12,887,008 6,921,265 2,301,272 9,222,537
Expenditures: Greensboro Home Program 7,190,770 4,087,223 885,421 4,972,644Greensboro Affordable Home Loans - ADDI 21,450 21,000 21,000Guilford County Home Program 821,094 178,953 241,878 420,831High Point Home Program 2,801,194 1,152,123 773,699 1,925,822Burlington Home Program 1,394,733 961,663 330,592 1,292,255Alamance County Home Program 642,382 339,755 168,528 508,283
Total Expenditures 12,871,623 6,719,717 2,421,118 9,140,835
Excess of Revenues Over (Under) Expenditures 15,385 201,548 (119,846) 81,702
Other Financing Uses:Transfers Out (15,385) (15,385) (15,385)
Excess of Revenues and Other FinancingSources Over (Under) Expendituresand Other Financing Uses $ 186,163 (119,846) 66,317
Fund Balance - July 1 186,163
Fund Balance - June 30 186,163$ 66,317$ 66,317$
-74-

Schedule 24
Hope VI Program FundSchedule of Revenues, Expenditures and Changes in Fund Balance - Budget and ActualFrom Project Inception and For the Fiscal Year Ended June 30, 2005
ActualProject Prior Current Total
Authorization Years Year To DateRevenues:
Investment Income 67,757$ 46,211$ 23,147$ 69,358$
Miscellaneous:Mortgage Collections 139,391 8,435 130,956 139,391Other Revenue 3,370 (3,295) 75
Total Miscellaneous 139,391 11,805 127,661 139,466
Total Revenues 207,148 58,016 150,808 208,824
Expenditures: Section 108 Loans 7,461,000 4,696,117 475,361 5,171,478Willow Oaks 207,148 59,046 11,410 70,456
Total Expenditures 7,668,148 4,755,163 486,771 5,241,934
Excess of Revenues Under Expenditures (7,461,000) (4,697,147) (335,963) (5,033,110)
Other Financing Sources:Debt Issuances:
Federal Loan Program 7,461,000 4,510,000 477,000 4,987,000
Excess of Revenues and Other FinancingSources Over (Under) Expenditures $ (187,147) 141,037 (46,110)
Fund Balance - July 1 (187,147)
Fund Balance - June 30 (187,147)$ (46,110)$ (46,110)$
-75-

Schedule 25
Workforce Investment Act FundSchedule of Revenues, Expenditures and Changes in Fund Balance - Budget and ActualFrom Project Inception and For the Fiscal Year Ended June 30, 2005
ActualProject Prior Current Total
Authorization Years Year To DateRevenues:
Intergovernmental:Federal Grants:
WIA Adult 3,928,673$ 2,388,689$ 890,591$ 3,279,280$ WIA Dislocated Worker 4,296,901 2,021,781 826,389 2,848,170WIA Youth 3,372,237 1,835,899 790,762 2,626,661WIA 10% Statewide Activities 792,253 379,698 211,657 591,355H-1B Technical Skills Training 2,721,000 1,194,024 1,194,024
Total Federal Grants 15,111,064 7,820,091 2,719,399 10,539,490
State Grants:NCETGP Grant 208,123 208,123 208,123
Total Intergovernmental 15,319,187 8,028,214 2,719,399 10,747,613
Investment Income 3,606 (4,747) (1,141)
Miscellaneous:Sale of Materials 1,809 215 2,024Sale of Equipment 93 93Other 2,272 2,272
Total Miscellaneous 4,174 215 4,389
Total Revenues 15,319,187 8,035,994 2,714,867 10,750,861
Expenditures:WIA Adult 3,928,673 2,424,786 868,644 3,293,430WIA Dislocated Worker 4,296,901 1,999,427 912,965 2,912,392WIA Youth 3,372,237 1,886,110 812,254 2,698,364WIA 10% Statewide Activities 792,253 323,524 254,746 578,270NCETGP Grant 208,123 208,123 208,123H-1B Technical Skills Training 2,721,000 1,194,024 1,194,024
Total Expenditures 15,319,187 8,035,994 2,848,609 10,884,603
Excess of Revenues Under Expenditures $ (133,742) (133,742)
Fund Balance - July 1
Fund Balance - June 30 $ (133,742)$ (133,742)$
-76-

Schedule 26
Job Training Consortium FundSchedule of Revenues and Expenditures - Budget and ActualFrom Project Inception and For the Fiscal Year Ended June 30, 2005
ActualProject Prior Current Total
Authorization Years Year To DateRevenues:
Intergovernmental:Federal Grants:
Welfare to Work 98-3751 964,293$ 964,293$ $ 964,293$ Welfare to Work PY 99 449,396 449,395 449,395
Total Intergovernmental 1,413,689 1,413,688 1,413,688
Miscellaneous:Other Revenue 3,623 62 3,685
Total Revenues 1,413,689 1,417,311 62 1,417,373
Expenditures:Economic Opportunity:
Federal Grants:Welfare to Work 98-3751 964,293 964,292 964,292Welfare to Work 99-3751 449,396 449,396 449,396
Total Expenditures 1,413,689 1,413,688 1,413,688
Excess of Revenues Over Expenditures $ 3,623 62 3,685
Fund Balance - July 1 3,623
Fund Balance - June 30 3,623$ 3,685$ 3,685$
-77-

Schedule 27
South Elm Street Redevelopment FundSchedule of Revenues and Expenditures - Budget and ActualFrom Project Inception and For the Fiscal Year Ended June 30, 2005
ActualProject Prior Current Total
Authorization Years Year To DateRevenues:
Intergovernmental:South Elm Street Section 108 3,000,000$ $ $ $ EPA Brownsfield Assessment 200,000 13,722 12,174 25,896 South Elm Street BEDI - 2005 2,000,000
Total Intergovernmental Revenue 5,200,000 13,722 12,174 25,896
Investment Income 989 989
Total Revenues 5,200,000 13,722 13,163 26,885
Expenditures:South Elm Street Section 108 3,000,000 122,645 122,645EPA Brownsfield Assessment 200,000 13,722 12,174 25,896South Elm Street BEDI - 2005 2,000,000 9,412 9,412
Total Expenditures 5,200,000 13,722 144,231 157,953
Excess of Revenues Under Expenditures $ (131,068) (131,068)
Fund Balance - July 1
Fund Balance - June 30 $ (131,068)$ (131,068)$
-78-

Schedule 28Page 1 of 2
State and Federal Grants FundSchedule of Revenues, Expenditures and Changes in Fund Balance - Budget and ActualFrom Project Inception and For the Fiscal Year Ended June 30, 2005
ActualProject Prior Current Total
Authorization Years Year To DateRevenues:
Intergovernmental:Federal Grants 14,017,528$ 4,693,911$ 2,479,053$ 7,172,964$ State Grants 14,481,611 3,071,959 3,006,915 6,078,874Local Grants 942,403 753,042 106,157 859,199
Total Intergovernmental 29,441,542 8,518,912 5,592,125 14,111,037
Investment Income 11,025 5,387 7,216 12,603
Miscellaneous:Mortgage Collections 4,100 4,100In-Kind and Matching Revenues 1,654,428 1,224,894 224,465 1,449,359
Total Miscellaneous 1,654,428 1,224,894 228,565 1,453,459
Total Revenues 31,106,995 9,749,193 5,827,906 15,577,099
Expenditures:General Government:
Scattered Site Rehab 2001-02 396,500 378,843 6,522 385,365GIS Data Clearinghouse 2,120 629 629Public Access Channel 607,100 443,908 88,177 532,085
Total General Government 1,005,720 823,380 94,699 918,079
Public Safety:Local Law Enforcement Block Grant 2003-04 268,258 52,659 15,975 68,634Local Law Enforcement Block Grant 2004/05 121,381 106,587 106,587Forfeiture Funds - 2001-02 100,000Forfeiture Funds - 2002-03 430,000 197,160 64,177 261,337Forfeiture Funds - 2003-04 527,500 70,017 422,239 492,256Forfeiture Funds - 2004-05 271,000 43,340 43,340Weed and Seed Operation 25,000Homeland Security Grant - 2004-05 308,000Governor's Highway Safety Regional Coordinator 10,000Violent Crime Task Force 227,027 209,242 209,242Violent Crime Task Force - 2001-02 130,000 31,278 18,873 50,151Financial Crimes Task Force - 2003-04 5,500 1,421 4,069 5,490Financial Crimes Task Force - 2004-05 4,000 4,000 4,000NC Joint Terrorism Task Force - 2004 11,705 7,458 3,392 10,850NC Joint Terrorism Task Force - 2005 14,670 9,014 9,014PNRC Grant - 2004 12,000 11,423 577 12,000COPS More - 2001 796,500 500,899 179,745 680,644Bulletproof Vest Partnership - 2004 14,916 14,916 14,916USDA Investigation Participation - 2005 15,000Traffic Enforcement Positions - 2004-07 1,042,680 313,501 313,501Ticket Today License Delay -2005 5,000 4,408 4,408Conflict Resolution Workshops at Dudley 7,000Fire Capital Equipment 280,000 278,044 278,044Metro Medical Response System - 2003 880,557 234,169 46,310 280,479Metro Medical Response System - 2004 400,000 446 446Structural Collapse Training 120,300 117,212 117,212Regional Hazmat Response Team - 2003-04 52,000 32,865 11,334 44,199Regional Hazmat Response Team - 2004-05 57,000 41,998 41,998Assistance to Firefighters Grant - 2002-03 475,200 474,832 474,832Assistance to Firefighters Grant - 2003-04 32,092 32,092 32,092Local Response Grant 90,900 85,743 4,364 90,107Hazmat Equipment Grant - 2003-04 21,739 451 16,276 16,727
Total Public Safety 6,756,925 2,304,873 1,357,633 3,662,506
Transportation: Transportation Planning - 2002-03 606,363 422,385 422,385 Transportation Planning - 2003-04 801,548 486,289 486,289Transportation Planning - 2004-05 703,481 313,508 313,508NC Association of Metropolitan Planning 4,000 2,680 2,680PART Regional Travel Model Services 22,000 20,905 20,905NCDOT US 29 Corridor 46,156 46,156 46,156Eckerson US 29 Environmental Study 750,000 26,457 63,772 90,229Section 5303 Metro Planning - 2002-03 51,350 51,350 51,350Section 5303 Metro Planning - 2003-04 69,210 30,320 38,890 69,210Section 5303 Metro Planning - 2004-05 73,120 73,120 73,120McKnight Mill Road Sidewalk 64,000
-79-

Schedule 28Page 2 of 2
State and Federal Grants FundSchedule of Revenues, Expenditures and Changes in Fund Balance - Budget and ActualFrom Project Inception and For the Fiscal Year Ended June 30, 2005
ActualProject Prior Current Total
Authorization Years Year To DateExpenditures: (Continued)
Transportation (continued):Holden/Market Street Intersection Improvement 491,158$ $ 491,158$ 491,158$ Bentley Road Improvement 92,000 92,000 92,000Hornaday Road Improvement 3,750,000 107,035 107,035NC 68/Triad Center Drive 263,368 242,106 (31,935) 210,171NC SE Trail Connector - 2002-03 66,000Lee Street Enhancement Grant - 2003-04 200,000 188,542 188,542Oka T. Hester Park Dam Construction 5,000,000 1,284,157 1,889,600 3,173,757
Total Transportation 13,053,754 2,610,125 3,228,370 5,838,495
Engineering and Inspections:16th Street Bridge Replacement 2,476,850 210,620 58,277 268,897Ballinger Road Bridge Replacement 625,000 66,026 66,026Clean Water Management 1,020,000 456,711 535,276 991,987Electronic Waste Recycling 2004-05 14,400 2,752 2,752Flood Mitigation Grant - 2001-02 20,000North Buffalo Water Quality Investigation 87,896 64,802 18,255 83,057Piedmont Triad Water Quality Yr 1 58,137 58,138 (1) 58,137Piedmont Triad Water Quality Yr 2 48,488 19,179 19,179Bioretention Areas Grant 150,000 28,454 112,575 141,029
Total Engineering and Inspections 4,500,771 884,751 746,313 1,631,064
Culture and Recreation:Glenwood Resource Center 171,100 96,917 33,332 130,249LSTA Digitization Starter - 2004-05 7,875 7,650 7,650TYGR Paws Project - 2003-04 5,500 61 4,806 4,867TYGR Paws Project - 2004-05 6,000 77 77Tannenbaum-Sternberger - 2001-02 30,000 16,635 10,895 27,530Environmental Design Crime Prevention 20,000 18,016 18,016Greening Greensboro Initiative 30,000 9,891 9,891Youth Football Program - 2003-04 2,000 1,054 946 2,000Musep Concert Series Program - 2003-04 20,000 1,050 18,950 20,000Musep Concert Series Program - 2004-05 21,500NCDENR Adopt a Trail - 2004-05 4,000 3,410 3,410Bicentennial Greenway Trail Program 63,950Youth Council Artistry Award 1,550 1,550 1,550GACVB Carolyn Allen Park Grant 26,000 26,000 26,000Senior Center Project - 2004-05 7,883 7,883 7,883Senior Games Project - 2004-05 2,222 2,222 2,222Youth First Teen Summit - 2004-05 3,500 3,500 3,500Youth First Teen Summit - 2005-08 3,500
Total Culture and Recreation 426,580 115,717 149,128 264,845
Community Development and Housing:Fair Housing Assistance - 2000-04 491,818 331,644 67,172 398,816NCHFA/Duke Power Energy Grant - 2001-02 150,000 128,271 14,349 142,620NCHFA/Duke Power Energy Grant - 2002-03 150,000 39,062 39,062Lead Paint Grant - 2002-05 3,000,000 2,159,580 819,448 2,979,028Lead Paint Grant - 2005-08 3,000,000 308,961 308,961Emergency Shelter Grant 86,218 75,533 75,533
Total Community Development and Housing 6,878,036 2,619,495 1,324,525 3,944,020
Total Expenditures 32,621,786 9,358,341 6,900,668 16,259,009
Excess of Revenues Over (Under) Expenditures (1,514,791) 390,852 (1,072,762) (681,910)
Other Financing Sources (Uses):Transfers In 1,652,973 1,245,529 219,849 1,465,378Transfers Out (138,182) (138,182) (138,182)
Total Other Financing Sources (Uses) 1,514,791 1,107,347 219,849 1,327,196
Excess of Revenues and Other FinancingSources Over (Under) Expenditures andOther Financing Uses $ 1,498,199 (852,913) 645,286
Fund Balance - July 1 1,498,199
Fund Balance - June 30 1,498,199$ 645,286$ 645,286$ -80-
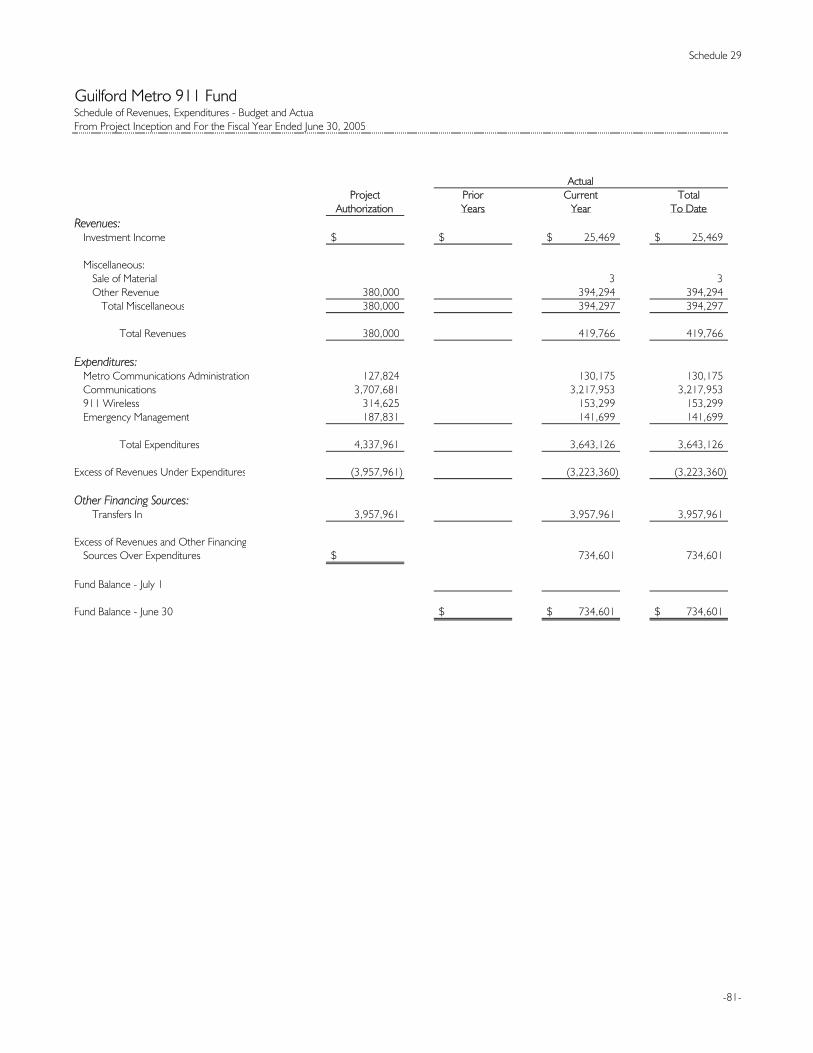
Schedule 29
Guilford Metro 911 FundSchedule of Revenues, Expenditures - Budget and ActualFrom Project Inception and For the Fiscal Year Ended June 30, 2005
ActualProject Prior Current Total
Authorization Years Year To DateRevenues:
Investment Income $ $ 25,469$ 25,469$
Miscellaneous:Sale of Material 3 3Other Revenue 380,000 394,294 394,294
Total Miscellaneous 380,000 394,297 394,297
Total Revenues 380,000 419,766 419,766
Expenditures: Metro Communications Administration 127,824 130,175 130,175Communications 3,707,681 3,217,953 3,217,953911 Wireless 314,625 153,299 153,299Emergency Management 187,831 141,699 141,699
Total Expenditures 4,337,961 3,643,126 3,643,126
Excess of Revenues Under Expenditures (3,957,961) (3,223,360) (3,223,360)
Other Financing Sources:Transfers In 3,957,961 3,957,961 3,957,961
Excess of Revenues and Other FinancingSources Over Expenditures $ 734,601 734,601
Fund Balance - July 1
Fund Balance - June 30 $ 734,601$ 734,601$
-81-

-82-
Debt Service Fund
This fund is used to account for the retirement of ad valorem tax-supported General Obligation Bonds. The retirement of all other General Obligation Bonds is accounted for in the Water Resources Enterprise Fund and the Technical Services Fund.

Schedule 30
Debt Service FundSchedule of Revenues, Expenditures and Changes in Fund Balance - Budget and ActualFor the Fiscal Year Ended June 30, 2005
VarianceFinal Positive
Budget Actual (Negative)Revenues: Intergovernmental: Local Reimbursements: Payment In Lieu of Taxes 120,000$ 107,291$ (12,709)$
Investment Income 2,419,761 2,810,798 391,037
Miscellaneous: Sales and Use Tax Refund 148,972 148,972 Other Revenue 100,000 187,526 87,526 Total Miscellaneous 100,000 336,498 236,498
Appropriated Fund Balance 3,256,800 (3,256,800)
Total Revenues 5,896,561 3,254,587 (2,641,974)
Expenditures: Debt Service: Principal Retirement 12,758,771 12,758,770 (1) Interest 6,870,290 5,605,100 (1,265,190) Fees and Other 883,527 360,224 (523,303) Total Expenditures 20,512,588 18,724,094 (1,788,494)
Excess of Revenues Under Expenditures (14,616,027) (15,469,507) (853,480)
Other Financing Sources (Uses): Debt Issuances: Refunding Bonds Issued 30,607,880 30,572,711 (35,169) Premium on Debt 2,641,815 2,641,815 Transfers In 14,425,000 14,426,541 1,541 Payment to Escrow Agent for Refunded Debt (33,058,668) (33,058,668) Total Other Financing Sources (Uses) 14,616,027 14,582,399 (33,628)
Excess of Revenues and Other Financing Sources Under Expenditures and Other Financing Uses $ (887,108) (887,108)
Fund Balance - July 1 13,917,614 13,917,614
Fund Balance - June 30 13,030,506$ 13,030,506$
-83-

-84-
Capital Projects Fund
Capital Projects Funds are used to account for all major capital improvements primarily financed with the proceeds of bond sales. The funds presented in this section represent those which account for general improvements. Improvements associated with the proprietary operations are reported in the Enterprise Funds and Internal Service Funds sections.
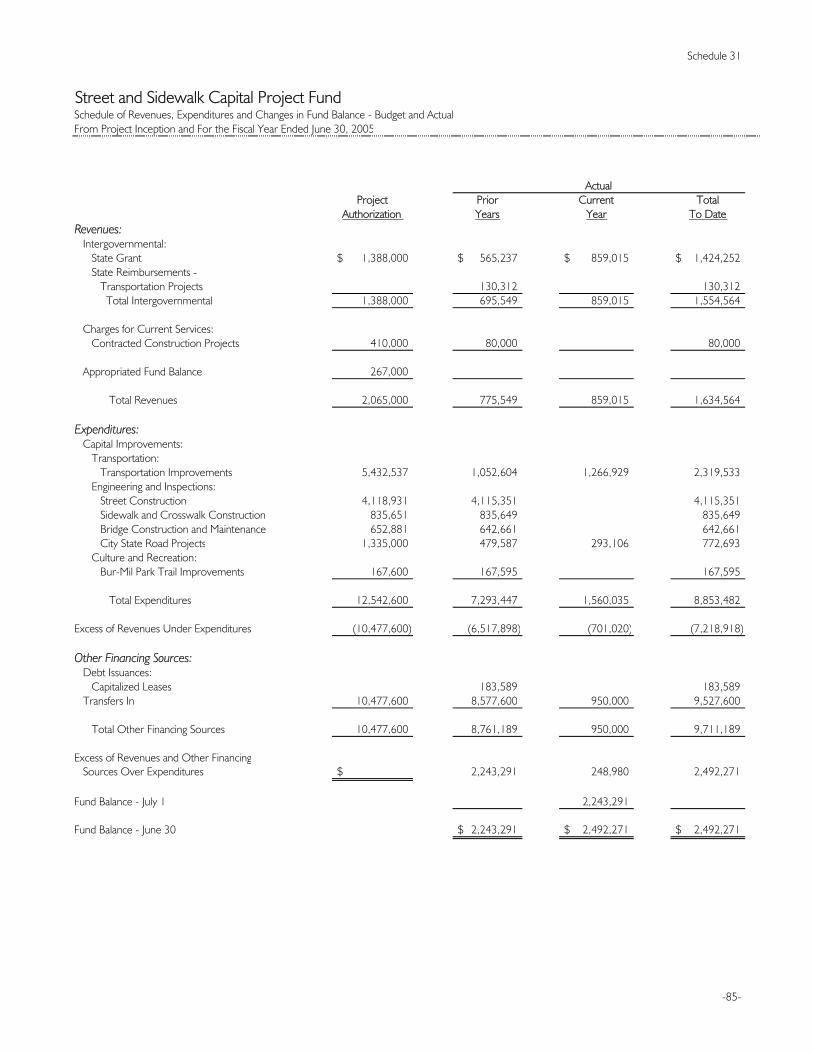
Schedule 31
Street and Sidewalk Capital Project FundSchedule of Revenues, Expenditures and Changes in Fund Balance - Budget and ActualFrom Project Inception and For the Fiscal Year Ended June 30, 2005
ActualProject Prior Current Total
Authorization Years Year To DateRevenues: Intergovernmental: State Grant 1,388,000$ 565,237$ 859,015$ 1,424,252$ State Reimbursements - Transportation Projects 130,312 130,312 Total Intergovernmental 1,388,000 695,549 859,015 1,554,564
Charges for Current Services: Contracted Construction Projects 410,000 80,000 80,000
Appropriated Fund Balance 267,000
Total Revenues 2,065,000 775,549 859,015 1,634,564
Expenditures: Capital Improvements: Transportation: Transportation Improvements 5,432,537 1,052,604 1,266,929 2,319,533 Engineering and Inspections: Street Construction 4,118,931 4,115,351 4,115,351 Sidewalk and Crosswalk Construction 835,651 835,649 835,649 Bridge Construction and Maintenance 652,881 642,661 642,661 City State Road Projects 1,335,000 479,587 293,106 772,693 Culture and Recreation: Bur-Mil Park Trail Improvements 167,600 167,595 167,595
Total Expenditures 12,542,600 7,293,447 1,560,035 8,853,482
Excess of Revenues Under Expenditures (10,477,600) (6,517,898) (701,020) (7,218,918)
Other Financing Sources: Debt Issuances: Capitalized Leases 183,589 183,589 Transfers In 10,477,600 8,577,600 950,000 9,527,600
Total Other Financing Sources 10,477,600 8,761,189 950,000 9,711,189
Excess of Revenues and Other Financing Sources Over Expenditures $ 2,243,291 248,980 2,492,271
Fund Balance - July 1 2,243,291
Fund Balance - June 30 2,243,291$ 2,492,271$ 2,492,271$
-85-
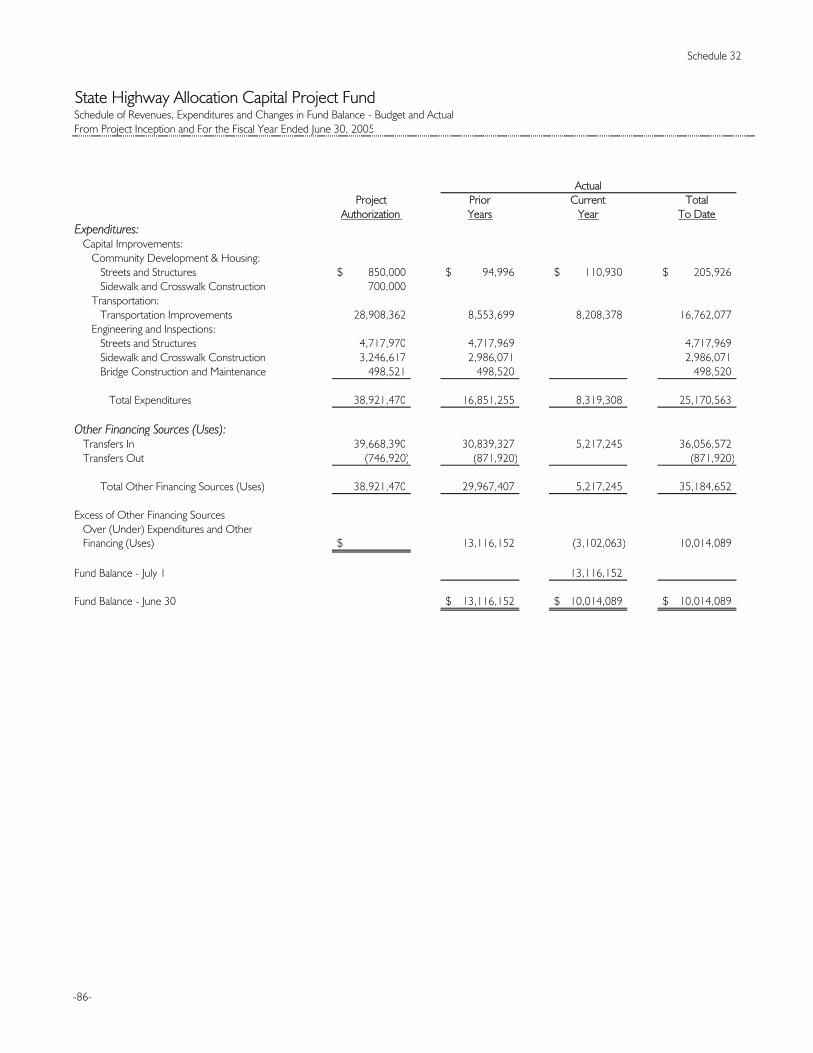
Schedule 32
State Highway Allocation Capital Project FundSchedule of Revenues, Expenditures and Changes in Fund Balance - Budget and ActualFrom Project Inception and For the Fiscal Year Ended June 30, 2005
ActualProject Prior Current Total
Authorization Years Year To DateExpenditures: Capital Improvements: Community Development & Housing: Streets and Structures 850,000$ 94,996$ 110,930$ 205,926$ Sidewalk and Crosswalk Construction 700,000 Transportation: Transportation Improvements 28,908,362 8,553,699 8,208,378 16,762,077 Engineering and Inspections: Streets and Structures 4,717,970 4,717,969 4,717,969 Sidewalk and Crosswalk Construction 3,246,617 2,986,071 2,986,071 Bridge Construction and Maintenance 498,521 498,520 498,520
Total Expenditures 38,921,470 16,851,255 8,319,308 25,170,563
Other Financing Sources (Uses): Transfers In 39,668,390 30,839,327 5,217,245 36,056,572 Transfers Out (746,920) (871,920) (871,920)
Total Other Financing Sources (Uses) 38,921,470 29,967,407 5,217,245 35,184,652
Excess of Other Financing Sources Over (Under) Expenditures and Other Financing (Uses) $ 13,116,152 (3,102,063) 10,014,089
Fund Balance - July 1 13,116,152
Fund Balance - June 30 13,116,152$ 10,014,089$ 10,014,089$
-86-

Schedule 33
General Capital Improvements FundSchedule of Revenues, Expenditures and Changes in Fund Balance - Budget and ActualFrom Project Inception and For the Fiscal Year Ended June 30, 2005
ActualProject Prior Current Total
Authorization Years Year To DateRevenues:Intergovernmental: State Grant 250,000$ $ $ $ Miscellaneous: Rent 25,000 25,000 Sale of Real Estate 360,000 4,600 360,000 364,600 Donations and Private Contributions 380,977 380,977 380,977
Total Revenues 990,977 410,577 360,000 770,577
Expenditures: Capital Improvements: General Government 757,628 737,754 300 738,054 Public Safety 2,007,051 1,582,051 155,212 1,737,263 Culture and Recreation 7,514,843 5,660,691 381,988 6,042,679 Total Expenditures 10,279,522 7,980,496 537,500 8,517,996
Excess of Revenues Under Expenditures (9,288,545) (7,569,919) (177,500) (7,747,419)
Other Financing Sources: Transfers In 9,288,545 9,023,153 200,000 9,223,153
Excess of Revenues and Other Financing Sources Over Expenditures $ 1,453,234 22,500 1,475,734
Fund Balance - July 1 1,453,234
Fund Balance - June 30 1,453,234$ 1,475,734$ 1,475,734$
-87-

Schedule 34
Public Improvement Bond Fund - Series 1990, 1992, 1994 and 1998Schedule of Revenues, Expenditures and Changes in Fund Balance - Budget and ActualFrom Project Inception and For the Fiscal Year Ended June 30, 2005
ActualProject Prior Current Total
Authorization Years Year To DateRevenues: Intergovernmental: State Grant 562,445$ 562,442$ $ 562,442$ Miscellaneous: Donations and Private Contributions 214,025 388,634 388,634 Construction Project Development 965,029 1,103,948 1,103,948 Other Revenue 3,162 3,162
Total Revenues 1,741,499 2,058,186 2,058,186
Expenditures: Capital Improvements: General Government: Public Buildings 2,131,350 2,128,071 2,128,071 Public Safety: Opticom System 204,310 204,308 204,308 Transportation: Transportation Improvements 1,879,734 1,879,719 1,879,719 Engineering and Inspections: Street Construction - 1985 1,995,371 1,984,294 1,984,294 Street Construction - 1988 71,116,329 69,864,382 6,522 69,870,904 Center City Improvements 2,972,075 2,927,687 2,927,687 Culture and Recreation: Recreation Centers 5,822,000 5,764,574 5,764,574 Community Development and Housing: Housing Program 4,000,000 4,000,009 4,000,009 Neighborhood Renewal 2,400,000 2,399,991 2,399,991
Total Expenditures 92,521,169 91,153,035 6,522 91,159,557
Excess of Revenues Under Expenditures (90,779,670) (89,094,849) (6,522) (89,101,371)
Other Financing Sources (Uses): Debt Issuances: General Obligation Bonds Issued 90,750,000 90,750,000 90,750,000 Transfers In 603,350 603,350 603,350 Transfers Out (573,680) (547,233) (547,233) Total Other Financing Sources (Uses) 90,779,670 90,806,117 90,806,117
Excess of Revenues and Other Financing Sources Over (Under) Expenditures and and Other Financing (Uses) $ 1,711,268 (6,522) 1,704,746
Fund Balance - July 1 1,711,268
Fund Balance - June 30 1,711,268$ 1,704,746$ 1,704,746$
-88- -
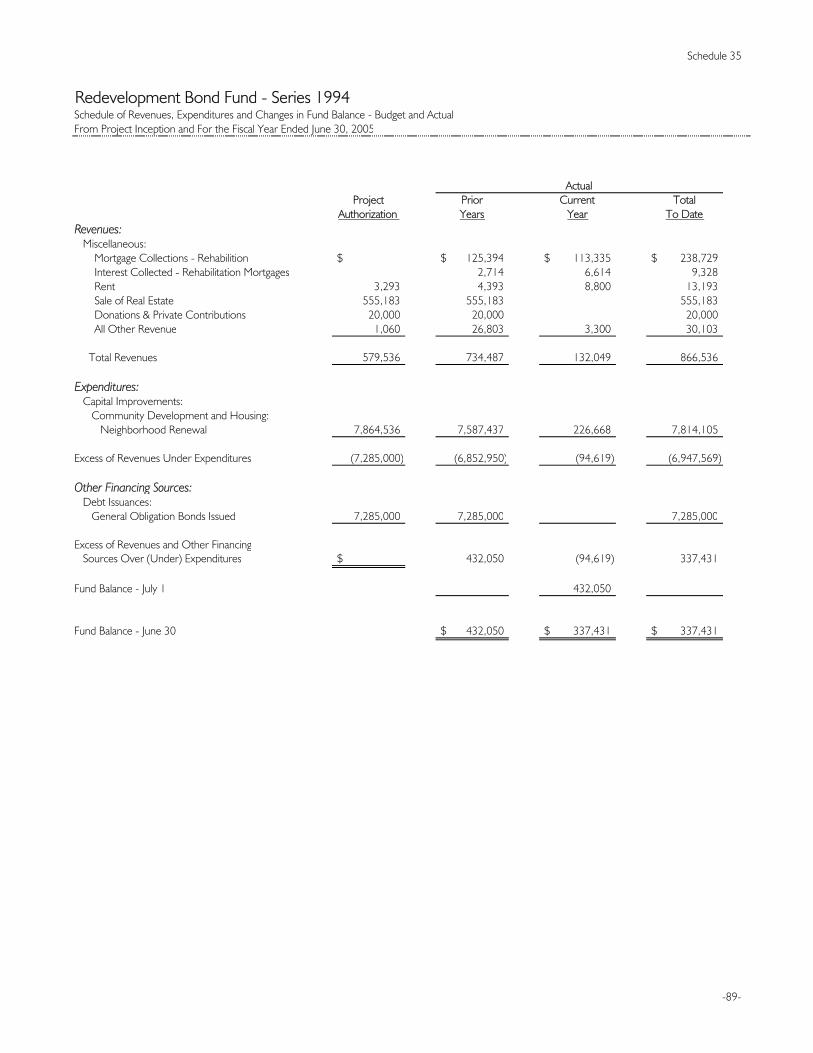
Schedule 35
Redevelopment Bond Fund - Series 1994Schedule of Revenues, Expenditures and Changes in Fund Balance - Budget and ActualFrom Project Inception and For the Fiscal Year Ended June 30, 2005
ActualProject Prior Current Total
Authorization Years Year To DateRevenues: Miscellaneous: Mortgage Collections - Rehabilition $ 125,394$ 113,335$ 238,729$ Interest Collected - Rehabilitation Mortgages 2,714 6,614 9,328 Rent 3,293 4,393 8,800 13,193 Sale of Real Estate 555,183 555,183 555,183 Donations & Private Contributions 20,000 20,000 20,000 All Other Revenue 1,060 26,803 3,300 30,103
Total Revenues 579,536 734,487 132,049 866,536
Expenditures: Capital Improvements: Community Development and Housing: Neighborhood Renewal 7,864,536 7,587,437 226,668 7,814,105
Excess of Revenues Under Expenditures (7,285,000) (6,852,950) (94,619) (6,947,569)
Other Financing Sources: Debt Issuances: General Obligation Bonds Issued 7,285,000 7,285,000 7,285,000
Excess of Revenues and Other Financing Sources Over (Under) Expenditures $ 432,050 (94,619) 337,431
Fund Balance - July 1 432,050
Fund Balance - June 30 432,050$ 337,431$ 337,431$
-89-

Schedule 36
Public Improvement Bond Fund - Series 1998ASchedule of Revenues, Expenditures and Changes in Fund Balance - Budget and ActualFrom Project Inception and For the Fiscal Year Ended June 30, 2005
ActualProject Prior Current Total
Authorization Years Year To DateExpenditures: Capital Improvements: Public Safety: Personnel Training Facilities 14,500,000$ 13,608,731$ 249,134$ 13,857,865$ Fire Station 1,500,000 1,497,690 2,114 1,499,804 Police Department 411,035 410,982 (410,982) Technology and Facilities: Municipal Buildings 2,000,000 2,630,025 (824,026) 1,805,999 Medford Center Improvements 4,374,965 146,201 2,059,937 2,206,138
Total Expenditures 22,786,000 18,293,629 1,076,177 19,369,806
Other Financing Sources (Uses): Debt Issuances: General Obligation Bonds Issued 22,000,000 22,000,000 22,000,000 Transfers In 786,000 786,000 786,000 Transfers Out (1,541) (1,541)
Total Other Financing Sources (Uses) 22,786,000 22,000,000 784,459 22,784,459
Excess of Other Financing Sources Over (Under) Expenditures $ 3,706,371 (291,718) 3,414,653
Fund Balance - July 1 3,706,371
Fund Balance - June 30 3,706,371$ 3,414,653$ 3,414,653$
-90-

Schedule 37
Public Improvement Bond Fund - Series 1998BSchedule of Revenues, Expenditures and Changes in Fund Balance - Budget and ActualFrom Project Inception and For the Fiscal Year Ended June 30, 2005
ActualProject Prior Current Total
Authorization Years Year To DateExpenditures: Capital Improvements: Community Development and Housing: Single Family Housing Programs 2,156,966$ 2,149,649$ 4,760$ 2,154,409$ Greensboro Housing Authority Projects 1,500,000 1,500,000 1,500,000
Total Expenditures 3,656,966 3,649,649 4,760 3,654,409
Other Financing Sources (Uses): Debt Issuances: General Obligation Bonds Issued 3,700,000 3,700,000 3,700,000 Transfers Out (43,034) (43,033) (43,033)
Total Other Financing Sources (Uses) 3,656,966 3,656,967 3,656,967
Excess of Other Financing Sources Over (Under) Expenditures and Other Financing (Uses) $ 7,318 (4,760) 2,558
Fund Balance - July 1 7,318
Fund Balance - June 30 7,318$ 2,558$ 2,558$
-91-

Schedule 38
Housing/Redevelopment Bond Fund - Series 1998Schedule of Revenues, Expenditures and Changes in Fund Balance - Budget and ActualFrom Project Inception and For the Fiscal Year Ended June 30, 2005
ActualProject Prior Current Total
Authorization Years Year To DateRevenues: Miscellaneous: Mortgage Collections - Rehabilitation $ $ 101,500$ 101,500$ Interest Collected - Rehabilitation Mortgages 754 754
Total Revenues 102,254 102,254
Expenditures: Capital Improvements: Community Development and Housing: Single Family Housing Program 3,025,000 2,891,640 76,782 2,968,422 Multi-family Housing Program 2,275,000 2,283,983 200,789 2,484,772 Neighborhood Renewal 1,000,000 785,377 32,972 818,349
Total Expenditures 6,300,000 5,961,000 310,543 6,271,543
Excess of Revenues Under Expenditures (6,300,000) (5,961,000) (208,289) (6,169,289)
Other Financing Sources: Debt Issuances: General Obligation Bonds Issued 6,300,000 6,300,000 6,300,000
Excess of Other Financing Sources Over (Under) Expenditures $ 339,000 (208,289) 130,711
Fund Balance - July 1 339,000
Fund Balance - June 30 339,000$ 130,711$ 130,711$
-92-

Schedule 39
Street Improvement Bond Fund - Series 2003Schedule of Revenues, Expenditures and Changes in Fund Balance - Budget and ActualFrom Project Inception and For the Fiscal Year Ended June 30, 2005
ActualProject Prior Current Total
Authorization Years Year To DateRevenues: Miscellaneous: $ $ 84,000$ 84,000$
Expenditures: Capital Improvements: Engineering and Inspections: Issuance Costs 392,975 198,621 43,923 242,544 Resurfacing and Signal Replacement 5,950,000 125,884 310,072 435,956 Roadway Improvements 46,107,025 1,626,436 2,682,504 4,308,940 Sidewalk and Bikeways Projects 5,300,000 297,279 190,180 487,459 Streetscape Projects 14,000,000 3,866,517 3,881,112 7,747,629
Total Expenditures 71,750,000 6,114,737 7,107,791 13,222,528
Excess of Revenues Under Expenditures (71,750,000) (6,114,737) (7,023,791) (13,138,528)
Other Financing Sources: Debt Issuances: General Obligation Bonds Issued 71,750,000 17,330,000 17,330,000 Premium on Debt 65,914 (65,914)
Total Other Financing Sources 71,750,000 17,395,914 (65,914) 17,330,000
Excess of Other Financing Sources Over (Under) Expenditures $ 11,281,177 (7,089,705) 4,191,472
Fund Balance - July 1 11,281,177
Fund Balance - June 30 11,281,177$ 4,191,472$ 4,191,472$
-93-

Schedule 40
Parks and Recreation Bond Fund - Series 2003 and 2005ASchedule of Revenues, Expenditures and Changes in Fund Balance - Budget and ActualFrom Project Inception and For the Fiscal Year Ended June 30, 2005
ActualProject Prior Current Total
Authorization Years Year To DateRevenues: Intergovernmental: State Grant 450,000$ 450,000$ $ 450,000$
Expenditures: Capital Improvements: Culture and Recreation: ADA Compliance for Park Restrooms 1,427,550 4,342 18,284 22,626 Barber Park Recreation Center 2,749,720 28 28 Barber Park Tennis Pavilion Roof 2,936,446 2,733,457 197,786 2,931,243 Carolyn Allen Community Park 3,177,670 3,144,762 27,184 3,171,946 Facility Floors and Bleacher Replacement 1,093,000 HVAC Installation in Recreation Centers 706,174 704,877 704,877 Keeley Park 6,790,198 Lake Facility Improvements 163,000 14,500 144,053 158,553 Playground Equipment and Bleachers 1,573,000 421,817 127,273 549,090 Southwest Greensboro Recreation Center 5,775,696 1,592,408 1,592,408 Northwest Walking Trail 397,867 384,629 384,629 Northeast Sports Center 6,050,027 6,050,027 6,050,027 Barber Park Master Plan 65,000 65,000 65,000 Gateway Garden Project 1,500,000 General Administration - Parks and Recreation 244,652 118,749 19,132 137,881
Total Expenditures 34,650,000 13,642,160 2,126,148 15,768,308
Excess of Revenues Under Expenditures (34,200,000) (13,192,160) (2,126,148) (15,318,308)
Other Financing Sources: Debt Issuances: General Obligation Bonds Issued 34,200,000 16,600,000 4,500,000 21,100,000 Premium on Debt 53,914 (53,914)
Total Other Financing Sources 34,200,000 16,653,914 4,446,086 21,100,000
Excess of Revenues and Other Financing Sources Over Expenditures $ 3,461,754 2,319,938 5,781,692
Fund Balance - July 1 3,461,754
Fund Balance - June 30 3,461,754$ 5,781,692$ 5,781,692$
-94-

Schedule 41
Fire Station Bond Fund - Series 2003 and 2005ASchedule of Revenues, Expenditures and Changes in Fund Balance - Budget and ActualFrom Project Inception and For the Fiscal Year Ended June 30, 2005
ActualProject Prior Current Total
Authorization Years Year To DateRevenues: Miscellaneous: Insurance Refunds and Claims 121,731$ 121,731$ $ 121,731$
Expenditures: Capital Improvements: Public Safety: Fire Station #11 Replacement 2,027,300 1,271,363 391,020 1,662,383 Grandover Fire Station 923 188 188 Horsepen Creek Fire Station 2,300,000 3,192 228,681 231,873 Lake Jeanette Fire Station 2,534,799 2,494,160 38,694 2,532,854 Orchard Fire Station 2,586,009 604,959 604,959 Willow Road Fire Station 222,700 222,648 222,648
Total Expenditures 9,671,731 3,768,903 1,486,002 5,254,905
Excess of Revenues Under Expenditures (9,550,000) (3,647,172) (1,486,002) (5,133,174)
Other Financing Sources: Debt Issuances: General Obligation Bonds Issued 9,550,000 5,170,000 4,380,000 9,550,000 Premium on Debt 26,421 (26,421)
Total Other Financing Sources 9,550,000 5,196,421 4,353,579 9,550,000
Excess of Revenues and Other Financing Sources Over Expenditures $ 1,549,249 2,867,577 4,416,826
Fund Balance - July 1 1,549,249
Fund Balance - June 30 1,549,249$ 4,416,826$ 4,416,826$
-95-

Schedule 42
Public Transportation Bond Fund - Series 2003 and 2005Schedule of Revenues, Expenditures and Changes in Fund Balance - Budget and ActualFrom Project Inception and For the Fiscal Year Ended June 30, 2005
ActualProject Prior Current Total
Authorization Years Year To DateExpenditures: Capital Improvements: Transportation 2,000,000$ 406,832$ 87,891$ 494,723$
Other Financing Sources: Debt Issuances: General Obligation Bonds Issued 2,000,000 500,000 500,000 1,000,000 Premium on Debt 1,624 (1,624)
Total Other Financing Sources 2,000,000 501,624 498,376 1,000,000
Excess of Other Financing Sources Over Expenditures $ 94,792 410,485 505,277
Fund Balance - July 1 94,792
Fund Balance - June 30 94,792$ 505,277$ 505,277$
-96-

Schedule 43
Natural Science Center Bond Fund - Series 2005ASchedule of Revenues, Expenditures and Changes in Fund Balance - Budget and ActualFrom Project Inception and For the Fiscal Year Ended June 30, 2005
ActualProject Prior Current Total
Authorization Years Year To DateExpenditures: Capital Improvements: Culture and Recreation 3,500,000$ $ 14,886$ 14,886$
Other Financing Sources: Debt Issuances: General Obligation Bonds Issued 3,500,000 3,500,000 3,500,000
Excess of Other Financing Sources Over Expenditures $ 3,485,114 3,485,114
Fund Balance - July 1
Fund Balance - June 30 $ 3,485,114$ 3,485,114$
-97-
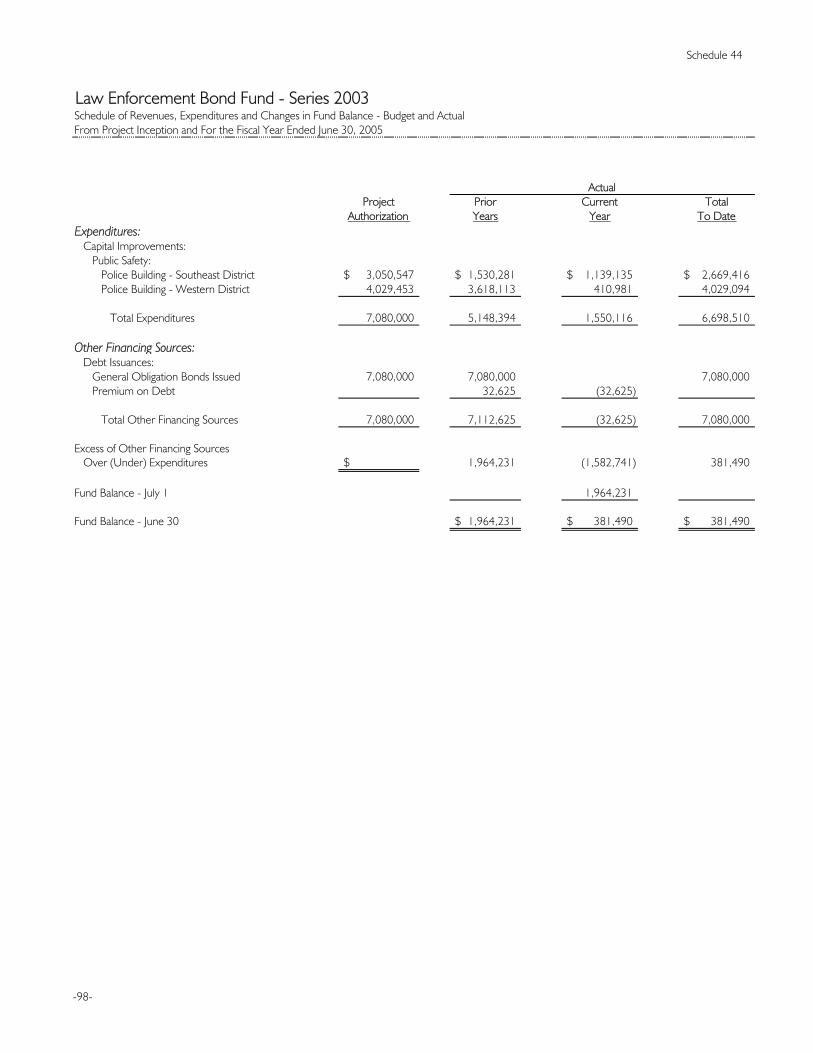
Schedule 44
Law Enforcement Bond Fund - Series 2003Schedule of Revenues, Expenditures and Changes in Fund Balance - Budget and ActualFrom Project Inception and For the Fiscal Year Ended June 30, 2005
ActualProject Prior Current Total
Authorization Years Year To DateExpenditures: Capital Improvements: Public Safety: Police Building - Southeast District 3,050,547$ 1,530,281$ 1,139,135$ 2,669,416$ Police Building - Western District 4,029,453 3,618,113 410,981 4,029,094
Total Expenditures 7,080,000 5,148,394 1,550,116 6,698,510
Other Financing Sources: Debt Issuances: General Obligation Bonds Issued 7,080,000 7,080,000 7,080,000 Premium on Debt 32,625 (32,625)
Total Other Financing Sources 7,080,000 7,112,625 (32,625) 7,080,000
Excess of Other Financing Sources Over (Under) Expenditures $ 1,964,231 (1,582,741) 381,490
Fund Balance - July 1 1,964,231
Fund Balance - June 30 1,964,231$ 381,490$ 381,490$
-98-

Schedule 45
Library Facilities Bond Fund - Series 2003 and 2005ASchedule of Revenues, Expenditures and Changes in Fund Balance - Budget and ActualFrom Project Inception and For the Fiscal Year Ended June 30, 2005
ActualProject Prior Current Total
Authorization Years Year To DateRevenues: Miscellaneous: Donations and Private Contributions 603,022$ 405,238$ 181,354$ 586,592$
Expenditures: Capital Improvements: Culture and Recreation: Hemphill Square Branch 2,975,340 2,106,867 871,313 2,978,180 Edwards Family Branch 2,792,912 2,032,402 754,915 2,787,317 Lake Jeanette Branch 74,770 74,768 74,768
Total Expenditures 5,843,022 4,214,037 1,626,228 5,840,265
Excess of Revenues Under Expenditures (5,240,000) (3,808,799) (1,444,874) (5,253,673)
Other Financing Sources: Debt Issuances: General Obligation Bonds Issued 5,020,000 3,320,000 1,700,000 5,020,000 Premium on Debt 13,993 13,993 Transfers In 220,000 220,000 220,000
Total Other Financing Sources 5,240,000 3,333,993 1,920,000 5,253,993
Excess of Revenues and Other Financing Sources Over (Under) Expenditures $ (474,806) 475,126 320
Fund Balance - July 1 (474,806)
Fund Balance - June 30 (474,806)$ 320$ 320$
-99-

Schedule 46
Neighborhood Redevelopment Bond Fund - Series 2005Schedule of Revenues, Expenditures and Changes in Fund Balance - Budget and ActualFrom Project Inception and For the Fiscal Year Ended June 30, 2005
ActualProject Prior Current Total
Authorization Years Year To DateExpenditures: Capital Improvements: Community Development and Housing 2,800,000$ $ 220,812$ 220,812$
Other Financing Sources: Debt Issuances: General Obligation Bonds Issued 2,800,000
Excess of Other Financing Sources Under Expenditures $ (220,812) (220,812)
Fund Balance - July 1
Fund Balance - June 30 $ (220,812)$ (220,812)$
-100-

-101-
Perpetual Care Fund
Perpetual Care Fund
The purpose of this fund is to account for monies to be used in the maintenance of the City’s cemeteries. A contribution of one-fourth of all lot sales from the Cemetery Fund is the only funding source of this fund. Income earned from the investment of the assets of this fund is credited directly to the Cemetery Fund to partially defray the costs of cemetery operations under provisions of the City Charter. No part of the principal may be expended from this fund, which classifies this fund as a Nonexpendable Trust Fund. No expenses were recorded in this fund during the current year. This fund can be found on the Combining Balance Sheet, page 33 and the Combining Statement of Revenues, Expenditures and Changes in Fund Balances, page 40.

-102-
Enterprise Funds
Water Resources Fund
The Water Resources Fund provides services to over 95,000 customers and is designed to be self-supporting. Revenues are sufficient to meet the operating expenses and to provide funds for water and sewer line construction. These revenues are also used to provide for principal and interest on all water and sewer debt. Continued expansion of the water and sewer system has been necessary to provide for the increase in residential, commercial and industrial requirements. Combined Enterprise System Revenue bonds as well as General Obligation bonds outstanding are recorded in this fund.
Stormwater Quality Control Fund
This fund was established to account for the federally mandated program of stormwater system management, which is supported by a citywide stormwater fee.
War Memorial Coliseum Fund
This fund administers monies necessary for the operation of the complex responsible for bringing top artists in the entertainment, educational and sports fields to Greensboro. The Coliseum Complex consists of an arena with a seating capacity of 23,500, an auditorium with a seating capacity of 2,400 and meeting and exhibition facilities of 167,000 square feet.
Parking Facilities Fund
This fund accounts for revenues and expenses related to City-owned parking garages, lots and curbside parking spaces. The City currently operates four parking garages providing over 2,800 parking spaces in the Center City area.
Solid Waste Management Fund
This fund accounts for waste collection, disposal and recycling operations of the City, as well as solid waste landfill improvements.

-103-
Enterprise Funds
Schedule of Revenues, Expenditures and Changes in Fund Balance
Budget and Actual (Non-GAAP)
The following Schedules present the results of operation for all Enterprise Funds on the modified accrual basis for comparison to the legally adopted budget for each fund. A reconciliation of the modified accrual basis to the full accrual basis (per generally accepted accounting principles) follows each Schedule.

Schedule 47Page 1 of 2
Water Resources FundSchedule of Revenues and Expenses Budget and Actual (Non-GAAP)For the Fiscal Year Ended June 30, 2005
VarianceFinal Positive
Budget Actual (Negative)Operating Revenues: Charges for Current Services 59,314,250$ 61,309,316$ 1,995,066$ Other Operating Revenues 873,040 1,407,438 534,398 Total Operating Revenues 60,187,290 62,716,754 2,529,464
Operating Expenses: Personal Services 12,071,483 11,540,473 (531,010) Fringe Benefits 3,957,907 3,844,037 (113,870) Maintenance and Operations 26,272,005 22,153,416 (4,118,589) Capital Outlay 2,371,430 563,362 (1,808,068) Total Operating Expenses 44,672,825 38,101,288 (6,571,537)
Operating Income 15,514,465 24,615,466 9,101,001
Nonoperating Revenues: Investment Income 431,054 1,065,055 634,001 Net Income from Joint Venture 832,030 832,030 Miscellaneous Nonoperating Revenue 5,464,257 5,455,342 (8,915) Total Nonoperating Revenues 5,895,311 7,352,427 1,457,116
Nonoperating Expenses: Principal Maturities 6,521,351 6,519,860 (1,491) Interest Expense 7,980,355 6,904,737 (1,075,618) Amortization of Underwriters' Expense 150,541 150,541 Miscellaneous Nonoperating Expense 501,195 554,309 53,114 Total Nonoperating Expenses 15,002,901 14,129,447 (873,454)
Excess of Revenues Over Expenses Before Contributions and Other Financing Sources (Uses) 6,406,875 17,838,446 11,431,571
Capital Contributions 6,027,748 6,027,748Other Financing Sources (Uses): Debt Issuances: Other Financing Agreements - Watershed 26,509 26,509 General Obligation Bonds Issued - Refunding 682,120 717,289 35,169 Revenue Bonds Issued - Refunding 31,070,000 31,070,000 Premium on Bonds Issued 680,275 680,275 Payment to Escrow Agent for Refunding of Debt (32,428,140) (32,428,140) Transfers Out (9,921,086) (9,921,086) Total Other Financing Sources (Uses) (9,916,831) (9,855,153) 61,678
Excess of Revenues, Contributions and Other Financing Sources Over (Under) Expenses and Other Financing Uses (3,509,956) 14,011,041 17,520,997
Appropriated Fund Balance 3,509,956 (3,509,956)
Excess of Revenues Over Expenses $ 14,011,041$ 14,011,041$
-104-

Schedule 47Page 2 of 2
Water Resources FundSchedule of Revenues and Expenses Budget and Actual (Non-GAAP)For the Fiscal Year Ended June 30, 2005
Reconciliation of Modified Accrual Basis to Full Accrual Basis: Total Revenues 70,069,181$ Total Expenses 52,230,735
Excess of Revenues Over Expenses Before Contributions and Other Financing Sources (Uses) 17,838,446
Adjustment to Full Accrual Basis: Depreciation (11,213,421) Principal Maturities 6,519,860 Capital Outlay 563,362 Capital Project Expenses (2,906,856) Capital Project Cost Sharing and Other Reimbursements 3,070,114 Loss on Disposal of Capital Assets (14,465)
Income Before Contributions and Transfers 13,857,040$
-105-

Schedule 48
Water Resources Bond Fund - Series 2001Schedule of Revenues and Expenses - Budget and Actual (Non-GAAP)From Project Inception and For the Year Ended June 30, 2005
ActualProject Prior Current Total
Authorization Years Year To DateExpenses: Capital Improvements: Steveco Building 1,672,300$ 1,584,299$ 74,615$ 1,658,914$ Lake Daniel Reservoir 3,224,340 3,224,704 3,224,704 Osborne Treatment Plant 20,167,118 20,228,270 (1,587,617) 18,640,653 North Buffalo Plant 1,250,995 1,236,488 14,500 1,250,988 South Buffalo Extension 2,142,941 2,142,677 2,142,677 Reedy Fork Pumping and Lift Station 1,041,523 1,033,513 1,033,513 Bledsoe Drive Pumping Station 905,579 905,578 905,578 Peach Orchard Pumping Station 895,000 853,698 40,246 893,944 Randleman Feeder Main/Engineering 22,000 22,000 22,000 Northside Feeder Main 331,192 331,191 331,191 Guilford College Water Line Relocation 43,000 Lake Brandt Dam Repair 1,288,975 1,288,975 1,288,975 Mitchell Water Plant 502,325 498,800 498,800 Mitchell Sediment Basin Improvements 2,670,145 2,670,140 2,670,140 Mitchell Pumping Station Drive 420,000 381,290 12,315 393,605 Mitchell Filter Rehabilitation 1,735,128 1,725,606 7,054 1,732,660 Randleman Water Supply 1,694,187 1,694,187 Reidsville Improvements 303,835 281,698 281,698 Burlington Water Interconnection 300,000 170,300 170,300 Muddy Branch Sewer Rehabilitation 1,340,428 1,340,425 1,340,425 Lawndale Lift Station 1,211,700 1,185,368 1,185,368 Townsend Plant Sediment Basin Improvements 1,784,000 1,776,727 1,776,727 Total Capital Improvements 43,252,524 42,881,747 255,300 43,137,047
Nonoperating Expenses: Interest Expense 2,100,000 2,318,574 2,318,574 Bond Issue Expense 800,000 566,698 (72,925) 493,773 Miscellaneous Bond Expenses 50,000 190,838 62,290 253,128 Total Expenses 46,202,524 45,957,857 244,665 46,202,522
Nonoperating Revenues: Investment Income 462,524 1,013,209 (586,187) 427,022 Cost Sharing Reimbursements 35,500 35,500 Total Nonoperating Revenues 462,524 1,048,709 (586,187) 462,522
Excess of Revenues Under Expenses Before Other Financing Sources (45,740,000) (44,909,148) (830,852) (45,740,000)
Other Financing Sources: Debt Issuances: Revenue Bonds Issued 45,740,000 45,740,000 45,740,000
Excess of Revenues and Other Financing Sources Over (Under) Expenses $ 830,852$ (830,852)$ $
-106-

Schedule 49
Water Resources Bond Fund - Series 2003Schedule of Revenues and Expenses - Budget and Actual (Non-GAAP)From Project Inception and For the Year Ended June 30, 2005
ActualProject Prior Current Total
Authorization Years Year To DateExpenses: Capital Improvements: Mapping Project of Water & Sewer System 344,650$ 344,650$ $ 344,650$ Water Resouces Operations Center 7,495,962 3,902,291 3,479,096 7,381,387 Water Supply 7,349,108 4,245,294 3,017,874 7,263,168 Water Treatment Plants 1,372,605 277,942 1,000,603 1,278,545 Sewer Pumping Stations 14,709,584 9,462,528 4,703,665 14,166,193 North Buffalo Pilot Facility 38,601 38,600 38,600 Osborne Treatment Plant 1,504,718 1,127,576 398,325 1,525,901 Haw River Project 7,823,573 7,798,023 25,550 7,823,573 Sewer Mains 4,876,225 4,168,350 187,992 4,356,342 Total Capital Improvements 45,515,026 31,365,254 12,813,105 44,178,359
Nonoperating Expenses: Interest Expense 1,895,086 1,155,086 740,000 1,895,086 Bond Issue Expense 589,888 589,888 589,888 Total Expenses 48,000,000 33,110,228 13,553,105 46,663,333
Nonoperating Revenues: Investment Income 1,000,000 249,867 204,448 454,315 Miscellaneous Nonoperating Revenue 2,904,000 2,904,000 Total Revenues 1,000,000 3,153,867 204,448 3,358,315
Excess of Revenues Under Expenses Before Other Financing Sources (47,000,000) (29,956,361) (13,348,657) (43,305,018)
Other Financing Sources: Debt Issuances: Revenue Bonds Issued 47,000,000 43,435,000 43,435,000
Excess of Revenues and Other Financing Sources Over (Under) Expenses $ 13,478,639$ (13,348,657)$ 129,982$
-107-

Schedule 50
Water Resources Bond Fund - Series 2005Schedule of Revenues and Expenses - Budget and Actual (Non-GAAP)From Project Inception and For the Year Ended June 30, 2005
ActualProject Prior Current Total
Authorization Years Year To DateExpenses: Capital Improvements: Mapping Project of Water & Sewer System 3,970,000$ 448,254$ 540,070$ 988,324$ Water Mains ,Tanks and Supply 7,648,000 58,122 2,112,611 2,170,733 Water Treatment Plants 8,965,000 962,294 962,294 Sewer Pumping Stations 7,000,000 4,495,276 4,495,276 Osborne Treatment Plant 4,125,705 1,596,705 1,596,705 Sewer Mains 18,291,295 2,223,083 2,223,083 Total Capital Improvements 50,000,000 506,376 11,930,039 12,436,415
Nonoperating Expenses: Interest Expense 2,300,000 Bond Issue Expense 700,000 477,365 477,365 Miscellaneous Bond Expenses 44 44 Total Expenses 53,000,000 506,376 12,407,448 12,913,824
Nonoperating Revenues: Investment Income 1,000,000 20,828 20,828
Excess of Revenues Under Expenses Before Other Financing Sources (52,000,000) (506,376) (12,386,620) (12,892,996)
Other Financing Sources: Debt Issuances: Revenue Bonds Issued 52,000,000 40,860,000 40,860,000
Excess of Revenues and Other Financing Sources Over (Under) Expenses $ (506,376)$ 28,473,380$ 27,967,004$
-108-

Schedule 51
Guilford County Construction Project FundSchedule of Revenues and Expenses - Budget and Actual (Non-GAAP)From Project Inception and For the Year Ended June 30, 2005
ActualProject Prior Current Total
Authorization Years Year To DateRevenues: Guilford County Construction: Reimbursements 2,867,883$ 518,386$ 869,974$ 1,388,360$ Miscellaneous Nonoperating Revenue 1,314 1,314 Total Revenues 2,867,883 518,386 871,288 1,389,674
Expenses: Capital Improvements: Sumner Elementary School 433,352 412,389 17,112 429,501 Bishop Road Sewer Outfall 530,248 44,147 472,157 516,304 Waldenbrook Water Line 158,928 71,235 84,529 155,764 Twilla Acres Water and Sewer Project 890,040 6,552 12,791 19,343 Sedgefield Water Line 411,120 Northeast High School Sewer Project 444,195 302,628 302,628 Total Expenses 2,867,883 534,323 889,217 1,423,540
Excess of Revenues Under Expenses $ (15,937)$ (17,929)$ (33,866)$
-109-

Schedule 52
Water Resources Capital Improvement FundSchedule of Revenues and Expenses - Budget and Actual (Non-GAAP)From Project Inception and For the Year Ended June 30, 2005
ActualProject Prior Current Total
Authorization Years Year To DateExpenses:Capital Improvements: Winston-Salem Water Line Project 264,307$ 264,307$ $ 264,307$ Water Line and Tank Construction 7,152,294 3,077,875 1,644,105 4,721,980 Randleman Dam Project 39,112,761 39,112,761 39,112,761 Osborne Improvements 4,202,675 3,645,483 3,645,483 Chloramine Conversion Project 2,797,000 Automated Meter Reading Project 2,447,257 Sewer Line Construction 15,161,515 10,323,971 2,277,251 12,601,222 Haw River Project 11,000,000 7,764,252 58,753 7,823,005 Billing Software Upgrade 3,000,000 1,645,196 1,251,835 2,897,031 Total Capital Improvements 85,137,809 65,833,845 5,231,944 71,065,789
Other Operating Revenues: Cost Sharing Reimbursements 275,000 31,576 31,576 Sales Tax Refund 2,043,774 2,043,774 Total Other Operating Revenues 275,000 2,075,350 2,075,350
Excess of Revenues Under Expenses Before Other Financing Sources (84,862,809) (63,758,495) (5,231,944) (68,990,439)
Other Financing Sources: Transfers from Water Resources: Capital Reserve Fund 48,919,863 46,419,863 46,419,863 Water Resources Operating Fund 27,285,271 19,050,000 9,735,271 28,785,271 Debt Issuances: Federal Loan Program 4,202,675 3,844,955 (28,906) 3,816,049 Total Other Financing Sources 80,407,809 69,314,818 9,706,365 79,021,183
Appropriated Fund Balance 4,455,000
Excess of Revenues and Other Financing Sources Over Expenses $ 5,556,323$ 4,474,421$ 10,030,744$
-110-

Schedule 53Page 1 of 2
Stormwater Management FundSchedule of Revenues and Expenses - Budget and Actual (Non-GAAP)For the Fiscal Year Ended June 30, 2005
VarianceFinal Positive
Budget Actual (Negative)Operating Revenues: Charges for Current Services 7,920,522$ 8,369,025$ 448,503$ Other Operating Revenues 11,500 19,460 7,960 Total Operating Revenues 7,932,022 8,388,485 456,463
Operating Expenses: Personal Services 2,627,570 2,442,637 (184,933) Fringe Benefits 938,631 862,500 (76,131) Maintenance and Operations 3,660,584 3,078,169 (582,415) Capital Outlay 6,067 5,680 (387) Total Operating Expenses 7,232,852 6,388,986 (843,866)
Operating Income 699,170 1,999,499 1,300,329
Nonoperating Revenues: Investment Income 150,000 155,235 5,235 Miscellaneous Nonoperating Revenue 3,000 (3,000) Total Nonoperating Revenues 153,000 155,235 2,235
Excess of Revenues Over Expenses Before Other Financing Uses 852,170 2,154,734 1,302,564
Capital Contributions 507,642 507,642Other Financing Uses: Transfers Out (2,943,204) (2,943,204)
Excess of Revenues Under Expenses and Other Financing Uses (2,091,034) (280,828) 1,810,206
Appropriated Fund Balance 2,091,034 (2,091,034)
Excess of Revenues Under Expenses and Other Financing Uses $ (280,828)$ (280,828)$
-111-

Schedule 53Page 2 of 2
Stormwater Management FundSchedule of Revenues and Expenses Budget and Actual (Non-GAAP)For the Fiscal Year Ended June 30, 2005
Reconciliation of Modified Accrual Basis to Full Accrual Basis: Total Revenues 8,543,720$ Total Expenses 6,388,986
Excess of Revenues Over Expenses Before Contributions and Other Financing Sources (Uses) 2,154,734
Adjustment to Full Accrual Basis: Depreciation (1,654,593) Capital Outlay 5,680 Net Capital Project Expenses (507,029)
Loss Before Contributions and Transfers (1,208)$
-112-
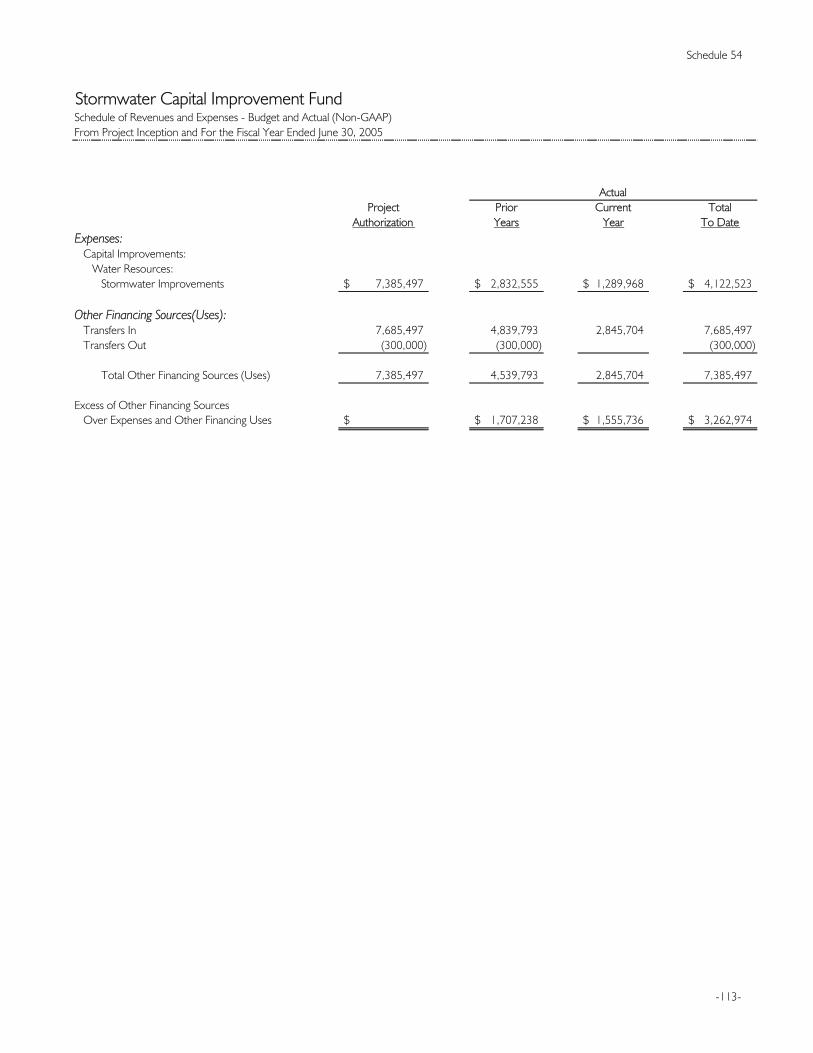
Schedule 54
Stormwater Capital Improvement FundSchedule of Revenues and Expenses - Budget and Actual (Non-GAAP)From Project Inception and For the Fiscal Year Ended June 30, 2005
ActualProject Prior Current Total
Authorization Years Year To DateExpenses: Capital Improvements: Water Resources: Stormwater Improvements 7,385,497$ 2,832,555$ 1,289,968$ 4,122,523$
Other Financing Sources(Uses): Transfers In 7,685,497 4,839,793 2,845,704 7,685,497 Transfers Out (300,000) (300,000) (300,000)
Total Other Financing Sources (Uses) 7,385,497 4,539,793 2,845,704 7,385,497
Excess of Other Financing Sources Over Expenses and Other Financing Uses $ 1,707,238$ 1,555,736$ 3,262,974$
-113-

Schedule 55Page 1 of 2
War Memorial Coliseum FundSchedule of Revenues and Expenses - Budget and Actual (Non-GAAP)For the Fiscal Year Ended June, 30, 2005
VarianceFinal Positive
Budget Actual (Negative)Operating Revenues: Charges for Current Services 8,589,300$ 7,621,544$ (967,756)$ Other Operating Revenues 205,000 226,675 21,675 Total Operating Revenues 8,794,300 7,848,219 (946,081)
Operating Expenses: Personal Services 3,781,655 3,306,756 (474,899) Fringe Benefits 929,531 841,762 (87,769) Maintenance and Operations 5,812,780 5,486,696 (326,084) Total Operating Expenses 10,523,966 9,635,214 (888,752)
Operating Loss (1,729,666) (1,786,995) (57,329)
Nonoperating Revenues: Investment Income 20,000 35,905 15,905 Miscellaneous Nonoperating Revenue 8,950 8,950 Total Nonoperating Revenues 20,000 44,855 24,855
Nonoperating Expenses: Principal Maturities 100,000 90,000 (10,000) Interest Expense 12,000 16,556 4,556 Miscellaneous Nonoperating Expense 5,000 19,242 14,242 Total Nonoperating Expenses 117,000 125,798 8,798
Excess of Revenues Under Expenses Before Other Financing Sources (Uses) (1,826,666) (1,867,938) (41,272)
Other Financing Sources (Uses): Transfers In 2,005,000 2,005,000 Transfers Out (205,000) (205,000) Total Other Financing Sources (Uses) 1,800,000 1,800,000
Excess of Revenues and Other Financing Sources Under Expenses and Other Financing Uses (26,666) (67,938) (41,272)
Appropriated Fund Balance 26,666 (26,666)
Excess of Revenues and Other Financing Sources Under Expenses and Other Financing Uses Over Expenses $ (67,938)$ (67,938)$
-114-

Schedule 55Page 2 of 2
War Memorial Coliseum FundSchedule of Revenues and Expenses - Budget and Actual (Non-GAAP)For the Fiscal Year Ended June 30, 2005
Reconciliation of Modified Accrual Basis to Full Accrual Basis: Total Revenues 7,893,074$ Total Expenses 9,761,012
Excess of Revenues Under Expenses Before Other Financing Sources (1,867,938)
Adjustment to Full Accrual Basis: Depreciation (2,076,124) Principal Maturities 90,000 Compensated Absences 13,770 Amortization of Bond Discount (671) Net Capital Project Revenues 1,328,214
Loss Before Transfers (2,512,749)$
-115-

Schedule 56
War Memorial Coliseum Capital Improvement FundSchedule of Revenues and Expenses - Budget and Actual (Non-GAAP)From Project Inception and For the Year Ended June 30, 2005
ActualProject Prior Current Total
Authorization Years Year To DateRevenues: Donations and Contributions 1,493,600$ 1,000,000$ 1,500,000$ 2,500,000$ Investment Income 5,950 22,799 28,749 Total Revenues 1,493,600 1,005,950 1,522,799 2,528,749
Expenses: Capital Improvements: Coliseum Complex Improvements 625,600 336,929 202,794 539,723
Excess of Revenues Over Expenses Before Other Financing Uses 868,000 669,021 1,320,005 1,989,026
Other Financing Uses: Transfers Out: Coliseum Operating Fund (868,000) (663,000) (205,000) (868,000)
Excess of Revenues Over Expenses and Other Financing Uses $ 6,021$ 1,115,005$ 1,121,026$
-116-

Schedule 57Page 1 of 2
Parking Facilities FundSchedule of Revenues and Expenses - Budget and Actual (Non-GAAP)For the Fiscal Year Ended June 30, 2005
VarianceFinal Positive
Budget Actual (Negative)Operating Revenues: Charges for Current Services 1,995,155$ 1,878,684$ (116,471)$ Other Operating Revenues 3,800 580 (3,220) Total Operating Revenues 1,998,955 1,879,264 (119,691)
Operating Expenses: Personal Services 338,361 335,371 (2,990) Fringe Benefits 104,463 109,160 4,697 Maintenance and Operations 685,981 477,069 (208,912) Capital Outlay 345,223 244,140 (101,083) Total Operating Expenses 1,474,028 1,165,740 (308,288)
Operating Income 524,927 713,524 188,597
Nonoperating Revenues: Investment Income 24,700 13,696 (11,004)
Nonoperating Expenses: Principal Maturities 1,941,005 1,941,000 (5) Interest Expense 277,090 269,671 (7,419) Amortization of Underwriters' Expense 21,657 21,657 Miscellaneous Nonoperating Expense 15,883 15,883 Total Nonoperating Expenses 2,218,095 2,248,211 30,116
Excess of Revenues Under Expenses Before Other Financing Sources (Uses) (1,668,468) (1,520,991) 147,477
Other Financing Sources (Uses): Transfers In 1,593,979 1,593,979 Transfers Out (367,584) (367,584) Total Other Financing Sources (Uses) 1,226,395 1,226,395
Excess of Revenues and Other Financing Sources Under Expenses and Other Financing Uses (442,073) (294,596) 147,477
Appropriated Fund Balance 442,073 (442,073)
Excess of Revenues and Other Financing Sources Under Expenses and Other Financing Uses $ (294,596)$ (294,596)$
-117-

Schedule 57Page 2 of 2
Parking Facilities FundSchedule of Revenues and Expenses - Budget and Actual (Non-GAAP)For the Fiscal Year Ended June 30, 2005
Reconciliation of Modified Accrual Basis to Full Accrual Basis: Total Revenues 1,892,960$ Total Expenses 3,413,951
Excess of Revenues Under Expenses Before Other Financing Sources (Uses) (1,520,991)
Adjustment to Full Accrual Basis: Depreciation (542,664) Principal Maturities 1,941,000 Capital Outlay 244,140 Trustee Debt Service Escrow Account (259,992)
Loss Before Transfers (138,507)$
-118-

Schedule 58Page 1 of 2
Solid Waste Management FundSchedule of Revenues and Expenses - Budget and Actual (Non-GAAP)For the Fiscal Year Ended June 30, 2005
VarianceFinal Positive
Budget Actual (Negative)Operating Revenues: Charges for Current Services 12,866,912$ 10,316,091$ (2,550,821)$ Other Operating Revenues 773,500 1,109,501 336,001 Total Operating Revenues 13,640,412 11,425,592 (2,214,820)
Operating Expenses: Personal Services 5,776,493 5,319,421 (457,072) Fringe Benefits 1,944,189 1,888,225 (55,964) Maintenance and Operations 18,121,572 13,320,915 (4,800,657) Capital Outlay 94,276 4,276 (90,000) Total Operating Expenses 25,936,530 20,532,837 (5,403,693)
Operating Loss (12,296,118) (9,107,245) 3,188,873
Nonoperating Revenues: Investment Income 300,000 424,118 124,118 Miscellaneous Nonoperating Revenue 1,121 1,121 Total Nonoperating Revenues 300,000 425,239 125,239
Nonoperating Expenses: Principal Maturities 1,590,000 1,040,000 (550,000) Interest Expense 578,880 588,403 9,523 Miscellaneous Nonoperating Expense 3,000 2,580 (420) Total Nonoperating Expenses 2,171,880 1,630,983 (540,897)
Excess of Revenues Under Expenses Before Other Financing Sources (Uses) (14,167,998) (10,312,989) 3,855,009
Other Financing Sources (Uses): Transfers In 10,373,045 10,373,045 Transfers Out (721,175) (721,175) Total Other Financing Sources (Uses) 9,651,870 9,651,870
Excess of Revenues and Other Financing Sources Under Expenses and Other Financing Uses (4,516,128) (661,119) 3,855,009
Appropriated Fund Balance 4,516,128 (4,516,128)
Excess of Revenues and Other Financing Sources Under Expenses and Other Financing Uses $ (661,119)$ (661,119)$
-119-
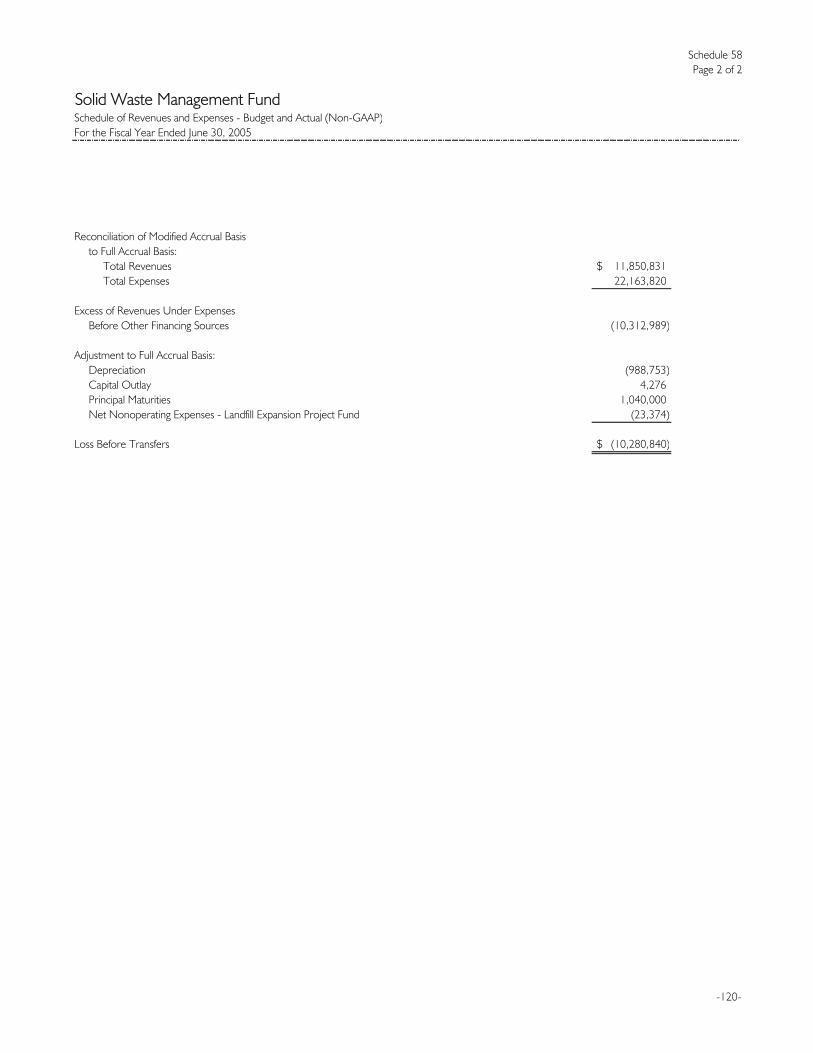
Schedule 58Page 2 of 2
Solid Waste Management FundSchedule of Revenues and Expenses - Budget and Actual (Non-GAAP)For the Fiscal Year Ended June 30, 2005
Reconciliation of Modified Accrual Basis to Full Accrual Basis: Total Revenues 11,850,831$ Total Expenses 22,163,820
Excess of Revenues Under Expenses Before Other Financing Sources (10,312,989)
Adjustment to Full Accrual Basis: Depreciation (988,753) Capital Outlay 4,276 Principal Maturities 1,040,000 Net Nonoperating Expenses - Landfill Expansion Project Fund (23,374)
Loss Before Transfers (10,280,840)$
-120-

Schedule 59
Solid Waste Capital Improvement FundSchedule of Revenues and Expenses - Budget and Actual (Non-GAAP)From Project Inception and For the Year Ended June 30, 2005
ActualProject Prior Current Total
Authorization Years Year To DateExpenses: Capital Improvements: Miscellaneous Capital Projects 2,193,780$ $ 92,997$ 92,997$ Landfill Expansion - Cell 2 and 3 381,220 528,809 528,809 Solid Waste Transfer Station 843,825 843,685 843,685 Total Expenses 3,418,825 1,372,494 92,997 1,465,491
Nonoperating Revenues: Investment Income 40,971 6,601 47,572
Excess of Revenues Under Expenses Before Other Financing Sources (3,418,825) (1,331,523) (86,396) (1,417,919)
Other Financing Sources: Transfers In 3,418,825 3,418,825
Excess of Revenues and Other Financing Sources Over (Under) Expenses (3,418,825)$ 2,087,302$ (86,396)$ 2,000,906$
-121-

Schedule 60
Solid Waste Bond Fund - Series 2005Schedule of Revenues and Expenses - Budget and Actual (Non-GAAP)From Project Inception and For the Year Ended June 30, 2005
ActualProject Prior Current Total
Authorization Years Year To DateExpenses: Capital Improvements: Solid Waste Transfer Station 7,050,000$ $ 293,000$ 293,000$
Nonoperating Expenses: Interest Expense 350,000 Bond Issue Expense 250,000 Total Expenses 7,650,000 293,000 293,000
Nonoperating Revenues: Investment Income 350,000
Excess of Revenues Under Expenses Before Other Financing Sources (7,300,000) (293,000) (293,000)
Other Financing Sources: Debt Issuances: Special Obligation Bonds Issued 7,300,000
Excess of Revenues and Other Financing Sources Under Expenses $ $ (293,000)$ (293,000)$
-122-

-123-
Internal Service Funds
Equipment Services Fund
This fund accounts for the costs of operating a maintenance facility for automotive equipment used by City departments. The costs of providing this service are billed to user departments. Automotive equipment is owned by the Equipment Services Fund.
Technical Services Fund
This fund accounts for the City’s two-way radio system and the Police mobile data system, including any peripheral equipment, except the computer hardware or software. The user departments are billed for the costs of operation.
City/County Telecommunications Services Fund
The City and Guilford County jointly own the Telecommunications System. This fund accounts for the costs of operating the telecommunications service and billing the County and the City’s user departments. The operating cost is shared between the two units based upon the number of telephone lines in service at each year end.
Graphic Services Fund
This fund accounts for all in-house printing services provided to the City, Guilford County and other agencies. The cost of providing this service is billed to user departments.
Employee Insurance Fund
This fund is maintained for employee health, dental and workers’ compensation coverage. The employees’ premium and the City’s contribution are deposited in this fund. Payments for workers’ compensation coverage are made to a third-party administrator for the statement of claims plus administrative expenses. The City administers the employee dental coverage plan. Health coverage is provided on a premium basis by a health insurance provider and is paid from this fund.
General Insurance Fund
This fund was established as a self-insurance fund to accumulate claim reserves and to pay claims and administrative fees for general liability, vehicle liability, public official liability, law enforcement liability and underground storage tank liability.
Capital Leasing Fund
This fund was established to account for major equipment purchases financed with lease-purchase agreements or certificates of participation.

Schedule 61Page 1 of 2
Internal Service FundsCombining Statement of Net AssetsJune 30, 2005
Equipment Technical City/County Graphic EmployeeASSETS Services Services Telecommunications Services Insurance
Current Assets: Cash and Cash Equivalents/Investments 6,266,830$ 4,035,136$ 1,169,980$ 29,867$ 14,965,911$ Receivables (Net): Intergovernmental 297,015 21,307 3,576 48,303 1,782 Interest 30,856 22,283 5,734 86,721 Inventories 604,052 35,374 41,250 Miscellaneous 39,455 45,197 Total Current Assets 7,238,208 4,123,923 1,214,664 119,420 15,054,414Noncurrent Assets: Restricted: Cash and Cash Equivalents/Investments Self-Funded Retention Deposits 1,140,829 Capital Assets: Non-Depreciable: Land Construction in Progress 268,634 Depreciable: Land Improvements 73,528 Buildings 252,294 173,863 Improvements Other than Buildings 11,108 Furniture, Fixtures, Machinery and Equipment 55,118,881 7,656,575 2,351,652 33,578 Less Accumulated Depreciation (39,405,364) (4,206,905) (1,793,470) (10,748) Total Noncurrent Assets 16,307,973 3,634,641 558,182 22,830 1,140,829 Total Assets 23,546,181 7,758,564 1,772,846 142,250 16,195,243
LIABILITIES Current Liabilities: Accounts Payable 156,428 51,441 17,834 329 6,212,553 General Obligation Bonds Payable 244,622 Lease-Purchase and Other Financing Agreements Payable Certificates of Participation Payable Customer Deposits Payable Compensated Absences 138,102 35,170 9,640 24,587 Total Current Liabilities 294,530 331,233 27,474 24,916 6,212,553Noncurrent Liabilities: General Obligation Bonds Payable 4,812,391 Lease-Purchase and Other Financing Agreements Payable Certificates of Participation Payable Compensated Absences 52,794 52,275 15,108 Total Noncurrent Liabilities 52,794 4,864,666 15,108 Total Liabilities 347,324 5,195,899 42,582 24,916 6,212,553
NET ASSETS Invested in Capital Assets, Net of Related Debt 16,307,973 (1,422,372) 558,182 22,830Restricted 1,140,829Unrestricted 6,890,884 3,985,037 1,172,082 94,504 8,841,861 Total Net Assets 23,198,857$ 2,562,665$ 1,730,264$ 117,334$ 9,982,690$
-124-

Schedule 61Page 2 of 2
General Capital
Insurance Leasing Totals
7,893,644$ 6,836,983$ 41,198,351$
23,533 395,516 45,117 23,706 214,417
680,676 103,950 188,602
7,938,761 6,988,172 42,677,562
1,339,336 1,339,336 10,917,685 12,058,514
1,660,541 1,660,541 2,173,719 2,442,353
749,902 823,430 1,092,388 1,518,545
11,108 29,702,771 94,863,457
(17,723,399) (63,139,886) 10,917,685 18,995,258 51,577,39818,856,446 25,983,430 94,254,960
1,244,746 59,255 7,742,586
244,622
521,975 521,975 3,500,000 3,500,000
31,612 31,612 207,499
1,276,358 4,081,230 12,248,294
4,812,391
93,262 93,262 10,500,000 10,500,000
120,177 10,593,262 15,525,830
1,276,358 14,674,492 27,774,124
4,380,021 19,846,634 10,917,685 12,058,514 6,662,403 6,928,917 34,575,688
17,580,088$ 11,308,938$ 66,480,836$
-125-

Schedule 62Page 1 of 2
Internal Service Funds
and Changes in Fund Net AssetsFor the Fiscal Year Ended June 30, 2005
Equipment Technical City/CountyServices Services Telecommunications
Operating Revenues: Charges for Current Services-Internal 14,809,613$ 2,256,658$ 1,074,267$ Charges for Current Services-External 79,722 265,576 Total Charges for Current Services 14,889,335 2,522,234 1,074,267 Miscellaneous 991,146 281,020 64,305 Total Operating Revenues 15,880,481 2,803,254 1,138,572
Operating Expenses: Personal Services 2,101,685 455,544 199,986 Fringe Benefits 676,101 128,527 54,446 Maintenance and Operations 6,414,619 1,564,768 692,317 Insurance Claims and Expenses 586,614 2,656 3,414 Depreciation 5,481,533 513,567 276,122 Total Operating Expenses 15,260,552 2,665,062 1,226,285
Operating Income (Loss) 619,929 138,192 (87,713)
Nonoperating Revenues(Expenses): Investment Income 125,426 225,616 24,579 Miscellaneous Nonoperating Revenue 13,931 12,010 Interest Expense (221,790) Loss on Disposal of Capital Assets (933,073) (312,942) Amortization of Underwriters' Expense (2,953) Miscellaneous Nonoperating Expense (18,441) (7,555) Total Nonoperating Revenues(Expenses) (812,157) 873 (283,908)
Income(Loss) Before Transfers (192,228) 139,065 (371,621)
Other Financing Sources (Uses): Transfers In 1,563,520 Transfers Out (786,000) (144,324) Total Other Financing Sources (Uses) 777,520 (144,324)
Change in Net Assets 585,292 (5,259) (371,621)
Net Assets - July 1 22,613,565 2,567,924 2,101,885Net Assets -June 30 23,198,857$ 2,562,665$ 1,730,264$
Combining Statement of Revenues, Expenses
-126-
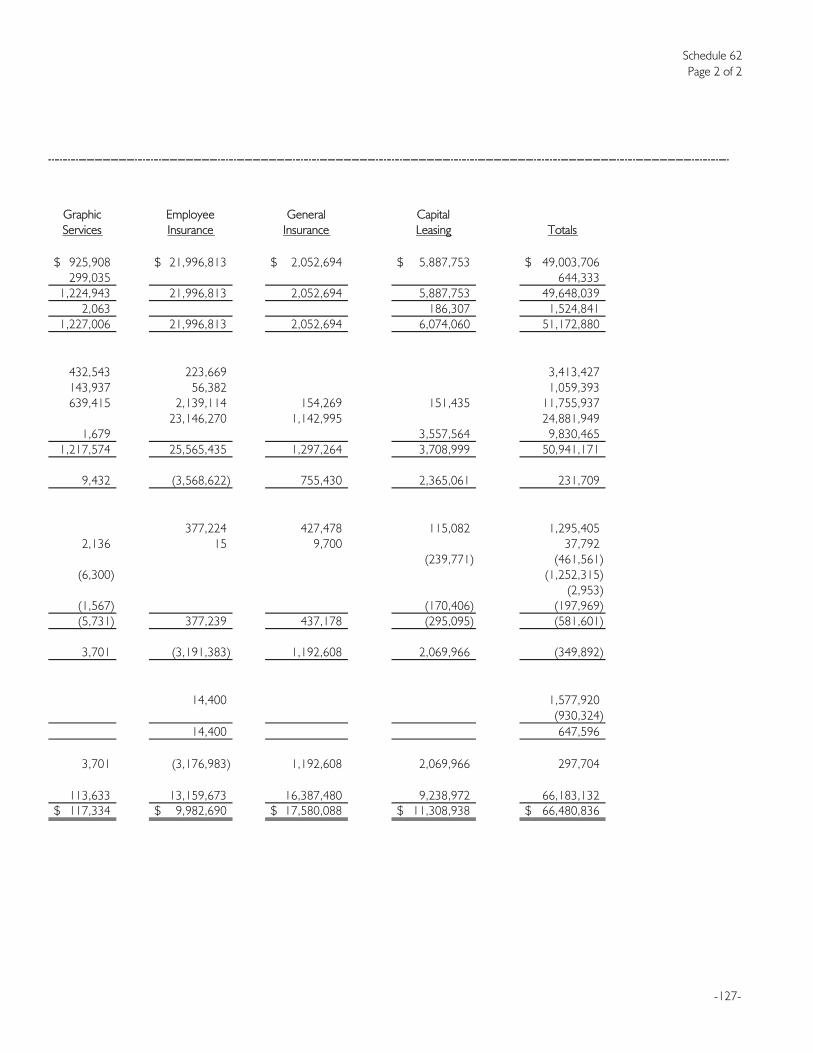
Schedule 62Page 2 of 2
Graphic Employee General CapitalServices Insurance Insurance Leasing Totals
925,908$ 21,996,813$ 2,052,694$ 5,887,753$ 49,003,706$ 299,035 644,333
1,224,943 21,996,813 2,052,694 5,887,753 49,648,039 2,063 186,307 1,524,841
1,227,006 21,996,813 2,052,694 6,074,060 51,172,880
432,543 223,669 3,413,427 143,937 56,382 1,059,393 639,415 2,139,114 154,269 151,435 11,755,937
23,146,270 1,142,995 24,881,949 1,679 3,557,564 9,830,465
1,217,574 25,565,435 1,297,264 3,708,999 50,941,171
9,432 (3,568,622) 755,430 2,365,061 231,709
377,224 427,478 115,082 1,295,405 2,136 15 9,700 37,792
(239,771) (461,561) (6,300) (1,252,315)
(2,953) (1,567) (170,406) (197,969) (5,731) 377,239 437,178 (295,095) (581,601)
3,701 (3,191,383) 1,192,608 2,069,966 (349,892)
14,400 1,577,920
(930,324) 14,400 647,596
3,701 (3,176,983) 1,192,608 2,069,966 297,704
113,633 13,159,673 16,387,480 9,238,972 66,183,132 117,334$ 9,982,690$ 17,580,088$ 11,308,938$ 66,480,836$
-127-

Schedule 63Page 1 of 2
Internal Service FundsCombining Statement of Cash FlowsFor the Fiscal Year Ended June 30, 2005Increase (Decrease) in Cash and Cash Equivalents/ Investments
Equipment Technical City/CountyServices Services Telecommunications
Cash Flows from Operating Activities: Receipts from Customers 14,889,335$ 2,522,234$ 1,074,266$ Payments to Suppliers (7,117,949) (1,540,007) (781,455) Payments to Employees (2,748,220) (715,123) (252,588) Other Receipts 991,146 281,020 64,305 Net Cash Provided By (Used for) Operating Activities 6,014,312 548,124 104,528
Cash Flows from Noncapital Financing Activities: Subsidies and Transfers In 1,563,520 Subsidies and Transfers Out (786,000) (144,324) Net Cash Provided By (Used for) Noncapital Financing Activities 777,520 (144,324) Cash Flows from Capital and Related Financing Activities: Capital Debt Issued Acquisition and Construction of Capital Assets (5,454,114) (36,032) Proceeds from Sale of Capital Assets Principal Paid on Capital Debt (234,724) Interest and Fiscal Charges Paid on Capital Debt (221,790) Net Cash Provided By (Used for) Capital and Related Financing Activities (5,454,114) (492,546)
Cash Flows from Investing Activities: Interest 116,742 223,527 23,540
Net Increase (Decrease) in Cash and Cash Equivalents/Investments 1,454,460 134,781 128,068
Balances - July 1 4,812,370 3,900,355 1,041,912
Balances - June 30 6,266,830$ 4,035,136$ 1,169,980$
Reconciliation of Operating Income (Loss) to Net Cash Provided By (Used for) Operating Activities: Operating Income (Loss) 619,929$ 138,192$ (87,713)$ Adjustments to Reconcile Operating Income (Loss) to Net Cash Provided By (Used for) Operating Activities: Depreciation 5,481,533 513,567 276,122 Changes in Assets and Liabilities: (Increase) in Inventories (150,176) (5,008) (Increase) Decrease in Intergovernmental Receivables (31,586) 29,008 53,342 (Increase) Decrease in Miscellaneous Assets 4,457 Increase (Decrease) in Accounts Payable 65,046 (1,591) (138,515) Increase (Decrease) in Compensated Absences Payable 29,566 (1,378) 1,843 (Decrease) in Intergovernmental Payables (129,674) Increase in Customer Deposits Payable Increase in Other Receipts Total Adjustments 5,394,383 409,932 192,241
Net Cash Provided By (Used for) Operating Activities 6,014,312$ 548,124$ 104,528$
Noncash Investing, Capital and Financing Activities: Lease-Purchase and Other Capital Financing Agreements $ $ $
-128-

Schedule 63Page 2 of 2
Graphic Employee General CapitalServices Insurance Insurance Leasing Totals
1,224,942$ 21,996,813$ 2,052,694$ 5,784,089$ 49,544,373$ (647,615) (21,952,479) (1,494,191) (93,760) (33,627,456) (581,895) (280,051) (4,577,877)
2,063 9,700 1,348,234 (2,505) (235,717) 568,203 5,690,329 12,687,274
14,400 1,577,920 (930,324)
14,400 647,596
7,000,000 7,000,000 (6,156,705) (11,646,851)
569 569 (4,445,292) (4,680,016)
(373,656) (595,446)
569 (3,975,653) (9,921,744)
348,210 423,627 134,714 1,270,360
(1,936) 126,893 991,830 1,849,390 4,683,486
31,803 14,839,018 6,901,814 6,326,929 37,854,201
29,867$ 14,965,911$ 7,893,644$ 8,176,319$ 42,537,687$
9,432$ (3,568,622)$ 755,430$ 2,365,061$ 231,709$
1,679 3,557,564 9,830,465
(3,408) (158,592) (4,793) (720) (159,698) (114,447)
(18,546) (231,547) (19,482) (265,118) 3,352,171 18,008 (53,116) 3,242,003
(5,388) 24,643 (27) (129,701)
16,612 16,612 9,700 9,700
(11,937) 3,332,905 (187,227) 3,325,268 12,455,565
(2,505)$ (235,717)$ 568,203$ 5,690,329$ 12,687,274$
$ $ $ 43,216$ 43,216$
-129-

Schedule 64
Internal Service FundsSchedule of Changes in Long-Term DebtFor the Fiscal Year Ended June 30, 2005
Debt DebtOutstanding OutstandingJuly 1, 2004 Additions Retirements June 30, 2005
Equipment Services: Compensated Absences 161,330$ 178,673$ 149,107$ 190,896$
Technical Services: General Obligation Bonds 5,291,737 234,724 5,057,013 Compensated Absences 88,823 28,994 30,372 87,445
Total Technical Services 5,380,560 28,994 265,096 5,144,458
City/County Telecommunications: Compensated Absences 22,904 14,774 12,930 24,748
Graphic Services: Compensated Absences 29,975 30,886 36,274 24,587
Capital Leasing: Lease-Purchase Agreements 1,771,707 43,216 1,199,686 615,237 Certificates of Participation 10,500,000 7,000,000 3,500,000 14,000,000
Total Capital Leasing 12,271,707 7,043,216 4,699,686 14,615,237
Total Internal Service Funds 17,866,476$ 7,296,543$ 5,163,093$ 19,999,926$
-130-

-131-
Internal Service Fund
Schedule of Revenues, Expenses and Changes in Fund Balance
Budget and Actual (Non-GAAP)
The following Schedules present the results of operation for all Internal Service Funds on the modified accrual basis for comparison to the legally adopted budget for each fund. A reconciliation of the modified accrual basis to the full accrual basis (per generally accepted accounting principles) follows each Schedule.

Schedule 65Page 1 of 2
Equipment Services FundSchedule of Revenues, Expenses and Changes in Fund Balance - Budget and Actual (Non-GAAP)For the Fiscal Year Ended June 30, 2005
VariancePositive
Budget Actual (Negative)Operating Revenues: Charges for Current Services 13,900,000$ 14,889,335$ 989,335$ Miscellaneous Operating Revenues 574,000 991,148 417,148 Total Operating Revenues 14,474,000 15,880,483 1,406,483 Operating Expenses: Personal Services 2,134,975 2,101,686 (33,289) Fringe Benefits 697,122 676,101 (21,021) Maintenance and Operations 6,901,188 7,001,234 100,046 Capital Outlay 7,418,746 5,099,096 (2,319,650) Total Operating Expenses 17,152,031 14,878,117 (2,273,914)
Operating Income (2,678,031) 1,002,366 3,680,397
Nonoperating Revenues: Investment Income 125,000 125,426 426 Miscellaneous Nonoperating Revenue 4,000 13,931 9,931 Total Nonoperating Revenues 129,000 139,357 10,357
Nonoperating Expenses: Miscellaneous Nonoperating Expense 18,441 18,441
Excess of Revenues Over (Under) Expenses Before Other Financing Sources (Uses) (2,549,031) 1,123,282 3,672,313
Other Financing Sources (Uses) : Transfers In 1,563,520 1,563,520 Transfers Out (786,000) (786,000) Total Other Financing Sources (Uses) 777,520 777,520
Excess of Revenues and Other Financing Sources Over (Under) Expenses and Other Financing Uses (1,771,511) 1,900,802 3,672,313
Appropriated Fund Balance 1,771,511 (1,771,511)
Excess of Revenues and Other Financing Sources Over Expenses and Other Financing Uses $ 1,900,802$ 1,900,802$
-132-

Schedule 65Page 2 of 2
Equipment Services FundSchedule of Revenues, Expenses and Changes in Fund Balance - Budget and Actual (Non-GAAP)For the Fiscal Year Ended June 30, 2005
Reconciliation of Modified Accrual Basis to Full Accrual Basis: Total Revenues 16,019,840$ Total Expenses 14,896,558
Excess of Revenues Over Expenses Before Other Financing Sources (Uses) 1,123,282
Adjustment to Full Accrual Basis: Depreciation (5,481,533) Capital Outlay 5,099,096 Loss on Disposal of Capital Assets (933,073)
Loss Before Transfers (192,228)$
-133-

Schedule 66Page 1 of 2
Technical Services FundSchedule of Revenues, Expenses and Changes in Fund Balance - Budget and Actual (Non-GAAP)For the Fiscal Year Ended June 30, 2005
VariancePositive
Budget Actual (Negative)Operating Revenues: Charges for Current Services 2,403,265$ 2,522,234$ 118,969$ Miscellaneous Operating Revenues 1,113,295 281,020 (832,275) Total Operating Revenues 3,516,560 2,803,254 (713,306) Operating Expenses: Personal Services 519,221 455,544 (63,677) Fringe Benefits 150,172 128,527 (21,645) Maintenance and Operations 2,929,204 1,567,424 (1,361,780) Capital Outlay 35,970 36,032 62 Total Operating Expenses 3,634,567 2,187,527 (1,447,040)
Operating Income (Loss) (118,007) 615,727 733,734
Nonoperating Revenues: Investment Income 91,000 225,616 134,616
Nonoperating Expenses: Principal Maturities 222,830 234,724 11,894 Interest Expense 279,390 221,790 (57,600) Miscellaneous Nonoperating Expense 5,150 2,953 (2,197) Total Nonoperating Expenses 507,370 459,467 (47,903)
Excess of Revenues Over (Under) Expenses Before Other Financing Uses (534,377) 381,876 916,253
Other Financing Uses: Transfers Out (144,324) 144,324
Appropriated Fund Balance 678,701 (678,701)
Excess of Revenues Over Expenses and Other Financing Uses $ 381,876$ 381,876$
-134-

Schedule 66Page 2 of 2
Technical Services FundSchedule of Revenues, Expenses and Changes in Fund Balance - Budget and Actual (Non-GAAP)For the Fiscal Year Ended June 30, 2005
Reconciliation of Modified Accrual Basis to Full Accrual Basis: Total Revenues 3,028,870$ Total Expenses 2,646,994
Excess of Revenues Over Expenses Before Other Financing Uses 381,876
Adjustment to Full Accrual Basis: Depreciation (513,567) Principal Maturities 234,724 Capital Outlay 36,032
Income Before Transfers 139,065$
-135-

Schedule 67Page 1 of 2
City/County Telecommunications FundSchedule of Revenues, Expenses and Changes in Fund Balance - Budget and Actual (Non-GAAP)For the Fiscal Year Ended June 30, 2005
VariancePositive
Budget Actual (Negative)Operating Revenues: Charges for Current Services 1,164,000$ 1,074,267$ (89,733)$ Miscellaneous Operating Revenues 1,800 64,305 62,505 Total Operating Revenues 1,165,800 1,138,572 (27,228)
Operating Expenses: Personal Services 198,656 199,986 1,330 Fringe Benefits 58,147 54,446 (3,701) Maintenance and Operations 981,915 695,731 (286,184) Total Operating Expenses 1,238,718 950,163 (288,555)
Operating Income (Loss) (72,918) 188,409 261,327
Nonoperating Revenues: Investment Income 16,600 24,579 7,979 Miscellaneous Nonoperating Revenue 1,600 12,010 10,410 Total Nonoperating Revenues 18,200 36,589 18,389
Nonoperating Expenses: Miscellaneous Nonoperating Expense 7,555 7,555
Excess of Revenues Over (Under) Expenses (54,718) 217,443 272,161
Appropriated Fund Balance 54,718 (54,718)
Excess of Revenues Over Expenses $ 217,443$ 217,443$
-136-

Schedule 67Page 2 of 2
City/County Telecommunications FundSchedule of Revenues, Expenses and Changes in Fund Balance - Budget and Actual (Non-GAAP)For the Fiscal Year Ended June 30, 2005
Reconciliation of Modified Accrual Basis to Full Accrual Basis: Total Revenues 1,175,161$ Total Expenses 957,718
Excess of Revenues Over Expenses 217,443
Adjustment to Full Accrual Basis: Depreciation (276,122) Loss on Disposal of Capital Assets (312,942)
Loss Before Transfers (371,621)$
-137-

Schedule 68Page 1 of 2
Graphic Services FundSchedule of Revenues, Expenses and Changes in Fund Balance - Budget and Actual (Non-GAAP)For the Fiscal Year Ended June 30, 2005
VariancePositive
Budget Actual (Negative)Operating Revenues: Charges for Current Services 1,344,642$ 1,224,943$ (119,699)$ Other Operating Revenues 115 2,063 1,948 Total Operating Revenues 1,344,757 1,227,006 (117,751) Operating Expenses: Personal Services 460,983 432,543 (28,440) Fringe Benefits 158,990 143,937 (15,053) Maintenance and Operations 741,460 639,415 (102,045) Total Operating Expenses 1,361,433 1,215,895 (145,538)
Operating Income (Loss) (16,676) 11,111 27,787
Nonoperating Revenues: Investment Income 2,500 (2,500) Miscellaneous Nonoperating Revenue 2,136 2,136 Total Nonoperating Revenues 2,500 2,136 (364)
Nonoperating Expenses: Miscellaneous Nonoperating Expense 1,567 1,567
Excess of Revenues Over (Under) Expenses (14,176) 11,680 25,856
Appropriated Fund Balance 14,176 (14,176)
Excess of Revenues Over Expenses $ 11,680$ 11,680$
-138-

Schedule 68Page 2 of 2
Graphic Services FundSchedule of Revenues, Expenses and Changes in Fund Balance - Budget and Actual (Non-GAAP)For the Fiscal Year Ended June 30, 2005
Reconciliation of Modified Accrual Basis to Full Accrual Basis: Total Revenues 1,229,142$ Total Expenses 1,217,462
Excess of Revenues Over Expenses 11,680
Adjustment to Full Accrual Basis: Depreciation (1,679) Loss on Disposal of Capital Assets (6,300)
Income Before Transfers 3,701$
-139-

Schedule 69Page 1 of 2
Employee Insurance FundSchedule of Revenues, Expenses and Changes in Fund Balance - Budget and Actual (Non-GAAP)For the Fiscal Year Ended June 30, 2005
VariancePositive
Budget Actual (Negative)Operating Revenues: Charges for Current Services 21,447,805$ 21,996,813$ 549,008$
Operating Expenses: Personal Services 216,191 223,669 7,478 Fringe Benefits 52,570 56,382 3,812 Maintenance and Operations 24,205,330 21,431,905 (2,773,425) Total Operating Expenses 24,474,091 21,711,956 (2,762,135)
Operating Income (Loss) (3,026,286) 284,857 3,311,143
Nonoperating Revenues: Investment Income 135,000 377,224 242,224
Miscellaneous Nonoperating Revenue 15 15 Total Nonoperating Revenues 135,000 377,239 242,239
Excess of Revenues Over (Under) Expenses Before Other Financing Sources (2,891,286) 662,096 3,553,382
Other Financing Sources: Transfers In 14,400 14,400
Excess of Revenues and Other Financing Sources Over (Under) Expenses (2,876,886) 676,496 3,553,382
Appropriated Fund Balance 2,876,886 (2,876,886)
Excess of Revenues and Other Financing Sources Over Expenses $ 676,496$ 676,496$
-140-

Schedule 69Page 2 of 2
Employee Insurance FundSchedule of Revenues, Expenses and Changes in Fund Balance - Budget and Actual (Non-GAAP)For the Fiscal Year Ended June 30, 2005
Reconciliation of Modified Accrual Basis to Full Accrual Basis: Total Revenues 22,374,052$ Total Expenses 21,711,956
Excess of Revenues Over Expenses 662,096
Adjustment to Full Accrual Basis: Accounts Payable-Actuarial Claims Estimate (3,853,479)
Loss Before Transfers (3,191,383)$
-141-

Schedule 70Page 1 of 2
General Insurance FundSchedule of Revenues, Expenses and Changes in Fund Balance - Budget and Actual (Non-GAAP)For the Fiscal Year Ended June 30, 2005
VariancePositive
Budget Actual (Negative)Operating Revenues: Charges for Current Services 2,030,586$ 2,052,694$ 22,108$
Operating Expenses: Maintenance and Operations 2,302,470 1,297,264 (1,005,206)
Operating Income (Loss) (271,884) 755,430 1,027,314
Nonoperating Revenues: Investment Income 201,201 427,478 226,277 Insurance Refunds and Claims 9,700 9,700 Total Nonoperating Revenues 201,201 437,178 235,977
Excess of Revenues Over (Under) Expenses (70,683) 1,192,608 1,263,291
Appropriated Fund Balance 70,683 (70,683)
Excess of Revenues Over Expenses $ 1,192,608$ 1,192,608$
-142-

Schedule 70Page 2 of 2
General Insurance FundSchedule of Revenues, Expenses and Changes in Fund Balance - Budget and Actual (Non-GAAP)For the Fiscal Year Ended June 30, 2005
Reconciliation of Modified Accrual Basis to Full Accrual Basis: Total Revenues 2,489,872$ Total Expenses 1,297,264
Income Before Transfers 1,192,608$
-143-

Schedule 71Page 1 of 2
Capital Leasing FundSchedule of Revenues, Expenses and Changes in Fund Balance - Budget and Actual (Non-GAAP)For the Fiscal Year Ended June 30, 2005
VariancePositive
Budget Actual (Negative)Operating Revenues: Charges for Current Services 7,251,000$ 5,887,753$ (1,363,247)$ Miscellaneous Operating Revenues 80,000 186,307 106,307 Total Operating Revenue 7,331,000 6,074,060 (1,256,940) Operating Expenses: Maintenance and Operations 94,450 151,435 56,985 Capital Outlay 12,937,103 5,948,842 (6,988,261) Total Operating Expenses 13,031,553 6,100,277 (6,931,276)
Operating Loss (5,700,553) (26,217) 5,674,336
Nonoperating Revenues: Investment Income 113,924 113,924
Nonoperating Expenses: Principal Maturities 6,000,000 4,362,962 (1,637,038) Interest Expense 950,000 247,451 (702,549) Miscellaneous Nonoperating Expense 170,000 114,243 (55,757) Total Nonoperating Expenses 7,120,000 4,724,656 (2,395,344)
Excess of Revenues Under Expenses Before Other Financing Sources (12,820,553) (4,636,949) 8,183,604
Other Financing Sources: Debt Issuances: Capitalized Leases 8,500,000 5,933,857 (2,566,143)
Excess of Revenues and Other Financing Sources Over (Under) Expenses (4,320,553) 1,296,908 5,617,461
Appropriated Fund Balance 4,320,553 (4,320,553)
Excess of Revenues and Other Financing Sources Over Expenses $ 1,296,908$ 1,296,908$
-144-

Schedule 71Page 2 of 2
Capital Leasing FundSchedule of Revenues, Expenses and Changes in Fund Balance - Budget and Actual (Non-GAAP)For the Fiscal Year Ended June 30, 2005
Reconciliation of Modified Accrual Basis to Full Accrual Basis: Total Revenues 6,187,984$ Total Expenses 10,824,933
Excess of Revenues Under Expenses Before Other Financing Sources (4,636,949)
Adjustment to Full Accrual Basis: Depreciation (3,557,564) Principal Maturities 4,362,962 Capital Outlay 5,948,842 Trustee Debt Service Escrow Account (47,325)
Income Before Transfers 2,069,966$
-145-

Schedule 72
Schedule of General Capital AssetsBy SourceJune 30, 2005
General Capital Assets:Land 52,096,326$ Improvements Other Than Buildings 12,745,348Buildings 120,421,526Furniture, Fixtures,Machinery and Equipment 110,909,544Infrastructure 191,045,444Construction in Progress 32,755,651Accumulated Depreciation (201,399,447)
Total General Capital Assets 318,574,392$
Investment in General Capital Assets by Source:General Fund 60,202,655$ General Obligation Bonds 100,587,141Grant Funds 15,016,640Infrastructure 242,847,969Internal Service Funds 101,319,434Accumulated Depreciation (201,399,447)
Total Investment in General Capital Assets 318,574,392$
-146-

Schedule 73Page 1 of 2
Schedule of General Capital AssetsBy Function and ActivityJune 30, 2005
ImprovementsOther Than
Land Buildings Buildings
General Government: Administration 210,295$ 752$ 3,290,682$ Job Training Consortium Total General Government 210,295 752 3,290,682
Public Safety: Police 984,526 13,750 6,796,931 Fire 1,367,579 47,093 25,868,523 Metro Communications Total Public Safety 2,352,105 60,843 32,665,454
Transportation 340,623 386,667 22,250 Infrastructure 28,994,660 Total Transportation 29,335,283 386,667 22,250
Engineering and Inspections 4,668,083 388,157 23,317,812
Culture and Recreation: Parks and Recreation 11,919,046 11,018,524 34,649,853 Library 1,950,973 55,867 24,956,930 Total Culture and Recreation 13,870,019 11,074,391 59,606,783
Internal Service Funds 1,660,541 834,538 1,518,545
Accumulated Depreciation (8,171,665) (36,518,257)
Total General Capital Assets 52,096,326$ 4,573,683$ 83,903,269$
-147-

Schedule 73Page 2 of 2
Furniture, Fixtures,Machinery Construction
and Equipment Infrastructure In Progress Total
3,520,342$ $ 79,826$ 7,101,897$ 58,875 58,875
3,579,217 79,826 7,160,772
3,193,999 781,505 11,770,7112,108,445 1,132,373 30,524,013
137,042 137,0425,302,444 2,050,920 42,431,766
1,571,238 158,373 2,479,151191,045,444 22,807,865 242,847,969
1,571,238 191,045,444 22,966,238 245,327,120
1,566,530 2,384,423 32,325,005
2,990,328 2,358,489 62,936,2401,036,330 473,402 28,473,5024,026,658 2,831,891 91,409,742
94,863,457 2,442,353 101,319,434
(71,694,552) (85,014,973) (201,399,447)
39,214,992$ 106,030,471$ 32,755,651$ 318,574,392$
-148-

Schedule 74Page 1 of 2
Schedule of Changes in General Capital AssetsBy Function and ActivityFor the Fiscal Year Ended June 30, 2005
GeneralCapital AssetsJuly 1, 2004 Additions
General Government: Administration 7,129,931$ $ Job Training Consortium 58,875 Total General Government 7,188,806
Public Safety: Police 8,628,327 2,422,261 Fire 25,506,262 3,885,379 Total Public Safety 34,134,589 6,307,640
Transportation 2,192,663 138,965 Infrastructure 217,629,132 2,410,972 Total Transportation 219,821,795 2,549,937
Engineering and Inspections 31,540,258 418,428
Environmental Services 99,199,013
Culture and Recreation: Parks and Recreation 57,281,372 3,444,987 Library 22,963,063 5,452,169 Total Culture and Recreation 80,244,435 8,897,156
Internal Service Funds 96,099,125 9,650,214
Construction in Progress 32,896,102 22,056,467
Accumulated Depreciation (235,083,483) (18,547,887)
Total General Capital Assets 366,040,640$ 31,331,955$
-149-

Schedule 74Page 2 of 2
GeneralTransfers Deductions/ Capital Assets
In Out Disposals June 30, 2005
$ $ 107,860$ 7,022,071$ 58,875 107,860 7,080,946
61,383 10,989,205 29,391,641
61,383 40,380,846
10,850 2,320,778 220,040,104
10,850 222,360,882
2,018,104 29,940,582
99,199,013
148,608 60,577,751
415,132 28,000,100 563,740 88,577,851 6,872,258 98,877,081
1,857,584 20,339,334 32,755,651
(44,893,187) (7,338,736) (201,399,447) $ 56,163,410$ 22,634,793$ 318,574,392$
-150-

Schedule 75Page 1 of 2
Schedule of Changes in General Long-Term DebtFor the Fiscal Year Ended June 30, 2005
DebtOutstanding July 1, 2004 Additions
Amount Available in Debt Service Fund for Retirement of Bonded Debt 13,649,034$ $
Amount to be Provided for Retirement of Bonded Debt 152,456,746 45,152,711
Total Amount to be Provided for Retirement of Bonded Debt 166,105,780 45,152,711
Amount Available in Special Revenue Fund for Retirement of Certificates of Participation 423,930
Amount to be Provided for Retirement of Certificates of Participation 35,824,430 7,000,000
Total Amount to be Provided for Retirement of Certificates of Participation 36,248,360 7,000,000
Amount to be Provided for Retirement of Other Long-Term Debt: Lease-Purchase and Other Financing Agreements 5,763,705 520,216 Compensated Absences Payable 8,701,503 6,622,552
Total Amount to be Provided for Retirement of Other Long-Term Debt 14,465,208 7,142,768
Total Available and to be Provided 216,819,348$ 59,295,479$
General Long-Term Debt Payable: General Obligation Bonds Payable 166,105,780$ 45,152,711$
Lease-Purchase and Other Financing Agreements Payable 5,763,705 520,216
Certificates of Participation Payable 36,248,360 7,000,000
Compensated Absences Payable 8,701,503 6,622,552
Total General Long-Term Debt Payable 216,819,348$ 59,295,479$
-151-

Schedule 75Page 2 of 2
DebtOutstanding
Transfers Retirements June 30, 2005
(847,096)$ $ 12,801,938$
847,096 44,708,494 153,748,059
44,708,494 166,549,997
(285,010) 138,920
285,010 5,514,000 37,595,440
5,514,000 37,734,360
1,505,684 4,778,237 (231,562) 5,854,741 9,237,752
(231,562) 7,360,425 14,015,989
(231,562)$ 57,582,919$ 218,300,346$
$ 44,708,494$ 166,549,997$
1,505,684 4,778,237
5,514,000 37,734,360
(231,562) 5,854,741 9,237,752
(231,562)$ 57,582,919$ 218,300,346$
-152-

-153-
Statistical Section
The statistical section reflects financial trends, demographic and economic data and the fiscal capacity of the City.

Table I
General Governmental Expenditures by Function (a)Fiscal Years Ended June 30, 1996-2005
Fiscal Year General Public Engineering Environmental
Ended Government Safety Transportation & Inspections Services
1996 17,798,273$ 50,683,777$ 15,253,900$ 6,828,133$ 1,989,217$
1997 18,032,730 52,787,732 16,677,743 8,306,073 2,000,721
1998 19,684,927 56,775,303 17,453,204 8,020,128 3,334,911
1999 19,188,780 60,379,463 18,128,536 7,575,725 3,127,775
2000 23,003,255 65,196,951 19,765,082 7,534,927 4,034,475
2001 27,767,738 69,590,703 17,706,040 8,220,175 5,295,458
2002 27,155,150 75,745,002 21,200,327 8,170,569 3,543,174
2003 29,401,783 77,082,617 22,537,089 8,742,605 2,454,233
2004 29,322,504 82,296,484 25,882,887 10,472,308 2,855,908
2005 21,952,495 88,894,417 21,771,748 16,905,640 655,149
(a) Includes General, Special Revenue and Debt Service Funds.
-154-

Table I
Culture Communityand Development Economic Debt
Recreation and Housing Opportunity Intergovernmental Service Total
19,696,454$ 5,450,074$ 2,200,208$ 757,062$ 17,912,111$ 138,569,209$
20,584,385 6,269,383 1,655,711 729,423 18,332,209 145,376,110
21,315,468 6,048,747 1,972,833 833,702 18,419,190 153,858,413
22,512,136 7,034,569 2,212,284 908,192 20,991,890 162,059,350
25,061,969 6,665,618 2,202,022 891,314 21,253,566 175,609,179
28,051,726 7,474,149 1,867,841 972,861 20,450,014 187,396,705
27,678,205 10,062,391 2,323,319 1,036,892 18,629,814 195,544,843
26,752,538 8,922,528 2,876,189 1,149,260 19,858,363 199,777,205
29,266,997 8,739,986 2,739,584 1,203,854 19,918,240 212,698,752
30,687,261 9,253,208 2,992,840 1,325,930 21,721,314 216,160,002
-155-

Table II
General Government Revenues By Source (a)Fiscal Years Ended June 30, 1996-2005
Fiscal Licenses FinesYear and and
Ended Taxes Intergovernmental Permits Forfeitures
1996 96,487,129$ 28,979,298$ 6,220,581$ 481,024$
1997 105,561,152 31,851,211 6,805,294 506,009
1998 111,693,978 34,128,412 7,630,527 663,428
1999 114,153,779 34,072,529 7,938,935 693,342
2000 119,319,081 35,874,133 8,085,184 691,472
2001 123,515,044 36,410,159 9,370,223 951,892
2002 125,253,973 27,624,342 9,436,921 849,289
2003 132,246,009 31,892,692 8,844,568 723,536
2004 137,152,517 39,184,108 8,481,016 823,071
2005 153,940,553 38,553,374 8,926,893 979,352
(a) Includes General, Special Revenue and Debt Service Funds.
-156-

Table II
Charges forCurrent InvestmentServices Income Miscellaneous Total
13,273,096$ 7,084,042$ 3,325,548$ 155,850,718$
14,440,553 6,463,961 2,818,232 168,446,412 -
14,807,346 6,944,999 3,172,316 179,041,006
15,279,931 7,279,173 4,049,839 183,467,528
20,372,456 8,245,016 2,707,229 195,294,571
22,650,699 11,777,523 2,277,819 206,953,359
25,431,823 7,718,648 3,503,049 199,818,045
26,219,562 4,907,774 5,135,075 209,969,216
28,324,184 1,518,483 3,199,026 218,682,405
21,437,475 3,989,090 3,383,157 231,209,894
-157-

Table III
General Governmental Tax Revenues By Source (a)Fiscal Years Ended June 30, 1996-2005
Fiscal Local RentalYear Ad Valorem Option Hotel/Motel Vehicle Gross
Ended Property Tax Sales Tax Occupancy Tax Receipts Tax Total
1996 71,555,461$ 23,219,514$ 1,712,154$ $ 96,487,129$
1997 78,908,631 24,680,520 1,972,001 105,561,152
1998 83,398,779 26,163,103 2,132,096 111,693,978
1999 84,026,579 27,703,995 2,423,205 114,153,779
2000 88,281,716 28,870,006 2,590,553 119,742,275
2001 90,637,797 29,764,504 2,700,853 411,890 (b) 123,515,044
2002 93,715,418 28,609,704 2,493,777 435,074 125,253,973
2003 99,250,995 30,023,807 2,623,791 347,416 132,246,009
2004 100,122,908 34,121,791 2,572,272 335,546 137,152,517
2005 115,341,324 35,542,429 2,734,573 322,227 153,940,553
(a) Includes General, Special Revenue and Debt Service Funds.
(b) First Year of Tax.
-158-

Table IV
Assessed Value of All Taxable PropertyFiscal Years Ended June 30, 1996-2005
Fiscal Total Year Tax Real Personal Corporate Assessed
Ended Year (b) Property Property Excess Value (a)
1996 1995 (c) 8,172,871,380$ 2,255,556,582$ 454,615,825$ 10,883,043,787$
1997 1996 (c) 10,477,875,609 2,490,686,370 532,336,721 13,500,898,700
1998 1997 (c) 10,855,772,662 2,787,632,052 530,852,680 14,174,257,394
1999 1998 (c) 10,982,681,696 3,306,668,644 553,306,664 14,842,657,004
2000 1999 (c) 11,290,118,175 3,747,352,541 580,691,567 15,618,162,283
2001 2000 (c) 11,730,230,339 3,881,959,402 540,286,350 16,152,476,091
2002 2001 (c) 12,101,262,851 3,975,144,763 582,404,785 16,658,812,399
2003 2002 (c) 12,496,032,410 3,707,812,375 531,613,540 16,735,458,325
2004 2003 (c) 12,751,289,348 3,635,487,740 477,767,729 16,864,544,817
2005 2004 (c) 16,668,949,428 3,747,486,309 542,354,044 20,958,789,781
(a) The City's property tax is levied each July 1 on the assessed value listed as ofthe prior January 1 for all real and personal property located within the City.Assessed valuations are established by Guilford County at 100% of estimatedmarket value for real property and 100% of actual value for personal property.Public service company (corporate excess) property is certified by the State ofNorth Carolina at 100% of actual value, with no distinction between real andpersonal property values. The City implemented a staggered motor vehicleproperty tax billing system during 1993 - 1994, which was required by statestatute. Under this system, property taxes are billed as motor vehicleregistrations are renewed.
(b) A revaluation of real property is required by North Carolina General Statutes atleast every eight years. The last revaluation was completed for tax year 2004.
(c) The City offered a 1% discount for taxes paid prior to September 1.This discount amounted to $556,299 for 2004.
-159-

Table V
Property Tax Levies and CollectionsFiscal Years Ended June 30, 1996-2005
Fiscal Net Current YearYear Tax Tax Percent
Ended Levy Collections Collected
1996 74,425,862$ 73,713,475$ 99.04 %
1997 82,689,999 81,777,207 98.90
1998 87,914,575 86,834,677 98.77
1,999 88,508,859 87,374,776 98.72
2000 92,905,836 91,647,025 98.65
2001 95,992,859 94,809,679 98.77
2002 98,928,643 97,679,465 98.74
2003 104,974,280 103,741,401 98.83
2004 106,015,920 104,456,282 98.53
2005 121,697,513 119,223,482 97.97
-160-

Table V
Delinquent Total Percent of OutstandingTax Collections Total Collections Delinquent
Collections During Year to Net Levy Taxes (a)
1,047,191$ 74,760,666$ 100.45 1,048,874$
911,245 82,688,452 100.00 1,135,412
804,332 87,639,009 99.69 1,638,846
700,723 88,075,499 99.51 2,265,952
826,179 92,473,204 99.53 2,611,856
1,043,390 95,853,069 99.85 2,667,612
972,243 98,651,708 99.72 2,769,386
862,914 104,604,315 99.65 3,299,514
908,278 105,364,560 99.39 3,660,297
1,126,836 120,350,318 98.89 4,180,132
(a) Outstanding delinquent taxes and levies are adjusted for rebates made during the current year. Historical amounts have not been adjusted for rebates. The City maintains 10 years of delinquent taxes receivable on its books and removes the oldest receivable each June 30.
(b) Amount includes $250,226 outstanding for GTA and $2,863 for Special Historic Tax Districts.
Current year outstanding taxes 2,474,031$ Prior year outstanding taxes 1,706,101
4,180,132$ (b)
-161-

Table VI
Analysis of Current Tax LevyFor the Fiscal Year Ended June 30, 2005
PropertyExcluding
City - Wide Registered RegisteredProperty Total Motor MotorValuation Rate Levy Vehicles Vehicles
Original Levy:Property taxed at current
year's rate 20,492,655,922$ $.5675 116,295,823$ 110,894,834$ 5,400,989$ Property taxed at prior
year's rate 705,811,747 .6175 4,358,388 4,358,388Registered motor vehicles
taxed at prior year's rates 473,083 Various 2,918 2,918Penalties 33,721 33,721Vehicle Fee 1,808,020 1,808,020Special Tax Districts 538,875 538,533 342
Total 21,198,940,752 123,037,745 113,275,108 9,762,637
Discoveries:Current year taxes 96,006,254 .5675 544,835 544,835Prior year taxes 19,085,263 Various 116,722 116,722Penalties 52,552 52,552
Total 115,091,517 714,109 714,109
Abatements 355,242,488 2,054,341 1,858,306 196,035
Total property valuation 20,958,789,781$
Net levy 121,697,513 112,130,911 9,566,602
Uncollected taxes at June 30, 2005 2,474,031 1,773,990 700,041
Current year's taxes collected 119,223,482$ 110,356,921$ 8,866,561$
Current levy collection percentage 97.97% 98.42% 92.68%
Total Levy
-162-

Table VII
Property Tax RatesDirect and Overlapping GovernmentsFiscal Years Ended June 30, 1996-2005
City of GreensboroFiscalYear General Transit
Ended Fund Fund Total
Tax Rate (Per $100)
1996 .6550 .0150 .6700
1997 .5845 .0130 .5975
1998 .5925 .0150 .6075
1999 .5675 .0150 .5825
2000 .5675 .0150 .5825
2001 .5625 .0200 .5825
2002 .5625 .0200 .5825
2003 .5975 .0200 .6175
2004 .5975 .0200 .6175
2005 .5500 .0175 .5675
Tax Rate Limits: The Property Tax Rate for units of local government is limitedto a combined rate of $1.50 per $100 of assessed value ofproperty subject to taxation. This limit may be raised if approvedby voter referendum. No limit is imposed on debt service or school tax rates.
Due Date for Current Taxes: September 1
Date Taxes Become Delinquent: January 6
-163-

Table VII
Combined County-Wide Total Tax Rate
$ .7548 $ .7548 $ 1.4248
.6572 .6572 1.255
.6572 .6572 1.265
.6372 .6372 1.22
.6372 .6372 1.22
.6372 .6372 1.2197
.6742 .6742 1.2567
.6742 .6742 1.2197
.7135 .7135 1.3310
.6184 .6184 1.1859
Penalty for Delinquent Taxes: On or after January 6, and before February 1, interestat the rate of 2% is added to the tax. On or afterFebruary 1, in addition to the 2%, interest at the rateof 3/4% per month shall be added to the tax.
Discounts Allowed: City of Greensboro and Guilford County - 1% of tax levy for ad valorem tax paid prior to September 1.
Procedures for Collecting Delinquent Taxes: Garnishment, levy, attachment and foreclosure.
School System Taxes: Subsequent to the merger of the Greensboro SchoolSystem and the Guilford County School System, schoolfunding has been provided for in the County-Wide tax levy.
Guilford County
-164-

Table VIII
Principal TaxpayersJune 30, 2005
Type of Current AssessedPercentage of Total Assessed
Firm Business Year's Tax Value Value
Koury Corporation Real Estate Development 2,256,547$ 397,629,435$ 1.90%Lorillard Tobacco Company Cigarette Manufacturing 1,335,115 235,262,485 1.12%Starmount Company Real Estate Development 965,558 170,142,463 0.81%Duke Energy Corporation Electric Utility 911,316 160,584,349 0.77%Highwoods/Forsyth Ltd. Real Estate Development 896,175 157,916,300 0.75%Proctor & Gamble Mfg. Co. Chemicals 821,392 144,738,692 0.69%RF Micro Devices, Inc. Service Communications 821,081 144,683,870 0.69%BellSouth Service Communications 731,800 128,951,508 0.62%Koury Ventures LTD Real Estate Development 729,929 128,621,923 0.61%TYCO Electronics (AMP, Inc.) Electronics Manufacturing 568,729 100,216,573 0.48%Jefferson-Pilot Life Ins Co. Insurance 559,431 98,578,185 0.47%Stockhausen, Inc. Specialty Chemicals 491,325 86,577,063 0.41%VF (Wrangler) Textile Manufacturing 442,210 77,922,476 0.37%BNP/Chrysson Phase I LLC Real Estate Management 431,318 76,003,132 0.36%URDT of North Carolina LLC Real Estate Development 406,560 71,464,332 0.34%Syngenta (Novartis, CIBA) Research & Development 343,787 60,579,224 0.29%
- Industrial Chemicals Harris-Teeter Food Distribution 321,035 56,570,088 0.27%AP Knight LP (Koger Equity, Inc.) Real Estate Development 302,712 53,341,307 0.25%Volvo Truck North America Truck Manufacturer 296,659 52,274,722 0.25%Greensboro Auto Auction, Inc. Automobile Auctioneer 285,998 50,396,197 0.24%Colonial Pipeline Company Petroleum Carrier 283,313 49,923,075 0.24%American Express Travel Credit Card Service Center 269,909 47,561,098 0.23%E R Squibb & Sons Inc. Medical Supplies 242,782 42,780,905 0.20%Piedmont Natural Gas Natural Gas Utility 241,230 42,507,491 0.20%Wal-Mart Stores, Inc. Retail Stores 240,343 42,351,150 0.20%Heritage Property Investment Real Estate Development 223,887 39,451,400 0.19%Greensboro Lease Management Property Management 222,490 39,205,300 0.19%Weaver Investment Company Real Estate Development 221,547 39,039,069 0.19%AT&T Communications Service Communications 219,334 38,649,241 0.18%Shannon Enterprises of the SE LLC Manufacturing 217,801 38,379,110 0.18%Time Warner Ent/Advance/Newhouse Cable Network 215,975 38,057,291 0.18%Marconi Commerce Sys Inc.(Gilbarco) Service Station Equipment 199,988 35,240,247 0.17%CP Venture Two LLC Real Estate Development 197,620 34,822,988 0.17%Highwoods Realty LP Real Estate Development 192,348 33,893,890 0.16%Cone Mills Corporation Textile Manufacturing 190,848 33,629,521 0.16%
Totals 17,298,092$ 3,047,946,100$ 14.53%
The Total Assessed Valuation for the City of Greensboro is $20,958,789,781
-165-

Table IX
Assessments Receivable and CollectionsFiscal Years Ended June 30, 1996-2005
Fiscal Assessments AssessmentsYear Receivable Additional Receivable
Ended July 1 Assessments Collections June 30
1996 1,145,980$ 259,358$ 568,683$ 836,655$
1997 836,655 598,226 687,414 747,467
1998 747,467 773,233 661,455 859,245
1999 859,245 1,071,530 743,704 1,187,071
2000 1,187,071 1,338,315 1,087,810 1,437,576
2001 1,437,576 423,396 745,255 1,115,717
2002 1,115,717 157,245 509,718 763,244
2003 763,244 400,339 436,345 727,238
2004 727,238 238,601 498,365 467,474
2005 467,474 406,391 400,044 473,821
Note: Uncollected assessments receivable at June 30, 2005 are represented by:
Total Less: NetAssessments Allowances for AssessmentsReceivable Uncollectibles Receivable
Water and Sewer Assessments Receivable $387,168 $19,358 $367,810Other Assessments Receivable 106,011 106,011
Total $493,179 $19,358 $473,821
-166-

Table X
Computation of Legal Debt MarginJune 30, 2005
Appraised Valuation - June 30, 2005 20,958,789,781$
Debt Limit - Eight (8) Percent of Appraised Valuation 1,676,703,182$
Gross Debt: Outstanding Bonded Debt: General Government Bonds 166,549,997$ Water Bonds 944,568 Sewer Bonds 1,585,435
Total General Obligation Bonds 169,080,000$
Combined Enterprise System Revenue Bonds 200,610,000
Bonds Authorized and Unissued: General Government Bonds 71,320,000
Outstanding Debt Not Evidenced by Bonds: Certificates of Participation 46,650,000 Lease-Purchase and Other Financing Agreements 9,978,870
Total Debt Not Evidenced by Bonds 56,628,870
Gross Debt 497,638,870
Statutory Deductions: Bonds Authorized and Unissued 71,320,000 Funds Available for Debt Retirement 12,940,858 Bonded Debt Incurred for Water/Sewer Utility 2,530,003 Revenue Bonds 200,610,000
Total Statutory Deductions 287,400,861
Net Debt - Total Amount Applicable to Debt Limit 210,238,009
Legal Debt Margin 1,466,465,173$
-167-

Table XI
Ratio of Annual Debt Service Expendituresfor General Obligation Bonded Debt to Total General Governmental ExpendituresFiscal Years Ended June 30, 1996-2005
Percent ofTotal Debt Service
Fiscal General To GeneralYear Governmental Governmental
Ended Principal Interest Total Expenditures (a) Expenditures
1996 7,200,000$ 7,824,759$ 15,024,759$ 138,569,209$ 10.8 %
1997 8,400,000 7,043,743 15,443,743 145,376,110 10.6
1998 8,470,000 6,891,778 15,361,778 153,858,413 10.0
1999 9,493,855 8,374,881 17,868,736 162,059,350 11.0
2000 9,611,989 7,914,360 17,526,349 175,609,179 9.9
2001 9,674,919 7,512,428 17,187,347 187,396,705 9.2
2002 9,697,142 6,096,087 15,793,229 195,544,843 8.1
2003 11,511,905 4,738,747 16,250,652 199,777,205 8.1
2004 10,706,596 6,135,364 16,841,960 212,698,752 7.9
2005 12,758,770 5,605,100 18,363,870 216,160,002 8.5
(a) Includes General, Special Revenue and Debt Service Funds.
Debt Service Requirements
-168-

Table XII
Ratio of Net General Obligation Bonded DebtTo Assessed Value and Net General Obligation Debt Per CapitaFiscal Years Ended June 30, 1996-2005
Less Amount Less DebtFiscal Revised Gross Available in Payable fromYear Assessed Bonded Debt Service Water Resources
Ended Valuation (a) Debt Fund Revenues
1996 10,883,043,787$ 154,285,000$ 2,422,371$ 11,440,000$
1997 13,500,898,700 145,085,000 4,320,275 10,640,000
1998 14,174,257,394 187,775,000 9,369,770 9,800,000
1999 14,842,657,004 177,235,000 9,837,391 8,920,000
2000 15,618,162,283 166,410,000 10,213,218 7,900,000
2001 16,152,476,091 155,520,000 13,305,006 6,885,000
2002 16,658,812,399 154,565,000 16,572,271 5,835,000
2003 16,735,458,323 181,630,000 16,106,751 4,857,797
2004 16,864,544,817 169,785,000 13,649,034 3,679,220
2005 20,958,789,781 169,080,000 12,801,938 2,530,003
(a) Assessed valuation represents one hundred percent (100%) of estimated market value.
(b) Population figures are based on the City Planning Department's estimatesas of July 1 each year.
(c) North Carolina Office of State Planning.
-169-

Table XII
Ratio of Net NetNet Bonded Debt To Bonded
Bonded Assessed Debt PerDebt Valuation Population (b) Capita
140,422,629$ 1.3 % 200,911 ( c) 699$
130,124,725 1.0 202,321 643
168,605,230 1.2 205,132 822
158,477,609 1.1 208,887 759
148,296,782 0.9 213,003 696
135,329,994 0.8 226,467 598
132,157,729 0.8 229,634 576
160,665,452 1.0 231,740 693
152,456,746 0.9 235,262 648
153,748,059 0.7 238,440 645
-170-

Table XIII
Computation of Direct and Overlapping Bonded DebtGeneral Obligation BondsFiscal Year Ended June 30, 2005
Percent City'sBonded Debt Applicable Share ofOutstanding To City (b) Debt
Direct Debt - City of Greensboro (a) 166,549,997$ 100.00% 166,549,997$
Overlapping Debt - Guilford County General Improvement Bonds 438,880,000 52.15% 228,875,920
Total Direct and Overlapping Debt 605,429,997$ 395,425,917$
(a) This total does not include $2,530,003 of Water and Sewer Bonds.
(b) Percentage of Direct and Overlapping Debt is based on 2004 Assessed Valuation of Guilford County as compared to the 2004 Assessed Valuation of the City of Greensboro.
-171-

Table XIV
Revenue and Special Obligation Bond CoverageFiscal Years Ended June 30, 1996 - 2005
Fiscal Year Net Revenue Ended
June 30Gross Revenues
(c) Gross Expenses
(d)Available for Debt Service Principal Interest Total Coverage (f)
1996 $29,086,187 19,732,739$ 9,353,448$ $ - 2,480,111$ 2,480,111$ 3.77
1997 33,860,896 22,034,403 11,826,493 1,060,000 2,472,161 3,532,161 3.35
1998 35,637,038 22,652,592 12,984,446 750,000 2,479,346 3,229,346 4.02
1999 42,966,795 24,468,614 18,498,181 835,000 2,357,724 3,192,724 5.79
2000 47,828,951 28,057,897 19,771,054 1,775,000 4,209,330 5,984,330 3.30
2001 50,176,686 31,735,595 18,441,091 1,905,000 4,143,637 6,048,637 3.05
2002 48,687,875 34,267,547 14,420,328 2,005,000 5,799,131 7,804,131 1.85
2003 49,486,992 34,432,254 15,054,738 3,170,000 5,371,060 8,541,060 1.76
2004 54,752,946 35,851,060 18,901,886 3,395,000 5,201,640 8,596,640 2.20
2005 63,641,182 38,713,873 24,927,309 4,720,000 6,125,286 10,845,286 2.30
Fiscal Year Sales TaxEnded
June 30 Revenues
Pledged (h) Principal Interest Total Coverage (g)
1998 10,206,764$ $ - 791,758$ 791,758$ 12.89
1999 10,866,670 - 789,322 789,322 13.77
2000 11,434,016 830,000 789,564 1,619,564 7.06
2001 11,893,302 865,000 752,214 1,617,214 7.35
2002 11,876,499 905,000 712,424 1,617,424 7.34
2003 11,501,475 950,000 684,476 1,634,476 7.04
2004 10,701,029 995,000 626,144 1,621,144 6.60
2005 11,093,510 1,040,000 588,403 1,628,403 6.81
(a) The City issued water and sewer revenue bonds in the amount of $50,000,000 dated June 1995 (refunded in 2001 and 2005) $40,000,000 dated June 1998, $45,740,000 dated June 2001 , $43,435,000 dated July 2003 and $40,780,000 dated June 2005(b) The City issued landfill special obligation bonds in the amount of $16,000,000 dated May 1997. (c) Gross revenues are for the combined Water Resources Enterprise Fund for the fiscal year.(d) Gross expenses exclude depreciation and bond interest.(e) Includes principal and interest of revenue bonds only.(f) The most restrictive required coverage is 1.60.(g) The required coverage is 2.00.(h) As defined in Articles 40 and 42 of the Sales Tax Act.
Debt Service Expenses (e)
Water Resources Enterprise Fund (a)
Solid Waste Management Fund (b)
Debt Service Expenses
-172-

Table XV
Demographic Statistics1996-2005
Per Capita School Percentage of Year Population Income Enrollment Unemployment (d)
1996 200,911 (e) 27,212 (b) 57,115 (c) 3.7
1997 202,321 (a) 27,416 (b) 58,404 (c) 3.3
1998 205,132 (a) 28,963 (b) 59,691 (g) 2.8
1999 208,887 (a) 29,268 (b) 59,615 (c) 2.5
2000 213,003 (a) 30,372 (b) 60,555 (c) 2.9
2001 226,467 (a) 30,932 (b) 62,570 (c) 4.9
2002 229,634 (a) 31,225 (b) 62,426 (c) 6.4
2003 231,740 (a) 31,786 (b) 64,500 (c) 6.3
2004 235,262 (a) - (f) 67,099 (c) 5.7
2005 238,440 (a) - (f) 67,099 (c) 5.1
(a) Greensboro Planning Department estimates.
(b) Bureau of Economic Analysis.
(c) Greensboro City and Guilford County Consolidated School System.
(d) North Carolina Employment Security Commission.
(e) North Carolina Office of State Planning.
(f) Information not available.
(g) State Department of Public Education.
-173-

Table XVI
Miscellaneous Statistical DataJune 30, 2005
I. City Vitae:
Date of Incorporation (Town) 1829 (City) 1870Date of Original Charter (Town) 1808 (City) 1870Form of Government Council - ManagerArea of the City 121.5 Sq. MilesPopulation 238,440Miles of Streets: Paved 1,306 Unpaved 3Miles of Water Mains 1,385Miles of Sanitary Sewer 1,486Gallons of Water Consumption 31,000,000Water Meters 95,060
II. City Workforce:
Municipal Employees: Permanent 2,770 Part-Time 149Police Protection: Sworn Officers 556 Civilians 117 School Crossing Guards 25Fire Protection: Fire Stations 19 Uniformed Employees 406
III. City Cultural and Recreational Facilities:
Libraries: Main Building/Branches 7Culture and Recreation: Parks, Open Spaces, Beautification Areas 350 Acres 5,749 Arboretum/Bicentennial Garden/Bog Garden/Arts Center/Historical Tannenbaum Park 5 Camp for Special Populations/Recreation Centers/Multicultural Center 15 Golf Courses 2 Tennis Courts 112 Swimming Pools 7 Ball Fields 56 Basketball Courts 44War Memorial Coliseum (Arena, Auditorium, Special Events Center, Meeting Rooms): Arena Seating Capacity 23,500 Auditorium Seating Capacity 2,430 Special Events Center (with Mini-Arena) Capacity in Square Feet 167,000 Total Number of Events 748 Total Attendance 1,035,691
-174-

Table XVII
Construction, Bank Deposits and Property ValuesFiscal Years Ended June 30, 1996-2005
New Non-Residential Construction New Residential ConstructionFiscalYear Number Number Total
Ended of Units Value of Units Value Value (a)
1996 1,158 (b) 170,941,830$ (b) 2,338 117,247,627$ 288,189,457$ (b)
1997 1,251 132,441,002 2,728 222,735,359 355,176,361
1998 1,390 292,080,846 2,944 134,257,506 426,338,352
1999 1,203 249,281,547 2,827 173,951,330 423,232,877
2000 1,186 227,822,335 2,730 156,369,375 384,191,710
2001 1,133 293,496,309 2,751 180,811,808 474,308,117
2002 1,194 256,985,784 3,000 194,924,079 451,909,863
2003 951 255,534,295 2,834 185,725,021 441,259,316
2004 1,067 170,338,710 3,220 235,495,488 405,834,198
2005 932 196,464,656 3,714 282,848,678 479,313,334
(a) Engineering and Inspections Department.
(b) Starting in 1993, new construction includes new buildings, additions, expansions and repairs. The "unit number" reflects all permits for new construction.
(c) Federal Deposit Insurance Corporation and National Credit Union Administration
(d) Approximate Values
(e) Not Available
(f) In 2005, reports modified to pull only City of Greensboro Non-Taxable property values.
-175-

Table XVII
Property Value (d)
Bank Deposits (c) (Thousands) Commercial Residential Nontaxable
3,841,289$ 4,558,583,077$ 6,324,461,710$ 2,002,603,400$
3,975,920 5,812,258,795 7,688,639,905 2,068,924,500
3,546,757 6,083,256,687 8,091,000,707 2,110,642,200
3,936,079 6,549,214,956 8,293,442,048 2,256,461,000
3,959,774 7,054,496,402 8,563,665,881 2,375,300,050
4,351,252 7,226,494,258 8,925,981,833 2,470,924,150
4,511,807 7,533,469,482 9,125,342,917 2,593,696,550
5,081,570 7,519,345,820 9,216,112,505 2,611,235,450
5,119,556 7,459,896,392 9,404,648,425 3,529,819,850
(e) 9,148,044,539 11,810,745,242 2,856,653,668 (f)
-176-

-177-
Single Audit Section The Single Audit Section is established to comply with the Federal and State Single Audit Acts. These Acts establish audit requirements for state and local governments that receive federal and state financial assistance. It provides for independent audits of financial operations, including compliance with certain provisions of federal law and regulations. These requirements are established to insure that audits are made on an organization-wide basis, rather than on a grant-by-grant basis. The accompanying financial statements are presented to reflect state and federal participation in various projects and programs, as adopted by the Greensboro City Council.

CHERRY BEKAERT&.. HOLLAND
Report on Internal Control Over Financial Reporting and on Compliance and Other Matters Based On An Audit of Financial Statements
Performed In Accordance With Government Auditing Standards
To the Honorable Mayor and Members of the City Council City of Greensboro, North Carolina
We have audited the financial statements of the governmental activities, the business-type activities, the Greensboro Housing Development Partnership and Greensboro Transit Authority, which are discretely presented component units, each major fund, and the aggregate remaining fund information of the City of Greensboro, North Carolina, as of and for the year ended June 30, 2005, which collectively comprise the City's basic financial statements, and have issued our report thereon dated October 7, 2005. We did not audit the financial statements of the Greensboro ABC Board. Those financial statements were audited by other auditors whose reports thereon have been furnished to us, and our opinion, insofar as it relates to the amounts included for the Greensboro ABC Board is based solely on the reports of the other auditors. We conducted our audit in accordance with auditing standards generally accepted in the United States of America and the standards applicable to financial audits contained in Government Auditing Standards, issued by the Comptroller General of the United States.
Internal Control Over Financial Reporting In planning and performing our audit, we considered the City of Greensboro's internal control over financial reporting in order to determine our auditing procedures for the purpose of expressing our opinion on the financial statements and not to provide an opinion on the internal control over financial reporting. Our consideration of the internal control over financial reporting would not necessarily disclose all matters in the internal control that might be material weaknesses. A material weakness is a reportable condition in which the design or operation of one or more of the internal control components does not reduce to a relatively low level the risk that misstatements caused by error or fraud in amounts that would be material in relation to the financial statements being audited may occur and not be detected within a timely period by employees in the normal course of performing their assigned functions. We noted no matters involving the internal control over financial reporting and its operation that we consider to be material weaknesses.
Compliance and Other Matters As part of obtaining reasonable assurance about whether the City of Greensboro's financial statements are free of material misstatement, we performed tests of its compliance with certain provisions of laws, regulations, contracts and grant agreements, noncompliance with which could have a direct and material effect on the determination of financial statement amounts. However, providing an opinion on compliance with those provisions was not an objective of our audit and, accordingly, we do not express such an opinion. The results of our tests disclosed no instances of noncompliance that are required to be reported under Government Auditing Standards.

We noted other matters involving the internal control over financial reporting that we have reported to management of City of Greensboro in a separate letter dated October 7, 2005.
This report is intended solely for the information and use of management, others within the organization, members of City Council, and federal and State awarding agencies and pass-through entities and is not intended to be and should not be used by anyone other than these specified parties.
Greensboro, North Carolina October 7, 2005

CHERRY BEKAEITT&. HOLLAND CERTIFIED PUBLIC ACCOUNTANTS & CONSULTANTS
Report On Compliance With Requirements Applicable To Each Major Federal Program And Internal Control Over Compliance In Accordance With OMB
Circular A-133 and the State Single Audit Implementation Act
To the Honorable Mayor and Members of the City Council City of Greensboro, North Carolina
Compliance We have audited the compliance of the City of Greensboro, North Carolina, with the types of compliance requirements described in U.S. Office of Management and Budget (OMB) Circular A-133 Compliance Supplement and the Audit Manual for Governmental Auditors in North Carolina issued by the Local Government Commission, that are applicable to each of its major federal programs forthe year ended June 30, 2005. The City of Greensboro's major federal programs are identified in the summary of auditor's results section of the accompanying schedule of findings and questioned costs. Compliance with the requirements of laws, regulations, contracts and grants applicable to each of its major federal programs is the responsibility of the City of Greensboro's management. Our responsibility is to express an opinion on the City of Greensboro's compliance based on our audit.
We conducted our audit of compliance in accordance with auditing standards generally accepted in the United States of America; the standards applicable to financial audits contained in Government Auditing Standards, issued by the Comptroller General of the United States; and OMB Circular A-133, Audits of States. Local Governments. and Non-Profit Organizations. and the State Single Audit Implementation Act. Those standards, OMB Circular A-133, and the State Single Audit Implementation Act require that we plan and perform the audit to obtain reasonable assurance about whether noncompliance with the types of compliance requirements referred to above that could have a direct and material effect on a major federal program occurred. An audit includes examining, on a test basis, evidence about the City of Greensboro's compliance with those requirements and performing such other procedures, as we considered necessary in the circumstances. We believe that our audit provides a reasonable basis for our opinion. Our audit does not provide a legal determination of the City of Greensboro's compliance with those requirements.
In our opinion, the City of Greensboro complied, in all material respects , with the requirements referred to above that are applicable to each of its major federal programs for the year ended June 30, 2005.
Internal Control Over Compliance The management of the City of Greensboro is responsible for establishing and maintaining effective internal control over compliance with requirements of laws, regulations, contracts and grants applicable to federal programs. In planning and performing our audit, we considered the City of Greensboro's internal control over compliance with requirements that could have a direct and material effect on a major federal program in order to determine our auditing procedures for the purpose of expressing our opinion on compliance and to test and report on internal control over compliance in accordance with OMB Circular A-133 and the State Single Audit Implementation Act.

Our consideration of the internal control over compliance would not necessarily disclose all matters in the internal control that might be material weaknesses. A material weakness is a reportable condition in which the design or operation of one or more of the internal control components does not reduce to a relatively low level the risk that noncompliance with applicable requirements of laws, regulations, contracts and grants caused by error or fraud, that would be material in relation to a major federal program being audited may occur and not be detected within a timely period by employees in the normal course of performing their assigned functions. We noted no matters involving the internal control over compliance and its operation that we consider to be material weaknesses.
This report is intended solely for the information and use of management, others within the organization, members of City Council, and federal and State awarding agencies and p~ss-through entities and is not intended to be and should not be used by anyone other than these specified parties.
Greensboro, North Carolina October 7, 2005
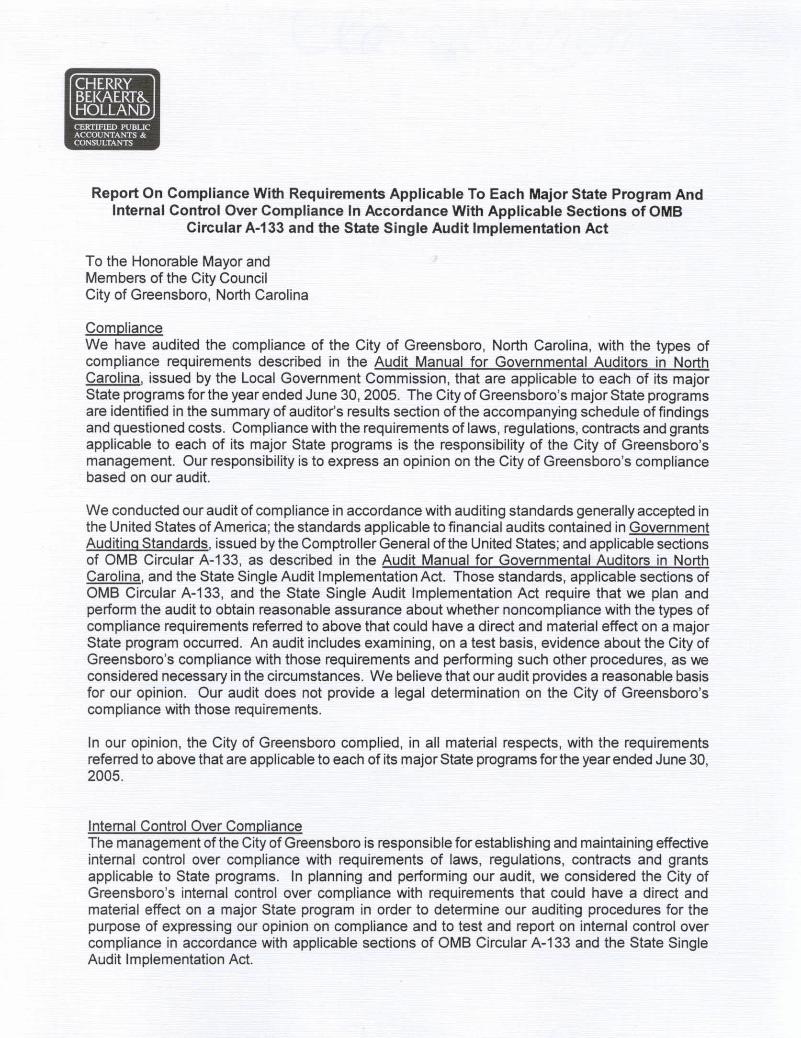
CHERRY BEKAERr&.. HOLLAND
Report On Compliance With Requirements Applicable To Each Major State Program And Internal Control Over Compliance In Accordance With Applicable Sections of OMB
Circular A-133 and the State Single Audit Implementation Act
To the Honorable Mayor and Members of the City Council City of Greensboro, North Carolina
Compliance We have audited the compliance of the City of Greensboro, North Carolina, with the types of compliance requirements described in the Audit Manual for Governmental Auditors in North Carolina, issued by the Local Government Commission, that are applicable to each of its major State programs forthe year ended June 30, 2005. The City of Greensboro's major State programs are identified in the summary of auditor's results section of the accompanying schedule of findings and questioned costs. Compliance with the requirements of laws, regulations, contracts and grants applicable to each of its major State programs is the responsibility of the City of Greensboro's management. Our responsibility is to express an opinion on the City of Greensboro's compliance based on our audit.
We conducted our audit of compliance in accordance with auditing standards generally accepted in the United States of America; the standards applicable to financial audits contained in Government Auditing Standards, issued by the Comptroller General of the United States; and applicable sections of OMB Circular A-133, as described in the Audit Manual for Governmental Auditors in North Carolina, and the State Single Audit Implementation Act. Those standards, applicable sections of OMB Circular A-133, and the State Single Audit Implementation Act require that we plan and perform the audit to obtain reasonable assurance about whether noncompliance with the types of compliance requirements referred to above that could have a direct and material effect on a major State program occurred. An audit includes examining, on a test basis, evidence about the City of Greensboro's compliance with those requirements and performing such other procedures, as we considered necessary in the circumstances. We believe that our audit provides a reasonable basis for our opinion. Our audit does not provide a legal determination on the City of Greensboro's compliance with those requirements.
In our opinion, the City of Greensboro complied, in all material respects, with the requirements referred to above that are applicable to each of its major State programs forthe year ended June 30, 2005.
Internal Control Over Compliance The management of the City of Greensboro is responsible for establishing and maintaining effective internal control over compliance with requirements of laws, regulations, contracts and grants applicable to State programs. In planning and performing our audit, we considered the City of Greensboro's internal control over compliance with requirements that could have a direct and material effect on a major State program in order to determine our auditing procedures for the purpose of expressing our opinion on compliance and to test and report on internal control over compliance in accordance with applicable sections of OMS Circular A-133 and the State Single Audit Implementation Act.

Our consideration of the internal control over compliance would not necessarily disclose all matters in the internal control that might be material weaknesses. A material weakness is a reportable condition in which the design or operation of one or more of the internal control components does not reduce to a relatively low level the risk that noncompliance with applicable requirements of laws, regulations, contracts and grants caused by error or fraud that would be material in relation to a major State program being audited may occur and not be detected within a timely period by employees in the normal course of performing their assigned functions. We noted no matters involving the internal control over compliance and its operation that we consider to be material weaknesses.
This report is intended solely for the information and use of management, others within the organization, members of City Council, and federal and State awarding agencies and pass-through entities and is not intended to be and should not be used by anyone other than these specified parties.
Greensboro, North Carolina October 7, 2005

. City of Greensboro, North Carolina Schedule of Findings and Questioned Costs
For the Fiscal Year Ended June 30, 2005
Section I - Summary of Auditor's Results
Financial Statements
Type of auditor's report issued: Unqualified
Internal control over financial reporting:
•
•
Material weakness(es) identified?
Reportable condition(s) identified That are not considered to be Material weaknesses
Noncompliance material to financial Statements noted
Federal Awards
Internal control over major federal programs:
•
•
Material weakness(es) identified?
Reportable condition(s) identified That are not considered to be Material weaknesses
Noncompliance material to federal awards
_yes
_Jes
_yes
_yes
_Jes
_ yes
2 no
2 none reported
2 no
2 no
2 none reported
2 no
Type of auditor's report issued on compliance for major federal program: Unqualified
Any audit findings disclosed that are required to be Reported in accordance wit~ ~ection 510(a) of Circular A-133 ·
Identification of major federal programs:
CFDA# 20.205, 20.500, 20.505, 20.507
__yes
Program Name Federal Transit Cluster
2 no

City of Greensboro, North Carolina Schedule of Findings and Questioned Costs
For the Fiscal Year Ended June 30, 2005
Dollar threshold used to distinguish Between Type A and Type B Programs
Auditee qualified as low-risk auditee
State Awards
Internal control over major State programs:
•
•
Material weakness(es) identified?
Reportable condition(s) identified That are not considered to be· Material weaknesses
Noncompliance material to State awards
$ 451,820
__L_yes
_yes
__yes
_yes
_no
_Kno
1 none reported
1 no
Type of auditor's report issued on compliance of major State programs: Unqualified
Any audit findings disclosed that are required to be Reported in accordance with the State Single Audit Implementation Act
Identification of major State programs:
Program Name Powell Bill
_yes
Division of Highways - Oka T. Hester Park Dam Construction Division of Highways - Holden/Market Municipal Agreement Governors Highway Safety Program - Traffic Enforcement Positions Federal Transit Cluster
Section II :.:.. Financial Statement Findings
None reported
X no
Section Ill - Federal Awards Findings and Questioned Costs
None reported
Section IV - State Award Findings and Questioned Costs
None reported

Federal ProgramsSchedule of Expenditures of Federal AwardsFor the Fiscal Year Ended June 30, 2005
CFDA GrantFederal Grantor/Pass-Through Grant or/Program Title Number Award Number
Department of Housing and Urban Development:CDBG Entitlement Cluster:
Community Development Block Grants 14.218 B-97-MC-37-0007Community Development Block Grants 14.218 B-98-MC-37-0007Community Development Block Grants 14.218 B-99-MC-37-0007Community Development Block Grants 14.218 B-00-MC-37-0007Community Development Block Grants 14.218 B-01-MC-37-0007Community Development Block Grants 14.218 B-02-MC-37-0007Community Development Block Grants 14.218 B-03-MC-37-0007Community Development Block Grants 14.218 B-04-MC-37-0007Section 108 Project 14.218Day Care-Kids - 1996-97 14.218Day Care-Kids - 1997-98 14.218Day Care-Kids - 1998-99 14.218Day Care-Kids - 2000-01 14.218Day Care-Kids - 2001-02 14.218Day Care-Kids - 2002-03 14.218Day Care-Kids - 2003-04 14.218Day Care-Kids - 2004-05 14.218HOPWA 14.241 NC19H02-F003Willow Oaks 14.218Camel Street Apartments - 2003-04 14.218Brownfield Economic Development - 2003 14.246 B-03-BD-37-0041
Total CDBG Entitlement Cluster
Homes - 1992 14.239 M-92-DC-37-0206Homes - 1993 14.239 M-93-DC-37-0206Homes - 1994 14.239 M-94-DC-37-0206Homes - 1995 14.239 M-95-DC-37-0206Homes - 1996 14.239 M-96-DC-37-0206Homes - 1997 14.239 M-97-DC-37-0206Homes - 1998 14.239 M-98-DC-37-0206Homes - 1999 14.239 M-99-DC-37-0206Homes - 2000 14.239 M-00-DC-37-0206Homes - 2001 14.239 M-01-DC-37-0206Homes - 2002 14.239 M-02-DC-37-0206Homes - 2003 14.239 M-03-DC-37-0206Homes - 2004 14.239 M-04-DC-37-0206Emergency Shelter Grants Program - 1993 14.231 S-93-MC-37-0004Emergency Shelter Grants Program - 2004 14.231 S-04-MC-37-0004
Total Other Community Development Programs
Office of Fair Housing & Equal Opportunity:Fair Housing Assistance Program 14.401 FF-204K-00-4013Fair Housing Assistance Program 14.401 FF-204K-02-4013Fair Housing Assistance Program 14.401 FF-204K-03-4013Fair Housing Assistance Program 14.401 FF-204K-04-4013
Total Office of Fair Housing & Equal Opportunity
Office of Healthy Homes & Lead Hazard Control:Lead Based Paint Grant - 2002-05 14.900 NCLHB0186-01Lead Based Paint Grant - 2005-08 14.900 NCLHB0186-04
Total Office of Healthy Homes & Lead Hazard Control
Total Department of Housing and Urban Development
Department of Justice:Office of Community Oriented Policing Services:
Cops More 2001 16.710 2001CLWX0027Total Office of Community Oriented Policing Services
Office of Justice:Local Law Enforcement Block Grant - 2003-04 16.592 03-LB-BX-1947Local Law Enforcement Block Grant - 2004-05 16.592 04-LB-BX-0736Federal Asset Forfeiture Funds 16.592Federal Asset Forfeiture Funds 16.005Weed and Seed Project 16.595
-178-

ExpendituresProgram
orAward Prior Current Total
Amount Years Year to Date
4,299,343$ 4,299,327$ 16$ 4,299,343$ 2,291,430 2,291,424 6 2,291,4302,512,741 2,505,778 6,963 2,512,7412,494,687 2,494,686 1 2,494,6872,628,455 2,626,899 1,556 2,628,4552,462,428 2,380,549 43,180 2,423,7293,262,573 1,552,849 840,267 2,393,1163,139,572 1,388,541 1,388,541
12,101,000 6,336,115 598,006 6,934,12119,132 19,131 19,13110,880 10,869 10,86920,265 20,409 100 20,50918,125 18,125 18,12511,599 11,598 11,59816,589 9,679 2,976 12,65545,265 8,614 28,197 36,81120,265 8,136 8,136
1,228,000 1,112,587 47,457 1,160,044207,148 59,046 11,410 70,456178,000 24,634 153,366 178,000
2,000,000 9,412 9,41238,967,497 25,782,319 3,139,590 28,921,909
987,000 987,000 987,000651,870 651,870 651,870756,955 756,954 1 756,955
2,013,117 2,000,267 2,000,2671,786,215 1,786,214 1 1,786,2151,442,832 1,442,832 1,442,8321,591,000 1,524,750 9,547 1,534,2971,786,979 1,648,402 70,142 1,718,5441,810,327 1,730,006 36,459 1,766,4651,945,023 1,463,017 184,999 1,648,0162,064,037 1,503,420 433,869 1,937,2891,998,835 374,872 827,206 1,202,0783,227,827 868,443 868,443
82,000 82,000 82,00086,218 75,533 75,533
22,230,235 15,951,604 2,506,200 18,457,804
265,589 262,960 2,629 265,58997,329 51,544 45,785 97,32968,700 17,140 18,585 35,72560,200 173 173
491,818 331,644 67,172 398,816
3,000,000 2,159,580 819,448 2,979,0283,000,000 308,961 308,9616,000,000 2,159,580 1,128,409 3,287,989
67,689,550 44,225,147 6,841,371 51,066,518
597,375 375,674 134,809 510,483597,375 375,674 134,809 510,483
235,560 47,393 14,378 61,771105,193 95,928 95,92837,861 5,266 12,256 17,522
1,662,626 444,712 634,236 1,078,94825,000
-179-

Federal ProgramsSchedule of Expenditures of Federal AwardsFor the Fiscal Year Ended June 30, 2005
CFDA GrantFederal Grantor/Pass-Through Grant or/Program Title Number Award Number
Joint Terrorism Task Force - 2003-04 16.614Joint Terrorism Task Force - 2004-05 16.614Bulletproof Vest Partnership Grant 16.607
Total Office of Justice
Passed through NC Department of Crime Control and Public SafetyBureau of Alcohol, Tobacco and Firearms:
Violent Crimes Task Force 2001-02 21.052 03-162-PState Homeland Security Grant - 2004 97.004 2004-GE-T4-0014
Total Bureau of Alcohol, Tobacco and Firearms
Total Department of Justice
Department of Homeland Security:U.S. Secret Service:
Financial Crimes Task Force - 2003-04 21.100Financial Crimes Task Force - 2004-05 21.100
Total U.S. Secret Service
Federal Emergency Management Agency:Assistance to Firefighters - 2002 97.044 EMW-2002-FG-18040Assistance to Firefighters - 2004 97.044 EMW-2002-FP-02475Metro Medical Response System - 2003 97.071 233-01-0040Metro Medical Response System - 2004 97.071 EMW-2004-GR-0699Domestic Preparedness Hazmat Grant - 2002-03 97.004 HS-TE-02-1111Hazmat Equipment Grant - 2002-03 97.004 HS-TE-03-4109Structural Collapse Training Grant 97.025Flood Mitigation - 2001-02 97.029 FMA-PL-01-01
Total Federal Emergency Management Agency
Total Department of Homeland Security
Department of Labor:JTPA Cluster:
Welfare to Work 98-3751 17.253 8-3751-42Welfare to Work 99-3751 17.253 9-3751-42
Total JTPA Cluster
Employment and Training Administration:WIA Adult 1999 17.255 1999 2020 42WIA Adult 2000 17.255 2000 2020 42WIA Adult 2001 17.255 2001 2020 42WIA Adult 2002 17.258 2002 2020 42WIA Adult 2003 17.258 2003 2020 42WIA Adult 2004 17.258 2004 2020 42WIA Dislocated Worker 1999 17.255 1999 2030 42WIA Dislocated Worker 2000 17.255 2000 2030 42WIA Dislocated Worker 2001 17.255 2001 2030 42WIA Dislocated Worker 2002 17.260 2002 2030 42WIA Dislocated Worker 2003 17.260 2003 2030 42WIA Dislocated Worker 2004 17.260 2004 2030 42WIA Youth 1999 17.255 1999 2040 42WIA Youth 2000 17.255 2000 2040 42WIA Youth 2001 17.259 2001 2040 42WIA Youth 2002 17.259 2002 2040 42WIA Youth 2003 17.259 2003 2040 42WIA Youth 2004 17.259 2004 2040 42WIA 10% Statewide Activities 1999 17.255 1999 2050 42WIA 10% Statewide Activities 2000 17.255 2000 2050 42WIA 10% Statewide Activities 2001 17.255 2001 2050 42WIA 10% Statewide Activities 2001 17.259 2001 2050 42WIA 10% Statewide Activities 2002 17.258 2002 2050 42WIA 10% Statewide Activities 2002 17.259 2002 2050 42WIA 10% Statewide Activities 2002 17.260 2002 2050 42WIA 10% Statewide Activities 2003 17.258 2003 2050 42WIA 10% Statewide Activities 2003 17.259 2003 2050 42WIA 10% Statewide Activities 2003 17.260 2003 2050 42WIA 10% Statewide Activities 2004 17.258 2004 2050 42
-180-

ExpendituresProgram
orAward Prior Current Total
Amount Years Year to Date
11,705$ 7,458$ 3,392$ 10,850$ 14,670 9,014 9,01414,916 14,916 14,916
2,107,531 504,829 784,120 1,288,949
130,000 31,278 18,873 50,151308,000438,000 31,278 18,873 50,151
3,142,906 911,781 937,802 1,849,583
5,500 1,421 4,069 5,4904,000 4,000 4,0009,500 1,421 8,069 9,490
332,640 332,382 332,38222,465 22,464 22,464
880,557 234,169 46,310 280,479400,000 446 44690,900 85,743 4,364 90,10721,739 451 16,276 16,727
120,300 117,212 117,21215,000
1,883,601 769,957 89,860 859,817
1,893,101 771,378 97,929 869,307
964,293 964,292 964,292449,396 449,396 449,396
1,413,689 1,413,688 1,413,688
320,712 320,713 320,713380,475 380,474 380,474403,907 403,908 403,908607,997 607,997 607,997
1,183,134 711,694 364,524 1,076,2181,032,448 504,120 504,120
185,611 185,611 185,611387,050 387,049 387,049402,950 402,950 402,950808,507 808,507 808,507
1,064,053 215,310 848,743 1,064,0531,448,730 64,222 64,222
39,861 39,861 39,861425,298 425,297 425,297487,609 487,609 487,609614,276 591,327 22,949 614,276773,627 342,016 431,611 773,627
1,031,566 357,694 357,69450,974 50,974 50,97455,733 55,733 55,73373,596 73,596 73,59641,140 41,140 41,14055,414 31,123 24,291 55,41452,652 29,572 23,080 52,65273,688 41,386 32,303 73,68948,070 38,419 38,41934,947 27,931 27,93149,746 39,759 39,75965,928 17,740 17,740
-181-

Federal ProgramsSchedule of Expenditures of Federal AwardsFor the Fiscal Year Ended June 30, 2005
CFDA GrantFederal Grantor/Pass-Through Grant or/Program Title Number Award Number
WIA 10% Statewide Activities 2004 17.259 2004 2050 42WIA 10% Statewide Activities 2004 17.260 2004 2050 42NCETGP 99-3590 17.258 1999 3590 42NCETGP 00-3590 17.258 2000 3590 42NCETGP 01-3590 17.258 2001 3590 42NCETGP 02-3590 17.258 2002 3590 42
Total Employment and Training Administration
Other Department of Labor Programs:H-1B Technical Skills 17.249 AH-11077-01-60
Total Other Department of Labor Programs
Total Department of Labor
Department of Transportation:Federal Transit Administration:
Section 3 Capital - 1993-94 20.500Section 5307 Operating Assistance - 2002-03 20.507 NC-90-X338-01Section 5303 Metro Planning - 2002-03 20.505 Section 5303 Metro Planning - 2003-04 20.505 Section 5303 Metro Planning - 2004-05 20.505 Section 5307 Capital Assistance Grant - 2000 20.500 NC-90-X274Section 5307 Capital Assistance Grant - 2002 20.507 NC-90-X298Section 5307 Planning Grant - 2002 20.507 NC-90-X298Section 5307 Capital Assistance Grant - 2003 20.500 NC-90-X324Section 5307 Capital Assistance Grant - 2003 20.507 NC-90-X336Section 5307 Capital Assistance Grant - 2004 20.507 NC-90-X338Section 5307 Capital Assistance Grant - 2004 20.507 NC-90-X338Section 5309 Capital Assistance Grant - 1999 20.507 NC-03-0042Section 5309 Capital Assistance Grant - 2000 20.507 NC-03-0047Section 5309 Capital Assistance Grant - 2001 20.507 NC-03-0046
Total Federal Transit Administration
Federal Highway Administration:FTA Capital - Surface Transportation 20.205 NC-90-X25216th Street Bridge Replacement 20.205 B-3930Ballinger Road Bridge Replacement 20.205 B-4695Bicentennial Greenway Trail Project 20.219 P05106
Total Federal Highway Administration
Total Department of Transportation
Department of Agriculture:Forest Service:
Environmental Design Crime Prevention 10.664 ATB-2004-07Greening Greensboro Initiative 10.664 ATB-2005-05
Total Forest Service
Office of Inspector General:USDA Investigation Participation
Total Office of Inspector General
Total Department of Agriculture
Environmental Protection Agency:Office of Water:
Water Revolving Loan 66.458Total Office of Water
Office of Solid Waste and Emergency Response:Brownsfield Assessment & Cleanup 66.818 BF-97491003-0
Total Office of Solid Waste and Emergency Response
Total Environmental Protection Agency
Total Federal Financial Assistance
-182-

ExpendituresProgram
orAward Prior Current Total
Amount Years Year to Date
77,874$ $ 20,954$ 20,954$ 112,491 30,269 30,269 69,161 69,161 69,161 59,582 59,582 59,582 73,683 73,683 73,683 5,697 5,697 5,697
12,598,187 6,841,970 2,848,609 9,690,579
2,721,000 1,194,024 1,194,024 2,721,000 1,194,024 1,194,024
16,732,876 9,449,682 2,848,609 12,298,291
960,000 921,169 921,169 2,002,966 1,890,858 1,890,858
41,080 41,080 41,080 55,368 24,256 31,112 55,368 58,496 58,496 58,496
351,327 321,880 321,880 333,837 267,451 267,451 200,000 136,831 16,151 152,982
2,634,360 542,232 2,049,768 2,592,000 2,080,000
298,000 91,947 91,947 100,000 19,349 19,349
5,122,288 5,119,763 (2,481) 5,117,282 3,275,877 3,153,724 103,714 3,257,438 1,471,643 1,028,495 1,028,495
18,985,242 11,556,881 4,258,914 15,815,795
6,548,173 6,540,033 3,296 6,543,329 1,981,480 168,496 46,621 215,117
500,000 52,821 52,821 50,000
9,079,653 6,761,350 49,917 6,811,267
28,064,895 18,318,231 4,308,831 22,627,062
10,000 9,008 9,008 15,000 4,946 4,946 25,000 13,954 13,954
15,000 15,000
40,000 13,954 13,954
4,202,675 3,645,483 3,645,483 4,202,675 3,645,483 3,645,483
200,000 13,722 12,174 25,896 200,000 13,722 12,174 25,896
4,402,675 3,659,205 12,174 3,671,379
121,966,003$ 77,335,424$ 15,060,670$ 92,396,094$
-183-

State ProgramsSchedule of Expenditures of State AwardsFor the Fiscal Year Ended June 30, 2005
CFDA GrantState Grantor/Program Title Number Award Number
Department of Cultural Resources:LSTA Digitalization Starter - 2004-05State Aid to Public Libraries
Total Department of Cultural Resources
Department of Administration:Alternative Fuels and Vehicle Incentive Program 2004-0450-10
Total Department of Administration
Emergency Management Agency:Flood Mitigation - 2001-02 FMA-PL-01-01
Total Emergency Management Agency
Department of Environmental Health and Natural Resources:Clean Water Management - 2001-02 02A-705Bioretention Areas Grant 66.460 EW03036Community Waste Reduction and Recycling - 2004-05 H05014Adopt a Trail - 2004-05 P05023Northeast Walking Trail 2003-283Carolyn Allen Community Park 2001-190
Total Department of Environmental Health and Natural Resources
Department of Crime Control and Public Safety:Violent Crimes Task Force 041-1-00-008-D-369Regional Hazardous Materials Response Team - 2003-04Regional Hazardous Materials Response Team - 2004-05Fire Capital Equipment 69.105 2001-TE-CX-0030
Total Department of Crime Control and Public Safety
Department of Juventile Justice and Delinquency Prevention:Conflict Resolution Workshops at Dudley 041-1-02-001-AJ-172
Total Department of Juvenile Justice and Delinquency Prevention
Office of State Planning:GIS Data Clearinghouse 99HQGR0155
Total Office of State Planning
Department of Transportation:Federal Transit Administration:
Section 3 Capital - 1993-94 20.500 93-03-006Section 5303 Metro Planning - 2002-03 20.505 03-08-007Section 5303 Metro Planning - 2003-04 20.505 04-08-007Section 5303 Metro Planning - 2004-05 20.505 05-08-007Transportation Planning - 2002-03 20.507Transportation Planning - 2003-04 20.507Transportation Planning - 2004-05 20.507Section 5307 Capital - 2000-01 20.500 01-09-012Section 5307 Capital - 2002-03 20.500 03-09-298Section 5307 Planning - 2002-03 20.500 03-09-298Section 5307 Capital - 2002-03 20.500 05-09-324Section 5307 Capital - 2003-04 20.507 05-09-336Section 5307 Capital - 2003-04 20.507Section 5307 Planning - 2003-04 20.507Section 5309 Capital Assistance - 1999-00 20.507 00-03-006Section 5309 Capital Assistance - 2000-01 20.507 01-03-019Section 5309 Capital Assistance - 2000-01 20.507 00-03-020
Total Federal Transit Administration
Federal Highway Administration:Section 5309 Capital Assistance - 2000-01 20.205 01-ST-001NC68/Triad Center Drive 9.8079835NCDOT US 29 Corridor FS-0207B WBS 34263.1.1Eckerson/US 29 Environmental Study R-4707 WBS 36599McKnight Mill Sidewalk Enhancement 20.205 E-4776 WBS 36468.1NCDOT SE Trail Connector - 2002-03 20.205 E-4777Lee Street Enhancement Grant - 2003-04 E-2973 G WBS 33914.3.14
Total Federal Highway Administration
Governor's Highway Safety Program:Governor's Highway Safety Regional Coordinator 157(b)2-05-14DTraffic Enforcement Positions - 2004-07 PT-05-04-05-08
Total Governor's Highway Safety Program
Division of Highways:Holden/Market Municipal Agreement - 2004-05 MA07202R WBS 39306Bentley Road Improvement - 2004-05 WBS 39389Hornaday Road Improvement - 2005 U-4750 WBS 39581.1.1
Total Division of Highways
Oka T. Hester Park Dam Construction 6.498016TBridge Construction & MaintenanceNorwalk Street Extension Project STP-000SState Maintenance Assistance Program FundsInterchange I-40 & High Point RoadNew Garden at Bryan Boulevard
Powell Bill:1995 Allocation1996 Allocation1997 Allocation1998 Allocation1999 Allocation2000 Allocation2001 Allocation2002 Allocation2003 Allocation2004 Allocation2005 Allocation
Total Department of Transportation
Total State Financial Assistance-184-

Program Expendituresor
Award Prior Current TotalAmount Years Year to Date
$7,875 $ $7,650 $7,650305,985 305,985 305,985313,860 313,635 313,635
4,098 4,0984,098 4,098
15,00015,000
570,000 255,758 299,755 555,51390,000 17,072 67,545 84,61712,960 2,477 2,4774,000 3,410 3,410
200,000 200,000 200,000250,000 250,000 250,000
1,126,960 722,830 373,187 1,096,017
170,270 156,932 156,93252,000 32,865 11,334 44,19957,000 41,998 41,998
280,000 278,044 278,044559,270 467,841 53,332 521,173
7,0007,000
2,120 629 6292,120 629 629
120,000 115,146 115,1465,135 5,135 5,1356,921 3,032 3,889 6,9217,312 7,312 7,312
485,090 337,908 337,908641,238 389,031 389,031562,785 250,806 250,80643,915 40,235 40,23541,730 33,431 33,43125,000 17,104 2,019 19,123
329,295 67,779 256,221 324,000260,00037,250 11,493 11,49312,500 2,419 2,419
640,286 637,180 2,481 639,661409,484 394,215 12,964 407,179183,955 128,562 128,562
3,811,896 2,168,758 549,604 2,718,362
818,521 817,505 412 817,91798,382 90,439 (11,929) 78,51046,156 46,156 46,156
750,000 26,457 63,772 90,22964,00052,800
200,000 188,542 188,5422,029,859 980,557 240,797 1,221,354
10,000782,010 253,957 253,957792,010 253,957 253,957
300,000 300,000 300,00092,000 92,000 92,000
3,750,000 107,035 107,0354,142,000 499,035 499,035
5,000,000 1,284,157 1,889,600 3,173,757320,000 320,000 320,000
1,068,000 479,586 293,107 772,6931,336,979 1,322,806 1,322,806
412,445 412,445 412,445150,000 150,000 150,000
6,087,152 6,087,152 6,087,1526,437,040 6,437,040 6,437,0407,065,172 7,065,172 7,065,1727,406,768 7,406,768 7,406,7687,641,257 7,641,257 7,641,2576,517,131 6,517,131 6,517,1316,881,019 6,881,019 6,881,0197,195,474 5,863,846 1,331,628 7,195,4746,826,430 6,826,430 6,826,4306,259,575 5,784,998 5,784,9986,590,139
93,970,346 59,694,888 18,991,962 78,686,850
$95,994,556 $60,886,188 $19,736,214 $80,622,402-185-

Job Training Partnership ActSchedule of Expenditures by Program and Cost CategoryFor the Fiscal Year Ended June 30, 2005
Grant Program BasicAward or Award Participants' Readjustment Retraining Total
Number Amount Training Support Administration Service Services June 30, 2005
8-3751-09 964,293$ $ $ $ $ $ $ 9-3751-09 449,396
1,413,689$ $ $ $ $ $ $
-186-

Notes to the Schedule of Expenditures of Federal and State AwardsFor the Fiscal Year Ended June 30, 2005
Note 1. Basis of Presentation
The accompanying schedule of expenditures of federal and state awards includes the federal and state grant activity of the Cityof Greensboro and is presented on the modified accrual basis of accounting. The information in this schedule is presented inaccordance with the requirements of OMB Circular A-133, Audits of States, Local Governments, and Governments, and Non-Profit Organizations. Therefore, some amounts presented in this schedule may differ from amounts presented in, orused in the preparation of, the general purpose financial statements.
Note 2. Subrecipients
Of the federal and state expenditures presented in the schedule, the City of Greensboro provided awards tosubrecipients as follows:
Community Development Block Grant--HOPWA $193,367Community Development Block Grant--HOPWA $47,457Community Development Block Grant--Emergency Shelter $75,533 GrantHome Investment Partnerships Grant $12,500
Amount Providedto Subrecipients
14.241
Federal
Federal CFDANumberProgram Title
14.231
14.241
14.239
-187-

City of Greensboro XI

City of Greensboro
City
of G
reen
sbor
o
Org
aniz
atio
nal
Deve
lopm
ent &
Com
mun
icat
ions
Fina
nce
Citiz
ens
of G
reen
sbor
o
Envi
ronm
enta
lSe
rvic
es
Park
s&
Recr
eatio
n
Wat
erRe
sour
ces
Engi
neer
ing
&In
spec
tions
Fire
May
or &
City
Cou
ncil
City
Man
ager
Colis
eum
Hous
ing
&Co
mm
unity
Deve
lopm
ent
Hum
anRe
sour
ces
Hum
anRe
sour
ces
Libr
arie
s
Polic
e
Plan
ning
Tran
spor
tatio
n
XII
Organizational Chart
Budg
et&
Eval
uatio
n
Man
agem
ent
Info
rmat
ion
Syst
ems
Lega
l

City of Greensboro
Greensboro City Council
Greensboro City CouncilGreensboro City CouncilGreensboro City CouncilGreensboro City CouncilGreensboro City Council
Keith A. Holiday, Mayor
Yvonne J. Johnson, Mayor Pro Tem
Thomas M. Phillips, At Large
Donald R. Vaughan, At Large
T. Dianne Bellamy-Small, District 1
Claudette Burroughs-White, District 2
Robert V. Perkins, District 3
Florence F. Gatten, District 4
Sandra G. Carmany, District 5
City ManagerCity ManagerCity ManagerCity ManagerCity Manager
Mitchell E. Johnson
FFFFFinance Directorinance Directorinance Directorinance Directorinance Director
Richard L. Lusk
XIII


![North Carolina register [serial] - NC.gov](https://static.fdokumen.com/doc/165x107/6327f539e491bcb36c0b8a23/north-carolina-register-serial-ncgov.jpg)


![feVU 6ZU Z_ GR]]Vj f_UVc TfcSd - Daily Pioneer](https://static.fdokumen.com/doc/165x107/6319c475c51d6b41aa048d95/fevu-6zu-z-grvj-fuvc-tfcsd-daily-pioneer.jpg)