Sum frequency generation spectroscopy of amyloid fibrils and oligomers at air/water interface
7
Sum frequency generation spectroscopy of amyloid fibrils and oligomers at air/water interface Gediminas Niaura ∗ a , Rima Budvytyte a , Zenonas Kuprionis b , Gintaras Valincius a a Institute of Biochemistry, Mokslininkų 12, LT-08662, Vilnius, Lithuania; b EKSPLA Ltd., Savanorių Av. 231, LT-02300 Vilnius, Lithuania ABSTRACT Structure of beta-amyloid oligomers and fibrils at air/water interface was studied by sum frequency generation (SFG) spectroscopy. It was found that both small (1-3 nm) and large (4-10 nm) oligomers as well as fibrils adsorb in ordered fashion at air/water interface. Intense resonances from methyl group stretching vibrations at 2875 and 2937 cm -1 and “ice-like” structured water bands were characteristic for adsorbed fibrils. Similar spectral pattern was observed for large oligomers. However, small oligomers exhibited intense SFG resonance near 2912 cm -1 due to methylene or methine C−H stretching vibration. No “ice-like” water band was observed in this case. The possibility of discrimination between the small (toxic) oligomers, large (non-toxic) oligomers and fibrils was demonstrated. Keywords: Sum frequency, beta amyloid, oligomers, fibrils, air/water interface, Alzheimer’s disease 1. INTRODUCTION Amyloid-β peptide is one of the major biochemical actors in the pathogenesis of Alzheimer’s disease (AD). 1 Through several sequential steps the peptide forms numerous aggregated forms – soluble oligomers, protofibrils, and fibrils, some of which are implicated in etiology of AD . 2 For a long time, the proteinaceous fibrilar plaques found in the post mortem autopsy brain of diseased AD patients, was considered as a primary factor responsible for early onset of the AD. 3 However, more recent evidence suggests the small molecular weight, soluble oligomer amyloid-β species may be the primary nourotoxic agents. 3,4 Amoyloid-β oligomers exhibit high level of polydispersity and polymorphism, making it extremely difficult to distinguish major amyloid pathogens from indifferent bystanders. Over the last decade, therefore, considerable efforts have been put towards establishing, which type of soluble oligomers may de directly involved in pathogenesis, and how their size, 5-7 morphology, 7 and structure 5,8 correlate with the disruption of normal function of neurons and other brain cells. Recently, we have shown that significant differences in neurotoxicity may be observed even within narrow distribution of the size of soluble amyloid oligomers. 6 Surprisingly, when probed with the IR- or CD- spectroscopy, only marginal spectral differences between toxic and non-toxin preparations of oligomers were detected indicating similarity of the secondary protein structure in both cases. 6 On the other hand, strong size-dependence of neurotoxicity suggest there may be differences in the arrangement of the secondary structure elements, leading to different hydrophobicity, morphology, electrostatic, and other physical properties of the amyloid-β particles. Consequently, the important issue in development of diagnostic tools for AD is the ability to discriminate between amyloid particles of high and low toxicity. This can be done by applying the experimental techniques sensitive to the structural arrangement, such as a vibrational sum frequency generation (SFG) spectroscopy. Unlike conventional IR- spectroscopy, the SFG technique is intrinsically sensitive to the symmetry and the orientational arrangement, thus, allowing distinguishing molecular systems of the same composition but with different structural organization. 9-11 In this work we have used SFG spectroscopy as surface and molecule specific tool to probe amyloid oligomers at air/water interface. It is well known that proteins tend to spontaneously accumulate at air/water interface. 12 In this regard air/water interface may act as an adsorbing surface for proteins of different aggregation state. The absence of reactive molecules at air/water interface even when the water phase itself contains denaturants makes this surface protein friendly, 11 and allows carrying out experiments under non-denaturizing conditions. In our work air/water interface was used to accumulate amyloid oligomers of different size and toxicity aiming to find size-dependent vibrational SFG markers for each of the population. We expected that due to the nature of the SFG signal these markers may be different ∗ [email protected].; phone +3705 272-9642; fax +3705 272-9196; bchi.lt
Transcript of Sum frequency generation spectroscopy of amyloid fibrils and oligomers at air/water interface

Sum frequency generation spectroscopy of amyloid fibrils and oligomers at air/water interface
Gediminas Niaura∗
a, Rima Budvytytea, Zenonas Kuprionisb, Gintaras Valinciusa
aInstitute of Biochemistry, Mokslininkų 12, LT-08662, Vilnius, Lithuania; bEKSPLA Ltd., Savanorių Av. 231, LT-02300 Vilnius, Lithuania
ABSTRACT
Structure of beta-amyloid oligomers and fibrils at air/water interface was studied by sum frequency generation (SFG) spectroscopy. It was found that both small (1-3 nm) and large (4-10 nm) oligomers as well as fibrils adsorb in ordered fashion at air/water interface. Intense resonances from methyl group stretching vibrations at 2875 and 2937 cm-1 and “ice-like” structured water bands were characteristic for adsorbed fibrils. Similar spectral pattern was observed for large oligomers. However, small oligomers exhibited intense SFG resonance near 2912 cm-1 due to methylene or methine C−H stretching vibration. No “ice-like” water band was observed in this case. The possibility of discrimination between the small (toxic) oligomers, large (non-toxic) oligomers and fibrils was demonstrated.
Keywords: Sum frequency, beta amyloid, oligomers, fibrils, air/water interface, Alzheimer’s disease
1. INTRODUCTION
Amyloid-β peptide is one of the major biochemical actors in the pathogenesis of Alzheimer’s disease (AD).1 Through several sequential steps the peptide forms numerous aggregated forms – soluble oligomers, protofibrils, and fibrils, some of which are implicated in etiology of AD .2 For a long time, the proteinaceous fibrilar plaques found in the post mortem autopsy brain of diseased AD patients, was considered as a primary factor responsible for early onset of the AD.3 However, more recent evidence suggests the small molecular weight, soluble oligomer amyloid-β species may be the primary nourotoxic agents.3,4 Amoyloid-β oligomers exhibit high level of polydispersity and polymorphism, making it extremely difficult to distinguish major amyloid pathogens from indifferent bystanders. Over the last decade, therefore, considerable efforts have been put towards establishing, which type of soluble oligomers may de directly involved in pathogenesis, and how their size,5-7 morphology,7 and structure5,8 correlate with the disruption of normal function of neurons and other brain cells. Recently, we have shown that significant differences in neurotoxicity may be observed even within narrow distribution of the size of soluble amyloid oligomers.6 Surprisingly, when probed with the IR- or CD-spectroscopy, only marginal spectral differences between toxic and non-toxin preparations of oligomers were detected indicating similarity of the secondary protein structure in both cases.6 On the other hand, strong size-dependence of neurotoxicity suggest there may be differences in the arrangement of the secondary structure elements, leading to different hydrophobicity, morphology, electrostatic, and other physical properties of the amyloid-β particles. Consequently, the important issue in development of diagnostic tools for AD is the ability to discriminate between amyloid particles of high and low toxicity. This can be done by applying the experimental techniques sensitive to the structural arrangement, such as a vibrational sum frequency generation (SFG) spectroscopy. Unlike conventional IR-spectroscopy, the SFG technique is intrinsically sensitive to the symmetry and the orientational arrangement, thus, allowing distinguishing molecular systems of the same composition but with different structural organization.9-11
In this work we have used SFG spectroscopy as surface and molecule specific tool to probe amyloid oligomers at air/water interface. It is well known that proteins tend to spontaneously accumulate at air/water interface.12 In this regard air/water interface may act as an adsorbing surface for proteins of different aggregation state. The absence of reactive molecules at air/water interface even when the water phase itself contains denaturants makes this surface protein friendly,11 and allows carrying out experiments under non-denaturizing conditions. In our work air/water interface was used to accumulate amyloid oligomers of different size and toxicity aiming to find size-dependent vibrational SFG markers for each of the population. We expected that due to the nature of the SFG signal these markers may be different
∗ [email protected].; phone +3705 272-9642; fax +3705 272-9196; bchi.lt

for various oligomer species once they self-organize differently at air/water interface. Here, we used 42-amino acid peptide Aβ-42 which is more prone to forming amyloid deposit. We also compared oligomer spectra to the spectrum produced by the Aβ-42 fibrils and large oligomers, which in our case did not exhibited toxicity towards the neuron cultures.6
2. EXPERIMENTAL SECTION 2.1 SFG spectrometer
SFG spectra were recorded using EKSPLA (Vilnius, Lithuania) picosecond spectrometer.14 The spectrometer is based on a mode-locked Nd-YAG laser generating 25 ps pulses with 10 Hz repetition rate. The second harmonic radiation (wavelength 532 nm, pulse energy 200-300 µJ) from this laser was used as a visible beam. The tunable from 1000 to 3800 cm-1 infrared beam pulses with the energies of 80 to 200 µJ, respectively, were produced in the parametric generator OPD/DFG pumped by the third harmonic and fundamental radiation of the laser. The bandwidth of infrared beam was < 6 cm-1. To produce vibrational sum frequency spectra the infrared and visible beams were incident at angles of 53 and 60o, respectively, and overlapped at the interface an area of 0.02 mm2. The signal was averaged over 50-100 pulses. SF spectra were normalized according to intensity of infrared beam to take into account the changes in radiation energy with wavelength. Spectra were collected in a glass cell which was 38 mm diameter. The cell was cleaned first with sodium hydroxide and subsequently with mixture of concentrated nitric and sulfuric acid solutions. After these procedures the cell was washed with ultrapure water. Before each set of experiments the cleanless of the cell and aqueous phase was tested by recording the sum frequency generation spectrum of water. Absence of peaks in the C−H stretching region served as an indication that interface is sufficiently clean with respect to organic contaminants. For a quantitative analysis of the sum frequency resonances, the experimental spectra have been fitted using the following expression:12
2(2)
nin
SFG NRn IR n n
A eIi
ψ
χω ω
∝ +− + Γ∑ (1)
where ISFG is the sum frequency intensity, )2(NRχ is the non resonant contribution to the nonlinear susceptibility, ωIR is the
frequency of the incident infrared beam, and An, ψn, ωn, and Γn are the strength, relative phase, resonant frequency and line width of the nth vibration, respectively.
2.2 Preparation of Aβ-42 oligomers and fibrils
Synthetic Aβ-42 peptide was purchased from American Peptide (California, USA). Millipore purified water (18.2 MΩ cm) was used throughout the work. Oligomers were prepared as previously described.5,6 Briefly, soluble oligomers were prepared by dissolving 1 mg of peptide in 400 µl HFIP for 30-60 min at room temperature. 100 µl of the resulting seedless solution was added to 900 µl H2O in a siliconized Eppendorf tube. After 10–20 min incubation at room temperature, the samples were centrifuged for 15 min at 12000 rpm, the supernatant was transferred to a new siliconized tube and HFIP was evaporated. Then, the samples were incubated in open vial for 24 hr at 20oC. Such protocol dubbed hereafter as protocol I. The usage of siliconized vials was essential to produce fractions of oligomeric particles below 3 nm. To generate larger, typically 4-10 nm oligomers, after the centrifugation, the supernatant was transferred to a non-siliconized Eppendorf centrifuge tube and was gently purged with nitrogen for 7 min. Then the preparation was stirred in the same vial at ~500 rpm for 24 hrs using a magnetic Teflon-coated stirring bar. Such a protocol will be further referred to as protocol II. Finally, the fibrils were formed by protocol III which included incubating aqueous solution of peptide (obtained after evaporation of HFIP) for 7 days. The final Aβ-42 monomer concentration in preparations was typically ~70 µM.
2.3 Characterization of Aβ-42 preparations
The size and morphology of Aβ–42 oligomer preparations were characterized using atomic force microscope (AFM), Agilent 5500 (Santa Clara, CA) scanning probe work station, operating in the tapping mode. Model TESP (Veeco, Plainview, NY) (f=257-301 kHz, k= 20-80 N/m) and model PPP-NCL-20 (f=146-236 kHz, k=21-98 N/m) (Nanosensors, Neuchatel, Switzerland) microcantilevers were used in this work. 20 µl of 10 µM Aβ-42 sample solution was spotted on freshly cleaved mica of V-4 quality (SPI Supplies, West Chester, PA), incubated at room temperature for 10 min, rinsed

with distilled water (Millipore, Inc.) and blown dry with filtered (<0.2 µm) nitrogen stream. The particle size was estimated by measuring the profile of the sample along the x-y plane of the AFM image. The mean z-height was estimated by SPIP software using Plane Correction (Flattening) module.
3. RESULTS AND DISCUSSION 3.1 AFM characterization of fibrils and oligomers
Depending on oligomerization/polymerization conditions, the size, structure and morphology of amyloid species may significantly varied in in vitro experiments.6,15 To make sure the proper preparation is obtained for a particular series of SFG measurements, an AFM analysis was carried out for each batch of amyloid samples. Typical data sets are shown in Figure 1. Evidently, not only the morphology (oligomers vs. fibrils) but also the size of soluble oligomers was dependent on preparation protocol. The topography analysis of AFM images indicates that the oligomers prepared in accordance to protocol I, exhibited mean z-height values from 1 to 3 nm (Fig. 1A) in few cases reaching 4-5 nm, while the protocol II yielded considerably larger round-shaped entities with the size distribution from 4 to 10 nm (Fig.1B). The length of fibrils was found to be > 1µm, while the z-height, which we believe must be close to the diameter of the fibrils typically reached ~ 5 nm (Fig.1C).
A B C
Figure 1. Amyloid Aβ–42 species of different size and morphology: A) Small soluble 1–3 nm (z-height) oligomers prepared by protocol I. B) Large, typically 4-10 nm (z-height) Aβ-42 oligomers prepared by protocol II. C) Amyloid Aβ–42 fibrils prepared by protocol III. The fibril length was found to be > 1 µm and the z-height ~ 5 nm. Samples after incubation (24 h) were diluted for AFM
analysis to total amyloid concentration 10 µM. The lateral size of all images is 4 x 4 µm.
3.2 SFG spectroscopy of fibrils
Figure 2 displays SFG spectra of fibrils taken with different polarization combinations of 532 nm, infrared, and sum frequency beams. Polarization-dependent experiments provide possibility to determine the orientation of particular molecular groups.16,17 Normal to surface components of vibrational transition moments are probed by ssp polarization combination, while parallel components are probed in sps spectra. Both, normal and parallel components contribute to ppp spectra. Spectral region of C−H stretching vibrations of methyl and methylene groups provide information on conformation and orientation of alkyl chains at interface.11,12 Presence of intense resonances at 2875 and 2937 cm-1 in ssp spectrum immediately indicates ordering of alkyl chains of adsorbed Aβ-42 fibrils. It should be noted that SFG spectroscopy probes only oriented polar molecular groups. Thus, for randomly oriented molecules no SFG resonances should be expected to be observed. The peak at 2875 cm-1 was assigned to symmetric CH3 vibration (labeled r+), while the 2937-cm-1 resonance is associated with symmetric CH3 vibration in Fermi resonance with methyl bending overtone (r+
FR).18 Presence of methylene groups at interface is visible from the shoulder at 2919 cm-1 which might be assigned to symmetric CH2 stretching vibration in Fermi resonance with bending obertone (d+
FR) or alternatively this resonance might be associated to asymmetric CH2 stretching mode (d-).17 The lower intensity peak near 3065 cm-1 belongs to =C−H stretching vibration of aromatic moieties (Aβ-42 peptide monomer contains 3 phenylalanine and 1 tyrosine aromatic amino acid residues). In contrast to ssp-polarized spectrum, resonances due to asymmetric stretching vibration of CH3 groups (r-) dominate in ppp (2966 cm-1) and sps (2962 cm-1) spectra (Fig. 2A). In addition, low intensity broad resonance
is visible near 2904 in the ppp polarized spectrum and low intensity feature near 2921 cm-1 in the sps spectrum. Presence of weak feature near 2921 cm-1 in sps spectrum allows to assign this band to d- mode.17 Since Ippp(r-) > Isps(r-) > Issp(r-), based on the orientational analysis provided by Wang and co-workers17 it might be suggested that the tilt angle ϑ between the CH3 group C3 symmetry axis and surface normal is about 40±5 degrees. In the high frequency region unusually strong resonances of water O-H stretching vibrations in the presence of fibrils at interface are visible in the ssp spectrum (Fig. 2B). Frequency of the most intense peak (3165 cm-1) is relatively low which indicates presence at interface of highly coordinated water molecules with strong symmetrical H-bonds. In fact, position of this band coincides well with the characteristic SFG resonance of ice observed at 3150 cm-1.19 SFG spectrum of liquid water features two broad bands near 3200 and 3450 cm-1 and sharp peak at 3700 cm-1.20 Thus, presented data show that fibrils at interface are able to organize water molecules to “ice-like” in nature structures. No resonances were observed in SFG spectrum obtained with sps polarization combination which samples in-plane transition dipoles (Fig. 2B), probably, because of cancellation of signals from contrariwise oriented O−H dipoles in the surface plane. Such directionally isotropic arrangement of water molecules might be realized for tetrahedral structure.20
Figure 2. SFG spectra of fibrils (10 µM, protocol III) at air/water interface in the C−H stretching (A) and O−H stretching
(B) spectral regions taken with ssp (s-SFG, s-532 nm, and p-IR), ppp, and sps polarization combinations.
3.3 SFG spectroscopy of large (4-10 nm) oligomers
Lower intensity, however, quite similar SFG spectra were observed from large (4-10 nm) Aβ-42 oligomers adsorbed at interface (Fig. 3). In the C−H stretching region (Fig. 3A) the relative intensity of r- resonance in sps spectrum was found to be slightly higher, while the intensity of this mode in ppp spectrum was lower. Such observations are consistent with slight decrease in tilt angle ϑ for CH3 group.17 In the O−H stretching region (Fig. 3B) the intensity of “ice-like” resonance near 3132 cm-1 was found to be considerably lower. In addition, broad water bands at 3360 and 3490 cm-1 disappeared, and resonance from weakly H-bounded O−H groups became visible near 3650 cm-1 in the ssp polarized spectrum. Similar resonance was also detected in the sps spectrum indicating presence of in-plane directionally anisotropic arrangement of weakly H-bonded O−H dipoles. Taking together these observations point on the

reorganization of water structure near the large oligomers as compared with fibrils. However, it should be noted that in both cases “ice-like” structured water is visible in ssp spectrum.
Figure 3. SFG spectra of large (4-10 nm, protocol II) oligomers (10 µM) at air/water interface in the C−H stretching (A) and
O−H stretching (B) spectral regions taken with ssp (s-SFG, s-532 nm, and p-IR), ppp, and sps polarization combinations.
3.4 SFG spectroscopy of small (1-3 nm) oligomers
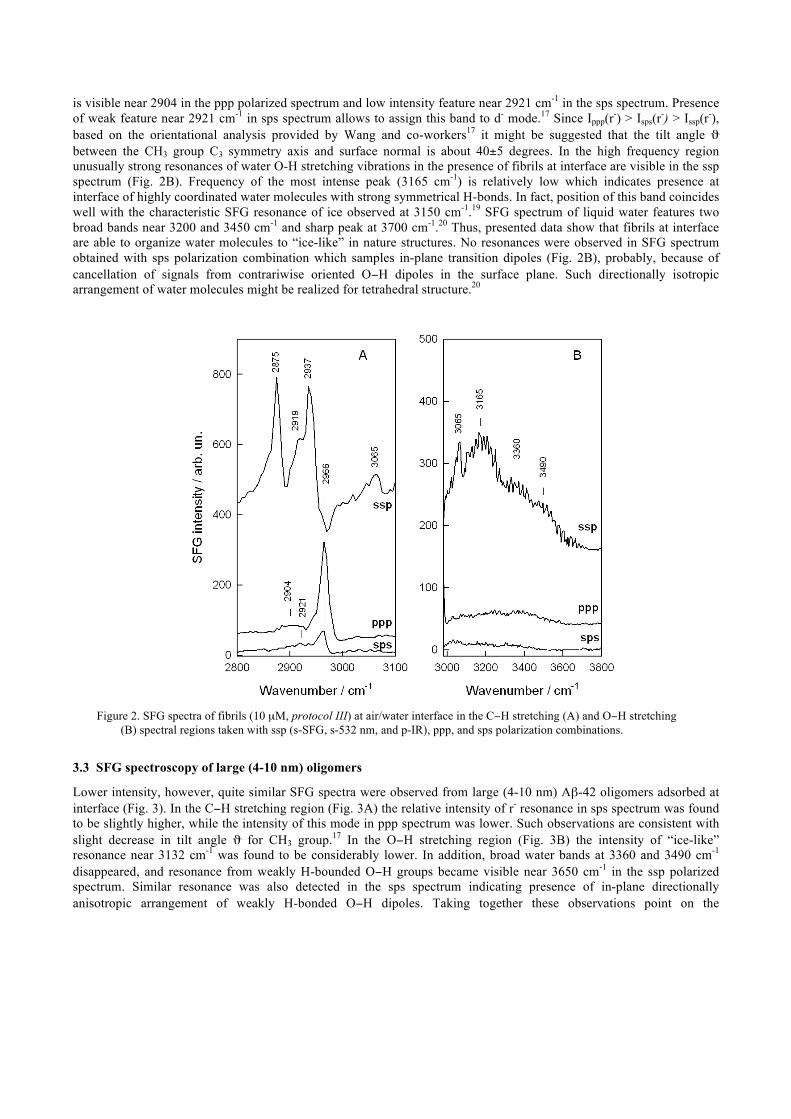
Introduction of small (1-3 nm) Aβ-42 oligomers in water results in considerably different SFG spectrum of air/water interface as compared with fibrils and large (4-10 nm) oligomers. Intense resonance at 2912 cm-1 was found to be dominant in the ssp spectrum of C−H stretching region (Fig. 4A). No corresponding frequency bands were detected in ppp and sps spectra. According to polarization selection rules17 this mode we assigned to CH2 symmetric stretching vibration in Fermi resonance with methylene deformation overtone (d+
FR). Alternatively, this resonance might be associated with methine group Cα−H stretching vibration. Similar band (2902 cm-1) was detected in ssp-polarized SFG spectrum of L-leucine at air/water interface,21 2-propanol (2914 cm-1) at vapor/alcohol interface,17 and in the spectra of amphiphilic peptides (2910 cm-1) adsorbed at polystyrene surface.22 Lower intensity resonances of the ssp spectrum at 2868, 2940, and 2962 cm-1 are due to r+, r+
FR, and r- vibrational modes, respectively. Such spectral pattern is rather unique in SFG spectroscopy of C−H stretching region. The low intensity 3051-cm-1 peak belongs to =C−H stretching vibration of aromatic rings. Bands due to CH2 asymmetric stretching vibration in Fermi resonance with bending methylene deformation obertone (d-
FR) and r- are clearly pronounced at 2880 and 2962 cm-1, respectively, in ppp-polarized spectrum, while only r- vibrational mode is visible in the sps spectrum. Since Ippp(d-
FR) considerably higher than Isps(d-
FR) or Issp(d-FR) (Fig. 4A), the orientational angle between the surface normal and C2 symmetry axis of methylene
groups must be high (>80 degrees).17 SFG spectra in O−H stretching region (Fig. 4B) differ considerably from corresponding spectra of fibrils and large oligomers. The most important difference is absence of “ice-like” in nature water band near 3132/3160 cm-1.
Figure 4. SFG spectra of small (1-3 nm, protocol I) oligomers (10 µM) at air/water interface in the C−H stretching (A) and
O−H stretching (B) spectral regions taken with ssp (s-SFG, s-532 nm, and p-IR), ppp, and sps polarization combinations.
Provided non-linear vibrational spectroscopy data reveal that both fibrils and oligomers adsorb in ordered fashion at air/water interface. However, based on SFG spectral pattern small toxic oligomers might be easily discriminated from non-toxic fibrils and large oligomers. SFG spectra of fibrils consist of intense methyl group resonances at 2875 and 2937 cm-1 as well as broad “ice-like” structure water peak near 3165 cm-1, while small oligomers exhibit intense resonance at 2912 cm-1 due to methylene or methine Cα−H stretching vibration. SFG spectra of large oligomers and fibrils were found to be similar.
ACKNOWLEDGEMENTS This work was supported by the Lithuanian State Science and Studies Foundation (AUT-15/2010 Amiloide).
REFERENCES
[1] Hardy, J., A. and Higgins, G., A.,"Alzheimers disease: the amyloid cascade hypothesis," Science 256, 184–185 (1992).
[2] Lansbury, P. T. and Lashuel, H., A., "A century-old debate on protein aggregation and neurodegeneration enters the clinic, " Nature 443, 774–779 (2006).
[3] Hardy, J. and Selkoe, D., J., "The amyloid hypothesis of Alzheimer’s disease: progress and problems on the road to therapeutics, " Science 297, 353–356 (2002).
[4] Arispe, N., Pollard, H., B. and Rojas, E., "Giant multilevel cation channels formed by Alzheimer disease amyloid b protein [AßP(1–40)] in bilayer membranes, " Proc. Natl. Acad. Sci. USA 90, 10573–10577 (1993).

[5] Kayed, R., Head, E., Thompson, J., L., McIntire, T., M., Milton, S., C., Cotman, C., W. and Glabe, C., G., "Common structure of soluble amyloid oligomers implies common mechanism of pathogenesis, " Science 300, 486–489 (2003).
[6] Cizas P., Budvytytė R., Morkūnienė R., Moldovan R., Broccio M., Lösche M., Niaura G., Valincius G. and Borutaitė V., "Sized-dependent neurotoxicity of amyloid oligomers, " Arch. Biochem. Biophys. 496, 84-92 (2010).
[7] Necula, M., Kayed, R., Milton, S. and Glabe, C. G., "Small molecule inhibitors of aggregation indicate that amyloid beta oligomerization and fibrillization pathways are independent and distinct," J. Biol. Chem. 282, 10311–10324 (2007).
[8] Yu, L., P., Edalji, R., Harlan, J., E., Holzman, T., F., Lopez, A., P., Labkovsky, B., Hillen, H., Barghorn, S., Ebert, U., Richardson, P., L., Miesbauer, L., Solomon, L., Bartley, D., Walter, K., Johnson, R., W., Hajduk, P., J. and Olejniczak, E., T., "Structural characterization of Soluble Amyloid-β peptide oligomer, " Biochemistry 48, 1870-1877 (2009).
[9] Anglin, T., C., Liu, J. and Conboy, J., C., "Facile lipid flip-flop in a phospholipids bilayer induced by gramicidin A measured by sum-frequency vibrational spectroscopy," Biophys. J. 92, L1-L3 (2007).
[10] Kim, G., Gurau, M., Kim, J. and Cremer, P., S., "Investigations of the orientation of a membrane peptide by sum frequency spectroscopy," Langmuir 18, 2807-2811 (2002).
[11] Conboy, J., C., Messmer, M., C. and Richmond, G.L., "Dependence of alkyl chain conformation of simple ionic surfactants on head group functionality as studied by vibrational sum-frequency spectroscopy," J. Phys. Chem. B 101(34), 6724-6733 (1997).
[12] Miranda, P.B. and Shen, Y.R., "Liquid interfaces: a study by sum-frequency vibrational spectroscopy," J. Phys. Chem. B 103(17), 3292-3307 (1999).
[13] Lin, J., M. and White, J., W., "Denaturation resistance of beta-Lactoglobulin in monomolecular films at the air-water interface," J. Phys. Chem. B. 113(43), 14513-14520 (2009).
[14] Niaura, G., Kuprionis, Z., Ignatjev, I., Kazemekaite, M., Valincius, G., Talaikyte, Z., Razumas, V. and Svendsen, A., "Probing of lipase activity at air/water interface by sum-frequency generation spectroscopy," J. Phys. Chem. B 112(13), 4094-4101 (2008).
[15] Stine, W., B., Jr., Dahlgren, K., N., Krafft, G., A. and LaDu, M.J., "In vitro characterization of conditions for amyloid-beta peptide oligomerization and fibrillogenesis," J. Biol. Chem. 278(13), 11612-11622 (2003).
[16] Conboy, J., C., Messmer, M., C. and Richmond, G.L., "Investigation of surfactant conformation and order at the liquid-liquid interface by total internal reflection sum-frequency vibrational spectroscopy," J. Phys. Chem. 100(18), 7617-7622 (1996).
[17] Lu, R., Gan, W., Wu, B., H., Zhang, Z., Guo, Y. and Wang, H., F., "C−H stretching vibrations of methyl, methylene and methane groups at the vapor/alcohol (n = 1-8) interfaces," J. Phys. Chem. B 109(29), 14118-14129 (2005).
[18] Voss, L., F., Hadad, C., M. and Allen, H., C., "Competition between atmospherically relevant fatty acid monolayers at the air/water interface," J. Phys. Chem. B 110(39), 19487-19490 (2006).
[19] Wei, X., Miranda, P., B. and Shen, Y.R., "Surface vibrational spectroscopic study of surface melting of ice," Phys. Rev. Lett. 86, 1554-1557 (2001).
[20] Richmond, G.L., "Molecular bonding and interactions at aqueous surfaces probed by vibrational sum frequency spectroscopy," Chem. Rev. 102(8), 2693-2724 (2002).
[21] Ji, N. and Shen, Y., R., "Sum frequency vibrational spectroscopy of leucine molecules adsorbed at air-water interface," J. Chem. Phys. 120, 7107-7112 (2004).
[22] Phillips, D., C., York, R., L., Mermut, O., McCrea, K., R., Ward, R.S. and Somorjai, G.A., "Side chain, chain length, and sequence effects on amphiphilic peptide adsorption at hydrophobic and hydrophilic surfaces studied by sum-frequency generation vibrational spectroscopy and quartz crystal microbalance, " J. Phys. Chem. C 111(1), 255-261 (2007).