Title: The fluid dynamic effect on the driving force for a cobalt oxide silica membrane module at...
34
Elsevier Editorial System(tm) for Chemical Engineering Science Manuscript Draft Manuscript Number: Title: The fluid dynamic effect on the driving force for a cobalt oxide silica membrane module at high temperatures Article Type: Regular Article Section/Category: Process Systems Engineering Keywords: fluid dynamics; driving force; hydrogen; molar fraction; gas mixture. Corresponding Author: Prof. J. C. Diniz da Costa, PhD Corresponding Author's Institution: The University of Queensland First Author: Guozhao Ji, MEng Order of Authors: Guozhao Ji, MEng; Guoxiong Wang, PhD; Kamel Hooman, PhD; Suresh Bhatia, PhD; J. C. Diniz da Costa, PhD Abstract: An experimentally validated theoretical model was developed to investigate the influence of operating conditions on the performance of a multi-tube membrane module containing cobalt oxide silica (COxS) membranes with molecular sieving properties. The model investigated the separation process for a binary gas mixture consisting of H2 and Ar at 400oC. Engineering parameters such as feed flow rate, feed pressure, module size and flow configuration were systematically varied in order to optimize the separation performance promoting three main goals: H2 yield, H2 purity and H2 recovery. Changing these parameters led to different flows and H2 fractions in the feed domain, thus altering the driving forces for the preferential permeation of H2. The simulated results suggest that gas separation was greatly improved by reducing the module radius which meets all of the three aforementioned optimization criteria. Interestingly, increasing the feed flow rate and feed pressure were found to be beneficial as the former led to lower H2 recovery whilst the latter did not deliver the same purity when compared to lower feed pressure. In addition, two flow configurations, counter- current and co-current, were compared. It was observed that the results of counter-current were effectively the same as the co-current. This was attributed to the high gas-through-gas diffusion for high-temperature membrane operation. Finally, neglecting diffusion effects, or considering advection only, leads to over prediction of H2 permeate molar fraction. Suggested Reviewers: David Sholl Professor, Chemical Engineering, Georgia Institute of Technology [email protected] Jerry Lin Department of Chemical Engineering, Arizona State University [email protected] Toshinori Tsuru Department of Chemical Engineering, Hiroshima University [email protected]
Transcript of Title: The fluid dynamic effect on the driving force for a cobalt oxide silica membrane module at...

Elsevier Editorial System(tm) for Chemical Engineering Science Manuscript Draft Manuscript Number: Title: The fluid dynamic effect on the driving force for a cobalt oxide silica membrane module at high temperatures Article Type: Regular Article Section/Category: Process Systems Engineering Keywords: fluid dynamics; driving force; hydrogen; molar fraction; gas mixture. Corresponding Author: Prof. J. C. Diniz da Costa, PhD Corresponding Author's Institution: The University of Queensland First Author: Guozhao Ji, MEng Order of Authors: Guozhao Ji, MEng; Guoxiong Wang, PhD; Kamel Hooman, PhD; Suresh Bhatia, PhD; J. C. Diniz da Costa, PhD Abstract: An experimentally validated theoretical model was developed to investigate the influence of operating conditions on the performance of a multi-tube membrane module containing cobalt oxide silica (COxS) membranes with molecular sieving properties. The model investigated the separation process for a binary gas mixture consisting of H2 and Ar at 400oC. Engineering parameters such as feed flow rate, feed pressure, module size and flow configuration were systematically varied in order to optimize the separation performance promoting three main goals: H2 yield, H2 purity and H2 recovery. Changing these parameters led to different flows and H2 fractions in the feed domain, thus altering the driving forces for the preferential permeation of H2. The simulated results suggest that gas separation was greatly improved by reducing the module radius which meets all of the three aforementioned optimization criteria. Interestingly, increasing the feed flow rate and feed pressure were found to be beneficial as the former led to lower H2 recovery whilst the latter did not deliver the same purity when compared to lower feed pressure. In addition, two flow configurations, counter-current and co-current, were compared. It was observed that the results of counter-current were effectively the same as the co-current. This was attributed to the high gas-through-gas diffusion for high-temperature membrane operation. Finally, neglecting diffusion effects, or considering advection only, leads to over prediction of H2 permeate molar fraction. Suggested Reviewers: David Sholl Professor, Chemical Engineering, Georgia Institute of Technology [email protected] Jerry Lin Department of Chemical Engineering, Arizona State University [email protected] Toshinori Tsuru Department of Chemical Engineering, Hiroshima University [email protected]

Li-Zhi Zhang Key Lab of Enhanced Heat Transfer and Energy Conservation, South China University of Technology [email protected] Martin Griffith Mechanical Engineering, Monash University [email protected] Jose Serra Institute of Chemical Engineering, Polytechnic University of Valencia [email protected] Opposed Reviewers:
The University of Queensland
School of Chemical Engineering
Brisbane QLD 4072 Australia
Professor J.C. Diniz da Costa
Email: [email protected]
Tel: +61 7 3365 6960
Fax: +61 7 3365 4199
www.chemeng.uq.edu.au/fimlab
18th September 2013.
Editor
Chemical Engineering Science
Dear Editor,
Re: Submission of Manuscript
Title: The fluid dynamic effect on the driving force for a cobalt oxide silica membrane module
at high temperatures
Authors: G. Ji, G. Wang, K. Hooman, S. Bhatia, J. C. Diniz da Costa
We have attached hereto our manuscript for your consideration for publication in Chemical
Engineering Science.
In this work we extended the one-dimensional to two-dimensional model as a more realistic CFD
approach for the simulation of hydrogen separation in binary gas feed stream at high temperatures.
The two-dimensional model was used to carry out simulations to investigate the gas concentration
distribution in both radial and axial directions. This work presents interesting results related to the
variation of the driving force along the multi-tube membrane line. The flow dynamic effect is
significant, thus affecting the driving force along the axial direction. Of particular interest, this
effect prevailed and greatly affected the temperature dependency transport properties of gas
mixtures through membranes, contrary to single gas permeation. The two-dimensional model was
validated against a reasonable size cobalt oxide silica membrane module.
Yours sincerely,
Prof. Joe da Costa
Cover Letter
The fluid dynamic effect on the driving force for a
cobalt oxide silica membrane module at high
temperatures
G. Ji1, G. Wang1, K. Hooman2, S. Bhatia1, João C. Diniz da Costa 1*
The University of Queensland, 1FIMLab – Films and Inorganic Membrane Laboratory, School
of Chemical Engineering, 2 School of Mechanical and Mining Engineering, Brisbane Qld 4072,
Australia.
*Corresponding author: J. C. Diniz da Costa, Tel: +61 7 3365 6960, Fax: +61 7 3365 4199,
Email: [email protected]
Highlights
The effect of binary gas (H2/Ar) composition and fluid dynamics up to 500oC.
The H2 molar fraction was the most influential factor affecting the driving force.
The decline of the H2 molar fraction in the feed domain was substantial at 45.3%.
The decline of the H2 molar fraction in the permeate domain was marginal by 2.2%.
Concentration-polarization in both feed and permeate domains were very weak.
.
*Highlights (for review)

The fluid dynamic effect on the driving force for a
cobalt oxide silica membrane module at high
temperatures
G. Ji1, G. Wang1, K. Hooman2, S. Bhatia1, João C. Diniz da Costa 1*
The University of Queensland, 1FIMLab – Films and Inorganic Membrane Laboratory, School
of Chemical Engineering, 2 School of Mechanical and Mining Engineering, Brisbane Qld 4072,
Australia.
*Corresponding author: J. C. Diniz da Costa, Tel: +61 7 3365 6960, Fax: +61 7 3365 4199,
Email: [email protected]
Abstract
This work presents a computational fluid dynamic (CFD) model to investigate the effect of binary gas
(H2/Ar) composition and fluid dynamics at high temperatures (from 200 up to 500oC) for a
reasonably sized membrane module containing two cobalt oxide silica membrane tubes in series for
H2 separation. The model provided the local information of velocity, pressure and H2 fraction for the
driving force analysis. The H2 molar fraction was found to be the most influential factor affecting the
driving force, though the total pressure varied slightly along the axial length. In feed domain the H2
molar fraction showed a clear decline in the axial direction from feed inlet to retentate outlet by
45.34% (for the case of feed fraction 50% H2 and feed flow rate 100 N ml min-1). In permeate domain,
H2 fraction showed the same trend but the decline slope was much less than feed domain being
2.22%. Concentration-polarizations in both feed and permeate domains were very weak with the
concentration polarization degree less than 0.4% and can be ignored in cobalt-oxide-silica
membrane module. High temperature promoted the performance of pure gas permeation, but had
little impact on mixed gas separation as the driving force reduction at higher temperature is more
significant.
*ManuscriptClick here to download Manuscript: CES_Ji_etal_mansucript_V15_19sept13.docx Click here to view linked References
Keywords: fluid dynamics; driving force; hydrogen; molar fraction; gas mixture.
1. Introduction
Hydrogen is an element of major interest in chemical engineering processes. Hydrogen is extensively
used for hydrogenation reactions in the production of diesel (Kan et al., 2012), alkanes (Cordero et
al., 2008; Slater, 1964) and Bergius process (Molyneux, 2001), or as a clean energy carrier in fuel cell
vehicles (Bahukudumbi and Ford, 2006). Hydrogen can be produced from a variety of sources
including fossil fuels, biomass, water and some industrial waste chemicals (McLellan et al., 2005).
Many of the conventional hydrogen processes involve fossil fuel as the primary feed stock, such as
natural gas reforming and coal gasification. These processes are characterised by high temperatures,
which require cooling down the gas stream for hydrogen separation if traditional gas separation
processes are used such as pressure swing adsorption or solvent absorption. Although these
separation processes are very effective with a long history of successful application in the chemical
engineering industry, cooling down large volumes of gases is a costly exercise with high operating
cost implications.
Therefore, separating hydrogen at high temperatures is becoming attractive, as it reduces the
energy penalties associated with the cooling requirements encountered with conventional gas
separation processes (Bracht et al., 1997; Smart et al., 2010). Among potential novel gas separation
technologies, inorganic membrane based metal oxide silica molecular structures have performed
well at high temperatures (Miller et al., 2013; Tsuru et al., 2011; Wang and Tsuru, 2011; Yacou et al.,
2012), and have demonstrated good stability under the exposure of steam (Igi et al., 2008) and
hydrogen sulphide (Uhlmann et al., 2011). These membranes have also been deployed in membrane
reactor configurations for hydrogen production via the water gas shift (WGS) reaction (Battersby et
al., 2010; Brunetti et al., 2007), and dehydrogenation reactions (Battersby et al., 2006). Many of the
previous works in this field have primarily focused on materials development and membrane
performance using single gas permeation in terms of hydrogen fluxes (e.g. as a production measure)
and hydrogen selectivity (e.g. as a measure of product quality). However, industrial gas streams
contain multi-component gas mixtures, which cannot be represented by ideal single gas
experimental work. In order to shift the inorganic membranes from a laboratory scale to an
industrial scale, it is paramount to develop simulations for large membrane modules and validate
against experimental data.

Experimental and/or numerical simulations of pure gas permeation are often performed to provide
an indication of optimized performance of membranes. However, the transport of a component in a
gas mixture through the membrane is affected by the presence of other penetrants either due to the
interactions among the permeating species or additional resistance in the gas phase (Coroneo et al.,
2009a; Krishna, 1990; Krishna and van Baten, 2011a). As a consequence, the preferential permeation
of a gas like hydrogen from a multicomponent gas mixture is significantly affected resulting in much
lower hydrogen fluxes for binary gas mixtures as compared to single gas permeation; as recently
demonstrated by Yacou and co-workers (Yacou et al., 2012) for multi-tube membrane modules. In
view of the multi-component gas effect, several research groups (Burggraaf et al., 1998; Chang and
Lee, 2006; Kapteijn, 2006; Keizer et al., 1998; Krishna, 2012; Xiao and Wei, 1992a, b) have developed
gas permeation models that specifically deal with selective permeation through membranes of feed
gas mixtures. These models have fixed boundary conditions on the feed interface and permeate
interface. However, this assumption is not realistic when considering gas separation processes, as
the boundary conditions are not constant along the axial length of a membrane.
In order to better understand mixed gas separation processes, detailed information (e.g. gas
concentration at every point) inside a membrane module should be investigated, though it is very
difficult to obtain such information through experimental work. To address this problem,
computational fluid dynamics (CFD) is a feasible approach to simulate detailed gas flow
characteristics at any point of a membrane separation system (Ghidossi et al., 2006; Ji et al., 2012;
Wiley and Fletcher, 2002). This has been demonstrated by previous CFD works for palladium (Chen
et al., 2011; Chen et al., 2012; Coroneo et al., 2009b), ceramic (Koukou et al., 1996; Koukou et al.,
1999), polymeric (Kawachale et al., 2010; Sean X. Liu, 2004; Siegel, 2008) and silica derived
membranes (Abdel-jawad et al., 2007). A general feature of these CFD works is the application for
small laboratory scales.
In the case of large scale membrane modules, Ji and co-workers (Ji et al., 2013) established a one-
dimensional model to investigate the impact of feed flow rate, feed pressure and module size on
hydrogen recovery, hydrogen product purity and hydrogen product yield. This work was validated
against a large multi-tube module containing cobalt oxide silica membranes as reported elsewhere
(Yacou et al., 2012). However, this model considered an almost constant radial gas concentration
which simplified calculations and computational time. Questions still remain on the effect of the
radial gas concentration together with the axial gas concentration, thus necessitating the

development of a two-dimensional model to better describe the effect of gas dispersion in
membrane modules for gas separation. In this work, we extend the one-dimensional to two-
dimensional model as a more realistic CFD approach for the simulation of hydrogen separation in
binary gas feed stream at high temperatures. The two-dimensional model is validated against a
cobalt oxide silica membrane module. Further, the two-dimensional model is used to carry out
simulations to investigate the gas concentration distribution in both radial and axial directions.
Ultimately, this leads to the determination of the driving force distribution also in both axial and
radial directions, thus explaining the phenomena observed for gas mixture separation at varying high
temperatures.
2. Modeling details
Fig. 1 The structure of the membrane separation module
The gas separation module depicted in Fig. 1 consists of two parts named as feed domain and
permeate domain. Two cobalt silica membranes with length 160 mm each are fixed in series inside
the module. Gas permeates from the outside of the membranes to the inside. The two virtual cross
sections are located at the middle of each membrane which is used to display the radial profile of H2
fraction. All other geometrical parameters are also displayed in Fig. 1. In the gas separation process,
a multicomponent feed gas is introduced from the inlet to the feed domain. The preferentially
permeable gas molecules diffuse across the membrane, though not totally as a fraction diffuses
along the axis towards the permeate stream, at the permeate outlet. The impermeable gas still flows
from feed domain to the retentate stream and finally exits at the retentate outlet. The gases in both
domains flow in the same direction as the co-current configuration. Binary gas mixtures consisting of

H2 and Ar were fed to the system at different temperatures using cobalt oxide silica (CoOxSi)
membranes.
2.1 The CFD model
In order to properly model the membrane separation performance, fluid dynamics was considered
since pressure, velocity and concentration fields have significant influences on the separation
process. In hydrogen gas separation with membranes, the feed flow rate is usually much slower than
other gas separation processes, as a consideration to maximise hydrogen recovery. The fluid flow in
the membranes is generally featured by laminar flow as the Reynolds number is always below 10.
This fluid flow phenomenon can be described by a cylindrical two-dimensional and steady state
model, which is the basis of this work.
The model is mathematically expressed by the governing equations consisting of continuity and
moment equations. The continuity equation can be derived from mass balance, giving
1
0r zr c u c ur r z
(1)
and the moment balance can typically be expressed by the Navier-Stokes equation as follows:
2
2 2
1 r r rr r z r
u u upu u u u r
r z r r r r z r
(2)
2
2
1 z zr z z z
u upu u u u r
r z z r r r z
(3)
Further for a binary component system, the continuity equation can be described in form of
component balance equation
1 11 1
1 1r z
c cr c u c u r D D
r r z r r r z z
(4)
where r is the radial coordinate, z the axial coordinate, c the total molar concentration, 1c the
molar concentration of component 1 ( 2 1c c c for component 2, accordingly), ru the radial
velocity, zu the axial velocity, the gas density, the gas viscosity and D the molecular diffusion

coefficient of component 1 in this gas mixture which can be evaluated from Fuller equation (Fuller et
al., 1966).
Unlike normal CFD models, models for membrane mass transfer have to account for discontinuous
flow in the vicinity of the membranes. In the permeable region, which has a membrane surface as a
boundary, the permeation across the membrane determines the mass balance of both feed domain
and permeate domain (see Fig. 1). Considering this situation, the continuity equation Eq. (1) and
component mass balance equation Eq. (4) should be modified for the permeable region to take the
gas permeation into consideration, giving
1 d
dr z
J Ar c u c u
r r z V
(5)
1 1 11 1
d1 1
dr z
c c J Ar c u c u r D D
r r z r r r z z V
(6)
where dV is the control volume, md d dV R z r ; dA the permeable area in this control volume,
md dA R z ; J the total permeate flux across this permeable area; and 1J the permeate flux of
component 1.
2.2 Membrane mass transfer
The mass transfer across the membrane is an important issue in membrane CFD modeling. It can
affect the fluid dynamic and hence affect the membrane mass transfer, including the mass transfer
in both the feed and permeate domains. The mechanisms of mass transfer across the membrane are
largely related to the intrinsic properties of the membrane material. Fick’s law is widely used to
describe the membrane mass transfer but proved to be less accurate than the Maxwell-Stefan
model (Bettens et al., 2007; Kapteijn et al., 1994). Therefore the mass transfer across the silica
membrane in this study uses the Maxwell-Stefan formalism (Krishna and van Baten, 2008; Pakizeh et
al., 2007):
1 dJ qÐ
RT dz
(7)
where is the chemical potential expressed as
pRT ln0 (8)
Combining Eqs. (7) and (8) gives
ln 1
ln 1
d p dq dqJ Ð Ð
d q dz dz
(9)
where is fractional occupancy of adsorption, and 1
1 is defined as thermodynamic factor. At
the temperature range considered in this work (200–500 oC), adsorption is very weak which implies
0 and thus 11
1
. Adsorption follows Henry’s law in this temperature range (Battersby et al.,
2010; Diniz da Costa et al., 2002; Krishna and van Baten, 2011b), and the adsorbed gas concentration,
q , is proportional to pressure, p , giving
q Kp (10)
Thus the single gas flux across the membrane can be expressed as
dpJ ÐK
dr (11)
Eq. (11) is mainly suitable for describing single gas transfer across the membrane. When the gas is
mixed with other gases, the multi-component equation should be applied to consider the counter-
exchange in the gas mixture (Kapteijn et al., 2000; Krishna and van Baten, 2009; Krishna and
Wesselingh, 1997; Newman, 2009). For a multiple component system the Maxwell-Stefan(M-S)
equation gives (Krishna, 1993)
1
1 nj i i j i
i
j i j i
x J x J Jp
RT Ð Ð
(12)
where iJ is the permeate molar flux of component i , ijÐ in Eq. (12) is Maxwell-Stefan diffusivity
describing interchange between i and j ; x is the molar fraction defined as ii
cx
c ; and iÐ is the

Maxwell-Stefan diffusivity of single gas i which can be obtained from single gas permeation test.
The proper estimation of ijÐ is difficult to ascertain. However, it can be calculated by the empirical
Vignes correlation, adapted to micropore diffusion by Krishna, Wesselingh and co-workers
(Wesselingh and Krishna, 1990), giving
jixx
ij ii jjÐ Ð Ð (13)
where iiÐ and jjÐ are defined as self-exchange coefficient. Since self-exchange coefficients are
rarely available, the assumption that 1ii iÐ Ð is often used for membranes with micropores
(Kapteijn et al., 2000; Krishna and Baur, 2003), leading to
jixx
ij i jÐ Ð Ð (14)
Eq. (15) can be cast into matrix form
JBpRT
1
(15)
For H2/Ar binary gas system, the elements of B are given by according to Eq. (12) (subscript 1 is
for H2 and 2 is for Ar)
2 1
12 1 12
2 1
12 12 2
1
1
x x
Ð Ð ÐB
x x
Ð Ð Ð
(16)
where 1Ð is the Maxwell-Stefan diffusivity of H2, and 2Ð is that of Ar. 12Ð is the Maxwell-Stefan
interchange diffusivity inside the membrane.
Multiplying both sides of Eq. (15) by 1B and re-arranging it give
pBRT
J 11
(17)

If we define another matrix L as
1 BL (18)
then the flux of the two species can be obtained from an explicit expression
1 (1,1) 1 (1,2) 2
2 (2,1) 1 (2,2) 2
1
1
J L p L pRT
J L p L pRT
(19)
As both L and p are functions of fraction 1x , it is necessary to solve the fraction 1x
distribution across membrane in advance.
By differentiating Eq. (19) with respect to r , and applying mass balance rule, we obtain
1
(1,1) 1 (1,2) 2 0d r J d
r L p L pdr dr
(20)
which finally leads to a second order differential equation of 1x to r
2(1,1) 1 (1,2) 11 1 1
1 (1,1) 1 (1,2) 1
(1,2) 1 1(1,1) 1 (1,2) 1 1 (1,2) 1
( )2
10
dL x dL x dp rdx d x dxdpx p r L x L x p r
dr dr dr dr dr dr dr
dL xdp r dp r dp rdxL x L x x p r L x
dr dr r dr dr dr
(21)
According to Eq. (12),
dr
rdp is constant and rp is known as well. Two boundary conditions for Eq.
(21) are available by extracting from the iteration results in the gas phase.
1 1,feedx x at m,feedr r (22)
1 1,permx x at m,permr r (23)

Thus the molar fraction 1x distribution across the membrane is derived from Eqs. (21), (22) and (23),
and permeate flux can be accurately calculated by Eq. (19).
2.3 Numerical method
Finite-difference method is used to solve the governing equations in the two-dimensional model in
this work. The continuity equation as indicated in Eqs. (5) and (6) and Navier-Stokes equations
described by Eqs. (2) and (3) were coupled by SIMPLE algorithm which is a robust method to couple
velocity and pressure (Tu et al., 2008). Staggered grid was chosen to discrete the variables. As shown
in Fig. 2, axial velocity ( , )z i ju was stored at the middle of the right edge. Radial velocity ( , )r i ju was
stored at the middle of the top edge. Pressure ( , )i jp , molar fraction( , )i jx , density ( , )i j and
concentration ( , )i jc were located at the centre of each control volume. This arrangement provides a
strong coupling between the velocities and pressure, which helps to avoid convergence problems
and oscillations in the pressure and velocity fields. Since density ( , )i j and concentration ( , )i jc are
not located at the same point as velocity, upwind scheme was used for discretization. Eqs. (24) to
(27) are the discretization of governing equations (2), (3), (5) and (6).
t ( , 1) ( , ) b ( , ) ( , 1) ( , ) ( , ) ( 1, ) ( 1, ) ( , )
c
1 i j r i j i j r i j i j z i j i j z i j i jr c u r c u c u c u J
r r z r
(24)
( , 2) ( , 1) ( , ) ( , 1) ( , ) ( , 1) ( 1, 1) ( 1, ) ( 1, 1) ( 1, ) ( 1, 1) ( 1, )
( , )
( , 1) ( , ) ( , 1) ( , ) ( , ) ( , 1)
t b
c
2 4 2
1 1
i j r i j i j r i j z i j z i j z i j z i j i j r i j i j r i j
r i j
i j i j r i j r i j r i j r i j
u u u u u u u uu
r z
p p u u u ur r
r r r r r
( 1, ) ( , ) ( 1, ) ( , )
2 2
c
2r i j r i j r i j r i ju u u u
z r
(25)
( , ) ( 1, ) ( , 1) ( 1, 1) ( , 1) ( , 1) ( , 1) ( , 1) ( 1, ) ( 1, ) ( 1, ) ( 1, )
( , )
( 1, ) ( , ) ( , 1) ( , ) ( , ) ( , 1)
t b
c
4 2 2
1 1
r i j r i j r i j r i j i j z i j i j z i j i j z i j i j z i j
z i j
i j i j z i j z i j z i j z i j
u u u u u u u uu
r z
p p u u u ur r
z r r r r
( 1, ) ( , ) ( 1, )
2
2z i j z i j z i ju u u
z
(26)

t 1( , 1) ( , ) b 1( , ) ( , 1) 1( , ) ( , ) 1( 1, ) ( 1, )
c
1( , 1) 1( , ) 1( , ) 1( , 1) 1( 1, ) 1( , ) 1( 1, ) 1( , )
t b 2
c
1
21 1
i j r i j i j r i j i j z i j i j z i j
i j i j i j i j i j i j i j i j
r c u r c u c u c u
r r z
c c c c c c c Jr D r D D
r r r r z r
(27)
Fig. 2 The staggered grid and the storage locations of variables
The mass transfer across the membrane could be easily computed after obtaining the solution of Eq.
(21). The dynamic boundary conditions of Eq. (21) are extracted from fluid dynamic parameters in
the gas phase. Since Eq. (21) is only one dimensional, it can be solved by a ready-made function
package in Matlab ‘bvp4c’ which is coded on basis of Runge-Kutta method (Shampine and Muir,
2004; Weiss, 1974).
Other boundary conditions used in the model were 51 10 Pa pressure at permeate outlet,
56 10
Pa pressure at retentate and constant parabolic velocity at the feed inlet in each case, but for
different cases the velocity at the feed inlet can be modified to a different scale. To solve the
governing equations under given boundary conditions, codes were compiled in Matlab. The solution
was considered achieved when the residuals converged to values less than the magnitude of 10-5
and all the variable values were not changed with iteration. Fig. 3 demonstrated the flowchart of this
model.

Fig. 3 The flowchart of the modeling strategy
The grid independence was checked by running the model with different mesh size. The radial grid
number in feed domain and permeate domain were denoted as A and B in Fig. 4, and the axial
number is denoted as C. To seek an appropriate grid system for the simulation, seven different grid
systems such as [(A+B)×C]=[(4+2)×20], [(4+2)×30], [(4+2)×40], [(4+2)×50], [(4+2)×100], [(8+4)×200]
and [(16+8)×400] were tested and compared with each other in terms of H2 molar fraction. The
distribution of H2 molar fraction along the feed domain in Fig. 5 indicates that the difference among
those grid systems is very insignificant when the grid number is over [(8+4)×200]. The mesh [(8+4)×
200] satisfied the grid independence requirement, thus this mesh is adopted in this work.

Fig. 4 The discretization of the domains in radial and axial direction
Fig. 5 The comparison of H2 molar fraction distribution in different grid systems
3. Model validation
A series of experiments with cobalt oxide silica (CoOxSi) membranes were conducted as reported
elsewhere (Yacou et al., 2012) for model validation. Briefly, two CoOxSi membranes were connected
in series as shown in Fig. 1, instead of a single long membrane, mainly attributed to the current
limitation of fabricating defect free longer single inorganic membrane tubes. CoOxSi membranes
derived by sol-gel synthesis were dip coated on high quality γ-alumina interlayers on -alumina
supports purchased from the Energy Centre of the Netherlands. Single gas and binary mixture
permeation were tested at temperatures ranging from 200–500oC. To obtain single gas permeance
at different temperatures, single gas permeation was carried out at the dead end mode, where the
retentate stream was closed. The binary gas mixtures of H2 and Ar were mixed using MKS mass flow
controllers. The permeate stream pressure was kept constant at 1 atm whilst the retentate pressure
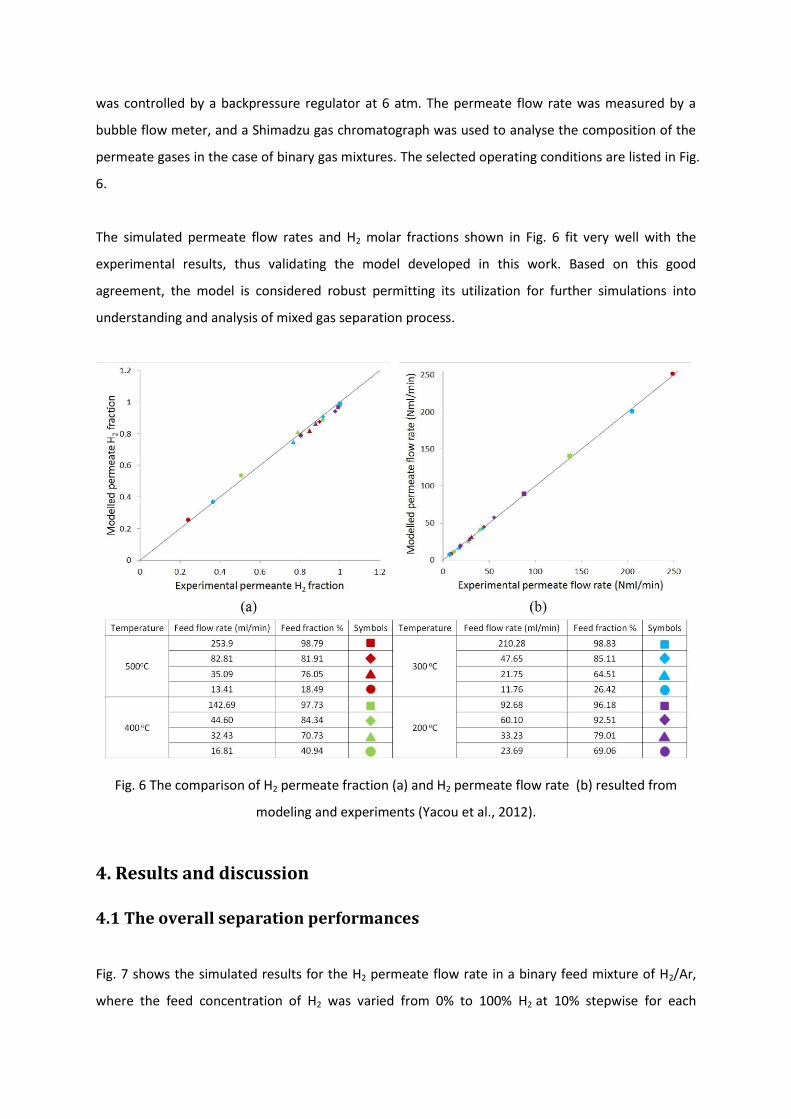
was controlled by a backpressure regulator at 6 atm. The permeate flow rate was measured by a
bubble flow meter, and a Shimadzu gas chromatograph was used to analyse the composition of the
permeate gases in the case of binary gas mixtures. The selected operating conditions are listed in Fig.
6.
The simulated permeate flow rates and H2 molar fractions shown in Fig. 6 fit very well with the
experimental results, thus validating the model developed in this work. Based on this good
agreement, the model is considered robust permitting its utilization for further simulations into
understanding and analysis of mixed gas separation process.
Fig. 6 The comparison of H2 permeate fraction (a) and H2 permeate flow rate (b) resulted from
modeling and experiments (Yacou et al., 2012).
4. Results and discussion
4.1 The overall separation performances
Fig. 7 shows the simulated results for the H2 permeate flow rate in a binary feed mixture of H2/Ar,
where the feed concentration of H2 was varied from 0% to 100% H2 at 10% stepwise for each
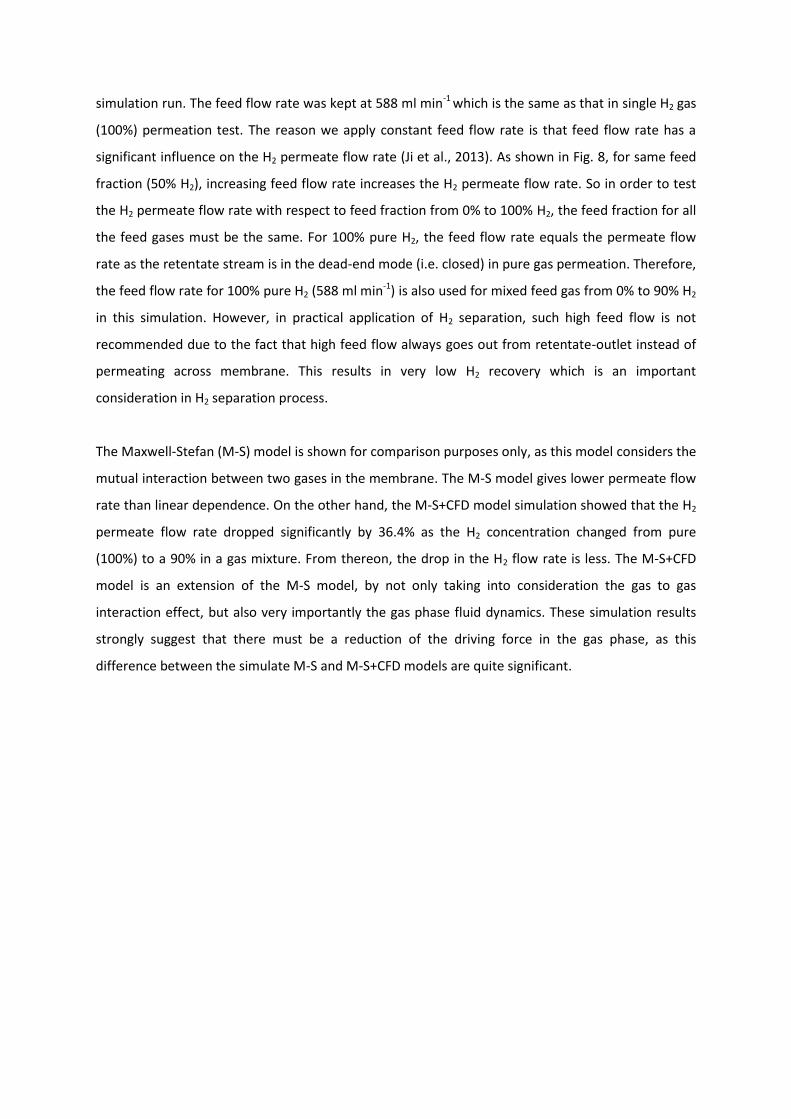
simulation run. The feed flow rate was kept at 588 ml min-1 which is the same as that in single H2 gas
(100%) permeation test. The reason we apply constant feed flow rate is that feed flow rate has a
significant influence on the H2 permeate flow rate (Ji et al., 2013). As shown in Fig. 8, for same feed
fraction (50% H2), increasing feed flow rate increases the H2 permeate flow rate. So in order to test
the H2 permeate flow rate with respect to feed fraction from 0% to 100% H2, the feed fraction for all
the feed gases must be the same. For 100% pure H2, the feed flow rate equals the permeate flow
rate as the retentate stream is in the dead-end mode (i.e. closed) in pure gas permeation. Therefore,
the feed flow rate for 100% pure H2 (588 ml min-1) is also used for mixed feed gas from 0% to 90% H2
in this simulation. However, in practical application of H2 separation, such high feed flow is not
recommended due to the fact that high feed flow always goes out from retentate-outlet instead of
permeating across membrane. This results in very low H2 recovery which is an important
consideration in H2 separation process.
The Maxwell-Stefan (M-S) model is shown for comparison purposes only, as this model considers the
mutual interaction between two gases in the membrane. The M-S model gives lower permeate flow
rate than linear dependence. On the other hand, the M-S+CFD model simulation showed that the H2
permeate flow rate dropped significantly by 36.4% as the H2 concentration changed from pure
(100%) to a 90% in a gas mixture. From thereon, the drop in the H2 flow rate is less. The M-S+CFD
model is an extension of the M-S model, by not only taking into consideration the gas to gas
interaction effect, but also very importantly the gas phase fluid dynamics. These simulation results
strongly suggest that there must be a reduction of the driving force in the gas phase, as this
difference between the simulate M-S and M-S+CFD models are quite significant.
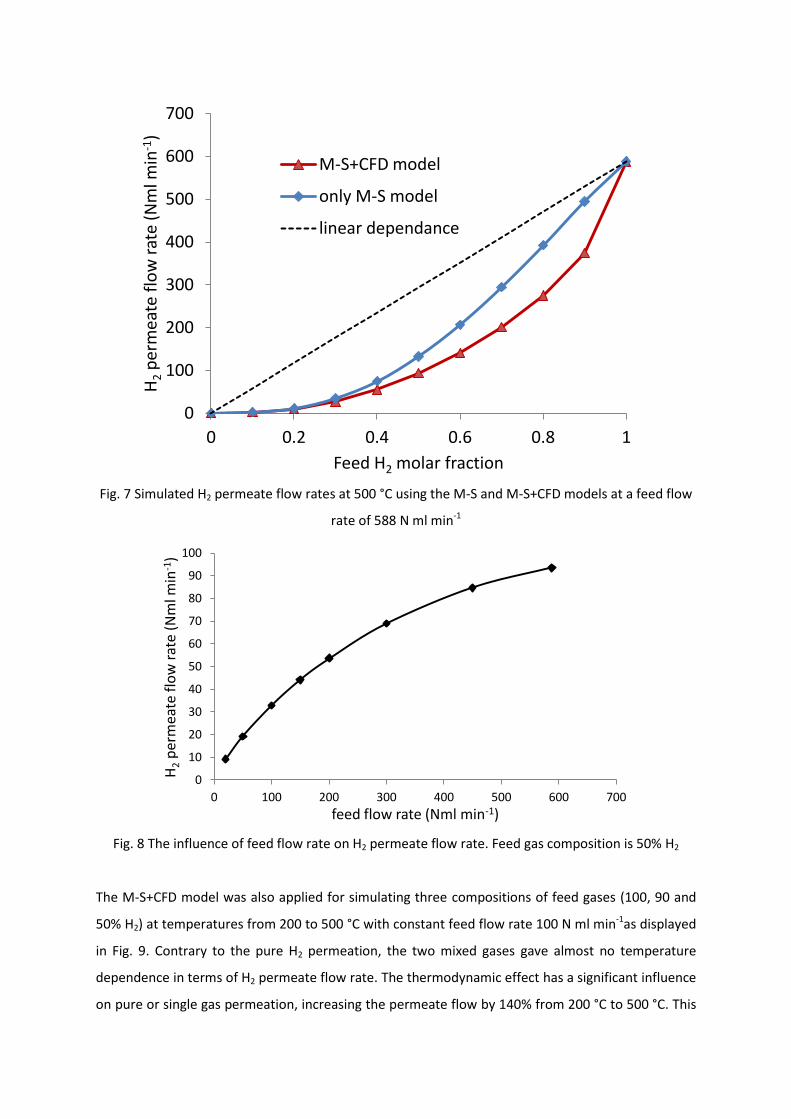
Fig. 7 Simulated H2 permeate flow rates at 500 °C using the M-S and M-S+CFD models at a feed flow
rate of 588 N ml min-1
Fig. 8 The influence of feed flow rate on H2 permeate flow rate. Feed gas composition is 50% H2
The M-S+CFD model was also applied for simulating three compositions of feed gases (100, 90 and
50% H2) at temperatures from 200 to 500 °C with constant feed flow rate 100 N ml min-1as displayed
in Fig. 9. Contrary to the pure H2 permeation, the two mixed gases gave almost no temperature
dependence in terms of H2 permeate flow rate. The thermodynamic effect has a significant influence
on pure or single gas permeation, increasing the permeate flow by 140% from 200 °C to 500 °C. This
0
100
200
300
400
500
600
700
0 0.2 0.4 0.6 0.8 1
H2 p
erm
eate
flo
w r
ate
(Nm
l min
-1)
Feed H2 molar fraction
M-S+CFD model
only M-S model
linear dependance
0
10
20
30
40
50
60
70
80
90
100
0 100 200 300 400 500 600 700
H2 p
erm
eate
flo
w r
ate
(Nm
l min
-1)
feed flow rate (Nml min-1)

follows a temperature dependent activated transport for H2 permeation, as reported by several
research groups (Battersby et al., 2009; de Vos and Verweij, 1998; Igi et al., 2008; Kanezashi and
Asaeda, 2006) for silica derived membranes. However, by introducing a small concentration of Ar
(10%) in the H2/Ar feed gas mixture the temperature dependence essentially disappeared as H2
fluxes became almost constant as a function of temperature. In addition, the decrease of H2 from 90
to 50% likewise resulted in the decrease of H2 flow rate by ~65%. These M-S+CFD simulate results
also matched the experimental results reported by Yacou and co-workers (Yacou et al., 2012). These
results give a clear indication that the effects of fluid dynamics in the gas phase in the module,
coupled with the gas concentration effect, are strong and overwhelm any temperature activation
effects as observed with pure gas permeation.
Fig. 9 H2 permeate flow rate from different feed gas mixtures. Feed flow rate = 100 ml min-1
4.2 Analysis of fluid dynamic in feed domain
To further understand the effect of fluid dynamics in the feed domain, Fig. 10(b) shows the axial
velocity on symmetry cross section (Fig. 10(a)). The simulation was based on fixed conditions of
H2/Ar gas mixture of 50/50 feed flow rate at 100 ml min-1. The axial velocity drops greatly from 1.6 x
10-4 m s-1 at the feed inlet to 1.6 x 10⁻⁵ m s-1 at the retentate outlet. In terms of chemical engineering
0
100
200
300
400
500
600
150 200 250 300 350 400 450 500 550
H2 P
erm
eate
flo
wr
ate
(ml m
in-1
)
Temperature (oC)
Pure H2
90%H2-10%Ar
50%H2-50%Ar
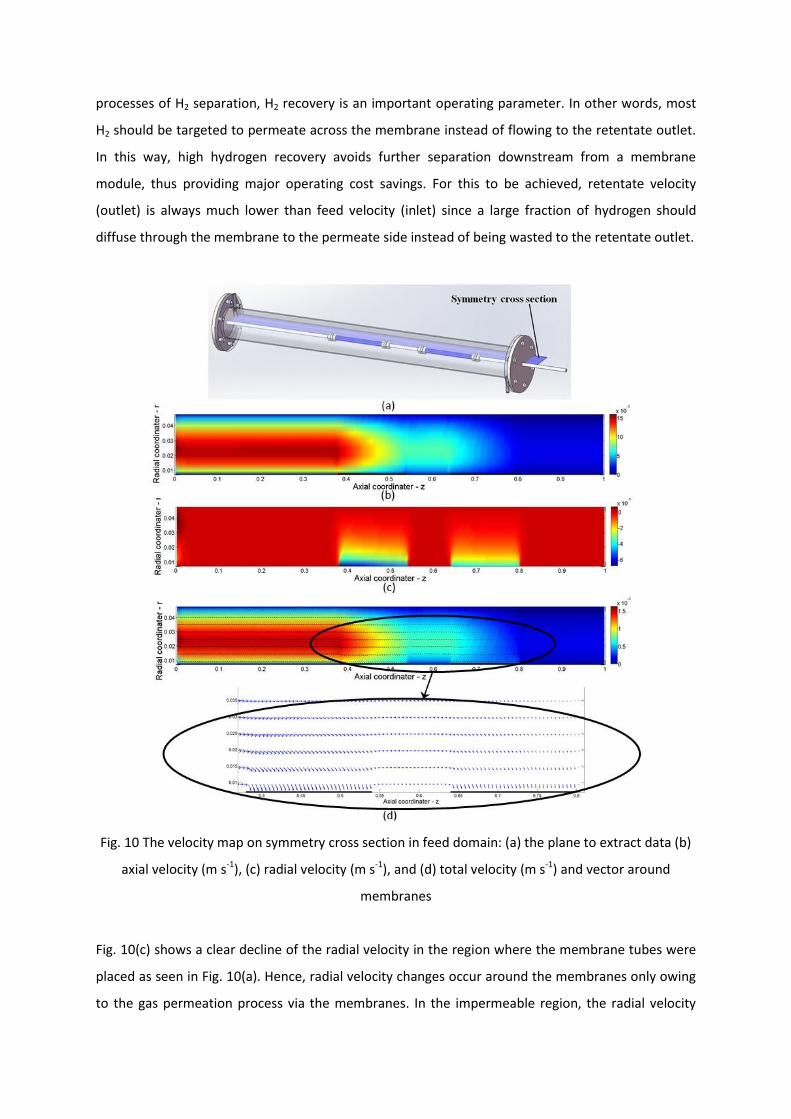
processes of H2 separation, H2 recovery is an important operating parameter. In other words, most
H2 should be targeted to permeate across the membrane instead of flowing to the retentate outlet.
In this way, high hydrogen recovery avoids further separation downstream from a membrane
module, thus providing major operating cost savings. For this to be achieved, retentate velocity
(outlet) is always much lower than feed velocity (inlet) since a large fraction of hydrogen should
diffuse through the membrane to the permeate side instead of being wasted to the retentate outlet.
Fig. 10 The velocity map on symmetry cross section in feed domain: (a) the plane to extract data (b)
axial velocity (m s-1), (c) radial velocity (m s-1), and (d) total velocity (m s-1) and vector around
membranes
Fig. 10(c) shows a clear decline of the radial velocity in the region where the membrane tubes were
placed as seen in Fig. 10(a). Hence, radial velocity changes occur around the membranes only owing
to the gas permeation process via the membranes. In the impermeable region, the radial velocity
does not change, and is almost zero. The absolute value of radial velocity around the first membrane
is higher than that around the second membrane. The mass transfer in the gas phase can be
described by total velocity and velocity vector in Fig. 10(d). The vectors in the permeable region also
show that the permeation in the first membrane is more severe. This clearly indicates that the
driving force is reduced along the module, since the model assumes the membrane permeability is
spatially even.
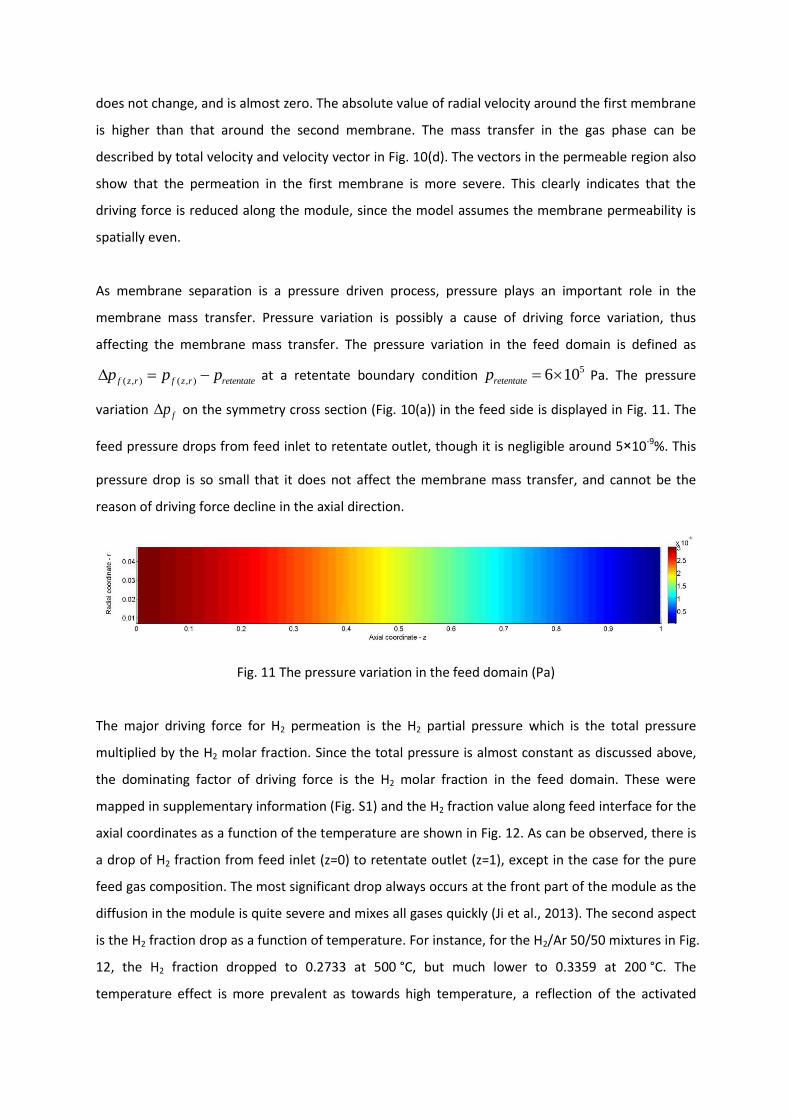
As membrane separation is a pressure driven process, pressure plays an important role in the
membrane mass transfer. Pressure variation is possibly a cause of driving force variation, thus
affecting the membrane mass transfer. The pressure variation in the feed domain is defined as
( , ) ( , )f z r f z r retentatep p p at a retentate boundary condition 56 10retentatep Pa. The pressure
variation fp on the symmetry cross section (Fig. 10(a)) in the feed side is displayed in Fig. 11. The
feed pressure drops from feed inlet to retentate outlet, though it is negligible around 5×10⁻⁹%. This
pressure drop is so small that it does not affect the membrane mass transfer, and cannot be the
reason of driving force decline in the axial direction.
Fig. 11 The pressure variation in the feed domain (Pa)
The major driving force for H2 permeation is the H2 partial pressure which is the total pressure
multiplied by the H2 molar fraction. Since the total pressure is almost constant as discussed above,
the dominating factor of driving force is the H2 molar fraction in the feed domain. These were
mapped in supplementary information (Fig. S1) and the H2 fraction value along feed interface for the
axial coordinates as a function of the temperature are shown in Fig. 12. As can be observed, there is
a drop of H2 fraction from feed inlet (z=0) to retentate outlet (z=1), except in the case for the pure
feed gas composition. The most significant drop always occurs at the front part of the module as the
diffusion in the module is quite severe and mixes all gases quickly (Ji et al., 2013). The second aspect
is the H2 fraction drop as a function of temperature. For instance, for the H2/Ar 50/50 mixtures in Fig.
12, the H2 fraction dropped to 0.2733 at 500 °C, but much lower to 0.3359 at 200 °C. The
temperature effect is more prevalent as towards high temperature, a reflection of the activated

transport of CoOxSi membranes. In other words, the membranes became more permeable as a
function of temperature, resulting in less H2 remaining in the feed domain and consequently lower
H2 partial pressure on the feed interface. Nevertheless, these results indicate that high temperatures
have a significant effect on the driving force reduction in the gas phase.
In the case of pure H2 feed gas, the H2 fraction is a constant value of 1 (100%) everywhere and
pressure is likewise almost constant. Hence, for pure single H2 permeation, the true driving force is
the same as that at inlet. In the case of gas mixture separation, the driving force is more complex
than that of single gas permeation. This is important as H2 preferentially diffuses through the
membrane, thus its driving force tends to reduce along the axial coordinates. At the same time, this
process is coupled with H2 permeation and transfer in the gas phase due to advection and gas to gas
diffusion. Though the diffusivity in the gas phase is several orders of magnitude higher than that
through the membrane layer (Abdel-jawad et al., 2007), the resistance in the gas phase cannot be
ignored. This is attributed to the distance in the gas phase which is much larger than the thickness of
the membrane and the gas phase resistance can be a significant resistance in the entire process.
Compared to pure gas permeation, the H2 permeate flow from feed gas mixtures delivers a dramatic
reduction due to presence of this extra resistance.
Fig. 12 The H2 molar fraction in the feed domain as a function of the axial coordinates
A common effect in separation processes is concentration polarization as the membrane selectively
permeates one component more than the other, thus leading to the accumulation of the other
component on the membrane surface (Haraya et al., 1987; Zhang et al., 2006). To further
0.25
0.3
0.35
0.4
0.45
0.5
0 0.2 0.4 0.6 0.8 1
H2 m
ola
r fr
acti
on
Axial coordinate-z(m)
500˚C
400˚C
300˚C
200˚C
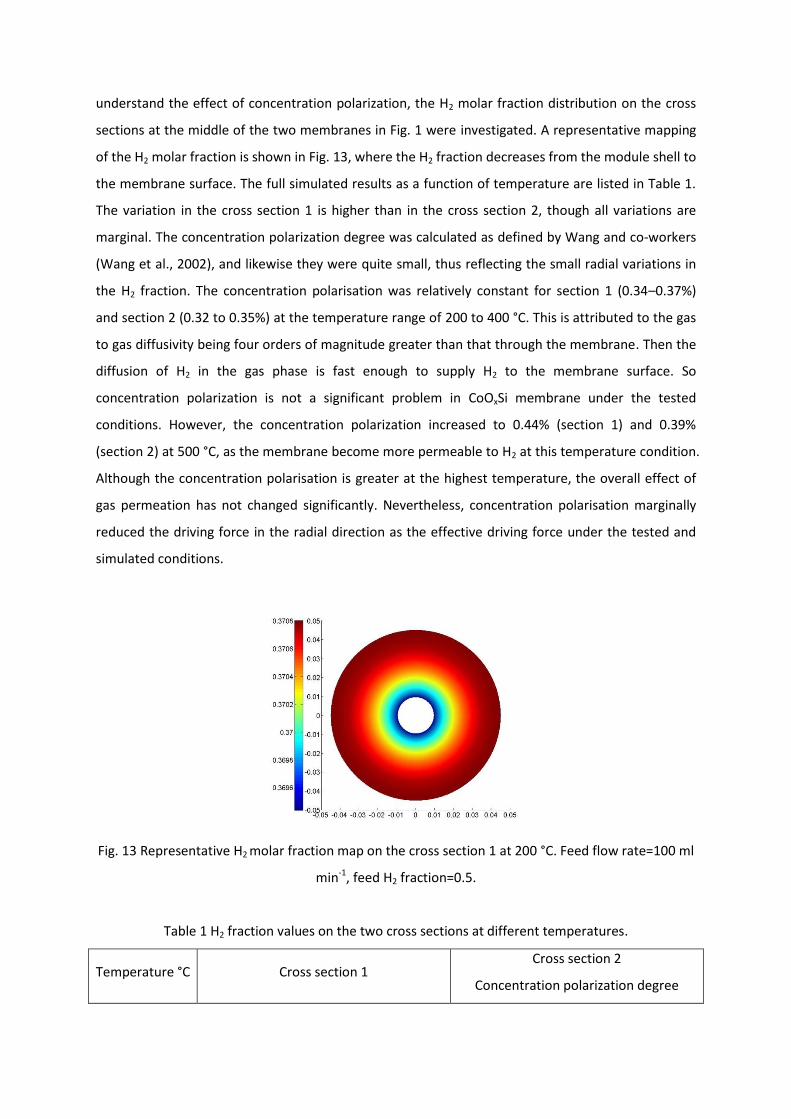
understand the effect of concentration polarization, the H2 molar fraction distribution on the cross
sections at the middle of the two membranes in Fig. 1 were investigated. A representative mapping
of the H2 molar fraction is shown in Fig. 13, where the H2 fraction decreases from the module shell to
the membrane surface. The full simulated results as a function of temperature are listed in Table 1.
The variation in the cross section 1 is higher than in the cross section 2, though all variations are
marginal. The concentration polarization degree was calculated as defined by Wang and co-workers
(Wang et al., 2002), and likewise they were quite small, thus reflecting the small radial variations in
the H2 fraction. The concentration polarisation was relatively constant for section 1 (0.34–0.37%)
and section 2 (0.32 to 0.35%) at the temperature range of 200 to 400 °C. This is attributed to the gas
to gas diffusivity being four orders of magnitude greater than that through the membrane. Then the
diffusion of H2 in the gas phase is fast enough to supply H2 to the membrane surface. So
concentration polarization is not a significant problem in CoOxSi membrane under the tested
conditions. However, the concentration polarization increased to 0.44% (section 1) and 0.39%
(section 2) at 500 °C, as the membrane become more permeable to H2 at this temperature condition.
Although the concentration polarisation is greater at the highest temperature, the overall effect of
gas permeation has not changed significantly. Nevertheless, concentration polarisation marginally
reduced the driving force in the radial direction as the effective driving force under the tested and
simulated conditions.
Fig. 13 Representative H2 molar fraction map on the cross section 1 at 200 °C. Feed flow rate=100 ml
min-1, feed H2 fraction=0.5.
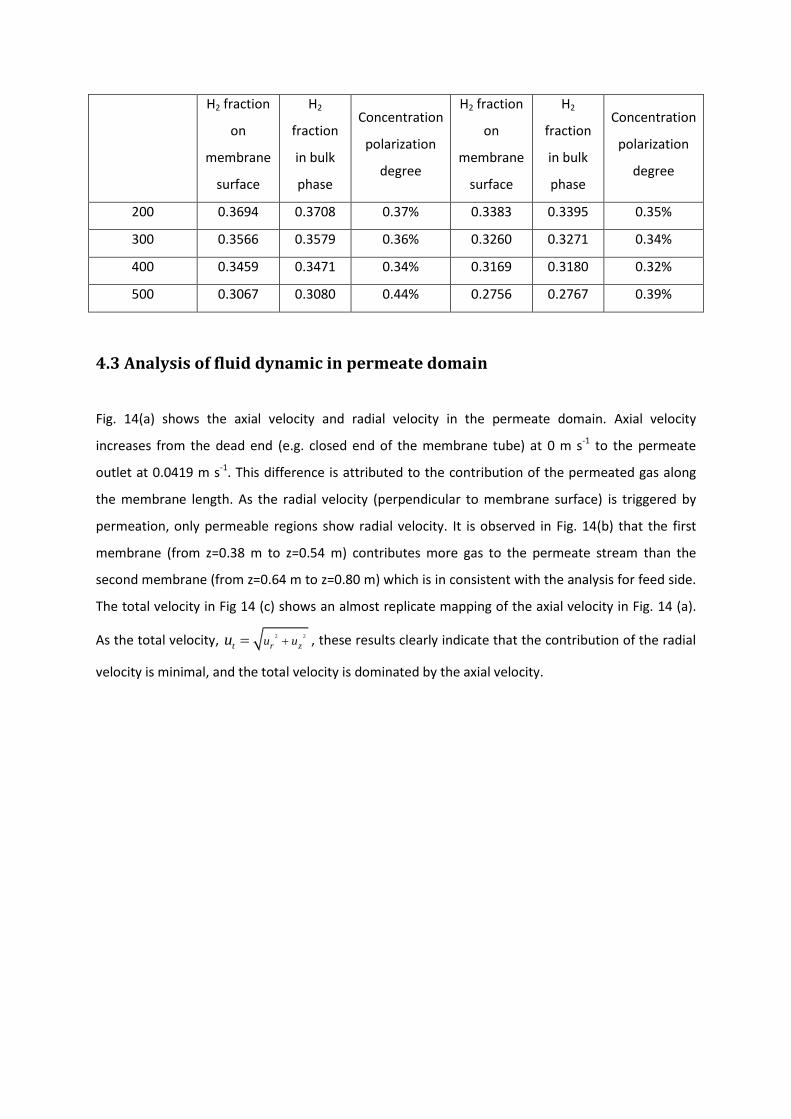
Table 1 H2 fraction values on the two cross sections at different temperatures.
Temperature °C Cross section 1 Cross section 2
Concentration polarization degree
H2 fraction
on
membrane
surface
H2
fraction
in bulk
phase
Concentration
polarization
degree
H2 fraction
on
membrane
surface
H2
fraction
in bulk
phase
Concentration
polarization
degree
200 0.3694 0.3708 0.37% 0.3383 0.3395 0.35%
300 0.3566 0.3579 0.36% 0.3260 0.3271 0.34%
400 0.3459 0.3471 0.34% 0.3169 0.3180 0.32%
500 0.3067 0.3080 0.44% 0.2756 0.2767 0.39%
4.3 Analysis of fluid dynamic in permeate domain
Fig. 14(a) shows the axial velocity and radial velocity in the permeate domain. Axial velocity
increases from the dead end (e.g. closed end of the membrane tube) at 0 m s-1 to the permeate
outlet at 0.0419 m s-1. This difference is attributed to the contribution of the permeated gas along
the membrane length. As the radial velocity (perpendicular to membrane surface) is triggered by
permeation, only permeable regions show radial velocity. It is observed in Fig. 14(b) that the first
membrane (from z=0.38 m to z=0.54 m) contributes more gas to the permeate stream than the
second membrane (from z=0.64 m to z=0.80 m) which is in consistent with the analysis for feed side.
The total velocity in Fig 14 (c) shows an almost replicate mapping of the axial velocity in Fig. 14 (a).
As the total velocity, 2 2
t r zu uu , these results clearly indicate that the contribution of the radial
velocity is minimal, and the total velocity is dominated by the axial velocity.
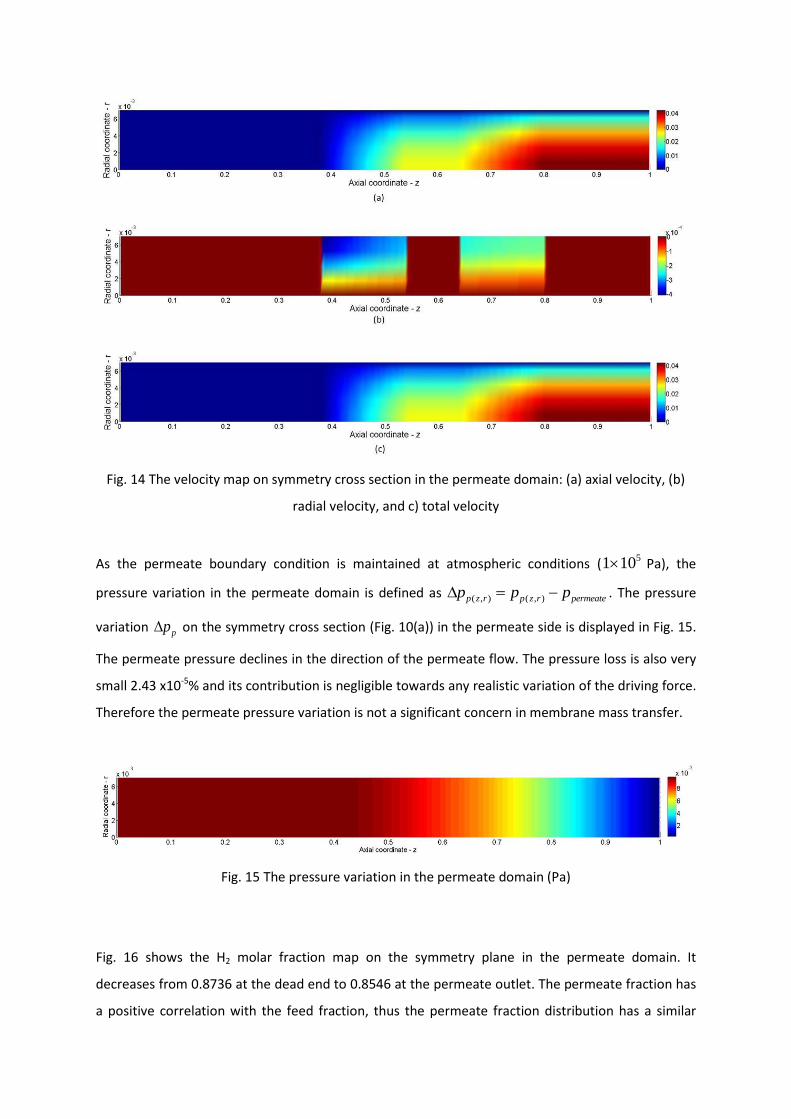
Fig. 14 The velocity map on symmetry cross section in the permeate domain: (a) axial velocity, (b)
radial velocity, and c) total velocity
As the permeate boundary condition is maintained at atmospheric conditions (51 10 Pa), the
pressure variation in the permeate domain is defined as ( , ) ( , )p z r p z r permeatep p p . The pressure
variation pp on the symmetry cross section (Fig. 10(a)) in the permeate side is displayed in Fig. 15.
The permeate pressure declines in the direction of the permeate flow. The pressure loss is also very
small 2.43 x10⁻⁵% and its contribution is negligible towards any realistic variation of the driving force.
Therefore the permeate pressure variation is not a significant concern in membrane mass transfer.
Fig. 15 The pressure variation in the permeate domain (Pa)
Fig. 16 shows the H2 molar fraction map on the symmetry plane in the permeate domain. It
decreases from 0.8736 at the dead end to 0.8546 at the permeate outlet. The permeate fraction has
a positive correlation with the feed fraction, thus the permeate fraction distribution has a similar

trend to feed fraction distribution. However, the variation of the permeate fraction at 500 °C is
2.22%, much smaller than that at the feed domain at 45.34%. As the membrane preferentially
diffuses H2 only, the variations of the H2 molar fraction in the permeate domain are almost constant.
Fig. 16 The H2 molar fraction map on symmetry cross section in the feed domain at different
As the permeate side connects to a low pressure region, the gas permeate velocity is higher than
that of the gas feed velocity (Fig. 10 and Fig. 14). This clearly indicates the effect of advection.
Meanwhile, the diffusivity in permeate domain was also higher than feed domain due to the lower
pressure. As a result of stronger advection and higher diffusivity, the gas in permeate domain mixed
much quicker than in the feed domain. Hence, the driving force, and consequently mass transfer, is
controlled by the conditions in the feed domain rather than in the permeate domain.
5. Conclusion
A computational fluid dynamics approach is presented in this study to investigate the fluid
conditions of a relatively large scale CoOxSi membrane module. The prediction from simulation
showed very good agreement with experiments over a large range of operating conditions in terms
of feed flow rates, feed H2 fractions and temperatures. This model is able to provide detailed
description of velocity, component fraction and pressure distribution in the CoOxSi membrane
module, thus allowing further analysis of driving force variation.
The simulation revealed that there is a significant H2 fraction drops in axial direction, thus affecting
the H2 permeation in gas mixture separation. This is reflected by the H2 fraction variation along the
axial direction was remarkable with 45.34% in the feed domain and retentate domain, whilst
marginal at 2.22% in the permeate domain. Hence, H2 permeation was mainly controlled by the
driving forces imposed by the H2 fractions in the permeate domain.

The effect of driving force variation at the radial direction was extremely marginal. It was found that
the concentration polarization was very weak in both feed domain and permeate domain owing to
the high gas to gas diffusivity at high temperature and low gas diffusion through membrane
permeance. This is mainly a reflection of the operating conditions which aimed to maximise H2
recovery. Hence, the gas flow in the membrane module was extremely slow, which allowed for gas
to gas diffusion to maintain the chemical equilibrium of gases; greatly reducing concentration
polarisation. In this operating condition, the total pressures in both feed and permeate domain
along axial and radial directions resulted in insignificant variations.
Although single gas permeation increased dramatically with temperature and complied with a
temperature dependent molecular sieving transport mechanism, the same effect was marginal for
gas mixture separation. This resulted in very weak temperature dependence as the driving force
reduction was more significant at higher temperature, which offsets the higher permeance at high
temperature.
Notation
c molar concentration (mol m-3)
dA permeable area in a grid (m2)
dV volume of a grid (m3)
D Fick diffusivity in gas phase (m2 s-1)
Ð Maxwell-Stefan diffusivity in the membrane (m2 s-1)
iÐ Maxwell-Stefan single gas diffusivity in membrane (m2 s-1)
iiÐ self-exchange coefficient (m2 s-1)
ijÐ Maxwell-Stefan mutual diffusivity describing (m2 s-1)
J permeate flux across membrane (mol m-2 s-1)
K Henry’s constant (mol m-3 Pa-1)
p pressure (Pa)
q concentration of adsorbed gas (mol m-3)
r radial coordinate (m)
r radial length of a grid (m)

mR radius of the membrane (m)
T temperature (K)
ru radial velocity (m s-1)
tu total velocity (m s-1)
zu axial velocity (m s-1)
x component molar fraction
z axial coordinate (m)
z axial length of a grid (m)
[ ]B coefficient matrix in Maxwell-Stefan equation
[ ]J matrix of flux across the membrane
[ ]L inversed matrix of
[ ]p matrix of pressure gradient
Greek letters
viscosity (Pa s)
fractional occupancy of adsorption
chemical potential (J mol-1)
density (kg m-3
)
Acknowledgements
Guozhao Ji acknowledges the scholarship provided by the University of Queensland and the China
Scholarship Council. The authors acknowledge funding support from the Australian Research Council
(DP110101185).
References
[1] Abdel-jawad, M.M., Gopalakrishnan, S., Duke, M.C., Macrossan, M.N., Schneider, P.S., Costa, J.C.D.d., 2007. Flowfields on feed and permeate sides of tubular molecular sieving silica (MSS) membranes. Journal of Membrane Science 299, 229-235. [2] Bahukudumbi, P., Ford, D.M., 2006. Molecular Modeling Study of the Permeability−Selectivity Trade-off in Polymeric and Microporous Membranes. Industrial & Engineering Chemistry Research 45, 5640-5648. [3] Battersby, S., Ladewig, B.P., Duke, M., Rudolph, V., Diniz da Costa, J.C., 2010. Membrane reactor modelling, validation and simulation for the WGS reaction using metal doped silica membranes. Asia-Pacific Journal of Chemical Engineering 5, 83-92.

[4] Battersby, S., Tasaki, T., Smart, S., Ladewig, B., Liu, S., Duke, M.C., Rudolph, V., Diniz da Costa, J.C., 2009. Performance of cobalt silica membranes in gas mixture separation. Journal of Membrane Science 329, 91-98. [5] Battersby, S., Teixeira, P.W., Beltramini, J., Duke, M.C., Rudolph, V., Diniz da Costa, J.C., 2006. An analysis of the Peclet and Damkohler numbers for dehydrogenation reactions using molecular sieve silica (MSS) membrane reactors. Catalysis Today 116, 12-17. [6] Bettens, B., Degrève, J., Van der Bruggen, B., Vandecasteele, C., 2007. Transport of Binary Mixtures in Pervaporation through a Microporous Silica Membrane: Shortcomings of Fickian Models. Separation Science and Technology 42, 1-23. [7] Bracht, M., Alderliesten, P.T., Kloster, R., Pruschek, R., Haupt, G., Xue, E., Ross, J.R.H., Koukou, M.K., Papayannakos, N., 1997. Water gas shift membrane reactor for CO2 control in IGCC systems: techno-economic feasibility study. Energy Conversion and Management 38, Supplement, S159-S164. [8] Brunetti, A., Barbieri, G., Drioli, E., Lee, K.H., Sea, B., Lee, D.W., 2007. WGS reaction in a membrane reactor using a porous stainless steel supported silica membrane. Chemical Engineering and Processing 46, 119-126. [9] Burggraaf, A.J., Vroon, Z.A.E.P., Keizer, K., Verweij, H., 1998. Permeation of single gases in thin zeolite MFI membranes. Journal of Membrane Science 144, 77-86. [10] Chang, W., Lee, T.-y., 2006. Molecular dynamics simulation of gas permeation phenomena in a microporous silica membrane. Chemical Engineering Science 61, 3974-3985. [11] Chen, W.-H., Syu, W.-Z., Hung, C.-I., 2011. Numerical characterization on concentration polarization of hydrogen permeation in a Pd-based membrane tube. International Journal of Hydrogen Energy 36, 14734-14744. [12] Chen, W.-H., Syu, W.-Z., Hung, C.-I., Lin, Y.-L., Yang, C.-C., 2012. A numerical approach of conjugate hydrogen permeation and polarization in a Pd membrane tube. International Journal of Hydrogen Energy 37, 12666-12679. [13] Cordero, B., Gomez, V., Platero-Prats, A.E., Reves, M., Echeverria, J., Cremades, E., Barragan, F., Alvarez, S., 2008. Covalent radii revisited. Dalton Transactions 0, 2832-2838. [14] Coroneo, M., Montante, G., Baschetti, M.G., Paglianti, A., 2009a. CFD modelling of inorganic membranemodules for gas mixture separation. Chemical Engineering Science 64, 1085-1094 [15] Coroneo, M., Montante, G., Catalano, J., Paglianti, A., 2009b. Modelling the effect of operating conditions on hydrodynamics and mass transfer in a Pd–Ag membrane module for H2 purification. Journal of Membrane Science 343, 34–41. [16] de Vos, R.M., Verweij, H., 1998. Improved performance of silica membranes for gas separation. Journal of Membrane Science 143, 37-51. [17] Diniz da Costa, J.C., Lu, G.Q., Rudolph, V., Lin, Y.S., 2002. Novel molecular sieve silica (MSS) membranes: characterisation and permeation of single-step and two-step sol-gel membranes. Journal of Membrane Science 198, 9-21. [18] Fuller, E.N., Schettler, P.D., Giddings, J.C., 1966. a new method for prediction of binary gas phase diffusion coefficients. Industrial & Engineering Chemistry 58, 18-27. [19] Ghidossi, R., Veyret, D., Moulin, P., 2006. Computational fluid dynamics applied to membranes: State of the art and opportunities. Chemical Engineering and Processing 45, 437–454. [20] Haraya, K., Hakuta, T., Yoshitome, H., Kimura, S., 1987. A Study of Concentration Polarization Phenomenon on the Surface of a Gas Separation Membrane. Separation Science and Technology 22, 1425-1438. [21] Igi, R., Yoshioka, T., Ikuhara, Y.H., Iwamoto, Y., Tsuru, T., 2008. Characterization of Co-Doped Silica for Improved Hydrothermal Stability and Application to Hydrogen Separation Membranes at High Temperatures. Journal of the American Ceramic Society 91, 2975-2981. [22] Ji, G., Wang, G., Hooman, K., Bhatia, S., Diniz da Costa, J., 2012. Computational fluid dynamics applied to high temperature hydrogen separation membranes. Frontiers of Chemical Science and Engineering 6, 3-12.
[23] Ji, G., Wang, G., Hooman, K., Bhatia, S., Diniz da Costa, J.C., 2013. Simulation of binary gas separation through multi-tube molecular sieving membranes at high temperatures. Chemical Engineering Journal 218, 394-404. [24] Kan, T., Sun, X., Wang, H., Li, C., Muhammad, U., 2012. Production of Gasoline and Diesel from Coal Tar via Its Catalytic Hydrogenation in Serial Fixed Beds. Energy & Fuels 26, 3604-3611. [25] Kanezashi, M., Asaeda, M., 2006. Hydrogen permeation characteristics and stability of Ni-doped silica membranes in steam at high temperature. Journal of Membrane Science 271, 86-93. [26] Kapteijn, F., 2006. zeolite membranes: modeling and application, in: Andrzej Cybulski, J.A.M. (Ed.), Structured Catalysts And Reactors. CRC Press, 2006. [27] Kapteijn, F., Bakker, W.J.W., Zheng, G., Moulijn, J.A., 1994. Temperature- and occupancy-dependent diffusion of n-butane through a silicalite-1 membrane. Microporous Materials 3, 227-234. [28] Kapteijn, F., Moulijn, J.A., Krishna, R., 2000. The generalized Maxwell–Stefan model for diffusion in zeolites:: sorbate molecules with different saturation loadings. Chemical Engineering Science 55, 2923-2930. [29] Kawachale, N., Kirpalani, D.M., Kumar, A., 2010. A mass transport and hydrodynamic evaluation of membrane separation cell. Chemical Engineering and Processing: Process Intensification 49, 680–688. [30] Keizer, K., Burggraaf, A.J., Vroon, Z.A.E.P., Verweij, H., 1998. Two component permeation through thin zeolite MFI membranes. Journal of Membrane Science 147, 159-172. [31] Koukou, M.K., Papayannakos, N., Markatos, N.C., 1996. Dispersion effects on membrane reactor performance. AIChE Journal 42, 2607-2615. [32] Koukou, M.K., Papayannakos, N., Markatos, N.C., Bracht, M., Van Veen, H.M., Roskam, A., 1999. Performance of ceramic membranes at elevated pressure and temperature: effect of non-ideal flow conditions in a pilot scale membrane separator. Journal of Membrane Science 155, 241-259. [33] Krishna, R., 1990. Multicomponent surface diffusion of adsorbed species: a description based on the generalized Maxwell—Stefan equations. Chemical Engineering Science 45, 1779-1791. [34] Krishna, R., 1993. A unified approach to the modelling of intraparticle diffusion in adsorption processes. Gas Separation & Purification 7, 91-104. [35] Krishna, R., 2012. Diffusion in porous crystalline materials. Chemical Society Reviews 41, 3099-3118. [36] Krishna, R., Baur, R., 2003. Modelling issues in zeolite based separation processes. Separation and Purification Technology 33, 213-254. [37] Krishna, R., van Baten, J.M., 2008. Insights into diffusion of gases in zeolites gained from molecular dynamics simulations. Microporous and Mesoporous Materials 109, 91-108. [38] Krishna, R., van Baten, J.M., 2009. Unified Maxwell-Stefan description of binary mixture diffusion in micro- and meso-porous materials. Chemical Engineering Science 64, 3159-3178. [39] Krishna, R., van Baten, J.M., 2011a. Maxwell–Stefan modeling of slowing-down effects in mixed gas permeation across porous membranes. Journal of Membrane Science 383, 289-300. [40] Krishna, R., van Baten, J.M., 2011b. A simplified procedure for estimation of mixture permeances from unary permeation data. Journal of Membrane Science 367, 204-210. [41] Krishna, R., Wesselingh, J.A., 1997. The Maxwell-Stefan approach to mass transfer. Chemical Engineering Science 52, 861-911. [42] McLellan, B., Shoko, E., Dicks, A.L., Diniz da Costa, J.C., 2005. Hydrogen production and utilisation opportunities for Australia. International Journal of Hydrogen Energy 30, 669-679. [43] Miller, C.R., Wang, D.K., Smart, S., Diniz da Costa, J.C., 2013. Reversible Redox Effect on Gas Permeation of Cobalt Doped Ethoxy Polysiloxane (ES40) Membranes. Sci. Rep. 3, 1-6. [44] Molyneux, P., 2001. “Transition-site” model for the permeation of gases and vapors through compact films of polymers. Journal of Applied Polymer Science 79, 981-1024. [45] Newman, J., 2009. Stefan–Maxwell mass transport. Chemical Engineering Science 64, 4796-4803.

[46] Pakizeh, M., Omidkhah, M.R., Zarringhalam, A., 2007. Study of mass transfer through new templated silica membranes prepared by sol–gel method. International Journal of Hydrogen Energy 32, 2032-2042. [47] Sean X. Liu, M.P., Leland Vane, 2004. CFD modeling of pervaporative mass transfer in the boundary layer. Chemical Engineering Science 59, 5853–5857. [48] Shampine, L.F., Muir, P.H., 2004. Estimating conditioning of BVPs for ODEs. Mathematical and Computer Modelling 40, 1309-1321. [49] Siegel, C., 2008. Review of computational heat and mass transfer modeling in polymer-electrolyte-membrane (PEM) fuel cells. Energy 33, 1331-1352. [50] Slater, J.C., 1964. Atomic Radii in Crystals. The Journal of Chemical Physics 41, 3199-3204. [51] Smart, S., Lin, C.X.C., Ding, L., Thambimuthu, K., Diniz da Costa, J.C., 2010. Ceramic membranes for gas processing in coal gasification. Energy & Environmental Science 3, 268-278. [52] Tsuru, T., Igi, R., Kanezashi, M., Yoshioka, T., Fujisaki, S., iwamoto, Y., 2011. Permeation properties of hydrogen and water vapor through porous silica membranes at high temperatures. AIChE Journal 57, 618-629. [53] Tu, J., Yeoh, G.H., Liu, C., 2008. Computational fluid dynamics: a practical approach. Butterworth-Heinemann. [54] Uhlmann, D., Smart, S., Diniz da Costa, J.C., 2011. H2S stability and separation performance of cobalt oxide silica membranes. Journal of Membrane Science 380, 48-54. [55] Wang, J., Tsuru, T., 2011. Cobalt-doped silica membranes for pervaporation dehydration of ethanol/water solutions. Journal of Membrane Science 369, 13-19. [56] Wang, R., Liu, S.L., Lin, T.T., Chung, T.S., 2002. Characterization of hollow fiber membranes in a permeator using binary gas mixtures. Chemical Engineering Science 57, 967-976. [57] Weiss, R., 1974. The Application of Implicit Runge-Kutta and Collocation Methods to Boundary-Value Problems. Mathematics of Computation 28, 449-464. [58] Wesselingh, J.A., Krishna, R., 1990. Mass transfer in Multicomponent Mixtures. E. Horwood. [59] Wiley, D.E., Fletcher, D.F., 2002. Computational fluid dynamics modelling of flow and permeation for pressure-driven membrane processes. Desalination 145, 183-186. [60] Xiao, J., Wei, J., 1992a. Diffusion mechanism of hydrocarbons in zeolites—I. Theory. Chemical Engineering Science 47, 1123-1141. [61] Xiao, J., Wei, J., 1992b. Diffusion mechanism of hydrocarbons in zeolites—II. Analysis of experimental observations. Chemical Engineering Science 47, 1143-1159. [62] Yacou, C., Smart, S., Diniz da Costa, J.C., 2012. Long term performance cobalt oxide silica membrane module for high temperature H2 separation. Energy & Environmental Science 5, 5820-5832. [63] Zhang, J., Liu, D., He, M., Xu, H., Li, W., 2006. Experimental and simulation studies on concentration polarization in H2 enrichment by highly permeable and selective Pd membranes. Journal of Membrane Science 274, 83-91.
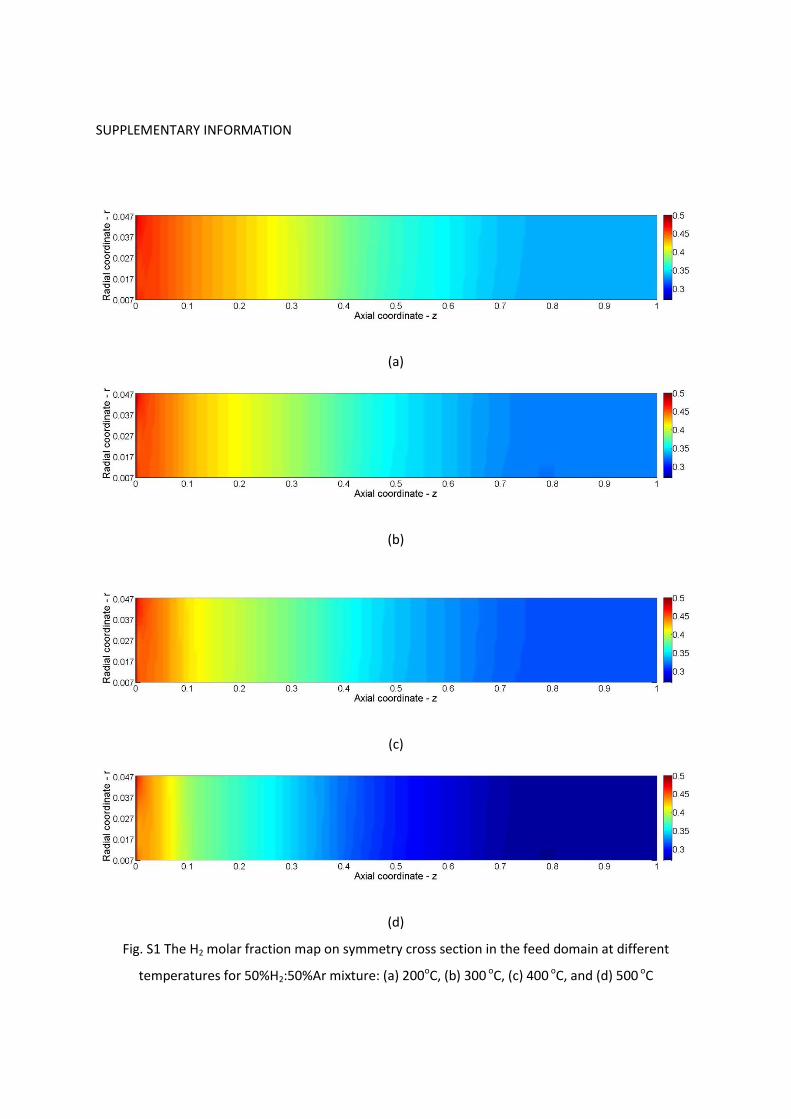
SUPPLEMENTARY INFORMATION
(a)
(b)
(c)
(d)
Fig. S1 The H2 molar fraction map on symmetry cross section in the feed domain at different
temperatures for 50%H2:50%Ar mixture: (a) 200oC, (b) 300 oC, (c) 400 oC, and (d) 500 oC