TITLE OF THE PAPER - Applied Ecology and Environmental ...
17
Hua: Spatial-temporal analysis of pattern changes and prediction in Penang Island, Malaysia using LULC and CA-Markov model - 4619 - APPLIED ECOLOGY AND ENVIRONMENTAL RESEARCH 16(4):4619-4635. http://www.aloki.hu ● ISSN 1589 1623 (Print) ● ISSN 1785 0037 (Online) DOI: http://dx.doi.org/10.15666/aeer/1604_46194635 2018, ALÖKI Kft., Budapest, Hungary SPATIAL-TEMPORAL ANALYSIS OF PATTERN CHANGES AND PREDICTION IN PENANG ISLAND, MALAYSIA USING LULC AND CA-MARKOV MODEL HUA, A. K. Department of Environmental Sciences, Faculty of Environmental Studies, Universiti Putra Malaysia (UPM), 43400 Serdang, Selangor, Malaysia e-mail: [email protected] (Received 27 th Feb 2018; accepted 11 th Jul 2018) Abstract. Penang Island has witnessed rapid urban development and economic growth in recent years. With the ambitious vision to become a developed country by 2020, planners and policy-makers need to know the most likely direction of future urban development without compromising on the forest landscape. In this study, remotely sensed data combined with cellular automata models were used to predict the land use land cover change in Penang Island, Malaysia. Cellular Automata (CA)-Markov models were applied in 1990 and 2006 to predict the land cover in 2016. Land use land cover maps for the study area were derived from 1990, 2006, and 2016 Landsat Images (MSS, TM, and OLI). The accuracy of models is above 80%. A Markov model was applied in 2006 and 2016 to predict the land cover in 2042. The results indicate that the built-up area had expanded more in the east towards the north and south, and also towards the centre of the island and moving upwards to the north. The models suggest limiting urban development in the centre of the island to protect forest landscapes. This study serves as guidelines for other studies which attempt to project land use land cover change in forest landscape while experiencing similar land use changes. Keywords: Penang Island, CA-Markov, land use land cover change, accuracy, future land use Introduction Environmentalists and landscape planners who are knowledgeable about land use and land cover (LULC) change are concerned that LULC can affect the global environment (Guan et al., 2011). Majority of the causes leading to biodiversity loss is due to changes in land use which are associated with habitat loss and fragmentation (Sala et al., 2000). Deforestation, urbanisation, agriculture intensification, as well as overgrazing and subsequent land degradation are all classified as land use changes in anthropogenic origin. The existence of nature, viz: slope and elevation are also involved in the change (Lambin, 1997), thus making the dynamics of land use a complex process. This complication which caused the LULC dynamics to change originates from economics, politics, culture and society as well as other legal aspects (Lambin, 1997). However, the main causes of land and forest degradation are severe changes made to urbanisation and agriculture. Such decline in natural resources which affects the environment quality through air pollution (Wu et al., 2012), water pollution (Hua, 2017), and can influence the climate are man-made changes (Angelsen and Kaimowitz, 1999). Therefore, having a good knowledge of land use land cover will be useful in providing information when decision making for using and managing the land use resources (Lu et al., 2004). A sudden growth in distant senses data in temporal, spatial and spectral resolutions appears to be beneficial as it provides essential tools for identifying changes on the Earth’s surface at different scales (Wu et al., 2006; Rogan and Chen, 2004). Several suitable approaches that have been used to model the land use land cover changes by
-
Upload
khangminh22 -
Category
Documents
-
view
1 -
download
0
Transcript of TITLE OF THE PAPER - Applied Ecology and Environmental ...

Hua: Spatial-temporal analysis of pattern changes and prediction in Penang Island, Malaysia using LULC and CA-Markov model
- 4619 -
APPLIED ECOLOGY AND ENVIRONMENTAL RESEARCH 16(4):4619-4635.
http://www.aloki.hu ● ISSN 1589 1623 (Print) ● ISSN 1785 0037 (Online)
DOI: http://dx.doi.org/10.15666/aeer/1604_46194635
2018, ALÖKI Kft., Budapest, Hungary
SPATIAL-TEMPORAL ANALYSIS OF PATTERN CHANGES AND
PREDICTION IN PENANG ISLAND, MALAYSIA USING LULC
AND CA-MARKOV MODEL
HUA, A. K.
Department of Environmental Sciences, Faculty of Environmental Studies, Universiti Putra
Malaysia (UPM), 43400 Serdang, Selangor, Malaysia
e-mail: [email protected]
(Received 27th Feb 2018; accepted 11
th Jul 2018)
Abstract. Penang Island has witnessed rapid urban development and economic growth in recent years.
With the ambitious vision to become a developed country by 2020, planners and policy-makers need to
know the most likely direction of future urban development without compromising on the forest landscape. In this study, remotely sensed data combined with cellular automata models were used to
predict the land use land cover change in Penang Island, Malaysia. Cellular Automata (CA)-Markov
models were applied in 1990 and 2006 to predict the land cover in 2016. Land use land cover maps for
the study area were derived from 1990, 2006, and 2016 Landsat Images (MSS, TM, and OLI). The
accuracy of models is above 80%. A Markov model was applied in 2006 and 2016 to predict the land
cover in 2042. The results indicate that the built-up area had expanded more in the east towards the north
and south, and also towards the centre of the island and moving upwards to the north. The models suggest
limiting urban development in the centre of the island to protect forest landscapes. This study serves as
guidelines for other studies which attempt to project land use land cover change in forest landscape while
experiencing similar land use changes.
Keywords: Penang Island, CA-Markov, land use land cover change, accuracy, future land use
Introduction
Environmentalists and landscape planners who are knowledgeable about land use
and land cover (LULC) change are concerned that LULC can affect the global
environment (Guan et al., 2011). Majority of the causes leading to biodiversity loss is
due to changes in land use which are associated with habitat loss and fragmentation
(Sala et al., 2000). Deforestation, urbanisation, agriculture intensification, as well as
overgrazing and subsequent land degradation are all classified as land use changes in
anthropogenic origin. The existence of nature, viz: slope and elevation are also involved
in the change (Lambin, 1997), thus making the dynamics of land use a complex process.
This complication which caused the LULC dynamics to change originates from
economics, politics, culture and society as well as other legal aspects (Lambin, 1997).
However, the main causes of land and forest degradation are severe changes made to
urbanisation and agriculture. Such decline in natural resources which affects the
environment quality through air pollution (Wu et al., 2012), water pollution (Hua,
2017), and can influence the climate are man-made changes (Angelsen and Kaimowitz,
1999). Therefore, having a good knowledge of land use land cover will be useful in
providing information when decision making for using and managing the land use
resources (Lu et al., 2004).
A sudden growth in distant senses data in temporal, spatial and spectral resolutions
appears to be beneficial as it provides essential tools for identifying changes on the
Earth’s surface at different scales (Wu et al., 2006; Rogan and Chen, 2004). Several
suitable approaches that have been used to model the land use land cover changes by

Hua: Spatial-temporal analysis of pattern changes and prediction in Penang Island, Malaysia using LULC and CA-Markov model
- 4620 -
APPLIED ECOLOGY AND ENVIRONMENTAL RESEARCH 16(4):4619-4635.
http://www.aloki.hu ● ISSN 1589 1623 (Print) ● ISSN 1785 0037 (Online)
DOI: http://dx.doi.org/10.15666/aeer/1604_46194635
2018, ALÖKI Kft., Budapest, Hungary
using remotely senses data are; statistical models (regression and structure equation
model), mathematical models (linear and static), systems model (stock and flow), agent
based models cellular models (Cellular Automata (CA) and Markov Chains), and
evolutionary models (neural networks) (Parker et al., 2003; Agarwal et al., 2002). Roger
and Chen (2004) cited that digital change detection is defined as the process of
determining and describing the changes in land use characteristic based on co-registered
multi-temporal remote sensing data. These techniques used for assessing change are
numerous including both statistical and rule-based methods (Coppin et al., 2004; Rogen
and Chen, 2004; Lu et al., 2004).
Modeling LULC change
To detect changes that have happened or are about to take place, LULC change
models are used (Veldkamp and Lambin, 2001). These change models involve
analysing historical land use data where the past land transformation and transition are
evaluated. The transition trend which has been identified is amalgamated with
environmental variables to provide an estimate of future land use (Eastman, 2009;
Pijanowski et al., 2002). Having an understanding of the factors of change (i.e
population growth, soil type, distance to road or other facilities), the models have the
ability to provide a probabilistic prediction of where the changes may happen
(Overmars et al., 2003). LULC model which was designed to evaluate the cumulative
impact of land use change and develop future activities (Veldkamp and Lambin, 2001)
which are essential in helping and supporting decision making of land use planning
(Guan et al., 2011). In particular, LULC change have been forecasted to be important
for understanding and highlighting of potential modifications and alterations that might
happen over landscapes in the future. LULC changes have been applied in different
situations viz; rural development and urban growth (Kityuttachai et al., 2013), selecting
conservation priority areas and setting alternative conservation measures (Adhikari and
Southworth, 2012) and simulating rangeland dynamics under different climate change
scenarios (Halmy et al., 2015; Freier et al., 2011).
To understand better the dynamics of land use change at different angles, the Markov
chain analysis has been extensively used (Baker, 1989; Muller and Middleton, 1994).
This chain analysis works on the probability of a system being in a certain state at a
certain time can be determined, if the state at an earlier time is known (Bell and
Hinojosa, 1977). To put it simply, this method develops a transition probability matrix
of land use change between two different dates by providing an estimation of
probability that each pixel of certain LULC class will be transformed to another or
remains in the class (Eastman, 2009). This method has an added advantage in modeling
land use change especially on a large scale (Weng, 2002). Although different from
logistic regression, Markov chain analysis cannot assume statistical independence data
(Overmars et al., 2003) but is suited for spatial dependent land use data but has the
ability to forecast all multidirectional land use changes among all classes land use
available (Pontius and Malanson, 2005). One problem that can arise when using
Markov chain models is that this method is more suitable for short term projections
(Sinha and Kimar, 2013) and not spatially explicit especially not providing the spatial
distribution of the changes (Sklar and Costanza, 1991). However, this problem can be
overcome by integrating with other different dynamic empirical models e.g. cellular
automata models (Guan et al., 2011; Weng, 2002). The CA- Markov is regarded as a
spatial transition model as it contains the stochastic aspatial Markov techniques with the

Hua: Spatial-temporal analysis of pattern changes and prediction in Penang Island, Malaysia using LULC and CA-Markov model
- 4621 -
APPLIED ECOLOGY AND ENVIRONMENTAL RESEARCH 16(4):4619-4635.
http://www.aloki.hu ● ISSN 1589 1623 (Print) ● ISSN 1785 0037 (Online)
DOI: http://dx.doi.org/10.15666/aeer/1604_46194635
2018, ALÖKI Kft., Budapest, Hungary
stochastic spatial cellular automata method (Eastman, 2009) which is capable of
predicting the two-way transitions among the available LULC classes (Pontius and
Malanson, 2005). Therefore, the main purpose of this study is to demonstrate the ability
of CA-Markov models to predict the LULC changes for year 2042 with special attention
on the ecologically impaired forest land in Penang Island, Malaysia.
Materials and methods
Study area
Penang Island is located in the northern part of Malaysia which lies within a latitude
of 5°12’N to 5°30’N and longitude of 100°09’E to 100°26’E (Fig. 1). The total area of
Penang Island is approximately 295 km2, and is also the most populated island in the
country with an estimated population of 720 000 (Tan et al., 2011, 2010). George Town
is the main capital city which is located in the east region of Penang Island. Generally,
Penang Island enjoys an equatorial climate with hot and humid conditions throughout
the entire year. In other words, the average mean of daily temperature is about 27 °C,
with a maximum and minimum average mean of daily temperature at 31.4 °C and
23.5 °C respectively. Specifically, the average annual temperature varies between 27 to
30 °C (Tan et al., 2011, 2010). Meanwhile, the average humidity is between 70 to 90%,
and having the daily mean humidity between 60.9 and 96.8% (Tan et al., 2011, 2010).
The average annual rainfall is 267 cm, and the annual total can reach up to a maximum
of 624 cm (Ahmad et al., 2006). When the monsoon winds arrive, the population of
Penang Island experienced sunshine during the day and rainfall in the evenings.
Figure 1. Study area of Penang Island
Since George Town constitutes a unique architectural and cultural townscape in the
country, the island received recognition from UNESCO World Heritage Site as one of
the tourism centres in Malaysia. This recognition will help to increase the number of
visitor arrivals to Penang Island. Nevertheless, an increase in population will increase in
the built up area and decline in forest land. Generally, the total area of forest land is
approximately 154 km2 with a population density of 132 persons per km
2. Forest land
(41%) was the predominant land use in Penang Island, followed by urban area (18%),
agriculture area (8%) and water bodies (33%) in 1990. Urbanisation and agricultural
practices indirectly had a negative impact on the fate of ecology and biodiversity of the
forestry land. The main reasons for choosing Penang Island for LULC change
prediction are the rapid population growth, availability of data sets with zero cost, and
Hua: Spatial-temporal analysis of pattern changes and prediction in Penang Island, Malaysia using LULC and CA-Markov model
- 4622 -
APPLIED ECOLOGY AND ENVIRONMENTAL RESEARCH 16(4):4619-4635.
http://www.aloki.hu ● ISSN 1589 1623 (Print) ● ISSN 1785 0037 (Online)
DOI: http://dx.doi.org/10.15666/aeer/1604_46194635
2018, ALÖKI Kft., Budapest, Hungary
ecological of forest land impaired (Tan et al., 2011, 2010). According to Tan et al.
(2011, 2010), the growing population rate between the year 2000-2010 was higher than
the years from 1990-2000 and will continue to increase in the coming future as well as
the infrastructure of development. Therefore, identifying the potential areas that are
likely to be converted into other land use classes would benefit the decision makers and
landscape planners as references and guidelines for the policies to be designed in a
better way for sustaining the ecology integrity of forest land.
Data sources
Three LULC vector data sets for Penang Island for 1990, 2006 and 2016 (Table 1)
were taken from USGS Earth Explorer. But the land use was grouped into four classes,
namely built-up area, agriculture area, forest land, and water bodies while the road
vector data was used to generate the land change suitability maps. Generally, images for
classification were chosen between the months of February to April because of clear sky
or cloud free during this period. All the dataset was rectified to Universal Transverse
Mercator (UTM) coordinate system, Malaysian Cassini State Plane zone 03, and WGS
1984 Datum and clipped to the island boundaries. For this particular study, different
software packages were applied as each one has its strength in certain operations needed
for analysis. ENVI v4.7 was used for the classification of images and accuracy
assessment; IDRISI Selva v.17 was used for CA-Markov modeling (Eastman, 2009);
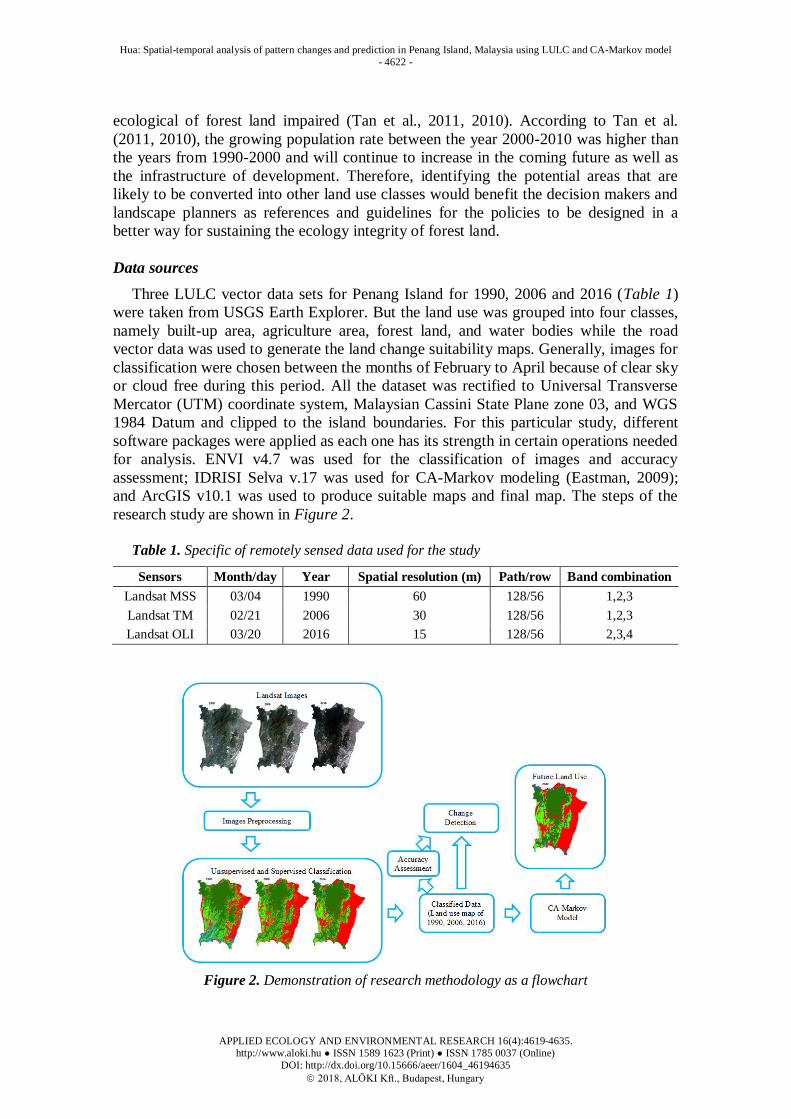
and ArcGIS v10.1 was used to produce suitable maps and final map. The steps of the
research study are shown in Figure 2.
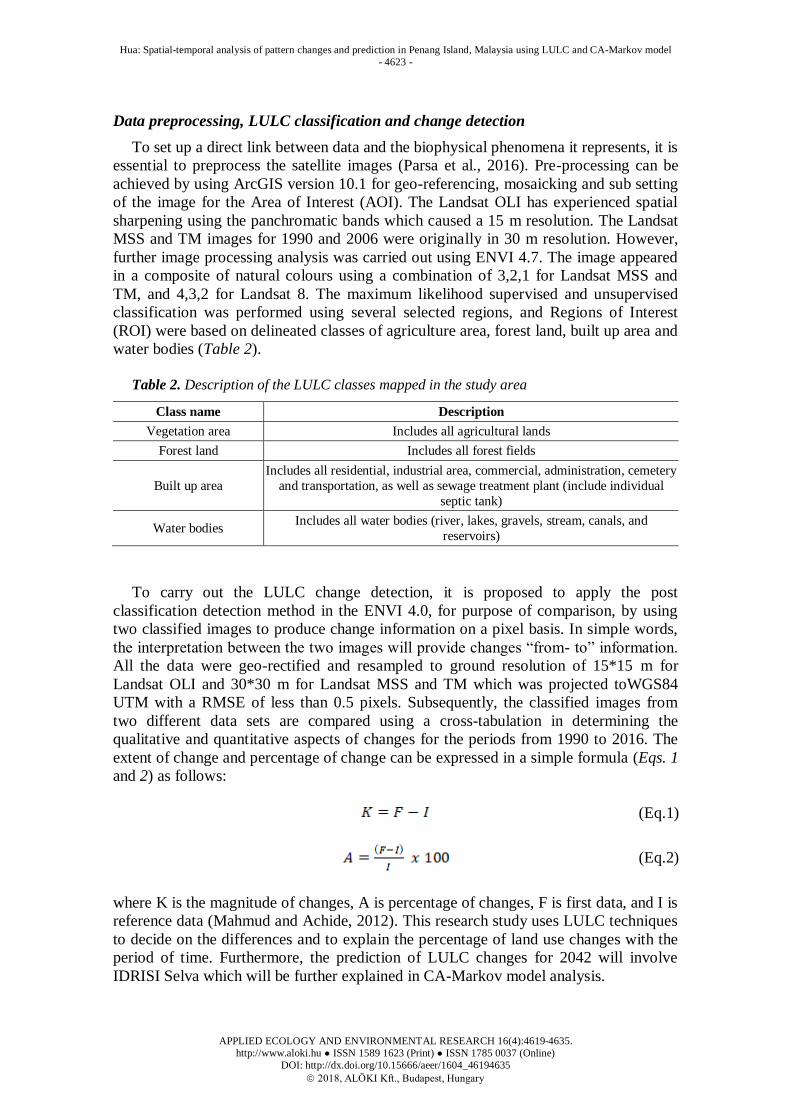
Table 1. Specific of remotely sensed data used for the study
Sensors Month/day Year Spatial resolution (m) Path/row Band combination
Landsat MSS 03/04 1990 60 128/56 1,2,3
Landsat TM 02/21 2006 30 128/56 1,2,3
Landsat OLI 03/20 2016 15 128/56 2,3,4
Figure 2. Demonstration of research methodology as a flowchart
Hua: Spatial-temporal analysis of pattern changes and prediction in Penang Island, Malaysia using LULC and CA-Markov model
- 4623 -
APPLIED ECOLOGY AND ENVIRONMENTAL RESEARCH 16(4):4619-4635.
http://www.aloki.hu ● ISSN 1589 1623 (Print) ● ISSN 1785 0037 (Online)
DOI: http://dx.doi.org/10.15666/aeer/1604_46194635
2018, ALÖKI Kft., Budapest, Hungary
Data preprocessing, LULC classification and change detection
To set up a direct link between data and the biophysical phenomena it represents, it is
essential to preprocess the satellite images (Parsa et al., 2016). Pre-processing can be
achieved by using ArcGIS version 10.1 for geo-referencing, mosaicking and sub setting
of the image for the Area of Interest (AOI). The Landsat OLI has experienced spatial
sharpening using the panchromatic bands which caused a 15 m resolution. The Landsat
MSS and TM images for 1990 and 2006 were originally in 30 m resolution. However,
further image processing analysis was carried out using ENVI 4.7. The image appeared
in a composite of natural colours using a combination of 3,2,1 for Landsat MSS and
TM, and 4,3,2 for Landsat 8. The maximum likelihood supervised and unsupervised
classification was performed using several selected regions, and Regions of Interest
(ROI) were based on delineated classes of agriculture area, forest land, built up area and
water bodies (Table 2).
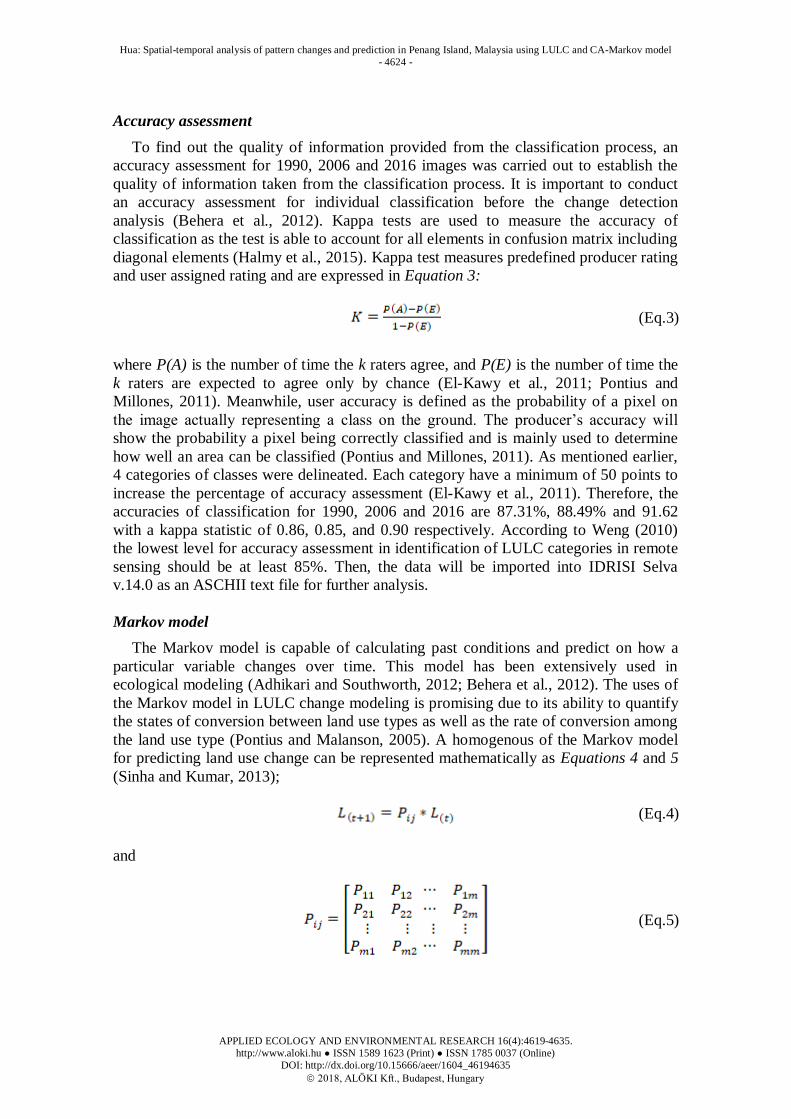
Table 2. Description of the LULC classes mapped in the study area
Class name Description
Vegetation area Includes all agricultural lands
Forest land Includes all forest fields
Built up area
Includes all residential, industrial area, commercial, administration, cemetery
and transportation, as well as sewage treatment plant (include individual
septic tank)
Water bodies Includes all water bodies (river, lakes, gravels, stream, canals, and
reservoirs)
To carry out the LULC change detection, it is proposed to apply the post
classification detection method in the ENVI 4.0, for purpose of comparison, by using
two classified images to produce change information on a pixel basis. In simple words,
the interpretation between the two images will provide changes “from- to” information.
All the data were geo-rectified and resampled to ground resolution of 15*15 m for
Landsat OLI and 30*30 m for Landsat MSS and TM which was projected toWGS84
UTM with a RMSE of less than 0.5 pixels. Subsequently, the classified images from
two different data sets are compared using a cross-tabulation in determining the
qualitative and quantitative aspects of changes for the periods from 1990 to 2016. The
extent of change and percentage of change can be expressed in a simple formula (Eqs. 1
and 2) as follows:
(Eq.1)
(Eq.2)
where K is the magnitude of changes, A is percentage of changes, F is first data, and I is
reference data (Mahmud and Achide, 2012). This research study uses LULC techniques
to decide on the differences and to explain the percentage of land use changes with the
period of time. Furthermore, the prediction of LULC changes for 2042 will involve
IDRISI Selva which will be further explained in CA-Markov model analysis.
Hua: Spatial-temporal analysis of pattern changes and prediction in Penang Island, Malaysia using LULC and CA-Markov model
- 4624 -
APPLIED ECOLOGY AND ENVIRONMENTAL RESEARCH 16(4):4619-4635.
http://www.aloki.hu ● ISSN 1589 1623 (Print) ● ISSN 1785 0037 (Online)
DOI: http://dx.doi.org/10.15666/aeer/1604_46194635
2018, ALÖKI Kft., Budapest, Hungary
Accuracy assessment
To find out the quality of information provided from the classification process, an
accuracy assessment for 1990, 2006 and 2016 images was carried out to establish the
quality of information taken from the classification process. It is important to conduct
an accuracy assessment for individual classification before the change detection
analysis (Behera et al., 2012). Kappa tests are used to measure the accuracy of
classification as the test is able to account for all elements in confusion matrix including
diagonal elements (Halmy et al., 2015). Kappa test measures predefined producer rating
and user assigned rating and are expressed in Equation 3:
(Eq.3)
where P(A) is the number of time the k raters agree, and P(E) is the number of time the
k raters are expected to agree only by chance (El-Kawy et al., 2011; Pontius and
Millones, 2011). Meanwhile, user accuracy is defined as the probability of a pixel on
the image actually representing a class on the ground. The producer’s accuracy will
show the probability a pixel being correctly classified and is mainly used to determine
how well an area can be classified (Pontius and Millones, 2011). As mentioned earlier,
4 categories of classes were delineated. Each category have a minimum of 50 points to
increase the percentage of accuracy assessment (El-Kawy et al., 2011). Therefore, the
accuracies of classification for 1990, 2006 and 2016 are 87.31%, 88.49% and 91.62
with a kappa statistic of 0.86, 0.85, and 0.90 respectively. According to Weng (2010)
the lowest level for accuracy assessment in identification of LULC categories in remote
sensing should be at least 85%. Then, the data will be imported into IDRISI Selva
v.14.0 as an ASCHII text file for further analysis.
Markov model
The Markov model is capable of calculating past conditions and predict on how a
particular variable changes over time. This model has been extensively used in
ecological modeling (Adhikari and Southworth, 2012; Behera et al., 2012). The uses of
the Markov model in LULC change modeling is promising due to its ability to quantify
the states of conversion between land use types as well as the rate of conversion among
the land use type (Pontius and Malanson, 2005). A homogenous of the Markov model
for predicting land use change can be represented mathematically as Equations 4 and 5
(Sinha and Kumar, 2013);
(Eq.4)
and
(Eq.5)

Hua: Spatial-temporal analysis of pattern changes and prediction in Penang Island, Malaysia using LULC and CA-Markov model
- 4625 -
APPLIED ECOLOGY AND ENVIRONMENTAL RESEARCH 16(4):4619-4635.
http://www.aloki.hu ● ISSN 1589 1623 (Print) ● ISSN 1785 0037 (Online)
DOI: http://dx.doi.org/10.15666/aeer/1604_46194635
2018, ALÖKI Kft., Budapest, Hungary
where, L(t + 1) and L(t) are the land use status at time t + 1 and t respectively. 0 ≤ Pij < 1
and is the transition probability matric in a state.
Cellular automata (CA) model
The cellular automata (CA) model, is an area spatially dynamic model, which is
frequently used for LULC change studies. In this model, the transition of a cell from
one land-cover to another depends on the state of the neighbourhood cells (Verburg et
al., 2004). Generally, a cell has a high probability to change to land-cover class ‘A’ than
to a land-cover class ‘B’ if the cell is closer proximity to land-cover class ‘A’. Similar to
the Markov Model, the CA applies previous state information of a land-cover as well as
the state of neighbourhood cells for its transition rules. Since CA models have been
extensively used in LULC changes analysis especially in forest cover change analysis
(Verburg et al., 2004; Messina and Walsh, 2001), it has the ability to integrate with the
Markov model and make it a dynamic spatial model.
CA-Markov model
The CA-Markov model is a combination between cellular automata, Markov chain,
multi-criteria, and multi-objective land allocation to predict land cover change over time
(Parsa et al., 2016; Behera et al., 2012). The Markov model is not only spatial
contiguity but is also the probable spatial transitions occur in a particular area over a
time. Markov and CA-Markov modules in IDRISI Selva were used to create transition
probability and transition area matrix (Eastman, 2009). Transition probability matrix is
formed by cross tabulation of two images of different time and determines the
probability of a pixel in a land use class to change into another class during that time
(Parsa et al., 2016; Eastman, 2009). Transition area matrix contains the number of
pixels that are expected to change to a land use class from another class during a time
period (Parsa et al., 2016; Behera et al., 2012; Eastman, 2009). Land use map dated
1990 and 2006 were used to create transition probability matrix in order to project land
use map for the year 2016. In creation transition probability matrix, Markov module in
IDRISI Selva was used and the proportional error was set to be 15% (Eastman, 2009).
IDRISI Selva uses CA-Markov model that repeatedly produce the land use allocation
until areas that are predicted by the Markov model are identified. The number of times
it is repeated depends on the number of years a projection is made. Here in this study,
the number of repeated process performed was 9 because the land use map of 2006 was
taken as a base map for projecting the land use in 2016. A contiguity filter of a kernel
size of 5*5 pixels that accounts the neighbourhood pixels was used to create spatially
explicit continuous weighting factors so that the pixels that are far from the existing
land use class have a lower suitability than the pixels that are near. In this study, the
filter used was for analysis:
0 0 1 0 0
0 1 1 1 0
1 1 1 1 1
0 1 1 1 0
0 0 1 0 0

Hua: Spatial-temporal analysis of pattern changes and prediction in Penang Island, Malaysia using LULC and CA-Markov model
- 4626 -
APPLIED ECOLOGY AND ENVIRONMENTAL RESEARCH 16(4):4619-4635.
http://www.aloki.hu ● ISSN 1589 1623 (Print) ● ISSN 1785 0037 (Online)
DOI: http://dx.doi.org/10.15666/aeer/1604_46194635
2018, ALÖKI Kft., Budapest, Hungary
After a predictive data has been built, the model is then validated to test the accuracy
of the model. The process of gauging the accuracy of the model will be illustrated in the
validation prediction model section. Then, the techniques of CA-Markov for producing
the transition probability matrix and transition area matrix is repeated by using land use
map dated 2006 and 2016 to cross tabulate to produce the land use map of the year 2042
(Table 8). In other words, the actual land use map of 2016 are used as based map to
produce simulated 2042 map of LULC at the study area.
Validation LULC prediction model
For purpose of evaluating and to avoid any miscalculation of the model, it is
necessary to investigate between the actual map and simulated map and to compare the
output from the model with the actual land use map. The evaluation model is based on
the Kappa Index of Agreement (KIA) approach, which is widely used in validation of
LULC change predictions (Parsa et al., 2016; Halmy et al., 2015; Behera et al., 2012).
Whereas the accuracy assessment process was done using the VALIDATE module in
IDRISI Selva. For this study, a simulated land use map of 2016 will be used to compare
with the actual land use map of 2016. The results of the comparison between the
simulated and actual map for year 2016 can be shown in Table 3 as well as Figure 3a
and b.
Table 3. Comparison of actual and projected LULC types in 2016
Category 2016A (ha) 2016S (ha)
Forest land 110 854 109 350
Built-up area 88 183 83 742
Agriculture area 53 992 62 617
Water bodies 41 971 39 291
Total 295 000 295 000
2016A = 2016 actual map, 2016S = 2016 simulated map
a b
Figure 3. LULC simulated map of 2016 (a) and 2042 (b)
Hua: Spatial-temporal analysis of pattern changes and prediction in Penang Island, Malaysia using LULC and CA-Markov model
- 4627 -
APPLIED ECOLOGY AND ENVIRONMENTAL RESEARCH 16(4):4619-4635.
http://www.aloki.hu ● ISSN 1589 1623 (Print) ● ISSN 1785 0037 (Online)
DOI: http://dx.doi.org/10.15666/aeer/1604_46194635
2018, ALÖKI Kft., Budapest, Hungary
A Kappa value of 0 illustrates the agreement between actual and reference map
(equals chance agreement), the upper and lower limit of kappa is +100 (it occurs when
in total agreement) and -1.00 (it happens when agreement is less chance) (Sinha and
Kumar, 2013). In this study, the validation indicates K values (Kno = 0.823,
Klocation = 0.851; KlocationStrate = 0.851; Kstandard = 0.831) above 0.8 showing
satisfactory level of accuracy. According to Pontius and Millones (2011), if the results
are greater than 0.8 for each kappa index agreement, then the K statistics are considered
accurate. Hence, CA-Markov modeling is suitable for accurate prediction of future
LULC’s.
Results and discussion
Land use land cover (LULC) changes
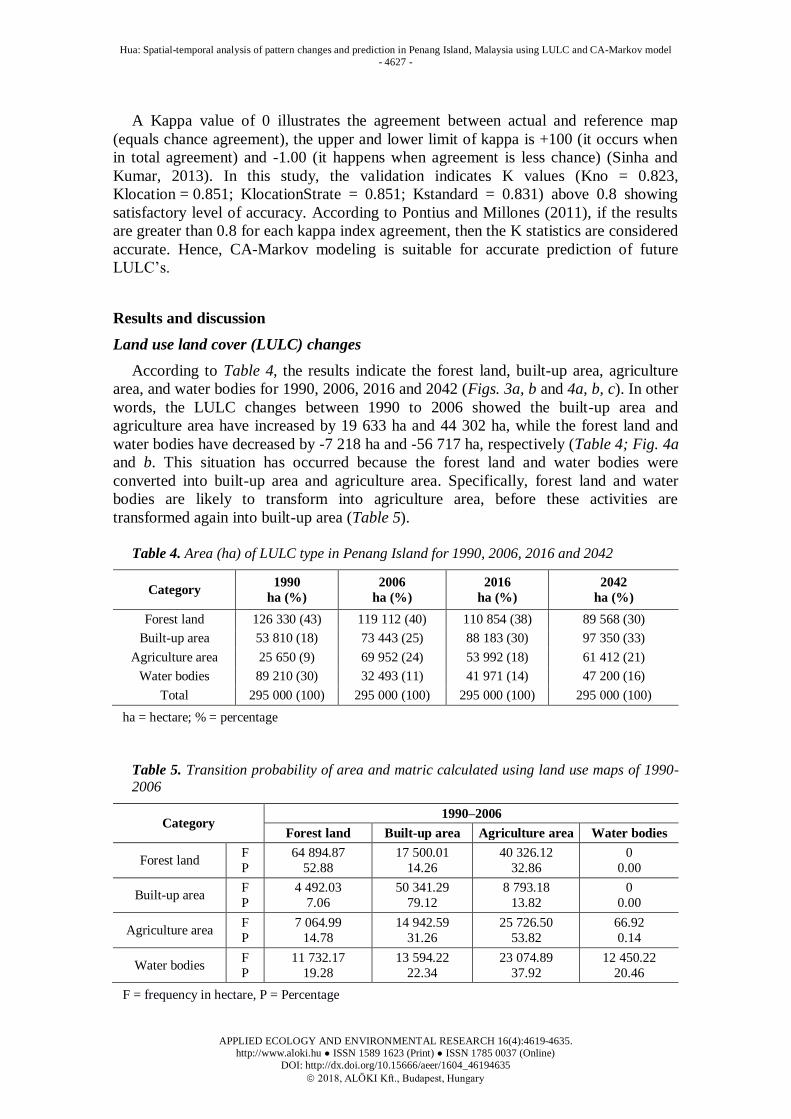
According to Table 4, the results indicate the forest land, built-up area, agriculture
area, and water bodies for 1990, 2006, 2016 and 2042 (Figs. 3a, b and 4a, b, c). In other
words, the LULC changes between 1990 to 2006 showed the built-up area and
agriculture area have increased by 19 633 ha and 44 302 ha, while the forest land and
water bodies have decreased by -7 218 ha and -56 717 ha, respectively (Table 4; Fig. 4a
and b. This situation has occurred because the forest land and water bodies were
converted into built-up area and agriculture area. Specifically, forest land and water
bodies are likely to transform into agriculture area, before these activities are
transformed again into built-up area (Table 5).
Table 4. Area (ha) of LULC type in Penang Island for 1990, 2006, 2016 and 2042
Category 1990
ha (%)
2006
ha (%)
2016
ha (%)
2042
ha (%)
Forest land 126 330 (43) 119 112 (40) 110 854 (38) 89 568 (30)
Built-up area 53 810 (18) 73 443 (25) 88 183 (30) 97 350 (33)
Agriculture area 25 650 (9) 69 952 (24) 53 992 (18) 61 412 (21)
Water bodies 89 210 (30) 32 493 (11) 41 971 (14) 47 200 (16)
Total 295 000 (100) 295 000 (100) 295 000 (100) 295 000 (100)
ha = hectare; % = percentage
Table 5. Transition probability of area and matric calculated using land use maps of 1990-
2006
Category 1990–2006
Forest land Built-up area Agriculture area Water bodies
Forest land F
P
64 894.87
52.88
17 500.01
14.26
40 326.12
32.86
0
0.00
Built-up area F
P
4 492.03
7.06
50 341.29
79.12
8 793.18
13.82
0
0.00
Agriculture area F
P
7 064.99
14.78
14 942.59
31.26
25 726.50
53.82
66.92
0.14
Water bodies F
P
11 732.17
19.28
13 594.22
22.34
23 074.89
37.92
12 450.22
20.46
F = frequency in hectare, P = Percentage

Hua: Spatial-temporal analysis of pattern changes and prediction in Penang Island, Malaysia using LULC and CA-Markov model
- 4628 -
APPLIED ECOLOGY AND ENVIRONMENTAL RESEARCH 16(4):4619-4635.
http://www.aloki.hu ● ISSN 1589 1623 (Print) ● ISSN 1785 0037 (Online)
DOI: http://dx.doi.org/10.15666/aeer/1604_46194635
2018, ALÖKI Kft., Budapest, Hungary
a b
c
Figure 4. LULC actual map of 1990 (a), 2006 (b), 2016 (c)
Sufficient water supply with fertile soil leads to the agriculture activities to be carried
out, while abandoned forest land would be in demand for built-up and agriculture
activities. In addition, with the country’s vision of 2020 to be a developed country, the
rapid development becomes prioritised and these encouraged the attraction of local and
non-local residents to concentrate on Penang Island. Due to the population growth and
rapid urbanisation, the demand for shelter and job opportunities could also increase.
Indirectly, this situation will raise the pressure on forest land and water bodies to
negatively affect in the quality and quantity, which could bring harm to living species
and cause extinction.
Nevertheless, the LULC change for the next 10 years indicated that forest land
continued to donate to the coverage area for agriculture activities for 31.22% before its
transformation into a built-up area for 29.72% (Table 6). Meanwhile, only the built-up
Hua: Spatial-temporal analysis of pattern changes and prediction in Penang Island, Malaysia using LULC and CA-Markov model
- 4629 -
APPLIED ECOLOGY AND ENVIRONMENTAL RESEARCH 16(4):4619-4635.
http://www.aloki.hu ● ISSN 1589 1623 (Print) ● ISSN 1785 0037 (Online)
DOI: http://dx.doi.org/10.15666/aeer/1604_46194635
2018, ALÖKI Kft., Budapest, Hungary
area will continue to increase especially in the north, south and centre of the island;
while others in east, northeast, and southeast show a high cluster of built-up area in
Penang (Fig. 4c). Besides that, water bodies also showed positive development, where
the minority coverage area of forest land and agricultural activities are being converted
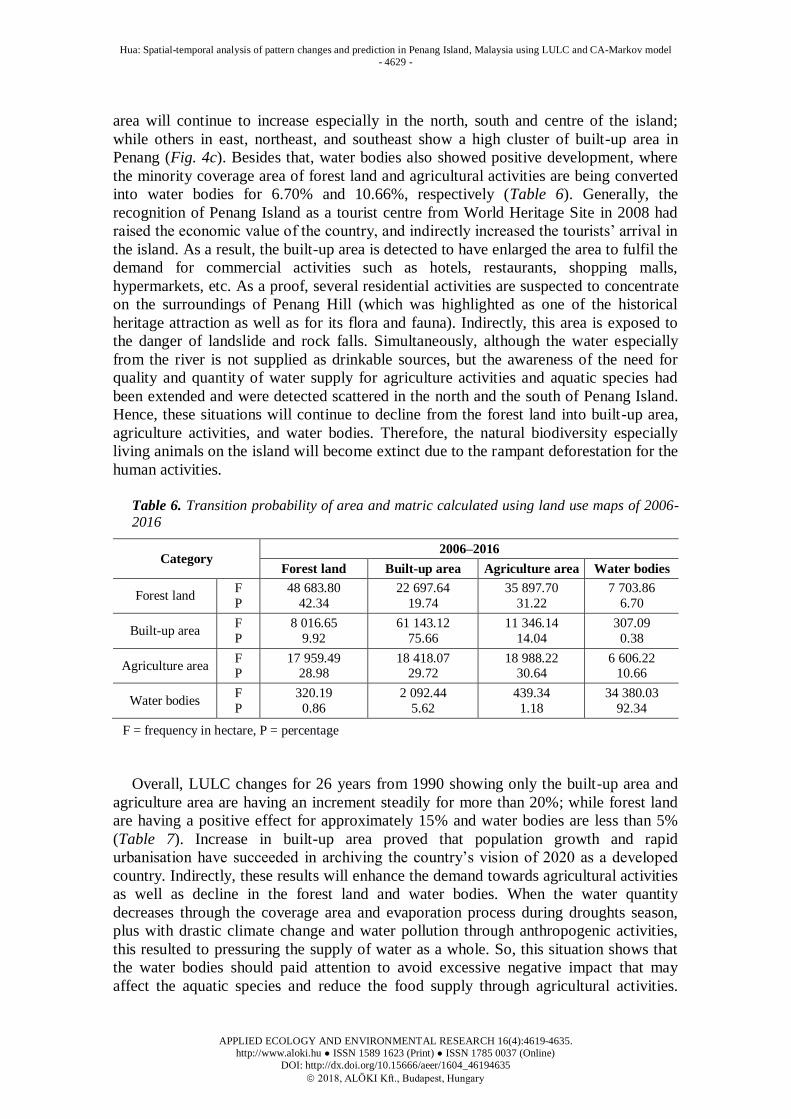
into water bodies for 6.70% and 10.66%, respectively (Table 6). Generally, the
recognition of Penang Island as a tourist centre from World Heritage Site in 2008 had
raised the economic value of the country, and indirectly increased the tourists’ arrival in
the island. As a result, the built-up area is detected to have enlarged the area to fulfil the
demand for commercial activities such as hotels, restaurants, shopping malls,
hypermarkets, etc. As a proof, several residential activities are suspected to concentrate
on the surroundings of Penang Hill (which was highlighted as one of the historical
heritage attraction as well as for its flora and fauna). Indirectly, this area is exposed to
the danger of landslide and rock falls. Simultaneously, although the water especially
from the river is not supplied as drinkable sources, but the awareness of the need for
quality and quantity of water supply for agriculture activities and aquatic species had
been extended and were detected scattered in the north and the south of Penang Island.
Hence, these situations will continue to decline from the forest land into built-up area,
agriculture activities, and water bodies. Therefore, the natural biodiversity especially
living animals on the island will become extinct due to the rampant deforestation for the
human activities.
Table 6. Transition probability of area and matric calculated using land use maps of 2006-2016
Category 2006–2016
Forest land Built-up area Agriculture area Water bodies
Forest land F
P
48 683.80
42.34
22 697.64
19.74
35 897.70
31.22
7 703.86
6.70
Built-up area F
P
8 016.65
9.92
61 143.12
75.66
11 346.14
14.04
307.09
0.38
Agriculture area F P
17 959.49 28.98
18 418.07 29.72
18 988.22 30.64
6 606.22 10.66
Water bodies F
P
320.19
0.86
2 092.44
5.62
439.34
1.18
34 380.03
92.34
F = frequency in hectare, P = percentage
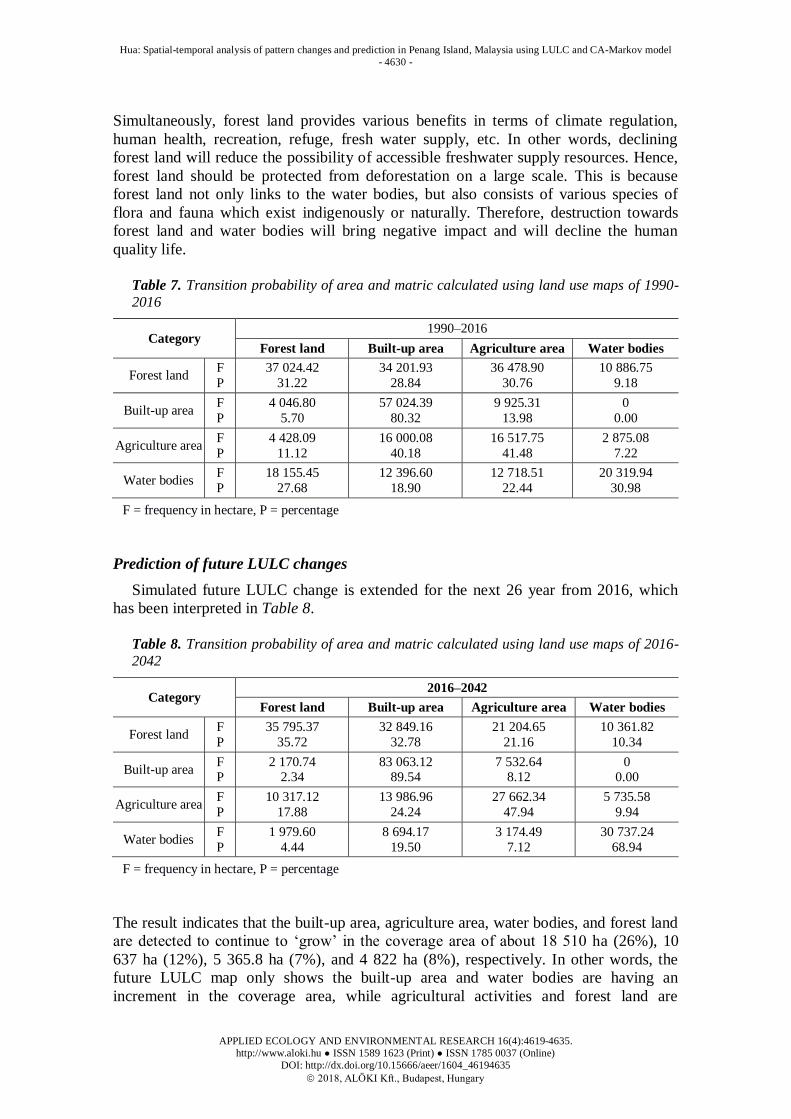
Overall, LULC changes for 26 years from 1990 showing only the built-up area and
agriculture area are having an increment steadily for more than 20%; while forest land
are having a positive effect for approximately 15% and water bodies are less than 5%
(Table 7). Increase in built-up area proved that population growth and rapid
urbanisation have succeeded in archiving the country’s vision of 2020 as a developed
country. Indirectly, these results will enhance the demand towards agricultural activities
as well as decline in the forest land and water bodies. When the water quantity
decreases through the coverage area and evaporation process during droughts season,
plus with drastic climate change and water pollution through anthropogenic activities,
this resulted to pressuring the supply of water as a whole. So, this situation shows that
the water bodies should paid attention to avoid excessive negative impact that may
affect the aquatic species and reduce the food supply through agricultural activities.
Hua: Spatial-temporal analysis of pattern changes and prediction in Penang Island, Malaysia using LULC and CA-Markov model
- 4630 -
APPLIED ECOLOGY AND ENVIRONMENTAL RESEARCH 16(4):4619-4635.
http://www.aloki.hu ● ISSN 1589 1623 (Print) ● ISSN 1785 0037 (Online)
DOI: http://dx.doi.org/10.15666/aeer/1604_46194635
2018, ALÖKI Kft., Budapest, Hungary
Simultaneously, forest land provides various benefits in terms of climate regulation,
human health, recreation, refuge, fresh water supply, etc. In other words, declining
forest land will reduce the possibility of accessible freshwater supply resources. Hence,
forest land should be protected from deforestation on a large scale. This is because
forest land not only links to the water bodies, but also consists of various species of
flora and fauna which exist indigenously or naturally. Therefore, destruction towards
forest land and water bodies will bring negative impact and will decline the human
quality life.
Table 7. Transition probability of area and matric calculated using land use maps of 1990-
2016
Category 1990–2016
Forest land Built-up area Agriculture area Water bodies
Forest land F
P
37 024.42
31.22
34 201.93
28.84
36 478.90
30.76
10 886.75
9.18
Built-up area F
P
4 046.80
5.70
57 024.39
80.32
9 925.31
13.98
0
0.00
Agriculture area F
P
4 428.09
11.12
16 000.08
40.18
16 517.75
41.48
2 875.08
7.22
Water bodies F
P
18 155.45
27.68
12 396.60
18.90
12 718.51
22.44
20 319.94
30.98
F = frequency in hectare, P = percentage
Prediction of future LULC changes
Simulated future LULC change is extended for the next 26 year from 2016, which
has been interpreted in Table 8.
Table 8. Transition probability of area and matric calculated using land use maps of 2016-
2042
Category 2016–2042
Forest land Built-up area Agriculture area Water bodies
Forest land F
P
35 795.37
35.72
32 849.16
32.78
21 204.65
21.16
10 361.82
10.34
Built-up area F P
2 170.74 2.34
83 063.12 89.54
7 532.64 8.12
0 0.00
Agriculture area F
P
10 317.12
17.88
13 986.96
24.24
27 662.34
47.94
5 735.58
9.94
Water bodies F
P
1 979.60
4.44
8 694.17
19.50
3 174.49
7.12
30 737.24
68.94
F = frequency in hectare, P = percentage
The result indicates that the built-up area, agriculture area, water bodies, and forest land
are detected to continue to ‘grow’ in the coverage area of about 18 510 ha (26%), 10
637 ha (12%), 5 365.8 ha (7%), and 4 822 ha (8%), respectively. In other words, the
future LULC map only shows the built-up area and water bodies are having an
increment in the coverage area, while agricultural activities and forest land are

Hua: Spatial-temporal analysis of pattern changes and prediction in Penang Island, Malaysia using LULC and CA-Markov model
- 4631 -
APPLIED ECOLOGY AND ENVIRONMENTAL RESEARCH 16(4):4619-4635.
http://www.aloki.hu ● ISSN 1589 1623 (Print) ● ISSN 1785 0037 (Online)
DOI: http://dx.doi.org/10.15666/aeer/1604_46194635
2018, ALÖKI Kft., Budapest, Hungary
suspected to decline. Generally, water provides food and water sources, recreation
activities, sustaining the ecosystem, maintaining the humidity of land surface from
overheating and the climate changes, etc. The benefits and importance of water
resources had increased the awareness of local residents to sustain the quality and
quantity from ‘disappearance’ and be concerned with environmental issues.
Nevertheless, LULC map in 2042 resulted to an increase in built-up area showing a sign
of warning that the population growth has increased and urbanisation could be achieved
in making Penang Island as one of the developed states. Indirectly, the built-up area will
increase the demand for water and food sources, shelter, employment, recreations, etc.;
as well as creating various numbers of environmental problems such as pollution, the
cause of extinction towards living and non-living being. This situation also signalled
that ‘confiscation’ of other class area in fulfillment of the quantity of the population will
happen.
As a proof that confiscation could happen, the CA-Markov analysis has shown that
forest land and agricultural activities is declining in the coverage area to contribute to
the built-up area. To be more specific, future LULC map in 2042 indicated that several
areas of forest land in the centre of Penang Island especially surrounding the high hills.
This was transformed into built-up area, as well as the north and the west of agriculture
area had been converted into water bodies. As explained previously, the forest land
plays an important role in providing the sustainability of water resources, food
resources, land resources, and air source (which was also referred to as the climatic
matter) to provide the comfort continuance of living overall. However, pressured in
fulfilling the demand of humans on the ‘greedy’ attitude had caused the forest land to
become a ‘victim’ of deforestation, which can be shown in Figure 3b. There are only
several areas that remained as forested land especially the high hills like Batu Feringghi,
Bukit Bendera, Bukit Ayer Hitam, and Bukit Relau; including several forested areas at
ground land like Teluk Bahang, Pantai Acheh, and Balik Pulau (Fig. 3b). Therefore,
these areas should be preserved and conserved so that nature can be maintained for its
originality and avoid from being damaged or destructed. As a summary, LULC change
for 1990 to 2016 shows that the built-up area and agriculture area experienced a gain
more than a loss by 29% and 21% (Fig. 5a); while forest land and water bodies have a
loss more than a gain by -33% and -17% (Fig. 5a). Furthermore, the next 26 years of
LULC change will indicate that the built-up area, agriculture area, and water bodies are
having a gain more than a loss (Fig. 5b) by 46%, 2% and 2% (Fig. 6b), respectively;
while only the forest land are having a loss more than a gain (Fig. 5b) by -50%
(Fig. 6b). Therefore, forest land should be given attention and priority from
deforestation on a large scale through various methods of laws, policies, moral and
ethical value, religion, and awareness, which are important to prevent it from being
constantly taken advantage of by other classes.
Conclusion
This study utilised satellite images (1990, 2006, and 2016) to analyse the land use
land cover of Penang Island, Malaysia. Two classified images (1990 and 2006) were
used as an input to the CA-Markov model to predict the 2016 land use land cover. The
model output is validated with an actual image of 2016. Based on the results, the model
is used to predict land use land cover for 2042. The overall results showed a
predominant increase in built-up areas from 18% of total land use in 1990 to 77% by

Hua: Spatial-temporal analysis of pattern changes and prediction in Penang Island, Malaysia using LULC and CA-Markov model
- 4632 -
APPLIED ECOLOGY AND ENVIRONMENTAL RESEARCH 16(4):4619-4635.
http://www.aloki.hu ● ISSN 1589 1623 (Print) ● ISSN 1785 0037 (Online)
DOI: http://dx.doi.org/10.15666/aeer/1604_46194635
2018, ALÖKI Kft., Budapest, Hungary
2042. The increase is found mainly at the expense of forest land, where these areas are
reduced from 41% in 1990 to 25% in 2042. Based on the environmental framework of
Penang Island in 2042 as planned by City Council of Penang Island, it is noted that
Penang Island is planned to expand more to the east towards north and south.
Nevertheless, the result of CA-Markov model in this study complied with the 2042
Master Plan, where the built-up areas are expected to encounter an expansion not only
from the east to the north and south, but also towards the centre of the island and
moving upwards to the north. In this model, it could suggest to limit urban development
in the centre of the island to protect forest landscapes. To understand how the changes
in the landscapes may influence the distribution of the important species will help guide
conservation planning in the area. This study can serve as guidelines for other studies
which attempt to project land use land cover change in forest landscape experiencing
similar land use changes.
Figure 5. Loss and gain for 1990-2016 (a) and 2016-2042 (b)
Figure 6. Net changes for 1990-2016 (a) and 2016-2042 (b)

Hua: Spatial-temporal analysis of pattern changes and prediction in Penang Island, Malaysia using LULC and CA-Markov model
- 4633 -
APPLIED ECOLOGY AND ENVIRONMENTAL RESEARCH 16(4):4619-4635.
http://www.aloki.hu ● ISSN 1589 1623 (Print) ● ISSN 1785 0037 (Online)
DOI: http://dx.doi.org/10.15666/aeer/1604_46194635
2018, ALÖKI Kft., Budapest, Hungary
Acknowledgements. The author would like to thank the United States Geological Survey (UGGS) for
providing the base data for remote sensing imageries. Gratitude is extended to Mr. Maher Aburas for
valuable support and assistance. The editor and the anonymous reviewers are acknowledged for their
constructive suggestions and comments.
REFERENCES
[1] Adhikari, S., Southworth, J. (2012): Simulating forest cover changes of Bannerghatta National Park based on a CA-Markov model: a remote sensing approach. – Remote
Sensing 4(10): 3215-3243.
[2] Agarwal, C., Green, G. M., Grove, J. M., Evans, T. P., Schweik, C. M. (2002): A Review and Assessment of Land-Use Change Models: Dynamics of Space, Time, and Human
Choice. – Gen. Tech. Rep. NE-297, U.S. department of Agriculture, Forest Service,
Northeastern Research Station, Newton Square, PA. [3] Ahmad, F., Yahaya, A. S., Farooqi, M. A. (2006): Characterization and geotechnical
properties of Penang residual soils with emphasis on landslides. – Am J Environ Sci 2(4):
121-128.
[4] Angelsen, A., Kaimowitz, D. (1999): Rethinking the causes of deforestation: lessons from economic models. – The World Bank Research Observer 14(1): 73-98.
[5] Baker, W. L. (1989): A review of models of landscape change. – Landscape Ecology
2(2): 111-133. [6] Behera, D. M., Borate, S. N., Panda, S. N., Behera, P. R., Roy, P. S. (2012): Modelling
and analyzing the watershed dynamics using Cellular Automata (CA)–Markov model–A
geo-information based approach. – Journal of Earth System Science 121(4): 1011-1024.
[7] Bell, E. J., Hinojosa, R. C. (1977): Markov analysis of land use change: continuous time and stationary processes. – Socio-Economic Planning Sciences 11(1): 13-17.
[8] Coppin, P., Jonckheere, I., Nackaerts, K., Muys, B., Lambin, E. (2004): Review
ArticleDigital change detection methods in ecosystem monitoring: a review. – International Journal of Remote Sensing 25(9): 1565-1596.
[9] Eastman, J. R. (2009): IDRISI Guide to GIS and Image Processing. – Accessed in IDRISI
Selva 17, pp. 182-185. Clark University, Worcester, MA. [10] El-Kawy, O. A., Rød, J. K., Ismail, H. A., Suliman, A. S. (2011): Land use and land
cover change detection in the western Nile delta of Egypt using remote sensing data. –
Applied Geography 31(2): 483-494.
[11] Freier, K. P., Schneider, U. A., Finckh, M. (2011): Dynamic interactions between vegetation and land use in semi-arid Morocco: Using a Markov process for modeling
rangelands under climate change. – Agriculture, Ecosystems & Environment 140(3): 462-
472. [12] Guan, D., Li, H., Inohae, T., Su, W., Nagaie, T., Hokao, K. (2011): Modeling urban land
use change by the integration of cellular automaton and Markov model. – Ecological
Modelling 222(20): 3761-3772. [13] Halmy, M. W. A., Gessler, P. E., Hicke, J. A., Salem, B. B. (2015): Land use/land cover
change detection and prediction in the north-western coastal desert of Egypt using
Markov-CA. – Applied Geography 63: 101-112.
[14] Hua, A. K. (2017): Land use land cover changes in detection of water quality: a study based on remote sensing and multivariate statistics. – Journal of Environmental and
Public Health 2017: 7515130. https://doi.org/10.1155/2017/7515130.
[15] Kityuttachai, K., Tripathi, N. K., Tipdecho, T., Shrestha, R. (2013): CA-Markov analysis of constrained coastal urban growth modeling: Hua Hin seaside city, Thailand. –
Sustainability 5(4): 1480-1500.
[16] Lambin, E. F. (1997): Modelling and monitoring land-cover change processes in tropical
regions. – Progress in physical Geography 21(3): 375-393.

Hua: Spatial-temporal analysis of pattern changes and prediction in Penang Island, Malaysia using LULC and CA-Markov model
- 4634 -
APPLIED ECOLOGY AND ENVIRONMENTAL RESEARCH 16(4):4619-4635.
http://www.aloki.hu ● ISSN 1589 1623 (Print) ● ISSN 1785 0037 (Online)
DOI: http://dx.doi.org/10.15666/aeer/1604_46194635
2018, ALÖKI Kft., Budapest, Hungary
[17] Lu, D., Mausel, P., Brondizio, E., Moran, E. (2004): Change detection techniques. –
International Journal of Remote Sensing 25(12): 2365-2401.
[18] Mahmud, A., Achide, A. S. (2012): Analysis of Land Use/Land Cover Changes to Monitor Urban Sprawl in Keffi-Nigeria. – Environmental Research Journal 6(2): 129-
134.
[19] Messina, J. P., Walsh, S. J. (2001): 2.5 D Morphogenesis: modeling landuse and
landcover dynamics in the Ecuadorian Amazon. – Plant Ecology 156(1): 75-88. [20] Muller, M. R., Middleton, J. (1994): A Markov model of land-use change dynamics in the
Niagara Region, Ontario, Canada. – Landscape Ecology 9(2): 151-157.
[21] Overmars, K. P., De Koning, G. H. J., Veldkamp, A. (2003): Spatial autocorrelation in multi scale land use models. – Ecological Modelling 164(2): 257-270.
[22] Parker, D. C., Manson, S. M., Janssen, M. A., Hoffmann, M. J., Deadman, P. (2003):
Multi agent systems for the simulation of land-use and land-cover change: a review. –
Annals of the Association of American Geographers 93(2): 314-337. [23] Parsa, V. A., Yavari, A., Nejadi, A. (2016): Spatio-temporal analysis of land use/land
cover pattern changes in Arasbaran Biosphere Reserve: Iran. – Modeling Earth Systems
and Environment 2(4): 178. [24] Pijanowski, B. C., Brown, D. G., Shellito, B. A., Manik, G. A. (2002): Using neural
networks and GIS to forecast land use changes: a land transformation model. –
Computers, Environment and Urban Systems 26(6): 553-575. [25] Pontius, G. R., Malanson, J. (2005): Comparison of the structure and accuracy of two
land change models. – International Journal of Geographical Information Science 19(2):
243-265.
[26] Pontius Jr, R. G., Millones, M. (2011): Death to Kappa: birth of quantity disagreement and allocation disagreement for accuracy assessment. – International Journal of Remote
Sensing 32(15): 4407-4429.
[27] Rogan, J., Chen, D. (2004): Remote sensing technology for mapping and monitoring land cover and land-use change. – Progress in Planning 61(4): 301-325.
[28] Sala, O. E., Chapin, F. S., Armesto, J. J., Berlow, E., Bloomfield, J., Dirzo, R., Huber
Sanwald, E. (2000): Global biodiversity scenarios for the year 2100. – Science 287(5459): 1770-1774.
[29] Sklar, F. H., Costanza, R. (1990): 10. The Development of Dynamic Spatial Models for
Landscape Ecology: A Review and Prognosis. – In: Turner, M. G., Gardner, R. H. (eds.)
Quantitative Methods in Landscape Ecology: The Analysis and Interpretation of Landscape Heterogeneity. Springer, New York, pp. 239-288.
[30] Sinha, P., Kumar, L. (2013): Markov land cover change modeling using pairs of time
series satellite images. – Photogramm. Eng. Remote Sens. 79(11): 1037-1051. [31] Tan, K. C., San Lim, H., MatJafri, M. Z., Abdullah, K. (2010): Landsat data to evaluate
urban expansion and determine land use/land cover changes in Penang Island, Malaysia.
– Environmental Earth Sciences 60(7): 1509-1521.
[32] Tan, K. C., Lim, H. S., Jafri, M. M. (2011). Detection of land use/land cover changes for Penang Island, Malaysia. – IEEE International Conference on Space Science and
Communication (IconSpace), July 2011, pp. 152-155.
[33] Veldkamp, A., Lambin, E. F. (2001): Predicting land-use change. – Agriculture, Ecosystem and Environment 85: 1-6.
[34] Verburg, P. H., de Nijs, T. C., van Eck, J. R., Visser, H., de Jong, K. (2004): A method to
analyse neighbourhood characteristics of land use patterns. – Computers, Environment and Urban Systems 28(6): 667-690.
[35] Weng, Q. H. (2010): Remote Sensing and GIS integration. McGraw-Hill, New York.
424p. Weng, Q. (2002): Land use change analysis in the Zhujiang Delta of China using
satellite remote sensing, GIS and stochastic modelling. – Journal of Environmental Management 64(3): 273-284.
Hua: Spatial-temporal analysis of pattern changes and prediction in Penang Island, Malaysia using LULC and CA-Markov model
- 4635 -
APPLIED ECOLOGY AND ENVIRONMENTAL RESEARCH 16(4):4619-4635.
http://www.aloki.hu ● ISSN 1589 1623 (Print) ● ISSN 1785 0037 (Online)
DOI: http://dx.doi.org/10.15666/aeer/1604_46194635
2018, ALÖKI Kft., Budapest, Hungary
[36] Wu, Q., Li, H. Q., Wang, R. S., Paulussen, J., He, Y., Wang, M., Wang, B. H., Wang, Z.
(2006): Monitoring and predicting land use change in Beijing using remote sensing and
GIS. – Landscape and Urban Planning 78(4): 322-333. [37] Wu, S., Mickley, L. J., Kaplan, J. O., Jacob, D. J. (2012): Impacts of changes in land use
and land cover on atmospheric chemistry and air quality over the 21st century. –
Atmospheric Chemistry and Physics 12(3): 1597-1609.