
Identification of Critical Transmission Lines in Complex Power ...
Upload
khangminh22Category
view
2download
0
Title High Power Microwave Wireless Power Transmission Systemwith Phase-Controlled Magnetrons( Dissertation_全文 )
Author(s) Yang, Bo
Citation 京都大学
Issue Date 2020-11-24
URL https://doi.org/10.14989/doctor.k22843
Right
“Experimental Study on a 5.8 GHz Power-Variable Phase-Controlled Magnetron”, IEICE Trans. Electron, Vol.E100-C,No.10, doi: 10.1587/transele.E100.C.901. “Evaluation of theModulation Performance of Injection-Locked Continuous-Wave Magnetrons”. IEEE Trans. ED, vol.66, no.1, doi:10.1109/TED.2018.2877204. Bo Yang, Tomohiko Mitani, andNaoki Shinohara, “A 5.8 GHz Phased Array System UsingPower-Variable Phase-Controlled Magnetrons for WirelessPower Transfer”.IEEE Trans. MTT,doi:10.1109/TMTT.2020.3007187. “Modeling andExperiments of an Injection-locked Magnetron with VariousLoad Reflection Levels”, IEEE Trans. ED, vol. 67, no. 9,doi:10.1109/TED.2020.3009901. “A High-efficiencyMicrowave Power Combining System based on Frequency-tuning Injection-Locked Magnetrons”, IEEE Trans. ED, inprint, 2020, doi: 10.1109/TED.2020.3013510
Type Thesis or Dissertation
Textversion ETD
Kyoto University

High Power Microwave Wireless Power
Transmission System with
Phase-Controlled Magnetrons
Bo YANG
October 2020


High Power Microwave Wireless PowerTransmission System with
Phase-Controlled Magnetrons
Bo YANG
October 2020
i
High Power Microwave Wireless PowerTransmission System with
Phase-Controlled Magnetrons
Bo YANG
Supervisor: Prof. Naoki Shinohara
Department of Electrical EngineeringKyoto University
This dissertation is submitted for the degree ofDoctor of Philosophy
October 2020

Acknowledgment
The present thesis summarizes the research while I am studying at the Department ofElectrical Engineering, Graduate School of Engineering, Kyoto University. I would like toacknowledge all the people supporting my doctoral study.
I would like to express my sincere and special appreciation to my supervisor, ProfessorNaoki Shinohara for giving me an opportunity to pursue the promising study. His valuablesuggestions and advice always indicated the guideline of my study. I sincerely thank ProfessorYoshiharu Omura for reviewing the thesis and suggesting the more clear explanations. I alsogreatly appreciate Associate Professor Yasuhito Gotoh for reviewing the thesis and advisingthe expression methods of the research results.
I am deeply grateful to Associate Professor Tomohiko Mitani for his insightful commentsand helpful suggestions through my whole research. I would like to show my gratitudefor his helpful suggestions. I would like to express my acknowledgments to ProfessorHirotsugu Kojima and Associate Professor Yusuke Ebihara, and Dr. Yoshikatsu Ueda fortheir encouragement and helpful suggestions at the monthly space group seminar.
I would like to thank Dr. Ce Wang, Mr. Xiaojie Chen, Mr. Jie Chu for overcomingdifficulties and completing the experiments together. Thanks to Katsumi Kawai for modifyingthe grammar of this thesis. I also would like to thank Mr. Seishirou Kojima, Mr. TakeshiNogi, Mr. Takashi Hirakawa, Dr. Yikai Hsieh and, all other researchers and students ofspace group of Research Institute for Sustainable Humanosphere (RISH) for their helpfulcomments and support. I thank to relevant departments supporting research and life duringthe COVID-19 pandemic.
I gratefully appreciate Kyoto University Special Admission Support Program for DoctoralStudent (KSPD) that providing one year scholarship.
I gratefully appreciate the financial support from Japan Society for the Promotion ofScience (JSPS) that could make me devote most of my time to this research. All theexperiments in the present study were conducted through a collaborative research program:Microwave Energy Transmission Laboratory (METLAB), at RISH, Kyoto University
Finally, thanks to Xi Yang and Niuniu for the greatest support.

Abstract
In this study, we are conducting research on high-power Wireless Power Transmission(WPT)systems that are deeply involved in microwave WPT technology. The constructed WPTsystems with injection-locking magnetrons as the DC–RF converter is aim to practical use.The magnetron are widely used in microwave oven. Magnetron has practical advantagessuch as high efficiency, large power, low cost, and light weight, comparing to semiconductorsDC–RF converters. On the other hand, it is difficult to realize phase control of the magnetron,and it has a drawback that it is noisy, so it was mainly used for microwave heating microwaveovens that do not consider the influence of noise. However, it is necessary to control the phaseof the magnetron for the WPT system which involved in controlling the power transmissiondirection.
To solve this problem, phase-controlled magnetrons methods realized from microwaveoven magnetrons have been developed. On the contrary, it is difficult to control the mag-netrons output power through the developed phase-controlled methods. In a bid to solvethis problem, this thesis developed a 5.8 GHz power-variable phase-controlled magnetron(PVPCM) which controls the phase of magnetron output by a phase shifter and controls thepower by the anode current of the magnetron. This method is different from the previous2.45 GHz phase-controlled magnetron which utilizes an injection method and a phase lockedloop by the anode current, since the frequency of 5.8 GHz magnetron hardly changes withthe anode current. Our experiments show that the developed 5.8 GHz PVPCM had a variableoutput power with 1% power stability from 160 W to 329 W, the phase accuracy was nearly±1◦, and the response time was less than 100 `s. Stable output power, high phase-controlledaccuracy, and fast response speed microwave sources based on the PVPCMs are suitable forphased array system for microwave WPT.
A phased array system with four developed PVPCMs was bulid by applying the injection-locking method and phase-locked-loop method. To reduce the cost and ensure the durabilityof the phased array, a waveguide slot array antenna was designed and used for the outputantenna of power-variable phase-controlled magnetrons. The slot antenna has an expectedangle deflection of 22.5◦, a gain of 24.9 dBi, and the half bandwidth of the main lobe was
10◦. The experiments demonstrated the properties of microwave beam forming and WPTbased on the magnetron phased array system. In horizontal directions, a beam scanningrange of ±3◦ was obtained by adjusting the output phase of the magnetrons. Furthermore, thereceived DC power reaches 142 W at a distance of 5 m when the output microwave power ofthe magnetron phased array is 1304 W.
This thesis also proved that 2.45 GHz and 5.8 GHz band continuous-wave magnetrons canbe used to perform amplitude, phase, and frequency modulations by applying an injection-locking method. The magnetron behaved like an amplifier, and its output could follow theinjection signal. In addition, we have achieved the transmission of amplitude shift keying dataat 200 kb/s as well as phase-shift keying and frequency-shift keying at 10 Mb/s. Moreover,we quantitatively discussed several demodulation performances of the injection-lockingmagnetrons. Finally, the transmission of audio and video information was demodulated usingthe injection-locking magnetrons.
Two low cost power supplies were improved. The improved low-cost power suppliesapplied to phase-controlled magnetron system, modulation magnetron system, magnetronload fluctuation experiment and magnetron output combining system.
Finally, the thesis introduced the wireless information and power transmission systemsand highly efficient WPT systems. The wireless TV transmission distance was about 3.5m, and we succeeded in developing a wireless TV system. The constructed 5.8 GHzmagnetron wireless power transmission system receives the received power of 109 W withthe transmission distance of 5.6 m, and the total efficiency of the system reaches up to 9.73%.We discussed for constructing a high-efficiency microwave wireless power transmissionsystem with higher efficiency.
Table of contents
List of figures ix
List of tables xv
1 Introduction 11.1 Wireless Power Transmission technologies . . . . . . . . . . . . . . . . . . 1
1.1.1 History of Wireless Power Transmission . . . . . . . . . . . . . . . 11.1.2 Applications of Wireless Power Transmission . . . . . . . . . . . . 61.1.3 Theory of Wireless Power Transmission . . . . . . . . . . . . . . . 9
1.2 High Power Microwave Wireless Power Transmission Systems . . . . . . . 121.3 High Power Microwave Transmitter . . . . . . . . . . . . . . . . . . . . . 15
1.3.1 GaN HEMT . . . . . . . . . . . . . . . . . . . . . . . . . . . . . . 151.3.2 Klystrons . . . . . . . . . . . . . . . . . . . . . . . . . . . . . . . 161.3.3 TWT . . . . . . . . . . . . . . . . . . . . . . . . . . . . . . . . . 171.3.4 Gyrotrons . . . . . . . . . . . . . . . . . . . . . . . . . . . . . . . 171.3.5 Magnetrons & CFA . . . . . . . . . . . . . . . . . . . . . . . . . . 18
1.4 Outline of the Thesis . . . . . . . . . . . . . . . . . . . . . . . . . . . . . 20
2 Power-Variable Phase-Controlled Magnetron 212.1 Introduction . . . . . . . . . . . . . . . . . . . . . . . . . . . . . . . . . . 212.2 Injection-Locking Magnetron . . . . . . . . . . . . . . . . . . . . . . . . 222.3 Design of a PVPCM . . . . . . . . . . . . . . . . . . . . . . . . . . . . . 26
2.3.1 Characteristics of 5.8 GHz Magnetrons . . . . . . . . . . . . . . . 262.3.2 Configuration of PLL . . . . . . . . . . . . . . . . . . . . . . . . . 282.3.3 Determination of Transfer Functions . . . . . . . . . . . . . . . . . 29
2.4 Measurement Experiments . . . . . . . . . . . . . . . . . . . . . . . . . . 312.4.1 Outline of Experiments . . . . . . . . . . . . . . . . . . . . . . . . 312.4.2 Experimental Results . . . . . . . . . . . . . . . . . . . . . . . . . 32

2.5 Summary . . . . . . . . . . . . . . . . . . . . . . . . . . . . . . . . . . . 34
3 Magnetron Phased Array 393.1 Introduction . . . . . . . . . . . . . . . . . . . . . . . . . . . . . . . . . . 393.2 Principle of Power-Variable Phase-Controlled Magnetrons and Magnetron
Phased Array System . . . . . . . . . . . . . . . . . . . . . . . . . . . . . 403.3 Design of Slot Array Antennas . . . . . . . . . . . . . . . . . . . . . . . . 433.4 Demonstration Experiments of Magnetron Phased Array . . . . . . . . . . 49
3.4.1 Beam Forming Experiments . . . . . . . . . . . . . . . . . . . . . 513.4.2 Wireless Power Transfer Experiments . . . . . . . . . . . . . . . . 55
3.5 Summary . . . . . . . . . . . . . . . . . . . . . . . . . . . . . . . . . . . 62
4 Modulation Performance with Injection-Locking Magnetrons 654.1 Introduction . . . . . . . . . . . . . . . . . . . . . . . . . . . . . . . . . . 654.2 Magnetron Characteristics . . . . . . . . . . . . . . . . . . . . . . . . . . 664.3 Modulation Performance Evaluation Experiments . . . . . . . . . . . . . . 69
4.3.1 Injection-Locking Magnetron for ASK . . . . . . . . . . . . . . . 694.3.2 Injection-Locking Magnetron for PSK . . . . . . . . . . . . . . . 724.3.3 Injection-Locking Magnetron for FSK . . . . . . . . . . . . . . . 75
4.4 Discussion of the Modulation Performance . . . . . . . . . . . . . . . . . 754.5 Demonstration Experiments . . . . . . . . . . . . . . . . . . . . . . . . . 80
4.5.1 Demonstration of a Phase-Controlled Magnetron for Transmittingan Audio Signal . . . . . . . . . . . . . . . . . . . . . . . . . . . 80
4.5.2 Demonstration of an Injection-Locking Magnetron for Transmittinga Video Signal . . . . . . . . . . . . . . . . . . . . . . . . . . . . 82
4.5.3 Demonstration of an Injection-Locking Magnetron for transferring data 834.6 Summary . . . . . . . . . . . . . . . . . . . . . . . . . . . . . . . . . . . 86
5 Power Supplies of the Magnetron 895.1 Introduction . . . . . . . . . . . . . . . . . . . . . . . . . . . . . . . . . . 895.2 Full Wave Doubler Rectifier . . . . . . . . . . . . . . . . . . . . . . . . . 89
5.2.1 Injection-Locking Magnetron with Full Wave Doubler Rectifier . . 945.2.2 Modulation Magnetron with Full Wave Doubler Rectifier . . . . . . 965.2.3 Phase-controlled Magnetron with Full Wave Doubler Rectifier . . . 99
5.3 Switched-Mode Power Supply . . . . . . . . . . . . . . . . . . . . . . . . 1035.3.1 Magnetron Various Load Reflection Experiments . . . . . . . . . . 1055.3.2 Magnetrons Output Power Combining Experiments . . . . . . . . . 109
5.4 Summary . . . . . . . . . . . . . . . . . . . . . . . . . . . . . . . . . . . 112
6 Microwave Wireless Power Transmission Systems 1156.1 Information Transmission System with Beam Forming . . . . . . . . . . . 1176.2 Wirelessly-Powered TV . . . . . . . . . . . . . . . . . . . . . . . . . . . . 118
6.2.1 Experimental Arrangement . . . . . . . . . . . . . . . . . . . . . 1196.2.2 Experimental Results . . . . . . . . . . . . . . . . . . . . . . . . 121
6.3 Charging in the Microwave Oven . . . . . . . . . . . . . . . . . . . . . . . 1226.4 Efficiency Measurement of the WPT System . . . . . . . . . . . . . . . . . 125
6.4.1 Magnetron WPT System with Horn Antenna . . . . . . . . . . . . 1256.4.2 Magnetron WPT System with Patch Antenna . . . . . . . . . . . . 126
6.5 Discussion of a High Efficiency WPT System . . . . . . . . . . . . . . . . 1306.6 Summary . . . . . . . . . . . . . . . . . . . . . . . . . . . . . . . . . . . 130
7 Conclusion 133
References 135
Publication List 145


List of figures
1.1 History of wireless power transmission(2-1). . . . . . . . . . . . . . . . . . 41.2 History of wireless power transmission(2-2). . . . . . . . . . . . . . . . . . 51.3 Applications of Wireless Power Transmission . . . . . . . . . . . . . . . . 81.4 Classification of wireless power transfer. . . . . . . . . . . . . . . . . . . . 91.5 WPT Research achieved efficiency with distance. . . . . . . . . . . . . . . 111.6 RF vacuum devices (black line) [52] in 1999 and solid-state devices (color
area) [53] in 2014 state of technology for single device performance. . . . . 161.7 Principle diagram of Magnetron. . . . . . . . . . . . . . . . . . . . . . . . 19
2.1 Schematic of the injection locked magnetron. . . . . . . . . . . . . . . . . 232.2 Injection locked spectrum and free-running spectrum of a 5.8 GHz Mag-
netron in max hold mode. . . . . . . . . . . . . . . . . . . . . . . . . . . . 242.3 Relationship of injection power and lock frequency range on 5.8 GHz mag-
netrons with difference serial numbers. . . . . . . . . . . . . . . . . . . . . 252.4 Phase difference between the reference signal and the injection locked mag-
netron output. . . . . . . . . . . . . . . . . . . . . . . . . . . . . . . . . . 252.5 Relationship of anode current and oscillation frequency on 5.8 GHz mag-
netrons with difference serial numbers. . . . . . . . . . . . . . . . . . . . 262.6 Relationship of anode current and output power on 5.8 GHz magnetrons with
difference serial numbers. . . . . . . . . . . . . . . . . . . . . . . . . . . 272.7 Schematic diagram of a 5.8 GHz PVPCM. . . . . . . . . . . . . . . . . . 282.8 Block diagram of a phase control loop. . . . . . . . . . . . . . . . . . . . . 292.9 Diagram of a low pass filter and a phase control circuit for a 5.8GHz PVPCM. 302.10 Bode diagrams of open-loop transfer function for a PLL. . . . . . . . . . . 312.11 Experimental schematic diagram of a 5.8 GHz PVPCM. . . . . . . . . . . 322.12 Photo of a 5.8 GHz PVPCM system (1: 5.8 GHz magnetron, 2: directional
coupler, 3: dummy load, 4: current meter, 5: circulator, 6: spectrum analyzer.) 33

2.13 Magnetron phase difference when the PLL circuit starts working measuredthrough oscilloscope. . . . . . . . . . . . . . . . . . . . . . . . . . . . . . 34
2.14 Magnetron phase difference and output power when the PLL circuit startsworking. . . . . . . . . . . . . . . . . . . . . . . . . . . . . . . . . . . . . 35
2.15 Phase stability when the PLL circuit was working. . . . . . . . . . . . . . . 352.16 Waveform of the PCM output and injection signal measured through oscillo-
scope. . . . . . . . . . . . . . . . . . . . . . . . . . . . . . . . . . . . . . 362.17 Magnetron phase difference when the output power was changed. . . . . . 362.18 Response time of the PLL circuit when the phase was changed. . . . . . . . 37
3.1 Diagram of a power-variable phase-controlled magnetron. . . . . . . . . . 413.2 Measured upper and lower frequency boundaries of magnetrons to the injec-
tion power. The magnetron frequency could be locked to the injection signalfrequency within the boundary. red line: S/N007, blue line: S/N012, greenline: S/N010, black line: S/N 005. The green zone indicates the lockingrange within which all the four magnetrons can be locked. . . . . . . . . . 43
3.3 Configurations of the developed slot array antenna. . . . . . . . . . . . . . 453.4 Simulation results of the slot array antenna. . . . . . . . . . . . . . . . . . 463.5 Photographs of the developed slot array antenna. . . . . . . . . . . . . . . 463.6 |𝑆11 | of the slot array antenna. . . . . . . . . . . . . . . . . . . . . . . . . 483.7 Beam patterns of the slot array antenna on the H-plane at 5.8 GHz. . . . . . 483.8 Block diagram of the 5.8GHz phased array. . . . . . . . . . . . . . . . . . 493.9 Photograph of the magnetron phased array system. . . . . . . . . . . . . . 503.10 Simulation results of the combined beam patterns of the 2 × 2 slot antenna
array on the E plane at 5.8 GHz. . . . . . . . . . . . . . . . . . . . . . . . 523.11 Photograph of the LED lamp rectenna elements. . . . . . . . . . . . . . . . 533.12 Beam forming experiments of the magnetron phased array system. . . . . . 543.13 Display of the LED lamp array and simulation beam pattern of states
No.1 No.5 (Black frame: LED lamp array). . . . . . . . . . . . . . . . . . 553.14 5.8 GHz rectenna array system. . . . . . . . . . . . . . . . . . . . . . . . . 563.15 Full view of 5.8 GHz WPT experimental system. . . . . . . . . . . . . . . 573.16 Power density distribution of the case No. 5. . . . . . . . . . . . . . . . . . 583.17 Transmission efficiency and RF-RF-DC efficiency with distances. (Black
line shows the maximum possible efficiency) . . . . . . . . . . . . . . . . 603.18 Transmission efficiency and RF-RF-DC efficiency with distances. (Schematic
diagram of the deviated beam pattern.) . . . . . . . . . . . . . . . . . . . . 61
4.1 Experimental system of the injection-locked magnetron. . . . . . . . . . . 674.2 Characteristics of the locked- frequency range of the 2.45 GHz and 5.8 GHz
band magnetrons versus the injection power. . . . . . . . . . . . . . . . . . 684.3 Phase noise of the 5.8 GHz Magnetron with the different injection power. . 684.4 Change in the output power of the 5.8 GHz band magnetron with the anode
current. . . . . . . . . . . . . . . . . . . . . . . . . . . . . . . . . . . . . 704.5 Characteristic of a 2.45GHz band magnetron output power with magnetic
coil current. . . . . . . . . . . . . . . . . . . . . . . . . . . . . . . . . . . 714.6 Photograph of a 2.45 GHz band magnetron with coil. . . . . . . . . . . . . 724.9 Result of the data signal and demodulation signal using a 5.8-GHz band
injection-locked magnetron ASK system. . . . . . . . . . . . . . . . . . . 724.7 Change in the output power of the magnetrons with the filament power. . . 734.8 Change in the output power of the magnetrons with the injection power levels. 734.10 Results of the PSK data signal and the demodulating signal. . . . . . . . . . 744.11 Results of the FSK data signal and the demodulating signal. . . . . . . . . . 754.12 Spectral curve of the injection-locked magnetron FSK system with different
data signals (Data signal on the upper trace: a square wave, lower trace: PN9code). . . . . . . . . . . . . . . . . . . . . . . . . . . . . . . . . . . . . . 77
4.13 Changes in the error vector magnitude of the injection-locked magnetronsystem for PSK with the injection power levels. . . . . . . . . . . . . . . . 79
4.14 Changes in the error vector magnitude of the injection-locked magnetronsystem for PSK with the transmission rates. . . . . . . . . . . . . . . . . . 80
4.15 Schematic of the PM injection-locked magnetron system. . . . . . . . . . . 814.16 Waveform of the PM injection-locked magnetron. . . . . . . . . . . . . . . 824.17 Schematic of the FM injection-locked magnetron system. . . . . . . . . . . 834.18 Photo of the FM injection-locked magnetron system (1: high voltage power
supply, 2: DVD player, 3: FM modulator, 4: amplifier, 5: horn antenna, 6:circulator, 7: magnetron, 8: TV). . . . . . . . . . . . . . . . . . . . . . . . 83
4.19 A wireless power transfer system for electric trolley. . . . . . . . . . . . . . 844.20 Schematic of data transfer system by FSK modulation. . . . . . . . . . . . 854.21 Transmitted data vs. received data. . . . . . . . . . . . . . . . . . . . . . . 864.22 Photos of data transfer system (1: Modulator, 2: High-Voltage Power Supply
and Amplifier, 3: Magnetron, 4: Circulator, 5: Transmitting antenna, 6:Electric trolley, 6.1: Demodulator, 6.2: Driver circuit). . . . . . . . . . . . 87
5.1 Power supply of the magnetron(a.microwave oven power supply, b.half wavevoltage doubler with smoothing capacity, c.full wave voltage doubler) . . . 91

5.2 Simulation results of the power supply voltage(a.microwave oven powersupply, b.half wave voltage doubler with smoothing capacity, c.full wavevoltage doubler, dot line: magnetron oscillation voltage) . . . . . . . . . . 92
5.3 Photo of the microwave power supply. . . . . . . . . . . . . . . . . . . . . 945.4 Photo of the full wave doubler rectifier. . . . . . . . . . . . . . . . . . . . 945.5 Spectral of the magnetron. (dot line:microwave oven, blue line: full wave
voltage doubler without injection signal, black line:full wave voltage doublerwith injection signal) . . . . . . . . . . . . . . . . . . . . . . . . . . . . . 95
5.6 The anode voltage and anode current of the magnetron worked by full wavevoltage doubler . . . . . . . . . . . . . . . . . . . . . . . . . . . . . . . . 96
5.7 FSK system block diagram. . . . . . . . . . . . . . . . . . . . . . . . . . . 975.8 FSK modulation/demodulation results. . . . . . . . . . . . . . . . . . . . . 975.9 Injection power vs. lock frequency range. . . . . . . . . . . . . . . . . . . 985.10 Characteristics of the magnetron (upper trace: oscillation frequency vs.
output power, lower trance: anode voltage vs. output power based on the fullwave voltage doubler). . . . . . . . . . . . . . . . . . . . . . . . . . . . . 99
5.11 Block diagram of a phase-controlled magnetron with full wave double rectifier.1005.12 Magnetron output phase. (upper: worked without PLL circuit, lower: worked
with PLL) . . . . . . . . . . . . . . . . . . . . . . . . . . . . . . . . . . . 1015.13 Voltage waveform of the injection signal and magnetron output without PLL.
(green line: injection signal, yellow line: magnetron) . . . . . . . . . . . . 1025.14 Voltage waveform of the injection signal and magnetron output with PLL at
1% voltage ripple. (green line: injection signal, yellow line: magnetron) . . 1025.15 Photo of the full wave doubler rectifier with 1% voltage ripple. . . . . . . . 1035.16 Circuit of the low cost power supply. . . . . . . . . . . . . . . . . . . . . . 1045.17 Photo of the improved power supply. . . . . . . . . . . . . . . . . . . . . . 1055.18 Block diagram of the experimental system. . . . . . . . . . . . . . . . . . 1075.19 Photograph of the experimental system.Components and devices: (1) mag-
netron; (2) coupler; (3) E–H tuner; (4) circulator; (5) dummy load; (6)power supply; (7) fan; (8) power sensor; (9) high-voltage probe; (10) currentprobe; (11) signal generator; (12) power amplifier; (13) power meter; (14)oscilloscope; and (15) signal analyzer. . . . . . . . . . . . . . . . . . . . . 108
5.20 Experimental spectra of the free-running magnetron, injection signal, andinjection-locking magnetron (both resolution bandwidth (RBW) and videobandwidth (VBW) are 5 kHz). . . . . . . . . . . . . . . . . . . . . . . . . 109
5.21 Block diagram of the experimental system. . . . . . . . . . . . . . . . . . 111
5.22 Photograph (b) of the experimental system. Components and devices: (1)magnetron; (2) waveguide coupler; (3) coaxial coupler; (4) power sensor; (5)magic T; (6) horn antenna; (7) wind-cooled dummy load; (8) waveguide tocoax adapter; (9) 3.75-cm straight waveguide; (10) fan; (11) signal analyzer;(12) power amplifier; (13) VNA; (14) signal generator; (15) dc power supply;(16) power amplifier; (17) oscilloscope; (18) current-probe amplifier; (19)current probe; (20) high-voltage probe; (21) power supply; and (22) ceramicabsorber wall. . . . . . . . . . . . . . . . . . . . . . . . . . . . . . . . . . 112
6.1 Photo of the OAM antenna. . . . . . . . . . . . . . . . . . . . . . . . . . . 1166.2 Simulation beam pattern of the OAM antenna. . . . . . . . . . . . . . . . . 1166.3 Measurement of beam phase in near field of the OAM antenna. . . . . . . . 1176.4 Experimental system of the information and power transfer system with
magnetron phased array. . . . . . . . . . . . . . . . . . . . . . . . . . . . 1186.5 Experimental system of the injection-locked magnetron. . . . . . . . . . . 1196.6 Photo of a 2.45GHz rectifier circuit board. . . . . . . . . . . . . . . . . . . 1206.7 Rectifier efficiency of the rectifier circuit with different load (input 50mW). 1206.8 Rectifier efficiency of the rectifier circuit with different input power (load:60Ω).1216.9 Photo of the wirelessly-powered TV. . . . . . . . . . . . . . . . . . . . . . 1216.10 Block diagram of the quick charging system. . . . . . . . . . . . . . . . . 1236.11 Photo of the receiver. (a. a rectifier circuit, b. rear view of rectenna array, c.
front view of rectenna array. d. receiver) . . . . . . . . . . . . . . . . . . . 1246.12 Rectifier circuit efficiency with different load @ input power 6 W. (Orange
line: rectifier efficiency, blue line: reflection efficiency) . . . . . . . . . . . 1246.13 Rectifier circuit efficiency with different input power @60 Ω load. (Orange
line: rectifier efficiency, blue line: reflection efficiency) . . . . . . . . . . . 1256.14 Photo of Magnetron WPT experiment with horn antenna. . . . . . . . . . . 1266.15 Photo of Magnetron WPT experiment with patch antenna. . . . . . . . . . 127


List of tables
1.1 MICROWAVE WIRELESS POWER TRANSMISSION SYSTEMS . . . . 141.2 HIGH POWER MICROWAVE DEVICE [58] . . . . . . . . . . . . . . . . 19
3.1 DESIGN PARAMETERS OF THE SLOT ARRAY ANTENNA . . . . . . 473.2 PHASE DIFFERENCE AMONG PCMS AND BEAM DIRECTION . . . . 543.3 EXPERIMENTAL RESULTS OF WIRELESS POWER TRANSFER . . . 573.4 EXPERIMENTAL RESULTS OF DIFFERENT DISTANCES . . . . . . . 573.5 COMPARISON OF OUR MAGNETRON POWER TRANSMITTER WITH
THOSE IN OTHER RESEARCHES . . . . . . . . . . . . . . . . . . . . . 62
4.1 PARAMETERS AND CONDITIONS OF THE INJECTION-LOCKEDMAGNETRON EXPERIMENTS . . . . . . . . . . . . . . . . . . . . . . . 69
4.2 MODULATION· PERFORMANCE RESULTS OF THE INJECTION-LOCKEDMAGNETRON . . . . . . . . . . . . . . . . . . . . . . . . . . . . . . . . 78
4.3 PARAMETER OF THE FSK MODULATION EXPERIMENTS . . . . . . 86
5.1 PARAMETERS OF THE INJECTION-LOCKING MAGNETRON . . . . 100
6.1 PARAMETERS OF THE WIRELESSLY-POWERED TV. . . . . . . . . . 1226.2 EXPERIMENT RESULTS OF MAGNETRON WPT SYSTEM WITH HORN
ANTENNA . . . . . . . . . . . . . . . . . . . . . . . . . . . . . . . . . . 1286.3 EXPERIMENT RESULTS OF MAGNETRON WPT SYSTEM WITH PATCH
ANTENNA IN DIFFERENT FREQUENCY . . . . . . . . . . . . . . . . . 1286.4 EXPERIMENT RESULTS OF MAGNETRON WPT SYSTEM WITH PATCH
ANTENNA IN DIFFERENT DISTANCE . . . . . . . . . . . . . . . . . . 1296.5 COMPARE OF MAGNETRON WPT SYSTEM WITH DIFFERENT AN-
TENNAS . . . . . . . . . . . . . . . . . . . . . . . . . . . . . . . . . . . 129

Chapter 1
Introduction
1.1 Wireless Power Transmission technologies
1.1.1 History of Wireless Power Transmission
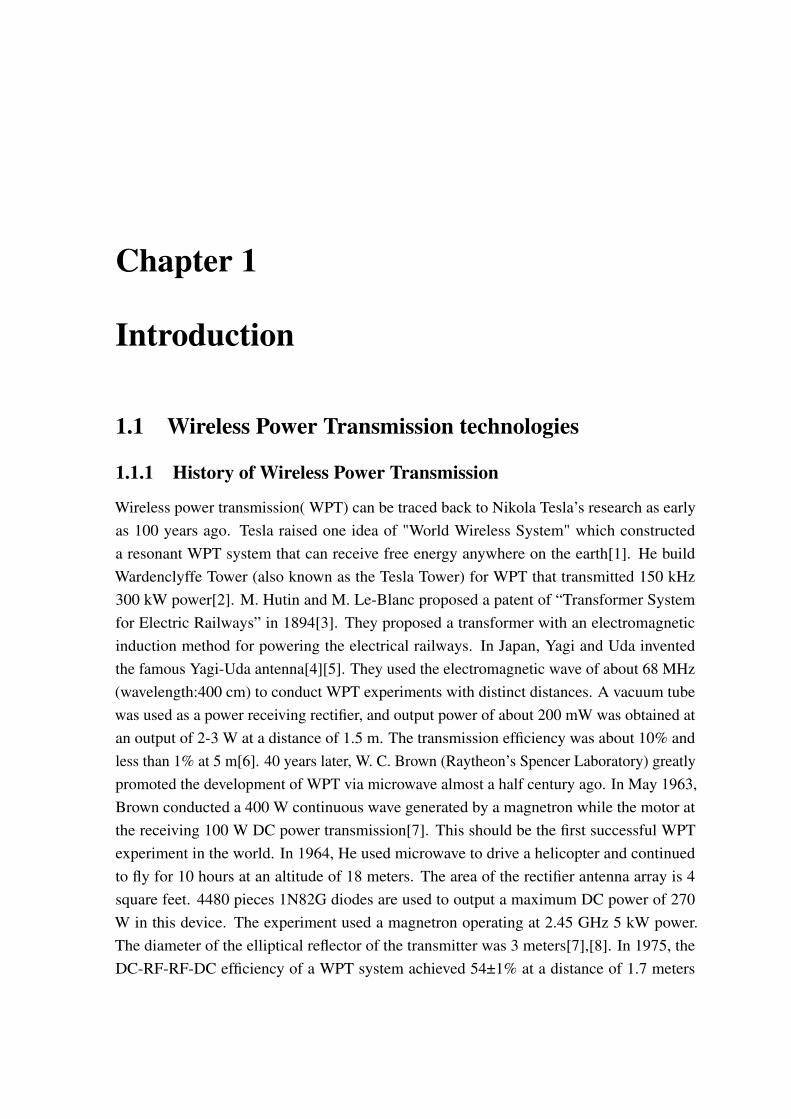
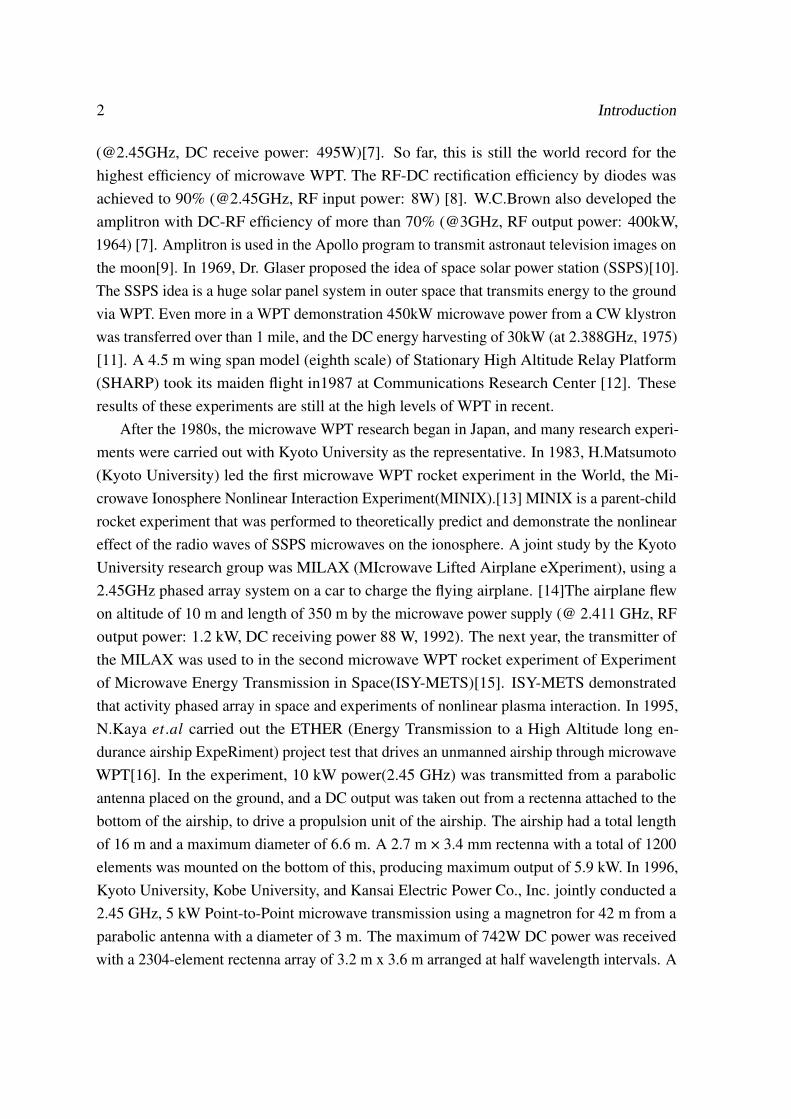
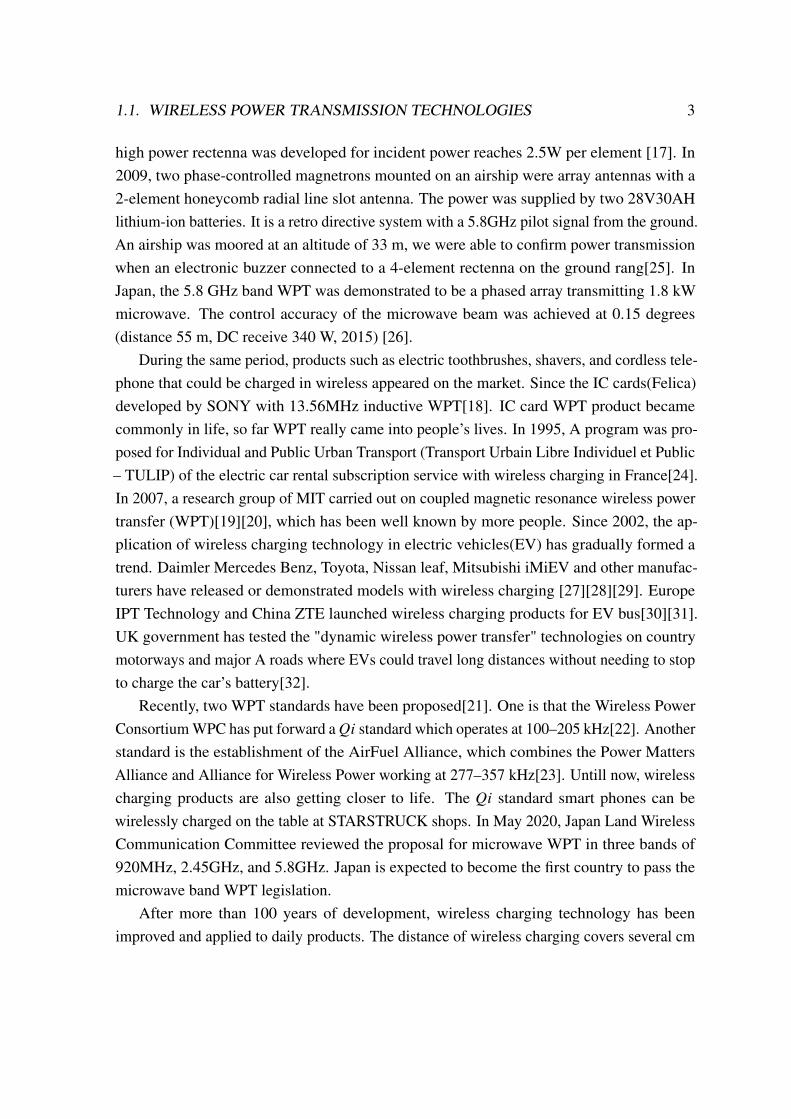
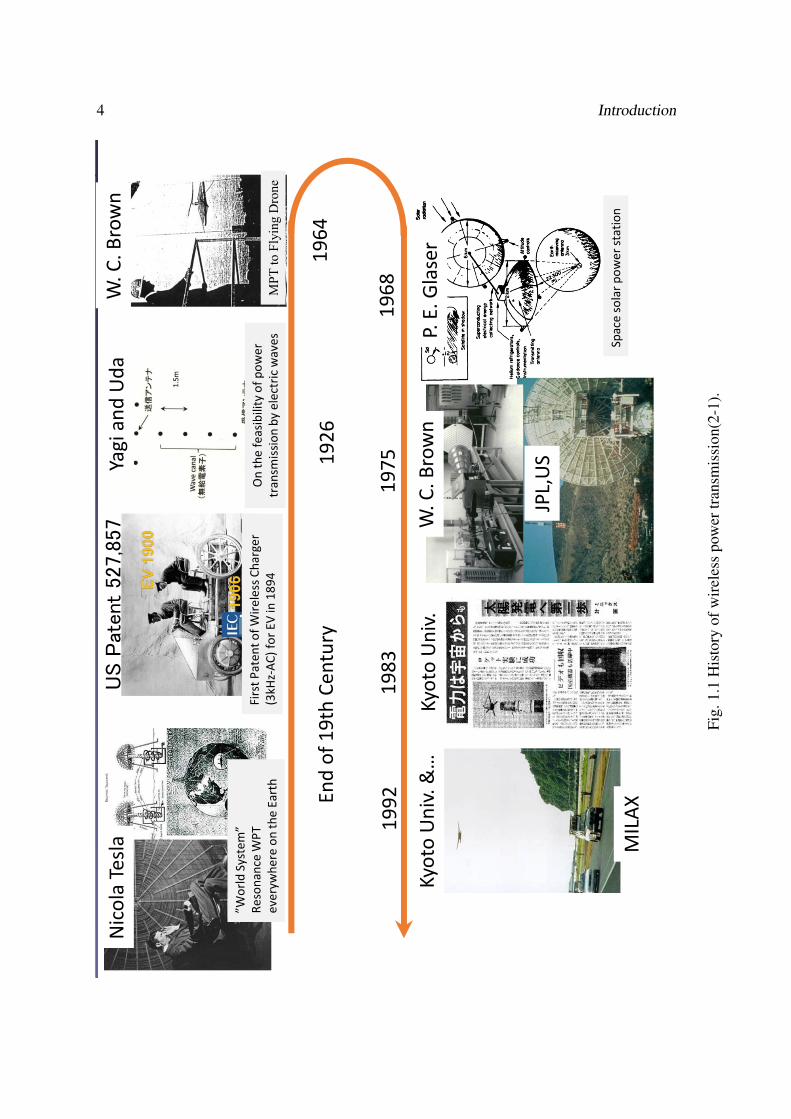
Wireless power transmission( WPT) can be traced back to Nikola Tesla’s research as earlyas 100 years ago. Tesla raised one idea of "World Wireless System" which constructeda resonant WPT system that can receive free energy anywhere on the earth[1]. He buildWardenclyffe Tower (also known as the Tesla Tower) for WPT that transmitted 150 kHz300 kW power[2]. M. Hutin and M. Le-Blanc proposed a patent of “Transformer Systemfor Electric Railways” in 1894[3]. They proposed a transformer with an electromagneticinduction method for powering the electrical railways. In Japan, Yagi and Uda inventedthe famous Yagi-Uda antenna[4][5]. They used the electromagnetic wave of about 68 MHz(wavelength:400 cm) to conduct WPT experiments with distinct distances. A vacuum tubewas used as a power receiving rectifier, and output power of about 200 mW was obtained atan output of 2-3 W at a distance of 1.5 m. The transmission efficiency was about 10% andless than 1% at 5 m[6]. 40 years later, W. C. Brown (Raytheon’s Spencer Laboratory) greatlypromoted the development of WPT via microwave almost a half century ago. In May 1963,Brown conducted a 400 W continuous wave generated by a magnetron while the motor atthe receiving 100 W DC power transmission[7]. This should be the first successful WPTexperiment in the world. In 1964, He used microwave to drive a helicopter and continuedto fly for 10 hours at an altitude of 18 meters. The area of the rectifier antenna array is 4square feet. 4480 pieces 1N82G diodes are used to output a maximum DC power of 270W in this device. The experiment used a magnetron operating at 2.45 GHz 5 kW power.The diameter of the elliptical reflector of the transmitter was 3 meters[7],[8]. In 1975, theDC-RF-RF-DC efficiency of a WPT system achieved 54±1% at a distance of 1.7 meters
2 Introduction
(@2.45GHz, DC receive power: 495W)[7]. So far, this is still the world record for thehighest efficiency of microwave WPT. The RF-DC rectification efficiency by diodes wasachieved to 90% (@2.45GHz, RF input power: 8W) [8]. W.C.Brown also developed theamplitron with DC-RF efficiency of more than 70% (@3GHz, RF output power: 400kW,1964) [7]. Amplitron is used in the Apollo program to transmit astronaut television images onthe moon[9]. In 1969, Dr. Glaser proposed the idea of space solar power station (SSPS)[10].The SSPS idea is a huge solar panel system in outer space that transmits energy to the groundvia WPT. Even more in a WPT demonstration 450kW microwave power from a CW klystronwas transferred over than 1 mile, and the DC energy harvesting of 30kW (at 2.388GHz, 1975)[11]. A 4.5 m wing span model (eighth scale) of Stationary High Altitude Relay Platform(SHARP) took its maiden flight in1987 at Communications Research Center [12]. Theseresults of these experiments are still at the high levels of WPT in recent.
After the 1980s, the microwave WPT research began in Japan, and many research experi-ments were carried out with Kyoto University as the representative. In 1983, H.Matsumoto(Kyoto University) led the first microwave WPT rocket experiment in the World, the Mi-crowave Ionosphere Nonlinear Interaction Experiment(MINIX).[13] MINIX is a parent-childrocket experiment that was performed to theoretically predict and demonstrate the nonlineareffect of the radio waves of SSPS microwaves on the ionosphere. A joint study by the KyotoUniversity research group was MILAX (MIcrowave Lifted Airplane eXperiment), using a2.45GHz phased array system on a car to charge the flying airplane. [14]The airplane flewon altitude of 10 m and length of 350 m by the microwave power supply (@ 2.411 GHz, RFoutput power: 1.2 kW, DC receiving power 88 W, 1992). The next year, the transmitter ofthe MILAX was used to in the second microwave WPT rocket experiment of Experimentof Microwave Energy Transmission in Space(ISY-METS)[15]. ISY-METS demonstratedthat activity phased array in space and experiments of nonlinear plasma interaction. In 1995,N.Kaya 𝑒𝑡.𝑎𝑙 carried out the ETHER (Energy Transmission to a High Altitude long en-durance airship ExpeRiment) project test that drives an unmanned airship through microwaveWPT[16]. In the experiment, 10 kW power(2.45 GHz) was transmitted from a parabolicantenna placed on the ground, and a DC output was taken out from a rectenna attached to thebottom of the airship, to drive a propulsion unit of the airship. The airship had a total lengthof 16 m and a maximum diameter of 6.6 m. A 2.7 m × 3.4 mm rectenna with a total of 1200elements was mounted on the bottom of this, producing maximum output of 5.9 kW. In 1996,Kyoto University, Kobe University, and Kansai Electric Power Co., Inc. jointly conducted a2.45 GHz, 5 kW Point-to-Point microwave transmission using a magnetron for 42 m from aparabolic antenna with a diameter of 3 m. The maximum of 742W DC power was receivedwith a 2304-element rectenna array of 3.2 m x 3.6 m arranged at half wavelength intervals. A
1.1. WIRELESS POWER TRANSMISSION TECHNOLOGIES 3
high power rectenna was developed for incident power reaches 2.5W per element [17]. In2009, two phase-controlled magnetrons mounted on an airship were array antennas with a2-element honeycomb radial line slot antenna. The power was supplied by two 28V30AHlithium-ion batteries. It is a retro directive system with a 5.8GHz pilot signal from the ground.An airship was moored at an altitude of 33 m, we were able to confirm power transmissionwhen an electronic buzzer connected to a 4-element rectenna on the ground rang[25]. InJapan, the 5.8 GHz band WPT was demonstrated to be a phased array transmitting 1.8 kWmicrowave. The control accuracy of the microwave beam was achieved at 0.15 degrees(distance 55 m, DC receive 340 W, 2015) [26].
During the same period, products such as electric toothbrushes, shavers, and cordless tele-phone that could be charged in wireless appeared on the market. Since the IC cards(Felica)developed by SONY with 13.56MHz inductive WPT[18]. IC card WPT product becamecommonly in life, so far WPT really came into people’s lives. In 1995, A program was pro-posed for Individual and Public Urban Transport (Transport Urbain Libre Individuel et Public– TULIP) of the electric car rental subscription service with wireless charging in France[24].In 2007, a research group of MIT carried out on coupled magnetic resonance wireless powertransfer (WPT)[19][20], which has been well known by more people. Since 2002, the ap-plication of wireless charging technology in electric vehicles(EV) has gradually formed atrend. Daimler Mercedes Benz, Toyota, Nissan leaf, Mitsubishi iMiEV and other manufac-turers have released or demonstrated models with wireless charging [27][28][29]. EuropeIPT Technology and China ZTE launched wireless charging products for EV bus[30][31].UK government has tested the "dynamic wireless power transfer" technologies on countrymotorways and major A roads where EVs could travel long distances without needing to stopto charge the car’s battery[32].
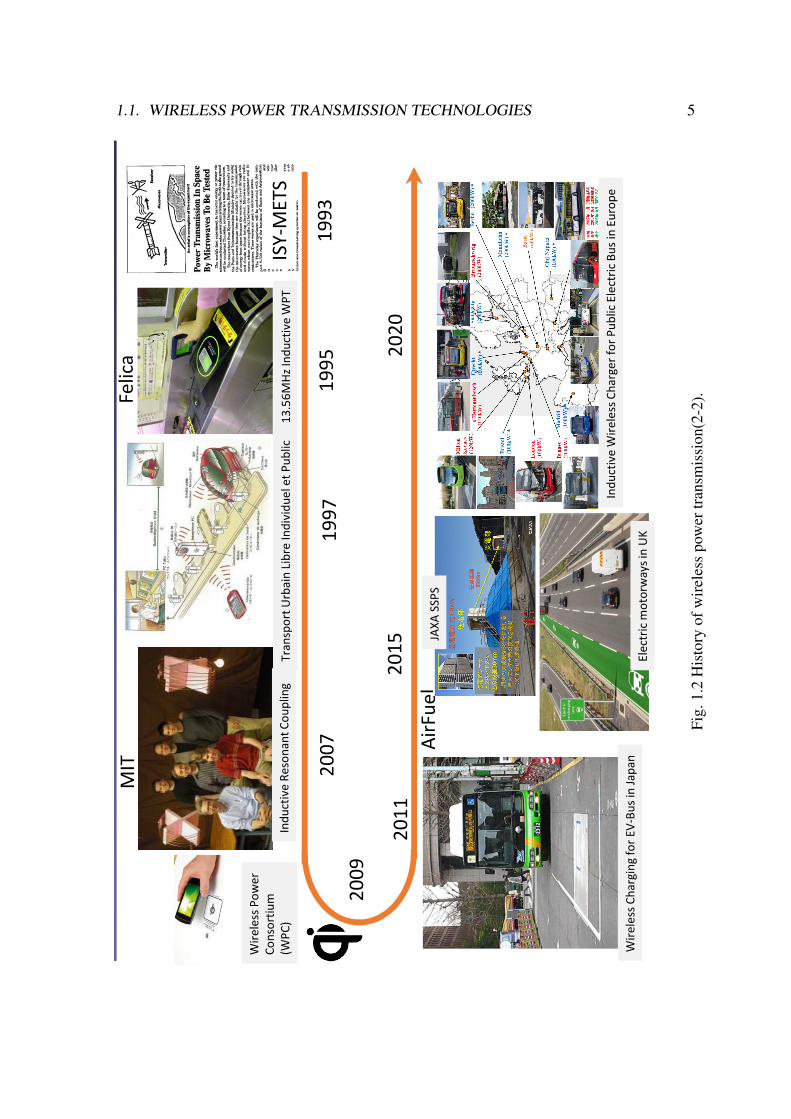
Recently, two WPT standards have been proposed[21]. One is that the Wireless PowerConsortium WPC has put forward a𝑄𝑖 standard which operates at 100–205 kHz[22]. Anotherstandard is the establishment of the AirFuel Alliance, which combines the Power MattersAlliance and Alliance for Wireless Power working at 277–357 kHz[23]. Untill now, wirelesscharging products are also getting closer to life. The 𝑄𝑖 standard smart phones can bewirelessly charged on the table at STARSTRUCK shops. In May 2020, Japan Land WirelessCommunication Committee reviewed the proposal for microwave WPT in three bands of920MHz, 2.45GHz, and 5.8GHz. Japan is expected to become the first country to pass themicrowave band WPT legislation.
After more than 100 years of development, wireless charging technology has beenimproved and applied to daily products. The distance of wireless charging covers several cm
4 Introduction
His
tory
of th
e W
PT
En
d o
f 1
9th
Ce
ntu
ry1
96
41
92
6
19
68
19
92
19
83
© R
ISH
, K
yo
to U
niv
.
Nic
ola
Te
sla
”Wo
rld
Sy
ste
m”
Re
son
an
ce W
PT
ev
ery
wh
ere
on
th
e E
art
h
US P
atent
527,8
57
Fir
st P
ate
nt
of
Wir
ele
ss C
ha
rge
r
(3k
Hz-
AC
) fo
r E
V in
18
94
On
th
e f
ea
sib
ilit
y o
f p
ow
er
tra
nsm
issi
on
by
ele
ctri
c w
av
es
Yag
i a
nd
Ud
a
MP
T t
o F
lyin
g D
ron
e
W.
C.
Bro
wn
Sp
ace
so
lar
po
we
r st
ati
on
P. E
. G
lase
r
19
75
W.
C.
Bro
wn
JPL,
US
Kyo
to U
niv
.
MIL
AX
Kyo
to U
niv
. &
…
Fig.
1.1
His
tory
ofw
irel
ess
pow
ertr
ansm
issi
on(2
-1).
1.1. WIRELESS POWER TRANSMISSION TECHNOLOGIES 5
His
tory
of th
e W
PT
19
93
© R
ISH
, K
yo
to U
niv
.
19
95
Fe
lica
ISY
-ME
TS
13
.56
MH
z In
du
ctiv
e W
PT
Tra
nsp
ort
Urb
ain
Lib
re I
nd
ivid
ue
l e
t P
ub
lic
19
97
MIT
Ind
uct
ive
Re
son
an
t C
ou
pli
ng
20
07
Wir
ele
ss P
ow
er
Co
nso
rtiu
m
(WP
C)
20
09
Air
Fu
el
20
15
Wir
ele
ss C
ha
rgin
g f
or
EV
-Bu
s in
Ja
pa
n
20
11
Ele
ctri
c m
oto
rwa
ys
in U
K
JAX
A S
SP
S
20
20
Ind
uct
ive
Wir
ele
ss C
ha
rge
r fo
r P
ub
lic
Ele
ctri
c B
us
in E
uro
pe
Fig.
1.2
His
tory
ofw
irel
ess
pow
ertr
ansm
issi
on(2
-2).
6 Introduction
to several kilometers, and the charging power ranges from several mW to several hundredkW. For some important events in the history of wireless charging as shown in Fig. 1.1 andFig. 1.2.
1.1.2 Applications of Wireless Power Transmission
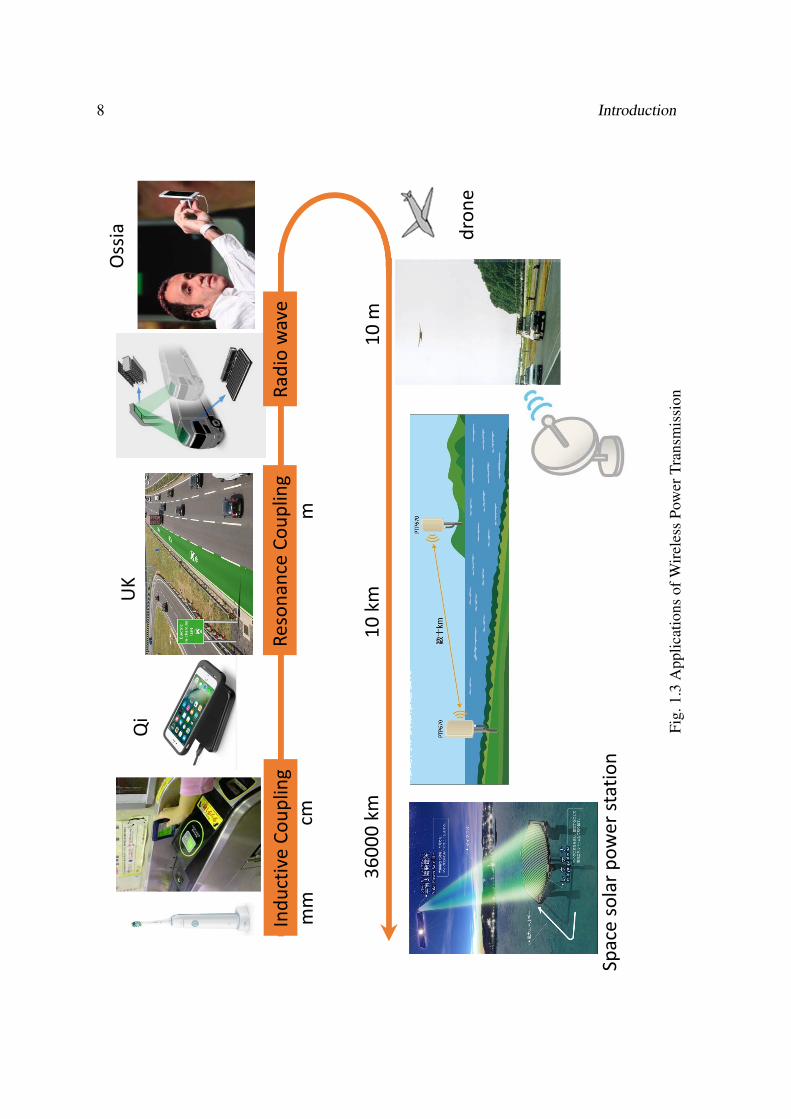
WPT technology, especially the application of wireless charging, can greatly facilitate dailylife. The wireless charging technology does not need to require connection joints with a lowwear rate. As shown in Fig. 1.3, the current application of WPT mainly includes wirelesscharging electric toothbrush, cordless phone, IC card, mobile phone charging, EV charging,drone charging, and island power transmission and SSPS.
Low frequency electromagnetic induction technology is used in electric toothbrushes,shavers, and cordless telephone, and their principles are similar to that of transformers.Specifically, the charging base for wireless charging is the primary coil of the transformer,and the receiving coils on the toothbrush and the telephone are the secondary coils of thetransformer. When the alternating current is connected to the primary coil, the secondary coilproduces an induced voltage. After rectification, the battery can be charged. The efficiencycan be as high as about 80% to 95%, without high frequency radiation, has passed the safetycertification of various countries, and the price is relatively low.
IC card, The RF reader sends a set of fixed frequency (13.56 MHz) electromagneticwaves to the IC card. There is a LC series circuit in the card, whose resonance frequency isthe same as the frequency emitted by the card reader. Therefore, so that under the excitationof electromagnetic waves, the LC resonance circuit resonates, which makes the capacitorgenerate electric charge; at the other end of the capacitor, a unidirectional electronic pumpis connected to transfer the electric charge in the capacitor to another capacitor for storage.When the accumulated charge reaches a certain voltage, the capacitor can be used as a powersupply to provide working voltage for other circuits, and transmit the data in the card orreceive the data from the card reader.
Mobile phone wireless charging technology is becoming mature. There is strong electro-magnetic field energy in wireless charging area. Adding some coils here produces a voltage.The induced voltage can be converted into the energy received by the mobile phone battery.However, mostly mobile phone wireless charging only carry out one-to-one short-distancecharging (𝑄𝑖 standard, within 1 cm, within 5 W[22]). Some research have developed onMultiple Input Multiple Output (MIMO) WPT[33][34]. In October 2017, the iPhone 8 wasreleased to support wireless charging Qi standard functions. Wireless charging technologyhas attracted more people’s attention again. We can look forward to wireless charging to beas convenient as connecting mobile phones to Wi-Fi in the future.
1.1. WIRELESS POWER TRANSMISSION TECHNOLOGIES 7
Internationally, automobile manufacturers such as Audi, BMW, Mercedes-Benz, Volvo,Toyota, Nissan leaf, Mitsubishi and other makers including IPT Technology, ZTE, DAI-HEN, etc. have all started to study the wireless charging technology of electric vehicles[27][28][29][30][31][35]. There are two main forms of wireless charging for cars, one isfixed-point charging when the car is parked and the other is charging while the car is drivingon the charging roads in UK[32]. Charging while driving technology can greatly improvethe driving distance of electric vehicles, making it not inferior to or even more than gasolinevehicles. On the other hand, the construction of charging roads requires a large amount offunds for road reconstruction. Fixed-point charging technology is developed by most manu-facturers. However, due to the lack of a unified industry standard, it is currently impossibleto charge products across manufacturers, which is the bottleneck of current development.
The longer WPT application is island power transmission. In France, there is a planto transmit 10kw of electricity from the summit to a mountain village on Reunion Island.When WPT 2001 was held on this island, it launched 800 W 2.45 GHz microwave as ademonstration, and obtained 65 W output 40 m away[36]. There is a research similar to theisland power transmission application, where wind power plants at sea use microwaves todeliver electricity to shore[37].
Since 1968, Peter E. Glaser proposed the SPSS concept[10], SSPS became the longestapplication of WPT. The United States, Japan, EU, and China have proposed relatedSSPS programs. The more representative programs are the DOE/NASA satellite powersystem[38], SPS2000[39], Tethered-SPS[40], JAXA model[41], SSPS USEF model[42],SPS-ALPHA[43], Multi-Rotary Joints SPS[44]. These programs proposed that solar panelsin the space environment use sunlight to generate electrical energy, and then supply it to theground through microwaves. In space, the amount of sunlight is not affected by the weather,and consequently it is stable throughout the day, the night, and the year. It is said that theamount of power generation as a comprehensive value will be about ten times that on theground. SSPS usually chooses geostationary orbit (at an altitude of 36,000 km). It faces theground receiving equipment in the power supply area for 24 hours, and at this altitude, thepower generation satellite is located outside the earth’s shadow. From space to ground, thereis a so-called "radio wave window" (frequency band from 1 GHz to 10 GHz, in which theradio wave attenuation is relatively small), and in the microwave system, the frequency of2.45 GHz to 5.8 GHz can be selected in the ISM band .The SSPS also faces another problem,how to send tens of thousands of tons of SSPS to the space orbit at low cost.
8 Introduction
WP
T s
yste
m a
pplic
ations
mm
cmm
10
m3
60
00
km
10
km
Sp
ace
so
lar
po
we
r st
ati
on
Qi
UK
Oss
ia dro
ne
Ind
uct
ive
Co
up
lin
gR
eso
na
nce
Co
up
lin
gR
ad
io w
ave
Fig.
1.3
App
licat
ions
ofW
irel
ess
Pow
erTr
ansm
issi
on
1.1. WIRELESS POWER TRANSMISSION TECHNOLOGIES 9
1.1.3 Theory of Wireless Power Transmission
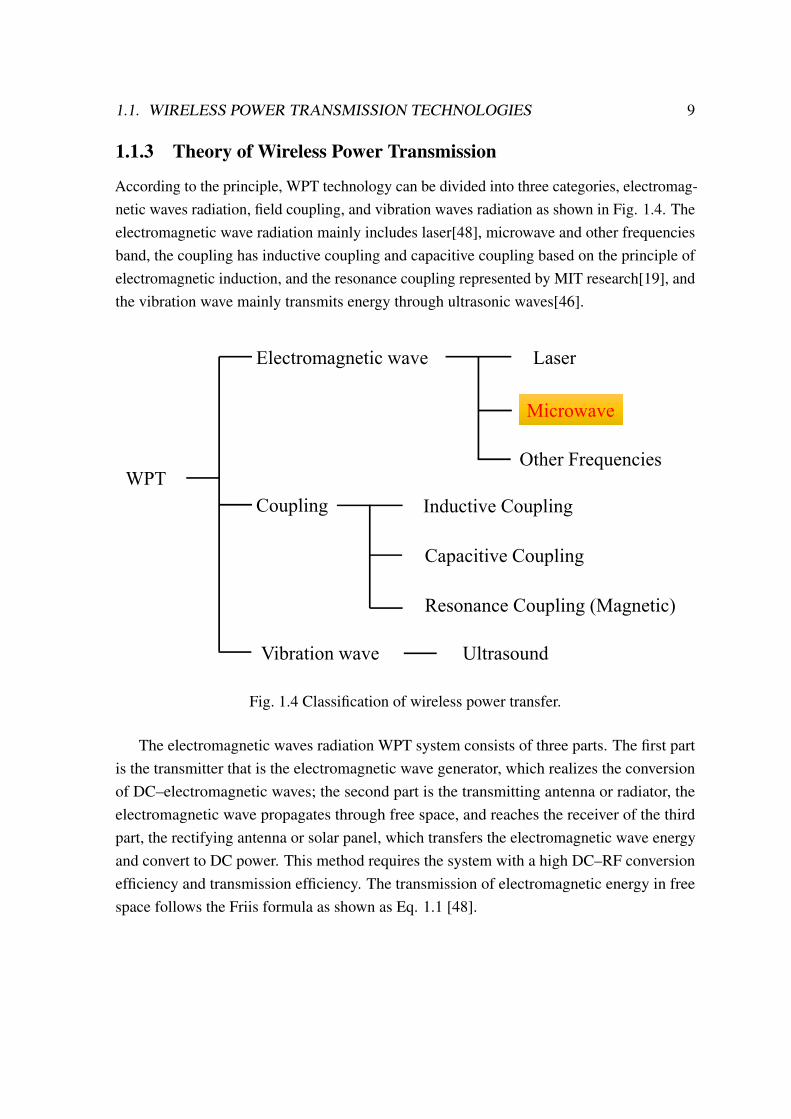
According to the principle, WPT technology can be divided into three categories, electromag-netic waves radiation, field coupling, and vibration waves radiation as shown in Fig. 1.4. Theelectromagnetic wave radiation mainly includes laser[48], microwave and other frequenciesband, the coupling has inductive coupling and capacitive coupling based on the principle ofelectromagnetic induction, and the resonance coupling represented by MIT research[19], andthe vibration wave mainly transmits energy through ultrasonic waves[46].
WPT
Laser
UltrasoundVibration wave
Electromagnetic wave
MicrowaveMicrowave
Coupling Inductive Coupling
Resonance Coupling (Magnetic)
Capacitive Coupling
Other Frequencies
Fig. 1.4 Classification of wireless power transfer.
The electromagnetic waves radiation WPT system consists of three parts. The first partis the transmitter that is the electromagnetic wave generator, which realizes the conversionof DC–electromagnetic waves; the second part is the transmitting antenna or radiator, theelectromagnetic wave propagates through free space, and reaches the receiver of the thirdpart, the rectifying antenna or solar panel, which transfers the electromagnetic wave energyand convert to DC power. This method requires the system with a high DC–RF conversionefficiency and transmission efficiency. The transmission of electromagnetic energy in freespace follows the Friis formula as shown as Eq. 1.1 [48].
10 Introduction
𝑃𝑟 =
(_
4𝜋𝐷
)2𝑃𝑡𝐺 𝑡𝐺𝑟 (1.1)
Here, 𝑃𝑡 , 𝑃𝑟 , 𝐺 𝑡 and 𝐺𝑟 are the transmitter power, receiver power, antenna gain of thetransmitter and receiver, respectively. 𝐷 is the transmission distance. _ is the wavelength. Eq.1.1 shows that a high transmission efficiency requires a high-gain receiving antenna and atransmitting antenna. The electromagnetic waves radiation WPT is suitable for long-distancepower transmission and is not limited by the transmission medium. The representative studyis that W. C. Brown developed WPT system achieved 54±1% DC-RF-RF-DC efficiency at1.7 meters distance (@2.45 GHz, DC receive power: 495 W, Receiver antenna diameter:nearly 1.5 m)[7].
The inductive coupling and capacitive coupling WPT system based on the principle oftransformer utilizes the method of electromagnetic induction. It separates the transformer’stightly coupled magnetic circuit of the system, and the primary and secondary windingsare wound on different structures to realize the energy transfer between the power supplyand the load unit without physical connection. The primary side and the secondary siderealize power transmission through electromagnetic induction. The primary side of thetransformer is input by the AC power rectified and filtered into DC power, and then invertedby a high-frequency inverter to provide high-frequency AC power. An AC voltage is inducedon the secondary side. The AC power is rectified into DC power. The DC–RF conversionefficiency can worked in high efficiency. The higher the transmission efficiency requires thehigh frequency and amplitude, the short primary and secondary distances. The theory ofinductive coupling and capacitive coupling WPT system limited the transmission distance.The inductive coupling technology is the most mature and widely used, and there are manycommercial products. For example, Daihen’s products for EV charging system achieved92% AC-DC-85 kHz AC-85 kHz AC-DC efficiency at transmission distance of 0.25 m (DCreceive power: 10 kW, Coil diameter: 0.75 m)[35].
The resonance coupling represented a 2 m transmission distance with 40% 9.9 MHz RF-9.9 MHz RF efficiency (RF receive power: 60 W, Coil diameter: 0.5 m) by MIT research[19].The principle is the same as the resonance principle of sound. The primary coil and thesecondary coil arranged in a magnetic field can supply power from one to another. Theresonance coupling is a special mode of electromagnetic induction coupling. The differencebetween them is the quality factor of the circuit. Resonant devices (inductors and capacitors)are used to make the transmitter and receiver reach a resonance frequency, thereby generating
1.1. WIRELESS POWER TRANSMISSION TECHNOLOGIES 11
magnetic resonance and energy transfer. The advantage of resonance coupling is longertransmission distance than inductive coupling and capacitive coupling.
At present, there is still relatively little research on the use of ultrasonic WPT. Thetransmission of sound waves (vibration waves) radiation is similar to electromagnetic wavesradiation. The system replaces the antenna of the electromagnetic wave radiation systemwith an acoustic wave transducer. Ignoring the absorption loss in the transmission medium,the transmission efficiency also follows the Friis formula. In addition to the transmissionloss, the power loss in the medium cannot be ignored. Compared with electromagneticwaves radiation, the advantage of using sound waves WPT technology that its transmissionspeed is much lower than the transmission speed of electromagnetic waves. Therefore, inthe case of the same wavelength, the frequency used by the sound wave WPT will be lower,and according a smaller energy loss. Sound waves WPT is very suitable for mediums withrelatively large attenuation of electromagnetic waves, such as in water, or environmentswithout electromagnetic interference, but not in vacuum. Among the sound waves, thecharacteristics of ultrasonic waves are particularly obvious. When the ultrasonic wavespropagate in the medium, the ultrasonic waves have a relatively high frequency. So they willdrive the particles in the medium to have a higher vibration frequency, which will producegreater power than ordinary sound waves. In addition, ultrasound also has good directivity,which can focus the sound waves well at the receiving point.
0%
20%
40%
60%
80%
100%
0.1 1 10 100 1000 10000
Efficiency
Distance(m)
[34]
[18]
[6]
[7]
[11][14]
[16] [25]
Coupling WPT
Microwave WPT
Fig. 1.5 WPT Research achieved efficiency with distance.
12 Introduction
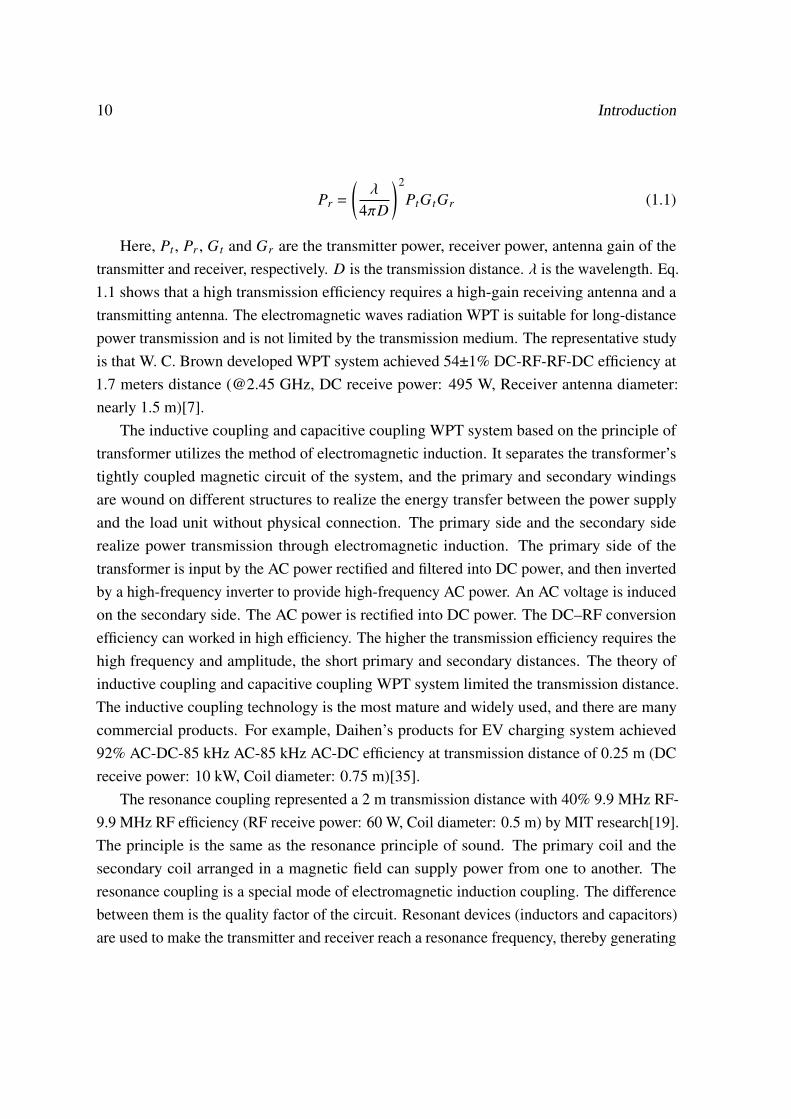
The above three technologies differ greatly in performance indicators. They differ inoutput power, transmission distance, efficiency, frequency and other aspects. Due to the fewresearch cases of laser and ultrasound, Fig. 1.5 only summarizes the research of couplingWPT and microwave WPT that the achieved efficiency levels with distance. The researchof microwave energy transmission type is the earliest, the transmission power as well asthe efficiency are low, but the transmission distance is relatively long. If the antennas forman array, the transmission distance and transmission power can reach a considerable scale.It has a unique advantage in transmission distance. Microwave beam forming technologycan be used to transfer power to the moving target. Therefore, its mainly research areas arein SPS, drones charging, and islands power transmission. Coupling charging technologyis widely used in large-scale transportation, mechanical equipment and portable electronicequipment power transmission and charging. The transmission efficiency drops sharplywith the increase of distance. At present, it is mainly the power transmission at close range.Resonance coupling technology basically meets the requirements of portable electronicdevices and household appliances, and can be used as a good solution in commercialapplications. Ultrasonic energy transmission research is in its infancy, and it is expected thatthis technology will be used for power transmission in special occasions such as underwater.The purpose of this study is to build a high-power long-distance power transmission system,the microwave WPT technology is most suitable.
1.2 High Power Microwave Wireless Power TransmissionSystems
Since the research of W.C.Brown, many verification experiments have been carried out in thefield of microwave WPT. Table 1.1 lists a relatively complete system with relatively high-power WPT experimental parameters, and compares the relevant experimental parameters.
In the Table 1.1, the highest microwave transmission efficiency is recorded by W.C.Brownsystem in 1975[7]. The DC–RF conversion efficiency of the magnetron used at the transmitterwas 69%, and the output was connected to a horn antenna with a length of more than 2meters. There was a receiving rectenna array 1.6 meters directly in front of the horn antenna,and the collection efficiency reached 95%. Rectenna arrays are juxtaposed according to thesame energy density distribution to improve the synthesis efficiency. The overall efficiency ofRF–DC reaches 82%. The efficiency of each item had reached the limit that can be reached atthat time. This is a milestone study in the history of WPT. Nearly 25 years later, another highefficiency microwave WPT was developed by Dr. Kwan-Ho Kim of Korea Electro technology
1.2. HIGH POWER MICROWAVE WIRELESS POWER TRANSMISSION SYSTEMS13
Research Institute (KERI) group from 1997 to 2000. The measured total DC–RF–RF–DCefficiency was 44% and the calculated total efficiency 50.6% with 50 m transmission distance.The calculated DC–RF conversion efficiency, RF–RF collection efficiency, and RF–DCrectification efficiency were 84.3%, 77.4% and 79.2% [47], respectively.
In 1975, the microwave WPT demonstration conducted at the JPL gold stone factorycreated another record[11]. A 450 kW transmitter at 2,388 MHz from a parabolic antennawith a diameter of 26 m was used for power transmission. The transmission distance was 1.54km, and a 7.3 m × 3.5 m rectenna array was used for power reception, and it was receivedmore than 30 kW DC power. So far, it is the WPT experiment with the highest transmitpower and received power and the longest transmission distance.
SHARP [12], MILAX[14], Semi-Autonomous BEam Rider (SABER)[49], and ETHER[16] systems are powered by the ground to airborne targets (airplanes, airship). SABER flewa model helicopter with a microwave-driven rotor with a diameter of 1.15 m. A 2.45 GHzmagnetron boosted to 1 kW was connected to a slot waveguide antenna and connected to arectenna array hanging under the helicopter. This rectenna array was used in an experiment.It supplied 180 W to a helicopter motor with a transmission distance of 3 m. MILAX isthe earliest use of semiconductor FET(GaAs) as the microwave amplifier in the list. Theconstructed phased array combined with CCD camera to track and transmit power to theairplane in flight. Although auxiliary cars are needed, this should be the first time to use aphased array with beam forming WPT experiment.
After the MILAX experiment, Point-to-Point MPT[17], Reunion Island[36] all usedmagnetrons for the experiment. Among them, Point-to-Point MPT also carried out up to 5months of endurance experiments and rainy power transmission experiments, which providedvaluable data for the practicality of WPT technology.
20 years later of the MILAX experiment, with the development of semiconductor technol-ogy, the semiconductor HEMT (GaN) is used in H. Ma 𝑒𝑡.𝑎𝑙 experiment [50] and the groundtest practical application demonstration of JAXA 𝑒𝑡.𝑎𝑙 [26]. The H. Ma 𝑒𝑡.𝑎𝑙 experimentconstructed the parabolic antenna with a diameter of 2.4 m as the transmitter antenna and2.4 m × 2.4 m patch antenna array as the receiving antenna. The beam collection efficiencyis 49% at a distance of 11 m, and the overall DC-RF-RF-DC efficiency is 16.9%. Here, theDC-RF conversion efficiency of the GaN transmitter is 59.3% when the output is 87.68 W.Although related research shows that the GaN amplifier delivered a maximum power-addedefficiency of 79% at 5.65 GHz @33.3 dBm [51]. But in tens of W power level microwaveamplifiers, it worked in high efficiency level. The phased arrays in JAXA’s demonstrationdemonstrated the high-precision beam control technology, which can direct high-power

14 Introduction
Tabl
e1.
1M
ICR
OW
AVE
WIR
EL
ESS
POW
ER
TR
AN
SMIS
SIO
NSY
STE
MS
Res
earc
hTr
ansm
itter
devi
ceTr
ansm
itter
RF
Pow
er(W
)R
ecei
ving
DC
Pow
er(W
)D
ista
nce
(m)
Effi
cien
cyR
F-R
F-D
CFr
eque
ncy
(GH
z)E
xper
imen
tTi
me
W.C
.Bro
wn
[7]
Mag
netr
on(6
9%)
635
495
1.7
78%
2.45
1975
R.M
.Dic
kins
on[1
1]K
lyst
ron
4500
0030
000
1540
6.67
%2.
388
1975
SHA
RP[
12]
Mag
netr
on10
0015
015
01.
50%
2.45
1987
MIL
AX
[14]
GaA
sFE
T12
5088
107.
04%
2.41
119
92Po
int-
to-P
oint
MPT
[17]
Mag
netr
on50
0074
242
14.8
4%2.
4519
95SA
BE
R[4
9]M
agne
tron
1000
180
318
%2.
4519
95E
TH
ER
[16]
Mag
netr
ons
1000
030
0035
30%
2.45
1995
K.H
Kim
Mag
netr
on(8
4.3%
)19
0010
2050
53.6
8%2.
4520
00R
euni
onIs
land
[36]
Mag
netr
on80
065
408.
12%
2.45
2001
JAX
Aet
.al[
26]
GaN
1800
340
5530
.60%
5.8
2015
H.M
aet
.al[
50]
GaN
(59.
3%)
>50
-11
28.6
4%2.
4520
15W
irel
ess
TV
(CH
6.2)
Mag
netr
on32
950
3.5
15.2
0%2.
4520
17M
agne
tron
Phas
edar
ray(
CH
3.4)
Mag
netr
ons(
60.7
%)
1204
142
511
.79%
5.8
2019
Mag
netr
on(C
H6.
4)M
agne
tron
(60.
46%
)72
410
95.
615
.12%
5.8
2020
1.3. HIGH POWER MICROWAVE TRANSMITTER 15
microwave beams to the receiving antenna with high precision and high efficiency. Provide avery feasible solution for the realization of the future SSPS system.
In the Table 1.1, there are the systems of this thesis (Chapter 3.4 and Chapter 6.4) areused 5.8 GHz band magnetrons. The Wireless TV experiment (Chapter 6.2) is a uniquesystem which transfer the power and information. Details of these experiments are describedlater.
1.3 High Power Microwave Transmitter
V. L. Granatstein 𝑒𝑡.𝑎𝑙 [52] and S. Oliver[53] have summarized the power-frequency perfor-mance of semiconductor devices and vacuum devices. The combined graph is shown in Fig.1.5. Fig. 1.5 shows that semiconductor devices are used in low-frequency and low-powerfields, and vacuum tube devices are used in high-frequency and high-power fields. Withthe development of semiconductor technology, semiconductor devices continue to achievehigher power and higher frequency. However, one single device is basically a vacuum tubeproduct in the field above 1 kW and the field above 100 GHz. In this section, it is introducedthat several devices suitable for high-power systems in microwave WPT. It mainly composedof Gallium Nitride High Electron Mobility Transistor (GaN HEMT), Klystron, TravelingWave Tube(TWT), Gyrotron, Magnetron and crossed-field amplifier (CFA).
1.3.1 GaN HEMT
Gallium nitride (GaN) is a semiconductor material with a wide direct band gap and canbe used in high-power, high-speed optoelectronic components. For example, GaN can beused in violet laser diodes. The earliest used in light-emitting diodes (LED). Y. AkasakiYu, H. Amano and S. Nakamura won the 2014 Nobel Prize in Physics for inventing blueLEDs[54]. GaN has the characteristics of high power, high voltage, high frequency andlow loss, which have exceeded the limits of Si power devices widely used today. The effectof making microwave power devices by GaN (in power density) is often far superior to allexisting semiconductor materials. It is highly expected to be used as next-generation powerdevices.
H. Ma et.al experiment [50] and JAXA’s demonstration [26] using GaN HEMT to buildthe microwave amplifier in the transmitter. GaN HEMT has the advantages of semiconductordevices and very low noise. JAXA’s demonstration demonstrated the high-precision beamcontrol performance. For microwave WPT transmitters, GaN HEMT works as a switchingdevice for amplifiers. In the class F amplifier circuit with a theoretical efficiency of 100%,

16 Introduction
Solid-State Devices
Vacuum
Devices
Magnetron
Max:1GWMax:150MW
Fig. 1.6 RF vacuum devices (black line) [52] in 1999 and solid-state devices (color area) [53]in 2014 state of technology for single device performance.
the highest 79% PAE of the amplifier is currently achieved [51]. However, to achieve high-power microwave output requires multi-stage amplification, which inevitably leads to lowerefficiency. A single amplifier circuit to construct a single array unit to complete the phasedarray should be the most efficient way. However, when the power of a single array element issmall, the size of the array becomes very huge. It requires GaN HMET to conduct furtherresearch on high efficiency and high power. GaN HEMT is processed using a semiconductorNano/Micro processing technology. From the cost calculated per unit power, both GaNHEMT individuals and GaN amplifiers are very expensive. This is a low noise, low efficiencyand expensive solution for WPT.
1.3.2 Klystrons
Klystron is a type of microwave tube that uses periodic modulation of electron injectionvelocity to achieve oscillation or amplification. Klystron also named velocity modulatedtube since its theory. It first modulates the velocity of the electron beam in the input cavity,converts it to density modulation after drifting. Then the clustered electron blocks exchangeenergy with the microwave field of the output cavity gap, and the electrons give the kineticenergy to the microwave field to complete oscillation or amplification. There are mainly
1.3. HIGH POWER MICROWAVE TRANSMITTER 17
two types of rectilinear type and reflective type klystron. The rectilinear type klystron has astructure in which a plurality of cavity resonators are connected in series. Microwaves aregenerated by repeating velocity modulation and density modulation between the plurality ofresonators. The power of a single tube can reach tens of kW in continuous wave, and thepulse wave can reach reach 150 MW level[55]. The DC-RF conversion efficiency from isaround 60–70%. The surplus kinetic energy of the electron beam is converted into heat bythe collector. Some papers show the expected efficiency range can reach 90% [56][57]. It ismainly used as an amplifier in the field of TV broadcasting and accelerator in the early UHFband. The reflective klystron is used as an oscillator and has low power (usually less than1W). A cavity resonator is used alone, and one resonator is used as an input and an output ofa high frequency electric field at the same time to cause electrons to retrograde at a reflectingelectrode to generate a microwave by resonance.
1.3.3 TWT
TWT utilizes the interaction that occurs between the electric field on the axis and the electronwhen the velocity of the electron flow emitted from the electron gun in vacuum is almostequal to the velocity of the radio wave on the delay circuit traveling in the same direction.Then, the microwave is amplified. The electron flow is finally collected by the collector.There are also compound devices that combine klystron and traveling wave tube technology,named twystrons[55]. Compared with klystron, TWT has unmatched bandwidth which iswidely used in satellite communications. The MPM (Microwave Power Module) is a singlemodule that integrates the high-frequency amplifier and power supply system. It is a new typeof microwave amplification device that combines a super mini TWT, which plays the role ofmicrowave amplification. TWT has a wide bandwidth, high gain, high power, high frequencycharacteristics. Thus, MPM is expected as a potential device in the field of communications.
1.3.4 Gyrotrons
Gyrotron is a large electron tube characterized by oscillating high-power microwaves with ashort wavelength using the motion of electrons that rotate at high speed along a magneticfield as an energy source. While entering the high frequency oscillator (cavity resonator), therotational power of the electron beam becomes high frequency. The rotation frequency 𝜔𝑐is shown in the Eq. 1.2. 𝑒, 𝑚 and 𝐵 are electron charge, mass, and magnetic flux density,respectively.
𝜔𝑐 =
( 𝑒𝑚
)𝐵 (1.2)

18 Introduction
Gyrotron as a large output oscillator is possible. The oscillation frequency band is 20 to250 GHz, and the output is usually 1 to 2 MW. A research had obtained an output of pulsewidth of 70ns and peak power of about 1 GW under an electron beam of 3.3 MV and 80kA[57]. Gyrotron mainly used for plasma heating in nuclear fusion, but also used for ionengines etc.
1.3.5 Magnetrons & CFA
The magnetron is the oldest microwave tube in use today and can be widely used as anunparalleled high-power oscillator. It is especially applied to microwave ovens and radar.Even before the widespread use of microwave ovens, high-frequency dielectric heating hasbeen used in industrial fields such as drying and bonding wood. Similar to other vacuumtubes, semiconductor devices have been tried, but their high output, high efficiency, and lowcost are still beyond the reach of semiconductor devices.
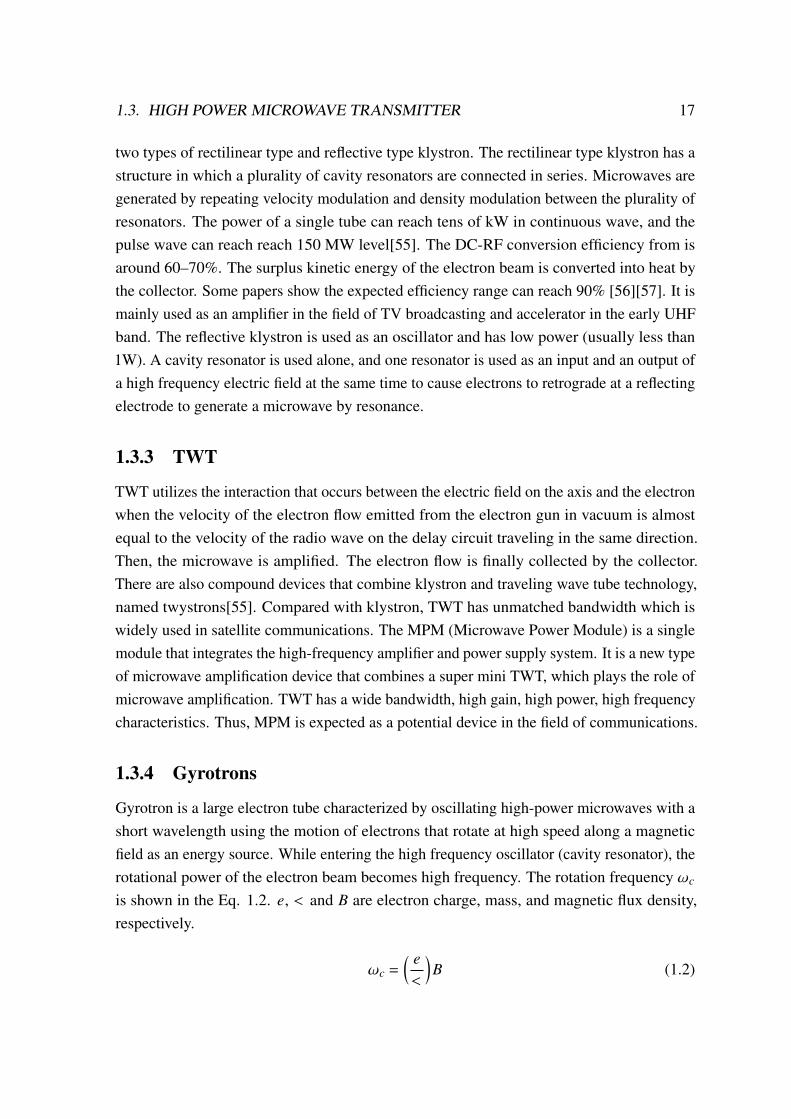
A magnetron is a special bipolar vacuum tube that applies a magnetic field from a magnet.Lorentz force acts on the electrons moving in the magnetic field, and the orbits of theelectrons are bent. As shown in Fig. 1.7, when the electrode structure of the bipolar vacuumtube is devised and a magnetic field is applied from the outside, the electrons emitted fromthe central cathode do not reach the outer anode, and circulate while rotating around thecathode. If the velocity 𝑣 of the electrons and the phase velocity of the electric field in theresonant cavity on the anode side are both equal to 𝐸/𝐵 as shown in Eq. 1.3, the electronswill be swarmed by the interaction of the electric fields. The electrons approach the cavityand the electric field gains energy and increases. Unlike other microwave vacuum tubes,the magnetron’s collector and anode are integrated, which is the cause of the magnetron’shigh efficiency. This vibration is resonated in the cavity provided on the anode side, and theenergy is taken out as a radio wave from the antenna.
𝑣 =𝐸
𝐵(1.3)
The disadvantage of magnetron is that the unstable oscillation frequency and the shortlife which is mainly decide by filament. W.C. Brown improved magnetron principles toinvent a new vacuum tube amplifier which he called an amplitron [60]. The electric andmagnetic fields in amplitron are perpendicular to each other (cross field) and hence the nameis cross field amplifier. Its working principle is basically the same as the magnetron, andmany characteristics are also very similar. The difference is that the CFA has an input port,which is an amplifier, and the magnetron is an oscillator. Due to the structural change of CFA,the unstable frequency is avoid. If the short-life filament is transformed into cold cathode,
1.3. HIGH POWER MICROWAVE TRANSMITTER 19
vacuum
Fig. 1.7 Principle diagram of Magnetron.
Table 1.2 HIGH POWER MICROWAVE DEVICE [58]
Devices Power level Frequency BandwidthEfficiency(Typical)
Lifetime Cost:W
GaN ∼100W Hz∼10GHz Normal 50% 800kh HighKlystrons 100W∼100MW MHz∼100GHz Normal 60% 30kh NormalTWT W∼100kW GHz∼100GHz Widely 50% 200kh HighGyrotron kW∼GW 10GHz∼THz Narrow 40% 50kh NormalCFA 10W∼10MW GHz∼10GHz Narrow 80% 40kh NormalMagnetron 10W∼MW 100MHz∼10GHz Narrow 70% 2kh Low
the life of CFA can reach more than 40,000 hours [61]. This should be the most suitabledevice for WPT, but it is difficult to buy related products.
Table 1.2 summarizes the parameters of these 6 kinds of microwave devices, which cancompare their advantages and disadvantages. The purpose of this research is to constructa high-power, long-distance, high-efficiency WPT system. There is no requirement forbandwidth in WPT research. Considering the convenience of purchase, magnetron is the bestchoice. The service life of 2000 hours is very lower than other devices, but it is far enoughfor research.
20 Introduction
1.4 Outline of the Thesis
This thesis consists of 7 chapters. The first chapter describes the the history, applications,principles of WPT. Then, the high power wireless power transmission system and high powermicrowave device are introduced . Chapter 2 is a study of phase-controlled magnetron to solvethe magnetron noise problem. The original phase control method using the anode current ofthe 2.45 GHz magnetron is that the 5.8 GHz magnetron cannot be used. We analyzed that thephase difference between the injected signal and the magnetron does not depend on the I- 𝑓characteristic, designed a phase-locked loop circuit, and developed a magnetron phase controlmethod with high versatility. In Chapter 3, four units phase-controlled magnetrons whichdeveloped in Chapter 2 were used to build the magnetron phased array. The magnetronswere arranged in a 2×2 form. By constructing a microwave WPT system, the output phaseand power of the magnetron phased array can be adjusted, and the direction control (beamforming) function was verified. Chapter 4 discovers the modulation performance of themagnetron which is expected to realize high-speed communication. In the conventionaltechnology, the magnetron was researched for communication with low transmission speed,but as a result of this research, the transmission speed was improved and a communicationspeed of 10 Mb/s could be realized. In addition, demonstration experiments such as voice,video, and motor operation control signal were conducted through magnetron communication.Chapter 5 describes the low cost power supply for magnetron. We introduce a half-wavevoltage doubler rectifier circuit by improving the power supply of the microwave oven and aswitching power supply. With low cost power supply, it becomes possible to realize phaseshift control magnetron, high-speed communication, power combining of magnetron, etc.Chapter 6 introduces the completed WPT systems by this research. It describes the magnetronphased array that can communicate, wireless TV, magnetron WPT system. Then, how tobuild a high efficiency WPT system was discussed. Finally, in Chapter 7 described theconclusion of this thesis and future issues.
Chapter 2
Power-Variable Phase-ControlledMagnetron
2.1 Introduction
Magnetrons have been widely used as microwave heating applications typified as microwaveovens. The advantages of magnetrons include high efficiency, low cost, and high outputpower. However, the magnetrons as transmitters have a wide bandwidth, difficult phasecontrol, poorly stable output frequency, and high phase noise. If they are used for wirelesspower transmission (WPT) and other applications, the magnetrons require a method to obtainrigorously stable output power, frequency and phase.
An ordinary approach of a phase-controlled magnetron (PCM) with stable output fre-quency and phase is utilizing an injection locking method to make the oscillation frequencyof magnetron stable, and a phase locked loop (PLL) method to control the magnetron phase[62]-[64]. The 2.45 GHz PCM has been developed and been used for WPT and a com-munication transmitter. Our research group has developed the PCM as the transmissionapparatus of a WPT system for several years. In 2001, we had developed a kW-class highpower phased array system called SPORTS (Space POwer Radio Transmission System)[65].Further, we developed a 2.45 GHz phase and amplitude controlled magnetron (PACM) forWPT system[66]-[68]. Also, another group developed a multi-magnetron microwave sourceto build a near-field 2.45 GHz microwave power transmission system[69]. Also, the PCMcan be used for a communication transmitter, whose transmission data rate at 2 Mb/s hasbeen achieved[70].
In previous studies, the PCM was achieved by controlling the anode current to lockthe phase of magnetron[62][63][66][67]. This method requires that the anode current and
22 CHAPTER 2. POWER-VARIABLE PHASE-CONTROLLED MAGNETRON
the oscillation frequency of the magnetron have a linear relationship. However, a 5.8 GHzmagnetron has different frequency-current characteristics from a 2.45 GHz magnetron.Furthermore, the PACM requires adding a coil to the magnetron to control the magneticfield[66]. This affects the convenience of PCAM and limit the use of PACM to otherapplications. The previous 2.4 GHz PCM studies were based on turn-off of the filamentcurrent[63], [66]. It makes the magnetron spectrum quiet and pure[66]. However, turn-off ofthe filament current of 5.8 GHz magnetron will reduce the output power and the signal-noiseratio. Moreover, there were few studies established a phase locked method for a 5.8 GHzmagnetron.
This work aims to build a 5.8 GHz power-variable phase-controlled magnetron (PVPCM)system with stable output power, frequency, and phase. In this study, we combine theinjection locking method and the PLL method by controlling a phase shifter to lock the phaseof the 5.8 GHz magnetron. The anode current of the magnetron is used to control the outputpower.
2.2 Injection-Locking Magnetron
As described in Sect. 1, the ordinary approach of the PCM was utilizing the injection lockingmethod and the PLL method[62]-[64]. The injection locking method is injecting a referencesignal to the magnetron to lock the oscillation frequency. The reference signal frequencyis set close to the self-oscillation frequency of the magnetron. The lock frequency rangeis expressed as Equations (2.1) and (2.2) [71], where Δ 𝑓 is the lock frequency range, 𝑓 isthe reference signal frequency, 𝑃𝑖 is the reference signal power, 𝑃𝑜 is the magnetron outputpower, and 𝑄𝑒 is the external Q-factor of the magnetron. Then, the phase difference \between the reference signal and the magnetron can be expressed by using the frequencydifference Δ 𝑓 ′ between the self-oscillation frequency and the reference signal frequency, asfollows,
Δ 𝑓
𝑓=
2𝑄𝑒
√𝑃𝑖
𝑃𝑜(2.1)
\ = sin−1 Δ 𝑓′𝑄𝑒
𝑓
√𝑃𝑖𝑃𝑜
(2.2)
These equations show that in the lock frequency range, the frequency and phase of magnetronoutput are locked with the reference signal. Therefore, controlling the reference signalparameters achieves the frequency and phase synchronization of the magnetron output.
2.2. INJECTION-LOCKING MAGNETRON 23
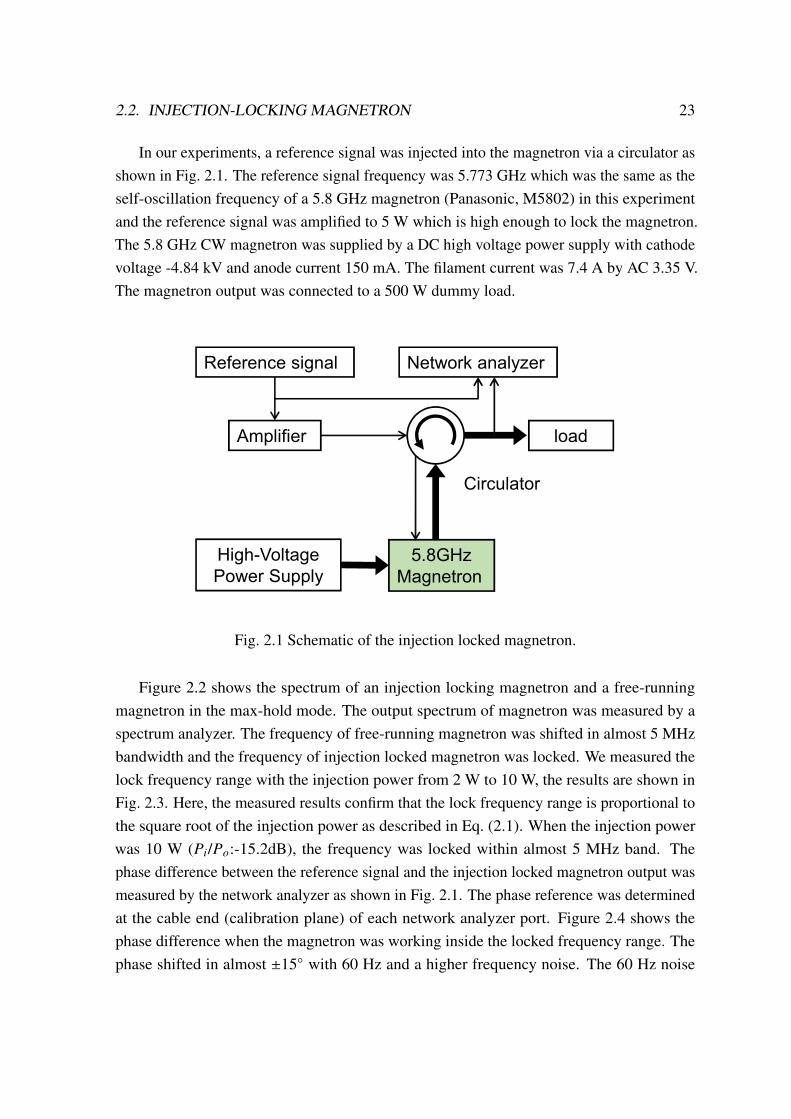
In our experiments, a reference signal was injected into the magnetron via a circulator asshown in Fig. 2.1. The reference signal frequency was 5.773 GHz which was the same as theself-oscillation frequency of a 5.8 GHz magnetron (Panasonic, M5802) in this experimentand the reference signal was amplified to 5 W which is high enough to lock the magnetron.The 5.8 GHz CW magnetron was supplied by a DC high voltage power supply with cathodevoltage -4.84 kV and anode current 150 mA. The filament current was 7.4 A by AC 3.35 V.The magnetron output was connected to a 500 W dummy load.
Reference signal
loadAmplifier
Circulator
5.8GHz
Magnetron
High-Voltage
Power Supply
Network analyzer
Fig. 2.1 Schematic of the injection locked magnetron.
Figure 2.2 shows the spectrum of an injection locking magnetron and a free-runningmagnetron in the max-hold mode. The output spectrum of magnetron was measured by aspectrum analyzer. The frequency of free-running magnetron was shifted in almost 5 MHzbandwidth and the frequency of injection locked magnetron was locked. We measured thelock frequency range with the injection power from 2 W to 10 W, the results are shown inFig. 2.3. Here, the measured results confirm that the lock frequency range is proportional tothe square root of the injection power as described in Eq. (2.1). When the injection powerwas 10 W (𝑃𝑖/𝑃𝑜:-15.2dB), the frequency was locked within almost 5 MHz band. Thephase difference between the reference signal and the injection locked magnetron output wasmeasured by the network analyzer as shown in Fig. 2.1. The phase reference was determinedat the cable end (calibration plane) of each network analyzer port. Figure 2.4 shows thephase difference when the magnetron was working inside the locked frequency range. Thephase shifted in almost ±15◦ with 60 Hz and a higher frequency noise. The 60 Hz noise
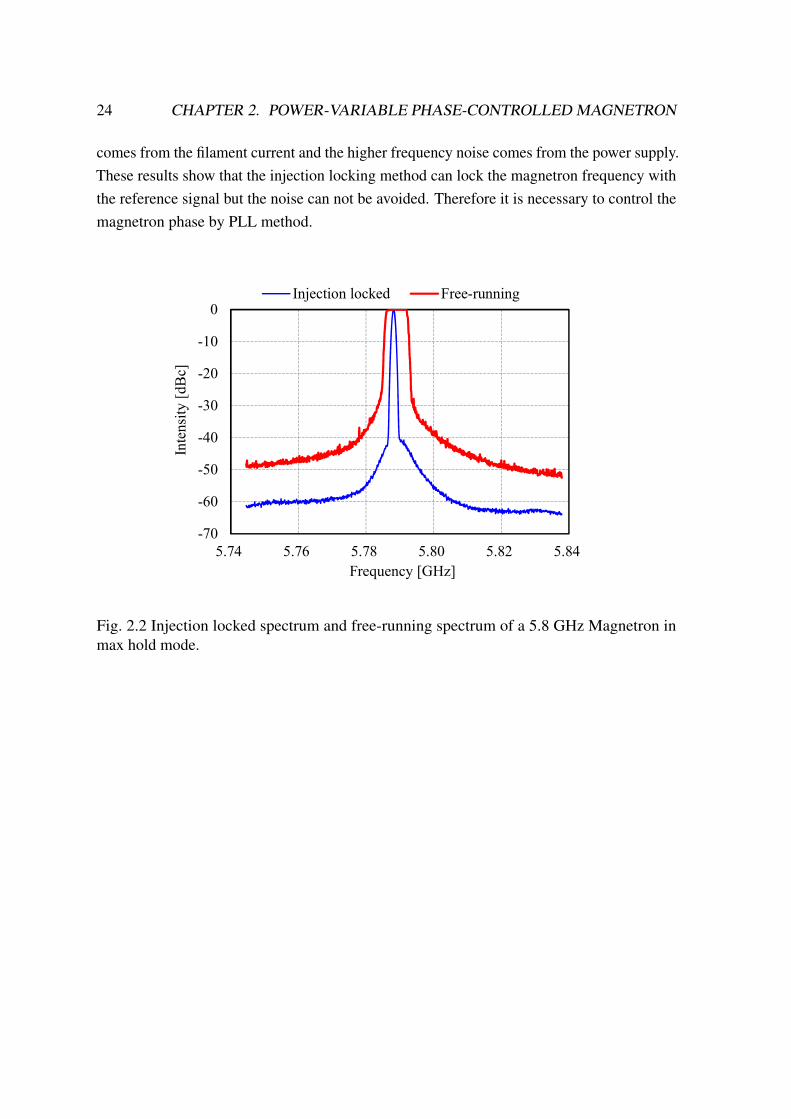
24 CHAPTER 2. POWER-VARIABLE PHASE-CONTROLLED MAGNETRON
comes from the filament current and the higher frequency noise comes from the power supply.These results show that the injection locking method can lock the magnetron frequency withthe reference signal but the noise can not be avoided. Therefore it is necessary to control themagnetron phase by PLL method.
-70
-60
-50
-40
-30
-20
-10
0
5.74 5.76 5.78 5.80 5.82 5.84
Inte
nsi
ty [
dB
c]
Frequency [GHz]
Injection locked Free-running
Fig. 2.2 Injection locked spectrum and free-running spectrum of a 5.8 GHz Magnetron inmax hold mode.
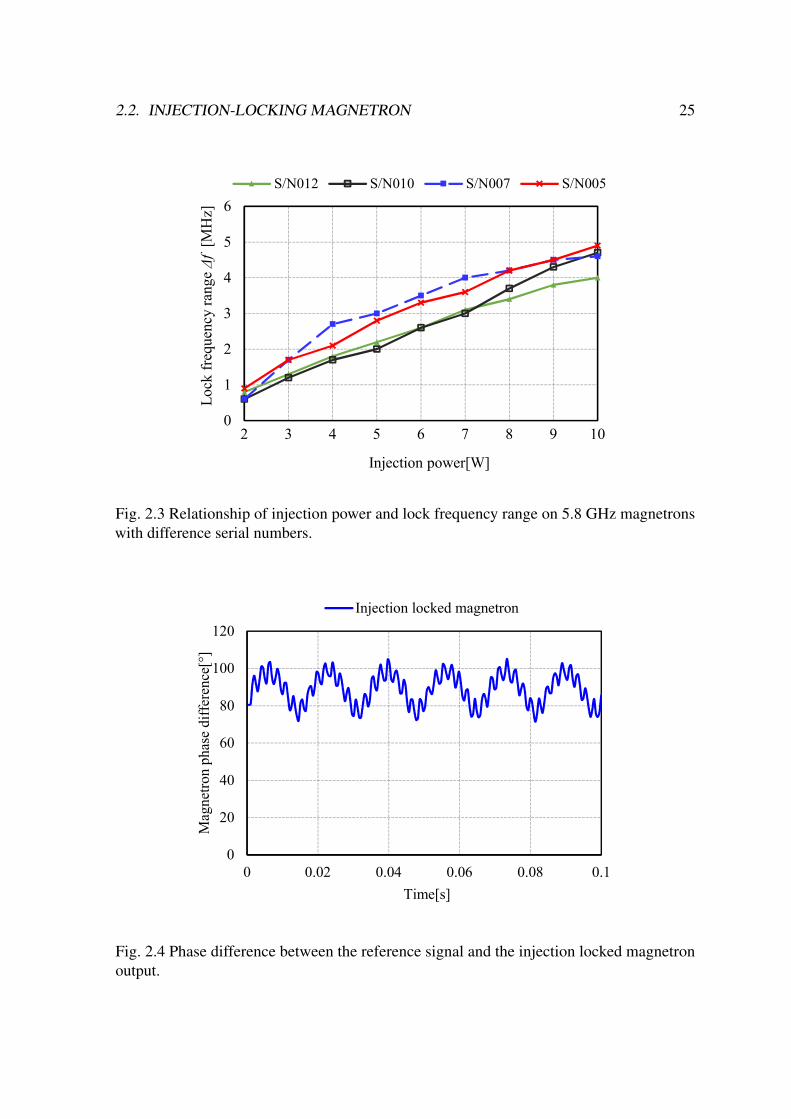
2.2. INJECTION-LOCKING MAGNETRON 25
0
1
2
3
4
5
6
2 3 4 5 6 7 8 9 10
Lo
ck f
req
uen
cy r
ang
e Δ
f [M
Hz]
Injection power[W]
S/N012 S/N010 S/N007 S/N005
Fig. 2.3 Relationship of injection power and lock frequency range on 5.8 GHz magnetronswith difference serial numbers.
0
20
40
60
80
100
120
0 0.02 0.04 0.06 0.08 0.1
Mag
net
ron p
has
e dif
fere
nce
[°]
Time[s]
Injection locked magnetron
Fig. 2.4 Phase difference between the reference signal and the injection locked magnetronoutput.
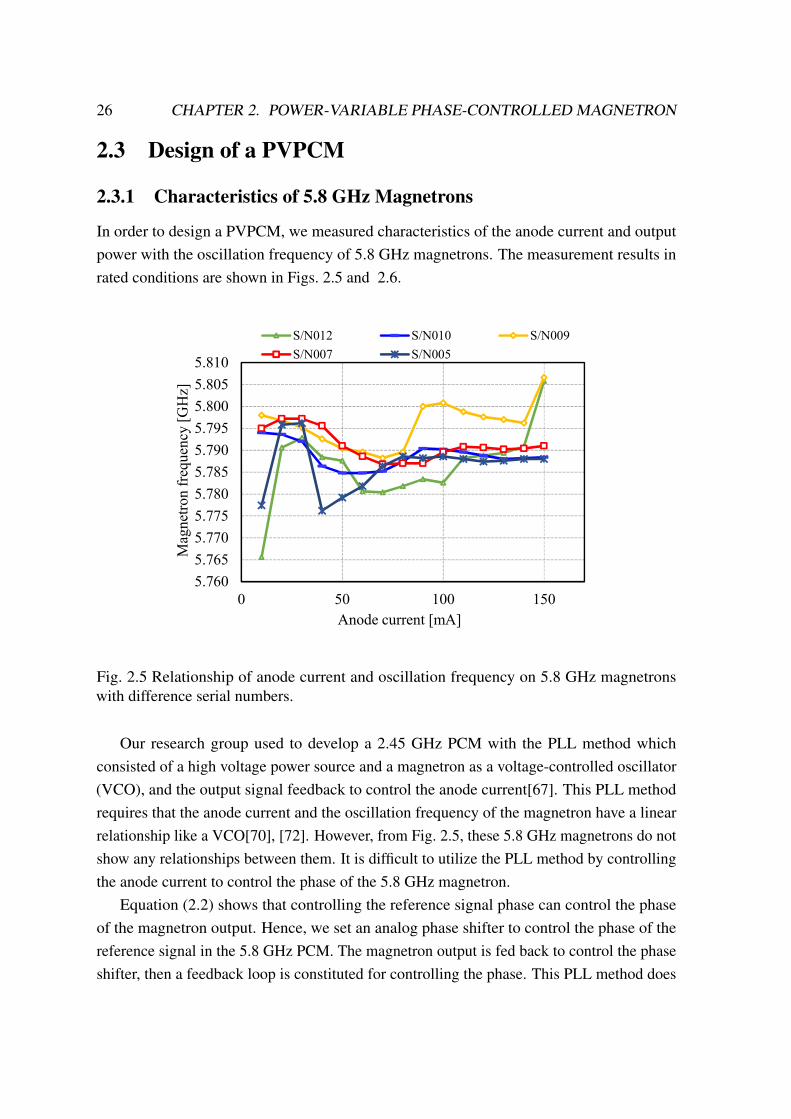
26 CHAPTER 2. POWER-VARIABLE PHASE-CONTROLLED MAGNETRON
2.3 Design of a PVPCM
2.3.1 Characteristics of 5.8 GHz Magnetrons
In order to design a PVPCM, we measured characteristics of the anode current and outputpower with the oscillation frequency of 5.8 GHz magnetrons. The measurement results inrated conditions are shown in Figs. 2.5 and 2.6.
5.760
5.765
5.770
5.775
5.780
5.785
5.790
5.795
5.800
5.805
5.810
0 50 100 150
Mag
net
ron
fre
qu
ency
[G
Hz]
Anode current [mA]
S/N012 S/N010 S/N009
S/N007 S/N005
Fig. 2.5 Relationship of anode current and oscillation frequency on 5.8 GHz magnetronswith difference serial numbers.
Our research group used to develop a 2.45 GHz PCM with the PLL method whichconsisted of a high voltage power source and a magnetron as a voltage-controlled oscillator(VCO), and the output signal feedback to control the anode current[67]. This PLL methodrequires that the anode current and the oscillation frequency of the magnetron have a linearrelationship like a VCO[70], [72]. However, from Fig. 2.5, these 5.8 GHz magnetrons do notshow any relationships between them. It is difficult to utilize the PLL method by controllingthe anode current to control the phase of the 5.8 GHz magnetron.
Equation (2.2) shows that controlling the reference signal phase can control the phaseof the magnetron output. Hence, we set an analog phase shifter to control the phase of thereference signal in the 5.8 GHz PCM. The magnetron output is fed back to control the phaseshifter, then a feedback loop is constituted for controlling the phase. This PLL method does
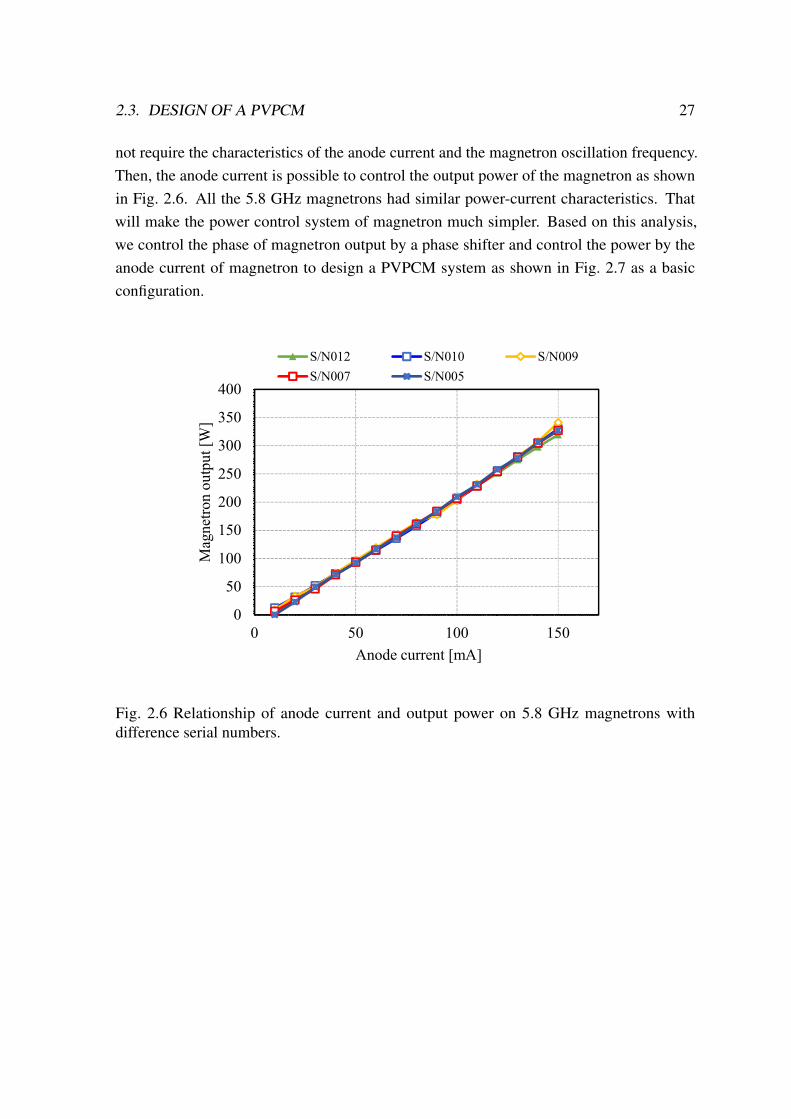
2.3. DESIGN OF A PVPCM 27
not require the characteristics of the anode current and the magnetron oscillation frequency.Then, the anode current is possible to control the output power of the magnetron as shownin Fig. 2.6. All the 5.8 GHz magnetrons had similar power-current characteristics. Thatwill make the power control system of magnetron much simpler. Based on this analysis,we control the phase of magnetron output by a phase shifter and control the power by theanode current of magnetron to design a PVPCM system as shown in Fig. 2.7 as a basicconfiguration.
0
50
100
150
200
250
300
350
400
0 50 100 150
Mag
net
ron o
utp
ut
[W]
Anode current [mA]
S/N012 S/N010 S/N009
S/N007 S/N005
Fig. 2.6 Relationship of anode current and output power on 5.8 GHz magnetrons withdifference serial numbers.
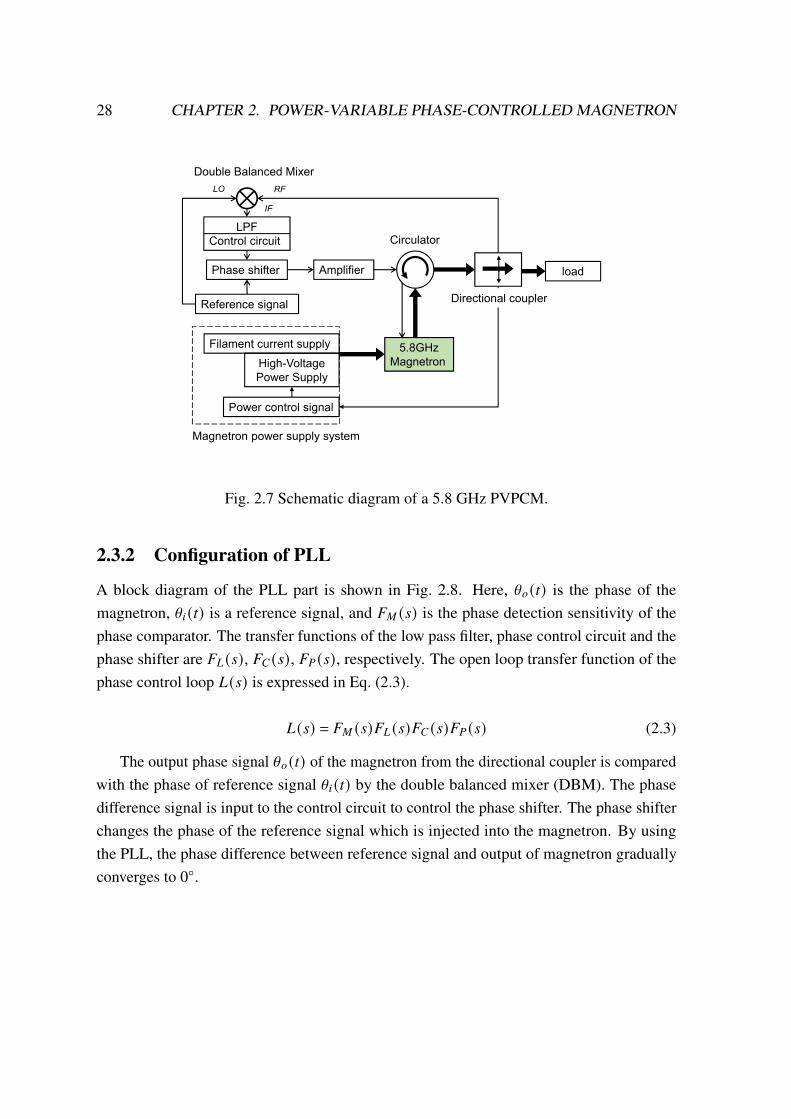
28 CHAPTER 2. POWER-VARIABLE PHASE-CONTROLLED MAGNETRON
Reference signal
Phase shifter loadAmplifier
Circulator
5.8GHz
Magnetron
Directional coupler
Double Balanced Mixer
LO RF
IF
LPF
Control circuit
Magnetron power supply system
High-Voltage
Power Supply
Power control signal
Filament current supply
Fig. 2.7 Schematic diagram of a 5.8 GHz PVPCM.
2.3.2 Configuration of PLL
A block diagram of the PLL part is shown in Fig. 2.8. Here, \𝑜 (𝑡) is the phase of themagnetron, \𝑖 (𝑡) is a reference signal, and 𝐹𝑀 (𝑠) is the phase detection sensitivity of thephase comparator. The transfer functions of the low pass filter, phase control circuit and thephase shifter are 𝐹𝐿 (𝑠), 𝐹𝐶 (𝑠), 𝐹𝑃 (𝑠), respectively. The open loop transfer function of thephase control loop 𝐿 (𝑠) is expressed in Eq. (2.3).
𝐿 (𝑠) = 𝐹𝑀 (𝑠)𝐹𝐿 (𝑠)𝐹𝐶 (𝑠)𝐹𝑃 (𝑠) (2.3)
The output phase signal \𝑜 (𝑡) of the magnetron from the directional coupler is comparedwith the phase of reference signal \𝑖 (𝑡) by the double balanced mixer (DBM). The phasedifference signal is input to the control circuit to control the phase shifter. The phase shifterchanges the phase of the reference signal which is injected into the magnetron. By usingthe PLL, the phase difference between reference signal and output of magnetron graduallyconverges to 0◦.
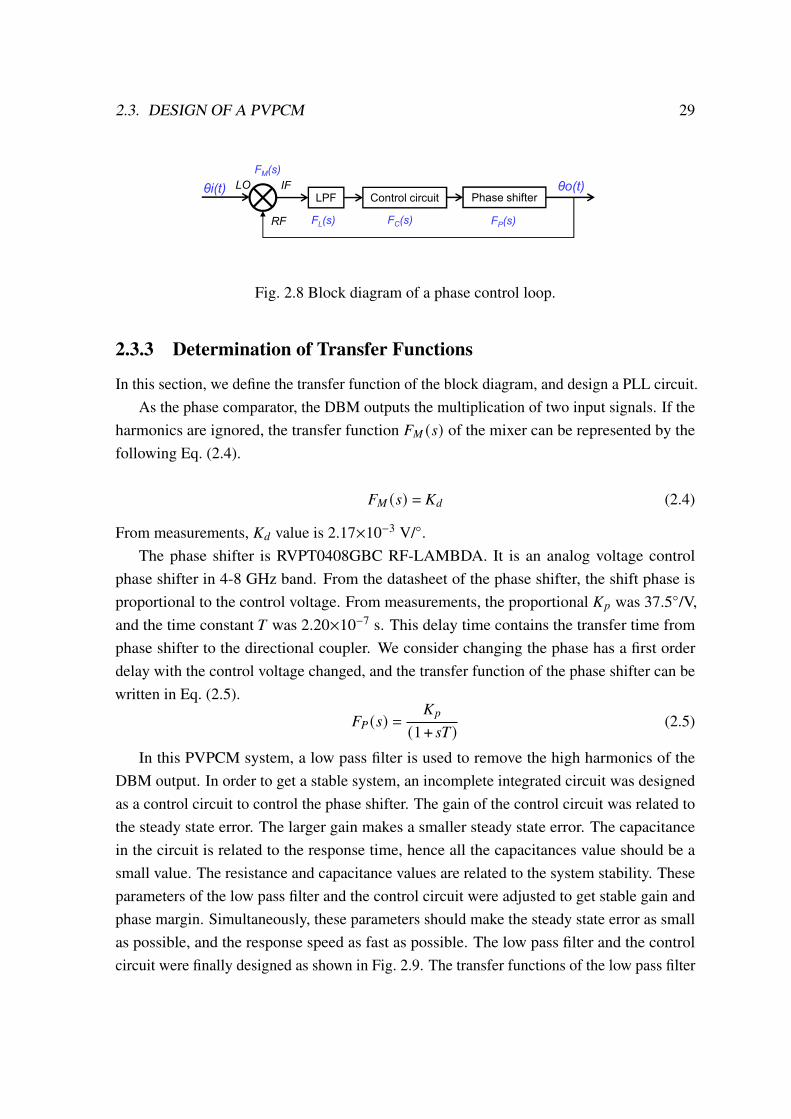
2.3. DESIGN OF A PVPCM 29
LO
RF
IFLPF Control circuit Phase shifter
θi(t) θo(t)
FL(s) FC(s) FP(s)
FM(s)
Fig. 2.8 Block diagram of a phase control loop.
2.3.3 Determination of Transfer Functions
In this section, we define the transfer function of the block diagram, and design a PLL circuit.As the phase comparator, the DBM outputs the multiplication of two input signals. If the
harmonics are ignored, the transfer function 𝐹𝑀 (𝑠) of the mixer can be represented by thefollowing Eq. (2.4).
𝐹𝑀 (𝑠) = 𝐾𝑑 (2.4)
From measurements, 𝐾𝑑 value is 2.17×10⁻³ V/◦.The phase shifter is RVPT0408GBC RF-LAMBDA. It is an analog voltage control
phase shifter in 4-8 GHz band. From the datasheet of the phase shifter, the shift phase isproportional to the control voltage. From measurements, the proportional 𝐾𝑝 was 37.5◦/V,and the time constant 𝑇 was 2.20×10⁻⁷ s. This delay time contains the transfer time fromphase shifter to the directional coupler. We consider changing the phase has a first orderdelay with the control voltage changed, and the transfer function of the phase shifter can bewritten in Eq. (2.5).
𝐹𝑃 (𝑠) =𝐾𝑝
(1+ 𝑠𝑇) (2.5)
In this PVPCM system, a low pass filter is used to remove the high harmonics of theDBM output. In order to get a stable system, an incomplete integrated circuit was designedas a control circuit to control the phase shifter. The gain of the control circuit was related tothe steady state error. The larger gain makes a smaller steady state error. The capacitancein the circuit is related to the response time, hence all the capacitances value should be asmall value. The resistance and capacitance values are related to the system stability. Theseparameters of the low pass filter and the control circuit were adjusted to get stable gain andphase margin. Simultaneously, these parameters should make the steady state error as smallas possible, and the response speed as fast as possible. The low pass filter and the controlcircuit were finally designed as shown in Fig. 2.9. The transfer functions of the low pass filter

30 CHAPTER 2. POWER-VARIABLE PHASE-CONTROLLED MAGNETRON
Vm
Vc
100KR4
820kR3
100pC1
3
21
NJM4558
3
21
NJM4558
47R1
330
R2
100p
C2
Vm
Vc
Fig. 2.9 Diagram of a low pass filter and a phase control circuit for a 5.8GHz PVPCM.
and the control circuit can be written as Eqs. (2.6) and (2.7), respectively. Here, the controlcircuit also can use the indefinite integration circuit which is without 𝑅3 in Fig. 2.9. Eq. (2.8)shows the transfer functions of the indefinite integration circuit that can work stable easily.
𝐹𝐿 (𝑠) =1
(1+ 𝑠𝑅1𝐶1)(2.6)
𝐹𝐶 (𝑠) = − 𝑅3/𝑅21+ 𝑠𝑅3𝐶2
(2.7)
𝐹𝐶 (𝑠) = − 1(1+ 𝑠𝑅2𝐶2)
(2.8)
The open loop transfer function of PLL 𝐿 (𝑠) is expressed as Eq. (2.9). The calculationformula of steady state error is written as Eq. (2.10). When the phase difference of \𝑜 and\𝑖 is set as the largest value 90◦ by a step response, the steady state error Y becomes 0.46◦.Bode diagrams of the open loop transfer function are shown in Fig. 2.10. From the bodediagrams, the gain margin 𝐺𝑚 was 38.6 dB and the phase margin 𝑃𝑚 was 63.7◦. This PLLcan be worked in a stable state.
𝐿 (𝑠) = −𝐾𝑝𝐾𝑑𝑅3
𝑅2(1+ 𝑠𝑇) (1+ 𝑠𝑅1𝐶1) (1+ 𝑠𝑅3𝐶2)(2.9)
Y = lim𝑡→∞
𝑒(𝑡) = lim𝑠→0
11+ 𝐿 (𝑠)
\𝑜 − \𝑖𝑠
𝑠 (2.10)

2.4. MEASUREMENT EXPERIMENTS 31
-300
-240
-180
-120
-60
0
1.E+00 1.E+02 1.E+04 1.E+06 1.E+08 1.E+10
Ph
ase
[deg
]
Frequency [Hz]
100 102 104 106 108 1010
P.M.: 63.7deg
f: 353kHz
-250
-200
-150
-100
-50
0
50
100
1.E+00 1.E+02 1.E+04 1.E+06 1.E+08 1.E+10
Gai
n [
dB
]
Frequency [Hz]
100 102 104 106 108 1010
G.M.: 38.6dB
f: 4.85MHz
Fig. 2.10 Bode diagrams of open-loop transfer function for a PLL.
2.4 Measurement Experiments
2.4.1 Outline of Experiments
Figure 2.11 shows an experimental schematic diagram of a 5.8 GHz PVPCM. A photo ofthe 5.8 GHz PVPCM is shown in Fig. 2.12. The 5.773 GHz reference signal was generatedfrom a signal generator, then went through a phase shifter and a 40 dB power amplifier. Thenthe reference signal was injected to the magnetron via a circulator. The magnetron outputpower was consumed by the dummy load. Also, a part of the reference signal was input tothe 𝐿𝑂 port of the DBM. The phase difference signal 𝑉𝑚 was measured by an oscilloscope,to observe the phase-locked state. When the phase is locked, the phase difference signal 𝑉𝑚value will be 0. The phase difference between the magnetron output from 𝐷𝑖𝑣𝑖𝑑𝑒𝑟1 and thereference signal from 𝐷𝑖𝑣𝑖𝑑𝑒𝑟2 was measured in a network analyzer.
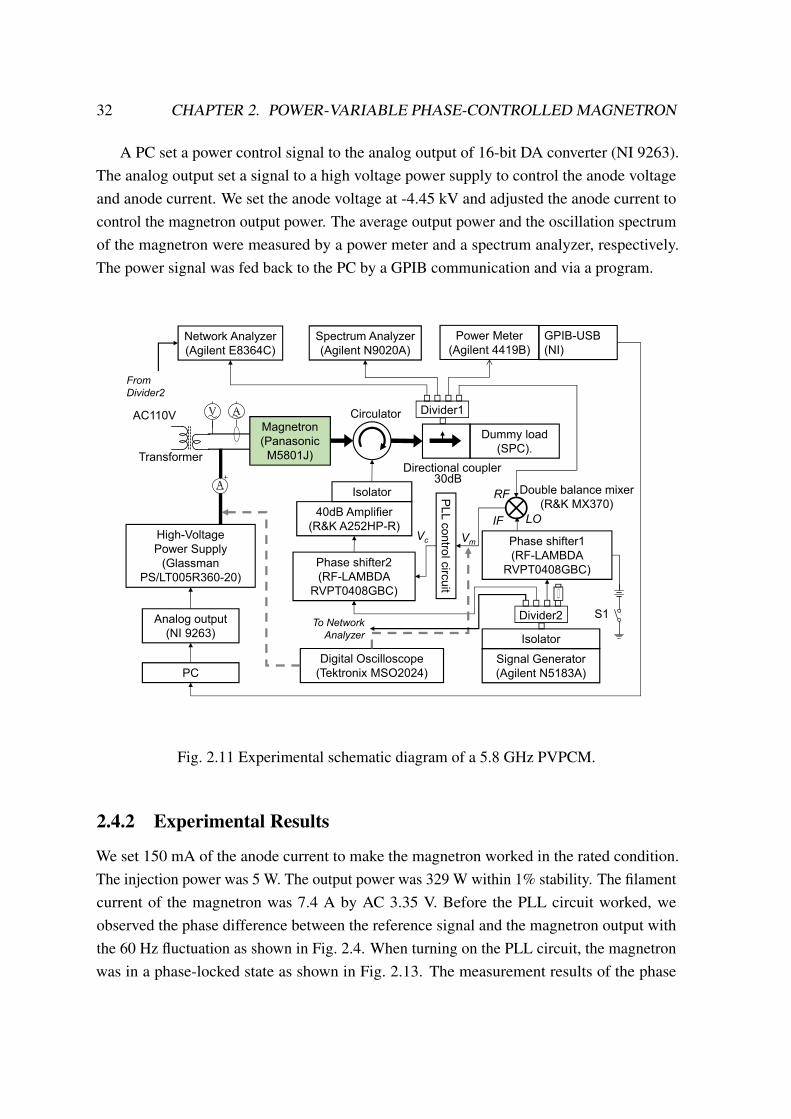
32 CHAPTER 2. POWER-VARIABLE PHASE-CONTROLLED MAGNETRON
A PC set a power control signal to the analog output of 16-bit DA converter (NI 9263).The analog output set a signal to a high voltage power supply to control the anode voltageand anode current. We set the anode voltage at -4.45 kV and adjusted the anode current tocontrol the magnetron output power. The average output power and the oscillation spectrumof the magnetron were measured by a power meter and a spectrum analyzer, respectively.The power signal was fed back to the PC by a GPIB communication and via a program.
Digital Oscilloscope
(Tektronix MSO2024)
Magnetron
(Panasonic
M5801J)
Circulator
High-Voltage
Power Supply
(Glassman
PS/LT005R360-20)
PC
Analog output
(NI 9263)
Directional coupler
Dummy load
(SPC).
PL
L c
on
trol c
ircu
itPower Meter
(Agilent 4419B)Spectrum Analyzer
(Agilent N9020A)
Network Analyzer
(Agilent E8364C)
Signal Generator
(Agilent N5183A)
40dB Amplifier
(R&K A252HP-R)
Phase shifter2
(RF-LAMBDA
RVPT0408GBC)
Double balance mixer
(R&K MX370)
Divider1
Divider2
Isolator
Isolator30dB
AC110V
Phase shifter1
(RF-LAMBDA
RVPT0408GBC)
S1
VmVc
LO
RF
IF
Transformer
GPIB-USB
(NI)
From
Divider2
To Network
Analyzer
Fig. 2.11 Experimental schematic diagram of a 5.8 GHz PVPCM.
2.4.2 Experimental Results
We set 150 mA of the anode current to make the magnetron worked in the rated condition.The injection power was 5 W. The output power was 329 W within 1% stability. The filamentcurrent of the magnetron was 7.4 A by AC 3.35 V. Before the PLL circuit worked, weobserved the phase difference between the reference signal and the magnetron output withthe 60 Hz fluctuation as shown in Fig. 2.4. When turning on the PLL circuit, the magnetronwas in a phase-locked state as shown in Fig. 2.13. The measurement results of the phase
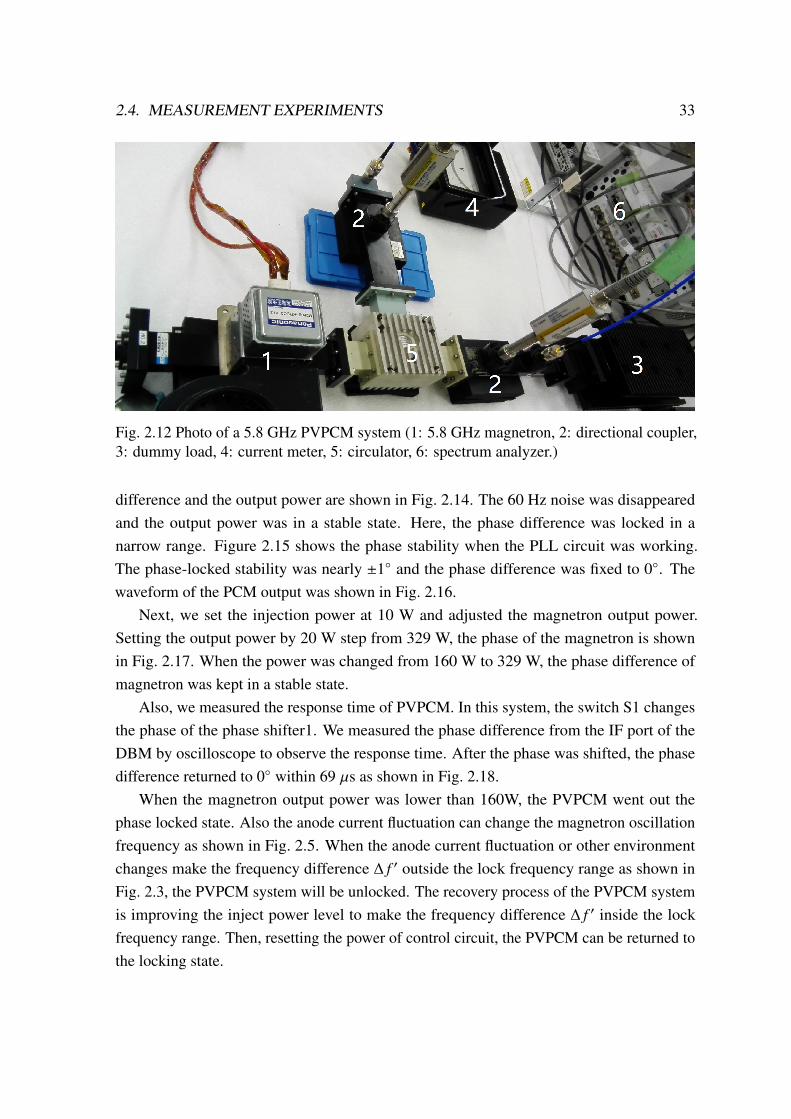
2.4. MEASUREMENT EXPERIMENTS 33
Fig. 2.12 Photo of a 5.8 GHz PVPCM system (1: 5.8 GHz magnetron, 2: directional coupler,3: dummy load, 4: current meter, 5: circulator, 6: spectrum analyzer.)
difference and the output power are shown in Fig. 2.14. The 60 Hz noise was disappearedand the output power was in a stable state. Here, the phase difference was locked in anarrow range. Figure 2.15 shows the phase stability when the PLL circuit was working.The phase-locked stability was nearly ±1◦ and the phase difference was fixed to 0◦. Thewaveform of the PCM output was shown in Fig. 2.16.
Next, we set the injection power at 10 W and adjusted the magnetron output power.Setting the output power by 20 W step from 329 W, the phase of the magnetron is shownin Fig. 2.17. When the power was changed from 160 W to 329 W, the phase difference ofmagnetron was kept in a stable state.
Also, we measured the response time of PVPCM. In this system, the switch S1 changesthe phase of the phase shifter1. We measured the phase difference from the IF port of theDBM by oscilloscope to observe the response time. After the phase was shifted, the phasedifference returned to 0◦ within 69 `s as shown in Fig. 2.18.
When the magnetron output power was lower than 160W, the PVPCM went out thephase locked state. Also the anode current fluctuation can change the magnetron oscillationfrequency as shown in Fig. 2.5. When the anode current fluctuation or other environmentchanges make the frequency difference Δ 𝑓 ′ outside the lock frequency range as shown inFig. 2.3, the PVPCM system will be unlocked. The recovery process of the PVPCM systemis improving the inject power level to make the frequency difference Δ 𝑓 ′ inside the lockfrequency range. Then, resetting the power of control circuit, the PVPCM can be returned tothe locking state.
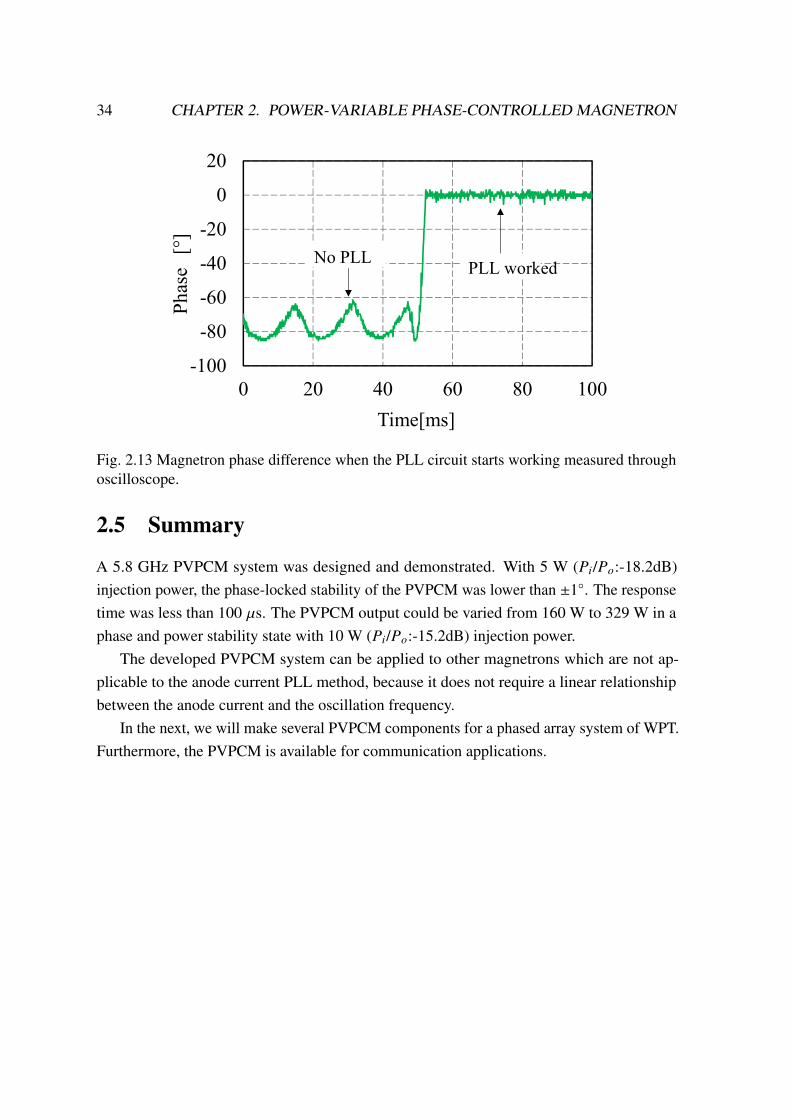
34 CHAPTER 2. POWER-VARIABLE PHASE-CONTROLLED MAGNETRON
-100
-80
-60
-40
-20
0
20
0 20 40 60 80 100
Ph
ase
[°]
Time[ms]
No PLLPLL worked
Fig. 2.13 Magnetron phase difference when the PLL circuit starts working measured throughoscilloscope.
2.5 Summary
A 5.8 GHz PVPCM system was designed and demonstrated. With 5 W (𝑃𝑖/𝑃𝑜:-18.2dB)injection power, the phase-locked stability of the PVPCM was lower than ±1◦. The responsetime was less than 100 `s. The PVPCM output could be varied from 160 W to 329 W in aphase and power stability state with 10 W (𝑃𝑖/𝑃𝑜:-15.2dB) injection power.
The developed PVPCM system can be applied to other magnetrons which are not ap-plicable to the anode current PLL method, because it does not require a linear relationshipbetween the anode current and the oscillation frequency.
In the next, we will make several PVPCM components for a phased array system of WPT.Furthermore, the PVPCM is available for communication applications.
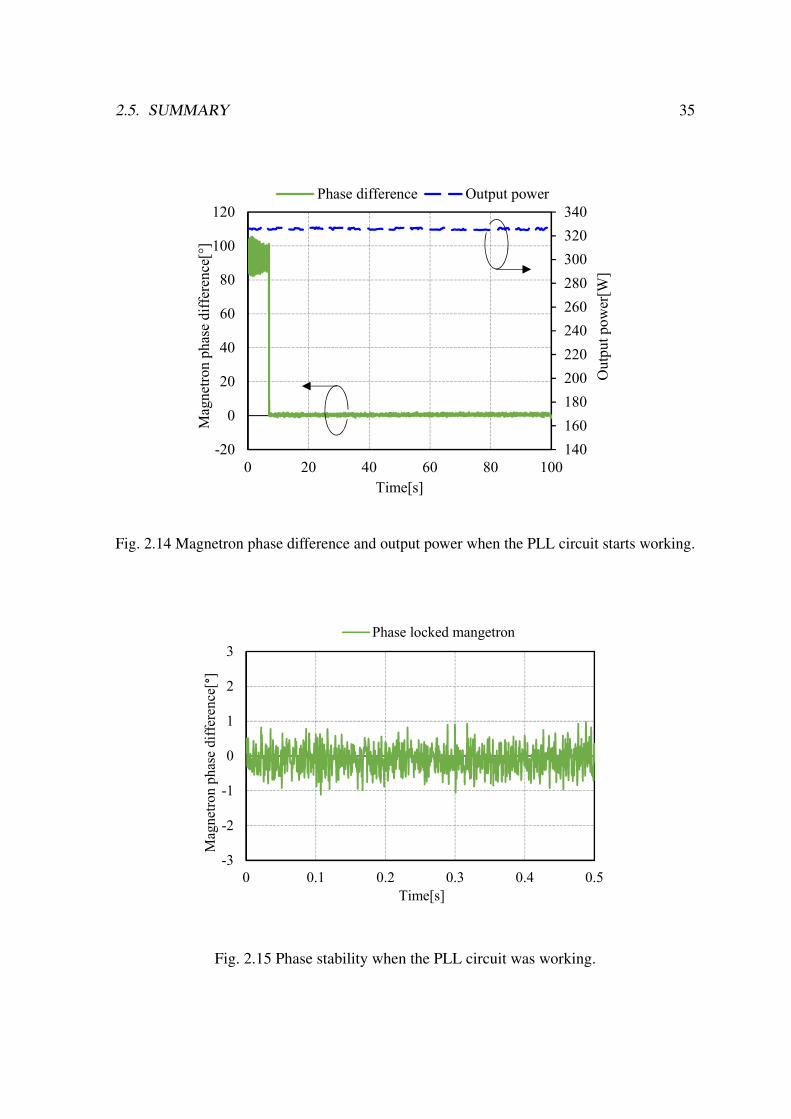
2.5. SUMMARY 35
140
160
180
200
220
240
260
280
300
320
340
-20
0
20
40
60
80
100
120
0 20 40 60 80 100
Ou
tpu
t p
ow
er[W
]
Mag
net
ron
ph
ase
dif
fere
nce
[°]
Time[s]
Phase difference Output power
Fig. 2.14 Magnetron phase difference and output power when the PLL circuit starts working.
-3
-2
-1
0
1
2
3
0 0.1 0.2 0.3 0.4 0.5
Mag
net
ron
ph
ase
dif
fere
nce
[°]
Time[s]
Phase locked mangetron
Fig. 2.15 Phase stability when the PLL circuit was working.
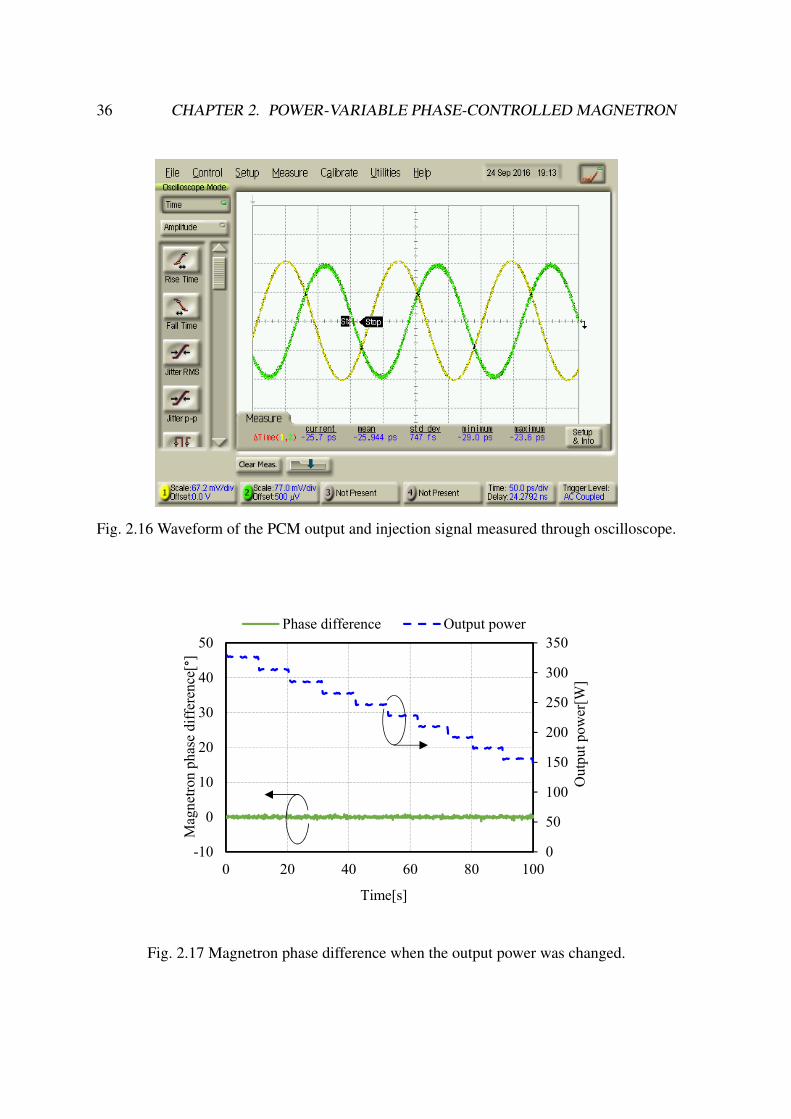
36 CHAPTER 2. POWER-VARIABLE PHASE-CONTROLLED MAGNETRON
Fig. 2.16 Waveform of the PCM output and injection signal measured through oscilloscope.
0
50
100
150
200
250
300
350
-10
0
10
20
30
40
50
0 20 40 60 80 100
Outp
ut
pow
er[W
]
Mag
net
ron p
has
e dif
fere
nce
[°]
Time[s]
Phase difference Output power
Fig. 2.17 Magnetron phase difference when the output power was changed.
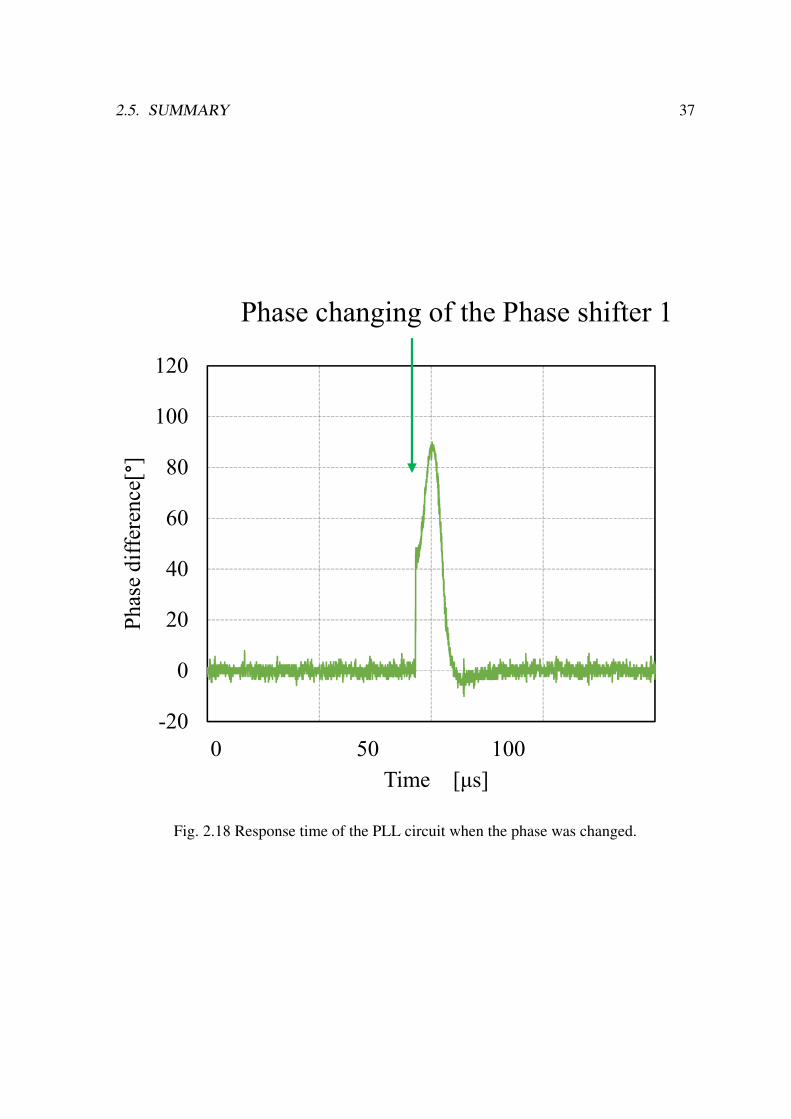
2.5. SUMMARY 37
PVPCM experiment results
21
-20
0
20
40
60
80
100
120
Phas
e diff
eren
ce[°
]
Time [μs]0 50 100
Reference signal
Phase shifter2
load
Control circuit
Divider Amplifier Circulator
Power signal 5.8GHzMagnetron
High-Voltage Power Supply
Comparer
Directional coupler
Double Balanced MixerLO RF
IF
Phase shifter1
RF-DC
Low pass filter
Response time less than 50 us.
Phase changing of the Phase shifter 1
Fig. 2.18 Response time of the PLL circuit when the phase was changed.

Chapter 3
Magnetron Phased Array
3.1 Introduction
Nikola Tesla proposed wireless power transfer (WPT) in far-field for more than one hundredyears [73]. Far-field WPT is more flexible to the transmission distance such as space solarpower stations [74] where the wires and near-field coupling cannot reach. Brown et al.promoted the development of WPT almost half a century ago. They developed the amplitron,which is one of the microwave amplification vacuum tubes. The DC-RF efficiency of theamplitron was more than 70% (@3 GHz, RF output power: 400 kW, 1964) [75]. The RF-DCrectification efficiency by diodes was achieved at 90% (@2.45 GHz, RF input power: 8 W)[76], and the DC-RF-RF-DC efficiency of a WPT system achieved 54 ± 1% at a distance of 2m (@2.45 GHz, DC receive power: 495 W, 1975) [77]. A long-distance WPT experiment wasdemonstrated over one mile at a microwave power of 450 kW generated from a continuouswave klystron. The rectified DC power reached 30 kW and it is the highest rectified powerlevel of the microwave WPT so far (@ 2.388 GHz, 1975) [78]. These experimental resultsare still high levels in WPT history.
Other research topics on WPT use phased array technologies. In 1992, MIcrowave LiftedAirplane eXperiment (MILAX) was conducted by using a 1.2 kW solid-state 2.45 GHzphased array system on a car to power a flying airplane. The airplane was driven by a stableDC rectified power of 88 W and flew at an altitude of 10 m and a flight distance of 350 m[79]. In 1993, the solid-state phased array [79] was also conducted in the ISY–METS rocketexperiment. A dipole antenna at different distances in space measured the received power[80]. Recently, a 1.8 kW solid-state 5.8 GHz phased array WPT was developed. A rectifiedDC power of 340 W with a distance of 55 m was obtained when a large majority of rectennaelements in the received panel were optimally activated by precise beamforming [81].
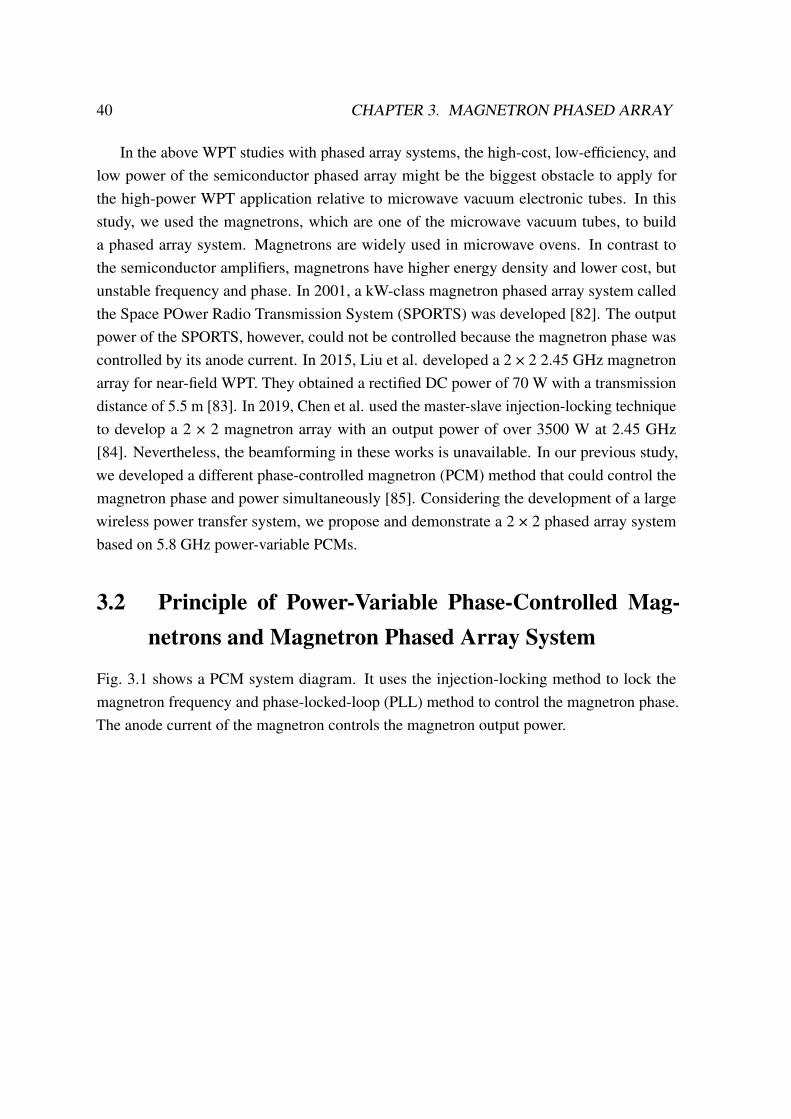
40 CHAPTER 3. MAGNETRON PHASED ARRAY
In the above WPT studies with phased array systems, the high-cost, low-efficiency, andlow power of the semiconductor phased array might be the biggest obstacle to apply forthe high-power WPT application relative to microwave vacuum electronic tubes. In thisstudy, we used the magnetrons, which are one of the microwave vacuum tubes, to builda phased array system. Magnetrons are widely used in microwave ovens. In contrast tothe semiconductor amplifiers, magnetrons have higher energy density and lower cost, butunstable frequency and phase. In 2001, a kW-class magnetron phased array system calledthe Space POwer Radio Transmission System (SPORTS) was developed [82]. The outputpower of the SPORTS, however, could not be controlled because the magnetron phase wascontrolled by its anode current. In 2015, Liu et al. developed a 2 × 2 2.45 GHz magnetronarray for near-field WPT. They obtained a rectified DC power of 70 W with a transmissiondistance of 5.5 m [83]. In 2019, Chen et al. used the master-slave injection-locking techniqueto develop a 2 × 2 magnetron array with an output power of over 3500 W at 2.45 GHz[84]. Nevertheless, the beamforming in these works is unavailable. In our previous study,we developed a different phase-controlled magnetron (PCM) method that could control themagnetron phase and power simultaneously [85]. Considering the development of a largewireless power transfer system, we propose and demonstrate a 2 × 2 phased array systembased on 5.8 GHz power-variable PCMs.
3.2 Principle of Power-Variable Phase-Controlled Mag-netrons and Magnetron Phased Array System
Fig. 3.1 shows a PCM system diagram. It uses the injection-locking method to lock themagnetron frequency and phase-locked-loop (PLL) method to control the magnetron phase.The anode current of the magnetron controls the magnetron output power.
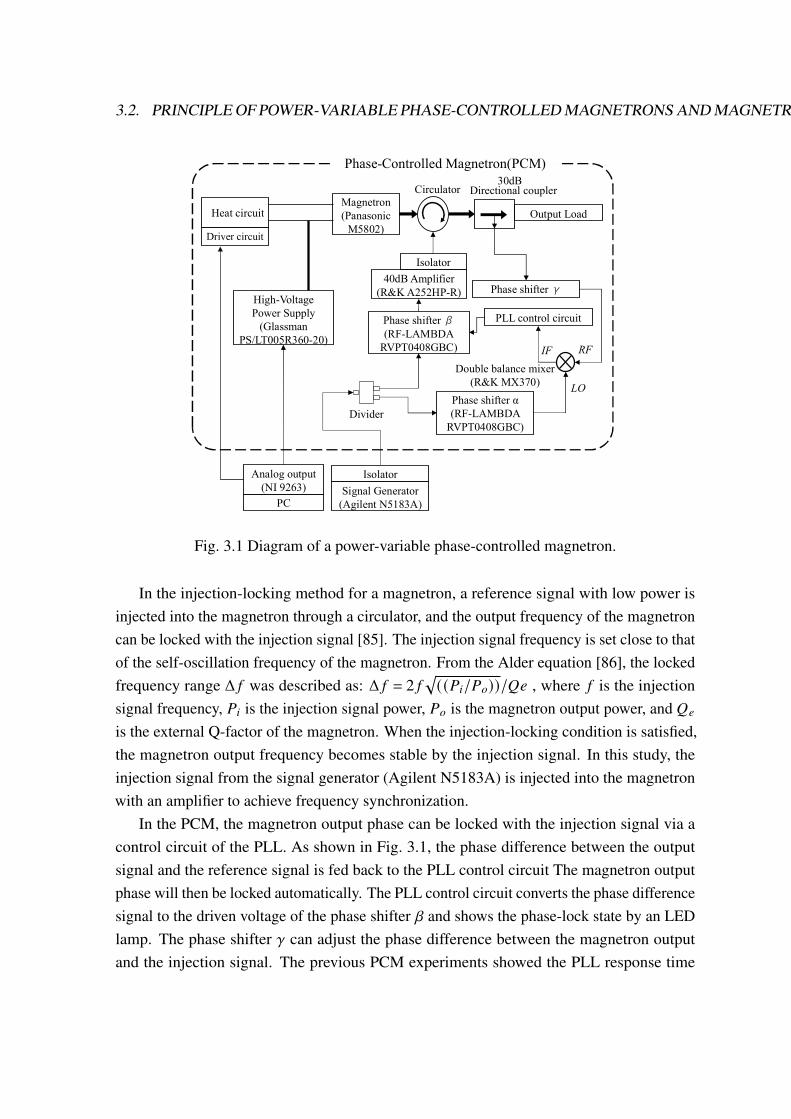
3.2. PRINCIPLE OF POWER-VARIABLE PHASE-CONTROLLED MAGNETRONS AND MAGNETRON PHASED ARRAY SYSTEM41IEEE TRANSACTIONS ON MICROWAVE THEORY AND TECHNIQUES
II. PRINCIPLE OF POWER-VARIABLE PHASE-CONTROLLED
MAGNETRONS AND MAGNETRON PHASED ARRAY SYSTEM
Fig. 1 shows a PCM system diagram. It uses the injection-
locking method to lock the magnetron frequency and phase-locked-loop (PLL) method to control the magnetron phase. The anode current of the magnetron controls the magnetron output power.
In the injection-locking method for a magnetron, a reference signal with low power is injected into the magnetron through a circulator, and the output frequency of the magnetron can be locked with the injection signal [13]. The injection signal frequency is set close to that of the self-oscillation frequency of the magnetron. From the Alder equation [14], the locked
frequency range Δf was described as: Δf = 2𝑓 (𝑃𝑖/𝑃𝑜)/𝑄𝑒, where f is the injection signal frequency, 𝑃𝑖 is the injection signal power, 𝑃𝑜 is the magnetron output power, and 𝑄𝑒 is the external Q-factor of the magnetron. When the injection-locking condition is satisfied, the magnetron output frequency becomes stable by the injection signal. In this study, the injection signal from the signal generator (Agilent N5183A) is injected into the magnetron with an amplifier to achieve frequency synchronization.
In the PCM, the magnetron output phase can be locked with the injection signal via a control circuit of the PLL. As shown in Fig. 1, the phase difference between the output signal and the reference signal is fed back to the PLL control circuit The magnetron output phase will then be locked automatically. The PLL control circuit converts the phase difference signal to the driven voltage of the phase shifter β and shows the phase-lock state by an LED lamp. The phase shifter γ can adjust the phase difference between the magnetron output and the injection signal. The previous PCM experiments showed the PLL response time is less than 50 μs, phase control accuracy less than ±1°, and the output power varies from 160 W to 450 W [13]. When the output power was lower than 160 W, the self-oscillation frequency of the magnetron would deviate from the locked frequency range. The frequency and phase-locking of the magnetron failed. Enlarging the injection signal power or closing the injection signal frequency can solve this problem.
A magnetron phased array system requires all the magnetrons worked at the same frequency. The manufacturing error, however, causes various self-oscillation frequencies in different magnetrons. According to the Alder equation, the locked frequency range Δf depends on the power ratio. To keep all the magnetrons working at the same frequency, we selected the magnetrons with similar self-oscillation frequencies. Then, a lower injection power can lock all the magnetrons. The anode current also affects the self-oscillation frequency of the magnetron. When controlling the output power of the magnetron, it should be worked in the locked frequency range Δf of the magnetron to prevent the PCM from the unlocked state. Fig. 2 shows the upper and lower
frequency boundaries, within which the magnetron frequency could be locked to the injection signal frequency. The frequency boundaries of four magnetrons were measured to the injection power, and the red, blue, green and orange colors correspond to the serial numbers of the measured magnetrons. For instance, the area indicated by the black arrow is the locked frequency range Δf of magnetron (S/N005) at an injection power of 7 W. All the magnetrons can be locked in the green zone where the magnetrons can be used as phased array transmitters.
III. DESIGN OF SLOT ARRAY ANTENNAS
In this study, we used four PCMs to build a 2 × 2
Magnetron(Panasonic
M5802)
Circulator
High-Voltage Power Supply
(Glassman PS/LT005R360-20)
PC
Analog output(NI 9263)
Directional coupler
Output Load
PLL control circuit
Signal Generator(Agilent N5183A)
40dB Amplifier(R&K A252HP-R)
Phase shifter β(RF-LAMBDA
RVPT0408GBC)
Double balance mixer(R&K MX370)
Divider
Isolator
Isolator
30dB
Phase shifter α(RF-LAMBDA
RVPT0408GBC)
LO
RFIF
Heat circuit
Phase-Controlled Magnetron(PCM)
Phase shifterγ
Driver circuit
Fig.1 Diagram of a power-variable phase-controlled magnetron. system.
Fig.2 Measured upper and lower frequency boundaries of magnetrons to the injection power. The magnetron frequency could be locked to the injection signal frequency within the boundary. red line: S/N007, blue line: S/N012, green line: S/N010, orange line: S/N 005. The green zone indicates the locking range within which all the four magnetrons can be locked.
5.782
5.784
5.786
5.788
5.790
5.792
0 1 2 3 4 5 6 7 8 9 10
Freq
uenc
y [G
Hz]
Injection Power [W]
△f
Fig. 3.1 Diagram of a power-variable phase-controlled magnetron.
In the injection-locking method for a magnetron, a reference signal with low power isinjected into the magnetron through a circulator, and the output frequency of the magnetroncan be locked with the injection signal [85]. The injection signal frequency is set close to thatof the self-oscillation frequency of the magnetron. From the Alder equation [86], the lockedfrequency range Δ 𝑓 was described as: Δ 𝑓 = 2 𝑓
√((𝑃𝑖/𝑃𝑜))/𝑄𝑒 , where 𝑓 is the injection
signal frequency, 𝑃𝑖 is the injection signal power, 𝑃𝑜 is the magnetron output power, and 𝑄𝑒
is the external Q-factor of the magnetron. When the injection-locking condition is satisfied,the magnetron output frequency becomes stable by the injection signal. In this study, theinjection signal from the signal generator (Agilent N5183A) is injected into the magnetronwith an amplifier to achieve frequency synchronization.
In the PCM, the magnetron output phase can be locked with the injection signal via acontrol circuit of the PLL. As shown in Fig. 3.1, the phase difference between the outputsignal and the reference signal is fed back to the PLL control circuit The magnetron outputphase will then be locked automatically. The PLL control circuit converts the phase differencesignal to the driven voltage of the phase shifter 𝛽 and shows the phase-lock state by an LEDlamp. The phase shifter 𝛾 can adjust the phase difference between the magnetron outputand the injection signal. The previous PCM experiments showed the PLL response time
42 CHAPTER 3. MAGNETRON PHASED ARRAY
is less than 50 `𝑠, phase control accuracy less than ±1◦, and the output power varies from160 W to 450 W [85]. When the output power was lower than 160 W, the self-oscillationfrequency of the magnetron would deviate from the locked frequency range. The frequencyand phase-locking of the magnetron failed. Enlarging the injection signal power or closingthe injection signal frequency can solve this problem.
A magnetron phased array system requires all the magnetrons worked at the samefrequency. The manufacturing error, however, causes various self-oscillation frequenciesin different magnetrons. According to the Alder equation, the locked frequency range Δ 𝑓
depends on the power ratio. To keep all the magnetrons working at the same frequency, weselected the magnetrons with similar self-oscillation frequencies. Then, a lower injectionpower can lock all the magnetrons. The anode current also affects the self-oscillationfrequency of the magnetron. When controlling the output power of the magnetron, it shouldbe worked in the locked frequency range Δ 𝑓 of the magnetron to prevent the PCM fromthe unlocked state. Fig. 3.2 shows the upper and lower frequency boundaries, within whichthe magnetron frequency could be locked to the injection signal frequency. The frequencyboundaries of four magnetrons were measured to the injection power, and the red, blue, greenand orange colors correspond to the serial numbers of the measured magnetrons. For instance,the area indicated by the black arrow is the locked frequency range Δ 𝑓 of magnetron (SN005)at an injection power of 7 W. All the magnetrons can be locked in the green zone where themagnetrons can be used as phased array transmitters.
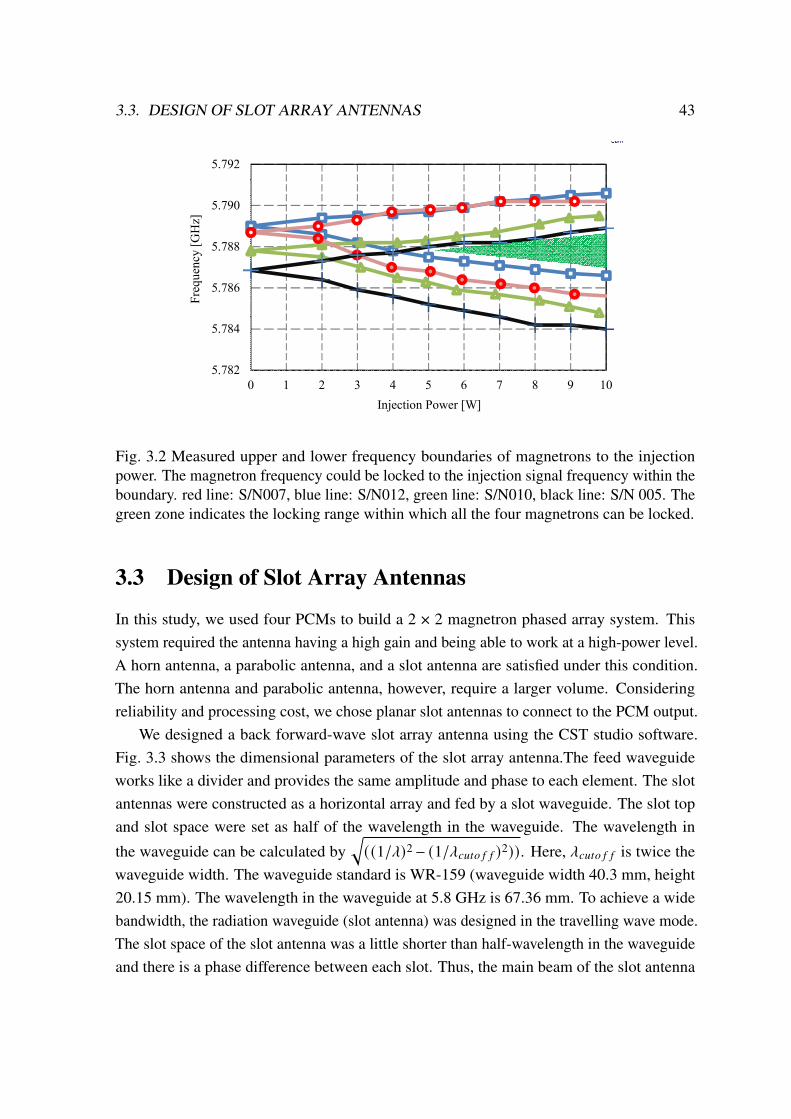
3.3. DESIGN OF SLOT ARRAY ANTENNAS 43
-50
-40
-30
-20
-10
0
10
5.2 5.4 5.6 5.8 6 6.2 6.4
Am
pli
tud
e [d
B]
Frequency[GHz]
No.1
No.2
No.3
No.4
Simulation
-60
-50
-40
-30
-20
-10
0
10
-90 -67.5 -45 -22.5 0 22.5 45 67.5 90
Am
pli
tud
e[d
Bc]
Angle[°]
Simulation
No.1
No.2
No.3
No.4
5.782
5.784
5.786
5.788
5.790
5.792
0 1 2 3 4 5 6 7 8 9 10
Fre
qu
ency
[G
Hz]
Injection Power [W]
-50
-40
-30
-20
-10
0
10
-25 -20 -15 -10 -5 0 5 10 15 20 25
Am
pli
tud
e [d
Bc]
Angle [°]
0°60°120°-120°-60°
Fig. 3.2 Measured upper and lower frequency boundaries of magnetrons to the injectionpower. The magnetron frequency could be locked to the injection signal frequency within theboundary. red line: S/N007, blue line: S/N012, green line: S/N010, black line: S/N 005. Thegreen zone indicates the locking range within which all the four magnetrons can be locked.
3.3 Design of Slot Array Antennas
In this study, we used four PCMs to build a 2 × 2 magnetron phased array system. Thissystem required the antenna having a high gain and being able to work at a high-power level.A horn antenna, a parabolic antenna, and a slot antenna are satisfied under this condition.The horn antenna and parabolic antenna, however, require a larger volume. Consideringreliability and processing cost, we chose planar slot antennas to connect to the PCM output.
We designed a back forward-wave slot array antenna using the CST studio software.Fig. 3.3 shows the dimensional parameters of the slot array antenna.The feed waveguideworks like a divider and provides the same amplitude and phase to each element. The slotantennas were constructed as a horizontal array and fed by a slot waveguide. The slot topand slot space were set as half of the wavelength in the waveguide. The wavelength in
the waveguide can be calculated by√((1/_)2 − (1/_𝑐𝑢𝑡𝑜 𝑓 𝑓 )2)). Here, _𝑐𝑢𝑡𝑜 𝑓 𝑓 is twice the
waveguide width. The waveguide standard is WR-159 (waveguide width 40.3 mm, height20.15 mm). The wavelength in the waveguide at 5.8 GHz is 67.36 mm. To achieve a widebandwidth, the radiation waveguide (slot antenna) was designed in the travelling wave mode.The slot space of the slot antenna was a little shorter than half-wavelength in the waveguideand there is a phase difference between each slot. Thus, the main beam of the slot antenna
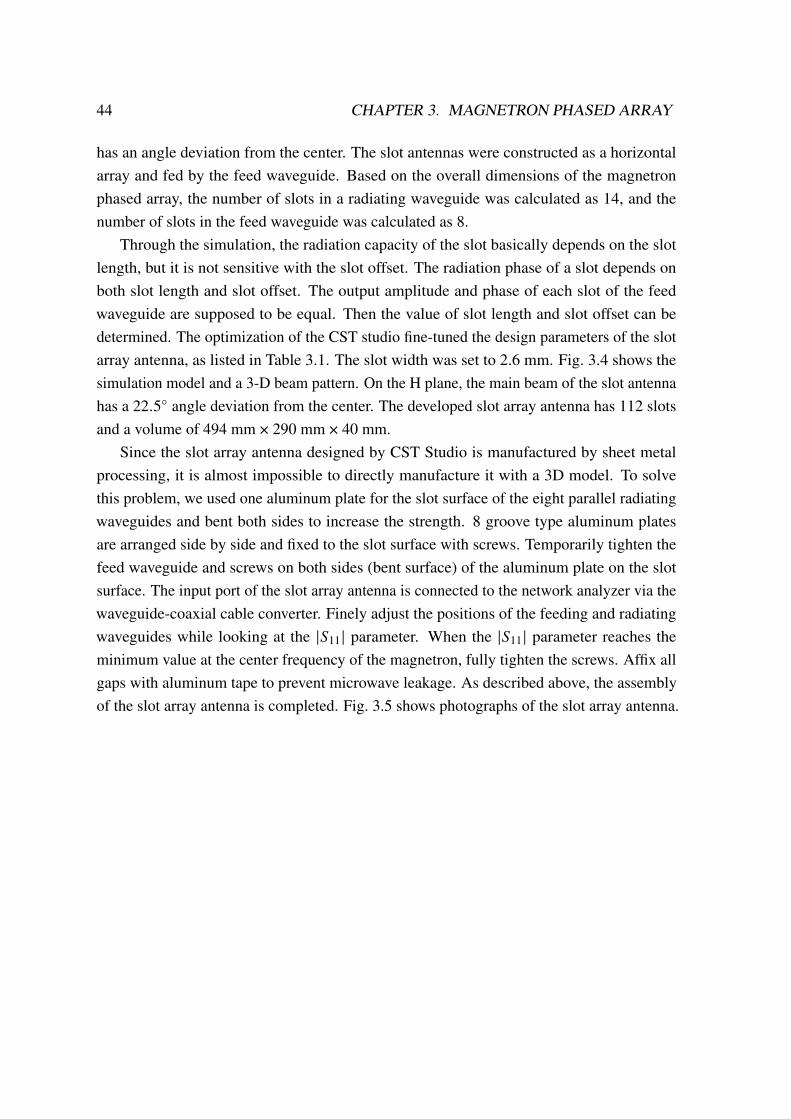
44 CHAPTER 3. MAGNETRON PHASED ARRAY
has an angle deviation from the center. The slot antennas were constructed as a horizontalarray and fed by the feed waveguide. Based on the overall dimensions of the magnetronphased array, the number of slots in a radiating waveguide was calculated as 14, and thenumber of slots in the feed waveguide was calculated as 8.
Through the simulation, the radiation capacity of the slot basically depends on the slotlength, but it is not sensitive with the slot offset. The radiation phase of a slot depends onboth slot length and slot offset. The output amplitude and phase of each slot of the feedwaveguide are supposed to be equal. Then the value of slot length and slot offset can bedetermined. The optimization of the CST studio fine-tuned the design parameters of the slotarray antenna, as listed in Table 3.1. The slot width was set to 2.6 mm. Fig. 3.4 shows thesimulation model and a 3-D beam pattern. On the H plane, the main beam of the slot antennahas a 22.5◦ angle deviation from the center. The developed slot array antenna has 112 slotsand a volume of 494 mm × 290 mm × 40 mm.
Since the slot array antenna designed by CST Studio is manufactured by sheet metalprocessing, it is almost impossible to directly manufacture it with a 3D model. To solvethis problem, we used one aluminum plate for the slot surface of the eight parallel radiatingwaveguides and bent both sides to increase the strength. 8 groove type aluminum platesare arranged side by side and fixed to the slot surface with screws. Temporarily tighten thefeed waveguide and screws on both sides (bent surface) of the aluminum plate on the slotsurface. The input port of the slot array antenna is connected to the network analyzer via thewaveguide-coaxial cable converter. Finely adjust the positions of the feeding and radiatingwaveguides while looking at the |𝑆11 | parameter. When the |𝑆11 | parameter reaches theminimum value at the center frequency of the magnetron, fully tighten the screws. Affix allgaps with aluminum tape to prevent microwave leakage. As described above, the assemblyof the slot array antenna is completed. Fig. 3.5 shows photographs of the slot array antenna.
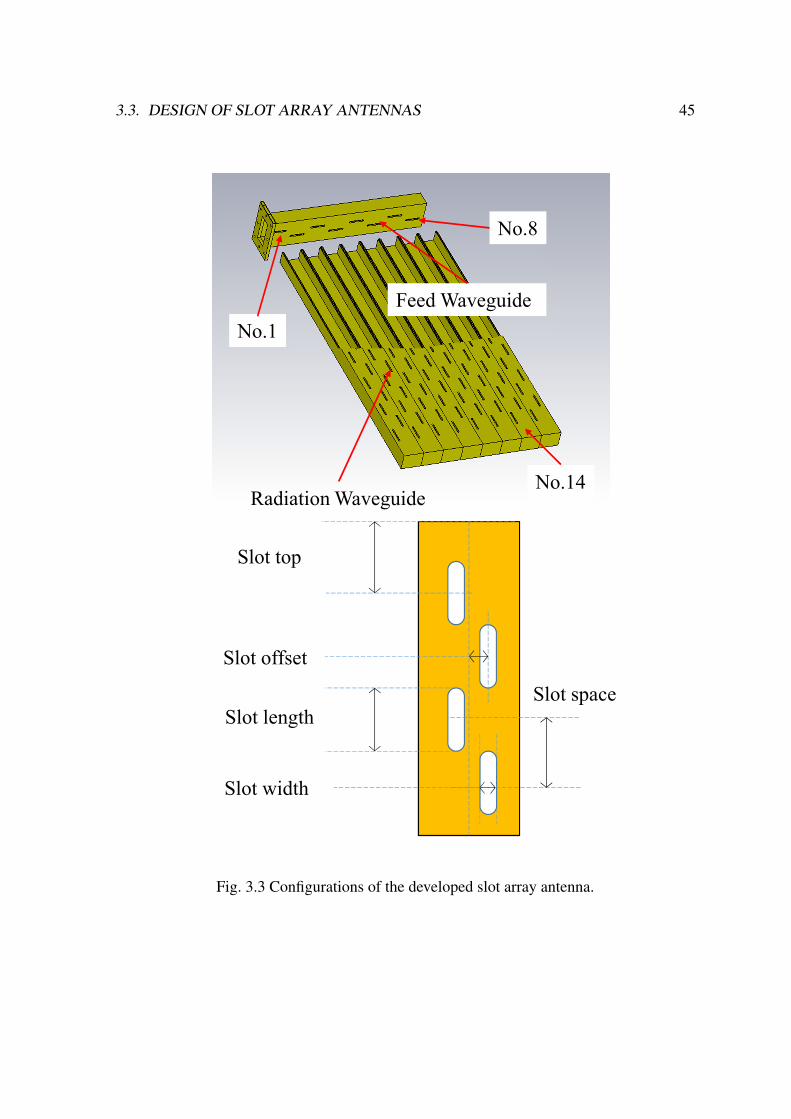
3.3. DESIGN OF SLOT ARRAY ANTENNAS 45
Slot offset
Slot length
Slot width
Slot top
Slot space
Feed Waveguide
Radiation Waveguide
No.1
No.14
No.8
Fig. 3.3 Configurations of the developed slot array antenna.
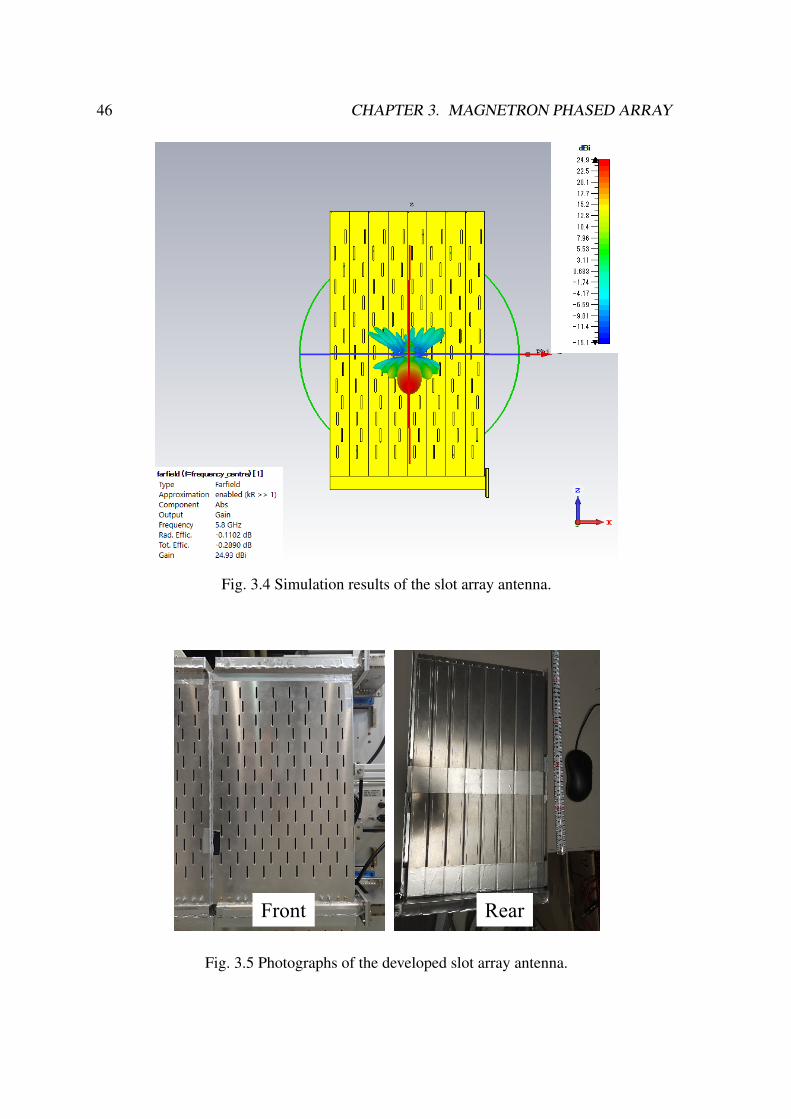
46 CHAPTER 3. MAGNETRON PHASED ARRAY
Fig. 3.4 Simulation results of the slot array antenna.
Front Rear
Fig. 3.5 Photographs of the developed slot array antenna.
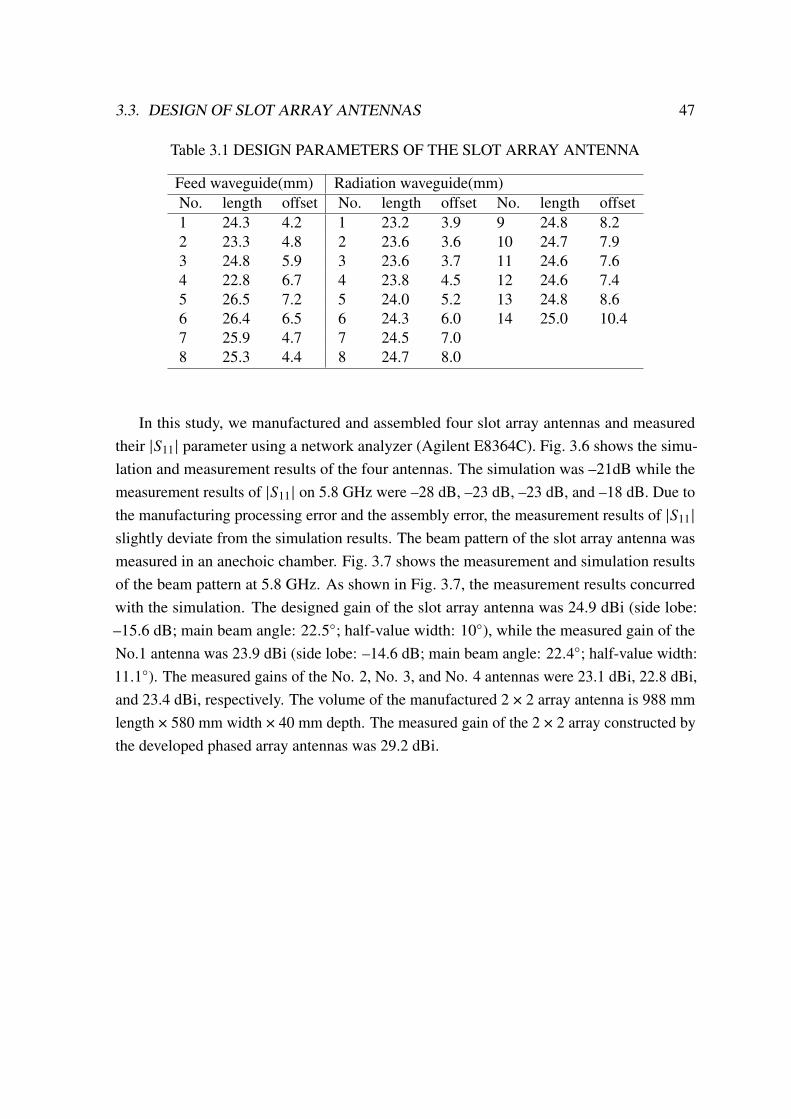
3.3. DESIGN OF SLOT ARRAY ANTENNAS 47
Table 3.1 DESIGN PARAMETERS OF THE SLOT ARRAY ANTENNA
Feed waveguide(mm) Radiation waveguide(mm)No. length offset No. length offset No. length offset1 24.3 4.2 1 23.2 3.9 9 24.8 8.22 23.3 4.8 2 23.6 3.6 10 24.7 7.93 24.8 5.9 3 23.6 3.7 11 24.6 7.64 22.8 6.7 4 23.8 4.5 12 24.6 7.45 26.5 7.2 5 24.0 5.2 13 24.8 8.66 26.4 6.5 6 24.3 6.0 14 25.0 10.47 25.9 4.7 7 24.5 7.08 25.3 4.4 8 24.7 8.0
In this study, we manufactured and assembled four slot array antennas and measuredtheir |𝑆11 | parameter using a network analyzer (Agilent E8364C). Fig. 3.6 shows the simu-lation and measurement results of the four antennas. The simulation was –21dB while themeasurement results of |𝑆11 | on 5.8 GHz were –28 dB, –23 dB, –23 dB, and –18 dB. Due tothe manufacturing processing error and the assembly error, the measurement results of |𝑆11 |slightly deviate from the simulation results. The beam pattern of the slot array antenna wasmeasured in an anechoic chamber. Fig. 3.7 shows the measurement and simulation resultsof the beam pattern at 5.8 GHz. As shown in Fig. 3.7, the measurement results concurredwith the simulation. The designed gain of the slot array antenna was 24.9 dBi (side lobe:–15.6 dB; main beam angle: 22.5◦; half-value width: 10◦), while the measured gain of theNo.1 antenna was 23.9 dBi (side lobe: –14.6 dB; main beam angle: 22.4◦; half-value width:11.1◦). The measured gains of the No. 2, No. 3, and No. 4 antennas were 23.1 dBi, 22.8 dBi,and 23.4 dBi, respectively. The volume of the manufactured 2 × 2 array antenna is 988 mmlength × 580 mm width × 40 mm depth. The measured gain of the 2 × 2 array constructed bythe developed phased array antennas was 29.2 dBi.
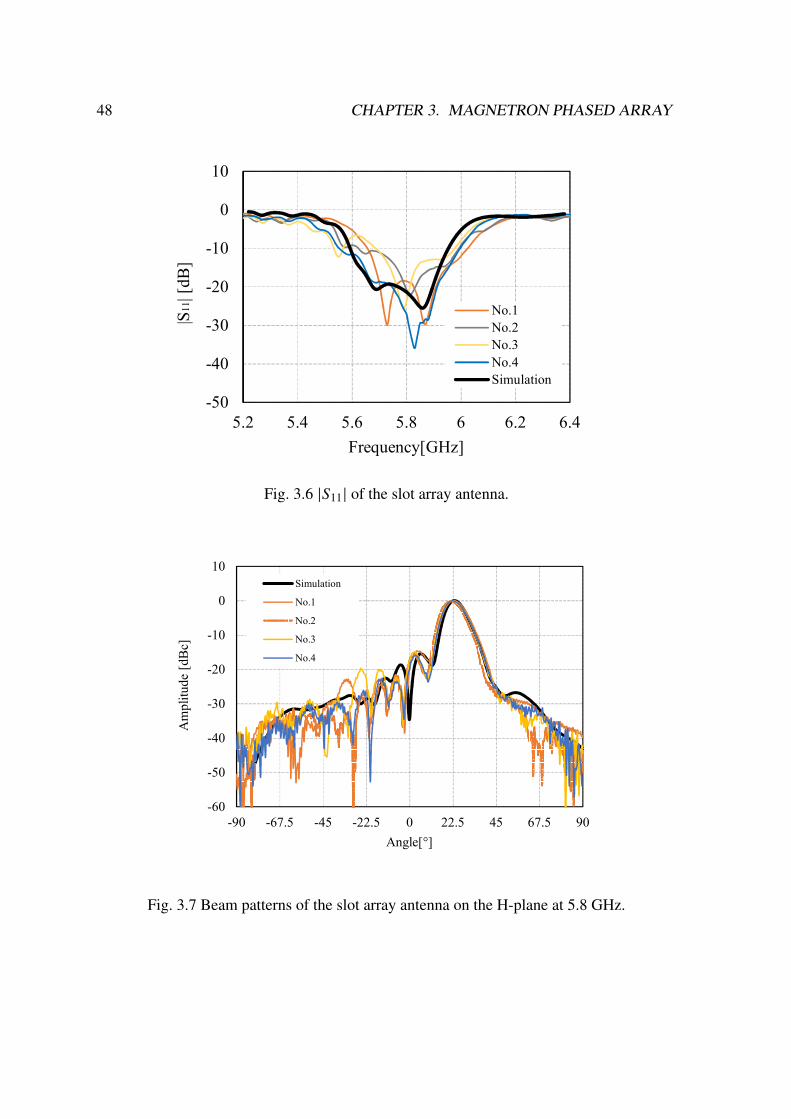
48 CHAPTER 3. MAGNETRON PHASED ARRAY
-50
-40
-30
-20
-10
0
10
5.2 5.4 5.6 5.8 6 6.2 6.4
|S11|[d
B]
Frequency[GHz]
No.1
No.2
No.3
No.4
Simulation
-60
-50
-40
-30
-20
-10
0
10
-90 -67.5 -45 -22.5 0 22.5 45 67.5 90
Am
pli
tude
[dB
c]
Angle[°]
Simulation
No.1
No.2
No.3
No.4
5.782
5.784
5.786
5.788
5.790
5.792
0 1 2 3 4 5 6 7 8 9 10
Fre
qu
ency
[G
Hz]
Injection Power [W]
-50
-40
-30
-20
-10
0
10
-25 -20 -15 -10 -5 0 5 10 15 20 25
Am
pli
tud
e [d
Bc]
Angle [°]
0°60°120°-120°-60°
Fig. 3.6 |𝑆11 | of the slot array antenna.
-50
-40
-30
-20
-10
0
10
5.2 5.4 5.6 5.8 6 6.2 6.4
Am
pli
tud
e [d
B]
Frequency[GHz]
No.1
No.2
No.3
No.4
Simulation
-60
-50
-40
-30
-20
-10
0
10
-90 -67.5 -45 -22.5 0 22.5 45 67.5 90
Am
pli
tud
e[d
Bc]
Angle[°]
Simulation
No.1
No.2
No.3
No.4
5.782
5.784
5.786
5.788
5.790
5.792
0 1 2 3 4 5 6 7 8 9 10
Fre
qu
ency
[G
Hz]
Injection Power [W]
-50
-40
-30
-20
-10
0
10
-25 -20 -15 -10 -5 0 5 10 15 20 25
Am
pli
tud
e [d
Bc]
Angle [°]
0°60°120°-120°-60°
Fig. 3.7 Beam patterns of the slot array antenna on the H-plane at 5.8 GHz.
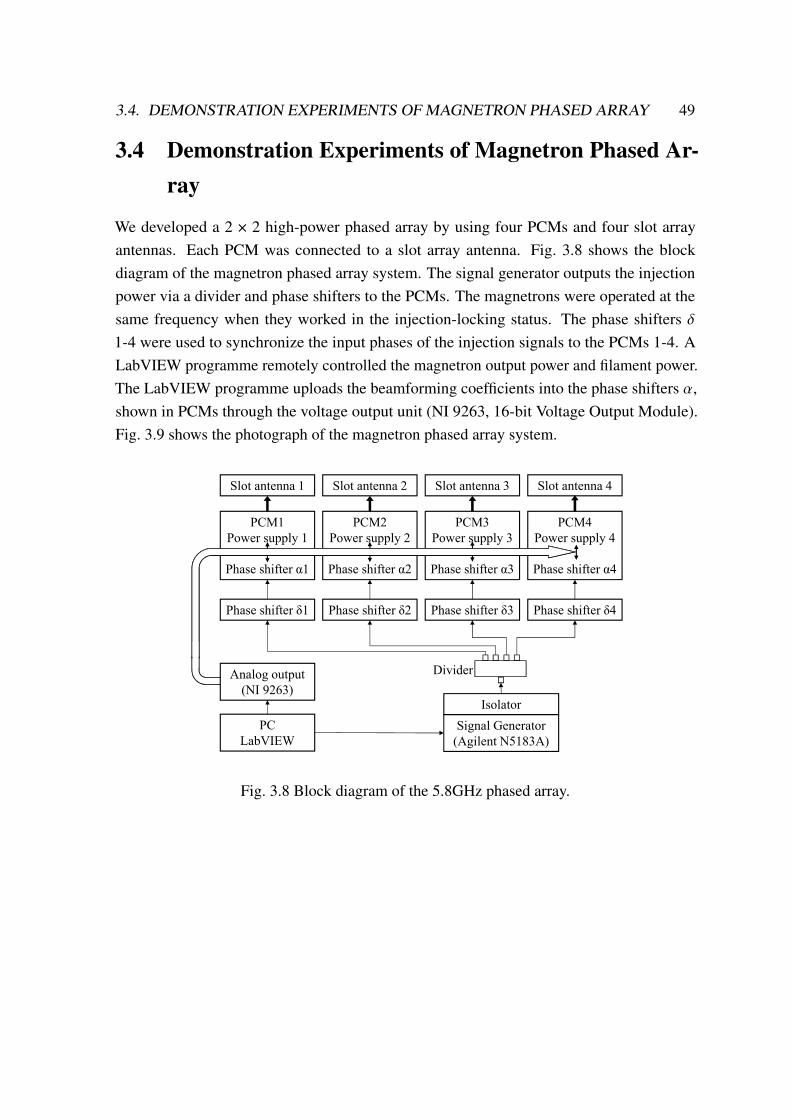
3.4. DEMONSTRATION EXPERIMENTS OF MAGNETRON PHASED ARRAY 49
3.4 Demonstration Experiments of Magnetron Phased Ar-ray
We developed a 2 × 2 high-power phased array by using four PCMs and four slot arrayantennas. Each PCM was connected to a slot array antenna. Fig. 3.8 shows the blockdiagram of the magnetron phased array system. The signal generator outputs the injectionpower via a divider and phase shifters to the PCMs. The magnetrons were operated at thesame frequency when they worked in the injection-locking status. The phase shifters 𝛿1-4 were used to synchronize the input phases of the injection signals to the PCMs 1-4. ALabVIEW programme remotely controlled the magnetron output power and filament power.The LabVIEW programme uploads the beamforming coefficients into the phase shifters 𝛼,shown in PCMs through the voltage output unit (NI 9263, 16-bit Voltage Output Module).Fig. 3.9 shows the photograph of the magnetron phased array system.
PC
LabVIEW
Signal Generator
(Agilent N5183A)
Isolator
Phase shifter δ1 Phase shifter δ2 Phase shifter δ3 Phase shifter δ4
PCM1
Power supply 1
Phase shifter α1
PCM2
Power supply 2
Phase shifter α2
PCM3
Power supply 3
Phase shifter α3
PCM4
Power supply 4
Phase shifter α4
Slot antenna 1 Slot antenna 2 Slot antenna 3 Slot antenna 4
Analog output
(NI 9263)
Divider
Fig. 3.8 Block diagram of the 5.8GHz phased array.

50 CHAPTER 3. MAGNETRON PHASED ARRAYIEEE TRANSACTIONS ON MICROWAVE THEORY AND TECHNIQUES
magnetrons are locked. Afterward, the PLL control circuits are
turned on to stabilise and manually adjust the magnetron
output phases. When all the magnetrons worked in the phase-
locking state, a vector voltmeter (Keysight N9928A) was
connected to directional couplers to detect and upload the data
of the phase difference and amplitude ratio. Finally, the phase
shifters and anode currents were automatically adjusted to
achieve the same output phase and output power by the
LabVIEW programme. To verify the performance of the
magnetron phased array system, we conducted beamforming
and wireless power transfer experiments.
A. Beam Forming Experiments
The phase shifter α was controlled to change the magnetron
output phase. The beam directivity of the array antenna is
related to the magnetron’s phases. As shown in (1), the
magnetron output phase difference can calculate the main lobe
deflection angle �. Here, ∆� is the phase difference between
the two adjacent antennas, d is the distance between the two
adjacent antennas, λ is the wavelength. In this system, the
horizontal and vertical distances between the element centers
are 290 mm and 470 mm, respectively. When the incoming
phase differences of horizontal and vertical adjacent elements
are respectively equalled to 107° and 116°, the main lobe
angle can be controlled to ±3° in horizontal and ± 2° vertical
directions. By uploading the above phase strategy to the
control system, the beam scanning can cover an area of ±3° in
horizontal and 22.5° ± 2° in vertical. Fig. 10 shows the
simulation results of the combined beam patterns of the 2 × 2
slot antenna array at 5.8 GHz.
sin � ��∆�
2� 1�
In the experiments, we used a 1.2 × 1.2 metre LED lamp
rectenna array consisting of 600 rectenna elements to display
the validity of beam scanning. The rectenna element receives
the microwave and rectifies the DC power to light the
corresponding LED lamp. The luminance of the lamps can
also symbolize the intensity of the received microwave. Fig.
11 shows the photograph of the LED lamp rectenna elements.
We placed the LED lamp array about 8.5 m in front of the
magnetron phased array and 4.5 m in height, as shown in Fig.
12. The LED lamp array was 9.2 m away from the center of
the slot array antennas. The elevation angle of the vertical
direction from the phased array antennas to the center of the
LED lamp array became 22.5°, which is exactly the radiating
angle of the array antennas.
After finishing setting the magnetron phased array, we
adjusted all the anodes current of the PCMs to 100 mA. At this
time, each PCM output was kept in the same phase. State 1 in
the upper section of Fig. 12 shows the appearance of the LED
lamp rectenna array under this situation. Adjusting the phase
shifters α which are analog phase shifters, could control the
beam in high resolution to scan an area both in vertical and
horizontal directions and the LED lamp array could display
Fig. 9. Photograph of the magnetron phased array system.
1300 mm
2060 mm
1420 mm
PCM3 PCM4
PCM1 PCM2
Fig. 10. Simulation results of the combined beam patterns of the 2 × 2 slot antenna array on the E plane at 5.8GHz.
-50
-40
-30
-20
-10
0
10
-25 -20 -15 -10 -5 0 5 10 15 20 25
Am
pli
tud
e [d
Bc]
Angle [°]
0°60°120°-120°-60°
Fig. 11. Photograph of the LED lamp rectenna elements.
Fig. 3.9 Photograph of the magnetron phased array system.
The operation procedure of the magnetron phased array is as follows. First, all themagnetrons are turned on and kept for close to 30 s, then the LabVIEW programme turns offthe filament power to obtain relative stable outputs. Next, the injection frequency and powerof each magnetron are respectively set as 5.788 GHz and 6 W, then all the magnetrons arelocked. Afterward, the PLL control circuits are turned on to stabilise and manually adjustthe magnetron output phases. When all the magnetrons worked in the phase-locking state,a vector voltmeter (Keysight N9928A) was connected to directional couplers to detect and
3.4. DEMONSTRATION EXPERIMENTS OF MAGNETRON PHASED ARRAY 51
upload the data of the phase difference and amplitude ratio. Finally, the phase shifters andanode currents were automatically adjusted to achieve the same output phase and outputpower by the LabVIEW programme. To verify the performance of the magnetron phasedarray system, we conducted beamforming and wireless power transfer experiments.
3.4.1 Beam Forming Experiments
The phase shifter 𝛼 was controlled to change the magnetron output phase. The beamdirectivity of the array antenna is related to the magnetron’s phases. As shown in equation(3.1), the magnetron output phase difference can calculate the main lobe deflection angle\. Here, Δ𝜑 is the phase difference between the two adjacent antennas, 𝑑 is the distancebetween the two adjacent antennas, _ is the wavelength. In this system, the horizontal andvertical distances between the element centers are 290 mm and 470 mm, respectively. Whenthe incoming phase differences of horizontal and vertical adjacent elements are respectivelyequalled to 107◦ and 116◦, the main lobe angle can be controlled to ±3◦ in horizontal and ±2◦ vertical directions. By uploading the above phase strategy to the control system, the beamscanning can cover an area of ±3◦ in horizontal and 22.5◦ ± 2◦ in vertical. Fig. 3.10 showsthe simulation results of the combined beam patterns of the 2 × 2 slot antenna array at 5.8GHz.
sin\ =_Δ𝜑
2𝜋𝑑(3.1)
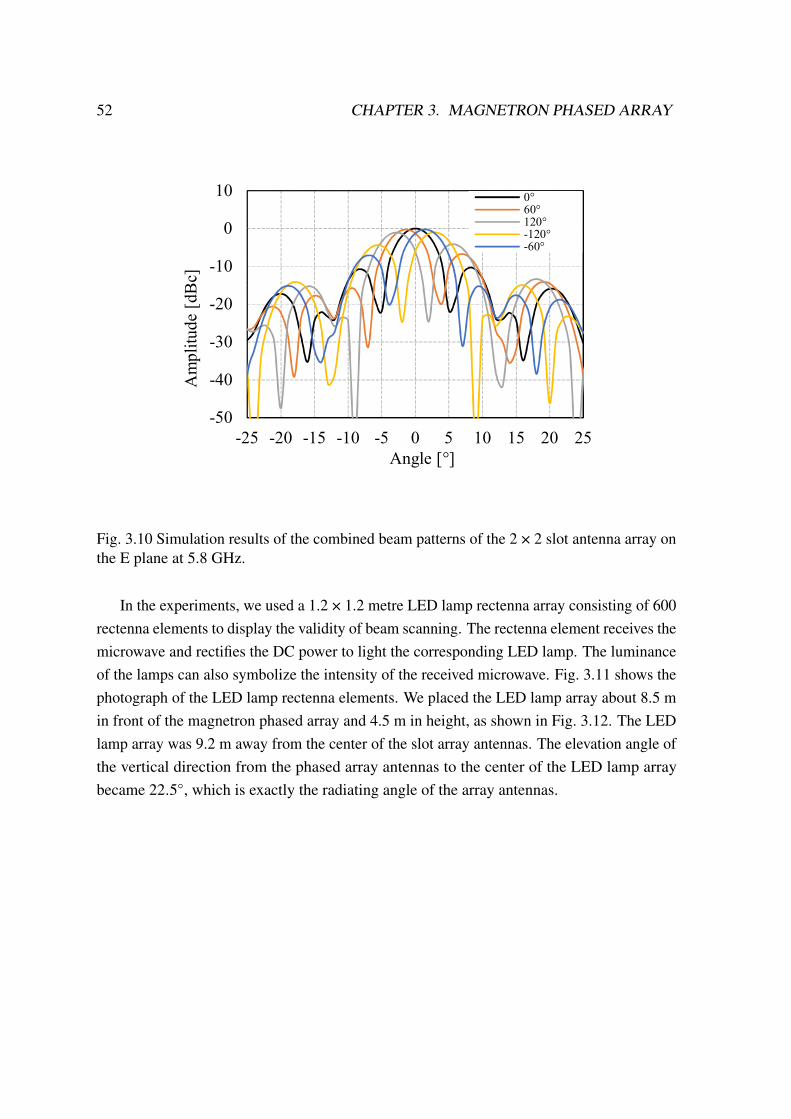
52 CHAPTER 3. MAGNETRON PHASED ARRAY
-50
-40
-30
-20
-10
0
10
5.2 5.4 5.6 5.8 6 6.2 6.4
Am
pli
tud
e [d
B]
Frequency[GHz]
No.1
No.2
No.3
No.4
Simulation
-60
-50
-40
-30
-20
-10
0
10
-90 -67.5 -45 -22.5 0 22.5 45 67.5 90
Am
pli
tude
[dB
c]
Angle[°]
Simulation
No.1
No.2
No.3
No.4
5.782
5.784
5.786
5.788
5.790
5.792
0 1 2 3 4 5 6 7 8 9 10
Fre
qu
ency
[G
Hz]
Injection Power [W]
-50
-40
-30
-20
-10
0
10
-25 -20 -15 -10 -5 0 5 10 15 20 25
Am
pli
tud
e [d
Bc]
Angle [°]
0°60°120°-120°-60°
Fig. 3.10 Simulation results of the combined beam patterns of the 2 × 2 slot antenna array onthe E plane at 5.8 GHz.
In the experiments, we used a 1.2 × 1.2 metre LED lamp rectenna array consisting of 600rectenna elements to display the validity of beam scanning. The rectenna element receives themicrowave and rectifies the DC power to light the corresponding LED lamp. The luminanceof the lamps can also symbolize the intensity of the received microwave. Fig. 3.11 shows thephotograph of the LED lamp rectenna elements. We placed the LED lamp array about 8.5 min front of the magnetron phased array and 4.5 m in height, as shown in Fig. 3.12. The LEDlamp array was 9.2 m away from the center of the slot array antennas. The elevation angle ofthe vertical direction from the phased array antennas to the center of the LED lamp arraybecame 22.5◦, which is exactly the radiating angle of the array antennas.
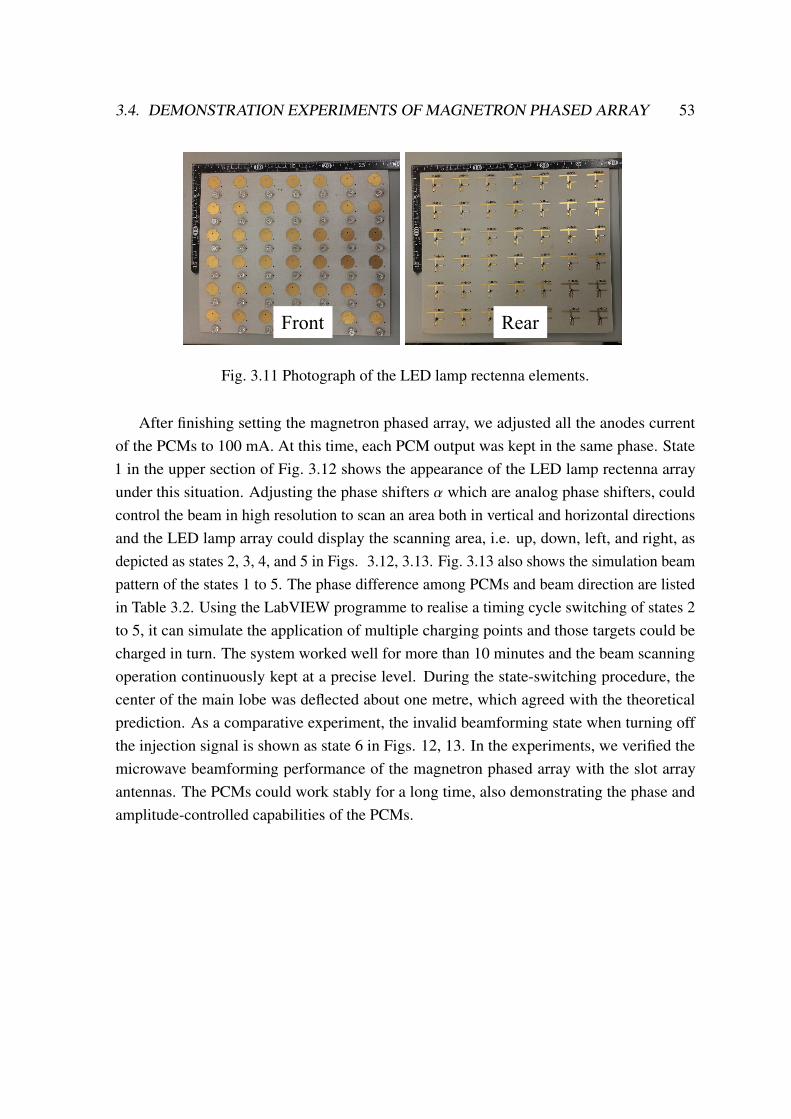
3.4. DEMONSTRATION EXPERIMENTS OF MAGNETRON PHASED ARRAY 53
Front Rear
Fig. 3.11 Photograph of the LED lamp rectenna elements.
After finishing setting the magnetron phased array, we adjusted all the anodes currentof the PCMs to 100 mA. At this time, each PCM output was kept in the same phase. State1 in the upper section of Fig. 3.12 shows the appearance of the LED lamp rectenna arrayunder this situation. Adjusting the phase shifters 𝛼 which are analog phase shifters, couldcontrol the beam in high resolution to scan an area both in vertical and horizontal directionsand the LED lamp array could display the scanning area, i.e. up, down, left, and right, asdepicted as states 2, 3, 4, and 5 in Figs. 3.12, 3.13. Fig. 3.13 also shows the simulation beampattern of the states 1 to 5. The phase difference among PCMs and beam direction are listedin Table 3.2. Using the LabVIEW programme to realise a timing cycle switching of states 2to 5, it can simulate the application of multiple charging points and those targets could becharged in turn. The system worked well for more than 10 minutes and the beam scanningoperation continuously kept at a precise level. During the state-switching procedure, thecenter of the main lobe was deflected about one metre, which agreed with the theoreticalprediction. As a comparative experiment, the invalid beamforming state when turning offthe injection signal is shown as state 6 in Figs. 12, 13. In the experiments, we verified themicrowave beamforming performance of the magnetron phased array with the slot arrayantennas. The PCMs could work stably for a long time, also demonstrating the phase andamplitude-controlled capabilities of the PCMs.
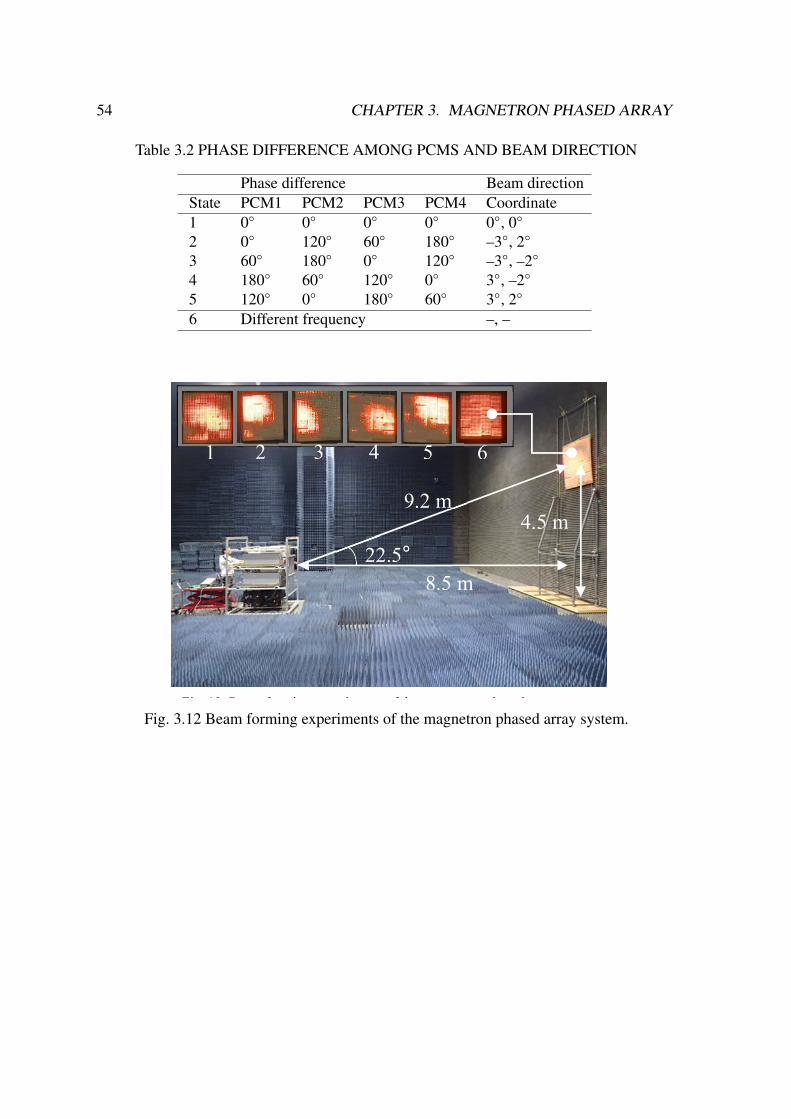
54 CHAPTER 3. MAGNETRON PHASED ARRAY
Table 3.2 PHASE DIFFERENCE AMONG PCMS AND BEAM DIRECTION
Phase difference Beam directionState PCM1 PCM2 PCM3 PCM4 Coordinate1 0◦ 0◦ 0◦ 0◦ 0◦, 0◦
2 0◦ 120◦ 60◦ 180◦ –3◦, 2◦
3 60◦ 180◦ 0◦ 120◦ –3◦, –2◦
4 180◦ 60◦ 120◦ 0◦ 3◦, –2◦
5 120◦ 0◦ 180◦ 60◦ 3◦, 2◦
6 Different frequency –, –
IEEE TRANSACTIONS ON MICROWAVE THEORY AND TECHNIQUES
the scanning area, i.e. up, down, left, and right, as depicted as
states 2, 3, 4, and 5 in Figs. 12, 13. Fig. 13 also shows the
simulation beam pattern of the states 1~5. The phase
difference among PCMs and beam direction are listed in Table
II. Using the LabVIEW programme to realise a timing cycle
switching of states 2 to 5, it can simulate the application of
multiple charging points and those targets could be charged in
turn. The system worked well for more than 10 minutes and
the beam scanning operation continuously kept at a precise
level.
During the state-switching procedure, the center of the main
lobe was deflected about one metre, which agreed with the
theoretical prediction. As a comparative experiment, the
invalid beamforming state when turning off the injection
signal is shown as state 6 in Figs. 12, 13. In the experiments,
we verified the microwave beamforming performance of the
magnetron phased array with the slot array antennas. The
PCMs could work stably for a long time, also demonstrating
the phase and amplitude-controlled capabilities of the PCMs.
TABLE II
PHASE DIFFERENCE AMONG PCMS AND BEAM DIRECTION
B. Wireless Power Transfer Experiments
Fig. 14 shows a 5.8 GHz rectenna array system (IHI Aero
Space) that was used as a microwave power receiver in the
WPT experiments [9]. This rectenna array system consists of
36 sub-arrays, each sub-array has 64 rectenna elements that
can tolerate a maximum microwave power intensity of 378
W/m2. These sub-arrays form a symmetrical octagonal
structure. In the center of the octagonal structure, there is a
null space for the retro directive module of the microwave
power transmission, which was not applied in the experiments.
The rectenna circuit element can achieve a maximum
microwave rectification efficiency of 63% at 200 mW to 800
mW input power. All the rectenna elements of a sub-array
combine the DC power and output to the load control unit,
keeping the load resistance working at 24 Ω. The rectified
output DC power of each sub-array was monitored in real-time.
The 36 load control units are connected to the synthesis unit
and charge the battery unit. There are 24 sensors installed in a
cross-shape to detect the microwave power density. Through
these sensors, we can observe the microwave whether it
exceeds the rated power density and spot the position of the
main lobe. A monitor PC communicates with the control units
the through optical fiber, reads the data of all sensors, and
controls the connection relays of each part. Combing the DC
output of the 2304 rectenna elements, the best rectification
efficiency can reach 50%. Furthermore, the rectenna array
Phase difference Beam direction
State PCM1 PCM2 PCM3 PCM4 Coordinate
1 0° 0° 0° 0° 0°,0°
2 0° 120° 60° 180° −3°,2°
3 60° 180° 0° 120° −3°,−2°
4 180° 60° 120° 0° 3°,−2°
5 120° 0° 180° 60° 3°,2°
6 Different frequency -,-
Fig. 12. Beam forming experiments of the magnetron phased array system.
8.5 m
4.5 m 9.2 m
22.5°
1 2 3 4 5 6
Fig. 14. 5.8 GHz rectenna array system.
2.7 m
2.7 m
3.5 m
Fig. 13. Display of the LED lamp array and simulation beam pattern of
states 1~5. (Black frame: LED lamp array)
1
2
3 4
5
Fig. 3.12 Beam forming experiments of the magnetron phased array system.
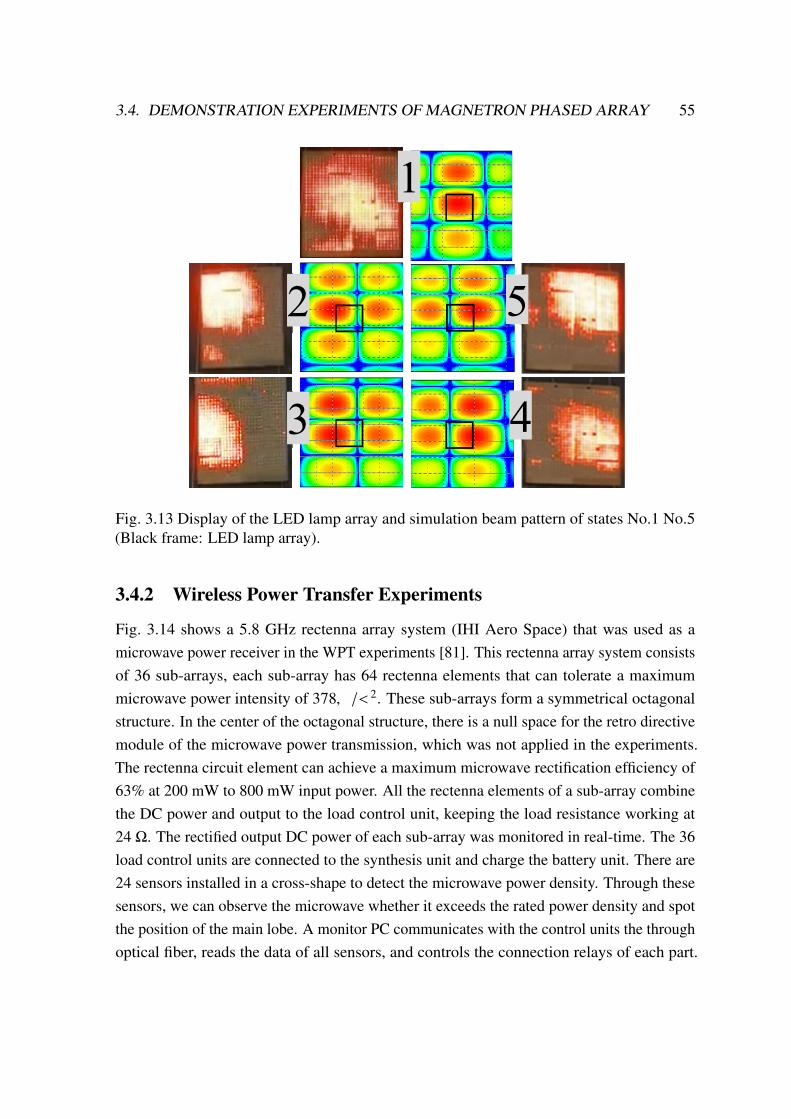
3.4. DEMONSTRATION EXPERIMENTS OF MAGNETRON PHASED ARRAY 55IEEE TRANSACTIONS ON MICROWAVE THEORY AND TECHNIQUES
the scanning area, i.e. up, down, left, and right, as depicted as
states 2, 3, 4, and 5 in Figs. 12, 13. Fig. 13 also shows the
simulation beam pattern of the states 1~5. The phase
difference among PCMs and beam direction are listed in Table
II. Using the LabVIEW programme to realise a timing cycle
switching of states 2 to 5, it can simulate the application of
multiple charging points and those targets could be charged in
turn. The system worked well for more than 10 minutes and
the beam scanning operation continuously kept at a precise
level.
During the state-switching procedure, the center of the main
lobe was deflected about one metre, which agreed with the
theoretical prediction. As a comparative experiment, the
invalid beamforming state when turning off the injection
signal is shown as state 6 in Figs. 12, 13. In the experiments,
we verified the microwave beamforming performance of the
magnetron phased array with the slot array antennas. The
PCMs could work stably for a long time, also demonstrating
the phase and amplitude-controlled capabilities of the PCMs.
TABLE II
PHASE DIFFERENCE AMONG PCMS AND BEAM DIRECTION
B. Wireless Power Transfer Experiments
Fig. 14 shows a 5.8 GHz rectenna array system (IHI Aero
Space) that was used as a microwave power receiver in the
WPT experiments [9]. This rectenna array system consists of
36 sub-arrays, each sub-array has 64 rectenna elements that
can tolerate a maximum microwave power intensity of 378
W/m2. These sub-arrays form a symmetrical octagonal
structure. In the center of the octagonal structure, there is a
null space for the retro directive module of the microwave
power transmission, which was not applied in the experiments.
The rectenna circuit element can achieve a maximum
microwave rectification efficiency of 63% at 200 mW to 800
mW input power. All the rectenna elements of a sub-array
combine the DC power and output to the load control unit,
keeping the load resistance working at 24 Ω. The rectified
output DC power of each sub-array was monitored in real-time.
The 36 load control units are connected to the synthesis unit
and charge the battery unit. There are 24 sensors installed in a
cross-shape to detect the microwave power density. Through
these sensors, we can observe the microwave whether it
exceeds the rated power density and spot the position of the
main lobe. A monitor PC communicates with the control units
the through optical fiber, reads the data of all sensors, and
controls the connection relays of each part. Combing the DC
output of the 2304 rectenna elements, the best rectification
efficiency can reach 50%. Furthermore, the rectenna array
Phase difference Beam direction
State PCM1 PCM2 PCM3 PCM4 Coordinate
1 0° 0° 0° 0° 0°,0°
2 0° 120° 60° 180° −3°,2°
3 60° 180° 0° 120° −3°,−2°
4 180° 60° 120° 0° 3°,−2°
5 120° 0° 180° 60° 3°,2°
6 Different frequency -,-
Fig. 12. Beam forming experiments of the magnetron phased array system.
8.5 m
4.5 m 9.2 m
22.5°
1 2 3 4 5 6
Fig. 14. 5.8 GHz rectenna array system.
2.7 m
2.7 m
3.5 m
Fig. 13. Display of the LED lamp array and simulation beam pattern of
states 1~5. (Black frame: LED lamp array)
1
2
3 4
5
Fig. 3.13 Display of the LED lamp array and simulation beam pattern of states No.1 No.5(Black frame: LED lamp array).
3.4.2 Wireless Power Transfer Experiments
Fig. 3.14 shows a 5.8 GHz rectenna array system (IHI Aero Space) that was used as amicrowave power receiver in the WPT experiments [81]. This rectenna array system consistsof 36 sub-arrays, each sub-array has 64 rectenna elements that can tolerate a maximummicrowave power intensity of 378𝑊/𝑚2. These sub-arrays form a symmetrical octagonalstructure. In the center of the octagonal structure, there is a null space for the retro directivemodule of the microwave power transmission, which was not applied in the experiments.The rectenna circuit element can achieve a maximum microwave rectification efficiency of63% at 200 mW to 800 mW input power. All the rectenna elements of a sub-array combinethe DC power and output to the load control unit, keeping the load resistance working at24 Ω. The rectified output DC power of each sub-array was monitored in real-time. The 36load control units are connected to the synthesis unit and charge the battery unit. There are24 sensors installed in a cross-shape to detect the microwave power density. Through thesesensors, we can observe the microwave whether it exceeds the rated power density and spotthe position of the main lobe. A monitor PC communicates with the control units the throughoptical fiber, reads the data of all sensors, and controls the connection relays of each part.
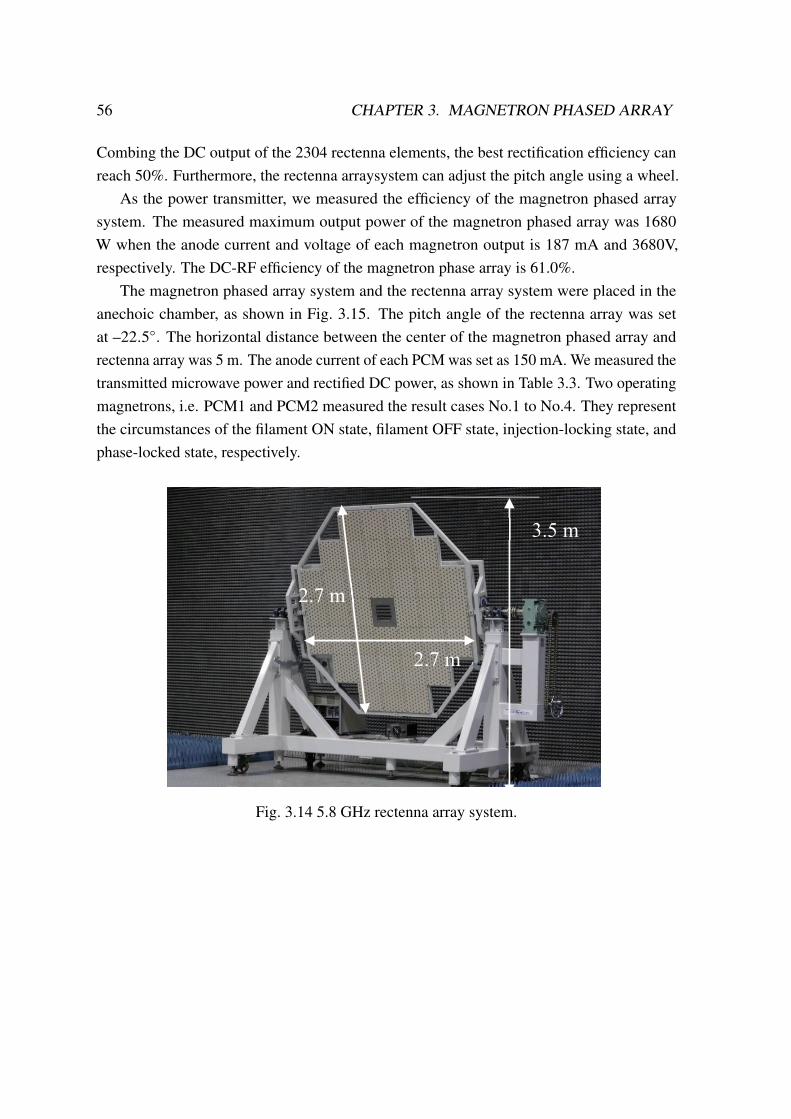
56 CHAPTER 3. MAGNETRON PHASED ARRAY
Combing the DC output of the 2304 rectenna elements, the best rectification efficiency canreach 50%. Furthermore, the rectenna arraysystem can adjust the pitch angle using a wheel.
As the power transmitter, we measured the efficiency of the magnetron phased arraysystem. The measured maximum output power of the magnetron phased array was 1680W when the anode current and voltage of each magnetron output is 187 mA and 3680V,respectively. The DC-RF efficiency of the magnetron phase array is 61.0%.
The magnetron phased array system and the rectenna array system were placed in theanechoic chamber, as shown in Fig. 3.15. The pitch angle of the rectenna array was setat –22.5◦. The horizontal distance between the center of the magnetron phased array andrectenna array was 5 m. The anode current of each PCM was set as 150 mA. We measured thetransmitted microwave power and rectified DC power, as shown in Table 3.3. Two operatingmagnetrons, i.e. PCM1 and PCM2 measured the result cases No.1 to No.4. They representthe circumstances of the filament ON state, filament OFF state, injection-locking state, andphase-locked state, respectively.
IEEE TRANSACTIONS ON MICROWAVE THEORY AND TECHNIQUES
the scanning area, i.e. up, down, left, and right, as depicted as
states 2, 3, 4, and 5 in Figs. 12, 13. Fig. 13 also shows the
simulation beam pattern of the states 1~5. The phase
difference among PCMs and beam direction are listed in Table
II. Using the LabVIEW programme to realise a timing cycle
switching of states 2 to 5, it can simulate the application of
multiple charging points and those targets could be charged in
turn. The system worked well for more than 10 minutes and
the beam scanning operation continuously kept at a precise
level.
During the state-switching procedure, the center of the main
lobe was deflected about one metre, which agreed with the
theoretical prediction. As a comparative experiment, the
invalid beamforming state when turning off the injection
signal is shown as state 6 in Figs. 12, 13. In the experiments,
we verified the microwave beamforming performance of the
magnetron phased array with the slot array antennas. The
PCMs could work stably for a long time, also demonstrating
the phase and amplitude-controlled capabilities of the PCMs.
TABLE II
PHASE DIFFERENCE AMONG PCMS AND BEAM DIRECTION
B. Wireless Power Transfer Experiments
Fig. 14 shows a 5.8 GHz rectenna array system (IHI Aero
Space) that was used as a microwave power receiver in the
WPT experiments [9]. This rectenna array system consists of
36 sub-arrays, each sub-array has 64 rectenna elements that
can tolerate a maximum microwave power intensity of 378
W/m2. These sub-arrays form a symmetrical octagonal
structure. In the center of the octagonal structure, there is a
null space for the retro directive module of the microwave
power transmission, which was not applied in the experiments.
The rectenna circuit element can achieve a maximum
microwave rectification efficiency of 63% at 200 mW to 800
mW input power. All the rectenna elements of a sub-array
combine the DC power and output to the load control unit,
keeping the load resistance working at 24 Ω. The rectified
output DC power of each sub-array was monitored in real-time.
The 36 load control units are connected to the synthesis unit
and charge the battery unit. There are 24 sensors installed in a
cross-shape to detect the microwave power density. Through
these sensors, we can observe the microwave whether it
exceeds the rated power density and spot the position of the
main lobe. A monitor PC communicates with the control units
the through optical fiber, reads the data of all sensors, and
controls the connection relays of each part. Combing the DC
output of the 2304 rectenna elements, the best rectification
efficiency can reach 50%. Furthermore, the rectenna array
Phase difference Beam direction
State PCM1 PCM2 PCM3 PCM4 Coordinate
1 0° 0° 0° 0° 0°,0°
2 0° 120° 60° 180° −3°,2°
3 60° 180° 0° 120° −3°,−2°
4 180° 60° 120° 0° 3°,−2°
5 120° 0° 180° 60° 3°,2°
6 Different frequency -,-
Fig. 12. Beam forming experiments of the magnetron phased array system.
8.5 m
4.5 m 9.2 m
22.5°
1 2 3 4 5 6
Fig. 14. 5.8 GHz rectenna array system.
2.7 m
2.7 m
3.5 m
Fig. 13. Display of the LED lamp array and simulation beam pattern of
states 1~5. (Black frame: LED lamp array)
1
2
3 4
5
Fig. 3.14 5.8 GHz rectenna array system.
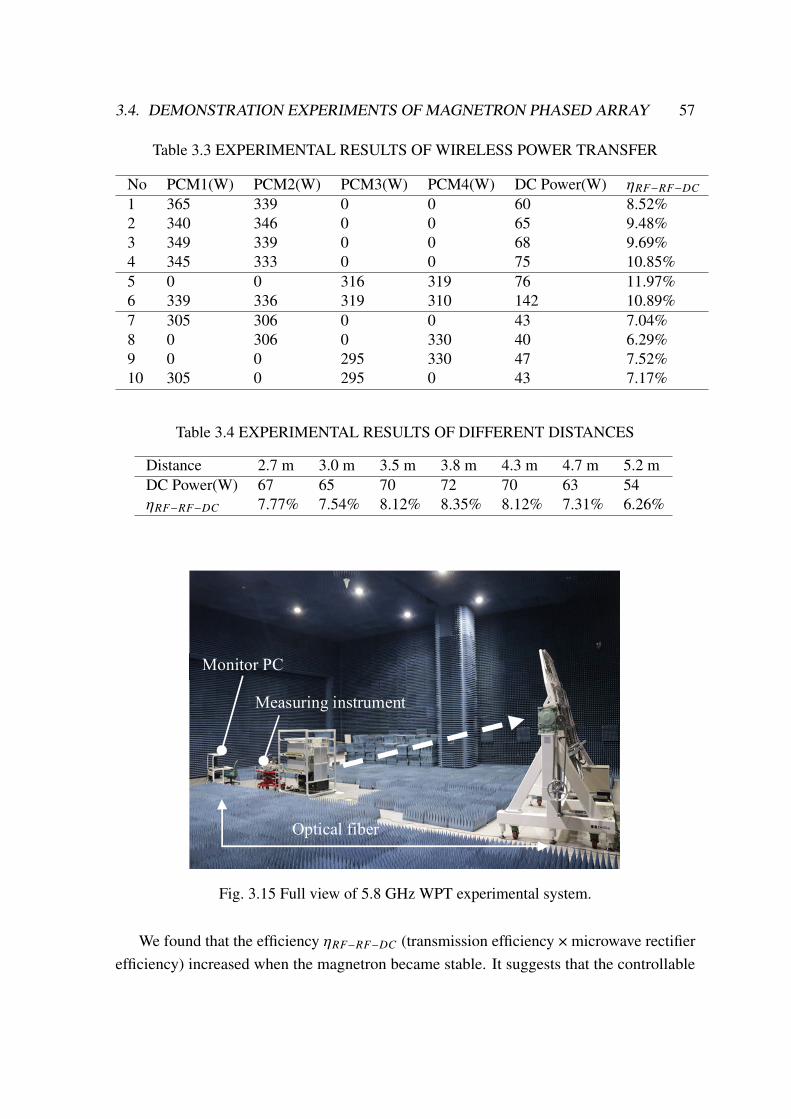
3.4. DEMONSTRATION EXPERIMENTS OF MAGNETRON PHASED ARRAY 57
Table 3.3 EXPERIMENTAL RESULTS OF WIRELESS POWER TRANSFER
No PCM1(W) PCM2(W) PCM3(W) PCM4(W) DC Power(W) [𝑅𝐹−𝑅𝐹−𝐷𝐶1 365 339 0 0 60 8.52%2 340 346 0 0 65 9.48%3 349 339 0 0 68 9.69%4 345 333 0 0 75 10.85%5 0 0 316 319 76 11.97%6 339 336 319 310 142 10.89%7 305 306 0 0 43 7.04%8 0 306 0 330 40 6.29%9 0 0 295 330 47 7.52%10 305 0 295 0 43 7.17%
Table 3.4 EXPERIMENTAL RESULTS OF DIFFERENT DISTANCES
Distance 2.7 m 3.0 m 3.5 m 3.8 m 4.3 m 4.7 m 5.2 mDC Power(W) 67 65 70 72 70 63 54[𝑅𝐹−𝑅𝐹−𝐷𝐶 7.77% 7.54% 8.12% 8.35% 8.12% 7.31% 6.26%
IEEE TRANSACTIONS ON MICROWAVE THEORY AND TECHNIQUES
system can adjust the pitch angle using a wheel.
As the power transmitter, we measured the efficiency of the
magnetron phased array system. The measured maximum
output power of the magnetron phased array was 1680 W
when the anode current and voltage of each magnetron output
is 187 mA and 3680V, respectively. The DC-RF efficiency of
the magnetron phase array is 61.0%.
The magnetron phased array system and the rectenna array
system were placed in the anechoic chamber, as shown in Fig.
15. The pitch angle of the rectenna array was set at −22.5°.
The horizontal distance between the center of the magnetron
phased array and rectenna array was 5 m. The anode current of
each PCM was set as 150 mA. We measured the transmitted
microwave power and rectified DC power, as shown in Table
III. Two operating magnetrons, i.e. PCM1 and PCM2
measured the result cases No.1~No.4. They represent the
circumstances of the filament ON state, filament OFF state,
injection-locking state, and phase-locked state, respectively.
TABLE III
EXPERIMENTAL RESULTS OF WIRELESS POWER TRANSFER
No PCM1 PCM2 PCM3 PCM4 DC
Power η RF-RF-
DC
1 365 339 0 0 60 8.52%
2 340 346 0 0 65 9.48%
3 349 339 0 0 68 9.69% 4 345 333 0 0 75 10.85%
5 0 0 316 319 76 11.97%
6 339 336 319 310 142 10.89%
7 305 306 0 0 43 7.04% 8 0 306 0 330 40 6.29%
9 0 0 295 330 47 7.52%
10 305 0 295 0 43 7.17%
TABLE IV
EXPERIMENTAL RESULTS OF DIFFERENT DISTANCES
Distance 2.7 m 3.0 m 3.5 m 3.8 m 4.3 m 4.7 m 5.2 m
DC Power 67 65 70 72 70 63 54
η RF-RF-DC 7.77% 7.54% 8.12% 8.35% 8.12% 7.31% 6.26%
We found that the efficiency ηRF-RF-DC (transmission
efficiency × microwave rectifier efficiency) increased when
the magnetron became stable. It suggests that the controllable
beam scanning will contribute to a higher transmission
efficiency. Case No.5 shows that the highest transfer
efficiency was observed when PCM3 and PCM4 were on. Fig.
16 shows the power density distribution of case No.5. The
distributed power densities of rectenna array were detected by
24 power sensors. An infrared image of the rectenna array
system in Fig. 16 was captured by a thermographic camera,
which can also reveal the received power distribution. The
highest received power is found in case No.6, when the output
power of the magnetron phased array was 1304 W. When the
pitch angle of the rectenna array is −12.5°, case No.7~No.10
illustrate the conditions that the adjacent two PCMs in
horizontal or vertical directions worked. The values of their
efficiency are near the same level. These values, however, are
lower than in case No.5 since they were measured in a
different transmit angle. Here, the result simulated the effect
of different incident angles on the transmission efficiency in
the WPT systems.
We then changed the transmission distance between the
center of the magnetron phased array and the rectenna array.
The anode current of each PCM was set as 150 mA. The
magnetron phased array output 862 W microwave and the
radiated beam remains constant. Table IV shows the measured
data when the distance varies from 2.7 m to 5 m. When the
distance is too close, the received power is focused on a few
sub-arrays where the rectified power is limited even if the
received microwave is continuously increasing. Besides, the
imperfection of the central area of the rectenna array will also
influence the transfer efficiency, otherwise, some parts of the
received microwave energy will distribute outside the rectenna
array panel when the transmission distance is relatively long.
We further analyzed the relationship between transmission
efficiency and transmission distance in the experiments. The
transmission distance of the experiment was less than 5.5m,
which is within the near-field region. Therefore, the
transmission efficiency can be expressed as the following (2)
[15],
�� � 1 � ���
� �� ��/��
� � � ��/4�
Monitor PC
Measuring instrument
Optical fiber
Fig. 15. Full view of 5.8 GHz WPT experimental system.
Fig. 16. Power density distribution of the case No.5.
101.5 74.7 91.7 75.3
116.4 118.3 153.5 127.2
66.3
107.0 26.1 0.0
0.0
24.2
29.3 115.6
0.0 0.0
0.0
0.0 0.0
30.5
45.0
23.6
Power density
(W/m2)
Fig. 3.15 Full view of 5.8 GHz WPT experimental system.
We found that the efficiency [𝑅𝐹−𝑅𝐹−𝐷𝐶 (transmission efficiency × microwave rectifierefficiency) increased when the magnetron became stable. It suggests that the controllable

58 CHAPTER 3. MAGNETRON PHASED ARRAY
beam scanning will contribute to a higher transmission efficiency. Case No.5 shows that thehighest transfer efficiency was observed when PCM3 and PCM4 were on. Fig. 3.16 showsthe power density distribution of case No.5. The distributed power densities of rectennaarray were detected by 24 power sensors. An infrared image of the rectenna array systemin Fig. 3.16 was captured by a thermographic camera, which can also reveal the receivedpower distribution. The highest received power is found in case No.6, when the output powerof the magnetron phased array was 1304 W. When the pitch angle of the rectenna array is–12.5◦, case No.7 No.10 illustrate the conditions that the adjacent two PCMs in horizontalor vertical directions worked. The values of their efficiency are near the same level. Thesevalues, however, are lower than in case No.5 since they were measured in a different transmitangle. Here, the result simulated the effect of different incident angles on the transmissionefficiency in the WPT systems.
Feed waveguide(mm) Radiation waveguide(mm)No. length offset No. length offset No. length offset1 24.3 4.2 1 23.2 3.9 9 24.8 8.22 23.3 4.8 2 23.6 3.6 10 24.7 7.93 24.8 5.9 3 23.6 3.7 11 24.6 7.64 22.8 6.7 4 23.8 4.5 12 24.6 7.45 26.5 7.2 5 24.0 5.2 13 24.8 8.66 26.4 6.5 6 24.3 6.0 14 25.0 10.47 25.9 4.7 7 24.5 7.08 25.3 4.4 8 24.7 8.0
No PCM1 PCM2 PCM3 PCM4 DC Power η RF-DC1 365 339 0 0 60 8.52%2 340 346 0 0 65 9.48%3 349 339 0 0 68 9.69%4 345 333 0 0 75 10.85%5 0 0 316 319 76 11.97%6 339 336 319 310 142 10.89%7 305 306 0 0 43 7.04%8 0 306 0 330 40 6.29%9 0 0 295 330 47 7.52%
10 305 0 295 0 43 7.17%
101.574.7
91.775.3
116.4118.3153.5
127.266.3
107.0 26.10.0
0.0
24.2
29.3 115.6
0.00.0
0.0
0.00.0
30.5
45.0
23.6
Fig. 3.16 Power density distribution of the case No. 5.
We then changed the transmission distance between the center of the magnetron phasedarray and the rectenna array. The anode current of each PCM was set as 150 mA. Themagnetron phased array output 862 W microwave and the radiated beam remains constant.Table 3.4 shows the measured data when the distance varies from 2.7 m to 5 m. When thedistance is too close, the received power is focused on a few sub-arrays where the rectifiedpower is limited even if the received microwave is continuously increasing. Besides, theimperfection of the central area of the rectenna array will also influence the transfer efficiency,
3.4. DEMONSTRATION EXPERIMENTS OF MAGNETRON PHASED ARRAY 59
otherwise, some parts of the received microwave energy will distribute outside the rectennaarray panel when the transmission distance is relatively long.
We further analyzed the relationship between transmission efficiency and transmissiondistance in the experiments. The transmission distance of the experiment was less than 5.5 m,which is within the near-field region. Therefore, the transmission efficiency can be expressedas the following equation (3.2) [87],
[0 = 1− 𝑒−𝜏2
𝜏 =𝐷𝑡 ×𝐷𝑟_𝐷
(3.2)
𝐷𝑡 and 𝐷𝑟 are the antenna diameters of the transmitter and receiver, respectively. Here,𝐷𝑡 is the diagonal of the slot array antenna, which is nearly 1.14 m. 𝐷𝑟 is edge-to-edgedistance, which is nearly 2.70 m. _ is the wavelength. 𝐷 is the transmission distance. Thetransmission efficiency [0 of this ideal model with distance is shown in the blue line inFig. 3.17. The power density distribution received by the rectenna array system is a powerdensity distribution formed by the slot array antenna at a transmission distance 𝐷. Thesimulation data of beam pattern were used to analyze the power distribution. The powerdensity distribution of the main lobe is approximately expressed as [88][89]
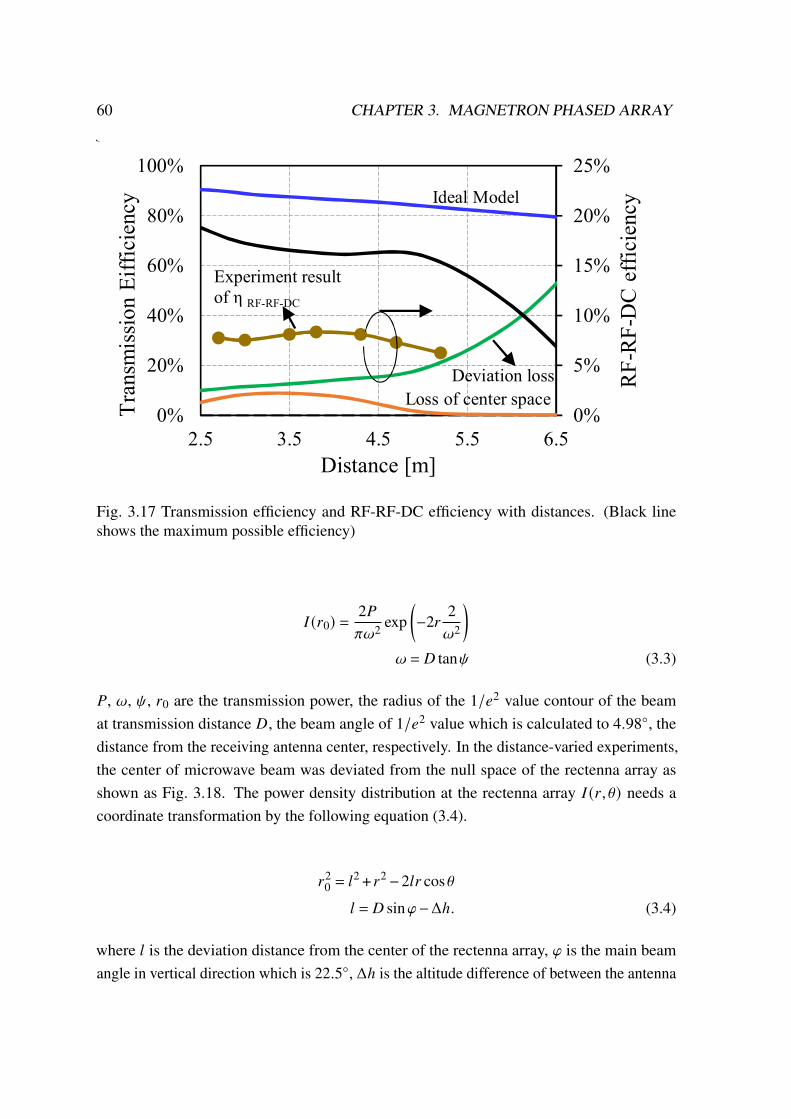
60 CHAPTER 3. MAGNETRON PHASED ARRAYIEEE TRANSACTIONS ON MICROWAVE THEORY AND TECHNIQUES
�� � ����/4 (2)
� and �� are the antenna gain of the transmitter and receiver,
respectively. � is the effective area of the transmitting
antenna area, which is nearly 0.18 m2. �� is the effective area
of the receiving antenna area, which is nearly 2.4 m2. D is the
transmission distance. The transmission efficiency �� of this
ideal model with distance is shown in the blue line in Fig. 17.
The power density distribution received by the rectenna array
system is a power density distribution formed by the slot array
antenna at a transmission distance . The simulation data of
beam pattern were used to analyze the power distribution. The
power density distribution of the main lobe is approximately
expressed as [16] [17]
����� �2�
�� ��� ��2���/���
� � tan � �3�
P, �, �, r0 are the transmission power, the radius of the 1/e2
value contour of the beam at transmission distance D, the
beam angle of 1/e2 value which is calculated to 4.98°, the
distance from the receiving antenna center, respectively. In the
distance-varied experiments, the center of microwave beam
was deviated from the null space of the rectenna array as
shown as Fig. 18. The power density distribution at the
rectenna array ���, � needs a coordinate transformation by the
following (4).
��� � !� " �� � 2!� cos
! � sin ' � ∆ℎ . (4)
where ! is the deviation distance from the center of the
rectenna array, ' is the main beam angle in vertical direction
which is 22.5°, ∆ℎ is the altitude difference of between the
antenna centers of Tx and Rx system which is 1.3 m. The
received power Pr of the rectenna array can be expressed as (5)
Pr=* * ���, �+,-
�
�.
�/�/ . (5)
/� is the equivalent diameter of the rectenna array system
which is 2.7 m. When setting l to 0, the receiving power is the
ideal model power �� . The loss of transmission efficiency
from the deviation of the rectenna array null center is written
as
01 � ��� � ���/�� . (6)
The D-01 curve is shown in the green line in Fig. 17. The
power loss of the center null space of the rectenna array can be
also expressed
Pn=* * ���, �2,-
�
�.
�/�/ . (7)
Here, 3� is the equivalent diameter of the null space , which is
0.49 m. The loss of transmission efficiency from the center
null space is expressed in the following equation and shown in
the orange line in Fig. 17.
04 � �4/�� . (8)
The black line in Fig. 17 shows the transmission efficiency of
the WPT experiments which is expressed as
� � �� 5 �1 � 01 � 04� � ��� � �4�/� . (9)
The antennas of rectenna array were circularly polarized.
However, the developed transmitting slot array antennas were
linearly polarized. Then, almost a half power would be wasted
at the receiving antennas. Additionally, containing the rectifier
loss (minimum 50%), the RF-RF-DC efficiency of the
experimental results is the brown line as shown in Fig. 17. The
black line in Fig. 17 also shows the maximum possible RF-RF-
DC efficiency by the secondary horizontal axis. In addition, the non-uniform received microwave intensity
fluctuates the rectifier efficiency [18] [19]. It proves that the
higher rectified efficiency needs as many rectennas working
optimally as possible. The phase adjustment, therefore, is
necessary for achieving a uniform or a specific microwave
energy distribution at the received array.
Table V shows a detailed comparison of the magnetron
microwave power transmitter and transfer parameters with
other works. Compared with the magnetron WPT transmitter
developed by Zhang et al. [11] and Chen et al. [12], it is the
first time that a beamforming transmitter is developed based
on power-variable and PCMs. Furthermore, the received DC
power is much higher than [11] reported, even if the operating
frequency is higher.
Fig. 17. Transmission efficiency and RF-RF-DC efficiency with
distances. (Black line shows the maximum possible efficiency)
0%
5%
10%
15%
20%
25%
0%
20%
40%
60%
80%
100%
2.5 3.5 4.5 5.5 6.5
RF
-RF
-DC
eff
icie
ncy
Tra
nsm
issi
on E
iffi
cien
cy
Distance [m]
Deviation loss
Experiment result
of η RF-RF-DC
Ideal Model
Loss of center space
Fig. 18. Schematic diagram of the deviated beam pattern.
φ
! ��
�
∆ℎ
Fig. 3.17 Transmission efficiency and RF-RF-DC efficiency with distances. (Black lineshows the maximum possible efficiency)
𝐼 (𝑟0) =2𝑃𝜋𝜔2 exp
(−2𝑟
2𝜔2
)𝜔 = 𝐷 tan𝜓 (3.3)
𝑃, 𝜔, 𝜓, 𝑟0 are the transmission power, the radius of the 1/𝑒2 value contour of the beamat transmission distance 𝐷, the beam angle of 1/𝑒2 value which is calculated to 4.98◦, thedistance from the receiving antenna center, respectively. In the distance-varied experiments,the center of microwave beam was deviated from the null space of the rectenna array asshown as Fig. 3.18. The power density distribution at the rectenna array 𝐼 (𝑟, \) needs acoordinate transformation by the following equation (3.4).
𝑟20 = 𝑙
2 + 𝑟2 −2𝑙𝑟 cos\
𝑙 = 𝐷 sin𝜑−Δℎ. (3.4)
where 𝑙 is the deviation distance from the center of the rectenna array, 𝜑 is the main beamangle in vertical direction which is 22.5◦, Δℎ is the altitude difference of between the antenna
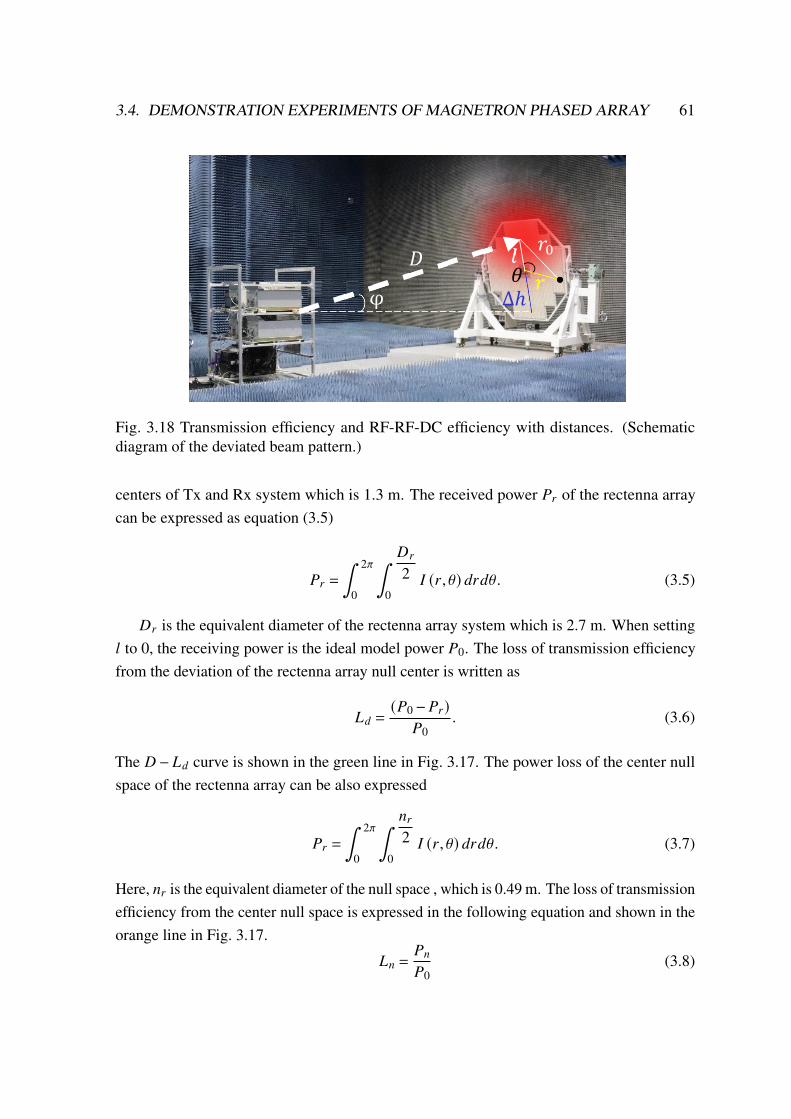
3.4. DEMONSTRATION EXPERIMENTS OF MAGNETRON PHASED ARRAY 61
IEEE TRANSACTIONS ON MICROWAVE THEORY AND TECHNIQUES
�� � ����/4 (2)
� and �� are the antenna gain of the transmitter and receiver,
respectively. � is the effective area of the transmitting
antenna area, which is nearly 0.18 m2. �� is the effective area
of the receiving antenna area, which is nearly 2.4 m2. D is the
transmission distance. The transmission efficiency �� of this
ideal model with distance is shown in the blue line in Fig. 17.
The power density distribution received by the rectenna array
system is a power density distribution formed by the slot array
antenna at a transmission distance . The simulation data of
beam pattern were used to analyze the power distribution. The
power density distribution of the main lobe is approximately
expressed as [16] [17]
����� �2�
�� ��� ��2���/���
� � tan � �3�
P, �, �, r0 are the transmission power, the radius of the 1/e2
value contour of the beam at transmission distance D, the
beam angle of 1/e2 value which is calculated to 4.98°, the
distance from the receiving antenna center, respectively. In the
distance-varied experiments, the center of microwave beam
was deviated from the null space of the rectenna array as
shown as Fig. 18. The power density distribution at the
rectenna array ���, � needs a coordinate transformation by the
following (4).
��� � !� " �� � 2!� cos
! � sin ' � ∆ℎ . (4)
where ! is the deviation distance from the center of the
rectenna array, ' is the main beam angle in vertical direction
which is 22.5°, ∆ℎ is the altitude difference of between the
antenna centers of Tx and Rx system which is 1.3 m. The
received power Pr of the rectenna array can be expressed as (5)
Pr=* * ���, �+,-
�
�.
�/�/ . (5)
/� is the equivalent diameter of the rectenna array system
which is 2.7 m. When setting l to 0, the receiving power is the
ideal model power �� . The loss of transmission efficiency
from the deviation of the rectenna array null center is written
as
01 � ��� � ���/�� . (6)
The D-01 curve is shown in the green line in Fig. 17. The
power loss of the center null space of the rectenna array can be
also expressed
Pn=* * ���, �2,-
�
�.
�/�/ . (7)
Here, 3� is the equivalent diameter of the null space , which is
0.49 m. The loss of transmission efficiency from the center
null space is expressed in the following equation and shown in
the orange line in Fig. 17.
04 � �4/�� . (8)
The black line in Fig. 17 shows the transmission efficiency of
the WPT experiments which is expressed as
� � �� 5 �1 � 01 � 04� � ��� � �4�/� . (9)
The antennas of rectenna array were circularly polarized.
However, the developed transmitting slot array antennas were
linearly polarized. Then, almost a half power would be wasted
at the receiving antennas. Additionally, containing the rectifier
loss (minimum 50%), the RF-RF-DC efficiency of the
experimental results is the brown line as shown in Fig. 17. The
black line in Fig. 17 also shows the maximum possible RF-RF-
DC efficiency by the secondary horizontal axis. In addition, the non-uniform received microwave intensity
fluctuates the rectifier efficiency [18] [19]. It proves that the
higher rectified efficiency needs as many rectennas working
optimally as possible. The phase adjustment, therefore, is
necessary for achieving a uniform or a specific microwave
energy distribution at the received array.
Table V shows a detailed comparison of the magnetron
microwave power transmitter and transfer parameters with
other works. Compared with the magnetron WPT transmitter
developed by Zhang et al. [11] and Chen et al. [12], it is the
first time that a beamforming transmitter is developed based
on power-variable and PCMs. Furthermore, the received DC
power is much higher than [11] reported, even if the operating
frequency is higher.
Fig. 17. Transmission efficiency and RF-RF-DC efficiency with
distances. (Black line shows the maximum possible efficiency)
0%
5%
10%
15%
20%
25%
0%
20%
40%
60%
80%
100%
2.5 3.5 4.5 5.5 6.5
RF
-RF
-DC
eff
icie
ncy
Tra
nsm
issi
on E
iffi
cien
cy
Distance [m]
Deviation loss
Experiment result
of η RF-RF-DC
Ideal Model
Loss of center space
Fig. 18. Schematic diagram of the deviated beam pattern.
φ
! ��
�
∆ℎ
Fig. 3.18 Transmission efficiency and RF-RF-DC efficiency with distances. (Schematicdiagram of the deviated beam pattern.)
centers of Tx and Rx system which is 1.3 m. The received power 𝑃𝑟 of the rectenna arraycan be expressed as equation (3.5)
𝑃𝑟 =
∫ 2𝜋
0
∫ 𝐷𝑟
20
𝐼 (𝑟, \) 𝑑𝑟𝑑\. (3.5)
𝐷𝑟 is the equivalent diameter of the rectenna array system which is 2.7 m. When setting𝑙 to 0, the receiving power is the ideal model power 𝑃0. The loss of transmission efficiencyfrom the deviation of the rectenna array null center is written as
𝐿𝑑 =(𝑃0 −𝑃𝑟)
𝑃0. (3.6)
The 𝐷 − 𝐿𝑑 curve is shown in the green line in Fig. 3.17. The power loss of the center nullspace of the rectenna array can be also expressed
𝑃𝑟 =
∫ 2𝜋
0
∫ 𝑛𝑟
20
𝐼 (𝑟, \) 𝑑𝑟𝑑\. (3.7)
Here, 𝑛𝑟 is the equivalent diameter of the null space , which is 0.49 m. The loss of transmissionefficiency from the center null space is expressed in the following equation and shown in theorange line in Fig. 3.17.
𝐿𝑛 =𝑃𝑛
𝑃0(3.8)
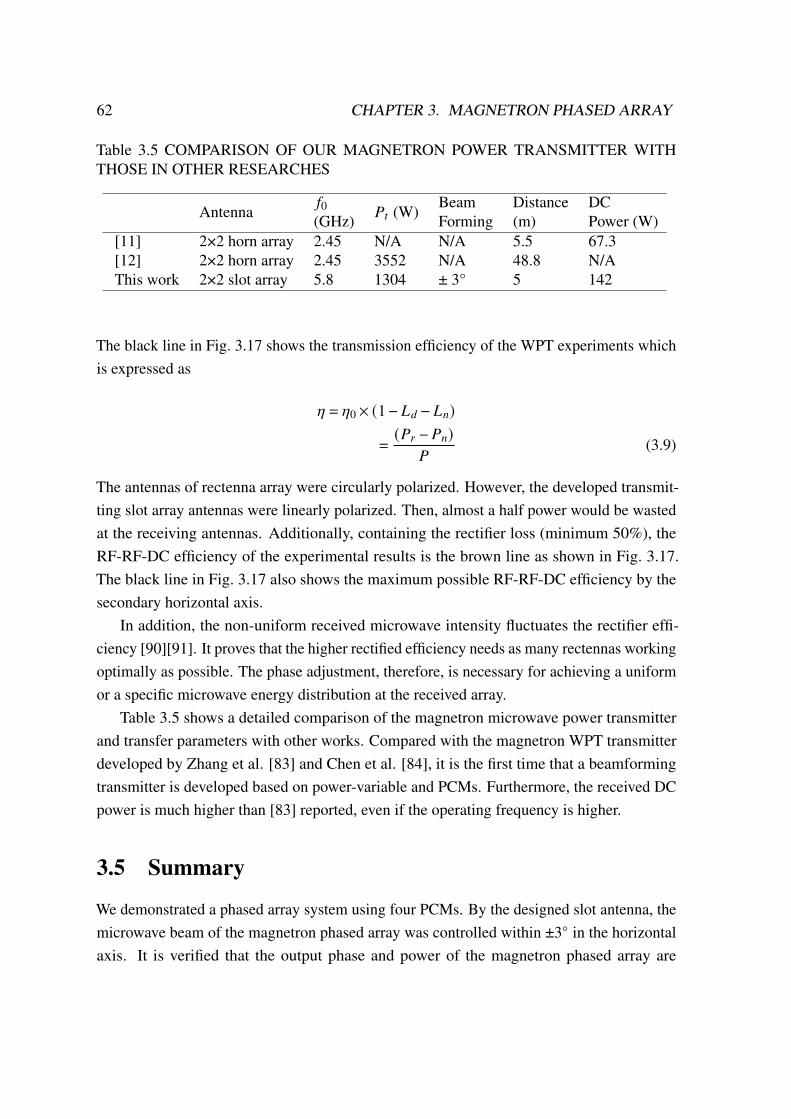
62 CHAPTER 3. MAGNETRON PHASED ARRAY
Table 3.5 COMPARISON OF OUR MAGNETRON POWER TRANSMITTER WITHTHOSE IN OTHER RESEARCHES
Antenna𝑓0(GHz) 𝑃𝑡 (W)
BeamForming
Distance(m)
DCPower (W)
[11] 2×2 horn array 2.45 N/A N/A 5.5 67.3[12] 2×2 horn array 2.45 3552 N/A 48.8 N/AThis work 2×2 slot array 5.8 1304 ± 3° 5 142
The black line in Fig. 3.17 shows the transmission efficiency of the WPT experiments whichis expressed as
[ = [0 × (1− 𝐿𝑑 − 𝐿𝑛)
=(𝑃𝑟 −𝑃𝑛)
𝑃(3.9)
The antennas of rectenna array were circularly polarized. However, the developed transmit-ting slot array antennas were linearly polarized. Then, almost a half power would be wastedat the receiving antennas. Additionally, containing the rectifier loss (minimum 50%), theRF-RF-DC efficiency of the experimental results is the brown line as shown in Fig. 3.17.The black line in Fig. 3.17 also shows the maximum possible RF-RF-DC efficiency by thesecondary horizontal axis.
In addition, the non-uniform received microwave intensity fluctuates the rectifier effi-ciency [90][91]. It proves that the higher rectified efficiency needs as many rectennas workingoptimally as possible. The phase adjustment, therefore, is necessary for achieving a uniformor a specific microwave energy distribution at the received array.
Table 3.5 shows a detailed comparison of the magnetron microwave power transmitterand transfer parameters with other works. Compared with the magnetron WPT transmitterdeveloped by Zhang et al. [83] and Chen et al. [84], it is the first time that a beamformingtransmitter is developed based on power-variable and PCMs. Furthermore, the received DCpower is much higher than [83] reported, even if the operating frequency is higher.
3.5 Summary
We demonstrated a phased array system using four PCMs. By the designed slot antenna, themicrowave beam of the magnetron phased array was controlled within ±3◦ in the horizontalaxis. It is verified that the output phase and power of the magnetron phased array are

3.5. SUMMARY 63
adjustable. The measured maximum output of the magnetron phased array was 1870 W with61.0% DC-RF efficiency. In the WPT experiments, the magnetron phased array output 1340W and received 142 W DC power at a transmission distance of 5 m. We investigated theeffect on power transmission efficiency under the condition of multiple output combinationsand different distances. The magnetron phased array provides a scheme of low-cost, high-efficiency WPT. Furthermore, the microwave power transmission technology should beapplied to other WPT systems.

Chapter 4
Modulation Performance withInjection-Locking Magnetrons
4.1 Introduction
Continues wave (CW) magnetrons are extensively used in heating applications, e.g., mi-crowave oven. The advantages of magnetrons include low-cost, high-efficiency, and high-level output. However, when magnetrons are used as transmitters, they exhibit severalshortcomings such as an unstable output frequency and high levels of phase noise [92].Several studies have investigated magnetron noise. For example, a study conducted by ourresearch group examined the magnetron noise and developed a phase-controlled magnetron(PCM) [93]. Further, we developed a kilowatt (kW)-class high-power phased array systemfor wireless power transfer (WPT) that can be referred to as space power radio transmissionsystem (SPORTS) and a power-variable phase-controlled magnetron (PVPCM) for the WPTsystems [94]–Ref45. Some other researchers established a phase-locking 15-kW magnetronfor coherent power combining [97]. Tahir 𝑒𝑡 𝑎𝑙. have achieved frequency and phase modu-lations using an injection-locked 2.45 GHz magnetron as a transmitter for communicationin which the transmission of phase-shift keying (PSK) data was achieved at 2 Mbps [98].In their study, a fast pin diode switch was used to drive two RF sources in the modulationsystem, which discontinued the phase of the frequency-shift keying (FSK) signal that causedunnecessary spectrum radiation.
In addition, several studies have explored 2.45 GHz injection-locked magnetrons usingthe phase-locking method by controlling the anode current at low noise levels [92]–[98]. Inthis method, the output power of the magnetron is observed to change with the anode current,which requires a linear relation between the anode current and the oscillation frequency
66CHAPTER 4. MODULATION PERFORMANCE WITH INJECTION-LOCKING MAGNETRONS
of the magnetron. However, a 5.8 GHz magnetron exhibits different frequency-currentcharacteristics compared to a 2.45 GHz magnetron. Therefore, our group has addressedthis problem in a previous study by developing a 5.8 GHz PCM by controlling the phaseof the injection signal to lock the magnetron phase [99]. Our study was necessary to verifythe modulation system based on the performances of different magnetrons. Another studydeveloped a 1 kW class microwave band solid-state amplifier with an 8-way combiner toreplace the vacuum-tube devices [100]. Similarly, N. Hasegawa 𝑒𝑡 𝑎𝑙. have developed a170 W high efficiency amplifier [101]. Recently, extensive research has been conducted onhigh-power amplifiers in the microwave band [102]–[104]. In these studies, the amplifierswere combined by N-way combiners to improve the output, which may increase the cost andcomplicate the manufacturing process.
In this study, a high versatility injection-locked magnetron system, which can be appliedto the 2.45 GHz as well as the 5.8 GHz magnetrons and act as a communication transmitterfor amplitude-shift keying (ASK), PSK and FSK, was developed. Additionally, a modulatingsignal was injected into the magnetron to amplify it. This method was also used to verifythe transmission of the ASK data at 200 kbps as well as the PSK and FSK data at 10 Mbps.Moreover, the audio and video data were modulated on a magnetron output and were furtherdemodulated to evaluate the modulation performance of the injection-locked magnetron.
4.2 Magnetron Characteristics
The injection locking method of magnetrons is injecting a signal into the magnetron to lockthe oscillation frequency. The value of the injection signal frequency is set to be close tothat of the self-oscillation frequency of the magnetron. The locked frequency range, Δ 𝑓 ,can be expressed by Alder equation [105] as follows: Δ 𝑓 = 2 𝑓
√(𝑃𝑖/𝑃𝑜)/𝑄𝑒, where 𝑓 is the
injection signal frequency, 𝑃𝑖 is the injection signal power, 𝑃𝑜 is the magnetron output powerand 𝑄𝑒 is the external Q-factor of the magnetron.
In the locked frequency range, the frequency and phase of the magnetron output arelocked with the injection signal. Therefore, controlling the parameter of the injection signalresults in frequency and phase synchronization of the magnetron output. Additionally, theinjection of a modulating signal allows the magnetron output to follow the injection signaland to amplify the modulating signal.
This study intended to develop a highly versatile modulation system, which can beapplied to the 2.45 GHz and 5.8 GHz band magnetrons. However, the study mainly evaluatedthe modulation performance of the 5.8 GHz band magnetron because it has a differentperformance and exhibits a higher noise level than the 2.45 GHz band magnetron [99].
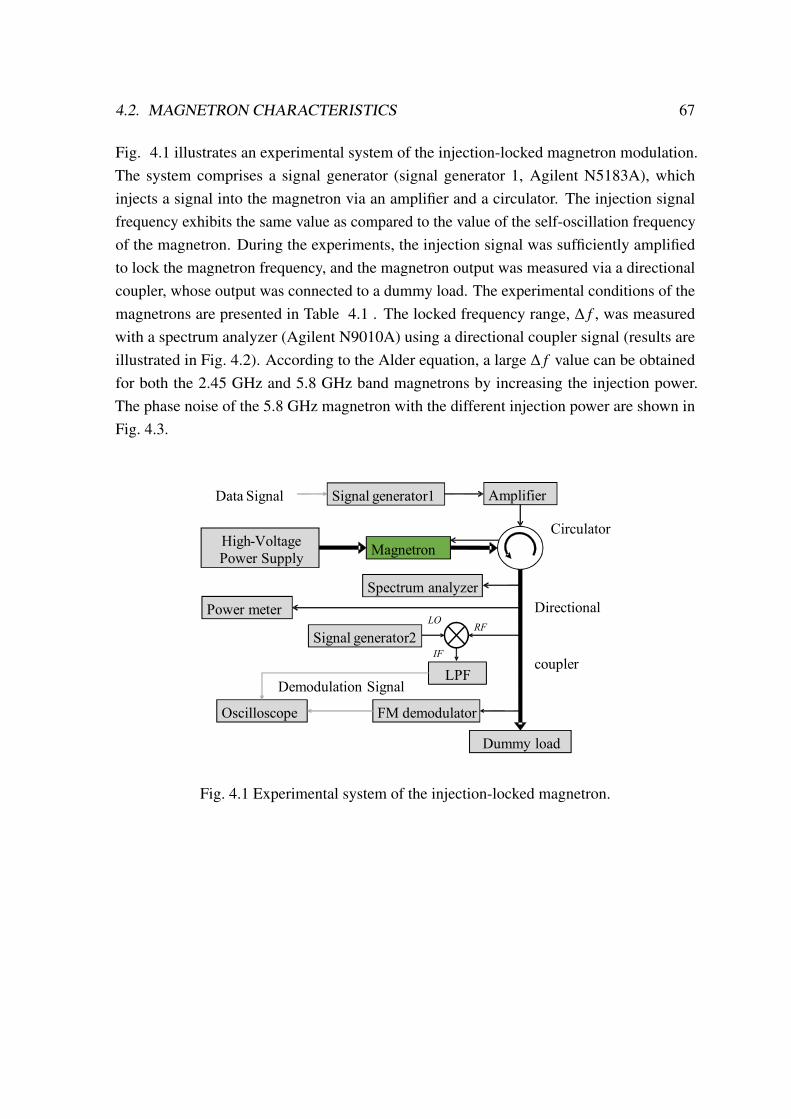
4.2. MAGNETRON CHARACTERISTICS 67
Fig. 4.1 illustrates an experimental system of the injection-locked magnetron modulation.The system comprises a signal generator (signal generator 1, Agilent N5183A), whichinjects a signal into the magnetron via an amplifier and a circulator. The injection signalfrequency exhibits the same value as compared to the value of the self-oscillation frequencyof the magnetron. During the experiments, the injection signal was sufficiently amplifiedto lock the magnetron frequency, and the magnetron output was measured via a directionalcoupler, whose output was connected to a dummy load. The experimental conditions of themagnetrons are presented in Table 4.1 . The locked frequency range, Δ 𝑓 , was measuredwith a spectrum analyzer (Agilent N9010A) using a directional coupler signal (results areillustrated in Fig. 4.2). According to the Alder equation, a large Δ 𝑓 value can be obtainedfor both the 2.45 GHz and 5.8 GHz band magnetrons by increasing the injection power.The phase noise of the 5.8 GHz magnetron with the different injection power are shown inFig. 4.3.
IF
Data Signal Signal generator1
Dummy load
Amplifier
Circulator
MagnetronHigh-Voltage
Power Supply
Demodulation Signal
RFLO
Signal generator2
LPF
Spectrum analyzer
FM demodulator
Directional
coupler
Oscilloscope
Power meter
Fig. 4.1 Experimental system of the injection-locked magnetron.
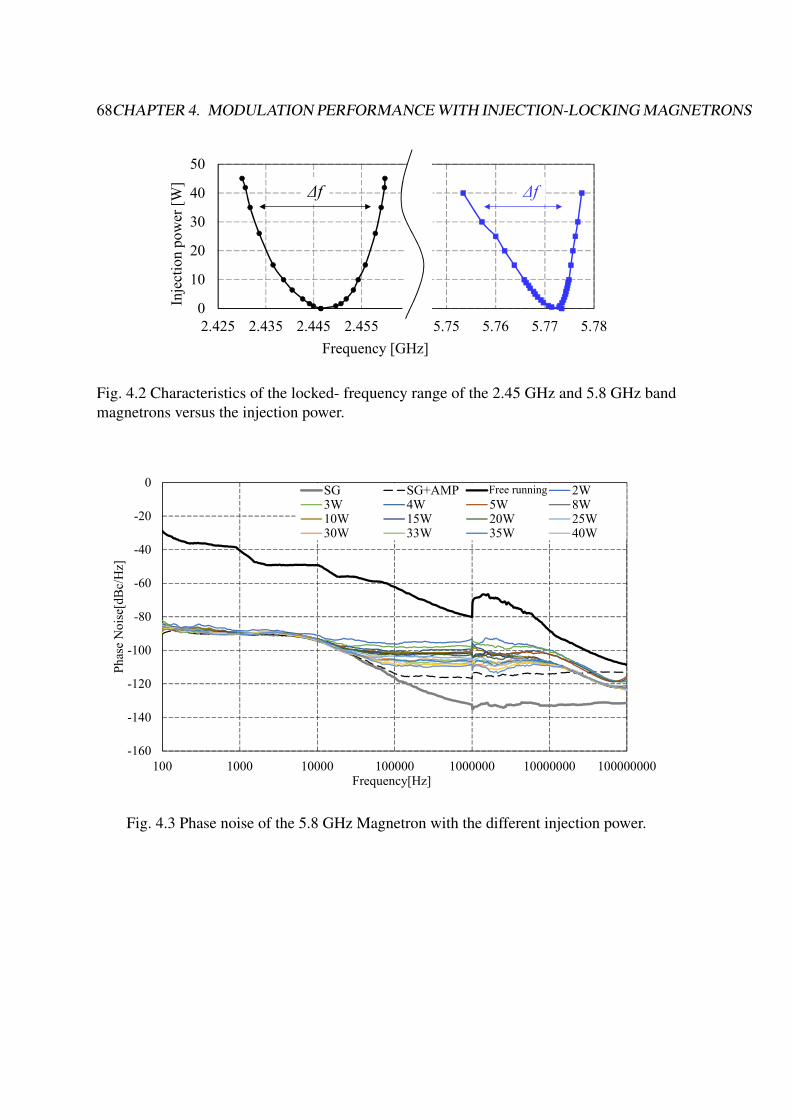
68CHAPTER 4. MODULATION PERFORMANCE WITH INJECTION-LOCKING MAGNETRONS
0
10
20
30
40
50
5.74 5.75 5.76 5.77 5.78
0
10
20
30
40
50
2.425 2.435 2.445 2.455 2.465
Inje
ctio
n p
ow
er [
W]
Frequency [GHz]
Δf Δf
Fig. 4.2 Characteristics of the locked- frequency range of the 2.45 GHz and 5.8 GHz bandmagnetrons versus the injection power.
-160
-140
-120
-100
-80
-60
-40
-20
0
100 1000 10000 100000 1000000 10000000 100000000
Ph
ase
No
ise[
dB
c/H
z]
Frequency[Hz]
SG SG+AMP 注入なし 2W3W 4W 5W 8W10W 15W 20W 25W30W 33W 35W 40W
Free running
Fig. 4.3 Phase noise of the 5.8 GHz Magnetron with the different injection power.
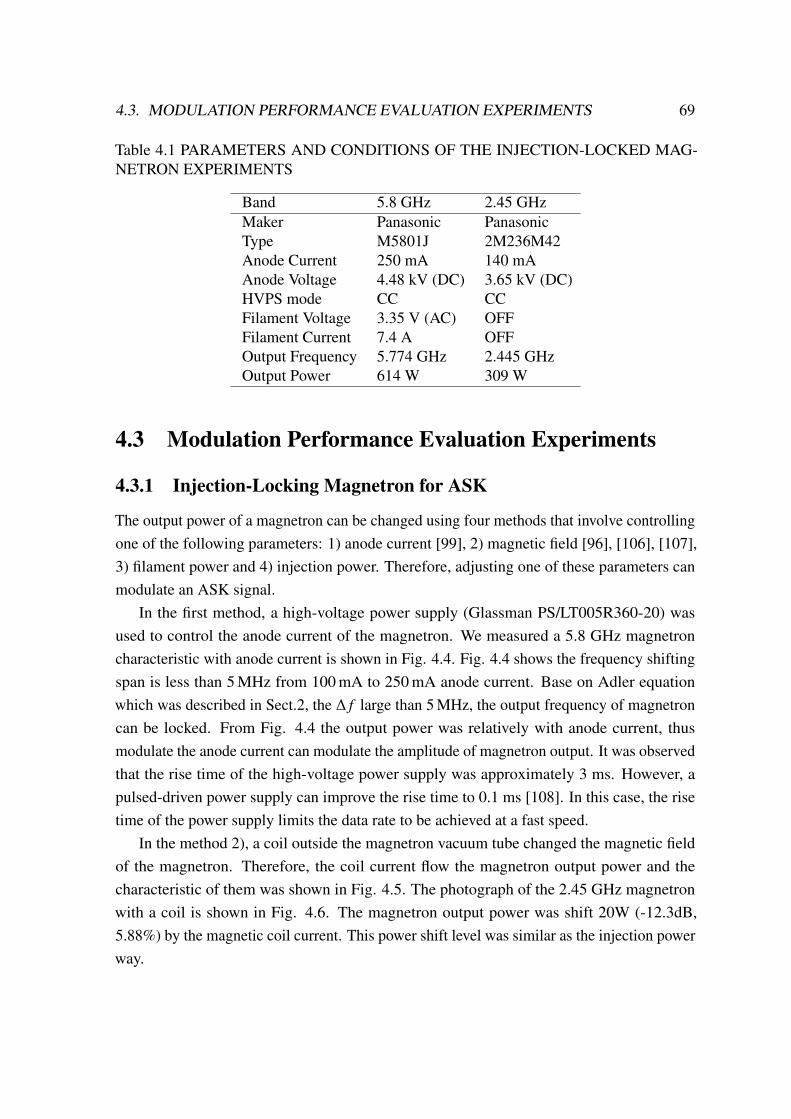
4.3. MODULATION PERFORMANCE EVALUATION EXPERIMENTS 69
Table 4.1 PARAMETERS AND CONDITIONS OF THE INJECTION-LOCKED MAG-NETRON EXPERIMENTS
Band 5.8 GHz 2.45 GHzMaker Panasonic PanasonicType M5801J 2M236M42Anode Current 250 mA 140 mAAnode Voltage 4.48 kV (DC) 3.65 kV (DC)HVPS mode CC CCFilament Voltage 3.35 V (AC) OFFFilament Current 7.4 A OFFOutput Frequency 5.774 GHz 2.445 GHzOutput Power 614 W 309 W
4.3 Modulation Performance Evaluation Experiments
4.3.1 Injection-Locking Magnetron for ASK
The output power of a magnetron can be changed using four methods that involve controllingone of the following parameters: 1) anode current [99], 2) magnetic field [96], [106], [107],3) filament power and 4) injection power. Therefore, adjusting one of these parameters canmodulate an ASK signal.
In the first method, a high-voltage power supply (Glassman PS/LT005R360-20) wasused to control the anode current of the magnetron. We measured a 5.8 GHz magnetroncharacteristic with anode current is shown in Fig. 4.4. Fig. 4.4 shows the frequency shiftingspan is less than 5 MHz from 100 mA to 250 mA anode current. Base on Adler equationwhich was described in Sect.2, the Δ 𝑓 large than 5 MHz, the output frequency of magnetroncan be locked. From Fig. 4.4 the output power was relatively with anode current, thusmodulate the anode current can modulate the amplitude of magnetron output. It was observedthat the rise time of the high-voltage power supply was approximately 3 ms. However, apulsed-driven power supply can improve the rise time to 0.1 ms [108]. In this case, the risetime of the power supply limits the data rate to be achieved at a fast speed.
In the method 2), a coil outside the magnetron vacuum tube changed the magnetic fieldof the magnetron. Therefore, the coil current flow the magnetron output power and thecharacteristic of them was shown in Fig. 4.5. The photograph of the 2.45 GHz magnetronwith a coil is shown in Fig. 4.6. The magnetron output power was shift 20W (-12.3dB,5.88%) by the magnetic coil current. This power shift level was similar as the injection powerway.

70CHAPTER 4. MODULATION PERFORMANCE WITH INJECTION-LOCKING MAGNETRONS
315
320
325
330
335
340
345
0 0.2 0.4 0.6 0.8 1 1.2
Outp
ut
Pow
er [
W]
Magnetic coil current [A]
450
460
470
480
490
500
510
520
530
540
295
300
305
310
315
320
325
0 10 20 30 40
Outp
ut
pow
er [
W]
Outp
ut
pow
er [
W]
Filament Power[W]
5.8G
2.4G
5.75
5.755
5.76
5.765
5.77
5.775
5.78
0
100
200
300
400
500
600
700
50 100 150 200 250
Fre
quen
cy[G
Hz]
Outp
ut
Pow
er[W
]
Anode current[mA]
280
290
300
310
320
330
340
500
510
520
530
540
550
0 10 20 30 40 50 60
Outp
ut
Pow
er [
W]
Outp
ut
Pow
er [
W]
Injection power [W]
5.8G
2.45G
Fig. 4.4 Change in the output power of the 5.8 GHz band magnetron with the anode current.
In the method 3), changing the filament power of the magnetron, the magnetron outputpower also was been changed. Here, we measured a different characteristic between 2.45GHz band and 5.8 GHz band magnetron as shown in Fig. 4.7. The 2.45 GHz band and 5.8GHz band magnetron output power were shifted 25W (-11dB, 7.85%) and 60W (-9.46dB,11.3%), respectively. The filament power setting of the 2.45 GHz magnetron is differentfrom the 5.8 GHz because turn-off of the filament current makes the 2.45 GHz magnetronspectrum quiet and pure [8]. However, turn-off of the filament current of 5.8 GHz magnetronwill reduce the output power and the signal-noise ratio. The reason for this different of themis that after the filament particles of the 5.8 GHz magnetron are increased, the reactive currentis increased, and in the constant current (CC) mode of the high-voltage power supply, theoutput power becomes smaller and the efficiency is reduced when the current is constant.
In methods 2) and 3), controlling the parameters requires a drive power that is larger than10 W; however, a digital data signal exhibits a low power level.
However, method 4) comprises plenty of ASK products, which exhibit a fast responsetime and a low date signal power level. Fig. 4.8 depicts the characteristic change in the outputpower of the injection-locked magnetrons with the injection power. The maximum shiftsin the output power of the 2.45 GHz band and the 5.8 GHz band magnetrons were 40 W(–9.16 dB, 12.1%) and 30 W (–12.5 dB, 5.56%), respectively. Therefore, an injection-lockedmagnetron ASK system was developed by adjusting the injection power level.
A 5.8-GHz injection-locked magnetron modulation system was developed and assessed.As illustrated in Fig. 4.1 , the carrier signal was set to be a 5.774-GHz sine signal that wasgenerated from signal generator 1. A 100 kHz (200 bps, 1 Hz = 2 symbol rate) square wavewas provided as input to signal generator 1 as the external data signal. Signal generator 1
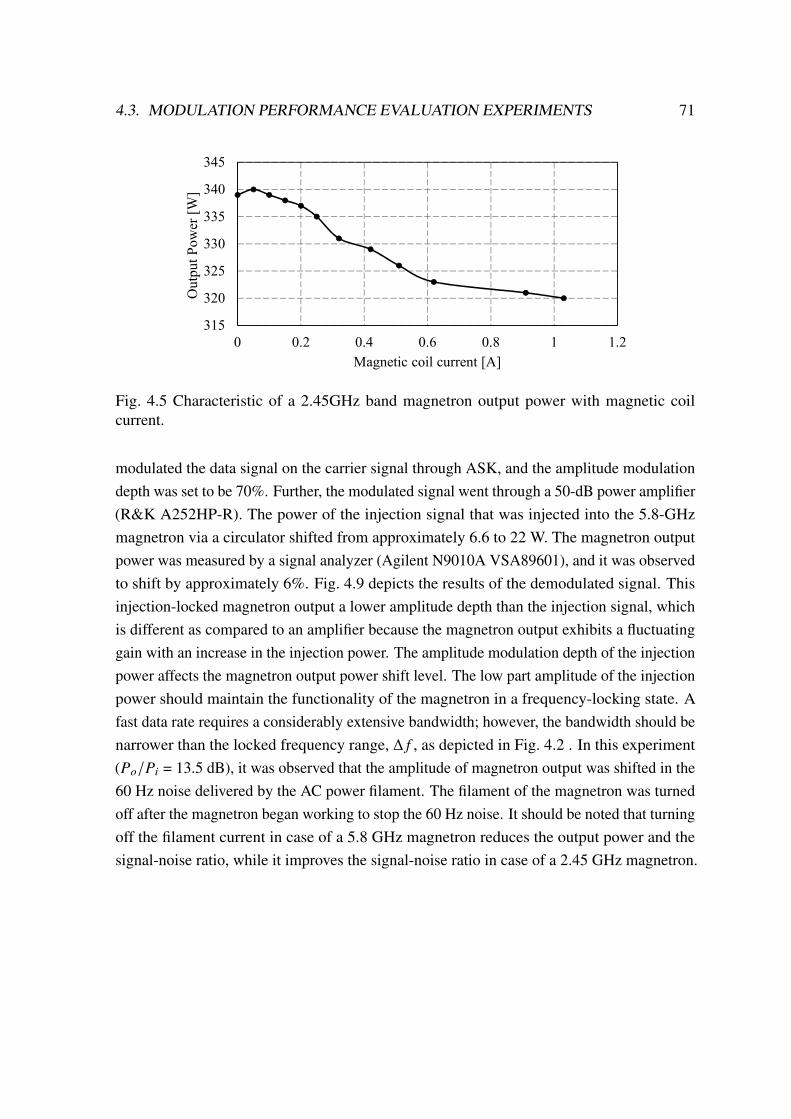
4.3. MODULATION PERFORMANCE EVALUATION EXPERIMENTS 71
315
320
325
330
335
340
345
0 0.2 0.4 0.6 0.8 1 1.2
Outp
ut
Pow
er [
W]
Magnetic coil current [A]
450
460
470
480
490
500
510
520
530
540
295
300
305
310
315
320
325
0 10 20 30 40
Outp
ut
pow
er [
W]
Outp
ut
pow
er [
W]
Filament Power[W]
5.8G
2.4G
5.75
5.755
5.76
5.765
5.77
5.775
5.78
0
100
200
300
400
500
600
700
50 100 150 200 250
Fre
quen
cy[G
Hz]
Outp
ut
Pow
er[W
]
Anode current[mA]
280
290
300
310
320
330
340
500
510
520
530
540
550
0 10 20 30 40 50 60
Outp
ut
Pow
er [
W]
Outp
ut
Pow
er [
W]
Injection power [W]
5.8G
2.45G
Fig. 4.5 Characteristic of a 2.45GHz band magnetron output power with magnetic coilcurrent.
modulated the data signal on the carrier signal through ASK, and the amplitude modulationdepth was set to be 70%. Further, the modulated signal went through a 50-dB power amplifier(R&K A252HP-R). The power of the injection signal that was injected into the 5.8-GHzmagnetron via a circulator shifted from approximately 6.6 to 22 W. The magnetron outputpower was measured by a signal analyzer (Agilent N9010A VSA89601), and it was observedto shift by approximately 6%. Fig. 4.9 depicts the results of the demodulated signal. Thisinjection-locked magnetron output a lower amplitude depth than the injection signal, whichis different as compared to an amplifier because the magnetron output exhibits a fluctuatinggain with an increase in the injection power. The amplitude modulation depth of the injectionpower affects the magnetron output power shift level. The low part amplitude of the injectionpower should maintain the functionality of the magnetron in a frequency-locking state. Afast data rate requires a considerably extensive bandwidth; however, the bandwidth should benarrower than the locked frequency range, Δ 𝑓 , as depicted in Fig. 4.2 . In this experiment(𝑃𝑜/𝑃𝑖 = 13.5 dB), it was observed that the amplitude of magnetron output was shifted in the60 Hz noise delivered by the AC power filament. The filament of the magnetron was turnedoff after the magnetron began working to stop the 60 Hz noise. It should be noted that turningoff the filament current in case of a 5.8 GHz magnetron reduces the output power and thesignal-noise ratio, while it improves the signal-noise ratio in case of a 2.45 GHz magnetron.
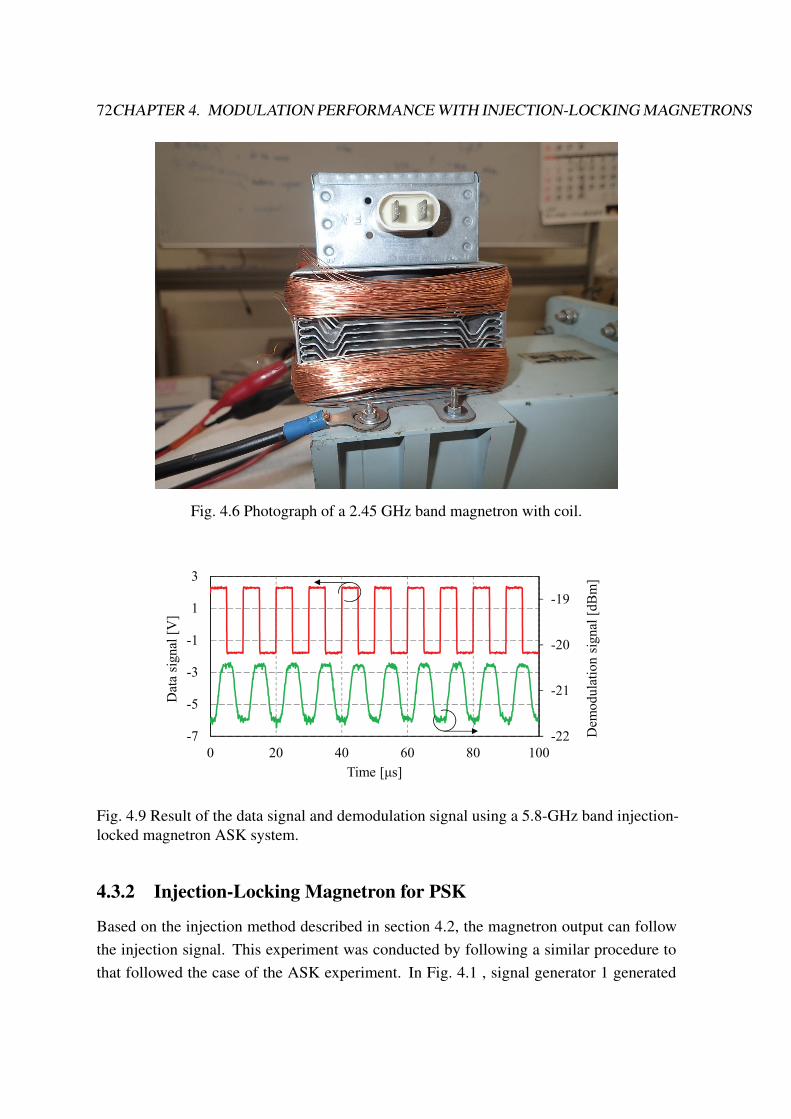
72CHAPTER 4. MODULATION PERFORMANCE WITH INJECTION-LOCKING MAGNETRONS
Fig. 4.6 Photograph of a 2.45 GHz band magnetron with coil.
-22
-21
-20
-19
-7
-5
-3
-1
1
3
0 20 40 60 80 100
Dem
odula
tion s
ignal
[dB
m]
Dat
a si
gnal
[V
]
Time [μs]
Fig. 4.9 Result of the data signal and demodulation signal using a 5.8-GHz band injection-locked magnetron ASK system.
4.3.2 Injection-Locking Magnetron for PSK
Based on the injection method described in section 4.2, the magnetron output can followthe injection signal. This experiment was conducted by following a similar procedure tothat followed the case of the ASK experiment. In Fig. 4.1 , signal generator 1 generated
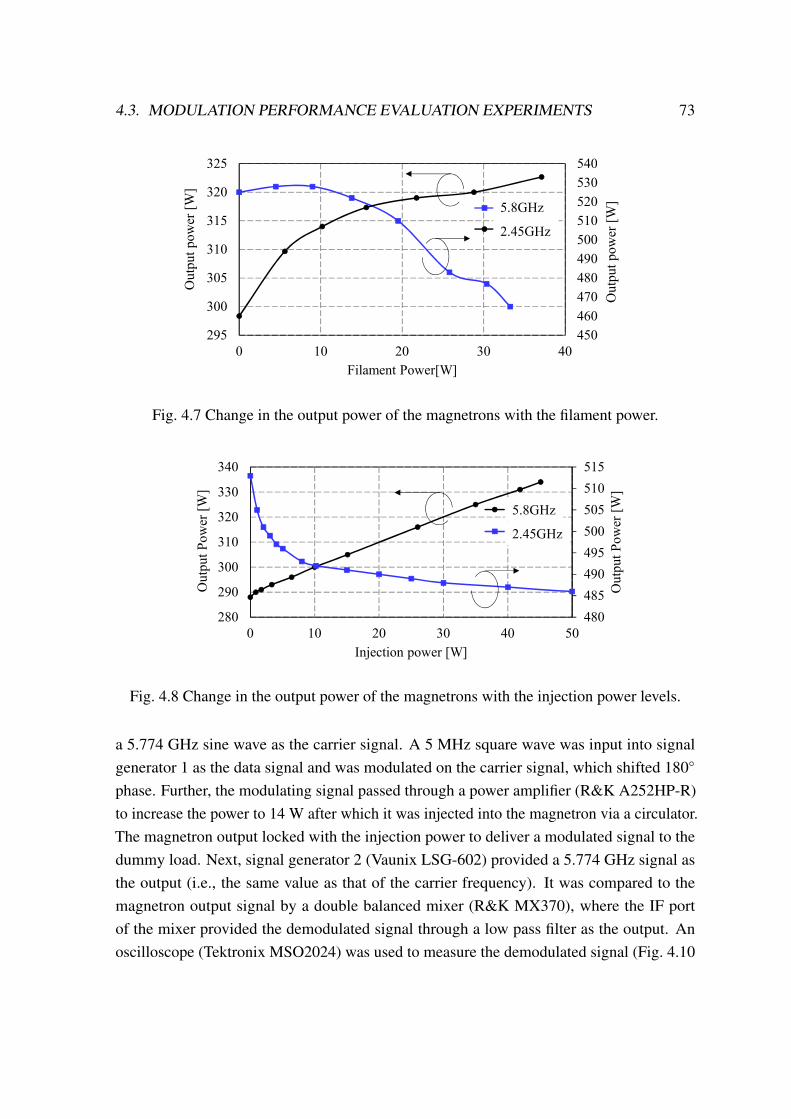
4.3. MODULATION PERFORMANCE EVALUATION EXPERIMENTS 73
315
320
325
330
335
340
345
0 0.2 0.4 0.6 0.8 1 1.2
Outp
ut
Pow
er [
W]
Magnetic coil current [A]
450
460
470
480
490
500
510
520
530
540
295
300
305
310
315
320
325
0 10 20 30 40
Outp
ut
pow
er [
W]
Outp
ut
pow
er [
W]
Filament Power[W]
5.8G
2.4G
5.75
5.755
5.76
5.765
5.77
5.775
5.78
0
100
200
300
400
500
600
700
50 100 150 200 250
Fre
quen
cy[G
Hz
]
Outp
ut
Pow
er[W
]
Anode current[mA]
480
485
490
495
500
505
510
515
280
290
300
310
320
330
340
0 10 20 30 40 50
Outp
ut
Pow
er [
W]
Outp
ut
Pow
er [
W]
Injection power [W]
2.45G
5.8G
5.8GHz
2.45GHz
5.8GHz
2.45GHz
Fig. 4.7 Change in the output power of the magnetrons with the filament power.
315
320
325
330
335
340
345
0 0.2 0.4 0.6 0.8 1 1.2
Outp
ut
Pow
er [
W]
Magnetic coil current [A]
450
460
470
480
490
500
510
520
530
540
295
300
305
310
315
320
325
0 10 20 30 40
Outp
ut
pow
er [
W]
Outp
ut
pow
er [
W]
Filament Power[W]
5.8G
2.4G
5.75
5.755
5.76
5.765
5.77
5.775
5.78
0
100
200
300
400
500
600
700
50 100 150 200 250
Fre
quen
cy[G
Hz
]
Outp
ut
Pow
er[W
]
Anode current[mA]
480
485
490
495
500
505
510
515
280
290
300
310
320
330
340
0 10 20 30 40 50
Outp
ut
Pow
er [
W]
Outp
ut
Pow
er [
W]
Injection power [W]
2.45G
5.8G
5.8GHz
2.45GHz
5.8GHz
2.45GHz
Fig. 4.8 Change in the output power of the magnetrons with the injection power levels.
a 5.774 GHz sine wave as the carrier signal. A 5 MHz square wave was input into signalgenerator 1 as the data signal and was modulated on the carrier signal, which shifted 180◦
phase. Further, the modulating signal passed through a power amplifier (R&K A252HP-R)to increase the power to 14 W after which it was injected into the magnetron via a circulator.The magnetron output locked with the injection power to deliver a modulated signal to thedummy load. Next, signal generator 2 (Vaunix LSG-602) provided a 5.774 GHz signal asthe output (i.e., the same value as that of the carrier frequency). It was compared to themagnetron output signal by a double balanced mixer (R&K MX370), where the IF portof the mixer provided the demodulated signal through a low pass filter as the output. Anoscilloscope (Tektronix MSO2024) was used to measure the demodulated signal (Fig. 4.10
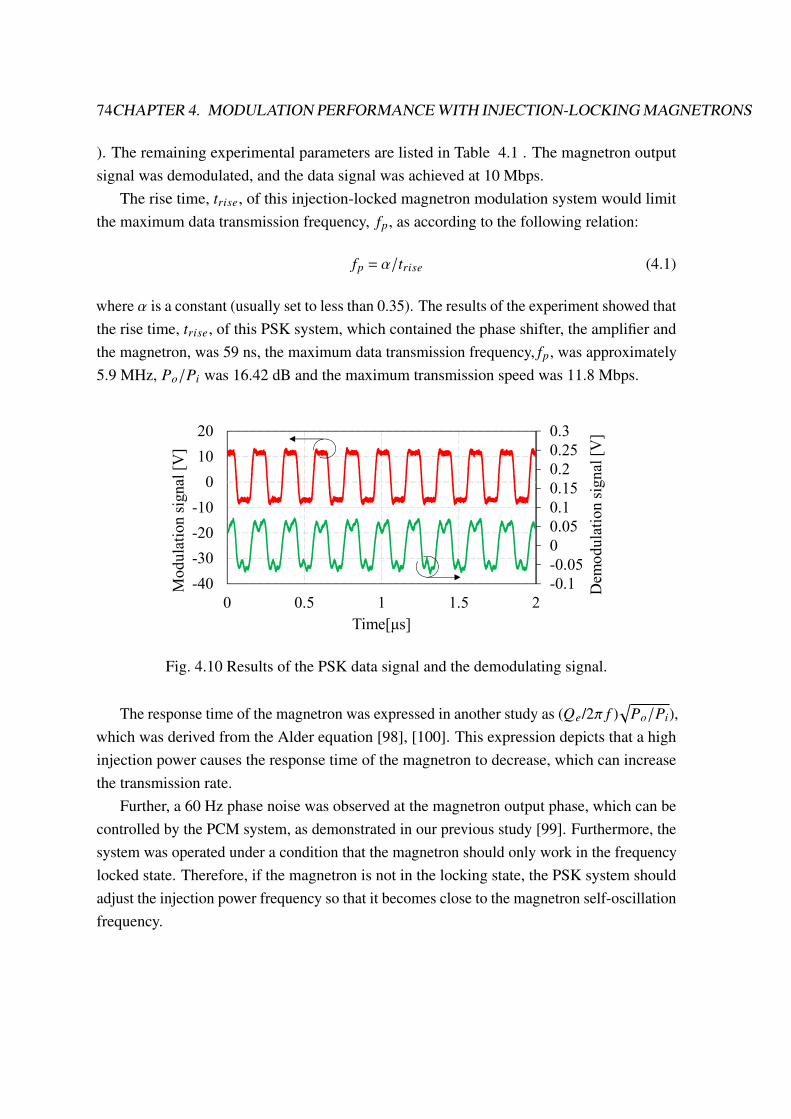
74CHAPTER 4. MODULATION PERFORMANCE WITH INJECTION-LOCKING MAGNETRONS
). The remaining experimental parameters are listed in Table 4.1 . The magnetron outputsignal was demodulated, and the data signal was achieved at 10 Mbps.
The rise time, 𝑡𝑟𝑖𝑠𝑒, of this injection-locked magnetron modulation system would limitthe maximum data transmission frequency, 𝑓𝑝, as according to the following relation:
𝑓𝑝 = 𝛼/𝑡𝑟𝑖𝑠𝑒 (4.1)
where 𝛼 is a constant (usually set to less than 0.35). The results of the experiment showed thatthe rise time, 𝑡𝑟𝑖𝑠𝑒, of this PSK system, which contained the phase shifter, the amplifier andthe magnetron, was 59 ns, the maximum data transmission frequency, 𝑓𝑝, was approximately5.9 MHz, 𝑃𝑜/𝑃𝑖 was 16.42 dB and the maximum transmission speed was 11.8 Mbps.
-0.1
-0.05
0
0.05
0.1
0.15
0.2
0.25
0.3
-40
-30
-20
-10
0
10
20
0 0.5 1 1.5 2D
emo
du
lati
on
sig
nal
[V
]
Mo
du
lati
on s
ignal
[V
]
Time[μs]
Fig. 4.10 Results of the PSK data signal and the demodulating signal.
The response time of the magnetron was expressed in another study as (𝑄𝑒/2𝜋 𝑓 )√𝑃𝑜/𝑃𝑖),
which was derived from the Alder equation [98], [100]. This expression depicts that a highinjection power causes the response time of the magnetron to decrease, which can increasethe transmission rate.
Further, a 60 Hz phase noise was observed at the magnetron output phase, which can becontrolled by the PCM system, as demonstrated in our previous study [99]. Furthermore, thesystem was operated under a condition that the magnetron should only work in the frequencylocked state. Therefore, if the magnetron is not in the locking state, the PSK system shouldadjust the injection power frequency so that it becomes close to the magnetron self-oscillationfrequency.
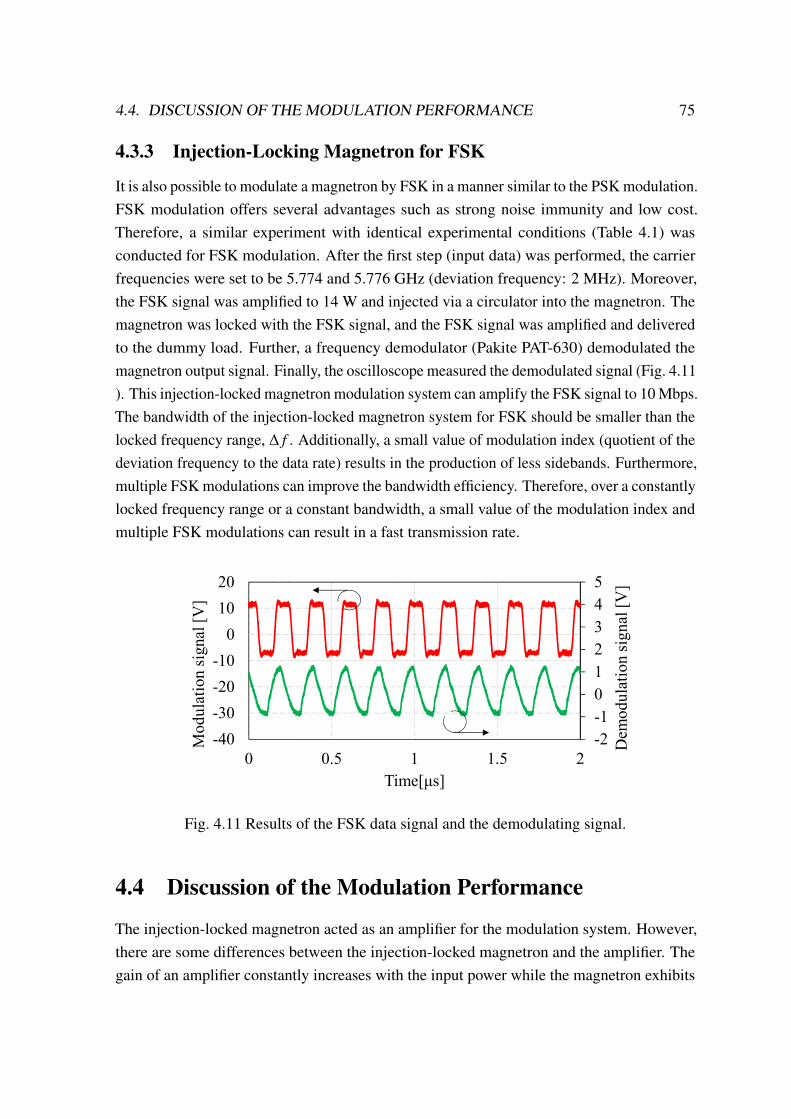
4.4. DISCUSSION OF THE MODULATION PERFORMANCE 75
4.3.3 Injection-Locking Magnetron for FSK
It is also possible to modulate a magnetron by FSK in a manner similar to the PSK modulation.FSK modulation offers several advantages such as strong noise immunity and low cost.Therefore, a similar experiment with identical experimental conditions (Table 4.1) wasconducted for FSK modulation. After the first step (input data) was performed, the carrierfrequencies were set to be 5.774 and 5.776 GHz (deviation frequency: 2 MHz). Moreover,the FSK signal was amplified to 14 W and injected via a circulator into the magnetron. Themagnetron was locked with the FSK signal, and the FSK signal was amplified and deliveredto the dummy load. Further, a frequency demodulator (Pakite PAT-630) demodulated themagnetron output signal. Finally, the oscilloscope measured the demodulated signal (Fig. 4.11). This injection-locked magnetron modulation system can amplify the FSK signal to 10 Mbps.The bandwidth of the injection-locked magnetron system for FSK should be smaller than thelocked frequency range, Δ 𝑓 . Additionally, a small value of modulation index (quotient of thedeviation frequency to the data rate) results in the production of less sidebands. Furthermore,multiple FSK modulations can improve the bandwidth efficiency. Therefore, over a constantlylocked frequency range or a constant bandwidth, a small value of the modulation index andmultiple FSK modulations can result in a fast transmission rate.
-2
-1
0
1
2
3
4
5
-40
-30
-20
-10
0
10
20
0 0.5 1 1.5 2
Dem
od
ula
tio
n s
ign
al [
V]
Mo
du
lati
on s
ignal
[V
]
Time[μs]
Fig. 4.11 Results of the FSK data signal and the demodulating signal.
4.4 Discussion of the Modulation Performance
The injection-locked magnetron acted as an amplifier for the modulation system. However,there are some differences between the injection-locked magnetron and the amplifier. Thegain of an amplifier constantly increases with the input power while the magnetron exhibits
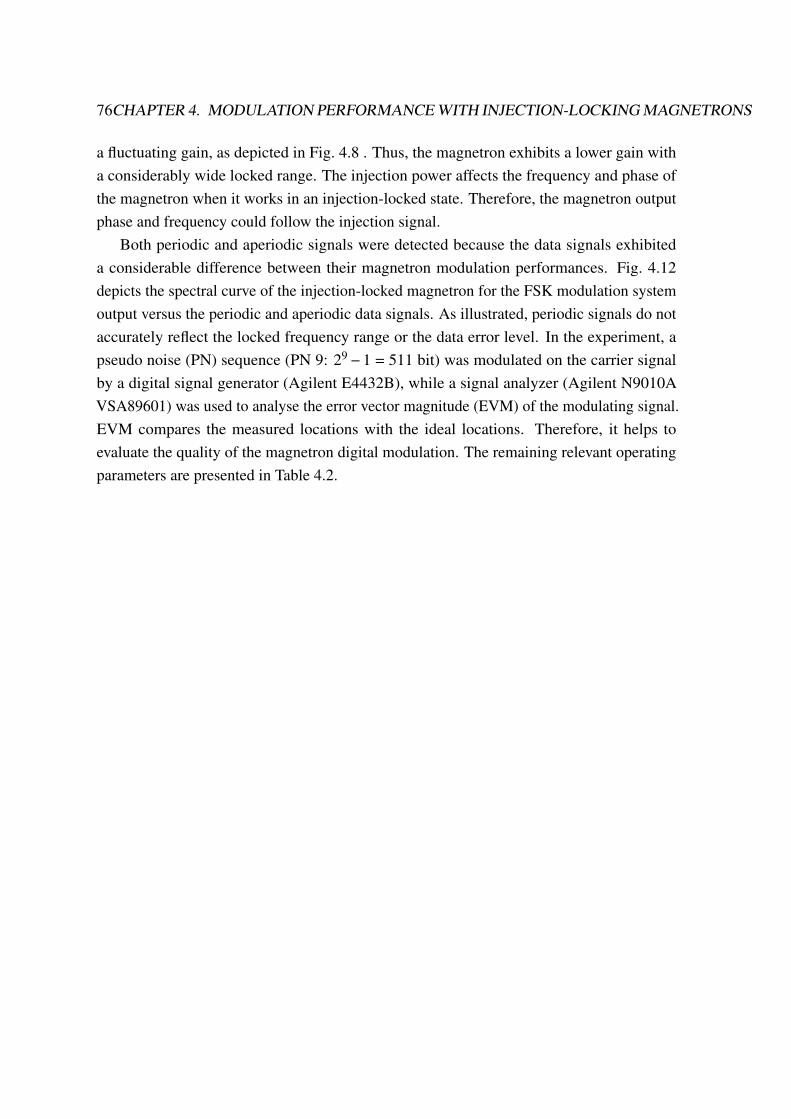
76CHAPTER 4. MODULATION PERFORMANCE WITH INJECTION-LOCKING MAGNETRONS
a fluctuating gain, as depicted in Fig. 4.8 . Thus, the magnetron exhibits a lower gain witha considerably wide locked range. The injection power affects the frequency and phase ofthe magnetron when it works in an injection-locked state. Therefore, the magnetron outputphase and frequency could follow the injection signal.
Both periodic and aperiodic signals were detected because the data signals exhibiteda considerable difference between their magnetron modulation performances. Fig. 4.12depicts the spectral curve of the injection-locked magnetron for the FSK modulation systemoutput versus the periodic and aperiodic data signals. As illustrated, periodic signals do notaccurately reflect the locked frequency range or the data error level. In the experiment, apseudo noise (PN) sequence (PN 9: 29 −1 = 511 bit) was modulated on the carrier signalby a digital signal generator (Agilent E4432B), while a signal analyzer (Agilent N9010AVSA89601) was used to analyse the error vector magnitude (EVM) of the modulating signal.EVM compares the measured locations with the ideal locations. Therefore, it helps toevaluate the quality of the magnetron digital modulation. The remaining relevant operatingparameters are presented in Table 4.2.
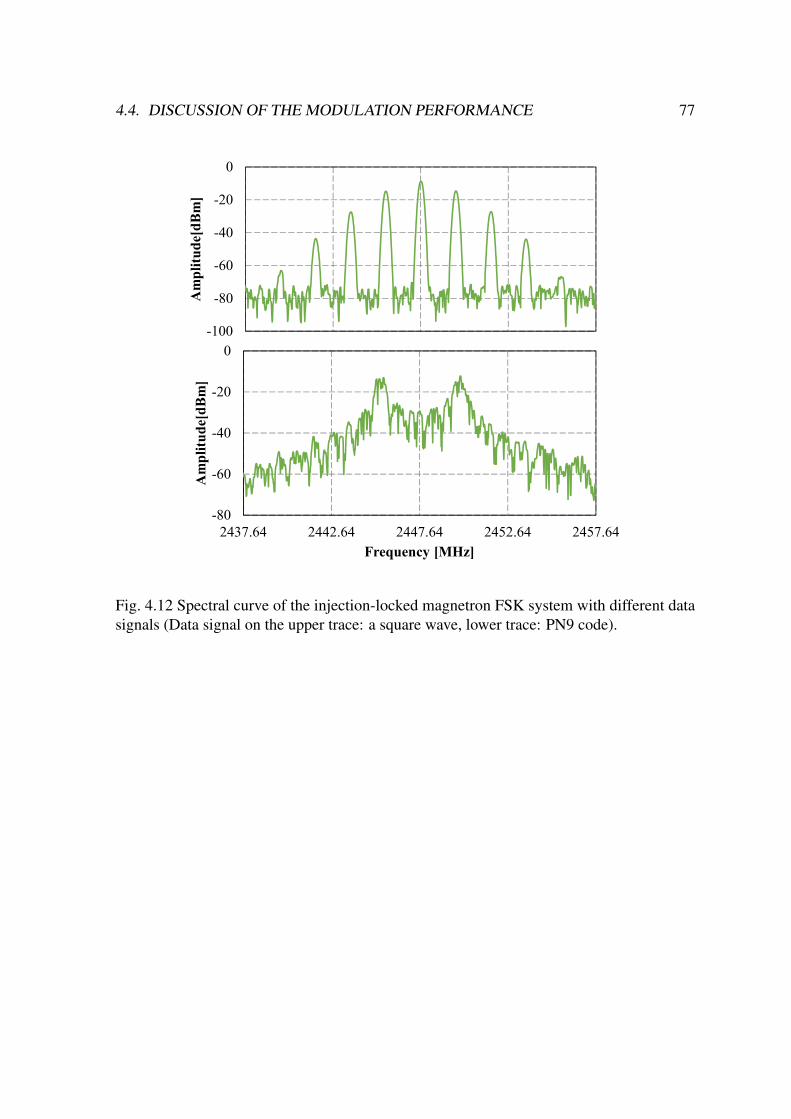
4.4. DISCUSSION OF THE MODULATION PERFORMANCE 77
-100
-80
-60
-40
-20
0
2437.64 2442.64 2447.64 2452.64 2457.64
Am
pli
tud
e[d
Bm
]
Frequency [MHz]
-80
-60
-40
-20
0
2437.64 2442.64 2447.64 2452.64 2457.64
Am
pli
tud
e[d
Bm
]
Frequency [MHz]
Fig. 4.12 Spectral curve of the injection-locked magnetron FSK system with different datasignals (Data signal on the upper trace: a square wave, lower trace: PN9 code).
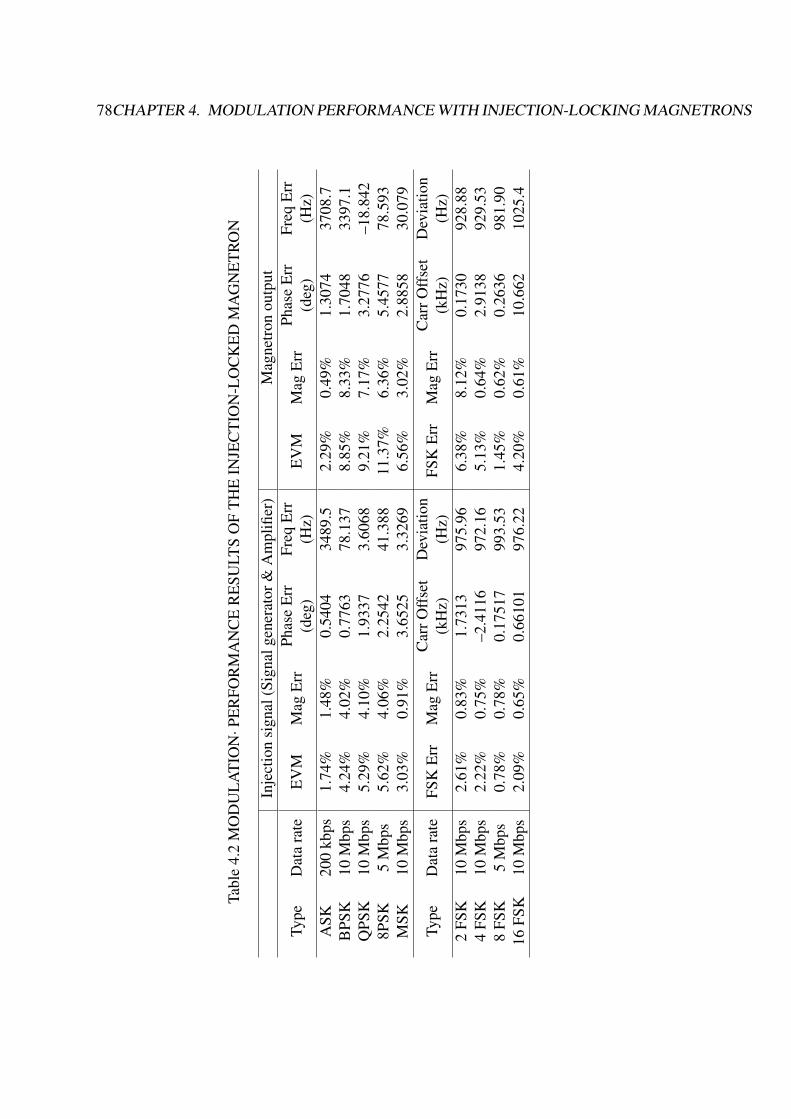
78CHAPTER 4. MODULATION PERFORMANCE WITH INJECTION-LOCKING MAGNETRONS
Tabl
e4.
2M
OD
UL
AT
ION
·PE
RFO
RM
AN
CE
RE
SULT
SO
FT
HE
INJE
CT
ION
-LO
CK
ED
MA
GN
ET
RO
N
Inje
ctio
nsi
gnal
(Sig
nalg
ener
ator
&A
mpl
ifier
)M
agne
tron
outp
ut
Type
Dat
ara
teE
VM
Mag
Err
Phas
eE
rr(d
eg)
Freq
Err
(Hz)
EV
MM
agE
rrPh
ase
Err
(deg
)Fr
eqE
rr(H
z)A
SK20
0kb
ps1.
74%
1.48
%0.
5404
3489
.52.
29%
0.49
%1.
3074
3708
.7B
PSK
10M
bps
4.24
%4.
02%
0.77
6378
.137
8.85
%8.
33%
1.70
4833
97.1
QPS
K10
Mbp
s5.
29%
4.10
%1.
9337
3.60
689.
21%
7.17
%3.
2776
–18.
842
8PSK
5M
bps
5.62
%4.
06%
2.25
4241
.388
11.3
7%6.
36%
5.45
7778
.593
MSK
10M
bps
3.03
%0.
91%
3.65
253.
3269
6.56
%3.
02%
2.88
5830
.079
Type
Dat
ara
teFS
KE
rrM
agE
rrC
arrO
ffse
t(k
Hz)
Dev
iatio
n(H
z)FS
KE
rrM
agE
rrC
arrO
ffse
t(k
Hz)
Dev
iatio
n(H
z)2
FSK
10M
bps
2.61
%0.
83%
1.73
1397
5.96
6.38
%8.
12%
0.17
3092
8.88
4FS
K10
Mbp
s2.
22%
0.75
%–2
.411
697
2.16
5.13
%0.
64%
2.91
3892
9.53
8FS
K5
Mbp
s0.
78%
0.78
%0.
1751
799
3.53
1.45
%0.
62%
0.26
3698
1.90
16FS
K10
Mbp
s2.
09%
0.65
%0.
6610
197
6.22
4.20
%0.
61%
10.6
6210
25.4
4.4. DISCUSSION OF THE MODULATION PERFORMANCE 79
Fig. 4.13 depicts that the 2.45 GHz band and 5.8 GHz band magnetrons exhibit similarEVM results at PSK modulation of 2 Mbps. A signal modulation can be achieved whenthe injection power is larger than 5 W. Therefore, the 5 W injection power level was set asthe condition for the magnetron to work under the injection-locked state at a transmissionbandwidth at 2 Mbps. The injection power is further increased under these conditions;however, the EVM value remains unchanged. Further, the transmission rate was changedfrom 0.5 to 2 Mbps, while the injection power was fixed at 5 W. It was observed that the2.45 GHz band and 5.8-GHz band magnetrons exhibited similar performances (Fig. 4.14). Consequently, it can be concluded that, under injection-locked conditions, adjusting thetransmission rate does not affect the transmission quality. Therefore, in a case where theinjection power is high enough to constantly lock the magnetron, the speed of modulationwill be limited by the response time of the injection-locked magnetron.
0%
10%
20%
30%
40%
50%
60%
0 2 4 6 8 10
EV
M
Injection Power [W]
2.455.8
0%
10%
20%
30%
40%
50%
0.5 0.75 1 1.25 1.5 1.75 2
EV
M
Transmission rate [Mbps]
2.45
5.8
Fig. 4.13 Changes in the error vector magnitude of the injection-locked magnetron systemfor PSK with the injection power levels.
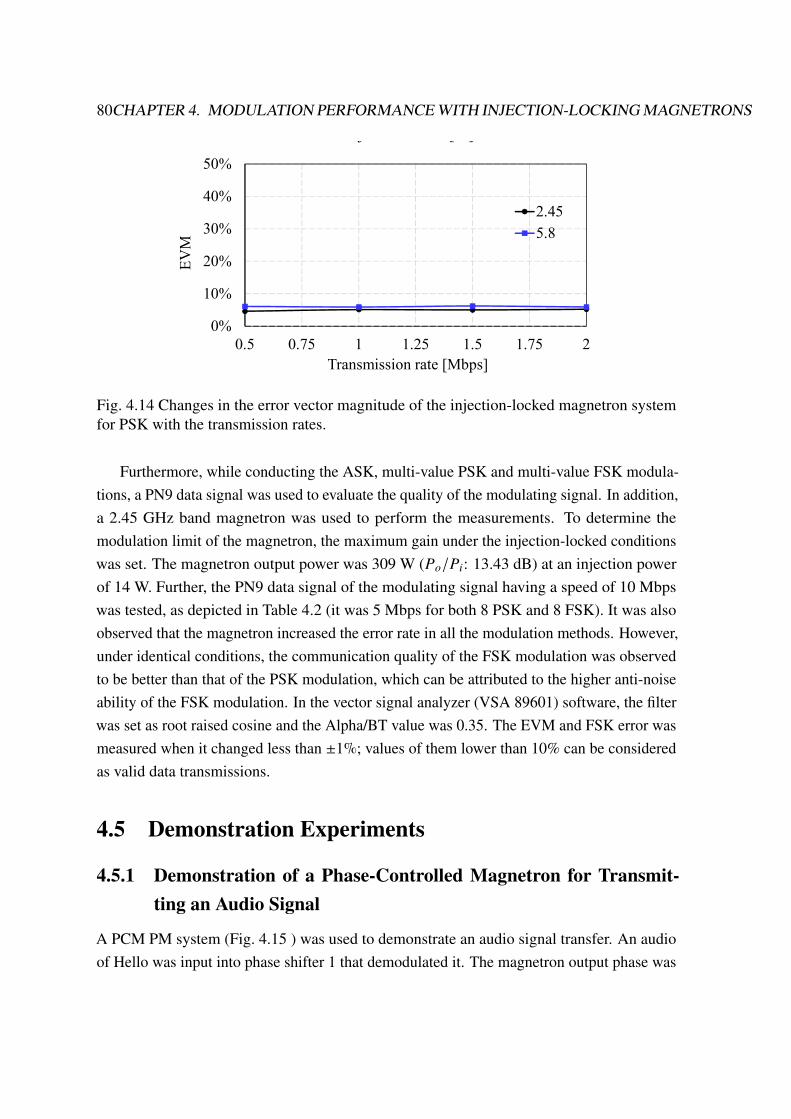
80CHAPTER 4. MODULATION PERFORMANCE WITH INJECTION-LOCKING MAGNETRONS0%
10%
20%
30%
40%
50%
60%
0 2 4 6 8 10
EV
M
Injection Power [W]
2.455.8
0%
10%
20%
30%
40%
50%
0.5 0.75 1 1.25 1.5 1.75 2
EV
M
Transmission rate [Mbps]
2.45
5.8
Fig. 4.14 Changes in the error vector magnitude of the injection-locked magnetron systemfor PSK with the transmission rates.
Furthermore, while conducting the ASK, multi-value PSK and multi-value FSK modula-tions, a PN9 data signal was used to evaluate the quality of the modulating signal. In addition,a 2.45 GHz band magnetron was used to perform the measurements. To determine themodulation limit of the magnetron, the maximum gain under the injection-locked conditionswas set. The magnetron output power was 309 W (𝑃𝑜/𝑃𝑖: 13.43 dB) at an injection powerof 14 W. Further, the PN9 data signal of the modulating signal having a speed of 10 Mbpswas tested, as depicted in Table 4.2 (it was 5 Mbps for both 8 PSK and 8 FSK). It was alsoobserved that the magnetron increased the error rate in all the modulation methods. However,under identical conditions, the communication quality of the FSK modulation was observedto be better than that of the PSK modulation, which can be attributed to the higher anti-noiseability of the FSK modulation. In the vector signal analyzer (VSA 89601) software, the filterwas set as root raised cosine and the Alpha/BT value was 0.35. The EVM and FSK error wasmeasured when it changed less than ±1%; values of them lower than 10% can be consideredas valid data transmissions.
4.5 Demonstration Experiments
4.5.1 Demonstration of a Phase-Controlled Magnetron for Transmit-ting an Audio Signal
A PCM PM system (Fig. 4.15 ) was used to demonstrate an audio signal transfer. An audioof Hello was input into phase shifter 1 that demodulated it. The magnetron output phase was

4.5. DEMONSTRATION EXPERIMENTS 81
further compared with the phase of the modulating signal in the mixer. The phase differencesignal was input into the phase-locked loop (PLL) circuit to control phase shifter 2, whichchanged the phase of the signal injected into the magnetron. Using the PLL circuit, thephase difference was gradually converged to zero, and the magnetron output followed themodulating signal. The receiver antenna was compared with the signal generator whichworked at the same frequency as that of the transmitter, and the mixer outputted the phasedifference. Fig. 4.16 depicts a part of an audio signal from among which high-frequencynoise that is out of the human hearing range (i.e., 20 Hz to 20 k Hz) is observed to be presentin the demodulated signal. The rise time, 𝑡𝑟𝑖𝑠𝑒, of this PM system was observed to be 1.78`s. In addition, it was observed that this system can avoid the 60 Hz phase noise from thefilament or the environmental impact and can amplify the multi-value PSK signal. Therefore,the analogue PM system acted as a radio broadcast.
IF
Audio signal
Transmitter
Signal generator Phase shifter2
Antenna
Amplifier
Circu
lator
5.8GHz
Magnetron
High-Voltage
Power Supply
PLL control circuit
Double Balanced MixerLO RF
IFPhase shifter1
Antenna
Audio signal
Receiver
RFLO
Signal generator
LPF
Fig. 4.15 Schematic of the PM injection-locked magnetron system.
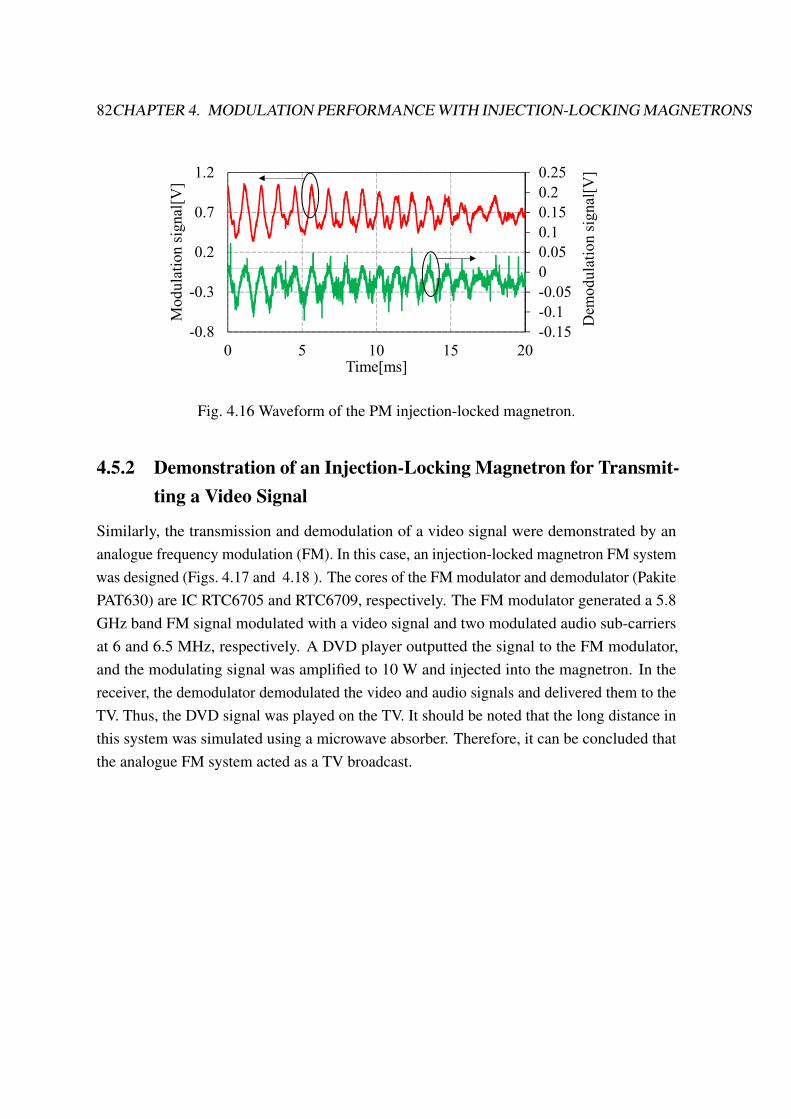
82CHAPTER 4. MODULATION PERFORMANCE WITH INJECTION-LOCKING MAGNETRONS
-0.15
-0.1
-0.05
0
0.05
0.1
0.15
0.2
0.25
-0.8
-0.3
0.2
0.7
1.2
0 5 10 15 20
Dem
od
ula
tio
n s
ign
al[V
]
Mo
du
lati
on s
ignal
[V]
Time[ms]
Fig. 4.16 Waveform of the PM injection-locked magnetron.
4.5.2 Demonstration of an Injection-Locking Magnetron for Transmit-ting a Video Signal
Similarly, the transmission and demodulation of a video signal were demonstrated by ananalogue frequency modulation (FM). In this case, an injection-locked magnetron FM systemwas designed (Figs. 4.17 and 4.18 ). The cores of the FM modulator and demodulator (PakitePAT630) are IC RTC6705 and RTC6709, respectively. The FM modulator generated a 5.8GHz band FM signal modulated with a video signal and two modulated audio sub-carriersat 6 and 6.5 MHz, respectively. A DVD player outputted the signal to the FM modulator,and the modulating signal was amplified to 10 W and injected into the magnetron. In thereceiver, the demodulator demodulated the video and audio signals and delivered them to theTV. Thus, the DVD signal was played on the TV. It should be noted that the long distance inthis system was simulated using a microwave absorber. Therefore, it can be concluded thatthe analogue FM system acted as a TV broadcast.
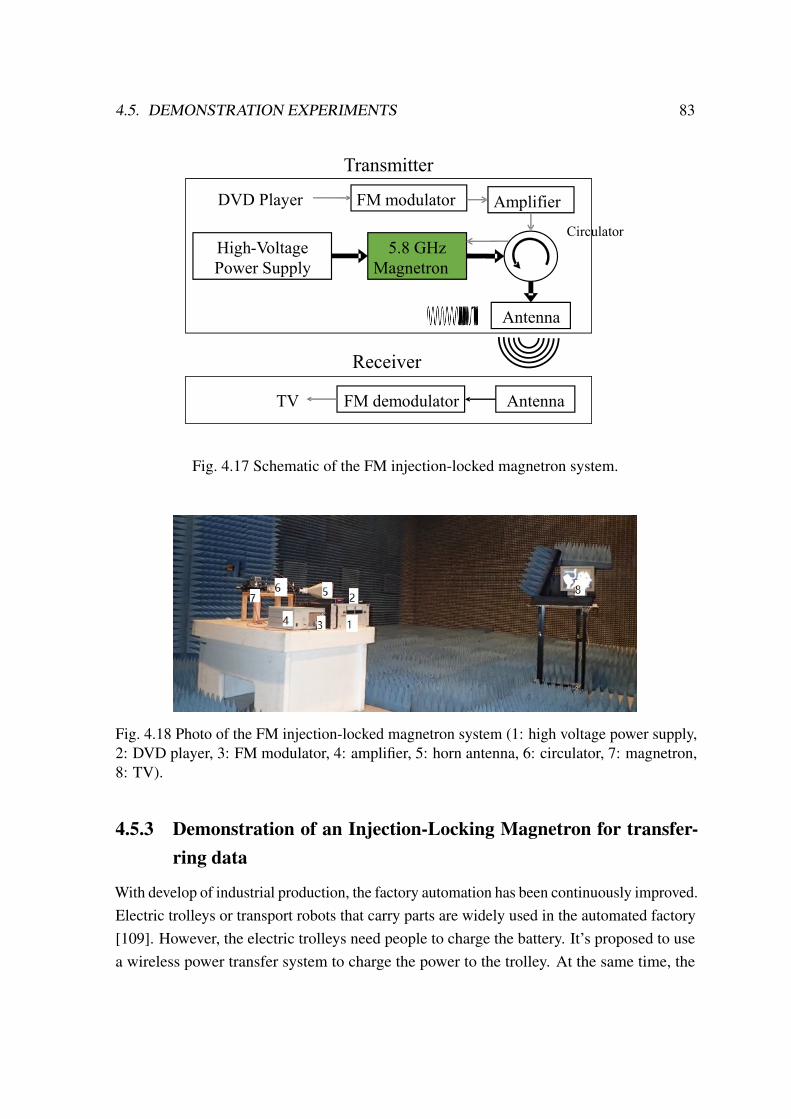
4.5. DEMONSTRATION EXPERIMENTS 83
FM modulator
Antenna
Amplifier
Circulator
5.8 GHz
Magnetron
High-Voltage
Power Supply
DVD Player
Transmitter
FM demodulatorTV
Receiver
Antenna
Fig. 4.17 Schematic of the FM injection-locked magnetron system.
Fig. 4.18 Photo of the FM injection-locked magnetron system (1: high voltage power supply,2: DVD player, 3: FM modulator, 4: amplifier, 5: horn antenna, 6: circulator, 7: magnetron,8: TV).
4.5.3 Demonstration of an Injection-Locking Magnetron for transfer-ring data
With develop of industrial production, the factory automation has been continuously improved.Electric trolleys or transport robots that carry parts are widely used in the automated factory[109]. However, the electric trolleys need people to charge the battery. It’s proposed to usea wireless power transfer system to charge the power to the trolley. At the same time, the
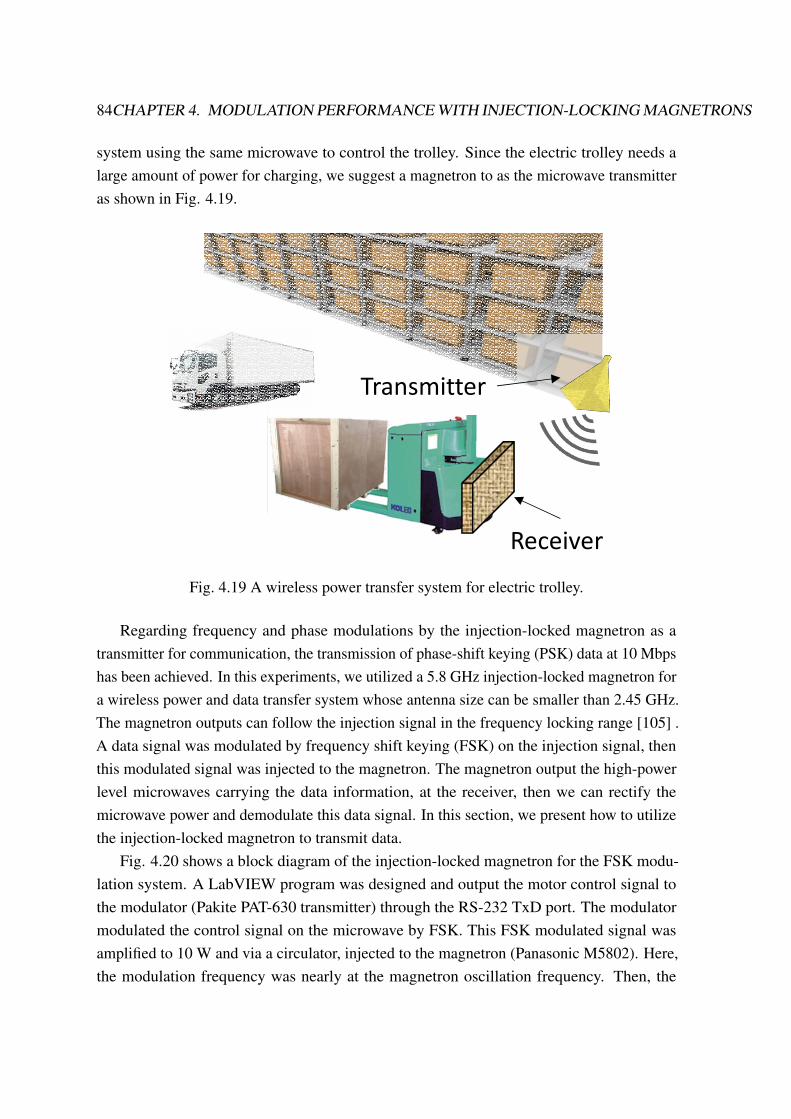
84CHAPTER 4. MODULATION PERFORMANCE WITH INJECTION-LOCKING MAGNETRONS
system using the same microwave to control the trolley. Since the electric trolley needs alarge amount of power for charging, we suggest a magnetron to as the microwave transmitteras shown in Fig. 4.19.
Receiver
Transmitter
Fig. 4.19 A wireless power transfer system for electric trolley.
Regarding frequency and phase modulations by the injection-locked magnetron as atransmitter for communication, the transmission of phase-shift keying (PSK) data at 10 Mbpshas been achieved. In this experiments, we utilized a 5.8 GHz injection-locked magnetron fora wireless power and data transfer system whose antenna size can be smaller than 2.45 GHz.The magnetron outputs can follow the injection signal in the frequency locking range [105] .A data signal was modulated by frequency shift keying (FSK) on the injection signal, thenthis modulated signal was injected to the magnetron. The magnetron output the high-powerlevel microwaves carrying the data information, at the receiver, then we can rectify themicrowave power and demodulate this data signal. In this section, we present how to utilizethe injection-locked magnetron to transmit data.
Fig. 4.20 shows a block diagram of the injection-locked magnetron for the FSK modu-lation system. A LabVIEW program was designed and output the motor control signal tothe modulator (Pakite PAT-630 transmitter) through the RS-232 TxD port. The modulatormodulated the control signal on the microwave by FSK. This FSK modulated signal wasamplified to 10 W and via a circulator, injected to the magnetron (Panasonic M5802). Here,the modulation frequency was nearly at the magnetron oscillation frequency. Then, the
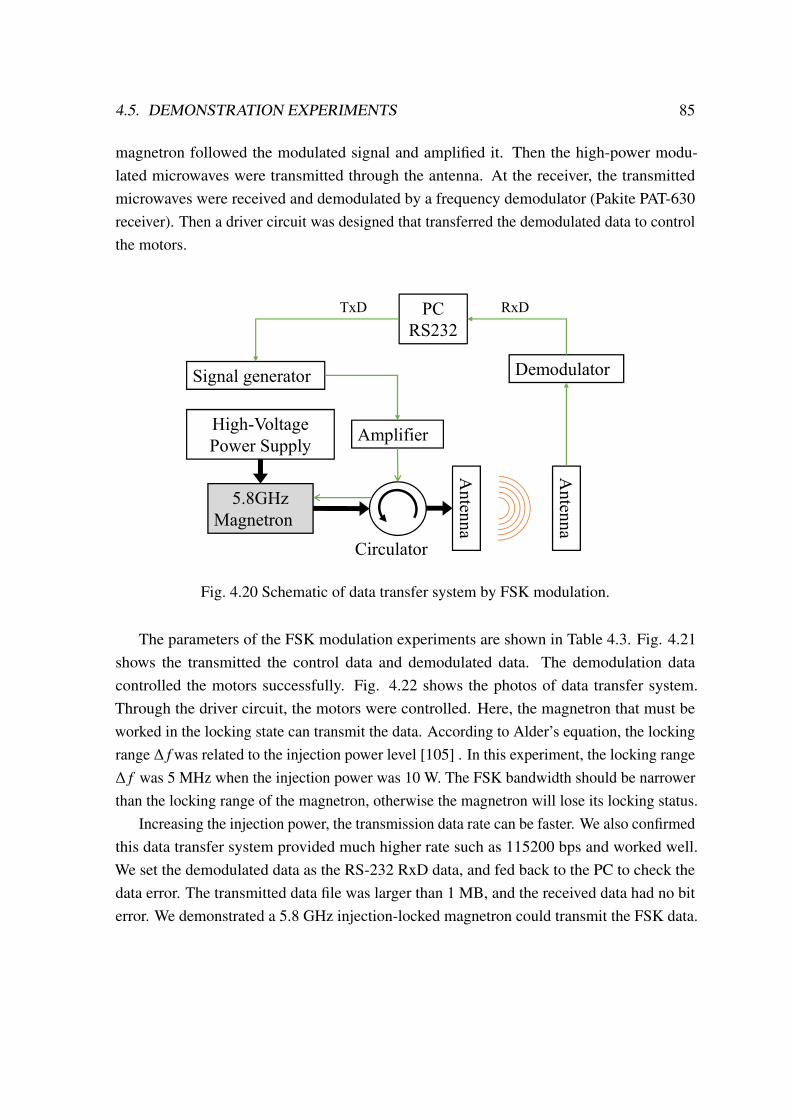
4.5. DEMONSTRATION EXPERIMENTS 85
magnetron followed the modulated signal and amplified it. Then the high-power modu-lated microwaves were transmitted through the antenna. At the receiver, the transmittedmicrowaves were received and demodulated by a frequency demodulator (Pakite PAT-630receiver). Then a driver circuit was designed that transferred the demodulated data to controlthe motors.
PC
RS232
Signal generator
An
tenn
a
Amplifier
Circulator
5.8GHz
Magnetron
High-Voltage
Power Supply
An
tenn
a
Demodulator
TxD RxD
Fig. 4.20 Schematic of data transfer system by FSK modulation.
The parameters of the FSK modulation experiments are shown in Table 4.3. Fig. 4.21shows the transmitted the control data and demodulated data. The demodulation datacontrolled the motors successfully. Fig. 4.22 shows the photos of data transfer system.Through the driver circuit, the motors were controlled. Here, the magnetron that must beworked in the locking state can transmit the data. According to Alder’s equation, the lockingrange Δ 𝑓was related to the injection power level [105] . In this experiment, the locking rangeΔ 𝑓 was 5 MHz when the injection power was 10 W. The FSK bandwidth should be narrowerthan the locking range of the magnetron, otherwise the magnetron will lose its locking status.
Increasing the injection power, the transmission data rate can be faster. We also confirmedthis data transfer system provided much higher rate such as 115200 bps and worked well.We set the demodulated data as the RS-232 RxD data, and fed back to the PC to check thedata error. The transmitted data file was larger than 1 MB, and the received data had no biterror. We demonstrated a 5.8 GHz injection-locked magnetron could transmit the FSK data.
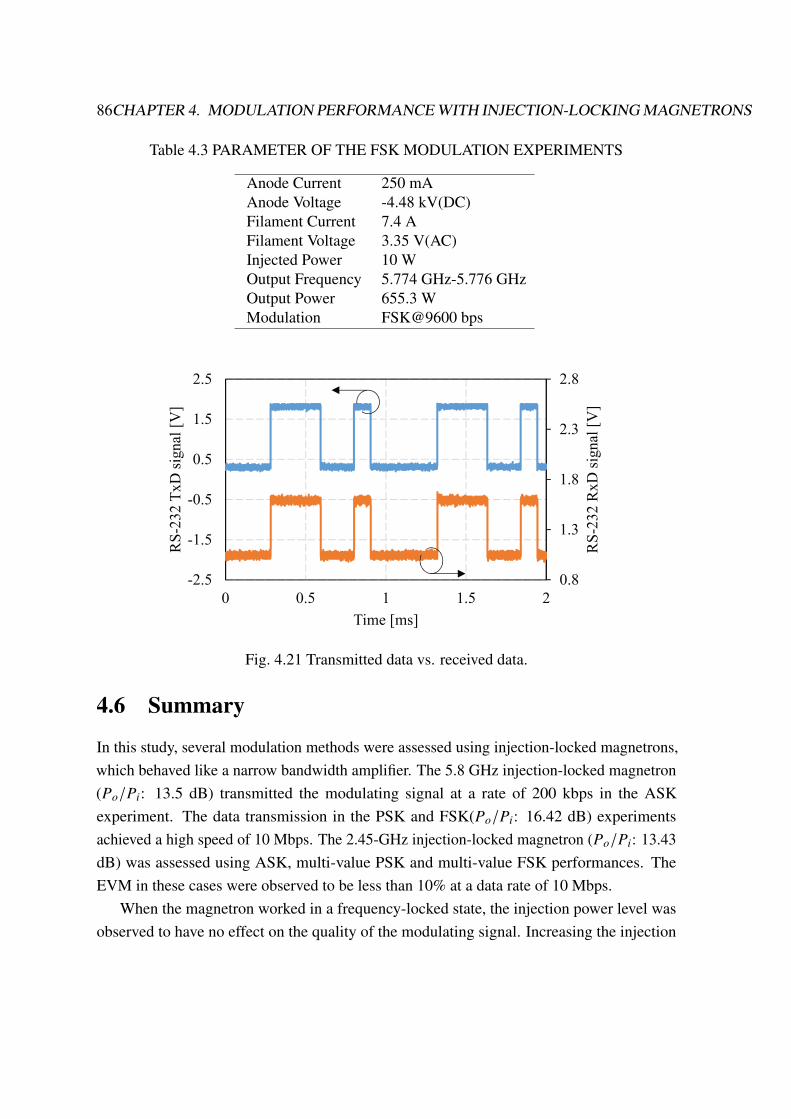
86CHAPTER 4. MODULATION PERFORMANCE WITH INJECTION-LOCKING MAGNETRONS
Table 4.3 PARAMETER OF THE FSK MODULATION EXPERIMENTS
Anode Current 250 mAAnode Voltage -4.48 kV(DC)Filament Current 7.4 AFilament Voltage 3.35 V(AC)Injected Power 10 WOutput Frequency 5.774 GHz-5.776 GHzOutput Power 655.3 WModulation FSK@9600 bps
0.8
1.3
1.8
2.3
2.8
-2.5
-1.5
-0.5
0.5
1.5
2.5
0 0.5 1 1.5 2R
S-2
32
Rx
D s
ign
al [
V]
RS
-23
2 T
xD
sig
nal
[V
]
Time [ms]
Fig. 4.21 Transmitted data vs. received data.
4.6 Summary
In this study, several modulation methods were assessed using injection-locked magnetrons,which behaved like a narrow bandwidth amplifier. The 5.8 GHz injection-locked magnetron(𝑃𝑜/𝑃𝑖: 13.5 dB) transmitted the modulating signal at a rate of 200 kbps in the ASKexperiment. The data transmission in the PSK and FSK(𝑃𝑜/𝑃𝑖: 16.42 dB) experimentsachieved a high speed of 10 Mbps. The 2.45-GHz injection-locked magnetron (𝑃𝑜/𝑃𝑖: 13.43dB) was assessed using ASK, multi-value PSK and multi-value FSK performances. TheEVM in these cases were observed to be less than 10% at a data rate of 10 Mbps.
When the magnetron worked in a frequency-locked state, the injection power level wasobserved to have no effect on the quality of the modulating signal. Increasing the injection
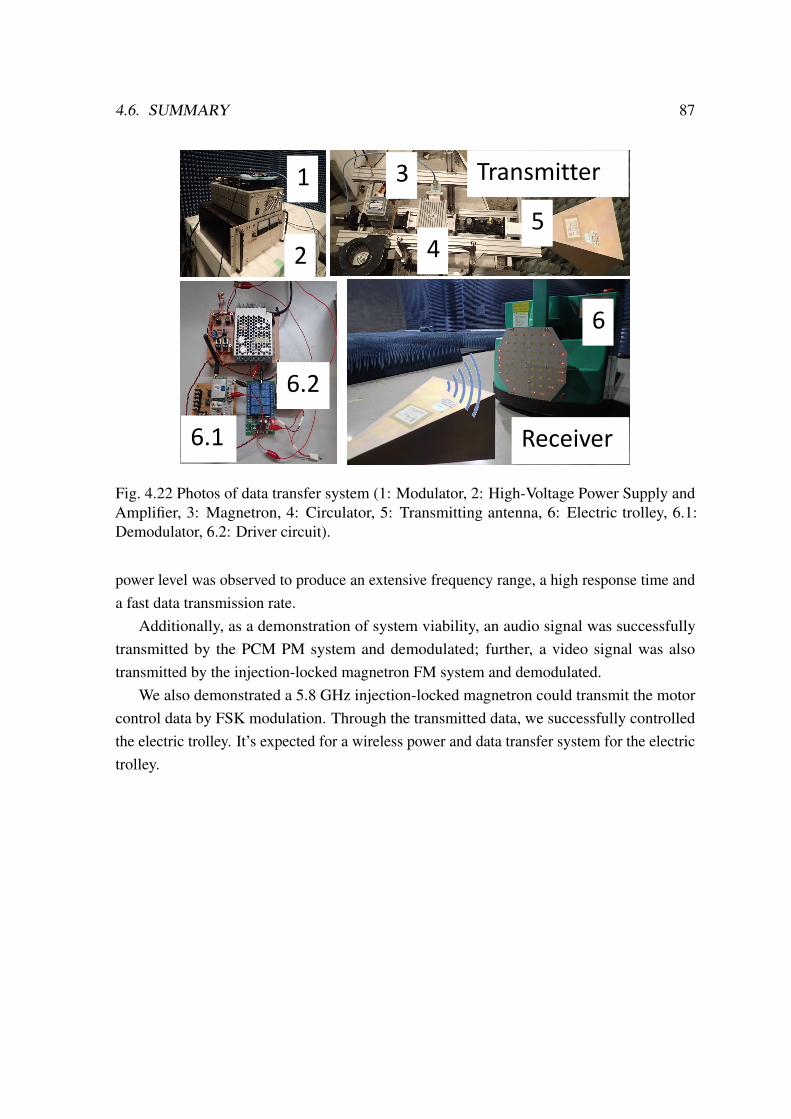
4.6. SUMMARY 87
1 3
4
5
2
6
Transmitter
Receiver6.1
6.2
Fig. 4.22 Photos of data transfer system (1: Modulator, 2: High-Voltage Power Supply andAmplifier, 3: Magnetron, 4: Circulator, 5: Transmitting antenna, 6: Electric trolley, 6.1:Demodulator, 6.2: Driver circuit).
power level was observed to produce an extensive frequency range, a high response time anda fast data transmission rate.
Additionally, as a demonstration of system viability, an audio signal was successfullytransmitted by the PCM PM system and demodulated; further, a video signal was alsotransmitted by the injection-locked magnetron FM system and demodulated.
We also demonstrated a 5.8 GHz injection-locked magnetron could transmit the motorcontrol data by FSK modulation. Through the transmitted data, we successfully controlledthe electric trolley. It’s expected for a wireless power and data transfer system for the electrictrolley.

Chapter 5
Power Supplies of the Magnetron
5.1 Introduction
Power supply is a key component of the magnetron system. The performance of the powersupply is related with the stability of the magnetron output. Our research group has developedthe phase-controlled magnetron as the transmission apparatus of a wireless power transfersystem [110]. In the other hand, another group has developed a phase-locking 15 kWmagnetron for coherent power combining [111]. Regarding frequency and phase modulationsby an injection-locked magnetron as a transmitter for communication, the transmission ofphase-shift-keying data at 2 Mbps has been achieved by Tahir et al. [112]. However, all thesepower supplies of the low noise magnetron systems are stabilized power supplies [110]-[112]which costs hundreds times than magnetron. It’s limited the magnetron to many practicalapplications, such as communication and wireless power transfer.
It was clarified that the noise factors of the magnetron are the stability of the power supplycircuit and the temperature of the electron emission filament inside the magnetron[113].The conventional phase-controlled magnetron use stabilized DC power sources to reducemagnetron noise by turning off filaments[114].
This chapter introduces two low cost power supplies which could be improved on voltageripple rate for magnetron systems.
5.2 Full Wave Doubler Rectifier
We utilized a full wave voltage doubler, which was improved from a power source ofmicrowave ovens and whose cost is almost nearly a magnetron.
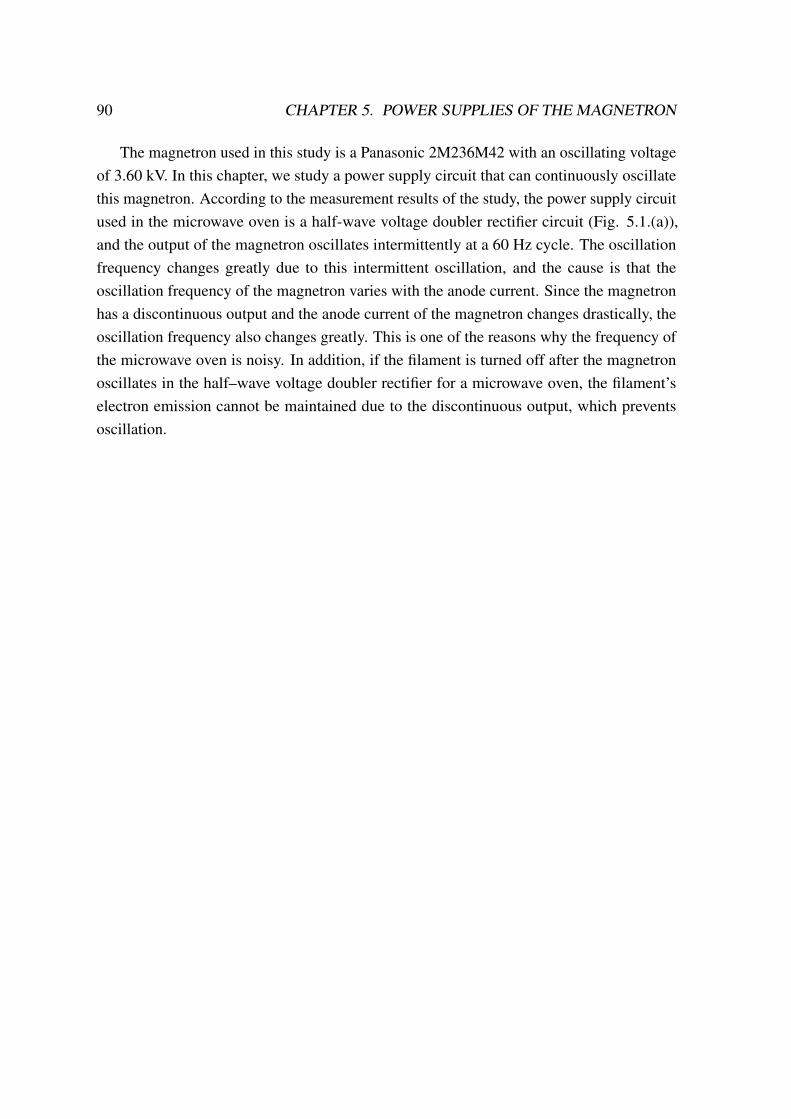
90 CHAPTER 5. POWER SUPPLIES OF THE MAGNETRON
The magnetron used in this study is a Panasonic 2M236M42 with an oscillating voltageof 3.60 kV. In this chapter, we study a power supply circuit that can continuously oscillatethis magnetron. According to the measurement results of the study, the power supply circuitused in the microwave oven is a half-wave voltage doubler rectifier circuit (Fig. 5.1.(a)),and the output of the magnetron oscillates intermittently at a 60 Hz cycle. The oscillationfrequency changes greatly due to this intermittent oscillation, and the cause is that theoscillation frequency of the magnetron varies with the anode current. Since the magnetronhas a discontinuous output and the anode current of the magnetron changes drastically, theoscillation frequency also changes greatly. This is one of the reasons why the frequency ofthe microwave oven is noisy. In addition, if the filament is turned off after the magnetronoscillates in the half–wave voltage doubler rectifier for a microwave oven, the filament’selectron emission cannot be maintained due to the discontinuous output, which preventsoscillation.

5.2. FULL WAVE DOUBLER RECTIFIER 91
(a)
(b)
(c)
D
C
T
T
D2
D1
C1
D2
D1
T
L
C1
C2
C2
MGT
MGT
MGT
Fig. 5.1 Power supply of the magnetron(a.microwave oven power supply, b.half wave voltagedoubler with smoothing capacity, c.full wave voltage doubler)
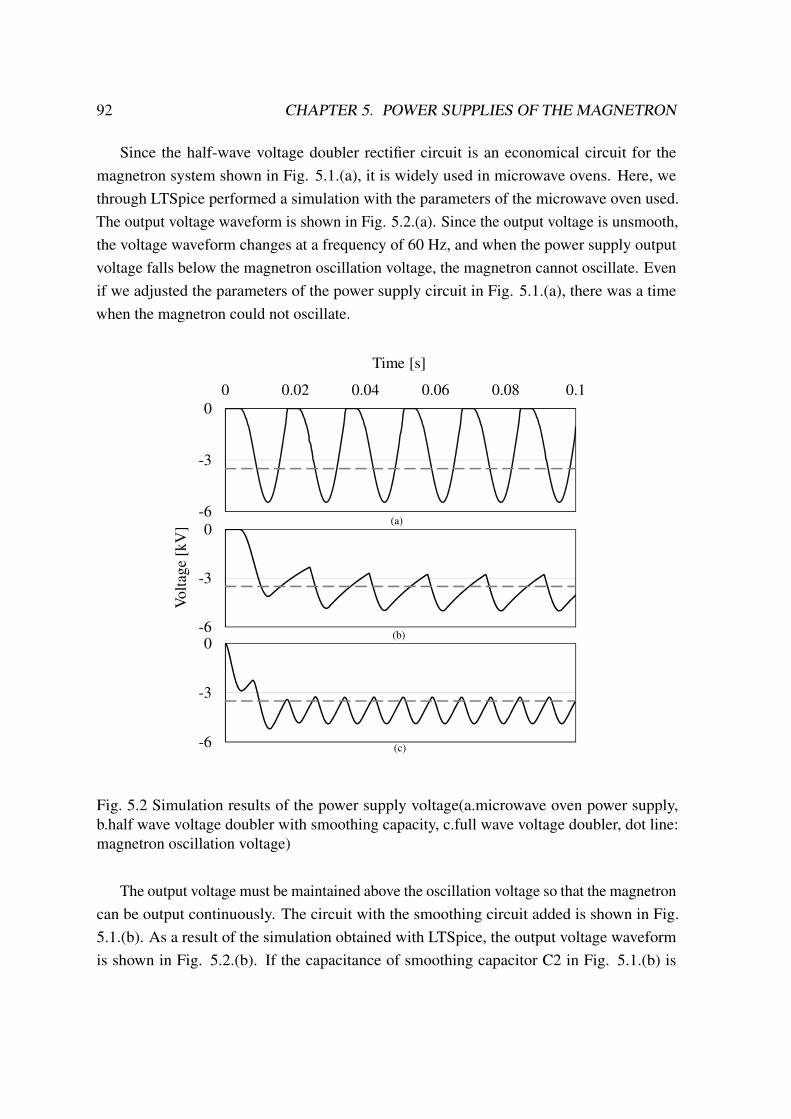
92 CHAPTER 5. POWER SUPPLIES OF THE MAGNETRON
Since the half-wave voltage doubler rectifier circuit is an economical circuit for themagnetron system shown in Fig. 5.1.(a), it is widely used in microwave ovens. Here, wethrough LTSpice performed a simulation with the parameters of the microwave oven used.The output voltage waveform is shown in Fig. 5.2.(a). Since the output voltage is unsmooth,the voltage waveform changes at a frequency of 60 Hz, and when the power supply outputvoltage falls below the magnetron oscillation voltage, the magnetron cannot oscillate. Evenif we adjusted the parameters of the power supply circuit in Fig. 5.1.(a), there was a timewhen the magnetron could not oscillate.
-6
-3
0
0 0.02 0.04 0.06 0.08 0.1
Time [s]
-6
-3
0
Vo
ltag
e [k
V]
-6
-3
0
(a)
(b)
(c)
Fig. 5.2 Simulation results of the power supply voltage(a.microwave oven power supply,b.half wave voltage doubler with smoothing capacity, c.full wave voltage doubler, dot line:magnetron oscillation voltage)
The output voltage must be maintained above the oscillation voltage so that the magnetroncan be output continuously. The circuit with the smoothing circuit added is shown in Fig.5.1.(b). As a result of the simulation obtained with LTSpice, the output voltage waveformis shown in Fig. 5.2.(b). If the capacitance of smoothing capacitor C2 in Fig. 5.1.(b) is
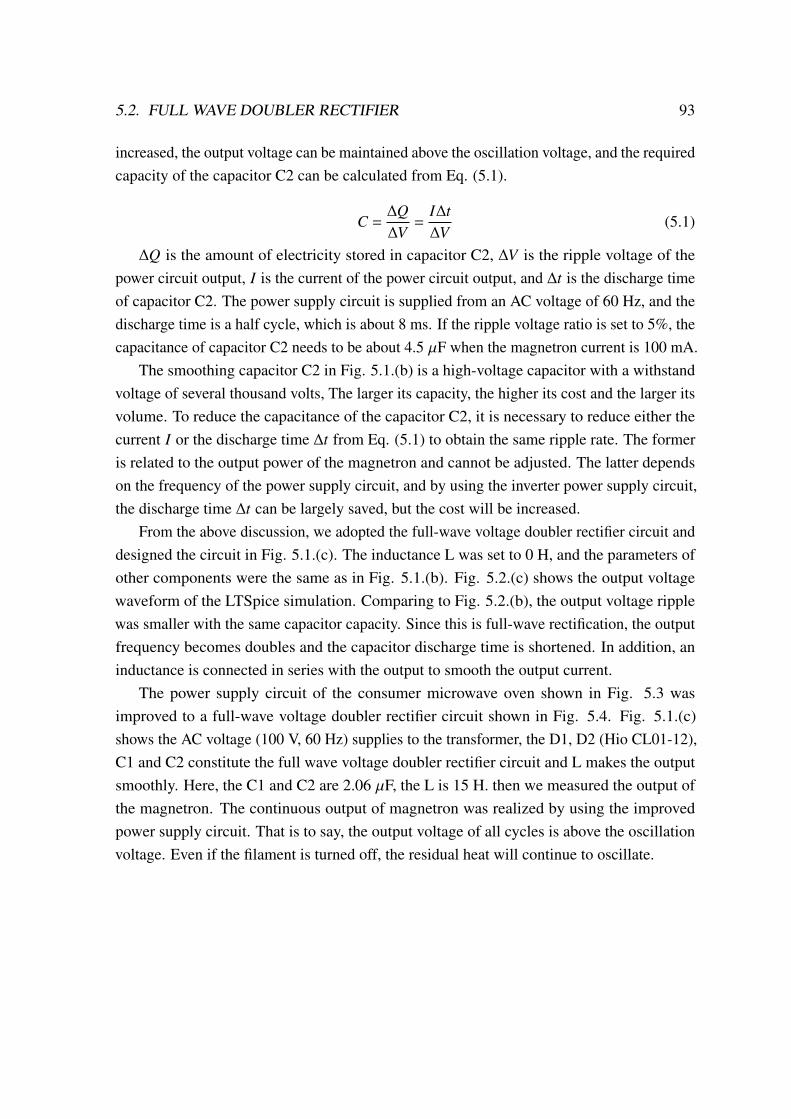
5.2. FULL WAVE DOUBLER RECTIFIER 93
increased, the output voltage can be maintained above the oscillation voltage, and the requiredcapacity of the capacitor C2 can be calculated from Eq. (5.1).
𝐶 =Δ𝑄
Δ𝑉=𝐼Δ𝑡
Δ𝑉(5.1)
Δ𝑄 is the amount of electricity stored in capacitor C2, Δ𝑉 is the ripple voltage of thepower circuit output, 𝐼 is the current of the power circuit output, and Δ𝑡 is the discharge timeof capacitor C2. The power supply circuit is supplied from an AC voltage of 60 Hz, and thedischarge time is a half cycle, which is about 8 ms. If the ripple voltage ratio is set to 5%, thecapacitance of capacitor C2 needs to be about 4.5 `F when the magnetron current is 100 mA.
The smoothing capacitor C2 in Fig. 5.1.(b) is a high-voltage capacitor with a withstandvoltage of several thousand volts, The larger its capacity, the higher its cost and the larger itsvolume. To reduce the capacitance of the capacitor C2, it is necessary to reduce either thecurrent 𝐼 or the discharge time Δ𝑡 from Eq. (5.1) to obtain the same ripple rate. The formeris related to the output power of the magnetron and cannot be adjusted. The latter dependson the frequency of the power supply circuit, and by using the inverter power supply circuit,the discharge time Δ𝑡 can be largely saved, but the cost will be increased.
From the above discussion, we adopted the full-wave voltage doubler rectifier circuit anddesigned the circuit in Fig. 5.1.(c). The inductance L was set to 0 H, and the parameters ofother components were the same as in Fig. 5.1.(b). Fig. 5.2.(c) shows the output voltagewaveform of the LTSpice simulation. Comparing to Fig. 5.2.(b), the output voltage ripplewas smaller with the same capacitor capacity. Since this is full-wave rectification, the outputfrequency becomes doubles and the capacitor discharge time is shortened. In addition, aninductance is connected in series with the output to smooth the output current.
The power supply circuit of the consumer microwave oven shown in Fig. 5.3 wasimproved to a full-wave voltage doubler rectifier circuit shown in Fig. 5.4. Fig. 5.1.(c)shows the AC voltage (100 V, 60 Hz) supplies to the transformer, the D1, D2 (Hio CL01-12),C1 and C2 constitute the full wave voltage doubler rectifier circuit and L makes the outputsmoothly. Here, the C1 and C2 are 2.06 `F, the L is 15 H. then we measured the output ofthe magnetron. The continuous output of magnetron was realized by using the improvedpower supply circuit. That is to say, the output voltage of all cycles is above the oscillationvoltage. Even if the filament is turned off, the residual heat will continue to oscillate.
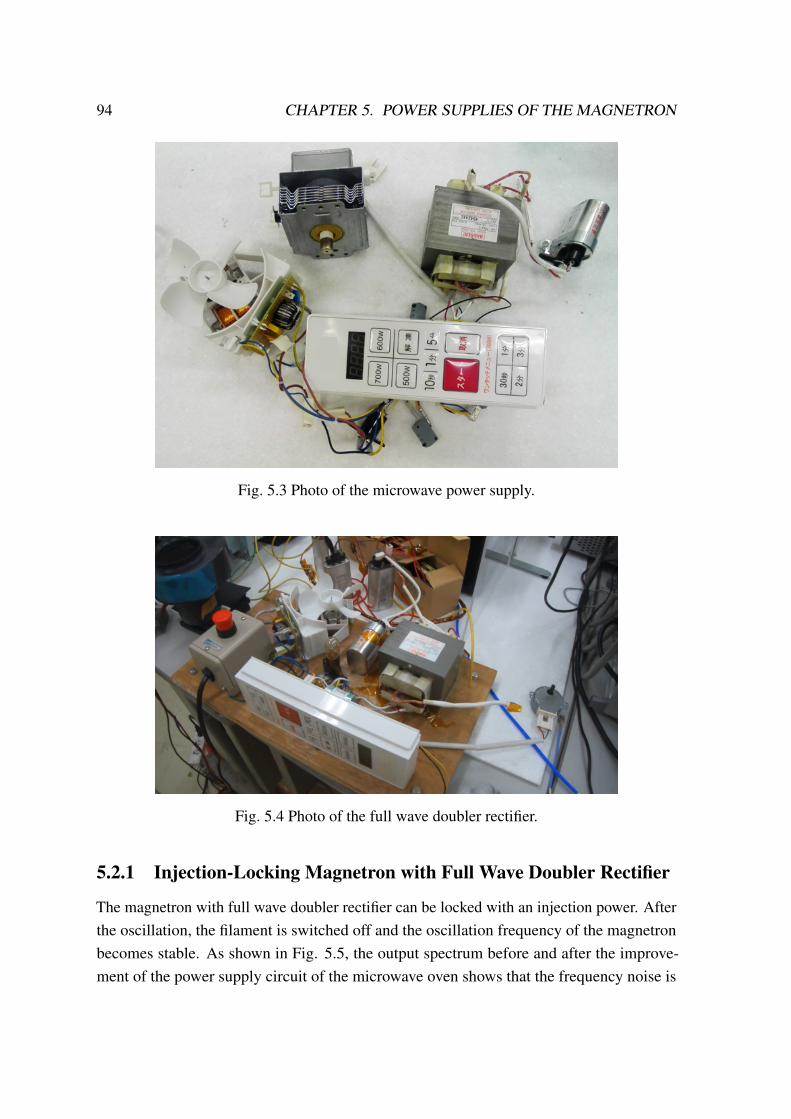
94 CHAPTER 5. POWER SUPPLIES OF THE MAGNETRON
Fig. 5.3 Photo of the microwave power supply.
Fig. 5.4 Photo of the full wave doubler rectifier.
5.2.1 Injection-Locking Magnetron with Full Wave Doubler Rectifier
The magnetron with full wave doubler rectifier can be locked with an injection power. Afterthe oscillation, the filament is switched off and the oscillation frequency of the magnetronbecomes stable. As shown in Fig. 5.5, the output spectrum before and after the improve-ment of the power supply circuit of the microwave oven shows that the frequency noise is
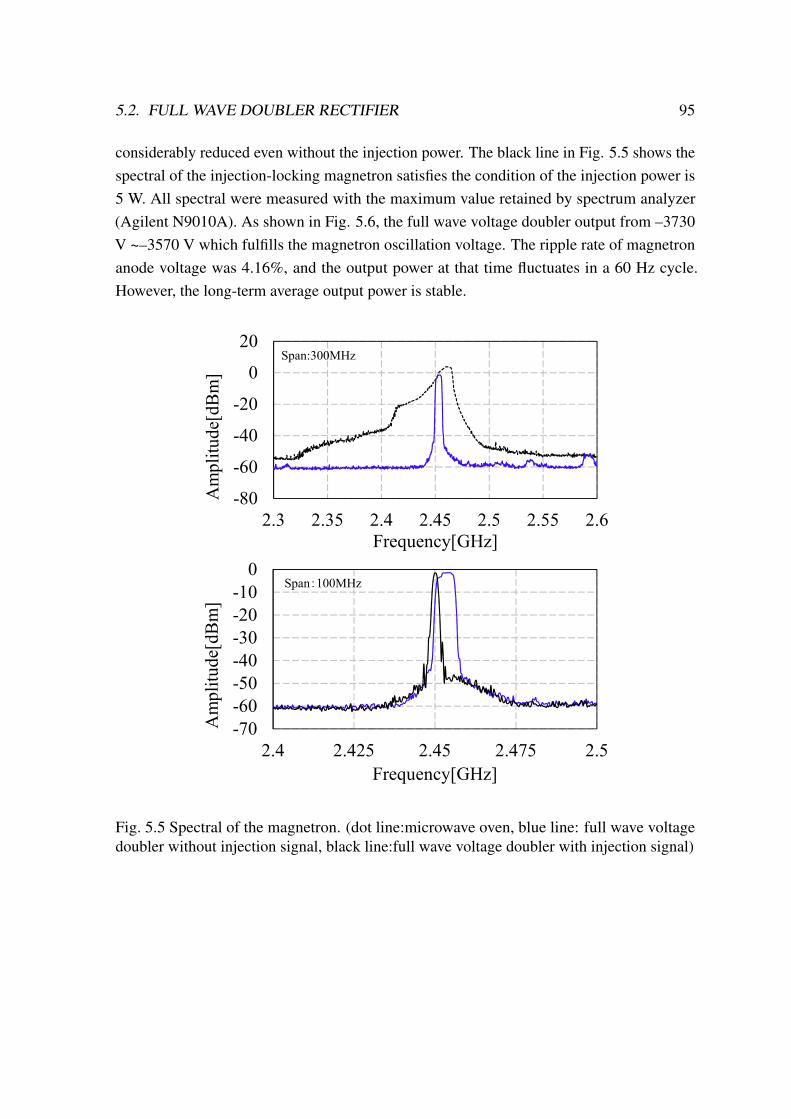
5.2. FULL WAVE DOUBLER RECTIFIER 95
considerably reduced even without the injection power. The black line in Fig. 5.5 shows thespectral of the injection-locking magnetron satisfies the condition of the injection power is5 W. All spectral were measured with the maximum value retained by spectrum analyzer(Agilent N9010A). As shown in Fig. 5.6, the full wave voltage doubler output from –3730V ~–3570 V which fulfills the magnetron oscillation voltage. The ripple rate of magnetronanode voltage was 4.16%, and the output power at that time fluctuates in a 60 Hz cycle.However, the long-term average output power is stable.
-80
-60
-40
-20
0
20
2.3 2.35 2.4 2.45 2.5 2.55 2.6
Amplitude[dBm]
Frequency[GHz]
Span:300MHz
-70
-60
-50
-40
-30
-20
-10
0
2.4 2.425 2.45 2.475 2.5
Amplitude[dBm]
Frequency[GHz]
Span:100MHz
Fig. 5.5 Spectral of the magnetron. (dot line:microwave oven, blue line: full wave voltagedoubler without injection signal, black line:full wave voltage doubler with injection signal)
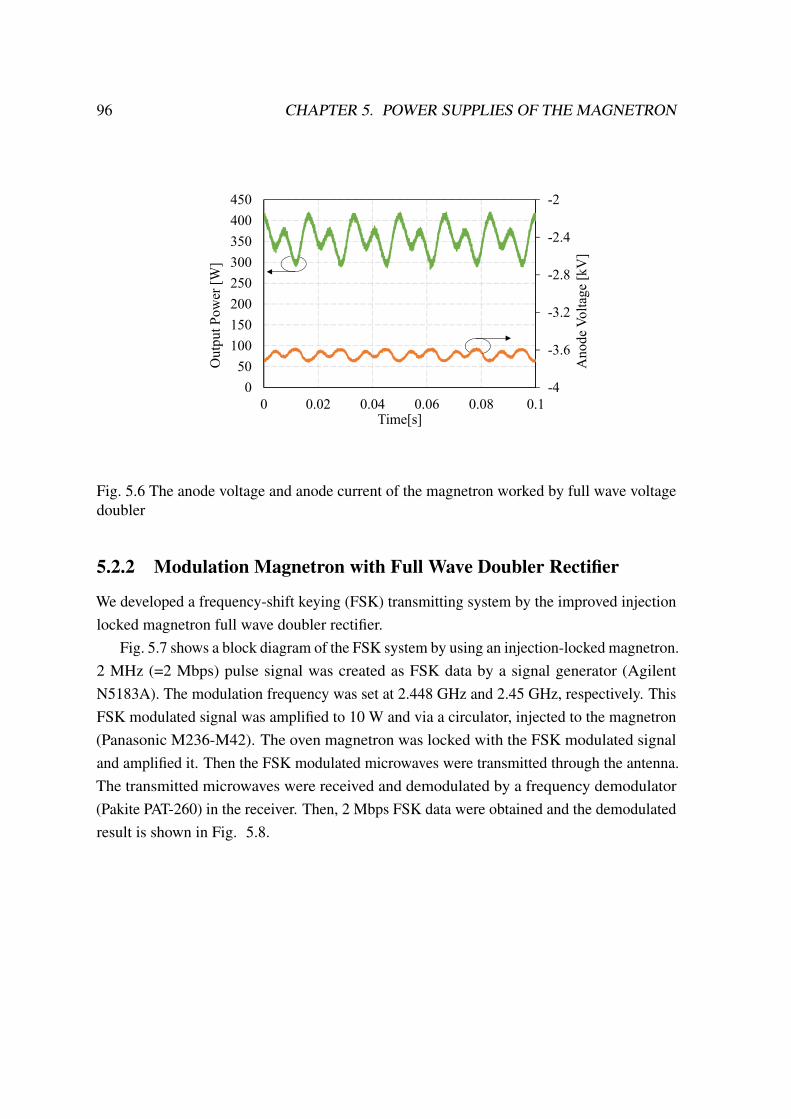
96 CHAPTER 5. POWER SUPPLIES OF THE MAGNETRON
-4
-3.6
-3.2
-2.8
-2.4
-2
0
50
100
150
200
250
300
350
400
450
0 0.02 0.04 0.06 0.08 0.1
An
od
e V
olt
age
[kV
]
Ou
tpu
tP
ow
er [
W]
Time[s]
Fig. 5.6 The anode voltage and anode current of the magnetron worked by full wave voltagedoubler
5.2.2 Modulation Magnetron with Full Wave Doubler Rectifier
We developed a frequency-shift keying (FSK) transmitting system by the improved injectionlocked magnetron full wave doubler rectifier.
Fig. 5.7 shows a block diagram of the FSK system by using an injection-locked magnetron.2 MHz (=2 Mbps) pulse signal was created as FSK data by a signal generator (AgilentN5183A). The modulation frequency was set at 2.448 GHz and 2.45 GHz, respectively. ThisFSK modulated signal was amplified to 10 W and via a circulator, injected to the magnetron(Panasonic M236-M42). The oven magnetron was locked with the FSK modulated signaland amplified it. Then the FSK modulated microwaves were transmitted through the antenna.The transmitted microwaves were received and demodulated by a frequency demodulator(Pakite PAT-260) in the receiver. Then, 2 Mbps FSK data were obtained and the demodulatedresult is shown in Fig. 5.8.
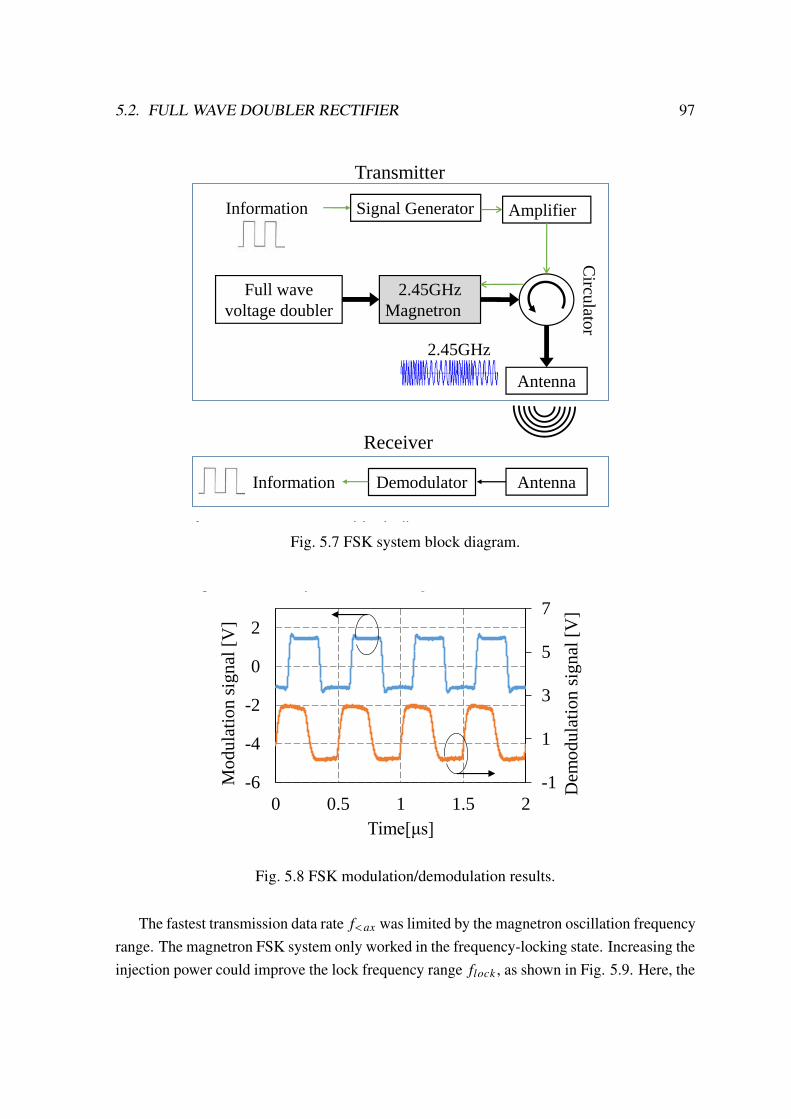
5.2. FULL WAVE DOUBLER RECTIFIER 97
Figure 2. FSK system block diagram
Figure 3. FSK modulation/demodulation result
level was changed, and the voltage should be kept above
the magnetron oscillation voltage all the time. However,
in this FSK system the magnetron worked at a ripple rate
of 4.16% and the output power was changed from 300 W
to 400 W. The oscillation frequency shifting fo was 3MHz
(2.4495-2.4524 GHz), and their relationships can be
defined as follows:
fmax <( flock - fo)/a
( If flock<fo, the magnetron goes off the injection locking )
Here, a is the modulation index. To achieve a faster
transmission rate, the injection power should be improved,
which could also improve the locking frequency range
flock, or the ripple rate should be reduced, which could
reduce the oscillation frequency shifting fo as well.
Conclusions We demonstrated FSK data transmission by an injection-
locked magnetron with a full wave voltage doubler. At 10
W injection power and 4.16% power source ripple, 2
Mbps FSK data transmission was achieved. Increasing the
injection power and reducing the voltage ripple, the
transmission data rate can be faster.
Figure 4. Injection power vs. lock frequency range
Figure 5. Characteristics of the magnetron (upper trace:
oscillation frequency vs. output power, lower trance: anode voltage vs. output power based on the full wave voltage doubler)
Acknowledgments This work was supported by the collaborative research
program: Microwave Energy Transmission Laboratory
(METLAB), Research Institute for Sustainable
Humanosphere, Kyoto University.
References 1. R. Adler, “A Study of Locking Phenomena in
Oscillators,” Proceedings of I.R.E and Waves and
Electrons, vol. 34, pp. 351-357, 1946
2. N. Shinohara, H. Matsumoto, K. Hashimoto, “Phase-
controlled magnetron development for SPORTS:
Space power radio transmission system,” Radio
Science Bulletin, vol. 2004, No. 310, pp. 29-35, 2004
3. C. Liu, H. Huang, Z. Liu, F. Huo, and K. Huang,
“Experimental Study on Microwave Power
Combining Based on Injection-Locked 15-kW S-
Band Continuous-Wave Magnetrons,” IEEE
Transactions on Plasma Science, vol.44, No. 8,
pp.1291–1297, August 2016.
4. I. Tahir, A. Dexter and R. Carter, “Frequency and
Phase Modulation Performance of an Injection-
Locked CW Magnetron,” IEEE Transactions on
Electron Devices, vol. 53, No. 7, pp. 1721-1729,
2006
Signal Generator
Antenna
AmplifierC
irculato
r
2.45GHz
Magnetron
Full wave
voltage doubler
Information
Transmitter
AntennaInformation
Receiver
Demodulator
2.45GHz
-1
1
3
5
7
-6
-4
-2
0
2
0 0.5 1 1.5 2
Dem
od
ula
tion
sig
nal
[V
]
Mo
du
lati
on
sig
nal
[V
]
Time[μs]
0
1
2
3
4
5
2 3 4 5 6 7 8 9 10
Lo
ckin
gfr
equ
ency
ran
ge
[MH
z]
Injetion Power [W]
3.4
3.5
3.6
3.7
3.8
3.9
4
2.442
2.444
2.446
2.448
2.45
2.452
2.454
2.456
0 200 400 600
|An
od
e v
olt
age
| [
kV
]
Mag
net
ron o
scil
lati
on
freq
uen
cy [
GH
z]Output of the Magnetron [W]
Fig. 5.7 FSK system block diagram.
Figure 2. FSK system block diagram
Figure 3. FSK modulation/demodulation result
level was changed, and the voltage should be kept above
the magnetron oscillation voltage all the time. However,
in this FSK system the magnetron worked at a ripple rate
of 4.16% and the output power was changed from 300 W
to 400 W. The oscillation frequency shifting fo was 3MHz
(2.4495-2.4524 GHz), and their relationships can be
defined as follows:
fmax <( flock - fo)/a
( If flock<fo, the magnetron goes off the injection locking )
Here, a is the modulation index. To achieve a faster
transmission rate, the injection power should be improved,
which could also improve the locking frequency range
flock, or the ripple rate should be reduced, which could
reduce the oscillation frequency shifting fo as well.
Conclusions We demonstrated FSK data transmission by an injection-
locked magnetron with a full wave voltage doubler. At 10
W injection power and 4.16% power source ripple, 2
Mbps FSK data transmission was achieved. Increasing the
injection power and reducing the voltage ripple, the
transmission data rate can be faster.
Figure 4. Injection power vs. lock frequency range
Figure 5. Characteristics of the magnetron (upper trace:
oscillation frequency vs. output power, lower trance: anode voltage vs. output power based on the full wave voltage doubler)
Acknowledgments This work was supported by the collaborative research
program: Microwave Energy Transmission Laboratory
(METLAB), Research Institute for Sustainable
Humanosphere, Kyoto University.
References 1. R. Adler, “A Study of Locking Phenomena in
Oscillators,” Proceedings of I.R.E and Waves and
Electrons, vol. 34, pp. 351-357, 1946
2. N. Shinohara, H. Matsumoto, K. Hashimoto, “Phase-
controlled magnetron development for SPORTS:
Space power radio transmission system,” Radio
Science Bulletin, vol. 2004, No. 310, pp. 29-35, 2004
3. C. Liu, H. Huang, Z. Liu, F. Huo, and K. Huang,
“Experimental Study on Microwave Power
Combining Based on Injection-Locked 15-kW S-
Band Continuous-Wave Magnetrons,” IEEE
Transactions on Plasma Science, vol.44, No. 8,
pp.1291–1297, August 2016.
4. I. Tahir, A. Dexter and R. Carter, “Frequency and
Phase Modulation Performance of an Injection-
Locked CW Magnetron,” IEEE Transactions on
Electron Devices, vol. 53, No. 7, pp. 1721-1729,
2006
Signal Generator
Antenna
Amplifier
Circu
lator
2.45GHz
Magnetron
Full wave
voltage doubler
Information
Transmitter
AntennaInformation
Receiver
Demodulator
2.45GHz
-1
1
3
5
7
-6
-4
-2
0
2
0 0.5 1 1.5 2
Dem
od
ula
tion
sig
nal
[V
]
Mo
du
lati
on
sig
nal
[V
]
Time[μs]
0
1
2
3
4
5
2 3 4 5 6 7 8 9 10
Lo
ckin
gfr
equ
ency
ran
ge
[MH
z]
Injetion Power [W]
3.4
3.5
3.6
3.7
3.8
3.9
4
2.442
2.444
2.446
2.448
2.45
2.452
2.454
2.456
0 200 400 600
|An
od
e v
olt
age
| [
kV
]
Mag
net
ron o
scil
lati
on
freq
uen
cy [
GH
z]
Output of the Magnetron [W]
Fig. 5.8 FSK modulation/demodulation results.
The fastest transmission data rate 𝑓𝑚𝑎𝑥 was limited by the magnetron oscillation frequencyrange. The magnetron FSK system only worked in the frequency-locking state. Increasing theinjection power could improve the lock frequency range 𝑓𝑙𝑜𝑐𝑘 , as shown in Fig. 5.9. Here, the
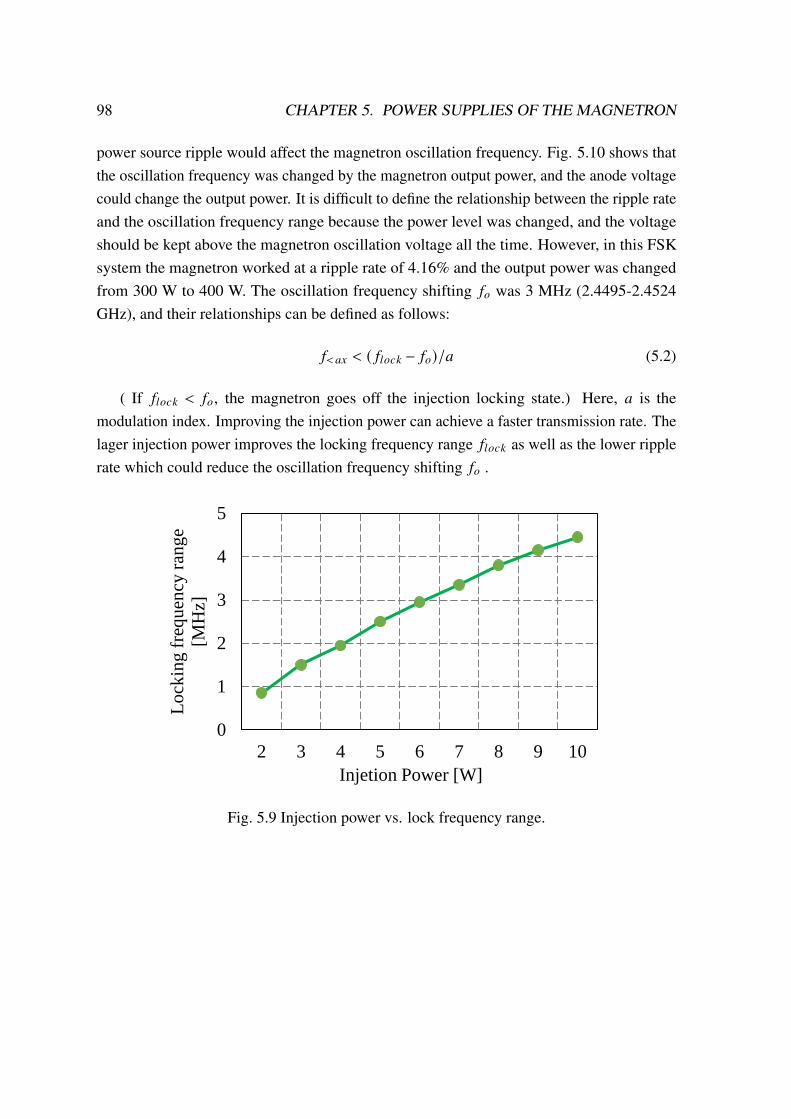
98 CHAPTER 5. POWER SUPPLIES OF THE MAGNETRON
power source ripple would affect the magnetron oscillation frequency. Fig. 5.10 shows thatthe oscillation frequency was changed by the magnetron output power, and the anode voltagecould change the output power. It is difficult to define the relationship between the ripple rateand the oscillation frequency range because the power level was changed, and the voltageshould be kept above the magnetron oscillation voltage all the time. However, in this FSKsystem the magnetron worked at a ripple rate of 4.16% and the output power was changedfrom 300 W to 400 W. The oscillation frequency shifting 𝑓𝑜 was 3 MHz (2.4495-2.4524GHz), and their relationships can be defined as follows:
𝑓𝑚𝑎𝑥 < ( 𝑓𝑙𝑜𝑐𝑘 − 𝑓𝑜)/𝑎 (5.2)
( If 𝑓𝑙𝑜𝑐𝑘 < 𝑓𝑜, the magnetron goes off the injection locking state.) Here, 𝑎 is themodulation index. Improving the injection power can achieve a faster transmission rate. Thelager injection power improves the locking frequency range 𝑓𝑙𝑜𝑐𝑘 as well as the lower ripplerate which could reduce the oscillation frequency shifting 𝑓𝑜 .
Figure 2. FSK system block diagram
Figure 3. FSK modulation/demodulation result
level was changed, and the voltage should be kept above
the magnetron oscillation voltage all the time. However,
in this FSK system the magnetron worked at a ripple rate
of 4.16% and the output power was changed from 300 W
to 400 W. The oscillation frequency shifting fo was 3MHz
(2.4495-2.4524 GHz), and their relationships can be
defined as follows:
fmax <( flock - fo)/a
( If flock<fo, the magnetron goes off the injection locking )
Here, a is the modulation index. To achieve a faster
transmission rate, the injection power should be improved,
which could also improve the locking frequency range
flock, or the ripple rate should be reduced, which could
reduce the oscillation frequency shifting fo as well.
Conclusions We demonstrated FSK data transmission by an injection-
locked magnetron with a full wave voltage doubler. At 10
W injection power and 4.16% power source ripple, 2
Mbps FSK data transmission was achieved. Increasing the
injection power and reducing the voltage ripple, the
transmission data rate can be faster.
Figure 4. Injection power vs. lock frequency range
Figure 5. Characteristics of the magnetron (upper trace:
oscillation frequency vs. output power, lower trance: anode voltage vs. output power based on the full wave voltage doubler)
Acknowledgments This work was supported by the collaborative research
program: Microwave Energy Transmission Laboratory
(METLAB), Research Institute for Sustainable
Humanosphere, Kyoto University.
References 1. R. Adler, “A Study of Locking Phenomena in
Oscillators,” Proceedings of I.R.E and Waves and
Electrons, vol. 34, pp. 351-357, 1946
2. N. Shinohara, H. Matsumoto, K. Hashimoto, “Phase-
controlled magnetron development for SPORTS:
Space power radio transmission system,” Radio
Science Bulletin, vol. 2004, No. 310, pp. 29-35, 2004
3. C. Liu, H. Huang, Z. Liu, F. Huo, and K. Huang,
“Experimental Study on Microwave Power
Combining Based on Injection-Locked 15-kW S-
Band Continuous-Wave Magnetrons,” IEEE
Transactions on Plasma Science, vol.44, No. 8,
pp.1291–1297, August 2016.
4. I. Tahir, A. Dexter and R. Carter, “Frequency and
Phase Modulation Performance of an Injection-
Locked CW Magnetron,” IEEE Transactions on
Electron Devices, vol. 53, No. 7, pp. 1721-1729,
2006
Signal Generator
Antenna
Amplifier
Circu
lator
2.45GHz
Magnetron
Full wave
voltage doubler
Information
Transmitter
AntennaInformation
Receiver
Demodulator
2.45GHz
-1
1
3
5
7
-6
-4
-2
0
2
0 0.5 1 1.5 2
Dem
od
ula
tio
nsi
gn
al [
V]
Mo
du
lati
on
sig
nal
[V
]
Time[μs]
0
1
2
3
4
5
2 3 4 5 6 7 8 9 10
Lo
ckin
gfr
equ
ency
ran
ge
[MH
z]
Injetion Power [W]
3.4
3.5
3.6
3.7
3.8
3.9
4
2.442
2.444
2.446
2.448
2.45
2.452
2.454
2.456
0 200 400 600
|An
od
e v
olt
age
| [
kV
]
Mag
net
ron o
scil
lati
on
freq
uen
cy [
GH
z]
Output of the Magnetron [W]
Fig. 5.9 Injection power vs. lock frequency range.
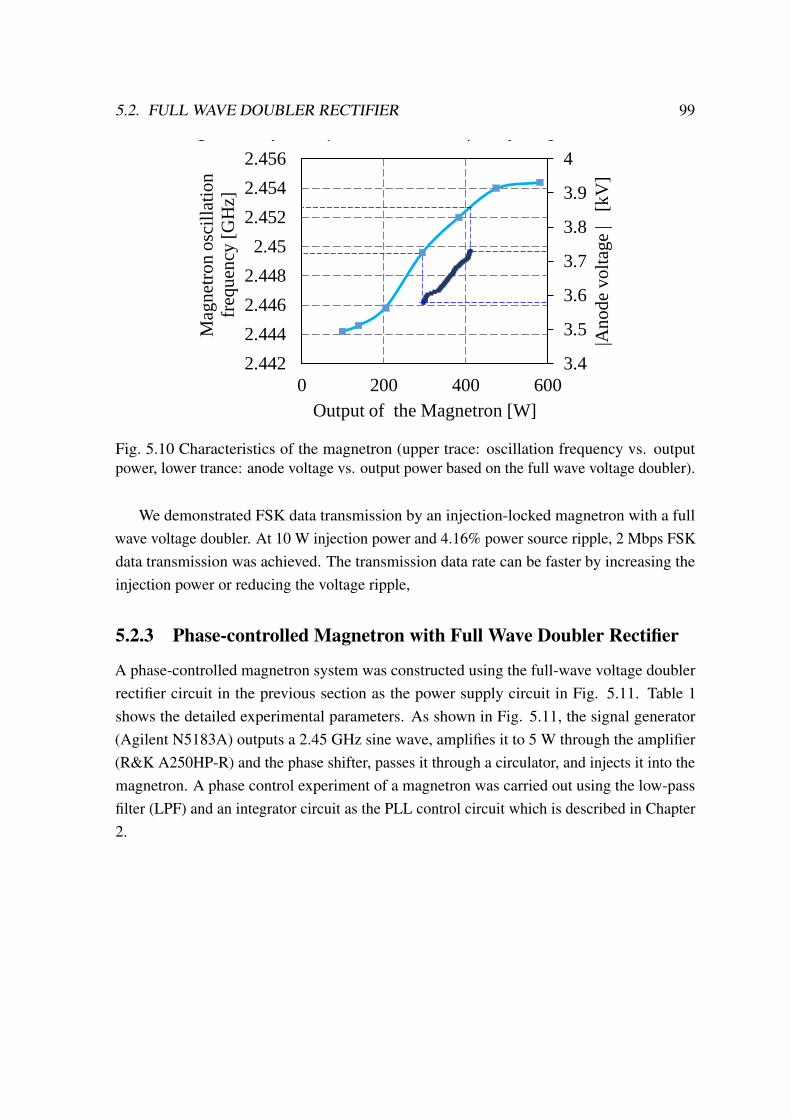
5.2. FULL WAVE DOUBLER RECTIFIER 99
Figure 2. FSK system block diagram
Figure 3. FSK modulation/demodulation result
level was changed, and the voltage should be kept above
the magnetron oscillation voltage all the time. However,
in this FSK system the magnetron worked at a ripple rate
of 4.16% and the output power was changed from 300 W
to 400 W. The oscillation frequency shifting fo was 3MHz
(2.4495-2.4524 GHz), and their relationships can be
defined as follows:
fmax <( flock - fo)/a
( If flock<fo, the magnetron goes off the injection locking )
Here, a is the modulation index. To achieve a faster
transmission rate, the injection power should be improved,
which could also improve the locking frequency range
flock, or the ripple rate should be reduced, which could
reduce the oscillation frequency shifting fo as well.
Conclusions We demonstrated FSK data transmission by an injection-
locked magnetron with a full wave voltage doubler. At 10
W injection power and 4.16% power source ripple, 2
Mbps FSK data transmission was achieved. Increasing the
injection power and reducing the voltage ripple, the
transmission data rate can be faster.
Figure 4. Injection power vs. lock frequency range
Figure 5. Characteristics of the magnetron (upper trace:
oscillation frequency vs. output power, lower trance: anode voltage vs. output power based on the full wave voltage doubler)
Acknowledgments This work was supported by the collaborative research
program: Microwave Energy Transmission Laboratory
(METLAB), Research Institute for Sustainable
Humanosphere, Kyoto University.
References 1. R. Adler, “A Study of Locking Phenomena in
Oscillators,” Proceedings of I.R.E and Waves and
Electrons, vol. 34, pp. 351-357, 1946
2. N. Shinohara, H. Matsumoto, K. Hashimoto, “Phase-
controlled magnetron development for SPORTS:
Space power radio transmission system,” Radio
Science Bulletin, vol. 2004, No. 310, pp. 29-35, 2004
3. C. Liu, H. Huang, Z. Liu, F. Huo, and K. Huang,
“Experimental Study on Microwave Power
Combining Based on Injection-Locked 15-kW S-
Band Continuous-Wave Magnetrons,” IEEE
Transactions on Plasma Science, vol.44, No. 8,
pp.1291–1297, August 2016.
4. I. Tahir, A. Dexter and R. Carter, “Frequency and
Phase Modulation Performance of an Injection-
Locked CW Magnetron,” IEEE Transactions on
Electron Devices, vol. 53, No. 7, pp. 1721-1729,
2006
Signal Generator
Antenna
Amplifier
Circu
lator
2.45GHz
Magnetron
Full wave
voltage doubler
Information
Transmitter
AntennaInformation
Receiver
Demodulator
2.45GHz
-1
1
3
5
7
-6
-4
-2
0
2
0 0.5 1 1.5 2
Dem
od
ula
tion
sig
nal
[V
]
Mo
du
lati
on
sig
nal
[V
]
Time[μs]
0
1
2
3
4
5
2 3 4 5 6 7 8 9 10
Lo
ckin
gfr
equ
ency
ran
ge
[MH
z]
Injetion Power [W]
3.4
3.5
3.6
3.7
3.8
3.9
4
2.442
2.444
2.446
2.448
2.45
2.452
2.454
2.456
0 200 400 600
|An
od
e v
olt
age
| [
kV
]
Mag
net
ron o
scil
lati
on
freq
uen
cy [
GH
z]
Output of the Magnetron [W]
Fig. 5.10 Characteristics of the magnetron (upper trace: oscillation frequency vs. outputpower, lower trance: anode voltage vs. output power based on the full wave voltage doubler).
We demonstrated FSK data transmission by an injection-locked magnetron with a fullwave voltage doubler. At 10 W injection power and 4.16% power source ripple, 2 Mbps FSKdata transmission was achieved. The transmission data rate can be faster by increasing theinjection power or reducing the voltage ripple,
5.2.3 Phase-controlled Magnetron with Full Wave Doubler Rectifier
A phase-controlled magnetron system was constructed using the full-wave voltage doublerrectifier circuit in the previous section as the power supply circuit in Fig. 5.11. Table 1shows the detailed experimental parameters. As shown in Fig. 5.11, the signal generator(Agilent N5183A) outputs a 2.45 GHz sine wave, amplifies it to 5 W through the amplifier(R&K A250HP-R) and the phase shifter, passes it through a circulator, and injects it into themagnetron. A phase control experiment of a magnetron was carried out using the low-passfilter (LPF) and an integrator circuit as the PLL control circuit which is described in Chapter2.
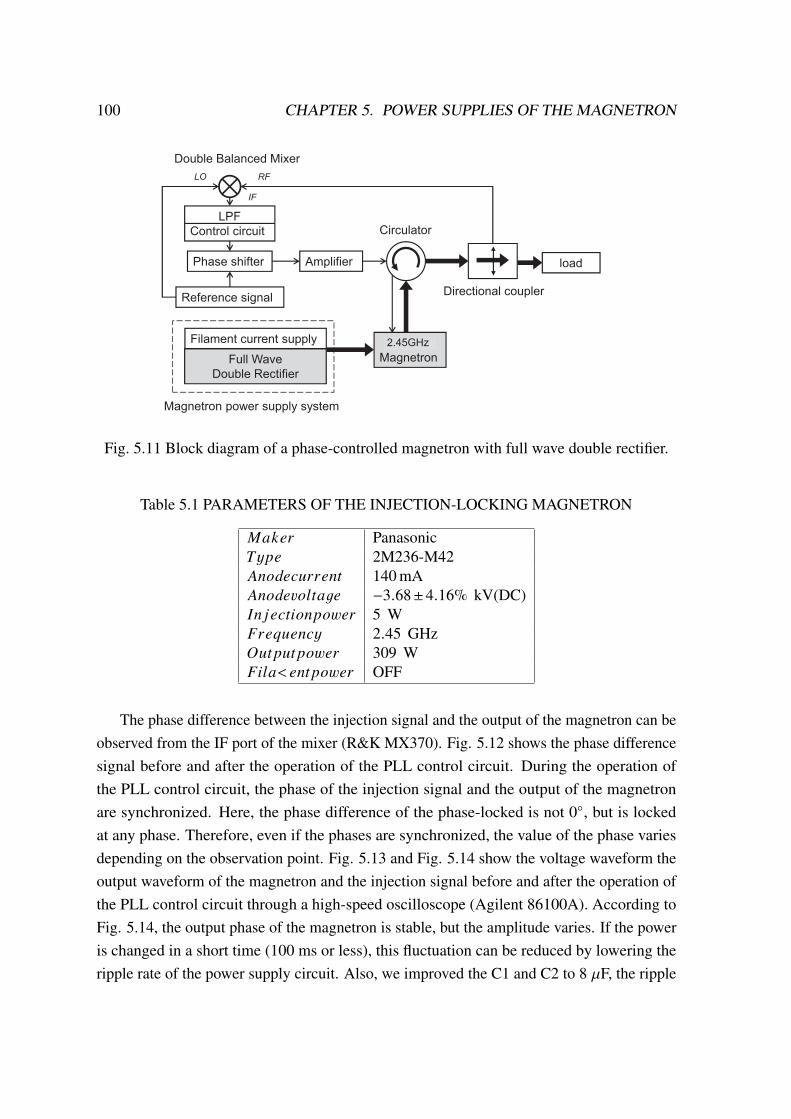
100 CHAPTER 5. POWER SUPPLIES OF THE MAGNETRON
��������������
����������� �����������
���������
������
��������
�����������������
������� ���������!��
�� ��
��
" #
�������������
�����������$��������%��%����
#����&�'��
��������������
#��������������������% 2.45GHz
Fig. 5.11 Block diagram of a phase-controlled magnetron with full wave double rectifier.
Table 5.1 PARAMETERS OF THE INJECTION-LOCKING MAGNETRON
𝑀𝑎𝑘𝑒𝑟 Panasonic𝑇𝑦𝑝𝑒 2M236-M42𝐴𝑛𝑜𝑑𝑒𝑐𝑢𝑟𝑟𝑒𝑛𝑡 140 mA𝐴𝑛𝑜𝑑𝑒𝑣𝑜𝑙𝑡𝑎𝑔𝑒 −3.68±4.16% kV(DC)𝐼𝑛 𝑗𝑒𝑐𝑡𝑖𝑜𝑛𝑝𝑜𝑤𝑒𝑟 5 W𝐹𝑟𝑒𝑞𝑢𝑒𝑛𝑐𝑦 2.45 GHz𝑂𝑢𝑡𝑝𝑢𝑡𝑝𝑜𝑤𝑒𝑟 309 W𝐹𝑖𝑙𝑎𝑚𝑒𝑛𝑡𝑝𝑜𝑤𝑒𝑟 OFF
The phase difference between the injection signal and the output of the magnetron can beobserved from the IF port of the mixer (R&K MX370). Fig. 5.12 shows the phase differencesignal before and after the operation of the PLL control circuit. During the operation ofthe PLL control circuit, the phase of the injection signal and the output of the magnetronare synchronized. Here, the phase difference of the phase-locked is not 0◦, but is lockedat any phase. Therefore, even if the phases are synchronized, the value of the phase variesdepending on the observation point. Fig. 5.13 and Fig. 5.14 show the voltage waveform theoutput waveform of the magnetron and the injection signal before and after the operation ofthe PLL control circuit through a high-speed oscilloscope (Agilent 86100A). According toFig. 5.14, the output phase of the magnetron is stable, but the amplitude varies. If the poweris changed in a short time (100 ms or less), this fluctuation can be reduced by lowering theripple rate of the power supply circuit. Also, we improved the C1 and C2 to 8 `F, the ripple
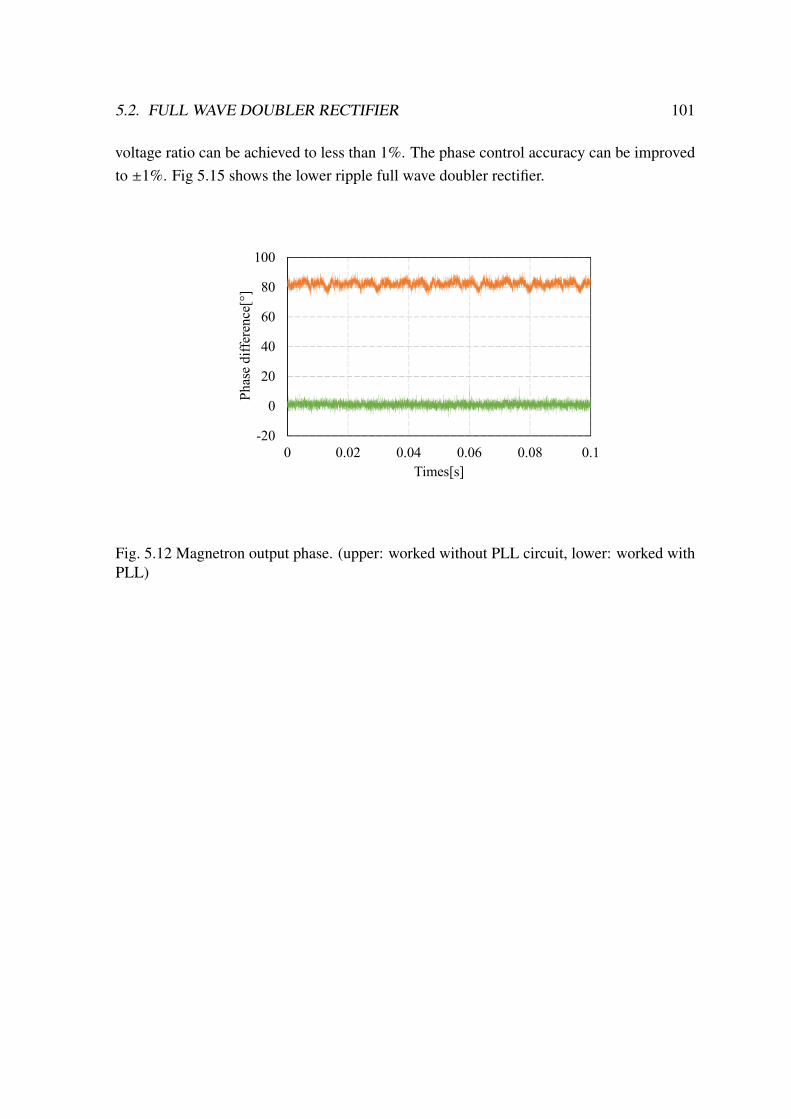
5.2. FULL WAVE DOUBLER RECTIFIER 101
voltage ratio can be achieved to less than 1%. The phase control accuracy can be improvedto ±1%. Fig 5.15 shows the lower ripple full wave doubler rectifier.
-20
0
20
40
60
80
100
0 0.02 0.04 0.06 0.08 0.1
Ph
ase
dif
fere
nce
[°]
Times[s]
Fig. 5.12 Magnetron output phase. (upper: worked without PLL circuit, lower: worked withPLL)
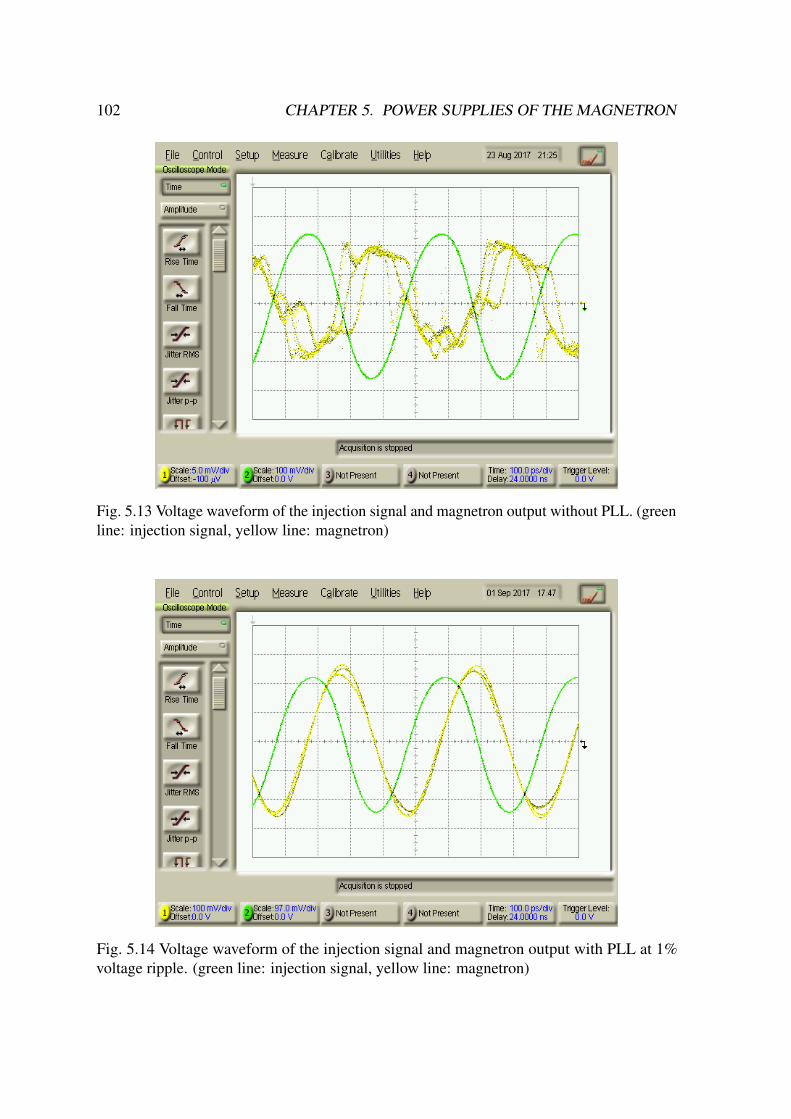
102 CHAPTER 5. POWER SUPPLIES OF THE MAGNETRON
Fig. 5.13 Voltage waveform of the injection signal and magnetron output without PLL. (greenline: injection signal, yellow line: magnetron)
Fig. 5.14 Voltage waveform of the injection signal and magnetron output with PLL at 1%voltage ripple. (green line: injection signal, yellow line: magnetron)
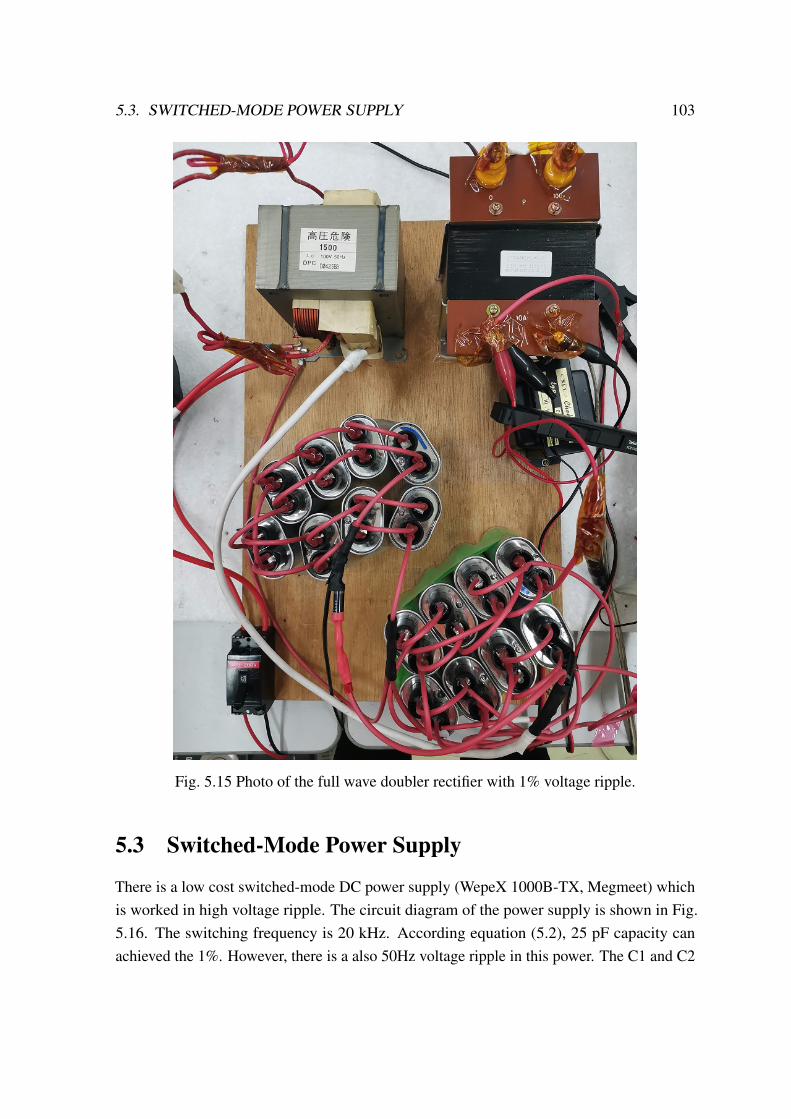
5.3. SWITCHED-MODE POWER SUPPLY 103
Fig. 5.15 Photo of the full wave doubler rectifier with 1% voltage ripple.
5.3 Switched-Mode Power Supply
There is a low cost switched-mode DC power supply (WepeX 1000B-TX, Megmeet) whichis worked in high voltage ripple. The circuit diagram of the power supply is shown in Fig.5.16. The switching frequency is 20 kHz. According equation (5.2), 25 pF capacity canachieved the 1%. However, there is a also 50Hz voltage ripple in this power. The C1 and C2
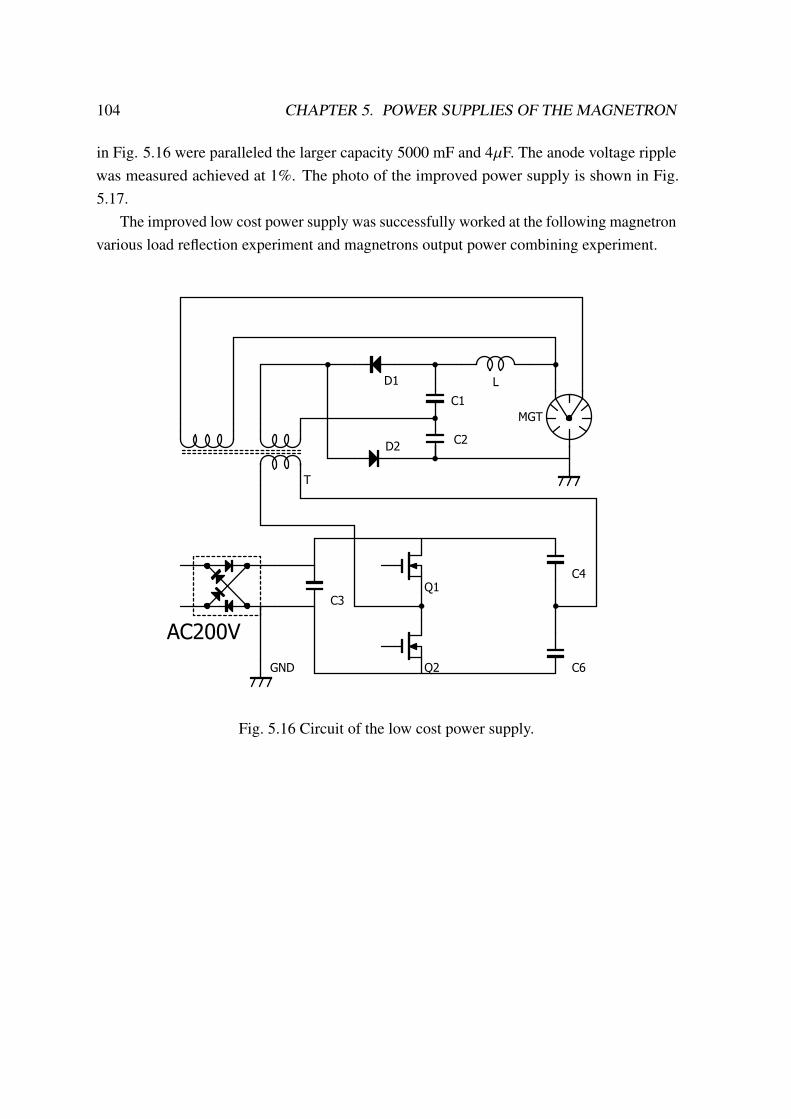
104 CHAPTER 5. POWER SUPPLIES OF THE MAGNETRON
in Fig. 5.16 were paralleled the larger capacity 5000 mF and 4`F. The anode voltage ripplewas measured achieved at 1%. The photo of the improved power supply is shown in Fig.5.17.
The improved low cost power supply was successfully worked at the following magnetronvarious load reflection experiment and magnetrons output power combining experiment.
1
2
A B C
1
2
A B C
AC200V
Q2
Q1C4
C6
D2
D1 L
C1
C2
MGT
T
C3
GND
Fig. 5.16 Circuit of the low cost power supply.
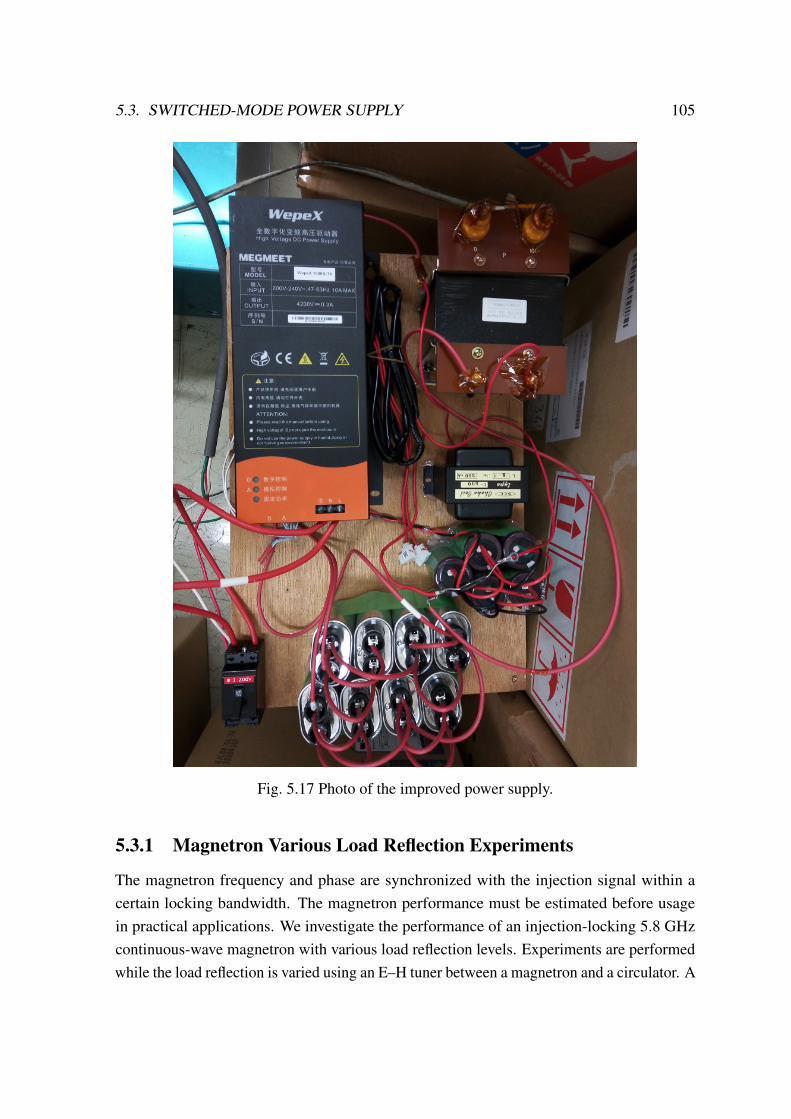
5.3. SWITCHED-MODE POWER SUPPLY 105
Fig. 5.17 Photo of the improved power supply.
5.3.1 Magnetron Various Load Reflection Experiments
The magnetron frequency and phase are synchronized with the injection signal within acertain locking bandwidth. The magnetron performance must be estimated before usagein practical applications. We investigate the performance of an injection-locking 5.8 GHzcontinuous-wave magnetron with various load reflection levels. Experiments are performedwhile the load reflection is varied using an E–H tuner between a magnetron and a circulator. A
106 CHAPTER 5. POWER SUPPLIES OF THE MAGNETRON
narrower locking bandwidth is observed under constant injection power with increasing loadreflection. The proper-mismatched system suppresses its sideband energy, thereby reducingphase noise. The experimental features qualitatively validate the theoretical analyses results.The investigation results also provide guidance for advanced applications in communicationand high-energy physics based on injection-locking magnetrons.
We developed a corresponding experimental system to explore the effects of the anodevoltage ripples on the injection-locked magnetron’s performance and verify our theoreticalanalysis. Fig. 5.21 and 5.22 shows the block diagram and photo of the system. Themagnetron (model: M5802-KRSC1) was manufactured by Panasonic Microwave Co. (Japan)with a 5.8 GHz continuous wave output. The filament current can be turned off after 5min of operation. A relatively sharp free-running spectrum was achieved. An oscilloscope(TDS-3054, Tektronix) was used to measure the anode voltage (high-voltage probe: P6015A,Tektronix) and current (AC/DC current probe: 1146A, Hewlett Packard). A reference signalwas generated using a signal generator (N5172B, Keysight) and amplified using a poweramplifier (CA5800BW50-4040R, R&K). The circulators provided a transmission path forthe injection of the amplified reference signal, thereby protecting the solid-state amplifier.Couplers were used to sample the signals and measure the power and spectrum using powermeters (A1914A, Agilent) and a signal analyzer (N9010A, Agilent), respectively. The outputmicrowave power was absorbed by a dummy load. Various load reflection levels wereintroduced through an E–H tuner (EMH-6H, Nihon Koshuha) placed between the magnetronand the circulator. The E–H tuner integrated the removable short-end slug at both E andH planes. Simultaneously, the load characteristic variation was measured using a vectornetwork analyzer (N9928A, Keysight). The effects of different load reflection levels on themagnetron’s injection locking performance were then investigated. The operating anodevoltage Va and the current Ia were 4.01 kV and 188 mA, respectively. The magnetronproduced a CW power of Pout = 370 W. Fig. 5.20 shows a comparison of the spectralvariations of the circumstances of free running, injection, and injection locking. The injectionlocking spectral shows the magnetron with the low cost noise was lower than –60 dB.

5.3. SWITCHED-MODE POWER SUPPLY 107
S.G.
Coupler #2
Magnetron
Dummy
Load #1
Dummy
Load #2
Coupler
#1
Power
Amplifier
Signal
Analyzer
E-H Tuner
Power
Meter
VNA
Coupler #3
Fig. 5.18 Block diagram of the experimental system.
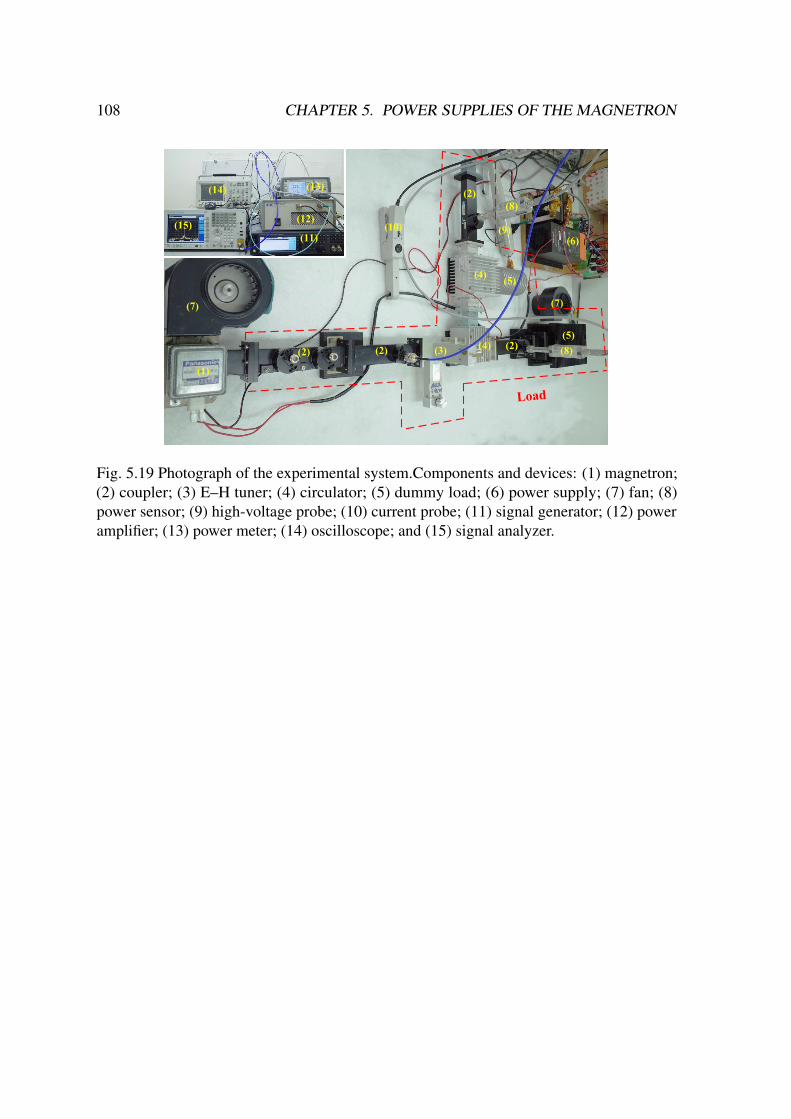
108 CHAPTER 5. POWER SUPPLIES OF THE MAGNETRON
(1)
(2) (2) (3)(4)
(4)
(2)(5)
(7) (7)
(6)(9)(10)
(2)
(8)
(8)
(5)
(15)
(14)
(11)
(12)
(13)
Fig. 5. Block diagram (a) and photograph (b) of the
experimental system. Components and devices: (1) magnetron;
(2) coupler; (3) E–H tuner; (4) circulator; (5) dummy load; (6)
power supply; (7) fan; (8) power sensor; (9) high-voltage probe;
(10) current probe; (11) signal generator; (12) power amplifier;
(13) power meter; (14) oscilloscope; and (15) signal analyzer.
Fig. 5.19 Photograph of the experimental system.Components and devices: (1) magnetron;(2) coupler; (3) E–H tuner; (4) circulator; (5) dummy load; (6) power supply; (7) fan; (8)power sensor; (9) high-voltage probe; (10) current probe; (11) signal generator; (12) poweramplifier; (13) power meter; (14) oscilloscope; and (15) signal analyzer.
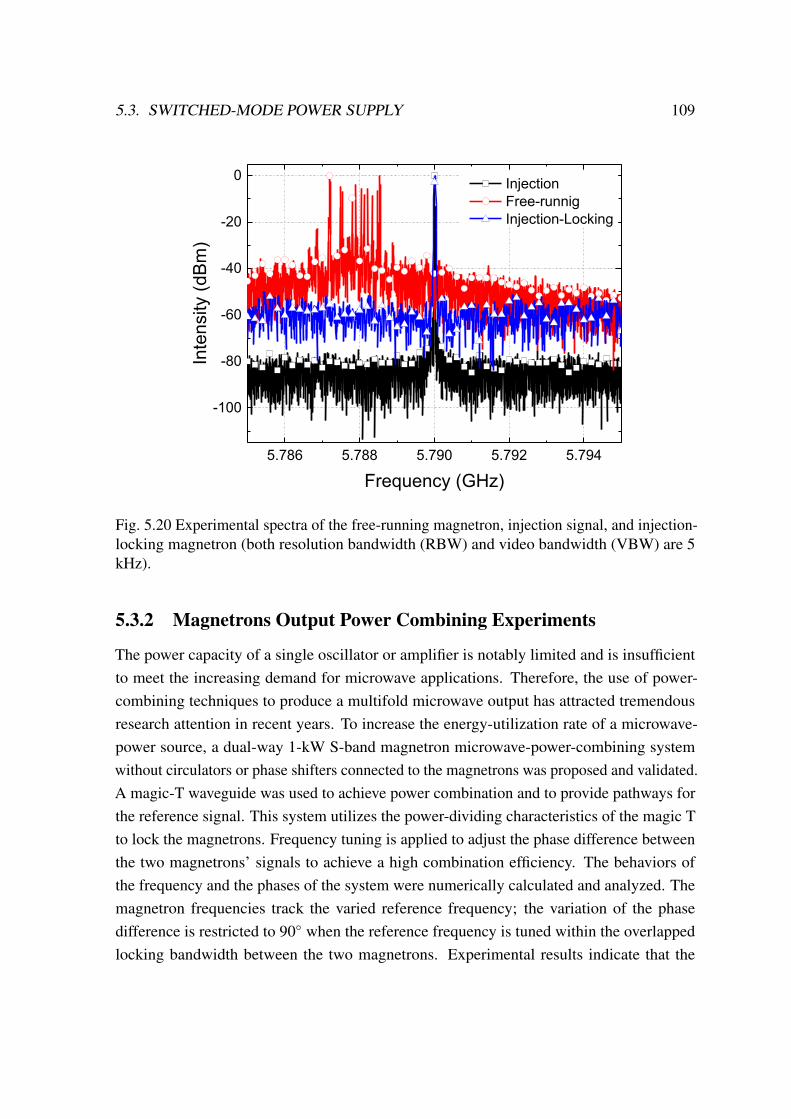
5.3. SWITCHED-MODE POWER SUPPLY 109
5.786 5.788 5.790 5.792 5.794
-100
-80
-60
-40
-20
0
Inte
nsity (
dB
m)
Frequency (GHz)
Injection
Free-runnig
Injection-Locking
Fig. 7. Experimental spectra of the free-running magnetron,
injection signal, and injection-locking magnetron (both
resolution bandwidth (RBW) and video bandwidth (VBW) are 5
kHz).
Fig. 5.20 Experimental spectra of the free-running magnetron, injection signal, and injection-locking magnetron (both resolution bandwidth (RBW) and video bandwidth (VBW) are 5kHz).
5.3.2 Magnetrons Output Power Combining Experiments
The power capacity of a single oscillator or amplifier is notably limited and is insufficientto meet the increasing demand for microwave applications. Therefore, the use of power-combining techniques to produce a multifold microwave output has attracted tremendousresearch attention in recent years. To increase the energy-utilization rate of a microwave-power source, a dual-way 1-kW S-band magnetron microwave-power-combining systemwithout circulators or phase shifters connected to the magnetrons was proposed and validated.A magic-T waveguide was used to achieve power combination and to provide pathways forthe reference signal. This system utilizes the power-dividing characteristics of the magic Tto lock the magnetrons. Frequency tuning is applied to adjust the phase difference betweenthe two magnetrons’ signals to achieve a high combination efficiency. The behaviors ofthe frequency and the phases of the system were numerically calculated and analyzed. Themagnetron frequencies track the varied reference frequency; the variation of the phasedifference is restricted to 90◦ when the reference frequency is tuned within the overlappedlocking bandwidth between the two magnetrons. Experimental results indicate that the
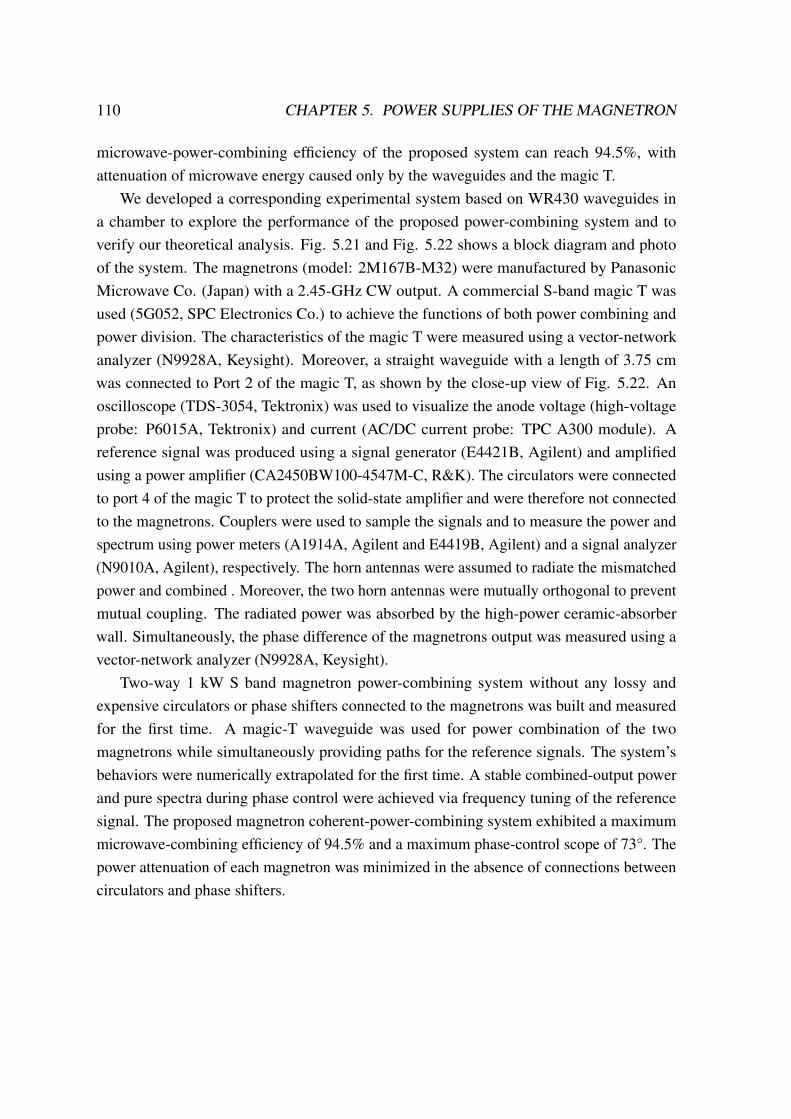
110 CHAPTER 5. POWER SUPPLIES OF THE MAGNETRON
microwave-power-combining efficiency of the proposed system can reach 94.5%, withattenuation of microwave energy caused only by the waveguides and the magic T.
We developed a corresponding experimental system based on WR430 waveguides ina chamber to explore the performance of the proposed power-combining system and toverify our theoretical analysis. Fig. 5.21 and Fig. 5.22 shows a block diagram and photoof the system. The magnetrons (model: 2M167B-M32) were manufactured by PanasonicMicrowave Co. (Japan) with a 2.45-GHz CW output. A commercial S-band magic T wasused (5G052, SPC Electronics Co.) to achieve the functions of both power combining andpower division. The characteristics of the magic T were measured using a vector-networkanalyzer (N9928A, Keysight). Moreover, a straight waveguide with a length of 3.75 cmwas connected to Port 2 of the magic T, as shown by the close-up view of Fig. 5.22. Anoscilloscope (TDS-3054, Tektronix) was used to visualize the anode voltage (high-voltageprobe: P6015A, Tektronix) and current (AC/DC current probe: TPC A300 module). Areference signal was produced using a signal generator (E4421B, Agilent) and amplifiedusing a power amplifier (CA2450BW100-4547M-C, R&K). The circulators were connectedto port 4 of the magic T to protect the solid-state amplifier and were therefore not connectedto the magnetrons. Couplers were used to sample the signals and to measure the power andspectrum using power meters (A1914A, Agilent and E4419B, Agilent) and a signal analyzer(N9010A, Agilent), respectively. The horn antennas were assumed to radiate the mismatchedpower and combined . Moreover, the two horn antennas were mutually orthogonal to preventmutual coupling. The radiated power was absorbed by the high-power ceramic-absorberwall. Simultaneously, the phase difference of the magnetrons output was measured using avector-network analyzer (N9928A, Keysight).
Two-way 1 kW S band magnetron power-combining system without any lossy andexpensive circulators or phase shifters connected to the magnetrons was built and measuredfor the first time. A magic-T waveguide was used for power combination of the twomagnetrons while simultaneously providing paths for the reference signals. The system’sbehaviors were numerically extrapolated for the first time. A stable combined-output powerand pure spectra during phase control were achieved via frequency tuning of the referencesignal. The proposed magnetron coherent-power-combining system exhibited a maximummicrowave-combining efficiency of 94.5% and a maximum phase-control scope of 73°. Thepower attenuation of each magnetron was minimized in the absence of connections betweencirculators and phase shifters.
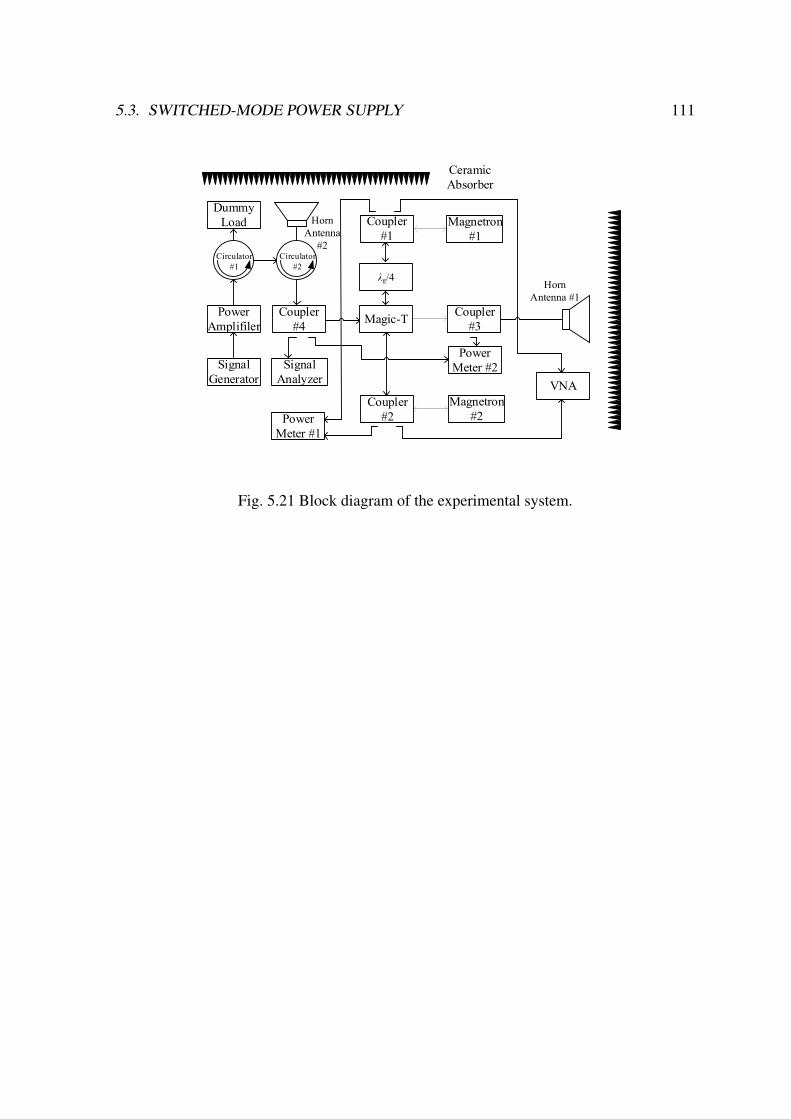
5.3. SWITCHED-MODE POWER SUPPLY 111
Magnetron
#2
Magnetron
#1
Signal
Generator
Dummy
Load
Magic-TCoupler
#4
Coupler
#3
Coupler
#1
Coupler
#2
Power
Amplifiler
VNA
Power
Meter #1
Signal
Analyzer
Power
Meter #2
λg/4Horn
Antenna #1
Horn
Antenna
#2
Ceramic
Absorber
Circulator
#1
Circulator
#2
0 50 100 150 200 250 300
900
1050
1200
1350
Pow
er
(W)
Time (sec)
Without reference signal
Injection-locking condition
Fig. 5.21 Block diagram of the experimental system.
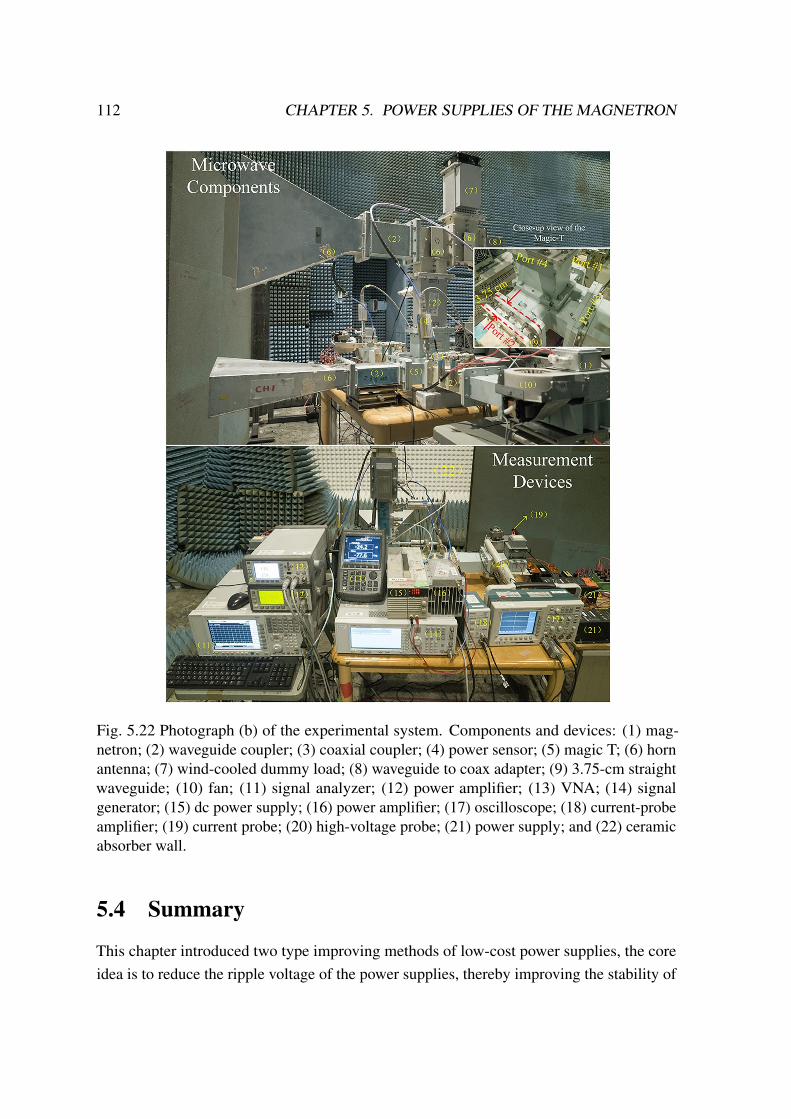
112 CHAPTER 5. POWER SUPPLIES OF THE MAGNETRON
Fig. 4. Block diagram (a) and photograph (b) of the
experimental system. Components and devices: (1) magnetron;
(2) waveguide coupler; (3) coaxial coupler; (4) power sensor;
(5) magic T; (6) horn antenna; (7) wind-cooled dummy load; (8)
waveguide to coax adapter; (9) 3.75-cm straight waveguide;
(10) fan; (11) signal analyzer; (12) power amplifier; (13) VNA;
(14) signal generator; (15) dc power supply; (16) power
amplifier; (17) oscilloscope; (18) current-probe amplifier; (19)
current probe; (20) high-voltage probe; (21) power supply; and
(22) ceramic absorber wall.
Fig. 5.22 Photograph (b) of the experimental system. Components and devices: (1) mag-netron; (2) waveguide coupler; (3) coaxial coupler; (4) power sensor; (5) magic T; (6) hornantenna; (7) wind-cooled dummy load; (8) waveguide to coax adapter; (9) 3.75-cm straightwaveguide; (10) fan; (11) signal analyzer; (12) power amplifier; (13) VNA; (14) signalgenerator; (15) dc power supply; (16) power amplifier; (17) oscilloscope; (18) current-probeamplifier; (19) current probe; (20) high-voltage probe; (21) power supply; and (22) ceramicabsorber wall.
5.4 Summary
This chapter introduced two type improving methods of low-cost power supplies, the coreidea is to reduce the ripple voltage of the power supplies, thereby improving the stability of

5.4. SUMMARY 113
the magnetron output. The ripple of the full-wave rectifier power supply improved in themicrowave oven power supply reached 4.16%. Based on the injection-locking magnetron,the transmission rate of 2 Mbps was realized. The relationship between the ripple rate, theinjection power and communication bandwidth are also analyzed. After further increasingthe capacitance of the capacitor, the ripple is reduced to less than 1%, and the phase controlaccuracy of the phase-controlled magnetron is within ±1%. In the switched-mode powersupply, its ripple has also reached below 1%. In the magnetron load variation experiment, thefrequency spectrum of the injection-locking magnetron is stable, and the noise is suppressedto below -60 dB. In addition, the combined efficiency of the two magnetrons using this powersupplies reached 94.5%.

Chapter 6
Microwave Wireless Power TransmissionSystems
Chapter 3 described the performance of the magnetron phased array to verify the beamforming and WPT experiment. Chapter 4 described the communication verification of themodulation magnetron. This chapter introduces systems that transmit power and information,then shows how to build efficiently WPT systems.
There are several isolation ways to complete the information and power transmissionsystem. The isolation factors were increased as time, frequency, polarization and mode.The simplest system is the different transmission frequency for information and powertransmission. A very forward-looking method is to use the mode of the orbital angularmomentum (OAM) wave, which are considered to be the next generation of communicationtechnology revolution due to their high isolation in different modes. The mode defined as thephase difference times of the 360◦ in one period. The direction of orbital angular defined themode that has positive and negative values.
The phase of the OAM wave speed is vortex-like and the power distribution in the centralarea is very low as donut-like. An OAM antenna was designed by 32 patch antenna array(in mode=1) as shown in Fig. 6.1 The patch antennas were generated by 1-32 divider inthe same phase and each antenna were rotated in 11.25◦ to the beside antennas. The phasedifference 𝜑 each antenna is also 11.25◦ whose mode 𝑀 is 1. The beam pattern is shownin Fig. 6.2 and its phase diagram is shown in Fig. 6.3. The main lobe ring angle \ and theantenna radius 𝑅 can be describe as (6.1).
sin\ ≈ _𝑀
2𝜋𝑅. (6.1)

116 CHAPTER 6. MICROWAVE WIRELESS POWER TRANSMISSION SYSTEMS
Here, _ is the wavelength of the transmission frequency. The lower mode has a smallermain lobe angle. However, it’s difficult to improve the OAM antenna gain and the receivingantenna also has donut distribution beam. It will be worked in a low transmission efficiencyand the future work is design a concentration beam of the OAM antenna.
Finally, there is anther method to construct the information and power transmissionsystem whose transmission wave in the same microwave. Here, two demonstration systemswas introduced as the phased array in beam forming in Section.1 and wireless TV in Section.2.
R
N=32
Fig. 6.1 Photo of the OAM antenna.
Fig. 6.2 Simulation beam pattern of the OAM antenna.
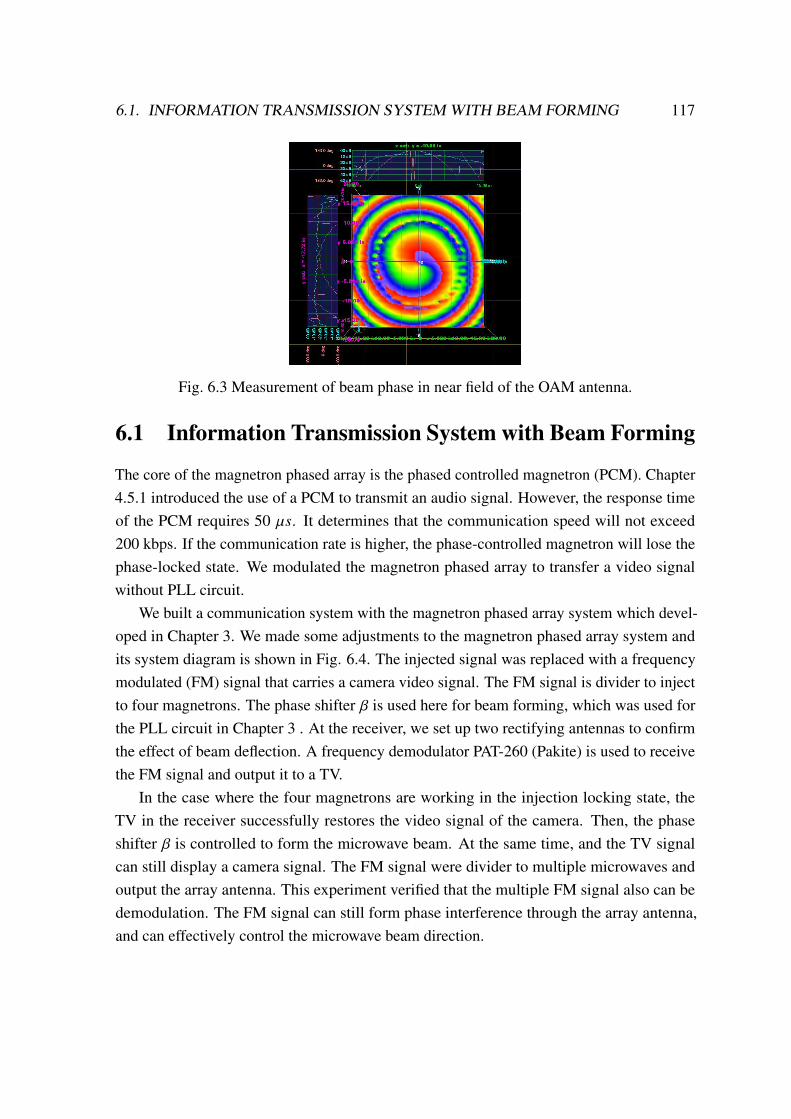
6.1. INFORMATION TRANSMISSION SYSTEM WITH BEAM FORMING 117
Fig. 6.3 Measurement of beam phase in near field of the OAM antenna.
6.1 Information Transmission System with Beam Forming
The core of the magnetron phased array is the phased controlled magnetron (PCM). Chapter4.5.1 introduced the use of a PCM to transmit an audio signal. However, the response timeof the PCM requires 50 `𝑠. It determines that the communication speed will not exceed200 kbps. If the communication rate is higher, the phase-controlled magnetron will lose thephase-locked state. We modulated the magnetron phased array to transfer a video signalwithout PLL circuit.
We built a communication system with the magnetron phased array system which devel-oped in Chapter 3. We made some adjustments to the magnetron phased array system andits system diagram is shown in Fig. 6.4. The injected signal was replaced with a frequencymodulated (FM) signal that carries a camera video signal. The FM signal is divider to injectto four magnetrons. The phase shifter 𝛽 is used here for beam forming, which was used forthe PLL circuit in Chapter 3 . At the receiver, we set up two rectifying antennas to confirmthe effect of beam deflection. A frequency demodulator PAT-260 (Pakite) is used to receivethe FM signal and output it to a TV.
In the case where the four magnetrons are working in the injection locking state, theTV in the receiver successfully restores the video signal of the camera. Then, the phaseshifter 𝛽 is controlled to form the microwave beam. At the same time, and the TV signalcan still display a camera signal. The FM signal were divider to multiple microwaves andoutput the array antenna. This experiment verified that the multiple FM signal also can bedemodulation. The FM signal can still form phase interference through the array antenna,and can effectively control the microwave beam direction.

118 CHAPTER 6. MICROWAVE WIRELESS POWER TRANSMISSION SYSTEMS
PC
LabVIEW
PAT630
FM Modulator
Phase shifter δ1 Phase shifter δ2 Phase shifter δ3 Phase shifter δ4
PCM1
Power supply 1
Phase shifter β1
PCM2
Power supply 2
Phase shifter β2
PCM3
Power supply 3
Phase shifter β3
PCM4
Power supply 4
Phase shifter β4
Slot antenna 1 Slot antenna 2 Slot antenna 3 Slot antenna 4
Analog output
(NI 9263)
Divider
Camera
PAT630
FM Demodulator
Rectenna 1 Rectenna 2 TV
Beam1 Beam2
Fig. 6.4 Experimental system of the information and power transfer system with magnetronphased array.
6.2 Wirelessly-Powered TV
A wireless power transfer system that transmitted microwave drove the power and videosignal of a TV which worked as a wirelessly-powered TV. At the transmitter, we modulateda video signal on a 2.45 GHz sine wave via frequency modulation, a 2.45 GHz injection-locked magnetron could amplify the frequency modulation signal. Utilizing injection lockingmethod, we injected the modulated signal to a 2.45 GHz magnetron and the magnetronamplified this modulation signal. At the receiver, we rectified the microwave energy tothe power source and demodulated this microwave to the video signal of the TV. Thewireless power transfer distance was 3.5 meters. At the aid of the transmitted microwave, wesuccessfully rectified 48 W DC power and demodulated the video signal.
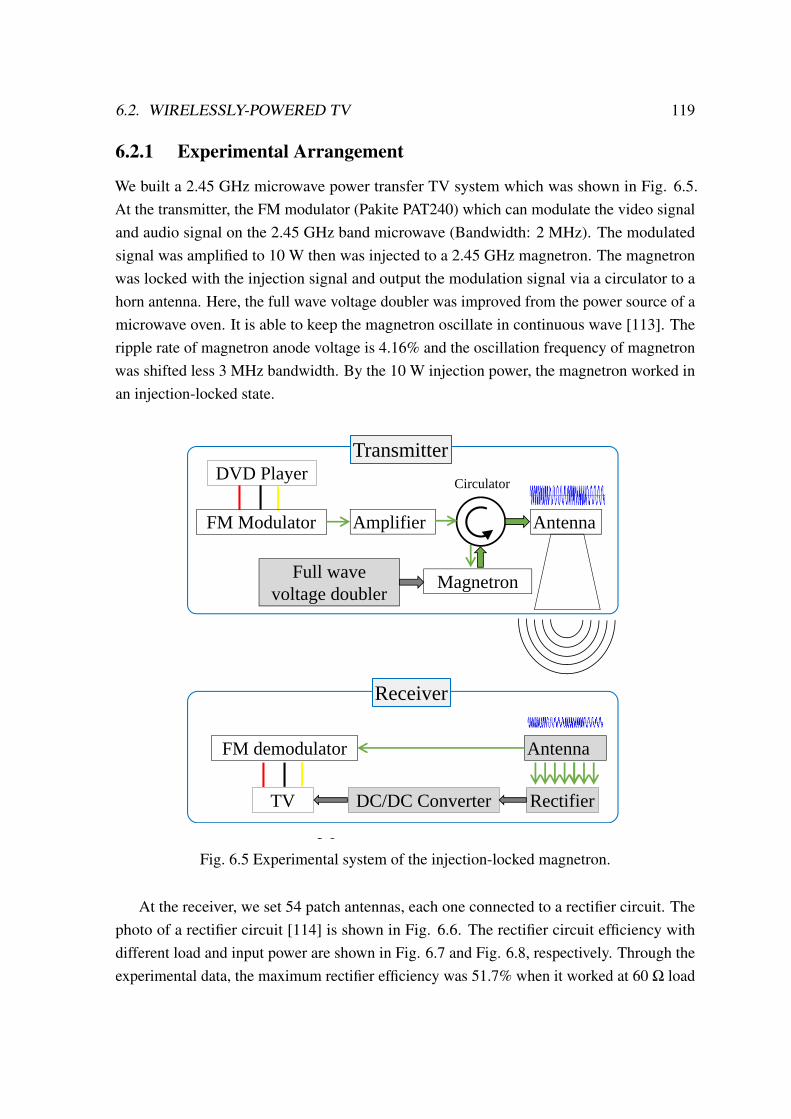
6.2. WIRELESSLY-POWERED TV 119
6.2.1 Experimental Arrangement
We built a 2.45 GHz microwave power transfer TV system which was shown in Fig. 6.5.At the transmitter, the FM modulator (Pakite PAT240) which can modulate the video signaland audio signal on the 2.45 GHz band microwave (Bandwidth: 2 MHz). The modulatedsignal was amplified to 10 W then was injected to a 2.45 GHz magnetron. The magnetronwas locked with the injection signal and output the modulation signal via a circulator to ahorn antenna. Here, the full wave voltage doubler was improved from the power source of amicrowave oven. It is able to keep the magnetron oscillate in continuous wave [113]. Theripple rate of magnetron anode voltage is 4.16% and the oscillation frequency of magnetronwas shifted less 3 MHz bandwidth. By the 10 W injection power, the magnetron worked inan injection-locked state.
XXX-X-XXXX-XXXX-X/XX/$XX.00 ©20XX IEEE
Injection-Locked CW Magnetron for a
wirelessly-powered TV
Bo Yang Tomohiko Mitani Naoki Shinohara
Research Institute for Sustainable Humanosphere
Kyoto University
Uji, Japan
{yang_bo, shino, mitani}@rish.kyoto-u.ac.jp
Abstract— It is shown a wireless power transfer system that
transmitted microwave drove the power and video signal of a
TV which worked as a wirelessly-powered TV. At the
transmitter, we modulated a video signal on a 2.45 GHz sine
wave via frequency modulation, a 2.45 GHz injection-locked
magnetron could amplify the frequency modulation signal.
Utilizing injection locking method, we injected the modulated
signal to a 2.45 GHz magnetron and the magnetron amplified
this modulation signal. At the receiver, we rectified the
microwave energy to the power source and demodulated this
microwave to the video signal of the TV. The wireless power
transfer distance was 3.5 meters. At the aid of the transmitted
microwave, we successfully rectified 48 W DC power and
demodulated the video signal.
Keywords—Magnetron, injection-locked, wireless power
transfer, frequency modulation, rectification
I. INTRODUCTION
Magnetrons as low cost and high efficiency microwave
sources, are widely applied in heating areas such as
microwave ovens. According to Alder's equation [1], our
research group has reduced the noise of the magnetron and
developed the phase-controlled magnetron as the transmitter
of a wireless power transfer system [2]. Using an injection-
locked magnetron, the transmission of phase-shift-keying
(PSK) data at 2 Mb/s has been achieved via Tahir et al. [3].
In the recent study, a full-wave voltage doubler circuit which
improved the power source of a microwave oven, was used
as the power source of the injection-locked magnetron. A 4
Mbps transmission of the frequency-shift-keying (FSK) data
was achieved [4]. Moreover, we evaluated several
modulation performance of the 2.45 GHz and 5.8 GHz band
injection-locked magnetron which achieved at 10 Mbps
(Po/Pi:13.43 dB) [5]. These research results show that the
magnetron noise can be limited in a low level, which is good
enough for wireless power transfer and communication.
In this study, we utilized this injection-locked magnetron
as the transmitter of the wirelessly-powered TV system. At
the receiver, through the received antenna and rectifier the
microwave was rectified to the DC power and was
demodulated to the video signal, as the power source and
signal of the TV.
II. EXPERIMENTAL ARRANGEMENT
We build a 2.45 GHz microwave power transfer TV system which was shown in Fig. 1. At the transmitter, the FM modulator (Pakite PAT240) which can modulate the video signal and audio signal on the 2.45 GHz band microwave (Bandwidth: 2 MHz). The modulated signal was amplified to 10 W then was injected to a 2.45 GHz
magnetron. The magnetron was locked with the injection signal and output the modulation signal via a circulator to a horn antenna. Here, the full wave voltage doubler was improved from the power source of a microwave oven. It is able to keep the magnetron oscillate in continuous wave [4]. The ripple rate of magnetron anode voltage is 4.16% and the oscillation frequency of magnetron was shifted less 3 MHz bandwidth. By the 10 W injection power, the magnetron worked in an injection-locked state.
DVD Player
FM Modulator Amplifier
Circulator
Full wave
voltage doublerMagnetron
Antenna
Transmitter
TV
FM demodulator Antenna
Rectifier
Receiver
DC/DC Converter
Fig. 1 Wirelessly-powered TV system diagram.
Fig. 2 Photo of a 2.45GHz rectifier circuit board
At the receiver, we set 54 patch antennas, each one connected to a rectifier circuit. The photo of a rectifier circuit[6] is shown in Fig. 2. The rectifier circuit efficiency with different load and input power are shown in Fig. 3 and Fig. 4, respectively. Through the experimental data, the maximum rectifier efficiency was 51.7% when it worked at 60 Ω load and 1.8 W input power. A rectifier circuit was
Fig. 6.5 Experimental system of the injection-locked magnetron.
At the receiver, we set 54 patch antennas, each one connected to a rectifier circuit. Thephoto of a rectifier circuit [114] is shown in Fig. 6.6. The rectifier circuit efficiency withdifferent load and input power are shown in Fig. 6.7 and Fig. 6.8, respectively. Through theexperimental data, the maximum rectifier efficiency was 51.7% when it worked at 60 Ω load

120 CHAPTER 6. MICROWAVE WIRELESS POWER TRANSMISSION SYSTEMS
and 1.8 W input power. A rectifier circuit was connected to the demodulator (Pakite PAT240).The other 53 rectifier circuits outputs are connected to a DC/DC converter in parallel. TheDC/DC converter limited the voltage lower than 16 V which is the TV work voltage. Thevideo signal and audio signal of the demodulator was connected to the TV. The distancebetween the transmitter and the receiver was 3.5 m. The other parameters are shown in Table.6.1.
XXX-X-XXXX-XXXX-X/XX/$XX.00 ©20XX IEEE
Injection-Locked CW Magnetron for a
wirelessly-powered TV
Bo Yang Tomohiko Mitani Naoki Shinohara
Research Institute for Sustainable Humanosphere
Kyoto University
Uji, Japan
{yang_bo, shino, mitani}@rish.kyoto-u.ac.jp
Abstract— It is shown a wireless power transfer system that
transmitted microwave drove the power and video signal of a
TV which worked as a wirelessly-powered TV. At the
transmitter, we modulated a video signal on a 2.45 GHz sine
wave via frequency modulation, a 2.45 GHz injection-locked
magnetron could amplify the frequency modulation signal.
Utilizing injection locking method, we injected the modulated
signal to a 2.45 GHz magnetron and the magnetron amplified
this modulation signal. At the receiver, we rectified the
microwave energy to the power source and demodulated this
microwave to the video signal of the TV. The wireless power
transfer distance was 3.5 meters. At the aid of the transmitted
microwave, we successfully rectified 48 W DC power and
demodulated the video signal.
Keywords—Magnetron, injection-locked, wireless power
transfer, frequency modulation, rectification
I. INTRODUCTION
Magnetrons as low cost and high efficiency microwave
sources, are widely applied in heating areas such as
microwave ovens. According to Alder's equation [1], our
research group has reduced the noise of the magnetron and
developed the phase-controlled magnetron as the transmitter
of a wireless power transfer system [2]. Using an injection-
locked magnetron, the transmission of phase-shift-keying
(PSK) data at 2 Mb/s has been achieved via Tahir et al. [3].
In the recent study, a full-wave voltage doubler circuit which
improved the power source of a microwave oven, was used
as the power source of the injection-locked magnetron. A 4
Mbps transmission of the frequency-shift-keying (FSK) data
was achieved [4]. Moreover, we evaluated several
modulation performance of the 2.45 GHz and 5.8 GHz band
injection-locked magnetron which achieved at 10 Mbps
(Po/Pi:13.43 dB) [5]. These research results show that the
magnetron noise can be limited in a low level, which is good
enough for wireless power transfer and communication.
In this study, we utilized this injection-locked magnetron
as the transmitter of the wirelessly-powered TV system. At
the receiver, through the received antenna and rectifier the
microwave was rectified to the DC power and was
demodulated to the video signal, as the power source and
signal of the TV.
II. EXPERIMENTAL ARRANGEMENT
We build a 2.45 GHz microwave power transfer TV system which was shown in Fig. 1. At the transmitter, the FM modulator (Pakite PAT240) which can modulate the video signal and audio signal on the 2.45 GHz band microwave (Bandwidth: 2 MHz). The modulated signal was amplified to 10 W then was injected to a 2.45 GHz
magnetron. The magnetron was locked with the injection signal and output the modulation signal via a circulator to a horn antenna. Here, the full wave voltage doubler was improved from the power source of a microwave oven. It is able to keep the magnetron oscillate in continuous wave [4]. The ripple rate of magnetron anode voltage is 4.16% and the oscillation frequency of magnetron was shifted less 3 MHz bandwidth. By the 10 W injection power, the magnetron worked in an injection-locked state.
DVD Player
FM Modulator Amplifier
Circulator
Full wave
voltage doublerMagnetron
Antenna
Transmitter
TV
FM demodulator Antenna
Rectifier
Receiver
DC/DC Converter
Fig. 1 Wirelessly-powered TV system diagram.
Fig. 2 Photo of a 2.45GHz rectifier circuit board
At the receiver, we set 54 patch antennas, each one connected to a rectifier circuit. The photo of a rectifier circuit[6] is shown in Fig. 2. The rectifier circuit efficiency with different load and input power are shown in Fig. 3 and Fig. 4, respectively. Through the experimental data, the maximum rectifier efficiency was 51.7% when it worked at 60 Ω load and 1.8 W input power. A rectifier circuit was
Fig. 6.6 Photo of a 2.45GHz rectifier circuit board.
connected to the demodulator (Pakite PAT240). The other 53 rectifier circuits outputs are connected to a DC/DC converter in parallel. The DC/DC converter limited the voltage lower than 16 V which is the TV work voltage. The video signal and audio signal of the demodulator was connected to the TV. The distance between the transmitter and the receiver was 3.5 m. The other parameters are shown in Table. I.
When the transmitter was activated, the TV was turned on by microwave power and the DVD data was properly displayed on the wirelessly-powered TV. 48W DC power was supplied to the TV and the demodulator. The photo of a wireless power transfer system of TV as shown in Fig. 5. As a wireless power transfer system, it requires a low power loss or a high transfer efficiency, which contains microwave conversion efficiency, antenna transfer efficiency and rectifier efficiency. In this system, the rectifier circuit didn’t work at the optimal load which can be improved. We also can improve the transfer efficiency via improving the effective antenna aperture.
0
10
20
30
40
50
0
2
4
6
8
10
10 100 1000
Eff
icie
ncy
[%]
Ou
tpu
t[m
W]
Load[Ω]
Output powerEfficiency
Fig. 3 Rectifier efficiency of the rectifier circuit with different
load(input 50mW).
0
10
20
30
40
50
60
0
200
400
600
800
1000
0 500 1000 1500 2000
Eff
icie
ncy
[%]
Ou
tpu
t[m
W]
Input[mW]
Out poweerEfficiency
Fig. 4 Rectifier efficiency of the rectifier circuit with different input
power(load:60Ω)
Fig. 5 Photo of the wirelessly-powered TV.
TABLE I. PARAMETERS OF THE WIRELESSLY-POWERED TV
III. CONCLUSIONS
We developed a wireless power and video transfer
system for the wirelessly-powered TV in the microwave
band. It demonstrated that a 2.45 GHz injection-locked
magnetron could transmit the microwave power and the
video signal by frequency modulation. Through the
transmitted microwave, we successfully rectified 48W DC
power for the TV and demodulated the video signal.
ACKNOWLEDGMENT
This work was supported by the collaborative research
program: Microwave Energy Transmission Laboratory
(METLAB), Research Institute for Sustainable
Humanosphere, Kyoto University.
REFERENCES
[1] R. Adler, “A Study of Locking Phenomena in Oscillators,” Proceedings of I.R.E and Waves and Electrons, vol. 34, pp. 351-357, 1946
[2] N. Shinohara, H. Matsumoto, K. Hashimoto, “Phasecontrolled magnetron development for SPORTS: Space power radio transmission system,” Radio Science Bulletin, vol. 2004, No. 310, pp. 29-35, 2004
[3] I. Tahir, A. Dexter and R. Carter, “Frequency and Phase Modulation Performance of an Injection-Locked CW Magnetron,” IEEE Transactions on Electron Devices, vol. 53, No. 7, pp. 1721-1729, 2006
[4] B. Yang, T. Mitani, N. Shinohara, “Experimental study on frequency modulation of an injection-locked magnetron based on full wave voltage doubler,” IVEC2018, Monterey, CA, USA, 2018
[5] B. Yang, T. Mitani, N. Shinohara, “Evaluation of the Modulation Performance of Injection-Locked Continuous-Wave Magnetrons,” IEEE Transactions on Electron Devices, Vol. 66, pp. 709–715, Jan. 2019
[6] J.Kojima, N.Shinohara, T.Mitani, T.Hashimoto, N.Kishi, H.Toyomura and A.Okazaki, “Development of highly efficient microwave wireless charging system for electric vehicle,” Technical Report of IEICE Information and Communication Engineers SPS2007-16 (2008-03)
Magnetron 2M236-M42(Panasonic)
Anode Current 140 mA
Anode Voltage -3.68 kV(DC)
Filament Current 7.4 A
Filament Voltage 3.35 V(AC 60Hz)
Injected Power 10 W
Output Frequency 2.448 GHz-2.450 GHz
Output Power 329 W(RF)
Rectified Power 48 W(DC)
Modulation Frequency ,odulation
Transmitter Antenna Gain 16 dBi (SPC)
TV LL-M1550A (Sharp)
Circulator
High voltage
power source
Magnetron
Horn antenna
Receiver antenna
TV
← 3.5m →
Power + Data
Fig. 6.7 Rectifier efficiency of the rectifier circuit with different load (input 50mW).
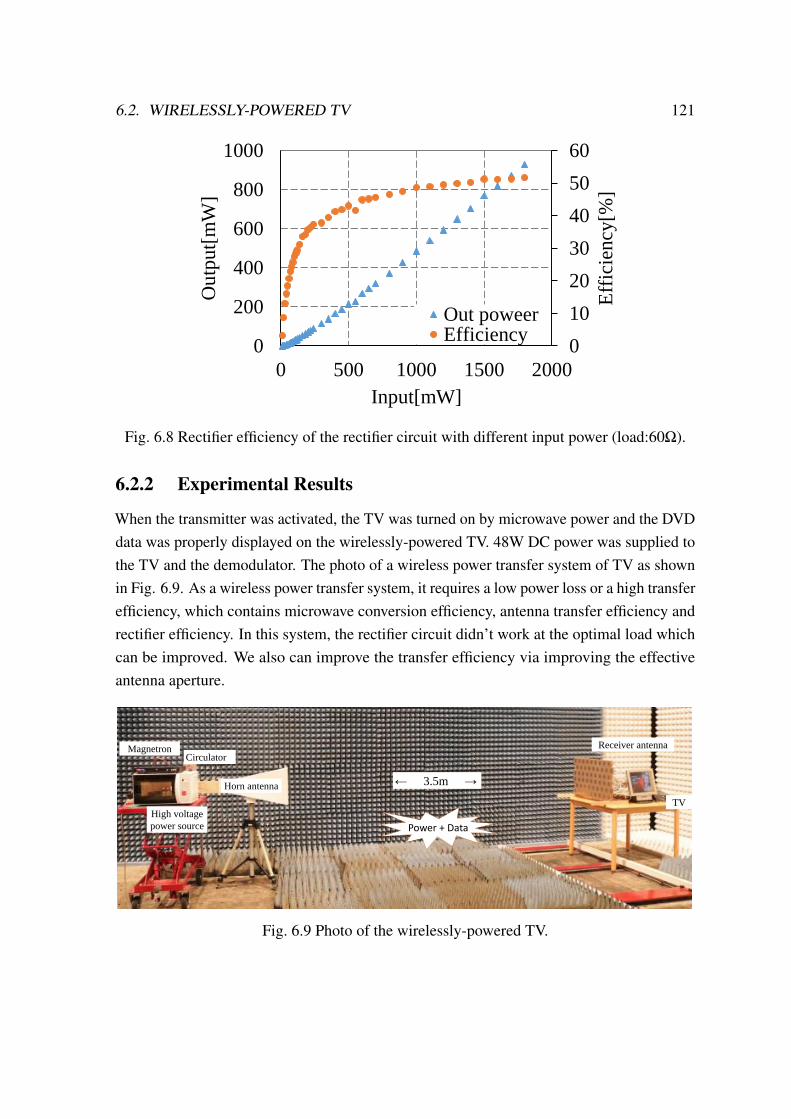
6.2. WIRELESSLY-POWERED TV 121
connected to the demodulator (Pakite PAT240). The other 53 rectifier circuits outputs are connected to a DC/DC converter in parallel. The DC/DC converter limited the voltage lower than 16 V which is the TV work voltage. The video signal and audio signal of the demodulator was connected to the TV. The distance between the transmitter and the receiver was 3.5 m. The other parameters are shown in Table. I.
When the transmitter was activated, the TV was turned on by microwave power and the DVD data was properly displayed on the wirelessly-powered TV. 48W DC power was supplied to the TV and the demodulator. The photo of a wireless power transfer system of TV as shown in Fig. 5. As a wireless power transfer system, it requires a low power loss or a high transfer efficiency, which contains microwave conversion efficiency, antenna transfer efficiency and rectifier efficiency. In this system, the rectifier circuit didn’t work at the optimal load which can be improved. We also can improve the transfer efficiency via improving the effective antenna aperture.
0
10
20
30
40
50
0
2
4
6
8
10
10 100 1000
Eff
icie
ncy
[%]
Ou
tpu
t[m
W]
Load[Ω]
Output powerEfficiency
Fig. 3 Rectifier efficiency of the rectifier circuit with different
load(input 50mW).
0
10
20
30
40
50
60
0
200
400
600
800
1000
0 500 1000 1500 2000
Eff
icie
ncy
[%]
Ou
tpu
t[m
W]
Input[mW]
Out poweerEfficiency
Fig. 4 Rectifier efficiency of the rectifier circuit with different input
power(load:60Ω)
Fig. 5 Photo of the wirelessly-powered TV.
TABLE I. PARAMETERS OF THE WIRELESSLY-POWERED TV
III. CONCLUSIONS
We developed a wireless power and video transfer
system for the wirelessly-powered TV in the microwave
band. It demonstrated that a 2.45 GHz injection-locked
magnetron could transmit the microwave power and the
video signal by frequency modulation. Through the
transmitted microwave, we successfully rectified 48W DC
power for the TV and demodulated the video signal.
ACKNOWLEDGMENT
This work was supported by the collaborative research
program: Microwave Energy Transmission Laboratory
(METLAB), Research Institute for Sustainable
Humanosphere, Kyoto University.
REFERENCES
[1] R. Adler, “A Study of Locking Phenomena in Oscillators,” Proceedings of I.R.E and Waves and Electrons, vol. 34, pp. 351-357, 1946
[2] N. Shinohara, H. Matsumoto, K. Hashimoto, “Phasecontrolled magnetron development for SPORTS: Space power radio transmission system,” Radio Science Bulletin, vol. 2004, No. 310, pp. 29-35, 2004
[3] I. Tahir, A. Dexter and R. Carter, “Frequency and Phase Modulation Performance of an Injection-Locked CW Magnetron,” IEEE Transactions on Electron Devices, vol. 53, No. 7, pp. 1721-1729, 2006
[4] B. Yang, T. Mitani, N. Shinohara, “Experimental study on frequency modulation of an injection-locked magnetron based on full wave voltage doubler,” IVEC2018, Monterey, CA, USA, 2018
[5] B. Yang, T. Mitani, N. Shinohara, “Evaluation of the Modulation Performance of Injection-Locked Continuous-Wave Magnetrons,” IEEE Transactions on Electron Devices, Vol. 66, pp. 709–715, Jan. 2019
[6] J.Kojima, N.Shinohara, T.Mitani, T.Hashimoto, N.Kishi, H.Toyomura and A.Okazaki, “Development of highly efficient microwave wireless charging system for electric vehicle,” Technical Report of IEICE Information and Communication Engineers SPS2007-16 (2008-03)
Magnetron 2M236-M42(Panasonic)
Anode Current 140 mA
Anode Voltage -3.68 kV(DC)
Filament Current 7.4 A
Filament Voltage 3.35 V(AC 60Hz)
Injected Power 10 W
Output Frequency 2.448 GHz-2.450 GHz
Output Power 329 W(RF)
Rectified Power 48 W(DC)
Modulation Frequency ,odulation
Transmitter Antenna Gain 16 dBi (SPC)
TV LL-M1550A (Sharp)
Circulator
High voltage
power source
Magnetron
Horn antenna
Receiver antenna
TV
← 3.5m →
Power + Data
Fig. 6.8 Rectifier efficiency of the rectifier circuit with different input power (load:60Ω).
6.2.2 Experimental Results
When the transmitter was activated, the TV was turned on by microwave power and the DVDdata was properly displayed on the wirelessly-powered TV. 48W DC power was supplied tothe TV and the demodulator. The photo of a wireless power transfer system of TV as shownin Fig. 6.9. As a wireless power transfer system, it requires a low power loss or a high transferefficiency, which contains microwave conversion efficiency, antenna transfer efficiency andrectifier efficiency. In this system, the rectifier circuit didn’t work at the optimal load whichcan be improved. We also can improve the transfer efficiency via improving the effectiveantenna aperture.
connected to the demodulator (Pakite PAT240). The other 53 rectifier circuits outputs are connected to a DC/DC converter in parallel. The DC/DC converter limited the voltage lower than 16 V which is the TV work voltage. The video signal and audio signal of the demodulator was connected to the TV. The distance between the transmitter and the receiver was 3.5 m. The other parameters are shown in Table. I.
When the transmitter was activated, the TV was turned on by microwave power and the DVD data was properly displayed on the wirelessly-powered TV. 48W DC power was supplied to the TV and the demodulator. The photo of a wireless power transfer system of TV as shown in Fig. 5. As a wireless power transfer system, it requires a low power loss or a high transfer efficiency, which contains microwave conversion efficiency, antenna transfer efficiency and rectifier efficiency. In this system, the rectifier circuit didn’t work at the optimal load which can be improved. We also can improve the transfer efficiency via improving the effective antenna aperture.
0
10
20
30
40
50
0
2
4
6
8
10
10 100 1000
Eff
icie
ncy
[%]
Ou
tpu
t[m
W]
Load[Ω]
Output powerEfficiency
Fig. 3 Rectifier efficiency of the rectifier circuit with different
load(input 50mW).
0
10
20
30
40
50
60
0
200
400
600
800
1000
0 500 1000 1500 2000
Eff
icie
ncy
[%]
Ou
tpu
t[m
W]
Input[mW]
Out poweerEfficiency
Fig. 4 Rectifier efficiency of the rectifier circuit with different input
power(load:60Ω)
Fig. 5 Photo of the wirelessly-powered TV.
TABLE I. PARAMETERS OF THE WIRELESSLY-POWERED TV
III. CONCLUSIONS
We developed a wireless power and video transfer
system for the wirelessly-powered TV in the microwave
band. It demonstrated that a 2.45 GHz injection-locked
magnetron could transmit the microwave power and the
video signal by frequency modulation. Through the
transmitted microwave, we successfully rectified 48W DC
power for the TV and demodulated the video signal.
ACKNOWLEDGMENT
This work was supported by the collaborative research
program: Microwave Energy Transmission Laboratory
(METLAB), Research Institute for Sustainable
Humanosphere, Kyoto University.
REFERENCES
[1] R. Adler, “A Study of Locking Phenomena in Oscillators,” Proceedings of I.R.E and Waves and Electrons, vol. 34, pp. 351-357, 1946
[2] N. Shinohara, H. Matsumoto, K. Hashimoto, “Phasecontrolled magnetron development for SPORTS: Space power radio transmission system,” Radio Science Bulletin, vol. 2004, No. 310, pp. 29-35, 2004
[3] I. Tahir, A. Dexter and R. Carter, “Frequency and Phase Modulation Performance of an Injection-Locked CW Magnetron,” IEEE Transactions on Electron Devices, vol. 53, No. 7, pp. 1721-1729, 2006
[4] B. Yang, T. Mitani, N. Shinohara, “Experimental study on frequency modulation of an injection-locked magnetron based on full wave voltage doubler,” IVEC2018, Monterey, CA, USA, 2018
[5] B. Yang, T. Mitani, N. Shinohara, “Evaluation of the Modulation Performance of Injection-Locked Continuous-Wave Magnetrons,” IEEE Transactions on Electron Devices, Vol. 66, pp. 709–715, Jan. 2019
[6] J.Kojima, N.Shinohara, T.Mitani, T.Hashimoto, N.Kishi, H.Toyomura and A.Okazaki, “Development of highly efficient microwave wireless charging system for electric vehicle,” Technical Report of IEICE Information and Communication Engineers SPS2007-16 (2008-03)
Magnetron 2M236-M42(Panasonic)
Anode Current 140 mA
Anode Voltage -3.68 kV(DC)
Filament Current 7.4 A
Filament Voltage 3.35 V(AC 60Hz)
Injected Power 10 W
Output Frequency 2.448 GHz-2.450 GHz
Output Power 329 W(RF)
Rectified Power 48 W(DC)
Modulation Frequency ,odulation
Transmitter Antenna Gain 16 dBi (SPC)
TV LL-M1550A (Sharp)
Circulator
High voltage
power source
Magnetron
Horn antenna
Receiver antenna
TV
← 3.5m →
Power + Data
Fig. 6.9 Photo of the wirelessly-powered TV.
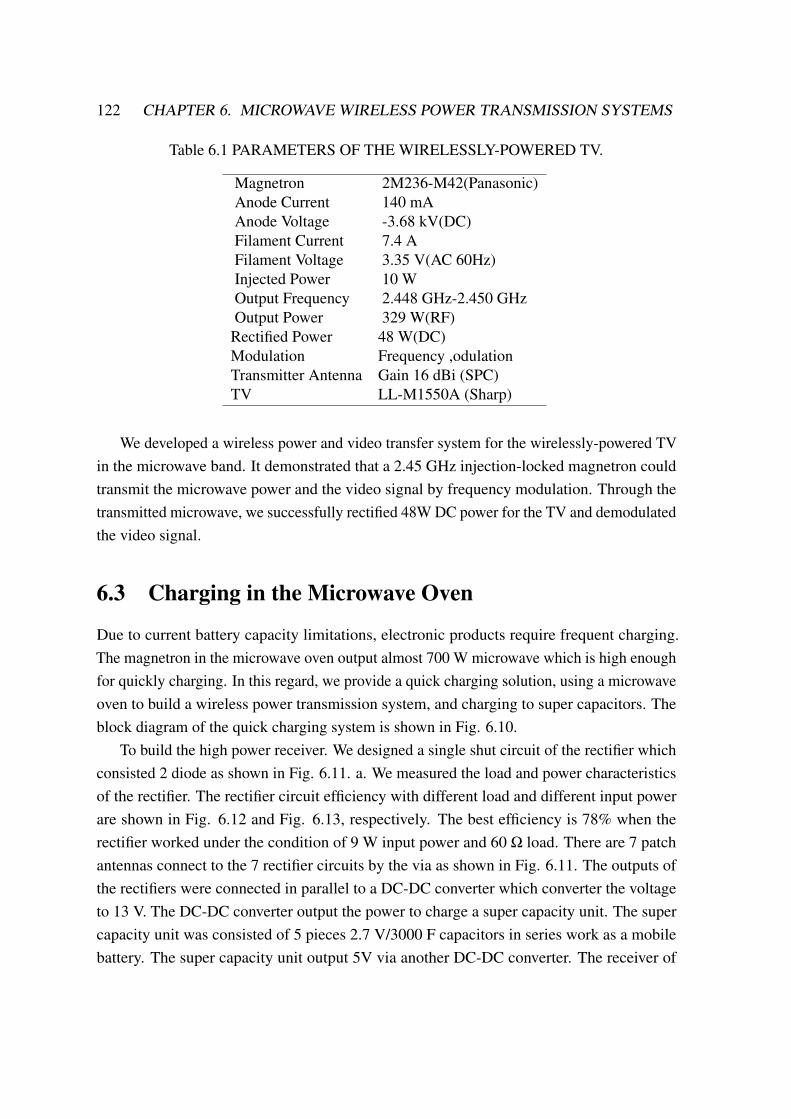
122 CHAPTER 6. MICROWAVE WIRELESS POWER TRANSMISSION SYSTEMS
Table 6.1 PARAMETERS OF THE WIRELESSLY-POWERED TV.
Magnetron 2M236-M42(Panasonic)Anode Current 140 mAAnode Voltage -3.68 kV(DC)Filament Current 7.4 AFilament Voltage 3.35 V(AC 60Hz)Injected Power 10 WOutput Frequency 2.448 GHz-2.450 GHzOutput Power 329 W(RF)
Rectified Power 48 W(DC)Modulation Frequency ,odulationTransmitter Antenna Gain 16 dBi (SPC)TV LL-M1550A (Sharp)
We developed a wireless power and video transfer system for the wirelessly-powered TVin the microwave band. It demonstrated that a 2.45 GHz injection-locked magnetron couldtransmit the microwave power and the video signal by frequency modulation. Through thetransmitted microwave, we successfully rectified 48W DC power for the TV and demodulatedthe video signal.
6.3 Charging in the Microwave Oven
Due to current battery capacity limitations, electronic products require frequent charging.The magnetron in the microwave oven output almost 700 W microwave which is high enoughfor quickly charging. In this regard, we provide a quick charging solution, using a microwaveoven to build a wireless power transmission system, and charging to super capacitors. Theblock diagram of the quick charging system is shown in Fig. 6.10.
To build the high power receiver. We designed a single shut circuit of the rectifier whichconsisted 2 diode as shown in Fig. 6.11. a. We measured the load and power characteristicsof the rectifier. The rectifier circuit efficiency with different load and different input powerare shown in Fig. 6.12 and Fig. 6.13, respectively. The best efficiency is 78% when therectifier worked under the condition of 9 W input power and 60 Ω load. There are 7 patchantennas connect to the 7 rectifier circuits by the via as shown in Fig. 6.11. The outputs ofthe rectifiers were connected in parallel to a DC-DC converter which converter the voltageto 13 V. The DC-DC converter output the power to charge a super capacity unit. The supercapacity unit was consisted of 5 pieces 2.7 V/3000 F capacitors in series work as a mobilebattery. The super capacity unit output 5V via another DC-DC converter. The receiver of
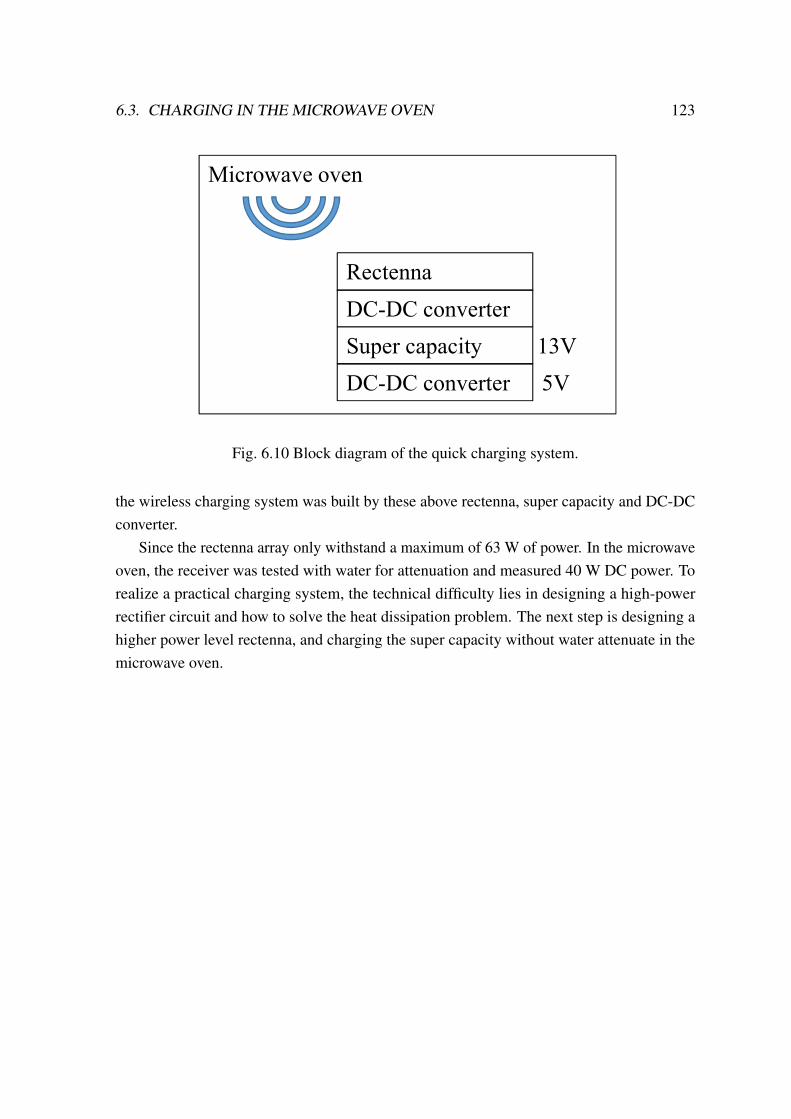
6.3. CHARGING IN THE MICROWAVE OVEN 123
0
20
40
60
80
100
0 2000 4000 6000 8000 10000
Eff
icie
ncy
[%
]
Input power[mW]
0
20
40
60
80
100
0 20 40 60 80 100
Eff
icie
ncy
[%
]
Load[Ω]
Microwave oven
Rectenna
DC-DC converter
Super capacity
DC-DC converter
13V
5V
a b
c d
Fig. 6.10 Block diagram of the quick charging system.
the wireless charging system was built by these above rectenna, super capacity and DC-DCconverter.
Since the rectenna array only withstand a maximum of 63 W of power. In the microwaveoven, the receiver was tested with water for attenuation and measured 40 W DC power. Torealize a practical charging system, the technical difficulty lies in designing a high-powerrectifier circuit and how to solve the heat dissipation problem. The next step is designing ahigher power level rectenna, and charging the super capacity without water attenuate in themicrowave oven.
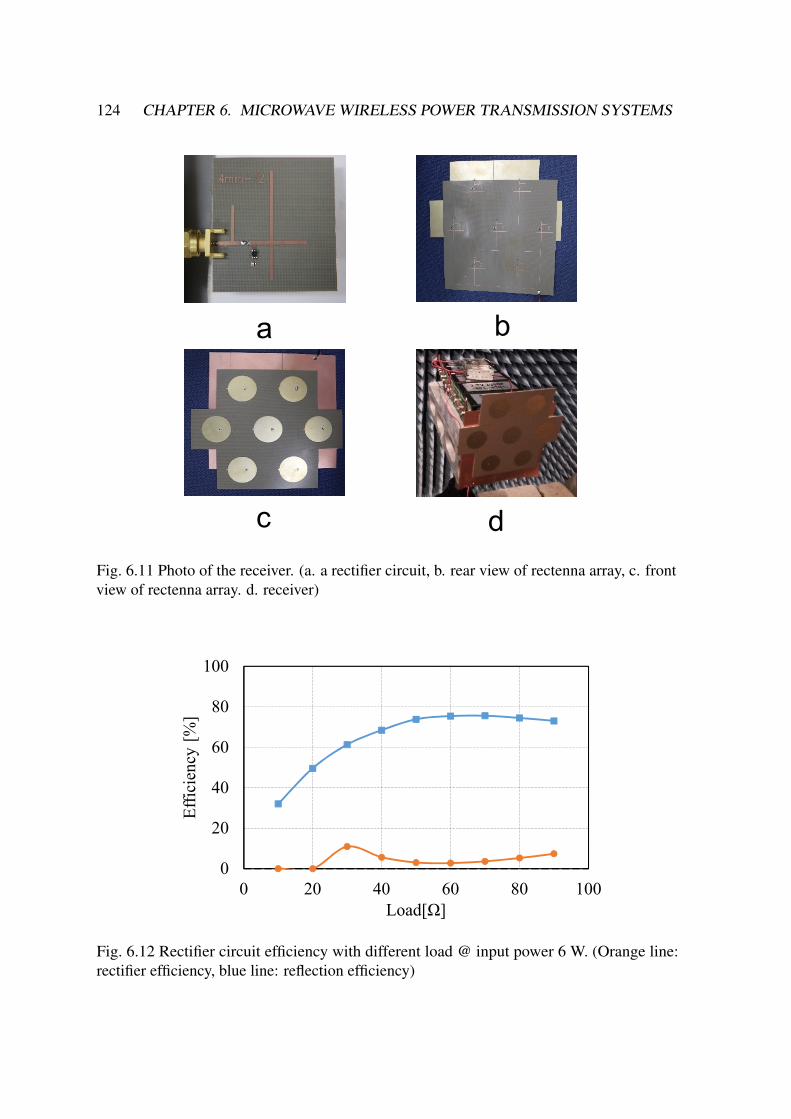
124 CHAPTER 6. MICROWAVE WIRELESS POWER TRANSMISSION SYSTEMS
0
20
40
60
80
100
0 2000 4000 6000 8000 10000
Eff
icie
ncy
[%
]
Input power[mW]
0
20
40
60
80
100
0 20 40 60 80 100E
ffic
iency
[%
]Load[Ω]
Microwave oven
Rectenna
DC-DC converter
Super capacity
DC-DC converter
13V
5V
a b
c d
Fig. 6.11 Photo of the receiver. (a. a rectifier circuit, b. rear view of rectenna array, c. frontview of rectenna array. d. receiver)
0
20
40
60
80
100
0 2000 4000 6000 8000 10000
Eff
icie
ncy
[%
]
Input power[mW]
0
20
40
60
80
100
0 20 40 60 80 100
Eff
icie
ncy
[%
]
Load[Ω]
Microwave oven
Rectenna
DC-DC converter
Super capacity
DC-DC converter
13V
5V
a b
c d
Fig. 6.12 Rectifier circuit efficiency with different load @ input power 6 W. (Orange line:rectifier efficiency, blue line: reflection efficiency)
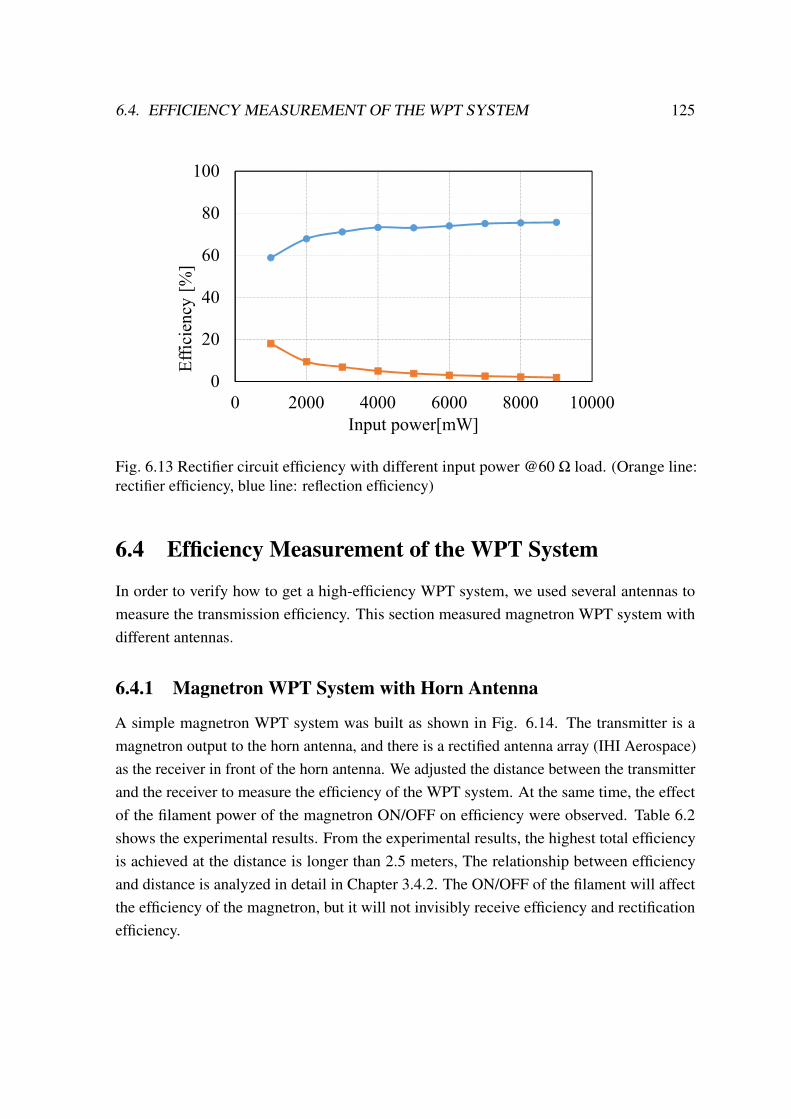
6.4. EFFICIENCY MEASUREMENT OF THE WPT SYSTEM 125
0
20
40
60
80
100
0 2000 4000 6000 8000 10000
Eff
icie
ncy
[%
]
Input power[mW]
0
20
40
60
80
100
0 20 40 60 80 100
Eff
icie
ncy
[%
]
Load[Ω]
Microwave oven
Rectenna
DC-DC converter
Super capacity
DC-DC converter
13V
5V
a b
c d
Fig. 6.13 Rectifier circuit efficiency with different input power @60 Ω load. (Orange line:rectifier efficiency, blue line: reflection efficiency)
6.4 Efficiency Measurement of the WPT System
In order to verify how to get a high-efficiency WPT system, we used several antennas tomeasure the transmission efficiency. This section measured magnetron WPT system withdifferent antennas.
6.4.1 Magnetron WPT System with Horn Antenna
A simple magnetron WPT system was built as shown in Fig. 6.14. The transmitter is amagnetron output to the horn antenna, and there is a rectified antenna array (IHI Aerospace)as the receiver in front of the horn antenna. We adjusted the distance between the transmitterand the receiver to measure the efficiency of the WPT system. At the same time, the effectof the filament power of the magnetron ON/OFF on efficiency were observed. Table 6.2shows the experimental results. From the experimental results, the highest total efficiencyis achieved at the distance is longer than 2.5 meters, The relationship between efficiencyand distance is analyzed in detail in Chapter 3.4.2. The ON/OFF of the filament will affectthe efficiency of the magnetron, but it will not invisibly receive efficiency and rectificationefficiency.
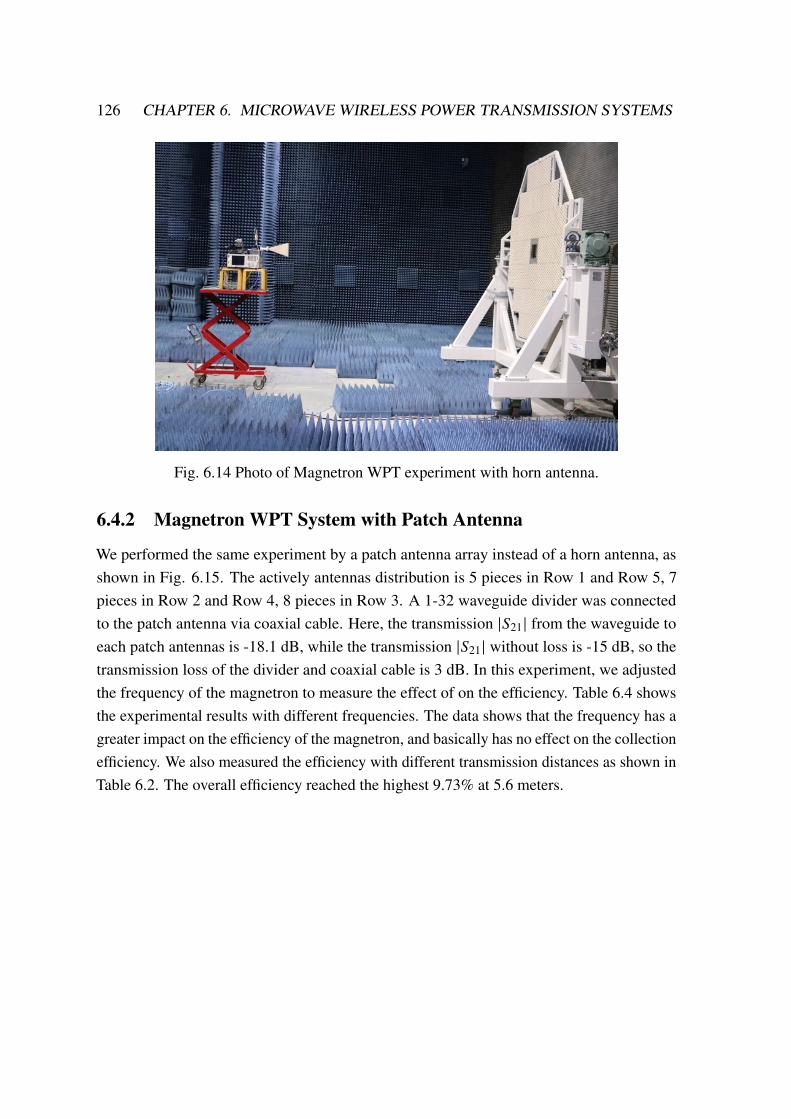
126 CHAPTER 6. MICROWAVE WIRELESS POWER TRANSMISSION SYSTEMS
Fig. 6.14 Photo of Magnetron WPT experiment with horn antenna.
6.4.2 Magnetron WPT System with Patch Antenna
We performed the same experiment by a patch antenna array instead of a horn antenna, asshown in Fig. 6.15. The actively antennas distribution is 5 pieces in Row 1 and Row 5, 7pieces in Row 2 and Row 4, 8 pieces in Row 3. A 1-32 waveguide divider was connectedto the patch antenna via coaxial cable. Here, the transmission |𝑆21 | from the waveguide toeach patch antennas is -18.1 dB, while the transmission |𝑆21 | without loss is -15 dB, so thetransmission loss of the divider and coaxial cable is 3 dB. In this experiment, we adjustedthe frequency of the magnetron to measure the effect of on the efficiency. Table 6.4 showsthe experimental results with different frequencies. The data shows that the frequency has agreater impact on the efficiency of the magnetron, and basically has no effect on the collectionefficiency. We also measured the efficiency with different transmission distances as shown inTable 6.2. The overall efficiency reached the highest 9.73% at 5.6 meters.
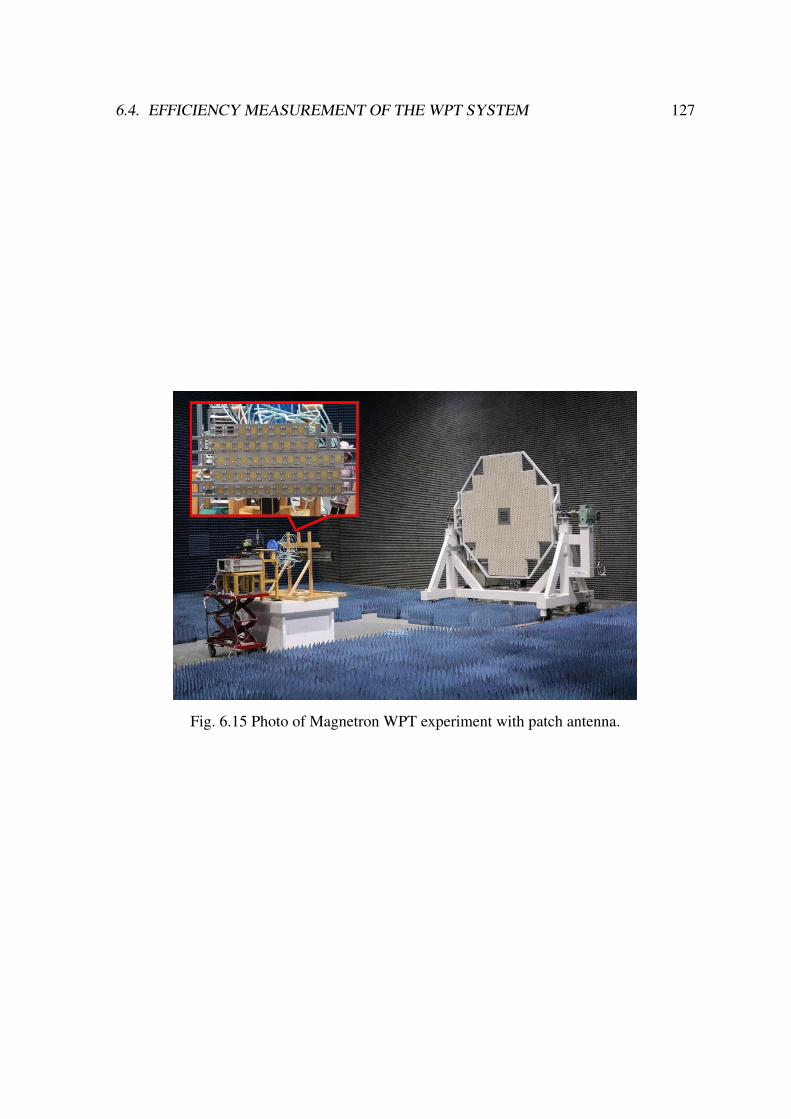
6.4. EFFICIENCY MEASUREMENT OF THE WPT SYSTEM 127
Fig. 6.15 Photo of Magnetron WPT experiment with patch antenna.
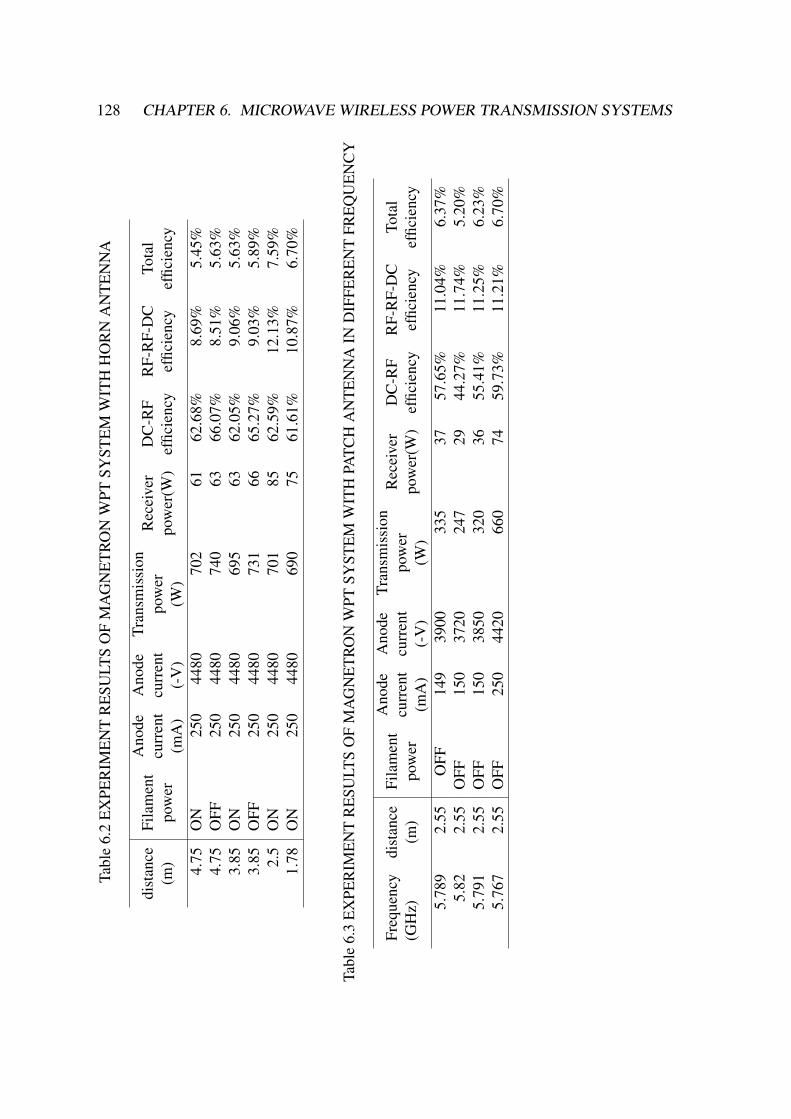
128 CHAPTER 6. MICROWAVE WIRELESS POWER TRANSMISSION SYSTEMSTa
ble
6.2
EX
PER
IME
NT
RE
SULT
SO
FM
AG
NE
TR
ON
WPT
SYST
EM
WIT
HH
OR
NA
NT
EN
NA
dist
ance
(m)
Fila
men
tpo
wer
Ano
decu
rren
t(m
A)
Ano
decu
rren
t(-
V)
Tran
smis
sion
pow
er(W
)
Rec
eive
rpo
wer
(W)
DC
-RF
effic
ienc
yR
F-R
F-D
Cef
ficie
ncy
Tota
lef
ficie
ncy
4.75
ON
250
4480
702
6162
.68%
8.69
%5.
45%
4.75
OFF
250
4480
740
6366
.07%
8.51
%5.
63%
3.85
ON
250
4480
695
6362
.05%
9.06
%5.
63%
3.85
OFF
250
4480
731
6665
.27%
9.03
%5.
89%
2.5
ON
250
4480
701
8562
.59%
12.1
3%7.
59%
1.78
ON
250
4480
690
7561
.61%
10.8
7%6.
70%
Tabl
e6.
3EX
PER
IMEN
TR
ESU
LTS
OF
MA
GN
ETR
ON
WPT
SYST
EMW
ITH
PATC
HA
NTE
NN
AIN
DIF
FER
ENT
FREQ
UEN
CY
Freq
uenc
y(G
Hz)
dist
ance
(m)
Fila
men
tpo
wer
Ano
decu
rren
t(m
A)
Ano
decu
rren
t(-
V)
Tran
smis
sion
pow
er(W
)
Rec
eive
rpo
wer
(W)
DC
-RF
effic
ienc
yR
F-R
F-D
Cef
ficie
ncy
Tota
lef
ficie
ncy
5.78
92.
55O
FF14
939
0033
537
57.6
5%11
.04%
6.37
%5.
822.
55O
FF15
037
2024
729
44.2
7%11
.74%
5.20
%5.
791
2.55
OFF
150
3850
320
3655
.41%
11.2
5%6.
23%
5.76
72.
55O
FF25
044
2066
074
59.7
3%11
.21%
6.70
%
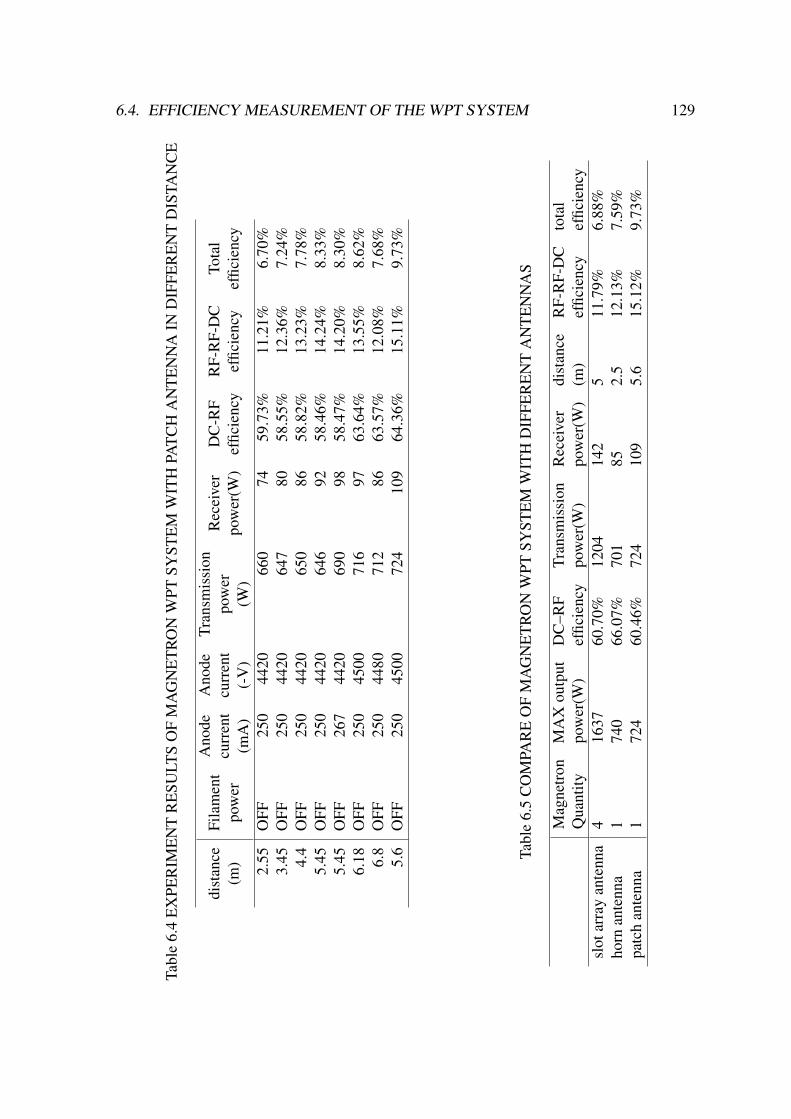
6.4. EFFICIENCY MEASUREMENT OF THE WPT SYSTEM 129
Tabl
e6.
4E
XPE
RIM
EN
TR
ESU
LTS
OF
MA
GN
ET
RO
NW
PTSY
STE
MW
ITH
PAT
CH
AN
TE
NN
AIN
DIF
FER
EN
TD
ISTA
NC
E
dist
ance
(m)
Fila
men
tpo
wer
Ano
decu
rren
t(m
A)
Ano
decu
rren
t(-
V)
Tran
smis
sion
pow
er(W
)
Rec
eive
rpo
wer
(W)
DC
-RF
effic
ienc
yR
F-R
F-D
Cef
ficie
ncy
Tota
lef
ficie
ncy
2.55
OFF
250
4420
660
7459
.73%
11.2
1%6.
70%
3.45
OFF
250
4420
647
8058
.55%
12.3
6%7.
24%
4.4
OFF
250
4420
650
8658
.82%
13.2
3%7.
78%
5.45
OFF
250
4420
646
9258
.46%
14.2
4%8.
33%
5.45
OFF
267
4420
690
9858
.47%
14.2
0%8.
30%
6.18
OFF
250
4500
716
9763
.64%
13.5
5%8.
62%
6.8
OFF
250
4480
712
8663
.57%
12.0
8%7.
68%
5.6
OFF
250
4500
724
109
64.3
6%15
.11%
9.73
%
Tabl
e6.
5C
OM
PAR
EO
FM
AG
NE
TR
ON
WPT
SYST
EM
WIT
HD
IFFE
RE
NT
AN
TE
NN
AS
Mag
netr
onQ
uant
ityM
AX
outp
utpo
wer
(W)
DC
–RF
effic
ienc
yTr
ansm
issi
onpo
wer
(W)
Rec
eive
rpo
wer
(W)
dist
ance
(m)
RF-
RF-
DC
effic
ienc
yto
tal
effic
ienc
ysl
otar
ray
ante
nna
416
3760
.70%
1204
142
511
.79%
6.88
%ho
rnan
tenn
a1
740
66.0
7%70
185
2.5
12.1
3%7.
59%
patc
han
tenn
a1
724
60.4
6%72
410
95.
615
.12%
9.73
%
130 CHAPTER 6. MICROWAVE WIRELESS POWER TRANSMISSION SYSTEMS
6.5 Discussion of a High Efficiency WPT System
For WPT, a very critical parameter is the total efficiency of the system. Table 6.5 summarizesthe data of the WPT experiment of the 5.8 GHz magnetron in this paper. Among them, thephased array magnetron are four magntrons which is different from other magnetrons system.The highest total efficiency in this paper is to use patch antenna to reach 9.73% at 5.6 m. It isnecessary to further improve the total efficiency.
For DC to RF inverters, the magnetron should be the most efficient of all devices. Themarketed 900 MHz magnetron achieves 90% efficiency, but there is no 2.45 GHz or 5.8GHz magnetron reaches this level. If combined with the problem of the life time of themagnetron, developing high-efficiency CFA or another improved magnetron should be aresearch direction.
The collection efficiency of wave beam depends on factors such as antenna gain andpolarity matching. The collection efficiency of W.C Brown reaches 95%, which is acceptableto WPT. The receiving array antenna used in this experiment did not exactly match thetransmitting antenna. For a system with high collection efficiency, the transmitting antennaand the receiving antenna must be well matched.
The receiver efficiency depends on microwave rectification efficiency and combiningefficiency. The efficiency of the 2.45 GHz rectifier circuit can reach more than 90%, butthis efficiency will change greatly under different loads and different power level. A betterreceiving system, according to the energy density distribution of the beam, set up a rectifiercircuit to achieve the best input power state. When combing with the rectifier circuit,the optimal load state should be considered. DC-DC output connection is the simplestsolution, but this will have about 10% loss. In the high-power rectifier device, Vanke’s CWCexperiment data is 2.45 GHz, 10 kW 83% rectification efficiency. However, there is norelevant information to show that the team continues related research, and it is also veryregrettable that CWC has not been applied to the relevant WPT system.
6.6 Summary
In this chapter, several situations of non-interference of signal-to-energy simultaneous trans-mission are described, and the design and test results of the OAM antenna are introducedin detail. Then, two information and power transmission systems using magnetrons wereintroduced, and both realized video transmission. In addition, the realization and technicaldifficulties of charging in a microwave oven. Then, a horn antenna and a micro-strip antennaarray were used for WPT experiments comparing with the experimental results of the slot

6.6. SUMMARY 131
antenna The total efficiency were measured with different frequency, different distance,injection locking and other different parameters. Finally, the high-efficiency WPT system isanalyzed.

Chapter 7
Conclusion
In this thesis, the history of WPT, microwave WPT, high power microwave transmitter wereintroduced in the Chapter 1. Chapter 2 devised a new Power-variable Phase-Controlledmethod of the Magnetron (PVPCM). The experimental results show that the developed 5.8GHz phase-controlled magnetron had a variable output power range from 160 to 329 W.Furthermore, the phase accuracy was nearly ±1◦, and the response time was less than 100 `s.
Chapter 3 introduced a magnetron phased array system, which was developed for theWPT. Four PVPCMs were proposed as a phased array system. A waveguide slot array antennawas designed and used for the output of the PVPCMs. We demonstrated the properties ofmicrowave beam forming and WPT based on the aforementioned magnetron phased arraysystem. In the horizontal and vertical directions both, a beam scanning range of ±3° wasobtained by adjusting the output phase of the magnetrons. Moreover, using a 5.8 GHzrectenna array system (IHI Aerospace) as the receiver, a microwave WPT system was built. Itis verified that the output phase and power of the magnetron phased array are adjustable. Themeasured maximum output of the magnetron phased array was 1870 W with 61.0% DC–RFefficiency. The received DC power reaches 142 W at a distance of 5 m when the outputmicrowave power of the magnetron phased array is 1304 W. It is the first time a beamformingtransmitter is developed based on power-variable magnetrons.
Development of the modulation magnetron was described in Chapter 4. In the past,magnetrons can communicate at a low transmission rate, which has been studied in theUnited States. While investigating the phase-controlled magnetrons, we discovered themodulation of the magnetron output and its enabled for communication. The transmissionrate was improved, and it achieved the transmission of phase-shift keying and frequency-shiftkeying at 10 Mbps. Finally, the transmission of the audio and video information and relaycontrolling data were demodulated.
134 CHAPTER 7. CONCLUSION
The ripple rate of full wave voltage doubler and switched-mode circuit of the lowcost power supply were improved to below 1% in Chapter 5. These power supplies weresuccessful used in phase-controlled magnetron, frequency modulation system, magnetronload fluctuation experiment, magnetron output combining system. It proposed a improvedmethod of the low cost power supplies for magnetron system.
Chapter 6 summarized the information and power transfer systems and efficiency mea-surement experiment. The magnetron phased array which was injected with frequencymodulation signal, also can form the microwave beam. It’s a new way for information andpower transfer system. Another information and power transfer system of a wireless TVsystem was invented at a low cost. The video signal and the power consumption of the TV aretransmitted with the same microwave from the magnetron. The receiving antenna is placed3.5 m away and the microwave is rectified to supply to the TV. Also, there is a demodulatorthat demodulated microwave into a video signal. It’s the first time for developing the wirelessTV that tested a 300 W class microwave wireless power and information transmission system.
The highest DC–RF–RF–DC efficiency of the 5.6 m distance WPT experiments in thisresearch was achieved at 9.73% . The paper suggested further on improving the efficiency ofthe microwave WPT system.
References
[1] N. Tesla, "Transmission of energy without wires," Sci Am (Suppl), vol. 57, pp. 237-260,1904.
[2] H. Winfield Secor,"Tesla’s Million Dollar Folly,"Export American Industries, pp. 52-53,March 1, 1916
[3] M. Hutin and M. Leblanc, "Transformer System for Electric Railways," US PatentUS527857A, 1894
[4] H. Yagi and S. Uda, "Projector of the Sharpest Beam of Electric Waves," Proc. ImperialAcademy of Japan, pp. 49-52. February 1926. doi:10.2183/pjab1912.2.49
[5] S. Uda, "On the WireleSS Beam Of Short Electric Waves," vol.46, pp.273-282,No.452,1926 doi:10.11526/ieejjournal1888.46.273
[6] Yagi, H., and S. Uda, "On the feasibility of power transmission by electric waves," Proc.Third pan-pacific congress held in Tokyo, Vol.2, pp.1306-1313, 1926
[7] W. C. Brown, The History of Power Transmission by Radio Waves," IEEE Transactionson Microwave Theory and Techniques, vol.32, Issue: 9, pp.1230-1242.Sep 1984, DOI:10.1109/TMTT.1984.1132833
[8] W. C. Brown, "The History of the Development of the Rectenna", Johnson Space CenterSolar Power Satellite Microwave Transmission and Reception in NASA, pp.271-280,1980
[9] Andrey D. Grigoriev, Vyacheslav A. Ivanov, Sergey I. Molokovsky, "Microwave Elec-tronics," Springer, pp247, 2018
[10] P. E. Glaser, "Power from the sun: Its future," Science, vol. 162, no.3856, pp. 857–861,Nov. 1968, DOI: 10.1126/science.162.3856.857
[11] Dickinson R. M, "Evaluation of a microwave high-power reception-conversion array forwireless power transmission," NASA STI/Recon Technical Report NASA-CR-145625,1975
[12] SHARP(Stationary High Altitude Relay Platform) [Online]. Available:https://www.friendsofcrc.ca/Projects/SHARP/sharp.html [Accessed: 25- June-2020]
136 REFERENCES
[13] H.Matsumoto, MINIX Plan [Online]. Available:http://www.isas.jaxa.jp/j/isasnews/backnumber/1982/ISASnews020.pdf [Accessed:25- June- 2020]
[14] N.Kaya, H. Matsumoto,"METS Rocket Experiment and MILAX Airplane Demonstra-tion," The Journal of Space Technology and Science 8.2 (1992)
[15] N.Kaya, H. Kojima, H. Matsumoto, M. Hinada and R. Akiba, "ISY-METS RocketExperiment for Microwave Energy Transmission, Acta Astronautica," 34, 43-46, 1994.doi:10.1016/0094-5765(94)90241-0
[16] Y. Fujino, M. Fujita, N. Kaya, S. Kunimi, M. Ishii, N. Ogihara, N. Kusaka and S. Ida,"A dual polarization microwave power transmission system for microwave propelledairship experiment," in proceedings of The International Symposium on antennas andPropagation JAPAN, 1996, pp. 393-396.
[17] N.Shimokura, N.Kaya, N.Shinohara, H.Matsumoto. "Point-to-Point Microwave PowerTransmission Experiment." Transactions of the Institute of Electrical Engineers ofJapan. B, 116(6), 648-653.(1996).
[18] J.Boyd, "Here comes the wallet phone [wireless credit card]." IEEE Spectrum 42.11(2005): 12-14.
[19] A. Kurs, A. Karalis, R. Moffatt, J. D. Joannopoulos, P. Fisher, and M. Solja£i¢, "Wire-less power transfer via strongly coupled magnetic resonances,"Science, vol. 317, no.5834, pp. 83-86, Jul. 2007.
[20] A. Karalis, J. D. Joannopoulos, and M. Solja£i¢, "Effcient wireless non-radiativemid-range energy transfer,"Ann. Phys., vol. 323, no. 1, pp. 34-48, Jan. 2008.
[21] Kim, Han Joon, Hirayama, Hiroshi , Kim, Sanghoek, Han, Ki, Zhang, Rui, Choi,Ji-Woong. (2017). Review of Near-Field Wireless Power and Communication forBiomedical Applications. IEEE Access. PP. 1-1. 10.1109/ACCESS.2017.2757267.
[22] Wireless Power Consortium Website. [Online]. Available:http://www.wirelesspowerconsortium.com[Accessed: 25- June- 2020]
[23] AirFuel Alliance Website. [Online]. Available: http://www.airfuel.org[Accessed: 25-June- 2020]
[24] G. Calabrese ,The Greening of the Automotive Industry,Business & Economics,pp58,2016
[25] K.Hashioto, H.Yamakawa, N.Shinohara, T.Mitani, F.Takahashi, H.Yonekura, T.HiranoT.Fujiwara, K.Nagano, and S.Kawasaki, Microwave Power Transmission Experimentfrom an Airship,Technical Report of IEICE,SPS2009-03, April.
[26] JAXA, "Ground demonstration testing of microwave wireless power transmission," [On-line]. Available: http://www.kenkai.jaxa.jp/eng/research/ssps/150301.html [Accessed:25- Feb- 2020]
REFERENCES 137
[27] [Online]. Available: https://www.daimler.com/innovation/case/electric/eq-ecosystem.html [Accessed: 25- June- 2020]
[28] [Online]. Available: https://www.nissan-global.com/JP/TECHNOLOGY/OVERVIEW/wcs.html[Accessed: 25- June- 2020]
[29] [Online]. Available: https://monoist.atmarkit.co.jp/mn/articles/1109/27/news077.html[Accessed: 25- June- 2020]
[30] [Online]. Available: https://ipt-technology.com/e-mobility/ [Accessed: 25- June- 2020]
[31] [Online]. Available: https://www.zte.com.cn/china/about/news/427348.html [Accessed:25- June- 2020]
[32] [Online]. Available: https://www.gov.uk/government/news/off-road-trials-for-electric-highways-technology [Accessed: 25- June- 2020]
[33] T. Aoki, Q. Yuan, D. Quang-Thang, M. Okada and H. Hsu, "Maximum TransferEfficiency of MIMO-WPT System," 2018 IEEE Wireless Power Transfer Conference(WPTC), Montreal, QC, Canada, 2018, pp. 1-3, doi: 10.1109/WPT.2018.8639417
[34] S. Kim and B. Lee, "Control of magnetic field distribution by excitation phasesof transmitters in MIMO WPT system," 2016 URSI Asia-Pacific Radio ScienceConference (URSI AP-RASC), Seoul, 2016, pp. 861-863, doi: 10.1109/URSIAP-RASC.2016.7601280..
[35] [Online]. Available: https://www.daihen.co.jp/products/wireless/ [Accessed: 25- June-2020]
[36] A. Celeste, P. Jeanty and G. Pignolet, "Case study in reunion island," Acta Astronaut.,vol. 54, no. 4, pp. 253-258 2004.
[37] T. Matsumuro, Y. Ishikawa, T. Mitani, N. Shinohara, M. Yanagase and M. Matsunaga,"Study of a single-frequency retrodirective system with a beam pilot signal using dual-mode dielectric resonator antenna elements," Wireless Power Transfer, vol. 4, no. 2, pp.132 2017.
[38] A.D. Kotin, "Satellite power system (SPS) resource requirements (critical materials,energy and land)," 1978.
[39] M. Omiya and K. Itoh, "Development of a Functional System Model of the Solar PowerSatellite, SPS2000," in proceedings of The International Symposium on Antennas andPropagation JAPAN, 1996, pp. 417-420.
[40] S. Sasaki, K. Tanaka, K. Higuchi, N. Okuizumi, S. Kawasaki, N. Shinohara, K. Sendaand K. Ishimura, "A new concept of solar power satellite: Tethered-SPS," Acta Astro-naut., vol. 60, no. 3, pp. 153-165 2007.
[41] M. Mori, H. Kagawa and Y. Saito, "Summary of studies on space solar power systemsof japan aerospace exploration agency (JAXA)," Acta Astronaut., vol. 59, no. 1-5, pp.132-138 2006.
138 REFERENCES
[42] T. Saito, Y. Kobayashi and H. Kanai, "Concept Study of Space Solar Power Systems inUSEF," in 55th International Astronautical Congress of the International AstronauticalFederation, the International Academy of Astronautics, and the International Instituteof Space Law, pp. R. 1.02, 2004.
[43] J. Mankins, N. Kaya and M. Vasile, "SPS-ALPHA: the first practical solar power satel-lite via arbitrarily large phased array (a 2011-2012 NIAC project)," in 10th InternationalEnergy Conversion Engineering Conference, 2012, pp. 3978.
[44] X. Hou, M. Li, L. Niu, L. Zhou, Y. Chen, Z. Cheng and H. Jia, "Multi-rotary jointsSPS," Online Journal of Space Communication, vol. 2016, no. 18 2016.
[45] K. Jin and W. Zhou, "Wireless laser power transmission: a review of recent progress,"IEEE Transactions on Power Electronics, vol. 34, pp. 3842-3859, 2018.
[46] Zhaohui, LI Zhijian ZHUANG Ganlin WU and L.B.Z. Xiulai, "Modeling of ultra-sonic wireless electrical energy transfer system," Journal of South China University ofTechnology (Natural Science), vol. 46, no. 3, pp. 72 2018.
[47] N.Shinohara, “Microwave and Millimeter Wave Power Transmission in the Far Field,”IEEE Journal of Microwaves, print in 2020
[48] H. T. Friis, “A note on a simple transmission formula,” Proc. IRE 34, 254–256 (1946).doi:10.1109/JRPROC.1946.234568
[49] J.W. Hawkins, The saber microwave-powered helicopter project and related WPTresearch at the University of Alaska Fairbanks AIP conference proceedings, 1092-1097,1998. doi:10.1063/1.54725.
[50] H. Ma, X. Li, L. Sun, H. Xu and L. Yang, "Design of high-efficiency microwave wirelesspower transmission system," Microwave Opt Technol Lett, vol. 58, pp. 1704-1707,2016.
[51] M. Kamiyama, R. Ishikawa and K. Honjo, "5.65 GHz High-Efficiency GaN HEMTPower Amplifier With Harmonics Treatment up to Fourth Order," in IEEE Microwaveand Wireless Components Letters, vol. 22, no. 6, pp. 315-317, June 2012, doi:10.1109/LMWC.2012.2197385.
[52] V. L. Granatstein, P. K. Parker, and C. M. Armstrong, "Scanning the TechnologyVacuum Electronics at the Dawn of the Twenty-First Century," Proc. IEEE, vol. 87, pp.702–716, May 1999
[53] S. Oliver, "Optimize a Power Scheme for these Transient Times", Electronic Design,Sep 30, 2014.
[54] [Online]. Available: https://www.nobelprize.org/prizes/physics/2014/summary/ [Ac-cessed: 25- June- 2020]
[55] D. Sprehn, R. M. Phillips, and G. Caryotakis, “The design and performance of 150- MWS-band klystrons,” SLAC-PUB-6677, Stanford Linear Accelerator Center, September1994.
REFERENCES 139
[56] Baikov, A.Y., Grushina, O.A. & Strikhanov, M.N. Simulation of conditions for themaximal efficiency of decimeter-wave klystrons. Tech. Phys. 59, 421–427 (2014).https://doi.org/10.1134/S1063784214030037
[57] A. Y. Bajkov and D. M. Petrov, "Problems of creation of powerful and super-powerklystrons with efficiency up to 90%," Proceedings International University Conference’Electronics and Radiophysics of Ultra-High Frequencies’ (Cat. No.99EX356), SaintPetersburg, Russia, 1999, pp. 5-8, doi: 10.1109/UHF.1999.787864.
[58] A. Gilmour, Klystrons, traveling wave tubes, magnetrons, crossed-field amplifiers, andgyrotrons, Artech House, 2011.
[59] J. Benford, J.A. Swegle and E. Schamiloglu, High power microwaves, CRC press,2015.
[60] W. Brown, J. Skowron, G. MacMaster and J. Buckley, "The super power CW amplitron,"in 1963 International Electron Devices Meeting, 1963, pp. 52-52.
[61] Crossed-Field Amplifiers. (n.d.). Microwave and RF Vacuum Electronic Power Sources,629–658. doi:10.1017/9780511979231.017
[62] I. Tahir, A. Dexter and R. Carter, "Noise Performance of Frequency- and Phase-LockedMagnetrons Operated as Current-Controlled Oscillators, IEEE Transactions on ElectronDevices, vol.52, No.9, pp.2096–2103, 2005.
[63] T. Mitani, N. Shinohara, and H. Matsumoto, Development of a Pulse-Driven Phase-Controlled Magnetron, Proc. 8th IEEE International Vacuum Electronics ConferenceIVEC 2007, pp.425–426, 2007.
[64] C. Liu, H. Huang, Z. Liu, F. Huo, and K. Huang, Experimental Study on MicrowavePower Combining Based on Injection-Locked 15-kW S-Band Continuous-Wave Mag-netrons, IEEE Transactions on Plasma Science, vol.44, no.8, pp.1291–1297, August2016.
[65] H. Matsumoto, K. Hashimoto, N. Shinohara, and T. Mitani, Experimental equipmentsfor microwave power transmission in Kyoto University, Proc. 4th International Confer-ence on Solar Power from Space (SPS 04), Spain, pp.131–138, June 2004.
[66] N. Shinohara and H. Matsumoto, Phased Array Technology with Phase and AmplitudeControlled Magnetron for Microwave Power Transmission, Proc. 4th InternationalConference on Solar Power from Space (SPS 04), Spain, pp.117–124, June 2004.
[67] N. Shinohara, T. Mitani, and H. Matsumoto, Development of phase and amplitudecontrolled magnetron, Proc. 6th International Vacuum Electronics Conference IVEC2005, pp.61–65, Netherlands, April 2005.
[68] A. Nagahama, T. Mitani, N. Shinohara, N. Tsuji, K. Fukuda, Y. Kanari and K. Yonemoto,Study on a Microwave Power Transmi tting System for Mars Observation Airplane,IEEE MTT-S International Microwave Workshop Series on Innovative Wireless PowerTransmission: Technologies, Systems, and Applications (IMWS-IWPT), IWPT3-5,Proceedings, pp.63–66, Uji, Japan, May 2011.
140 REFERENCES
[69] B. Zhang, W. Jiang, Y. Yang, C. Yu, K. Huang and C. Liu, Experimental study on anS-band near-field microwave magnetron power transmission system on hundred-wattlevel, International Journal of Electronics, vol.102, No.11, pp.1818–1830, 2015.
[70] I. Tahir, A. Dexter and R. Carter, Frequency and Phase Modulation Performance ofan Injection-Locked CW Magnetron, IEEE Transactions on Electron Devices, vol.53,No.7, pp.1721–1729, July 2006.
[71] R. Adler, A Study of Locking Phenomena in Oscillators, Proceedings of I.R.E andWaves and Electrons, vol.34, pp.351–357, 1946.
[72] N. Shinohara, H. Matsumoto and K. Hashimoto, Solar Power Station/Satellite (SPS)with Phase Controlled Magnetrons, IEICE Trans.Electron, vol.E86-C, No.8, pp.1550–1555, August 2003.
[73] N. Tesla, "Transmission of energy without wires," Sci Am (Suppl), vol. 57, pp. 237-2601904.
[74] P. E. Glaser, "Power from the sun: Its future," Science, vol. 162, no.3856, pp. 857–861,Nov. 1968, DOI: 10.1126/science.162.3856.857
[75] W. C. Brown, T. Moreno, "Microwave power generation", IEEE Spectrum vol. 1, Issue:10, pp.77-81, Oct. 1964, DOI: 10.1109/MSPEC.1964.6501192
[76] W. C. Brown, "The History of the Development of the Rectenna", Johnson Space CenterSolar Power Satellite Microwave Transmission and Reception in NASA, pp.271-280,1980
[77] W. C. Brown, "The History of Power Transmission by Radio Waves," IEEE Transactionson Microwave Theory and Techniques, vol.32, Issue: 9, pp.1230-1242.Sep 1984, DOI:10.1109/TMTT.1984.1132833
[78] Dickinson R. M, "Evaluation of a microwave high-power reception-conversion array forwireless power transmission," NASA STI/Recon Technical Report NASA-CR-145625,1975
[79] N. Shinohara, "Beam Control Technologies with a High-Efficiency Phased Array forMicrowave Power Transmission in Japan," Proceedings of the IEEE, vol. 101, no. 6, pp.1448-1463, June 2013, DOI: 10.1109/JPROC.2013.2253062
[80] N. Kaya, H. Matsumoto, R. Akiba, "Rocket experiment METS microwave energytransmission in space," Space Power, vol. 11, no. 1&2, pp. 267-274, 1993.
[81] JAXA, "Ground demonstration testing of microwave wireless power transmission,"[Online]. Available: http://www.kenkai.jaxa.jp/eng/research/ssps/150301.html [Ac-cessed: 25- Feb- 2020]
[82] H. Matsumoto, K. Hashimoto, N. Shinohara, and T. Mitani, "Experimental equipmentfor microwave power transmission in Kyoto University," in Proc. 4th InternationalConference on Solar Power from Space (SPS ’04), pp.131–138, Spain, 2004.

REFERENCES 141
[83] B. Zhang, W. Jiang, Y. Yang, et al. "Experimental study on an S-band near-fieldmicrowave magnetron power transmission system on hundred-watt level". Interna-tional Journal of Electronics, vol. 102, no. 11, pp. 1818-1830, Jan 2015, DOI:10.1080/00207217.2014.996784
[84] C. Chen, K. Huang, Y. Yang. "Microwave transmitting system based on four-waymaster–slave injection-locked magnetrons and horn arrays with suppressed sidelobes",IEEE Transactions on Microwave Theory and Techniques, vol. 66, no. 5, pp. 2416-2424,May 2018, DOI: 10.1109/TMTT.2018.2790924
[85] B. Yang, T. Mitani, N. Shinohara, "Experimental Study on a 5.8 GHz Power-VariablePhase-Controlled Magnetron", IEICE Transactions on Electronics, Vol.E100-C, No. 10,pp. 901-907, Oct. 2017, DOI: 10.1587/transele.E100.C.901
[86] R. Adler, "A Study of Locking Phenomena in Oscillators," Proceedings of I.R.Eand Waves and Electrons, Vol.34, pp. 351–357, 1946, 10. DOI: 10.1109/434 JR-PROC.1946.229930.
[87] J. Benford, "Space Applications of High-Power Microwaves," in IEEE Transactions onPlasma Science, vol. 36, no. 3, pp. 569-581, June 2008. DOI: 10.1109/TPS.2008.923760
[88] "Gaussian Beam Optics." CVI Laser Optics, IDEX Optics & Photonics.
[89] Bandres, Miguel A., and Julio C. Gutiérrez-Vega. "Ince–gaussian beams." Optics letters29.2 (2004): 144-146.
[90] Yang, Yang, et al. "A 5.8 GHz circularly polarized rectenna with harmonic suppres-sion and rectenna array for wireless power transfer." IEEE Antennas and Wirelesspropagation letters 17.7 (2018): 1276-1280. DOI:10.1109/lawp.2018.2842105
[91] Yang, Yang, et al. "A circularly polarized rectenna array based on substrate integratedwaveguide structure with harmonic suppression." IEEE Antennas and Wireless Propa-gation Letters 17.4 (2018): 684-688. DOI:10.1109/lawp.2018.2811860
[92] I. Tahir, A. Dexter and R. Carter, "Noise Performance of Frequency-and Phase-LockedMagnetrons Operated as Current-Controlled Oscillators," IEEE Transactions on Elec-tron Devices, Vol.52, No.9, pp. 2096–2103, 2005, DOI: 10.1109/TED.2005.854276.
[93] T. Mitani, N. Shinohara, and H. Matsumoto, "Development of a Pulse-Driven Phase-Controlled Magnetron," Proc. 8th IEEE International Vacuum Electronics ConferenceIVEC 2007, pp. 425–426, 2007.
[94] H. Matsumoto, K. Hashimoto, N. Shinohara, and T. Mitani, "Experimental equip-ment for microwave power transmission in Kyoto University," Proc. 4th InternationalConference on Solar Power from Space (SPS ’04), Spain, pp. 131–138, June 2004.
[95] N. Shinohara and H. Matsumoto, "Phased Array Technology with Phase and AmplitudeControlled Magnetron for Microwave Power Transmission," Proc. 4th InternationalConference on Solar Power from Space (SPS ’04), Spain, pp. 117–124, June 2004.
142 REFERENCES
[96] N. Shinohara, T. Mitani, and H. Matsumoto, "Development of phase and amplitudecontrolled magnetron," Proc. 6th International Vacuum Electronics Conference IVEC2005, pp. 61–65, Netherlands, April 2005.
[97] C. Liu, H. Huang, Z. Liu, F. Huo, and K. Huang, "Experimental Study on MicrowavePower Combining Based on Injection-Locked 15-kW S-Band Continuous-Wave Mag-netrons," IEEE Transactions on Plasma Science, Vol.44, no. 8, pp. 1291–1297, August2016, DOI: 10.1109/TPS.2016.2565564.
[98] I. Tahir, A. Dexter and R. Carter, "Frequency and Phase Modulation Performance ofan Injection-Locked CW Magnetron," IEEE Transactions on Electron Devices, Vol.53,No.7, pp. 1721–1729, 2006, DOI: 10.1109/TED.2006.876268.
[99] B. Yang, T. Mitani, N. Shinohara, "Experimental Study on a 5.8 GHz Power-VariablePhase-Controlled Magnetron," IEICE Transactions on Electronics, Vol.E100-C, No.10,pp. 901-907, Oct. 2017, DOI: 10.1587/transele.E100.C.901.
[100] Y. Kobayshi, Y. Yoshida, Z.-I. Yamamoto, and S. Kawasaki, "S-band GaNon Si based 1KW-class SSPA system for space wireless applications", IEICETransactions on Electronics, Vol.E96-C, No.10, pp. 1140-1146, Oct. 2016, DOI:10.1587/transele.E96.C.1245.
[101] N. Hasegawa, N. Shinohara, S. Kawasaki, "A 7.1 GHz 170W Solid-State Power Ampli-fier with 20-Way Combiner for Space Applications", IEICE Transactions on Electronics,Vol.E99-C, No.10, pp. 1245-1253, Oct. 2016, DOI: 10.1587/transele.E99.C.1140.
[102] T. Yamasaki, Y. Kittaka, H. Minamide, K. Yamauchi, S. Miwa, S. Goto, M. Nakayama,M. Kono, and N. Yoshida, "A 68% efficiency C-band 100W GaN power amplifier forspace applications," IEEE MTT-S Int. Conf., Anaheim, CA, pp. 1384–1387, May 2010.
[103] I. Takenaka, K. Ishikura, K. Asano, S. Takahashi, Y. Murase, Y. Ando, H. Takahashi,and C. Sasaoka, "High-efficiency and high power microwave amplifier using GaN-on-SiFET with improved high-temperature operation characteristics," IEEE Transactionson Microwave Theory and Techniques, Vol.62, no.3, pp. 502–512, Jan. 2014, DOI:10.1109/TMTT.2014.2298381.
[104] N.-S. Cheng, P. Jia, D.B. Rensch, and R.A. York, "A 120-W X-band spatially combinedsolid-state amplifier," IEEE Transactions on Microwave Theory and Techniques, Vol.47,no. 12, pp. 2557–2561, Dec. 1999, DOI: 10.1109/22.809006.
[105] R. Adler, "A Study of Locking Phenomena in Oscillators," Proceedings of I.R.E andWaves and Electrons, Vol.34, pp. 351–357, 1946, DOI: 10.1109/JRPROC.1946.229930.
[106] W. C. Brown, "The high signal to noise ratio of the microwave oven magnetron andevidence of a negative feedback loop to control it," Proc.1st Int. Workshop Cross-FieldDevices, Aug. 1995, pp. 178-187.
[107] W. C. Brown, "Update on the Solar Power Satellite transmitter design," Space Power(ISSN 0883-6272), Vol. 6, 1986, pp. 123-135.

REFERENCES 143
[108] T. Mitani, N. Shinohara, H. Matsumoto, "Development of a Pulse-Driven Phase-Controlled Magnetron", Proc. International Vacuum Electronics Conference IVEC2007, Kitakyushu, 2007.
[109] S. Schneider, F. Hegger, N. Hochgeschwender, R. Dwiputra, A. Mori-arty, J. Berghofer,G. K. Kraetzschmar, "Design and development of a benchmarking testbed for theFactory of the Future", 2015 IEEE 20th Conference on Emerging Technologies &Factory Automation (ETFA), pp. 1-7, 2015.
[110] N. Shinohara, H. Matsumoto, K. Hashimoto, "Phase-controlled magnetron develop-ment for SPORTS: Space power radio transmission system," Radio Science Bulletin,vol. 2004, No. 310, pp. 29-35, 2004
[111] C. Liu, H. Huang, Z. Liu, F. Huo, and K. Huang, "Experimental Study on MicrowavePower Combining Based on Injection-Locked 15-kW S-Band Continuous-Wave Mag-netrons," IEEE Transactions on Plasma Science, vol.44, No. 8, pp.1291–1297, August2016.
[112] I. Tahir, A. Dexter and R. Carter, "Frequency and Phase Modulation Performance ofan Injection-Locked CW Magnetron," IEEE Transactions on Electron Devices, vol. 53,No. 7, pp. 1721-1729, 2006
[113] B. Yang, T. Mitani, N. Shinohara, "Experimental study on frequency modulation of aninjection-locked magnetron based on full wave voltage doubler," IVEC2018, Monterey,CA, USA, 2018
[114] J.Kojima, N.Shinohara, T.Mitani, T.Hashimoto, N.Kishi, H.Toyomura and A.Okazaki,"Development of highly efficient microwave wireless charging system for electric vehi-cle," Technical Report of IEICE Information and Communication Engineers SPS2007-16 (2008-03)


Publication list
Journal papers1. Bo Yang, Tomohiko Mitani, and Naoki Shinohara, “Experimental Study on a 5.8 GHz
Power-Variable Phase-Controlled Magnetron”, IEICE Trans. Electron, Vol.E100-C,No.10, pp.901-907, 2017, doi: 10.1587/transele.E100.C.901.
2. Bo Yang, Tomohiko Mitani, and Naoki Shinohara, “Evaluation of the ModulationPerformance of Injection-Locked Continuous-Wave Magnetrons”. IEEE Trans. ED,vol.66, no.1, pp.709-715, 2019, doi: 10.1109/TED.2018.2877204.
3. Ce Wang, Bo Yang, Seishiro Kojima, and Naoki Shinohara, “The Application ofGHz Band Charge Pump Rectifier and Rectenna Array for Satellite Internal Wire-less System”, Cambridge J. Wireless Power Transfer, pp.190-195, 2019.11, doi:10.1017/wpt.2019.13.
4. Bo Yang, Xiaojie Chen, Jie Chu, Tomohiko Mitani, and Naoki Shinohara, “A 5.8GHz Phased Array System Using Power-Variable Phase-Controlled Magnetrons forWireless Power Transfer”. IEEE Trans. MTT, vol.68, no.11, 2020, doi:10.1109/TMTT.2020.3007187.
5. Xiaojie Chen, Bo Yang, Naoki Shinohara, and Changjun Li, “Modeling and Experi-ments of an Injection-locked Magnetron with Various Load Reflection Levels”, IEEETrans. ED, vol.67, no.9, pp.3802-3808, 2020.9, doi: 10.1109/TED.2020.3009901.
6. Xiaojie Chen, Bo Yang, Naoki Shinohara, and Changjun Li, “A High-efficiency Mi-crowave Power Combining System based on Frequency-tuning Injection-LockedMagnetrons”, IEEE Trans. ED,vol.67, no.10, pp.4447-4452, 2020, doi: 10.1109/TED.2020.3013510.
International conference1. Bo Yang, Tomohiko Mitani, Naoki Shinohara, “Study on a 5.8GHz Power-Variable
Phase-Controlled Magnetron for wireless power transfer”, 2016 Asian Wireless PowerTransfer Workshop (AWPT), Chengdu, 2016.12.16-18.
2. Bo Yang, Tomohiko Mitani, Naoki Shinohara, “Development of a 5.8 GHz Power-Variable Phase-Controlled Magnetron”, 18th International Vacuum Electronics Confer-ence (IVEC), London, 2017.4.24-26.

146 PUBLICATION LIST
3. Bo Yang, Tomohiko Mitani, Naoki Shinohara, “Study on Phase Controlled Mag-netron for Phase Modulation”, 2017 Thailand-Japan Microwave (TJMW), Bangkok,2017.6.14-16.
4. Bo Yang, Tomohiko Mitani, Naoki Shinohara, “Experimental Study on FrequencyModulation of an Injection-Locked Magnetron Based on Full Wave Voltage Doubler”,19 th International Vacuum Electronics Conference (IVEC), Monterey, 2018.4.24-26.
5. Bo Yang, Tomohiko Mitani, Naoki Shinohara, “Study on a 5.8 GHz Injection-lockedMagnetron for Transferring Data”, 31st International Vacuum Nanoelectronics Confer-ence (IVNC), Kyoto, 2018.7.9-13.
6. Bo Yang, Tomohiko Mitani, Naoki Shinohara, “Injection-Locked CW Magnetron for awirelessly-powered TV”, 20 th International Vacuum Electronics Conference (IVEC),Busan, 2019.4.30-5.1.(keynote)
7. Bo Yang, Tomohiko Mitani, Naoki Shinohara, “A 5.8GHz Magnetron Phased ArraySystem”, 2019 Asia Wireless Power Transfer Workshop (AWPT), Xian, 2019.10.31-11.2.
Awards1. IEEE MTT-S Kansai Chapter WTC (Wakate Technical Committee) Presentation Award,
for “Study on a 5.8GHz Power-Variable Phase-Controlled Magnetron”, 9th KansaiMicrowave Meeting for Young Engineers, 2016.7.2.
2. 2016 Asia Wireless Power Transfer Workshop Student Paper Competition First Prize,for Bo Yang, Tomohiko Mitani, and Naoki Shinohara, “Study on a 5.8GHz Power-Variable Phase-Controlled Magnetron for Wireless Power Transfer”, 2016.12.16-18.
3. 2017 Thailand-Japan Microwave Presentation Encouragement Award, for Bo Yang,Tomohiko Mitani, and Naoki Shinohara, “Study on Phase Controlled Magnetron forPhase Modulation”, 2017.6.14-17.
4. 2017 Thailand-Japan Microwave Student Design Competition Winner, for KoutaOkazaki, Takashi Hirakawa, Bo Yang, 2017.6.14-17.
5. Best MHz Rectenna Award for Ce Wang, Seshiro Kojima, Bo Yang, Daichi Nishio,and Kono Tomoki, IEICE Wireless Power Transfer Technical Committee RectennaContest (in Japanese), 2017.9.12.
6. 2017 Best Student Presantation Award of IEICE Elecgtron Device Technical Com-mittee, for Bo Yang, Tomohiko Mitania, and Naoki Shinohara, “Study on a Phasecontrolled Magnetron based on Full Wave Voltage Doubler (in Japanese)”, 2017.10.26-27.
7. 2019 Asia Wireless Power Transfer Workshop Best Student Award, for Bo Yang,Tomohiko Mitani, and Naoki Shinohara, “A 5.8GHz Magnetron Phased Array System”,2019.10.31-11.2.

PUBLICATION LIST 147
8. 2019 Asia Wireless Power Transfer Workshop WiPoT Award, for Bo Yang, Tomo-hiko Mitani, and Naoki Shinohara, “A 5.8GHz Magnetron Phased Array System”,2019.10.31-11.2.
Patent1. Bo Yang, Tomohiko Mitani, Naoki Shinohara, Microwave Transmission Device, Japan
Patent 2019-80147.
Fellowship1. Japan Society for the Promotion of Science (JSPS) Research Fellowship for Young
Scientists (DC2), 19J12459.

Copyright © 2022 FDOKUMEN