Tissue- and stage-specific roles of the ubiquitously expressed ...
304
Tissue- and Stage-Specific Roles of the Ubiquitously Expressed Transcription Factor Sp1 in Haematopoietic Development Leigh O’Connor A thesis submitted to the University of Birmingham for the degree of DOCTOR OF PHILOSOPHY Institute of Cancer and Genomic Sciences College of Medical and Dental Sciences University of Birmingham September 2017
-
Upload
khangminh22 -
Category
Documents
-
view
0 -
download
0
Transcript of Tissue- and stage-specific roles of the ubiquitously expressed ...

Tissue- and Stage-Specific Roles of the
Ubiquitously Expressed Transcription Factor Sp1
in Haematopoietic Development
Leigh O’Connor
A thesis submitted to the University of Birmingham for the degree of
DOCTOR OF PHILOSOPHY
Institute of Cancer and Genomic Sciences
College of Medical and Dental Sciences
University of Birmingham
September 2017

University of Birmingham Research Archive
e-theses repository This unpublished thesis/dissertation is copyright of the author and/or third parties. The intellectual property rights of the author or third parties in respect of this work are as defined by The Copyright Designs and Patents Act 1988 or as modified by any successor legislation. Any use made of information contained in this thesis/dissertation must be in accordance with that legislation and must be properly acknowledged. Further distribution or reproduction in any format is prohibited without the permission of the copyright holder.

Abstract
Sp1 is a ubiquitously expressed transcription factor and regulates a range of genes
including housekeeping and tissue-specific genes. Studies using a DNA binding domain
(DBD)-deficient Sp1 have shown that Sp1 is required for haematopoietic specification.
Here, we generated a Sp1-DBD deficient ESC line to recapitulate the previous model, as
well as a novel Sp1 null ESC line. Sp1 knockout cells demonstrated a complete absence
of haematopoietic differentiation, indicating a crucial role for Sp1 at the early stages of
blood cell specification. In contrast, Sp1 DBD-deficient cells were able to differentiate to
haematopoietic progenitors, but failed to terminally differentiate, suggesting a different
mechanism of Sp1-mediated transcriptional regulation in early and later stages.
Gene expression analysis in Sp1 knockout cells indicated a novel role for Sp1 in ESC
differentiation potential and mesoderm formation, while chromatin accessibility profiling
revealed changes in chromatin structure in the absence of Sp1. We found Sp3, a close
family member of Sp1, is able to compensate for loss of Sp1 at most sites, but not at
some important genes encoding developmental regulators. This work provides novel
insights into the interplay between Sp1 and Sp3 and furthers our understanding of the
function of one of the earliest discovered TFs.

Acknowledgements
I would first like to thank my supervisor Prof Constanze Bonifer for her knowledge,
enthusiasm and, perhaps most importantly, her time.
I thank everyone in the Bonifer-Cockerill lab for their support and frequent discussions,
which often led to new ideas and insights into my work. I especially mention Ben
Edginton-White for the conversations and his help both in and outside of the lab.
Many people have helped develop this project. Dr Nadine Obier spent a lot of time with
me when I first arrived and taught me the basics of ESC culture and cloning. I am
extremely grateful to Dr Jane Gilmour. As well as performing the studies that formed the
basis of this project, she was a constant source of support, technical expertise and advice.
Dr Salam Assi, Dr Christopher Middleton and Dr Peter Keane together performed the
bioinformatics analysis; I thank them for their time and hard work.
I thank the Wellcome Trust for funding my PhD.
Finally, thank you to my friends for their encouragement during the stressful times and to
my parents and husband, Luke, for their continuous support.

Contents 1. INTRODUCTION ....................................................................................................... 1
1.1 Chromatin ........................................................................................................... 1
1.2 Transcriptional Regulation .................................................................................. 3
1.2.1 Transcription factors .................................................................................... 4
1.2.2 Promoters .................................................................................................... 5
1.2.3 CpG Islands ................................................................................................. 7
1.2.4 Enhancers ..................................................................................................10
1.2.5 Chromatin and epigenetic transcription regulation ......................................13
1.3 Transcription ......................................................................................................14
1.3.1 Initiation ......................................................................................................14
1.3.2 Elongation ..................................................................................................15
1.3.3 Termination ................................................................................................15
1.4 Haematopoiesis .................................................................................................17
1.4.1 Anatomical sites of embryonic haematopoiesis ...........................................18
1.4.2 Cellular origin of embryonic haematopoiesis ...............................................21
1.4.3 In vitro ESC differentiation as a model of embryonic haematopoiesis .........25
1.4.4 Role of TFs in haematopoietic specification ................................................26
1.5 Transcriptional regulation by Sp1 and the Sp family of TFs ...............................31
1.6 Aims and objectives ...........................................................................................32
2. MATERIALS AND METHODS ..................................................................................34
2.1 ESC culture .......................................................................................................34
2.2 ESC differentiation .............................................................................................34
2.3 Macrophage release assay ................................................................................35
2.4 Flow cytometry and fluorescence activated cell sorting (FACS) .........................35

2.5 Western blotting .................................................................................................37
2.6 RNA extraction, cDNA synthesis and qPCR gene expression analysis ..............38
2.7 RNA-sequencing library preparation ..................................................................39
2.8 Generation of SP1-expressing ESCs to rescue the Sp1-deficient phenotype .....41
2.9 CRISPR-Cas9 in vitro system ............................................................................43
2.10 CRISPR-Cas9 targeting of Sp1 in ESCs ............................................................44
2.11 Chromatin Immunoprecipitation (ChIP) ..............................................................46
2.12 ChIP-sequencing (ChIP-seq) library preparation ................................................52
2.13 ATAC-seq ..........................................................................................................52
2.14 Immunofluorescence Assays .............................................................................54
2.15 Bioinformatics Data Analysis .............................................................................55
2.15.1 ATAC-seq and ChIP-seq data analysis .......................................................55
2.15.2 RNA-seq data analysis ...............................................................................57
3. RESULTS .................................................................................................................60
3.1 Knockout of Sp1 in ESCs disrupts haematopoietic specification ........................60
3.1.1 Targeting of Sp1 in ESCs by the CRISPR-Cas9 system .............................60
3.1.2 Generation of ESC lines targeted deletions in the Sp1 locus ......................63
3.1.3 Sp1 mutation impairs differentiation of ESCs to the haematopoietic lineage
66
3.1.4 Haematopoiesis in the Sp1 mutant clones can be rescued with expression of
WT Sp1 72
3.1.5 Expression of the Sp1 DBD in Sp1del/del may be sufficient to recover
haematopoietic potential ...........................................................................................74
3.2 Disruption of Sp1 is associated with gene expression changes related to defects
in haematopoietic differentiation ...................................................................................76

3.2.1 Global gene expression in WT and mutant cells at each stage of
differentiation ............................................................................................................76
3.2.2 Global gene expression patterns are largely unaffected by the Sp1 mutation
80
3.2.3 The trajectory of the Sp1 mutant cells through differentiation is altered ......83
3.3 Gene expression changes upon disruption of Sp1 correlate with changes in
chromatin structure.......................................................................................................98
3.3.1 Chromatin accessibility profiles are altered in Sp1 null Flk1+ cells ..............98
3.3.2 Changes in chromatin accessibility correlate with changes in gene
expression .............................................................................................................. 100
3.4 Differences in Sp1del/del and Sp1-/- cannot be explained by residual Sp1 binding to
DNA 110
3.4.1 ChIP-seq reveals genome-wide binding sites of Sp1 ................................ 110
3.4.2 The truncated protein expressed in Sp1del/del cells does not bind to DNA
despite its nuclear localisation ................................................................................ 112
3.5 Sp3 can partially compensate for the loss of Sp1 ............................................ 116
3.5.1 The binding of both Sp1 and Sp3 shifts in the ESC-Flk1+ transition ......... 117
3.5.2 A high level of overlap between Sp1 and Sp3 binding .............................. 122
3.5.3 Sp3 binding distribution is mostly unchanged in Sp1 mutant cells............. 126
3.5.4 The difference in Sp1 binding in WT cells and Sp3 binding in Sp1-/- and
Sp1del/del cells is associated with changes in gene expression ................................. 134
3.5.5 Changes in Sp3 binding in Sp1del/del and Sp1-/- cells correlate with changes in
gene expression ..................................................................................................... 144
4. DISCUSSION AND FUTURE EXPERIMENTS ....................................................... 151
4.1 Generation of Sp1 mutant cells ........................................................................ 151
4.2 Sp1 regulates key developmental regulators ................................................... 156
4.3 Sp1del/del cells are comparable to previous models ........................................... 163
4.4 Sp1 deficiency impacts on chromatin structure ................................................ 165
4.5 Sp1del/del vs. Sp1-/- cells .................................................................................... 168
4.6 Interplay between Sp1 and Sp3 ....................................................................... 170
4.7 Tissue-specific gene regulation by Sp1 ............................................................ 176
5. Supplementary Data ............................................................................................... 180
5.1 Sequence data of CRISPR-generated Sp1 mutant clones ............................... 180
6. References ............................................................................................................. 258
List of Figures Figure 1.1 – Nucleosome structure ................................................................................... 3
Figure 1.2 – Conserved sequences in core promoters ...................................................... 7
Figure 1.3 – Active chromatin state at CpG islands ..........................................................10
Figure 1.4 – Enhancers can mediate tissue-specific patterns of gene expression ............12
Figure 1.5 – Transcription initiation ..................................................................................16
Figure 1.6 – Classical hierarchy model of haematopoietic cell differentiation ...................18
Figure 1.7 – Embryonic haematopoiesis occurs in distinct anatomical sites at different
times ................................................................................................................................21
Figure 1.8 – Blood cell formation in embryogenesis .........................................................24
Figure 2.1 – Sp1 ChIP-qPCR shows enrichment at known Sp1 binding regions ..............50
Figure 2.2 – qPCR validation of Sp3 ChIP .......................................................................51
Figure 2.3 – Schematic of the ATAC-seq technique .........................................................54
Figure 3.1 – CRISPR-Cas9 targeting strategy to knockout the Sp1 DNA binding domain 62
Figure 3.2 – Generation of ESC lines lacking the Sp1 DBD, heterozygous cells expressing
WT Sp1 and DBD-deficient Sp1, and a complete Sp1 null line. .......................................65
Figure 3.3 – In vitro model of embryonic haematopoiesis ................................................67
Figure 3.4 – Differentiation of Sp1 mutant cells is impaired ..............................................69
Figure 3.5 – Absence of Sp1 abolishes the ability to terminally differentiate into mature
haematopoietic cells ........................................................................................................71
Figure 3.6 – The Sp1 mutant phenotype can be rescued by the constitutive expression of
WT Sp1............................................................................................................................74
Figure 3.7 – Expression of the DBD of the Sp1 protein in Sp1del/del ESCs can rescue
haematopoietic specification ............................................................................................76
Figure 3.8 – Specific cell populations through differentiation were isolated for RNA-seq ..78
Figure 3.9 – RNA-seq data confirm the Sp1 mutation and show differential expression of
key developmental regulator genes .................................................................................79
Figure 3.10 – Gene expression of WT and Sp1 mutant clones cluster based on
differentiation cell type .....................................................................................................81
Figure 3.11 - Global gene expression is similar at each stage of differentiation between
the different Sp1 mutant clones .......................................................................................82
Figure 3.12 – A limited numbers of genes are deregulated by Sp1 deficiency .................83
Figure 3.13 - The differential expression of genes as the cells transition between
differentiation stages is altered with Sp1 mutation ...........................................................88
Figure 3.14 – qPCR analysis supports the RNA-seq results ............................................95
Figure 3.15 – Gene expression profiles of two different Sp1 DBD-deficient cell clones are
similar ..............................................................................................................................98
Figure 3.16 – ATAC-seq profiles cluster by cell type ........................................................99
Figure 3.17 – Changes in chromatin accessibility in Sp1 mutant ESCs correlate with gene
expression ..................................................................................................................... 103
Figure 3.18 – Changes in chromatin profile in Sp1 mutant Flk1+ cells compared to WT
correlate with gene expression changes ........................................................................ 105
Figure 3.19 – Most of the changes in chromatin accessibility following Sp1 manipulation
occur at distal sites ........................................................................................................ 107
Figure 3.20 – Differential open chromatin regions are detected by ATAC-seq and correlate
with changes in gene expression ................................................................................... 108
Figure 3.21 – Quality of ATAC-seq data is consistent between different cell clones ....... 109
Figure 3.22 – High confidence protein-DNA binding sites were generated by filtering for
open chromatin regions. ................................................................................................ 111
Figure 3.23 – Most accessible CpG islands are bound by Sp1 ...................................... 112
Figure 3.24 – There is no Sp1 binding in Sp1 hypomorph cells and reduced Sp1 binding in
heterozygous cells ......................................................................................................... 113
Figure 3.25 – Sp1 ChIP-seq showed no binding in Sp1del/del cells................................... 114
Figure 3.26 – DBD-deficient Sp1 protein is localised to the nucleus .............................. 115

Figure 3.27 – Sp3 protein expression is unchanged with CRISPR-Cas9 targeting of Sp1
...................................................................................................................................... 117
Figure 3.28 – Sp1 binding changes between ESC and Flk1+ cells ................................ 120
Figure 3.29 – ESC and Flk1+ cells show different Sp3 binding patterns ........................ 122
Figure 3.30 – Sp1 and Sp3 show overlapping, yet distinct, binding patterns .................. 124
Figure 3.31 – Sp3 binding is correlated with CTCF binding ............................................ 126
Figure 3.32 – Sp1 and Sp3 generally show similar binding patterns .............................. 128
Figure 3.33 – Sp1 and Sp3 binding patterns are well correlated .................................... 129
Figure 3.34 –The genomic distribution of Sp3 binding does not change in cells with Sp1
knockout ........................................................................................................................ 130
Figure 3.35 – The binding pattern of Sp3 does not change in the absence of Sp1 ......... 132
Figure 3.36 – Sp3 binding is increased in ESCs lacking Sp1 ......................................... 134
Figure 3.37 – Sp3 binding in Sp1del/del and Sp1-/- ESCs relative to Sp1 binding in WT ESCs
correlates with subtle changes in gene expression, but not in Sp1+/del clones ................ 137
Figure 3.38 – Genes that normally bind Sp1 and do not bind Sp3 in Sp1del/del Flk1+ cells
were slightly downregulated ........................................................................................... 139
Figure 3.39 – WT Sp1 sites, which Sp3 is not able to bind in Sp1del/del and Sp1-/- cells, are
associated with downregulation of genes involved in important cellular processes ........ 142
Figure 3.40 – Differential Sp3 binding correlates with change in gene expression ......... 143
Figure 3.41 – Sp3 binding and gene expression in Sp1-deficient ESCs are unaffected . 148
Figure 3.42 – Changes in Sp3 binding in Sp1del/del Flk1+ cells correlate with minor changes
in gene expression ......................................................................................................... 150
Figure 4.1 – Potential mechanism of Sp3 compensation in Sp1 deficient cells............... 175
Supplementary Figure 5.1 – Variation in Flk1+ cell generation in WT, Sp1del/del and Sp1-/-
cells ............................................................................................................................... 184
Supplementary Figure 5.2 – Specific cell populations from a clast culture were isolated by
FACS ............................................................................................................................. 185

Supplementary Figure 5.3 – RNA-seq replicates are well correlated .............................. 186
Supplementary Figure 5.4 – Changes in chromatin accessibility in Sp1 mutant clones
occurs at distal elements ............................................................................................... 187

List of Tables Table 2.1 – Antibodies used in flow cytometry experiments .............................................36
Table 2.2 – Antibodies used for Western blotting .............................................................38
Table 2.3 – Primers used for gene expression analysis ...................................................39
Table 2.4 – Sequences of guide RNAs used in the in vitro Cas9 assay. ..........................44
Table 2.5 – Sequences of CRISPR guides used to target Sp1 DBD-coding region. .........44
Table 2.6 – Antibodies used in ChIP ................................................................................48
Table 2.7 – Primers used in Sp1 and Sp3 ChIP qPCR validations ...................................49
Table 3.1 – Deregulation of developmental genes between ESC and Flk1+ with Sp1
knockout. .........................................................................................................................90
Table 3.2 – Deregulation of key genes in differentiation of ESC to Flk1+ cells in Sp1
hypomorph cells ...............................................................................................................92
Table 3.3 – Gene expression changes through differentiation of Sp1 hypomorph cells in
blast culture .....................................................................................................................94
Supplementary Table 1.1 – Deregulated genes between ESC and Flk1+ cells in Sp1-/-
cells compared to WT cells ............................................................................................ 205
Supplementary Table 1.2 – Deregulated genes between ESC and Flk1+ cells in Sp1del/del
cells compared to WT cells ............................................................................................ 226
Supplementary Table 1.3 – Deregulation of genes between Flk1+ cells and HE1 in
Sp1del/del cells .................................................................................................................. 241
Supplementary Table 1.4 – Gene expression deregulation between HE1 and HE2 stages
in Sp1del/del cells .............................................................................................................. 247
Supplementary Table 1.5 – Gene deregulation between HE2 and haematopoietic
progenitors in Sp1del/del cells ........................................................................................... 257
Abbreviations AGM – aorta-gonad-mesonephros
ATAC – assay for transposase accessible chromatin
ATP – adenosine triphosphate
bp – base pair
BSA – bovine serum albumin
ChIP – chromatin immunoprecipitation
cDNA – complementary DNA
CRISPR – clustered regularly interspaced short palindromic repeats
DAM-ID – DNA-adenine methyltransferase identification
DBD – DNA binding domain
DMEM – Dulbecco’s Modified Eagle’s Medium
DNMT – DNA methyltransferase
DSG – disuccinimidyl glutarate
E – embryonic day
EB – embryonic body
EHT – endothelial-haematopoietic transition
ESC – embryonic stem cell
FACS – fluorescence activated cell sorting
FCS – foetal calf serum
FPKM – Fragments per kilobase of transcript per million mapped reads
GSEA – gene set enrichment analysis
GTF – general transcription factor
HAT – histone acetyltransferase
HDAC – histone deacetylase
HE – haemogenic endothelium
HSC – haematopoietic stem cell
ID – inhibitory domain
IMDM – Iscove Modified Dulbecco Medium

ITR – inverted terminal repeat sequences
Kb – kilobase
LIF – leukaemia inhibitory factor
MACS – magnetic activated cell sorting
M-CSF - macrophage colony stimulating factor
MEF - mouse embryonic fibroblast
MEP – megakaryocyte-erythroid progenitor
NDR – nucleosome-depleted region
NHEJ – non-homologous end joining
nt – nucleotides
PB – PiggyBac
PBS - phosphate buffered saline
PCR – polymerase chain reaction
PIC – protease inhibitor cocktail
PTM – post-translational modification
qPCR – quantitative PCR
RIPA – radioimmunoprecipitation assay
RNAPII – RNA polymerase II
Seq – sequencing
Sp1 – specificity protein 1
TAD – transactivation domain
TALEN – transcription activator-like effector nuclease
TF – transcription factor
TSS – transcription start site
WT – wildtype
YS – yolk sac
ZFN – zinc-finger nuclease

1
1. INTRODUCTION
1.1 Chromatin
Every human cell contains its genetic information encoded in ~2 metres of DNA. The
DNA is compacted into chromatin, enabling it to fit inside the nucleus of the cell. This
function of chromatin was first discovered in the 1970’s, but a torrent of follow-up studies
found chromatin also acts as a regulatory mechanism, controlling access of proteins, such
as transcription factors (TFs), to the DNA (Weintraub & Groudine, 1976; Wu, 1980; Li et
al., 2007).
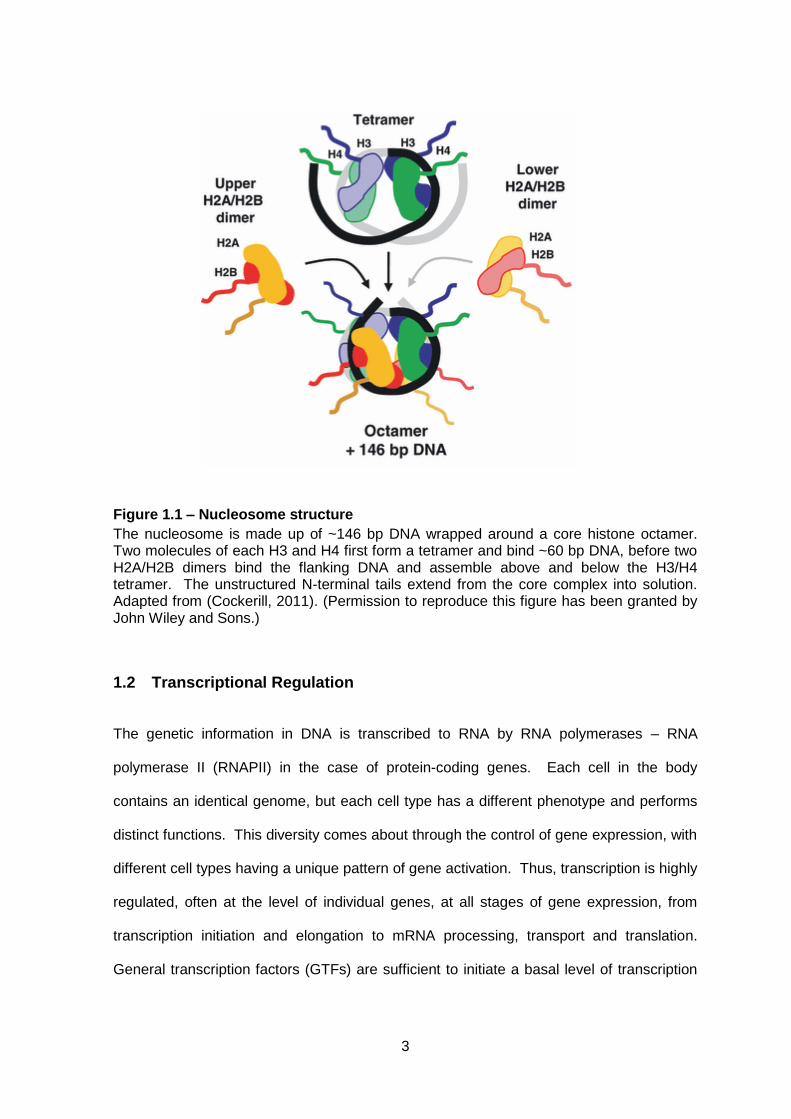
Chromatin is formed by repeating units of nucleosomes (Kornberg & Thonmas, 1974).
The nucleosome is formed of ~146 base pairs (bp) of DNA wrapped around a histone
core, which is made up of two molecules each of the four histone proteins – H2A, H2B, H3
and H4. The histone octamer forms a globular structure, except for unstructured N-
terminal tails that extend out of the complex (Luger et al., 1997) (Figure 1.1). The N-
terminal tails are subject to an array of post-translational modifications, which can
influence both the stability of the nucleosome structure and the binding of regulatory
proteins and enzymatic complexes (Strahl & Allis, 2000).
Nucleosomes then assemble into a higher order structure (a 30 nm fibre) with the help of
linker proteins, such as histone H1, which binds on the edge of the nucleosome,
constraining an extra ~20 bp DNA, as well as determining the trajectory of the DNA
entering and exiting the nucleosome to aid in formation of the higher order structure
(Routh et al., 2008). The structure of the 30 nm fibre is still debated. The zigzag model
suggests the nucleosomes stack on top of each other, forming a double helix while the
2
linker DNA zigzags between them (Schalch et al., 2005). In contrast, the solenoid model
states nucleosomes from adjacent coils are interdigitated (Robinson et al., 2006).
Chromatin can be further ordered in 3D space in the nucleus. Imaging studies have
shown areas of condensed, inactive ‘heterochromatin’ and more accessible ‘euchromatin’,
containing active genes (Heitz, 1928; Gilbert et al., 2004; Cockerill, 2011). Histone
modifications can aid in the establishment and preservation of these chromatin domains.
For example, euchromatin is associated with acetylation, H3 lysine 4 trimethylation
(H3K4me3), H3K79me3 and H3K36me3, whereas heterochromatin is associated with
repressive marks, such as H3K9me3 and H3K27me3 (Yan & Boyd, 2006; Kouzarides,
2007). Indeed, more recently, the genome-wide mapping of histone modifications, as
well as chromatin-binding proteins, in Drosophila led to the identification of several
subcategories of euchromatin and heterochromatin (Filion et al., 2010).
Chromatin can also form large megabase-sized domains called topologically associated
domains (TADs), defined as intrachromasomal regions that display a high frequency of
physical interaction (Dixon et al., 2012). They are stable across cell division/differentiation
and are often conserved between species. TADs can function to cluster similarly-
regulated genes, such as lineage-specific genes, and promote/direct contacts between
genes and their regulatory elements (Neems et al., 2016).
3
Figure 1.1 – Nucleosome structure
The nucleosome is made up of ~146 bp DNA wrapped around a core histone octamer. Two molecules of each H3 and H4 first form a tetramer and bind ~60 bp DNA, before two H2A/H2B dimers bind the flanking DNA and assemble above and below the H3/H4 tetramer. The unstructured N-terminal tails extend from the core complex into solution. Adapted from (Cockerill, 2011). (Permission to reproduce this figure has been granted by John Wiley and Sons.)
1.2 Transcriptional Regulation
The genetic information in DNA is transcribed to RNA by RNA polymerases – RNA
polymerase II (RNAPII) in the case of protein-coding genes. Each cell in the body
contains an identical genome, but each cell type has a different phenotype and performs
distinct functions. This diversity comes about through the control of gene expression, with
different cell types having a unique pattern of gene activation. Thus, transcription is highly
regulated, often at the level of individual genes, at all stages of gene expression, from
transcription initiation and elongation to mRNA processing, transport and translation.
General transcription factors (GTFs) are sufficient to initiate a basal level of transcription

4
at any gene, but transcription frequency is modulated by specific activators and cofactors,
as well as the chromatin state.
1.2.1 Transcription factors
TFs control the expression of genes involved in all cellular processes, including cell cycle
progression, differentiation/development and homeostasis. Indeed, TFs are
overrepresented among oncogenes (Furney et al., 2006) and a third of developmental
disorders are thought to be caused by dysfunctional TFs (Boyadjiev & Jabs, 2000),
highlighting their importance.
TFs function to modulate the rate of transcription of their target genes. They generally
have modular structures, split into distinct domains, including the DNA-binding domain
(DBD), transactivation domain (TAD) (through which its effector functions are mediated)
and dimerization/interaction domain (Brent & Ptashne, 1985). The DBD gives TFs the
ability to recognise and bind specific sequences in the DNA – typically a stretch of 6-12 bp
degenerate sequences called motifs. TFs can be characterised into families, often
distinguished by the type of DBD, such as zinc fingers and helix-loop-helix (Luscombe et
al., 2000). These motifs denote fairly low sequence specificity in the genome, meaning
additional levels of regulation are required to ensure specific TF binding, including
accessibility of the site in the chromatin and combinatorial TF binding (Biggin, 2011).
Indeed, TFs regularly interact together to affect each other’s binding and, thus, activity.
For instance, TFs can cooperatively bind, thereby increasing their affinities for the DNA
sequence, or they can bind and synergistically activate transcription, upregulating gene
expression more than by any individually (Spitz & Furlong, 2012). Given the relatively few
types of TFs compared to the number of genes, each requiring specific regulation, the

5
ability of TFs and cofactors to act together adds complexity and diversity to gene
regulation and creates dynamic transcription networks.
TFs activate transcription by promoting recruitment of the basal transcriptional machinery.
Some TFs can interact directly with the GTFs; others can interact with non-DNA binding
cofactors, which can, in turn, recruit the GTFs or increase accessibility of the DNA for the
transcription machinery (Kadonaga, 2004).
1.2.2 Promoters
Transcription is regulated through the integrated action of many regulatory elements in the
DNA, both those near to the 5’ end of the gene and others more distal. The core promoter
contains the transcription start site (TSS), typically spanning ~40 bp to either side, and is
where the transcription machinery assembles (Zhang, 1998). The proximal promoter
stretches up to a few hundred bp upstream from the core promoter and contains a number
of binding sites for sequence-specific TFs (activators) to fine-tune transcription initiated at
the core promoter (Maston et al., 2006).
The core promoter is enriched for a variety of conserved motifs (Smale & Kadonaga,
2003; Kadonaga, 2012). The TATA box is the most widely used in nature, and so was the
first found and the most studied. It is positioned ~30 bp upstream of the TSS (Hu &
Manley, 1981). Inr is the most common core promoter element, which spans the TSS
(Smale & Baltimore, 1989). Other motifs include BRE, DPE and MTE (Figure 1.2). The
motifs can bind components of the general transcription machinery – for example, TBP
(TFIID) can bind the TATA box and TFIIB can bind BRE (Kim et al., 1993; Lagrange et al.,
1998). The motif composition can affect gene regulation as different sets of factors
6
mediate basal transcription from different types of core promoter (Lewis et al., 2005;
Wright et al., 2006).
However, not all promoters contain these core motifs. Indeed, only 10-20% of promoters
are thought to have the canonical TATA box (Gershenzon & Ioshikhes, 2005; Cooper et
al., 2006). Some promoters are associated with an enrichment of unmethylated CG
dinucleotides called a CpG island, which tend to lack the conventional core promoter
motifs (Blake et al., 1990). While promoters containing the conserved motifs have a very
defined TSS (“sharp”), defined by sequences such as Inr, CG-rich promoters have several
TSSs throughout the promoter (“broad”) (Carninci et al., 2006). This formed the basis for
the different classes of promoter (Lenhard et al., 2012). Type I promoters normally
contain a TATA box, have low CG content and typically regulate expression of inducible
genes and tissue-specific genes (Schug et al., 2005; Yamashita et al., 2005; Carninci et
al., 2006). Type II promoters are generally associated with constitutively-expressed
housekeeping genes. They tend to have a short CpG island over the TSS and are TATA-
depleted, but can have DREs and other weaker, less-characterised motifs (FitzGerald et
al., 2006). In contrast, type III promoters often have several large CpG islands that can
extend into the gene body and, while still classed as “broad”, have a sharper TSS than
type II (Akalin et al., 2009). They are mostly associated with developmentally-regulated
genes, which are often highly-regulated by enhancers and can be repressed by Polycomb
proteins (Ernst et al., 2011). The promoter classes are also associated with specific
epigenetic marks. For example, while all active promoters have a nucleosome-depleted
region (NDR), broad CG-rich promoters have precisely positioned -1,+1 nucleosomes
either side of the promoter, whereas nucleosomes flanking sharp TATA-rich promoters
have less defined positions (Cairns, 2009; Rach et al., 2011).
7
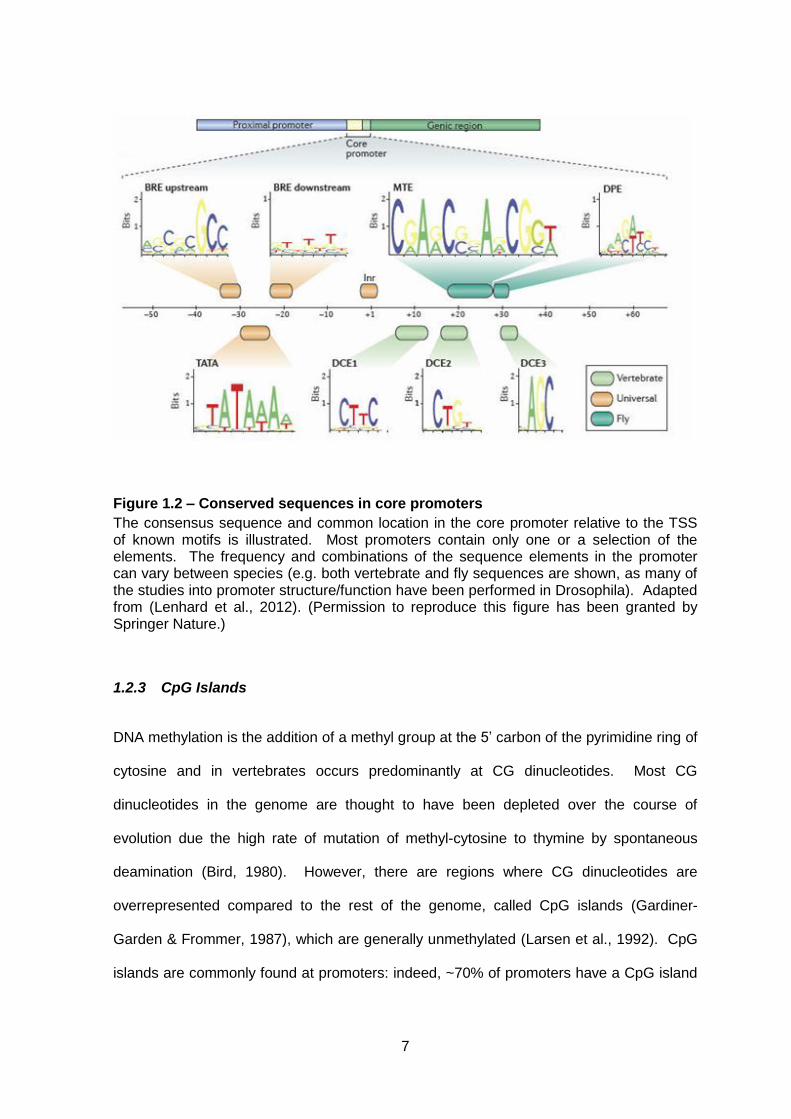
Figure 1.2 – Conserved sequences in core promoters
The consensus sequence and common location in the core promoter relative to the TSS of known motifs is illustrated. Most promoters contain only one or a selection of the elements. The frequency and combinations of the sequence elements in the promoter can vary between species (e.g. both vertebrate and fly sequences are shown, as many of the studies into promoter structure/function have been performed in Drosophila). Adapted from (Lenhard et al., 2012). (Permission to reproduce this figure has been granted by Springer Nature.)
1.2.3 CpG Islands
DNA methylation is the addition of a methyl group at the 5’ carbon of the pyrimidine ring of
cytosine and in vertebrates occurs predominantly at CG dinucleotides. Most CG
dinucleotides in the genome are thought to have been depleted over the course of
evolution due the high rate of mutation of methyl-cytosine to thymine by spontaneous
deamination (Bird, 1980). However, there are regions where CG dinucleotides are
overrepresented compared to the rest of the genome, called CpG islands (Gardiner-
Garden & Frommer, 1987), which are generally unmethylated (Larsen et al., 1992). CpG
islands are commonly found at promoters: indeed, ~70% of promoters have a CpG island
8
and it is thought to be one of the most reliable indicators of a promoter element (Saxonov
et al., 2006). Generally, CpG island promoters are associated with widely-expressed
housekeeping genes (Larsen et al., 1992; Yamashita et al., 2005).
CpG islands are inherently transcriptionally permissive. They are usually associated with
a NDR. In vitro nucleosome formation studies have suggested that the DNA sequence
itself makes the assembly of stable nucleosomes unfavourable, thus enabling some TFs
to bind their target sites within chromatin, which would otherwise require the help of
nucleosome remodelling factors (Ramirez-Carrozzi et al., 2009). Furthermore, in ESCs,
RNAPII was found bound at the CpG island promoters of many inactive genes, suggesting
transcription can readily initiate at these elements (Guenther et al., 2007).
CpG islands are commonly marked by the histone modification H3K4me3, which is linked
to actively transcribed genes (Figure 1.3). H3K4me3 can act as a binding site for
activating factors, such as the NuRF remodelling complex (Wysocka et al., 2006) and
histone acetyltransferases (HATs) (Saksouk et al., 2009), which help to create a
permissive chromatin structure. It can also recruit the transcriptional machinery, for
example via TFIID (van Ingen et al., 2008). H3K4me3 at CpG islands is thought to be
established by CXXC-domain containing proteins (which preferentially bind unmethylated
CpG sequences), such as Setd1, a H3K4 methyltransferase (Thomson et al., 2010). The
transcriptional machinery can also recruit Setd1; hence it is likely that active transcription
from CpG island promoters contributes to the levels of H3K4me3. However, H3K4me3
can often persist even when the gene is inactive (Guenther et al., 2007) and CpG density
in the CpG island correlates with levels of H3K4me3, suggesting the underlying DNA
sequence is important (Illingworth et al., 2010). Interestingly, H3K4me3 can repress the
binding of DNA methyltransferases (DNMTs), thus helping to maintain an active,
unmethylated promoter (Ooi et al., 2007). Another theory is that DNA methylation is
9
actively removed at CpG islands promoters, as the demethylating enzyme Tet1 contains a
CXXC domain and preferentially binds to CpG islands (Wu et al., 2011).
CpG island promoters are often targets of Polycomb-mediated silencing, through the
deposition of the negative histone modification H3K27me3 (Mikkelsen et al., 2007). In
embryonic stem cells (ESCs), CpG islands are associated with bivalent promoters,
marked with both active H3K4me3 and repressive H3K27me3, thought to silence
developmentally-regulated genes in ESCs, but keep them poised for activation upon
differentiation (Bernstein et al., 2006; Ku et al., 2008). While the DNA sequence has a
role in Polycomb recruitment, as it preferentially binds at CpG islands, the presence of TF
motifs/binding can also play a role in preventing Polycomb binding (Ku et al., 2008).
CpG island promoters do not tend to contain core promoter motifs, such as TATA box
(although there are exceptions, such as α-globin and erythropoietin) (Deaton & Bird,
2011). Thus, CpG island promoters often rely on the binding of TFs to recruit the
transcriptional machinery, for example Sp1 can recruit TBP/TFIID to TATA-less promoters
(Pugh & Tjian, 1991). Many TF motifs are CG-rich and contain CpG dinucleotides, such
as Sp1, ETS and E-box, and these binding sites are enriched at CpG island promoters
(Rozenberg et al., 2008). Therefore, CpG islands can promote TF binding.

10
Figure 1.3 – Active chromatin state at CpG islands
CpG islands are normally unmethylated and transcriptionally permissive. They are marked by active histone modifications, such as acetylation and H3K4me3 (which is mediated through the recruitment of Setd1 via its CXXC-domain Cfp1). They are also associated with nucleosome deficiency and TF binding, which can recruit RNAPII. DNA demethylation may be mediated by Tet1, also recruited by a CXXC domain. Adapted from (Deaton & Bird, 2011) (available under a Creative Commons license).
1.2.4 Enhancers
Enhancers are regulatory elements that modulate expression of its target gene through
the recruitment of TFs and cofactors (Banerji et al., 1981). They often regulate
tissue/developmental stage-specific or inducible genes, giving rise to specific patterns of
temporal and spatial activity (Spitz & Furlong, 2012). Enhancers can be positioned
upstream, downstream or within an intron of its target gene, as well as at large distances
from its promoter, as far as megabases away (Sanyal et al., 2012). They are also
associated with a NDR and H3K4me1 and H3K27ac marks (Rada-Iglesias et al., 2011).
Gene expression levels correlate with the number of associated enhancers (Chepelev et
al., 2012). One promoter can interact with several enhancers, either at the same time to

11
give high expression levels, or different enhancers can be active in different cell types to
alter the transcriptional programme of the cell (Ernst et al., 2011) (Figure 1.4). Enhancers
commonly contain multiple TF motifs, with combinatorial TF binding resulting in diverse
and precise patterns of transcription, dependent on levels of each TF and response to
signalling pathways in the cell.
Enhancers act by physically interacting with its target promoter and thereby recruiting the
transcriptional machinery (often via the mediator complex (Allen & Taatjes, 2015)) and
histone modifying enzymes to generate a permissive chromatin structure. The DNA
between the enhancer and promoter is looped out, so bringing the enhancer and promoter
into close proximity in the nucleus, as demonstrated by chromosome conformation assays
(Marsman & Horsfield, 2012). This enhancer-promoter interaction is cell-type specific,
occurring when the enhancer is active (Figure 1.4). For example, in brain cells, the β-
globin locus is linear, while in erythrocytes, the enhancer region is in close proximity to the
β-globin genes, coinciding with their expression, while intervening inactive globin genes
are looped out (Tolhuis et al., 2002). Looping is mediated by proteins such as CTCF and
cohesin (Splinter et al., 2006; Ebmeier & Taatjes, 2010), as well by interactions between
specific TFs bound at the enhancer and promoter (Song et al., 2007; Nolis et al., 2009),
which also help ensure specific enhancer-promoter activity. Moreover, some studies have
suggested that enhancers have preferences for different core promoter motifs or classes
of promoter (Engström et al., 2007; Zabidi et al., 2015), while the formation of TADs can
promote specific enhancer-promoter contacts and minimise erroneous enhancer
interactions (Zabidi & Stark, 2016). Insulators, another type of regulatory sequence, can
prevent genes being affected by the activities of neighbouring elements, for example by
blocking enhancer-promoter communications and stopping the spread of heterochromatin.

12
Figure 1.4 – Enhancers can mediate tissue-specific patterns of gene expression
(A) Enhancers are distal regulatory elements that can bind specific TFs and upregulate the expression of its associated gene. (B,C) Enhancers may only be active in certain cell types to elicit a tissue-specific pattern of transcription. Active enhancers are bound by TFs and brought into close spatial proximity with their target promoters through looping of the intervening DNA. Looping is mediated by cohesin and other proteins, such as CTCF. Active enhancers are commonly marked by H3K4me1 and H3K27ac. Inactive enhancers can be silenced by H3K27me3, be kept away from the promoter in space (e.g. by CTCF) or be bound by repressor proteins. Adapted from (Shlyueva et al., 2014). (Permission to reproduce this figure has been granted by Springer Nature.)
13
1.2.5 Chromatin and epigenetic transcription regulation
The chromatin environment at a gene’s regulatory elements can impact on transcription
regulation. Many TFs cannot bind to its target site if within a nucleosome (Li et al., 1994;
Gutiérrez et al., 2000) and the transcription machinery cannot assemble on the promoter if
the TSS is covered by a nucleosome (Workman & Roeder, 1987; Beato & Eisfeld, 1997).
Chromatin remodelling complexes, recruited by specific TFs, use ATP to change the
positioning of the nucleosome by sliding the nucleosome (such as ISWI) or displacing the
nucleosome (e.g. SWI/SNF) (Clapier et al., 2017). Remodellers can also mediate
exchange of the core histones for histone variants. H3.3 and H2A.Z are commonly found
at promoters as they form less stable nucleosomes (Zhang et al., 2005a; Jin et al., 2009).
Pioneer TFs can also bind within compacted chromatin, disrupting the nucleosome
structure to allow the binding of other TFs, for example FoxO1, which has a similar
structure to H1 to enable it to compete for chromatin binding (Cirillo et al., 2002; Hatta &
Cirillo, 2007; Zaret & Mango, 2016).
Histone modifications can also affect transcriptional activation (Kouzarides, 2007; Zhang
et al., 2015). They can act as binding sites to recruit TFs and cofactors, for example
H3K4me3 at promoters can recruit histone acetyltransferases and TFIID to promote
transcription (van Ingen et al., 2008). Histone modifications can also impact on chromatin
stability. Lysine acetylation neutralises its basic charge, weakening DNA-histone
interactions and making histones easier to displace (Ito et al., 2000; Reinke & Hörz,
2003). Acetylation can also interfere with higher order chromatin structure, as H4K16
acetylation inhibits formation of 30 nm fibres (Shogren-Knaak et al., 2006).
Correspondingly, levels of acetylation at promoters correlate with gene expression
(Pokholok et al., 2005). Histone modifications are also associated with transcription
progress, for example, H3K4me3 is present at the 5’ end of genes and H3K36me3 is

14
present in the body of the gene to inhibit cryptic transcription initiation (Barth & Imhof,
2010).
Furthermore, DNA methylation can inhibit transcription by preventing binding of some TFs
(Domcke et al., 2015) or by recruiting other repressors such as histone deacetylases
(HDACs) (Jones et al., 1998). However, some TFs can still bind despite DNA
methylation, such as CEBPβ (Mann et al., 2013) and Sp1 (Höller et al., 1988), while
others can prevent DNA methylation, e.g. REST, which occupies enhancers during ESC
differentiation to neural progenitors and prevents their methylation (Stadler et al., 2011).
Sp1 has also been shown to prevent DNA methylation at the Aprt locus (Macleod et al.,
1994) and may have a role in preventing DNA methylation at CpG island promoters in
general by its constitutive binding (Höller et al., 1988). DNA methylation is also targeted
to gene bodies during transcription to inhibit cryptic initiation (Neri et al., 2017).
1.3 Transcription
1.3.1 Initiation
For transcription initiation, GTFs assemble on the core promoter in a step-wise manner
(Thomas & Chiang, 2006; Luse, 2014) (Figure 1.5). TFIID binds to the core promoter
motifs. TFIID consists of TBP, which recognises TATA box, as well as 13-14 TBP-
associated factors (TAFs), which can assist in promoter binding, for example TAF1/2 can
bind Inr and TAF6 can bind DPE. TFIIA then binds, which in turn recruits TFIIB. TFIIB
recruits the pre-formed TFIIF-RNAPII complex and together, TFIIB and TFIIF orient the
DNA template and select the TSS. Finally, TFIIE and TFIIH are recruited, the latter of
15
which has helicase activity to melt the DNA and it phosphorylates the C-terminal domain
of RNAPII (Ser5 of the repeat) (Tirode et al., 1999).
1.3.2 Elongation
Once the initiation complex has been established, RNAPII moves into the gene body,
while TFIID, TFIIA, TFIIE and TFIIH remain at the promoter as a scaffold to promote re-
initiation (Yudkovsky et al., 2000). RNAPII pauses ~20-60 nucleotides downstream of the
TSS and is stabilised in this state by NELF and DSIF (Lee et al., 2008a). This pausing
acts as a regulatory step, ensuring that the mRNA is capped at the 5’ end. P-TEFb is
recruited, often by TFs or cofactors such as mediator (Takahashi et al., 2011), to trigger
release of the paused RNAPII by phosphorylating both NELF and DSIF, as well as
RNAPII on Ser2 of the C-terminal repeat, which can in turn recruit necessary elongation
factors (Lis et al., 2000; Jonkers & Lis, 2015). RNAPII can then proceed to productive
elongation. The rate of elongation can vary between genes, depending on histone
modifications and features of the gene itself, e.g. the number of exons, which link to co-
transcriptional processes such as splicing (de la Mata et al., 2003).
1.3.3 Termination
Transcription termination is closely linked to 3’ end processing of the nascent mRNA
(Porrua & Libri, 2015). Cleavage and polyadenylation factors are recruited to the RNAPII
complex and recognise the polyadenylation signal in the mRNA, triggering cleavage ~18-
30 nt downstream. This enables XRN2, an RNA exonuclease, to degrade the RNA, travel
to the paused RNAPII and displace it (West et al., 2004). However, another model
suggests that conformational changes in RNAPII and loss of elongation factors following
transcription of the polyadenylation signals cause decreased processivity and finally

16
termination (Zhang et al., 2005b). A combination of the two models is likely (Lemay &
Bachand, 2015).
Figure 1.5 – Transcription initiation
GTFs assemble on the promoter in a stepwise manner, along with RNAPII, to form a preinitiation complex (PIC), which position RNAPII on the TSS. TFIID recognises many of the core promoter sequence elements to aid binding to the promoter. The transcriptional machinery can also be recruited by sequence-specific TFs (activators), either directly or via co-factors such as mediator. (Maston et al., 2006). (Available to reproduce from Annual Reviews).

17
1.4 Haematopoiesis
Haematopoiesis is the process of blood cell development, which in adult mammals occurs
in the bone marrow. Haematopoietic stem cells (HSCs), formed during embryogenesis,
represent a life-long pool to generate the relatively short-lived mature blood cell types
found in adult blood and peripheral tissues such as lymph nodes, thymus and spleen.
Each blood cell type performs individual, crucial functions from oxygen supply to the body
to immune defence. HSCs differentiate through a series of intermediate progenitors, each
gradually more restricted to a specific lineage, to the final mature blood cell types (Figure
1.6). This process is controlled by the expression of stage-specific TFs, which in turn
establish a cell-type specific pattern of gene expression. It is worth noting that this
traditional stepwise hierarchical model of haematopoiesis is now being questioned, with
recent advances in single-cell technology suggesting a continuous differentiation process
along one trajectory from the HSC, with the intermediate progenitors (e.g. MPPs)
representing transitory states, rather than discrete cell types (Naik et al., 2013; Velten et
al., 2017).
HSCs are defined as multipotent (able to generate all blood cell types), have the capacity
to self-renew and provide long-term engraftment and reconstitution of the entire
haematopoietic system upon transplant into irradiated adult recipients. The process of
HSC formation in the embryo has been extensively studied and still represents a much-
used system in which to investigate principles of development and the roles of TFs in cell-
fate decisions. Our current knowledge of embryonic haematopoiesis will be discussed.
18
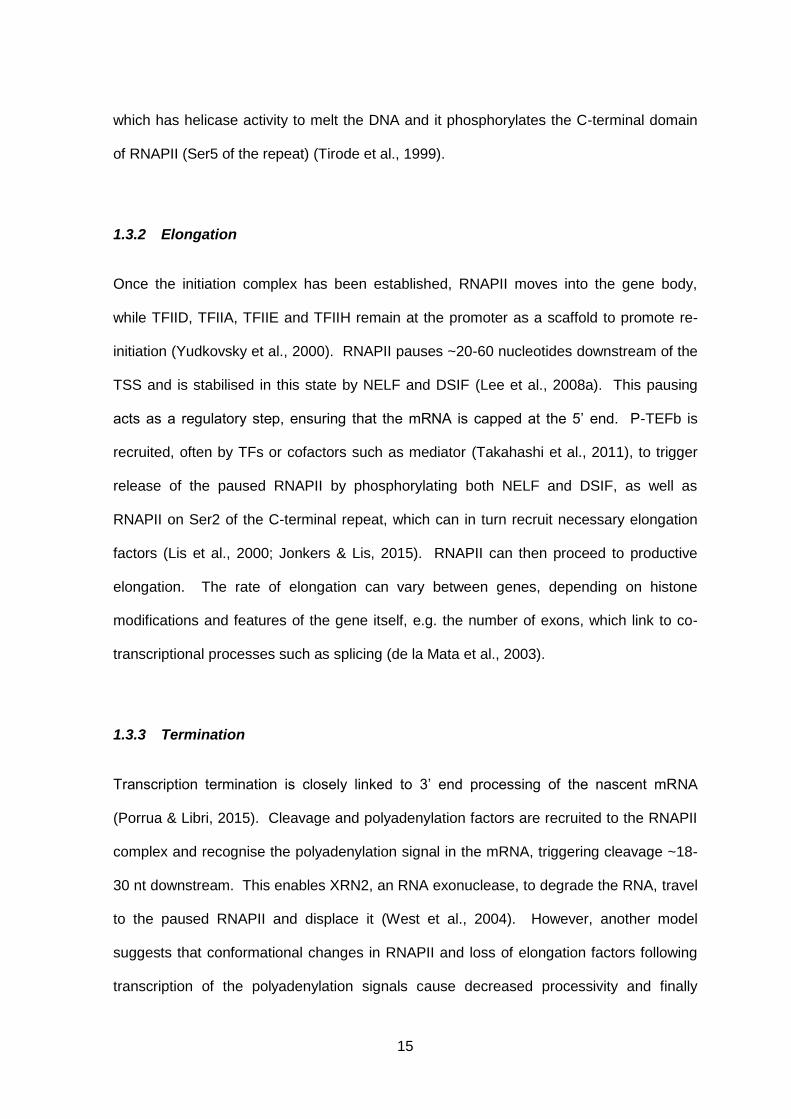
Figure 1.6 – Classical hierarchy model of haematopoietic cell differentiation
Adult bone marrow contains a self-renewing population of HSCs, which can differentiate through various multipotent progenitors to generate the mature blood cells that make up the haematopoietic system. However, recent models suggest that, rather than differentiating through discrete progenitors, the HSCs gradually and continuously acquire the transcriptome of a single lineage.
1.4.1 Anatomical sites of embryonic haematopoiesis
During embryonic development, gastrulation gives rise to the three germ layers –
ectoderm, mesoderm and endoderm – which form the basis of the body plan. The extra-
and intra-embryonic territories become defined during this process, constituting the yolk
sac (YS) and embryo, respectively.

19
The first haematopoietic cells were identified in the YS in the 1920’s (Sabin, 1920) and it
was long thought to be the first source of HSCs, before they migrate to the embryo proper
(Moore & Metcalf, 1970). However, this theory was questioned in the 1970’s when no
long-term repopulating HSCs could be found in the YS before the circulation was formed.
An elegant chimera study involved engraftment of a quail embryo to a chick YS and found
all cells in the haematopoietic organs (the spleen and thymus) were of the quail,
suggesting an intra-embryonic source of HSCs (Dieterlen-Lievre, 1975). Indeed, a
number of later studies confirmed an intra-embryonic site of HSC generation.
Transplantation of cells derived from different embryonic tissues found that only those
from the aorta-gonad-mesonephros (AGM) region (derived from the mesodermal germ
layer) were capable of long-term reconstitution of the haematopoietic system in lethally
irradiated mice (Muller et al., 1994). Furthermore, to remove the compounding factor of
cellular exchange between the YS and AGM region in the embryo, the YS, AGM and liver
were cultured individually in vitro. Only the AGM could both maintain HSCs and increase
the number of HSCs in culture, indicating it is the main source of HSCs in the embryo
(Medvinsky & Dzierzak, 1996). More specifically, HSC development is localised to the
dorsal aorta (as well as the vitelline artery and umbilical vessels) of the AGM (de Bruijn et
al., 2000). However, there is some controversy in whether the intra-embryonic
environment is the defining factor in HSC formation, as a study has found culturing YS
derived cells with AGM stromal cells is sufficient to generate HSCs (Matsuoka et al.,
2001).
These studies led to the model that the haematopoietic system is established in
successive waves during embryogenesis (Figure 1.7) (Lacaud & Kouskoff, 2017). The
first wave occurs in mesoderm-derived blood islands in the YS shortly after gastrulation at
around embryonic day 7.25 (E7.25) in the mouse (Palis et al., 1995; Palis et al., 1999),
giving rise to primitive progenitors. These cells have reduced differentiation potential

20
compared to HSCs, being primed to form only a subset of haematopoietic lineages
(Cumano et al., 1996). Firstly, primitive erythroid cells are formed, found only during early
embryogenesis (containing foetal haemoglobin) and function to deliver oxygen rapidly to
the growing embryo (Palis et al., 1999). Macrophage and megakaryocyte precursors are
also formed during this first stage (Palis et al., 1999; Tober et al., 2007). The second,
partially overlapping, wave of haematopoiesis begins at ~E8.25 with the emergence of
erythromyeloid progenitors (EMPs) in the YS (Palis et al., 1999; Bertrand et al., 2005;
McGrath et al., 2015). The EMPs colonise the foetal liver and give rise to the first
definitive (or adult-like) erythrocytes and myeloid cells (Palis et al., 1999; McGrath et al.,
2011). The first lymphoid progenitors emerge at ~E9.5 (Yoshimoto et al., 2011; Yoshimoto
et al., 2012). These transient populations are essential to maintain the embryo before
HSC formation and expansion (McGrath et al., 2015). Recent studies have also found
that tissue-resident macrophages that remain throughout life are generated in the first
wave of haematopoiesis (Schulz et al., 2012; Gomez Perdiguero et al., 2015).
The third wave occurs at E10.5 at the ventral part of the dorsal aorta in the AGM region of
the embryo. It is here that the definitive HSCs are generated (Medvinsky & Dzierzak,
1996; de Bruijn et al., 2000). They migrate to through the newly developed circulation to
the foetal liver where they are expanded, before moving to the bone marrow at E16.5,
which remains the haematopoietic niche throughout adult life. This dynamic production of
distinct haematopoietic cells throughout embryogenesis provides the embryo with the cells
it requires at each stage as it develops.
21
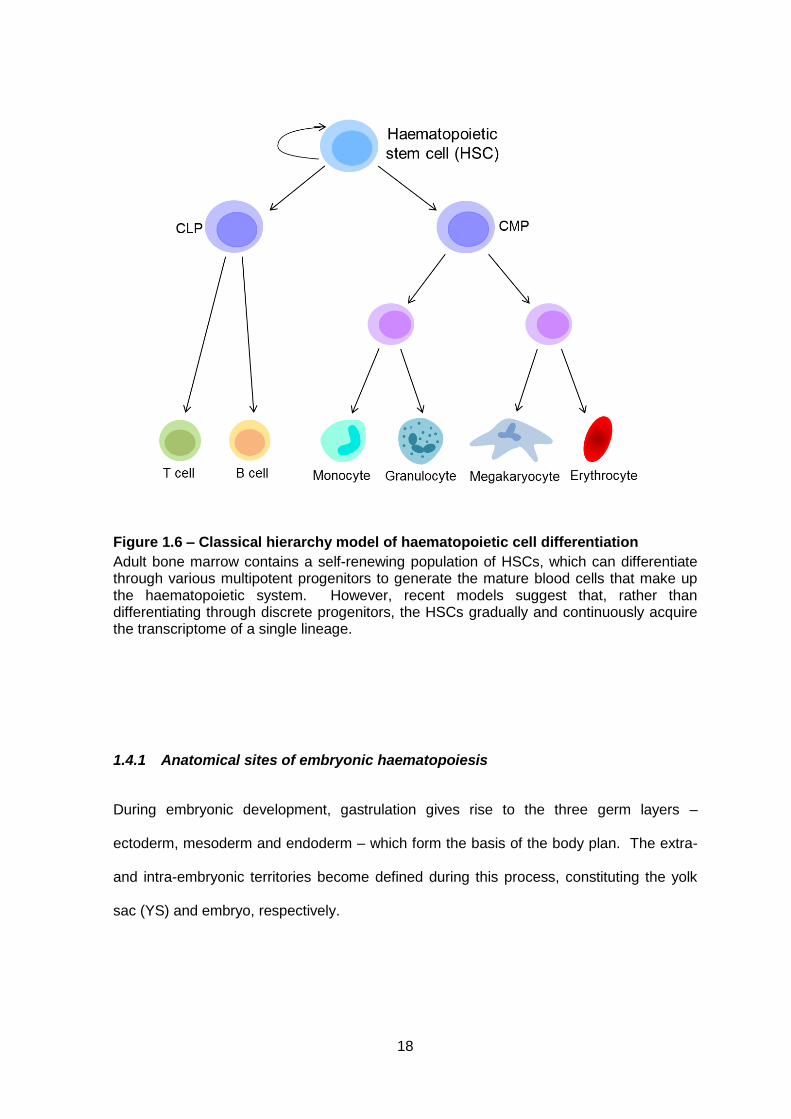
Figure 1.7 – Embryonic haematopoiesis occurs in distinct anatomical sites at
different times
In murine embryos, the first haematopoietic progenitors are generated in blood islands in the YS at ~E8. At ~E10.5, specialised cells called the HE emerge in the dorsal aorta of the AGM region, as well as in the placenta and vitelline and umbilical arteries, which give rise to the HSCs. Once circulation is established, the HSCs and primitive cells from the YS colonise the foetal liver, where they are expanded. Finally, the HSCs move to the bone marrow before birth, which remains the main haematopoietic niche during adult life. Adapted from (Costa et al., 2012; Swiers et al., 2013). (Permission granted by Elsevier.)
1.4.2 Cellular origin of embryonic haematopoiesis
The blood islands in the YS are formed from an aggregation of mesoderm cells. As they
develop, the central cells differentiate to embryonic haematopoietic cells, while the
peripheral cells differentiate to endothelium to form vasculature. This close association in

22
the development of haematopoietic and endothelial cells led to the hypothesis that they
arise from a common mesodermal precursor, named the haemangioblast (Sabin, 1920;
Murray, 1932).
The first evidence for the haemangioblast came from in vitro studies involving
differentiation of mouse ESCs to the haematopoietic lineage. ESCs can be differentiated
to form 3D colonies called embryoid bodies (EBs), before culturing to form blast colonies
containing both haematopoietic and endothelial precursors. Mixing studies (using two
ESC lines with different resistance genes) showed both the haematopoietic and
endothelial cells within the blast colony were derived from the same cell, suggesting a
common precursor (Choi et al., 1998). Similar results were found using cells derived from
the embryos of mice containing different markers, again supporting the existence of the
haemangioblast (Huber et al., 2004). It was found to be a rare and transient population,
present in a narrow and defined time window of development (Huber et al., 2004). The
haemangioblast was confirmed as having a mesodermal origin and is identified by the
expression of mesodermal marker Brachyury and Flk1 (VEGF receptor) (Fehling et al.,
2003). Indeed, the origin of all blood cells in the mouse can be traced to a Flk1+
mesoderm progenitor (Lugus et al., 2009). However, there is still no in vivo evidence (e.g.
based on lineage tracing) for the existence of the haemangioblast.
An endothelial origin of HSCs was proposed when clusters of haematopoietic precursor
cells were found on the endothelial lining of the dorsal aorta (Jaffredo et al., 1998;
Bertrand et al., 2005). Lineage tracing confirmed an endothelial precursor of HSCs
(Jaffredo et al., 1998; Zovein et al., 2008), while the use of transgenic markers in the
mouse embryo showed the first HSCs localised to the endothelial cell layer of the dorsal
aorta wall (de Bruijn et al., 2002). This precursor was termed the haemogenic
endothelium (HE).
23
Our understanding of the transition from endothelium to haematopoietic precursors has
been enhanced by live imaging studies. Continuous long-term imaging at the single cell
level was used to monitor differentiation of an in vitro ESC-derived mesodermal cell
population to endothelial cells. Using morphological and molecular markers, the
detachment of round haematopoietic precursors from tightly packed endothelial cells was
visualised, with a concomitant gradual loss of endothelial markers and adhesion (Eilken et
al., 2009).
Furthermore, high resolution imaging of live zebrafish embryos showed the emergence of
HSCs directly from the endothelial floor of the dorsal aorta into the sub-aortic space to
form clusters, before detaching into the blood stream. Specific cells in the endothelium
(the HE) upregulate haematopoietic markers and transform into round haematopoietic
cells before detaching. This endothelial-haematopoietic transition (EHT) occurs not by
asymmetric cell division, but rather a bending and rounding of the cell before losing its cell
contacts in the endothelial layer (Bertrand et al., 2005; Kissa & Herbomel, 2010). Imaging
of the AGM region of dissected mouse embryos supported the process of an EHT and
confirmed the haematopoietic cells in the intra-aortic clusters expressed markers
consistent with long-term repopulating HSCs (Boisset et al., 2010).
In vitro ESC differentiation studies proved the existence of an HE intermediate in HSC
development. Flk1-expressing haemangioblast cells were cultured to differentiate to blast
colonies containing clusters of endothelial cells with haemogenic potential. The HE
upregulated haematopoietic markers (e.g. CD41) and concomitantly downregulated
endothelial markers (such as Tie2) as they proceeded through the EHT and committed to
the haematopoietic lineage. This identified the HE as an intermediate in haematopoiesis:

24
the haemangioblast (Flk1+, Brachyury+) differentiates via the HE (Tie2+, Kit+) to generate
haematopoietic progenitors (CD41+, Kit+, Tie2-) (Lancrin et al., 2009) (Figure 1.8).
Figure 1.8 – Blood cell formation in embryogenesis
During embryo development, the haematopoietic system is formed by the differentiation of mesoderm through various transient cell types to generate HSCs and finally, the mature blood cells. Some of the key markers at each cell stage are indicated, as well as some of the significant factors (TFs and signalling molecules) that help determine the differentiation path. (Lancrin et al., 2010). (Permission to reproduce this figure has been granted by Springer Nature.)

25
1.4.3 In vitro ESC differentiation as a model of embryonic haematopoiesis
The first few divisions in embryo development give rise to identical daughter cells. During
blastocyst formation, the cells begin to differentiate, with some cells forming the
trophoectoderm and others forming the inner cell mass. It is the inner cell mass which will
develop into the foetus, and so the cells of the inner cell mass are pluripotent – i.e. able to
differentiate into all tissues of the adult body. These cells can be isolated from the embryo
and cultured in vitro as ESCs (Evans & Kaufman, 1981). ESCs can self-renew when
cultured in appropriate conditions (commonly grown on mouse embryonic fibroblasts
[MEFs] in the presence of leukaemia inhibitory factor [LIF]) and have the capacity to
differentiate into the three germ layers. The differentiation of ESCs in vitro can be driven
to a variety of cell types using specific culture conditions, growth factors and cytokines.
The differentiation conditions to generate haematopoietic cells have been well-established
and this system has been extensively studied (Keller, 2005; Sroczynska et al., 2009;
Garcia-Alegria et al., 2016).
Briefly, ESCs are differentiated to form EBs, before sorting the cells to isolate Flk1-
expressing cells, containing haemangioblast cells. This cell population can be further
differentiated in a blast culture containing BMP4, Activin A and VEGF to smooth muscle,
endothelial and HE cells (Pearson et al., 2015). The HE undergo an EHT, with a gradual
loss of the endothelial programme and concurrent upregulation of the haematopoietic
programme, to generate round, floating haematopoietic progenitor cells (Lancrin et al.,
2009). ESCs can also be plated into methylcellulose, in the presence of appropriate
cytokines, to form colonies that differentiate to the various blood cell lineages, which can
be quantified and identified (Kennedy et al., 1997).

26
Generally, the in vitro ESC differentiation system is thought to be an excellent model of
embryonic haematopoiesis (Ottersbach et al., 2010). The generation of haematopoietic
cells occurs through the same intermediate cell types (Fehling et al., 2003; Keller, 2005;
Lancrin et al., 2009) and the temporal emergence of each of the blood lineages closely
resembles the sequential emergence seen in vivo (Irion et al., 2010). Furthermore, the
same network of TFs appear to drive each stage of haematopoietic specification, resulting
in a similar gene expression profile in ESC-derived cells compared to those found in vivo
(Keller et al., 1993; Moignard et al., 2013). However, it is important to note that HSCs are
not generated in the ESC differentiation system; therefore, it can be considered an
excellent model of YS embryonic haematopoiesis, but not of AGM haematopoiesis.
ESC haematopoietic differentiation therefore offers a quick and inexpensive model to
study haematopoiesis. Previously, studies have been hampered by the sparsity of cells in
the embryo. However, the ability to generate haematopoietic lineages in cultures provides
access to early precursors, as well as to rare and transient cell populations (such as the
haemangioblast, (Choi et al., 1998)) to analyse the molecular mechanisms controlling
development. Advancing technology has also made genetic manipulation of ESCs
relatively easy, enabling the manipulation of genes encoding specific TFs to elucidate
their role in haematopoiesis (discussed further below) - particularly useful for those factors
that are essential for development and can lead to embryonic lethality at an early stage.
1.4.4 Role of TFs in haematopoietic specification
Cell fate is determined by TFs and their interaction with epigenetic machinery to modulate
the chromatin state, through the establishment of cell-type specific programmes of gene
expression. During haematopoiesis, developmental stage-specific TFs become activated

27
in a temporal manner to regulate transcription of stage-specific genes. Together with the
genes they regulate, TFs form a dynamic network, with successive activation of distinct
TFs to drive differentiation along a particular lineage (Goode et al., 2016).
Many of the TFs that are essential for the specification of distinct stages of embryonic
haematopoiesis have been identified, often using an in vitro model. For example, ETV2 is
expressed in early mesoderm in a subset of Flk1+ cells that have
endothelial/haematopoietic potential. Knockout of the gene in mouse embryos is lethal,
as blood islands in the YS fail to develop, resulting in no primitive erythropoiesis or
vasculogenesis (Lee et al., 2008b). However, conditional knockout at a later stage had
little effect, suggesting ETV2 is no longer needed after Flk1+ cells have developed and
therefore, there is a precise time-window in which ETV2 is required for haemangioblast
formation (Kataoka et al., 2011; Wareing et al., 2012).
ETV2 activates the expression of a number of TFs required for the next stage of
differentiation, such as SCL/TAL1, FLI1 and GATA2 (Wareing et al., 2012). Deletion of
the gene encoding SCL/TAL1 in mouse embryos caused vascular defects and a failure to
generate any haematopoietic cells (Robb et al., 1995). In vitro studies found that the
haemangioblast was formed, but it was unable to generate endothelial and
haematopoietic cells, instead forming clusters of smooth muscle cells (D'Souza et al.,
2005). SCL/TAL1 was later confirmed to be required for HE development (Lancrin et al.,
2009). Intriguingly, DNA-binding by SCL/TAL1 was found to be dispensable for
establishment of haematopoietic and vascular programmes in ESCs and a zebrafish
model (Porcher et al., 1999). Although SCL/TAL1 DNA-binding was required for the
production of normal numbers of definitive haematopoietic cells and for maturation of
erythrocyte and megakaryocyte precursors, these studies suggested that DBD-deficient
SCL/TAL1 was highly active at early stages of haematopoiesis (Porcher et al., 1999;

28
Kassouf et al., 2010). It is possible that it is tethered to DNA in a transcriptional regulatory
complex through its partner proteins (such as LMO2). These studies also indicate
alternative mechanisms of gene expression regulation by transcription factors.
SCL/TAL1 is involved in regulating the expression of the TF RUNX1 in the HE. Knockout
of Runx1 in mouse embryos causes lethality at ~E12.5 with no haematopoietic clusters
formed in the dorsal aorta (North et al., 1999). Knockout in ESCs revealed that RUNX1 is
essential for the EHT (Lancrin et al., 2009) and in vivo studies showed RUNX1 is required
for the formation of HSCs (Okuda et al., 1996; Chen et al., 2009; Lancrin et al., 2009).
RUNX1 establishes a haematopoietic gene expression programme through the activation
of haematopoietic genes and TFs, but it also orchestrates the down-regulation of the
endothelial programme, for example by the activation of transcriptional repressors GFI1
and GFI1B (Lancrin et al., 2012). GFI1 and GFI1B act by binding to the regulatory
regions of a large set of genes involved in cardiovascular and blood vessel development.
They then recruit the histone demethylase LSD1, which is part of the coREST complex
with histone deacetylases HDAC1 and HDAC2, thus epigenetically silencing the
endothelial programme in the HE (Thambyrajah et al., 2016). This is an example of how
TFs interact with epigenetic regulatory machinery to establish specific patterns of gene
expression.
TFs can also play a role in priming the genes required later on in development. The
inducible expression of RUNX1 in a Runx1 knockout background revealed that SCL/TAL1,
FLI1 and CEBPβ bind regulatory elements of haematopoietic genes, priming them for
expression at later stages (Lichtinger et al., 2012). Upon RUNX1 activation in the HE,
there is a re-organisation of TF complexes (including changes in the binding of SCL and
FLI1), along with local changes in histone acetylation. Thus, RUNX1 establishes a

29
haematopoietic-specific programme of TF binding and gene expression (Lichtinger et al.,
2012; Goode et al., 2016).
The importance of priming is highlighted in the differentiation to mature blood cells, which
requires the expression of additional factors, such as PU.1 (coded for by Spi1) and
CSF1R for myeloid specification. SCL/TAL1, FLI1 and CEBPβ bind and prime a Spi1
enhancer, with mutation of these binding sites resulting in delayed expression of Spi1
(Lichtinger et al., 2012). Csf1r expression, however, requires the activity of RUNX1, PU.1
and other PU.1-induced factors, meaning it is expressed later (Hoogenkamp et al., 2009).
A number of studies have examined cell-fate decisions at specific stages of embryonic
haematopoiesis or during the differentiation of HSCs to mature blood cells. However, a
recent study analysed the cell transitions across six consecutive developmental stages of
haematopoiesis, from ESCs to macrophages (Goode et al., 2016). Goode et al.
integrated global gene expression, chromatin accessibility, histone modification and TF
binding data at each differentiation stage to investigate how the stage-specific gene
expression programme is established. A dynamic regulatory network, involving the
interplay of stage-specific TFs and the chromatin landscape, was proposed to describe
haematopoietic specification. These data also provide a resource for future studies. For
example, the analyses indicated the time course of TF binding and which factors were
most important in controlling lineage specification. This data was then used to identify
factors important in cellular reprogramming, while analysis of TF motifs at specific stages
identified a novel role for a known TF in haematopoietic specification (Goode et al., 2016).
The data can be applied in the study of other factors and their role in the haematopoietic
pathway.
30
Ubiquitously-expressed TFs can also play a role in establishing tissue-specific
programmes of gene expression. For example, TEAD4, a TF involved in Hippo-signalling,
can bind to the DNA with tissue-specific TFs, such as SCL, and is essential for the
generation of haematopoietic cells in vitro (Goode et al., 2016; Obier et al., 2016).
Moreover, the ubiquitous TF Sp1 has a role in embryonic haematopoiesis. Deletion in
ESCs causes a failure to terminally differentiate to mature blood cells, while conditional
deletion at later stages had little effect, suggesting a role at early stages of haematopoietic
specification (Marin et al., 1997; Gilmour et al., 2014).
This data highlights the interplay between TFs to ensure correct temporal expression of
stage-specific genes to regulate gene expression at specific developmental stages.
Highly dynamic transcription networks are established, involving tissue-specific and
ubiquitous TFs, as well as their impact on the chromatin structure, to regulate
developmental transitions and cell fate decisions.
31
1.5 Transcriptional regulation by Sp1 and the Sp family of TFs
PMCID: 5168829
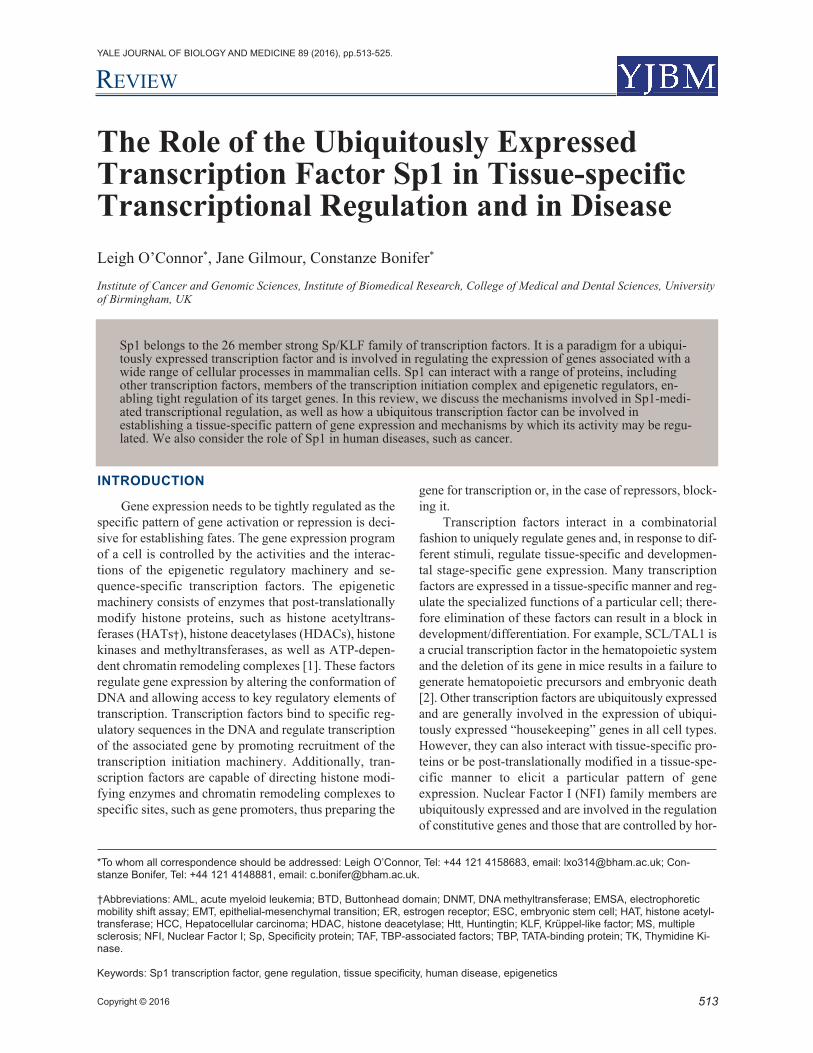
Title: The Role of the Ubiquitously Expressed Transcription Factor Sp1 in Tissue-specific
Transcriptional Regulation and in Disease (O'Connor et al., 2016)
Page: 31
513Copyright © 2016
The Role of the Ubiquitously ExpressedTranscription Factor Sp1 in Tissue-specificTranscriptional Regulation and in DiseaseLeigh O’Connor*, Jane Gilmour, Constanze Bonifer*
Institute of Cancer and Genomic Sciences, Institute of Biomedical Research, College of Medical and Dental Sciences, Universityof Birmingham, UK
INTRODUCTION
Gene expression needs to be tightly regulated as thespecific pattern of gene activation or repression is deci-sive for establishing fates. The gene expression programof a cell is controlled by the activities and the interac-tions of the epigenetic regulatory machinery and se-quence-specific transcription factors. The epigeneticmachinery consists of enzymes that post-translationallymodify histone proteins, such as histone acetyltrans-ferases (HATs†), histone deacetylases (HDACs), histonekinases and methyltransferases, as well as ATP-depen-dent chromatin remodeling complexes [1]. These factorsregulate gene expression by altering the conformation ofDNA and allowing access to key regulatory elements oftranscription. Transcription factors bind to specific reg-ulatory sequences in the DNA and regulate transcriptionof the associated gene by promoting recruitment of thetranscription initiation machinery. Additionally, tran-scription factors are capable of directing histone modi-fying enzymes and chromatin remodeling complexes tospecific sites, such as gene promoters, thus preparing the
gene for transcription or, in the case of repressors, block-ing it.
Transcription factors interact in a combinatorialfashion to uniquely regulate genes and, in response to dif-ferent stimuli, regulate tissue-specific and developmen-tal stage-specific gene expression. Many transcriptionfactors are expressed in a tissue-specific manner and reg-ulate the specialized functions of a particular cell; there-fore elimination of these factors can result in a block indevelopment/differentiation. For example, SCL/TAL1 isa crucial transcription factor in the hematopoietic systemand the deletion of its gene in mice results in a failure togenerate hematopoietic precursors and embryonic death[2]. Other transcription factors are ubiquitously expressedand are generally involved in the expression of ubiqui-tously expressed “housekeeping” genes in all cell types.However, they can also interact with tissue-specific pro-teins or be post-translationally modified in a tissue-spe-cific manner to elicit a particular pattern of geneexpression. Nuclear Factor I (NFI) family members areubiquitously expressed and are involved in the regulationof constitutive genes and those that are controlled by hor-
*To whom all correspondence should be addressed: Leigh O’Connor, Tel: +44 121 4158683, email: [email protected]; Con-stanze Bonifer, Tel: +44 121 4148881, email: [email protected].
†Abbreviations: AML, acute myeloid leukemia; BTD, Buttonhead domain; DNMT, DNA methyltransferase; EMSA, electrophoreticmobility shift assay; EMT, epithelial-mesenchymal transition; ER, estrogen receptor; ESC, embryonic stem cell; HAT, histone acetyl-transferase; HCC, Hepatocellular carcinoma; HDAC, histone deacetylase; Htt, Huntingtin; KLF, Krüppel-like factor; MS, multiplesclerosis; NFI, Nuclear Factor I; Sp, Specificity protein; TAF, TBP-associated factors; TBP, TATA-binding protein; TK, Thymidine Ki-nase.
Keywords: Sp1 transcription factor, gene regulation, tissue specificity, human disease, epigenetics
RevIeW
Sp1 belongs to the 26 member strong Sp/KLF family of transcription factors. It is a paradigm for a ubiqui-tously expressed transcription factor and is involved in regulating the expression of genes associated with awide range of cellular processes in mammalian cells. Sp1 can interact with a range of proteins, includingother transcription factors, members of the transcription initiation complex and epigenetic regulators, en-abling tight regulation of its target genes. In this review, we discuss the mechanisms involved in Sp1-medi-ated transcriptional regulation, as well as how a ubiquitous transcription factor can be involved inestablishing a tissue-specific pattern of gene expression and mechanisms by which its activity may be regu-lated. We also consider the role of Sp1 in human diseases, such as cancer.
YALE JOURNAL OF BIOLOGY AND MEDICINE 89 (2016), pp.513-525.

monal, nutritional, and developmental signaling [3]. How-ever, the knockout of individual NFI members results intissue-specific defects. For example, NFI-A knockoutmice have a defect in brain development (formation of thecorpus callosum) but few other anatomical problems [4].This suggests that the four NFI family members haveoverlapping roles and can compensate for the lack of NFI-A activity, but there are distinct functions in specific tis-sues, revealed by the defects, indicating ubiquitoustranscription factors have important roles in developmentand tissue-specific gene expression. Conversely, knock-out of the gene encoding OCT1, another ubiquitously ex-pressed transcription factor, leads to developmental arrestat a very early embryonic stage [5], suggesting widespreadroles. Although OCT1 is important in the expression ofhousekeeping genes, such as H2B [6], it also activates tis-sue-specific genes, often via interactions with cell-specificproteins [7-9]. The IL3 locus is an example of such a tar-get. T Cell Receptor signaling leads to activation of an in-ducible T cell-specific enhancer upstream of the IL3 gene,containing NFAT and OCT1 binding sites. Studies haveshown the two transcription factors interact at the en-hancer to synergistically activate T cell-specific IL3 ex-pression [8]. Importantly, this system demonstrates howcooperation with a cell-specific protein can alter the bind-ing or the activity of a ubiquitous transcription factor tobring about tissue-specific gene expression.
Sp1 is a transcription factor that has been found to bepresent in all mammalian cell types [10]. Thus, it was longthought to be solely a regulator of housekeeping genes andindeed, knockout of Sp1 in mice causes embryonic lethal-ity at an early stage of development (around day 10.5 ofgestation) with a broad range of phenotypic abnormali-ties, suggesting a general function in many cell types [11].However, Sp1 is now also known to be involved in theregulation of tissue-specific, cell cycle, and signaling path-way response genes [12], with chromosome mappingstudies estimating there are at least 12,000 Sp1 bindingsites in the human genome, associated with genes involvedin most cellular processes [13]. Furthermore, its expres-sion levels were seen to vary in different cell types andthrough different stages of mouse development [14], andit is required for the transcriptional activation of Hsp70.1,one of the first genes expressed after fertilization in mouseembryos [15], highlighting Sp1’s importance in develop-ment. It has also been shown to play a role in numeroushuman diseases, including cancer. Therefore, it is impor-tant to fully understand Sp1’s mode of action and contri-bution to gene regulation.
THE SP/KLF FAMILYSp1 was the first mammalian transcription factor to
be cloned and characterized, named originally accordingto the purification procedure used (Sephacryl and phos-phocellulose columns), but now more commonly named
Specificity protein 1 [16,17]. When whole cell extractswere prepared from HeLa cells to study the factors re-quired for transcription initiation in vitro, Dynan and Tjianidentified that one of these factors, Sp1, showed sequencespecificity and was able to bind to the Sv40 early pro-moter and activate transcription of the gene [18].
Sp1 is the founding member of the Specificity pro-tein/Krüppel-like factor (Sp/KLF) family of transcriptionfactors, which currently has a total of 26 members [19].The family is characterized by the highly conserved DNAbinding domain (sequence identity > 65 percent) near tothe C-terminus of all members, which recognize GC (con-sensus sequence: GGGGCGGGG), as well as GT/CACC(GGTGTGGGG) boxes [16,20-22]. The DNA binding do-main is made up of three adjacent Cys2His2-type zinc fin-gers consisting of exactly 81 amino acids in every protein[17]. Not only are the amino acids within the individualzinc finger structures conserved, but there are also con-straints on the residues in the interfinger regions, with theconserved linker sequence T/S-G-Q-R/K-P, suggestingthe zinc fingers act as a single unit [23]. The residues thatare directly in contact with the DNA, and therefore pro-viding the specific base recognition, are the most con-served parts of the protein. In Sp1, these residues wereidentified as KHA in the first zinc finger, ReR in the sec-ond and RHK in the third, although there are slightchanges in some of the other family members that corre-spond with differing preference to GT boxes rather thanGC boxes, or differing binding affinities [16,24].
The Sp/KLF family is split into two groups based onthe structure at the N-terminus: Sp-like transcription fac-tors (Sp1-9) (Figure 1) and the KLF-like transcription fac-tors, named from the Cys2His2 zinc finger Krüppelprotein in Drosophila. In general, the Sp-like family rec-ognize GC boxes in preference to GT boxes, while the re-verse is found for the KLF-like family, which comprisesboth transcriptional activator and repressor proteins. Interms of structure, the nine Sp-like members are distin-guished from the KLF-like proteins by the presence of aconserved Buttonhead domain (BTD, first identified in theDrosophila Sp1 homologue Buttonhead) N-terminal to theDNA binding domain [23,25]. Its function is debated, butstudies suggest it is involved in the transactivation or syn-ergistic activities of the Sp proteins [26,27]. Another fea-ture in most Sp-like proteins is a conserved stretch ofamino acids at the N-terminus of the protein with the se-quence SPLALLAATCSR/KI, termed the Sp box [23].Again, the precise function of this motif is unknown, butas it contains an endoproteolytic cleavage site and is lo-cated close to the region in Sp1 that targets proteasome-dependent cleavage [28], one theory is that it may have afunction in regulation of protein degradation.
The Sp-like protein family can be further subdividedinto Sp1-4 and Sp5-9, with Sp1-4 being distinguishableby the presence of N-terminal glutamine-rich transcrip-tional activation domains. Overall, Sp1-4 have a very sim-
514 O’Connor et al.: Transcriptional regulation by Sp1

ilar modular domain structure with Sp1, Sp3 and Sp4being more closely related in structure and activity thanSp2. The former proteins have a highly conserved DNAbinding domain sequence and bind to GC boxes (and to alesser extent, GT boxes) with similar affinities. Sp2, how-ever, preferentially binds GT boxes due to changes fromthe consensus zinc finger DNA-binding residues, with aleucine substituted for the conserved histidine residue inthe first zinc finger [21,29]. Sp1, Sp3, and Sp4 each con-tain two glutamine-rich transactivation domains, termedA and B, located near to a serine/threonine-rich sequence,which is the target of many posttranslational modifica-tions. Sp2, on the other hand, only contains one glutamine-rich domain, but they share a highly charged regionadjacent to the DNA binding domain (domain C) [21].
Both Sp1 and Sp3 are ubiquitously expressed inmammalian cells. They have highly similar structures,with their DNA binding domains sharing over 90 percentDNA sequence homology, meaning that the two tran-scription factors recognize the same DNA sequence ele-ment and bind with similar affinity [21,30]. However,while knockout of Sp1 in mice causes death at around day10.5 of gestation [11], Sp3 knockout mice die postnatal,apparently of respiratory failure [31,32]. In addition, miceheterozygous for either transcription factor appear normal,albeit slightly smaller, but being heterozygous for bothproteins leads to embryonic lethality with a diverse rangeof phenotypes [32]. This suggests that, despite having verysimilar DNA specificity and affinity, the two transcriptionfactors perform distinct functions in the cell. In support,high resolution fluorescent microscopy studying im-munolocalization of Sp1 and Sp3 in the MCF-7 cell linerevealed that both proteins were concentrated in discreteregions of the nucleus and are part of different promotercomplexes [33]. However, the expression of many Sp tar-
get genes in Sp1-/- mice was found to be unaffected, sug-gesting that Sp3 may be able to compensate, in part, forloss of Sp1-mediated transcription and thus there is po-tential redundancy between Sp1 and Sp3 functions [11].
The biggest differences between the structures of Sp1and Sp3 are a) the presence of a domain D at the C-termi-nal end of Sp1 only (important for synergy and multimer-ization, see below) [34] and b) the position of theinhibitory domain, which suppresses the transcription ac-tivation potential. In Sp1, the inhibitory domain is locatedat the N-terminus and acts by interacting with co-repres-sor molecules [35], while in Sp3, it is positioned just N-terminal to the three zinc fingers [36]. Transfection of Sp3into Drosophila SL2 cells showed that it could only acti-vate a portion of Sp target promoters and could not acti-vate reporter gene constructs [37]. Mutation analysisidentified the inhibitory domain, which worked to silencethe two transactivation domains, and highlighted the im-portance of a highly charged amino acid motif ‘Kee’ forinhibitory behavior. Mutation of the Kee motif to alanineresidues converted Sp3 into a strong transcriptional acti-vator, identifying a means by which Sp3 activity could beregulated [36]. It is theorized that these structural differ-ences are responsible for the functional differences of Sp1and Sp3 [29,31].
The functions of other Sp proteins have also beenstudied. expression of Sp2 is detectable in embryonicstem cells (eSCs) and in all tissues during embryogenesis(except the heart). It was initially found to be unable tostimulate transcription from promoters that are activatedby other Sp members [38], but knockout of Sp2 in miceled to embryonic death at day 9.5, showing it is an essen-tial transcription factor in mouse development [39]. Sp4knockout mice show no obvious abnormalities, but twothirds die within their first month and the surviving mice
515O’Connor et al.: Transcriptional regulation by Sp1
Figure 1. Primary structure of the Sp-like transcription factors.Conserved domains of the Sp-like transcription factors are illustrated. Two glutamine (Q)-rich domains (A and B) formthe transactivation domains, while the inhibitory domains (ID) present in Sp1 and Sp3 are also indicated. Three zincfingers at the C-terminus comprise the DNA binding domain and domain C contains a highly charged region adjacentto the DNA binding domain. Domain D in Sp1 enables synergistic binding with other Sp1 proteins. The conserved se-quence motifs, BTD and Sp boxes, are also shown and the length of the protein in amino acids is indicated on theright.
are smaller in size with abnormal reproductive organs[40,41]. Overall, Sp4 knockout studies suggest that thetranscription factor is required for specification of the car-diac conduction system [42] and normal brain develop-ment [43]. Knockout of members of the KLF family havealso been found to be embryonic lethal (KLF1, 2, 5 and 6),with the others displaying abnormalities in a range of tis-sues [44]. These deletion studies show the importance ofthe Sp/KLF transcription factors, while the variety of phe-notypes shows that despite their structural similarity, theyhave distinct functions.
SP1-MEDIATED TRANSCRIPTION REGULATION
The Sp-like family of transcription factors generallyfunction to activate transcription, whereas the KLF-likesubgroup contains both activators and repressors of geneexpression. Sp1 functions by recruiting the basal tran-scription machinery and, specifically, interacting withmembers of the TFiiD complex. TFiiD is composed of theTATA-binding protein (TBP) and multiple TBP-associ-ated factors (TAFs). It is the first component of the tran-scription machinery to bind to the promoter, which thentriggers formation of the pre-initiation complex. These in-teractions are known to be regulated by various transcrip-tion activators [45]. An in vitro transcription system firstrevealed that TFiiD was necessary and sufficient for Sp1mediated transcription [46]. Characterization of the com-ponents of the TFiiD complex showed that the Drosophilaprotein dTAFii110 (the human homologue is hTAFii130)contained both glutamine- and serine/threonine-rich do-mains, similar to that of Sp1, leading to the hypothesis thatthe two proteins were functionally linked. Indeed, a yeasttwo hybrid assay demonstrated interactions between thetransactivation domains of Sp1 and the N-terminus ofdTAFii110, and transcription activation by Sp1 was in-creased with the addition of the dTAFii110 N-terminalfragment [46]. Deletion mutants revealed that each Sp1transactivation domain interacts with distinct regions ofhTAFii130. Of the four glutamine-rich domains (Q1 toQ4) within hTAFii130, the interaction with transactiva-tion domain B of Sp1 was only disrupted upon deletion ofQ1, whereas transactivation domain A made multiple con-tacts to hTAFii130 at Q2, Q3 and Q4 [47]. Interestingly,it was found that it was the hydrophobic residues withinthe transactivation domains that were important for thebinding to dTAFii110 and subsequent transcription acti-vation, whereas mutation of the glutamine residues had noeffect [48]. These studies were then followed by the dis-covery that Sp1 also binds to TBP with the interaction oc-curring via the Sp1 glutamine-rich transactivationdomains and the conserved C-terminus of TBP. There wasa correlation between the extent of binding and the levelof transcription in vitro, but TBP alone was not sufficientto activate Sp1-mediated transcription [45]. Therefore,
Sp1 regulates transcription by communication with theRNA polymerase II transcription machinery.
Sp1 also regulates gene expression by affecting thechromatin state. It has been found to interact with histonemodifying enzymes, including the HAT p300 [1,49]. Theinteraction between the DNA binding domain of Sp1 andthe acetyltransferase catalytic domain of p300 leads to in-creased binding of Sp1 to DNA. Despite the DNA bindingdomain of Sp1 being acetylated by p300 during the inter-action, there was little effect on DNA binding under vary-ing acetylation conditions, suggesting that the increase inDNA binding was due to the direct interaction of the twoproteins [49]. Thus, gene expression can be promoted bothby changing the chromatin modifications at the promotertowards a more permissive structure and by the bindingof a transcription activator, in this case Sp1. DNA bindingof Sp1 then causes a release of p300, allowing it to regu-late expression at further genes [49]. An example of co-operation between Sp1 and p300 is found during neuronaldifferentiation (in response to nerve growth factor signal-ing) when they activate the p21 promoter to bring aboutwithdrawal of the progenitor neural cells from the cellcycle [50].
Sp1 can also interact with negative epigenetic modi-fiers to cause down-regulation of gene expression [12,33].Trichostatin A, an HDAC inhibitor molecule, was shownto lead to activation of the Thymidine Kinase (TK) gene.This gene is a target of Sp1 and indeed, co-immunopre-cipitation experiments showed HDAC1 and Sp1 to be partof the same complex with interactions occurring via theC-terminal DNA binding domain of Sp1. The presence ofSp1 was also required for HDAC1-mediated TK repres-sion, showing that Sp1 is involved in HDAC-mediatedtranscription inhibition [51]. HDAC1 was similarly foundto be associated with Sp1 at the p21 promoter in prolifer-ating cells, so regulating cell cycle progression [52]. Inaddition, the DNA methyltransferase DNMT1 was foundto bind to Sp1 and elicit repression of some Sp1 targetgenes, such as MAZ [53]. DNMT1 bound to seven con-sensus amino acids in the N-terminus of Sp1 and, at theSurvivin promoter, were found to act together to inhibitgene expression (in response to p53 signaling and cellstress). In addition, Sp1 gradually recruited other tran-scriptional repressors, such as HDAC1 [54], to controlgene expression in response to changing cell conditions. Incontrast, Sp1 is involved in the maintenance of a methy-lation free state at the CpG islands in target gene promot-ers, for example at the APRT gene [55,56]. Themethylation free CpG islands on APRT corresponded tothree GC boxes, which footprinting revealed were boundby Sp1. The promoter region became methylated upondeletion or mutagenesis of the Sp1 binding sites, suggest-ing that Sp1 sites are required for the maintenance of CpGislands and the activation of gene expression [56]. Simi-lar interactions with epigenetic regulators have also beenreported for Sp3 [57-59].
516 O’Connor et al.: Transcriptional regulation by Sp1
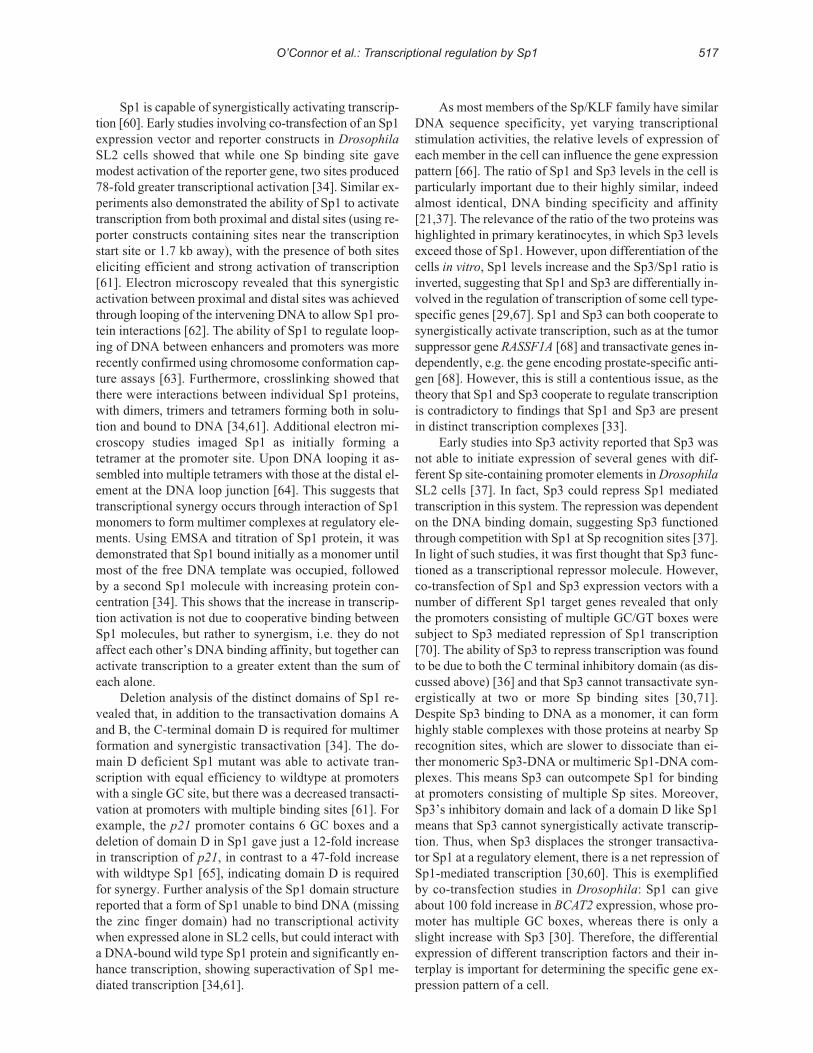
Sp1 is capable of synergistically activating transcrip-tion [60]. early studies involving co-transfection of an Sp1expression vector and reporter constructs in DrosophilaSL2 cells showed that while one Sp binding site gavemodest activation of the reporter gene, two sites produced78-fold greater transcriptional activation [34]. Similar ex-periments also demonstrated the ability of Sp1 to activatetranscription from both proximal and distal sites (using re-porter constructs containing sites near the transcriptionstart site or 1.7 kb away), with the presence of both siteseliciting efficient and strong activation of transcription[61]. electron microscopy revealed that this synergisticactivation between proximal and distal sites was achievedthrough looping of the intervening DNA to allow Sp1 pro-tein interactions [62]. The ability of Sp1 to regulate loop-ing of DNA between enhancers and promoters was morerecently confirmed using chromosome conformation cap-ture assays [63]. Furthermore, crosslinking showed thatthere were interactions between individual Sp1 proteins,with dimers, trimers and tetramers forming both in solu-tion and bound to DNA [34,61]. Additional electron mi-croscopy studies imaged Sp1 as initially forming atetramer at the promoter site. Upon DNA looping it as-sembled into multiple tetramers with those at the distal el-ement at the DNA loop junction [64]. This suggests thattranscriptional synergy occurs through interaction of Sp1monomers to form multimer complexes at regulatory ele-ments. Using eMSA and titration of Sp1 protein, it wasdemonstrated that Sp1 bound initially as a monomer untilmost of the free DNA template was occupied, followedby a second Sp1 molecule with increasing protein con-centration [34]. This shows that the increase in transcrip-tion activation is not due to cooperative binding betweenSp1 molecules, but rather to synergism, i.e. they do notaffect each other’s DNA binding affinity, but together canactivate transcription to a greater extent than the sum ofeach alone.
Deletion analysis of the distinct domains of Sp1 re-vealed that, in addition to the transactivation domains Aand B, the C-terminal domain D is required for multimerformation and synergistic transactivation [34]. The do-main D deficient Sp1 mutant was able to activate tran-scription with equal efficiency to wildtype at promoterswith a single GC site, but there was a decreased transacti-vation at promoters with multiple binding sites [61]. Forexample, the p21 promoter contains 6 GC boxes and adeletion of domain D in Sp1 gave just a 12-fold increasein transcription of p21, in contrast to a 47-fold increasewith wildtype Sp1 [65], indicating domain D is requiredfor synergy. Further analysis of the Sp1 domain structurereported that a form of Sp1 unable to bind DNA (missingthe zinc finger domain) had no transcriptional activitywhen expressed alone in SL2 cells, but could interact witha DNA-bound wild type Sp1 protein and significantly en-hance transcription, showing superactivation of Sp1 me-diated transcription [34,61].
As most members of the Sp/KLF family have similarDNA sequence specificity, yet varying transcriptionalstimulation activities, the relative levels of expression ofeach member in the cell can influence the gene expressionpattern [66]. The ratio of Sp1 and Sp3 levels in the cell isparticularly important due to their highly similar, indeedalmost identical, DNA binding specificity and affinity[21,37]. The relevance of the ratio of the two proteins washighlighted in primary keratinocytes, in which Sp3 levelsexceed those of Sp1. However, upon differentiation of thecells in vitro, Sp1 levels increase and the Sp3/Sp1 ratio isinverted, suggesting that Sp1 and Sp3 are differentially in-volved in the regulation of transcription of some cell type-specific genes [29,67]. Sp1 and Sp3 can both cooperate tosynergistically activate transcription, such as at the tumorsuppressor gene RASSF1A [68] and transactivate genes in-dependently, e.g. the gene encoding prostate-specific anti-gen [68]. However, this is still a contentious issue, as thetheory that Sp1 and Sp3 cooperate to regulate transcriptionis contradictory to findings that Sp1 and Sp3 are presentin distinct transcription complexes [33].
early studies into Sp3 activity reported that Sp3 wasnot able to initiate expression of several genes with dif-ferent Sp site-containing promoter elements in DrosophilaSL2 cells [37]. In fact, Sp3 could repress Sp1 mediatedtranscription in this system. The repression was dependenton the DNA binding domain, suggesting Sp3 functionedthrough competition with Sp1 at Sp recognition sites [37].In light of such studies, it was first thought that Sp3 func-tioned as a transcriptional repressor molecule. However,co-transfection of Sp1 and Sp3 expression vectors with anumber of different Sp1 target genes revealed that onlythe promoters consisting of multiple GC/GT boxes weresubject to Sp3 mediated repression of Sp1 transcription[70]. The ability of Sp3 to repress transcription was foundto be due to both the C terminal inhibitory domain (as dis-cussed above) [36] and that Sp3 cannot transactivate syn-ergistically at two or more Sp binding sites [30,71].Despite Sp3 binding to DNA as a monomer, it can formhighly stable complexes with those proteins at nearby Sprecognition sites, which are slower to dissociate than ei-ther monomeric Sp3-DNA or multimeric Sp1-DNA com-plexes. This means Sp3 can outcompete Sp1 for bindingat promoters consisting of multiple Sp sites. Moreover,Sp3’s inhibitory domain and lack of a domain D like Sp1means that Sp3 cannot synergistically activate transcrip-tion. Thus, when Sp3 displaces the stronger transactiva-tor Sp1 at a regulatory element, there is a net repression ofSp1-mediated transcription [30,60]. This is exemplifiedby co-transfection studies in Drosophila: Sp1 can giveabout 100 fold increase in BCAT2 expression, whose pro-moter has multiple GC boxes, whereas there is only aslight increase with Sp3 [30]. Therefore, the differentialexpression of different transcription factors and their in-terplay is important for determining the specific gene ex-pression pattern of a cell.
517O’Connor et al.: Transcriptional regulation by Sp1
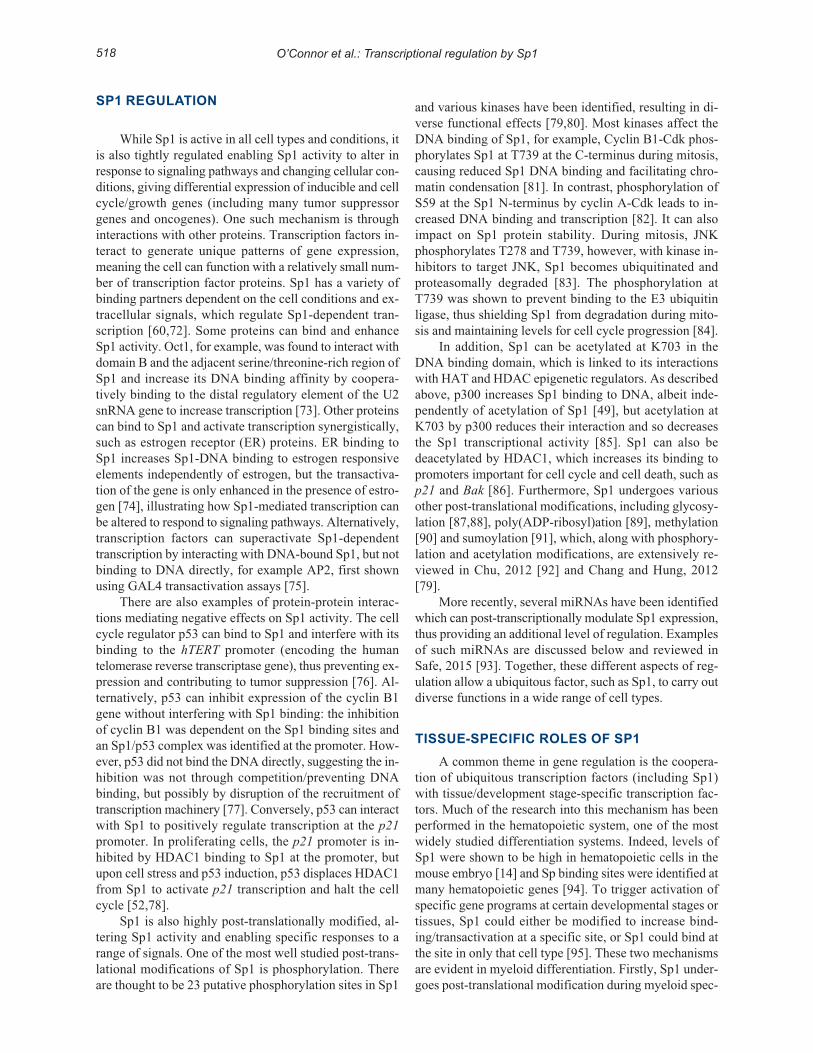
SP1 REGULATION
While Sp1 is active in all cell types and conditions, itis also tightly regulated enabling Sp1 activity to alter inresponse to signaling pathways and changing cellular con-ditions, giving differential expression of inducible and cellcycle/growth genes (including many tumor suppressorgenes and oncogenes). One such mechanism is throughinteractions with other proteins. Transcription factors in-teract to generate unique patterns of gene expression,meaning the cell can function with a relatively small num-ber of transcription factor proteins. Sp1 has a variety ofbinding partners dependent on the cell conditions and ex-tracellular signals, which regulate Sp1-dependent tran-scription [60,72]. Some proteins can bind and enhanceSp1 activity. Oct1, for example, was found to interact withdomain B and the adjacent serine/threonine-rich region ofSp1 and increase its DNA binding affinity by coopera-tively binding to the distal regulatory element of the U2snRNA gene to increase transcription [73]. Other proteinscan bind to Sp1 and activate transcription synergistically,such as estrogen receptor (eR) proteins. eR binding toSp1 increases Sp1-DNA binding to estrogen responsiveelements independently of estrogen, but the transactiva-tion of the gene is only enhanced in the presence of estro-gen [74], illustrating how Sp1-mediated transcription canbe altered to respond to signaling pathways. Alternatively,transcription factors can superactivate Sp1-dependenttranscription by interacting with DNA-bound Sp1, but notbinding to DNA directly, for example AP2, first shownusing GAL4 transactivation assays [75].
There are also examples of protein-protein interac-tions mediating negative effects on Sp1 activity. The cellcycle regulator p53 can bind to Sp1 and interfere with itsbinding to the hTERT promoter (encoding the humantelomerase reverse transcriptase gene), thus preventing ex-pression and contributing to tumor suppression [76]. Al-ternatively, p53 can inhibit expression of the cyclin B1gene without interfering with Sp1 binding: the inhibitionof cyclin B1 was dependent on the Sp1 binding sites andan Sp1/p53 complex was identified at the promoter. How-ever, p53 did not bind the DNA directly, suggesting the in-hibition was not through competition/preventing DNAbinding, but possibly by disruption of the recruitment oftranscription machinery [77]. Conversely, p53 can interactwith Sp1 to positively regulate transcription at the p21promoter. In proliferating cells, the p21 promoter is in-hibited by HDAC1 binding to Sp1 at the promoter, butupon cell stress and p53 induction, p53 displaces HDAC1from Sp1 to activate p21 transcription and halt the cellcycle [52,78].
Sp1 is also highly post-translationally modified, al-tering Sp1 activity and enabling specific responses to arange of signals. One of the most well studied post-trans-lational modifications of Sp1 is phosphorylation. Thereare thought to be 23 putative phosphorylation sites in Sp1
and various kinases have been identified, resulting in di-verse functional effects [79,80]. Most kinases affect theDNA binding of Sp1, for example, Cyclin B1-Cdk phos-phorylates Sp1 at T739 at the C-terminus during mitosis,causing reduced Sp1 DNA binding and facilitating chro-matin condensation [81]. In contrast, phosphorylation ofS59 at the Sp1 N-terminus by cyclin A-Cdk leads to in-creased DNA binding and transcription [82]. It can alsoimpact on Sp1 protein stability. During mitosis, JNKphosphorylates T278 and T739, however, with kinase in-hibitors to target JNK, Sp1 becomes ubiquitinated andproteasomally degraded [83]. The phosphorylation atT739 was shown to prevent binding to the e3 ubiquitinligase, thus shielding Sp1 from degradation during mito-sis and maintaining levels for cell cycle progression [84].
In addition, Sp1 can be acetylated at K703 in theDNA binding domain, which is linked to its interactionswith HAT and HDAC epigenetic regulators. As describedabove, p300 increases Sp1 binding to DNA, albeit inde-pendently of acetylation of Sp1 [49], but acetylation atK703 by p300 reduces their interaction and so decreasesthe Sp1 transcriptional activity [85]. Sp1 can also bedeacetylated by HDAC1, which increases its binding topromoters important for cell cycle and cell death, such asp21 and Bak [86]. Furthermore, Sp1 undergoes variousother post-translational modifications, including glycosy-lation [87,88], poly(ADP-ribosyl)ation [89], methylation[90] and sumoylation [91], which, along with phosphory-lation and acetylation modifications, are extensively re-viewed in Chu, 2012 [92] and Chang and Hung, 2012[79].
More recently, several miRNAs have been identifiedwhich can post-transcriptionally modulate Sp1 expression,thus providing an additional level of regulation. examplesof such miRNAs are discussed below and reviewed inSafe, 2015 [93]. Together, these different aspects of reg-ulation allow a ubiquitous factor, such as Sp1, to carry outdiverse functions in a wide range of cell types.
TISSUE-SPECIFIC ROLES OF SP1A common theme in gene regulation is the coopera-
tion of ubiquitous transcription factors (including Sp1)with tissue/development stage-specific transcription fac-tors. Much of the research into this mechanism has beenperformed in the hematopoietic system, one of the mostwidely studied differentiation systems. Indeed, levels ofSp1 were shown to be high in hematopoietic cells in themouse embryo [14] and Sp binding sites were identified atmany hematopoietic genes [94]. To trigger activation ofspecific gene programs at certain developmental stages ortissues, Sp1 could either be modified to increase bind-ing/transactivation at a specific site, or Sp1 could bind atthe site in only that cell type [95]. These two mechanismsare evident in myeloid differentiation. Firstly, Sp1 under-goes post-translational modification during myeloid spec-
518 O’Connor et al.: Transcriptional regulation by Sp1
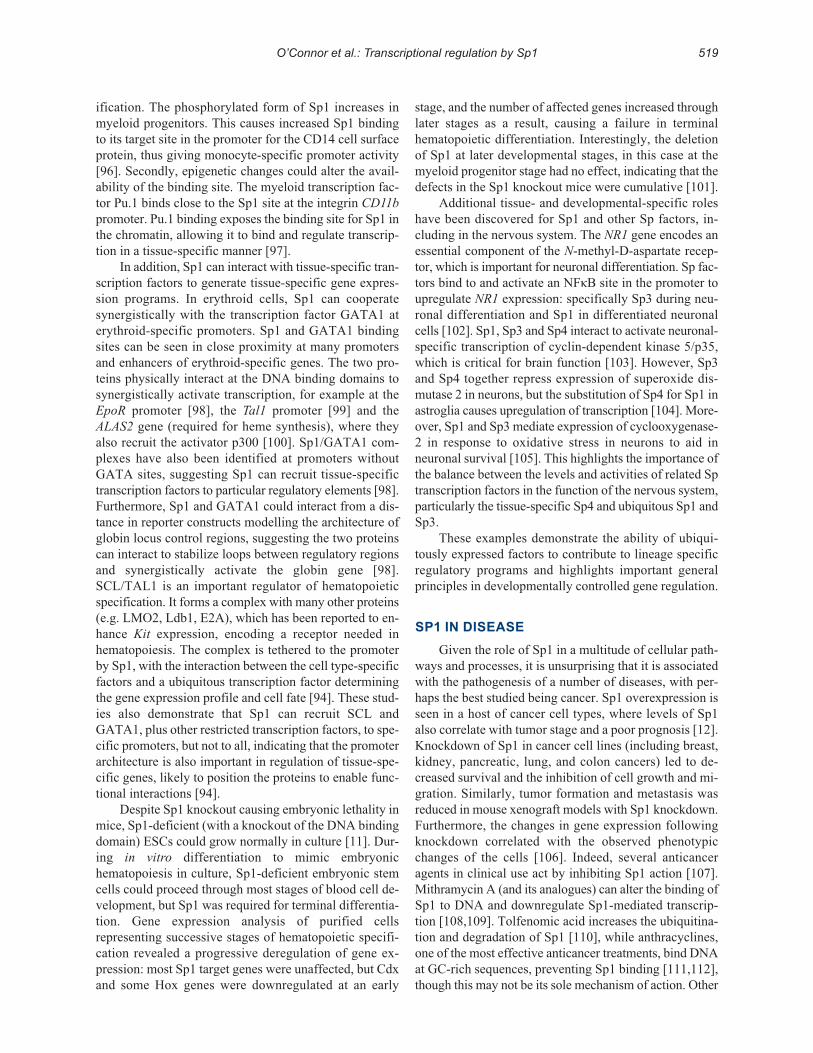
ification. The phosphorylated form of Sp1 increases inmyeloid progenitors. This causes increased Sp1 bindingto its target site in the promoter for the CD14 cell surfaceprotein, thus giving monocyte-specific promoter activity[96]. Secondly, epigenetic changes could alter the avail-ability of the binding site. The myeloid transcription fac-tor Pu.1 binds close to the Sp1 site at the integrin CD11bpromoter. Pu.1 binding exposes the binding site for Sp1 inthe chromatin, allowing it to bind and regulate transcrip-tion in a tissue-specific manner [97].
In addition, Sp1 can interact with tissue-specific tran-scription factors to generate tissue-specific gene expres-sion programs. In erythroid cells, Sp1 can cooperatesynergistically with the transcription factor GATA1 aterythroid-specific promoters. Sp1 and GATA1 bindingsites can be seen in close proximity at many promotersand enhancers of erythroid-specific genes. The two pro-teins physically interact at the DNA binding domains tosynergistically activate transcription, for example at theEpoR promoter [98], the Tal1 promoter [99] and theALAS2 gene (required for heme synthesis), where theyalso recruit the activator p300 [100]. Sp1/GATA1 com-plexes have also been identified at promoters withoutGATA sites, suggesting Sp1 can recruit tissue-specifictranscription factors to particular regulatory elements [98].Furthermore, Sp1 and GATA1 could interact from a dis-tance in reporter constructs modelling the architecture ofglobin locus control regions, suggesting the two proteinscan interact to stabilize loops between regulatory regionsand synergistically activate the globin gene [98].SCL/TAL1 is an important regulator of hematopoieticspecification. It forms a complex with many other proteins(e.g. LMO2, Ldb1, e2A), which has been reported to en-hance Kit expression, encoding a receptor needed inhematopoiesis. The complex is tethered to the promoterby Sp1, with the interaction between the cell type-specificfactors and a ubiquitous transcription factor determiningthe gene expression profile and cell fate [94]. These stud-ies also demonstrate that Sp1 can recruit SCL andGATA1, plus other restricted transcription factors, to spe-cific promoters, but not to all, indicating that the promoterarchitecture is also important in regulation of tissue-spe-cific genes, likely to position the proteins to enable func-tional interactions [94].
Despite Sp1 knockout causing embryonic lethality inmice, Sp1-deficient (with a knockout of the DNA bindingdomain) eSCs could grow normally in culture [11]. Dur-ing in vitro differentiation to mimic embryonichematopoiesis in culture, Sp1-deficient embryonic stemcells could proceed through most stages of blood cell de-velopment, but Sp1 was required for terminal differentia-tion. Gene expression analysis of purified cellsrepresenting successive stages of hematopoietic specifi-cation revealed a progressive deregulation of gene ex-pression: most Sp1 target genes were unaffected, but Cdxand some Hox genes were downregulated at an early
stage, and the number of affected genes increased throughlater stages as a result, causing a failure in terminalhematopoietic differentiation. Interestingly, the deletionof Sp1 at later developmental stages, in this case at themyeloid progenitor stage had no effect, indicating that thedefects in the Sp1 knockout mice were cumulative [101].
Additional tissue- and developmental-specific roleshave been discovered for Sp1 and other Sp factors, in-cluding in the nervous system. The NR1 gene encodes anessential component of the N-methyl-D-aspartate recep-tor, which is important for neuronal differentiation. Sp fac-tors bind to and activate an NFκB site in the promoter toupregulate NR1 expression: specifically Sp3 during neu-ronal differentiation and Sp1 in differentiated neuronalcells [102]. Sp1, Sp3 and Sp4 interact to activate neuronal-specific transcription of cyclin-dependent kinase 5/p35,which is critical for brain function [103]. However, Sp3and Sp4 together repress expression of superoxide dis-mutase 2 in neurons, but the substitution of Sp4 for Sp1 inastroglia causes upregulation of transcription [104]. More-over, Sp1 and Sp3 mediate expression of cyclooxygenase-2 in response to oxidative stress in neurons to aid inneuronal survival [105]. This highlights the importance ofthe balance between the levels and activities of related Sptranscription factors in the function of the nervous system,particularly the tissue-specific Sp4 and ubiquitous Sp1 andSp3.
These examples demonstrate the ability of ubiqui-tously expressed factors to contribute to lineage specificregulatory programs and highlights important generalprinciples in developmentally controlled gene regulation.
SP1 IN DISEASEGiven the role of Sp1 in a multitude of cellular path-
ways and processes, it is unsurprising that it is associatedwith the pathogenesis of a number of diseases, with per-haps the best studied being cancer. Sp1 overexpression isseen in a host of cancer cell types, where levels of Sp1also correlate with tumor stage and a poor prognosis [12].Knockdown of Sp1 in cancer cell lines (including breast,kidney, pancreatic, lung, and colon cancers) led to de-creased survival and the inhibition of cell growth and mi-gration. Similarly, tumor formation and metastasis wasreduced in mouse xenograft models with Sp1 knockdown.Furthermore, the changes in gene expression followingknockdown correlated with the observed phenotypicchanges of the cells [106]. Indeed, several anticanceragents in clinical use act by inhibiting Sp1 action [107].Mithramycin A (and its analogues) can alter the binding ofSp1 to DNA and downregulate Sp1-mediated transcrip-tion [108,109]. Tolfenomic acid increases the ubiquitina-tion and degradation of Sp1 [110], while anthracyclines,one of the most effective anticancer treatments, bind DNAat GC-rich sequences, preventing Sp1 binding [111,112],though this may not be its sole mechanism of action. Other
519O’Connor et al.: Transcriptional regulation by Sp1
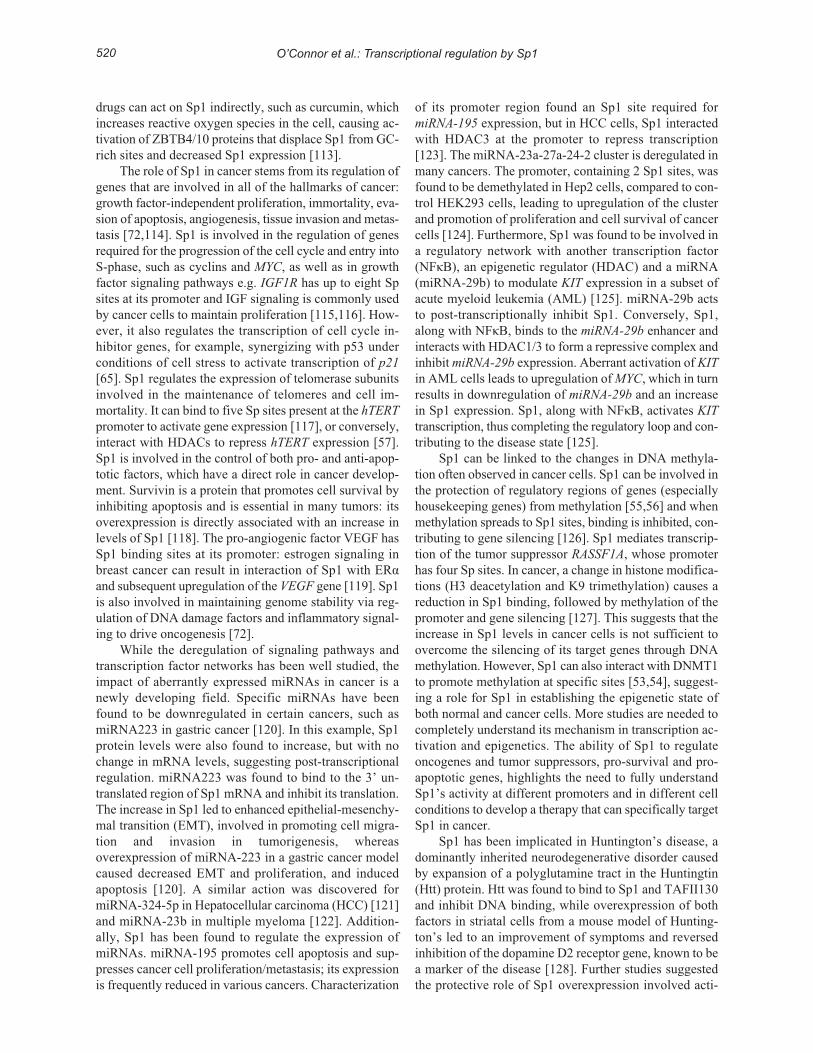
drugs can act on Sp1 indirectly, such as curcumin, whichincreases reactive oxygen species in the cell, causing ac-tivation of ZBTB4/10 proteins that displace Sp1 from GC-rich sites and decreased Sp1 expression [113].
The role of Sp1 in cancer stems from its regulation ofgenes that are involved in all of the hallmarks of cancer:growth factor-independent proliferation, immortality, eva-sion of apoptosis, angiogenesis, tissue invasion and metas-tasis [72,114]. Sp1 is involved in the regulation of genesrequired for the progression of the cell cycle and entry intoS-phase, such as cyclins and MYC, as well as in growthfactor signaling pathways e.g. IGF1R has up to eight Spsites at its promoter and IGF signaling is commonly usedby cancer cells to maintain proliferation [115,116]. How-ever, it also regulates the transcription of cell cycle in-hibitor genes, for example, synergizing with p53 underconditions of cell stress to activate transcription of p21[65]. Sp1 regulates the expression of telomerase subunitsinvolved in the maintenance of telomeres and cell im-mortality. It can bind to five Sp sites present at the hTERTpromoter to activate gene expression [117], or conversely,interact with HDACs to repress hTERT expression [57].Sp1 is involved in the control of both pro- and anti-apop-totic factors, which have a direct role in cancer develop-ment. Survivin is a protein that promotes cell survival byinhibiting apoptosis and is essential in many tumors: itsoverexpression is directly associated with an increase inlevels of Sp1 [118]. The pro-angiogenic factor veGF hasSp1 binding sites at its promoter: estrogen signaling inbreast cancer can result in interaction of Sp1 with eRαand subsequent upregulation of the VEGF gene [119]. Sp1is also involved in maintaining genome stability via reg-ulation of DNA damage factors and inflammatory signal-ing to drive oncogenesis [72].
While the deregulation of signaling pathways andtranscription factor networks has been well studied, theimpact of aberrantly expressed miRNAs in cancer is anewly developing field. Specific miRNAs have beenfound to be downregulated in certain cancers, such asmiRNA223 in gastric cancer [120]. In this example, Sp1protein levels were also found to increase, but with nochange in mRNA levels, suggesting post-transcriptionalregulation. miRNA223 was found to bind to the 3’ un-translated region of Sp1 mRNA and inhibit its translation.The increase in Sp1 led to enhanced epithelial-mesenchy-mal transition (eMT), involved in promoting cell migra-tion and invasion in tumorigenesis, whereasoverexpression of miRNA-223 in a gastric cancer modelcaused decreased eMT and proliferation, and inducedapoptosis [120]. A similar action was discovered formiRNA-324-5p in Hepatocellular carcinoma (HCC) [121]and miRNA-23b in multiple myeloma [122]. Addition-ally, Sp1 has been found to regulate the expression ofmiRNAs. miRNA-195 promotes cell apoptosis and sup-presses cancer cell proliferation/metastasis; its expressionis frequently reduced in various cancers. Characterization
of its promoter region found an Sp1 site required formiRNA-195 expression, but in HCC cells, Sp1 interactedwith HDAC3 at the promoter to repress transcription[123]. The miRNA-23a-27a-24-2 cluster is deregulated inmany cancers. The promoter, containing 2 Sp1 sites, wasfound to be demethylated in Hep2 cells, compared to con-trol HeK293 cells, leading to upregulation of the clusterand promotion of proliferation and cell survival of cancercells [124]. Furthermore, Sp1 was found to be involved ina regulatory network with another transcription factor(NFκB), an epigenetic regulator (HDAC) and a miRNA(miRNA-29b) to modulate KIT expression in a subset ofacute myeloid leukemia (AML) [125]. miRNA-29b actsto post-transcriptionally inhibit Sp1. Conversely, Sp1,along with NFκB, binds to the miRNA-29b enhancer andinteracts with HDAC1/3 to form a repressive complex andinhibit miRNA-29b expression. Aberrant activation of KITin AML cells leads to upregulation of MYC, which in turnresults in downregulation of miRNA-29b and an increasein Sp1 expression. Sp1, along with NFκB, activates KITtranscription, thus completing the regulatory loop and con-tributing to the disease state [125].
Sp1 can be linked to the changes in DNA methyla-tion often observed in cancer cells. Sp1 can be involved inthe protection of regulatory regions of genes (especiallyhousekeeping genes) from methylation [55,56] and whenmethylation spreads to Sp1 sites, binding is inhibited, con-tributing to gene silencing [126]. Sp1 mediates transcrip-tion of the tumor suppressor RASSF1A, whose promoterhas four Sp sites. In cancer, a change in histone modifica-tions (H3 deacetylation and K9 trimethylation) causes areduction in Sp1 binding, followed by methylation of thepromoter and gene silencing [127]. This suggests that theincrease in Sp1 levels in cancer cells is not sufficient toovercome the silencing of its target genes through DNAmethylation. However, Sp1 can also interact with DNMT1to promote methylation at specific sites [53,54], suggest-ing a role for Sp1 in establishing the epigenetic state ofboth normal and cancer cells. More studies are needed tocompletely understand its mechanism in transcription ac-tivation and epigenetics. The ability of Sp1 to regulateoncogenes and tumor suppressors, pro-survival and pro-apoptotic genes, highlights the need to fully understandSp1’s activity at different promoters and in different cellconditions to develop a therapy that can specifically targetSp1 in cancer.
Sp1 has been implicated in Huntington’s disease, adominantly inherited neurodegenerative disorder causedby expansion of a polyglutamine tract in the Huntingtin(Htt) protein. Htt was found to bind to Sp1 and TAFII130and inhibit DNA binding, while overexpression of bothfactors in striatal cells from a mouse model of Hunting-ton’s led to an improvement of symptoms and reversedinhibition of the dopamine D2 receptor gene, known to bea marker of the disease [128]. Further studies suggestedthe protective role of Sp1 overexpression involved acti-
520 O’Connor et al.: Transcriptional regulation by Sp1
vation of cystathione γ-lyase gene expression, the biosyn-thetic enzyme for cysteine, which is depleted in diseasetissues [129]. However, this issue is still disputed, as otherstudies have found Sp1 contributes to the pathology inHuntington’s disease. Sp1 was found to be overexpressedin the brains of mouse models and in model cell lines: in-hibition or knockout of Sp1 led to amelioration of toxic-ity caused by mutant Htt and the mice survived longer,possibly due to Sp1 negatively regulating the DopamineD2 gene. This suggests Sp1 is a potential therapeutic tar-get in Huntington’s disease [130].
A positive role of Sp1 has been found in Alzheimer’sdisease, where inhibition of Sp1 with mithramycin A intransgenic mouse models led to further memory impair-ment and an increase in the levels of Amyloidβ peptides(a major hallmark of the disease) [131]. A polymorphismin an Sp1 binding site of the COL1A1 gene, encodingcollagenα1, a major protein in bone, is associated with apredisposition to osteoporosis by altering the ratio of col-lagen α1 to α2 chains, causing reduced biomechanicstrength in the bones [132]. In contrast, there was a nega-tive correlation between the same polymorphism and hiposteoarthritis, suggesting there is a reduced risk of the dis-ease [133]. Furthermore, Sp1 has been implicated in thedevelopment of multiple sclerosis (MS). Polymorphismsin the IRF5 and CD24 genes, factors involved in MS, canlead to increased Sp1 binding at these genes and an in-creased risk of MS [134,135]. Gene expression analysisin MS patients suggested the involvement of Sp1 in gen-der-specific gene signatures and inhibition of Sp1 tran-scription reduced the incidence and severity ofexperimental autoimmune encephalomyelitis in mice (themodel of MS), highlighting Sp1 as a potential therapeutictarget in MS [136].
CONCLUSIONSp1 was the first characterized and still is one of the
best studied mammalian transcription factors. It functionsas a transcriptional activator of a variety of genes includ-ing house-keeping genes, cell cycle regulators and tissue-restricted genes. It is ubiquitously expressed, but itsactivity can be modified to respond to external stimuli,different stages of the cell cycle and different cell func-tions through post-translational modification and interac-tion with other transcriptional regulators. It can alsoregulate tissue- and developmental stage-specific gene ex-pression, but there is still little known about the proteininteractions and/or post-translational modifications thatoccur to elicit the specific patterns of Sp1-mediated geneexpression. Therefore, more work is needed to both fur-ther understand the role of ubiquitous transcription factorsin tissue-specific gene regulation and the dynamic tran-scription network controlling cell specification. This re-view highlights the importance of models of developmentto elucidate the mechanism of transcription activation, as
well as the need to further our understanding of Sp1-me-diated transcription in development and disease.
REFERENCES1. Davie JR, He S, Li L, Sekhavat A, espino P, Drobic B, et al.
Nuclear organization and chromatin dynamics--Sp1, Sp3 andhistone deacetylases. Adv enzyme Regul. 2008;48:189-208.
2. Robb L, Lyons I, Li R, Hartley L, Kontgen F, Harvey RP, etal. Absence of yolk sac hematopoiesis from mice with a tar-geted disruption of the scl gene. Proc Natl Acad Sci U S A.1995;92(15):7075-9.
3. Gronostajski RM. Roles of the NFI/CTF gene family in tran-scription and development. Gene. 2000;249(1-2):31-45.
4. das Neves L, Duchala CS, Tolentino-Silva F, Haxhiu MA,Colmenares C, Macklin WB, et al. Disruption of the murinenuclear factor I-A gene (Nfia) results in perinatal lethality,hydrocephalus, and agenesis of the corpus callosum. ProcNatl Acad Sci U S A. 1999;96(21):11946-51.
5. Sebastiano v, Dalvai M, Gentile L, Schubart K, Sutter J, WuG-M, et al. Oct1 regulates trophoblast development duringearly mouse embryogenesis. Development.2010;137(21):3551-60.
6. Hinkley C, Perry M. Histone H2b Gene-Transcription duringXenopus early Development Requires Functional Coopera-tion between Proteins Bound to the Ccaat and Octamer Mo-tifs. Mol Cell Biol. 1992;12(10):4400-11.
7. Strubin M, Newell JW, Matthias P. OBF-1, a novel B cell-specific coactivator that stimulates immunoglobulin pro-moter activity through association with octamer-bindingproteins. Cell. 1995;80(3):497-506.
8. Duncliffe KN, Bert AG, vadas MA, Cockerill PN. A T cell-specific enhancer in the interleukin-3 locus is activated co-operatively by Oct and NFAT elements within a DNaseI-hypersensitive site. Immunity. 1997;6(2):175-85.
9. Donner AL, episkopou v, Maas RL. Sox2 and Pou2f1 inter-act to control lens and olfactory placode development. DevBiol. 2007;303(2):784-99.
10. Briggs MR, Kadonaga JT, Bell SP, Tjian R. Purification andbiochemical characterization of the promoter-specific tran-scription factor, Sp1. Science. 1986;234(4772):47-52.
11. Marin M, Karis A, visser P, Grosveld F, Philipsen S. Tran-scription Factor Sp1 Is essential for early embryonic De-velopment but Dispensable for Cell Growth andDifferentiation. Cell. 1997;89(4):619-28.
12. Li L, Davie JR. The role of Sp1 and Sp3 in normal and can-cer cell biology. Ann Anat. 2010;192(5):275-83.
13. Cawley S, Bekiranov S, Ng HH, Kapranov P, Sekinger eA,Kampa D, et al. Unbiased mapping of transcription factorbinding sites along human chromosomes 21 and 22 pointsto widespread regulation of noncoding RNAs. Cell.2004;116(4):499-509.
14. Saffer JD, Jackson SP, Annarella MB. Developmental ex-pression of Sp1 in the mouse. Mol Cell Biol.1991;11(4):2189-99.
15. Bevilacqua A, Fiorenza MT, Mangia F. A developmentallyregulated GAGA box-binding factor and Sp1 are requiredfor transcription of the hsp70.1 gene at the onset of mousezygotic genome activation. Development.2000;127(7):1541-51.
16. Philipsen S, Suske G. A tale of three fingers: the family ofmammalian Sp/XKLF transcription factors. Nucleic AcidsRes. 1999;27(15):2991-3000.
17. Kadonaga JT, Carner KR, Masiarz FR, Tjian R. Isolation ofcDNA encoding transcription factor Sp1 and functionalanalysis of the DNA binding domain. Cell. 1987;51(6):1079-90.
18. Dynan WS, Tjian R. The promoter-specific transcription fac-tor Sp1 binds to upstream sequences in the Sv40 early pro-moter. Cell. 1983;35(1):79-87.
19. van vliet J, Crofts LA, Quinlan KGR, Czolij R, Perkins AC,Crossley M. Human klf17 is a new member of the sp/klf
521O’Connor et al.: Transcriptional regulation by Sp1

family of transcription factors. Genomics. 2006;87(4):474-82.
20. Hagen G, Muller S, Beato M, Suske G. Cloning by recogni-tion site screening of two novel GT box binding proteins: afamily of Sp1 related genes. Nucleic Acids Res.1992;20(21):5519-25.
21. Kingsley C, Winoto A. Cloning of GT box-binding proteins:a novel Sp1 multigene family regulating T-cell receptor geneexpression. Mol Cell Biol. 1992;12(10):4251-61.
22. Matsumoto N, Laub F, Aldabe R, Zhang W, Ramirez F,Yoshida T, et al. Cloning the cDNA for a new human zincfinger protein defines a group of closely related Kruppel-liketranscription factors. J Biol Chem. 1998;273(43):28229-37.
23. Harrison SM, Houzelstein D, Dunwoodie SL, BeddingtonRS. Sp5, a new member of the Sp1 family, is dynamicallyexpressed during development and genetically interacts withBrachyury. Dev Biol. 2000;227(2):358-72.
24. Narayan vA, Kriwacki RW, Caradonna JP. Structures ofzinc finger domains from transcription factor Sp1. Insightsinto sequence-specific protein-DNA recognition. J BiolChem. 1997;272(12):7801-9
25. Suske G, Bruford e, Philipsen S. Mammalian SP/KLF tran-scription factors: Bring in the family. Genomics.2005;85(5):551-6.
26. Courey AJ, Tjian R. Analysis of Sp1 in vivo reveals multi-ple transcriptional domains, including a novel glutamine-richactivation motif. Cell. 1988;55(5):887-98.
27. Athanikar JN, Sanchez HB, Osborne TF. Promoter selectivetranscriptional synergy mediated by sterol regulatory ele-ment binding protein and Sp1: a critical role for the Btd do-main of Sp1. Mol Cell Biol. 1997;17(9):5193-200.
28. Su K, Roos MD, Yang X, Han I, Paterson AJ, Kudlow Je.An N-terminal Region of Sp1 Targets Its Proteasome-de-pendent Degradation in vitro. J Biol Chem.1999;274(21):15194-202.
29. Suske G. The Sp-family of transcription factors. Gene.1999;238(2):291-300.
30. Yu B, Datta PK, Bagchi S. Stability of the Sp3-DNA com-plex is promoter-specific: Sp3 efficiently competes with Sp1for binding to promoters containing multiple Sp-sites. Nu-cleic Acids Res. 2003;31(18):5368-76.
31. Bouwman P, Gollner H, elsasser HP, eckhoff G, Karis A,Grosveld F, et al. Transcription factor Sp3 is essential forpost-natal survival and late tooth development. embo J.2000;19(4):655-61.
32. Kruger I, vollmer M, Simmons DG, elsasser HP, PhilipsenS, Suske G. Sp1/Sp3 compound heterozygous mice are notviable: impaired erythropoiesis and severe placental defects.Dev Dyn. 2007;236(8):2235-44.
33. He S, Sun JM, Li L, Davie JR. Differential intranuclear or-ganization of transcription factors Sp1 and Sp3. Mol BiolCell. 2005;16(9):4073-83.
34. Pascal e, Tjian R. Different activation domains of Sp1 gov-ern formation of multimers and mediate transcriptional syn-ergism. Genes Dev. 1991;5(9):1646-56.
35. Murata Y, Kim HG, Rogers KT, Udvadia AJ, Horowitz JM.Negative regulation of Sp1 trans-activation is correlated withthe binding of cellular proteins to the amino terminus of theSp1 trans-activation domain. J Biol Chem.1994;269(32):20674-81.
36. Dennig J, Beato M, Suske G. An inhibitor domain in Sp3regulates its glutamine-rich activation domains. embo J.1996;15(20):5659-67.
37. Hagen G, Muller S, Beato M, Suske G. Sp1-Mediated Tran-scriptional Activation Is Repressed by Sp3. embo J.1994;13(16):3843-51.
38. Moorefield KS, Fry SJ, Horowitz JM. Sp2 DNA binding ac-tivity and trans-activation are negatively regulated in mam-malian cells. J Biol Chem. 2004;279(14):13911-24.
39. Baur F, Nau K, Sadic D, Allweiss L, elsässer H-P, Gille-mans N, et al. Specificity Protein 2 (Sp2) Is essential forMouse Development and Autonomous Proliferation of
Mouse embryonic Fibroblasts. PLoS ONe.2010;5(3):e9587.
40. Supp DM, Witte DP, Branford WW, Smith eP, Potter SS.Sp4, a Member of the Sp1-Family of Zinc Finger Transcrip-tion Factors, Is Required for Normal Murine Growth, via-bility, and Male Fertility. Dev Biol. 1996;176(2):284-99.
41. Gollner H, Bouwman P, Mangold M, Karis A, Braun H,Rohner I, et al. Complex phenotype of mice homozygous fora null mutation in the Sp4 transcription factor gene. GenesCells. 2001;6(8):689-97.
42. Nguyen-Tran vT, Kubalak SW, Minamisawa S, Fiset C,Wollert KC, Brown AB, et al. A novel genetic pathway forsudden cardiac death via defects in the transition betweenventricular and conduction system cell lineages. Cell.2000;102(5):671-82.
43. Zhou X, Qyang Y, Kelsoe JR, Masliah e, Geyer MA. Im-paired postnatal development of hippocampal dentate gyrusin Sp4 null mutant mice. Genes Brain Behav. 2007;6(3):269-76.
44. Pearson R, Fleetwood J, eaton S, Crossley M, Bao S. Krüp-pel-like transcription factors: A functional family. Int JBiochem Cell Biol. 2008;40(10):1996-2001.
45. emili A, Greenblatt J, Ingles CJ. Species-specific interactionof the glutamine-rich activation domains of Sp1 with theTATA box-binding protein. Mol Cell Biol. 1994;14(3):1582-93.
46. Hoey T, Weinzierl RO, Gill G, Chen JL, Dynlacht BD, TjianR. Molecular cloning and functional analysis of DrosophilaTAF110 reveal properties expected of coactivators. Cell.1993;72(2):247-60.
47. Saluja D, vassallo MF, Tanese N. Distinct subdomains ofhuman TAFII130 are required for interactions with gluta-mine-rich transcriptional activators. Mol Cell Biol.1998;18(10):5734-43.
48. Gill G, Pascal e, Tseng ZH, Tjian R. A glutamine-rich hy-drophobic patch in transcription factor Sp1 contacts thedTAFII110 component of the Drosophila TFIID complexand mediates transcriptional activation. Proc Natl Acad SciU S A. 1994;91(1):192-6.
49. Suzuki T, Kimura A, Nagai R, Horikoshi M. Regulation ofinteraction of the acetyltransferase region of p300 and theDNA-binding domain of Sp1 on and through DNA binding.Genes Cells. 2000;5(1):29-41.
50. Billon N, Carlisi D, Datto MB, van Grunsven LA, Watt A,Wang XF, et al. Cooperation of Sp1 and p300 in the induc-tion of the CDK inhibitor p21WAF1/CIP1 during NGF-me-diated neuronal differentiation. Oncogene.1999;18(18):2872-82.
51. Doetzlhofer A, Rotheneder H, Lagger G, Koranda M, Kurtevv, Brosch G, et al. Histone deacetylase 1 can repress tran-scription by binding to Sp1. Mol Cell Biol. 1999;19(8):5504-11.
52. Lagger G, Doetzlhofer A, Schuettengruber B, Haidweger e,Simboeck e, Tischler J, et al. The Tumor Suppressor p53and Histone Deacetylase 1 Are Antagonistic Regulators ofthe Cyclin-Dependent Kinase Inhibitor p21/WAF1/CIP1Gene. Mol Cell Biol. 2003;23(8):2669-79.
53. Song J, Ugai H, Kanazawa I, Sun K, Yokoyama KK. Inde-pendent Repression of a GC-rich Housekeeping Gene bySp1 and MAZ Involves the Same cis-elements. J Biol Chem.2001;276(23):19897-904.
54. esteve PO, Chin HG, Pradhan S. Molecular mechanisms oftransactivation and doxorubicin-mediated repression of sur-vivin gene in cancer cells. J Biol Chem. 2007;282(4):2615-25.
55. Brandeis M, Frank D, Keshet I, Siegfried Z, Mendelsohn M,Nemes A, et al. Sp1 elements protect a CpG island from denovo methylation. Nature. 1994;371(6496):435-8.
56. Macleod D, Charlton J, Mullins J, Bird AP. Sp1 sites in themouse aprt gene promoter are required to prevent methyla-tion of the CpG island. Genes Dev. 1994;8(19):2282-92.
522 O’Connor et al.: Transcriptional regulation by Sp1

57. Won J, Yim J, Kim TK. Sp1 and Sp3 Recruit HistoneDeacetylase to Repress Transcription of Human TelomeraseReverse Transcriptase (hTeRT) Promoter in Normal HumanSomatic Cells. J Biol Chem. 2002;277(41):38230-8.
58. Sun JM, Chen HY, Moniwa M, Litchfield DW, Seto e,Davie JR. The transcriptional repressor Sp3 is associatedwith CK2-phosphorylated histone deacetylase 2. J BiolChem. 2002;277(39):35783-6.
59. Ammanamanchi S, Freeman JW, Brattain MG. Acetylatedsp3 is a transcriptional activator. J Biol Chem.2003;278(37):35775-80.
60. Wierstra I. Sp1: emerging roles—Beyond constitutive acti-vation of TATA-less housekeeping genes. Biochem BiophysRes Commun. 2008;372(1):1-13.
61. Courey AJ, Holtzman DA, Jackson SP, Tjian R. Synergisticactivation by the glutamine-rich domains of human tran-scription factor Sp1. Cell. 1989;59(5):827-36.
62. Su W, Jackson S, Tjian R, echols H. DNA Looping betweenSites for Transcriptional Activation - Self-Association ofDNA-Bound Sp1. Genes Dev. 1991;5(5):820-6.
63. Deshane J, Kim J, Bolisetty S, Hock TD, Hill-KapturczakN, Agarwal A. Sp1 regulates chromatin looping between anintronic enhancer and distal promoter of the human hemeoxygenase-1 gene in renal cells. J Biol Chem.2010;285(22):16476-86.
64. Mastrangelo IA, Courey AJ, Wall JS, Jackson SP, HoughPv. DNA looping and Sp1 multimer links: a mechanism fortranscriptional synergism and enhancement. Proc Natl AcadSci U S A. 1991;88(13):5670-4.
65. Koutsodontis G, vasilaki e, Chou W-C, Papakosta P, Kar-dassis D. Physical and functional interactions between mem-bers of the tumour suppressor p53 and the Sp families oftranscription factors: importance for the regulation of genesinvolved in cell-cycle arrest and apoptosis. Biochem J.2005;389(2):443-55.
66. Black AR, Black JD, Azizkhan-Clifford J. Sp1 and kruppel-like factor family of transcription factors in cell growth reg-ulation and cancer. J Cell Physiol. 2001;188(2):143-60.
67. Apt D, Watts RM, Suske G, Bernard HU. High Sp1/Sp3 ra-tios in epithelial cells during epithelial differentiation andcellular transformation correlate with the activation of theHPv-16 promoter. virology. 1996;224(1):281-91.
68. Lee vHY, Chow BKC, Lo KW, Chow LSN, Man C, TsaoSW, et al. Regulation of RASSF1A in nasopharyngeal cellsand its response to Uv irradiation. Gene. 2009;443(1–2):55-63.
69. Shin T, Sumiyoshi H, Matsuo N, Satoh F, Nomura Y, Mi-mata H, et al. Sp1 and Sp3 transcription factors upregulatethe proximal promoter of the human prostate-specific anti-gen gene in prostate cancer cells. Arch Biochem Biophys.2005;435(2):291-302.
70. Birnbaum MJ, vanWijnen AJ, Odgren PR, Last TJ, Suske G,Stein GS, et al. Sp1 trans-activation of cell cycle regulatedpromoters is selectively repressed by Sp3. Biochemistry.1995;34(50):16503-8.
71. Majello B, De Luca P, Lania L. Sp3 Is a Bifunctional Tran-scription Regulator with Modular Independent Activationand Repression Domains. J Biol Chem. 1997;272(7):4021-6.
72. Beishline K, Azizkhan-Clifford J. Sp1 and the 'hallmarks ofcancer'. FeBS J. 2015;282(2):224-58.
73. Strom AC, Forsberg M, Lillhager P, Westin G. The tran-scription factors Sp1 and Oct-1 interact physically to regu-late human U2 snRNA gene expression. Nucleic Acids Res.1996;24(11):1981-6.
74. Porter W, Saville B, Hoivik D, Safe S. Functional synergybetween the transcription factor Sp1 and the estrogen recep-tor. Mol endocrinol. 1997;11(11):1569-80.
75. Pena P, Reutens AT, Albanese C, D'Amico M, Watanabe G,Donner A, et al. Activator protein-2 mediates transcriptionalactivation of the CYP11A1 gene by interaction with Sp1
rather than binding to DNA. Mol endocrinol.1999;13(8):1402-16.
76. Xu D, Wang Q, Gruber A, Bjorkholm M, Chen Z, Zaid A, etal. Downregulation of telomerase reverse transcriptasemRNA expression by wild type p53 in human tumor cells.Oncogene. 2000;19(45):5123-33.
77. Innocente SA, Lee JM. p53 is a NF-Y- and p21-independent,Sp1-dependent repressor of cyclin B1 transcription. FeBSLett. 2005;579(5):1001-7.
78. Huang L, Sowa Y, Sakai T, Pardee AB. Activation of thep21WAF1/CIP1 promoter independent of p53 by the histonedeacetylase inhibitor suberoylanilide hydroxamic acid(SAHA) through the Sp1 sites. Oncogene.2000;19(50):5712-9.
79. Chang WC, Hung JJ. Functional role of post-translationalmodifications of Sp1 in tumorigenesis. J Biomed Sci.2012;19:94.
80. Tan NY, Khachigian LM. Sp1 phosphorylation and its reg-ulation of gene transcription. Mol Cell Biol.2009;29(10):2483-8.
81. Chuang JY, Wang SA, Yang WB, Yang HC, Hung CY, SuTP, et al. Sp1 phosphorylation by cyclin-dependent kinase1/cyclin B1 represses its DNA-binding activity during mito-sis in cancer cells. Oncogene. 2012;31(47):4946-59.
82. Fojas de Borja P, Collins NK, Du P, Azizkhan-Clifford J,Mudryj M. Cyclin A-CDK phosphorylates Sp1 and enhancesSp1-mediated transcription. embo J. 2001;20(20):5737-47.
83. Chuang JY, Wang YT, Yeh SH, Liu YW, Chang WC, HungJJ. Phosphorylation by c-Jun NH2-terminal kinase 1 regu-lates the stability of transcription factor Sp1 during mitosis.Mol Biol Cell. 2008;19(3):1139-51.
84. Wang Y-T, Yang W-B, Chang W-C, Hung J-J. Interplay ofPosttranslational Modifications in Sp1 Mediates Sp1 Stabil-ity during Cell Cycle Progression. J Mol Biol.2011;414(1):1-14.
85. Hung J-J, Wang Y-T, Chang W-C. Sp1 Deacetylation In-duced by Phorbol ester Recruits p300 To Activate 12(S)-Lipoxygenase Gene Transcription. Mol Cell Biol.2006;26(5):1770-85.
86. Waby JS, Chirakkal H, Yu C, Griffiths GJ, Benson RSP,Bingle CD, et al. Sp1 acetylation is associated with loss ofDNA binding at promoters associated with cell cycle arrestand cell death in a colon cell line. Mol Cancer. 2010;9:275.
87. Jackson SP, Tjian R. O-glycosylation of eukaryotic tran-scription factors: implications for mechanisms of transcrip-tional regulation. Cell. 1988;55(1):125-33.
88. Yang X, Su K, Roos MD, Chang Q, Paterson AJ, Kudlow Je.O-linkage of N-acetylglucosamine to Sp1 activation domaininhibits its transcriptional capability. Proc Natl Acad Sci US A. 2001;98(12):6611-6.
89. Zaniolo K, Desnoyers S, Leclerc S, Guerin SL. Regulation ofpoly(ADP-ribose) polymerase-1 (PARP-1) gene expressionthrough the post-translational modification of Sp1: a nucleartarget protein of PARP-1. BMC Mol Biol. 2007;8:96.
90. Chuang JY, Chang WC, Hung JJ. Hydrogen peroxide in-duces Sp1 methylation and thereby suppresses cyclin B1 viarecruitment of Suv39H1 and HDAC1 in cancer cells. FreeRadic Biol Med. 2011;51(12):2309-18.
91. Spengler ML, Brattain MG. Sumoylation Inhibits Cleavageof Sp1 N-terminal Negative Regulatory Domain and InhibitsSp1-dependent Transcription. J Biol Chem.2006;281(9):5567-74.
92. Chu S. Transcriptional regulation by post-transcriptionalmodification--role of phosphorylation in Sp1 transcriptionalactivity. Gene. 2012;508(1):1-8.
93. Safe S. MicroRNA-Specificity Protein (Sp) TranscriptionFactor Interactions and Significance in Carcinogenesis. CurrPharmacol Rep. 2015;1(2):73-78.
94. Lecuyer e, Herblot S, Saint-Denis M, Martin R, Begley CG,Porcher C, et al. The SCL complex regulates c-kit expres-sion in hematopoietic cells through functional interactionwith Sp1. Blood. 2002;100(7):2430-40.
523O’Connor et al.: Transcriptional regulation by Sp1

95. Tenen DG, Hromas R, Licht JD, Zhang De. Transcriptionfactors, normal myeloid development, and leukemia. Blood.1997;90(2):489-519.
96. Zhang De, Hetherington CJ, Tan S, Dziennis Se, GonzalezDA, Chen HM, et al. Sp1 is a critical factor for the mono-cytic specific expression of human CD14. J Biol Chem.1994;269(15):11425-34.
97. Chen HM, Pahl HL, Scheibe RJ, Zhang De, Tenen DG. TheSp1 transcription factor binds the CD11b promoter specifi-cally in myeloid cells in vivo and is essential for myeloid-specific promoter activity. J Biol Chem.1993;268(11):8230-9.
98. Merika M, Orkin SH. Functional synergy and physical in-teractions of the erythroid transcription factor GATA-1 withthe Kruppel family proteins Sp1 and eKLF. Mol Cell Biol.1995;15(5):2437-47.
99. Lecointe N, Bernard O, Naert K, Joulin v, Larsen CJ, RomeoPH, et al. GATA-and SP1-binding sites are required for thefull activity of the tissue-specific promoter of the tal-1 gene.Oncogene. 1994;9(9):2623-32.
100. Han L, Lu J, Pan L, Wang X, Shao Y, Han S, et al. Histoneacetyltransferase p300 regulates the transcription of humanerythroid-specific 5-aminolevulinate synthase gene.Biochem Biophys Res Commun. 2006;348(3):799-806.
101. Gilmour J, Assi SA, Jaegle U, Kulu D, van de Werken H,Clarke D, et al. A crucial role for the ubiquitously expressedtranscription factor Sp1 at early stages of hematopoieticspecification. Development. 2014;141(12):2391-401.
102. Liu A, Hoffman PW, Lu W, Bai G. NF-κB Site Interactswith Sp Factors and Up-regulates the NR1 Promoter duringNeuronal Differentiation. J Biol Chem. 2004;279(17):17449-58.
103. Ross S, Tienhaara A, Lee M-S, Tsai L-H, Gill G. GC Box-binding Transcription Factors Control the Neuronal SpecificTranscription of the Cyclin-dependent Kinase 5 Regulatorp35. J Biol Chem. 2002;277(6):4455-64.
104. Mao X, Moerman-Herzog AM, Wang W, Barger SW. Dif-ferential Transcriptional Control of the Superoxide Dismu-tase-2 κB element in Neurons and Astrocytes. J Biol Chem.2006;281(47):35863-72.
105. Lee J, Kosaras B, Aleyasin H, Han JA, Park DS, Ratan RR,et al. Role of cyclooxygenase-2 induction by transcriptionfactor Sp1 and Sp3 in neuronal oxidative and DNA damageresponse. FASeB J. 2006;20(13):2375-7.
106. Hedrick e, Cheng Y, Jin UH, Kim K, Safe S. Specificityprotein (Sp) transcription factors Sp1, Sp3 and Sp4 are non-oncogene addiction genes in cancer cells. Oncotarget.2016;7(16):22245-56.
107. vizcaino C, Mansilla S, Portugal J. Sp1 transcription fac-tor: A long-standing target in cancer chemotherapy. Phar-macol Ther. 2015;152:111-24.
108. Fernandez-Guizan A, Mansilla S, Barcelo F, vizcaino C,Nunez Le, Moris F, et al. The activity of a novelmithramycin analog is related to its binding to DNA, cellu-lar accumulation, and inhibition of Sp1-driven gene tran-scription. Chem Biol Interact. 2014;219:123-32.
109. Snyder RC, Ray R, Blume S, Miller DM. Mithramycinblocks transcriptional initiation of the c-myc P1 and P2 pro-moters. Biochemistry. 1991;30(17):4290-7.
110. Abdelrahim M, Baker CH, Abbruzzese JL, Safe S. Tolfe-namic acid and pancreatic cancer growth, angiogenesis, andSp protein degradation. J Natl Cancer Inst. 2006;98(12):855-68.
111. Mansilla S, Portugal J. Sp1 transcription factor as a targetfor anthracyclines: effects on gene transcription. Biochimie.2008;90(7):976-87.
112. Frederick CA, Williams LD, Ughetto G, van der Marel GA,van Boom JH, Rich A, et al. Structural comparison of anti-cancer drug-DNA complexes: adriamycin and daunomycin.Biochemistry. 1990;29(10):2538-49.
113. Noratto GD, Jutooru I, Safe S, Angel-Morales G, Mertens-Talcott SU. The drug resistance suppression induced by cur-
cuminoids in colon cancer SW-480 cells is mediated by re-active oxygen species-induced disruption of the microRNA-27a-ZBTB10-Sp axis. Mol Nutr Food Res.2013;57(9):1638-48.
114. Oleaga C, Welten S, Belloc A, Solé A, Rodriguez L, Men-cia N, et al. Identification of novel Sp1 targets involved inproliferation and cancer by functional genomics. BiochemPharmacol. 2012;84(12):1581-91.
115. Chitnis MM, Yuen JS, Protheroe AS, Pollak M, MacaulayvM. The type 1 insulin-like growth factor receptor pathway.Clin Cancer Res. 2008;14(20):6364-70.
116. Zhu JL, Kaytor eN, Pao CI, Meng XP, Phillips LS. In-volvement of Sp1 in the transcriptional regulation of the ratinsulin-like growth factor-1 gene. Mol Cell endocrinol.2000;164(1–2):205-18.
117. Kyo S, Takakura M, Taira T, Kanaya T, Itoh H, Yutsudo M,et al. Sp1 cooperates with c-Myc to activate transcription ofthe human telomerase reverse transcriptase gene (hTeRT).Nucleic Acids Res. 2000;28(3):669-77.
118. Asanuma K, Tsuji N, endoh T, Yagihashi A, Watanabe N.Survivin enhances Fas ligand expression via up-regulationof specificity protein 1-mediated gene transcription in coloncancer cells. J Immunol. 2004;172(6):3922-9.
119. Stoner M, Wormke M, Saville B, Samudio I, Qin C, Ab-delrahim M, et al. estrogen regulation of vascular endothe-lial growth factor gene expression in ZR-75 breast cancercells through interaction of estrogen receptor [alpha] and SPproteins. Oncogene. 2003;23(5):1052-63.
120. Hu J, Shan Z, Hu K, Ren F, Zhang W, Han M, et al.miRNA-223 inhibits epithelial-mesenchymal transition ingastric carcinoma cells via Sp1. Int J Oncol. 2016;49(1):325-35.
121. Cao L, Xie B, Yang X, Liang H, Jiang X, Zhang D, et al.MiR-324-5p Suppresses Hepatocellular Carcinoma Cell In-vasion by Counteracting eCM Degradation through Post-Transcriptionally Downregulating eTS1 and SP1. PLoSONe. 2015;10(7):e0133074.
122. Fulciniti M, Amodio N, Bandi RL, Cagnetta A, Samur MK,Acharya C, et al. miR-23b/SP1/c-myc forms a feed-forwardloop supporting multiple myeloma cell growth. Blood Can-cer J. 2016;6:e380
123. Zhao N, Li S, Wang R, Xiao M, Meng Y, Zeng C, et al. ex-pression of microRNA-195 is transactivated by Sp1 but in-hibited by histone deacetylase 3 in hepatocellular carcinomacells. Biochim Biophys Acta. 2016;1859(7):933-42.
124. Wang Y, Zhang Z-X, Chen S, Qiu G-B, Xu Z-M, Fu W-N.Methylation Status of SP1 Sites within miR-23a-27a-24-2Promoter Region Influences Laryngeal Cancer Cell Prolif-eration and Apoptosis. BioMed Research International.2016;2016:2061248.
125. Liu S, Wu L-C, Pang J, Santhanam R, Schwind S, Wu Y-Z, et al. Sp1/NFκB/HDAC/miR-29b Regulatory Network inKIT-driven Myeloid Leukemia. Cancer Cell.2010;17(4):333-47.
126. Clark SJ, Harrison J, Molloy PL. Sp1 binding is inhibitedby mCpmCpG methylation. Gene. 1997;195(1):67-71.
127. Strunnikova M, Schagdarsurengin U, Kehlen A, Garbe JC,Stampfer MR, Dammann R. Chromatin Inactivation Pre-cedes De Novo DNA Methylation during the Progressiveepigenetic Silencing of the RASSF1A Promoter. Mol CellBiol. 2005;25(10):3923-33.
128. Dunah AW, Jeong H, Griffin A, Kim YM, Standaert DG,Hersch SM, et al. Sp1 and TAFII130 transcriptional activitydisrupted in early Huntington's disease. Science.2002;296(5576):2238-43.
129. Paul BD, Sbodio JI, Xu R, vandiver MS, Cha JY, Snow-man AM, et al. Cystathionine gamma-lyase deficiency me-diates neurodegeneration in Huntington's disease. Nature.2014;509(7498):96-100.
130. Qiu Z, Norflus F, Singh B, Swindell MK, Buzescu R, Be-jarano M, et al. Sp1 is up-regulated in cellular and transgenicmodels of Huntington disease, and its reduction is neuro-
524 O’Connor et al.: Transcriptional regulation by Sp1
protective. J Biol Chem. 2006;281(24):16672-80.131. Citron BA, Saykally JN, Cao C, Dennis JS, Runfeldt M,
Arendash GW. Transcription factor Sp1 inhibition, memory,and cytokines in a mouse model of Alzheimer's disease. AmJ Neurodegener Dis. 2015;4(2):40-8.
132. Mann v, Hobson ee, Li B, Stewart TL, Grant SFA, RobinsSP, et al. A COL1A1 Sp1 binding site polymorphism pre-disposes to osteoporotic fracture by affecting bone densityand quality. J Clin Invest. 2001;107(7):899-907.
133. Lian K, Zmuda JM, Nevitt MC, Lui L, Hochberg MC,Greene D, et al. Type I collagen alpha1 Sp1 transcriptionfactor binding site polymorphism is associated with reducedrisk of hip osteoarthritis defined by severe joint space nar-rowing in elderly women. Arthritis Rheum.2005;52(5):1431-6.
134. Kristjansdottir G, Sandling JK, Bonetti A, Roos IM, MilaniL, Wang C, et al. Interferon regulatory factor 5 (IRF5) genevariants are associated with multiple sclerosis in three dis-tinct populations. J Med Genet. 2008;45(6):362-9.
135. Wang L, Liu R, Li D, Lin S, Fang X, Backer G, et al. A hy-permorphic SP1-binding CD24 variant associates with riskand progression of multiple sclerosis. Am J Transl Res.2012;4(3):347-56.
136. Menon R, Di Dario M, Cordiglieri C, Musio S, La MantiaL, Milanese C, et al. Gender-based blood transcriptomes andinteractomes in multiple sclerosis: Involvement of SP1 de-pendent gene transcription. J Autoimmun. 2012;38(2-3):J144-J55.
525O’Connor et al.: Transcriptional regulation by Sp1

32
1.6 Aims and objectives
Our group have previously reported a novel role for Sp1 in haematopoietic specification.
Using in vitro differentiation of Sp1 DBD-deficient ESCs, Gilmour et al. found Sp1 was
dispensable for the formation of haematopoietic progenitors, but it was essential for
terminal haematopoietic differentiation. The loss of functional Sp1 was accompanied by
gene expression changes, including several important developmental regulators.
However, many questions still need to be addressed to better understand the mechanism
behind the mutant phenotype. In this study, we aim to:
1) Generate a complete Sp1 knockout ESC line and recapitulate the Sp1 DBD-deficient
model in a different ESC background
We will first delete the Sp1 DBD coding region in a different ESC line (A17 2lox), which
could allow for the generation of an inducible expression system in a mutant background.
The results from these cells will also be compared to the previous Sp1 DBD-deficient
model to confirm the role of Sp1 in haematopoiesis. However, no studies have yet
investigated the effect of deletion of the entire Sp1 gene; therefore, we aim to knockout
the complete Sp1 protein in ESCs and compare the phenotype to those lacking only the
DBD.
2) Characterise the gene expression changes associated with loss of Sp1
Gilmour et al. analysed changes in gene expression through in vitro haematopoietic
differentiation using microarrays. We aim to validate their findings, plus examine the
changes in the transcriptome in more detail using RNA-seq in our Sp1 mutant cells.

33
3) Analyse epigenetic changes in Sp1 mutant cells
The binding of Sp1 is widespread across the genome and it is involved in the regulation of
genes in a range of cellular processes. It also interacts with several epigenetic factors,
but the effect of Sp1 deficiency on the chromatin profile of the cell has never before been
investigated. We will therefore show how the chromatin structure changes with loss of
Sp1 function using ATAC-seq.
4) Investigate the interplay between Sp1 and Sp3
Sp3 is a ubiquitously expressed transcription factor with a highly similar structure and
binding specificity to Sp1. We plan to examine how Sp3 functions to regulate gene
expression in the absence of Sp1 by mapping the binding sites of Sp1 and Sp3 using
ChIP-seq in Sp1 mutant cells. We will also show the binding of Sp1 and Sp3 relative to
each other in WT cells and how this changes upon ESC differentiation to gain insight into
the relationship between Sp1 and Sp3.

34
2. MATERIALS AND METHODS
2.1 ESC culture
ESCs were plated onto mitomycin-C–treated murine embryonic fibroblasts (MEFs) and
cultured in Dulbecco’s Modified Eagle’s Medium (DMEM, Sigma) supplemented with 1
mM L-glutamine, 15% (v/v) foetal calf serum (FCS, Stem Cell Technologies), 1 mM
sodium pyruvate, 0.15 mM MTG, 25 mM HEPES buffer, 1x non-essential amino acids,
100 units/ml penicillin and 100 µg/ml streptomycin, and 103 units/ml Leukaemia Inhibitory
Factor (LIF, ESGRO, Millipore), at 37°C. For passaging, the cells were washed in
phosphate buffered saline (PBS) and incubated at 37°C with TrypLE dissociation reagent
(Life Technologies). Medium was then added and the cells re-plated at the appropriate
density.
2.2 ESC differentiation
The differentiation procedure was performed as described in Gilmour et al., 2014. Briefly,
ESCs were cultured on gelatinised plates for one day in DMEM ESC and for a second day
in Iscove’s Modified Dulbecco Medium (IMDM, Sigma) ESC medium. The cells were
transferred to low adherence plates (Sterilin) in IVD media (IMDM supplemented with 15%
(v/v) FCS (Gibco), 100 units/ml penicillin and 100 µg/ml streptomycin, 1 mM glutamine,
0.45 mM MTG, 0.18 mg/ml human transferrin (Roche) and 50 μg/ml ascorbic acid) to form
embryoid bodies (EBs). After 3.75 days, the EBs were harvested and dispersed to a
single cell suspension using TrypLE reagent (Life Technologies) and passing through a
cell strainer. Flk1+ cells were isolated by magnetic activated cell sorting (MACS). The
cells were incubated with a biotin-conjugated Flk1 antibody (eBioscience 13-5821) at 5

35
μl/107 cells for 15 min on ice. The cells were washed, incubated with MACS anti-biotin
beads at 20 µl/107 cells and passed through MACS LS columns (Miltenyi Biotec). The
Flk1+ cells were cultured for 2-3 days in blast medium (IMDM supplemented with 10%
FCS (v/v), 100 units/ml penicillin and 100 µg/ml streptomycin, 1 mM glutamine, 0.45 mM
MTG, 0.18 mg/ml human transferrin (Roche), 25 μg/ml ascorbic acid, 20% D4T
conditioned media (v/v), 5 μg/L VEGF [Peprotech] and 10 μg/L IL-6 [Peprotech]) to form
haematopoietic progenitors.
2.3 Macrophage release assay
ES cells were seeded at an appropriate density in methylcellulose media: IMDM (Sigma)
with 1.1% (v/v) methylcellulose (Methocult, Stem Cell Technologies), 1x Pen/Strep, 1 mM
glutamine, 10% (v/v) FCS (Gibco), 10 μg/ml insulin, 0.45 mM MTG, 10% (v/v) M-CSF
conditioned media (obtained from the culture of L cells), 5% (v/v) IL-3 conditioned media
(harvested from a culture of X63 Ag8-653 myeloma cells carrying an IL-3 expression
cassette), 100 units/ml IL-1, supplemented with 25 ng/ml recombinant macrophage colony
stimulating factor (M-CSF) and 5 ng/ml IL-3 cytokines (Peprotech) to promote
differentiation to macrophages. The cells were incubated at 37°C for approximately 2
weeks, at which time macrophage-releasing EBs were counted.
2.4 Flow cytometry and fluorescence activated cell sorting (FACS)
Approximately 1x10⁵ cells were harvested, washed in MACS buffer (PBS, 0.5% bovine
serum albumin [BSA] and 2 mM EDTA) and resuspended in the remaining supernatant
(approx. 50 µl). The antibody was added (0.5 µl) (Table 2.1) and the cell suspension was
incubated on ice, in the dark, for 15-30 min. The cell suspension was then washed with
MACS buffer and the cell composition was analysed using a CyAn ADP machine
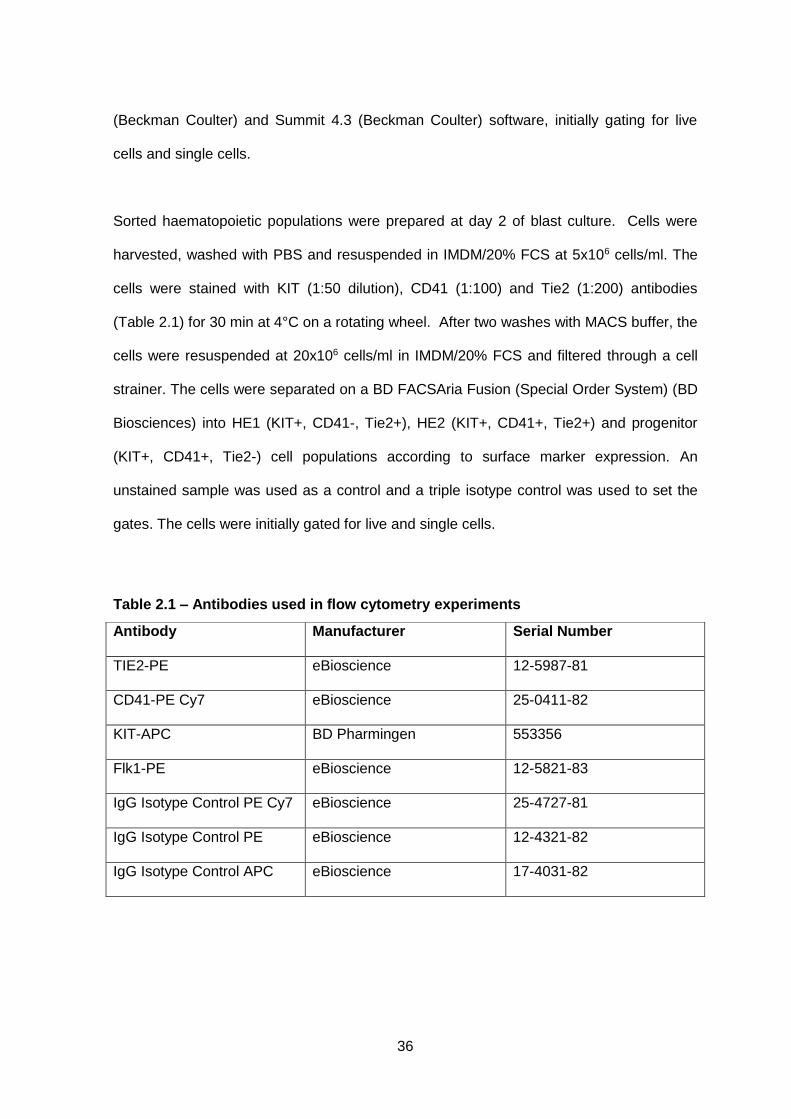
36
(Beckman Coulter) and Summit 4.3 (Beckman Coulter) software, initially gating for live
cells and single cells.
Sorted haematopoietic populations were prepared at day 2 of blast culture. Cells were
harvested, washed with PBS and resuspended in IMDM/20% FCS at 5x10⁶ cells/ml. The
cells were stained with KIT (1:50 dilution), CD41 (1:100) and Tie2 (1:200) antibodies
(Table 2.1) for 30 min at 4°C on a rotating wheel. After two washes with MACS buffer, the
cells were resuspended at 20x106 cells/ml in IMDM/20% FCS and filtered through a cell
strainer. The cells were separated on a BD FACSAria Fusion (Special Order System) (BD
Biosciences) into HE1 (KIT+, CD41-, Tie2+), HE2 (KIT+, CD41+, Tie2+) and progenitor
(KIT+, CD41+, Tie2-) cell populations according to surface marker expression. An
unstained sample was used as a control and a triple isotype control was used to set the
gates. The cells were initially gated for live and single cells.
Table 2.1 – Antibodies used in flow cytometry experiments
Antibody Manufacturer Serial Number
TIE2-PE eBioscience 12-5987-81
CD41-PE Cy7 eBioscience 25-0411-82
KIT-APC BD Pharmingen 553356
Flk1-PE eBioscience 12-5821-83
IgG Isotype Control PE Cy7 eBioscience 25-4727-81
IgG Isotype Control PE eBioscience 12-4321-82
IgG Isotype Control APC eBioscience 17-4031-82

37
2.5 Western blotting
Cells were harvested, washed with PBS and centrifuged (300 x g, 5 min). The pellet was
resuspended in radioimmunoprecipitation assay (RIPA) buffer (150 mM NaCl, 10 mM Tris
[pH 7.2], 0.1% [w/v] SDS, 1% [v/v] Triton X-100, 1% [w/v] Sodium Deoxycholate, 5 mM
EDTA) supplemented with protease inhibitor cocktail (PIC) (Sigma P8340, at 1:100
dilution) at a ratio of 100 μl per 1x10⁶ cells and incubated at 4oC for 30 min on a rotating
wheel. The samples were centrifuged (13.5 x g, 10 min, 4oC) and the supernatant was
collected. Protein concentrations were measured using the Pierce BCA protein assay
(Thermo Scientific), according to manufacturer’s instructions. Appropriate amounts of the
sample were mixed with 5x Laemmli buffer (0.3125M Tris [pH6.8], 10% [w/v] SDS, 25%
[v/v] glycerol, 10% [v/v] β-2 Mercaptoethanol, 0.05% [v/v] Bromophenol blue) and
incubated for 5 min at 95oC to denature the protein.
The samples were loaded onto Mini-PROTEAN TGX precast gradient polyacrylamide gels
(Bio-Rad) in running buffer (0.025 M Tris, 0.2 M Glycine, 3.5 mM SDS) and the proteins
separated by SDS-PAGE. The protein was transferred to a nitrocellulose membrane (Bio-
Rad) using the Trans-Blot Turbo transfer system (Bio-Rad) and blocked with 5% non-fat
dry milk (Marvel) in TBST (0.2% [v/v] Tween™ 20, 0.075 M sodium chloride [NaCl] and
0.01 M Tris [pH 7.5]) for at least 30 min. The membrane was incubated with primary
antibody at the appropriate dilution (see Table 2.2) in 2.5% milk on a rotary shaker for a
minimum of 3 hours. The blot was washed with TBST, and then peroxidase-linked
secondary antibody (anti-mouse and anti-goat by Jackson ImmunoResearch; anti-rabbit
by Cell Signaling) (diluted in 2.5% milk) was added for 1-2 hours. The blot was washed
for 3x10 min with TBST on a rotary shaker, before the addition of ECL detection reagent
(GE Healthcare) and development using Bio-Rad Universal Hood II.
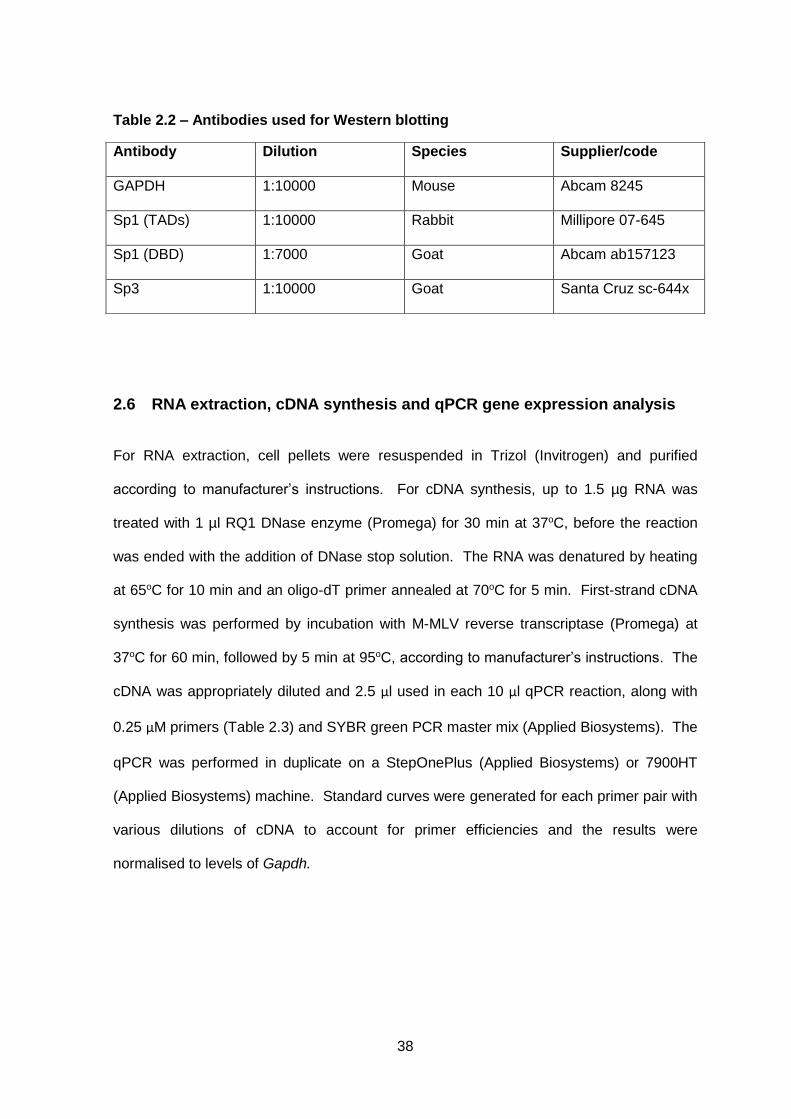
38
Table 2.2 – Antibodies used for Western blotting
2.6 RNA extraction, cDNA synthesis and qPCR gene expression analysis
For RNA extraction, cell pellets were resuspended in Trizol (Invitrogen) and purified
according to manufacturer’s instructions. For cDNA synthesis, up to 1.5 µg RNA was
treated with 1 µl RQ1 DNase enzyme (Promega) for 30 min at 37oC, before the reaction
was ended with the addition of DNase stop solution. The RNA was denatured by heating
at 65oC for 10 min and an oligo-dT primer annealed at 70oC for 5 min. First-strand cDNA
synthesis was performed by incubation with M-MLV reverse transcriptase (Promega) at
37oC for 60 min, followed by 5 min at 95oC, according to manufacturer’s instructions. The
cDNA was appropriately diluted and 2.5 μl used in each 10 μl qPCR reaction, along with
0.25 μM primers (Table 2.3) and SYBR green PCR master mix (Applied Biosystems). The
qPCR was performed in duplicate on a StepOnePlus (Applied Biosystems) or 7900HT
(Applied Biosystems) machine. Standard curves were generated for each primer pair with
various dilutions of cDNA to account for primer efficiencies and the results were
normalised to levels of Gapdh.
Antibody Dilution Species Supplier/code
GAPDH 1:10000 Mouse Abcam 8245
Sp1 (TADs) 1:10000 Rabbit Millipore 07-645
Sp1 (DBD) 1:7000 Goat Abcam ab157123
Sp3 1:10000 Goat Santa Cruz sc-644x
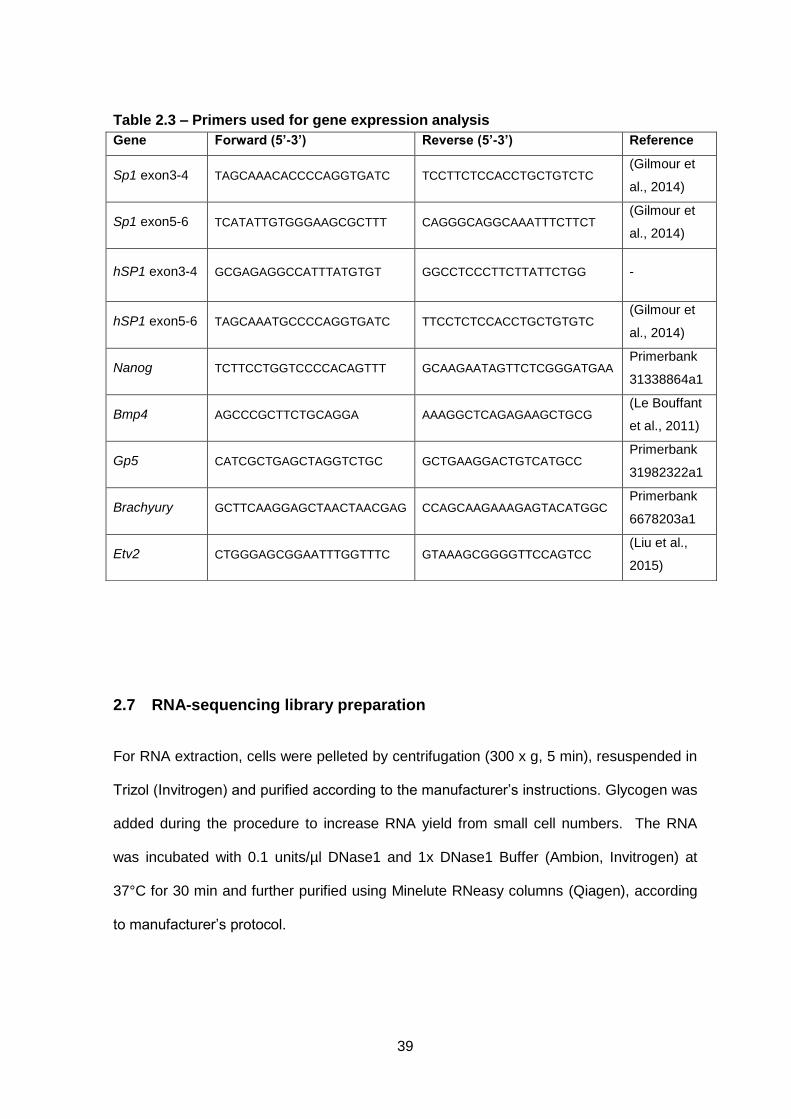
39
Table 2.3 – Primers used for gene expression analysis
2.7 RNA-sequencing library preparation
For RNA extraction, cells were pelleted by centrifugation (300 x g, 5 min), resuspended in
Trizol (Invitrogen) and purified according to the manufacturer’s instructions. Glycogen was
added during the procedure to increase RNA yield from small cell numbers. The RNA
was incubated with 0.1 units/µl DNase1 and 1x DNase1 Buffer (Ambion, Invitrogen) at
37°C for 30 min and further purified using Minelute RNeasy columns (Qiagen), according
to manufacturer’s protocol.
Gene Forward (5’-3’) Reverse (5’-3’) Reference
Sp1 exon3-4 TAGCAAACACCCCAGGTGATC TCCTTCTCCACCTGCTGTCTC (Gilmour et
al., 2014)
Sp1 exon5-6 TCATATTGTGGGAAGCGCTTT CAGGGCAGGCAAATTTCTTCT (Gilmour et
al., 2014)
hSP1 exon3-4 GCGAGAGGCCATTTATGTGT GGCCTCCCTTCTTATTCTGG -
hSP1 exon5-6 TAGCAAATGCCCCAGGTGATC TTCCTCTCCACCTGCTGTGTC (Gilmour et
al., 2014)
Nanog TCTTCCTGGTCCCCACAGTTT GCAAGAATAGTTCTCGGGATGAA Primerbank
31338864a1
Bmp4 AGCCCGCTTCTGCAGGA AAAGGCTCAGAGAAGCTGCG (Le Bouffant
et al., 2011)
Gp5 CATCGCTGAGCTAGGTCTGC GCTGAAGGACTGTCATGCC Primerbank
31982322a1
Brachyury GCTTCAAGGAGCTAACTAACGAG CCAGCAAGAAAGAGTACATGGC Primerbank
6678203a1
Etv2 CTGGGAGCGGAATTTGGTTTC GTAAAGCGGGGTTCCAGTCC (Liu et al.,
2015)

40
RNA-seq libraries were prepared using the TruSeq Stranded Total RNA Library Prep Kit
(Illumina), according to manufacturer’s instructions. Briefly, 10 µl of the RNA sample was
incubated with 5 µl rRNA binding buffer and 5 µl rRNA removal mix at 68°C for 5 min, then
rRNA removal beads added to remove rRNA by magnetic separation. The RNA was
further purified using RNAClean XP magnetic beads and fragmented at 94°C for 8 min.
For first strand cDNA synthesis, 8 µl of a master mix consisting of one part SuperScript II
Reverse Transcriptase to nine parts First Strand Act D Mix was added and incubated at
25°C for 10 min, 42°C for 15 min and 70°C for 15 min. To synthesise the second cDNA
strand, 20 µl Second Strand Marking Mix was added, along with 5 µl resuspension buffer,
and incubated for 1 hour at 16°C. The cDNA was purified using 1.8 x AMPure XP beads
(Beckman Coulter) and eluted in 15 µl resuspension buffer.
The cDNA ends were adenylated by adding 2.5 µl resuspension buffer and 12.5 µl A-
tailing Mix, before incubating at 37°C for 30 min, then 70°C for 5 min. Next, indexing
adapters (Illumina) were ligated to the ends of the double-stranded cDNA to enable
hybridisation onto a flow cell. Appropriate adapters were diluted 1 in 4 and 2.5 µl added to
the sample, along with 2.5 µl resuspension buffer and 2.5 µl ligation mix, before
incubating at 30°C for 10 min. The reaction was stopped with 5 µl Stop Ligation Buffer
and the cDNA purified by two successive 1 x AMPure XP magnetic clean ups, resulting in
20 µl sample in resuspension buffer. To amplify the cDNA, 5 µl PCR Primer Cocktail and
25 µl PCR Master Mix was added and a PCR performed (98°C for 30 sec, followed by 15
cycles of 98°C for 10 sec, 60°C for 30 sec and 72°C for 30, then hold at 72°C for 30 sec).
The cDNA then underwent a final clean up using 1 x AMPure XP magnetic beads and
eluting in 30 µl resuspension buffer.

41
The library was validated by running on Bioanalyzer 2100 (Agilent) and quantified using
KAPA KK4835 Library Quantification Kit (Kapa Biosystems) according manufacturer’s
instructions. Samples were sequenced on a Hiseq 2500 (Illumina) using rapid run
chemistry with 100 bp paired end reads.
2.8 Generation of SP1-expressing ESCs to rescue the Sp1-deficient phenotype
A DNA fragment coding for the PGK promoter and SP1 gene was first generated, from
two separate vectors, using fusion PCR. The human SP1 gene was isolated by PCR from
a cDNA clone, courtesy of Sjaak Phillipsen, using primers to give the addition of a 3’
HindIII restriction site (5’- CAGTAAAAGCTTTCAGAAGCCATTGCCACTG -3’), and a 5’
Kozak sequence, preceded by a 20 bp sequence overlapping that found at the 3’ end of
the PGK promoter (5’- CATCTCCGGGCCTTTCGACCCCGCCATGGATGAAATGACAGC
TGTGG -3’). The PGK promoter was isolated from the p2lox plasmid (courtesy of Michael
Kyba), using primers with a 5’ SalI site overhang (5’- ATTGTGTCGACCGACCTCGAAATT
CTACCGG -3’) and a 3’ sequence overlapping with the 5’ region of SP1 (5’-
CTGTCATTTCATCCATGGCGGGGTCGAAAGGCCCGGAGATG -3’).
The PCR products were then annealed and amplified as one DNA fragment by incubating
equimolar amounts of SP1 and PGK products in a PCR reaction for 30 sec at 90°C, then
thermocycling for 5 cycles of 98°C for 10 sec, 65°C for 30 sec and 72°C for 30 sec,
followed by 25 cycles of 98°C for 10 sec and 72°C for 3 min, and finally holding at 72°C
for 10 min. The reactions were purified using a Qiagen PCR Purification Minelute kit,
according to manufacturer’s instructions.

42
The PCR product was digested with SalI and HindIII enzymes (NEB), along with the PB-
TRE-Gata1-2A-mCherry plasmid, courtesy of George Lacaud, thus removing the TRE-
Gata1 section of the plasmid. The reactions were separated by gel electrophoresis and
the desired fragments cut out and purified using the Qiagen Gel Extraction Minelute kit,
according to manufacturer’s instructions. The fragments were ligated together using T4
DNA ligase (NEB) at a ratio of 3x insert (totalling 30-50 ng) to 1x plasmid for 2-3 hours at
room temperature to generate a PB-PGK-SP1-2A-mCherry plasmid.
The vector was transformed into DH5α E. coli by heat shock and the bacteria were plated
onto ampicillin LB plates to select for successfully transformed cells. Single colonies were
picked and cultured in ampicillin-containing LB broth, then the plasmid was purified using
Macherey-Nagel NucleoBond Xtra Midi EF kit according to manufacturer’s instructions.
The resulting DNA was sequenced to ensure correct incorporation of the PGK promoter
and SP1 gene into the plasmid using the PCR primers above, plus: 5’-AGCAGGATG
GTTCTGGTCAA -3’, 5’- GAGCAAAACCAGCAGACACA -3’, 5’- AAGACAGTGAAGGAAG
GGGC -3’, 5’- AGTCAGAAACAACTTTGGCACA -3’ and 5’- TCCTGGACCTGGATTGCT
TT -3’.
Sp1del/del and Sp1-/- ES cells were co-transfected with the PB-PGK-SP1-2A-mCherry vector
and a PiggyBac (PB) transposase expression vector, PL623, at a two to one ratio (as
described in (Wang et al., 2008)) using the P3 4D-nucleofector kit (Lonza V4XP-3024),
according to manufacturer’s guidelines, and a 4D-Nucleofector™ X Unit. The PB-PGK-
SP1-2A-mCherry plasmid contains a PB transposon element, made up of inverted
terminal repeat sequences (ITRs), either side of the transgene. The PB transposase
recognises the PB ITRs and cuts at these sites, triggering a transposition reaction to insert
the intervening transgene into the genome randomly at TTAA sites.

43
Cells were sorted after 48 hours for mCherry expression, replated onto MEFs for
approximately 5 days, before individual clones were picked and expanded. SP1
expression was then assayed by qPCR analysis and Western blotting.
For the expression of the Sp1 DBD in Sp1del/del cells, the protocol as above was repeated,
but primers to isolate the DBD fragment from the SP1 cDNA were based on those used in
Koutsodontis et al. 2005: 5’- GACCCTTAAGCAATTGCCGCCATGGGGGATCCTGGCAA
AAAGAAAC -3’ and 5’- CAGTAAAAGCTTGAAGCCATTGCCACTGATATTAATG -3’
(Koutsodontis et al., 2005).
2.9 CRISPR-Cas9 in vitro system
The efficiency of guide sequences was tested in vitro using the SureGuide Cas9 Nuclease
Kit (Agilent), according to manufacturer’s instructions. The target region (between the
beginning of exon 5 of Sp1 and the end of the gene) was isolated from mESC genomic
DNA using PCR (F: 5’-GGTCAGCCTTGTCTACTTAGTAA-3’; R: 5’- CAGTGACATTGGG
TGCCA-3’) and purified using Qiagen PCR MinElute Purification kit, according to
manufacturer’s instructions. Guide RNAs, along with a tracrRNA, were obtained from
Dharmacon. Guides 1 and 3 were designed to target the start of exon 5, while guides 14
and 18 were designed to cut at the end of the gene (Table 2.4).
In a 20 µl reaction, 50 ng DNA (1425 bp) was mixed with 1 µl Cas9, 50 nM gRNA, 50 nM
tracrRNA and 1x Cas9 Digestion Buffer, made up to 20 µl with water. The sample was
incubated at 37°C for 30 min, followed by 65°C for 15 min, before analysing the digestion
pattern by gel electrophoresis on a 1% agarose gel.

44
Table 2.4 – Sequences of guide RNAs used in the in vitro Cas9 assay.
Note, the sequence GUUUUAGAGCUAUGCUGUUUUG was added at the 3’ end to act as a scaffold and promote Cas9 activity.
2.10 CRISPR-Cas9 targeting of Sp1 in ESCs
Four guide sequences, two to target the start of Sp1 exon 5 (1 and 3) and two at the end
of the gene (14 and 18) (thus flanking the DBD-coding region), were designed using The
CRISPR Design Tool by the Zhang lab (a programme based on the specificity analysis
performed Hsu et al. (Hsu et al., 2013)). The guides were then shortened from 20
nucleotides (nt) to 18 nt (taken from the opposite end to the PAM sequence), which was
found to reduce off-target effects (Fu et al., 2014) (Table 2.5).
Table 2.5 – Sequences of CRISPR guides used to target Sp1 DBD-coding region.
The guide sequences were cloned into the PX458 plasmid (Addgene), encoding Cas9-2A-
GFP, based on the protocols described in Ran et al., 2014 and Bauer et al., 2015. Briefly,
the sequences were ordered as oligos (Sigma) in both the sense and antisense direction
to allow them to anneal as double-stranded DNA. Flanking sequences were incorporated
Guide RNA oligo sequence (5’-3’)
1 CAUAUACUUUGCCGCAUCCU
3 AAUAUUAUGAUUUAUCACUC
14 CCUUGCAUCCCGGGCUUAGU
18 AUCCCGGGCUUAGUGGGUAU
Guide Sense Sequence (5’-3’)
1 TATACTTTGCCGCATCCT
3 TATTATGATTTATCACTC
14 TTGCATCCCGGGCTTAGT
18 CCCGGGCTTAGTGGGTAT
45
at each end of the oligo to generate sticky ends for direct cloning into the PX458 plasmid.
Thus, the sense oligo sequence was: 5’-CACCGNNN…-3’, while the antisense oligo had
the sequence: 5’-AAACNN…NNC-3’. The two complementary sense and antisense
oligos were annealed and phosphorylated by incubating 10 µM of each oligo with 1 µl T4
10x ligation buffer (NEB) and 1 µl T4 Polynucleotide Kinase (NEB) in a 10 µl reaction for
37°C for 30 min, then 95°C for 5 min, before cooling to 25°C at a rate of 5°C/min. The
annealed oligos were diluted 1:10 and added to a reaction to both digest PX458 with BbsI
(NEB), and ligate the guide oligos into the plasmid. 1 µl diluted oligo duplex was mixed
with 100 ng PX458, 5 µl RE buffer 2.1 (NEB), 2 µl BbsI, 1 mM ATP, 0.5 µl BSA and 1.875
µl T4 ligase (NEB), making up to 50 µl with water. The sample was incubated at 37°C for
5 min, then 20°C for 5 min, repeated for 20 cycles, followed by 80°C for 20 min.
The vector was transformed into DH5α E. coli by heat shock and the bacteria were plated
onto ampicillin LB plates to select for successfully transformed cells. Single colonies were
picked and cultured in ampicillin-containing LB broth, then the plasmid purified using
Macherey-Nagel NucleoBond Xtra Midi EF kit according to manufacturer’s instructions.
The resulting DNA was sequenced by Sanger sequencing to ensure correct incorporation
of the guide sequence using a primer in the U6 promoter (5’-GAGGGCCTATTTCCCATG
ATTCC-3’).
A17 2lox murine ESCs (courtesy of Michael Kyba) were transfected with two collaborating
plasmids (each expressing a guide RNA targeting either side of the Sp1 DBD coding
region) using the P3 4D-nucleofector kit (Lonza V4XP-3024), according to manufacturer’s
guidelines, and a 4D-Nucleofector™ X Unit. The cells were plated onto gelatine for 24
hours, before isolating GFP-expressing cells by FACS and seeding a proportion as single
cells in a 96-well plate on MEFs.
46
The GFP-positive bulk population was harvested for DNA extraction using the Macheray-
Nagel Nucleospin Tissue kit, according to manufacturer’s protocol. Disruption of the Sp1
gene was assayed using PCR with primers F: 5’-TGGCACACATACCTTTAATCCT-3’ and
R: 5’-ACCTGGGATGAGATAAATGCTG-3’. The product obtained from WT DNA was
1564 bp, whereas successful deletion of the target region resulted in a product of 496 bp.
When a successful targeting event was detected in the bulk population, the single cell
cultures were expanded, splitting into two 96-well plates – one to freeze on MEFs and one
on gelatine for DNA extraction. The cells were washed with PBS, and then incubated at
60°C for 2-3 hours with 50 µl lysis buffer (10 mM Tris-HCl pH7.5, 10 mM EDTA, 10 mM
NaCl, 0.5% Sarcosyl [Sigma], 1 mg/ml proteinase K [Roche]). 150 µl precipitation buffer
(100 mM NaCl, 100% EtOH) was added for 30 min at room temperature, followed by
centrifugation (5 min, 1750 x g). The supernatant was discarded and the DNA pellet
washed with 70% EtOH. The DNA was resuspended in 0.1x TE. PCR was performed
with 0.8 µl DNA from each well and the primer as above, and the products analysed on a
gel to detect clones with disruption at the target site.
2.11 Chromatin Immunoprecipitation (ChIP)
Cells were harvested and washed with PBS, before resuspending in PBS at 3.3x10⁶
cells/ml and double crosslinking. Disuccinimidyl glutarate (DSG) (Sigma) was added at
830 µg/ml and incubated at room temperature for 45 mins on a roller. The cells were
washed four times with PBS and subsequently resuspended in IMDM/20% FBS with 1%
(v/v) formaldehyde (Thermo Scientific Pierce) at 1 ml/106 cells. The cells were incubated
on a roller for 10 min and the reaction quenched with the addition of a tenth of the volume
2 M glycine. The cells were then washed twice with ice-cold PBS.

47
To isolate the chromatin, the cell pellet was resuspended in ice-cold buffer A (10 mM
HEPES pH 8.0, 10 mM EDTA, 0.5 mM EGTA, 0.25% Triton X-100, 1:1000 PIC [Roche
UK] and 0.1 mM PMSF) at 1x10⁷ cells/ml and rotated at 4°C for 10 min. The sample was
centrifuged (500 x g, 5 min, 4°C) and pelleted nuclei were resuspended in buffer B (10
mM HEPES pH 8.0, 200 mM NaCl, 1 mM EDTA, 0.5 mM EGTA, 0.01% Triton X-100,
1:1000 PIC and 0.1 mM PMSF ) at 1x10⁷ cells/ml, followed by rotation for 10 min at 4°C.
The nuclei were pelleted again (at 500 x g, 5 min, 4°C) and resuspended in ice-cold IP
buffer I (25 mM Tris-HCl pH 8.0, 150 mM NaCl, 2 mM EDTA, 1% Triton X-100, 0.25%
SDS, 1:1000 PIC and 0.1 mM PMSF) at 2x10⁷ cells/ml.
To fragment the chromatin, the sample was sonicated using Diagenode Bioruptor for the
appropriate number of cycles (high 240 W, 30 sec on, 30 sec off, 4°C) for the cell type.
The sample was centrifuged (16,000 x g, 10 min, 4°C) and the supernatant diluted by
added 2 volumes of ice-cold IP buffer II (25 mM Tris-HCl pH 8.0,150 mM NaCl, 2 mM
EDTA, 1% Triton X-100, 7.5% glycerol, 1:1000 PIC and 0.1 mM PMSF).
For immunoprecipitation (IP), 15 µl Dynabeads-Protein G (Invitrogen) was washed with
0.1 M citrate-phosphate buffer pH5 (CP buffer) by magnetic separation. The beads were
resuspended in 15 µl CP buffer, plus 0.5% BSA (v/w) and 2 µg primary antibody (Table
2.6), then rotated at 4°C for 1-2 hours to allow the antibody to bind the Dynabeads-Protein
G. The mixture was washed with CP buffer to remove non-bound antibodies and the
beads resuspended in 15 µl CP buffer/BSA. The antibody-Dynabeads were added to the
chromatin (1-2x10⁶ cells per IP) and rotated at 4°C overnight (10% of the chromatin
material was taken as an input control).
The sample was then washed by magnetic separation with: wash buffer 1 (150 mM NaCl,
1% Triton X-100, 20 mM Tris-HCl, 0.1% SDS and 2mM EDTA), twice with wash buffer 2

48
(500 mM NaCl,1% Triton X-100, 20 mM Tris-HCl, 0.1% SDS and 2mM EDTA), LiCl buffer
(250 mM LiCl , 0.5% NP-40, 10 mM Tris-HCl pH 8.0, 0.5% Na-deoxycholate and 1 mM
EDTA) and twice with TE/NaCl buffer (50 mM NaCl,10 mM Tris-HCl pH 8.0 and 1 mM
EDTA). The DNA was eluted from the beads with 100 µl elution buffer (1% SDS, 100mM
NaHCO3) for 30 min with shaking. Reverse crosslinking was performed by adding 0.2 M
NaCl and 25 µg Proteinase K, and incubating overnight at 65°C. The input control was
incubated with 10 µg RNaseA for 30 min at 37°C and made up to 100 µl with 1% SDS
(w/v), 50 µg Proteinase K and water, before also reverse crosslinking at 65°C. The DNA
was then purified using Agencourt AMPure beads (Beckman Coulter), according to
manufacturer’s protocol, and eluted in 100 µl 0.1 x TE.
The resulting DNA was assessed by qPCR. The results were normalised to the values
obtained with the input control and at a gene-poor control region (Chr2). The enrichment
was analysed using primers at known binding sites (positive control regions), compared to
regions that are not bound by the protein of interest (negative controls) (Table 2.7). qPCR
validations of Sp1 and Sp3 ChIPs are shown in Figure 2.1 and Figure 2.2, respectively.
Table 2.6 – Antibodies used in ChIP
Antibody Company Product number
Sp1 Millipore 17-601
Sp3 Santa Cruz sc-644x

49
Table 2.7 – Primers used in Sp1 and Sp3 ChIP qPCR validations
Primer region Forward (5’-3’) Reverse (5’-3’)
Chr2 AGGGATGCCCATGCAGTCT CCTGTCATCAGTCCATTCTCCAT
Sp1 promoter CGAGAGAGCGAGTCCTACCA TAATCCCCGCCCCTTATCTA
Flad1 promoter GCCAGGCCCCTATTTTTACT ATCGCGGAGCTAGAGGAAAT
Caprin2 promoter CGGACTGTGGTGGTCTAGC GCCTATTTCCGGTCCTCTG
Sp1 gene body GTGCATTGGGTACTTCAGGGA AGGATGTCTTACCTGGGGTGT
Itga2b gene body CAGCGACACGTTGAGGCTTA CCCAGCACAGAGACAGATAGC

50
Figure 2.1 – Sp1 ChIP-qPCR shows enrichment at known Sp1 binding regions
Sp1 ChIP was performed in ESC and Flk1+ cells of each of the Sp1 mutant cell clones, followed by qPCR at known Sp1-binding regions and negative control regions. The enrichment is shown as normalised to input and Chr2 (a gene-poor control region). Libraries were made from this ChIP and sequenced to determine Sp1 binding sites across the genome.

51
Figure 2.2 – qPCR validation of Sp3 ChIP
Sp3 ChIP was performed in ESC and Flk1+ cells of each of the Sp1 mutant cell clones. qPCR was performed using primers at known Sp1-binding regions and negative control regions, and the results normalised to input and Chr2 (a gene-poor control region). ChIP-seq libraries were then made.

52
2.12 ChIP-sequencing (ChIP-seq) library preparation
ChIP-seq libraries were prepared using the KAPA Hyper Prep Kit (Illumina Platforms),
following the manufacturer’s recommended protocol. Briefly, 50 µl of the ChIP-obtained
DNA (re-purified using Agencourt AMPure beads to elute in the correct volume, if
required) was incubated with 7 µl End Repair and A-tailing buffer and 3 µl of the
corresponding enzyme at 20°C for 30 min and 65°C for 30 min. To ligate the sequencing
adapter, 30 µl ligation buffer, 5 µl DNA ligase, 5 µl adapter (diluted 1:6) and 5 µl water
were added and incubated at 20°C for 15 min. The DNA was purified using 1.2x
Agencourt AMPure XP beads (Beckman Coulter), according to manufacturer’s
instructions, and eluted in 20 µl 10 mM Tris-HCl pH8. Half of the library was then
amplified by adding 12.5 µl 2x KAPA HiFi HotStart ReadyMix and 5 µl 10x primer mix and
incubated at 98 for 45 sec, an appropriate number of cycles (often 16 cycles) of 98°C for
15 sec, 60°C for 30 sec, 72°C for 30 sec, and then finally 72°C for 1 min. The remaining
half was reserved if a suboptimal number of cycles was used. The reaction was then
purified using AMPure XP reagent. Size selection was performed by running the sample
on a 2% agarose gel, separating the DNA fragments by electrophoresis and isolating the
~250-450bp fragments by cutting them out of the gel and purifying using the Qiagen
MinElute Gel Extraction kit. Finally, libraries were quantified by Kapa library quantification
kit (Kapa Biosystems) and run in a pool of indexed libraries on a HiSeq 2500 (Illumina).
2.13 ATAC-seq
Assay for transposable accessible chromatin, followed by sequencing (ATAC-seq), was
performed based on Buenrostro et al., 2015 (Buenrostro et al., 2015a). Briefly, 5x10⁴ cells
were pelleted by centrifugation (500 x g, 5 min, 4°C) and resuspended in a transposition
reaction mix consisting of 0.27 µl 1 x digitonin (Promega G9441), 25 µl 2 x Tagment DNA

53
Buffer (Illumina #FC-121-1030), 2.5 µl Tn5 Transposase (Illumina #FC-121-1030) and
22.23 µl water. The sample was incubated at 37°C for 30 min with shaking at 300 rpm.
The Qiagen MinElute Reaction Clean up Kit was used to purify the DNA and elute in 11 µl
EB buffer. To amplify the transposed DNA fragments, the following were combined: 10 µl
transposed DNA, 10 µl water, 25 µl NEBNext High-Fidelity 2x PCR Master Mix (New
England Biolabs) and 2.5 µl each of 25 µM customised Nextera PCR primer 1 and 2
(sequences as described in Buenrostro et al., 2013) (Buenrostro et al., 2013). The
following PCR conditions were used: 72°C for 5 min, 98 °C for 30 sec, and thermocycling
at 98°C for 10 sec, 63°C for 30 sec and 72°C for 1 min. In order to reduce GC and size
bias in the PCR, the reaction was monitored to stop amplification before saturation. The
PCR was initially performed for 5 cycles and an aliquot of 5 µl was taken (with the
remaining kept on ice) and analysed by qPCR by adding 5 µl NEBNext High-Fidelity 2x
PCR Master Mix, 4.44 µl water, 0.06 µl 100x Sybr Green and 0.25 µl each of 25 µM
customised Nextera PCR primer 1 and 2. The qPCR was performed for 30 cycles and the
number of cycles that corresponded to a third of the maximum fluorescence intensity
calculated (accounting for fluorescence from water control reaction). The remaining 45 µl
of PCR sample was then ran for the appropriate number of cycles in the reaction: 98°C for
30 sec, then thermocycling at 98°C for 10 sec, 63°C for 30 sec and 72 °C for 1 min. The
reaction was purified with the Qiagen PCR purification kit, eluting in 15 µl EB, and
subsequently with 1.2x AMPure XP beads (Beckman Coulter), according to
manufacturer’s recommendations, eluting in 20 µl 0.1x TE. The libraries were validated
by running on Bioanalyzer 2100 (Agilent) and sequenced on an Illumina HiSeq 2500.
An illustration of how ATAC-seq works to elucidate regions of open chromatin is shown in
Figure 2.3.
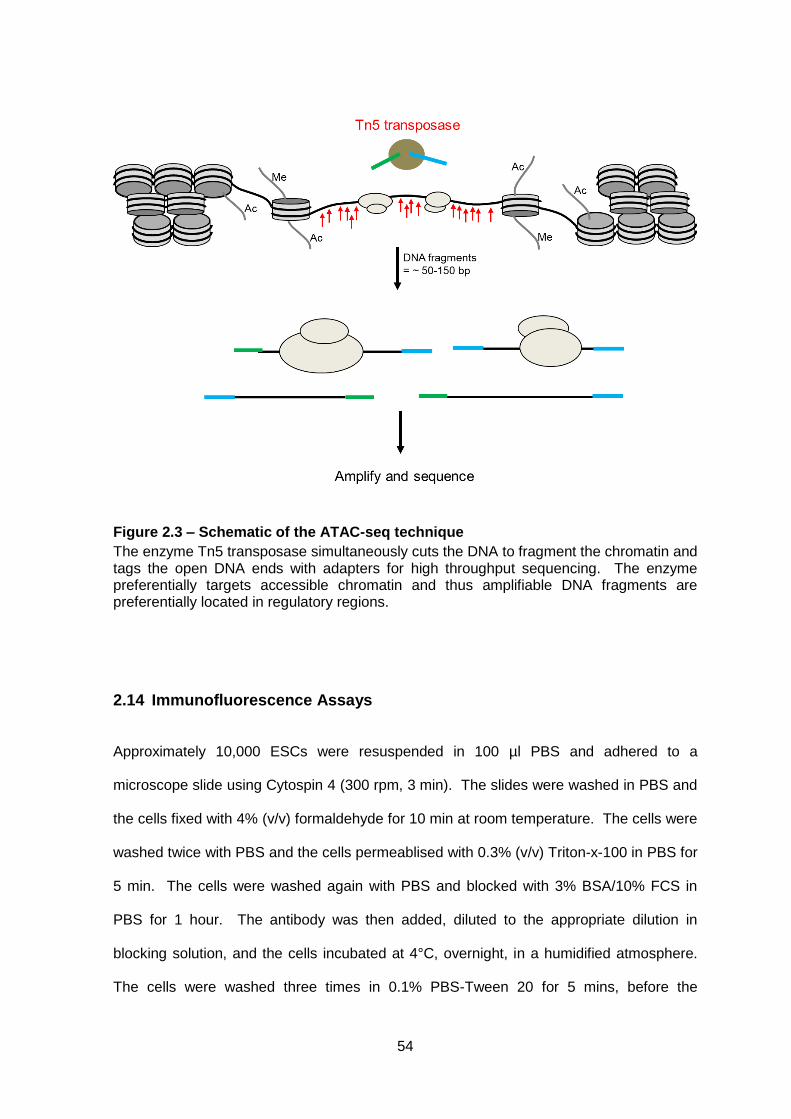
54
Figure 2.3 – Schematic of the ATAC-seq technique
The enzyme Tn5 transposase simultaneously cuts the DNA to fragment the chromatin and tags the open DNA ends with adapters for high throughput sequencing. The enzyme preferentially targets accessible chromatin and thus amplifiable DNA fragments are preferentially located in regulatory regions.
2.14 Immunofluorescence Assays
Approximately 10,000 ESCs were resuspended in 100 µl PBS and adhered to a
microscope slide using Cytospin 4 (300 rpm, 3 min). The slides were washed in PBS and
the cells fixed with 4% (v/v) formaldehyde for 10 min at room temperature. The cells were
washed twice with PBS and the cells permeablised with 0.3% (v/v) Triton-x-100 in PBS for
5 min. The cells were washed again with PBS and blocked with 3% BSA/10% FCS in
PBS for 1 hour. The antibody was then added, diluted to the appropriate dilution in
blocking solution, and the cells incubated at 4°C, overnight, in a humidified atmosphere.
The cells were washed three times in 0.1% PBS-Tween 20 for 5 mins, before the
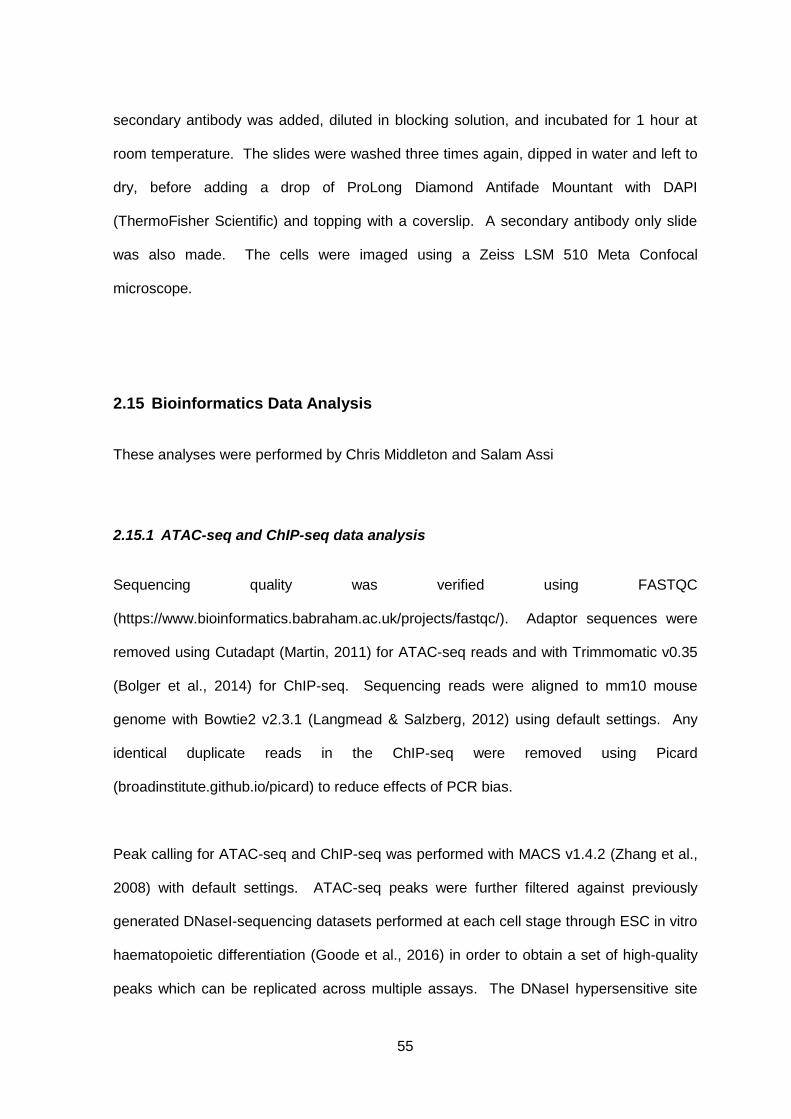
55
secondary antibody was added, diluted in blocking solution, and incubated for 1 hour at
room temperature. The slides were washed three times again, dipped in water and left to
dry, before adding a drop of ProLong Diamond Antifade Mountant with DAPI
(ThermoFisher Scientific) and topping with a coverslip. A secondary antibody only slide
was also made. The cells were imaged using a Zeiss LSM 510 Meta Confocal
microscope.
2.15 Bioinformatics Data Analysis
These analyses were performed by Chris Middleton and Salam Assi
2.15.1 ATAC-seq and ChIP-seq data analysis
Sequencing quality was verified using FASTQC
(https://www.bioinformatics.babraham.ac.uk/projects/fastqc/). Adaptor sequences were
removed using Cutadapt (Martin, 2011) for ATAC-seq reads and with Trimmomatic v0.35
(Bolger et al., 2014) for ChIP-seq. Sequencing reads were aligned to mm10 mouse
genome with Bowtie2 v2.3.1 (Langmead & Salzberg, 2012) using default settings. Any
identical duplicate reads in the ChIP-seq were removed using Picard
(broadinstitute.github.io/picard) to reduce effects of PCR bias.
Peak calling for ATAC-seq and ChIP-seq was performed with MACS v1.4.2 (Zhang et al.,
2008) with default settings. ATAC-seq peaks were further filtered against previously
generated DNaseI-sequencing datasets performed at each cell stage through ESC in vitro
haematopoietic differentiation (Goode et al., 2016) in order to obtain a set of high-quality
peaks which can be replicated across multiple assays. The DNaseI hypersensitive site
56
peaks were merged across all cell types to identify any possible regions of open
chromatin. Overlaps between ATAC-seq and DNaseI-seq were accepted if the summit of
the ATAC-seq peak was positioned between the start and end coordinates of a peak in
the merged DNaseI-seq dataset. ChIP-seq peaks were filtered against the ATAC-seq
peaks using BEDTools and Homer (Heinz et al., 2010) to generate a set of high
confidence ChIP-seq peaks representing a binding site in an open chromatin region.
Peaks were annotated to gene promoters if within 2 kb of a TSS and as distal, otherwise.
Peaks were annotated to the closest gene using Homer AnnotatePeaks.pl (Heinz et al.,
2010).
To perform clustering analysis, the ATAC-seq datasets were first merged to identify any
potential regions of open chromatin. The peaks were defined as being the same open
region between datasets if the summits were within 200 bp of each other using BEDTools
v2.25.0 intersect function. The peaks were normalised by total read depth within each
sample. Pearson correlation coefficients were calculated between samples using the log2
of the normalised read counts of each peak. Hierarchical clustering of ATAC-seq peaks
was performed with average linkage clustering of the Euclidean distances using R.
Heatmaps were generated using Mev (Saeed et al., 2006) or with R. ChIP data was
clustered in the same way.
The read count across the summit over a 2 kb window was measured using Homer
AnnotatePeaks.pl function with the wig file generated by MACS. Average profiles of the
average read counts across the 2 kb window of the peak were plotted using R. Density
plots were created by first calculating the fold-difference of the read count within peaks
between each dataset being compared. The fold-difference was calculated by counting
the number of mapped reads in a 400 bp window centred on the peak summit, and then
normalised by total tag count across all peaks. Peaks were then ranked according to this

57
fold-difference, and the read density was calculated in a 2kb window surrounding the peak
summits. The density plot was then plotted using Java TreeView (Saldanha, 2004).
De novo motif analysis was performed with the Homer FindMotifsGenome.pl script. Motifs
were filtered based on similarity to the consensus motif and presence in at least 2% of
sites with a significant p value (p≤0.01). Motif enrichment plots were made by plotting the
position of the motif across the 2 kb window in the union of peaks used in the density plot.
2.15.2 RNA-seq data analysis
Sequencing quality was verified using FASTQC
(https://www.bioinformatics.babraham.ac.uk/projects/fastqc/). Adaptor sequences and
low-quality bases were removed from the raw sequencing data using Trimmomatic v0.35
(Bolger et al., 2014). RNA-Seq paired-end reads were aligned to the mm10 mouse
genome build using STAR (Dobin & Gingeras, 2002) with the default parameters.
Separate density tracks for the positive and negative strand were generated for RNA-Seq
data using bedtools (http://bedtools.readthedocs.io/en/latest/) and were uploaded to the
UCSC genome browser. Fragments per kilobase of transcript per million mapped reads
(FPKM) values for each gene were calculated using Cufflinks (http://cole-trapnell-
lab.github.io/cufflinks/) and differentially expressed genes were determined using Cuffdiff
function (using individual replicates). All genes with FPKM ≥ 1 in at least one condition
were considered. The replicates were merged using Cuffdiff and the average FPKM value
across replicates was used as a summary metric in the clustering analyses and
subsequent plotting of heatmaps to show how the expression between cell types clustered
(simplifying the heatmaps due to the large number of samples/conditions in the study).
Note the high correlation between replicates enabled them to be merged (see Results
chapter 3.2.1 for replicate correlations).

58
RNA-seq data between samples was normalised using the entire distribution of FPKM
values for all genes, rather than just those of housekeeping genes to avoid introducing
false variation between samples. The RNA-seq data was validated by checking the
expression of developmentally-regulated genes were expressed as expected across the
course of differentiation (e.g. Fli1, Runx1, Oct4) and checking if differentially expressed
genes (found by RNAseq) are also differentially expressed by manual qPCR (both
approaches discussed in more detail in results section 3.2.1).
The correlation between any two samples was obtained with Pearson correlation
coefficient of log2 FPKM values over all genes. A correlation matrix was generated for all
the samples and hierarchically clustered using Mev (Saeed et al., 2006).
For comparisons in gene expression between samples within the same cell type, a two-
fold cut off was used to classify deregulated genes. For changes in expression between
samples of genes that are differentially expressed between cell stages of differentiation,
deregulated genes were identified by a two-fold change between clone and WT if the
gene is differentially expressed by a two-fold change between cell stages in both the clone
or WT cells, while only 1.5-fold change used if the change was at least two-fold in either
WT or clone between stages. This was identified as the most significant threshold to
consider.
Clustering of gene expression was carried out on log2 FPKM for all expressed genes and
on fold-changes for genes associated with fold changes described above. Hierarchical
clustering was used with Euclidean distance and average linkage clustering. Heatmaps
were generated using Mev (Saeed et al., 2006). Gene expression fold changes were
grouped according to patterns of expression throughout differentiation. Twelve clusters of
expression patterns were identified for each differentiated stage – this covers all the ways

59
the gene expression between cell stages could change compared with WT (e.g. gene is
upregulated in both WT and Sp1 mutant, more upregulated in Sp1 mutant, less
downregulated in Sp1 mutant etc.).
Gene ontology analysis was performed using DAVID v6.8 (Huang et al., 2008). The
GSEA software (Subramanian et al., 2005) was used to perform gene set enrichment
analysis on groups of genes.

60
3. RESULTS
3.1 Knockout of Sp1 in ESCs disrupts haematopoietic specification
3.1.1 Targeting of Sp1 in ESCs by the CRISPR-Cas9 system
Deletion of the DBD-coding region of the Sp1 gene in mouse ESCs has been previously
shown, by use of the in vitro differentiation system, to lead to a failure in terminal
differentiation of the haematopoietic lineage (Gilmour et al., 2014). However, the precise
role of Sp1 in haematopoietic specification and the mechanism behind the impaired
haematopoiesis in Sp1 DBD-deficient ESCs is still not well understood. Additionally, there
is no complete Sp1 knockout model available, which could help to elucidate the function of
Sp1 in haematopoiesis. Therefore, to further investigate these questions, we aimed to
recapitulate the previous model by deleting the DBD-coding region of Sp1 in A17 2lox
murine ESCs, as well as develop a complete Sp1 knockout ESC model.
A number of genome editing techniques have been developed over recent years,
including zinc-finger nucleases (ZFNs) and transcription activator-like effector nucleases
(TALENs) that involve generating unique protein DNA-binding domains tethered to a
nuclease domain. However, the CRISPR-Cas9 system is becoming more widely used
due to its high efficiency, specificity and ease compared to ZFNs and TALENs. The
CRISPR-Cas9 technique (reviewed by (Zhang et al., 2014)) allows targeted
knockout/mutation with the use of a vector expressing the endonuclease Cas9 and an
RNA molecule complementary to the target site. The ‘guide’ RNA forms a hybrid structure
with a transactivating crRNA (tracrRNA), which is recognised by Cas9. Subsequently,
Cas9 is directed to the DNA target sequence, where, providing there is a 5’ protospacer
adjacent motif (PAM) present, Cas9 cleaves the DNA to cause a double-strand break.

61
Thus, the combination of two guide RNA molecules can give deletion of the intervening
DNA. The DNA double-strand break can also be repaired by error-prone non-homologous
end-joining (NHEJ), which can introduce random mutations (Figure 3.1A).
Guide RNAs were initially designed to target the DBD-coding region of Sp1 – at the start
of exon 5 and at the end of the coding region (after exon 6). PCR primers were designed
to isolate the target region and enable screening of the treated cells (Figure 3.1B). Two
guide sequences were initially identified at each site (guides 1 and 3 at the start of the
DBD-coding region; guides 14 and 18 at the end) and the efficiency to target Cas9 was
assessed using an in vitro CRISPR-Cas9 system (Agilent). The target region was
amplified from genomic DNA by PCR, before incubating with the RNA guides in two
alternative combinations and the Cas9 protein. DNA cutting efficiency at the target sites
was analysed from the resulting digestion pattern. The results showed that a combination
of guides 1 and 18, as well as guides 3 and 14, were predominantly targeting to only one
site. However, the major product of the alternate guide pairing was the desired fragment
generated by cutting at both target sites (Figure 3.1C) and thus, this guide combination
was used in in vivo experiments.
The guide sequences were cloned into PX458, a Cas9-GFP expressing plasmid, and
were expressed under the control of the U6 promoter. Upon transfection of the pairs of
plasmids, the A17 2lox ESCs were sorted for GFP expression and the bulk populations
were analysed by PCR. A successful gene targeting event was detected in the 1+14
population (Figure 3.1D). The cells were further sorted as single cells and the expanded
clones screened for Sp1 mutations by PCR.
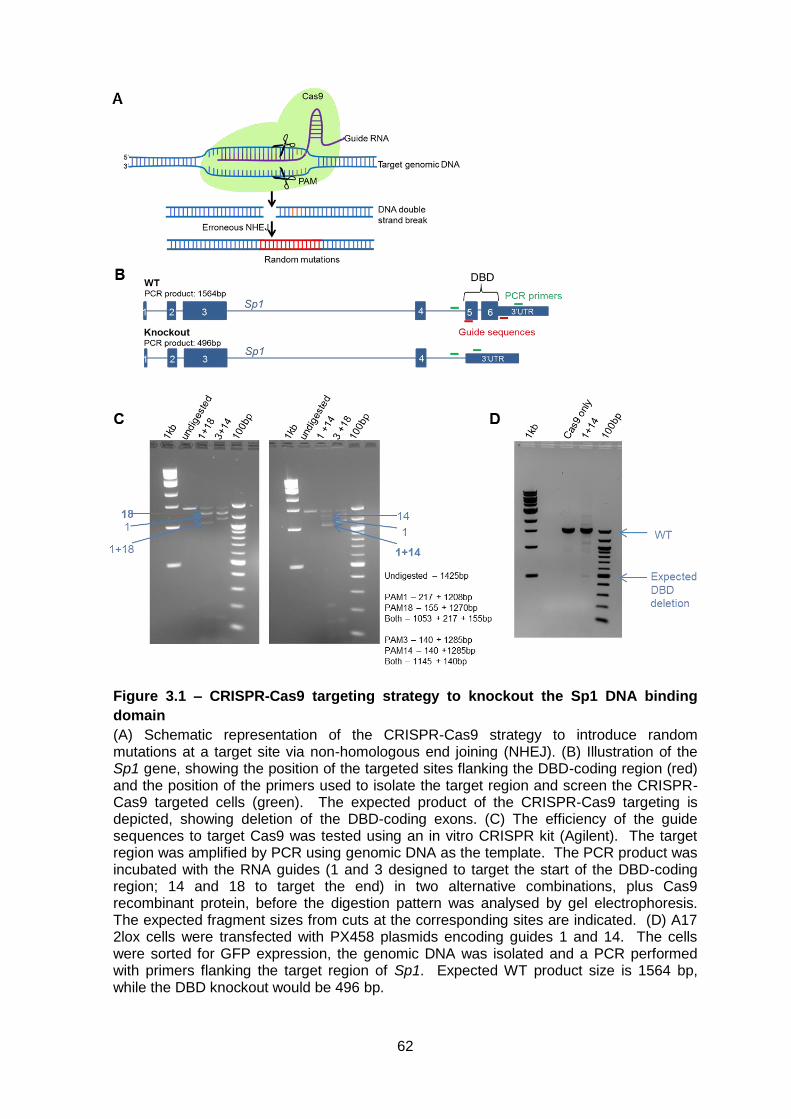
62
Figure 3.1 – CRISPR-Cas9 targeting strategy to knockout the Sp1 DNA binding
domain
(A) Schematic representation of the CRISPR-Cas9 strategy to introduce random mutations at a target site via non-homologous end joining (NHEJ). (B) Illustration of the Sp1 gene, showing the position of the targeted sites flanking the DBD-coding region (red) and the position of the primers used to isolate the target region and screen the CRISPR-Cas9 targeted cells (green). The expected product of the CRISPR-Cas9 targeting is depicted, showing deletion of the DBD-coding exons. (C) The efficiency of the guide sequences to target Cas9 was tested using an in vitro CRISPR kit (Agilent). The target region was amplified by PCR using genomic DNA as the template. The PCR product was incubated with the RNA guides (1 and 3 designed to target the start of the DBD-coding region; 14 and 18 to target the end) in two alternative combinations, plus Cas9 recombinant protein, before the digestion pattern was analysed by gel electrophoresis. The expected fragment sizes from cuts at the corresponding sites are indicated. (D) A17 2lox cells were transfected with PX458 plasmids encoding guides 1 and 14. The cells were sorted for GFP expression, the genomic DNA was isolated and a PCR performed with primers flanking the target region of Sp1. Expected WT product size is 1564 bp, while the DBD knockout would be 496 bp.
63
3.1.2 Generation of ESC lines targeted deletions in the Sp1 locus
ESC clones that had been successfully targeted to disrupt the Sp1 gene were expanded
and deletions were verified by PCR analysis (Figure 3.2A). The clones were further
characterised by qPCR to analyse Sp1 gene expression using primers in the target region
(exons 5-6) and upstream in the gene, which should be unaffected by CRISPR-Cas9
activity (exons 3-4) (Figure 3.2B). The Sp1 protein expression was also analysed by
Western blotting (Figure 3.2C). Although PCR analysis of clone 12 detected the presence
of a mutant allele (in addition to a wildtype allele), there was no change in the Sp1 protein;
therefore clone 12, along with clone 2 which appeared similar to WT in all analyses, was
excluded from further investigations. The PCR products derived from DNA of each of the
remaining clones were integrated into the pBlueScript plasmid to allow sequencing of the
individual alleles, with the resulting mutations illustrated in Figure 3.2D and the full
sequence information in Supplementary Data 5.1.
Clone 4 was the only clone that carried the desired DBD knockout (and so termed
Sp1del/del): the DNA sequence corresponded to accurate cutting at the targeted sites and
high fidelity repair, and Western blotting showed it expressed only a truncated Sp1 protein
(of a size corresponding to a DBD deletion). Interestingly, there was a much lower level of
Sp1 protein compared to in WT cells, suggesting the truncated protein is less stable. A
similar phenomenon was seen with the previous Sp1 DBD-deficient model (Gilmour et al.,
2014), which gave us confidence that this was indeed the correct protein. Furthermore,
while no Sp1 gene expression was detected in exons 5-6, as expected, there was
unusually high expression of exons 3-4 compared to WT cells, suggesting the cell may be
trying to compensate for the lack of a functional Sp1 protein.
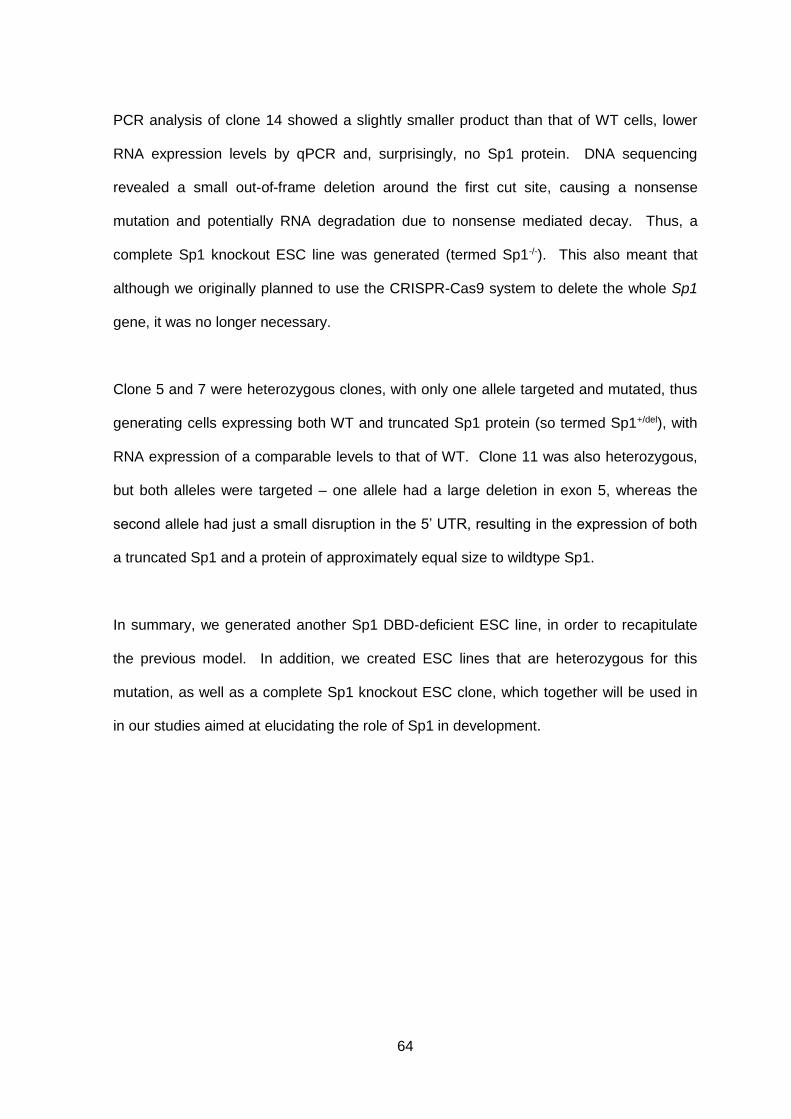
64
PCR analysis of clone 14 showed a slightly smaller product than that of WT cells, lower
RNA expression levels by qPCR and, surprisingly, no Sp1 protein. DNA sequencing
revealed a small out-of-frame deletion around the first cut site, causing a nonsense
mutation and potentially RNA degradation due to nonsense mediated decay. Thus, a
complete Sp1 knockout ESC line was generated (termed Sp1-/-). This also meant that
although we originally planned to use the CRISPR-Cas9 system to delete the whole Sp1
gene, it was no longer necessary.
Clone 5 and 7 were heterozygous clones, with only one allele targeted and mutated, thus
generating cells expressing both WT and truncated Sp1 protein (so termed Sp1+/del), with
RNA expression of a comparable levels to that of WT. Clone 11 was also heterozygous,
but both alleles were targeted – one allele had a large deletion in exon 5, whereas the
second allele had just a small disruption in the 5’ UTR, resulting in the expression of both
a truncated Sp1 and a protein of approximately equal size to wildtype Sp1.
In summary, we generated another Sp1 DBD-deficient ESC line, in order to recapitulate
the previous model. In addition, we created ESC lines that are heterozygous for this
mutation, as well as a complete Sp1 knockout ESC clone, which together will be used in
in our studies aimed at elucidating the role of Sp1 in development.

65
Figure 3.2 – Generation of ESC lines lacking the Sp1 DBD, heterozygous cells
expressing WT Sp1 and DBD-deficient Sp1, and a complete Sp1 null line.
(A) ESCs were transfected with Cas9-GFP plasmids, also expressing guides sequences 1 and 14 to target the Sp1 DBD. Successfully targeted clones were analysed for genomic DNA mutations by PCR. (B) Sp1 protein levels in the clones were analysed by Western blotting (asterisk indicates a mutant phenotype) (n=3). (C) RNA expression levels of Sp1 were analysed by qPCR using primers spanning exons 5 and 6 (the region targeted for deletion), and exons 3 and 4 (which should be unaffected). Expression levels were normalised to those of WT cells. Error bars represent standard deviation (n=3). Clone 4
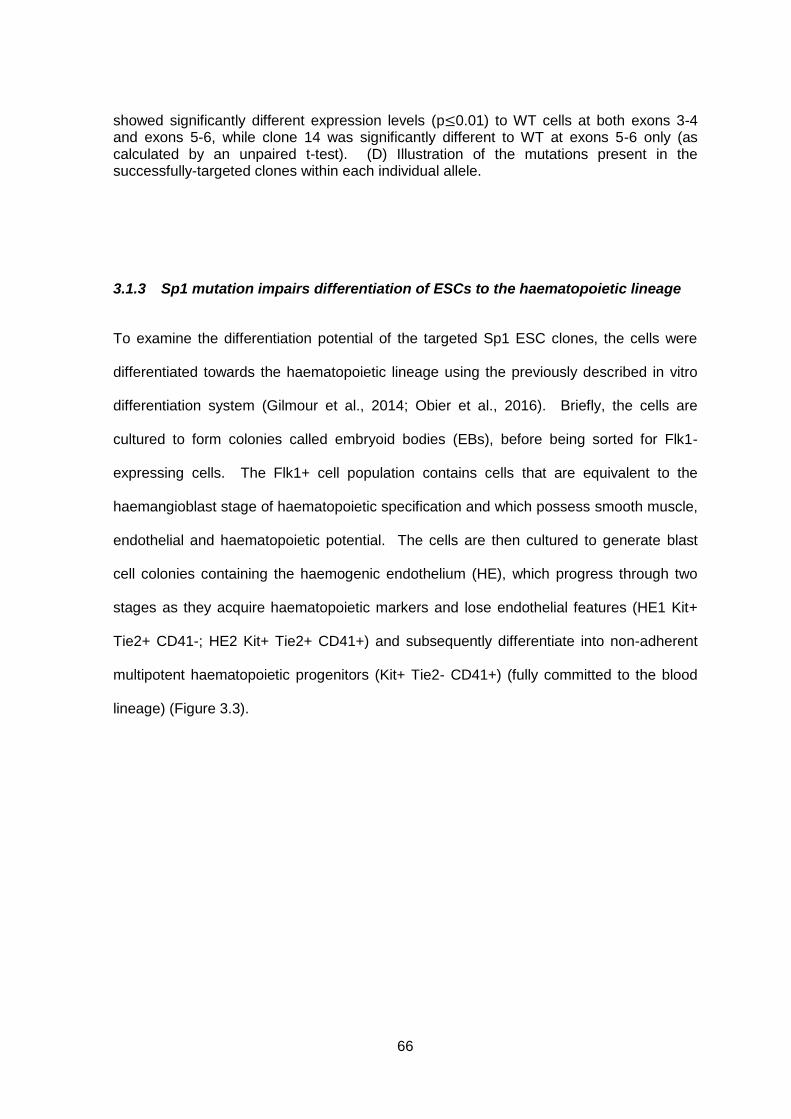
66
showed significantly different expression levels (p≤0.01) to WT cells at both exons 3-4 and exons 5-6, while clone 14 was significantly different to WT at exons 5-6 only (as calculated by an unpaired t-test). (D) Illustration of the mutations present in the successfully-targeted clones within each individual allele. 3.1.3 Sp1 mutation impairs differentiation of ESCs to the haematopoietic lineage
To examine the differentiation potential of the targeted Sp1 ESC clones, the cells were
differentiated towards the haematopoietic lineage using the previously described in vitro
differentiation system (Gilmour et al., 2014; Obier et al., 2016). Briefly, the cells are
cultured to form colonies called embryoid bodies (EBs), before being sorted for Flk1-
expressing cells. The Flk1+ cell population contains cells that are equivalent to the
haemangioblast stage of haematopoietic specification and which possess smooth muscle,
endothelial and haematopoietic potential. The cells are then cultured to generate blast
cell colonies containing the haemogenic endothelium (HE), which progress through two
stages as they acquire haematopoietic markers and lose endothelial features (HE1 Kit+
Tie2+ CD41-; HE2 Kit+ Tie2+ CD41+) and subsequently differentiate into non-adherent
multipotent haematopoietic progenitors (Kit+ Tie2- CD41+) (fully committed to the blood
lineage) (Figure 3.3).
67
Figure 3.3 – In vitro model of embryonic haematopoiesis
Schematic of in vitro ESC differentiation to mimic embryonic haematopoiesis. ESCs are maintained on embryonic fibroblasts in LIF-containing medium before beginning culture as embryoid bodies (EBs) for 3.75 days. Flk1+ cells, which contain haemangioblast cells, are sorted from dissociated EBs and, during a blast culture of 2-3 days, give rise to smooth muscle and endothelial lineages, as well as haematopoietic progenitors via a haemogenic endothelium (HE) intermediate stage.
The cells were analysed at the Flk1+ stage for the proportion of Flk1+ cells in the EBs by
cell staining and flow cytometry. The blast culture was analysed by staining for Kit, CD41
and Tie2, followed by flow cytometry (Figure 3.4). The results show that the differentiation
of the heterozygous clones was largely unaffected: Sp1+/del(5) and Sp1+/del(7) cells
differentiated to give a good proportion of Flk1+ cells in the EB culture and further
differentiated to form both HE and progenitors at levels comparable to that of wildtype
cells. However, the differentiation of Sp1del/del cells was impaired, generating consistently
lower levels of Flk1+ cells than WT cells, but generally forming a similar proportion of HE
and progenitors in the blast culture. A complete loss of Sp1 caused a severe impairment
in haematopoietic specification. Sp1-/- cells failed to differentiate to the Flk1+ stage,
forming a very low number of Flk1+ cells, suggesting Sp1 is essential for this stage of
haematopoiesis. When the few Flk1+ cells were taken to the next stage of differentiation,
while the blast culture looked poor and the proportion of haematopoietic cells was lower
68
than for WT, Sp1-/- cells were capable of forming HE and progenitors. These results show
the importance of Sp1 in the process of haematopoietic specification. However, as Sp1-/-
cells are unable to generate Flk1+ cells, it may be that Sp1 is essential at an early stage
of the process, particularly in mesoderm formation (as not all Flk1+ are haemangioblasts).
These results also suggest the Sp1 DBD-deficient cells (and indeed, the previously used
model) likely still possess some Sp1 function – i.e. they are hypomorphs.

69
Figure 3.4 – Differentiation of Sp1 mutant cells is impaired
In vitro differentiation was performed with wildtype ESCs and with each of the CRISPR-generated Sp1 mutant clones. At the EB stage, the proportion of cells expressing Flk1 (a marker of the haemangioblast) was analysed by staining and flow cytometry (top plot). After three days blast culture, the cell population was analysed by staining for Kit, CD41 and Tie2. The cells were first gated for Kit expression (indicating cells with haematopoietic potential), before analysing the relative levels of CD41 and Tie2, which showed the proportion of HE and progenitors in the blast culture. n=4, except for Sp1-/- blast culture, which was only performed once due to low numbers of Flk1+ cells.

70
Previously, it was found that Sp1 DBD-deficient ESCs were impaired in terminal
haematopoietic differentiation (Gilmour et al., 2014). To confirm this finding with the
Sp1del/del ESC clone, and to investigate the terminal differentiation potential of the Sp1-/-
cells, macrophage release assays were performed with each of the Sp1 clones (Figure
3.5). Briefly, ESCs were cultured in methylcellulose medium, supplemented with
cytokines to promote macrophage differentiation. Consistent with the results from the in
vitro differentiation experiments, the heterozygous clones efficiently formed macrophages,
at similar levels to that of WT cells. Sp1del/del cells were significantly impaired in
macrophage differentiation, whereas Sp1-/- cells were unable to form macrophages.
These findings support those of previous study (Gilmour et al., 2014), which showed
Sp1del/del cells can form haematopoietic progenitors, but fail to terminally differentiate to
macrophages. However, the stages of haematopoiesis cannot be distinguished in the
macrophage release assay. Therefore, it may be that the reduction in macrophage
formation in the Sp1del/del and Sp1-/- cells stems from the defect in these cells to form Flk1+
cells.. Again, Sp1del/del cells show a less severe phenotype than Sp1-/- cells, suggesting
they retain some Sp1 function.

71
Figure 3.5 – Absence of Sp1 abolishes the ability to terminally differentiate into
mature haematopoietic cells
Each of the Sp1 mutant ESC clones were placed in a macrophage release assay. EBs were allowed to form in methylcellulose under macrophage-promoting conditions. Sp1−/− and Sp1del/del cells showed a reduced capacity to form macrophage-releasing Ebs, while heterozygous cells that still contain a WT Sp1 allele are unaffected. Error bars represent s.d. (n=3). ** indicates a p≤0.01, as calculated by an unpaired t-test with Bonferronni correction.

72
3.1.4 Haematopoiesis in the Sp1 mutant clones can be rescued with expression of
WT Sp1
To verify the observed phenotypic effects were due to the relating Sp1 mutations and not
off-target effects of CRISPR-Cas9 editing, Sp1del/del and Sp1-/- ESCs were transfected with
a PiggyBac vector containing the WT human SP1 gene with a mCherry reporter gene
(section 2.8). The SP1-2A-mCherry gene (under the control of the constitutive PGK
promoter) was randomly integrated into the genome and the cells sorted for mCherry
expression, before individual clones were isolated. SP1 expression was identified in two
clones with a Sp1del/del background and one clone of Sp1-/-. The gene expression was
verified by qPCR (Figure 3.6A) and the protein expression was analysed by Western
blotting, showing expression of a WT Sp1 protein in each PiggyBac-SP1 clone, albeit at
lower levels than normally found in WT cells (Figure 3.6B).
The differentiation potential of the PiggyBac-transfected SP1-expressing clones was
investigated using the in vitro differentiation system. All of the clones generated
consistently higher levels of Flk1+ cells than the corresponding Sp1 mutant cells (Figure
3.6C) (see Results 1.1.3 for differentiation profiles of the original clones and
Supplementary Figure 5.1 for Flk1+ levels of WT cells compared with Sp1 mutant clones).
They could also differentiate further to HE and progenitors in the blast culture (Figure
3.6D). Thus, expression of a WT Sp1 protein was able to rescue the impairment in
haematopoietic specification in Sp1del/del and Sp1-/- cells.
This result confirms that the defects in haematopoietic differentiation in Sp1del/del and Sp1-/-
cells are caused by their corresponding Sp1 mutations, rather than any off-target effects
of the CRISPR-Cas9 targeting system.

73
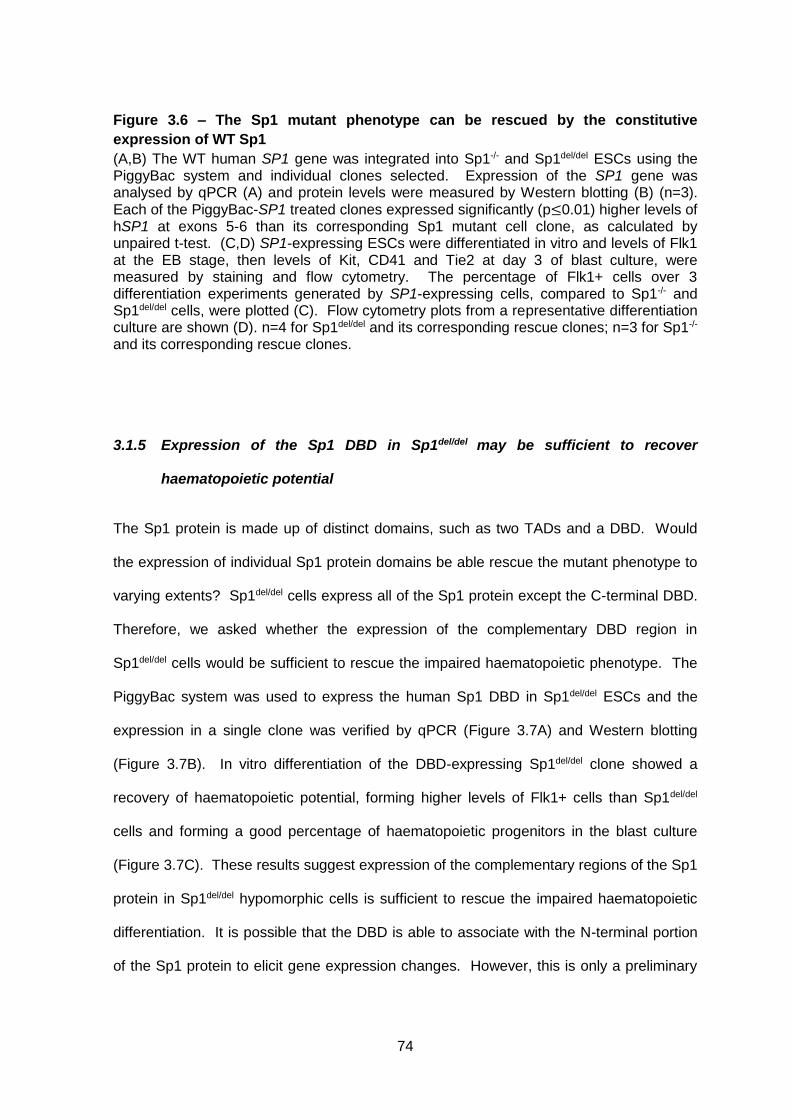
74
Figure 3.6 – The Sp1 mutant phenotype can be rescued by the constitutive
expression of WT Sp1
(A,B) The WT human SP1 gene was integrated into Sp1-/- and Sp1del/del ESCs using the PiggyBac system and individual clones selected. Expression of the SP1 gene was analysed by qPCR (A) and protein levels were measured by Western blotting (B) (n=3). Each of the PiggyBac-SP1 treated clones expressed significantly (p≤0.01) higher levels of hSP1 at exons 5-6 than its corresponding Sp1 mutant cell clone, as calculated by unpaired t-test. (C,D) SP1-expressing ESCs were differentiated in vitro and levels of Flk1 at the EB stage, then levels of Kit, CD41 and Tie2 at day 3 of blast culture, were measured by staining and flow cytometry. The percentage of Flk1+ cells over 3 differentiation experiments generated by SP1-expressing cells, compared to Sp1-/- and Sp1del/del cells, were plotted (C). Flow cytometry plots from a representative differentiation culture are shown (D). n=4 for Sp1del/del and its corresponding rescue clones; n=3 for Sp1-/- and its corresponding rescue clones. 3.1.5 Expression of the Sp1 DBD in Sp1del/del may be sufficient to recover
haematopoietic potential
The Sp1 protein is made up of distinct domains, such as two TADs and a DBD. Would
the expression of individual Sp1 protein domains be able rescue the mutant phenotype to
varying extents? Sp1del/del cells express all of the Sp1 protein except the C-terminal DBD.
Therefore, we asked whether the expression of the complementary DBD region in
Sp1del/del cells would be sufficient to rescue the impaired haematopoietic phenotype. The
PiggyBac system was used to express the human Sp1 DBD in Sp1del/del ESCs and the
expression in a single clone was verified by qPCR (Figure 3.7A) and Western blotting
(Figure 3.7B). In vitro differentiation of the DBD-expressing Sp1del/del clone showed a
recovery of haematopoietic potential, forming higher levels of Flk1+ cells than Sp1del/del
cells and forming a good percentage of haematopoietic progenitors in the blast culture
(Figure 3.7C). These results suggest expression of the complementary regions of the Sp1
protein in Sp1del/del hypomorphic cells is sufficient to rescue the impaired haematopoietic
differentiation. It is possible that the DBD is able to associate with the N-terminal portion
of the Sp1 protein to elicit gene expression changes. However, this is only a preliminary

75
result; only one clone was found to express the DBD efficiently (likely due to the instability
of expressing an individual domain away from the context of the complete protein) and so
the influence of ESC clonal differences on the results cannot be excluded.

76
Figure 3.7 – Expression of the DBD of the Sp1 protein in Sp1del/del ESCs can rescue
haematopoietic specification
The PiggyBac system was used to express the human Sp1 DBD in Sp1del/del cells. (A) Expression of the SP1 DBD in a single clone was verified by qPCR using primers specific to both mouse and human Sp1 regions (n=3, error bars represent standard deviation). The expression of the DBD, as shown by hSP1 exon 5-6 primers, was significantly
(p≤0.01) higher in Sp1del/del+DBD cells than WT or Sp1del/del cells, as calculated by unpaired t-test. (B) Expression of the Sp1 DBD protein (over 3 replicates) was measured by Western blot using a Millipore Sp1 antibody recognising the full-length protein, except DBD, and an Abcam antibody that recognises only the C-terminus. (C) In vitro differentiation of the Sp1del/del + DBD ESCs. The proportion of Flk1+ cells in the EBs was measured and the levels of haematopoietic populations in the blast culture at day 3 was analysed by flow cytometry after staining with antibodies against Kit, CD41 and Tie2 surface molecules. The experiment was performed three times and representative plots are shown.
3.2 Disruption of Sp1 is associated with gene expression changes related to defects in haematopoietic differentiation
3.2.1 Global gene expression in WT and mutant cells at each stage of
differentiation
In order to investigate whether the defects in Sp1 result in changes in gene expression,
and whether these changes could explain the observed defects in haematopoietic
specification in the Sp1 mutant clones, we performed RNA-seq throughout differentiation.
Purified cell populations were obtained at each stage of differentiation: ESCs, Flk1+ cells
(obtained by MACS), and HE1, HE2 and progenitors (obtained by harvesting the blast
culture and immunostaining for Tie2, Kit and CD41, followed by FACS) (Supplementary
Figure 5.2). The purity of the resulting populations was verified by cell staining for the
associated markers and flow cytometry (Figure 3.8). RNA was purified from the cells and
next generation sequencing performed to analyse gene expression levels genome-wide.
RNA-seq was performed in duplicate, with the duplicate correlations shown in
Supplementary Figure 5.1, and combined for further analyses. Unsurprisingly, the RNA-

77
seq browser tracks show an absence of reads over exons 5 and 6 of Sp1 in Sp1del/del cells
(Figure 3.9A). Furthermore, developmental stage-specific genes can be seen to change
expression across differentiation stages as expected, such as Fli1 (Figure 3.9B), thus
validating the RNA-seq experiments.
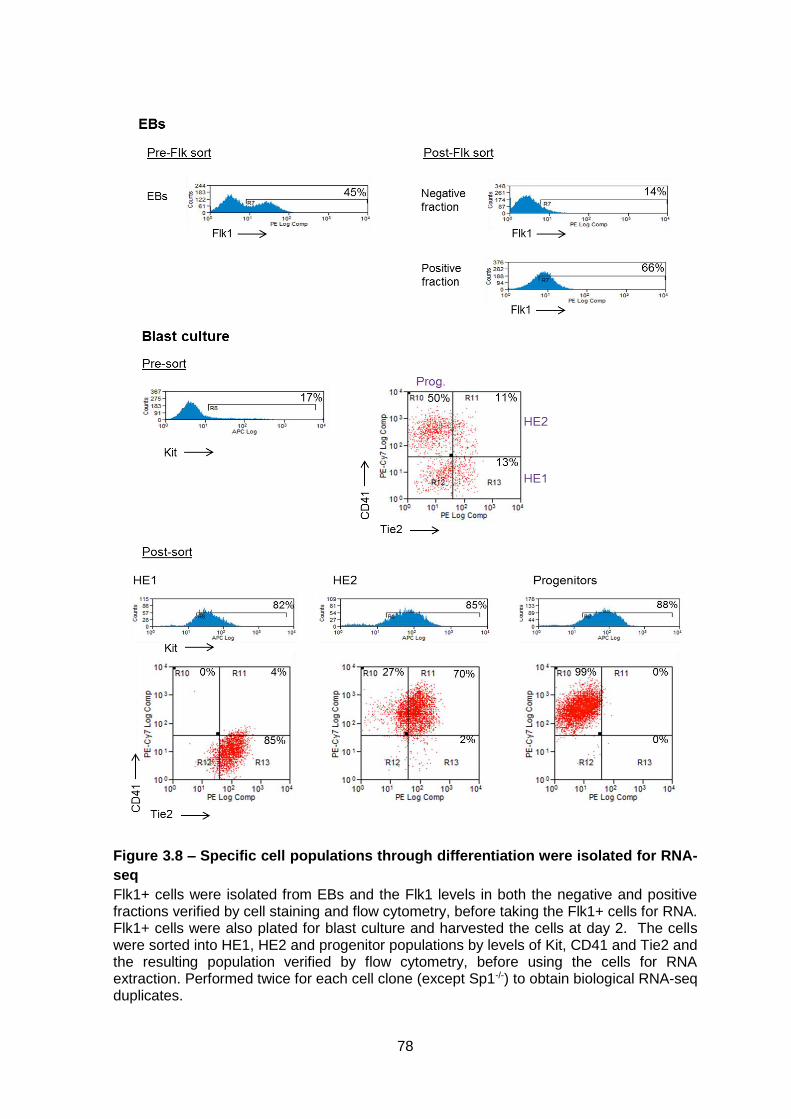
78
Figure 3.8 – Specific cell populations through differentiation were isolated for RNA-
seq
Flk1+ cells were isolated from EBs and the Flk1 levels in both the negative and positive fractions verified by cell staining and flow cytometry, before taking the Flk1+ cells for RNA. Flk1+ cells were also plated for blast culture and harvested the cells at day 2. The cells were sorted into HE1, HE2 and progenitor populations by levels of Kit, CD41 and Tie2 and the resulting population verified by flow cytometry, before using the cells for RNA extraction. Performed twice for each cell clone (except Sp1-/-) to obtain biological RNA-seq duplicates.

79
Figure 3.9 – RNA-seq data confirm the Sp1 mutation and show differential
expression of key developmental regulator genes
(A) RNA-seq analysis was performed for each of the CRISPR-generated Sp1 mutant clones. The browser track at ESC stage at the Sp1 gene shows the deletion of exons 5 and 6 in Sp1del/del cells, with a concomitant increase in gene expression. (B) RNA-seq was carried out at each stage of haematopoietic specification. Fli1, an example of a stage-specific transcriptional regulator gene, is shown with expression levels changing through differentiation in WT cells.

80
3.2.2 Global gene expression patterns are largely unaffected by the Sp1 mutation
We then asked if gene expression profiles were changed as a result of Sp1 mutation.
Hierarchical clustering analysis of the similarity between the RNA-sequences of each Sp1
mutant cell clone at each stage of differentiation showed that gene expression patterns
clustered based on cell type (or differentiation stage), rather than by Sp1 mutation. A high
correlation was also seen within each cell type between the different Sp1 mutant clones
and WT cells (Figure 3.10). Moreover, hierarchical clustering of the expression of all
expressed genes at each individual stage of differentiation showed a generally similar
pattern of gene expression in each clone compared to the WT (Figure 3.11). However,
while the overall patterns of highly and lowly expressed genes were similar, there were
some differences in the actual expression levels; this was particularly apparent in the
progenitor cells.
Overall, these results suggest that the gene expression profiles are largely unaffected with
Sp1 mutation and the global expression pattern is very similar in the Sp1 mutant clones
and WT cells. Indeed, there were only a few hundred genes significantly deregulated (by
at least two-fold) at each stage in the Sp1 mutant clones compared to WT cells (Figure
3.12). However, the number of deregulated genes was higher in Sp1del/del and Sp1-/- cells
than in the heterozygous clones, while these clones also generally clustered away from
WT and heterozygous cells when examining expression levels of every expressed gene
(Figure 3.11), suggesting gene expression changes upon Sp1 mutation could be linked to
impaired haematopoietic differentiation. Intriguingly, the number of deregulated genes
was larger in hypomorph ESCs than complete Sp1 knockout cells, despite the less severe
phenotype, which may indicate heterogeneity in the population and reflect the diverse
phenotypes seen in the Sp1 DBD-deficient mouse model (Marin et al., 1997).
Interestingly, many histone genes were consistently downregulated in Sp1-/- and Sp1del/del

81
cells across the differentiation stages, likely reflecting their slower growth observed in
culture. Slower growth can be expected, as Sp1 regulates a number of genes involved in
the cell cycle and growth (Li & Davie, 2010).
Figure 3.10 – Gene expression of WT and Sp1 mutant clones cluster based on
differentiation cell type
RNA-seq was performed in WT cells and Sp1 mutant clones at each stage of in vitro haematopoietic differentiation. The Pearson correlation of the global gene expression levels between all clones (pairwise), at each cell stage, was calculated. Hierarchical clustering of the Pearson correlations was performed and the results shown as a heatmap.
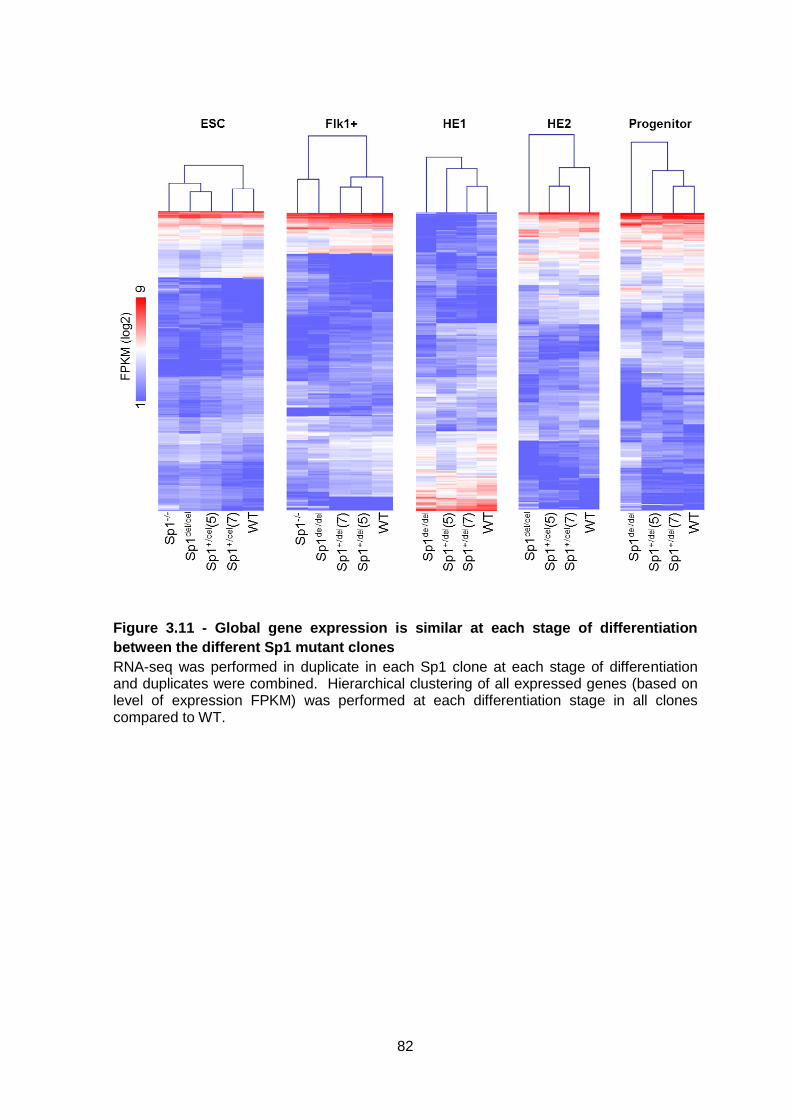
82
Figure 3.11 - Global gene expression is similar at each stage of differentiation
between the different Sp1 mutant clones
RNA-seq was performed in duplicate in each Sp1 clone at each stage of differentiation and duplicates were combined. Hierarchical clustering of all expressed genes (based on level of expression FPKM) was performed at each differentiation stage in all clones compared to WT.

83
Figure 3.12 – A limited numbers of genes are deregulated by Sp1 deficiency
RNA-seq was performed in each Sp1 mutant clone at each stage of in vitro haematopoietic differentiation. The graph shows the number of genes that are deregulated by at least two-fold compared to WT at each cell stage.
3.2.3 The trajectory of the Sp1 mutant cells through differentiation is altered
In spite of the ubiquitous expression of Sp1, the majority of genes were similarly
expressed between WT and mutant clones at each distinct stage of differentiation.
However, we questioned whether there was a change in the expression of
developmentally-regulated genes, whose levels can vary between stages of
differentiation. As key developmental regulator genes fall into this category, it may explain
a link to the observed haematopoietic defects.
Therefore, the genes that are normally differentially expressed between stages of
differentiation were identified (such as between ESC and Flk1+) and the expression of

84
these genes were examined in the Sp1 mutant clones. The gene expression was then
grouped for each clone, in each transition stage, based on how the gene expression
levels were changing between differentiation stages compared to the WT. This generated
12 clusters for each condition, showing for example: less down-regulated compared to
WT, up-regulated but unchanged in WT (Figure 3.13, Supplementary Tables 5.1-5.5).
This analysis showed many more genes were deregulated, in contrast to looking at
changes within discrete cell types, suggesting the trajectory of the cells through
differentiation was altered. The number of deregulated genes was also higher at the
ESC-Flk1+ transition than at later stages. This could indicate that the first stage is when
Sp1 is crucially required, which corresponds with the failure of Sp1-/- cells to form Flk1+
cells. Alternatively, it could indicate a threshold effect – only those Sp1del/del cells (and
indeed Sp1+/del cells) with sufficient Sp1 activity could proceed to the next differentiation
stage and so fewer genes are deregulated at later stages.
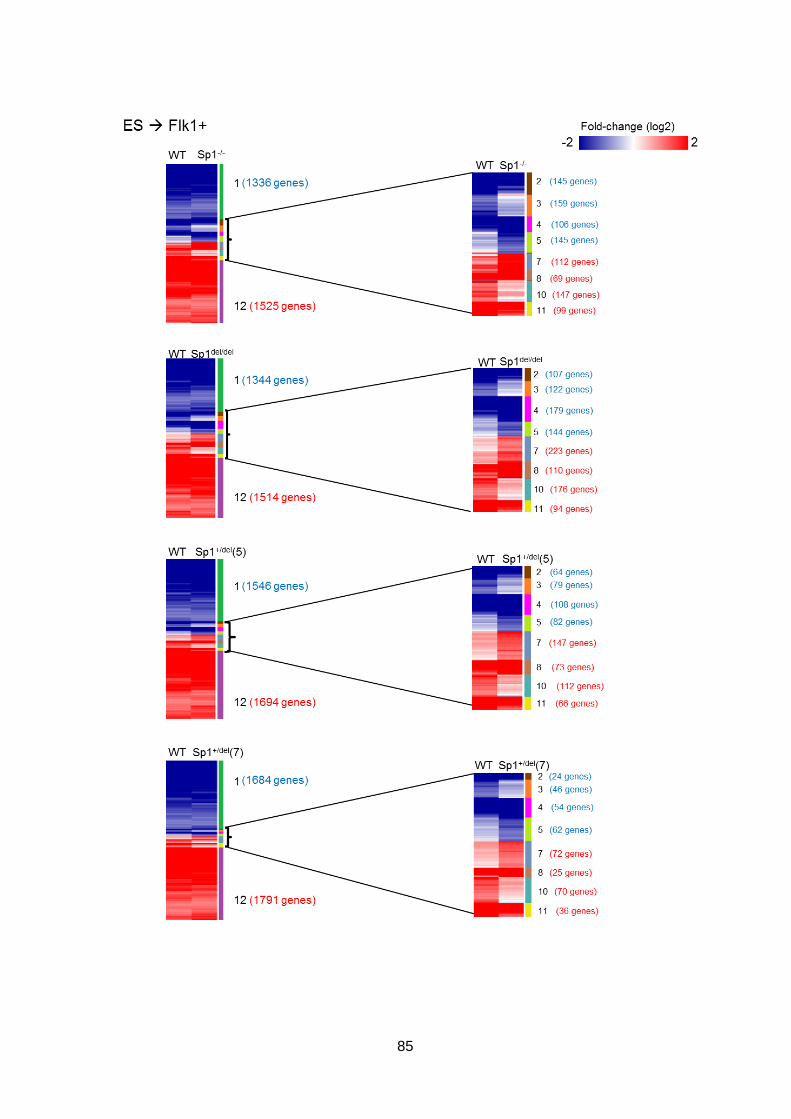
85
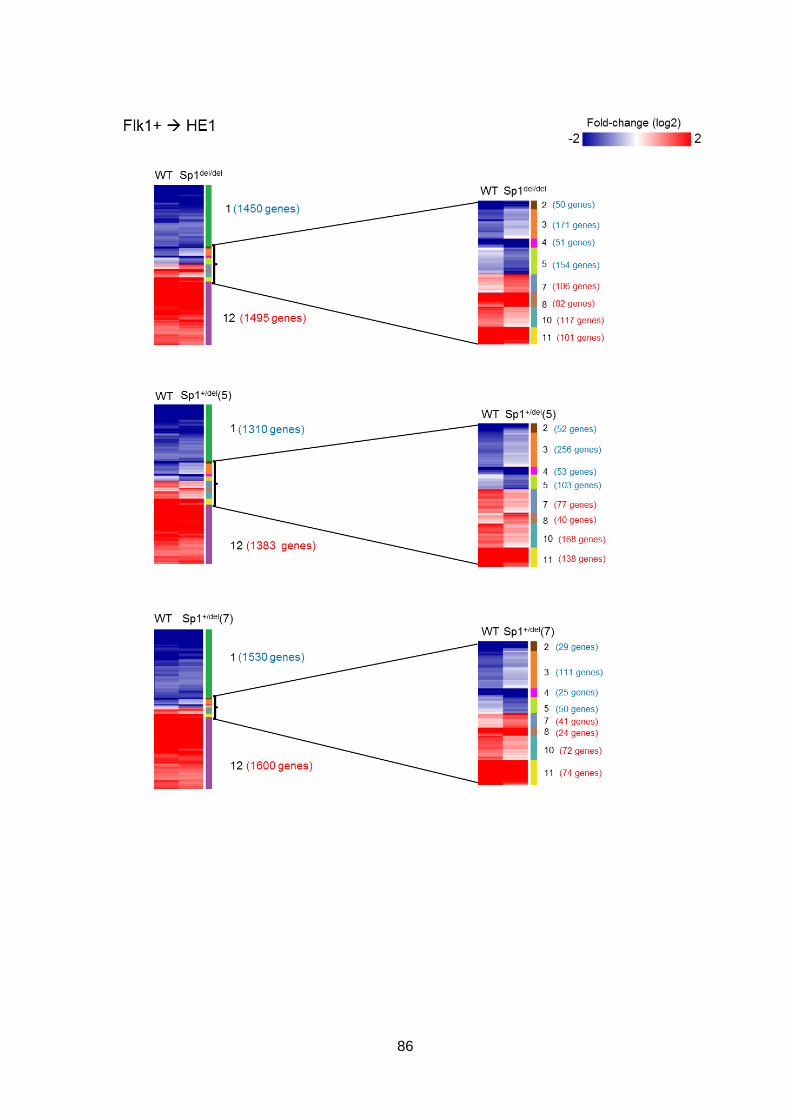
86
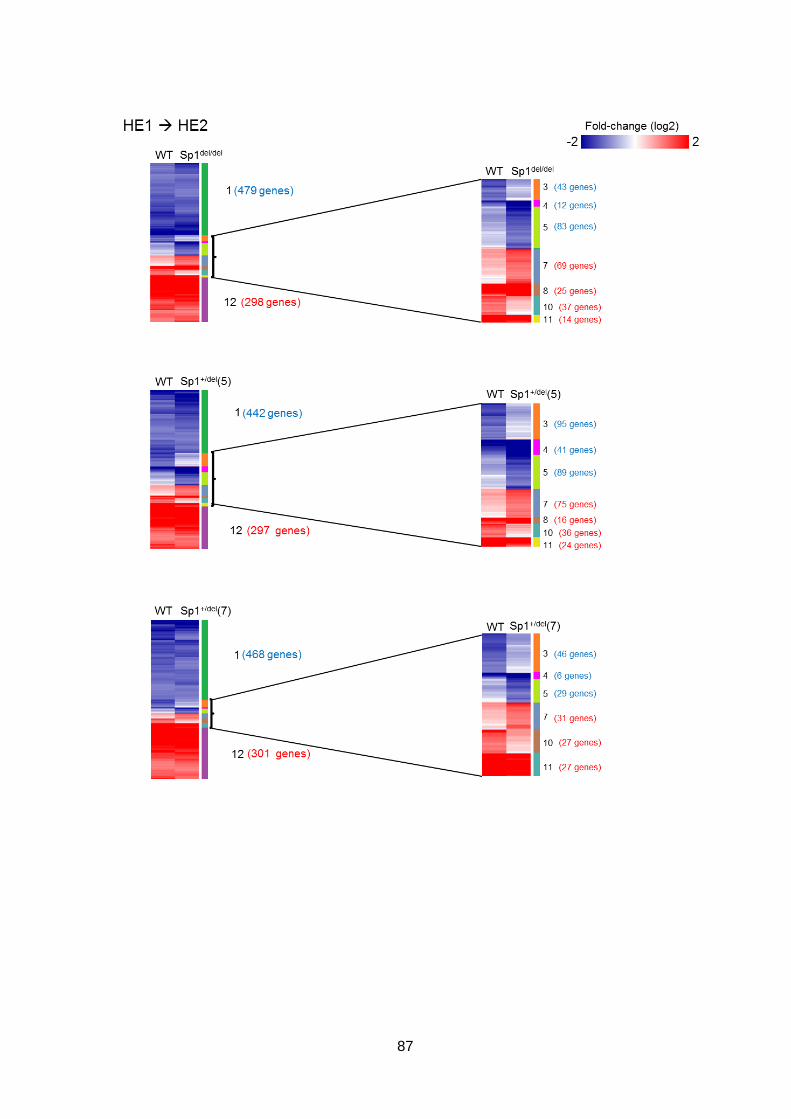
87

88
Figure 3.13 - The differential expression of genes as the cells transition between
differentiation stages is altered with Sp1 mutation
Genes that were differentially expressed (at least two-fold) between consecutive differentiation stages in WT cells were first identified. The same list was generated in each of the Sp1 mutant clones and the genes that were differently differentially regulated between differentiation stages in the Sp1 clone, compared to the WT, were identified. The expression fold change (log2 value), compared to WT, of the differential genes is shown and grouped into how the gene expression is altered upon Sp1 mutation, for each of the four differentiation stage transitions.

89
Clusters: 1 – still downregulated in mutant, 2 – less downregulated in mutant, 3 – not downregulated in mutant, 4 – more downregulated in mutant, 5 – downregulated in mutant/no change in WT, 6 – downregulated in mutant/up-regulated in WT, 7 – upregulated in mutant/ no change in WT, 8 – more upregulated in mutant, 9 – upregulated in mutant/downregulated in WT, 10 – not upregulated in mutant, 11 – less upregulated in mutant, 12 – still upregulated in mutant.
When we examined these deregulated genes more closely, we identified several key
developmental genes, which could be involved in causing the defects in haematopoietic
differentiation. The Sp1-/- ESC to Flk1+ transition showed a deregulation of genes
associated with ESC differentiation potential, BMP/Wnt signalling and mesoderm markers
(Table 3.1). BMP and Wnt signalling is known to be important in determining cell fate
during gastrulation and beyond, such as regulating the differentiation from mesoderm to
haemangioblast or cardiac mesoderm (Murry & Keller, 2008). Correspondingly, there was
a downregulation of a number of important mesoderm regulators/markers, such as
Brachyury (T) and Bmp4 (Kispert & Herrmann, 1994; Winnier et al., 1995). The first stage
of in vitro differentiation is the specification to mesoderm, before differentiating to
Brachyury+ Flk1+ haemangioblast cells. Thus, the deregulation of key mesoderm-
defining factors and signalling pathways may underlie the inability of Sp1-/- cells to reach
the first Flk1+ stage. Correspondingly, there was also a downregulation of Etv2, which is
important for haemangioblast specification (Wareing et al., 2012). The deregulation of
Brachyury, Bmp4 and Etv2 was confirmed by qPCR analysis (Figure 3.14). This data
suggests Sp1 is important for mesoderm/haemangioblast specification.
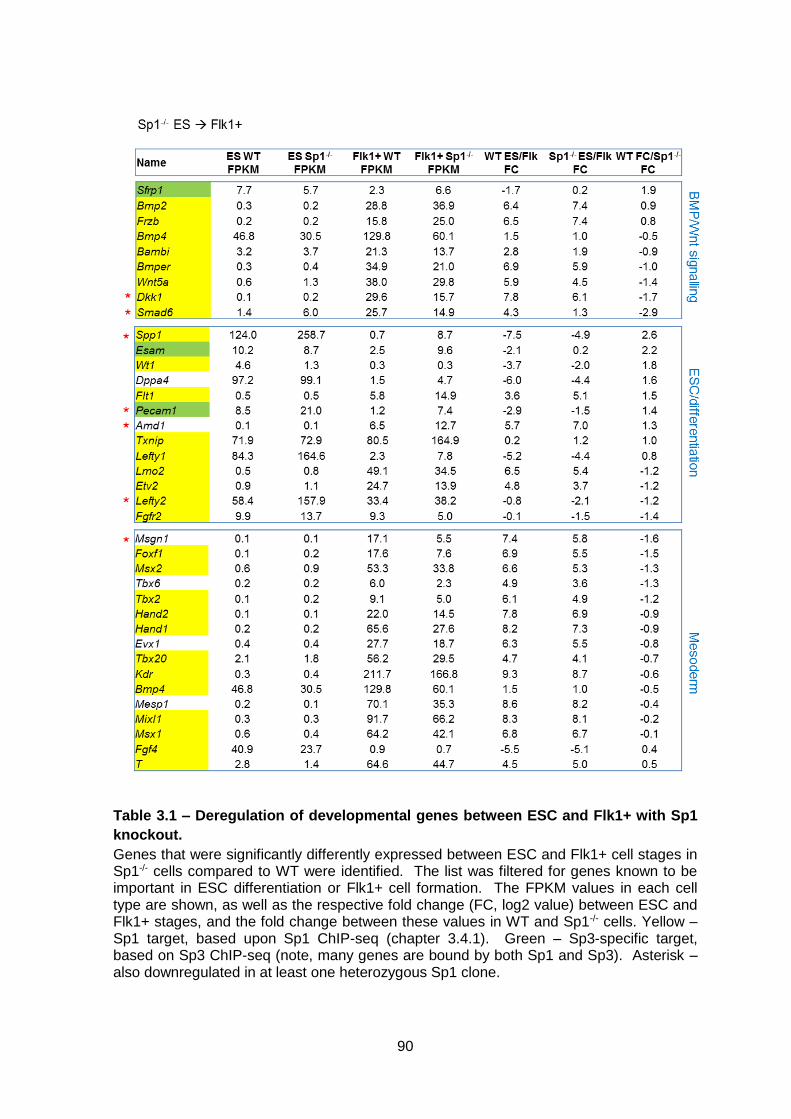
90
Table 3.1 – Deregulation of developmental genes between ESC and Flk1+ with Sp1
knockout.
Genes that were significantly differently expressed between ESC and Flk1+ cell stages in Sp1-/- cells compared to WT were identified. The list was filtered for genes known to be important in ESC differentiation or Flk1+ cell formation. The FPKM values in each cell type are shown, as well as the respective fold change (FC, log2 value) between ESC and Flk1+ stages, and the fold change between these values in WT and Sp1-/- cells. Yellow – Sp1 target, based upon Sp1 ChIP-seq (chapter 3.4.1). Green – Sp3-specific target, based on Sp3 ChIP-seq (note, many genes are bound by both Sp1 and Sp3). Asterisk – also downregulated in at least one heterozygous Sp1 clone.

91
The Sp1del/del ESC to Flk1+ transition (Table 3.2) indicated a deregulation of genes
involved in ESC maintenance and differentiation potential, as well as some genes
involved in the first stages of haematopoietic differentiation, such as Etv2 and the
mesoderm marker Gsc (Tada et al., 2005; Wareing et al., 2012). Most noticeably, there
was a group of genes involved in ESC pluripotency that were commonly deregulated.
Those involved in promoting pluripotency were generally up-regulated, such as Nanog
(which is validated by qPCR analysis in Figure 3.14) and Esrrb (Silva et al., 2009;
Festuccia et al., 2012), while those involved in promoting differentiation were
downregulated, such as Eif2s3y and Satb1 (Savarese et al., 2009; Li et al., 2016). These
effects could explain the impaired differentiation of Sp1del/del cells, thus forming lower
numbers of Flk1+ cells. However, many of the ESC pluripotency-associated genes were
also deregulated in one or both of the heterozygous clones, which differentiated normally.
Both the Sp1del/del and Sp1+/del cells express a truncated form of Sp1, although the
heterozygous cells also express WT Sp1. Therefore, it may be that the truncated Sp1
protein interferes with transcriptional regulation, for example by inhibiting complex
formation with partner proteins. Thus, the gene deregulation in all three mutant clones
may come about through the same mechanism, but with WT Sp1 present in Sp1+/del(5)
and Sp1+/del(7), the effects are less severe. Alternatively, the truncated Sp1 could be
associating with DNA (e.g. via its binding partners), but is only able to form transient
complexes, decreasing transcription initiation efficiency. The lower concentration of Sp1
found in Sp1+/del cells relative to WT may also elicit inefficient transcription initiation, but to
a lesser extent than in Sp1del/del cells. Indeed, this could again suggest a threshold level of
Sp1 activity for the cells to progress to the next stage of differentiation, meaning
differentiation is less efficient in Sp1del/del cells.
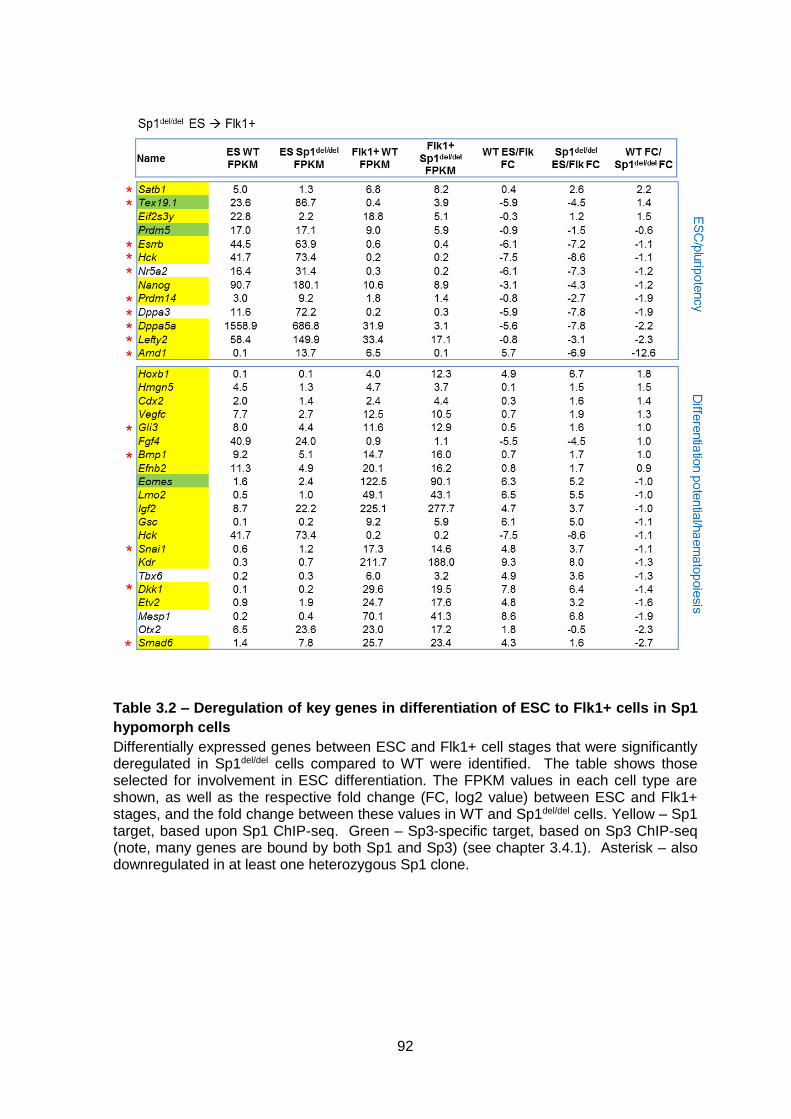
92
Table 3.2 – Deregulation of key genes in differentiation of ESC to Flk1+ cells in Sp1
hypomorph cells
Differentially expressed genes between ESC and Flk1+ cell stages that were significantly deregulated in Sp1del/del cells compared to WT were identified. The table shows those selected for involvement in ESC differentiation. The FPKM values in each cell type are shown, as well as the respective fold change (FC, log2 value) between ESC and Flk1+ stages, and the fold change between these values in WT and Sp1del/del cells. Yellow – Sp1 target, based upon Sp1 ChIP-seq. Green – Sp3-specific target, based on Sp3 ChIP-seq (note, many genes are bound by both Sp1 and Sp3) (see chapter 3.4.1). Asterisk – also downregulated in at least one heterozygous Sp1 clone.

93
The gene expression during the Sp1del/del Flk1+ to HE1 transition (Table 3.3) showed the
deregulation of a number of genes associated with angiogenesis (as blood vessels can
also be formed at this stage) and in HE/haematopoietic specification. Again, most of
these genes were also deregulated in the Sp1+/del cells, suggesting haematopoietic
specification is less efficient in Sp1del/del cells.
The latter differentiation stages of Sp1del/del cells displayed fewer gene expression
changes. The HE1 to HE2 transition showed only small changes in gene expression and
no significant changes in known regulators were seen. In contrast, the HE2 to progenitor
transition (Table 3.3) showed an upregulation of megakaryocyte and platelet-associated
genes (not seen in Sp1+/del clones), suggesting a bias for this haematopoietic lineage and
explaining their impaired differentiation to macrophages. In support, Gp5, which encodes
a platelet cell surface protein that is important in haemostasis (Calverley et al., 1995), is
highly upregulated in Sp1del/del progenitors by qPCR analysis (Figure 3.14).

94
Table 3.3 – Gene expression changes through differentiation of Sp1 hypomorph
cells in blast culture
Genes that are differentially expressed in WT cells between differentiation stages were identified and the expression levels compared to that in Sp1del/del cells. Important regulators and markers that were deregulated between Flk1+ and HE1, and HE2 to progenitor are shown. Few genes were identified during HE1 to HE2 stages. The FPKM values in each cell type are shown, as well as the respective fold change (FC, log2 value) between ESC and Flk1+ stages, and the fold change between these values in WT and Sp1del/del cells. Asterisk represents those that were also deregulated in at least one Sp1 heterozygous clone.

95
Figure 3.14 – qPCR analysis supports the RNA-seq results
RNA was obtained from WT and four Sp1 mutant clones at each stage of in vitro haematopoietic differentiation. This was performed in duplicate and RNA-seq carried out. The RNA-seq duplicates were merged for further analysis and the genes of several key developmental regulators found to be deregulated in Sp1-/- and/or Sp1del/del cells. The deregulation of five of these candidate genes was validated by reverse transcription, followed by qPCR analysis, of the RNA used for the RNA-seq libraries. The graphs show the average of the relative gene expression calculated from the two biological replicates and the error bars show the variation of the two independent replicates from the mean.
96
Gilmour et al. previously analysed the gene expression in Sp1 DBD-deficient cells through
in vitro haematopoietic differentiation using microarrays. To compare the gene expression
changes in the two Sp1del/del cell lines, GSEA plots were made by analysing the
enrichment of genes that were either up- or downregulated in Sp1del/del cells vs. WT cells
in Gilmour et al., as compared to the differentially expressed genes in Sp1del/del vs. WT
cells of the present study (Figure 3.15). The plots show that generally the same genes
were up- or downregulated in the DBD-deficient cells, which is consistent with the highly
similar phenotype between the Sp1del/del cell clones. However, there were some
differences. Indeed, some of the key deregulated genes identified (e.g. several Hox and
Cdx genes) are not shared between the two studies.
In summary, while the global gene expression programme is generally maintained in Sp1
mutant clones, there is a deregulation of genes across differentiation stages, suggesting
that the trajectory of the cells has changed. Groups of deregulated genes encoding
important cell fate regulators have been identified. These analyses showed Sp1-/- cells
likely fail to differentiate to Flk1+ cells due to a deregulation of mesoderm regulators.
Sp1del/del cells, however, seem to be able to differentiate to the haematopoietic lineage, but
they do so less efficiently than WT cells. This feature is associated with the deregulation
of genes for pluripotency and differentiation potential at early stages, haematopoietic
specification genes at HE, and finally an upregulation of megakaryocyte/platelet genes,
suggesting a bias in their differentiation.

97
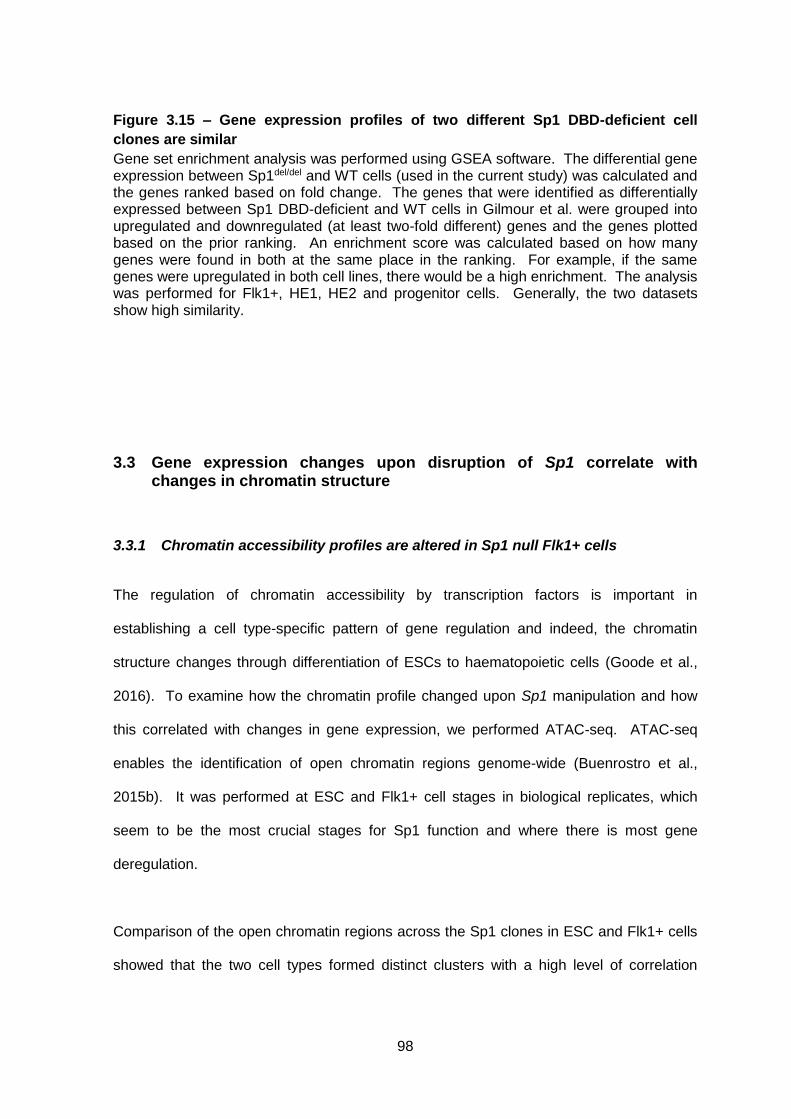
98
Figure 3.15 – Gene expression profiles of two different Sp1 DBD-deficient cell
clones are similar
Gene set enrichment analysis was performed using GSEA software. The differential gene expression between Sp1del/del and WT cells (used in the current study) was calculated and the genes ranked based on fold change. The genes that were identified as differentially expressed between Sp1 DBD-deficient and WT cells in Gilmour et al. were grouped into upregulated and downregulated (at least two-fold different) genes and the genes plotted based on the prior ranking. An enrichment score was calculated based on how many genes were found in both at the same place in the ranking. For example, if the same genes were upregulated in both cell lines, there would be a high enrichment. The analysis was performed for Flk1+, HE1, HE2 and progenitor cells. Generally, the two datasets show high similarity.
3.3 Gene expression changes upon disruption of Sp1 correlate with changes in chromatin structure
3.3.1 Chromatin accessibility profiles are altered in Sp1 null Flk1+ cells
The regulation of chromatin accessibility by transcription factors is important in
establishing a cell type-specific pattern of gene regulation and indeed, the chromatin
structure changes through differentiation of ESCs to haematopoietic cells (Goode et al.,
2016). To examine how the chromatin profile changed upon Sp1 manipulation and how
this correlated with changes in gene expression, we performed ATAC-seq. ATAC-seq
enables the identification of open chromatin regions genome-wide (Buenrostro et al.,
2015b). It was performed at ESC and Flk1+ cell stages in biological replicates, which
seem to be the most crucial stages for Sp1 function and where there is most gene
deregulation.
Comparison of the open chromatin regions across the Sp1 clones in ESC and Flk1+ cells
showed that the two cell types formed distinct clusters with a high level of correlation
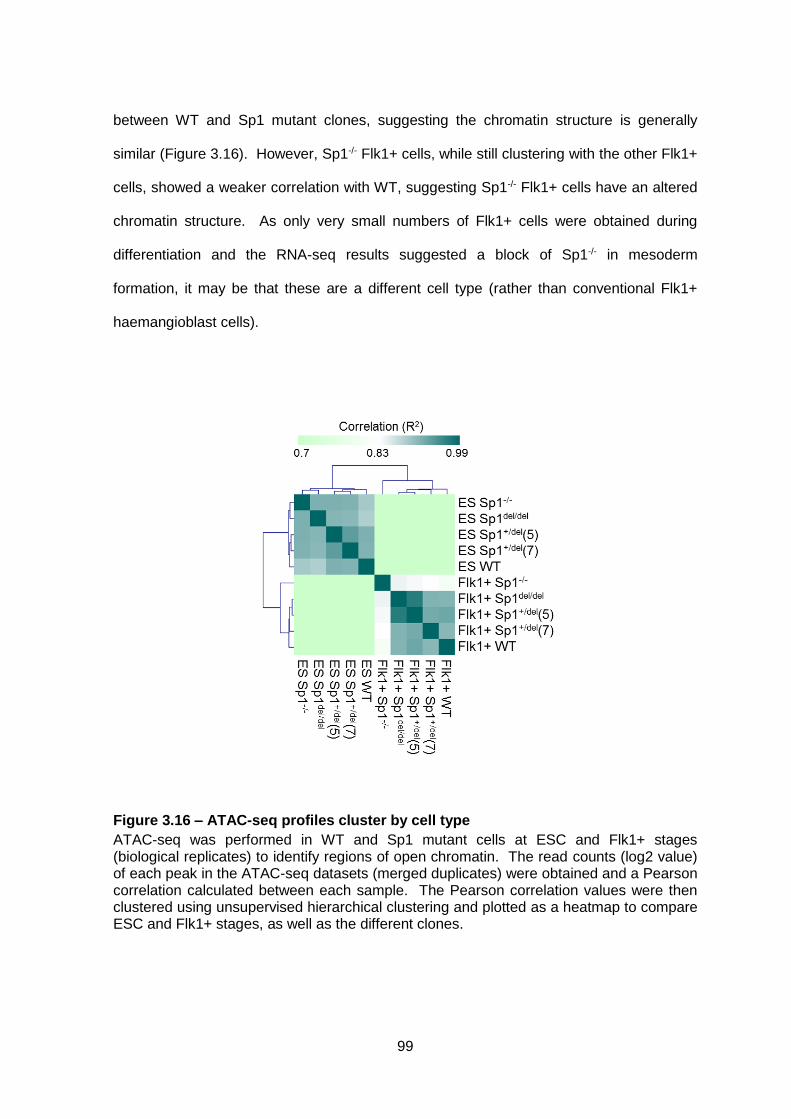
99
between WT and Sp1 mutant clones, suggesting the chromatin structure is generally
similar (Figure 3.16). However, Sp1-/- Flk1+ cells, while still clustering with the other Flk1+
cells, showed a weaker correlation with WT, suggesting Sp1-/- Flk1+ cells have an altered
chromatin structure. As only very small numbers of Flk1+ cells were obtained during
differentiation and the RNA-seq results suggested a block of Sp1-/- in mesoderm
formation, it may be that these are a different cell type (rather than conventional Flk1+
haemangioblast cells).
Figure 3.16 – ATAC-seq profiles cluster by cell type
ATAC-seq was performed in WT and Sp1 mutant cells at ESC and Flk1+ stages (biological replicates) to identify regions of open chromatin. The read counts (log2 value) of each peak in the ATAC-seq datasets (merged duplicates) were obtained and a Pearson correlation calculated between each sample. The Pearson correlation values were then clustered using unsupervised hierarchical clustering and plotted as a heatmap to compare ESC and Flk1+ stages, as well as the different clones.

100
3.3.2 Changes in chromatin accessibility correlate with changes in gene
expression
To look in more detail at the changes in chromatin accessibility within cells carrying the
different Sp1 mutations, we compared each clone to WT in a pairwise comparison in
ESCs (Figure 3.17) and in Flk1+ cells (Figure 3.18). As before, the density plots showed
a generally similar pattern of chromatin accessibility in WT and Sp1 mutant clones.
However, while there were few uniquely open regions, there were a considerable number
of regions that were at least two-fold different (more or less open based on number of
reads) in cells with the Sp1 mutation compared to WT cells. The extent of these
differences compared to WT was similar in all four clones in ESCs. In Flk1+ cells, again
the numbers of clone- or WT-specific sites were comparable in Sp1del/del, Sp1+/del(5) and
Sp1+/del(7), whereas Sp1-/- Flk1+ cells showed a very different chromatin profile, again
suggesting they may be a different cell type.
We then analysed whether the changes in chromatin structure were having an impact on
gene expression. The open chromatin regions identified by ATAC-seq peaks were
assigned to the nearest gene and the differential gene expression in Sp1 mutant clone
compared to WT was plotted (Figure 3.17, Figure 3.18). It must be noted that only small
changes in gene expression were identified, but there was a correlation between gene
expression changes and changes in chromatin accessibility. For example, in Figure
3.17A, the WT-specific open chromatin regions were associated with a downregulation of
gene expression in the Sp1del/del. This trend was most prominent in Sp1del/del and Sp1-/-
cells, rather than the heterozygous clones, which showed less gene deregulation. These
results suggest the changes in chromatin accessibility are associated with changes in
gene regulation and that Sp1 has a role in establishing or maintaining chromatin structure.

101
We further investigated the common, Sp1 mutant- and WT-specific regions of open
chromatin by performing de novo motif discovery (Figure 3.17, Figure 3.18) using the
HOMER software (Heinz et al., 2010). This method identifies consensus TF-binding
motifs that are enriched in each group of sites in an unbiased way, thus suggesting which
transcription factor family may be bound there. The common sites in each pairwise
comparison were enriched in promoter-associated motifs, such as those bound by the
transcription factor NFY. The differential sites were more enriched with enhancer-
associated motifs and showed motifs for cell type-specific factors, e.g. Pou5f1 (OCT4)
which were found in ESCs, whereas GATA motifs were identified in Flk1+ cells. This is
consistent with the fact that the majority of promoters are commonly associated with open
chromatin regions, while the accessibility at enhancers is often induced by TFs, chromatin
remodellers and histone modifiers to ensure cell type- or stage-specific activation.
Furthermore, in Flk1+ cells, motifs linked with differentiation progression, such as GATA
and TEAD, were associated with WT-specific sites, which may underlie a defect in
haematopoietic differentiation.
Importantly, the Sp1 motif – the GC-box – was enriched in WT-specific and common sites
of open chromatin, but not in Sp1 mutant-specific sites. Overall, these results suggest the
chromatin structure in the Sp1 mutant clones may be altering to allow the cells to adjust
for the lack (or decrease) of functional Sp1. Thus, it may be that sites are opening that do
not bind Sp1, but which bind factors that can compensate for the loss of Sp1, to some
extent, and therefore, resulting in minimal changes in gene regulation.
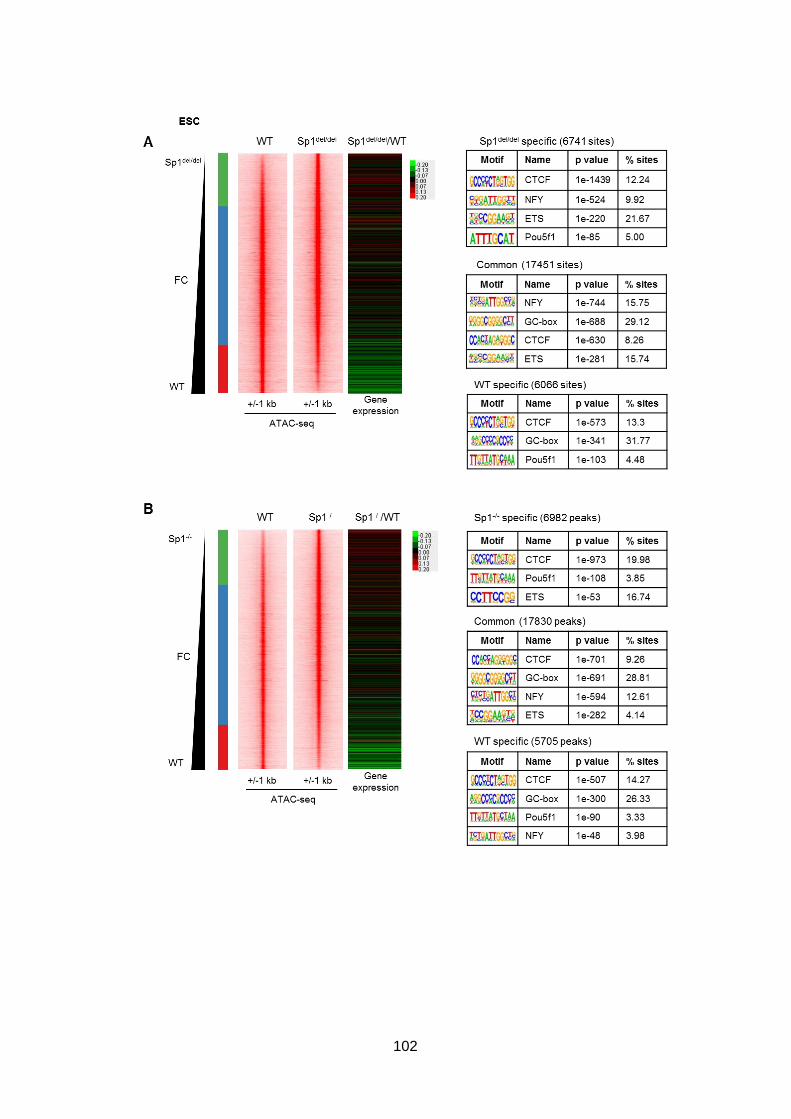
102

103
Figure 3.17 – Changes in chromatin accessibility in Sp1 mutant ESCs correlate with
gene expression
Density plots showing fold change (FC) of read count (log2 value) in ATAC-seq peaks in CRISPR-generated Sp1-mutant ESCs compared to WT ESCs. The peaks that are at least 2-fold different are indicated by the green and red sections of the coloured bar (showing regions of open chromatin in each Sp1 mutant clone that are gained and lost, respectively). A de novo motif search was performed using Homer to identify any motifs that were enriched in the common, WT-specific or Sp1 mutant-specific peaks, as shown in the tables. Each ATAC-seq peak was assigned to the nearest gene and the corresponding gene expression fold change (log2 value) in the Sp1 clone vs WT plotted alongside. Sp1del/del (A), Sp1-/- (B), Sp1+/del(5) (C) and Sp1+/del(7) (D) profiles are shown.

104

105
Figure 3.18 – Changes in chromatin profile in Sp1 mutant Flk1+ cells compared to
WT correlate with gene expression changes
The fold change (FC) of read count (log2 value) in ATAC-seq peaks (indicating accessible chromatin) in Sp1 mutant Flk1+ cells compared to WT cells are shown as density plots. The green and red sections of the bar indicate the peaks that were significantly different (two-fold) between cell types. The motifs (identified using Homer de novo motif discovery) that were enriched in the common, WT-specific or Sp1 clone-specific peaks are shown in the tables. The gene expression change in the Sp1 mutant clones vs WT of the nearest gene to the ATAC-seq peak (fold change, log2 value) is plotted on the same axis. Sp1del/del (A), Sp1-/- (B), Sp1+/del(5) (C) and Sp1+/del(7) (D) profiles are shown.
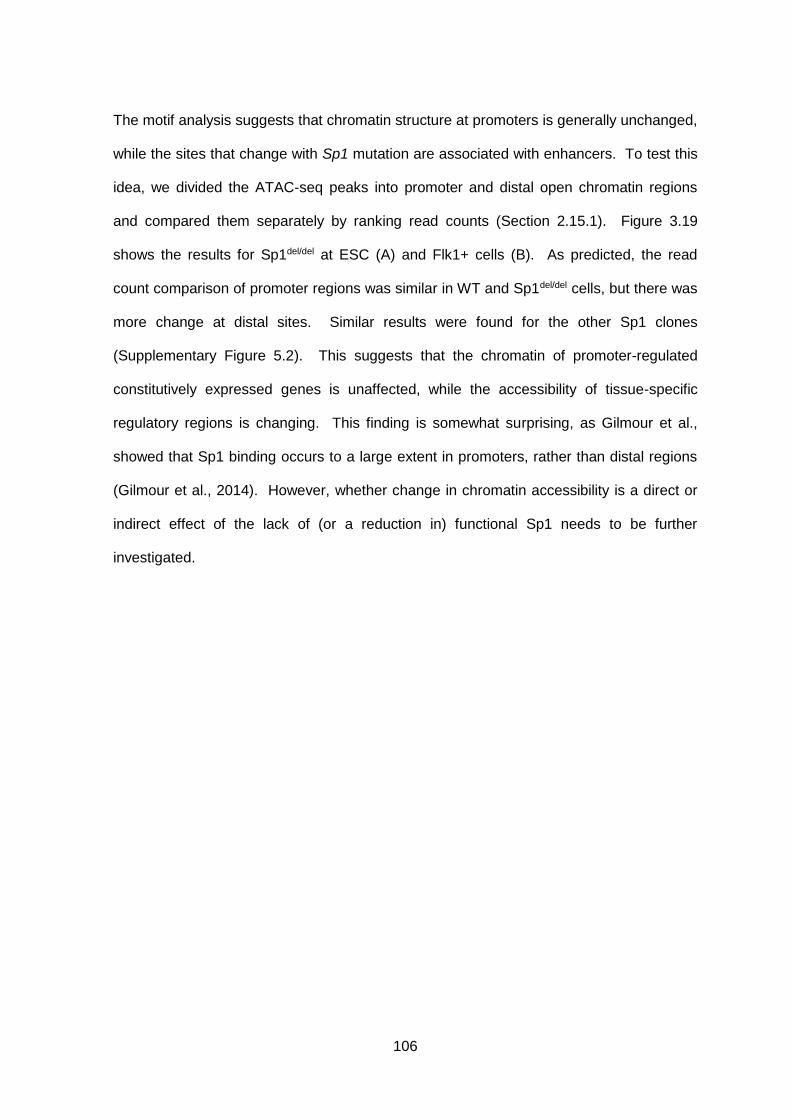
106
The motif analysis suggests that chromatin structure at promoters is generally unchanged,
while the sites that change with Sp1 mutation are associated with enhancers. To test this
idea, we divided the ATAC-seq peaks into promoter and distal open chromatin regions
and compared them separately by ranking read counts (Section 2.15.1). Figure 3.19
shows the results for Sp1del/del at ESC (A) and Flk1+ cells (B). As predicted, the read
count comparison of promoter regions was similar in WT and Sp1del/del cells, but there was
more change at distal sites. Similar results were found for the other Sp1 clones
(Supplementary Figure 5.2). This suggests that the chromatin of promoter-regulated
constitutively expressed genes is unaffected, while the accessibility of tissue-specific
regulatory regions is changing. This finding is somewhat surprising, as Gilmour et al.,
showed that Sp1 binding occurs to a large extent in promoters, rather than distal regions
(Gilmour et al., 2014). However, whether change in chromatin accessibility is a direct or
indirect effect of the lack of (or a reduction in) functional Sp1 needs to be further
investigated.
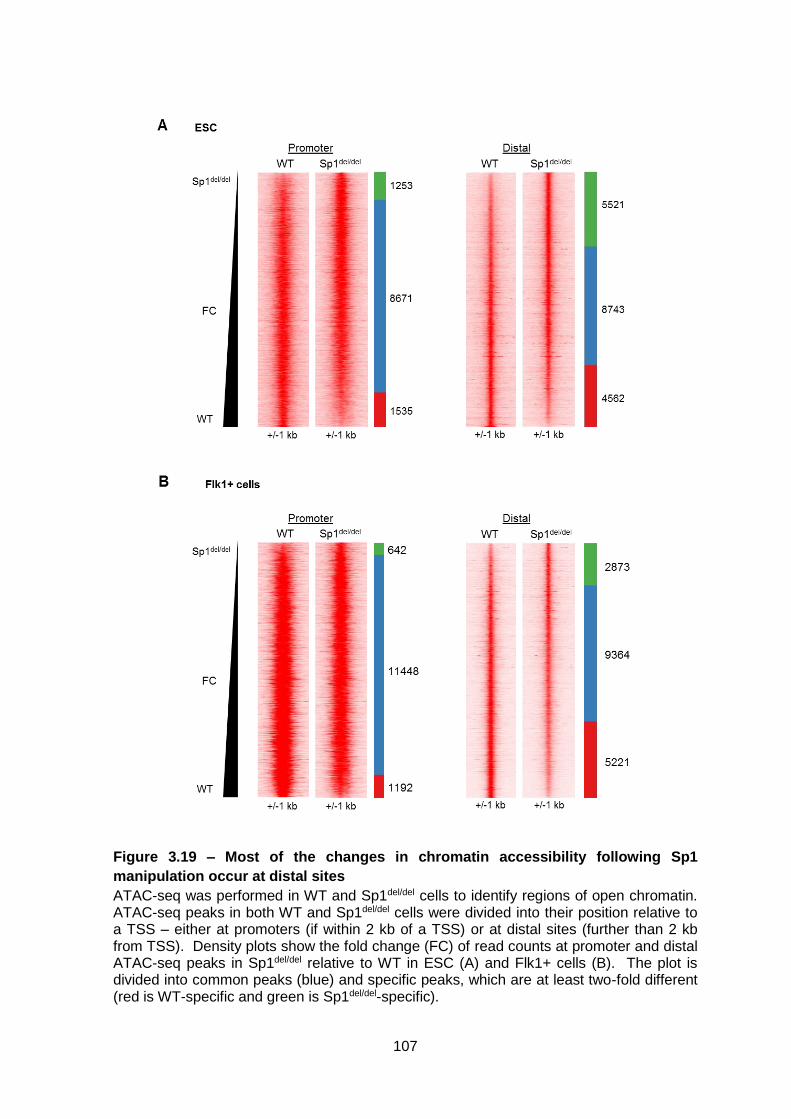
107
Figure 3.19 – Most of the changes in chromatin accessibility following Sp1
manipulation occur at distal sites
ATAC-seq was performed in WT and Sp1del/del cells to identify regions of open chromatin. ATAC-seq peaks in both WT and Sp1del/del cells were divided into their position relative to a TSS – either at promoters (if within 2 kb of a TSS) or at distal sites (further than 2 kb from TSS). Density plots show the fold change (FC) of read counts at promoter and distal ATAC-seq peaks in Sp1del/del relative to WT in ESC (A) and Flk1+ cells (B). The plot is divided into common peaks (blue) and specific peaks, which are at least two-fold different (red is WT-specific and green is Sp1del/del-specific).
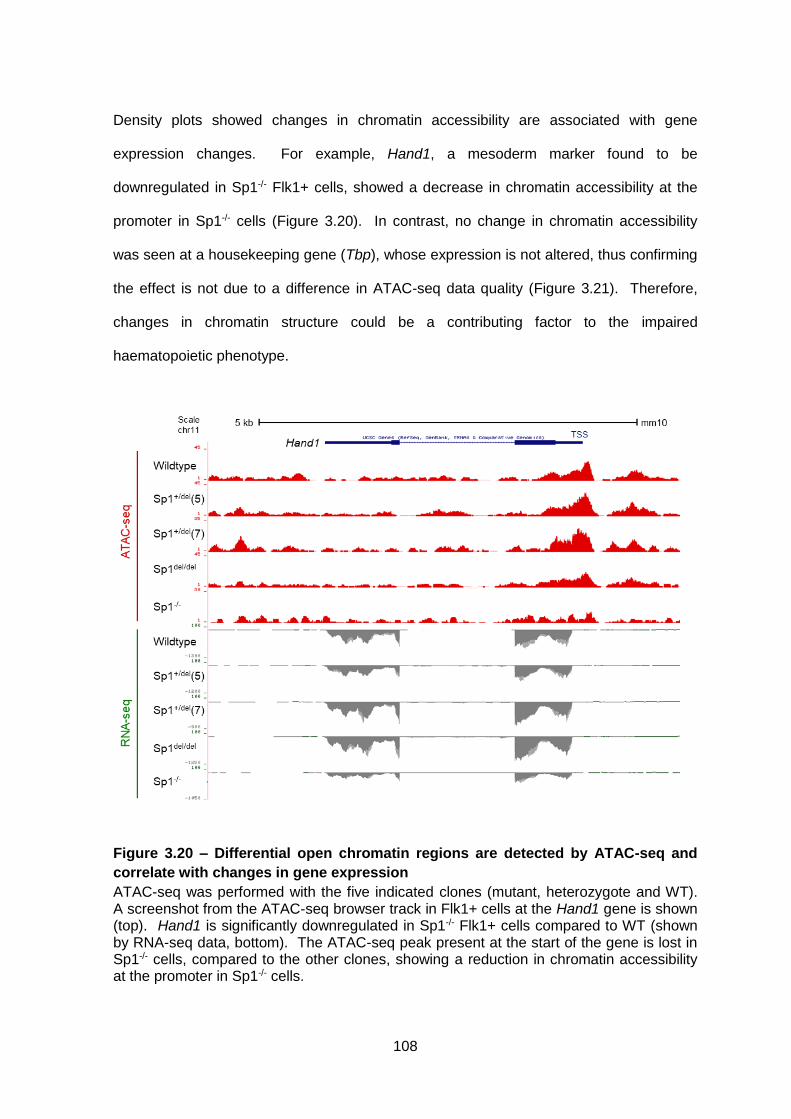
108
Density plots showed changes in chromatin accessibility are associated with gene
expression changes. For example, Hand1, a mesoderm marker found to be
downregulated in Sp1-/- Flk1+ cells, showed a decrease in chromatin accessibility at the
promoter in Sp1-/- cells (Figure 3.20). In contrast, no change in chromatin accessibility
was seen at a housekeeping gene (Tbp), whose expression is not altered, thus confirming
the effect is not due to a difference in ATAC-seq data quality (Figure 3.21). Therefore,
changes in chromatin structure could be a contributing factor to the impaired
haematopoietic phenotype.
Figure 3.20 – Differential open chromatin regions are detected by ATAC-seq and
correlate with changes in gene expression
ATAC-seq was performed with the five indicated clones (mutant, heterozygote and WT). A screenshot from the ATAC-seq browser track in Flk1+ cells at the Hand1 gene is shown (top). Hand1 is significantly downregulated in Sp1-/- Flk1+ cells compared to WT (shown by RNA-seq data, bottom). The ATAC-seq peak present at the start of the gene is lost in Sp1-/- cells, compared to the other clones, showing a reduction in chromatin accessibility at the promoter in Sp1-/- cells.
109
Figure 3.21 – Quality of ATAC-seq data is consistent between different cell clones
ATAC-seq was performed in WT and Sp1 mutant cell clones at ESC and Flk1+ cell stages. UCSC browser screenshot at the housekeeping gene Tbp shows an ATAC-seq peak at the start of the gene in all samples.

110
3.4 Differences in Sp1del/del and Sp1-/- cannot be explained by residual Sp1 binding to DNA
3.4.1 ChIP-seq reveals genome-wide binding sites of Sp1
The in vitro differentiation experiments (described in chapter 3.1) showed that
haematopoietic specification is severely impaired with Sp1-/- cells, failing to form Flk1+
cells. In contrast, Sp1del/del cells are more mildly impaired – they are able to differentiate to
Flk1+ cells and haematopoietic progenitors, albeit with reduced efficiency, but they fail to
terminally differentiate. We therefore asked the question of the underlying cause of this
difference in differentiation potential. Sp1-/- cells express no Sp1 protein; Sp1del/del cells
express a truncated Sp1 protein that lacks the DBD. As the truncated Sp1 cannot directly
bind DNA, we would expect it to be non-functional. However, the differentiation results
suggest that it is hypomorphic. Consequently, we asked whether DBD-deficient Sp1
could be binding indirectly to the DNA, for example through protein-protein interactions
with its DNA-binding partner proteins, and impacting on gene regulation through the action
of its intact TADs. To investigate this, ChIP-seq was performed (with double crosslinking)
in ESC and Flk1+ cells, in each of the Sp1 clones, to identify sites of Sp1 binding to DNA,
genome-wide. (Note: ChIP-seq was not possible in Sp1-/- Flk1+ cells due to low cell
numbers.) Furthermore, while Sp1 ChIP-seq was performed in WT cells by Gilmour et al.,
residual Sp1 binding was not explored in Sp1 DBD-deficient cells, thus these experiments
provide novel datasets (Gilmour et al., 2014). High confidence binding site data was
generated by filtering Sp1 ChIP-seq peaks with ATAC-seq peaks (merged of all clones),
thereby identifying binding sites that were present in regions of open chromatin (Figure
3.22). We found that a high proportion of Sp1 binding sites were located at open CpG
islands in WT ESC and Flk1+ cells (Figure 3.23). Conversely, ~91% of accessible CpG
islands were bound by Sp1 in both cell types, showing that nearly all CpG islands contain
Sp1 binding sites. In addition, the majority of key deregulated genes identified by RNA-
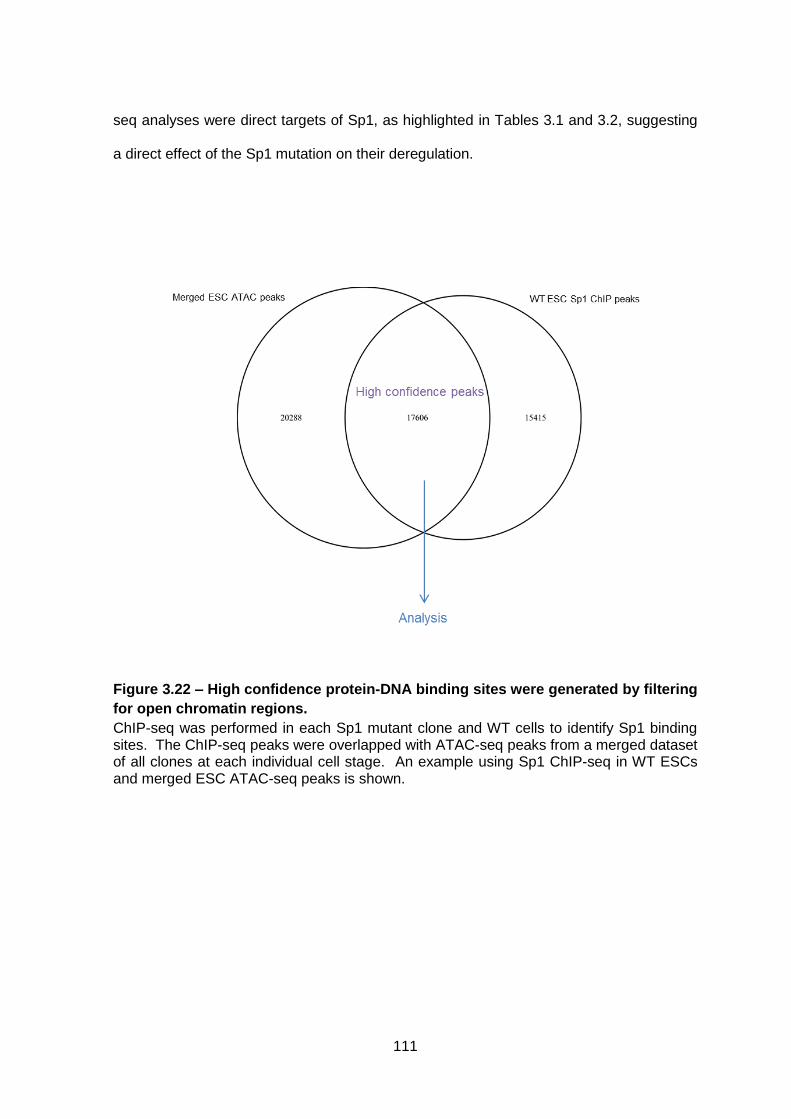
111
seq analyses were direct targets of Sp1, as highlighted in Tables 3.1 and 3.2, suggesting
a direct effect of the Sp1 mutation on their deregulation.
Figure 3.22 – High confidence protein-DNA binding sites were generated by filtering
for open chromatin regions.
ChIP-seq was performed in each Sp1 mutant clone and WT cells to identify Sp1 binding sites. The ChIP-seq peaks were overlapped with ATAC-seq peaks from a merged dataset of all clones at each individual cell stage. An example using Sp1 ChIP-seq in WT ESCs and merged ESC ATAC-seq peaks is shown.
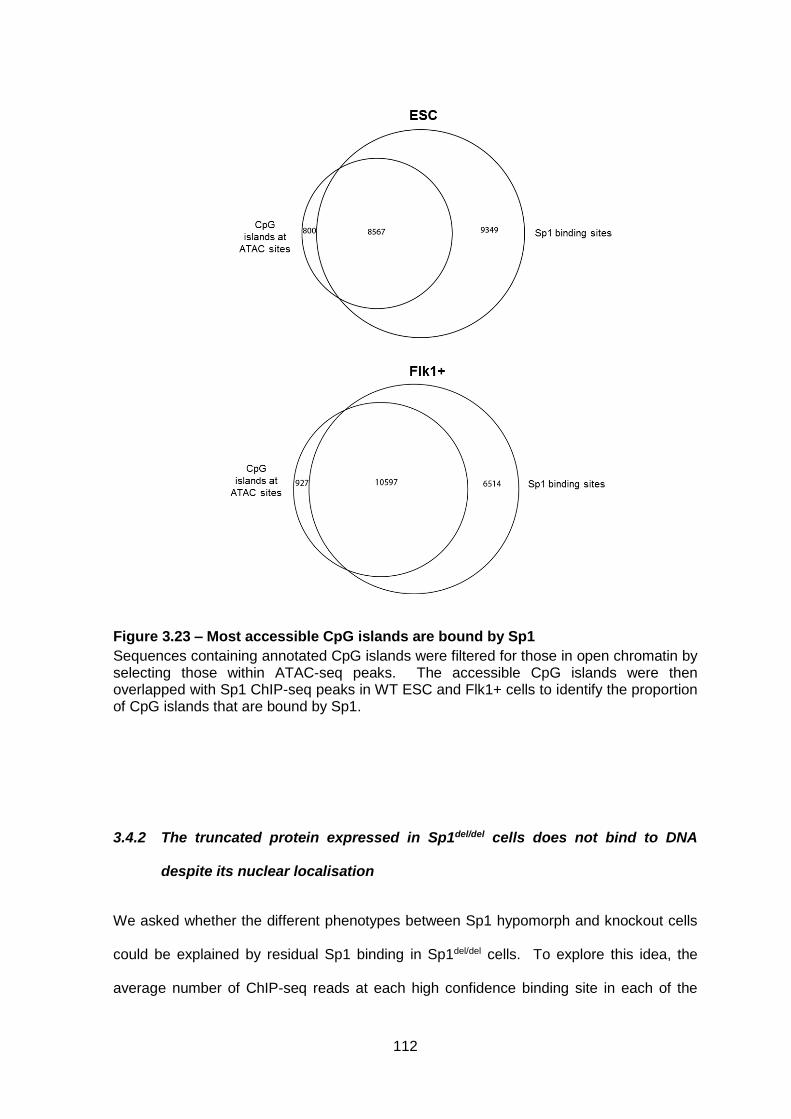
112
Figure 3.23 – Most accessible CpG islands are bound by Sp1
Sequences containing annotated CpG islands were filtered for those in open chromatin by selecting those within ATAC-seq peaks. The accessible CpG islands were then overlapped with Sp1 ChIP-seq peaks in WT ESC and Flk1+ cells to identify the proportion of CpG islands that are bound by Sp1.
3.4.2 The truncated protein expressed in Sp1del/del cells does not bind to DNA
despite its nuclear localisation
We asked whether the different phenotypes between Sp1 hypomorph and knockout cells
could be explained by residual Sp1 binding in Sp1del/del cells. To explore this idea, the
average number of ChIP-seq reads at each high confidence binding site in each of the
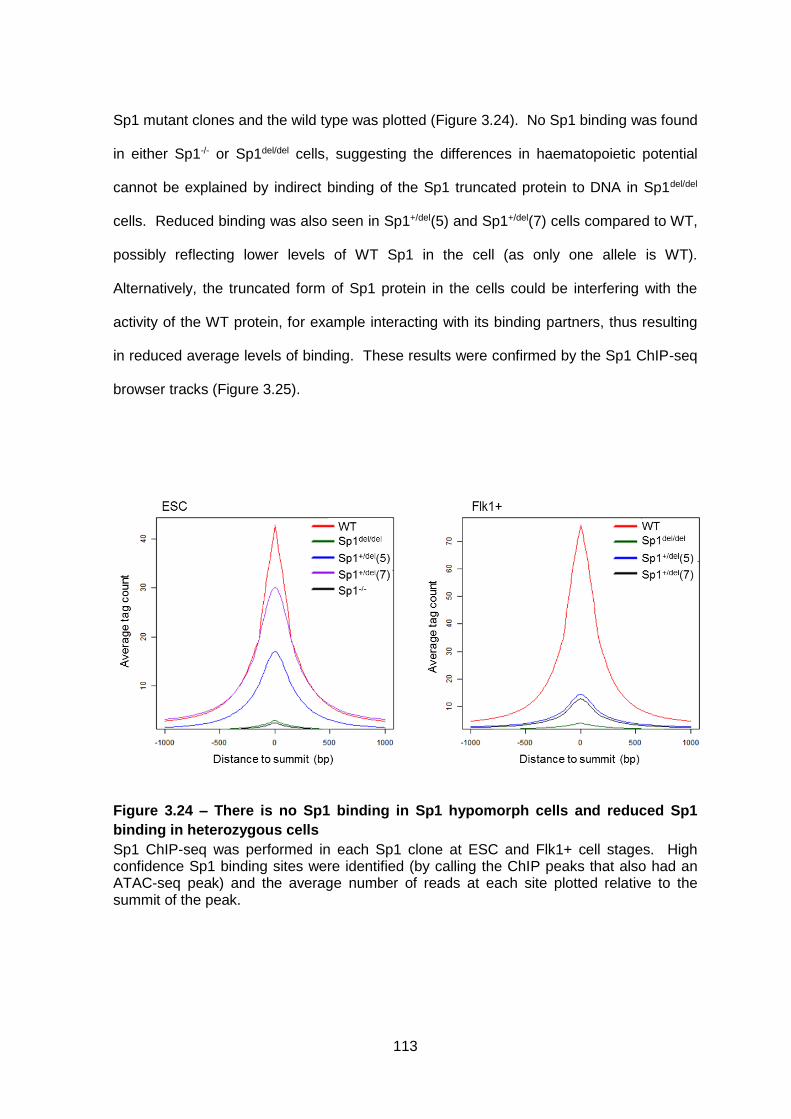
113
Sp1 mutant clones and the wild type was plotted (Figure 3.24). No Sp1 binding was found
in either Sp1-/- or Sp1del/del cells, suggesting the differences in haematopoietic potential
cannot be explained by indirect binding of the Sp1 truncated protein to DNA in Sp1del/del
cells. Reduced binding was also seen in Sp1+/del(5) and Sp1+/del(7) cells compared to WT,
possibly reflecting lower levels of WT Sp1 in the cell (as only one allele is WT).
Alternatively, the truncated form of Sp1 protein in the cells could be interfering with the
activity of the WT protein, for example interacting with its binding partners, thus resulting
in reduced average levels of binding. These results were confirmed by the Sp1 ChIP-seq
browser tracks (Figure 3.25).
Figure 3.24 – There is no Sp1 binding in Sp1 hypomorph cells and reduced Sp1
binding in heterozygous cells
Sp1 ChIP-seq was performed in each Sp1 clone at ESC and Flk1+ cell stages. High confidence Sp1 binding sites were identified (by calling the ChIP peaks that also had an ATAC-seq peak) and the average number of reads at each site plotted relative to the summit of the peak.

114
Figure 3.25 – Sp1 ChIP-seq showed no binding in Sp1del/del cells
Sp1 ChIP-seq was carried out in all Sp1 clones at ESC and Flk1+ cell stages. UCSC browser screenshot at the Sp1 locus shows differential Sp1 binding (a peak) at the promoter.
The nuclear localisation signal of Sp1 is thought to reside in the C-terminal DBD (Ito et al.,
2009). Thus, to assess whether the DBD-deficient Sp1 protein in the Sp1del/del clone is
able to enter the nucleus, we performed immunofluorescence staining assays, using an
antibody to target Sp1 and β-actin, to view Sp1 localisation in WT and Sp1del/del ESCs
(Figure 3.26). The results confirmed the truncated Sp1 protein was present in the nucleus
of Sp1del/del cells, similar to levels seen for WT Sp1 in WT cells.
Altogether, Sp1 ChIP-seq experiments have shown there is no Sp1 binding to DNA in
Sp1del/del cells, despite its presence in the nucleus. Therefore, the mechanisms behind the
differences in knockout and hypomorph phenotypes need to be further investigated.

115

116
Figure 3.26 – DBD-deficient Sp1 protein is localised to the nucleus
Sp1 localisation in WT and Sp1del/del ESCs was measured by immunofluorescence and confocal microscopy. Antibodies specific to Sp1 and β-actin were used with fluorescently tagged secondary antibodies, DAPI was used to stain the nucleus and secondary antibody only samples used as a control (n=3).
3.5 Sp3 can partially compensate for the loss of Sp1
Sp3 is a close family member of Sp1. It has a very similar structure, including a highly
conserved DBD, and so can often recognise the same sites in the DNA. Like Sp1, it is
also ubiquitously expressed. Consequently, we speculated whether Sp3 could be
compensating for the lack of a functional Sp1 in Sp1del/del and/or Sp1-/- cells. This may
explain why the ESCs are relatively unaffected and why there are only limited changes in
the global gene expression programme.
Due to the high similarity of the Sp1 and Sp3 DNA sequence, we first verified that levels of
Sp3 protein were unaffected by the CRISPR-Cas9 system in the Sp1 mutant cell clones
by Western blotting (Figure 3.27A). The blot showed the levels of Sp3 were comparable
in all of the CRISPR-generated Sp1 mutant clones and WT cells. However, interestingly,
there appeared to be shift in the relative levels of the four isoforms of Sp3 with loss of Sp1
activity. Quantification of the Sp3 protein levels in the Western blot showed an increase in
the ratio of long/short isoforms in Sp1-/- and Sp1del/del cells (Figure 3.27B).
We next performed Sp3 ChIP-seq in each of the Sp1 mutant cells as ESCs and Flk1+
cells. High confidence sites in open chromatin regions were identified as with the Sp1
ChIP-seq.

117
Figure 3.27 – Sp3 protein expression is unchanged with CRISPR-Cas9 targeting of
Sp1
Protein was extracted from ESCs of each of the CRISPR-generated Sp1 mutant cell clones and a Western blot performed to measure levels of Sp3 expression (A) (n=2). The protein was resolved into two bands – one representing the two long isoforms and the second showing the two short isoforms. The levels were quantified by normalising to levels of GAPDH and the ratio between long and short isoforms calculated (B).
3.5.1 The binding of both Sp1 and Sp3 shifts in the ESC-Flk1+ transition
Both Sp1 and Sp3 are ubiquitously expressed proteins and involved in the regulation of
many housekeeping genes. Earlier results (chapter 3.1), in addition to a previous study
(Gilmour et al., 2014), have suggested that Sp1 can have a tissue-specific role in
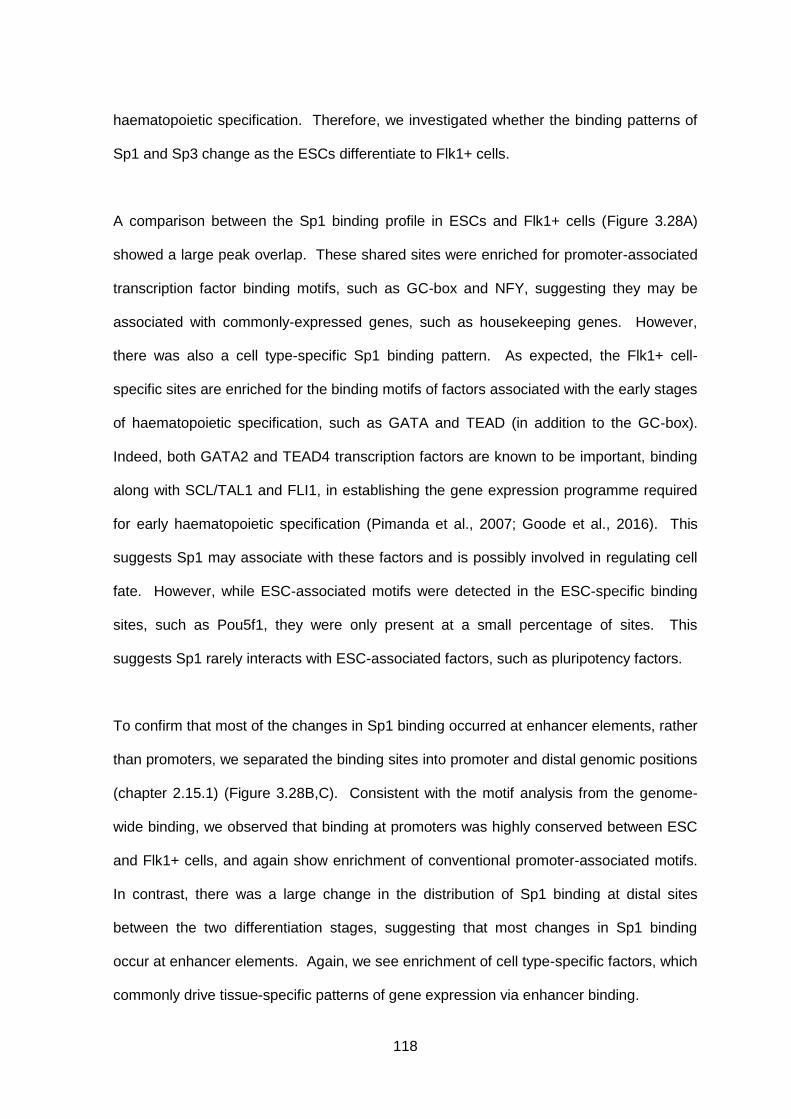
118
haematopoietic specification. Therefore, we investigated whether the binding patterns of
Sp1 and Sp3 change as the ESCs differentiate to Flk1+ cells.
A comparison between the Sp1 binding profile in ESCs and Flk1+ cells (Figure 3.28A)
showed a large peak overlap. These shared sites were enriched for promoter-associated
transcription factor binding motifs, such as GC-box and NFY, suggesting they may be
associated with commonly-expressed genes, such as housekeeping genes. However,
there was also a cell type-specific Sp1 binding pattern. As expected, the Flk1+ cell-
specific sites are enriched for the binding motifs of factors associated with the early stages
of haematopoietic specification, such as GATA and TEAD (in addition to the GC-box).
Indeed, both GATA2 and TEAD4 transcription factors are known to be important, binding
along with SCL/TAL1 and FLI1, in establishing the gene expression programme required
for early haematopoietic specification (Pimanda et al., 2007; Goode et al., 2016). This
suggests Sp1 may associate with these factors and is possibly involved in regulating cell
fate. However, while ESC-associated motifs were detected in the ESC-specific binding
sites, such as Pou5f1, they were only present at a small percentage of sites. This
suggests Sp1 rarely interacts with ESC-associated factors, such as pluripotency factors.
To confirm that most of the changes in Sp1 binding occurred at enhancer elements, rather
than promoters, we separated the binding sites into promoter and distal genomic positions
(chapter 2.15.1) (Figure 3.28B,C). Consistent with the motif analysis from the genome-
wide binding, we observed that binding at promoters was highly conserved between ESC
and Flk1+ cells, and again show enrichment of conventional promoter-associated motifs.
In contrast, there was a large change in the distribution of Sp1 binding at distal sites
between the two differentiation stages, suggesting that most changes in Sp1 binding
occur at enhancer elements. Again, we see enrichment of cell type-specific factors, which
commonly drive tissue-specific patterns of gene expression via enhancer binding.

119

120
Figure 3.28 – Sp1 binding changes between ESC and Flk1+ cells
Sp1 ChIP-seq was performed in WT ESC and Flk1+ cells and high confidence Sp1 binding sites identified (with an overlapping ATAC-seq peak). Density plots show the fold change (FC) between ESC and Flk1+ Sp1 binding genome-wide (A) and specifically at promoters (B) and distal elements (C) (Promoters were classified if within 2 kb of a TSS and as distal otherwise). Green and red sections of the bar indicate ChIP-seq peaks that are at least two-fold different. Motifs (identified using Homer de novo motif discovery) that are significantly enriched at common, ESC- and Flk1-specific sites are shown. Sp3 binding in ESCs and Flk1+ cells shows a remarkably similar pattern, with common
binding predominantly at promoters and cell type-specific binding associated with distal
regulatory elements and tissue-specific transcription factor binding motifs (Figure 3.29).
However, surprisingly, there was an enrichment of CTCF binding sites, particularly at
distal sites in Flk1+ cells. CTCF is a common motif in distal regions, with CTCF involved
in DNA looping between promoters and enhancers, as well as having a role as an
insulator of chromatin domains (Zlatanova & Caiafa, 2009). Therefore, ChIP-seq
experiments show a potential role of Sp1 and Sp3 in early haematopoiesis by binding

121
tissue-specific enhancer elements and possibly interacting with cell type-specific
transcription factors.

122
Figure 3.29 – ESC and Flk1+ cells show different Sp3 binding patterns
Sp3 ChIP-seq was performed in WT ESC and Flk1+ cells. Density plots of the fold change (FC) of Sp3 binding (based on high confidence ChIP-seq peaks) between ESC and Flk1+ cells genome-wide (A) and specifically at promoters (B) and at distal elements (C). Green and red sections of the coloured bar indicate sites with differential Sp3 binding (at least two-fold difference). Motifs (identified using Homer de novo motif discovery) that are significantly enriched at common, ESC- and Flk1-specific sites are shown.
3.5.2 A high level of overlap between Sp1 and Sp3 binding
Sp1 and Sp3 have been shown to bind to the same DNA sites in in vitro studies and at
individual loci. We investigated whether the same was true on a genome-wide level by
comparing the Sp1 and Sp3 binding sites identified by ChIP-seq in WT ESC and Flk1+
cells (Figure 3.30). Indeed, we found a large overlap in Sp1 and Sp3 binding in both ESC
and Flk1+ cells, with the vast majority of sites bound by both transcription factors.
However, at some sites we observed specific binding by Sp1 or Sp3. The Sp1-specific

123
sites show a very similar pattern of motif enrichment to the shared sites – common
promoter-associated transcription factor motifs such as GC-box, NFY and ETS. This is
consistent with the important role of Sp1 in regulating housekeeping genes and recruiting
the transcriptional machinery to TATA-less promoters (Zhou & Chiang, 2002).
Surprisingly, the Sp3-specific sites are not enriched for the canonical GC-box. This
suggests Sp3 may be recruited to chromatin via a binding partner protein. Interestingly,
the CTCF motif is enriched in the Sp3-specific sites (consistent with the results of Figure
3.29). In support, ZBTB33 (Kaiso) motif is also enriched, which is known to interact with
CTCF (Defossez et al., 2005).

124
Figure 3.30 – Sp1 and Sp3 show overlapping, yet distinct, binding patterns
Sp1 and Sp3 ChIP-seq was performed in WT ESCs (A) and Flk1+ cells (B). Density plots show the fold change (FC) in Sp1/Sp3 binding (based on high confidence ChIP-seq peaks). The Sp3- and Sp1-specific binding sites are indicated by the green and red bars, respectively. Motif discovery was carried out at the specific and common peaks and the significantly enriched motifs shown.

125
To further investigate a possible association between Sp3 and CTCF, we plotted the
binding of CTCF (obtained from a publicly available ChIP-seq dataset in ESCs) against
the Sp1/Sp3 binding comparison (Figure 3.31). CTCF binding was indeed found to be
associated with Sp3-specific binding (with no or little Sp1 present). Furthermore, a plot of
the localisation of Sp1 (GC-box) and CTCF motifs found that they negatively correlate.
This suggests that Sp3, and not Sp1, is associated with CTCF binding. These Sp3-
specific, CTCF-enriched sites, also show low enrichment of the GC-box motif, suggesting
Sp3 may be associating with other factors (CTCF?) in order to bind to DNA. Sp3 may
also be able to bind to certain CTCF motifs, which display some sequence similarity to
GC-boxes.
Overall, these results show that Sp1 and Sp3 have very similar binding patterns, but there
are differences, indicating they perform different functions in the cell.
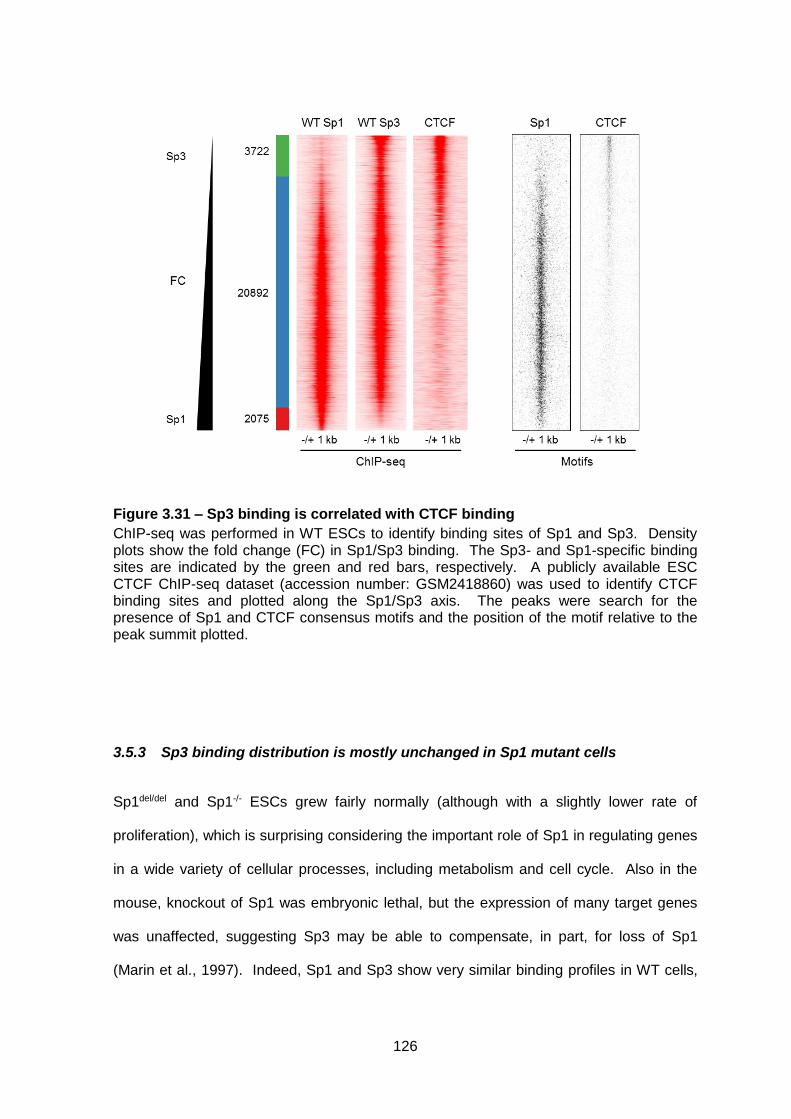
126
Figure 3.31 – Sp3 binding is correlated with CTCF binding
ChIP-seq was performed in WT ESCs to identify binding sites of Sp1 and Sp3. Density plots show the fold change (FC) in Sp1/Sp3 binding. The Sp3- and Sp1-specific binding sites are indicated by the green and red bars, respectively. A publicly available ESC CTCF ChIP-seq dataset (accession number: GSM2418860) was used to identify CTCF binding sites and plotted along the Sp1/Sp3 axis. The peaks were search for the presence of Sp1 and CTCF consensus motifs and the position of the motif relative to the peak summit plotted. 3.5.3 Sp3 binding distribution is mostly unchanged in Sp1 mutant cells
Sp1del/del and Sp1-/- ESCs grew fairly normally (although with a slightly lower rate of
proliferation), which is surprising considering the important role of Sp1 in regulating genes
in a wide variety of cellular processes, including metabolism and cell cycle. Also in the
mouse, knockout of Sp1 was embryonic lethal, but the expression of many target genes
was unaffected, suggesting Sp3 may be able to compensate, in part, for loss of Sp1
(Marin et al., 1997). Indeed, Sp1 and Sp3 show very similar binding profiles in WT cells,

127
however, there are also unique sites. Could the binding distribution of Sp3 be altered
upon Sp1 knockout to now bind at Sp1-specific sites to rescue gene regulation? To
investigate this, we compared the binding of Sp1 in WT (and Sp1+/del clones) to Sp3 in the
Sp1 mutant clones using ChIP-seq.
Generally, the binding of Sp3 in each of the Sp1 wild type and mutant cell clones
appeared very similar to each other and to the binding of Sp1 in WT cells (Figure 3.32).
Moreover, we found a strong correlation overall between Sp1 and Sp3 binding (Figure
3.33), but there were also differences, consistent with the results in Figure 3.30. The
binding correlations clustered based on the cell type (ESC and Flk1+) and on Sp1 or Sp3
specificity, rather than by any differences between the individual clones, suggesting that
the overall binding of Sp3 pattern is similar with or without Sp1 mutations. However, due
to the relatively small number of Sp1- and Sp3-specific sites compared to shared sites,
changes may not be detected in this heatmap.
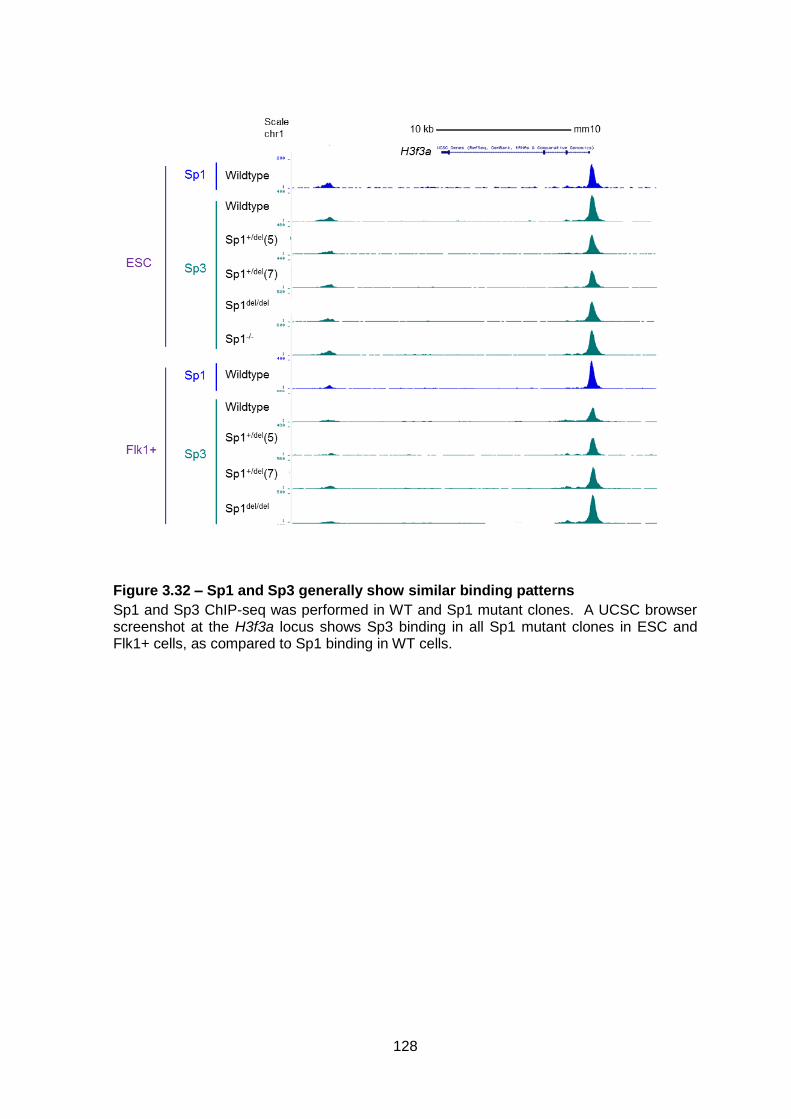
128
Figure 3.32 – Sp1 and Sp3 generally show similar binding patterns
Sp1 and Sp3 ChIP-seq was performed in WT and Sp1 mutant clones. A UCSC browser screenshot at the H3f3a locus shows Sp3 binding in all Sp1 mutant clones in ESC and Flk1+ cells, as compared to Sp1 binding in WT cells.
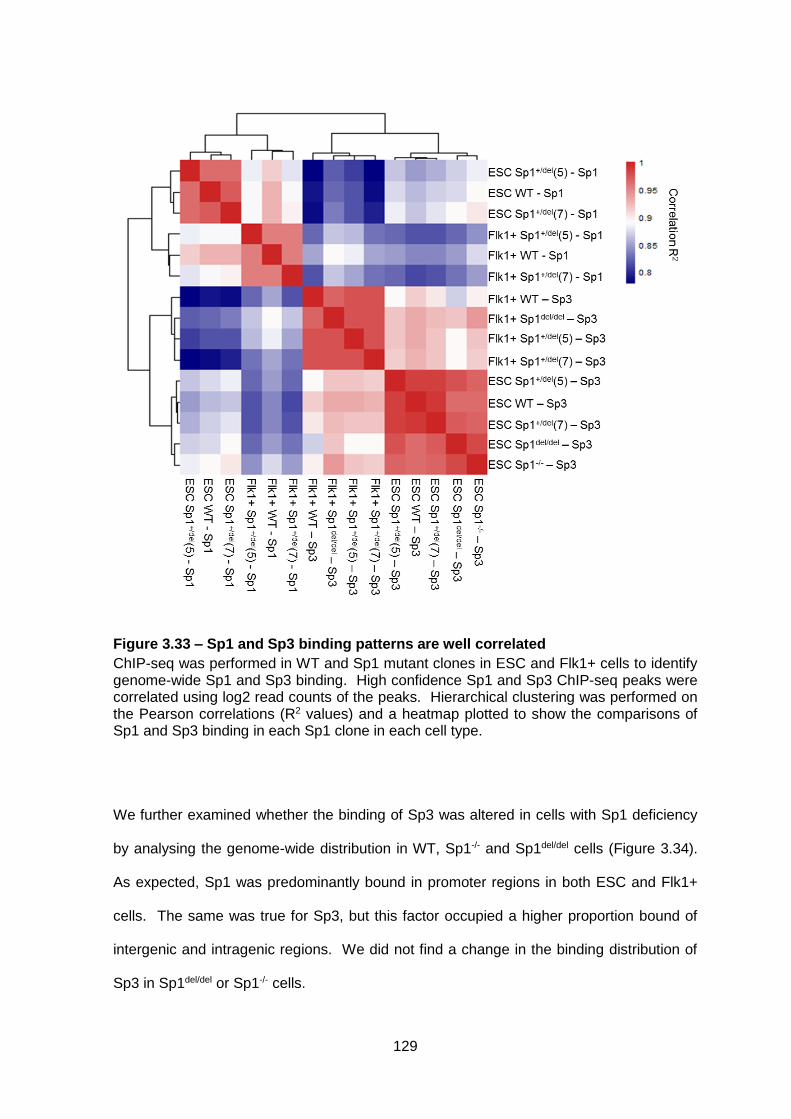
129
Figure 3.33 – Sp1 and Sp3 binding patterns are well correlated
ChIP-seq was performed in WT and Sp1 mutant clones in ESC and Flk1+ cells to identify genome-wide Sp1 and Sp3 binding. High confidence Sp1 and Sp3 ChIP-seq peaks were correlated using log2 read counts of the peaks. Hierarchical clustering was performed on the Pearson correlations (R2 values) and a heatmap plotted to show the comparisons of Sp1 and Sp3 binding in each Sp1 clone in each cell type.
We further examined whether the binding of Sp3 was altered in cells with Sp1 deficiency
by analysing the genome-wide distribution in WT, Sp1-/- and Sp1del/del cells (Figure 3.34).
As expected, Sp1 was predominantly bound in promoter regions in both ESC and Flk1+
cells. The same was true for Sp3, but this factor occupied a higher proportion bound of
intergenic and intragenic regions. We did not find a change in the binding distribution of
Sp3 in Sp1del/del or Sp1-/- cells.
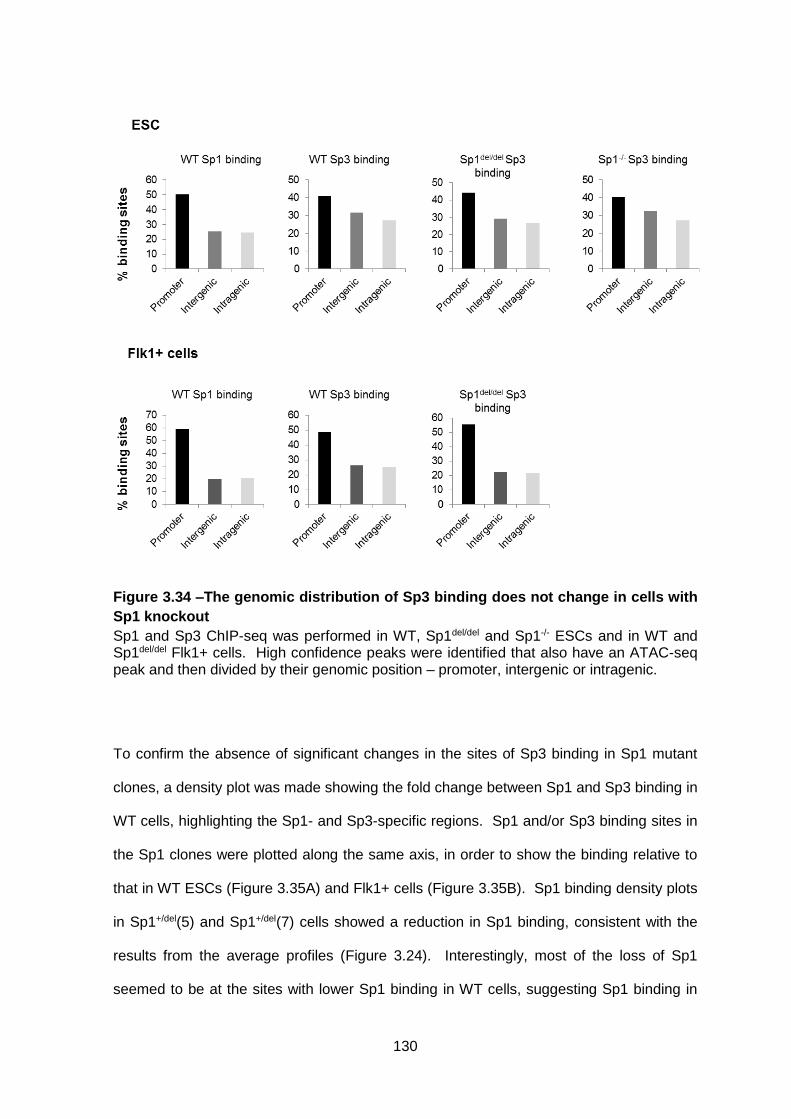
130
Figure 3.34 –The genomic distribution of Sp3 binding does not change in cells with
Sp1 knockout
Sp1 and Sp3 ChIP-seq was performed in WT, Sp1del/del and Sp1-/- ESCs and in WT and Sp1del/del Flk1+ cells. High confidence peaks were identified that also have an ATAC-seq peak and then divided by their genomic position – promoter, intergenic or intragenic.
To confirm the absence of significant changes in the sites of Sp3 binding in Sp1 mutant
clones, a density plot was made showing the fold change between Sp1 and Sp3 binding in
WT cells, highlighting the Sp1- and Sp3-specific regions. Sp1 and/or Sp3 binding sites in
the Sp1 clones were plotted along the same axis, in order to show the binding relative to
that in WT ESCs (Figure 3.35A) and Flk1+ cells (Figure 3.35B). Sp1 binding density plots
in Sp1+/del(5) and Sp1+/del(7) cells showed a reduction in Sp1 binding, consistent with the
results from the average profiles (Figure 3.24). Interestingly, most of the loss of Sp1
seemed to be at the sites with lower Sp1 binding in WT cells, suggesting Sp1 binding in

131
Sp1+/del cells is first lost at the sites with lowest binding affinity. Despite this alteration in
Sp1 binding, possibly due to interference by the truncated Sp1 molecule in WT Sp1
complex formation, we observed no change in the binding of Sp3 in Sp1+/del ESC or Flk1+
cells. No change was also seen in Sp1-/- and Sp1del/del cells, suggesting that even with the
loss of Sp1 DNA binding, Sp3 does not bind at the Sp1-specific sites. Therefore, Sp3
may be able to compensate for Sp1 knockout (or loss of function) at shared genes, but not
at all Sp1-target genes.

132
Figure 3.35 – The binding pattern of Sp3 does not change in the absence of Sp1
High confidence Sp3 and Sp1 binding sites were identified using ChIP-seq in each Sp1 clone in ESCs (A) and Flk1+ cells (B). The fold change between Sp1 and Sp3 binding in WT cells (based on number of reads in the peak) is plotted. The binding in the Sp1 mutant clones is plotted along the same axis in order to compare the regions of Sp1 and Sp3 binding in the mutant clones compared to that in WT.

133
To obtain quantitative data, we determined the mean levels of Sp3 binding in WT and Sp1
mutant cells by averaging the number of reads at each high confidence ChIP-seq peak
(Figure 3.36). This analysis showed an increase in average Sp3 binding in Sp1-/- ESCs
compared to WT cells. This suggests that although we saw no change in where Sp3 is
bound, there was a global increase in the amount of Sp3 bound at its normal sites. This
finding may be explained by a loss of competition from Sp1 for the same sites. Sp3
therefore appears to contribute to the maintenance of gene regulation in ESCs by
compensating for the lack of Sp1.
In contrast, Sp3 binding was only slightly reduced overall in Sp1del/del, Sp1+/del(5) and
Sp1+/del(7) ESCs. The fact that it occurred in all three clones suggests that the presence
of the truncated Sp1 protein was causing this effect, possibly by interfering with normal
complex formation. However, we saw no change in levels of Sp3 binding in Flk1+ cells.
Thus, it may be that only those cells that can bind Sp3 at a sufficient level, and are able to
compensate for loss of Sp1 function in the case of Sp1del/del cells, can successfully
differentiate to Flk1+ cells.

134
Figure 3.36 – Sp3 binding is increased in ESCs lacking Sp1
Sp3 ChIP-seq was performed in each Sp1 clone at ESC and Flk1+ cell stages. High confidence Sp3 binding sites were identified (by calling the ChIP peaks that also had a ATAC-seq peak) and the average reads at each site plotted relative to the summit of the peak.
3.5.4 The difference in Sp1 binding in WT cells and Sp3 binding in Sp1-/- and
Sp1del/del cells is associated with changes in gene expression
To further investigate the role of Sp3 in Sp1del/del and Sp1-/- cells, we performed pairwise
comparisons of Sp1 binding in WT cells and Sp3 binding in Sp1 mutant cells at ESC
(Figure 3.37) and Flk1+ cell stages (Figure 3.38). This enabled us to view the differences
in Sp1 and Sp3 binding with each type of Sp1 mutation. Similar to what we found in the
WT Sp1/Sp3 density plots, there was a large overlap between Sp1 binding in WT cells
and Sp3 binding in Sp1 mutant cell clones, but we also observed specific sites of Sp1
binding in WT cells and Sp3-specific binding sites in Sp1 mutant cells. This pattern was
seen in all mutant clones in both ESCs and Flk1+ cells. The Sp3 binding in WT cells was

135
ranked by the fold change between Sp1 binding in WT cells and Sp3 binding in mutant
cells and showed Sp3 binding was overall very similar between WT and the Sp1 clones.
To examine how the interplay of Sp1 and Sp3 regulated gene expression, we assigned
the binding sites to the nearest gene, as the most likely gene for which it was regulating,
and analysed the expression fold change in the Sp1 mutant cell clones vs. WT cells. In
Sp1-/- and Sp1del/del cells, we found an association between WT cell Sp1-specific sites and
genes displaying a minor downregulation of expression. This result suggests that Sp3 is
unable to compensate at these genes. However, despite the presence of WT cell Sp1-
specific binding sites in Sp1+/del(5) or Sp1+/del(7) cells, they were not associated with gene
expression changes. This finding can be explained by the presence of WT Sp1 protein
that can still bind and regulate expression of Sp1-specific genes.

136
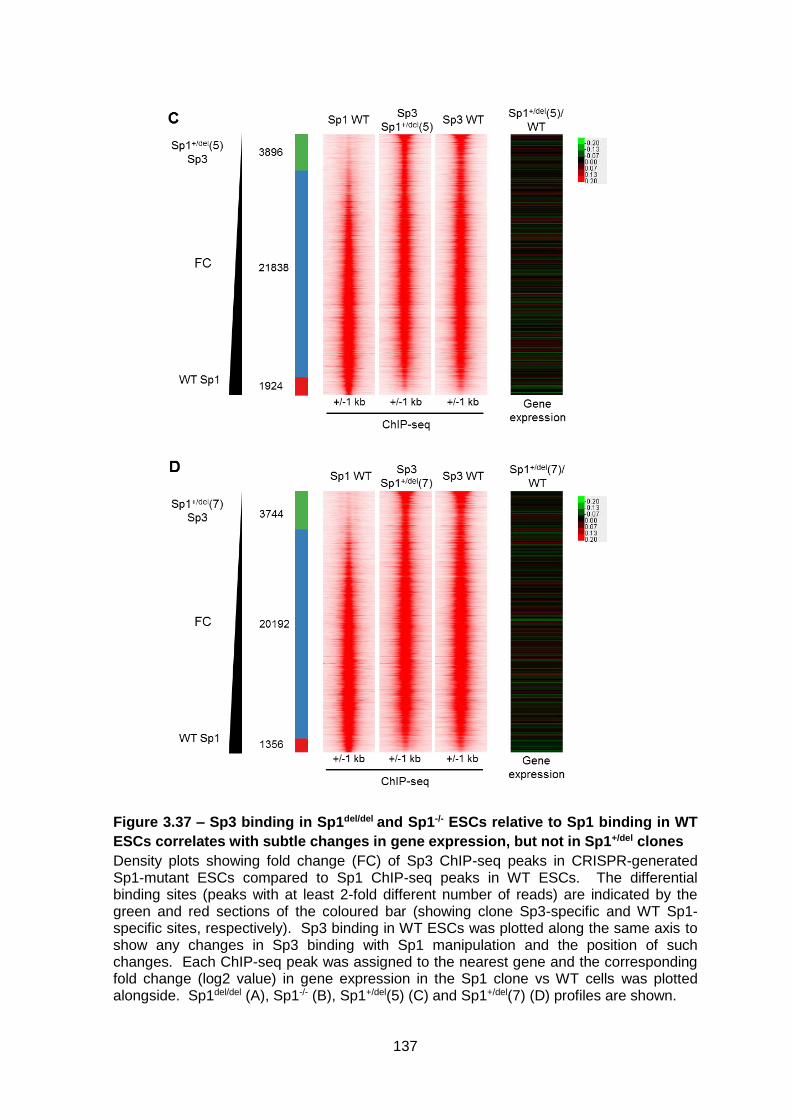
137
Figure 3.37 – Sp3 binding in Sp1del/del and Sp1-/- ESCs relative to Sp1 binding in WT
ESCs correlates with subtle changes in gene expression, but not in Sp1+/del clones
Density plots showing fold change (FC) of Sp3 ChIP-seq peaks in CRISPR-generated Sp1-mutant ESCs compared to Sp1 ChIP-seq peaks in WT ESCs. The differential binding sites (peaks with at least 2-fold different number of reads) are indicated by the green and red sections of the coloured bar (showing clone Sp3-specific and WT Sp1-specific sites, respectively). Sp3 binding in WT ESCs was plotted along the same axis to show any changes in Sp3 binding with Sp1 manipulation and the position of such changes. Each ChIP-seq peak was assigned to the nearest gene and the corresponding fold change (log2 value) in gene expression in the Sp1 clone vs WT cells was plotted alongside. Sp1del/del (A), Sp1-/- (B), Sp1+/del(5) (C) and Sp1+/del(7) (D) profiles are shown.
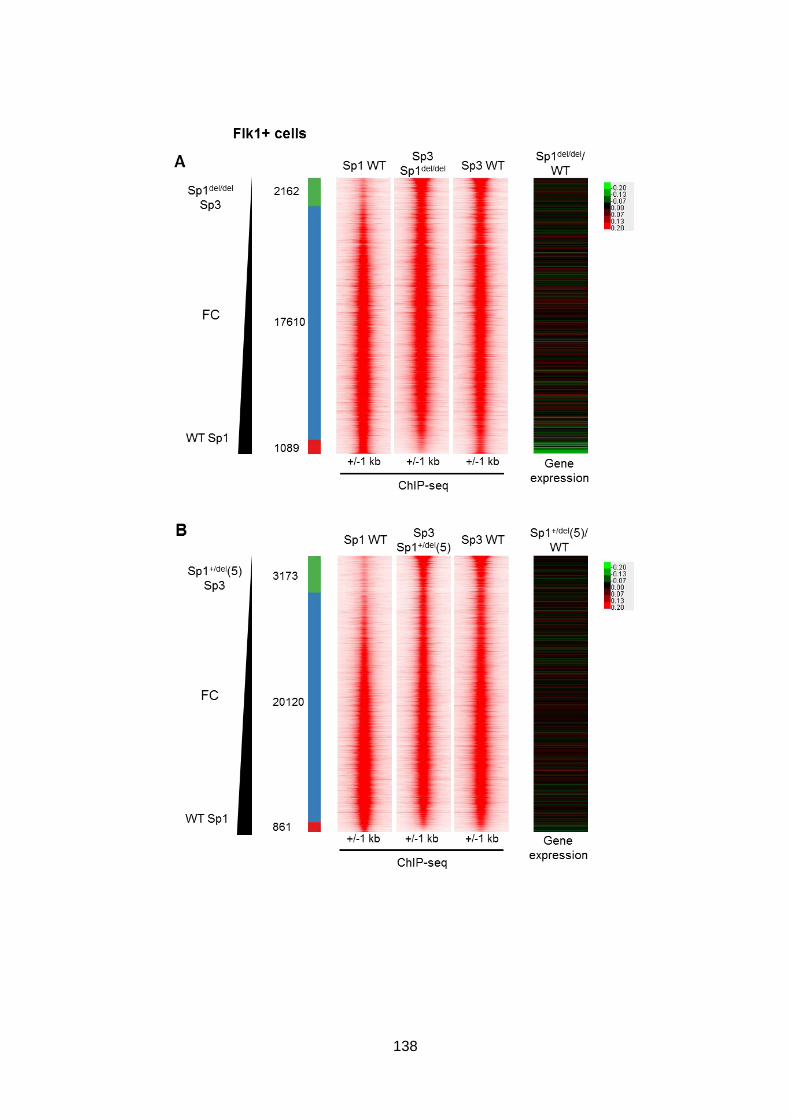
138

139
Figure 3.38 – Genes that normally bind Sp1 and do not bind Sp3 in Sp1del/del Flk1+
cells were slightly downregulated
Density plots showing fold change (FC) of Sp1 ChIP-seq peaks in WT Flk1+ cells compared to Sp3 ChIP-seq peaks in Sp1 mutant Flk1+ cell clones. Differential binding sites (at least 2-fold difference in number of reads) are indicated by the green and red sections of the coloured bar (showing clone Sp3-specific and WT Sp1-specific sites, respectively). Sp3 binding in WT Flk1+ cells was plotted along the same axis to show any changes in Sp3 binding with Sp1 mutation. Each ChIP-seq peak was assigned to the nearest gene and the corresponding fold change (log2 value) in gene expression in the Sp1 clone vs WT cells plotted alongside. Sp1del/del (A), Sp1+/del(5) (B) and Sp1+/del(7) (C) profiles are shown.
Absence of Sp3 was associated with genes that were slightly downregulated in Sp1del/del
and Sp1-/- cells. To examine whether downregulation of important regulator genes could
be involved in the impairment of haematopoietic differentiation, the gene ontology terms of
the WT cell Sp1-specific genes (relative to Sp1del/del and Sp1-/- Sp3 binding individually)
were determined (Figure 3.39). In ESC, gene ontology analysis identified groups of genes
associated with regulation of transcription, signalling and cell proliferation in both Sp1del/del
and Sp1-/- clones. These groups included genes encoding TFs (such as numerous zinc-
finger proteins), epigenetic modifiers (such as the DNA methyltransferase Dnmt3a (Okano

140
et al., 1999) and chromatin remodeller Smarca2 (Wilson & Roberts, 2011)) and signalling
molecules (e.g. Notch1 and growth factor Gdf11 (Andersson et al., 2006; Gerhardt et al.,
2014)). Genes associated with development, cell adhesion and angiogenesis were
enriched in Sp1del/del Flk1+ cells, such as Mesp1, a regulator of mesoderm cell fate, e.g. to
haemangioblasts or cardiac cells (Chan et al., 2013), and Sox17, encoding a TF important
in the development of HE (Clarke et al., 2013). Collectively, the identified gene ontology
terms represent important cellular pathways and their deregulation due to a loss of Sp1
(and inability of Sp3 to bind) may be impacting on the cells’ ability to differentiate.

141
142
Figure 3.39 – WT Sp1 sites, which Sp3 is not able to bind in Sp1del/del and Sp1-/- cells,
are associated with downregulation of genes involved in important cellular
processes
Pairwise comparison of Sp1 binding in WT cells and Sp3 binding in Sp1 mutant cells showed a group of sites that are specifically bound by Sp1 in WT cells. When the sites are assigned to the corresponding nearest gene, the Sp1-specific sites were associated with a general downregulation of gene expression in the Sp1 clone compared to WT. These genes were used in a gene ontology analysis and the resulting significant terms shown. An example of the impact of differential Sp3 binding on gene expression is the Eif2s3y
gene, which is involved in suppressing the pluripotency of ESCs (Li et al., 2016). Eif2s3y
is significantly downregulated by approx. ten-fold in Sp1del/del ESCs and showed reduced
Sp3 binding at the promoter in Sp1del/del ESCs, while the binding and gene expression in
other clones was unaffected (Figure 3.40). This suggests the ability of Sp3 to
compensate for Sp1 or not can impact on gene regulation and influence the cell
phenotype.

143
Figure 3.40 – Differential Sp3 binding correlates with change in gene expression
UCSC browser tracks at the Eif2s3y locus showing Sp1 and Sp3 ChIP-seq, as well as RNA-seq, in ESC Sp1 clones. Eif2s3y is significantly downregulated in Sp1del/del hypomorph cells and correlates with a decrease in Sp3 binding compared to WT cells.
However, while there was an association between absence of Sp3 where Sp1 is normally
bound and the downregulation of gene expression in Sp1del/del and Sp1-/- cells, the
changes in gene expression are small overall (Figure 3.37, Figure 3.38). Indeed, many of
the target genes identified as deregulated by the RNA-seq analysis, which are likely
important in causing impaired of haematopoiesis, are not found in the WT Sp1-specific
list. However, Sp3 does have different transcriptional activities and is often considered a
weaker activator than Sp1. Therefore, it is possible that, even though Sp3 can bind to

144
Sp1-target genes, it may not be able to fully compensate and establish normal levels of
expression.
In conclusion, it is likely that a combination of mechanisms is involved in establishing the
genome-wide gene regulation programme in the Sp1 mutant cell clones. We have shown
that the inability of Sp3 to bind at all Sp1 target genes causes a downregulation of gene
expression (albeit to a small extent), which is associated with important cellular processes
such as transcription and development. We have also shown that differential Sp3 binding
at an individual locus can significantly deregulate gene expression when there is no Sp1
binding. Finally, we have shown that many significantly deregulated genes are bound by
Sp3 (at a level comparable to WT cells), but Sp3 may not be able to fully restore gene
expression because it is a weaker activator. However, the majority of Sp1-target genes
are not deregulated upon loss of Sp1 binding, suggesting Sp3 can compensate to some
degree and likely maintain ESC function.
3.5.5 Changes in Sp3 binding in Sp1del/del and Sp1-/- cells correlate with changes in
gene expression
While the distribution of Sp3 relative to normal Sp1 binding did not change substantially in
cells with Sp1 deficiency, we next questioned whether the overall binding of Sp3 genome-
wide was affected. To examine this, we compared WT Sp3 binding to Sp3 binding in
each Sp1 mutant clone using pairwise density plots in ESCs (Figure 3.41) and Flk1+ cells
(Figure 3.42).
145
Once again, we saw a very similar Sp3 binding pattern in WT and Sp1 mutant cell clones
in ESCs (Figure 3.41), suggesting there was little change in global Sp3 binding with loss
of Sp1. We also found a large overlap between Sp1 binding sites, both in WT cells and in
the corresponding Sp1+/del cell clones, consistent with previous results. Despite, the little
change in Sp3 binding between WT and Sp1-/- or Sp1del/del cells, the fold change in Sp3
binding did correlate with gene expression changes between the Sp1 mutant cell clones
and WT cells. For example, the expression of genes where Sp3 binding was lower in
Sp1-/- cells compared to WT cells was generally downregulated, albeit to a small extent
(Figure 3.41B). However, no association was found between fold change in Sp3 binding
and gene expression changes between WT cells and Sp1+/del(5) and Sp1+/del(7) cells. The
reason for this finding may be that Sp1-/- and Sp1del/del are more dependent on Sp3 for
transcriptional regulation, due to a lack of Sp1 (or Sp1 binding to DNA), than Sp1+/del cells,
which also express WT Sp1 protein. Thus, the gene expression profile changes as a
result of the intrinsic differences in the ability of Sp3 to activate transcription compared to
Sp1. However, these gene expression profiles only show a trend towards gene
deregulation and overall, the changes in gene expression were small, suggesting that Sp3
is largely able to compensate for Sp1 in maintaining gene expression.
Similar results were found in Flk1+ cells: Sp3 binding in Sp1 mutant clones was very
similar to that of WT cells with a high overlap of Sp3 binding and Sp1 in WT cells, and Sp3
binding in WT/Sp1del/del correlating with gene expression changes (but not in Sp1+/del cells).
However, at this cell stage, we found slightly more alterations in Sp3 binding in the Sp1
mutant cell clones, for example 1710 sites lose Sp3 binding by at least two-fold in Sp1del/del
Flk1+ cells, while this number is 1615 in Sp1+/del(5) cells and 864 in Sp1+/del(7) cells. We
also observed a gain of Sp3 binding at some sites. To investigate whether changes in the
chromatin accessibility of such regions could explain the differences, we plotted the
ATAC-seq profile along the same axis. The ATAC-seq shows similar results in WT and

146
Sp1 mutant cell clones at these regions (although perhaps some slight reduction in
accessibility is seen at the regions that lose Sp3 binding) (Figure 3.42). However, gene
regulation in differentiated cells (Flk1+ cells) is generally considered more dependent on
chromatin state than in ESCs, in which chromatin is largely permissive to enable the cells
to activate/repress a wide range of genes required for different cell lineages (Chen &
Dent, 2014). Thus, the role of chromatin in gene regulation and the changes in chromatin
accessibility that occur with Sp1 mutation (Section 3.3), may be the basis of the changes
seen in Sp3 binding in Flk1+ cells, but not (or to a lesser extent) in ESCs.

147

148
Figure 3.41 – Sp3 binding and gene expression in Sp1-deficient ESCs are
unaffected
ChIP-seq was performed to identify Sp3 binding sites throughout the genome in WT and Sp1 mutant ESCs. Density plots show the fold change (FC) between Sp3 ChIP-seq peaks (based on read count of each peak) in WT and Sp1 mutant cells, in order to view any changes in Sp3 binding upon loss of Sp1. The differential binding sites (at least two-fold different) are indicated by the red and green sections of the bar. Sp1 binding (based on ChIP-seq peaks) in WT cells (and Sp1+/del where appropriate) was plotted along the same axis to compare Sp1 and Sp3 binding. ATAC-seq peaks, showing regions of open chromatin, at each binding site in WT and the corresponding clone were plotted along the same axis. Each ChIP-seq peak was assigned to the nearest gene and the corresponding fold change (log2 value) in gene expression in the Sp1 clone vs WT cells plotted alongside. Sp1del/del (A), Sp1-/- (B), Sp1+/del(5) (C) and Sp1+/del(7) (D) profiles are shown.

149
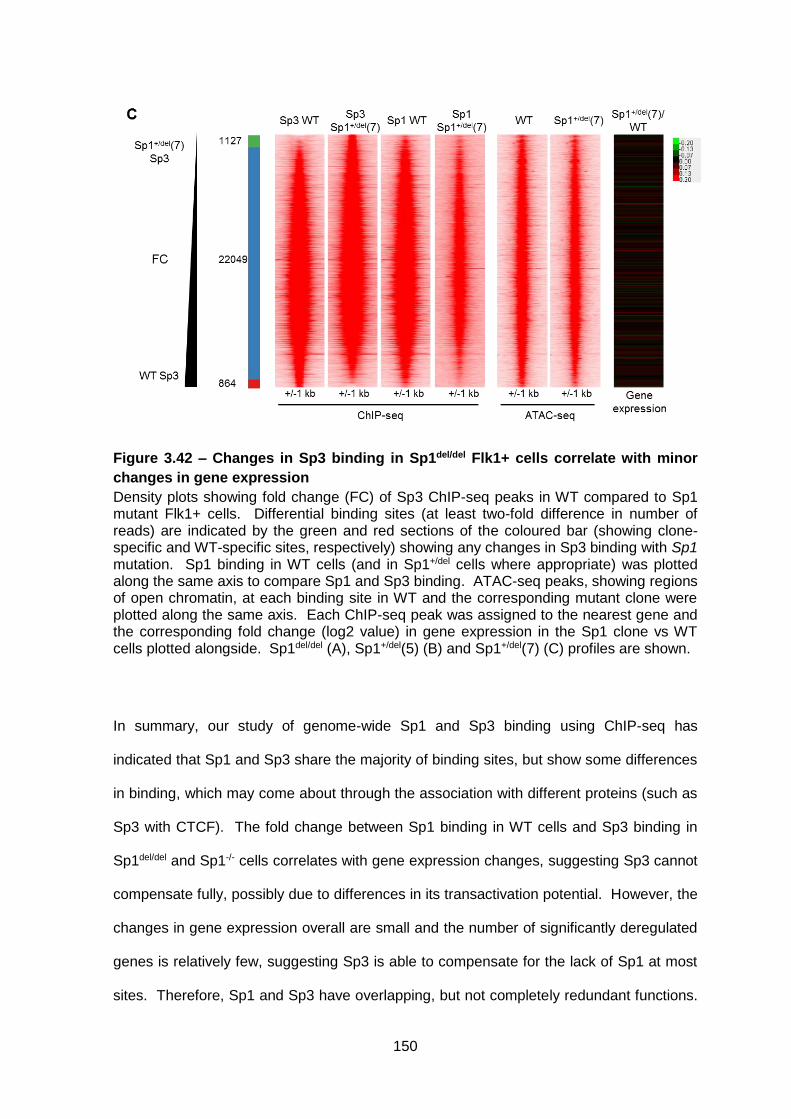
150
Figure 3.42 – Changes in Sp3 binding in Sp1del/del Flk1+ cells correlate with minor
changes in gene expression
Density plots showing fold change (FC) of Sp3 ChIP-seq peaks in WT compared to Sp1 mutant Flk1+ cells. Differential binding sites (at least two-fold difference in number of reads) are indicated by the green and red sections of the coloured bar (showing clone-specific and WT-specific sites, respectively) showing any changes in Sp3 binding with Sp1 mutation. Sp1 binding in WT cells (and in Sp1+/del cells where appropriate) was plotted along the same axis to compare Sp1 and Sp3 binding. ATAC-seq peaks, showing regions of open chromatin, at each binding site in WT and the corresponding mutant clone were plotted along the same axis. Each ChIP-seq peak was assigned to the nearest gene and the corresponding fold change (log2 value) in gene expression in the Sp1 clone vs WT cells plotted alongside. Sp1del/del (A), Sp1+/del(5) (B) and Sp1+/del(7) (C) profiles are shown.
In summary, our study of genome-wide Sp1 and Sp3 binding using ChIP-seq has
indicated that Sp1 and Sp3 share the majority of binding sites, but show some differences
in binding, which may come about through the association with different proteins (such as
Sp3 with CTCF). The fold change between Sp1 binding in WT cells and Sp3 binding in
Sp1del/del and Sp1-/- cells correlates with gene expression changes, suggesting Sp3 cannot
compensate fully, possibly due to differences in its transactivation potential. However, the
changes in gene expression overall are small and the number of significantly deregulated
genes is relatively few, suggesting Sp3 is able to compensate for the lack of Sp1 at most
sites. Therefore, Sp1 and Sp3 have overlapping, but not completely redundant functions.

151
4. DISCUSSION AND FUTURE EXPERIMENTS
In this study, we find novel insights into the function of the ubiquitously expressed TF Sp1
in haematopoietic development and, more generally, further our understanding of the role
of a ubiquitous TF in tissue-specific gene regulation. We manipulated Sp1 to generate
ESC lines that express (i) no Sp1, (ii) DBD-deficient Sp1 (recapitulating the previous
model (Gilmour et al., 2014)) and (iii) both WT and DBD-deficient Sp1. Our work
highlighted the importance of Sp1 in haematopoietic specification, investigated the effects
of Sp1 disruption on chromatin structure and gene expression and uncovered novel
insights into how the interplay of Sp1 and its close relative Sp3 establish and maintain
gene expression programmes.
4.1 Generation of Sp1 mutant cells
Gilmour et al. discovered that Sp1 is crucial for haematopoietic specification during
embryogenesis, but the precise stage that Sp1 is required in the process was still
unknown (Gilmour et al., 2014). To answer this question, we aimed to delete the DBD-
coding region of the Sp1 gene in murine ESCs to recapitulate the previous Sp1 null ESC
model as well as generate a complete Sp1 knockout ESC line, which has never before
been studied. Thus, we targeted the Sp1 gene in A17 2lox ESCs, which contain an
expression cassette in the genome, with the reverse tetracycline transactivator stably
expressed at the ROSA26 locus and a targeting site at the HPRT locus to enable site-
specific integration of an expression construct (Kyba et al., 2002). This integration places
the target gene under the control of a tetracycline-inducible promoter. We hoped to
inactivate Sp1 in these cells, before inducing Sp1 expression at different time points
through in vitro differentiation to elucidate at which stage Sp1 is crucially required.
However, our A17 2lox cell clones appeared to be sensitive to doxycycline alone; addition
152
of doxycycline caused impaired differentiation even on cells not containing the transgene
(data not shown). Therefore, this strategy was abandoned, but the generation of
complete Sp1 null and DBD-deficient Sp1 cells in the same background meant these cells
could still provide new insights into the role of Sp1 in haematopoiesis.
The CRISPR-Cas9 system was used to target Sp1, as it has shown to be effective and
relatively simple experimentally, requiring only the design of the guide RNA sequences
(Jinek et al., 2012; Wang et al., 2013). However, several studies have found that the
CRISPR-Cas9 system could have unwanted off-target effects. Indeed, while Cas9 is
targeted by the 20 nt guide sequence (in addition to requiring the presence of an adjacent
PAM sequence) it could tolerate three to five bp mismatches to the genomic DNA
sequence, particularly in the region of the guide sequence distal to the PAM (Fu et al.,
2013; Hsu et al., 2013). A number of methods have been reported to minimise off-target
effects, for example a mutant nickase Cas9, which cleaves only one strand of DNA and
thus, requires two guide sequences to generate a DNA double-strand break. While this
increases the specificity, it may also decrease on-target cleavage efficiency and limit the
targeting region (Hsu et al., 2013; Ran et al., 2013; Cho et al., 2014). Alternatively,
shortening the 20 nt guide sequence to 18 nt was found to improve specificity and
decrease off-target cleavage (Fu et al., 2014). Therefore, 18 nt guide RNAs were
designed in this study. The CRISPR/Cas9-targeted heterozygous Sp1+/del cell clones
grew and differentiated well, and the expression of the majority of genes in the Sp1-/- and
Sp1+/del ESCs was unchanged, suggesting minimal unwanted effects. In addition, the
differentiation of Sp1-/- and Sp1del/del cells could be rescued by expression of the WT SP1
gene (constitutively expressed to avoid doxycycline-related effects), indicating that the
phenotypes were caused by Sp1 mutation.

153
We successfully generated an ESC line expressing a truncated Sp1, lacking the DBD.
The differentiation of these cells to the haematopoietic lineage was impaired, forming
Flk1+ mesoderm cells, which include haemangioblast cells, with decreased efficiency
compared to WT cells and being unable to terminally differentiate to macrophages. The
size of the Sp1 protein and levels of expression in this ESC clone were very similar to that
seen with the previous Sp1 DBD-deficient ESC model used by Gilmour et al. Moreover,
the phenotypes of the two cell lines were highly comparable, showing that we successfully
recapitulated the previous model, providing a system to validate, as well as build on, past
findings.
Interestingly, the expression level of the DBD-deficient Sp1 protein was much lower than
that of WT Sp1, suggesting it may be less stable. Sp1 is highly post-translationally
modified, including by phosphorylation, glycosylation, sumoylation and acetylation, which
occur on various residues along the length of the protein and that can regulate Sp1’s
activity e.g. by modulating DNA binding or protein-protein interactions (Tan & Khachigian,
2009; Chang & Hung, 2012). Post-translational modification of Sp1 can also affect protein
stability. For example, phosphorylation of T739, which is absent in the truncated Sp1
protein, prevents Sp1 degradation, particularly during mitosis (Chuang et al., 2008; Wang
et al., 2011). Therefore, an alteration in the post-translational modifications of DBD-
deficient Sp1, as compared to the WT protein, may result in changes in its stability (as
well as its transcriptional activity). Despite the decrease in protein level, there was an
increase in mRNA expression levels, possibly due to the cell trying to compensate for the
lack of functional Sp1 protein. Similarly high expression levels were seen in the Sp1del/del
cells that were rescued by expression of WT Sp1. It is possible that we do not see a
reduction in the mRNA expression levels in these cells because this upregulation has
been selected for and is epigenetically stable.

154
Fortuitously, an ESC clone that expressed no Sp1 protein was also generated. Random
mutations caused by the repair of the Cas9-induced DNA double strand break at exon 5 of
the Sp1 gene resulted in a premature stop codon. Nonsense-mediated decay is a
process in the cell that acts as a surveillance pathway, triggering the degradation of
mRNA containing premature stop codons to prevent the expression of truncated proteins,
which may have adverse effects for the cell (Hug et al., 2016). While the mutation
occurred late into the gene sequence, the presence of another intron and exon following
the stop codon would signal for its degradation (Zhang et al., 1998). In support of this
theory, the mRNA expression is significantly lower in Sp1-/- ESCs compared with WT
ESCs. However, this effect is not seen in the RNA-seq browser tracks (Figure 3.9A). The
RNA-seq results are normalised by total number of reads and by expression of
housekeeping genes (e.g. Gapdh) to enable comparison between samples. It may be that
loss of Sp1 causes a global reduction in transcription and the decrease in Sp1
transcription in Sp1-/- cells is minimised by the normalisation.
Only one clone of each the Sp1del/del and Sp1-/- mutations were generated, which may limit
the reliability of the results due to possible clonal differences, as well as potential
unwanted gene targeting effects. However, the similarity of the Sp1del/del phenotype
compared with the previous DBD-deficient ESC line (Gilmour et al., 2014), as well as the
ability of both clones to be rescued with WT Sp1 expression suggests the mutant
phenotypes of the cells are caused by the manipulation of Sp1. Future studies could
generate additional Sp1 mutant clones to further support our results.
A complete Sp1 knockout model has never before been studied. Surprisingly, the ESCs
grew well, albeit slightly slower, likely due to the role of Sp1 in regulating growth and cell
cycle associated genes. However, in vitro differentiation of the Sp1-/- cells showed they
failed to reach the Flk1+ cell stage, a much more severe phenotype than Sp1del/del cells,

155
suggesting that DBD-deficient cells are actually hypomorphic. This is a novel finding,
which has repercussions on a number of other studies using this model, including the Sp1
knockout mouse model. Marin et al. deleted the Sp1 DBD coding region in mice (termed
a Sp1 knockout model) and found that although the mutation was embryonic lethal, the
embryos did not die until ~E11. Many normal embryonic structures and tissues had also
formed in some of the best developed Sp1 knockout embryos. Therefore, they concluded
that Sp1 is dispensable for growth and differentiation of primitive cells, but Sp1 is
important for the maintenance of differentiated cells (Marin et al., 1997). However, our
results suggest Sp1 is important for differentiation and a mouse with complete loss of Sp1
may have a more severe phenotype.
Sp1 is made up of distinct protein domains. Preliminary experiments suggested that
expression of the Sp1 DBD in the DBD-deficient Sp1del/del cells was sufficient to rescue the
mutant phenotype. The DBD may therefore be able to associate with the remainder of the
protein to complement protein function. Conversely, another study used expression of the
DBD alone as a dominant negative protein – i.e. it inhibited the activity of Sp1 and
transcription of Sp1-regulated reporter genes was diminished (Al-Sarraj et al., 2005). The
DBD was expressed in the presence of the full-length Sp1 protein; a different effect may
be seen with only a truncated Sp1 with limited function. However, our experiments were
only performed with one ESC clone (likely due to the difficulty of expressing a single
protein domain stably), so we cannot exclude clonal effects. Therefore, to confirm the
results, we plan to generate additional DBD-expressing Sp1del/del ESC clones and test their
differentiation potential. ChIP experiments could also be performed to show whether
binding of the N-terminal TAD-containing region of Sp1 to DNA has increased with
expression of the DBD. Furthermore, additional domains or portions of Sp1 could be
expressed in Sp1del/del cells as well as Sp1-/- cells to determine if any other Sp1 domains
can partially rescue the phenotypes. For example, is expression of one or both of the

156
TADs sufficient to rescue Sp1-/- cells? This will also provide additional information on the
functions of the individual Sp1 domains in the cell.
4.2 Sp1 regulates key developmental regulators
We next aimed to investigate the changes in gene expression with Sp1 mutation during
haematopoietic specification. Gilmour et al. used microarray experiments to examine the
gene expression profiles of WT E14 ESCs compared to the Sp1 DBD-deficient ESCs. In
this study, we used RNA-seq to a) confirm the findings of the previous study (Gilmour et
al., 2014) and b) examine the changes in the transcriptome in more detail. RNA-seq is
more sensitive, enabling the detection of low abundance transcripts; it is unbiased (unlike
microarray which relies on transcript probes), thereby enabling detection of splicing
variants, sequence variants and novel transcripts, and it can identify TSSs and promoter
usage (Zhao et al., 2014). Thus, these experiments have provided a data resource for
future studies to further investigate how Sp1 mutation impacts on the transcriptome.
Gene expression analysis at each stage of differentiation in the current study showed that
only a limited number of genes were substantially deregulated and overall, the gene
expression pattern was similar between WT cells and Sp1 mutant cells. This result was
surprising considering the drastic phenotype and the role of Sp1 in a wide variety of
cellular processes and its expression in every cell type (Li & Davie, 2010). In addition,
only small changes in gene expression were observed when correlated against changes
in chromatin accessibility (shown by ATAC-seq). While compensation by other TFs, such
as Sp3, is likely to play an important part in the maintenance of gene regulation in the
absence of functional Sp1, population effects may also play a role. Indeed, the RNA-seq,
ATAC-seq and ChIP-seq experiments in this study were performed using a bulk
population of cells. Therefore, any effects seen in just a subset of cells may be lessened
157
when averaged in the population. Heterogeneity in the population could be a particularly
important factor when analysing dynamic gene expression programmes. Population
heterogeneity has been particularly well studied in ESCs. Many TFs have been found to
be heterogeneously expressed in an ESC population, including pluripotency factors such
as NANOG that acts as the gatekeeper between self-renewal and differentiation
(Chambers et al., 2003; Silva et al., 2009; Navarro et al., 2012; Torres-Padilla &
Chambers, 2014). Nanog can switch between expressed and non-expressed states, with
the non-expressing cells more prone to differentiation (Chambers et al., 2007).
Transcription of lineage-associated TFs can also increase in cells that have lost NANOG
(but can be silenced if Nanog is re-expressed), thus creating a fluctuating population of
lineage-biased, but not committed, cell types, enabling the population of ESCs to be able
to both self-renew and commit to different cell fates (Canham et al., 2010; MacArthur et
al., 2012). These studies highlight the potential heterogeneity within a cell population.
Furthermore, the inactivation of Sp1 in the mouse (by deletion of the DBD-coding region)
generated a variety of phenotypes. Sp1 inactivation was embryonic lethal at ~E11, with
phenotypes ranging from developmental arrest as an undefined cell mass to retarded
embryos with some recognisable tissues and structures (Marin et al., 1997). Therefore,
Sp1del/del cells may represent a heterogeneous population, with varying residual Sp1
functionality and ability to differentiate. This diversity may also explain the higher number
of deregulated genes found in Sp1del/del cells as compared to Sp1-/- cells, despite the
milder phenotype. To study this effect further, single cell experiments could be performed.
Recent advances in single cell technology now mean gene expression, chromatin
accessibility and TF binding can be analysed on a genome-wide scale in a single cell
(Trott & Martinez Arias, 2013; Buenrostro et al., 2015b; Rotem et al., 2015; Ye et al.,
2017). These studies could show the effects of Sp1 knockout or inactivation in each cell
158
and draw attention to more dynamic gene expression changes or transient protein-DNA
interactions.
Analysis of the expression of genes that alter between stages of differentiation rather than
at discrete cell stages identified many more genes that are deregulated in the Sp1 mutant
cells, indicating that the dynamics of differentiation were altered. We observed both an
upregulation and downregulation of gene expression, showing the dual role of Sp1 as
both a transcriptional activator and a repressor. In addition, genes that are differentially
expressed through differentiation often encode developmental regulators, such as
lineage-specific TFs. Therefore, the deregulation of these genes may underlie the defect
in haematopoietic differentiation and suggest that the trajectory of the Sp1 mutant cells
through differentiation is altered.
Deregulation of gene expression in Sp1-/- cells: In spite of the small number of
deregulated genes, a number of key regulators in the early stages of haematopoietic
differentiation were deregulated between Sp1-/- ESC and Flk1+ cells. Flk1+
haemangioblast cells originate from a mesodermal precursor (Fehling et al., 2003).
Among the genes that were deregulated in Sp1-/- cells were several encoding factors
important in mesoderm formation. Brachyury (T), as mentioned in the introduction, is
involved in mesoderm specification and is often used as a marker (along with Flk1) of
haemangioblast cells. Knockout of T in mouse embryos causes a reduction in the number
of mesodermal cells, with an increase in ectoderm, and abnormalities in mesoderm
derivative structures, such as the primitive streak and allantois (Yanagisawa et al., 1981;
Yanagisawa, 1990), showing its importance in development. MIXL1 is co-expressed with
Brachyury during embryogenesis and is required for mesoderm and endoderm patterning
(Pereira et al., 2011). Both T and Mixl1 were downregulated with loss of Sp1. Other
genes acted downstream of these factors. Brachyury activates expression of the

159
transcription factor TBX6, which in turn activates Msgn1 that is required for presomitic
mesoderm maturation (Wittler et al., 2007). MESP1 acts to determine mesoderm
patterning to haemangioblasts (by activating Tal1 and Etv2 expression) or cardiac
precursors, in a context-dependent manner (Chan et al., 2013). Indeed, Msgn1, Mesp1,
Tbx6, Kdr (Flk1) and Etv2 are downregulated in Sp1-/- cells.
Additionally, the expression factors that are part of signalling pathways involved in
mesoderm development were altered. FGF signalling via FGF4, whose gene was
downregulated in Sp1-/- cells, promotes mesoderm formation through activation of T box
factors (such as T and Tbx6) (Ciruna & Rossant, 2001). Wnt and BMP signalling also
play an important role in mesoderm specification. Wnt signalling is involved in mesoderm
formation early in gastrulation, while both Wnt (including the protein Wnt5a) and BMP
signalling, particularly BMP4, drive mesoderm differentiation to the haemangioblast (Murry
& Keller, 2008; Nostro et al., 2008). Altogether, these results show there is
downregulation of TFs and signalling molecules involved in mesoderm and
haemangioblast specification with the loss of Sp1, which may explain the defect in
differentiation. Future studies could further explore the consequence of the deregulation
of these factors. For example, knockdown studies using siRNA could be used to
downregulate identified genes and analyse the effect on differentiation in our in vitro
system. If a similar phenotype is seen, it would indicate the deregulation of these genes
causes the differentiation failure. Moreover, while mesoderm differentiation appears to be
blocked, it may be the cells are instead moving to a different lineage. No significant
upregulation of endoderm or ectoderm markers was detected; however, the cells were
selected for Flk1 expression. Therefore, future studies could analyse the population of
cells in the EBs to see if there is a higher proportion of endoderm or ectoderm cells
compared to WT.
160
Deregulation of gene expression in Sp1del/del cells: Gene expression analysis of
Sp1del/del cells showed an upregulation of pluripotency-associated genes in the ESC to
Flk1+ cell transition indicating that the timing of exit of pluripotency was altered. For
example, Nanog was highly expressed in Sp1del/del ESCs. NANOG maintains pluripotency
in ESCs is often considered the gatekeeper of differentiation (Chambers et al., 2007).
Similarly, Essrb, Dppa5a (Esg1) and Amd1, which were also upregulated, are all involved
in ESC self-renewal and maintaining pluripotency (Tanaka et al., 2002; Festuccia et al.,
2012; Zhang et al., 2012). Conversely, factors which promote differentiation of ESCs
such as Eif2s3y, which is involved in suppressing pluripotency (Li et al., 2016), and Satb1,
knockdown of which causes an upregulation of Nanog and impaired differentiation, were
downregulated (Savarese et al., 2009). The result of the deregulation of these genes may
be decreased differentiation potential. Correspondingly, we found that Sp1del/del ESCs
formed smaller, tighter colonies that were less prone to spontaneous differentiation. We
also identified the deregulation of several genes important for regulating differentiation
and cell fate, including Kdr (Flk1) and Etv2 in haemangioblast specification, discussed
above, and Gsc and Hoxb1, which are involved in organising the body plan in vertebrate
embryos (McGinnis & Krumlauf, 1992; Ulmer et al., 2017).
At the Flk1+ cell to HE1 transition, we saw a deregulation (generally downregulation) of
genes associated with specification of the HE, including the markers Tek (Tie2) and
Itga2b (CD41). Several genes involved in angiogenesis and vascular development were
also identified, such as Angpt1/2, which are growth factors to promote angiogenesis
(Maisonpierre et al., 1997), Plxnd1, which is expressed in endothelial cells of the
developing vasculature (Gitler et al., 2004) and Pecam1, encoding an endothelial cell-cell
adhesion molecule (DeLisser et al., 1997). Again, this deregulation may result in impaired
haematopoietic specification.
161
No genes were significantly deregulated at the HE1 to HE2 transition, but there was an
upregulation of genes associated with megakaryocyte/platelet cells between HE2 and
progenitor cells. For example, VWF is a plasma glycoprotein, which binds a receptor on
the surface of platelets (Wise et al., 1991). GP5 forms part of this receptor and is cleaved
during coagulation to mediate platelet adhesion to blood vessel walls (Calverley et al.,
1995). G6B is present on the surface of platelets and acts to inhibit aggregation (Newland
et al., 2007), while CLEC1B is involved in signalling pathways to activate platelets during
haemostasis (Suzuki-Inoue et al., 2011). The expression of each of these genes was
upregulated in Sp1del/del cells. These findings suggest Sp1del/del cells are biased towards
one haematopoietic lineage and may explain their impaired ability to form macrophages.
While the deregulation of these genes may explain the impaired differentiation potential of
Sp1del/del cells, it was interesting to find that many of the same genes (until the progenitor
stage) were deregulated in Sp1+/del cells, suggesting that the genes were being
deregulated by the same mechanism. It is possible that the truncated Sp1, while still
retaining some function, interferes with interactions between TFs. Indeed, Sp1 has been
reported to interact with some of its binding partners via the TADs (Gill et al., 1994;
Koutsodontis et al., 2005). The decreased levels of Sp1 in the cell may also impact on the
levels of transcription initiation. However, Sp1+/del cells can differentiate efficiently despite
the same genes being deregulated, suggesting that Sp1del/del cells differentiate less
efficiently and in a biased way, rather than being incapable of differentiation (as Sp1-/-
cells are). Only at the HE2 to progenitor transition do Sp1del/del cells show a different set of
deregulated genes to Sp1+/del cells, which reflects the inability of Sp1del/del as compared to
Sp1+/del cells to terminally differentiate. This idea could be further investigated by
analysing the rate of Sp1del/del differentiation compared to WT cells. The formation of
Flk1+ cells, while normally taking ~3.75 days, may be delayed in Sp1del/del, which could be
examined with time course experiments. Finally, it was interesting to find that most of the

162
deregulated genes, while the majority were direct targets of Sp1, were different between
Sp1-/- and Sp1del/del cells, suggesting a different mechanism at work and shows that DBD-
deficient Sp1 still has some function. Given the slower growth of Sp1del/del and Sp1-/- cells,
it would also be interesting to investigate the number of haematopoietic cells generated in
the blast culture per Flk1+ input cell in these cells compared with WT and Sp1+/del cells.
A question still to be answered following the study by Gilmour et al. was at which stage
Sp1 is required in haematopoiesis? The failure of Sp1-/- cells to form Flk1+ cells in our in
vitro differentiation system, along with the deregulation of important genes in mesoderm
specification suggests a role of Sp1 very early on in embryonic haematopoiesis. While
there has been no reported role of Sp1 specifically in mesoderm or haemangioblast
formation, many genes associated with these developmental stages were deregulated
upon loss of Sp1 (the majority of which are direct targets of Sp1) suggesting Sp1 is
important in this process.
Furthermore, the highest number of deregulated genes in Sp1del/del cells was found at the
ESC to Flk1+ cell transition, supporting the theory that Sp1 is most important at this early
stage. However, Sp1del/del cells are able to continue to make progenitor cells, albeit with
decreased efficiency than WT cells and with a megakaryocyte bias. It is possible that Sp1
functions via a threshold effect: only the cells that are less affected are able to differentiate
further, so we see fewer deregulated genes at later stages. Interestingly, studies of DBD-
deficient SCL/TAL1 in mice have shown that DNA-binding activity of SCL/TAL1 is not
required at early stages of haematopoietic specification, but it is required for terminal
differentiation to erythroid cells (Kassouf et al., 2008), suggesting a TF’s mechanism of
action can change in different contexts or developmental stages. Therefore, Sp1 DNA-
binding may not be essential for early stages of haematopoiesis, although the presence of

163
the TADs is required, but DNA-binding may be needed for terminal differentiation. This
hypothesis could be investigated in future studies by expressing WT Sp1 in Sp1del/del cells
at a later stage, such as in progenitors, and testing their ability to make macrophages.
Conditional Sp1 knockout mouse studies support the requirement of Sp1 at early stages.
When the Sp1 DBD-coding region was deleted at the myeloid progenitor stage in mice,
the cells were still able to efficiently generate macrophages in vitro (Gilmour et al., 2014).
In contrast, deletion of the DBD in ESCs prevented differentiation to macrophages. To
conclusively show at which stage Sp1 is crucially required in haematopoiesis, Sp1 could
be induced at specific time points during differentiation in a Sp1-null background. While
the A17 2lox cells used in this study are not amenable to this strategy, Sp1 could be
targeted again in a doxycycline-insensitive ESC line. Alternatively, a conditional Sp1
knockout ESC line could be generated.
4.3 Sp1del/del cells are comparable to previous models
Another study by our lab first showed a role for Sp1 in haematopoiesis using ESCs
expressing DBD-deficient Sp1 (Gilmour et al., 2014). The Sp1del/del cells produced in the
present study with a different ESC line background show a remarkably similar phenotype
– the cells differentiate to haematopoietic progenitors, albeit with reduced efficiency, but
fail to terminally differentiate to macrophages. Indeed, the gene expression data was very
comparable from both cell lines that lack the Sp1 DBD, with GSEA plots showing that
generally the same genes were up- or downregulated in the DBD-deficient cells, although
there were some differences.
However, in spite of the broad similarities, most of the deregulated genes that were
identified as likely to be contributing to the phenotype are different between the two.

164
Gilmour et al. found a downregulation of Cdx1 and Cdx2, which are important in early
haematopoiesis, and the consequent deregulation of several Hox genes, in Sp1del/del Flk1+
cells. However, only the upregulation of Hoxb1 was consistent with our results. Several
genes involved in the BMP and Wnt signalling pathways were deregulated in the previous
study. While we identified a number of deregulated genes encoding BMP and Wnt
signalling proteins in Sp1-/- cells, the same was not found in our Sp1del/del cells.
Interestingly, Gilmour et al. found an upregulation of erythroid-associated genes at the
progenitor cell stage, such as Klf1 and Gata1, which are essential TF regulators of the
erythroid lineage (Weiss et al., 1994; Tallack et al., 2010). Instead, we observed the
upregulation of numerous genes associated with the megakaryocyte/platelet lineage. We
also detected an upregulation of Gata1, which in addition to its well-known role in
erythroid development, is essential for megakaryocyte growth and platelet development
(Shivdasani et al., 1997; Noh et al., 2015). Moreover, erythroid and megakaryocytes
originate from the same precursor, the megakaryocyte-erythroid progenitor (MEP),
suggesting these cells may be predisposed to differentiate to the same pathway.
Gilmour et al. also identified a progressive gene deregulation throughout differentiation
(Gilmour et al., 2014). They found a smaller number of deregulated genes in Flk1+ cells,
but a larger number were direct Sp1 targets, suggesting that a deregulation of key
developmental regulators at an early stage led to increasing gene deregulation as the
cells progressed, until they failed to terminally differentiate. However, while still
suggesting a crucial role for Sp1 at early stages, our results show no increasing numbers
of deregulated genes through differentiation and the highest number actually in ESCs.
These differences may be the outcome of various changes in experimental method. As
discussed above, gene expression analysis was performed using RNA-seq in the present
study, but with microarrays in Gilmour et al. which are less sensitive and rely on specific

165
probes to identify transcripts. Furthermore, cell culture conditions were different, for
example with different types of serum, which could introduce altered differentiation biases.
Gene expression was also not analysed in ESCs in Gilmour et al. Thus, it would be
interesting in future work to perform RNA-seq with the original Sp1 DBD-deficient cells,
including in ESCs, and compare the results to our findings and the previous microarray
results. As the phenotypes are very similar, it is likely the commonly deregulated genes
are most important in causing impaired haematopoietic specification.
Furthermore, the Sp1del/del cells in Gilmour et al. and the present study were generated in
a different ESC line, thus a different genetic background. We have also shown that loss
of Sp1 activity results in changes in the chromatin profile of the cell. Therefore, there may
be epigenetic drift in ESCs in the absence of functional Sp1 that could explain the
differences between the two studies and possibly making the cells predisposed to
differentiate in different directions. Such effects could be avoided in future studies by
using a conditional Sp1 knockout model.
4.4 Sp1 deficiency impacts on chromatin structure
Our study as well as previous reports (Gilmour et al., 2014), have demonstrated a
deregulation of the gene expression programme upon Sp1 loss or inactivation and a
consequent defect in haematopoietic specification. However, no studies have
investigated the impact of Sp1 deficiency on chromatin structure during haematopoiesis.
Therefore, we aimed to analyse chromatin accessibility in the Sp1 mutant cells using
ATAC-seq and link any changes to gene expression.

166
Our results showed the chromatin state in Sp1del/del and Sp1-/-, as well as Sp1+/del cells,
was altered. Although there were few unique sites of open chromatin in WT or Sp1
mutant cells, there were several thousand sites at which the accessibility was significantly
different (based on a two-fold difference in the ATAC-seq reads). While the number of
differential sites was comparable in Sp1del/del and Sp1+/del ESC and Flk1+ cells, the
chromatin structure appeared to be vastly different in Sp1-/- Flk1+ cells compared to WT
cells, suggesting mesoderm or haemangioblast formation is severely impaired and the
cells are altered from conventional Flk1+ cells. This is consistent with the deregulation of
mesoderm/haemangioblast associated genes in Sp1-/- cells. Most of the changes in each
Sp1 mutant cell occurred at distal regions, indicating a role for Sp1 at enhancers and
distal regulatory regions, as well as at promoters. Furthermore, the ATAC-seq dataset
was initially filtered using high-read depth DNAse1 hypersensitive site data generated
from WT cells throughout haematopoiesis (Methods 2.15.1). This approach allowed the
generation of a set of high-confidence peaks, but it is possible that some open sites
unique to Sp1 mutant cells were missed in the analysis. This could be investigated in
further analyses.
Each Sp1 mutant cell clone contained sites at which accessibility was gained and sites
that were lost. Sp1 has a number of reported roles in regulating chromatin state. Sp1
interacts with histone modifying enzymes – both positive, such as p300 (Suzuki et al.,
2000), and negative, such as HDAC1 (Doetzlhofer et al., 1999) (discussed further in the
introduction). Thus the disruption of Sp1 binding may affect the histone modifications at
its binding sites and lead to a change in accessibility. Sp1 is also reported to have a more
direct role in regulating chromatin accessibility as it can recruit the remodelling complex
SWI/SNF, which likely acts to maintain a nucleosome depleted region at its target
promoters and enhancers (Kadam & Emerson, 2003; Iwafuchi-Doi et al., 2016).
Therefore, a loss of Sp1 DNA binding may result in more closed chromatin structures at
167
these regions. As open chromatin is required for TF binding at regulatory regions (with
the exception of pioneer factors) and for transcription initiation, a change in accessibility
would likely result in altered gene expression. Indeed, the change in chromatin
accessibility in the Sp1 mutant cell clones compared to WT cells did correlate with a
difference in gene expression. However, the gene expression changes were generally
very small, suggesting minimal effects on the cell.
Some sites became more accessible following manipulation of Sp1, which may be a sign
of the cell trying to compensate for the loss of Sp1 activity. Other factors may increase
their DNA-binding and transcription activity to maintain the gene expression programme,
thus resulting in generally small gene expression changes in the Sp1 mutant cells. To
investigate this, the Sp1 mutant-specific open regions could be analysed to find which TFs
are binding. De novo motif analysis in ESC Sp1 mutant-specific sites showed an
enrichment of common promoter and enhancer associated motifs, such as NFY and ETS,
as well as an enrichment of Pou5f1 motifs, which may indicate the pluripotency factor
Pou5f1 (OCT4) was acting to maintain the ESC gene expression programme. In contrast,
CTCF was most commonly found in the Sp1 mutant-specific open regions in Flk1+ cells.
Our binding data could be integrated with the data obtained by Goode et al., who
performed ChIP-seq on several TFs that are important throughout haematopoiesis
(Goode et al., 2016), to analyse in more detail what factors may be bound. Furthermore,
it would be interesting to examine in future studies whether the same sites are
opening/closing in each Sp1 mutant cell clone. These comparisons may reveal whether
there is a global modification of the chromatin structure due to Sp1 deficiency, or whether
specific Sp1 binding sites are affected. The ATAC-seq experiments could also be
performed in the later stages of haematopoiesis, i.e. HE1, HE2 and progenitors cells, to
investigate whether the impact of Sp1 mutation is different at the various stages.

168
Sp1 has also been found to have a role in higher chromatin structure. In vitro studies
have shown Sp1 can mediate looping between gene regulatory elements to activate gene
transcription. Looping can occur through interactions with other Sp1 molecules, forming
Sp1 tetramers at the DNA loop junction (Mastrangelo et al., 1991; Nolis et al., 2009;
Deshane et al., 2010), as well as with other TFs, including tissue-specific TFs to establish
cell type-specific patterns of gene expression. An example is the synergistic interaction of
Sp1 and GATA1 in erythroid cells between the locus control region and the promoter at
the β-globin locus (Merika & Orkin, 1995). The impact of Sp1 on higher order chromatin
and the establishment of promoter-enhancer contacts could be explored in future studies
by chromatin conformation assays, such as Hi-C (Belton et al., 2012), in WT and Sp1
mutant cells.
4.5 Sp1del/del vs. Sp1-/- cells
In this study, we generated a novel Sp1 null ESC line. All previous Sp1 loss of function
studies used a DBD-deficient Sp1 model, including Gilmour et al. 2014. While Sp1 DBD-
deficient ESC lines reproducibly showed impaired differentiation to haematopoietic
progenitors, Sp1 null ESCs were unable to differentiate to haemangioblasts, showing for
the first time that cells lacking the Sp1 DBD were hypomorphs and Sp1 likely retained
some activity.
Similar properties were found for the TF SCL/TAL1. Deletion of Tal1 in mouse embryos
resulted in embryonic lethality due to a complete lack of haematopoiesis (Robb et al.,
1995; D'Souza et al., 2005). However, HSCs were detected in embryos lacking just the
DBD of SCL/TAL1, but the maturation of erythrocytes was severely impaired, suggesting
DNA-binding activity of SCL/TAL1 is not required for haematopoietic specification, but it is

169
crucial for erythroid development (Porcher et al., 1999; Kassouf et al., 2008). A similar
phenotype was found for Sp1 DBD-deficient cells: they could differentiate in vitro to
haematopoietic progenitors, but failed to form macrophages. Thus, Sp1 DNA-binding may
not be essential for haematopoietic specification, but it is for terminal differentiation. It
was proposed that SCL/TAL1 binds to DNA indirectly via binding partners, and indeed it
was found to bind to ~20% of its targets in primary foetal liver erythrocytes using ChIP-seq
(Kassouf et al., 2010). However, this was at a late stage when DNA-binding was required,
rather than at earlier in haematopoietic specification.
Therefore, we hypothesised Sp1 may still be binding to DNA indirectly as part of a
complex with other TFs. Sp1 retains its two TADs, meaning it may still be able to activate
transcription. However, Sp1 ChIP-seq with double crosslinking in Sp1del/del cells showed
no Sp1 binding. This result is consistent with electrophoretic mobility shift assays (EMSA)
performed with the original Sp1 DBD-deficient ESCs, which showed no binding of the
truncated Sp1 protein to DNA (Marin et al., 1997).
Despite this result, the difference in phenotype of Sp1-/- and Sp1del/del cells still points to
some residual function of the DBD-deficient Sp1. Although the antibody was able to bind
the truncated Sp1 in Western blotting, it may be that it cannot recognise the native
structure of the protein in cells. The ability of the antibody to bind DBD-deficient Sp1
could be confirmed by immunoprecipitation assays to verify the Sp1 protein can be
isolated in the Sp1del/del cells. The double-crosslinking used in the ChIP method may also
not have been sufficient to capture indirect TF binding to DNA. The use of double-
crosslinking in ChIP to detect indirect binding could be validated with a control ChIP
experiment of known transcription cofactors that bind indirectly to DNA.

170
Alternatively, it may be the ChIP-seq protocol used was not sensitive enough to detect the
potentially very transient or unstable interactions between truncated Sp1 and its DNA-
bound partner proteins. Recently, ChIP-seq has been modified to increase sensitivity, for
example ChIP-exo (which uses an exonuclease to remove flanking DNA) has been shown
to identify low-occupancy binding sites at a higher resolution (Rhee & Pugh, 2011). DNA-
adenine methyltransferase identification (DAM-ID) may also be used. The technique
takes advantage of the near absence of adenine methylation in eukaryotes, while it is
abundant in prokaryotes and catalysed by the DAM enzyme. DAM is fused to the desired
TF, resulting in adenine methylation at its binding sites. The DNA is then extracted,
fragmented using the methylation-sensitive DpnI and the methylated fragments amplified
and sequenced (Steensel & Henikoff, 2000). This technique allows identification of sites
with even transient binding and with low levels of protein. For example, it was used to
map RUNX1 binding in the HE, which is itself a transient population (hence present in low
cell numbers) and with very low RUNX1 expression (Lie-A-Ling et al., 2014). Therefore,
future investigations could use these techniques to discover any DBD-deficient Sp1
binding in Sp1del/del cells and analyse which proteins it may be bound with.
4.6 Interplay between Sp1 and Sp3
Sp1 and its homologue Sp3 have very similar structures, including a highly conserved
DBD, meaning they recognise the same DNA motif. Therefore, we aimed to investigate
how the interplay between Sp1 and Sp3 regulates transcription in ESC and Flk1+ cells,
and how this relationship is affected with the loss of Sp1 activity. To this end, we
identified the genome wide binding sites of Sp1 and Sp3 in WT and Sp1 mutant cells by
ChIP-seq.

171
A large overlap was found between Sp1 and Sp3 binding sites, as we could have
expected. However, there is still some debate over whether Sp1 and Sp3 occupy the
same sites simultaneously, or whether they compete for the same sites. For example,
Sp1 and Sp3 were found to physically interact at the promoter for the HGF receptor gene
(c-met) and synergistically activate transcription (Zhang et al., 2003). However, other
studies have shown Sp1 and Sp3 do not associate with each other: Sun et al. was only
able to immunoprecipitate either Sp1 or Sp3, never both, while He et al. used
immunofluorescence to show they localised to distinct parts of the nucleus (Sun et al.,
2002; He et al., 2005). Reports at several different loci have shown Sp1 and Sp3
compete for binding and can elicit different transcriptional effects (Yu et al., 2003; Lee et
al., 2004; Liu et al., 2004; de León et al., 2005). The relationship between Sp1 and Sp3
binding at their shared sites could be further examined using re-ChIP experiments. Re-
ChIP involves consecutive immunoprecipitations in order to show simultaneous co-
occupancy of proteins at genomic sites or protein-protein interactions, for example if a TF
binds as part of a complex (Chaya et al., 2001; Kinkley et al., 2016).
The significant overlap between Sp1 and Sp3 binding, as well the minor changes in gene
expression when correlated to the Sp1 binding in WT cells vs Sp3 binding in Sp1 mutant
cells, suggest Sp3 is largely able to compensate for the absence of Sp1. However, the
mutant phenotype suggests that Sp3 cannot functionally compensate completely,
particularly at genes important in developmental progression. This result is supported by
knockout mice studies. Deletion of the Sp1 DBD in mice is embryonic lethal at ~E11 with
a range of phenotypes, although only a small number of genes are deregulated,
suggesting that other factors (likely Sp3) were compensating for loss of Sp1 (Marin et al.,
1997). On the other hand, mice lacking Sp3 die postnatally, apparently from respiratory
defects (Bouwman et al., 2000), indicating that while there is some redundancy between
their functions, Sp1 and Sp3 have specific roles in individual tissues.

172
While the majority of binding sites are shared by Sp1 and Sp3, we did identify some Sp1-
and Sp3-specific sites in WT cells. The Sp3 binding distribution was unchanged in the
Sp1 mutant cells, suggesting that Sp3 cannot bind at Sp1-specific sites, even without Sp1
bound. However, it is interesting to note that total Sp3 binding was higher in Sp1-/- ESCs,
which may be responsible for the lack of phenotype in ESCs. Therefore, Sp3 cannot
compensate at sites normally bound solely by Sp1. These sites were associated with a
deregulation of genes associated with important cellular processes, such as transcription
and development, thus there may be detrimental effect on the cell – possibly indirectly
impacting on differentiation. However, many of the genes that were identified as being
significantly deregulated with Sp1 deficiency and likely to be important in haematopoiesis
were not found to be regulated by Sp1 specifically. Therefore, their deregulation may be
an effect of Sp3’s different transactivation abilities. There are numerous examples of
where both Sp1 and Sp3 can activate transcription, such as p21 (Gartel et al., 2000),
COL1A2 (Ihn & Trojanowska, 1997) and POLD1 (Zhao & Chang, 1997). In contrast, Sp3
can elicit different effects to Sp1 at some genes. Indeed, Sp3 is often thought of as a
weaker activator or even a repressor of Sp1-mediated transcription. For example, Sp1
activates gene expression, whereas Sp3 represses transcription at the topoisomerase IIα
promoter (Williams et al., 2007) and c-myc promoter (Majello et al., 1995). Secretin
expression is regulated by the ratio of Sp1/Sp3: in expressing cells, NeuroD, E2A, Sp1
and Sp3 bind the promoter, but there are high levels of Sp3 bound in non-expressing
cells, which repress transcription (Lee et al., 2004).
The basis of Sp3 repression of Sp1-mediated transcription is thought to be its inability to
multimerise. At sites with multiple GC-boxes, Sp1 can form a complex and synergistically
activate transcription. Sp3, which lacks the interaction domain D (Hagen et al., 1994),
cannot synergise, but can bind more stably to DNA at some of these sites, thus out-
173
competing Sp1 and eliciting weaker activation of transcription than Sp1 (Yu et al., 2003).
In future studies, it would be interesting to analyse if there was a difference in the
composition of sites at which Sp3 cannot compensate in the Sp1 mutant cell – for
example, do they commonly contain multiple GC boxes?
Sp3 also contains a unique inhibitory domain (ID) adjacent to the zinc fingers (Dennig et
al., 1996). Sumoylation in the ID is thought to recruit negative histone modifiers and
chromatin remodellers, such as HP1 and SETDB1 (Stielow et al., 2008). Mutation of a
KEE sequence in the ID can transform Sp3 into a strong activator of Sp1 target genes
(Dennig et al., 1996), showing the presence of the ID in Sp3, as opposed to Sp1, can
explain some of the differences in activity. Further studies could try to rescue Sp1-/- and
Sp1del/del cells with the expression of Sp3 with a mutant ID, as the expression of Sp3 that
is able to activate expression from Sp1 target genes may be sufficient to partially rescue
differentiation.
There are four isoforms of Sp3, which originate from alternative translational start sites.
The two long form (781 and 769 amino acids) can behave as activators or repressors,
depending on the promoter, while the two short isoforms (496 and 479 amino acids),
which only contain one TAD, are always inactive (Sapetschnig et al., 2004). Again, this
shows Sp3 is not simply a functional equivalent of Sp1. Furthermore, a significant shift
towards the long isoforms is seen in Sp1 deficient ESCs, showing the expression of the
individual isoforms is regulated and it may be a mechanism to compensate for loss of Sp1
(Sapetschnig et al., 2004). Quantification of the Sp3 protein levels showed a shift in
Sp1del/del and Sp1-/- ESCs towards the longer isoforms, suggesting a similar effect is
occurring. The impact of the ratio of Sp3 isoforms on Sp3’s ability to compensate for lack
of Sp1 could be investigated in future studies by allowing the separation of all four
isoforms and comparing their relative expressions in WT compared to Sp1 mutant cells.
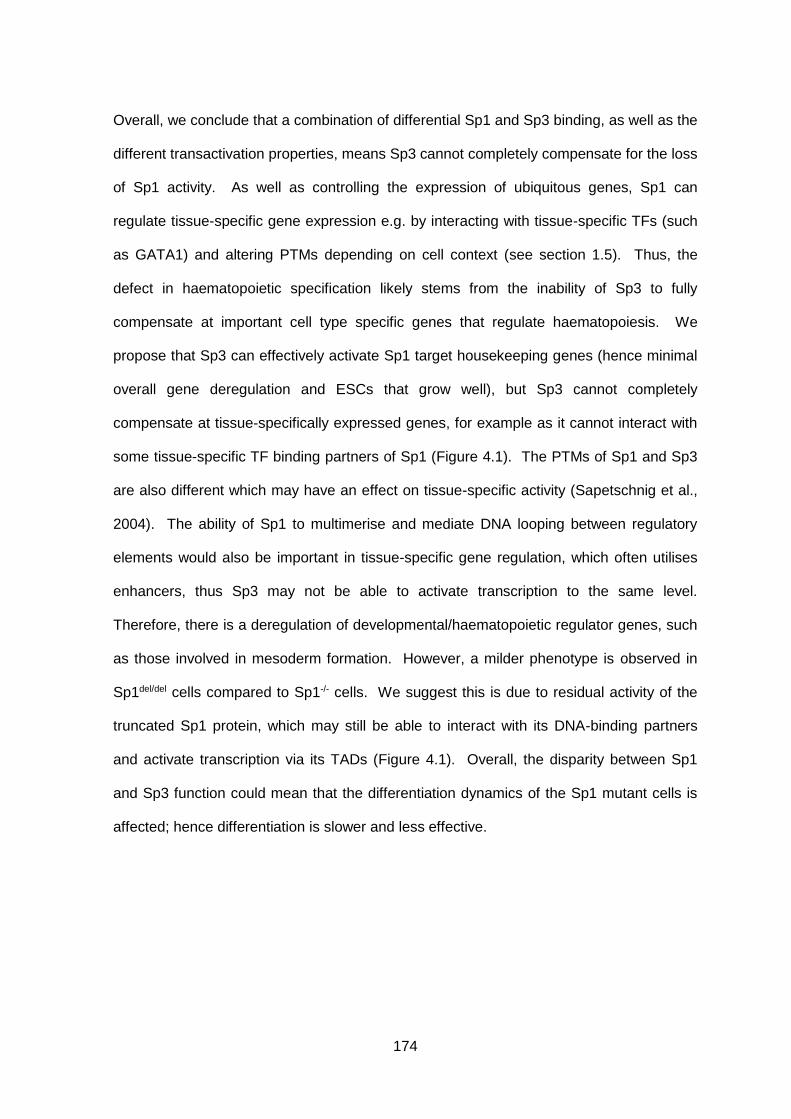
174
Overall, we conclude that a combination of differential Sp1 and Sp3 binding, as well as the
different transactivation properties, means Sp3 cannot completely compensate for the loss
of Sp1 activity. As well as controlling the expression of ubiquitous genes, Sp1 can
regulate tissue-specific gene expression e.g. by interacting with tissue-specific TFs (such
as GATA1) and altering PTMs depending on cell context (see section 1.5). Thus, the
defect in haematopoietic specification likely stems from the inability of Sp3 to fully
compensate at important cell type specific genes that regulate haematopoiesis. We
propose that Sp3 can effectively activate Sp1 target housekeeping genes (hence minimal
overall gene deregulation and ESCs that grow well), but Sp3 cannot completely
compensate at tissue-specifically expressed genes, for example as it cannot interact with
some tissue-specific TF binding partners of Sp1 (Figure 4.1). The PTMs of Sp1 and Sp3
are also different which may have an effect on tissue-specific activity (Sapetschnig et al.,
2004). The ability of Sp1 to multimerise and mediate DNA looping between regulatory
elements would also be important in tissue-specific gene regulation, which often utilises
enhancers, thus Sp3 may not be able to activate transcription to the same level.
Therefore, there is a deregulation of developmental/haematopoietic regulator genes, such
as those involved in mesoderm formation. However, a milder phenotype is observed in
Sp1del/del cells compared to Sp1-/- cells. We suggest this is due to residual activity of the
truncated Sp1 protein, which may still be able to interact with its DNA-binding partners
and activate transcription via its TADs (Figure 4.1). Overall, the disparity between Sp1
and Sp3 function could mean that the differentiation dynamics of the Sp1 mutant cells is
affected; hence differentiation is slower and less effective.

175
Figure 4.1 – Potential mechanism of Sp3 compensation in Sp1 deficient cells
Sp1 binds at promoter (and enhancer) elements of both housekeeping and tissue-specific genes to regulate gene expression. Sp1 can bind alone (or as Sp1 multimers) or interact with other TFs, such as tissue-specific TFs, to fine-tune its specificity or activity at its target genes. Upon complete knockout of Sp1, or deletion of its DBD, Sp3 can compensate at the majority of genes and maintain their expression (left). This includes at housekeeping genes, meaning the Sp1-deficient ESCs grow relatively normally. However, Sp3 cannot compensate at all genes, such as genes important in developmental progression, thus there is a defect in the differentiation of Sp1-/- and Sp1del/del cells to the haematopoietic lineage (right). This may occur as Sp3 cannot interact with Sp1 partner proteins, thus causing gene deregulation, such as of mesoderm regulators in Sp1-/- cells. The phenotype is less severe with knockout of just the Sp1 DBD, suggesting the truncated Sp1 protein may still be recruited to some gene regulatory elements via its partner proteins to activate transcription with its TADs. DBD-deficient Sp1 may also play a role in binding partner TFs and preventing them interacting with Sp3.
176
4.7 Tissue-specific gene regulation by Sp1
ChIP-seq experiments in this study have provided a wealth of information on the binding
of Sp1 relative to Sp3 and how the binding changes between stages of differentiation.
Motif analysis was performed at the Sp1 and Sp3 sites in an aim to identify potential TF
interaction partners. We found some differences in the TF motifs that were enriched at
the Sp1 and Sp3 sites, including the CTCF motif which was enriched in Sp3-specific sites,
but not at Sp1-bound sites. Publicly available CTCF ChIP-seq data in ESCs confirmed
this pattern, with CTCF binding strongly negatively correlated with the fold change of
Sp1/Sp3 binding. CTCF is a ubiquitously expressed eleven-zinc finger protein. It has
various functions, including insulating regions of chromatin to prevent spreading of
active/repressive states and regulating contacts between promoters and enhancers
(Zlatanova & Caiafa, 2009). We were surprised to find a potential link between CTCF and
Sp3, however CTCF’s binding is widespread across the genome, particularly at distal
regions (Kim et al., 2007; Chen et al., 2012). The ZBTB33 motif was also identified in
Sp3-specific regions, which is a known binding partner of CTCF, thus supporting the
possibility of an association between Sp3 and CTCF (Defossez et al., 2005).
Recently, CTCF has been found to interact with TFs in gene regulation. For example, the
tissue-specific TF LDB1 binds at the enhancers of some erythroid-specific genes and
contacts CTCF bound at the promoter, via DNA looping, to activate transcription (Lee et
al., 2017). Thus, CTCF is involved in mediating long range interactions between
regulatory regions to establish a cell type-specific pattern of gene expression. Sp3 may
be interacting with CTCF in a similar way. Sp3 lacks the domain D that enables Sp1 to
form multimers and mediate DNA looping (Hagen et al., 1994; Yu et al., 2003), therefore it
may interact with CTCF to enable it to still regulate gene expression from distal elements.
However, the inability of Sp3 to form multimers and establish DNA loops, in contrast to

177
Sp1, has previously been proposed to be a reason for Sp3’s weaker transactivation
properties, or even its repressive activity at some loci, for example by displacing Sp1 and
preventing looping between regulatory elements (Williams et al., 2007). Alternatively, one
study has demonstrated the presence of an overlapping CTCF and Sp1/Sp3 binding site
at the promoter of the ALF gene, with the GC-box beginning within the CTCF motif. CTCF
and Sp3 repress transcription, while Sp1 can activate it, suggesting the ratio between TFs
determines the expression of the gene at specific developmental stages or specific tissues
(e.g. CTCF levels decrease in germ cells where ALF is expressed) (Kim et al., 2006).
Therefore, the Sp3 binding sites could be further examined for a novel longer motif
combining the two binding sites. However, as this is the first time a potential relationship
between Sp3 and CTCF has been observed, the findings could be verified by repeating
the ChIP-seq with different antibodies, to ensure there was no cross-reactivity.
The Sp1 and Sp3 ChIP-seq data provide a resource for future studies to potentially
identify new binding partners. A large proportion of Sp1 binding sites were located in CpG
islands, while nearly all open CpG islands were bound by Sp1, supporting a role for Sp1 in
maintaining a DNA methylation-free state and the promoters active (Brandeis et al., 1994;
Macleod et al., 1994). Correspondingly, a number of TF motifs commonly associated with
promoters were enriched at both Sp1 and Sp3 sites. For example, NFY binds to a
CCAAT box, which is one of the most common elements in promoters, regulating a range
of tissue-specific, inducible and housekeeping genes (Bucher, 1990). NFY interacts with
Sp1 at several promoters to cooperatively bind or synergistically activate transcription
(Wright et al., 1995; Yamada et al., 2000; Iwano et al., 2001; Schardt et al., 2015). The
ETS motif was also enriched, which can be bound by a number of TFs, such as FLI1
which is important in embryonic development and haematopoiesis and can interact with
Sp1 (Shirasaki et al., 1999).

178
Sp1 also has roles in tissue-specific gene regulation, often with the interaction with tissue-
specific TFs. However, it is still unknown what interactions occur to give Sp1 its tissue-
specificity during embryonic haematopoiesis. While there was a low enrichment of ESC-
associated motifs, such as Pou5f1, at Sp1 sites in ESCs, there was an enrichment of
GATA and TEAD motifs at Sp1 sites in Flk1+ cells. GATA2 is required for haematopoiesis
and is expressed at the haemangioblast stage (Tsai et al., 1994; Pimanda et al., 2007).
GATA sites, commonly with ETS sites, are crucial for the activation of early
haematopoietic genes, such as Fli1, Tal1 and Runx1 (Pimanda et al., 2007; Wilson &
Roberts, 2011). Furthermore, GATA2, FLI1 and SCL/TAL1 interact to establish the gene
expression programme at early stages of haematopoiesis (Pimanda et al., 2008). Sp1
has previously been found to interact with these factors, for example Sp1 interacts with
the “SCL complex” (containing SCL/TAL1, E2A, GATA2, LMO2 and LDB1) and tethers it
to the DNA at the Kit promoter (Lecuyer et al., 2002). Moreover, the interaction between
Sp1 and GATA1 in erythroid cells has been extensively studied. Sp1 and GATA1 interact
via the DBD and synergistically activate transcription of erythrocyte-specific genes, such
as β-globin (Merika & Orkin, 1995). Indeed, Sp1 can recruit GATA1 to a promoter in the
absence of GATA binding sites and vice versa. Thus, due to similarity in GATA family
members, a similar interaction may occur with GATA2 at earlier stages of haematopoiesis.
Recently, TEAD4 was identified as required in early stages of embryonic haematopoiesis,
prior to the EHT. The motif was particularly enriched at the haemangioblast stage,
consistent with our data, and TEAD4 bound several important genes in haematopoietic
development, including Runx1 and Kit (Goode et al., 2016). As the TEAD motif was
enriched at Sp1 binding sites, there may be an interaction between the proteins, leading
to tissue-specific gene regulation by Sp1.
The interactions of Sp1 with developmental stage-specific TFs could be further
investigated by integrating our data with the ChIP-seq results obtained in Goode et al.
179
which mapped the binding of various TFs across the different stages of haematopoietic
differentiation (Goode et al., 2016). This analysis could show factors that co-localise with
Sp1 and may interact to regulate transcription, thus revealing novel binding partners of
Sp1. Our study has shown Sp1 is crucial for haematopoietic specification, thus it would
be interesting to examine what determines the tissue-specific expression of some Sp1
target genes (e.g. via the interaction of cell type-specific TFs). Sp3 is unable to
compensate for the loss of Sp1 at some of these genes encoding haematopoietic
regulators (hence a defect in differentiation of Sp1-deficient ESC). Therefore, the Sp3
ChIP-seq data may show differences in the ability of Sp1 and Sp3 to bind with other
factors. For example, Sp3 may not be able to interact with Sp1’s partner proteins. Future
studies could also investigate the role of PTMs in generating cell type-specific gene
regulation by Sp1, e.g. phosphorylation in myeloid progenitors can promote binding to
monocyte-specific promoters (Zhang et al., 1994).
In conclusion, we have developed a novel complete Sp1 null ESC model, which has
demonstrated a crucial role for Sp1 at the early stages of haematopoiesis. The
contrasting ability of Sp1 DBD-deficient cells to form haematopoietic progenitors, but not
macrophages, suggests different mechanisms of action at different stages of
development. We found that Sp1’s family member, Sp3, is able to compensate to some
extent for the loss of Sp1, but not at some important genes in developmental progression,
possibly due to differences in protein-protein interactions with tissue-specific TFs. This
study therefore gathered novel biological insights into the function of one of the first
discovered TFs and has generated a resource for future work to further investigate the
tissue-specific roles of a ubiquitously expressed TF.

180
5. Supplementary Data
5.1 Sequence data of CRISPR-generated Sp1 mutant clones
WT DNA sequence ggtcagccttgtctacttagtaagttccaggacagccagagctacatagagtctttctcaaaaacaaaggaatgggttaagtaattgcttctgacaattactattctaatttcttggttccctactttctagctccagagtgataaatcataatattctcatttttagAGCCTCAGGAGATCCTGGCAAAAAGAAACAGCACATTTGTCACATCCAAGGATGCGGCAAAGTATATGGCAAGACCTCACATCTCCGAGCACACTTGCGCTGGCATACAGGGGAGAGGCCATTCATGTGTAATTGGTCATATTGTGGGAAGCGCTTTACACGTTCGGACGAGCTTCAGAGACATAAACGTACACATACAGgtgagtaagacccaagggaaaagggaaagtagtagacagaaaagaaatgagggctggagaaatggctcagtggttaagagcattgactgctcttccagaggtcctgatttcaattcccagcaaccacatagaggctcataaccatctataatgggatccaatgccctcttcagacagctacaatgtattcatgaataaaatagataaatctttaaaaaaaaaagaagaaagaaagaaagaaatgagctcataagctctcacctctcttattctcatctccagctctccccctcccttccctcctttctccacttggccatggcagtcctctctctttctaccttctctctttctgtctttctataataaagctctaaaaccataaaaagaaaagaaaaaagaaatgatatgcccatgaagcaaactgaaattcctaaacaatgtatatgtgaaactaagcgtgtctccaagagtacttgaattagtccagaaggatacacatcaacctcaactttgttctgactgctttttggctaatttatcttttttttttttttttttaaactagGAGAGAAGAAATTTGCCTGCCCTGAGTGCCCTAAGCGTTTCATGAGGAGTGATCACCTGTCAAAGCATATCAAGACTCACCAGAACAAGAAGGGAGGCCCAGGTGTAGCCCTGAGTGTGGGCACATTGCCCCTGGACAGTGGGGCAGGTTCAGAAGGCACTGCCACTCCTTCAGCCCTTATTACCACCAATATGGTAGCCATGGAGGCCATCTGTCCAGAGGGTATTGCCCGTCTTGCCAACAGTGGCATCAACGTCATGCAGGTGACAGAGCTGCAGTCCATTAATATCAGTGGCAATGGTTTCTAAGATTAGACACCCAGTGCCAGAGACATATGGGCCAATACCCACTAAGCCCGGGATGCAAGGTAGCATGGGTCCAAGAGACATCTGGAAGAGAGAGCCATGAGGCATTAATGTGCTTGGTGGTAGGAAGAATTGGGAGATGGTACAAAAAAAAGAGATGGGATTGTGGCACCCAATGTCACTG Introns are shown in lower case, exons in upper case Guide 1 (PAM) Guide 14 (PAM) Stop codon PCR primers Amino acid sequence A S G D P G K K K Q H I C H I Q G C G K V Y G K T S H L R A H L R W H T G E R P F M C N W S Y C G K R F T R S D E L Q R H K R T H T G E K K F A C P E C P K R F M R S D H L S K H I K T H Q N K K G G P G V A L S V G T L P L D S G A G S E G T A T P S A L I T T N M V A M E A I C P E G I A R L A N S G I N V M Q V T E L Q S I N I S G N G F
Sp1del/del
DNA sequence gccttgtctacttagtgagttccaggacagccagagctacatagtctttctcaaaaacaaaggaatgggttaagtaattgcttctgacaattactattctaatttcttggttccctactttctagatccagagtgataaatcattatattctcatttttagAGCCTCAGGAG
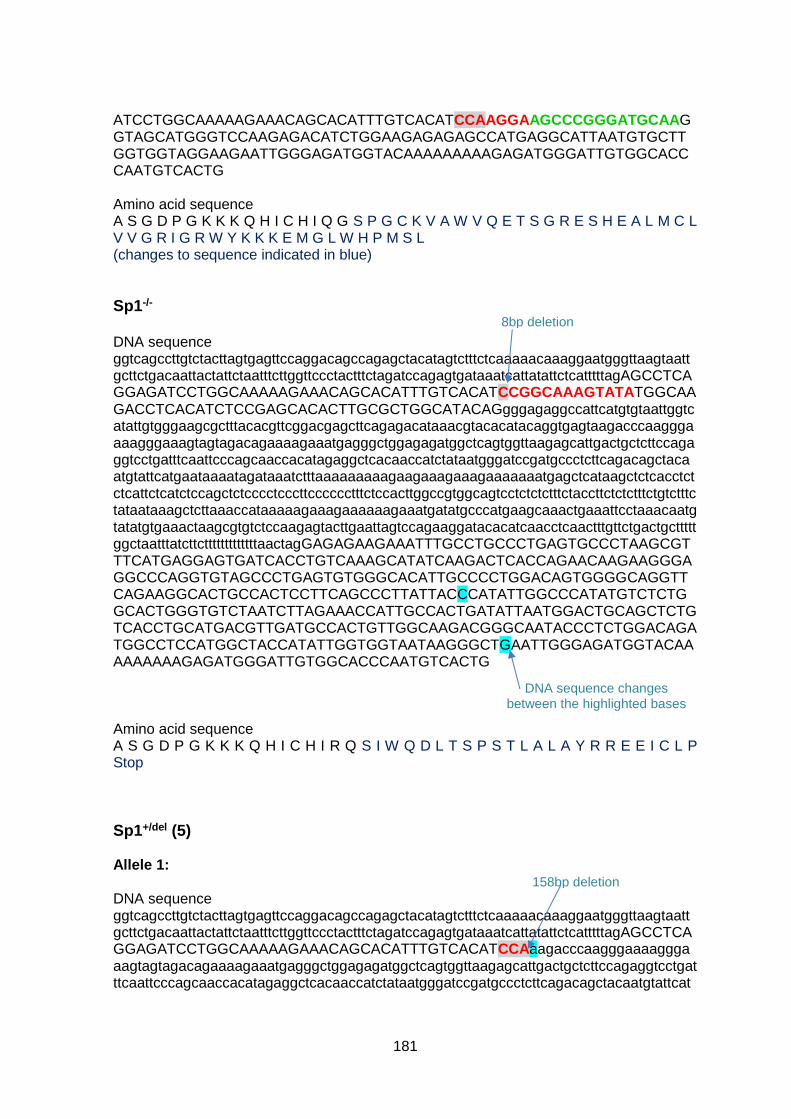
181
8bp deletion
DNA sequence changes between the highlighted bases
158bp deletion
ATCCTGGCAAAAAGAAACAGCACATTTGTCACATCCAAGGAAGCCCGGGATGCAAGGTAGCATGGGTCCAAGAGACATCTGGAAGAGAGAGCCATGAGGCATTAATGTGCTTGGTGGTAGGAAGAATTGGGAGATGGTACAAAAAAAAAGAGATGGGATTGTGGCACCCAATGTCACTG Amino acid sequence A S G D P G K K K Q H I C H I Q G S P G C K V A W V Q E T S G R E S H E A L M C L V V G R I G R W Y K K K E M G L W H P M S L (changes to sequence indicated in blue)
Sp1-/-
DNA sequence ggtcagccttgtctacttagtgagttccaggacagccagagctacatagtctttctcaaaaacaaaggaatgggttaagtaattgcttctgacaattactattctaatttcttggttccctactttctagatccagagtgataaatcattatattctcatttttagAGCCTCAGGAGATCCTGGCAAAAAGAAACAGCACATTTGTCACATCCGGCAAAGTATATGGCAAGACCTCACATCTCCGAGCACACTTGCGCTGGCATACAGgggagaggccattcatgtgtaattggtcatattgtgggaagcgctttacacgttcggacgagcttcagagacataaacgtacacatacaggtgagtaagacccaagggaaaagggaaagtagtagacagaaaagaaatgagggctggagagatggctcagtggttaagagcattgactgctcttccagaggtcctgatttcaattcccagcaaccacatagaggctcacaaccatctataatgggatccgatgccctcttcagacagctacaatgtattcatgaataaaatagataaatctttaaaaaaaaagaagaaagaaagaaaaaaatgagctcataagctctcacctctctcattctcatctccagctctcccctcccttcccccctttctccacttggccgtggcagtcctctctctttctaccttctctctttctgtctttctataataaagctcttaaaccataaaaagaaagaaaaaagaaatgatatgcccatgaagcaaactgaaattcctaaacaatgtatatgtgaaactaagcgtgtctccaagagtacttgaattagtccagaaggatacacatcaacctcaactttgttctgactgctttttggctaatttatcttctttttttttttttaactagGAGAGAAGAAATTTGCCTGCCCTGAGTGCCCTAAGCGTTTCATGAGGAGTGATCACCTGTCAAAGCATATCAAGACTCACCAGAACAAGAAGGGAGGCCCAGGTGTAGCCCTGAGTGTGGGCACATTGCCCCTGGACAGTGGGGCAGGTTCAGAAGGCACTGCCACTCCTTCAGCCCTTATTACCCATATTGGCCCATATGTCTCTGGCACTGGGTGTCTAATCTTAGAAACCATTGCCACTGATATTAATGGACTGCAGCTCTGTCACCTGCATGACGTTGATGCCACTGTTGGCAAGACGGGCAATACCCTCTGGACAGATGGCCTCCATGGCTACCATATTGGTGGTAATAAGGGCTGAATTGGGAGATGGTACAAAAAAAAAGAGATGGGATTGTGGCACCCAATGTCACTG Amino acid sequence A S G D P G K K K Q H I C H I R Q S I W Q D L T S P S T L A L A Y R R E E I C L P Stop
Sp1+/del (5) Allele 1: DNA sequence ggtcagccttgtctacttagtgagttccaggacagccagagctacatagtctttctcaaaaacaaaggaatgggttaagtaattgcttctgacaattactattctaatttcttggttccctactttctagatccagagtgataaatcattatattctcatttttagAGCCTCAGGAGATCCTGGCAAAAAGAAACAGCACATTTGTCACATCCAaagacccaagggaaaagggaaagtagtagacagaaaagaaatgagggctggagagatggctcagtggttaagagcattgactgctcttccagaggtcctgatttcaattcccagcaaccacatagaggctcacaaccatctataatgggatccgatgccctcttcagacagctacaatgtattcat
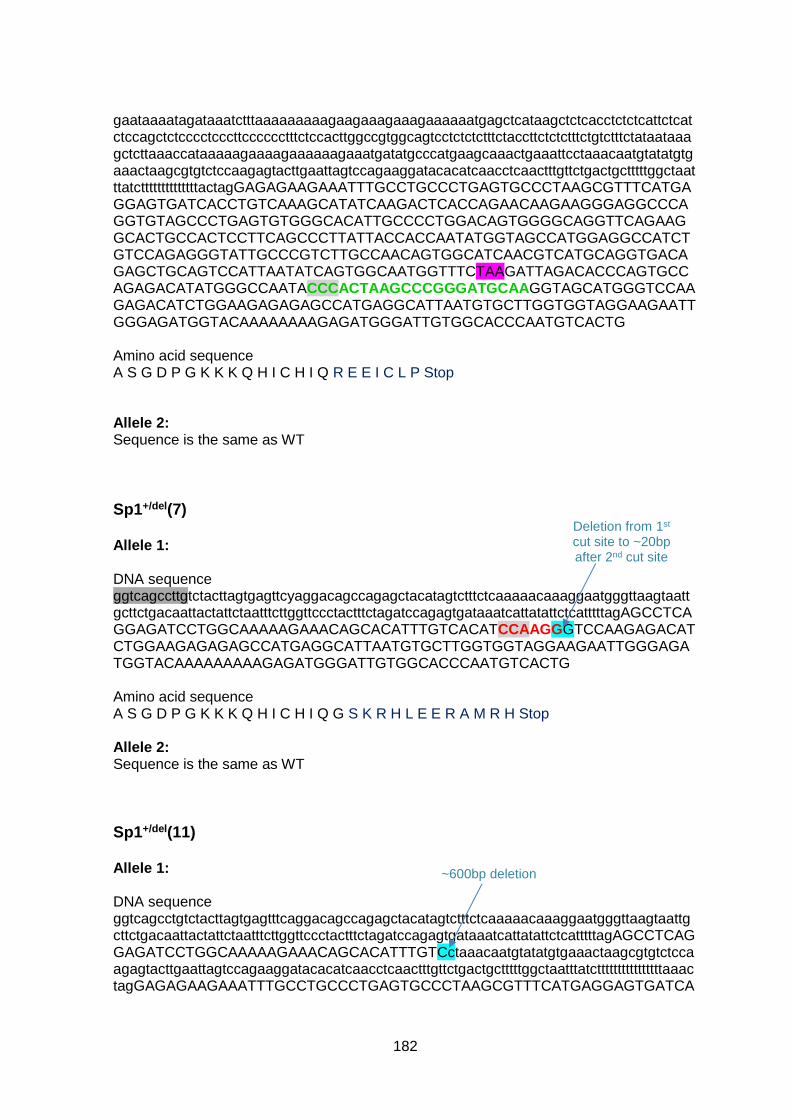
182
Deletion from 1st cut site to ~20bp after 2nd cut site
~600bp deletion
gaataaaatagataaatctttaaaaaaaaagaagaaagaaagaaaaaatgagctcataagctctcacctctctcattctcatctccagctctcccctcccttcccccctttctccacttggccgtggcagtcctctctctttctaccttctctctttctgtctttctataataaagctcttaaaccataaaaagaaaagaaaaaagaaatgatatgcccatgaagcaaactgaaattcctaaacaatgtatatgtgaaactaagcgtgtctccaagagtacttgaattagtccagaaggatacacatcaacctcaactttgttctgactgctttttggctaatttatcttttttttttttttactagGAGAGAAGAAATTTGCCTGCCCTGAGTGCCCTAAGCGTTTCATGAGGAGTGATCACCTGTCAAAGCATATCAAGACTCACCAGAACAAGAAGGGAGGCCCAGGTGTAGCCCTGAGTGTGGGCACATTGCCCCTGGACAGTGGGGCAGGTTCAGAAGGCACTGCCACTCCTTCAGCCCTTATTACCACCAATATGGTAGCCATGGAGGCCATCTGTCCAGAGGGTATTGCCCGTCTTGCCAACAGTGGCATCAACGTCATGCAGGTGACAGAGCTGCAGTCCATTAATATCAGTGGCAATGGTTTCTAAGATTAGACACCCAGTGCCAGAGACATATGGGCCAATACCCACTAAGCCCGGGATGCAAGGTAGCATGGGTCCAAGAGACATCTGGAAGAGAGAGCCATGAGGCATTAATGTGCTTGGTGGTAGGAAGAATTGGGAGATGGTACAAAAAAAAGAGATGGGATTGTGGCACCCAATGTCACTG Amino acid sequence A S G D P G K K K Q H I C H I Q R E E I C L P Stop Allele 2: Sequence is the same as WT
Sp1+/del(7) Allele 1: DNA sequence ggtcagccttgtctacttagtgagttcyaggacagccagagctacatagtctttctcaaaaacaaaggaatgggttaagtaattgcttctgacaattactattctaatttcttggttccctactttctagatccagagtgataaatcattatattctcatttttagAGCCTCAGGAGATCCTGGCAAAAAGAAACAGCACATTTGTCACATCCAAGGGTCCAAGAGACATCTGGAAGAGAGAGCCATGAGGCATTAATGTGCTTGGTGGTAGGAAGAATTGGGAGATGGTACAAAAAAAAAGAGATGGGATTGTGGCACCCAATGTCACTG Amino acid sequence A S G D P G K K K Q H I C H I Q G S K R H L E E R A M R H Stop Allele 2: Sequence is the same as WT
Sp1+/del(11) Allele 1: DNA sequence ggtcagcctgtctacttagtgagtttcaggacagccagagctacatagtctttctcaaaaacaaaggaatgggttaagtaattgcttctgacaattactattctaatttcttggttccctactttctagatccagagtgataaatcattatattctcatttttagAGCCTCAGGAGATCCTGGCAAAAAGAAACAGCACATTTGTCctaaacaatgtatatgtgaaactaagcgtgtctccaagagtacttgaattagtccagaaggatacacatcaacctcaactttgttctgactgctttttggctaatttatcttttttttttttttttaaactagGAGAGAAGAAATTTGCCTGCCCTGAGTGCCCTAAGCGTTTCATGAGGAGTGATCA
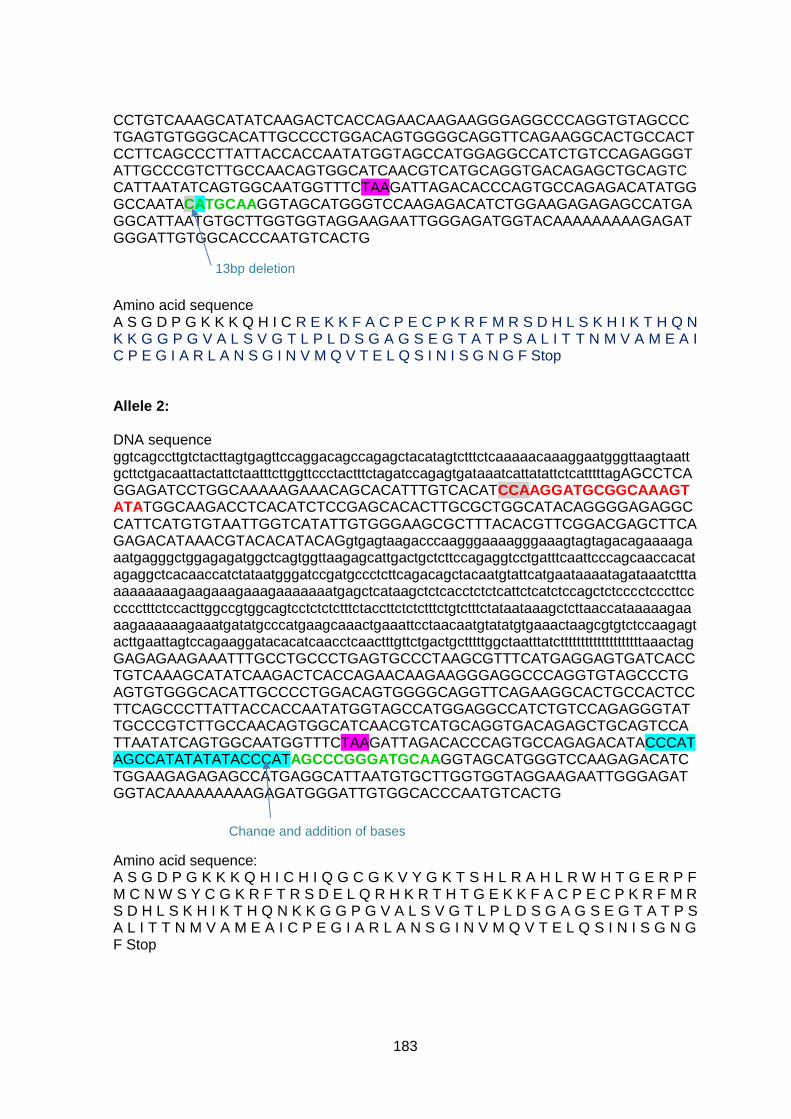
183
13bp deletion
Change and addition of bases
CCTGTCAAAGCATATCAAGACTCACCAGAACAAGAAGGGAGGCCCAGGTGTAGCCCTGAGTGTGGGCACATTGCCCCTGGACAGTGGGGCAGGTTCAGAAGGCACTGCCACTCCTTCAGCCCTTATTACCACCAATATGGTAGCCATGGAGGCCATCTGTCCAGAGGGTATTGCCCGTCTTGCCAACAGTGGCATCAACGTCATGCAGGTGACAGAGCTGCAGTCCATTAATATCAGTGGCAATGGTTTCTAAGATTAGACACCCAGTGCCAGAGACATATGGGCCAATACATGCAAGGTAGCATGGGTCCAAGAGACATCTGGAAGAGAGAGCCATGAGGCATTAATGTGCTTGGTGGTAGGAAGAATTGGGAGATGGTACAAAAAAAAAGAGATGGGATTGTGGCACCCAATGTCACTG Amino acid sequence A S G D P G K K K Q H I C R E K K F A C P E C P K R F M R S D H L S K H I K T H Q N K K G G P G V A L S V G T L P L D S G A G S E G T A T P S A L I T T N M V A M E A I C P E G I A R L A N S G I N V M Q V T E L Q S I N I S G N G F Stop Allele 2: DNA sequence ggtcagccttgtctacttagtgagttccaggacagccagagctacatagtctttctcaaaaacaaaggaatgggttaagtaattgcttctgacaattactattctaatttcttggttccctactttctagatccagagtgataaatcattatattctcatttttagAGCCTCAGGAGATCCTGGCAAAAAGAAACAGCACATTTGTCACATCCAAGGATGCGGCAAAGTATATGGCAAGACCTCACATCTCCGAGCACACTTGCGCTGGCATACAGGGGAGAGGCCATTCATGTGTAATTGGTCATATTGTGGGAAGCGCTTTACACGTTCGGACGAGCTTCAGAGACATAAACGTACACATACAGgtgagtaagacccaagggaaaagggaaagtagtagacagaaaagaaatgagggctggagagatggctcagtggttaagagcattgactgctcttccagaggtcctgatttcaattcccagcaaccacatagaggctcacaaccatctataatgggatccgatgccctcttcagacagctacaatgtattcatgaataaaatagataaatctttaaaaaaaaagaagaaagaaagaaaaaaatgagctcataagctctcacctctctcattctcatctccagctctcccctcccttcccccctttctccacttggccgtggcagtcctctctctttctaccttctctctttctgtctttctataataaagctcttaaccataaaaagaaaagaaaaaagaaatgatatgcccatgaagcaaactgaaattcctaacaatgtatatgtgaaactaagcgtgtctccaagagtacttgaattagtccagaaggatacacatcaacctcaactttgttctgactgctttttggctaatttatcttttttttttttttttttttaaactagGAGAGAAGAAATTTGCCTGCCCTGAGTGCCCTAAGCGTTTCATGAGGAGTGATCACCTGTCAAAGCATATCAAGACTCACCAGAACAAGAAGGGAGGCCCAGGTGTAGCCCTGAGTGTGGGCACATTGCCCCTGGACAGTGGGGCAGGTTCAGAAGGCACTGCCACTCCTTCAGCCCTTATTACCACCAATATGGTAGCCATGGAGGCCATCTGTCCAGAGGGTATTGCCCGTCTTGCCAACAGTGGCATCAACGTCATGCAGGTGACAGAGCTGCAGTCCATTAATATCAGTGGCAATGGTTTCTAAGATTAGACACCCAGTGCCAGAGACATACCCATAGCCATATATATACCCATAGCCCGGGATGCAAGGTAGCATGGGTCCAAGAGACATCTGGAAGAGAGAGCCATGAGGCATTAATGTGCTTGGTGGTAGGAAGAATTGGGAGATGGTACAAAAAAAAAGAGATGGGATTGTGGCACCCAATGTCACTG Amino acid sequence: A S G D P G K K K Q H I C H I Q G C G K V Y G K T S H L R A H L R W H T G E R P F M C N W S Y C G K R F T R S D E L Q R H K R T H T G E K K F A C P E C P K R F M R S D H L S K H I K T H Q N K K G G P G V A L S V G T L P L D S G A G S E G T A T P S A L I T T N M V A M E A I C P E G I A R L A N S G I N V M Q V T E L Q S I N I S G N G F Stop
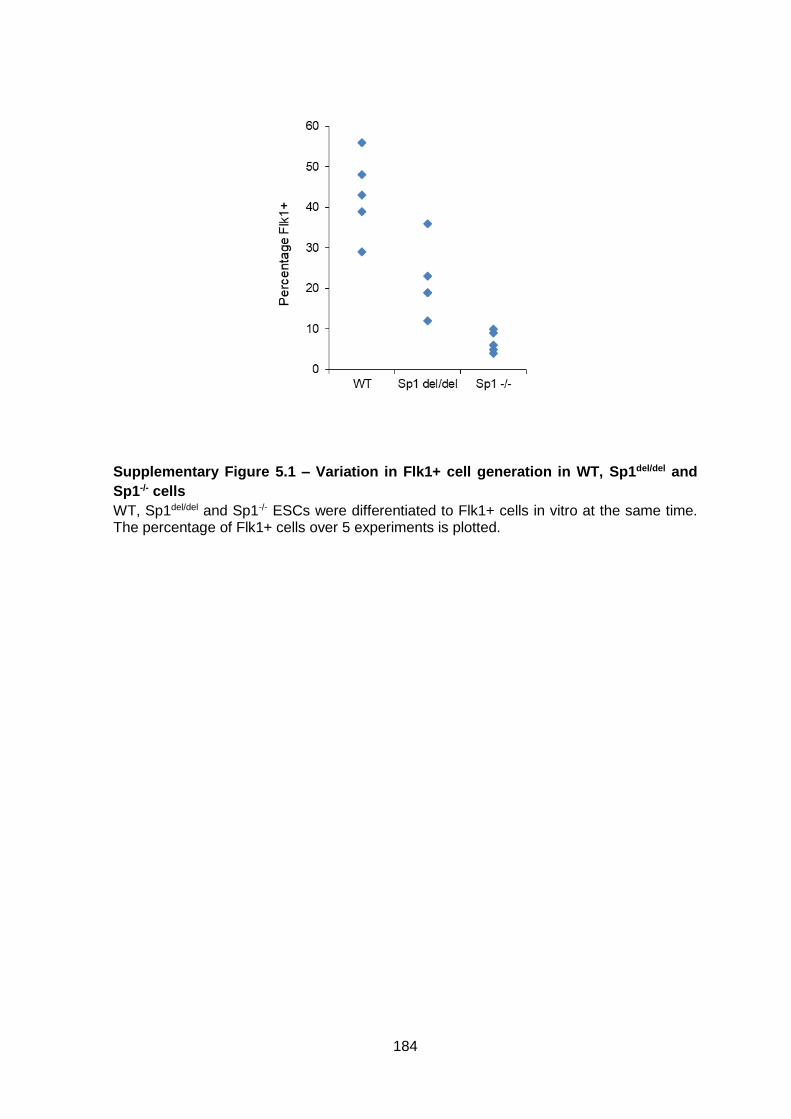
184
Supplementary Figure 5.1 – Variation in Flk1+ cell generation in WT, Sp1del/del and
Sp1-/- cells
WT, Sp1del/del and Sp1-/- ESCs were differentiated to Flk1+ cells in vitro at the same time. The percentage of Flk1+ cells over 5 experiments is plotted.

185
Supplementary Figure 5.2 – Specific cell populations from a clast culture were
isolated by FACS
Flk1+ cells were cultured to form blast cell colonies. The blast culture was harvested at day 2 and the cells processed by FACS to isolate the distinct haematopoietic populations. The cells were first gated by forward and side scatter (area parameter) (FSC-A and SSC-A) to isolate living cells, before gating for forward scatter (area and width parameters) (FSC-A and FSC-W) to isolate single cells (removing doublets). The cells were sorted for expression of Kit to identify haematopoietic cells, and finally for levels of Tie2 and CD41 expression to isolate HE1, HE2 and progenitor populations. An unstained sample was used as a control and a triple IgG isotype control sample (PE Cy7, PE and APC) was used to set the gates. A representative WT sort is shown and the resulting populations verified in Figure 3.8.
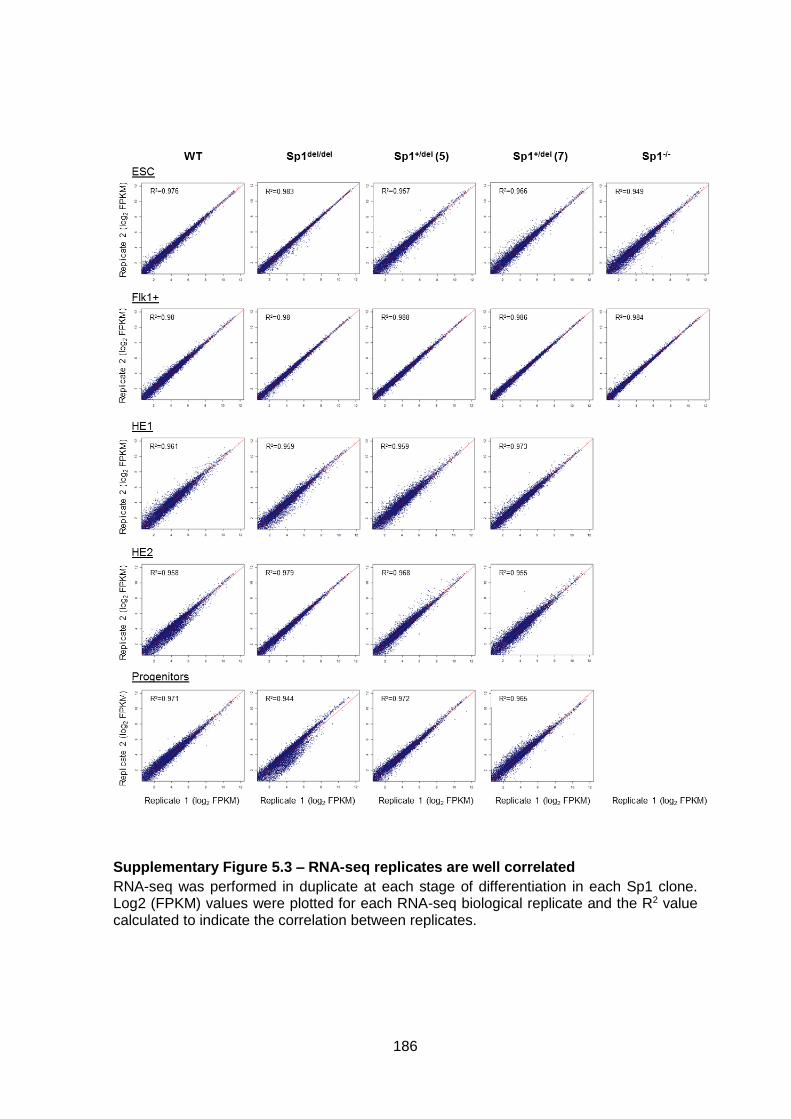
186
Supplementary Figure 5.3 – RNA-seq replicates are well correlated
RNA-seq was performed in duplicate at each stage of differentiation in each Sp1 clone. Log2 (FPKM) values were plotted for each RNA-seq biological replicate and the R2 value calculated to indicate the correlation between replicates.
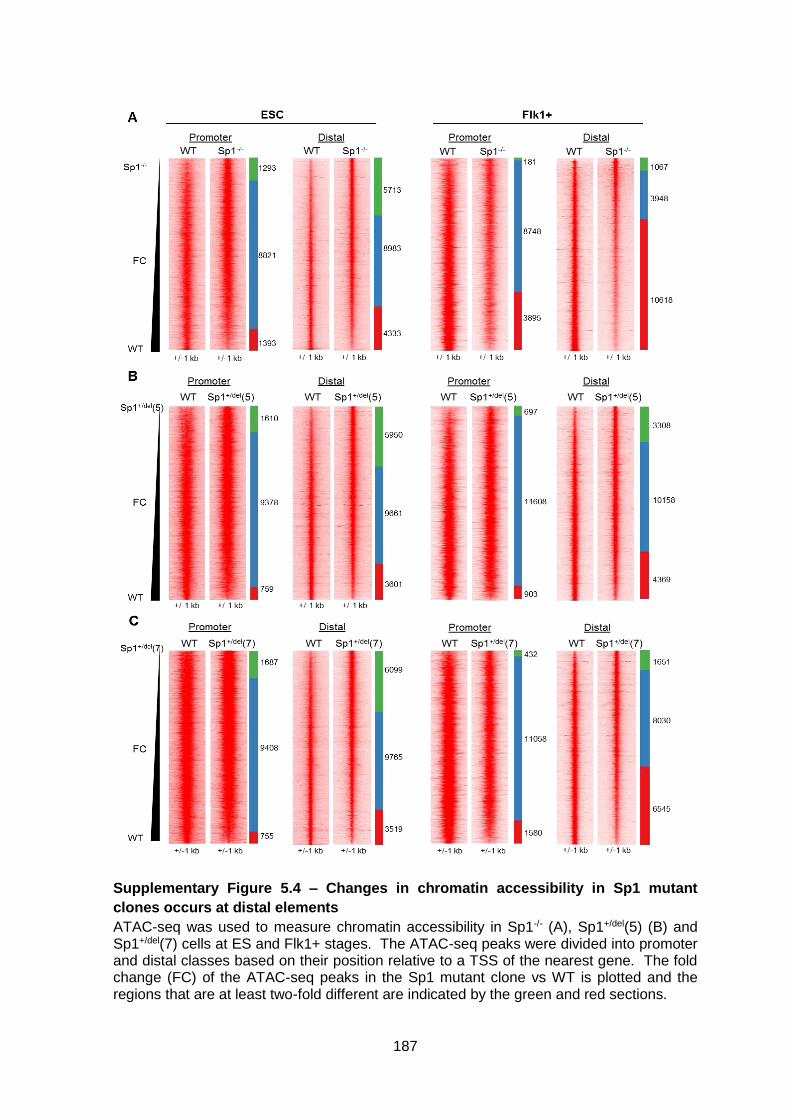
187
Supplementary Figure 5.4 – Changes in chromatin accessibility in Sp1 mutant
clones occurs at distal elements
ATAC-seq was used to measure chromatin accessibility in Sp1-/- (A), Sp1+/del(5) (B) and Sp1+/del(7) cells at ES and Flk1+ stages. The ATAC-seq peaks were divided into promoter and distal classes based on their position relative to a TSS of the nearest gene. The fold change (FC) of the ATAC-seq peaks in the Sp1 mutant clone vs WT is plotted and the regions that are at least two-fold different are indicated by the green and red sections.

188
Supplementary Table 5.1
Sp1-/- ESC – Flk1+ cells Cluster 2: less downregulated in mutant
Gene ES WT FPKM
ES Sp1-/- FPKM
Flk1+ WT FPKM
Flk1+ Sp1-
/- FPKM WT ES/Flk log2 FC
Sp1-/- ES/Flk log2 FC
WT FC/Sp1-/- FC
Trap1a 56.59 65.89 0.7 18.09 -6.34 -1.86 4.5
Rhox6 14.14 22.48 0.23 6.4 -5.93 -1.81 4.1
Rhox9 9.5 13.3 0.15 3.58 -5.94 -1.89 4.1
Laptm5 16.93 10.48 0.57 3.58 -4.88 -1.55 3.3
Tex11 3.18 5.09 0.15 1.49 -4.43 -1.77 2.7
Mfng 4.74 2.15 0.24 0.68 -4.3 -1.66 2.6
Hap1 15.21 10.37 0.42 1.79 -5.18 -2.54 2.6
Pde2a 9.61 5.57 0.65 2.24 -3.88 -1.32 2.6
Spp1 124.01 258.72 0.71 8.67 -7.46 -4.9 2.6
4933402E13Rik 8.72 6.5 0.13 0.57 -6.04 -3.51 2.5
Anxa1 28.43 41.98 0.43 3.53 -6.06 -3.57 2.5
Pla2g7 8.2 4.3 0.72 2.02 -3.52 -1.09 2.4
Scrn1 7.34 5.06 0.2 0.68 -5.2 -2.89 2.3
Rnf17 11.87 11.52 1.15 5.33 -3.37 -1.11 2.3
Ddx4 10.94 13.63 0.54 3.17 -4.34 -2.1 2.2
Tex19.1 23.63 66.68 0.39 5.26 -5.9 -3.66 2.2
Crmp1 23.15 13.32 1.99 5.03 -3.54 -1.4 2.1
Fam19a4 3.92 1.36 0.22 0.33 -4.17 -2.05 2.1
Mup6 13.57 18.06 0.51 2.83 -4.74 -2.67 2.1
Hmga1-rs1 4.73 1.13 0.1 0.1 -5.52 -3.5 2.0
Psma8 10.86 11.38 0.19 0.8 -5.85 -3.83 2.0
Hopx 13.07 4.9 0.38 0.56 -5.11 -3.13 2.0
Mael 7.73 6.19 0.13 0.4 -5.92 -3.94 2.0
Lrp2 14.85 28.7 0.63 4.64 -4.56 -2.63 1.9
Calca 16.36 8.41 0.65 1.22 -4.66 -2.78 1.9
Samd12 1.91 1.35 0.17 0.44 -3.49 -1.64 1.9
Adgrv1 4.75 4.08 0.17 0.54 -4.78 -2.93 1.9
Stk31 4.77 5.9 0.18 0.81 -4.7 -2.87 1.8
Gprc5a 3.67 2.46 0.29 0.68 -3.67 -1.85 1.8
Hsf2bp 20.29 21.2 0.52 1.93 -5.28 -3.46 1.8
Fam25c 22.63 27.19 0.1 0.43 -7.82 -6 1.8
Itga3 43.63 28.81 1.35 3.11 -5.01 -3.21 1.8
Tacstd2 2.99 2.54 0.38 1.1 -3 -1.21 1.8
Pde9a 3.5 1.23 0.49 0.58 -2.83 -1.08 1.8
Wt1 4.57 1.32 0.34 0.33 -3.74 -1.99 1.8
Enpp3 37.8 44.91 0.64 2.48 -5.89 -4.18 1.7
Sncg 3.21 1.81 0.14 0.25 -4.57 -2.88 1.7
Camk2b 2.22 1.76 0.31 0.8 -2.82 -1.14 1.7
Aire 4.49 2.3 0.1 0.16 -5.49 -3.81 1.7
Vat1l 3.69 2.5 0.32 0.68 -3.53 -1.88 1.7
Dppa4 97.16 99.05 1.5 4.72 -6.02 -4.39 1.6
Ddx58 6.04 5.14 0.88 2.29 -2.79 -1.17 1.6
Abca1 10.14 10.26 0.24 0.73 -5.42 -3.82 1.6
Wipf3 1.73 1.09 0.3 0.57 -2.54 -0.95 1.6
Trf 1.52 1.31 0.17 0.43 -3.18 -1.6 1.6
Vsig2 4.24 1.56 0.55 0.6 -2.93 -1.39 1.5
Gstp2 9.14 5.35 0.31 0.53 -4.88 -3.34 1.5
Ntn1 14.21 9.32 2.13 4 -2.74 -1.22 1.5
Cd74 3.22 1.85 0.53 0.86 -2.61 -1.1 1.5
Pdzd2 9.09 5.4 0.25 0.42 -5.17 -3.67 1.5
Pipox 20.43 22.86 0.25 0.78 -6.38 -4.88 1.5
Pnldc1 11.8 13.2 1.94 6.03 -2.6 -1.13 1.5
Triml2 37.76 33.45 0.34 0.82 -6.82 -5.35 1.5
Mmp25 3.59 2.87 0.34 0.75 -3.39 -1.93 1.5
Akr1b8 18.61 12.04 0.87 1.55 -4.42 -2.96 1.5
Smagp 23.68 13.33 0.99 1.52 -4.58 -3.13 1.5
Slco4a1 3.13 1.82 0.16 0.26 -4.25 -2.82 1.4
AU018091 42.27 52.24 0.3 1 -7.13 -5.7 1.4

189
Sp1-/- ESC – Flk1+ cells Cluster 2: less downregulated in mutant
Gene ES WT FPKM
ES Sp1-/- FPKM
Flk1+ WT FPKM
Flk1+ Sp1-
/- FPKM WT ES/Flk log2 FC
Sp1-/- ES/Flk log2 FC
WT FC/Sp1-/- FC
Ptk2b 17.26 14.25 0.78 1.73 -4.46 -3.04 1.4
Alox5ap 6.95 2.3 0.47 0.41 -3.9 -2.49 1.4
Plaur 35.04 25.26 1.47 2.82 -4.57 -3.16 1.4
Sox2 90.05 108.55 0.86 2.75 -6.71 -5.3 1.4
Rps6kl1 4.27 2.34 0.57 0.83 -2.9 -1.5 1.4
E2f2 9.24 4.72 1.16 1.55 -2.99 -1.6 1.4
Nkx6-3 3.98 1.56 0.1 0.1 -5.32 -3.93 1.4
Pecam1 8.45 21.01 1.16 7.43 -2.87 -1.5 1.4
Cldn7 11.56 7.57 1 1.7 -3.53 -2.16 1.4
Zbtb32 8.3 6.01 0.37 0.7 -4.48 -3.11 1.4
Cryab 8.2 11.3 0.85 2.98 -3.27 -1.92 1.4
Bmp8b 2.37 1.66 0.16 0.28 -3.92 -2.57 1.4
Rnf125 15.69 16.97 0.49 1.34 -5.01 -3.66 1.4
Urah 32.86 22.88 0.27 0.49 -6.9 -5.55 1.4
Spta1 16.2 12.3 0.13 0.26 -6.91 -5.56 1.4
Arc 10.54 5.49 0.41 0.54 -4.67 -3.35 1.3
Crct1 3.38 1.35 0.1 0.1 -5.08 -3.76 1.3
Gdf3 62.35 70.76 0.4 1.12 -7.29 -5.98 1.3
Slc44a4 4.41 2.19 0.29 0.35 -3.94 -2.66 1.3
Rbmxl2 23.55 23.13 0.27 0.64 -6.46 -5.18 1.3
Itgb4 3.84 1.52 0.22 0.2 -4.16 -2.89 1.3
Slc52a3 2.85 1.06 0.12 0.1 -4.63 -3.36 1.3
Ppl 5.5 2.87 0.21 0.26 -4.72 -3.45 1.3
Dnmt3l 260.79 233.53 0.55 1.18 -8.89 -7.62 1.3
Cd37 4.6 2.14 0.16 0.17 -4.89 -3.63 1.3
Tmprss11d 3.17 1.33 0.1 0.1 -4.99 -3.73 1.3
Tec 2.48 1.31 0.31 0.39 -2.99 -1.75 1.2
Arhgap30 4.36 1.51 0.32 0.26 -3.77 -2.53 1.2
Cdh1 175.73 146.84 7.73 15.18 -4.51 -3.27 1.2
Gpx2 5.33 1.92 0.12 0.11 -5.42 -4.19 1.2
Zcwpw1 25.12 36.65 5.13 17.51 -2.29 -1.07 1.2
Kank4 2.1 1.13 0.33 0.4 -2.69 -1.49 1.2
Dtx4 2.84 2.05 0.62 1.01 -2.2 -1.02 1.2
Stk38l 10.11 10.78 1.88 4.51 -2.43 -1.26 1.2
Hist3h2ba 48.96 69.51 5.74 18.35 -3.09 -1.92 1.2
Ocln 6.22 3.99 0.61 0.88 -3.35 -2.18 1.2
Prrg4 38.82 33.51 1.58 3.04 -4.62 -3.46 1.2
Atp1b1 29.13 22.45 0.93 1.59 -4.97 -3.82 1.2
Cdkn1c 108.1 40.99 17.23 14.43 -2.65 -1.51 1.1
Mtus1 8.74 8.47 1.77 3.77 -2.3 -1.17 1.1
Col18a1 137.7 150.6 19.11 45.67 -2.85 -1.72 1.1
Ppp1r1a 14.24 16.27 1.83 4.58 -2.96 -1.83 1.1
Mov10l1 2.6 2.58 0.17 0.36 -3.97 -2.84 1.1
Dtna 6.4 6.78 0.25 0.58 -4.66 -3.53 1.1
Cd109 3.79 3.74 0.82 1.77 -2.2 -1.08 1.1
Syk 8.33 6 1.45 2.24 -2.53 -1.42 1.1
Zbbx 1.84 1.21 0.1 0.14 -4.21 -3.1 1.1
Tex14 2.14 1.88 0.3 0.55 -2.85 -1.76 1.1
Mcam 18.1 20.71 2.18 5.29 -3.06 -1.97 1.1
Syt13 2.58 1.76 0.3 0.44 -3.1 -2.01 1.1
Palm3 17.15 17.48 0.61 1.32 -4.82 -3.73 1.1
Slain1 13.03 11.27 1.47 2.68 -3.15 -2.07 1.1
Rasgrp2 15.62 13.49 1.15 2.11 -3.76 -2.68 1.1
Tdh 295.87 257.45 1.54 2.84 -7.58 -6.5 1.1
Kcnj3 5.55 5.64 1.31 2.8 -2.08 -1.01 1.1
Bcl3 13.37 11.46 0.39 0.69 -5.11 -4.04 1.1
Slc5a11 5.23 2.92 0.14 0.17 -5.18 -4.11 1.1
Arhgef3 10.98 8.63 1.65 2.69 -2.73 -1.68 1.1
Syce1 10.22 8.71 0.21 0.37 -5.61 -4.56 1.1
Bmp8a 3.02 1.62 0.23 0.25 -3.72 -2.68 1.0
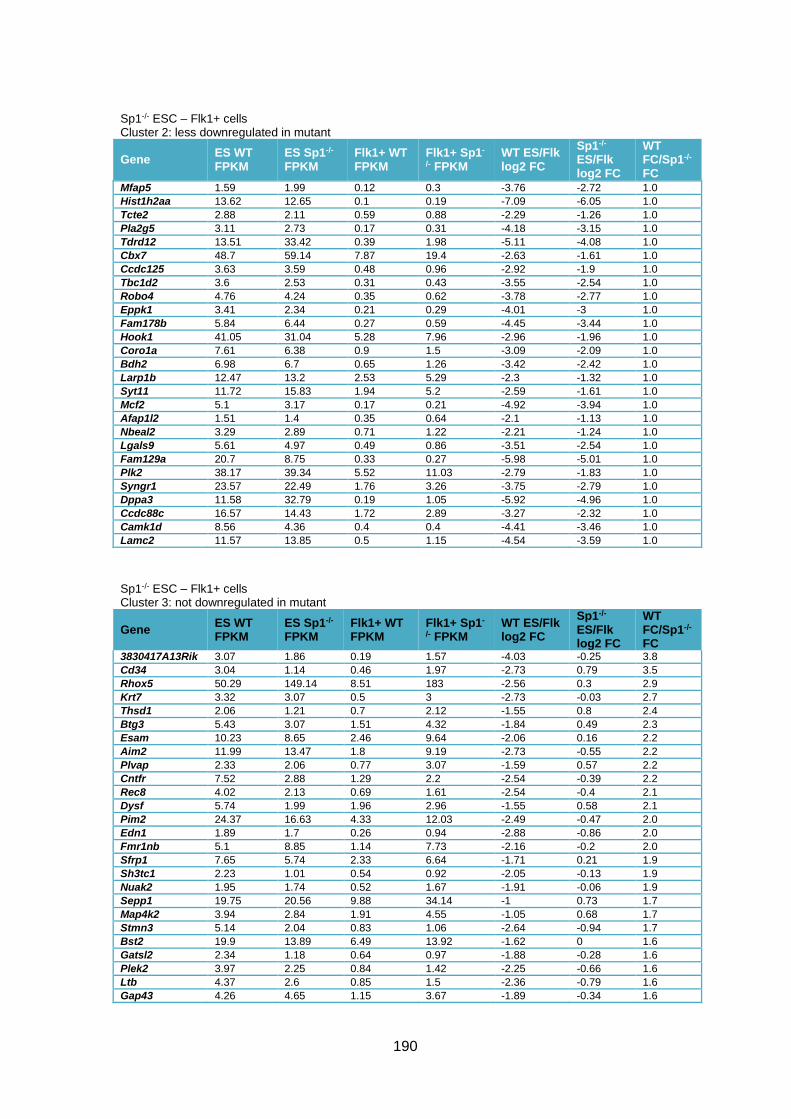
190
Sp1-/- ESC – Flk1+ cells Cluster 2: less downregulated in mutant
Gene ES WT FPKM
ES Sp1-/- FPKM
Flk1+ WT FPKM
Flk1+ Sp1-
/- FPKM WT ES/Flk log2 FC
Sp1-/- ES/Flk log2 FC
WT FC/Sp1-/- FC
Mfap5 1.59 1.99 0.12 0.3 -3.76 -2.72 1.0
Hist1h2aa 13.62 12.65 0.1 0.19 -7.09 -6.05 1.0
Tcte2 2.88 2.11 0.59 0.88 -2.29 -1.26 1.0
Pla2g5 3.11 2.73 0.17 0.31 -4.18 -3.15 1.0
Tdrd12 13.51 33.42 0.39 1.98 -5.11 -4.08 1.0
Cbx7 48.7 59.14 7.87 19.4 -2.63 -1.61 1.0
Ccdc125 3.63 3.59 0.48 0.96 -2.92 -1.9 1.0
Tbc1d2 3.6 2.53 0.31 0.43 -3.55 -2.54 1.0
Robo4 4.76 4.24 0.35 0.62 -3.78 -2.77 1.0
Eppk1 3.41 2.34 0.21 0.29 -4.01 -3 1.0
Fam178b 5.84 6.44 0.27 0.59 -4.45 -3.44 1.0
Hook1 41.05 31.04 5.28 7.96 -2.96 -1.96 1.0
Coro1a 7.61 6.38 0.9 1.5 -3.09 -2.09 1.0
Bdh2 6.98 6.7 0.65 1.26 -3.42 -2.42 1.0
Larp1b 12.47 13.2 2.53 5.29 -2.3 -1.32 1.0
Syt11 11.72 15.83 1.94 5.2 -2.59 -1.61 1.0
Mcf2 5.1 3.17 0.17 0.21 -4.92 -3.94 1.0
Afap1l2 1.51 1.4 0.35 0.64 -2.1 -1.13 1.0
Nbeal2 3.29 2.89 0.71 1.22 -2.21 -1.24 1.0
Lgals9 5.61 4.97 0.49 0.86 -3.51 -2.54 1.0
Fam129a 20.7 8.75 0.33 0.27 -5.98 -5.01 1.0
Plk2 38.17 39.34 5.52 11.03 -2.79 -1.83 1.0
Syngr1 23.57 22.49 1.76 3.26 -3.75 -2.79 1.0
Dppa3 11.58 32.79 0.19 1.05 -5.92 -4.96 1.0
Ccdc88c 16.57 14.43 1.72 2.89 -3.27 -2.32 1.0
Camk1d 8.56 4.36 0.4 0.4 -4.41 -3.46 1.0
Lamc2 11.57 13.85 0.5 1.15 -4.54 -3.59 1.0
Sp1-/- ESC – Flk1+ cells Cluster 3: not downregulated in mutant
Gene ES WT FPKM
ES Sp1-/- FPKM
Flk1+ WT FPKM
Flk1+ Sp1-
/- FPKM WT ES/Flk log2 FC
Sp1-/- ES/Flk log2 FC
WT FC/Sp1-/- FC
3830417A13Rik 3.07 1.86 0.19 1.57 -4.03 -0.25 3.8
Cd34 3.04 1.14 0.46 1.97 -2.73 0.79 3.5
Rhox5 50.29 149.14 8.51 183 -2.56 0.3 2.9
Krt7 3.32 3.07 0.5 3 -2.73 -0.03 2.7
Thsd1 2.06 1.21 0.7 2.12 -1.55 0.8 2.4
Btg3 5.43 3.07 1.51 4.32 -1.84 0.49 2.3
Esam 10.23 8.65 2.46 9.64 -2.06 0.16 2.2
Aim2 11.99 13.47 1.8 9.19 -2.73 -0.55 2.2
Plvap 2.33 2.06 0.77 3.07 -1.59 0.57 2.2
Cntfr 7.52 2.88 1.29 2.2 -2.54 -0.39 2.2
Rec8 4.02 2.13 0.69 1.61 -2.54 -0.4 2.1
Dysf 5.74 1.99 1.96 2.96 -1.55 0.58 2.1
Pim2 24.37 16.63 4.33 12.03 -2.49 -0.47 2.0
Edn1 1.89 1.7 0.26 0.94 -2.88 -0.86 2.0
Fmr1nb 5.1 8.85 1.14 7.73 -2.16 -0.2 2.0
Sfrp1 7.65 5.74 2.33 6.64 -1.71 0.21 1.9
Sh3tc1 2.23 1.01 0.54 0.92 -2.05 -0.13 1.9
Nuak2 1.95 1.74 0.52 1.67 -1.91 -0.06 1.9
Sepp1 19.75 20.56 9.88 34.14 -1 0.73 1.7
Map4k2 3.94 2.84 1.91 4.55 -1.05 0.68 1.7
Stmn3 5.14 2.04 0.83 1.06 -2.64 -0.94 1.7
Bst2 19.9 13.89 6.49 13.92 -1.62 0 1.6
Gatsl2 2.34 1.18 0.64 0.97 -1.88 -0.28 1.6
Plek2 3.97 2.25 0.84 1.42 -2.25 -0.66 1.6
Ltb 4.37 2.6 0.85 1.5 -2.36 -0.79 1.6
Gap43 4.26 4.65 1.15 3.67 -1.89 -0.34 1.6
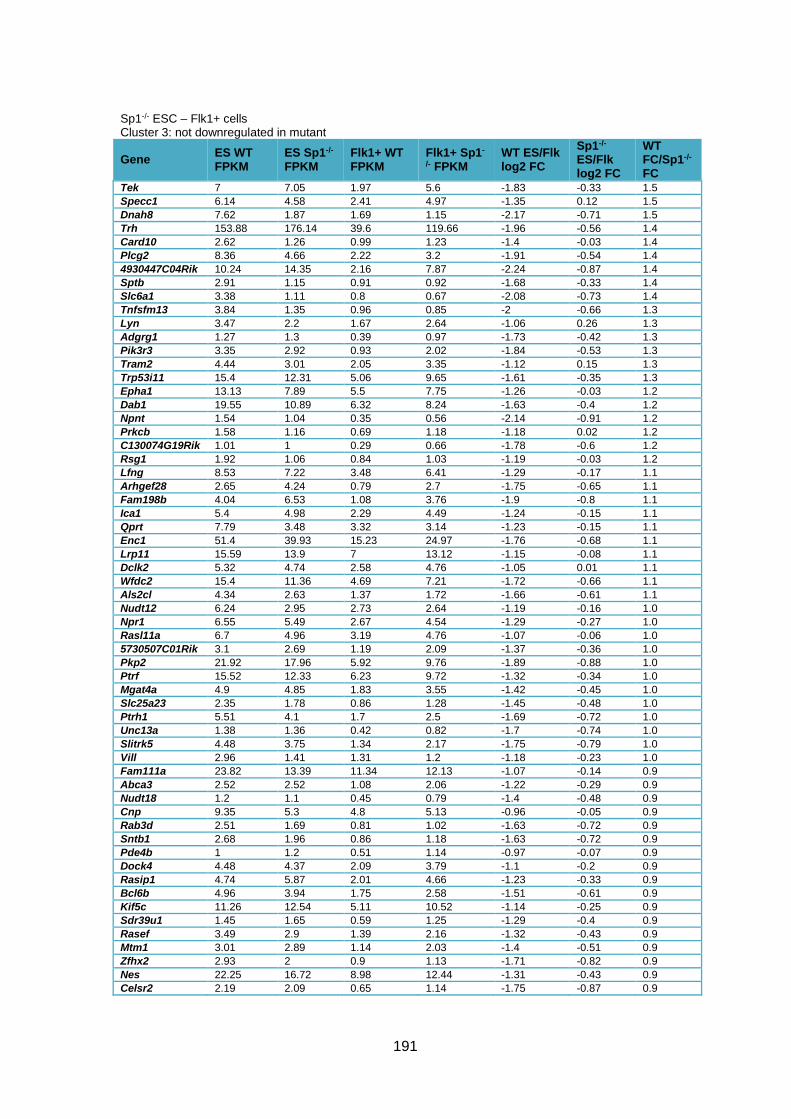
191
Sp1-/- ESC – Flk1+ cells Cluster 3: not downregulated in mutant
Gene ES WT FPKM
ES Sp1-/- FPKM
Flk1+ WT FPKM
Flk1+ Sp1-
/- FPKM WT ES/Flk log2 FC
Sp1-/- ES/Flk log2 FC
WT FC/Sp1-/- FC
Tek 7 7.05 1.97 5.6 -1.83 -0.33 1.5
Specc1 6.14 4.58 2.41 4.97 -1.35 0.12 1.5
Dnah8 7.62 1.87 1.69 1.15 -2.17 -0.71 1.5
Trh 153.88 176.14 39.6 119.66 -1.96 -0.56 1.4
Card10 2.62 1.26 0.99 1.23 -1.4 -0.03 1.4
Plcg2 8.36 4.66 2.22 3.2 -1.91 -0.54 1.4
4930447C04Rik 10.24 14.35 2.16 7.87 -2.24 -0.87 1.4
Sptb 2.91 1.15 0.91 0.92 -1.68 -0.33 1.4
Slc6a1 3.38 1.11 0.8 0.67 -2.08 -0.73 1.4
Tnfsfm13 3.84 1.35 0.96 0.85 -2 -0.66 1.3
Lyn 3.47 2.2 1.67 2.64 -1.06 0.26 1.3
Adgrg1 1.27 1.3 0.39 0.97 -1.73 -0.42 1.3
Pik3r3 3.35 2.92 0.93 2.02 -1.84 -0.53 1.3
Tram2 4.44 3.01 2.05 3.35 -1.12 0.15 1.3
Trp53i11 15.4 12.31 5.06 9.65 -1.61 -0.35 1.3
Epha1 13.13 7.89 5.5 7.75 -1.26 -0.03 1.2
Dab1 19.55 10.89 6.32 8.24 -1.63 -0.4 1.2
Npnt 1.54 1.04 0.35 0.56 -2.14 -0.91 1.2
Prkcb 1.58 1.16 0.69 1.18 -1.18 0.02 1.2
C130074G19Rik 1.01 1 0.29 0.66 -1.78 -0.6 1.2
Rsg1 1.92 1.06 0.84 1.03 -1.19 -0.03 1.2
Lfng 8.53 7.22 3.48 6.41 -1.29 -0.17 1.1
Arhgef28 2.65 4.24 0.79 2.7 -1.75 -0.65 1.1
Fam198b 4.04 6.53 1.08 3.76 -1.9 -0.8 1.1
Ica1 5.4 4.98 2.29 4.49 -1.24 -0.15 1.1
Qprt 7.79 3.48 3.32 3.14 -1.23 -0.15 1.1
Enc1 51.4 39.93 15.23 24.97 -1.76 -0.68 1.1
Lrp11 15.59 13.9 7 13.12 -1.15 -0.08 1.1
Dclk2 5.32 4.74 2.58 4.76 -1.05 0.01 1.1
Wfdc2 15.4 11.36 4.69 7.21 -1.72 -0.66 1.1
Als2cl 4.34 2.63 1.37 1.72 -1.66 -0.61 1.1
Nudt12 6.24 2.95 2.73 2.64 -1.19 -0.16 1.0
Npr1 6.55 5.49 2.67 4.54 -1.29 -0.27 1.0
Rasl11a 6.7 4.96 3.19 4.76 -1.07 -0.06 1.0
5730507C01Rik 3.1 2.69 1.19 2.09 -1.37 -0.36 1.0
Pkp2 21.92 17.96 5.92 9.76 -1.89 -0.88 1.0
Ptrf 15.52 12.33 6.23 9.72 -1.32 -0.34 1.0
Mgat4a 4.9 4.85 1.83 3.55 -1.42 -0.45 1.0
Slc25a23 2.35 1.78 0.86 1.28 -1.45 -0.48 1.0
Ptrh1 5.51 4.1 1.7 2.5 -1.69 -0.72 1.0
Unc13a 1.38 1.36 0.42 0.82 -1.7 -0.74 1.0
Slitrk5 4.48 3.75 1.34 2.17 -1.75 -0.79 1.0
Vill 2.96 1.41 1.31 1.2 -1.18 -0.23 1.0
Fam111a 23.82 13.39 11.34 12.13 -1.07 -0.14 0.9
Abca3 2.52 2.52 1.08 2.06 -1.22 -0.29 0.9
Nudt18 1.2 1.1 0.45 0.79 -1.4 -0.48 0.9
Cnp 9.35 5.3 4.8 5.13 -0.96 -0.05 0.9
Rab3d 2.51 1.69 0.81 1.02 -1.63 -0.72 0.9
Sntb1 2.68 1.96 0.86 1.18 -1.63 -0.72 0.9
Pde4b 1 1.2 0.51 1.14 -0.97 -0.07 0.9
Dock4 4.48 4.37 2.09 3.79 -1.1 -0.2 0.9
Rasip1 4.74 5.87 2.01 4.66 -1.23 -0.33 0.9
Bcl6b 4.96 3.94 1.75 2.58 -1.51 -0.61 0.9
Kif5c 11.26 12.54 5.11 10.52 -1.14 -0.25 0.9
Sdr39u1 1.45 1.65 0.59 1.25 -1.29 -0.4 0.9
Rasef 3.49 2.9 1.39 2.16 -1.32 -0.43 0.9
Mtm1 3.01 2.89 1.14 2.03 -1.4 -0.51 0.9
Zfhx2 2.93 2 0.9 1.13 -1.71 -0.82 0.9
Nes 22.25 16.72 8.98 12.44 -1.31 -0.43 0.9
Celsr2 2.19 2.09 0.65 1.14 -1.75 -0.87 0.9

192
Sp1-/- ESC – Flk1+ cells Cluster 3: not downregulated in mutant
Gene ES WT FPKM
ES Sp1-/- FPKM
Flk1+ WT FPKM
Flk1+ Sp1-
/- FPKM WT ES/Flk log2 FC
Sp1-/- ES/Flk log2 FC
WT FC/Sp1-/- FC
Rassf3 18.29 12.92 5.76 7.38 -1.67 -0.81 0.9
Lmbr1 3.78 3.09 1.91 2.81 -0.99 -0.14 0.9
Prmt8 1.46 1.39 0.73 1.23 -1.01 -0.17 0.8
Lekr1 1.21 1.15 0.44 0.73 -1.47 -0.66 0.8
9930012K11Rik 10.59 7.49 3.22 3.98 -1.72 -0.91 0.8
Cadps2 2.06 1.25 1.06 1.12 -0.96 -0.16 0.8
4930432K21Rik 2.1 2.29 0.8 1.51 -1.4 -0.6 0.8
Moap1 4.88 3.87 2.42 3.3 -1.01 -0.23 0.8
Rbm12b1 3.97 3.23 1.43 1.99 -1.48 -0.7 0.8
Hspa4l 3.76 4.17 1.32 2.51 -1.51 -0.73 0.8
Samd9l 1.42 2.36 0.49 1.38 -1.55 -0.77 0.8
Dnajb5 8.17 7.44 2.61 4.09 -1.64 -0.86 0.8
Ankrd33b 2.52 1.14 1.11 0.85 -1.18 -0.42 0.8
Ddx3y 5.52 1.08 2.12 0.7 -1.38 -0.62 0.8
Rundc3b 1.94 2.21 0.67 1.29 -1.52 -0.77 0.8
9030624G23Rik 3.91 3.06 1.87 2.43 -1.07 -0.33 0.7
Nmrk1 3.55 4.5 1.49 3.14 -1.26 -0.52 0.7
Rfng 8.86 6.16 3.53 4.09 -1.33 -0.59 0.7
Dhrs11 3.66 3.68 1.28 2.15 -1.51 -0.77 0.7
Myo5b 1.5 1.14 0.52 0.66 -1.52 -0.78 0.7
Rltpr 1.77 1.2 0.58 0.66 -1.6 -0.86 0.7
Hvcn1 9.11 6.69 4.19 5.01 -1.12 -0.42 0.7
Sat1 42.34 28.19 20.59 22.18 -1.04 -0.35 0.7
Slc6a8 24.2 15.38 11.54 11.86 -1.07 -0.38 0.7
Uchl4 1.99 1.12 0.71 0.64 -1.5 -0.81 0.7
Nrgn 1.72 2.1 0.57 1.13 -1.59 -0.9 0.7
Gabrb3 3.09 2.11 1.59 1.72 -0.96 -0.29 0.7
Gabarapl2 61.54 45.11 30.77 35.77 -1 -0.33 0.7
Rdh10 5.77 4.89 2.79 3.69 -1.05 -0.4 0.7
Stmn2 33.61 38.07 13.4 23.82 -1.33 -0.68 0.7
Jmjd1c 69.51 58.86 32.08 42.24 -1.12 -0.48 0.6
Synrg 5.74 5.04 2.54 3.48 -1.17 -0.53 0.6
F11r 43.31 39.99 14.62 21.03 -1.57 -0.93 0.6
Spry2 97.93 70.59 43.56 48.39 -1.17 -0.54 0.6
Tbc1d9 7.17 6.65 3.61 5.13 -0.99 -0.37 0.6
3110002H16Rik 14.41 13.18 5.68 7.99 -1.34 -0.72 0.6
Fam129b 40.4 32.66 15.56 19.34 -1.38 -0.76 0.6
Syne1 2.36 2.01 1.17 1.51 -1.02 -0.41 0.6
Tmem19 12.8 13.69 5.3 8.65 -1.27 -0.66 0.6
Bik 1.73 1.72 0.61 0.92 -1.5 -0.89 0.6
Akr1b10 11.85 9.49 5.22 6.36 -1.18 -0.58 0.6
Procr 2.87 3.18 1.01 1.69 -1.51 -0.91 0.6
Hdac6 23.2 32.85 10.82 23.08 -1.1 -0.51 0.6
Kbtbd7 14.57 13.15 6.01 8.15 -1.28 -0.69 0.6
Synj2 3.98 3.87 1.88 2.73 -1.08 -0.5 0.6
Sorl1 7.44 6.67 3.45 4.62 -1.11 -0.53 0.6
Rtn4ip1 6.46 5.56 2.86 3.69 -1.17 -0.59 0.6
Nfib 3.62 1.74 1.55 1.11 -1.22 -0.64 0.6
Isyna1 73.82 53.3 31.08 33.51 -1.25 -0.67 0.6
G3bp2 162.39 118.91 66.73 73.35 -1.28 -0.7 0.6
Amt 41.32 34.01 18.75 22.89 -1.14 -0.57 0.6
Ehmt2 83.96 57.75 36.69 37.67 -1.19 -0.62 0.6
Arhgap44 3.01 2.42 1.3 1.55 -1.21 -0.64 0.6
Rab15 9.17 5.01 3.42 2.77 -1.42 -0.85 0.6
Abhd3 1.66 1.05 0.61 0.57 -1.45 -0.89 0.6
Gbe1 9.18 5.38 4.25 3.65 -1.11 -0.56 0.6
Clip4 4.09 3.98 1.62 2.3 -1.34 -0.79 0.6
Igsf9 13.87 11.95 5.47 6.93 -1.34 -0.79 0.6
Fam222a 1.25 1.05 0.48 0.59 -1.37 -0.82 0.6
Cib1 25.83 22.96 9.82 12.76 -1.4 -0.85 0.6

193
Sp1-/- ESC – Flk1+ cells Cluster 3: not downregulated in mutant
Gene ES WT FPKM
ES Sp1-/- FPKM
Flk1+ WT FPKM
Flk1+ Sp1-
/- FPKM WT ES/Flk log2 FC
Sp1-/- ES/Flk log2 FC
WT FC/Sp1-/- FC
Frem2 9.7 10.16 4.78 7.3 -1.02 -0.48 0.5
B4galt4 4.12 2.09 1.85 1.37 -1.15 -0.61 0.5
Pitpnc1 24.31 16.92 9.68 9.79 -1.33 -0.79 0.5
AI464131 2.35 2.92 0.91 1.65 -1.36 -0.82 0.5
Sec24a 10.34 9.4 5.32 6.96 -0.96 -0.43 0.5
Aktip 16.69 18.52 8.39 13.44 -0.99 -0.46 0.5
Znfx1 7.51 10.62 3.48 7.09 -1.11 -0.58 0.5
Gsap 2.42 1.39 1 0.83 -1.27 -0.74 0.5
Dtx3l 10.13 9.93 3.98 5.58 -1.35 -0.83 0.5
Celsr3 2.01 2.18 0.73 1.14 -1.46 -0.94 0.5
Slc31a2 8.48 8.02 3.63 4.86 -1.23 -0.72 0.5
Lig4 6.43 5.23 2.68 3.08 -1.27 -0.76 0.5
Cfap74 3.55 2.97 1.41 1.67 -1.34 -0.83 0.5
Sp1-/- ESC – Flk1+ cells Cluster 4: more downregulated in mutant
Gene ES WT FPKM
ES Sp1-/- FPKM
Flk1+ WT FPKM
Flk1+ Sp1-
/- FPKM WT ES/Flk log2 FC
Sp1-/- ES/Flk log2 FC
WT FC/Sp1-/- FC
Igfbp7 2.32 9.86 0.22 0.15 -3.42 -6.03 -2.6
Inhba 1.27 6.51 0.13 0.11 -3.32 -5.89 -2.6
Lox 1.56 13.45 0.13 0.2 -3.64 -6.09 -2.5
Trim47 1.52 6.94 0.38 0.32 -2.01 -4.42 -2.4
Cav1 2.71 13.74 0.41 0.41 -2.74 -5.08 -2.3
Ptgs2 1.82 9.01 0.29 0.28 -2.67 -4.99 -2.3
Sigirr 13.12 8.96 1.38 0.21 -3.25 -5.39 -2.1
Timp1 29.16 45.4 6.62 2.61 -2.14 -4.12 -2.0
Bcl2l14 1.09 1 0.46 0.12 -1.24 -3.1 -1.9
Grem1 1.37 5 0.24 0.24 -2.54 -4.4 -1.9
Pga5 1 2.84 0.31 0.24 -1.69 -3.54 -1.9
Tnk1 3.35 3.29 0.84 0.23 -1.99 -3.83 -1.8
Celf4 5.21 5.57 1.23 0.36 -2.09 -3.93 -1.8
Dppa5a 1558.91 1102.11 31.85 6.4 -5.61 -7.43 -1.8
Rsph1 1.37 2.51 0.65 0.34 -1.08 -2.89 -1.8
Neurog3 1.66 4.55 0.13 0.1 -3.71 -5.49 -1.8
Gjb1 1.69 5.92 0.1 0.1 -4.08 -5.86 -1.8
Naaa 2.85 7.04 1.04 0.76 -1.45 -3.21 -1.8
Tcfl5 25.17 14.54 4.97 0.85 -2.34 -4.1 -1.8
Chmp4c 10.49 10.68 2.98 0.91 -1.81 -3.55 -1.7
Raet1a 13.48 14.22 0.95 0.31 -3.82 -5.52 -1.7
Pla2g4a 1.75 3.23 0.3 0.18 -2.54 -4.18 -1.6
Anxa8 2.55 4.98 0.18 0.11 -3.82 -5.44 -1.6
Bnipl 11.39 8.89 1.74 0.45 -2.71 -4.3 -1.6
Slco4c1 4.23 10.79 0.26 0.22 -4.05 -5.62 -1.6
Rbp7 4.81 4.01 1.36 0.39 -1.82 -3.38 -1.6
Calcoco2 4.51 9.4 0.16 0.11 -4.82 -6.38 -1.6
Rab27a 6.66 14.13 2.39 1.73 -1.48 -3.03 -1.6
Apoc1 28.06 24.72 5.68 1.72 -2.31 -3.85 -1.5
Nkx2-9 2.23 5.44 0.14 0.11 -4.03 -5.57 -1.5
S100a4 8.57 58.94 0.16 0.38 -5.75 -7.29 -1.5
Rln3 1.08 2 0.21 0.14 -2.35 -3.87 -1.5
Mia 3.25 3.55 0.63 0.24 -2.38 -3.88 -1.5
Col9a2 3.33 5.06 0.4 0.22 -3.06 -4.54 -1.5
Tekt1 1.1 1.55 0.25 0.13 -2.14 -3.61 -1.5
4930519F16Rik 2.49 3.42 0.21 0.1 -3.59 -5.05 -1.5
Tmem40 4.22 10.3 0.41 0.37 -3.36 -4.81 -1.5
Tex21 2.79 4.05 0.33 0.18 -3.07 -4.51 -1.4
Cpne5 3.95 10.14 1.08 1.04 -1.87 -3.29 -1.4
Cbs 6.16 3.69 1.66 0.37 -1.89 -3.31 -1.4

194
Sp1-/- ESC – Flk1+ cells Cluster 4: more downregulated in mutant
Gene ES WT FPKM
ES Sp1-/- FPKM
Flk1+ WT FPKM
Flk1+ Sp1-
/- FPKM WT ES/Flk log2 FC
Sp1-/- ES/Flk log2 FC
WT FC/Sp1-/- FC
Steap3 5.46 9.05 0.42 0.26 -3.71 -5.13 -1.4
Upk1a 1.54 2.13 0.66 0.34 -1.22 -2.63 -1.4
Glod5 5.06 11.56 0.14 0.12 -5.18 -6.59 -1.4
Phf19 3.14 4.95 0.9 0.54 -1.81 -3.21 -1.4
Ceacam1 8.97 6.01 1.97 0.52 -2.19 -3.54 -1.4
Dnajc6 5.43 11.35 0.19 0.16 -4.82 -6.17 -1.4
D630023F18Rik 4.19 9.31 0.34 0.3 -3.62 -4.94 -1.3
Zfp750 1.39 3.09 0.16 0.14 -3.11 -4.42 -1.3
Gsn 8.49 13.7 3.66 2.41 -1.21 -2.51 -1.3
2610305D13Rik 114.23 100.3 9.38 3.33 -3.61 -4.91 -1.3
Smox 3.47 8.21 1.35 1.31 -1.37 -2.65 -1.3
Notum 17.56 19.95 2.35 1.1 -2.9 -4.18 -1.3
Stac2 1.76 2.97 0.82 0.57 -1.11 -2.37 -1.3
Plcxd1 3.71 5.36 0.87 0.52 -2.1 -3.36 -1.3
Ccno 3.19 3.11 0.71 0.29 -2.17 -3.43 -1.3
Fcgrt 2.47 3.56 0.24 0.14 -3.37 -4.63 -1.3
Hecw2 2.14 6.04 0.6 0.72 -1.84 -3.06 -1.2
Tmem45a 2.2 2.02 0.57 0.22 -1.96 -3.18 -1.2
Tlr2 5.51 6.45 1.8 0.92 -1.62 -2.81 -1.2
Anxa11 21.88 22.2 5.62 2.5 -1.96 -3.15 -1.2
Glrx 6.92 8.36 1.32 0.7 -2.39 -3.58 -1.2
Plekha4 1.51 2.57 0.38 0.29 -1.98 -3.16 -1.2
A830018L16Rik 1.65 2.75 0.35 0.26 -2.25 -3.43 -1.2
Myo5c 1.62 1.95 0.37 0.2 -2.13 -3.3 -1.2
Ddit4l 3.92 3.23 0.88 0.32 -2.16 -3.33 -1.2
Plau 1.24 2.82 0.4 0.41 -1.63 -2.78 -1.2
Calcr 1.79 2.22 0.49 0.27 -1.87 -3.02 -1.2
Fbxo2 6.97 10.24 0.76 0.5 -3.19 -4.34 -1.2
Tert 5.46 4.17 2.16 0.76 -1.33 -2.46 -1.1
Mok 5.06 8.52 1.91 1.47 -1.41 -2.54 -1.1
Fzd9 1.44 1.44 0.39 0.18 -1.88 -3.01 -1.1
Gjb3 24.41 37.73 2.62 1.84 -3.22 -4.35 -1.1
Tmem102 2.01 2.05 0.71 0.33 -1.51 -2.63 -1.1
Fam83g 2.8 1.51 1.08 0.27 -1.38 -2.49 -1.1
Sdc4 22.96 50.47 7.08 7.19 -1.7 -2.81 -1.1
Ass1 19.68 24.02 4.67 2.65 -2.07 -3.18 -1.1
Ggnbp1 2.5 4.7 0.79 0.71 -1.65 -2.73 -1.1
Cpsf4l 13.36 34.98 0.43 0.53 -4.96 -6.04 -1.1
Sptbn2 8.14 16.85 0.88 0.87 -3.21 -4.28 -1.1
Celf5 1.94 1.79 0.6 0.27 -1.69 -2.75 -1.1
C030039L03Rik 2.2 4.34 1.08 1.03 -1.02 -2.07 -1.1
Arl5c 1.25 1.66 0.33 0.21 -1.92 -2.97 -1.1
Rims1 2.08 4.24 0.32 0.31 -2.71 -3.76 -1.1
Htatip2 1.32 1.73 0.18 0.12 -2.85 -3.89 -1.0
Sgol2b 1.27 2.66 0.1 0.1 -3.66 -4.7 -1.0
Papolb 1.44 2.13 0.58 0.42 -1.32 -2.35 -1.0
Serping1 4.74 7.28 0.98 0.74 -2.27 -3.3 -1.0
Ckb 106.41 205.42 17.4 16.63 -2.61 -3.63 -1.0
Tmem51 6.92 5.31 2.65 1.01 -1.38 -2.39 -1.0
Pdk4 1.95 3.5 0.55 0.49 -1.84 -2.84 -1.0
Mpzl2 11.9 11.4 1.46 0.7 -3.03 -4.03 -1.0
Sox15 9.73 11.14 0.7 0.4 -3.79 -4.79 -1.0
Gtsf1l 38.07 31.46 0.37 0.15 -6.7 -7.7 -1.0
Prr19 4.23 2.87 0.59 0.2 -2.83 -3.82 -1.0
Hist1h2ba 8.13 8.85 0.37 0.2 -4.47 -5.46 -1.0
2200002D01Rik 18.63 13.45 4.06 1.48 -2.2 -3.18 -1.0
Ap1m2 29.57 29.12 4.04 2.02 -2.87 -3.85 -1.0
Aifm2 5.97 4.67 0.81 0.32 -2.88 -3.86 -1.0
Ephx1 2.96 4.15 0.29 0.2 -3.36 -4.34 -1.0
Msc 5.9 10.49 0.11 0.1 -5.72 -6.7 -1.0

195
Sp1-/- ESC – Flk1+ cells Cluster 4: more downregulated in mutant
Gene ES WT FPKM
ES Sp1-/- FPKM
Flk1+ WT FPKM
Flk1+ Sp1-
/- FPKM WT ES/Flk log2 FC
Sp1-/- ES/Flk log2 FC
WT FC/Sp1-/- FC
Alcam 1.18 1.9 0.38 0.32 -1.62 -2.59 -1.0
Prss23 4.31 14.06 0.69 1.16 -2.63 -3.6 -1.0
Ckmt1 5.71 7.29 0.67 0.44 -3.08 -4.05 -1.0
Tspan17 2.23 1.88 0.79 0.34 -1.5 -2.46 -1.0
AI467606 6.13 4.79 1.03 0.41 -2.58 -3.54 -1.0
Abcb1b 20.26 20.22 2.13 1.1 -3.25 -4.2 -1.0
Sp1-/- ESC – Flk1+ cells Cluster 5: downregulated in mutant/no change in WT
Gene ES WT FPKM
ES Sp1-/- FPKM
Flk1+ WT FPKM
Flk1+ Sp1-
/- FPKM WT ES/Flk log2 FC
Sp1-/- ES/Flk log2 FC
WT FC/Sp1-/- FC
E030030I06Rik 1.16 4.92 1.17 0.45 0.01 -3.45 -3.5
Aspg 2.86 1.7 3.68 0.26 0.36 -2.72 -3.1
Tmem159 4.53 3.3 5.66 0.6 0.32 -2.46 -2.8
Hist1h4j 5.56 8.09 4.99 1.3 -0.16 -2.64 -2.5
Bgn 3.46 15.2 3.4 2.96 -0.02 -2.36 -2.3
Sycp3 12.44 9.19 10.33 1.58 -0.27 -2.54 -2.3
Smim20 15.29 10.56 14.69 2.34 -0.06 -2.17 -2.1
Mgmt 13.53 5.75 7.85 0.78 -0.79 -2.88 -2.1
Prdm14 3.01 7.21 1.75 0.99 -0.78 -2.86 -2.1
Tcaf2 2.48 1.25 2.39 0.29 -0.05 -2.12 -2.1
Neurl1a 3.71 4.42 4.71 1.35 0.34 -1.71 -2.1
Fam184b 1.33 1.1 1.03 0.21 -0.36 -2.4 -2.0
Ctsz 34.51 28.2 59.5 12.13 0.79 -1.22 -2.0
Efemp1 1.36 2.19 2.08 0.86 0.61 -1.35 -2.0
H60b 2.64 6.23 3.17 1.93 0.26 -1.69 -2.0
Klk8 12.48 9.22 10.02 1.92 -0.32 -2.27 -2.0
Selm 9.02 10.28 9.17 2.83 0.02 -1.86 -1.9
Csf1 1.89 8.25 2 2.42 0.08 -1.77 -1.9
Gm20594 2.92 5.29 2.95 1.51 0.02 -1.81 -1.8
Galnt12 3.76 3.31 4.85 1.26 0.37 -1.39 -1.8
Trim67 1.39 2.41 1.03 0.53 -0.42 -2.18 -1.8
Insl6 1.24 1.02 0.98 0.24 -0.34 -2.08 -1.7
Hddc2 26.86 28.78 42.82 14.36 0.67 -1 -1.7
Smim22 1.3 1.45 1.19 0.42 -0.12 -1.79 -1.7
Wdr86 4.36 3.19 3.05 0.72 -0.52 -2.15 -1.6
Aldoc 5.01 3.27 6.44 1.38 0.36 -1.24 -1.6
Nrk 2.65 4.41 2.78 1.53 0.07 -1.53 -1.6
Prelid2 9.49 2.62 10.23 0.94 0.11 -1.48 -1.6
Hist2h3b 31.25 32.63 38.87 13.83 0.31 -1.24 -1.6
Cenpm 13.45 22.09 10.51 5.92 -0.36 -1.9 -1.5
Raet1e 2.34 2.32 2.61 0.89 0.15 -1.38 -1.5
Tex15 3.88 3.32 2.69 0.8 -0.53 -2.06 -1.5
B230217C12Rik 1.87 2.91 2.27 1.29 0.28 -1.18 -1.5
Psors1c2 2.46 2.8 1.35 0.59 -0.86 -2.24 -1.4
Rbfa 25.37 16.9 17.2 4.44 -0.56 -1.93 -1.4
Mkx 5.84 7.32 3.73 1.8 -0.65 -2.02 -1.4
Fgfr2 9.88 13.66 9.29 5.01 -0.09 -1.45 -1.4
Ghdc 4.32 2.69 3.1 0.76 -0.48 -1.83 -1.4
Alpl 23.96 28.25 23.64 11.01 -0.02 -1.36 -1.3
Gsto1 29.73 34.09 29.03 13.45 -0.03 -1.34 -1.3
Radil 2.57 3.45 2.09 1.15 -0.3 -1.59 -1.3
Gng10 20.81 14.32 16.83 4.76 -0.31 -1.59 -1.3
Pkd2 13.21 11.24 12.25 4.36 -0.11 -1.37 -1.3
Gstt3 6.76 5.73 4.39 1.57 -0.62 -1.87 -1.3
Lefty2 58.4 157.91 33.38 38.24 -0.81 -2.05 -1.2
Qpct 1.61 1.52 1.06 0.43 -0.6 -1.83 -1.2
Myl9 14.47 27.24 11.13 8.99 -0.38 -1.6 -1.2
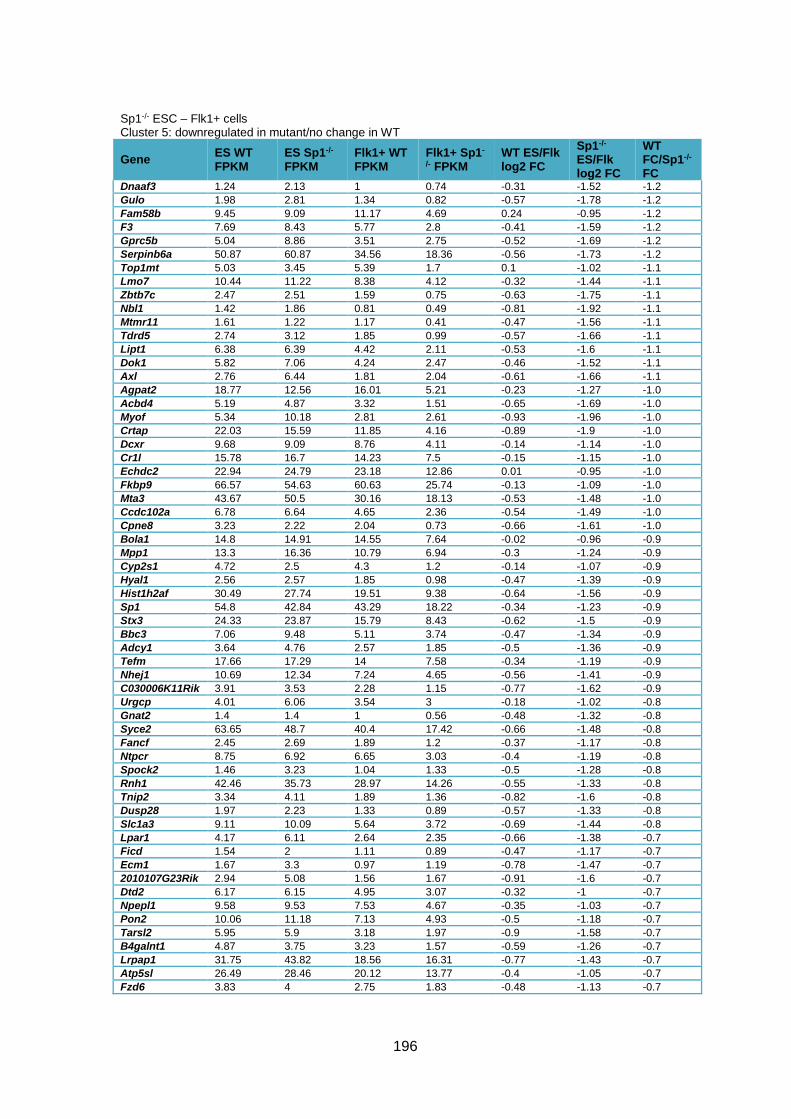
196
Sp1-/- ESC – Flk1+ cells Cluster 5: downregulated in mutant/no change in WT
Gene ES WT FPKM
ES Sp1-/- FPKM
Flk1+ WT FPKM
Flk1+ Sp1-
/- FPKM WT ES/Flk log2 FC
Sp1-/- ES/Flk log2 FC
WT FC/Sp1-/- FC
Dnaaf3 1.24 2.13 1 0.74 -0.31 -1.52 -1.2
Gulo 1.98 2.81 1.34 0.82 -0.57 -1.78 -1.2
Fam58b 9.45 9.09 11.17 4.69 0.24 -0.95 -1.2
F3 7.69 8.43 5.77 2.8 -0.41 -1.59 -1.2
Gprc5b 5.04 8.86 3.51 2.75 -0.52 -1.69 -1.2
Serpinb6a 50.87 60.87 34.56 18.36 -0.56 -1.73 -1.2
Top1mt 5.03 3.45 5.39 1.7 0.1 -1.02 -1.1
Lmo7 10.44 11.22 8.38 4.12 -0.32 -1.44 -1.1
Zbtb7c 2.47 2.51 1.59 0.75 -0.63 -1.75 -1.1
Nbl1 1.42 1.86 0.81 0.49 -0.81 -1.92 -1.1
Mtmr11 1.61 1.22 1.17 0.41 -0.47 -1.56 -1.1
Tdrd5 2.74 3.12 1.85 0.99 -0.57 -1.66 -1.1
Lipt1 6.38 6.39 4.42 2.11 -0.53 -1.6 -1.1
Dok1 5.82 7.06 4.24 2.47 -0.46 -1.52 -1.1
Axl 2.76 6.44 1.81 2.04 -0.61 -1.66 -1.1
Agpat2 18.77 12.56 16.01 5.21 -0.23 -1.27 -1.0
Acbd4 5.19 4.87 3.32 1.51 -0.65 -1.69 -1.0
Myof 5.34 10.18 2.81 2.61 -0.93 -1.96 -1.0
Crtap 22.03 15.59 11.85 4.16 -0.89 -1.9 -1.0
Dcxr 9.68 9.09 8.76 4.11 -0.14 -1.14 -1.0
Cr1l 15.78 16.7 14.23 7.5 -0.15 -1.15 -1.0
Echdc2 22.94 24.79 23.18 12.86 0.01 -0.95 -1.0
Fkbp9 66.57 54.63 60.63 25.74 -0.13 -1.09 -1.0
Mta3 43.67 50.5 30.16 18.13 -0.53 -1.48 -1.0
Ccdc102a 6.78 6.64 4.65 2.36 -0.54 -1.49 -1.0
Cpne8 3.23 2.22 2.04 0.73 -0.66 -1.61 -1.0
Bola1 14.8 14.91 14.55 7.64 -0.02 -0.96 -0.9
Mpp1 13.3 16.36 10.79 6.94 -0.3 -1.24 -0.9
Cyp2s1 4.72 2.5 4.3 1.2 -0.14 -1.07 -0.9
Hyal1 2.56 2.57 1.85 0.98 -0.47 -1.39 -0.9
Hist1h2af 30.49 27.74 19.51 9.38 -0.64 -1.56 -0.9
Sp1 54.8 42.84 43.29 18.22 -0.34 -1.23 -0.9
Stx3 24.33 23.87 15.79 8.43 -0.62 -1.5 -0.9
Bbc3 7.06 9.48 5.11 3.74 -0.47 -1.34 -0.9
Adcy1 3.64 4.76 2.57 1.85 -0.5 -1.36 -0.9
Tefm 17.66 17.29 14 7.58 -0.34 -1.19 -0.9
Nhej1 10.69 12.34 7.24 4.65 -0.56 -1.41 -0.9
C030006K11Rik 3.91 3.53 2.28 1.15 -0.77 -1.62 -0.9
Urgcp 4.01 6.06 3.54 3 -0.18 -1.02 -0.8
Gnat2 1.4 1.4 1 0.56 -0.48 -1.32 -0.8
Syce2 63.65 48.7 40.4 17.42 -0.66 -1.48 -0.8
Fancf 2.45 2.69 1.89 1.2 -0.37 -1.17 -0.8
Ntpcr 8.75 6.92 6.65 3.03 -0.4 -1.19 -0.8
Spock2 1.46 3.23 1.04 1.33 -0.5 -1.28 -0.8
Rnh1 42.46 35.73 28.97 14.26 -0.55 -1.33 -0.8
Tnip2 3.34 4.11 1.89 1.36 -0.82 -1.6 -0.8
Dusp28 1.97 2.23 1.33 0.89 -0.57 -1.33 -0.8
Slc1a3 9.11 10.09 5.64 3.72 -0.69 -1.44 -0.8
Lpar1 4.17 6.11 2.64 2.35 -0.66 -1.38 -0.7
Ficd 1.54 2 1.11 0.89 -0.47 -1.17 -0.7
Ecm1 1.67 3.3 0.97 1.19 -0.78 -1.47 -0.7
2010107G23Rik 2.94 5.08 1.56 1.67 -0.91 -1.6 -0.7
Dtd2 6.17 6.15 4.95 3.07 -0.32 -1 -0.7
Npepl1 9.58 9.53 7.53 4.67 -0.35 -1.03 -0.7
Pon2 10.06 11.18 7.13 4.93 -0.5 -1.18 -0.7
Tarsl2 5.95 5.9 3.18 1.97 -0.9 -1.58 -0.7
B4galnt1 4.87 3.75 3.23 1.57 -0.59 -1.26 -0.7
Lrpap1 31.75 43.82 18.56 16.31 -0.77 -1.43 -0.7
Atp5sl 26.49 28.46 20.12 13.77 -0.4 -1.05 -0.7
Fzd6 3.83 4 2.75 1.83 -0.48 -1.13 -0.7
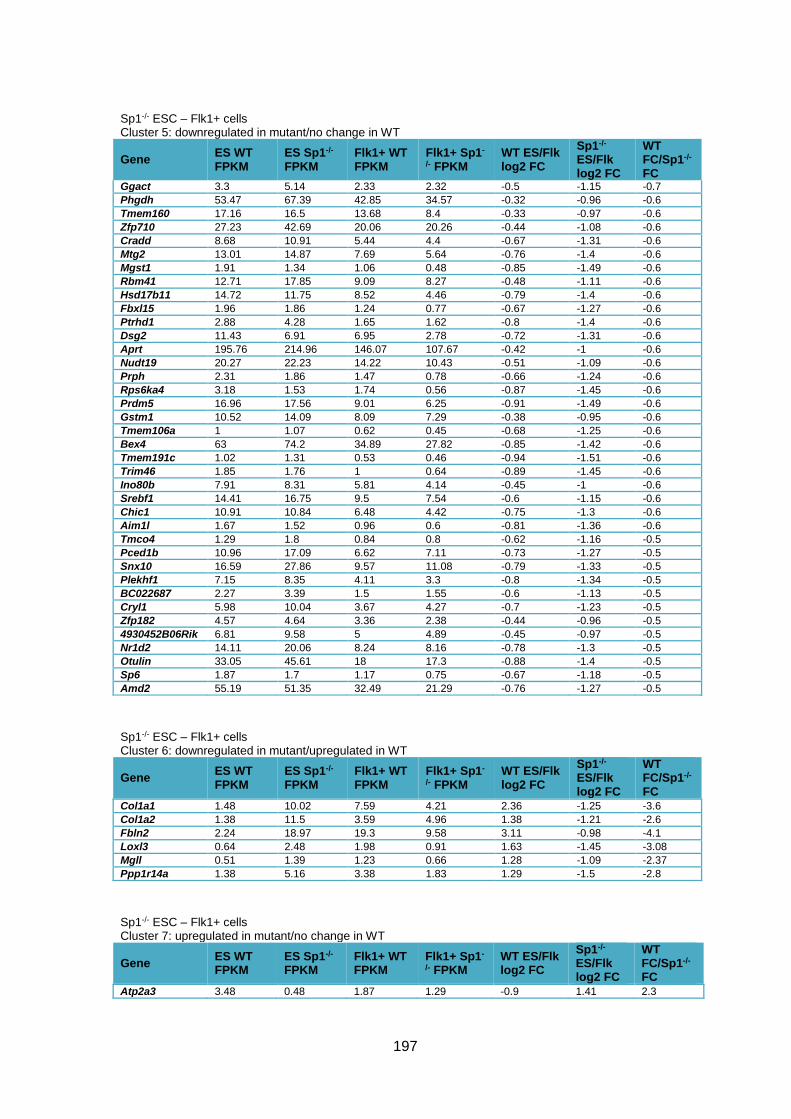
197
Sp1-/- ESC – Flk1+ cells Cluster 5: downregulated in mutant/no change in WT
Gene ES WT FPKM
ES Sp1-/- FPKM
Flk1+ WT FPKM
Flk1+ Sp1-
/- FPKM WT ES/Flk log2 FC
Sp1-/- ES/Flk log2 FC
WT FC/Sp1-/- FC
Ggact 3.3 5.14 2.33 2.32 -0.5 -1.15 -0.7
Phgdh 53.47 67.39 42.85 34.57 -0.32 -0.96 -0.6
Tmem160 17.16 16.5 13.68 8.4 -0.33 -0.97 -0.6
Zfp710 27.23 42.69 20.06 20.26 -0.44 -1.08 -0.6
Cradd 8.68 10.91 5.44 4.4 -0.67 -1.31 -0.6
Mtg2 13.01 14.87 7.69 5.64 -0.76 -1.4 -0.6
Mgst1 1.91 1.34 1.06 0.48 -0.85 -1.49 -0.6
Rbm41 12.71 17.85 9.09 8.27 -0.48 -1.11 -0.6
Hsd17b11 14.72 11.75 8.52 4.46 -0.79 -1.4 -0.6
Fbxl15 1.96 1.86 1.24 0.77 -0.67 -1.27 -0.6
Ptrhd1 2.88 4.28 1.65 1.62 -0.8 -1.4 -0.6
Dsg2 11.43 6.91 6.95 2.78 -0.72 -1.31 -0.6
Aprt 195.76 214.96 146.07 107.67 -0.42 -1 -0.6
Nudt19 20.27 22.23 14.22 10.43 -0.51 -1.09 -0.6
Prph 2.31 1.86 1.47 0.78 -0.66 -1.24 -0.6
Rps6ka4 3.18 1.53 1.74 0.56 -0.87 -1.45 -0.6
Prdm5 16.96 17.56 9.01 6.25 -0.91 -1.49 -0.6
Gstm1 10.52 14.09 8.09 7.29 -0.38 -0.95 -0.6
Tmem106a 1 1.07 0.62 0.45 -0.68 -1.25 -0.6
Bex4 63 74.2 34.89 27.82 -0.85 -1.42 -0.6
Tmem191c 1.02 1.31 0.53 0.46 -0.94 -1.51 -0.6
Trim46 1.85 1.76 1 0.64 -0.89 -1.45 -0.6
Ino80b 7.91 8.31 5.81 4.14 -0.45 -1 -0.6
Srebf1 14.41 16.75 9.5 7.54 -0.6 -1.15 -0.6
Chic1 10.91 10.84 6.48 4.42 -0.75 -1.3 -0.6
Aim1l 1.67 1.52 0.96 0.6 -0.81 -1.36 -0.6
Tmco4 1.29 1.8 0.84 0.8 -0.62 -1.16 -0.5
Pced1b 10.96 17.09 6.62 7.11 -0.73 -1.27 -0.5
Snx10 16.59 27.86 9.57 11.08 -0.79 -1.33 -0.5
Plekhf1 7.15 8.35 4.11 3.3 -0.8 -1.34 -0.5
BC022687 2.27 3.39 1.5 1.55 -0.6 -1.13 -0.5
Cryl1 5.98 10.04 3.67 4.27 -0.7 -1.23 -0.5
Zfp182 4.57 4.64 3.36 2.38 -0.44 -0.96 -0.5
4930452B06Rik 6.81 9.58 5 4.89 -0.45 -0.97 -0.5
Nr1d2 14.11 20.06 8.24 8.16 -0.78 -1.3 -0.5
Otulin 33.05 45.61 18 17.3 -0.88 -1.4 -0.5
Sp6 1.87 1.7 1.17 0.75 -0.67 -1.18 -0.5
Amd2 55.19 51.35 32.49 21.29 -0.76 -1.27 -0.5
Sp1-/- ESC – Flk1+ cells Cluster 6: downregulated in mutant/upregulated in WT
Gene ES WT FPKM
ES Sp1-/- FPKM
Flk1+ WT FPKM
Flk1+ Sp1-
/- FPKM WT ES/Flk log2 FC
Sp1-/- ES/Flk log2 FC
WT FC/Sp1-/- FC
Col1a1 1.48 10.02 7.59 4.21 2.36 -1.25 -3.6
Col1a2 1.38 11.5 3.59 4.96 1.38 -1.21 -2.6
Fbln2 2.24 18.97 19.3 9.58 3.11 -0.98 -4.1
Loxl3 0.64 2.48 1.98 0.91 1.63 -1.45 -3.08
Mgll 0.51 1.39 1.23 0.66 1.28 -1.09 -2.37
Ppp1r14a 1.38 5.16 3.38 1.83 1.29 -1.5 -2.8
Sp1-/- ESC – Flk1+ cells Cluster 7: upregulated in mutant/no change in WT
Gene ES WT FPKM
ES Sp1-/- FPKM
Flk1+ WT FPKM
Flk1+ Sp1-
/- FPKM WT ES/Flk log2 FC
Sp1-/- ES/Flk log2 FC
WT FC/Sp1-/- FC
Atp2a3 3.48 0.48 1.87 1.29 -0.9 1.41 2.3

198
Sp1-/- ESC – Flk1+ cells Cluster 7: upregulated in mutant/no change in WT
Gene ES WT FPKM
ES Sp1-/- FPKM
Flk1+ WT FPKM
Flk1+ Sp1-
/- FPKM WT ES/Flk log2 FC
Sp1-/- ES/Flk log2 FC
WT FC/Sp1-/- FC
Mecom 1.01 0.59 1.25 3.44 0.31 2.55 2.2
Coro2b 1.96 0.62 1.16 1.72 -0.75 1.47 2.2
Ecscr 6.32 3.77 4.33 11.92 -0.55 1.66 2.2
Nfkbie 1.94 0.96 1.62 3.23 -0.26 1.75 2.0
Uty 4.06 0.58 3.26 1.8 -0.31 1.63 1.9
Gdpd5 1 0.54 1.75 3.56 0.8 2.72 1.9
Col8a2 1.06 0.46 1.68 2.75 0.67 2.58 1.9
Plet1 5.58 3.16 4.38 7.72 -0.35 1.29 1.6
Tal2 2.05 1.43 2.29 4.79 0.16 1.75 1.6
Satb1 5.04 2.16 6.78 8.58 0.43 1.99 1.6
Pcdh17 1.1 0.69 1.61 2.95 0.55 2.1 1.6
Sema7a 1.55 0.78 2.41 3.39 0.64 2.12 1.5
Xylt1 1.86 1.01 1.58 2.34 -0.24 1.22 1.5
Cnr1 0.84 0.85 1.29 3.55 0.62 2.06 1.4
Psmb9 2.1 0.88 2.29 2.47 0.12 1.49 1.4
Arnt2 1.73 0.92 2.03 2.73 0.23 1.56 1.3
Cib2 2.18 1.95 2.94 6.5 0.43 1.74 1.3
Bmf 2.49 1.59 2.34 3.65 -0.09 1.2 1.3
Slc9a7 1.34 0.51 2.09 1.93 0.65 1.93 1.3
Tnfsf9 1.64 0.73 1.54 1.66 -0.09 1.18 1.3
Adamts15 0.84 0.5 1.1 1.53 0.38 1.63 1.3
Morn1 1.74 0.75 2.45 2.39 0.49 1.66 1.2
Atf3 2.7 1.63 4.46 6.11 0.73 1.9 1.2
Bcl11a 1.71 0.54 3.14 2.22 0.88 2.05 1.2
Mapk12 5.09 3.85 6.91 11.7 0.44 1.6 1.2
Rassf2 1.64 1.06 2.23 3.23 0.45 1.61 1.2
Sema6a 3.57 2.54 5.42 8.5 0.6 1.74 1.1
Gpm6b 1.03 0.69 1.73 2.54 0.75 1.87 1.1
Tmem151b 1.26 0.91 1.22 1.91 -0.04 1.07 1.1
Ppp1r13b 3.64 3.44 3.65 7.32 0 1.09 1.1
Dapk1 17.55 13.29 31.49 49.83 0.84 1.91 1.1
Syne2 3.27 2.47 5.86 9.24 0.84 1.91 1.1
Trim34a 0.83 0.51 1.06 1.35 0.35 1.41 1.1
Ccdc112 2.47 1.98 3 4.96 0.28 1.33 1.1
Zkscan7 1.04 0.86 1.51 2.56 0.54 1.58 1.0
Txnip 71.88 72.93 80.45 164.94 0.16 1.18 1.0
Rnd2 11.48 5.76 17.35 17.52 0.6 1.61 1.0
Capn2 38.54 22.01 43.17 48.82 0.16 1.15 1.0
Akap5 1.09 1.19 1.93 4.18 0.83 1.82 1.0
Ssbp2 1.74 1.07 3.28 4.03 0.92 1.91 1.0
Ogfrl1 3.81 2.05 3.79 3.99 -0.01 0.96 1.0
Trib1 6.19 4.2 11.15 14.83 0.85 1.82 1.0
Itpkb 1.37 0.89 2.42 3.03 0.82 1.78 1.0
Asap2 4.82 3.12 8.75 11.04 0.86 1.82 1.0
Dusp18 1.48 1.21 1.87 2.93 0.33 1.27 0.9
Tm6sf1 0.95 0.82 1.61 2.62 0.75 1.68 0.9
Fhod3 1.43 0.56 2.72 2.04 0.93 1.86 0.9
Stat6 7.63 3.61 10.47 9.42 0.46 1.38 0.9
Col11a1 1.23 1.24 1.27 2.4 0.05 0.96 0.9
Has3 1.21 0.86 2.04 2.72 0.75 1.66 0.9
Celsr1 2.55 2.05 4.45 6.64 0.8 1.7 0.9
Aldh1a2 1.78 1.44 3.18 4.8 0.84 1.74 0.9
Car4 7.97 8.01 11.08 20.47 0.47 1.35 0.9
Rerg 0.73 0.43 1.14 1.25 0.65 1.52 0.9
Gbp2 10.11 7.24 15.09 19.7 0.58 1.44 0.9
Ttc39c 0.8 0.47 1.52 1.62 0.92 1.78 0.9
Cmklr1 1.56 1.24 2.19 3.13 0.49 1.34 0.9
Ppp2r2c 2.73 2.76 4.58 8.3 0.75 1.59 0.8
Tagln2 80.28 62.79 117.28 161.8 0.55 1.37 0.8
D830031N03Rik 6.45 5.25 9.67 13.74 0.58 1.39 0.8
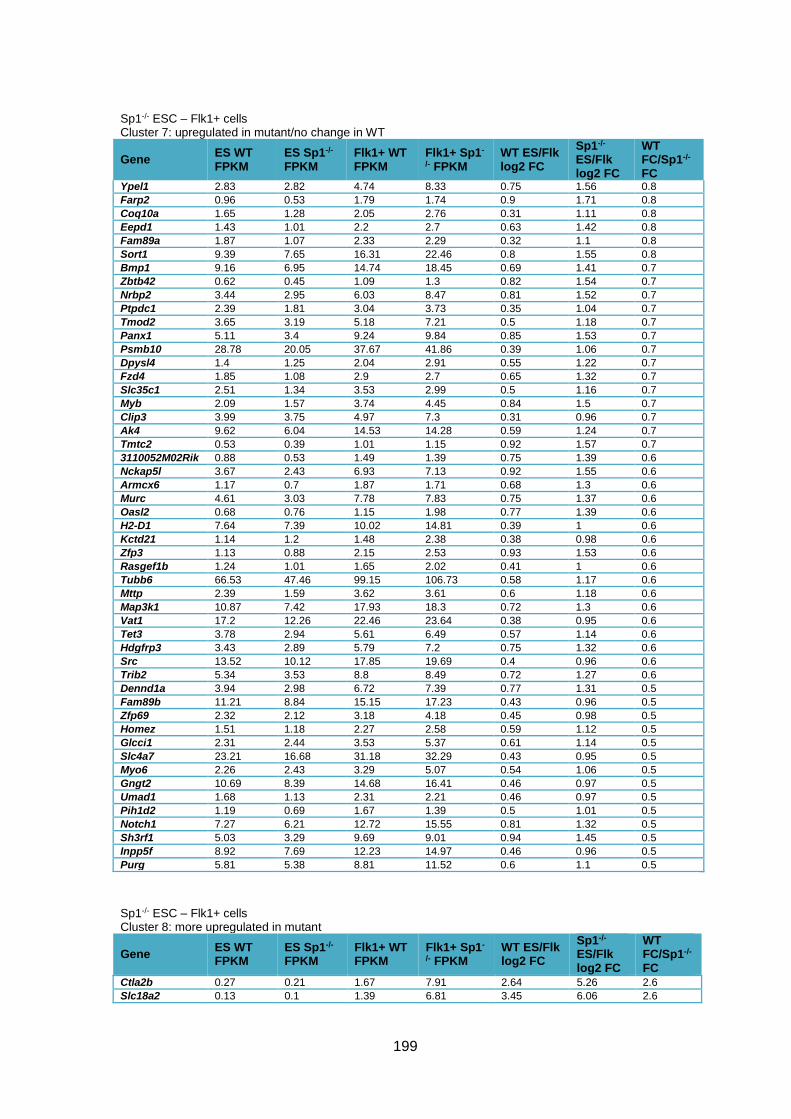
199
Sp1-/- ESC – Flk1+ cells Cluster 7: upregulated in mutant/no change in WT
Gene ES WT FPKM
ES Sp1-/- FPKM
Flk1+ WT FPKM
Flk1+ Sp1-
/- FPKM WT ES/Flk log2 FC
Sp1-/- ES/Flk log2 FC
WT FC/Sp1-/- FC
Ypel1 2.83 2.82 4.74 8.33 0.75 1.56 0.8
Farp2 0.96 0.53 1.79 1.74 0.9 1.71 0.8
Coq10a 1.65 1.28 2.05 2.76 0.31 1.11 0.8
Eepd1 1.43 1.01 2.2 2.7 0.63 1.42 0.8
Fam89a 1.87 1.07 2.33 2.29 0.32 1.1 0.8
Sort1 9.39 7.65 16.31 22.46 0.8 1.55 0.8
Bmp1 9.16 6.95 14.74 18.45 0.69 1.41 0.7
Zbtb42 0.62 0.45 1.09 1.3 0.82 1.54 0.7
Nrbp2 3.44 2.95 6.03 8.47 0.81 1.52 0.7
Ptpdc1 2.39 1.81 3.04 3.73 0.35 1.04 0.7
Tmod2 3.65 3.19 5.18 7.21 0.5 1.18 0.7
Panx1 5.11 3.4 9.24 9.84 0.85 1.53 0.7
Psmb10 28.78 20.05 37.67 41.86 0.39 1.06 0.7
Dpysl4 1.4 1.25 2.04 2.91 0.55 1.22 0.7
Fzd4 1.85 1.08 2.9 2.7 0.65 1.32 0.7
Slc35c1 2.51 1.34 3.53 2.99 0.5 1.16 0.7
Myb 2.09 1.57 3.74 4.45 0.84 1.5 0.7
Clip3 3.99 3.75 4.97 7.3 0.31 0.96 0.7
Ak4 9.62 6.04 14.53 14.28 0.59 1.24 0.7
Tmtc2 0.53 0.39 1.01 1.15 0.92 1.57 0.7
3110052M02Rik 0.88 0.53 1.49 1.39 0.75 1.39 0.6
Nckap5l 3.67 2.43 6.93 7.13 0.92 1.55 0.6
Armcx6 1.17 0.7 1.87 1.71 0.68 1.3 0.6
Murc 4.61 3.03 7.78 7.83 0.75 1.37 0.6
Oasl2 0.68 0.76 1.15 1.98 0.77 1.39 0.6
H2-D1 7.64 7.39 10.02 14.81 0.39 1 0.6
Kctd21 1.14 1.2 1.48 2.38 0.38 0.98 0.6
Zfp3 1.13 0.88 2.15 2.53 0.93 1.53 0.6
Rasgef1b 1.24 1.01 1.65 2.02 0.41 1 0.6
Tubb6 66.53 47.46 99.15 106.73 0.58 1.17 0.6
Mttp 2.39 1.59 3.62 3.61 0.6 1.18 0.6
Map3k1 10.87 7.42 17.93 18.3 0.72 1.3 0.6
Vat1 17.2 12.26 22.46 23.64 0.38 0.95 0.6
Tet3 3.78 2.94 5.61 6.49 0.57 1.14 0.6
Hdgfrp3 3.43 2.89 5.79 7.2 0.75 1.32 0.6
Src 13.52 10.12 17.85 19.69 0.4 0.96 0.6
Trib2 5.34 3.53 8.8 8.49 0.72 1.27 0.6
Dennd1a 3.94 2.98 6.72 7.39 0.77 1.31 0.5
Fam89b 11.21 8.84 15.15 17.23 0.43 0.96 0.5
Zfp69 2.32 2.12 3.18 4.18 0.45 0.98 0.5
Homez 1.51 1.18 2.27 2.58 0.59 1.12 0.5
Glcci1 2.31 2.44 3.53 5.37 0.61 1.14 0.5
Slc4a7 23.21 16.68 31.18 32.29 0.43 0.95 0.5
Myo6 2.26 2.43 3.29 5.07 0.54 1.06 0.5
Gngt2 10.69 8.39 14.68 16.41 0.46 0.97 0.5
Umad1 1.68 1.13 2.31 2.21 0.46 0.97 0.5
Pih1d2 1.19 0.69 1.67 1.39 0.5 1.01 0.5
Notch1 7.27 6.21 12.72 15.55 0.81 1.32 0.5
Sh3rf1 5.03 3.29 9.69 9.01 0.94 1.45 0.5
Inpp5f 8.92 7.69 12.23 14.97 0.46 0.96 0.5
Purg 5.81 5.38 8.81 11.52 0.6 1.1 0.5
Sp1-/- ESC – Flk1+ cells Cluster 8: more upregulated in mutant
Gene ES WT FPKM
ES Sp1-/- FPKM
Flk1+ WT FPKM
Flk1+ Sp1-
/- FPKM WT ES/Flk log2 FC
Sp1-/- ES/Flk log2 FC
WT FC/Sp1-/- FC
Ctla2b 0.27 0.21 1.67 7.91 2.64 5.26 2.6
Slc18a2 0.13 0.1 1.39 6.81 3.45 6.06 2.6

200
Sp1-/- ESC – Flk1+ cells Cluster 8: more upregulated in mutant
Gene ES WT FPKM
ES Sp1-/- FPKM
Flk1+ WT FPKM
Flk1+ Sp1-
/- FPKM WT ES/Flk log2 FC
Sp1-/- ES/Flk log2 FC
WT FC/Sp1-/- FC
Icam2 0.13 0.1 1.23 5.43 3.22 5.72 2.5
Slc38a5 0.59 0.13 1.33 1.36 1.16 3.38 2.2
Cdh5 0.47 0.38 4.12 14.41 3.14 5.26 2.1
Erg 0.16 0.14 1.14 3.94 2.8 4.82 2.0
Mef2c 0.41 0.24 1.05 2.43 1.35 3.34 2.0
Samd3 0.1 0.1 1.09 4.14 3.45 5.37 1.9
Vav3 1.01 0.43 3.45 4.9 1.77 3.52 1.8
Sox17 0.19 0.13 1.01 2.29 2.42 4.16 1.7
Tie1 0.4 0.65 1.17 5.96 1.56 3.21 1.7
Spns2 0.46 0.32 1.17 2.41 1.35 2.94 1.6
Ptprb 0.16 0.16 1.37 4.28 3.12 4.71 1.6
Cer1 0.1 0.11 2.5 7.95 4.64 6.22 1.6
Gm15284 0.38 0.1 1.58 1.21 2.07 3.6 1.5
Egr2 0.44 0.26 1.03 1.75 1.22 2.73 1.5
Fignl2 2.67 0.9 10.55 10 1.98 3.47 1.5
Samsn1 0.1 0.1 1.14 3.3 3.51 5 1.5
Itga8 3.97 1.8 8.66 11 1.13 2.61 1.5
Flt1 0.48 0.45 5.81 14.93 3.59 5.07 1.5
Ubash3b 0.83 0.42 5.34 7.25 2.68 4.11 1.4
Jakmip1 0.77 0.42 1.94 2.82 1.34 2.74 1.4
Slc32a1 0.14 0.1 1.13 2.25 3.04 4.44 1.4
Sall3 2.27 0.82 10.84 10.26 2.25 3.64 1.4
Dusp2 1.09 0.63 12.85 19.43 3.56 4.94 1.4
Optn 2.41 0.85 8.72 7.76 1.85 3.19 1.3
Hbb-bh1 0.1 0.1 3.18 7.92 4.99 6.31 1.3
Gfi1b 0.18 0.13 1.24 2.16 2.77 4.07 1.3
Dll3 2.28 1.6 12.38 20.94 2.44 3.71 1.3
Amd1 0.12 0.1 6.49 12.72 5.7 6.95 1.3
Dpysl5 3.96 2.21 28.7 37.76 2.86 4.09 1.2
Hhex 2 1.03 6.59 7.85 1.72 2.94 1.2
Arhgef26 2.12 1.27 4.72 6.56 1.16 2.37 1.2
Myl4 5.76 2.46 13.21 13.07 1.2 2.41 1.2
Parm1 0.97 0.65 2.55 3.95 1.4 2.61 1.2
Myl7 3.52 1.77 65 74.95 4.21 5.4 1.2
Ctsc 11.92 7.26 34.3 47.57 1.53 2.71 1.2
Gfra2 0.59 0.31 13.26 16.04 4.5 5.68 1.2
Nol4l 0.86 0.39 5.4 5.57 2.65 3.82 1.2
Pkdcc 1.87 1.54 9.79 17.72 2.39 3.53 1.1
Robo3 0.21 0.16 1.77 2.95 3.04 4.18 1.1
Cdh8 0.31 0.16 2.37 2.68 2.94 4.07 1.1
Gad2 0.12 0.13 1.58 3.85 3.73 4.85 1.1
Hivep2 2.36 1.32 4.64 5.57 0.97 2.08 1.1
Grik5 2.38 1 5.46 4.97 1.2 2.31 1.1
Rgs3 0.54 0.39 2.64 4.08 2.28 3.39 1.1
Ndufa4l2 2.57 0.31 13.3 3.49 2.37 3.48 1.1
Sp5 1.05 0.66 9.28 12.65 3.15 4.25 1.1
Nxph4 0.29 0.11 3.6 2.86 3.65 4.74 1.1
Itga2b 0.25 0.24 1.45 3 2.55 3.63 1.1
Dbndd1 0.85 0.54 1.9 2.57 1.17 2.24 1.1
Skap1 0.13 0.1 2.03 3.21 3.92 4.99 1.1
Cntnap2 0.59 0.47 2.6 4.21 2.13 3.16 1.0
Tmem164 6.32 3.68 31.48 37.6 2.32 3.35 1.0
Gbp9 0.35 0.23 3.01 3.94 3.09 4.1 1.0
Calcrl 0.35 0.41 3.48 8.16 3.3 4.31 1.0
Man1c1 1.58 0.69 15.97 14.21 3.34 4.35 1.0
Gata4 1.35 0.61 77.28 69.82 5.84 6.84 1.0
Optc 0.1 0.11 4.99 10.44 5.64 6.63 1.0
Epm2a 0.27 0.26 2.06 3.86 2.93 3.91 1.0
Zic2 0.98 0.5 10.98 11.02 3.48 4.46 1.0
Ptprj 4.43 1.9 13.6 11.39 1.62 2.59 1.0

201
Sp1-/- ESC – Flk1+ cells Cluster 8: more upregulated in mutant
Gene ES WT FPKM
ES Sp1-/- FPKM
Flk1+ WT FPKM
Flk1+ Sp1-
/- FPKM WT ES/Flk log2 FC
Sp1-/- ES/Flk log2 FC
WT FC/Sp1-/- FC
Srgap1 0.63 0.55 2.08 3.56 1.73 2.7 1.0
Mlycd 1.31 0.6 4.43 3.95 1.75 2.72 1.0
Bcorl1 1.47 0.91 10.13 12.3 2.79 3.76 1.0
Podxl2 0.33 0.3 1.09 1.93 1.71 2.67 1.0
Pcp4 0.4 0.1 3 1.47 2.92 3.88 1.0
Cdc14a 2.48 1.43 5.2 5.83 1.07 2.02 1.0
Tspan18 0.22 0.14 4.6 5.79 4.4 5.35 1.0
Sp1-/- ESC – Flk1+ cells Cluster 9: upregulated in mutant/downregulated in WT
Gene ES WT FPKM
ES Sp1-/- FPKM
Flk1+ WT FPKM
Flk1+ Sp1-
/- FPKM WT ES/Flk log2 FC
Sp1-/- ES/Flk log2 FC
WT FC/Sp1-/- FC
Afap1l1 3.29 2.07 1.71 4.59 -0.95 1.15 2.1
Ebf1 1.9 0.82 0.83 1.76 -1.19 1.11 2.3
Nos3 2.67 0.81 1.14 1.79 -1.22 1.14 2.4
Ulbp1 3.29 3.49 1.49 8.01 -1.14 1.2 2.3
Sp1-/- ESC – Flk1+ cells Cluster 10: not upregulated in mutant
Gene ES WT FPKM
ES Sp1-/- FPKM
Flk1+ WT FPKM
Flk1+ Sp1-
/- FPKM WT ES/Flk log2 FC
Sp1-/- ES/Flk log2 FC
WT FC/Sp1-/- FC
3830417A13Rik 3.07 1.86 0.19 1.57 -4.03 -0.25 3.8
Cd34 3.04 1.14 0.46 1.97 -2.73 0.79 3.5
Rhox5 50.29 149.14 8.51 183 -2.56 0.3 2.9
Krt7 3.32 3.07 0.5 3 -2.73 -0.03 2.7
Thsd1 2.06 1.21 0.7 2.12 -1.55 0.8 2.4
Btg3 5.43 3.07 1.51 4.32 -1.84 0.49 2.3
Esam 10.23 8.65 2.46 9.64 -2.06 0.16 2.2
Aim2 11.99 13.47 1.8 9.19 -2.73 -0.55 2.2
Plvap 2.33 2.06 0.77 3.07 -1.59 0.57 2.2
Cntfr 7.52 2.88 1.29 2.2 -2.54 -0.39 2.2
Rec8 4.02 2.13 0.69 1.61 -2.54 -0.4 2.1
Dysf 5.74 1.99 1.96 2.96 -1.55 0.58 2.1
Pim2 24.37 16.63 4.33 12.03 -2.49 -0.47 2.0
Edn1 1.89 1.7 0.26 0.94 -2.88 -0.86 2.0
Fmr1nb 5.1 8.85 1.14 7.73 -2.16 -0.2 2.0
Sfrp1 7.65 5.74 2.33 6.64 -1.71 0.21 1.9
Sh3tc1 2.23 1.01 0.54 0.92 -2.05 -0.13 1.9
Nuak2 1.95 1.74 0.52 1.67 -1.91 -0.06 1.9
Sepp1 19.75 20.56 9.88 34.14 -1 0.73 1.7
Map4k2 3.94 2.84 1.91 4.55 -1.05 0.68 1.7
Stmn3 5.14 2.04 0.83 1.06 -2.64 -0.94 1.7
Bst2 19.9 13.89 6.49 13.92 -1.62 0 1.6
Gatsl2 2.34 1.18 0.64 0.97 -1.88 -0.28 1.6
Plek2 3.97 2.25 0.84 1.42 -2.25 -0.66 1.6
Ltb 4.37 2.6 0.85 1.5 -2.36 -0.79 1.6
Gap43 4.26 4.65 1.15 3.67 -1.89 -0.34 1.6
Tek 7 7.05 1.97 5.6 -1.83 -0.33 1.5
Specc1 6.14 4.58 2.41 4.97 -1.35 0.12 1.5
Dnah8 7.62 1.87 1.69 1.15 -2.17 -0.71 1.5
Trh 153.88 176.14 39.6 119.66 -1.96 -0.56 1.4
Card10 2.62 1.26 0.99 1.23 -1.4 -0.03 1.4
Plcg2 8.36 4.66 2.22 3.2 -1.91 -0.54 1.4
4930447C04Rik 10.24 14.35 2.16 7.87 -2.24 -0.87 1.4
Sptb 2.91 1.15 0.91 0.92 -1.68 -0.33 1.4
Slc6a1 3.38 1.11 0.8 0.67 -2.08 -0.73 1.4

202
Sp1-/- ESC – Flk1+ cells Cluster 10: not upregulated in mutant
Gene ES WT FPKM
ES Sp1-/- FPKM
Flk1+ WT FPKM
Flk1+ Sp1-
/- FPKM WT ES/Flk log2 FC
Sp1-/- ES/Flk log2 FC
WT FC/Sp1-/- FC
Tnfsfm13 3.84 1.35 0.96 0.85 -2 -0.66 1.3
Lyn 3.47 2.2 1.67 2.64 -1.06 0.26 1.3
Adgrg1 1.27 1.3 0.39 0.97 -1.73 -0.42 1.3
Pik3r3 3.35 2.92 0.93 2.02 -1.84 -0.53 1.3
Tram2 4.44 3.01 2.05 3.35 -1.12 0.15 1.3
Trp53i11 15.4 12.31 5.06 9.65 -1.61 -0.35 1.3
Epha1 13.13 7.89 5.5 7.75 -1.26 -0.03 1.2
Dab1 19.55 10.89 6.32 8.24 -1.63 -0.4 1.2
Npnt 1.54 1.04 0.35 0.56 -2.14 -0.91 1.2
Prkcb 1.58 1.16 0.69 1.18 -1.18 0.02 1.2
C130074G19Rik 1.01 1 0.29 0.66 -1.78 -0.6 1.2
Rsg1 1.92 1.06 0.84 1.03 -1.19 -0.03 1.2
Lfng 8.53 7.22 3.48 6.41 -1.29 -0.17 1.1
Arhgef28 2.65 4.24 0.79 2.7 -1.75 -0.65 1.1
Fam198b 4.04 6.53 1.08 3.76 -1.9 -0.8 1.1
Ica1 5.4 4.98 2.29 4.49 -1.24 -0.15 1.1
Qprt 7.79 3.48 3.32 3.14 -1.23 -0.15 1.1
Enc1 51.4 39.93 15.23 24.97 -1.76 -0.68 1.1
Lrp11 15.59 13.9 7 13.12 -1.15 -0.08 1.1
Dclk2 5.32 4.74 2.58 4.76 -1.05 0.01 1.1
Wfdc2 15.4 11.36 4.69 7.21 -1.72 -0.66 1.1
Als2cl 4.34 2.63 1.37 1.72 -1.66 -0.61 1.1
Nudt12 6.24 2.95 2.73 2.64 -1.19 -0.16 1.0
Npr1 6.55 5.49 2.67 4.54 -1.29 -0.27 1.0
Rasl11a 6.7 4.96 3.19 4.76 -1.07 -0.06 1.0
5730507C01Rik 3.1 2.69 1.19 2.09 -1.37 -0.36 1.0
Pkp2 21.92 17.96 5.92 9.76 -1.89 -0.88 1.0
Ptrf 15.52 12.33 6.23 9.72 -1.32 -0.34 1.0
Mgat4a 4.9 4.85 1.83 3.55 -1.42 -0.45 1.0
Slc25a23 2.35 1.78 0.86 1.28 -1.45 -0.48 1.0
Ptrh1 5.51 4.1 1.7 2.5 -1.69 -0.72 1.0
Unc13a 1.38 1.36 0.42 0.82 -1.7 -0.74 1.0
Slitrk5 4.48 3.75 1.34 2.17 -1.75 -0.79 1.0
Vill 2.96 1.41 1.31 1.2 -1.18 -0.23 1.0
Fam111a 23.82 13.39 11.34 12.13 -1.07 -0.14 0.9
Abca3 2.52 2.52 1.08 2.06 -1.22 -0.29 0.9
Nudt18 1.2 1.1 0.45 0.79 -1.4 -0.48 0.9
Cnp 9.35 5.3 4.8 5.13 -0.96 -0.05 0.9
Rab3d 2.51 1.69 0.81 1.02 -1.63 -0.72 0.9
Sntb1 2.68 1.96 0.86 1.18 -1.63 -0.72 0.9
Pde4b 1 1.2 0.51 1.14 -0.97 -0.07 0.9
Dock4 4.48 4.37 2.09 3.79 -1.1 -0.2 0.9
Rasip1 4.74 5.87 2.01 4.66 -1.23 -0.33 0.9
Bcl6b 4.96 3.94 1.75 2.58 -1.51 -0.61 0.9
Kif5c 11.26 12.54 5.11 10.52 -1.14 -0.25 0.9
Sdr39u1 1.45 1.65 0.59 1.25 -1.29 -0.4 0.9
Rasef 3.49 2.9 1.39 2.16 -1.32 -0.43 0.9
Mtm1 3.01 2.89 1.14 2.03 -1.4 -0.51 0.9
Zfhx2 2.93 2 0.9 1.13 -1.71 -0.82 0.9
Nes 22.25 16.72 8.98 12.44 -1.31 -0.43 0.9
Celsr2 2.19 2.09 0.65 1.14 -1.75 -0.87 0.9
Rassf3 18.29 12.92 5.76 7.38 -1.67 -0.81 0.9
Lmbr1 3.78 3.09 1.91 2.81 -0.99 -0.14 0.9
Prmt8 1.46 1.39 0.73 1.23 -1.01 -0.17 0.8
Lekr1 1.21 1.15 0.44 0.73 -1.47 -0.66 0.8
9930012K11Rik 10.59 7.49 3.22 3.98 -1.72 -0.91 0.8
Cadps2 2.06 1.25 1.06 1.12 -0.96 -0.16 0.8
4930432K21Rik 2.1 2.29 0.8 1.51 -1.4 -0.6 0.8
Moap1 4.88 3.87 2.42 3.3 -1.01 -0.23 0.8
Rbm12b1 3.97 3.23 1.43 1.99 -1.48 -0.7 0.8

203
Sp1-/- ESC – Flk1+ cells Cluster 10: not upregulated in mutant
Gene ES WT FPKM
ES Sp1-/- FPKM
Flk1+ WT FPKM
Flk1+ Sp1-
/- FPKM WT ES/Flk log2 FC
Sp1-/- ES/Flk log2 FC
WT FC/Sp1-/- FC
Hspa4l 3.76 4.17 1.32 2.51 -1.51 -0.73 0.8
Samd9l 1.42 2.36 0.49 1.38 -1.55 -0.77 0.8
Dnajb5 8.17 7.44 2.61 4.09 -1.64 -0.86 0.8
Ankrd33b 2.52 1.14 1.11 0.85 -1.18 -0.42 0.8
Ddx3y 5.52 1.08 2.12 0.7 -1.38 -0.62 0.8
Rundc3b 1.94 2.21 0.67 1.29 -1.52 -0.77 0.8
9030624G23Rik 3.91 3.06 1.87 2.43 -1.07 -0.33 0.7
Nmrk1 3.55 4.5 1.49 3.14 -1.26 -0.52 0.7
Rfng 8.86 6.16 3.53 4.09 -1.33 -0.59 0.7
Dhrs11 3.66 3.68 1.28 2.15 -1.51 -0.77 0.7
Myo5b 1.5 1.14 0.52 0.66 -1.52 -0.78 0.7
Rltpr 1.77 1.2 0.58 0.66 -1.6 -0.86 0.7
Hvcn1 9.11 6.69 4.19 5.01 -1.12 -0.42 0.7
Sat1 42.34 28.19 20.59 22.18 -1.04 -0.35 0.7
Slc6a8 24.2 15.38 11.54 11.86 -1.07 -0.38 0.7
Uchl4 1.99 1.12 0.71 0.64 -1.5 -0.81 0.7
Nrgn 1.72 2.1 0.57 1.13 -1.59 -0.9 0.7
Gabrb3 3.09 2.11 1.59 1.72 -0.96 -0.29 0.7
Gabarapl2 61.54 45.11 30.77 35.77 -1 -0.33 0.7
Rdh10 5.77 4.89 2.79 3.69 -1.05 -0.4 0.7
Stmn2 33.61 38.07 13.4 23.82 -1.33 -0.68 0.7
Jmjd1c 69.51 58.86 32.08 42.24 -1.12 -0.48 0.6
Synrg 5.74 5.04 2.54 3.48 -1.17 -0.53 0.6
F11r 43.31 39.99 14.62 21.03 -1.57 -0.93 0.6
Spry2 97.93 70.59 43.56 48.39 -1.17 -0.54 0.6
Tbc1d9 7.17 6.65 3.61 5.13 -0.99 -0.37 0.6
3110002H16Rik 14.41 13.18 5.68 7.99 -1.34 -0.72 0.6
Fam129b 40.4 32.66 15.56 19.34 -1.38 -0.76 0.6
Syne1 2.36 2.01 1.17 1.51 -1.02 -0.41 0.6
Tmem19 12.8 13.69 5.3 8.65 -1.27 -0.66 0.6
Bik 1.73 1.72 0.61 0.92 -1.5 -0.89 0.6
Akr1b10 11.85 9.49 5.22 6.36 -1.18 -0.58 0.6
Procr 2.87 3.18 1.01 1.69 -1.51 -0.91 0.6
Hdac6 23.2 32.85 10.82 23.08 -1.1 -0.51 0.6
Kbtbd7 14.57 13.15 6.01 8.15 -1.28 -0.69 0.6
Synj2 3.98 3.87 1.88 2.73 -1.08 -0.5 0.6
Sorl1 7.44 6.67 3.45 4.62 -1.11 -0.53 0.6
Rtn4ip1 6.46 5.56 2.86 3.69 -1.17 -0.59 0.6
Nfib 3.62 1.74 1.55 1.11 -1.22 -0.64 0.6
Isyna1 73.82 53.3 31.08 33.51 -1.25 -0.67 0.6
G3bp2 162.39 118.91 66.73 73.35 -1.28 -0.7 0.6
Amt 41.32 34.01 18.75 22.89 -1.14 -0.57 0.6
Ehmt2 83.96 57.75 36.69 37.67 -1.19 -0.62 0.6
Arhgap44 3.01 2.42 1.3 1.55 -1.21 -0.64 0.6
Rab15 9.17 5.01 3.42 2.77 -1.42 -0.85 0.6
Abhd3 1.66 1.05 0.61 0.57 -1.45 -0.89 0.6
Gbe1 9.18 5.38 4.25 3.65 -1.11 -0.56 0.6
Clip4 4.09 3.98 1.62 2.3 -1.34 -0.79 0.6
Igsf9 13.87 11.95 5.47 6.93 -1.34 -0.79 0.6
Fam222a 1.25 1.05 0.48 0.59 -1.37 -0.82 0.6
Cib1 25.83 22.96 9.82 12.76 -1.4 -0.85 0.6
Frem2 9.7 10.16 4.78 7.3 -1.02 -0.48 0.5
B4galt4 4.12 2.09 1.85 1.37 -1.15 -0.61 0.5
Pitpnc1 24.31 16.92 9.68 9.79 -1.33 -0.79 0.5
AI464131 2.35 2.92 0.91 1.65 -1.36 -0.82 0.5
Sec24a 10.34 9.4 5.32 6.96 -0.96 -0.43 0.5
Aktip 16.69 18.52 8.39 13.44 -0.99 -0.46 0.5
Znfx1 7.51 10.62 3.48 7.09 -1.11 -0.58 0.5
Gsap 2.42 1.39 1 0.83 -1.27 -0.74 0.5
Dtx3l 10.13 9.93 3.98 5.58 -1.35 -0.83 0.5

204
Sp1-/- ESC – Flk1+ cells Cluster 10: not upregulated in mutant
Gene ES WT FPKM
ES Sp1-/- FPKM
Flk1+ WT FPKM
Flk1+ Sp1-
/- FPKM WT ES/Flk log2 FC
Sp1-/- ES/Flk log2 FC
WT FC/Sp1-/- FC
Celsr3 2.01 2.18 0.73 1.14 -1.46 -0.94 0.5
Slc31a2 8.48 8.02 3.63 4.86 -1.23 -0.72 0.5
Lig4 6.43 5.23 2.68 3.08 -1.27 -0.76 0.5
Cfap74 3.55 2.97 1.41 1.67 -1.34 -0.83 0.5
Sp1-/- ESC – Flk1+ cells Cluster 11: less upregulated in mutant
Gene ES WT FPKM
ES Sp1-/- FPKM
Flk1+ WT FPKM
Flk1+ Sp1-
/- FPKM
WT ES/Flk log2 FC
Sp1-/- ES/Flk log2 FC
WT FC/Sp1-/- FC
Cdh11 0.65 3.9 111.21 78.93 7.41 4.34 -3.1
Smad6 1.35 5.96 25.65 14.92 4.25 1.33 -2.9
Grrp1 0.13 0.44 24.21 13.78 7.55 4.96 -2.6
Pdlim4 0.8 2.3 28.44 15.29 5.16 2.73 -2.4
Ifi27l2a 0.1 0.28 6.56 3.75 6.04 3.72 -2.3
Tmem176a 0.1 0.32 13.77 9.95 7.11 4.94 -2.2
Angptl2 0.44 1.56 6.13 4.93 3.81 1.66 -2.2
Col4a5 0.36 1.23 3.11 2.46 3.12 1 -2.1
Ifi27 0.14 0.94 3.54 5.81 4.63 2.63 -2.0
Stard8 3.11 9.45 32.9 25.41 3.4 1.43 -2.0
Ism2 0.27 0.68 2.53 1.73 3.26 1.35 -1.9
Cd59a 0.7 1.23 8.58 4.07 3.61 1.73 -1.9
Lbh 0.38 1.78 3.08 4.13 3.04 1.22 -1.8
Nrp1 0.76 2.13 77.77 63.75 6.68 4.9 -1.8
Rgs4 0.11 0.53 3.66 5.42 5.08 3.36 -1.7
Hoxb2 0.1 0.23 5.47 3.88 5.77 4.05 -1.7
Dkk1 0.13 0.23 29.64 15.67 7.81 6.1 -1.7
Fabp7 0.27 0.57 2.94 1.95 3.46 1.77 -1.7
Sema3a 0.24 0.85 12.54 13.8 5.69 4.03 -1.7
Msgn1 0.1 0.1 17.05 5.49 7.41 5.78 -1.6
Efnb3 0.9 2.14 15.83 12.16 4.13 2.51 -1.6
Alx3 0.1 0.18 2.62 1.5 4.71 3.09 -1.6
Pcdh18 0.39 0.95 31.26 25.18 6.34 4.72 -1.6
Pcdh7 0.41 0.99 73.99 60.15 7.51 5.92 -1.6
Pygl 0.35 0.29 3.92 1.09 3.47 1.92 -1.6
Efna1 1.29 2 12.2 6.5 3.24 1.7 -1.5
Isg15 0.32 0.53 1.86 1.07 2.52 1.01 -1.5
Dapk2 0.66 1.46 7.35 5.75 3.47 1.98 -1.5
St3gal6 0.52 0.76 13.26 6.9 4.67 3.18 -1.5
Foxf1 0.14 0.17 17.58 7.61 6.94 5.45 -1.5
Ackr3 2.79 4.5 26.01 15.04 3.22 1.74 -1.5
Lhfp 0.78 2.83 11.74 15.44 3.91 2.45 -1.5
Jdp2 0.6 0.95 3.73 2.16 2.63 1.19 -1.4
Slc39a8 1.35 3.11 14.26 12.07 3.4 1.96 -1.4
Zfp703 0.22 0.29 10.6 5.09 5.57 4.16 -1.4
Six2 0.12 0.18 7.07 4.09 5.89 4.48 -1.4
Wnt5a 0.63 1.31 37.98 29.84 5.9 4.51 -1.4
Atp2b4 0.54 2.09 3.3 4.89 2.61 1.23 -1.4
Amhr2 1.71 1.91 13.46 5.82 2.97 1.61 -1.4
Gjb2 0.22 0.25 5.22 2.32 4.59 3.24 -1.4
Zfp516 3.04 6.11 32.47 25.79 3.42 2.08 -1.3
Daam2 0.1 0.15 4.69 2.7 5.55 4.22 -1.3
Msx2 0.56 0.88 53.33 33.75 6.58 5.26 -1.3
Greb1l 3.25 8.69 23.1 25.17 2.83 1.53 -1.3
Ifngr2 1.81 2.79 17.73 11.08 3.29 1.99 -1.3
Sat2 0.37 0.84 2.3 2.15 2.64 1.35 -1.3
Tbx6 0.2 0.19 5.96 2.33 4.89 3.62 -1.3
Letmd1 1.55 3.47 7.44 6.93 2.26 1 -1.3
Cyp26a1 0.8 1.65 215.35 185.47 8.06 6.81 -1.3
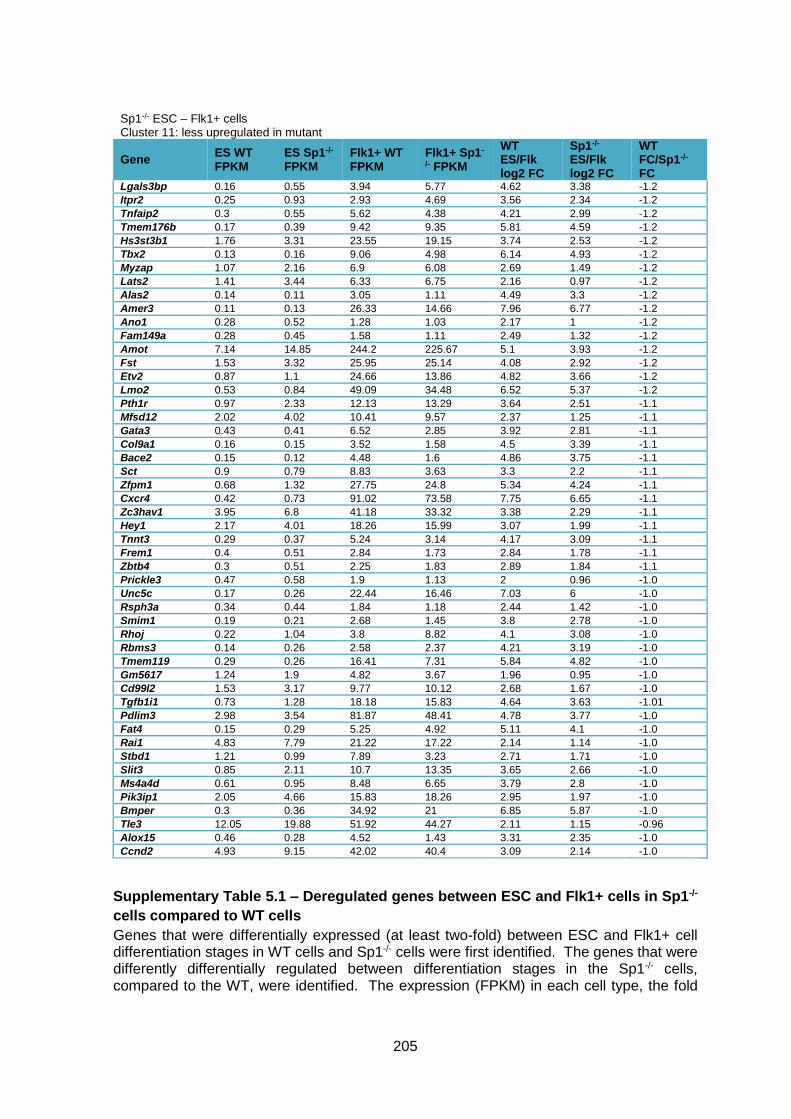
205
Sp1-/- ESC – Flk1+ cells Cluster 11: less upregulated in mutant
Gene ES WT FPKM
ES Sp1-/- FPKM
Flk1+ WT FPKM
Flk1+ Sp1-
/- FPKM
WT ES/Flk log2 FC
Sp1-/- ES/Flk log2 FC
WT FC/Sp1-/- FC
Lgals3bp 0.16 0.55 3.94 5.77 4.62 3.38 -1.2
Itpr2 0.25 0.93 2.93 4.69 3.56 2.34 -1.2
Tnfaip2 0.3 0.55 5.62 4.38 4.21 2.99 -1.2
Tmem176b 0.17 0.39 9.42 9.35 5.81 4.59 -1.2
Hs3st3b1 1.76 3.31 23.55 19.15 3.74 2.53 -1.2
Tbx2 0.13 0.16 9.06 4.98 6.14 4.93 -1.2
Myzap 1.07 2.16 6.9 6.08 2.69 1.49 -1.2
Lats2 1.41 3.44 6.33 6.75 2.16 0.97 -1.2
Alas2 0.14 0.11 3.05 1.11 4.49 3.3 -1.2
Amer3 0.11 0.13 26.33 14.66 7.96 6.77 -1.2
Ano1 0.28 0.52 1.28 1.03 2.17 1 -1.2
Fam149a 0.28 0.45 1.58 1.11 2.49 1.32 -1.2
Amot 7.14 14.85 244.2 225.67 5.1 3.93 -1.2
Fst 1.53 3.32 25.95 25.14 4.08 2.92 -1.2
Etv2 0.87 1.1 24.66 13.86 4.82 3.66 -1.2
Lmo2 0.53 0.84 49.09 34.48 6.52 5.37 -1.2
Pth1r 0.97 2.33 12.13 13.29 3.64 2.51 -1.1
Mfsd12 2.02 4.02 10.41 9.57 2.37 1.25 -1.1
Gata3 0.43 0.41 6.52 2.85 3.92 2.81 -1.1
Col9a1 0.16 0.15 3.52 1.58 4.5 3.39 -1.1
Bace2 0.15 0.12 4.48 1.6 4.86 3.75 -1.1
Sct 0.9 0.79 8.83 3.63 3.3 2.2 -1.1
Zfpm1 0.68 1.32 27.75 24.8 5.34 4.24 -1.1
Cxcr4 0.42 0.73 91.02 73.58 7.75 6.65 -1.1
Zc3hav1 3.95 6.8 41.18 33.32 3.38 2.29 -1.1
Hey1 2.17 4.01 18.26 15.99 3.07 1.99 -1.1
Tnnt3 0.29 0.37 5.24 3.14 4.17 3.09 -1.1
Frem1 0.4 0.51 2.84 1.73 2.84 1.78 -1.1
Zbtb4 0.3 0.51 2.25 1.83 2.89 1.84 -1.1
Prickle3 0.47 0.58 1.9 1.13 2 0.96 -1.0
Unc5c 0.17 0.26 22.44 16.46 7.03 6 -1.0
Rsph3a 0.34 0.44 1.84 1.18 2.44 1.42 -1.0
Smim1 0.19 0.21 2.68 1.45 3.8 2.78 -1.0
Rhoj 0.22 1.04 3.8 8.82 4.1 3.08 -1.0
Rbms3 0.14 0.26 2.58 2.37 4.21 3.19 -1.0
Tmem119 0.29 0.26 16.41 7.31 5.84 4.82 -1.0
Gm5617 1.24 1.9 4.82 3.67 1.96 0.95 -1.0
Cd99l2 1.53 3.17 9.77 10.12 2.68 1.67 -1.0
Tgfb1i1 0.73 1.28 18.18 15.83 4.64 3.63 -1.01
Pdlim3 2.98 3.54 81.87 48.41 4.78 3.77 -1.0
Fat4 0.15 0.29 5.25 4.92 5.11 4.1 -1.0
Rai1 4.83 7.79 21.22 17.22 2.14 1.14 -1.0
Stbd1 1.21 0.99 7.89 3.23 2.71 1.71 -1.0
Slit3 0.85 2.11 10.7 13.35 3.65 2.66 -1.0
Ms4a4d 0.61 0.95 8.48 6.65 3.79 2.8 -1.0
Pik3ip1 2.05 4.66 15.83 18.26 2.95 1.97 -1.0
Bmper 0.3 0.36 34.92 21 6.85 5.87 -1.0
Tle3 12.05 19.88 51.92 44.27 2.11 1.15 -0.96
Alox15 0.46 0.28 4.52 1.43 3.31 2.35 -1.0
Ccnd2 4.93 9.15 42.02 40.4 3.09 2.14 -1.0
Supplementary Table 5.1 – Deregulated genes between ESC and Flk1+ cells in Sp1-/-
cells compared to WT cells
Genes that were differentially expressed (at least two-fold) between ESC and Flk1+ cell differentiation stages in WT cells and Sp1-/- cells were first identified. The genes that were differently differentially regulated between differentiation stages in the Sp1-/- cells, compared to the WT, were identified. The expression (FPKM) in each cell type, the fold

206
change (log2 value) between the stages in each cell clone, and the FC between these values in Sp1del/del compared to WT is shown. The genes were grouped into clusters based on how the gene expression is altered upon loss of Sp1.
Supplementary Table 5.2
Sp1del/del ESC – Flk1+ cells Cluster 2: less downregulated in mutant
Gene ES WT FPKM
ES Sp1del/del FPKM
Flk1+ WT FPKM
Flk1+ Sp1del/del FPKM
WT ES/Flk log2 FC
Sp1del/del ES/Flk log2 FC
WT FC/Sp1del/del FC
Trap1a 56.59 72.82 0.7 16.75 -6.34 -2.12 4.2
Anxa1 28.43 19.74 0.43 2.66 -6.06 -2.89 3.2
Laptm5 16.93 10.11 0.57 1.95 -4.88 -2.38 2.5
Pde2a 9.61 2.78 0.65 0.91 -3.88 -1.61 2.3
Rnf17 11.87 11.62 1.15 5.32 -3.37 -1.13 2.2
Hopx 13.07 2.32 0.38 0.31 -5.11 -2.89 2.2
Tex11 3.18 6.07 0.15 1.26 -4.43 -2.26 2.2
Mroh6 8.84 1.71 0.2 0.16 -5.47 -3.39 2.1
Crmp1 23.15 8.72 1.99 2.96 -3.54 -1.56 2.0
Sned1 8.12 1.82 0.39 0.34 -4.37 -2.44 1.9
Serpini1 8.08 7.02 0.32 1.01 -4.64 -2.8 1.8
Soga3 10.82 2.39 1.23 0.97 -3.14 -1.3 1.8
Nkx6-3 3.98 1.47 0.1 0.13 -5.32 -3.49 1.8
Akr1b8 18.61 12.6 0.87 2.09 -4.42 -2.59 1.8
Pla2g7 8.2 3.49 0.72 1.03 -3.52 -1.77 1.8
Scrn1 7.34 3.27 0.2 0.3 -5.2 -3.46 1.7
Zfp936 50.5 25.6 0.42 0.7 -6.9 -5.19 1.7
3830417A13Rik 3.07 1.44 0.19 0.28 -4.03 -2.35 1.7
Pde9a 3.5 1.22 0.49 0.54 -2.83 -1.17 1.7
E2f2 9.24 4.55 1.16 1.8 -2.99 -1.34 1.7
Ddx4 10.94 15.71 0.54 2.41 -4.34 -2.7 1.6
Gm13242 34.06 11.41 0.31 0.31 -6.8 -5.18 1.6
Syt13 2.58 1.04 0.3 0.37 -3.1 -1.49 1.6
Mfng 4.74 1.77 0.24 0.27 -4.3 -2.7 1.6
Hap1 15.21 9.67 0.42 0.8 -5.18 -3.6 1.6
Vat1l 3.69 1.69 0.32 0.43 -3.53 -1.97 1.6
EU599041 34.36 30.91 1.03 2.67 -5.06 -3.53 1.5
Samd12 1.91 1.83 0.17 0.47 -3.49 -1.96 1.5
Stmn3 5.14 1.6 0.83 0.74 -2.64 -1.12 1.5
Slco4a1 3.13 1.46 0.16 0.22 -4.25 -2.75 1.5
Zfp709 3.62 2.1 0.66 1.08 -2.45 -0.95 1.5
Dock3 2.9 1.51 0.42 0.6 -2.8 -1.32 1.5
Rhox6 14.14 29.28 0.23 1.33 -5.93 -4.47 1.5
Coro1a 7.61 5.61 0.9 1.81 -3.09 -1.63 1.5
Cd37 4.6 2.32 0.16 0.21 -4.89 -3.46 1.4
Tex19.1 23.63 86.72 0.39 3.87 -5.9 -4.48 1.4
Adgrv1 4.75 3.05 0.17 0.29 -4.78 -3.37 1.4
Ppl 5.5 1.68 0.21 0.17 -4.72 -3.32 1.4
Fam129a 20.7 4.83 0.33 0.2 -5.98 -4.63 1.4
Palm3 17.15 18.03 0.61 1.63 -4.82 -3.47 1.4
Stk31 4.77 7.17 0.18 0.7 -4.7 -3.35 1.4
Epas1 28.76 13.86 0.97 1.18 -4.9 -3.56 1.3
Rex2 13.64 4.06 0.22 0.17 -5.94 -4.61 1.3
Pdzd2 9.09 3.67 0.25 0.25 -5.17 -3.86 1.3
Zfp534 41.88 17.89 1.72 1.81 -4.61 -3.31 1.3
Fam19a4 3.92 1.34 0.22 0.18 -4.17 -2.89 1.3
Cdkn2a 2.2 2 0.32 0.71 -2.78 -1.5 1.3
Tcte2 2.88 1.72 0.59 0.85 -2.29 -1.02 1.3
Jam2 26.77 12.12 0.46 0.5 -5.87 -4.61 1.3
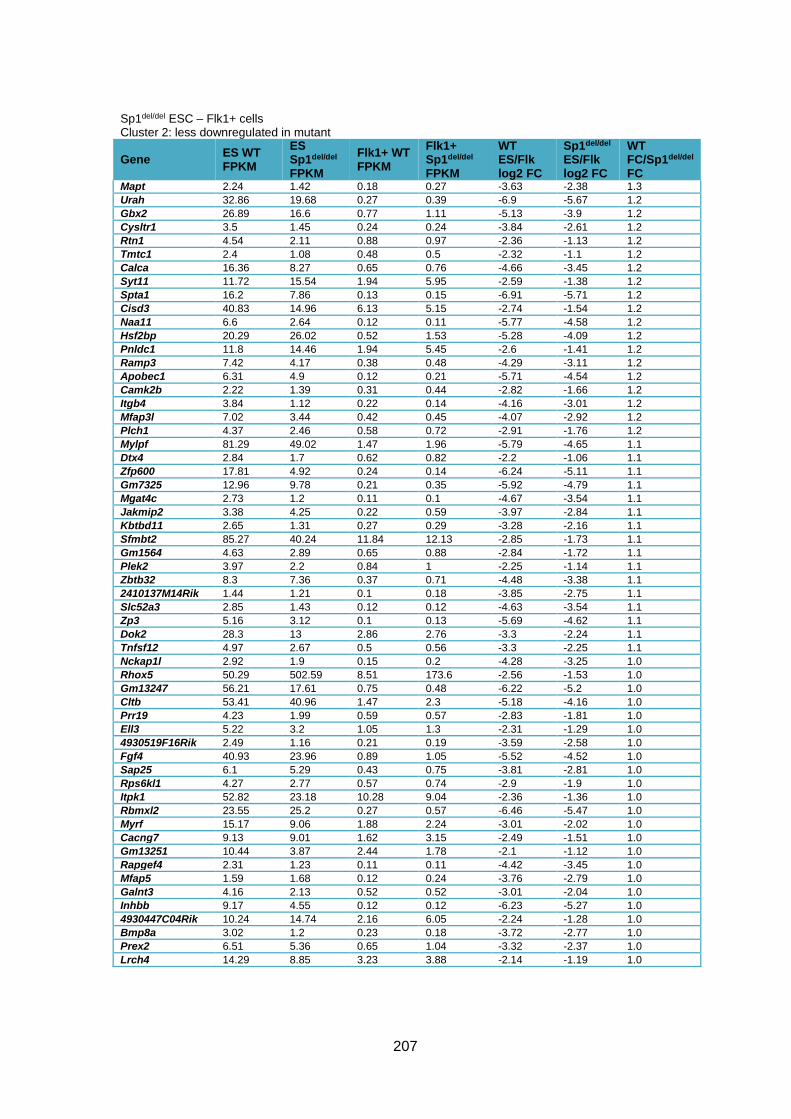
207
Sp1del/del ESC – Flk1+ cells Cluster 2: less downregulated in mutant
Gene ES WT FPKM
ES Sp1del/del FPKM
Flk1+ WT FPKM
Flk1+ Sp1del/del FPKM
WT ES/Flk log2 FC
Sp1del/del ES/Flk log2 FC
WT FC/Sp1del/del FC
Mapt 2.24 1.42 0.18 0.27 -3.63 -2.38 1.3
Urah 32.86 19.68 0.27 0.39 -6.9 -5.67 1.2
Gbx2 26.89 16.6 0.77 1.11 -5.13 -3.9 1.2
Cysltr1 3.5 1.45 0.24 0.24 -3.84 -2.61 1.2
Rtn1 4.54 2.11 0.88 0.97 -2.36 -1.13 1.2
Tmtc1 2.4 1.08 0.48 0.5 -2.32 -1.1 1.2
Calca 16.36 8.27 0.65 0.76 -4.66 -3.45 1.2
Syt11 11.72 15.54 1.94 5.95 -2.59 -1.38 1.2
Spta1 16.2 7.86 0.13 0.15 -6.91 -5.71 1.2
Cisd3 40.83 14.96 6.13 5.15 -2.74 -1.54 1.2
Naa11 6.6 2.64 0.12 0.11 -5.77 -4.58 1.2
Hsf2bp 20.29 26.02 0.52 1.53 -5.28 -4.09 1.2
Pnldc1 11.8 14.46 1.94 5.45 -2.6 -1.41 1.2
Ramp3 7.42 4.17 0.38 0.48 -4.29 -3.11 1.2
Apobec1 6.31 4.9 0.12 0.21 -5.71 -4.54 1.2
Camk2b 2.22 1.39 0.31 0.44 -2.82 -1.66 1.2
Itgb4 3.84 1.12 0.22 0.14 -4.16 -3.01 1.2
Mfap3l 7.02 3.44 0.42 0.45 -4.07 -2.92 1.2
Plch1 4.37 2.46 0.58 0.72 -2.91 -1.76 1.2
Mylpf 81.29 49.02 1.47 1.96 -5.79 -4.65 1.1
Dtx4 2.84 1.7 0.62 0.82 -2.2 -1.06 1.1
Zfp600 17.81 4.92 0.24 0.14 -6.24 -5.11 1.1
Gm7325 12.96 9.78 0.21 0.35 -5.92 -4.79 1.1
Mgat4c 2.73 1.2 0.11 0.1 -4.67 -3.54 1.1
Jakmip2 3.38 4.25 0.22 0.59 -3.97 -2.84 1.1
Kbtbd11 2.65 1.31 0.27 0.29 -3.28 -2.16 1.1
Sfmbt2 85.27 40.24 11.84 12.13 -2.85 -1.73 1.1
Gm1564 4.63 2.89 0.65 0.88 -2.84 -1.72 1.1
Plek2 3.97 2.2 0.84 1 -2.25 -1.14 1.1
Zbtb32 8.3 7.36 0.37 0.71 -4.48 -3.38 1.1
2410137M14Rik 1.44 1.21 0.1 0.18 -3.85 -2.75 1.1
Slc52a3 2.85 1.43 0.12 0.12 -4.63 -3.54 1.1
Zp3 5.16 3.12 0.1 0.13 -5.69 -4.62 1.1
Dok2 28.3 13 2.86 2.76 -3.3 -2.24 1.1
Tnfsf12 4.97 2.67 0.5 0.56 -3.3 -2.25 1.1
Nckap1l 2.92 1.9 0.15 0.2 -4.28 -3.25 1.0
Rhox5 50.29 502.59 8.51 173.6 -2.56 -1.53 1.0
Gm13247 56.21 17.61 0.75 0.48 -6.22 -5.2 1.0
Cltb 53.41 40.96 1.47 2.3 -5.18 -4.16 1.0
Prr19 4.23 1.99 0.59 0.57 -2.83 -1.81 1.0
Ell3 5.22 3.2 1.05 1.3 -2.31 -1.29 1.0
4930519F16Rik 2.49 1.16 0.21 0.19 -3.59 -2.58 1.0
Fgf4 40.93 23.96 0.89 1.05 -5.52 -4.52 1.0
Sap25 6.1 5.29 0.43 0.75 -3.81 -2.81 1.0
Rps6kl1 4.27 2.77 0.57 0.74 -2.9 -1.9 1.0
Itpk1 52.82 23.18 10.28 9.04 -2.36 -1.36 1.0
Rbmxl2 23.55 25.2 0.27 0.57 -6.46 -5.47 1.0
Myrf 15.17 9.06 1.88 2.24 -3.01 -2.02 1.0
Cacng7 9.13 9.01 1.62 3.15 -2.49 -1.51 1.0
Gm13251 10.44 3.87 2.44 1.78 -2.1 -1.12 1.0
Rapgef4 2.31 1.23 0.11 0.11 -4.42 -3.45 1.0
Mfap5 1.59 1.68 0.12 0.24 -3.76 -2.79 1.0
Galnt3 4.16 2.13 0.52 0.52 -3.01 -2.04 1.0
Inhbb 9.17 4.55 0.12 0.12 -6.23 -5.27 1.0
4930447C04Rik 10.24 14.74 2.16 6.05 -2.24 -1.28 1.0
Bmp8a 3.02 1.2 0.23 0.18 -3.72 -2.77 1.0
Prex2 6.51 5.36 0.65 1.04 -3.32 -2.37 1.0
Lrch4 14.29 8.85 3.23 3.88 -2.14 -1.19 1.0

208
Sp1del/del ESC – Flk1+ cells Cluster 3: not downregulated in mutant
Gene ES WT FPKM
ES Sp1del/del FPKM
Flk1+ WT FPKM
Flk1+ Sp1del/del FPKM
WT ES/Flk log2 FC
Sp1del/del ES/Flk log2 FC
WT FC/Sp1del/del FC
Cdkn1c 108.1 21.45 17.23 22.03 -2.65 0.04 2.7
Cntfr 7.52 1.81 1.29 1.73 -2.54 -0.06 2.5
Dysf 5.74 1.14 1.96 1.8 -1.55 0.66 2.2
Slc29a4 3.36 1.63 0.94 1.64 -1.84 0 1.8
Aim2 11.99 13.33 1.8 7.02 -2.73 -0.92 1.8
Fmr1nb 5.1 9.09 1.14 6.72 -2.16 -0.44 1.7
Tnfsfm13 3.84 1.41 0.96 1.14 -2 -0.31 1.7
Rec8 4.02 2.15 0.69 1.16 -2.54 -0.89 1.7
Sdr39u1 1.45 1.1 0.59 1.4 -1.29 0.34 1.6
Acap1 3.2 1 1.57 1.46 -1.03 0.55 1.6
Slitrk5 4.48 2.64 1.34 2.34 -1.75 -0.18 1.6
Dnah8 7.62 1.28 1.69 0.83 -2.17 -0.63 1.5
Ulbp1 3.29 4.89 1.49 6.43 -1.14 0.4 1.5
Lfng 8.53 5.59 3.48 6.49 -1.29 0.21 1.5
Btg3 5.43 4.16 1.51 3.26 -1.84 -0.35 1.5
Gbe1 9.18 3.17 4.25 4.07 -1.11 0.36 1.5
Dab1 19.55 6.88 6.32 5.97 -1.63 -0.2 1.4
Fmn2 2.94 1.28 0.72 0.83 -2.02 -0.62 1.4
Nfib 3.62 1.15 1.55 1.3 -1.22 0.18 1.4
Uchl4 1.99 1.02 0.71 0.94 -1.5 -0.11 1.4
Map4k2 3.94 2.75 1.91 3.25 -1.05 0.24 1.3
Pik3r3 3.35 2.56 0.93 1.71 -1.84 -0.58 1.3
Inpp1 8.06 3.04 2.18 1.95 -1.88 -0.64 1.2
Rasl11a 6.7 4.19 3.19 4.69 -1.07 0.16 1.2
Nefm 1.18 1.05 0.29 0.61 -2.01 -0.79 1.2
Nudt12 6.24 2.89 2.73 2.95 -1.19 0.03 1.2
Prkcb 1.58 1.17 0.69 1.19 -1.18 0.02 1.2
Necab3 1.98 1.57 0.5 0.9 -1.98 -0.81 1.2
5730507C01Rik 3.1 2.37 1.19 2 -1.37 -0.24 1.1
Zfp423 28.8 19.07 9.6 13.69 -1.59 -0.48 1.1
Kif5c 11.26 11.02 5.11 10.64 -1.14 -0.05 1.1
Sepp1 19.75 20.37 9.88 21.57 -1 0.08 1.1
Pkp2 21.92 12.69 5.92 7.19 -1.89 -0.82 1.1
Fbxo17 3.46 1.82 1.41 1.56 -1.29 -0.22 1.1
Epha1 13.13 6.74 5.5 5.92 -1.26 -0.19 1.1
Ptrf 15.52 7.5 6.23 6.26 -1.32 -0.26 1.1
Isyna1 73.82 40.4 31.08 35.52 -1.25 -0.19 1.1
Cacna2d1 3.93 1.58 1.49 1.24 -1.4 -0.35 1.1
Fam111a 23.82 10.69 11.34 10.53 -1.07 -0.02 1.1
Lyn 3.47 1.63 1.67 1.61 -1.06 -0.01 1.1
Ankrd33b 2.52 1.14 1.11 1.03 -1.18 -0.14 1.0
Fam198b 4.04 5.75 1.08 3.15 -1.9 -0.87 1.0
Nes 22.25 10.84 8.98 8.91 -1.31 -0.28 1.0
E130309D14Rik 4.11 1.07 1.71 0.91 -1.26 -0.23 1.0
Afap1l1 3.29 2.27 1.71 2.35 -0.95 0.05 1.0
Gabrb3 3.09 1.97 1.59 2.01 -0.96 0.03 1.0
Slc6a8 24.2 14.47 11.54 13.28 -1.07 -0.12 1.0
Pias3 7.45 5.51 3.43 4.87 -1.12 -0.18 0.9
Rab3d 2.51 1.65 0.81 1.02 -1.63 -0.7 0.9
Lekr1 1.21 1.18 0.44 0.8 -1.47 -0.55 0.9
Cnp 9.35 5.38 4.8 5.25 -0.96 -0.04 0.9
Neto2 5.33 3.72 1.51 1.95 -1.82 -0.93 0.9
Pitpnc1 24.31 13.81 9.68 10.22 -1.33 -0.44 0.9
Map1a 5.95 4.49 2.83 3.96 -1.07 -0.18 0.9
Rfng 8.86 6.83 3.53 4.95 -1.33 -0.46 0.9
Tram2 4.44 3.21 2.05 2.71 -1.12 -0.25 0.9
2810474O19Rik 83.07 53.62 25.94 30.43 -1.68 -0.82 0.9
Capn1 11.52 5.9 5.38 5 -1.1 -0.24 0.9
Lmbr1 3.78 3.45 1.91 3.16 -0.99 -0.13 0.9
Bik 1.73 1.08 0.61 0.68 -1.5 -0.66 0.8
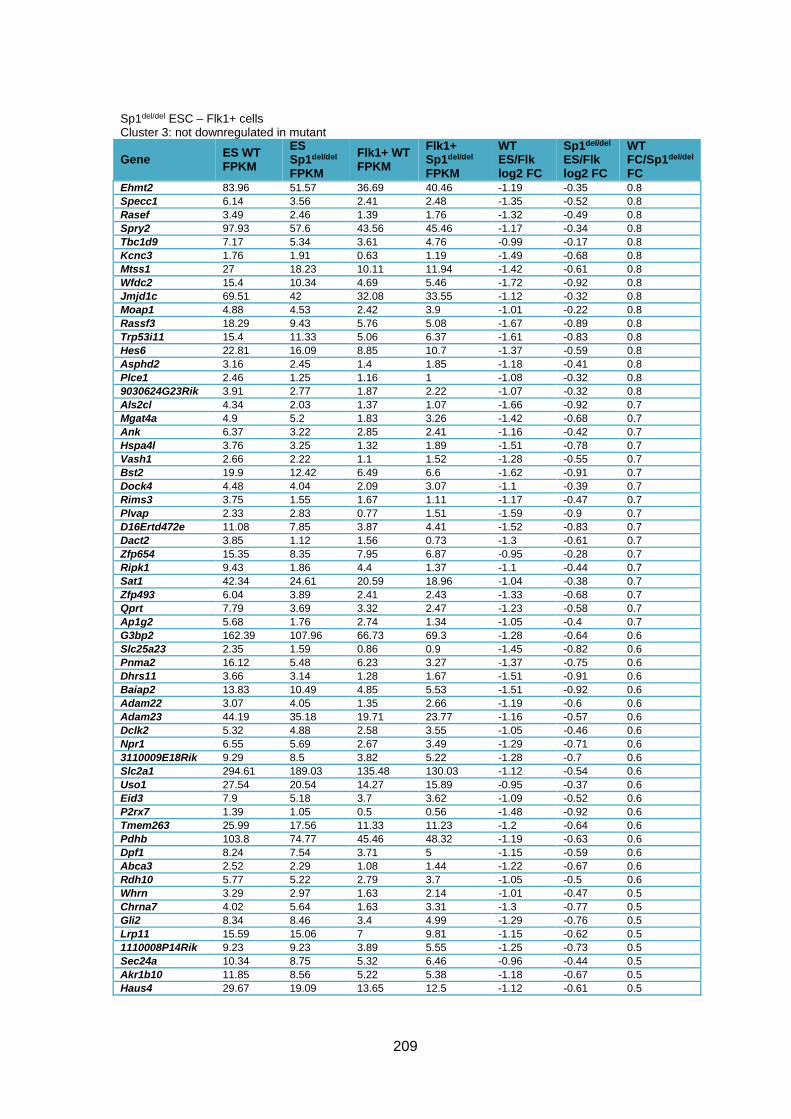
209
Sp1del/del ESC – Flk1+ cells Cluster 3: not downregulated in mutant
Gene ES WT FPKM
ES Sp1del/del FPKM
Flk1+ WT FPKM
Flk1+ Sp1del/del FPKM
WT ES/Flk log2 FC
Sp1del/del ES/Flk log2 FC
WT FC/Sp1del/del FC
Ehmt2 83.96 51.57 36.69 40.46 -1.19 -0.35 0.8
Specc1 6.14 3.56 2.41 2.48 -1.35 -0.52 0.8
Rasef 3.49 2.46 1.39 1.76 -1.32 -0.49 0.8
Spry2 97.93 57.6 43.56 45.46 -1.17 -0.34 0.8
Tbc1d9 7.17 5.34 3.61 4.76 -0.99 -0.17 0.8
Kcnc3 1.76 1.91 0.63 1.19 -1.49 -0.68 0.8
Mtss1 27 18.23 10.11 11.94 -1.42 -0.61 0.8
Wfdc2 15.4 10.34 4.69 5.46 -1.72 -0.92 0.8
Jmjd1c 69.51 42 32.08 33.55 -1.12 -0.32 0.8
Moap1 4.88 4.53 2.42 3.9 -1.01 -0.22 0.8
Rassf3 18.29 9.43 5.76 5.08 -1.67 -0.89 0.8
Trp53i11 15.4 11.33 5.06 6.37 -1.61 -0.83 0.8
Hes6 22.81 16.09 8.85 10.7 -1.37 -0.59 0.8
Asphd2 3.16 2.45 1.4 1.85 -1.18 -0.41 0.8
Plce1 2.46 1.25 1.16 1 -1.08 -0.32 0.8
9030624G23Rik 3.91 2.77 1.87 2.22 -1.07 -0.32 0.8
Als2cl 4.34 2.03 1.37 1.07 -1.66 -0.92 0.7
Mgat4a 4.9 5.2 1.83 3.26 -1.42 -0.68 0.7
Ank 6.37 3.22 2.85 2.41 -1.16 -0.42 0.7
Hspa4l 3.76 3.25 1.32 1.89 -1.51 -0.78 0.7
Vash1 2.66 2.22 1.1 1.52 -1.28 -0.55 0.7
Bst2 19.9 12.42 6.49 6.6 -1.62 -0.91 0.7
Dock4 4.48 4.04 2.09 3.07 -1.1 -0.39 0.7
Rims3 3.75 1.55 1.67 1.11 -1.17 -0.47 0.7
Plvap 2.33 2.83 0.77 1.51 -1.59 -0.9 0.7
D16Ertd472e 11.08 7.85 3.87 4.41 -1.52 -0.83 0.7
Dact2 3.85 1.12 1.56 0.73 -1.3 -0.61 0.7
Zfp654 15.35 8.35 7.95 6.87 -0.95 -0.28 0.7
Ripk1 9.43 1.86 4.4 1.37 -1.1 -0.44 0.7
Sat1 42.34 24.61 20.59 18.96 -1.04 -0.38 0.7
Zfp493 6.04 3.89 2.41 2.43 -1.33 -0.68 0.7
Qprt 7.79 3.69 3.32 2.47 -1.23 -0.58 0.7
Ap1g2 5.68 1.76 2.74 1.34 -1.05 -0.4 0.7
G3bp2 162.39 107.96 66.73 69.3 -1.28 -0.64 0.6
Slc25a23 2.35 1.59 0.86 0.9 -1.45 -0.82 0.6
Pnma2 16.12 5.48 6.23 3.27 -1.37 -0.75 0.6
Dhrs11 3.66 3.14 1.28 1.67 -1.51 -0.91 0.6
Baiap2 13.83 10.49 4.85 5.53 -1.51 -0.92 0.6
Adam22 3.07 4.05 1.35 2.66 -1.19 -0.6 0.6
Adam23 44.19 35.18 19.71 23.77 -1.16 -0.57 0.6
Dclk2 5.32 4.88 2.58 3.55 -1.05 -0.46 0.6
Npr1 6.55 5.69 2.67 3.49 -1.29 -0.71 0.6
3110009E18Rik 9.29 8.5 3.82 5.22 -1.28 -0.7 0.6
Slc2a1 294.61 189.03 135.48 130.03 -1.12 -0.54 0.6
Uso1 27.54 20.54 14.27 15.89 -0.95 -0.37 0.6
Eid3 7.9 5.18 3.7 3.62 -1.09 -0.52 0.6
P2rx7 1.39 1.05 0.5 0.56 -1.48 -0.92 0.6
Tmem263 25.99 17.56 11.33 11.23 -1.2 -0.64 0.6
Pdhb 103.8 74.77 45.46 48.32 -1.19 -0.63 0.6
Dpf1 8.24 7.54 3.71 5 -1.15 -0.59 0.6
Abca3 2.52 2.29 1.08 1.44 -1.22 -0.67 0.6
Rdh10 5.77 5.22 2.79 3.7 -1.05 -0.5 0.6
Whrn 3.29 2.97 1.63 2.14 -1.01 -0.47 0.5
Chrna7 4.02 5.64 1.63 3.31 -1.3 -0.77 0.5
Gli2 8.34 8.46 3.4 4.99 -1.29 -0.76 0.5
Lrp11 15.59 15.06 7 9.81 -1.15 -0.62 0.5
1110008P14Rik 9.23 9.23 3.89 5.55 -1.25 -0.73 0.5
Sec24a 10.34 8.75 5.32 6.46 -0.96 -0.44 0.5
Akr1b10 11.85 8.56 5.22 5.38 -1.18 -0.67 0.5
Haus4 29.67 19.09 13.65 12.5 -1.12 -0.61 0.5

210
Sp1del/del ESC – Flk1+ cells Cluster 3: not downregulated in mutant
Gene ES WT FPKM
ES Sp1del/del FPKM
Flk1+ WT FPKM
Flk1+ Sp1del/del FPKM
WT ES/Flk log2 FC
Sp1del/del ES/Flk log2 FC
WT FC/Sp1del/del FC
Prune 28.82 22.47 13.07 14.43 -1.14 -0.64 0.5
Gale 17.01 13.58 8.66 9.8 -0.97 -0.47 0.5
Sp1del/del ESC – Flk1+ cells Cluster 4: more downregulated in mutant
Gene ES WT FPKM
ES Sp1del/del FPKM
Flk1+ WT FPKM
Flk1+ Sp1del/del FPKM
WT ES/Flk log2 FC
Sp1del/del ES/Flk log2 FC
WT FC/Sp1del/del FC
Trim47 1.52 9.11 0.38 0.21 -2.01 -5.42 -3.4
1700019A02Rik 2.6 5.14 0.37 0.1 -2.81 -5.68 -2.9
Apoc1 28.06 21.32 5.68 0.64 -2.31 -5.05 -2.7
Rln3 1.08 3 0.21 0.1 -2.35 -4.91 -2.6
Npw 1.1 1.77 0.51 0.14 -1.1 -3.66 -2.6
Pga5 1 3.47 0.31 0.19 -1.69 -4.2 -2.5
Sigirr 13.12 7.61 1.38 0.15 -3.25 -5.7 -2.5
Rab27a 6.66 18.5 2.39 1.29 -1.48 -3.84 -2.4
Gm6792 8.38 15.69 0.25 0.1 -5.05 -7.29 -2.2
Aldh1b1 1.38 7.97 0.41 0.5 -1.76 -3.99 -2.2
Smox 3.47 10.09 1.35 0.84 -1.37 -3.59 -2.2
Dppa5a 1558.91 686.82 31.85 3.1 -5.61 -7.79 -2.2
Nkx2-9 2.23 7.03 0.14 0.1 -4.03 -6.13 -2.1
A830018L16Rik 1.65 3.25 0.35 0.16 -2.25 -4.32 -2.1
Bcl2l14 1.09 1.7 0.46 0.17 -1.24 -3.31 -2.1
Igfbp7 2.32 4.27 0.22 0.1 -3.42 -5.42 -2.0
Sptbn2 8.14 20.46 0.88 0.56 -3.21 -5.2 -2.0
Rbm47 15.2 31.1 0.95 0.51 -4 -5.93 -1.9
Calcoco2 4.51 17.91 0.16 0.17 -4.82 -6.74 -1.9
Dppa3 11.58 72.22 0.19 0.32 -5.92 -7.83 -1.9
D630023F18Rik 4.19 13.56 0.34 0.29 -3.62 -5.53 -1.9
Snai3 2.24 4.56 0.19 0.11 -3.54 -5.43 -1.9
Esrp1 19.89 31.42 2.45 1.05 -3.02 -4.9 -1.9
Il17b 1.27 4.59 0.1 0.1 -3.67 -5.52 -1.9
Erbb3 10.1 19.52 1.26 0.69 -3 -4.83 -1.8
Grem1 1.37 2.79 0.24 0.14 -2.54 -4.37 -1.8
Cd1d1 1.6 4.27 0.33 0.25 -2.26 -4.08 -1.8
Raet1a 13.48 12.54 0.95 0.26 -3.82 -5.6 -1.8
Col9a2 3.33 5.56 0.4 0.19 -3.06 -4.84 -1.8
Rnd1 2.48 5.56 0.41 0.27 -2.6 -4.36 -1.8
Prdm1 4.39 12.39 1.2 1 -1.87 -3.63 -1.8
Cpsf4l 13.36 41.04 0.43 0.39 -4.96 -6.71 -1.8
Fabp3 24 43.04 8.17 4.4 -1.56 -3.29 -1.7
Sdc4 22.96 64.05 7.08 6.02 -1.7 -3.41 -1.7
Celf5 1.94 2.68 0.6 0.26 -1.69 -3.36 -1.7
Sohlh2 2.31 5.42 0.17 0.13 -3.74 -5.4 -1.7
Anxa8 2.55 4.57 0.18 0.1 -3.82 -5.46 -1.6
Lypd2 2.17 4.1 0.16 0.1 -3.76 -5.36 -1.6
Ap1m2 29.57 37.29 4.04 1.68 -2.87 -4.47 -1.6
Phldb3 1.17 1.22 0.32 0.11 -1.86 -3.46 -1.6
Tfap2c 13.35 29.59 2.12 1.57 -2.65 -4.23 -1.6
Fcgrt 2.47 4.77 0.24 0.16 -3.37 -4.93 -1.6
Mt1 30.28 22.36 11.38 2.85 -1.41 -2.97 -1.6
Plcxd1 3.71 6.38 0.87 0.51 -2.1 -3.65 -1.6
Klk10 1.51 3.71 0.12 0.1 -3.67 -5.21 -1.5
Gjb1 1.69 4.86 0.1 0.1 -4.08 -5.6 -1.5
Cav1 2.71 4.8 0.41 0.25 -2.74 -4.26 -1.5
Tnk1 3.35 2.87 0.84 0.26 -1.99 -3.48 -1.5
Tmem45a 2.2 1.45 0.57 0.13 -1.96 -3.45 -1.5
1700019D03Rik 28.03 28.7 1.6 0.59 -4.13 -5.61 -1.5
Zfp750 1.39 3.8 0.16 0.16 -3.11 -4.59 -1.5

211
Sp1del/del ESC – Flk1+ cells Cluster 4: more downregulated in mutant
Gene ES WT FPKM
ES Sp1del/del FPKM
Flk1+ WT FPKM
Flk1+ Sp1del/del FPKM
WT ES/Flk log2 FC
Sp1del/del ES/Flk log2 FC
WT FC/Sp1del/del FC
Timp1 29.16 27.56 6.62 2.24 -2.14 -3.62 -1.5
Pdk4 1.95 4.59 0.55 0.46 -1.84 -3.32 -1.5
Sgk1 90.84 196.32 31.03 24.21 -1.55 -3.02 -1.5
Fbxo15 51.7 112.9 0.96 0.76 -5.75 -7.21 -1.5
Lox 1.56 5.47 0.13 0.16 -3.64 -5.1 -1.5
Meox1 1.81 6.29 0.28 0.35 -2.69 -4.15 -1.5
Cdh3 12.78 32.6 1.78 1.68 -2.84 -4.28 -1.4
Cox7a1 19.02 15.88 9.37 2.89 -1.02 -2.46 -1.4
Zfp296 20.9 24.6 1.38 0.6 -3.92 -5.35 -1.4
Calml4 22.1 46.15 0.16 0.13 -7.07 -8.49 -1.4
Gtsf1l 38.07 33.88 0.37 0.12 -6.7 -8.12 -1.4
Tmem30b 2.86 6.3 0.23 0.19 -3.64 -5.06 -1.4
Ceacam1 8.97 8.86 1.97 0.73 -2.19 -3.61 -1.4
Phf19 3.14 5.17 0.9 0.55 -1.81 -3.23 -1.4
Ifitm3 123.18 148.81 63.2 28.73 -0.96 -2.37 -1.4
Spata22 1.26 3.32 0.1 0.1 -3.66 -5.06 -1.4
Gadd45b 7.05 18.38 3.23 3.19 -1.13 -2.53 -1.4
Map7 15.51 22.72 0.89 0.49 -4.13 -5.52 -1.4
Ly6a 1.86 2.48 0.53 0.27 -1.8 -3.19 -1.4
Tjp3 2.45 4.67 0.45 0.32 -2.46 -3.84 -1.4
Sfn 65.84 44.77 3.09 0.81 -4.41 -5.78 -1.4
Cldn4 27.53 40.01 2.07 1.17 -3.73 -5.1 -1.4
Dnajc6 5.43 14.42 0.19 0.2 -4.82 -6.18 -1.4
Mab21l3 1.28 2.08 0.65 0.41 -0.97 -2.33 -1.4
Kctd12b 1.35 5.25 0.31 0.47 -2.14 -3.49 -1.4
Naaa 2.85 4.7 1.04 0.67 -1.45 -2.8 -1.4
Slco4c1 4.23 11.84 0.26 0.28 -4.05 -5.39 -1.3
Cnksr1 2 2.12 0.41 0.17 -2.3 -3.63 -1.3
Ano9 19.43 20.36 0.6 0.25 -5.02 -6.34 -1.3
Atp6v0a4 1.79 3.41 0.14 0.11 -3.7 -5.02 -1.3
Plekha4 1.51 3.84 0.38 0.39 -1.98 -3.3 -1.3
Ephx2 10.01 3.43 4.11 0.57 -1.28 -2.59 -1.3
Klhl13 104.93 223.76 13.17 11.46 -2.99 -4.29 -1.3
Gjb3 24.41 39.06 2.62 1.71 -3.22 -4.51 -1.3
Neurog3 1.66 3.18 0.13 0.1 -3.71 -4.99 -1.3
Prss8 10.79 9.8 3.28 1.23 -1.72 -3 -1.3
Fam110b 5.42 9.1 2 1.38 -1.44 -2.72 -1.3
Gls2 8.07 11.92 3.56 2.18 -1.18 -2.45 -1.3
Cd55 5.91 7.32 3.07 1.57 -0.95 -2.22 -1.3
Tmem102 2.01 2.21 0.71 0.32 -1.51 -2.77 -1.3
Ttyh1 2.24 2.99 1.02 0.57 -1.13 -2.39 -1.3
Tex21 2.79 5.06 0.33 0.25 -3.07 -4.32 -1.3
Nanos3 3.66 9.31 0.47 0.5 -2.97 -4.22 -1.3
Ptgs2 1.82 3.83 0.29 0.25 -2.67 -3.92 -1.3
Nr5a2 16.4 31.38 0.25 0.2 -6.06 -7.3 -1.2
Dpys 2.95 7.09 0.13 0.13 -4.51 -5.75 -1.2
Sult6b1 3.24 6.97 0.3 0.27 -3.43 -4.67 -1.2
Nanog 90.69 180.1 10.59 8.87 -3.1 -4.34 -1.2
Ckb 106.41 237.53 17.4 16.46 -2.61 -3.85 -1.2
Tekt1 1.1 3.2 0.25 0.31 -2.14 -3.38 -1.2
Mok 5.06 11.56 1.91 1.85 -1.41 -2.65 -1.2
1700007K13Rik 13.2 16.64 1.08 0.58 -3.61 -4.84 -1.2
Trp73 1 1.87 0.13 0.1 -2.97 -4.2 -1.2
Pnp2 1.93 2.88 0.45 0.28 -2.11 -3.34 -1.2
Celf4 5.21 6.99 1.23 0.7 -2.09 -3.32 -1.2
Fgfbp1 28.63 82.26 0.4 0.5 -6.15 -7.37 -1.2
Khdc3 5.44 12.75 0.1 0.1 -5.77 -6.99 -1.2
Kcnk5 17.27 23.24 1.75 1.01 -3.3 -4.52 -1.2
Pde1b 8.85 18.64 1.19 1.07 -2.9 -4.12 -1.2
Serping1 4.74 8.13 0.98 0.72 -2.27 -3.49 -1.2
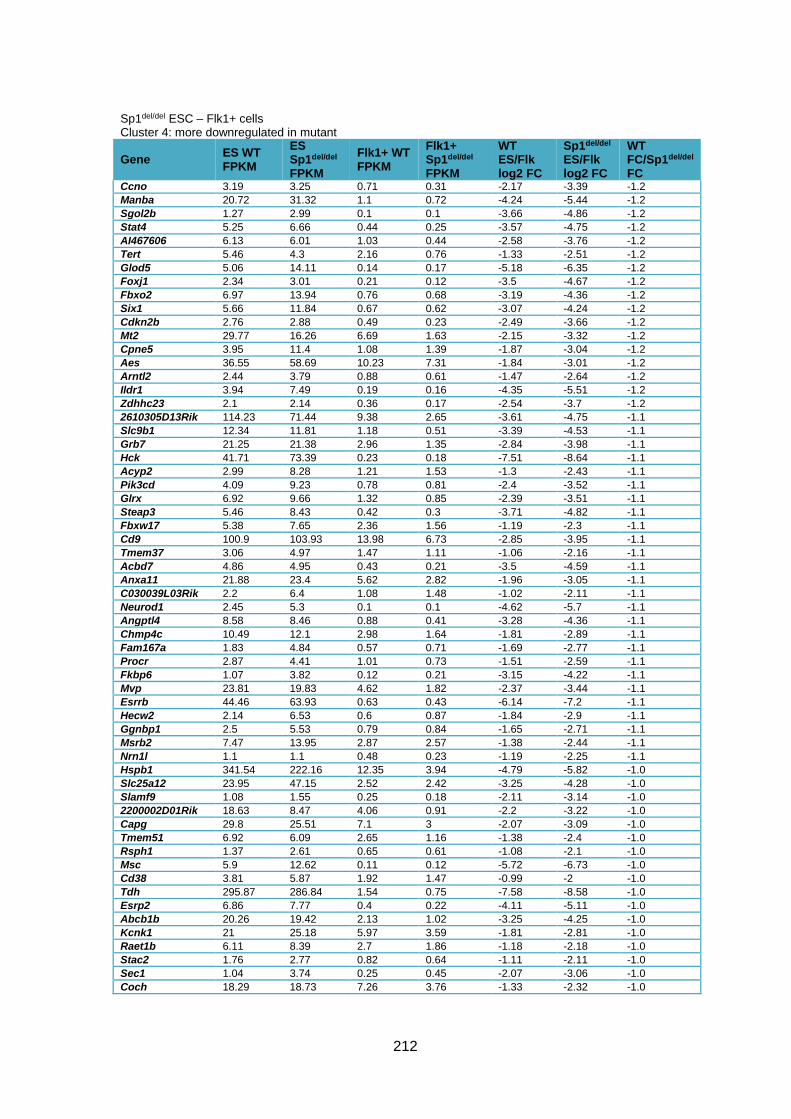
212
Sp1del/del ESC – Flk1+ cells Cluster 4: more downregulated in mutant
Gene ES WT FPKM
ES Sp1del/del FPKM
Flk1+ WT FPKM
Flk1+ Sp1del/del FPKM
WT ES/Flk log2 FC
Sp1del/del ES/Flk log2 FC
WT FC/Sp1del/del FC
Ccno 3.19 3.25 0.71 0.31 -2.17 -3.39 -1.2
Manba 20.72 31.32 1.1 0.72 -4.24 -5.44 -1.2
Sgol2b 1.27 2.99 0.1 0.1 -3.66 -4.86 -1.2
Stat4 5.25 6.66 0.44 0.25 -3.57 -4.75 -1.2
AI467606 6.13 6.01 1.03 0.44 -2.58 -3.76 -1.2
Tert 5.46 4.3 2.16 0.76 -1.33 -2.51 -1.2
Glod5 5.06 14.11 0.14 0.17 -5.18 -6.35 -1.2
Foxj1 2.34 3.01 0.21 0.12 -3.5 -4.67 -1.2
Fbxo2 6.97 13.94 0.76 0.68 -3.19 -4.36 -1.2
Six1 5.66 11.84 0.67 0.62 -3.07 -4.24 -1.2
Cdkn2b 2.76 2.88 0.49 0.23 -2.49 -3.66 -1.2
Mt2 29.77 16.26 6.69 1.63 -2.15 -3.32 -1.2
Cpne5 3.95 11.4 1.08 1.39 -1.87 -3.04 -1.2
Aes 36.55 58.69 10.23 7.31 -1.84 -3.01 -1.2
Arntl2 2.44 3.79 0.88 0.61 -1.47 -2.64 -1.2
Ildr1 3.94 7.49 0.19 0.16 -4.35 -5.51 -1.2
Zdhhc23 2.1 2.14 0.36 0.17 -2.54 -3.7 -1.2
2610305D13Rik 114.23 71.44 9.38 2.65 -3.61 -4.75 -1.1
Slc9b1 12.34 11.81 1.18 0.51 -3.39 -4.53 -1.1
Grb7 21.25 21.38 2.96 1.35 -2.84 -3.98 -1.1
Hck 41.71 73.39 0.23 0.18 -7.51 -8.64 -1.1
Acyp2 2.99 8.28 1.21 1.53 -1.3 -2.43 -1.1
Pik3cd 4.09 9.23 0.78 0.81 -2.4 -3.52 -1.1
Glrx 6.92 9.66 1.32 0.85 -2.39 -3.51 -1.1
Steap3 5.46 8.43 0.42 0.3 -3.71 -4.82 -1.1
Fbxw17 5.38 7.65 2.36 1.56 -1.19 -2.3 -1.1
Cd9 100.9 103.93 13.98 6.73 -2.85 -3.95 -1.1
Tmem37 3.06 4.97 1.47 1.11 -1.06 -2.16 -1.1
Acbd7 4.86 4.95 0.43 0.21 -3.5 -4.59 -1.1
Anxa11 21.88 23.4 5.62 2.82 -1.96 -3.05 -1.1
C030039L03Rik 2.2 6.4 1.08 1.48 -1.02 -2.11 -1.1
Neurod1 2.45 5.3 0.1 0.1 -4.62 -5.7 -1.1
Angptl4 8.58 8.46 0.88 0.41 -3.28 -4.36 -1.1
Chmp4c 10.49 12.1 2.98 1.64 -1.81 -2.89 -1.1
Fam167a 1.83 4.84 0.57 0.71 -1.69 -2.77 -1.1
Procr 2.87 4.41 1.01 0.73 -1.51 -2.59 -1.1
Fkbp6 1.07 3.82 0.12 0.21 -3.15 -4.22 -1.1
Mvp 23.81 19.83 4.62 1.82 -2.37 -3.44 -1.1
Esrrb 44.46 63.93 0.63 0.43 -6.14 -7.2 -1.1
Hecw2 2.14 6.53 0.6 0.87 -1.84 -2.9 -1.1
Ggnbp1 2.5 5.53 0.79 0.84 -1.65 -2.71 -1.1
Msrb2 7.47 13.95 2.87 2.57 -1.38 -2.44 -1.1
Nrn1l 1.1 1.1 0.48 0.23 -1.19 -2.25 -1.1
Hspb1 341.54 222.16 12.35 3.94 -4.79 -5.82 -1.0
Slc25a12 23.95 47.15 2.52 2.42 -3.25 -4.28 -1.0
Slamf9 1.08 1.55 0.25 0.18 -2.11 -3.14 -1.0
2200002D01Rik 18.63 8.47 4.06 0.91 -2.2 -3.22 -1.0
Capg 29.8 25.51 7.1 3 -2.07 -3.09 -1.0
Tmem51 6.92 6.09 2.65 1.16 -1.38 -2.4 -1.0
Rsph1 1.37 2.61 0.65 0.61 -1.08 -2.1 -1.0
Msc 5.9 12.62 0.11 0.12 -5.72 -6.73 -1.0
Cd38 3.81 5.87 1.92 1.47 -0.99 -2 -1.0
Tdh 295.87 286.84 1.54 0.75 -7.58 -8.58 -1.0
Esrp2 6.86 7.77 0.4 0.22 -4.11 -5.11 -1.0
Abcb1b 20.26 19.42 2.13 1.02 -3.25 -4.25 -1.0
Kcnk1 21 25.18 5.97 3.59 -1.81 -2.81 -1.0
Raet1b 6.11 8.39 2.7 1.86 -1.18 -2.18 -1.0
Stac2 1.76 2.77 0.82 0.64 -1.11 -2.11 -1.0
Sec1 1.04 3.74 0.25 0.45 -2.07 -3.06 -1.0
Coch 18.29 18.73 7.26 3.76 -1.33 -2.32 -1.0

213
Sp1del/del ESC – Flk1+ cells Cluster 4: more downregulated in mutant
Gene ES WT FPKM
ES Sp1del/del FPKM
Flk1+ WT FPKM
Flk1+ Sp1del/del FPKM
WT ES/Flk log2 FC
Sp1del/del ES/Flk log2 FC
WT FC/Sp1del/del FC
Msln 5.94 7.43 0.16 0.1 -5.24 -6.22 -1.0
Tmem125 3.72 6.64 0.16 0.14 -4.58 -5.56 -1.0
Vwa2 2.36 3.21 0.23 0.16 -3.37 -4.35 -1.0
Arhgap8 18.36 18.58 1.94 0.99 -3.25 -4.23 -1.0
Pqlc1 10.92 23.73 3.21 3.53 -1.77 -2.75 -1.0
Gsn 8.49 7.28 3.66 1.59 -1.21 -2.19 -1.0
Lgals9 5.61 6.09 0.49 0.28 -3.51 -4.47 -1.0
Noxred1 1.98 3.99 0.34 0.36 -2.53 -3.48 -1.0
Sp1del/del ESC – Flk1+ cells Cluster 5: downregulated in mutant/no change in WT
Gene ES WT FPKM
ES Sp1del/del FPKM
Flk1+ WT FPKM
Flk1+ Sp1del/del FPKM
WT ES/Flk log2 FC
Sp1del/del ES/Flk log2 FC
WT FC/Sp1del/del FC
E030030I06Rik 1.16 7.26 1.17 0.7 0.01 -3.38 -3.4
Prelid2 9.49 1.62 10.23 0.32 0.11 -2.35 -2.5
Lefty2 58.4 149.87 33.38 17.14 -0.81 -3.13 -2.3
Aspg 2.86 1.03 3.68 0.27 0.36 -1.96 -2.3
Gm20594 2.92 6.44 2.95 1.52 0.02 -2.09 -2.1
Mgmt 13.53 1.86 7.85 0.28 -0.79 -2.73 -1.9
Prdm14 3.01 9.18 1.75 1.44 -0.78 -2.67 -1.9
H60b 2.64 5.03 3.17 1.71 0.26 -1.56 -1.8
Ifitm1 97.4 284.19 161.52 141.3 0.73 -1.01 -1.7
Prrc1 5.61 16.82 8.56 7.78 0.61 -1.11 -1.7
Rhpn2 12.32 31.98 16.32 13.24 0.41 -1.27 -1.7
As3mt 5.67 5.4 6.34 1.93 0.16 -1.49 -1.7
Tmem106a 1 1.51 0.62 0.3 -0.68 -2.31 -1.6
Acta1 5.14 18.77 3.4 4.03 -0.6 -2.22 -1.6
Wdr86 4.36 2.85 3.05 0.66 -0.52 -2.11 -1.6
Cenpm 13.45 26.95 10.51 7 -0.36 -1.95 -1.6
Klk8 12.48 8.81 10.02 2.35 -0.32 -1.91 -1.6
Apol8 1.02 2.09 0.68 0.48 -0.58 -2.13 -1.6
Tmem159 4.53 1.78 5.66 0.77 0.32 -1.21 -1.5
Gulo 1.98 3.12 1.34 0.74 -0.57 -2.08 -1.5
Dnaaf3 1.24 2.58 1 0.73 -0.31 -1.82 -1.5
Nrk 2.65 4.78 2.78 1.85 0.07 -1.37 -1.4
Nudt6 1.16 1.2 1.45 0.57 0.32 -1.08 -1.4
Myof 5.34 10.01 2.81 2.02 -0.93 -2.31 -1.4
Nkx3-1 1.43 2.81 0.99 0.74 -0.54 -1.92 -1.4
Sycp3 12.44 5.94 10.33 1.89 -0.27 -1.65 -1.4
B230217C12Rik 1.87 5.08 2.27 2.37 0.28 -1.1 -1.4
Psors1c2 2.46 5.02 1.35 1.09 -0.86 -2.21 -1.4
2010107G23Rik 2.94 6.39 1.56 1.37 -0.91 -2.22 -1.3
Gimap9 1.76 4.31 1.55 1.53 -0.18 -1.49 -1.3
Fam58b 9.45 8.57 11.17 4.34 0.24 -0.98 -1.2
Gprc5b 5.04 9.13 3.51 2.77 -0.52 -1.72 -1.2
Selm 9.02 8.42 9.17 3.74 0.02 -1.17 -1.2
Lrpap1 31.75 52.17 18.56 13.52 -0.77 -1.95 -1.2
Alpl 23.96 29.19 23.64 12.72 -0.02 -1.2 -1.2
Birc3 2.59 3.85 2.28 1.52 -0.19 -1.34 -1.2
Smim20 15.29 5.44 14.69 2.37 -0.06 -1.2 -1.1
Tnip2 3.34 4.31 1.89 1.12 -0.82 -1.95 -1.1
Id4 1.75 3.54 1.11 1.03 -0.66 -1.78 -1.1
Prkch 1.69 3.73 1.22 1.25 -0.47 -1.58 -1.1
Bgn 3.46 6.55 3.4 2.99 -0.02 -1.13 -1.1
Hyal1 2.56 2.41 1.85 0.86 -0.47 -1.49 -1.0
Rbm43 3.12 7.66 2.77 3.35 -0.17 -1.19 -1.0
Urgcp 4.01 7.34 3.54 3.22 -0.18 -1.19 -1.0
Rundc3a 1.28 3.69 0.8 1.16 -0.67 -1.67 -1.0
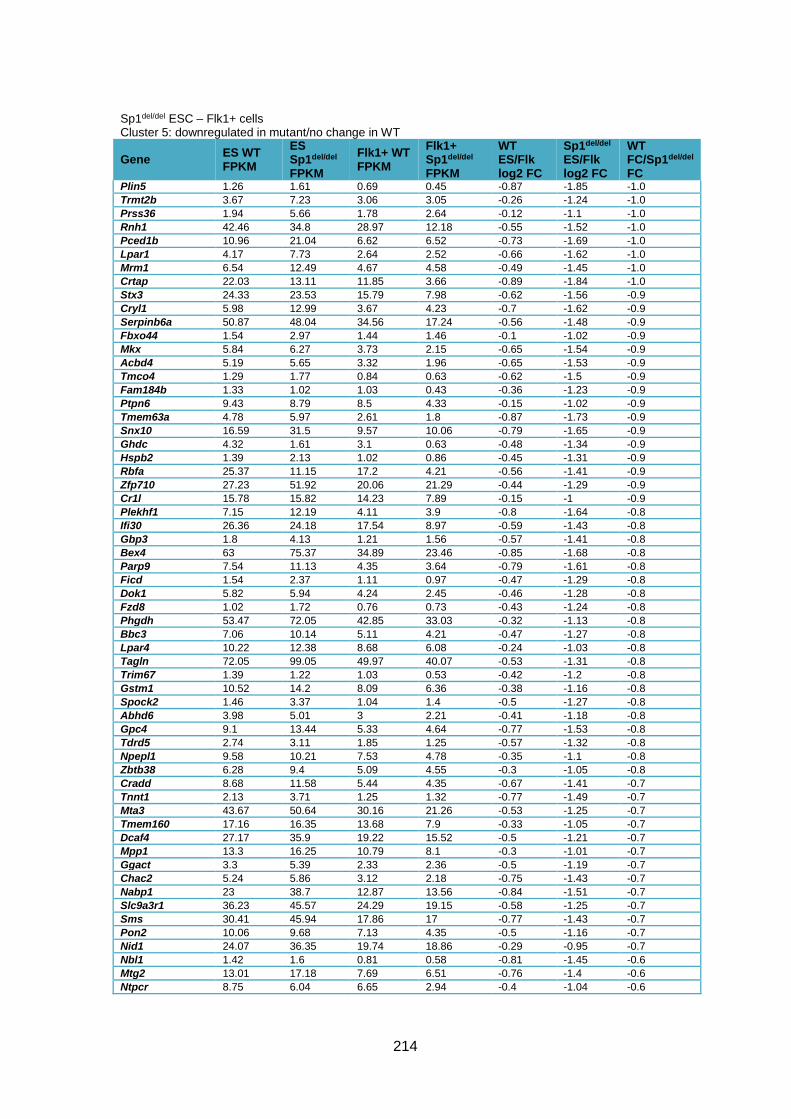
214
Sp1del/del ESC – Flk1+ cells Cluster 5: downregulated in mutant/no change in WT
Gene ES WT FPKM
ES Sp1del/del FPKM
Flk1+ WT FPKM
Flk1+ Sp1del/del FPKM
WT ES/Flk log2 FC
Sp1del/del ES/Flk log2 FC
WT FC/Sp1del/del FC
Plin5 1.26 1.61 0.69 0.45 -0.87 -1.85 -1.0
Trmt2b 3.67 7.23 3.06 3.05 -0.26 -1.24 -1.0
Prss36 1.94 5.66 1.78 2.64 -0.12 -1.1 -1.0
Rnh1 42.46 34.8 28.97 12.18 -0.55 -1.52 -1.0
Pced1b 10.96 21.04 6.62 6.52 -0.73 -1.69 -1.0
Lpar1 4.17 7.73 2.64 2.52 -0.66 -1.62 -1.0
Mrm1 6.54 12.49 4.67 4.58 -0.49 -1.45 -1.0
Crtap 22.03 13.11 11.85 3.66 -0.89 -1.84 -1.0
Stx3 24.33 23.53 15.79 7.98 -0.62 -1.56 -0.9
Cryl1 5.98 12.99 3.67 4.23 -0.7 -1.62 -0.9
Serpinb6a 50.87 48.04 34.56 17.24 -0.56 -1.48 -0.9
Fbxo44 1.54 2.97 1.44 1.46 -0.1 -1.02 -0.9
Mkx 5.84 6.27 3.73 2.15 -0.65 -1.54 -0.9
Acbd4 5.19 5.65 3.32 1.96 -0.65 -1.53 -0.9
Tmco4 1.29 1.77 0.84 0.63 -0.62 -1.5 -0.9
Fam184b 1.33 1.02 1.03 0.43 -0.36 -1.23 -0.9
Ptpn6 9.43 8.79 8.5 4.33 -0.15 -1.02 -0.9
Tmem63a 4.78 5.97 2.61 1.8 -0.87 -1.73 -0.9
Snx10 16.59 31.5 9.57 10.06 -0.79 -1.65 -0.9
Ghdc 4.32 1.61 3.1 0.63 -0.48 -1.34 -0.9
Hspb2 1.39 2.13 1.02 0.86 -0.45 -1.31 -0.9
Rbfa 25.37 11.15 17.2 4.21 -0.56 -1.41 -0.9
Zfp710 27.23 51.92 20.06 21.29 -0.44 -1.29 -0.9
Cr1l 15.78 15.82 14.23 7.89 -0.15 -1 -0.9
Plekhf1 7.15 12.19 4.11 3.9 -0.8 -1.64 -0.8
Ifi30 26.36 24.18 17.54 8.97 -0.59 -1.43 -0.8
Gbp3 1.8 4.13 1.21 1.56 -0.57 -1.41 -0.8
Bex4 63 75.37 34.89 23.46 -0.85 -1.68 -0.8
Parp9 7.54 11.13 4.35 3.64 -0.79 -1.61 -0.8
Ficd 1.54 2.37 1.11 0.97 -0.47 -1.29 -0.8
Dok1 5.82 5.94 4.24 2.45 -0.46 -1.28 -0.8
Fzd8 1.02 1.72 0.76 0.73 -0.43 -1.24 -0.8
Phgdh 53.47 72.05 42.85 33.03 -0.32 -1.13 -0.8
Bbc3 7.06 10.14 5.11 4.21 -0.47 -1.27 -0.8
Lpar4 10.22 12.38 8.68 6.08 -0.24 -1.03 -0.8
Tagln 72.05 99.05 49.97 40.07 -0.53 -1.31 -0.8
Trim67 1.39 1.22 1.03 0.53 -0.42 -1.2 -0.8
Gstm1 10.52 14.2 8.09 6.36 -0.38 -1.16 -0.8
Spock2 1.46 3.37 1.04 1.4 -0.5 -1.27 -0.8
Abhd6 3.98 5.01 3 2.21 -0.41 -1.18 -0.8
Gpc4 9.1 13.44 5.33 4.64 -0.77 -1.53 -0.8
Tdrd5 2.74 3.11 1.85 1.25 -0.57 -1.32 -0.8
Npepl1 9.58 10.21 7.53 4.78 -0.35 -1.1 -0.8
Zbtb38 6.28 9.4 5.09 4.55 -0.3 -1.05 -0.8
Cradd 8.68 11.58 5.44 4.35 -0.67 -1.41 -0.7
Tnnt1 2.13 3.71 1.25 1.32 -0.77 -1.49 -0.7
Mta3 43.67 50.64 30.16 21.26 -0.53 -1.25 -0.7
Tmem160 17.16 16.35 13.68 7.9 -0.33 -1.05 -0.7
Dcaf4 27.17 35.9 19.22 15.52 -0.5 -1.21 -0.7
Mpp1 13.3 16.25 10.79 8.1 -0.3 -1.01 -0.7
Ggact 3.3 5.39 2.33 2.36 -0.5 -1.19 -0.7
Chac2 5.24 5.86 3.12 2.18 -0.75 -1.43 -0.7
Nabp1 23 38.7 12.87 13.56 -0.84 -1.51 -0.7
Slc9a3r1 36.23 45.57 24.29 19.15 -0.58 -1.25 -0.7
Sms 30.41 45.94 17.86 17 -0.77 -1.43 -0.7
Pon2 10.06 9.68 7.13 4.35 -0.5 -1.16 -0.7
Nid1 24.07 36.35 19.74 18.86 -0.29 -0.95 -0.7
Nbl1 1.42 1.6 0.81 0.58 -0.81 -1.45 -0.6
Mtg2 13.01 17.18 7.69 6.51 -0.76 -1.4 -0.6
Ntpcr 8.75 6.04 6.65 2.94 -0.4 -1.04 -0.6

215
Sp1del/del ESC – Flk1+ cells Cluster 5: downregulated in mutant/no change in WT
Gene ES WT FPKM
ES Sp1del/del FPKM
Flk1+ WT FPKM
Flk1+ Sp1del/del FPKM
WT ES/Flk log2 FC
Sp1del/del ES/Flk log2 FC
WT FC/Sp1del/del FC
Lmo7 10.44 9.2 8.38 4.74 -0.32 -0.96 -0.6
Prdm5 16.96 17.14 9.01 5.89 -0.91 -1.54 -0.6
Tsacc 8.3 13.41 5.13 5.37 -0.69 -1.32 -0.6
Aim1l 1.67 1.56 0.96 0.58 -0.81 -1.43 -0.6
Syce2 63.65 50.02 40.4 20.54 -0.66 -1.28 -0.6
Zfp583 3.44 3.81 2.25 1.62 -0.61 -1.23 -0.6
Qpct 1.61 1.33 1.06 0.57 -0.6 -1.22 -0.6
Parp12 5.09 7.12 3.86 3.5 -0.4 -1.02 -0.6
Lace1 4.49 5.9 3.47 2.98 -0.37 -0.99 -0.6
Zbtb24 9.56 13.64 7.08 6.69 -0.43 -1.03 -0.6
Plec 21.45 23.61 12.27 8.95 -0.81 -1.4 -0.6
Tpk1 6.34 11.56 3.67 4.45 -0.79 -1.38 -0.6
Nr1d2 14.11 22.27 8.24 8.63 -0.78 -1.37 -0.6
L2hgdh 24.48 36.5 15.57 15.41 -0.65 -1.24 -0.6
Tarsl2 5.95 6.58 3.18 2.36 -0.9 -1.48 -0.6
Mrpl36 36.31 49.58 22.43 20.55 -0.7 -1.27 -0.6
Rpusd1 7.19 10.53 4.47 4.41 -0.69 -1.26 -0.6
Nudt14 15.33 19.28 11.29 9.58 -0.44 -1.01 -0.6
Arxes2 13.16 13.13 9.95 6.72 -0.4 -0.97 -0.6
Slc10a3 3.67 5.19 2.29 2.19 -0.68 -1.24 -0.6
Prr5l 3.37 5.03 1.78 1.82 -0.92 -1.47 -0.6
Zfp185 4.25 5.22 2.64 2.21 -0.69 -1.24 -0.6
Engase 2.59 4.32 1.87 2.14 -0.47 -1.02 -0.6
Aprt 195.76 225.67 146.07 115.24 -0.42 -0.97 -0.6
Rbl2 3.11 4.61 1.73 1.75 -0.85 -1.39 -0.5
Hist1h2af 30.49 28.6 19.51 12.59 -0.64 -1.18 -0.5
Ormdl2 20.44 21.34 13.64 9.83 -0.58 -1.12 -0.5
Enoph1 34.81 50.66 23.97 23.93 -0.54 -1.08 -0.5
Top3b 33.37 51.4 20.38 21.69 -0.71 -1.24 -0.5
Slc1a3 9.11 11.51 5.64 4.93 -0.69 -1.22 -0.5
Jund 7.95 10.96 5.19 4.95 -0.62 -1.15 -0.5
4930452B06Rik 6.81 10.62 5 5.4 -0.45 -0.98 -0.5
Angptl6 1.55 3.62 0.83 1.35 -0.9 -1.42 -0.5
Pak4 24.47 29.46 15.73 13.22 -0.64 -1.16 -0.5
Zbed5 11.82 14.64 7.21 6.3 -0.71 -1.22 -0.5
Rnf19b 15.76 20.73 11.65 10.74 -0.44 -0.95 -0.5
Tmem2 29.18 53.33 21.46 27.65 -0.44 -0.95 -0.5
Cpt1c 14.62 16.04 7.76 6.05 -0.91 -1.41 -0.5
Fgd1 20.15 27.88 12.42 12.17 -0.7 -1.2 -0.5
Sp1del/del ESC – Flk1+ cells Cluster 7: upregulated in mutant/no change in WT
Gene ES WT FPKM
ES Sp1del/del FPKM
Flk1+ WT FPKM
Flk1+ Sp1del/del FPKM
WT ES/Flk log2 FC
Sp1del/del ES/Flk log2 FC
WT FC/Sp1del/del FC
Coro2b 1.96 0.52 1.16 1.9 -0.75 1.86 2.6
Ogfrl1 3.81 0.85 3.79 4.26 -0.01 2.33 2.3
Satb1 5.04 1.31 6.78 8.16 0.43 2.64 2.2
Zfp438 2.16 0.42 2.32 2.09 0.1 2.3 2.2
Osbpl10 3.14 0.9 3.64 4.06 0.21 2.17 2.0
Aldh1a2 1.78 0.91 3.18 5.71 0.84 2.65 1.8
Mecom 1.01 0.48 1.25 2 0.31 2.05 1.7
Cib2 2.18 1.19 2.94 5.34 0.43 2.16 1.7
Emc9 1.46 0.58 1.12 1.42 -0.38 1.3 1.7
Xylt1 1.86 0.88 1.58 2.36 -0.24 1.42 1.7
Capn2 38.54 13.02 43.17 45.4 0.16 1.8 1.6
Slco3a1 2.28 0.56 3.49 2.55 0.61 2.18 1.6
Eif2s3y 22.76 2.2 18.84 5.12 -0.27 1.22 1.5
Hmgn5 4.53 1.28 4.74 3.69 0.06 1.53 1.5

216
Sp1del/del ESC – Flk1+ cells Cluster 7: upregulated in mutant/no change in WT
Gene ES WT FPKM
ES Sp1del/del FPKM
Flk1+ WT FPKM
Flk1+ Sp1del/del FPKM
WT ES/Flk log2 FC
Sp1del/del ES/Flk log2 FC
WT FC/Sp1del/del FC
Fzd4 1.85 0.95 2.9 4.05 0.65 2.09 1.4
Arnt2 1.73 0.88 2.03 2.79 0.23 1.66 1.4
Rasal1 1.2 0.49 1.04 1.14 -0.21 1.21 1.4
Bcl11a 1.71 0.45 3.14 2.2 0.88 2.29 1.4
Smarca1 15.08 6.65 21.45 24.8 0.51 1.9 1.4
Ttc39c 0.8 0.33 1.52 1.62 0.92 2.29 1.4
Fhod3 1.43 0.43 2.72 2.07 0.93 2.28 1.4
Cdx2 2.02 1.43 2.41 4.36 0.26 1.61 1.4
Acadl 13.65 3.01 16.88 9.38 0.31 1.64 1.3
Basp1 46.7 20.76 46.33 51.52 -0.01 1.31 1.3
Zbtb42 0.62 0.33 1.09 1.42 0.82 2.1 1.3
Pacsin3 5.95 2.5 5.14 5.21 -0.21 1.06 1.3
Vegfc 7.74 2.74 12.49 10.5 0.69 1.94 1.3
Ncs1 5.81 2.98 10.79 13 0.89 2.13 1.2
Fam89a 1.87 0.69 2.33 2.03 0.32 1.56 1.2
Tnfsf9 1.64 0.61 1.54 1.34 -0.09 1.13 1.2
Mafk 7.46 3.31 6.73 6.92 -0.15 1.07 1.2
Mapk12 5.09 3.54 6.91 10.83 0.44 1.61 1.2
Ckap4 43.04 18.6 40.49 39.05 -0.09 1.07 1.2
Gdpd5 1 0.59 1.75 2.27 0.8 1.95 1.2
Ak4 9.62 4.95 14.53 16.29 0.59 1.72 1.1
Rap1gds1 21.39 9.56 35.75 34.68 0.74 1.86 1.1
Gngt2 10.69 6.24 14.68 18.61 0.46 1.58 1.1
Zfp948 11.06 3.64 19.37 13.74 0.81 1.92 1.1
Ptprn 3.71 1.74 4.79 4.84 0.37 1.47 1.1
Ssbp2 1.74 1.06 3.28 4.27 0.92 2.01 1.1
Pgbd1 1.57 0.86 2.15 2.51 0.45 1.54 1.1
Cnr1 0.84 0.55 1.29 1.78 0.62 1.7 1.1
Slc35c1 2.51 1.07 3.53 3.17 0.5 1.57 1.1
Casp3 39.06 14.93 47.39 37.75 0.28 1.34 1.1
Nrbp2 3.44 2.44 6.03 8.87 0.81 1.86 1.1
Tet3 3.78 2.18 5.61 6.74 0.57 1.62 1.1
Bend4 16.25 6.72 18.35 15.72 0.18 1.23 1.1
Col8a2 1.06 0.7 1.68 2.3 0.67 1.71 1.0
Rnd2 11.48 5.73 17.35 17.84 0.6 1.64 1.0
Gli3 8.04 4.35 11.58 12.89 0.53 1.57 1.0
Ldlrap1 8.38 3.36 8.54 7.01 0.03 1.06 1.0
Akap9 13.78 6.7 17.43 17.25 0.34 1.36 1.0
Zdbf2 25.92 15.51 28.14 34.09 0.12 1.14 1.0
Ankrd12 2.72 1.38 4.12 4.2 0.6 1.61 1.0
Farp2 0.96 0.54 1.79 2.02 0.9 1.9 1.0
Selo 2.7 1.1 4.83 3.94 0.84 1.84 1.0
Gpr161 2.07 0.79 3.64 2.78 0.82 1.82 1.0
Sema7a 1.55 0.83 2.41 2.58 0.64 1.64 1.0
Inpp5f 8.92 5.11 12.23 14.07 0.46 1.46 1.0
Ccdc112 2.47 1.89 3 4.6 0.28 1.28 1.0
Kctd12 5.32 2.33 6.16 5.4 0.21 1.21 1.0
Kif1a 4.49 1.42 4.5 2.86 0 1 1.0
Asap2 4.82 2.92 8.75 10.49 0.86 1.85 1.0
Slc30a4 3.8 1.61 6.77 5.65 0.83 1.81 1.0
Kcnt2 0.85 0.37 1.4 1.21 0.72 1.7 1.0
Irgq 3.7 2.06 3.81 4.18 0.04 1.02 1.0
Atf3 2.7 1.07 4.46 3.49 0.73 1.7 1.0
Cxcl12 0.86 0.68 1.04 1.62 0.29 1.26 1.0
Sort1 9.39 6.14 16.31 20.77 0.8 1.76 1.0
Bmp1 9.16 5.07 14.74 15.96 0.69 1.65 1.0
Tmem158 0.71 0.39 1.11 1.21 0.65 1.61 1.0
Arl4c 8.97 5.06 9.64 10.52 0.1 1.06 1.0
D1Ertd622e 4.6 2.43 5.44 5.55 0.24 1.19 1.0
6720489N17Rik 6.47 3.42 10.88 11.03 0.75 1.69 0.9
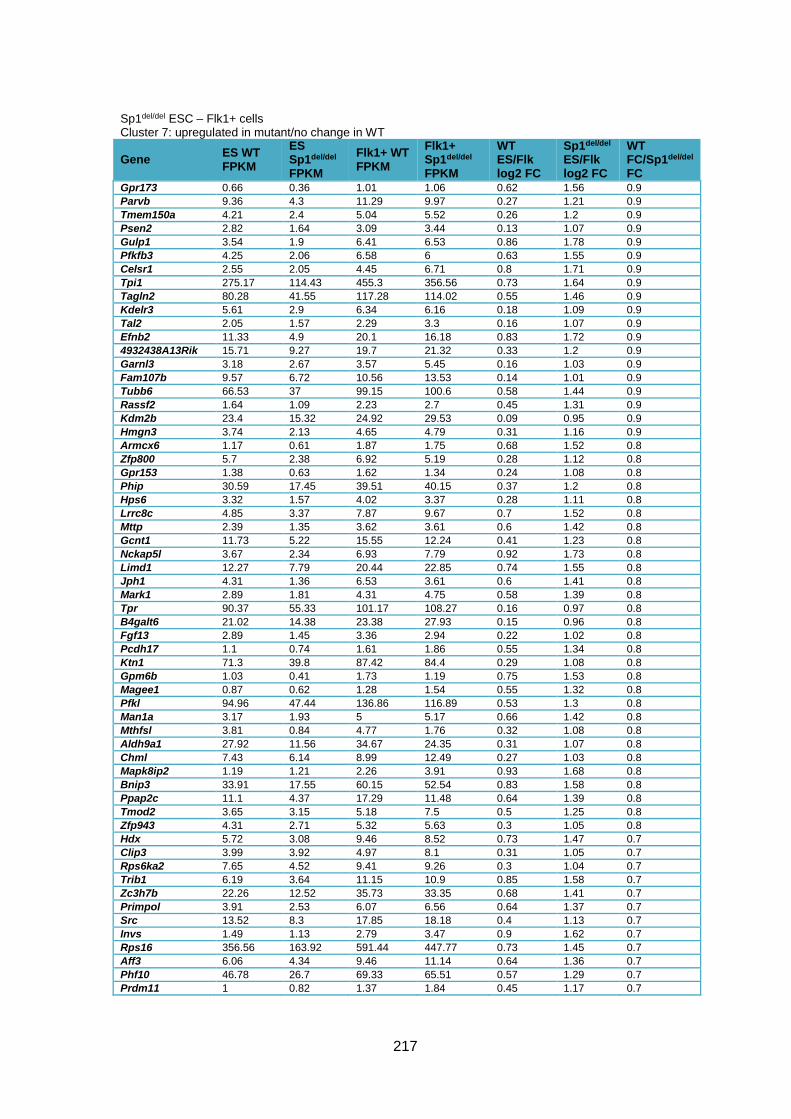
217
Sp1del/del ESC – Flk1+ cells Cluster 7: upregulated in mutant/no change in WT
Gene ES WT FPKM
ES Sp1del/del FPKM
Flk1+ WT FPKM
Flk1+ Sp1del/del FPKM
WT ES/Flk log2 FC
Sp1del/del ES/Flk log2 FC
WT FC/Sp1del/del FC
Gpr173 0.66 0.36 1.01 1.06 0.62 1.56 0.9
Parvb 9.36 4.3 11.29 9.97 0.27 1.21 0.9
Tmem150a 4.21 2.4 5.04 5.52 0.26 1.2 0.9
Psen2 2.82 1.64 3.09 3.44 0.13 1.07 0.9
Gulp1 3.54 1.9 6.41 6.53 0.86 1.78 0.9
Pfkfb3 4.25 2.06 6.58 6 0.63 1.55 0.9
Celsr1 2.55 2.05 4.45 6.71 0.8 1.71 0.9
Tpi1 275.17 114.43 455.3 356.56 0.73 1.64 0.9
Tagln2 80.28 41.55 117.28 114.02 0.55 1.46 0.9
Kdelr3 5.61 2.9 6.34 6.16 0.18 1.09 0.9
Tal2 2.05 1.57 2.29 3.3 0.16 1.07 0.9
Efnb2 11.33 4.9 20.1 16.18 0.83 1.72 0.9
4932438A13Rik 15.71 9.27 19.7 21.32 0.33 1.2 0.9
Garnl3 3.18 2.67 3.57 5.45 0.16 1.03 0.9
Fam107b 9.57 6.72 10.56 13.53 0.14 1.01 0.9
Tubb6 66.53 37 99.15 100.6 0.58 1.44 0.9
Rassf2 1.64 1.09 2.23 2.7 0.45 1.31 0.9
Kdm2b 23.4 15.32 24.92 29.53 0.09 0.95 0.9
Hmgn3 3.74 2.13 4.65 4.79 0.31 1.16 0.9
Armcx6 1.17 0.61 1.87 1.75 0.68 1.52 0.8
Zfp800 5.7 2.38 6.92 5.19 0.28 1.12 0.8
Gpr153 1.38 0.63 1.62 1.34 0.24 1.08 0.8
Phip 30.59 17.45 39.51 40.15 0.37 1.2 0.8
Hps6 3.32 1.57 4.02 3.37 0.28 1.11 0.8
Lrrc8c 4.85 3.37 7.87 9.67 0.7 1.52 0.8
Mttp 2.39 1.35 3.62 3.61 0.6 1.42 0.8
Gcnt1 11.73 5.22 15.55 12.24 0.41 1.23 0.8
Nckap5l 3.67 2.34 6.93 7.79 0.92 1.73 0.8
Limd1 12.27 7.79 20.44 22.85 0.74 1.55 0.8
Jph1 4.31 1.36 6.53 3.61 0.6 1.41 0.8
Mark1 2.89 1.81 4.31 4.75 0.58 1.39 0.8
Tpr 90.37 55.33 101.17 108.27 0.16 0.97 0.8
B4galt6 21.02 14.38 23.38 27.93 0.15 0.96 0.8
Fgf13 2.89 1.45 3.36 2.94 0.22 1.02 0.8
Pcdh17 1.1 0.74 1.61 1.86 0.55 1.34 0.8
Ktn1 71.3 39.8 87.42 84.4 0.29 1.08 0.8
Gpm6b 1.03 0.41 1.73 1.19 0.75 1.53 0.8
Magee1 0.87 0.62 1.28 1.54 0.55 1.32 0.8
Pfkl 94.96 47.44 136.86 116.89 0.53 1.3 0.8
Man1a 3.17 1.93 5 5.17 0.66 1.42 0.8
Mthfsl 3.81 0.84 4.77 1.76 0.32 1.08 0.8
Aldh9a1 27.92 11.56 34.67 24.35 0.31 1.07 0.8
Chml 7.43 6.14 8.99 12.49 0.27 1.03 0.8
Mapk8ip2 1.19 1.21 2.26 3.91 0.93 1.68 0.8
Bnip3 33.91 17.55 60.15 52.54 0.83 1.58 0.8
Ppap2c 11.1 4.37 17.29 11.48 0.64 1.39 0.8
Tmod2 3.65 3.15 5.18 7.5 0.5 1.25 0.8
Zfp943 4.31 2.71 5.32 5.63 0.3 1.05 0.8
Hdx 5.72 3.08 9.46 8.52 0.73 1.47 0.7
Clip3 3.99 3.92 4.97 8.1 0.31 1.05 0.7
Rps6ka2 7.65 4.52 9.41 9.26 0.3 1.04 0.7
Trib1 6.19 3.64 11.15 10.9 0.85 1.58 0.7
Zc3h7b 22.26 12.52 35.73 33.35 0.68 1.41 0.7
Primpol 3.91 2.53 6.07 6.56 0.64 1.37 0.7
Src 13.52 8.3 17.85 18.18 0.4 1.13 0.7
Invs 1.49 1.13 2.79 3.47 0.9 1.62 0.7
Rps16 356.56 163.92 591.44 447.77 0.73 1.45 0.7
Aff3 6.06 4.34 9.46 11.14 0.64 1.36 0.7
Phf10 46.78 26.7 69.33 65.51 0.57 1.29 0.7
Prdm11 1 0.82 1.37 1.84 0.45 1.17 0.7

218
Sp1del/del ESC – Flk1+ cells Cluster 7: upregulated in mutant/no change in WT
Gene ES WT FPKM
ES Sp1del/del FPKM
Flk1+ WT FPKM
Flk1+ Sp1del/del FPKM
WT ES/Flk log2 FC
Sp1del/del ES/Flk log2 FC
WT FC/Sp1del/del FC
Murc 4.61 2.56 7.78 7.04 0.75 1.46 0.7
Slc4a7 23.21 12.73 31.18 28.15 0.43 1.14 0.7
Rin3 1.66 1.34 2.15 2.85 0.38 1.09 0.7
Lcorl 5.54 2.95 6.95 6.09 0.33 1.04 0.7
Dennd2a 12.24 8.49 23.15 26.19 0.92 1.62 0.7
Lrrfip1 15.19 8.76 23.72 22.22 0.64 1.34 0.7
1700017B05Rik 9.74 4.76 14.08 11.18 0.53 1.23 0.7
Slc9a7 1.34 0.67 2.09 1.7 0.65 1.34 0.7
Amn1 5.53 4.58 8.29 11.04 0.58 1.27 0.7
Zfp319 1.9 1.6 3.44 4.67 0.86 1.54 0.7
D830031N03Rik 6.45 4.98 9.67 11.89 0.58 1.26 0.7
Nagk 6.07 3.85 9.08 9.21 0.58 1.26 0.7
Fam189b 1.83 1.24 2.56 2.78 0.48 1.16 0.7
Ctsf 5.4 2.93 7.3 6.32 0.43 1.11 0.7
Plekha2 14.82 9.14 17.82 17.61 0.27 0.95 0.7
Maff 5.17 3.07 9.22 8.7 0.83 1.5 0.7
Hmgcll1 1.78 1.17 2.71 2.82 0.6 1.27 0.7
Plxna3 4.56 3.63 6.32 8.01 0.47 1.14 0.7
Nipbl 27.29 16.07 36.79 34.46 0.43 1.1 0.7
Gpx7 6.61 2.38 8.66 4.96 0.39 1.06 0.7
Impad1 27.5 14.05 50.19 40.53 0.87 1.53 0.7
Panx1 5.11 3.28 9.24 9.32 0.85 1.51 0.7
Ppp2r2c 2.73 1.83 4.58 4.82 0.75 1.4 0.7
2810417H13Rik 53.58 36.81 71.39 76.99 0.41 1.06 0.7
Dusp16 9 5.36 11.14 10.41 0.31 0.96 0.7
Prkaca 23.26 19.81 28.8 38.44 0.31 0.96 0.7
Tmem86b 1.39 0.88 2.3 2.25 0.73 1.36 0.6
Trim44 24.83 12.2 38.82 29.5 0.64 1.27 0.6
Homez 1.51 1.23 2.27 2.87 0.59 1.22 0.6
Simc1 7.58 3.33 11.17 7.61 0.56 1.19 0.6
Slc30a9 24.28 16.57 35.12 36.97 0.53 1.16 0.6
Pde4dip 7.89 6.04 12.86 15.12 0.7 1.32 0.6
Elovl1 13.45 8.16 19.67 18.34 0.55 1.17 0.6
Exoc6b 15.26 10.07 20.53 20.82 0.43 1.05 0.6
Arhgef11 8.84 6.13 11.26 12.02 0.35 0.97 0.6
Zdhhc8 4.06 3 5.51 6.21 0.44 1.05 0.6
Ptpdc1 2.39 1.98 3.04 3.85 0.35 0.96 0.6
Dusp22 5.96 3.6 10.97 10.03 0.88 1.48 0.6
Myo9a 12.14 9.46 16.75 19.78 0.46 1.06 0.6
Dync2h1 5.28 3.53 9.78 9.87 0.89 1.48 0.6
Repin1 4.76 3.42 8.82 9.52 0.89 1.48 0.6
Slc43a3 1.99 1.14 3.28 2.85 0.72 1.31 0.6
Cenpf 33.42 19.66 53.02 46.97 0.67 1.26 0.6
Zkscan7 1.04 0.76 1.51 1.67 0.54 1.13 0.6
Nbeal1 10.47 7.1 13.8 14.07 0.4 0.99 0.6
Adamts15 0.84 0.52 1.1 1.02 0.38 0.97 0.6
Scd2 70.34 64.5 133.51 182.17 0.92 1.5 0.6
Ptk7 55.7 43.82 101.35 118.63 0.86 1.44 0.6
Sptbn1 61.35 43.61 111.35 118.21 0.86 1.44 0.6
Cnot6l 5.67 3.67 10.1 9.73 0.83 1.41 0.6
Dvl3 5.2 3.72 7.94 8.48 0.61 1.19 0.6
Car4 7.97 7.49 11.08 15.51 0.47 1.05 0.6
Ap1m1 18.81 14.99 25.25 29.97 0.42 1 0.6
Fgfr3 1.45 1.53 2.74 4.3 0.92 1.49 0.6
Nlgn3 1.02 1.45 1.64 3.44 0.68 1.25 0.6
Wrn 6.17 4.12 9.78 9.76 0.67 1.24 0.6
Slc4a3 1.12 0.93 1.54 1.91 0.46 1.03 0.6
Vat1 17.2 9.93 22.46 19.19 0.38 0.95 0.6
Myb 2.09 1.52 3.74 4 0.84 1.4 0.6
Syne2 3.27 2.76 5.86 7.28 0.84 1.4 0.6
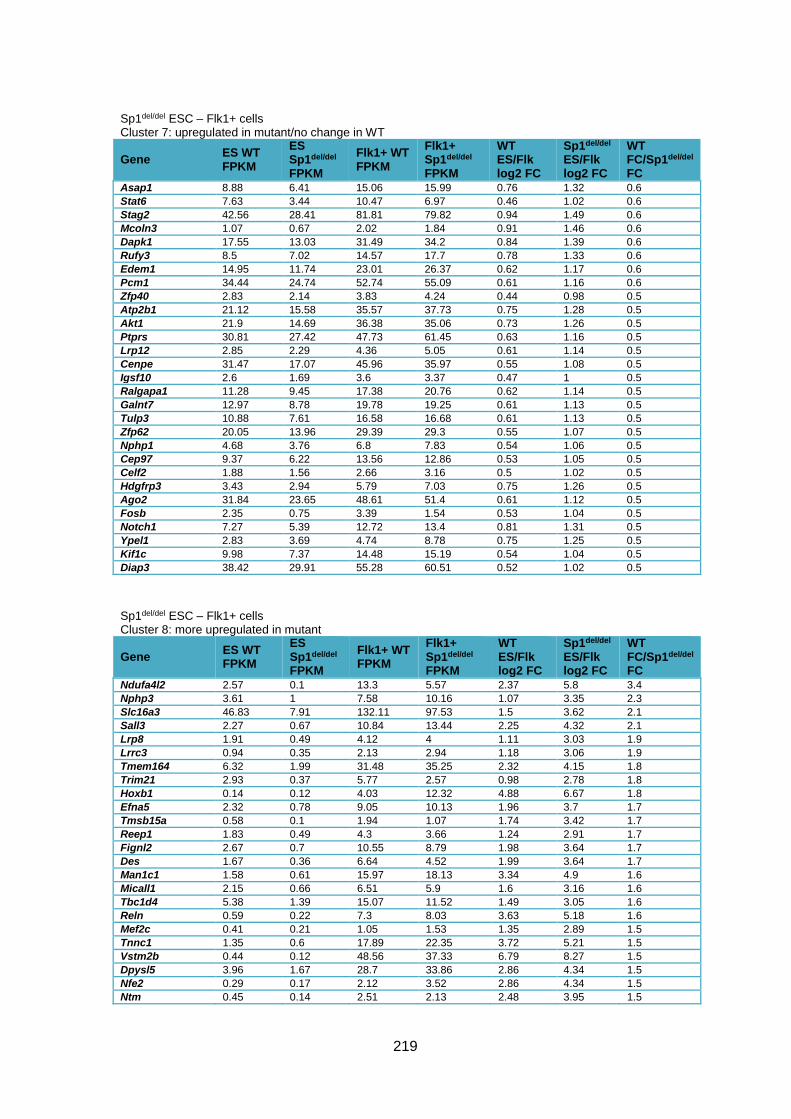
219
Sp1del/del ESC – Flk1+ cells Cluster 7: upregulated in mutant/no change in WT
Gene ES WT FPKM
ES Sp1del/del FPKM
Flk1+ WT FPKM
Flk1+ Sp1del/del FPKM
WT ES/Flk log2 FC
Sp1del/del ES/Flk log2 FC
WT FC/Sp1del/del FC
Asap1 8.88 6.41 15.06 15.99 0.76 1.32 0.6
Stat6 7.63 3.44 10.47 6.97 0.46 1.02 0.6
Stag2 42.56 28.41 81.81 79.82 0.94 1.49 0.6
Mcoln3 1.07 0.67 2.02 1.84 0.91 1.46 0.6
Dapk1 17.55 13.03 31.49 34.2 0.84 1.39 0.6
Rufy3 8.5 7.02 14.57 17.7 0.78 1.33 0.6
Edem1 14.95 11.74 23.01 26.37 0.62 1.17 0.6
Pcm1 34.44 24.74 52.74 55.09 0.61 1.16 0.6
Zfp40 2.83 2.14 3.83 4.24 0.44 0.98 0.5
Atp2b1 21.12 15.58 35.57 37.73 0.75 1.28 0.5
Akt1 21.9 14.69 36.38 35.06 0.73 1.26 0.5
Ptprs 30.81 27.42 47.73 61.45 0.63 1.16 0.5
Lrp12 2.85 2.29 4.36 5.05 0.61 1.14 0.5
Cenpe 31.47 17.07 45.96 35.97 0.55 1.08 0.5
Igsf10 2.6 1.69 3.6 3.37 0.47 1 0.5
Ralgapa1 11.28 9.45 17.38 20.76 0.62 1.14 0.5
Galnt7 12.97 8.78 19.78 19.25 0.61 1.13 0.5
Tulp3 10.88 7.61 16.58 16.68 0.61 1.13 0.5
Zfp62 20.05 13.96 29.39 29.3 0.55 1.07 0.5
Nphp1 4.68 3.76 6.8 7.83 0.54 1.06 0.5
Cep97 9.37 6.22 13.56 12.86 0.53 1.05 0.5
Celf2 1.88 1.56 2.66 3.16 0.5 1.02 0.5
Hdgfrp3 3.43 2.94 5.79 7.03 0.75 1.26 0.5
Ago2 31.84 23.65 48.61 51.4 0.61 1.12 0.5
Fosb 2.35 0.75 3.39 1.54 0.53 1.04 0.5
Notch1 7.27 5.39 12.72 13.4 0.81 1.31 0.5
Ypel1 2.83 3.69 4.74 8.78 0.75 1.25 0.5
Kif1c 9.98 7.37 14.48 15.19 0.54 1.04 0.5
Diap3 38.42 29.91 55.28 60.51 0.52 1.02 0.5
Sp1del/del ESC – Flk1+ cells Cluster 8: more upregulated in mutant
Gene ES WT FPKM
ES Sp1del/del FPKM
Flk1+ WT FPKM
Flk1+ Sp1del/del FPKM
WT ES/Flk log2 FC
Sp1del/del ES/Flk log2 FC
WT FC/Sp1del/del FC
Ndufa4l2 2.57 0.1 13.3 5.57 2.37 5.8 3.4
Nphp3 3.61 1 7.58 10.16 1.07 3.35 2.3
Slc16a3 46.83 7.91 132.11 97.53 1.5 3.62 2.1
Sall3 2.27 0.67 10.84 13.44 2.25 4.32 2.1
Lrp8 1.91 0.49 4.12 4 1.11 3.03 1.9
Lrrc3 0.94 0.35 2.13 2.94 1.18 3.06 1.9
Tmem164 6.32 1.99 31.48 35.25 2.32 4.15 1.8
Trim21 2.93 0.37 5.77 2.57 0.98 2.78 1.8
Hoxb1 0.14 0.12 4.03 12.32 4.88 6.67 1.8
Efna5 2.32 0.78 9.05 10.13 1.96 3.7 1.7
Tmsb15a 0.58 0.1 1.94 1.07 1.74 3.42 1.7
Reep1 1.83 0.49 4.3 3.66 1.24 2.91 1.7
Fignl2 2.67 0.7 10.55 8.79 1.98 3.64 1.7
Des 1.67 0.36 6.64 4.52 1.99 3.64 1.7
Man1c1 1.58 0.61 15.97 18.13 3.34 4.9 1.6
Micall1 2.15 0.66 6.51 5.9 1.6 3.16 1.6
Tbc1d4 5.38 1.39 15.07 11.52 1.49 3.05 1.6
Reln 0.59 0.22 7.3 8.03 3.63 5.18 1.6
Mef2c 0.41 0.21 1.05 1.53 1.35 2.89 1.5
Tnnc1 1.35 0.6 17.89 22.35 3.72 5.21 1.5
Vstm2b 0.44 0.12 48.56 37.33 6.79 8.27 1.5
Dpysl5 3.96 1.67 28.7 33.86 2.86 4.34 1.5
Nfe2 0.29 0.17 2.12 3.52 2.86 4.34 1.5
Ntm 0.45 0.14 2.51 2.13 2.48 3.95 1.5

220
Sp1del/del ESC – Flk1+ cells Cluster 8: more upregulated in mutant
Gene ES WT FPKM
ES Sp1del/del FPKM
Flk1+ WT FPKM
Flk1+ Sp1del/del FPKM
WT ES/Flk log2 FC
Sp1del/del ES/Flk log2 FC
WT FC/Sp1del/del FC
Pde5a 2.53 0.71 8.12 6.25 1.68 3.13 1.5
Trim62 0.53 0.31 1.33 2.13 1.33 2.78 1.5
Soga1 3.22 1.37 11.82 13.68 1.88 3.32 1.4
Cdh8 0.31 0.11 2.37 2.13 2.94 4.34 1.4
Itga8 3.97 1.22 8.66 7 1.13 2.52 1.4
Slc30a3 0.54 0.19 4.53 4.2 3.06 4.44 1.4
Zfp629 2.18 0.75 11.43 10.14 2.39 3.75 1.4
Gas1 0.71 0.2 24.72 17.56 5.12 6.47 1.4
Slc32a1 0.14 0.11 1.13 2.23 3.04 4.39 1.4
Rsph3b 0.99 0.23 2.22 1.32 1.17 2.52 1.4
Il3ra 1.3 0.48 2.83 2.66 1.13 2.48 1.4
Mapre3 0.53 0.26 1.21 1.51 1.2 2.51 1.3
Zmiz1 5.04 2.36 17.95 20.48 1.83 3.12 1.3
Dusp10 2.63 1.07 10.09 9.94 1.94 3.22 1.3
E330009J07Rik 2.87 1.05 9.49 8.44 1.73 3.01 1.3
Grb10 47.73 20.41 158.29 163.92 1.73 3.01 1.3
Ubash3b 0.83 0.41 5.34 6.24 2.68 3.94 1.3
Nol4l 0.86 0.42 5.4 6.32 2.65 3.91 1.3
Prrg1 0.79 0.29 2.97 2.63 1.91 3.17 1.3
Emilin2 0.83 0.47 4.69 6.4 2.51 3.76 1.3
Klhl29 0.25 0.14 1.05 1.41 2.07 3.32 1.3
Dact1 2.11 1.11 6.26 7.78 1.57 2.81 1.2
Prkd1 1.16 0.53 22.11 23.91 4.25 5.48 1.2
Ager 0.46 0.26 1.95 2.6 2.09 3.32 1.2
Ccdc109b 0.24 0.18 2.07 3.66 3.12 4.33 1.2
Ccdc136 7.11 3.58 14.92 17.33 1.07 2.27 1.2
Gfra2 0.59 0.3 13.26 15.57 4.5 5.69 1.2
Has2 4.58 1.76 85.58 74.42 4.22 5.4 1.2
Col26a1 0.32 0.17 3.51 4.15 3.47 4.65 1.2
Stc1 0.62 0.29 2.59 2.76 2.06 3.24 1.2
Ptprj 4.43 1.59 13.6 11.08 1.62 2.8 1.2
Axin2 4.39 2.05 26.2 27.43 2.58 3.75 1.2
Slc38a5 0.59 0.3 1.33 1.53 1.16 2.33 1.2
Bmp6 0.32 0.18 1.96 2.5 2.61 3.76 1.2
Ptprd 0.61 0.32 1.89 2.2 1.64 2.79 1.2
Ano10 2.03 0.31 15.22 5.19 2.91 4.05 1.1
Kcnmb4 0.47 0.24 7.92 8.84 4.07 5.2 1.1
Plac1 0.14 0.1 2.28 3.58 4.03 5.16 1.1
Asxl3 0.93 0.43 5.25 5.3 2.49 3.61 1.1
Nfxl1 9.61 6.74 34.74 52.82 1.85 2.97 1.1
Optn 2.41 0.8 8.72 6.31 1.85 2.97 1.1
Apln 0.57 0.23 2.03 1.78 1.84 2.96 1.1
Usp51 1.58 0.58 7.24 5.75 2.19 3.3 1.1
Siah2 1.48 0.73 5.9 6.34 2 3.11 1.1
Zbtb16 0.17 0.1 1.24 1.59 2.83 3.93 1.1
Farp1 3.55 1.95 11.71 13.8 1.72 2.82 1.1
Sacs 3.14 1.43 6.07 5.95 0.95 2.05 1.1
Cep112 0.39 0.23 2.11 2.65 2.43 3.51 1.1
Zyx 15.47 8.67 31.73 37.63 1.04 2.12 1.1
Erg 0.16 0.11 1.14 1.66 2.8 3.87 1.1
Adra2a 0.25 0.14 1.62 1.98 2.71 3.78 1.1
Ccnjl 2.47 1.16 10.86 10.68 2.13 3.2 1.1
Ppic 18.1 7.32 171.04 144.04 3.24 4.3 1.1
Arhgap10 4.78 2.12 10.12 9.35 1.08 2.14 1.1
Zcchc24 4.11 2.42 8.44 10.35 1.04 2.1 1.1
Ptgds 0.75 0.1 9.23 2.53 3.62 4.66 1.0
Slc18a2 0.13 0.11 1.39 2.42 3.45 4.49 1.0
Sema4c 1.36 0.59 10.24 9.18 2.92 3.96 1.0
Clip1 4.28 2.41 14.24 16.43 1.74 2.77 1.0
Fras1 0.83 0.49 2.38 2.83 1.52 2.55 1.0
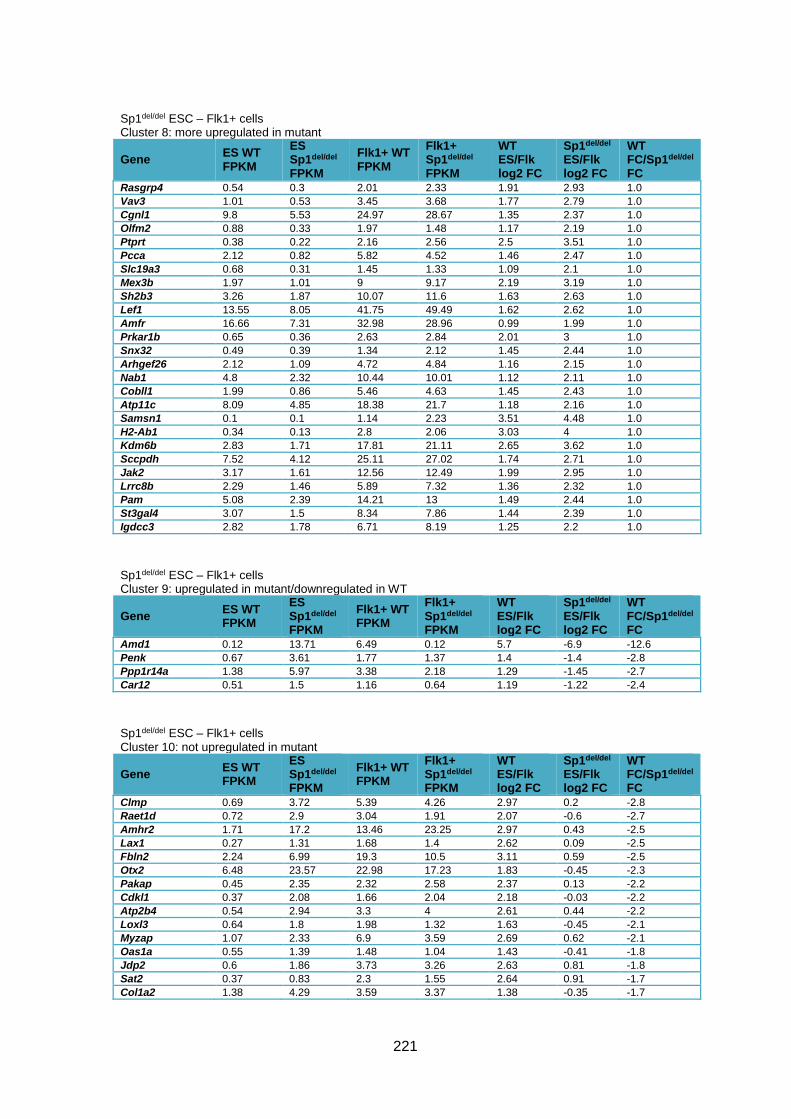
221
Sp1del/del ESC – Flk1+ cells Cluster 8: more upregulated in mutant
Gene ES WT FPKM
ES Sp1del/del FPKM
Flk1+ WT FPKM
Flk1+ Sp1del/del FPKM
WT ES/Flk log2 FC
Sp1del/del ES/Flk log2 FC
WT FC/Sp1del/del FC
Rasgrp4 0.54 0.3 2.01 2.33 1.91 2.93 1.0
Vav3 1.01 0.53 3.45 3.68 1.77 2.79 1.0
Cgnl1 9.8 5.53 24.97 28.67 1.35 2.37 1.0
Olfm2 0.88 0.33 1.97 1.48 1.17 2.19 1.0
Ptprt 0.38 0.22 2.16 2.56 2.5 3.51 1.0
Pcca 2.12 0.82 5.82 4.52 1.46 2.47 1.0
Slc19a3 0.68 0.31 1.45 1.33 1.09 2.1 1.0
Mex3b 1.97 1.01 9 9.17 2.19 3.19 1.0
Sh2b3 3.26 1.87 10.07 11.6 1.63 2.63 1.0
Lef1 13.55 8.05 41.75 49.49 1.62 2.62 1.0
Amfr 16.66 7.31 32.98 28.96 0.99 1.99 1.0
Prkar1b 0.65 0.36 2.63 2.84 2.01 3 1.0
Snx32 0.49 0.39 1.34 2.12 1.45 2.44 1.0
Arhgef26 2.12 1.09 4.72 4.84 1.16 2.15 1.0
Nab1 4.8 2.32 10.44 10.01 1.12 2.11 1.0
Cobll1 1.99 0.86 5.46 4.63 1.45 2.43 1.0
Atp11c 8.09 4.85 18.38 21.7 1.18 2.16 1.0
Samsn1 0.1 0.1 1.14 2.23 3.51 4.48 1.0
H2-Ab1 0.34 0.13 2.8 2.06 3.03 4 1.0
Kdm6b 2.83 1.71 17.81 21.11 2.65 3.62 1.0
Sccpdh 7.52 4.12 25.11 27.02 1.74 2.71 1.0
Jak2 3.17 1.61 12.56 12.49 1.99 2.95 1.0
Lrrc8b 2.29 1.46 5.89 7.32 1.36 2.32 1.0
Pam 5.08 2.39 14.21 13 1.49 2.44 1.0
St3gal4 3.07 1.5 8.34 7.86 1.44 2.39 1.0
Igdcc3 2.82 1.78 6.71 8.19 1.25 2.2 1.0
Sp1del/del ESC – Flk1+ cells Cluster 9: upregulated in mutant/downregulated in WT
Gene ES WT FPKM
ES Sp1del/del FPKM
Flk1+ WT FPKM
Flk1+ Sp1del/del FPKM
WT ES/Flk log2 FC
Sp1del/del ES/Flk log2 FC
WT FC/Sp1del/del FC
Amd1 0.12 13.71 6.49 0.12 5.7 -6.9 -12.6
Penk 0.67 3.61 1.77 1.37 1.4 -1.4 -2.8
Ppp1r14a 1.38 5.97 3.38 2.18 1.29 -1.45 -2.7
Car12 0.51 1.5 1.16 0.64 1.19 -1.22 -2.4
Sp1del/del ESC – Flk1+ cells Cluster 10: not upregulated in mutant
Gene ES WT FPKM
ES Sp1del/del FPKM
Flk1+ WT FPKM
Flk1+ Sp1del/del FPKM
WT ES/Flk log2 FC
Sp1del/del ES/Flk log2 FC
WT FC/Sp1del/del FC
Clmp 0.69 3.72 5.39 4.26 2.97 0.2 -2.8
Raet1d 0.72 2.9 3.04 1.91 2.07 -0.6 -2.7
Amhr2 1.71 17.2 13.46 23.25 2.97 0.43 -2.5
Lax1 0.27 1.31 1.68 1.4 2.62 0.09 -2.5
Fbln2 2.24 6.99 19.3 10.5 3.11 0.59 -2.5
Otx2 6.48 23.57 22.98 17.23 1.83 -0.45 -2.3
Pakap 0.45 2.35 2.32 2.58 2.37 0.13 -2.2
Cdkl1 0.37 2.08 1.66 2.04 2.18 -0.03 -2.2
Atp2b4 0.54 2.94 3.3 4 2.61 0.44 -2.2
Loxl3 0.64 1.8 1.98 1.32 1.63 -0.45 -2.1
Myzap 1.07 2.33 6.9 3.59 2.69 0.62 -2.1
Oas1a 0.55 1.39 1.48 1.04 1.43 -0.41 -1.8
Jdp2 0.6 1.86 3.73 3.26 2.63 0.81 -1.8
Sat2 0.37 0.83 2.3 1.55 2.64 0.91 -1.7
Col1a2 1.38 4.29 3.59 3.37 1.38 -0.35 -1.7
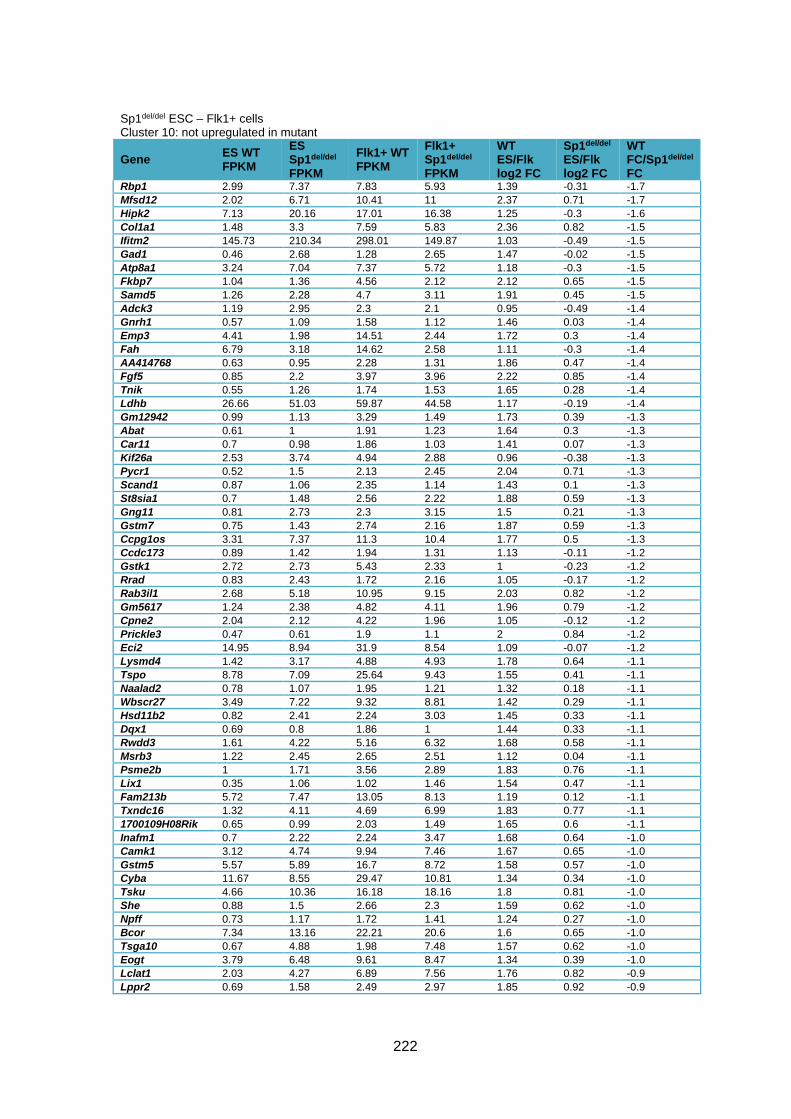
222
Sp1del/del ESC – Flk1+ cells Cluster 10: not upregulated in mutant
Gene ES WT FPKM
ES Sp1del/del FPKM
Flk1+ WT FPKM
Flk1+ Sp1del/del FPKM
WT ES/Flk log2 FC
Sp1del/del ES/Flk log2 FC
WT FC/Sp1del/del FC
Rbp1 2.99 7.37 7.83 5.93 1.39 -0.31 -1.7
Mfsd12 2.02 6.71 10.41 11 2.37 0.71 -1.7
Hipk2 7.13 20.16 17.01 16.38 1.25 -0.3 -1.6
Col1a1 1.48 3.3 7.59 5.83 2.36 0.82 -1.5
Ifitm2 145.73 210.34 298.01 149.87 1.03 -0.49 -1.5
Gad1 0.46 2.68 1.28 2.65 1.47 -0.02 -1.5
Atp8a1 3.24 7.04 7.37 5.72 1.18 -0.3 -1.5
Fkbp7 1.04 1.36 4.56 2.12 2.12 0.65 -1.5
Samd5 1.26 2.28 4.7 3.11 1.91 0.45 -1.5
Adck3 1.19 2.95 2.3 2.1 0.95 -0.49 -1.4
Gnrh1 0.57 1.09 1.58 1.12 1.46 0.03 -1.4
Emp3 4.41 1.98 14.51 2.44 1.72 0.3 -1.4
Fah 6.79 3.18 14.62 2.58 1.11 -0.3 -1.4
AA414768 0.63 0.95 2.28 1.31 1.86 0.47 -1.4
Fgf5 0.85 2.2 3.97 3.96 2.22 0.85 -1.4
Tnik 0.55 1.26 1.74 1.53 1.65 0.28 -1.4
Ldhb 26.66 51.03 59.87 44.58 1.17 -0.19 -1.4
Gm12942 0.99 1.13 3.29 1.49 1.73 0.39 -1.3
Abat 0.61 1 1.91 1.23 1.64 0.3 -1.3
Car11 0.7 0.98 1.86 1.03 1.41 0.07 -1.3
Kif26a 2.53 3.74 4.94 2.88 0.96 -0.38 -1.3
Pycr1 0.52 1.5 2.13 2.45 2.04 0.71 -1.3
Scand1 0.87 1.06 2.35 1.14 1.43 0.1 -1.3
St8sia1 0.7 1.48 2.56 2.22 1.88 0.59 -1.3
Gng11 0.81 2.73 2.3 3.15 1.5 0.21 -1.3
Gstm7 0.75 1.43 2.74 2.16 1.87 0.59 -1.3
Ccpg1os 3.31 7.37 11.3 10.4 1.77 0.5 -1.3
Ccdc173 0.89 1.42 1.94 1.31 1.13 -0.11 -1.2
Gstk1 2.72 2.73 5.43 2.33 1 -0.23 -1.2
Rrad 0.83 2.43 1.72 2.16 1.05 -0.17 -1.2
Rab3il1 2.68 5.18 10.95 9.15 2.03 0.82 -1.2
Gm5617 1.24 2.38 4.82 4.11 1.96 0.79 -1.2
Cpne2 2.04 2.12 4.22 1.96 1.05 -0.12 -1.2
Prickle3 0.47 0.61 1.9 1.1 2 0.84 -1.2
Eci2 14.95 8.94 31.9 8.54 1.09 -0.07 -1.2
Lysmd4 1.42 3.17 4.88 4.93 1.78 0.64 -1.1
Tspo 8.78 7.09 25.64 9.43 1.55 0.41 -1.1
Naalad2 0.78 1.07 1.95 1.21 1.32 0.18 -1.1
Wbscr27 3.49 7.22 9.32 8.81 1.42 0.29 -1.1
Hsd11b2 0.82 2.41 2.24 3.03 1.45 0.33 -1.1
Dqx1 0.69 0.8 1.86 1 1.44 0.33 -1.1
Rwdd3 1.61 4.22 5.16 6.32 1.68 0.58 -1.1
Msrb3 1.22 2.45 2.65 2.51 1.12 0.04 -1.1
Psme2b 1 1.71 3.56 2.89 1.83 0.76 -1.1
Lix1 0.35 1.06 1.02 1.46 1.54 0.47 -1.1
Fam213b 5.72 7.47 13.05 8.13 1.19 0.12 -1.1
Txndc16 1.32 4.11 4.69 6.99 1.83 0.77 -1.1
1700109H08Rik 0.65 0.99 2.03 1.49 1.65 0.6 -1.1
Inafm1 0.7 2.22 2.24 3.47 1.68 0.64 -1.0
Camk1 3.12 4.74 9.94 7.46 1.67 0.65 -1.0
Gstm5 5.57 5.89 16.7 8.72 1.58 0.57 -1.0
Cyba 11.67 8.55 29.47 10.81 1.34 0.34 -1.0
Tsku 4.66 10.36 16.18 18.16 1.8 0.81 -1.0
She 0.88 1.5 2.66 2.3 1.59 0.62 -1.0
Npff 0.73 1.17 1.72 1.41 1.24 0.27 -1.0
Bcor 7.34 13.16 22.21 20.6 1.6 0.65 -1.0
Tsga10 0.67 4.88 1.98 7.48 1.57 0.62 -1.0
Eogt 3.79 6.48 9.61 8.47 1.34 0.39 -1.0
Lclat1 2.03 4.27 6.89 7.56 1.76 0.82 -0.9
Lppr2 0.69 1.58 2.49 2.97 1.85 0.92 -0.9

223
Sp1del/del ESC – Flk1+ cells Cluster 10: not upregulated in mutant
Gene ES WT FPKM
ES Sp1del/del FPKM
Flk1+ WT FPKM
Flk1+ Sp1del/del FPKM
WT ES/Flk log2 FC
Sp1del/del ES/Flk log2 FC
WT FC/Sp1del/del FC
Tmem80 2.19 5.29 5.72 7.24 1.38 0.45 -0.9
Dnajb4 1.88 3.62 4.81 4.9 1.36 0.44 -0.9
Nme4 35.35 42.19 72.93 45.74 1.04 0.12 -0.9
Prob1 0.6 0.94 1.23 1.01 1.03 0.11 -0.9
Dynlt3 4.44 11.03 13.99 18.66 1.66 0.76 -0.9
Spata1 0.43 1.75 1.36 2.93 1.64 0.74 -0.9
B4gat1 4.48 7.42 9.24 8.19 1.04 0.14 -0.9
Zfp672 1.84 5.79 3.68 6.19 1 0.1 -0.9
Csf2ra 0.95 0.9 2.65 1.35 1.48 0.59 -0.9
B9d2 1.15 1.76 3.06 2.52 1.41 0.52 -0.9
Ehd2 1.83 2.92 3.78 3.29 1.05 0.17 -0.9
Mpst 5.48 12.31 10.73 13.09 0.97 0.09 -0.9
Serpinf1 0.98 2.17 2.51 3.02 1.35 0.48 -0.9
Ssh3 0.87 0.78 2.17 1.06 1.32 0.45 -0.9
Hist1h2ak 91.34 109.31 191.49 125.8 1.07 0.2 -0.9
Trpv2 0.74 1.16 1.45 1.25 0.97 0.11 -0.9
Aldh1l1 0.82 0.72 2.63 1.28 1.68 0.84 -0.8
Zfp712 0.92 2.05 2.37 2.96 1.37 0.53 -0.8
Kitl 1.85 3.16 4.07 3.88 1.14 0.3 -0.8
Sox4 6.39 11.15 20.19 20.09 1.66 0.85 -0.8
Stox2 1.06 2.84 2.98 4.56 1.49 0.68 -0.8
Stradb 2.24 4.46 5.4 6.18 1.27 0.47 -0.8
Rab39 0.55 1.14 1.27 1.53 1.22 0.42 -0.8
Dnajb14 2.33 2.95 7.43 5.42 1.67 0.88 -0.8
Stard13 1.35 1.56 3.58 2.4 1.41 0.62 -0.8
Mrpl23 21.57 36.77 47.6 47.03 1.14 0.35 -0.8
Cep131 3.25 6.29 6.84 7.65 1.07 0.28 -0.8
Gjc1 16.34 33.18 32.27 37.77 0.98 0.19 -0.8
Rtkn 4.17 7.29 10.05 10.4 1.27 0.51 -0.8
Map3k5 3.34 4.76 6.49 5.5 0.96 0.21 -0.8
Rasl11b 1.61 3.29 3.7 4.54 1.2 0.47 -0.7
Ift57 5.36 9.56 12.13 13.03 1.18 0.45 -0.7
Fam78a 0.89 1.75 1.98 2.34 1.15 0.42 -0.7
Cyth1 1.4 2.33 3.06 3.08 1.13 0.4 -0.7
Tapbpl 1.18 1.34 2.58 1.75 1.12 0.39 -0.7
Tpm2 11.5 6.77 22.34 7.96 0.96 0.23 -0.7
Lenep 1.2 2.1 3.37 3.6 1.5 0.78 -0.7
Hsd17b7 4.34 6.45 10.58 9.55 1.29 0.57 -0.7
Zbed3 1.95 2.19 4.64 3.16 1.25 0.53 -0.7
Yif1a 10.33 13.47 22.81 18.07 1.14 0.42 -0.7
Slc27a3 6.55 8.25 13.44 10.28 1.04 0.32 -0.7
Pcdhga4 0.97 1.47 2.77 2.57 1.51 0.8 -0.7
Ubxn11 0.7 0.85 1.5 1.12 1.11 0.4 -0.7
Hist1h4h 237.53 260.79 489.67 328.52 1.04 0.33 -0.7
Hspb6 0.69 0.9 1.68 1.34 1.28 0.58 -0.7
Plat 0.78 1.45 1.81 2.08 1.22 0.52 -0.7
Efna4 9.04 13.73 18.77 17.5 1.05 0.35 -0.7
Slc25a47 0.57 0.91 1.6 1.6 1.49 0.8 -0.7
Sft2d3 0.87 1.29 2.22 2.05 1.35 0.67 -0.7
Ccdc107 4.2 6.12 9.7 8.86 1.21 0.53 -0.7
Cdc42ep4 15.68 25.19 34.06 34.29 1.12 0.44 -0.7
Lyrm2 7.44 15.23 19.66 25.19 1.4 0.73 -0.7
Pcdhgb8 0.9 1.34 1.86 1.72 1.04 0.37 -0.7
Ggta1 9.96 9.63 19.85 11.98 0.99 0.32 -0.7
Srd5a3 4.29 5.73 11.31 9.58 1.4 0.74 -0.7
Sh3pxd2a 8.31 12.68 17.89 17.35 1.11 0.45 -0.7
Cers4 5.15 1.38 10.22 1.73 0.99 0.33 -0.7
Mdfic 0.48 0.71 1.36 1.28 1.5 0.85 -0.7
Ppapdc2 0.93 0.94 2.01 1.3 1.11 0.46 -0.7
Tmem218 1.84 4.38 3.97 6.03 1.11 0.46 -0.7
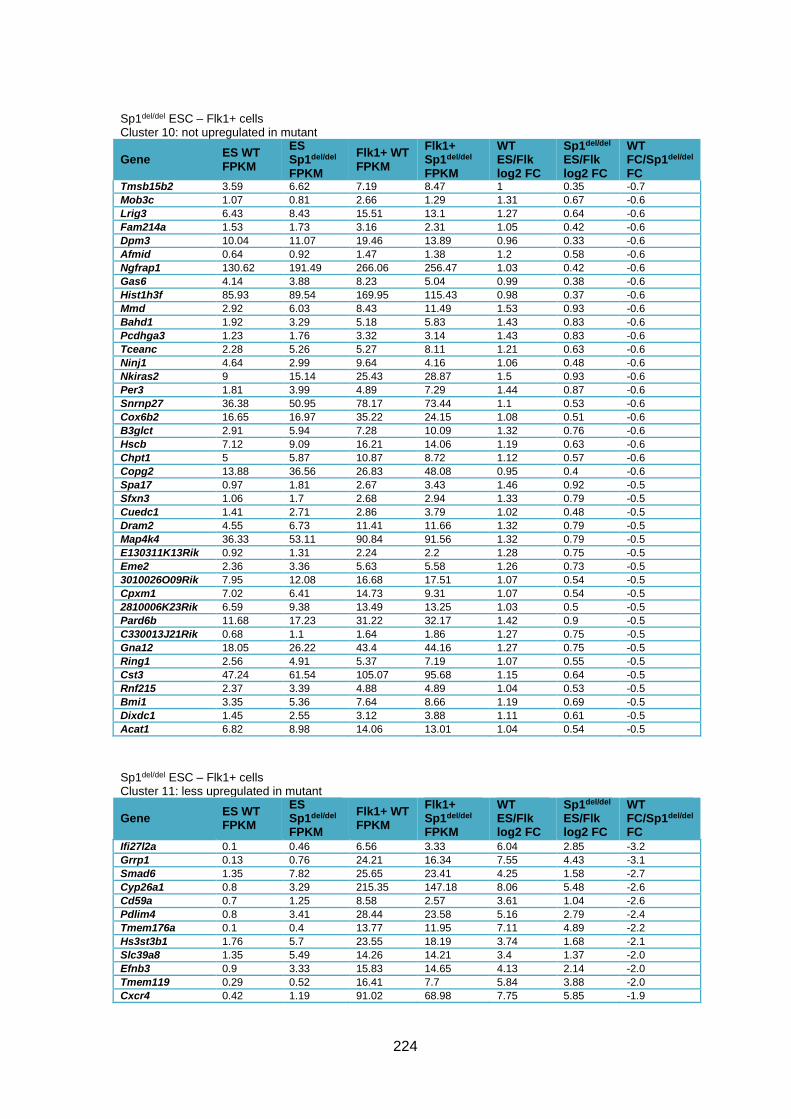
224
Sp1del/del ESC – Flk1+ cells Cluster 10: not upregulated in mutant
Gene ES WT FPKM
ES Sp1del/del FPKM
Flk1+ WT FPKM
Flk1+ Sp1del/del FPKM
WT ES/Flk log2 FC
Sp1del/del ES/Flk log2 FC
WT FC/Sp1del/del FC
Tmsb15b2 3.59 6.62 7.19 8.47 1 0.35 -0.7
Mob3c 1.07 0.81 2.66 1.29 1.31 0.67 -0.6
Lrig3 6.43 8.43 15.51 13.1 1.27 0.64 -0.6
Fam214a 1.53 1.73 3.16 2.31 1.05 0.42 -0.6
Dpm3 10.04 11.07 19.46 13.89 0.96 0.33 -0.6
Afmid 0.64 0.92 1.47 1.38 1.2 0.58 -0.6
Ngfrap1 130.62 191.49 266.06 256.47 1.03 0.42 -0.6
Gas6 4.14 3.88 8.23 5.04 0.99 0.38 -0.6
Hist1h3f 85.93 89.54 169.95 115.43 0.98 0.37 -0.6
Mmd 2.92 6.03 8.43 11.49 1.53 0.93 -0.6
Bahd1 1.92 3.29 5.18 5.83 1.43 0.83 -0.6
Pcdhga3 1.23 1.76 3.32 3.14 1.43 0.83 -0.6
Tceanc 2.28 5.26 5.27 8.11 1.21 0.63 -0.6
Ninj1 4.64 2.99 9.64 4.16 1.06 0.48 -0.6
Nkiras2 9 15.14 25.43 28.87 1.5 0.93 -0.6
Per3 1.81 3.99 4.89 7.29 1.44 0.87 -0.6
Snrnp27 36.38 50.95 78.17 73.44 1.1 0.53 -0.6
Cox6b2 16.65 16.97 35.22 24.15 1.08 0.51 -0.6
B3glct 2.91 5.94 7.28 10.09 1.32 0.76 -0.6
Hscb 7.12 9.09 16.21 14.06 1.19 0.63 -0.6
Chpt1 5 5.87 10.87 8.72 1.12 0.57 -0.6
Copg2 13.88 36.56 26.83 48.08 0.95 0.4 -0.6
Spa17 0.97 1.81 2.67 3.43 1.46 0.92 -0.5
Sfxn3 1.06 1.7 2.68 2.94 1.33 0.79 -0.5
Cuedc1 1.41 2.71 2.86 3.79 1.02 0.48 -0.5
Dram2 4.55 6.73 11.41 11.66 1.32 0.79 -0.5
Map4k4 36.33 53.11 90.84 91.56 1.32 0.79 -0.5
E130311K13Rik 0.92 1.31 2.24 2.2 1.28 0.75 -0.5
Eme2 2.36 3.36 5.63 5.58 1.26 0.73 -0.5
3010026O09Rik 7.95 12.08 16.68 17.51 1.07 0.54 -0.5
Cpxm1 7.02 6.41 14.73 9.31 1.07 0.54 -0.5
2810006K23Rik 6.59 9.38 13.49 13.25 1.03 0.5 -0.5
Pard6b 11.68 17.23 31.22 32.17 1.42 0.9 -0.5
C330013J21Rik 0.68 1.1 1.64 1.86 1.27 0.75 -0.5
Gna12 18.05 26.22 43.4 44.16 1.27 0.75 -0.5
Ring1 2.56 4.91 5.37 7.19 1.07 0.55 -0.5
Cst3 47.24 61.54 105.07 95.68 1.15 0.64 -0.5
Rnf215 2.37 3.39 4.88 4.89 1.04 0.53 -0.5
Bmi1 3.35 5.36 7.64 8.66 1.19 0.69 -0.5
Dixdc1 1.45 2.55 3.12 3.88 1.11 0.61 -0.5
Acat1 6.82 8.98 14.06 13.01 1.04 0.54 -0.5
Sp1del/del ESC – Flk1+ cells Cluster 11: less upregulated in mutant
Gene ES WT FPKM
ES Sp1del/del FPKM
Flk1+ WT FPKM
Flk1+ Sp1del/del FPKM
WT ES/Flk log2 FC
Sp1del/del ES/Flk log2 FC
WT FC/Sp1del/del FC
Ifi27l2a 0.1 0.46 6.56 3.33 6.04 2.85 -3.2
Grrp1 0.13 0.76 24.21 16.34 7.55 4.43 -3.1
Smad6 1.35 7.82 25.65 23.41 4.25 1.58 -2.7
Cyp26a1 0.8 3.29 215.35 147.18 8.06 5.48 -2.6
Cd59a 0.7 1.25 8.58 2.57 3.61 1.04 -2.6
Pdlim4 0.8 3.41 28.44 23.58 5.16 2.79 -2.4
Tmem176a 0.1 0.4 13.77 11.95 7.11 4.89 -2.2
Hs3st3b1 1.76 5.7 23.55 18.19 3.74 1.68 -2.1
Slc39a8 1.35 5.49 14.26 14.21 3.4 1.37 -2.0
Efnb3 0.9 3.33 15.83 14.65 4.13 2.14 -2.0
Tmem119 0.29 0.52 16.41 7.7 5.84 3.88 -2.0
Cxcr4 0.42 1.19 91.02 68.98 7.75 5.85 -1.9
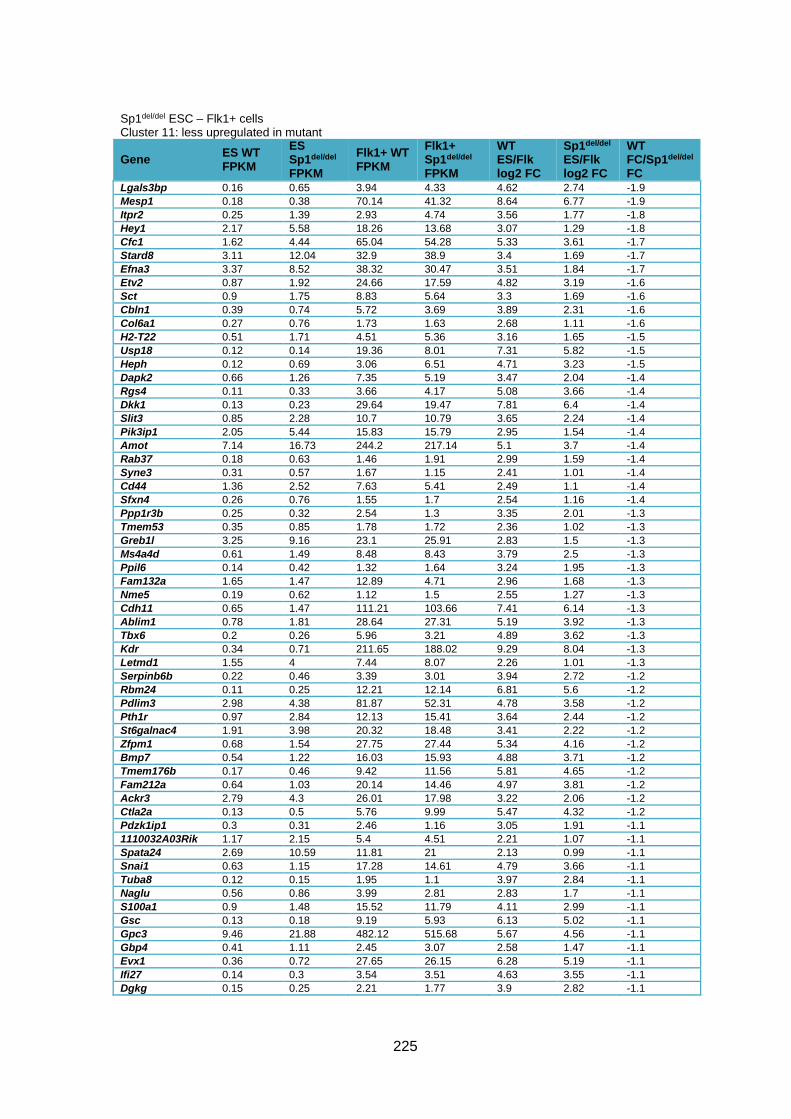
225
Sp1del/del ESC – Flk1+ cells Cluster 11: less upregulated in mutant
Gene ES WT FPKM
ES Sp1del/del FPKM
Flk1+ WT FPKM
Flk1+ Sp1del/del FPKM
WT ES/Flk log2 FC
Sp1del/del ES/Flk log2 FC
WT FC/Sp1del/del FC
Lgals3bp 0.16 0.65 3.94 4.33 4.62 2.74 -1.9
Mesp1 0.18 0.38 70.14 41.32 8.64 6.77 -1.9
Itpr2 0.25 1.39 2.93 4.74 3.56 1.77 -1.8
Hey1 2.17 5.58 18.26 13.68 3.07 1.29 -1.8
Cfc1 1.62 4.44 65.04 54.28 5.33 3.61 -1.7
Stard8 3.11 12.04 32.9 38.9 3.4 1.69 -1.7
Efna3 3.37 8.52 38.32 30.47 3.51 1.84 -1.7
Etv2 0.87 1.92 24.66 17.59 4.82 3.19 -1.6
Sct 0.9 1.75 8.83 5.64 3.3 1.69 -1.6
Cbln1 0.39 0.74 5.72 3.69 3.89 2.31 -1.6
Col6a1 0.27 0.76 1.73 1.63 2.68 1.11 -1.6
H2-T22 0.51 1.71 4.51 5.36 3.16 1.65 -1.5
Usp18 0.12 0.14 19.36 8.01 7.31 5.82 -1.5
Heph 0.12 0.69 3.06 6.51 4.71 3.23 -1.5
Dapk2 0.66 1.26 7.35 5.19 3.47 2.04 -1.4
Rgs4 0.11 0.33 3.66 4.17 5.08 3.66 -1.4
Dkk1 0.13 0.23 29.64 19.47 7.81 6.4 -1.4
Slit3 0.85 2.28 10.7 10.79 3.65 2.24 -1.4
Pik3ip1 2.05 5.44 15.83 15.79 2.95 1.54 -1.4
Amot 7.14 16.73 244.2 217.14 5.1 3.7 -1.4
Rab37 0.18 0.63 1.46 1.91 2.99 1.59 -1.4
Syne3 0.31 0.57 1.67 1.15 2.41 1.01 -1.4
Cd44 1.36 2.52 7.63 5.41 2.49 1.1 -1.4
Sfxn4 0.26 0.76 1.55 1.7 2.54 1.16 -1.4
Ppp1r3b 0.25 0.32 2.54 1.3 3.35 2.01 -1.3
Tmem53 0.35 0.85 1.78 1.72 2.36 1.02 -1.3
Greb1l 3.25 9.16 23.1 25.91 2.83 1.5 -1.3
Ms4a4d 0.61 1.49 8.48 8.43 3.79 2.5 -1.3
Ppil6 0.14 0.42 1.32 1.64 3.24 1.95 -1.3
Fam132a 1.65 1.47 12.89 4.71 2.96 1.68 -1.3
Nme5 0.19 0.62 1.12 1.5 2.55 1.27 -1.3
Cdh11 0.65 1.47 111.21 103.66 7.41 6.14 -1.3
Ablim1 0.78 1.81 28.64 27.31 5.19 3.92 -1.3
Tbx6 0.2 0.26 5.96 3.21 4.89 3.62 -1.3
Kdr 0.34 0.71 211.65 188.02 9.29 8.04 -1.3
Letmd1 1.55 4 7.44 8.07 2.26 1.01 -1.3
Serpinb6b 0.22 0.46 3.39 3.01 3.94 2.72 -1.2
Rbm24 0.11 0.25 12.21 12.14 6.81 5.6 -1.2
Pdlim3 2.98 4.38 81.87 52.31 4.78 3.58 -1.2
Pth1r 0.97 2.84 12.13 15.41 3.64 2.44 -1.2
St6galnac4 1.91 3.98 20.32 18.48 3.41 2.22 -1.2
Zfpm1 0.68 1.54 27.75 27.44 5.34 4.16 -1.2
Bmp7 0.54 1.22 16.03 15.93 4.88 3.71 -1.2
Tmem176b 0.17 0.46 9.42 11.56 5.81 4.65 -1.2
Fam212a 0.64 1.03 20.14 14.46 4.97 3.81 -1.2
Ackr3 2.79 4.3 26.01 17.98 3.22 2.06 -1.2
Ctla2a 0.13 0.5 5.76 9.99 5.47 4.32 -1.2
Pdzk1ip1 0.3 0.31 2.46 1.16 3.05 1.91 -1.1
1110032A03Rik 1.17 2.15 5.4 4.51 2.21 1.07 -1.1
Spata24 2.69 10.59 11.81 21 2.13 0.99 -1.1
Snai1 0.63 1.15 17.28 14.61 4.79 3.66 -1.1
Tuba8 0.12 0.15 1.95 1.1 3.97 2.84 -1.1
Naglu 0.56 0.86 3.99 2.81 2.83 1.7 -1.1
S100a1 0.9 1.48 15.52 11.79 4.11 2.99 -1.1
Gsc 0.13 0.18 9.19 5.93 6.13 5.02 -1.1
Gpc3 9.46 21.88 482.12 515.68 5.67 4.56 -1.1
Gbp4 0.41 1.11 2.45 3.07 2.58 1.47 -1.1
Evx1 0.36 0.72 27.65 26.15 6.28 5.19 -1.1
Ifi27 0.14 0.3 3.54 3.51 4.63 3.55 -1.1
Dgkg 0.15 0.25 2.21 1.77 3.9 2.82 -1.1
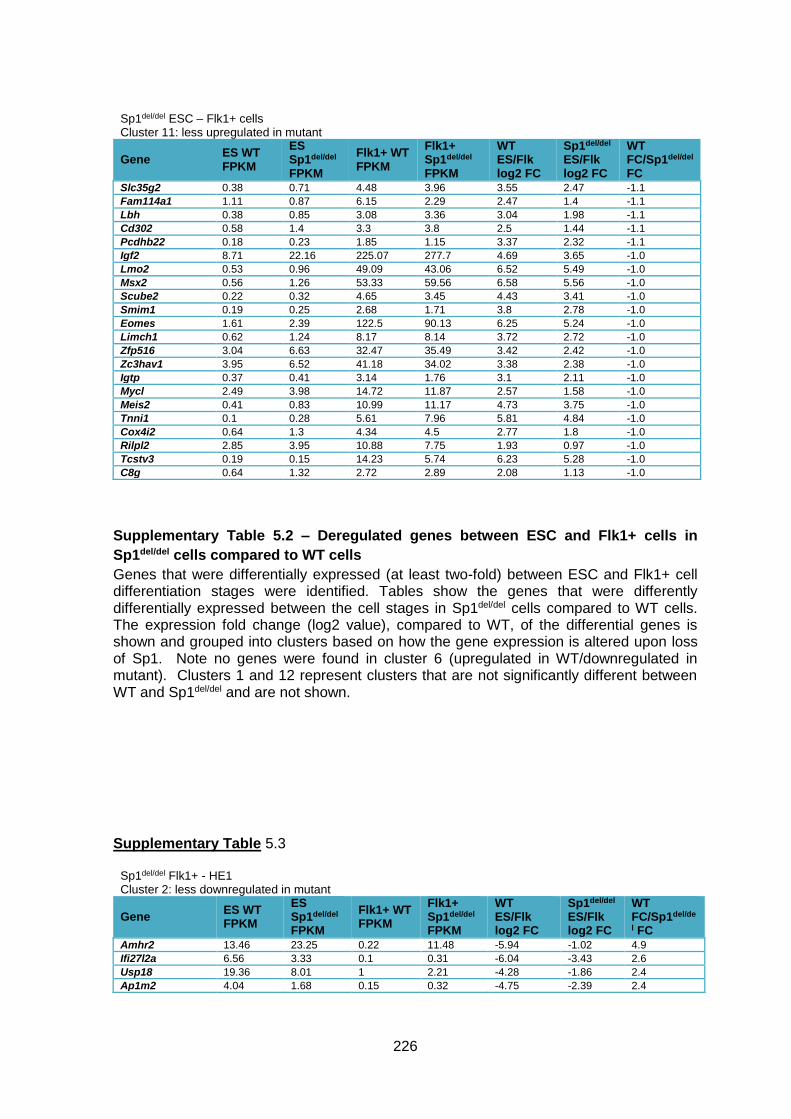
226
Sp1del/del ESC – Flk1+ cells Cluster 11: less upregulated in mutant
Gene ES WT FPKM
ES Sp1del/del FPKM
Flk1+ WT FPKM
Flk1+ Sp1del/del FPKM
WT ES/Flk log2 FC
Sp1del/del ES/Flk log2 FC
WT FC/Sp1del/del FC
Slc35g2 0.38 0.71 4.48 3.96 3.55 2.47 -1.1
Fam114a1 1.11 0.87 6.15 2.29 2.47 1.4 -1.1
Lbh 0.38 0.85 3.08 3.36 3.04 1.98 -1.1
Cd302 0.58 1.4 3.3 3.8 2.5 1.44 -1.1
Pcdhb22 0.18 0.23 1.85 1.15 3.37 2.32 -1.1
Igf2 8.71 22.16 225.07 277.7 4.69 3.65 -1.0
Lmo2 0.53 0.96 49.09 43.06 6.52 5.49 -1.0
Msx2 0.56 1.26 53.33 59.56 6.58 5.56 -1.0
Scube2 0.22 0.32 4.65 3.45 4.43 3.41 -1.0
Smim1 0.19 0.25 2.68 1.71 3.8 2.78 -1.0
Eomes 1.61 2.39 122.5 90.13 6.25 5.24 -1.0
Limch1 0.62 1.24 8.17 8.14 3.72 2.72 -1.0
Zfp516 3.04 6.63 32.47 35.49 3.42 2.42 -1.0
Zc3hav1 3.95 6.52 41.18 34.02 3.38 2.38 -1.0
Igtp 0.37 0.41 3.14 1.76 3.1 2.11 -1.0
Mycl 2.49 3.98 14.72 11.87 2.57 1.58 -1.0
Meis2 0.41 0.83 10.99 11.17 4.73 3.75 -1.0
Tnni1 0.1 0.28 5.61 7.96 5.81 4.84 -1.0
Cox4i2 0.64 1.3 4.34 4.5 2.77 1.8 -1.0
Rilpl2 2.85 3.95 10.88 7.75 1.93 0.97 -1.0
Tcstv3 0.19 0.15 14.23 5.74 6.23 5.28 -1.0
C8g 0.64 1.32 2.72 2.89 2.08 1.13 -1.0
Supplementary Table 5.2 – Deregulated genes between ESC and Flk1+ cells in
Sp1del/del cells compared to WT cells
Genes that were differentially expressed (at least two-fold) between ESC and Flk1+ cell differentiation stages were identified. Tables show the genes that were differently differentially expressed between the cell stages in Sp1del/del cells compared to WT cells. The expression fold change (log2 value), compared to WT, of the differential genes is shown and grouped into clusters based on how the gene expression is altered upon loss of Sp1. Note no genes were found in cluster 6 (upregulated in WT/downregulated in mutant). Clusters 1 and 12 represent clusters that are not significantly different between WT and Sp1del/del and are not shown.
Supplementary Table 5.3
Sp1del/del Flk1+ - HE1 Cluster 2: less downregulated in mutant
Gene ES WT FPKM
ES Sp1del/del FPKM
Flk1+ WT FPKM
Flk1+ Sp1del/del FPKM
WT ES/Flk log2 FC
Sp1del/del ES/Flk log2 FC
WT FC/Sp1del/de
l FC
Amhr2 13.46 23.25 0.22 11.48 -5.94 -1.02 4.9
Ifi27l2a 6.56 3.33 0.1 0.31 -6.04 -3.43 2.6
Usp18 19.36 8.01 1 2.21 -4.28 -1.86 2.4
Ap1m2 4.04 1.68 0.15 0.32 -4.75 -2.39 2.4

227
Sp1del/del Flk1+ - HE1 Cluster 2: less downregulated in mutant
Gene ES WT FPKM
ES Sp1del/del FPKM
Flk1+ WT FPKM
Flk1+ Sp1del/del FPKM
WT ES/Flk log2 FC
Sp1del/del ES/Flk log2 FC
WT FC/Sp1del/de
l FC Krtcap3 3.78 1.78 0.24 0.58 -3.98 -1.62 2.4
4930447C04Rik 2.16 6.05 0.14 1.8 -3.95 -1.75 2.2
Ptgds 9.23 2.53 0.1 0.1 -6.53 -4.66 1.9
Cyp2s1 4.3 2.51 0.33 0.7 -3.7 -1.84 1.9
T 64.59 52.02 0.16 0.44 -8.66 -6.89 1.8
Stk26 8.3 3.79 0.97 1.4 -3.1 -1.44 1.7
Ctsc 34.3 34.18 1.93 5.63 -4.15 -2.6 1.6
Ntm 2.51 2.13 0.13 0.31 -4.27 -2.78 1.5
Kcnk1 5.97 3.59 0.81 1.34 -2.88 -1.42 1.5
L1td1 7.34 4.27 0.77 1.2 -3.25 -1.83 1.4
Gjb5 2.75 1.01 0.32 0.31 -3.1 -1.7 1.4
Pdzk1ip1 2.46 1.16 0.29 0.36 -3.08 -1.69 1.4
Podn 2.15 1.34 0.4 0.65 -2.43 -1.04 1.4
Tcstv3 14.23 5.74 0.1 0.1 -7.15 -5.84 1.3
Pgr 1.93 1.43 0.15 0.27 -3.69 -2.4 1.3
Rxrg 2.24 1.97 0.25 0.54 -3.16 -1.87 1.3
Ndufa4l2 13.3 5.57 0.1 0.1 -7.06 -5.8 1.3
Penk 1.77 1.37 0.18 0.33 -3.3 -2.05 1.3
Pdgfra 45.47 35.75 9.82 18.4 -2.21 -0.96 1.3
Jakmip1 1.94 1.28 0.2 0.31 -3.28 -2.05 1.2
Ptpn3 2.81 1.81 0.47 0.71 -2.58 -1.35 1.2
Mt2 6.69 1.63 0.69 0.38 -3.28 -2.1 1.2
Tbx6 5.96 3.21 0.44 0.53 -3.76 -2.6 1.2
Ptprj 13.6 11.08 2.1 3.81 -2.7 -1.54 1.2
Arhgap22 3.62 1.98 0.25 0.3 -3.86 -2.72 1.1
Ripk4 9.56 5.94 0.94 1.28 -3.35 -2.21 1.1
Sp8 2.5 1.99 0.36 0.63 -2.8 -1.66 1.1
Epcam 10.24 5.1 0.48 0.52 -4.42 -3.29 1.1
Dnajc22 2.24 2.38 0.4 0.91 -2.49 -1.39 1.1
Mesp2 1.7 1.43 0.13 0.23 -3.71 -2.64 1.1
Tsacc 5.13 5.37 1.12 2.42 -2.2 -1.15 1.1
Egflam 3.94 2.75 0.6 0.86 -2.72 -1.68 1.0
Aldoc 6.44 1.68 0.47 0.25 -3.78 -2.75 1.0
Tmem243 11.9 11.63 2.24 4.47 -2.41 -1.38 1.0
Alox15 4.52 2.59 0.13 0.15 -5.12 -4.11 1.0
Dkk1 29.64 19.47 1.58 2.09 -4.23 -3.22 1.0
Bmp7 16.03 15.93 0.2 0.4 -6.32 -5.32 1.0
Ppp4r4 3.88 2.24 0.32 0.37 -3.6 -2.6 1.0
Stmn2 13.4 18.04 3.04 8.17 -2.14 -1.14 1.0
Sulf1 40.64 47.49 10.43 24.48 -1.96 -0.96 1.0
Tnfrsf19 30.65 32.61 1.14 2.41 -4.75 -3.76 1.0
Bnip3 60.15 52.54 6.63 11.52 -3.18 -2.19 1.0
Chic1 6.48 5.16 1.56 2.48 -2.05 -1.06 1.0
Fam49a 8.13 6.27 2.08 3.16 -1.97 -0.99 1.0
Esrp1 2.45 1.05 0.18 0.15 -3.77 -2.81 1.0
Nptx2 3.74 4.25 0.77 1.7 -2.28 -1.32 1.0
Sp1del/del Flk1+ - HE1 Cluster 3: not downregulated in mutant
Gene ES WT FPKM
ES Sp1del/del FPKM
Flk1+ WT FPKM
Flk1+ Sp1del/del FPKM
WT ES/Flk log2 FC
Sp1del/del ES/Flk log2 FC
WT FC/Sp1del/del FC
Acta1 3.4 4.03 1.54 7.04 -1.14 0.8 1.9
Gbp2b 5.54 3.49 2.31 5.42 -1.26 0.64 1.9
Ifi30 17.54 8.97 5.18 9.82 -1.76 0.13 1.9
Cox7a1 9.37 2.89 2.56 2.81 -1.87 -0.04 1.8
Cbln1 5.72 3.69 1.34 2.6 -2.09 -0.51 1.6
Gja6 1.53 1.21 0.41 0.9 -1.9 -0.43 1.5
Mt1 11.38 2.85 4.37 2.95 -1.38 0.05 1.4

228
Sp1del/del Flk1+ - HE1 Cluster 3: not downregulated in mutant
Gene ES WT FPKM
ES Sp1del/del FPKM
Flk1+ WT FPKM
Flk1+ Sp1del/del FPKM
WT ES/Flk log2 FC
Sp1del/del ES/Flk log2 FC
WT FC/Sp1del/del FC
Slc6a15 6.43 5.09 1.62 3.31 -1.99 -0.62 1.4
Cdh1 7.73 6.05 2.24 4.34 -1.79 -0.48 1.3
2610305D13Rik 9.38 2.65 4.16 2.88 -1.17 0.12 1.3
Lgals3 4.87 1.81 1.4 1.23 -1.8 -0.56 1.2
H2-DMa 1.42 1.1 0.46 0.83 -1.63 -0.41 1.2
Gbp2 15.09 9.01 5.93 8.24 -1.35 -0.13 1.2
Zfp65 9.83 8.89 4.09 8.58 -1.27 -0.05 1.2
Cd68 6.18 3.29 2.28 2.8 -1.44 -0.23 1.2
Mybl1 6.4 6.04 2.22 4.68 -1.53 -0.37 1.2
Gria4 3.12 3.25 1.43 3.32 -1.13 0.03 1.2
Cth 11.93 6.86 3.92 4.97 -1.61 -0.46 1.2
Gm13154 3.83 2.36 1.1 1.49 -1.8 -0.66 1.1
Spint2 11.16 5.27 2.73 2.81 -2.03 -0.91 1.1
Acy1 19.38 20.13 6.21 13.59 -1.64 -0.57 1.1
Loxl4 1.16 1.08 0.55 1.07 -1.08 -0.01 1.1
Sp4 4.8 11.57 1.45 7.27 -1.73 -0.67 1.1
St14 2.14 1.05 1.02 1.04 -1.07 -0.01 1.1
Shisa2 1.53 1.77 0.4 0.95 -1.94 -0.9 1.0
Gbp8 1.36 1.16 0.41 0.71 -1.73 -0.71 1.0
Stbd1 7.89 3.94 2.12 2.12 -1.9 -0.89 1.0
Zfp760 13.48 14.16 4.63 9.73 -1.54 -0.54 1.0
Adcy2 2.6 1.58 1.02 1.24 -1.35 -0.35 1.0
Esf1 36.71 28.58 11.93 18.48 -1.62 -0.63 1.0
Pdgfa 11.84 10.37 4.38 7.67 -1.43 -0.44 1.0
Dusp9 45.57 33.59 17.22 25.28 -1.4 -0.41 1.0
Gm14124 1.54 1.31 0.61 1.03 -1.34 -0.35 1.0
Zfp53 5.14 4.32 2.37 3.96 -1.12 -0.13 1.0
Vps13a 6.85 3.65 3.23 3.42 -1.08 -0.09 1.0
Zfp729b 11.01 9.08 3.83 6.23 -1.52 -0.54 1.0
Slc16a1 109.73 90.48 41.63 67.8 -1.4 -0.42 1.0
Ube2v2 4.92 3.86 1.86 2.86 -1.4 -0.43 1.0
Rgs4 3.66 4.17 1.89 4.24 -0.95 0.02 1.0
Zfp85 3.73 3.63 1.8 3.38 -1.05 -0.1 1.0
Tmem53 1.78 1.72 0.71 1.3 -1.33 -0.4 0.9
AU041133 5.92 4.99 2.36 3.7 -1.33 -0.43 0.9
Rnase4 7.12 4.22 2.38 2.61 -1.58 -0.69 0.9
Thoc2 32.38 28.41 13.56 21.98 -1.26 -0.37 0.9
Stxbp6 2 1.62 0.72 1.07 -1.47 -0.6 0.9
Clstn2 1.33 1.63 0.56 1.25 -1.25 -0.38 0.9
Sfmbt2 11.84 12.13 4.57 8.5 -1.37 -0.51 0.9
Pdgfrl 2.92 2.69 1.33 2.23 -1.13 -0.27 0.9
Wdr35 10.71 9.54 4.97 8.01 -1.11 -0.25 0.9
Arhgdig 8.05 8.92 2.48 4.95 -1.7 -0.85 0.9
Lrif1 15.6 11.99 6.62 9.13 -1.24 -0.39 0.9
Zfp758 5.66 4.72 1.68 2.5 -1.75 -0.92 0.8
Cep290 6.86 6.82 2.25 3.96 -1.61 -0.78 0.8
Zfp40 3.83 4.24 1.36 2.69 -1.49 -0.66 0.8
Rab38 2.96 1.68 1.49 1.5 -0.99 -0.16 0.8
Frs3 1.82 1.61 0.67 1.05 -1.44 -0.62 0.8
1700109H08Rik 2.03 1.49 1.05 1.36 -0.95 -0.13 0.8
Zfp942 15.03 13.2 4.78 7.37 -1.65 -0.84 0.8
Etohi1 13.31 11.59 4.45 6.74 -1.58 -0.78 0.8
Oasl2 1.15 1.06 0.51 0.82 -1.17 -0.37 0.8
Nbeal1 13.8 14.07 6.21 11.07 -1.15 -0.35 0.8
Bmp4 129.83 95.92 40.04 51.19 -1.7 -0.91 0.8
Zfp617 5.88 5.58 2.94 4.82 -1 -0.21 0.8
Wnk3 6.96 7.23 2.2 3.92 -1.66 -0.88 0.8
Ankrd12 4.12 4.2 2.12 3.7 -0.96 -0.18 0.8
Dock11 48.32 45.3 16.25 25.93 -1.57 -0.8 0.8
Fam126b 5.35 4.46 1.86 2.65 -1.52 -0.75 0.8
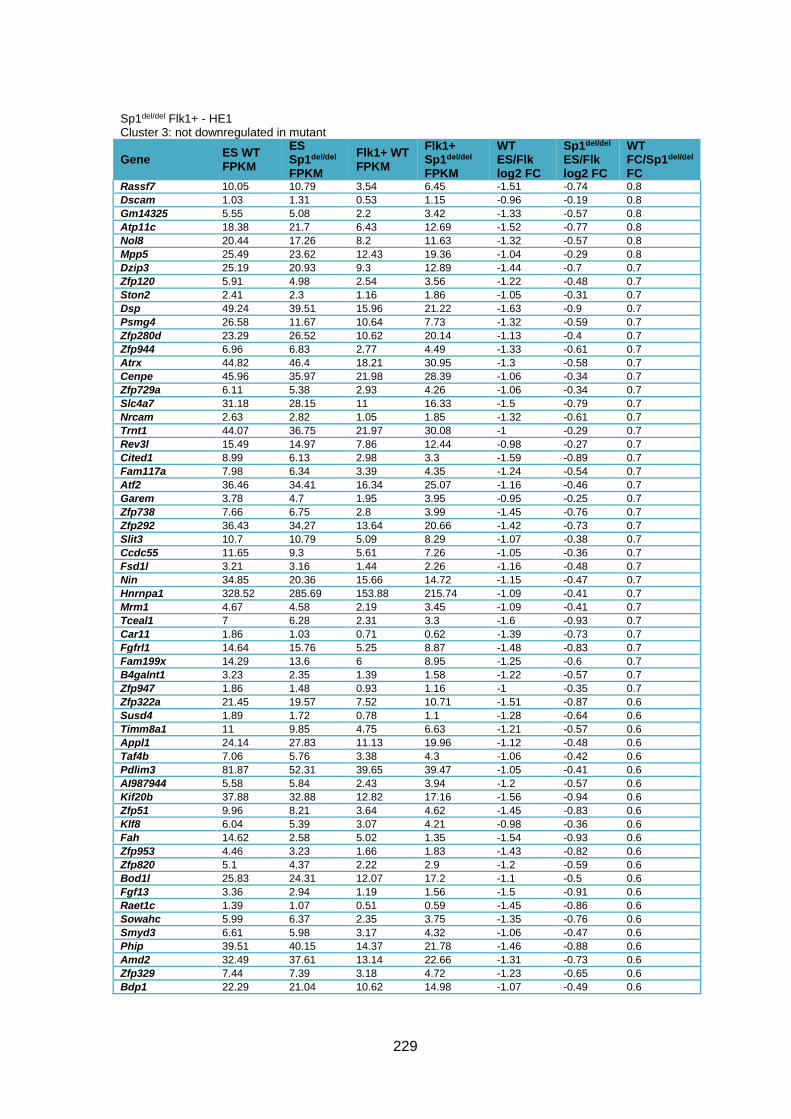
229
Sp1del/del Flk1+ - HE1 Cluster 3: not downregulated in mutant
Gene ES WT FPKM
ES Sp1del/del FPKM
Flk1+ WT FPKM
Flk1+ Sp1del/del FPKM
WT ES/Flk log2 FC
Sp1del/del ES/Flk log2 FC
WT FC/Sp1del/del FC
Rassf7 10.05 10.79 3.54 6.45 -1.51 -0.74 0.8
Dscam 1.03 1.31 0.53 1.15 -0.96 -0.19 0.8
Gm14325 5.55 5.08 2.2 3.42 -1.33 -0.57 0.8
Atp11c 18.38 21.7 6.43 12.69 -1.52 -0.77 0.8
Nol8 20.44 17.26 8.2 11.63 -1.32 -0.57 0.8
Mpp5 25.49 23.62 12.43 19.36 -1.04 -0.29 0.8
Dzip3 25.19 20.93 9.3 12.89 -1.44 -0.7 0.7
Zfp120 5.91 4.98 2.54 3.56 -1.22 -0.48 0.7
Ston2 2.41 2.3 1.16 1.86 -1.05 -0.31 0.7
Dsp 49.24 39.51 15.96 21.22 -1.63 -0.9 0.7
Psmg4 26.58 11.67 10.64 7.73 -1.32 -0.59 0.7
Zfp280d 23.29 26.52 10.62 20.14 -1.13 -0.4 0.7
Zfp944 6.96 6.83 2.77 4.49 -1.33 -0.61 0.7
Atrx 44.82 46.4 18.21 30.95 -1.3 -0.58 0.7
Cenpe 45.96 35.97 21.98 28.39 -1.06 -0.34 0.7
Zfp729a 6.11 5.38 2.93 4.26 -1.06 -0.34 0.7
Slc4a7 31.18 28.15 11 16.33 -1.5 -0.79 0.7
Nrcam 2.63 2.82 1.05 1.85 -1.32 -0.61 0.7
Trnt1 44.07 36.75 21.97 30.08 -1 -0.29 0.7
Rev3l 15.49 14.97 7.86 12.44 -0.98 -0.27 0.7
Cited1 8.99 6.13 2.98 3.3 -1.59 -0.89 0.7
Fam117a 7.98 6.34 3.39 4.35 -1.24 -0.54 0.7
Atf2 36.46 34.41 16.34 25.07 -1.16 -0.46 0.7
Garem 3.78 4.7 1.95 3.95 -0.95 -0.25 0.7
Zfp738 7.66 6.75 2.8 3.99 -1.45 -0.76 0.7
Zfp292 36.43 34.27 13.64 20.66 -1.42 -0.73 0.7
Slit3 10.7 10.79 5.09 8.29 -1.07 -0.38 0.7
Ccdc55 11.65 9.3 5.61 7.26 -1.05 -0.36 0.7
Fsd1l 3.21 3.16 1.44 2.26 -1.16 -0.48 0.7
Nin 34.85 20.36 15.66 14.72 -1.15 -0.47 0.7
Hnrnpa1 328.52 285.69 153.88 215.74 -1.09 -0.41 0.7
Mrm1 4.67 4.58 2.19 3.45 -1.09 -0.41 0.7
Tceal1 7 6.28 2.31 3.3 -1.6 -0.93 0.7
Car11 1.86 1.03 0.71 0.62 -1.39 -0.73 0.7
Fgfrl1 14.64 15.76 5.25 8.87 -1.48 -0.83 0.7
Fam199x 14.29 13.6 6 8.95 -1.25 -0.6 0.7
B4galnt1 3.23 2.35 1.39 1.58 -1.22 -0.57 0.7
Zfp947 1.86 1.48 0.93 1.16 -1 -0.35 0.7
Zfp322a 21.45 19.57 7.52 10.71 -1.51 -0.87 0.6
Susd4 1.89 1.72 0.78 1.1 -1.28 -0.64 0.6
Timm8a1 11 9.85 4.75 6.63 -1.21 -0.57 0.6
Appl1 24.14 27.83 11.13 19.96 -1.12 -0.48 0.6
Taf4b 7.06 5.76 3.38 4.3 -1.06 -0.42 0.6
Pdlim3 81.87 52.31 39.65 39.47 -1.05 -0.41 0.6
AI987944 5.58 5.84 2.43 3.94 -1.2 -0.57 0.6
Kif20b 37.88 32.88 12.82 17.16 -1.56 -0.94 0.6
Zfp51 9.96 8.21 3.64 4.62 -1.45 -0.83 0.6
Klf8 6.04 5.39 3.07 4.21 -0.98 -0.36 0.6
Fah 14.62 2.58 5.02 1.35 -1.54 -0.93 0.6
Zfp953 4.46 3.23 1.66 1.83 -1.43 -0.82 0.6
Zfp820 5.1 4.37 2.22 2.9 -1.2 -0.59 0.6
Bod1l 25.83 24.31 12.07 17.2 -1.1 -0.5 0.6
Fgf13 3.36 2.94 1.19 1.56 -1.5 -0.91 0.6
Raet1c 1.39 1.07 0.51 0.59 -1.45 -0.86 0.6
Sowahc 5.99 6.37 2.35 3.75 -1.35 -0.76 0.6
Smyd3 6.61 5.98 3.17 4.32 -1.06 -0.47 0.6
Phip 39.51 40.15 14.37 21.78 -1.46 -0.88 0.6
Amd2 32.49 37.61 13.14 22.66 -1.31 -0.73 0.6
Zfp329 7.44 7.39 3.18 4.72 -1.23 -0.65 0.6
Bdp1 22.29 21.04 10.62 14.98 -1.07 -0.49 0.6

230
Sp1del/del Flk1+ - HE1 Cluster 3: not downregulated in mutant
Gene ES WT FPKM
ES Sp1del/del FPKM
Flk1+ WT FPKM
Flk1+ Sp1del/del FPKM
WT ES/Flk log2 FC
Sp1del/del ES/Flk log2 FC
WT FC/Sp1del/del FC
Zfp943 5.32 5.63 2 3.14 -1.41 -0.84 0.6
Smc3 69.92 65.79 27.61 38.61 -1.34 -0.77 0.6
Zfp182 3.36 2.7 1.66 1.98 -1.02 -0.45 0.6
C330027C09Rik 34.54 28.94 17.43 21.66 -0.99 -0.42 0.6
Mbtd1 35.33 32.32 13.09 17.65 -1.43 -0.87 0.6
Acrbp 3.3 2.66 1.26 1.5 -1.39 -0.83 0.6
Pcmtd1 18.45 16 7.03 9 -1.39 -0.83 0.6
Smc6 44.73 44.89 18.16 26.8 -1.3 -0.74 0.6
Zfp874b 8.5 7.07 3.7 4.53 -1.2 -0.64 0.6
Upf2 17.09 18.33 7.52 11.95 -1.18 -0.62 0.6
Capn6 45.42 43.38 20.3 28.6 -1.16 -0.6 0.6
Twist1 11.24 7.26 5.23 5.01 -1.1 -0.54 0.6
Ncl 174.21 140.72 83.07 99.15 -1.07 -0.51 0.6
Sorl1 3.45 3.76 1.28 2.04 -1.43 -0.88 0.6
St8sia2 2.11 2.27 0.98 1.54 -1.11 -0.56 0.6
Snapc1 4.66 4.92 2.33 3.61 -1 -0.45 0.6
Prrg1 2.97 2.63 1.52 1.97 -0.97 -0.42 0.6
Carf 4.53 4.16 1.96 2.61 -1.21 -0.67 0.5
Chpf 7.12 6.86 2.67 3.69 -1.42 -0.89 0.5
Senp8 6.21 9.03 2.41 5.06 -1.37 -0.84 0.5
Aasdhppt 22.95 19.7 9.18 11.43 -1.32 -0.79 0.5
Atxn3 17.4 20.63 7.09 12.06 -1.3 -0.77 0.5
Hspbap1 5.56 4.94 2.29 2.94 -1.28 -0.75 0.5
Mrps36 22.64 18.56 10.07 11.95 -1.17 -0.64 0.5
2300009A05Rik 2.33 2.1 1.1 1.43 -1.08 -0.55 0.5
Tbc1d16 12.97 12.47 6.3 8.77 -1.04 -0.51 0.5
Imp3 55.56 38.71 27.87 27.93 -1 -0.47 0.5
Glmn 20.66 25.86 10.61 19.23 -0.96 -0.43 0.5
Dusp28 1.33 1.55 0.49 0.82 -1.44 -0.92 0.5
Mettl5 19.08 17.69 7.32 9.73 -1.38 -0.86 0.5
Dixdc1 3.12 3.88 1.24 2.21 -1.33 -0.81 0.5
Tmem88 71.73 36.56 28.48 20.85 -1.33 -0.81 0.5
Zfp518a 16.43 18.64 6.68 10.87 -1.3 -0.78 0.5
Gm20939 2.97 2.65 1.32 1.69 -1.17 -0.65 0.5
Nova1 1.8 1.74 0.69 0.95 -1.38 -0.87 0.5
Dctd 26.4 19.61 10.3 10.85 -1.36 -0.85 0.5
Trim12c 9.13 8.99 3.77 5.27 -1.28 -0.77 0.5
Ythdc2 7.04 8.04 3.11 5.04 -1.18 -0.67 0.5
Rsf1 18.65 18.39 9.34 13.12 -1 -0.49 0.5
Nars2 8.17 7.67 4.12 5.5 -0.99 -0.48 0.5
Helb 5.55 4.96 2.19 2.78 -1.34 -0.84 0.5
Zfp62 29.39 29.3 12.54 17.64 -1.23 -0.73 0.5
Akap7 8.35 7.63 3.62 4.65 -1.21 -0.71 0.5
2210404O09Rik 4.05 2.91 1.84 1.87 -1.14 -0.64 0.5
Sp1del/del Flk1+ - HE1 Cluster 4: more downregulated in mutant
Gene ES WT FPKM
ES Sp1del/del FPKM
Flk1+ WT FPKM
Flk1+ Sp1del/del FPKM
WT ES/Flk log2 FC
Sp1del/del ES/Flk log2 FC
WT FC/Sp1del/del FC
Ccdc106 2.63 5.69 0.39 0.24 -2.75 -4.57 -1.8
Rbp4 2.06 3.37 0.51 0.25 -2.01 -3.75 -1.7
Il18 1.36 2.46 0.46 0.25 -1.56 -3.3 -1.7
Rims3 1.67 1.11 0.84 0.17 -0.99 -2.71 -1.7
Scara5 1.05 2.11 0.26 0.16 -2.01 -3.72 -1.7
Asb4 51.6 75.26 13.47 6.04 -1.94 -3.64 -1.7
Nlgn3 1.64 3.44 0.33 0.22 -2.31 -3.97 -1.7
Slc32a1 1.13 2.23 0.22 0.14 -2.36 -3.99 -1.6

231
Sp1del/del Flk1+ - HE1 Cluster 4: more downregulated in mutant
Gene ES WT FPKM
ES Sp1del/del FPKM
Flk1+ WT FPKM
Flk1+ Sp1del/del FPKM
WT ES/Flk log2 FC
Sp1del/del ES/Flk log2 FC
WT FC/Sp1del/del FC
Hoxb1 4.03 12.32 0.1 0.1 -5.33 -6.94 -1.6
Raet1e 2.61 2.16 0.43 0.12 -2.6 -4.17 -1.6
Slc22a21 2.2 1.45 1.09 0.26 -1.01 -2.48 -1.5
Asic4 2.46 3.5 0.36 0.19 -2.77 -4.2 -1.4
Grik4 1.15 1.33 0.39 0.17 -1.56 -2.97 -1.4
Zcwpw1 5.13 14.91 1.43 1.59 -1.84 -3.23 -1.4
H2-Bl 1.22 1.19 0.26 0.1 -2.23 -3.57 -1.3
Kcnj5 3.58 3.6 0.5 0.2 -2.84 -4.17 -1.3
Tcf7 21.31 19.51 4.88 1.81 -2.13 -3.43 -1.3
Myb 3.74 4 1.14 0.5 -1.71 -3 -1.3
Gfra2 13.26 15.57 2.53 1.23 -2.39 -3.66 -1.3
Hoga1 1.49 1.35 0.56 0.21 -1.41 -2.68 -1.3
EU599041 1.03 2.67 0.13 0.14 -2.99 -4.25 -1.3
Lrrc3 2.13 2.94 0.96 0.56 -1.15 -2.39 -1.2
Tnni3 1.02 1.39 0.17 0.1 -2.58 -3.8 -1.2
Lrrc16b 2.24 3.48 0.6 0.4 -1.9 -3.12 -1.2
Slc8a2 2.27 3.1 0.27 0.16 -3.07 -4.28 -1.2
Neurl1a 4.71 2.52 2.42 0.56 -0.96 -2.17 -1.2
Etv2 24.66 17.59 3.34 1.04 -2.88 -4.08 -1.2
Lrfn1 3.13 3.01 1.12 0.47 -1.48 -2.68 -1.2
Grin2c 2.84 1.98 0.68 0.21 -2.06 -3.24 -1.2
Rangrf 22.65 16.66 9.97 3.25 -1.18 -2.36 -1.2
Slc12a7 16.78 15.64 6.94 2.9 -1.27 -2.43 -1.2
BC051142 1.02 2.01 0.27 0.24 -1.92 -3.07 -1.2
Syndig1 7.5 9.12 0.23 0.13 -5.03 -6.13 -1.1
Glt1d1 11.54 10.01 1.06 0.43 -3.44 -4.54 -1.1
Megf6 1.45 2.22 0.74 0.53 -0.97 -2.07 -1.1
Ccdc109b 2.07 3.66 0.29 0.24 -2.84 -3.93 -1.1
Nyap1 2.96 2.49 0.8 0.32 -1.89 -2.96 -1.1
Mpp2 3.45 4.23 1.78 1.06 -0.95 -2 -1.1
Celsr1 4.45 6.71 0.64 0.47 -2.8 -3.84 -1.0
Ubxn11 1.5 1.12 0.49 0.18 -1.61 -2.64 -1.0
Il15ra 2.02 2.31 0.92 0.52 -1.13 -2.15 -1.0
Pygo1 2.88 3.2 1.33 0.73 -1.11 -2.13 -1.0
Lgi2 1.67 3.65 0.23 0.25 -2.86 -3.87 -1.0
Col23a1 9.72 9.37 1.77 0.85 -2.46 -3.46 -1.0
Fgf8 24.7 20.56 0.24 0.1 -6.69 -7.68 -1.0
Ak8 1.27 2.02 0.55 0.44 -1.21 -2.2 -1.0
Efr3b 1.39 1.74 0.68 0.43 -1.03 -2.02 -1.0
Pcdhac2 1.73 2.42 0.17 0.12 -3.35 -4.33 -1.0
Padi3 5.18 6.5 0.61 0.39 -3.09 -4.06 -1.0
Cmklr1 2.19 2.93 0.89 0.61 -1.3 -2.26 -1.0
Dnase2a 3.27 2.32 1.63 0.6 -1 -1.95 -1.0
Sp1del/del Flk1+ - HE1 Cluster 5: downregulated in mutant/no change in WT
Gene ES WT FPKM
ES Sp1del/del FPKM
Flk1+ WT FPKM
Flk1+ Sp1del/del FPKM
WT ES/Flk log2 FC
Sp1del/del ES/Flk log2 FC
WT FC/Sp1del/del FC
Gstk1 5.43 2.33 6.95 0.65 0.36 -1.84 -2.2
Ifitm5 1.84 1.15 1.19 0.2 -0.63 -2.52 -1.9
Rnaset2a 2.49 2.81 1.97 0.7 -0.34 -2.01 -1.7
Hoxd1 1.53 2.53 1.06 0.58 -0.53 -2.13 -1.6
Efna1 12.2 11.76 13.11 4.45 0.1 -1.4 -1.5
Epor 3.84 3.69 2.63 0.9 -0.55 -2.04 -1.5
Map1a 2.83 3.96 2.32 1.15 -0.29 -1.78 -1.5
Rfx2 1.02 1.97 1.03 0.71 0.01 -1.47 -1.5
Ccdc8 16.92 13.88 11.99 3.64 -0.5 -1.93 -1.4
Sapcd1 7.13 4.29 7.45 1.77 0.06 -1.28 -1.3

232
Sp1del/del Flk1+ - HE1 Cluster 5: downregulated in mutant/no change in WT
Gene ES WT FPKM
ES Sp1del/del FPKM
Flk1+ WT FPKM
Flk1+ Sp1del/del FPKM
WT ES/Flk log2 FC
Sp1del/del ES/Flk log2 FC
WT FC/Sp1del/del FC
Nmb 10.14 12.56 5.9 2.93 -0.78 -2.1 -1.3
Gm20604 5.46 5.66 3.47 1.47 -0.65 -1.94 -1.3
Gfi1b 1.24 1.69 0.86 0.48 -0.53 -1.82 -1.3
Mylpf 1.47 1.96 1.41 0.77 -0.06 -1.35 -1.3
Aplnr 92.27 90.6 80.97 33.27 -0.19 -1.45 -1.3
Thbs3 6.65 12.39 3.86 3.03 -0.78 -2.03 -1.3
Fam221a 1.67 2.05 1.08 0.56 -0.63 -1.87 -1.2
Rad9b 1.99 3.6 1.4 1.08 -0.51 -1.74 -1.2
Tmem121 1.19 1.11 1.11 0.44 -0.1 -1.33 -1.2
Slc46a3 5.98 7.44 4.92 2.7 -0.28 -1.46 -1.2
1700010I14Rik 1.18 1.02 1.02 0.39 -0.21 -1.39 -1.2
Impa2 15.23 13.81 8.15 3.34 -0.9 -2.05 -1.2
Nme5 1.12 1.5 0.68 0.41 -0.72 -1.87 -1.2
Lad1 5 7.51 5.29 3.59 0.08 -1.06 -1.1
Trim62 1.33 2.13 0.89 0.67 -0.58 -1.67 -1.1
Nsmf 12.5 11.8 10.47 4.74 -0.26 -1.32 -1.1
Fbxo36 5.15 4.61 4.01 1.74 -0.36 -1.41 -1.1
Fsbp 2.36 3.62 1.25 0.93 -0.92 -1.96 -1.0
Sema3f 9.87 10.59 7.85 4.1 -0.33 -1.37 -1.0
Myo7a 1.78 1.68 1.15 0.53 -0.63 -1.66 -1.0
Clcf1 1.42 2 0.83 0.58 -0.77 -1.79 -1.0
Tnks1bp1 16.91 17.31 14.55 7.32 -0.22 -1.24 -1.0
Fancf 1.89 2.11 1.38 0.77 -0.45 -1.45 -1.0
Fam98c 5.32 8.9 3.54 2.98 -0.59 -1.58 -1.0
Acaa2 34.73 30.95 27.64 12.39 -0.33 -1.32 -1.0
Slc30a3 4.53 4.2 3.4 1.61 -0.41 -1.38 -1.0
Trim46 1 1.21 0.95 0.59 -0.07 -1.04 -1.0
Sh3bp2 4.44 4.99 2.35 1.36 -0.92 -1.88 -1.0
Smim20 14.69 2.37 11.52 0.96 -0.35 -1.3 -1.0
Kif24 5.12 6.04 2.89 1.78 -0.83 -1.76 -0.9
Mblac1 1.8 1.84 1.5 0.81 -0.26 -1.18 -0.9
Zfp41 12.29 15.04 8.21 5.37 -0.58 -1.49 -0.9
Dnmt3a 19.82 20.1 14.18 7.65 -0.48 -1.39 -0.9
Ccdc24 3.43 5.81 2.6 2.38 -0.4 -1.29 -0.9
Pif1 3.72 3.84 3.38 1.88 -0.14 -1.03 -0.9
Shf 6.82 9.13 4.86 3.54 -0.49 -1.37 -0.9
Fam129c 1.27 1.61 1.06 0.74 -0.26 -1.12 -0.9
Cetn4 1.08 1.03 0.97 0.51 -0.15 -1.01 -0.9
Mks1 2.88 5.6 1.78 1.93 -0.69 -1.54 -0.9
Nipsnap1 23.07 22.02 15.01 7.95 -0.62 -1.47 -0.9
4931428F04Rik 5.98 7.21 4.7 3.13 -0.35 -1.2 -0.9
Cenpv 7.22 4.41 4.09 1.4 -0.82 -1.66 -0.8
H1f0 63 49.85 34.94 15.61 -0.85 -1.68 -0.8
Tmem218 3.97 6.03 2.6 2.23 -0.61 -1.44 -0.8
Hist1h1b 510.96 507.15 343.33 192.46 -0.57 -1.4 -0.8
Mypop 1.13 1.81 0.62 0.56 -0.87 -1.69 -0.8
Zfp446 2.13 2.6 1.39 0.96 -0.62 -1.44 -0.8
Nat2 2.83 1.88 2.1 0.79 -0.43 -1.25 -0.8
Ndrg2 10.61 4.1 5.83 1.29 -0.86 -1.67 -0.8
Creb3l4 1.76 1.03 0.99 0.33 -0.83 -1.64 -0.8
Dtx3 27.58 34.64 18.15 13.04 -0.6 -1.41 -0.8
Loxl3 1.98 1.32 1.55 0.59 -0.35 -1.16 -0.8
Ldhal6b 1.04 1.19 0.83 0.54 -0.33 -1.14 -0.8
Pstpip2 1.4 1.44 0.76 0.45 -0.88 -1.68 -0.8
Stag3 5.81 28.7 3.31 9.4 -0.81 -1.61 -0.8
Lfng 3.48 6.49 2.52 2.7 -0.47 -1.27 -0.8
Eid2b 1.33 1.59 1.07 0.74 -0.31 -1.1 -0.8
Hoxb2 5.47 8.32 2.95 2.64 -0.89 -1.66 -0.8
Hacl1 4.58 3.72 3.29 1.56 -0.48 -1.25 -0.8
Nup210 6.53 6.79 3.46 2.13 -0.92 -1.67 -0.8

233
Sp1del/del Flk1+ - HE1 Cluster 5: downregulated in mutant/no change in WT
Gene ES WT FPKM
ES Sp1del/del FPKM
Flk1+ WT FPKM
Flk1+ Sp1del/del FPKM
WT ES/Flk log2 FC
Sp1del/del ES/Flk log2 FC
WT FC/Sp1del/del FC
Cttnbp2 2.51 3.25 1.68 1.29 -0.58 -1.33 -0.8
Dcp1b 2.29 2.79 1.97 1.42 -0.22 -0.97 -0.8
Wdr76 12.34 13.25 8.1 5.21 -0.61 -1.35 -0.7
Rnaseh2c 29.35 32.16 22.22 14.64 -0.4 -1.14 -0.7
Slc15a2 7.67 8.08 4.04 2.58 -0.92 -1.65 -0.7
Ptms 121.25 148.53 92.92 68.87 -0.38 -1.11 -0.7
Tep1 3.28 1.49 2.77 0.76 -0.24 -0.97 -0.7
Nphp1 6.8 7.83 4.37 3.05 -0.64 -1.36 -0.7
Pck2 11.36 5.73 6.87 2.11 -0.73 -1.44 -0.7
Slc46a1 1.76 1.83 1.31 0.83 -0.43 -1.14 -0.7
Xndc1 12.18 14.49 6.64 4.84 -0.88 -1.58 -0.7
Mdc1 27.46 41.05 18.25 16.82 -0.59 -1.29 -0.7
Hjurp 13.02 17.16 9.43 7.62 -0.47 -1.17 -0.7
Cdh24 2.11 1.59 1.66 0.77 -0.35 -1.05 -0.7
Timeless 30.58 32.74 17.44 11.6 -0.81 -1.5 -0.7
B930041F14Rik 1.5 1.32 0.99 0.54 -0.6 -1.29 -0.7
Ppox 6.04 7.38 4 3.04 -0.59 -1.28 -0.7
Sfi1 11.44 31.84 6.11 10.62 -0.9 -1.58 -0.7
Dpysl4 2.04 3 1.23 1.13 -0.73 -1.41 -0.7
A730008H23Rik 29.6 36.46 17.25 13.32 -0.78 -1.45 -0.7
Pbk 65.32 112.9 39.85 43.51 -0.71 -1.38 -0.7
Rbl1 9.44 15.79 5.94 6.23 -0.67 -1.34 -0.7
Zc3h8 5.01 6.62 3.84 3.19 -0.38 -1.05 -0.7
Hlcs 4.6 5.32 3.6 2.62 -0.35 -1.02 -0.7
Pomt1 7.72 7.88 6.2 3.98 -0.32 -0.99 -0.7
Pdk2 2.37 2.51 1.32 0.89 -0.84 -1.5 -0.7
Prom1 7.14 8.5 4.48 3.39 -0.67 -1.33 -0.7
Mdm1 13.82 18.9 8.79 7.64 -0.65 -1.31 -0.7
Nadsyn1 4.9 5.82 3.32 2.5 -0.56 -1.22 -0.7
Mcm3 119.66 125.66 82.31 54.8 -0.54 -1.2 -0.7
Stxbp2 23.7 14.9 18.04 7.21 -0.39 -1.05 -0.7
Zfp692 10.11 12.79 6.85 5.54 -0.56 -1.21 -0.7
Traf3ip1 3.28 3.84 2.63 1.96 -0.32 -0.97 -0.7
Fanca 5.93 9.25 4.73 4.72 -0.33 -0.97 -0.6
Mcm5 94.81 93.63 57.54 36.8 -0.72 -1.35 -0.6
Ppp1r3f 1.26 1.69 0.86 0.75 -0.55 -1.17 -0.6
Zkscan4 1.43 1.51 0.94 0.65 -0.61 -1.22 -0.6
Camk1 9.94 7.46 5.28 2.62 -0.91 -1.51 -0.6
Lig1 70.39 66.68 38.67 24.28 -0.86 -1.46 -0.6
Mok 1.91 1.85 1.27 0.81 -0.59 -1.19 -0.6
Klf11 10.87 11.91 7.34 5.28 -0.57 -1.17 -0.6
Swsap1 4.74 5.7 3.48 2.75 -0.45 -1.05 -0.6
Bard1 9.76 13.86 7.25 6.77 -0.43 -1.03 -0.6
Ift27 12.5 14.36 9.48 7.2 -0.4 -1 -0.6
Nodal 4.08 4.03 2.65 1.74 -0.62 -1.21 -0.6
Espl1 21.16 23.98 15.41 11.55 -0.46 -1.05 -0.6
Nuggc 1.19 1.88 0.65 0.69 -0.87 -1.45 -0.6
Rgs10 4.61 3.77 2.73 1.49 -0.76 -1.34 -0.6
Mamdc4 1.4 1.62 0.81 0.63 -0.79 -1.36 -0.6
Pole 20.66 26.23 11.94 10.27 -0.79 -1.35 -0.6
Mllt6 8.33 9.33 4.89 3.7 -0.77 -1.33 -0.6
Mterf1b 1.57 1.8 0.99 0.77 -0.67 -1.23 -0.6
Primpol 6.07 6.56 3.82 2.8 -0.67 -1.23 -0.6
Nup85 66.42 72.54 43.75 32.57 -0.6 -1.16 -0.6
Gpt 2.13 2.79 1.18 1.06 -0.85 -1.4 -0.6
Acacb 1.44 1.68 0.87 0.69 -0.73 -1.28 -0.6
Phf10 69.33 65.51 43.63 28.17 -0.67 -1.22 -0.6
Pttg1 68.34 40.31 44.58 17.89 -0.62 -1.17 -0.6
Sh3bp1 17.9 18.61 12.14 8.62 -0.56 -1.11 -0.6
Thra 15.01 19.9 10.16 9.25 -0.56 -1.11 -0.6

234
Sp1del/del Flk1+ - HE1 Cluster 5: downregulated in mutant/no change in WT
Gene ES WT FPKM
ES Sp1del/del FPKM
Flk1+ WT FPKM
Flk1+ Sp1del/del FPKM
WT ES/Flk log2 FC
Sp1del/del ES/Flk log2 FC
WT FC/Sp1del/del FC
Nacc2 1.05 1 0.72 0.47 -0.54 -1.09 -0.6
Cdc45 33.3 31.96 19.1 12.62 -0.8 -1.34 -0.5
Clspn 18.86 21.89 11.31 8.99 -0.74 -1.28 -0.5
Ppp1r16a 13.08 14.4 7.81 5.93 -0.74 -1.28 -0.5
Rad9a 16.35 19.54 10.96 9.01 -0.58 -1.12 -0.5
Rnf145 36.55 43.43 26.82 21.89 -0.45 -0.99 -0.5
Lenep 3.37 3.6 1.82 1.35 -0.89 -1.42 -0.5
Cdt1 35.68 33.33 20.27 13.11 -0.82 -1.35 -0.5
Uhrf1 127.12 151.58 76.08 62.67 -0.74 -1.27 -0.5
Chaf1b 36.4 49.97 23.59 22.34 -0.63 -1.16 -0.5
Helq 6.51 7.25 4.67 3.61 -0.48 -1.01 -0.5
Ftsj2 5.74 5.49 4.29 2.85 -0.42 -0.95 -0.5
Psmc3ip 19.66 19.08 10.39 7.03 -0.92 -1.44 -0.5
Rnf113a1 3.47 4.4 1.95 1.73 -0.83 -1.35 -0.5
Fan1 4.93 5.56 2.92 2.29 -0.76 -1.28 -0.5
Tipin 85 86.8 50.75 36.21 -0.74 -1.26 -0.5
Setdb2 5.94 5.78 3.69 2.49 -0.69 -1.21 -0.5
Ptpn6 8.5 4.33 4.61 1.65 -0.88 -1.39 -0.5
Sv2a 2.88 3.23 1.64 1.29 -0.81 -1.32 -0.5
Arhgef25 33.42 31.9 22.31 15.01 -0.58 -1.09 -0.5
Nek3 6.12 7.07 4.35 3.53 -0.49 -1 -0.5
Ticrr 13.09 14.88 7.15 5.74 -0.87 -1.37 -0.5
Rtel1 18.16 18.9 11.64 8.57 -0.64 -1.14 -0.5
Cchcr1 5.12 6.83 3.45 3.25 -0.57 -1.07 -0.5
Sp1del/del Flk1+ - HE1 Cluster 7: upregulated in mutant/no change in WT
Gene ES WT FPKM
ES Sp1del/del FPKM
Flk1+ WT FPKM
Flk1+ Sp1del/del FPKM
WT ES/Flk log2 FC
Sp1del/del ES/Flk log2 FC
WT FC/Sp1del/del FC
Gm20594 2.95 1.52 1.57 5.78 -0.91 1.93 2.8
Naalad2 1.95 1.21 2.16 4.67 0.15 1.95 1.8
Ube2ql1 2.7 1.89 1.88 4.23 -0.52 1.16 1.7
Nbl1 0.81 0.58 1.08 2.4 0.42 2.05 1.6
Nudt6 1.45 0.57 1.25 1.53 -0.21 1.42 1.6
Nr1d1 1.86 1.4 1.52 3.36 -0.29 1.26 1.6
Lpar4 8.68 6.08 7.93 15.33 -0.13 1.33 1.5
Acyp2 1.21 1.53 1.53 5.14 0.34 1.75 1.4
Krt19 20.21 8.17 34.93 37.28 0.79 2.19 1.4
Fstl3 0.92 0.7 1 1.87 0.12 1.42 1.3
Efemp1 2.08 1.07 2.13 2.64 0.03 1.3 1.3
Arap2 3.01 2.17 4.65 7.91 0.63 1.87 1.2
Abracl 63.7 33.56 67.86 81.29 0.09 1.28 1.2
Zfp52 1.52 0.81 2.09 2.5 0.46 1.63 1.2
Arhgap42 5.09 3.52 4.83 7.5 -0.08 1.09 1.2
Pltp 4.82 2.69 6.39 7.97 0.41 1.57 1.2
Flrt3 10.97 10.47 17.33 36.4 0.66 1.8 1.1
Apln 2.03 1.78 3.4 6.52 0.74 1.87 1.1
Lmo7 8.38 4.74 10.24 12.69 0.29 1.42 1.1
Plekhh2 0.92 1.03 1.36 3.28 0.56 1.67 1.1
Parp3 1.92 1.56 3.38 5.74 0.82 1.88 1.1
Lpar1 2.64 2.52 2.83 5.55 0.1 1.14 1.0
Gsto1 29.03 15.4 53.47 57.75 0.88 1.91 1.0
Fzd6 2.75 1.61 2.65 3.17 -0.05 0.98 1.0
Tmed5 9.85 9.25 10.98 21.03 0.16 1.18 1.0
Rnf128 11.25 8.02 11.6 16.57 0.04 1.05 1.0
Gadd45b 3.23 3.19 3.5 6.93 0.12 1.12 1.0
Fam13c 0.54 0.55 1 2.02 0.89 1.88 1.0
F8 1.42 1.65 1.94 4.39 0.45 1.41 1.0
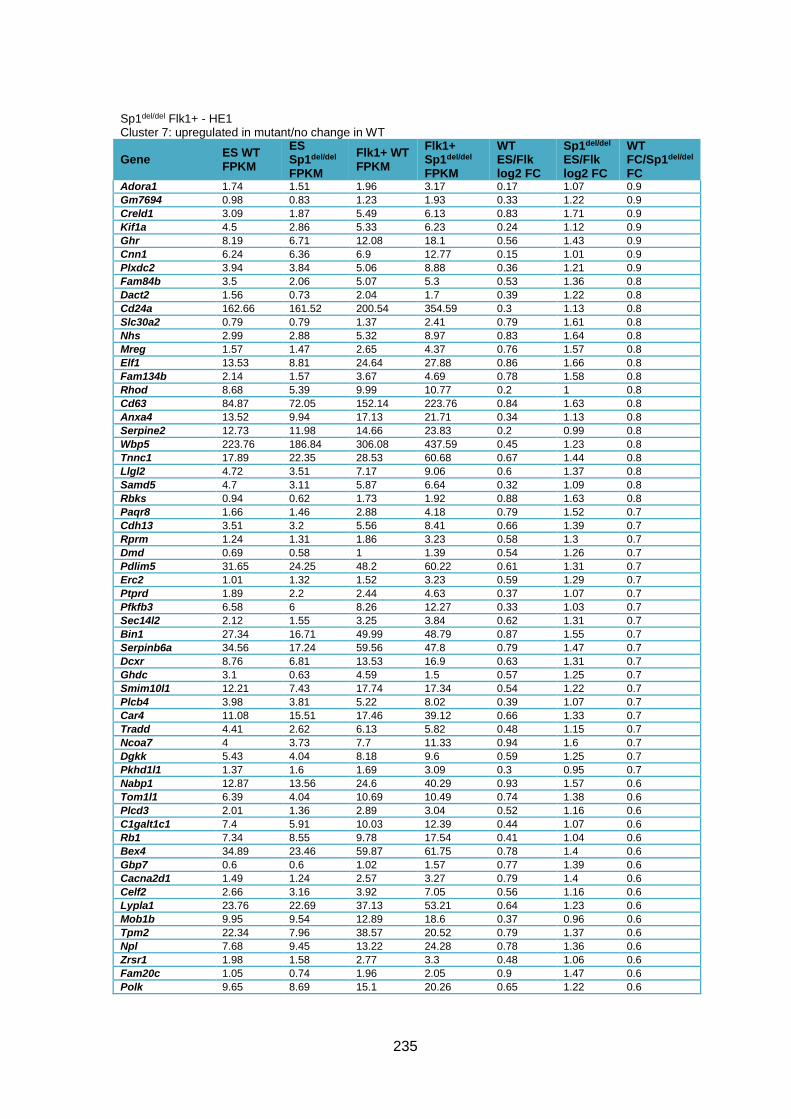
235
Sp1del/del Flk1+ - HE1 Cluster 7: upregulated in mutant/no change in WT
Gene ES WT FPKM
ES Sp1del/del FPKM
Flk1+ WT FPKM
Flk1+ Sp1del/del FPKM
WT ES/Flk log2 FC
Sp1del/del ES/Flk log2 FC
WT FC/Sp1del/del FC
Adora1 1.74 1.51 1.96 3.17 0.17 1.07 0.9
Gm7694 0.98 0.83 1.23 1.93 0.33 1.22 0.9
Creld1 3.09 1.87 5.49 6.13 0.83 1.71 0.9
Kif1a 4.5 2.86 5.33 6.23 0.24 1.12 0.9
Ghr 8.19 6.71 12.08 18.1 0.56 1.43 0.9
Cnn1 6.24 6.36 6.9 12.77 0.15 1.01 0.9
Plxdc2 3.94 3.84 5.06 8.88 0.36 1.21 0.9
Fam84b 3.5 2.06 5.07 5.3 0.53 1.36 0.8
Dact2 1.56 0.73 2.04 1.7 0.39 1.22 0.8
Cd24a 162.66 161.52 200.54 354.59 0.3 1.13 0.8
Slc30a2 0.79 0.79 1.37 2.41 0.79 1.61 0.8
Nhs 2.99 2.88 5.32 8.97 0.83 1.64 0.8
Mreg 1.57 1.47 2.65 4.37 0.76 1.57 0.8
Elf1 13.53 8.81 24.64 27.88 0.86 1.66 0.8
Fam134b 2.14 1.57 3.67 4.69 0.78 1.58 0.8
Rhod 8.68 5.39 9.99 10.77 0.2 1 0.8
Cd63 84.87 72.05 152.14 223.76 0.84 1.63 0.8
Anxa4 13.52 9.94 17.13 21.71 0.34 1.13 0.8
Serpine2 12.73 11.98 14.66 23.83 0.2 0.99 0.8
Wbp5 223.76 186.84 306.08 437.59 0.45 1.23 0.8
Tnnc1 17.89 22.35 28.53 60.68 0.67 1.44 0.8
Llgl2 4.72 3.51 7.17 9.06 0.6 1.37 0.8
Samd5 4.7 3.11 5.87 6.64 0.32 1.09 0.8
Rbks 0.94 0.62 1.73 1.92 0.88 1.63 0.8
Paqr8 1.66 1.46 2.88 4.18 0.79 1.52 0.7
Cdh13 3.51 3.2 5.56 8.41 0.66 1.39 0.7
Rprm 1.24 1.31 1.86 3.23 0.58 1.3 0.7
Dmd 0.69 0.58 1 1.39 0.54 1.26 0.7
Pdlim5 31.65 24.25 48.2 60.22 0.61 1.31 0.7
Erc2 1.01 1.32 1.52 3.23 0.59 1.29 0.7
Ptprd 1.89 2.2 2.44 4.63 0.37 1.07 0.7
Pfkfb3 6.58 6 8.26 12.27 0.33 1.03 0.7
Sec14l2 2.12 1.55 3.25 3.84 0.62 1.31 0.7
Bin1 27.34 16.71 49.99 48.79 0.87 1.55 0.7
Serpinb6a 34.56 17.24 59.56 47.8 0.79 1.47 0.7
Dcxr 8.76 6.81 13.53 16.9 0.63 1.31 0.7
Ghdc 3.1 0.63 4.59 1.5 0.57 1.25 0.7
Smim10l1 12.21 7.43 17.74 17.34 0.54 1.22 0.7
Plcb4 3.98 3.81 5.22 8.02 0.39 1.07 0.7
Car4 11.08 15.51 17.46 39.12 0.66 1.33 0.7
Tradd 4.41 2.62 6.13 5.82 0.48 1.15 0.7
Ncoa7 4 3.73 7.7 11.33 0.94 1.6 0.7
Dgkk 5.43 4.04 8.18 9.6 0.59 1.25 0.7
Pkhd1l1 1.37 1.6 1.69 3.09 0.3 0.95 0.7
Nabp1 12.87 13.56 24.6 40.29 0.93 1.57 0.6
Tom1l1 6.39 4.04 10.69 10.49 0.74 1.38 0.6
Plcd3 2.01 1.36 2.89 3.04 0.52 1.16 0.6
C1galt1c1 7.4 5.91 10.03 12.39 0.44 1.07 0.6
Rb1 7.34 8.55 9.78 17.54 0.41 1.04 0.6
Bex4 34.89 23.46 59.87 61.75 0.78 1.4 0.6
Gbp7 0.6 0.6 1.02 1.57 0.77 1.39 0.6
Cacna2d1 1.49 1.24 2.57 3.27 0.79 1.4 0.6
Celf2 2.66 3.16 3.92 7.05 0.56 1.16 0.6
Lypla1 23.76 22.69 37.13 53.21 0.64 1.23 0.6
Mob1b 9.95 9.54 12.89 18.6 0.37 0.96 0.6
Tpm2 22.34 7.96 38.57 20.52 0.79 1.37 0.6
Npl 7.68 9.45 13.22 24.28 0.78 1.36 0.6
Zrsr1 1.98 1.58 2.77 3.3 0.48 1.06 0.6
Fam20c 1.05 0.74 1.96 2.05 0.9 1.47 0.6
Polk 9.65 8.69 15.1 20.26 0.65 1.22 0.6
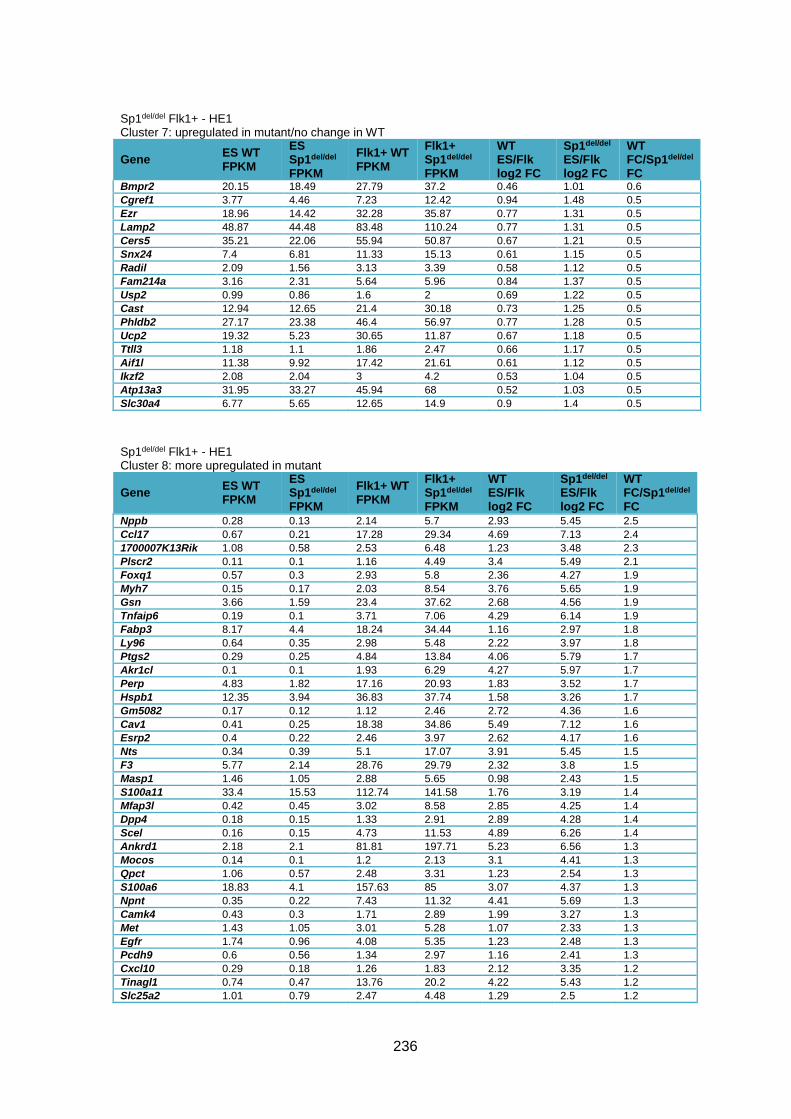
236
Sp1del/del Flk1+ - HE1 Cluster 7: upregulated in mutant/no change in WT
Gene ES WT FPKM
ES Sp1del/del FPKM
Flk1+ WT FPKM
Flk1+ Sp1del/del FPKM
WT ES/Flk log2 FC
Sp1del/del ES/Flk log2 FC
WT FC/Sp1del/del FC
Bmpr2 20.15 18.49 27.79 37.2 0.46 1.01 0.6
Cgref1 3.77 4.46 7.23 12.42 0.94 1.48 0.5
Ezr 18.96 14.42 32.28 35.87 0.77 1.31 0.5
Lamp2 48.87 44.48 83.48 110.24 0.77 1.31 0.5
Cers5 35.21 22.06 55.94 50.87 0.67 1.21 0.5
Snx24 7.4 6.81 11.33 15.13 0.61 1.15 0.5
Radil 2.09 1.56 3.13 3.39 0.58 1.12 0.5
Fam214a 3.16 2.31 5.64 5.96 0.84 1.37 0.5
Usp2 0.99 0.86 1.6 2 0.69 1.22 0.5
Cast 12.94 12.65 21.4 30.18 0.73 1.25 0.5
Phldb2 27.17 23.38 46.4 56.97 0.77 1.28 0.5
Ucp2 19.32 5.23 30.65 11.87 0.67 1.18 0.5
Ttll3 1.18 1.1 1.86 2.47 0.66 1.17 0.5
Aif1l 11.38 9.92 17.42 21.61 0.61 1.12 0.5
Ikzf2 2.08 2.04 3 4.2 0.53 1.04 0.5
Atp13a3 31.95 33.27 45.94 68 0.52 1.03 0.5
Slc30a4 6.77 5.65 12.65 14.9 0.9 1.4 0.5
Sp1del/del Flk1+ - HE1 Cluster 8: more upregulated in mutant
Gene ES WT FPKM
ES Sp1del/del FPKM
Flk1+ WT FPKM
Flk1+ Sp1del/del FPKM
WT ES/Flk log2 FC
Sp1del/del ES/Flk log2 FC
WT FC/Sp1del/del FC
Nppb 0.28 0.13 2.14 5.7 2.93 5.45 2.5
Ccl17 0.67 0.21 17.28 29.34 4.69 7.13 2.4
1700007K13Rik 1.08 0.58 2.53 6.48 1.23 3.48 2.3
Plscr2 0.11 0.1 1.16 4.49 3.4 5.49 2.1
Foxq1 0.57 0.3 2.93 5.8 2.36 4.27 1.9
Myh7 0.15 0.17 2.03 8.54 3.76 5.65 1.9
Gsn 3.66 1.59 23.4 37.62 2.68 4.56 1.9
Tnfaip6 0.19 0.1 3.71 7.06 4.29 6.14 1.9
Fabp3 8.17 4.4 18.24 34.44 1.16 2.97 1.8
Ly96 0.64 0.35 2.98 5.48 2.22 3.97 1.8
Ptgs2 0.29 0.25 4.84 13.84 4.06 5.79 1.7
Akr1cl 0.1 0.1 1.93 6.29 4.27 5.97 1.7
Perp 4.83 1.82 17.16 20.93 1.83 3.52 1.7
Hspb1 12.35 3.94 36.83 37.74 1.58 3.26 1.7
Gm5082 0.17 0.12 1.12 2.46 2.72 4.36 1.6
Cav1 0.41 0.25 18.38 34.86 5.49 7.12 1.6
Esrp2 0.4 0.22 2.46 3.97 2.62 4.17 1.6
Nts 0.34 0.39 5.1 17.07 3.91 5.45 1.5
F3 5.77 2.14 28.76 29.79 2.32 3.8 1.5
Masp1 1.46 1.05 2.88 5.65 0.98 2.43 1.5
S100a11 33.4 15.53 112.74 141.58 1.76 3.19 1.4
Mfap3l 0.42 0.45 3.02 8.58 2.85 4.25 1.4
Dpp4 0.18 0.15 1.33 2.91 2.89 4.28 1.4
Scel 0.16 0.15 4.73 11.53 4.89 6.26 1.4
Ankrd1 2.18 2.1 81.81 197.71 5.23 6.56 1.3
Mocos 0.14 0.1 1.2 2.13 3.1 4.41 1.3
Qpct 1.06 0.57 2.48 3.31 1.23 2.54 1.3
S100a6 18.83 4.1 157.63 85 3.07 4.37 1.3
Npnt 0.35 0.22 7.43 11.32 4.41 5.69 1.3
Camk4 0.43 0.3 1.71 2.89 1.99 3.27 1.3
Met 1.43 1.05 3.01 5.28 1.07 2.33 1.3
Egfr 1.74 0.96 4.08 5.35 1.23 2.48 1.3
Pcdh9 0.6 0.56 1.34 2.97 1.16 2.41 1.3
Cxcl10 0.29 0.18 1.26 1.83 2.12 3.35 1.2
Tinagl1 0.74 0.47 13.76 20.2 4.22 5.43 1.2
Slc25a2 1.01 0.79 2.47 4.48 1.29 2.5 1.2
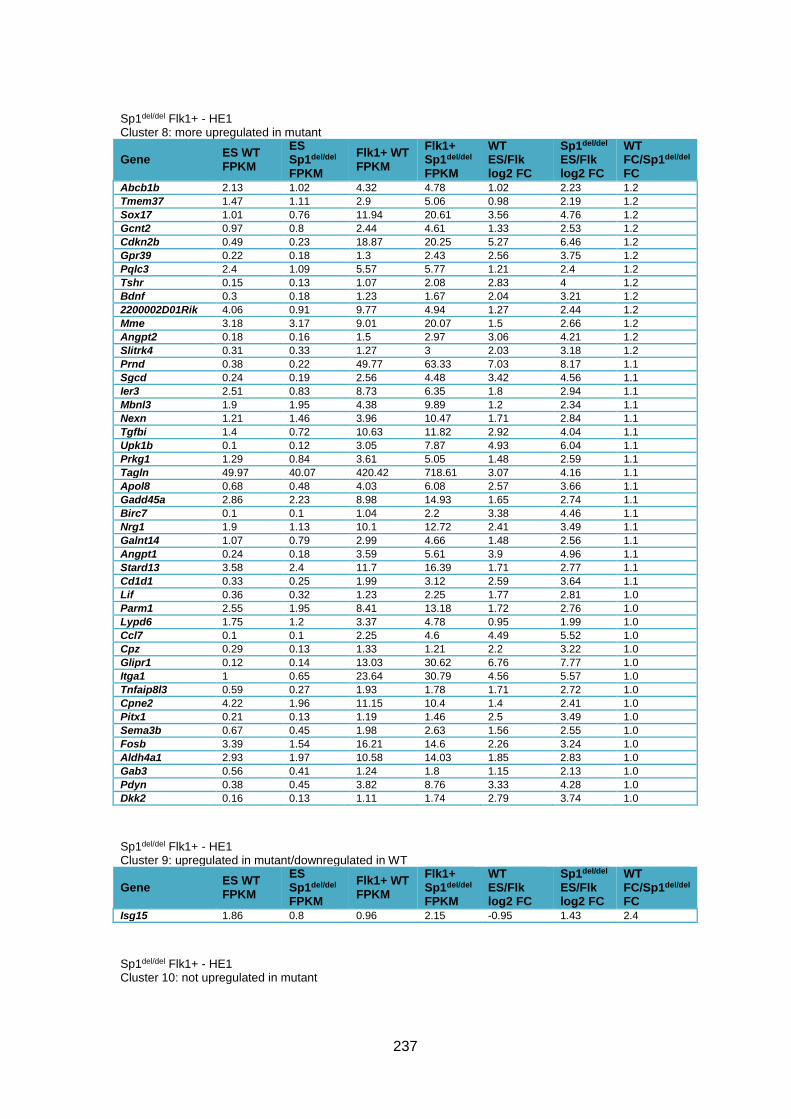
237
Sp1del/del Flk1+ - HE1 Cluster 8: more upregulated in mutant
Gene ES WT FPKM
ES Sp1del/del FPKM
Flk1+ WT FPKM
Flk1+ Sp1del/del FPKM
WT ES/Flk log2 FC
Sp1del/del ES/Flk log2 FC
WT FC/Sp1del/del FC
Abcb1b 2.13 1.02 4.32 4.78 1.02 2.23 1.2
Tmem37 1.47 1.11 2.9 5.06 0.98 2.19 1.2
Sox17 1.01 0.76 11.94 20.61 3.56 4.76 1.2
Gcnt2 0.97 0.8 2.44 4.61 1.33 2.53 1.2
Cdkn2b 0.49 0.23 18.87 20.25 5.27 6.46 1.2
Gpr39 0.22 0.18 1.3 2.43 2.56 3.75 1.2
Pqlc3 2.4 1.09 5.57 5.77 1.21 2.4 1.2
Tshr 0.15 0.13 1.07 2.08 2.83 4 1.2
Bdnf 0.3 0.18 1.23 1.67 2.04 3.21 1.2
2200002D01Rik 4.06 0.91 9.77 4.94 1.27 2.44 1.2
Mme 3.18 3.17 9.01 20.07 1.5 2.66 1.2
Angpt2 0.18 0.16 1.5 2.97 3.06 4.21 1.2
Slitrk4 0.31 0.33 1.27 3 2.03 3.18 1.2
Prnd 0.38 0.22 49.77 63.33 7.03 8.17 1.1
Sgcd 0.24 0.19 2.56 4.48 3.42 4.56 1.1
Ier3 2.51 0.83 8.73 6.35 1.8 2.94 1.1
Mbnl3 1.9 1.95 4.38 9.89 1.2 2.34 1.1
Nexn 1.21 1.46 3.96 10.47 1.71 2.84 1.1
Tgfbi 1.4 0.72 10.63 11.82 2.92 4.04 1.1
Upk1b 0.1 0.12 3.05 7.87 4.93 6.04 1.1
Prkg1 1.29 0.84 3.61 5.05 1.48 2.59 1.1
Tagln 49.97 40.07 420.42 718.61 3.07 4.16 1.1
Apol8 0.68 0.48 4.03 6.08 2.57 3.66 1.1
Gadd45a 2.86 2.23 8.98 14.93 1.65 2.74 1.1
Birc7 0.1 0.1 1.04 2.2 3.38 4.46 1.1
Nrg1 1.9 1.13 10.1 12.72 2.41 3.49 1.1
Galnt14 1.07 0.79 2.99 4.66 1.48 2.56 1.1
Angpt1 0.24 0.18 3.59 5.61 3.9 4.96 1.1
Stard13 3.58 2.4 11.7 16.39 1.71 2.77 1.1
Cd1d1 0.33 0.25 1.99 3.12 2.59 3.64 1.1
Lif 0.36 0.32 1.23 2.25 1.77 2.81 1.0
Parm1 2.55 1.95 8.41 13.18 1.72 2.76 1.0
Lypd6 1.75 1.2 3.37 4.78 0.95 1.99 1.0
Ccl7 0.1 0.1 2.25 4.6 4.49 5.52 1.0
Cpz 0.29 0.13 1.33 1.21 2.2 3.22 1.0
Glipr1 0.12 0.14 13.03 30.62 6.76 7.77 1.0
Itga1 1 0.65 23.64 30.79 4.56 5.57 1.0
Tnfaip8l3 0.59 0.27 1.93 1.78 1.71 2.72 1.0
Cpne2 4.22 1.96 11.15 10.4 1.4 2.41 1.0
Pitx1 0.21 0.13 1.19 1.46 2.5 3.49 1.0
Sema3b 0.67 0.45 1.98 2.63 1.56 2.55 1.0
Fosb 3.39 1.54 16.21 14.6 2.26 3.24 1.0
Aldh4a1 2.93 1.97 10.58 14.03 1.85 2.83 1.0
Gab3 0.56 0.41 1.24 1.8 1.15 2.13 1.0
Pdyn 0.38 0.45 3.82 8.76 3.33 4.28 1.0
Dkk2 0.16 0.13 1.11 1.74 2.79 3.74 1.0
Sp1del/del Flk1+ - HE1 Cluster 9: upregulated in mutant/downregulated in WT
Gene ES WT FPKM
ES Sp1del/del FPKM
Flk1+ WT FPKM
Flk1+ Sp1del/del FPKM
WT ES/Flk log2 FC
Sp1del/del ES/Flk log2 FC
WT FC/Sp1del/del FC
Isg15 1.86 0.8 0.96 2.15 -0.95 1.43 2.4
Sp1del/del Flk1+ - HE1 Cluster 10: not upregulated in mutant
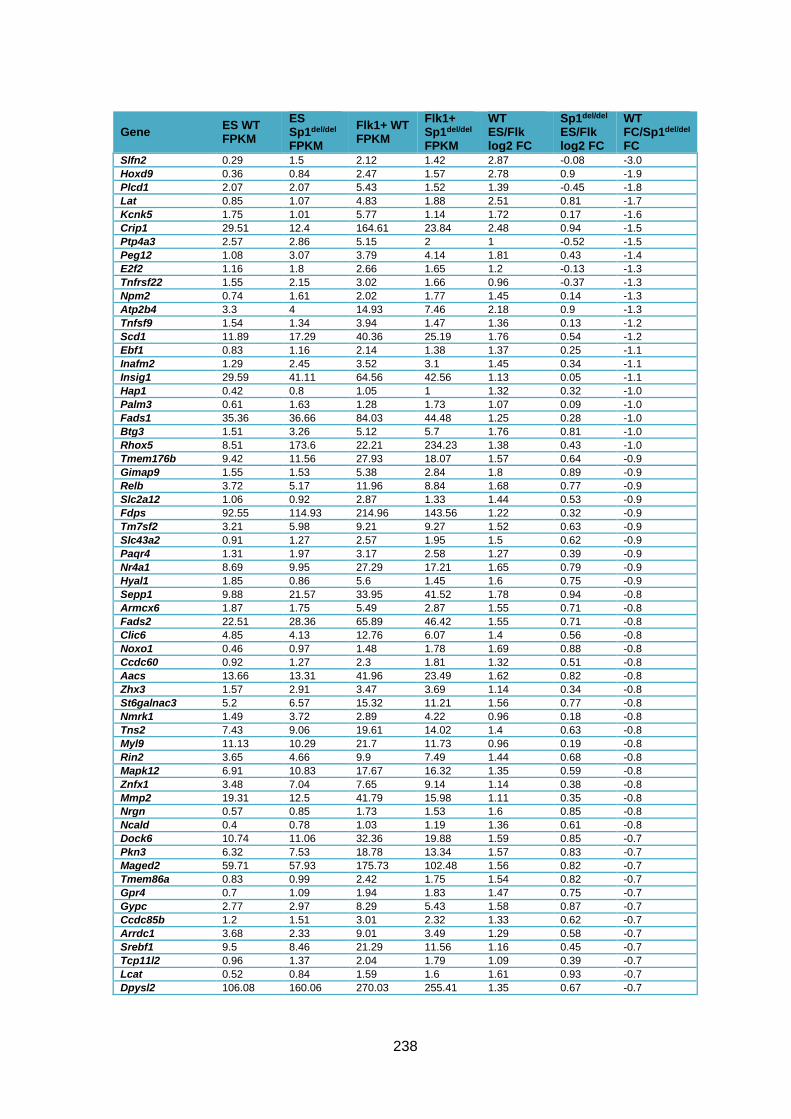
238
Gene ES WT FPKM
ES Sp1del/del FPKM
Flk1+ WT FPKM
Flk1+ Sp1del/del FPKM
WT ES/Flk log2 FC
Sp1del/del ES/Flk log2 FC
WT FC/Sp1del/del FC
Slfn2 0.29 1.5 2.12 1.42 2.87 -0.08 -3.0
Hoxd9 0.36 0.84 2.47 1.57 2.78 0.9 -1.9
Plcd1 2.07 2.07 5.43 1.52 1.39 -0.45 -1.8
Lat 0.85 1.07 4.83 1.88 2.51 0.81 -1.7
Kcnk5 1.75 1.01 5.77 1.14 1.72 0.17 -1.6
Crip1 29.51 12.4 164.61 23.84 2.48 0.94 -1.5
Ptp4a3 2.57 2.86 5.15 2 1 -0.52 -1.5
Peg12 1.08 3.07 3.79 4.14 1.81 0.43 -1.4
E2f2 1.16 1.8 2.66 1.65 1.2 -0.13 -1.3
Tnfrsf22 1.55 2.15 3.02 1.66 0.96 -0.37 -1.3
Npm2 0.74 1.61 2.02 1.77 1.45 0.14 -1.3
Atp2b4 3.3 4 14.93 7.46 2.18 0.9 -1.3
Tnfsf9 1.54 1.34 3.94 1.47 1.36 0.13 -1.2
Scd1 11.89 17.29 40.36 25.19 1.76 0.54 -1.2
Ebf1 0.83 1.16 2.14 1.38 1.37 0.25 -1.1
Inafm2 1.29 2.45 3.52 3.1 1.45 0.34 -1.1
Insig1 29.59 41.11 64.56 42.56 1.13 0.05 -1.1
Hap1 0.42 0.8 1.05 1 1.32 0.32 -1.0
Palm3 0.61 1.63 1.28 1.73 1.07 0.09 -1.0
Fads1 35.36 36.66 84.03 44.48 1.25 0.28 -1.0
Btg3 1.51 3.26 5.12 5.7 1.76 0.81 -1.0
Rhox5 8.51 173.6 22.21 234.23 1.38 0.43 -1.0
Tmem176b 9.42 11.56 27.93 18.07 1.57 0.64 -0.9
Gimap9 1.55 1.53 5.38 2.84 1.8 0.89 -0.9
Relb 3.72 5.17 11.96 8.84 1.68 0.77 -0.9
Slc2a12 1.06 0.92 2.87 1.33 1.44 0.53 -0.9
Fdps 92.55 114.93 214.96 143.56 1.22 0.32 -0.9
Tm7sf2 3.21 5.98 9.21 9.27 1.52 0.63 -0.9
Slc43a2 0.91 1.27 2.57 1.95 1.5 0.62 -0.9
Paqr4 1.31 1.97 3.17 2.58 1.27 0.39 -0.9
Nr4a1 8.69 9.95 27.29 17.21 1.65 0.79 -0.9
Hyal1 1.85 0.86 5.6 1.45 1.6 0.75 -0.9
Sepp1 9.88 21.57 33.95 41.52 1.78 0.94 -0.8
Armcx6 1.87 1.75 5.49 2.87 1.55 0.71 -0.8
Fads2 22.51 28.36 65.89 46.42 1.55 0.71 -0.8
Clic6 4.85 4.13 12.76 6.07 1.4 0.56 -0.8
Noxo1 0.46 0.97 1.48 1.78 1.69 0.88 -0.8
Ccdc60 0.92 1.27 2.3 1.81 1.32 0.51 -0.8
Aacs 13.66 13.31 41.96 23.49 1.62 0.82 -0.8
Zhx3 1.57 2.91 3.47 3.69 1.14 0.34 -0.8
St6galnac3 5.2 6.57 15.32 11.21 1.56 0.77 -0.8
Nmrk1 1.49 3.72 2.89 4.22 0.96 0.18 -0.8
Tns2 7.43 9.06 19.61 14.02 1.4 0.63 -0.8
Myl9 11.13 10.29 21.7 11.73 0.96 0.19 -0.8
Rin2 3.65 4.66 9.9 7.49 1.44 0.68 -0.8
Mapk12 6.91 10.83 17.67 16.32 1.35 0.59 -0.8
Znfx1 3.48 7.04 7.65 9.14 1.14 0.38 -0.8
Mmp2 19.31 12.5 41.79 15.98 1.11 0.35 -0.8
Nrgn 0.57 0.85 1.73 1.53 1.6 0.85 -0.8
Ncald 0.4 0.78 1.03 1.19 1.36 0.61 -0.8
Dock6 10.74 11.06 32.36 19.88 1.59 0.85 -0.7
Pkn3 6.32 7.53 18.78 13.34 1.57 0.83 -0.7
Maged2 59.71 57.93 175.73 102.48 1.56 0.82 -0.7
Tmem86a 0.83 0.99 2.42 1.75 1.54 0.82 -0.7
Gpr4 0.7 1.09 1.94 1.83 1.47 0.75 -0.7
Gypc 2.77 2.97 8.29 5.43 1.58 0.87 -0.7
Ccdc85b 1.2 1.51 3.01 2.32 1.33 0.62 -0.7
Arrdc1 3.68 2.33 9.01 3.49 1.29 0.58 -0.7
Srebf1 9.5 8.46 21.29 11.56 1.16 0.45 -0.7
Tcp11l2 0.96 1.37 2.04 1.79 1.09 0.39 -0.7
Lcat 0.52 0.84 1.59 1.6 1.61 0.93 -0.7
Dpysl2 106.08 160.06 270.03 255.41 1.35 0.67 -0.7
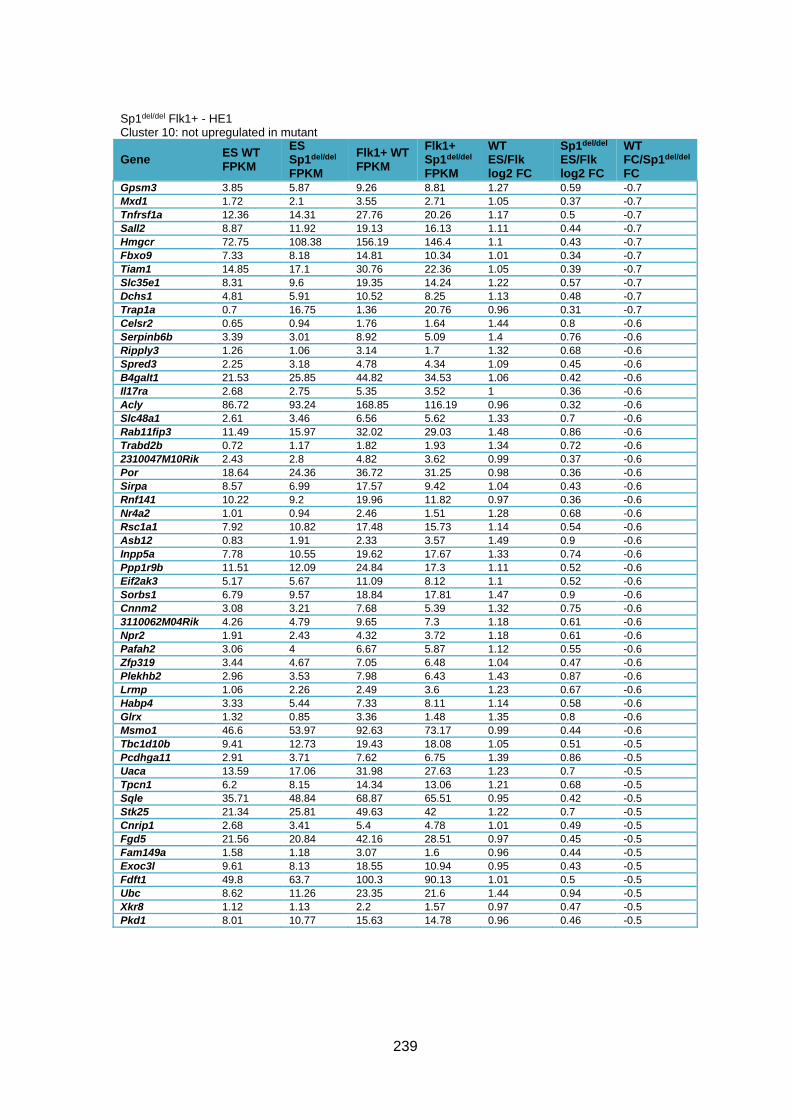
239
Sp1del/del Flk1+ - HE1 Cluster 10: not upregulated in mutant
Gene ES WT FPKM
ES Sp1del/del FPKM
Flk1+ WT FPKM
Flk1+ Sp1del/del FPKM
WT ES/Flk log2 FC
Sp1del/del ES/Flk log2 FC
WT FC/Sp1del/del FC
Gpsm3 3.85 5.87 9.26 8.81 1.27 0.59 -0.7
Mxd1 1.72 2.1 3.55 2.71 1.05 0.37 -0.7
Tnfrsf1a 12.36 14.31 27.76 20.26 1.17 0.5 -0.7
Sall2 8.87 11.92 19.13 16.13 1.11 0.44 -0.7
Hmgcr 72.75 108.38 156.19 146.4 1.1 0.43 -0.7
Fbxo9 7.33 8.18 14.81 10.34 1.01 0.34 -0.7
Tiam1 14.85 17.1 30.76 22.36 1.05 0.39 -0.7
Slc35e1 8.31 9.6 19.35 14.24 1.22 0.57 -0.7
Dchs1 4.81 5.91 10.52 8.25 1.13 0.48 -0.7
Trap1a 0.7 16.75 1.36 20.76 0.96 0.31 -0.7
Celsr2 0.65 0.94 1.76 1.64 1.44 0.8 -0.6
Serpinb6b 3.39 3.01 8.92 5.09 1.4 0.76 -0.6
Ripply3 1.26 1.06 3.14 1.7 1.32 0.68 -0.6
Spred3 2.25 3.18 4.78 4.34 1.09 0.45 -0.6
B4galt1 21.53 25.85 44.82 34.53 1.06 0.42 -0.6
Il17ra 2.68 2.75 5.35 3.52 1 0.36 -0.6
Acly 86.72 93.24 168.85 116.19 0.96 0.32 -0.6
Slc48a1 2.61 3.46 6.56 5.62 1.33 0.7 -0.6
Rab11fip3 11.49 15.97 32.02 29.03 1.48 0.86 -0.6
Trabd2b 0.72 1.17 1.82 1.93 1.34 0.72 -0.6
2310047M10Rik 2.43 2.8 4.82 3.62 0.99 0.37 -0.6
Por 18.64 24.36 36.72 31.25 0.98 0.36 -0.6
Sirpa 8.57 6.99 17.57 9.42 1.04 0.43 -0.6
Rnf141 10.22 9.2 19.96 11.82 0.97 0.36 -0.6
Nr4a2 1.01 0.94 2.46 1.51 1.28 0.68 -0.6
Rsc1a1 7.92 10.82 17.48 15.73 1.14 0.54 -0.6
Asb12 0.83 1.91 2.33 3.57 1.49 0.9 -0.6
Inpp5a 7.78 10.55 19.62 17.67 1.33 0.74 -0.6
Ppp1r9b 11.51 12.09 24.84 17.3 1.11 0.52 -0.6
Eif2ak3 5.17 5.67 11.09 8.12 1.1 0.52 -0.6
Sorbs1 6.79 9.57 18.84 17.81 1.47 0.9 -0.6
Cnnm2 3.08 3.21 7.68 5.39 1.32 0.75 -0.6
3110062M04Rik 4.26 4.79 9.65 7.3 1.18 0.61 -0.6
Npr2 1.91 2.43 4.32 3.72 1.18 0.61 -0.6
Pafah2 3.06 4 6.67 5.87 1.12 0.55 -0.6
Zfp319 3.44 4.67 7.05 6.48 1.04 0.47 -0.6
Plekhb2 2.96 3.53 7.98 6.43 1.43 0.87 -0.6
Lrmp 1.06 2.26 2.49 3.6 1.23 0.67 -0.6
Habp4 3.33 5.44 7.33 8.11 1.14 0.58 -0.6
Glrx 1.32 0.85 3.36 1.48 1.35 0.8 -0.6
Msmo1 46.6 53.97 92.63 73.17 0.99 0.44 -0.6
Tbc1d10b 9.41 12.73 19.43 18.08 1.05 0.51 -0.5
Pcdhga11 2.91 3.71 7.62 6.75 1.39 0.86 -0.5
Uaca 13.59 17.06 31.98 27.63 1.23 0.7 -0.5
Tpcn1 6.2 8.15 14.34 13.06 1.21 0.68 -0.5
Sqle 35.71 48.84 68.87 65.51 0.95 0.42 -0.5
Stk25 21.34 25.81 49.63 42 1.22 0.7 -0.5
Cnrip1 2.68 3.41 5.4 4.78 1.01 0.49 -0.5
Fgd5 21.56 20.84 42.16 28.51 0.97 0.45 -0.5
Fam149a 1.58 1.18 3.07 1.6 0.96 0.44 -0.5
Exoc3l 9.61 8.13 18.55 10.94 0.95 0.43 -0.5
Fdft1 49.8 63.7 100.3 90.13 1.01 0.5 -0.5
Ubc 8.62 11.26 23.35 21.6 1.44 0.94 -0.5
Xkr8 1.12 1.13 2.2 1.57 0.97 0.47 -0.5
Pkd1 8.01 10.77 15.63 14.78 0.96 0.46 -0.5
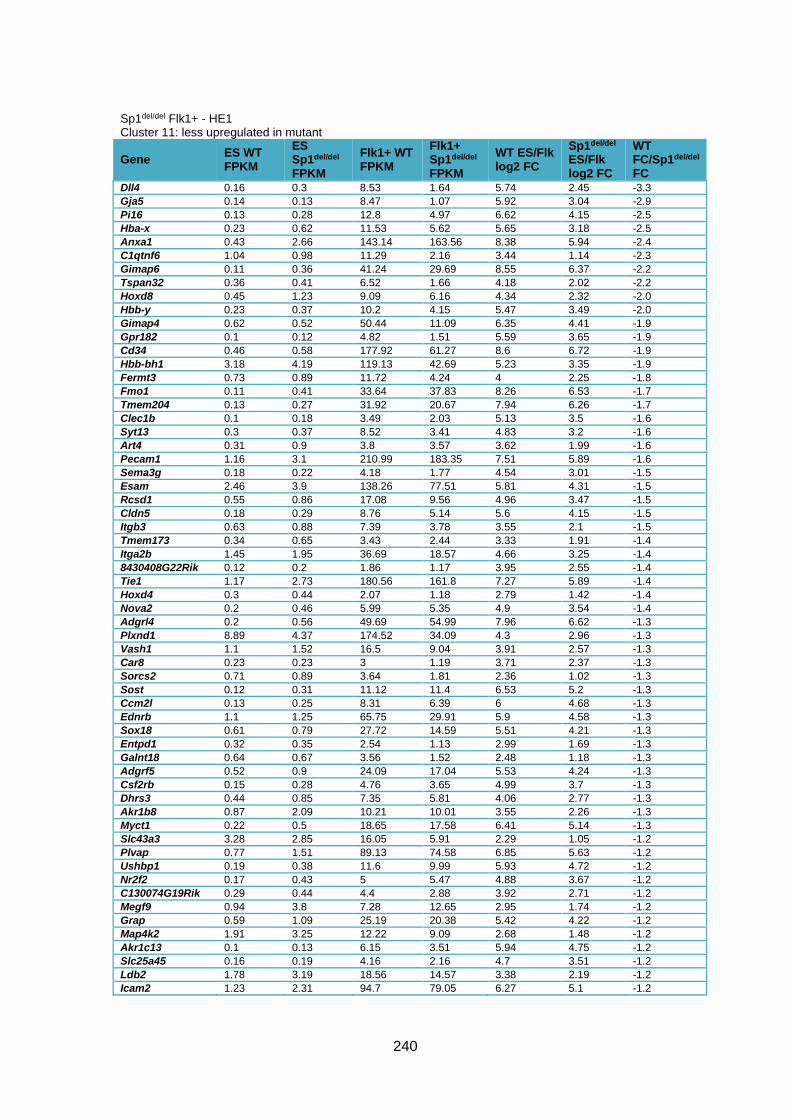
240
Sp1del/del Flk1+ - HE1 Cluster 11: less upregulated in mutant
Gene ES WT FPKM
ES Sp1del/del FPKM
Flk1+ WT FPKM
Flk1+ Sp1del/del FPKM
WT ES/Flk log2 FC
Sp1del/del ES/Flk log2 FC
WT FC/Sp1del/del FC
Dll4 0.16 0.3 8.53 1.64 5.74 2.45 -3.3
Gja5 0.14 0.13 8.47 1.07 5.92 3.04 -2.9
Pi16 0.13 0.28 12.8 4.97 6.62 4.15 -2.5
Hba-x 0.23 0.62 11.53 5.62 5.65 3.18 -2.5
Anxa1 0.43 2.66 143.14 163.56 8.38 5.94 -2.4
C1qtnf6 1.04 0.98 11.29 2.16 3.44 1.14 -2.3
Gimap6 0.11 0.36 41.24 29.69 8.55 6.37 -2.2
Tspan32 0.36 0.41 6.52 1.66 4.18 2.02 -2.2
Hoxd8 0.45 1.23 9.09 6.16 4.34 2.32 -2.0
Hbb-y 0.23 0.37 10.2 4.15 5.47 3.49 -2.0
Gimap4 0.62 0.52 50.44 11.09 6.35 4.41 -1.9
Gpr182 0.1 0.12 4.82 1.51 5.59 3.65 -1.9
Cd34 0.46 0.58 177.92 61.27 8.6 6.72 -1.9
Hbb-bh1 3.18 4.19 119.13 42.69 5.23 3.35 -1.9
Fermt3 0.73 0.89 11.72 4.24 4 2.25 -1.8
Fmo1 0.11 0.41 33.64 37.83 8.26 6.53 -1.7
Tmem204 0.13 0.27 31.92 20.67 7.94 6.26 -1.7
Clec1b 0.1 0.18 3.49 2.03 5.13 3.5 -1.6
Syt13 0.3 0.37 8.52 3.41 4.83 3.2 -1.6
Art4 0.31 0.9 3.8 3.57 3.62 1.99 -1.6
Pecam1 1.16 3.1 210.99 183.35 7.51 5.89 -1.6
Sema3g 0.18 0.22 4.18 1.77 4.54 3.01 -1.5
Esam 2.46 3.9 138.26 77.51 5.81 4.31 -1.5
Rcsd1 0.55 0.86 17.08 9.56 4.96 3.47 -1.5
Cldn5 0.18 0.29 8.76 5.14 5.6 4.15 -1.5
Itgb3 0.63 0.88 7.39 3.78 3.55 2.1 -1.5
Tmem173 0.34 0.65 3.43 2.44 3.33 1.91 -1.4
Itga2b 1.45 1.95 36.69 18.57 4.66 3.25 -1.4
8430408G22Rik 0.12 0.2 1.86 1.17 3.95 2.55 -1.4
Tie1 1.17 2.73 180.56 161.8 7.27 5.89 -1.4
Hoxd4 0.3 0.44 2.07 1.18 2.79 1.42 -1.4
Nova2 0.2 0.46 5.99 5.35 4.9 3.54 -1.4
Adgrl4 0.2 0.56 49.69 54.99 7.96 6.62 -1.3
Plxnd1 8.89 4.37 174.52 34.09 4.3 2.96 -1.3
Vash1 1.1 1.52 16.5 9.04 3.91 2.57 -1.3
Car8 0.23 0.23 3 1.19 3.71 2.37 -1.3
Sorcs2 0.71 0.89 3.64 1.81 2.36 1.02 -1.3
Sost 0.12 0.31 11.12 11.4 6.53 5.2 -1.3
Ccm2l 0.13 0.25 8.31 6.39 6 4.68 -1.3
Ednrb 1.1 1.25 65.75 29.91 5.9 4.58 -1.3
Sox18 0.61 0.79 27.72 14.59 5.51 4.21 -1.3
Entpd1 0.32 0.35 2.54 1.13 2.99 1.69 -1.3
Galnt18 0.64 0.67 3.56 1.52 2.48 1.18 -1.3
Adgrf5 0.52 0.9 24.09 17.04 5.53 4.24 -1.3
Csf2rb 0.15 0.28 4.76 3.65 4.99 3.7 -1.3
Dhrs3 0.44 0.85 7.35 5.81 4.06 2.77 -1.3
Akr1b8 0.87 2.09 10.21 10.01 3.55 2.26 -1.3
Myct1 0.22 0.5 18.65 17.58 6.41 5.14 -1.3
Slc43a3 3.28 2.85 16.05 5.91 2.29 1.05 -1.2
Plvap 0.77 1.51 89.13 74.58 6.85 5.63 -1.2
Ushbp1 0.19 0.38 11.6 9.99 5.93 4.72 -1.2
Nr2f2 0.17 0.43 5 5.47 4.88 3.67 -1.2
C130074G19Rik 0.29 0.44 4.4 2.88 3.92 2.71 -1.2
Megf9 0.94 3.8 7.28 12.65 2.95 1.74 -1.2
Grap 0.59 1.09 25.19 20.38 5.42 4.22 -1.2
Map4k2 1.91 3.25 12.22 9.09 2.68 1.48 -1.2
Akr1c13 0.1 0.13 6.15 3.51 5.94 4.75 -1.2
Slc25a45 0.16 0.19 4.16 2.16 4.7 3.51 -1.2
Ldb2 1.78 3.19 18.56 14.57 3.38 2.19 -1.2
Icam2 1.23 2.31 94.7 79.05 6.27 5.1 -1.2
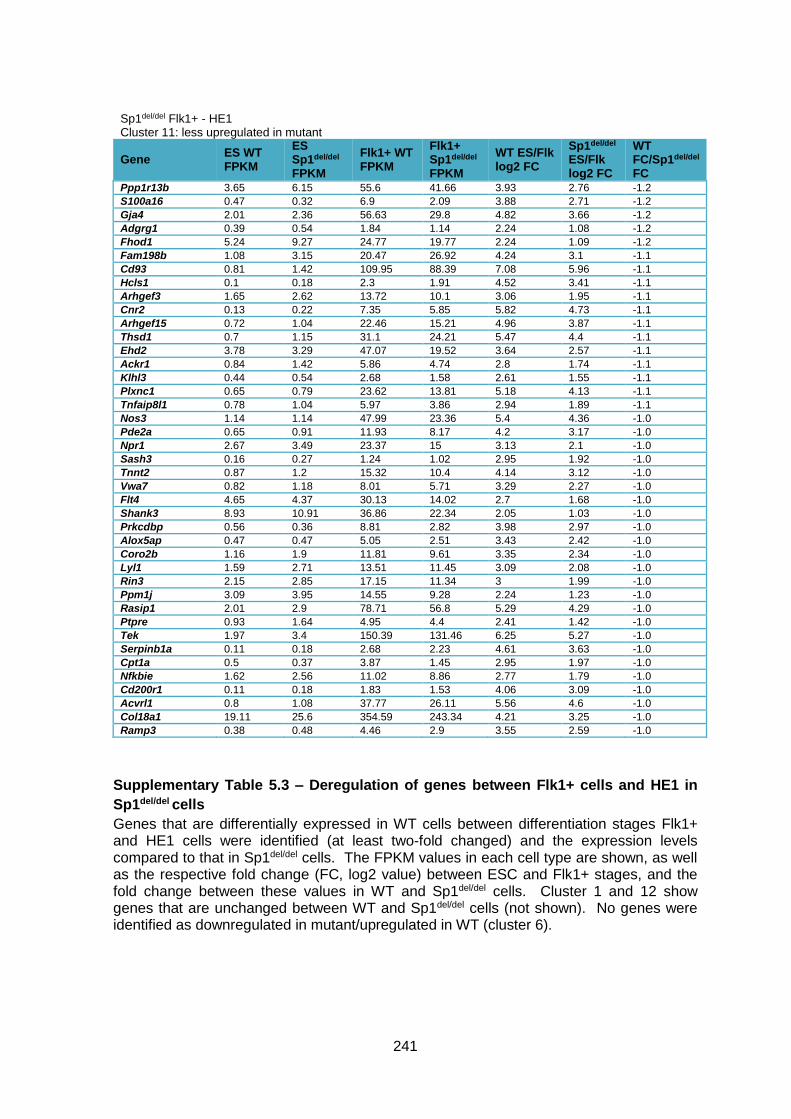
241
Sp1del/del Flk1+ - HE1 Cluster 11: less upregulated in mutant
Gene ES WT FPKM
ES Sp1del/del FPKM
Flk1+ WT FPKM
Flk1+ Sp1del/del FPKM
WT ES/Flk log2 FC
Sp1del/del ES/Flk log2 FC
WT FC/Sp1del/del FC
Ppp1r13b 3.65 6.15 55.6 41.66 3.93 2.76 -1.2
S100a16 0.47 0.32 6.9 2.09 3.88 2.71 -1.2
Gja4 2.01 2.36 56.63 29.8 4.82 3.66 -1.2
Adgrg1 0.39 0.54 1.84 1.14 2.24 1.08 -1.2
Fhod1 5.24 9.27 24.77 19.77 2.24 1.09 -1.2
Fam198b 1.08 3.15 20.47 26.92 4.24 3.1 -1.1
Cd93 0.81 1.42 109.95 88.39 7.08 5.96 -1.1
Hcls1 0.1 0.18 2.3 1.91 4.52 3.41 -1.1
Arhgef3 1.65 2.62 13.72 10.1 3.06 1.95 -1.1
Cnr2 0.13 0.22 7.35 5.85 5.82 4.73 -1.1
Arhgef15 0.72 1.04 22.46 15.21 4.96 3.87 -1.1
Thsd1 0.7 1.15 31.1 24.21 5.47 4.4 -1.1
Ehd2 3.78 3.29 47.07 19.52 3.64 2.57 -1.1
Ackr1 0.84 1.42 5.86 4.74 2.8 1.74 -1.1
Klhl3 0.44 0.54 2.68 1.58 2.61 1.55 -1.1
Plxnc1 0.65 0.79 23.62 13.81 5.18 4.13 -1.1
Tnfaip8l1 0.78 1.04 5.97 3.86 2.94 1.89 -1.1
Nos3 1.14 1.14 47.99 23.36 5.4 4.36 -1.0
Pde2a 0.65 0.91 11.93 8.17 4.2 3.17 -1.0
Npr1 2.67 3.49 23.37 15 3.13 2.1 -1.0
Sash3 0.16 0.27 1.24 1.02 2.95 1.92 -1.0
Tnnt2 0.87 1.2 15.32 10.4 4.14 3.12 -1.0
Vwa7 0.82 1.18 8.01 5.71 3.29 2.27 -1.0
Flt4 4.65 4.37 30.13 14.02 2.7 1.68 -1.0
Shank3 8.93 10.91 36.86 22.34 2.05 1.03 -1.0
Prkcdbp 0.56 0.36 8.81 2.82 3.98 2.97 -1.0
Alox5ap 0.47 0.47 5.05 2.51 3.43 2.42 -1.0
Coro2b 1.16 1.9 11.81 9.61 3.35 2.34 -1.0
Lyl1 1.59 2.71 13.51 11.45 3.09 2.08 -1.0
Rin3 2.15 2.85 17.15 11.34 3 1.99 -1.0
Ppm1j 3.09 3.95 14.55 9.28 2.24 1.23 -1.0
Rasip1 2.01 2.9 78.71 56.8 5.29 4.29 -1.0
Ptpre 0.93 1.64 4.95 4.4 2.41 1.42 -1.0
Tek 1.97 3.4 150.39 131.46 6.25 5.27 -1.0
Serpinb1a 0.11 0.18 2.68 2.23 4.61 3.63 -1.0
Cpt1a 0.5 0.37 3.87 1.45 2.95 1.97 -1.0
Nfkbie 1.62 2.56 11.02 8.86 2.77 1.79 -1.0
Cd200r1 0.11 0.18 1.83 1.53 4.06 3.09 -1.0
Acvrl1 0.8 1.08 37.77 26.11 5.56 4.6 -1.0
Col18a1 19.11 25.6 354.59 243.34 4.21 3.25 -1.0
Ramp3 0.38 0.48 4.46 2.9 3.55 2.59 -1.0
Supplementary Table 5.3 – Deregulation of genes between Flk1+ cells and HE1 in
Sp1del/del cells
Genes that are differentially expressed in WT cells between differentiation stages Flk1+ and HE1 cells were identified (at least two-fold changed) and the expression levels compared to that in Sp1del/del cells. The FPKM values in each cell type are shown, as well as the respective fold change (FC, log2 value) between ESC and Flk1+ stages, and the fold change between these values in WT and Sp1del/del cells. Cluster 1 and 12 show genes that are unchanged between WT and Sp1del/del cells (not shown). No genes were identified as downregulated in mutant/upregulated in WT (cluster 6).
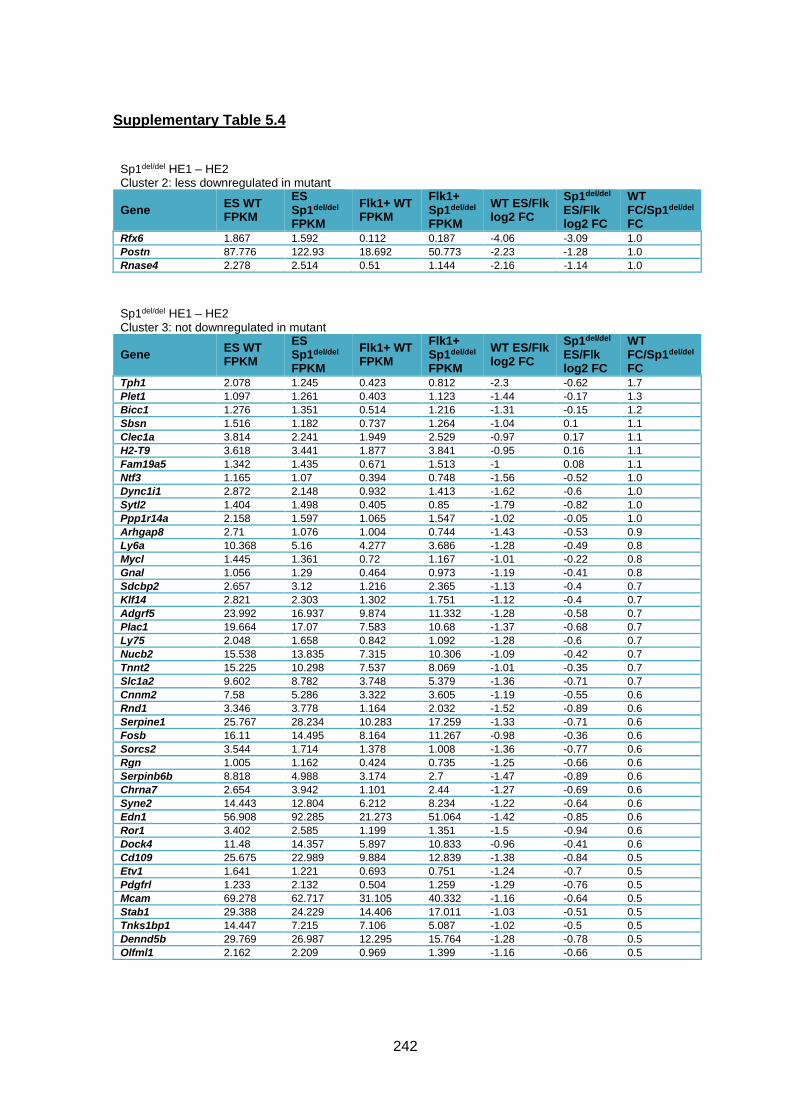
242
Supplementary Table 5.4
Sp1del/del HE1 – HE2 Cluster 2: less downregulated in mutant
Gene ES WT FPKM
ES Sp1del/del FPKM
Flk1+ WT FPKM
Flk1+ Sp1del/del FPKM
WT ES/Flk log2 FC
Sp1del/del ES/Flk log2 FC
WT FC/Sp1del/del FC
Rfx6 1.867 1.592 0.112 0.187 -4.06 -3.09 1.0
Postn 87.776 122.93 18.692 50.773 -2.23 -1.28 1.0
Rnase4 2.278 2.514 0.51 1.144 -2.16 -1.14 1.0
Sp1del/del HE1 – HE2 Cluster 3: not downregulated in mutant
Gene ES WT FPKM
ES Sp1del/del FPKM
Flk1+ WT FPKM
Flk1+ Sp1del/del FPKM
WT ES/Flk log2 FC
Sp1del/del ES/Flk log2 FC
WT FC/Sp1del/del FC
Tph1 2.078 1.245 0.423 0.812 -2.3 -0.62 1.7
Plet1 1.097 1.261 0.403 1.123 -1.44 -0.17 1.3
Bicc1 1.276 1.351 0.514 1.216 -1.31 -0.15 1.2
Sbsn 1.516 1.182 0.737 1.264 -1.04 0.1 1.1
Clec1a 3.814 2.241 1.949 2.529 -0.97 0.17 1.1
H2-T9 3.618 3.441 1.877 3.841 -0.95 0.16 1.1
Fam19a5 1.342 1.435 0.671 1.513 -1 0.08 1.1
Ntf3 1.165 1.07 0.394 0.748 -1.56 -0.52 1.0
Dync1i1 2.872 2.148 0.932 1.413 -1.62 -0.6 1.0
Sytl2 1.404 1.498 0.405 0.85 -1.79 -0.82 1.0
Ppp1r14a 2.158 1.597 1.065 1.547 -1.02 -0.05 1.0
Arhgap8 2.71 1.076 1.004 0.744 -1.43 -0.53 0.9
Ly6a 10.368 5.16 4.277 3.686 -1.28 -0.49 0.8
Mycl 1.445 1.361 0.72 1.167 -1.01 -0.22 0.8
Gnal 1.056 1.29 0.464 0.973 -1.19 -0.41 0.8
Sdcbp2 2.657 3.12 1.216 2.365 -1.13 -0.4 0.7
Klf14 2.821 2.303 1.302 1.751 -1.12 -0.4 0.7
Adgrf5 23.992 16.937 9.874 11.332 -1.28 -0.58 0.7
Plac1 19.664 17.07 7.583 10.68 -1.37 -0.68 0.7
Ly75 2.048 1.658 0.842 1.092 -1.28 -0.6 0.7
Nucb2 15.538 13.835 7.315 10.306 -1.09 -0.42 0.7
Tnnt2 15.225 10.298 7.537 8.069 -1.01 -0.35 0.7
Slc1a2 9.602 8.782 3.748 5.379 -1.36 -0.71 0.7
Cnnm2 7.58 5.286 3.322 3.605 -1.19 -0.55 0.6
Rnd1 3.346 3.778 1.164 2.032 -1.52 -0.89 0.6
Serpine1 25.767 28.234 10.283 17.259 -1.33 -0.71 0.6
Fosb 16.11 14.495 8.164 11.267 -0.98 -0.36 0.6
Sorcs2 3.544 1.714 1.378 1.008 -1.36 -0.77 0.6
Rgn 1.005 1.162 0.424 0.735 -1.25 -0.66 0.6
Serpinb6b 8.818 4.988 3.174 2.7 -1.47 -0.89 0.6
Chrna7 2.654 3.942 1.101 2.44 -1.27 -0.69 0.6
Syne2 14.443 12.804 6.212 8.234 -1.22 -0.64 0.6
Edn1 56.908 92.285 21.273 51.064 -1.42 -0.85 0.6
Ror1 3.402 2.585 1.199 1.351 -1.5 -0.94 0.6
Dock4 11.48 14.357 5.897 10.833 -0.96 -0.41 0.6
Cd109 25.675 22.989 9.884 12.839 -1.38 -0.84 0.5
Etv1 1.641 1.221 0.693 0.751 -1.24 -0.7 0.5
Pdgfrl 1.233 2.132 0.504 1.259 -1.29 -0.76 0.5
Mcam 69.278 62.717 31.105 40.332 -1.16 -0.64 0.5
Stab1 29.388 24.229 14.406 17.011 -1.03 -0.51 0.5
Tnks1bp1 14.447 7.215 7.106 5.087 -1.02 -0.5 0.5
Dennd5b 29.769 26.987 12.295 15.764 -1.28 -0.78 0.5
Olfml1 2.162 2.209 0.969 1.399 -1.16 -0.66 0.5

243
Sp1del/del HE1 – HE2 Cluster 4: more downregulated in mutant
Gene ES WT FPKM
ES Sp1del/del FPKM
Flk1+ WT FPKM
Flk1+ Sp1del/del FPKM
WT ES/Flk log2 FC
Sp1del/del ES/Flk log2 FC
WT FC/Sp1del/del FC
Dkk1 1.48 1.986 0.698 0.326 -1.08 -2.61 -1.5
Cited1 2.882 3.2 1.391 0.589 -1.05 -2.44 -1.4
Adora1 1.864 3.068 0.513 0.328 -1.86 -3.23 -1.4
Fabp3 18.142 34.345 5.213 4.092 -1.8 -3.07 -1.3
Pth1r 1.105 2.834 0.373 0.4 -1.57 -2.82 -1.3
Shisa4 3.133 2.339 1.209 0.41 -1.37 -2.51 -1.1
Efna3 3.338 2.775 1.625 0.62 -1.04 -2.16 -1.1
Pdyn 3.715 8.655 0.687 0.765 -2.43 -3.5 -1.1
Tnnt3 3.22 2.682 1.445 0.577 -1.16 -2.22 -1.1
Rai2 1.353 1.023 0.618 0.225 -1.13 -2.18 -1.1
Mertk 1.258 2.376 0.467 0.43 -1.43 -2.47 -1.0
Lsr 9.053 7.2 4.314 1.781 -1.07 -2.02 -1.0
Sp1del/del HE1 – HE2 Cluster 5: downregulated in mutant/no change in WT
Gene ES WT FPKM
ES Sp1del/del FPKM
Flk1+ WT FPKM
Flk1+ Sp1del/del FPKM
WT ES/Flk log2 FC
Sp1del/del ES/Flk log2 FC
WT FC/Sp1del/del FC
Hist1h4j 2.092 1.366 3.506 0.498 0.74 -1.46 -2.2
Gm20594 1.467 5.677 1.865 1.84 0.35 -1.63 -2.0
Spata5l1 1.433 1.779 2.132 0.851 0.57 -1.06 -1.6
Acta1 1.441 6.938 1.02 1.651 -0.5 -2.07 -1.6
Fah 4.917 1.249 4.438 0.378 -0.15 -1.72 -1.6
Tmem51 1.595 1.094 1.062 0.256 -0.59 -2.1 -1.5
Samd12 1.391 4.877 1.089 1.478 -0.35 -1.72 -1.4
Mocos 1.096 2.031 0.647 0.485 -0.76 -2.07 -1.3
Hoxd9 2.365 1.468 1.402 0.378 -0.75 -1.96 -1.2
B4galnt1 1.288 1.478 1.432 0.719 0.15 -1.04 -1.2
Pard6g 5.07 8.042 4.321 3.067 -0.23 -1.39 -1.2
Tmem243 2.145 4.367 2.159 1.997 0.01 -1.13 -1.1
Bend5 2.647 4.485 2.313 1.799 -0.19 -1.32 -1.1
Slc6a15 1.525 3.215 0.892 0.872 -0.77 -1.88 -1.1
Abhd14b 2.175 2.18 1.367 0.634 -0.67 -1.78 -1.1
Lrpap1 36.02 39.63 23.09 12.05 -0.64 -1.72 -1.1
Pdgfa 4.28 7.572 2.424 2.074 -0.82 -1.87 -1.1
Snai1 1.751 2.066 1.339 0.778 -0.39 -1.41 -1.0
Rac3 2.047 3.814 1.563 1.465 -0.39 -1.38 -1.0
Fam213b 3.71 1.489 2.775 0.57 -0.42 -1.39 -1.0
Slc16a1 41.527 67.704 34.863 29.862 -0.25 -1.18 -0.9
Phyh 2.47 2.848 2.061 1.254 -0.26 -1.18 -0.9
Nppb 2.041 5.6 1.256 1.829 -0.7 -1.61 -0.9
Mob3b 2.18 3.699 1.38 1.257 -0.66 -1.56 -0.9
Gatsl3 4.157 3.537 2.28 1.059 -0.87 -1.74 -0.9
Zfp52 1.986 2.399 1.503 1 -0.4 -1.26 -0.9
Llgl2 7.075 8.957 4.141 2.937 -0.77 -1.61 -0.8
Hpcal1 18.707 17.864 15.038 8.081 -0.31 -1.14 -0.8
Moap1 2.943 5.964 2.532 2.899 -0.22 -1.04 -0.8
Agpat2 4.528 2.587 3.98 1.297 -0.19 -1 -0.8
Nodal 2.552 1.645 1.543 0.572 -0.73 -1.52 -0.8
Garnl3 1.539 2.231 0.803 0.678 -0.94 -1.72 -0.8
Nupr1 1.551 4.496 1.113 1.883 -0.48 -1.26 -0.8
Cdh1 2.143 4.244 1.172 1.358 -0.87 -1.64 -0.8
Sptb 6.81 7.014 4.03 2.448 -0.76 -1.52 -0.8
Tmc7 1.237 2.165 0.806 0.839 -0.62 -1.37 -0.8
Efna2 1.332 1.674 0.905 0.675 -0.56 -1.31 -0.8
Ddit4l 2.599 1.61 2 0.736 -0.38 -1.13 -0.8
Dll1 1.1 1.234 0.865 0.579 -0.35 -1.09 -0.7
Tgfb3 1.19 1.411 0.949 0.672 -0.33 -1.07 -0.7
Mapk8ip1 2.11 3.113 1.414 1.258 -0.58 -1.31 -0.7

244
Sp1del/del HE1 – HE2 Cluster 5: downregulated in mutant/no change in WT
Gene ES WT FPKM
ES Sp1del/del FPKM
Flk1+ WT FPKM
Flk1+ Sp1del/del FPKM
WT ES/Flk log2 FC
Sp1del/del ES/Flk log2 FC
WT FC/Sp1del/del FC
Cd302 2.274 2.12 1.699 0.959 -0.42 -1.14 -0.7
Mfap2 2.007 4.621 1.274 1.803 -0.66 -1.36 -0.7
1700007K13Rik 2.431 6.379 1.31 2.137 -0.89 -1.58 -0.7
Gria4 1.326 3.223 1.022 1.543 -0.38 -1.06 -0.7
Dact2 1.943 1.602 1.201 0.625 -0.69 -1.36 -0.7
1110008P14Rik 2.312 3.206 1.589 1.383 -0.54 -1.21 -0.7
Pvrl1 1.427 1.755 0.996 0.767 -0.52 -1.19 -0.7
Mtcl1 1.865 2.226 1.161 0.879 -0.68 -1.34 -0.7
Sall4 16.016 20.791 10.791 8.838 -0.57 -1.23 -0.7
Prr5 9.728 6.861 6.597 2.936 -0.56 -1.22 -0.7
Ano10 23.867 7.702 13.613 2.807 -0.81 -1.46 -0.7
Nr1d1 1.416 3.262 1.057 1.555 -0.42 -1.07 -0.7
Hspbap1 2.194 2.841 1.69 1.405 -0.38 -1.02 -0.6
Shb 4.24 5.09 2.312 1.794 -0.87 -1.5 -0.6
Tnfrsf19 1.037 2.306 0.645 0.925 -0.69 -1.32 -0.6
Twist1 5.133 4.914 3.204 1.986 -0.68 -1.31 -0.6
B3galnt1 2.926 4.825 1.984 2.115 -0.56 -1.19 -0.6
Slc9a3r1 14.16 13.29 9.937 6.049 -0.51 -1.14 -0.6
Kcnip3 2.716 2.614 2.004 1.247 -0.44 -1.07 -0.6
Hand1 9.998 14.797 5.219 5.07 -0.94 -1.55 -0.6
Prrx2 1.753 1.929 1.145 0.83 -0.61 -1.22 -0.6
Dpf1 1.101 2.054 0.634 0.79 -0.8 -1.38 -0.6
Pik3ip1 2.129 2.915 1.566 1.435 -0.44 -1.02 -0.6
Angpt2 1.398 2.868 0.761 1.047 -0.88 -1.45 -0.6
Htra1 1.396 2.203 1 1.065 -0.48 -1.05 -0.6
Hid1 2.634 2.003 1.996 1.032 -0.4 -0.96 -0.6
Rtn1 1.888 2.572 1.009 0.942 -0.9 -1.45 -0.6
Abcb1b 4.215 4.677 2.278 1.729 -0.89 -1.44 -0.6
Bdh1 2.424 1.614 1.368 0.619 -0.83 -1.38 -0.6
Plekha7 6.967 7.588 4.485 3.331 -0.64 -1.19 -0.6
Fas 1.654 2.043 1.159 0.983 -0.51 -1.06 -0.6
Enox1 1.53 3.246 1.135 1.643 -0.43 -0.98 -0.6
Wwc1 1.991 1.912 1.497 0.986 -0.41 -0.96 -0.6
Plekhf1 6.667 7.065 3.655 2.664 -0.87 -1.41 -0.5
Mdk 149.04 84.772 105.106 41.22 -0.5 -1.04 -0.5
Tob1 6.471 7.282 4.088 3.193 -0.66 -1.19 -0.5
Fam124a 1.712 2.221 1.21 1.089 -0.5 -1.03 -0.5
Dact1 3.01 2.14 1.647 0.819 -0.87 -1.39 -0.5
Tppp3 5.424 5.626 3.995 2.897 -0.44 -0.96 -0.5
Lbh 3.658 4.414 2.058 1.758 -0.83 -1.33 -0.5
Dnajb2 5.489 5.914 3.569 2.729 -0.62 -1.12 -0.5
Gm7694 1.127 1.826 0.749 0.855 -0.59 -1.09 -0.5
Sp1del/del HE1 – HE2 Cluster 7: upregulated in mutant/no change in WT
Gene ES WT FPKM
ES Sp1del/del FPKM
Flk1+ WT FPKM
Flk1+ Sp1del/del FPKM
WT ES/Flk log2 FC
Sp1del/del ES/Flk log2 FC
WT FC/Sp1del/del FC
Rnaset2a 1.87 0.60 1.72 2.09 -0.13 1.80 1.9
Pygo1 1.23 0.63 1.05 1.67 -0.23 1.41 1.6
Gstk1 6.85 0.55 7.05 1.75 0.04 1.67 1.6
Gnrh1 2.73 1.79 2.66 4.77 -0.03 1.42 1.5
Gm20604 3.37 1.37 3.65 4.00 0.12 1.55 1.4
Ccrl2 1.44 0.40 1.70 1.20 0.24 1.59 1.4
Tspan15 1.16 0.37 1.28 1.00 0.14 1.44 1.3
Npff 2.19 1.65 1.90 3.56 -0.20 1.10 1.3
Tnfrsf14 1.97 0.69 3.68 3.08 0.90 2.16 1.3
Mylpf 1.31 0.67 1.69 2.01 0.37 1.59 1.2
Klk8 3.50 0.46 6.21 1.89 0.83 2.03 1.2

245
Sp1del/del HE1 – HE2 Cluster 7: upregulated in mutant/no change in WT
Gene ES WT FPKM
ES Sp1del/del FPKM
Flk1+ WT FPKM
Flk1+ Sp1del/del FPKM
WT ES/Flk log2 FC
Sp1del/del ES/Flk log2 FC
WT FC/Sp1del/del FC
Nr4a2 2.36 1.41 2.54 3.45 0.10 1.29 1.2
Nsun3 2.42 1.59 2.15 3.08 -0.17 0.95 1.1
Slc30a3 3.30 1.52 3.27 3.11 -0.01 1.04 1.1
Trim30a 1.45 0.96 2.53 3.30 0.80 1.79 1.0
Nat2 2.00 0.69 2.17 1.48 0.12 1.10 1.0
Zfp667 1.56 1.04 1.71 2.20 0.14 1.09 1.0
Nfkbid 1.03 0.56 1.82 1.82 0.81 1.71 0.9
Naip7 2.48 0.84 4.40 2.69 0.82 1.68 0.9
Rwdd3 1.12 0.99 1.66 2.62 0.56 1.41 0.9
H2-T23 0.77 2.05 1.10 5.21 0.51 1.35 0.8
Aplnr 80.87 33.17 103.56 75.56 0.36 1.19 0.8
Pon3 4.29 0.93 6.66 2.54 0.63 1.45 0.8
Rasgrp4 0.69 0.56 1.11 1.56 0.69 1.48 0.8
Slc15a2 3.94 2.49 5.85 6.37 0.57 1.36 0.8
Gfi1 4.59 2.75 5.18 5.35 0.17 0.96 0.8
Rad9b 1.30 0.98 1.45 1.89 0.16 0.95 0.8
Tcea2 4.12 3.26 5.32 7.19 0.37 1.14 0.8
Slc26a6 1.18 0.98 1.47 2.08 0.32 1.08 0.8
Ltc4s 8.09 2.68 11.95 6.65 0.56 1.31 0.8
Adamtsl2 1.05 0.76 1.22 1.49 0.22 0.97 0.8
2610044O15Rik8 1.40 1.00 1.91 2.27 0.45 1.19 0.7
Ifi35 3.51 1.80 5.79 4.93 0.72 1.45 0.7
Tmc6 6.56 2.12 9.81 5.16 0.58 1.29 0.7
Naip6 1.07 0.61 1.78 1.63 0.74 1.43 0.7
Atp2b4 14.83 7.36 19.51 15.42 0.40 1.07 0.7
Pdk2 1.22 0.79 1.82 1.86 0.58 1.24 0.7
Cmpk2 2.50 1.53 4.43 4.24 0.82 1.47 0.7
Lcp1 13.89 10.67 20.93 25.24 0.59 1.24 0.7
Ccdc60 2.20 1.71 3.01 3.67 0.45 1.10 0.7
Tst 1.92 0.81 2.55 1.68 0.40 1.05 0.7
Naip5 2.00 1.04 2.95 2.40 0.56 1.20 0.6
Ankrd37 1.26 1.27 2.13 3.32 0.76 1.39 0.6
Elovl7 3.62 1.91 5.19 4.24 0.52 1.15 0.6
Tmem176a 21.87 10.03 28.09 19.99 0.36 0.99 0.6
Zcwpw1 1.33 1.49 2.31 4.01 0.80 1.42 0.6
Ccdc57 1.10 0.75 1.85 1.93 0.74 1.36 0.6
Frat2 3.27 2.08 4.23 4.12 0.37 0.99 0.6
Arap1 6.75 2.95 10.79 7.21 0.68 1.29 0.6
Rad51b 2.35 1.66 3.37 3.65 0.52 1.13 0.6
Gm13889 3.46 2.73 4.58 5.51 0.40 1.01 0.6
Lepr 0.75 0.57 1.37 1.58 0.87 1.47 0.6
Tmem177 2.40 0.83 3.64 1.90 0.60 1.20 0.6
Pcbd1 3.32 1.79 4.64 3.72 0.48 1.05 0.6
Fam111a 14.95 10.95 28.68 31.06 0.94 1.50 0.6
Smim20 11.42 0.86 17.73 1.98 0.64 1.20 0.6
Sh2d4b 3.00 3.81 4.06 7.63 0.44 1.00 0.6
Hif3a 4.00 2.04 7.04 5.27 0.82 1.37 0.6
Lgals3bp 4.55 4.44 7.86 11.29 0.79 1.34 0.6
Mthfsl 1.60 0.49 2.49 1.12 0.64 1.19 0.6
Fancf 1.28 0.67 1.87 1.40 0.54 1.08 0.5
Zfp784 0.69 0.80 1.14 1.90 0.71 1.24 0.5
Hacl1 3.19 1.46 4.80 3.14 0.59 1.11 0.5
Atp8a1 4.51 4.01 7.46 9.46 0.73 1.24 0.5
Accs 3.34 1.88 5.17 4.16 0.63 1.14 0.5
Abca7 5.52 3.53 8.12 7.40 0.56 1.07 0.5
Iqgap2 17.57 14.45 24.18 28.23 0.46 0.97 0.5
Trim21 2.59 0.70 3.55 1.37 0.45 0.96 0.5
Kif24 2.79 1.68 4.93 4.20 0.82 1.32 0.5
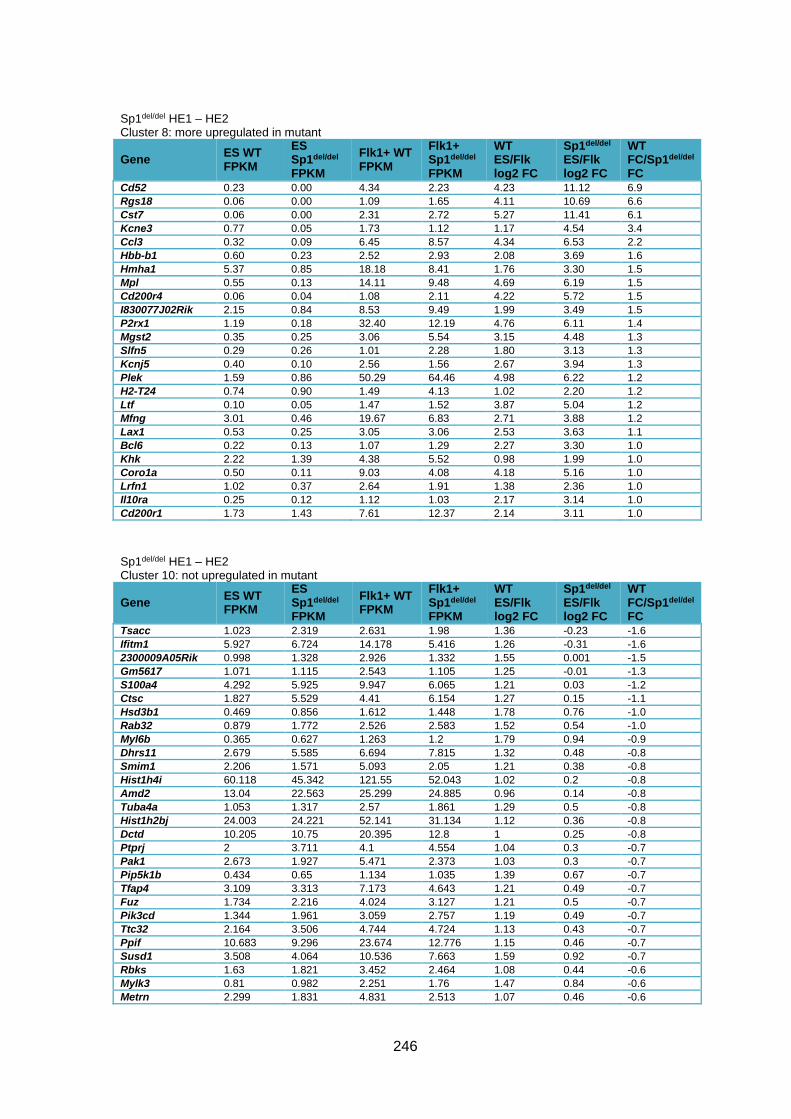
246
Sp1del/del HE1 – HE2 Cluster 8: more upregulated in mutant
Gene ES WT FPKM
ES Sp1del/del FPKM
Flk1+ WT FPKM
Flk1+ Sp1del/del FPKM
WT ES/Flk log2 FC
Sp1del/del ES/Flk log2 FC
WT FC/Sp1del/del FC
Cd52 0.23 0.00 4.34 2.23 4.23 11.12 6.9
Rgs18 0.06 0.00 1.09 1.65 4.11 10.69 6.6
Cst7 0.06 0.00 2.31 2.72 5.27 11.41 6.1
Kcne3 0.77 0.05 1.73 1.12 1.17 4.54 3.4
Ccl3 0.32 0.09 6.45 8.57 4.34 6.53 2.2
Hbb-b1 0.60 0.23 2.52 2.93 2.08 3.69 1.6
Hmha1 5.37 0.85 18.18 8.41 1.76 3.30 1.5
Mpl 0.55 0.13 14.11 9.48 4.69 6.19 1.5
Cd200r4 0.06 0.04 1.08 2.11 4.22 5.72 1.5
I830077J02Rik 2.15 0.84 8.53 9.49 1.99 3.49 1.5
P2rx1 1.19 0.18 32.40 12.19 4.76 6.11 1.4
Mgst2 0.35 0.25 3.06 5.54 3.15 4.48 1.3
Slfn5 0.29 0.26 1.01 2.28 1.80 3.13 1.3
Kcnj5 0.40 0.10 2.56 1.56 2.67 3.94 1.3
Plek 1.59 0.86 50.29 64.46 4.98 6.22 1.2
H2-T24 0.74 0.90 1.49 4.13 1.02 2.20 1.2
Ltf 0.10 0.05 1.47 1.52 3.87 5.04 1.2
Mfng 3.01 0.46 19.67 6.83 2.71 3.88 1.2
Lax1 0.53 0.25 3.05 3.06 2.53 3.63 1.1
Bcl6 0.22 0.13 1.07 1.29 2.27 3.30 1.0
Khk 2.22 1.39 4.38 5.52 0.98 1.99 1.0
Coro1a 0.50 0.11 9.03 4.08 4.18 5.16 1.0
Lrfn1 1.02 0.37 2.64 1.91 1.38 2.36 1.0
Il10ra 0.25 0.12 1.12 1.03 2.17 3.14 1.0
Cd200r1 1.73 1.43 7.61 12.37 2.14 3.11 1.0
Sp1del/del HE1 – HE2 Cluster 10: not upregulated in mutant
Gene ES WT FPKM
ES Sp1del/del FPKM
Flk1+ WT FPKM
Flk1+ Sp1del/del FPKM
WT ES/Flk log2 FC
Sp1del/del ES/Flk log2 FC
WT FC/Sp1del/del FC
Tsacc 1.023 2.319 2.631 1.98 1.36 -0.23 -1.6
Ifitm1 5.927 6.724 14.178 5.416 1.26 -0.31 -1.6
2300009A05Rik 0.998 1.328 2.926 1.332 1.55 0.001 -1.5
Gm5617 1.071 1.115 2.543 1.105 1.25 -0.01 -1.3
S100a4 4.292 5.925 9.947 6.065 1.21 0.03 -1.2
Ctsc 1.827 5.529 4.41 6.154 1.27 0.15 -1.1
Hsd3b1 0.469 0.856 1.612 1.448 1.78 0.76 -1.0
Rab32 0.879 1.772 2.526 2.583 1.52 0.54 -1.0
Myl6b 0.365 0.627 1.263 1.2 1.79 0.94 -0.9
Dhrs11 2.679 5.585 6.694 7.815 1.32 0.48 -0.8
Smim1 2.206 1.571 5.093 2.05 1.21 0.38 -0.8
Hist1h4i 60.118 45.342 121.55 52.043 1.02 0.2 -0.8
Amd2 13.04 22.563 25.299 24.885 0.96 0.14 -0.8
Tuba4a 1.053 1.317 2.57 1.861 1.29 0.5 -0.8
Hist1h2bj 24.003 24.221 52.141 31.134 1.12 0.36 -0.8
Dctd 10.205 10.75 20.395 12.8 1 0.25 -0.8
Ptprj 2 3.711 4.1 4.554 1.04 0.3 -0.7
Pak1 2.673 1.927 5.471 2.373 1.03 0.3 -0.7
Pip5k1b 0.434 0.65 1.134 1.035 1.39 0.67 -0.7
Tfap4 3.109 3.313 7.173 4.643 1.21 0.49 -0.7
Fuz 1.734 2.216 4.024 3.127 1.21 0.5 -0.7
Pik3cd 1.344 1.961 3.059 2.757 1.19 0.49 -0.7
Ttc32 2.164 3.506 4.744 4.724 1.13 0.43 -0.7
Ppif 10.683 9.296 23.674 12.776 1.15 0.46 -0.7
Susd1 3.508 4.064 10.536 7.663 1.59 0.92 -0.7
Rbks 1.63 1.821 3.452 2.464 1.08 0.44 -0.6
Mylk3 0.81 0.982 2.251 1.76 1.47 0.84 -0.6
Metrn 2.299 1.831 4.831 2.513 1.07 0.46 -0.6
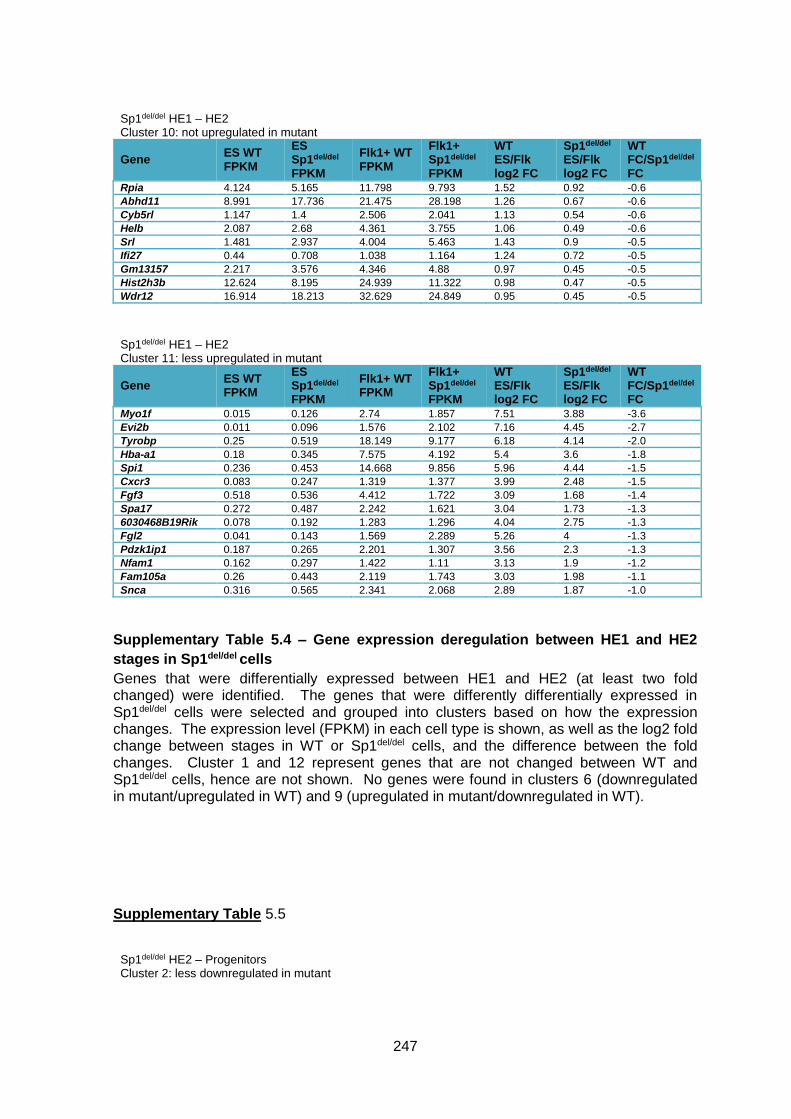
247
Sp1del/del HE1 – HE2 Cluster 10: not upregulated in mutant
Gene ES WT FPKM
ES Sp1del/del FPKM
Flk1+ WT FPKM
Flk1+ Sp1del/del FPKM
WT ES/Flk log2 FC
Sp1del/del ES/Flk log2 FC
WT FC/Sp1del/del FC
Rpia 4.124 5.165 11.798 9.793 1.52 0.92 -0.6
Abhd11 8.991 17.736 21.475 28.198 1.26 0.67 -0.6
Cyb5rl 1.147 1.4 2.506 2.041 1.13 0.54 -0.6
Helb 2.087 2.68 4.361 3.755 1.06 0.49 -0.6
Srl 1.481 2.937 4.004 5.463 1.43 0.9 -0.5
Ifi27 0.44 0.708 1.038 1.164 1.24 0.72 -0.5
Gm13157 2.217 3.576 4.346 4.88 0.97 0.45 -0.5
Hist2h3b 12.624 8.195 24.939 11.322 0.98 0.47 -0.5
Wdr12 16.914 18.213 32.629 24.849 0.95 0.45 -0.5
Sp1del/del HE1 – HE2 Cluster 11: less upregulated in mutant
Gene ES WT FPKM
ES Sp1del/del FPKM
Flk1+ WT FPKM
Flk1+ Sp1del/del FPKM
WT ES/Flk log2 FC
Sp1del/del ES/Flk log2 FC
WT FC/Sp1del/del FC
Myo1f 0.015 0.126 2.74 1.857 7.51 3.88 -3.6
Evi2b 0.011 0.096 1.576 2.102 7.16 4.45 -2.7
Tyrobp 0.25 0.519 18.149 9.177 6.18 4.14 -2.0
Hba-a1 0.18 0.345 7.575 4.192 5.4 3.6 -1.8
Spi1 0.236 0.453 14.668 9.856 5.96 4.44 -1.5
Cxcr3 0.083 0.247 1.319 1.377 3.99 2.48 -1.5
Fgf3 0.518 0.536 4.412 1.722 3.09 1.68 -1.4
Spa17 0.272 0.487 2.242 1.621 3.04 1.73 -1.3
6030468B19Rik 0.078 0.192 1.283 1.296 4.04 2.75 -1.3
Fgl2 0.041 0.143 1.569 2.289 5.26 4 -1.3
Pdzk1ip1 0.187 0.265 2.201 1.307 3.56 2.3 -1.3
Nfam1 0.162 0.297 1.422 1.11 3.13 1.9 -1.2
Fam105a 0.26 0.443 2.119 1.743 3.03 1.98 -1.1
Snca 0.316 0.565 2.341 2.068 2.89 1.87 -1.0
Supplementary Table 5.4 – Gene expression deregulation between HE1 and HE2
stages in Sp1del/del cells
Genes that were differentially expressed between HE1 and HE2 (at least two fold changed) were identified. The genes that were differently differentially expressed in Sp1del/del cells were selected and grouped into clusters based on how the expression changes. The expression level (FPKM) in each cell type is shown, as well as the log2 fold change between stages in WT or Sp1del/del cells, and the difference between the fold changes. Cluster 1 and 12 represent genes that are not changed between WT and Sp1del/del cells, hence are not shown. No genes were found in clusters 6 (downregulated in mutant/upregulated in WT) and 9 (upregulated in mutant/downregulated in WT).
Supplementary Table 5.5
Sp1del/del HE2 – Progenitors Cluster 2: less downregulated in mutant

248
Gene ES WT FPKM
ES Sp1del/del FPKM
Flk1+ WT FPKM
Flk1+ Sp1del/del FPKM
WT ES/Flk log2 FC
Sp1del/del ES/Flk log2 FC
WT FC/Sp1del/del FC
Cyyr1 3.04 2.99 0.02 0.12 -7.66 -4.63 3.0
Ly6h 4.43 1.84 0.13 0.37 -5.15 -2.31 2.8
Pirt 1.52 1.54 0.03 0.19 -5.87 -3.04 2.8
Galnt18 2.83 2.04 0.12 0.54 -4.51 -1.92 2.6
Nr5a2 1.48 1.30 0.01 0.04 -7.36 -5.21 2.1
Serpina3i 2.10 2.64 0.08 0.33 -4.72 -3.02 1.7
Cxcl1 2.17 2.67 0.14 0.53 -3.94 -2.34 1.6
Tppp 2.52 1.16 0.29 0.39 -3.13 -1.57 1.6
Ly6c1 5.51 5.42 0.70 1.87 -2.98 -1.54 1.4
Lyve1 14.20 8.50 2.14 3.17 -2.73 -1.42 1.3
Dupd1 1.33 1.56 0.08 0.22 -4.13 -2.84 1.3
Ramp3 3.69 3.09 0.06 0.12 -5.99 -4.71 1.3
Slc2a12 2.08 1.10 0.28 0.33 -2.90 -1.74 1.2
Sh3gl3 6.75 11.33 0.20 0.75 -5.06 -3.92 1.1
Il27ra 2.77 2.70 0.56 1.07 -2.32 -1.34 1.0
Sp1del/del HE2 – Progenitors Cluster 3: not downregulated in mutant
Gene ES WT FPKM
ES Sp1del/del FPKM
Flk1+ WT FPKM
Flk1+ Sp1del/del FPKM
WT ES/Flk log2 FC
Sp1del/del ES/Flk log2 FC
WT FC/Sp1del/del FC
Rsad2 6.55 5.96 1.73 5.52 -1.92 -0.11 1.8
Vwf 8.54 19.17 1.87 14.23 -2.19 -0.43 1.8
Wt1 2.46 1.84 0.51 1.24 -2.26 -0.57 1.7
Trpc6 1.55 2.48 0.55 2.59 -1.50 0.06 1.6
Pi16 7.96 4.62 2.69 4.22 -1.57 -0.13 1.4
Parvb 11.95 9.64 4.66 9.98 -1.36 0.05 1.4
Bcl11a 2.33 1.23 0.92 1.14 -1.35 -0.10 1.2
Sorcs2 1.38 1.01 0.35 0.59 -1.99 -0.77 1.2
Naip7 4.40 2.69 1.53 2.16 -1.52 -0.32 1.2
Wscd1 3.89 3.36 1.69 3.26 -1.21 -0.04 1.2
Ccm2l 12.47 11.70 3.45 7.07 -1.85 -0.73 1.1
Ly6a 4.28 3.69 1.71 3.19 -1.32 -0.21 1.1
Pon3 6.66 2.54 1.69 1.39 -1.98 -0.87 1.1
Etv2 2.82 1.63 1.41 1.73 -1.00 0.09 1.1
Bst2 11.53 14.42 5.63 14.86 -1.03 0.04 1.1
Capn5 23.88 13.43 7.04 8.22 -1.76 -0.71 1.1
Ocln 2.55 2.22 0.73 1.24 -1.81 -0.83 1.0
Naip5 2.95 2.40 0.90 1.41 -1.72 -0.77 1.0
Akr1c12 1.93 1.35 0.93 1.24 -1.06 -0.12 0.9
Efhc1 1.91 1.47 0.69 1.00 -1.47 -0.56 0.9
Lgals9 79.16 34.27 40.12 32.28 -0.98 -0.09 0.9
Rab6b 1.49 1.62 0.46 0.93 -1.68 -0.80 0.9
Casp4 2.26 1.87 0.74 1.12 -1.62 -0.74 0.9
Robo3 3.59 8.04 1.31 5.39 -1.45 -0.58 0.9
Gnrh1 2.66 4.77 1.10 3.55 -1.28 -0.42 0.9
Vamp5 7.89 5.85 3.10 4.03 -1.35 -0.54 0.8
Gbp9 1.57 2.45 0.52 1.40 -1.60 -0.81 0.8
Scn3b 1.77 1.34 0.64 0.81 -1.48 -0.72 0.8
Nfkbie 8.47 6.33 3.88 4.81 -1.13 -0.40 0.7
Spata1 1.51 2.88 0.63 1.98 -1.27 -0.54 0.7
6430548M08Rik 1.05 1.03 0.36 0.57 -1.56 -0.84 0.7
Cdkn1c 12.51 10.11 4.83 6.33 -1.37 -0.68 0.7
Smtnl2 54.75 28.79 24.22 20.46 -1.18 -0.49 0.7
Glcci1 1.28 2.23 0.65 1.78 -0.98 -0.33 0.7
Cdc42ep1 48.69 27.31 17.21 15.00 -1.50 -0.86 0.6
Tmem86a 1.70 2.03 0.86 1.58 -0.98 -0.36 0.6
Tnfaip8l1 5.62 3.55 2.21 2.13 -1.35 -0.74 0.6
Sult5a1 1.71 1.06 0.80 0.76 -1.09 -0.48 0.6
Nefl 16.05 15.51 6.41 9.40 -1.33 -0.72 0.6
Gfi1 5.18 5.35 2.03 3.16 -1.35 -0.76 0.6
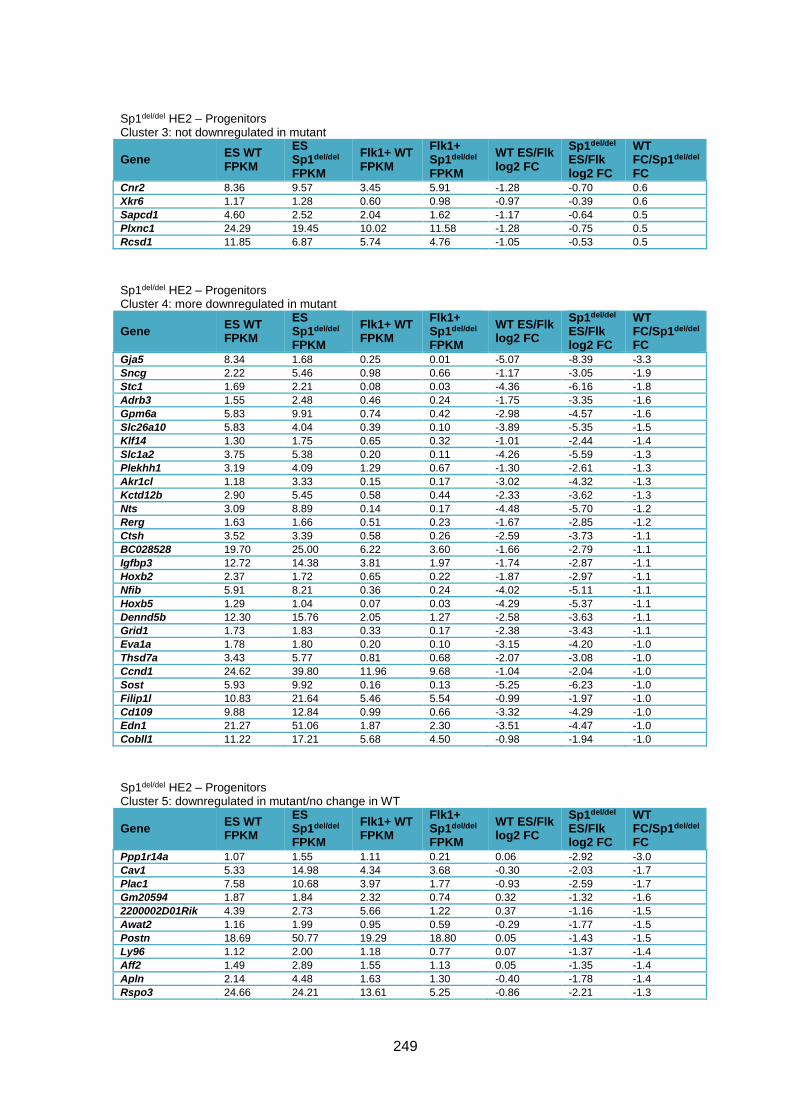
249
Sp1del/del HE2 – Progenitors Cluster 3: not downregulated in mutant
Gene ES WT FPKM
ES Sp1del/del FPKM
Flk1+ WT FPKM
Flk1+ Sp1del/del FPKM
WT ES/Flk log2 FC
Sp1del/del ES/Flk log2 FC
WT FC/Sp1del/del FC
Cnr2 8.36 9.57 3.45 5.91 -1.28 -0.70 0.6
Xkr6 1.17 1.28 0.60 0.98 -0.97 -0.39 0.6
Sapcd1 4.60 2.52 2.04 1.62 -1.17 -0.64 0.5
Plxnc1 24.29 19.45 10.02 11.58 -1.28 -0.75 0.5
Rcsd1 11.85 6.87 5.74 4.76 -1.05 -0.53 0.5
Sp1del/del HE2 – Progenitors Cluster 4: more downregulated in mutant
Gene ES WT FPKM
ES Sp1del/del FPKM
Flk1+ WT FPKM
Flk1+ Sp1del/del FPKM
WT ES/Flk log2 FC
Sp1del/del ES/Flk log2 FC
WT FC/Sp1del/del FC
Gja5 8.34 1.68 0.25 0.01 -5.07 -8.39 -3.3
Sncg 2.22 5.46 0.98 0.66 -1.17 -3.05 -1.9
Stc1 1.69 2.21 0.08 0.03 -4.36 -6.16 -1.8
Adrb3 1.55 2.48 0.46 0.24 -1.75 -3.35 -1.6
Gpm6a 5.83 9.91 0.74 0.42 -2.98 -4.57 -1.6
Slc26a10 5.83 4.04 0.39 0.10 -3.89 -5.35 -1.5
Klf14 1.30 1.75 0.65 0.32 -1.01 -2.44 -1.4
Slc1a2 3.75 5.38 0.20 0.11 -4.26 -5.59 -1.3
Plekhh1 3.19 4.09 1.29 0.67 -1.30 -2.61 -1.3
Akr1cl 1.18 3.33 0.15 0.17 -3.02 -4.32 -1.3
Kctd12b 2.90 5.45 0.58 0.44 -2.33 -3.62 -1.3
Nts 3.09 8.89 0.14 0.17 -4.48 -5.70 -1.2
Rerg 1.63 1.66 0.51 0.23 -1.67 -2.85 -1.2
Ctsh 3.52 3.39 0.58 0.26 -2.59 -3.73 -1.1
BC028528 19.70 25.00 6.22 3.60 -1.66 -2.79 -1.1
Igfbp3 12.72 14.38 3.81 1.97 -1.74 -2.87 -1.1
Hoxb2 2.37 1.72 0.65 0.22 -1.87 -2.97 -1.1
Nfib 5.91 8.21 0.36 0.24 -4.02 -5.11 -1.1
Hoxb5 1.29 1.04 0.07 0.03 -4.29 -5.37 -1.1
Dennd5b 12.30 15.76 2.05 1.27 -2.58 -3.63 -1.1
Grid1 1.73 1.83 0.33 0.17 -2.38 -3.43 -1.1
Eva1a 1.78 1.80 0.20 0.10 -3.15 -4.20 -1.0
Thsd7a 3.43 5.77 0.81 0.68 -2.07 -3.08 -1.0
Ccnd1 24.62 39.80 11.96 9.68 -1.04 -2.04 -1.0
Sost 5.93 9.92 0.16 0.13 -5.25 -6.23 -1.0
Filip1l 10.83 21.64 5.46 5.54 -0.99 -1.97 -1.0
Cd109 9.88 12.84 0.99 0.66 -3.32 -4.29 -1.0
Edn1 21.27 51.06 1.87 2.30 -3.51 -4.47 -1.0
Cobll1 11.22 17.21 5.68 4.50 -0.98 -1.94 -1.0
Sp1del/del HE2 – Progenitors Cluster 5: downregulated in mutant/no change in WT
Gene ES WT FPKM
ES Sp1del/del FPKM
Flk1+ WT FPKM
Flk1+ Sp1del/del FPKM
WT ES/Flk log2 FC
Sp1del/del ES/Flk log2 FC
WT FC/Sp1del/del FC
Ppp1r14a 1.07 1.55 1.11 0.21 0.06 -2.92 -3.0
Cav1 5.33 14.98 4.34 3.68 -0.30 -2.03 -1.7
Plac1 7.58 10.68 3.97 1.77 -0.93 -2.59 -1.7
Gm20594 1.87 1.84 2.32 0.74 0.32 -1.32 -1.6
2200002D01Rik 4.39 2.73 5.66 1.22 0.37 -1.16 -1.5
Awat2 1.16 1.99 0.95 0.59 -0.29 -1.77 -1.5
Postn 18.69 50.77 19.29 18.80 0.05 -1.43 -1.5
Ly96 1.12 2.00 1.18 0.77 0.07 -1.37 -1.4
Aff2 1.49 2.89 1.55 1.13 0.05 -1.35 -1.4
Apln 2.14 4.48 1.63 1.30 -0.40 -1.78 -1.4
Rspo3 24.66 24.21 13.61 5.25 -0.86 -2.21 -1.3
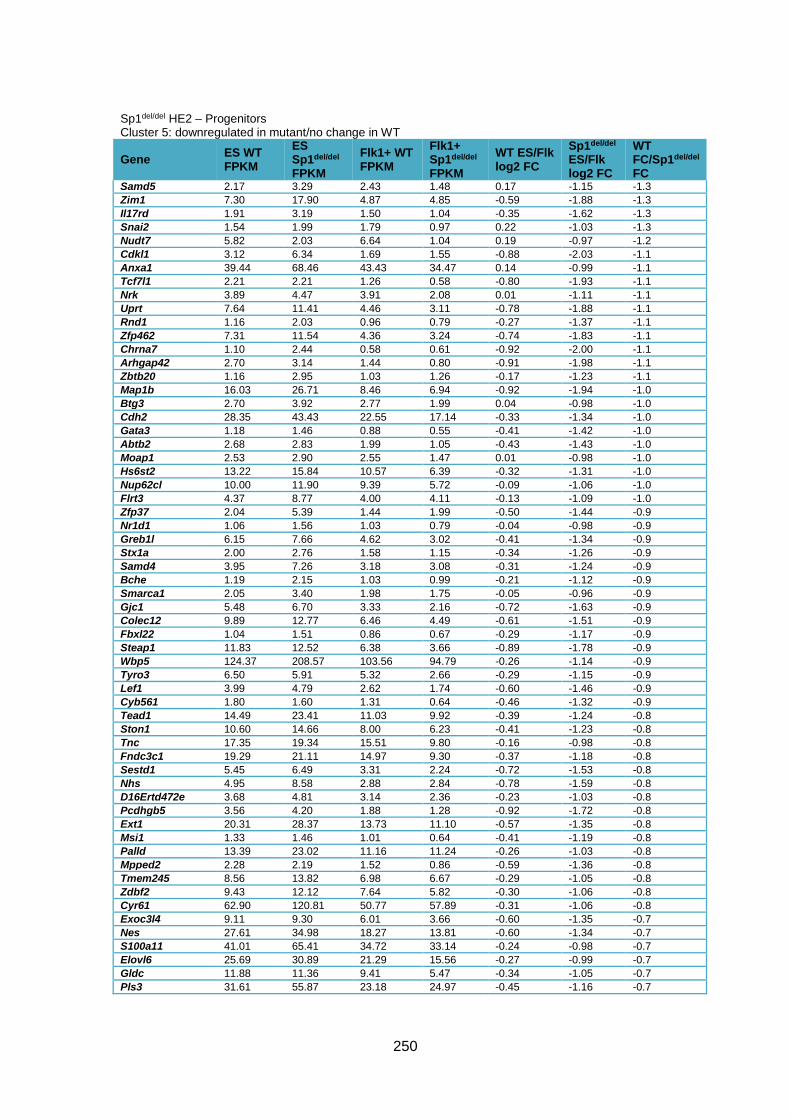
250
Sp1del/del HE2 – Progenitors Cluster 5: downregulated in mutant/no change in WT
Gene ES WT FPKM
ES Sp1del/del FPKM
Flk1+ WT FPKM
Flk1+ Sp1del/del FPKM
WT ES/Flk log2 FC
Sp1del/del ES/Flk log2 FC
WT FC/Sp1del/del FC
Samd5 2.17 3.29 2.43 1.48 0.17 -1.15 -1.3
Zim1 7.30 17.90 4.87 4.85 -0.59 -1.88 -1.3
Il17rd 1.91 3.19 1.50 1.04 -0.35 -1.62 -1.3
Snai2 1.54 1.99 1.79 0.97 0.22 -1.03 -1.3
Nudt7 5.82 2.03 6.64 1.04 0.19 -0.97 -1.2
Cdkl1 3.12 6.34 1.69 1.55 -0.88 -2.03 -1.1
Anxa1 39.44 68.46 43.43 34.47 0.14 -0.99 -1.1
Tcf7l1 2.21 2.21 1.26 0.58 -0.80 -1.93 -1.1
Nrk 3.89 4.47 3.91 2.08 0.01 -1.11 -1.1
Uprt 7.64 11.41 4.46 3.11 -0.78 -1.88 -1.1
Rnd1 1.16 2.03 0.96 0.79 -0.27 -1.37 -1.1
Zfp462 7.31 11.54 4.36 3.24 -0.74 -1.83 -1.1
Chrna7 1.10 2.44 0.58 0.61 -0.92 -2.00 -1.1
Arhgap42 2.70 3.14 1.44 0.80 -0.91 -1.98 -1.1
Zbtb20 1.16 2.95 1.03 1.26 -0.17 -1.23 -1.1
Map1b 16.03 26.71 8.46 6.94 -0.92 -1.94 -1.0
Btg3 2.70 3.92 2.77 1.99 0.04 -0.98 -1.0
Cdh2 28.35 43.43 22.55 17.14 -0.33 -1.34 -1.0
Gata3 1.18 1.46 0.88 0.55 -0.41 -1.42 -1.0
Abtb2 2.68 2.83 1.99 1.05 -0.43 -1.43 -1.0
Moap1 2.53 2.90 2.55 1.47 0.01 -0.98 -1.0
Hs6st2 13.22 15.84 10.57 6.39 -0.32 -1.31 -1.0
Nup62cl 10.00 11.90 9.39 5.72 -0.09 -1.06 -1.0
Flrt3 4.37 8.77 4.00 4.11 -0.13 -1.09 -1.0
Zfp37 2.04 5.39 1.44 1.99 -0.50 -1.44 -0.9
Nr1d1 1.06 1.56 1.03 0.79 -0.04 -0.98 -0.9
Greb1l 6.15 7.66 4.62 3.02 -0.41 -1.34 -0.9
Stx1a 2.00 2.76 1.58 1.15 -0.34 -1.26 -0.9
Samd4 3.95 7.26 3.18 3.08 -0.31 -1.24 -0.9
Bche 1.19 2.15 1.03 0.99 -0.21 -1.12 -0.9
Smarca1 2.05 3.40 1.98 1.75 -0.05 -0.96 -0.9
Gjc1 5.48 6.70 3.33 2.16 -0.72 -1.63 -0.9
Colec12 9.89 12.77 6.46 4.49 -0.61 -1.51 -0.9
Fbxl22 1.04 1.51 0.86 0.67 -0.29 -1.17 -0.9
Steap1 11.83 12.52 6.38 3.66 -0.89 -1.78 -0.9
Wbp5 124.37 208.57 103.56 94.79 -0.26 -1.14 -0.9
Tyro3 6.50 5.91 5.32 2.66 -0.29 -1.15 -0.9
Lef1 3.99 4.79 2.62 1.74 -0.60 -1.46 -0.9
Cyb561 1.80 1.60 1.31 0.64 -0.46 -1.32 -0.9
Tead1 14.49 23.41 11.03 9.92 -0.39 -1.24 -0.8
Ston1 10.60 14.66 8.00 6.23 -0.41 -1.23 -0.8
Tnc 17.35 19.34 15.51 9.80 -0.16 -0.98 -0.8
Fndc3c1 19.29 21.11 14.97 9.30 -0.37 -1.18 -0.8
Sestd1 5.45 6.49 3.31 2.24 -0.72 -1.53 -0.8
Nhs 4.95 8.58 2.88 2.84 -0.78 -1.59 -0.8
D16Ertd472e 3.68 4.81 3.14 2.36 -0.23 -1.03 -0.8
Pcdhgb5 3.56 4.20 1.88 1.28 -0.92 -1.72 -0.8
Ext1 20.31 28.37 13.73 11.10 -0.57 -1.35 -0.8
Msi1 1.33 1.46 1.01 0.64 -0.41 -1.19 -0.8
Palld 13.39 23.02 11.16 11.24 -0.26 -1.03 -0.8
Mpped2 2.28 2.19 1.52 0.86 -0.59 -1.36 -0.8
Tmem245 8.56 13.82 6.98 6.67 -0.29 -1.05 -0.8
Zdbf2 9.43 12.12 7.64 5.82 -0.30 -1.06 -0.8
Cyr61 62.90 120.81 50.77 57.89 -0.31 -1.06 -0.8
Exoc3l4 9.11 9.30 6.01 3.66 -0.60 -1.35 -0.7
Nes 27.61 34.98 18.27 13.81 -0.60 -1.34 -0.7
S100a11 41.01 65.41 34.72 33.14 -0.24 -0.98 -0.7
Elovl6 25.69 30.89 21.29 15.56 -0.27 -0.99 -0.7
Gldc 11.88 11.36 9.41 5.47 -0.34 -1.05 -0.7
Pls3 31.61 55.87 23.18 24.97 -0.45 -1.16 -0.7

251
Sp1del/del HE2 – Progenitors Cluster 5: downregulated in mutant/no change in WT
Gene ES WT FPKM
ES Sp1del/del FPKM
Flk1+ WT FPKM
Flk1+ Sp1del/del FPKM
WT ES/Flk log2 FC
Sp1del/del ES/Flk log2 FC
WT FC/Sp1del/del FC
Efna4 4.88 4.66 3.81 2.22 -0.36 -1.07 -0.7
Ccdc80 9.48 10.85 7.48 5.24 -0.34 -1.05 -0.7
Cald1 76.05 115.14 53.54 49.70 -0.51 -1.21 -0.7
H2afy2 9.32 12.48 6.08 5.02 -0.62 -1.31 -0.7
Fndc3b 13.63 16.24 7.20 5.32 -0.92 -1.61 -0.7
Bcar3 4.89 6.57 2.81 2.35 -0.80 -1.48 -0.7
Hmgn3 3.87 5.22 2.81 2.36 -0.46 -1.14 -0.7
Phldb2 17.96 24.58 10.31 8.78 -0.80 -1.49 -0.7
Anxa3 49.70 38.85 37.70 18.40 -0.40 -1.08 -0.7
Aim2 6.63 18.74 4.60 8.16 -0.53 -1.20 -0.7
Zfyve9 9.38 9.40 6.89 4.34 -0.44 -1.11 -0.7
Mum1l1 14.85 23.03 11.70 11.43 -0.34 -1.01 -0.7
Unc5b 32.88 34.32 17.37 11.45 -0.92 -1.58 -0.7
Pcdhgb4 3.50 4.79 1.95 1.69 -0.85 -1.51 -0.7
Etv4 1.31 1.43 0.98 0.68 -0.42 -1.08 -0.7
Slc39a14 7.97 11.23 5.43 4.87 -0.55 -1.21 -0.7
Col1a2 16.59 10.80 11.86 4.92 -0.48 -1.13 -0.6
Tulp4 8.38 12.13 4.53 4.20 -0.89 -1.53 -0.6
Tbx15 1.01 1.08 0.74 0.51 -0.45 -1.09 -0.6
Usp43 1.19 2.22 0.62 0.75 -0.93 -1.57 -0.6
Igf2bp2 35.37 28.54 25.77 13.41 -0.46 -1.09 -0.6
Dmpk 1.79 1.90 1.41 0.97 -0.35 -0.98 -0.6
Timp1 8.15 2.87 5.97 1.36 -0.45 -1.08 -0.6
Arhgap32 2.60 3.75 1.84 1.72 -0.50 -1.13 -0.6
Fam101b 3.31 5.12 2.42 2.44 -0.45 -1.07 -0.6
Lrp4 5.80 7.68 4.28 3.69 -0.44 -1.06 -0.6
Fzd3 4.27 4.96 2.59 1.96 -0.72 -1.34 -0.6
Tmem47 6.77 10.28 3.67 3.65 -0.88 -1.49 -0.6
Stk39 5.94 6.72 3.24 2.42 -0.87 -1.47 -0.6
Met 1.33 2.13 0.73 0.77 -0.87 -1.47 -0.6
Atp2b1 30.14 46.64 19.03 19.54 -0.66 -1.25 -0.6
Gprc5a 3.12 4.32 1.88 1.73 -0.73 -1.32 -0.6
Bmp2 20.64 21.87 13.84 9.75 -0.58 -1.17 -0.6
Zfp383 2.14 2.89 1.59 1.43 -0.43 -1.02 -0.6
Sema5a 1.54 1.36 1.17 0.69 -0.40 -0.98 -0.6
Ctif 3.83 5.50 2.29 2.21 -0.74 -1.32 -0.6
Mxra7 5.46 4.90 3.57 2.15 -0.61 -1.19 -0.6
D830031N03Rik 16.77 22.79 11.39 10.40 -0.56 -1.13 -0.6
Rep15 2.64 3.64 1.46 1.35 -0.86 -1.43 -0.6
Hip1 15.40 17.33 8.88 6.74 -0.79 -1.36 -0.6
Rassf3 20.34 19.51 13.46 8.74 -0.60 -1.16 -0.6
Sntb2 6.41 6.22 4.09 2.69 -0.65 -1.21 -0.6
Rock2 23.88 33.35 14.14 13.46 -0.76 -1.31 -0.6
Akap2 20.16 29.00 11.91 11.68 -0.76 -1.31 -0.6
Chst7 1.86 2.16 0.97 0.77 -0.94 -1.49 -0.6
Arl5b 11.04 14.93 5.96 5.50 -0.89 -1.44 -0.6
Erbb2 2.97 2.97 1.89 1.29 -0.65 -1.20 -0.5
Ppp2r3a 5.14 7.59 3.59 3.64 -0.52 -1.06 -0.5
Itgav 23.91 30.61 16.56 14.56 -0.53 -1.07 -0.5
Col5a2 1.64 4.79 1.20 2.42 -0.45 -0.99 -0.5
Slc12a2 12.23 20.56 8.35 9.66 -0.55 -1.09 -0.5
Ermp1 12.26 15.17 6.99 5.99 -0.81 -1.34 -0.5
Parva 31.90 38.53 18.01 15.08 -0.82 -1.35 -0.5
Rcbtb1 29.79 31.18 17.63 12.82 -0.76 -1.28 -0.5
Nexn 1.68 4.04 1.20 2.01 -0.49 -1.01 -0.5
Zfp516 10.12 10.62 6.44 4.72 -0.65 -1.17 -0.5
Tead4 4.90 5.68 2.65 2.15 -0.89 -1.40 -0.5
Dlg5 10.03 8.92 7.34 4.59 -0.45 -0.96 -0.5
Macf1 73.99 110.31 40.24 42.17 -0.88 -1.39 -0.5
Dab2 10.11 14.17 5.52 5.47 -0.87 -1.37 -0.5
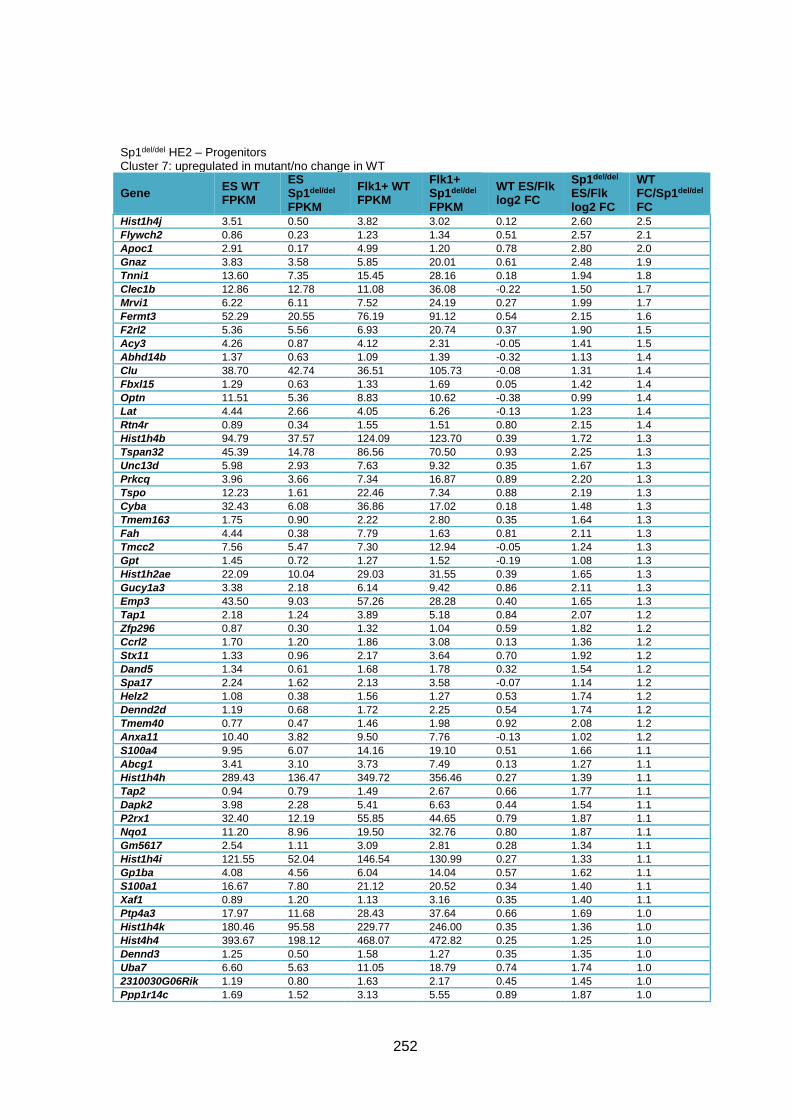
252
Sp1del/del HE2 – Progenitors Cluster 7: upregulated in mutant/no change in WT
Gene ES WT FPKM
ES Sp1del/del FPKM
Flk1+ WT FPKM
Flk1+ Sp1del/del FPKM
WT ES/Flk log2 FC
Sp1del/del ES/Flk log2 FC
WT FC/Sp1del/del FC
Hist1h4j 3.51 0.50 3.82 3.02 0.12 2.60 2.5
Flywch2 0.86 0.23 1.23 1.34 0.51 2.57 2.1
Apoc1 2.91 0.17 4.99 1.20 0.78 2.80 2.0
Gnaz 3.83 3.58 5.85 20.01 0.61 2.48 1.9
Tnni1 13.60 7.35 15.45 28.16 0.18 1.94 1.8
Clec1b 12.86 12.78 11.08 36.08 -0.22 1.50 1.7
Mrvi1 6.22 6.11 7.52 24.19 0.27 1.99 1.7
Fermt3 52.29 20.55 76.19 91.12 0.54 2.15 1.6
F2rl2 5.36 5.56 6.93 20.74 0.37 1.90 1.5
Acy3 4.26 0.87 4.12 2.31 -0.05 1.41 1.5
Abhd14b 1.37 0.63 1.09 1.39 -0.32 1.13 1.4
Clu 38.70 42.74 36.51 105.73 -0.08 1.31 1.4
Fbxl15 1.29 0.63 1.33 1.69 0.05 1.42 1.4
Optn 11.51 5.36 8.83 10.62 -0.38 0.99 1.4
Lat 4.44 2.66 4.05 6.26 -0.13 1.23 1.4
Rtn4r 0.89 0.34 1.55 1.51 0.80 2.15 1.4
Hist1h4b 94.79 37.57 124.09 123.70 0.39 1.72 1.3
Tspan32 45.39 14.78 86.56 70.50 0.93 2.25 1.3
Unc13d 5.98 2.93 7.63 9.32 0.35 1.67 1.3
Prkcq 3.96 3.66 7.34 16.87 0.89 2.20 1.3
Tspo 12.23 1.61 22.46 7.34 0.88 2.19 1.3
Cyba 32.43 6.08 36.86 17.02 0.18 1.48 1.3
Tmem163 1.75 0.90 2.22 2.80 0.35 1.64 1.3
Fah 4.44 0.38 7.79 1.63 0.81 2.11 1.3
Tmcc2 7.56 5.47 7.30 12.94 -0.05 1.24 1.3
Gpt 1.45 0.72 1.27 1.52 -0.19 1.08 1.3
Hist1h2ae 22.09 10.04 29.03 31.55 0.39 1.65 1.3
Gucy1a3 3.38 2.18 6.14 9.42 0.86 2.11 1.3
Emp3 43.50 9.03 57.26 28.28 0.40 1.65 1.3
Tap1 2.18 1.24 3.89 5.18 0.84 2.07 1.2
Zfp296 0.87 0.30 1.32 1.04 0.59 1.82 1.2
Ccrl2 1.70 1.20 1.86 3.08 0.13 1.36 1.2
Stx11 1.33 0.96 2.17 3.64 0.70 1.92 1.2
Dand5 1.34 0.61 1.68 1.78 0.32 1.54 1.2
Spa17 2.24 1.62 2.13 3.58 -0.07 1.14 1.2
Helz2 1.08 0.38 1.56 1.27 0.53 1.74 1.2
Dennd2d 1.19 0.68 1.72 2.25 0.54 1.74 1.2
Tmem40 0.77 0.47 1.46 1.98 0.92 2.08 1.2
Anxa11 10.40 3.82 9.50 7.76 -0.13 1.02 1.2
S100a4 9.95 6.07 14.16 19.10 0.51 1.66 1.1
Abcg1 3.41 3.10 3.73 7.49 0.13 1.27 1.1
Hist1h4h 289.43 136.47 349.72 356.46 0.27 1.39 1.1
Tap2 0.94 0.79 1.49 2.67 0.66 1.77 1.1
Dapk2 3.98 2.28 5.41 6.63 0.44 1.54 1.1
P2rx1 32.40 12.19 55.85 44.65 0.79 1.87 1.1
Nqo1 11.20 8.96 19.50 32.76 0.80 1.87 1.1
Gm5617 2.54 1.11 3.09 2.81 0.28 1.34 1.1
Hist1h4i 121.55 52.04 146.54 130.99 0.27 1.33 1.1
Gp1ba 4.08 4.56 6.04 14.04 0.57 1.62 1.1
S100a1 16.67 7.80 21.12 20.52 0.34 1.40 1.1
Xaf1 0.89 1.20 1.13 3.16 0.35 1.40 1.1
Ptp4a3 17.97 11.68 28.43 37.64 0.66 1.69 1.0
Hist1h4k 180.46 95.58 229.77 246.00 0.35 1.36 1.0
Hist4h4 393.67 198.12 468.07 472.82 0.25 1.25 1.0
Dennd3 1.25 0.50 1.58 1.27 0.35 1.35 1.0
Uba7 6.60 5.63 11.05 18.79 0.74 1.74 1.0
2310030G06Rik 1.19 0.80 1.63 2.17 0.45 1.45 1.0
Ppp1r14c 1.69 1.52 3.13 5.55 0.89 1.87 1.0

253
Sp1del/del HE2 – Progenitors Cluster 7: upregulated in mutant/no change in WT
Gene ES WT FPKM
ES Sp1del/del FPKM
Flk1+ WT FPKM
Flk1+ Sp1del/del FPKM
WT ES/Flk log2 FC
Sp1del/del ES/Flk log2 FC
WT FC/Sp1del/del FC
Hist1h4c 300.54 160.65 354.49 372.00 0.24 1.21 1.0
Hist1h4a 267.84 123.47 315.62 284.09 0.24 1.20 1.0
Ap5b1 1.48 0.70 2.78 2.56 0.91 1.87 1.0
Hist3h2bb-ps 7.78 4.20 10.02 10.51 0.36 1.33 1.0
Serpina3f 0.78 0.72 1.27 2.26 0.70 1.66 1.0
Stxbp2 27.22 10.77 41.03 31.27 0.59 1.54 0.9
Ndrg2 3.39 1.73 3.57 3.49 0.07 1.01 0.9
Hist1h2ak 90.59 43.58 126.08 116.38 0.48 1.42 0.9
Slc45a4 6.28 3.69 8.39 9.44 0.42 1.36 0.9
Hist1h2an 13.49 7.22 15.20 15.49 0.17 1.10 0.9
Mblac1 2.12 1.12 2.36 2.37 0.16 1.09 0.9
Spata5l1 2.13 0.85 2.42 1.82 0.18 1.10 0.9
Pde5a 3.22 3.89 5.19 11.80 0.69 1.60 0.9
Dennd2c 6.37 5.35 7.22 11.38 0.18 1.09 0.9
Hist2h2ac 59.74 25.14 71.84 56.67 0.27 1.17 0.9
Ube2l6 6.49 4.08 7.16 8.22 0.14 1.01 0.9
Ufsp1 2.29 2.21 4.35 7.61 0.93 1.78 0.9
Hist1h2ad 23.96 15.89 33.63 40.35 0.49 1.34 0.9
Blvrb 22.58 13.54 41.16 44.61 0.87 1.72 0.9
Fkbpl 4.67 3.19 5.36 6.63 0.20 1.05 0.9
Fam65c 2.48 2.41 3.46 6.04 0.48 1.33 0.8
Parp12 1.52 1.86 2.31 5.08 0.61 1.45 0.8
Hist1h4f 408.15 222.88 515.58 502.49 0.34 1.17 0.8
Mpl 14.11 9.48 24.91 29.74 0.82 1.65 0.8
Hist1h2ab 133.63 75.39 163.23 163.23 0.29 1.11 0.8
Alox5ap 46.34 24.76 82.36 77.68 0.83 1.65 0.8
Vps33b 11.33 9.78 14.73 22.46 0.38 1.20 0.8
Hist1h2af 22.84 12.20 32.10 30.25 0.49 1.31 0.8
Capg 13.16 4.22 22.27 12.56 0.76 1.57 0.8
Tbc1d10c 1.67 1.64 2.27 3.89 0.44 1.25 0.8
2300009A05Rik 2.93 1.33 4.70 3.75 0.68 1.49 0.8
Fam210b 6.59 3.88 7.68 7.91 0.22 1.03 0.8
Hist2h3b 24.94 11.32 33.51 26.49 0.43 1.23 0.8
Inafm2 4.14 3.59 6.50 9.80 0.65 1.45 0.8
Itgb3 132.96 96.82 182.40 229.77 0.46 1.25 0.8
Hist1h2bh 231.52 137.99 307.81 317.22 0.41 1.20 0.8
Fam132a 2.96 0.71 3.86 1.60 0.38 1.17 0.8
Ckb 23.82 18.95 28.29 38.83 0.25 1.03 0.8
Dscc1 7.03 4.26 8.49 8.87 0.27 1.06 0.8
Il15 1.16 0.88 1.56 2.04 0.43 1.21 0.8
Draxin 1.98 2.07 2.48 4.44 0.32 1.10 0.8
Dtx3l 2.56 2.80 3.50 6.56 0.45 1.23 0.8
Hist1h3h 71.24 39.83 86.94 83.16 0.29 1.06 0.8
Lrrc29 2.78 2.73 3.50 5.88 0.33 1.11 0.8
Hist1h3f 78.71 39.94 114.33 99.05 0.54 1.31 0.8
Mettl18 6.67 4.19 8.31 8.86 0.32 1.08 0.8
Tmem86b 2.94 2.20 3.52 4.46 0.26 1.02 0.8
Hist1h4d 767.39 427.87 949.76 891.81 0.31 1.06 0.8
Arrdc1 12.39 4.96 16.42 11.02 0.41 1.15 0.7
Ada 1.94 0.95 2.57 2.11 0.41 1.16 0.7
Isg20 1.12 2.05 1.87 5.74 0.74 1.49 0.7
Mpst 6.71 7.29 8.30 15.10 0.31 1.05 0.7
Trim21 3.55 1.37 5.70 3.67 0.68 1.42 0.7
Syngr1 14.79 9.96 23.92 26.85 0.69 1.43 0.7
Smagp 53.74 30.96 72.01 68.88 0.42 1.15 0.7
Sp140 1.82 0.97 3.17 2.80 0.80 1.53 0.7
Hist1h2bj 52.14 31.13 64.08 63.47 0.30 1.03 0.7
Dok2 22.35 23.93 39.79 70.63 0.83 1.56 0.7
Cox7a1 4.53 5.78 6.80 14.24 0.59 1.30 0.7
Hist1h2ag 31.92 16.74 40.78 34.99 0.35 1.06 0.7

254
Sp1del/del HE2 – Progenitors Cluster 7: upregulated in mutant/no change in WT
Gene ES WT FPKM
ES Sp1del/del FPKM
Flk1+ WT FPKM
Flk1+ Sp1del/del FPKM
WT ES/Flk log2 FC
Sp1del/del ES/Flk log2 FC
WT FC/Sp1del/del FC
Arap1 10.79 7.21 13.94 15.23 0.37 1.08 0.7
Ccbl1 2.80 1.95 4.07 4.62 0.54 1.25 0.7
Cuedc1 8.39 8.85 10.15 17.44 0.27 0.98 0.7
Hist1h3c 215.25 120.98 265.96 243.25 0.31 1.01 0.7
Hist1h3b 259.72 161.70 311.98 315.62 0.26 0.96 0.7
Hist1h2ah 5.66 3.62 7.41 7.70 0.39 1.09 0.7
Tgfb1 50.54 33.37 69.47 74.33 0.46 1.16 0.7
Cenpw 9.57 7.01 13.54 15.98 0.50 1.19 0.7
Trim30a 2.53 3.30 3.76 7.89 0.57 1.26 0.7
Cryl1 3.33 2.60 4.04 5.09 0.28 0.97 0.7
Tnfsf9 2.94 2.19 3.55 4.25 0.27 0.96 0.7
Glrx 5.43 3.16 8.66 8.09 0.67 1.36 0.7
Hist2h4 148.16 82.08 188.94 168.25 0.35 1.04 0.7
Ank3 9.40 10.22 15.37 26.81 0.71 1.39 0.7
Ucp2 27.09 8.30 40.38 19.85 0.58 1.26 0.7
Hist1h3e 265.96 155.28 358.25 335.63 0.43 1.11 0.7
Fam117a 4.34 2.99 7.10 7.84 0.71 1.39 0.7
Rasgef1b 12.30 10.93 18.31 26.09 0.57 1.25 0.7
Hist1h2bk 151.83 86.94 205.89 188.41 0.44 1.12 0.7
Hspa2 2.80 3.52 3.68 7.39 0.40 1.07 0.7
Dap 19.38 14.54 24.62 29.45 0.35 1.02 0.7
Nedd4l 3.11 2.65 4.52 6.11 0.54 1.21 0.7
Ehbp1l1 18.60 9.93 32.48 27.50 0.80 1.47 0.7
I830077J02Rik 8.53 9.49 13.57 23.85 0.67 1.33 0.7
Ocel1 2.31 1.66 3.16 3.59 0.45 1.11 0.7
Hist1h3g 96.40 51.20 127.60 106.89 0.40 1.06 0.7
Prodh 18.31 10.88 24.25 22.62 0.40 1.06 0.7
Rbfa 26.26 5.81 38.73 13.39 0.56 1.21 0.6
Ifit2 2.54 4.86 3.72 11.12 0.55 1.19 0.6
Hist1h2ac 47.27 31.82 61.30 63.83 0.37 1.00 0.6
Ccbl2 1.33 0.66 1.94 1.47 0.54 1.17 0.6
Stat1 9.35 10.34 14.23 24.30 0.61 1.23 0.6
Plscr1 31.32 23.11 50.09 56.64 0.68 1.29 0.6
Aldh9a1 32.53 18.69 42.75 37.61 0.39 1.01 0.6
Oxld1 4.66 3.17 6.02 6.27 0.37 0.98 0.6
Fbxl8 0.97 0.69 1.26 1.37 0.38 0.99 0.6
Ubash3b 37.74 37.21 48.10 72.39 0.35 0.96 0.6
Unc119 9.80 6.03 12.49 11.66 0.35 0.95 0.6
H2-T23 1.10 5.21 1.69 12.16 0.62 1.22 0.6
F10 3.97 4.01 6.57 10.05 0.73 1.32 0.6
Tmem179b 21.35 19.05 28.71 38.73 0.43 1.02 0.6
Ccdc8 15.33 5.17 22.51 11.47 0.55 1.15 0.6
Orai2 4.22 4.27 8.07 12.31 0.93 1.53 0.6
Rasgrp2 9.33 8.67 17.79 24.90 0.93 1.52 0.6
Myd88 11.48 6.35 17.42 14.49 0.60 1.19 0.6
Slfn2 6.08 6.25 10.88 16.80 0.84 1.43 0.6
Hps6 3.60 1.56 5.04 3.28 0.48 1.07 0.6
Crlf2 3.46 1.92 5.02 4.17 0.54 1.12 0.6
Prrt4 4.76 3.97 7.18 8.98 0.59 1.18 0.6
Pnpo 35.51 28.99 55.73 68.19 0.65 1.23 0.6
Tnnt1 1.76 2.46 2.63 5.48 0.58 1.16 0.6
Hist1h2bc 232.45 140.14 305.98 275.07 0.40 0.97 0.6
AI467606 9.17 5.90 14.80 14.14 0.69 1.26 0.6
Mknk1 15.89 11.32 28.43 30.02 0.84 1.41 0.6
Gypc 35.04 28.93 56.44 69.08 0.69 1.26 0.6
Rbm43 11.03 12.04 15.51 25.06 0.49 1.06 0.6
Pts 20.75 17.10 28.98 35.28 0.48 1.04 0.6
Hist1h2ai 53.78 34.30 72.12 67.70 0.42 0.98 0.6
Fam58b 11.85 2.31 15.79 4.52 0.41 0.97 0.6
Man2b2 6.62 6.50 9.25 13.34 0.48 1.04 0.6

255
Sp1del/del HE2 – Progenitors Cluster 7: upregulated in mutant/no change in WT
Gene ES WT FPKM
ES Sp1del/del FPKM
Flk1+ WT FPKM
Flk1+ Sp1del/del FPKM
WT ES/Flk log2 FC
Sp1del/del ES/Flk log2 FC
WT FC/Sp1del/del FC
Fech 22.68 16.68 38.96 42.06 0.78 1.33 0.6
Susd1 10.54 7.66 18.98 20.22 0.85 1.40 0.6
Cml1 0.80 0.52 1.14 1.07 0.50 1.05 0.5
Parp9 2.96 3.98 4.11 8.09 0.47 1.02 0.5
Kalrn 2.92 2.80 4.17 5.84 0.51 1.06 0.5
Rab27a 10.27 5.48 16.43 12.80 0.68 1.22 0.5
Diap1 29.26 26.03 49.55 64.21 0.76 1.30 0.5
Hist1h2bg 275.97 210.24 382.38 423.66 0.47 1.01 0.5
Rltpr 1.11 0.44 2.03 1.17 0.87 1.41 0.5
Cnst 7.13 7.48 9.62 14.62 0.43 0.97 0.5
Prorsd1 3.82 2.21 6.33 5.31 0.73 1.26 0.5
Smim3 39.06 32.18 63.35 75.32 0.70 1.23 0.5
Lrwd1 23.43 16.19 34.56 34.15 0.56 1.08 0.5
Nme3 8.79 5.87 15.72 15.00 0.84 1.35 0.5
Hmbs 50.48 37.15 78.11 81.98 0.63 1.14 0.5
Gusb 23.87 16.11 37.05 35.61 0.63 1.14 0.5
Bola1 6.91 3.49 11.34 8.11 0.71 1.22 0.5
Marveld2 0.63 0.42 1.07 1.02 0.77 1.27 0.5
Sp1del/del HE2 – Progenitors Cluster 8: more upregulated in mutant
Gene ES WT FPKM
ES Sp1del/del FPKM
Flk1+ WT FPKM
Flk1+ Sp1del/del FPKM
WT ES/Flk log2 FC
Sp1del/del ES/Flk log2 FC
WT FC/Sp1del/del FC
Npy 0.70 0.10 2.35 9.07 1.74 6.58 4.8
Hbq1b 0.66 0.07 2.21 3.39 1.75 5.56 3.8
Trim10 0.45 0.13 2.26 3.22 2.34 4.65 2.3
Gp5 0.99 1.10 2.81 15.44 1.51 3.82 2.3
Itln1 0.26 0.12 1.02 2.18 1.96 4.22 2.3
Gp9 0.85 0.56 3.48 10.43 2.04 4.21 2.2
Tubb1 4.00 2.78 18.41 53.41 2.20 4.26 2.1
Gp1bb 0.40 0.28 2.16 5.84 2.44 4.41 2.0
Ptger3 0.40 0.09 2.27 1.84 2.51 4.41 1.9
Unc93b1 1.59 0.34 6.19 4.82 1.96 3.84 1.9
Kcnj5 2.56 1.56 5.51 11.05 1.10 2.82 1.7
Il1b 0.30 0.11 1.39 1.58 2.19 3.91 1.7
Pf4 1.28 1.95 3.09 15.30 1.27 2.97 1.7
E130309D14Rik 0.66 0.18 2.04 1.72 1.62 3.27 1.7
Il10ra 1.12 1.03 5.27 14.59 2.24 3.83 1.6
Ctrl 0.81 0.17 1.88 1.19 1.21 2.78 1.6
Pkd1l3 1.36 1.84 3.07 12.01 1.17 2.70 1.5
Milr1 0.33 0.19 1.21 1.97 1.87 3.36 1.5
Csf2rb2 4.94 6.27 10.28 35.52 1.06 2.50 1.4
Selenbp1 1.92 0.43 4.64 2.79 1.27 2.70 1.4
Ajap1 0.77 0.39 2.91 4.00 1.92 3.35 1.4
Mcf2l 0.40 0.22 1.02 1.49 1.36 2.78 1.4
G6b 0.31 0.64 1.31 7.12 2.06 3.48 1.4
Colec11 0.90 1.46 1.75 7.32 0.97 2.32 1.4
Fam110c 1.02 0.31 2.70 2.12 1.41 2.75 1.3
Treml2 2.68 1.27 12.85 15.38 2.26 3.60 1.3
Proser2 0.34 0.30 1.08 2.38 1.66 2.99 1.3
Slc14a1 0.20 0.07 2.41 1.91 3.56 4.88 1.3
Irgm2 1.22 0.72 2.89 4.23 1.25 2.55 1.3
Clec4n 0.65 0.29 3.45 3.74 2.40 3.70 1.3
AF251705 0.73 0.37 2.85 3.48 1.96 3.25 1.3
Igsf6 0.26 0.10 2.16 2.09 3.06 4.36 1.3
Soat2 1.42 1.33 3.51 8.02 1.30 2.60 1.3
Atp2a3 23.80 7.83 56.53 45.36 1.25 2.53 1.3
Matn1 0.69 0.32 3.47 3.92 2.34 3.62 1.3

256
Sp1del/del HE2 – Progenitors Cluster 8: more upregulated in mutant
Gene ES WT FPKM
ES Sp1del/del FPKM
Flk1+ WT FPKM
Flk1+ Sp1del/del FPKM
WT ES/Flk log2 FC
Sp1del/del ES/Flk log2 FC
WT FC/Sp1del/del FC
Tyrobp 18.15 9.18 89.95 110.66 2.31 3.59 1.3
Mylk3 2.25 1.76 7.67 14.52 1.77 3.04 1.3
Epor 3.79 1.65 11.35 11.90 1.58 2.85 1.3
Btk 1.65 1.21 7.20 12.66 2.13 3.39 1.3
Pira11 0.17 0.07 1.50 1.50 3.15 4.40 1.3
Hsd3b1 1.61 1.45 6.04 12.87 1.91 3.15 1.2
Grtp1 0.59 0.31 1.63 2.06 1.48 2.72 1.2
Tnfrsf1b 1.06 0.24 3.75 1.97 1.82 3.05 1.2
BC035044 0.71 0.39 2.10 2.71 1.56 2.79 1.2
Coro2a 0.74 0.27 5.40 4.61 2.86 4.09 1.2
Chchd10 2.44 0.61 5.13 3.01 1.07 2.30 1.2
Aqp8 2.53 1.87 8.72 14.79 1.79 2.98 1.2
Alas2 9.27 3.43 21.04 17.72 1.18 2.37 1.2
Tbxas1 0.27 0.31 1.92 4.91 2.83 4.00 1.2
Tgm1 2.30 0.45 6.35 2.79 1.46 2.63 1.2
Pstpip2 1.59 0.91 7.87 10.03 2.31 3.46 1.2
Rab37 0.92 0.67 4.57 7.33 2.31 3.46 1.2
Rgs1 0.33 0.30 1.83 3.68 2.47 3.61 1.1
Gata1 4.61 3.21 31.72 48.72 2.78 3.92 1.1
Plcb2 1.20 0.91 4.74 7.79 1.98 3.10 1.1
Ak8 0.47 0.39 1.14 2.03 1.28 2.38 1.1
Tmod1 1.28 0.71 8.79 10.43 2.78 3.88 1.1
Sla2 5.97 3.66 12.07 15.73 1.02 2.10 1.1
Il1r2 0.61 0.36 2.64 3.29 2.11 3.19 1.1
Map3k6 1.08 0.37 2.42 1.74 1.17 2.24 1.1
Smim1 5.09 2.05 14.19 12.04 1.48 2.55 1.1
Ubash3a 5.42 3.17 14.09 17.36 1.38 2.45 1.1
Hmha1 18.18 8.41 38.08 36.74 1.07 2.13 1.1
Trim58 0.51 0.41 2.02 3.38 1.98 3.04 1.1
Acp5 0.70 0.44 3.69 4.84 2.40 3.46 1.1
Syk 13.00 9.00 26.51 38.07 1.03 2.08 1.1
Samd14 3.79 2.13 15.72 18.32 2.05 3.10 1.0
Slc38a5 0.22 0.14 2.21 2.85 3.32 4.37 1.0
Rgs10 19.12 14.37 56.49 87.40 1.56 2.60 1.0
Mfsd2b 8.30 4.95 21.40 26.11 1.37 2.40 1.0
Fam109b 5.05 1.95 14.85 11.72 1.56 2.59 1.0
Ttc39a 1.82 0.62 4.16 2.91 1.19 2.22 1.0
Tnni2 1.00 0.80 4.03 6.58 2.01 3.03 1.0
Ifit3 0.99 2.19 1.94 8.82 0.98 2.01 1.0
Siglecf 1.07 0.91 6.60 11.36 2.63 3.65 1.0
Rgs18 1.09 1.65 4.59 14.10 2.08 3.10 1.0
Susd3 2.72 0.83 8.12 5.01 1.58 2.59 1.0
Gfi1b 21.92 16.50 53.34 80.77 1.28 2.29 1.0
Csf2rb 27.05 27.74 73.13 149.04 1.43 2.43 1.0
1110008P14Rik 1.59 1.38 3.75 6.45 1.24 2.22 1.0
Lst1 2.75 1.99 7.37 10.51 1.42 2.40 1.0
Alox5 6.51 2.99 26.11 23.68 2.00 2.98 1.0
Zbtb16 1.22 0.43 7.82 5.46 2.68 3.66 1.0
Sptb 4.03 2.45 15.62 18.39 1.95 2.91 1.0
Mpp2 2.22 0.81 6.32 4.49 1.51 2.46 1.0
Sp1del/del HE2 – Progenitors Cluster 10: not upregulated in mutant
Gene ES WT FPKM
ES Sp1del/del FPKM
Flk1+ WT FPKM
Flk1+ Sp1del/del FPKM
WT ES/Flk log2 FC
Sp1del/del ES/Flk log2 FC
WT FC/Sp1del/del FC
Rps27 6.33 5.49 39.85 7.30 2.66 0.41 -2.2
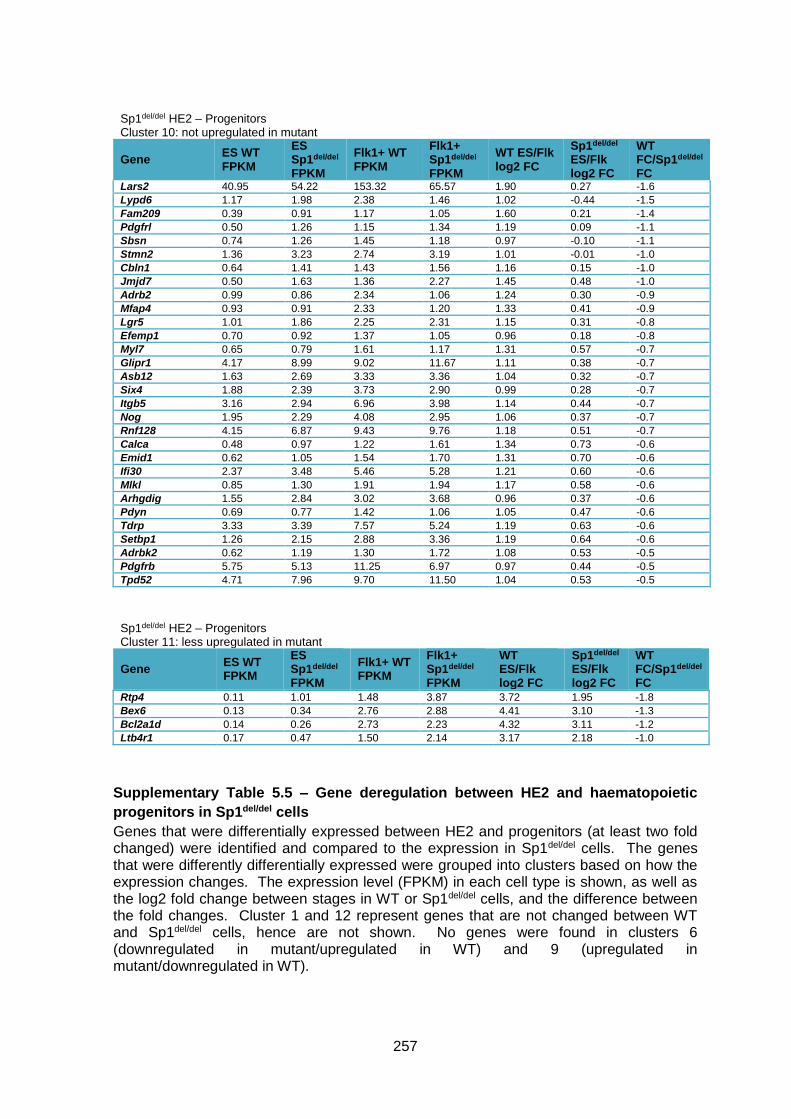
257
Sp1del/del HE2 – Progenitors Cluster 10: not upregulated in mutant
Gene ES WT FPKM
ES Sp1del/del FPKM
Flk1+ WT FPKM
Flk1+ Sp1del/del FPKM
WT ES/Flk log2 FC
Sp1del/del ES/Flk log2 FC
WT FC/Sp1del/del FC
Lars2 40.95 54.22 153.32 65.57 1.90 0.27 -1.6
Lypd6 1.17 1.98 2.38 1.46 1.02 -0.44 -1.5
Fam209 0.39 0.91 1.17 1.05 1.60 0.21 -1.4
Pdgfrl 0.50 1.26 1.15 1.34 1.19 0.09 -1.1
Sbsn 0.74 1.26 1.45 1.18 0.97 -0.10 -1.1
Stmn2 1.36 3.23 2.74 3.19 1.01 -0.01 -1.0
Cbln1 0.64 1.41 1.43 1.56 1.16 0.15 -1.0
Jmjd7 0.50 1.63 1.36 2.27 1.45 0.48 -1.0
Adrb2 0.99 0.86 2.34 1.06 1.24 0.30 -0.9
Mfap4 0.93 0.91 2.33 1.20 1.33 0.41 -0.9
Lgr5 1.01 1.86 2.25 2.31 1.15 0.31 -0.8
Efemp1 0.70 0.92 1.37 1.05 0.96 0.18 -0.8
Myl7 0.65 0.79 1.61 1.17 1.31 0.57 -0.7
Glipr1 4.17 8.99 9.02 11.67 1.11 0.38 -0.7
Asb12 1.63 2.69 3.33 3.36 1.04 0.32 -0.7
Six4 1.88 2.39 3.73 2.90 0.99 0.28 -0.7
Itgb5 3.16 2.94 6.96 3.98 1.14 0.44 -0.7
Nog 1.95 2.29 4.08 2.95 1.06 0.37 -0.7
Rnf128 4.15 6.87 9.43 9.76 1.18 0.51 -0.7
Calca 0.48 0.97 1.22 1.61 1.34 0.73 -0.6
Emid1 0.62 1.05 1.54 1.70 1.31 0.70 -0.6
Ifi30 2.37 3.48 5.46 5.28 1.21 0.60 -0.6
Mlkl 0.85 1.30 1.91 1.94 1.17 0.58 -0.6
Arhgdig 1.55 2.84 3.02 3.68 0.96 0.37 -0.6
Pdyn 0.69 0.77 1.42 1.06 1.05 0.47 -0.6
Tdrp 3.33 3.39 7.57 5.24 1.19 0.63 -0.6
Setbp1 1.26 2.15 2.88 3.36 1.19 0.64 -0.6
Adrbk2 0.62 1.19 1.30 1.72 1.08 0.53 -0.5
Pdgfrb 5.75 5.13 11.25 6.97 0.97 0.44 -0.5
Tpd52 4.71 7.96 9.70 11.50 1.04 0.53 -0.5
Sp1del/del HE2 – Progenitors Cluster 11: less upregulated in mutant
Gene ES WT FPKM
ES Sp1del/del FPKM
Flk1+ WT FPKM
Flk1+ Sp1del/del FPKM
WT ES/Flk log2 FC
Sp1del/del ES/Flk log2 FC
WT FC/Sp1del/del FC
Rtp4 0.11 1.01 1.48 3.87 3.72 1.95 -1.8
Bex6 0.13 0.34 2.76 2.88 4.41 3.10 -1.3
Bcl2a1d 0.14 0.26 2.73 2.23 4.32 3.11 -1.2
Ltb4r1 0.17 0.47 1.50 2.14 3.17 2.18 -1.0
Supplementary Table 5.5 – Gene deregulation between HE2 and haematopoietic
progenitors in Sp1del/del cells
Genes that were differentially expressed between HE2 and progenitors (at least two fold changed) were identified and compared to the expression in Sp1del/del cells. The genes that were differently differentially expressed were grouped into clusters based on how the expression changes. The expression level (FPKM) in each cell type is shown, as well as the log2 fold change between stages in WT or Sp1del/del cells, and the difference between the fold changes. Cluster 1 and 12 represent genes that are not changed between WT and Sp1del/del cells, hence are not shown. No genes were found in clusters 6 (downregulated in mutant/upregulated in WT) and 9 (upregulated in mutant/downregulated in WT).
258
6. References
Akalin, A., Fredman, D., Arner, E., Dong, X., Bryne, J. C., Suzuki, H., Daub, C. O., Hayashizaki, Y., & Lenhard, B. (2009). Transcriptional features of genomic regulatory blocks. Genome Biology, 10(4), R38
Al-Sarraj, A., Day, R. M., & Thiel, G. (2005). Specificity of transcriptional regulation by the zinc finger transcription factors Sp1, Sp3, and Egr-1. J. Cell. Biochem., 94(1), 153-167
Allen, B. L., & Taatjes, D. J. (2015). The Mediator complex: a central integrator of transcription. Nat Rev Mol Cell Biol, 16(3), 155-166
Andersson, O., Reissmann, E., & Ibáñez, C. F. (2006). Growth differentiation factor 11 signals through the transforming growth factor-β receptor ALK5 to regionalize the anterior–posterior axis. EMBO reports, 7(8), 831-837
Banerji, J., Rusconi, S., & Schaffner, W. (1981). Expression of a β-globin gene is enhanced by remote SV40 DNA sequences. Cell, 27(2), 299-308
Barth, T. K., & Imhof, A. (2010). Fast signals and slow marks: the dynamics of histone modifications. Trends in biochemical sciences, 35(11), 618-626
Beato, M., & Eisfeld, K. (1997). Transcription factor access to chromatin. Nucleic acids research, 25(18), 3559-3563
Belton, J.-M., McCord, R. P., Gibcus, J., Naumova, N., Zhan, Y., & Dekker, J. (2012). Hi-C: A comprehensive technique to capture the conformation of genomes. Methods (San Diego, Calif.), 58(3), 10.1016/j.ymeth.2012.1005.1001
Bernstein, B. E., Mikkelsen, T. S., Xie, X., Kamal, M., Huebert, D. J., Cuff, J., Fry, B., Meissner, A., Wernig, M., Plath, K., Jaenisch, R., Wagschal, A., Feil, R., Schreiber, S. L., & Lander, E. S. (2006). A Bivalent Chromatin Structure Marks Key Developmental Genes in Embryonic Stem Cells. Cell, 125(2), 315-326
Bertrand, J. Y., Giroux, S., Golub, R., Klaine, M., Jalil, A., Boucontet, L., Godin, I., & Cumano, A. (2005). Characterization of purified intraembryonic hematopoietic stem cells as a tool to define their site of origin. Proceedings of the National Academy of Sciences of the United States of America, 102(1), 134-139
Biggin, Mark D. (2011). Animal Transcription Networks as Highly Connected, Quantitative Continua. Developmental Cell, 21(4), 611-626
Bird, A. P. (1980). DNA methylation and the frequency of CpG in animal DNA. Nucleic acids research, 8(7), 1499-1504
Blake, M. C., Jambou, R. C., Swick, A. G., Kahn, J. W., & Azizkhan, J. C. (1990). Transcriptional initiation is controlled by upstream GC-box interactions in a TATAA-less promoter. Molecular and cellular biology, 10(12), 6632-6641
Boisset, J.-C., van Cappellen, W., Andrieu-Soler, C., Galjart, N., Dzierzak, E., & Robin, C. (2010). In vivo imaging of haematopoietic cells emerging from the mouse aortic endothelium. Nature, 464(7285), 116-120
Bolger, A. M., Lohse, M., & Usadel, B. (2014). Trimmomatic: a flexible trimmer for Illumina sequence data. Bioinformatics, 30(15), 2114-2120
Bouwman, P., Gollner, H., Elsasser, H. P., Eckhoff, G., Karis, A., Grosveld, F., Philipsen, S., & Suske, G. (2000). Transcription factor Sp3 is essential for post-natal survival and late tooth development. Embo J, 19(4), 655-661
Boyadjiev, S., & Jabs, E. (2000). Online Mendelian Inheritance in Man (OMIM) as a knowledgebase for human developmental disorders. Clin. Genet., 57(4), 253-266
Brandeis, M., Frank, D., Keshet, I., Siegfried, Z., Mendelsohn, M., Nemes, A., Temper, V., Razin, A., & Cedar, H. (1994). Sp1 elements protect a CpG island from de novo methylation. Nature, 371(6496), 435-438
259
Brent, R., & Ptashne, M. (1985). A eukaryotic transcriptional activator bearing the DNA specificity of a prokaryotic repressor. Cell, 43(3), 729-736
Bucher, P. (1990). Weight matrix descriptions of four eukaryotic RNA polymerase II promoter elements derived from 502 unrelated promoter sequences. Journal of Molecular Biology, 212(4), 563-578
Buenrostro, J., Wu, B., Chang, H., & Greenleaf, W. (2015a). ATAC-seq: A Method for Assaying Chromatin Accessibility Genome-Wide. Current protocols in molecular biology / edited by Frederick M. Ausubel ... [et al.], 109, 21.29.21-21.29.29
Buenrostro, J. D., Giresi, P. G., Zaba, L. C., Chang, H. Y., & Greenleaf, W. J. (2013). Transposition of native chromatin for fast and sensitive epigenomic profiling of open chromatin, DNA-binding proteins and nucleosome position. Nat Meth, 10(12), 1213-1218
Buenrostro, J. D., Wu, B., Litzenburger, U. M., Ruff, D., Gonzales, M. L., Snyder, M. P., Chang, H. Y., & Greenleaf, W. J. (2015b). Single-cell chromatin accessibility reveals principles of regulatory variation. Nature, 523(7561), 486-490
Cairns, B. R. (2009). The logic of chromatin architecture and remodelling at promoters. Nature, 461(7261), 193-198
Calverley, D., Yagi, M., Stray, S., & Roth, G. (1995). Human platelet glycoprotein V: its role in enhancing expression of the glycoprotein Ib receptor. Blood, 86(4), 1361-1367
Canham, M. A., Sharov, A. A., Ko, M. S. H., & Brickman, J. M. (2010). Functional Heterogeneity of Embryonic Stem Cells Revealed through Translational Amplification of an Early Endodermal Transcript. PLOS Biology, 8(5), e1000379
Carninci, P., Sandelin, A., Lenhard, B., Katayama, S., Shimokawa, K., Ponjavic, J., Semple, C. A. M., Taylor, M. S., Engstrom, P. G., Frith, M. C., Forrest, A. R. R., Alkema, W. B., Tan, S. L., Plessy, C., Kodzius, R., Ravasi, T., Kasukawa, T., Fukuda, S., Kanamori-Katayama, M., Kitazume, Y., Kawaji, H., Kai, C., Nakamura, M., Konno, H., Nakano, K., Mottagui-Tabar, S., Arner, P., Chesi, A., Gustincich, S., Persichetti, F., Suzuki, H., Grimmond, S. M., Wells, C. A., Orlando, V., Wahlestedt, C., Liu, E. T., Harbers, M., Kawai, J., Bajic, V. B., Hume, D. A., & Hayashizaki, Y. (2006). Genome-wide analysis of mammalian promoter architecture and evolution. Nat. Genet., 38(6), 626-635
Chambers, I., Colby, D., Robertson, M., Nichols, J., Lee, S., Tweedie, S., & Smith, A. (2003). Functional Expression Cloning of Nanog, a Pluripotency Sustaining Factor in Embryonic Stem Cells. Cell, 113(5), 643-655
Chambers, I., Silva, J., Colby, D., Nichols, J., Nijmeijer, B., Robertson, M., Vrana, J., Jones, K., Grotewold, L., & Smith, A. (2007). Nanog safeguards pluripotency and mediates germline development. Nature, 450(7173), 1230-1234
Chan, S. S.-K., Shi, X., Toyama, A., Arpke, R. W., Dandapat, A., Iacovino, M., Kang, J.-J., Le, G., Hagen, H. R., Garry, D. J., & Kyba, M. (2013). Mesp1 patterns mesoderm into cardiac, hematopoietic, or skeletal myogenic progenitors in a context-dependent manner. Cell Stem Cell, 12(5), 587-601
Chang, W. C., & Hung, J. J. (2012). Functional role of post-translational modifications of Sp1 in tumorigenesis. Journal of biomedical science, 19(1423-0127 (Electronic)), 94
Chaya, D., Hayamizu, T., Bustin, M., & Zaret, K. S. (2001). Transcription Factor FoxA (HNF3) on a Nucleosome at an Enhancer Complex in Liver Chromatin. Journal of Biological Chemistry, 276(48), 44385-44389
Chen, H., Tian, Y., Shu, W., Bo, X., & Wang, S. (2012). Comprehensive Identification and Annotation of Cell Type-Specific and Ubiquitous CTCF-Binding Sites in the Human Genome. PLoS ONE, 7(7), e41374

260
Chen, M. J., Yokomizo, T., Zeigler, B. M., Dzierzak, E., & Speck, N. A. (2009). Runx1 is required for the endothelial to haematopoietic cell transition but not thereafter. Nature, 457(7231), 887-891
Chen, T., & Dent, S. Y. R. (2014). Chromatin modifiers and remodellers: regulators of cellular differentiation. Nat Rev Genet, 15(2), 93-106
Chepelev, I., Wei, G., Wangsa, D., Tang, Q., & Zhao, K. (2012). Characterization of genome-wide enhancer-promoter interactions reveals co-expression of interacting genes and modes of higher order chromatin organization. Cell Res., 22(3), 490-503
Cho, S. W., Kim, S., Kim, Y., Kweon, J., Kim, H. S., Bae, S., & Kim, J.-S. (2014). Analysis of off-target effects of CRISPR/Cas-derived RNA-guided endonucleases and nickases. Genome Res., 24(1), 132-141
Choi, K., Kennedy, M., Kazarov, A., Papadimitriou, J. C., & Keller, G. (1998). A common precursor for hematopoietic and endothelial cells. Development, 125(4), 725-732
Chuang, J. Y., Wang, Y. T., Yeh, S. H., Liu, Y. W., Chang, W. C., & Hung, J. J. (2008). Phosphorylation by c-Jun NH2-terminal kinase 1 regulates the stability of transcription factor Sp1 during mitosis. Mol. Biol. Cell, 19(3), 1139-1151
Cirillo, L. A., Lin, F. R., Cuesta, I., Friedman, D., Jarnik, M., & Zaret, K. S. (2002). Opening of Compacted Chromatin by Early Developmental Transcription Factors HNF3 (FoxA) and GATA-4. Mol. Cell, 9(2), 279-289
Ciruna, B., & Rossant, J. (2001). FGF Signaling Regulates Mesoderm Cell Fate Specification and Morphogenetic Movement at the Primitive Streak. Developmental Cell, 1(1), 37-49
Clapier, C. R., Iwasa, J., Cairns, B. R., & Peterson, C. L. (2017). Mechanisms of action and regulation of ATP-dependent chromatin-remodelling complexes. Nat Rev Mol Cell Biol, 18(7), 407-422
Clarke, R. L., Yzaguirre, A. D., Yashiro-Ohtani, Y., Bondue, A., Blanpain, C., Pear, W. S., Speck, N. A., & Keller, G. (2013). The expression of Sox17 identifies and regulates haemogenic endothelium. Nat Cell Biol, 15(5), 502-510
Cockerill, P. N. (2011). Structure and function of active chromatin and DNase I hypersensitive sites. FEBS Journal, 278(13), 2182-2210
Cooper, S. J., Trinklein, N. D., Anton, E. D., Nguyen, L., & Myers, R. M. (2006). Comprehensive analysis of transcriptional promoter structure and function in 1% of the human genome. Genome Res., 16(1), 1-10
Costa, G., Kouskoff, V., & Lacaud, G. (2012). Origin of blood cells and HSC production in the embryo. Trends in Immunology, 33(5), 215-223
Cumano, A., Dieterlen-Lievre, F., & Godin, I. (1996). Lymphoid Potential, Probed before Circulation in Mouse, Is Restricted to Caudal Intraembryonic Splanchnopleura. Cell, 86(6), 907-916
D'Souza, S. L., Elefanty, A. G., & Keller, G. (2005). SCL/Tal-1 is essential for hematopoietic commitment of the hemangioblast but not for its development. Blood, 105(10), 3862-3870
de Bruijn, M. F. T. R., Ma, X., Robin, C., Ottersbach, K., Sanchez, M.-J., & Dzierzak, E. (2002). Hematopoietic Stem Cells Localize to the Endothelial Cell Layer in the Midgestation Mouse Aorta. Immunity, 16(5), 673-683
de Bruijn, M. F. T. R., Speck, N. A., Peeters, M. C. E., & Dzierzak, E. (2000). Definitive hematopoietic stem cells first develop within the major arterial regions of the mouse embryo. The EMBO journal, 19(11), 2465-2474
de la Mata, M., Alonso, C. R., Kadener, S., Fededa, J. P., Blaustein, M. a., Pelisch, F., Cramer, P., Bentley, D., & Kornblihtt, A. R. (2003). A Slow RNA Polymerase II Affects Alternative Splicing In Vivo. Mol. Cell, 12(2), 525-532
de León, M. B., Montañez, C., Gómez, P., Morales-Lázaro, S. L., Tapia-Ramírez, V., Valadez-Graham, V., Recillas-Targa, F., Yaffe, D., Nudel, U., & Cisneros, B.

261
(2005). Dystrophin Dp71 Expression Is Down-regulated during Myogenesis: ROLE OF Sp1 AND Sp3 ON THE Dp71 PROMOTER ACTIVITY. Journal of Biological Chemistry, 280(7), 5290-5299
Deaton, A. M., & Bird, A. (2011). CpG islands and the regulation of transcription. Genes & development, 25(10), 1010-1022
Defossez, P.-A., Kelly, K. F., Filion, G. J. P., Pérez-Torrado, R., Magdinier, F., Menoni, H., Nordgaard, C. L., Daniel, J. M., & Gilson, E. (2005). The Human Enhancer Blocker CTC-binding Factor Interacts with the Transcription Factor Kaiso. Journal of Biological Chemistry, 280(52), 43017-43023
DeLisser, H. M., Christofidou-Solomidou, M., Strieter, R. M., Burdick, M. D., Robinson, C. S., Wexler, R. S., Kerr, J. S., Garlanda, C., Merwin, J. R., Madri, J. A., & Albelda, S. M. (1997). Involvement of endothelial PECAM-1/CD31 in angiogenesis. The American Journal of Pathology, 151(3), 671-677
Dennig, J., Beato, M., & Suske, G. (1996). An inhibitor domain in Sp3 regulates its glutamine-rich activation domains. Embo J, 15(20), 5659-5667
Deshane, J., Kim, J., Bolisetty, S., Hock, T. D., Hill-Kapturczak, N., & Agarwal, A. (2010). Sp1 regulates chromatin looping between an intronic enhancer and distal promoter of the human heme oxygenase-1 gene in renal cells. J. Biol. Chem., 285(22), 16476-16486
Dieterlen-Lievre, p. F. (1975). On the origin of haemopoietic stem cells in the avian embryo: an experimental approach. J. Embryol. Exp. Morphol., 33(3), 607-619
Dixon, J. R., Selvaraj, S., Yue, F., Kim, A., Li, Y., Shen, Y., Hu, M., Liu, J. S., & Ren, B. (2012). Topological domains in mammalian genomes identified by analysis of chromatin interactions. Nature, 485(7398), 376-380
Dobin, A., & Gingeras, T. R. (2002). Mapping RNA-seq Reads with STAR Current Protocols in Bioinformatics: John Wiley & Sons, Inc.
Doetzlhofer, A., Rotheneder, H., Lagger, G., Koranda, M., Kurtev, V., Brosch, G., Wintersberger, E., & Seiser, C. (1999). Histone deacetylase 1 can repress transcription by binding to Sp1. Molecular and cellular biology, 19(8), 5504-5511
Domcke, S., Bardet, A. F., Adrian Ginno, P., Hartl, D., Burger, L., & Schübeler, D. (2015). Competition between DNA methylation and transcription factors determines binding of NRF1. Nature, 528(7583), 575-579
Ebmeier, C. C., & Taatjes, D. J. (2010). Activator-Mediator binding regulates Mediator-cofactor interactions. Proceedings of the National Academy of Sciences, 107(25), 11283-11288
Eilken, H. M., Nishikawa, S.-I., & Schroeder, T. (2009). Continuous single-cell imaging of blood generation from haemogenic endothelium. Nature, 457(7231), 896-900
Engström, P. G., Ho Sui, S. J., Drivenes, Ø., Becker, T. S., & Lenhard, B. (2007). Genomic regulatory blocks underlie extensive microsynteny conservation in insects. Genome Res., 17(12), 1898-1908
Ernst, J., Kheradpour, P., Mikkelsen, T. S., Shoresh, N., Ward, L. D., Epstein, C. B., Zhang, X., Wang, L., Issner, R., Coyne, M., Ku, M., Durham, T., Kellis, M., & Bernstein, B. E. (2011). Mapping and analysis of chromatin state dynamics in nine human cell types. Nature, 473(7345), 43-49
Evans, M. J., & Kaufman, M. H. (1981). Establishment in culture of pluripotential cells from mouse embryos. Nature, 292(5819), 154-156
Fehling, H. J., Lacaud, G., Kubo, A., Kennedy, M., Robertson, S., Keller, G., & Kouskoff, V. (2003). Tracking mesoderm induction and its specification to the hemangioblast during embryonic stem cell differentiation. Development, 130(17), 4217-4227
Festuccia, N., Osorno, R., Halbritter, F., Karwacki-Neisius, V., Navarro, P., Colby, D., Wong, F., Yates, A., Tomlinson, Simon R., & Chambers, I. (2012). Esrrb Is a Direct Nanog Target Gene that Can Substitute for Nanog Function in Pluripotent Cells. Cell Stem Cell, 11(4), 477-490

262
Filion, G. J., van Bemmel, J. G., Braunschweig, U., Talhout, W., Kind, J., Ward, L. D., Brugman, W., de Castro, I. J., Kerkhoven, R. M., Bussemaker, H. J., & van Steensel, B. (2010). Systematic Protein Location Mapping Reveals Five Principal Chromatin Types in Drosophila Cells. Cell, 143(2), 212-224
FitzGerald, P. C., Sturgill, D., Shyakhtenko, A., Oliver, B., & Vinson, C. (2006). Comparative genomics of Drosophila and human core promoters. Genome Biology, 7(7), R53
Fu, Y., Foden, J. A., Khayter, C., Maeder, M. L., Reyon, D., Joung, J. K., & Sander, J. D. (2013). High frequency off-target mutagenesis induced by CRISPR-Cas nucleases in human cells. Nature biotechnology, 31(9), 822-826
Fu, Y., Sander, J. D., Reyon, D., Cascio, V. M., & Joung, J. K. (2014). Improving CRISPR-Cas nuclease specificity using truncated guide RNAs. Nat. Biotechnol., 32(3), 279-284
Furney, S. J., Higgins, D. G., Ouzounis, C. A., & López-Bigas, N. (2006). Structural and functional properties of genes involved in human cancer. BMC Genomics, 7(1), 3
Garcia-Alegria, E., Menegatti, S., Batta, K., Cuvertino, S., Florkowska, M., & Kouskoff, V. (2016). Emerging concepts for the in vitro derivation of murine haematopoietic stem and progenitor cells. FEBS letters, 590(22), 4116-4125
Gardiner-Garden, M., & Frommer, M. (1987). CpG Islands in vertebrate genomes. Journal of Molecular Biology, 196(2), 261-282
Gartel, A. L., Goufman, E., Najmabadi, F., & Tyner, A. L. (2000). Sp1 and Sp3 activate p21 (WAF1/CIP1) gene transcription in the Caco-2 colon adenocarcinoma cell line. Oncogene, 19(45), 5182
Gerhardt, D. M., Pajcini, K. V., D’altri, T., Tu, L., Jain, R., Xu, L., Chen, M. J., Rentschler, S., Shestova, O., Wertheim, G. B., Tobias, J. W., Kluk, M., Wood, A. W., Aster, J. C., Gimotty, P. A., Epstein, J. A., Speck, N., Bigas, A., & Pear, W. S. (2014). The Notch1 transcriptional activation domain is required for development and reveals a novel role for Notch1 signaling in fetal hematopoietic stem cells. Genes & development, 28(6), 576-593
Gershenzon, N. I., & Ioshikhes, I. P. (2005). Synergy of human Pol II core promoter elements revealed by statistical sequence analysis. Bioinformatics, 21(8), 1295-1300
Gilbert, N., Boyle, S., Fiegler, H., Woodfine, K., Carter, N. P., & Bickmore, W. A. (2004). Chromatin Architecture of the Human Genome. Cell, 118(5), 555-566
Gill, G., Pascal, E., Tseng, Z. H., & Tjian, R. (1994). A glutamine-rich hydrophobic patch in transcription factor Sp1 contacts the dTAFII110 component of the Drosophila TFIID complex and mediates transcriptional activation. Proc. Natl. Acad. Sci. U. S. A., 91(1), 192-196
Gilmour, J., Assi, S. A., Jaegle, U., Kulu, D., van de Werken, H., Clarke, D., Westhead, D. R., Philipsen, S., & Bonifer, C. (2014). A crucial role for the ubiquitously expressed transcription factor Sp1 at early stages of hematopoietic specification. Development, 141(12), 2391-2401
Gitler, A. D., Lu, M. M., & Epstein, J. A. (2004). PlexinD1 and Semaphorin Signaling Are Required in Endothelial Cells for Cardiovascular Development. Developmental Cell, 7(1), 107-116
Gomez Perdiguero, E., Klapproth, K., Schulz, C., Busch, K., Azzoni, E., Crozet, L., Garner, H., Trouillet, C., de Bruijn, M. F., Geissmann, F., & Rodewald, H.-R. (2015). Tissue-resident macrophages originate from yolk-sac-derived erythro-myeloid progenitors. Nature, 518(7540), 547-551
Goode, Debbie K., Obier, N., Vijayabaskar, M. S., Lie-A-Ling, M., Lilly, Andrew J., Hannah, R., Lichtinger, M., Batta, K., Florkowska, M., Patel, R., Challinor, M., Wallace, K., Gilmour, J., Assi, Salam A., Cauchy, P., Hoogenkamp, M., Westhead, David R., Lacaud, G., Kouskoff, V., Göttgens, B., & Bonifer, C. (2016). Dynamic
263
Gene Regulatory Networks Drive Hematopoietic Specification and Differentiation. Developmental Cell, 36(5), 572-587
Guenther, M. G., Levine, S. S., Boyer, L. A., Jaenisch, R., & Young, R. A. (2007). A Chromatin Landmark and Transcription Initiation at Most Promoters in Human Cells. Cell, 130(1), 77-88
Gutiérrez, J., Sierra, J., Medina, R., Puchi, M., Imschenetzky, M., van Wijnen, A., Lian, J., Stein, G., Stein, J., & Montecino, M. (2000). Interaction of CBFα/AML/PEBP2α Transcription Factors with Nucleosomes Containing Promoter Sequences Requires Flexibility in the Translational Positioning of the Histone Octamer and Exposure of the CBFα Site. Biochemistry, 39(44), 13565-13574
Hagen, G., Muller, S., Beato, M., & Suske, G. (1994). Sp1-Mediated Transcriptional Activation Is Repressed by Sp3. Embo J, 13(16), 3843-3851
Hatta, M., & Cirillo, L. A. (2007). Chromatin Opening and Stable Perturbation of Core Histone:DNA Contacts by FoxO1. Journal of Biological Chemistry, 282(49), 35583-35593
He, S., Sun, J. M., Li, L., & Davie, J. R. (2005). Differential intranuclear organization of transcription factors Sp1 and Sp3. Mol. Biol. Cell, 16(9), 4073-4083
Heinz, S., Benner, C., Spann, N., Bertolino, E., Lin, Y. C., Laslo, P., Cheng, J. X., Murre, C., Singh, H., & Glass, C. K. (2010). Simple combinations of lineage-determining transcription factors prime cis-regulatory elements required for macrophage and B cell identities. Mol. Cell, 38(4), 576-589
Heitz, E. (1928). Heterochromatin der Moose. Jahrb Wiss Botanik, 69, 762-818 Höller, M., Westin, G., Jiricny, J., & Schaffner, W. (1988). Sp1 transcription factor binds
DNA and activates transcription even when the binding site is CpG methylated. Genes & development, 2(9), 1127-1135
Hoogenkamp, M., Lichtinger, M., Krysinska, H., Lancrin, C., Clarke, D., Williamson, A., Mazzarella, L., Ingram, R., Jorgensen, H., Fisher, A., Tenen, D. G., Kouskoff, V., Lacaud, G., & Bonifer, C. (2009). Early chromatin unfolding by RUNX1: a molecular explanation for differential requirements during specification versus maintenance of the hematopoietic gene expression program. Blood, 114(2), 299-309
Hsu, P. D., Scott, D. A., Weinstein, J. A., Ran, F. A., Konermann, S., Agarwala, V., Li, Y., Fine, E. J., Wu, X., Shalem, O., Cradick, T. J., Marraffini, L. A., Bao, G., & Zhang, F. (2013). DNA targeting specificity of RNA-guided Cas9 nucleases. Nat. Biotechnol., 31(9), 827-832
Hu, S. L., & Manley, J. L. (1981). DNA sequence required for initiation of transcription in vitro from the major late promoter of adenovirus 2. Proceedings of the National Academy of Sciences, 78(2), 820-824
Huang, D. W., Sherman, B. T., & Lempicki, R. A. (2008). Systematic and integrative analysis of large gene lists using DAVID bioinformatics resources. Nat. Protocols, 4(1), 44-57
Huber, T. L., Kouskoff, V., Joerg Fehling, H., Palis, J., & Keller, G. (2004). Haemangioblast commitment is initiated in the primitive streak of the mouse embryo. Nature, 432(7017), 625-630
Hug, N., Longman, D., & Cáceres, J. F. (2016). Mechanism and regulation of the nonsense-mediated decay pathway. Nucleic acids research, 44(4), 1483-1495
Ihn, H., & Trojanowska, M. (1997). Sp3 is a transcriptional activator of the human α2(I) collagen gene. Nucleic acids research, 25(18), 3712-3717
Illingworth, R. S., Gruenewald-Schneider, U., Webb, S., Kerr, A. R. W., James, K. D., Turner, D. J., Smith, C., Harrison, D. J., Andrews, R., & Bird, A. P. (2010). Orphan CpG Islands Identify Numerous Conserved Promoters in the Mammalian Genome. PLOS Genetics, 6(9), e1001134

264
Irion, S., Clarke, R. L., Luche, H., Kim, I., Morrison, S. J., Fehling, H.-J., & Keller, G. M. (2010). Temporal specification of blood progenitors from mouse embryonic stem cells and induced pluripotent stem cells. Development, 137(17), 2829-2839
Ito, T., Azumano, M., Uwatoko, C., Itoh, K., & Kuwahara, J. (2009). Role of zinc finger structure in nuclear localization of transcription factor Sp1. Biochemical and biophysical research communications, 380(1), 28-32
Ito, T., Ikehara, T., Nakagawa, T., Kraus, W. L., & Muramatsu, M. (2000). p300-Mediated acetylation facilitates the transfer of histone H2A–H2B dimers from nucleosomes to a histone chaperone. Genes & development, 14(15), 1899-1907
Iwafuchi-Doi, M., Donahue, G., Kakumanu, A., Watts, Jason A., Mahony, S., Pugh, B. F., Lee, D., Kaestner, Klaus H., & Zaret, Kenneth S. (2016). The Pioneer Transcription Factor FoxA Maintains an Accessible Nucleosome Configuration at Enhancers for Tissue-Specific Gene Activation. Mol. Cell, 62(1), 79-91
Iwano, S., Saito, T., Takahashi, Y., Fujita, K.-i., & Kamataki, T. (2001). Cooperative Regulation of CYP3A5 Gene Transcription by NF-Y and Sp Family Members. Biochemical and biophysical research communications, 286(1), 55-60
Jaffredo, T., Gautier, R., Eichmann, A., & Dieterlen-Lievre, F. (1998). Intraaortic hemopoietic cells are derived from endothelial cells during ontogeny. Development, 125(22), 4575-4583
Jin, C., Zang, C., Wei, G., Cui, K., Peng, W., Zhao, K., & Felsenfeld, G. (2009). H3.3/H2A.Z double variant-containing nucleosomes mark 'nucleosome-free regions' of active promoters and other regulatory regions. Nat. Genet., 41(8), 941-945
Jinek, M., Chylinski, K., Fonfara, I., Hauer, M., Doudna, J. A., & Charpentier, E. (2012). A programmable dual-RNA-guided DNA endonuclease in adaptive bacterial immunity. Science (New York, N.Y.), 337(6096), 816-821
Jones, P. L., Jan Veenstra, G. C., Wade, P. A., Vermaak, D., Kass, S. U., Landsberger, N., Strouboulis, J., & Wolffe, A. P. (1998). Methylated DNA and MeCP2 recruit histone deacetylase to repress transcription. Nat. Genet., 19(2), 187-191
Jonkers, I., & Lis, J. T. (2015). Getting up to speed with transcription elongation by RNA polymerase II. Nat Rev Mol Cell Biol, 16(3), 167-177
Kadam, S., & Emerson, B. M. (2003). Transcriptional Specificity of Human SWI/SNF BRG1 and BRM Chromatin Remodeling Complexes. Mol. Cell, 11(2), 377-389
Kadonaga, J. T. (2004). Regulation of RNA Polymerase II Transcription by Sequence-Specific DNA Binding Factors. Cell, 116(2), 247-257
Kadonaga, J. T. (2012). Perspectives on the RNA Polymerase II Core Promoter. Wiley interdisciplinary reviews. Developmental biology, 1(1), 40-51
Kassouf, M. T., Chagraoui, H., Vyas, P., & Porcher, C. (2008). Differential use of SCL/TAL-1 DNA-binding domain in developmental hematopoiesis. Blood, 112(4), 1056-1067
Kassouf, M. T., Hughes, J. R., Taylor, S., McGowan, S. J., Soneji, S., Green, A. L., Vyas, P., & Porcher, C. (2010). Genome-wide identification of TAL1's functional targets: Insights into its mechanisms of action in primary erythroid cells. Genome Res., 20(8), 1064-1083
Kataoka, H., Hayashi, M., Nakagawa, R., Tanaka, Y., Izumi, N., Nishikawa, S., Jakt, M. L., Tarui, H., & Nishikawa, S.-I. (2011). Etv2/ER71 induces vascular mesoderm from Flk1+ PDGFRα+ primitive mesoderm. Blood, 118(26), 6975-6986
Keller, G. (2005). Embryonic stem cell differentiation: emergence of a new era in biology and medicine. Genes & development, 19(10), 1129-1155
Keller, G., Kennedy, M., Papayannopoulou, T., & Wiles, M. V. (1993). Hematopoietic commitment during embryonic stem cell differentiation in culture. Molecular and cellular biology, 13(1), 473-486

265
Kennedy, M., Firpo, M., Choi, K., Wall, C., Robertson, S., Kabrun, N., & Keller, G. (1997). A common precursor for primitive erythropoiesis and definitive haematopoiesis. Nature, 386(6624), 488-493
Kim, J. L., Nikolov, D. B., & Burley, S. K. (1993). Co-crystal structure of TBP recognizing the minor groove of a TATA element. Nature, 365(6446), 520-527
Kim, M., Li, D., Cui, Y., Mueller, K., Chears, W. C., & DeJong, J. (2006). Regulatory Factor Interactions and Somatic Silencing of the Germ Cell-specific ALF Gene. Journal of Biological Chemistry, 281(45), 34288-34298
Kim, T. H., Abdullaev, Z. K., Smith, A. D., Ching, K. A., Loukinov, D. I., Green, R. D., Zhang, M. Q., Lobanenkov, V. V., & Ren, B. (2007). Analysis of the vertebrate insulator protein CTCF binding sites in the human genome. Cell, 128(6), 1231-1245
Kinkley, S., Helmuth, J., Polansky, J. K., Dunkel, I., Gasparoni, G., Fröhler, S., Chen, W., Walter, J., Hamann, A., & Chung, H.-R. (2016). reChIP-seq reveals widespread bivalency of H3K4me3 and H3K27me3 in CD4+ memory T cells. 7, 12514
Kispert, A., & Herrmann, B. G. (1994). Immunohistochemical Analysis of the Brachyury Protein in Wild-Type and Mutant Mouse Embryos. Developmental biology, 161(1), 179-193
Kissa, K., & Herbomel, P. (2010). Blood stem cells emerge from aortic endothelium by a novel type of cell transition. Nature, 464(7285), 112-115
Kornberg, R. D., & Thonmas, J. O. (1974). Chromatin Structure: Oligomers of the Histones. Science, 184(4139), 865-868
Koutsodontis, G., Vasilaki, E., Chou, W.-C., Papakosta, P., & Kardassis, D. (2005). Physical and functional interactions between members of the tumour suppressor p53 and the Sp families of transcription factors: importance for the regulation of genes involved in cell-cycle arrest and apoptosis. Biochemical Journal, 389(2), 443-455
Kouzarides, T. (2007). Chromatin Modifications and Their Function. Cell, 128(4), 693-705 Ku, M., Koche, R. P., Rheinbay, E., Mendenhall, E. M., Endoh, M., Mikkelsen, T. S.,
Presser, A., Nusbaum, C., Xie, X., Chi, A. S., Adli, M., Kasif, S., Ptaszek, L. M., Cowan, C. A., Lander, E. S., Koseki, H., & Bernstein, B. E. (2008). Genomewide Analysis of PRC1 and PRC2 Occupancy Identifies Two Classes of Bivalent Domains. PLOS Genetics, 4(10), e1000242
Kyba, M., Perlingeiro, R. C. R., & Daley, G. Q. (2002). HoxB4 Confers Definitive Lymphoid-Myeloid Engraftment Potential on Embryonic Stem Cell and Yolk Sac Hematopoietic Progenitors. Cell, 109(1), 29-37
Lacaud, G., & Kouskoff, V. (2017). Hemangioblast, hemogenic endothelium, and primitive versus definitive hematopoiesis. Exp. Hematol., 49, 19-24
Lagrange, T., Kapanidis, A. N., Tang, H., Reinberg, D., & Ebright, R. H. (1998). New core promoter element in RNA polymerase II-dependent transcription: sequence-specific DNA binding by transcription factor IIB. Genes & development, 12(1), 34-44
Lancrin, C., Mazan, M., Stefanska, M., Patel, R., Lichtinger, M., Costa, G., Vargel, Ö., Wilson, N. K., Möröy, T., Bonifer, C., Göttgens, B., Kouskoff, V., & Lacaud, G. (2012). GFI1 and GFI1B control the loss of endothelial identity of hemogenic endothelium during hematopoietic commitment. Blood, 120(2), 314-322
Lancrin, C., Sroczynska, P., Serrano, A. G., Gandillet, A., Ferreras, C., Kouskoff, V., & Lacaud, G. (2010). Blood cell generation from the hemangioblast. J. Mol. Med., 88(2), 167-172
Lancrin, C., Sroczynska, P., Stephenson, C., Allen, T., Kouskoff, V., & Lacaud, G. (2009). The haemangioblast generates haematopoietic cells through a haemogenic endothelium stage. Nature, 457(7231), 892-895

266
Langmead, B., & Salzberg, S. L. (2012). Fast gapped-read alignment with Bowtie 2. Nat Meth, 9(4), 357-359
Larsen, F., Gundersen G Fau - Lopez, R., Lopez R Fau - Prydz, H., & Prydz, H. (1992). CpG islands as gene markers in the human genome. Genomics, 13(4), 1095-1107
Le Bouffant, R., Souquet, B., Duval, N., Duquenne, C., Herve, R., Frydman, N., Robert, B., Habert, R., & Livera, G. (2011). Msx1 and Msx2 promote meiosis initiation. Development, 138(24), 5393-5402
Lecuyer, E., Herblot, S., Saint-Denis, M., Martin, R., Begley, C. G., Porcher, C., Orkin, S. H., & Hoang, T. (2002). The SCL complex regulates c-kit expression in hematopoietic cells through functional interaction with Sp1. Blood, 100(7), 2430-2440
Lee, C., Li, X., Hechmer, A., Eisen, M., Biggin, M. D., Venters, B. J., Jiang, C., Li, J., Pugh, B. F., & Gilmour, D. S. (2008a). NELF and GAGA Factor Are Linked to Promoter-Proximal Pausing at Many Genes in Drosophila. Molecular and cellular biology, 28(10), 3290-3300
Lee, D., Park, C., Lee, H., Lugus, J. J., Kim, S. H., Arentson, E., Chung, Y. S., Gomez, G., Kyba, M., Lin, S., Janknecht, R., Lim, D.-S., & Choi, K. (2008b). ER71 Acts Downstream of BMP, Notch, and Wnt Signaling in Blood and Vessel Progenitor Specification. Cell Stem Cell, 2(5), 497-507
Lee, J., Krivega, I., Dale, R. K., & Dean, A. (2017). The LDB1 Complex Co-opts CTCF for Erythroid Lineage-Specific Long-Range Enhancer Interactions. Cell Reports, 19(12), 2490-2502
Lee, L. T.-O., Tan-Un, K.-C., Pang, R. T.-K., Lam, D. T.-W., & Chow, B. K.-C. (2004). Regulation of the Human Secretin Gene Is Controlled by the Combined Effects of CpG Methylation, Sp1/Sp3 Ratio, and the E-Box Element. Mol Endocrinol, 18(7), 1740-1755
Lemay, J.-F., & Bachand, F. (2015). Fail-safe transcription termination: Because one is never enough. RNA Biology, 12(9), 927-932
Lenhard, B., Sandelin, A., & Carninci, P. (2012). Metazoan promoters: emerging characteristics and insights into transcriptional regulation. Nat Rev Genet, 13(4), 233-245
Lewis, B. A., Sims, R. J., Lane, W. S., & Reinberg, D. (2005). Functional Characterization of Core Promoter Elements: DPE-Specific Transcription Requires the Protein Kinase CK2 and the PC4 Coactivator. Mol. Cell, 18(4), 471-481
Li, B., Adams, C. C., & Workman, J. L. (1994). Nucleosome binding by the constitutive transcription factor Sp1. Journal of Biological Chemistry, 269(10), 7756-7763
Li, B., Carey, M., & Workman, J. L. (2007). The Role of Chromatin during Transcription. Cell, 128(4), 707-719
Li, L., & Davie, J. R. (2010). The role of Sp1 and Sp3 in normal and cancer cell biology. Annals of anatomy = Anatomischer Anzeiger : official organ of the Anatomische Gesellschaft, 192(5), 275-283
Li, N., Mu, H., Zheng, L., Li, B., Wu, C., Niu, B., Shen, Q., He, X., & Hua, J. (2016). EIF2S3Y suppresses the pluripotency state and promotes the proliferation of mouse embryonic stem cells. Oncotarget, 7(10), 11321-11331
Lichtinger, M., Ingram, R., Hannah, R., Müller, D., Clarke, D., Assi, S. A., Lie‐A‐Ling, M., Noailles, L., Vijayabaskar, M. S., Wu, M., Tenen, D. G., Westhead, D. R., Kouskoff, V., Lacaud, G., Göttgens, B., & Bonifer, C. (2012). RUNX1 reshapes the epigenetic landscape at the onset of haematopoiesis. The EMBO journal, 31(22), 4318-4333
Lie-A-Ling, M., Marinopoulou, E., Li, Y., Patel, R., Stefanska, M., Bonifer, C., Miller, C., Kouskoff, V., & Lacaud, G. (2014). RUNX1 positively regulates a cell adhesion and migration program in murine hemogenic endothelium prior to blood emergence. Blood, 124(11), e11-e20

267
Lis, J. T., Mason, P., Peng, J., Price, D. H., & Werner, J. (2000). P-TEFb kinase recruitment and function at heat shock loci. Genes & development, 14(7), 792-803
Liu, A., Hoffman, P. W., Lu, W., & Bai, G. (2004). NF-κB Site Interacts with Sp Factors and Up-regulates the NR1 Promoter during Neuronal Differentiation. Journal of Biological Chemistry, 279(17), 17449-17458
Liu, F., Li, D., Yu, Y. Y. L., Kang, I., Cha, M.-J., Kim, J. Y., Park, C., Watson, D. K., Wang, T., & Choi, K. (2015). Induction of hematopoietic and endothelial cell program orchestrated by ETS transcription factor ER71/ETV2. EMBO reports, 16(5), 654-669
Luger, K., Mader, A. W., Richmond, R. K., Sargent, D. F., & Richmond, T. J. (1997). Crystal structure of the nucleosome core particle at 2.8[thinsp]A resolution. Nature, 389(6648), 251-260
Lugus, J. J., Park, C., Ma, Y. D., & Choi, K. (2009). Both primitive and definitive blood cells are derived from Flk-1+ mesoderm. Blood, 113(3), 563-566
Luscombe, N. M., Austin, S. E., Berman, H. M., & Thornton, J. M. (2000). An overview of the structures of protein-DNA complexes. Genome Biology, 1(1), reviews001.001
Luse, D. S. (2014). The RNA polymerase II preinitiation complex: Through what pathway is the complex assembled? Transcription, 5(1), e27050
MacArthur, B. D., Sevilla, A., Lenz, M., Müller, F.-J., Schuldt, B. M., Schuppert, A. A., Ridden, S. J., Stumpf, P. S., Fidalgo, M., Ma’ayan, A., Wang, J., & Lemischka, I. R. (2012). Nanog-dependent feedback loops regulate murine embryonic stem cell heterogeneity. Nat Cell Biol, 14(11), 1139-1147
Macleod, D., Charlton, J., Mullins, J., & Bird, A. P. (1994). Sp1 sites in the mouse aprt gene promoter are required to prevent methylation of the CpG island. Genes & development, 8(19), 2282-2292
Maisonpierre, P. C., Suri, C., Jones, P. F., Bartunkova, S., Wiegand, S. J., Radziejewski, C., Compton, D., McClain, J., Aldrich, T. H., Papadopoulos, N., Daly, T. J., Davis, S., Sato, T. N., & Yancopoulos, G. D. (1997). Angiopoietin-2, a Natural Antagonist for Tie2 That Disrupts in vivo Angiogenesis. Science, 277(5322), 55-60
Majello, B., Deluca, P., Suske, G., & Lania, L. (1995). Differential Transcriptional Regulation of C-Myc Promoter through the Same DNA-Binding Sites Targeted by Sp1-Like Proteins. Oncogene, 10(9), 1841-1848
Mann, I. K., Chatterjee, R., Zhao, J., He, X., Weirauch, M. T., Hughes, T. R., & Vinson, C. (2013). CG methylated microarrays identify a novel methylated sequence bound by the CEBPB|ATF4 heterodimer that is active in vivo. Genome Res., 23(6), 988-997
Marin, M., Karis, A., Visser, P., Grosveld, F., & Philipsen, S. (1997). Transcription Factor Sp1 Is Essential for Early Embryonic Development but Dispensable for Cell Growth and Differentiation. Cell, 89(4), 619-628
Marsman, J., & Horsfield, J. A. (2012). Long distance relationships: Enhancer–promoter communication and dynamic gene transcription. Biochimica et Biophysica Acta (BBA) - Gene Regulatory Mechanisms, 1819(11–12), 1217-1227
Martin, M. (2011). Cutadapt removes adapter sequences from high-throughput sequencing reads. 2011, 17(1)
Maston, G. A., Evans, S. K., & Green, M. R. (2006). Transcriptional Regulatory Elements in the Human Genome. Annual Review of Genomics and Human Genetics, 7(1), 29-59
Mastrangelo, I. A., Courey, A. J., Wall, J. S., Jackson, S. P., & Hough, P. V. (1991). DNA looping and Sp1 multimer links: a mechanism for transcriptional synergism and enhancement. Proceedings of the National Academy of Sciences, 88(13), 5670-5674
Matsuoka, S., Tsuji, K., Hisakawa, H., Xu, M.-j., Ebihara, Y., Ishii, T., Sugiyama, D., Manabe, A., Tanaka, R., Ikeda, Y., Asano, S., & Nakahata, T. (2001). Generation
268
of definitive hematopoietic stem cells from murine early yolk sac and paraaortic splanchnopleures by aorta-gonad-mesonephros region–derived stromal cells. Blood, 98(1), 6-12
McGinnis, W., & Krumlauf, R. (1992). Homeobox genes and axial patterning. Cell, 68(2), 283-302
McGrath, Kathleen E., Frame, Jenna M., Fegan, Katherine H., Bowen, James R., Conway, Simon J., Catherman, Seana C., Kingsley, Paul D., Koniski, Anne D., & Palis, J. (2015). Distinct Sources of Hematopoietic Progenitors Emerge before HSCs and Provide Functional Blood Cells in the Mammalian Embryo. Cell Reports, 11(12), 1892-1904
McGrath, K. E., Frame, J. M., Fromm, G. J., Koniski, A. D., Kingsley, P. D., Little, J., Bulger, M., & Palis, J. (2011). A transient definitive erythroid lineage with unique regulation of the beta-globin locus in the mammalian embryo. Blood, 117(17), 4600-4608
Medvinsky, A., & Dzierzak, E. (1996). Definitive Hematopoiesis Is Autonomously Initiated by the AGM Region. Cell, 86(6), 897-906
Merika, M., & Orkin, S. H. (1995). Functional synergy and physical interactions of the erythroid transcription factor GATA-1 with the Kruppel family proteins Sp1 and EKLF. Molecular and cellular biology, 15(5), 2437-2447
Mikkelsen, T. S., Ku, M., Jaffe, D. B., Issac, B., Lieberman, E., Giannoukos, G., Alvarez, P., Brockman, W., Kim, T.-K., Koche, R. P., Lee, W., Mendenhall, E., O/'Donovan, A., Presser, A., Russ, C., Xie, X., Meissner, A., Wernig, M., Jaenisch, R., Nusbaum, C., Lander, E. S., & Bernstein, B. E. (2007). Genome-wide maps of chromatin state in pluripotent and lineage-committed cells. Nature, 448(7153), 553-560
Moignard, V., Woodhouse, S., Fisher, J., & Göttgens, B. (2013). Transcriptional hierarchies regulating early blood cell development. Blood Cells. Mol. Dis., 51(4), 239-247
Moore, M. A. S., & Metcalf, D. (1970). Ontogeny of the Haemopoietic System: Yolk Sac Origin of In Vivo and In Vitro Colony Forming Cells in the Developing Mouse Embryo*. Br. J. Haematol., 18(3), 279-296
Muller, A. M., Medvinsky, A., Strouboulis, J., Grosveld, F., & Dzierzak, E. (1994). Development of hematopoietic stem cell activity in the mouse embryo. Immunity, 1(4), 291-301
Murray, P. D. F. (1932). The Development in vitro of the Blood of the Early Chick Embryo. Proceedings of the Royal Society of London. Series B, Containing Papers of a Biological Character, 111(773), 497-521
Murry, C. E., & Keller, G. (2008). Differentiation of Embryonic Stem Cells to Clinically Relevant Populations: Lessons from Embryonic Development. Cell, 132(4), 661-680
Naik, S. H., Perie, L., Swart, E., Gerlach, C., van Rooij, N., de Boer, R. J., & Schumacher, T. N. (2013). Diverse and heritable lineage imprinting of early haematopoietic progenitors. Nature, 496(7444), 229-232
Navarro, P., Festuccia, N., Colby, D., Gagliardi, A., Mullin, N. P., Zhang, W., Karwacki‐Neisius, V., Osorno, R., Kelly, D., Robertson, M., & Chambers, I. (2012). OCT4/SOX2‐independent <em>Nanog</em> autorepression modulates heterogeneous <em>Nanog</em> gene expression in mouse ES cells. The EMBO journal, 31(24), 4547-4562
Neems, D. S., Garza-Gongora, A. G., Smith, E. D., & Kosak, S. T. (2016). Topologically associated domains enriched for lineage-specific genes reveal expression-dependent nuclear topologies during myogenesis. Proceedings of the National Academy of Sciences, 113(12), E1691-E1700

269
Neri, F., Rapelli, S., Krepelova, A., Incarnato, D., Parlato, C., Basile, G., Maldotti, M., Anselmi, F., & Oliviero, S. (2017). Intragenic DNA methylation prevents spurious transcription initiation. Nature, 543(7643), 72-77
Newland, S. A., Macaulay, I. C., Floto, A. R., de Vet, E. C., Ouwehand, W. H., Watkins, N. A., Lyons, P. A., & Campbell, D. R. (2007). The novel inhibitory receptor G6B is expressed on the surface of platelets and attenuates platelet function in vitro. Blood, 109(11), 4806-4809
Noh, J.-Y., Gandre-Babbe, S., Wang, Y., Hayes, V., Yao, Y., Gadue, P., Sullivan, S. K., Chou, S. T., Machlus, K. R., Italiano, J. E., Kyba, M., Finkelstein, D., Ulirsch, J. C., Sankaran, V. G., French, D. L., Poncz, M., & Weiss, M. J. (2015). Inducible Gata1 suppression expands megakaryocyte-erythroid progenitors from embryonic stem cells. The Journal of clinical investigation, 125(6), 2369-2374
Nolis, I. K., McKay, D. J., Mantouvalou, E., Lomvardas, S., Merika, M., & Thanos, D. (2009). Transcription factors mediate long-range enhancer–promoter interactions. Proceedings of the National Academy of Sciences, 106(48), 20222-20227
North, T., Gu, T. L., Stacy, T., Wang, Q., Howard, L., Binder, M., Marin-Padilla, M., & Speck, N. A. (1999). Cbfa2 is required for the formation of intra-aortic hematopoietic clusters. Development, 126(11), 2563-2575
Nostro, M. C., Cheng, X., Keller, G. M., & Gadue, P. (2008). Wnt, Activin, and BMP Signaling Regulate Distinct Stages in the Developmental Pathway from Embryonic Stem Cells to Blood. Cell Stem Cell, 2(1), 60-71
O'Connor, L., Gilmour, J., & Bonifer, C. (2016). The Role of the Ubiquitously Expressed Transcription Factor Sp1 in Tissue-specific Transcriptional Regulation and in Disease. Yale J. Biol. Med., 89(4), 513-525
Obier, N., Cauchy, P., Assi, S. A., Gilmour, J., Lie-A-Ling, M., Lichtinger, M., Hoogenkamp, M., Noailles, L., Cockerill, P. N., Lacaud, G., Kouskoff, V., & Bonifer, C. (2016). Cooperative binding of AP-1 and TEAD4 modulates the balance between vascular smooth muscle and hemogenic cell fate. Development, 143(23), 4324-4340
Okano, M., Bell, D. W., Haber, D. A., & Li, E. (1999). DNA Methyltransferases Dnmt3a and Dnmt3b Are Essential for De Novo Methylation and Mammalian Development. Cell, 99(3), 247-257
Okuda, T., van Deursen, J., Hiebert, S. W., Grosveld, G., & Downing, J. R. (1996). AML1, the target of multiple chromosomal translocations in human leukemia, is essential for normal fetal liver hematopoiesis. Cell, 84(2), 321-330
Ooi, S. K. T., Qiu, C., Bernstein, E., Li, K., Jia, D., Yang, Z., Erdjument-Bromage, H., Tempst, P., Lin, S.-P., Allis, C. D., Cheng, X., & Bestor, T. H. (2007). DNMT3L connects unmethylated lysine 4 of histone H3 to de novo methylation of DNA. Nature, 448(7154), 714-717
Ottersbach, K., Smith, A., Wood, A., & Göttgens, B. (2010). Ontogeny of haematopoiesis: recent advances and open questions. Br. J. Haematol., 148(3), 343-355
Palis, J., McGrath, K., & Kingsley, P. (1995). Initiation of hematopoiesis and vasculogenesis in murine yolk sac explants. Blood, 86(1), 156-163
Palis, J., Robertson, S., Kennedy, M., Wall, C., & Keller, G. (1999). Development of erythroid and myeloid progenitors in the yolk sac and embryo proper of the mouse. Development, 126(22), 5073-5084
Pearson, S., Cuvertino, S., Fleury, M., Lacaud, G., & Kouskoff, V. (2015). In Vivo Repopulating Activity Emerges at the Onset of Hematopoietic Specification during Embryonic Stem Cell Differentiation. Stem Cell Reports, 4(3), 431-444
Pereira, L. A., Wong, M. S., Lim, S. M., Sides, A., Stanley, E. G., & Elefanty, A. G. (2011). Brachyury and Related Tbx Proteins Interact with the Mixl1 Homeodomain Protein and Negatively Regulate Mixl1 Transcriptional Activity. PLoS ONE, 6(12), e28394

270
Pimanda, J. E., Chan, W. Y. I., Wilson, N. K., Smith, A. M., Kinston, S., Knezevic, K., Janes, M. E., Landry, J.-R., Kolb-Kokocinski, A., Frampton, J., Tannahill, D., Ottersbach, K., Follows, G. A., Lacaud, G., Kouskoff, V., & Göttgens, B. (2008). Endoglin Expression in Blood and Endothelium is Differentially Regulated by Modular Assembly of the Ets/Gata Hemangioblast Code. Blood, 112(12), 4512-4522
Pimanda, J. E., Ottersbach, K., Knezevic, K., Kinston, S., Chan, W. Y. I., Wilson, N. K., Landry, J.-R., Wood, A. D., Kolb-Kokocinski, A., Green, A. R., Tannahill, D., Lacaud, G., Kouskoff, V., & Göttgens, B. (2007). Gata2, Fli1, and Scl form a recursively wired gene-regulatory circuit during early hematopoietic development. Proceedings of the National Academy of Sciences, 104(45), 17692-17697
Pokholok, D. K., Harbison, C. T., Levine, S., Cole, M., Hannett, N. M., Lee, T. I., Bell, G. W., Walker, K., Rolfe, P. A., Herbolsheimer, E., Zeitlinger, J., Lewitter, F., Gifford, D. K., & Young, R. A. (2005). Genome-wide Map of Nucleosome Acetylation and Methylation in Yeast. Cell, 122(4), 517-527
Porcher, C., Liao, E. C., Fujiwara, Y., Zon, L. I., & Orkin, S. H. (1999). Specification of hematopoietic and vascular development by the bHLH transcription factor SCL without direct DNA binding. Development, 126(20), 4603-4615
Porrua, O., & Libri, D. (2015). Transcription termination and the control of the transcriptome: why, where and how to stop. Nat Rev Mol Cell Biol, 16(3), 190-202
Pugh, B. F., & Tjian, R. (1991). Transcription from a TATA-less promoter requires a multisubunit TFIID complex. Genes & development, 5(11), 1935-1945
Rach, E. A., Winter, D. R., Benjamin, A. M., Corcoran, D. L., Ni, T., Zhu, J., & Ohler, U. (2011). Transcription Initiation Patterns Indicate Divergent Strategies for Gene Regulation at the Chromatin Level. PLOS Genetics, 7(1), e1001274
Rada-Iglesias, A., Bajpai, R., Swigut, T., Brugmann, S. A., Flynn, R. A., & Wysocka, J. (2011). A unique chromatin signature uncovers early developmental enhancers in humans. Nature, 470(7333), 279-283
Ramirez-Carrozzi, V. R., Braas, D., Bhatt, D. M., Cheng, C. S., Hong, C., Doty, K. R., Black, J. C., Hoffmann, A., Carey, M., & Smale, S. T. (2009). A Unifying Model for the Selective Regulation of Inducible Transcription by CpG Islands and Nucleosome Remodeling. Cell, 138(1), 114-128
Ran, F. A., Hsu, Patrick D., Lin, C.-Y., Gootenberg, Jonathan S., Konermann, S., Trevino, A. E., Scott, David A., Inoue, A., Matoba, S., Zhang, Y., & Zhang, F. (2013). Double Nicking by RNA-Guided CRISPR Cas9 for Enhanced Genome Editing Specificity. Cell, 154(6), 1380-1389
Reinke, H., & Hörz, W. (2003). Histones Are First Hyperacetylated and Then Lose Contact with the Activated PHO5 Promoter. Mol. Cell, 11(6), 1599-1607
Rhee, H. S., & Pugh, B. F. (2011). Comprehensive genome-wide protein-DNA interactions detected at single-nucleotide resolution. Cell, 147(6), 1408-1419
Robb, L., Lyons, I., Li, R., Hartley, L., Kontgen, F., Harvey, R. P., Metcalf, D., & Begley, C. G. (1995). Absence of yolk sac hematopoiesis from mice with a targeted disruption of the scl gene. Proceedings of the National Academy of Sciences of the United States of America, 92(15), 7075-7079
Robinson, P. J. J., Fairall, L., Huynh, V. A. T., & Rhodes, D. (2006). EM measurements define the dimensions of the “30-nm” chromatin fiber: Evidence for a compact, interdigitated structure. Proceedings of the National Academy of Sciences, 103(17), 6506-6511
Rotem, A., Ram, O., Shoresh, N., Sperling, R. A., Goren, A., Weitz, D. A., & Bernstein, B. E. (2015). Single-cell ChIP-seq reveals cell subpopulations defined by chromatin state. Nature biotechnology, 33(11), 1165-1172
271
Routh, A., Sandin, S., & Rhodes, D. (2008). Nucleosome repeat length and linker histone stoichiometry determine chromatin fiber structure. Proceedings of the National Academy of Sciences, 105(26), 8872-8877
Rozenberg, J. M., Shlyakhtenko, A., Glass, K., Rishi, V., Myakishev, M. V., FitzGerald, P. C., & Vinson, C. (2008). All and only CpG containing sequences are enriched in promoters abundantly bound by RNA polymerase II in multiple tissues. BMC Genomics, 9(1), 67
Sabin, F. (1920). Studies on the origin of blood vessels and of red blood corpuscles as seen in the living blastoderm of chicks during the second day of incubation. Contr. Embryol., 9, 215-262
Saeed, A. I., Bhagabati, N. K., Braisted, J. C., Liang, W., Sharov, V., Howe, E. A., Li, J., Thiagarajan, M., White, J. A., & Quackenbush, J. (2006). TM4 microarray software suite. Methods Enzymol, 411, 134-193
Saksouk, N., Avvakumov, N., Champagne, K. S., Hung, T., Doyon, Y., Cayrou, C., Paquet, E., Ullah, M., Landry, A.-J., Côté, V., Yang, X.-J., Gozani, O., Kutateladze, T. G., & Côté, J. (2009). HBO1 HAT Complexes Target Chromatin throughout Gene Coding Regions via Multiple PHD Finger Interactions with Histone H3 Tail. Mol. Cell, 33(2), 257-265
Saldanha, A. J. (2004). Java Treeview—extensible visualization of microarray data. Bioinformatics, 20(17), 3246-3248
Sanyal, A., Lajoie, B. R., Jain, G., & Dekker, J. (2012). The long-range interaction landscape of gene promoters. Nature, 489(7414), 109-113
Sapetschnig, A., Koch, F., Rischitor, G., Mennenga, T., & Suske, G. (2004). Complexity of Translationally Controlled Transcription Factor Sp3 Isoform Expression. Journal of Biological Chemistry, 279(40), 42095-42105
Savarese, F., Dávila, A., Nechanitzky, R., De La Rosa-Velazquez, I., Pereira, C. F., Engelke, R., Takahashi, K., Jenuwein, T., Kohwi-Shigematsu, T., Fisher, A. G., & Grosschedl, R. (2009). Satb1 and Satb2 regulate embryonic stem cell differentiation and Nanog expression. Genes & development, 23(22), 2625-2638
Saxonov, S., Berg, P., & Brutlag, D. L. (2006). A genome-wide analysis of CpG dinucleotides in the human genome distinguishes two distinct classes of promoters. Proceedings of the National Academy of Sciences, 103(5), 1412-1417
Schalch, T., Duda, S., Sargent, D. F., & Richmond, T. J. (2005). X-ray structure of a tetranucleosome and its implications for the chromatin fibre. Nature, 436(7047), 138-141
Schardt, J. A., Keller, M., Seipel, K., & Pabst, T. (2015). Functional interplay of SP family members and nuclear factor Y is essential for transcriptional activation of the human Calreticulin gene. Biochimica et Biophysica Acta (BBA) - Gene Regulatory Mechanisms, 1849(9), 1188-1197
Schug, J., Schuller, W.-P., Kappen, C., Salbaum, J. M., Bucan, M., & Stoeckert, C. J. (2005). Promoter features related to tissue specificity as measured by Shannon entropy. Genome Biology, 6(4), R33
Schulz, C., Perdiguero, E. G., Chorro, L., Szabo-Rogers, H., Cagnard, N., Kierdorf, K., Prinz, M., Wu, B., Jacobsen, S. E. W., Pollard, J. W., Frampton, J., Liu, K. J., & Geissmann, F. (2012). A Lineage of Myeloid Cells Independent of Myb and Hematopoietic Stem Cells. Science, 336(6077), 86-90
Shirasaki, F., Makhluf, H. A., LeRoy, C., Watson, D. K., & Trojanowska, M. (1999). Ets transcription factors cooperate with Sp1 to activate the human tenascin-C promoter. Oncogene, 18(54), 7755-7764
Shivdasani, R. A., Fujiwara, Y., McDevitt, M. A., & Orkin, S. H. (1997). A lineage-selective knockout establishes the critical role of transcription factor GATA-1 in megakaryocyte growth and platelet development. The EMBO journal, 16(13), 3965-3973

272
Shlyueva, D., Stampfel, G., & Stark, A. (2014). Transcriptional enhancers: from properties to genome-wide predictions. Nat Rev Genet, 15(4), 272-286
Shogren-Knaak, M., Ishii, H., Sun, J.-M., Pazin, M. J., Davie, J. R., & Peterson, C. L. (2006). Histone H4-K16 Acetylation Controls Chromatin Structure and Protein Interactions. Science, 311(5762), 844-847
Silva, J., Nichols, J., Theunissen, T. W., Guo, G., van Oosten, A. L., Barrandon, O., Wray, J., Yamanaka, S., Chambers, I., & Smith, A. (2009). Nanog Is the Gateway to the Pluripotent Ground State. Cell, 138(4), 722-737
Smale, S. T., & Baltimore, D. (1989). The “initiator” as a transcription control element. Cell, 57(1), 103-113
Smale, S. T., & Kadonaga, J. T. (2003). The RNA Polymerase II Core Promoter. Annu. Rev. Biochem., 72(1), 449-479
Song, S.-H., Hou, C., & Dean, A. (2007). A Positive Role for NLI/Ldb1 in Long-Range β-Globin Locus Control Region Function. Mol. Cell, 28(5), 810-822
Spitz, F., & Furlong, E. E. M. (2012). Transcription factors: from enhancer binding to developmental control. Nat Rev Genet, 13(9), 613-626
Splinter, E., Heath, H., Kooren, J., Palstra, R.-J., Klous, P., Grosveld, F., Galjart, N., & de Laat, W. (2006). CTCF mediates long-range chromatin looping and local histone modification in the β-globin locus. Genes & development, 20(17), 2349-2354
Sroczynska, P., Lancrin, C., Pearson, S., Kouskoff, V., & Lacaud, G. (2009). In Vitro Differentiation of Embryonic Stem Cells as a Model of Early Hematopoietic Development. In C. W. Eric So (Ed.), Leukemia: Methods and Protocols (pp. 317-334). Totowa, NJ: Humana Press.
Stadler, M. B., Murr, R., Burger, L., Ivanek, R., Lienert, F., Scholer, A., Wirbelauer, C., Oakeley, E. J., Gaidatzis, D., Tiwari, V. K., & Schubeler, D. (2011). DNA-binding factors shape the mouse methylome at distal regulatory regions. Nature, 480(7378), 490-495
Steensel, B. v., & Henikoff, S. (2000). Identification of in vivo DNA targets of chromatin proteins using tethered Dam methyltransferase. Nat Biotech, 18(4), 424-428
Stielow, B., Sapetschnig, A., Wink, C., Krüger, I., & Suske, G. (2008). SUMO-modified Sp3 represses transcription by provoking local heterochromatic gene silencing. EMBO reports, 9(9), 899-906
Strahl, B. D., & Allis, C. D. (2000). The language of covalent histone modifications. Nature, 403(6765), 41-45
Subramanian, A., Tamayo, P., Mootha, V. K., Mukherjee, S., Ebert, B. L., Gillette, M. A., Paulovich, A., Pomeroy, S. L., Golub, T. R., Lander, E. S., & Mesirov, J. P. (2005). Gene set enrichment analysis: a knowledge-based approach for interpreting genome-wide expression profiles. Proc Natl Acad Sci U S A, 102(43), 15545-15550
Sun, J.-M., Chen, H. Y., Moniwa, M., Litchfield, D. W., Seto, E., & Davie, J. R. (2002). The Transcriptional Repressor Sp3 Is Associated with CK2-phosphorylated Histone Deacetylase 2. Journal of Biological Chemistry, 277(39), 35783-35786
Suzuki-Inoue, K., Inoue, O., & Ozaki, Y. (2011). Novel platelet activation receptor CLEC-2: from discovery to prospects. Journal of Thrombosis and Haemostasis, 9, 44-55
Suzuki, T., Kimura, A., Nagai, R., & Horikoshi, M. (2000). Regulation of interaction of the acetyltransferase region of p300 and the DNA-binding domain of Sp1 on and through DNA binding. Genes to cells : devoted to molecular & cellular mechanisms, 5(1), 29-41
Swiers, G., Rode, C., Azzoni, E., & de Bruijn, M. F. (2013). A short history of hemogenic endothelium. Blood Cells. Mol. Dis., 51(4), 206-212
Tada, S., Era, T., Furusawa, C., Sakurai, H., Nishikawa, S., Kinoshita, M., Nakao, K., Chiba, T., & Nishikawa, S.-I. (2005). Characterization of mesendoderm: a
273
diverging point of the definitive endoderm and mesoderm in embryonic stem cell differentiation culture. Development, 132(19), 4363-4374
Takahashi, H., Parmely, Tari J., Sato, S., Tomomori-Sato, C., Banks, Charles A. S., Kong, Stephanie E., Szutorisz, H., Swanson, Selene K., Martin-Brown, S., Washburn, Michael P., Florens, L., Seidel, Chris W., Lin, C., Smith, Edwin R., Shilatifard, A., Conaway, Ronald C., & Conaway, Joan W. (2011). Human Mediator Subunit MED26 Functions as a Docking Site for Transcription Elongation Factors. Cell, 146(1), 92-104
Tallack, M. R., Whitington, T., Shan Yuen, W., Wainwright, E. N., Keys, J. R., Gardiner, B. B., Nourbakhsh, E., Cloonan, N., Grimmond, S. M., Bailey, T. L., & Perkins, A. C. (2010). A global role for KLF1 in erythropoiesis revealed by ChIP-seq in primary erythroid cells. Genome Res., 20(8), 1052-1063
Tan, N. Y., & Khachigian, L. M. (2009). Sp1 phosphorylation and its regulation of gene transcription. Molecular and cellular biology, 29(10), 2483-2488
Tanaka, T. S., Kunath, T., Kimber, W. L., Jaradat, S. A., Stagg, C. A., Usuda, M., Yokota, T., Niwa, H., Rossant, J., & Ko, M. S. H. (2002). Gene Expression Profiling of Embryo-Derived Stem Cells Reveals Candidate Genes Associated With Pluripotency and Lineage Specificity. Genome Res., 12(12), 1921-1928
Thambyrajah, R., Mazan, M., Patel, R., Moignard, V., Stefanska, M., Marinopoulou, E., Li, Y., Lancrin, C., Clapes, T., Moroy, T., Robin, C., Miller, C., Cowley, S., Gottgens, B., Kouskoff, V., & Lacaud, G. (2016). GFI1 proteins orchestrate the emergence of haematopoietic stem cells through recruitment of LSD1. Nat Cell Biol, 18(1), 21-32
Thomas, M. C., & Chiang, C.-M. (2006). The General Transcription Machinery and General Cofactors. Crit. Rev. Biochem. Mol. Biol., 41(3), 105-178
Thomson, J. P., Skene, P. J., Selfridge, J., Clouaire, T., Guy, J., Webb, S., Kerr, A. R. W., Deaton, A., Andrews, R., James, K. D., Turner, D. J., Illingworth, R., & Bird, A. (2010). CpG islands influence chromatin structure via the CpG-binding protein Cfp1. Nature, 464(7291), 1082-1086
Tirode, F., Busso, D., Coin, F., & Egly, J.-M. (1999). Reconstitution of the Transcription Factor TFIIH. Mol. Cell, 3(1), 87-95
Tober, J., Koniski, A., McGrath, K. E., Vemishetti, R., Emerson, R., de Mesy-Bentley, K. K., Waugh, R., & Palis, J. (2007). The megakaryocyte lineage originates from hemangioblast precursors and is an integral component both of primitive and of definitive hematopoiesis. Blood, 109(4), 1433-1441
Tolhuis, B., Palstra, R.-J., Splinter, E., Grosveld, F., & de Laat, W. (2002). Looping and Interaction between Hypersensitive Sites in the Active β-globin Locus. Mol. Cell, 10(6), 1453-1465
Torres-Padilla, M.-E., & Chambers, I. (2014). Transcription factor heterogeneity in pluripotent stem cells: a stochastic advantage. Development, 141(11), 2173-2181
Trott, J., & Martinez Arias, A. (2013). Single cell lineage analysis of mouse embryonic stem cells at the exit from pluripotency. Biology Open, 2(10), 1049-1056
Tsai, F.-Y., Keller, G., Kuo, F. C., Weiss, M., Chen, J., Rosenblatt, M., Alt, F. W., & Orkin, S. H. (1994). An early haematopoietic defect in mice lacking the transcription factor GATA-2. Nature, 371(6494), 221-226
Ulmer, B., Tingler, M., Kurz, S., Maerker, M., Andre, P., Mönch, D., Campione, M., Deißler, K., Lewandoski, M., Thumberger, T., Schweickert, A., Fainsod, A., Steinbeißer, H., & Blum, M. (2017). A novel role of the organizer gene Goosecoid as an inhibitor of Wnt/PCP-mediated convergent extension in Xenopus and mouse. Scientific Reports, 7, 43010
van Ingen, H., van Schaik, F. M. A., Wienk, H., Ballering, J., Rehmann, H., Dechesne, A. C., Kruijzer, J. A. W., Liskamp, R. M. J., Timmers, H. T. M., & Boelens, R. (2008). Structural Insight into the Recognition of the H3K4me3 Mark by the TFIID Subunit TAF3. Structure, 16(8), 1245-1256

274
Velten, L., Haas, S. F., Raffel, S., Blaszkiewicz, S., Islam, S., Hennig, B. P., Hirche, C., Lutz, C., Buss, E. C., Nowak, D., Boch, T., Hofmann, W.-K., Ho, A. D., Huber, W., Trumpp, A., Essers, M. A. G., & Steinmetz, L. M. (2017). Human haematopoietic stem cell lineage commitment is a continuous process. Nat Cell Biol, 19(4), 271-281
Wang, H., Yang, H., Shivalila, C. S., Dawlaty, M. M., Cheng, A. W., Zhang, F., & Jaenisch, R. (2013). One-Step Generation of Mice Carrying Mutations in Multiple Genes by CRISPR/Cas-Mediated Genome Engineering. Cell, 153(4), 910-918
Wang, W., Lin, C., Lu, D., Ning, Z., Cox, T., Melvin, D., Wang, X., Bradley, A., & Liu, P. (2008). Chromosomal transposition of PiggyBac in mouse embryonic stem cells. Proceedings of the National Academy of Sciences, 105(27), 9290-9295
Wang, Y.-T., Yang, W.-B., Chang, W.-C., & Hung, J.-J. (2011). Interplay of Posttranslational Modifications in Sp1 Mediates Sp1 Stability during Cell Cycle Progression. Journal of Molecular Biology, 414(1), 1-14
Wareing, S., Mazan, A., Pearson, S., Göttgens, B., Lacaud, G., & Kouskoff, V. (2012). The Flk1-Cre-Mediated Deletion of ETV2 Defines Its Narrow Temporal Requirement During Embryonic Hematopoietic Development. Stem Cells, 30(7), 1521-1531
Weintraub, H., & Groudine, M. (1976). Chromosomal subunits in active genes have an altered conformation. Science, 193(4256), 848-856
Weiss, M. J., Keller, G., & Orkin, S. H. (1994). Novel insights into erythroid development revealed through in vitro differentiation of GATA-1 embryonic stem cells. Genes & development, 8(10), 1184-1197
West, S., Gromak, N., & Proudfoot, N. J. (2004). Human 5[prime] [rarr] 3[prime] exonuclease Xrn2 promotes transcription termination at co-transcriptional cleavage sites. Nature, 432(7016), 522-525
Williams, A. O., Isaacs, R. J., & Stowell, K. M. (2007). Down-regulation of human topoisomerase IIα expression correlates with relative amounts of specificity factors Sp1 and Sp3 bound at proximal and distal promoter regions. BMC molecular biology, 8(1), 36
Wilson, B. G., & Roberts, C. W. M. (2011). SWI/SNF nucleosome remodellers and cancer. Nat Rev Cancer, 11(7), 481-492
Winnier, G., Blessing, M., Labosky, P. A., & Hogan, B. L. (1995). Bone morphogenetic protein-4 is required for mesoderm formation and patterning in the mouse. Genes & development, 9(17), 2105-2116
Wise, R. J., Dorner, A. J., Krane, M., Pittman, D. D., & Kaufman, R. J. (1991). The role of von Willebrand factor multimers and propeptide cleavage in binding and stabilization of factor VIII. Journal of Biological Chemistry, 266(32), 21948-21955
Wittler, L., Shin, E.-h., Grote, P., Kispert, A., Beckers, A., Gossler, A., Werber, M., & Herrmann, B. G. (2007). Expression of Msgn1 in the presomitic mesoderm is controlled by synergism of WNT signalling and Tbx6. EMBO reports, 8(8), 784-789
Workman, J. L., & Roeder, R. G. (1987). Binding of transcription factor TFIID to the major late promoter during in vitro nucleosome assembly potentiates subsequent initiation by RNA polymerase II. Cell, 51(4), 613-622
Wright, K. J., Marr, M. T., & Tjian, R. (2006). TAF4 nucleates a core subcomplex of TFIID and mediates activated transcription from a TATA-less promoter. Proceedings of the National Academy of Sciences, 103(33), 12347-12352
Wright, K. L., Moore, T. L., Vilen, B. J., Brown, A. M., & Ting, Jenny P.-Y. (1995). Major Histocompatibility Complex Class II-associated Invariant Chain Gene Expression Is Up-regulated by Cooperative Interactions of Sp1 and NF-Y. Journal of Biological Chemistry, 270(36), 20978-20986
Wu, C. (1980). The 5' ends of Drosophila heat shock genes in chromatin are hypersensitive to DNase I. Nature, 286(5776), 854-860
275
Wu, H., D'Alessio, A. C., Ito, S., Xia, K., Wang, Z., Cui, K., Zhao, K., Sun, Y. E., & Zhang, Y. (2011). Dual functions of Tet1 in transcriptional regulation in mouse embryonic stem cells. Nature, 473(7347), 389-393
Wysocka, J., Swigut, T., Xiao, H., Milne, T. A., Kwon, S. Y., Landry, J., Kauer, M., Tackett, A. J., Chait, B. T., Badenhorst, P., Wu, C., & Allis, C. D. (2006). A PHD finger of NURF couples histone H3 lysine 4 trimethylation with chromatin remodelling. Nature, 442(7098), 86-90
Yamada, K., Tanaka, T., Miyamoto, K., & Noguchi, T. (2000). Sp Family Members and Nuclear Factor-Y Cooperatively Stimulate Transcription from the Rat Pyruvate Kinase M Gene Distal Promoter Region via Their Direct Interactions. Journal of Biological Chemistry, 275(24), 18129-18137
Yamashita, R., Suzuki, Y., Sugano, S., & Nakai, K. (2005). Genome-wide analysis reveals strong correlation between CpG islands with nearby transcription start sites of genes and their tissue specificity. Gene, 350(2), 129-136
Yan, C., & Boyd, D. D. (2006). Histone H3 Acetylation and H3 K4 Methylation Define Distinct Chromatin Regions Permissive for Transgene Expression. Molecular and cellular biology, 26(17), 6357-6371
Yanagisawa, K. O. (1990). Does the <i>T</i> gene determine the anteroposterior axis of a mouse embryo? The Japanese Journal of Genetics, 65(5), 287-297
Yanagisawa, K. O., Fujimoto, H., & Urushihara, H. (1981). Effects of the Brachyury (T) mutation on morphogenetic movement in the mouse embryo. Developmental biology, 87(2), 242-248
Ye, F., Huang, W., & Guo, G. (2017). Studying hematopoiesis using single-cell technologies. Journal of Hematology & Oncology, 10(1), 27
Yoshimoto, M., Montecino-Rodriguez, E., Ferkowicz, M. J., Porayette, P., Shelley, W. C., Conway, S. J., Dorshkind, K., & Yoder, M. C. (2011). Embryonic day 9 yolk sac and intra-embryonic hemogenic endothelium independently generate a B-1 and marginal zone progenitor lacking B-2 potential. Proc. Natl. Acad. Sci. U. S. A., 108(4), 1468-1473
Yoshimoto, M., Porayette, P., Glosson, N. L., Conway, S. J., Carlesso, N., Cardoso, A. A., Kaplan, M. H., & Yoder, M. C. (2012). Autonomous murine T-cell progenitor production in the extra-embryonic yolk sac before HSC emergence. Blood, 119(24), 5706-5714
Yu, B., Datta, P. K., & Bagchi, S. (2003). Stability of the Sp3-DNA complex is promoter-specific: Sp3 efficiently competes with Sp1 for binding to promoters containing multiple Sp-sites. Nucleic acids research, 31(18), 5368-5376
Yudkovsky, N., Ranish, J. A., & Hahn, S. (2000). A transcription reinitiation intermediate that is stabilized by activator. Nature, 408(6809), 225-229
Zabidi, M. A., Arnold, C. D., Schernhuber, K., Pagani, M., Rath, M., Frank, O., & Stark, A. (2015). Enhancer-core-promoter specificity separates developmental and housekeeping gene regulation. Nature, 518(7540), 556-559
Zabidi, M. A., & Stark, A. (2016). Regulatory Enhancer–Core-Promoter Communication via Transcription Factors and Cofactors. Trends Genet., 32(12), 801-814
Zaret, K. S., & Mango, S. E. (2016). Pioneer transcription factors, chromatin dynamics, and cell fate control. Curr. Opin. Genet. Dev., 37, 76-81
Zhang, D., Zhao, T., Ang, H. S., Chong, P., Saiki, R., Igarashi, K., Yang, H., & Vardy, L. A. (2012). AMD1 is essential for ESC self-renewal and is translationally down-regulated on differentiation to neural precursor cells. Genes & development, 26(5), 461-473
Zhang, D. E., Hetherington, C. J., Tan, S., Dziennis, S. E., Gonzalez, D. A., Chen, H. M., & Tenen, D. G. (1994). Sp1 is a critical factor for the monocytic specific expression of human CD14. Journal of Biological Chemistry, 269(15), 11425-11434

276
Zhang, F., Wen, Y., & Guo, X. (2014). CRISPR/Cas9 for genome editing: progress, implications and challenges. Hum. Mol. Genet., 23(R1), R40-R46
Zhang, H., Roberts, D. N., & Cairns, B. R. (2005a). Genome-Wide Dynamics of Htz1, a Histone H2A Variant that Poises Repressed/Basal Promoters for Activation through Histone Loss. Cell, 123(2), 219-231
Zhang, J., Sun, X., Qian, Y., LaDuca, J. P., & Maquat, L. E. (1998). At Least One Intron Is Required for the Nonsense-Mediated Decay of Triosephosphate Isomerase mRNA: a Possible Link between Nuclear Splicing and Cytoplasmic Translation. Molecular and cellular biology, 18(9), 5272-5283
Zhang, M. Q. (1998). Identification of Human Gene Core Promoters in Silico. Genome Res., 8(3), 319-326
Zhang, T., Cooper, S., & Brockdorff, N. (2015). The interplay of histone modifications – writers that read. EMBO reports, 16(11), 1467-1481
Zhang, X., Li, Y., Dai, C., Yang, J., Mundel, P., & Liu, Y. (2003). Sp1 and Sp3 transcription factors synergistically regulate HGF receptor gene expression in kidney. American Journal of Physiology - Renal Physiology, 284(1), F82-F94
Zhang, Y., Liu, T., Meyer, C. A., Eeckhoute, J., Johnson, D. S., Bernstein, B. E., Nusbaum, C., Myers, R. M., Brown, M., Li, W., & Liu, X. S. (2008). Model-based Analysis of ChIP-Seq (MACS). Genome Biology, 9(9), R137
Zhang, Z., Fu, J., & Gilmour, D. S. (2005b). CTD-dependent dismantling of the RNA polymerase II elongation complex by the pre-mRNA 3′-end processing factor, Pcf11. Genes & development, 19(13), 1572-1580
Zhao, L., & Chang, L.-S. (1997). The Human POLD1 Gene: IDENTIFICATION OF AN UPSTREAM ACTIVATOR SEQUENCE, ACTIVATION BY Sp1 AND Sp3, AND CELL CYCLE REGULATION. Journal of Biological Chemistry, 272(8), 4869-4882
Zhao, S., Fung-Leung, W.-P., Bittner, A., Ngo, K., & Liu, X. (2014). Comparison of RNA-Seq and Microarray in Transcriptome Profiling of Activated T Cells. PLoS ONE, 9(1), e78644
Zhou, T., & Chiang, C.-M. (2002). Sp1 and AP2 regulate but do not constitute TATA-less human TAF(II)55 core promoter activity. Nucleic acids research, 30(19), 4145-4157
Zlatanova, J., & Caiafa, P. (2009). CTCF and its protein partners: divide and rule? J. Cell Sci., 122(9), 1275-1284
Zovein, A. C., Hofmann, J. J., Lynch, M., French, W. J., Turlo, K. A., Yang, Y., Becker, M. S., Zanetta, L., Dejana, E., Gasson, J. C., Tallquist, M. D., & Iruela-Arispe, M. L. (2008). Fate Tracing Reveals the Endothelial Origin of Hematopoietic Stem Cells. Cell Stem Cell, 3(6), 625-636