Timing of antimicrobial use influences the evolution of antimicrobial resistance during disease...
12
Evolution, Medicine, and Public Health [2014] pp. 150–161 doi:10.1093/emph/eou027 Timing of antimicrobial use influences the evolution of antimicrobial resistance during disease epidemics Mark M. Tanaka* 1 , Benjamin M. Althouse 2 and Carl T. Bergstrom 3 1 School of Biotechnology and Biomolecular Sciences, University of New South Wales, Kensington NSW 2052, Australia; 2 Santa Fe Institute, 1399 Hyde Park Rd., Santa Fe, NM 87501, USA; 3 Department of Biology, University of Washington, Seattle, WA 98195-1800, USA *Corresponding author. School of Biotechnology and Biomolecular Sciences, University of New South Wales, Kensington NSW 2052, Australia; Tel: +61-2-9385-2038; Fax: +61-2-9385-1483; E-mail: [email protected] Received 19 May 2014; revised version accepted 29 October 2014 ABSTRACT Background: Although the emergence and spread of antibiotic resistance have been well studied for endemic infections, comparably little is understood for epidemic infections such as influenza. The availability of antimicrobial treatments for epidemic diseases raises the urgent question of how to deploy treatments to achieve maximum benefit despite resistance evolution. Recent simulation studies have shown that the number of cases prevented by antimicrobials can be maximized by delaying the use of treatments during an epidemic. Those studies focus on indirect effects of antimicrobial use: pre- venting disease among untreated individuals. Here, we identify and examine direct effects of antimicro- bial use: the number of successfully treated cases. Methodology: We develop mathematical models to study how the schedule of antiviral use influences the success or failure of subsequent use due to the spread of resistant strains. Results: Direct effects are maximized by postponing drug use, even with unlimited stockpiles of drugs. This occurs because the early use of antimicrobials disproportionately drives emergence and spread of antibiotic resistance, leading to subsequent treatment failure. However, for antimicrobials with low effect on transmission, the relative benefit of delaying antimicrobial deployment is greatly reduced and can only be reaped if the trajectory of the epidemic can be accurately estimated early. Conclusions and implications: Health planners face uncertainties during epidemics, including the pos- sibility of early containment. Hence, despite the optimal deployment time near the epidemic peak, it will often be preferable to initiate widespread antimicrobial use as early as possible, particularly if the drug is ineffective in reducing transmission. KEYWORDS: influenza; antiviral; oseltamivir; zanamivir; evolution; drug resistance original research article 150 ß The Author(s) 2014. Published by Oxford University Press on behalf of the Foundation for Evolution, Medicine, and Public Health. This is an Open Access article distributed under the terms of the Creative Commons Attribution License (http://creativecommons.org/licenses/by/4.0/), which permits unrestricted reuse, distribution, and reproduction in any medium, provided the original work is properly cited. by guest on June 21, 2016 http://emph.oxfordjournals.org/ Downloaded from
-
Upload
independent -
Category
Documents
-
view
2 -
download
0
Transcript of Timing of antimicrobial use influences the evolution of antimicrobial resistance during disease...

[27112014ndash612pm] [150ndash161] Paper OP-EMPH140027
Evolution Medicine and Public Health [2014] pp 150ndash161
doi101093empheou027
Timing of antimicrobial useinfluences the evolution ofantimicrobial resistanceduring disease epidemicsMark M Tanaka1 Benjamin M Althouse2 and Carl T Bergstrom3
1School of Biotechnology and Biomolecular Sciences University of New South Wales Kensington NSW 2052 Australia2Santa Fe Institute 1399 Hyde Park Rd Santa Fe NM 87501 USA 3Department of Biology University of Washington
Seattle WA 98195-1800 USA
Corresponding author School of Biotechnology and Biomolecular Sciences University of New South Wales Kensington
NSW 2052 Australia Tel +61-2-9385-2038 Fax +61-2-9385-1483 E-mail mtanakaunsweduau
Received 19 May 2014 revised version accepted 29 October 2014
A B S T R A C T
Background Although the emergence and spread of antibiotic resistance have been well studied for
endemic infections comparably little is understood for epidemic infections such as influenza The
availability of antimicrobial treatments for epidemic diseases raises the urgent question of how to
deploy treatments to achieve maximum benefit despite resistance evolution Recent simulation studies
have shown that the number of cases prevented by antimicrobials can be maximized by delaying the use
of treatments during an epidemic Those studies focus on indirect effects of antimicrobial use pre-
venting disease among untreated individuals Here we identify and examine direct effects of antimicro-
bial use the number of successfully treated cases
Methodology We develop mathematical models to study how the schedule of antiviral use influences
the success or failure of subsequent use due to the spread of resistant strains
Results Direct effects are maximized by postponing drug use even with unlimited stockpiles of drugs
This occurs because the early use of antimicrobials disproportionately drives emergence and spread of
antibiotic resistance leading to subsequent treatment failure However for antimicrobials with low
effect on transmission the relative benefit of delaying antimicrobial deployment is greatly reduced
and can only be reaped if the trajectory of the epidemic can be accurately estimated early
Conclusions and implications Health planners face uncertainties during epidemics including the pos-
sibility of early containment Hence despite the optimal deployment time near the epidemic peak it will
often be preferable to initiate widespread antimicrobial use as early as possible particularly if the drug is
ineffective in reducing transmission
K E Y W O R D S influenza antiviral oseltamivir zanamivir evolution drug resistance
original
research
article
150
The Author(s) 2014 Published by Oxford University Press on behalf of the Foundation for Evolution Medicine and Public Health
This is an Open Access article distributed under the terms of the Creative Commons Attribution License (httpcreativecommonsorglicensesby40)
which permits unrestricted reuse distribution and reproduction in any medium provided the original work is properly cited
by guest on June 21 2016httpem
phoxfordjournalsorgD
ownloaded from
[27112014ndash612pm] [150ndash161] Paper OP-EMPH140027
INTRODUCTION
An extensive body of research explores the way in
which the schedule of antimicrobial usage is ex-
pected to influence the emergence and spread of
antibiotic resistance For example theoretical
models have been developed to address antibiotic
resistant strains of Haemophilus influenzae and
Streptococcus pneumoniae in the community [1ndash3]
and methicillin-resistant Staphylococcus aureus and
vancomycin-resistant enterococci in hospitals
[4ndash13] For the most part this body of work deals
with endemic disease only recently have epidemi-
ologists considered the dynamics of resistance evo-
lution in pathogens that undergo epidemic spread
There is a good reason for this historical asymmetry
of interest until recently we lacked antimicrobials
that were effective against common epidemic dis-
eases The current generation of anti-infleunza
therapiesmdashoseltamivir and zanamivirmdashchanges
this These drugs act against seasonal and pan-
demic influenza both of which are characterized
by epidemic rather than endemic dynamics Thus
we urgently need to understand how the schedule of
antimicrobial use benefits the patient population
and how the evolution of antimicrobial resistance
impacts this process
In doing so it is important to account for both the
direct and the indirect effects of antimicrobial use
[14]
(1) The lsquodirect effectsrsquo of antimicrobial use ac-
crue from the reduction in mortality and
morbidity in treated individuals Once anti-
microbial resistance evolves and spreads
however further drug use can fail to confer
the direct benefit of successful treatment
(2) The lsquoindirect effectsrsquo of antimicrobial use
manifest as changes in the trajectory of an
epidemic Thus the use of antimicrobials can
ultimately alter the total number of casesmdash
treated or otherwisemdashthat occurs over the
course of the epidemic
A series of studies has recently addressed the in-
direct effects of antiviral usage [15ndash21] For example
Wu et al [22] Meng et al [23] Handel et al [24]
Moghadas et al [25] Althouse et al [26] and
Hansen and Day [27] explore optimal schedules of
antimicrobial use during an epidemic but focus on
the indirect effect of these drugs ie the resulting
changes in the epidemic curves for resistant and
sensitive pathogens (Though Wu et al [22] do
acknowledge the importance of having low levels
of resistance to maximize antiviral treatment effect-
iveness they do not explicitly quantify the direct ef-
fects of treatment) Because these studies disregard
the direct effects of antimicrobial use on treated in-
dividuals the entire benefit of treatment in those
models comes from keeping the effective reproduct-
ive number low once herd immunity is generated
That is in these models antivirals derive value from
reducing the spread of infections late in the epi-
demic and thereby reduce the amount of lsquoovershootrsquo
[28] beyond the minimum number of cases to es-
tablish herd immunity (Fig 1) (One can infer direct
effects from eg Wu et al [22] as the difference be-
tween the total attack rate and the resistant attack
rate while under antiviral treatment but this is not a
focus in that article)
In this article we examine how the schedule of
antimicrobial use during an epidemic influences dir-
ect and indirect effects and then infer how these in-
fluences are caused by the timing of resistance
evolution We begin with a model that allows us to
track both the direct and indirect effects of antiviral
use and we use it to explore how the timing of drug
use affects each type of benefit We then turn to the
specific case of influenza Based on recent estimates
of epidemiological parameters we argue that direct
rather than indirect effects are responsible for most
of the benefits of treating seasonal influenza with
currently available antivirals We present an analyt-
ical model of resistance evolution during an influ-
enza epidemic and use this model to show how the
timing of antiviral use can be controlled to maximize
the direct benefits derived from an antiviral stock-
pile For this model we consider the case in which
the antimicrobial does not reduce disease transmis-
sion as has been found for the drug oseltamivir used
to treat influenza [29 30]
METHODOLOGY
A model of antiviral resistance evolution
We model the dynamics of the epidemic using a
susceptible-infected-removed (SIR) compartment
model expanded to track sensitive and resistant in-
fection and treated and untreated patient classes
(Fig 2) In this model X is the fraction of uninfected
individuals in the population of size N YSU is the
fraction infected with sensitive virus and untreated
YST is the fraction infected with sensitive virus and
treated YR is infected with resistant virus (treated or
Evolution of antimicrobial resistance in disease epidemics Tanaka et al | 151
by guest on June 21 2016httpem
phoxfordjournalsorgD
ownloaded from
[27112014ndash612pm] [150ndash161] Paper OP-EMPH140027
not) and Z is the fraction of recovered individuals
Resistance evolves in treated individuals infected
with drug-sensitive virus at a rate per case per unit
time We assume that resistance does not evolve in
the absence of treatment Untreated and treated re-
sistant individuals recover from infection spontan-
eously at a rate Treated sensitive cases recover
at rate =eth1 eTHORN so that e can be viewed as the
reduction in duration of infection due to treatment
Transmission is by mass action is the trans-
mission parameter and resistance imposes a
transmission cost of c on the virus In addition to
reducing the duration of infection via e treatment
also reduces the transmissibility of the virus as ex-
pressed by the parameter
We consider population-level strategies in which
the drugs once initially deployed at time are used
continuously until they run out or the epidemic is
over During the period of drug treatment a fraction
f of the new cases receive the drug The stockpile of
drugs consists of k treatment courses The indirect
effects of treatment are given by the number of cases
prevented by use of the antimicrobial The direct ef-
fects are given by the cumulative number of success-
fully treated cases through the end of the epidemic
We include two indicator variables to track drug use
K tracks the number of remaining treatment courses
starting from k and A tracks the number of success-
fully treated patients starting from zero
The model illustrated in Figure 2 is specified by
the following system of differential equations
_X frac14 X ethYSU thorn eth1 THORNYSTTHORN eth1 cTHORNXYR
_Y SU frac14 eth1 f THORN X ethYSU thorn eth1 THORNYSTTHORN YSU
_Y ST frac14 f X ethYSU thorn eth1 THORNYSTTHORN
eth=eth1 eTHORNTHORN YST YST
_Y R frac14 eth1 cTHORNX YR YR thorn YST
_Z frac14 ethYSU thorn YRTHORN thorn eth=eth1 eTHORNTHORN YST
eth1THORN
where the dot above each state variable indicates a
time derivative and where = 1 if etht amp K gt 1THORN and
= 0 otherwise The indicators change according to
_K frac14 f X ethYSU thorn eth1 THORNYST thorn eth1 cTHORNYRTHORNN
_A frac14 eth=eth1 eTHORNTHORNYSTN
eth2THORN
This model structure is similar to that of Lipsitch
et al [17] but we do not consider any prophylaxis
Apart from slight differences in parametrization the
other distinguishing features are (i) we include vari-
ables that track the number of successfully treated
cases (A) and the remaining stockpile size (K) and
(ii) their de novo mutation to resistance occurs at
transmission while in our model it can occur at any
time during infection
To quantify the indirect effects of treatment we
track the number of cases prevented Let be the
number of individuals infected by the end of an epi-
demic (the final epidemic size) in which no treat-
ment is used (ie f = 0) which is N times the
solution of x frac14 1 eR0x [31] If Z1 is the fraction
Figure 2 A schematic diagram of the epidemic model
Susceptible individuals (X) are infected by drug-sensitive
(YSU and YST) and drug-resistant (YR) strains by mass action
as given in Equation (1) If antimicrobial treatment is ongoing
( = 1) a fraction f of the infected individuals are treated and a
fraction 1 f are not otherwise no individuals are treated
Sensitive treated cases evolve resistance at rate Sensitive
cases recover at rate in the absence of drug treatment and at
rate =eth1 eTHORN in the presence of drug treatment resistant
cases recover at rate irrespective of treatment All recovered
individuals enter the removed class (Z) Individuals passing
through the red ring increment the tally A of successfully
treated cases
Figure 1 Epidemic trajectory in an SIR model after reference
[28] Overshoot is the number of cases exceeding the min-
imum cases needed to generate herd immunity
152 | Tanaka et al Evolution Medicine and Public Health
by guest on June 21 2016httpem
phoxfordjournalsorgD
ownloaded from
[27112014ndash612pm] [150ndash161] Paper OP-EMPH140027
of recovered individuals at the end of the epidemic
with treatment the number of cases prevented by
treatment is then NZ1 To quantify the direct
effects we track the cumulative number of success-
fully treated cases through the end of the epidemic
given by A as t1
Table 1 provides a summary of the parameters
used in this model along with values used in the nu-
merical analysis Seasonal influenza has a basic re-
productive number of around R0 frac14 13 [32] while the
pandemic strain of 1918 had an R0 of 2ndash3 [33] We
therefore set the basic reproductive number of the
disease to R0 frac14 18 corresponding to a strain of in-
fluenza that has the potential to cause a pandemic
(see also [34]) Influenza typically lasts 6 days [35 36]
giving a recovery rate of frac14 017 per day We used a
population size N of a million to model a medium
sized city The default mutation rate was set to a low
value of 001 this is similar to values used by Wu et al
[22] which were based on observations that de novo
resistance occurred in 04 and 55 of outpatient
adults and outpatient children respectively [37]
The mutation rate and other parameters were given
wide ranges to reflect uncertainty in current know-
ledge (eg the efficacy of the drug) or our interest
in understanding the effect of varying a parameter
(eg time of drug deployment )
RESULTS
Numerical analysis
Figure 3 shows the direct and indirect effects of treat-
ment as a function of the time at which antimicrobial
treatment is initiated The six panels illustrate six
different parameter sets In all six panels there is a
limited stockpile with doses enough to cover only
one 10th of the total population In the top row
panels there is no cost of resistance whereas in
the bottom row resistant strains suffer a 10 trans-
mission cost In the left column drug use reduces
the duration of infectiousness in the center column
drug use reduces transmissibility and in the right
column drug use reduces both duration and
transmissibility
Indirect and direct effects are not equivalent
Indirect effects represent cases entirely avoided
whereas direct effects represent cases that occur
but are successfully treated A health planner faced
with a pandemic should aim to maximize neither the
direct effects by themselves nor the indirect effects
by themselves Rather a planner would typically aim
to maximize some weighted sum of the direct and
indirect effects where the weighting of direct ef-
fects reflects the value of a case successfully treated
relative to a case avoided entirely The panels in
Figure 3 therefore show a weighted sum of direct
and indirect effects as well where the weight is
chosen as frac14 033 to reflect treatmentrsquos reduction
in risk of lower respiratory complications [38] A
number of general results emerge
First in all cases the direct effects of antimicro-
bials are maximized by postponing the onset of anti-
microbial usage until well into the epidemic These
results derive from a simple observation about re-
sistance dynamics in an epidemic setting the timing
of the appearance of initial resistant clades will have
a major effect on the subsequent prevalence of
Table 1 Parameters of the model
Symbol Parameter description Value
R0SU Basic reproductive number (sensitive untreated) 18
M Rate of spontaneous recovery 017 per day
B Transmission parameter R0
c Cost of resistance to transmission 0 01
Rate of evolution to resistance 001 per case per day
e Reduction in infection duration due to treatment 0 05
Reduction in disease transmission due to treatment 0 05
Time at which drugs are deployed 60 days
f Fraction of new cases receiving drug 05
N Population size 106
k Drug stockpile size N or 01 N
Evolution of antimicrobial resistance in disease epidemics Tanaka et al | 153
by guest on June 21 2016httpem
phoxfordjournalsorgD
ownloaded from
[27112014ndash612pm] [150ndash161] Paper OP-EMPH140027
resistant strains in the population Figure 4 illus-
trates this principle When resistance evolves early
in a growing population a larger clade results than
when resistance emerges late in the epidemic
Deploying drugs right from the onset of the epi-
demic risks early evolution of resistance and thus
takes the chance that a large fraction of the epidemic
cases will be resistant Assuming that the initial
cases are drug sensitive postponing drug use for a
few weeks gives sensitive clones a sufficient head
start that the large majority of cases in the epidemic
will be drug sensitive (Note the analogy between
evolution of resistance in this model and mutation
in the Luria-Delbruck process [39] Under the Luria-
Delbruck process the number of mutants arising in
an exponentially growing bacterial culture has a
skewed distribution with a high variance This high
variation is precisely due to the unpredictability
of the timing of mutations during exponential
growth where early mutation events lead to large
clades and later mutation events lead to small
clades) We further note that the reduced direct
effect from early deployment is also partially due to
the fact that early treatment limits the number of
sensitive cases when the drug affects transmission
If treatment is started too late the epidemic will
Figure 3 Effects of antimicrobial therapy as a function of the time at which treatment is deployed Direct effects (solid line) are
measured in thousands of cases treated successfully ie by treatment of individuals infected with drug-sensitive strains Indirect
effects (dashed line) reflect the change in the epidemic trajectory due to antimicrobial use the indirect effects of treatment are
quantified by the decrease in the number of cases in thousands when treatment is used relative to the number that would have
occurred in the absence of treatment The weighted sum of effects (indirect effects + 033direct effects) is shown with red dot-
dashed lines In the top panels (AndashC) the cost of resistance c is zero in the bottom panels (DndashF) cost c = 01 A and D treatment
reduces duration of infection (e frac14 05) but not transmissibility ( = 0) B and E treatment reduces transmissibility ( frac14 05) but
not duration (e= 0) C and F treatment reduces duration (e frac14 05) and transmissibility ( frac14 05) Unless indicated otherwise the
other parameters are as given in Table 1 with stockpile size k frac14 01N
If resistance arises later onlya small resistant clade ensues
If resistance arises early alarge resistant clade results
Time
Figure 4 The timing at which the first resistant clade arises
has a strong impact on the subsequent prevalence of resistant
strains in the population If the first resistant strain arises early
in the epidemic a large resistance clade (blue) is created If the
first resistant strain arises after several generations of trans-
mission the resulting resistant clade (red) is far smaller
154 | Tanaka et al Evolution Medicine and Public Health
by guest on June 21 2016httpem
phoxfordjournalsorgD
ownloaded from
[27112014ndash612pm] [150ndash161] Paper OP-EMPH140027
conclude before the stockpile has been exhausted
and the unused courses will be wasted As a result
there is an intermediate optimum time to initiate
treatment
Second when there is no cost of resistance the
indirect effects are also maximized by postponing
the onset of antimicrobial use Assuming that the
epidemic cannot be contained indirect effects result
from minimizing the degree of overshoot ie
minimizing the number of cases beyond the number
that would be required to reach the epidemic thresh-
old (Fig 1) If drugs are deployed too early the stock-
pile will be exhausted before reaching the epidemic
peak and large resistant clades will render treatment
less effective at reducing the effective reproductive
number if drugs are deployed too late treatment
courses will go unused Thus again we see an inter-
mediate optimum time to start treatment near the
epidemic peak as noted by Hansen and Day [27] Wu
et al [22] and Althouse et al [26]
Third when resistance imposes fitness costs in-
direct effects can be larger when treatment is
initiated early This effect arises because the resist-
ant strains now have relatively lsquolowrsquo fitness once the
drugs run out so that starting early and producing
large resistant clades reduces the overall size of the
epidemic Looking at the weighted sum of direct and
indirect effects the optimal times again shift to later
in the epidemic but the cost of waiting is often
minimal
Fourth the effects of antimicrobial use are similar
whether they come about through a reduction of
duration or a reduction of transmissibility
We have also investigated the effect of the de novo
mutation rate on direct and indirect effects and
their weighted sum (Fig 5) Low mutation rates lead
to few resistant clades and therefore more success-
fully treated casesmdashhigh direct effectsmdashwhile high
rates lead to large resistant clades and low direct
effects However the resistance mutation rate has
the opposite effect on indirect effects when there is a
transmission cost of resistance This is because re-
sistant strains are less fit than sensitive strains and
therefore the final epidemic size is lower with more
resistant viruses When there is no resistance cost
but the drug reduces transmission there is a greater
indirect effect under low mutation rates because the
drug is effective in preventing cases when there are
more sensitive cases
Application to influenza
In this section we apply the model to influenza A
virus and treatment with the antiviral oseltamivir
(Tamiflu) Although oseltamivir can shorten the dur-
ation of illness and reduce the severity of symptoms
[40ndash42] Yang et al [29] have argued that unlike
osteltamivir prophylaxis oseltamivir treatment of in-
fected cases has little or no ability to prevent trans-
mission (see also [30 43 44]) This finding makes
sense because most transmission occurs before
treatment has substantive effect on viral titre [18]
If a drug has no effect on transmission the indir-
ect effects of treatment are zero but the direct effects
may be substantial Figure 6 shows direct effects in
the case where the drug is not effective in reducing
000 005 010 015 020
020
4060
8010
0 DirectIndirectWeighted sum
γ = 0 c = 01
000 005 010 015 020
020
4060
8010
0 DirectIndirectWeighted sum
γ = 05 c = 01
000 005 010 015 020
020
4060
8010
0 DirectIndirectWeighted sum
γ = 05 c = 0
Dir
ect a
nd in
dire
ct e
ffec
ts (
case
s 1
03 )
Rate of mutation to resistance θ (day)
A B C
Figure 5 The effect of rate of mutation to resistance () on direct and indirect effects A the drug does not reduce disease
transmission ( = 0) and resistance comes with cost c = 01 B the drug does reduce disease transmission ( frac14 05) and resist-
ance comes with cost c = 01 C the drug reduces transmission ( frac14 05) but resistance is cost-free (c = 0) Treatment start time
is set to 60 days the efficacy of the drug to reduce infection duration is e= 0 stockpile size is k frac14 01N the remaining parameters
except are as given in Table 1
Evolution of antimicrobial resistance in disease epidemics Tanaka et al | 155
by guest on June 21 2016httpem
phoxfordjournalsorgD
ownloaded from
[27112014ndash612pm] [150ndash161] Paper OP-EMPH140027
either transmission or duration of infection ( = 0
e= 0) Panel A shows that when drug efficacy in
reducing transmission is zero the indirect effects
are zero but direct effects remain high Again the
optimal time to start treatment according to the
direct criterion is near the peak of the epidemic
(Panel B) shows the effects of treatment when there
is a small cost of resistance Figure 6 explores the
direct effects of treatment for limited stockpiles
(Panel C) and unlimited stockpiles (Panel D) when
varying both starting time and the proportion of
cases treated f Whether or not doses are limited
the optimal start time is still near the peak of the
epidemic Starting earlier results in a mild decrease
in direct effects but this decrease is much smaller
than the case in which antimicrobials can reduce
transmission (Fig 3) because in that case the size
of the sensitive outbreak is reduced by early
deployment
In the Appendix 1 we present an analytical model
to show how and why these effects arise
DISCUSSION
The theory of how antimicrobials should be used in a
population differs in character between epidemic
and endemic disease In epidemics case numbers
rise approximately exponentially at first before
declining to low numbers There is a need to recon-
sider the optimization of control strategies under
such conditions By considering the indirect effects
of antimicrobial use recent work has found that
the optimal time to commence treatment in a
population is well into the course of an epidemic
[21 22 26 27] We have examined a different effect
of drugs the direct effects of successful treatment
Our analysis shows that delaying the deployment of
drug treatments in a population increases the
A B
C D
Figure 6 Effects under zero effect of treatment on transmission rate ( = 0) and recovery time (e= 0) A B direct and indirect
effects and weighted sum as a function of the starting time with no cost c of resistance (panel A) and a small cost c = 01 (panel
B) Here the fraction treated is f = 05 C D direct effects of drugs as a function of both treatment start time and proportion of
cases treated f with limited stockpile (k=N frac14 01 panel C) and unlimited stockpile (k=N frac14 1 panel D) of drugs Here the cost of
resistance is set to zero The other parameters are as given in Table 1 recovery rate frac14 017 mutation rate frac14 001 population
size N frac14 106 basic reproductive ratio for susceptible untreated cases R0SU frac14 18 is computed from R0SU and The effects are
given in units of thousands of cases
156 | Tanaka et al Evolution Medicine and Public Health
by guest on June 21 2016httpem
phoxfordjournalsorgD
ownloaded from
[27112014ndash612pm] [150ndash161] Paper OP-EMPH140027
number of successfully treated cases even if there is
an unlimited stockpile of a drug The reason for the
advantage of delay is that it prevents large clades of
resistant virus from arising early in the epidemic
The size of a resistant clade depends on the number
of cases in the population at the time a resistant
mutant appears It is also strongly influenced by
the rate at which resistance arises de novo by muta-
tion Delaying treatment until near the epidemic
peak keeps the relative frequency of drug resistant
infections low
How much does it matter whether treatment
starts near the peak of the epidemic Where anti-
microbials have little efficacy in reducing transmis-
sion which may apply to influenza A [29 44] the
direct effects are not much lower than if drugs start
to be deployed near the beginning of the epidemic
compared with starting deployment near the peak
(Fig 6) Because sensitive strains have equal fitness
to resistant strains as the epidemic initially grows
exponentially there is a large and growing pool of
(sensitive) cases that can successfully be treated
Although this sensitive pool would be larger if drugs
are deployed later in the epidemic on average it
would not be much larger as long as the mutation
rate is low
Other considerations also argue against exces-
sively delaying the deployment of antimicrobials
Early on in the course of an epidemic there is con-
siderable uncertainty about its future trajectory
Misestimating the course of the disease and waiting
too long to initiate drug use carries the risk of failing
to use the full stockpile before the epidemic is over
This is arguably worse than running out of drugs
before the epidemic is finished [20] Early in an epi-
demic there may be other reasons for immediate
and aggressive use of available drugs Most import-
antly there may be a non-zero probability of success-
ful containment and eradication of the outbreak if
the drug reduces transmission sufficiently or if other
effective measures can be applied [34 45 46]
Withholding available antiviral treatment from indi-
vidual patients who could potentially benefit from
their use also poses an ethical problem pitting the
rights of the individual against the good of the col-
lective On the balance we expect that in most situ-
ations immediate use of a stockpile is likely to be the
best approach If stockpiles of two drugs are avail-
able the approach proposed by Wu et al [22] may be
particularly effective use the smaller stockpile first
as a way to delay the use of the larger stockpile and
thus delay the evolution of resistance to this latter
drug In any event we will rarely if ever detect the very
first cases of an epidemic in real time by the time a
problem is identified the epidemic may have pro-
gressed far enough that immediate use of the stock-
pile will be optimal
CONCLUSIONS AND IMPLICATIONS
This study distinguishes between the direct and in-
direct effects of deploying antimicrobial drugs The
indirect effects of lowering the final epidemic sizemdash
that is averting casesmdashare large whenever the anti-
microbials have substantial efficacy in reducing
transmission or duration of disease This benefit is
often taken to be an important objective of disease
control strategies [eg 27] but planners will also
want to consider the direct effects of antimicrobial
use on infected patients In particular when anti-
virals have little effect on transmission there is little
indirect effect but the direct effects of treating cases
successfully can be substantial These direct effects
accrue as long as resistant clades are small and
available treatments are used before the epidemic
ends The direct effects count the treatment of sen-
sitive cases regardless of whether drugs change the
epidemic trajectory In principle a particular usage
policy might result in more successful instances of
treatment because it has the highly undesirable con-
sequence of creating a larger epidemic and therefore
offering more patients to treat Thus maximizing dir-
ect effects should not be used alone as an objective
in disease control planning Instead planners will
typically want to make decisions based on a com-
posite of both direct and indirect effects
acknowledgements
We thank Rustom Antia Troy Day and Marc Lipsitch for
helpful discussions
FUNDING
This work was supported by US National Institutes
of Health 1U54GM088558-01 lsquoModels of Infectious
Disease Agent Studyrsquo and by Australian Research
Council grants DP110100465 and DP0987302
BMA acknowledges support of a Santa Fe
Institute Omidyar Postdoctoral Fellowship
Conflict of interest None declared
Evolution of antimicrobial resistance in disease epidemics Tanaka et al | 157
by guest on June 21 2016httpem
phoxfordjournalsorgD
ownloaded from
[27112014ndash612pm] [150ndash161] Paper OP-EMPH140027
references
1 Bonhoeffer S Lipsitch M Levin B Evaluating treatment
protocols to prevent antibiotic resistance Proc Natl Acad
Sci U S A 19979412106
2 Opatowski L Mandel J Varon E et al Antibiotic dose impact
on resistance selection in the community a mathematical
model of beta-lactams and Streptococcus pneumoniae dy-
namics Antimicrob Agents Chemother 2010542330ndash2337
3 Singer ME Harding I Jacobs MR Jaffe DH Impact of
antimicrobial resistance on health outcomes in the out-
patient treatment of adult community-acquired pneumo-
nia a probability model J Antimicrob Chemother 200351
1269ndash1282
4 Sebille V Chevret S Valleron A Modeling the spread of
resistant nosocomial pathogens in an intensive-care unit
Infect Control Hosp Epidemiol 19971884ndash92
5 Austin D Kristinsson K Anderson R The relationship be-
tween the volume of antimicrobial consumption in human
communities and the frequency of resistance Proc Natl
Acad Sci U S A 1999961152
6 Austin D Bonten M Weinstein R et al Vancomycin-resistant
enterococci in intensive-care hospital settings transmission
dynamics persistence and the impact of infection control
programs Proc Natl Acad Sci U S A 1999966908
7 Cooper B Medley G Scott G Preliminary analysis of the
transmission dynamics of nosocomial infections stochas-
tic and management effects J Hosp Infect 199943131ndash47
8 Bergstrom CT Lo M Lipsitch M Ecological theory sug-
gests that antimicrobial cycling will not reduce antimicro-
bial resistance in hospitals Proc Natl Acad Sci U S A 2004
10113285ndash90
9 Cooper BS Medley GF Stone SP et al Methicillin-resistant
Staphylococcus aureus in hospitals and the community
stealth dynamics and control catastrophes Proc Natl
Acad Sci U S A 200410110223ndash8
10 Lipsitch M Bergstrom CT Levin BR The epidemiology of
antibiotic resistance in hospitals paradoxes and prescrip-
tions Proc Natl Acad Sci U S A 2000971938ndash43
11 Lipsitch M Samore MH Antimicrobial use and antimicro-
bial resistance a population perspective Emerg Infect Dis
20028(4) 347ndash354
12 Pressley J DrsquoAgata EMC Webb GF The effect of co-colon-
ization with community-acquired and hospital-acquired
methicillin-resistant Staphylococcus aureus strains on com-
petitive exclusion J Theor Biol 2010264645ndash56
13 Wang YC Lipsitch M Upgrading antibiotic use within a
class tradeoff between resistance and treatment success
Proc Natl Acad Sci U S A 20061039655ndash60
14 Althouse BM Bergstrom TC Bergstrom CT Evolution in
health and medicine Sackler colloquium a public choice
framework for controlling transmissible and evolving dis-
eases Proc Natl Acad Sci U S A 20101071696ndash701
15 Stilianakis NI Perelson AS Hayden FG Emergence of
drug resistance during an influenza epidemic insights
from a mathematical model J Infect Dis 1998177863ndash73
16 Regoes RR Bonhoeffer S Emergence of drug-resistant in-
fluenza virus population dynamical considerations
Science 2006312389ndash91
17 Lipsitch M Cohen T Murray M Levin BR Antiviral resist-
ance and the control of pandemic influenza PLoS Med
20074e15
18 Alexander ME Bowman CS Feng Z et al Emergence of
drug resistance implications for antiviral control of pan-
demic influenza Proc Biol Sci 20072741675ndash84
19 McCaw JM Wood JG McCaw CT McVernon J Impact of
emerging antiviral drug resistance on influenza contain-
ment and spread influence of subclinical infection and
strategic use of a stockpile containing one or two drugs
PLoS One 20083e2362
20 Arinaminpathy N McLean AR Antiviral treatment for the
control of pandemic influenza some logistical con-
straints J R Soc Interface 20085545ndash53
21 Hollingsworth TD Klinkenberg D Heesterbeek H
Anderson RM Mitigation strategies for pandemic influ-
enza A balancing conflicting policy objectives PLoS
Comput Biol 20117e1001076
22 Wu JT Leung GM Lipsitch M et al Hedging against anti-
viral resistance during the next influenza pandemic using
small stockpiles of an alternative chemotherapy PLoS
Med 20096e1000085
23 Meng EH Day T Arino J et al Strategies for the use of
oseltamivir and zanamivir during pandemic outbreaks
Can J Infect Dis Med Micro 201021e28ndash63
24 Handel A Longini IM Antia R Antiviral resistance and the
control of pandemic influenza the roles of stochasticity
evolution and model details J Theor Biol 2009256117ndash25
25 Moghadas SM Bowman CS Rost G Wu J Population-
wide emergence of antiviral resistance during pandemic
influenza PLoS One 20083e1839
26 Althouse BM Patterson-Lomba O Goerg GM Hebert-
Dufresne L The timing and targeting of treatment in in-
fluenza pandemics influences the emergence of resist-
ance in structured populations PLoS Comput Biol 2013
9e1002912
27 Hansen E Day T Optimal antiviral treatment strategies
and the effects of resistance Proc Biol Sci 2011278
1082ndash9
28 Handel A Longini IM Antia R What is the best control
strategy for multiple infectious disease outbreaks Proc
Biol Sci 2007274833ndash7
29 Yang Y Halloran ME Longini IM A Bayesian model for
evaluating influenza antiviral efficacy in household studies
with asymptomatic infections Biostatistics 200910
390ndash403
30 Jefferson T Jones M Doshi P et al Oseltamivir for influ-
enza in adults and children systematic review of clinical
study reports and summary of regulatory comments BMJ
2014348g2545
31 Kermack WO McKendrick AG A contribution to the math-
ematical theory of epidemics Proc Roy Soc Lond A 1927
115700ndash21
158 | Tanaka et al Evolution Medicine and Public Health
by guest on June 21 2016httpem
phoxfordjournalsorgD
ownloaded from
[27112014ndash612pm] [150ndash161] Paper OP-EMPH140027
32 Chowell G Miller MA Viboud C Seasonal influenza in the
United States France and Australia transmission and
prospects for control Epidemiol Infect 2008136852ndash64
33 Mills CE Robins JM Lipsitch M Transmissibility of 1918
pandemic influenza Nature 2004432904ndash6
34 Ferguson NM Cummings DAT Cauchemez S et al
Strategies for containing an emerging influenza pandemic
in Southeast Asia Nature 2005437209ndash14
35 Carrat F Vergu E Ferguson NM et al Time lines of infec-
tion and disease in human influenza a review of volunteer
challenge studies Am J Epidemiol 2008167775ndash85
36 Cao B Li X-W Mao Y et al Clinical features of the initial
cases of 2009 pandemic influenza A (H1N1) virus infec-
tion in China N Engl J Med 20093612507ndash17
37 Ong AK Hayden FG John F Enders lecture 2006 anti-
virals for influenza J Infect Dis 2007196181ndash90
38 Lipsitch M Hernan MA Oseltamivir effect on antibiotic-
treated lower respiratory tract complications in virologic-
ally positive randomized trial participants Clin Infect Dis
2013571368ndash9
39 Luria SE Delbruck M Mutations of bacteria from virus
sensitivity to virus resistance Genetics 194328491ndash511
40 Aoki FY Macleod MD Paggiaro P et al Early administra-
tion of oral oseltamivir increases the benefits of influenza
treatment J Antimicrob Chemother 200351123ndash9
41 Nicholson KG Aoki FY et al Efficacy and safety of
oseltamivir in treatment of acute influenza a randomised
controlled trial Lancet 20003551845ndash50
42 Treanor JJ Hayden FG Vrooman PS et al Efficacy and
safety of the oral neuraminidase inhibitor oseltamivir in
treating acute influenza JAMA 20002831016ndash24
43 Black AJ House T Keeling MJ Ross JV Epidemiological
consequences of household-based antiviral prophylaxis
for pandemic influenza J R Soc Interface 201310
20121019
44 Jefferson T Jones MA Doshi P et al Neuraminidase in-
hibitors for preventing and treating influenza in healthy
adults and children Cochrane Database Syst Rev 20121
CD008965
45 Longini IM Jr Nizam A Xu S et al Containing pandemic
influenza at the source Science 20053091083ndash7
46 Halloran ME Ferguson NM Eubank S et al Modeling
targeted layered containment of an influenza pandemic
in the United States Proc Natl Acad Sci U S A 2008105
4639ndash44
APPENDIX 1
ANALYSIS OF A SIMPLIFIED MODEL
Here we analyse a simplified version of the model
for the case in which the drug does not affect trans-
mission though it may reduce symptoms In the
Results we discuss how these conditions apply to
treatment of influenza A virus with oseltamivir
We begin with a general function describing the
trajectory of the epidemic and then investigate how
the timing of treatment influences the evolution and
spread of resistance and the consequent instances
of treatment failure In the analytical model as in
Figure 6 treatment does not reduce transmission
neither the timing of resistance evolution nor the
schedule of antiviral therapy exerts an influence on
the net trajectory of the epidemic The value of drug
use lies entirely in reducing the morbidity suffered by
the treated individual There is no transmission cost
of resistance and no selective differential operating
between resistant and sensitive strains
We define the epidemic trajectory F(s) as the cur-
rent number of infectious cases in a population after
s transmission events have taken place Note that by
parameterizing this curve in terms of cumulative
transmission events s rather than calendar time t
we use a variable-speed clock that ticks every time
a new case occurs This approach considerably
simplifies the analysis We further assume that once
treatment is initiated all infected cases are treated
(f = 1) until the drug supply is exhausted
The epidemic trajectory
To provide an example of the epidemic trajectory
function F(s) we use an SIR model without births
or deaths [31] The parameters of this model are
the total population size N the transmission coeffi-
cient and the recovery rate Let X Y Z track the
proportion of susceptible infectious and recovered
individuals We do not differentiate between resist-
ant and sensitive strains here The differential equa-
tions for this process are
dX
dtfrac14 XY
dY
dtfrac14 XY Y
The fraction of recovered individuals Z is
1 ethX thorn YTHORN The basic reproductive number is
R0 frac14 =
Now define s frac14 NethY thorn ZTHORN frac14 Neth1 XTHORN which
tracks time through transmissions This transmis-
sion-counting variable ldquoticksrdquo at each transmission
event The above system can be rewritten as
ds
dtfrac14 ethN sTHORNY
dY
dtfrac14 ethN sTHORNY=N Y
Evolution of antimicrobial resistance in disease epidemics Tanaka et al | 159
by guest on June 21 2016httpem
phoxfordjournalsorgD
ownloaded from
[27112014ndash612pm] [150ndash161] Paper OP-EMPH140027
and so
dY
dsfrac14
dY=dt
ds=dtfrac14
1
N
ethN sTHORNfrac14
1
N
1
R0ethN sTHORN
for Y 6frac14 0 The solution of this differential equation
with initial condition Yeth0THORN frac14 1=N is eth1thorn sTHORN=
Nthorn eth1=R0THORN log eth1 s=NTHORN Thus for this model the
epidemic trajectory is
FethsTHORN frac14 N YethsTHORN frac14 1thorn sthornN
R0log
N s
N
eth3THORN
Unlimited doses
First consider the case in which health planners
have access to an unlimited stockpile of the antiviral
We consider the case in which drug resistance and
sensitivity are neutral there is no advantage to sen-
sitive virus in the absence of treatment (c = 0) or to
resistant virus in the presence of treatment
( frac14 e frac14 0) Let be the final size of the epidemic
be the probability of mutation to resistance per
transmission and be the case number at which
treatment is initiated in the population A mutant
appears at case number s with probability and at
frequency of 1=FethsTHORNwhich will remain unchanged for
the remainder of the epidemic on average because it
is selectively neutral At case s there are s
remaining cases in the epidemic and therefore the
mutant at s will have eth sTHORN=FethsTHORN descendants The
direct effects of antiviral use denoted by is the
number of successfully treated cases which is ap-
proximately
ethTHORNampeth THORN Z
eth sTHORN
FethsTHORNds eth4THORN
Here the eth THORN term represents the total number
of treated cases successful or unsuccessful and the
integral represents the number of treatment failures
due to resistance The approximation assumes that
mutation from sensitivity to resistance is rare and
does not directly alter the number of drug sensitive
cases
We aim to select a starting point to maximize
the number of successful treatments If an interior
maximum exists a necessary condition is that
d=d frac14 0 To evaluate this derivative of we
apply the Leibniz rule for differentiation under the
integral sign
d
dfrac14eth THORN
FethTHORN 1
Thus the extremum if it exists occurs at frac14
where
Feth THORN frac14 eth THORN eth5THORN
This extremum is a maximum the second deriva-
tive is
d2
d2frac14FethTHORN dFethTHORN
d eth THORN
FethTHORN2
The quantities FethTHORN and eth THORN are all positive
dFethTHORN=d is also positive at frac14 in the case of an
epidemic with a single peak as illustrated below
Therefore for any the second derivative d2=d2
lt 0 and is maximized at
The epidemic trajectory F(s) can take any func-
tional form but we illustrate in Figure 7A how the
analysis is applied to the standard SIR model [31]
using Equation (3) The straight line in the right hand
side of Equation (5) has a positive intercept and
crosses the rising epidemic curve FethTHORN Because
many cases occur rapidly near the peak of the epi-
demic this intercept is still relatively late in the epi-
demic in terms of calendar time units Our model
reveals that even with an unlimited supply of the
drug it is not optimal to start treatment in the popu-
lation at the beginning of the epidemic Starting
treatment too early creates large clades of resistant
viruses as a result many treatment failures will
occur
A B
Figure 7 Solutions for the optimal starting time of treat-
ments when the supply of the drug is (A) unlimited and
(B) limited In each case the epidemic trajectory FethTHORN (solid
curve) is scaled by the reciprocal of the population size 1N
Treatment start time is also scaled by 1=N A unlimited
stockpile The dashed line is eth THORN which intersects with
the epidemic trajectory FethTHORN (solid curve) at the optimum
B limited stockpile the dashed curve is the harmonic
mean number of cases from the start of treatment in the popu-
lation until the drug runs out This curve intersects the epi-
demic trajectory F(s) (solid curve) at the optimum
This example uses a standard SIR model with no birth
or death The parameters here are as given in Table 1
R0 frac14 18 frac14 017 frac14 001 k=N frac14 01
160 | Tanaka et al Evolution Medicine and Public Health
by guest on June 21 2016httpem
phoxfordjournalsorgD
ownloaded from
[27112014ndash612pm] [150ndash161] Paper OP-EMPH140027
Limited doses
Second we consider the case in which the number of
antiviral treatment courses is limited Here we de-
rive an expression for the number of successful treat-
ments with a minor modification of Equation (4)
If k courses of treatment are available and all are
used before the end of epidemic the number of suc-
cessful treatments is given by
ethTHORN frac14 k
Z thornk
eth thorn k sTHORN
FethsTHORNds eth6THORN
If doses still remain after the epidemic has ended
the number of successful treatments is again given
by Equation (4) Otherwise to find the optimal case
number on which to initiate treatment we consider
the derivative with respect to again applying
Leibnizrsquos rule so that
d
dfrac14
k
FethTHORN
Z thornk
1
FethsTHORNds
This derivative is zero when
Feth THORN frac14kZ thornk
frac121=FethsTHORN ds
This relation holds when the number of infectious
cases at the start of treatment in the population is
equal to the harmonic mean of the number of cases
until the drug runs out
With a single epidemic peak this implies that is
just left of the peak F(t) must rise from that point
then drop below Feth THORN Therefore Feth THORN gt Feth thorn kTHORN
The second derivative is
d2
d2frac14
k
FethTHORN2
1
Feth thorn kTHORN
1
FethTHORN
which is negative at frac14 because k FethTHORN are all
positive and because Feth THORN gt Feth thorn kTHORN Figure 7B il-
lustrates the position of the optimal start time near
the peak of the epidemic If there were multiple
waves in the epidemic curve F(s) both conditions
on the derivatives would only hold for the peaks
The optimal placement of is near the peak be-
cause that is when the frequency of resistant
lineages will be the lowest when they arise
(ie 1=FethsTHORN) By this heuristic argument it is clear
that for a single epidemic wave it is optimal to place
all treatment courses into a single contiguous block
near the peak rather than say (i) treating only a frac-
tion of cases once the drug starts to be used or (ii)
treating all people in discontinuous blocks of time
(Hansen and Day [27] show this result for indirect
effects using different models and methods)
If the rate of mutation to resistance is high the
probability of early emergence of resistance is high
along with the risk of large resistant viral clades
Although the mutation rate does not affect the opti-
mal time to start treating cases the higher the mu-
tation the stronger the need to start treatment near
the epidemic peak to minimize the impact of treat-
ment failure This can be understood mathematic-
ally through the second derivative of the direct
effects expression ethTHORN which is proportional to
the mutation rate
Evolution of antimicrobial resistance in disease epidemics Tanaka et al | 161
by guest on June 21 2016httpem
phoxfordjournalsorgD
ownloaded from

[27112014ndash612pm] [150ndash161] Paper OP-EMPH140027
resistant strains in the population Figure 4 illus-
trates this principle When resistance evolves early
in a growing population a larger clade results than
when resistance emerges late in the epidemic
Deploying drugs right from the onset of the epi-
demic risks early evolution of resistance and thus
takes the chance that a large fraction of the epidemic
cases will be resistant Assuming that the initial
cases are drug sensitive postponing drug use for a
few weeks gives sensitive clones a sufficient head
start that the large majority of cases in the epidemic
will be drug sensitive (Note the analogy between
evolution of resistance in this model and mutation
in the Luria-Delbruck process [39] Under the Luria-
Delbruck process the number of mutants arising in
an exponentially growing bacterial culture has a
skewed distribution with a high variance This high
variation is precisely due to the unpredictability
of the timing of mutations during exponential
growth where early mutation events lead to large
clades and later mutation events lead to small
clades) We further note that the reduced direct
effect from early deployment is also partially due to
the fact that early treatment limits the number of
sensitive cases when the drug affects transmission
If treatment is started too late the epidemic will
Figure 3 Effects of antimicrobial therapy as a function of the time at which treatment is deployed Direct effects (solid line) are
measured in thousands of cases treated successfully ie by treatment of individuals infected with drug-sensitive strains Indirect
effects (dashed line) reflect the change in the epidemic trajectory due to antimicrobial use the indirect effects of treatment are
quantified by the decrease in the number of cases in thousands when treatment is used relative to the number that would have
occurred in the absence of treatment The weighted sum of effects (indirect effects + 033direct effects) is shown with red dot-
dashed lines In the top panels (AndashC) the cost of resistance c is zero in the bottom panels (DndashF) cost c = 01 A and D treatment
reduces duration of infection (e frac14 05) but not transmissibility ( = 0) B and E treatment reduces transmissibility ( frac14 05) but
not duration (e= 0) C and F treatment reduces duration (e frac14 05) and transmissibility ( frac14 05) Unless indicated otherwise the
other parameters are as given in Table 1 with stockpile size k frac14 01N
If resistance arises later onlya small resistant clade ensues
If resistance arises early alarge resistant clade results
Time
Figure 4 The timing at which the first resistant clade arises
has a strong impact on the subsequent prevalence of resistant
strains in the population If the first resistant strain arises early
in the epidemic a large resistance clade (blue) is created If the
first resistant strain arises after several generations of trans-
mission the resulting resistant clade (red) is far smaller
154 | Tanaka et al Evolution Medicine and Public Health
by guest on June 21 2016httpem
phoxfordjournalsorgD
ownloaded from
[27112014ndash612pm] [150ndash161] Paper OP-EMPH140027
conclude before the stockpile has been exhausted
and the unused courses will be wasted As a result
there is an intermediate optimum time to initiate
treatment
Second when there is no cost of resistance the
indirect effects are also maximized by postponing
the onset of antimicrobial use Assuming that the
epidemic cannot be contained indirect effects result
from minimizing the degree of overshoot ie
minimizing the number of cases beyond the number
that would be required to reach the epidemic thresh-
old (Fig 1) If drugs are deployed too early the stock-
pile will be exhausted before reaching the epidemic
peak and large resistant clades will render treatment
less effective at reducing the effective reproductive
number if drugs are deployed too late treatment
courses will go unused Thus again we see an inter-
mediate optimum time to start treatment near the
epidemic peak as noted by Hansen and Day [27] Wu
et al [22] and Althouse et al [26]
Third when resistance imposes fitness costs in-
direct effects can be larger when treatment is
initiated early This effect arises because the resist-
ant strains now have relatively lsquolowrsquo fitness once the
drugs run out so that starting early and producing
large resistant clades reduces the overall size of the
epidemic Looking at the weighted sum of direct and
indirect effects the optimal times again shift to later
in the epidemic but the cost of waiting is often
minimal
Fourth the effects of antimicrobial use are similar
whether they come about through a reduction of
duration or a reduction of transmissibility
We have also investigated the effect of the de novo
mutation rate on direct and indirect effects and
their weighted sum (Fig 5) Low mutation rates lead
to few resistant clades and therefore more success-
fully treated casesmdashhigh direct effectsmdashwhile high
rates lead to large resistant clades and low direct
effects However the resistance mutation rate has
the opposite effect on indirect effects when there is a
transmission cost of resistance This is because re-
sistant strains are less fit than sensitive strains and
therefore the final epidemic size is lower with more
resistant viruses When there is no resistance cost
but the drug reduces transmission there is a greater
indirect effect under low mutation rates because the
drug is effective in preventing cases when there are
more sensitive cases
Application to influenza
In this section we apply the model to influenza A
virus and treatment with the antiviral oseltamivir
(Tamiflu) Although oseltamivir can shorten the dur-
ation of illness and reduce the severity of symptoms
[40ndash42] Yang et al [29] have argued that unlike
osteltamivir prophylaxis oseltamivir treatment of in-
fected cases has little or no ability to prevent trans-
mission (see also [30 43 44]) This finding makes
sense because most transmission occurs before
treatment has substantive effect on viral titre [18]
If a drug has no effect on transmission the indir-
ect effects of treatment are zero but the direct effects
may be substantial Figure 6 shows direct effects in
the case where the drug is not effective in reducing
000 005 010 015 020
020
4060
8010
0 DirectIndirectWeighted sum
γ = 0 c = 01
000 005 010 015 020
020
4060
8010
0 DirectIndirectWeighted sum
γ = 05 c = 01
000 005 010 015 020
020
4060
8010
0 DirectIndirectWeighted sum
γ = 05 c = 0
Dir
ect a
nd in
dire
ct e
ffec
ts (
case
s 1
03 )
Rate of mutation to resistance θ (day)
A B C
Figure 5 The effect of rate of mutation to resistance () on direct and indirect effects A the drug does not reduce disease
transmission ( = 0) and resistance comes with cost c = 01 B the drug does reduce disease transmission ( frac14 05) and resist-
ance comes with cost c = 01 C the drug reduces transmission ( frac14 05) but resistance is cost-free (c = 0) Treatment start time
is set to 60 days the efficacy of the drug to reduce infection duration is e= 0 stockpile size is k frac14 01N the remaining parameters
except are as given in Table 1
Evolution of antimicrobial resistance in disease epidemics Tanaka et al | 155
by guest on June 21 2016httpem
phoxfordjournalsorgD
ownloaded from
[27112014ndash612pm] [150ndash161] Paper OP-EMPH140027
either transmission or duration of infection ( = 0
e= 0) Panel A shows that when drug efficacy in
reducing transmission is zero the indirect effects
are zero but direct effects remain high Again the
optimal time to start treatment according to the
direct criterion is near the peak of the epidemic
(Panel B) shows the effects of treatment when there
is a small cost of resistance Figure 6 explores the
direct effects of treatment for limited stockpiles
(Panel C) and unlimited stockpiles (Panel D) when
varying both starting time and the proportion of
cases treated f Whether or not doses are limited
the optimal start time is still near the peak of the
epidemic Starting earlier results in a mild decrease
in direct effects but this decrease is much smaller
than the case in which antimicrobials can reduce
transmission (Fig 3) because in that case the size
of the sensitive outbreak is reduced by early
deployment
In the Appendix 1 we present an analytical model
to show how and why these effects arise
DISCUSSION
The theory of how antimicrobials should be used in a
population differs in character between epidemic
and endemic disease In epidemics case numbers
rise approximately exponentially at first before
declining to low numbers There is a need to recon-
sider the optimization of control strategies under
such conditions By considering the indirect effects
of antimicrobial use recent work has found that
the optimal time to commence treatment in a
population is well into the course of an epidemic
[21 22 26 27] We have examined a different effect
of drugs the direct effects of successful treatment
Our analysis shows that delaying the deployment of
drug treatments in a population increases the
A B
C D
Figure 6 Effects under zero effect of treatment on transmission rate ( = 0) and recovery time (e= 0) A B direct and indirect
effects and weighted sum as a function of the starting time with no cost c of resistance (panel A) and a small cost c = 01 (panel
B) Here the fraction treated is f = 05 C D direct effects of drugs as a function of both treatment start time and proportion of
cases treated f with limited stockpile (k=N frac14 01 panel C) and unlimited stockpile (k=N frac14 1 panel D) of drugs Here the cost of
resistance is set to zero The other parameters are as given in Table 1 recovery rate frac14 017 mutation rate frac14 001 population
size N frac14 106 basic reproductive ratio for susceptible untreated cases R0SU frac14 18 is computed from R0SU and The effects are
given in units of thousands of cases
156 | Tanaka et al Evolution Medicine and Public Health
by guest on June 21 2016httpem
phoxfordjournalsorgD
ownloaded from
[27112014ndash612pm] [150ndash161] Paper OP-EMPH140027
number of successfully treated cases even if there is
an unlimited stockpile of a drug The reason for the
advantage of delay is that it prevents large clades of
resistant virus from arising early in the epidemic
The size of a resistant clade depends on the number
of cases in the population at the time a resistant
mutant appears It is also strongly influenced by
the rate at which resistance arises de novo by muta-
tion Delaying treatment until near the epidemic
peak keeps the relative frequency of drug resistant
infections low
How much does it matter whether treatment
starts near the peak of the epidemic Where anti-
microbials have little efficacy in reducing transmis-
sion which may apply to influenza A [29 44] the
direct effects are not much lower than if drugs start
to be deployed near the beginning of the epidemic
compared with starting deployment near the peak
(Fig 6) Because sensitive strains have equal fitness
to resistant strains as the epidemic initially grows
exponentially there is a large and growing pool of
(sensitive) cases that can successfully be treated
Although this sensitive pool would be larger if drugs
are deployed later in the epidemic on average it
would not be much larger as long as the mutation
rate is low
Other considerations also argue against exces-
sively delaying the deployment of antimicrobials
Early on in the course of an epidemic there is con-
siderable uncertainty about its future trajectory
Misestimating the course of the disease and waiting
too long to initiate drug use carries the risk of failing
to use the full stockpile before the epidemic is over
This is arguably worse than running out of drugs
before the epidemic is finished [20] Early in an epi-
demic there may be other reasons for immediate
and aggressive use of available drugs Most import-
antly there may be a non-zero probability of success-
ful containment and eradication of the outbreak if
the drug reduces transmission sufficiently or if other
effective measures can be applied [34 45 46]
Withholding available antiviral treatment from indi-
vidual patients who could potentially benefit from
their use also poses an ethical problem pitting the
rights of the individual against the good of the col-
lective On the balance we expect that in most situ-
ations immediate use of a stockpile is likely to be the
best approach If stockpiles of two drugs are avail-
able the approach proposed by Wu et al [22] may be
particularly effective use the smaller stockpile first
as a way to delay the use of the larger stockpile and
thus delay the evolution of resistance to this latter
drug In any event we will rarely if ever detect the very
first cases of an epidemic in real time by the time a
problem is identified the epidemic may have pro-
gressed far enough that immediate use of the stock-
pile will be optimal
CONCLUSIONS AND IMPLICATIONS
This study distinguishes between the direct and in-
direct effects of deploying antimicrobial drugs The
indirect effects of lowering the final epidemic sizemdash
that is averting casesmdashare large whenever the anti-
microbials have substantial efficacy in reducing
transmission or duration of disease This benefit is
often taken to be an important objective of disease
control strategies [eg 27] but planners will also
want to consider the direct effects of antimicrobial
use on infected patients In particular when anti-
virals have little effect on transmission there is little
indirect effect but the direct effects of treating cases
successfully can be substantial These direct effects
accrue as long as resistant clades are small and
available treatments are used before the epidemic
ends The direct effects count the treatment of sen-
sitive cases regardless of whether drugs change the
epidemic trajectory In principle a particular usage
policy might result in more successful instances of
treatment because it has the highly undesirable con-
sequence of creating a larger epidemic and therefore
offering more patients to treat Thus maximizing dir-
ect effects should not be used alone as an objective
in disease control planning Instead planners will
typically want to make decisions based on a com-
posite of both direct and indirect effects
acknowledgements
We thank Rustom Antia Troy Day and Marc Lipsitch for
helpful discussions
FUNDING
This work was supported by US National Institutes
of Health 1U54GM088558-01 lsquoModels of Infectious
Disease Agent Studyrsquo and by Australian Research
Council grants DP110100465 and DP0987302
BMA acknowledges support of a Santa Fe
Institute Omidyar Postdoctoral Fellowship
Conflict of interest None declared
Evolution of antimicrobial resistance in disease epidemics Tanaka et al | 157
by guest on June 21 2016httpem
phoxfordjournalsorgD
ownloaded from
[27112014ndash612pm] [150ndash161] Paper OP-EMPH140027
references
1 Bonhoeffer S Lipsitch M Levin B Evaluating treatment
protocols to prevent antibiotic resistance Proc Natl Acad
Sci U S A 19979412106
2 Opatowski L Mandel J Varon E et al Antibiotic dose impact
on resistance selection in the community a mathematical
model of beta-lactams and Streptococcus pneumoniae dy-
namics Antimicrob Agents Chemother 2010542330ndash2337
3 Singer ME Harding I Jacobs MR Jaffe DH Impact of
antimicrobial resistance on health outcomes in the out-
patient treatment of adult community-acquired pneumo-
nia a probability model J Antimicrob Chemother 200351
1269ndash1282
4 Sebille V Chevret S Valleron A Modeling the spread of
resistant nosocomial pathogens in an intensive-care unit
Infect Control Hosp Epidemiol 19971884ndash92
5 Austin D Kristinsson K Anderson R The relationship be-
tween the volume of antimicrobial consumption in human
communities and the frequency of resistance Proc Natl
Acad Sci U S A 1999961152
6 Austin D Bonten M Weinstein R et al Vancomycin-resistant
enterococci in intensive-care hospital settings transmission
dynamics persistence and the impact of infection control
programs Proc Natl Acad Sci U S A 1999966908
7 Cooper B Medley G Scott G Preliminary analysis of the
transmission dynamics of nosocomial infections stochas-
tic and management effects J Hosp Infect 199943131ndash47
8 Bergstrom CT Lo M Lipsitch M Ecological theory sug-
gests that antimicrobial cycling will not reduce antimicro-
bial resistance in hospitals Proc Natl Acad Sci U S A 2004
10113285ndash90
9 Cooper BS Medley GF Stone SP et al Methicillin-resistant
Staphylococcus aureus in hospitals and the community
stealth dynamics and control catastrophes Proc Natl
Acad Sci U S A 200410110223ndash8
10 Lipsitch M Bergstrom CT Levin BR The epidemiology of
antibiotic resistance in hospitals paradoxes and prescrip-
tions Proc Natl Acad Sci U S A 2000971938ndash43
11 Lipsitch M Samore MH Antimicrobial use and antimicro-
bial resistance a population perspective Emerg Infect Dis
20028(4) 347ndash354
12 Pressley J DrsquoAgata EMC Webb GF The effect of co-colon-
ization with community-acquired and hospital-acquired
methicillin-resistant Staphylococcus aureus strains on com-
petitive exclusion J Theor Biol 2010264645ndash56
13 Wang YC Lipsitch M Upgrading antibiotic use within a
class tradeoff between resistance and treatment success
Proc Natl Acad Sci U S A 20061039655ndash60
14 Althouse BM Bergstrom TC Bergstrom CT Evolution in
health and medicine Sackler colloquium a public choice
framework for controlling transmissible and evolving dis-
eases Proc Natl Acad Sci U S A 20101071696ndash701
15 Stilianakis NI Perelson AS Hayden FG Emergence of
drug resistance during an influenza epidemic insights
from a mathematical model J Infect Dis 1998177863ndash73
16 Regoes RR Bonhoeffer S Emergence of drug-resistant in-
fluenza virus population dynamical considerations
Science 2006312389ndash91
17 Lipsitch M Cohen T Murray M Levin BR Antiviral resist-
ance and the control of pandemic influenza PLoS Med
20074e15
18 Alexander ME Bowman CS Feng Z et al Emergence of
drug resistance implications for antiviral control of pan-
demic influenza Proc Biol Sci 20072741675ndash84
19 McCaw JM Wood JG McCaw CT McVernon J Impact of
emerging antiviral drug resistance on influenza contain-
ment and spread influence of subclinical infection and
strategic use of a stockpile containing one or two drugs
PLoS One 20083e2362
20 Arinaminpathy N McLean AR Antiviral treatment for the
control of pandemic influenza some logistical con-
straints J R Soc Interface 20085545ndash53
21 Hollingsworth TD Klinkenberg D Heesterbeek H
Anderson RM Mitigation strategies for pandemic influ-
enza A balancing conflicting policy objectives PLoS
Comput Biol 20117e1001076
22 Wu JT Leung GM Lipsitch M et al Hedging against anti-
viral resistance during the next influenza pandemic using
small stockpiles of an alternative chemotherapy PLoS
Med 20096e1000085
23 Meng EH Day T Arino J et al Strategies for the use of
oseltamivir and zanamivir during pandemic outbreaks
Can J Infect Dis Med Micro 201021e28ndash63
24 Handel A Longini IM Antia R Antiviral resistance and the
control of pandemic influenza the roles of stochasticity
evolution and model details J Theor Biol 2009256117ndash25
25 Moghadas SM Bowman CS Rost G Wu J Population-
wide emergence of antiviral resistance during pandemic
influenza PLoS One 20083e1839
26 Althouse BM Patterson-Lomba O Goerg GM Hebert-
Dufresne L The timing and targeting of treatment in in-
fluenza pandemics influences the emergence of resist-
ance in structured populations PLoS Comput Biol 2013
9e1002912
27 Hansen E Day T Optimal antiviral treatment strategies
and the effects of resistance Proc Biol Sci 2011278
1082ndash9
28 Handel A Longini IM Antia R What is the best control
strategy for multiple infectious disease outbreaks Proc
Biol Sci 2007274833ndash7
29 Yang Y Halloran ME Longini IM A Bayesian model for
evaluating influenza antiviral efficacy in household studies
with asymptomatic infections Biostatistics 200910
390ndash403
30 Jefferson T Jones M Doshi P et al Oseltamivir for influ-
enza in adults and children systematic review of clinical
study reports and summary of regulatory comments BMJ
2014348g2545
31 Kermack WO McKendrick AG A contribution to the math-
ematical theory of epidemics Proc Roy Soc Lond A 1927
115700ndash21
158 | Tanaka et al Evolution Medicine and Public Health
by guest on June 21 2016httpem
phoxfordjournalsorgD
ownloaded from
[27112014ndash612pm] [150ndash161] Paper OP-EMPH140027
32 Chowell G Miller MA Viboud C Seasonal influenza in the
United States France and Australia transmission and
prospects for control Epidemiol Infect 2008136852ndash64
33 Mills CE Robins JM Lipsitch M Transmissibility of 1918
pandemic influenza Nature 2004432904ndash6
34 Ferguson NM Cummings DAT Cauchemez S et al
Strategies for containing an emerging influenza pandemic
in Southeast Asia Nature 2005437209ndash14
35 Carrat F Vergu E Ferguson NM et al Time lines of infec-
tion and disease in human influenza a review of volunteer
challenge studies Am J Epidemiol 2008167775ndash85
36 Cao B Li X-W Mao Y et al Clinical features of the initial
cases of 2009 pandemic influenza A (H1N1) virus infec-
tion in China N Engl J Med 20093612507ndash17
37 Ong AK Hayden FG John F Enders lecture 2006 anti-
virals for influenza J Infect Dis 2007196181ndash90
38 Lipsitch M Hernan MA Oseltamivir effect on antibiotic-
treated lower respiratory tract complications in virologic-
ally positive randomized trial participants Clin Infect Dis
2013571368ndash9
39 Luria SE Delbruck M Mutations of bacteria from virus
sensitivity to virus resistance Genetics 194328491ndash511
40 Aoki FY Macleod MD Paggiaro P et al Early administra-
tion of oral oseltamivir increases the benefits of influenza
treatment J Antimicrob Chemother 200351123ndash9
41 Nicholson KG Aoki FY et al Efficacy and safety of
oseltamivir in treatment of acute influenza a randomised
controlled trial Lancet 20003551845ndash50
42 Treanor JJ Hayden FG Vrooman PS et al Efficacy and
safety of the oral neuraminidase inhibitor oseltamivir in
treating acute influenza JAMA 20002831016ndash24
43 Black AJ House T Keeling MJ Ross JV Epidemiological
consequences of household-based antiviral prophylaxis
for pandemic influenza J R Soc Interface 201310
20121019
44 Jefferson T Jones MA Doshi P et al Neuraminidase in-
hibitors for preventing and treating influenza in healthy
adults and children Cochrane Database Syst Rev 20121
CD008965
45 Longini IM Jr Nizam A Xu S et al Containing pandemic
influenza at the source Science 20053091083ndash7
46 Halloran ME Ferguson NM Eubank S et al Modeling
targeted layered containment of an influenza pandemic
in the United States Proc Natl Acad Sci U S A 2008105
4639ndash44
APPENDIX 1
ANALYSIS OF A SIMPLIFIED MODEL
Here we analyse a simplified version of the model
for the case in which the drug does not affect trans-
mission though it may reduce symptoms In the
Results we discuss how these conditions apply to
treatment of influenza A virus with oseltamivir
We begin with a general function describing the
trajectory of the epidemic and then investigate how
the timing of treatment influences the evolution and
spread of resistance and the consequent instances
of treatment failure In the analytical model as in
Figure 6 treatment does not reduce transmission
neither the timing of resistance evolution nor the
schedule of antiviral therapy exerts an influence on
the net trajectory of the epidemic The value of drug
use lies entirely in reducing the morbidity suffered by
the treated individual There is no transmission cost
of resistance and no selective differential operating
between resistant and sensitive strains
We define the epidemic trajectory F(s) as the cur-
rent number of infectious cases in a population after
s transmission events have taken place Note that by
parameterizing this curve in terms of cumulative
transmission events s rather than calendar time t
we use a variable-speed clock that ticks every time
a new case occurs This approach considerably
simplifies the analysis We further assume that once
treatment is initiated all infected cases are treated
(f = 1) until the drug supply is exhausted
The epidemic trajectory
To provide an example of the epidemic trajectory
function F(s) we use an SIR model without births
or deaths [31] The parameters of this model are
the total population size N the transmission coeffi-
cient and the recovery rate Let X Y Z track the
proportion of susceptible infectious and recovered
individuals We do not differentiate between resist-
ant and sensitive strains here The differential equa-
tions for this process are
dX
dtfrac14 XY
dY
dtfrac14 XY Y
The fraction of recovered individuals Z is
1 ethX thorn YTHORN The basic reproductive number is
R0 frac14 =
Now define s frac14 NethY thorn ZTHORN frac14 Neth1 XTHORN which
tracks time through transmissions This transmis-
sion-counting variable ldquoticksrdquo at each transmission
event The above system can be rewritten as
ds
dtfrac14 ethN sTHORNY
dY
dtfrac14 ethN sTHORNY=N Y
Evolution of antimicrobial resistance in disease epidemics Tanaka et al | 159
by guest on June 21 2016httpem
phoxfordjournalsorgD
ownloaded from
[27112014ndash612pm] [150ndash161] Paper OP-EMPH140027
and so
dY
dsfrac14
dY=dt
ds=dtfrac14
1
N
ethN sTHORNfrac14
1
N
1
R0ethN sTHORN
for Y 6frac14 0 The solution of this differential equation
with initial condition Yeth0THORN frac14 1=N is eth1thorn sTHORN=
Nthorn eth1=R0THORN log eth1 s=NTHORN Thus for this model the
epidemic trajectory is
FethsTHORN frac14 N YethsTHORN frac14 1thorn sthornN
R0log
N s
N
eth3THORN
Unlimited doses
First consider the case in which health planners
have access to an unlimited stockpile of the antiviral
We consider the case in which drug resistance and
sensitivity are neutral there is no advantage to sen-
sitive virus in the absence of treatment (c = 0) or to
resistant virus in the presence of treatment
( frac14 e frac14 0) Let be the final size of the epidemic
be the probability of mutation to resistance per
transmission and be the case number at which
treatment is initiated in the population A mutant
appears at case number s with probability and at
frequency of 1=FethsTHORNwhich will remain unchanged for
the remainder of the epidemic on average because it
is selectively neutral At case s there are s
remaining cases in the epidemic and therefore the
mutant at s will have eth sTHORN=FethsTHORN descendants The
direct effects of antiviral use denoted by is the
number of successfully treated cases which is ap-
proximately
ethTHORNampeth THORN Z
eth sTHORN
FethsTHORNds eth4THORN
Here the eth THORN term represents the total number
of treated cases successful or unsuccessful and the
integral represents the number of treatment failures
due to resistance The approximation assumes that
mutation from sensitivity to resistance is rare and
does not directly alter the number of drug sensitive
cases
We aim to select a starting point to maximize
the number of successful treatments If an interior
maximum exists a necessary condition is that
d=d frac14 0 To evaluate this derivative of we
apply the Leibniz rule for differentiation under the
integral sign
d
dfrac14eth THORN
FethTHORN 1
Thus the extremum if it exists occurs at frac14
where
Feth THORN frac14 eth THORN eth5THORN
This extremum is a maximum the second deriva-
tive is
d2
d2frac14FethTHORN dFethTHORN
d eth THORN
FethTHORN2
The quantities FethTHORN and eth THORN are all positive
dFethTHORN=d is also positive at frac14 in the case of an
epidemic with a single peak as illustrated below
Therefore for any the second derivative d2=d2
lt 0 and is maximized at
The epidemic trajectory F(s) can take any func-
tional form but we illustrate in Figure 7A how the
analysis is applied to the standard SIR model [31]
using Equation (3) The straight line in the right hand
side of Equation (5) has a positive intercept and
crosses the rising epidemic curve FethTHORN Because
many cases occur rapidly near the peak of the epi-
demic this intercept is still relatively late in the epi-
demic in terms of calendar time units Our model
reveals that even with an unlimited supply of the
drug it is not optimal to start treatment in the popu-
lation at the beginning of the epidemic Starting
treatment too early creates large clades of resistant
viruses as a result many treatment failures will
occur
A B
Figure 7 Solutions for the optimal starting time of treat-
ments when the supply of the drug is (A) unlimited and
(B) limited In each case the epidemic trajectory FethTHORN (solid
curve) is scaled by the reciprocal of the population size 1N
Treatment start time is also scaled by 1=N A unlimited
stockpile The dashed line is eth THORN which intersects with
the epidemic trajectory FethTHORN (solid curve) at the optimum
B limited stockpile the dashed curve is the harmonic
mean number of cases from the start of treatment in the popu-
lation until the drug runs out This curve intersects the epi-
demic trajectory F(s) (solid curve) at the optimum
This example uses a standard SIR model with no birth
or death The parameters here are as given in Table 1
R0 frac14 18 frac14 017 frac14 001 k=N frac14 01
160 | Tanaka et al Evolution Medicine and Public Health
by guest on June 21 2016httpem
phoxfordjournalsorgD
ownloaded from
[27112014ndash612pm] [150ndash161] Paper OP-EMPH140027
Limited doses
Second we consider the case in which the number of
antiviral treatment courses is limited Here we de-
rive an expression for the number of successful treat-
ments with a minor modification of Equation (4)
If k courses of treatment are available and all are
used before the end of epidemic the number of suc-
cessful treatments is given by
ethTHORN frac14 k
Z thornk
eth thorn k sTHORN
FethsTHORNds eth6THORN
If doses still remain after the epidemic has ended
the number of successful treatments is again given
by Equation (4) Otherwise to find the optimal case
number on which to initiate treatment we consider
the derivative with respect to again applying
Leibnizrsquos rule so that
d
dfrac14
k
FethTHORN
Z thornk
1
FethsTHORNds
This derivative is zero when
Feth THORN frac14kZ thornk
frac121=FethsTHORN ds
This relation holds when the number of infectious
cases at the start of treatment in the population is
equal to the harmonic mean of the number of cases
until the drug runs out
With a single epidemic peak this implies that is
just left of the peak F(t) must rise from that point
then drop below Feth THORN Therefore Feth THORN gt Feth thorn kTHORN
The second derivative is
d2
d2frac14
k
FethTHORN2
1
Feth thorn kTHORN
1
FethTHORN
which is negative at frac14 because k FethTHORN are all
positive and because Feth THORN gt Feth thorn kTHORN Figure 7B il-
lustrates the position of the optimal start time near
the peak of the epidemic If there were multiple
waves in the epidemic curve F(s) both conditions
on the derivatives would only hold for the peaks
The optimal placement of is near the peak be-
cause that is when the frequency of resistant
lineages will be the lowest when they arise
(ie 1=FethsTHORN) By this heuristic argument it is clear
that for a single epidemic wave it is optimal to place
all treatment courses into a single contiguous block
near the peak rather than say (i) treating only a frac-
tion of cases once the drug starts to be used or (ii)
treating all people in discontinuous blocks of time
(Hansen and Day [27] show this result for indirect
effects using different models and methods)
If the rate of mutation to resistance is high the
probability of early emergence of resistance is high
along with the risk of large resistant viral clades
Although the mutation rate does not affect the opti-
mal time to start treating cases the higher the mu-
tation the stronger the need to start treatment near
the epidemic peak to minimize the impact of treat-
ment failure This can be understood mathematic-
ally through the second derivative of the direct
effects expression ethTHORN which is proportional to
the mutation rate
Evolution of antimicrobial resistance in disease epidemics Tanaka et al | 161
by guest on June 21 2016httpem
phoxfordjournalsorgD
ownloaded from
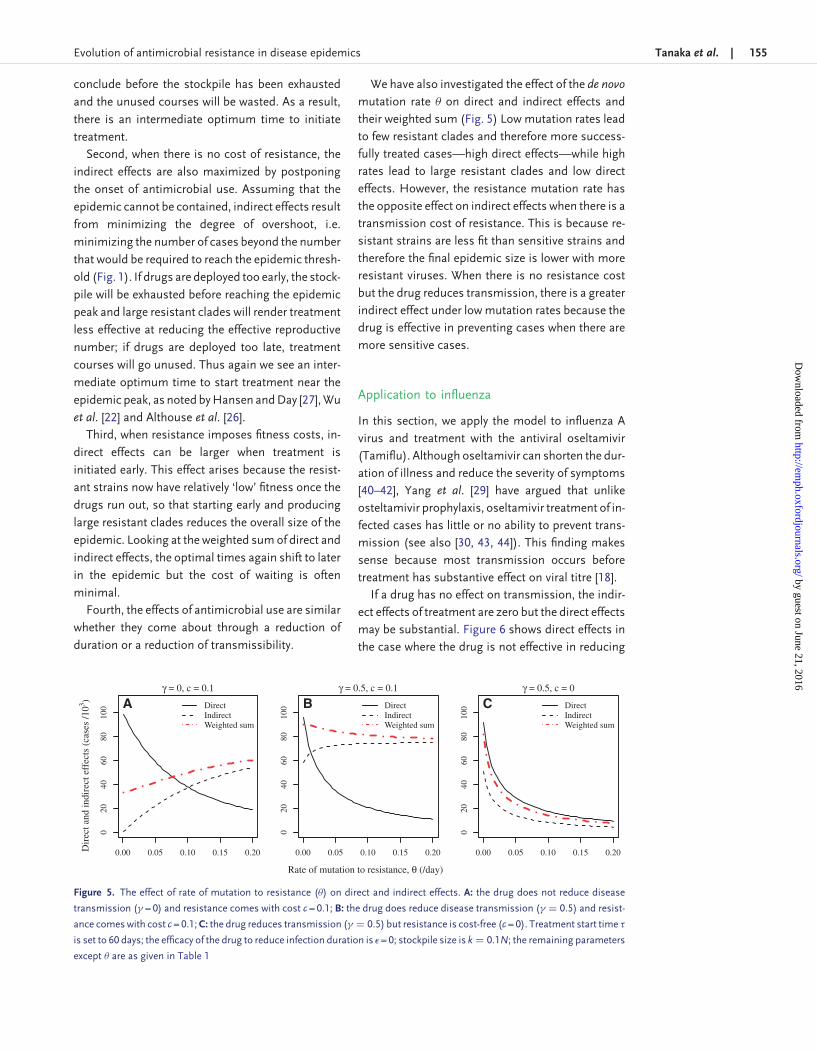
[27112014ndash612pm] [150ndash161] Paper OP-EMPH140027
Limited doses
Second we consider the case in which the number of
antiviral treatment courses is limited Here we de-
rive an expression for the number of successful treat-
ments with a minor modification of Equation (4)
If k courses of treatment are available and all are
used before the end of epidemic the number of suc-
cessful treatments is given by
ethTHORN frac14 k
Z thornk
eth thorn k sTHORN
FethsTHORNds eth6THORN
If doses still remain after the epidemic has ended
the number of successful treatments is again given
by Equation (4) Otherwise to find the optimal case
number on which to initiate treatment we consider
the derivative with respect to again applying
Leibnizrsquos rule so that
d
dfrac14
k
FethTHORN
Z thornk
1
FethsTHORNds
This derivative is zero when
Feth THORN frac14kZ thornk
frac121=FethsTHORN ds
This relation holds when the number of infectious
cases at the start of treatment in the population is
equal to the harmonic mean of the number of cases
until the drug runs out
With a single epidemic peak this implies that is
just left of the peak F(t) must rise from that point
then drop below Feth THORN Therefore Feth THORN gt Feth thorn kTHORN
The second derivative is
d2
d2frac14
k
FethTHORN2
1
Feth thorn kTHORN
1
FethTHORN
which is negative at frac14 because k FethTHORN are all
positive and because Feth THORN gt Feth thorn kTHORN Figure 7B il-
lustrates the position of the optimal start time near
the peak of the epidemic If there were multiple
waves in the epidemic curve F(s) both conditions
on the derivatives would only hold for the peaks
The optimal placement of is near the peak be-
cause that is when the frequency of resistant
lineages will be the lowest when they arise
(ie 1=FethsTHORN) By this heuristic argument it is clear
that for a single epidemic wave it is optimal to place
all treatment courses into a single contiguous block
near the peak rather than say (i) treating only a frac-
tion of cases once the drug starts to be used or (ii)
treating all people in discontinuous blocks of time
(Hansen and Day [27] show this result for indirect
effects using different models and methods)
If the rate of mutation to resistance is high the
probability of early emergence of resistance is high
along with the risk of large resistant viral clades
Although the mutation rate does not affect the opti-
mal time to start treating cases the higher the mu-
tation the stronger the need to start treatment near
the epidemic peak to minimize the impact of treat-
ment failure This can be understood mathematic-
ally through the second derivative of the direct
effects expression ethTHORN which is proportional to
the mutation rate
Evolution of antimicrobial resistance in disease epidemics Tanaka et al | 161
by guest on June 21 2016httpem
phoxfordjournalsorgD
ownloaded from