The Quality of Childcare in Chile: Its Stability and International Ranking
Department of EconomicsWorking Paper 2013:10
Time Investment by Parents in Cognitive and Non-cognitive Childcare Activities
Mohammad Sepahvand, Roujman Shahbazian and Ranjula Bali Swain

Department of Economics Working paper 2013:10Uppsala University May 2013P.O. Box 513 ISSN 1653-6975 SE-751 20 UppsalaSwedenFax: +46 18 471 14 78
Time Investment by Parents in Cognitive and Non-cognitive Childcare Activities
Mohammad Sepahvand, Roujman Shahbazian and Ranjula Bali Swain
Papers in the Working Paper Series are published on internet in PDF formats. Download from http://www.nek.uu.se or from S-WoPEC http://swopec.hhs.se/uunewp/

Time Investment by Parents in Cognitive and
Non-cognitive Childcare Activities
Mohammad Sepahvand*, Roujman Shahbazian**and Ranjula Bali Swain*1
May 07, 2013
We investigate the time investment in cognitive and non-cognitive childcare activities by parents with
different educational attainment. In a second step we also investigate this effect for three different
child age cohorts. Past research shows that the degree of success in the labour market is highly
connected to the individual’s cognitive and non-cognitive skills. We compare evidence based on
Multinational Time Use Study (MTUS) for five countries: France, Netherlands, Spain, United
Kingdom and United States of America in order to identify any systematic pattern. The results indicate
that the educational gradients for cognitive and non-cognitive childcare activities are overall positive
with respect to the level of education. Furthermore, the results seem to be consistent with the
technology of skill formation. They indicate a concave function between time investment and the age
of the child for cognitive childcare activities and a decreasing function for non-cognitive childcare
activities.
Keywords: Time allocation, cognitive skills, non-cognitive skills, intergenerational transmissions,
human capital, technology of skill formation
JEL classification: I21, J13
1 *Uppsala University, Box 513, 751 20 Uppsala, Sweden. [email protected] and [email protected].
**Swedish Institute for Social Research (SOFI), Stockholm University, 106 91 Stockholm, Sweden.
[email protected]. We thank Center for Time Use Research for providing the data and seminar participants at
the Institute for Evaluation of Labour Market and Education Policy (IFAU), Swedish Institute for Social Research (SOFI)
and IATUR Conferences (Oxford University, UK and Matsue, Japan).
2
Introduction
The puzzle of why intergenerational transmissions2 of education and income are so strong is a
constant ongoing debate among researchers. A substantial body of research has indicated that
both nature and nurture influences the intergenerational transmissions (Turkheimer et al.
2003; Black et al. 2005; Björklund et al. 2006; Cunha et al. 2006; Black and Devereux 2010).
One important piece of this puzzle is to study the parents’ time allocation into cognitive and
non-cognitive childcare activities. Analyzing time use data we investigate the association of
parents’ educational level on these two different childcare activities: First, by aggregating all
children into one cohort, and later by dividing the children into different age-cohorts. We
conduct robustness checks for all the individuals in our sample by the gender of the parent,
but also by dividing the samples into subgroups of working and non-working. For each
subsection the results are presented for parents, mothers and fathers separately. It is important
to note that our results indicate patterns and associations rather than a causal relationship.
There is a growing interest within economics concerning how a child’s well-being and
development affects labour market outcomes later in life. Several theoretical and empirical
studies focus on this mechanism. A useful separation of child well-being is to divide it into
three domains3: child’s health, child’s cognitive development and child’s social and emotional
development. While many economists have started to investigate children’s health and labour
market outcomes (see Case and Paxson 2010; Currie 2009 for a literature review), other
researchers focus on the child’s cognitive development and how that affects the return to
schooling and future earnings (Carneiro et al. 2003; Nordin 2008). Recent studies, like
Lindqvist and Vestman (2011), try to account for both the cognitive and social/emotional
development of the child and its implications on their labour market outcomes.
Cognitive skills are traditionally measured as the IQ of an individual, however are thus
difficult to measure. Within the field of economics, non-cognitive development/skills refer to
abilities such as motivation, social skills, persistence, patience and emotional stability of the
individual. These skills are derived from the concept of the concept of the social and
emotional development of the child. According to Heckman et al. (2006), non-cognitive skills
are mainly affected and nourished during earlier stages of childhood and parents play a
significant role in its development. The cognitive variable in our study is constructed from
parent’s time investment in specific childcare activities, such as teaching and showing the
2 Intergenerational transmission is the transfer of individual abilities, behavior and/or outcome from parents to
their children. 3 These three domains are not mutually exclusive. There is a close interaction between them (Waldfogel 2004).
3
child how to perform tasks directly involved in learning. The non-cognitive skills variable
includes time investment from parents on a range of childcare activities such as physical and
medical care of the child, feeding, changing diapers, toilet training, dressing but also telling
stories, conversation, playing social games like Monopoly and Risk, performing sporting
activities and so on. The separation into cognitive and non-cognitive skills is not perfect, since
non-cognitive activities could involve some form of cognition. However, this separation is in
line with past research (Duncan et al. (2007); Borghans et al. 2008; Lindqvist and Vestman
2011).
Recent literature within the field of economics, such as Heckman et al. (2006),
Grönqvist and Vlachos (2008), Grönqvist et al. (2010) Nordin (2008), Lundborg et al. (2009)
and Lindqvist and Vestman (2011) try to disentangle the effects of cognitive and non-
cognitive skills4 in relation to different labour market outcomes. A major part of this literature
uses military enlistment data for individuals between the ages of 18 and 19. However,
evidence suggests that cognitive and non-cognitive skills are developed at a much younger
age (Cunha et al. 2006). Following Cunha and Heckman’s (2007) theoretical framework, two
important factors concerning skill formation emerge: the age of the child and the parents’
willingness to invest in the child’s skill formation. It is also imperative to keep in mind that it
is vital to capture both mother’s and father’s time investment in the child, because the
intergenerational transmissions of education are influenced by both parents. Therefore, when
conducting a study that deals with time investment on childcare the focus should be on the
total household if the aim is to capture intergenerational transmission of education.
Using the Multinational Time Use Study (MTUS) database, we analyze the following
countries: France, Netherlands, Spain, UK and US.5 Our dependent variables (cognitive and
non-cognitive childcare activities) are regressed on the following control variables: parents’
level of education, hours worked by the parent, number of children, the age of the youngest
child and the gender of the parent. In a second step we divide the samples into three different
child age cohorts in order to capture the time investment during children’s upbringing and
analyse the pattern between parents’ level of education and investment on the childcare
activities.
4 We will not make any distinction between skills and ability.
5 The countries selected in this paper are based on the following factors: i.) Only surveys from OECD members
have been included that are not restricted due to data availability policy ii.) Only surveys harmonized in such a
detailed level so that it is possible to create cognitive and non-cognitive childcare variables have been included.
iii.) Only surveys that were collected during the five year period of 1998-2003 are included.
4
Our results indicate that the educational gradients for cognitive and non-cognitive
childcare activities are overall positive and increasing with respect to the level of education,
which is consistent with existing literature (Rosenzweig & Wolpin 1994). This may be one
reason why the intergenerational transmissions of education and income are high. Moreover,
when dividing the sample into different child age cohorts the results indicate that time
investment in cognitive childcare by parents is a concave function of the age of the child.
However, non-cognitive childcare time investments by parents display a decreasing function
between level of education and the age of the child. This finding is consistent with the
theoretical framework of technology of skill formation as formulated by Cunha and Heckman
(2007). Furthermore, as the educational gradient level increases more parental time is invested
in their children’s non-cognitive childcare activities, irrespective of sample, gender and age
cohort of the child.
The paper contributes to the existing literature on several levels. First, it investigates the
association between parents’ level of education and time investments on cognitive and non-
cognitive childcare. Second, we exploit the age of the child to show the pattern of time
investment of parents on our two childcare variables. Third we increase the external validity
of our findings by making a cross-national comparison. Furthermore, this paper contributes to
the small but growing empirical literature on the technology of skill formation.
Parental time investment and childcare activity
One of the pioneering theoretical studies in economics concerning child development is the
work by Becker and Tomes (1986)6. They assume that parents cannot invest in their children’s
endowments; however they can invest in their schooling which in turn increases their future
earnings. However, Becker and Tomes (1986) present a single period model where the age of
child at the point of investment in the child’s human capital is not important. Thus, a lump
sum investment in the child at the age of 17 is equally effective as smoothing the investment
during the child’s upbringing. An important result of their theoretical framework is that capital
markets are the major cause of the relatively high intergenerational transmission that is
6 However, the conceptual work was started by Ben-Porath (1967), with inputs such as child’s ability and school
quality. This work was carried on and improved by Liebowitz (1974), which conditional on parent’s investment
on children at home, analyzed how the child’s cognitive skills are affected by time investment on the childcare
activities reading and or playing.
5
apparent in most developed economies.7 Cunha and Heckman (2007) argue that parents’ can
in fact invest and increase their child’s endowment to a certain degree, as shown in
psychological and cognitive research (Cunha et al. 2006; Todd and Wolpin 2003; Turkheimer
et al. 2003; Cunha et al. 2010). They further suggest that the stage at which the investment in
the child’s human capital is made also matters (i.e. there are several critical time periods).
According to them the skill formation of a child critically depends on the investments in the
early preschool period (see Heckman et al. 2006 for a detailed overview). Ramey and Ramey
(2010) further emphasize that children with age-appropriate cognitive, social and emotional
skills have a greater probability to experience early and continued school success.
Previous findings show that mothers spend a substantially greater amount on time on
childcare as compared to fathers (Bianchi et al. 2000; Sayer et al. 2004a). This is explained in
terms of social norms that perceive childcare as typically a woman’s responsibility. However,
recent literature shows that there is a growing convergence between father’s and mother’s
time investment on childcare. Bryant and Zick (1996) show that the historical trend that
mothers spend more time on childcare than fathers has changed, in terms of fathers now
spending more time with their children. Using Australian time use data Craig (2006)
investigates Australian parents in order to detect gender differences in total childcare time.
The results show that motherhood involves more time alone with children and a greater
overall responsibility for managing children. This is also evident when the mother works full
time.8 Meanwhile fathers tend to allocate more time on flexible childcare activities such as
playing and teaching which is also supported by Guryan et al. (2008). In another study,
Averette et al. (2006) find that paternal care for young children is no better or worse than any
other type of arrangements (such as center care, family day care or care performed by
relatives). However, children with paternal childcare in the early stages of life, seemed to
have slightly worse cognitive outcomes than those with non-paternal childcare. In a study
with US data Guryan et al. (2008), analyze how parents allocate time to four different
childcare types9, conditional on employment status. One important result of their study is that
parents with high income and education seem to regard childcare as an investment in the
children’s human capital, and therefore devote more time towards childcare activities. This
7 Capital markets are the major cause for high intergenerational transmissions, because poor families have often
difficulties financing investments in children due to their credit constraint (Becker and Tomes 1986).
8 However, studies such as Baydar et al. (1999), shows that working compared to non-working mothers allocate
less time to childcare. Furthermore, Connelly and Kimmel (2009) show that mothers invest less time on
childcare as the child gets older.
9 Total childcare, basic childcare, recreational childcare and educational childcare.

6
result is also confirmed by Sepahvand et al. (2011); Sayer et al. (2004a, 2004b) and
Rosenzweig and Wolpin (1994).
Family structure, i.e. single or two-parent families, has an impact on how much time is
allocated towards children. Hofferth (2001) finds that single-mother families allocate
approximately one-third less time on childcare than two-parent families. One explanation for
the difference in time investment is that single-parent families are under greater time
constraints than two-parent families (Sandberg and Hofferth 2001).
Research has found that employment status has a negative, but small, effect, on the time
that is allocated towards childcare (Bianchi 2000). However, Hofferth (2001) shows that the
difference tends to affect mainly passive supervision rather than time spent on direct
engagement with children. In two-parent families the change in working hours of one of the
parents can affect the time spent on childcare by the other parents. Hallberg and Klevmarken
(2003) found, with Swedish data, that the variation in the wife’s working hours has no effect
on the husband’s childcare time. The reverse is found in a study by Kitterød and Pettersen
(2006). In contrast to the above literature, Joesch and Spiess (2006) find that the employment
status of the mother does not explain the cross-country differences in the mean number of
hours mothers reported looking after children.
Some literature (like Hofferth 2001 and Sayer et al. 2004a) shows that the age of
parents is associated with the amount of time spent with children. Sayer at al. (2004a) show
that parents aged 25-34 allocate the highest amount of time towards childcare activities as
compared to younger and older parents. They argue that the reason behind this finding has to
do with selection; older parents are more likely to have planned the birth and thereby may be
inclined to invest more time in childcare compared to younger parents.
Previous findings in economics have emphasized that skills are multidimensional. The
focus has been mainly on skills acquired through reading, writing or doing math. However,
recently there is a greater focus on the non-cognitive childcare activities and skill formation.
In the recent studies by Cunha and Heckman (2007); Butler et al. (2009) and Lindquist and
Vestman (2011) the child’s skills such as social skills have also been included while
discussing educational attainment and labour market outcomes.
7
Modeling parental investment on childcare
There are many factors that influence parents’ decision to invest time in their child’s cognitive
and non-cognitive skills. Parents may invest time in their child for altruistic reasons. They
could also choose to invest time in their child because they prefer to have a well behaved
child, which results in increasing parents’ own utility. Furthermore, parents’ time investment
in their child could also be related to more traditional reasons, which implies that an
investment in time would result in increased human capital of the child and future earnings.
In order to capture the parents’ time investment in their children’s abilities, cognitive
and non-cognitive childcare activities will be regressed upon a set of education dummy
variables (which can also be regarded as a proxy variable for income) but also a set of control
variables. Following earlier research on parental time use (Bryant and Zick 1996; Sayer et al.
2004a; Guryan et al. 2008) the following control variables for parents’ time allocation are
included in this study given their documented importance: the number of children, the age of
the youngest child, the couple status, the gender of the parent, hours worked, age and age
squared. For a discussion about the connection between previous research and the control
variables used in this study, see section Parental time investment and childcare activity.
The dependent variables cognitive and non-cognitive skills are constructed by parents’
investment on cognitive and non-cognitive childcare activities. The cognitive variable consists
of time use activities that are related to parents’ time investment towards learning, while the
non-cognitive variable is related to care and socializing. The estimations in this paper are
based on OLS regressions with robust standard errors, following a large body of literature
(Price 2008; Guryan et al. 2008; Brown and Dunn 2011; Gershuny 2012; Foster and
Kalenkoski 2012).
Cognitive and non-cognitive childcare activities
The cognitive variable captures time investment in activities related to the learning process of
the child, such as teaching and showing the child how to perform different tasks that involve
learning and stimulating the child’s cognitive skills. For instance, time investment in helping
the child with school work. It is crucial to understand why time investment in activities
related to the learning process (i.e. reading, writing and counting) is closely connected to

8
cognitive skills such as memory, concentration and reflection. Furthermore, as the child learns
to read and write, her cognitive skills develop and improve.
Memory, as one part of the cognitive ability of a child, is developed and improved
through reading and writing. When a child devotes time to reading, writing and/or counting,
she gets familiarized with words and numbers which help to improve and develop the
memory capacity of the child. Therefore, time investment by parents in these activities helps
to intensify the development of cognitive skills. (Snow et al. 1995)
Another aspect is concentration, which is for how long and to what extent the child can
focus on one activity without being distracted by her surroundings. Krampen (2008) shows
that when helping or teaching the child to perform a specific task (such as picture-book
reading when the child is young), the child’s concentration would increase. For instance, by
parents sitting down with the child and helping her to write, the child increases her
concentration through focusing on distinguishing between words and letters to be able to
make sense of a sentence. This example provides a good overlap to the third aspect of
cognitive ability, i.e. reflection.
According to Neuman and Roskos (1997) making sense of a sentence involves
understanding symbols and reflecting upon them. Therefore, a child without the ability to
understand symbols would not be able to create sentences by using different forms of letters
and words. Thus, investing time in tasks directly involving learning, the parent would not only
develop and improve the memory and concentration of a child, but also the ability to reflect.
The term non-cognitive skills is used extensively in economic literature, other
disciplines use terms more related to the characteristics of the child as her temperament, for
instance the mood or sensitivity (MacClowry 1995; Deal et al. 2005) or social-cognitive skills
(Forrester 1995). The term non-cognitive skills, independent of definition, refers to those
individual abilities, considered ”personality characteristics”, which are acquired during
childhood and adolescence. It has long been assumed that non-cognitive skills are endowed
genetically. However, this perception has changed with time (Coneus and Laucht 2008; Cunha
et al. 2006). Research shows that non-cognitive skills in an individual are mainly determined
through interactions during the child’s upbringing and the stimulus in her surroundings.
The non-cognitive variable10
is constructed from parents’ time investment on a range of
different childcare activities, such as physical and medical care of the child, feeding, changing
10 In order to check the robustness of our non-cognitive results, we have excluded the basic element of childcare
(meaning activities such as: physical and medical care of the child, feeding, changing diapers, toilet training and
dressing). Despite doing this the pattern of our result do not change.

9
diapers, toilet training and dressing. But also telling stories, conversation, playing social
games like Monopoly and Risk, participating in sport activities and so on. It should be noted
that the non-cognitive skill variable refers to activities that do not directly relate to the
memory, concentration and reflection (i.e. cognitive ability) of the child. Instead, the activities
in the non-cognitive variable are assumed to increase skills such as persistence, motivation,
emotional stability, social competence, outgoing character, independence, power of initiative,
patience and time preferences etc.
It is crucial to understand the link between time investment in early child activities
(such as feeding, changing diapers, toilet training, dressing, etc.) and non-cognitive skills.
Bretherton (1992) provides argument that small children need to feel secure, needed and
nurtured in their early stages of childcare, which would increase their self-esteem later in
life.11
Moreover, research has pointed out that the investment in these basic childcare
activities must be followed up by (at a later stage of childhood) activities that encourage the
child to interact with others to experience other perspectives. This implies that activities such
as playing have a vital role as Trawick-Smith and Dziurgot (2011) also point out.12
In other
words, the assumption is that increased time in the basic childcare activities would increase
the non-cognitive skills of the child (such as self-esteem and emotional stability) which
impacts the labour markets outcomes when the child has become an adult.
According to Leslie (1987) a fundamental trace of human development is the ability to
pretend and understand pretense in others. In other words, to pretend and/or do as others do,
develops the non-cognitive skills of a child such as social skills. This ability can be
encouraged and developed through parents investing time in activities such as playing games,
telling stories and having a conversation with the child.
The activities included in cognitive and non-cognitive childcare for each selected
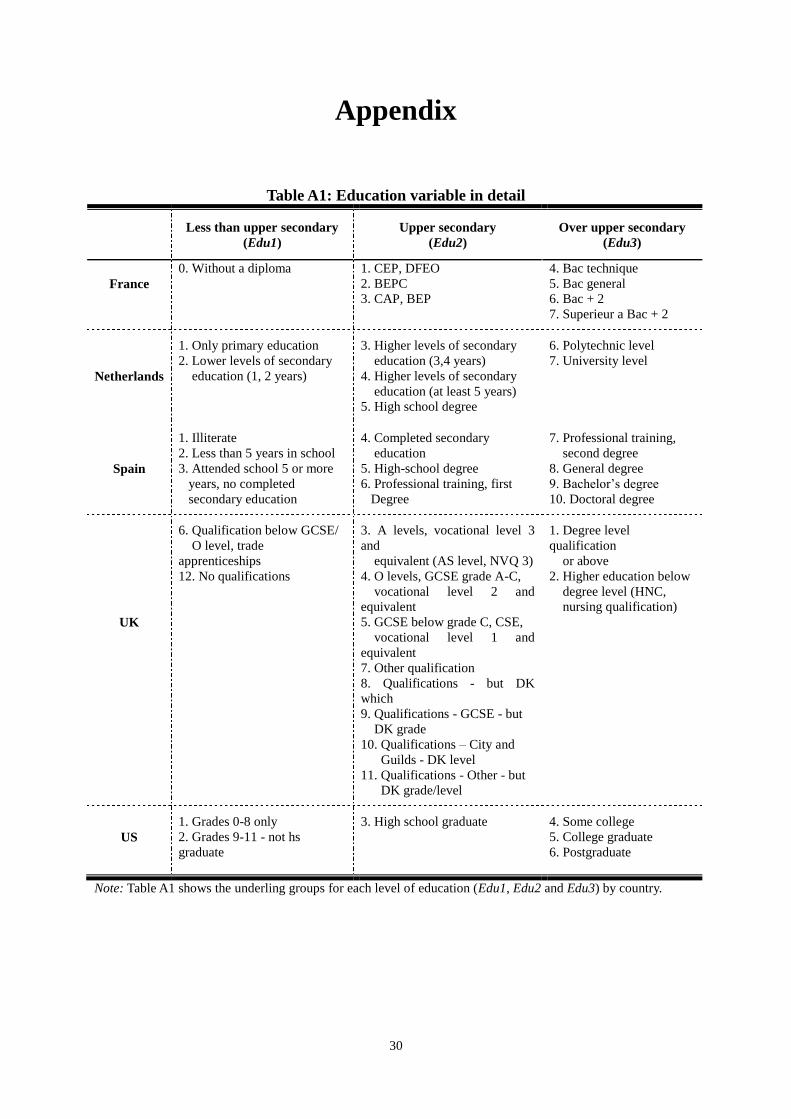
country is described by Table A2 in the Appendix. The education variable is divided into three
categories as specified by MTUS during the harmonization process and is based on
International Standard Classification of Education (ISCED), developed by UNESCO: not
completed upper secondary (edu1), completed upper secondary (edu2) and above upper
secondary (edu3). Edu1 includes all those persons that have not completed or have less than
upper secondary education, edu2 includes those who have completed their upper secondary
education and edu3 consists of those who have an education above upper secondary. The
11 A more detailed discussion can be found in Forrester (1995) where Piaget’s notion of egocentrism in early
childhood is discussed. Piaget’s notion of egocentrism implies that since small children only see the world from
their own perspective, their needs have to be fulfilled in order for the child to develop healthfully.
12 For a further discussion about the effect of playing and non-cognitive skills, see Vygotsky (1978).

10
classification for each selected country and a more detailed categorization of the education
variables used in this study can be seen in Table A1 in the Appendix.
The data used in this study allow us, due to its gender-ratio, to conduct an analysis
separately for each gender. Moreover, to test whether parents are essential in the long-term
development of skill formation (Cunha and Heckman 2007), the effect of parents (fathers and
mothers) are scaled down at different child age cohorts. The following age cohorts have been
used: Age1 = children between 0-4 years, Age2 = children between 5-11 years and Age3 =
children between 12-17 years. This will enable us to detect if there are heterogeneous age
effects. This can shed more light on whether or not parents’ education attainment can
influence skill formation even during child’s adolescence, and hence might suggest that these
abilities are not totally determined at a young age.
Understanding Time Use Data
The analysis in this study is based on MTUS which is a harmonized cross sectional data set.13
Table 1 provides survey information for the selected countries (France, Netherlands, Spain,
UK and US) in this study; such as the sample size, response rate, survey year, time interval for
each given time use activity and the number of diary days. The countries included are those
that could separate the childcare variable into cognitive and non-cognitive childcare. We only
consider the respondents between the ages of 21 and 55 with at least one child under age 18
and with a complete 24-hour time diary.
Different countries have conducted their surveys during different periods. Table 1 also
shows information on the time interval for each given time use activity that is filled in by the
respondents. The point estimates of each country cannot be comparable in a cross country
fashion, due to institutional differences when it comes to education, childcare, parental leave
and market-labour conditions. However, the pattern of the results is comparable across
countries and consistent as shown below in our empirical result section. For instance, in the
US and the UK there exists a more liberal welfare state where market solutions are prevalent.
While countries like Spain and France are categorized as more conservative welfare state,
where market solution are not as dominating as in liberal welfare states (Esping-Andersen
1990).
13 For a detailed information see Fisher et al. (2012).

11
Table 1: Survey information
Country Number of
observations
Response
rate %
Number of
diary days
Survey
year
Time
interval
minutes
France 15 441 88,3 1 1998/99 10
Netherlands 15 428 37 7 2005 15
Spain 46 774 86.0 1 2002/03 10
UK 11 667 45.0 2 2000/01 10
US 45 496 57 1 2003 Free
Notes: Table 1 illustrates the technical information for each survey in the selected
countries. The samples are restricted to include only individuals between the ages of 21
and 55 with at least one child under the age of 18 present in the household.
Furthermore, the samples include only individuals who had completed time diaries (i.e.
1440 minutes). The time intervals are for each given activity that is filled in by the
respondent in the diary.
The descriptive analysis is shown for cognitive and non-cognitive childcare activities in all
countries and the samples are Full, Working and Non-Working. The categories are Parent,
Fathers and Mothers and the three different educational attainments are uncompleted,
completed and above upper secondary school.
According to studies by Bryant and Zick (1996) and Sayer et al. (2004a), the gender of
the parent has a major influence on the time invested in the child. These findings indicate that
mothers invest significantly larger amount of time on their children than fathers. This fact is
also supported in table 2. For instance, British mothers in the Full sample invest on average
almost 38 minutes more per day on non-cognitive activities compared to fathers (the
corresponding difference for cognitive activities is 1.63 minutes per day).
According to Becker (1991), an individual’s time investment in the household is
strongly related to the specialization that takes place within the household, i.e. market work
status. The obvious pattern should be that employed individuals have less time to invest in the
household than unemployed. This is supported by comparing table 3 and table 4, as indicated
through the clear pattern between the Working and Non-Working samples. The French non-
working parents invest on average 40 minutes more per day on non-cognitive activities
compared to the French working parents (this is also confirmed by the corresponding
cognitive childcare). This pattern is also evident for French non-working mothers (and
fathers), as they on average invest 37 minutes (8 minutes) more on their child’s non-cognitive
skills than working mothers (fathers).
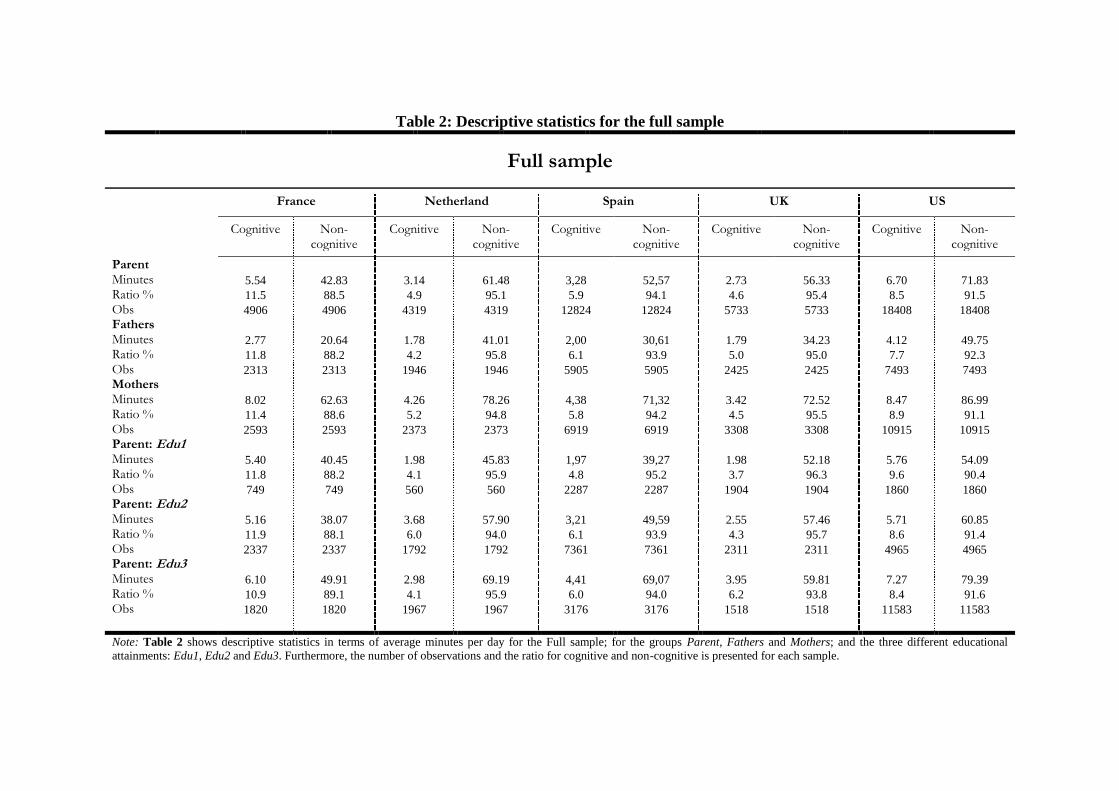
Table 2: Descriptive statistics for the full sample
Full sample
France Netherland Spain UK US
Cognitive Non-cognitive
Cognitive Non-cognitive
Cognitive Non-cognitive
Cognitive Non-cognitive
Cognitive Non-cognitive
Parent
Minutes 5.54 42.83 3.14 61.48 3,28 52,57 2.73 56.33 6.70 71.83
Ratio % 11.5 88.5 4.9 95.1 5.9 94.1 4.6 95.4 8.5 91.5
Obs 4906 4906 4319 4319 12824 12824 5733 5733 18408 18408
Fathers
Minutes 2.77 20.64 1.78 41.01 2,00 30,61 1.79 34.23 4.12 49.75
Ratio % 11.8 88.2 4.2 95.8 6.1 93.9 5.0 95.0 7.7 92.3
Obs 2313 2313 1946 1946 5905 5905 2425 2425 7493 7493
Mothers
Minutes 8.02 62.63 4.26 78.26 4,38 71,32 3.42 72.52 8.47 86.99
Ratio % 11.4 88.6 5.2 94.8 5.8 94.2 4.5 95.5 8.9 91.1
Obs 2593 2593 2373 2373 6919 6919 3308 3308 10915 10915
Parent: Edu1
Minutes 5.40 40.45 1.98 45.83 1,97 39,27 1.98 52.18 5.76 54.09
Ratio % 11.8 88.2 4.1 95.9 4.8 95.2 3.7 96.3 9.6 90.4
Obs 749 749 560 560 2287 2287 1904 1904 1860 1860
Parent: Edu2
Minutes 5.16 38.07 3.68 57.90 3,21 49,59 2.55 57.46 5.71 60.85
Ratio % 11.9 88.1 6.0 94.0 6.1 93.9 4.3 95.7 8.6 91.4
Obs 2337 2337 1792 1792 7361 7361 2311 2311 4965 4965
Parent: Edu3
Minutes 6.10 49.91 2.98 69.19 4,41 69,07 3.95 59.81 7.27 79.39
Ratio % 10.9 89.1 4.1 95.9 6.0 94.0 6.2 93.8 8.4 91.6
Obs 1820 1820 1967 1967 3176 3176 1518 1518 11583 11583
Note: Table 2 shows descriptive statistics in terms of average minutes per day for the Full sample; for the groups Parent, Fathers and Mothers; and the three different educational
attainments: Edu1, Edu2 and Edu3. Furthermore, the number of observations and the ratio for cognitive and non-cognitive is presented for each sample.

13
Table 3: Descriptive statistics for the working sample
Working
France Netherland Spain UK US
Cognitive Non-cognitive
Cognitive Non-cognitive
Cognitive Non-cognitive
Cognitive Non-cognitive
Cognitive Non-cognitive
Parent
Minutes 4.57 33.43 2.55 55.87 2,45 43,09 2.50 45.69 5.43 61.87
Ratio % 12.0 88.0 4.4 95.6 5.4 94.6 5.2 94.8 8.1 91.9
Obs 3774 3774 3549 3549 8855 8855 4398 4398 14503 14503
Fathers
Minutes 2.66 19.91 1.81 37.81 1,98 30,76 1.88 32.88 3.83 48.88
Ratio % 11.8 88.2 4.6 95.4 6.0 94.0 5.4 94.6 7.3 92.7
Obs 2077 2077 1827 1827 5300 5300 2186 2186 6877 6877
Mothers
Minutes 6.90 49.99 3.34 75.03 3,16 61,48 3.11 58.35 6.88 73.58
Ratio % 12.1 87.9 4.3 95.7 4.9 95.1 5.1 94.9 8.6 91.4
Obs 1697 1697 1722 1722 3555 3555 2212 2212 7626 7626
Parent: Edu1
Minutes 4.40 22.95 1.59 37.33 1,35 23,90 1.74 38.08 2.96 35.92
Ratio % 16.1 83.9 4.1 95.9 5.4 94.6 4.4 95.6 7.6 92.4
Obs 425 425 434 434 1258 1258 1261 1261 1134 1134
Parent: Edu2
Minutes 4.23 28.07 2.71 50.51 2,04 37,35 2.16 46.11 4.36 50.65
Ratio % 13.1 86.9 5.1 94.9 5.2 94.8 4.5 95.5 7.9 92.1
Obs 1848 1848 1393 1393 4971 4971 1841 1841 3803 3803
Parent: Edu3
Minutes 5.04 43.01 2.67 64.88 3,75 63,16 3.72 52.51 6.16 69.41
Ratio % 10.5 89.5 3.9 96.1 5.6 94.4 6.6 93.4 8.1 91.9
Obs 1501 1501 1722 1722 2626 2626 1296 1296 9566 9566
Note: Table 3 shows descriptive statistics in terms of average minutes per day for the Working sample; for the groups Parent, Fathers and Mothers; and the three different educational
attainments: Edu1, Edu2 and Edu3. Furthermore, the number of observations and the ratio for cognitive and non-cognitive is presented for each sample.

14
Table 4: Descriptive statistics for the non-working sample
Non-Working
France Netherland Spain UK US
Cognitive Non-cognitive
Cognitive Non-cognitive
Cognitive Non-cognitive
Cognitive Non-cognitive
Cognitive Non-cognitive
Parent
Minutes 8.79 74.09 5.86 87.31 5,14 73,73 3.50 91.36 11.40 108.84
Ratio % 10.6 89.4 6.3 93.7 6.5 93.5 3.7 96.3 9.5 90.5
Obs 1132 1132 770 770 3969 3969 1335 1335 3905 3905
Fathers
Minutes 3.71 27.05 1.26 90.25 2,18 29,29 0.96 46.61 7.40 59.46
Ratio % 12.1 87.9 1.4 98.6 6.9 93.1 2.0 98.0 11.1 88.9
Obs 236 236 119 119 605 605 239 239 616 616
Mothers
Minutes 10.13 86.50 6.71 86.77 5,68 81,72 4.05 101.12 12.14 118.08
Ratio % 10.5 89.5 7.2 92.8 6.5 93.5 3.9 96.1 9.3 90.7
Obs 896 896 651 651 3364 3364 1096 1096 3289 3289
Parent: Edu1
Minutes 6.70 63.30 3.33 75.12 2,73 58,07 2.46 79.83 10.13 82.46
Ratio % 9.6 90.4 4.2 95.8 4.5 95.5 3.0 97.0 10.9 89.1
Obs 324 324 126 126 1029 1029 643 643 726 726
Parent: Edu2
Minutes 8.67 75.89 7.07 83.68 5,63 75,06 4.09 101.91 10.14 94.27
Ratio % 10.3 89.7 7.8 92.2 7.0 93.0 3.9 96.1 9.7 90.3
Obs 489 489 399 399 2390 2390 470 470 1162 1162
Parent: Edu3
Minutes 11.13 82.38 5.20 99.49 7,56 97,25 5.27 102.43 12.58 126.72
Ratio % 11.9 88.1 5.0 95.0 7.2 92.8 4.9 95.1 9.0 91.0
Obs 319 319 245 245 550 550 222 222 2017 2017
Note: Table 4 shows descriptive statistics in terms of average minutes per day for the Non-Working sample; for the groups Parent, Fathers and Mothers; and the three different
educational attainments: Edu1, Edu2 and Edu3. Furthermore, the number of observations and the ratio for cognitive and non-cognitive is presented for each sample.

Furthermore, tables 2-4 also presents average minutes per day invested on the child’s
cognitive and non-cognitive skills conditional on the level of education of the parent. The
essential feature is that time investment on both cognitive and non-cognitive childcare
increases as the level of education of the parent increase. For instance, the Spanish working
parent invests on average around 24, 37 and 63 minutes per day on non-cognitive childcare as
their level of education increases (the corresponding values for cognitive childcare are 1.35,
2.04 and 3.75 minutes per day). Therefore, the highest educated Spanish working parents
invest on average almost 39 minutes more per day on their child’s non-cognitive skills
compared to the lowest educated group (the corresponding values for cognitive childcare is
2.4 minutes).
One important piece of information is how large proportion of the time spent on
childcare is constituted by cognitive and non-cognitive activities, in order to detect any
systematic patters. For instance, in the Full sample British parents allocate on average 4.6
percent of their time to cognitive childcare activities, as shown by table 2. Independent of
which group we look at (parent, fathers, mothers, etc.) in the full sample, almost the same
proportion is invested in cognitive and non-cognitive childcare activities but with more
relative time devoted to non-cognitive childcare. This pattern is evident for table 3 and 4
(Working and Non-working) as well. One interpretation is that there is a systematic pattern in
the behavior of the parents when it comes to how large proportion of childcare that is devoted
to cognitive and non-cognitive activities. In other words, relative time devoted to childcare
activities does not change between different groups of parents although the absolute time
devoted to childcare is quite volatile. This pattern holds for all countries in the study. In order
to check that our results were not driven by the large absolute values for parental time
investment on non-cognitive childcare, the basic childcare part of non-cognitive childcare,
was dropped. The result with this modified non-cognitive childcare indicated the same
pattern.
Investment patterns on cognitive and non-cognitive activities
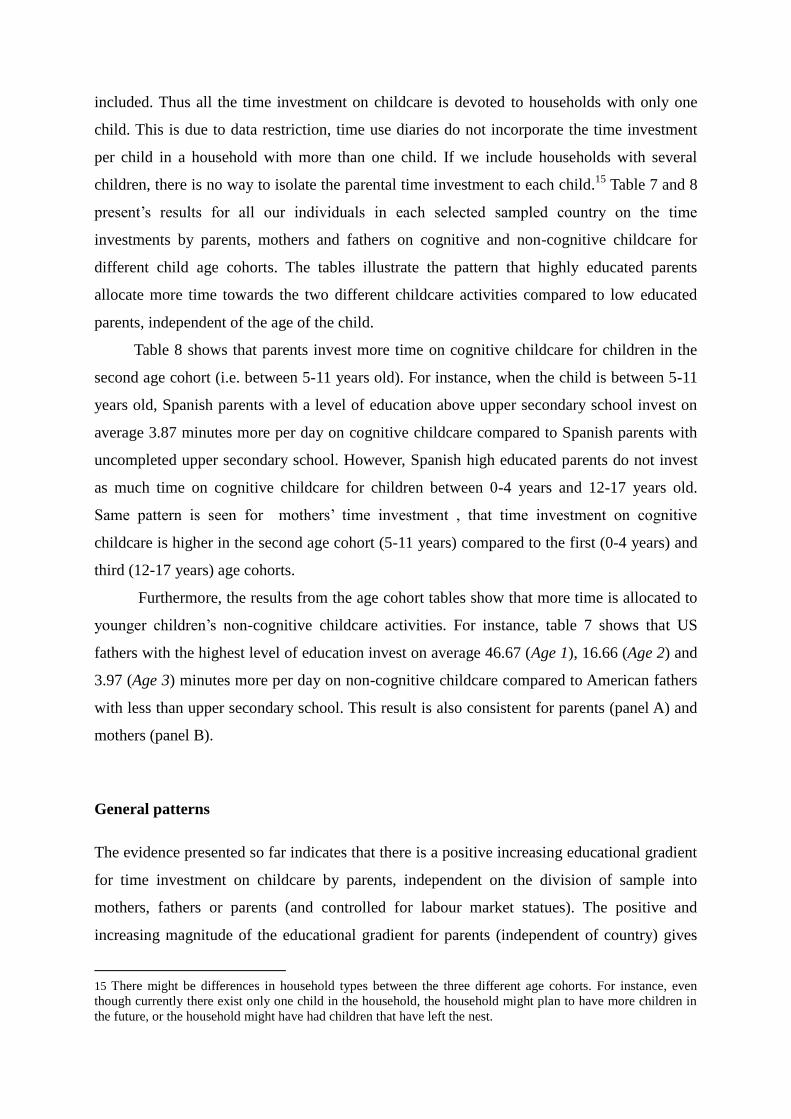
Empirical results from the parents’ time allocation towards cognitive and non-cognitive
childcare activities are presented in table 5 and 6. These tables present the conditional
16
differences for time invested by the parents on cognitive and non-cognitive14
childcare
activities for three different samples (Full, Working and Non-working). Results from further
analysis are reported for the age of the child, conditional on the level of education. The
estimation results for the two highest levels of education variables completed and above upper
secondary school, should be interpreted as additional minutes per day invested by the parents
on their children’s cognitive and non-cognitive skills relative to the lowest level of education.
Level of Education
We start by analyzing the impact of parents’ time investment on their children’s cognitive and
non-cognitive activities for all the individuals in our sample given their level of education,
and then proceed to examine the investment by working and non-working parents.
Tables 5 and 6 shows that parents’ time investment has a positive educational gradient
for both cognitive and non-cognitive childcare. For instance, US parents in the Full sample
with an education above upper secondary school invest on average 2.15 minutes more per day
on their children’s cognitive childcare compared to US parents with an not completed upper
secondary school as seen in Table 6. The effect from parents’ investment on non-cognitive
childcare activities is presented in table 5. For instance, in the US Full sample, parents with
education above upper secondary school invest on average around 32 minutes more per day
on non-cognitive activities compared to those US parents’ with uncompleted upper secondary
school. The same positive pattern can also be depicted for those with completed upper
secondary school, where on average 18 minutes more per day is invested. Furthermore, the
same pattern is evident for Dutch parents in the Full sample. For instance, the educational
gradient increases with almost 4.5 minutes per day on average for parents with completed
upper secondary school investing in the children’s non-cognitive chidlcare, while the increase
between completed and above upper secondary school is almost 11 minutes per day on
average. Positive patterns of the education gradient in terms of parents’ investment on non-
cognitive childcare indicate that there are similarities between investing in children’s non-
cognitive skills and parents’ level of education but also that parents on average invest more
time per day on non-cognitive activities compared to cognitive.
14
We have tried to exclude the basic childcare activities from our non-cognitive variable, but this does not
change any of our results in any significant way.

Table 5: Conditional differences for non-cognitive childcare
Non-cognitive childcare
France Netherlands Spain UK US
Parents Mothers Fathers Parents Mothers Fathers Parents Mothers Fathers Parents Mothers Father Parents Mothers Fathers
Panel A: Full sample
Edu2 9.13*** 10.28** 5.54** 4.49 8.52* -0.47 7.97*** 7.78*** 5.94*** 0.14 -0.85 0.17 17.71*** 17.79*** 14.96***
Edu3 15.15*** 16.49*** 11.86*** 15.52*** 21.63*** 8.28** 21.23*** 19.54*** 18.50*** 9.54*** 11.48*** 6.61** 32.45*** 34.28*** 26.70***
OBS 4906 2593 2313 4319 2373 1946 12824 6919 5905 5733 3308 2425 13079 7730 5349
Panel B: Working sample
Edu2 5.63** 2.57 5.86*** 0.76 3.81 -2.85 5.48*** 5.61 4.75*** -1.41 -4.81 0.46 17.86*** 18.10*** 16.06***
Edu3 12.48*** 8.80* 13.01*** 12.53*** 13.51** 9.22** 20.45*** 20.50*** 17.29*** 8.14*** 9.97** 6.27** 31.28*** 32.40*** 28.30***
OBS 3774 1697 2077 3549 1722 1827 8844 3549 5295 4398 2212 2186 10290 5396 4894
Panel C: Non-working sample
Edu2 13.36** 15.40** 5.05 17.61** 12.91 0.43 11.06*** 9.70*** 13.82*** 3.33 5.70 -3.70 14.27** 13.74* 8.60
Edu3 21.90*** 24.17*** 8.52 24.07*** 31.49*** -32.30 21.65*** 19.01*** 30.15*** 10.36 8.98 19.88 33.56*** 35.45*** 17.99
OBS 1132 896 236 770 651 119 3980 3370 610 1335 1096 239 2789 2334 455
Note: Table 5 shows the conditional differences by level of education for time spent on non-cognitive childcare activity for all parents, mothers and fathers in all the selected countries. All time
use measures are presented in minutes per day. Conditional differences reports the coefficients from an OLS regression with robust standard errors with the following control variables: age, age-
square, age of the youngest child, number of children, hours worked, couple status, gender dummy and proposed diary weights. The reference category for the level of education dummy
variables is Edu1. *, ** and *** illustrates significant level at 10 %, 5% and 1%.

18
Table 6: Conditional differences for cognitive childcare
Cognitive childcare
France Netherlands Spain UK US
Parents Mothers Fathers Parents Mothers Fathers Parents Mothers Fathers Parents Mothers Father Parents Mothers Fathers
Panel A: Full sample
Edu2 1.11 1.40 1.11 1.27** 3.37*** -0.06 1.80*** 2.45*** 0.90*** 0.93** 1.36** 0.22 1.03 0.67 1.59*
Edu3 1.98** 3.04** 1.08 1.15** 3.05*** -0.07 3.40*** 4.12*** 2.54*** 2.09*** 2.95*** 0.87 2.15*** 2.68** 1.58**
OBS 4906 2593 2313 4319 2373 1946 12824 6919 5905 5733 3308 2425 13079 7730 5349
Panel B: Working sample
Edu2 0.02 -1.03 0.82 0.86* 2.38*** 0.10 0.78** 0.24 1.00*** 0.63 1.01* 0.23 0.97 0.42 1.72*
Edu3 0.18 -0.90 0.96 0.94* 2.57*** 0.05 2.28*** 1.52** 2.68*** 1.77*** 2.56*** 0.84 2.16*** 2.57** 1.79**
OBS 3774 1697 2077 3549 1722 1827 8844 3549 5295 4398 2212 2186 10290 5396 4894
Panel C: Non-working sample
Edu2 2.49* 2.61 2.62 2.99** 4.41*** -1.91 3.16*** 3.73*** 0.66 1.61* 1.97** -0.33 1.31 1.02 0.82
Edu3 6.86*** 8.39*** 0.79 2.32* 3.28* -0.60 5.69*** 6.70*** 1.38 2.81** 3.13** 0.94 2.30 2.49 -0.53
OBS 1132 896 236 770 651 119 3980 3370 610 1335 1096 239 2789 2334 455
Note: Table 6 shows the conditional differences by level of education for time spent on cognitive childcare activity for all parents, mothers and fathers in all the selected countries. All time use
measures are presented in minutes per day. Conditional differences reports the coefficients from an OLS regression with robust standard errors with the following control variables: age, age-
square, age of the youngest child, number of children, hours worked, couple status, gender dummy and proposed diary weights. The reference category for the level of education dummy
variables is Edu1. *, ** and *** illustrates significant level at 10 %, 5% and 1%.

The same positive pattern between the level of education and time investment on non-
cognitive childcare activities for working parent can also be seen. For instance, Spanish
working parents with above upper secondary school education invest on average around 20
minutes more per day on non-cognitive activities compared to Spanish parents with
uncompleted upper secondary school. This pattern can also be depicted when comparing the
levels of education corresponding to complete and uncompleted upper secondary school for
the Spanish working parents. Here, Spanish parents that are in the labour market and have an
completed level of education invest on average almost 5 minutes more per day on non-
cognitive childcare, compare to parents with the lowest level of education. Furthermore,
looking at the difference between Spanish working parents with above upper secondary
school and those with completed upper secondary school, we can depict a positive significant
pattern in terms of time investment on non-cognitive childcare were working parents with
above upper secondary school invest on average almost 15 minutes more per day on non-
cognitive activities.
The positive patterns concerning the education gradient in terms of parents’ investment
on non-cognitive childcare that is shown for Full sample and Working sample, are also
depicted for Non-working sample. For instance, French non-working parents with above
upper secondary education invest on average almost 22 minutes more per day on non-
cognitive childcare compared to those parents that have the uncompleted upper secondary
school. This pattern can also be depicted when comparing uncompleted and completed upper
secondary school for French non-working parents, as those with completed upper secondary
school invest on average 13 minutes more on their child’s non-cognitive skills. A final
comparison of the tables shows that as the level of education increases, the time invested by
parents on their children’s cognitive and non-cognitive skills increases on average per day
however with the clear differences that more time is devoted to non-cognitive childcare
activities. Moreover, the same patterns can be depicted when excluding the basic childcare
element from the non-cognitive childcare variable.
Age of the child
We next turn our attention to parents’ time investment on cognitive and non-cognitive
childcare activities for different child age cohorts. In order to draw conclusions about parents’
time investment on cognitive and non-cognitive childcare, only parents with one child are
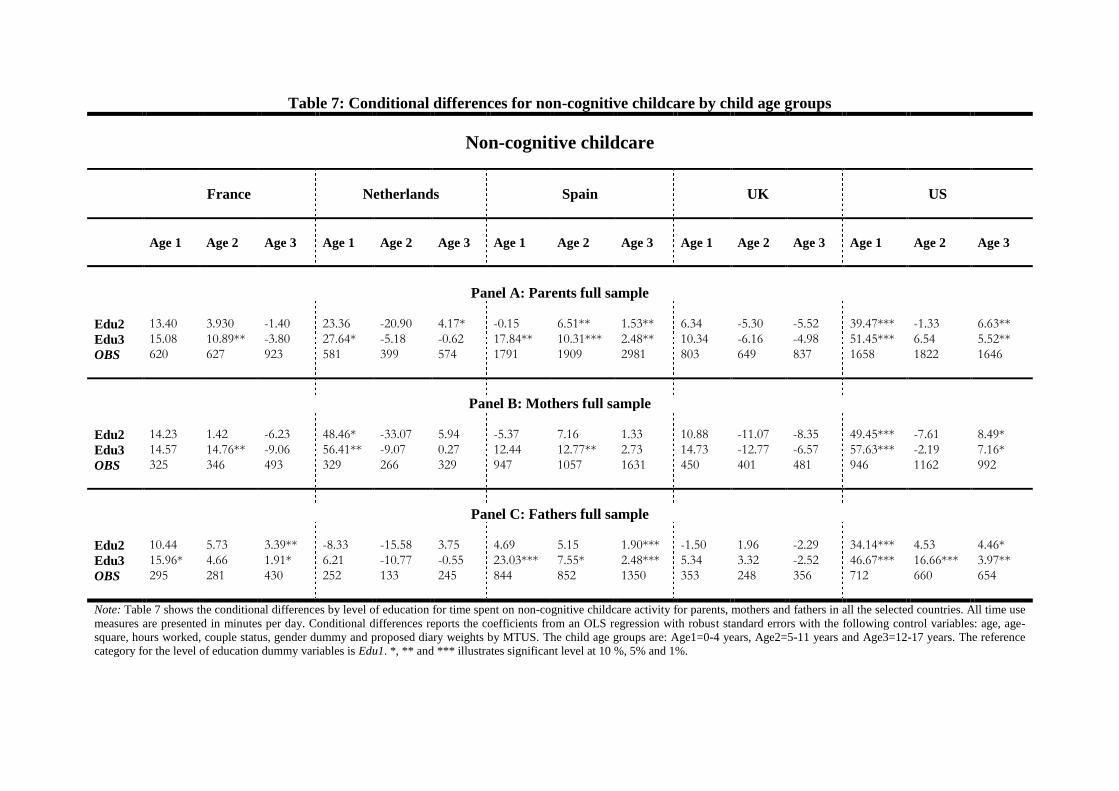
Table 7: Conditional differences for non-cognitive childcare by child age groups
Non-cognitive childcare
France Netherlands Spain UK US
Age 1 Age 2 Age 3 Age 1 Age 2 Age 3 Age 1 Age 2 Age 3 Age 1 Age 2 Age 3 Age 1 Age 2 Age 3
Panel A: Parents full sample
Edu2 13.40 3.930 -1.40 23.36 -20.90 4.17* -0.15 6.51** 1.53** 6.34 -5.30 -5.52 39.47*** -1.33 6.63**
Edu3 15.08 10.89** -3.80 27.64* -5.18 -0.62 17.84** 10.31*** 2.48** 10.34 -6.16 -4.98 51.45*** 6.54 5.52**
OBS 620 627 923 581 399 574 1791 1909 2981 803 649 837 1658 1822 1646
Panel B: Mothers full sample
Edu2 14.23 1.42 -6.23 48.46* -33.07 5.94 -5.37 7.16 1.33 10.88 -11.07 -8.35 49.45*** -7.61 8.49*
Edu3 14.57 14.76** -9.06 56.41** -9.07 0.27 12.44 12.77** 2.73 14.73 -12.77 -6.57 57.63*** -2.19 7.16*
OBS 325 346 493 329 266 329 947 1057 1631 450 401 481 946 1162 992
Panel C: Fathers full sample
Edu2 10.44 5.73 3.39** -8.33 -15.58 3.75 4.69 5.15 1.90*** -1.50 1.96 -2.29 34.14*** 4.53 4.46*
Edu3 15.96* 4.66 1.91* 6.21 -10.77 -0.55 23.03*** 7.55* 2.48*** 5.34 3.32 -2.52 46.67*** 16.66*** 3.97**
OBS 295 281 430 252 133 245 844 852 1350 353 248 356 712 660 654
Note: Table 7 shows the conditional differences by level of education for time spent on non-cognitive childcare activity for parents, mothers and fathers in all the selected countries. All time use
measures are presented in minutes per day. Conditional differences reports the coefficients from an OLS regression with robust standard errors with the following control variables: age, age-
square, hours worked, couple status, gender dummy and proposed diary weights by MTUS. The child age groups are: Age1=0-4 years, Age2=5-11 years and Age3=12-17 years. The reference
category for the level of education dummy variables is Edu1. *, ** and *** illustrates significant level at 10 %, 5% and 1%.
21
Table 8: Conditional differences for cognitive childcare by child age groups
Cognitive childcare
France Netherlands Spain UK US
Age 1 Age 2 Age 3 Age 1 Age 2 Age 3 Age 1 Age 2 Age 3 Age 1 Age 2 Age 3 Age 1 Age 2 Age 3
Panel A: Parents full sample
Edu2 0.10 2.98* 0.41 -1.01 1.83 -1.95 0.14 1.22 0.55*** 0.01 1.34 2.00* -2.31 1.68 0.44
Edu3 0.44 3.40* 3.18** -1.55 0.43 -1.45 -0.08 3.87*** 1.83*** 0.11 3.25* 1.56 -2.07 2.05 0.72
OBS 620 627 923 581 399 574 1791 1909 2981 803 649 837 1658 1822 1646
Panel B: Mothers full sample
Edu2 0.11 2.65 -0.12 -1.51 3.68* -1.15 0.17 1.94 0.64*** -0.04 1.36 0.21 -0.90 2.70 -0.55
Edu3 0.81 3.81 3.56 -1.83 1.58 -1.45 -0.27 4.82** 1.29** 0.02 4.87* 2.38 -0.90 3.05 0.70
OBS 325 346 493 329 266 329 947 1057 1631 450 401 481 946 1162 992
Panel C: Fathers full sample
Edu2 0.13 3.48*** 1.13* -0.53 8.254** -1.40 0.07 0.08 0.34** 0.08 1.71 4.08 -3.62 -0.13 1.40
Edu3 0.02 2.71** 2.92** -1.19 6.528** -0.43 0.10 2.57 2.19*** 0.29 0.10 0.41 -3.09 0.25 0.74
OBS 295 281 430 252 133 245 844 852 1350 353 248 356 712 660 654
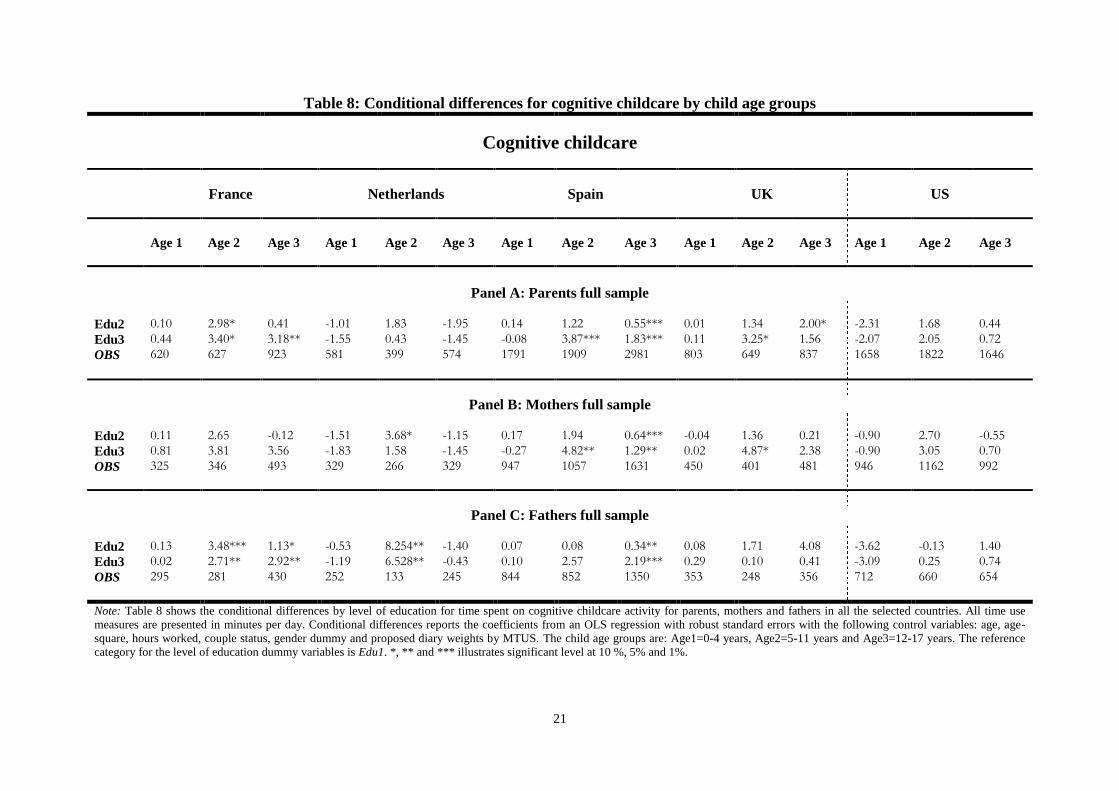
Note: Table 8 shows the conditional differences by level of education for time spent on cognitive childcare activity for parents, mothers and fathers in all the selected countries. All time use
measures are presented in minutes per day. Conditional differences reports the coefficients from an OLS regression with robust standard errors with the following control variables: age, age-
square, hours worked, couple status, gender dummy and proposed diary weights by MTUS. The child age groups are: Age1=0-4 years, Age2=5-11 years and Age3=12-17 years. The reference
category for the level of education dummy variables is Edu1. *, ** and *** illustrates significant level at 10 %, 5% and 1%.
included. Thus all the time investment on childcare is devoted to households with only one
child. This is due to data restriction, time use diaries do not incorporate the time investment
per child in a household with more than one child. If we include households with several
children, there is no way to isolate the parental time investment to each child.15
Table 7 and 8
present’s results for all our individuals in each selected sampled country on the time
investments by parents, mothers and fathers on cognitive and non-cognitive childcare for
different child age cohorts. The tables illustrate the pattern that highly educated parents
allocate more time towards the two different childcare activities compared to low educated
parents, independent of the age of the child.
Table 8 shows that parents invest more time on cognitive childcare for children in the
second age cohort (i.e. between 5-11 years old). For instance, when the child is between 5-11
years old, Spanish parents with a level of education above upper secondary school invest on
average 3.87 minutes more per day on cognitive childcare compared to Spanish parents with
uncompleted upper secondary school. However, Spanish high educated parents do not invest
as much time on cognitive childcare for children between 0-4 years and 12-17 years old.
Same pattern is seen for mothers’ time investment , that time investment on cognitive
childcare is higher in the second age cohort (5-11 years) compared to the first (0-4 years) and
third (12-17 years) age cohorts.
Furthermore, the results from the age cohort tables show that more time is allocated to
younger children’s non-cognitive childcare activities. For instance, table 7 shows that US
fathers with the highest level of education invest on average 46.67 (Age 1), 16.66 (Age 2) and
3.97 (Age 3) minutes more per day on non-cognitive childcare compared to American fathers
with less than upper secondary school. This result is also consistent for parents (panel A) and
mothers (panel B).
General patterns
The evidence presented so far indicates that there is a positive increasing educational gradient
for time investment on childcare by parents, independent on the division of sample into
mothers, fathers or parents (and controlled for labour market statues). The positive and
increasing magnitude of the educational gradient for parents (independent of country) gives
15 There might be differences in household types between the three different age cohorts. For instance, even
though currently there exist only one child in the household, the household might plan to have more children in
the future, or the household might have had children that have left the nest.

23
empirical prominence to why the intergenerational transmissions of education are high,
because high compared to low educated fathers and mothers increase their investment on both
cognitive and non-cognitive childcare. In order to detect any systematic patterns we have
plotted the point estimates for the highest educated in Parents full sample (panel A) from table
7 and 8.
Figure 1: Parental time investment as a function of the age of the child for US
Non-cognitive childcare Cognitive childcare
France
Netherlands
Spain
UK
US
Note: Figure 1 illustrates parents’ time investment on cognitive and non-cognitive childcare as a function of the
age of the child for parents with above upper secondary. The y-axel is time investment on childcare activities and
the x-axel is the age of the child (1=0-4 years, 2=5-11 years, 3=12-17 years).
-10
10
30
1 2 3 -1
1
3
5
1 2 3
-20
30
1 2 3 -2
0
2
4
1 2 3
0
10
20
30
1 2 3 -2
0
2
4
6
1 2 3
-10
0
10
20
1 2 3 -1
1
3
5
1 2 3
-20
30
1 2 3 -4
1
6
1 2 3

24
The results depicted in figure 1 seems to suggest the presence of a concave rather than linear
time investment function when analyzing parents time investment on cognitive childcare by
different age cohorts. During the early years of childhood very little time is invested on the
different types of cognitive childcare activities. Moreover, it seems that more highly educated
parents allocated less time on cognitive childcare when the child is between the age 0-4,
compared to less educated parents. As the age of the child increases, more time is allocated
towards cognitive childcare (i.e. a movement occurs along the function). However, during the
child’s adolescence period the time investment on cognitive childcare decreases. This may be
due to two interacting reasons: 1.) upper secondary school is not mandatory and therefore not
attended by every child. 2.) During adolescence, children begin to take decisions about their
own usage and allocation of time and therefore parents are not necessarily the primary input
when cognitive help is needed (Del Boca et al. 2012).
The findings also indicate that when dividing the sample into different age cohorts,
there is also a non-linear pattern for non-cognitive childcare. It seems that as the age of the
child increases, less time is allocated towards non-cognitive childcare (i.e. a movement along
the function in figure 1). Two likely reasons behind this movement can be: 1.) during the
early stages of childhood the child is totally dependent on the care that she receives from
parents and 2.) as she grows up the child becomes more in control of her time usage. Once
again the pattern of the intergenerational transmission of education and it being high is
highlighted, independent of the division of sample or country.
Concluding remarks
Economic studies have focused on how cognitive skills affect labour market outcomes.
However, recent literature has just begun investigating the effects of non-cognitive skills on
labour market outcomes later on in life. These findings indicate that both cognitive and non-
cognitive skills are important in explaining higher earnings and the success of the individual
in the labour market.
Previous findings show that environment and nurture have a large effect on the skill
formation of the child, in terms of cognitive or non-cognitive skills. We examine the time
investment of the parents in the household, in order to detect patterns and associations in their
investment on these two childcare activities. Our analysis is conditional on the educational

25
attainment of parents and for different child age cohorts using time use data from France,
Netherlands, Spain, UK and US.
The results indicate that for the full sample (i.e. both working and non-working
parents), there is a positive educational gradient with respect to time invested on cognitive
and non-cognitive childcare. In other words, as the level of education increases, the time on
both childcare activities increases. Furthermore, the educational gradient for non-cognitive
childcare increases for each level of education, i.e. more time is invested on non-cognitive
childcare. This result can be an indication of why the mobility of intergenerational
transmission is low. Parents with higher education invest more on their child’s human capital,
which in turn leads to higher intergenerational transmissions.
Dividing the full sample into working and non-working parents, our results show that
the slope of the educational gradient for non-cognitive childcare increases for working
parents. This result indicates the low mobility of intergenerational transmissions: parents who
are in the labour market invest more on non-cognitive childcare as their level of education
increases. To conclude, for all countries and samples we can detect a strong pattern when it
comes to how higher educated parents invest more on their children’s non-cognitive childcare
activities. This is also the case for the youngest child age cohort and the highest level of
education, which is an indication that childcare activities should be considered in a
multidimensional fashion.
Within the Beckerian perspective, our results imply that parents with higher educational
levels invest more time in their child. This is especially interesting since this positive
educational gradient for both cognitive and non-cognitive childcare is evidently independent
of the parent’s working status. In other words even parents with a higher opportunity cost of
time (i.e. higher wage rates) allocate more time towards both cognitive and non-cognitive
childcare activities, as compared to parents with a low opportunity cost of time.
The theoretical framework proposed by Becker and Tomes (1986), indicates that
imperfect capital markets could be the reason for the high intergenerational transmissions in
developed countries. Because, not every family have the same possibility to borrow financial
capital for their child’s human capital investment, due to credit constraints. The findings of
this study indicate that, despite perfect capital markets, the intergenerational transmissions of
education and income would still be high. The reason: parents with higher education are more
inclined to invest time in their child’s cognitive and non-cognitive skills.
The part of our results which indicates that parents’ time investment in cognitive
childcare seems to be a concave function of the age of the child, strengthens one of the
26
assumptions of the technology of skill formation, namely the one about critical time periods.
It matters at which stage some investments are made in the child’s human capital formation.
The results of this paper seem to indicate that high educated parents increase their rate of
investment in cognitive childcare when the child is between five and eleven years old.
The fact that parents’ time investment on non-cognitive childcare is a decreasing
function of the age of the child, supports Cunha and Heckman’s argument that skill formation
is highly sensitive to the timing of investment on children (i.e. during the early preschool
period). The results of this paper show that high compared to low educated parents invest
proportionally more on non-cognitive childcare when children are small. This indicates the
strong pervious pattern that parents with a higher level of education allocate more of their
time resource to the non-cognitive variable, which is in line with Cunha and Heckman’s
technology of skill formation.

27
References
Averett, S.L., Gennetian, L.A., Peters, H.E. (2005). Paternal Child Care and Children’s Development. Journal of
Population Economics (18), 391-414
Becker GS, Tomes N (1986) Human Capital and the Rise and Fall of Families. Journal of labor Economics,
4(3), 1-39
Becker, GS (1991). A Treatise on the Family. Harvard University Press
Ben-Porath, Y. (1967). The Production of Human Capital and the Lifecycle of Earnings. Journal of
Political Economy, 75, 352-365.
Baydar N., Greek A., Gritz M., (1999). Young Mothers’ Time spent at work and Time spent caring for children.
Journal of Family and Economic issues, 20 (1), 61-84.
Bianchi, S. M., Milkie, M. A., Sayer, L. C., Robinson, J. P. (2000). Is anyone doing the housework? Trends in
the gender division of household labor. Social Forces, 79, 191–234.
Björklund, A., Lindahl, M., Plug, E. (2006). The origins of intergenerational Associations: Lessons From
Swedish Adoption Data. The Quarterly Journal of Economics, (3), 999-1028
Black, S.P., Devereux, P.J., Salvanes, K. (2005). Why the Apple Doesn’t Fall Far: Understanding
Intergenerational Transmission of Human Capital. American Economic Review, 95(1), 437-42
Black, S.P., Devereux, P.J. (2010), Recent Development in Intergenerational Mobility, The Institute for the
Study of Labor (IZA), D.P. No 4866
Bretherton, I. (1992). The origins of attachment theory: John Bowlby and Mary Ainsworth. Development
Psychology, (28), 759-775
Brown, J. E., Dunn. P.K, (2011) Comparisons of Tobit, Linear, and Poisson-Gamma Regression Models: An
Application of Time Use Data. Sociological Methods & Research 40(3): 511-535.
Bryant, W.K., Zick, C.D. (1996). An Examination of Parent-child chared time, Journal of Marriage and Family,
58(1), 227-37
Borghans, L., Meijer, H., ter Weel, B. (2008). The Role of Noncognitive Skills in Explaining Cognitive Test
Scores. Economic Inquiry, 56(1), 2-12
Butler, J., Giuliano, P., Guiso, L. (2009). The Right Amount of Trust. NBER Working Paper 15344.
Carneiro, P., Hansen, KT., Heckman, J.J. (2003). Estimating Distributions of Treatment effects with an
Application to the Returns to Schooling and measurement of the Effects of uncertainty on
schooling choice. International Economic Review, 44(2), 361-422
Case, A., Paxson, C. (2010). Causes and Consequences of Early Life Health. NBER Working Paper No. 15637
Coneus, K., Laucht, M. (2008), The effect of early noncognitive skills on social outcomes in adolescence. ZEW
Centre for European Economic Research Discussion Paper No. 08-115.
Craig, L. (2006). Does Fathers care mean fathers share? A comparison of how mothers and fathers in intact
families spend time with children. Gender and Society 20(2), 259-81
Connelly, R., Kimmel, J. (2009). Spousal influences on parents’ non-market time choices. Review of Economics
of the Household , 7(4), 361-394
Cunha, F., Heckman, J.J., Locher, L., Masterov, D.V. (2006). Interpreting the Evidence on Life Cycle Skill
Formation. In Hanushek E. and Welch F. (Ed.), Handbook of the Economics of Education. (pp.
697-812). Amsterdam: North Holland
Cunha, F., & Heckman, J. (2007).The Technology of Skill Formation. American Economic Review 97(2), 31-47
Cunha, F. Heckman, J. J., Schennach, S. M. (2010). Estimating the Technology of Cognitive and Noncognitive
Skill Formation. Econometrica 78(3), 883–931.
Currie, J. (2009). Healthy, Wealthy, and Wise: Socioeconomic Status, Poor Health in Childhood, and Human
Capital Development. Journal of Economic Literature 47(1), 87-122
Deal, J.E., Halverson, C.F., Havill. V., Martin. R.P. (2005). Temperament Factors as Longitudinal Predictors of
Young Adult Personality. Journal of Developmental Psychology 51(3), 315-34
Del Boca, D., Monfardini, C., Nicoletti. C. (2012). Children’s and parents’ time-use choices and cognitive
development during adolescence. Working paper nr. 2012-006,University of Chicago
Duncan, G.J., Dowsett, C.J., Claessens, M., Magnuson, K., Huston, A.C., Klebanov, P., Pagani, L.S., Feinstein,
l., Engel, M., Brooks-Gunn, J., Sexton, H., Duckworth, K., Japel, C. (2007). School Readiness
and Later Achievement. Developmental Psychology, 43(6), 1428–46
Esping-Andersen G. (1990). The three Worlds of Welfare Capitalism, Princeton, NJ: Princton University Press
Forrester, M. (1995). The Development of Young Children’s Social-Cognitive Skills. PSYCHOLOGY PRESS
Foster, G., Kalenskoski, C.M. (2012). Tobit or OLS? An Empirical Evaluation Under Different Diary Window
Lengths. Applied Economics 45(20), 2994-3010
28
Fisher, K., Gershuny, J. and Gauthier A.H., with contributions from Altintas E., Borkosky, A., Bortnik, A. Corey, M.,
Dosman, D., Fedick, Frederick, T., Grund, T., Jones, S., Jun, J., Lai, A., Lin, Q., Lu, T., Lui, F., MacRae,
L., Monna, E., Nadal, J., Pauls, M., Pawlak, C., Shipley, A., Tinonin, C., Torres, N., Victorino, C., Yeung,
Q., (2012) Multinational Time Use Study User’s Guide and Documentation. Oxford: Centre for Time Use
Research.
Gershuny, J. I. (2012). Too Many Zeros: A Method for Estimating Long-term Time-Use from Short Diaries.
Annales d'Ėconomie et de Statistique 105/106: 247-270.
Grönqvist, E. & Vlachos, J. (2008). One Size Fits All? The Effects of Teacher Cognitive and Non-Cognitive
Abilities on Student Achievement. Institute for Labour Market Policy Evaluation (IFAU)
Working Paper 2008(25)
Grönqvist, E., Vlachos, J. & Öckert, B. (2010). The intergenerational transmission of cognitive and non-
cognitive abilities. Institute for Labour Market Policy Evaluation (IFAU) Working Paper
2010(12).
Guryan, J., Hurst, E., Kearney, M. (2008). Parental Education and Parental Time with Children. Journal of
Economic Perspectives, 22(3), 23-46
Hallberg, D., & Klevmarken, A. (2003). Time for children: A study of parent’s time allocation. Journal of
Population Economics, 16, 205–226.
Heckman, J., Stixrund, J., Urzua, S. (2006). The Effects of Cognitive and Non-cognitive Abilities on Labour
Market Outcomes and Social Behaviour. Journal of Labor Economics, 24(3), 411-82
Hofferth, S. (2001). Women’s employment and care of children in the United States. In T. Van, L. der Lippe and
Van. Dijk (Eds.), Women’s employment in a comparative perspective (pp. 151174). New York:
Aldine de Gruyter
Joesch, J. M., Spiess, K. C. (2006) 'European mothers' time spent looking after children differences and
similarities across nine countries', International Journal of Time-Use Research 3(1): 1-27.
Kitterød, R. H., & Pettersen, S. V. (2006). Making up for mothers’ employed working hours? Housework
and childcare among Norwegian fathers. Work, Employment and Society, 30, 473–392.
Krampen, G. (2008). Effects of education-psychological interventions on concentration performance in
preschool- and elementary-school-aged children with concentration deficits: Results from 10
experimental studies. Psychologie in Erziehung und Unterricht, 55(3), 196-210
Leibowitz, A. (1974). Home Investments in Children. Journal of Political Economy 82(2):111-131.
Leslie, A.M. (1987). Pretense and Representation: The Origins of “Theory of Mind”. Psychological Review,
94(4), 412-26
Lindqvist, E. & Vestman, R. (2011). The labor Market Returns to Cognitive and Noncognitive Ability:
Evidence from the Swedish Enlistment. American Economic Journal: Applied Economics, 3,
101-128
Lundborg, P., Nystedt, P., Rooth, D.O. (2009). The Height Premium in Earnings: The Role of Physical Capacity
and Cognitive and Non-cognitive Skills. Institute for the Study of Labor (IZA), Discussion
Paper 4266
MacClowry, S.G. (1995). The Influence of temperament on development during middle childhood. Journal of
Pediatric Nursing, 10(3), 160-5
Neuman, S.B., Roskos, K. (1997). Literacy knowledge in practice: Contexts of participation for young writers
and readers. Reading Research Quarterly, 32(1), 10–3
Nordin, M. (2008). Ability and Rates of Return to Schooling – Making Use of the Swedish Enlistment Battery
Test. Journal of Population Economics, 21(3), 703-17
Price, J. (2008). Parent-Child Quality Time, The Journal of Human Resources, 43(1), 240-65
Ramey, C.T., Ramey, (2010). Head Start: Strategies to improve outcome for children living in poverty. In R.
Haskins and W.s. Barnett (Eds). Investing in Young Children: New Direction in Federal and
Early Childhood Policy. (pp.59-67) Washington, DC: Brookings Institution Press
Rosenzweig, M.R., Wolpin, K.I. (1994). Parental and Public Transfers to Young Women and Their Children.
American Economic Review, 84(5), 1195-1212
Sayer, L.C., Bianchi, S., Robinson, J. (2004a). Are Parents Investing Less in Children? Trends in Mothers’ and
Fathers’ Time with children. American Journal of Sociology, 110(1),1-4
Sayer, L.C., Gauthier, A.H., Furstenberg Jr, F.F. (2004b). Educational differences in parents’ time with children:
Cross-national variations. Journal of Marriage and Family, 66(5), 1152-1169
Sandberg, J. F., & Hofferth, S. L. (2001). Changes in children’s time with parents: United States, 1981–1997.
Demography, 38, 423–436
Sepahvand, M., Shahbazian, R., Bali Swain, R. (2011). Degree of Substitutability in the Household Production
Model: Evidence of from Time Use Data in Nine Countries. Unpublished draft, Uppsala
University
Snow, C., Tabors, P., Nicholson, P., Kurland, B. (1995). SHELL: Oral language and early literacy skills in
kindergarten and first-grade children. Journal of Research in Childhood Education, 10, 37–48

29
Todd, P., Wolpin, K. (2003). On the Specification and Estimation of the Production Function for Cognitive
Achievement, Economic Journal, 113: 3-33.
Trawick-Smith, J., Dziurgot, T. (2011). “Good-fit” teacher-child play interactions and subsequent autonomous
plat of preschool children. Early Childhood Research Quarterly, 26(1), 110-23
Turkheimer, E., Haley, A., Waldron, M., D’Onofrio, B., Gottesman, I.I. (2003). Socioeconomic status modifies
heritability of IQ in young children. Psychological Science, 14(6), 523-628
Vygotky, L.S. (1978). Mind in Society: The development of higher psychological processes. Cambridge, MA:
Harvard University Press
Waldfogel, J. (2004). Social Mobility, Life Chances, and the Early Years. CASE paper No. 88
30
Appendix
Table A1: Education variable in detail
Less than upper secondary
(Edu1)
Upper secondary
(Edu2)
Over upper secondary
(Edu3)
France
0. Without a diploma
1. CEP, DFEO
2. BEPC
3. CAP, BEP
4. Bac technique
5. Bac general
6. Bac + 2
7. Superieur a Bac + 2
Netherlands
1. Only primary education
2. Lower levels of secondary
education (1, 2 years)
3. Higher levels of secondary
education (3,4 years)
4. Higher levels of secondary
education (at least 5 years)
5. High school degree
6. Polytechnic level
7. University level
Spain
1. Illiterate
2. Less than 5 years in school
3. Attended school 5 or more
years, no completed
secondary education
4. Completed secondary
education
5. High-school degree
6. Professional training, first
Degree
7. Professional training,
second degree
8. General degree
9. Bachelor’s degree
10. Doctoral degree
UK
6. Qualification below GCSE/
O level, trade
apprenticeships
12. No qualifications
3. A levels, vocational level 3
and
equivalent (AS level, NVQ 3)
4. O levels, GCSE grade A-C,
vocational level 2 and
equivalent
5. GCSE below grade C, CSE,
vocational level 1 and
equivalent
7. Other qualification
8. Qualifications - but DK
which
9. Qualifications - GCSE - but
DK grade
10. Qualifications – City and
Guilds - DK level
11. Qualifications - Other - but
DK grade/level
1. Degree level
qualification
or above
2. Higher education below
degree level (HNC,
nursing qualification)
US
1. Grades 0-8 only
2. Grades 9-11 - not hs
graduate
3. High school graduate 4. Some college
5. College graduate
6. Postgraduate
Note: Table A1 shows the underling groups for each level of education (Edu1, Edu2 and Edu3) by country.

31
Table A2: Codes for Country Specific Original Time Diary Files
Codes for Country Specific Original Time Diary Files
Country Cognitive childcare codes Non-cognitive childcare codes
France 420 - teach child with
associative aim; 421 -
supervise homework
410 - Look after children with an associative aim; 411 - Look
after children; 412 - Medical care to children away from home;
413 - Medical care to children at home; 422 - Conversations
with the children; 423 - Indoor games, artistic and sport
training; 424 - Outdoor games, promenade, sport training; 414
- Other activity on behalf of children
Netherlands 220 - Help children with
homework, assignments
200 - Looking after, taking care of babies; 260 - Taking
children to doctors, dentists etc.; 240 - Playing inside the home
with children; 250 - Take walks, cycle, play outside with
children
Spain 421 - Help with homework
411 - Care of infants; 412 - Care of older children; 413 -
Medical care of children outside home; 414 - Medical care of
children in the home; 577 - Help with childcare; 422 - talking
with children; 423 - Playing with children; 424 - Outside plays
and walks with children; 415 - Accompanying children; 416 -
Visiting the school; 425 - Waiting associated to childcare
UK 3820 - Teaching the child;
4272 - Teaching a child as
help
3800 - Unspecified childcare; 3810 - Unspecified physical care
and supervision; 3811 - Feeding the child; 3819 - Other
specified physical care; 4270 - Unspecified childcare as help;
4271 - Physical child care as help; 3830 - Playing and talking
with child; 4273 - Talk to child as help; 3840 - Accompanying
child; 3890 - Other specified childcare; 4274 - Accompany
child as help; 4279 - Other specified childcare as help
US 420 - play with/teach child
with associative aim; 421 -
supervise homework
410 - Look after children with an associative aim; 411 - Look
after children; 412 - Medical care to children away from home;
413 - Medical care to children at home; 422 - Conversations
with the children; 423 - Indoor games, artistic and sport
training; 424 - Outdoor games, promenade, sport training; 414
- Other activity on behalf of children
Note: http://www.timeuse.org/mtus/surveys

WORKING PAPERS*
Editor: Nils Gottfries
2012:2 Susanne Ek, Unemployment benefits or taxes: How should policy makers
redistribute income over the business cycle? 30 pp.
2012:3 Karin Edmark, Che-Yuan Liang, Eva Mörk and Håkan Selin, Evaluation of
the Swedish earned income tax credit. 39 pp.
2012:4 Simona Bejenariu and Andreea Mitrut, Save Some, Lose Some: Biological
Consequences of an Unexpected Wage Cut. 67 pp.
2012:5 Pedro Carneiro and Rita Ginja, Long Term Impacts of Compensatory
Preschool on Health and Behavior: Evidence from Head Start. 82 pp.
2012:6 Magnus Carlsson and Stefan Eriksson, Do Reported Attitudes towards
Immigrants Predict Ethnic Discrimination? 23 pp.
2012:7 Mikael Bask and Christian R. Proaño, Optimal Monetary Policy under
Learning in a New Keynesian Model with Cost Channel and Inflation Inertia.
25 pp.
2012:8 Mikael Elinder and Oscar Erixson, Every man for himself. Gender, Norms
and Survival in Maritime Disasters. 78 pp.
2012:9 Bertil Holmlund, Wage and Employment Determination in Volatile Times:
Sweden 1913–1939. 43 pp.
2012:10 Indraneel Chakraborty, Hans A. Holter and Serhiy Stepanchuk, Marriage
Stability, Taxation and Aggregate Labor Supply in the U.S. vs. Europe. 63
pp.
2012:11 Niklas Bengtsson, Bertil Holmlund and Daniel Waldeström, Lifetime versus
Annual Tax Progressivity: Sweden, 1968–2009. 56 pp.
2012:12 Martin Jacob and Jan Södersten, Mitigating shareholder taxation in small
open economies? 16 pp.
2012:13 John P. Conley, Ali Sina Önder and Benno Torgler, Are all High-Skilled
Cohorts Created Equal? Unemployment, Gender, and Research Productivity.
19 pp.
2012:14 Che-yan Liang and Mattias Nordin, The Internet, News Consumption, and
Political Attitudes. 29 pp.
2012:15 Krzysztof Karbownik and Michal Myck, For some mothers more than others:
how children matter for labour market outcomes when both fertility and
female employment are low. 28 pp.
* A list of papers in this series from earlier years will be sent on request by the department.
2012:16 Karolina Stadin, Vacancy Matching and Labor Market Conditions. 51 pp.
2012:17 Anne Boschini, Jan Pettersson, Jesper Roine, The Resource Curse and its
Potential Reversal. 46 pp.
2012:18 Gunnar Du Rietz, Magnus Henrekson and Daniel Waldenström, The Swedish
Inheritance and Gift Taxation, 1885–2004. 47pp.
2012:19 Helge Bennmarker, Erik Grönqvist and Björn Öckert, Effects of contracting
out employment services: Evidence from a randomized experiment. 55 pp.
2012:20 Pedro Carneiro and Rita Ginja, Partial Insurance and Investments in
Children. 32pp.
2013:1 Jan Pettersson and Johan Wikström, Peeing out of poverty? Human fertilizer
and the productivity of farming households. 43 pp.
2013:2 Olof Åslund and Mattias Engdahl, The value of earning for learning:
Performance bonuses in immigrant language training. 52 pp.
2013:3 Michihito Ando, Estimating the effects of nuclear power facilities on local
income levels: A quasi-experimental approach. 44 pp.
2013:4 Matz Dahlberg, Karin Edmak and Heléne Lundqvist, Ethnic Diversity and
Preferences for Redistribution: Reply. 23 pp.
2013:5 Ali Sina Önder and Marko Terviö, Is Economics a House Divided? Analysis
of Citation Networks. 20 pp.
2013:6 Per Engström and Eskil Forsell, Demand effects of consumers' stated and
revealed preferences. 27 pp.
2013:7 Che-Yuan Liang, Optimal Inequality behind the Veil of Ignorance. 26 pp.
2013:8 Pia Fromlet, Monetary Policy Under Discretion Or Commitment? -An
Empirical Study. 57 pp.
2013:9 Olof Åslund and Mattias Engdahl, Open borders, transport links and local
labor markets. 41 pp.
2013:10 Mohammad Sepahvand, Roujman Shahbazian and Ranjula Bali Swain, Time
Investment by Parents in Cognitive and Non-cognitive Childcare Activities.
31 pp.
See also working papers published by the Office of Labour Market Policy Evaluation
http://www.ifau.se/ ISSN 1653-6975
Copyright © 2022 FDOKUMEN