Supporting Young Parents | Urban Institute
34
RESEARCH REPORT Supporting Young Parents Impacts of the New York City Performance Partnership Pilot (P3) on Young Parents’ Outcomes Theresa Anderson Alex Carther with Alan Dodkowitz March 2022 BUILDING AMERICA’S WORKFORCE
-
Upload
khangminh22 -
Category
Documents
-
view
2 -
download
0
Transcript of Supporting Young Parents | Urban Institute

RESEARCH REPORT
Supporting Young Parents Impacts of the New York City Performance Partnership Pilot (P3) on Young
Parents’ Outcomes
Theresa Anderson Alex Carther
with Alan Dodkowitz
March 2022
B U I L D I N G A M E R I C A ’ S W O R K F O R C E
ABOUT THE URBAN INSTITUTE
The nonprofit Urban Institute is a leading research organization dedicated to developing evidence-based insights
that improve people’s lives and strengthen communities. For 50 years, Urban has been the trusted source for
rigorous analysis of complex social and economic issues; strategic advice to policymakers, philanthropists, and
practitioners; and new, promising ideas that expand opportunities for all. Our work inspires effective decisions
that advance fairness and enhance the well-being of people and places.
Copyright © March 2022. Urban Institute. Permission is granted for reproduction of this file, with attribution to the
Urban Institute. Cover image by Tim Meko.

Contents Acknowledgments iv
Response Letter from the NYC P3 Collaborative v
Supporting Young Parents 1
Summary of the NYC P3 Program 2
Participant Characteristics 3
Differences in Activities and Impacts on Outcomes 5
In-Program Services 6
Education and Training, Employment, and Connection 8
Educational Credentials 12
Insights from the Data Walk 13
Discussion 14
Lessons from Program Successes 14
Lessons Learned along the Way 15
Programmatic Suggestions 15
Structural Challenges 16
Methods 17
Impact Evaluation 17
Employment and Earnings Outcomes 19
Stakeholder Data Walk 19
Notes 21
References 23
About the Authors 24
Statement of Independence 25

i v A C K N O W L E D G M E N T S
Acknowledgments This brief was funded by the New York City DYCD through a Performance Partnership Pilot grant
from the US Department of Labor. The program was operated by Opportunities for a Better
Tomorrow and the evaluation was contracted by the Mayor’s Office for Economic Opportunity. We
are grateful to them and to all our funders, who make it possible for Urban to advance its mission.
The views expressed are those of the authors and should not be attributed to the Urban Institute,
its trustees, or its funders. Funders do not determine research findings or the insights and
recommendations of Urban experts. Further information on the Urban Institute’s funding principles is
available at urban.org/fundingprinciples.
We are particularly grateful to Jin Kim, Jean-Marie Callan, Megan Keenan-Berryman, Theodore
Latimore, Sujin Lee, Jihyun Shin, Leah Hebert, Jessica Raithel, Zain Khan, Oonagh Jordan, and David
Berman for their assistance with project leadership, data provision, and product review. Thanks also to
Lauren Eyster of the Urban Institute for her input on the project and products.

R E S P O N S E L E T T E R F R O M T H E N Y C P 3 C O L L A B O R A T I V E v
Response Letter from the NYC P3
Collaborative The New York City Department of Youth and Community Development, the Mayor’s Office of Youth
Employment, and the Mayor’s Office for Economic Opportunity Response to Evaluation of the
Performance Partnership Pilot Evaluation
March 2022
In 2014, Congress passed the Consolidated Appropriations Act, launching the Performance
Partnership Pilot (P3) initiative. The P3 initiative allowed grantees to pool funding from various federal
sources to test innovative program models to improve outcomes for youth who were out of school
and out of work, and provided grantees with flexibility by easing some program requirements. New
York City applied for a P3 grant, proposing an enhancement to federally funded Workforce Innovation
and Opportunity Act (WIOA) Out-of-School Youth (OSY) services to serve the needs of young parents
who were out of school and out of work.
New York City was awarded P3 funding in fall 2016, and starting in September 2017, the program
enrolled 50 young parents who lived in NYC, were already enrolled in WIOA OSY programming, and
were between the ages of 17 and 24. WIOA OSY works with young people to connect them with
educational and training credentials and opportunities for up to one year. The NYC P3 initiative
enhanced WIOA OSY supports in three key ways:
◼ Services were extended from one to up to two years.
◼ A child care navigator connected participants’ children to child care, provided parenting
support, and delivered additional supportive services.
◼ Programming was supported by multiple federal funding sources and had modified program
performance monitoring metrics.
The NYC P3 program was spearheaded by a group of NYC offices and agencies that formed the
P3 Collaborative: the Department of Youth and Community Development, the Administration for
Children’s Services, the Mayor’s Office of Youth Employment, the Department of Education, the
Children’s Cabinet, and the NYC Mayor’s Office for Economic Opportunity. The program was
implemented by Opportunities for a Better Tomorrow (OBT), a workforce development nonprofit, at
two of their Brooklyn locations.

v i R E S P O N S E L E T T E R F R O M T H E N Y C P 3 C O L L A B O R A T I V E
The evaluation of the NYC P3 program was conducted by the Urban Institute, which included a
qualitative implementation study and a participant outcomes analysis published in April 2021, as well
as an exploratory impact study. The researchers also hosted a Data Walk in April 2021 with NYC
program and policy stakeholders from NYC agencies, nonprofit service providers, and educational
institutions to share study findings and solicit input and feedback. The April 2021 report found that
the program was implemented successfully despite challenges, and that the majority of participants
recorded skills gains and achieved some educational or training credential during the program.
For the exploratory impact study, the research team used a quasi-experimental analysis to
compare the outcomes of NYC P3 participants to participants in standard WIOA OSY services. The
research team found that P3 participants were:
◼ more likely to complete occupational training and participate in other education and job-
oriented program services;
◼ over four-and-a-half times more likely to complete a high school equivalency credential;
◼ more likely to be in education or training in the second quarter after exiting the program; and
◼ more likely to earn secondary and other credentials within a year after program exit.
Though the researchers did not observe any significant impacts on employment or earnings in the
18 months after program exit, findings around increased participation in other services and increased
educational and training credential attainment suggest that P3 participants may have not been seeking
employment in the follow-up period.
One finding of the study was that while the participants benefited from having a child care
navigator to connect them to programming, they reported that the child care options available did not
fit parents’ needs, and in some cases, could create hurdles for parents. Common issues included
complex application processes, long application timelines, limited infant slots, unanticipated out-of-
pocket costs, and limited availability for low-income working parents. In total, only 34 percent of P3
participants used publicly funded child care while they were enrolled in the P3 initiative. One bright
spot in the effort to secure child care was the NYC DOE District 79 LYFE centers in public high
schools, which serve the children of DOE students and provide early childhood education to infants
and toddlers. Thanks to a partnership with OBT, P3 participants were able to secure subsidized child
care through the LYFE centers and had the opportunity to continue child care after program
participation if they were enrolled in an education or training program.
R E S P O N S E L E T T E R F R O M T H E N Y C P 3 C O L L A B O R A T I V E v i i
While NYC P3 participants had positive outcomes in education and training, the small size of the
program and single provider means any analysis is exploratory. Despite this, the findings suggest the
NYC P3 program should be expanded in order to further explore the navigator model and its impacts
on young parents who are out of school and out of work.
The P3 collaborative is exploring options to expand the P3 initiative model to include justice-
involved, housing-insecure, and foster care youth. Any replication of P3 will be informed by this study
and the recommendations put forward by the Urban Institute. Success for the program, however, also
rests on a child care system for low-income participants with young children that is accessible,
available, and high quality. This evaluation demonstrates that our current child care system lacks the
resources to meet the demand for services, and that the system is burdensome for parents to
navigate— even those being supported by a trained child care navigator. Child care is an essential
service for many, and we look forward to working to improve access to child care for all New Yorkers.
The Mayor’s Office for Economic Opportunity (NYC Opportunity) is committed to investing in and
studying navigator models that help support low-income residents in easily accessing the array of
services that are available to them. The P3 study demonstrates that tailored service navigation
support can connect participants to crucial services that increase their likelihood of success. The P3
initiative is just one example of programs and products that NYC Opportunity has supported that
guide participants through resources to support them. This includes Connections to Care, a program
that reduces barriers to receiving mental health supports in community-based settings, and innovative
digital tools, such as AccessNYC, GrowingUpNYC, GenerationNYC, Mental Health for All, and
WorkingNYC, which connect New Yorkers to benefits, programs, and resources. In the coming years,
NYC Opportunity looks forward to piloting new programs and products that incorporate service
navigation after we complete a research phase.
The Department of Youth and Community Development has already begun to use findings from
the P3 pilot to inform other youth workforce development program models, including the Advance &
Earn and NYC Unity Works programs. While these programs target different portions of the
opportunity youth population, both include navigators and extended program timeframes to support
comprehensive service delivery and participant retention in programs. It is anticipated that these
findings will also inform the program model put forth in the upcoming Workforce Innovation and
Opportunity Act (WIOA) concept paper and request for proposal (RFP) for Out of School Youth
programs.
v i i i R E S P O N S E L E T T E R F R O M T H E N Y C P 3 C O L L A B O R A T I V E
The Mayor’s Office of Youth Employment (MOYE), alongside NYC Opportunity and DYCD, has a
keen interest in navigator-based service delivery to workforce programs for youth and young adults.
In addition to supporting the Parent Empowerment Program and Unity Works, MOYE piloted a
program called CareerLift to help invest in job retention and advancement services that reduce worker
turnover, saving employers time and money and helping low-income workers stabilize their
circumstances and build toward long-term success. Using lessons from this program, the city can work
with employers to understand and address drivers of high turnover while connecting workers to
wraparound services that can remove barriers to ongoing employment, such as child care,
transportation, and housing.
This evaluation adds to a strong knowledge base on how to meet the needs of young people who
are out of school and out of work. We will learn from this and other studies to continue developing
initiatives to support our city’s young parents and youth more broadly.
New York City Department of Youth and Community Development
Mayor’s Office of Youth Employment
Mayor’s Office for Economic Opportunity

Supporting Young Parents In New York City, the problem of early pregnancy and childbearing is acute. In 2018, there were over
2,800 children born to mothers ages 15 to 19 in the city.1 Neighborhoods with poverty rates above 30
percent have a teen pregnancy rate of nearly seven percent, more than triple that of neighborhoods in
the city with a less than 10 percent poverty rate (Yunzal-Butler et al. 2017). The city has nearly 60
youth programs, only a few of which target young parents (Disconnected Youth Task Force 2020).
The city government has sought new ways to create opportunities for job training and placement to
help young parents advance their education and skills and find permanent work.
This brief presents findings from an exploratory impact evaluation of the New York City (NYC)
Performance Partnership Pilot (P3) program, an effort to enhance existing youth workforce services
for young parents. NYC P3 extended program eligibility, added child care navigation and support, and
offered flexibility in program financing. The NYC Department of Youth and Community Development
(DYCD) led the NYC P3 effort, coordinating a collaborative of six city-level agencies—called the P3
Collaborative—to run the pilot demonstration for young parents.2 Opportunities for a Better
Tomorrow delivered the NYC P3 services at two Brooklyn locations: Bushwick and Sunset Park.3 The
intervention enhanced existing Workforce Innovation and Opportunity Act (WIOA) Out-of-School
Youth (OSY) programming.
Using a quasi-experimental analysis, we find that the NYC P3 participants were
◼ more likely to complete occupational training and participate in other education and job-
oriented program services,
◼ over four-and-a-half times more likely to complete a high school equivalency credential,
◼ more likely to be in education or training in the second quarter after exiting the program, and
◼ more likely to earn secondary and other credentials within a year after exit.
NYC P3 participants earned high school equivalency credentials nearly four months sooner than
comparison group members, on average.
We do not see significant impacts on employment or earnings in any of the six quarters after exit.
One explanation is that participants might not have been seeking work in the follow-up period if they
were enrolled in education and training. Still, NYC P3 offers program and policy opportunities to help
young people build connections to employment.

2 I M P A C T O F T H E N E W Y O R K C I T Y P 3 P R O G R A M O N Y O U N G P A R E N T S ’ O U T C O M E S
We also summarize reactions and insights from a spring 2021 Data Walk4 in which city-level
stakeholders responded to preliminary results and reflected on policy implications.
Summary of the NYC P3 Program
The federal P3 initiative was launched in 2014 following passage of the Consolidated Appropriations
Act. This initiative “offer[s] a unique opportunity to test innovative, cost-effective, and outcome-
focused strategies for improving results for disconnected youth.”5,6 P3 allows grantees to blend
multiple sources of funding from several different areas into one source and develop new means of
serving disconnected youth. For this initiative, pilot sites can use funding from the US Department of
Education, US Department of Labor, US Department of Health and Human Services, the US
Department of Housing and Urban Development, the US Department of Justice, the Corporation for
National and Community Service, and the Institute for Museum and Library Services. The federal
government offers additional flexibility to ease certain program requirements.7
New York City received a P3 grant as part of the third round of federal funding, issued in fall
2016. Between September 2017 and January 2019 (the study period), the NYC P3 program enrolled
50 young fathers and mothers between the ages of 17 and 24 living in the city.8 Each of these young
parents enrolled in federally funded WIOA OSY services to obtain high school equivalency credentials,
vocational training, and further employment and educational opportunities. OSY services include
education and training, postsecondary bridging, various support services, internship opportunities, and
career services, typically offered for up to one year.
The Bushwick and Sunset Park locations of Opportunities for a Better Tomorrow offered the NYC
P3 program to young parents enrolled in their WIOA OSY services. As part of NYC P3, participants
were offered three enhancements to the existing WIOA OSY offerings:
1. OSY services were extended from one to up to two years.
2. A child care navigator linked participants’ children to child care slots, provided parenting
support, and delivered additional supportive services.
3. Programming was supported by multiple sources of federal funds and waivers, along with
modified metrics to measure program performance
The child care navigator worked with a smaller caseload of participants than traditional WIOA case
managers: 25 youth per navigator versus a typical caseload of 40 to 60 youth per case manager.
I M P A C T O F T H E N E W Y O R K C I T Y P 3 P R O G R A M O N Y O U N G P A R E N T S ’ O U T C O M E S 3
Navigators helped young parents in NYC P3 programming identify child care options, taught parenting
workshops, and offered additional supportive services.9 A more complete description of the program
and the problem it was established to address appears in Anderson, Carther, and Dodkowitz (2021).
Box 1 summarizes our research methods for the NYC P3 evaluation.
BOX 1
Summary of Research Methods
The Urban Institute’s NYC P3 evaluation was informed by the following activities:
◼ A qualitative implementation study: This involved two rounds of site visits (June 2018 and May 2019), including interviews and focus groups with staff and participants, as well as regular discussions with the NYC P3 Collaborative.
◼ A descriptive participation and outcomes study: Using city administrative data, we described participant characteristics and mapped participant experiences and outcomes.
◼ An exploratory impact study: Using city administrative data, we conducted quasi-experimental propensity score matching to understand how participant outcomes compared with a similar group of WIOA OSY youth who did not participate in the program. The research was exploratory because the program pilot was small, with 50 enrollees in the evaluation period.
◼ Stakeholder engagement: We conducted a Data Walk in April 2021 to share preliminary findings with 26 program and policy stakeholders from NYC agencies, educational institutions, and nonprofit service providers. A Data Walk is an engaging session with program stakeholders (and sometimes also participants) to share preliminary research findings and solicit reactions and insights.
Note: A more detailed description of findings from the implementation and descriptive outcomes study appears in Anderson,
Carther, and Dodkowitz (2021). More detail about the impact study methods and stakeholder engagement methods appear in
the methods section.
Participant Characteristics
The NYC P3 program served 50 participants, who enrolled between September 2017 and January
2019 and continued to be served as late as June 2019. Participants were mostly female (88 percent).
During the Data Walk discussion of preliminary findings, a stakeholder inquired about why so many
participants were female. Program administrators clarified that when young people are parenting, the
young woman is the one who tends to seek services and identify as the primary caregiver. The
program did conduct outreach to fatherhood-serving organizations. NYC P3 saw more men enroll in
the first year than in the second, though administrators are unsure of the reason. Urban Institute
4 I M P A C T O F T H E N E W Y O R K C I T Y P 3 P R O G R A M O N Y O U N G P A R E N T S ’ O U T C O M E S
researchers also noted that women are more likely to enroll in education and training programs,
particularly programs focused on academics, such as high school completion and college enrollment.10
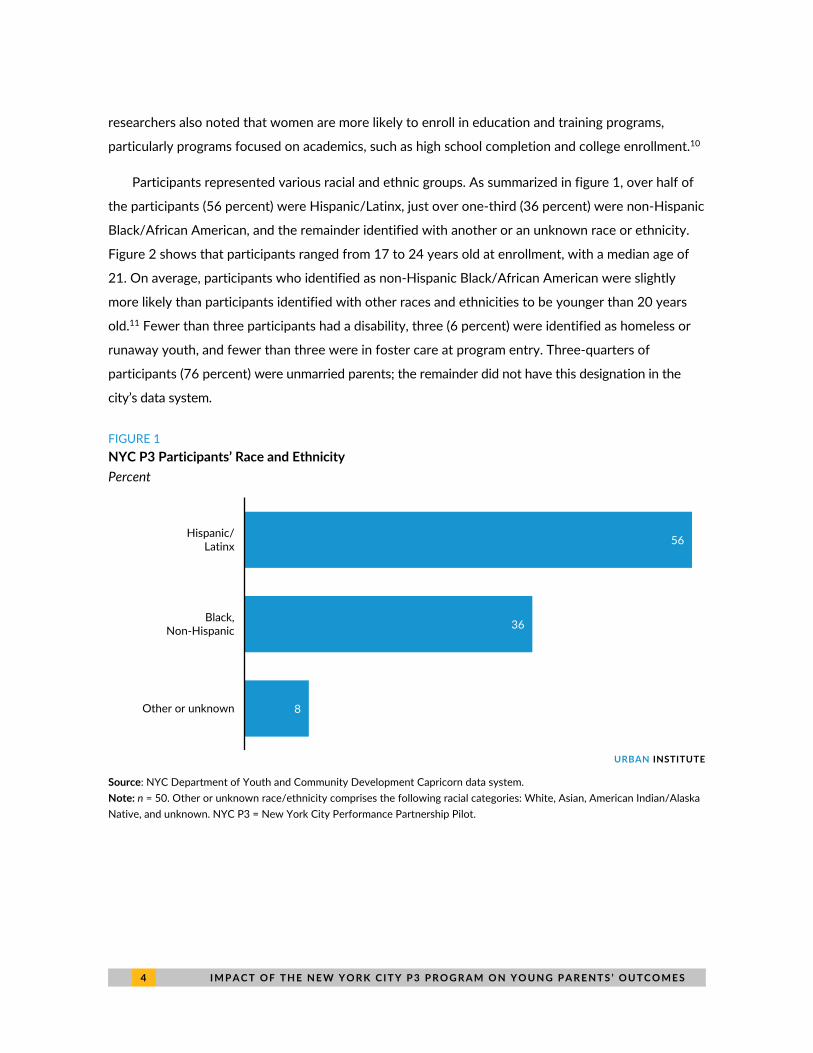
Participants represented various racial and ethnic groups. As summarized in figure 1, over half of
the participants (56 percent) were Hispanic/Latinx, just over one-third (36 percent) were non-Hispanic
Black/African American, and the remainder identified with another or an unknown race or ethnicity.
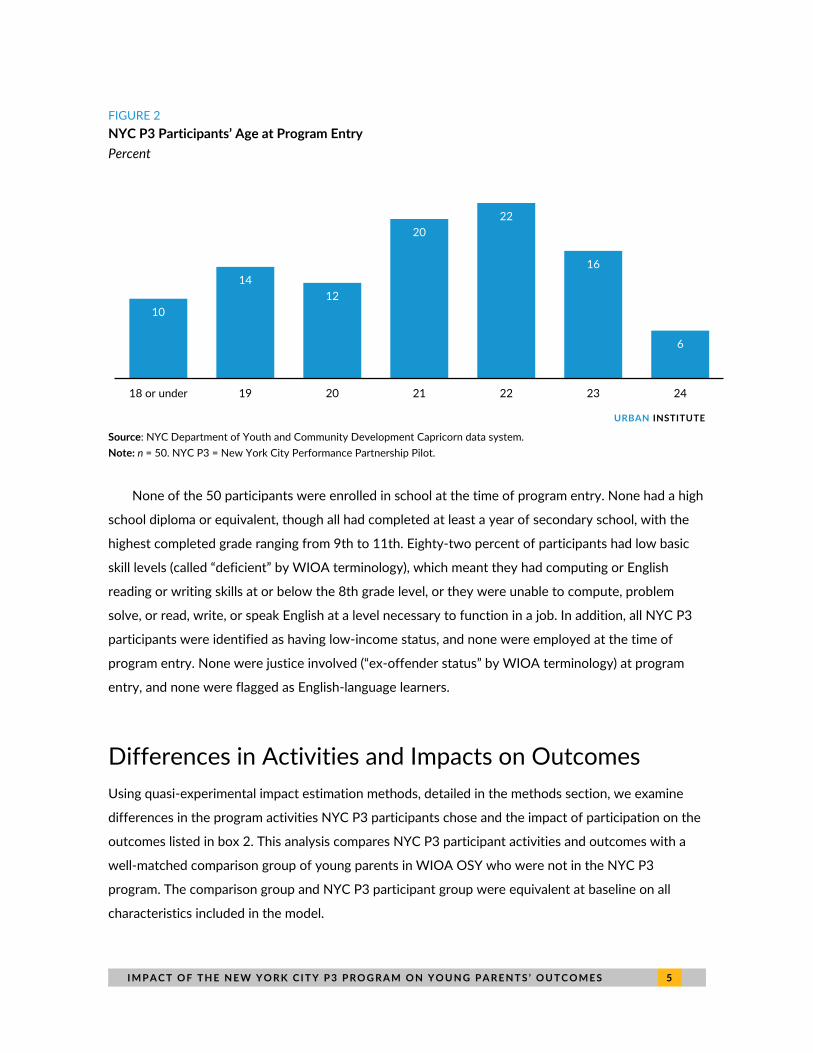
Figure 2 shows that participants ranged from 17 to 24 years old at enrollment, with a median age of
21. On average, participants who identified as non-Hispanic Black/African American were slightly
more likely than participants identified with other races and ethnicities to be younger than 20 years
old.11 Fewer than three participants had a disability, three (6 percent) were identified as homeless or
runaway youth, and fewer than three were in foster care at program entry. Three-quarters of
participants (76 percent) were unmarried parents; the remainder did not have this designation in the
city’s data system.
FIGURE 1
NYC P3 Participants’ Race and Ethnicity
Percent
URBAN INSTITUTE
Source: NYC Department of Youth and Community Development Capricorn data system.
Note: n = 50. Other or unknown race/ethnicity comprises the following racial categories: White, Asian, American Indian/Alaska
Native, and unknown. NYC P3 = New York City Performance Partnership Pilot.
8
36
56
Other or unknown
Black,Non-Hispanic
Hispanic/Latinx
I M P A C T O F T H E N E W Y O R K C I T Y P 3 P R O G R A M O N Y O U N G P A R E N T S ’ O U T C O M E S 5
FIGURE 2
NYC P3 Participants’ Age at Program Entry
Percent
URBAN INSTITUTE
Source: NYC Department of Youth and Community Development Capricorn data system.
Note: n = 50. NYC P3 = New York City Performance Partnership Pilot.
None of the 50 participants were enrolled in school at the time of program entry. None had a high
school diploma or equivalent, though all had completed at least a year of secondary school, with the
highest completed grade ranging from 9th to 11th. Eighty-two percent of participants had low basic
skill levels (called “deficient” by WIOA terminology), which meant they had computing or English
reading or writing skills at or below the 8th grade level, or they were unable to compute, problem
solve, or read, write, or speak English at a level necessary to function in a job. In addition, all NYC P3
participants were identified as having low-income status, and none were employed at the time of
program entry. None were justice involved (“ex-offender status” by WIOA terminology) at program
entry, and none were flagged as English-language learners.
Differences in Activities and Impacts on Outcomes
Using quasi-experimental impact estimation methods, detailed in the methods section, we examine
differences in the program activities NYC P3 participants chose and the impact of participation on the
outcomes listed in box 2. This analysis compares NYC P3 participant activities and outcomes with a
well-matched comparison group of young parents in WIOA OSY who were not in the NYC P3
program. The comparison group and NYC P3 participant group were equivalent at baseline on all
characteristics included in the model.
10
14
12
20
22
16
6
18 or under 19 20 21 22 23 24

6 I M P A C T O F T H E N E W Y O R K C I T Y P 3 P R O G R A M O N Y O U N G P A R E N T S ’ O U T C O M E S
Because the number of participants was small—only 50—this impact analysis is exploratory. It
complements and provides additional insight on earlier mixed-methods research about the NYC P3
program (Anderson, Carther, and Dodkowitz 2021). Future impact research on a larger group may
produce different findings. We also do not estimate subgroup impacts because of the small sample
size.
BOX 2
Activities and Outcomes Examined in Exploratory Impact Analysis
We considered whether an NYC P3 participant
◼ completed any occupational training while in the program,
◼ received other program services (financial literacy services, educational achievement services, labor market information, work experience services, and postsecondary transition and preparatory activities),
◼ was in education or training in the second quarter after exit,
◼ was in education or training in the fourth quarter after exit,
◼ was in education or training in the second or fourth quarter after exit,
◼ was employed in each of the first through sixth quarters after exit,
◼ was employed or in education or training in any of the four quarters after exit,
◼ had earned a secondary (high school) credential by the fourth quarter after exit,
◼ had earned an occupational credential by the fourth quarter after exit,
◼ had earned any other credential by the fourth quarter after exit, and
◼ had earned any credential by the fourth quarter after exit.
In addition, we examined participants’ average earned income in each of the first through sixth
quarters after exit.
Note: A more detailed description of methods and findings from the implementation and descriptive outcomes study appears in
Anderson, Carther, and Dodkowitz (2021).
In-Program Services
As described in the NYC P3 implementation and outcome report (Anderson, Carther, and Dodkowitz
2021), NYC P3 parents participated in a wide range of education and job-oriented services. Relative to
the comparison group, NYC P3 participants were more likely to complete occupational skills training
and engage in financial literacy services,12 educational achievement services (such as tutoring and

I M P A C T O F T H E N E W Y O R K C I T Y P 3 P R O G R A M O N Y O U N G P A R E N T S ’ O U T C O M E S 7
study skills training), labor market information, and postsecondary transition and preparatory activities
(figure 3). Notably, NYC P3 participants were 35 percentage points more likely to complete an
occupational skills training, 56 percent higher than the comparison group rate, and 31 percentage
points more likely to participate in postsecondary transition and support services, almost three times
the comparison group rate. In addition, all NYC P3 participants and all members of the comparison
group received general support services, general youth services, and youth follow-up services (not
graphed).13
FIGURE 3
Impact of NYC P3 Participation on Enrollment in Education and Employment Services while in WIOA
OSY Programming
URBAN INSTITUTE
Source: NYC Department of Youth and Community Development Capricorn data system.
Note: n = 50 in the treatment group and an equal number of weighted cases in the comparison group. Impact estimates come
from propensity-score matching with three nearest neighbors, with replacement (see methods section). Impact estimates may
not equal the difference between the treatment and matched comparison group means because of rounding.
NYC P3 = New York City Performance Partnership Pilot; perc. pts. = percentage points; WIOA OSY = Workforce Innovation
and Opportunity Act Out-of-School Youth.
* p<0.1, ** p<0.05, *** p<0.01.
98%94%
80%
66%
52%48%
63%
54%
66%
34%
41%
18%
Occupationaltraining completed
Financial literacyservices
Educationalachievement
services
Labor marketinformation
Work experienceservices
Postsecondarytransition andpreparatory
activities
Treatment Matched comparison
+35 perc. pts.***56% higher
+40 perc. pts.***74% higher
+14 perc. pts.**21% higher
+34 perc. pts.***96% higher
+11 perc. pts.not significant +31 perc. pts.***
174% higher

8 I M P A C T O F T H E N E W Y O R K C I T Y P 3 P R O G R A M O N Y O U N G P A R E N T S ’ O U T C O M E S
Additionally, 53 percent of NYC P3 participants completed a 100-hour internship, and 8 percent
completed two internships. Though all WIOA OSY youth may complete internships, internship
participation data are not available for the comparison group. Attendees at the Data Walk discussed
why some participants completed two internships while others did not complete any. Program
administrators clarified that the internships were contingent on a young person’s original goals and
interests. They noted that a second internship was helpful for young people who wanted to try
different things and explore new opportunities. Some participants were unable to complete an
internship because of timing—because enrollment was rolling, some participants who enrolled in the
second year could not fit in an internship. Participants may also have chosen to focus on other
services that aligned more with their goals in lieu of an internship.
Finally, 34 percent of participants used publicly funded child care while enrolled in NYC P3
programming. Data on child care receipt are not available for the comparison group. Data Walk
participants further clarified the child care offerings, which was a point of confusion for participants:
there was one free child care option, while other options required parents to contribute a small subsidy,
which some were unable to afford. Enrolling in subsidy-based child care may also have triggered a
citywide benefits review, which some parents were reluctant to accept. Program operators also learned
that proximity of child care to the family’s home and the parents’ school mattered, meaning the offerings
were not appealing to everyone.
Education and Training, Employment, and Connection
We track participant outcomes for four to six quarters after program exit. Data on education and
training participation are only available in the second and fourth quarters after exit, while employment
and earnings are tracked for each of the six quarters. NYC P3 participants were 9.7 percentage points
more likely to be in education or training in the second quarter after exit, which is statistically
significant and over 400 percent higher (i.e., more than five times higher) than the comparison group,
of whom very few were in education or training (figure 4). While NYC P3 participants were more likely
to be in education or training in the fourth quarter and any quarter, these differences were not
statistically significant (which means we cannot be confident the differences are not actually zero).

I M P A C T O F T H E N E W Y O R K C I T Y P 3 P R O G R A M O N Y O U N G P A R E N T S ’ O U T C O M E S 9
FIGURE 4
Impact of NYC P3 Participation on Probability of Being Enrolled in Education or Training in the
Second Quarter, Fourth Quarter, and Any Quarter after Program Exit
URBAN INSTITUTE
Source: NYC Department of Youth and Community Development Capricorn data system.
Note: n = 50 in the treatment group and an equal number of weighted cases in the comparison group. Impact estimates come
from propensity-score matching with three nearest neighbors, with replacement (see methods section). Impact estimates may
not equal the difference between the treatment and matched comparison group means because of rounding.
NYC P3 = New York City Performance Partnership Pilot.
* p<0.1, ** p<0.05, *** p<0.01.
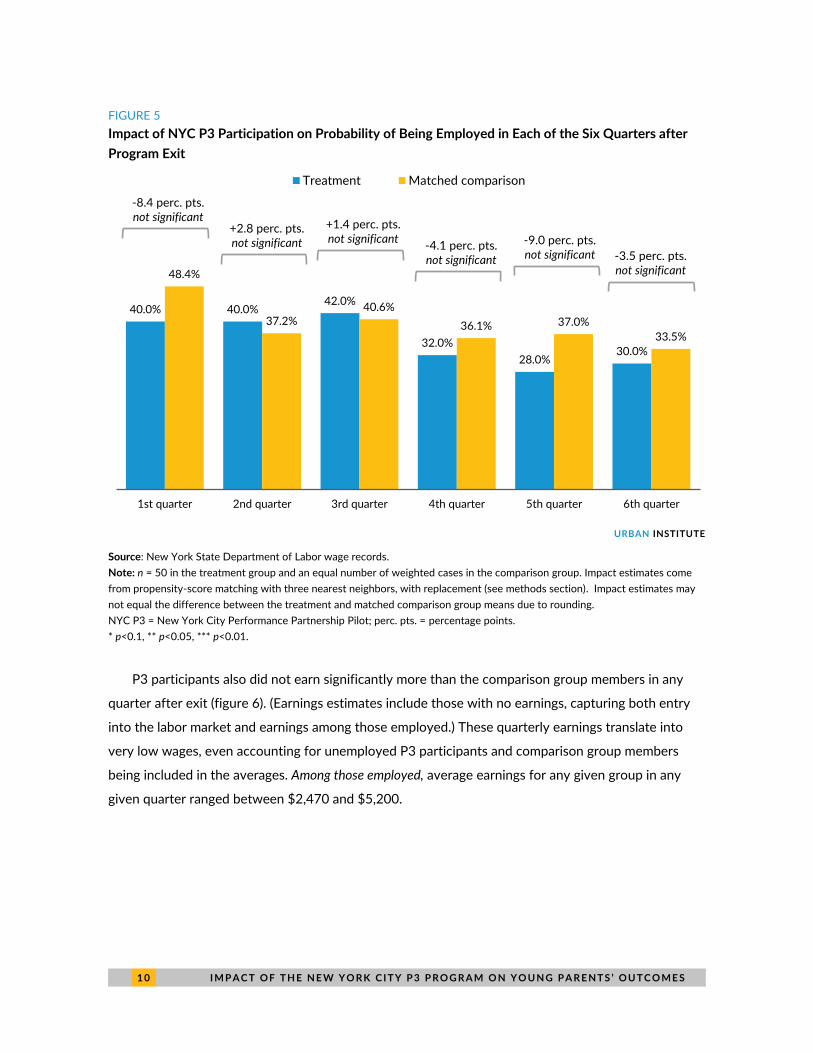
P3 participants were not more likely to be employed in any quarter after exit (figure 5). Though
there are some slight differences between groups, they are not in a consistent direction and none are
statistically significant. We may not expect to see employment effects if participants were not seeking
work in the follow-up period because they were enrolled in education and training.
12.0%
6.0%
12.0%
2.4%
3.6%
4.7%
Educational achievement services Labor market information Work experience services
Treatment Matched comparison
+7.3 percentage pointsnot significant
+2.4 percentage pointsnot significant
+9.7 percentage points**411% higher
1 0 I M P A C T O F T H E N E W Y O R K C I T Y P 3 P R O G R A M O N Y O U N G P A R E N T S ’ O U T C O M E S
FIGURE 5
Impact of NYC P3 Participation on Probability of Being Employed in Each of the Six Quarters after
Program Exit
URBAN INSTITUTE
Source: New York State Department of Labor wage records.
Note: n = 50 in the treatment group and an equal number of weighted cases in the comparison group. Impact estimates come
from propensity-score matching with three nearest neighbors, with replacement (see methods section). Impact estimates may
not equal the difference between the treatment and matched comparison group means due to rounding.
NYC P3 = New York City Performance Partnership Pilot; perc. pts. = percentage points.
* p<0.1, ** p<0.05, *** p<0.01.
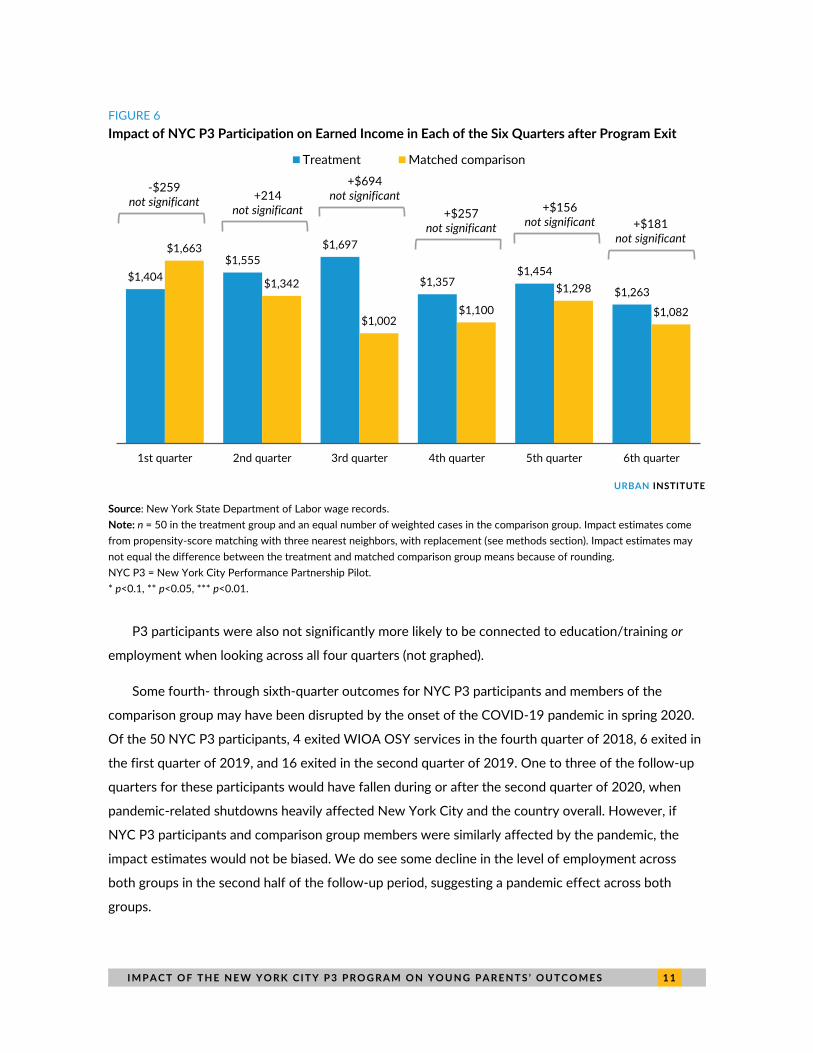
P3 participants also did not earn significantly more than the comparison group members in any
quarter after exit (figure 6). (Earnings estimates include those with no earnings, capturing both entry
into the labor market and earnings among those employed.) These quarterly earnings translate into
very low wages, even accounting for unemployed P3 participants and comparison group members
being included in the averages. Among those employed, average earnings for any given group in any
given quarter ranged between $2,470 and $5,200.
40.0% 40.0%42.0%
32.0%
28.0%30.0%
48.4%
37.2%40.6%
36.1% 37.0%
33.5%
1st quarter 2nd quarter 3rd quarter 4th quarter 5th quarter 6th quarter
Treatment Matched comparison
-9.0 perc. pts.not significant
-4.1 perc. pts.not significant
+1.4 perc. pts.not significant
+2.8 perc. pts.not significant
-8.4 perc. pts.not significant
-3.5 perc. pts.not significant
I M P A C T O F T H E N E W Y O R K C I T Y P 3 P R O G R A M O N Y O U N G P A R E N T S ’ O U T C O M E S 1 1
FIGURE 6
Impact of NYC P3 Participation on Earned Income in Each of the Six Quarters after Program Exit
URBAN INSTITUTE
Source: New York State Department of Labor wage records.
Note: n = 50 in the treatment group and an equal number of weighted cases in the comparison group. Impact estimates come
from propensity-score matching with three nearest neighbors, with replacement (see methods section). Impact estimates may
not equal the difference between the treatment and matched comparison group means because of rounding.
NYC P3 = New York City Performance Partnership Pilot.
* p<0.1, ** p<0.05, *** p<0.01.
P3 participants were also not significantly more likely to be connected to education/training or
employment when looking across all four quarters (not graphed).
Some fourth- through sixth-quarter outcomes for NYC P3 participants and members of the
comparison group may have been disrupted by the onset of the COVID-19 pandemic in spring 2020.
Of the 50 NYC P3 participants, 4 exited WIOA OSY services in the fourth quarter of 2018, 6 exited in
the first quarter of 2019, and 16 exited in the second quarter of 2019. One to three of the follow-up
quarters for these participants would have fallen during or after the second quarter of 2020, when
pandemic-related shutdowns heavily affected New York City and the country overall. However, if
NYC P3 participants and comparison group members were similarly affected by the pandemic, the
impact estimates would not be biased. We do see some decline in the level of employment across
both groups in the second half of the follow-up period, suggesting a pandemic effect across both
groups.
$1,404
$1,555
$1,697
$1,357$1,454
$1,263
$1,663
$1,342
$1,002$1,100
$1,298
$1,082
1st quarter 2nd quarter 3rd quarter 4th quarter 5th quarter 6th quarter
Treatment Matched comparison
+$156not significant
+$257not significant
+$694not significant+214
not significant
-$259not significant
+$181not significant
1 2 I M P A C T O F T H E N E W Y O R K C I T Y P 3 P R O G R A M O N Y O U N G P A R E N T S ’ O U T C O M E S
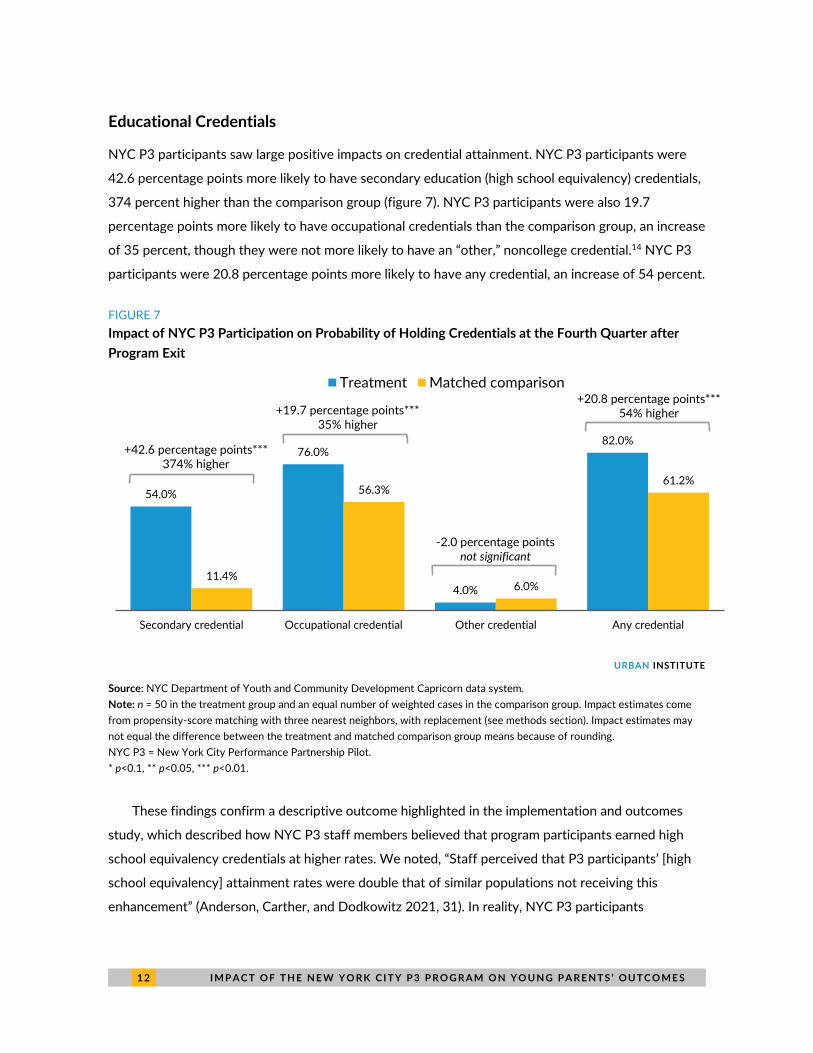
Educational Credentials
NYC P3 participants saw large positive impacts on credential attainment. NYC P3 participants were
42.6 percentage points more likely to have secondary education (high school equivalency) credentials,
374 percent higher than the comparison group (figure 7). NYC P3 participants were also 19.7
percentage points more likely to have occupational credentials than the comparison group, an increase
of 35 percent, though they were not more likely to have an “other,” noncollege credential.14 NYC P3
participants were 20.8 percentage points more likely to have any credential, an increase of 54 percent.
FIGURE 7
Impact of NYC P3 Participation on Probability of Holding Credentials at the Fourth Quarter after
Program Exit
URBAN INSTITUTE
Source: NYC Department of Youth and Community Development Capricorn data system.
Note: n = 50 in the treatment group and an equal number of weighted cases in the comparison group. Impact estimates come
from propensity-score matching with three nearest neighbors, with replacement (see methods section). Impact estimates may
not equal the difference between the treatment and matched comparison group means because of rounding.
NYC P3 = New York City Performance Partnership Pilot.
* p<0.1, ** p<0.05, *** p<0.01.
These findings confirm a descriptive outcome highlighted in the implementation and outcomes
study, which described how NYC P3 staff members believed that program participants earned high
school equivalency credentials at higher rates. We noted, “Staff perceived that P3 participants’ [high
school equivalency] attainment rates were double that of similar populations not receiving this
enhancement” (Anderson, Carther, and Dodkowitz 2021, 31). In reality, NYC P3 participants
54.0%
76.0%
4.0%
82.0%
11.4%
56.3%
6.0%
61.2%
Secondary credential Occupational credential Other credential Any credential
Treatment Matched comparison
+42.6 percentage points***374% higher
+19.7 percentage points***35% higher
-2.0 percentage pointsnot significant
+20.8 percentage points***54% higher
I M P A C T O F T H E N E W Y O R K C I T Y P 3 P R O G R A M O N Y O U N G P A R E N T S ’ O U T C O M E S 1 3
completed high school equivalency credentials at a rate over four and a half times higher than similar
young parents in non-P3 WIOA OSY services. And participants received the credentials an average of
117 days (nearly four months) sooner than those in the comparison group who also earned these
credentials, which means credential attainment by NYC P3 participants was not solely a result of the
longer program.15
Insights from the Data Walk
The Urban Institute research team presented these findings at a Data Walk in April 2021. Attendees
were asked to reflect on how NYC P3 outcomes relate to broader issues and their own work. Several
themes emerged.
There are big issues in the NYC labor market. For young people, transitioning into better-paying
jobs that align with their interests is challenging in a tight labor market. It can also be difficult for
participants to find an internship opportunity that matches their interests and gets them into a high-
paying, permanent job. Labor market challenges are particularly acute for Black and Latinx parents. An
attendee noted that addressing the challenges with getting good jobs should be the top priority, to
help people transition off public assistance.
Child care challenges were surprising to some. One attendee noted that child care “shouldn’t be
as hard” and that NYC can be doing better to meet the immediate needs of student-parents and young
parents as they go to school and work.
Few young parents in programs like NYC P3 are prepared for higher education. Few participants
took advantage of higher education, which raised questions for attendees about how to create access
and success. What do student parents need to thrive in a college setting? What could the partners
have done in a project like this?
Young parents need more basic supports. It is challenging to navigate available supports in the
city, and some supports have restrictions. For example, an attendee noted that those who receive cash
assistance also receive child care and transportation assistance to help offset barriers, though these
may come with limiting conditions that make them less useful. Lack of necessary supports can lead
people—especially young parents—to leave education before they finish their degrees.
Virtual programs are only a partial solution. Many services transitioned to a virtual setting during
the COVID-19 pandemic. While participants working and learning remotely do not need
1 4 I M P A C T O F T H E N E W Y O R K C I T Y P 3 P R O G R A M O N Y O U N G P A R E N T S ’ O U T C O M E S
transportation and need less child care, they do need equipment and internet. In addition, parenting a
child while learning online can make it difficult to separate home from work or school. An attendee
noted that sometimes it is better for parents to bring a child along to an in-person class or training,
when public health conditions allow for it.
Discussion
These findings show that the NYC P3 pilot was successful in helping young parents access
occupational training and other education and job-oriented services and continue training after exiting
the program. NYC P3 also helped participants gain secondary and occupational credentials relative to
very similar young parents in WIOA OSY services who did not have access to NYC P3 enhancements.
We did not see these impacts translate into employment or earnings gains in the follow-up period.
However, one explanation could be that NYC P3 participants were engaged in education and training
during the follow-up period, so they may not have been actively pursuing employment. Our analysis
was exploratory, so these findings suggest important patterns, but the program would benefit from
additional research on new cohorts.
It is difficult to know which component of the NYC P3 program should be credited for the positive
education and training outcomes. Because few participants chose to use the child care options, it may
have been a combination of factors, including the offer of child care assistance, the support of a
navigator, additional engagement with program and navigator-provided services, and the extra time to
benefit from WIOA OSY services. Future research could examine the causal pathway of impact in light
of these findings.
We developed lessons and recommendations based on qualitative insights reported in Anderson,
Carther, and Dodkowitz (2021), findings from the impact study, and the Data Walk discussion. The list
below builds on those highlighted in the earlier publication.
Lessons from Program Successes
◼ Build and maintain strong partnerships among organizations. Building on existing
organizational relationships where possible, with clear lines of responsibility, smooths
implementation, even when challenges arise. This allows for creative solutions, such as
identifying an alternative publicly subsidized child care provider, if initial plans do not work.
◼ Extend program length. Allowing youth to engage in services for longer reduces pressure on
staff and participants, gives participants more opportunity to meet milestones even if they

I M P A C T O F T H E N E W Y O R K C I T Y P 3 P R O G R A M O N Y O U N G P A R E N T S ’ O U T C O M E S 1 5
experience unanticipated disruptions (e.g., childbirth), and allows for better postprogram
planning. Programs might consider routinely offering longer guaranteed service windows (e.g.,
more than one year for WIOA OSY).
◼ Reconsider case management. Caseloads should be scaled to allow staff and participants build
meaningful relationships and help staff work with participants through unanticipated
challenges. This pilot reduced caseloads by about 40 to 60 percent from standard WIOA OSY
practice. In addition, programs may want to move away from the term “case manager” or be
more discerning in staff titles.16
Lessons Learned along the Way
◼ Make participant recruitment clear and consistent. Advertising regarding key program
components (e.g., cost of child care) should be clear so participants know what to expect. In
addition, recruitment may be challenging during a strong economy, but positive program
experiences help word-of-mouth recruitment. Finally, to increase male enrollment, it may be
necessary to explicitly target outreach and program services to young fathers, including their
perceived role as a parent.
◼ Meet participants where they are. Staff found that curricula used for young parents should be
appropriate for youth, given their developmental stage and life experiences. In addition,
internships and other work experience opportunities that interest participants and clearly help
them move toward their goals may help them build momentum toward positive outcomes.
Finally, virtual programs can be a good long-term option for “make-up” work or to provide
flexibility for participants who might otherwise have to withdraw temporarily because of life
circumstances.
◼ Plan for staff turnover. Staff turnover is common in direct-service programs, but succession
planning for key staff—perhaps with cross-training or job shadowing—can help smooth
transitions, shorten onboarding time, and maintain connection with participants. Though the
reasons for navigator turnover were not specified in this study, staff members may need more
personal supports as they help participants navigate complex and traumatizing situations that
go beyond the staff members’ training.
Programmatic Suggestions
◼ Strengthen connections to higher education. A first step is for program staff to help young
people see themselves as worthy of being in higher education and help them envision a career
pathway. Providers should also inform young people about the risks of predatory institutions
that will get them into deep student debt. High-quality postsecondary institutions could make
an extra effort to welcome students transitioning out of WIOA OSY services. Programs may
1 6 I M P A C T O F T H E N E W Y O R K C I T Y P 3 P R O G R A M O N Y O U N G P A R E N T S ’ O U T C O M E S
also wish to connect young people with existing supportive bridge programs, such as those
available through the City University of New York.
◼ Strengthen connections to employment. While NYC P3 participants had better success in
education than the comparison group members, they did not see these gains translate into
more employment or higher earnings in the follow-up period. Strengthening employment
outcomes may require more employer engagement and explicit pathways to employment,
such as guaranteed interviews, subsidized employment arrangements, or other opportunities
for direct placement.17
◼ Improve access to basic supports for young parents. Helping young people understand the
supports available for them and their families is crucial. In addition, the New York City
government could increase accessibility by allowing cash assistance clients pass-through
eligibility for other supportive services. Finally, restrictions on the use of some supports, such
as Metro cards, could be eased.
◼ Build out data. Tracking measures of well-being and outcomes after program exit would
provide more valuable insights into program experiences and effectiveness for different types
of participants: family or household composition (and changes), child care receipt (during and
after programming), dosage of services (e.g., hours), service location, details about credentials
received, whether internships lead to permanent employment, and additional well-being
measures.
Structural Challenges
◼ Funding constraints: Cuts to and challenges accessing the Community Services Block Grant
excluded one anticipated funding source that might have otherwise supported the NYC P3
program. Different flexible funding sources (e.g., City tax levy funds) might be explored to
cover costs other funding streams restrict or to fill gaps in authorization from core funding
streams (e.g., to anticipate a longer tenure in navigator job descriptions).
◼ Barriers to accessing child care: Challenges to helping young parents access publicly funded
child care (which helps their educational and employment growth) include complex application
processes, long application timelines, extensive documentation requirements, limited infant
slots, unanticipated out-of-pocket costs, frequent holidays and breaks in NYC Department of
Education programs, loss of access to some programs when status changes (e.g., after
completing high school equivalency credentials), burdensome recertification requirements,
and limited availability for low-income working parents (who are reportedly subject to a
waiting period after they begin employment, which may in turn endanger their employment
because they do not have reliable child care). As much as possible, child care options offered
during and following the program should be easy, convenient, and affordable (or free) and
should not put other benefits at risk. One way to lower these barriers to child care would be
for the city to give young parents and student-parents priority for public child care supports.
I M P A C T O F T H E N E W Y O R K C I T Y P 3 P R O G R A M O N Y O U N G P A R E N T S ’ O U T C O M E S 1 7
◼ The labor market: It can be hard to find a career-track job in New York City without
substantial education, experience, and luck. Agency and organizational stakeholders may want
to explicitly discuss labor market challenges among each other and with former out-of-school
youth so they can work together to identify strategies for improving career opportunities.
It may not be reasonable for the NYC P3 program to meet all of these recommendations. One
potential solution is for NYC P3 and other programs like it to purposefully connect young people
exiting the program with next-step programs or supports that will help them make further progress in
education and employment.
Methods
The Urban Institute’s NYC P3 evaluation was informed by a qualitative implementation analysis, a
descriptive participation and outcomes study that used city administrative data, a quasi-experimental
impact study, and a Data Walk that offered stakeholder perspectives. This section describes methods
that informed new information reported in this brief: the impact evaluation, the analysis of
employment and earnings outcomes, and the stakeholder Data Walk. A description of other methods
appears in the implementation and outcome report (Anderson, Carther, and Dodkowitz 2021).
Impact Evaluation
We estimated the program impacts using propensity-score matching, a method that statistically aligns
treatment group members with similar members of a comparison group based on their probability of
receiving treatment (Caliendo and Kopeinig 2008). Using this method, we calculated the probability of
receiving treatment as a probit regression of individual characteristics (summarized in table 1), which
produced a “propensity score.” We matched members of the treatment group with members of the
comparison group who had a similar propensity score. In this case, we matched each of the 50
treatment group members with three comparison group members who had the closest propensity
scores and weighted each of those three comparison group members at one-third, so the matched
comparison group had the same weight as the treatment group. We allowed each comparison group
member to be matched with more than one member of the treatment group if that person was the
best match (known as matching with replacement). The most often the match used a single comparison
group member was six times, giving that most-used comparison group member a total weight of 2.0
(1/3 weight*6 matches).
1 8 I M P A C T O F T H E N E W Y O R K C I T Y P 3 P R O G R A M O N Y O U N G P A R E N T S ’ O U T C O M E S
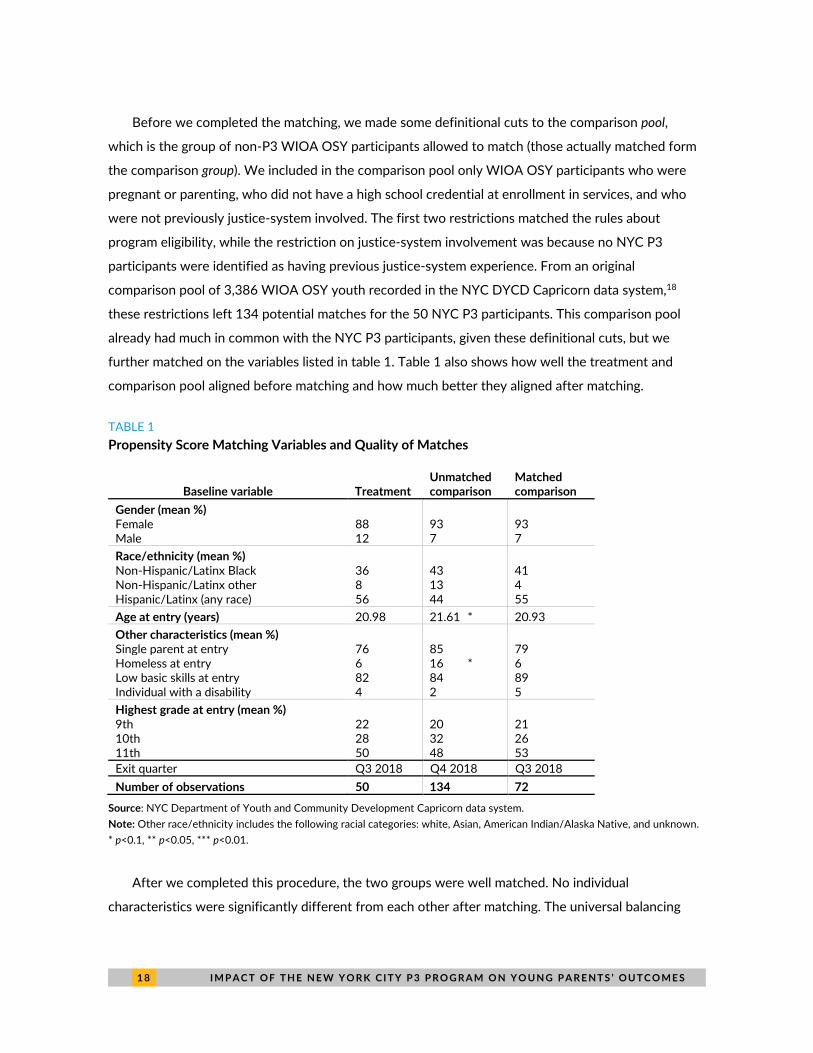
Before we completed the matching, we made some definitional cuts to the comparison pool,
which is the group of non-P3 WIOA OSY participants allowed to match (those actually matched form
the comparison group). We included in the comparison pool only WIOA OSY participants who were
pregnant or parenting, who did not have a high school credential at enrollment in services, and who
were not previously justice-system involved. The first two restrictions matched the rules about
program eligibility, while the restriction on justice-system involvement was because no NYC P3
participants were identified as having previous justice-system experience. From an original
comparison pool of 3,386 WIOA OSY youth recorded in the NYC DYCD Capricorn data system,18
these restrictions left 134 potential matches for the 50 NYC P3 participants. This comparison pool
already had much in common with the NYC P3 participants, given these definitional cuts, but we
further matched on the variables listed in table 1. Table 1 also shows how well the treatment and
comparison pool aligned before matching and how much better they aligned after matching.
TABLE 1
Propensity Score Matching Variables and Quality of Matches
Baseline variable Treatment Unmatched comparison
Matched comparison
Gender (mean %) Female 88 93 93 Male 12 7 7
Race/ethnicity (mean %) Non-Hispanic/Latinx Black 36 43 41 Non-Hispanic/Latinx other 8 13 4 Hispanic/Latinx (any race) 56 44 55
Age at entry (years) 20.98 21.61 * 20.93
Other characteristics (mean %) Single parent at entry 76 85 79 Homeless at entry 6 16 * 6 Low basic skills at entry 82 84 89 Individual with a disability 4 2 5
Highest grade at entry (mean %) 9th 22 20 21 10th 28 32 26 11th 50 48 53
Exit quarter Q3 2018 Q4 2018 Q3 2018
Number of observations 50 134 72
Source: NYC Department of Youth and Community Development Capricorn data system.
Note: Other race/ethnicity includes the following racial categories: white, Asian, American Indian/Alaska Native, and unknown.
* p<0.1, ** p<0.05, *** p<0.01.
After we completed this procedure, the two groups were well matched. No individual
characteristics were significantly different from each other after matching. The universal balancing

I M P A C T O F T H E N E W Y O R K C I T Y P 3 P R O G R A M O N Y O U N G P A R E N T S ’ O U T C O M E S 1 9
test had a p value of 0.988, for which 1.0 would indicate that there are no statistically distinguishable
differences in the characteristics of the treatment group and the matched comparison group.
Therefore, we are highly confident in the internal validity of these results, even though this was a
quasi-experimental impact study with a small sample size.
After matching, we compared the groups using a regression equation that included the same
variables used in matching. This alleviated any remaining observable mismatch between the treatment
and comparison groups and increased the precision of the estimates. This approach may not account
for unobserved differences between the groups, such as intrinsic motivation. It would have been
useful to match each group on city borough, personal characteristics like motivation, and employment
activity before joining the program, but we did not have these data. Nonetheless, we believe that the
comparison group is a highly similar group—they enrolled in the same WIOA OSY services as the NYC
P3 group, presumably for similar reasons. Comparison group members likely enrolled at locations that
did not offer P3 enhancements. Assuming the groups are well-matched, the regression coefficient on
NYC P3 enrollment yields the estimated impacts of program participation on the specified outcomes.
Employment and Earnings Outcomes
We were able to use New York State Department of Labor wage records to track employment and
earnings for NYC P3 participants and the comparison group. However, because of state data
disclosure restrictions, the Urban Institute research team could not access the individual-level records.
Instead, the research team conducted the match as described above and then prepared a data file and
analysis code for the city to run on our behalf. Through a partnership between the Mayor’s Office for
Economic Opportunity and the NYC Human Resources Administration, city staff ran the analysis for
the research team and shared the regression results and descriptive data elements (mean, standard
deviation, and sample size) following disclosure review. This analysis enhanced the quality of the
evaluation, though the research team was not able to use the preprogram employment or earnings
data for matching, and we were not able to further investigate patterns in employment or earnings
outcomes (such changes in employment patterns caused by the pandemic).
Stakeholder Data Walk
The Urban Institute conducted a Data Walk on April 13, 2021, with 26 participants (besides the
facilitators) from Opportunities for a Better Tomorrow, the Mayor’s Office for Economic Opportunity,
City University of New York, the NYC Department of Education, the NYC Center for Youth

2 0 I M P A C T O F T H E N E W Y O R K C I T Y P 3 P R O G R A M O N Y O U N G P A R E N T S ’ O U T C O M E S
Employment, the NYC DYCD, the NYC Human Resources Administration, and the Partnership for
New York City. Members of the NYC P3 Collaborative identified invitees, though there were some
“snowball” invitations.
In the 90-minute session, the Urban Institute presented a slide deck with four virtual “stations” of
study findings, focusing on participants, services, outcomes and impacts, and lessons learned and
issues raised. Each station included time for questions and brief discussion. The attendees were then
invited to choose a breakout room for a focused discussion of policy implications or program updates.
The sessions ended with attendees reporting from the small group sessions and further reflection on
the findings.19
N O T E S 2 1
Notes
1 “Vital Statistics of New York State, 2018,” New York State Department of Health, Table 30, revised October
2020, accessed June 24, 2021, https://www.health.ny.gov/statistics/vital_statistics/2018/.
2 The P3 Collaborative included the Department of Youth and Community Development; the Administration for
Children’s Services (ACS); the New York City Department of Education (DOE), particularly the Living for the
Young Family through Education (LYFE) child care centers and District 79 Pathways to Graduation; the Center
for Youth Employment; the Mayor’s Office for Economic Opportunity; and the Children’s Cabinet.
3 Opportunities for a Better Tomorrow is a nonprofit service provider contracted by the New York City
government to deliver Workforce Innovation and Opportunity Act Out-of-School Youth services at multiple
locations across the city. The P3 Collaborative partnered with Opportunities for a Better Tomorrow because of
their “historically strong and highly integrated” high school equivalency preparation services, according to a
Collaborative member.
4 See more information about Data Walks in Murray, Falkenburger, and Saxena (2015).
5 “P3 Fact Sheet,” Youth.gov, https://youth.gov/youth-topics/reconnecting-youth/performance-partnership-
pilots/fact-sheet.
6 The Consolidated Appropriations Act defines disconnected youth as individuals between the ages of 14 and 24
who are low income and homeless, in foster care, involved in the juvenile justice system, unemployed, or not
enrolled in or at risk of dropping out of an educational institution (Pub. L. No: 113-76 § 526).
7 “Round 4 Program List,” Youth.gov, https://youth.gov/youth-topics/reconnecting-youth/performance-
partnership-pilots/round-4-program-list.
8 Expectant parents were also eligible for P3 services, but we refer to the service population as “young parents”
for simplicity.
9 In the Data Walk discussion, attendees clarified the differences between a child care navigator and a traditional
WIOA case manager. The navigator role was conceptualized as someone focused on parenting support and
child care services, rather than having a broad case management directive (though navigators did blend in other
case management functions). Navigators had smaller caseloads than traditional WIOA case managers. NYC P3
program operators reported that participants wanted a higher-intensity program with substantial engagement,
so they considered the lower caseloads a major component of success. Navigators developed the supports
they offered following an evidence-based curriculum that accounted for developmental milestones. Over time,
navigators then improved the services based on participants’ feedback and their own experiences.
10 For example, enrollees in WIOA youth and adult programs are more likely to be female, according to program
performance reports available at “Workforce Performance Results,” US Department of Labor, Employment and
Training Administration, https://www.dol.gov/agencies/eta/performance/results.
11 To protect participant confidentiality, we cannot report detailed race by age.
12 Financial literacy services include services that help recipients with creating budgets, opening checking and
savings accounts, applying for and managing loans and credit cards, learning about credit reports and credit
scores, and detecting identity theft.
13 Data for the comparison group were not available for all services reported in Anderson, Carther, and
Dodkowitz (2021). We report differences in services with receipt data across groups.
14 No member of the treatment or comparison group held a college credential one year after exit, so those results
are not shown.
2 2 N O T E S
15 There was no significant difference between program and comparison groups in time to completion of an
occupational credential.
16 Data Walk attendees noted that human service professionals have debated moving away from the term “case
manager” because it carries stigma around the concept of managing a person as a “case,” which comes off as a
dehumanizing or clinical term. “Case manager” can also sound like an entry-level position, while “navigator,”
“specialist,” or “coach” can be helpful in identifying specialized positions.
17 Strategies to connect education with better employment outcomes are discussed in Madeline Brown and
Lauren Eyster, “Four Strategies Community Colleges Are Using to Connect Their Students to Employment,”
Urban Wire (blog), Urban Institute, January 16, 2020, https://www.urban.org/urban-wire/four-strategies-
community-colleges-are-using-connect-their-students-employment.
18 See Anderson, Carther, and Dodkowitz (2021) for more detail about the dataset and source.
19 This format was an adaptation of the Data Walk concept developed by the Urban Institute (Murray,
Falkenburger, and Saxena 2015).
R E F E R E N C E S 2 3
References Anderson, Theresa, Alex Carther, and Alan Dodkowitz. 2021. Supporting Young Parents in NYC: Outcomes Study of
the New York City Performance Partnership Pilot. Washington, DC: Urban Institute.
Caliendo, Marco, and Sabine Kopeinig. 2008. “Some Practical Guidance for the Implementation of Propensity
Score Matching.” Journal of Economic Surveys 22 (1): 31–72.
Disconnected Youth Task Force. 2020. Connecting Our Future: 2020 Disconnected Youth Task Force Report. New
York City: NYC Center for Youth Employment.
Murray, Brittany, Elsa Falkenburger, and Priya Saxena. 2015. Data Walks: An Innovative Way to Share Data with
Communities. Washington, DC: Urban Institute.
Yunzal-Butler Cristina, Rebecca Fisher, Kinjia Hinterland, and Tracy Agerton. 2017. Trends in Pregnancy, Sexual
Behavior, and Use of Contraception among Teens in New York City. Epi Data Brief 98. New York City: New York
City Department of Health and Mental Hygiene.

2 4 A B O U T T H E A U T H O R S
About the Authors
Theresa Anderson is a principal research associate at the Urban Institute. She is a member of the
Building America’s Workforce cross-center initiative in the Income and Benefits Policy Center and is
affiliated with the Education Data and Policy Center. She leads teams in conducting in-depth, mixed-
methods research on important policy issues, primarily evaluations of workforce, education, and social
safety net programs and policies. She is particularly interested in improving access to and success in
education throughout the life course—from early childhood to adulthood. Her work has focused on
student-parents, low-income families, opportunity youth, adult education students, underprepared
college students, high school students from historically underserved populations, and public housing
residents. She holds a master’s degree in public policy and a Ph.D. in public policy and public
administration, both from the George Washington University.
Alexander Carther is a research assistant in the Center on Labor, Human Services, and Population at
the Urban Institute. He is involved in research focusing on welfare and policies of the social safety net.
Before joining Urban, Carther supported research in the Development and Early Education Lab at
Northwestern University, where he earned his undergraduate degree with a major in economics. His
research interests include income inequality, unemployment, and the impact of race and gender on
financial health and stability.

STATEMENT OF INDEPENDENCE
The Urban Institute strives to meet the highest standards of integrity and quality in its research and analyses and
in the evidence-based policy recommendations offered by its researchers and experts. We believe that operating
consistent with the values of independence, rigor, and transparency is essential to maintaining those standards.
As an organization, the Urban Institute does not take positions on issues, but it does empower and support its
experts in sharing their own evidence-based views and policy recommendations that have been shaped by
scholarship. Funders do not determine our research findings or the insights and recommendations of our experts.
Urban scholars and experts are expected to be objective and follow the evidence wherever it may lead.

500 L’Enfant Plaza SW
Washington, DC 20024
www.urban.org