
Entry, Retention and Loss: A Study of Childcare Students and Workers
148
Research Report No 275 Entry, Retention and Loss: A Study of Childcare Students and Workers Claire Cameron, Charlie Owen, Peter Moss Thomas Coram Research Unit, Institute of Education, University of London The views expressed in this report are the authors' and do not necessarily reflect those of the Department for Education and Employment. © Queen’s Printer 2001. Published with the permission of DfES on behalf of the Controller of Her Majesty's Stationery Office. Applications for reproduction should be made in writing to The Crown Copyright Unit, Her Majesty's Stationery Office, St Clements House, 2-16 Colegate, Norwich NR3 1BQ. ISBN 1 84185 524 3 July 2001
-
Upload
independent -
Category
Documents
-
view
1 -
download
0
Transcript of Entry, Retention and Loss: A Study of Childcare Students and Workers

Research Report No 275
Entry, Retention and Loss: A Study of Childcare Students and
Workers
Claire Cameron, Charlie Owen, Peter Moss Thomas Coram Research Unit, Institute of Education, University of London
The views expressed in this report are the authors' and do not necessarily reflect those of the Department for Education and Employment. © Queen’s Printer 2001. Published with the permission of DfES on behalf of the Controller of Her Majesty's Stationery Office. Applications for reproduction should be made in writing to The Crown Copyright Unit, Her Majesty's Stationery Office, St Clements House, 2-16 Colegate, Norwich NR3 1BQ. ISBN 1 84185 524 3 July 2001

Contents Contents ...........................................................................................................................1 Tables...............................................................................................................................4 Figures..............................................................................................................................6 Executive Summary .........................................................................................................7 Acknowledgements ........................................................................................................12 Chapter 1 Introduction ...................................................................................................13
1. 1 Policy background...............................................................................................13 1.2 Childcare and early education services ................................................................14 1.3 Training and qualifications in childcare and playwork ........................................17 1.4 The study overall ..................................................................................................18
1.4.1 The student and worker studies..................................................................18 1.5 Perspective adopted..............................................................................................19 1.6 Methods................................................................................................................20 2.1 Labour Force Survey ............................................................................................23 2.2 Standard Occupational Classification...................................................................23
2.2.1 Childcare and Related Occupations ...........................................................23 2.2.2 Census estimates ........................................................................................26 2.2.3 Labour Force Survey estimates ..................................................................26 2.2.4 Qualifications .............................................................................................27 2.2.5 Income........................................................................................................27
2.3 Childcare Workforce ............................................................................................27 2.3.1 Qualifications .............................................................................................30 2.3.2 Income........................................................................................................31
2.4 Key findings .........................................................................................................32 Chapter 3. The student survey........................................................................................33
3.1 Introduction ..........................................................................................................33 3.2 Personal Characteristics........................................................................................33
3.2.1 Main and core samples: Gender .................................................................33 3.2.2 Main and core samples: Age ......................................................................33 3.2.3 Main and core samples: Ethnicity ..............................................................33 3.2.4 Main and core samples: Household ...........................................................34 3.2.5 Main and core samples: Parent status and age of children.........................34 3.2.6 Differences for those on non-core courses and from minority ethnic backgrounds ........................................................................................................34
3.3 Education and employment background ..............................................................36 3.3.1 Pathways to colleges ..................................................................................36 3.3.2 Prior experiences........................................................................................36 3.3.3 Alternatives to childcare considered ..........................................................37 3.3.4 Differences for those on non-core courses and from minority ethnic backgrounds ........................................................................................................38
3.4 Childcare: in training and as an occupation .........................................................38 3.4.1 Reasons for choosing childcare training ....................................................38 3.4.2 Views on the course and the college ..........................................................38 3.4.3 Students’ present and future employment..................................................40 3.4.4 Differences for those on non-core courses and from minority ethnic backgrounds ........................................................................................................41
3.5 Work preferences and expectations......................................................................42 3.5.1 Preferred childcare employment settings ...................................................42 3.5.2 Employment obtained ................................................................................44 3.5.3 Matching employment obtained with stated preferences ...........................44
3.6 Views on childcare, employment and the next five years ....................................46 3.6.1 Views on non-parental childcare................................................................47 3.6.2 Future caring responsibilities and employment .........................................47
1

3. 7 Key findings ........................................................................................................49 Chapter 4. The Focus Groups ........................................................................................51
4.1 Introduction ..........................................................................................................51 4.2 Childcare careers ..................................................................................................52
4.2.1 A job or a career? .......................................................................................52 4.2.2 Careers and motherhood ............................................................................53 4.2.3 Belief one: You should be available to your children................................54 4.2.4 Belief two: You shouldn’t leave young children to be cared for by others55 4.2.5 Perceptions of careers for those participants who were not mothers .........57
4.3 Valuing childcare careers .....................................................................................57 4.3.1 Sources of devaluation of childcare and playwork: low wages and poor conditions ............................................................................................................58 4.3.2 Sources of devaluation of childcare and playwork: skills and responsibility.............................................................................................................................58 4.3.3 Sources of devaluation of childcare and playwork: parents’ views ...........59 4.3.4 Sources of devaluation in childcare and playwork: the role of government.............................................................................................................................60
4.4 Expectations of the Course...................................................................................60 4.4.1 Playwork courses .......................................................................................61 4.4.2 Childcare courses .......................................................................................62
4.5 Key findings .........................................................................................................63 5.1 Introduction ..........................................................................................................64 5.2 The nurseries and staff .........................................................................................64
5.2.1 The nurseries ..............................................................................................64 5.2.2 Registered places and numbers of children................................................65 5.2.3 Ages of children .........................................................................................66 5.2.4 Other services.............................................................................................67 5.2.5 Staffing.......................................................................................................67 5.2.6 Replacing staff ...........................................................................................67 5.2.7 Methods of recruitment ..............................................................................69 5.2.8 Suitability of applicants and recruits..........................................................70 5.2.9 Effect of the National Minimum Wage on nurseries .................................71
5.3 The staff................................................................................................................71 5.3.1 Age .............................................................................................................71 5.3.2 Gender ........................................................................................................72 5.3.3 Ethnicity .....................................................................................................72 5.3.4 Disability ....................................................................................................73 5.3.5 Own children..............................................................................................73 5.3.6 Household arrangement .............................................................................73
5.4 Entry to the childcare workforce ..........................................................................73 5.4.1 Reasons for working in childcare...............................................................74 5.4.2 Careers advice ............................................................................................74 5.4.3 Qualifications: school leaving....................................................................74 5.4.4 Qualifications: childcare and/or early education........................................75 5.4.5 Qualifications: management and business training ....................................76 5.4.6 Qualifications: Higher education ...............................................................76 5.4.7 Previous employment experience: childcare and early education..............77 5.4.8 History of employment in childcare...........................................................77 5.4.9 Previous employment experience: non-childcare or early education.........78
5.5 Retention ..............................................................................................................78 5.5.1 Job titles and supervision of other staff......................................................78 5.5.2 Hours worked in previous week and annual salary....................................79 5.5.3 Contract, pension, sick pay and sick leave.................................................80 5.5.4 Holidays and other benefits........................................................................81
2

5.5.5 Membership of a trade union or professional organisation........................81 5.5.6 Access to training.......................................................................................81 5.5.7 Commitment to childcare and early education work..................................82 5.5.8 Prospects in childcare and early education: five years ahead ....................84 5.5.9 Prospects in childcare and early education: combining work and family commitments .......................................................................................................86
5.6 Loss ......................................................................................................................86 5.6.1 Reasons for leaving present job .................................................................86 5.6.2 Future plans................................................................................................87
5.7 Key Findings ........................................................................................................88 Chapter 6. Conclusions ..................................................................................................91
6.1 Introduction ..........................................................................................................91 6.2 What we found .....................................................................................................91
6.2.1 Entry characteristics ...................................................................................91 6.2.2. Factors influencing retention of staff in day nurseries and childcare work.............................................................................................................................92 6.2.3 Factors influencing the loss of childcare workers ......................................92
6.3 Conclusions ..........................................................................................................92 Appendix 1.....................................................................................................................99
Childcare Student Survey – Summer 1999 ................................................................99 Appendix 2...................................................................................................................109
Focus Groups with childcare and playwork students ...............................................109 Appendix 3...................................................................................................................111
Staffing survey, heads and other staff ......................................................................111 Appendix 4...................................................................................................................146
Childcare and early education qualifications held by more than 5% of respondents..................................................................................................................................146
Appendix 5...................................................................................................................147 Qualifications held grouped by level........................................................................147
3

Tables Table 1.1 Childcare student survey, main and supplementary samples; core and non-
core courses; ethnicity ............................................................................................21 Table 1.2 Details of achieving the sample of nurseries..................................................22 Table 2.1 Minor Group 65: Childcare and Related Occupations...................................24 Table 2.2 Census counts for childcare and related occupations.....................................26 Table 2.3 Preschool childcare and education workforce by gender...............................27 Table 2.6: Selected qualifications for the workforce .....................................................31 Table 2.7: Gross pay per week, £...................................................................................32 Table 3.1: Age distribution by sample type, course type and ethnicity: numbers and
percent ....................................................................................................................33 Table 3.2: Ethnic backgrounds by sample type and course type: numbers and percent 34 Table 3.3: Household arrangements by sample type, course type and ethnicity: numbers
and percent..............................................................................................................34 Table 3.4 Children of students by age bands and sample groups, numbers and percent35 Figure 3.1 Proportion of students aged 16-19, living with parents and have own
children in different sample types...........................................................................36 Table 3.5 Experience students bring to childcare courses: employment, further
education, voluntary work and unpaid caring responsibilities, numbers and percent................................................................................................................................37
Table 3.6 Reasons for choosing childcare courses, numbers and percent .....................38 Table 3.7 Student ratings of academic and practice preparation on childcare courses,
numbers and percent ...............................................................................................39 Table 3.8 Methods of helping students find employment, numbers and percent...........40 Table 3.9 Expectations of working with children, numbers and percent .......................41 Table 3.10: Preferred childcare settings for employment by sample type, course type
and ethnicity, numbers and percentages .................................................................43 Table 3.11: Preferred working conditions in childcare settings: hours a week and weeks
a year, by sample type, course type and ethnicity, numbers and percent ...............44 Table 3.12: Employment obtained in childcare settings by sample type, course type and
ethnicity, percent.....................................................................................................44 Table 3.13 Matching preferences to employment obtained, hours per week and weeks
per year, percent......................................................................................................45 Table 3.14 Job presence and absence and views on finding a job, numbers and percent
................................................................................................................................46 Table 3.15 Students’ views on the best form of non-parental childcare in three age
bands, under 1, 1–2, 3–school age, percent ............................................................47 Table 3.16 The next five years: daytime caring responsibilities for preschool aged
children and elder or disabled kin, by sample type, numbers and percent .............48 Table 3.17 Preferred work pattern when combined with own preschool children,
numbers and percent ...............................................................................................48 Table 3.18 Students’ projected destinations in five years time, numbers and percent...49 Table 4.1: Characteristics of focus group participants by course type...........................51 Table 5.1 Management of nurseries ...............................................................................65 Table 5.2 Number of places in sampled nurseries .........................................................65 Table 5.3 Full-time and part-time children on roll, numbers and percentages ..............66 Table 5.4 Age distribution in sampled nurseries (1) ......................................................66 Table 5.5 Age distribution in sampled nurseries: percentages (2) .................................66 Table 5.6 Size of nurseries: number and percentage of full-time and part-time childcare
and education staff posts.........................................................................................67 Table 5.7 Whether vacant posts and number of vacant posts ........................................68 Table 5.8 Whether staff left in previous 12 months and number of staff left in previous
12 months ...............................................................................................................68
4

Table 5.9 Whether recruited staff and number recruited in previous 12 months...........69 Table 5.10 Average length of time to induct new recruits and replace members of staff,
numbers and percentages ........................................................................................69 Table 5.11 Methods of recruitment, numbers and percentages......................................70 Table 5.12 Nursery heads’ views on applicants, numbers and percentages...................70 Table 5.13 Nursery heads’ views on inadequate recent recruits, numbers and
percentages .............................................................................................................71 Table 5.14 Effects of the National Minimum Wage, numbers and percentages............71 Table 5.15 Age of nursery heads and other childcare and education staff, numbers and
percent ....................................................................................................................72 Table 5.16 Ethnicity of nursery heads and other childcare and education staff, numbers
and percentages.......................................................................................................72 Table 5.17 Own children of nursery heads and other staff, numbers and percentages ..73 Table 5.18 Living arrangements for nursery heads and other staff, numbers and
percentages .............................................................................................................73 Table 5.19 Reasons for working in childcare, heads and other staff: numbers and
percentages .............................................................................................................74 Table 5.20 Careers advice given to heads and other staff, numbers and percentages....74 Table 5.21 School leaving qualifications, heads and other staff, numbers and
percentages .............................................................................................................75 Table 5.22 Levels of childcare and early education qualification attained by heads and
staff, numbers and percentages...............................................................................75 Table 5.22 Non-childcare qualifications attained by heads and other staff, numbers and
percentages .............................................................................................................77 Table 5.23 Previous relevant employment experience, heads and other staff, numbers
and percentages.......................................................................................................77 Table 5.24 Duration of childcare or early education employment, heads and other staff,
numbers and percentages ........................................................................................78 Table 5.25 Non-childcare employment experience, heads and other staff, numbers and
percentages .............................................................................................................78 Table 5.26 Job titles of heads of nurseries by scope of post ..........................................79 Table 5.27 Job titles and supervision responsibilities of other staff ..............................79 Table 5.28 Hours worked in previous week, heads and other staff, numbers and
percentages .............................................................................................................80 Table 5.29 Number of days sick leave, heads and other staff, numbers and percentages
................................................................................................................................81 Table 5.30 Number of days paid holiday, heads and other staff, numbers and
percentages .............................................................................................................81 Table 5.31 Short courses attended in the previous year by heads and other staff,
numbers and percentages ........................................................................................82 Table 5.32 Commitment to the childcare field and to current job, heads of other staff,
numbers and percentages ........................................................................................83 Table 5.33 Reasons for feeling settled in childcare and early education work, heads and
other staff, numbers and percentages......................................................................83 Table 5.34 Five years ahead: envisaged employment, heads and other staff, numbers
and percentages.......................................................................................................84 Table 5.35 Expectations of work five years ahead, heads and other staff, numbers and
percentages .............................................................................................................85 Table 5.36 Whether paid course fees influences take up of further qualifications ........85 Table 5.37 Reasons for leaving childcare work, numbers and percentages...................87 Table 5.38 Destinations for those thinking of leaving ...................................................87
5

Figures Figure 3.1 Proportion of students aged 16-19, living with parents and have own
children in different sample types ......................................................................... 38
6

Executive Summary Three studies of the childcare workforce in training and at work are reported here. These include two national surveys, one of childcare students, and one of day nursery workers, and a focus group study of childcare workers and playworkers in training. All the studies were commissioned by the Department for Education and Skills (DfES) (formerly known as the Department for Education and Employment, DfEE) and took place between 1998 and 2000. The main aim of the studies was to investigate issues of entry, retention and loss in the childcare workforce at a time when government policy supports a major expansion of childcare services and so of this workforce. Particular objectives were to describe the characteristics of those people who train, and work, in the childcare field, to identify their views and experiences of training and employment and to explore how their commitment to childcare employment is combined with other commitments they may have. This report provides a detailed account of the three studies in separate chapters. The policy background, perspective and methods employed in each study are reported in Chapter 1. Chapter 2 provides a broad description of the childcare workforce, and compares it with other kinds of early childhood and caring work, drawing on secondary analysis of a large data set, the Labour Force Survey. The survey of childcare students is reported in Chapter 3, followed by the findings from the focus groups in Chapter 4. The focus groups were undertaken in order to provide some in-depth exploration of issues that arose in the student survey, and to offer representation to groups of students largely missed in the survey. Chapter 5 details the survey of childcare workers who work in registered day nurseries, and is the first UK study to interview a large sample of childcare workers in detail about their personal circumstances and ambitions and their perspectives on their workplace. In Chapter 6 we give an overview of our findings organised according to our three key issues - entry, retention and loss - as well as offering some conclusions about the future of the childcare workforce. Two themes run through these studies. The first is that of the value placed on childcare and playwork as an occupation and as a service. Workers and students reported a high level of intrinsic commitment to, and reward from, childcare and playwork. But they also repeatedly claimed that their work was not valued sufficiently highly both within the early years field and by society at large. A combination of high commitment and persistent undervaluation of the work must make these workers vulnerable to competing sources of employment. The second theme is combining childcare work itself with parenting. Given that most of the childcare workforce is female and many are young, this combination of roles is already, or will soon be, a reality for many workers and the possibilities and difficulties of doing so from both a practical and ideological viewpoint are highlighted throughout the report. Major findings are: Chapter 2 Using data from the Labour Force Survey for 1996-1998 it was found that:
• There were almost 100,000 ‘nursery nurses’ working in Great Britain • Almost all were female • Their average age was 32, with a third aged under 26 • Most were white • Almost one third were single and almost half lived with their own children • Over half had a teaching or nursing qualification, or a vocational qualification
(which might or might not be in childcare) • Two-thirds worked full-time
7

• Average gross pay per week was £142 Chapter 3
• The survey covered students completing diploma and certificate childcare courses at a random sample of further education colleges offering diploma courses in 1999
• Most childcare students are female, white and aged 16–19. They mostly live with their parents and are not mothers themselves
• Students from minority ethnic backgrounds are more likely to be older, to live independently from their parents, and to have children of their own
• Many students begin their courses with related employment or voluntary work experience or are familiar with childcare from childhood
• Over 90% of students are satisfied with the academic and practical preparation provided by their courses
• Nearly three-quarters of white students, but fewer than half of minority ethnic students, are employed while studying combine study and employment
• Two thirds of those that combined study and paid employment said this was difficult
• Over 85% of childcare students are committed to working in the early years field and many want to continue their studies
• Other employment options considered were nursing, social work, clerical work, working with animals, performing arts, and health and beauty work
• The most popular childcare employment option was working in a nursery school or class, followed by working in a day nursery or as a nanny
• Minority ethnic students preferred local authority day nursery and special needs work to working in private day nurseries and very few would choose to work as a nanny
• There is often a mismatch between preferred and obtained employment. Where students had obtained jobs, few were in schools, and employment was more likely to be in private nurseries or as nannies
• Over three-quarters of students wanted to work full-time, but around half wanted to work school terms only
• Students tended to believe that relatives provided the best non-parental care for children under the age of one, and day nurseries provided the best form of non-parental care for children aged three to school age1. For children aged one and two, the best option was more evenly divided between day nurseries, nannies, childminders and relatives
• Minority ethnic students rated day nurseries as the preferable option at an earlier age, after the age of one
• 52% of students envisaged having day time caring responsibilities for their own children in the coming five years
• Part-time employment was the most common method envisaged for combining employment with care of own preschool aged children, followed by not working at all, and working from home. Working full-time was the least favoured option, although minority ethnic students were more likely to consider this possibility than were white students
Chapter 4
• The focus group participants were broadly similar to the student survey respondents in respect of some factors, such as gender, educational background
1 Options for nonparental care referred to all day care and did not include nursery education in nursery schools or classes.
8

and ethnicity, but were selected to be different in others: they were older, usually had additional responsibilities (jobs and children at home) and included students from playwork courses and NVQ courses
• Participants found childcare work and playwork rewarding, varied and stimulating
• Many participants thought of childcare and playwork as a career, but saw considerable constraints operating around achieving a career. Major constraints were having children and priority given to partners’ careers, hours of work and occupational mobility
• A further constraint was the effect of two particular beliefs, which provided a framework for the combination of work and motherhood. One was that mothers (and fathers to a lesser extent) should be available to their children, and the second was that you shouldn’t leave your children to be cared for by others
• Achieving a career in childcare and playwork was also constrained by a perceived devaluation of the work from many sources including low wages generally and a competitive pay environment in the early years field; poor recognition of the level of skills and responsibility required for childcare and playwork; parents’ views and government policies
• Courses were reported to be stimulating and demanding but in some cases organisational problems detracted from students’ learning experiences
Chapter 5
• The survey covered over 2,000 heads and other staff working in 251 registered day nurseries in England
• Three-quarters of the nurseries were privately owned. The average size was 44 places, with considerable variation. Most nurseries were open all day
• Most children attended part time, and the most common ages were 2 and 3 year olds. Nearly all nurseries said they would care for children with special needs, and nearly all actually had at least one child with special needs
• There was an average of 7 full-time and 3 part-time childcare staff per nursery. Nearly a third of nursery heads had at least one vacancy, and nearly three quarters of nurseries had had at least one member of staff leave in the preceding 12 months. By far the most common ways of recruiting staff were via local adverts and word of mouth
• Nearly three-quarters of nursery heads who had recruited in the past year felt there had been problems with applicants - either there were not enough, or else they lacked adequate experience or qualifications
• The National Minimum Wage had had little effect, as most nurseries had already paid at or above the rate
• The characteristics of nursery staff were homogeneous: overwhelmingly female; mostly young (average age 24); largely white and able-bodied. A third of nursery staff had their own children and two-fifths lived with family. Heads of nurseries were older and most had their own children
• On average heads have worked 13 years in the childcare field, other staff 6 years
• Staff had typically left full-time education with GCSEs or equivalent qualifications
• Compared with the national average, day nursery staff were as likely to have GCSEs or equivalent but were much less likely to have A-level qualifications
• Most staff cited positive reasons for working in childcare, such as liking working with children, or finding the work rewarding, but had usually had no careers advice about working in this field
9

• 22% of heads and 33% of other staff did not hold any relevant childcare or early education qualifications
• 59% or heads and 52% of other staff held a Level 3 (diploma) qualification; 3% of heads and 13% of other staff held a Level 2 (certificate) qualification. 16% of heads and 3% of other staff held a Level 4/5 (professional/vocational) qualification
• 40% of heads had either completed a managerial or assessment qualification such as the NVQ Assessor Award, or some other form of management or business training
• 56% of heads and 71% of other staff would consider further training in childcare in the next five years
• Most staff worked full time: the average working week was 39 hours for heads and 35 hours for other staff
• Three quarters of heads worked additional hours unpaid, but only 17% of other staff did this
• Most staff had permanent contracts and averaged 20 days paid holiday per year • Gross annual salaries were low. The mean annual salary before tax for heads
was £13,400 and £7,700 for other staff. This is well below the national average for full-time non-manual female employees, which in 2000 was £19,193
• Very few staff had pensions or were members of trade unions or professional organisations
• Nearly all viewed their work as a longer-term career, most felt settled in their present post and there were, overall, very high levels of job satisfaction
• Looking forward five years, three quarters of the heads but only 48% of the other staff expected still to be working in day nurseries
• During the coming five years, 26% of heads and 34% of other staff expected to have caring commitments (for children or elder kin) that would take them away from employment
• Reasons for feeling settled in current jobs related to the intrinsic nature of the work, in particular, the children, as well as organisational aspects, such as working as a staff team
• 8% of heads and 14% of other staff were actively thinking of leaving their present job. The reasons for leaving were both to do with the nature of the job and the working conditions, but the most commonly cited factor was the poor rate of pay
• Among other staff, those with higher level qualifications and those with higher rates of pay were more likely to expect to leave their present jobs than other groups
• Among the staff who were thinking of leaving, only a small minority planned to leave childcare work altogether
Chapter 6 • The high degree of commitment to childcare work is a real strength of the
current workforce • But other findings in these three studies give cause for concern about the future
of the childcare workforce • Achieving a career in childcare is not easy, particularly if and when workers
combine working with motherhood. Pay is low and there are few other benefits to suggest that nurseries support their workforce
• Staff retention relies on individual staff commitment • The backgrounds of staff are strikingly homogenous. The main areas of under-
representation and older people and men
10

• This over-reliance on one segment of the workforce may exacerbate recruitment and retention difficulties
• The pool of labour available from young women is diminishing just as demand is growing. This is due to several factors: • The educational achievements of and opportunities for young women are
growing nationally • Motherhood is much more likely among younger women with lower levels
of educational qualifications than other groups • Many of the childcare students and workers anticipate full-time
motherhood and leaving employment for a few years at least while their children are young
• These factors point to discontinuity of employment and consequent high turnover and in-built instability in the day nursery workforce placing increasing demands on nurseries and their management
• The problems of recruitment and retention in childcare are also evident in social care which recruits people from similar backgrounds
• Three possible options are posed: • Diversify the compositions of the workforce, addressing the gender and age
imbalance • Improve pay and other conditions, including ‘family friendly’ working
conditions • Revalue childcare work and improve its status, addressing the question:
How should we understand early childhood work and what training is appropriate to its meaning?
11

Acknowledgements The studies on which this report is based were conducted with the help of a large number of people whom the authors would like to thank. These include the lecturers, tutors and managers in further education colleges who helped deliver the student survey and facilitated the focus groups; Caroline Bell, who took a major role in the organisation of both the surveys; Paul Bonel and the National Play Centres who helped find participants; Phil Barnett from System Three International, the market research company which conducted the survey of staff; and the heads of nurseries who agreed to participate in a study that demanded considerable staff time. The studies also benefited from advice from members of the Advisory Committee set up by officers from the DfES. In addition, the work could not have been completed without the assistance of data entry staff and transcribers at Thomas Coram Research Unit. But most of all, the authors would like to thank the thousands of students and workers whose lives, views and experiences are brought together in this report. Material from the Labour Force Survey is Crown Copyright; has been made available by the Office for National Statistics through the Data Archive and has been used with permission. Neither the ONS nor the Data Archive bears any responsibility for the analysis or interpretation of the data reported here. Thomas Coram Research Unit, which receives support from the Department of Health and the Department for Education and Skills, undertook this work: the views expressed in this report are those of the authors and not necessarily those of either Department.
12

Chapter 1 Introduction 1. 1 Policy background The three studies of the childcare workforce, in training or in work, covered by this report come at an auspicious time for policy and practice in early childhood services2. The current Government has shown unprecedented interest in improving the availability, quality and accessibility of services for young children through a range of initiatives and programmes: • Educational provision has been made for all 4 year olds and is to be extended to at
least two-thirds of 3 year olds by 2002 through nursery education grants. • A National Childcare Strategy is in place to support parents and children through
increasing the supply of, and enhancing the quality in, services designed to care for children while parents are in employment or training. This Strategy is being implemented by Early Years Development and Childcare Partnerships, informed and guided by childcare audits and local early years development and childcare plans.
• The Sure Start initiative targets children under 4 years of age and their families in disadvantaged areas, with 250 local programmes envisaged by the end of 2002 (and further extended in the 2000 Comprehensive Spending Review).
• A programme of Centres of Early Excellence, intended to highlight ‘best practice’ has been launched.
• New sources of funding have been provided, including a Childcare Tax Credit for parents introduced in October 1999.
• Two of the existing systems for regulating early years education and child care in the voluntary and private sectors (inspections by OFSTED under Section 122 of the Nursery Education and Grant Maintained Schools Act 1996 and by social services under the Children Act 1989) are being brought together within a new Early Years Directorate within OFSTED, and a new set of national standards for the regulation of childcare services is being drafted.
• Desirable learning outcomes have been replaced by early learning goals complemented by guidance.
• The Qualifications and Curriculum Authority (QCA) has produced a framework of nationally accredited qualifications for early years education, childcare and playwork. The formal educational orientation of preschool services has never been more forcefully emphasised, with implications for the roles and responsibilities of staff employed in early childhood services.
• The DfES has mounted an extensive recruitment campaign for childcare workers. The workforce is a major issue that runs through all of these policies and initiatives. It has a major bearing on availability, quality and accessibility of early childhood services: the achievement of these goals is contingent on recruiting and retaining sufficient, appropriately trained workers. This has been recognised by government, for example through training initiatives outlined above and a recruitment campaign for childcare workers launched in 2000. The project reported here addresses entry, retention and loss at several levels: the childcare training stage in further education colleges, training while also employed, and in one important part of the early childhood workforce itself: day nursery staff. It sheds light on how these services can recruit and retain ‘competent individuals’, whose
2 Early childhood services refer to all the services that young children attend for care, education and play, such as childminders, day nurseries, playgroups, nursery schools and classes, and out of school or playwork services (Pugh, 1996).
13

expertise, skills and qualifications are acknowledged in the National Childcare Strategy as an essential contributor to quality services. 1.2 Childcare and early education services In the UK, services designed for the care and education of preschool aged children are characterised by immense diversity. This diversity is the result of several factors. First, there has been a long-standing structural divide in governmental responsibility for care services on the one hand and early education services on the other. Second, this division has traditionally led to different kinds of services, with differing priorities, goals and ethos, and different types of funding, being supported by different government and local authority departments. Within the Department of Health (DH), for example, there has been a discretionary responsibility on local authorities to support day nurseries3. The health and welfare concerns of this department and local authority social services departments meant that the primary role of these nurseries was largely (but not always exclusively) to care for socially, emotionally or materially deprived children aged 0–5, and not all children. These publicly provided day care services have accounted for a small minority of the total number of places for preschool aged children (there were 15,500 places in local authority provided nurseries in 19994). Local authorities could also pay for children to attend services in the private and voluntary sector, and, in 1998, they paid for, or sponsored, 5,400 such day nursery places. Over the last decade, the number of places in publicly provided places has been decreasing, and is today almost half of the 1989 total (28,800). Instead, local authorities have begun to focus on the provision of services for families, known as family centres, and these services (there were 470 of them in 1999, rising from 400 in 1989) may or may not provide day care for children, and are not necessarily exclusively for children under five. The workers in these day nurseries and family centres were traditionally known as ‘nursery nurses’, a term that is used in the collection of statistical data (see chapter 2), but in many centres and nurseries this term is not used so the collective term we have used in this report is childcare worker. These workers may be trained or untrained, and will typically include a good proportion with a childcare diploma qualification, as well as other qualifications such as social work or nursing (EO/IDeA, 1999a). The Department for Education and Skills (DfES) and local education authorities have had different concerns. Their responsibility is to provide education for all children over the age of five. An historic discretionary responsibility to provide preschool education5 has been given a new emphasis by the government and now local education authorities have a responsibility to provide a free early education place for all four year olds prior to the beginning of compulsory education at the age of five. Historically, the focus here has been on establishing nursery schools and nursery classes within infant and primary schools, catering for children aged three and four, which in practice were unevenly distributed (Owen and Moss, 1989). Many four-year-old children also attend reception classes in primary schools. This provision is more extensive, with, in 1999, 713,608 children attending such schools and classes in the maintained sector and a further 57,542 two, three and four year old children attending independent schools6. Most of 3 This responsibility was given to local authorities in the Maternity and Child Welfare Act 1918. 4 All statistics in this section are from Children’s Day Care Facilities at 31 March 1999 England, Statistics of Education, DfES, 1999 unless referenced separately. 5 This provision was contained in the Education Act 1918. 6 Pupils Under Five Years of Age in Maintained Schools in England, Statistical First Releases, DfES, 1998; Statistics of Education: Schools in England 2000, DfES, 2000. http://www.DfES.gov.uk/statistics/DB/VOL/v0192/vol04-2000.pdf
14

the children attending nursery schools and classes attend part-time, for 2½-hour sessions, whereas most children in reception classes attend full-time. The Government has pledged to increase the availability of nursery education: it is ‘working towards a target of universal nursery education for all three and four year olds’ (Hodge, 2000). Part of the method of doing this is to provide grants to care and education services in the private and voluntary sectors who provide an accredited curriculum (see below). Maintained sector schools employ diploma qualified nursery nurses to assist early years teachers (EO/IDeA, 2000). Beyond the statutory provision, there are three major kinds of services in terms of places available. The first two are playgroups or preschools, voluntary sector groups originating in the self-help tradition and usually run by a parent-led management committee (347,200 places in 1999) and childminders, or self-employed persons (usually women) who charge fees to care for children under the age of eight in their own homes (337,000 places in 1999)7. Both these kinds of services appear to be in decline. While historically the information base in early childhood services is not good so it is difficult to rely entirely on national statistics (Moss, et al., 1998) (although recent changes may lead to improvements), the best available national figures suggest that there has been a drop in both playgroup places (65,400 down since 1994) and in childminder places (45,700 down since 1996). The third major type of provision, and the main concern of this report, is registered day nurseries. Day nurseries in the private and voluntary sector (also known as independent or registered day nurseries) offer all day care for children aged 0–4 (and some offer additional services for older children such as breakfast or after school care or holiday schemes). They are largely dependent on parental fees (subsidies in the form of nursery education grants are now available for four-year-old children and some three-year-old children in nurseries running an accredited educational programme) and cater for the children of working parents. They have seen rapid growth in the last decade, from 1,700 in 1989 to 6,400 in 1999, offering a total of 220,200 places. A recent survey estimated that there were about 43,300 care and education staff working in registered day nurseries in 1998 (EO/IDeA, 1999a). These nurseries are a primary source of employment for childcare workers (or ‘nursery nurses’) with diploma and certificate (and other) qualifications. They also employ a proportion of unqualified childcare workers (ibid.). A third division between care and education systems has also, until recently, been seen in arrangements for the regulation of services. All care services (childminders, playgroups and day nurseries) are required to be registered with local authorities under the Children Act 1989 (Part X). With a few exceptions8, they are then subject to an annual inspection. Local maintained nursery schools, primary schools with nursery classes and independent schools are subject to inspection by OFSTED under the Schools Inspection Act 1996. Since 1998, day care providers wanting to access the nursery education grant available for three and four-year-old children have had an OFSTED inspection under the Nursery Education and Grant Maintained Schools Act 1996. Following the administrative integration of childcare and early education responsibilities in the DfES in 1998, a single OFSTED inspection system for all childcare and education services will be introduced by the new Early Years Directorate. This will be introduced in 2001 under Part V1 of the Care Standards Act 2000 to ease inconsistencies and overlap between the two methods of quality assurance.
7 Around 9,000 children had places in playgroups or with childminders paid for by local authorities in 1998. 8 Namely, some local authority nurseries and some nurseries on NHS property.
15

The system already described is complicated. However, there are also other, unregistered, services, such as nannies, who are persons (usually women) employed to care for young children in their employer’s home, either living in or out, and generally have a diploma qualification, although this is not a requirement. Because this service is not registered, it is not possible to quantify the number of nannies, although a survey of childcare use showed that 2 percent of working mothers with dependent children used nannies in 1994 (Finlayson et al., 1996). Apart from the main early childhood services for preschool aged children, there are also other occupations where trained childcare workers might be employed, such as in children’s wards in hospitals, or as children’s representatives for holiday companies. It is not possible at present to estimate the number of childcare workers in these occupations. In addition, childcare workers are employed as learning support or classroom assistants in nursery, primary, secondary, independent and special schools. A recent survey estimated that there were 121,472 education support staff working in maintained and independent schools (EO/IDeA, 2000). Education support staff covered a wide range of job titles, and around a third of them held a childcare diploma level qualification. Trained childcare workers are also employed as playworkers with school-aged children. Playwork services such as after-school (or out of school) clubs or holiday playschemes are another growth area, as care for children outside school hours is seen as key to facilitating mothers’ paid employment. If they include children under eight, they also need to be registered under the Children Act 1989: in 1999 there were 90,400 places in after-school clubs and 345,200 places in registered holiday playschemes. In addition, some local authorities provide after school clubs (8,800 places) and holiday schemes (71,600 places in 1999). Although specific training and qualifications for playworkers are fast being developed (SPRITO, 1999; QCA, 1999) and many workers do not hold a relevant qualification, around a quarter of playworkers hold childcare qualifications (EO/IDeA, 1999b). The final point on childcare services is that of availability and accessibility. Until recent policy initiatives to increase the supply of childcare services by offering financial support to services and to low and middle income parents take effect, registered childcare services for preschool and school aged children cater for an estimated one in nine children under the age of eight (Day Care Trust, 1997). In these circumstances it is not surprising that many families do not used registered childcare at all: Finlayson et al. (1996) showed that, in 1994, 50 percent of working mothers with children under the aged of four used informal care provided by relatives such as partners, parents and parents-in-law. Trends in the national figures suggest that the volume of some services is declining (local authority day nurseries, playgroups, and childminders) while others are growing rapidly (private and voluntary sector day nurseries, after school clubs and holiday schemes). In this report, the focus is on the main growth area in childcare employment: in the private and voluntary sector day nurseries and to a lesser extent in playwork. Staff working in public sector services such as day nurseries, family centres and schools have not been included, and separate studies have considered the staffing situation for childminders (Mooney et al., 2000), and playgroups (Brophy et al., 1992; Statham et al., 1990).
16

1.3 Training and qualifications in childcare and playwork Training to work in the early childhood field of education, care and playwork is currently undergoing enormous change. Taking just one early childhood service, a survey of day nurseries in 1998 (EO/IDeA, 1999a) used information from responding heads of nurseries and established that 90 percent of nursery managers and 75 percent of other childcare and education staff had some relevant qualification9. A similar method was used for a survey of day care providers in 1994 (Moss et al., 1995), which showed that most nurseries surveyed employed a mixture of qualified and unqualified staff. A historical problem in the early years field noted by Cordeaux et al. (1999) was that of extreme fragmentation in the range and level of relevant qualifications so that although a wide range of possible qualifications existed, many had little currency across administrative boundaries and there was inconsistency between employers about which qualifications were relevant for particular posts.
Since the advent of the National Childcare Strategy, which aimed to establish a clear, comprehensive qualifications and careers structure (DfES, 1998: 2.31), many initiatives have begun to both raise the proportion of qualified staff and improve the coherence of training and qualifications. For example, an Early Years National Training Organisation (EYNTO) has been introduced, and a Playwork Unit has been formed within the National Training Organisation for Sport, Recreation and Allied Occupations (SPRITO), each charged with improving the training and qualifications base within their fields. A training and qualifications framework (QCA, 1999; QCA, 2000) has begun the process of constructing a coherent set of qualifications that address the different occupations within the early years sectors, rationalising the number of accredited qualifications; and local Early Years Development and Childcare Partnerships have been introduced with a responsibility to co-ordinate a broad programme of vocational training and qualifications through a training strategy. These initiatives represent a concerted attempt to improve the qualification base in the early years field. These initiatives build on the system of accrediting competence through the National Vocational Qualifications (NVQ/SNVQ) framework introduced in the mid-1980s (Hevey and Curtis, 1996). Designed to be modular, flexible and to reflect experience as well as training, the NVQ system has a series of levels, which denote increasing competence and specialisation in particular areas. However, NVQs are not solely workplace-based, or workplace and college-based forms of accrediting competence: the system has also been developed to map the series of levels onto the existing qualifications in order to provide a coherent ladder or climbing frame of qualifications and occupations (QCA, 1999). The main types of training in childcare, early education and playwork are these: • Two-year college plus placement Diploma courses aimed at working with babies
and young children (e.g. CACHE Diploma in Child Care and Education (previously the NNEB Diploma in Nursery Nursing); BTEC/EdExcel National Diploma in Childhood Studies (Nursery Nursing)10). These two qualifications are the most commonly found qualifications in nurseries (46 percent of all childcare and education staff hold one of these two (EO/IDeA, 1999a))
9 Relevant qualifications included CACHE and BTEC Diplomas, Advanced Diplomas and Certificates, teaching and nursing qualifications, Montessori qualifications, S/NVQs Levels 2, 3, and 4 in Childcare and Education and in Playwork, professional social work qualifications, and PLA/PPA diplomas. 10 The EdExcel qualification has been submitted to the QCA, but at the time of writing not approved, with a new title: Level 3 National Diploma in Early Years.
17

• One-year college plus placement Certificate courses aimed at preparation for the Diploma courses or employment under supervision in nurseries (e.g. CACHE Level 2 Certificate in Child Care and Education; National Certificate in Childhood Studies (Nursery Nursing)11). This kind of qualification is held by about 5 percent of staff (EO/IDeA, 1999a).
• S/NVQ (Scottish/National Vocational Qualifications) Levels 2 and 3 in Early Years Care and Education designed for those in employment, with completion of discreet modules at students’ own pace, and with some college-based or training centre commitments. S/NVQ Levels 2 and 3 are each held by about 6 percent of the nursery workforce (EO/IDeA, 1999a). A higher-level award, an NVQ Level 4, designed for managers and those with specialist interests, has recently been accredited (QCA, 2000) for use in England and Wales.
• S/NVQ levels 2 and 3 in Playwork designed for those in employment, with completion of discreet modules at students’ own pace, and with some college-based on training centre commitments. These NVQs are held by about 2 percent of the nursery workforce, and about 5% of those who work in registered out of school clubs (EO/IdeA, 1999b). The NVQ Level 4 in Early Years Care and Education is also available for playwork managers and development officers (QCA, 2000).
• Modern Apprenticeships (MAs) for Early Years Care and Education, a system of accreditation during employment at NVQ Level 3, and can take up to 3 ½ years for completion of the necessary modules. These are completed through a partnership between TECs, employers and apprentices based on a Training Agreement including an Individual Training Plan.
• Post-qualifying or higher education qualifications (e.g. Advanced Diploma in Childcare and Education (ADCE); HE Diploma in playwork; BEd and PGCE in Early Years).
• Specific occupation orientated training (e.g. CACHE Level 3 Diploma in Preschool Practice; CACHE Level 3 Certificate in Childminding Practice).
1.4 The study overall In 1998, the DfES commissioned the Thomas Coram Research Unit to undertake a study of childcare students and the day nursery workforce in order to inform policy and practice on recruitment, retention and training of childcare workers. This was linked to a preceding study for the DH by the same team on gender issues in the childcare workforce (cf. Owen et al., 1998; Cameron et al., 1999). Further work by the Thomas Coram Research Unit is in progress to carry out telephone follow-up studies of students and workers interviewed in this study. This will assess the rate of staff turnover and the subsequent destinations of staff and students, and include a qualitative, in-depth study of former childcare students and workers. 1.4.1 The student and worker studies
This research report brings together three studies all concerned with issues of entry, retention and loss. First, a survey of students undertaking central qualifications in childcare, such as the diploma and certificate courses is reported in Chapter 3. Second, Chapter 4 details the conclusions of a series of six focus groups with groups of childcare and playwork students. The third element, in Chapter 5 is a major survey of the registered nursery workforce. This is the first UK study to interview a large sample of childcare workers in detail about their personal circumstances and ambitions and their perspectives on their workplace.
11 The EdExcel qualification has been submitted to the QCA, but at the time of writing not approved, with a new title: Level 2 National Diploma in Early Years.
18

The aims of all three studies are to investigate who is being recruited to childcare courses, to understand which factors help staff stay in childcare and playwork employment, and conversely, which factors encourage the training or employed workforce to leave the childcare field. Two themes run through the results of these studies. The first is the value placed on the work as an occupation and a service. Workers and students reported a high level of intrinsic commitment to their work but forcefully claimed that wider society did not value their work highly. The second theme is combining employment with family commitments. Practical and ideological problems and possibilities arising from this combination of roles are highlighted throughout the report. 1.5 Perspective adopted The approach adopted was to obtain a picture of students’ and workers’ lives that integrated their employment and training with other commitments and interests in their lives such as caring responsibilities or career ambitions. Reasons for entry, retention and loss in the registered day nursery workforce may be related to factors outside the employment or training environment as well as within it. In addition, there is a well-documented gender imbalance in the childcare and playwork workforce, with well over 95 percent of the workforce being women (Cameron and Moss, 1998). Most women, regardless of marital or parental status, now expect to be employed for much of their adult lives (Crompton, 1997). However, the structure of women’s employment alters with additional commitments, such as families and children. For example, women’s working lives incorporate domestic commitments to a much greater extent than men’s (Brannen and Moss, 1991; Jowell et al., 1992), with higher rates of part-time working, shift working, and periods of time spent outside the labour market altogether in order to carry out domestic or caring responsibilities (Crompton, 1997; Holtermann et al., 1999). The fastest rate of increase within female employment is that of mothers with children under five. Between 1990 and 1997, the proportion of this group of mothers who were employed rose from 45 percent to 57 percent (Holtermann et al., 1999) and is likely to continue to rise. However, the rate of increase was unevenly distributed. Mothers with higher levels of education and higher salaries were far more likely to be returning to employment than those with lower levels of education and lower potential salaries (ibid.). But the potential earning power is not the only factor that may influence mothers’ decisions in relation to the labour market. There has also been a historically pervasive set of ideas about, or clear normative expectations of, the motherhood role (Cameron, 1999). Influenced by processes of industrialisation, by psychological theories of child development, and by public policy, these normative expectations held that ideally, mothering was a full-time, home-based occupation that largely precluded employment outside the home (ibid.). In other words, for a mother of young children to be employed would involve stepping outside normative behaviour and may incur social disapproval or indeed self-criticism. These normative ideas about motherhood may or may not be being eroded by or accommodated within the patterns of female employment described above. The interesting question for the research on the childcare workforce was whether these kinds of ideas played a part in the workers’ and students’ decisions to participate in the childcare labour market once they became mothers; and whether they held views about whether other mothers should be using childcare services while they were themselves employed.
19

1.6 Methods The methods used in each of the three studies are reported in detail here, beginning with the national survey of students on childcare courses, then the focus groups and last the survey of the day nursery workforce. For the student survey, colleges were selected from a data base of further education colleges in England offering the two-year CACHE Diploma in Child Care and Education and the BTEC National Diploma in Childhood Studies (or their equivalent courses), a total of more than 400 colleges. The aim was to survey students leaving courses designed to prepare them for employment with young children in the summer of 1999. Twenty-seven colleges were selected randomly. This was the main sample. Six further colleges were added to the sample, from areas of relatively dense minority ethnic population (based on the 1991 census), to provide additional minority ethnic students. These colleges were not selected at random, because of the deliberate method of selection, and are referred to as the supplementary sample. This made a total of 33 recruited colleges, representing urban and rural areas, and from all the regions of England. The design of the survey aimed to maximise participation by students with economy of distribution. Childcare lecturers were initially contacted in February 1999 by telephone and their help with the survey obtained. The questionnaires were sent to lecturers in the summer term (copy in Appendix 1). Lecturers were asked to ensure that students completed the questionnaire during a group teaching session and that students returned it using a sealable envelope (provided by the research team) to the lecturer. Each college’s questionnaires were then to be returned to the research team. Even after several reminders, one college in the main sample and one in the supplementary sample did not return their questionnaires, reducing the number of colleges to 31. The two-year diploma courses were the ones of key interest to the study, and these have been designated the ‘core’ courses. However, students on the other ‘non-core’ courses were also of interest. These courses, such as the certificate course, were of shorter duration and were aimed at preparation for further study or supervised employment12. Lecturers were asked also to distribute questionnaires to students on these other courses. Thus, although the survey covered the predominant qualifying courses in childcare, some of the course categories described in section 1.3 were not included in this survey, namely, the modern apprenticeships, the post-qualifying training and the specific occupation oriented training. A total of 1,094 questionnaires were returned, 775 from students on the ‘core’ or diploma courses and 319 from students on ‘non-core’ or certificate and other courses. Since it was not possible to get reliable figures on the number of eligible students in each college, it is not possible to calculate an overall response rate. Lecturers were asked to report the reasons for any non-completion of questionnaires. These mostly involved the unreliability of students’ attendance at college towards the end of the summer term, pressing deadlines for written work, and failures of lecturers to ensure the completion of questionnaires during teaching sessions. However, most reported that almost all eligible students had in fact completed a questionnaire. For this report, the key group comprises students in the main sample on core courses. These students form a random sample of students at colleges in England offering the CACHE or BTEC diploma or equivalent. In addition, results are presented for students in these same colleges following non-core courses. However, since these courses will 12 The BTEC/EdExcel certificate course is an exception to this general rule: it has been designated a ‘core’ course, because of the level at which it is set.
20

be offered in colleges in addition to those on the database of colleges offering the core courses, these students do not form a truly random sample of students on the non-core courses. Results are also presented by ethnicity, comparing white students with those from minority ethnic backgrounds. These results use data from both the main and the supplementary samples. Since the supplementary sample was a purposively selected, not random, sample, these samples are not random. Table 1.1 indicates the numbers of students in each of the categories. Table 1.1 Childcare student survey, main and supplementary samples; core and non-
core courses; ethnicity Main sample Supplementary
sample Total
Core Courses 648 127 775 Non-core courses 241 78 319 White* 795 90 885 Minority ethnic* 85 112 197 *12 missing cases The focus groups were designed to augment the student survey findings. This would occur both through exploring in greater depth issues raised in the survey, and through targeting groups of students that proved difficult to access through college courses. In particular, these groups were playwork students, whose courses were not necessarily or even likely to be based in colleges of further education; NVQ students, whose status as workers in training was not well reflected through the survey; and mature students, whose views and experiences may differ from those of school leaver students. In total, six focus groups were conducted between January and March 2000, and from various regions of England, from the north-east to the south-west. The topic guide for the focus groups was based on the same topics as those explored in the student questionnaire, but the discussion technique allowed for more in-depth probing of these topics (copy in Appendix 2). In total 30 students participated from six childcare and education and playwork courses. This was fewer students than anticipated, despite careful preparation, albeit at a distance, through lecturers and tutors. However, the results (see Chapter 4) are remarkably consistent. When asked about the reasons for non-participation, lecturers and tutors reported that students either found it difficult to see the relevance of the project to them, or participation entailed extra time commitments, which were difficult to accommodate in their busy work/study schedules. For the future, serious consideration must be given to financial reward for participation in focus groups. The focus group interviews took between an hour and an hour and three-quarters to complete. They were tape-recorded and fully transcribed, with transcripts of between 30 and 40 pages long. The analysis was completed with assistance of a computer package (NVivo) and informed by the perspective on women’s work and motherhood described above. Each discussant also completed a short questionnaire about their individual circumstances. The survey of day nursery staff aimed to survey the characteristics and views of around 2,000 staff working in registered day nurseries in a stratified random sample of local authorities in England. The sample was stratified by type of authority, using the National Audit Office categories: inner London, outer London, metropolitan, unitary or two-tier. Lists of registered day nurseries were requested from each sample authority by letter and subsequently by telephone. Appropriate nurseries (i.e. excluding those that
21

did not offer full-day all-year round care) were then selected, using a random numbers table where there were sufficient nurseries within the local authority, and all nurseries where there were not, and written to asking for permission to interview all the staff. The achieved sample comprised 2,060 staff from 251 nurseries in 16 local authorities. These nurseries were drawn from all the regions of England and include rural and inner-city areas. Public Attitude Surveys (PAS), a market research company, carried out the fieldwork, using a questionnaire designed and piloted by the research team (copy in Appendix 3). Each member of staff was also given a self-completion questionnaire to fill in to assess job satisfaction and motivation (copy in Appendix 4). The response rate from those nurseries contacted was 64 percent. Table 1.2 sets out the details of obtaining the sample. Of those nursery heads who refused to participate, only two cited refusal on the part of the staff: the two main reasons given concerned their workload, they were unable to spare the staff for individual interviews or were too busy. Table 1.2 Details of achieving the sample of nurseries N %
Addresses supplied 441 100
Uncontactable: Unobtainable/ no response to messages/ did not answer telephone/ closed down
45 10
Refused: Not able to spare staff Too busy Not interested Irrelevant Private nursery – commercial considerations precluded participation Staff refused Other/not given
32 18
9 5 3 2
76
Total Participated
145 251
33
Response rate – including uncontactable Response rate – excluding uncontactable
57 64
The questionnaire data was coded by PAS and returned to the research team for analysis; a self-completion schedule was returned for inputting by the research team. The analysis of the data reported here is mostly descriptive, with some exploratory and explanatory cross-tabs used in addition. The use of statistical significance tests is limited.
22

Chapter 2. The larger picture: secondary analysis of the Labour Force Survey The Labour Force Survey is the largest of the government’s regular household surveys (Owen, 1999). It collects a range of demographic data from all members of the household, including details of their occupation. Thus it provides us with the opportunity of forming a picture of the childcare workforce, looking at such features as age, qualifications and hours of work. There are limitations in using the LFS, however. These are to do with the way occupations are classified, the level of detail on qualifications and the small numbers of people in childcare occupations included each year. These limitations are outlined below. The LFS has been analysed for this report, to put the results of our own data into a wider context. Figures are presented for some childcare occupations, alongside some other care and education occupations for comparison. 2.1 Labour Force Survey The Labour Force Survey (LFS) is a national survey of private households in the United Kingdom. It collects data from approximately 60,000 households per quarter. The survey is conducted by the Office for National Statistics (ONS) on behalf of the government. Results are published in the LFS Quarterly Supplement to Labour Market Trends. Data are collected on a wide range of subjects, including occupation, training, marital status and household composition. When people in a household agree to take part in the LFS, they are interviewed five times at quarterly intervals. Most questions are repeated each quarter, but income questions are not asked every quarter. (This is discussed further below.) For the 1991 Census a new occupational classification was introduced, and this is also used by the LFS. 2.2 Standard Occupational Classification The Standard Occupational Classification is a detailed classification of occupations. (See Office of Population Censuses and Surveys, 1990). It is a hierarchical classification with nine major groups, 87 minor groups and hundreds of unit groups. Unit groups are sets of specific occupations, grouped together on the basis of the tasks performed and on similarities of qualifications, training, skills and experience commonly associated with those tasks. 2.2.1 Childcare and Related Occupations
Minor Group 65 is called Childcare and Related Occupations. The description for this group is as follows: ‘Childcare and related workers supervise play and other activities for pre-school age children, assist teachers with their non-teaching duties and care for children in day or residential nurseries, children’s homes and private households.’ (p. 204) From this definition it is clear that childcare is not confined to pre-school age children. The group includes four unit groups: Nursery Nurses; Playgroup Leaders; Educational Assistants; and Other Childcare and Related Occupations. This last group includes such jobs as au pair, child minder, nanny, etc. This minor group does not include nursery teachers: these are classified with other teachers, and appear in the same unit group as primary school teachers, for children aged 5-11. The definitions for the occupations are shown in Table 2.1.
23

Table 2.1 Minor Group 65: Childcare and Related Occupations 650: Nursery nurses 651: Playgroup leaders Nursery nurses care for
children in day or residential nurseries, children’s homes,
maternity units and similar establishments.
Playgroup leaders supervise play and other activities for
pre-school age children.
Typical entry routes and associated qualifications
Entry is most common with GCSE/SCE S-grades and the
National Nursery Examination Board/ Scottish
Nurses Examination Board certificate, but is possible
with other academic qualifications and/or
professional training13.
Entry does not depend on academic qualifications
although some employers require candidates to hold
National Nursery Examination Board/ Scottish
National Nursery Examination Board
certificates. Entry is possible with experience alone.
Tasks Baths, dresses, prepares feed for and feeds babies;
Changes babies clothing whenever necessary;
Supervises young children at mealtimes;
Organises games and other activities and supervises
children’s play.
Supervises children’s games and encourages the
development of physical, social and language skills;
Prepares paints, glue, paper, toys, etc. for children’s
activities; Supervises children’s
activities to ensure safety; Puts away equipment and cleans premises after use.
Related job titles Crèche attendant Nursery assistant (childcare)
Nursery nurse
Play leader Playgroup leader
13 The National Nursery Examination Board/Scottish Nurses Examination Board certificates no longer exist in this form: the modern equivalent is the CACHE Diploma in Child Care and Education
24

652: Educational assistants 659: Other childcare and
related occupations Educational assistants assist
teachers with, or relieve them of, a variety of non-teaching
duties.
Workers in this unit group perform a variety of childcare
and related occupations not elsewhere classified in
MINOR GROUP 65: Childcare and Related
Occupations Typical entry routes and associated qualifications
Academic qualifications may be required but entry is
possible with relevant experience alone.
Entry may not depend on qualifications, though some
employers require candidates to hold GCSE/SCE S-grades
and the National Nursery Examination Board/ Scottish Nursery Nurses Examination
Board Certificate or other qualifications.
Tasks Assists teacher with preparation or clearing up of
classroom; Looks after lesson materials
such as paper, pencils and crayons;
Assists children with washing or dressing for outdoor and
similar activities; Assists teachers with other
non-teaching duties as required.
Assists children to wash and dress;
Prepares and serves children’s meals;
Mends, washes and irons children’s clothes and tidies
their rooms; Supervises children during
meals and keeps order in playground and after meals and before classes resume;
Assists playgroup leader with the preparation and
supervision of children’s games and their other
activities. Related job titles Classroom helper
Educational assistant School helper
Au pair Child minder
Dinner supervisor Nanny
Playgroup assistant Playgroup helper
Source: OPCS (1990: 204-205) As can be seen, the first two occupations, nursery nurse, playgroup leader and educational assistants, are fairly clearly defined. The term ‘nursery nurse’ covers all those people who work with children in day nurseries except managers, who are separately classified, and thus is a reasonably close match with the workforce surveyed in Chapter 5 of this report. Nursery nurses and playgroup leaders would seem to be involved exclusively with the care of preschool-aged children, whereas educational assistants clearly care for school-aged children, although probably confined to primary schools (EO/IDeA, 2000). However, the final category covers a wide range of duties and roles. The category includes playgroup workers who are not leaders, as well as some staff employed in residential children’s homes, childminders and nannies. It was hoped that another classification applied to occupations would assist in distinguishing between occupations in this ‘other’ group. In particular, it was hoped that childminders and nannies could each be identified separately. This other
25

classification is the Standard Industrial Classification (SIC) (Central Statistical Office, 1992): it classifies the industry or location where a job is carried out. However, information supplied by ONS indicates that there is no simple relation between the SIC codes and occupations within SOC 659 that can be used to disentangle different childcare jobs. Consequently, it has not been possible to subdivide this group any further. 2.2.2 Census estimates
The 1991 census used the SOC codes. From these data the numbers of men and women in childcare occupations was estimated. These figures are shown in Table 2.2. In 1991 there were almost 57,000 nursery nurses. Nursery managers and officers in charge were not included in these figures: they were included with other managers and could not be identified separately. In addition, there were 19,000 playgroup leaders and 42,000 educational assistants. The largest group, however, was the other childcare occupations, with 186,000 people. Overall, 99 percent of the childcare workforce were women. Table 2.2 Census counts for childcare and related occupations
Population estimates, Great Britain
Main occupation
650
Nursery nurse
651
Playgroup leader
652
Education assistant
659 Other childcare
65 Total
childcare
Count
56,380
18,430
40,690
184,140
299,640
Female
Percent
98.9
97.1
97.4
99.1
98.7
Count
600
560
1,070
1,640
3,870
Male
Percent
1.1
2.9
2.6
0.9
1.3
Count
56,980
18,990
41,760
185,780
303,510
Total
Percent
100
100
100
100
100
Source: Census 1991 Economic Activity Table 4 2.2.3 Labour Force Survey estimates
The LFS provides much more detail than the census. Although it is a sample survey, the LFS also produces population estimates by weighting the data. Three years of Labour Force Survey data have been combined, 1996 to 1998, and data from the Spring quarter for each year has been used. Three years have been used because of the small numbers of childcare staff included in any one year. All estimates are averaged over the three years. Table 2.3 shows the population estimates derived from the LFS, along with the sample numbers on which these estimates are based. It can be seen that just over 4,000 childcare staff were interviewed. The total workforce is estimated at over half a million people. (All tables show figures for Great Britain.) These figures can be compared to those from the EO/IDeA workforce surveys. The EO/IDeA estimated there were 30,170 childcare and education staff in independent day nurseries (EO/IDeA, 1999a) and 25,560 playgroup leaders in registered playgroups (EO/IDeA, 1999c). The LFS gives higher estimates: 56,980 and 29,452 respectively. However, the estimates are not directly comparable as the LFS, unlike the EO/IDeA surveys, includes workers in the public sector and the EO/IDeA published results were for England, whereas the LFS results are given for Great Britain.
26

27
Table 2.3 Preschool childcare and education workforce by gender
Population estimates, Great Britain
Main occupation
650
Nursery nurse
651
Playgroup leader
652
Education assistant
659 Other childcare
65 Total
childcare
Count
98,563
28,996
132,237
255,110
514,996
Female
Percent
99.1
98.5
96.7
97.9
97.8
Count
915
456
4,555
5,461
11,387
Male
Percent
0.9
1.5
3.3
2.1
2.2
Count
99,478
29,452
136,882
260,571
526,382
Total
Percent
100
100
100
100
100
Sample number
756
234
1,065
2,023
4,078
Source: Labour Force Survey, 1996-1998, Spring Quarter 2.2.4 Qualifications
The LFS collects data on educational qualifications. However, it does not specifically code childcare qualifications. These are very varied, both in their titles and their awarding bodies (see section 1.2, Chapter 1). The level of the qualification is not always evident, and they could come under a number of codes, depending on their level. In addition, some would be coded as code 23: Other professional, vocational and foreign qualifications. (Qualifications are discussed in more detail below.) 2.2.5 Income
The LFS also includes questions on income, but these are not asked of everybody. From 1997 the income questions are asked on the first and fifth interviews; prior to that the questions were only asked in the fifth interview. The rationale for not asking the income questions prior to the final interview had been based on a concern that people might object to disclosing their income, and so refuse to take part in the survey at all, reducing the overall response rate. However, over 90 percent of interviewees who were asked the questions did in fact answer them so it was decided also to include them in the initial interview. 2.3 Childcare Workforce Some key statistics on the childcare workforce are shown in Table 2.4, alongside some other occupations also involved in care and education: primary teachers (which includes nursery teachers), secondary teachers, social workers, care assistants, nurses and midwives.

Table 2.4 Key statistics for childcare occupations and other care and education occupations from the Labour Force Survey, percentages Population estimates, Great Britain
Educational qualifications
Female
Under 26
White
Single
Live with
own children
Full-time
Temporary
Shifts
Degree
None
Nursery nurses
99.1
32.5
95.4
30.7
46.3
66.0
10.6
16.4
2.0
3.7
Playgroup leaders
98.5
4.3
97.1
4.3
77.9
7.7
5.7
3.6
6.7
5.4
Educational assistants
96.7
6.7
96.5
7.5
70.1
33.0
36.0
1.2
6.3
14.6
Other childcare
97.9
18.9
97.2
19.2
60.6
26.4
16.0
3.5
2.0
22.4
Primary teachers
85.5
5.9
97.8
13.4
50.9
78.0
17.4
0.3
57.9
0.2
Secondary teachers
53.8
5.6
97.4
17.7
46.1
82.4
12.8
0.3
81.2
0.1
Social workers
72.0
4.7
91.5
18.5
41.5
77.4
7.5
25.2
41.7
1.3
Care assistants
91.7
19.2
95.1
19.1
40.7
44.6
6.7
58.8
2.2
21.7
Nurses
89.1
8.3
93.5
16.7
48.1
62.4
6.9
66.1
8.3
0.2
Midwives
100
5.6
91.3
15.6
62.2
59.1
4.8
80.2
8.7
0.0
Source: Labour Force Survey, 1996-1998 (Spring quarter)

It can be seen that the childcare workforce is predominantly female, about 98 percent - a little below midwives. (There are male midwives, but none were interviewed in these three years of the LFS: the census counted 140 in 1991.) As a percentage, there are fewer female primary teachers (86 percent) and even fewer female social workers (72 percent). However, not all social workers have contact with children, and it may be that those who do are more likely to be female. Nurses (89 percent) and care assistants (92 percent) are also both largely female occupations. Childcare workers are young, especially nursery nurses (33 percent aged under 26), much younger than the other groups. ‘Other’ childcare occupations and care assistants both have 19 percent aged under 26. Playgroup leaders are the least likely of the childcare occupations to be under 26. For nursery nurses, the proportion who are white (95 percent) is much the same as for the population as a whole (94 percent: Schuman, 1999). Midwives (91 percent) and social workers (92 percent) have a noticeably lower percentage who are white. Playgroup leaders, educational assistants and other childcare occupations all have higher percentages of white staff (97 percent), as do primary teachers (98 percent) and secondary teachers (97 percent). Table 2.5 gives a more detailed breakdown by ethnic group for the childcare workforce. It can be seen that the childcare workforce is predominantly white, especially playgroup leaders and other childcare occupations (97 percent each). Almost 3 percent of nursery nurses are black, which is in line with the total population, but few of the other groups were black; there are few childcare workers from Asian backgrounds, fewer than in the population (3 percent). Table 2.5: Preschool childcare and education workforce by ethnic group
Population estimates, Great Britain
Main occupation
650
Nursery nurse
651
Playgroup leader
652
Education assistant
659 Other childcare
65 Total
childcare
Count
94,900
28,606
132,106
253,210
508,793
White
Percent
95
97
97
97
98
Count
4,600
-
4,800
7,400
17,600
Minority ethnic
Percent
5
-
3
3
2 Source: Labour Force Survey, 1996-1998, Spring Quarter Almost one third of nursery nurses (31 percent) are single - twice the percentage for nurses - but very few playgroup leaders (4 percent) or educational assistants (8 percent) are. Other childcare occupations are intermediate, perhaps reflecting a mixture of younger, single women working as nannies and older, married women with children, working as childminders, plus some other categories of childcare occupations. Less than half of nursery nurses (46 percent) were living with their own children, whereas over 70 percent of playgroup leaders (78 percent) or educational assistants (70 percent) were. The other childcare occupations were again intermediate. Fewer care assistants (19 percent) and nurses (17 percent) than nursery nurses were single, but about the same percentages were living with their own children (41 and 48 percent respectively).

Two-thirds of nursery nurses worked full-time (66 percent), but this was not typical of childcare occupations. Only one-third of educational assistants (33 percent), a quarter of those in ‘other’ childcare occupations and 8 percent of playgroup leaders worked full-time. Just under half of care assistants (45 percent) worked full-time, but otherwise the majority of staff in the other care and education occupations were working full-time (from 59 to 82 percent). Eleven percent of nursery nurses described their contracts as temporary. Fewer playgroup leaders (6 percent) were temporary, but more educational assistants (36 percent) and other childcare occupations (16 percent). Teachers were more likely to be temporary (17 percent for primary and 13 percent for secondary) than were nursery nurses, but the social care and nursing occupations were less likely to be (5-8 percent). Nursery nurses are more likely to work shifts (16 percent), than other childcare workers (3 percent). Shift working was more common in the social care and nursing occupations (25-80 percent). Few nursery nurses or playgroup leaders (4 and 5 percent respectively) had no educational qualifications, most having a professional or vocational qualification of some kind. Few had degrees (2 and 7 percent respectively). Educational assistants and other childcare workers were more likely to have no formal qualifications (15 and 22 percent). Care assistants were rather like the other childcare occupations: more had no educational qualifications (22 percent) and few (2 percent) had degrees. Although almost no nurses or midwives had no qualifications, only 8-9 percent had degrees, although this is rising. Almost half of social workers had a degree (42 percent), but a majority of teachers (58 percent for primary and 81 percent for secondary). 2.3.1 Qualifications
Although the LFS collects data on educational qualifications, it does not specifically ask about childcare qualifications. Consequently, it is difficult to assess how appropriately the childcare workforce is qualified. Table 2.6 shows a few key categories of qualification.
30

Table 2.6: Selected qualifications for the workforce Population estimates, Great Britain
Main occupation
650
Nursery nurse
651
Playgroup leader
652
Education assistant
659 Other childcare
65 Total
childcare
Count
1,989
1,957
8,544
5,223
17,565
Degree
Percent
2.0
6.7
6.3
2.0
3.4
Count
2,527
1,611
4,624
1,784
10,547
Teaching
Percent
2.6
5.5
3.4
0.7
2.0
Count
10,625
1,130
4,893
7,048
23,696
Nursing
Percent
10.9
3.9
3.6
2.7
4.6
Count
38,322
10,945
30,930
73,222
153,419
Professional vocational
Percent
39.2
37.7
22.8
28.4
29.5 Count
3,627
1,577
19,803
57,739
82,746
None
Percent
3.7
5.4
14.6
22.4
15.9
Count
97,832
29,059
135,375
257,426
519,692
Total
Percent
18.8
5.6
26.0
49.5
100
Source: Labour Force Survey, 1996-1998, Spring Quarter
From Table 2.6 it is clear that few in the childcare workforce had a degree (3 percent), a teaching qualification (2 percent) or a nursing qualification (4 percent). More playgroup leaders had a teaching qualification (6 percent) and more nursery nurses had a nursing qualification (11 percent: it is possible that some of these are mis-codings, with a nursery nurse qualification being coded as a nursing qualification). Almost a third (30 percent) had some professional or vocational qualification. This was especially high for nursery nurses (39 percent) and playgroup leaders (38 percent). However, it is not possible to get any more detail on these qualifications, or even how long the training took. Consequently this category might include people with the professional training for nursery nursing (CACHE/BTEC diploma), which generally involves a two-year full-time training, as well as people with just a few hours training: as noted above, the HERA2 project found childcare courses ‘ranging from 2 hours in service training to 3 year full time’ (HERA2, 1998: 9). Overall 16 percent of the childcare workforce had no qualifications: few nursery nurses (4 percent) or playgroup leaders (5 percent) had no qualifications, but large numbers of educational assistants (15 percent) and other childcare occupations (22 percent) had no qualifications whatsoever. 2.3.2 Income
The LFS provides data in terms of gross weekly pay. Table 2.7 shows the mean gross weekly pay for the childcare workforce, as well as the median and quartiles. (The figures have not been adjusted for inflation, but the increase in average earnings between 1997 and 2000 is 14% (New Earnings Survey, personal communication,
31

2000.)) The table shows some big differences between different categories of workers: there was a marked difference between those who worked in ‘formal’ settings (nursery nurses and educational assistants) and those who worked in more ‘informal’ settings (playgroups, childminders, nannies, etc.), with the former being paid considerably more than the latter. Some of this is accounted for by differences in usual hours of work, since more nursery nurses (66 percent) and educational assistants (33 percent) work full-time. Table 2.7: Gross pay per week, £
Population estimates, Great Britain
Main occupation
650
Nursery nurse
651
Playgroup leader
652
Education assistant
659 Other childcare
65 Total
childcare
Mean
142
46
107
56
93
SD
80
24
63
64
145
25
74
25
62
21
29
50
144
45
98
30
63
Percentile
75
208
58
136
55
127
Sample Number
147
51
272
333
803
Source: Labour Force Survey, 1996-1998, Spring Quarter 2.4 Key findings The data presented in this chapter comes from the Labour Force Survey for 1996-1998. Using occupational categories that approximate to the day nursery workforce surveyed in more detail in Chapter 5, it has been found that: • There were almost 100,000 nursery nurses working in Great Britain • 99 percent were female • Their average age was 32, with a third aged under 26 • 95 percent were white • Almost one third were single (31 percent) and almost half lived with their own
children (46 percent) • 54 percent had a teaching or nursing qualification, or a vocational qualification
(which might or might not be in childcare) • 66 percent worked full-time • Average gross pay per week was £142
32

Chapter 3. The student survey 3.1 Introduction The results of the student survey will be presented in five sections, which are: personal characteristics; educational and employment backgrounds; the student’s views on childcare, both in training and as an occupation; their employment preferences and expectations; and their views on childcare, employment and the next five years. As noted in section 1.6, there are two types of sample included within the student survey and two types of course. Analysis was also conducted by ethnicity. For ease of reading, the results will be presented in the following order: findings from students in the main sample and doing core courses; findings from students in the main sample undertaking non-core courses; findings from students in the supplementary sample; from minority ethnic students and finally from white students. 3.2 Personal Characteristics 3.2.1 Main and core samples: Gender
In common with other studies of both students and workers (Cameron, 1997; Cameron and Moss, 1998; EO/IDeA, 1999a), the overwhelming majority of childcare students in this sample were female. This was the case for 99 percent of students in the main sample and 99.5 percent of those doing core courses. 3.2.2 Main and core samples: Age
The majority of students were aged 16–19 at the time the survey was completed. Among the main sample, 71 percent of the students were aged 16–19; this was also the case for 68 percent of those doing core courses. However, this proportion still leaves a substantial minority of students, over 30 percent, who are aged 20 or over. Table 3.1 shows how the age distribution of the main and core course samples compare with other sample types. Table 3.1: Age distribution by sample type, course type and ethnicity: numbers and
percent Main Core Non-core Supple-
mentary Minority
ethnic White
N % N % N % N % N % N % 16 – 19 623 71 436 68 187 79 97 48 81 42 631 72 20 – 24 95 11 79 12 16 7 26 13 25 13 95 11 25 – 34 77 9 61 10 16 7 41 20 47 24 69 8 35+ 81 9 64 10 17 7 37 18 40 21 77 9 Total 876 100 640 100 236 100 201 100 193 100 872 100 Note: variation in total n between this and subsequent tables due to missing cases 3.2.3 Main and core samples: Ethnicity
In the main sample, 90 percent of respondents were white. Using the 1991 Census categories, 3 percent of students described themselves as Black (African, Caribbean or Other) and 3 percent were Indian, Pakistani or Bangladeshi. A further 3 percent described themselves as Other. The pattern was similar across the core and non-core courses. This compares with two studies of the day nursery workforce: the EO/IDeA study, which used reports from managers to assess the minority ethnic backgrounds of staff and found that 96 percent of staff were white, and the study reported in Chapter 5, which used individual interviews to describe ethnicity, and found that 90% of staff were white.
33

Table 3.2: Ethnic backgrounds by sample type and course type: numbers and percent Main Core Non-core Supplementary N % N % N % N % White 795 90 586 91 209 89 90 45 Black Caribbean 12 1 7 1 5 2 16 8 Black African 10 1 6 1 4 2 9 5 Black Other 7 1 4 1 3 1 9 5 Indian 17 2 10 2 7 3 36 18 Pakistani 8 1 7 1 1 - 14 7 Bangladeshi 2 - 2 - 0 - 11 5 Other 29 3 22 3 7 3 17 8 Total 880 100 644 100 236 100 202 100 3.2.4 Main and core samples: Household
Most students lived with their parents. Seventy-eight percent of students in the main sample lived with their parents, while 16 percent lived with a partner and just 7 percent lived independently, on their own, or in halls or shared accommodation. A similar pattern emerged across course types, with a similar proportion (77 percent) of those on core courses living with their parents, while 17 percent were living with a partner. Table 3.3: Household arrangements by sample type, course type and ethnicity: numbers
and percent Main Core Non-core Supplem-
entary Minority
ethnic White
N % N % N % N % N % N % Parents 682 78 492 77 190 80 115 60 104 57 687 78 Partner 140 16 107 17 33 14 44 23 42 23 138 16 Living independently
58 6 42 7 16 7 33 17 37 20 53 6
Total 880 100 641 100 239 100 192 100 183 100 878 100 3.2.5 Main and core samples: Parent status and age of children
Seventeen percent of the main sample and 18% of those doing core courses were parents (see Figure 3.1, below). Most commonly, respondents’ children were of school age. Among the respondents in the main sample, there were 40 children aged 0-4 years; 153 children aged 5–11 years; 88 children aged between 12 and 19; and 17 aged 20+. 3.2.6 Differences for those on non-core courses and from minority ethnic backgrounds There were slightly more male students on non-core courses and from minority ethnic backgrounds (2 percent and 4 percent respectively) than in the main samples and on core courses. Furthermore, minority ethnic students tended to be older: only 42 percent were aged 16–19 years, and 45 percent were over 25, compared to 71 and 9 percent respectively in the main sample. There are several possible explanations for the finding that students from minority ethnic backgrounds are likely to be older than other students. First, it could be that such students enter the workforce later due to family commitments or lack of initial qualifications through school. Second, it could be that colleges situated in areas where minority ethnic students live make a deliberate effort to attract mature students, as a higher proportion (39 percent) of students from the supplementary sample were also in the older age groups.
34

Using a supplementary sample successfully boosted the number of students from a minority ethnic background included within the survey. Of the students in the supplementary sample, 45 percent were white, while 17 percent were Black (African, Caribbean or Other) and 30 percent were either Indian, Pakistani or of Bangladeshi origin. Again, these categories showed themselves to be limited as 8 percent of respondents described themselves as ‘other’. Combining both main and supplementary samples showed that in total, 82 percent of the students were ethnically white, while 18 percent came from a minority ethnic background. Of this latter group, incorporating the subgroups meant that 32 percent were Black, 25 percent Asian and 24 percent described themselves as ‘other’. However, for reasons of the sampling technique, it would be misleading to suggest that these proportions reflected the childcare student population at large. The older age group represented in the supplementary sample had an effect on the household arrangements of students from minority ethnic backgrounds. Of these students, a lower proportion than in the main sample (57 percent) lived with their parents, 23 percent lived with a partner and 20 percent were living independently. There was no difference between those doing non-core courses and the main sample in household arrangements. A pattern is beginning to emerge of differences in the demographic characteristics between the sample types, and the differences are most marked for those from minority ethnic backgrounds. The analysis of parental status continues this pattern. A significantly higher proportion of students in the supplementary sample were already parents (38 percent); and for the minority ethnic group of students, the proportion was even higher, at 41 percent. The children of minority ethnic students were more likely to be older (24 aged 0-4 years; 63 aged 5–11 years; 56 aged 12–19 years and 12 aged over 20). Figure 3.1 illustrates this pattern in demographic characteristics in the different sample types, and Table 3.4 shows how this pattern is extended to the ages of children of respondents, with a higher proportion of students from minority ethnic backgrounds and from the supplementary sample having children of all age groups than those in other sample types. Table 3.4 Children of students by age bands and sample groups, numbers and percent Percent of students with children in age bands 0-4 5-11 12-19 20+ Total Main sample/ core courses N
% 23
4 79 12
48 7
9 1
638 100
Main sample/ non-core courses N %
11 5
17 7
12 5
4 2
237 100
Supplementary sample N %
22 11
51 25
33 16
9 4
201 100
Minority ethnic N %
22 11
48 24
34 17
8 4
193 100
White N %
34 4
96 11
58 7
14 2
871 100
Total N %
56 5
147 14
93 9
22 2
1,076 100
35

Figure 3.1 Proportion of students aged 16-19, living with parents and have own children in different sample types
Main - coreMain - non-core
SupplementaryAll minority ethnic
All white0
20
40
60
80
100Percent
Aged 16-19 Living with parents Have children
3.3 Education and employment background 3.3.1 Pathways to colleges
Eighty-one percent of students in the main sample and doing core courses left school by the age of 16. The most common pattern for these students was to begin their childcare studies straight after leaving school (54 percent), usually at the age of 17. Forty-six percent of students in the main sample doing core courses did not begin their courses straight after leaving school. Some of these began their course shortly afterwards, 22% by the age of 19. However 7 percent began their course between the ages of 20 and 29; 9 percent between the ages of 30 and 39 and 3 percent of students began when in their forties. This gap between leaving school and starting childcare courses means that approaching half of core course students also have some life experience beyond compulsory schooling. 3.3.2 Prior experiences
A quarter of all students in the main sample doing a core course had been employed prior to starting their course. Almost a third of this group had done some further education (31 percent), some had done voluntary work (14 percent of the main sample/core course), and some had had unpaid, full-time caring responsibilities at home (10 percent). Table 3.5 sets out the prior experience of childcare students.
36

Table 3.5 Experience students bring to childcare courses: employment, further education, voluntary work and unpaid caring responsibilities, numbers and percent
Employment Further
education Voluntary
work Unpaid, full-time
caring work at home N 154 199 93 68 Main sample/ core
course % 24 31 14 10
N 51 60 34 26 Main sample/ non core course % 21 25 14 11
N 75 88 43 47 Supplementary sample % 37 43 21 23
N 75 83 23 24 Both samples/ Minority ethnic % 38 42 43 45
N 202 259 124 92 Both samples/ white % 23 29 14 10
Analysis of the written comments provided by students indicates that most previous employment experience was in one of the following categories: catering; office work; shop and sales work; and a few had been employed in manufacturing. In addition, many had experience in personal services work such as hairdressing, cleaning, care work, and work with children such as nannying, childminding and nursery assistant work. Seventy-two students mentioned fifty further education courses. These covered a range of subjects, most commonly mentioned were health and social care; the certificate course in care and education; courses concerned with typing, business, administration, finance or computing; and others including O- and A-levels, in English, Maths and Sociology, and diplomas and degrees in arts, dance and drama. Nearly all the voluntary work mentioned by students was related to childcare work, such as helping in primary school classes or playgroups, or in nurseries. A few had worked with elderly people, with disabled children, in community centres or corresponding with prison inmates. Those who had cared for others at home on a full-time basis were nearly always caring for kin, usually their own or relatives’ children. Two students mentioned caring for their own parents. 3.3.3 Alternatives to childcare considered
We asked students whether they had considered other types of jobs or career. The list of suggested options was compiled with reference to other, similarly gender segregated, employment. The responses suggested that while students may cast around for ideas about courses or employment that are not necessarily gender segregated, they eventually select a subject in line with normative expectations about ‘women’s work’. Across all the groups, 35 percent of students had also considered nursing as a career, 17 percent clerical work, and 12 percent hairdressing. However, 41 percent had considered courses leading to other jobs. Forty-two different occupations were mentioned by students, the most commonly mentioned were veterinary nurse or working with animals, performing arts, other kinds of caring work, such as midwifery, social work or nursing, and health and beauty work. A few said they would have done A-levels if they had not begun their childcare course. Comments from lecturers indicated that some responding students felt the list offered was insufficiently broad and too obviously ‘sexist’. It may be that students do not like to consider themselves as making gendered choices, and cast their net widely: they may prefer to see their choice in terms of personal aptitude, but in the event do make such gendered choices anyway.
37

3.3.4 Differences for those on non-core courses and from minority ethnic backgrounds
Analysis of the employment and educational backgrounds by course types and ethnicity showed that the students from minority ethnic backgrounds tended to start their courses at later ages than students in the main sample and on core courses. The majority of students begin between the ages of 17 and 19, both students from minority ethnic backgrounds and for white students. However, minority ethnic students were, on average, almost three years older. The average age of core and non-core course students did not differ significantly. Table 3.5 above shows that minority ethnic students are considerably more likely than main sample/core course students to have had all types of prior experience recorded, particularly unpaid caring responsibilities (45 percent vs 10 percent) and voluntary work experience (43 percent vs 14 percent). 3.4 Childcare: in training and as an occupation 3.4.1 Reasons for choosing childcare training
Despite the finding reported above that the majority of students entered their course of study straight after leaving school, nearly three-quarters of the students chose to train in childcare because they had had childcare work experience14. Other reasons for choosing the course were: previous relevant voluntary work experience; employment prospects in childcare work; and encouragement from family members or a careers agency. A few students chose childcare courses because they did not know what else to do. Those who gave ‘other’ reasons mostly cited a long-term commitment to, and enjoyment of, working with children such as ‘I always knew I wanted to work with children’. Table 3.6 Reasons for choosing childcare courses, numbers and percent
Childcare work
experie-nce
Relevant voluntary work ex-perience
Good employ-
ment prospects
Encourag-ement from
family
Advised by
careers agency
Other reason
Did not know
what else to do
Total
N 469 250 64 97 59 153 13 639 Main sample/ core course % 73 39 10 15 9 24 2 100
N 170 96 14 46 22 46 6 237 Main sample/ non core course % 72 41 6 19 9 21 3 100
N 138 71 40 43 15 38 9 203 Supplementary sample % 68 35 20 21 7 19 4 100
N 123 59 33 36 11 36 6 191 Both samples/ Minority ethnic % 65 31 17 19 6 19 3 100
N 646 354 85 148 84 199 22 876 Both samples/ white % 74 40 10 17 10 23 3 100
Note: Respondents could give more than one option so percentages exceed 100. 3.4.2 Views on the course and the college Students were asked how well the course had prepared them both academically and practically for employment in childcare work. Table 3.7 sets out their responses. Two-thirds of main sample/core course students thought the academic content of the course
14 Work experience could include paid work in childcare or work placements at school.
38

had prepared them very well; and nearly a third thought this aspect of preparation was ‘OK’. Table 3.7 Student ratings of academic and practice preparation on childcare courses,
numbers and percent Academic content Practice placements Very
well OK Not
very well
Total Very well
OK Not very well
Total
N 418 220 6 644 518 109 3 630 Main sample/ core course % 65 34 1 100 82 17 1 100
N 129 110 2 241 170 56 2 228 Main sample/non core course % 54 46 1 100 75 25 1 100
N 130 64 4 198 141 51 6 198 Supplementary sample % 62 37 1 100 80 19 1 100
N 120 67 3 190 125 58 3 186 Both samples/ minority ethnic % 63 35 2 100 67 31 2 100
N 551 321 9 881 692 158 8 858 Both samples/white % 63 36 1 100 81 18 1 100
Only a tiny minority of students thought their preparation for work had been inadequate. A higher approval rating was given to the practice preparation included on the course. Eighty two percent of main sample/core course students thought practice preparation was very good while 17 percent rated it ‘OK’ and very few rated it inadequate. Analysis of comments made by students found that they appreciated the breadth and depth of topics on their courses. They referred to gaining a better knowledge of child development and child behaviour, and to the range of services available. Students also appreciated clear organization of their work, and helpful tutors whose advice helped to build students’ confidence for future employment. Conversely, students found disorganization in colleges difficult to cope with. Students responding to this question frequently placed a premium on the value of practical experience. For example, one said ‘the information was good and helpful but the practical experience was more helpful’. Very few students made any criticism of their practice placements. Experience of practice was rather said by them to build up confidence and familiarity with work settings and to expose them to the variety of different services available. They also mentioned gaining an insight into the workforce, professionalism at work and building up relationship skills with children. One said ‘it has given me hands on experience of what my career life will entail’. Students were also asked how actively colleges helped them with careers advice and job finding. The most common method of helping students, as set out in Table 3.8, was to provide them with a list of vacancies in the local area. Other forms of help were advice from tutors, and careers advice. Eleven percent of students on core courses in the main sample reported that colleges gave ‘no help’. Where colleges did give help with findings jobs, over 87 percent of main sample/core course students found this helpful. For example, some students mentioned that speakers such as employment agencies had visited the college.
39

Table 3.8 Methods of helping students find employment, numbers and percent List of
vacancies Tutor advice Careers
advice No help Total
(respond-ents)
N 373 319 301 71 631 Main sample/ core course % 59 51 48 11 100
N 69 53 37 87 211 Main sample/non core course % 33 25 18 41 100
N 79 60 59 48 189 Supplementary sample % 53 40 44 19 100
N 73 70 72 42 180 Both samples/ Minority ethnic % 41 39 40 23 100
N 443 359 320 160 839 Both samples/white % 53 43 38 19 100
Note. More than one method could be indicated, so percentages exceed 100. 3.4.3 Students’ present and future employment
Many childcare students are also employed. The experience of being a student is not total: they also have to earn an income. This was the case for 70 percent of those on core courses in the main sample. Of those who were employed, nearly two-thirds found it difficult to combine the two roles: most comments here concerned having insufficient time to complete course work and paid work and college attendance satisfactorily. Those who had additional commitments found the combination of college requirements, paid work and caring for a family particularly difficult. One said she would have preferred to take a part-time course, but this would not have been funded, so she had to take the full-time course, alongside paid work, with adverse consequences for her and her family’s needs. The problem of adequate time posed by paid work and college work combined was exacerbated in some students’ views by the considerable written workload demanded of them on the course. Those who felt paid work and college work combined well referred to the need for planning ahead, and confining paid work to a few hours on weekends. Turning to future expectations of employment, the overwhelming majority of students, towards the end of their courses, still wanted and expected to work with children. Ninety percent of students in the main sample on core courses wanted to work with children, and only slightly fewer, 86 percent, expected to work with children given the constraints of local employment markets. Few had decided definitely against childcare employment (less than 2 percent), and the remainder (8 percent) were not sure. Overall, 84 percent both wanted to work with children and expected to do so. There were no statistically significant differences between the samples on intention or expectation to work with children. Students in the main sample on core courses who had voluntary childcare work experience before starting their courses were more likely to still want to work with children than students who had not had such experience (χ2 = 7.2 p<0.01), whereas students who said they chose the course because they did not know what else to do were significantly less likely to want to work with children than students who gave other reasons (χ2=20.9 p<0.001).
40

Table 3.9 Expectations of working with children, numbers and percent Want to work with children Total Expect to work with
children
Total
Yes No Not sure
Yes No Not sure
N 580 10 53 643 544 21 70 643 Main sample/ core course % 90 2 8 100 86 3 11 100
N 217 5 16 238 Main sample/non core course
189 15 21 238 % 91 2 7 100 84 7 9 100 N 173 1 21 195 160 8 17 195 Supplementary
sample % 89 - 11 100 85 4 11 100 N 162 7 17 186 144 9 21 174 Both samples/
Minority ethnic % 87 4 9 100 83 5 12 100 N 798 9 71 878 740 34 85 859 Both samples/white % 91 1 8 100 86 4 10 100
A few students gave comments on why they were unsure about, or had definitely decided not to pursue a career in childcare. The reasons given were: that they had not enjoyed the course or their experience of working with children while on the course; that they had other interests they wanted to pursue, such as working with animals, joining the police force, office work, or going into social services type work; or that they would only want to work in early years if they could work in a school where they had long summer holidays. Those who were unsure about or certain not to enter childcare employment were asked what they would do next. Few responded to this question but the most common option was to do another course after the present one (29 altogether). These courses were mostly the diploma in childcare and education (for those doing the certificate course); other courses mentioned were a BA in Childhood Studies, an early years teaching course, an advanced secretarial course, an access course in health care, psychology and computing courses. Four students thought they would go into employment unrelated to childcare, such as office work, police force, or social services work with older children, or temporary childcare employment while they looked around; a few expected to travel (2) or be unemployed (1). These results suggest that students who do not enter the workforce immediately on qualifying are not necessarily lost to the childcare or wider caring work field, and the path through childcare training to higher education should be perhaps be integrated and promoted, as is starting to happen with, for example, the BTEC/EdExcel National Diploma. 3.4.4 Differences for those on non-core courses and from minority ethnic backgrounds
Analysis by those on non-core courses and by ethnicity suggests that differences in the experience of being a student and preparing for, or being in employment do emerge. While the reasons for choosing a childcare course are similar for main/core course students and those from a minority ethnic background, the latter group’s perception of the content of the course was more critical than the former as Table 3.7 showed. In particular, students from minority ethnic backgrounds were more critical of practice placements than were white students, students on core courses or students attending colleges in the supplementary sample. Table 3.8 showed that students from minority ethnic backgrounds were also more likely to report that colleges were ‘no help’ in looking for employment than students from
41

core courses and in the main sample (23 percent vs. 11 percent). Minority ethnic students were also more likely to record ‘no help’ than students in the supplementary sample (23 percent vs. 19 percent). An even higher proportion of students on non-core courses in the main sample also reported that colleges offered ‘no help’ with finding employment (41 percent). This stands out, but should perhaps take into account the fact that non-core courses are primarily designed to prepare students for further training rather than employment, so a lack of career help at this stage may not be indicative of lack of help overall. A picture is emerging of students from minority ethnic backgrounds having different experiences of their courses of study and perhaps being more critical of them. A further striking divergence from the main findings is that only 43 percent of students from a minority ethnic background were employed while studying, compared to 70 percent of main sample/core course students and a similar proportion of white students. However, as fewer of the students in the supplementary sample had employment (52 percent), and this was also where the majority of minority ethnic students lived, the reasons for lower levels of employment may lie in the lack of availability of employment. A further possible reason is that continuing domestic commitments (students from minority ethnic backgrounds were more likely to have children) prevent taking up employment. Further investigation of this would be required to fully understand the reasons for this disparity. Where minority ethnic students did have a job, both they (69 percent), and those on non-core courses (66 percent), were more likely to report difficulties than other groups in combining the two (or in some cases three) roles. Finally, students from minority ethnic backgrounds expressed more reservations about whether they would enter childcare employment than other groups, with 4 percent saying they did not want to work in childcare and 9 percent unsure, but the difference in this finding between this sample and other sample types was not statistically significant. Further, qualitative, research could investigate these differences of experience between minority ethnic students and white students more thoroughly. 3.5 Work preferences and expectations Students intending to work in childcare were asked about their preferences and expectations for future employment. They were asked about aspects of work such as the type of service they would like to work in, the hours per week, weeks a year and age group of children they would prefer to be employed in. They were then asked about aspects of employment they had already obtained, with the aim of ascertaining how preferences diverge (or not) from expectations and experiences. For the purposes of this section, the types of analysis have been presented together for the different sample groups in order to show similarities and differences in preferences and experiences more clearly. 3.5.1 Preferred childcare employment settings
Table 3.10 sets out the popularity of various types of childcare setting by the different types of analysis used in the report. The three most popular settings in each column are emboldened.
42

Table 3.10: Preferred childcare settings for employment by sample type, course type and ethnicity, numbers and percentages
Main
sample/ core course
Main sample/
non-core course
Supplem-entary
sample
Both samples/ Minority
ethnic
Both samples/
White
N % N % N % N % N % School Nursery Nurse 262 42 72 32 111 58 101 58 338 39 Private nursery 196 31 64 28 44 23 33 19 267 31 Nanny 147 23 49 22 28 15 14 8 207 24 Special needs work 141 22 39 17 49 26 43 24 184 21 Local authority nursery 116 18 39 17 40 21 45 25 150 18 Playgroup/preschool 66 11 45 20 34 18 36 20 108 13 Childminder 58 9 47 21 24 13 19 11 107 13 After School Club 37 6 16 7 24 13 23 13 53 6 Family Centre 38 6 9 4 27 14 22 12 51 6 Other† 114 18 49 22 19 10 25 14 155 18
Total (respondents) 629 100 228 100 191 100 178 100 858 100 Note. Respondents could choose more than one preferred setting so percentages exceed 100. † e.g. early years teacher, hospital based childcare, midwifery, social worker, children’s holiday representative Table 3.10 shows that these childcare students held clear preferences for work in schools (the first preference for all groups), and for work in group settings, such as nurseries. However, only minority ethnic students rate local authority nursery work among their top three preferences, although work with children who have special needs was popular among the supplementary sample, those doing non-core courses and those from minority ethnic backgrounds. It is notable that while nannying was popular among those on core courses and in the main sample, and among white students, it rated well below other settings, such as private nursery, preschool and work in after school clubs for minority ethnic students. A final note on this table is the second place awarded to private nurseries as a preferred option for employment. This may be a reflection of the recent growth in this sector of caring employment, and so the availability of work, rather than an awareness of the pay and conditions in this sector, which are generally poorer than those in the public sector (Vernon and Smith, 1994; Penn, 1995; Nursery World, 1999). The majority of students wanted to work full time, as Table 3.11 shows. However, there was a fairly even split between those who wanted to work all year round, and those who would prefer to work school terms only. Of particular note is that of those in the supplementary sample, and from minority ethnic backgrounds, 60 percent and 66 percent respectively wanted to work school terms only and this was also the case for 44 percent of the main sample/core course. This preference among the former groups may be a reflection of these groups being relatively older, being more likely to have school age children of their own to care for, and requiring employment that fits in with family commitments.
43

Table 3.11: Preferred working conditions in childcare settings: hours a week and weeks a year, by sample type, course type and ethnicity, numbers and percent
Main
sample/ core
course/
Main sample/ non-core course
Supplementary sample
Both samples/ minority ethnic
Both samples/
white
N % N % N % N % N % Work full-time 525 84 190 84 146 77 138 77 716 85 Work part-time 86 14 32 14 34 18 34 19 114 14 Work less than 20 hours 11 2 4 2 10 5 7 4 17 2 Total 622 100 226 100 190 100 179 100 847 100 Work all-year round 319 53 135 62 68 38 51 31 465 57 Work school terms only 264 44 73 34 109 60 108 66 332 41 Other 16 3 9 4 4 2 6 3 23 2 Total 599 100 217 100 181 100 165 100 820 100 Note. Respondents could choose more than one preferred setting so percentages exceed 100. 3.5.2 Employment obtained
An indication of how far expectations of employment matched preferences was sought through the minority of students who had already found employment for after their course finished. Thirty-three percent of the main sample/core course students had found employment. Fewer students from the non-core courses (19 percent), from the supplementary sample (24 percent) and in the minority ethnic group (21 percent) had found employment. Table 3.12 sets out the findings based on the responses of those who had found a job. Although the numbers are small, the findings suggest that students’ preferences for employment were not entirely matched in the jobs they had found. Table 3.12: Employment obtained in childcare settings by sample type, course type and
ethnicity, percent Main
sample/ core course
Main sample/ non-core course
Supplem-entary sample
Both samples/ minority ethnic
Both samples/
white
N % N % N % N % N % School nursery nurse 9 4 3 8 6 16 4 12 14 6 Private nursery 93 46 10 26 11 29 6 18 108 44 Nanny 30 15 6 15 3 8 1 3 38 15 Special needs work 13 4 2 8 5 13 6 18 14 6 Local authority nursery
8 4 3 8 4 11 4 12 11 5
Playgroup/ preschool 9 4 5 13 - - 1 3 13 5 Childminder 3 2 3 8 1 3 1 3 6 2 After school club 8 4 4 10 3 8 5 15 10 4 Family centre 2 1 0 - - - 2 6 - - Other 29 14 3 8 5 13 4 12 32 13 Total 204 100 39 100 38 100 34 100 246 100
3.5.3 Matching employment obtained with stated preferences
While the majority of childcare students would prefer to work in schools, few had actually obtained such jobs by a few weeks before the end of term when they completed
44

the questionnaire. This is not surprising because there are comparatively few nursery nurse jobs available in nursery schools and classes or reception classes15. Students from the supplementary sample and minority ethnic students were more likely to have employment in schools: this may be due to the fact that the areas where these colleges were sited were also more likely to have a higher density of maintained sector nursery education where nursery nurses could be employed (Owen and Moss, 1989). More common was for students to be recruited into private nurseries (46 percent of the main sample/core course) or as nannies (15 percent of the main sample/core course). Also worth noting from Table 3.12 is the recruitment of minority ethnic students into after school clubs (15 percent of the total) and into special needs work (18 percent). When we turn to the hours being worked, the weeks worked per year and the ages of children being worked with, the pattern of discrepancy between preference and experience is still apparent. For example, while 84 percent of main sample/core course students wanted full-time work, only 61 percent of those with jobs had obtained this. Conversely, more students were doing part-time hours and very part-time hours (up to 20 hours per week) than wanted to as is shown in Table 3.13. Turning to the weeks worked per year, Table 3.13 also shows that more students than would ideally like would be working all year round, and fewer would be working school terms only. Among the main sample/core course, 53 percent had said they wanted to work all year round, but 61 percent of the jobs offered required this: for the minority ethnic sample, 31 percent had wanted to work all year round, but 47 percent of the jobs already found required year-round employment. Similarly, while 44 percent of the main sample would prefer to work school terms, only 29 percent of the jobs would allow this. The only near match in terms of weeks worked per year was for those doing non-core courses. While 34 percent of these students had said they would prefer school term working, 40 percent had obtained this. This may correlate with the finding reported in the above table that a relatively high proportion of these students had found employment working with special needs children, work which may be based in education or voluntary sector based employment following school terms. Table 3.13 Matching preferences to employment obtained, hours per week and weeks
per year, percent % Full time Part time Under 20
hours All year round
School terms only
Total (n)
P* O* P O P O P O P O
Main sample/ core course
84 61 14 25 2 14 53 61 44 29 198
Main sample/ non-core course
84 51 14 35 2 14 62 51 34 40 43
Supplementary 77 51 18 34 5 15 38 58 60 38 41
Minority ethnic 77 52 19 37 4 11 31 47 66 47 34
White 85 59 14 26 2 15 57 60 41 30 240
*P = preferred, O = obtained 15 An estimate derived from a recent survey of educational support staff for nursery nurses working in maintained sector schools with children aged 3-5 is that there are around 12,000 posts for diploma qualified nursery nurses (from EO/IDeA, 2000).
45

Among the age group preferences, more students than would prefer would be working with babies, and with over fives, and fewer working with the 2-5 year age range. For example, among those doing core courses, 49 percent said they wanted to work with children under two, but 61 percent of the jobs required this. Similarly, while 54 percent of the minority ethnic students wanted to work with children aged 2–5, only 29 percent of the jobs offered this. The same pattern was true for work with children over five years: 19 percent of minority ethnic students gave this as a preference, but 35 percent of jobs involved this age group. Finally, we asked all the students whether it was easy or difficult to find employment in childcare. Forty percent of respondents thought it had been easy to find work; 60 percent reported difficulties. Analysis of comments written by students found that the major reason for difficulties was the students’ perception of the available job market in their local area, coupled with the effect of, as one put it, ‘a lot of people on childcare courses at the various colleges, all looking for a job at the same time’. Some students referred to difficulties finding the most suitable job for them, with stipulations as to the kind of service, hours of work and convenient location. For students in the main sample, those on core courses were significantly more likely to already have a job (χ² =16.3, p<0.001), although they did differ in their views of how easy or difficult it would be to find a job. Students in the supplementary sample were slightly more likely to think it would be difficult to find a job (χ²=5.7, p<0.05), although they not less likely to have a job. Although there was no significant difference between the white and the minority ethnic students in their views of how easy or difficult to would be to find a job in childcare, the minority ethnic students were significantly less likely to already have a job (χ²=6.5, p<0.01). Table 3.14 Job presence and absence and views on finding a job, numbers and percent
Have a job To find a job Yes No Easy Difficult
N 208 416 219 305 Main sample/core course % 33 67 42 58 N 44 186 71 112 Main sample/non-core
course % 19 81 39 61 N 44 140 45 101 Supplementary sample % 24 76 31 69 N 38 143 51 76 Minority ethnic % 21 79 40 60 N 257 588 279 438 White % 30 70 39 61
Total N 295 731 330 514 % 28 71 39 61
3.6 Views on childcare, employment and the next five years In the last section of the student survey, we sought students’ broader perspectives on employment and childcare, and to see how far caring responsibilities would have to mesh with their own employment careers.
46

3.6.1 Views on non-parental childcare Students were asked their views on which form of non-parental childcare was best for children of different ages16. As Table 3.15 shows, students tended to hold the view that individualised forms of care for children was preferable until the age of around two, from which point group care was seen as much the most preferable. There was little variation in this view across the various groups, as is shown by the emboldened columns. Table 3.15 Students’ views on the best form of non-parental childcare in three age
bands, under 1, 1–2, 3–school age, percent
% Children aged under 1 Children aged 1-2 Children aged 3– school age
Total (n)
CM DN N R CM DN N R CM DN N R Main sample/ core course
10 10 31 48 19 41 24 15 10 80 5 6 589
Main sample/ non-core course
16 16 25 43 20 49 21 11 15 75 4 6 210
Supplementary 16 21 20 43 20 55 14 11 11 79 3 7 179 Minority ethnic 17 23 20 40 19 59 13 9 10 83 3 5 161 White 12 12 29 48 19 43 23 14 12 78 5 6 809
Note: CM = childminder, DN = day nursery, N = nanny, R = relative For children under the age of one, approaching half of the students thought a relative provided the best form of non-parental care, followed by a nanny (31 percent). A smaller proportion of students thought childminders and day nurseries were most appropriate for children under one. However, Table 3.15 also shows that there is a clear difference of view about day nurseries between minority ethnic and white students. While 23 percent of the former group rated day nurseries as most appropriate for very young children, only 12 percent of white students rated them thus. The next age band was one to two years of age. Here, day nurseries were seen as the best form of care by 41 percent of the main sample/core course respondents, followed by nannies, childminders and relatives. Again, a higher proportion of minority ethnic students (59 percent) rated day nurseries highly for this age group. For children over three to school age, nurseries were seen as by far the best form of non-parental care, with a rating of around 80 percent, with a small minority preferring childminders, relatives or nannies. 3.6.2 Future caring responsibilities and employment
Just over half the respondents in the main sample doing core courses envisaged that they would have daytime caring responsibilities for their own children in the coming five years (see Table 3.16). Around 15 percent of respondents anticipated having caring responsibilities for elderly or disabled kin in the coming five years. There was some overlap in the responses, but just over half of the respondents anticipated they would have one or both of these caring responsibilities. These types of responsibilities are likely to be a factor that draw childcare workers out of the labour market, particularly in light of the belief, articulated above, that individual forms of child care in the very early years are preferable. This point will be referred to again in the workforce survey (Chapter 5). 16 Options for nonparental childcare referred to all day care and did not include nursery education in nursery schools or classes.
47

Table 3.16 The next five years: daytime caring responsibilities for preschool aged children and elder or disabled kin, by sample type, numbers and percent
Own children Elder or disabled kin
%
Yes No Total Yes No Total
N 321 281 602 74 417 491 Main sample/ core course % 53 47 100 15 85 100
N 138 70 208 33 121 154 Main sample/ non-core course % 66 34 100 21 79 100
N 96 70 166 13 101 114 Supplementary % 58 42 100 11 89 100 N 90 67 157 19 81 100 Minority ethnic % 57 43 100 19 81 100 N 455 352 807 99 553 652 White % 56 44 100 15 85 100
The suggestion that commitment to employment diminishes during early parenting years was confirmed when we asked respondents what pattern of employment they would prefer should they have preschool aged children of their own. For some respondents, this question was of course hypothetical, as they were not parents, while for others it reflected preference in the light of experience. In either case, while the summarised results were remarkably uniform across the sample types, differences could be elicited between the white and minority ethnic samples. Table 3.17 Preferred work pattern when combined with own preschool children,
numbers and percent Work part-
time Work full-
time Work from
home No paid
work at all Total
N 250 54 124 144 584 Main sample/core course % 43 9 21 25 100
N 96 30 58 25 215 Main sample/ non-core course % 45 14 27 12 100
N 87 38 23 20 168 Supplementary % 52 23 14 11 100
N 71 42 16 26 155 Minority ethnic % 46 27 10 16 100 N 355 79 186 181 801 White % 44 10 23 23 100
Table 3.17 shows that between 9 and 27 percent of the various sample types would prefer to work full-time. This compares with between 43 and 52 percent who would prefer to work part-time and between 10 and 27 percent who would prefer to work from home. This left 25 percent of main sample/core course students but fewer of the other groups who would prefer not be employed while their children were under the age of five. This analysis shows clear differences of preference among the various groups represented. For example, the proportion who would prefer to work full-time was significantly higher among those from the minority ethnic and supplementary samples, than among the core course and white respondents. Similarly, those who would not
48

combine paid employment with parenting very young children were more likely to be in the main sample/core course group, or in the white respondent group. Thus, although these latter groups of students formed the predominant group of childcare students, they are also the group likely to have the highest rate of employment leavers due to childrearing responsibilities. Two other findings from this table are worth noting: first, nearly half of the students would prefer to work part-time, suggesting that flexibility in employment is important; and second, a substantial proportion would work from home, suggesting a continuing popularity attached to childminding as a means of combining parenting and employment. Commitment to childcare employment in the future was also gauged by asking the students what they thought they would be doing in five years time. Table 3.18 shows that most students thought they would be employed in childcare as a regular worker or as a senior childcare worker. Some, particularly those in the supplementary sample or with minority ethnic backgrounds, saw themselves in further education in five years time. A smaller group saw themselves working in childcare abroad, while a few envisaged employment outside childcare or travelling. Six percent thought they would be full-time parents and not in employment altogether. This is a lower figure than given in the earlier question about caring responsibilities (about half thought they would have young children within five years), but possibly shows a commitment to combining parenting with employment in some form or other. Table 3.18 Students’ projected destinations in five years time, numbers and percent
Abroad Childcare worker
Senior childcare
work
Further education
Childcare Not childcare
Employ-ment
outside childcare
Full-time
parent-ing
Total (n)
N 322 67 57 34 7 16 37 613 Core course/ main sample % 53 11 9 6 1 3 6 100
N 133 21 12 17 5 3 13 228 Non-core course/ main sample 58 9 5 8 2 1 6 100
N 97 26 24 11 1 6 6 184 Supplementary % 53 14 13 6 1 3 3 100
N 169 Minority ethnic % 46 12 15 5 1 7 4 100 N 845 White % 56 11 8 6 1 2 6 100
These findings suggest there is a high degree of commitment to the childcare field. This is further evident in the finding that between 51 percent of main sample/core course students and 67 percent of non-core/main sample students thought they would undertake further education or training in the coming five years. This was also the case for 64 percent of minority ethnic students. It is notable that the higher figures for anticipating further training coincided with those groups where the students were older. Slightly fewer students of all the groups thought they would be promoted (41 percent). Anticipating promotion was more likely among the supplementary sample (49 percent) than among the minority ethnic sample (37 percent). 3. 7 Key findings • The student survey gave a comprehensive picture of the views and experiences of
1094 childcare students from a range of diploma and certificate level childcare courses as they neared completion in the summer of 1999.
49

• Presentation of the findings included an analysis of the views of students from minority ethnic backgrounds, and those attending a supplementary group of colleges.
• Nearly all (99 percent) childcare students on the courses surveyed were female. • Approaching three-quarters (71 percent) of the students were aged 16 – 19,
however the proportion was much lower (42 percent) for minority ethnic students. • Minority ethnic students were on average three years older than white students. • Nearly all the students were white (90 percent), but the proportion reduced to 45
percent in the supplementary sample of colleges. • Over three-quarters (78 percent) of the students lived with their parents, but the
proportion was lower (60 percent) among the supplementary sample. • Fewer than one fifth (17 percent) of the students were parents themselves, but the
pictured differed for minority ethnic students, of whom 41 percent were parents; • Over three-quarters (81 percent) of the students had left full-time school at the age
of 16. • Patterns of entry to childcare courses are mixed, with just over half beginning the
course straight after school, but a substantial minority (46 percent) beginning later, usually after a period of further education and/or employment.
• Around two thirds (65 percent) of students thought the courses prepared them for employment very well academically. A higher proportion (82 percent) thought the practical preparation was very good. However, minority ethnic students were more critical of courses.
• Seventy percent of students were also employed, a combination described as difficult by two thirds of those who did it.
• Help finding employment from colleges was most often provided through vacancy lists. Careers advice was mostly found helpful.
• Minority ethnic students were more critical of how colleges helped them find employment than other sample groups
• Ninety percent of students want to work with children at the end of their course, and 86 percent expect to work with children given the constraints of local labour markets.
• Around ten percent of respondents did not want to work in childcare, or were unsure. They either did not enjoy their experience or had other work interests they wanted to pursue.
• This minority group was less likely to have had voluntary work experience before beginning their childcare course and were more likely to have chosen the course because they did not know what else to do.
• Alternative course and employment options students considered included nursing, social work, clerical work, working with animals, performing arts, and health and beauty work.
• Working in nursery schools and classes was the most commonly preferred type of childcare employment (between 32 and 58 percent of the sample groups).
• Employment in private nurseries and as nannies was also popular, particularly among main sample/core course and among white students.
• Where jobs had already been obtained, most were in private nurseries and as nannies.
• Among the supplementary sample, those doing non-core courses and the minority ethnic sample, trends in employment preferences and employment obtained were less clear, with special needs work, local authority nursery work, playgroup/ preschool work, family centre and after school club work all recording significant mentions.
• Most (84 percent) students wanted to work full-time, but just under half (44 percent) would like to work school terms only.
50

• One third had already obtained a job by the end of the course; around 60 percent of students thought it had been or would be difficult to find appropriate work.
• There was a disparity between ideal preferences for employment type and conditions of work and employment obtained by the end of the course.
• Approaching two thirds of the students thought that in the five years time they would be working in childcare as a childcare worker (53 percent) or as a senior childcare worker (11 percent).
• Most students believed individualised forms of non-parental care such as nannies (31 percent) or relatives (48 percent) are best for children under one; by the age of three, group care in nurseries (80 percent) is seen as best.
• Over half (53 percent) the students think they will have caring responsibilities of their own in the next five years.
• Most students would want to combine motherhood of preschool age children with working part-time (43 percent), or working from home (21 percent). The least preferred option was working full-time (9 percent).
• A quarter of the main sample (25 percent) would not work at all when also a mother of young children
• Among the minority ethnic sample, just over a quarter (27 percent) would combine full-time work with motherhood of young children.
Chapter 4. The Focus Groups 4.1 Introduction Lecturers and tutors who ran various childcare and playwork courses were asked to find students who would be prepared to participate in a group discussion about their careers as childcare/playwork workers. All the students on the courses were sent an explanatory letter about the study prior to their agreement to participate. As discussed in section 1.5 we chose courses and students that were poorly represented in the national survey in order to maximise the breadth of issues discussed in the study overall. The students who took part differed in two respects from those students who took part in the national survey. First, there was a deliberate attempt to include some students with additional responsibilities (i.e. young children of their own) into focus groups. This meant that a higher proportion than in the survey were from older age groups. Second, there were almost no students from minority ethnic backgrounds among the focus group participants. This was due to difficulties obtaining access to students in colleges in appropriate locations. Table 4.1 sets out the characteristics of the focus group participants. Table 4.1: Characteristics of focus group participants by course type Course type Age
range Gender Ethnicity Disability Employed
(FT/PT/Not)
Own children
Total
1. Level 3 NVQ award (CCE)
19 - 42 Female 12white/ 1 mixed
None 5/8/0 10 13
2. Level 3 Diploma (CCE)
23 – 42 Female White None 0/0/3 3 3
3. Level 4/5 Playwork
20 - 36 Female White None 0/5/2 2 7
4. Level 2 Playwork
28 - 50 1 male White None 1/6/0 7 7
Total 0 6/19/5 22 30
51

As with the student survey, virtually all the participants were female. None of them was registered disabled17. Of the 25 participants who also had employment, all but two worked in childcare or playwork. Most of these worked part-time. Twenty-six of the respondents had voluntary or paid work experience in childcare or playwork prior to beginning their course. At the time of the focus groups, the following types of childcare work and playwork were represented: welfare and learning assistants in schools; childminding; sessional playwork manager and supervisors; sessional playworkers; dinner lady; family centre manager; family centre worker; day nursery workers; preschool supervisors and assistants. In line with the aim of achieving some discussion of issues from the perspective of students with additional responsibilities, 22 of the participants were over the age of 25 and 22 had children of their own. Nearly all of the students’ children were of school age. Leading on from this, most of the students lived independently of their parents, either with a partner and/or with their children. The educational background of the students was broadly similar to the main sample. Most had left full-time education after compulsory schooling. Only three of the 30 had entered training shortly after leaving school, for the rest, a return to study meant a time and financial commitment alongside existing employment and caring responsibilities. Because so many of the students were training while also being employed, or had employment experience on which they drew during training, much of the discussion in the focus groups was about being employed in childcare and playwork, as much studying for employment. The overlap between studying and employment also meant that it was difficult to identify to what extent being in training represented an opportunity for a shift in perspectives on childcare and/or playwork. The purpose of the focus groups was to extend the discussion of issues raised by the national survey. The topic guide for the focus groups was based on the national survey questionnaire but discussion was allowed to range around these issues. The presentation of the results of the focus groups will therefore be structured around those debates that were of most concern to the participants, as demonstrated in the length of time devoted to the discussions. 4.2 Childcare careers 4.2.1 A job or a career?
The reasons for coming into childcare and playwork presented a familiar picture. Focus group participants reported that they found working with children rewarding; that they ‘enjoyed the company of children’ and ‘teaching they everyday things’; that there was a wide variety of jobs to choose from as well as an ‘infinite variety of children’; that it could offer a high level of responsibility and required particular skills, such as creativity, practicality and physicality; and that it was work with which they were familiar from their own childhood and social networks. However, for most of the participants, training for a childcare qualification represented a shift towards seeing themselves as pursuing a childcare career. This was the case both for those who had worked in childcare for many years (e.g. as childminders) and for those who had no prior employment experience in childcare (e.g. mothers returning to
17 The term ‘registered disabled’ was used to find a systematic means of classifying disability. It may not include all those who consider themselves to be disabled.
52

study). When asked to differentiate between a job and a career, participants referred to jobs as work that bring in money, that fit in with other commitments and work that is the easier option in given circumstances. A career, on the other hand, was seen as a chosen field, that takes time and planning ahead to build up, and that presents goals to reach. Participants did not uniformly hold these distinctions. For example, some participants argued that it was possible to plan for a career that fitted in with responsibilities for young children, and one or two of the participants thought that working in childcare was always a job rather than a career, because there was ‘not enough money involved’ to make it a career. But a few, mainly the younger students, and particularly those doing playwork, were uncertain about their future direction in the field, and indeed were uncertain whether a career existed in the field. Three playwork students commented:
A ‘I don’t know whether I want to actually go into playwork or not, or whether I want to do something else. But at the minute I’m undecided. I don’t know whether I want it as a career or not.’ B ‘I don’t want it as a career, I know I don’t.’ C ‘I can see it as a career for some people, though. I have a lot of respect for the people that do it.’ B ’And you’d probably have to do it, I think, to get, like, further up. But I’ve done my nursery nursing, I’ve worked with kids, like, children, for probably about four years, and I don’t want to do it any more. I’m bored of it. I want a bit more of a challenge.’
These three students were either undecided or definitely not going to pursue playwork as a long-term career. They were all relatively new to the field of playwork, but could see that there was no structure to the career and would lead to their progression in terms of salary or seniority. 4.2.2 Careers and motherhood
There was a general consensus among participants that the advent of motherhood shapes the extent to which women can pursue careers, and indeed the kind of career it is feasible to pursue. Women saw themselves as primarily responsible for their children’s care and so their careers had to accommodate these responsibilities. Employment that involved long or irregular hours, for example, rarely fitted in with children’s or families’ needs. For some participants, whose partners worked for employers who demanded geographic flexibility, planning the direction of a childcare career was more or less impossible. One woman illustrated the difficulty of planning a career when she said:
‘My husband has the sort of job that moves him around. And in that respect you make a choice. Do you go with your husband or do you go for yourself. And I made a choice when I married my husband, when we had a family, that the family was where we all were. So therefore I do what I can, on a vocational basis, to satisfy my needs, but without the career hype’.
For many of the students, childcare training and work offered an opportunity for a chosen career doing something they enjoyed, but where it was also possible to combine their childcare responsibilities with employment. One woman on the NVQ course exemplified this kind of planned commitment when she said:
‘Mine was definitely chosen, because I sat down and worked out which direction I wanted to go, once my children were in school ... I purposefully picked this course. I definitely consider it a career. Because I had a career before I had children … I did well at it. I earned lots of money at it. But I
53

purposefully picked a different career. I’d done that, had my children, and now was doing something that I’d planned to do for me. Definitely’.
This kind of planning that involved choosing a particular course was particularly found among the BTEC, CACHE Diploma, and the more mature NVQ Level 3 students. Apart from a planning-led career route into childcare work, focus group participants also described an ‘accidental’ route into the work. In line with previous research on the childcare workforce (Brophy et al., 1992), some students talked about ‘coming into the work by chance’. Examples of this were helping out dinner ladies and being asked to work there permanently, helping out in playgroups and after school clubs and being approached to become a paid worker. One respondent illustrated this process when she said she had begun to help out the dinner ladies in her son’s school and then ‘they suddenly had this need to have a permanent person. And I wasn’t thinking about doing it as a job. But they said, ‘Please come and help us. We really do need the help’, and – you know – it was a bit of emotional blackmail’. This accidental route is usually dependent on being a mother first, in order to be using the services at all. However, while motherhood presented an opportunity to change career, to plan for a different kind of career, and gave access to services where there were employment opportunities, it also represented constraints on the development of a childcare career. Most of the constraints surrounded beliefs about what constituted ‘good’ parenting and appropriate alternative care. Two of these beliefs are discussed below because they structured the courses of action open to those who wanted to work in childcare.
4.2.3 Belief one: You should be available to your children
Many women believed it was important to be available to their own children during the course of the school day, and to be at home after school hours. One NVQ student who was also a childminder said:
‘When my children are a bit older, then I can go into a different type of care … Nursery work. At the moment my children like me to be there during the day. They like to know I’m at home. Whether they’re there or not, they’re at school. But they like to know that I am there if they need me. And they like me to be there after school. And if I went into a nursery, I’d still have to find care for my own children after school’.
Other respondents echoed this view, even when their children were of secondary school age. One said:
‘I think that’s when a child, at that age, is developing so quickly. And if you don’t develop with them, then you’re going to lose them. That’s my way. I think you should also be there for them when they’re teenagers, and not just when they are tots’.
This view has implications for the timing of a childcare career and the hours of employment. In particular, the kind of childcare work open to a mother is restricted to work available within the home such as childminding, and of short duration, such as sessional work in school hours. Mothers holding this view would find it difficult to become after school playworkers unless they could take their children with them to sessions.
Among playworker participants, there were varying experiences of taking children with them to sessions. One respondent reported that with the advent of the regulations under the Children Act 1989 on the age of children in sessional group care, she was unable to take own children with her, whereas previously she had been able to do so. This had
54

meant she had had to seek alternative care for her child while she worked. Another discussant saw taking children to work as problematic for the play service. She said that sometimes workers who brought children, ‘instead of actually doing their job, they were looking after their child and there would be twenty or thirty children running riot.’ In another area, being able to take one’s own children was seen as ‘part and parcel of the job. That’s why we are able to do the job’. Furthermore they saw parenting as helpful experience for doing the job, with the only drawback being that their own children expected them to become a full-time playworker at home as well as at work.
4.2.4 Belief two: You shouldn’t leave young children to be cared for by others
The timing of undertaking childcare qualifications, or beginning or resuming childcare employment is affected by a belief that children should not be ‘left’ to be cared for by others. One CACHE Diploma student, the mother of a three year old, said:
‘I have been thinking of it (doing this course). But it’s really this year when she’s – I thought I’d have to wait until she’s at least at nursery, and then obviously next year she’ll be at school. But I couldn’t have done it before. It would have been just too long away from her. I mean now I wish I’d waited until next year … because it’s so much work’.
Another Diploma student said she would have ‘missed out’ on her son if she had started her course earlier. She said, ‘I wanted to be around. I didn’t want anyone else to have that responsibility. I wanted to be the one that told him he was good or bad’. There was agreement in this group that young children get ‘very tired’ away from home and that and ‘the only time they really relax is in their own home … so you have to be careful how long their day is’.
A group of older playwork students related how this belief about ‘leaving’ young children is held by other family members and used as a form of criticism of their decision to work. They referred to the ‘guilt’ of leaving their young child. One said, ‘It used to be stigmatised. You know, the proper way to do it is within your family’, and another said:
‘Maybe that’s why I’m against childcare … it’s a huge guilt trip. Now I can imagine that if it wasn’t at my mum’s, and he was in childcare (the reaction would be) ‘Again?’. I thought that what I had done was right … I took five years out, made sure that – you know, he’s not perfect, but he’s got all his – everything in place. He settled well in school, and then I picked my life back up, because I thought I was entitled to. But apparently not! I was told I was a selfish cow!’
Furthermore, the students had seen examples of this belief among parents who used the after school clubs. One participant, not a mother herself, said:
‘And parents will come in and they look at you as sort of – you know, ‘What did you do with my child this afternoon?’ And there’s that – you know - there’s that loss. It’s not a respect thing, it’s just they – it’s a guilt thing. They shuffle in, take them home as if they’ve never been there. They’re terribly apologetic for having used the club’.
It would appear that a belief that children should not be ‘left’ to be cared for by others is widespread among the constituent groups involved in childcare: workers, parents and relatives. There are two implications of this belief. First, that mothers should provide day-to-day care for their children, and this is widely held, such that it is a normative expectation of motherhood (Cameron, 1999). The second is that ‘leaving’ children often equates to the service they are using being seen as inferior to caring for them at home. This view was supported by a nursery worker doing the NVQ course, not a parent herself, who said:
55

‘With what I see at the nursery, babies are starting at three months old, and (parents are) going to work. And they’re like full-time, from eight ‘til six. [Do you not think that they get good care in the nursery?] Yeah, they do. But they should be with their mum or dad’.
Part of the meaning of ‘leaving children’ thus seems to be about not providing the ideal childcare service to your own children, while being employed to provide good care for others. As the following excerpt of a discussion among playwork students shows, this dilemma is very acute to workers in the childcare field:
A: ‘What I used to get really concerned about, is that we’re looking after other people’s children, but – B: We neglect ours. I went through a huge guilt trip – A: It is awful, but it does feel like you’re neglecting your own. While you’re B: You’re out at work. A: - looking for, looking out for other people’s kids, and you think, ‘Hang on, I’ve lost the plot here’.
The continuity of the sentences above suggests a consensus between the women about the social meaning being discussed: they both intimately understood the other’s viewpoint.
Attention has been paid to this belief because it was frequently referred to in the discussions about when to resume employment after having children and what kind of care was seen as appropriate for their young children. The most commonly used form of care by students’ children was a grandmother. This was for three main reasons: availability; cost; and appropriateness.
Availability was seen as important because playwork and childcare work may be unpredictable, sessional, may overrun its set hours, and may be take place when other services are shut, meaning that flexibility was very important criteria. Added to this was the working hours of partners, which were also frequently unpredictable. As one student said: ‘I can’t just phone somebody up and say, ‘Right, you’ll have to have him today’. That’s, I suppose that’s why I came to rely on my mum so much. Because I know I can do that. I can just drop him off’ Cost was also important. All the playworkers with young children said they would only be able to do the work if they had free childcare through their mothers. One said:
‘It’s a personal thing, but I do think that my mum should be valued for the work that she’s done. And it’s not always possible. They don’t always get paid. Because she’s got an allowance, and she would lose her money if I was to pay her’.
Last, many of the students said the only alternative care they would use would be their mothers. For example, one said:
‘I wouldn’t allow anybody else but my mum to look after my little boy. Even if I had the money, I wouldn’t pay for childcare … I just won’t trust people … if my mum couldn’t look after my son, then I wouldn’t work’.
Another student concurred: ‘I don’t think, being a first time mum – and I was only twenty-one as well – I don’t think I could have let anybody look after her. It had to be my mum’. Some reservations were expressed about using grandmothers. Some students thought grandmothers were not necessarily as aware of child development and children’s needs as they were. Other, younger students, thought their own mothers
56
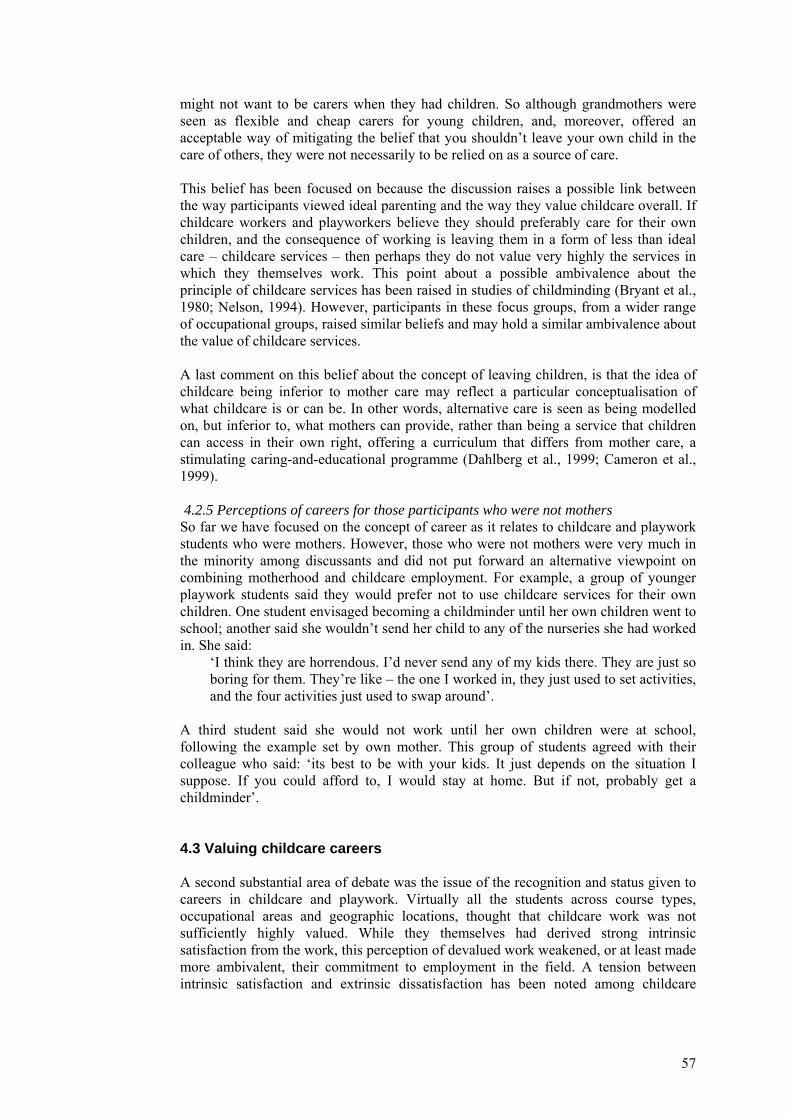
might not want to be carers when they had children. So although grandmothers were seen as flexible and cheap carers for young children, and, moreover, offered an acceptable way of mitigating the belief that you shouldn’t leave your own child in the care of others, they were not necessarily to be relied on as a source of care. This belief has been focused on because the discussion raises a possible link between the way participants viewed ideal parenting and the way they value childcare overall. If childcare workers and playworkers believe they should preferably care for their own children, and the consequence of working is leaving them in a form of less than ideal care – childcare services – then perhaps they do not value very highly the services in which they themselves work. This point about a possible ambivalence about the principle of childcare services has been raised in studies of childminding (Bryant et al., 1980; Nelson, 1994). However, participants in these focus groups, from a wider range of occupational groups, raised similar beliefs and may hold a similar ambivalence about the value of childcare services. A last comment on this belief about the concept of leaving children, is that the idea of childcare being inferior to mother care may reflect a particular conceptualisation of what childcare is or can be. In other words, alternative care is seen as being modelled on, but inferior to, what mothers can provide, rather than being a service that children can access in their own right, offering a curriculum that differs from mother care, a stimulating caring-and-educational programme (Dahlberg et al., 1999; Cameron et al., 1999). 4.2.5 Perceptions of careers for those participants who were not mothers
So far we have focused on the concept of career as it relates to childcare and playwork students who were mothers. However, those who were not mothers were very much in the minority among discussants and did not put forward an alternative viewpoint on combining motherhood and childcare employment. For example, a group of younger playwork students said they would prefer not to use childcare services for their own children. One student envisaged becoming a childminder until her own children went to school; another said she wouldn’t send her child to any of the nurseries she had worked in. She said:
‘I think they are horrendous. I’d never send any of my kids there. They are just so boring for them. They’re like – the one I worked in, they just used to set activities, and the four activities just used to swap around’.
A third student said she would not work until her own children were at school, following the example set by own mother. This group of students agreed with their colleague who said: ‘its best to be with your kids. It just depends on the situation I suppose. If you could afford to, I would stay at home. But if not, probably get a childminder’. 4.3 Valuing childcare careers A second substantial area of debate was the issue of the recognition and status given to careers in childcare and playwork. Virtually all the students across course types, occupational areas and geographic locations, thought that childcare work was not sufficiently highly valued. While they themselves had derived strong intrinsic satisfaction from the work, this perception of devalued work weakened, or at least made more ambivalent, their commitment to employment in the field. A tension between intrinsic satisfaction and extrinsic dissatisfaction has been noted among childcare
57

workers in previous studies. A review by Cameron (1997) noted a study of job satisfaction among US childcare workers that concluded:
‘overall it appears that the work itself is a key factor in job commitment and satisfaction. Working with children is both valued and enjoyed by child care workers. It appears that this factor overshadows the negative aspects…' (Schryer, 1994: 44).
Among the focus group students in the present study there was a similar tension between appreciation of the rewards of working in childcare and playwork versus the realisation that this work was not valued by others. 4.3.1 Sources of devaluation of childcare and playwork: low wages and poor conditions
The lack of valuing of childcare was seen to come from various sources. First, the wages were seen as insufficiently high for childcare to be a highly valued career. In response to a question about what makes people leave childcare or playwork, all the participants in four of the groups responded by saying that poor wages were the key factor. In the remaining two groups, poor wages were cited as a secondary factor after a more general lack of valuing of childcare or playwork. In sum, all the groups concurred that low wages were a problem for gaining status and recognition for their training and experience. Second, the problem of low wages was exacerbated within the sector. Two examples demonstrated divisions within care and education work. In one local authority, nursery teachers had had a pay rise, but this was withheld from nursery nurses working in the same nursery schools and classes, and doing the same job. The same problem was noted by a playgroup leader doing an NVQ who said she was working to the same Early Learning Goals as nursery teachers, with the same age group of children, involving the same amount of planning and recording, but the pay was very unequal. The second example concerned recruitment vis a vis qualifications. One student reported that she had applied for a job she wanted and was turned down in favour of a less well-qualified person. Similarly, a student applying for a job in a private nursery was told she was ‘more than qualified’ but only offered £3 an hour. She said, ‘He might not value me, but, I value myself a lot higher than that … he doesn’t give two hoots about the staff and conditions’. Other dimensions of being undervalued by employers were noted, too. Those working in private nurseries reported that their conditions of work could be eroded, by, for example, having to go without a lunch break, or unqualified workers/students being perceived as the ‘runabout’ and given the ‘cheap’ jobs to do. Similarly, students reported that working as a volunteer is devalued, and in these circumstances, incompetence is often assumed. Other students reported a problem with local authorities as employers, referring in particular to an apparently poor regard held for learning and welfare assistants, as well as the nursery nurses referred to above. One learning assistant reported being left in charge of whole classes of children for extended periods of time. She said: ‘For what I get paid and for what the class teacher gets paid … I just feel they are taking advantage’. 4.3.2 Sources of devaluation of childcare and playwork: skills and responsibility
Undervaluing of childcare was also reported in a lack of recognition of the skills and level of responsibility required to care for children. Childminder-NVQ students referred to their intense feeling of responsibility when taking children out on the street. One said:
58

‘You are so aware that you are responsible for the child, even though you are just taking them to the schools or something. The more so than in the nursery environment, because you are so responsible for them’.
A playwork student concurred when she said:
‘I've been a childminder as well, and, to me, that is one of the most - it is so important, that you're totally responsible for this child that isn't yours. It's such a responsibility. You know, anything could happen to this child. But I don't think people look past the fact that – ‘Oh, you're just caring for my child. I'm going out to - you know – work’, and, you know…’ (emphasis in original)
Playwork students referred to a lack of recognition of the level of preparation involved in each session. Members of one group said:
‘A: I don’t think anybody could ever actually afford my wages if I was to be paid for everything I do. You know, like the planning of the two-hour session, and the things that you do that you don’t think about. They couldn’t possibly afford it’. B: ‘We get paid for two and a half hours, fifteen minutes before, and fifteen afterwards. But we go home and we will plan our sessions. We’ll be going to the library and getting books out. We don’t get paid for that. And that’s the frustration of it. Because we do so much preparation and development…’ C: ‘In my limited experience … it’s completely personal, and it’s all or nothing. If you’re in supervisory role, you can’t half do it. You can’t half have twenty kids. And you – for what you’re responsible for, you can’t just go and sit in the corner ‘off you go and play’ … ‘ A: ‘My life revolves around kids’ clubs. It does. It honestly revolves around kids’ clubs’.
This extract shows the high level of commitment to the work, but also the deeply felt lack of recognition for the extent of prior and ongoing planning for the work. This group of students also spoke about a lack of recognition of what they referred to as ‘playwork values’. They argued that playwork was difficult to ‘place’ because the values promoted by playwork were not teaching values or parenting values, but were described as ‘independent’ of both. This leads to a lack of understanding about what is going on during playwork sessions. The students reported that parents may complain about the noise levels and apparent chaos in playwork sessions, and teachers expect playworkers to sit the children down and do class work. They attributed the lack of understanding of playwork to a societal failure to value children. One said: ‘I don’t think we value our children, or the importance of play. And until we do that, playworkers won’t get the recognition that they deserve’. 4.3.3 Sources of devaluation of childcare and playwork: parents’ views
Students in most of the groups referred to a problem of valuing of their work by parents, which some students thought was linked to how caring is valued overall, whether unpaid or paid. One playwork student said she felt ‘taken for granted’ by parents in her work in a family centre. She said in her previous childminding work in small villages in an affluent area:
‘You were valued, because they understood we're educated people, and things. And now I don't feel that sense of worth as much. Inside, I do, because I actually think I'm doing a better job here. Because I think they need me more. Whereas I didn't - you know, I was sort of just there before. But I'm not sure of the parents' perception here. And I don't know whether that does come with education more’ (emphases in original).
59

A childminder-NVQ student said:
‘I think a lot of parents think that because they are paying you to look after their children, they owe you something. And I know that some of them have that attitude. And I know you’re offering them a service, but it’s very patronising. Some of them can be extremely patronising’.
Some students found that parents did value their work as childminders and playworkers. One NVQ student-childminder said:
‘I find that parents are very grateful for what I do … they go out of their way to make life as easy as they possibly can … I know that with the parents I’ve got I’m very lucky … they are two extremely nice people. And I’ve heard some real horror stories’.
Another playwork student said of parents she meets: ‘I think they admire you. They really do’. 4.3.4 Sources of devaluation in childcare and playwork: the role of government
Finally, when the focus groups were asked to specify where the lack of valuing of childcare work came from, there was some discussion about the role played by government and government policies. For example, one playwork student who was a family centre manager said she thought part of the reason parents do not value childcare workers is that they do not value themselves as parents. Part of the reason for this, she thought, was that the choice to stay at home and raise children was no longer supported by government policies. She said:
‘Childcare is not given the importance that it should be. Whether that means - whether that's paid childcare for someone to look after yours, or whether that's you yourself choosing to be the childcarer at home. It's not given any importance. I mean, like, single parents are really between a rock and a hard place. If they stay at home with their children, then they're called ‘lazy dole-pinching’, or whatever the word is. And if they go out to work, then they're not good parents because they're leaving their children in childcare somewhere. So it's, like, you know, where is childcare in that? And how is it valued? So, if people aren't valuing themselves as parents, and nobody's told them they're doing a good job, or it's valuable what they do, or all those sort of things, then I think that's probably why they're not - they're not appearing to value the work that you do with the children either. . .But whilst you've got legislation around that says, you know, single parents must be encouraged - nay, forced, to go back to work, whilst there's legislation like that around, how does that equate to valuing childcare?’ (emphasis in original)
A last point on the government’s policies was the system of funding for services. Supporting start-up costs but not ongoing costs was seen as leading to instability in the level of service and eventually to cuts in the service, while new services were supported. As one playworker said: ‘New groups get the funding. Existing groups are losing out’ (emphasis in original). 4.4 Expectations of the Course The final section of the discussions to be reported here concerns how the students viewed the courses themselves. Did they live up to expectations? What kinds of things were problematic for students? How well did life outside college fit with course commitments?
60

Most of the students thought that the courses lived up to expectations, in that the content was stimulating and enlightening and challenging. One student thought that the course had ‘exceeded’ her expectations, and her colleagues joined in that ‘there’s a lot involved, a lot more involvement than we thought… or dreamed of!’ Another student said ‘It’s made a big difference with me, because we’ve really focused on what the children need to learn, and what the important things are. And I was sort of beginning to understand that in my imagination, whereas before I was learning it through hands on experience in nurseries, and trying to pick it up from other people who have been trained’. However, there were important exceptions to this general picture. Most significantly, difficulties with the organisation of the course distracted from student’s enjoyment of the work. 4.4.1 Playwork courses
The courses examined varied in their target intake. One playwork course was run over part-time sessions with additional written assignments. All of the students were working in a relevant field either paid or as a volunteer, the course itself was free or virtually free, but the students often had to arrange to be away from work which sometimes meant paying someone else to do the work or to care for their own children. Fitting in the course was not easy, but all the students on this course thought the level at which the course was pitched was high but taught in such a way was to be accessible. The range of prior experience was extensive, from relatively inexperienced dinner ladies to a family centre manager, but all found that the course was useful either as a first taste of childcare/playwork training, or as a refresher. Managers seemed to be key in directing workers onto the course and supporting the progress of students. One manager was doing the course with her workers partly as a means of demonstrating support for the training. Views on how the course had helped alter student’s views about working with children included: • Being more aware of the physical environment and hazards therein; • Being better equipped to discuss sensitive matters with parents, such as how to deal
with a parent who was shocked at seeing photos of her son dressing up in a skirt; and
• A thorough knowledge of the relevant legislation and procedures for protecting children and running clubs safely and effectively.
The second playwork course was a two-year full-time diploma course. The students on this course were more disappointed with the course than with the shorter playwork course described above. The major criticisms were: • A possible threat to the promised playwork degree and an inflexible approach
towards those wanting to transfer elsewhere to complete a degree in playwork; • The lack of a career structure into which to fit their qualification: experienced
playwork supervisors would be returning to their original jobs as there were no promotion prospects; inexperienced playworkers could not see a career route that would include financial independence in playwork with their qualification;
• While potential employment horizons had been opened through doing the course the choice of that particular course had already narrowed their own employment options because subsequent financial support for retraining would rarely be available;
• Poor organisation of teaching so students did see each other enough; • Some modules were pitched either ‘too basic’ or assumed too much prior
knowledge. One mature student summarised their dissatisfaction when she said:
61

‘We came on this course wanting to get the qualification … to give us a career in the job that we actually enjoy doing … but at the end…we’re still going to be supervisors. We’re still going to be on the same rate of pay, working the same amount of hours. And still not valued. So we’ve just put two years of our lives in for nothing’.
However, an inexperienced mature student was more positive, and said she liked the course because ‘it pulls in all the different elements, and it suits me because it’s practical, and a bit academic … And I have a respect for the [institution] and the course level, because I do feel that it is diploma level. And we do work hard’. 4.4.2 Childcare courses
Three courses aimed at younger children were represented: a modular NVQ Level 3 course and two full-time diploma early childhood programmes aimed at, or including mature students. Students had a range of comments about the content, organisation and impact of these courses. Most of the students thought they and their colleagues were on the course because they enjoyed being with children and wanted to improve their employment options in childcare. Asked whether the course had altered their views on working with children, one or two thought they were, as one said: ‘more positive now. And I know the different angles at dealing with problems that arise. And I also know the angle of going into something with a child’. Another reported that the course had ’made a big difference with me, because we’re really focused on what the children need to learn, and what the important things are. And I was sort of beginning to understand that in my imagination, whereas before I was learning it through hands on experience in nurseries, and trying to pick it up from other people who have been trained’. A student reflecting on her group thought they held a lot of potential. She said ‘there’s a lot on the course that are very capable, and will be very good. But there’s another small section, I think, that will end up either changing courses or going in a different direction. Because it’s very different to what they expected. I think it’s just the lack of maturity’. However, the discussants thought the courses offered ‘a lot of scope’ for future career directions, once completed. Major comments about the organisation of the courses were: • NVQ students reported that the terminology was difficult to understand, there was a
lot of repetition, and ‘you have to do a lot of cross-referencing … it’s a lot of numbers. Codes. It’s like learning a foreign language’.
• NVQ students also reported organisational difficulties with the course. For example, delays in arranging for assessments to be completed, tutors were difficult to contact by ‘phone, there had been too few personal tutorials, and arrangements to place lessons on the internet had not materialised.
• Diploma students also referred to organisational problems. One said ‘We always feel in a bit of a muddle. Things come at us very fast at the last minute and there’s quite a lot of resentment about that’.
The motive for choosing a course was said by one student to be financially rather than educationally inspired. She said: ‘I could’ve done two straight years of an NNEB. But I decided to do an NVQ, because, well, for money. I needed money, and you just didn’t get to do paid work, being full-time. And I wish I had done the straight year with the NNEB, because it’s so much easier … Even though the money wasn’t good when I was doing my NVQ. But I needed to have some money rather than none’.
62

Students with additional responsibilities reported difficulties in combining the three roles of working, caring and studying. One said: ‘you’re doing two jobs, at home with three kids who I can’t say to them like, ‘you can’t go to this club’, I have to let my children do ... I have one night a week where I can actually sit down … I don’t know where I find the time…’ 4.5 Key findings • The concept of career is well developed in the thinking of childcare students, but
considerable constraints operate around their achievement of it. • The major constraint comes when women have children. • There was a consensus among participants that while childcare employment may
have been chosen at least in part because it is possible to combine it with family responsibilities, this combination was only viable under certain conditions.
• These conditions were both practical (i.e. what would work in the circumstances) and based on beliefs about normative expectations of motherhood.
• The two main beliefs represented in this study were that mother should be available to their young children, and that mothers should not leave young children to be cared for by others.
• Students who were not mothers held the same views and saw the same constraints as those who were mothers.
• The power of these constraints is such as to exert a major influence on women’s participation in the childcare workforce.
• Students perceive a widespread problem of low valuation of childcare both as employment and as parenting.
• This lack of valuing of childcare occurs at many levels and includes the level of wages; divisions within the care and education sector; erosion of conditions of work; lack of recognition of childcare and playwork skills and ethos by parents and wider society.
• Lack of valuing of childcare work seen as linked to low valuation of parenting by government policies.
• The extent of the problem of low valuation on childcare careers may well have an adverse effect on workers’ long term career commitment to employment in childcare and playwork.
63

Chapter 5. The nursery workforce survey 5.1 Introduction The nursery workforce survey was the first survey of English day nurseries to interview all individual members of staff in a large sample of nurseries. (Details of the sampling are given above, in section 1.6) Previous surveys had collected information about staff from the heads of the nursery. An earlier survey from the Thomas Coram Research Unit (Moss et al., 1995) had included interviews with 121 day nursery managers in England and Wales, 248 playgroup leaders and 250 childminders. More recently, a more extensive survey was conducted by EO/IDeA (1999a). This was a postal survey of the heads of all 5,515 day nurseries registered in England under the Children Act 1989 in 1998. Questionnaires were received from 1,904 day nurseries, a response rate of 41 percent. The main points of difference between the current survey and that reported by EO/IDeA are: 1) the EO/IDeA survey covered a larger number of nurseries with a broader approach; 2) by using individual interviews, the TCRU survey included details of individual characteristics; and 3) as well as mapping the workforce, the TCRU survey aimed to answer specific questions about recruitment and retention. Both surveys included only day nurseries registered under the Children Act, and did not cover local authority nurseries or those exempt from registration. The present survey collected data from 251 nursery heads and 1,809 other staff. This compares with 756 nursery nurses interviewed over three years of the Labour Force Survey (LFS) (1996-1998), analysed in chapter 2. The LFS included nursery nurses who worked in any setting, and not just registered day nurseries. This chapter is divided into four main sections. First, the 251 participating nurseries are described, along with the heads of centres and staff who work in them. The second section will explore how and why workers come into childcare work; third, questions of retention will be examined, including the conditions of work and how settled childcare staff feel in their work. Last, the issue of loss in the childcare workforce will be explored in the data. 5.2 The nurseries and staff 5.2.1 The nurseries
Two hundred and fifty-one nurseries took part in the survey. Three-quarters of these were privately owned and managed, mostly by an owner/manager owning just one nursery. This is a slightly lower proportion than in the EO/IDeA survey (84 percent), but with a similar proportion belonging to a chain of nurseries (8 percent in the EO/IDeA survey).
64

Table 5.1 Management of nurseries N = 251 Number %
Private owner manager (one nursery) 121 48 Private owner/manager (two or three) 39 16 Private owner/manager (three or chain) 23 9 Subtotal 201 73 Voluntary management committee 18 7 Owned by college of further education 14 6 Jointly managed scheme (not local authority) 12 5 Workplace nursery (manager plus committee) 11 4 Jointly managed scheme (local authority) 6 2 Total 251 100
The nurseries mostly kept opening times to cater for working parents. The predominant pattern was to open at 7.30 or 8 am and to close at 5.30 or 6pm. A few opened very early (6.30am) and/or closed very late (7.30pm). Predominant and outlying patterns: • opening between 7.30 and 8.30 am: 88% • opening before 7.30am: 8% • opening after 8.30am: 5% • closing between 5pm and 6pm: 85% • closing before 5pm: 5% • closing after 6pm: 10% 5.2.2 Registered places and numbers of children
The mean number of registered places in the nurseries surveyed was 44, but the variation was considerable. These nurseries were larger than those in the EO/IDeA survey (average 36 places per nursery), and the average recorded by the DfES in 1999 (34 places) (DfES, 1999a). For the purposes of this report, the number of places has been divided into bands: small; regular; large and very large. Table 5.2 Number of places in sampled nurseries N = 251 Number % Small: 10 – 20 places 35 14 Regular: 21 – 50 places 142 57 Large: 51 – 90 places 59 24 Very large: 91 + places 15 6 Total 251 100
The number of children on roll also varied considerably, with more part-time children than full-time children. Nearly half (47 percent) of nurseries had ten or fewer full-time children.
65

Table 5.3 Full-time and part-time children on roll, numbers and percentages N = 251 Nurseries with full-time
children Nurseries with part-time
children N % N % 0 - 10 children 117 47 44 18 11 – 20 children 78 31 66 26 21 – 30 children 30 12 53 21 31 – 40 children 15 6 66 26 41 – 50 children 11 4 21 8 Total 251 100 250 100
5.2.3 Ages of children
Tables 5.4 and 5.5 show that children attending these day nurseries were highly likely to be two or three years of age, but around three-quarters of nurseries also had places for children aged under two, with the proportion of four-year-olds using day nurseries possibly dropping off as more children begin attending school at the age of four. Meltzer (1994) also noted that more three-year-old than four-year-old children attended day nurseries, while the reverse was true for those attending nursery class or school. Table 5.4 Age distribution in sampled nurseries (1)
N = 251 Number of nurseries taking this age
group
% of nurseries taking this age
group
Percent (mean) of children in this age
group Under one year of age 173 69 12 One year old 199 80 19 Two years old 239 96 29 Three years old 234 94 28 Four years old 164 66 10 Five – seven years old 27 11 1 Seven + years old 17 7 -
Table 5.5 provides a more detailed breakdown of the age distribution in nurseries, showing that 57 percent of nurseries had 10 percent or fewer of their children aged 12 months or younger, while 61 percent of nurseries had 10 percent or fewer of their children aged four years old. Table 5.5 Age distribution in sampled nurseries: percentages (2)
N = 251 Under 10 %
11 – 20 %
21 – 30 %
31 – 40 %
41 – 50 %
51 – 60 %
60+ %
Under 1 year 57 30 8 2 1 - - 1 year 34 27 23 10 4 - 2 2 years 11 20 29 23 12 2 5 3 years 18 18 29 18 10 3 5 4 years 61 22 10 5 1 - - 5 – 7 years 96 3 - - - - -
66

5.2.4 Other services Approaching half (41 percent) of the nurseries offered additional services to full-day care. These were mostly holiday care schemes (31 percent of nurseries offered this); and after school clubs (25 percent) and some breakfast clubs (19 percent). The figures for school aged children in Table 5.5 show that these services for school aged children cater for a small minority of the total group of children cared for in day nurseries. In addition, nearly all (96 percent) nurseries said they would care for children with special needs, such as physical disabilities, learning difficulties, social and behavioural difficulties or children who did not speak English. This was considerably higher than a previous survey of day nursery heads in 1994, which found that 78 percent of nurseries had had a child with special needs or a disability, and 90 percent of those who had not cared for such children would like one (Moss et al., 1995). During the week of interview nearly all of the nurseries (96 percent) had at least one child with special needs. Sixty-three percent of nurseries who were looking after children with special needs had one child; a further 30 percent of nurseries had between 2 and 5 such children, and the remaining seven percent had six or more special needs children. One nursery reported having 32 children with special needs during the interview week. 5.2.5 Staffing
The mean number of full-time and part-time childcare and education staff posts per nursery was seven and three respectively. A few nurseries (5 percent) had no full-time posts and 30 percent of nurseries had no part-time posts. Table 5.6 Size of nurseries: number and percentage of full-time and part-time childcare
and education staff posts
N = 251 Nurseries with full-time staff Nurseries with part-time staff
N % N %
0 staff 13 5 74 30
1 – 4 staff 75 30 129 51
5 – 9 staff 80 32 36 14
10 – 14 staff 53 21 10 4
15 or more staff 30 12 2 1
Total 251 100 251 100
Approaching a third (29 percent) of nurseries had no other support staff such as cooks, cleaners or administrative staff. A further 61 percent of nurseries had between 1 and 3 other members of staff, while ten percent had between 4 and 10 other members of staff. Over three-quarters (85 percent) of nurseries use volunteers or students. During the week of interview, 45 percent of nurseries that used volunteers or students had one, and a further 40 percent had two or three that week. The remaining 15 percent had between 4 and 7 volunteers or students that week. 5.2.6 Replacing staff
The childcare workforce appears to be a fairly mobile workforce, with workload consequences for managers and other staff. As Table 5.7 shows, nearly one third (30
67

percent) of nursery heads reported that they had vacancies for childcare and education staff during the week of interview. For over half (59 percent) of these nurseries, this was just one vacancy; for a further 30 percent, there were two staff vacancies. Ten percent had between three and seven posts vacant. Table 5.7 Whether vacant posts and number of vacant posts
N = 251
N %
Vacancies during week of interview Yes No
76 175
30 70
Total 251 100
Number of vacant posts
1 vacant posts 45 59
2 vacant posts 23 30
3 or more vacant posts 8 10
Total 76 100
Over two-thirds of nurseries (71 percent) reported that staff had left in the previous 12 months: 57 percent of nurseries had had between 1 and 3 members of staff leave and 14 percent had had between 4 and 8 members of staff leave them. Table 5.8 Whether staff left in previous 12 months and number of staff left in previous
12 months
N = 251 N % Staff left in previous 12 months Yes
No 178
73 71 29
Number of staff left
1 – 3 143 57 4 – 8 35 14 Total 251 100
Table 5.9 shows that 84 percent of nurseries had recruited staff in the previous 12 months. While over half of the nurseries had gone through this process for fewer than three posts, some appeared to have been doing a lot of recruiting – up to 16 members of staff.
68

Table 5.9 Whether recruited staff and number recruited in previous 12 months
N = 251 N % Recruited staff in previous 12 months
Yes No
210
41
84 16
Number recruited 1 – 3 146 58 4 – 8 56 22 10 – 16 8 3 Total 251 100
Table 5.10 shows that there is wide variation in the time it takes to fully induct a new member of staff, and to replace a member of staff. Nearly sixty percent of nursery heads said that both procedures, inducting new staff, and replacing a member of staff takes between one and three months. Table 5.10 Average length of time to induct new recruits and replace members of staff,
numbers and percentages
N = 251 Average length of time to induct new recruit
Average length of time to replace member of staff
N % N % One week or less 38 15 33 13 Two or three weeks 37 15 20 8 Four to six weeks 65 26 82 33 Two to three months 81 32 66 26 Six months 4 2 2 1 One year - - 3 1 Varies/depends 5 2 6 2 Other/don’t know 21 8 39 16 Total 251 100 251 100
5.2.7 Methods of recruitment
Table 5.11 sets out the methods of recruitment. The most popular means of advertising vacancies was local advertising; 86 percent of nurseries used this method. Least popular was advertising in Nursery World magazine (2 percent), although 18 percent used national advertising, which may include additional use of specialist magazines such as Nursery World. Of note here is that just over half of nurseries (51 percent) used word of mouth as a means of filling vacancies, which may have adverse implications for ensuring that vacancies are advertised to the widest possible range of potential recruits and so for building up a staff team with diverse characteristics.
69

Table 5.11 Methods of recruitment, numbers and percentages
N = 251 Number of nurseries using the method
% of nurseries using the method
Local advertising 215 86 Word of mouth 127 51 Agencies 72 29 National advertising 45 18 Local job centre 45 18 Advertise in colleges 23 9 Internal trawl 9 4 Nursery World magazine 6 2 Other 51 20 Total 251 100
Note. Multiple response item so percentages do not total 100 5.2.8 Suitability of applicants and recruits
Just under one third (28 percent) of nursery heads who had recruited in the past year thought there was an adequate number and choice of applicants. This means nearly two thirds of nursery heads thought there were some problems with recent applicants. Over half of those who thought there were problems with applicants thought there were not enough applicants to choose from, and/or that they did not have enough experience or had inadequate qualifications. Table 5.12 Nursery heads’ views on applicants, numbers and percentages
N = 251 Number of heads of nurseries
% of heads of nurseries
Adequate number and choice of applicants Yes No
71
180
28 72
Total 251 100 Inadequate number and choice of applicants 92 51 Inadequate experience 69 38 Inadequate qualifications 70 38 Other 11 6 Total 180 100
Note. Multiple response item so percentages do not total 100 Nursery heads were also asked to consider the adequacy of the staff they had recruited over the past year. Of the 210 heads who had recruited staff, nearly half (43 percent) thought they were ‘good’, while 29 percent thought they were ‘adequate’. However, this still left nearly a quarter who thought they were either fairly inadequate (17 percent) or very inadequate (6 percent). Those nursery heads who thought new recruits were inadequate mostly thought they had insufficient qualifications or experience for the posts, as set out in Table 5.13.
70

Table 5.13 Nursery heads’ views on inadequate recent recruits, numbers and percentages
N = 48 N % Inadequate experience 28 58 Inadequate qualifications 24 50 Poor motivation 19 40 Poor social skills 6 13 Other 5 10 Total 48 100
Note. More than one view could be given, so percentages exceed 100 5.2.9 Effect of the National Minimum Wage on nurseries
According to this sample of nursery heads, the introduction of the National Minimum Wage (NMW) had not had an effect on the majority of nurseries. Two-thirds (67 percent) reported that they already paid staff either at the NMW level or above. Effects are summarised in Table 5.14. Table 5.14 Effects of the National Minimum Wage, numbers and percentages
N = 251 Heads reporting this effect
N %
No effect/already paying staff at NMW level or above 143 67 NMW led to increase in pay 8 4 NMW led to increase in parents’ fees 3 1 NMW led to paying unqualified staff as qualified 2 1 NMW led to more applicants 2 1 Nursery could not afford to pay NMW level 5 2 Other/don’t know 49 23
Total 212 100
5.3 The staff The total of 2060 staff was made up of 251 heads of nurseries and 1809 other childcare and education staff. In this section, biographical details from both groups will be reported alongside each other, in order that comparisons can be made between them. 5.3.1 Age
The nursery staff were young. While two-thirds of heads were aged between 30 and 49, with the most common single age being 40, nearly three-quarters of other staff were under 30 years of age, with an average age of 24 years. This is considerably less than the average age of 32 found in the Labour Force Survey analysis (see chapter 2). It is possible that some of the heads of nurseries were counted as nursery nurses by the LFS, giving a higher average age.
71

Table 5.15 Age of nursery heads and other childcare and education staff, numbers and percent
N = 2,060 Heads Other staff N % N % 16 – 19 years - - 285 16 20 – 29 years 45 18 988 55 30 – 39 years 76 30 245 14 40 – 49 years 91 36 198 11 50 + years 39 16 93 5 Total 251 100 1,809 100
5.3.2 Gender
As with the student survey (see chapter 3), other studies, the 1991 census (Cameron and Moss, 1998; EO/IDeA, 1999a) and the Labour Force Survey (see chapter 2), this survey found that the nursery workforce is overwhelmingly female. Ninety-seven percent of nursery heads and 99 percent of other staff were female. There were eight male nursery heads and 14 male other staff in the survey. Comparing this figure with proportion of male to female nursery workers in the 1991 census shows that there has been no change in the gender balance employed in nurseries over ten years. 5.3.3 Ethnicity
Ninety percent of heads, and almost the same proportion of other staff, were ethnically white. Among heads, 5 percent were Black and 3 percent Asian. Among other staff, six percent were Black and three percent Asian. This compares with earlier survey findings (EO/IDeA, 1999a) where 96 percent of managers were white, two percent Black and one percent Asian, whilst for other staff they found 94 percent were white, three percent black and two percent Asian. These figures show a much higher percentage of minority ethnic staff than estimates from the LFS (see chapter 2). It is not obvious why there should be this difference, as both are based on national samples. The LFS does show an increase in the percentage of minority ethnic staff since the early 1990s, although the sample numbers these figures are based on are very small. (A total of three minority ethnic nursery nurses were interviewed in the 1986 LFS, and this rose to 11 in 1998.) Table 5.16 Ethnicity of nursery heads and other childcare and education staff, numbers
and percentages
N = 2,059 Heads Other staff N % N % Black Caribbean 6 2 68 4 Black African 3 1 18 1 Black Other 3 1 33 2 Indian 6 2 21 1 Pakistani 2 1 18 1 Bangladeshi 0 0 14 1 Chinese 3 1 3 - Other 2 1 23 1 White 226 90 1,610 89 Total 251 100 *1,808 100
* One member of staff did not answer this question.
72

5.3.4 Disability
None of the nursery heads were registered disabled, but ten of the other staff were. 5.3.5 Own children
Whilst three-quarters (74 percent) of nursery heads had their own children, only a third (32 percent) of the other staff did so. The most common age groups represented was school age children. Sixteen percent of heads and nine percent of other staff had preschool aged children, while 43 percent of heads and 16 percent of other staff had school-aged children. The remaining children were adult. Table 5.17 Own children of nursery heads and other staff, numbers and percentages
N = 2,060 Heads Other staff N % N % No children 65 26 1,235 68 Preschool children 41 16 159 9 School-aged children 108 43 296 16 Older children 99 39 252 14 Total number of children 418 1,182 Total 251 100 1,809 100
5.3.6 Household arrangement
Over three-quarters of nursery heads (82 percent) lived with a partner and/or children, and the most common pattern for other staff was to live with relatives. Table 5.18 Living arrangements for nursery heads and other staff, numbers and
percentages
N = 2,060 Heads Other staff N % N % Live with partner and children 129 51 390 22 Live with partner 55 22 389 22 Live with children 21 8 85 5 Live alone 24 10 105 6 Live with relatives 16 6 731 40 Live in a shared house 6 2 94 5 Other - - 15 1 Total 251 100 1,809 100
5.4 Entry to the childcare workforce This section will explore why workers come to work in childcare, and what qualifications and experience they bring with them. The findings confirm the general picture given above of a fairly homogenous workforce.
73

5.4.1 Reasons for working in childcare The most common reasons for working in childcare given by both heads and other staff are positive: liking children and wanting to work with children. This shows a high degree of intrinsic commitment to the field of childcare. Table 5.19 summarises these reasons into four broad categories. Table 5.19 Reasons for working in childcare, heads and other staff: numbers and
percentages
N = 2,060 Heads Other staff
N % N % Family/children related e.g. enjoyed babysitting, through own children, mother worked with children
34 14 291 16
Fits in with own children 19 8 70 4
Positive e.g. love children, like working with children, good at childcare, rewarding/satisfying work, recommended by others, varied/challenging work, helping children, caring profession
178 71 1,324 73
Negative 28 11 129 7 e.g. didn’t want to do office work, instead of teaching, just happened/drifted in, easy job, couldn’t do first choice Other e.g. feel comfortable with it, special needs experience, opportunity to travel, other
21 11 127 7
Total 251 100 1,809 100 Note: multiple response item so percentages do not total 100. 5.4.2 Careers advice
Many of the childcare staff interviewed were committed to childcare work in spite of, rather than because of any careers advice they may have received about the work. Two thirds of heads did not receive any career advice about childcare work. This was also the case for just over half (53 percent) of other staff. Table 5.20 summarises the advice that was given. Table 5.20 Careers advice given to heads and other staff, numbers and percentages
N = 1,914 Heads Other staff N % N % Neutral advice 36 15 471 28 Positive advice 23 10 311 19 Negative advice 16 7 97 6 No advice 169 72 884 53 Total 236 100 1,678 100
Note: multiple response item so percentages do not total 100. 5.4.3 Qualifications: school leaving
Nearly all (92 percent) the staff claimed to have some qualifications on leaving school, although only 70 percent of heads and 47 percent of other staff said they had 4 GCSEs
74

or equivalent. Table 5.21 summarises these qualifications. The percentages given show the proportion of staff attaining each type of qualification. Respondents were asked for all their qualifications, so each member of staff could record more than one type of qualification. Table 5.21 School leaving qualifications, heads and other staff, numbers and
percentages N = 2,060 Heads Other staff N % N % CSE/O-Level/GCSEs 223 89 1,601 89 A-Level/AS-Level 49 70 153 47 Other: NVQ/other vocational 25 10 262 15 Pitman’s/RSA/other clerical 27 11 133 7 None 19 8 152 8 Total 251 100 1,809 100 Note. Staff may have more than one qualification, so percentages do not total 100 These findings can be compared with the national figures for school leaving qualifications. In 1999, 73 percent of school leavers held at least one GCSE graded A*-C, and 94 percent held at least one GCSE graded A*-G. Six percent of school leavers had no qualifications. As a percentage of the age cohort, 24 percent of students achieved at least one A-level (DfES, 1999). This means the day nursery workforce has about the average level of GCSE qualifications among its staff, and slightly more staff have no school leaving qualifications than the 1999 national average. However, the proportion of both heads and other staff with A-Levels is well below the national average. 5.4.4 Qualifications: childcare and/or early education
Seventy-eight percent of heads and 67 percent of other staff said they had qualifications, relevant to their work in childcare/early education, equivalent to at least NVQ level 2. This compares with 80 percent of all managerial and other childcare and education staff who were reported by managers to hold one of a broad range of relevant childcare, education or playwork qualifications in the EO/IDeA survey (EO/IDeA, 1999a). Around 22 percent of heads and 33 percent of other staff did not hold any relevant qualification at the time of interview. In the EO/IDeA survey, 10 percent of heads and 25 percent of other childcare and education staff did not hold a qualification (EO/IDeA, 1999a: Table F). There was a wide range of qualifications represented among both heads of nurseries and other staff, which have been summarised into indicative NVQ levels following the model provided by the QCA framework (QCA, 1999). Table 5.22 Levels of childcare and early education qualification attained by heads and
staff, numbers and percentages
N = 2,060 Heads Other staff Indicative level N % N % Level 2 (approx certificate) 7 3 232 13 Level 3 (approx diploma) 149 59 943 52 Level 4/5 (professional/ vocational) 41 16 46 3 None 54 22 588 33 Total 251 100 1,809 100
75

Note: Levels assessed using QCA framework and with advice from HERA2 project. A full list of qualifications included within each level is given in Appendix 4. In addition, 23 percent of heads and 3 percent of other staff had a managerial or assessment qualification such as the NVQ Assessor Award. Fifteen percent of heads of nurseries were studying for a qualification at the time of interview. The largest single group was NVQ Assessors (6 percent); followed by High Scope implementation certificate (2 percent) and S/NVQ Levels 2 and 3 (4 percent). Other qualifications being studied for included the Advanced Diploma in Childcare and Education; the Diploma in Childcare and Education; the PLA basic/introductory certificate; NAMCW certificate and diploma; Montessori teaching certificate; advanced baby practitioner; BA Hons degree in Childhood studies; and NVQ management award. Twenty-five percent of other staff were studying for relevant qualifications. Most of these were NVQ in childcare levels 2 and 3 (6 percent and 13 percent respectively) followed by NVQ assessors (1 percent). Other qualifications being studied for were the CACHE diploma in childcare and education, the CACHE advanced diploma and the BTEC diploma and certificate. In addition, members of staff were studying for a further 26 qualifications. More than half (60 percent) of the heads of nurseries and three-quarters (75 percent) of other staff reported that they did not have to pay the fees for courses they were doing. This meant that over a third (40 percent) of heads and a quarter (24 percent) of other staff paid some, most or all of the fees. 5.4.5 Qualifications: management and business training
Over half of heads of nurseries (60 percent) had not done any management or business skills training, while 40 percent had done some. Just over a tenth (11 percent) of other staff had done some training in management or business skills. For the heads, the most common course/training was an NVQ in customer service (52 percent of those studying management or business); followed by unspecified business studies (18 percent), and NEBS management (12 percent). Other courses include the ADCE, NVQs in business, IT/CLAIT, and management, and a retail management course. For other staff, NVQs in customer service (24 percent of those studying management or business), business and administration (5 percent), IT/CLAIT (13 percent), and management (10 percent) were most popular. A further 15 were doing an unspecified NVQ award. Nine were doing an ADCE, and 5 were doing a certificate in nursery management. Twenty-one were doing business studies qualifications, 10 were doing a management or retail management qualification, and 9 were doing a secretarial qualification. Lastly, 7 were doing other qualifications. 5.4.6 Qualifications: Higher education
Few of the staff had any higher education qualifications. Eight percent of heads and three percent of other staff had a degree, a diploma in higher education or their equivalent. A few had nursing or teaching qualifications. These are summarised in Table 5.22.
76

Table 5.22 Non-childcare qualifications attained by heads and other staff, numbers and percentages
N= 2,060 Heads Other staff N % N % Degree/diploma in HE equivalent 19 8 56 3 Nursing 8 3 7 - Teaching 14 6 11 1 Total staff 251 100 1,809 100
Note. Multiple response item so percentages do not total 100. 5.4.7 Previous employment experience: childcare and early education
Over three-quarters of heads (83 percent) had previously worked in childcare, and 62 percent of other staff had done so. This left 43 heads of nurseries (17 percent) with no previous employment experience in childcare, and 686 (38 percent) other staff in the same position. Table 5.23 sets out the kinds of employment experience heads and other staff had had. Table 5.23 Previous relevant employment experience, heads and other staff, numbers
and percentages
N = 2060 Heads Other staff N % N % Nursery worker 136 55 638 36 Nursery school/class or reception class 68 28 189 11 Nanny 65 26 326 18 Playgroup worker 40 16 209 12 Childminder 27 11 132 7 Teacher 12 5 9 1 Hospital/children’s ward 11 4 17 1 Hospital/special care baby unit 6 2 3 - Crèche 5 2 25 1 Other† 11 4 116 6 None 43 17 686 38 Total 251 100 1809 100
Note. Multiple response item so percentages do not total 100. † Other includes au pair, playscheme, youth work, after school club, special needs work, baby sitting, lunchtime assistant, holiday representative, nursery manager 5.4.8 History of employment in childcare
Alongside a wide range of qualifications and previous experience, many of the heads of nurseries in particular had been working in childcare and early education for many years. For example, over 30 percent of heads had begun working in childcare over 20 years ago. Other staff were less experienced, with over 80 percent who had begun work in the field in the 1990s, as shown in Table 5.24.
77

Table 5.24 Duration of childcare or early education employment, heads and other staff, numbers and percentages
N = 2,059 Heads Other staff N % N % Under 1 year - - 54 3 1 – 10 years 83 33 1,419 78 11 - 20 years 87 35 244 14 21 – 30 years 63 25 74 4 31 - 40 years 18 7 17 1 Total 251 100 1,808 100
5.4.9 Previous employment experience: non-childcare or early education
Nearly two-thirds of both heads and other staff had also had experience of other kinds of employment. The types of employment have been grouped into broad categories, as summarised in Table 5.25. Table 5.25 Non-childcare employment experience, heads and other staff, numbers and
percentages
N = 2,060 Heads Other staff N % N % Catering 26 10 296 16 Office work 66 26 253 14 Shop/sales work 38 15 567 31 Manufacturing 8 3 78 4 Personal services† 35 14 228 13 None 89 36 589 33 Total 251 100 1,809 100
Note. Multiple response item percentages do not total 100. † Includes nursing, teaching, youth work, care assistant, chambermaid, cleaning, hairdressing 5.5 Retention This section will examine factors contributing towards retaining staff in childcare and early education employment. These factors will include their working conditions, including access to training courses, whether staff feel settled in their jobs and committed to childcare careers, and what makes them feel settled and committed. Overall, as would follow from the finding that staff mostly gave positive reasons for wanting to work in childcare, staff were intrinsically committed to the childcare and early years field. 5.5.1 Job titles and supervision of other staff
Among the 251 heads of nurseries interviewed, 13 main job titles were given (plus 20 others). Table 5.26 summarises these job titles into four groups, and examines the scope of post. This shows that the predominant pattern among owners is for them to also
78

manage the nursery; but the most common arrangement ???? is to have employed managers or officers in charge, who do not also own the nursery. Table 5.26 Job titles of heads of nurseries by scope of post
N = 251 Manager Owner Both Total % Owner/proprietor/principal/director 3 22 43 68 27 Manager/officer in charge 111 4 18 133 53 Teacher/co-ordinator/childcare (services) 16 - 2 18 7 Supervisor/deputy supervisor 12 - - 12 5 Other 11 2 7 20 8 Total 251 100
Among other staff, 50 main job titles were given, plus 62 others. These have also been grouped into five main categories in Table 5.27, where an indication of supervisory responsibilities is also given. This shows that around one third of the nursery nurse staff supervise other staff. Table 5.27 Job titles and supervision responsibilities of other staff
N = 1,809 Supervise other staff Total
Yes No N % Senior/nursery nurse/ worker/ childcare worker/officer
284 675 959 53
Senior/nursery assistant/ trainee 55 467 522 29 Deputy/manager/supervisor/ co-ordinator
229 7 236 13
Teacher/educator 10 20 30 2 Other 34 28 62 3 Total 612 1,197 1,809 100
5.5.2 Hours worked in previous week and annual salary
Many staff worked long hours, particularly the heads of nurseries. Hours worked were divided into ‘short hours’, part-time, full-time and ‘long hours’, as set out in Table 5.28. The definition of long hours follows that given in the European Working Time Directive. Three-quarters of both staff types worked between 31 and 48 hours during the week preceding interview, and the most common working week for both types was 40 hours. However, a far greater proportion of heads (75 percent) worked unpaid hours than did other staff (17 percent). Around half of both staff types worked shifts (49 percent of heads, 57 percent of other staff).
79

Table 5.28 Hours worked in previous week, heads and other staff, numbers and percentages
N = 2060 Heads Other staff N % N % Short (0 – 15) hours 6 3 89 5 Part-time (16 – 30) hours 21 9 319 18 Full-time (31 – 39) hours 82 35 591 34 Full-time (40 - 48) hours 96 41 716 41 Long (49+) hours 29 12 29 2 Mean 39 35 Total 234 100 1,744 100
An analysis was done of working hours with parental status and ages of children to assess whether having children, and young children in particular, affected the hours staff worked. We found that there was no difference in the working hours of heads with preschool aged children and those without. The difference in working hours for other staff was marginal: a mean of 35 hours in the last week for those without young children, and 31 for those with preschool aged children. Neither was there any difference for heads with school aged children: both groups worked on average 38 hours. For other staff with school aged children, there was a difference of eight hours: an average of 28 hours for those with school-aged children and 36 hours for those without. This suggests that there were some restrictions on working hours for those staff with school aged children, although not as great as might have been anticipated from data on women’s part-time working (Holtermann et al., 1999). Over half (54 percent) of the staff with school-aged children worked part-time (i.e. no more than 30 hours per week) compared to 18 percent of those without. Combined with relatively long working hours, staff nevertheless reported low salaries. The mean annual salary before tax for heads of nurseries was £13,400, and for other staff this was £7,700, calculated across the whole sample. This amounts to an hourly rate of £7.34 for heads of nurseries and £4.45 for other staff. This compares with a survey of pay in the early years overall completed in 1999 which found that managers earned on average £14,895 p.a., while nursery nurses in the private and voluntary sector day nurseries earned on average £8,419 p.a. (Nursery World, 16.9.99:3). The average annual salary for full-time non-manual female employees in Britain in 2000 was £19,193 (New Earnings Survey, p.c.). It would appear that with their average of 15 years employment experience, professional qualifications and high level of managerial responsibility, and an average age of 40, managers earn below average for full-time female employees. For other staff, the pay is less than half the average. 5.5.3 Contract, pension, sick pay and sick leave
Two-thirds (69 percent) of heads of nurseries were on permanent contracts. For a further 27 percent, the issue of contracts was not applicable, as they owned the nursery. Four percent were on fixed term contracts. Among other staff, a large proportion were also on permanent contracts (82 percent); eight percent were on fixed term contracts; five percent were casual staff and for five percent the question was not applicable as they were self-employed. Very few staff had pensions. Over half (55 percent) of heads had no pension, nor did 90 percent of other staff. Over half of both staff types (60 percent of heads and 54 percent of other staff) have paid sick pay, or pay themselves when they are sick in the case of owner/managers. However, half of the heads (51 percent), and over a quarter (28 percent) of other staff
80

had not taken any sick leave in the twelve months preceding interview, and most of those who had had only taken a few days, as Table 5.29 shows. Table 5.29 Number of days sick leave, heads and other staff, numbers and percentages
N = 2,041 Heads Other staff N % N % No sick leave in past year 128 51 506 28 Between 1 and 5 days 96 38 875 49 Between 6 and 10 days 12 5 256 14 Between 11 and 20 days 11 4 102 6 Over 20 days 4 2 51 3 Total 251 100 1,790 100
5.5.4 Holidays and other benefits
The mean number of days of paid holiday was 20. However, 21 heads (9 percent) and a similar proportion of other staff (8 percent) said they had no paid holiday, as shown in Table 5.30 Table 5.30 Number of days paid holiday, heads and other staff, numbers and
percentages
N = 2060 Heads Other staff N % N % No paid holiday 21 9 131 8 Between 2 and 10 days 21 9 84 5 Between 11 and 20 days 90 37 1,031 61 Between 21 and 30 days 99 41 435 26 Over 30 days 11 4 20 1 Missing 9 - 108 - Total 251 100 1,809 100
A study of staffing in North America found that a common benefit to staff was the availability of free or subsidised childcare places for workers’ own preschool aged children (59 percent of childcare centres, Whitebook, 1993). In the TCRU survey, about 8 percent of nurseries offered this benefit. Nineteen of the heads and 75 of the other staff used this facility. Those who didn’t use the facility where it was available said they used relatives instead (8 mentions), the child/ren went to school (3), there was a waiting list (2), or they were not comfortable with using the facility (2). 5.5.5 Membership of a trade union or professional organisation
Childcare staff were not well represented by trade unions or professional organisations. Twenty-two percent of heads of nurseries belonged to a trade union or professional organisation, which meant that over three-quarters (78 percent) were not members of any representative organisation. This trend was even more acute among other staff, where only 6 percent belonged to any kind of organisation to represent them. 5.5.6 Access to training
Nearly three-quarters of heads of nurseries (71 percent) and over half (53 percent) of other staff had done one or more of a wide range of other non-qualification courses in
81

the 12 months preceding interview. Among both the heads and the other staff, the three most popular courses concerned safety issues: first aid, child abuse and child protection and food hygiene. This concern with safety was also reported by an earlier survey of nursery managers (Moss et al., 1995). Fewer than half of the staff did courses concerned with the curriculum. Table 5.31 summarises the courses into five main groups. Table 5.31 Short courses attended in the previous year by heads and other staff,
numbers and percentages
N = 2,060 Heads Other staff N % N % Safety issues e.g. first aid, child protection, food hygiene, HIV, meningitis awareness, health and hygiene
120 48 671 37
Curriculum E.g. music and art for under twos, cultural awareness, art/craft/pottery, maths/ numeracy, outdoors, heuristic play
51 20 221 12
Special needs/behaviour e.g. manual handling, sign language, speech/language/ literacy, autism, child behaviour management
55 22 237 13
Organisational/staffing issues e.g. communication skills, Children Act, domestic violence, early years partnership, stress management, assessment
14 6 67 4
Other e.g. computer/IT, nursery workshops
9 4 43 2
No courses 70 29 798 47 Total 251 100 1,809 100
5.5.7 Commitment to childcare and early education work
Nearly all heads (97 percent) and only slightly fewer other staff (91 percent) saw their work in childcare and early education as a longer-term career rather than as a temporary or short-term job. For other staff, their level of childcare qualifications was significantly related to seeing childcare as a long-term career. Furthermore, 83 percent of heads thought they were settled in their job and a further 11 percent thought they were mostly settled. Among other staff 80 percent felt settled, while 13 percent felt they were mostly settled. For heads, feeling settled was not related to their level of childcare qualifications; for other staff, those with NVQ level 3 or above reported feeling less settled. For both heads and other staff, feeling that childcare was a long-term career and feeling settled in their current job were not related to taking further training. However, feeling settled was significantly related to pay for other staff, although not for heads. This finding of high levels of feeling settled provides a point of apparent contrast with the findings about relatively high levels of staff vacancies reported by heads of nurseries in section 5.2.6. It may be that other factors besides feeling settled and viewing the work as a long-term career cause day nursery workers to leave their jobs.
82

Table 5.32 Commitment to the childcare field and to current job, heads of other staff, numbers and percentages
Heads Other staff
N % N %
Long-term career 243 97 1,642 91
Short-term job 8 3 162 9
Feel settled in current job 209 83 1,440 80
Feel mostly settled in current job 27 11 242 13
Do not feel settled in current job 15 6 127 7
Total 251 100 1,809 100
The rest of this section will focus on those who said they were settled and mostly settled: those who did not feel settled will be discussed in the next section (para.5.6.1). The most common reasons for feeling settled were related to intrinsic rewards from the work: the staff team, the children and so on. Each respondent could give more than one reason and these are summarised in Table 5.33. Table 5.33 Reasons for feeling settled in childcare and early education work, heads and
other staff, numbers and percentages
N = 2,060 Heads Other staff
N % N %
Own family/children related e.g. hours fit with family, own children attend, local
13 5 99 6
Staff/organisational related e.g. like the staff, team work, good atmosphere
119 47 1,350 75
Working conditions e.g. good pay, holidays, opportunities, own the business, good management
62 25 262 15
Children related e.g. like/got to know the children, like the age group, see development of children
55 22 692 38
Personal satisfaction e.g. feel relaxed, familiarity, satisfying/rewarding, responsibility
91 36 498 28
No reason given 15 6 127 7
Total respondents 251 100 1,809 100 Note. Multiple response item percentages do not total 100. For heads, the reasons given for feeling settled in their current job were not related to their age, qualifications or ongoing training. However, for other staff, younger staff were less likely to give family reasons for feeling settled, but more likely to refer to staff, working conditions and the children as reasons for feeling settled. Their reasons were not related to qualifications or ongoing training.
83

5.5.8 Prospects in childcare and early education: five years ahead The evidence that the majority of the workforce are committed to their work is reinforced by the finding that in five years time, almost three-quarters of heads (73 percent) and almost half (48 percent) of other staff expected to be working in their present or another day nursery. Furthermore, 13 percent of heads and 35 percent of other staff expect to be working in the broader field of early years. In total this means that around half (51 percent) of staff working in day nurseries now expect to be working in them in five years time and 32 percent expect to be working in early years childcare or education. Only eight percent of respondents did not expect to be working in childcare or early years related work at all. Table 5.34 Five years ahead: envisaged employment, heads and other staff, numbers
and percentages N = 2,060 Heads Other staff
N % N % This or another day nursery 184 73 866 48 Other childcare/education 32 13 636 35 Other, e.g. not childcare related, not working 21 8 146 8 Don’t know 14 6 161 9
Total 251 100 1,809 100
Analysis of a job satisfaction scale completed by staff indicates that they are comparatively satisfied with their work. Using a self-completion, 15 item, 7-point scale ranging from extremely dissatisfied to extremely satisfied, heads of nurseries scored a mean of 87, and other staff scored a mean of 79. By comparison, a previous study of blue collar male workers using the same scale showed a mean score of 71 and a study of university graduates showed a mean score of 75 (Warr et al., 1979). Recently, a large survey of social services staff used the same scale (Balloch et al., 1999). For staff in England they found a mean score of 70. The high level of job satisfaction found here confirms findings of Rose (1999), whose analysis of the British Household Panel Survey found that childcare workers were among those groups of workers most satisfied with their jobs. To summarise, nursery staff are very satisfied with their work, particularly heads of nurseries, in comparison with other occupational groups. However, staff did not on the whole, express major ambitions in the early years field. Table 5.35 sets out the expectations of heads and other staff in terms of promotion and working hours. Just under half of both heads and other staff did not expect either promotion or to be running their own business in the coming five years. Many more heads expected to be running their own business (41 percent) than to be promoted, while the reverse was true for other staff: 40 percent expected to be promoted but only 14 percent expected to be running their own business.
84

Table 5.35 Expectations of work five years ahead, heads and other staff, numbers and percentages
N = 2,060 Heads Other staff N % N % Expect promotion 33 14 669 40 Expect to be running own business 95 41 229 14 Neither 99 43 743 45 Expect to be working full-time 144 63 1,201 72 Expect to be working part-time 66 29 350 21 Don’t know 20 9 112 7
Total 230 100 1,663 100
Staff largely expected to be working full-time in the coming years. Most staff (63 percent heads; 72 percent other staff) expected to be working full-time in five years time. Approaching a third (29 percent) of heads and a fifth of other staff (21 percent) envisaged part-time work. Nine percent of heads and 7 percent of other staff didn’t know. In addition, further training was a popular option for both heads and other staff, and for many this was the case regardless of whether they had to pay course fees themselves. Over half of the heads (56 percent) were likely to consider gaining further qualifications in the coming five years. These qualifications were most likely to be in childcare (54 percent of heads would consider doing this); education (26 percent); management (26 percent); social work (5); an unspecified degree (4); or computing (2). Among other staff, approaching three-quarters (71 percent) would consider studying for a further childcare qualification in the coming five years, and around half (51 percent) would consider doing an education and/or a management qualification. A few were considering qualifications in other subjects, such as nursing (6); computing (6), social work (6) and other (3). However, a total of 248 (16 percent) other staff would not consider gaining further qualifications. Neither heads nor other staff gave any reasons why they would not study for further qualifications. Table 5.36 sets out the extent to which respondents thought that paid course fees would effect the likelihood of them undertaking further courses of study. Table 5.36 Whether paid course fees influences take up of further qualifications N = 2,060 Heads Other staff N % N % More likely 127 51 1,182 65 Less likely 1 - 7 - No difference 123 49 573 32 Total 251 100 1,809 100 Half of the heads and two-thirds of other staff thought they would be more likely to undertake further study if they were financially supported to do so. For heads, this figure was only slightly more than those who said whether course fees were paid for would not make any difference. Other staff were less likely to commit themselves to course fees regardless of other financial help: 32 percent thought whether fees were
85

paid for would not make any difference. Only one head and seven other staff said they would be less likely to study if fees were paid for. 5.5.9 Prospects in childcare and early education: combining work and family commitments
Just over a quarter (26 percent) of heads and one-third of other staff (34 percent) said they expected to have any time away from employment in the next few years for family or caring reasons. For both heads and other staff, this was most likely to be for children (82 and 91 percent respectively, of those expecting to have time away for family reasons). Time away to care for elderly or disabled relatives (21 and 13 percent) or for other family members (2 and 1 percent) were much less common. However, as a quarter of heads and a third of other staff did expect to have some time away from employment for caring commitments, this would indicate that, despite the high level of commitment and satisfaction, there are other obligations and commitments in the lives of this workforce, as discussed in findings of the student survey and the focus groups (Chapters 3 and 4). This movement of staff will inevitably have a bearing on the level of vacancies, recruitment and turnover in nurseries. 5.6 Loss This section will examine findings from the relatively small group of workers who were thinking about or who wanted to leave either their current job or childcare and early education work altogether. It will look at the reasons for leaving and the alternative destinations being considered. 5.6.1 Reasons for leaving present job
Forty-two heads (17 percent) said they were not settled or only mostly settled and were asked whether they were thinking of leaving their present job. Nineteen (8 percent of the total sample) said they were, 23 (11 percent) were not. Among other staff, 257 of those who said they were not settled or mostly settled said they were thinking of leaving. This represents 14 percent of the total sample of other staff. The reasons for leaving are divided into intrinsic and extrinsic sources of dissatisfaction with the present job, and other reasons not to do with the job. The most commonly mentioned single item by both heads and other staff was dissatisfaction with the rate of pay: three and five percent respectively of all staff gave pay as a reason for leaving; of staff thinking of leaving the percentage citing pay as a reason was 37 and 33 percent respectively. On the self-completion questionnaire, 23 percent of heads and 48 percent of other staff said they were dissatisfied with their rate of pay. Staff thinking of leaving were significantly more dissatisfied with their pay, for both heads and other staff (Mann-Whitney U-test, p<0.01). Aside from pay, heads mention dissatisfaction with intrinsic items more often than other staff, who mention dissatisfaction with extrinsic items more often.
86

Table 5.37 Reasons for leaving childcare work, numbers and percentages
N = 2,060 Heads Other staff N % N % Intrinsic reasons for leaving e.g. job satisfaction, other staff, management, organisational changes, want different setting
10 4 101 6
Pay 7 3 84 5
Extrinsic reasons for leaving e.g. benefits, prospects, hours, location, job security
3 1 53 3
Other reasons: Study Own family Travel Moving area End of contract Other
- - - - 2 -
- - - - 1 -
18 12
7 6 5 3
1 1 - - - -
Thinking of leaving 19 8 257 14 Not thinking of leaving 232 92 1,552 86 Total 251 100 1,809 100
Note. Multiple response item so percentages do not total 100. For staff other than heads, thinking of leaving their current job was significantly related to level of childcare qualification, with the more qualified being more likely to expect to leave, and to pay, with the higher paid being more likely to expect to leave. 5.6.2 Future plans
Those staff who were thinking of leaving were asked about their future plans. Thirteen of the 19 heads said they would go to another childcare job: the remaining six were not specific about their employment destinations: they didn’t know, were moving area, or were going to other, unspecified jobs. Among the other staff, again the most common future destinations for those thinking of leaving was another childcare job (61 percent), followed by going into further education (11 percent). Few were moving out of childcare or early education altogether: 22 wanted another job that wasn’t childcare; three were planning to travel, two were moving area. A further 44 either didn’t know or had another, unspecified intention. Table 5.38 Destinations for those thinking of leaving
N = 276 Heads Other staff N % N % Another childcare job 13 68 152 61 Further education - - 27 11 Another job not childcare 1 5 22 9 Travel /moving area 1 5 5 2 Don’t know/unspecified 4 21 44 18 Total 19 100 257 100
When asked what would make another childcare job better than the existing one, the issue of pay was predominant. Better pay was the primary reason for moving to another childcare job for 8 of the 13 heads, and for nearly half (46 percent) of the intended
87

leavers among other staff. Other factors that would make another childcare job more attractive were more opportunities (5 mentions by heads; 18 by other staff), be more appreciated (3 and 18 respectively), more challenging (2 and 13), higher job satisfaction (1 and 6), and more training (1and 9). Other staff were also looking for better management (6), different hours (28), better benefits (9), more security or variety (3 each), a nicer or friendlier environment (5), a more convenient location (8) and work with older children (7). No heads were planning to leave due to pregnancy or family caring reasons or for further study. There were a few other staff who were intending to leave work due to pregnancy: two of these planned to return after a period of maternity leave, three planned not to return to work and two didn’t know their plans. Very few heads or other staff gave any reasons for leaving either their current job or childcare, but of those that did, the reason mentioned most often was poor pay. However, amongst other staff, those expecting to leave childcare were being paid significantly more than those not expecting to leave (£9,000 compared to £7,900), although they were not working longer hours. Ten percent of staff who said they worked unpaid hours said they expected to leave childcare, compared to five percent of those who did not work unpaid hours: this difference is small, but was statistically significant (x²=12.9 p<0.001). Expecting to leave childcare was not related to level of childcare qualification. A final possible option considered in the survey was further study. However, it was not entirely clear which qualifications were planned. Of the 27 other staff planning to study, only one qualification was itemised, the BEd, which three respondents were planning to take. 5.7 Key Findings • 251 registered day nurseries and 2060 heads and other childcare staff took part in
the survey. Three-quarters were privately owned and managed • Three quarters were privately owned and managed • Over 80 percent had opening hours that cater for full-time working parents. • On average, nurseries had 44 places, with some very large nurseries. • More part-time children attend nurseries than full-time. The long hours of opening
do not necessarily mean that children attend for long days every day. • Children were most likely to be aged between 12 and 47 months. • Half of nurseries offered additional services to school aged children. • Nearly all nurseries were looking after at least one child with special needs during
the interview week. • The mean number of staff was seven. • 30 percent of nurseries had at least one vacancy during the interview week. • Over 80 percent of nurseries had recruited staff in the previous 12 months. • Three-quarters of nursery heads thought there were some difficulties with recent
applicants for staff posts, usually a lack of experience and/or qualification. • To date the introduction of the National Minimum Wage has had an effect on only
a small minority of nurseries • The staff who work in day nurseries largely share certain characteristics: by far the
majority are young, white, female and able bodied. • The heads of nurseries tend to be older than other staff, are more likely to have their
own children, and are more likely to be living with a partner and/or their own children.
88

• Both heads and other staff cite mostly positive reasons for wanting to work in childcare and early education: they like working with children and like working in staff teams.
• Most heads and others staff have usually had no careers advice about working in childcare and early education
• Respondents had typically left school with GCSEs or equivalent qualifications, matching the national average for attainment, but on ‘A’ Level attainment both heads and other staff are below the national average.
• 59 percent of heads and 52 percent of other staff held a Level 3 diploma such as the CACHE diploma in Child Care and Education or equivalent.
• 23 percent of heads and three percent of other staff held a managerial or assessment award such as the NVQ Assessor Award and six percent of heads were studying for the same award.
• 40 percent of heads had done management or business skills training: the most popular course for those who are doing or had done some is the NVQ in customer service or similar.
• 17 percent of heads and 38 percent of other staff had no relevant previous employment experience.
• On average, heads had worked in the childcare and early education field for 15 years and other staff for six years
• Two thirds of both heads and other staff have other, unrelated, employment experience, usually in office work, shop or sales work.
• Compared with other occupational groups, childcare heads and staff are highly committed to and satisfied with childcare work
• Measures to retain staff rely on this individual commitment rather than explicit retention policies.
• Most staff worked full-time, with heads in particular working long, often unpaid hours.
• Gross salary levels were low: £14,000 per annum for nursery heads, £8,000 for other staff
• 69 percent of heads and 82 percent of other staff have permanent contracts but only 45 percent of heads and 10 percent of other staff have occupational pensions
• Over half of staff have paid sick leave: most of those who have taken sick leave had taken between 1 and 5 days leave in the previous year
• Staff get on average 20 days annual leave per year • There is low membership of trade unions and professional organisations • Three-quarters of heads and half of other staff had done short courses in the
previous year • 97 percent of heads and 91 percent of other staff viewed their work as a long term
career and around 80 percent of both heads and other staff felt settled in their current post
• Heads and other staff particularly value working in staff teams, the personal satisfaction gained from childcare work and working with young children
• Despite the high level of commitment, in five years time only half the current childcare staff expect to be working in day nurseries, although 73% of heads expect to still be working in day nurseries.
• 56 percent of heads and 71 percent of other staff thought they were likely to consider gaining further childcare qualifications in the coming five years
• 26 percent of heads and 34 percent of other staff expected to have time away from employment in the next few years for family or caring reasons.
• Eight percent of heads and 14 percent of other staff were thinking of leaving their current post.
89

• Reasons for leaving were evenly divided between factors to do with the job itself, and factors related to the working conditions. However, the most commonly cited individual item was a desire to improve the rate of pay from a different job.
• More than a third of those thinking of leaving their job cited low pay as a reason • Destinations for staff thinking of leaving were other childcare jobs or further
education. While many in this group were not sure what they would do next, very few were thinking of leaving the childcare and early education field altogether.
90
Chapter 6. Conclusions 6.1 Introduction The success of measures to expand the availability, and improve the quality, of early childhood services relies on the staff in place and available to be recruited to the early childhood workforce. This report has described and discussed the characteristics and views of an important section of the early childhood workforce. These are childcare students and day nursery workers, with some additional data from playwork students and workers. They have a vital role to play underpinning the expansion of services envisaged in the National Childcare Strategy. This report provides the most detailed account available of working in this particular sector of the childcare field, drawing on both survey and focus group data. It provides the most comprehensive insight into factors affecting entry, retention and loss for the day nursery workforce. However, it is important to remember that day nursery workers constitute only part of the early childhood and childcare services workforce. Other important groups include teachers and assistants, playgroup staff and childminders. Information on childminders as an occupational group is provided in a parallel study that has been conducted at the Thomas Coram Research Unit, as part of the Joseph Rowntree Foundation Work and Family Programme. Like the study presented in this report, the childminding study has combined secondary analysis, a workforce survey, and more intensive work with smaller numbers of workers (Mooney, Moss & Owen, forthcoming) 6.2 What we found The main points from the data presented in previous chapters on childcare students and day nursery workers are summarised into the three main themes: entry, retention and loss 6.2.1 Entry characteristics
• Nearly all students and workers are women • Ninety percent are ethnically white • Around 70 percent of students are under 20 and 70 percent of workers are under
thirty • Students and workers were most likely to live with relatives (usually parents):
heads of nurseries were most likely to live with partners and children • Students and workers find caring work rewarding, enjoyable and familiar from
previous work, family or voluntary work experience • Students and workers are mostly educated to GCSE standard • Only half of workers hold a Level 3 (diploma) qualification in childcare or early
years; a quarter do not hold any relevant qualifications • Students and workers are highly committed to employment in the childcare field • Students would clearly prefer work in schools and work in group settings, but this
is not necessarily available • Students view individualised forms of care as best for children under two years, and
group settings as best for children aged three years and above; • Students consider early years work to be substantially undervalued by wider society
91

6.2.2. Factors influencing retention of staff in day nurseries and childcare work • One third of nursery heads reported childcare and education staff vacancies • Replacing staff usually takes between 1 and 3 months • Most nursery heads recruit staff through local advertising, or through word of
mouth • Most nursery heads thought there was a problem with the supply, qualifications or
experience of recent applicants and recruits • Many nursery heads worked long hours, often unpaid • Gross salary levels were low: £14,000 per annum for nursery heads, £8,000 for
other staff • Most staff were on permanent contracts but few had occupational pensions • Three-quarters of heads and a half of other staff had done short courses in the past
year • Levels of job satisfaction were very high, in absolute terms and compared to other
occupational groups, and most workers felt settled in their work, mostly for staff/organisational reasons
• Three-quarters of the nursery heads and half of the other staff envisage employment in their present or another day nursery in five years time
• Two thirds of the staff would consider further training in childcare or education in the coming five years
• Most students, looking forward to their own motherhood and employment, would prefer to work part time, not at all or work from home. Least popular was working full time.
6.2.3 Factors influencing the loss of childcare workers • Only half of the existing workforce expect to be working in day nurseries in five
years time, indicating a considerable potential loss; however, many of the remainder expect to be working elsewhere in the early years childcare or education field
• One quarter of heads and one third of other staff expected to have caring commitments for children or elder kin that would take them away from employment in the coming five years
• Ten percent of students were unsure about or did not want to work in childcare. They had not enjoyed the course, they wanted to only work in early years with the right conditions, or they wanted to pursue other interests
• Ten percent of the workers were actively thinking of leaving their present jobs, equally divided between intrinsic reasons (e.g. job dissatisfaction) and extrinsic reasons (e.g. poor conditions). The most common reason given for leaving was low pay
• Most who were thinking of leaving were going to go to another childcare job, which would offer better pay, more opportunities, more appreciation of staff efforts or more training
• Those who wanted to leave childcare work altogether were also searching for better pay, conditions and opportunities
6.3 Conclusions Most day nursery workers are highly committed to the work. In the main, they are settled in their jobs and express high levels of job satisfaction. Most expect to continue
92

in early childhood work, if not in nurseries then in some other capacity. As with studies of staffing in childcare work in other countries, and in other studies within Britain, English childcare workers find their work intrinsically rewarding (Cameron, 1997). These are encouraging findings, pointing to real strengths in the current workforce. But other findings give cause for concern about the future of the childcare workforce, or at least that part of it studied for this project. The focus groups point to the struggle of many childcare students and workers in training to make a career from their desire to work with young children. They struggle with their own expectations of bringing up a family and how to combine this with often necessary employment, they struggle with the poor occupational and career status that childcare and playwork hold, both in wider society and within the care and education sector itself. They also struggle with the courses themselves, which were described as having poor organisation and variable teaching quality. They struggle with financing their education, whether this is undergraduate fees or childcare payments to enable attendance at otherwise free courses, or whether it is NVQ modules. Striking from one group of younger students was how the effect of taking a degree in a professional-vocational subject (playwork) had narrowed both their further education options and their employment options. They would not be able to take another degree without vast expense, yet they had discovered (largely too late) that playwork would not offer them the career opportunities they had originally thought. Many of these struggles are not confined to students. The need to raise the low status of childcare work and the childcare workforce has been recognised by the Government (Hodge, 2000). Day nursery workers are paid well below the national average; the search for better pay was the major reason given in our survey for looking for other jobs. While nearly all staff got paid holiday and paid sick leave, very few got occupational pensions or other benefits such as subsidised childcare fees. While an important support for parents who used their services, it was unclear how far nurseries were, or would be, supportive of staff who were parents: most jobs were, for example, full time. Most respondents said they would prefer more flexible hours and to work part-time when their children were young. Around half of staff had done short courses in the previous year, which might be considered a staff benefit, but the majority of these had been on health and safety issues, which would support the nursery rather than the skills base of individual workers. Retention seemed to rely on the commitment of staff to the kind of work they were doing, despite poor salaries and long working hours. Another theme to emerge from the findings is the considerable homogeneity, across students and workers. Most of the current entrants into childcare consist of young women, with relatively low educational qualifications: childcare has traditionally been seen as a significant source of employment for this group. Unlike most heads of nurseries, most other staff have not yet had children. Indeed, there can be few other occupations where so many of the staff are concentrated at a particular life course stage, in this case just before child bearing and rearing. Where are the under-represented groups? Black and other minority ethnic workers currently make up about 10 percent of the nursery workforce. Although there is always scope to recruit more, these groups are not particularly under represented in relation to the general population. The main areas of under-representation are older people (70 percent of current staff are under 30) and above all men (who make up less than 2 percent of the current nursery workforce).
93

Another facet of the homogeneity of the workforce is widely shared beliefs about child care. This entails a consensus of understanding about the roles and responsibilities of childcare workers: that the work is based on ‘taking care of’ young children using, for the most part, one-to-one relationships, and in both practical and conceptual ways replacing the absent mother. This understanding may be part of the commonly held belief, discussed in Chapter 4, that, ideally, young children should be with their mothers (and/or fathers, but in practice, usually mothers). This view was reinforced by the finding in Chapter 3, that most childcare students would want to work part time, work from home or not at all, when their own children were young, reserving the use of group care services until their child reached the age of three. The current heavy reliance on this rather homogeneous group of mainly young women, situated at a particular life course stage, has two implications. First, with an average age of 24 and relatively low educational qualifications, a very high proportion of the current workforce will become mothers within the next 5 years. Moreover, as already noted, while most childcare workers are committed to work in day nurseries or other early childhood services over the long term, on becoming mothers many will prefer to work part time, work from home or not to work at all. Around a third of workers expect to have day time caring responsibilities for children or kin in the coming five years, which would suggest at the least a reduction of working hours for some years, and possibly leaving the workforce altogether for a period, as also indicated in the student survey in Chapter 3. These factors point to future discontinuity of employment for many day nursery workers, with subsequent high turnover and in-built instability in the nursery workforce placing increasing demands on nurseries and their management. Second, the pool from which childcare has for many years drawn most of its labour force may be diminishing, at the very moment when demand is increasing. The reason for this is increasing levels of educational qualification among young women, and therefore fewer young women with lower levels of qualification: for example, analysis of the Labour Force Survey shows that the proportion of women aged 25-29 with no qualifications beyond GCSE level has fallen from 67 percent in 1985 to 52 percent in 1998. With higher qualifications, as well as a wider range of job opportunities, most offering better pay and conditions than childcare, a question mark hangs over whether childcare can continue to rely so heavily on its traditional main source of labour supply. Indeed, the situation may be even more problematic if viewed from a wider perspective. Childcare in its broadest sense (i.e. also including people working with children over 5) can be seen as part of a wider ‘care sector’, which also includes what is termed ‘social care’ (i.e. work with children and adults within the welfare system). Social care constitutes a huge area of employment, which is rapidly expanding and heavily dependent on women, many of whom with low levels of educational qualification:
Social care has been one of the fastest growing employment sectors in recent years, and the workforce now numbers around one million. This includes people working in a wide range of care settings, two thirds of them in the independent sector (mainly working in residential homes)...80 percent of this large workforce which works directly with very vulnerable people have no recognised qualifications or training (Department of Health, 1998: 84).
Social care is also facing recruitment problems. The most recent report of the Chief Inspector of Social Services (2000: p.7) notes ‘serious problems in the recruitment and retention of staff’:
94

During the year councils have reported to us that they are having the utmost difficulty recruiting competent staff to fill posts which are critical to the delivery of the government’s agenda....[Amongst the issues raised] there do not appear to be enough people working in the service, many posts in social care offer less pay than less demanding jobs in supermarkets
Viewed from this wider perspective, the future of care work – or at least care work as it has been up to now - becomes more uncertain in the face of increasing demand for carers and a potentially decreasing supply. These considerations point to three areas and three questions meriting further attention in terms of recruitment and retention. First, the possibility of diversifying the workforce, for example by addressing the extreme gender imbalance and age concentration - have day nurseries (but also perhaps other types of childcare provision) saturated their traditional sources of labour, and do they need to recruit staff from under-represented groups in order to grow? Second, an improvement in pay and other conditions, including the feasibility of providing more ‘family friendly’ employment conditions for nursery workers with children - in a labour market offering increasing opportunities for women, what additional incentives will day nursery managers and other providers have to offer to attract and retain staff, many of whom will have or plan to have children? Third, revaluing childcare work and improving its status, which may involve the first two areas, as well as consideration given to the nature of the work and the breadth, level and coherence of training that the work requires - how should we understand early childhood work and what training is appropriate to that understanding?
95

References Balloch, S., McLean, J. and Fisher, M. (1999) Social Services: Working Under
Pressure, Bristol, Policy Press Brannen, J. and Moss, P. (1991) Managing Mothers: Dual Earner Households after
Maternity Leave, London, Unwin Hyman Bryant, B., Harris, M. and Newton, D. (1980) Children and Minders, London, Grant
McIntyre Brophy, J., Statham, J. and Moss, P. (1992) Playgroups in Practice: Self-help and
public policy, London, HMSO Cameron, C., Moss, P. and Owen, C. (1999) Men in the Nursery: Gender and caring
work, London, Paul Chapman Publishing Cameron, C. (1999) Child Protection and Independent Day Care Services: Examining
the interface of policy and practice, unpublished PhD thesis, London, Institute of Education, University of London
Cameron, C. and Moss, P. (1998) Men as Carers for Children: An introduction, in C. Owen, C. Cameron and P. Moss (eds.), Men as Workers in Services for Young Children: Issues of a Mixed Gender Workforce, London, Bedford Way Papers, Institute of Education, University of London
Cameron, C. (1997) A Review of Staffing in Childcare Centres in Six Countries, Early Child Development and Care, 137, 47 – 67
Central Statistical Office (1992) Standard industrial classification of economic activities, 1992, London, HMSO
Cordeaux, C., Hall, B. Owen, S. and Miles, R (1999) HERA2 Final Report, Child Care Training in the United Kingdom, Ipswich, Suffolk County Council Social Services
Crompton, R. (1997) Women and Work in Modern Britain, Oxford, Oxford University Press
Dahlberg, G., Moss, P. and Pence, A. (1999) Beyond Quality in Early Childhood Education and Care: Postmodern perspectives, London, Falmer Press
Day Care Trust (1997) The Childcare Gap, Briefing paper 1, London, Day Care Trust Department for Education and Employment (1998) Meeting the Childcare Challenge: A
Framework and Consultation Document, London, DfEE, Cm 3959 Department for Education and Employment (1998) Pupils Under Five Years of Age in
Maintained Schools in England, Statistical First Releases, Schools in England 1998, London, DfEE
Department for Education and Employment (1999a) Children’s Day Care Facilities at 31 March 1999, Statistics of Education, London, DfEE
Department for Education and Employment (1999) GCSE/GNVQ and GCE A/AS/Advanced GNVQ results for young people in England, 1998/99 (Provisional). SFR 35/1999
EO/IDeA (1999a) Independent Day Nursery Workforce Survey 1998, London, EO/IDeA
EO/IDeA (1999b) Registered Out of School Clubs Workforce Survey 1998, London, EO/IDeA
EO/IDeA (1999c) Registered Pre-School/Playgroup Workforce Survey 1998, London, EO/IDeA
EO/IDeA (2000) Survey of Education Support Staff and Volunteers in Nursery and Primary Schools in England 1999, London, EO/IDeA
Finlayson, L., Ford, R. and Marsh, A. (1996) Paying more for Child Care, Labour Market Trends, July, 295 – 303
HERA2. (1998). Interim Report. Child Care Training in the United Kingdom. Ipswich: Suffolk County Council.
96

Hevey, D. and Curtis, A. (1996) Training to Work in the Early Years in G. Pugh (ed.) Contemporary Issues in the Early Years: Working Collaboratively for Children, London, Paul Chapman Publishing National Children’s Bureau
Hodge, M. (2000) Campaign Launched Today to Recruit Thousands more Childcare Workers, 3 July http://www.DfES.gov.uk/news/news
Holtermann, S., Brannen, J. Moss, P. and Owen, C. (1999) Lone Parents and the Labour Market: Results from the 1997 Labour Force Survey and Review of Research, London, Employment Service, DfES
Jowell, R., Brook, L. Taylor, B. and Prior, G. (1992) British Social Attitudes – the 8th Report, London, Social and Community Planning Research
Meltzer, H. (1994) Day Care Services for Children, London, HMSO Mooney, A., Knight, A., Moss, P. and Owen, C. (forthcoming) Who Cares?
Childminding in the 1990s, A Report for the Joseph Rowntree Foundation Moss, P., Owen, C. and Statham, J. (1998) Informing Ourselves about Early Childhood
Services, Children and Society 12, 263 - 274 Moss, P, Owen, C., Statham, J. Bull, J., Cameron, C. and Candappa, M. (1995) Survey
of Day Care Providers in England and Wales: A Working Paper from the TCRU Children Act Project, London, Institute of Education, University of London
Moss, P. and Penn, H. (1996) Transforming Nursery Education, London, Paul Chapman Publishing
Nelson, M (1994) Family Day Care Providers: Dilemmas of daily practice, In E. Glenn, G. Chang and L. Forcey, (eds) Mothering, Ideology, Experience and Agency, New York Routledge
Nursery World (1999) Pay Survey 1999, 16 September Office of Population Censuses and Surveys (1990) Standard Occupational
Classification, London, HMSO Owen, C. (1999) Government household surveys, in D. Dorling and S. Simpson (eds)
Statistics in Society, London, Arnold, 19-28 Owen, C., Cameron, C. and Moss, P. (Eds.) (1998) Men as Workers in Services for
Young Children, Bedford Way Papers, London, Institute of Education Qualifications and Curriculum Authority (1999) Early Years Education, Childcare and
Playwork: A framework of nationally accredited qualifications, London, QCA Qualifications and Curriculum Authority (2000) Early Years Childcare Framework,
Childcare Accreditations Update, http://www.qca.org.uk/child_care/childcareaccred.htm
Penn, H. (1995) The Relationship of Private Daycare and Nursery Education in the UK, European Early Childhood Education and Research Journal, 3, 2, 29 - 41
Rose, M. (1999) Explaining and Forecasting Job Satisfaction: The Contribution of Occupational Profiling. Bath, University of Bath.
Schryer, M. (1994) The Relationship between Centre Size and Child Care Workers’ level of Job Satisfaction, Master of Education thesis, National College of Education, National Louise University.
Schuman, J. (1999) Britain’s ethnic minority populations – the latest estimates, Population Trends, 96, 33-43
Statham, J., Lloyd, E., Moss, P., Melhuish, E. and Owen, C. (1990) Playgroups in a Changing World, London, HMSO
Vernon, J. and Smith, C. (1994) Day Nurseries at a Crossroads: Meeting the challenge of child care in the 1990s, London, National Children’s Bureau
Warr, P., Cook, J. and Wall, T. (1979) Scales for the Measurement of Some Work Attitudes and Aspects of Psychological Well-being, Journal of Occupational Psychology, 52, 129 – 148
Whitebook, M., Howes, C. and Phillips, D. (1989) Who Cares? Child Care Teachers and the Quality of Care in America, Final Report, Oakland, National Child Care Staffing Study
97

Whitebook, M. Phillips, D. and Howes, C. (1993) National Child Care Staffing Study Revisited. Four Years in the Life of Center-Based Child Care, Oakland, Child Care Employee Project
98

Appendix 1 Childcare Student Survey – Summer 1999 Copy of Questionnaire
99

CHILDCARE STUDENT SURVEY SUMMER 1999
What do you think about work?
Did you like the course?
What will you be doing next?
What about life beyond work?
This questionnaire asks about your experience as a student on a childcare course and about your views on employment,
careers and life beyond work
THOMAS CORAM RESEARCH UNIT 27/28 Woburn Square, London, WC1H OAA
INSTITUTE OF EDUCATION UNIVERSITY OF LONDON

This is a survey of childcare students. There are some questions about your personal situation and some questions about your views on matters related to study, work, and life out of work. All the information you give will be confidential. College .............................................................................................................................................. Course ............................................................................................................................................... Your background Please tick the boxes that apply to you 1. Are you: Female G Male G 2. Are you: 16-19 years old G 20-24 years old G 25-34 years old G 35+ years old G 3. How would you describe your ethnic group? Please tick as many boxes as you feel apply to you: White G Black Caribbean G Black African G Black Other G Indian G Pakistani G Bangladeshi G Chinese G Other G Please describe............................................................................................. 4. Please tell us about your household Do you live with: your parent(s) G a partner G shared house/friends G on your own G halls of residence G 5. Do you have any children? Yes G No G
If so, please write in their age(s) .......................................................................................... 6. How old were you when you left full-time school? ...................................................................... 7. After leaving school, did you go straight to this course? Yes G No G
If Yes, go to Question 9 If No, how old were you when you started the current course? ...........................................
8. Please tell us what you did between school and starting the course: a) Employment: Yes G No G
If Yes, please say what jobs you have had, and which year you worked in them ............................................................................................................................................... ............................................................................................................................................... ...............................................................................................................................................

b) Further education: Yes G No G
If Yes, please what courses you have done, and which year you did them
...............................................................................................................................................
...............................................................................................................................................
...............................................................................................................................................
c) Voluntary work: Yes G No G
If Yes, please say what kind of voluntary work you did and which year you did it
...............................................................................................................................................
...............................................................................................................................................
d) Unpaid, full-time caring work at home - children or relatives: Yes G No G
If Yes, please say who you cared for and which year(s) you did this
...............................................................................................................................................
...............................................................................................................................................
e) Other, e.g. travel: Yes G No G
If Yes, please what you did and which year you did this
...............................................................................................................................................
...............................................................................................................................................
Your Course
9. If you hadn't chosen childcare, what other job(s) do you think you might have considered?
Nursing G Hairdressing G Clerical/secretarial work G
Other G (please say what) .................................................................................................................
...........................................................................................................................................................

10. What do you think led you to choose a childcare course? Please tick all those that apply to you Previous childcare work experience G Previous childcare voluntary experience G Good employment prospects G Family encouraged me to G Employment/careers agency told me about it G Didn't know what else to do on leaving school G
.......................................................................................................Other (please write in) G 11. How well do you think the academic content of the course has prepared you for work in
childcare? Very well G OK G Not very well G
What makes you say that? ............................................................................................................................................... 12. How well do you think the practice placements have prepared you for work in childcare?
Very well G OK G Not very well G What makes you say that?
...............................................................................................................................................
13. Has the college given you any help with finding jobs, such as: Careers advice G Tutor's help G
Noticeboard with vacancies G None G Other G (what) .......................................................................................................... 14. Was the help useful? Yes G No G
How could it have been improved? ...............................................................................................................................................


15. What would you have liked to have been different about the course, if anything? ............................................................................................................................................................ ............................................................................................................................................................ ............................................................................................................................................................ 16. While you have been studying, have you also been employed? Yes G No G
If Yes, Please tell us the job title (s), and how many hours a week you have worked
...............................................................................................................................................
Was it easy or difficult to combine employment and studying? Easy G
Difficult G Can you say why?
............................................................................................................................................... ............................................................................................................................................... 17. Having done the course, do you want to work with children? Yes G No G Not sure G
What makes you say that? ............................................................................................................................................... ............................................................................................................................................... 18. Having done the course, do you expect to work with children? (comments indicate expect is
difficult term - relative to local employment situations etc). Yes G No G Not sure G
If No, If you do not expect to work with children, what will you do after leaving the course?
Non-childcare employment (for example) ............................................................. G Childcare employment until something else turns up G Travel G Work abroad G Be unemployed until decide what to do next G
Do another course (say what) ............................................................................... G

Your next work move The following questions ask about the various types of job available in childcare. 19. Please tell us about the job you would most like to get. (Please answer each section.)
Childcare settings Group day care:Private nursery G
Local authority nursery/centre G Preschool/playgroup worker G After school/holiday play scheme G Family centre G
Home based: Childminder G Nanny G
Education: School nursery nurse G Special needs assistant G
Other.............................................................................. G
Hours of work
Full time (35+ hours a week) G Part time (20+ hours a week) G Part time (less than 20 hours a week) G
Weeks a year
All year round G School terms only G
Other ..................................................................... G
Age group of children 0 - 2 years G 3 - 5 years G 5+ years G
20. Do you already have a childcare job to go to when you finish the course? Yes G No G
If yes, please describe the job: Childcare settings Group day care: Private nursery G
Local authority nursery/centre G Preschool/playgroup worker G After school/holiday play scheme G Family centre G
Home based: Childminder G Nanny G
Education: School nursery nurse G Special needs assistant G
Other.............................................................................. G

Hours of work Full time (35+ hours a week) G Part time (20+ hours a week) G Part time (less than 20 hours a week) G
Weeks a year
All year round G School terms only G
Other ..................................................................... G
Age group of children 0 - 2 years G 3 - 5 years G 5+ years G
21. Was it/do you think it will be easy or difficult to find a job in childcare? Easy G Difficult G
What makes you say that? ............................................................................................................................................... 22. In your opinion, what is the best type of non-parental childcare for young children: Childminder Day nursery Nanny Relative Under 1 year G G G G Over 1 year and under 3 years G G G G Over 3 years to full-time school entry G G G G The Future 23. In the next five years, do you think you will have day time caring responsibilities for:
Your own children (including step children, adopted or fostered) Yes G No G Elderly or disabled relatives Yes G No G
24. If you had your own preschool aged children, what pattern of work do you think you would
adopt? Work full time G Work part time G
Work from home (e.g. childminding or work evenings at home) G Not work while they were preschool age G
Other (please say what you think you would do) G ...............................................................................................................................................

25. What do you imagine yourself doing in five years time Working full time as a childcare worker G Working full time in childcare at a senior level (owner/manager) G Working in childcare abroad G At university or in further education G Left childcare work for a different kind of employment G Left childcare work to travel or work abroad G Left childcare work to be a full time mother/father G
Other (please say what) ..................................................................................................... G 26. Do you have any plans for your career such as further training or education, and/or being
promoted? Further training/education Yes G No G
If Yes, what kind of training, and in which year do you plan to do it?
............................................................................................................................................... Promoted Yes G No G
If Yes, can you say what job title plan to be promoted to and in which year you would like to see this happen?
...............................................................................................................................................
Finally We would like to contact you again in about six months time, to find out what you have been doing. Please write in your home address and telephone number. We will not reveal your personal details to anybody not involved with the survey Name ................................................................................................................................................. Address ............................................................................................................................................. ............................................................................................................................................................ ............................................................................................................................................................ Telephone Number ............................................................................................................................ In case you have moved, could you also please give us the name and phone number of someone, such as a relative, who is likely to know how to contact you: ............................................................................................................................................................ THANK YOU VERY MUCH FOR YOUR TIME

Appendix 2 Focus Groups with childcare and playwork students Topic Guide and Questionnaire
1. Preamble, including purpose, funder, confidentiality, what we want, i.e. views and experiences, facilitator’s role.
2. Introductions and questionnaire 3. What does the term ‘career’ mean to you? Probes: is childcare work a job or a career?
Compared to other jobs? Are there any conflicts between having a childcare career and family responsibilities? How important is it to earn an income? What will you be doing in five years time?
4. Why do people come into childcare work? Probes: What does it offer that other jobs don’t? What is satisfying and/or sources of dissatisfaction? Why do people leave childcare work? What makes it difficult to work in childcare?
5. How has this course met your requirements? Probes: Has it lived up to your expectations? Did you consider other options? Were there any difficulties completing the course? Have your views on working with children changed? How? How well do you feel equipped for future employment?
6. What is the best way of combining family and work commitments? Probes: does childcare work help or hinder combining family and work? How should services be organised to help combine family and work? What patterns of work would you or do you adopt if you have preschool aged children?
7. What is you next work move? What do you think you will do? Have you got anything lined up?
8. Endings. Thank you very much for coming today. Expenses.
109

THOMAS CORAM RESEARCH UNIT CHILDCARE STAFFING STUDY FOCUS GROUP QUESTIONNAIRE We would be very grateful if you could supply the following information about yourself. All information is entirely confidential. Neither your name, that of your college or course will be available to any person or organisation outside the research team at Thomas Coram Research Unit. 1. What qualification or course are you studying for? ________________________________ 2. Do you also have a paid job? Yes _ No _ If Yes at Q2 3. Is this full-time or part-time? Full-time _ Part-time _ 4. Please write in the job title __________________________________________________ All 5. Please write in your age last birthday ___________________ 6. How would you describe your ethnic background? White _ Black Caribbean _ Black African _ Black Other _ Indian _ Pakistani _ Bangladeshi _ Chinese _ Other (write in) _______________________________________ _ 7. Are you registered disabled? Yes _ No _ 8. Which of these household arrangements best describes your position Live alone _ Live in shared household _ Live with a partner _ Live with a partner and children _ Live with children _ Live with relatives (other than above) _ Other (write in) ________________________________ _ Do you have any children of your own? Yes _
No _ If Yes to Q9, Please write in the ages of your children 1) ______ 2) ______ 3) _______ 4) _______ 5) ________ 10. Are you female or male? Female _ Male _ 11. One of the aims of the project is to establish the turnover of staff in the childcare workforce. Would it be possible to telephone you in about 12 months time to see what you are doing? Yes _ No _ If Yes at Q11 Please write in your name _____________________________________ And a ‘phone number where we can contact you ___________________ Last, could we have an alternative ‘phone number in case you move (e.g., a relative) _______

Appendix 3 Staffing survey, heads and other staff Copy of each questionnaire and copy of self completion questionnaire

PAS 7368/PB/HC INTERVIEW STARTED (130 - 133)
THOMAS CORAM RESEARCH UNIT STAFFING STUDY - ENTRY RETENTION AND LOSS
SURVEY OF NURSERY STAFF
HEAD OF CENTRE
This is a study of staff who work in nurseries across England. Your nursery has been selected at random. The study is funded by the DfES, who want to know more about the mobility and stability of the childcare workforce. We would be grateful if you could answer some questions about the nursery itself, and about your position as head of the centre. All your replies are entirely confidential. We will not pass on your name or that of your workplace to anyone outside the research team at Thomas Coram Research Unit.
(134) BLANK Q.1 What is your job title?
_________________________________________________________ (135) (136)
Q.2 Are you the manager or owner of the nursery, or both? CODE ONE
ONLY (137) MANAGER 1 OWNER 2 BOTH 3
Q.3 SHOW CARD 1 How is the nursery managed? CODE ONE ONLY (138) Private owner manager - single nursery 1 Private owner manager - two or three nurseries 2 Private owner - more than three nurseries or chain 3 Voluntary management committee 4 Jointly managed scheme involving a local authority 5 Jointly managed scheme not involving a local authority 6 Workplace nursery (manager plus committee) 7 OTHER (PLEASE SPECIFY) 8
_______________________________________
Q.4 What are the nursery opening hours? USE LEADING ZEROS
(139 - 142) (143 - 146) Q.5 How many registered (full time equivalent) places does the nursery
have? USE LEADING ZEROS
(147-149)

Q.6 How many full- and part-time children are currently on your roll? USE LEADING ZEROS FULL TIME (150-151)
PART TIME (152-153)
(154-176) BLANK (177-180) JN 7368 Q.7 SHOW CARD 2 Which age ranges of children does the nursery cater for, and approximately what
percentage of children currently on roll fall into each category? PLEASE INDICATE ON THE TABLE BELOW
START CARD 02 (206-207)
MONTHS/YEARS 0 - 11 12 - 23 24 - 35 36 - 47 48 - 59 5-7 YEARS 7+ YEARS
CODE THOSE THAT APPLY 1 (208) 1 (209) 1 (210) 1 (211) 1 (212) 1 (213) 1 (214)
APPROXIMATE PERCENTAGE IN EACH GROUP (WRITE IN & USE LEADING ZEROS) (215-217) (218-220) (221-223) (224-226) (227-229) (230-232) (233-235)
Q.8 Do you run other services such as a breakfast club, after school care or a holiday scheme? CODE ALL THAT APPLY
BREAKFAST/PRE-SCHOOL CLUB 1 (236) AFTER SCHOOL CLUB 1 (237) HOLIDAY CARE SCHEME 1 (238)
Q.9a Does the nursery ever take any children with special needs, such as physical disabilities, learning difficulties, social and behavioural difficulties or non-English speaking children?
(239) YES 1 - GO TO Q.9b
----------------------------- ------------------------------------ NO 2 - SKIP TO Q.10
IF YES TO Q.9aQ.9b How many such children is the nursery looking after this week? USE LEADING ZEROS (240-241)
Q.10 How many full-time paid childcare and education posts (including unfilled posts) do you currently have in this nursery, including your own?
USE LEADING ZEROS (242-243)
Q.11 How many part-time paid childcare and education posts (including unfilled posts) do you have in the nursery, including your own?
USE LEADING ZEROS (244-245)

Q.12 How many other paid employees (ancillary staff, eg. cooks, cleaners,
administrative) do you have? USE LEADING ZEROS
(246-247)
Q.13 How many staff, including yourself, have a managerial role or supervise other staff? USE LEADING ZEROS
(248-249)
Q.14 Do you have any volunteers or students working in the nursery? (250) YES 1 - GO TO Q.15
----------------------------- ------------------------------------ NO 2 - SKIP TO Q.16a
IF YES TO Q.14Q.15 How many volunteers or students do you have this week? USE LEADING ZEROS
(251-252)
Q.16a Do you have any vacancies for childcare and education staff as of this week?
(253) YES 1 - GO TO Q.16b
----------------------------- ------------------------------------ NO 2 - SKIP TO Q.17
IF YES TO Q.16aQ.16b How many vacancies do you have? USE LEADING ZEROS
(254-255)
Q.17 How many paid childcare and education staff have left the nursery’s employment in the last 12 months? USE LEADING ZEROS
(256-257)
Q.18 How many paid childcare and education staff have you recruited in the last 12 months (including any who may have left already)?
USE LEADING ZEROS (258-259)
Q.19 How long does it take, on average, for a new recruit to be fully inducted into the nursery? PROMPT WITH FOLLOWING DEFINITION OF INDUCTION ‘making a contribution rather than being shown what to do’.
_________________________________________________________
(260) (261)

Q.20 Do you have a structured induction procedure for new staff? (262) YES 1 NO 2
Q.21 How long does it take, on average, to replace a member of staff? (from one person leaving to another starting)
_________________________________________________________ (263) (264)
Q.22 What methods of recruitment do you use? CODE ALL THAT APPLY Advertising (locally) 1 (265) Advertising (nationally) 1 (266) Word of mouth 1 (267) Agencies 1 (268) Other (PLEASE SPECIFY) 1 (269)
_________________________________________________________ (270) (271)
_________________________________________________________
(272) (273)
IF 0 AT Q.18 SKIP TO Q.27 IF ONE OR MORE AT Q.18 ASK Q.23 Q.23 Thinking about your experience of recruiting staff over the last 12
months, what is your view of the suitability of applicants for childcare and education posts? READ OUT AND CODE ALL THAT APPLY
Adequate number and choice of applicants 1 (274) Inadequate number of applicants to shortlist from 1 (275) Inadequate work experience of applicants 1 (276) Inadequately qualified applicants 1 (277) DON’T KNOW 1 (278) OTHER (PLEASE SPECIFY) 1 (279)
_________________________________________________________ (280) (281)
START CARD 03 (306-307) IF ONE OR MORE AT Q.18 Q.24 What is your view of the suitability of new recruits over the last 12
months? CODE ONE ONLY (308) Good 1 Adequate 2 Fairly inadequate 3 Very inadequate 4 DON’T KNOW 5

IF CODED 3 OR 4 AT Q.24Q.25 Can you say in what respect new recruits are inadequate? READ OUT.
CODE ALL THAT APPLY Level or amount of qualifications/ training 1 (309) Poor motivation 1 (310) Lack of appropriate experience 1 (311) Other (PLEASE SPECIFY) 1 (312)
_________________________________________________________ (313) (314)
_________________________________________________________
(315) (316)
_________________________________________________________
(317) (318)
Q.26 In your view, what has been the effect, if any, of the introduction of the
National Minimum Wage on the recruitment of staff in your nursery?
_________________________________________________________ (319) (320)
_________________________________________________________
(321) (322)
(323-331) BLANK In the following sections, we would like to ask some questions about your educational background and career and about you as a person. Q.27 When did you start managing this nursery? USE LEADING ZEROS
MONTH: YEAR: (332-333) (334 - 337)
Q.28 How many paid hours did you work last week?
(338-339)
Q.29 Did you work any unpaid hours last week, for example, at the end of shifts, to attend staff meetings, or parents’ evenings, or take written work home, or for any other reason?
(340) NO 1 YES 2
Q.30 Do you work shifts? (341) YES 1 NO 2
Q.31 How many days paid holiday do you get, or give yourself, per year? USE LEADING ZEROS
(342-343)
Q.32 Do you get, or provide yourself with, an occupational pension?

(344) YES 1 NO 2
Q.33 Do you get, or provide yourself with, paid sick leave? (345) YES 1 NO 2
Q.34 How many days sick leave (paid or unpaid) have you taken in the past year?
USE LEADING ZEROS
(346-347)
Q.35 Is your current job a fixed term or a permanent contract? READ OUT CODE ONE ONLY (348) Fixed term 1 Permanent 2 Casual 3 Not applicable (ie self employed) 4
Q.36a Do you have any other paying jobs at present? (349) YES 1 - GO TO Q.36b
----------------------------- ------------------------------------ NO 2 - SKIP TO Q.38a
IF YES TO Q.36aQ.36b What other jobs do you do?
_________________________________________________________ (350) (351)
_________________________________________________________
(352) (353)
IF YES TO Q.36aQ.37 How many hours did you work on other jobs last week? USE LEADING ZEROS
(354-355)

WORK HISTORY
Q.38 Besides this job, have you had any other paid jobs in childcare? (356) YES 1 - GO TO Q.39
----------------------------- ------------------------------------ NO 2 - SKIP TO Q.40
IF YES TO Q.38a Q.39 Have you had any of these jobs in childcare? READ OUT. CODE ALL THAT APPLY Childminder 1 (357) Nanny 1 (358) Playgroup Worker 1 (359) Nursery Worker 1 (360) Nursery/Reception class/in schools 1 (361) OTHER (PLEASE SPECIFY) 1 (362)
_________________________________________________________ (363) (364)
ASK ALL Q.40 How long have you worked in childcare altogether (excluding any
breaks)? USE LEADING ZEROS
MONTHS YEARS (365-366) (367-368)
Q.41 In which year did you start working in childcare? USE LEADING ZEROS
(369-372)
Q.42a Have you had any other kinds of employment? (373) YES 1 - GO TO Q.42b
----------------------------- ------------------------------------ NO 2 - SKIP TO Q.43a
IF YES TO Q.42a Q.42b What other kinds of employment?
_________________________________________________________ (374) (375)
_________________________________________________________
(376) (377)
ASK ALL Q.43a Do you have any qualifications from school? (378) YES 1 - GO TO Q.43b
----------------------------- ------------------------------------ NO 2 - SKIP TO Q.44
(379-380) BLANK

START CARD 04 (406-407)
IF YES TO Q.43a Q.43b SHOW CARD 3 Can you say how many of each type of qualification you
hold? READ OUT. CODE ALL THAT APPLY & USE LEADING ZEROS
CSE (408-409)
O LEVEL (410-411)
GCSE (412-413)
A LEVEL (414-415)
AS LEVEL (416-417)
NVQ (418-419)
GNVQ (420-421)
RSA (422-423)
OTHER (PLEASE SPECIFY) (424-425)
(426) (427)
__________________________________________________ (428-429)
(430) (431)
__________________________________________________ (432-433)
(434) (435)
Q.44 Do you hold 4 GCSEs or O Levels at level C and above? (436) YES 1 NO 2
Q.45a Do you hold, or are you currently studying for, any vocational qualifications or training in childcare, playwork or early years education?
(437) YES 1 - GO TO Q.45b
----------------------------- ------------------------------------ NO 2 - SKIP TO Q.46a
(438-480) BLANK

START CARD 05 (506-507)
IF YES TO Q.45a Q.45b SHOW CARD 4 Which of the following courses have you completed, or are you currently studying for?
AWARDING BODY/COURSE COURSES COMPLETED
CURRENTLY STUDYING
CACHE/NNEB Diploma in Nursery Nursing/Childcare and Education 1 (508) 1 (509) CACHE Certificate in Childcare and Education 1 (510) 1 (511)
CACHE Advanced Diploma in Childcare and Education 1 (512) 1 (513) CACHE Certificate in Childminding Practice 1 (514) 1 (515)
CACHE Certificate of Professional Development in work with children and young people 1 (516) 1 (517)
BTEC/EdExcel Diploma in childhood studies (Nursery Nursing) 1 (518) 1 (519) BTEC/EdExcel Certificate in childhood studies (Nursery Nursing) 1 (520) 1 (521)
S/NVQ childcare Level 2 1 (522) 1 (523) S/NVQ childcare Level 3 1 (524) 1 (525) S/NVQ childcare Level 4 1 (526) 1 (527)
PLA/PPA Foundation/Diploma 1 (528) 1 (529) PLA/PPA Basic/Introductory/ Further Basic 1 (530) 1 (531)
NAMCW Certificate in Nursery Management Skills/other certificate 1 (532) 1 (533) NAMCW Advanced Certificate in Childcare and Education 1 (534) 1 (535)
NAMCW Diploma in Nursery Nursing 1 (536) 1 (537) NVQ Assessor 1 (538) 1 (539)
Teaching - infant/early years (Qualified teacher status) 1 (540) 1 (541) Teaching - Montessori 1 (542) 1 (543)
Professional Social work - CQSW/Dip SW/CSS 1 (544) 1 (545) Nursing - paediatric/ general 1 (546) 1 (547)
HighScope Implementation Certificate 1 (548) 1 (549) ABC Playwork with children over Five 1 (550) 1 (551)
City and Guilds Progression Award in Playwork Level 2 1 (552) 1 (553) City and Guilds Progression Award in Early Years Care and Education 1 (554) 1 (555)
City and Guilds Playworker Certificate 1 (556) 1 (557) National Centre for Playwork Education Take Ten for Play Certificate 1 (558) 1 (559)
Other (WRITE IN)
___________________________________________
(560) (561) (562) (563)
__________________________________________
_
(564) (565) (566) (567)
(568-569) BLANK
Q.46a Have you done or are you doing any qualifications or training in management or business skills?
(570) YES 1 - GO TO Q.46b
----------------------------- ------------------------------------ NO 2 - SKIP TO Q.47a
IF YES TO Q.46aQ.46b Please give the course title(s).
_________________________________________________________ (571) (572)
_________________________________________________________
(573) (574)

Q.47a Do you have any other educational or vocational qualifications, not
mentioned above? Please include any which are not relevant to childcare or early years education.
(575) YES 1 - GO TO Q.47b
----------------------------- ------------------------------------ NO 2 - SKIP TO Q.48a
(576-580) BLANK
IF YES TO Q.47aQ.47b SHOW CARD 5 What other qualifications do you hold? READ OUT
AND START CARD 06 CODE ALL THAT APPLY (606-607) DEGREE LEVEL QUALIFICATION 1 (608) DEGREE LEVEL OR EQUIVALENT Ie (PGCE) 1 (609) DIPLOMA IN HIGHER EDUCATION 1 (610) TEACHING QUALIFICATION 1 (611) NURSING OR OTHER MEDICAL QUALIFICATION 1 (612) HNC/HND 1 (613) ONC/OND 1 (614) BTEC, BEC OR TEC 1 (615) RSA 1 (616) CITY AND GUILDS 1 (617) OPEN COLLEGE CREDIT (LOCF/NELAF) 1 (618) NVQ/SVQ 1 (619) A CERTIFICATE 1 (620) ANY OTHER PROFESSIONS/VOCATIONAL/FOREIGN QUALIFICATIONS 1 (621)
_________________________________________________________ (622) (623)
_________________________________________________________
(624) (625)
_________________________________________________________
(626) (627)
Q.48a In the last year, have you done any training or courses not leading to
qualifications? (628) YES 1 - GO TO Q.48b
----------------------------- ------------------------------------ NO 2 - SKIP TO Q.51
IF YES TO Q.48aQ.48b Please give the course titles.
_________________________________________________________ (629) (630)
_________________________________________________________
(631) (632)
_________________________________________________________
(633) (634)

Q.49 Have you paid for courses or training yourself? (635) YES 1 SOMETIMES 2 GO TO Q.50
----------------------------- ------------------------------------ NO 3 - SKIP TO Q.51
IF CODED 1 OR 2 AT Q.49Q.50 Would you say that you had paid for all, most, some or none of the fees
for your training? READ OUT AND CODE ONE ONLY (636) ALL 1 MOST 2 SOME 3 NONE 4
ASK ALL Q.51 Looking back, why did you decide to go into childcare work?
_________________________________________________________ (637) (638)
_________________________________________________________
(639) (640)
_________________________________________________________
(641) (642)
_________________________________________________________
(643) (644)
Q.52a Did you have any careers advice about childcare or early years
education work? (645) YES 1 - GO TO Q.52b
----------------------------- ------------------------------------ NO 2 - SKIP TO Q.53
IF YES TO Q.52a Q.52b What did they say?
_________________________________________________________ (646) (647)
_________________________________________________________
(648) (649)

THE FUTURE
ASK ALL Q.53 Do you consider your work in childcare and early education to be a
temporary or short term job or a longer term career? CODE ONE ONLY (650) TEMPORARY/SHORT TERM 1 LONGER TERM 2
Q.54 Thinking about this job, do you feel settled here? CODE ONE ONLY (651) YES 1 MOSTLY 2 GO TO Q.55
----------------------------- ------------------------------------ NO 3 - GO TO Q.56
IF YES OR MOSTLY TO Q.54Q.55 What is it about the job that makes you feel settled here?
_________________________________________________________ (652) (653)
_________________________________________________________
(654) (655)
_________________________________________________________
(656) (657)
IF YES AT Q.54, GO TO Q.64 IF CODED 2 OR 3 AT Q.54Q.56 Are you thinking of leaving this job? (658) YES 1 - GO TO Q.57
----------------------------- ------------------------------------ NO 2 - SKIP TO Q.64
IF YES AT ASK Q.56Q.57 Why are you thinking of leaving? PROBE FOR PARTICULAR ASPECTS OF JOB THAT ARE DISLIKED
_________________________________________________________ (659) (660)
_________________________________________________________
(661) (662)
IF PREGNANT OR PLANNING PREGNANCY AT Q.57Q.58 Are you planning to take maternity leave and return to work, or to leave
altogether? (663) MATERNITY LEAVE + RETURN 1 GO TO NOT COMING BACK 2 Q42

IF YES TO Q.56Q.59 If you leave this job what will you do next? CODE ONE ONLY (664) OTHER CHILDCARE JOB 1 - GO TO Q.60
----------------------------- ------------------------------------ OTHER JOB NOT CHILDCARE 2 TRAVEL 3 MOVING AREA 4
SKIP TO Q.61
----------------------------- ------------------------------------ STUDY 5 - SKIP TO Q.63
----------------------------- ------------------------------------ OTHER (WRITE IN) 6
_______________________________________ DON’T KNOW 7
SKIP TO Q.64
IF CODED 1 AT Q.59Q.60 What would make another childcare job better than the current job?
_________________________________________________________ (665) (666)
_________________________________________________________
(667) (668)
GO TO Q.64 IF CODED 2, 3 OR 4 AT Q.59Q.61 Why are you thinking of leaving childcare altogether?
_________________________________________________________ (669) (670)
_________________________________________________________
(671) (672)
Q.62 What do you think you will do instead of working in childcare?
_________________________________________________________ (673) (674)
_________________________________________________________
(675) (676)
GO TO Q.64 IF CODED 5 AT Q.59Q.63 Can you give the title of the qualification?
_________________________________________________________ (677) (678)
(679-680) BLANK

START CARD 07 (706-707)
ASK ALL Q.64 Thinking ahead five years, what type of setting do you think you will be
working in? CODE ONE ONLY (708) DAY NURSERY (THIS OR ANOTHER NURSERY) 1 CHILDMINDING/NANNYING 2 PUBLIC SECTOR NURSERY OR FAMILY CENTRE 3 SCHOOL 4 OTHER - CHILDCARE (WRITE IN) 5
SKIP TO Q.66
_________________________________________________________
(709) (710)
OTHER NOT CHILDCARE (WRITE IN) 6 - GO TO Q.65
_________________________________________________________ (711) (712)
NOT WORKING 7 – GO TO Q.65 DON’T KNOW 8 - SKIP TO Q.66
IF CODED 6 or 7 AT Q.64Q.65 Can you say why you think you will not be working in childcare in five
years time?
_________________________________________________________ (713) (714)
_________________________________________________________
(715) (716)
_________________________________________________________
(717) (718)
IF CODED 1, 2, 3, 4, 5 OR 7 AT Q.64Q.66 Thinking about five years ahead, do you think you will be promoted or be
running your own business? CODE ONE ONLY (719) PROMOTED 1 RUNNING OWN BUSINESS 2 NEITHER 3
ASK ALL Q.67 Again thinking five years ahead, do you think you will be working full-time
or part-time? CODE ONE ONLY (720) FULL-TIME 1 PART-TIME 2 DON’T KNOW 3
Q.68 Would you consider gaining further qualifications in the following areas in the next five years? READ OUT AND CODE ALL THAT APPLY
Childcare 1 (721) Education 1 (722) Management 1 (723) Other (PLEASE SPECIFY) 1 (724)
SKIP TO Q.70
_________________________________________________________
(725) (726)
NONE 5 - GO TO Q.69

IF CODED 5 TO Q.68Q.69 Can you say why you would not consider study for any further
qualifications?
_________________________________________________________ (727) (728)
_________________________________________________________
(729) (730)
_________________________________________________________
(731) (732)
ASK ALL Q.70 If course fees for childcare and related qualifications were paid for, do
you think you would be more or less likely to undertake further study, or would it not make any difference? CODE ONE ONLY
(733) MORE LIKELY 1 LESS LIKELY 2 NOT MAKE ANY DIFFERENCE 3
Q.71a Thinking ahead to the next few years, do you expect to have time away from employment for family or caring reasons?
(734) YES 1 - GO TO Q.71b
----------------------------- ------------------------------------ NO 2 - SKIP TO Q.72
IF YES TO Q.71aQ.71b Do you think this will be for …? (735) CHILDREN 1 ELDER OR DISABLED RELATIVES 2 BOTH 3 OTHER (WRITE IN) 4
_________________________________________________________ (736) (737)
In this last section, we would like to ask some questions about you. ASK ALL Q.72 Could you tell me your age?
(738-739)
Q.73 SHOW CARD 6 How would you describe your ethnic background? CODE ONE ONLY (740) WHITE 1 BLACK CARIBBEAN 2 BLACK AFRICAN 3 BLACK OTHER 4 INDIAN 5 PAKISTANI 6 BANGLADESHI 7 CHINESE 8 OTHER (WRITE IN) 9
_________________________________________________________ (741) (742)

Q.74a Do you have any children of your own? (743) YES 1 - GO TO Q.74b
----------------------------- ------------------------------------ NO 2 - SKIP TO Q.78
IF YES TO Q.74aQ.74b Can you tell me their ages? USE LEADING ZEROS
FIRST CHILD (744-745)
SECOND CHILD (746-747)
THIRD CHILD (748-749)
FOURTH CHILD (750-751)
FIFTH CHILD (752-753)
IF RESPONDENT HAS ANY CHILDREN AGED UNDER FIVE Q.75 Are you entitled to free or subsidised childcare places in the nursery
where you work? (754) YES 1 - GO TO Q.76
----------------------------- ------------------------------------ NO 2 - SKIP TO Q.78
IF YES TO Q.75Q.76 Do you use this benefit? (755) YES 1 NO 2
IF NO TO Q.76Q.77 Can you say why not?
_________________________________________________________ (756) (757)
_________________________________________________________
(758) (759)
ASK ALL Q.78 Are you registered disabled? (760) YES 1 NO 2

Q.79 What household arrangement best describes your position? READ OUT
AND CODE ONE ONLY (761) Live alone 1 Live in shared household 2 Live with a partner 3 Live with a partner and children 4 Live with children 5 Live with relatives (other than above) 6 Other (WRITE IN) 7
_________________________________________________________ (762) (763)
Q.80 Can you tell me approximately how much you are paid before tax? USE LEADING ZEROS
£ (764-769) Is that per week or per month or per year? CODE ONE ONLY (770) WEEK 1 MONTH 2 YEAR 3
Q81 Do you belong to a trade union or any professional childcare or early childhood organisation? (e.g., UNISON, PANN, NCB, DCT etc)
(771) YES 1 NO 2
Q.82 PLEASE NOTE GENDER OF RESPONDENT (772) MALE 1 FEMALE 2
Q.83a One of the aims of the project is to establish the turnover of staff in the childcare workforce. Would it be possible to telephone you in about 12 months time to see what you are doing? (773)
YES 1 NO 2
(774-780) BLANK
IF YES AT Q.82aQ.83b Can you give me your name? __________________________________________________________ Which ’phone number is the best one to contact you on? ____________________________________________________(HOME) Is there an alternative ‘phone number we could record, in case you
move? __________________________________________________________
THANK YOU VERY MUCH FOR YOUR HELP AND TIME

PAS 7368/PB/NS INTERVIEW STARTED (130 - 133)
(134-176) BLANK (177-180) JN 7368
THOMAS CORAM RESEARCH UNIT STAFFING STUDY - ENTRY RETENTION AND LOSS
SURVEY OF NURSERY STAFF
This is a survey of the childcare and education staff who work in the nursery. We want to find out how people come into the work, and what helps people stay in or leave childcare work. The study is funded by the Department of Education and Employment. All your replies are entirely confidential. We will not pass on your name or the name of your workplace to anyone outside the research team at Thomas Coram Research Unit. YOUR CURRENT JOB
START CARD 02 (206-207) (208-280) BLANK
Q.1 In this job, what is your job title? START CARD 03 (306-307) (308-322) BLANK
_________________________________________________________ (323) (324)
Q.2 Do you supervise other staff? (325) YES 1 NO 2
Q.3 When did you start working in this nursery? USE LEADING ZEROS
MONTH: YEAR: (326-327) (328 - 331)
(332-337) BLANK
Q.4 How many paid hours did you work last week? USE LEADING ZEROS
(338-339)
Q.5 Did you work any unpaid hours last week, for example, at the end of shifts, to attend staff meetings, or parents’ evenings, or take written work home, or for any other reason?
(340) NO 1 YES 2
Q.6 Do you work shifts? (341) YES 1 NO 2
Q.7 How many days paid holiday do you get per year? USE LEADING ZEROS
(342-343)

Q.8 Do you get an occupational pension? (344) YES 1 NO 2
Q.9 Do you get paid sick leave? (345) YES 1 NO 2
Q.10 How many days sick leave (paid or unpaid) have you taken in the past
year? USE LEADING ZEROS
(346-347)
Q.11 Is your current job a fixed term or a permanent contract? READ OUT. CODE ONE ONLY (348) Fixed term 1 Permanent 2 Casual 3 Tied to training (eg., NVQ) 4
Q.12a Do you have any other paying jobs at present? (349) YES 1 - GO TO Q.12b
----------------------------- ------------------------------------ NO 2 - SKIP TO Q.14
IF YES TO Q.12aQ.12b What other jobs do you do?
_________________________________________________________ (350) (351)
_________________________________________________________
(352) (353)
IF YES TO Q.12aQ.13 How many hours did you work on other jobs last week? USE LEADING
ZEROS
(354-355)

WORK HISTORY
ASK ALL Q.14 Besides this job, have you had any other paid jobs in childcare? (356) YES 1 - GO TO Q.15
----------------------------- ------------------------------------ NO 2 - SKIP TO Q.16
IF YES TO Q,14 Q.15 Have you had any of these jobs in childcare? READ OUT. CODE ALL THAT APPLY Childminder 1 (357) Nanny 1 (358) Playgroup Worker 1 (359) Nursery Worker 1 (360) Nursery/Reception class/in schools 1 (361) OTHER (PLEASE SPECIFY) 1 (362)
_________________________________________________________ (363) (364)
ASK ALL Q.16 How long have you worked in childcare altogether (excluding any
breaks)? USE LEADING ZEROS
MONTHS YEARS (365-366) (367-368)
Q.17 In which year did you start working in childcare? USE LEADING ZEROS
(369-372)
Q.18a Have you had any other kinds of employment? (373) YES 1 - GO TO Q.18b
----------------------------- ------------------------------------ NO 2 - SKIP TO Q.19a
IF YES TO Q.18a Q.18b What other kinds of employment?
_________________________________________________________ (374) (375)
_________________________________________________________
(376) (377)
ASK ALL Q.19a Do you have any qualifications from school? (378) YES 1 - GO TO Q.19b
----------------------------- ------------------------------------ NO 2 - SKIP TO Q.20
(379-380) BLANK

START CARD 04 (406-407)
IF YES TO Q.19a Q.19b SHOW CARD 1 Can you say how many of each type of qualification you
hold? READ OUT. CODE ALL THAT APPLY AND USE LEADING ZEROS
CSE (408-409)
O LEVEL (410-411)
GCSE (412-413)
A LEVEL (414-415)
AS LEVEL (416-417)
NVQ (418-419)
GNVQ (420-421)
RSA (422-423)
OTHER (PLEASE SPECIFY) (424-425)
(426) (427)
__________________________________________________ (428-429)
(430) (431)
__________________________________________________ (432-433)
(434) (435)
Q.20 Do you hold 4 GCSEs or O Levels at level C and above? (436) YES 1 NO 2
Q.21a Do you hold, or are you currently studying for, any vocational
qualifications or training in childcare, playwork or early years education? (437) YES 1 - GO TO Q.21b
----------------------------- ------------------------------------ NO 2 - SKIP TO Q.22
(438-480) BLANK

START CARD 05 (506-507)
IF YES TO Q.21a Q.21b SHOW CARD 2 Which of the following courses have you completed, or are you currently studying for?
AWARDING BODY/COURSE COURSES COMPLETED
CURRENTLY STUDYING
CACHE/NNEB Diploma in Nursery Nursing/Childcare and Education 1 (508) 1 (509) CACHE Certificate in Childcare and Education 1 (510) 1 (511)
CACHE Advanced Diploma in Childcare and Education 1 (512) 1 (513) CACHE Certificate in Childminding Practice 1 (514) 1 (515)
CACHE Certificate of Professional Development in work with children and young people 1 (516) 1 (517)
BTEC/EdExcel Diploma in childhood studies (Nursery Nursing) 1 (518) 1 (519) BTEC/EdExcel Certificate in childhood studies (Nursery Nursing) 1 (520) 1 (521)
S/NVQ childcare Level 2 1 (522) 1 (523) S/NVQ childcare Level 3 1 (524) 1 (515) S/NVQ childcare Level 4 1 (526) 1 (527)
PLA/PPA Foundation/Diploma 1 (528) 1 (529) PLA/PPA Basic/Introductory/ Further Basic 1 (530) 1 (531)
NAMCW Certificate in Nursery Management Skills/other certificate 1 (532) 1 (533) NAMCW Advanced Certificate in Childcare and Education 1 (534) 1 (535)
NAMCW Diploma in Nursery Nursing 1 (536) 1 (537) NVQ Assessor 1 (538) 1 (539)
Teaching - infant/early years (Qualified teacher status) 1 (540) 1 (541) Teaching - Montessori 1 (542) 1 (543)
Professional Social work - CQSW/Dip SW/CSS 1 (544) 1 (545) Nursing - paediatric/ general 1 (546) 1 (547)
HighScope Implementation Certificate 1 (548) 1 (549) ABC Playwork with children over Five 1 (550) 1 (551)
City and Guilds Progression Award in Playwork Level 2 1 (552) 1 (553) City and Guilds Progression Award in Early Years Care and Education 1 (554) 1 (555)
City and Guilds Playworker Certificate 1 (556) 1 (557) National Centre for Playwork Education Take Ten for Play Certificate 1 (558) 1 (559)
Other (WRITE IN)
___________________________________________
(560) (561) (562) (563)
___________________________________________
(564) (565) (566) (567)
Q.22 Are you doing a Modern Apprenticeship? (568) YES 1 NO 2
Q.23 Are you on the New Deal? (569) YES 1 NO 2

Q.24a Have you done or are you doing any qualifications or training in
management or business skills? (570) YES 1 - GO TO Q.24b
----------------------------- ------------------------------------ NO 2 - SKIP TO Q.25a
IF YES TO Q.24aQ.24b Please give the course title(s).
_________________________________________________________ (571) (572)
_________________________________________________________
(573) (574)
Q.25a Do you have any other educational or vocational qualifications, not
mentioned above? Please include any which are not relevant to childcare or early years education.
(575) YES 1 - GO TO Q.25b
----------------------------- ------------------------------------ NO 2 - SKIP TO Q.26a
(576-580) BLANK
IF YES TO Q.25aQ.25b SHOW CARD 5 What other qualifications do you hold? READ OUT
AND START CARD 06 CODE ALL THAT APPLY (606-607) DEGREE LEVEL QUALIFICATION 1 (608) DEGREE LEVEL OR EQUIVALENT IE (PGCE) 1 (609) DIPLOMA IN HIGHER EDUCATION 1 (610) TEACHING QUALIFICATION 1 (611) NURSING OR OTHER MEDICAL QUALIFICATION 1 (612) HNC/HND 1 (613) ONC/OND 1 (614) BTEC, BEC OR TEC 1 (615) RSA 1 (616) CITY AND GUILDS 1 (617) OPEN COLLEGE CREDIT (LOCF/NELAF) 1 (618) NVQ/SVQ 1 (619) YT CERTIFICATE 1 (620) ANY OTHER PROFESSIONS/VOCATIONAL/FOREIGN QUALIFICATIONS 1 (621)
_________________________________________________________ (622) (623)
_________________________________________________________
(624) (625)
_________________________________________________________
(626) (627)

Q.26a In the last year, have you done any training or courses not leading to qualifications?
(628) YES 1 - GO TO Q.26b
----------------------------- ------------------------------------ NO 2 - SKIP TO Q.29
IF YES TO Q.26aQ.26b Please give the course titles.
_________________________________________________________ (629) (630)
_________________________________________________________
(631) (632)
_________________________________________________________
(633) (634)
Q.27 Have you paid for courses or training yourself? (635) YES 1 -GO TO SOMETIMES 2 Q.28
----------------------------- ------------------------------------ NO 3 - SKIP TO Q.29
IF YES CODED 1 OR 2 TO Q.27Q.28 Would you say that you had paid for all, most, some or none of the fees
for your training? READ OUT. CODE ONE ONLY (636) ALL 1 MOST 2 SOME 3 NONE 4
ASK ALL Q.29 Looking back, why did you decide to go into childcare work?
_________________________________________________________ (637) (638)
_________________________________________________________
(639) (640)
_________________________________________________________
(641) (642)
_________________________________________________________
(643) (644)
Q.30a Did you have any careers advice about childcare or early years education work?
(645) YES 1 - GO TO Q.30b
----------------------------- ------------------------------------ NO 2 - SKIP TO Q.31
IF YES TO Q.30a Q.30b What did they say?
_________________________________________________________ (646) (647)
_________________________________________________________
(648) (649)

THE FUTURE
ASK ALL Q.31 Do you consider your work in childcare and early education to be a
temporary or short term job or a longer term career? CODE ONE ONLY (650) TEMPORARY/SHORT TERM 1 LONGER TERM 2
Q.32 Do you feel settled here? CODE ONE ONLY (651) YES 1 GO TO MOSTLY 2 Q.33
----------------------------- ------------------------------------ NO 3 - SKIP TO Q.34
IF CODED 1 OR 2 AT Q.32Q.33 What is it about the job that makes you feel settled here?
_________________________________________________________ (652) (653)
_________________________________________________________
(654) (655)
_________________________________________________________
(656) (657)
IF YES AT Q.32 GO TO Q.42 IF CODED 2 OR 3 AT Q.32Q.34 Are you thinking of leaving this job? (658) YES 1 - GO TO Q.35
----------------------------- ------------------------------------ NO 2 - SKIP TO Q.42
IF YES TO Q.34Q.35 Why are you thinking of leaving? PROBE FOR PARTICULAR ASPECTS OF THE JOB THAT ARE DISLIKED
_________________________________________________________ (659) (660)
_________________________________________________________
(661) (662)
IF PREGNANT OR PLANNING PREGNANCY AT Q.35Q.36 Are you planning to take maternity leave and return to work, or to leave
altogether? (663) MATERNITY LEAVE + RETURN 1 GO TO NOT COMING BACK 2 Q42

IF YES TO Q.34Q.37 If you leave this job what will you do next? CODE ONE ONLY (664) OTHER CHILDCARE JOB 1 - GO TO Q.38
----------------------------- ------------------------------------ OTHER JOB NOT CHILDCARE 2 TRAVEL 3 SKIP TO Q.39 MOVING AREA 4
----------------------------- ------------------------------------ STUDY 5 - SKIP TO Q.40
----------------------------- ------------------------------------ OTHER (WRITE IN) 6 SKIP TO Q.42
_______________________________________
DON’T KNOW 7
IF CODED 1 AT Q.37Q.38 What would make another childcare job better than the current job?
_________________________________________________________ (665) (666)
_________________________________________________________
(667) (668)
GO TO Q.42 IF CODED 2, 3 OR 4 AT Q.37Q.39 Why are you thinking of leaving childcare altogether?
_________________________________________________________ (669) (670)
_________________________________________________________
(671) (672)
Q.40 What do you think you will do instead of working in childcare?
_________________________________________________________ (673) (674)
_________________________________________________________
(675) (676)
GO TO Q42 IF CODED 5 AT Q.37Q.41 Can you give the title of the qualification?
_________________________________________________________ (677) (678)
(679-680) BLANK

START CARD 07 (706-707)
ASK ALL Q.42 Thinking ahead five years, what type of setting do you think you will be
working in? CODE ONE ONLY (708) DAY NURSERY (THIS OR ANOTHER NURSERY) 1 CHILDMINDING/NANNYING 2 PUBLIC SECTOR NURSERY OR FAMILY CENTRE 3 SCHOOL 4 OTHER - CHILDCARE (WRITE IN) 5
_________________________________________________________ (709) (710)
OTHER NOT CHILDCARE (WRITE IN) 6 - GO TO Q.43
_________________________________________________________ (711) (712)
NOT WORKING 7 – GO TO Q.43 DON’T KNOW 8 - SKIP TO Q.44
IF CODED 6 or 7 AT Q.42Q.43 Can you say why you think you will not be working in childcare in five
years time?
_________________________________________________________ (713) (714)
_________________________________________________________
(715) (716)
_________________________________________________________
(717) (718)
GO TO Q.50 IF CODED 1, 2, 3, 4, 5 OR 7 AT Q.42Q.44 Thinking about five years ahead, do you think you will be promoted or be
running your own business? CODE ONE ONLY (719) PROMOTED 1 RUNNING OWN BUSINESS 2 NEITHER 3
ASK ALL Q.45 Again thinking five years ahead, do you think you will be working full-time
or part-time? CODE ONE ONLY (720) FULL-TIME 1 PART-TIME 2 DON’T KNOW 3
Q.46 Would you consider gaining further qualifications in the following areas in the next five years? READ OUT. CODE ALL THAT APPLY
Childcare 1 (721) Education 1 (722) Management 1 (723) Other (PLEASE SPECIFY) 1 (724)
_________________________________________________________ (725) (726)
NONE 5 - GO TO Q.47
SKIP TO
SKIP TO Q.44

IF CODED 5 AT Q.46Q.47 Can you say why you would not consider study for any further
qualifications?
_________________________________________________________ (727) (728)
_________________________________________________________
(729) (730)
_________________________________________________________
(731) (732)
ASK ALL Q.48 If course fees for childcare and related qualifications were paid for, do
you think you would be more or less likely to undertake further study, or would it not make any difference? CODE ONE ONLY
(733) MORE LIKELY 1 LESS LIKELY 2 NOT MAKE ANY DIFFERENCE 3
Q.49a Thinking ahead to the next few years, do you expect to have time away
from employment for family or caring reasons? (734) YES 1 - GO TO Q.49b
----------------------------- ------------------------------------ NO 2 - SKIP TO Q.50
IF YES TO Q.49aQ.49b Do you think this will be for …? CODE ALL THAT APPLY (735) CHILDREN 1 ELDER OR DISABLED RELATIVES 2 BOTH 3 OTHER (WRITE IN) 4
_________________________________________________________ (736) (737)
In this last section, we would like to ask some questions about you. ASK ALL Q.50 Could you tell me your age?
(738-739)

Q.51 SHOW CARD 6 How would you describe your ethnic background? CODE ONE ONLY (740) WHITE 1 BLACK CARIBBEAN 2 BLACK AFRICAN 3 BLACK OTHER 4 INDIAN 5 PAKISTANI 6 BANGLADESHI 7 CHINESE 8 OTHER (WRITE IN) 9
_________________________________________________________ (741) (742)
Q.52a Do you have any children of your own? (743) YES 1 - GO TO Q.52b
----------------------------- ------------------------------------ NO 2 - SKIP TO Q.56
IF YES TO Q.52aQ.52b Can you tell me their ages? USE LEADING ZEROS
FIRST CHILD (744-745)
SECOND CHILD (746-747)
THIRD CHILD (748-749)
FOURTH CHILD (750-751)
FIFTH CHILD (752-753)
IF RESPONDENT HAS ANY CHILDREN AGED UNDER FIVE Q.53 Are you entitled to free or subsidised childcare places in the nursery
where you work? (754) YES 1 - GO TO Q.54
----------------------------- ------------------------------------ NO 2 - SKIP TO Q.55
IF YES TO Q.53Q.54 Do you use this benefit? (755) YES 1 - SKIP TO Q.56
----------------------------- ------------------------------------ NO 2 - GO TO Q.55

IF NO TO Q.54Q.55 Can you say why not?
_________________________________________________________ (756) (757)
_________________________________________________________
(758) (759)
ASK ALL Q.56 Are you registered disabled? (760) YES 1 NO 2
Q.57 What household arrangement best describes your position? READ OUT.
CODE ONE ONLY (761) Live alone 1 Live in shared household 2 Live with a partner 3 Live with a partner and children 4 Live with children 5 Live with relatives (other than above) 6 Other (WRITE IN) 7
_________________________________________________________ (762) (763)
Q.58 Can you tell me approximately how much you are paid before tax? USE LEADING ZEROS
£ (764-769)
Is that per week or per month or per year? CODE ONLY ONLY (770) WEEK 1 MONTH 2 YEAR 3
Q.59 Do you belong to a trade union or any professional childcare or early
childhood organisation? (e.g., UNISON, PANN, NCB, DCT etc) (771) YES 1 NO 2
Q.60 PLEASE NOTE GENDER OF RESPONDENT (772) MALE 1 FEMALE 2

Q.61a One of the aims of the project is to establish the turnover of staff in the childcare workforce. Would it be possible to telephone you in about 12 months time to see what you are doing?
(773) YES 1 NO 2
(774-780) BLANK
IF YES AT Q.61aQ.61b Can you give me your name? Which ’phone number is the best one to contact you on? ___________________________________________________(HOME) Is there an alternative ‘phone number we could record, in case you
move? __________________________________________________________
THANK YOU VERY MUCH FOR YOUR HELP AND TIME

THOMAS CORAM RESEARCH UNIT
STAFFING STUDY - ENTRY RETENTION AND LOSS
SURVEY OF NURSERY STAFF
Self completion questionnaire
We would be very grateful if you could spend a few minutes completing this short
questionnaire.
As we said in the interview, we want to find out how people come into childcare work,
and what helps people stay in or leave the work. The questions are about your approach
to work and most of them can be answered very quickly by circling a number. Your
replies will remain entirely confidential. Neither your name nor the organisation you
work for will be revealed through this research.
Please ensure you return the questionnaire to the researcher before they leave today.
Nursery number___________
Staff number ___________

144
A. Your satisfaction with aspects of your job
The following statements are about different aspects of your job. For each statement please
circle the number that most closely matches your satisfaction with your job. There are no right
or wrong answers, but your opinions are very valuable to us.
dissatisfied satisfied
Extremely very moderately not sure moderately very extremely
1. The physical conditions in which you work 1 2 3 4 5 6 7
2. Freedom to choose own working methods 1 2 3 4 5 6 7
3. Your fellow workers 1 2 3 4 5 6 7
4. The recognition you get for good work 1 2 3 4 5 6 7
5. Your immediate boss 1 2 3 4 5 6 7
6. The amount of responsibility you are given 1 2 3 4 5 6 7
7. Your rate of pay 1 2 3 4 5 6 7
8. Your opportunity to use your abilities 1 2 3 4 5 6 7
9. Relations between management and staff 1 2 3 4 5 6 7
10. Your chance of promotion 1 2 3 4 5 6 7
11. The way you are managed 1 2 3 4 5 6 7
12. The attention paid to suggestions you make 1 2 3 4 5 6 7
13. The hours of work 1 2 3 4 5 6 7
14. The amount of variety in your job 1 2 3 4 5 6 7
15. Your job security. 1 2 3 4 5 6 7

dissatisfied satisfied
Extremely very moderately not sure moderately very extremely
16. Opportunities for training and study 1 2 3 4 5 6 7
17. Amount of stress arising from work 1 2 3 4 5 6 7
18. Increases in pay 1 2 3 4 5 6 7
19. The job suiting your lifestyle 1 2 3 4 5 6 7
20. The activity of looking after children 1 2 3 4 5 6 7
B. These questions are about your approach to your current workplace
Please circle the number that most closely matches your view about each statement. 1
indicates you strongly agree with the statement and 5 indicates you strongly disagree with the
statement
Agree Disagree
Strongly Strongly
1. I feel very committed to this place 1 2 3 4 5
2. I put a lot of effort into my work 1 2 3 4 5
3. I don=t really care what happens to this place
after I leave 1 2 3 4 5
4. It would be difficult for me to find another job
as good as this one 1 2 3 4 5
5. It=s hard to feel committed to this place 1 2 3 4 5
6. I sometimes feel trapped in this job 1 2 3 4 5
THANKYOU VERY MUCH FOR YOUR HELP

Appendix 4 Childcare and early education qualifications held by more than 5% of respondents Heads of nurseries and other staff; numbers and percent
Heads Other staff Qualification held
N % N %
CACHE Diploma in nursery nursing/ childcare and education
135 53.8 616 34
BTEC/EdExcel Diploma in early years
- - 151 8.3
S/NVQ Level 3 childcare and early years
21 8.4 168 9.3
S/NVQ Level 2 childcare and early years
- - 234 13.0
PLA/PPA Foundation/Diploma 19 7.6 - -
Teaching – infant/early years 18 7.2 - -
CACHE advanced diploma 13 5.2 - -
NVQ assessor (management qualification) 52 20.7 - -
None 44 17.5 540 29.9
39 other qualifications
124 49.4 553 30.6
No. of staff holding more than one qualification
114 45.4 369 20.4
Total 251 100 1809 100
146

Appendix 5 Qualifications held grouped by level. There is no Level 1 in the childcare and early years field. Level 2. • CACHE certificate in child care and early education • S/NVQ childcare level 2 • PLA/PPA foundation • PLA/PPA basic/introductory • NAMCW certificate in nursery management skills • ABC playwork with children • City and Guilds progression award in early years care and education • City and Guilds progression award in playwork • City and Guilds family work • City and Guilds childcare • National Centre for Playwork Education Take ten for play • BTEC Caring Level 3. • CACHE/NNEB diploma in nursery nursing/childhood studies/child care and education • BTEC/EdExcel Diploma in childhood studies • BTEC/EdExcel Certificate in childhood studies • S/NVQ level 3 • NAMCW advanced certificate • NAMCW diploma in nursery nursing • Montessori teaching certificate • HighScope Implementation certificate • NOCN Advanced baby practitioner award • Early years curriculum • PLA diploma in preschool practice Level 4/5 • CACHE advanced diploma in childcare and education • S/NVQ level 4 • Teaching certificate/B.Ed for infants or early years • Professional social work qualifications (e.g., CQSW/CSS/Diploma in Social Work) • Paediatric nursing • Certificate in post-qualifying studies • Diploma in post qualifying studies • HNC early childhood Others • NVQ assessor • City and Guilds 7307 • Special needs • First aid certificate
147