Time and money explain social class differences in students’ social integration at university.
16
Social Class and Social Integration at University 1 Time and Money Explain Social Class Differences in Students’ Social Integration at University Mark Rubin 1 and Chrysalis Wright 2 1 The University of Newcastle, Australia 2 University of Central Florida Citation: Rubin, M., & Wright, C. L. (2017). Time and money explain social class differences in students’ social integration at university. Studies in Higher Education, 42, 315-330. doi: 10.1080/03075079.2015.1045481 Abstract Working-class students tend to be less socially integrated at university than middle-class students (Rubin, 2012a). The present research investigated two potential reasons for this working-class social exclusion effect. First, working-class students may have fewer finances available to participate in social activities. Second, working-class students tend to be older than middle-class students and, consequently, they are likely to have more work and/or childcare commitments. These additional commitments may prevent them from attending campus which, in turn, reduces their opportunity for social integration. These predictions were confirmed among undergraduate students at an Australian university (N = 433) and a USA university (N = 416). Strategies for increasing working-class students’ social integration at university are discussed. Keywords: first-generation students; social class; social inclusion; social integration; socioeconomic status Copyright © The Author. OPEN ACCESS: This material is published under the terms of the Creative Commons Attribution-NonCommercial-NoDerivatives 4.0 International licence (CC BY-NC-ND 4.0; https://creativecommons.org/licenses/by- nc-nd/4.0/). This licence permits you to copy and redistribute this material in any medium or format for noncommerical purposes without remixing, transforming, or building on the material provided that proper attribution to the authors is given. This self-archived article is provided for non-commercial and scholarly purposes only. Please note that, in an earlier published version of this document, the sign for the association between social class and satisfaction with finances for socializing in Figures 1 and 2 was incorrect. It was indicated as negative, but it should have been positive. This error may have occurred due to a change in the way in which the satisfaction with their finances variable was coded. It does not occur for any of the other associations with satisfaction with finances in Figures 1 or 2, and it does not occur in Tables 1 or 2. Furthermore, the error does not alter the substantive hypotheses or conclusions in the article. In particular, it remain s correct that “working-class students tended to be less satisfied with their finances and, consequently, less socially integrated at university.” The error has been corrected in Figures 1 and 2 of the current document, and a correction has been issued for the version that is published in Studies in Higher Education. Correspondence concerning this article should be addressed to Mark Rubin at the School of Psychology, Behavioural Sciences Building, The University of Newcastle, Callaghan, NSW 2308, Australia. Tel: +61 (0)2 4921 6706. Fax: +61 (0)2 4921 6980. E-mail: [email protected] Web: http://bit.ly/QgpV4O
-
Upload
newcastle-au -
Category
Documents
-
view
2 -
download
0
Transcript of Time and money explain social class differences in students’ social integration at university.
Social Class and Social Integration at University 1
Time and Money Explain Social Class Differences in
Students’ Social Integration at University
Mark Rubin1 and Chrysalis Wright2
1The University of Newcastle, Australia 2 University of Central Florida
Citation: Rubin, M., & Wright, C. L. (2017). Time and money explain social class differences in students’ social
integration at university. Studies in Higher Education, 42, 315-330. doi: 10.1080/03075079.2015.1045481
Abstract
Working-class students tend to be less socially integrated at university than middle-class
students (Rubin, 2012a). The present research investigated two potential reasons for this
working-class social exclusion effect. First, working-class students may have fewer finances
available to participate in social activities. Second, working-class students tend to be older
than middle-class students and, consequently, they are likely to have more work and/or
childcare commitments. These additional commitments may prevent them from attending
campus which, in turn, reduces their opportunity for social integration. These predictions
were confirmed among undergraduate students at an Australian university (N = 433) and a
USA university (N = 416). Strategies for increasing working-class students’ social
integration at university are discussed.
Keywords: first-generation students; social class; social inclusion; social integration;
socioeconomic status
Copyright © The Author. OPEN ACCESS: This material is published under the terms
of the Creative Commons Attribution-NonCommercial-NoDerivatives 4.0
International licence (CC BY-NC-ND 4.0; https://creativecommons.org/licenses/by-
nc-nd/4.0/). This licence permits you to copy and redistribute this material in any
medium or format for noncommerical purposes without remixing, transforming, or
building on the material provided that proper attribution to the authors is given.
This self-archived article is provided for non-commercial and scholarly purposes only.
Please note that, in an earlier published version of this document, the sign for the association between
social class and satisfaction with finances for socializing in Figures 1 and 2 was incorrect. It was indicated as
negative, but it should have been positive. This error may have occurred due to a change in the way in which the
satisfaction with their finances variable was coded. It does not occur for any of the other associations with
satisfaction with finances in Figures 1 or 2, and it does not occur in Tables 1 or 2. Furthermore, the error does not
alter the substantive hypotheses or conclusions in the article. In particular, it remains correct that “working-class
students tended to be less satisfied with their finances and, consequently, less socially integrated at university.” The
error has been corrected in Figures 1 and 2 of the current document, and a correction has been issued for the version
that is published in Studies in Higher Education.
Correspondence concerning this article should be addressed to Mark Rubin at the School of Psychology,
Behavioural Sciences Building, The University of Newcastle, Callaghan, NSW 2308, Australia. Tel: +61 (0)2 4921
6706. Fax: +61 (0)2 4921 6980. E-mail: [email protected] Web: http://bit.ly/QgpV4O
Social Class and Social Integration at University 2
Research conducted in the USA and Australia has found that working-class students tend
to be less socially integrated at university than middle-class students (for recent evidence, see
Langhout, Drake, & Rosselli, 2009; Martin, 2012; Ostrove & Long, 2007; Rubin & Wright, in
press; Soria, Stebleton, & Huesman, 2013; Stuber, 2009; for meta-analyses, see Robbins, Le,
Davis, Lauver, Langley, & Carlstrom, 2004; Rubin, 2012a). For example, in a recent meta-
analysis of 35 studies that sampled over 62,000 students, Rubin (2012a) found that working-class
students participated in fewer formal activities (e.g., campus-based clubs, societies, and
organizations) and fewer informal social activities (e.g., number of friends on campus, dates,
parties, nonclassroom conversations). They also felt less of a sense of belonging to their
institutions.
This social class difference in social integration at university is important because it relates
to social class differences in academic outcomes. Compared to middle-class students, working-
class students are less likely to be academically engaged (e.g., Martinez, Sher, Krull, & Wood,
2009; Nuñez & Cuccaro-Alamin, 1998; Soria, 2012), less likely to obtain good grades and develop
intellectually (e.g., Robbins, Allen, Casillas, Peterson, & Le, 2006; for a meta-analysis, see
Robbins et al., 2004), less likely to stay enrolled in their courses and complete their degrees (e.g.,
Inman & Mayes, 1999; Robbins et al., 2006; for a meta-analysis, see Robbins et al., 2004), and
less likely to be satisfied with their university experience (Martin, 2012).
Social integration provides a potential remedy for these social class differences. Social
integration is beneficial for students’ academic performance, persistence and retention (for meta-
analyses, see Napoli & Wortman, 1996; Robbins et al., 2004; for narrative reviews, see
McConnell, 2000; Pascarella & Terenzini, 1991, 2005; Tripp, 1997). It leads to better learning,
cognitive growth, critical thinking, and personal and moral development (for reviews, see Gellin,
2003; Hernandez, Hogan, Hathaway, & Lovell, 1999; McConnell, 2000; Moore, Lovell, McGann,
& Wyrick, 1998; Pascarella & Terenzini, 1991, 2005). It also leads to greater satisfaction with the
university experience (Martin, 2012) and changes in students’ attitudes and behaviours that
improve their employment prospects (e.g., Moore et al., 1998, p. 8; Stuber, 2009, p. 880).
Given that social integration leads to better academic outcomes, and given that working-
class students tend to lack social integration, a potentially important means of improving working-
class students’ academic outcomes is to increase their social integration at university (Rubin,
2012b). Consistent with this view, Ostrove and Long (2007) found that sense of belonging at
college mediated the relation between social class and academic adjustment.
However, before we attempt to improve working-class students’ social integration at
university, we first need to understand why they tend to lack this integration. It is only after we
have a clear understanding about the reasons for this lack of integration that we will be in a position
to develop evidence-based interventions that address this issue. The present research investigated
two potential reasons for social class differences in social integration at university: time and
money.
Time and Money as Mediators of Social Class Differences in Social Integration
Rubin and Wright (in press) recently found that age differences help to explain social class
differences in students’ friendships at university. Following Rubin (2012a), these researchers
assumed that older students tend to have less time than younger students to develop friendships
because they spend more time engaged in other commitments. However, Rubin and Wright did
not provide direct evidence of this age difference in time commitments, and they assessed student
friendships rather than social integration more generally.
Social Class and Social Integration at University 3
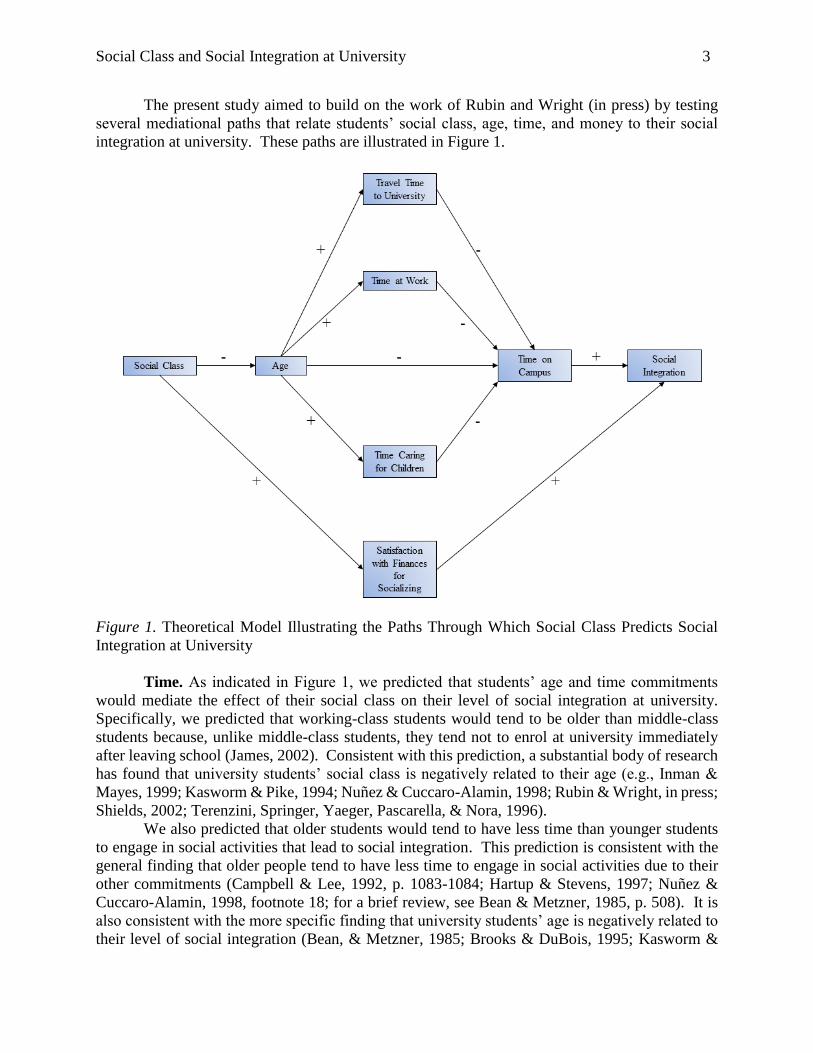
The present study aimed to build on the work of Rubin and Wright (in press) by testing
several mediational paths that relate students’ social class, age, time, and money to their social
integration at university. These paths are illustrated in Figure 1.
Figure 1. Theoretical Model Illustrating the Paths Through Which Social Class Predicts Social
Integration at University
Time. As indicated in Figure 1, we predicted that students’ age and time commitments
would mediate the effect of their social class on their level of social integration at university.
Specifically, we predicted that working-class students would tend to be older than middle-class
students because, unlike middle-class students, they tend not to enrol at university immediately
after leaving school (James, 2002). Consistent with this prediction, a substantial body of research
has found that university students’ social class is negatively related to their age (e.g., Inman &
Mayes, 1999; Kasworm & Pike, 1994; Nuñez & Cuccaro-Alamin, 1998; Rubin & Wright, in press;
Shields, 2002; Terenzini, Springer, Yaeger, Pascarella, & Nora, 1996).
We also predicted that older students would tend to have less time than younger students
to engage in social activities that lead to social integration. This prediction is consistent with the
general finding that older people tend to have less time to engage in social activities due to their
other commitments (Campbell & Lee, 1992, p. 1083-1084; Hartup & Stevens, 1997; Nuñez &
Cuccaro-Alamin, 1998, footnote 18; for a brief review, see Bean & Metzner, 1985, p. 508). It is
also consistent with the more specific finding that university students’ age is negatively related to
their level of social integration (Bean, & Metzner, 1985; Brooks & DuBois, 1995; Kasworm &
Social Class and Social Integration at University 4
Pike, 1994; Lundberg, 2003; Napoli & Wortman, 1998; Rubin & Wright, in press; for a review,
see Kasworm & Pike, 1994).
Finally, we predicted that older students would tend to have less time than younger, more
middle-class students to engage in social activities at university because they have more paid work
and childcare commitments. These additional commitments were expected to limit the amount of
time that students spend on campus which, in turn, was expected to limit the opportunity to engage
in social activities. Consistent with these predictions, previous research has found that older and
working-class students tend to spend more time working for pay in off-campus jobs (Astin, 1993;
Inman & Mayes, 1999; Kuh, Gonyea, and Palmer, 2001; Martinez et al., 2009; Nuñez, & Cuccaro-
Alamin, 1998; Shields, 2002; Soria et al., 2013; Stuber, 2009; Terenzini et al., 1996), and working
for pay limits the amount of time that students have available to socialize (Manthei & Gilmore,
2005; Moreau & Leathwood, 2006). In addition, some research suggests that working-class
students tend to have more dependent children than middle-class students (Terenzini et al., 1996),
and that they tend to spend more time looking after their siblings, children, or other people’s
children (e.g., Hurtado et al., 2007; Kuh et al., 2001).
We also expected that older students would tend to live further from university due to less
flexible accommodation arrangements with their families and, consequently, that they would tend
to have a longer commute to university. Again, travel time to university was expected to be
negatively related to time spent on campus and, consequently, to social integration. Consistent
with this prediction, Kuh et al. (2001) found that older and working-class students were more likely
to drive to university, rather than to walk to their campus or to live on campus, and that people
who drove to university tended to be less socially and academically engaged at university (see also
Bean & Metzner, 1985, p. 508).
Money. We also predicted that satisfaction with finances for socializing would mediate the
effect of students’ social class on their level of social integration. Specifically, working-class
students should be less satisfied with their finances and, consequently, less likely to engage in
social activities at university because social activities often cost money (e.g., society membership
fees, social events, on-campus drinks and meals; e.g., Bean, 1985; Cabrera, Nora, & Castañeda,
1992; Martin, 2012; Stuber, 2009, p. 895). Consistent with this possibility, students’ concerns
about finances are negatively related to their sense of belonging and contact with other students
(Bean, 1985; Hefner & Eisenberg, 2009; Hurtado et al., 2007). In addition, the receipt of financial
aid is positively associated with social integration (Bean, 1985; Cabrera et al., 1992; Oliver,
Rodriguez, & Mickelson, 1985).
Method
Institutions
We tested our theoretical model with students who were recruited from two universities
that were located in different countries: Australia and the United States of America (USA). In
both countries, we selected large, multi-campus, non-elite, public universities that did not focus
solely on external or mixed-mode education and that had a good representation of working-class
students. We reasoned that if we found similar results at the Australian and USA universities, then
our results would be less likely to be limited to either university setting and more likely to be
generalizable across the university settings.
The Australian institution was a three- and four-year university in New South Wales. The
USA institution was a four-year university in Florida. The Australian university had fewer student
Social Class and Social Integration at University 5
enrolments (37,450) than the USA university (59,740) and a smaller student-to-faculty ratio
(Australian university: 21.84; USA university: 31.10).
Participants
Australian sample. Australian participants were undergraduate students who were
enrolled in first-year psychology courses that were optional for students who were enrolled in a
variety of different degrees. We collected data from 433 students (approximately 65% of the first-
year psychology population). However, 10 students declined their informed consent at the end of
the study and so were excluded from the data analysis. These exclusions left a total of 423
participants (minimum response rate of 97.69%) who had a mean age of 22.24 years (SD = 6.78),
ranging from 17 to 59 years. The sample contained 25.53% men (108 men, 315 women). This
gender imbalance is typical for psychology courses.
Based on the subjective measure of social class (see below for details), 20.09% of
participants described themselves as working-class, 10.87% as lower middle-class, 33.59% as
middle-class, 18.44% as upper middle-class, and .99% as upper-class. The remaining participants
did not respond to this question, or they indicated that they did not know their social class
(12.06%).
USA sample. Unlike the Australian sample, which only included freshmen, the USA
sample included freshmen (20.91%), sophomores (14.66%), juniors (31.97%), and seniors
(32.45%). However, this difference between Australian and USA samples was not expected to
have a significant effect on our results because Rubin’s (2012a) meta-analysis found that the size
of the relation between social class and social integration did not vary significantly between studies
that only sampled first-year students and studies that sampled students from other years or all years
of study.
The USA sample included data from 430 students (approximately 6.62% of the population
of 6,500 students who undertake research participation). However, 3 students withdrew from the
research partway through the survey, and 11 declined their informed consent at the end of the
study. These 14 participants were excluded from the data analysis, leaving a total of 416 students
(minimum response rate of 96.74%).
Similar to the Australian sample, the mean age of participants in the USA sample was 22.00
years (SD = 4.72) and ranged from 18 to 51 years. Most participants (57.5%) were enrolled in
science degrees, with the next highest percentage (10.6%) being enrolled in health and public affair
degrees. The sample contained 32.93% men (137 men, 279 women).
Based on the subjective measure of social class, 17.31% of participants described
themselves as working-class, 15.87% as lower middle-class, 33.17% as middle-class, 16.83% as
upper middle-class, and 1.44% as upper-class. The remaining participants did not respond to this
question, or they indicated that they did not know their social class (15.34%). This distribution of
social class categories was very similar to that for the Australian sample.
Combined sample. We conducted our analyses on the Australian and USA samples both
separately and combined. The combined sample consisted of 839 students (29.20% men; 245 men,
594 women) who had a mean age of 22.12 years (SD = 5.85), ranging from 17 to 59 years. Based
on the subjective measure of social class, 18.71% of participants described themselves as working-
class, 13.35% as lower middle-class, 35.40% as middle-class, 17.64% as upper middle-class, and
1.19% as upper-class.

Social Class and Social Integration at University 6
Procedure and Measures
At both universities, the study was advertised via an online research participant pool
system. Participation was voluntary, and participants were awarded course credit in exchange for
their participation.
The research instrument consisted of an online self-report survey that was titled “Social
Life at the University.” The modal time for participants to complete the survey was 8 minutes.
Social class. We included measures of social class at the end of the survey in order to
avoid cuing students to the relevance of this variable prior to their reports of social integration
(Langhout et al., 2009). Following previous research in this area, we assessed social class using
measures of parental education, income, and occupation as well as measures of self-identified
social class identity (for a review, see Rubin, 2012a).
Students indicated the highest education level of (a) their mother and (b) their father. We
used the following categories for the USA survey: no formal schooling, elementary school, middle
school (junior high school), high school (secondary education), university or college - but did not
graduate, university or college - graduated with an undergraduate degree (e.g., Bachelors),
university or college - graduated with a postgraduate degree (Masters or Phd), don’t know. In
the Australian survey, we adjusted these categories for the Australian context.
Students also indicated how they thought most people would rate the occupation of (a) their
mother and (b) their father in terms of its prestige and status on an 11-point scale anchored
extremely high status and prestige (11) and extremely low status and prestige (1), with a don’t
know option available. They also provided a subjective indication of their family income during
childhood using a 5-point scale anchored well above average (5) and well below average (1), with
a don’t know option available.
Finally, students completed three subjective measures of social class (e.g., Ostrove & Long,
2007; Soria et al., 2013; Rubin & Wright, in press; for a discussion, see Rubin, Denson, Kilpatrick,
Matthews, Stehlik, & Zyngier, 2014). Participants indicated the social class that they felt best
described (a) themselves, (b) their mother, and (c) their father using a 6-point scale: poor (1),
working class (2), lower middle-class (3), middle-class (4), upper middle-class (5), upper class
(6), with a don’t know option available.
Social integration. To measure the extent of social integration, we asked participants to
estimate the number of university friends who were important to their identity and sense of self
(e.g., Rubin & Wright, in press; Sandler, 2000). Participants also reported the number of friends
at university with whom they had communicated via face-to-face conversations, text messages, e-
mail, and phone during the last week (4 items). To measure interpersonal contact time, we asked
participants to report the number of hours per average week of the semester that they had socialized
with friends at university. Finally, to obtain a general assessment of the extent of social integration
at university, we asked participants to complete an adapted version of the 5-item Community
Participation subscale of Herro and Gracia’s (2007) Perceived Community Support Questionnaire
using a 7-point response scale (7 = strongly agree, 1 = strongly disagree).
We also included four measures of the quality of social integration at university (e.g.,
Langhout et al., 2009; Martinez et al., 2009; Sandler, 2000). Participants responded to these
quality measures using a 7-point Likert-type scale anchored strongly agree (7) and strongly
disagree (1).
Social Class and Social Integration at University 7
First, we included a single item that measured the closeness of students’ university
friendships: “I feel close to my friends at the university.” Second, we included an adapted version
of Rubin and Wright’s (in press) Relevance of University Friends to Identity scale (4 items). Third,
we included an adapted version of Hawthorne’s (2006) Friendship Scale (6 items). Finally, we
used a modified and extended version of Hurtado and Carter’s (1997) sense of belonging measure
(6 items). We randomized the order of presentation of the social integration measures and the
items within each measure for each participant. To view the specific items that we used in our
measures of social class and social integration, please see the online supplementary information
that is associated with this article.
Explanatory variables. We also included measures that were expected to explain the
relation between social class and social integration at university. We included a 2-item measure
that assessed participants’ satisfaction with their finances for socializing at university: “I can’t
afford to spend money on social activities at the university” (reverse scored), and “I have enough
money to go out with friends from the university.” We also included a set of items that asked
students to think about an average week during the semester and then to indicate approximately
how many hours in this average week they would normally engage in a number of activities,
including “work for pay (including travelling to and from work),” “look after your own children,
siblings, or someone else’s children (unpaid),” and “be at the university campus.” A single item
measured participants’ travel time to university: “Approximately how long does it take you to
travel from the place where you currently live to your campus’ student union?” Participants were
asked to give their responses in minutes rounded to the nearest 5 minutes. Single items were used
to assess participants’ accommodation arrangements, enrolment status, which campus they
attended most often, degree program, possession of scholarships and financial assistance, gender,
and age.
Data Reduction
The data for several variables were not normally distributed. In order to produce more
normal distributions, we used a log 10 transformation on these variables.
The degree of communication with friends items, Community Participation subscale,
Relevance of University Friends to Identity scale, Friendship Scale, sense of belonging scale, and
satisfaction with finances for socializing scale all had acceptable internal reliabilities in the
Australian sample (Cronbach αs = .66, .81, .91, .88, .92, & .83 respectively), the USA sample
(Cronbach αs = .79, .87, .94, .83, .92, & .76 respectively), and both samples combined (Cronbach
αs = .75, .84, .92, .86. .92, & .79 respectively). Consequently, we computed mean values for each
of these scales.
After conversion to z scores, the eight measures of social integration had a good mean
correlation with one another and good internal reliability in the Australian sample (r = .52;
Cronbach α = .89), the USA sample (r = .48; Cronbach α = .88), and both samples combined (r =
.49; Cronbach α = .88). Similarly, after conversion to z scores, the eight measures of social class
had a good mean correlation with one another and good internal reliability in the Australian sample
(r = .37; Cronbach α = .82), the USA sample (r = .37; Cronbach α = .82), and both samples
combined (r = .37; Cronbach α = .82). Consequently, we computed a composite measure of social
integration and a composite measure of social class based on the mean of the relevant z scores of
each separate index (for a similar approach, see Rubin & Wright, in press). Note that, we treated
Social Class and Social Integration at University 8
social class as a continuous variable in our analyses, rather than a categorical variable, because the
continuous variable approach has been shown to achieve greater statistical power (Sirin, 2005).
Results
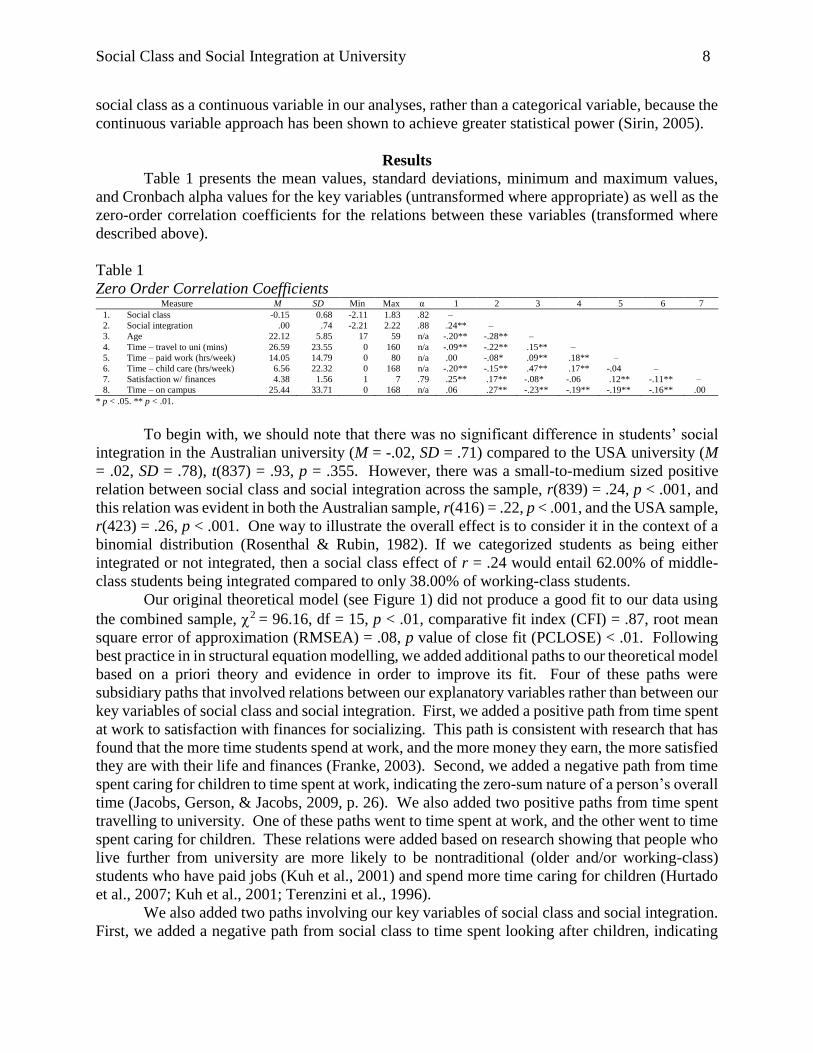
Table 1 presents the mean values, standard deviations, minimum and maximum values,
and Cronbach alpha values for the key variables (untransformed where appropriate) as well as the
zero-order correlation coefficients for the relations between these variables (transformed where
described above).
Table 1
Zero Order Correlation Coefficients Measure M SD Min Max α 1 2 3 4 5 6 7
1. Social class -0.15 0.68 -2.11 1.83 .82 –
2. Social integration .00 .74 -2.21 2.22 .88 .24** –
3. Age 22.12 5.85 17 59 n/a -.20** -.28** –
4. Time – travel to uni (mins) 26.59 23.55 0 160 n/a -.09** -.22** .15** –
5. Time – paid work (hrs/week) 14.05 14.79 0 80 n/a .00 -.08* .09** .18** –
6. Time – child care (hrs/week) 6.56 22.32 0 168 n/a -.20** -.15** .47** .17** -.04 –
7. Satisfaction w/ finances 4.38 1.56 1 7 .79 .25** .17** -.08* -.06 .12** -.11** –
8. Time – on campus 25.44 33.71 0 168 n/a .06 .27** -.23** -.19** -.19** -.16** .00
* p < .05. ** p < .01.
To begin with, we should note that there was no significant difference in students’ social
integration in the Australian university (M = -.02, SD = .71) compared to the USA university (M
= .02, SD = .78), t(837) = .93, p = .355. However, there was a small-to-medium sized positive
relation between social class and social integration across the sample, r(839) = .24, p < .001, and
this relation was evident in both the Australian sample, r(416) = .22, p < .001, and the USA sample,
r(423) = .26, p < .001. One way to illustrate the overall effect is to consider it in the context of a
binomial distribution (Rosenthal & Rubin, 1982). If we categorized students as being either
integrated or not integrated, then a social class effect of r = .24 would entail 62.00% of middle-
class students being integrated compared to only 38.00% of working-class students.
Our original theoretical model (see Figure 1) did not produce a good fit to our data using
the combined sample, 2 = 96.16, df = 15, p < .01, comparative fit index (CFI) = .87, root mean
square error of approximation (RMSEA) = .08, p value of close fit (PCLOSE) < .01. Following
best practice in in structural equation modelling, we added additional paths to our theoretical model
based on a priori theory and evidence in order to improve its fit. Four of these paths were
subsidiary paths that involved relations between our explanatory variables rather than between our
key variables of social class and social integration. First, we added a positive path from time spent
at work to satisfaction with finances for socializing. This path is consistent with research that has
found that the more time students spend at work, and the more money they earn, the more satisfied
they are with their life and finances (Franke, 2003). Second, we added a negative path from time
spent caring for children to time spent at work, indicating the zero-sum nature of a person’s overall
time (Jacobs, Gerson, & Jacobs, 2009, p. 26). We also added two positive paths from time spent
travelling to university. One of these paths went to time spent at work, and the other went to time
spent caring for children. These relations were added based on research showing that people who
live further from university are more likely to be nontraditional (older and/or working-class)
students who have paid jobs (Kuh et al., 2001) and spend more time caring for children (Hurtado
et al., 2007; Kuh et al., 2001; Terenzini et al., 1996).
We also added two paths involving our key variables of social class and social integration.
First, we added a negative path from social class to time spent looking after children, indicating
Social Class and Social Integration at University 9
that, regardless of their age, working-class students tended to spend more time looking after
children than middle-class students (e.g., Hurtado et al., 2007; Kuh et al., 2001). Second, we added
a negative path from time spent travelling to university to social integration, indicating that,
regardless of time spent on campus, social integration increases as time spent travelling to
university decreases. This additional path is appropriate given that social integration with
university peers can take place off campus as well as on campus (Henry, 2012), and the opportunity
for off-campus social integration increases as the travel time to the university decreases and the
density of local students increases (e.g., Daggett, Gutkowski, & Pe, 2003).
After the addition of the above six paths, the adjusted model had a good fit to the combined
data set, 2 = 11.11, df = 9, p = .27, CFI = 1.00, RMSEA = .02, PCLOSE = .98. Inspection of the
residuals and modification indices revealed no ill-fit in the model.
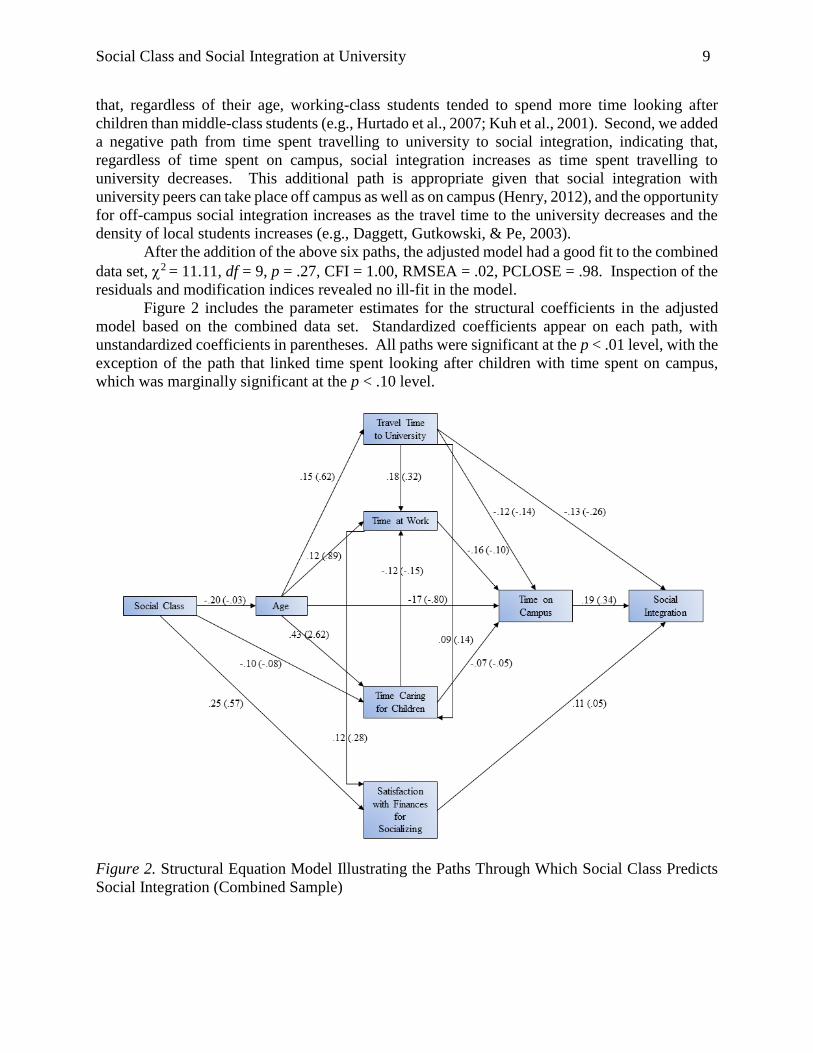
Figure 2 includes the parameter estimates for the structural coefficients in the adjusted
model based on the combined data set. Standardized coefficients appear on each path, with
unstandardized coefficients in parentheses. All paths were significant at the p < .01 level, with the
exception of the path that linked time spent looking after children with time spent on campus,
which was marginally significant at the p < .10 level.
Figure 2. Structural Equation Model Illustrating the Paths Through Which Social Class Predicts
Social Integration (Combined Sample)
Social Class and Social Integration at University 10
The adjusted model was a good-fitting model for the USA sample, 2 = 10.47, df = 9, p =
.31, CFI = 1.00, RMSEA = .02, PCLOSE = .87. However, the path from time spent caring for
children to time spent working for pay was not significant in this sample.
The adjusted model was also a good fit for the Australian sample, 2 = 15.55, df = 9, p =
.08, CFI = .98, RMSEA = .04, PCLOSE = .61. However, inspection of modification indices
revealed that model fit could be improved further by adding a path from social class to time spent
working for pay. Given that prior research has established that working-class students tend to
spend more time in paid work (Astin, 1993; Inman & Mayes, 1999; Kuh et al., 2001; Martinez et
al., 2009; Nuñez, & Cuccaro-Alamin, 1998; Shields, 2002; Soria et al., 2013; Stuber, 2009;
Terenzini et al., 1996), we added this path to the Australian model in order to improve model fit.
After this path was added, the fit of the model was improved, 2= 9.97, df = 8, p = .27, CFI = .99,
RMSEA = .02, PCLOSE = .82, and inspection of the residuals and modification indices revealed
no ill-fit in the model. However, the following paths were no longer significant: (a) social class to
time spent caring for children, (b) time spent caring for children to time spent on campus, (c)
student age to time spent travelling to university, and (d) time spent travelling to university to time
spent on campus.
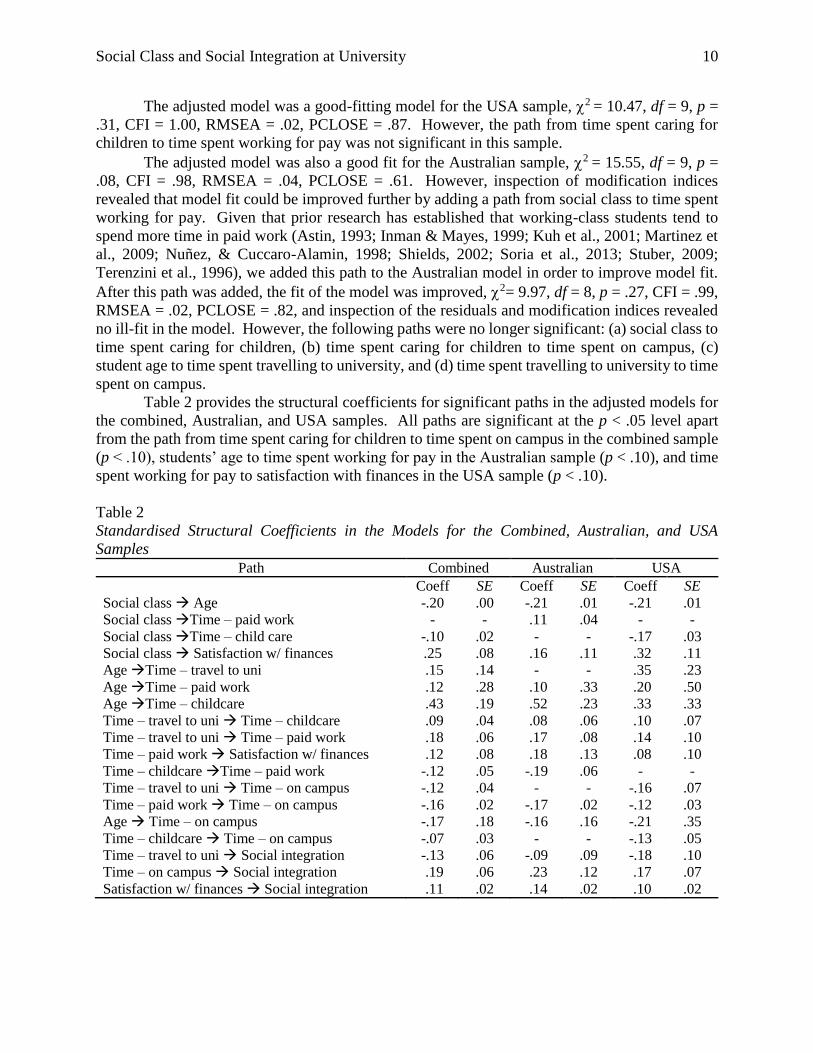
Table 2 provides the structural coefficients for significant paths in the adjusted models for
the combined, Australian, and USA samples. All paths are significant at the p < .05 level apart
from the path from time spent caring for children to time spent on campus in the combined sample
(p < .10), students’ age to time spent working for pay in the Australian sample (p < .10), and time
spent working for pay to satisfaction with finances in the USA sample (p < .10).
Table 2
Standardised Structural Coefficients in the Models for the Combined, Australian, and USA
Samples
Path Combined Australian USA
Coeff SE Coeff SE Coeff SE
Social class Age -.20 .00 -.21 .01 -.21 .01
Social class Time – paid work - - .11 .04 - -
Social class Time – child care -.10 .02 - - -.17 .03
Social class Satisfaction w/ finances .25 .08 .16 .11 .32 .11
Age Time – travel to uni .15 .14 - - .35 .23
Age Time – paid work .12 .28 .10 .33 .20 .50
Age Time – childcare .43 .19 .52 .23 .33 .33
Time – travel to uni Time – childcare .09 .04 .08 .06 .10 .07
Time – travel to uni Time – paid work .18 .06 .17 .08 .14 .10
Time – paid work Satisfaction w/ finances .12 .08 .18 .13 .08 .10
Time – childcare Time – paid work -.12 .05 -.19 .06 - -
Time – travel to uni Time – on campus -.12 .04 - - -.16 .07
Time – paid work Time – on campus -.16 .02 -.17 .02 -.12 .03
Age Time – on campus -.17 .18 -.16 .16 -.21 .35
Time – childcare Time – on campus -.07 .03 - - -.13 .05
Time – travel to uni Social integration -.13 .06 -.09 .09 -.18 .10
Time – on campus Social integration .19 .06 .23 .12 .17 .07
Satisfaction w/ finances Social integration .11 .02 .14 .02 .10 .02
Social Class and Social Integration at University 11
Discussion
As predicted, satisfaction with finances for socializing mediated the effect of students’
social class on their level of social integration. In particular, working-class students tended to be
less satisfied with their finances and, consequently, less socially integrated at university. In
addition, students’ age and time commitments mediated the effect of social class on social
integration. Working-class students tended to be older than middle-class students, older students
tended to have more paid work and childcare commitments and take longer to travel to university
than younger students, students with more of these commitments tended to spend less time on
campus, and students who spent less time on campus tended to be less socially integrated at
university. Hence, consistent with our theoretical model, working-class students tended to be
social excluded at university because they were both financially poor and time poor.
Differences Between the Australian and USA Samples
The above findings tended to hold true across the Australian and USA samples. However,
there were some notable differences between these samples.
First, social class predicted working for pay in the Australian sample but not in the USA
sample, and it predicted time spent caring for children in the USA sample but not in the Australian
sample. Speculatively, these differences may reflect a difference in cultural norms, with
Australian working-class norms being more associated with paid employment and American
working-class norms being more associated with childcare. What is important from the present
perspective is that working-class students from both countries spent more time than middle-class
students engaged in these activities, and that these time commitments were negatively related to
the time that they spent on campus and engaging in social activities with their peers.
Second, time spent caring for children and time spent travelling to university did not predict
time spent on campus in the Australian sample. These discrepancies may be due to local
differences in the availability of childcare facilities and convenient public transport between the
Australian and USA universities. For example, the Australian university had four on-campus
childcare centers, whereas the USA university had only one childcare center that was located at
the main campus.
Third, student age was not significantly related to time spent travelling to university in the
Australian sample, and time spent caring for children was not significantly related to time spent
working for pay in the USA sample. We are unclear about the reasons for these discrepancies.
Limitations and Future Research
An important limitation of the present research is that it used a cross-sectional correlational
research design. Consequently, we are unable to make definitive statements about the causal
direction of the relations that we identified.
A further limitation is that we restricted our investigation to two large, multi-campus, non-
elite, public universities that did not focus on external or mixed-mode education. Future research
should determine whether our findings are equally applicable to smaller, single-campus, elite, and
private universities as well as universities that employ more external or mixed-model forms of
education.
Finally, our two samples underrepresented men relative to their respective university
populations. In his meta-analysis, Rubin (2012a) found no evidence that gender moderates the
size of the relation between social class and social integration. Hence, we do not believe that this
gender imbalance represents a major threat to the validity of our findings. Nonetheless, future
Social Class and Social Integration at University 12
research should recruit more representative samples in order to ensure that its conclusions can be
appropriately generalized to both men and women.
Implications
The present research builds on recent qualitative research that has identified time and
money as salient constraints for mature-aged working-class students at university (Stone &
O'Shea, 2013). In particular, the present research highlights two key pathways along which
improvements in working-class students’ social integration may take place.
First, working-class students’ social exclusion at university is related to their dissatisfaction
with finances for socializing. An obvious remedy to this problem is for universities to subsidize
social integration opportunities in order to allow students who have less money to participate.
Certainly, previous research has found that financial aid can increase social integration (Bean,
1985; Cabrera et al., 1992, p. 585; Oliver et al., 1985, p. 12).
Second, working-class students’ tend to be older than middle-class students, and older
students tend to spend more time travelling to university, working for pay, and/or caring for
children. These time commitments prevent students from spending time on campus which, in turn,
reduces their opportunity for social integration. There are a number of complementary approaches
that may be used to address this second pathway. In order to reduce travel time, universities can
improve on-campus and close-to-campus family accommodation for older students who are more
likely to want to live with one or more family members (Rubin & Wright, in press). Universities
can also subsidize on-campus childcare facilities and implement affirmative action schemes that
facilitate the on-campus employment of working-class students. In addition, universities can foster
greater social integration within the classroom, allowing working-class students to combine their
social integration with their academic integration in a time-effective manner. Finally, universities
can develop online forms of social integration that do not require campus attendance (e.g., through
social media sites such as Facebook and Twitter).
In conclusion, the present research indicates that working-class students are less integrated
at Australian and USA universities because they lack both the time and the money that is necessary
to engage in social activities. Previous research has shown that this lack of social integration has
deleterious implications for working-class students’ academic outcomes. Future research should
explore interventions that are designed to improve working-class students’ social integration and
that take into account their time and money limitations.
References
Astin, A. W. (1993). What matters in college? Four critical years revisited. San Francisco, CA:
Jossey-Bass.
Bean, J. P. (1985). Interaction effects based on class level in an explanatory model of college
student dropout syndrome. American Educational Research Journal, 22, 35–64. doi:
10.3102/00028312022001035
Bean, J. P., & Metzner, B. S. (1985). A conceptual model of nontraditional undergraduate student
attrition. Review of Educational Research, 55, 485-540. doi: 10.3102/00346543055004485
Brooks, J. H., & DuBois, D. L. (1995). Individual and environmental predictors of adjustment
during the first year of college. Journal of College Student Development, 36, 347-360.
Cabrera, A. F., Nora, A., & Castañeda, M. B. (1992). The role of finances in the persistence
process: A structural model. Research in Higher Education, 33, 571-593. doi:
10.1007/BF00973759
Social Class and Social Integration at University 13
Campbell, K. E., & Lee, B. A. (1992). Sources of personal neighbor networks: Social integration,
need, or time? Social Forces, 70, 1077-1100. doi: 10.1093/sf/70.4.1077
Daggett, J., Gutkowski, A. R., & Pe, P. (2003, July). University transportation survey. In
Proceedings of the Transportation Research Board 82nd Annual Meeting. Washington, DC:
Peter Lang.
Franke, S. (2003). Studying and working: The busy lives of students with paid employment.
Statistics Canada – Canadian Social Trends.
Gellin, A. (2003). The effect of undergraduate student involvement on critical thinking: A meta-
analysis of the literature 1991-2000. Journal of College Student Development, 44, 746-762.
doi: 10.1353/csd.2003.0066
Hartup, W. W., & Stevens, N. (1997). Friendships and adaptation in the life course. Psychological
Bulletin, 121, 355-370. doi: 10.1037/0033-2909.121.3.355
Hawthorne, G. (2006). Measuring social isolation in older adults: Development and initial
validation of the friendship scale. Social Indicators Research, 77, 521-548. doi:
10.1007/s11205-005-7746-y
Hefner, J., & Eisenberg, D. (2009). Social support and mental health among college students.
American Journal of Orthopsychiatry, 79, 491-499. doi: 10.1037/a0016918
Henry, S. K. (2012). On social connection in university life. About CAmpuS, 16, 18-24. doi:
10.1002/abc.20083
Hernandez, K., Hogan, S., Hathaway, C., & Lovell, C. D. (1999). Analysis of the literature on the
impact of student involvement on student development and learning: More questions than
answers? NASPA Journal, 36, 184-197. doi: 10.2202/1949-6605.1082
Herro, J., & Gracia, E. (2007). Measuring perceived community support: Factorial structure,
longitudinal invariance, and predictive validity of the PCSQ (Perceived Community
Support Questionnaire). Journal of Community Psychology, 35, 197–217. doi:
10.1002/jcop.20143
Hurtado, S., & Carter, D. (1997). Effects of college transition and perceptions of the campus racial
climate on Latino college students’ sense of belonging. Sociology of Education, 70, 324-
345. doi: 10.2307/2673270
Hurtado, S., Han, J. C., Sáenz, V. B., Espinosa, L. L., Cabrera, N. L., & Cerna, O. S. (2007).
Predicting transition and adjustment to college: Biomedical and behavioral science
aspirants’ and minority students’ first year of college. Research in Higher Education, 48,
841-887. doi: 10.1007/s11162-007-9051-x
Inman, W. E., & Mayes, L. D. (1999). The importance of being first: Unique characteristics of
first-generation community college students. Community College Review, 26, 3-22. doi:
10.1177/009155219902600402
Jacobs, J. A., Gerson, K., & Jacobs, J. A. (2009). The time divide: Work, family, and gender
inequality. Cambridge, MA: Harvard University Press.
James, R. (2002). Socioeconomic background and higher education participation: An analysis of
school students’ aspirations and expectations. Canberra, ACT, Australia: Evaluations and
Investigations Programme of the Department of Education, Science and Training.
Retrieved from http://bit.ly/1nuV40P
Kasworm, C. E., & Pike, G. R. (1994). Adult undergraduate students: Evaluating the
appropriateness of a traditional model of academic performance. Research in Higher
Education, 35, 689-710. doi: 10.1007/BF02497082
Social Class and Social Integration at University 14
Kuh, G. D., Gonyea, R. M., & Palmer, M. (2001). The disengaged commuter student: Fact or
fiction. Commuter Perspectives, 27, 2-5.
Langhout, R. D., Drake, P., & Rosselli, F. (2009). Classism in the university setting: Examining
student antecedents and outcomes. Journal of Diversity in Higher Education, 2, 166-181.
doi: 10.1037/a0016209
Lundberg, C. A. (2003). The influence of time-limitations, faculty, and peer relationships on adult
student learning: A causal model. Journal of Higher Education, 74, 665-688.
Manthei, R. J., & Gilmore, A. (2005). The effect of paid employment on university students' lives.
Education+ Training, 47, 202-215. doi: 10.1108/00400910510592248
Martin, N. D. (2012). The privilege of ease: social class and campus life at highly selective, private
universities. Research in Higher Education, 53, 426-452. doi: 10.1007/s11162-011-9234-
3
Martinez, J. A., Sher, K. J., Krull, J. L., & Wood, P. K. (2009). Blue-collar scholars?: Mediators
and moderators of university attrition in first-generation college students. Journal of
College Student Development, 50, 87-103. doi: 10.1353/csd.0.0053
McConnell, P. J. (2000). ERIC review: What community colleges should do to assist first-
generation students. Community College Review, 28, 75-87. doi:
10.1177/009155210002800305
Moore, J., Lovell, C. D., McGann, T., & Wyrick, J. (1998). Why involvement matters: A review
of research on student involvement in the collegiate setting. College Student Affairs
Journal, 17, 4-17.
Moreau, M. P., & Leathwood, C. (2006). Balancing paid work and studies: Working (‐class)
students in higher education. Studies in Higher Education, 31, 23-42. doi:
10.1080/03075070500340135
Napoli, A. R., & Wortman, P. M. (1996). A meta-analysis of the impact of academic and social
integration on persistence of community college students. Journal of Applied Research in
the Community College, 4, 5-21.
Nuñez, A-. M., & Cuccaro-Alamin, S. (1998). First-generation students: Undergraduates whose
parents never enrolled in postsecondary education (Report No. NCES 98-082).
Washington, DC: US Department of Education, National Centre for Education Statistics.
Retrieved from http://1.usa.gov/Pf2YzQ
Oliver, M. L., Rodriguez, C. J., & Mickelson, R. A. (1985). Brown and Black in White: The social
adjustment and academic performance of Chicano and Black students in a predominantly
White university. The Urban Review, 17, 3-24. doi: 10.1007/BF01141631
Ostrove, J. M., & Long, S. M. (2007). Social class and belonging: Implications for college
adjustment. Review of Higher Education, 30, 363-389.
Pascarella, E. T., & Terenzini, P. T. (1991). How college affects students: Findings and insights
from twenty years of research. San Francisco, CA: Jossey-Bass.
Pascarella, E. T., & Terenzini, P. T. (2005). How college affects students volume 2: A third decade
of research. San Francisco, CA: Jossey-Bass.
Robbins, S. B., Allen, J., Casillas, A., Peterson, C. H., & Le, H. (2006). Unraveling the differential
effects of motivation and skills, social, and self-management measures from traditional
predictors of college outcomes. Journal of Educational Psychology, 98, 598-616. doi:
10.1037/0022-0663.98.3.598

Social Class and Social Integration at University 15
Robbins, S. B., Le, H., Davis, D., Lauver, K., Langley, R., & Carlstrom, A. (2004). Do
psychosocial and study skill factors predict college outcomes? A meta-analysis.
Psychological Bulletin, 130, 261-288. doi: 10.1037/0033-2909.130.2.261
Rosenthal, R., & Rubin, D. B. (1982). A simple, general purpose display of magnitude of
experimental effect. Journal of Educational Psychology, 74, 166-169. doi: 10.1037/0022-
0663.74.2.166
Rubin, M. (2012a). Social class differences in social integration among students in higher
education: A meta-analysis and recommendations for future research. Journal of Diversity
in Higher Education, 5, 22-38. doi: 10.1037/a0026162
Rubin, M. (2012b). Working-class students need more friends at university: A cautionary note for
Australia’s higher education equity initiative. Higher Education Research and
Development, 31, 431-433. doi: 10.1080/07294360.2012.689246
Rubin, M., Denson, N., Kilpatrick, S., Matthews, K. E., Stehlik, T., & Zyngier, D. (2014). “I am
working-class”: Subjective self-definition as a missing measure of social class and
socioeconomic status in higher education research. Educational Researcher, 43, 196-200.
doi: 10.3102/0013189X14528373
Rubin, M., & Wright, C. L. (in press). Age differences explain social class differences in students’
friendship at university: Implications for transition and retention. Higher Education. doi:
10.1007/s10734-014-9844-8
Sandler, M. E. (2000). Career decision-making self-efficacy, perceived stress, and an integrated
model of student persistence: A structural model of finances, attitudes, behavior, and career
development. Research in Higher Education, 41, 537–580. doi:
10.1023/A:1007032525530
Shields, N. (2002). Anticipatory socialization, adjustment to university life, and perceived stress:
Generational and sibling stress. Social Psychology of Education, 5, 365-392. doi:
10.1023/A:1020929822361
Sirin, S. R. (2005). Socioeconomic status and academic achievement: A meta-analytic review of
research. Review of Educational Research, 75, 417-453. doi:
10.3102/00346543075003417
Soria, K. M. (2012). Creating a successful transition for working-class first-year students. The
Journal of College Orientation and Transition, 20, 44-55.
Soria, K. M., Stebleton, M. J., & Huesman, R. L. (2013). Class counts: Exploring differences in
academic and social integration between working-class and middle/upper-class students at
large, public research universities. Journal of College Student Retention: Research, Theory
and Practice, 15, 215-242. doi: 10.2190/CS.15.2.e
Stone, C., & O'Shea, S. E. (2013). Time, money, leisure and guilt-the gendered challenges of
higher education for mature-age students. Australian Journal of Adult Learning, 53, 95-
116.
Stuber, J. M. (2009). Class, culture, and participation in the collegiate extra-curriculum.
Sociological Forum, 24, 877-900. doi: 10.1111/j.1573-7861.2009.01140.x
Terenzini, P. T., Springer, L., Yaeger, P. M., Pascarella, E. T., & Nora, A. (1996). First-generation
college students: Characteristics, experiences, and cognitive development. Research in
Higher Education, 37, 1-22. doi: 10.1007/BF01680039
Tripp, R. (1997). Greek organizations and student development: A review of the research. College
Student Affairs Journal, 16, 31-39.
Social Class and Social Integration at University 16
Funding
The authors declare no funding sources. Conflict of Interest
The authors declare no conflict of interest.